UNITED STATES
SECURITIES AND EXCHANGE COMMISSION
Washington, D.C. 20549
FORM N-CSR
CERTIFIED SHAREHOLDER REPORT OF REGISTERED
MANAGEMENT INVESTMENT COMPANIES
| Investment Company Act file number | 811-06247 | |||||
| AMERICAN CENTURY WORLD MUTUAL FUNDS, INC. | ||||||
| (Exact name of registrant as specified in charter) | ||||||
| 4500 MAIN STREET, KANSAS CITY, MISSOURI | 64111 | |||||
| (Address of principal executive offices) | (Zip Code) | |||||
CHARLES A. ETHERINGTON 4500 MAIN STREET, KANSAS CITY, MISSOURI 64111 | ||||||
| (Name and address of agent for service) | ||||||
| Registrant’s telephone number, including area code: | 816-531-5575 | |||||
| Date of fiscal year end: | 11-30 | |||||
| Date of reporting period: | 11-30-2011 | |||||
ITEM 1. REPORTS TO STOCKHOLDERS.
ANNUAL REPORT NOVEMBER 30, 2011


| Emerging Markets Fund |
| President’s Letter | 2 |
| Independent Chairman’s Letter | 3 |
| Market Perspective | 4 |
| Performance | 5 |
| Portfolio Commentary | 7 |
| Fund Characteristics | 9 |
| Shareholder Fee Example | 10 |
| Schedule of Investments | 12 |
| Statement of Assets and Liabilities | 15 |
| Statement of Operations | 16 |
| Statement of Changes in Net Assets | 17 |
| Notes to Financial Statements | 18 |
| Financial Highlights | 24 |
| Report of Independent Registered Public Accounting Firm | 26 |
| Management | 27 |
| Approval of Management Agreement | 30 |
| Additional Information | 35 |
Any opinions expressed in this report reflect those of the author as of the date of the report, and do not necessarily represent the opinions of American Century Investments® or any other person in the American Century Investments organization. Any such opinions are subject to change at any time based upon market or other conditions and American Century Investments disclaims any responsibility to update such opinions. These opinions may not be relied upon as investment advice and, because investment decisions made by American Century Investments funds are based on numerous factors, may not be relied upon as an indication of trading intent on behalf of any American Century Investments fund. Security examples are used for representational purposes only and are not intended as recommendations to purchase or sell securities. Performance information for comparative indices and securities is provided to American Century Investments by third party vendors. To the best of American Century Investments’ knowledge, such information is accurate at the time of printing.

Jonathan Thomas
Dear Investor:
Thank you for reviewing this annual report for the period ended November 30, 2011. Our report offers investment performance and portfolio information, presented with the expert perspective of our portfolio management team.
This report remains one of our most important vehicles for conveying information about fund returns, as well as market factors and strategies that affected fund performance. For additional, updated information, we encourage you to visit our website, americancentury.com. Click on the “Fund Performance” and “Insights & News” headings at the top of our Individual Investors site.
Reporting Period’s Divided Nature Resulted in Mixed Returns
The financial market performance that most U.S. investors experienced during the 12 months ended November 30, 2011 generally reflected the period’s divided nature. For the first six months, confidence in global economic growth, strong corporate earnings, and increased risk-taking generally ruled the markets. The MSCI EAFE Index and the S&P 500 Index advanced approximately 15% for the six months ended May 31, 2011, as stocks broadly outperformed high-quality bonds for that period.
However, the tables reversed sharply for the final six months. The risk-taking tide ebbed during the summer months, constrained by high fuel prices, federal budget management concerns in the U.S., and the worsening sovereign debt crisis in Europe. High-quality bonds, led by long-maturity U.S. Treasury securities, mostly outpaced stocks. The MSCI EAFE Index and the S&P 500 Index returned –16.56% and –6.25%, respectively, during the six months ended November 30, 2011, despite a significant market rebound in October.
As a result of this volatility, returns were mixed for the full 12-month period. U.S. and international bonds and U.S. stocks generally outperformed international stocks. The S&P 500 Index and the MSCI EAFE Index returned 7.83% and –4.12%, respectively, for the fiscal year.
Unfortunately, further volatility appears likely in 2012 as the markets wrestle with uncertainties regarding European debt, economic strength, government budget deficits, and the U.S. presidential election. We believe strongly in adhering to a disciplined, diversified, long-term investment approach during volatile periods, and we appreciate your continued trust in us during these unsettled times.
Sincerely,

Jonathan Thomas
President and Chief Executive Officer
American Century Investments
2

Dear Fellow Shareholders,
The board of directors of the fund was pleased at the announcement of a new strategic partner for the investment advisor to the American Century Investments funds. Canadian Imperial Bank of Commerce (CIBC), a leading Canadian financial institution, purchased the 41 percent economic interest in American Century Companies, the parent corporation of the advisor, previously held by JPMorgan Chase & Co. Based in Toronto, CIBC provides a full range of retail and wholesale banking services to almost 11 million clients through approximately 1,100 branches and offices in Canada, the U.S. and around the world. This transaction will benefit fund shareholders by bolstering the financial strength of the advisor and providing a strategic partner to help support its growth initiative to broaden non-U.S. distribution of its products and services.
The board also has been briefed throughout the year on the impact on fund performance of the European banking crisis, the U.S. deficit reduction debates, and the pace of economic growth. While the performance of all funds has been affected, the majority of American Century Investments funds overseen by the board are exceeding their benchmarks for the one-, three-, five-, and ten-year periods ended September 30, 2011. This is commendable performance, particularly in these challenging market conditions.
We are completing another year of board oversight on your behalf. We appreciate any comments you would like to share with the board. Send them to me at dhpratt@fundboardchair.com. Thank you for your continued investment in American Century Investments funds.
Best regards,

Don Pratt
3

By Mark Kopinski,
Chief Investment Officer, Global and Non-U.S. Equity
Stocks Struggled as Growth Slowed
Global stock markets kicked off the 12-month period in generally robust fashion, no easy feat considering investors had to weigh brightening economic outlooks against mounting inflationary pressures, ongoing sovereign debt concerns, and an onslaught of political unrest and natural disasters. Nevertheless, negative forces—primarily expanding sovereign debt problems in Europe and the United States—gradually tightened their hold on the worldwide economy, and market sentiment began to deteriorate. The downdraft culminated with a sharp global market selloff in the third calendar quarter of 2011, triggered primarily by Standard & Poor’s first-ever downgrade of the United States’ long-term credit rating and mounting fears of a default in Greece. Worried about the potential for another global recession, the International Monetary Fund (IMF) trimmed its global growth outlook for 2012.
Overall, emerging market stocks underperformed developed international markets for the 12-month period, as investors retreated from riskier investments. In addition, falling global growth prospects sparked stock slumps, particularly in export-heavy emerging-market economies of South Korea and China. Economic growth continued to moderate in China, but inflationary pressures continued to build, prompting IMF calls for China to allow its currency to appreciate to temper a surge in inflation.
Outlook Hinges on Fiscal Strategies
The period ended with the United States, Japan and China releasing relatively strong economic data, thereby diminishing concerns for a synchronized global recession. Yet, European Union countries continued to falter. As the eurozone crisis continues, global demand likely will decrease as a function of deleveraging, which should negatively influence export-driven markets. In addition, volatility in the financial markets may remain heightened, as investors react to European reform plans.
Ultimately, we believe the global economy can and will resume a strong growth trend. But to do so, each region and country will have to address its specific fiscal challenges. We believe these are solvable problems, as long as government policy supports the private sector and its role in driving economic output and employment based on the profit incentive.
| International Equity Total Returns | ||||
| For the 12 months ended November 30, 2011 (in U.S. dollars) | ||||
| MSCI EAFE Index | -4.12% | MSCI Europe Index | -2.08% | |
| MSCI EAFE Growth Index | -3.96% | MSCI World Index | 1.46% | |
| MSCI EAFE Value Index | -4.27% | MSCI Japan Index | -8.56% | |
| MSCI Emerging Markets Index | -11.54% | |||
4
| Total Returns as of November 30, 2011 | ||||||
| Average Annual Returns | ||||||
Ticker Symbol | 1 year | 5 years | 10 years | Since Inception | Inception Date | |
| Investor Class | TWMIX | -12.77% | -0.25% | 11.52% | 6.68% | 9/30/97 |
| MSCI Emerging Markets Growth Index | — | -12.60% | 1.68% | 12.99% | N/A(1) | — |
| Institutional Class | AMKIX | -12.60% | -0.04% | 11.72% | 10.91% | 1/28/99 |
A Class(2) No sales charge* With sales charge* | AEMMX | -13.00% -17.98% | -0.45% -1.62% | 11.24% 10.57% | 8.33% 7.82% | 5/12/99 |
| C Class | ACECX | -13.75% | -1.24% | — | 10.00% | 12/18/01 |
| R Class | AEMRX | -13.30% | — | — | -8.86% | 9/28/07 |
* | Sales charges include initial sales charges and contingent deferred sales charges (CDSCs), as applicable. A Class shares have a 5.75% maximum initial sales charge and may be subject to a maximum CDSC of 1.00%. C Class shares redeemed within 12 months of purchase are subject to a maximum CDSC of 1.00%. The SEC requires that mutual funds provide performance information net of maximum sales charges in all cases where charges could be applied. |
| (1) | Benchmark data first available 1/1/01. |
| (2) | Prior to September 4, 2007, the A Class was referred to as the Advisor Class and did not have a front-end sales charge. Performance prior to that date has been adjusted to reflect this charge. |
Data presented reflect past performance. Past performance is no guarantee of future results. Current performance may be higher or lower than the performance shown. Investment return and principal value will fluctuate, and redemption value may be more or less than original cost. To obtain performance data current to the most recent month end, please call 1-800-345-2021 or visit americancentury.com. International investing involves special risks, such as political instability and currency fluctuations. Investing in emerging markets may accentuate these risks.
Unless otherwise indicated, performance reflects Investor Class shares; performance for other share classes will vary due to differences in fee structure. For information about other share classes available, please consult the prospectus. Data assumes reinvestment of dividends and capital gains, and none of the charts reflect the deduction of taxes that a shareholder would pay on fund distributions or the redemption of fund shares. Returns for the index are provided for comparison. The fund’s total returns include operating expenses (such as transaction costs and management fees) that reduce returns, while the total returns of the index do not.
5
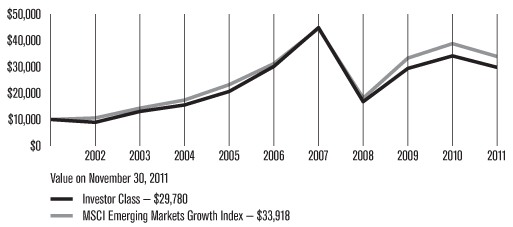
| Growth of $10,000 Over 10 Years |
| $10,000 investment made November 30, 2001 |
| Total Annual Fund Operating Expenses | ||||
| Investor Class | Institutional Class | A Class | C Class | R Class |
| 1.73% | 1.53% | 1.98% | 2.73% | 2.23% |
The total annual fund operating expenses shown is as stated in the fund’s prospectus current as of the date of this report. The prospectus may vary from the expense ratio shown elsewhere in this report because it is based on a different time period, includes acquired fund fees and expenses, and, if applicable, does not include fee waivers or expense reimbursements.
Data presented reflect past performance. Past performance is no guarantee of future results. Current performance may be higher or lower than the performance shown. Investment return and principal value will fluctuate, and redemption value may be more or less than original cost. To obtain performance data current to the most recent month end, please call 1-800-345-2021 or visit americancentury.com. International investing involves special risks, such as political instability and currency fluctuations. Investing in emerging markets may accentuate these risks.
Unless otherwise indicated, performance reflects Investor Class shares; performance for other share classes will vary due to differences in fee structure. For information about other share classes available, please consult the prospectus. Data assumes reinvestment of dividends and capital gains, and none of the charts reflect the deduction of taxes that a shareholder would pay on fund distributions or the redemption of fund shares. Returns for the index are provided for comparison. The fund’s total returns include operating expenses (such as transaction costs and management fees) that reduce returns, while the total returns of the index do not.
6
Performance Summary
Emerging Markets declined -12.77%* for the 12 months ended November 30, 2011, compared with its benchmark, the MSCI Emerging Markets Growth Index, which declined -12.60%.
Global stocks generally struggled during the 12-month period, as investors grappled with the ongoing and expanding sovereign debt problems in several developed nations. Mounting inflationary pressures in China and other emerging markets, combined with fears that a global economic slowdown would stifle demand for their goods, drove down stocks in the developing world. Emerging market stocks sharply underperformed their developed market counterparts.
The portfolio narrowly underperformed its benchmark for the period, with stock selection in the consumer discretionary, consumer staples, and utilities sectors slightly offsetting favorable stock selection in the industrials, information technology, and energy sectors. Overall, our sector allocations were slightly positive.
India was Leading Detractor
Weak stock selection hurt relative performance in India, which was the portfolio’s largest performance detractor on a regional basis. A portfolio-only position in ICICI Bank, the nation’s largest private lender, was among the top individual detractors. An aggressive rate-tightening policy by the central bank (13 rate increases since March 2010) to tame inflation pushed interest rates in India to their highest level since the global financial crisis in 2008. Despite relatively healthy performance from the bank, including better-than-expected profitability in the second quarter, investors worried that higher rates would stifle loan demand and trigger defaults. In addition, ratings agency Moody’s Investor Service downgraded its outlook for India’s banking system, due to concerns about slowing growth in India and overseas hurting asset quality, capitalization, and profitability.
Another prominent detractor included India-based drug company Aurobindo Pharma, a portfolio-only holding that plummeted after the U.S. Food and Drug Administration banned the import of drugs produced at one of the company’s manufacturing plants. The facility primarily produces a series of antibiotics known as cephalosporins. The stock recovered somewhat after U.S. drug giant Pfizer agreed to market some of Aurobindo Pharma’s products in the United States and Europe.
Other leading detractors from a regional perspective included South Africa, where stock selection dragged down results, and Malaysia, where an underweight and stock selection were negative influences.
*All fund returns referenced in this commentary are for Investor Class shares.
7
South Korea was Top Contributor
In terms of the portfolio’s favorable regional exposure, South Korea led all contributors for the 12-month period, as the nation’s stock market fared much better than the broad emerging markets index. In fact, four of the portfolio’s top 10 individual contributors were South Korea-based stocks, including Hyundai Glovis Co., which drove performance in the portfolio’s industrials sector. The global transportation and logistics affiliate of Hyundai Motor Co., also a top contributor to portfolio performance, advanced strongly after reporting a 92% increase in second-quarter net income. Hyundai Motor posted sales and market share gains in key markets, as the March 2011 earthquake and tsunami forced its leading Japanese competitors to cut near-term production forecasts. Moreover, as demand steadily climbed, the automaker ramped up near-term production plans.
Russia also was among the portfolio’s top-performing countries, driven by strong stock selection, including an overweight position in natural gas producer NovaTek OAO, which was the portfolio’s top individual contributor for the period. In May 2011, the company reported a 69% increase in its year-over-year first-quarter net profits and better-than-expected revenue gains, along with rising hydrocarbon prices and sales. In addition, NovaTek said it had successfully integrated its recently acquired new assets into the company’s operations, including Sibneftegaz, the holder of licenses to develop gas fields in the Arctic.
Outlook
We believe good opportunities exist in several emerging markets and we will continue to focus on companies with the potential for better structural growth, rather than companies with greater sensitivity to economic data. We believe the impact of demand from consumers in the emerging markets should be a positive force for consumption growth from the expanding wealthy class in these markets.
8
| Fund Characteristics |
| NOVEMBER 30, 2011 | |
| Top Ten Holdings | % of net assets |
| Samsung Electronics Co. Ltd. | 4.2% |
| Vale SA Preference Shares | 4.0% |
| Taiwan Semiconductor Manufacturing Co. Ltd. | 3.0% |
| Sberbank of Russia | 2.9% |
| NovaTek OAO GDR | 2.6% |
| Cia de Bebidas das Americas Preference Shares ADR | 2.4% |
| Hon Hai Precision Industry Co. Ltd. | 2.2% |
| Itau Unibanco Holding SA Preference Shares | 2.0% |
| Hyundai Glovis Co. Ltd. | 1.8% |
| Kia Motors Corp. | 1.8% |
| Types of Investments in Portfolio | % of net assets |
| Foreign Common Stocks | 99.5% |
| Temporary Cash Investments | 0.4% |
| Other Assets and Liabilities | 0.1% |
| Investments by Country | % of net assets |
| South Korea | 15.7% |
| Brazil | 13.7% |
| People’s Republic of China | 11.3% |
| Taiwan (Republic of China) | 7.8% |
| Russian Federation | 7.7% |
| South Africa | 7.5% |
| Hong Kong | 5.9% |
| Mexico | 5.5% |
| Indonesia | 5.2% |
| India | 4.5% |
| Thailand | 4.0% |
| Turkey | 3.2% |
| United Kingdom | 2.3% |
| Other Countries | 5.2% |
| Cash and Equivalents* | 0.5% |
*Includes temporary cash investments and other assets and liabilities.
9
Fund shareholders may incur two types of costs: (1) transaction costs, including sales charges (loads) on purchase payments and redemption/exchange fees; and (2) ongoing costs, including management fees; distribution and service (12b-1) fees; and other fund expenses. This example is intended to help you understand your ongoing costs (in dollars) of investing in your fund and to compare these costs with the ongoing cost of investing in other mutual funds.
The example is based on an investment of $1,000 made at the beginning of the period and held for the entire period from June 1, 2011 to November 30, 2011.
Actual Expenses
The table provides information about actual account values and actual expenses for each class. You may use the information, together with the amount you invested, to estimate the expenses that you paid over the period. First, identify the share class you own. Then simply divide your account value by $1,000 (for example, an $8,600 account value divided by $1,000 = 8.6), then multiply the result by the number under the heading “Expenses Paid During Period” to estimate the expenses you paid on your account during this period.
If you hold Investor Class shares of any American Century Investments fund, or Institutional Class shares of the American Century Diversified Bond Fund, in an American Century Investments account (i.e., not a financial intermediary or retirement plan account), American Century Investments may charge you a $12.50 semiannual account maintenance fee if the value of those shares is less than $10,000. We will redeem shares automatically in one of your accounts to pay the $12.50 fee. In determining your total eligible investment amount, we will include your investments in all personal accounts (including American Century Investments Brokerage accounts) registered under your Social Security number. Personal accounts include individual accounts, joint accounts, UGMA/UTMA accounts, personal trusts, Coverdell Education Savings Accounts and IRAs (including traditional, Roth, Rollover, SEP-, SARSEP- and SIMPLE-IRAs), and certain other retirement accounts. If you have only business, business retirement, employer-sponsored or American Century Investments Brokerage accounts, you are currently not subject to this fee. We will not charge the fee as long as you choose to manage your accounts exclusively online. If you are subject to the Account Maintenance Fee, your account value could be reduced by the fee amount.
Hypothetical Example for Comparison Purposes
The table also provides information about hypothetical account values and hypothetical expenses based on the actual expense ratio of each class of your fund and an assumed rate of return of 5% per year before expenses, which is not the actual return of a fund’s share class. The hypothetical account values and expenses may not be used to estimate the actual ending account balance or expenses you paid for the period. You may use this information to compare the ongoing costs of investing in your fund and other funds. To do so, compare this 5% hypothetical example with the 5% hypothetical examples that appear in the shareholder reports of the other funds.
10
Please note that the expenses shown in the table are meant to highlight your ongoing costs only and do not reflect any transactional costs, such as sales charges (loads) or redemption/exchange fees. Therefore, the table is useful in comparing ongoing costs only, and will not help you determine the relative total costs of owning different funds. In addition, if these transactional costs were included, your costs would have been higher.
Beginning Account Value 6/1/11 | Ending Account Value 11/30/11 | Expenses Paid During Period(1) 6/1/11 – 11/30/11 | Annualized Expense Ratio(1) | |
| Actual | ||||
| Investor Class | $1,000 | $796.10 | $7.83 | 1.74% |
| Institutional Class | $1,000 | $797.50 | $6.94 | 1.54% |
| A Class | $1,000 | $795.60 | $8.96 | 1.99% |
| C Class | $1,000 | $791.70 | $12.31 | 2.74% |
| R Class | $1,000 | $794.30 | $10.08 | 2.24% |
| Hypothetical | ||||
| Investor Class | $1,000 | $1,016.34 | $8.80 | 1.74% |
| Institutional Class | $1,000 | $1,017.35 | $7.79 | 1.54% |
| A Class | $1,000 | $1,015.09 | $10.05 | 1.99% |
| C Class | $1,000 | $1,011.33 | $13.82 | 2.74% |
| R Class | $1,000 | $1,013.84 | $11.31 | 2.24% |
| (1) | Expenses are equal to the class’s annualized expense ratio listed in the table above, multiplied by the average account value over the period, multiplied by 183, the number of days in the most recent fiscal half-year, divided by 365, to reflect the one-half year period. |
11
NOVEMBER 30, 2011
| Shares | Value | |||||||
| Common Stocks — 99.5% | ||||||||
| BRAZIL — 13.7% | ||||||||
| BR Malls Participacoes SA | 808,400 | $8,185,254 | ||||||
| Cia de Bebidas das Americas Preference Shares ADR | 331,702 | 11,403,915 | ||||||
| Cia Hering | 277,200 | 5,870,965 | ||||||
| Itau Unibanco Holding SA Preference Shares | 554,700 | 9,785,125 | ||||||
| PDG Realty SA Empreendimentos e Participacoes | 1,042,600 | 3,874,400 | ||||||
| Tim Participacoes SA ADR | 146,323 | 3,483,951 | ||||||
| Ultrapar Participacoes SA | 265,400 | 4,670,018 | ||||||
| Vale SA Preference Shares | 889,000 | 19,187,475 | ||||||
| 66,461,103 | ||||||||
| CHILE — 1.6% | ||||||||
| ENTEL Chile SA | 206,992 | 4,194,835 | ||||||
| SACI Falabella | 396,411 | 3,305,667 | ||||||
| 7,500,502 | ||||||||
| HONG KONG — 5.9% | ||||||||
Brilliance China Automotive Holdings Ltd.(1) | 4,196,000 | 4,921,222 | ||||||
| China Overseas Land & Investment Ltd. | 2,466,000 | 4,347,537 | ||||||
| China Unicom Ltd. | 3,214,000 | 6,922,339 | ||||||
| CNOOC Ltd. | 4,384,000 | 8,455,685 | ||||||
| Comba Telecom Systems Holdings Ltd. | 2,555,030 | 2,324,503 | ||||||
| GOME Electrical Appliances Holding Ltd. | 6,989,000 | 1,812,846 | ||||||
| 28,784,132 | ||||||||
| INDIA — 4.5% | ||||||||
| HDFC Bank Ltd. | 684,997 | 5,888,875 | ||||||
| ICICI Bank Ltd. | 100,412 | 1,407,076 | ||||||
| ITC Ltd. | 1,667,417 | 6,483,811 | ||||||
Jubilant Foodworks Ltd.(1) | 263,422 | 3,992,089 | ||||||
| Tata Motors Ltd. | 1,155,863 | 3,970,662 | ||||||
| 21,742,513 | ||||||||
| INDONESIA — 5.2% | ||||||||
| PT Astra International Tbk | 846,500 | 6,805,555 | ||||||
| PT Bank Rakyat Indonesia (Persero) Tbk | 9,650,000 | 7,144,860 | ||||||
| PT Charoen Pokphand Indonesia Tbk | 13,203,500 | 3,474,692 | ||||||
| PT Indofood CBP Sukses Makmur Tbk | 4,549,000 | 2,637,652 | ||||||
| PT Semen Gresik (Persero) Tbk | 5,055,000 | 5,312,389 | ||||||
| 25,375,148 | ||||||||
| MALAYSIA — 0.7% | ||||||||
| CIMB Group Holdings Bhd | 1,487,000 | $3,425,335 | ||||||
| MEXICO — 5.5% | ||||||||
| Alfa SAB de CV, Series A | 532,776 | 6,250,348 | ||||||
| America Movil SAB de CV Series L ADR | 183,147 | 4,362,562 | ||||||
| Fomento Economico Mexicano SAB de CV ADR | 87,205 | 5,948,253 | ||||||
| Mexichem SAB de CV | 1,039,598 | 3,636,677 | ||||||
| Wal-Mart de Mexico SAB de CV | 2,387,041 | 6,424,612 | ||||||
| 26,622,452 | ||||||||
| PEOPLE’S REPUBLIC OF CHINA — 11.3% | ||||||||
51job, Inc. ADR(1) | 91,473 | 4,151,959 | ||||||
| Agricultural Bank of China Ltd. H Shares | 5,045,000 | 2,168,807 | ||||||
Baidu, Inc. ADR(1) | 50,320 | 6,591,417 | ||||||
| China BlueChemical Ltd. H Shares | 5,554,000 | 4,475,733 | ||||||
| China Oilfield Services Ltd. H Shares | 1,794,000 | 2,785,043 | ||||||
Focus Media Holding Ltd. ADR(1) | 397,034 | 7,353,070 | ||||||
| Golden Eagle Retail Group Ltd. | 1,092,000 | 2,524,040 | ||||||
| Industrial & Commercial Bank of China Ltd. H Shares | 7,039,645 | 4,174,891 | ||||||
| Ping An Insurance Group Co. H Shares | 1,101,000 | 7,643,563 | ||||||
| Sany Heavy Equipment International Holdings Co. Ltd. | 3,077,500 | 2,999,549 | ||||||
| Tencent Holdings Ltd. | 241,200 | 4,711,312 | ||||||
| ZTE Corp. H Shares | 1,746,120 | 5,327,554 | ||||||
| 54,906,938 | ||||||||
| PERU — 1.6% | ||||||||
| Credicorp Ltd. | 71,561 | 7,772,956 | ||||||
| POLAND — 0.5% | ||||||||
| Powszechna Kasa Oszczednosci Bank Polski SA | 256,891 | 2,581,364 | ||||||
| RUSSIAN FEDERATION — 7.7% | ||||||||
| Magnit OJSC GDR | 188,726 | 4,193,959 | ||||||
Mail.ru Group Ltd. GDR(1) | 126,961 | 3,919,920 | ||||||
| Mobile Telesystems OJSC ADR | 147,207 | 2,543,737 | ||||||
| NovaTek OAO GDR | 81,228 | 12,488,009 | ||||||
| Sberbank of Russia | 4,924,766 | 14,229,895 | ||||||
| 37,375,520 | ||||||||
12
| Shares | Value | |||||||
| SOUTH AFRICA — 7.5% | ||||||||
| Barloworld Ltd. | 309,358 | $2,768,075 | ||||||
| Clicks Group Ltd. | 721,645 | 3,970,389 | ||||||
| Exxaro Resources Ltd. | 368,826 | 8,218,400 | ||||||
| Mr Price Group Ltd. | 547,943 | 5,418,992 | ||||||
| MTN Group Ltd. | 300,879 | 5,413,399 | ||||||
| Naspers Ltd. N Shares | 61,803 | 2,791,595 | ||||||
| Sasol Ltd. | 162,178 | 7,797,090 | ||||||
| 36,377,940 | ||||||||
| SOUTH KOREA — 15.7% | ||||||||
Asia Pacific Systems, Inc.(1) | 107,747 | 1,419,537 | ||||||
| Celltrion, Inc. | 76,544 | 2,540,842 | ||||||
| Hyundai Glovis Co. Ltd. | 44,175 | 8,831,970 | ||||||
| Hyundai Heavy Industries Co. Ltd. | 12,810 | 3,230,054 | ||||||
| Hyundai Motor Co. | 7,980 | 1,546,891 | ||||||
| Hyundai Steel Co. | 24,626 | 2,178,080 | ||||||
| Kia Motors Corp. | 136,115 | 8,635,609 | ||||||
| LG Chem Ltd. | 15,511 | 4,605,629 | ||||||
| LG Household & Health Care Ltd. | 18,050 | 8,493,582 | ||||||
| Mando Corp. | 31,080 | 5,656,368 | ||||||
| NCSoft Corp. | 30,273 | 8,242,687 | ||||||
| Samsung Electronics Co. Ltd. | 22,577 | 20,496,944 | ||||||
| 75,878,193 | ||||||||
| SWITZERLAND — 0.8% | ||||||||
| Ferrexpo plc | 860,520 | 4,086,107 | ||||||
| TAIWAN (REPUBLIC OF CHINA) — 7.8% | ||||||||
| Catcher Technology Co. Ltd. | 1,228,315 | 5,998,134 | ||||||
| E Ink Holdings, Inc. | 1,312,000 | 2,422,041 | ||||||
| Hiwin Technologies Corp. | 326,374 | 2,686,879 | ||||||
| Hon Hai Precision Industry Co. Ltd. | 3,923,666 | 10,650,866 | ||||||
| Taiwan Semiconductor Manufacturing Co. Ltd. | 5,768,939 | 14,527,715 | ||||||
TPK Holding Co. Ltd.(1) | 106,450 | 1,454,767 | ||||||
| 37,740,402 | ||||||||
| THAILAND — 4.0% | ||||||||
| Advanced Info Service PCL | 502,700 | 2,296,044 | ||||||
| Banpu PCL | 306,050 | 5,525,711 | ||||||
| CP ALL PCL | 2,791,000 | 4,562,846 | ||||||
| Kasikornbank PCL NVDR | 1,171,700 | 4,508,074 | ||||||
| Siam Cement PCL NVDR | 228,000 | 2,361,574 | ||||||
| 19,254,249 | ||||||||
| TURKEY — 3.2% | ||||||||
| BIM Birlesik Magazalar AS | 171,477 | $4,867,070 | ||||||
| Koza Altin Isletmeleri AS | 212,660 | 3,200,482 | ||||||
| Turkiye Garanti Bankasi AS | 1,173,483 | 4,026,939 | ||||||
| Turkiye Sise ve Cam Fabrikalari AS | 1,950,297 | 3,306,315 | ||||||
| 15,400,806 | ||||||||
| UNITED KINGDOM — 2.3% | ||||||||
| Antofagasta plc | 188,653 | 3,533,246 | ||||||
| Petrofac Ltd. | 143,052 | 3,270,142 | ||||||
| Tullow Oil plc | 199,849 | 4,366,733 | ||||||
| 11,170,121 | ||||||||
TOTAL COMMON STOCKS(Cost $400,365,729) | 482,455,781 | |||||||
| Temporary Cash Investments — 0.4% | ||||||||
Repurchase Agreement, Bank America Merrill Lynch, (collateralized by various U.S. Treasury obligations, 3.50%, 5/15/20, valued at $665,777), in a joint trading account at 0.06%, dated 11/30/11, due 12/1/11 (Delivery value $655,268) | 655,267 | |||||||
Repurchase Agreement, Credit Suisse First Boston, Inc., (collateralized by various U.S. Treasury obligations, 5.00%, 5/15/37, valued at $667,313), in a joint trading account at 0.05%, dated 11/30/11, due 12/1/11 (Delivery value $655,268) | 655,267 | |||||||
Repurchase Agreement, Goldman Sachs & Co., (collateralized by various U.S. Treasury obligations, 4.375%, 2/15/38, valued at $616,143), in a joint trading account at 0.04%, dated 11/30/11, due 12/1/11 (Delivery value $603,151) | 603,150 | |||||||
| SSgA U.S. Government Money Market Fund | 41 | 41 | ||||||
TOTAL TEMPORARY CASH INVESTMENTS (Cost $1,913,725) | 1,913,725 | |||||||
TOTAL INVESTMENT SECURITIES — 99.9%(Cost $402,279,454) | 484,369,506 | |||||||
| OTHER ASSETS AND LIABILITIES — 0.1% | 270,175 | |||||||
| TOTAL NET ASSETS — 100.0% | $484,639,681 | |||||||
13
| Market Sector Diversification | ||||
| (as a % of net assets) | ||||
| Information Technology | 18.2 | % | ||
| Financials | 17.9 | % | ||
| Consumer Discretionary | 15.6 | % | ||
| Materials | 12.6 | % | ||
| Consumer Staples | 12.1 | % | ||
| Energy | 10.2 | % | ||
| Industrials | 6.4 | % | ||
| Telecommunication Services | 6.0 | % | ||
| Health Care | 0.5 | % | ||
| Cash and Equivalents* | 0.5 | % | ||
*Includes temporary cash investments and other assets and liabilities.
| Notes to Schedule of Investments |
ADR = American Depositary Receipt
GDR = Global Depositary Receipt
NVDR = Non-Voting Depositary Receipt
OJSC = Open Joint Stock Company
| (1) | Non-income producing. |
See Notes to Financial Statements.
14
| NOVEMBER 30, 2011 | ||||
| Assets | ||||
| Investment securities, at value (cost of $402,279,454) | $484,369,506 | |||
| Foreign currency holdings, at value (cost of $427,182) | 428,326 | |||
| Receivable for investments sold | 6,506,561 | |||
| Receivable for capital shares sold | 885,415 | |||
| Dividends and interest receivable | 141,716 | |||
| Other assets | 252,344 | |||
| 492,583,868 | ||||
| Liabilities | ||||
| Payable for investments purchased | 6,736,681 | |||
| Payable for capital shares redeemed | 506,343 | |||
| Accrued management fees | 694,472 | |||
| Distribution and service fees payable | 6,691 | |||
| 7,944,187 | ||||
| Net Assets | $484,639,681 | |||
| Net Assets Consist of: | ||||
| Capital (par value and paid-in surplus) | $549,745,899 | |||
| Undistributed net investment income | 86,949 | |||
| Accumulated net realized loss | (147,260,415 | ) | ||
| Net unrealized appreciation | 82,067,248 | |||
| $484,639,681 | ||||
| Net assets | Shares outstanding | Net asset value per share | ||||
| Investor Class, $0.01 Par Value | $435,079,200 | 58,956,595 | $7.38 | |||
| Institutional Class, $0.01 Par Value | $29,695,007 | 3,928,796 | $7.56 | |||
| A Class, $0.01 Par Value | $15,338,514 | 2,141,670 | $7.16* | |||
| C Class, $0.01 Par Value | $3,895,543 | 569,263 | $6.84 | |||
| R Class, $0.01 Par Value | $631,417 | 86,467 | $7.30 | |||
*Maximum offering price $7.60 (net asset value divided by 0.9425)
See Notes to Financial Statements.
15
| YEAR ENDED NOVEMBER 30, 2011 | ||||
| Investment Income (Loss) | ||||
| Income: | ||||
| Dividends (net of foreign taxes withheld of $863,416) | $11,374,036 | |||
| Interest | 1,354 | |||
| 11,375,390 | ||||
| Expenses: | ||||
| Management fees | 10,285,918 | |||
| Distribution and service fees: | ||||
| A Class | 62,709 | |||
| B Class | 2,544 | |||
| C Class | 48,227 | |||
| R Class | 3,711 | |||
| Directors’ fees and expenses | 27,855 | |||
| Other expenses | 6,296 | |||
| 10,437,260 | ||||
| Net investment income (loss) | 938,130 | |||
| Realized and Unrealized Gain (Loss) | ||||
| Net realized gain (loss) on: | ||||
| Investment transactions | 50,082,320 | |||
| Foreign currency transactions (net of foreign tax expenses paid (refunded) of $344,752) | (726,927 | ) | ||
| 49,355,393 | ||||
| Change in net unrealized appreciation (depreciation) on: | ||||
| Investments (net of deferred foreign taxes of $(244,235)) | (120,217,135 | ) | ||
| Translation of assets and liabilities in foreign currencies | (10,430 | ) | ||
| (120,227,565 | ) | |||
| Net realized and unrealized gain (loss) | (70,872,172 | ) | ||
| Net Increase (Decrease) in Net Assets Resulting from Operations | $(69,934,042 | ) | ||
See Notes to Financial Statements.
16
| YEARS ENDED NOVEMBER 30, 2011 AND NOVEMBER 30, 2010 | ||||||||
| Increase (Decrease) in Net Assets | November 30, 2011 | November 30, 2010 | ||||||
| Operations | ||||||||
| Net investment income (loss) | $938,130 | $(207,000 | ) | |||||
| Net realized gain (loss) | 49,355,393 | 77,686,448 | ||||||
| Change in net unrealized appreciation (depreciation) | (120,227,565 | ) | 14,439,135 | |||||
| Net increase (decrease) in net assets resulting from operations | (69,934,042 | ) | 91,918,583 | |||||
| Capital Share Transactions | ||||||||
| Net increase (decrease) in net assets from capital share transactions | (106,484,925 | ) | (55,654,147 | ) | ||||
| Redemption Fees | ||||||||
| Increase in net assets from redemption fees | 144,876 | 224,631 | ||||||
| Net increase (decrease) in net assets | (176,274,091 | ) | 36,489,067 | |||||
| Net Assets | ||||||||
| Beginning of period | 660,913,772 | 624,424,705 | ||||||
| End of period | $484,639,681 | $660,913,772 | ||||||
| Accumulated undistributed net investment income (loss) | $86,949 | $(126,422 | ) | |||||
See Notes to Financial Statements.
17
NOVEMBER 30, 2011
1. Organization
American Century World Mutual Funds, Inc. (the corporation) is registered under the Investment Company Act of 1940, as amended (the 1940 Act), as an open-end management investment company and is organized as a Maryland corporation. Emerging Markets Fund (the fund) is one fund in a series issued by the corporation. The fund is diversified as defined under the 1940 Act. The fund’s investment objective is to seek capital growth. The fund pursues its objective by investing at least 80% of its assets in equity securities of companies located in emerging market countries.
The fund is authorized to issue the Investor Class, the Institutional Class, the A Class, the B Class, the C Class and the R Class. The A Class may incur an initial sales charge. The A Class, B Class and C Class may be subject to a contingent deferred sales charge. The share classes differ principally in their respective sales charges and distribution and shareholder servicing expenses and arrangements. The Institutional Class is made available to institutional shareholders or through financial intermediaries whose clients do not require the same level of shareholder and administrative services as shareholders of other classes. As a result, the Institutional Class is charged a lower unified management fee. On October 21, 2011, all outstanding B Class shares were converted to A Class shares and the fund discontinued issuance of the B Class.
2. Significant Accounting Policies
The following is a summary of significant accounting policies consistently followed by the fund in preparation of its financial statements. The financial statements are prepared in conformity with accounting principles generally accepted in the United States of America, which may require management to make certain estimates and assumptions at the date of the financial statements. Actual results could differ from these estimates.
Investment Valuations — The fund determines the fair value of its investments and computes its net asset value per share as of the close of regular trading (usually 4 p.m. Eastern time) on the New York Stock Exchange (NYSE) on each day the NYSE is open.
Equity securities that are listed or traded on a domestic securities exchange are valued at the last reported sales price or at the official closing price as provided by the exchange. Equity securities traded on foreign securities exchanges are typically valued at the closing price on the exchange where primarily traded or as of the close of the NYSE, if that is earlier. If no last sales price is reported, or if local convention or regulation so provides, the mean of the latest bid and asked prices is used. Depending on local convention or regulation, securities traded over-the-counter are valued at the mean of the latest bid and asked prices, the last sales price, or the official closing price. In its determination of fair value, the fund may review several factors including: market information specific to a security; news developments in U.S. and foreign markets; the performance of particular U.S. and foreign securities, indices, comparable securities, American Depositary Receipts, Exchange-Traded Funds, and other relevant market indicators.
Debt securities maturing within 60 days at the time of purchase may be valued at cost, plus or minus any amortized discount or premium or at the evaluated mean as provided by an independent pricing service. Evaluated mean prices are commonly derived through utilization of market models, which may consider, among other factors, trade data, quotations from dealers and active market makers, relevant yield curve and spread data, related sector levels, creditworthiness, and other relevant market information on the same or comparable securities.
Investments in open-end management investment companies are valued at the reported net asset value per share. Repurchase agreements are valued at cost.
The value of investments initially expressed in foreign currencies is translated into U.S. dollars at prevailing exchange rates.
18
If the fund determines that the market price for a portfolio security is not readily available or the valuation methods mentioned above do not reflect a security’s fair value, such security is valued as determined in good faith by the Board of Directors or its designee, in accordance with procedures adopted by the Board of Directors. Circumstances that may cause the fund to use these procedures to value a security include, but are not limited to: a security has been declared in default; trading in a security has been halted during the trading day; there is a foreign market holiday and no trading occurred; or an event occurred between the close of a foreign exchange and the NYSE that may affect the value of a security.
Security Transactions — Security transactions are accounted for as of the trade date. Net realized gains and losses are determined on the identified cost basis, which is also used for federal income tax purposes. Certain countries impose taxes on realized gains on the sale of securities registered in their country. The fund records the foreign tax expense, if any, on an accrual basis. The foreign tax expense on realized gains and unrealized appreciation reduces the net realized gain (loss) on investment transactions and net unrealized appreciation (depreciation) on investments, respectively.
Investment Income — Dividend income less foreign taxes withheld, if any, is recorded as of the ex-dividend date. Interest income is recorded on the accrual basis and includes accretion of discounts and amortization of premiums.
Foreign Currency Translations — All assets and liabilities initially expressed in foreign currencies are translated into U.S. dollars at prevailing exchange rates at period end. The fund may enter into spot foreign currency exchange contracts to facilitate transactions denominated in a foreign currency. Purchases and sales of investment securities, dividend and interest income, spot foreign currency exchange contracts, and expenses are translated at the rates of exchange prevailing on the respective dates of such transactions. Net realized and unrealized foreign currency exchange gains or losses related to investment securities are a component of net realized gain (loss) on investment transactions and change in net unrealized appreciation (depreciation) on investments, respectively. Certain countries impose taxes on the contract amount of purchases and sales of foreign currency contracts in their currency. The fund records the foreign tax expense, if any, as a reduction to the net realized gain (loss) on foreign currency transactions.
Repurchase Agreements — The fund may enter into repurchase agreements with institutions that American Century Investment Management, Inc. (ACIM) (the investment advisor) has determined are creditworthy pursuant to criteria adopted by the Board of Directors. The fund requires that the collateral, represented by securities, received in a repurchase transaction be transferred to the custodian in a manner sufficient to enable the fund to obtain those securities in the event of a default under the repurchase agreement. ACIM monitors, on a daily basis, the securities transferred to ensure the value, including accrued interest, of the securities under each repurchase agreement is equal to or greater than amounts owed to the fund under each repurchase agreement.
Joint Trading Account — Pursuant to an Exemptive Order issued by the Securities and Exchange Commission, the fund, along with certain other funds in the American Century Investments family of funds, may transfer uninvested cash balances into a joint trading account. These balances are invested in one or more repurchase agreements that are collateralized by U.S. Treasury or Agency obligations.
Income Tax Status — It is the fund’s policy to distribute substantially all net investment income and net realized gains to shareholders and to otherwise qualify as a regulated investment company under provisions of the Internal Revenue Code. The fund is no longer subject to examination by tax authorities for years prior to 2008. Additionally, non-U.S. tax returns filed by the fund due to investments in certain foreign securities remain subject to examination by the relevant taxing authority for seven years from the date of filing. At this time, management believes there are no uncertain tax positions which, based on their technical merit, would not be sustained upon examination and for which it is reasonably possible that the total amounts of unrecognized tax benefits will significantly change in the next twelve months. Accordingly, no provision has been made for federal or state income taxes.
19
Multiple Class — All shares of the fund represent an equal pro rata interest in the net assets of the class to which such shares belong, and have identical voting, dividend, liquidation and other rights and the same terms and conditions, except for class specific expenses and exclusive rights to vote on matters affecting only individual classes. Income, non-class specific expenses, and realized and unrealized capital gains and losses of the fund are allocated to each class of shares based on their relative net assets.
Distributions to Shareholders — Distributions from net investment income and net realized gains, if any, are generally declared and paid annually. The fund may make distributions on a more frequent basis to comply with the distribution requirements of the Internal Revenue Code, in all events in a manner consistent with provisions of the 1940 Act.
Redemption — The fund may impose a 2.00% redemption fee on shares held less than 60 days. The fee may not be applicable to all classes. The redemption fee is retained by the fund and helps cover transaction costs that long-term investors may bear when the fund sells securities to meet investor redemptions. Prior to November 14, 2011, the redemption fee applied to shares held less than 180 days.
Indemnifications — Under the corporation’s organizational documents, its officers and directors are indemnified against certain liabilities arising out of the performance of their duties to the fund. In addition, in the normal course of business, the fund enters into contracts that provide general indemnifications. The maximum exposure under these arrangements is unknown as this would involve future claims that may be made against a fund. The risk of material loss from such claims is considered by management to be remote.
3. Fees and Transactions with Related Parties
Management Fees — The corporation has entered into a management agreement with ACIM, under which ACIM provides the fund with investment advisory and management services in exchange for a single, unified management fee (the fee) per class. The agreement provides that all expenses of managing and operating the fund, except distribution and service fees, brokerage expenses, taxes, interest, fees and expenses of the independent directors (including legal counsel fees), and extraordinary expenses, will be paid by ACIM. The fee is computed and accrued daily based on each class’s daily net assets and paid monthly in arrears. The rate of the fee is determined by applying a fee rate calculation formula. This formula takes into account the fund’s assets as well as certain assets, if any, of other clients of the investment advisor outside the American Century Investments family of funds (such as subadvised funds and separate accounts) that have very similar investment teams and investment strategies (strategy assets). The strategy assets of the fund include the assets of NT Emerging Markets Fund, one fund in a series issued by the corporation. The annual management fee schedule ranges from 1.25% to 1.85% for the Investor Class, A Class, B Class, C Class and R Class. The Institutional Class is 0.20% less at each point within the range. The effective annual management fee for each class for the year ended November 30, 2011 was 1.71% for the Investor Class, A Class,
C Class and R Class and 1.51% for the Institutional Class.
Distribution and Service Fees — The Board of Directors has adopted a separate Master Distribution and Individual Shareholder Services Plan for each of the A Class, B Class, C Class and R Class (collectively the plans), pursuant to Rule 12b-1 of the 1940 Act. The plans provide that the A Class will pay American Century Investment Services, Inc. (ACIS) an annual distribution and service fee of 0.25%. The plans provide that the B Class and C Class will each pay ACIS an annual distribution and service fee of 1.00%, of which 0.25% is paid for individual shareholder services and 0.75% is paid for distribution services. The plans provide that the R Class will pay ACIS an annual distribution and service fee of 0.50%. The fees are computed and accrued daily based on each class’s daily net assets and paid monthly in arrears. The fees are used to pay financial intermediaries for distribution and individual shareholder services. Fees incurred under the plans during the year ended November 30, 2011 are detailed in the Statement of Operations.
20
Related Parties — Certain officers and directors of the corporation are also officers and/or directors of American Century Companies, Inc. (ACC), the parent of the corporation’s investment advisor, ACIM, the distributor of the corporation, ACIS, and the corporation’s transfer agent, American Century Services, LLC. Various funds in a series issued by American Century Asset Allocation Portfolios, Inc. (ACAAP) own, in aggregate, 15% of the shares of the fund. ACAAP does not invest in the fund for the purpose of exercising management or control.
The fund was eligible to invest in a money market fund for temporary purposes, which is managed by J.P. Morgan Investment Management, Inc. (JPMIM). The fund had a securities lending agreement with JPMorgan Chase Bank (JPMCB) and a mutual funds services agreement with J.P. Morgan Investor Services Co. (JPMIS). JPMCB was a custodian of the fund. JPMIM, JPMIS and JPMCB are wholly owned subsidiaries of JPMorgan Chase & Co. (JPM). Prior to August 31, 2011, JPM was an equity investor in ACC. The services provided to the fund by JPMIM, JPMIS and JPMCB terminated on July 31, 2011.
4. Investment Transactions
Purchases and sales of investment securities, excluding short-term investments, for the year ended November 30, 2011 were $430,909,275 and $532,253,342, respectively.
5. Capital Share Transactions
Transactions in shares of the fund were as follows:
| Year ended November 30, 2011 | Year ended November 30, 2010 | |||||||||||||||
| Shares | Amount | Shares | Amount | |||||||||||||
| Investor Class/Shares Authorized | 235,000,000 | 235,000,000 | ||||||||||||||
| Sold | 6,538,088 | $55,636,956 | 10,049,637 | $78,127,996 | ||||||||||||
| Redeemed | (16,579,314 | ) | (141,943,249 | ) | (18,943,255 | ) | (143,285,753 | ) | ||||||||
| (10,041,226 | ) | (86,306,293 | ) | (8,893,618 | ) | (65,157,757 | ) | |||||||||
| Institutional Class/Shares Authorized | 40,000,000 | 40,000,000 | ||||||||||||||
| Sold | 814,282 | 7,001,115 | 2,068,557 | 15,260,457 | ||||||||||||
| Redeemed | (1,621,034 | ) | (14,518,773 | ) | (1,073,145 | ) | (8,148,864 | ) | ||||||||
| (806,752 | ) | (7,517,658 | ) | 995,412 | 7,111,593 | |||||||||||
| A Class/Shares Authorized | 40,000,000 | 40,000,000 | ||||||||||||||
| Sold | 2,314,402 | 20,284,532 | 1,865,594 | 14,476,416 | ||||||||||||
| Redeemed | (3,764,042 | ) | (31,735,094 | ) | (1,549,076 | ) | (11,528,392 | ) | ||||||||
| (1,449,640 | ) | (11,450,562 | ) | 316,518 | 2,948,024 | |||||||||||
| B Class/Shares Authorized | 10,000,000 | 10,000,000 | ||||||||||||||
| Sold | 2,549 | 21,664 | 8,745 | 69,194 | ||||||||||||
| Redeemed | (39,638 | ) | (294,160 | ) | (4,918 | ) | (35,138 | ) | ||||||||
| (37,089 | ) | (272,496 | ) | 3,827 | 34,056 | |||||||||||
| C Class/Shares Authorized | 5,000,000 | 5,000,000 | ||||||||||||||
| Sold | 99,057 | 738,536 | 134,226 | 979,767 | ||||||||||||
| Redeemed | (193,003 | ) | (1,533,169 | ) | (250,782 | ) | (1,785,645 | ) | ||||||||
| (93,946 | ) | (794,633 | ) | (116,556 | ) | (805,878 | ) | |||||||||
| R Class/Shares Authorized | 10,000,000 | 10,000,000 | ||||||||||||||
| Sold | 42,747 | 331,354 | 69,308 | 533,453 | ||||||||||||
| Redeemed | (54,656 | ) | (474,637 | ) | (41,838 | ) | (317,638 | ) | ||||||||
| (11,909 | ) | (143,283 | ) | 27,470 | 215,815 | |||||||||||
| Net increase (decrease) | (12,440,562 | ) | $(106,484,925 | ) | (7,666,947 | ) | $(55,654,147 | ) | ||||||||
21
6. Fair Value Measurements
The fund’s securities valuation process is based on several considerations and may use multiple inputs to determine the fair value of the positions held by the fund. In conformity with accounting principles generally accepted in the United States of America, the inputs used to determine a valuation are classified into three broad levels as follows:
| ● | Level 1 valuation inputs consist of unadjusted quoted prices in an active market for identical securities; |
| ● | Level 2 valuation inputs consist of direct or indirect observable market data (including quoted prices for similar securities, evaluations of subsequent market events, interest rates, prepayment speeds, credit risk, etc.); or |
| ● | Level 3 valuation inputs consist of unobservable data (including a fund’s own assumptions). |
The level classification is based on the lowest level input that is significant to the fair valuation measurement. The valuation inputs are not necessarily an indication of the risks associated with investing in these securities or other financial instruments.
The following is a summary of the level classifications as of period end. The Schedule of Investments provides additional information on the fund’s portfolio holdings.
| Level 1 | Level 2 | Level 3 | ||||||||||
| Investment Securities | ||||||||||||
| Foreign Common Stocks | $53,611,820 | $428,843,961 | — | |||||||||
| Temporary Cash Investments | 41 | 1,913,684 | — | |||||||||
| Total Value of Investment Securities | $53,611,861 | $430,757,645 | — | |||||||||
7. Risk Factors
There are certain risks involved in investing in foreign securities. These risks include those resulting from future adverse political, social and economic developments, fluctuations in currency exchange rates, the possible imposition of exchange controls, and other foreign laws or restrictions. Investing in emerging markets may accentuate these risks.
22
8. Federal Tax Information
The book-basis character of distributions made during the year from net investment income or net realized gains may differ from their ultimate characterization for federal income tax purposes. These differences reflect the differing character of certain income items and net realized gains and losses for financial statement and tax purposes, and may result in reclassification among certain capital accounts on the financial statements. There were no distributions paid by the fund during the years ended November 30, 2011 and November 30, 2010.
As of November 30, 2011, the federal tax cost of investments and the components of distributable earnings on a tax-basis were as follows:
| Federal tax cost of investments | $405,070,693 | |||
| Gross tax appreciation of investments | $98,793,353 | |||
| Gross tax depreciation of investments | (19,494,540 | ) | ||
| Net tax appreciation (depreciation) of investments | $79,298,813 | |||
Net tax appreciation (depreciation) on translation of assets and liabilities in foreign currencies | $13,101 | |||
| Net tax appreciation (depreciation) | $79,311,914 | |||
| Undistributed ordinary income | $51,044 | |||
| Accumulated capital losses | $(131,458,384 | ) | ||
| Capital loss deferral | $(13,010,792 | ) |
The difference between book-basis and tax-basis cost and unrealized appreciation (depreciation) is attributable primarily to the tax deferral of losses on wash sales and the realization for tax purposes of unrealized gains (losses) on certain foreign currency exchange contracts.
The accumulated capital losses represent net capital loss carryovers that may be used to offset future realized capital gains for federal income tax purposes. Future capital loss carryover utilization in any given year may be subject to Internal Revenue Code limitations. Capital loss carryovers of $(14,251,983) and $(117,206,401) expire in 2016 and 2017, respectively.
The capital loss deferral represents net capital losses incurred in the one-month period ended November 30, 2011. The fund has elected to treat such losses as having been incurred in the following fiscal year for federal income tax purposes.
On December 22, 2010, the Regulated Investment Company Modernization Act of 2010 (the “Act”) was enacted, which changed various technical rules governing the tax treatment of regulated investment companies. The changes are generally effective for taxable years beginning after the date of enactment. Under the Act, the fund will be permitted to carry forward capital losses incurred in taxable years beginning after the date of enactment for an unlimited period. However, any losses incurred during those future taxable years will be required to be utilized prior to the losses incurred in pre-enactment taxable years, which carry an expiration date. As a result of this ordering rule, pre-enactment capital loss carryforwards may be more likely to expire unused.
23
| For a Share Outstanding Throughout the Years Ended November 30 (except as noted) | ||||||||||||||
| Per-Share Data | Ratios and Supplemental Data | |||||||||||||
| Income From Investment Operations: | Distributions From: | Ratio to Average Net Assets of: | ||||||||||||
Net Asset Value, Beginning of Period | Net Investment Income (Loss)(1) | Net Realized and Unrealized Gain (Loss) | Total From Investment Operations | Net Investment Income | Net Realized Gains | Total Distributions | Redemption Fees(1) | Net Asset Value, End of Period | Total Return(2) | Operating Expenses | Net Investment Income (Loss) | Portfolio Turnover Rate | Net Assets, End of Period (in thousands) | |
| Investor Class | ||||||||||||||
| 2011 | $8.46 | 0.01 | (1.09) | (1.08) | — | — | — | —(3) | $7.38 | (12.77)% | 1.71% | 0.17% | 71% | $435,079 |
| 2010 | $7.28 | —(3) | 1.18 | 1.18 | — | — | — | —(3) | $8.46 | 16.21% | 1.72% | (0.02)% | 87% | $583,978 |
| 2009 | $4.17 | 0.01 | 3.13 | 3.14 | (0.03) | — | (0.03) | —(3) | $7.28 | 75.36% | 1.78% | 0.11% | 126% | $567,248 |
| 2008 | $12.69 | 0.09 | (7.21) | (7.12) | (0.10) | (1.31) | (1.41) | 0.01 | $4.17 | (62.66)% | 1.66% | 1.06% | 121% | $316,695 |
| 2007 | $10.06 | 0.10 | 4.06 | 4.16 | (0.13) | (1.42) | (1.55) | 0.02 | $12.69 | 48.81% | 1.66% | 0.96% | 85% | $1,070,138 |
| Institutional Class | ||||||||||||||
| 2011 | $8.65 | 0.03 | (1.12) | (1.09) | — | — | — | —(3) | $7.56 | (12.60)% | 1.51% | 0.37% | 71% | $29,695 |
| 2010 | $7.43 | 0.02 | 1.20 | 1.22 | — | — | — | —(3) | $8.65 | 16.42% | 1.52% | 0.18% | 87% | $40,969 |
| 2009 | $4.26 | 0.02 | 3.18 | 3.20 | (0.03) | — | (0.03) | —(3) | $7.43 | 75.92% | 1.58% | 0.31% | 126% | $27,787 |
| 2008 | $12.92 | 0.12 | (7.35) | (7.23) | (0.13) | (1.31) | (1.44) | 0.01 | $4.26 | (62.63)% | 1.46% | 1.26% | 121% | $27,235 |
| 2007 | $10.21 | 0.12 | 4.14 | 4.26 | (0.15) | (1.42) | (1.57) | 0.02 | $12.92 | 49.21% | 1.46% | 1.16% | 85% | $74,897 |
A Class(4) | ||||||||||||||
| 2011 | $8.23 | (0.01) | (1.06) | (1.07) | — | — | — | —(3) | $7.16 | (13.00)% | 1.96% | (0.08)% | 71% | $15,339 |
| 2010 | $7.10 | (0.02) | 1.15 | 1.13 | — | — | — | —(3) | $8.23 | 15.92% | 1.97% | (0.27)% | 87% | $29,572 |
| 2009 | $4.07 | (0.01) | 3.06 | 3.05 | (0.02) | — | (0.02) | —(3) | $7.10 | 75.24% | 2.03% | (0.14)% | 126% | $23,260 |
| 2008 | $12.40 | 0.07 | (7.03) | (6.96) | (0.07) | (1.31) | (1.38) | 0.01 | $4.07 | (62.78)% | 1.91% | 0.81% | 121% | $17,105 |
| 2007 | $9.85 | 0.07 | 3.99 | 4.06 | (0.11) | (1.42) | (1.53) | 0.02 | $12.40 | 48.61% | 1.91% | 0.71% | 85% | $36,795 |
24
| For a Share Outstanding Throughout the Years Ended November 30 (except as noted) | ||||||||||||||
| Per-Share Data | Ratios and Supplemental Data | |||||||||||||
| Income From Investment Operations: | Distributions From: | Ratio to Average Net Assets of: | ||||||||||||
Net Asset Value, Beginning of Period | Net Investment Income (Loss)(1) | Net Realized and Unrealized Gain (Loss) | Total From Investment Operations | Net Investment Income | Net Realized Gains | Total Distributions | Redemption Fees(1) | Net Asset Value, End of Period | Total Return(2) | Operating Expenses | Net Investment Income (Loss) | Portfolio Turnover Rate | Net Assets, End of Period (in thousands) | |
| C Class | ||||||||||||||
| 2011 | $7.93 | (0.07) | (1.02) | (1.09) | — | — | — | —(3) | $6.84 | (13.75)% | 2.71% | (0.83)% | 71% | $3,896 |
| 2010 | $6.89 | (0.07) | 1.11 | 1.04 | — | — | — | —(3) | $7.93 | 15.09% | 2.72% | (1.02)% | 87% | $5,257 |
| 2009 | $3.96 | (0.05) | 2.98 | 2.93 | — | — | — | —(3) | $6.89 | 73.99% | 2.78% | (0.89)% | 126% | $5,372 |
| 2008 | $12.10 | 0.01 | (6.87) | (6.86) | — | (1.29) | (1.29) | 0.01 | $3.96 | (63.09)% | 2.66% | 0.06% | 121% | $3,217 |
| 2007 | $9.64 | (0.01) | 3.90 | 3.89 | (0.03) | (1.42) | (1.45) | 0.02 | $12.10 | 47.39% | 2.66% | (0.04)% | 85% | $9,098 |
| R Class | ||||||||||||||
| 2011 | $8.42 | (0.03) | (1.09) | (1.12) | — | — | — | —(3) | $7.30 | (13.30)% | 2.21% | (0.33)% | 71% | $631 |
| 2010 | $7.28 | (0.04) | 1.18 | 1.14 | — | — | — | —(3) | $8.42 | 15.66% | 2.22% | (0.52)% | 87% | $828 |
| 2009 | $4.17 | (0.02) | 3.14 | 3.12 | (0.01) | — | (0.01) | —(3) | $7.28 | 74.94% | 2.28% | (0.39)% | 126% | $516 |
| 2008 | $12.68 | 0.05 | (7.22) | (7.17) | (0.04) | (1.31) | (1.35) | 0.01 | $4.17 | (62.92)% | 2.19% | 0.53% | 121% | $144 |
2007(5) | $12.15 | (0.01) | 0.52 | 0.51 | — | — | — | 0.02 | $12.68 | 4.36% | 2.08%(6) | (0.68)%(6) | 85%(7) | $27 |
Notes to Financial Highlights
| (1) | Computed using average shares outstanding throughout the period. |
| (2) | Total returns are calculated based on the net asset value of the last business day and do not reflect applicable sales charges, if any. Total returns for periods less than one year are not annualized. |
| (3) | Per-share amount was less than $0.005. |
| (4) | Prior to September 4, 2007, the A Class was referred to as the Advisor Class. |
| (5) | September 28, 2007 (commencement of sale) through November 30, 2007. |
| (6) | Annualized. |
| (7) | Portfolio turnover is calculated at the fund level. Percentage indicated was calculated for the year ended November 30, 2007. |
See Notes to Financial Statements.
25
The Board of Directors and Shareholders,
American Century World Mutual Funds, Inc.:
We have audited the accompanying statement of assets and liabilities, including the schedule of investments, of Emerging Markets Fund, one of the funds constituting American Century World Mutual Funds, Inc. (the “Corporation”), as of November 30, 2011, and the related statement of operations for the year then ended, the statements of changes in net assets for each of the two years in the period then ended, and the financial highlights for each of the five years in the period then ended. These financial statements and financial highlights are the responsibility of the Corporation’s management. Our responsibility is to express an opinion on these financial statements and financial highlights based on our audits.
We conducted our audits in accordance with the standards of the Public Company Accounting Oversight Board (United States). Those standards require that we plan and perform the audit to obtain reasonable assurance about whether the financial statements and financial highlights are free of material misstatement. The Corporation is not required to have, nor were we engaged to perform, an audit of its internal control over financial reporting. Our audits included consideration of internal control over financial reporting as a basis for designing audit procedures that are appropriate in the circumstances, but not for the purpose of expressing an opinion on the effectiveness of the Corporation’s internal control over financial reporting. Accordingly, we express no such opinion. An audit also includes examining, on a test basis, evidence supporting the amounts and disclosures in the financial statements, assessing the accounting principles used and significant estimates made by management, as well as evaluating the overall financial statement presentation. Our procedures included confirmation of securities owned as of November 30, 2011, by correspondence with the custodian and brokers; where replies were not received from brokers, we performed other auditing procedures. We believe that our audits provide a reasonable basis for our opinion.
In our opinion, the financial statements and financial highlights referred to above present fairly, in all material respects, the financial position of Emerging Markets Fund of American Century World Mutual Funds, Inc., as of November 30, 2011, the results of its operations for the year then ended, the changes in its net assets for each of the two years in the period then ended, and the financial highlights for each of the five years in the period then ended, in conformity with accounting principles generally accepted in the United States of America.
Deloitte & Touche LLP
Kansas City, Missouri
January 20, 2012
26
The Board of Directors
The individuals listed below serve as directors of the funds. Each director will continue to serve in this capacity until death, retirement, resignation or removal from office. The mandatory retirement age for directors who are not “interested persons,” as that term is defined in the Investment Company Act (independent directors), is 72. However, the mandatory retirement age for an individual director may be extended with the approval of the remaining independent directors.
Mr. Thomas is the only director who is an “interested person” because he currently serves as President and Chief Executive Officer of American Century Companies, Inc. (ACC), the parent company of American Century Investment Management, Inc. (ACIM or the advisor).
The other directors (more than three-fourths of the total number) are independent; that is, they have never been employees, directors or officers of, and have no financial interest in, ACC or any of its wholly owned, direct or indirect, subsidiaries, including ACIM, American Century Investment Services, Inc. (ACIS) and American Century Services, LLC (ACS). The directors serve in this capacity for seven (in the case of Mr. Thomas, 15) registered investment companies in the American Century Investments family of funds.
The following presents additional information about the directors. The mailing address for each director is 4500 Main Street, Kansas City, Missouri 64111.
Name (Year of Birth) | Position(s) Held with Funds | Length of Time Served | Principal Occupation(s) During Past 5 Years | Number of American Century Portfolios Overseen by Director | Other Directorships Held During Past 5 Years |
| Independent Directors | |||||
Thomas A. Brown (1940) | Director | Since 1980 | Managing Member, Associated Investments, LLC (real estate investment company); Brown Cascade Properties, LLC (real estate investment company) (2001 to 2009) | 65 | None |
Andrea C. Hall (1945) | Director | Since 1997 | Retired as advisor to the President, Midwest Research Institute (not-for-profit research organization) (June 2006) | 65 | None |
Jan M. Lewis (1957) | Director | Since 2011 | President and Chief Executive Officer, Catholic Charities of Northeast Kansas (human services organization) (2006 to present); President, BUCON, Inc. (full-service design-build construction company) (2004 to 2006) | 65 | None |
James A. Olson (1942) | Director | Since 2007 | Member, Plaza Belmont LLC (private equity fund manager); Chief Financial Officer, Plaza Belmont LLC (September 1999 to September 2006) | 65 | Saia, Inc. and Entertainment Properties Trust |
27
Name (Year of Birth) | Position(s) Held with Funds | Length of Time Served | Principal Occupation(s) During Past 5 Years | Number of American Century Portfolios Overseen by Director | Other Directorships Held During Past 5 Years |
| Independent Directors | |||||
Donald H. Pratt (1937) | Director and Chairman of the Board | Since 1995 (Chairman since 2005) | Chairman and Chief Executive Officer, Western Investments, Inc. (real estate company) | 65 | None |
M. Jeannine Strandjord (1945) | Director | Since 1994 | Retired | 65 | DST Systems Inc., Euronet Worldwide Inc., and Charming Shoppes, Inc. |
John R. Whitten (1946) | Director | Since 2008 | Project Consultant, Celanese Corp. (industrial chemical company) | 65 | Rudolph Technologies, Inc. |
Stephen E. Yates (1948) | Advisory Director | Since 2011 | Retired; Executive Vice President, Technology & Operations, KeyCorp. (computer services) (2004 to 2010) | 65 | Applied Industrial Technology (2001 to 2010) |
| Interested Director | |||||
Jonathan S. Thomas (1963) | Director and President | Since 2007 | President and Chief Executive Officer, ACC (March 2007 to present); Chief Administrative Officer, ACC (February 2006 to February 2007); Executive Vice President, ACC (November 2005 to February 2007). Also serves as: Chief Executive Officer and Manager, ACS; Executive Vice President, ACIM; Director, ACC, ACIM and other ACC subsidiaries | 106 | None |
28
Officers
The following table presents certain information about the executive officers of the funds. Each officer serves as an officer for each of the 15 investment companies in the American Century family of funds, unless otherwise noted. No officer is compensated for his or her service as an officer of the funds. The listed officers are interested persons of the funds and are appointed or re-appointed on an annual basis. The mailing address for each officer listed below is 4500 Main Street, Kansas City, Missouri 64111.
Name (Year of Birth) | Offices with the Funds | Principal Occupation(s) During the Past Five Years |
Jonathan S. Thomas (1963) | Director and President since 2007 | President and Chief Executive Officer, ACC (March 2007 to present); Chief Administrative Officer, ACC (February 2006 to February 2007); Executive Vice President, ACC (November 2005 to February 2007). Also serves as: Chief Executive Officer and Manager, ACS; Executive Vice President, ACIM; Director, ACC, ACIM and other ACC subsidiaries |
Barry Fink (1955) | Executive Vice President since 2007 | Chief Operating Officer and Executive Vice President, ACC (September 2007 to present); President, ACS (October 2007 to present); Managing Director, Morgan Stanley (2000 to 2007); Global General Counsel, Morgan Stanley (2000 to 2006). Also serves as: Manager, ACS and Director, ACC and certain ACC subsidiaries |
Maryanne L. Roepke (1956) | Chief Compliance Officer since 2006 and Senior Vice President since 2000 | Chief Compliance Officer, American Century funds, ACIM and ACS (August 2006 to present); Assistant Treasurer, ACC (January 1995 to August 2006); and Treasurer and Chief Financial Officer, various American Century funds (July 2000 to August 2006). Also serves as: Senior Vice President, ACS |
Charles A. Etherington (1957) | General Counsel since 2007 and Senior Vice President since 2006 | Attorney, ACC (February 1994 to present); Vice President, ACC (November 2005 to present), General Counsel, ACC (March 2007 to present); Also serves as General Counsel, ACIM, ACS, ACIS and other ACC subsidiaries; and Senior Vice President, ACIM and ACS |
Robert J. Leach (1966) | Vice President, Treasurer and Chief Financial Officer since 2006 | Vice President, ACS (February 2000 to present); and Controller, various American Century funds (1997 to September 2006) |
David H. Reinmiller (1963) | Vice President since 2000 | Attorney, ACC (January 1994 to present); Associate General Counsel, ACC (January 2001 to present). Also serves as Vice President, ACIM and ACS |
Ward D. Stauffer (1960) | Secretary since 2005 | Attorney, ACC (June 2003 to present) |
The Statement of Additional Information has additional information about the fund’s directors and is available without charge, upon request, by calling 1-800-345-2021.
29
| Approval of Management Agreement |
At a meeting held on June 9, 2011, the Fund’s Board of Directors unanimously approved the renewal of the management agreement pursuant to which American Century Investment Management, Inc. (the “Advisor”) acts as the investment advisor for the Fund. Under Section 15(c) of the Investment Company Act, contracts for investment advisory services are required to be reviewed, evaluated, and approved by a majority of a fund’s independent directors (the “Directors”) each year.
As a part of the approval process, the Board requested and reviewed extensive data and information compiled by the Advisor and certain independent providers of evaluation data concerning the Fund and the services provided to the Fund by the Advisor. This review was in addition to the oversight and evaluation undertaken by the Board and its committees on a continuous basis throughout the year and included, but was not limited to the following:
| • | the nature, extent, and quality of investment management, shareholder services, and other services provided by the Advisor to the Fund; |
| • | the wide range of other programs and services the Advisor provides to the Fund and its shareholders on a routine and non-routine basis; |
| • | the investment performance of the fund, including data comparing the Fund’s performance to appropriate benchmarks and/or a peer group of other mutual funds with similar investment objectives and strategies; |
| • | data comparing the cost of owning the Fund to the cost of owning similar funds; |
| • | the Advisor’s compliance policies, procedures, and regulatory experience; |
| • | financial data showing the cost of services provided to the Fund, the profitability of the Fund to the Advisor, and the overall profitability of the Advisor; |
| • | data comparing services provided and charges to other investment management clients of the Advisor; and |
| • | consideration of collateral benefits derived by the Advisor from the management of the Fund and any potential economies of scale relating thereto. |
In keeping with its practice, the Board held two in-person meetings and one telephonic meeting to review and discuss the information provided. The Directors also had the benefit of the advice of independent counsel throughout the period.
Factors Considered
The Directors considered all of the information provided by the Advisor, the independent data providers, and independent counsel, and evaluated such information for the Fund. In connection with their review, the Directors did not identify any single factor as being all-important or controlling, and each Director may have attributed different levels of importance to different factors. In deciding to renew the management agreement, the Board based its decision on a number of factors, including the following:
30
Nature, Extent and Quality of Services — Generally. Under the management agreement, the Advisor is responsible for providing or arranging for all services necessary for the operation of the Fund. The Board noted that under the management agreement, the Advisor provides or arranges at its own expense a wide variety of services including:
| • | constructing and designing the Fund |
| • | portfolio research and security selection |
| • | initial capitalization/funding |
| • | securities trading |
| • | Fund administration |
| • | custody of Fund assets |
| • | daily valuation of the Fund’s portfolio |
| • | shareholder servicing and transfer agency, including shareholder confirmations, recordkeeping, and communications |
| • | legal services |
| • | regulatory and portfolio compliance |
| • | financial reporting |
| • | marketing and distribution |
The Board noted that many of these services have expanded over time both in terms of quantity and complexity in response to shareholder demands, competition in the industry, changing distribution channels, and the changing regulatory environment.
Investment Management Services. The nature of the investment management services provided to the Fund is quite complex and allows Fund shareholders access to professional money management, instant diversification of their investments within an asset class, the opportunity to easily diversify among asset classes by investing in or exchanging among various American Century Investments funds, and liquidity. In evaluating investment performance, the Board expects the Advisor to manage the Fund in accordance with its investment objectives and approved strategies. Further, the Directors recognize that the Advisor has an obligation to monitor trading activities, and in particular to seek the best execution of fund trades, and to evaluate the use of and payment for research. In providing these services, the Advisor utilizes teams of investment professionals (portfolio managers, analysts, research assistants, and securities traders) who require extensive information technology, research, training, compliance and other systems to conduct their business. The Board, directly and through its Fund Performance Review Committee, regularly reviews investment performance information for the Fund, together with comparative information for appropriate benchmarks and/or peer groups of similarly-managed funds, over different time horizons.
31
The Directors also review detailed performance information during the management agreement approval process. If performance concerns are identified, the Fund receives special reviews until performance improves, during which the Board discusses with the Advisor the reasons for such results (e.g., market conditions, security selection) and any efforts being undertaken to improve performance. Taking all these factors into consideration, the Board found the investment management services provided by the Advisor to the Fund to meet or exceed industry standards. More detailed information about the Fund’s performance can be found in the Performance and Portfolio Commentary sections of this report.
Shareholder and Other Services. Under the management agreement, the Advisor provides the Fund with a comprehensive package of transfer agency, shareholder, and other services. The Board, directly and through various committees of the Board, regularly reviews reports and evaluations of such services at its regular meetings. These reports include, but are not limited to, information regarding the operational efficiency and accuracy of the shareholder and transfer agency services provided, staffing levels, shareholder satisfaction (as measured by external as well as internal sources), technology support, new products and services offered to Fund shareholders, securities trading activities, portfolio valuation services, auditing services, and legal and operational compliance activities. Certain aspects of shareholder and transfer agency service level efficiency and the quality of securities trading activities are measured by independent third party providers and are presented in comparison to other fund groups not managed by the Advisor. The Board found the services provided by the Advisor to the Fund under the management agreement to be competitive and of high quality.
Costs of Services and Profitability. The Advisor provides detailed information concerning its cost of providing various services to the Fund, its profitability in managing the Fund, its overall profitability, and its financial condition. The Directors have reviewed with the Advisor the methodology used to prepare this financial information. The financial information regarding the Advisor is considered in evaluating the Advisor’s financial condition, ability to continue to provide services under the management agreement, and the reasonableness of the current management fee. The Board concluded that the Advisor’s profits were reasonable in light of the services provided to the Fund.
Ethics. The Board generally considers the Advisor’s commitment to providing quality services to shareholders and to conducting its business ethically. They noted that the Advisor’s practices generally meet or exceed industry best practices.
Economies of Scale. The Board also reviewed information provided by the Advisor regarding the possible existence of economies of scale in connection with the management of the Fund. The Board concluded that economies of scale are difficult to measure and predict with precision, especially on a fund-by-fund basis. The Board concluded that the Advisor is appropriately sharing economies of scale through its competitive fee structure, offering competitive fees from fund inception, and through reinvestment in its business to provide shareholders additional content and services.
32
Comparison to Other Funds’ Fees. The management agreement provides that the Fund pay the Advisor a single, all-inclusive (or unified) management fee for providing all services necessary for the management and operation of the Fund, other than brokerage expenses, taxes, interest, extraordinary expenses, and the fees and expenses of the Fund’s independent directors (including their independent legal counsel) and expenses incurred in connection with the provision of shareholder services and distribution services under a plan adopted pursuant to Rule 12b-1 under the 1940 Act. Under the unified fee structure, the Advisor is responsible for providing all investment advisory, custody, audit, administrative, compliance, recordkeeping, marketing and shareholder services, or arranging and supervising third parties to provide such services. By contrast, most other funds are charged a variety of fees, including an investment advisory fee, a transfer agency fee, an administrative fee, distribution charges and other expenses. Other than their investment advisory fees and any applicable Rule 12b-1 distribution fees, all other components of the total fees charged by these other funds may be increased without shareholder approval. The Board believes the unified fee structure is a benefit to Fund shareholders because it clearly discloses to shareholders the cost of owning Fund shares, and, since the unified fee cannot be increased without a vote of Fund shareholders, it shifts to the Advisor the risk of increased costs of operating the Fund and provides a direct incentive to minimize administrative inefficiencies. Part of the Board’s analysis of fee levels involves reviewing certain evaluative data compiled by an independent provider and comparing the Fund’s unified fee to the total expense ratio of other funds in the Fund’s peer group. The Board concluded that the management fee paid by the Fund to the Advisor under the management agreement is reasonable in light of the services provided to the Fund.
Comparison to Fees and Services Provided to Other Clients of the Advisor. The Board also requested and received information from the Advisor concerning the nature of the services, fees, costs and profitability of its advisory services to advisory clients other than the Fund. They observed that these varying types of client accounts require different services and involve different regulatory and entrepreneurial risks than the management of the Fund. The Board analyzed this information and concluded that the fees charged and services provided to the Fund were reasonable by comparison.
Collateral or “Fall-Out” Benefits Derived by the Advisor. The Board considered the existence of collateral benefits the Advisor may receive as a result of its relationship with the Fund. They concluded that the Advisor’s primary business is managing mutual funds and it generally does not use fund or shareholder information to generate profits in other lines of business, and therefore does not derive any significant collateral benefits from them. The Board noted that the Advisor receives proprietary research from broker-dealers that execute fund portfolio transactions and concluded that this research is likely to benefit Fund shareholders. The Board also determined that the Advisor is able to provide investment management services to certain clients other than the Fund, at least in part, due to its existing infrastructure built to serve the fund complex. The Board concluded, however, that the assets of those other clients are not material to the analysis and, where applicable, may be included with the assets of the Fund to determine breakpoints in the management fee schedule.
33
Existing Relationship. The Board also considered whether there was any reason for not continuing the existing arrangement with the Advisor. In this regard, the Board was mindful of the potential disruptions of the Fund’s operations and various risks, uncertainties, and other effects that could occur as a result of a decision not to continue such relationship. In particular, the Board recognized that most shareholders have invested in the Fund on the strength of the Advisor’s industry standing and reputation and in the expectation that the Advisor will have a continuing role in providing advisory services to the Fund.
Conclusion of the Directors. As a result of this process, the Board, including all of the independent directors, taking into account all of the factors discussed above and the information provided by the Advisor and others, concluded that the management agreement between the Fund and the Advisor is fair and reasonable in light of the services provided and should be renewed.
34
Retirement Account Information
As required by law, distributions you receive from certain IRAs, or 403(b), 457 and qualified plans are subject to federal income tax withholding, unless you elect not to have withholding apply. Tax will be withheld on the total amount withdrawn even though you may be receiving amounts that are not subject to withholding, such as nondeductible contributions. In such case, excess amounts of withholding could occur. You may adjust your withholding election so that a greater or lesser amount will be withheld.
If you don’t want us to withhold on this amount, you must notify us to not withhold the federal income tax. You may notify us in writing or in certain situations by telephone or through other electronic means. You have the right to revoke your withholding election at any time and any election you make may remain in effect until revoked by filing a new election.
Remember, even if you elect not to have income tax withheld, you are liable for paying income tax on the taxable portion of your withdrawal. If you elect not to have income tax withheld or you don’t have enough income tax withheld, you may be responsible for payment of estimated tax. You may incur penalties under the estimated tax rules if your withholding and estimated tax payments are not sufficient. You can reduce or defer the income tax on a distribution by directly or indirectly rolling such distribution over to another IRA or eligible plan. You should consult your tax advisor for additional information.
State tax will be withheld if, at the time of your distribution, your address is within one of the mandatory withholding states and you have federal income tax withheld. State taxes will be withheld from your distribution in accordance with the respective state rules.
Proxy Voting Guidelines
American Century Investment Management, Inc., the fund’s investment advisor, is responsible for exercising the voting rights associated with the securities purchased and/or held by the fund. A description of the policies and procedures the advisor uses in fulfilling this responsibility is available without charge, upon request, by calling 1-800-345-2021. It is also available on American Century Investments’ website at americancentury.com and on the Securities and Exchange Commission’s website at sec.gov. Information regarding how the investment advisor voted proxies relating to portfolio securities during the most recent 12-month period ended June 30 is available on the “About Us” page at americancentury.com. It is also available at sec.gov.
Quarterly Portfolio Disclosure
The fund files its complete schedule of portfolio holdings with the Securities and Exchange Commission (SEC) for the first and third quarters of each fiscal year on Form N-Q. The fund’s Forms N-Q are available on the SEC’s website at sec.gov, and may be reviewed and copied at the SEC’s Public Reference Room in Washington, DC. Information on the operation of the Public Reference Room may be obtained by calling 1-800-SEC-0330. The fund also makes its complete schedule of portfolio holdings for the most recent quarter of its fiscal year available on its website at americancentury.com and, upon request, by calling 1-800-345-2021.
35
36
| Contact Us | americancentury.com |
| Automated Information Line | 1-800-345-8765 |
| Investor Services Representative | 1-800-345-2021 or 816-531-5575 |
| Investors Using Advisors | 1-800-378-9878 |
Business, Not-For-Profit, Employer-Sponsored Retirement Plans | 1-800-345-3533 |
Banks and Trust Companies, Broker-Dealers, Financial Professionals, Insurance Companies | 1-800-345-6488 |
| Telecommunications Device for the Deaf | 1-800-634-4113 |
American Century World Mutual Funds, Inc.
Investment Advisor:
American Century Investment Management, Inc.
Kansas City, Missouri
This report and the statements it contains are submitted for the general information of our shareholders. The report is not authorized for distribution to prospective investors unless preceded or accompanied by an effective prospectus.
©2012 American Century Proprietary Holdings, Inc. All rights reserved.
CL-ANN-74138 1201
ANNUAL REPORT NOVEMBER 30, 2011
| International Discovery Fund |
| President’s Letter | 2 |
| Independent Chairman’s Letter | 3 |
| Market Perspective | 4 |
| Performance | 5 |
| Portfolio Commentary | 7 |
| Fund Characteristics | 9 |
| Shareholder Fee Example | 10 |
| Schedule of Investments | 12 |
| Statement of Assets and Liabilities | 14 |
| Statement of Operations | 15 |
| Statement of Changes in Net Assets | 16 |
| Notes to Financial Statements | 17 |
| Financial Highlights | 23 |
| Report of Independent Registered Public Accounting Firm | 25 |
| Management | 26 |
| Approval of Management Agreement | 29 |
| Additional Information | 34 |
Any opinions expressed in this report reflect those of the author as of the date of the report, and do not necessarily represent the opinions of American Century Investments® or any other person in the American Century Investments organization. Any such opinions are subject to change at any time based upon market or other conditions and American Century Investments disclaims any responsibility to update such opinions. These opinions may not be relied upon as investment advice and, because investment decisions made by American Century Investments funds are based on numerous factors, may not be relied upon as an indication of trading intent on behalf of any American Century Investments fund. Security examples are used for representational purposes only and are not intended as recommendations to purchase or sell securities. Performance information for comparative indices and securities is provided to American Century Investments by third party vendors. To the best of American Century Investments’ knowledge, such information is accurate at the time of printing.
Dear Investor:
Thank you for reviewing this annual report for the period ended November 30, 2011. Our report offers investment performance and portfolio information, presented with the expert perspective of our portfolio management team.
This report remains one of our most important vehicles for conveying information about fund returns, as well as market factors and strategies that affected fund performance. For additional, updated information, we encourage you to visit our website, americancentury.com. Click on the “Fund Performance” and “Insights & News” headings at the top of our Individual Investors site.
Reporting Period’s Divided Nature Resulted in Mixed Returns
The financial market performance that most U.S. investors experienced during the 12 months ended November 30, 2011 generally reflected the period’s divided nature. For the first six months, confidence in global economic growth, strong corporate earnings, and increased risk-taking generally ruled the markets. The MSCI EAFE Index and the S&P 500 Index advanced approximately 15% for the six months ended May 31, 2011, as stocks broadly outperformed high-quality bonds for that period.
However, the tables reversed sharply for the final six months. The risk-taking tide ebbed during the summer months, constrained by high fuel prices, federal budget management concerns in the U.S., and the worsening sovereign debt crisis in Europe. High-quality bonds, led by long-maturity U.S. Treasury securities, mostly outpaced stocks. The MSCI EAFE Index and the S&P 500 Index returned –16.56% and –6.25%, respectively, during the six months ended November 30, 2011, despite a significant market rebound in October.
As a result of this volatility, returns were mixed for the full 12-month period. U.S. and international bonds and U.S. stocks generally outperformed international stocks. The S&P 500 Index and the MSCI EAFE Index returned 7.83% and –4.12%, respectively, for the fiscal year.
Unfortunately, further volatility appears likely in 2012 as the markets wrestle with uncertainties regarding European debt, economic strength, government budget deficits, and the U.S. presidential election. We believe strongly in adhering to a disciplined, diversified, long-term investment approach during volatile periods, and we appreciate your continued trust in us during these unsettled times.
Sincerely,
Jonathan Thomas
President and Chief Executive Officer
American Century Investments
2
Dear Fellow Shareholders,
The board of directors of the fund was pleased at the announcement of a new strategic partner for the investment advisor to the American Century Investments funds. Canadian Imperial Bank of Commerce (CIBC), a leading Canadian financial institution, purchased the 41 percent economic interest in American Century Companies, the parent corporation of the advisor, previously held by JPMorgan Chase & Co. Based in Toronto, CIBC provides a full range of retail and wholesale banking services to almost 11 million clients through approximately 1,100 branches and offices in Canada, the U.S. and around the world. This transaction will benefit fund shareholders by bolstering the financial strength of the advisor and providing a strategic partner to help support its growth initiative to broaden non-U.S. distribution of its products and services.
The board also has been briefed throughout the year on the impact on fund performance of the European banking crisis, the U.S. deficit reduction debates, and the pace of economic growth. While the performance of all funds has been affected, the majority of American Century Investments funds overseen by the board are exceeding their benchmarks for the one-, three-, five-, and ten-year periods ended September 30, 2011. This is commendable performance, particularly in these challenging market conditions.
We are completing another year of board oversight on your behalf. We appreciate any comments you would like to share with the board. Send them to me at dhpratt@fundboardchair.com. Thank you for your continued investment in American Century Investments funds.
Best regards,
Don Pratt
3
By Mark Kopinski, Chief Investment Officer, Global and Non-U.S. Equity
Stocks Struggled as Growth Slowed
Global stock markets kicked off the 12-month period in generally robust fashion, no easy feat considering investors had to weigh brightening economic outlooks against mounting inflationary pressures, ongoing sovereign debt concerns, and an onslaught of political unrest and natural disasters. Nevertheless, negative forces—primarily expanding sovereign debt problems in Europe and the United States—gradually tightened their hold on the worldwide economy, and market sentiment began to deteriorate. The downdraft culminated with a sharp global market selloff in the third calendar quarter of 2011, triggered primarily by Standard & Poor’s first-ever downgrade of the United States’ long-term credit rating and mounting fears of a default in Greece. Worried about the potential for another global recession, the International Monetary Fund (IMF) trimmed its global growth outlook for 2012.
Overall, emerging market stocks underperformed developed international markets for the 12-month period, as investors retreated from riskier investments. In addition, falling global growth prospects sparked stock slumps, particularly in export-heavy emerging-market economies of South Korea and China. Economic growth continued to moderate in China, but inflationary pressures continued to build, prompting IMF calls for China to allow its currency to appreciate to temper a surge in inflation.
Outlook Hinges on Fiscal Strategies
The period ended with the United States, Japan and China releasing relatively strong economic data, thereby diminishing concerns for a synchronized global recession. Yet, European Union countries continued to falter. As the eurozone crisis continues, global demand likely will decrease as a function of deleveraging, which should negatively influence export-driven markets. In addition, volatility in the financial markets may remain heightened, as investors react to European reform plans.
Ultimately, we believe the global economy can and will resume a strong growth trend. But to do so, each region and country will have to address its specific fiscal challenges. We believe these are solvable problems, as long as government policy supports the private sector and its role in driving economic output and employment based on the profit incentive.
| International Equity Total Returns | ||||
| For the 12 months ended November 30, 2011 (in U.S. dollars) | ||||
| MSCI EAFE Index | -4.12% | MSCI Europe Index | -2.08% | |
| MSCI EAFE Growth Index | -3.96% | MSCI World Index | 1.46% | |
| MSCI EAFE Value Index | -4.27% | MSCI Japan Index | -8.56% | |
| MSCI Emerging Markets Index | -11.54% | |||
4
| Total Returns as of November 30, 2011 | ||||||
| Average Annual Returns | ||||||
Ticker Symbol | 1 year | 5 years | 10 years | Since Inception | Inception Date | |
| Investor Class | TWEGX | -6.58% | -2.55% | 8.35% | 10.67% | 4/1/94 |
MSCI All Country World ex-U.S. Mid Cap Growth Index | — | -6.30% | -2.98% | 7.04% | N/A(1) | — |
| Institutional Class | TIDIX | -6.41% | -2.34% | 8.57% | 9.12% | 1/2/98 |
A Class(2) No sales charge* With sales charge* | ACIDX | -6.83% -12.18% | -2.78% -3.92% | 8.10% 7.47% | 7.19% 6.72% | 4/28/98 |
| C Class | TWECX | -7.43% | — | — | 3.91% | 3/1/10 |
| R Class | TWERX | -7.10% | — | — | 4.36% | 3/1/10 |
* | Sales charges include initial sales charges and contingent deferred sales charges (CDSCs), as applicable. A Class shares have a 5.75% maximum initial sales charge and may be subject to a maximum CDSC of 1.00%. C Class shares redeemed within 12 months of purchase are subject to a maximum CDSC of 1.00%. The SEC requires that mutual funds provide performance information net of maximum sales charges in all cases where charges could be applied. |
| (1) | Benchmark data first available June 1994. |
| (2) | Prior to March 1, 2010, the A Class was referred to as the Advisor Class and did not have a front-end sales charge. Performance prior to that date has been adjusted to reflect this charge. |
Data presented reflect past performance. Past performance is no guarantee of future results. Current performance may be higher or lower than the performance shown. Investment return and principal value will fluctuate, and redemption value may be more or less than original cost. To obtain performance data current to the most recent month end, please call 1-800-345-2021 or visit americancentury.com. Historically, small company stocks have been more volatile than the stocks of larger, more established companies. International investing involves special risks, such as political instability and currency fluctuations. Investing in emerging markets may accentuate these risks. The fund’s investment process may result in high portfolio turnover, which could mean high transaction costs, affecting both performance and capital gains tax liabilities to investors.
Unless otherwise indicated, performance reflects Investor Class shares; performance for other share classes will vary due to differences in fee structure. For information about other share classes available, please consult the prospectus. Data assumes reinvestment of dividends and capital gains, and none of the charts reflect the deduction of taxes that a shareholder would pay on fund distributions or the redemption of fund shares. Returns for the index are provided for comparison. The fund’s total returns include operating expenses (such as transaction costs and management fees) that reduce returns, while the total returns of the index do not.
5
| Growth of $10,000 Over 10 Years |
| $10,000 investment made November 30, 2001 |
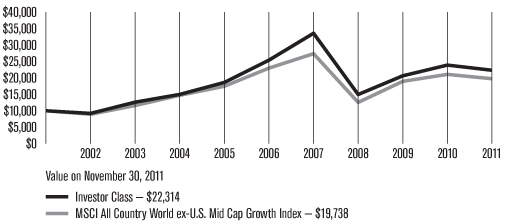
| Total Annual Fund Operating Expenses | ||||
| Investor Class | Institutional Class | A Class | C Class | R Class |
| 1.43% | 1.23% | 1.68% | 2.43% | 1.93% |
The total annual fund operating expenses shown is as stated in the fund’s prospectus current as of the date of this report. The prospectus may vary from the expense ratio shown elsewhere in this report because it is based on a different time period, includes acquired fund fees and expenses, and, if applicable, does not include fee waivers or expense reimbursements.
Data presented reflect past performance. Past performance is no guarantee of future results. Current performance may be higher or lower than the performance shown. Investment return and principal value will fluctuate, and redemption value may be more or less than original cost. To obtain performance data current to the most recent month end, please call 1-800-345-2021 or visit americancentury.com. Historically, small company stocks have been more volatile than the stocks of larger, more established companies. International investing involves special risks, such as political instability and currency fluctuations. Investing in emerging markets may accentuate these risks. The fund’s investment process may result in high portfolio turnover, which could mean high transaction costs, affecting both performance and capital gains tax liabilities to investors.
Unless otherwise indicated, performance reflects Investor Class shares; performance for other share classes will vary due to differences in fee structure. For information about other share classes available, please consult the prospectus. Data assumes reinvestment of dividends and capital gains, and none of the charts reflect the deduction of taxes that a shareholder would pay on fund distributions or the redemption of fund shares. Returns for the index are provided for comparison. The fund’s total returns include operating expenses (such as transaction costs and management fees) that reduce returns, while the total returns of the index do not.
6
Portfolio Managers: Mark Kopinski and Brian Brady
Performance Summary
International Discovery declined -6.58%* for the 12 months ended November 30, 2011, compared with its benchmark, the MSCI All Country World ex-U.S. Mid Cap Growth Index, which declined -6.30%.
Global stocks generally struggled during the 12-month period, as investors grappled with the ongoing and expanding sovereign debt problems in several developed nations. In particular, fears of a default in Greece and contagion throughout the rest of the eurozone weighed on stocks. In addition, mounting inflationary pressures in China and other emerging markets, combined with fears that a global economic slowdown would stifle demand for their goods, drove down stocks in the developing world. Within the developed markets, large-cap stocks showed a slight performance advantage over their small-cap brethren.
Earnings growth, which is an important component of the portfolio’s investment process, fell out of favor during much of the 12-month period, as investors focused on dividend and value-oriented stocks in the uncertain environment. Overall, stock selection was generally positive on a relative basis, while sector and regional allocations were slightly negative compared with the benchmark.
Economically Sensitive Sectors Lagged
Increased uncertainty relating to global economic growth drove down performance in the market’s more economically sensitive sectors, including industrials, consumer discretionary, and information technology. In particular, the media industry, which is part of the consumer discretionary sector, was among the portfolio’s worst performers, driven by China’s Focus Media Holding. Despite reporting better-than-expected results, shares tumbled after a Hong Kong research firm said the digital media company committed fraud to hide losses and benefit insiders—charges Focus Media denied.
Germany Led Country Detractors
From a regional perspective, exposure to Germany detracted the most from relative performance, followed by Taiwan and Japan. A sudden slowdown in industrial production drove down performance from many of Germany’s machinery and chemicals stocks. For example, a portfolio-only position in Kloeckner & Co. was among the largest detractors. Shares of the steel and metals trader declined after the company said an expected post-summer rebound in demand did not materialize. Additionally, falling metals prices prompted Kloeckner to cut its growth forecast for the year. An overweight position in German chemical company Wacker Chemie also was among the portfolio’s weakest holdings. Shares of the company fell as high raw materials costs led to lower-than-expected profits for the polysilicon maker. In addition, the company warned slower economic growth may weaken near-term profits.
*All fund returns referenced in this commentary are for Investor Class shares.
7
Sweden was Top Contributor
From a regional perspective, our exposure to Sweden, Australia, and South Korea made the greatest contribution to relative performance. Our portfolio-only position in Sweden’s Lundin Petroleum, an oil and natural gas exploration and production company, was the leading contributor to portfolio performance. Shares advanced on news the company may significantly increase its oil reserve estimates due to a major North Sea discovery. In addition, an overweight position in Australia’s Iluka Resources, a miner of mineral sands, was among the portfolio’s top contributors. The company reported strong revenues and said it expects prices for zircon, a mineral used in ceramics production and other applications, to increase.
An overweight position in South Korea-based Celltrion, Inc., a manufacturer of protein drugs, also was a top contributor to the portfolio’s relative performance. Celltrion’s share price advanced on news the company is set to complete its global clinical trials of drugs to treat breast cancer and arthritis. In addition, the company will begin selling its products in the United States, India, South America and other emerging countries in early 2012 and in Europe in 2014, further enhancing its growth opportunities.
Outlook
While bottom-up stock selection remains our focus, we will continue to look for opportunities to take advantage of prevailing global themes. In particular, the impact of demand from consumers in the emerging markets remains a positive factor for the banking industry and for increased consumption by the increasingly wealthier populations in these markets. The health care industry may be at the start of a new cycle with better growth from new product pipelines. In addition, health care companies have been diligent in reducing costs and gaining greater efficiencies in research and development spending. Here, too, we believe emerging economies should provide incremental growth with accelerating sales of pharmaceuticals and related products. Overall, we will continue to seek small- to medium-sized companies located around the world (excluding the United States) offering promising growth characteristics.
8
| NOVEMBER 30, 2011 | |
| Top Ten Holdings | % of net assets |
| Lundin Petroleum AB | 3.1% |
| Technip SA | 2.9% |
| Gemalto NV | 2.4% |
| Aggreko plc | 2.3% |
| Weir Group plc (The) | 2.2% |
| First Quantum Minerals Ltd. | 2.2% |
| Sanrio Co. Ltd. | 2.0% |
| Focus Media Holding Ltd. ADR | 1.8% |
| Iluka Resources Ltd. | 1.7% |
| ARM Holdings plc | 1.7% |
| Types of Investments in Portfolio | % of net assets |
| Foreign Common Stocks | 98.2% |
| Other Assets and Liabilities | 1.8% |
| Investments by Country | % of net assets |
| United Kingdom | 16.6% |
| Japan | 12.6% |
| Canada | 9.4% |
| France | 7.9% |
| South Korea | 7.3% |
| Sweden | 6.5% |
| Australia | 5.3% |
| People’s Republic of China | 4.8% |
| Germany | 3.8% |
| Netherlands | 3.5% |
| Hong Kong | 2.9% |
| Switzerland | 2.8% |
| Italy | 2.6% |
| Taiwan (Republic of China) | 2.3% |
| Ireland | 2.1% |
| Other Countries | 7.8% |
| Other Assets and Liabilities | 1.8% |
9
Fund shareholders may incur two types of costs: (1) transaction costs, including sales charges (loads) on purchase payments and redemption/exchange fees; and (2) ongoing costs, including management fees; distribution and service (12b-1) fees; and other fund expenses. This example is intended to help you understand your ongoing costs (in dollars) of investing in your fund and to compare these costs with the ongoing cost of investing in other mutual funds.
The example is based on an investment of $1,000 made at the beginning of the period and held for the entire period from June 1, 2011 to November 30, 2011.
Actual Expenses
The table provides information about actual account values and actual expenses for each class. You may use the information, together with the amount you invested, to estimate the expenses that you paid over the period. First, identify the share class you own. Then simply divide your account value by $1,000 (for example, an $8,600 account value divided by $1,000 = 8.6), then multiply the result by the number under the heading “Expenses Paid During Period” to estimate the expenses you paid on your account during this period.
If you hold Investor Class shares of any American Century Investments fund, or Institutional Class shares of the American Century Diversified Bond Fund, in an American Century Investments account (i.e., not a financial intermediary or retirement plan account), American Century Investments may charge you a $12.50 semiannual account maintenance fee if the value of those shares is less than $10,000. We will redeem shares automatically in one of your accounts to pay the $12.50 fee. In determining your total eligible investment amount, we will include your investments in all personal accounts (including American Century Investments Brokerage accounts) registered under your Social Security number. Personal accounts include individual accounts, joint accounts, UGMA/UTMA accounts, personal trusts, Coverdell Education Savings Accounts and IRAs (including traditional, Roth, Rollover, SEP-, SARSEP- and SIMPLE-IRAs), and certain other retirement accounts. If you have only business, business retirement, employer-sponsored or American Century Investments Brokerage accounts, you are currently not subject to this fee. We will not charge the fee as long as you choose to manage your accounts exclusively online. If you are subject to the Account Maintenance Fee, your account value could be reduced by the fee amount.
Hypothetical Example for Comparison Purposes
The table also provides information about hypothetical account values and hypothetical expenses based on the actual expense ratio of each class of your fund and an assumed rate of return of 5% per year before expenses, which is not the actual return of a fund’s share class. The hypothetical account values and expenses may not be used to estimate the actual ending account balance or expenses you paid for the period. You may use this information to compare the ongoing costs of investing in your fund and other funds. To do so, compare this 5% hypothetical example with the 5% hypothetical examples that appear in the shareholder reports of the other funds.
10
Please note that the expenses shown in the table are meant to highlight your ongoing costs only and do not reflect any transactional costs, such as sales charges (loads) or redemption/exchange fees. Therefore, the table is useful in comparing ongoing costs only, and will not help you determine the relative total costs of owning different funds. In addition, if these transactional costs were included, your costs would have been higher.
Beginning Account Value 6/1/11 | Ending Account Value 11/30/11 | Expenses Paid During Period(1) 6/1/11 - 11/30/11 | Annualized Expense Ratio(1) | |
| Actual | ||||
| Investor Class | $1,000 | $813.20 | $6.55 | 1.44% |
| Institutional Class | $1,000 | $814.50 | $5.64 | 1.24% |
| A Class | $1,000 | $812.40 | $7.68 | 1.69% |
| C Class | $1,000 | $810.20 | $11.07 | 2.44% |
| R Class | $1,000 | $811.30 | $8.81 | 1.94% |
| Hypothetical | ||||
| Investor Class | $1,000 | $1,017.85 | $7.28 | 1.44% |
| Institutional Class | $1,000 | $1,018.85 | $6.28 | 1.24% |
| A Class | $1,000 | $1,016.60 | $8.54 | 1.69% |
| C Class | $1,000 | $1,012.84 | $12.31 | 2.44% |
| R Class | $1,000 | $1,015.34 | $9.80 | 1.94% |
| (1) | Expenses are equal to the class’s annualized expense ratio listed in the table above, multiplied by the average account value over the period, multiplied by 183, the number of days in the most recent fiscal half-year, divided by 365, to reflect the one-half year period. |
11
NOVEMBER 30, 2011
| Shares | Value | |
| Common Stocks — 98.2% | ||
| AUSTRALIA — 5.3% | ||
| Amcor Ltd. | 1,398,900 | $10,692,691 |
| Atlas Iron Ltd. | 969,400 | 3,042,025 |
| Boart Longyear Ltd. | 1,510,500 | 4,859,009 |
| Coca-Cola Amatil Ltd. | 144,600 | 1,765,998 |
| Iluka Resources Ltd. | 819,900 | 13,150,858 |
Mesoblast Ltd.(1) | 915,200 | 6,677,920 |
| 40,188,501 | ||
| BERMUDA — 0.8% | ||
| Golar LNG Ltd. | 145,600 | 6,348,160 |
| BRAZIL — 0.8% | ||
| Cia Hering | 289,000 | 6,120,884 |
| CANADA — 9.4% | ||
| Alimentation Couche Tard, Inc. B Shares | 41,600 | 1,195,039 |
| Finning International, Inc. | 417,900 | 9,563,004 |
| First Quantum Minerals Ltd. | 811,300 | 16,385,882 |
| Franco-Nevada Corp. | 159,800 | 6,766,765 |
| IAMGOLD Corp. | 117,700 | 2,379,503 |
Imax Corp.(1) | 130,664 | 2,536,188 |
| Intact Financial Corp. | 46,300 | 2,582,940 |
| Metro, Inc. A Shares | 38,600 | 1,950,909 |
Open Text Corp.(1) | 145,400 | 8,290,708 |
| Penn West Petroleum Ltd. | 404,800 | 7,375,456 |
Precision Drilling Corp.(1) | 936,000 | 10,819,589 |
| Tim Hortons, Inc. | 36,600 | 1,855,209 |
| 71,701,192 | ||
| CAYMAN ISLANDS — 1.3% | ||
| Herbalife Ltd. | 178,900 | 9,893,170 |
| DENMARK — 0.4% | ||
| FLSmidth & Co. A/S | 46,100 | 2,970,365 |
| FINLAND — 0.3% | ||
| Nokian Renkaat Oyj | 70,300 | 2,313,997 |
| FRANCE — 7.9% | ||
| Edenred | 486,600 | 12,978,700 |
| Eutelsat Communications SA | 169,900 | 6,603,319 |
| Safran SA | 204,000 | 6,046,261 |
| Sodexo | 36,300 | 2,640,443 |
| Technip SA | 232,700 | 22,240,141 |
| Zodiac Aerospace | 114,900 | 9,423,468 |
| 59,932,332 | ||
| GERMANY — 3.8% | ||
| Fraport AG | 34,100 | 1,937,103 |
| GEA Group AG | 317,000 | 9,333,020 |
| Hugo Boss AG Preference Shares | 108,224 | 9,788,536 |
Kabel Deutschland Holding AG(1) | 132,200 | $7,333,769 |
| Lanxess AG | 13,800 | 771,344 |
| 29,163,772 | ||
| HONG KONG — 2.9% | ||
Brilliance China Automotive Holdings Ltd.(1) | 9,702,000 | 11,378,860 |
| China Lumena New Materials Corp. | 44,073,600 | 9,129,418 |
| China Resources Cement Holdings Ltd. | 2,184,000 | 1,639,209 |
| 22,147,487 | ||
| INDIA — 0.4% | ||
| Dabur India Ltd. | 550,948 | 1,014,177 |
| Petronet LNG Ltd. | 685,400 | 2,172,971 |
| 3,187,148 | ||
| INDONESIA — 0.4% | ||
| PT Bank Danamon Indonesia Tbk | 6,236,323 | 3,085,332 |
| IRELAND — 2.1% | ||
Elan Corp. plc ADR(1) | 846,000 | 9,153,720 |
| Experian plc | 354,800 | 4,719,853 |
James Hardie Industries SE(1) | 350,900 | 2,499,004 |
| 16,372,577 | ||
| ISRAEL — 0.9% | ||
Mellanox Technologies Ltd.(1) | 200,600 | 7,023,006 |
| ITALY — 2.6% | ||
| Davide Campari-Milano SpA | 1,052,500 | 7,537,060 |
| Pirelli & C SpA | 1,289,400 | 12,137,842 |
| 19,674,902 | ||
| JAPAN — 12.6% | ||
| Anritsu Corp. | 241,000 | 2,734,018 |
| Capcom Co. Ltd. | 467,900 | 11,956,310 |
| Chiyoda Corp. | 810,000 | 8,918,747 |
| Credit Saison Co. Ltd. | 234,300 | 4,278,367 |
| CyberAgent, Inc. | 2,900 | 9,688,598 |
| Daihatsu Motor Co. Ltd. | 212,000 | 3,726,107 |
| JGC Corp. | 171,000 | 4,295,582 |
| Lawson, Inc. | 108,600 | 6,439,159 |
| Nippon Television Network Corp. | 33,200 | 4,517,080 |
| OKUMA Corp. | 284,000 | 2,182,327 |
| Park24 Co. Ltd. | 638,100 | 7,793,822 |
| Sanrio Co. Ltd. | 285,600 | 14,959,098 |
| Sharp Corp. | 446,000 | 4,559,714 |
| Sysmex Corp. | 149,500 | 5,159,878 |
12
| Shares | Value |
| Tamron Co. Ltd. | 98,100 | $2,632,356 |
| Ushio, Inc. | 149,600 | 2,262,961 |
| 96,104,124 | ||
| JERSEY — 1.3% | ||
| Randgold Resources Ltd. ADR | 90,100 | 9,632,591 |
| NETHERLANDS — 3.5% | ||
| Gemalto NV | 373,700 | 18,477,602 |
| Koninklijke Vopak NV | 149,200 | 8,202,429 |
| 26,680,031 | ||
| PEOPLE’S REPUBLIC OF CHINA — 4.8% | ||
| AAC Technologies Holdings, Inc. | 1,786,000 | 4,301,712 |
| Dongyue Group | 12,389,000 | 11,175,410 |
| Evergrande Real Estate Group Ltd. | 4,850,000 | 2,052,114 |
Focus Media Holding Ltd. ADR(1) | 751,700 | 13,921,484 |
| Spreadtrum Communications, Inc. ADR | 200,100 | 4,952,475 |
| 36,403,195 | ||
| SINGAPORE — 0.3% | ||
Biosensors International Group Ltd.(1) | 2,400,000 | 2,631,785 |
| SOUTH KOREA — 7.3% | ||
| Celltrion, Inc. | 225,300 | 7,478,726 |
| Dongbu Insurance Co. Ltd. | 242,800 | 11,297,455 |
Duksan Hi-Metal Co. Ltd.(1) | 44,600 | 1,114,426 |
E-Mart Co. Ltd.(1) | 15,100 | 3,872,372 |
| Hyundai Glovis Co. Ltd. | 56,500 | 11,296,125 |
| KT&G Corp. | 53,100 | 3,580,856 |
| LG Household & Health Care Ltd. | 2,400 | 1,129,340 |
| NCSoft Corp. | 42,700 | 11,626,292 |
| Nexen Tire Corp. | 201,100 | 3,863,011 |
| 55,258,603 | ||
| SPAIN — 0.9% | ||
Grifols SA(1) | 414,100 | 6,692,338 |
| SWEDEN — 6.5% | ||
| Elekta AB B Shares | 119,600 | 5,090,161 |
| Kinnevik Investment AB B Shares | 561,200 | 11,394,810 |
Lundin Petroleum AB(1) | 929,000 | 23,953,105 |
| Swedish Match AB | 288,300 | 9,436,870 |
| 49,874,946 | ||
| SWITZERLAND — 2.8% | ||
Adecco SA(1) | 240,500 | 10,448,174 |
| Aryzta AG | 218,300 | 10,519,656 |
| 20,967,830 | ||
| TAIWAN (REPUBLIC OF CHINA) — 2.3% | ||
| Catcher Technology Co. Ltd. | 2,272,085 | 11,095,095 |
| E Ink Holdings, Inc. | 2,152,000 | 3,972,737 |
TPK Holding Co. Ltd.(1) | 156,000 | 2,131,927 |
| 17,199,759 | ||
| UNITED KINGDOM — 16.6% | ||
| Aggreko plc | 584,200 | 17,410,758 |
| ARM Holdings plc | 1,398,400 | 13,127,409 |
| Ashmore Group plc | 1,222,300 | 6,495,091 |
| Ashtead Group plc | 1,346,002 | 3,913,707 |
| Babcock International Group plc | 691,200 | 7,894,820 |
Berkeley Group Holdings plc(1) | 194,400 | 3,907,244 |
| Burberry Group plc | 571,900 | 11,464,320 |
| Croda International plc | 222,400 | 6,400,858 |
| Drax Group plc | 403,100 | 3,545,336 |
| Persimmon plc | 1,352,800 | 10,496,778 |
Subsea 7 SA(1) | 424,700 | 8,399,151 |
| Weir Group plc (The) | 525,800 | 17,111,536 |
| Whitbread plc | 314,800 | 8,137,381 |
| Willis Group Holdings plc | 224,300 | 7,908,818 |
| 126,213,207 | ||
TOTAL INVESTMENT SECURITIES — 98.2% (Cost $691,529,072) | 747,781,234 | |
| OTHER ASSETS AND LIABILITIES — 1.8% | 13,548,901 | |
| TOTAL NET ASSETS — 100.0% | $761,330,135 | |
| Market Sector Diversification | |
| (as a % of net assets) | |
| Industrials | 21.6% |
| Consumer Discretionary | 20.4% |
| Information Technology | 13.1% |
| Materials | 12.2% |
| Energy | 10.6% |
| Consumer Staples | 7.7% |
| Financials | 6.4% |
| Health Care | 5.7% |
| Utilities | 0.5% |
| Other Assets and Liabilities | 1.8% |
Notes to Schedule of Investments
ADR = American Depositary Receipt
(1) Non-income producing.
See Notes to Financial Statements.
13
| NOVEMBER 30, 2011 | ||||
| Assets | ||||
| Investment securities, at value (cost of $691,529,072) | $747,781,234 | |||
| Foreign currency holdings, at value (cost of $197,232) | 195,727 | |||
| Receivable for investments sold | 26,714,369 | |||
| Receivable for capital shares sold | 55,173 | |||
| Dividends and interest receivable | 1,260,081 | |||
| Other assets | 177,774 | |||
| 776,184,358 | ||||
| Liabilities | ||||
| Disbursements in excess of demand deposit cash | 128,825 | |||
| Payable for investments purchased | 12,802,570 | |||
| Payable for capital shares redeemed | 1,022,703 | |||
| Accrued management fees | 899,394 | |||
| Distribution and service fees payable | 731 | |||
| 14,854,223 | ||||
| Net Assets | $761,330,135 | |||
| Net Assets Consist of: | ||||
| Capital (par value and paid-in surplus) | $1,049,152,808 | |||
| Undistributed net investment income | 190,650 | |||
| Accumulated net realized loss | (344,196,601 | ) | ||
| Net unrealized appreciation | 56,183,278 | |||
| $761,330,135 | ||||
| Net assets | Shares outstanding | Net asset value per share | ||||||||||
| Investor Class, $0.01 Par Value | $660,971,091 | 71,681,719 | $9.22 | |||||||||
| Institutional Class, $0.01 Par Value | $97,062,616 | 10,394,042 | $9.34 | |||||||||
| A Class, $0.01 Par Value | $3,182,010 | 353,565 | $9.00 | * | ||||||||
| C Class, $0.01 Par Value | $87,496 | 9,636 | $9.08 | |||||||||
| R Class, $0.01 Par Value | $26,922 | 2,941 | $9.15 | |||||||||
*Maximum offering price $9.55 (net asset value divided by 0.9425)
See Notes to Financial Statements.
14
| YEAR ENDED NOVEMBER 30, 2011 | ||||
| Investment Income (Loss) | ||||
| Income: | ||||
| Dividends (net of foreign taxes withheld of $1,449,699) | $15,343,621 | |||
| Interest | 1,925 | |||
| 15,345,546 | ||||
| Expenses: | ||||
| Management fees | 13,660,145 | |||
| Distribution and service fees: | ||||
| A Class | 10,351 | |||
| C Class | 1,376 | |||
| R Class | 152 | |||
| Directors’ fees and expenses | 41,980 | |||
| Other expenses | 10,218 | |||
| 13,724,222 | ||||
| Net investment income (loss) | 1,621,324 | |||
| Realized and Unrealized Gain (Loss) | ||||
| Net realized gain (loss) on: | ||||
| Investment transactions (net of foreign tax expenses paid (refunded) of $359,895) | 48,520,032 | |||
| Foreign currency transactions (net of foreign tax expenses paid (refunded) of $404,241) | (701,975 | ) | ||
| 47,818,057 | ||||
| Change in net unrealized appreciation (depreciation) on: | ||||
| Investments (net of deferred foreign taxes of $(772,440)) | (110,014,416 | ) | ||
| Translation of assets and liabilities in foreign currencies | (65,263 | ) | ||
| (110,079,679 | ) | |||
| Net realized and unrealized gain (loss) | (62,261,622 | ) | ||
| Net Increase (Decrease) in Net Assets Resulting from Operations | $(60,640,298 | ) | ||
See Notes to Financial Statements.
15
| YEARS ENDED NOVEMBER 30, 2011 AND NOVEMBER 30, 2010 | |||||||
| Increase (Decrease) in Net Assets | November 30, 2011 | November 30, 2010 | |||||
| Operations | |||||||
| Net investment income (loss) | $1,621,324 | $107,461 | |||||
| Net realized gain (loss) | 47,818,057 | 177,770,803 | |||||
| Change in net unrealized appreciation (depreciation) | (110,079,679 | ) | (41,952,929 | ) | |||
| Net increase (decrease) in net assets resulting from operations | (60,640,298 | ) | 135,925,335 | ||||
| Distributions to Shareholders | |||||||
| From net investment income | |||||||
| Investor Class | — | (1,891,482 | ) | ||||
| Institutional Class | — | (506,500 | ) | ||||
| Decrease in net assets from distributions | — | (2,397,982 | ) | ||||
| Capital Share Transactions | |||||||
| Net increase (decrease) in net assets from capital share transactions | (158,780,647 | ) | (112,046,954 | ) | |||
| Redemption Fees | |||||||
| Increase in net assets from redemption fees | 135,065 | 98,785 | |||||
| Net increase (decrease) in net assets | (219,285,880 | ) | 21,579,184 | ||||
| Net Assets | |||||||
| Beginning of period | 980,616,015 | 959,036,831 | |||||
| End of period | $761,330,135 | $980,616,015 | |||||
| Accumulated undistributed net investment income (loss) | $190,650 | $(368,804 | ) | ||||
See Notes to Financial Statements.
16
NOVEMBER 30, 2011
1. Organization
American Century World Mutual Funds, Inc. (the corporation) is registered under the Investment Company Act of 1940, as amended (the 1940 Act), as an open-end management investment company and is organized as a Maryland corporation. International Discovery Fund (the fund) is one fund in a series issued by the corporation. The fund is diversified as defined under the 1940 Act. The fund’s investment objective is to seek capital growth. The fund pursues its objective by investing primarily in equity securities of companies that are small- to medium-sized at time of purchase and are located in foreign developed countries or emerging market countries.
The fund is authorized to issue the Investor Class, the Institutional Class, the A Class (formerly Advisor Class), the C Class and the R Class. The A Class may incur an initial sales charge. The A Class and C Class may be subject to a contingent deferred sales charge. The share classes differ principally in their respective sales charges and distribution and shareholder servicing expenses and arrangements. The Institutional Class is made available to institutional shareholders or through financial intermediaries whose clients do not require the same level of shareholder and administrative services as shareholders of other classes. As a result, the Institutional Class is charged a lower unified management fee. Sale of the C Class and R Class commenced on March 1, 2010.
2. Significant Accounting Policies
The following is a summary of significant accounting policies consistently followed by the fund in preparation of its financial statements. The financial statements are prepared in conformity with accounting principles generally accepted in the United States of America, which may require management to make certain estimates and assumptions at the date of the financial statements. Actual results could differ from these estimates.
Investment Valuations — The fund determines the fair value of its investments and computes its net asset value per share as of the close of regular trading (usually 4 p.m. Eastern time) on the New York Stock Exchange (NYSE) on each day the NYSE is open.
Equity securities that are listed or traded on a domestic securities exchange are valued at the last reported sales price or at the official closing price as provided by the exchange. Equity securities traded on foreign securities exchanges are typically valued at the closing price on the exchange where primarily traded or as of the close of the NYSE, if that is earlier. If no last sales price is reported, or if local convention or regulation so provides, the mean of the latest bid and asked prices is used. Depending on local convention or regulation, securities traded over-the-counter are valued at the mean of the latest bid and asked prices, the last sales price, or the official closing price. In its determination of fair value, the fund may review several factors including: market information specific to a security; news developments in U.S. and foreign markets; the performance of particular U.S. and foreign securities, indices, comparable securities, American Depositary Receipts, Exchange-Traded Funds, and other relevant market indicators.
Debt securities maturing within 60 days at the time of purchase may be valued at cost, plus or minus any amortized discount or premium or at the evaluated mean as provided by an independent pricing service. Evaluated mean prices are commonly derived through utilization of market models, which may consider, among other factors, trade data, quotations from dealers and active market makers, relevant yield curve and spread data, related sector levels, creditworthiness, and other relevant market information on the same or comparable securities.
Investments in open-end management investment companies are valued at the reported net asset value per share. Repurchase agreements are valued at cost.
17
The value of investments initially expressed in foreign currencies is translated into U.S. dollars at prevailing exchange rates.
If the fund determines that the market price for a portfolio security is not readily available or the valuation methods mentioned above do not reflect a security’s fair value, such security is valued as determined in good faith by the Board of Directors or its designee, in accordance with procedures adopted by the Board of Directors. Circumstances that may cause the fund to use these procedures to value a security include, but are not limited to: a security has been declared in default; trading in a security has been halted during the trading day; there is a foreign market holiday and no trading occurred; or an event occurred between the close of a foreign exchange and the NYSE that may affect the value of a security.
Security Transactions — Security transactions are accounted for as of the trade date. Net realized gains and losses are determined on the identified cost basis, which is also used for federal income tax purposes. Certain countries impose taxes on realized gains on the sale of securities registered in their country. The fund records the foreign tax expense, if any, on an accrual basis. The foreign tax expense on realized gains and unrealized appreciation reduces the net realized gain (loss) on investment transactions and net unrealized appreciation (depreciation) on investments, respectively.
Investment Income — Dividend income less foreign taxes withheld, if any, is recorded as of the ex-dividend date. Interest income is recorded on the accrual basis and includes accretion of discounts and amortization of premiums.
Foreign Currency Translations — All assets and liabilities initially expressed in foreign currencies are translated into U.S. dollars at prevailing exchange rates at period end. The fund may enter into spot foreign currency exchange contracts to facilitate transactions denominated in a foreign currency. Purchases and sales of investment securities, dividend and interest income, spot foreign currency exchange contracts, and expenses are translated at the rates of exchange prevailing on the respective dates of such transactions. Net realized and unrealized foreign currency exchange gains or losses related to investment securities are a component of net realized gain (loss) on investment transactions and change in net unrealized appreciation (depreciation) on investments, respectively. Certain countries impose taxes on the contract amount of purchases and sales of foreign currency contracts in their currency. The fund records the foreign tax expense, if any, as a reduction to the net realized gain (loss) on foreign currency transactions.
Repurchase Agreements — The fund may enter into repurchase agreements with institutions that American Century Investment Management, Inc. (ACIM) (the investment advisor) has determined are creditworthy pursuant to criteria adopted by the Board of Directors. The fund requires that the collateral, represented by securities, received in a repurchase transaction be transferred to the custodian in a manner sufficient to enable the fund to obtain those securities in the event of a default under the repurchase agreement. ACIM monitors, on a daily basis, the securities transferred to ensure the value, including accrued interest, of the securities under each repurchase agreement is equal to or greater than amounts owed to the fund under each repurchase agreement.
Joint Trading Account — Pursuant to an Exemptive Order issued by the Securities and Exchange Commission, the fund, along with certain other funds in the American Century Investments family of funds, may transfer uninvested cash balances into a joint trading account. These balances are invested in one or more repurchase agreements that are collateralized by U.S. Treasury or Agency obligations.
Income Tax Status — It is the fund’s policy to distribute substantially all net investment income and net realized gains to shareholders and to otherwise qualify as a regulated investment company under provisions of the Internal Revenue Code. The fund is no longer subject to examination by tax authorities for years prior to 2008. Additionally, non-U.S. tax returns filed by the fund due to investments in certain foreign securities remain subject to examination by the relevant taxing authority for seven years from the date of filing. At this time, management believes there are no uncertain tax positions which, based on their technical merit, would not be sustained upon examination and for which it is reasonably possible that the total amounts of unrecognized tax benefits will significantly change in the next twelve months. Accordingly, no provision has been made for federal or state income taxes.
18
Multiple Class — All shares of the fund represent an equal pro rata interest in the net assets of the class to which such shares belong, and have identical voting, dividend, liquidation and other rights and the same terms and conditions, except for class specific expenses and exclusive rights to vote on matters affecting only individual classes. Income, non-class specific expenses, and realized and unrealized capital gains and losses of the fund are allocated to each class of shares based on their relative net assets.
Distributions to Shareholders — Distributions from net investment income and net realized gains, if any, are generally declared and paid annually. The fund may make distributions on a more frequent basis to comply with the distribution requirements of the Internal Revenue Code, in all events in a manner consistent with provisions of the 1940 Act.
Redemption — The fund may impose a 2.00% redemption fee on shares held less than 60 days. The fee may not be applicable to all classes. The redemption fee is retained by the fund and helps cover transaction costs that long-term investors may bear when the fund sells securities to meet investor redemptions. Prior to November 14, 2011, the redemption fee applied to shares held less than 180 days.
Indemnifications — Under the corporation’s organizational documents, its officers and directors are indemnified against certain liabilities arising out of the performance of their duties to the fund. In addition, in the normal course of business, the fund enters into contracts that provide general indemnifications. The maximum exposure under these arrangements is unknown as this would involve future claims that may be made against a fund. The risk of material loss from such claims is considered by management to be remote.
3. Fees and Transactions with Related Parties
Management Fees — The corporation has entered into a management agreement with ACIM, under which ACIM provides the fund with investment advisory and management services in exchange for a single, unified management fee (the fee) per class. The agreement provides that all expenses of managing and operating the fund, except distribution and service fees, brokerage expenses, taxes, interest, fees and expenses of the independent directors (including legal counsel fees), and extraordinary expenses, will be paid by ACIM. The fee is computed and accrued daily based on each class’s daily net assets and paid monthly in arrears. The rate of the fee is determined by applying a fee rate calculation formula. This formula takes into account the fund’s assets as well as certain assets, if any, of other clients of the investment advisor outside the American Century Investments family of funds (such as subadvised funds and separate accounts) that have very similar investment teams and investment strategies (strategy assets). The annual management fee schedule ranges from 1.20% to 1.75% for the Investor Class, A Class, C Class and R Class. The Institutional Class is 0.20% less at each point within the range. The effective annual management fee for each class for the year ended November 30, 2011 was 1.41% for the Investor Class, A Class, C Class and R Class and 1.21% for the Institutional Class.
Distribution and Service Fees — The Board of Directors has adopted a separate Master Distribution and Individual Shareholder Services Plan for each of the A Class, C Class and R Class (collectively the plans), pursuant to Rule 12b-1 of the 1940 Act. The plans provide that the A Class will pay American Century Investment Services, Inc. (ACIS) an annual distribution and service fee of 0.25%. The plans provide that the C Class will pay ACIS an annual distribution and service fee of 1.00%, of which 0.25% is paid for individual shareholder services and 0.75% is paid for distribution services. The plans provide that the R Class will pay ACIS an annual distribution and service fee of 0.50%. The fees are computed and accrued daily based on each class’s daily net assets and paid monthly in arrears. The fees are used to pay financial intermediaries for distribution and individual shareholder services. Fees incurred under the plans during the year ended November 30, 2011 are detailed in the Statement of Operations.
19
Related Parties — Certain officers and directors of the corporation are also officers and/or directors of American Century Companies, Inc. (ACC), the parent of the corporation’s investment advisor, ACIM, the distributor of the corporation, ACIS, and the corporation’s transfer agent, American Century Services, LLC.
The fund was eligible to invest in a money market fund for temporary purposes, which is managed by J.P. Morgan Investment Management, Inc. (JPMIM). The fund had a securities lending agreement with JPMorgan Chase Bank (JPMCB) and a mutual funds services agreement with J.P. Morgan Investor Services Co. (JPMIS). JPMCB was a custodian of the fund. JPMIM, JPMIS and JPMCB are wholly owned subsidiaries of JPMorgan Chase & Co. (JPM). Prior to August 31, 2011, JPM was an equity investor in ACC. The services provided to the fund by JPMIM, JPMIS and JPMCB terminated on July 31, 2011.
4. Investment Transactions
Purchases and sales of investment securities, excluding short-term investments, for the year ended November 30, 2011 were $1,630,956,736 and $1,797,661,068, respectively.
5. Capital Share Transactions
Transactions in shares of the fund were as follows:
| Year ended November 30, 2011 | Year ended November 30, 2010(1) | |||||||||||
| Shares | Amount | Shares | Amount | |||||||||
| Investor Class/Shares Authorized | 400,000,000 | 400,000,000 | ||||||||||
| Sold | 7,072,349 | $75,279,226 | 5,837,481 | $53,064,107 | ||||||||
| Issued in reinvestment of distributions | — | — | 203,829 | 1,811,258 | ||||||||
| Redeemed | (24,303,658 | ) | (240,508,259 | ) | (19,175,078 | ) | (171,056,059 | ) | ||||
| (17,231,309 | ) | (165,229,033 | ) | (13,133,768 | ) | (116,180,694 | ) | |||||
| Institutional Class/Shares Authorized | 70,000,000 | 70,000,000 | ||||||||||
| Sold | 3,483,268 | 35,787,791 | 2,373,343 | 22,884,811 | ||||||||
| Issued in reinvestment of distributions | — | — | 53,799 | 482,824 | ||||||||
| Redeemed | (2,818,293 | ) | (27,863,390 | ) | (1,913,932 | ) | (17,129,073 | ) | ||||
| 664,975 | 7,924,401 | 513,210 | 6,238,562 | |||||||||
| A Class/Shares Authorized | 10,000,000 | 10,000,000 | ||||||||||
| Sold | 91,116 | 944,432 | 163,936 | 1,475,514 | ||||||||
| Redeemed | (235,457 | ) | (2,458,608 | ) | (423,496 | ) | (3,674,496 | ) | ||||
| (144,341 | ) | (1,514,176 | ) | (259,560 | ) | (2,198,982 | ) | |||||
| C Class/Shares Authorized | 10,000,000 | 10,000,000 | ||||||||||
| Sold | 11,986 | 130,918 | 7,793 | 69,160 | ||||||||
| Redeemed | (10,143 | ) | (92,757 | ) | — | — | ||||||
| 1,843 | 38,161 | 7,793 | 69,160 | |||||||||
| R Class/Shares Authorized | 10,000,000 | 10,000,000 | ||||||||||
| Sold | — | — | 2,941 | 25,000 | ||||||||
| Net increase (decrease) | (16,708,832 | ) | $(158,780,647 | ) | (12,869,384 | ) | $(112,046,954 | ) | ||||
(1) March 1, 2010 (commencement of sale) through November 30, 2010 for the C Class and R Class.
20
6. Fair Value Measurements
The fund’s securities valuation process is based on several considerations and may use multiple inputs to determine the fair value of the positions held by the fund. In conformity with accounting principles generally accepted in the United States of America, the inputs used to determine a valuation are classified into three broad levels as follows:
| • | Level 1 valuation inputs consist of unadjusted quoted prices in an active market for identical securities; |
| • | Level 2 valuation inputs consist of direct or indirect observable market data (including quoted prices for similar securities, evaluations of subsequent market events, interest rates, prepayment speeds, credit risk, etc.); or |
| • | Level 3 valuation inputs consist of unobservable data (including a fund’s own assumptions). |
The level classification is based on the lowest level input that is significant to the fair valuation measurement. The valuation inputs are not necessarily an indication of the risks associated with investing in these securities or other financial instruments.
The following is a summary of the level classifications as of period end. The Schedule of Investments provides additional information on the fund’s portfolio holdings.
| Level 1 | Level 2 | Level 3 | |
| Investment Securities | |||
| Total Value of Investment Securities | $87,035,776 | $660,745,458 | — |
7. Risk Factors
There are certain risks involved in investing in foreign securities. These risks include those resulting from future adverse political, social and economic developments, fluctuations in currency exchange rates, the possible imposition of exchange controls, and other foreign laws or restrictions. Investing in emerging markets may accentuate these risks.
The fund concentrates its investments in common stocks of smaller companies. Because of this, the fund may be subject to greater risk and market fluctuations than a fund investing in larger, more established companies.
The fund’s investment process may result in high portfolio turnover, which could mean high transaction costs, affecting both performance and capital gains tax liabilities to investors.
8. Federal Tax Information
The tax character of distributions paid during the years ended November 30, 2011 and November 30, 2010 were as follows:
| 2011 | 2010 | |||||||
| Distributions Paid From | ||||||||
| Ordinary income | — | $2,397,982 | ||||||
| Long-term capital gains | — | — | ||||||
The book-basis character of distributions made during the year from net investment income or net realized gains may differ from their ultimate characterization for federal income tax purposes. These differences reflect the differing character of certain income items and net realized gains and losses for financial statement and tax purposes, and may result in reclassification among certain capital accounts on the financial statements.
21
As of November 30, 2011, the federal tax cost of investments and the components of distributable earnings on a tax-basis were as follows:
| Federal tax cost of investments | $701,470,364 | |||
| Gross tax appreciation of investments | $83,555,154 | |||
| Gross tax depreciation of investments | (37,244,284 | ) | ||
| Net tax appreciation (depreciation) of investments | $46,310,870 | |||
Net tax appreciation (depreciation) on translation of assets and liabilities in foreign currencies | $(59,091 | ) | ||
| Net tax appreciation (depreciation) | $46,251,779 | |||
| Undistributed ordinary income | $281,399 | |||
| Accumulated capital losses | $(325,858,641 | ) | ||
| Capital loss deferral | $(8,497,210 | ) |
The difference between book-basis and tax-basis cost and unrealized appreciation (depreciation) is attributable primarily to the tax deferral of losses on wash sales and the realization for tax purposes of unrealized gains (losses) on certain foreign currency exchange contracts and investments in passive foreign investment companies.
The accumulated capital losses represent net capital loss carryovers that may be used to offset future realized capital gains for federal income tax purposes. Future capital loss carryover utilization in any given year may be subject to Internal Revenue Code limitations. Capital loss carryovers of $(84,373,986) and $(241,484,655) expire in 2016 and 2017, respectively.
The capital loss deferral represents net capital losses incurred in the one-month period ended November 30, 2011. The fund has elected to treat such losses as having been incurred in the following fiscal year for federal income tax purposes.
On December 22, 2010, the Regulated Investment Company Modernization Act of 2010 (the “Act”) was enacted, which changed various technical rules governing the tax treatment of regulated investment companies. The changes are generally effective for taxable years beginning after the date of enactment. Under the Act, the fund will be permitted to carry forward capital losses incurred in taxable years beginning after the date of enactment for an unlimited period. However, any losses incurred during those future taxable years will be required to be utilized prior to the losses incurred in pre-enactment taxable years, which carry an expiration date. As a result of this ordering rule, pre-enactment capital loss carryforwards may be more likely to expire unused.
22
| For a Share Outstanding Throughout the Years Ended November 30 (except as noted) | |||||||||||||
| Per-Share Data | Ratios and Supplemental Data | ||||||||||||
| Income From Investment Operations: | Distributions From: | Ratio to Average Net Assets of: | |||||||||||
Net Asset Value, Beginning of Period | Net Investment Income (Loss)(1) | Net Realized and Unrealized Gain (Loss) | Total From Investment Operations | Net Investment Income | Net Realized Gains | Total Distributions | Net Asset Value, End of Period | Total Return(2) | Operating Expenses | Net Investment Income (Loss) | Portfolio Turnover Rate | Net Assets, End of Period (in thousands) | |
| Investor Class | |||||||||||||
| 2011 | $9.88 | 0.02 | (0.68) | (0.66) | — | — | — | $9.22 | (6.58)% | 1.42% | 0.14% | 167% | $660,971 |
| 2010 | $8.55 | —(3) | 1.35 | 1.35 | (0.02) | — | (0.02) | $9.88 | 15.80% | 1.43% | 0.00%(4) | 199% | $878,530 |
| 2009 | $6.26 | 0.01 | 2.34 | 2.35 | (0.06) | — | (0.06) | $8.55 | 38.06% | 1.48% | 0.13% | 207% | $872,865 |
| 2008 | $18.40 | 0.06 | (8.09) | (8.03) | (0.06) | (4.05) | (4.11) | $6.26 | (55.48)% | 1.37% | 0.51% | 175% | $713,764 |
| 2007 | $18.01 | 0.05 | 4.60 | 4.65 | — | (4.26) | (4.26) | $18.40 | 32.18% | 1.36% | 0.30% | 162% | $1,758,335 |
| Institutional Class | |||||||||||||
| 2011 | $9.99 | 0.03 | (0.68) | (0.65) | — | — | — | $9.34 | (6.41)% | 1.22% | 0.34% | 167% | $97,063 |
| 2010 | $8.66 | 0.02 | 1.36 | 1.38 | (0.05) | — | (0.05) | $9.99 | 16.06% | 1.23% | 0.20% | 199% | $97,167 |
| 2009 | $6.34 | 0.02 | 2.37 | 2.39 | (0.07) | — | (0.07) | $8.66 | 38.32% | 1.28% | 0.33% | 207% | $79,830 |
| 2008 | $18.59 | 0.08 | (8.18) | (8.10) | (0.10) | (4.05) | (4.15) | $6.34 | (55.37)% | 1.17% | 0.71% | 175% | $55,091 |
| 2007 | $18.16 | 0.09 | 4.64 | 4.73 | — | (4.30) | (4.30) | $18.59 | 32.45% | 1.16% | 0.50% | 162% | $145,723 |
A Class(5) | |||||||||||||
| 2011 | $9.67 | (0.02) | (0.65) | (0.67) | — | — | — | $9.00 | (6.83)% | 1.67% | (0.11)% | 167% | $3,182 |
| 2010 | $8.37 | (0.02) | 1.32 | 1.30 | — | — | — | $9.67 | 15.53% | 1.68% | (0.25)% | 199% | $4,814 |
| 2009 | $6.13 | —(3) | 2.29 | 2.29 | (0.05) | — | (0.05) | $8.37 | 37.71% | 1.73% | (0.12)% | 207% | $6,342 |
| 2008 | $18.08 | 0.06 | (7.95) | (7.89) | (0.01) | (4.05) | (4.06) | $6.13 | (55.56)% | 1.63% | 0.25% | 175% | $10,622 |
| 2007 | $17.76 | 0.07 | 4.46 | 4.53 | — | (4.21) | (4.21) | $18.08 | 31.83% | 1.61% | 0.05% | 162% | $2,494 |
23
| For a Share Outstanding Throughout the Years Ended November 30 (except as noted) | |||||||||||||
| Per-Share Data | Ratios and Supplemental Data | ||||||||||||
| Income From Investment Operations: | Distributions From: | Ratio to Average Net Assets of: | |||||||||||
Net Asset Value, Beginning of Period | Net Investment Income (Loss)(1) | Net Realized and Unrealized Gain (Loss) | Total From Investment Operations | Net Investment Income | Net Realized Gains | Total Distributions | Net Asset Value, End of Period | Total Return(2) | Operating Expenses | Net Investment Income (Loss) | Portfolio Turnover Rate | Net Assets, End of Period (in thousands) | |
| C Class | |||||||||||||
| 2011 | $9.82 | (0.07) | (0.67) | (0.74) | — | — | — | $9.08 | (7.43)% | 2.42% | (0.86)% | 167% | $87 |
2010(6) | $8.50 | (0.05) | 1.37 | 1.32 | — | — | — | $9.82 | 15.53% | 2.43%(7) | (0.77)%(7) | 199%(8) | $77 |
| R Class | |||||||||||||
| 2011 | $9.86 | (0.04) | (0.67) | (0.71) | — | — | — | $9.15 | (7.10)% | 1.92% | (0.36)% | 167% | $27 |
2010(6) | $8.50 | (0.01) | 1.37 | 1.36 | — | — | — | $9.86 | 16.00% | 1.93%(7) | (0.16)%(7) | 199%(8) | $29 |
Notes to Financial Highlights
| (1) | Computed using average shares outstanding throughout the period. |
| (2) | Total returns are calculated based on the net asset value of the last business day and do not reflect applicable sales charges, if any. Total returns for periods less than one year are not annualized. |
| (3) | Per-share amount was less than $0.005. |
| (4) | Ratio was less than 0.005%. |
| (5) | Prior to March 1, 2010, the A Class was referred to as the Advisor Class. |
| (6) | March 1, 2010 (commencement of sale) through November 30, 2010. |
| (7) | Annualized. |
| (8) | Portfolio turnover is calculated at the fund level. Percentage indicated was calculated for the year ended November 30, 2010. |
See Notes to Financial Statements.
24
The Board of Directors and Shareholders,
American Century World Mutual Funds, Inc.:
We have audited the accompanying statement of assets and liabilities, including the schedule of investments, of International Discovery Fund, one of the funds constituting American Century World Mutual Funds, Inc. (the “Corporation”), as of November 30, 2011, and the related statement of operations for the year then ended, the statements of changes in net assets for each of the two years in the period then ended, and the financial highlights for each of the five years in the period then ended. These financial statements and financial highlights are the responsibility of the Corporation’s management. Our responsibility is to express an opinion on these financial statements and financial highlights based on our audits.
We conducted our audits in accordance with the standards of the Public Company Accounting Oversight Board (United States). Those standards require that we plan and perform the audit to obtain reasonable assurance about whether the financial statements and financial highlights are free of material misstatement. The Corporation is not required to have, nor were we engaged to perform, an audit of its internal control over financial reporting. Our audits included consideration of internal control over financial reporting as a basis for designing audit procedures that are appropriate in the circumstances, but not for the purpose of expressing an opinion on the effectiveness of the Corporation’s internal control over financial reporting. Accordingly, we express no such opinion. An audit also includes examining, on a test basis, evidence supporting the amounts and disclosures in the financial statements, assessing the accounting principles used and significant estimates made by management, as well as evaluating the overall financial statement presentation. Our procedures included confirmation of securities owned as of November 30, 2011, by correspondence with the custodian and brokers; where replies were not received from brokers, we performed other auditing procedures. We believe that our audits provide a reasonable basis for our opinion.
In our opinion, the financial statements and financial highlights referred to above present fairly, in all material respects, the financial position of International Discovery Fund of American Century World Mutual Funds, Inc., as of November 30, 2011, the results of its operations for the year then ended, the changes in its net assets for each of the two years in the period then ended, and the financial highlights for each of the five years in the period then ended, in conformity with accounting principles generally accepted in the United States of America.
Deloitte & Touche LLP
Kansas City, Missouri
January 20, 2012
25
The Board of Directors
The individuals listed below serve as directors of the funds. Each director will continue to serve in this capacity until death, retirement, resignation or removal from office. The mandatory retirement age for directors who are not “interested persons,” as that term is defined in the Investment Company Act (independent directors), is 72. However, the mandatory retirement age for an individual director may be extended with the approval of the remaining independent directors.
Mr. Thomas is the only director who is an “interested person” because he currently serves as President and Chief Executive Officer of American Century Companies, Inc. (ACC), the parent company of American Century Investment Management, Inc. (ACIM or the advisor).
The other directors (more than three-fourths of the total number) are independent; that is, they have never been employees, directors or officers of, and have no financial interest in, ACC or any of its wholly owned, direct or indirect, subsidiaries, including ACIM, American Century Investment Services, Inc. (ACIS) and American Century Services, LLC (ACS). The directors serve in this capacity for seven (in the case of Mr. Thomas, 15) registered investment companies in the American Century Investments family of funds.
The following presents additional information about the directors. The mailing address for each director is 4500 Main Street, Kansas City, Missouri 64111.
Name (Year of Birth) | Position(s) Held with Funds | Length of Time Served | Principal Occupation(s) During Past 5 Years | Number of American Century Portfolios Overseen by Director | Other Directorships Held During Past 5 Years |
| Independent Directors | |||||
Thomas A. Brown (1940) | Director | Since 1980 | Managing Member, Associate Investments, LLC (real estate investment company); Brown Cascade Properties, LLC (real estate investment company) (2001 to 2009) | 65 | None |
Andrea C. Hall (1945) | Director | Since 1997 | Retired as advisor to the President, Midwest Research Institute (not-for-profit research organization) (June 2006) | 65 | None |
Jan M. Lewis (1957) | Director | Since 2011 | President and Chief Executive Officer, Catholic Charities of Northeast Kansas (human services organization)(2006 to present); President, BUCON, Inc. (full-service design-build construction company) (2004 to 2006) | 65 | None |
James A. Olson (1942) | Director | Since 2007 | Member, Plaza Belmont LLC (private equity fund manager); Chief Financial Officer, Plaza Belmont LLC (September 1999 to September 2006) | 65 | Saia, Inc. and Entertainment Properties Trust |
26
Name (Year of Birth) | Position(s) Held with Funds | Length of Time Served | Principal Occupation(s) During Past 5 Years | Number of American Century Portfolios Overseen by Director | Other Directorships Held During Past 5 Years |
| Independent Directors | |||||
Donald H. Pratt (1937) | Director and Chairman of the Board | Since 1995 (Chairman since 2005) | Chairman and Chief Executive Officer, Western Investments, Inc. (real estate company) | 65 | None |
M. Jeannine Strandjord (1945) | Director | Since 1994 | Retired | 65 | DST Systems Inc., Euronet Worldwide Inc., and Charming Shoppes, Inc. |
John R. Whitten (1946) | Director | Since 2008 | Project Consultant, Celanese Corp. (industrial chemical company) | 65 | Rudolph Technologies, Inc. |
Stephen E. Yates (1948) | Advisory Director | Since 2011 | Retired; Executive Vice President, Technology & Operations, KeyCorp. (computer services)(2004 to 2010) | 65 | Applied Industrial Technology (2001 to 2010) |
| Interested Director | |||||
Jonathan S. Thomas (1963) | Director and President | Since 2007 | President and Chief Executive Officer, ACC (March 2007 to present); Chief Administrative Officer, ACC (February 2006 to February 2007); Executive Vice President, ACC (November 2005 to February 2007). Also serves as: Chief Executive Officer and Manager, ACS; Executive Vice President, ACIM; Director, ACC, ACIM and other ACC subsidiaries | 106 | None |
27
Officers
The following table presents certain information about the executive officers of the funds. Each officer serves as an officer for each of the 15 investment companies in the American Century family of funds, unless otherwise noted. No officer is compensated for his or her service as an officer of the funds. The listed officers are interested persons of the funds and are appointed or re-appointed on an annual basis. The mailing address for each officer listed below is 4500 Main Street, Kansas City, Missouri 64111.
Name (Year of Birth) | Offices with the Funds | Principal Occupation(s) During the Past Five Years |
Jonathan S. Thomas (1963) | Director and President since 2007 | President and Chief Executive Officer, ACC (March 2007 to present); Chief Administrative Officer, ACC (February 2006 to February 2007); Executive Vice President, ACC (November 2005 to February 2007). Also serves as: Chief Executive Officer and Manager, ACS; Executive Vice President, ACIM; Director, ACC, ACIM and other ACC subsidiaries |
Barry Fink (1955) | Executive Vice President since 2007 | Chief Operating Officer and Executive Vice President, ACC (September 2007 to present); President, ACS (October 2007 to present); Managing Director, Morgan Stanley (2000 to 2007); Global General Counsel, Morgan Stanley (2000 to 2006). Also serves as: Manager, ACS and Director, ACC and certain ACC subsidiaries |
Maryanne L. Roepke (1956) | Chief Compliance Officer since 2006 and Senior Vice President since 2000 | Chief Compliance Officer, American Century funds, ACIM and ACS (August 2006 to present); Assistant Treasurer, ACC (January 1995 to August 2006); and Treasurer and Chief Financial Officer, various American Century funds (July 2000 to August 2006). Also serves as: Senior Vice President, ACS |
Charles A. Etherington (1957) | General Counsel since 2007 and Senior Vice President since 2006 | Attorney, ACC (February 1994 to present); Vice President, ACC (November 2005 to present), General Counsel, ACC (March 2007 to present); Also serves as General Counsel, ACIM, ACS, ACIS and other ACC subsidiaries; and Senior Vice President, ACIM and ACS |
Robert J. Leach (1966) | Vice President, Treasurer and Chief Financial Officer since 2006 | Vice President, ACS (February 2000 to present); and Controller, various American Century funds (1997 to September 2006) |
David H. Reinmiller (1963) | Vice President since 2000 | Attorney, ACC (January 1994 to present); Associate General Counsel, ACC (January 2001 to present). Also serves as Vice President, ACIM and ACS |
Ward D. Stauffer (1960) | Secretary since 2005 | Attorney, ACC (June 2003 to present) |
The Statement of Additional Information has additional information about the fund’s directors and is available without charge, upon request, by calling 1-800-345-2021.
28
At a meeting held on June 9, 2011, the Fund’s Board of Directors unanimously approved the renewal of the management agreement pursuant to which American Century Investment Management, Inc. (the “Advisor”) acts as the investment advisor for the Fund. Under Section 15(c) of the Investment Company Act, contracts for investment advisory services are required to be reviewed, evaluated, and approved by a majority of a fund’s independent directors (the “Directors”) each year.
As a part of the approval process, the Board requested and reviewed extensive data and information compiled by the Advisor and certain independent providers of evaluation data concerning the Fund and the services provided to the Fund by the Advisor. This review was in addition to the oversight and evaluation undertaken by the Board and its committees on a continuous basis throughout the year and included, but was not limited to the following:
| • | the nature, extent, and quality of investment management, shareholder services, and other services provided by the Advisor to the Fund; |
| • | the wide range of other programs and services the Advisor provides to the Fund and its shareholders on a routine and non-routine basis; |
| • | the investment performance of the fund, including data comparing the Fund’s performance to appropriate benchmarks and/or a peer group of other mutual funds with similar investment objectives and strategies; |
| • | data comparing the cost of owning the Fund to the cost of owning similar funds; |
| • | the Advisor’s compliance policies, procedures, and regulatory experience; |
| • | financial data showing the cost of services provided to the Fund, the profitability of the Fund to the Advisor, and the overall profitability of the Advisor; |
| • | data comparing services provided and charges to other investment management clients of the Advisor; and |
| • | consideration of collateral benefits derived by the Advisor from the management of the Fund and any potential economies of scale relating thereto. |
In keeping with its practice, the Board held two in-person meetings and one telephonic meeting to review and discuss the information provided. The Directors also had the benefit of the advice of independent counsel throughout the period.
Factors Considered
The Directors considered all of the information provided by the Advisor, the independent data providers, and independent counsel, and evaluated such information for the Fund. In connection with their review, the Directors did not identify any single factor as being all-important or controlling, and each Director may have attributed different levels of importance to different factors. In deciding to renew the management agreement, the Board based its decision on a number of factors, including the following:
29
Nature, Extent and Quality of Services - Generally. Under the management agreement, the Advisor is responsible for providing or arranging for all services necessary for the operation of the Fund. The Board noted that under the management agreement, the Advisor provides or arranges at its own expense a wide variety of services including:
| • | constructing and designing the Fund |
| • | portfolio research and security selection |
| • | initial capitalization/funding |
| • | securities trading |
| • | Fund administration |
| • | custody of Fund assets |
| • | daily valuation of the Fund’s portfolio |
| • | shareholder servicing and transfer agency, including shareholder confirmations, recordkeeping, and communications |
| • | legal services |
| • | regulatory and portfolio compliance |
| • | financial reporting |
| • | marketing and distribution |
The Board noted that many of these services have expanded over time both in terms of quantity and complexity in response to shareholder demands, competition in the industry, changing distribution channels, and the changing regulatory environment.
Investment Management Services. The nature of the investment management services provided to the Fund is quite complex and allows Fund shareholders access to professional money management, instant diversification of their investments within an asset class, the opportunity to easily diversify among asset classes by investing in or exchanging among various American Century Investments funds, and liquidity. In evaluating investment performance, the Board expects the Advisor to manage the Fund in accordance with its investment objectives and approved strategies. Further, the Directors recognize that the Advisor has an obligation to monitor trading activities, and in particular to seek the best execution of fund trades, and to evaluate the use of and payment for research. In providing these services, the Advisor utilizes teams of investment professionals (portfolio managers, analysts, research assistants, and securities traders) who require extensive information technology, research, training, compliance and other systems to conduct their business. The Board, directly and through its Fund Performance Review Committee, regularly reviews investment performance information for the Fund, together with comparative information for appropriate benchmarks and/or peer groups of similarly-managed funds, over different time horizons.
30
The Directors also review detailed performance information during the management agreement approval process. If performance concerns are identified, the Fund receives special reviews until performance improves, during which the Board discusses with the Advisor the reasons for such results (e.g., market conditions, security selection) and any efforts being undertaken to improve performance. Taking all these factors into consideration, the Board found the investment management services provided by the Advisor to the Fund to meet or exceed industry standards. More detailed information about the Fund’s performance can be found in the Performance and Portfolio Commentary sections of this report.
Shareholder and Other Services. Under the management agreement, the Advisor provides the Fund with a comprehensive package of transfer agency, shareholder, and other services. The Board, directly and through various committees of the Board, regularly reviews reports and evaluations of such services at its regular meetings. These reports include, but are not limited to, information regarding the operational efficiency and accuracy of the shareholder and transfer agency services provided, staffing levels, shareholder satisfaction (as measured by external as well as internal sources), technology support, new products and services offered to Fund shareholders, securities trading activities, portfolio valuation services, auditing services, and legal and operational compliance activities. Certain aspects of shareholder and transfer agency service level efficiency and the quality of securities trading activities are measured by independent third party providers and are presented in comparison to other fund groups not managed by the Advisor. The Board found the services provided by the Advisor to the Fund under the management agreement to be competitive and of high quality.
Costs of Services and Profitability. The Advisor provides detailed information concerning its cost of providing various services to the Fund, its profitability in managing the Fund, its overall profitability, and its financial condition. The Directors have reviewed with the Advisor the methodology used to prepare this financial information. The financial information regarding the Advisor is considered in evaluating the Advisor’s financial condition, ability to continue to provide services under the management agreement, and the reasonableness of the current management fee. The Board concluded that the Advisor’s profits were reasonable in light of the services provided to the Fund.
Ethics. The Board generally considers the Advisor’s commitment to providing quality services to shareholders and to conducting its business ethically. They noted that the Advisor’s practices generally meet or exceed industry best practices.
Economies of Scale. The Board also reviewed information provided by the Advisor regarding the possible existence of economies of scale in connection with the management of the Fund. The Board concluded that economies of scale are difficult to measure and predict with precision, especially on a fund-by-fund basis. The Board concluded that the Advisor is appropriately sharing economies of scale through its competitive fee structure, offering competitive fees from fund inception, and through reinvestment in its business to provide shareholders additional content and services.
31
Comparison to Other Funds’ Fees. The management agreement provides that the Fund pay the Advisor a single, all-inclusive (or unified) management fee for providing all services necessary for the management and operation of the Fund, other than brokerage expenses, taxes, interest, extraordinary expenses, and the fees and expenses of the Fund’s independent directors (including their independent legal counsel) and expenses incurred in connection with the provision of shareholder services and distribution services under a plan adopted pursuant to Rule 12b-1 under the 1940 Act. Under the unified fee structure, the Advisor is responsible for providing all investment advisory, custody, audit, administrative, compliance, recordkeeping, marketing and shareholder services, or arranging and supervising third parties to provide such services. By contrast, most other funds are charged a variety of fees, including an investment advisory fee, a transfer agency fee, an administrative fee, distribution charges and other expenses. Other than their investment advisory fees and any applicable Rule 12b-1 distribution fees, all other components of the total fees charged by these other funds may be increased without shareholder approval. The Board believes the unified fee structure is a benefit to Fund shareholders because it clearly discloses to shareholders the cost of owning Fund shares, and, since the unified fee cannot be increased without a vote of Fund shareholders, it shifts to the Advisor the risk of increased costs of operating the Fund and provides a direct incentive to minimize administrative inefficiencies. Part of the Board’s analysis of fee levels involves reviewing certain evaluative data compiled by an independent provider and comparing the Fund’s unified fee to the total expense ratio of other funds in the Fund’s peer group. The Board concluded that the management fee paid by the Fund to the Advisor under the management agreement is reasonable in light of the services provided to the Fund.
Comparison to Fees and Services Provided to Other Clients of the Advisor. The Board also requested and received information from the Advisor concerning the nature of the services, fees, costs and profitability of its advisory services to advisory clients other than the Fund. They observed that these varying types of client accounts require different services and involve different regulatory and entrepreneurial risks than the management of the Fund. The Board analyzed this information and concluded that the fees charged and services provided to the Fund were reasonable by comparison.
Collateral or “Fall-Out” Benefits Derived by the Advisor. The Board considered the existence of collateral benefits the Advisor may receive as a result of its relationship with the Fund. They concluded that the Advisor’s primary business is managing mutual funds and it generally does not use fund or shareholder information to generate profits in other lines of business, and therefore does not derive any significant collateral benefits from them. The Board noted that the Advisor receives proprietary research from broker-dealers that execute fund portfolio transactions and concluded that this research is likely to benefit Fund shareholders. The Board also determined that the Advisor is able to provide investment management services to certain clients other than the Fund, at least in part, due to its existing infrastructure built to serve the fund complex. The Board concluded, however, that the assets of those other clients are not material to the analysis and, where applicable, may be included with the assets of the Fund to determine breakpoints in the management fee schedule.
32
Existing Relationship. The Board also considered whether there was any reason for not continuing the existing arrangement with the Advisor. In this regard, the Board was mindful of the potential disruptions of the Fund’s operations and various risks, uncertainties, and other effects that could occur as a result of a decision not to continue such relationship. In particular, the Board recognized that most shareholders have invested in the Fund on the strength of the Advisor’s industry standing and reputation and in the expectation that the Advisor will have a continuing role in providing advisory services to the Fund.
Conclusion of the Directors. As a result of this process, the Board, including all of the independent directors, taking into account all of the factors discussed above and the information provided by the Advisor and others, concluded that the management agreement between the Fund and the Advisor is fair and reasonable in light of the services provided and should be renewed.
33
Retirement Account Information
As required by law, distributions you receive from certain IRAs, or 403(b), 457 and qualified plans are subject to federal income tax withholding, unless you elect not to have withholding apply. Tax will be withheld on the total amount withdrawn even though you may be receiving amounts that are not subject to withholding, such as nondeductible contributions. In such case, excess amounts of withholding could occur. You may adjust your withholding election so that a greater or lesser amount will be withheld.
If you don’t want us to withhold on this amount, you must notify us to not withhold the federal income tax. You may notify us in writing or in certain situations by telephone or through other electronic means. You have the right to revoke your withholding election at any time and any election you make may remain in effect until revoked by filing a new election.
Remember, even if you elect not to have income tax withheld, you are liable for paying income tax on the taxable portion of your withdrawal. If you elect not to have income tax withheld or you don’t have enough income tax withheld, you may be responsible for payment of estimated tax. You may incur penalties under the estimated tax rules if your withholding and estimated tax payments are not sufficient. You can reduce or defer the income tax on a distribution by directly or indirectly rolling such distribution over to another IRA or eligible plan. You should consult your tax advisor for additional information.
State tax will be withheld if, at the time of your distribution, your address is within one of the mandatory withholding states and you have federal income tax withheld. State taxes will be withheld from your distribution in accordance with the respective state rules.
Proxy Voting Guidelines
American Century Investment Management, Inc., the fund’s investment advisor, is responsible for exercising the voting rights associated with the securities purchased and/or held by the fund. A description of the policies and procedures the advisor uses in fulfilling this responsibility is available without charge, upon request, by calling 1-800-345-2021. It is also available on American Century Investments’ website at americancentury.com and on the Securities and Exchange Commission’s website at sec.gov. Information regarding how the investment advisor voted proxies relating to portfolio securities during the most recent 12-month period ended June 30 is available on the “About Us” page at americancentury.com. It is also available at sec.gov.
Quarterly Portfolio Disclosure
The fund files its complete schedule of portfolio holdings with the Securities and Exchange Commission (SEC) for the first and third quarters of each fiscal year on Form N-Q. The fund’s Forms N-Q are available on the SEC’s website at sec.gov, and may be reviewed and copied at the SEC’s Public Reference Room in Washington, DC. Information on the operation of the Public Reference Room may be obtained by calling 1-800-SEC-0330. The fund also makes its complete schedule of portfolio holdings for the most recent quarter of its fiscal year available on its website at americancentury.com and, upon request, by calling 1-800-345-2021.
34
35
36
| Contact Us | americancentury.com |
| Automated Information Line | 1-800-345-8765 |
| Investor Services Representative | 1-800-345-2021 or 816-531-5575 |
| Investors Using Advisors | 1-800-378-9878 |
Business, Not-For-Profit, Employer-Sponsored Retirement Plans | 1-800-345-3533 |
Banks and Trust Companies, Broker-Dealers, Financial Professionals, Insurance Companies | 1-800-345-6488 |
| Telecommunications Device for the Deaf | 1-800-634-4113 |
American Century World Mutual Funds, Inc.
Investment Advisor:
American Century Investment Management, Inc.
Kansas City, Missouri
This report and the statements it contains are submitted for the general information of our shareholders. The report is not authorized for distribution to prospective investors unless preceded or accompanied by an effective prospectus.
©2012 American Century Proprietary Holdings, Inc. All rights reserved.
CL-ANN-74139 1201
ANNUAL REPORT NOVEMBER 30, 2011
| Global Growth Fund |
| President’s Letter | 2 |
| Independent Chairman’s Letter | 3 |
| Market Perspective | 4 |
| Performance | 5 |
| Portfolio Commentary | 7 |
| Fund Characteristics | 9 |
| Shareholder Fee Example | 10 |
| Schedule of Investments | 12 |
| Statement of Assets and Liabilities | 14 |
| Statement of Operations | 15 |
| Statement of Changes in Net Assets | 16 |
| Notes to Financial Statements | 17 |
| Financial Highlights | 23 |
| Report of Independent Registered Public Accounting Firm | 25 |
| Management | 26 |
| Approval of Management Agreement | 29 |
| Additional Information | 34 |
Any opinions expressed in this report reflect those of the author as of the date of the report, and do not necessarily represent the opinions of American Century Investments® or any other person in the American Century Investments organization. Any such opinions are subject to change at any time based upon market or other conditions and American Century Investments disclaims any responsibility to update such opinions. These opinions may not be relied upon as investment advice and, because investment decisions made by American Century Investments funds are based on numerous factors, may not be relied upon as an indication of trading intent on behalf of any American Century Investments fund. Security examples are used for representational purposes only and are not intended as recommendations to purchase or sell securities. Performance information for comparative indices and securities is provided to American Century Investments by third party vendors. To the best of American Century Investments’ knowledge, such information is accurate at the time of printing.
Dear Investor:
Thank you for reviewing this annual report for the period ended November 30, 2011. Our report offers investment performance and portfolio information, presented with the expert perspective of our portfolio management team.
This report remains one of our most important vehicles for conveying information about fund returns, as well as market factors and strategies that affected fund performance. For additional, updated information, we encourage you to visit our website, americancentury.com. Click on the “Fund Performance” and “Insights & News” headings at the top of our Individual Investors site.
Reporting Period’s Divided Nature Resulted in Mixed Returns
The financial market performance that most U.S. investors experienced during the 12 months ended November 30, 2011 generally reflected the period’s divided nature. For the first six months, confidence in global economic growth, strong corporate earnings, and increased risk-taking generally ruled the markets. The MSCI EAFE Index and the S&P 500 Index advanced approximately 15% for the six months ended May 31, 2011, as stocks broadly outperformed high-quality bonds for that period.
However, the tables reversed sharply for the final six months. The risk-taking tide ebbed during the summer months, constrained by high fuel prices, federal budget management concerns in the U.S., and the worsening sovereign debt crisis in Europe. High-quality bonds, led by long-maturity U.S. Treasury securities, mostly outpaced stocks. The MSCI EAFE Index and the S&P 500 Index returned –16.56% and –6.25%, respectively, during the six months ended November 30, 2011, despite a significant market rebound in October.
As a result of this volatility, returns were mixed for the full 12-month period. U.S. and international bonds and U.S. stocks generally outperformed international stocks. The S&P 500 Index and the MSCI EAFE Index returned 7.83% and –4.12%, respectively, for the fiscal year.
Unfortunately, further volatility appears likely in 2012 as the markets wrestle with uncertainties regarding European debt, economic strength, government budget deficits, and the U.S. presidential election. We believe strongly in adhering to a disciplined, diversified, long-term investment approach during volatile periods, and we appreciate your continued trust in us during these unsettled times.
Sincerely,
Jonathan Thomas
President and Chief Executive Officer
American Century Investments
2
Dear Fellow Shareholders,
The board of directors of the fund was pleased at the announcement of a new strategic partner for the investment advisor to the American Century Investments funds. Canadian Imperial Bank of Commerce (CIBC), a leading Canadian financial institution, purchased the 41 percent economic interest in American Century Companies, the parent corporation of the advisor, previously held by JPMorgan Chase & Co. Based in Toronto, CIBC provides a full range of retail and wholesale banking services to almost 11 million clients through approximately 1,100 branches and offices in Canada, the U.S. and around the world. This transaction will benefit fund shareholders by bolstering the financial strength of the advisor and providing a strategic partner to help support its growth initiative to broaden non-U.S. distribution of its products and services.
The board also has been briefed throughout the year on the impact on fund performance of the European banking crisis, the U.S. deficit reduction debates, and the pace of economic growth. While the performance of all funds has been affected, the majority of American Century Investments funds overseen by the board are exceeding their benchmarks for the one-, three-, five-, and ten-year periods ended September 30, 2011. This is commendable performance, particularly in these challenging market conditions.
We are completing another year of board oversight on your behalf. We appreciate any comments you would like to share with the board. Send them to me at dhpratt@fundboardchair.com. Thank you for your continued investment in American Century Investments funds.
Best regards,
Don Pratt
3
By Mark Kopinski,
Chief Investment Officer, Global and Non-U.S. Equity
Stocks Struggled as Growth Slowed
Global stock markets kicked off the 12-month period in generally robust fashion, no easy feat considering investors had to weigh brightening economic outlooks against mounting inflationary pressures, ongoing sovereign debt concerns, and an onslaught of political unrest and natural disasters. Nevertheless, negative forces—primarily expanding sovereign debt problems in Europe and the United States—gradually tightened their hold on the worldwide economy, and market sentiment began to deteriorate. The downdraft culminated with a sharp global market selloff in the third calendar quarter of 2011, triggered primarily by Standard & Poor’s first-ever downgrade of the United States’ long-term credit rating and mounting fears of a default in Greece. Worried about the potential for another global recession, the International Monetary Fund (IMF) trimmed its global growth outlook for 2012.
Overall, emerging market stocks underperformed developed international markets for the 12-month period, as investors retreated from riskier investments. In addition, falling global growth prospects sparked stock slumps, particularly in export-heavy emerging-market economies of South Korea and China. Economic growth continued to moderate in China, but inflationary pressures continued to build, prompting IMF calls for China to allow its currency to appreciate to temper a surge in inflation.
Outlook Hinges on Fiscal Strategies
The period ended with the United States, Japan and China releasing relatively strong economic data, thereby diminishing concerns for a synchronized global recession. Yet, European Union countries continued to falter. As the eurozone crisis continues, global demand likely will decrease as a function of deleveraging, which should negatively influence export-driven markets. In addition, volatility in the financial markets may remain heightened, as investors react to European reform plans.
Ultimately, we believe the global economy can and will resume a strong growth trend. But to do so, each region and country will have to address its specific fiscal challenges. We believe these are solvable problems, as long as government policy supports the private sector and its role in driving economic output and employment based on the profit incentive.
| International Equity Total Returns | ||||
| For the 12 months ended November 30, 2011 (in U.S. dollars) | ||||
| MSCI EAFE Index | -4.12% | MSCI Europe Index | -2.08% | |
| MSCI EAFE Growth Index | -3.96% | MSCI World Index | 1.46% | |
| MSCI EAFE Value Index | -4.27% | MSCI Japan Index | -8.56% | |
| MSCI Emerging Markets Index | -11.54% | |||
4
| Total Returns as of November 30, 2011 | ||||||
| Average Annual Returns | ||||||
Ticker Symbol | 1 year | 5 years | 10 years | Since Inception | Inception Date | |
| Investor Class | TWGGX | 1.82% | 0.26% | 5.70% | 7.00% | 12/1/98 |
| MSCI World Index | — | 1.46% | -1.96% | 3.69% | 2.34%(1) | — |
| Institutional Class | AGGIX | 2.00% | 0.45% | 5.92% | 1.78% | 8/1/00 |
A Class(2) No sales charge* With sales charge* | AGGRX | 1.58% -4.31% | 0.00% -1.18% | 5.43% 4.80% | 5.92% 5.43% | 2/5/99 |
| C Class | AGLCX | 0.77% | -0.73% | — | 4.88% | 3/1/02 |
| R Class | AGORX | 1.21% | -0.27% | — | 3.46% | 7/29/05 |
| * | Sales charges include initial sales charges and contingent deferred sales charges (CDSCs), as applicable. A Class shares have a 5.75% maximum initial sales charge and may be subject to a maximum CDSC of 1.00%. C Class shares redeemed within 12 months of purchase are subject to a maximum CDSC of 1.00%. The SEC requires that mutual funds provide performance information net of maximum sales charges in all cases where charges could be applied. |
| (1) | Since 11/30/98, the date nearest the Investor Class’s inception for which data are available. |
| (2) | Prior to September 4, 2007, the A Class was referred to as the Advisor Class and did not have a front-end sales charge. Performance prior to that date has been adjusted to reflect this charge. |
Data presented reflect past performance. Past performance is no guarantee of future results. Current performance may be higher or lower than the performance shown. Investment return and principal value will fluctuate, and redemption value may be more or less than original cost. To obtain performance data current to the most recent month end, please call 1-800-345-2021 or visit americancentury.com. International investing involves special risks, such as political instability and currency fluctuations. Investing in emerging markets may accentuate these risks.
Unless otherwise indicated, performance reflects Investor Class shares; performance for other share classes will vary due to differences in fee structure. For information about other share classes available, please consult the prospectus. Data assumes reinvestment of dividends and capital gains, and none of the charts reflect the deduction of taxes that a shareholder would pay on fund distributions or the redemption of fund shares. Returns for the index are provided for comparison. The fund’s total returns include operating expenses (such as transaction costs and management fees) that reduce returns, while the total returns of the index do not.
5
| Growth of $10,000 Over 10 Years |
| $10,000 investment made November 30, 2001 |
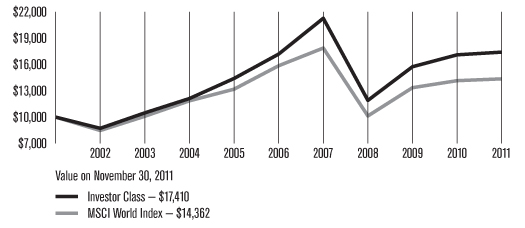
| Total Annual Fund Operating Expenses | ||||
| Investor Class | Institutional Class | A Class | C Class | R Class |
| 1.16% | 0.96% | 1.41% | 2.16% | 1.66% |
The total annual fund operating expenses shown is as stated in the fund’s prospectus current as of the date of this report. The prospectus may vary from the expense ratio shown elsewhere in this report because it is based on a different time period, includes acquired fund fees and expenses, and, if applicable, does not include fee waivers or expense reimbursements.
Data presented reflect past performance. Past performance is no guarantee of future results. Current performance may be higher or lower than the performance shown. Investment return and principal value will fluctuate, and redemption value may be more or less than original cost. To obtain performance data current to the most recent month end, please call 1-800-345-2021 or visit americancentury.com. International investing involves special risks, such as political instability and currency fluctuations. Investing in emerging markets may accentuate these risks.
Unless otherwise indicated, performance reflects Investor Class shares; performance for other share classes will vary due to differences in fee structure. For information about other share classes available, please consult the prospectus. Data assumes reinvestment of dividends and capital gains, and none of the charts reflect the deduction of taxes that a shareholder would pay on fund distributions or the redemption of fund shares. Returns for the index are provided for comparison. The fund’s total returns include operating expenses (such as transaction costs and management fees) that reduce returns, while the total returns of the index do not.
6
Portfolio Managers: Keith Creveling and Brent Puff
Performance Summary
Global Growth returned 1.82%* for the 12 months ended November 30, 2011, compared with its benchmark, the MSCI World Index, which returned 1.46%.
Global stocks generally struggled during the 12-month period, as investors grappled with the ongoing and expanding sovereign debt problems in several developed nations. In particular, fears of a default in Greece and contagion throughout the rest of the eurozone weighed on stocks. In addition, mounting inflationary pressures in China and other emerging markets, combined with fears that a global economic slowdown would stifle demand for their goods, drove down stocks in the developing world. Within the developed markets, growth stocks outpaced their value counterparts, while large-cap stocks showed a slight performance advantage over their small-cap brethren.
Overall, strong stock selection in Japan, France, and Germany and in several market sectors accounted for the bulk of the portfolio’s outperformance. Stock selection in Europe and portfolio-only positions in emerging markets detracted from results.
Technology Sector was Top Contributor
The portfolio’s information technology sector was the top contributor to performance, buoyed by strong stock selection and an overweight position. In particular, U.S.-based personal technology developer Apple was among the portfolio’s leading performers. With its iPhone ascending to the No. 1 spot in the global smartphone market, its Mac computers growing market share, its iPad tablet computer gaining traction among corporate users, and its product line penetrating China and the emerging markets, investors remained upbeat toward the company, despite the departure (and subsequent death) of visionary founder and CEO Steve Jobs.
Also in the technology sector, China’s Baidu, a Chinese-language internet search provider, was among the portfolio’s top performers. The company enjoyed strong profits driven by an increase in ad sales. Furthermore, Baidu maintained its dominance over its competitors in China’s search advertising market, including Google, which continued its tumultuous relationship with China’s government.
An overweight position in e-commerce firm Rakuten drove the portfolio’s outperformance in Japan and led the contributors in the portfolio’s consumer discretionary sector. The company’s online marketplace continued to gain a greater share of overall consumer spending, as more Japanese consumers shifted their spending habits to online purchasing.
*All fund returns referenced in this commentary are for Investor Class shares.
7
Health Care Stocks Lagged
Stock selection primarily drove down relative results in the portfolio’s health care sector, the largest performance detractor for the period, with an overweight position in U.S.-based pharmacy benefits manager Express Scripts leading the laggards. After announcing the acquisition of rival Medco Health Solutions in July 2011, the company’s stock soared. But, in subsequent months, investors grew concerned that regulators would block the transaction and, absent the deal approval, earnings growth would slow. In addition, a contract dispute and lawsuit with Walgreen’s further soured investor enthusiasm for the stock.
Banking stocks also struggled during the 12-month period, as fears related to Europe’s growing sovereign debt crisis left much of the financial sector out of favor, including in the emerging markets. A portfolio-only position in China-based financial services firm Industrial and Commercial Bank of China was among the largest performance detractors, retreating on ripples from Europe’s debt woes. In addition, reports of investigations by U.S. regulators into accounting practices at several publicly traded China-based companies pressured the broader Chinese market. A portfolio-only position in Turkiye Garanti Bankasi AS, one of Turkey’s largest banks, also slid. In addition to feeling the effects of the European contagion, Garanti’s financial performance suffered from the central bank’s unorthodox monetary policy, which pressured the banking sector’s profitability.
Outlook
We continue to invest in businesses we believe offer sustainable, secular growth drivers that will help them continue to thrive and prosper in spite of continued sluggish global economic growth. We believe good opportunities exist in the developed markets of Asia and select emerging markets. Furthermore, we expect growth in the emerging markets to continue providing a powerful benefit for many companies based in the developed markets, particularly in the consumer sectors.
8
| NOVEMBER 30, 2011 | |
| Top Ten Holdings | % of net assets |
| Apple, Inc. | 3.7% |
| Google, Inc., Class A | 2.9% |
| Danone SA | 2.5% |
| Schlumberger Ltd. | 2.4% |
| EMC Corp. | 2.2% |
| Precision Castparts Corp. | 2.1% |
| Oracle Corp. | 2.1% |
| Union Pacific Corp. | 2.1% |
| Occidental Petroleum Corp. | 2.0% |
| Danaher Corp. | 2.0% |
| Types of Investments in Portfolio | % of net assets |
| Domestic Common Stocks | 55.9% |
Foreign Common Stocks(1) | 43.2% |
| Total Equity Exposure | 99.1% |
| Temporary Cash Investments | 1.2% |
| Other Assets and Liabilities | (0.3)% |
(1)Includes depositary shares, dual listed securities and foreign ordinary shares. | |
| Investments by Country | % of net assets |
| United States | 55.9% |
| United Kingdom | 10.0% |
| Japan | 6.1% |
| Switzerland | 5.7% |
| France | 3.8% |
| People’s Republic of China | 3.1% |
| Germany | 2.0% |
| Other Countries | 12.5% |
Cash and Equivalents(2) | 0.9% |
(2)Includes temporary cash investments and other assets and liabilities. | |
9
Fund shareholders may incur two types of costs: (1) transaction costs, including sales charges (loads) on purchase payments and redemption/exchange fees; and (2) ongoing costs, including management fees; distribution and service (12b-1) fees; and other fund expenses. This example is intended to help you understand your ongoing costs (in dollars) of investing in your fund and to compare these costs with the ongoing cost of investing in other mutual funds.
The example is based on an investment of $1,000 made at the beginning of the period and held for the entire period from June 1, 2011 to November 30, 2011.
Actual Expenses
The table provides information about actual account values and actual expenses for each class. You may use the information, together with the amount you invested, to estimate the expenses that you paid over the period. First, identify the share class you own. Then simply divide your account value by $1,000 (for example, an $8,600 account value divided by $1,000 = 8.6), then multiply the result by the number under the heading ��Expenses Paid During Period” to estimate the expenses you paid on your account during this period.
If you hold Investor Class shares of any American Century Investments fund, or Institutional Class shares of the American Century Diversified Bond Fund, in an American Century Investments account (i.e., not a financial intermediary or retirement plan account), American Century Investments may charge you a $12.50 semiannual account maintenance fee if the value of those shares is less than $10,000. We will redeem shares automatically in one of your accounts to pay the $12.50 fee. In determining your total eligible investment amount, we will include your investments in all personal accounts (including American Century Investments Brokerage accounts) registered under your Social Security number. Personal accounts include individual accounts, joint accounts, UGMA/UTMA accounts, personal trusts, Coverdell Education Savings Accounts and IRAs (including traditional, Roth, Rollover, SEP-, SARSEP- and SIMPLE-IRAs), and certain other retirement accounts. If you have only business, business retirement, employer-sponsored or American Century Investments Brokerage accounts, you are currently not subject to this fee. We will not charge the fee as long as you choose to manage your accounts exclusively online. If you are subject to the Account Maintenance Fee, your account value could be reduced by the fee amount.
Hypothetical Example for Comparison Purposes
The table also provides information about hypothetical account values and hypothetical expenses based on the actual expense ratio of each class of your fund and an assumed rate of return of 5% per year before expenses, which is not the actual return of a fund’s share class. The hypothetical account values and expenses may not be used to estimate the actual ending account balance or expenses you paid for the period. You may use this information to compare the ongoing costs of investing in your fund and other funds. To do so, compare this 5% hypothetical example with the 5% hypothetical examples that appear in the shareholder reports of the other funds.
10
Please note that the expenses shown in the table are meant to highlight your ongoing costs only and do not reflect any transactional costs, such as sales charges (loads) or redemption/exchange fees. Therefore, the table is useful in comparing ongoing costs only, and will not help you determine the relative total costs of owning different funds. In addition, if these transactional costs were included, your costs would have been higher.
Beginning Account Value 6/1/11 | Ending Account Value 11/30/11 | Expenses Paid During Period* 6/1/11 – 11/30/11 | Annualized Expense Ratio* | |
| Actual | ||||
| Investor Class | $1,000 | $889.40 | $5.26 | 1.11% |
| Institutional Class | $1,000 | $889.30 | $4.31 | 0.91% |
| A Class | $1,000 | $887.80 | $6.44 | 1.36% |
| C Class | $1,000 | $884.30 | $9.97 | 2.11% |
| R Class | $1,000 | $886.00 | $7.61 | 1.61% |
| Hypothetical | ||||
| Investor Class | $1,000 | $1,019.50 | $5.62 | 1.11% |
| Institutional Class | $1,000 | $1,020.51 | $4.61 | 0.91% |
| A Class | $1,000 | $1,018.25 | $6.88 | 1.36% |
| C Class | $1,000 | $1,014.49 | $10.66 | 2.11% |
| R Class | $1,000 | $1,017.00 | $8.14 | 1.61% |
| * | Expenses are equal to the class’s annualized expense ratio listed in the table above, multiplied by the average account value over the period, multiplied by 183, the number of days in the most recent fiscal half-year, divided by 365, to reflect the one-half year period. |
11
NOVEMBER 30, 2011
| Shares | Value | |
| Common Stocks — 99.1% | ||
| AUSTRALIA — 1.7% | ||
| BHP Billiton Ltd. | 176,390 | $ 6,586,596 |
| BRAZIL — 0.4% | ||
| Itau Unibanco Holding SA ADR | 80,040 | 1,424,712 |
| CANADA — 0.4% | ||
| Suncor Energy, Inc. | 46,620 | 1,404,154 |
| CHILE — 0.3% | ||
| Sociedad Quimica y Minera de Chile SA ADR | 20,690 | 1,186,365 |
| DENMARK — 1.1% | ||
| Novo Nordisk A/S B Shares | 38,090 | 4,332,108 |
| FRANCE — 3.8% | ||
| Danone SA | 148,620 | 9,830,468 |
| Pernod-Ricard SA | 31,180 | 2,936,788 |
| Safran SA | 74,160 | 2,197,994 |
| 14,965,250 | ||
| GERMANY — 2.0% | ||
| Bayerische Motoren Werke AG | 34,240 | 2,577,581 |
| Fresenius Medical Care AG & Co. KGaA | 57,430 | 3,924,675 |
| Lanxess AG | 26,770 | 1,496,296 |
| 7,998,552 | ||
| HONG KONG — 0.9% | ||
| China Unicom Ltd. | 1,668,000 | 3,592,552 |
| INDONESIA — 0.4% | ||
| PT Bank Mandiri (Persero) Tbk | 1,997,631 | 1,462,922 |
| ITALY — 1.9% | ||
| Pirelli & C SpA | 84,690 | 797,234 |
| Saipem SpA | 151,010 | 6,754,133 |
| 7,551,367 | ||
| JAPAN — 6.1% | ||
| Daihatsu Motor Co. Ltd. | 72,000 | 1,265,470 |
| FANUC CORP. | 17,900 | 2,938,597 |
| Komatsu Ltd. | 142,300 | 3,623,068 |
| Nitori Holdings Co. Ltd. | 19,750 | 1,847,149 |
| ORIX Corp. | 50,260 | 4,231,393 |
| Rakuten, Inc. | 5,152 | 5,513,111 |
| Unicharm Corp. | 89,300 | 4,230,012 |
| 23,648,800 | ||
| NETHERLANDS — 1.0% | ||
| ASML Holding NV New York Shares | 50,170 | 1,983,220 |
| European Aeronautic Defence and Space Co. NV | 61,800 | 1,853,404 |
| 3,836,624 | ||
| PEOPLE’S REPUBLIC OF CHINA — 3.1% | ||
Baidu, Inc. ADR(1) | 53,810 | 7,048,572 |
| Industrial & Commercial Bank of China Ltd. H Shares | 8,288,000 | $ 4,915,233 |
| 11,963,805 | ||
| POLAND — 0.4% | ||
| Powszechna Kasa Oszczednosci Bank Polski SA | 150,450 | 1,511,794 |
| PORTUGAL — 0.7% | ||
| Jeronimo Martins SGPS SA | 143,960 | 2,628,015 |
| RUSSIAN FEDERATION — 0.8% | ||
| Magnit OJSC GDR | 49,090 | 1,090,901 |
Sberbank of Russia ADR(1) | 178,400 | 2,179,205 |
| 3,270,106 | ||
| SOUTH KOREA — 0.9% | ||
| Hyundai Motor Co. | 18,580 | 3,601,659 |
| SPAIN — 0.5% | ||
Grifols SA(1) | 127,921 | 2,067,352 |
| SWEDEN — 0.4% | ||
| Atlas Copco AB A Shares | 72,620 | 1,560,758 |
| SWITZERLAND — 5.7% | ||
Adecco SA(1) | 70,770 | 3,074,500 |
| Nestle SA | 121,460 | 6,810,506 |
| Novartis AG | 87,680 | 4,731,462 |
| Swatch Group AG (The) | 8,330 | 3,246,745 |
Syngenta AG(1) | 5,430 | 1,601,577 |
| Xstrata plc | 169,630 | 2,732,170 |
| 22,196,960 | ||
| TURKEY — 0.7% | ||
| Turkiye Garanti Bankasi AS | 793,840 | 2,724,152 |
| UNITED KINGDOM — 10.0% | ||
| Admiral Group plc | 124,030 | 1,799,501 |
| ARM Holdings plc | 204,460 | 1,919,358 |
| BG Group plc | 307,300 | 6,594,731 |
| Burberry Group plc | 139,920 | 2,804,839 |
| Capita Group plc (The) | 375,520 | 3,729,773 |
| Compass Group plc | 710,170 | 6,576,561 |
| HSBC Holdings plc | 649,180 | 5,062,580 |
| Kingfisher plc | 736,780 | 2,968,989 |
| Reckitt Benckiser Group plc | 37,775 | 1,909,466 |
| Rio Tinto plc | 49,810 | 2,636,714 |
| WM Morrison Supermarkets plc | 620,610 | 3,143,837 |
| 39,146,349 | ||
| UNITED STATES — 55.9% | ||
| Air Products & Chemicals, Inc. | 50,130 | 4,198,387 |
Amazon.com, Inc.(1) | 9,710 | 1,867,136 |
| American Express Co. | 137,940 | 6,626,638 |
American Tower Corp., Class A(1) | 123,900 | 7,310,100 |
| Apache Corp. | 28,280 | 2,812,163 |
12
| Shares | Value |
Apple, Inc.(1) | 37,610 | $ 14,374,542 |
BE Aerospace, Inc.(1) | 46,830 | 1,824,029 |
Celgene Corp.(1) | 36,330 | 2,291,696 |
Cerner Corp.(1) | 39,860 | 2,430,663 |
| Charles Schwab Corp. (The) | 512,900 | 6,134,284 |
CIT Group, Inc.(1) | 68,040 | 2,303,834 |
| Colgate-Palmolive Co. | 81,170 | 7,427,055 |
| Costco Wholesale Corp. | 19,150 | 1,633,495 |
| Danaher Corp. | 158,518 | 7,669,101 |
Electronic Arts, Inc.(1) | 43,070 | 998,793 |
EMC Corp.(1) | 376,380 | 8,660,504 |
Equinix, Inc.(1) | 36,500 | 3,650,730 |
| Expeditors International of Washington, Inc. | 30,790 | 1,339,673 |
Express Scripts, Inc.(1) | 92,500 | 4,222,625 |
| FactSet Research Systems, Inc. | 25,890 | 2,413,725 |
Google, Inc., Class A(1) | 18,810 | 11,274,526 |
| Harley-Davidson, Inc. | 122,690 | 4,511,311 |
IntercontinentalExchange, Inc.(1) | 46,838 | 5,701,121 |
Intuitive Surgical, Inc.(1) | 2,550 | 1,107,236 |
| Johnson Controls, Inc. | 107,190 | 3,374,341 |
| Kraft Foods, Inc., Class A | 67,060 | 2,424,219 |
Las Vegas Sands Corp.(1) | 73,960 | 3,454,672 |
Liberty Global, Inc. Class A(1) | 133,480 | 5,257,777 |
| MasterCard, Inc., Class A | 19,820 | 7,423,581 |
| Mead Johnson Nutrition Co. | 51,049 | 3,847,053 |
| Monsanto Co. | 26,660 | 1,958,177 |
| National Oilwell Varco, Inc. | 29,870 | 2,141,679 |
| NIKE, Inc., Class B | 16,410 | 1,578,314 |
O’Reilly Automotive, Inc.(1) | 18,200 | 1,405,768 |
| Occidental Petroleum Corp. | 79,080 | 7,821,012 |
| Oracle Corp. | 256,930 | 8,054,755 |
Polypore International, Inc.(1) | 48,240 | 2,366,172 |
| Precision Castparts Corp. | 50,690 | 8,351,177 |
priceline.com, Inc.(1) | 13,004 | 6,318,514 |
| QUALCOMM, Inc. | 89,940 | 4,928,712 |
| Rockwell Automation, Inc. | 23,010 | 1,726,440 |
| Schlumberger Ltd. | 125,230 | 9,433,576 |
| Starbucks Corp. | 67,850 | 2,950,118 |
| Union Pacific Corp. | 77,360 | 7,999,798 |
VeriFone Systems, Inc.(1) | 53,010 | 2,324,488 |
Waters Corp.(1) | 32,880 | 2,630,400 |
| Wells Fargo & Co. | 181,810 | 4,701,607 |
| Whole Foods Market, Inc. | 37,189 | 2,532,571 |
| 217,788,288 | ||
TOTAL COMMON STOCKS(Cost $317,879,214) | 386,449,240 | |
| Temporary Cash Investments — 1.2% | ||
Repurchase Agreement, Bank America Merrill Lynch, (collateralized by various U.S. Treasury obligations, 3.50%, 5/15/20, valued at $1,612,515), in a joint trading account at 0.06%, dated 11/30/11, due 12/1/11 (Delivery value $1,587,062) | 1,587,059 | |
Repurchase Agreement, Credit Suisse First Boston, Inc., (collateralized by various U.S. Treasury obligations, 5.00%, 5/15/37, valued at $1,616,234), in a joint trading account at 0.05%, dated 11/30/11, due 12/1/11 (Delivery value $1,587,061) | 1,587,059 | |
Repurchase Agreement, Goldman Sachs & Co., (collateralized by various U.S. Treasury obligations, 4.375%, 2/15/38, valued at $1,492,302), in a joint trading account at 0.04%, dated 11/30/11, due 12/1/11 (Delivery value $1,460,835) | 1,460,833 | |
| SSgA U.S. Government Money Market Fund | 28 | 28 |
TOTAL TEMPORARY CASH INVESTMENTS (Cost $4,634,979) | 4,634,979 | |
TOTAL INVESTMENT SECURITIES — 100.3%(Cost $322,514,193) | 391,084,219 | |
| OTHER ASSETS AND LIABILITIES — (0.3)% | (1,319,822) | |
| TOTAL NET ASSETS — 100.0% | $389,764,397 | |
| Market Sector Diversification | |
| (as a % of net assets) | |
| Information Technology | 19.9% |
| Consumer Discretionary | 15.8% |
| Financials | 13.2% |
| Consumer Staples | 12.9% |
| Industrials | 12.8% |
| Energy | 9.4% |
| Health Care | 6.5% |
| Materials | 5.8% |
| Telecommunication Services | 2.8% |
| Cash and Equivalents* | 0.9% |
| *Includes temporary cash investments and other assets and liabilities. | |
Notes to Schedule of Investments
ADR = American Depositary Receipt
GDR = Global Depositary Receipt
OJSC = Open Joint Stock Company
(1) Non-income producing.
See Notes to Financial Statements.
13
| NOVEMBER 30, 2011 | ||||
| Assets | ||||
| Investment securities, at value (cost of $322,514,193) | $391,084,219 | |||
| Foreign currency holdings, at value (cost of $58,003) | 57,988 | |||
| Receivable for investments sold | 266,302 | |||
| Receivable for capital shares sold | 358,163 | |||
| Dividends and interest receivable | 584,780 | |||
| Other assets | 48,097 | |||
| 392,399,549 | ||||
| Liabilities | ||||
| Payable for investments purchased | 2,053,633 | |||
| Payable for capital shares redeemed | 228,565 | |||
| Accrued management fees | 344,317 | |||
| Distribution and service fees payable | 8,637 | |||
| 2,635,152 | ||||
| Net Assets | $389,764,397 | |||
| Net Assets Consist of: | ||||
| Capital (par value and paid-in surplus) | $384,318,767 | |||
| Undistributed net investment income | 211,799 | |||
| Accumulated net realized loss | (63,372,379 | ) | ||
| Net unrealized appreciation | 68,606,210 | |||
| $389,764,397 | ||||
| Net assets | Shares outstanding | Net asset value per share | ||||||||||
| Investor Class, $0.01 Par Value | $322,671,614 | 37,882,906 | $8.52 | |||||||||
| Institutional Class, $0.01 Par Value | $35,991,367 | 4,183,162 | $8.60 | |||||||||
| A Class, $0.01 Par Value | $26,908,138 | 3,206,471 | $8.39 | * | ||||||||
| C Class, $0.01 Par Value | $3,557,002 | 452,032 | $7.87 | |||||||||
| R Class, $0.01 Par Value | $636,276 | 75,800 | $8.39 | |||||||||
| *Maximum offering price $8.90 (net asset value divided by 0.9425) | ||||||||||||
See Notes to Financial Statements.
14
| YEAR ENDED NOVEMBER 30, 2011 | ||||
| Investment Income (Loss) | ||||
| Income: | ||||
| Dividends (net of foreign taxes withheld of $341,077) | $5,954,107 | |||
| Interest | 1,837 | |||
| 5,955,944 | ||||
| Expenses: | ||||
| Management fees | 4,650,232 | |||
| Distribution and service fees: | ||||
| A Class | 78,067 | |||
| B Class | 6,772 | |||
| C Class | 42,831 | |||
| R Class | 3,337 | |||
| Directors’ fees and expenses | 20,049 | |||
| Other expenses | 1,474 | |||
| 4,802,762 | ||||
| Net investment income (loss) | 1,153,182 | |||
| Realized and Unrealized Gain (Loss) | ||||
| Net realized gain (loss) on: | ||||
| Investment transactions (net of foreign tax expenses paid (refunded) of $(32,547)) | 28,119,170 | |||
| Foreign currency transactions (net of foreign tax expenses paid (refunded) of $24,669) | (73,039 | ) | ||
| 28,046,131 | ||||
| Change in net unrealized appreciation (depreciation) on: | ||||
| Investments (net of deferred foreign taxes of $(22,256)) | (18,793,853 | ) | ||
| Translation of assets and liabilities in foreign currencies | 27,366 | |||
| (18,766,487 | ) | |||
| Net realized and unrealized gain (loss) | 9,279,644 | |||
| Net Increase (Decrease) in Net Assets Resulting from Operations | $10,432,826 | |||
See Notes to Financial Statements.
15
| YEARS ENDED NOVEMBER 30, 2011 AND NOVEMBER 30, 2010 | |||||||
| Increase (Decrease) in Net Assets | November 30, 2011 | November 30, 2010 | |||||
| Operations | |||||||
| Net investment income (loss) | $1,153,182 | $1,347,177 | |||||
| Net realized gain (loss) | 28,046,131 | 29,603,358 | |||||
| Change in net unrealized appreciation (depreciation) | (18,766,487 | ) | 2,576,737 | ||||
| Net increase (decrease) in net assets resulting from operations | 10,432,826 | 33,527,272 | |||||
| Distributions to Shareholders | |||||||
| From net investment income: | |||||||
| Investor Class | (1,819,577 | ) | (2,545,624 | ) | |||
| Institutional Class | (300,047 | ) | (512,165 | ) | |||
| A Class | (82,583 | ) | (82,118 | ) | |||
| Decrease in net assets from distributions | (2,202,207 | ) | (3,139,907 | ) | |||
| Capital Share Transactions | |||||||
| Net increase (decrease) in net assets from capital share transactions | (48,395,004 | ) | (31,398,727 | ) | |||
| Redemption Fees | |||||||
| Increase in net assets from redemption fees | 13,588 | 14,569 | |||||
| Net increase (decrease) in net assets | (40,150,797 | ) | (996,793 | ) | |||
| Net Assets | |||||||
| Beginning of period | 429,915,194 | 430,911,987 | |||||
| End of period | $389,764,397 | $429,915,194 | |||||
| Undistributed net investment income | $211,799 | $879,180 | |||||
See Notes to Financial Statements.
16
NOVEMBER 30, 2011
1. Organization
American Century World Mutual Funds, Inc. (the corporation) is registered under the Investment Company Act of 1940, as amended (the 1940 Act), as an open-end management investment company and is organized as a Maryland corporation. Global Growth Fund (the fund) is one fund in a series issued by the corporation. The fund is diversified as defined under the 1940 Act. The fund’s investment objective is to seek capital growth. The fund pursues its objective by investing primarily in equity securities of issuers in the United States and other developed countries.
The fund is authorized to issue the Investor Class, the Institutional Class, the A Class, the B Class, the C Class and the R Class. The A Class may incur an initial sales charge. The A Class, B Class and C Class may be subject to a contingent deferred sales charge. The share classes differ principally in their respective sales charges and distribution and shareholder servicing expenses and arrangements. The Institutional Class is made available to institutional shareholders or through financial intermediaries whose clients do not require the same level of shareholder and administrative services as shareholders of other classes. As a result, the Institutional Class is charged a lower unified management fee. On October 21, 2011, all outstanding B Class shares were converted to A Class shares and the fund discontinued issuance of the B Class.
2. Significant Accounting Policies
The following is a summary of significant accounting policies consistently followed by the fund in preparation of its financial statements. The financial statements are prepared in conformity with accounting principles generally accepted in the United States of America, which may require management to make certain estimates and assumptions at the date of the financial statements. Actual results could differ from these estimates.
Investment Valuations — The fund determines the fair value of its investments and computes its net asset value per share as of the close of regular trading (usually 4 p.m. Eastern time) on the New York Stock Exchange (NYSE) on each day the NYSE is open.
Equity securities that are listed or traded on a domestic securities exchange are valued at the last reported sales price or at the official closing price as provided by the exchange. Equity securities traded on foreign securities exchanges are typically valued at the closing price on the exchange where primarily traded or as of the close of the NYSE, if that is earlier. If no last sales price is reported, or if local convention or regulation so provides, the mean of the latest bid and asked prices is used. Depending on local convention or regulation, securities traded over-the-counter are valued at the mean of the latest bid and asked prices, the last sales price, or the official closing price. In its determination of fair value, the fund may review several factors including: market information specific to a security; news developments in U.S. and foreign markets; the performance of particular U.S. and foreign securities, indices, comparable securities, American Depositary Receipts, Exchange-Traded Funds, and other relevant market indicators.
Debt securities maturing within 60 days at the time of purchase may be valued at cost, plus or minus any amortized discount or premium or at the evaluated mean as provided by an independent pricing service. Evaluated mean prices are commonly derived through utilization of market models, which may consider, among other factors, trade data, quotations from dealers and active market makers, relevant yield curve and spread data, related sector levels, creditworthiness, and other relevant market information on the same or comparable securities.
Investments in open-end management investment companies are valued at the reported net asset value per share. Repurchase agreements are valued at cost.
The value of investments initially expressed in foreign currencies is translated into U.S. dollars at prevailing exchange rates.
17
If the fund determines that the market price for a portfolio security is not readily available or the valuation methods mentioned above do not reflect a security’s fair value, such security is valued as determined in good faith by the Board of Directors or its designee, in accordance with procedures adopted by the Board of Directors. Circumstances that may cause the fund to use these procedures to value a security include, but are not limited to: a security has been declared in default; trading in a security has been halted during the trading day; there is a foreign market holiday and no trading occurred; or an event occurred between the close of a foreign exchange and the NYSE that may affect the value of a security.
Security Transactions — Security transactions are accounted for as of the trade date. Net realized gains and losses are determined on the identified cost basis, which is also used for federal income tax purposes. Certain countries impose taxes on realized gains on the sale of securities registered in their country. The fund records the foreign tax expense, if any, on an accrual basis. The foreign tax expense on realized gains and unrealized appreciation reduces the net realized gain (loss) on investment transactions and net unrealized appreciation (depreciation) on investments, respectively.
Investment Income — Dividend income less foreign taxes withheld, if any, is recorded as of the ex-dividend date. Interest income is recorded on the accrual basis and includes accretion of discounts and amortization of premiums.
Foreign Currency Translations — All assets and liabilities initially expressed in foreign currencies are translated into U.S. dollars at prevailing exchange rates at period end. The fund may enter into spot foreign currency exchange contracts to facilitate transactions denominated in a foreign currency. Purchases and sales of investment securities, dividend and interest income, spot foreign currency exchange contracts, and expenses are translated at the rates of exchange prevailing on the respective dates of such transactions. Net realized and unrealized foreign currency exchange gains or losses related to investment securities are a component of net realized gain (loss) on investment transactions and change in net unrealized appreciation (depreciation) on investments, respectively. Certain countries impose taxes on the contract amount of purchases and sales of foreign currency contracts in their currency. The fund records the foreign tax expense, if any, as a reduction to the net realized gain (loss) on foreign currency transactions.
Repurchase Agreements — The fund may enter into repurchase agreements with institutions that American Century Investment Management, Inc. (ACIM) (the investment advisor) has determined are creditworthy pursuant to criteria adopted by the Board of Directors. The fund requires that the collateral, represented by securities, received in a repurchase transaction be transferred to the custodian in a manner sufficient to enable the fund to obtain those securities in the event of a default under the repurchase agreement. ACIM monitors, on a daily basis, the securities transferred to ensure the value, including accrued interest, of the securities under each repurchase agreement is equal to or greater than amounts owed to the fund under each repurchase agreement.
Joint Trading Account — Pursuant to an Exemptive Order issued by the Securities and Exchange Commission, the fund, along with certain other funds in the American Century Investments family of funds, may transfer uninvested cash balances into a joint trading account. These balances are invested in one or more repurchase agreements that are collateralized by U.S. Treasury or Agency obligations.
Income Tax Status — It is the fund’s policy to distribute substantially all net investment income and net realized gains to shareholders and to otherwise qualify as a regulated investment company under provisions of the Internal Revenue Code. The fund is no longer subject to examination by tax authorities for years prior to 2008. Additionally, non-U.S. tax returns filed by the fund due to investments in certain foreign securities remain subject to examination by the relevant taxing authority for seven years from the date of filing. At this time, management believes there are no uncertain tax positions which, based on their technical merit, would not be sustained upon examination and for which it is reasonably possible that the total amounts of unrecognized tax benefits will significantly change in the next twelve months. Accordingly, no provision has been made for federal or state income taxes.
18
Multiple Class — All shares of the fund represent an equal pro rata interest in the net assets of the class to which such shares belong, and have identical voting, dividend, liquidation and other rights and the same terms and conditions, except for class specific expenses and exclusive rights to vote on matters affecting only individual classes. Income, non-class specific expenses, and realized and unrealized capital gains and losses of the fund are allocated to each class of shares based on their relative net assets.
Distributions to Shareholders — Distributions from net investment income and net realized gains, if any, are generally declared and paid annually. The fund may make distributions on a more frequent basis to comply with the distribution requirements of the Internal Revenue Code, in all events in a manner consistent with provisions of the 1940 Act.
Redemption — The fund may impose a 2.00% redemption fee on shares held less than 60 days. The fee may not be applicable to all classes. The redemption fee is retained by the fund and helps cover transaction costs that long-term investors may bear when the fund sells securities to meet investor redemptions.
Indemnifications — Under the corporation’s organizational documents, its officers and directors are indemnified against certain liabilities arising out of the performance of their duties to the fund. In addition, in the normal course of business, the fund enters into contracts that provide general indemnifications. The maximum exposure under these arrangements is unknown as this would involve future claims that may be made against a fund. The risk of material loss from such claims is considered by management to be remote.
3. Fees and Transactions with Related Parties
Management Fees — The corporation has entered into a management agreement with ACIM, under which ACIM provides the fund with investment advisory and management services in exchange for a single, unified management fee (the fee) per class. The agreement provides that all expenses of managing and operating the fund, except distribution and service fees, brokerage expenses, taxes, interest, fees and expenses of the independent directors (including legal counsel fees), and extraordinary expenses, will be paid by ACIM. The fee is computed and accrued daily based on each class’s daily net assets and paid monthly in arrears. The rate of the fee is determined by applying a fee rate calculation formula. This formula takes into account the fund’s assets as well as certain assets, if any, of other clients of the investment advisor outside the American Century Investments family of funds (such as subadvised funds and separate accounts) that have very similar investment teams and investment strategies (strategy assets). The annual management fee schedule ranges from 1.05% to 1.30% for the Investor Class, A Class, B Class, C Class and R Class. The Institutional Class is 0.20% less at each point within the range. The effective annual management fee for each class for the year ended November 30, 2011 was 1.11% for the Investor Class, A Class, C Class and R Class and 0.91% for the Institutional Class.
Distribution and Service Fees — The Board of Directors has adopted a separate Master Distribution and Individual Shareholder Services Plan for each of the A Class, B Class, C Class and R Class (collectively the plans), pursuant to Rule 12b-1 of the 1940 Act. The plans provide that the A Class will pay American Century Investment Services, Inc. (ACIS) an annual distribution and service fee of 0.25%. The plans provide that the B Class and C Class will each pay ACIS an annual distribution and service fee of 1.00%, of which 0.25% is paid for individual shareholder services and 0.75% is paid for distribution services. The plans provide that the R Class will pay ACIS an annual distribution and service fee of 0.50%. The fees are computed and accrued daily based on each class’s daily net assets and paid monthly in arrears. The fees are used to pay financial intermediaries for distribution and individual shareholder services. Fees incurred under the plans during the year ended November 30, 2011 are detailed in the Statement of Operations.
Related Parties — Certain officers and directors of the corporation are also officers and/or directors of American Century Companies, Inc. (ACC), the parent of the corporation’s investment advisor, ACIM, the distributor of the corporation, ACIS, and the corporation’s transfer agent, American Century Services, LLC.
19
The fund was eligible to invest in a money market fund for temporary purposes, which is managed by J.P. Morgan Investment Management, Inc. (JPMIM). The fund had a securities lending agreement with JPMorgan Chase Bank (JPMCB) and a mutual funds services agreement with J.P. Morgan Investor Services Co. (JPMIS). JPMCB was a custodian of the fund. JPMIM, JPMIS and JPMCB are wholly owned subsidiaries of JPMorgan Chase & Co. (JPM). Prior to August 31, 2011, JPM was an equity investor in ACC. The services provided to the fund by JPMIM, JPMIS and JPMCB terminated on July 31, 2011.
4. Investment Transactions
Purchases and sales of investment securities, excluding short-term investments, for the year ended November 30, 2011 were $228,087,249 and $278,444,120, respectively.
5. Capital Share Transactions
Transactions in shares of the fund were as follows:
| Year ended November 30, 2011 | Year ended November 30, 2010 | ||||||||||
| Shares | Amount | Shares | Amount | ||||||||
| Investor Class/Shares Authorized | 200,000,000 | 200,000,000 | |||||||||
| Sold | 2,343,841 | $20,895,594 | 2,860,976 | $22,458,592 | |||||||
| Issued in reinvestment of distributions | 162,223 | 1,481,093 | 263,938 | 2,088,844 | |||||||
| Redeemed | (5,653,429 | ) | (50,792,438 | ) | (6,501,756 | ) | (50,811,427 | ) | |||
| (3,147,365 | ) | (28,415,751 | ) | (3,376,842 | ) | (26,263,991 | ) | ||||
| Institutional Class/Shares Authorized | 35,000,000 | 35,000,000 | |||||||||
| Sold | 423,252 | 3,859,467 | 812,187 | 6,377,294 | |||||||
| Issued in reinvestment of distributions | 32,478 | 299,125 | 63,922 | 510,882 | |||||||
| Redeemed | (1,625,818 | ) | (14,879,113 | ) | (1,188,547 | ) | (9,210,872 | ) | |||
| (1,170,088 | ) | (10,720,521 | ) | (312,438 | ) | (2,322,696 | ) | ||||
| A Class/Shares Authorized | 35,000,000 | 35,000,000 | |||||||||
| Sold | 1,000,371 | 8,676,341 | 1,033,001 | 8,031,650 | |||||||
| Issued in reinvestment of distributions | 8,817 | 79,446 | 10,288 | 80,224 | |||||||
| Redeemed | (1,864,354 | ) | (16,217,606 | ) | (1,511,064 | ) | (11,713,971 | ) | |||
| (855,166 | ) | (7,461,819 | ) | (467,775 | ) | (3,602,097 | ) | ||||
| B Class/Shares Authorized | 10,000,000 | 10,000,000 | |||||||||
| Sold | 3,403 | 30,316 | 2,143 | 18,252 | |||||||
| Redeemed | (101,931 | ) | (836,156 | ) | (16,767 | ) | (123,192 | ) | |||
| (98,528 | ) | (805,840 | ) | (14,624 | ) | (104,940 | ) | ||||
| C Class/Shares Authorized | 10,000,000 | 10,000,000 | |||||||||
| Sold | 195,017 | 1,642,864 | 343,317 | 2,611,325 | |||||||
| Redeemed | (329,591 | ) | (2,780,205 | ) | (243,114 | ) | (1,735,817 | ) | |||
| (134,574 | ) | (1,137,341 | ) | 100,203 | 875,508 | ||||||
| R Class/Shares Authorized | 5,000,000 | 5,000,000 | |||||||||
| Sold | 50,734 | 453,279 | 28,084 | 221,956 | |||||||
| Redeemed | (34,078 | ) | (307,011 | ) | (26,494 | ) | (202,467 | ) | |||
| 16,656 | 146,268 | 1,590 | 19,489 | ||||||||
| Net increase (decrease) | (5,389,065 | ) | $(48,395,004 | ) | (4,069,886 | ) | $(31,398,727 | ) | |||
20
6. Fair Value Measurements
The fund’s securities valuation process is based on several considerations and may use multiple inputs to determine the fair value of the positions held by the fund. In conformity with accounting principles generally accepted in the United States of America, the inputs used to determine a valuation are classified into three broad levels as follows:
| • | Level 1 valuation inputs consist of unadjusted quoted prices in an active market for identical securities; |
| • | Level 2 valuation inputs consist of direct or indirect observable market data (including quoted prices for similar securities, evaluations of subsequent market events, interest rates, prepayment speeds, credit risk, etc.); or |
| • | Level 3 valuation inputs consist of unobservable data (including a fund’s own assumptions). |
The level classification is based on the lowest level input that is significant to the fair valuation measurement. The valuation inputs are not necessarily an indication of the risks associated with investing in these securities or other financial instruments.
The following is a summary of the level classifications as of period end. The Schedule of Investments provides additional information on the fund’s portfolio holdings.
| Level 1 | Level 2 | Level 3 | ||||||||||
| Investment Securities | ||||||||||||
| Domestic Common Stocks | $217,788,288 | — | — | |||||||||
| Foreign Common Stocks | 11,642,869 | $157,018,083 | — | |||||||||
| Temporary Cash Investments | 28 | 4,634,951 | — | |||||||||
| Total Value of Investment Securities | $229,431,185 | $161,653,034 | — | |||||||||
7. Risk Factors
There are certain risks involved in investing in foreign securities. These risks include those resulting from future adverse political, social and economic developments, fluctuations in currency exchange rates, the possible imposition of exchange controls, and other foreign laws or restrictions. Investing in emerging markets may accentuate these risks.
8. Federal Tax Information
The tax character of distributions paid during the years ended November 30, 2011 and November 30, 2010 were as follows:
| 2011 | 2010 | |||||||
| Distributions Paid From | ||||||||
| Ordinary income | $2,202,207 | $3,139,907 | ||||||
| Long-term capital gains | — | — | ||||||
The book-basis character of distributions made during the year from net investment income or net realized gains may differ from their ultimate characterization for federal income tax purposes. These differences reflect the differing character of certain income items and net realized gains and losses for financial statement and tax purposes, and may result in reclassification among certain capital accounts on the financial statements.
21
As of November 30, 2011, the federal tax cost of investments and the components of distributable earnings on a tax-basis were as follows:
| Federal tax cost of investments | $325,725,901 | |||
| Gross tax appreciation of investments | $81,909,657 | |||
| Gross tax depreciation of investments | (16,551,339 | ) | ||
| Net tax appreciation (depreciation) of investments | $65,358,318 | |||
Net tax appreciation (depreciation) on translation of assets and liabilities in foreign currencies | $29,730 | |||
| Net tax appreciation (depreciation) | $65,388,048 | |||
| Undistributed ordinary income | $1,232,099 | |||
| Accumulated capital losses | $(60,962,868 | ) | ||
| Capital loss deferral | $(211,649 | ) |
The difference between book-basis and tax-basis cost and unrealized appreciation (depreciation) is attributable primarily to the tax deferral of losses on wash sales and the realization for tax purposes of unrealized gains (losses) on certain foreign currency exchange contracts and investments in passive foreign investment companies.
The accumulated capital losses represent net capital loss carryovers that may be used to offset future realized capital gains for federal income tax purposes. Future capital loss carryover utilization in any given year may be subject to Internal Revenue Code limitations. Capital loss carryovers expire in 2017.
The capital loss deferral represents net capital losses incurred in the one-month period ended November 30, 2011. The fund has elected to treat such losses as having been incurred in the following fiscal year for federal income tax purposes.
On December 22, 2010, the Regulated Investment Company Modernization Act of 2010 (the “Act”) was enacted, which changed various technical rules governing the tax treatment of regulated investment companies. The changes are generally effective for taxable years beginning after the date of enactment. Under the Act, the fund will be permitted to carry forward capital losses incurred in taxable years beginning after the date of enactment for an unlimited period. However, any losses incurred during those future taxable years will be required to be utilized prior to the losses incurred in pre-enactment taxable years, which carry an expiration date. As a result of this ordering rule, pre-enactment capital loss carryforwards may be more likely to expire unused.
22
| For a Share Outstanding Throughout the Years Ended November 30 (except as noted) | |||||||||||||
| Per-Share Data | Ratios and Supplemental Data | ||||||||||||
Net Asset Value, Beginning of Period | Income From Investment Operations: | Distributions From: | Total Return(2) | Ratio to Average Net Assets of: | |||||||||
Net Investment Income (Loss)(1) | Net Realized and Unrealized Gain (Loss) | Total From Investment Operations | Net Investment Income | Net Realized Gains | Total Distributions | Net Asset Value, End of Period | Operating Expenses | Net Investment Income (Loss) | Portfolio Turnover Rate | Net Assets, End of Period (in thousands) | |||
| Investor Class | |||||||||||||
| 2011 | $8.41 | 0.03 | 0.13 | 0.16 | (0.05) | — | (0.05) | $8.52 | 1.82% | 1.11% | 0.28% | 53% | $322,672 |
| 2010 | $7.80 | 0.03 | 0.64 | 0.67 | (0.06) | — | (0.06) | $8.41 | 8.61% | 1.16% | 0.33% | 100% | $344,950 |
| 2009 | $5.90 | 0.04 | 1.86 | 1.90 | —(3) | — | —(3) | $7.80 | 32.24% | 1.22% | 0.62% | 103% | $346,590 |
| 2008 | $12.69 | 0.04 | (4.75) | (4.71) | — | (2.08) | (2.08) | $5.90 | (44.01)% | 1.26% | 0.40% | 121% | $274,599 |
| 2007 | $10.52 | 0.03 | 2.41 | 2.44 | (0.05) | (0.22) | (0.27) | $12.69 | 23.73% | 1.30% | 0.29% | 108% | $481,553 |
| Institutional Class | |||||||||||||
| 2011 | $8.49 | 0.04 | 0.13 | 0.17 | (0.06) | — | (0.06) | $8.60 | 2.00% | 0.91% | 0.48% | 53% | $35,991 |
| 2010 | $7.90 | 0.04 | 0.64 | 0.68 | (0.09) | — | (0.09) | $8.49 | 8.68% | 0.96% | 0.53% | 100% | $45,459 |
| 2009 | $5.97 | 0.05 | 1.89 | 1.94 | (0.01) | — | (0.01) | $7.90 | 32.61% | 1.02% | 0.82% | 103% | $44,752 |
| 2008 | $12.79 | 0.07 | (4.81) | (4.74) | — | (2.08) | (2.08) | $5.97 | (43.88)% | 1.05% | 0.61% | 121% | $28,477 |
| 2007 | $10.60 | 0.06 | 2.42 | 2.48 | (0.07) | (0.22) | (0.29) | $12.79 | 23.99% | 1.10% | 0.49% | 108% | $16,298 |
A Class(4) | |||||||||||||
| 2011 | $8.28 | —(3) | 0.13 | 0.13 | (0.02) | — | (0.02) | $8.39 | 1.58% | 1.36% | 0.03% | 53% | $26,908 |
| 2010 | $7.67 | 0.01 | 0.62 | 0.63 | (0.02) | — | (0.02) | $8.28 | 8.20% | 1.41% | 0.08% | 100% | $33,641 |
| 2009 | $5.81 | 0.02 | 1.84 | 1.86 | — | — | — | $7.67 | 32.01% | 1.47% | 0.37% | 103% | $34,744 |
| 2008 | $12.56 | 0.01 | (4.68) | (4.67) | — | (2.08) | (2.08) | $5.81 | (44.17)% | 1.51% | 0.15% | 121% | $22,447 |
| 2007 | $10.41 | 0.01 | 2.38 | 2.39 | (0.02) | (0.22) | (0.24) | $12.56 | 23.74% | 1.55% | 0.04% | 108% | $18,402 |
23
| For a Share Outstanding Throughout the Years Ended November 30 (except as noted) | |||||||||||||
| Per-Share Data | Ratios and Supplemental Data | ||||||||||||
Net Asset Value, Beginning of Period | Income From Investment Operations: | Distributions From: | Total Return(2) | Ratio to Average Net Assets of: | |||||||||
Net Investment Income (Loss)(1) | Net Realized and Unrealized Gain (Loss) | Total From Investment Operations | Net Investment Income | Net Realized Gains | Total Distributions | Net Asset Value, End of Period | Operating Expenses | Net Investment Income (Loss) | Portfolio Turnover Rate | Net Assets, End of Period (in thousands) | |||
| C Class | |||||||||||||
| 2011 | $7.81 | (0.06) | 0.12 | 0.06 | — | — | — | $7.87 | 0.77% | 2.11% | (0.72)% | 53% | $3,557 |
| 2010 | $7.27 | (0.05) | 0.59 | 0.54 | — | — | — | $7.81 | 7.43% | 2.16% | (0.67)% | 100% | $4,579 |
| 2009 | $5.54 | (0.02) | 1.75 | 1.73 | — | — | — | $7.27 | 31.23% | 2.22% | (0.38)% | 103% | $3,535 |
| 2008 | $12.16 | (0.05) | (4.49) | (4.54) | — | (2.08) | (2.08) | $5.54 | (44.64)% | 2.26% | (0.60)% | 121% | $2,382 |
| 2007 | $10.14 | (0.07) | 2.31 | 2.24 | — | (0.22) | (0.22) | $12.16 | 22.54% | 2.30% | (0.71)% | 108% | $2,625 |
| R Class | |||||||||||||
| 2011 | $8.29 | (0.02) | 0.12 | 0.10 | — | — | — | $8.39 | 1.21% | 1.61% | (0.22)% | 53% | $636 |
| 2010 | $7.67 | (0.01) | 0.63 | 0.62 | — | — | — | $8.29 | 8.08% | 1.66% | (0.17)% | 100% | $490 |
| 2009 | $5.82 | —(3) | 1.85 | 1.85 | — | — | — | $7.67 | 31.79% | 1.72% | 0.12% | 103% | $442 |
| 2008 | $12.62 | (0.01) | (4.71) | (4.72) | — | (2.08) | (2.08) | $5.82 | (44.40)% | 1.76% | (0.10)% | 121% | $253 |
| 2007 | $10.47 | 0.02 | 2.35 | 2.37 | — | (0.22) | (0.22) | $12.62 | 23.08% | 1.80% | (0.21)% | 108% | $202 |
Notes to Financial Highlights
| (1) | Computed using average shares outstanding throughout the period. |
| (2) | Total returns are calculated based on the net asset value of the last business day and do not reflect applicable sales charges, if any. Total returns for periods less than one year are not annualized. |
| (3) | Per-share amount was less than $0.005. |
| (4) | Prior to September 4, 2007, the A Class was referred to as the Advisor Class. |
See Notes to Financial Statements.
24
The Board of Directors and Shareholders,
American Century World Mutual Funds, Inc.:
We have audited the accompanying statement of assets and liabilities, including the schedule of investments, of Global Growth Fund, one of the funds constituting American Century World Mutual Funds, Inc. (the “Corporation”), as of November 30, 2011, and the related statement of operations for the year then ended, the statements of changes in net assets for each of the two years in the period then ended, and the financial highlights for each of the five years in the period then ended. These financial statements and financial highlights are the responsibility of the Corporation’s management. Our responsibility is to express an opinion on these financial statements and financial highlights based on our audits.
We conducted our audits in accordance with the standards of the Public Company Accounting Oversight Board (United States). Those standards require that we plan and perform the audit to obtain reasonable assurance about whether the financial statements and financial highlights are free of material misstatement. The Corporation is not required to have, nor were we engaged to perform, an audit of its internal control over financial reporting. Our audits included consideration of internal control over financial reporting as a basis for designing audit procedures that are appropriate in the circumstances, but not for the purpose of expressing an opinion on the effectiveness of the Corporation’s internal control over financial reporting. Accordingly, we express no such opinion. An audit also includes examining, on a test basis, evidence supporting the amounts and disclosures in the financial statements, assessing the accounting principles used and significant estimates made by management, as well as evaluating the overall financial statement presentation. Our procedures included confirmation of securities owned as of November 30, 2011, by correspondence with the custodian and brokers; where replies were not received from brokers, we performed other auditing procedures. We believe that our audits provide a reasonable basis for our opinion.
In our opinion, the financial statements and financial highlights referred to above present fairly, in all material respects, the financial position of Global Growth Fund of American Century World Mutual Funds, Inc., as of November 30, 2011, the results of its operations for the year then ended, the changes in its net assets for each of the two years in the period then ended, and the financial highlights for each of the five years in the period then ended, in conformity with accounting principles generally accepted in the United States of America.
Deloitte & Touche LLP
Kansas City, Missouri
January 20, 2012
25
The Board of Directors
The individuals listed below serve as directors of the funds. Each director will continue to serve in this capacity until death, retirement, resignation or removal from office. The mandatory retirement age for directors who are not “interested persons,” as that term is defined in the Investment Company Act (independent directors), is 72. However, the mandatory retirement age for an individual director may be extended with the approval of the remaining independent directors.
Mr. Thomas is the only director who is an “interested person” because he currently serves as President and Chief Executive Officer of American Century Companies, Inc. (ACC), the parent company of American Century Investment Management, Inc. (ACIM or the advisor).
The other directors (more than three-fourths of the total number) are independent; that is, they have never been employees, directors or officers of, and have no financial interest in, ACC or any of its wholly owned, direct or indirect, subsidiaries, including ACIM, American Century Investment Services, Inc. (ACIS) and American Century Services, LLC (ACS). The directors serve in this capacity for seven (in the case of Mr. Thomas, 15) registered investment companies in the American Century Investments family of funds.
The following presents additional information about the directors. The mailing address for each director is 4500 Main Street, Kansas City, Missouri 64111.
Name (Year of Birth) | Position(s) Held with Funds | Length of Time Served | Principal Occupation(s) During Past 5 Years | Number of American Century Portfolios Overseen by Director | Other Directorships Held During Past 5 Years |
| Independent Directors | |||||
Thomas A. Brown (1940) | Director | Since 1980 | Managing Member, Associate Investments, LLC (real estate investment company); Brown Cascade Properties, LLC (real estate investment company) (2001 to 2009) | 65 | None |
Andrea C. Hall (1945) | Director | Since 1997 | Retired as advisor to the President, Midwest Research Institute (not-for-profit research organization) (June 2006) | 65 | None |
Jan M. Lewis (1957) | Director | Since 2011 | President and Chief Executive Officer, Catholic Charities of Northeast Kansas (human services organization) (2006 to present); President, BUCON, Inc. (full-service design-build construction company) (2004 to 2006) | 65 | None |
James A. Olson (1942) | Director | Since 2007 | Member, Plaza Belmont LLC (private equity fund manager); Chief Financial Officer, Plaza Belmont LLC (September 1999 to September 2006) | 65 | Saia, Inc. and Entertainment Properties Trust |
26
Name (Year of Birth) | Position(s) Held with Funds | Length of Time Served | Principal Occupation(s) During Past 5 Years | Number of American Century Portfolios Overseen by Director | Other Directorships Held During Past 5 Years |
| Independent Directors | |||||
Donald H. Pratt (1937) | Director and Chairman of the Board | Since 1995 (Chairman since 2005) | Chairman and Chief Executive Officer, Western Investments, Inc. (real estate company) | 65 | None |
M. Jeannine Strandjord (1945) | Director | Since 1994 | Retired | 65 | DST Systems Inc., Euronet Worldwide Inc., and Charming Shoppes, Inc. |
John R. Whitten (1946) | Director | Since 2008 | Project Consultant, Celanese Corp. (industrial chemical company) | 65 | Rudolph Technologies, Inc. |
Stephen E. Yates (1948) | Advisory Director | Since 2011 | Retired; Executive Vice President, Technology & Operations, KeyCorp. (computer services) (2004 to 2010) | 65 | Applied Industrial Technology (2001 to 2010) |
| Interested Director | |||||
Jonathan S. Thomas (1963) | Director and President | Since 2007 | President and Chief Executive Officer, ACC (March 2007 to present); Chief Administrative Officer, ACC (February 2006 to February 2007); Executive Vice President, ACC (November 2005 to February 2007). Also serves as: Chief Executive Officer and Manager, ACS; Executive Vice President, ACIM; Director, ACC, ACIM and other ACC subsidiaries | 106 | None |
27
Officers
The following table presents certain information about the executive officers of the funds. Each officer serves as an officer for each of the 15 investment companies in the American Century family of funds, unless otherwise noted. No officer is compensated for his or her service as an officer of the funds. The listed officers are interested persons of the funds and are appointed or re-appointed on an annual basis. The mailing address for each officer listed below is 4500 Main Street, Kansas City, Missouri 64111.
Name (Year of Birth) | Offices with the Funds | Principal Occupation(s) During the Past Five Years |
Jonathan S. Thomas (1963) | Director and President since 2007 | President and Chief Executive Officer, ACC (March 2007 to present); Chief Administrative Officer, ACC (February 2006 to February 2007); Executive Vice President, ACC (November 2005 to February 2007). Also serves as: Chief Executive Officer and Manager, ACS; Executive Vice President, ACIM; Director, ACC, ACIM and other ACC subsidiaries |
Barry Fink (1955) | Executive Vice President since 2007 | Chief Operating Officer and Executive Vice President, ACC (September 2007 to present); President, ACS (October 2007 to present); Managing Director, Morgan Stanley (2000 to 2007); Global General Counsel, Morgan Stanley (2000 to 2006). Also serves as: Manager, ACS and Director, ACC and certain ACC subsidiaries |
Maryanne L. Roepke (1956) | Chief Compliance Officer since 2006 and Senior Vice President since 2000 | Chief Compliance Officer, American Century funds, ACIM and ACS (August 2006 to present); Assistant Treasurer, ACC (January 1995 to August 2006); and Treasurer and Chief Financial Officer, various American Century funds (July 2000 to August 2006). Also serves as: Senior Vice President, ACS |
Charles A. Etherington (1957) | General Counsel since 2007 and Senior Vice President since 2006 | Attorney, ACC (February 1994 to present); Vice President, ACC (November 2005 to present), General Counsel, ACC (March 2007 to present); Also serves as General Counsel, ACIM, ACS, ACIS and other ACC subsidiaries; and Senior Vice President, ACIM and ACS |
Robert J. Leach (1966) | Vice President, Treasurer and Chief Financial Officer since 2006 | Vice President, ACS (February 2000 to present); and Controller, various American Century funds (1997 to September 2006) |
David H. Reinmiller (1963) | Vice President since 2000 | Attorney, ACC (January 1994 to present); Associate General Counsel, ACC (January 2001 to present). Also serves as Vice President, ACIM and ACS |
Ward D. Stauffer (1960) | Secretary since 2005 | Attorney, ACC (June 2003 to present) |
The Statement of Additional Information has additional information about the fund’s directors and is available without charge, upon request, by calling 1-800-345-2021.
28
At a meeting held on June 9, 2011, the Fund’s Board of Directors unanimously approved the renewal of the management agreement pursuant to which American Century Investment Management, Inc. (the “Advisor”) acts as the investment advisor for the Fund. Under Section 15(c) of the Investment Company Act, contracts for investment advisory services are required to be reviewed, evaluated, and approved by a majority of a fund’s independent directors (the “Directors”) each year.
As a part of the approval process, the Board requested and reviewed extensive data and information compiled by the Advisor and certain independent providers of evaluation data concerning the Fund and the services provided to the Fund by the Advisor. This review was in addition to the oversight and evaluation undertaken by the Board and its committees on a continuous basis throughout the year and included, but was not limited to the following:
| • | the nature, extent, and quality of investment management, shareholder services, and other services provided by the Advisor to the Fund; |
| • | the wide range of other programs and services the Advisor provides to the Fund and its shareholders on a routine and non-routine basis; |
| • | the investment performance of the fund, including data comparing the Fund’s performance to appropriate benchmarks and/or a peer group of other mutual funds with similar investment objectives and strategies; |
| • | data comparing the cost of owning the Fund to the cost of owning similar funds; |
| • | the Advisor’s compliance policies, procedures, and regulatory experience; |
| • | financial data showing the cost of services provided to the Fund, the profitability of the Fund to the Advisor, and the overall profitability of the Advisor; |
| • | data comparing services provided and charges to other investment management clients of the Advisor; and |
| • | consideration of collateral benefits derived by the Advisor from the management of the Fund and any potential economies of scale relating thereto. |
In keeping with its practice, the Board held two in-person meetings and one telephonic meeting to review and discuss the information provided. The Directors also had the benefit of the advice of independent counsel throughout the period.
Factors Considered
The Directors considered all of the information provided by the Advisor, the independent data providers, and independent counsel, and evaluated such information for the Fund. In connection with their review, the Directors did not identify any single factor as being all-important or controlling, and each Director may have attributed different levels of importance to different factors. In deciding to renew the management agreement, the Board based its decision on a number of factors, including the following:
29
Nature, Extent and Quality of Services — Generally. Under the management agreement, the Advisor is responsible for providing or arranging for all services necessary for the operation of the Fund. The Board noted that under the management agreement, the Advisor provides or arranges at its own expense a wide variety of services including:
| • | constructing and designing the Fund |
| • | portfolio research and security selection |
| • | initial capitalization/funding |
| • | securities trading |
| • | Fund administration |
| • | custody of Fund assets |
| • | daily valuation of the Fund’s portfolio |
| • | shareholder servicing and transfer agency, including shareholder confirmations, recordkeeping, and communications |
| • | legal services |
| • | regulatory and portfolio compliance |
| • | financial reporting |
| • | marketing and distribution |
The Board noted that many of these services have expanded over time both in terms of quantity and complexity in response to shareholder demands, competition in the industry, changing distribution channels, and the changing regulatory environment.
Investment Management Services. The nature of the investment management services provided to the Fund is quite complex and allows Fund shareholders access to professional money management, instant diversification of their investments within an asset class, the opportunity to easily diversify among asset classes by investing in or exchanging among various American Century Investments funds, and liquidity. In evaluating investment performance, the Board expects the Advisor to manage the Fund in accordance with its investment objectives and approved strategies. Further, the Directors recognize that the Advisor has an obligation to monitor trading activities, and in particular to seek the best execution of fund trades, and to evaluate the use of and payment for research. In providing these services, the Advisor utilizes teams of investment professionals (portfolio managers, analysts, research assistants, and securities traders) who require extensive information technology, research, training, compliance and other systems to conduct their business. The Board, directly and through its Fund Performance Review Committee, regularly reviews investment performance information for the Fund, together with comparative information for appropriate benchmarks and/or peer groups of similarly-managed funds, over different
30
time horizons. The Directors also review detailed performance information during the management agreement approval process. If performance concerns are identified, the Fund receives special reviews until performance improves, during which the Board discusses with the Advisor the reasons for such results (e.g., market conditions, security selection) and any efforts being undertaken to improve performance. Taking all these factors into consideration, the Board found the investment management services provided by the Advisor to the Fund to meet or exceed industry standards. More detailed information about the Fund’s performance can be found in the Performance and Portfolio Commentary sections of this report.
Shareholder and Other Services. Under the management agreement, the Advisor provides the Fund with a comprehensive package of transfer agency, shareholder, and other services. The Board, directly and through various committees of the Board, regularly reviews reports and evaluations of such services at its regular meetings. These reports include, but are not limited to, information regarding the operational efficiency and accuracy of the shareholder and transfer agency services provided, staffing levels, shareholder satisfaction (as measured by external as well as internal sources), technology support, new products and services offered to Fund shareholders, securities trading activities, portfolio valuation services, auditing services, and legal and operational compliance activities. Certain aspects of shareholder and transfer agency service level efficiency and the quality of securities trading activities are measured by independent third party providers and are presented in comparison to other fund groups not managed by the Advisor. The Board found the services provided by the Advisor to the Fund under the management agreement to be competitive and of high quality.
Costs of Services and Profitability. The Advisor provides detailed information concerning its cost of providing various services to the Fund, its profitability in managing the Fund, its overall profitability, and its financial condition. The Directors have reviewed with the Advisor the methodology used to prepare this financial information. The financial information regarding the Advisor is considered in evaluating the Advisor’s financial condition, ability to continue to provide services under the management agreement, and the reasonableness of the current management fee. The Board concluded that the Advisor’s profits were reasonable in light of the services provided to the Fund.
Ethics. The Board generally considers the Advisor’s commitment to providing quality services to shareholders and to conducting its business ethically. They noted that the Advisor’s practices generally meet or exceed industry best practices.
Economies of Scale. The Board also reviewed information provided by the Advisor regarding the possible existence of economies of scale in connection with the management of the Fund. The Board concluded that economies of scale are difficult to measure and predict with precision, especially on a fund-by-fund basis. The Board concluded that the Advisor is appropriately sharing economies of scale through its competitive fee structure, offering competitive fees from fund inception, and through reinvestment in its business to provide shareholders additional content and services.
31
Comparison to Other Funds’ Fees. The management agreement provides that the Fund pay the Advisor a single, all-inclusive (or unified) management fee for providing all services necessary for the management and operation of the Fund, other than brokerage expenses, taxes, interest, extraordinary expenses, and the fees and expenses of the Fund’s independent directors (including their independent legal counsel) and expenses incurred in connection with the provision of shareholder services and distribution services under a plan adopted pursuant to Rule 12b-1 under the 1940 Act. Under the unified fee structure, the Advisor is responsible for providing all investment advisory, custody, audit, administrative, compliance, recordkeeping, marketing and shareholder services, or arranging and supervising third parties to provide such services. By contrast, most other funds are charged a variety of fees, including an investment advisory fee, a transfer agency fee, an administrative fee, distribution charges and other expenses. Other than their investment advisory fees and any applicable Rule 12b-1 distribution fees, all other components of the total fees charged by these other funds may be increased without shareholder approval. The Board believes the unified fee structure is a benefit to Fund shareholders because it clearly discloses to shareholders the cost of owning Fund shares, and, since the unified fee cannot be increased without a vote of Fund shareholders, it shifts to the Advisor the risk of increased costs of operating the Fund and provides a direct incentive to minimize administrative inefficiencies. Part of the Board’s analysis of fee levels involves reviewing certain evaluative data compiled by an independent provider and comparing the Fund’s unified fee to the total expense ratio of other funds in the Fund’s peer group. The Board concluded that the management fee paid by the Fund to the Advisor under the management agreement is reasonable in light of the services provided to the Fund.
Comparison to Fees and Services Provided to Other Clients of the Advisor. The Board also requested and received information from the Advisor concerning the nature of the services, fees, costs and profitability of its advisory services to advisory clients other than the Fund. They observed that these varying types of client accounts require different services and involve different regulatory and entrepreneurial risks than the management of the Fund. The Board analyzed this information and concluded that the fees charged and services provided to the Fund were reasonable by comparison.
Collateral or “Fall-Out” Benefits Derived by the Advisor. The Board considered the existence of collateral benefits the Advisor may receive as a result of its relationship with the Fund. They concluded that the Advisor’s primary business is managing mutual funds and it generally does not use fund or shareholder information to generate profits in other lines of business, and therefore does not derive any significant collateral benefits from them. The Board noted that the Advisor receives proprietary research from broker-dealers that execute fund portfolio transactions and concluded that this research is likely to benefit Fund shareholders. The Board also determined that the Advisor is able to provide investment management services to certain clients other than the Fund, at least in part, due to its existing infrastructure built to serve the fund complex. The Board concluded, however, that the assets of those other clients are not material to the analysis and, where applicable, may be included with the assets of the Fund to determine breakpoints in the management fee schedule.
32
Existing Relationship. The Board also considered whether there was any reason for not continuing the existing arrangement with the Advisor. In this regard, the Board was mindful of the potential disruptions of the Fund’s operations and various risks, uncertainties, and other effects that could occur as a result of a decision not to continue such relationship. In particular, the Board recognized that most shareholders have invested in the Fund on the strength of the Advisor’s industry standing and reputation and in the expectation that the Advisor will have a continuing role in providing advisory services to the Fund.
Conclusion of the Directors. As a result of this process, the Board, including all of the independent directors, taking into account all of the factors discussed above and the information provided by the Advisor and others, concluded that the management agreement between the Fund and the Advisor is fair and reasonable in light of the services provided and should be renewed.
33
Retirement Account Information
As required by law, distributions you receive from certain IRAs, or 403(b), 457 and qualified plans are subject to federal income tax withholding, unless you elect not to have withholding apply. Tax will be withheld on the total amount withdrawn even though you may be receiving amounts that are not subject to withholding, such as nondeductible contributions. In such case, excess amounts of withholding could occur. You may adjust your withholding election so that a greater or lesser amount will be withheld.
If you don’t want us to withhold on this amount, you must notify us to not withhold the federal income tax. You may notify us in writing or in certain situations by telephone or through other electronic means. You have the right to revoke your withholding election at any time and any election you make may remain in effect until revoked by filing a new election.
Remember, even if you elect not to have income tax withheld, you are liable for paying income tax on the taxable portion of your withdrawal. If you elect not to have income tax withheld or you don’t have enough income tax withheld, you may be responsible for payment of estimated tax. You may incur penalties under the estimated tax rules if your withholding and estimated tax payments are not sufficient. You can reduce or defer the income tax on a distribution by directly or indirectly rolling such distribution over to another IRA or eligible plan. You should consult your tax advisor for additional information.
State tax will be withheld if, at the time of your distribution, your address is within one of the mandatory withholding states and you have federal income tax withheld. State taxes will be withheld from your distribution in accordance with the respective state rules.
Proxy Voting Guidelines
American Century Investment Management, Inc., the fund’s investment advisor, is responsible for exercising the voting rights associated with the securities purchased and/or held by the fund. A description of the policies and procedures the advisor uses in fulfilling this responsibility is available without charge, upon request, by calling 1-800-345-2021. It is also available on American Century Investments’ website at americancentury.com and on the Securities and Exchange Commission’s website at sec.gov. Information regarding how the investment advisor voted proxies relating to portfolio securities during the most recent 12-month period ended June 30 is available on the “About Us” page at americancentury.com. It is also available at sec.gov.
Quarterly Portfolio Disclosure
The fund files its complete schedule of portfolio holdings with the Securities and Exchange Commission (SEC) for the first and third quarters of each fiscal year on Form N-Q. The fund’s Forms N-Q are available on the SEC’s website at sec.gov, and may be reviewed and copied at the SEC’s Public Reference Room in Washington, DC. Information on the operation of the Public Reference Room may be obtained by calling 1-800-SEC-0330. The fund also makes its complete schedule of portfolio holdings for the most recent quarter of its fiscal year available on its website at americancentury.com and, upon request, by calling 1-800-345-2021.
34
Other Tax Information
The following information is provided pursuant to provisions of the Internal Revenue Code.
The fund hereby designates up to the maximum amount allowable as qualified dividend income for the fiscal year ended November 30, 2011.
For corporate taxpayers, the fund hereby designates $1,891,774, or up to the maximum amount allowable, of ordinary income distributions paid during the fiscal year ended November 30, 2011 as qualified for the corporate dividends received deduction.
35
36
| Contact Us | americancentury.com |
| Automated Information Line | 1-800-345-8765 |
| Investor Services Representative | 1-800-345-2021 or 816-531-5575 |
| Investors Using Advisors | 1-800-378-9878 |
Business, Not-For-Profit, Employer-Sponsored Retirement Plans | 1-800-345-3533 |
Banks and Trust Companies, Broker-Dealers, Financial Professionals, Insurance Companies | 1-800-345-6488 |
| Telecommunications Device for the Deaf | 1-800-634-4113 |
American Century World Mutual Funds, Inc.
Investment Advisor:
American Century Investment Management, Inc.
Kansas City, Missouri
This report and the statements it contains are submitted for the general information of our shareholders. The report is not authorized for distribution to prospective investors unless preceded or accompanied by an effective prospectus.
©2012 American Century Proprietary Holdings, Inc. All rights reserved.
CL-ANN-74136 1201
ANNUAL REPORT NOVEMBER 30, 2011
| NT Emerging Markets Fund |
| President’s Letter | 2 |
| Independent Chairman’s Letter | 3 |
| Market Perspective | 4 |
| Performance | 5 |
| Portfolio Commentary | 6 |
| Fund Characteristics | 8 |
| Shareholder Fee Example | 9 |
| Schedule of Investments | 11 |
| Statement of Assets and Liabilities | 14 |
| Statement of Operations | 15 |
| Statement of Changes in Net Assets | 16 |
| Notes to Financial Statements | 17 |
| Financial Highlights | 22 |
| Report of Independent Registered Public Accounting Firm | 23 |
| Management | 24 |
| Approval of Management Agreement | 27 |
| Additional Information | 32 |
Any opinions expressed in this report reflect those of the author as of the date of the report, and do not necessarily represent the opinions of American Century Investments® or any other person in the American Century Investments organization. Any such opinions are subject to change at any time based upon market or other conditions and American Century Investments disclaims any responsibility to update such opinions. These opinions may not be relied upon as investment advice and, because investment decisions made by American Century Investments funds are based on numerous factors, may not be relied upon as an indication of trading intent on behalf of any American Century Investments fund. Security examples are used for representational purposes only and are not intended as recommendations to purchase or sell securities. Performance information for comparative indices and securities is provided to American Century Investments by third party vendors. To the best of American Century Investments’ knowledge, such information is accurate at the time of printing.
Dear Investor:
Thank you for reviewing this annual report for the period ended November 30, 2011. Our report offers investment performance and portfolio information, presented with the expert perspective of our portfolio management team.
This report remains one of our most important vehicles for conveying information about fund returns, as well as market factors and strategies that affected fund performance. For additional, updated information, we encourage you to visit our website, americancentury.com. Click on the “Fund Performance” and “Insights & News” headings at the top of our Individual Investors site.
Reporting Period’s Divided Nature Resulted in Mixed Returns
The financial market performance that most U.S. investors experienced during the 12 months ended November 30, 2011 generally reflected the period’s divided nature. For the first six months, confidence in global economic growth, strong corporate earnings, and increased risk-taking generally ruled the markets. The MSCI EAFE Index and the S&P 500 Index advanced approximately 15% for the six months ended May 31, 2011, as stocks broadly outperformed high-quality bonds for that period.
However, the tables reversed sharply for the final six months. The risk-taking tide ebbed during the summer months, constrained by high fuel prices, federal budget management concerns in the U.S., and the worsening sovereign debt crisis in Europe. High-quality bonds, led by long-maturity U.S. Treasury securities, mostly outpaced stocks. The MSCI EAFE Index and the S&P 500 Index returned –16.56% and –6.25%, respectively, during the six months ended November 30, 2011, despite a significant market rebound in October.
As a result of this volatility, returns were mixed for the full 12-month period. U.S. and international bonds and U.S. stocks generally outperformed international stocks. The S&P 500 Index and the MSCI EAFE Index returned 7.83% and –4.12%, respectively, for the fiscal year.
Unfortunately, further volatility appears likely in 2012 as the markets wrestle with uncertainties regarding European debt, economic strength, government budget deficits, and the U.S. presidential election. We believe strongly in adhering to a disciplined, diversified, long-term investment approach during volatile periods, and we appreciate your continued trust in us during these unsettled times.
Sincerely,
Jonathan Thomas
President and Chief Executive Officer
American Century Investments
2
Dear Fellow Shareholders,
The board of directors of the fund was pleased at the announcement of a new strategic partner for the investment advisor to the American Century Investments funds. Canadian Imperial Bank of Commerce (CIBC), a leading Canadian financial institution, purchased the 41 percent economic interest in American Century Companies, the parent corporation of the advisor, previously held by JPMorgan Chase & Co. Based in Toronto, CIBC provides a full range of retail and wholesale banking services to almost 11 million clients through approximately 1,100 branches and offices in Canada, the U.S. and around the world. This transaction will benefit fund shareholders by bolstering the financial strength of the advisor and providing a strategic partner to help support its growth initiative to broaden non-U.S. distribution of its products and services.
The board also has been briefed throughout the year on the impact on fund performance of the European banking crisis, the U.S. deficit reduction debates, and the pace of economic growth. While the performance of all funds has been affected, the majority of American Century Investments funds overseen by the board are exceeding their benchmarks for the one-, three-, five-, and ten-year periods ended September 30, 2011. This is commendable performance, particularly in these challenging market conditions.
We are completing another year of board oversight on your behalf. We appreciate any comments you would like to share with the board. Send them to me at dhpratt@fundboardchair.com. Thank you for your continued investment in American Century Investments funds.
Best regards,
Don Pratt
3
By Mark Kopinski,
Chief Investment Officer, Global and Non-U.S. Equity
Stocks Struggled as Growth Slowed
Global stock markets kicked off the 12-month period in generally robust fashion, no easy feat considering investors had to weigh brightening economic outlooks against mounting inflationary pressures, ongoing sovereign debt concerns, and an onslaught of political unrest and natural disasters. Nevertheless, negative forces—primarily expanding sovereign debt problems in Europe and the United States—gradually tightened their hold on the worldwide economy, and market sentiment began to deteriorate. The downdraft culminated with a sharp global market selloff in the third calendar quarter of 2011, triggered primarily by Standard & Poor’s first-ever downgrade of the United States’ long-term credit rating and mounting fears of a default in Greece. Worried about the potential for another global recession, the International Monetary Fund (IMF) trimmed its global growth outlook for 2012.
Overall, emerging market stocks underperformed developed international markets for the 12-month period, as investors retreated from riskier investments. In addition, falling global growth prospects sparked stock slumps, particularly in export-heavy emerging-market economies of South Korea and China. Economic growth continued to moderate in China, but inflationary pressures continued to build, prompting IMF calls for China to allow its currency to appreciate to temper a surge in inflation.
Outlook Hinges on Fiscal Strategies
The period ended with the United States, Japan and China releasing relatively strong economic data, thereby diminishing concerns for a synchronized global recession. Yet, European Union countries continued to falter. As the eurozone crisis continues, global demand likely will decrease as a function of deleveraging, which should negatively influence export-driven markets. In addition, volatility in the financial markets may remain heightened, as investors react to European reform plans.
Ultimately, we believe the global economy can and will resume a strong growth trend. But to do so, each region and country will have to address its specific fiscal challenges. We believe these are solvable problems, as long as government policy supports the private sector and its role in driving economic output and employment based on the profit incentive.
| International Equity Total Returns | ||||
| For the 12 months ended November 30, 2011 (in U.S. dollars) | ||||
| MSCI EAFE Index | -4.12% | MSCI Europe Index | -2.08% | |
| MSCI EAFE Growth Index | -3.96% | MSCI World Index | 1.46% | |
| MSCI EAFE Value Index | -4.27% | MSCI Japan Index | -8.56% | |
| MSCI Emerging Markets Index | -11.54% | |||
4
| Total Returns as of November 30, 2011 | |||||
| Average Annual Returns | |||||
| Ticker Symbol | 1 year | 5 years | Since Inception | Inception Date | |
| Institutional Class | ACLKX | -12.70% | -0.08% | 1.67% | 5/12/06 |
| MSCI Emerging Markets Growth Index | — | -12.60% | 1.68% | 2.64%(1) | — |
| (1) | Since 4/30/06, the date nearest the Institutional Class’s inception for which data are available. |
| Growth of $10,000 Over Life of Class |
| $10,000 investment made May 12, 2006 |
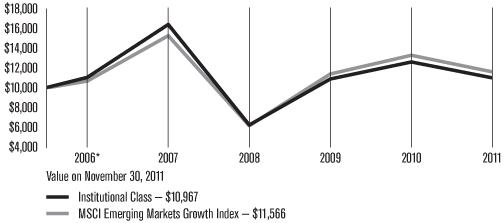
* From 5/12/06, the Institutional Class’s inception date. Index data from 4/30/06, the date nearest the fund’s inception for which data are available. Not annualized.
| Total Annual Fund Operating Expenses |
Institutional Class 1.52% |
The total annual fund operating expenses shown is as stated in the fund’s prospectus current as of the date of this report. The prospectus may vary from the expense ratio shown elsewhere in this report because it is based on a different time period, includes acquired fund fees and expenses, and, if applicable, does not include fee waivers or expense reimbursements.
Data presented reflect past performance. Past performance is no guarantee of future results. Current performance may be higher or lower than the performance shown. Investment return and principal value will fluctuate, and redemption value may be more or less than original cost. To obtain performance data current to the most recent month end, please call 1-800-345-2021 or visit americancentury.com. International investing involves special risks, such as political instability and currency fluctuations. Investing in emerging markets may accentuate these risks.
Data assumes reinvestment of dividends and capital gains, and none of the charts reflect the deduction of taxes that a shareholder would pay on fund distributions or the redemption of fund shares. Returns for the index are provided for comparison. The fund’s total returns include operating expenses (such as transaction costs and management fees) that reduce returns, while the total returns of the index do not.
5
Portfolio Managers: Patricia Ribeiro and Anthony Han
Performance Summary
NT Emerging Markets declined -12.70% for the 12 months ended November 30, 2011, compared with its benchmark, the MSCI Emerging Markets Growth Index, which declined -12.60%.
Global stocks generally struggled during the 12-month period, as investors grappled with the ongoing and expanding sovereign debt problems in several developed nations. Mounting inflationary pressures in China and other emerging markets, combined with fears that a global economic slowdown would stifle demand for their goods, drove down stocks in the developing world. Emerging market stocks sharply underperformed their developed market counterparts.
The portfolio narrowly underperformed its benchmark for the period, with stock selection in the consumer discretionary, financials, and utilities sectors slightly offsetting favorable stock selection in the industrials and information technology sectors.
India was Leading Detractor
Weak stock selection hurt relative performance in India, which was the portfolio’s largest performance detractor on a regional basis. A portfolio-only position in ICICI Bank, the nation’s largest private lender, was among the top individual detractors. An aggressive rate-tightening policy by the central bank (13 rate increases since March 2010) to tame inflation pushed interest rates in India to their highest level since the global financial crisis in 2008. Despite relatively healthy performance from the bank, including better-than-expected profitability in the second quarter, investors worried that higher rates would stifle loan demand and trigger defaults. In addition, ratings agency Moody’s Investor Service downgraded its outlook for India’s banking system, due to concerns about slowing growth in India and overseas hurting asset quality, capitalization, and profitability.
Another prominent detractor included India-based drug company Aurobindo Pharma, a portfolio-only holding that plummeted after the U.S. Food and Drug Administration banned the import of drugs produced at one of the company’s manufacturing plants. The facility primarily produces a series of antibiotics known as cephalosporins. The stock recovered somewhat after U.S. drug giant Pfizer agreed to market some of Aurobindo Pharma’s products in the United States and Europe.
Other leading detractors from a regional perspective included South Africa, where stock selection dragged down results, and Malaysia, where an underweight and stock selection were negative influences.
South Korea was Top Contributor
In terms of the portfolio’s favorable regional exposure, South Korea led all contributors for the 12-month period, as the nation’s stock market fared much better than the broad emerging markets index. In fact, four of the portfolio’s top
6
10 individual contributors were South Korea-based stocks, including Hyundai Glovis Co., which drove performance in the portfolio’s industrials sector. The global transportation and logistics affiliate of Hyundai Motor Co., also a top contributor to portfolio performance, advanced strongly after reporting a 92% increase in second-quarter net income. Hyundai Motor posted sales and market share gains in key markets, as the March 2011 earthquake and tsunami forced its leading Japanese competitors to cut near-term production forecasts. Moreover, as demand steadily climbed, the automaker ramped up near-term production plans.
Russia also was among the portfolio’s top-performing countries, driven by strong stock selection, including an overweight position in natural gas producer NovaTek OAO, which was the portfolio’s top individual contributor for the period. In May 2011, the company reported a 69% increase in its year-over-year first-quarter net profits and better-than-expected revenue gains, along with rising hydrocarbon prices and sales. In addition, NovaTek said it had successfully integrated its recently acquired new assets into the company’s operations, including Sibneftegaz, the holder of licenses to develop gas fields in the Arctic.
Outlook
We believe good opportunities exist in several emerging markets, and we will continue to focus on companies with the potential for better structural growth, rather than companies with greater sensitivity to economic data. We believe the impact of demand from consumers in the emerging markets should be a positive force for consumption growth from the expanding wealthy class in these markets.
7
| NOVEMBER 30, 2011 | |
| Top Ten Holdings | % of net assets |
| Samsung Electronics Co. Ltd. | 4.2% |
| Vale SA Preference Shares | 4.0% |
| Taiwan Semiconductor Manufacturing Co. Ltd. | 3.0% |
| Sberbank of Russia | 2.9% |
| NovaTek OAO GDR | 2.7% |
| Cia de Bebidas das Americas Preference Shares ADR | 2.4% |
| Hon Hai Precision Industry Co. Ltd. | 2.2% |
| Itau Unibanco Holding SA Preference Shares | 1.9% |
| Hyundai Glovis Co. Ltd. | 1.9% |
| Kia Motors Corp. | 1.8% |
| Types of Investments in Portfolio | % of net assets |
| Foreign Common Stocks | 98.6% |
| Temporary Cash Investments | 2.1% |
| Other Assets and Liabilities | (0.7)% |
| Investments by Country | % of net assets |
| South Korea | 15.7% |
| Brazil | 13.8% |
| People’s Republic of China | 11.4% |
| Russian Federation | 7.9% |
| Taiwan (Republic of China) | 7.7% |
| South Africa | 7.5% |
| Hong Kong | 5.9% |
| Mexico | 5.6% |
| Indonesia | 5.3% |
| Thailand | 4.0% |
| Turkey | 3.3% |
| India | 3.1% |
| United Kingdom | 2.3% |
| Other Countries | 5.1% |
| Cash and Equivalents* | 1.4% |
| *Includes temporary cash investments and other assets and liabilities. | |
8
Fund shareholders may incur two types of costs: (1) transaction costs, including sales charges (loads) on purchase payments and redemption/exchange fees; and (2) ongoing costs, including management fees; distribution and service (12b-1) fees; and other fund expenses. This example is intended to help you understand your ongoing costs (in dollars) of investing in your fund and to compare these costs with the ongoing cost of investing in other mutual funds.
The example is based on an investment of $1,000 made at the beginning of the period and held for the entire period from June 1, 2011 to November 30, 2011.
Actual Expenses
The table provides information about actual account values and actual expenses for each class. You may use the information, together with the amount you invested, to estimate the expenses that you paid over the period. First, identify the share class you own. Then simply divide your account value by $1,000 (for example, an $8,600 account value divided by $1,000 = 8.6), then multiply the result by the number under the heading “Expenses Paid During Period” to estimate the expenses you paid on your account during this period.
If you hold Investor Class shares of any American Century Investments fund, or Institutional Class shares of the American Century Diversified Bond Fund, in an American Century Investments account (i.e., not a financial intermediary or retirement plan account), American Century Investments may charge you a $12.50 semiannual account maintenance fee if the value of those shares is less than $10,000. We will redeem shares automatically in one of your accounts to pay the $12.50 fee. In determining your total eligible investment amount, we will include your investments in all personal accounts (including American Century Investments Brokerage accounts) registered under your Social Security number. Personal accounts include individual accounts, joint accounts, UGMA/UTMA accounts, personal trusts, Coverdell Education Savings Accounts and IRAs (including traditional, Roth, Rollover, SEP-, SARSEP- and SIMPLE-IRAs), and certain other retirement accounts. If you have only business, business retirement, employer-sponsored or American Century Investments Brokerage accounts, you are currently not subject to this fee. We will not charge the fee as long as you choose to manage your accounts exclusively online. If you are subject to the Account Maintenance Fee, your account value could be reduced by the fee amount.
Hypothetical Example for Comparison Purposes
The table also provides information about hypothetical account values and hypothetical expenses based on the actual expense ratio of each class of your fund and an assumed rate of return of 5% per year before expenses, which is not the actual return of a fund’s share class. The hypothetical account values and expenses may not be used to estimate the actual ending account balance or expenses you paid for the period. You may use this information to compare the ongoing costs of investing in your fund and other funds. To do so, compare this 5% hypothetical example with the 5% hypothetical examples that appear in the shareholder reports of the other funds.
9
Please note that the expenses shown in the table are meant to highlight your ongoing costs only and do not reflect any transactional costs, such as sales charges (loads) or redemption/exchange fees. Therefore, the table is useful in comparing ongoing costs only, and will not help you determine the relative total costs of owning different funds. In addition, if these transactional costs were included, your costs would have been higher.
Beginning Account Value 6/1/11 | Ending Account Value 11/30/11 | Expenses Paid During Period(1) 6/1/11 - 11/30/11 | Annualized Expense Ratio(1) | |
| Actual | ||||
| Institutional Class | $1,000 | $797.50 | $6.94 | 1.54% |
| Hypothetical | ||||
| Institutional Class | $1,000 | $1,017.35 | $7.79 | 1.54% |
| (1) | Expenses are equal to the class’s annualized expense ratio listed in the table above, multiplied by the average account value over the period, multiplied by 183, the number of days in the most recent fiscal half-year, divided by 365, to reflect the one-half year period. |
10
NOVEMBER 30, 2011
| Shares | Value | |
| Common Stocks — 98.6% | ||
| BRAZIL — 13.8% | ||
| BR Malls Participacoes SA | 206,000 | $2,085,802 |
| Cia de Bebidas das Americas Preference Shares ADR | 82,532 | 2,837,450 |
| Cia Hering | 69,300 | 1,467,741 |
| Itau Unibanco Holding SA Preference Shares | 131,500 | 2,319,711 |
| PDG Realty SA Empreendimentos e Participacoes | 257,000 | 955,036 |
| Tim Participacoes SA ADR | 37,154 | 884,637 |
| Ultrapar Participacoes SA | 66,400 | 1,168,385 |
| Vale SA Preference Shares | 221,000 | 4,769,890 |
| 16,488,652 | ||
| CHILE — 1.5% | ||
| ENTEL Chile SA | 51,648 | 1,046,682 |
| SACI Falabella | 86,553 | 721,765 |
| 1,768,447 | ||
| HONG KONG — 5.9% | ||
Brilliance China Automotive Holdings Ltd.(1) | 1,030,000 | 1,208,022 |
| China Overseas Land & Investment Ltd. | 604,000 | 1,064,847 |
| China Unicom Ltd. | 788,000 | 1,697,201 |
| CNOOC Ltd. | 1,058,000 | 2,040,628 |
| Comba Telecom Systems Holdings Ltd. | 629,800 | 572,976 |
| GOME Electrical Appliances Holding Ltd. | 1,725,000 | 447,440 |
| 7,031,114 | ||
| INDIA — 3.1% | ||
| HDFC Bank Ltd. | 168,337 | 1,447,182 |
| ICICI Bank Ltd. | 24,676 | 345,786 |
Jubilant Foodworks Ltd.(1) | 65,863 | 998,136 |
| Tata Motors Ltd. | 283,221 | 972,931 |
| 3,764,035 | ||
| INDONESIA — 5.3% | ||
| PT Astra International Tbk | 205,500 | 1,652,146 |
| PT Bank Rakyat Indonesia (Persero) Tbk | 2,422,000 | 1,793,248 |
| PT Charoen Pokphand Indonesia Tbk | 3,342,500 | 879,627 |
| PT Indofood CBP Sukses Makmur Tbk | 1,103,500 | 639,844 |
| PT Semen Gresik (Persero) Tbk | 1,280,000 | 1,345,175 |
| 6,310,040 | ||
| MALAYSIA — 0.7% | ||
| CIMB Group Holdings Bhd | 371,300 | 855,297 |
| MEXICO — 5.6% | ||
| Alfa SAB de CV, Series A | 136,813 | 1,605,044 |
| America Movil SAB de CV Series L ADR | 43,888 | 1,045,412 |
| Fomento Economico Mexicano SAB de CV ADR | 22,297 | 1,520,878 |
| Mexichem SAB de CV | 260,269 | 910,462 |
| Wal-Mart de Mexico SAB de CV | 607,938 | 1,636,238 |
| 6,718,034 | ||
| PEOPLE’S REPUBLIC OF CHINA — 11.4% | ||
51job, Inc. ADR(1) | 24,409 | 1,107,925 |
| Agricultural Bank of China Ltd. H Shares | 1,103,000 | 474,171 |
Baidu, Inc. ADR(1) | 13,254 | 1,736,141 |
| China BlueChemical Ltd. H Shares | 1,356,000 | 1,092,743 |
| China Oilfield Services Ltd. H Shares | 420,000 | 652,017 |
Focus Media Holding Ltd. ADR(1) | 99,272 | 1,838,517 |
| Golden Eagle Retail Group Ltd. | 269,000 | 621,764 |
| Industrial & Commercial Bank of China Ltd. H Shares | 1,749,095 | 1,037,308 |
| Ping An Insurance Group Co. H Shares | 272,000 | 1,888,328 |
| Sany Heavy Equipment International Holdings Co. Ltd. | 748,500 | 729,541 |
| Tencent Holdings Ltd. | 59,500 | 1,162,202 |
| ZTE Corp. H Shares | 428,960 | 1,308,792 |
| 13,649,449 | ||
| PERU — 1.6% | ||
| Credicorp Ltd. | 17,831 | 1,936,803 |
| POLAND — 0.5% | ||
| Powszechna Kasa Oszczednosci Bank Polski SA | 65,423 | 657,402 |
| RUSSIAN FEDERATION — 7.9% | ||
| Magnit OJSC GDR | 47,026 | 1,045,034 |
Mail.ru Group Ltd. GDR(1) | 31,927 | 985,746 |
| Mobile Telesystems OJSC ADR | 36,853 | 636,820 |
| NovaTek OAO GDR | 20,904 | 3,213,785 |
| Sberbank of Russia | 1,219,229 | 3,522,909 |
| 9,404,294 | ||
11
| Shares | Value |
| SOUTH AFRICA — 7.5% | ||
| Barloworld Ltd. | 74,971 | $670,826 |
| Clicks Group Ltd. | 182,792 | 1,005,696 |
| Exxaro Resources Ltd. | 86,450 | 1,926,330 |
| Mr Price Group Ltd. | 142,857 | 1,412,813 |
| MTN Group Ltd. | 74,146 | 1,334,031 |
| Naspers Ltd. N Shares | 14,883 | 672,254 |
| Sasol Ltd. | 39,743 | 1,910,738 |
| 8,932,688 | ||
| SOUTH KOREA — 15.7% | ||
Asia Pacific Systems, Inc.(1) | 26,479 | 348,853 |
| Celltrion, Inc. | 18,863 | 626,148 |
| Hyundai Glovis Co. Ltd. | 11,184 | 2,236,033 |
| Hyundai Heavy Industries Co. Ltd. | 3,185 | 803,101 |
| Hyundai Motor Co. | 1,858 | 360,166 |
| Hyundai Steel Co. | 5,818 | 514,581 |
| Kia Motors Corp. | 34,479 | 2,187,468 |
| LG Chem Ltd. | 3,744 | 1,111,693 |
| LG Household & Health Care Ltd. | 4,400 | 2,070,458 |
| Mando Corp. | 7,630 | 1,388,613 |
| NCSoft Corp. | 7,668 | 2,087,832 |
| Samsung Electronics Co. Ltd. | 5,564 | 5,051,379 |
| 18,786,325 | ||
| SWITZERLAND — 0.8% | ||
| Ferrexpo plc | 212,051 | 1,006,906 |
| TAIWAN (REPUBLIC OF CHINA) — 7.7% | ||
| Catcher Technology Co. Ltd. | 299,145 | 1,460,791 |
| E Ink Holdings, Inc. | 321,000 | 592,588 |
| Hiwin Technologies Corp. | 77,016 | 634,035 |
| Hon Hai Precision Industry Co. Ltd. | 960,553 | 2,607,439 |
| Taiwan Semiconductor Manufacturing Co. Ltd. | 1,416,774 | 3,567,812 |
TPK Holding Co. Ltd.(1) | 26,400 | 360,788 |
| 9,223,453 | ||
| THAILAND — 4.0% | ||
| Advanced Info Service PCL | 123,500 | 564,077 |
| Banpu PCL | 76,200 | 1,375,785 |
| CP ALL PCL | 683,400 | 1,117,252 |
| Kasikornbank PCL NVDR | 288,000 | 1,108,070 |
| Siam Cement PCL NVDR | 56,100 | 581,071 |
| 4,746,255 | ||
| TURKEY — 3.3% | ||
| BIM Birlesik Magazalar AS | 45,010 | 1,277,529 |
| Koza Altin Isletmeleri AS | 53,093 | 799,037 |
| Turkiye Garanti Bankasi AS | 299,249 | 1,026,907 |
| Turkiye Sise ve Cam Fabrikalari AS | 479,281 | 812,519 |
| 3,915,992 | ||
| UNITED KINGDOM — 2.3% | ||
| Antofagasta plc | 47,950 | 898,047 |
| Petrofac Ltd. | 35,637 | 814,655 |
| Tullow Oil plc | 50,589 | 1,105,378 |
| 2,818,080 | ||
TOTAL COMMON STOCKS (Cost $106,140,529) | 118,013,266 | |
| Temporary Cash Investments — 2.1% | ||
Repurchase Agreement, Bank America Merrill Lynch, (collateralized by various U.S. Treasury obligations, 3.50%, 5/15/20, valued at $858,467), in a joint trading account at 0.06%, dated 11/30/11, due 12/1/11 (Delivery value $844,916) | 844,915 | |
Repurchase Agreement, Credit Suisse First Boston, Inc., (collateralized by various U.S. Treasury obligations, 5.00%, 5/15/37, valued at $860,447), in a joint trading account at 0.05%, dated 11/30/11, due 12/1/11 (Delivery value $844,916) | 844,915 | |
Repurchase Agreement, Goldman Sachs & Co., (collateralized by various U.S. Treasury obligations, 4.375%, 2/15/38, valued at $794,468), in a joint trading account at 0.04%, dated 11/30/11, due 12/1/11 (Delivery value $777,716) | 777,715 | |
| SSgA U.S. Government Money Market Fund | 31,790 | 31,790 |
TOTAL TEMPORARY CASH INVESTMENTS (Cost $2,499,335) | 2,499,335 | |
TOTAL INVESTMENT SECURITIES — 100.7% (Cost $108,639,864) | 120,512,601 | |
| OTHER ASSETS AND LIABILITIES — (0.7)% | (831,077) | |
| TOTAL NET ASSETS — 100.0% | $119,681,524 | |
12
| Market Sector Diversification | |
| (as a % of net assets) | |
| Information Technology | 18.4% |
| Financials | 18.0% |
| Consumer Discretionary | 15.6% |
| Materials | 12.3% |
| Consumer Staples | 11.0% |
| Energy | 10.3% |
| Industrials | 6.5% |
| Telecommunication Services | 6.0% |
| Health Care | 0.5% |
| Cash and Equivalents* | 1.4% |
*Includes temporary cash investments and other assets and liabilities.
Notes to Schedule of Investments
| ADR = American Depositary Receipt |
| GDR = Global Depositary Receipt |
| NVDR = Non-Voting Depositary Receipt |
| OJSC = Open Joint Stock Company |
| (1) Non-income producing. |
See Notes to Financial Statements.
13
| NOVEMBER 30, 2011 | ||||
| Assets | ||||
| Investment securities, at value (cost of $108,639,864) | $120,512,601 | |||
| Foreign currency holdings, at value (cost of $71,612) | 71,833 | |||
| Receivable for investments sold | 1,649,869 | |||
| Receivable for capital shares sold | 37,422 | |||
| Dividends and interest receivable | 21,592 | |||
| Other assets | 17,268 | |||
| 122,310,585 | ||||
| Liabilities | ||||
| Payable for investments purchased | 2,477,936 | |||
| Accrued management fees | 151,125 | |||
| 2,629,061 | ||||
| Net Assets | $119,681,524 | |||
| Institutional Class Capital Shares, $0.01 Par Value | ||||
| Shares authorized | 100,000,000 | |||
| Shares outstanding | 13,384,112 | |||
| Net Asset Value Per Share | $8.94 | |||
| Net Assets Consist of: | ||||
| Capital (par value and paid-in surplus) | $113,577,402 | |||
| Undistributed net investment income | 125,579 | |||
| Accumulated net realized loss | (5,890,329 | ) | ||
| Net unrealized appreciation | 11,868,872 | |||
| $119,681,524 | ||||
See Notes to Financial Statements.
14
| YEAR ENDED NOVEMBER 30, 2011 | ||||
| Investment Income (Loss) | ||||
| Income: | ||||
| Dividends (net of foreign taxes withheld of $161,318) | $2,107,789 | |||
| Interest | 670 | |||
| 2,108,459 | ||||
| Expenses: | ||||
| Management fees | 1,688,382 | |||
| Directors’ fees and expenses | 4,594 | |||
| Other expenses | 1,190 | |||
| 1,694,166 | ||||
| Net investment income (loss) | 414,293 | |||
| Realized and Unrealized Gain (Loss) | ||||
| Net realized gain (loss) on: | ||||
| Investment transactions (net of foreign tax expenses paid (refunded) of $(14,380)) | (2,553,912 | ) | ||
| Foreign currency transactions (net of foreign tax expenses paid (refunded) of $194,520) | (283,876 | ) | ||
| (2,837,788 | ) | |||
| Change in net unrealized appreciation (depreciation) on: | ||||
| Investments (net of deferred foreign tax of $(152,342)) | (12,471,630 | ) | ||
| Translation of assets and liabilities in foreign currencies | (3,989 | ) | ||
| (12,475,619 | ) | |||
| Net realized and unrealized gain (loss) | (15,313,407 | ) | ||
| Net Increase (Decrease) in Net Assets Resulting from Operations | $(14,899,114 | ) | ||
See Notes to Financial Statements.
15
| YEARS ENDED NOVEMBER 30, 2011 AND NOVEMBER 30, 2010 | |||||||
| Increase (Decrease) in Net Assets | November 30, 2011 | November 30, 2010 | |||||
| Operations | |||||||
| Net investment income (loss) | $414,293 | $140,792 | |||||
| Net realized gain (loss) | (2,837,788 | ) | 5,992,671 | ||||
| Change in net unrealized appreciation (depreciation) | (12,475,619 | ) | 6,356,851 | ||||
| Net increase (decrease) in net assets resulting from operations | (14,899,114 | ) | 12,490,314 | ||||
| Distributions to Shareholders | |||||||
| From net investment income | — | (94,843 | ) | ||||
| Capital Share Transactions | |||||||
| Proceeds from shares sold | 47,150,673 | 26,050,487 | |||||
| Payments for shares redeemed | (3,679,600 | ) | (7,646,938 | ) | |||
| Net increase (decrease) in net assets from capital share transactions | 43,471,073 | 18,403,549 | |||||
| Net increase (decrease) in net assets | 28,571,959 | 30,799,020 | |||||
| Net Assets | |||||||
| Beginning of period | 91,109,565 | 60,310,545 | |||||
| End of period | $119,681,524 | $91,109,565 | |||||
| Accumulated undistributed net investment income (loss) | $125,579 | $(19,219 | ) | ||||
| Transactions in Shares of the Fund | |||||||
| Sold | 4,848,404 | 2,902,783 | |||||
| Redeemed | (360,351 | ) | (810,053 | ) | |||
| Net increase (decrease) in shares of the fund | 4,488,053 | 2,092,730 | |||||
See Notes to Financial Statements.
16
NOVEMBER 30, 2011
1. Organization
American Century World Mutual Funds, Inc. (the corporation) is registered under the Investment Company Act of 1940, as amended (the 1940 Act), as an open-end management investment company and is organized as a Maryland corporation. NT Emerging Markets Fund (the fund) is one fund in a series issued by the corporation. The fund is diversified as defined under the 1940 Act. The fund’s investment objective is to seek capital growth. The fund pursues its objective by investing at least 80% of its assets in equity securities of companies located in emerging market countries. The fund is not permitted to invest in any securities issued by companies assigned by the Global Industry Classification Standard to the tobacco industry.
2. Significant Accounting Policies
The following is a summary of significant accounting policies consistently followed by the fund in preparation of its financial statements. The financial statements are prepared in conformity with accounting principles generally accepted in the United States of America, which may require management to make certain estimates and assumptions at the date of the financial statements. Actual results could differ from these estimates.
Investment Valuations — The fund determines the fair value of its investments and computes its net asset value per share as of the close of regular trading (usually 4 p.m. Eastern time) on the New York Stock Exchange (NYSE) on each day the NYSE is open.
Equity securities that are listed or traded on a domestic securities exchange are valued at the last reported sales price or at the official closing price as provided by the exchange. Equity securities traded on foreign securities exchanges are typically valued at the closing price on the exchange where primarily traded or as of the close of the NYSE, if that is earlier. If no last sales price is reported, or if local convention or regulation so provides, the mean of the latest bid and asked prices is used. Depending on local convention or regulation, securities traded over-the-counter are valued at the mean of the latest bid and asked prices, the last sales price, or the official closing price. In its determination of fair value, the fund may review several factors including: market information specific to a security; news developments in U.S. and foreign markets; the performance of particular U.S. and foreign securities, indices, comparable securities, American Depositary Receipts, Exchange-Traded Funds, and other relevant market indicators.
Debt securities maturing within 60 days at the time of purchase may be valued at cost, plus or minus any amortized discount or premium or at the evaluated mean as provided by an independent pricing service. Evaluated mean prices are commonly derived through utilization of market models, which may consider, among other factors, trade data, quotations from dealers and active market makers, relevant yield curve and spread data, related sector levels, creditworthiness, and other relevant market information on the same or comparable securities.
Investments in open-end management investment companies are valued at the reported net asset value per share. Repurchase agreements are valued at cost.
The value of investments initially expressed in foreign currencies is translated into U.S. dollars at prevailing exchange rates.
If the fund determines that the market price for a portfolio security is not readily available or the valuation methods mentioned above do not reflect a security’s fair value, such security is valued as determined in good faith by the Board of Directors or its designee, in accordance with procedures adopted by the Board of Directors. Circumstances that may cause the fund to use these procedures to value a security include, but are not limited to: a security has been declared in default; trading in a security has been halted during the trading day; there is a foreign market holiday and no trading occurred; or an event occurred between the close of a foreign exchange and the NYSE that may affect the value of a security.
17
Security Transactions — Security transactions are accounted for as of the trade date. Net realized gains and losses are determined on the identified cost basis, which is also used for federal income tax purposes. Certain countries impose taxes on realized gains on the sale of securities registered in their country. The fund records the foreign tax expense, if any, on an accrual basis. The foreign tax expense on realized gains and unrealized appreciation reduces the net realized gain (loss) on investment transactions and net unrealized appreciation (depreciation) on investments, respectively.
Investment Income — Dividend income less foreign taxes withheld, if any, is recorded as of the ex-dividend date. Interest income is recorded on the accrual basis and includes accretion of discounts and amortization of premiums.
Foreign Currency Translations — All assets and liabilities initially expressed in foreign currencies are translated into U.S. dollars at prevailing exchange rates at period end. The fund may enter into spot foreign currency exchange contracts to facilitate transactions denominated in a foreign currency. Purchases and sales of investment securities, dividend and interest income, spot foreign currency exchange contracts, and expenses are translated at the rates of exchange prevailing on the respective dates of such transactions. Net realized and unrealized foreign currency exchange gains or losses related to investment securities are a component of net realized gain (loss) on investment transactions and change in net unrealized appreciation (depreciation) on investments, respectively. Certain countries impose taxes on the contract amount of purchases and sales of foreign currency contracts in their currency. The fund records the foreign tax expense, if any, as a reduction to the net realized gain (loss) on foreign currency transactions.
Repurchase Agreements — The fund may enter into repurchase agreements with institutions that American Century Investment Management, Inc. (ACIM) (the investment advisor) has determined are creditworthy pursuant to criteria adopted by the Board of Directors. The fund requires that the collateral, represented by securities, received in a repurchase transaction be transferred to the custodian in a manner sufficient to enable the fund to obtain those securities in the event of a default under the repurchase agreement. ACIM monitors, on a daily basis, the securities transferred to ensure the value, including accrued interest, of the securities under each repurchase agreement is equal to or greater than amounts owed to the fund under each repurchase agreement.
Joint Trading Account — Pursuant to an Exemptive Order issued by the Securities and Exchange Commission, the fund, along with certain other funds in the American Century Investments family of funds, may transfer uninvested cash balances into a joint trading account. These balances are invested in one or more repurchase agreements that are collateralized by U.S. Treasury or Agency obligations.
Income Tax Status — It is the fund’s policy to distribute substantially all net investment income and net realized gains to shareholders and to otherwise qualify as a regulated investment company under provisions of the Internal Revenue Code. The fund is no longer subject to examination by tax authorities for years prior to 2008. Additionally, non-U.S. tax returns filed by the fund due to investments in certain foreign securities remain subject to examination by the relevant taxing authority for seven years from the date of filing. At this time, management believes there are no uncertain tax positions which, based on their technical merit, would not be sustained upon examination and for which it is reasonably possible that the total amounts of unrecognized tax benefits will significantly change in the next twelve months. Accordingly, no provision has been made for federal or state income taxes.
Distributions to Shareholders — Distributions from net investment income and net realized gains, if any, are generally declared and paid annually. The fund may make distributions on a more frequent basis to comply with the distribution requirements of the Internal Revenue Code, in all events in a manner consistent with provisions of the 1940 Act.
Indemnifications — Under the corporation’s organizational documents, its officers and directors are indemnified against certain liabilities arising out of the performance of their duties to the fund. In addition, in the normal course of business, the fund enters into contracts that provide general indemnifications. The maximum exposure under these arrangements is unknown as this would involve future claims that may be made against a fund. The risk of material loss from such claims is considered by management to be remote.
18
3. Fees and Transactions with Related Parties
Management Fees — The corporation has entered into a management agreement with ACIM, under which ACIM provides the fund with investment advisory and management services in exchange for a single, unified management fee (the fee). The agreement provides that all expenses of managing and operating the fund, except distribution and service fees, brokerage expenses, taxes, interest, fees and expenses of the independent directors (including legal counsel fees), and extraordinary expenses, will be paid by ACIM. The fee is computed and accrued daily based on the daily net assets of the fund and paid monthly in arrears. The rate of the fee is determined by applying a fee rate calculation formula. This formula takes into account the fund’s assets as well as certain assets, if any, of other clients of the investment advisor outside the American Century Investments family of funds (such as subadvised funds and separate accounts) that have very similar investment teams and investment strategies (strategy assets). The strategy assets of the fund include the assets of Emerging Markets Fund, one fund in a series issued by the corporation. The annual management fee schedule ranges from 1.05% to 1.65%. The effective annual management fee for the year ended November 30, 2011 was 1.51%.
Related Parties — Certain officers and directors of the corporation are also officers and/or directors of American Century Companies, Inc. (ACC), the parent of the corporation’s investment advisor, ACIM, the distributor of the corporation, American Century Investment Services, Inc., and the corporation’s transfer agent, American Century Services, LLC. The fund is wholly owned, in aggregate, by various funds in a series issued by American Century Asset Association Portfolios, Inc. (ACAAP). ACAAP does not invest in the fund for the purpose of exercising management or control.
The fund was eligible to invest in a money market fund for temporary purposes, which is managed by J.P. Morgan Investment Management, Inc. (JPMIM). The fund had a securities lending agreement with JPMorgan Chase Bank (JPMCB) and a mutual funds services agreement with J.P. Morgan Investor Services Co. (JPMIS). JPMCB was a custodian of the fund. JPMIM, JPMIS and JPMCB are wholly owned subsidiaries of JPMorgan Chase & Co. (JPM). Prior to August 31, 2011, JPM was an equity investor in ACC. The services provided to the fund by JPMIM, JPMIS and JPMCB terminated on July 31, 2011.
4. Investment Transactions
Purchases and sales of investment securities, excluding short-term investments, for the year ended November 30, 2011 were $138,881,995 and $95,747,575, respectively.
5. Fair Value Measurements
The fund’s securities valuation process is based on several considerations and may use multiple inputs to determine the fair value of the positions held by the fund. In conformity with accounting principles generally accepted in the United States of America, the inputs used to determine a valuation are classified into three broad levels as follows:
| • | Level 1 valuation inputs consist of unadjusted quoted prices in an active market for identical securities; |
| • | Level 2 valuation inputs consist of direct or indirect observable market data (including quoted prices for similar securities, evaluations of subsequent market events, interest rates, prepayment speeds, credit risk, etc.); or |
| • | Level 3 valuation inputs consist of unobservable data (including a fund’s own assumptions). |
The level classification is based on the lowest level input that is significant to the fair valuation measurement. The valuation inputs are not necessarily an indication of the risks associated with investing in these securities or other financial instruments.
19
The following is a summary of the level classifications as of period end. The Schedule of Investments provides additional information on the fund’s portfolio holdings.
| Level 1 | Level 2 | Level 3 | ||||||||||
| Investment Securities | ||||||||||||
| Foreign Common Stocks | $13,544,583 | $104,468,683 | — | |||||||||
| Temporary Cash Investments | 31,790 | 2,467,545 | — | |||||||||
| Total Value of Investment Securities | $13,576,373 | $106,936,228 | — | |||||||||
6. Risk Factors
There are certain risks involved in investing in foreign securities. These risks include those resulting from future adverse political, social and economic developments, fluctuations in currency exchange rates, the possible imposition of exchange controls, and other foreign laws or restrictions. Investing in emerging markets may accentuate these risks.
7. Federal Tax Information
The tax character of distributions paid during the years ended November 30, 2011 and November 30, 2010 were as follows:
| 2011 | 2010 | |||||||
| Distributions Paid From | ||||||||
| Ordinary income | — | $94,843 | ||||||
| Long-term capital gains | — | — | ||||||
The book-basis character of distributions made during the year from net investment income or net realized gains may differ from their ultimate characterization for federal income tax purposes. These differences reflect the differing character of certain income items and net realized gains and losses for financial statement and tax purposes, and may result in reclassification among certain capital accounts on the financial statements.
As of November 30, 2011, the federal tax cost of investments and the components of distributable earnings on a tax-basis were as follows:
| Federal tax cost of investments | $110,195,798 | |||
| Gross tax appreciation of investments | $14,814,511 | |||
| Gross tax depreciation of investments | (4,497,708 | ) | ||
| Net tax appreciation (depreciation) of investments | $10,316,803 | |||
Net tax appreciation (depreciation) on translation of assets and liabilities in foreign currencies | $4,714 | |||
| Net tax appreciation (depreciation) | $10,321,517 | |||
| Undistributed ordinary income | $117,000 | |||
| Accumulated capital losses | $(1,146,451 | ) | ||
| Capital loss deferral | $(3,187,944 | ) |
20
The difference between book-basis and tax-basis cost and unrealized appreciation (depreciation) is attributable primarily to the tax deferral of losses on wash sales and the realization for tax purposes of unrealized gains (losses) on certain foreign currency exchange contracts.
The accumulated capital losses represent net capital loss carryovers that may be used to offset future realized capital gains for federal income tax purposes. Future capital loss carryover utilization in any given year may be subject to Internal Revenue Code limitations. Capital loss carryovers expire in 2017.
The capital loss deferral represents net capital losses incurred in the one-month period ended November 30, 2011. The fund has elected to treat such losses as having been incurred in the following fiscal year for federal income tax purposes.
On December 22, 2010, the Regulated Investment Company Modernization Act of 2010 (the “Act”) was enacted, which changed various technical rules governing the tax treatment of regulated investment companies. The changes are generally effective for taxable years beginning after the date of enactment. Under the Act, the fund will be permitted to carry forward capital losses incurred in taxable years beginning after the date of enactment for an unlimited period. However, any losses incurred during those future taxable years will be required to be utilized prior to the losses incurred in pre-enactment taxable years, which carry an expiration date. As a result of this ordering rule, pre-enactment capital loss carryforwards may be more likely to expire unused.
21
| For a Share Outstanding Throughout the Years Ended November 30 (except as noted) | |||||||||||||
| Per-Share Data | Ratios and Supplemental Data | ||||||||||||
| Income From Investment Operations: | Distributions From: | Ratio to Average Net Assets of: | |||||||||||
Net Asset Value, Beginning of Period | Net Investment Income (Loss) | Net Realized and Unrealized Gain (Loss) | Total From Investment Operations | Net Investment Income | Net Realized Gains | Total Distributions | Net Asset Value, End of Period | Total Return(1) | Operating Expenses | Net Investment Income (Loss) | Portfolio Turnover Rate | Net Assets, End of Period (in thousands) | |
| Institutional Class | |||||||||||||
| 2011 | $10.24 | 0.04(2) | (1.34) | (1.30) | — | — | — | $8.94 | (12.70)% | 1.52% | 0.37% | 87% | $119,682 |
| 2010 | $8.86 | 0.02(2) | 1.37 | 1.39 | (0.01) | — | (0.01) | $10.24 | 15.73% | 1.52% | 0.19% | 94% | $91,110 |
| 2009 | $5.12 | 0.02(2) | 3.74 | 3.76 | (0.02) | — | (0.02) | $8.86 | 73.87% | 1.57% | 0.36% | 158% | $60,311 |
| 2008 | $16.19 | 0.11(2) | (8.52) | (8.41) | (0.20) | (2.46) | (2.66) | $5.12 | (61.75)% | 1.52% | 1.17% | 157% | $20,715 |
| 2007 | $11.01 | 0.15 | 5.12 | 5.27 | (0.09) | — | (0.09) | $16.19 | 48.22% | 1.46% | 1.12% | 113% | $28,378 |
Notes to Financial Highlights
| (1) | Total returns are calculated based on the net asset value of the last business day. Total returns for periods less than one year are not annualized. |
| (2) | Computed using average shares outstanding throughout the period. |
See Notes to Financial Statements.
22
The Board of Directors and Shareholders,
American Century World Mutual Funds, Inc.:
We have audited the accompanying statement of assets and liabilities, including the schedule of investments, of NT Emerging Markets Fund, one of the funds constituting American Century World Mutual Funds, Inc. (the “Corporation”), as of November 30, 2011, and the related statement of operations for the year then ended, the statements of changes in net assets for each of the two years in the period then ended, and the financial highlights for each of the five years in the period then ended. These financial statements and financial highlights are the responsibility of the Corporation’s management. Our responsibility is to express an opinion on these financial statements and financial highlights based on our audits.
We conducted our audits in accordance with the standards of the Public Company Accounting Oversight Board (United States). Those standards require that we plan and perform the audit to obtain reasonable assurance about whether the financial statements and financial highlights are free of material misstatement. The Corporation is not required to have, nor were we engaged to perform, an audit of its internal control over financial reporting. Our audits included consideration of internal control over financial reporting as a basis for designing audit procedures that are appropriate in the circumstances, but not for the purpose of expressing an opinion on the effectiveness of the Corporation’s internal control over financial reporting. Accordingly, we express no such opinion. An audit also includes examining, on a test basis, evidence supporting the amounts and disclosures in the financial statements, assessing the accounting principles used and significant estimates made by management, as well as evaluating the overall financial statement presentation. Our procedures included confirmation of securities owned as of November 30, 2011, by correspondence with the custodian and brokers; where replies were not received from brokers, we performed other auditing procedures. We believe that our audits provide a reasonable basis for our opinion.
In our opinion, the financial statements and financial highlights referred to above present fairly, in all material respects, the financial position of NT Emerging Markets Fund of American Century World Mutual Funds, Inc., as of November 30, 2011, the results of its operations for the year then ended, the changes in its net assets for each of the two years in the period then ended, and the financial highlights for each of the five years in the period then ended, in conformity with accounting principles generally accepted in the United States of America.
Deloitte & Touche LLP
Kansas City, Missouri
January 20, 2012
23
The Board of Directors
The individuals listed below serve as directors of the funds. Each director will continue to serve in this capacity until death, retirement, resignation or removal from office. The mandatory retirement age for directors who are not “interested persons,” as that term is defined in the Investment Company Act (independent directors), is 72. However, the mandatory retirement age for an individual director may be extended with the approval of the remaining independent directors.
Mr. Thomas is the only director who is an “interested person” because he currently serves as President and Chief Executive Officer of American Century Companies, Inc. (ACC), the parent company of American Century Investment Management, Inc. (ACIM or the advisor).
The other directors (more than three-fourths of the total number) are independent; that is, they have never been employees, directors or officers of, and have no financial interest in, ACC or any of its wholly owned, direct or indirect, subsidiaries, including ACIM, American Century Investment Services, Inc. (ACIS) and American Century Services, LLC (ACS). The directors serve in this capacity for seven (in the case of Mr. Thomas, 15) registered investment companies in the American Century Investments family of funds.
The following presents additional information about the directors. The mailing address for each director is 4500 Main Street, Kansas City, Missouri 64111.
Name (Year of Birth) | Position(s) Held with Funds | Length of Time Served | Principal Occupation(s) During Past 5 Years | Number of American Century Portfolios Overseen by Director | Other Directorships Held During Past 5 Years |
| Independent Directors | |||||
Thomas A. Brown (1940) | Director | Since 1980 | Managing Member, Associated Investments, LLC (real estate investment company); Brown Cascade Properties, LLC (real estate investment company) (2001 to 2009) | 65 | None |
Andrea C. Hall (1945) | Director | Since 1997 | Retired as advisor to the President, Midwest Research Institute (not-for-profit research organization) (June 2006) | 65 | None |
Jan M. Lewis (1957) | Director | Since 2011 | President and Chief Executive Officer, Catholic Charities of Northeast Kansas (human services organization)(2006 to present); President, BUCON, Inc. (full-service design-build construction company) (2004 to 2006) | 65 | None |
James A. Olson (1942) | Director | Since 2007 | Member, Plaza Belmont LLC (private equity fund manager); Chief Financial Officer, Plaza Belmont LLC (September 1999 to September 2006) | 65 | Saia, Inc. and Entertainment Properties Trust |
24
| (Year of Birth) | Position(s) Held with Funds | Length of Time Served | Principal Occupation(s) During Past 5 Years | Number of American Century Portfolios Overseen by Director | Other Directorships Held During Past 5 Years |
| Independent Directors | |||||
Donald H. Pratt (1937) | Director and Chairman of the Board | Since 1995 (Chairman since 2005) | Chairman and Chief Executive Officer, Western Investments, Inc. (real estate company) | 65 | None |
M. Jeannine Strandjord (1945) | Director | Since 1994 | Retired | 65 | DST Systems Inc., Euronet Worldwide Inc., and Charming Shoppes, Inc. |
John R. Whitten (1946) | Director | Since 2008 | Project Consultant, Celanese Corp. (industrial chemical company) | 65 | Rudolph Technologies, Inc. |
Stephen E. Yates (1948) | Advisory Director | Since 2011 | Retired; Executive Vice President, Technology & Operations, KeyCorp. (computer services)(2004 to 2010) | 65 | Applied Industrial Technology (2001 to 2010) |
| Interested Director | |||||
Jonathan S. Thomas (1963) | Director and President | Since 2007 | President and Chief Executive Officer, ACC (March 2007 to present); Chief Administrative Officer, ACC (February 2006 to February 2007); Executive Vice President, ACC (November 2005 to February 2007). Also serves as: Chief Executive Officer and Manager, ACS; Executive Vice President, ACIM; Director, ACC, ACIM and other ACC subsidiaries | 106 | None |
25
Officers
The following table presents certain information about the executive officers of the funds. Each officer serves as an officer for each of the 15 investment companies in the American Century family of funds, unless otherwise noted. No officer is compensated for his or her service as an officer of the funds. The listed officers are interested persons of the funds and are appointed or re-appointed on an annual basis. The mailing address for each officer listed below is 4500 Main Street, Kansas City, Missouri 64111.
Name (Year of Birth) | Offices with the Funds | Principal Occupation(s) During the Past Five Years |
Jonathan S.Thomas (1963) | Director and President since 2007 | President and Chief Executive Officer, ACC (March 2007 to present); Chief Administrative Officer, ACC (February 2006 to February 2007); Executive Vice President, ACC (November 2005 to February 2007). Also serves as: Chief Executive Officer and Manager, ACS; Executive Vice President, ACIM; Director, ACC, ACIM and other ACC subsidiaries |
Barry Fink (1955) | Executive Vice President since 2007 | Chief Operating Officer and Executive Vice President, ACC (September 2007 to present); President, ACS (October 2007 to present); Managing Director, Morgan Stanley (2000 to 2007); Global General Counsel, Morgan Stanley (2000 to 2006). Also serves as: Manager, ACS and Director, ACC and certain ACC subsidiaries |
Maryanne L. Roepke (1956) | Chief Compliance Officer since 2006 and Senior Vice President since 2000 | Chief Compliance Officer, American Century funds, ACIM and ACS (August 2006 to present); Assistant Treasurer, ACC (January 1995 to August 2006); and Treasurer and Chief Financial Officer, various American Century funds (July 2000 to August 2006). Also serves as: Senior Vice President, ACS |
Charles A. Etherington (1957) | General Counsel since 2007 and Senior Vice President since 2006 | Attorney, ACC (February 1994 to present); Vice President, ACC (November 2005 to present), General Counsel, ACC (March 2007 to present); Also serves as General Counsel, ACIM, ACS, ACIS and other ACC subsidiaries; and Senior Vice President, ACIM and ACS |
Robert J. Leach (1966) | Vice President, Treasurer and Chief Financial Officer since 2006 | Vice President, ACS (February 2000 to present); and Controller, various American Century funds (1997 to September 2006) |
David H. Reinmiller (1963) | Vice President since 2000 | Attorney, ACC (January 1994 to present); Associate General Counsel, ACC (January 2001 to present). Also serves as Vice President, ACIM and ACS |
Ward D. Stauffer (1960) | Secretary since 2005 | Attorney, ACC (June 2003 to present) |
The Statement of Additional Information has additional information about the fund’s directors and is available without charge, upon request, by calling 1-800-345-2021.
26
At a meeting held on June 9, 2011, the Fund’s Board of Directors unanimously approved the renewal of the management agreement pursuant to which American Century Investment Management, Inc. (the “Advisor”) acts as the investment advisor for the Fund. Under Section 15(c) of the Investment Company Act, contracts for investment advisory services are required to be reviewed, evaluated, and approved by a majority of a fund’s independent directors (the “Directors”) each year.
As a part of the approval process, the Board requested and reviewed extensive data and information compiled by the Advisor and certain independent providers of evaluation data concerning the Fund and the services provided to the Fund by the Advisor. This review was in addition to the oversight and evaluation undertaken by the Board and its committees on a continuous basis throughout the year and included, but was not limited to the following:
| • | the nature, extent, and quality of investment management, shareholder services, and other services provided by the Advisor to the Fund; |
| • | the wide range of other programs and services the Advisor provides to the Fund and its shareholders on a routine and non-routine basis; |
| • | the investment performance of the fund, including data comparing the Fund’s performance to appropriate benchmarks and/or a peer group of other mutual funds with similar investment objectives and strategies; |
| • | data comparing the cost of owning the Fund to the cost of owning similar funds; |
| • | the Advisor’s compliance policies, procedures, and regulatory experience; |
| • | financial data showing the cost of services provided to the Fund, the profitability of the Fund to the Advisor, and the overall profitability of the Advisor; |
| • | data comparing services provided and charges to other investment management clients of the Advisor; and |
| • | consideration of collateral benefits derived by the Advisor from the management of the Fund and any potential economies of scale relating thereto. |
In keeping with its practice, the Board held two in-person meetings and one telephonic meeting to review and discuss the information provided. The Directors also had the benefit of the advice of independent counsel throughout the period.
Factors Considered
The Directors considered all of the information provided by the Advisor, the independent data providers, and independent counsel, and evaluated such information for the Fund. In connection with their review, the Directors did not identify any single factor as being all-important or controlling, and each Director may have attributed different levels of importance to different factors. In deciding to renew the management agreement, the Board based its decision on a number of factors, including the following:
27
Nature, Extent and Quality of Services - Generally. Under the management agreement, the Advisor is responsible for providing or arranging for all services necessary for the operation of the Fund. The Board noted that under the management agreement, the Advisor provides or arranges at its own expense a wide variety of services including:
| • | constructing and designing the Fund |
| • | portfolio research and security selection |
| • | initial capitalization/funding |
| • | securities trading |
| • | Fund administration |
| • | custody of Fund assets |
| • | daily valuation of the Fund’s portfolio |
| • | shareholder servicing and transfer agency, including shareholder confirmations, recordkeeping, and communications |
| • | legal services |
| • | regulatory and portfolio compliance |
| • | financial reporting |
| • | marketing and distribution |
The Board noted that many of these services have expanded over time both in terms of quantity and complexity in response to shareholder demands, competition in the industry, changing distribution channels, and the changing regulatory environment.
Investment Management Services. The nature of the investment management services provided to the Fund is quite complex and allows Fund shareholders access to professional money management, instant diversification of their investments within an asset class, the opportunity to easily diversify among asset classes by investing in or exchanging among various American Century Investments funds, and liquidity. In evaluating investment performance, the Board expects the Advisor to manage the Fund in accordance with its investment objectives and approved strategies. Further, the Directors recognize that the Advisor has an obligation to monitor trading activities, and in particular to seek the best execution of fund trades, and to evaluate the use of and payment for research. In providing these services, the Advisor utilizes teams of investment professionals (portfolio managers, analysts, research assistants, and securities traders) who require extensive information technology, research, training, compliance and other systems to conduct their business. The Board, directly and through its Fund Performance Review Committee, regularly reviews investment performance information for the Fund, together with comparative information for appropriate benchmarks and/or peer groups of similarly-managed funds, over different time horizons.
28
The Directors also review detailed performance information during the management agreement approval process. If performance concerns are identified, the Fund receives special reviews until performance improves, during which the Board discusses with the Advisor the reasons for such results (e.g., market conditions, security selection) and any efforts being undertaken to improve performance. Taking all these factors into consideration, the Board found the investment management services provided by the Advisor to the Fund to meet or exceed industry standards. More detailed information about the Fund’s performance can be found in the Performance and Portfolio Commentary sections of this report.
Shareholder and Other Services. Under the management agreement, the Advisor provides the Fund with a comprehensive package of transfer agency, shareholder, and other services. The Board, directly and through various committees of the Board, regularly reviews reports and evaluations of such services at its regular meetings. These reports include, but are not limited to, information regarding the operational efficiency and accuracy of the shareholder and transfer agency services provided, staffing levels, shareholder satisfaction (as measured by external as well as internal sources), technology support, new products and services offered to Fund shareholders, securities trading activities, portfolio valuation services, auditing services, and legal and operational compliance activities. Certain aspects of shareholder and transfer agency service level efficiency and the quality of securities trading activities are measured by independent third party providers and are presented in comparison to other fund groups not managed by the Advisor. The Board found the services provided by the Advisor to the Fund under the management agreement to be competitive and of high quality.
Costs of Services and Profitability. The Advisor provides detailed information concerning its cost of providing various services to the Fund, its profitability in managing the Fund, its overall profitability, and its financial condition. The Directors have reviewed with the Advisor the methodology used to prepare this financial information. The financial information regarding the Advisor is considered in evaluating the Advisor’s financial condition, ability to continue to provide services under the management agreement, and the reasonableness of the current management fee. The Board concluded that the Advisor’s profits were reasonable in light of the services provided to the Fund.
Ethics. The Board generally considers the Advisor’s commitment to providing quality services to shareholders and to conducting its business ethically. They noted that the Advisor’s practices generally meet or exceed industry best practices.
Economies of Scale. The Board also reviewed information provided by the Advisor regarding the possible existence of economies of scale in connection with the management of the Fund. The Board concluded that economies of scale are difficult to measure and predict with precision, especially on a fund-by-fund basis. The Board concluded that the Advisor is appropriately sharing economies of scale through its competitive fee structure, offering competitive fees from fund inception, and through reinvestment in its business to provide shareholders additional content and services.
29
Comparison to Other Funds’ Fees. The management agreement provides that the Fund pay the Advisor a single, all-inclusive (or unified) management fee for providing all services necessary for the management and operation of the Fund, other than brokerage expenses, taxes, interest, extraordinary expenses, and the fees and expenses of the Fund’s independent directors (including their independent legal counsel) and expenses incurred in connection with the provision of shareholder services and distribution services under a plan adopted pursuant to Rule 12b-1 under the 1940 Act. Under the unified fee structure, the Advisor is responsible for providing all investment advisory, custody, audit, administrative, compliance, recordkeeping, marketing and shareholder services, or arranging and supervising third parties to provide such services. By contrast, most other funds are charged a variety of fees, including an investment advisory fee, a transfer agency fee, an administrative fee, distribution charges and other expenses. Other than their investment advisory fees and any applicable Rule 12b-1 distribution fees, all other components of the total fees charged by these other funds may be increased without shareholder approval. The Board believes the unified fee structure is a benefit to Fund shareholders because it clearly discloses to shareholders the cost of owning Fund shares, and, since the unified fee cannot be increased without a vote of Fund shareholders, it shifts to the Advisor the risk of increased costs of operating the Fund and provides a direct incentive to minimize administrative inefficiencies. Part of the Board’s analysis of fee levels involves reviewing certain evaluative data compiled by an independent provider and comparing the Fund’s unified fee to the total expense ratio of other funds in the Fund’s peer group. The Board concluded that the management fee paid by the Fund to the Advisor under the management agreement is reasonable in light of the services provided to the Fund.
Comparison to Fees and Services Provided to Other Clients of the Advisor. The Board also requested and received information from the Advisor concerning the nature of the services, fees, costs and profitability of its advisory services to advisory clients other than the Fund. They observed that these varying types of client accounts require different services and involve different regulatory and entrepreneurial risks than the management of the Fund. The Board analyzed this information and concluded that the fees charged and services provided to the Fund were reasonable by comparison.
Collateral or “Fall-Out” Benefits Derived by the Advisor. The Board considered the existence of collateral benefits the Advisor may receive as a result of its relationship with the Fund. They concluded that the Advisor’s primary business is managing mutual funds and it generally does not use fund or shareholder information to generate profits in other lines of business, and therefore does not derive any significant collateral benefits from them. The Board noted that the Advisor receives proprietary research from broker-dealers that execute fund portfolio transactions and concluded that this research is likely to benefit Fund shareholders. The Board also determined that the Advisor is able to provide investment management services to certain clients other than the Fund, at least in part, due to its existing infrastructure built to serve the fund complex. The Board concluded, however, that the assets of those other clients are not material to the analysis and, where applicable, may be included with the assets of the Fund to determine breakpoints in the management fee schedule.
30
Existing Relationship. The Board also considered whether there was any reason for not continuing the existing arrangement with the Advisor. In this regard, the Board was mindful of the potential disruptions of the Fund’s operations and various risks, uncertainties, and other effects that could occur as a result of a decision not to continue such relationship. In particular, the Board recognized that most shareholders have invested in the Fund on the strength of the Advisor’s industry standing and reputation and in the expectation that the Advisor will have a continuing role in providing advisory services to the Fund.
Conclusion of the Directors. As a result of this process, the Board, including all of the independent directors, taking into account all of the factors discussed above and the information provided by the Advisor and others, concluded that the management agreement between the Fund and the Advisor is fair and reasonable in light of the services provided and should be renewed.
31
Retirement Account Information
As required by law, distributions you receive from certain IRAs, or 403(b), 457 and qualified plans are subject to federal income tax withholding, unless you elect not to have withholding apply. Tax will be withheld on the total amount withdrawn even though you may be receiving amounts that are not subject to withholding, such as nondeductible contributions. In such case, excess amounts of withholding could occur. You may adjust your withholding election so that a greater or lesser amount will be withheld.
If you don’t want us to withhold on this amount, you must notify us to not withhold the federal income tax. You may notify us in writing or in certain situations by telephone or through other electronic means. You have the right to revoke your withholding election at any time and any election you make may remain in effect until revoked by filing a new election.
Remember, even if you elect not to have income tax withheld, you are liable for paying income tax on the taxable portion of your withdrawal. If you elect not to have income tax withheld or you don’t have enough income tax withheld, you may be responsible for payment of estimated tax. You may incur penalties under the estimated tax rules if your withholding and estimated tax payments are not sufficient. You can reduce or defer the income tax on a distribution by directly or indirectly rolling such distribution over to another IRA or eligible plan. You should consult your tax advisor for additional information.
State tax will be withheld if, at the time of your distribution, your address is within one of the mandatory withholding states and you have federal income tax withheld. State taxes will be withheld from your distribution in accordance with the respective state rules.
Proxy Voting Guidelines
American Century Investment Management, Inc., the fund’s investment advisor, is responsible for exercising the voting rights associated with the securities purchased and/or held by the fund. A description of the policies and procedures the advisor uses in fulfilling this responsibility is available without charge, upon request, by calling 1-800-345-2021. It is also available on American Century Investments’ website at americancentury.com and on the Securities and Exchange Commission’s website at sec.gov. Information regarding how the investment advisor voted proxies relating to portfolio securities during the most recent 12-month period ended June 30 is available on the “About Us” page at americancentury.com. It is also available at sec.gov.
Quarterly Portfolio Disclosure
The fund files its complete schedule of portfolio holdings with the Securities and Exchange Commission (SEC) for the first and third quarters of each fiscal year on Form N-Q. The fund’s Forms N-Q are available on the SEC’s website at sec.gov, and may be reviewed and copied at the SEC’s Public Reference Room in Washington, DC. Information on the operation of the Public Reference Room may be obtained by calling 1-800-SEC-0330. The fund also makes its complete schedule of portfolio holdings for the most recent quarter of its fiscal year available on its website at americancentury.com and, upon request, by calling 1-800-345-2021.
32
| Contact Us | americancentury.com |
| Automated Information Line | 1-800-345-8765 |
| Investor Services Representative | 1-800-345-2021 or 816-531-5575 |
| Investors Using Advisors | 1-800-378-9878 |
Business, Not-For-Profit, Employer-Sponsored Retirement Plans | 1-800-345-3533 |
Banks and Trust Companies, Broker-Dealers, Financial Professionals, Insurance Companies | 1-800-345-6488 |
| Telecommunications Device for the Deaf | 1-800-634-4113 |
American Century World Mutual Funds, Inc.
Investment Advisor:
American Century Investment Management, Inc.
Kansas City, Missouri
This report and the statements it contains are submitted for the general information of our shareholders. The report is not authorized for distribution to prospective investors unless preceded or accompanied by an effective prospectus.
©2012 American Century Proprietary Holdings, Inc. All rights reserved.
CL-ANN-74132 1201
ANNUAL REPORT NOVEMBER 30, 2011
| NT International Growth Fund |
| President’s Letter | 2 |
| Independent Chairman’s Letter | 3 |
| Market Perspective | 4 |
| Performance | 5 |
| Portfolio Commentary | 6 |
| Fund Characteristics | 8 |
| Shareholder Fee Example | 9 |
| Schedule of Investments | 11 |
| Statement of Assets and Liabilities | 14 |
| Statement of Operations | 15 |
| Statement of Changes in Net Assets | 16 |
| Notes to Financial Statements | 17 |
| Financial Highlights | 22 |
| Report of Independent Registered Public Accounting Firm | 23 |
| Management | 24 |
| Approval of Management Agreement | 27 |
| Additional Information | 32 |
Any opinions expressed in this report reflect those of the author as of the date of the report, and do not necessarily represent the opinions of American Century Investments® or any other person in the American Century Investments organization. Any such opinions are subject to change at any time based upon market or other conditions and American Century Investments disclaims any responsibility to update such opinions. These opinions may not be relied upon as investment advice and, because investment decisions made by American Century Investments funds are based on numerous factors, may not be relied upon as an indication of trading intent on behalf of any American Century Investments fund. Security examples are used for representational purposes only and are not intended as recommendations to purchase or sell securities. Performance information for comparative indices and securities is provided to American Century Investments by third party vendors. To the best of American Century Investments’ knowledge, such information is accurate at the time of printing.
Dear Investor:
Thank you for reviewing this annual report for the period ended November 30, 2011. Our report offers investment performance and portfolio information, presented with the expert perspective of our portfolio management team.
This report remains one of our most important vehicles for conveying information about fund returns, as well as market factors and strategies that affected fund performance. For additional, updated information, we encourage you to visit our website, americancentury.com. Click on the “Fund Performance” and “Insights & News” headings at the top of our Individual Investors site.
Reporting Period’s Divided Nature Resulted in Mixed Returns
The financial market performance that most U.S. investors experienced during the 12 months ended November 30, 2011 generally reflected the period’s divided nature. For the first six months, confidence in global economic growth, strong corporate earnings, and increased risk-taking generally ruled the markets. The MSCI EAFE Index and the S&P 500 Index advanced approximately 15% for the six months ended May 31, 2011, as stocks broadly outperformed high-quality bonds for that period.
However, the tables reversed sharply for the final six months. The risk-taking tide ebbed during the summer months, constrained by high fuel prices, federal budget management concerns in the U.S., and the worsening sovereign debt crisis in Europe. High-quality bonds, led by long-maturity U.S. Treasury securities, mostly outpaced stocks. The MSCI EAFE Index and the S&P 500 Index returned –16.56% and –6.25%, respectively, during the six months ended November 30, 2011, despite a significant market rebound in October.
As a result of this volatility, returns were mixed for the full 12-month period. U.S. and international bonds and U.S. stocks generally outperformed international stocks. The S&P 500 Index and the MSCI EAFE Index returned 7.83% and –4.12%, respectively, for the fiscal year.
Unfortunately, further volatility appears likely in 2012 as the markets wrestle with uncertainties regarding European debt, economic strength, government budget deficits, and the U.S. presidential election. We believe strongly in adhering to a disciplined, diversified, long-term investment approach during volatile periods, and we appreciate your continued trust in us during these unsettled times.
Sincerely,
Jonathan Thomas
President and Chief Executive Officer
American Century Investments
2
Dear Fellow Shareholders,
The board of directors of the fund was pleased at the announcement of a new strategic partner for the investment advisor to the American Century Investments funds. Canadian Imperial Bank of Commerce (CIBC), a leading Canadian financial institution, purchased the 41 percent economic interest in American Century Companies, the parent corporation of the advisor, previously held by JPMorgan Chase & Co. Based in Toronto, CIBC provides a full range of retail and wholesale banking services to almost 11 million clients through approximately 1,100 branches and offices in Canada, the U.S. and around the world. This transaction will benefit fund shareholders by bolstering the financial strength of the advisor and providing a strategic partner to help support its growth initiative to broaden non-U.S. distribution of its products and services.
The board also has been briefed throughout the year on the impact on fund performance of the European banking crisis, the U.S. deficit reduction debates, and the pace of economic growth. While the performance of all funds has been affected, the majority of American Century Investments funds overseen by the board are exceeding their benchmarks for the one-, three-, five-, and ten-year periods ended September 30, 2011. This is commendable performance, particularly in these challenging market conditions.
We are completing another year of board oversight on your behalf. We appreciate any comments you would like to share with the board. Send them to me at dhpratt@fundboardchair.com. Thank you for your continued investment in American Century Investments funds.
Best regards,
Don Pratt
3
By Mark Kopinski,
Chief Investment Officer, Global and Non-U.S. Equity
Stocks Struggled as Growth Slowed
Global stock markets kicked off the 12-month period in generally robust fashion, no easy feat considering investors had to weigh brightening economic outlooks against mounting inflationary pressures, ongoing sovereign debt concerns, and an onslaught of political unrest and natural disasters. Nevertheless, negative forces—primarily expanding sovereign debt problems in Europe and the United States—gradually tightened their hold on the worldwide economy, and market sentiment began to deteriorate. The downdraft culminated with a sharp global market selloff in the third calendar quarter of 2011, triggered primarily by Standard & Poor’s first-ever downgrade of the United States’ long-term credit rating and mounting fears of a default in Greece. Worried about the potential for another global recession, the International Monetary Fund (IMF) trimmed its global growth outlook for 2012.
Overall, emerging market stocks underperformed developed international markets for the 12-month period, as investors retreated from riskier investments. In addition, falling global growth prospects sparked stock slumps, particularly in export-heavy emerging-market economies of South Korea and China. Economic growth continued to moderate in China, but inflationary pressures continued to build, prompting IMF calls for China to allow its currency to appreciate to temper a surge in inflation.
Outlook Hinges on Fiscal Strategies
The period ended with the United States, Japan and China releasing relatively strong economic data, thereby diminishing concerns for a synchronized global recession. Yet, European Union countries continued to falter. As the eurozone crisis continues, global demand likely will decrease as a function of deleveraging, which should negatively influence export-driven markets. In addition, volatility in the financial markets may remain heightened, as investors react to European reform plans.
Ultimately, we believe the global economy can and will resume a strong growth trend. But to do so, each region and country will have to address its specific fiscal challenges. We believe these are solvable problems, as long as government policy supports the private sector and its role in driving economic output and employment based on the profit incentive.
| International Equity Total Returns | ||||
| For the 12 months ended November 30, 2011 (in U.S. dollars) | ||||
| MSCI EAFE Index | -4.12% | MSCI Europe Index | -2.08% | |
| MSCI EAFE Growth Index | -3.96% | MSCI World Index | 1.46% | |
| MSCI EAFE Value Index | -4.27% | MSCI Japan Index | -8.56% | |
| MSCI Emerging Markets Index | -11.54% | |||
4
| Total Returns as of November 30, 2011 | |||||
| Average Annual Returns | |||||
Ticker Symbol | 1 year | 5 years | Since Inception | Inception Date | |
| Institutional Class | ACLNX | -3.47% | -1.87% | -1.09% | 5/12/06 |
| MSCI EAFE Index | — | -4.12% | -3.95% | -2.39%(1) | — |
| MSCI EAFE Growth Index | — | -3.96% | -2.37% | -1.37%(1) | — |
(1)Since 4/30/06, the date nearest the Institutional Class’s inception for which data are available.
| Growth of $10,000 Over Life of Class |
| $10,000 investment made May 12, 2006 |
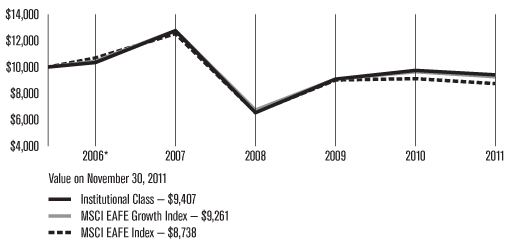
*From 5/12/06, the Institutional Class’s inception date. Index data from 4/30/06, the date nearest the Institutional Class’s inception for which data are available. Not annualized.
| Total Annual Fund Operating Expenses |
Institutional Class 1.14% |
The total annual fund operating expenses shown is as stated in the fund’s prospectus current as of the date of this report. The prospectus may vary from the expense ratio shown elsewhere in this report because it is based on a different time period, includes acquired fund fees and expenses, and, if applicable, does not include fee waivers or expense reimbursements.
Data presented reflect past performance. Past performance is no guarantee of future results. Current performance may be higher or lower than the performance shown. Investment return and principal value will fluctuate, and redemption value may be more or less than original cost. To obtain performance data current to the most recent month end, please call 1-800-345-2021 or visit americancentury.com. International investing involves special risks, such as political instability and currency fluctuations. Investing in emerging markets may accentuate these risks.
Data assumes reinvestment of dividends and capital gains, and none of the charts reflect the deduction of taxes that a shareholder would pay on fund distributions or the redemption of fund shares. Returns for the indices are provided for comparison. The fund’s total returns include operating expenses (such as transaction costs and management fees) that reduce returns, while the total returns of the indices do not.
5
Portfolio Managers: Alex Tedder and Raj Gandhi
Performance Summary
NT International Growth declined -3.47% for the 12 months ended November 30, 2011, compared with its benchmark, the MSCI EAFE Index, which declined -4.12%.
Global stocks generally struggled during the 12-month period, as investors grappled with the ongoing and expanding sovereign debt problems in several developed nations. In particular, fears of a default in Greece and contagion throughout the rest of the eurozone weighed on stocks. In addition, mounting inflationary pressures in China and other emerging markets, combined with fears that a global economic slowdown would stifle demand for their goods, drove down stocks in the developing world. Within the developed markets, growth stocks outpaced their value counterparts, while large-cap stocks showed a slight performance advantage over their small-cap brethren.
Overall, stock selection, particularly in the utilities, consumer discretionary and industrials sectors, drove the portfolio’s outperformance relative to the benchmark. Our sector allocations, including an underweight in the utilities sector, also had an overall positive influence on the portfolio’s relative performance.
From a regional perspective, stock selection in France and Germany and an underweight position in Japan contributed the most to the portfolio’s relative performance. At the opposite end of the spectrum, the United Kingdom, Switzerland and portfolio-only positions in Taiwan and other emerging markets detracted from relative performance.
Consumer Discretionary, Industrials Led Sector Results
The portfolio’s consumer discretionary stocks led all sectors on a relative basis, driven by strong stock selection in the automobile industry. In particular, a portfolio-only position in South Korea’s Hyundai Motor Co. was among the sector’s top contributors. The company posted sales and market share gains in key markets, as the March 2011 earthquake and tsunami forced its leading Japanese competitors to cut near-term production forecasts. Moreover, as demand steadily climbed, the automaker ramped up near-term production plans.
In addition, an overweight position in the United Kingdom’s Aggreko, a provider of temporary power, was a top contributor in the portfolio’s industrials sector. The company raised its full-year profit outlook primarily due to strong revenues from its unit that provides temporary power stations to developing countries.
The portfolio’s technology sector also was a strong contributor to performance, with an overweight position in United Kingdom-based ARM Holdings leading the charge. The company’s shares advanced on robust demand for smartphones and tablet computers. Furthermore, the company maintained a competitive edge in the smartphone market, where its designs are behind the chips powering many next-generation handsets, and in the tablet computer market, which one analyst predicted would grow six-fold in the next two years. Meanwhile, U.S. software giant Microsoft announced the next generation of its Windows operating system would be able to run on ARM-designed chips.
6
Financials Sector Struggled
The portfolio’s financials sector was the largest detractor to performance, primarily due to stock selection in the commercial banking industry. Europe’s expanding sovereign debt crisis sent ripples through the global financial system, particularly for banks with exposure to the troubled credits of Greece, Italy, Spain, and Portugal. Among the portfolio holdings that suffered the most due to these events were UniCredit and Lloyds Banking Group. Shares of Italy-based UniCredit sagged amid concerns earnings weren’t sufficiently growing. In addition, Italy’s deteriorating economic outlook raised questions about the country’s stability going forward.
Similarly, United Kingdom-based Lloyds Banking Group was among the portfolio’s largest detractors. Shares struggled throughout the reporting period, but they took a severe hit late in the period, when the British government raised its levy on banks to raise money and discourage financial institutions from becoming overly dependent on unguaranteed debts to avoid another bailout. Also, Standard & Poor’s downgraded the credit ratings of Lloyds and other large global financial institutions due to weaker confidence in governments’ ability to bail out troubled banks.
The consumer staples sector also detracted from relative performance, primarily due to stock selection in the beverage industry. In addition, the portfolio’s health care sector detracted from relative performance, primarily due to an underweight position in the pharmaceuticals industry.
Outlook
We continue to focus on companies with the potential for better structural growth in all regions, rather than economically-sensitive companies. We believe good opportunities exist in the developed markets of Asia and select emerging markets. Furthermore, we expect growth in the emerging markets to continue providing a powerful benefit for many companies based in the developed markets, particularly in the consumer sectors. We will continue to focus on finding companies located in developed countries around the world (excluding the United States) with the potential to deliver sustainable growth characteristics and promising long-term outlooks.
7
| NOVEMBER 30, 2011 | |
| Top Ten Holdings | % of net assets |
| Nestle SA | 2.0% |
| BHP Billiton Ltd. | 1.8% |
| BG Group plc | 1.6% |
| SAP AG | 1.5% |
| Royal Dutch Shell plc, Class A | 1.3% |
| Reckitt Benckiser Group plc | 1.3% |
| Saipem SpA | 1.3% |
| Seadrill Ltd. | 1.3% |
| WM Morrison Supermarkets plc | 1.3% |
| Syngenta AG | 1.2% |
| Types of Investments in Portfolio | % of net assets |
| Foreign Common Stocks | 99.0% |
| Temporary Cash Investments | 1.5% |
| Other Assets and Liabilities | (0.5)% |
| Investments by Country | % of net assets |
| United Kingdom | 18.2% |
| Japan | 12.9% |
| France | 8.7% |
| Germany | 8.4% |
| Switzerland | 8.4% |
| Netherlands | 4.1% |
| Australia | 4.1% |
| Sweden | 2.9% |
| Italy | 2.8% |
| Hong Kong | 2.6% |
| Spain | 2.2% |
| South Korea | 2.2% |
| People’s Republic of China | 2.0% |
| Belgium | 2.0% |
| Other Countries | 17.5% |
| Cash and Equivalents* | 1.0% |
| *Includes temporary cash investments and other assets and liabilities. | |
8
Fund shareholders may incur two types of costs: (1) transaction costs, including sales charges (loads) on purchase payments and redemption/exchange fees; and (2) ongoing costs, including management fees; distribution and service (12b-1) fees; and other fund expenses. This example is intended to help you understand your ongoing costs (in dollars) of investing in your fund and to compare these costs with the ongoing cost of investing in other mutual funds.
The example is based on an investment of $1,000 made at the beginning of the period and held for the entire period from June 1, 2011 to November 30, 2011.
Actual Expenses
The table provides information about actual account values and actual expenses for each class. You may use the information, together with the amount you invested, to estimate the expenses that you paid over the period. First, identify the share class you own. Then simply divide your account value by $1,000 (for example, an $8,600 account value divided by $1,000 = 8.6), then multiply the result by the number under the heading “Expenses Paid During Period” to estimate the expenses you paid on your account during this period.
If you hold Investor Class shares of any American Century Investments fund, or Institutional Class shares of the American Century Diversified Bond Fund, in an American Century Investments account (i.e., not a financial intermediary or retirement plan account), American Century Investments may charge you a $12.50 semiannual account maintenance fee if the value of those shares is less than $10,000. We will redeem shares automatically in one of your accounts to pay the $12.50 fee. In determining your total eligible investment amount, we will include your investments in all personal accounts (including American Century Investments Brokerage accounts) registered under your Social Security number. Personal accounts include individual accounts, joint accounts, UGMA/UTMA accounts, personal trusts, Coverdell Education Savings Accounts and IRAs (including traditional, Roth, Rollover, SEP-, SARSEP- and SIMPLE-IRAs), and certain other retirement accounts. If you have only business, business retirement, employer-sponsored or American Century Investments Brokerage accounts, you are currently not subject to this fee. We will not charge the fee as long as you choose to manage your accounts exclusively online. If you are subject to the Account Maintenance Fee, your account value could be reduced by the fee amount.
Hypothetical Example for Comparison Purposes
The table also provides information about hypothetical account values and hypothetical expenses based on the actual expense ratio of each class of your fund and an assumed rate of return of 5% per year before expenses, which is not the actual return of a fund’s share class. The hypothetical account values and expenses may not be used to estimate the actual ending account balance or expenses you paid for the period. You may use this information to compare the ongoing costs of investing in your fund and other funds. To do so, compare this 5% hypothetical example with the 5% hypothetical examples that appear in the shareholder reports of the other funds.
9
Please note that the expenses shown in the table are meant to highlight your ongoing costs only and do not reflect any transactional costs, such as sales charges (loads) or redemption/exchange fees. Therefore, the table is useful in comparing ongoing costs only, and will not help you determine the relative total costs of owning different funds. In addition, if these transactional costs were included, your costs would have been higher.
Beginning Account Value 6/1/11 | Ending Account Value 11/30/11 | Expenses Paid During Period(1) 6/1/11 – 11/30/11 | Annualized Expense Ratio(1) | |||||||||||||
| Actual | ||||||||||||||||
| Institutional Class | $1,000 | $832.70 | $5.19 | 1.13 | % | |||||||||||
| Hypothetical | ||||||||||||||||
| Institutional Class | $1,000 | $1,019.40 | $5.72 | 1.13 | % | |||||||||||
| (1) | Expenses are equal to the class’s annualized expense ratio listed in the table above, multiplied by the average account value over the period, multiplied by 183, the number of days in the most recent fiscal half-year, divided by 365, to reflect the one-half year period. |
10
NOVEMBER 30, 2011
| Shares | Value | |
| Common Stocks — 99.0% | ||
| ARGENTINA — 0.3% | ||
| MercadoLibre, Inc. | 13,200 | $ 1,157,508 |
| AUSTRALIA — 4.1% | ||
| BHP Billiton Ltd. | 162,931 | 6,084,022 |
| Commonwealth Bank of Australia | 70,408 | 3,531,374 |
| Iluka Resources Ltd. | 134,400 | 2,155,721 |
| Wesfarmers Ltd. | 70,513 | 2,266,417 |
| 14,037,534 | ||
| BELGIUM — 2.0% | ||
| Anheuser-Busch InBev NV | 53,308 | 3,188,987 |
Telenet Group Holding NV(1) | 52,983 | 1,982,526 |
| Umicore SA | 42,400 | 1,826,070 |
| 6,997,583 | ||
| BERMUDA — 1.3% | ||
| Seadrill Ltd. | 124,600 | 4,353,933 |
| BRAZIL — 0.7% | ||
| Banco do Brasil SA | 179,100 | 2,396,782 |
| CANADA — 1.6% | ||
| Bank of Nova Scotia | 48,100 | 2,431,055 |
| Canadian National Railway Co. | 21,000 | 1,623,874 |
| Potash Corp. of Saskatchewan, Inc. | 32,100 | 1,399,251 |
| 5,454,180 | ||
| DENMARK — 1.3% | ||
| Christian Hansen Holding A/S | 91,602 | 1,939,871 |
| Novo Nordisk A/S B Shares | 22,700 | 2,581,750 |
| 4,521,621 | ||
| FINLAND — 0.5% | ||
| Kone Oyj | 31,200 | 1,758,706 |
| FRANCE — 8.7% | ||
| Air Liquide SA | 27,220 | 3,454,886 |
| Cie Generale d’Optique Essilor International SA | 25,100 | 1,794,524 |
| Danone SA | 51,422 | 3,401,307 |
| Eutelsat Communications SA | 59,100 | 2,296,976 |
| LVMH Moet Hennessy Louis Vuitton SA | 22,400 | 3,521,503 |
| Pernod-Ricard SA | 24,958 | 2,350,749 |
| Publicis Groupe SA | 18,300 | 873,924 |
| Safran SA | 89,700 | 2,658,577 |
| Sanofi | 44,000 | 3,079,903 |
| Technip SA | 37,900 | 3,622,266 |
| Zodiac Aerospace | 38,200 | 3,132,954 |
| 30,187,569 | ||
| GERMANY — 8.4% | ||
| adidas AG | 21,700 | 1,529,989 |
| BASF SE | 33,000 | 2,398,583 |
| Bayerische Motoren Werke AG | 41,300 | 3,109,056 |
| Fresenius Medical Care AG & Co. KGaA | 55,770 | 3,811,233 |
| Hugo Boss AG Preference Shares | 23,700 | 2,143,594 |
Kabel Deutschland Holding AG(1) | 76,924 | 4,267,344 |
| Muenchener Rueckversicherungs AG | 30,800 | 3,894,862 |
| SAP AG | 85,700 | 5,113,112 |
| Siemens AG | 27,900 | 2,815,904 |
| 29,083,677 | ||
| HONG KONG — 2.6% | ||
| AIA Group Ltd. | 584,700 | 1,838,416 |
| China Unicom Ltd. ADR | 188,900 | 4,074,573 |
| Li & Fung Ltd. | 654,000 | 1,335,750 |
| Link Real Estate Investment Trust (The) | 448,000 | 1,618,995 |
| 8,867,734 | ||
| INDIA — 1.0% | ||
| Bharti Airtel Ltd. | 299,300 | 2,233,053 |
| HDFC Bank Ltd. | 158,400 | 1,361,755 |
| 3,594,808 | ||
| INDONESIA — 0.9% | ||
| PT Bank Mandiri (Persero) Tbk | 4,283,750 | 3,137,113 |
| IRELAND — 1.3% | ||
| Experian plc | 126,900 | 1,688,132 |
| Shire plc | 79,200 | 2,658,313 |
| 4,346,445 | ||
| ITALY — 2.8% | ||
| Pirelli & C SpA | 361,600 | 3,403,943 |
Prada SpA(1) | 359,600 | 1,774,245 |
| Saipem SpA | 98,262 | 4,394,905 |
| 9,573,093 | ||
| JAPAN — 12.9% | ||
| Daihatsu Motor Co. Ltd. | 231,000 | 4,060,051 |
| Dentsu, Inc. | 39,400 | 1,145,820 |
| FANUC CORP. | 20,900 | 3,431,099 |
| Fast Retailing Co. Ltd. | 13,200 | 2,137,816 |
| JGC Corp. | 61,000 | 1,532,342 |
| Komatsu Ltd. | 107,800 | 2,744,672 |
| Konami Corp. | 63,600 | 1,913,849 |
| Lawson, Inc. | 30,100 | 1,784,702 |
| Mitsubishi Corp. | 123,500 | 2,551,265 |
11
| Shares | Value |
| Mitsubishi UFJ Financial Group, Inc. | 523,200 | $ 2,273,020 |
| Murata Manufacturing Co. Ltd. | 50,000 | 2,961,232 |
| Nitori Holdings Co. Ltd. | 31,200 | 2,918,028 |
| ORIX Corp. | 47,000 | 3,956,933 |
| Rakuten, Inc. | 3,600 | 3,852,329 |
| SOFTBANK CORP. | 57,900 | 1,950,812 |
| Sumitomo Realty & Development Co. Ltd. | 51,000 | 1,011,845 |
| Unicharm Corp. | 88,300 | 4,182,643 |
| 44,408,458 | ||
| LUXEMBOURG — 1.1% | ||
| Millicom International Cellular SA | 34,806 | 3,766,883 |
| MACAU — 0.5% | ||
Sands China Ltd.(1) | 580,000 | 1,750,984 |
| NETHERLANDS — 4.1% | ||
| ASML Holding NV | 64,700 | 2,524,571 |
| European Aeronautic Defence and Space Co. NV | 105,900 | 3,175,979 |
| Royal Dutch Shell plc, Class A | 132,864 | 4,620,338 |
| Unilever NV CVA | 114,300 | 3,892,633 |
| 14,213,521 | ||
| PEOPLE’S REPUBLIC OF CHINA — 2.0% | ||
Baidu, Inc. ADR(1) | 30,100 | 3,942,799 |
Focus Media Holding Ltd. ADR(1) | 44,185 | 818,306 |
| Industrial & Commercial Bank of China Ltd. H Shares | 3,900,715 | 2,313,336 |
| 7,074,441 | ||
| POLAND — 0.6% | ||
| Powszechna Kasa Oszczednosci Bank Polski SA | 208,176 | 2,091,853 |
| PORTUGAL — 1.2% | ||
| Jeronimo Martins SGPS SA | 225,000 | 4,107,414 |
| RUSSIAN FEDERATION — 1.3% | ||
| Sberbank of Russia | 1,102,900 | 3,186,781 |
X5 Retail Group NV GDR(1) | 47,300 | 1,251,736 |
| 4,438,517 | ||
| SINGAPORE — 0.8% | ||
| DBS Group Holdings Ltd. | 267,000 | 2,658,319 |
| SOUTH KOREA — 2.2% | ||
| Hyundai Motor Co. | 18,295 | 3,546,413 |
| Samsung Electronics Co. Ltd. | 4,400 | 3,994,621 |
| 7,541,034 | ||
| SPAIN — 2.2% | ||
| Banco Bilbao Vizcaya Argentaria SA | 343,843 | 2,918,484 |
Grifols SA(1) | 147,800 | 2,388,620 |
| Inditex SA | 28,000 | 2,377,853 |
| 7,684,957 | ||
| SWEDEN — 2.9% | ||
| Alfa Laval AB | 116,700 | 2,251,030 |
| Atlas Copco AB A Shares | 145,900 | 3,135,700 |
| Swedbank AB A Shares | 218,100 | 2,919,784 |
| Telefonaktiebolaget LM Ericsson B Shares | 151,100 | 1,608,050 |
| 9,914,564 | ||
| SWITZERLAND — 8.4% | ||
ABB Ltd.(1) | 74,700 | 1,415,629 |
Adecco SA(1) | 29,300 | 1,272,896 |
| Nestle SA | 122,200 | 6,852,000 |
| Novartis AG | 72,165 | 3,894,228 |
| Swatch Group AG (The) | 5,700 | 2,221,662 |
Syngenta AG(1) | 14,500 | 4,276,770 |
UBS AG(1) | 195,000 | 2,397,012 |
| Wolseley plc | 80,600 | 2,417,141 |
| Xstrata plc | 141,800 | 2,283,922 |
Zurich Financial Services AG(1) | 9,200 | 2,023,201 |
| 29,054,461 | ||
| TAIWAN (REPUBLIC OF CHINA) — 1.9% | ||
| Hon Hai Precision Industry Co. Ltd. | 611,000 | 1,658,571 |
| MediaTek, Inc. | 165,000 | 1,568,407 |
| Taiwan Semiconductor Manufacturing Co. Ltd. | 1,307,000 | 3,291,372 |
| 6,518,350 | ||
| THAILAND — 0.6% | ||
| Kasikornbank PCL NVDR | 564,100 | 2,170,355 |
| TURKEY — 0.6% | ||
| Turkiye Garanti Bankasi AS | 626,000 | 2,148,190 |
| UNITED KINGDOM — 18.2% | ||
| Admiral Group plc | 91,341 | 1,325,230 |
| Aggreko plc | 69,350 | 2,066,820 |
| Antofagasta plc | 103,213 | 1,933,057 |
| ARM Holdings plc | 399,600 | 3,751,225 |
| BG Group plc | 249,931 | 5,363,578 |
| British Sky Broadcasting Group plc | 125,800 | 1,517,625 |
| Burberry Group plc | 108,014 | 2,165,251 |
| Capita Group plc (The) | 148,777 | 1,477,696 |
12
| Shares | Value |
| Carnival plc | 51,127 | $1,776,640 |
| Compass Group plc | 185,800 | 1,720,609 |
| GlaxoSmithKline plc | 169,800 | 3,762,466 |
| HSBC Holdings plc (Hong Kong) | 272,178 | 2,146,576 |
| Intertek Group plc | 72,600 | 2,200,952 |
| Kingfisher plc | 410,500 | 1,654,184 |
Lloyds Banking Group plc(1) | 3,248,300 | 1,277,765 |
| National Grid plc | 351,300 | 3,451,619 |
| Reckitt Benckiser Group plc | 87,777 | 4,436,988 |
| Rio Tinto plc | 73,000 | 3,864,286 |
| Standard Chartered plc | 136,264 | 2,975,195 |
| Tullow Oil plc | 53,900 | 1,177,724 |
| Vodafone Group plc | 1,189,100 | 3,225,923 |
| Weir Group plc (The) | 90,700 | 2,951,724 |
| Whitbread plc | 83,100 | 2,148,082 |
| WM Morrison Supermarkets plc | 852,800 | 4,320,047 |
| 62,691,262 | ||
TOTAL COMMON STOCKS(Cost $316,125,435) | 341,701,849 | |
| Temporary Cash Investments — 1.5% | ||
Repurchase Agreement, Bank America Merrill Lynch, (collateralized by various U.S. Treasury obligations, 3.50%, 5/15/20, valued at $1,862,135), in a joint trading account at 0.06%, dated 11/30/11, due 12/1/11 (Delivery value $1,832,744) | 1,832,741 | |
Repurchase Agreement, Credit Suisse First Boston, Inc., (collateralized by various U.S. Treasury obligations, 5.00%, 5/15/37, valued at $1,866,430), in a joint trading account at 0.05%, dated 11/30/11, due 12/1/11 (Delivery value $1,832,741) | 1,832,738 | |
Repurchase Agreement, Goldman Sachs & Co., (collateralized by various U.S. Treasury obligations, 4.375%, 2/15/38, valued at $1,723,312), in a joint trading account at 0.04%, dated 11/30/11, due 12/1/11 (Delivery value $1,686,974) | 1,686,972 | |
TOTAL TEMPORARY CASH INVESTMENTS (Cost $5,352,451) | 5,352,451 | |
TOTAL INVESTMENT SECURITIES — 100.5% (Cost $321,477,886) | 347,054,300 | |
| OTHER ASSETS AND LIABILITIES — (0.5)% | (1,819,903) | |
| TOTAL NET ASSETS — 100.0% | $345,234,397 | |
| Market Sector Diversification | |
| (as a % of net assets) | |
| Financials | 17.4% |
| Consumer Discretionary | 17.1% |
| Industrials | 13.4% |
| Consumer Staples | 12.3% |
| Information Technology | 9.8% |
| Materials | 9.2% |
| Health Care | 6.9% |
| Energy | 6.9% |
| Telecommunication Services | 5.0% |
| Utilities | 1.0% |
| Cash and Equivalents* | 1.0% |
*Includes temporary cash investments and other assets and liabilities.
Notes to Schedule of Investments
ADR = American Depositary Receipt
CVA = Certificaten Van Aandelen
GDR = Global Depositary Receipt
NVDR = Non-Voting Depositary Receipt
(1) Non-income producing.
See Notes to Financial Statements.
13
| NOVEMBER 30, 2011 | ||||
| Assets | ||||
| Investment securities, at value (cost of $321,477,886) | $347,054,300 | |||
| Foreign currency holdings, at value (cost of $1,132,757) | 1,126,760 | |||
| Receivable for investments sold | 857,929 | |||
| Dividends and interest receivable | 1,160,712 | |||
| Other assets | 4,254 | |||
| 350,203,955 | ||||
| Liabilities | ||||
| Payable for investments purchased | 4,660,020 | |||
| Accrued management fees | 309,538 | |||
| 4,969,558 | ||||
| Net Assets | $345,234,397 | |||
| Institutional Class Capital Shares, $0.01 Par Value | ||||
| Shares authorized | 100,000,000 | |||
| Shares outstanding | 39,638,912 | |||
| Net Asset Value Per Share | $8.71 | |||
| Net Assets Consist of: | ||||
| Capital (par value and paid-in surplus) | $336,316,796 | |||
| Undistributed net investment income | 2,456,478 | |||
| Accumulated net realized loss | (19,139,842 | ) | ||
| Net unrealized appreciation | 25,600,965 | |||
| $345,234,397 | ||||
See Notes to Financial Statements.
14
| YEAR ENDED NOVEMBER 30, 2011 | ||||
| Investment Income (Loss) | ||||
| Income: | ||||
| Dividends (net of foreign taxes withheld of $634,881) | $6,721,881 | |||
| Interest | 1,541 | |||
| 6,723,422 | ||||
| Expenses: | ||||
| Management fees | 3,465,440 | |||
| Directors’ fees and expenses | 12,794 | |||
| Other expenses | 4,412 | |||
| 3,482,646 | ||||
| Net investment income (loss) | 3,240,776 | |||
| Realized and Unrealized Gain (Loss) | ||||
| Net realized gain (loss) on: | ||||
| Investment transactions (net of foreign tax expenses paid (refunded) of $17,062) | (7,194,616 | ) | ||
| Foreign currency transactions (net of foreign tax expenses paid (refunded) of $82,350) | (236,530 | ) | ||
| (7,431,146 | ) | |||
| Change in net unrealized appreciation (depreciation) on: | ||||
| Investments (net of deferred foreign taxes of $(72,247)) | (10,603,221 | ) | ||
| Translation of assets and liabilities in foreign currencies | 17,065 | |||
| (10,586,156 | ) | |||
| Net realized and unrealized gain (loss) | (18,017,302 | ) | ||
| Net Increase (Decrease) in Net Assets Resulting from Operations | $(14,776,526 | ) | ||
See Notes to Financial Statements.
15
| YEARS ENDED NOVEMBER 30, 2011 AND NOVEMBER 30, 2010 | |||||||
| Increase (Decrease) in Net Assets | November 30, 2011 | November 30, 2010 | |||||
| Operations | |||||||
| Net investment income (loss) | $3,240,776 | $1,978,829 | |||||
| Net realized gain (loss) | (7,431,146 | ) | 11,374,128 | ||||
| Change in net unrealized appreciation (depreciation) | (10,586,156 | ) | 3,791,324 | ||||
| Net increase (decrease) in net assets resulting from operations | (14,776,526 | ) | 17,144,281 | ||||
| Distributions to Shareholders | |||||||
| From net investment income | (2,574,499 | ) | (2,270,324 | ) | |||
| Capital Share Transactions | |||||||
| Proceeds from shares sold | 125,698,997 | 87,778,606 | |||||
| Proceeds from reinvestment of distributions | 2,574,499 | — | |||||
| Payments for shares redeemed | (15,905,615 | ) | (15,911,311 | ) | |||
| Net increase (decrease) in net assets from capital share transactions | 112,367,881 | 71,867,295 | |||||
| Net increase (decrease) in net assets | 95,016,856 | 86,741,252 | |||||
| Net Assets | |||||||
| Beginning of period | 250,217,541 | 163,476,289 | |||||
| End of period | $345,234,397 | $250,217,541 | |||||
| Undistributed net investment income | $2,456,478 | $1,878,510 | |||||
| Transactions in Shares of the Fund | |||||||
| Sold | 13,582,598 | 10,301,837 | |||||
| Issued in reinvestment of distributions | 266,500 | — | |||||
| Redeemed | (1,689,808 | ) | (1,809,370 | ) | |||
| Net increase (decrease) in shares of the fund | 12,159,290 | 8,492,467 | |||||
See Notes to Financial Statements.
16
NOVEMBER 30, 2011
1. Organization
American Century World Mutual Funds, Inc. (the corporation) is registered under the Investment Company Act of 1940, as amended (the 1940 Act), as an open-end management investment company and is organized as a Maryland corporation. NT International Growth Fund (the fund) is one fund in a series issued by the corporation. The fund is diversified as defined under the 1940 Act. The fund’s investment objective is to seek capital growth. The fund pursues its objective by investing primarily in equity securities of companies in at least three developed countries (excluding the United States). The fund is not permitted to invest in any securities issued by companies assigned by the Global Industry Classification Standard to the tobacco industry.
2. Significant Accounting Policies
The following is a summary of significant accounting policies consistently followed by the fund in preparation of its financial statements. The financial statements are prepared in conformity with accounting principles generally accepted in the United States of America, which may require management to make certain estimates and assumptions at the date of the financial statements. Actual results could differ from these estimates.
Investment Valuations — The fund determines the fair value of its investments and computes its net asset value per share as of the close of regular trading (usually 4 p.m. Eastern time) on the New York Stock Exchange (NYSE) on each day the NYSE is open.
Equity securities that are listed or traded on a domestic securities exchange are valued at the last reported sales price or at the official closing price as provided by the exchange. Equity securities traded on foreign securities exchanges are typically valued at the closing price on the exchange where primarily traded or as of the close of the NYSE, if that is earlier. If no last sales price is reported, or if local convention or regulation so provides, the mean of the latest bid and asked prices is used. Depending on local convention or regulation, securities traded over-the-counter are valued at the mean of the latest bid and asked prices, the last sales price, or the official closing price. In its determination of fair value, the fund may review several factors including: market information specific to a security; news developments in U.S. and foreign markets; the performance of particular U.S. and foreign securities, indices, comparable securities, American Depositary Receipts, Exchange-Traded Funds, and other relevant market indicators.
Debt securities maturing within 60 days at the time of purchase may be valued at cost, plus or minus any amortized discount or premium or at the evaluated mean as provided by an independent pricing service. Evaluated mean prices are commonly derived through utilization of market models, which may consider, among other factors, trade data, quotations from dealers and active market makers, relevant yield curve and spread data, related sector levels, creditworthiness, and other relevant market information on the same or comparable securities.
Investments in open-end management investment companies are valued at the reported net asset value per share. Repurchase agreements are valued at cost.
The value of investments initially expressed in foreign currencies is translated into U.S. dollars at prevailing exchange rates.
If the fund determines that the market price for a portfolio security is not readily available or the valuation methods mentioned above do not reflect a security’s fair value, such security is valued as determined in good faith by the Board of Directors or its designee, in accordance with procedures adopted by the Board of Directors. Circumstances that may cause the fund to use these procedures to value a security include, but are not limited to: a security has been declared in default; trading in a security has been halted during the trading day; there is a foreign market holiday and no trading occurred; or an event occurred between the close of a foreign exchange and the NYSE that may affect the value of a security.
17
Security Transactions — Security transactions are accounted for as of the trade date. Net realized gains and losses are determined on the identified cost basis, which is also used for federal income tax purposes. Certain countries impose taxes on realized gains on the sale of securities registered in their country. The fund records the foreign tax expense, if any, on an accrual basis. The foreign tax expense on realized gains and unrealized appreciation reduces the net realized gain (loss) on investment transactions and net unrealized appreciation (depreciation) on investments, respectively.
Investment Income — Dividend income less foreign taxes withheld, if any, is recorded as of the ex-dividend date. Interest income is recorded on the accrual basis and includes accretion of discounts and amortization of premiums.
Foreign Currency Translations — All assets and liabilities initially expressed in foreign currencies are translated into U.S. dollars at prevailing exchange rates at period end. The fund may enter into spot foreign currency exchange contracts to facilitate transactions denominated in a foreign currency. Purchases and sales of investment securities, dividend and interest income, spot foreign currency exchange contracts, and expenses are translated at the rates of exchange prevailing on the respective dates of such transactions. Net realized and unrealized foreign currency exchange gains or losses related to investment securities are a component of net realized gain (loss) on investment transactions and change in net unrealized appreciation (depreciation) on investments, respectively. Certain countries impose taxes on the contract amount of purchases and sales of foreign currency contracts in their currency. The fund records the foreign tax expense, if any, as a reduction to the net realized gain (loss) on foreign currency transactions.
Repurchase Agreements — The fund may enter into repurchase agreements with institutions that American Century Investment Management, Inc. (ACIM) (the investment advisor) has determined are creditworthy pursuant to criteria adopted by the Board of Directors. The fund requires that the collateral, represented by securities, received in a repurchase transaction be transferred to the custodian in a manner sufficient to enable the fund to obtain those securities in the event of a default under the repurchase agreement. ACIM monitors, on a daily basis, the securities transferred to ensure the value, including accrued interest, of the securities under each repurchase agreement is equal to or greater than amounts owed to the fund under each repurchase agreement.
Joint Trading Account — Pursuant to an Exemptive Order issued by the Securities and Exchange Commission, the fund, along with certain other funds in the American Century Investments family of funds, may transfer uninvested cash balances into a joint trading account. These balances are invested in one or more repurchase agreements that are collateralized by U.S. Treasury or Agency obligations.
Income Tax Status — It is the fund’s policy to distribute substantially all net investment income and net realized gains to shareholders and to otherwise qualify as a regulated investment company under provisions of the Internal Revenue Code. The fund is no longer subject to examination by tax authorities for years prior to 2008. Additionally, non-U.S. tax returns filed by the fund due to investments in certain foreign securities remain subject to examination by the relevant taxing authority for seven years from the date of filing. At this time, management believes there are no uncertain tax positions which, based on their technical merit, would not be sustained upon examination and for which it is reasonably possible that the total amounts of unrecognized tax benefits will significantly change in the next twelve months. Accordingly, no provision has been made for federal or state income taxes.
Distributions to Shareholders — Distributions from net investment income and net realized gains, if any, are generally declared and paid annually. The fund may make distributions on a more frequent basis to comply with the distribution requirements of the Internal Revenue Code, in all events in a manner consistent with provisions of the 1940 Act.
Indemnifications — Under the corporation’s organizational documents, its officers and directors are indemnified against certain liabilities arising out of the performance of their duties to the fund. In addition, in the normal course of business, the fund enters into contracts that provide general indemnifications. The maximum exposure under these arrangements is unknown as this would involve future claims that may be made against a fund. The risk of material loss from such claims is considered by management to be remote.
18
3. Fees and Transactions with Related Parties
Management Fees —The corporation has entered into a management agreement with ACIM, under which ACIM provides the fund with investment advisory and management services in exchange for a single, unified management fee (the fee). The agreement provides that all expenses of managing and operating the fund, except distribution and service fees, brokerage expenses, taxes, interest, fees and expenses of the independent directors (including legal counsel fees), and extraordinary expenses, will be paid by ACIM. The fee is computed and accrued daily based on the daily net assets of the fund and paid monthly in arrears. The rate of the fee is determined by applying a fee rate calculation formula. This formula takes into account the fund’s assets as well as certain assets, if any, of other clients of the investment advisor outside the American Century Investments family of funds (such as subadvised funds and separate accounts) that have very similar investment teams and investment strategies (strategy assets). The strategy assets of the fund include the assets of International Growth Fund, one fund in a series issued by the corporation. The annual management fee schedule ranges from 0.90% to 1.30%. The effective annual management fee for the year ended November 30, 2011 was 1.11%.
Related Parties — Certain officers and directors of the corporation are also officers and/or directors of American Century Companies, Inc. (ACC), the parent of the corporation’s investment advisor, ACIM, the distributor of the corporation, American Century Investment Services, Inc., and the corporation’s transfer agent, American Century Services, LLC. The fund is wholly owned, in aggregate, by various funds in a series issued by American Century Asset Allocation Portfolios, Inc. (ACAAP). ACAAP does not invest in the fund for the purpose of exercising management or control.
The fund was eligible to invest in a money market fund for temporary purposes, which is managed by J.P. Morgan Investment Management, Inc. (JPMIM). The fund had a securities lending agreement with JPMorgan Chase Bank (JPMCB) and a mutual funds services agreement with J.P. Morgan Investor Services Co. (JPMIS). JPMCB was a custodian of the fund. JPMIM, JPMIS and JPMCB are wholly owned subsidiaries of JPMorgan Chase & Co. (JPM). Prior to August 31, 2011, JPM was an equity investor in ACC. The services provided to the fund by JPMIM, JPMIS and JPMCB terminated on July 31, 2011.
4. Investment Transactions
Purchases and sales of investment securities, excluding short-term investments, for the year ended November 30, 2011 were $356,999,248 and $241,396,762, respectively.
5. Fair Value Measurements
The fund’s securities valuation process is based on several considerations and may use multiple inputs to determine the fair value of the positions held by the fund. In conformity with accounting principles generally accepted in the United States of America, the inputs used to determine a valuation are classified into three broad levels as follows:
| • | Level 1 valuation inputs consist of unadjusted quoted prices in an active market for identical securities; |
| • | Level 2 valuation inputs consist of direct or indirect observable market data (including quoted prices for similar securities, evaluations of subsequent market events, interest rates, prepayment speeds, credit risk, etc.); or |
| • | Level 3 valuation inputs consist of unobservable data (including a fund’s own assumptions). |
The level classification is based on the lowest level input that is significant to the fair valuation measurement. The valuation inputs are not necessarily an indication of the risks associated with investing in these securities or other financial instruments.
19
The following is a summary of the level classifications as of period end. The Schedule of Investments provides additional information on the fund’s portfolio holdings.
| Level 1 | Level 2 | Level 3 | ||||||||||
| Investment Securities | ||||||||||||
| Foreign Common Stocks | $9,993,186 | $331,708,663 | — | |||||||||
| Temporary Cash Investments | — | 5,352,451 | — | |||||||||
| Total Value of Investment Securities | $9,993,186 | $337,061,114 | — | |||||||||
6. Risk Factors
There are certain risks involved in investing in foreign securities. These risks include those resulting from future adverse political, social and economic developments, fluctuations in currency exchange rates, the possible imposition of exchange controls, and other foreign laws or restrictions. Investing in emerging markets may accentuate these risks.
7. Federal Tax Information
On December 20, 2011, the fund declared and paid a $0.0739 per-share distribution from net investment income to shareholders of record on December 19, 2011.
The tax character of distributions paid during the years ended November 30, 2011 and November 30, 2010 were as follows:
| 2011 | 2010 | |||||||
| Distributions Paid From | ||||||||
| Ordinary income | $2,574,499 | $2,270,324 | ||||||
| Long-term capital gains | — | — | ||||||
The book-basis character of distributions made during the year from net investment income or net realized gains may differ from their ultimate characterization for federal income tax purposes. These differences reflect the differing character of certain income items and net realized gains and losses for financial statement and tax purposes, and may result in reclassification among certain capital accounts on the financial statements.
As of November 30, 2011, the federal tax cost of investments and the components of distributable earnings on a tax-basis were as follows:
| Federal tax cost of investments | $326,987,178 | |||
| Gross tax appreciation of investments | $32,744,425 | |||
| Gross tax depreciation of investments | (12,677,303 | ) | ||
| Net tax appreciation (depreciation) of investments | $20,067,122 | |||
Net tax appreciation (depreciation) on translation of assets and liabilities in foreign currencies | $8,542 | |||
| Net tax appreciation (depreciation) | $20,075,664 | |||
| Undistributed ordinary income | $2,983,375 | |||
| Accumulated capital losses | $(8,278,098 | ) | ||
| Capital loss deferral | $(5,863,340 | ) |
20
The difference between book-basis and tax-basis cost and unrealized appreciation (depreciation) is attributable primarily to the tax deferral of losses on wash sales and the realization for tax purposes of unrealized gains (losses) on certain foreign currency exchange contracts and investments in passive foreign investment companies.
The accumulated capital losses represent net capital loss carryovers that may be used to offset future realized capital gains for federal income tax purposes. Future capital loss carryover utilization in any given year may be subject to Internal Revenue Code limitations. Capital loss carryovers expire in 2017.
The capital loss deferral represents net capital losses incurred in the one-month period ended November 30, 2011. The fund has elected to treat such losses as having been incurred in the following fiscal year for federal income tax purposes.
On December 22, 2010, the Regulated Investment Company Modernization Act of 2010 (the “Act”) was enacted, which changed various technical rules governing the tax treatment of regulated investment companies. The changes are generally effective for taxable years beginning after the date of enactment. Under the Act, the fund will be permitted to carry forward capital losses incurred in taxable years beginning after the date of enactment for an unlimited period. However, any losses incurred during those future taxable years will be required to be utilized prior to the losses incurred in pre-enactment taxable years, which carry an expiration date. As a result of this ordering rule, pre-enactment capital loss carryforwards may be more likely to expire unused.
21
| For a Share Outstanding Throughout the Years Ended November 30 (except as noted) | |||||||||||||
| Per-Share Data | Ratios and Supplemental Data | ||||||||||||
| Income From Investment Operations: | Distributions From: | Ratio to Average Net Assets of: | |||||||||||
Net Asset Value, Beginning of Period | Net Investment Income (Loss) | Net Realized and Unrealized Gain (Loss) | Total From Investment Operations | Net Investment Income | Net Realized Gains | Total Distributions | Net Asset Value, End of Period | Total Return(1) | Operating Expenses | Net Investment Income (Loss) | Portfolio Turnover Rate | Net Assets, End of Period (in thousands) | |
| Institutional Class | |||||||||||||
| 2011 | $9.11 | 0.10(2) | (0.41) | (0.31) | (0.09) | — | (0.09) | $8.71 | (3.47)% | 1.12% | 1.04% | 77% | $345,234 |
| 2010 | $8.61 | 0.08(2) | 0.54 | 0.62 | (0.12) | — | (0.12) | $9.11 | 7.28% | 1.14% | 0.95% | 85% | $250,218 |
| 2009 | $6.29 | 0.10(2) | 2.33 | 2.43 | (0.11) | — | (0.11) | $8.61 | 39.09% | 1.18% | 1.41% | 132% | $163,476 |
| 2008 | $12.72 | 0.16(2) | (6.18) | (6.02) | (0.12) | (0.29) | (0.41) | $6.29 | (48.82)% | 1.12% | 1.62% | 119% | $55,860 |
| 2007 | $10.34 | 0.12 | 2.29 | 2.41 | (0.03) | — | (0.03) | $12.72 | 23.40% | 1.07% | 1.15% | 104% | $67,703 |
Notes to Financial Highlights
| (1) | Total returns are calculated based on the net asset value of the last business day. Total returns for periods less than one year are not annualized. |
| (2) | Computed using average shares outstanding throughout the period. |
See Notes to Financial Statements.
22
The Board of Directors and Shareholders,
American Century World Mutual Funds, Inc.:
We have audited the accompanying statement of assets and liabilities, including the schedule of investments, of NT International Growth Fund, one of the funds constituting American Century World Mutual Funds, Inc. (the “Corporation”), as of November 30, 2011, and the related statement of operations for the year then ended, the statements of changes in net assets for each of the two years in the period then ended, and the financial highlights for each of the five years in the period then ended. These financial statements and financial highlights are the responsibility of the Corporation’s management. Our responsibility is to express an opinion on these financial statements and financial highlights based on our audits.
We conducted our audits in accordance with the standards of the Public Company Accounting Oversight Board (United States). Those standards require that we plan and perform the audit to obtain reasonable assurance about whether the financial statements and financial highlights are free of material misstatement. The Corporation is not required to have, nor were we engaged to perform, an audit of its internal control over financial reporting. Our audits included consideration of internal control over financial reporting as a basis for designing audit procedures that are appropriate in the circumstances, but not for the purpose of expressing an opinion on the effectiveness of the Corporation’s internal control over financial reporting. Accordingly, we express no such opinion. An audit also includes examining, on a test basis, evidence supporting the amounts and disclosures in the financial statements, assessing the accounting principles used and significant estimates made by management, as well as evaluating the overall financial statement presentation. Our procedures included confirmation of securities owned as of November 30, 2011, by correspondence with the custodian and brokers; where replies were not received from brokers, we performed other auditing procedures. We believe that our audits provide a reasonable basis for our opinion.
In our opinion, the financial statements and financial highlights referred to above present fairly, in all material respects, the financial position of NT International Growth Fund of American Century World Mutual Funds, Inc., as of November 30, 2011, the results of its operations for the year then ended, the changes in its net assets for each of the two years in the period then ended, and the financial highlights for each of the five years in the period then ended, in conformity with accounting principles generally accepted in the United States of America.
Deloitte & Touche LLP
Kansas City, Missouri
January 20, 2012
23
The Board of Directors
The individuals listed below serve as directors of the funds. Each director will continue to serve in this capacity until death, retirement, resignation or removal from office. The mandatory retirement age for directors who are not “interested persons,” as that term is defined in the Investment Company Act (independent directors), is 72. However, the mandatory retirement age for an individual director may be extended with the approval of the remaining independent directors.
Mr. Thomas is the only director who is an “interested person” because he currently serves as President and Chief Executive Officer of American Century Companies, Inc. (ACC), the parent company of American Century Investment Management, Inc. (ACIM or the advisor).
The other directors (more than three-fourths of the total number) are independent; that is, they have never been employees, directors or officers of, and have no financial interest in, ACC or any of its wholly owned, direct or indirect, subsidiaries, including ACIM, American Century Investment Services, Inc. (ACIS) and American Century Services, LLC (ACS). The directors serve in this capacity for seven (in the case of Mr. Thomas, 15) registered investment companies in the American Century Investments family of funds.
The following presents additional information about the directors. The mailing address for each director is 4500 Main Street, Kansas City, Missouri 64111.
Name (Year of Birth) | Position(s) Held with Funds | Length of Time Served | Principal Occupation(s) During Past 5 Years | Number of American Century Portfolios Overseen by Director | Other Directorships Held During Past 5 Years |
| Independent Directors | |||||
Thomas A. Brown (1940) | Director | Since 1980 | Managing Member, Associated Investments, LLC (real estat investment company); Brown Cascade Properties, LLC (real estate investment company) (2001 to 2009) | 65 | None |
Andrea C. Hall (1945) | Director | Since 1997 | Retired as advisor to the President, Midwest Research Institute (not-for-profit research organization) (June 2006) | 65 | None |
Jan M. Lewis (1957) | Director | Since 2011 | President and Chief Executive Officer, Catholic Charities of Northeast Kansas (human services organization)(2006 to present); President, BUCON Inc. (full-service design-build construction company) (2004 to 2006) | 65 | None |
James A. Olson (1942) | Director | Since 2007 | Member, Plaza Belmont LLC (private equity fund manager); Chief Financial Officer, Plaza Belmont LLC (September 1999 to September 2006) | 65 | Saia, Inc. and Entertainment Properties Trust |
24
Name (Year of Birth) | Position(s) Held with Funds | Length of Time Served | Principal Occupation(s) During Past 5 Years | Number of American Century Portfolios Overseen by Director | Other Directorships Held During Past 5 Years |
| Independent Directors | |||||
Donald H. Pratt (1937) | Director and Chairman of the Board | Since 1995 (Chairman since 2005) | Chairman and Chief Executive Officer, Western Investments, Inc. (real estate company) | 65 | None |
M. Jeannine Strandjord (1945) | Director | Since 1994 | Retired | 65 | DST Systems Inc., Euronet Worldwide Inc., and Charming Shoppes, Inc. |
John R. Whitten (1946) | Director | Since 2008 | Project Consultant, Celanese Corp. (industrial chemical company) | 65 | Rudolph Technologies, Inc. |
Stephen E. Yates (1948) | Advisory Director | Since 2011 | Retired; Executive Vice President, Technology & Operations, KeyCorp. (computer services) (2004 to 2010) | 65 | Applied Industrial Technology (2001 to 2010) |
| Interested Director | |||||
Jonathan S. Thomas (1963) | Director and President | Since 2007 | President and Chief Executive Officer, ACC (March 2007 to present); Chief Administrative Officer, ACC (February 2006 to February 2007); Executive Vice President, ACC (November 2005 to February 2007). Also serves as: Chief Executive Officer and Manager, ACS; Executive Vice President, ACIM; Director, ACC, ACIM and other ACC subsidiaries | 106 | None |
25
Officers
The following table presents certain information about the executive officers of the funds. Each officer serves as an officer for each of the 15 investment companies in the American Century family of funds, unless otherwise noted. No officer is compensated for his or her service as an officer of the funds. The listed officers are interested persons of the funds and are appointed or re-appointed on an annual basis. The mailing address for each officer listed below is 4500 Main Street, Kansas City, Missouri 64111.
Name (Year of Birth) | Offices with the Funds | Principal Occupation(s) During the Past Five Years |
Jonathan S. Thomas (1963) | Director and President since 2007 | President and Chief Executive Officer, ACC (March 2007 to present); Chief Administrative Officer, ACC (February 2006 to February 2007); Executive Vice President, ACC (November 2005 to February 2007). Also serves as: Chief Executive Officer and Manager, ACS; Executive Vice President, ACIM; Director, ACC, ACIM and other ACC subsidiaries |
Barry Fink (1955) | Executive Vice President since 2007 | Chief Operating Officer and Executive Vice President, ACC (September 2007 to present); President, ACS (October 2007 to present); Managing Director, Morgan Stanley (2000 to 2007); Global General Counsel, Morgan Stanley (2000 to 2006). Also serves as: Manager, ACS and Director, ACC and certain ACC subsidiaries |
Maryanne L. Roepke (1956) | Chief Compliance Officer since 2006 and Senior Vice President since 2000 | Chief Compliance Officer, American Century funds, ACIM and ACS (August 2006 to present); Assistant Treasurer, ACC (January 1995 to August 2006); and Treasurer and Chief Financial Officer, various American Century funds (July 2000 to August 2006). Also serves as: Senior Vice President, ACS |
Charles A. Etherington (1957) | General Counsel since 2007 and Senior Vice President since 2006 | Attorney, ACC (February 1994 to present); Vice President, ACC (November 2005 to present), General Counsel, ACC (March 2007 to present); Also serves as General Counsel, ACIM, ACS, ACIS and other ACC subsidiaries; and Senior Vice President, ACIM and ACS |
Robert J. Leach (1966) | Vice President, Treasurer and Chief Financial Officer since 2006 | Vice President, ACS (February 2000 to present); and Controller, various American Century funds (1997 to September 2006) |
David H. Reinmiller (1963) | Vice President since 2000 | Attorney, ACC (January 1994 to present); Associate General Counsel, ACC (January 2001 to present). Also serves as Vice President, ACIM and ACS |
Ward D. Stauffer (1960) | Secretary since 2005 | Attorney, ACC (June 2003 to present) |
The Statement of Additional Information has additional information about the fund’s directors and is available without charge, upon request, by calling 1-800-345-2021.
26
At a meeting held on June 9, 2011, the Fund’s Board of Directors unanimously approved the renewal of the management agreement pursuant to which American Century Investment Management, Inc. (the “Advisor”) acts as the investment advisor for the Fund. Under Section 15(c) of the Investment Company Act, contracts for investment advisory services are required to be reviewed, evaluated, and approved by a majority of a fund’s independent directors (the “Directors”) each year.
As a part of the approval process, the Board requested and reviewed extensive data and information compiled by the Advisor and certain independent providers of evaluation data concerning the Fund and the services provided to the Fund by the Advisor. This review was in addition to the oversight and evaluation undertaken by the Board and its committees on a continuous basis throughout the year and included, but was not limited to the following:
| • | the nature, extent, and quality of investment management, shareholder services, and other services provided by the Advisor to the Fund; |
| • | the wide range of other programs and services the Advisor provides to the Fund and its shareholders on a routine and non-routine basis; |
| • | the investment performance of the fund, including data comparing the Fund’s performance to appropriate benchmarks and/or a peer group of other mutual funds with similar investment objectives and strategies; |
| • | data comparing the cost of owning the Fund to the cost of owning similar funds; |
| • | the Advisor’s compliance policies, procedures, and regulatory experience; |
| • | financial data showing the cost of services provided to the Fund, the profitability of the Fund to the Advisor, and the overall profitability of the Advisor; |
| • | data comparing services provided and charges to other investment management clients of the Advisor; and |
| • | consideration of collateral benefits derived by the Advisor from the management of the Fund and any potential economies of scale relating thereto. |
In keeping with its practice, the Board held two in-person meetings and one telephonic meeting to review and discuss the information provided. The Directors also had the benefit of the advice of independent counsel throughout the period.
Factors Considered
The Directors considered all of the information provided by the Advisor, the independent data providers, and independent counsel, and evaluated such information for the Fund. In connection with their review, the Directors did not identify any single factor as being all-important or controlling, and each Director may have attributed different levels of importance to different factors. In deciding to renew the management agreement, the Board based its decision on a number of factors, including the following:
27
Nature, Extent and Quality of Services — Generally. Under the management agreement, the Advisor is responsible for providing or arranging for all services necessary for the operation of the Fund. The Board noted that under the management agreement, the Advisor provides or arranges at its own expense a wide variety of services including:
| • | constructing and designing the Fund |
| • | portfolio research and security selection |
| • | initial capitalization/funding |
| • | securities trading |
| • | Fund administration |
| • | custody of Fund assets |
| • | daily valuation of the Fund’s portfolio |
| • | shareholder servicing and transfer agency, including shareholder confirmations, recordkeeping, and communications |
| • | legal services |
| • | regulatory and portfolio compliance |
| • | financial reporting |
| • | marketing and distribution |
The Board noted that many of these services have expanded over time both in terms of quantity and complexity in response to shareholder demands, competition in the industry, changing distribution channels, and the changing regulatory environment.
Investment Management Services. The nature of the investment management services provided to the Fund is quite complex and allows Fund shareholders access to professional money management, instant diversification of their investments within an asset class, the opportunity to easily diversify among asset classes by investing in or exchanging among various American Century Investments funds, and liquidity. In evaluating investment performance, the Board expects the Advisor to manage the Fund in accordance with its investment objectives and approved strategies. Further, the Directors recognize that the Advisor has an obligation to monitor trading activities, and in particular to seek the best execution of fund trades, and to evaluate the use of and payment for research. In providing these services, the Advisor utilizes teams of investment professionals (portfolio managers, analysts, research assistants, and securities traders) who require extensive information technology, research, training, compliance and other systems to conduct their business. The Board, directly and through its Fund Performance Review Committee, regularly reviews investment performance information for the Fund, together with comparative information for appropriate benchmarks and/or peer groups of similarly-managed funds, over different
28
time horizons. The Directors also review detailed performance information during the management agreement approval process. If performance concerns are identified, the Fund receives special reviews until performance improves, during which the Board discusses with the Advisor the reasons for such results (e.g., market conditions, security selection) and any efforts being undertaken to improve performance. Taking all these factors into consideration, the Board found the investment management services provided by the Advisor to the Fund to meet or exceed industry standards. More detailed information about the Fund’s performance can be found in the Performance and Portfolio Commentary sections of this report.
Shareholder and Other Services. Under the management agreement, the Advisor provides the Fund with a comprehensive package of transfer agency, shareholder, and other services. The Board, directly and through various committees of the Board, regularly reviews reports and evaluations of such services at its regular meetings. These reports include, but are not limited to, information regarding the operational efficiency and accuracy of the shareholder and transfer agency services provided, staffing levels, shareholder satisfaction (as measured by external as well as internal sources), technology support, new products and services offered to Fund shareholders, securities trading activities, portfolio valuation services, auditing services, and legal and operational compliance activities. Certain aspects of shareholder and transfer agency service level efficiency and the quality of securities trading activities are measured by independent third party providers and are presented in comparison to other fund groups not managed by the Advisor. The Board found the services provided by the Advisor to the Fund under the management agreement to be competitive and of high quality.
Costs of Services and Profitability. The Advisor provides detailed information concerning its cost of providing various services to the Fund, its profitability in managing the Fund, its overall profitability, and its financial condition. The Directors have reviewed with the Advisor the methodology used to prepare this financial information. The financial information regarding the Advisor is considered in evaluating the Advisor’s financial condition, ability to continue to provide services under the management agreement, and the reasonableness of the current management fee. The Board concluded that the Advisor’s profits were reasonable in light of the services provided to the Fund.
Ethics. The Board generally considers the Advisor’s commitment to providing quality services to shareholders and to conducting its business ethically. They noted that the Advisor’s practices generally meet or exceed industry best practices.
Economies of Scale. The Board also reviewed information provided by the Advisor regarding the possible existence of economies of scale in connection with the management of the Fund. The Board concluded that economies of scale are difficult to measure and predict with precision, especially on a fund-by-fund basis. The Board concluded that the Advisor is appropriately sharing economies of scale through its competitive fee structure, offering competitive fees from fund inception, and through reinvestment in its business to provide shareholders additional content and services.
29
Comparison to Other Funds’ Fees. The management agreement provides that the Fund pay the Advisor a single, all-inclusive (or unified) management fee for providing all services necessary for the management and operation of the Fund, other than brokerage expenses, taxes, interest, extraordinary expenses, and the fees and expenses of the Fund’s independent directors (including their independent legal counsel) and expenses incurred in connection with the provision of shareholder services and distribution services under a plan adopted pursuant to Rule 12b-1 under the 1940 Act. Under the unified fee structure, the Advisor is responsible for providing all investment advisory, custody, audit, administrative, compliance, recordkeeping, marketing and shareholder services, or arranging and supervising third parties to provide such services. By contrast, most other funds are charged a variety of fees, including an investment advisory fee, a transfer agency fee, an administrative fee, distribution charges and other expenses. Other than their investment advisory fees and any applicable Rule 12b-1 distribution fees, all other components of the total fees charged by these other funds may be increased without shareholder approval. The Board believes the unified fee structure is a benefit to Fund shareholders because it clearly discloses to shareholders the cost of owning Fund shares, and, since the unified fee cannot be increased without a vote of Fund shareholders, it shifts to the Advisor the risk of increased costs of operating the Fund and provides a direct incentive to minimize administrative inefficiencies. Part of the Board’s analysis of fee levels involves reviewing certain evaluative data compiled by an independent provider and comparing the Fund’s unified fee to the total expense ratio of other funds in the Fund’s peer group. The Board concluded that the management fee paid by the Fund to the Advisor under the management agreement is reasonable in light of the services provided to the Fund.
Comparison to Fees and Services Provided to Other Clients of the Advisor. The Board also requested and received information from the Advisor concerning the nature of the services, fees, costs and profitability of its advisory services to advisory clients other than the Fund. They observed that these varying types of client accounts require different services and involve different regulatory and entrepreneurial risks than the management of the Fund. The Board analyzed this information and concluded that the fees charged and services provided to the Fund were reasonable by comparison.
Collateral or “Fall-Out” Benefits Derived by the Advisor. The Board considered the existence of collateral benefits the Advisor may receive as a result of its relationship with the Fund. They concluded that the Advisor’s primary business is managing mutual funds and it generally does not use fund or shareholder information to generate profits in other lines of business, and therefore does not derive any significant collateral benefits from them. The Board noted that the Advisor receives proprietary research from broker-dealers that execute fund portfolio transactions and concluded that this research is likely to benefit Fund shareholders. The Board also determined that the Advisor is able to provide investment management services to certain clients other than the Fund, at least in part, due to its existing infrastructure built to serve the fund complex. The Board concluded, however, that the assets of those other clients are not material to the analysis and, where applicable, may be included with the assets of the Fund to determine breakpoints in the management fee schedule.
30
Existing Relationship. The Board also considered whether there was any reason for not continuing the existing arrangement with the Advisor. In this regard, the Board was mindful of the potential disruptions of the Fund’s operations and various risks, uncertainties, and other effects that could occur as a result of a decision not to continue such relationship. In particular, the Board recognized that most shareholders have invested in the Fund on the strength of the Advisor’s industry standing and reputation and in the expectation that the Advisor will have a continuing role in providing advisory services to the Fund.
Conclusion of the Directors. As a result of this process, the Board, including all of the independent directors, taking into account all of the factors discussed above and the information provided by the Advisor and others, concluded that the management agreement between the Fund and the Advisor is fair and reasonable in light of the services provided and should be renewed.
31
Retirement Account Information
As required by law, distributions you receive from certain IRAs, or 403(b), 457 and qualified plans are subject to federal income tax withholding, unless you elect not to have withholding apply. Tax will be withheld on the total amount withdrawn even though you may be receiving amounts that are not subject to withholding, such as nondeductible contributions. In such case, excess amounts of withholding could occur. You may adjust your withholding election so that a greater or lesser amount will be withheld.
If you don’t want us to withhold on this amount, you must notify us to not withhold the federal income tax. You may notify us in writing or in certain situations by telephone or through other electronic means. You have the right to revoke your withholding election at any time and any election you make may remain in effect until revoked by filing a new election.
Remember, even if you elect not to have income tax withheld, you are liable for paying income tax on the taxable portion of your withdrawal. If you elect not to have income tax withheld or you don’t have enough income tax withheld, you may be responsible for payment of estimated tax. You may incur penalties under the estimated tax rules if your withholding and estimated tax payments are not sufficient. You can reduce or defer the income tax on a distribution by directly or indirectly rolling such distribution over to another IRA or eligible plan. You should consult your tax advisor for additional information.
State tax will be withheld if, at the time of your distribution, your address is within one of the mandatory withholding states and you have federal income tax withheld. State taxes will be withheld from your distribution in accordance with the respective state rules.
Proxy Voting Guidelines
American Century Investment Management, Inc., the fund’s investment advisor, is responsible for exercising the voting rights associated with the securities purchased and/or held by the fund. A description of the policies and procedures the advisor uses in fulfilling this responsibility is available without charge, upon request, by calling 1-800-345-2021. It is also available on American Century Investments’ website at americancentury.com and on the Securities and Exchange Commission’s website at sec.gov. Information regarding how the investment advisor voted proxies relating to portfolio securities during the most recent 12-month period ended June 30 is available on the “About Us” page at americancentury.com. It is also available at sec.gov.
Quarterly Portfolio Disclosure
The fund files its complete schedule of portfolio holdings with the Securities and Exchange Commission (SEC) for the first and third quarters of each fiscal year on Form N-Q. The fund’s Forms N-Q are available on the SEC’s website at sec.gov, and may be reviewed and copied at the SEC’s Public Reference Room in Washington, DC. Information on the operation of the Public Reference Room may be obtained by calling 1-800-SEC-0330. The fund also makes its complete schedule of portfolio holdings for the most recent quarter of its fiscal year available on its website at americancentury.com and, upon request, by calling 1-800-345-2021.
32
Other Tax Information
The following information is provided pursuant to provisions of the Internal Revenue Code.
The fund hereby designates up to the maximum amount allowable as qualified dividend income for the fiscal year ended November 30, 2011.
For corporate taxpayers, the fund hereby designates $2,480, or up to the maximum amount allowable, of ordinary income distributions paid during the fiscal year ended November 30, 2011 as qualified for the corporate dividends received deduction.
For the fiscal year ended November 30, 2011, the fund intends to pass through to shareholders $626,800, or up to the maximum amount allowable, as a foreign tax credit which represents taxes paid on income derived from sources within foreign countries or possessions of the United States. During the fiscal year ended November 30, 2011, the fund earned $6,770,548 from income derived from foreign sources. Foreign source income and foreign tax expense per outstanding share on November 30, 2011 are $0.1708 and $0.0158, respectively.
33
34
35
36
| Contact Us | americancentury.com |
| Automated Information Line | 1-800-345-8765 |
| Investor Services Representative | 1-800-345-2021 or 816-531-5575 |
| Investors Using Advisors | 1-800-378-9878 |
Business, Not-For-Profit, Employer-Sponsored Retirement Plans | 1-800-345-3533 |
Banks and Trust Companies, Broker-Dealers, Financial Professionals, Insurance Companies | 1-800-345-6488 |
| Telecommunications Device for the Deaf | 1-800-634-4113 |
American Century World Mutual Funds, Inc.
Investment Advisor:
American Century Investment Management, Inc.
Kansas City, Missouri
This report and the statements it contains are submitted for the general information of our shareholders. The report is not authorized for distribution to prospective investors unless preceded or accompanied by an effective prospectus.
©2012 American Century Proprietary Holdings, Inc. All rights reserved.
CL-ANN-74133 1201
ANNUAL REPORT | NOVEMBER 30, 2011
| International Growth Fund |
| President’s Letter | 2 |
| Independent Chairman’s Letter | 3 |
| Market Perspective | 4 |
| Performance | 5 |
| Portfolio Commentary | 7 |
| Fund Characteristics | 9 |
| Shareholder Fee Example | 10 |
| Schedule of Investments | 12 |
| Statement of Assets and Liabilities | 15 |
| Statement of Operations | 16 |
| Statement of Changes in Net Assets | 17 |
| Notes to Financial Statements | 18 |
| Financial Highlights | 25 |
| Report of Independent Registered Public Accounting Firm | 27 |
| Management | 28 |
| Approval of Management Agreement | 31 |
| Additional Information | 36 |
Any opinions expressed in this report reflect those of the author as of the date of the report, and do not necessarily represent the opinions of American Century Investments® or any other person in the American Century Investments organization. Any such opinions are subject to change at any time based upon market or other conditions and American Century Investments disclaims any responsibility to update such opinions. These opinions may not be relied upon as investment advice and, because investment decisions made by American Century Investments funds are based on numerous factors, may not be relied upon as an indication of trading intent on behalf of any American Century Investments fund. Security examples are used for representational purposes only and are not intended as recommendations to purchase or sell securities. Performance information for comparative indices and securities is provided to American Century Investments by third party vendors. To the best of American Century Investments’ knowledge, such information is accurate at the time of printing.
Thank you for reviewing this annual report for the period ended November 30, 2011. Our report offers investment performance and portfolio information, presented with the expert perspective of our portfolio management team.
This report remains one of our most important vehicles for conveying information about fund returns, as well as market factors and strategies that affected fund performance. For additional, updated information, we encourage you to visit our website, americancentury.com. Click on the “Fund Performance” and “Insights & News” headings at the top of our Individual Investors site.
Reporting Period’s Divided Nature Resulted in Mixed Returns
The financial market performance that most U.S. investors experienced during the 12 months ended November 30, 2011 generally reflected the period’s divided nature. For the first six months, confidence in global economic growth, strong corporate earnings, and increased risk-taking generally ruled the markets. The MSCI EAFE Index and the S&P 500 Index advanced approximately 15% for the six months ended May 31, 2011, as stocks broadly outperformed high-quality bonds for that period.
However, the tables reversed sharply for the final six months. The risk-taking tide ebbed during the summer months, constrained by high fuel prices, federal budget management concerns in the U.S., and the worsening sovereign debt crisis in Europe. High-quality bonds, led by long-maturity U.S. Treasury securities, mostly outpaced stocks. The MSCI EAFE Index and the S&P 500 Index returned –16.56% and –6.25%, respectively, during the six months ended November 30, 2011, despite a significant market rebound in October.
As a result of this volatility, returns were mixed for the full 12-month period. U.S. and international bonds and U.S. stocks generally outperformed international stocks. The S&P 500 Index and the MSCI EAFE Index returned 7.83% and –4.12%, respectively, for the fiscal year.
Unfortunately, further volatility appears likely in 2012 as the markets wrestle with uncertainties regarding European debt, economic strength, government budget deficits, and the U.S. presidential election. We believe strongly in adhering to a disciplined, diversified, long-term investment approach during volatile periods, and we appreciate your continued trust in us during these unsettled times.
Sincerely,
Jonathan Thomas
President and Chief Executive Officer
American Century Investments
2
The board of directors of the fund was pleased at the announcement of a new strategic partner for the investment advisor to the American Century Investments funds. Canadian Imperial Bank of Commerce (CIBC), a leading Canadian financial institution, purchased the 41 percent economic interest in American Century Companies, the parent corporation of the advisor, previously held by JPMorgan Chase & Co. Based in Toronto, CIBC provides a full range of retail and wholesale banking services to almost 11 million clients through approximately 1,100 branches and offices in Canada, the U.S. and around the world. This transaction will benefit fund shareholders by bolstering the financial strength of the advisor and providing a strategic partner to help support its growth initiative to broaden non-U.S. distribution of its products and services.
The board also has been briefed throughout the year on the impact on fund performance of the European banking crisis, the U.S. deficit reduction debates, and the pace of economic growth. While the performance of all funds has been affected, the majority of American Century Investments funds overseen by the board are exceeding their benchmarks for the one-, three-, five-, and ten-year periods ended September 30, 2011. This is commendable performance, particularly in these challenging market conditions.
We are completing another year of board oversight on your behalf. We appreciate any comments you would like to share with the board. Send them to me at dhpratt@fundboardchair.com. Thank you for your continued investment in American Century Investments funds.
Best regards,
Don Pratt
3
By Mark Kopinski, Chief Investment Officer, Global and Non-U.S. Equity
Stocks Struggled as Growth Slowed
Global stock markets kicked off the 12-month period in generally robust fashion, no easy feat considering investors had to weigh brightening economic outlooks against mounting inflationary pressures, ongoing sovereign debt concerns, and an onslaught of political unrest and natural disasters. Nevertheless, negative forces—primarily expanding sovereign debt problems in Europe and the United States—gradually tightened their hold on the worldwide economy, and market sentiment began to deteriorate. The downdraft culminated with a sharp global market selloff in the third calendar quarter of 2011, triggered primarily by Standard & Poor’s first-ever downgrade of the United States’ long-term credit rating and mounting fears of a default in Greece. Worried about the potential for another global recession, the International Monetary Fund (IMF) trimmed its global growth outlook for 2012.
Overall, emerging market stocks underperformed developed international markets for the 12-month period, as investors retreated from riskier investments. In addition, falling global growth prospects sparked stock slumps, particularly in export-heavy emerging-market economies of South Korea and China. Economic growth continued to moderate in China, but inflationary pressures continued to build, prompting IMF calls for China to allow its currency to appreciate to temper a surge in inflation.
Outlook Hinges on Fiscal Strategies
The period ended with the United States, Japan and China releasing relatively strong economic data, thereby diminishing concerns for a synchronized global recession. Yet, European Union countries continued to falter. As the eurozone crisis continues, global demand likely will decrease as a function of deleveraging, which should negatively influence export-driven markets. In addition, volatility in the financial markets may remain heightened, as investors react to European reform plans.
Ultimately, we believe the global economy can and will resume a strong growth trend. But to do so, each region and country will have to address its specific fiscal challenges. We believe these are solvable problems, as long as government policy supports the private sector and its role in driving economic output and employment based on the profit incentive.
| International Equity Total Returns | ||||
| For the 12 months ended November 30, 2011 (in U.S. dollars) | ||||
| MSCI EAFE Index | -4.12% | MSCI Europe Index | -2.08% | |
| MSCI EAFE Growth Index | -3.96% | MSCI World Index | 1.46% | |
| MSCI EAFE Value Index | -4.27% | MSCI Japan Index | -8.56% | |
| MSCI Emerging Markets Index | -11.54% | |||
4
| Total Returns as of November 30, 2011 | ||||||
| Average Annual Returns | ||||||
| Ticker Symbol | 1 year | 5 years | 10 years | Since Inception | Inception Date | |
| Investor Class | TWIEX | -2.57% | -1.74% | 4.05% | 7.32% | 5/9/91 |
| MSCI EAFE Index | — | -4.12% | -3.95% | 4.83% | 4.65%(1) | — |
| MSCI EAFE Growth Index | — | -3.96% | -2.37% | 4.47% | 3.30%(1) | — |
| Institutional Class | TGRIX | -2.27% | -1.53% | 4.27% | 4.63% | 11/20/97 |
A Class(2) No sales charge* With sales charge* | TWGAX | -2.76% -8.37% | -1.97% -3.13% | 3.80% 3.18% | 5.25% 4.84% | 10/2/96 |
| C Class | AIWCX | -3.55% | -2.71% | 3.01% | 1.33% | 6/4/01 |
| R Class | ATGRX | -3.05% | -2.23% | — | 5.69% | 8/29/03 |
*Sales charges include initial sales charges and contingent deferred sales charges (CDSCs), as applicable. A Class shares have a 5.75% maximum initial sales charge and may be subject to a maximum CDSC of 1.00%. C Class shares redeemed within 12 months of purchase are subject to a maximum CDSC of 1.00%. The SEC requires that mutual funds provide performance information net of maximum sales charges in all cases where charges could be applied.
| (1) | Since 4/30/91, the date nearest the Investor Class’s inception for which data are available. |
| (2) | Prior to December 3, 2007, the A Class was referred to as the Advisor Class and did not have a front-end sales charge. Performance prior to that date has been adjusted to reflect this charge. |
Data presented reflect past performance. Past performance is no guarantee of future results. Current performance may be higher or lower than the performance shown. Investment return and principal value will fluctuate, and redemption value may be more or less than original cost. To obtain performance data current to the most recent month end, please call 1 800-345-2021 or visit americancentury.com. International investing involves special risks, such as political instability and currency fluctuations. Investing in emerging markets may accentuate these risks. The fund’s investment process may result in high portfolio turnover, which could mean high transaction costs, affecting both performance and capital gains tax liabilities to investors.
Unless otherwise indicated, performance reflects Investor Class shares; performance for other share classes will vary due to differences in fee structure. For information about other share classes available, please consult the prospectus. Data assumes reinvestment of dividends and capital gains, and none of the charts reflect the deduction of taxes that a shareholder would pay on fund distributions or the redemption of fund shares. Returns for the indices are provided for comparison. The fund’s total returns include operating expenses (such as transaction costs and management fees) that reduce returns, while the total returns of the indices do not.
5
| Growth of $10,000 Over 10 Years |
| $10,000 investment made November 30, 2001 |
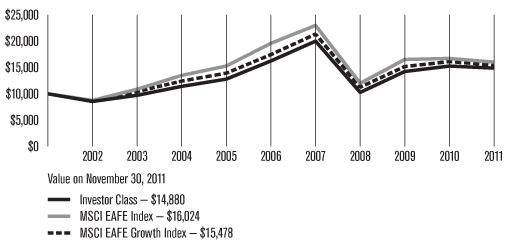
| Total Annual Fund Operating Expenses | ||||
| Investor Class | Institutional Class | A Class | C Class | R Class |
| 1.35% | 1.15% | 1.60% | 2.35% | 1.85% |
The total annual fund operating expenses shown is as stated in the fund’s prospectus current as of the date of this report. The prospectus may vary from the expense ratio shown elsewhere in this report because it is based on a different time period, includes acquired fund fees and expenses, and, if applicable, does not include fee waivers or expense reimbursements.
Data presented reflect past performance. Past performance is no guarantee of future results. Current performance may be higher or lower than the performance shown. Investment return and principal value will fluctuate, and redemption value may be more or less than original cost. To obtain performance data current to the most recent month end, please call 1-800-345-2021 or visit americancentury.com. International investing involves special risks, such as political instability and currency fluctuations. Investing in emerging markets may accentuate these risks. The fund’s investment process may result in high portfolio turnover, which could mean high transaction costs, affecting both performance and capital gains tax liabilities to investors.
Unless otherwise indicated, performance reflects Investor Class shares; performance for other share classes will vary due to differences in fee structure. For information about other share classes available, please consult the prospectus. Data assumes reinvestment of dividends and capital gains, and none of the charts reflect the deduction of taxes that a shareholder would pay on fund distributions or the redemption of fund shares. Returns for the indices are provided for comparison. The fund’s total returns include operating expenses (such as transaction costs and management fees) that reduce returns, while the total returns of the indices do not.
6
Performance Summary
International Growth declined -2.57%* for the 12 months ended November 30, 2011, compared with its benchmark, the MSCI EAFE Index, which declined -4.12%.
Global stocks generally struggled during the 12-month period, as investors grappled with the ongoing and expanding sovereign debt problems in several developed nations. In particular, fears of a default in Greece and contagion throughout the rest of the eurozone weighed on stocks. In addition, mounting inflationary pressures in China and other emerging markets, combined with fears that a global economic slowdown would stifle demand for their goods, drove down stocks in the developing world. Within the developed markets, growth stocks outpaced their value counterparts, while large-cap stocks showed a slight performance advantage over their small-cap brethren.
Overall, stock selection, particularly in the utilities, consumer discretionary and industrials sectors, drove the portfolio’s outperformance relative to the benchmark. Our sector allocations, including an underweight in the utilities sector, also had an overall positive influence on the portfolio’s relative performance.
From a regional perspective, stock selection in France and Germany and an underweight position in Japan contributed the most to the portfolio’s relative performance. At the opposite end of the spectrum, the United Kingdom, Australia and Switzerland and exposure to the emerging markets detracted from relative performance, primarily due to weak stock selection.
Consumer Discretionary, Industrials Led Sector Results
The portfolio’s consumer discretionary stocks led all sectors on a relative basis, driven by strong stock selection in the automobile industry. In particular, a portfolio-only position in South Korea’s Hyundai Motor Co. was among the portfolio’s top contributors. The company posted sales and market share gains in key markets, as the March 2011 earthquake and tsunami forced its leading Japanese competitors to cut near-term production forecasts. Moreover, as demand steadily climbed, the automaker ramped up near-term production plans.
In addition, a portfolio-only position in Canadian National Railway Co. drove results in the industrials sector. Shares in the operator of Canada’s largest railroad system benefited from the overall modest growth in Canada’s economy, compared with other large, developed nations. In addition, the company reported solid third-quarter results, driven by record car loadings and revenues and cost controls, and it maintained an attractive dividend payment.
The portfolio’s technology sector also was a strong contributor to performance, with United Kingdom-based ARM Holdings leading the charge. The company’s shares advanced on robust demand for smartphones and tablet computers. Furthermore, the company maintained a competitive edge in the smartphone market, where its designs are behind the chips powering many next-generation handsets, and in the tablet computer market, which one analyst predicted would
*All fund returns referenced in this commentary are for Investor Class shares.
7
grow six-fold in the next two years. Meanwhile, U.S. software giant Microsoft announced the next generation of its Windows operating system would be able to run on ARM-designed chips.
Financials Sector Struggled
The portfolio’s financials sector was the largest detractor to performance, primarily due to stock selection in the commercial banking industry. Europe’s expanding sovereign debt crisis sent ripples through the global financial system, particularly for banks with exposure to the troubled credits of Greece, Italy, Spain, and Portugal. Among the portfolio holdings that suffered the most due to these events were UniCredit and Lloyds Banking Group. Shares of Italy based UniCredit sagged amid concerns earnings weren’t sufficiently growing. In addition, Italy’s deteriorating economic outlook raised questions about the country’s stability going forward.
Similarly, United Kingdom-based Lloyds Banking Group was among the portfolio’s largest detractors. Shares struggled throughout the reporting period, but they took a severe hit late in the period, when the British government raised its levy on banks to raise money and discourage financial institutions from becoming overly dependent on unguaranteed debts to avoid another bailout. Also, Standard & Poor’s downgraded the credit ratings of Lloyds and other large global financial institutions due to weaker confidence in governments’ ability to bail out troubled banks.
The health care sector also detracted from relative performance, primarily due to an underweight position in the pharmaceuticals industry. In addition, the portfolio’s materials sector slightly detracted from relative performance, primarily due to stock selection in the chemicals industry.
Outlook
We continue to focus on companies with the potential for better structural growth in all regions, rather than economically-sensitive companies. We believe good opportunities exist in the developed markets of Asia and select emerging markets. Furthermore, we expect growth in the emerging markets to continue providing a powerful benefit for many companies based in the developed markets, particularly in the consumer sectors. We will continue to focus on finding companies located in developed countries around the world (excluding the United States) with the potential to deliver sustainable growth characteristics and promising long-term outlooks.
8
| NOVEMBER 30, 2011 | |
| Top Ten Holdings | % of net assets |
| Royal Dutch Shell plc B Shares | 2.0% |
| Nestle SA | 1.9% |
| BHP Billiton Ltd. | 1.9% |
| BG Group plc | 1.9% |
| Rio Tinto plc | 1.7% |
| British American Tobacco plc | 1.5% |
| SAP AG | 1.5% |
| WM Morrison Supermarkets plc | 1.4% |
| Syngenta AG | 1.3% |
| Saipem SpA | 1.3% |
| Types of Investments in Portfolio | % of net assets |
| Foreign Common Stocks | 99.4% |
| Temporary Cash Investments | 0.3% |
| Other Assets and Liabilities | 0.3% |
| Investments by Country | % of net assets |
| United Kingdom | 21.4% |
| Japan | 14.4% |
| Switzerland | 9.1% |
| Germany | 7.4% |
| France | 7.3% |
| Australia | 3.8% |
| Netherlands | 3.4% |
| South Korea | 2.4% |
| Canada | 2.3% |
| Sweden | 2.3% |
| Hong Kong | 2.3% |
| Italy | 2.3% |
| Spain | 2.2% |
| Other Countries | 18.8% |
| Cash and Equivalents* | 0.6% |
| *Includes temporary cash investments and other assets and liabilities. | |
9
Fund shareholders may incur two types of costs: (1) transaction costs, including sales charges (loads) on purchase payments and redemption/exchange fees; and (2) ongoing costs, including management fees; distribution and service (12b-1) fees; and other fund expenses. This example is intended to help you understand your ongoing costs (in dollars) of investing in your fund and to compare these costs with the ongoing cost of investing in other mutual funds.
The example is based on an investment of $1,000 made at the beginning of the period and held for the entire period from June 1, 2011 to November 30, 2011.
Actual Expenses
The table provides information about actual account values and actual expenses for each class. You may use the information, together with the amount you invested, to estimate the expenses that you paid over the period. First, identify the share class you own. Then simply divide your account value by $1,000 (for example, an $8,600 account value divided by $1,000 = 8.6), then multiply the result by the number under the heading “Expenses Paid During Period” to estimate the expenses you paid on your account during this period.
If you hold Investor Class shares of any American Century Investments fund, or Institutional Class shares of the American Century Diversified Bond Fund, in an American Century Investments account (i.e., not a financial intermediary or retirement plan account), American Century Investments may charge you a $12.50 semiannual account maintenance fee if the value of those shares is less than $10,000. We will redeem shares automatically in one of your accounts to pay the $12.50 fee. In determining your total eligible investment amount, we will include your investments in all personal accounts (including American Century Investments Brokerage accounts) registered under your Social Security number. Personal accounts include individual accounts, joint accounts, UGMA/UTMA accounts, personal trusts, Coverdell Education Savings Accounts and IRAs (including traditional, Roth, Rollover, SEP-, SARSEP- and SIMPLE-IRAs), and certain other retirement accounts. If you have only business, business retirement, employer-sponsored or American Century Investments Brokerage accounts, you are currently not subject to this fee. We will not charge the fee as long as you choose to manage your accounts exclusively online. If you are subject to the Account Maintenance Fee, your account value could be reduced by the fee amount.
Hypothetical Example for Comparison Purposes
The table also provides information about hypothetical account values and hypothetical expenses based on the actual expense ratio of each class of your fund and an assumed rate of return of 5% per year before expenses, which is not the actual return of a fund’s share class. The hypothetical account values and expenses may not be used to estimate the actual ending account balance or expenses you paid for the period. You may use this information to compare the ongoing costs of investing in your fund and other funds. To do so, compare this 5% hypothetical example with the 5% hypothetical examples that appear in the shareholder reports of the other funds.
10
Please note that the expenses shown in the table are meant to highlight your ongoing costs only and do not reflect any transactional costs, such as sales charges (loads) or redemption/exchange fees. Therefore, the table is useful in comparing ongoing costs only, and will not help you determine the relative total costs of owning different funds. In addition, if these transactional costs were included, your costs would have been higher.
Beginning Account Value 6/1/11 | Ending Account Value 11/30/11 | Expenses Paid During Period(1) 6/1/11 – 11/30/11 | Annualized Expense Ratio(1) | |
| Actual | ||||
| Investor Class | $1,000 | $835.40 | $6.12 | 1.33% |
| Institutional Class | $1,000 | $836.70 | $5.20 | 1.13% |
| A Class | $1,000 | $834.30 | $7.27 | 1.58% |
| C Class | $1,000 | $830.80 | $10.69 | 2.33% |
| R Class | $1,000 | $832.90 | $8.41 | 1.83% |
| Hypothetical | ||||
| Investor Class | $1,000 | $1,018.40 | $6.73 | 1.33% |
| Institutional Class | $1,000 | $1,019.40 | $5.72 | 1.13% |
| A Class | $1,000 | $1,017.15 | $7.99 | 1.58% |
| C Class | $1,000 | $1,013.39 | $11.76 | 2.33% |
| R Class | $1,000 | $1,015.89 | $9.25 | 1.83% |
| (1) | Expenses are equal to the class’s annualized expense ratio listed in the table above, multiplied by the average account value over the period, multiplied by 183, the number of days in the most recent fiscal half-year, divided by 365, to reflect the one-half year period. |
11
| Shares | Value | |||||||
| Common Stocks — 99.4% | ||||||||
| ARGENTINA — 0.3% | ||||||||
| MercadoLibre, Inc. | 59,020 | $5,175,464 | ||||||
| AUSTRALIA — 3.8% | ||||||||
| BHP Billiton Ltd. | 752,676 | 28,105,747 | ||||||
| Commonwealth Bank of Australia | 296,738 | 14,883,151 | ||||||
| Iluka Resources Ltd. | 98,130 | 1,573,965 | ||||||
| Wesfarmers Ltd. | 363,454 | 11,682,077 | ||||||
| 56,244,940 | ||||||||
| BELGIUM — 1.6% | ||||||||
| Anheuser-Busch InBev NV | 257,429 | 15,399,894 | ||||||
| Umicore SA | 195,184 | 8,406,123 | ||||||
| 23,806,017 | ||||||||
| BERMUDA — 1.2% | ||||||||
| Seadrill Ltd. | 516,100 | 18,034,228 | ||||||
| BRAZIL — 0.7% | ||||||||
| Banco do Brasil SA | 780,500 | 10,444,936 | ||||||
| CANADA — 2.3% | ||||||||
| Bank of Nova Scotia | 206,690 | 10,446,463 | ||||||
| Canadian National Railway Co. | 197,999 | 15,310,732 | ||||||
| Potash Corp. of Saskatchewan, Inc. | 207,480 | 9,044,130 | ||||||
| 34,801,325 | ||||||||
| DENMARK — 1.5% | ||||||||
| Christian Hansen Holding A/S | 254,523 | 5,390,077 | ||||||
| Novo Nordisk A/S B Shares | 145,417 | 16,538,780 | ||||||
| 21,928,857 | ||||||||
| FINLAND — 0.7% | ||||||||
| Kone Oyj | 183,360 | 10,335,781 | ||||||
| FRANCE — 7.3% | ||||||||
| Air Liquide SA | 83,707 | 10,624,473 | ||||||
| Cie Generale d’Optique Essilor International SA | 133,433 | 9,539,789 | ||||||
| Danone SA | 198,056 | 13,100,411 | ||||||
| Eutelsat Communications SA | 92,470 | 3,593,931 | ||||||
| LVMH Moet Hennessy Louis Vuitton SA | 81,426 | 12,800,977 | ||||||
| Pernod-Ricard SA | 81,067 | 7,635,554 | ||||||
| Safran SA | 339,840 | 10,072,360 | ||||||
| Sanofi | 178,240 | 12,476,406 | ||||||
| Technip SA | 166,444 | 15,907,769 | ||||||
| Zodiac Aerospace | 142,960 | 11,724,795 | ||||||
| 107,476,465 | ||||||||
| GERMANY — 7.4% | ||||||||
| adidas AG | 86,520 | 6,100,215 | ||||||
| BASF SE | 177,450 | 12,897,833 | ||||||
| Bayerische Motoren Werke AG | 131,878 | 9,927,749 | ||||||
| Fresenius Medical Care AG & Co. KGaA | 173,734 | 11,872,706 | ||||||
Kabel Deutschland Holding AG(1) | 309,413 | 17,164,625 | ||||||
| Muenchener Rueckversicherungs AG | 123,600 | 15,630,032 | ||||||
| SAP AG | 371,660 | 22,174,321 | ||||||
| Siemens AG | 135,123 | 13,637,758 | ||||||
| 109,405,239 | ||||||||
| HONG KONG — 2.3% | ||||||||
| AIA Group Ltd. | 1,800,600 | 5,661,453 | ||||||
| China Unicom Ltd. ADR | 796,934 | 17,189,867 | ||||||
| Li & Fung Ltd. | 1,908,000 | 3,896,959 | ||||||
| Link Real Estate Investment Trust (The) | 1,938,000 | 7,003,601 | ||||||
| 33,751,880 | ||||||||
| INDIA — 0.8% | ||||||||
| Bharti Airtel Ltd. | 781,970 | 5,834,215 | ||||||
| HDFC Bank Ltd. ADR | 210,950 | 5,834,877 | ||||||
| 11,669,092 | ||||||||
| INDONESIA — 0.8% | ||||||||
| PT Bank Mandiri (Persero) Tbk | 17,145,452 | 12,556,105 | ||||||
| IRELAND — 1.4% | ||||||||
| Experian plc | 569,092 | 7,570,549 | ||||||
| Shire plc | 370,390 | 12,431,977 | ||||||
| 20,002,526 | ||||||||
| ITALY — 2.3% | ||||||||
| Pirelli & C SpA | 1,478,000 | 13,913,239 | ||||||
| Saipem SpA | 441,628 | 19,752,429 | ||||||
| 33,665,668 | ||||||||
| JAPAN — 14.4% | ||||||||
| Daihatsu Motor Co. Ltd. | 1,038,000 | 18,243,866 | ||||||
| Dentsu, Inc. | 170,300 | 4,952,619 | ||||||
| FANUC CORP. | 90,300 | 14,824,317 | ||||||
| Fast Retailing Co. Ltd. | 45,900 | 7,433,769 | ||||||
| Japan Tobacco, Inc. | 3,830 | 18,259,475 | ||||||
| JGC Corp. | 297,000 | 7,460,748 | ||||||
| Komatsu Ltd. | 456,300 | 11,617,752 | ||||||
| Konami Corp. | 307,400 | 9,250,270 | ||||||
| Lawson, Inc. | 131,100 | 7,773,238 | ||||||
12
| Shares | Value |
| Mitsubishi Corp. | 798,000 | $16,485,097 | ||||||
| Mitsubishi UFJ Financial Group, Inc. | 1,964,100 | 8,532,947 | ||||||
| Murata Manufacturing Co. Ltd. | 224,800 | 13,313,697 | ||||||
| Nitori Holdings Co. Ltd. | 144,950 | 13,556,673 | ||||||
| ORIX Corp. | 196,460 | 16,539,981 | ||||||
| Rakuten, Inc. | 15,433 | 16,514,721 | ||||||
| SOFTBANK CORP. | 266,500 | 8,979,125 | ||||||
| Sumitomo Realty & Development Co. Ltd. | 229,000 | 4,543,384 | ||||||
| Unicharm Corp. | 310,800 | 14,722,146 | ||||||
| 213,003,825 | ||||||||
| LUXEMBOURG — 1.2% | ||||||||
| Millicom International Cellular SA | 159,733 | 17,287,123 | ||||||
| MACAU — 0.4% | ||||||||
Sands China Ltd.(1) | 1,774,400 | 5,356,803 | ||||||
| NETHERLANDS — 3.4% | ||||||||
| ASML Holding NV | 189,584 | 7,397,501 | ||||||
| European Aeronautic Defence and Space Co. NV | 455,400 | 13,657,611 | ||||||
| Royal Dutch Shell plc B Shares | 833,394 | 30,022,024 | ||||||
| 51,077,136 | ||||||||
| PEOPLE’S REPUBLIC OF CHINA — 1.9% | ||||||||
Baidu, Inc. ADR(1) | 133,694 | 17,512,577 | ||||||
Focus Media Holding Ltd. ADR(1) | 154,090 | 2,853,747 | ||||||
| Industrial & Commercial Bank of China Ltd. H Shares | 12,826,435 | 7,606,771 | ||||||
| 27,973,095 | ||||||||
| POLAND — 0.6% | ||||||||
| Powszechna Kasa Oszczednosci Bank Polski SA | 893,435 | 8,977,665 | ||||||
| PORTUGAL — 1.3% | ||||||||
| Jeronimo Martins SGPS SA | 1,067,060 | 19,479,366 | ||||||
| RUSSIAN FEDERATION — 1.2% | ||||||||
| Sberbank of Russia | 4,365,830 | 12,614,873 | ||||||
X5 Retail Group NV GDR(1) | 204,189 | 5,403,610 | ||||||
| 18,018,483 | ||||||||
| SINGAPORE — 0.5% | ||||||||
| DBS Group Holdings Ltd. | 756,000 | 7,526,926 | ||||||
| SOUTH KOREA — 2.4% | ||||||||
| Hyundai Motor Co. | 85,773 | 16,626,755 | ||||||
| Samsung Electronics Co. Ltd. | 20,873 | 18,949,936 | ||||||
| 35,576,691 | ||||||||
| SPAIN — 2.2% | ||||||||
| Banco Bilbao Vizcaya Argentaria SA | 1,393,977 | 11,831,853 | ||||||
Grifols SA(1) | 581,423 | 9,396,473 | ||||||
| Inditex SA | 140,228 | 11,908,628 | ||||||
| 33,136,954 | ||||||||
| SWEDEN — 2.3% | ||||||||
| Alfa Laval AB | 314,163 | 6,059,901 | ||||||
| Atlas Copco AB A Shares | 575,584 | 12,370,519 | ||||||
| Swedbank AB A Shares | 563,741 | 7,547,006 | ||||||
| Telefonaktiebolaget LM Ericsson B Shares | 777,480 | 8,274,167 | ||||||
| 34,251,593 | ||||||||
| SWITZERLAND — 9.1% | ||||||||
ABB Ltd.(1) | 371,020 | 7,031,148 | ||||||
Adecco SA(1) | 109,886 | 4,773,838 | ||||||
| Nestle SA | 513,343 | 28,784,174 | ||||||
| Novartis AG | 323,403 | 17,451,743 | ||||||
| SGS SA | 4,115 | 6,947,387 | ||||||
| Swatch Group AG (The) | 28,886 | 11,258,761 | ||||||
Syngenta AG(1) | 67,530 | 19,917,948 | ||||||
UBS AG(1) | 626,584 | 7,702,203 | ||||||
| Wolseley plc | 355,070 | 10,648,316 | ||||||
| Xstrata plc | 736,301 | 11,859,338 | ||||||
Zurich Financial Services AG(1) | 39,220 | 8,624,992 | ||||||
| 134,999,848 | ||||||||
| TAIWAN (REPUBLIC OF CHINA) — 1.5% | ||||||||
| Hon Hai Precision Industry Co. Ltd. | 2,738,000 | 7,432,353 | ||||||
| MediaTek, Inc. | 534,000 | 5,075,935 | ||||||
| Taiwan Semiconductor Manufacturing Co. Ltd. ADR | 803,390 | 10,379,799 | ||||||
| 22,888,087 | ||||||||
| THAILAND — 0.7% | ||||||||
| Kasikornbank PCL NVDR | 2,554,300 | 9,827,579 | ||||||
| TURKEY — 0.5% | ||||||||
| Turkiye Garanti Bankasi AS | 2,016,012 | 6,918,173 | ||||||
| UNITED KINGDOM — 21.4% | ||||||||
| Admiral Group plc | 443,510 | 6,434,707 | ||||||
| Aggreko plc | 136,184 | 4,058,656 | ||||||
| Antofagasta plc | 577,697 | 10,819,577 | ||||||
| ARM Holdings plc | 1,661,509 | 15,597,332 | ||||||
| BG Group plc | 1,286,897 | 27,617,115 | ||||||
| British American Tobacco plc | 484,407 | 22,482,407 | ||||||
| British Sky Broadcasting Group plc | 391,180 | 4,719,114 | ||||||
13
| Shares | Value |
| Burberry Group plc | 569,714 | $11,420,499 | ||||||
| Capita Group plc (The) | 650,421 | 6,460,169 | ||||||
| Carnival plc | 267,542 | 9,296,962 | ||||||
| Compass Group plc | 802,880 | 7,435,106 | ||||||
| GlaxoSmithKline plc | 730,080 | 16,177,274 | ||||||
| HSBC Holdings plc (Hong Kong) | 1,219,212 | 9,615,513 | ||||||
| Kingfisher plc | 2,225,310 | 8,967,292 | ||||||
Lloyds Banking Group plc(1) | 12,368,500 | 4,865,325 | ||||||
| National Grid plc | 1,525,740 | 14,990,817 | ||||||
| Petrofac Ltd. | 373,508 | 8,538,323 | ||||||
| Reckitt Benckiser Group plc | 349,222 | 17,652,618 | ||||||
| Rio Tinto plc | 469,580 | 24,857,419 | ||||||
| Standard Chartered plc | 426,890 | 9,320,738 | ||||||
| Unilever plc | 556,060 | 18,682,437 | ||||||
| Vodafone Group plc | 5,329,350 | 14,458,055 | ||||||
| Weir Group plc (The) | 372,110 | 12,109,877 | ||||||
| Whitbread plc | 358,020 | 9,254,590 | ||||||
| WM Morrison Supermarkets plc | 4,069,800 | 20,616,472 | ||||||
| 316,448,394 | ||||||||
TOTAL COMMON STOCKS (Cost $1,248,537,568) | 1,472,046,264 | |||||||
| Temporary Cash Investments — 0.3% | ||||||||
| Repurchase Agreement, Bank America Merrill Lynch, (collateralized by various U.S. Treasury obligations, 3.50%, 5/15/20, valued at $1,736,881), in a joint trading account at 0.06%, dated 11/30/11, due 12/1/11 (Delivery value $1,709,468) | 1,709,465 | |||||||
| Repurchase Agreement, Credit Suisse First Boston, Inc., (collateralized by various U.S. Treasury obligations, 5.00%, 5/15/37, valued at $1,740,887), in a joint trading account at 0.05%, dated 11/30/11, due 12/1/11 (Delivery value $1,709,463) | 1,709,461 | |||||||
| Repurchase Agreement, Goldman Sachs & Co., (collateralized by various U.S. Treasury obligations, 4.375%, 2/15/38, valued at $1,607,396), in a joint trading account at 0.04%, dated 11/30/11, due 12/1/11 (Delivery value $1,573,501) | 1,573,499 | |||||||
TOTAL TEMPORARY CASH INVESTMENTS (Cost $4,992,425) | 4,992,425 | |||||||
TOTAL INVESTMENT SECURITIES — 99.7% (Cost $1,253,529,993) | 1,477,038,689 | |||||||
| OTHER ASSETS AND LIABILITIES — 0.3% | 4,795,383 | |||||||
| TOTAL NET ASSETS — 100.0% | $1,481,834,072 | |||||||
| Market Sector Diversification | |
| (as a % of net assets) | |
| Financials | 15.5% |
| Consumer Discretionary | 15.5% |
| Consumer Staples | 15.0% |
| Industrials | 13.6% |
| Materials | 9.7% |
| Information Technology | 9.5% |
| Energy | 8.1% |
| Health Care | 7.2% |
| Telecommunication Services | 4.3% |
| Utilities | 1.0% |
| Cash and Equivalents* | 0.6% |
*Includes temporary cash investments and other assets and liabilities.
Notes to Schedule of Investments
ADR = American Depositary Receipt
GDR = Global Depositary Receipt
NVDR = Non-Voting Depositary Receipt
| (1) | Non-income producing. |
See Notes to Financial Statements.
14
| NOVEMBER 30, 2011 | ||||
| Assets | ||||
| Investment securities, at value (cost of $1,253,529,993) | $1,477,038,689 | |||
| Foreign currency holdings, at value (cost of $3,685,995) | 3,665,961 | |||
| Receivable for investments sold | 15,019,693 | |||
| Receivable for capital shares sold | 992,071 | |||
| Dividends and interest receivable | 8,158,915 | |||
| Other assets | 1,096,789 | |||
| 1,505,972,118 | ||||
| Liabilities | ||||
| Payable for investments purchased | 21,242,179 | |||
| Payable for capital shares redeemed | 1,267,709 | |||
| Accrued management fees | 1,588,077 | |||
| Distribution and service fees payable | 40,081 | |||
| 24,138,046 | ||||
| Net Assets | $1,481,834,072 | |||
| Net Assets Consist of: | ||||
| Capital (par value and paid-in surplus) | $1,533,566,412 | |||
| Undistributed net investment income | 12,578,355 | |||
| Accumulated net realized loss | (288,082,304 | ) | ||
| Net unrealized appreciation | 223,771,609 | |||
| $1,481,834,072 | ||||
| Net assets | Shares outstanding | Net asset value per share | |
| Investor Class, $0.01 Par Value | $1,189,244,677 | 120,134,013 | $9.90 |
| Institutional Class, $0.01 Par Value | $113,741,305 | 11,506,357 | $9.89 |
| A Class, $0.01 Par Value | $172,901,417 | 17,431,305 | $9.92* |
| C Class, $0.01 Par Value | $2,724,593 | 278,843 | $9.77 |
| R Class, $0.01 Par Value | $3,222,080 | 323,182 | $9.97 |
*Maximum offering price $10.53 (net asset value divided by 0.9425)
See Notes to Financial Statements.
15
| YEAR ENDED NOVEMBER 30, 2011 | ||||
| Investment Income (Loss) | ||||
| Income: | ||||
| Dividends (net of foreign taxes withheld of $3,145,958) | $37,833,204 | |||
| Interest | 30,804 | |||
| 37,864,008 | ||||
| Expenses: | ||||
| Management fees | 21,667,516 | |||
| Distribution and service fees: | ||||
| A Class | 484,189 | |||
| B Class | 10,709 | |||
| C Class | 30,293 | |||
| R Class | 21,665 | |||
| Directors’ fees and expenses | 79,592 | |||
| Other expenses | 38,258 | |||
| 22,332,222 | ||||
| Net investment income (loss) | 15,531,786 | |||
| Realized and Unrealized Gain (Loss) | ||||
| Net realized gain (loss) on: | ||||
| Investment transactions (net of foreign tax expenses paid (refunded) of $105,482) | 65,057,470 | |||
| Foreign currency transactions (net of foreign tax expenses paid (refunded) of $407,276) | (1,174,518 | ) | ||
| 63,882,952 | ||||
| Change in net unrealized appreciation (depreciation) on: | ||||
| Investments (net of deferred foreign taxes of $(608,182)) | (110,975,706 | ) | ||
| Translation of assets and liabilities in foreign currencies | 184,153 | |||
| (110,791,553 | ) | |||
| Net realized and unrealized gain (loss) | (46,908,601 | ) | ||
| Net Increase (Decrease) in Net Assets Resulting from Operations | $(31,376,815 | ) | ||
See Notes to Financial Statements.
16
| YEARS ENDED NOVEMBER 30, 2011 AND NOVEMBER 30, 2010 | ||||||||
| Increase (Decrease) in Net Assets | November 30, 2011 | November 30, 2010 | ||||||
| Operations | ||||||||
| Net investment income (loss) | $15,531,786 | $12,895,767 | ||||||
| Net realized gain (loss) | 63,882,952 | 133,596,891 | ||||||
| Change in net unrealized appreciation (depreciation) | (110,791,553 | ) | (48,350,927 | ) | ||||
| Net increase (decrease) in net assets resulting from operations | (31,376,815 | ) | 98,141,731 | |||||
| Distributions to Shareholders | ||||||||
| From net investment income: | ||||||||
| Investor Class | (19,326,387 | ) | (19,906,669 | ) | ||||
| Institutional Class | (1,926,383 | ) | (1,322,640 | ) | ||||
| A Class | (1,708,891 | ) | (1,881,933 | ) | ||||
| R Class | (16,637 | ) | (29,305 | ) | ||||
| Decrease in net assets from distributions | (22,978,298 | ) | (23,140,547 | ) | ||||
| Capital Share Transactions | ||||||||
| Net increase (decrease) in net assets from capital share transactions | (75,665,759 | ) | 2,472,875 | |||||
| Redemption Fees | ||||||||
| Increase in net assets from redemption fees | 44,407 | 47,277 | ||||||
| Net increase (decrease) in net assets | (129,976,465 | ) | 77,521,336 | |||||
| Net Assets | ||||||||
| Beginning of period | 1,611,810,537 | 1,534,289,201 | ||||||
| End of period | $1,481,834,072 | $1,611,810,537 | ||||||
| Undistributed net investment income | $12,578,355 | $18,737,564 | ||||||
See Notes to Financial Statements.
17
1. Organization
American Century World Mutual Funds, Inc. (the corporation) is registered under the Investment Company Act of 1940, as amended (the 1940 Act), as an open-end management investment company and is organized as a Maryland corporation. International Growth Fund (the fund) is one fund in a series issued by the corporation. The fund is diversified as defined under the 1940 Act. The fund’s investment objective is to seek capital growth. The fund pursues its objective by investing primarily in equity securities of companies in at least three developed countries (excluding the United States).
The fund is authorized to issue the Investor Class, the Institutional Class, the A Class, the B Class, the C Class and the R Class. The A Class may incur an initial sales charge. The A Class, B Class and C Class may be subject to a contingent deferred sales charge. The share classes differ principally in their respective sales charges and distribution and shareholder servicing expenses and arrangements. The Institutional Class is made available to institutional shareholders or through financial intermediaries whose clients do not require the same level of shareholder and administrative services as shareholders of other classes. As a result, the Institutional Class is charged a lower unified management fee. On October 21, 2011, all outstanding B Class shares were converted to A Class shares and the fund discontinued issuance of the B Class.
2. Significant Accounting Policies
The following is a summary of significant accounting policies consistently followed by the fund in preparation of its financial statements. The financial statements are prepared in conformity with accounting principles generally accepted in the United States of America, which may require management to make certain estimates and assumptions at the date of the financial statements. Actual results could differ from these estimates.
Investment Valuations — The fund determines the fair value of its investments and computes its net asset value per share as of the close of regular trading (usually 4 p.m. Eastern time) on the New York Stock Exchange (NYSE) on each day the NYSE is open.
Equity securities that are listed or traded on a domestic securities exchange are valued at the last reported sales price or at the official closing price as provided by the exchange. Equity securities traded on foreign securities exchanges are typically valued at the closing price on the exchange where primarily traded or as of the close of the NYSE, if that is earlier. If no last sales price is reported, or if local convention or regulation so provides, the mean of the latest bid and asked prices is used. Depending on local convention or regulation, securities traded over-the-counter are valued at the mean of the latest bid and asked prices, the last sales price, or the official closing price. In its determination of fair value, the fund may review several factors including: market information specific to a security; news developments in U.S. and foreign markets; the performance of particular U.S. and foreign securities, indices, comparable securities, American Depositary Receipts, Exchange-Traded Funds, and other relevant market indicators.
Debt securities maturing within 60 days at the time of purchase may be valued at cost, plus or minus any amortized discount or premium or at the evaluated mean as provided by an independent pricing service. Evaluated mean prices are commonly derived through utilization of market models, which may consider, among other factors, trade data, quotations from dealers and active market makers, relevant yield curve and spread data, related sector levels, creditworthiness, and other relevant market information on the same or comparable securities.
Investments in open-end management investment companies are valued at the reported net asset value per share. Repurchase agreements are valued at cost.
The value of investments initially expressed in foreign currencies is translated into U.S. dollars at prevailing exchange rates.
18
If the fund determines that the market price for a portfolio security is not readily available or the valuation methods mentioned above do not reflect a security’s fair value, such security is valued as determined in good faith by the Board of Directors or its designee, in accordance with procedures adopted by the Board of Directors. Circumstances that may cause the fund to use these procedures to value a security include, but are not limited to: a security has been declared in default; trading in a security has been halted during the trading day; there is a foreign market holiday and no trading occurred; or an event occurred between the close of a foreign exchange and the NYSE that may affect the value of a security.
Security Transactions — Security transactions are accounted for as of the trade date. Net realized gains and losses are determined on the identified cost basis, which is also used for federal income tax purposes. Certain countries impose taxes on realized gains on the sale of securities registered in their country. The fund records the foreign tax expense, if any, on an accrual basis. The foreign tax expense on realized gains and unrealized appreciation reduces the net realized gain (loss) on investment transactions and net unrealized appreciation (depreciation) on investments, respectively.
Investment Income — Dividend income less foreign taxes withheld, if any, is recorded as of the ex-dividend date. Interest income is recorded on the accrual basis and includes accretion of discounts and amortization of premiums.
Foreign Currency Translations — All assets and liabilities initially expressed in foreign currencies are translated into U.S. dollars at prevailing exchange rates at period end. The fund may enter into spot foreign currency exchange contracts to facilitate transactions denominated in a foreign currency. Purchases and sales of investment securities, dividend and interest income, spot foreign currency exchange contracts, and expenses are translated at the rates of exchange prevailing on the respective dates of such transactions. Net realized and unrealized foreign currency exchange gains or losses related to investment securities are a component of net realized gain (loss) on investment transactions and change in net unrealized appreciation (depreciation) on investments, respectively. Certain countries impose taxes on the contract amount of purchases and sales of foreign currency contracts in their currency. The fund records the foreign tax expense, if any, as a reduction to the net realized gain (loss) on foreign currency transactions.
Repurchase Agreements — The fund may enter into repurchase agreements with institutions that American Century Investment Management, Inc. (ACIM) (the investment advisor) has determined are creditworthy pursuant to criteria adopted by the Board of Directors. The fund requires that the collateral, represented by securities, received in a repurchase transaction be transferred to the custodian in a manner sufficient to enable the fund to obtain those securities in the event of a default under the repurchase agreement. ACIM monitors, on a daily basis, the securities transferred to ensure the value, including accrued interest, of the securities under each repurchase agreement is equal to or greater than amounts owed to the fund under each repurchase agreement.
Joint Trading Account — Pursuant to an Exemptive Order issued by the Securities and Exchange Commission, the fund, along with certain other funds in the American Century Investments family of funds, may transfer uninvested cash balances into a joint trading account. These balances are invested in one or more repurchase agreements that are collateralized by U.S. Treasury or Agency obligations.
Income Tax Status — It is the fund’s policy to distribute substantially all net investment income and net realized gains to shareholders and to otherwise qualify as a regulated investment company under provisions of the Internal Revenue Code. The fund is no longer subject to examination by tax authorities for years prior to 2008. Additionally, non-U.S. tax returns filed by the fund due to investments in certain foreign securities remain subject to examination by the relevant taxing authority for seven years from the date of filing. At this time, management believes there are no uncertain tax positions which, based on their technical merit, would not be sustained upon examination and for which it is reasonably possible that the total amounts of unrecognized tax benefits will significantly change in the next twelve months. Accordingly, no provision has been made for federal or state income taxes.
19
Multiple Class — All shares of the fund represent an equal pro rata interest in the net assets of the class to which such shares belong, and have identical voting, dividend, liquidation and other rights and the same terms and conditions, except for class specific expenses and exclusive rights to vote on matters affecting only individual classes. Income, non-class specific expenses, and realized and unrealized capital gains and losses of the fund are allocated to each class of shares based on their relative net assets.
Distributions to Shareholders — Distributions from net investment income and net realized gains, if any, are generally declared and paid annually. The fund may make distributions on a more frequent basis to comply with the distribution requirements of the Internal Revenue Code, in all events in a manner consistent with provisions of the 1940 Act.
Redemption — The fund may impose a 2.00% redemption fee on shares held less than 60 days. The fee may not be applicable to all classes. The redemption fee is retained by the fund and helps cover transaction costs that long-term investors may bear when the fund sells securities to meet investor redemptions.
Indemnifications — Under the corporation’s organizational documents, its officers and directors are indemnified against certain liabilities arising out of the performance of their duties to the fund. In addition, in the normal course of business, the fund enters into contracts that provide general indemnifications. The maximum exposure under these arrangements is unknown as this would involve future claims that may be made against a fund. The risk of material loss from such claims is considered by management to be remote.
3. Fees and Transactions with Related Parties
Management Fees — The corporation has entered into a management agreement with ACIM, under which ACIM provides the fund with investment advisory and management services in exchange for a single, unified management fee (the fee) per class. The agreement provides that all expenses of managing and operating the fund, except distribution and service fees, brokerage expenses, taxes, interest, fees and expenses of the independent directors (including legal counsel fees), and extraordinary expenses, will be paid by ACIM. The fee is computed and accrued daily based on each class’s daily net assets and paid monthly in arrears. The rate of the fee is determined by applying a fee rate calculation formula. This formula takes into account the fund’s assets as well as certain assets, if any, of other clients of the investment advisor outside the American Century Investments family of funds (such as subadvised funds and separate accounts) that have very similar investment teams and investment strategies (strategy assets). The strategy assets of the fund include the assets of NT International Growth Fund, one fund in a series issued by the corporation. The annual management fee schedule ranges from 1.10% to 1.50% for the Investor Class, A Class, B Class, C Class and R Class. The Institutional Class is 0.20% less at each point within the range. The effective annual management fee for each class for the year ended November 30, 2011 was 1.31% for the Investor Class, A Class, C Class and R Class and 1.11% for the Institutional Class.
Distribution and Service Fees — The Board of Directors has adopted a separate Master Distribution and Individual Shareholder Services Plan for each of the A Class, B Class, C Class and R Class (collectively the plans), pursuant to Rule 12b-1 of the 1940 Act. The plans provide that the A Class will pay American Century Investment Services, Inc. (ACIS) an annual distribution and service fee of 0.25%. The plans provide that the B Class and C Class will each pay ACIS an annual distribution and service fee of 1.00%, of which 0.25% is paid for individual shareholder services and 0.75% is paid for distribution services. The plans provide that the R Class will pay ACIS an annual distribution and service fee of 0.50%. The fees are computed and accrued daily based on each class’s daily net assets and paid monthly in arrears. The fees are used to pay financial intermediaries for distribution and individual shareholder services. Fees incurred under the plans during the year ended November 30, 2011 are detailed in the Statement of Operations.
Related Parties — Certain officers and directors of the corporation are also officers and/or directors of American Century Companies, Inc. (ACC), the parent of the corporation’s investment advisor, ACIM, the distributor of the corporation, ACIS, and the corporation’s transfer agent, American Century Services, LLC. Various funds in a series issued by American Century Asset Allocation Portfolios, Inc. (ACAAP) own, in aggregate, 13% of the shares of the fund. ACAAP does not invest in the fund for the purpose of exercising management or control.
20
The fund was eligible to invest in a money market fund for temporary purposes, which is managed by J.P. Morgan Investment Management, Inc. (JPMIM). The fund had a securities lending agreement with JPMorgan Chase Bank (JPMCB) and a mutual funds services agreement with J.P. Morgan Investor Services Co. (JPMIS). JPMCB was a custodian of the fund. JPMIM, JPMIS and JPMCB are wholly owned subsidiaries of JPMorgan Chase & Co. (JPM). Prior to August 31, 2011, JPM was an equity investor in ACC. The services provided to the fund by JPMIM, JPMIS and JPMCB terminated on July 31, 2011.
4. Investment Transactions
Purchases and sales of investment securities, excluding short-term investments, for the year ended November 30, 2011 were $2,092,133,457 and $2,179,275,603, respectively.
5. Capital Share Transactions
Transactions in shares of the fund were as follows:
| Year ended November 30, 2011 | Year ended November 30, 2010 | |||||||||||||||
| Shares | Amount | Shares | Amount | |||||||||||||
| Investor Class/Shares Authorized | 1,050,000,000 | 1,050,000,000 | ||||||||||||||
| Sold | 10,121,066 | $109,941,099 | 8,998,458 | $87,341,556 | ||||||||||||
| Issued in connection with reorganization (Note 9) | — | — | 6,962,925 | 74,712,185 | ||||||||||||
| Issued in reinvestment of distributions | 1,682,293 | 18,745,403 | 1,715,678 | 16,876,319 | ||||||||||||
| Redeemed | (19,927,980 | ) | (217,005,403 | ) | (20,641,413 | ) | (195,052,248 | ) | ||||||||
| (8,124,621 | ) | (88,318,901 | ) | (2,964,352 | ) | (16,122,188 | ) | |||||||||
| Institutional Class/Shares Authorized | 150,000,000 | 150,000,000 | ||||||||||||||
| Sold | 3,306,762 | 34,650,632 | 4,557,606 | 41,463,495 | ||||||||||||
| Issued in reinvestment of distributions | 171,269 | 1,903,792 | 124,940 | 1,229,822 | ||||||||||||
| Redeemed | (1,541,029 | ) | (16,717,393 | ) | (1,958,144 | ) | (18,855,853 | ) | ||||||||
| 1,937,002 | 19,837,031 | 2,724,402 | 23,837,464 | |||||||||||||
| A Class/Shares Authorized | 125,000,000 | 125,000,000 | ||||||||||||||
| Sold | 7,748,808 | 81,672,620 | 4,383,626 | 42,679,057 | ||||||||||||
| Issued in reinvestment of distributions | 93,927 | 1,049,896 | 128,516 | 1,263,884 | ||||||||||||
| Redeemed | (8,287,690 | ) | (87,839,910 | ) | (4,926,258 | ) | (47,071,221 | ) | ||||||||
| (444,955 | ) | (5,117,394 | ) | (414,116 | ) | (3,128,280 | ) | |||||||||
| B Class/Shares Authorized | 10,000,000 | 10,000,000 | ||||||||||||||
| Sold | 415 | 4,343 | 530 | 5,119 | ||||||||||||
| Redeemed | (121,378 | ) | (1,230,969 | ) | (31,944 | ) | (307,445 | ) | ||||||||
| (120,963 | ) | (1,226,626 | ) | (31,414 | ) | (302,326 | ) | |||||||||
| C Class/Shares Authorized | 10,000,000 | 10,000,000 | ||||||||||||||
| Sold | 57,636 | 635,001 | 20,492 | 198,669 | ||||||||||||
| Redeemed | (44,445 | ) | (469,982 | ) | (74,746 | ) | (691,551 | ) | ||||||||
| 13,191 | 165,019 | (54,254 | ) | (492,882 | ) | |||||||||||
| R Class/Shares Authorized | 5,000,000 | 5,000,000 | ||||||||||||||
| Sold | 64,918 | 725,158 | 136,723 | 1,333,762 | ||||||||||||
| Issued in reinvestment of distributions | 1,323 | 14,931 | 2,819 | 27,821 | ||||||||||||
| Redeemed | (167,533 | ) | (1,744,977 | ) | (274,140 | ) | (2,680,496 | ) | ||||||||
| (101,292 | ) | (1,004,888 | ) | (134,598 | ) | (1,318,913 | ) | |||||||||
| Net increase (decrease) | (6,841,638 | ) | $(75,665,759 | ) | (874,332 | ) | $2,472,875 | |||||||||
21
6. Fair Value Measurements
The fund’s securities valuation process is based on several considerations and may use multiple inputs to determine the fair value of the positions held by the fund. In conformity with accounting principles generally accepted in the United States of America, the inputs used to determine a valuation are classified into three broad levels as follows:
| • | Level 1 valuation inputs consist of unadjusted quoted prices in an active market for identical securities; |
| • | Level 2 valuation inputs consist of direct or indirect observable market data (including quoted prices for similar securities, evaluations of subsequent market events, interest rates, prepayment speeds, credit risk, etc.); or |
| • | Level 3 valuation inputs consist of unobservable data (including a fund’s own assumptions). |
The level classification is based on the lowest level input that is significant to the fair valuation measurement. The valuation inputs are not necessarily an indication of the risks associated with investing in these securities or other financial instruments.
The following is a summary of the level classifications as of period end. The Schedule of Investments provides additional information on the fund’s portfolio holdings.
| Level 1 | Level 2 | Level 3 | ||||||||||
| Investment Securities | ||||||||||||
| Foreign Common Stocks | $58,946,331 | $1,413,099,933 | — | |||||||||
| Temporary Cash Investments | — | 4,992,425 | — | |||||||||
| Total Value of Investment Securities | $58,946,331 | $1,418,092,358 | — | |||||||||
7. Risk Factors
There are certain risks involved in investing in foreign securities. These risks include those resulting from future adverse political, social and economic developments, fluctuations in currency exchange rates, the possible imposition of exchange controls, and other foreign laws or restrictions. Investing in emerging markets may accentuate these risks.
The fund’s investment process may result in high portfolio turnover, which could mean high transaction costs, affecting both performance and capital gains tax liabilities to investors.
8. Federal Tax Information
On December 20, 2011, the fund declared and paid the following per-share distributions from net investment income to shareholders of record on December 19, 2011:
| Investor | Institutional | A | C | R |
| $0.0494 | $0.0678 | $0.0260 | — | $0.0030 |
The tax character of distributions paid during the years ended November 30, 2011 and November 30, 2010 were as follows:
| 2011 | 2010 | |
| Distributions Paid From | ||
| Ordinary income | $22,978,298 | $23,140,547 |
| Long-term capital gains | — | — |
22
The book-basis character of distributions made during the year from net investment income or net realized gains may differ from their ultimate characterization for federal income tax purposes. These differences reflect the differing character of certain income items and net realized gains and losses for financial statement and tax purposes, and may result in reclassification among certain capital accounts on the financial statements.
As of November 30, 2011, the federal tax cost of investments and the components of distributable earnings on a tax-basis were as follows:
| Federal tax cost of investments | $1,296,814,818 | |||
| Gross tax appreciation of investments | $225,854,554 | |||
| Gross tax depreciation of investments | (45,630,683 | ) | ||
| Net tax appreciation (depreciation) of investments | $180,223,871 | |||
| Net tax appreciation (depreciation) on translation of assets and liabilities in foreign currencies | $222,871 | |||
| Net tax appreciation (depreciation) | $180,446,742 | |||
| Undistributed ordinary income | $15,912,094 | |||
| Accumulated capital losses | $(223,323,814 | ) | ||
| Capital loss deferral | $(24,767,362 | ) |
The difference between book-basis and tax-basis cost and unrealized appreciation (depreciation) is attributable primarily to the tax deferral of losses on wash sales and the realization for tax purposes of unrealized gains (losses) on certain foreign currency exchange contracts and investments in passive foreign investment companies.
The accumulated capital losses represent net capital loss carryovers that may be used to offset future realized capital gains for federal income tax purposes. Future capital loss carryover utilization in any given year may be subject to Internal Revenue Code limitations. Capital loss carryovers of $(12,343,552) and $(210,980,262) expire in 2016 and 2017, respectively.
The capital loss deferral represents net capital losses incurred in the one-month period ended November 30, 2011. The fund has elected to treat such losses as having been incurred in the following fiscal year for federal income tax purposes.
On December 22, 2010, the Regulated Investment Company Modernization Act of 2010 (the “Act”) was enacted, which changed various technical rules governing the tax treatment of regulated investment companies. The changes are generally effective for taxable years beginning after the date of enactment. Under the Act, the fund will be permitted to carry forward capital losses incurred in taxable years beginning after the date of enactment for an unlimited period. However, any losses incurred during those future taxable years will be required to be utilized prior to the losses incurred in pre-enactment taxable years, which carry an expiration date. As a result of this ordering rule, pre-enactment capital loss carryforwards may be more likely to expire unused.
9. Reorganization Plan
On June 10, 2010, the Board of Directors approved a plan of reorganization (the reorganization), pursuant to which International Growth acquired all of the assets of International Stock Fund (International Stock), one fund in a series issued by the corporation, in exchange for shares of equal value of International Growth and assumption by International Growth of certain ordinary course liabilities of International Stock. The financial statements and performance history of International Growth were carried over post-reorganization. The reorganization was effective at the close of business on October 29, 2010.
23
The reorganization was accomplished by a tax-free exchange of shares. On October 29, 2010, International Stock exchanged its shares for shares of International Growth as follows:
| Original Fund/Class | Shares Exchanged | New Fund/Class | Shares Received | |
| International Stock — Investor Class | 6,294,203 | International Growth — Investor Class | 6,962,925 |
The net assets of International Stock and International Growth immediately before the reorganization were $74,712,185 and $1,612,017,503, respectively. International Stock’s unrealized appreciation of $16,115,391 was combined with that of International Growth. Immediately after the reorganization, the combined net assets were $1,686,729,688. International Growth acquired capital loss carryovers of $(24,021,757) from International Stock.
24
| For a Share Outstanding Throughout the Years Ended November 30 (except as noted) | |||||||||||||||||||||||||||||||||||||
| Per-Share Data | Ratios and Supplemental Data | ||||||||||||||||||||||||||||||||||||
| Income From Investment Operations: | Distributions From: | Ratio to Average Net Assets of: | |||||||||||||||||||||||||||||||||||
Net Asset Value, Beginning of Period | Net Investment Income (Loss)(1) | Net Realized and Unrealized Gain (Loss) | Total From Investment Operations | Net Investment Income | Net Realized Gains | Total Distributions | Net Asset Value, End of Period | Total Return(2) | Operating Expenses | Net Investment Income (Loss) | Portfolio Turnover Rate | Net Assets, End of Period (in thousands) | |||||||||||||||||||||||||
| Investor Class | |||||||||||||||||||||||||||||||||||||
| 2011 | $10.30 | 0.10 | (0.35 | ) | (0.25 | ) | (0.15 | ) | — | (0.15 | ) | $9.90 | (2.57 | )% | 1.32 | % | 0.95 | % | 125 | % | $1,189,245 | ||||||||||||||||
| 2010 | $9.75 | 0.09 | 0.61 | 0.70 | (0.15 | ) | — | (0.15 | ) | $10.30 | 7.28 | % | 1.35 | % | 0.87 | % | 130 | % | $1,320,906 | ||||||||||||||||||
| 2009 | $7.15 | 0.09 | 2.64 | 2.73 | (0.13 | ) | — | (0.13 | ) | $9.75 | 38.66 | % | 1.38 | % | 1.18 | % | 151 | % | $1,279,615 | ||||||||||||||||||
| 2008 | $14.87 | 0.14 | (6.96 | ) | (6.82 | ) | (0.11 | ) | (0.79 | ) | (0.90 | ) | $7.15 | (48.67 | )% | 1.31 | % | 1.18 | % | 144 | % | $1,018,753 | |||||||||||||||
| 2007 | $12.17 | 0.13 | 2.66 | 2.79 | (0.09 | ) | — | (0.09 | ) | $14.87 | 23.09 | % | 1.27 | % | 0.94 | % | 133 | % | $2,267,093 | ||||||||||||||||||
| Institutional Class | |||||||||||||||||||||||||||||||||||||
| 2011 | $10.30 | 0.12 | (0.33 | ) | (0.21 | ) | (0.20 | ) | — | (0.20 | ) | $9.89 | (2.27 | )% | 1.12 | % | 1.15 | % | 125 | % | $113,741 | ||||||||||||||||
| 2010 | $9.78 | 0.10 | 0.61 | 0.71 | (0.19 | ) | — | (0.19 | ) | $10.30 | 7.38 | % | 1.15 | % | 1.07 | % | 130 | % | $98,610 | ||||||||||||||||||
| 2009 | $7.17 | 0.11 | 2.64 | 2.75 | (0.14 | ) | — | (0.14 | ) | $9.78 | 38.96 | % | 1.18 | % | 1.38 | % | 151 | % | $66,920 | ||||||||||||||||||
| 2008 | $14.91 | 0.15 | (6.96 | ) | (6.81 | ) | (0.14 | ) | (0.79 | ) | (0.93 | ) | $7.17 | (48.55 | )% | 1.11 | % | 1.38 | % | 144 | % | $37,160 | |||||||||||||||
| 2007 | $12.20 | 0.17 | 2.66 | 2.83 | (0.12 | ) | — | (0.12 | ) | $14.91 | 23.36 | % | 1.07 | % | 1.14 | % | 133 | % | $80,452 | ||||||||||||||||||
A Class(3) | |||||||||||||||||||||||||||||||||||||
| 2011 | $10.29 | 0.08 | (0.35 | ) | (0.27 | ) | (0.10 | ) | — | (0.10 | ) | $9.92 | (2.76 | )% | 1.57 | % | 0.70 | % | 125 | % | $172,901 | ||||||||||||||||
| 2010 | $9.72 | 0.06 | 0.61 | 0.67 | (0.10 | ) | — | (0.10 | ) | $10.29 | 6.98 | % | 1.60 | % | 0.62 | % | 130 | % | $183,990 | ||||||||||||||||||
| 2009 | $7.13 | 0.07 | 2.63 | 2.70 | (0.11 | ) | — | (0.11 | ) | $9.72 | 38.30 | % | 1.63 | % | 0.93 | % | 151 | % | $177,804 | ||||||||||||||||||
| 2008 | $14.82 | 0.11 | (6.94 | ) | (6.83 | ) | (0.07 | ) | (0.79 | ) | (0.86 | ) | $7.13 | (48.79 | )% | 1.56 | % | 0.93 | % | 144 | % | $140,798 | |||||||||||||||
| 2007 | $12.12 | 0.08 | 2.68 | 2.76 | (0.06 | ) | — | (0.06 | ) | $14.82 | 22.87 | % | 1.52 | % | 0.69 | % | 133 | % | $241,579 | ||||||||||||||||||
25
| For a Share Outstanding Throughout the Years Ended November 30 (except as noted) | |||||||||||||||||||||||||||||||||||||
| Per-Share Data | Ratios and Supplemental Data | ||||||||||||||||||||||||||||||||||||
| Income From Investment Operations: | Distributions From: | Ratio to Average Net Assets of: | |||||||||||||||||||||||||||||||||||
Net Asset Value, Beginning of Period | Net Investment Income (Loss)(1) | Net Realized and Unrealized Gain (Loss) | Total From Investment Operations | Net Investment Income | Net Realized Gains | Total Distributions | Net Asset Value, End of Period | Total Return(2) | Operating Expenses | Net Investment Income (Loss) | Portfolio Turnover Rate | Net Assets, End of Period (in thousands) | |||||||||||||||||||||||||
| C Class | |||||||||||||||||||||||||||||||||||||
| 2011 | $10.13 | — | (4) | (0.36 | ) | (0.36 | ) | — | — | — | $9.77 | (3.55 | )% | 2.32 | % | (0.05 | )% | 125 | % | $2,725 | |||||||||||||||||
| 2010 | $9.54 | (0.01 | ) | 0.60 | 0.59 | — | — | — | $10.13 | 6.18 | % | 2.35 | % | (0.13 | )% | 130 | % | $2,691 | |||||||||||||||||||
| 2009 | $7.00 | 0.01 | 2.59 | 2.60 | (0.06 | ) | — | (0.06 | ) | $9.54 | 37.29 | % | 2.38 | % | 0.18 | % | 151 | % | $3,051 | ||||||||||||||||||
| 2008 | $14.60 | 0.02 | (6.83 | ) | (6.81 | ) | — | (0.79 | ) | (0.79 | ) | $7.00 | (49.18 | )% | 2.31 | % | 0.18 | % | 144 | % | $3,210 | ||||||||||||||||
| 2007 | $11.97 | — | (4) | 2.63 | 2.63 | — | — | — | $14.60 | 21.97 | % | 2.27 | % | (0.06 | )% | 133 | % | $7,318 | |||||||||||||||||||
| R Class | |||||||||||||||||||||||||||||||||||||
| 2011 | $10.32 | 0.05 | (0.36 | ) | (0.31 | ) | (0.04 | ) | — | (0.04 | ) | $9.97 | (3.05 | )% | 1.82 | % | 0.45 | % | 125 | % | $3,222 | ||||||||||||||||
| 2010 | $9.72 | 0.03 | 0.62 | 0.65 | (0.05 | ) | — | (0.05 | ) | $10.32 | 6.75 | % | 1.85 | % | 0.37 | % | 130 | % | $4,381 | ||||||||||||||||||
| 2009 | $7.13 | 0.06 | 2.62 | 2.68 | (0.09 | ) | — | (0.09 | ) | $9.72 | 37.97 | % | 1.88 | % | 0.68 | % | 151 | % | $5,436 | ||||||||||||||||||
| 2008 | $14.81 | 0.09 | (6.96 | ) | (6.87 | ) | (0.02 | ) | (0.79 | ) | (0.81 | ) | $7.13 | (48.92 | )% | 1.81 | % | 0.68 | % | 144 | % | $2,727 | |||||||||||||||
| 2007 | $12.12 | 0.07 | 2.65 | 2.72 | (0.03 | ) | — | (0.03 | ) | $14.81 | 22.48 | % | 1.77 | % | 0.44 | % | 133 | % | $4,042 | ||||||||||||||||||
Notes to Financial Highlights
| (1) | Computed using average shares outstanding throughout the period. |
| (2) | Total returns are calculated based on the net asset value of the last business day and do not reflect applicable sales charges, if any. Total returns for periods less than one year are not annualized. |
| (3) | Prior to December 3, 2007, the A Class was referred to as the Advisor Class. |
| (4) | Per-share amount was less than $0.005. |
See Notes to Financial Statements.
26
American Century World Mutual Funds, Inc.:
We have audited the accompanying statement of assets and liabilities, including the schedule of investments, of International Growth Fund, one of the funds constituting American Century World Mutual Funds, Inc. (the “Corporation”), as of November 30, 2011, and the related statement of operations for the year then ended, the statements of changes in net assets for each of the two years in the period then ended, and the financial highlights for each of the five years in the period then ended. These financial statements and financial highlights are the responsibility of the Corporation’s management. Our responsibility is to express an opinion on these financial statements and financial highlights based on our audits.
We conducted our audits in accordance with the standards of the Public Company Accounting Oversight Board (United States). Those standards require that we plan and perform the audit to obtain reasonable assurance about whether the financial statements and financial highlights are free of material misstatement. The Corporation is not required to have, nor were we engaged to perform, an audit of its internal control over financial reporting. Our audits included consideration of internal control over financial reporting as a basis for designing audit procedures that are appropriate in the circumstances, but not for the purpose of expressing an opinion on the effectiveness of the Corporation’s internal control over financial reporting. Accordingly, we express no such opinion. An audit also includes examining, on a test basis, evidence supporting the amounts and disclosures in the financial statements, assessing the accounting principles used and significant estimates made by management, as well as evaluating the overall financial statement presentation. Our procedures included confirmation of securities owned as of November 30, 2011, by correspondence with the custodian and brokers; where replies were not received from brokers, we performed other auditing procedures. We believe that our audits provide a reasonable basis for our opinion.
In our opinion, the financial statements and financial highlights referred to above present fairly, in all material respects, the financial position of International Growth Fund of American Century World Mutual Funds, Inc., as of November 30, 2011, the results of its operations for the year then ended, the changes in its net assets for each of the two years in the period then ended, and the financial highlights for each of the five years in the period then ended, in conformity with accounting principles generally accepted in the United States of America.
Deloitte & Touche LLP
Kansas City, Missouri
January 20, 2012
27
The individuals listed below serve as directors of the funds. Each director will continue to serve in this capacity until death, retirement, resignation or removal from office. The mandatory retirement age for directors who are not “interested persons,” as that term is defined in the Investment Company Act (independent directors), is 72. However, the mandatory retirement age for an individual director may be extended with the approval of the remaining independent directors.
Mr. Thomas is the only director who is an “interested person” because he currently serves as President and Chief Executive Officer of American Century Companies, Inc. (ACC), the parent company of American Century Investment Management, Inc. (ACIM or the advisor).
The other directors (more than three-fourths of the total number) are independent; that is, they have never been employees, directors or officers of, and have no financial interest in, ACC or any of its wholly owned, direct or indirect, subsidiaries, including ACIM, American Century Investment Services, Inc. (ACIS) and American Century Services, LLC (ACS). The directors serve in this capacity for seven (in the case of Mr. Thomas, 15) registered investment companies in the American Century Investments family of funds.
The following presents additional information about the directors. The mailing address for each director is 4500 Main Street, Kansas City, Missouri 64111.
Name (Year of Birth) | Position(s) Held with Funds | Length of Time Served | Principal Occupation(s) During Past 5 Years | Number of American Century Portfolios Overseen by Director | Other Directorships Held During Past 5 Years | |||||
| Independent Directors | ||||||||||
| Thomas A. Brown (1940) | Director | Since 1980 | Managing Member, Associated Investments, LLC (real estate investment company); Brown Cascade Properties, LLC (real estate investment company) (2001 to 2009) | 65 | None | |||||
| Andrea C. Hall (1945) | Director | Since 1997 | Retired as advisor to the President, Midwest Research Institute (not-for-profit research organization) (June 2006) | 65 | None | |||||
| Jan M. Lewis (1957) | Director | Since 2011 | President and Chief Executive Officer, Catholic Charities of Northeast Kansas (human services organization)(2006 to present); President, BUCON, Inc. (full-service design-build construction company) (2004 to 2006) | 65 | None | |||||
| James A. Olson (1942) | Director | Since 2007 | Member, Plaza Belmont LLC (private equity fund manager); Chief Financial Officer, Plaza Belmont LLC (September 1999 to September 2006) | 65 | Saia, Inc. and Entertainment Properties Trust | |||||
28
Name (Year of Birth) | Position(s) Held with Funds | Length of Time Served | Principal Occupation(s) During Past 5 Years | Number of American Century Portfolios Overseen by Director | Other Directorships Held During Past 5 Years | |||||
| Independent Directors | ||||||||||
| Donald H. Pratt (1937) | Director and Chairman of the Board | Since 1995 (Chairman since 2005) | Chairman and Chief Executive Officer, Western Investments, Inc. (real estate company) | 65 | None | |||||
M. Jeannine Strandjord (1945) | Director | Since 1994 | Retired | 65 | DST Systems Inc., Euronet Worldwide Inc., and Charming Shoppes, Inc. | |||||
| John R. Whitten (1946) | Director | Since 2008 | Project Consultant, Celanese Corp. (industrial chemical company) | 65 | Rudolph Technologies, Inc. | |||||
| Stephen E. Yates (1948) | Advisory Director | Since 2011 | Retired; Executive Vice President, Technology & Operations, KeyCorp. (computer services) (2004 to 2010) | 65 | Applied Industrial Technology (2001 to 2010) | |||||
| Interested Director | ||||||||||
Jonathan S. Thomas (1963) | Director and President | Since 2007 | President and Chief Executive Officer, ACC (March 2007 to present); Chief Administrative Officer, ACC (February 2006 to February 2007); Executive Vice President, ACC (November 2005 to February 2007). Also serves as: Chief Executive Officer and Manager, ACS; Executive Vice President, ACIM; Director, ACC, ACIM and other ACC subsidiaries | 106 | None | |||||
29
Officers
The following table presents certain information about the executive officers of the funds. Each officer serves as an officer for each of the 15 investment companies in the American Century family of funds, unless otherwise noted. No officer is compensated for his or her service as an officer of the funds. The listed officers are interested persons of the funds and are appointed or re-appointed on an annual basis. The mailing address for each officer listed below is 4500 Main Street, Kansas City, Missouri 64111.
Name (Year of Birth) | Offices with the Funds | Principal Occupation(s) During the Past Five Years | ||
Jonathan S. Thomas (1963) | Director and President since 2007 | President and Chief Executive Officer, ACC (March 2007 to present); Chief Administrative Officer, ACC (February 2006 to February 2007); Executive Vice President, ACC (November 2005 to February 2007). Also serves as: Chief Executive Officer and Manager, ACS; Executive Vice President, ACIM; Director, ACC, ACIM and other ACC subsidiaries | ||
Barry Fink (1955) | Executive Vice President since 2007 | Chief Operating Officer and Executive Vice President, ACC (September 2007 to present); President, ACS (October 2007 to present); Managing Director, Morgan Stanley (2000 to 2007); Global General Counsel, Morgan Stanley (2000 to 2006). Also serves as: Manager, ACS and Director, ACC and certain ACC subsidiaries | ||
Maryanne L. Roepke (1956) | Chief Compliance Officer since 2006 and Senior Vice President since 2000 | Chief Compliance Officer, American Century funds, ACIM and ACS (August 2006 to present); Assistant Treasurer, ACC (January 1995 to August 2006); and Treasurer and Chief Financial Officer, various American Century funds (July 2000 to August 2006). Also serves as: Senior Vice President, ACS | ||
| Charles A. Etherington (1957) | General Counsel since 2007 and Senior Vice President since 2006 | Attorney, ACC (February 1994 to present); Vice President, ACC (November 2005 to present), General Counsel, ACC (March 2007 to present); Also serves as General Counsel, ACIM, ACS, ACIS and other ACC subsidiaries; and Senior Vice President, ACIM and ACS | ||
| Robert J. Leach (1966) | Vice President, Treasurer and Chief Financial Officer since 2006 | Vice President, ACS (February 2000 to present); and Controller, various American Century funds (1997 to September 2006) | ||
| David H. Reinmiller (1963) | Vice President since 2000 | Attorney, ACC (January 1994 to present); Associate General Counsel, ACC (January 2001 to present). Also serves as Vice President, ACIM and ACS | ||
| Ward D. Stauffer (1960) | Secretary since 2005 | Attorney, ACC (June 2003 to present) |
The Statement of Additional Information has additional information about the fund’s directors and is available without charge, upon request, by calling 1-800-345-2021.
30
At a meeting held on June 9, 2011, the Fund’s Board of Directors unanimously approved the renewal of the management agreement pursuant to which American Century Investment Management, Inc. (the “Advisor”) acts as the investment advisor for the Fund. Under Section 15(c) of the Investment Company Act, contracts for investment advisory services are required to be reviewed, evaluated, and approved by a majority of a fund’s independent directors (the “Directors”) each year.
As a part of the approval process, the Board requested and reviewed extensive data and information compiled by the Advisor and certain independent providers of evaluation data concerning the Fund and the services provided to the Fund by the Advisor. This review was in addition to the oversight and evaluation undertaken by the Board and its committees on a continuous basis throughout the year and included, but was not limited to the following:
| • | the nature, extent, and quality of investment management, shareholder services, and other services provided by the Advisor to the Fund; |
| • | the wide range of other programs and services the Advisor provides to the Fund and its shareholders on a routine and non-routine basis; |
| • | the investment performance of the fund, including data comparing the Fund’s performance to appropriate benchmarks and/or a peer group of other mutual funds with similar investment objectives and strategies; |
| • | data comparing the cost of owning the Fund to the cost of owning similar funds; |
| • | the Advisor’s compliance policies, procedures, and regulatory experience; |
| • | financial data showing the cost of services provided to the Fund, the profitability of the Fund to the Advisor, and the overall profitability of the Advisor; |
| • | data comparing services provided and charges to other investment management clients of the Advisor; and |
| • | consideration of collateral benefits derived by the Advisor from the management of the Fund and any potential economies of scale relating thereto. |
In keeping with its practice, the Board held two in-person meetings and one telephonic meeting to review and discuss the information provided. The Directors also had the benefit of the advice of independent counsel throughout the period.
Factors Considered
The Directors considered all of the information provided by the Advisor, the independent data providers, and independent counsel, and evaluated such information for the Fund. In connection with their review, the Directors did not identify any single factor as being all-important or controlling, and each Director may have attributed different levels of importance to different factors. In deciding to renew the management agreement, the Board based its decision on a number of factors, including the following:
31
Nature, Extent and Quality of Services — Generally. Under the management agreement, the Advisor is responsible for providing or arranging for all services necessary for the operation of the Fund. The Board noted that under the management agreement, the Advisor provides or arranges at its own expense a wide variety of services including:
| • | constructing and designing the Fund |
| • | portfolio research and security selection |
| • | initial capitalization/funding |
| • | securities trading |
| • | Fund administration |
| • | custody of Fund assets |
| • | daily valuation of the Fund’s portfolio |
| • | shareholder servicing and transfer agency, including shareholder confirmations, recordkeeping, and communications |
| • | legal services |
| • | regulatory and portfolio compliance |
| • | financial reporting |
| • | marketing and distribution |
The Board noted that many of these services have expanded over time both in terms of quantity and complexity in response to shareholder demands, competition in the industry, changing distribution channels, and the changing regulatory environment.
Investment Management Services. The nature of the investment management services provided to the Fund is quite complex and allows Fund shareholders access to professional money management, instant diversification of their investments within an asset class, the opportunity to easily diversify among asset classes by investing in or exchanging among various American Century Investments funds, and liquidity. In evaluating investment performance, the Board expects the Advisor to manage the Fund in accordance with its investment objectives and approved strategies. Further, the Directors recognize that the Advisor has an obligation to monitor trading activities, and in particular to seek the best execution of fund trades, and to evaluate the use of and payment for research. In providing these services, the Advisor utilizes teams of investment professionals (portfolio managers, analysts, research assistants, and securities traders) who require extensive information technology, research, training, compliance and other systems to conduct their business. The Board, directly and through its Fund Performance Review Committee, regularly reviews investment performance information for the Fund, together with comparative information for appropriate benchmarks and/or peer groups of similarly-managed funds, over different
32
time horizons. The Directors also review detailed performance information during the management agreement approval process. If performance concerns are identified, the Fund receives special reviews until performance improves, during which the Board discusses with the Advisor the reasons for such results (e.g., market conditions, security selection) and any efforts being undertaken to improve performance. Taking all these factors into consideration, the Board found the investment management services provided by the Advisor to the Fund to meet or exceed industry standards. More detailed information about the Fund’s performance can be found in the Performance and Portfolio Commentary sections of this report.
Shareholder and Other Services. Under the management agreement, the Advisor provides the Fund with a comprehensive package of transfer agency, shareholder, and other services. The Board, directly and through various committees of the Board, regularly reviews reports and evaluations of such services at its regular meetings. These reports include, but are not limited to, information regarding the operational efficiency and accuracy of the shareholder and transfer agency services provided, staffing levels, shareholder satisfaction (as measured by external as well as internal sources), technology support, new products and services offered to Fund shareholders, securities trading activities, portfolio valuation services, auditing services, and legal and operational compliance activities. Certain aspects of shareholder and transfer agency service level efficiency and the quality of securities trading activities are measured by independent third party providers and are presented in comparison to other fund groups not managed by the Advisor. The Board found the services provided by the Advisor to the Fund under the management agreement to be competitive and of high quality.
Costs of Services and Profitability. The Advisor provides detailed information concerning its cost of providing various services to the Fund, its profitability in managing the Fund, its overall profitability, and its financial condition. The Directors have reviewed with the Advisor the methodology used to prepare this financial information. The financial information regarding the Advisor is considered in evaluating the Advisor’s financial condition, ability to continue to provide services under the management agreement, and the reasonableness of the current management fee. The Board concluded that the Advisor’s profits were reasonable in light of the services provided to the Fund.
Ethics. The Board generally considers the Advisor’s commitment to providing quality services to shareholders and to conducting its business ethically. They noted that the Advisor’s practices generally meet or exceed industry best practices.
Economies of Scale. The Board also reviewed information provided by the Advisor regarding the possible existence of economies of scale in connection with the management of the Fund. The Board concluded that economies of scale are difficult to measure and predict with precision, especially on a fund-by-fund basis. The Board concluded that the Advisor is appropriately sharing economies of scale through its competitive fee structure, offering competitive fees from fund inception, and through reinvestment in its business to provide shareholders additional content and services.
33
Comparison to Other Funds’ Fees. The management agreement provides that the Fund pay the Advisor a single, all-inclusive (or unified) management fee for providing all services necessary for the management and operation of the Fund, other than brokerage expenses, taxes, interest, extraordinary expenses, and the fees and expenses of the Fund’s independent directors (including their independent legal counsel) and expenses incurred in connection with the provision of shareholder services and distribution services under a plan adopted pursuant to Rule 12b-1 under the 1940 Act. Under the unified fee structure, the Advisor is responsible for providing all investment advisory, custody, audit, administrative, compliance, recordkeeping, marketing and shareholder services, or arranging and supervising third parties to provide such services. By contrast, most other funds are charged a variety of fees, including an investment advisory fee, a transfer agency fee, an administrative fee, distribution charges and other expenses. Other than their investment advisory fees and any applicable Rule 12b-1 distribution fees, all other components of the total fees charged by these other funds may be increased without shareholder approval. The Board believes the unified fee structure is a benefit to Fund shareholders because it clearly discloses to shareholders the cost of owning Fund shares, and, since the unified fee cannot be increased without a vote of Fund shareholders, it shifts to the Advisor the risk of increased costs of operating the Fund and provides a direct incentive to minimize administrative inefficiencies. Part of the Board’s analysis of fee levels involves reviewing certain evaluative data compiled by an independent provider and comparing the Fund’s unified fee to the total expense ratio of other funds in the Fund’s peer group. The Board concluded that the management fee paid by the Fund to the Advisor under the management agreement is reasonable in light of the services provided to the Fund.
Comparison to Fees and Services Provided to Other Clients of the Advisor. The Board also requested and received information from the Advisor concerning the nature of the services, fees, costs and profitability of its advisory services to advisory clients other than the Fund. They observed that these varying types of client accounts require different services and involve different regulatory and entrepreneurial risks than the management of the Fund. The Board analyzed this information and concluded that the fees charged and services provided to the Fund were reasonable by comparison.
Collateral or “Fall-Out” Benefits Derived by the Advisor. The Board considered the existence of collateral benefits the Advisor may receive as a result of its relationship with the Fund. They concluded that the Advisor’s primary business is managing mutual funds and it generally does not use fund or shareholder information to generate profits in other lines of business, and therefore does not derive any significant collateral benefits from them. The Board noted that the Advisor receives proprietary research from broker-dealers that execute fund portfolio transactions and concluded that this research is likely to benefit Fund shareholders. The Board also determined that the Advisor is able to provide investment management services to certain clients other than the Fund, at least in part, due to its existing infrastructure built to serve the fund complex. The Board concluded, however, that the assets of those other clients are not material to the analysis and, where applicable, may be included with the assets of the Fund to determine breakpoints in the management fee schedule.
34
Existing Relationship. The Board also considered whether there was any reason for not continuing the existing arrangement with the Advisor. In this regard, the Board was mindful of the potential disruptions of the Fund’s operations and various risks, uncertainties, and other effects that could occur as a result of a decision not to continue such relationship. In particular, the Board recognized that most shareholders have invested in the Fund on the strength of the Advisor’s industry standing and reputation and in the expectation that the Advisor will have a continuing role in providing advisory services to the Fund.
Conclusion of the Directors. As a result of this process, the Board, including all of the independent directors, taking into account all of the factors discussed above and the information provided by the Advisor and others, concluded that the management agreement between the Fund and the Advisor is fair and reasonable in light of the services provided and should be renewed.
35
As required by law, distributions you receive from certain IRAs, or 403(b), 457 and qualified plans are subject to federal income tax withholding, unless you elect not to have withholding apply. Tax will be withheld on the total amount withdrawn even though you may be receiving amounts that are not subject to withholding, such as nondeductible contributions. In such case, excess amounts of withholding could occur. You may adjust your withholding election so that a greater or lesser amount will be withheld.
If you don’t want us to withhold on this amount, you must notify us to not withhold the federal income tax. You may notify us in writing or in certain situations by telephone or through other electronic means. You have the right to revoke your withholding election at any time and any election you make may remain in effect until revoked by filing a new election.
Remember, even if you elect not to have income tax withheld, you are liable for paying income tax on the taxable portion of your withdrawal. If you elect not to have income tax withheld or you don’t have enough income tax withheld, you may be responsible for payment of estimated tax. You may incur penalties under the estimated tax rules if your withholding and estimated tax payments are not sufficient. You can reduce or defer the income tax on a distribution by directly or indirectly rolling such distribution over to another IRA or eligible plan. You should consult your tax advisor for additional information.
State tax will be withheld if, at the time of your distribution, your address is within one of the mandatory withholding states and you have federal income tax withheld. State taxes will be withheld from your distribution in accordance with the respective state rules.
Proxy Voting Guidelines
American Century Investment Management, Inc., the fund’s investment advisor, is responsible for exercising the voting rights associated with the securities purchased and/or held by the fund. A description of the policies and procedures the advisor uses in fulfilling this responsibility is available without charge, upon request, by calling 1-800-345-2021. It is also available on American Century Investments’ website at americancentury.com and on the Securities and Exchange Commission’s website at sec.gov. Information regarding how the investment advisor voted proxies relating to portfolio securities during the most recent 12-month period ended June 30 is available on the “About Us” page at americancentury.com. It is also available at sec.gov.
Quarterly Portfolio Disclosure
The fund files its complete schedule of portfolio holdings with the Securities and Exchange Commission (SEC) for the first and third quarters of each fiscal year on Form N-Q. The fund’s Forms N-Q are available on the SEC’s website at sec.gov, and may be reviewed and copied at the SEC’s Public Reference Room in Washington, DC. Information on the operation of the Public Reference Room may be obtained by calling 1-800-SEC-0330. The fund also makes its complete schedule of portfolio holdings for the most recent quarter of its fiscal year available on its website at americancentury.com and, upon request, by calling 1-800-345-2021.
36
Other Tax Information
The following information is provided pursuant to provisions of the Internal Revenue Code.
The fund hereby designates up to the maximum amount allowable as qualifieddividend income for the fiscal year ended November 30, 2011.
For corporate taxpayers, the fund hereby designates $10,379, or up to the maximum amount allowable, of ordinary income distributions paid during the fiscal year ended November 30, 2011 as qualified for the corporate dividends received deduction.
For the fiscal year ended November 30, 2011, the fund intends to pass through to shareholders $3,116,541, or up to the maximum amount allowable, as a foreign tax credit which represents taxes paid on income derived from sources within foreign countries or possessions of the United States. During the fiscal year ended November 30, 2011, the fund earned $37,486,117 from income derived from foreign sources. Foreign source income and foreign tax expense per outstanding share on November 30, 2011 are $0.2505 and $0.0208, respectively.
37
38
39
40
| Contact Us | americancentury.com |
| Automated Information Line | 1-800-345-8765 |
| Investor Services Representative | 1-800-345-2021 or 816-531-5575 |
| Investors Using Advisors | 1-800-378-9878 |
| Business, Not-For-Profit, Employer-Sponsored Retirement Plans | 1-800-345-3533 |
| Banks and Trust Companies, Broker-Dealers, Financial Professionals, Insurance Companies | 1-800-345-6488 |
| Telecommunications Device for the Deaf | 1-800-634-4113 |
American Century World Mutual Funds, Inc.
Investment Advisor:
American Century Investment Management, Inc.
Kansas City, Missouri
This report and the statements it contains are submitted for the general information of our shareholders. The report is not authorized for distribution to prospective investors unless preceded or accompanied by an effective prospectus.
©2012 American Century Proprietary Holdings, Inc. All rights reserved.
CL-ANN-74135 1201
ANNUAL REPORT | NOVEMBER 30, 2011
| International Value Fund |
| President’s Letter | 2 |
| Independent Chairman’s Letter | 3 |
| Market Perspective | 4 |
| Performance | 5 |
| Portfolio Commentary | 7 |
| Fund Characteristics | 9 |
| Shareholder Fee Example | 10 |
| Schedule of Investments | 12 |
| Statement of Assets and Liabilities | 14 |
| Statement of Operations | 15 |
| Statement of Changes in Net Assets | 16 |
| Notes to Financial Statements | 17 |
| Financial Highlights | 23 |
| Report of Independent Registered Public Accounting Firm | 25 |
| Management | 26 |
| Approval of Management Agreement | 29 |
| Additional Information | 34 |
Any opinions expressed in this report reflect those of the author as of the date of the report, and do not necessarily represent the opinions of American Century Investments® or any other person in the American Century Investments organization. Any such opinions are subject to change at any time based upon market or other conditions and American Century Investments disclaims any responsibility to update such opinions. These opinions may not be relied upon as investment advice and, because investment decisions made by American Century Investments funds are based on numerous factors, may not be relied upon as an indication of trading intent on behalf of any American Century Investments fund. Security examples are used for representational purposes only and are not intended as recommendations to purchase or sell securities. Performance information for comparative indices and securities is provided to American Century Investments by third party vendors. To the best of American Century Investments’ knowledge, such information is accurate at the time of printing.
Thank you for reviewing this annual report for the period ended November 30, 2011. Our report offers investment performance and portfolio information, presented with the expert perspective of our portfolio management team.
This report remains one of our most important vehicles for conveying information about fund returns, as well as market factors and strategies that affected fund performance. For additional, updated information, we encourage you to visit our website, americancentury.com. Click on the “Fund Performance” and “Insights & News” headings at the top of our Individual Investors site.
Reporting Period’s Divided Nature Resulted in Mixed Returns
The financial market performance that most U.S. investors experienced during the 12 months ended November 30, 2011 generally reflected the period’s divided nature. For the first six months, confidence in global economic growth, strong corporate earnings, and increased risk-taking generally ruled the markets. The MSCI EAFE Index and the S&P 500 Index advanced approximately 15% for the six months ended May 31, 2011, as stocks broadly outperformed high-quality bonds for that period.
However, the tables reversed sharply for the final six months. The risk-taking tide ebbed during the summer months, constrained by high fuel prices, federal budget management concerns in the U.S., and the worsening sovereign debt crisis in Europe. High-quality bonds, led by long-maturity U.S. Treasury securities, mostly outpaced stocks. The MSCI EAFE Index and the S&P 500 Index returned –16.56% and –6.25%, respectively, during the six months ended November 30, 2011, despite a significant market rebound in October.
As a result of this volatility, returns were mixed for the full 12-month period. U.S. and international bonds and U.S. stocks generally outperformed international stocks. The S&P 500 Index and the MSCI EAFE Index returned 7.83% and –4.12%, respectively, for the fiscal year.
Unfortunately, further volatility appears likely in 2012 as the markets wrestle with uncertainties regarding European debt, economic strength, government budget deficits, and the U.S. presidential election. We believe strongly in adhering to a disciplined, diversified, long-term investment approach during volatile periods, and we appreciate your continued trust in us during these unsettled times.
Sincerely,
Jonathan Thomas
President and Chief Executive Officer
American Century Investments
2
The board of directors of the fund was pleased at the announcement of a new strategic partner for the investment advisor to the American Century Investments funds. Canadian Imperial Bank of Commerce (CIBC), a leading Canadian financial institution, purchased the 41 percent economic interest in American Century Companies, the parent corporation of the advisor, previously held by JPMorgan Chase & Co. Based in Toronto, CIBC provides a full range of retail and wholesale banking services to almost 11 million clients through approximately 1,100 branches and offices in Canada, the U.S. and around the world. This transaction will benefit fund shareholders by bolstering the financial strength of the advisor and providing a strategic partner to help support its growth initiative to broaden non-U.S. distribution of its products and services.
The board also has been briefed throughout the year on the impact on fund performance of the European banking crisis, the U.S. deficit reduction debates, and the pace of economic growth. While the performance of all funds has been affected, the majority of American Century Investments funds overseen by the board are exceeding their benchmarks for the one-, three-, five-, and ten-year periods ended September 30, 2011. This is commendable performance, particularly in these challenging market conditions.
We are completing another year of board oversight on your behalf. We appreciate any comments you would like to share with the board. Send them to me at dhpratt@fundboardchair.com. Thank you for your continued investment in American Century Investments funds.
Best regards,
Don Pratt
3
By Mark Kopinski, Chief Investment Officer, Global and Non-U.S. Equity
Stocks Struggled as Growth Slowed
Global stock markets kicked off the 12-month period in generally robust fashion, no easy feat considering investors had to weigh brightening economic outlooks against mounting inflationary pressures, ongoing sovereign debt concerns, and an onslaught of political unrest and natural disasters. Nevertheless, negative forces—primarily expanding sovereign debt problems in Europe and the United States—gradually tightened their hold on the worldwide economy, and market sentiment began to deteriorate. The downdraft culminated with a sharp global market selloff in the third calendar quarter of 2011, triggered primarily by Standard & Poor’s first-ever downgrade of the United States’ long-term credit rating and mounting fears of a default in Greece. Worried about the potential for another global recession, the International Monetary Fund (IMF) trimmed its global growth outlook for 2012.
Overall, emerging market stocks underperformed developed international markets for the 12-month period, as investors retreated from riskier investments. In addition, falling global growth prospects sparked stock slumps, particularly in export-heavy emerging-market economies of South Korea and China. Economic growth continued to moderate in China, but inflationary pressures continued to build, prompting IMF calls for China to allow its currency to appreciate to temper a surge in inflation.
Outlook Hinges on Fiscal Strategies
The period ended with the United States, Japan and China releasing relatively strong economic data, thereby diminishing concerns for a synchronized global recession. Yet, European Union countries continued to falter. As the eurozone crisis continues, global demand likely will decrease as a function of deleveraging, which should negatively influence export-driven markets. In addition, volatility in the financial markets may remain heightened, as investors react to European reform plans.
Ultimately, we believe the global economy can and will resume a strong growth trend. But to do so, each region and country will have to address its specific fiscal challenges. We believe these are solvable problems, as long as government policy supports the private sector and its role in driving economic output and employment based on the profit incentive.
| International Equity Total Returns | ||||
| For the 12 months ended November 30, 2011 (in U.S. dollars) | ||||
| MSCI EAFE Index | -4.12% | MSCI Europe Index | -2.08% | |
| MSCI EAFE Growth Index | -3.96% | MSCI World Index | 1.46% | |
| MSCI EAFE Value Index | -4.27% | MSCI Japan Index | -8.56% | |
| MSCI Emerging Markets Index | -11.54% | |||
4
| Total Returns as of November 30, 2011 | ||||||
| Average Annual Returns | ||||||
| Ticker Symbol | 1 year | 5 years | 10 years | Since Inception | Inception Date | |
A Class No sales charge* With sales charge* | MEQAX | 0.45% -5.29% | -2.76%(1) -3.91%(1) | 4.90%(1) 4.28%(1) | 3.08%(1) 2.66%(1) | 3/31/97 |
MSCI EAFE Value Index(2) | — | -4.27% | -5.58% | 5.10% | 4.59% | — |
| MSCI EAFE Index | — | -4.12% | -3.95% | 4.83% | 3.65% | — |
| Investor Class | ACEVX | 0.57% | -2.55% | — | -0.32% | 4/3/06 |
| Institutional Class | ACVUX | 0.92% | -2.36% | — | -0.12% | 4/3/06 |
| C Class | ACCOX | -0.31% | -3.54% | — | -1.32% | 4/3/06 |
| R Class | ACVRX | 0.20% | -3.04% | — | -0.82% | 4/3/06 |
*Sales charges include initial sales charges and contingent deferred sales charges (CDSCs), as applicable. A Class shares have a 5.75% maximum initial sales charge and may be subject to a maximum CDSC of 1.00%. C Class shares redeemed within 12 months of purchase are subject to a maximum CDSC of 1.00%. The SEC requires that mutual funds provide performance information net of maximum sales charges in all cases where charges could be applied.
International Value acquired all the net assets of the Mason Street International Equity Fund on March 31, 2006, pursuant to a plan of reorganization approved by the acquired fund’s shareholders on March 15, 2006. Performance information prior to April 1, 2006, is that of the Mason Street International Equity Fund.
| (1) | Returns would have been lower if a portion of the fees had not been waived. |
| (2) | Effective November 30, 2011, the fund’s benchmark changed from the MSCI EAFE Index to the MSCI EAFE Value Index. The fund’s investment advisor believes that the MSCI EAFE Value Index aligns better with the fund’s strategy. |
Data presented reflect past performance. Past performance is no guarantee of future results. Current performance may be higher or lower than the performance shown. Investment return and principal value will fluctuate, and redemption value may be more or less than original cost. To obtain performance data current to the most recent month end, please call 1-800-345-2021 or visit americancentury.com. International investing involves special risks, such as political instability and currency fluctuations. Investing in emerging markets may accentuate these risks.
Unless otherwise indicated, performance reflects A Class shares; performance for other share classes will vary due to differences in fee structure. For information about other share classes available, please consult the prospectus. Data assumes reinvestment of dividends and capital gains, and none of the charts reflect the deduction of taxes that a shareholder would pay on fund distributions or the redemption of fund shares. Returns for the indices are provided for comparison. The fund’s total returns include operating expenses (such as transaction costs and management fees) that reduce returns, while the total returns of the indices do not.
5
| Growth of $10,000 Over 10 Years |
| $10,000 investment made November 30, 2001* |
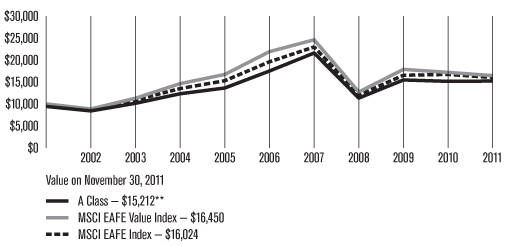
| * | The A Class’s initial investment is $9,425 to reflect the maximum 5.75% initial sales charge. |
| ** | Ending value would have been lower if a portion of the fees had not been waived. |
| Total Annual Fund Operating Expenses | ||||
| Investor Class | Institutional Class | A Class | C Class | R Class |
| 1.32% | 1.12% | 1.57% | 2.32% | 1.82% |
The total annual fund operating expenses shown is as stated in the fund’s prospectus current as of the date of this report. The prospectus may vary from the expense ratio shown elsewhere in this report because it is based on a different time period, includes acquired fund fees and expenses, and, if applicable, does not include fee waivers or expense reimbursements.
Data presented reflect past performance. Past performance is no guarantee of future results. Current performance may be higher or lower than the performance shown. Investment return and principal value will fluctuate, and redemption value may be more or less than original cost. To obtain performance data current to the most recent month end, please call 1-800-345-2021 or visit americancentury.com. International investing involves special risks, such as political instability and currency fluctuations. Investing in emerging markets may accentuate these risks.
Unless otherwise indicated, performance reflects A Class shares; performance for other share classes will vary due to differences in fee structure. For information about other share classes available, please consult the prospectus. Data assumes reinvestment of dividends and capital gains, and none of the charts reflect the deduction of taxes that a shareholder would pay on fund distributions or the redemption of fund shares. Returns for the indices are provided for comparison. The fund’s total returns include operating expenses (such as transaction costs and management fees) that reduce returns, while the total returns of the indices do not.
6
Effective December 1, 2011, American Century Investments terminated its subadvisory agreement with Franklin Templeton and assumed direct management of International Value. Portfolio managers Armando Lacayo and Elizabeth Xie, who also manage International Core Equity, have taken over management of International Value.
Performance Summary
International Value returned 0.45%* for the fiscal year ended November 30, 2011, compared with the –4.12% return of the MSCI EAFE Index and the –4.27% return of the MSCI EAFE Value Index. Effective November 30, 2011, International Value’s benchmark changed from the MSCI EAFE Index to the MSCI EAFE
Value Index.
International Value’s fractionally positive return outpaced the decline of its benchmark index. The fund’s outperformance of its benchmark resulted primarily from country allocation, including an underweight position in Japan (whose market tumbled sharply during the period) and overweight positions in smaller Asian markets such as South Korea and Singapore. In contrast, the fund’s holdings in Australia detracted from relative results.
Defensive Sectors Contributed to Absolute Performance
On an absolute basis, the more defensive sectors of the portfolio posted the best returns for the 12-month period. The fund’s holdings in the utilities, consumer staples, and health care sectors generated double-digit gains for the period. The leading individual contributors included South Korean auto manufacturer Hyundai Motor, global energy producer Royal Dutch Shell, and South Korean consumer electronics maker Samsung Electronics.
On the downside, the fund’s financial holdings—by far the fund’s largest sector weighting, comprising approximately a quarter of the portfolio—had the biggest negative impact on absolute performance. The more economically sensitive sectors, such as industrials and materials, also declined for the reporting period. The most significant individual detractors from absolute performance included Chinese electrical equipment manufacturer Shanghai Electric Group, U.K. financial services firm HSBC Holdings, and Japanese video game maker Nintendo.
Consumer Discretionary and Utilities Outperformed
Looking at relative performance, the fund’s holdings in the consumer discretionary and utilities sectors contributed the most to its outperformance versus the MSCI EAFE Value Index. Stock selection among auto makers and specialty retailers generated virtually all of the outperformance in the consumer discretionary sector. The top contributors in this sector were South Korean auto maker Hyundai Motor, which gained market share in the U.S. and elsewhere, and British home improvement retailer Kingfisher, which benefited from higher profit margins and increased market share.
| * | All fund returns referenced in this commentary are for A Class shares and are not reduced by sales charges. A Class shares are subject to a maximum sales charge of 5.75%. Had the sales charge been applied, returns would have been lower than those shown. |
7
In the utilities sector, stock choices among electric utilities provided the bulk of the outperformance. In particular, the fund avoided Japanese utility Tokyo Electric Power, which declined sharply after suffering severe damage in the wake of the devastating earthquake and tsunami in Japan, including a major incident at one of the company’s nuclear power plants.
Other leading contributors in the portfolio included German pharmaceutical firm Merck KGaA and German enterprise software maker SAP. Merck boosted results via some beneficial acquisitions, while SAP consistently exceeded earnings expectations thanks to strong growth in Asia.
Energy, Industrials Lagged
The fund’s holdings in the energy and industrials sectors underperformed their counterparts in the MSCI EAFE Value Index for the 12-month period. Stock selection among oil and gas producers was largely responsible for the underperformance in the energy sector. Exposure to Brazilian energy producer Petroleo Brasileiro and Canadian petroleum company Talisman Energy (neither of which are represented in the index) detracted the most. Petrobras faced delays in developing offshore oilfields, while Talisman lowered its annual output projections.
In the industrials sector, overweight positions in electrical equipment makers and airline companies had the biggest negative impact on relative results. Notable detractors included Chinese electrical equipment manufacturer Shanghai Electric Group, which slumped amid slowing global economic growth, and German airline Deutsche Lufthansa, which faced lower traffic and higher fuel costs that weighed on profits.
New Management Team and Philosophy
As stated at the beginning of this report, American Century Investments has taken over management of International Value from Franklin Templeton as of the end of the reporting period. Our investment approach emphasizes individual stock selection over country and sector allocation. We employ a quantitative investment process, used by a number of other American Century funds, that seeks to exploit inefficiencies and irrational behavior in the global equity markets. We select stocks based on a multi-factor model that incorporates valuation, quality, and momentum. Portfolio weightings are determined by an optimization process that balances expected risk and expected return. As a consequence, the fund’s country and sector weightings will not stray significantly from the benchmark’s country and sector profile.
In comparison to its past management strategy, the fund is expected to have a lower risk profile, less exposure to emerging markets, and greater adherence to the benchmark index going forward.
A Look Ahead
As we move into 2012, uncertainty regarding the economic environment and the sovereign debt situation in Europe is likely to result in continued volatility in the global equity markets. We believe that our disciplined investment process is especially critical in periods of extreme market volatility, because we adhere to our investment approach regardless of the short-term swings and emotion sweeping the financial markets. We believe this approach will produce favorable returns over the long term.
8
| NOVEMBER 30, 2011 | |
| Top Ten Holdings | % of net assets |
| Royal Dutch Shell plc B Shares | 3.3% |
| Merck KGaA | 3.0% |
| Vodafone Group plc | 2.9% |
| Samsung Electronics Co. Ltd. | 2.9% |
| Roche Holding AG | 2.6% |
| AIA Group Ltd. | 2.3% |
| GlaxoSmithKline plc | 2.3% |
| Hana Financial Group, Inc. | 2.2% |
| SAP AG | 2.2% |
| China Mobile Ltd. | 2.1% |
| Types of Investments in Portfolio | % of net assets |
| Foreign Common Stocks | 98.6% |
| Temporary Cash Investments | 0.4% |
| Other Assets and Liabilities | 1.0% |
| Investments by Country | % of net assets |
| United Kingdom | 17.1% |
| Germany | 11.0% |
| Netherlands | 9.6% |
| France | 9.5% |
| Switzerland | 7.3% |
| South Korea | 6.9% |
| Japan | 6.1% |
| Hong Kong | 5.4% |
| People’s Republic of China | 5.0% |
| Italy | 3.5% |
| Singapore | 3.3% |
| Brazil | 2.7% |
| Taiwan (Republic of China) | 2.5% |
| Other Countries | 8.7% |
| Cash and Equivalents* | 1.4% |
| *Includes temporary cash investments and other assets and liabilities. | |
9
Fund shareholders may incur two types of costs: (1) transaction costs, including sales charges (loads) on purchase payments and redemption/exchange fees; and (2) ongoing costs, including management fees; distribution and service (12b-1) fees; and other fund expenses. This example is intended to help you understand your ongoing costs (in dollars) of investing in your fund and to compare these costs with the ongoing cost of investing in other mutual funds.
The example is based on an investment of $1,000 made at the beginning of the period and held for the entire period from June 1, 2011 to November 30, 2011.
Actual Expenses
The table provides information about actual account values and actual expenses for each class. You may use the information, together with the amount you invested, to estimate the expenses that you paid over the period. First, identify the share class you own. Then simply divide your account value by $1,000 (for example, an $8,600 account value divided by $1,000 = 8.6), then multiply the result by the number under the heading “Expenses Paid During Period” to estimate the expenses you paid on your account during this period.
If you hold Investor Class shares of any American Century Investments fund, or Institutional Class shares of the American Century Diversified Bond Fund, in an American Century Investments account (i.e., not a financial intermediary or retirement plan account), American Century Investments may charge you a $12.50 semiannual account maintenance fee if the value of those shares is less than $10,000. We will redeem shares automatically in one of your accounts to pay the $12.50 fee. In determining your total eligible investment amount, we will include your investments in all personal accounts (including American Century Investments Brokerage accounts) registered under your Social Security number. Personal accounts include individual accounts, joint accounts, UGMA/UTMA accounts, personal trusts, Coverdell Education Savings Accounts and IRAs (including traditional, Roth, Rollover, SEP-, SARSEP- and SIMPLE-IRAs), and certain other retirement accounts. If you have only business, business retirement, employer-sponsored or American Century Investments Brokerage accounts, you are currently not subject to this fee. We will not charge the fee as long as you choose to manage your accounts exclusively online. If you are subject to the Account Maintenance Fee, your account value could be reduced by the fee amount.
Hypothetical Example for Comparison Purposes
The table also provides information about hypothetical account values and hypothetical expenses based on the actual expense ratio of each class of your fund and an assumed rate of return of 5% per year before expenses, which is not the actual return of a fund’s share class. The hypothetical account values and expenses may not be used to estimate the actual ending account balance or expenses you paid for the period. You may use this information to compare the ongoing costs of investing in your fund and other funds. To do so, compare this 5% hypothetical example with the 5% hypothetical examples that appear in the shareholder reports of the other funds.
10
Please note that the expenses shown in the table are meant to highlight your ongoing costs only and do not reflect any transactional costs, such as sales charges (loads) or redemption/exchange fees. Therefore, the table is useful in comparing ongoing costs only, and will not help you determine the relative total costs of owning different funds. In addition, if these transactional costs were included, your costs would have been higher.
Beginning Account Value 6/1/11 | Ending Account Value 11/30/11 | Expenses Paid During Period(1) 6/1/11 – 11/30/11 | Annualized Expense Ratio(1) | |
| Actual | ||||
| Investor Class | $1,000 | $850.70 | $6.12 | 1.32% |
| Institutional Class | $1,000 | $852.90 | $5.20 | 1.12% |
| A Class | $1,000 | $850.20 | $7.28 | 1.57% |
| C Class | $1,000 | $846.50 | $10.74 | 2.32% |
| R Class | $1,000 | $849.70 | $8.44 | 1.82% |
| Hypothetical | ||||
| Investor Class | $1,000 | $1,018.45 | $6.68 | 1.32% |
| Institutional Class | $1,000 | $1,019.45 | $5.67 | 1.12% |
| A Class | $1,000 | $1,017.20 | $7.94 | 1.57% |
| C Class | $1,000 | $1,013.44 | $11.71 | 2.32% |
| R Class | $1,000 | $1,015.94 | $9.20 | 1.82% |
| (1) | Expenses are equal to the class’s annualized expense ratio listed in the table above, multiplied by the average account value over the period, multiplied by 183, the number of days in the most recent fiscal half-year, divided by 365, to reflect the one-half year period. |
11
| Shares | Value | |||||||
| Common Stocks — 98.6% | ||||||||
| AUSTRALIA — 0.2% | ||||||||
| BlueScope Steel Ltd. | 109,900 | $45,756 | ||||||
| BRAZIL — 2.7% | ||||||||
| Centrais Eletricas Brasileiras SA | 16,355 | 149,862 | ||||||
| Petroleo Brasileiro SA-Petrobras ADR | 11,580 | 312,544 | ||||||
| Vale SA Preference Shares ADR | 9,950 | 217,606 | ||||||
| 680,012 | ||||||||
| CANADA — 0.9% | ||||||||
| Husky Energy, Inc. | 2,810 | 69,978 | ||||||
| Talisman Energy, Inc. | 12,040 | 164,791 | ||||||
| 234,769 | ||||||||
| FRANCE — 9.5% | ||||||||
| Alstom SA | 2,320 | 80,614 | ||||||
| AXA SA | 26,237 | 381,657 | ||||||
| Carrefour SA | 1,670 | 44,444 | ||||||
| Cie Generale des Etablissements Michelin Class B | 7,988 | 509,744 | ||||||
| Credit Agricole SA | 22,000 | 142,273 | ||||||
| France Telecom SA | 3,020 | 52,164 | ||||||
| Sanofi | 5,813 | 406,897 | ||||||
| Thales SA | 2,020 | 63,890 | ||||||
| Total SA | 9,030 | 466,468 | ||||||
| Vivendi SA | 10,030 | 231,451 | ||||||
| 2,379,602 | ||||||||
| GERMANY — 11.0% | ||||||||
| Deutsche Lufthansa AG | 5,350 | 69,315 | ||||||
| Deutsche Post AG | 11,140 | 168,300 | ||||||
| E.ON AG | 18,920 | 468,342 | ||||||
| MAN SE | 670 | 57,998 | ||||||
| Merck KGaA | 7,660 | 760,810 | ||||||
| Muenchener Rueckversicherungs AG | 1,880 | 237,738 | ||||||
| SAP AG | 9,280 | 553,672 | ||||||
| Siemens AG | 630 | 63,585 | ||||||
| Siemens AG ADR | 3,670 | 372,175 | ||||||
| 2,751,935 | ||||||||
| HONG KONG — 5.4% | ||||||||
| AIA Group Ltd. | 185,200 | 582,307 | ||||||
| Cheung Kong Holdings Ltd. | 10,300 | 117,797 | ||||||
| China Mobile Ltd. | 53,500 | 527,409 | ||||||
| Citic Pacific Ltd. | 64,000 | 121,198 | ||||||
| 1,348,711 | ||||||||
| IRELAND — 0.6% | ||||||||
| CRH plc | 7,810 | 150,699 | ||||||
| ITALY — 3.5% | ||||||||
| ENI SpA | 19,180 | 406,479 | ||||||
| Intesa Sanpaolo SpA | 88,780 | 147,854 | ||||||
| UniCredit SpA | 296,880 | 310,012 | ||||||
| 864,345 | ||||||||
| JAPAN — 6.1% | ||||||||
| ITOCHU Corp. | 31,100 | 315,948 | ||||||
| Nintendo Co. Ltd. | 1,330 | 201,678 | ||||||
| Nissan Motor Co. Ltd. | 15,660 | 143,723 | ||||||
| NKSJ Holdings, Inc. | 8,000 | 158,874 | ||||||
| Nomura Holdings, Inc. | 45,700 | 151,501 | ||||||
| Toyota Motor Corp. | 5,800 | 190,700 | ||||||
| Trend Micro, Inc. | 11,600 | 356,096 | ||||||
| 1,518,520 | ||||||||
| NETHERLANDS — 9.6% | ||||||||
Aegon NV(1) | 19,030 | 83,329 | ||||||
| Akzo Nobel NV | 6,200 | 314,833 | ||||||
ING Groep NV CVA(1) | 56,972 | 444,289 | ||||||
| Koninklijke Philips Electronics NV | 7,837 | 159,482 | ||||||
| Randstad Holding NV | 6,110 | 190,879 | ||||||
| Royal Dutch Shell plc B Shares | 23,125 | 833,051 | ||||||
| SBM Offshore NV | 9,788 | 210,107 | ||||||
TomTom NV(1) | 42,160 | 174,245 | ||||||
| 2,410,215 | ||||||||
| NORWAY — 1.9% | ||||||||
| Telenor ASA | 27,590 | 471,519 | ||||||
| PEOPLE’S REPUBLIC OF CHINA — 5.0% | ||||||||
| China Coal Energy Co. Ltd. H Shares | 99,980 | 120,972 | ||||||
| China Life Insurance Co. Ltd. H Shares | 27,000 | 72,332 | ||||||
| China Shenhua Energy Co. Ltd. H Shares | 40,680 | 179,795 | ||||||
| China Telecom Corp. Ltd. H Shares | 746,000 | 457,408 | ||||||
| Shanghai Electric Group Co. Ltd. H Shares | 916,000 | 414,470 | ||||||
| 1,244,977 | ||||||||
| RUSSIAN FEDERATION — 1.3% | ||||||||
| OAO Gazprom ADR | 27,900 | 323,244 | ||||||
| SINGAPORE — 3.3% | ||||||||
| DBS Group Holdings Ltd. | 43,700 | 435,088 | ||||||
Flextronics International Ltd.(1) | 20,340 | 121,430 | ||||||
| Singapore Telecommunications Ltd. | 112,000 | 271,973 | ||||||
| 828,491 | ||||||||
12
| Shares | Value |
| SOUTH KOREA — 6.9% | ||||||||
| Hana Financial Group, Inc. | 15,320 | $560,680 | ||||||
| KB Financial Group, Inc. | 7,050 | 245,329 | ||||||
| Samsung Electronics Co. Ltd. | 790 | 717,216 | ||||||
| Shinhan Financial Group Co. Ltd. | 5,350 | 202,557 | ||||||
| 1,725,782 | ||||||||
| SPAIN — 1.8% | ||||||||
Distribuidora Internacional de Alimentacion SA(1) | 1,670 | 7,534 | ||||||
| Telefonica SA ADR | 23,580 | 442,125 | ||||||
| 449,659 | ||||||||
| SWEDEN — 0.6% | ||||||||
| Telefonaktiebolaget LM Ericsson B Shares | 14,000 | 148,992 | ||||||
| SWITZERLAND — 7.3% | ||||||||
Basilea Pharmaceutica(1) | 1,960 | 67,925 | ||||||
Credit Suisse Group AG(1) | 14,690 | 356,143 | ||||||
Lonza Group AG(1) | 2,680 | 164,142 | ||||||
| Roche Holding AG | 4,010 | 637,817 | ||||||
Swiss Re AG(1) | 6,757 | 355,965 | ||||||
UBS AG(1) | 18,790 | 230,974 | ||||||
| 1,812,966 | ||||||||
| TAIWAN (REPUBLIC OF CHINA) — 2.5% | ||||||||
| Compal Electronics, Inc. | 127,684 | 117,104 | ||||||
| Siliconware Precision Industries Co. | 143,000 | 131,200 | ||||||
| Taiwan Semiconductor Manufacturing Co. Ltd. | 150,749 | 379,626 | ||||||
| 627,930 | ||||||||
| THAILAND — 1.4% | ||||||||
| Bangkok Bank PCL | 68,000 | 353,304 | ||||||
| UNITED KINGDOM — 17.1% | ||||||||
| Aviva plc | 95,440 | 470,112 | ||||||
| BAE Systems plc | 37,660 | 162,547 | ||||||
| BP plc | 53,240 | 387,120 | ||||||
| GlaxoSmithKline plc | 25,720 | 569,909 | ||||||
| HSBC Holdings plc | 50,800 | 400,642 | ||||||
International Consolidated Airlines Group SA(1) | 35,440 | 82,302 | ||||||
| Kingfisher plc | 83,390 | 336,035 | ||||||
Lloyds Banking Group plc(1) | 126,050 | 49,584 | ||||||
| Marks & Spencer Group plc | 56,340 | 293,402 | ||||||
Rentokil Initial plc(1) | 46,140 | 48,338 | ||||||
| Rexam plc | 54,590 | 296,128 | ||||||
| Tesco plc | 70,670 | 450,722 | ||||||
| Vodafone Group plc | 264,953 | 718,794 | ||||||
| 4,265,635 | ||||||||
TOTAL COMMON STOCKS (Cost $24,345,012) | 24,637,063 | |||||||
| Value | ||||
| Temporary Cash Investments — 0.4% | ||||
| Repurchase Agreement, Bank America Merrill Lynch, (collateralized by various U.S. Treasury obligations, 3.50%, 5/15/20, valued at $38,542), in a joint trading account at 0.06%, dated 11/30/11, due 12/1/11 (Delivery value $37,933) | $37,933 | |||
| Repurchase Agreement, Credit Suisse First Boston, Inc., (collateralized by various U.S. Treasury obligations, 5.00%, 5/15/37, valued at $38,630), in a joint trading account at 0.05%, dated 11/30/11, due 12/1/11 (Delivery value $37,933) | 37,933 | |||
| Repurchase Agreement, Goldman Sachs & Co, (collateralized by various U.S. Treasury obligations, 4.375%, 2/15/38, valued at $35,668), in a joint trading account at 0.04%, dated 11/30/11, due 12/1/11 (Delivery value $34,917) | 34,917 | |||
TOTAL TEMPORARY CASH INVESTMENTS (Cost $110,783) | 110,783 | |||
TOTAL INVESTMENT SECURITIES — 99.0% (Cost $24,455,795) | 24,747,846 | |||
| OTHER ASSETS AND LIABILITIES — 1.0% | 237,804 | |||
| TOTAL NET ASSETS — 100.0% | $24,985,650 | |||
| Market Sector Diversification | |
| (as a % of net assets) | |
| Financials | 25.8% |
| Energy | 13.7% |
| Telecommunication Services | 11.8% |
| Information Technology | 10.9% |
| Health Care | 10.5% |
| Industrials | 9.7% |
| Consumer Discretionary | 7.5% |
| Materials | 4.2% |
| Utilities | 2.5% |
| Consumer Staples | 2.0% |
| Cash and Equivalents* | 1.4% |
*Includes temporary cash investments and other assets and liabilities.
Notes to Schedule of Investments
ADR = American Depositary Receipt
CVA = Certificaten Van Aandelen
| (1) | Non-income producing. |
See Notes to Financial Statements.
13
| NOVEMBER 30, 2011 | ||||
| Assets | ||||
| Investment securities, at value (cost of $24,455,795) | $24,747,846 | |||
| Foreign currency holdings, at value (cost of $9,981) | 10,035 | |||
| Receivable for capital shares sold | 112,870 | |||
| Dividends and interest receivable | 179,816 | |||
| 25,050,567 | ||||
| Liabilities | ||||
| Payable for investments purchased | 37 | |||
| Payable for capital shares redeemed | 35,014 | |||
| Accrued management fees | 26,050 | |||
| Distribution and service fees payable | 3,816 | |||
| 64,917 | ||||
| Net Assets | $24,985,650 | |||
| Net Assets Consist of: | ||||
| Capital (par value and paid-in surplus) | $30,710,843 | |||
| Undistributed net investment income | 439,674 | |||
| Accumulated net realized loss | (6,467,461 | ) | ||
| Net unrealized appreciation | 302,594 | |||
| $24,985,650 | ||||
| Net assets | Shares outstanding | Net asset value per share | |
| Investor Class, $0.01 Par Value | $9,390,877 | 1,372,245 | $6.84 |
| Institutional Class, $0.01 Par Value | $243,767 | 35,649 | $6.84 |
| A Class, $0.01 Par Value | $13,980,629 | 2,035,015 | $6.87* |
| C Class, $0.01 Par Value | $1,136,647 | 166,120 | $6.84 |
| R Class, $0.01 Par Value | $233,730 | 34,170 | $6.84 |
*Maximum offering price $7.29 (net asset value divided by 0.9425)
See Notes to Financial Statements.
14
| YEAR ENDED NOVEMBER 30, 2011 | ||||
| Investment Income (Loss) | ||||
| Income: | ||||
| Dividends (net of foreign taxes withheld of $67,154) | $873,774 | |||
| Interest | 426 | |||
| 874,200 | ||||
| Expenses: | ||||
| Management fees | 356,249 | |||
| Distribution and service fees: | ||||
| A Class | 37,298 | |||
| B Class | 7,381 | |||
| C Class | 11,316 | |||
| R Class | 1,471 | |||
| Directors’ fees and expenses | 1,960 | |||
| Other expenses | 1,049 | |||
| 416,724 | ||||
| Net investment income (loss) | 457,476 | |||
| Realized and Unrealized Gain (Loss) | ||||
| Net realized gain (loss) on: | ||||
| Investment transactions | 1,916,517 | |||
| Foreign currency transactions (net of foreign tax expenses paid (refunded) of $4,302) | (17,508 | ) | ||
| 1,899,009 | ||||
| Change in net unrealized appreciation (depreciation) on: | ||||
| Investments | (2,464,734 | ) | ||
| Translation of assets and liabilities in foreign currencies | 7,338 | |||
| (2,457,396 | ) | |||
| Net realized and unrealized gain (loss) | (558,387 | ) | ||
| Net Increase (Decrease) in Net Assets Resulting from Operations | $(100,911 | ) | ||
See Notes to Financial Statements.
15
| YEARS ENDED NOVEMBER 30, 2011 AND NOVEMBER 30, 2010 | ||||||||
| Increase (Decrease) in Net Assets | November 30, 2011 | November 30, 2010 | ||||||
| Operations | ||||||||
| Net investment income (loss) | $457,476 | $398,260 | ||||||
| Net realized gain (loss) | 1,899,009 | 421,106 | ||||||
| Change in net unrealized appreciation (depreciation) | (2,457,396 | ) | (1,828,731 | ) | ||||
| Net increase (decrease) in net assets resulting from operations | (100,911 | ) | (1,009,365 | ) | ||||
| Distributions to Shareholders | ||||||||
| From net investment income: | ||||||||
| Investor Class | (140,866 | ) | (281,159 | ) | ||||
| Institutional Class | (26,763 | ) | (73,160 | ) | ||||
| A Class | (203,043 | ) | (645,217 | ) | ||||
| B Class | (5,247 | ) | (28,789 | ) | ||||
| C Class | (6,656 | ) | (19,261 | ) | ||||
| R Class | (3,336 | ) | (4,722 | ) | ||||
| Decrease in net assets from distributions | (385,911 | ) | (1,052,308 | ) | ||||
| Capital Share Transactions | ||||||||
| Net increase (decrease) in net assets from capital share transactions | (1,290,177 | ) | (1,004,655 | ) | ||||
| Redemption Fees | ||||||||
| Increase in net assets from redemption fees | 4,942 | 3,710 | ||||||
| Net increase (decrease) in net assets | (1,772,057 | ) | (3,062,618 | ) | ||||
| Net Assets | ||||||||
| Beginning of period | 26,757,707 | 29,820,325 | ||||||
| End of period | $24,985,650 | $26,757,707 | ||||||
| Undistributed net investment income | $439,674 | $385,617 | ||||||
See Notes to Financial Statements.
16
1. Organization
American Century World Mutual Funds, Inc. (the corporation) is registered under the Investment Company Act of 1940, as amended (the 1940 Act), as an open-end management investment company and is organized as a Maryland corporation. International Value Fund (the fund) is one fund in a series issued by the corporation. The fund is diversified as defined under the 1940 Act. The fund’s investment objective is to seek long-term capital growth. The fund pursues its objective by investing at least 80% of its assets in equity securities and at least 65% of its assets in securities from a minimum of three countries outside the United States.
The fund is authorized to issue the Investor Class, the Institutional Class, the A Class, the B Class, the C Class and the R Class. The A Class may incur an initial sales charge. The A Class, B Class and C Class may be subject to a contingent deferred sales charge. The share classes differ principally in their respective sales charges and distribution and shareholder servicing expenses and arrangements. The Institutional Class is made available to institutional shareholders or through financial intermediaries whose clients do not require the same level of shareholder and administrative services as shareholders of other classes. As a result, the Institutional Class is charged a lower unified management fee. On October 21, 2011, all outstanding B Class shares were converted to A Class shares and the fund discontinued issuance of the B Class.
2. Significant Accounting Policies
The following is a summary of significant accounting policies consistently followed by the fund in preparation of its financial statements. The financial statements are prepared in conformity with accounting principles generally accepted in the United States of America, which may require management to make certain estimates and assumptions at the date of the financial statements. Actual results could differ from these estimates.
Investment Valuations — The fund determines the fair value of its investments and computes its net asset value per share as of the close of regular trading (usually 4 p.m. Eastern time) on the New York Stock Exchange (NYSE) on each day the NYSE is open.
Equity securities that are listed or traded on a domestic securities exchange are valued at the last reported sales price or at the official closing price as provided by the exchange. Equity securities traded on foreign securities exchanges are typically valued at the closing price on the exchange where primarily traded or as of the close of the NYSE, if that is earlier. If no last sales price is reported, or if local convention or regulation so provides, the mean of the latest bid and asked prices is used. Depending on local convention or regulation, securities traded over-the-counter are valued at the mean of the latest bid and asked prices, the last sales price, or the official closing price. In its determination of fair value, the fund may review several factors including: market information specific to a security; news developments in U.S. and foreign markets; the performance of particular U.S. and foreign securities, indices, comparable securities, American Depositary Receipts, Exchange-Traded Funds, and other relevant market indicators.
Debt securities maturing within 60 days at the time of purchase may be valued at cost, plus or minus any amortized discount or premium or at the evaluated mean as provided by an independent pricing service. Evaluated mean prices are commonly derived through utilization of market models, which may consider, among other factors, trade data, quotations from dealers and active market makers, relevant yield curve and spread data, related sector levels, creditworthiness, and other relevant market information on the same or comparable securities.
Investments in open-end management investment companies are valued at the reported net asset value per share. Repurchase agreements are valued at cost.
The value of investments initially expressed in foreign currencies is translated into U.S. dollars at prevailing exchange rates.
17
If the fund determines that the market price for a portfolio security is not readily available or the valuation methods mentioned above do not reflect a security’s fair value, such security is valued as determined in good faith by the Board of Directors or its designee, in accordance with procedures adopted by the Board of Directors. Circumstances that may cause the fund to use these procedures to value a security include, but are not limited to: a security has been declared in default; trading in a security has been halted during the trading day; there is a foreign market holiday and no trading occurred; or an event occurred between the close of a foreign exchange and the NYSE that may affect the value of a security.
Security Transactions — Security transactions are accounted for as of the trade date. Net realized gains and losses are determined on the identified cost basis, which is also used for federal income tax purposes.
Investment Income — Dividend income less foreign taxes withheld, if any, is recorded as of the ex-dividend date. Interest income is recorded on the accrual basis and includes accretion of discounts and amortization of premiums.
Foreign Currency Translations — All assets and liabilities initially expressed in foreign currencies are translated into U.S. dollars at prevailing exchange rates at period end. The fund may enter into spot foreign currency exchange contracts to facilitate transactions denominated in a foreign currency. Purchases and sales of investment securities, dividend and interest income, spot foreign currency exchange contracts, and expenses are translated at the rates of exchange prevailing on the respective dates of such transactions. Net realized and unrealized foreign currency exchange gains or losses related to investment securities are a component of net realized gain (loss) on investment transactions and change in net unrealized appreciation (depreciation) on investments, respectively. Certain countries impose taxes on the contract amount of purchases and sales of foreign currency contracts in their currency. The fund records the foreign tax expense, if any, as a reduction to the net realized gain (loss) on foreign currency transactions.
Repurchase Agreements — The fund may enter into repurchase agreements with institutions that American Century Investment Management, Inc. (ACIM) (the investment advisor) has determined are creditworthy pursuant to criteria adopted by the Board of Directors. The fund requires that the collateral, represented by securities, received in a repurchase transaction be transferred to the custodian in a manner sufficient to enable the fund to obtain those securities in the event of a default under the repurchase agreement. ACIM monitors, on a daily basis, the securities transferred to ensure the value, including accrued interest, of the securities under each repurchase agreement is equal to or greater than amounts owed to the fund under each repurchase agreement.
Joint Trading Account — Pursuant to an Exemptive Order issued by the Securities and Exchange Commission, the fund, along with certain other funds in the American Century Investments family of funds, may transfer uninvested cash balances into a joint trading account. These balances are invested in one or more repurchase agreements that are collateralized by U.S. Treasury or Agency obligations.
Income Tax Status — It is the fund’s policy to distribute substantially all net investment income and net realized gains to shareholders and to otherwise qualify as a regulated investment company under provisions of the Internal Revenue Code. The fund is no longer subject to examination by tax authorities for years prior to 2008. At this time, management believes there are no uncertain tax positions which, based on their technical merit, would not be sustained upon examination and for which it is reasonably possible that the total amounts of unrecognized tax benefits will significantly change in the next twelve months. Accordingly, no provision has been made for federal or state income taxes.
Multiple Class — All shares of the fund represent an equal pro rata interest in the net assets of the class to which such shares belong, and have identical voting, dividend, liquidation and other rights and the same terms and conditions, except for class specific expenses and exclusive rights to vote on matters affecting only individual classes. Income, non-class specific expenses, and realized and unrealized capital gains and losses of the fund are allocated to each class of shares based on their relative net assets.
18
Distributions to Shareholders — Distributions from net investment income and net realized gains, if any, are generally declared and paid annually. The fund may make distributions on a more frequent basis to comply with the distribution requirements of the Internal Revenue Code, in all events in a manner consistent with provisions of the 1940 Act.
Redemption — The fund may impose a 2.00% redemption fee on shares held less than 60 days. The fee may not be applicable to all classes. The redemption fee is retained by the fund and helps cover transaction costs that long-term investors may bear when the fund sells securities to meet investor redemptions.
Indemnifications — Under the corporation’s organizational documents, its officers and directors are indemnified against certain liabilities arising out of the performance of their duties to the fund. In addition, in the normal course of business, the fund enters into contracts that provide general indemnifications. The maximum exposure under these arrangements is unknown as this would involve future claims that may be made against a fund. The risk of material loss from such claims is considered by management to be remote.
3. Fees and Transactions with Related Parties
Management Fees — The corporation has entered into a management agreement with ACIM, under which ACIM provides the fund with investment advisory and management services in exchange for a single, unified management fee (the fee) per class. The agreement provides that all expenses of managing and operating the fund, except distribution and service fees, brokerage expenses, taxes, interest, fees and expenses of the independent directors (including legal counsel fees), and extraordinary expenses, will be paid by ACIM. The fee is computed and accrued daily based on each class’s daily net assets and paid monthly in arrears. The rate of the fee is determined by applying a fee rate calculation formula. This formula takes into account the fund’s assets as well as certain assets, if any, of other clients of the investment advisor outside the American Century Investments family of funds (such as subadvised funds and separate accounts) that have very similar investment teams and investment strategies (strategy assets). The annual management fee schedule ranges from 1.10% to 1.30% for the Investor Class, A Class, B Class, C Class and R Class. The Institutional Class is 0.20% less at each point within the range. The effective annual management fee for each class for the year ended November 30, 2011 was 1.30% for the Investor Class, A Class, C Class and R Class and 1.10% for the Institutional Class.
ACIM has entered into a subadvisory agreement with Templeton Investment Counsel, LLC (Templeton) on behalf of the fund. Templeton makes investment decisions for the fund in accordance with the fund’s investment objectives, policies, and restrictions under the supervision of ACIM and the Board of Directors. ACIM pays all costs associated with retaining Templeton as the subadvisor of the fund. Effective December 1, 2011, ACIM terminated the subadvisory agreement with Templeton on behalf of the fund. ACIM has assumed the responsibilities performed by the subadvisor. The termination of the subadvisory agreement was approved by the Board of Directors on September 8, 2011.
Distribution and Service Fees — The Board of Directors has adopted a separate Master Distribution and Individual Shareholder Services Plan for each of the A Class, B Class, C Class and R Class (collectively the plans), pursuant to Rule 12b-1 of the 1940 Act. The plans provide that the A Class will pay American Century Investment Services, Inc. (ACIS) an annual distribution and service fee of 0.25%. The plans provide that the B Class and C Class will each pay ACIS an annual distribution and service fee of 1.00%, of which 0.25% is paid for individual shareholder services and 0.75% is paid for distribution services. The plans provide that the R Class will pay ACIS an annual distribution and service fee of 0.50%. The fees are computed and accrued daily based on each class’s daily net assets and paid monthly in arrears. The fees are used to pay financial intermediaries for distribution and individual shareholder services. Fees incurred under the plans during the year ended November 30, 2011 are detailed in the Statement of Operations.
Related Parties — Certain officers and directors of the corporation are also officers and/or directors of American Century Companies, Inc. (ACC), the parent of the corporation’s investment advisor, ACIM, the distributor of the corporation, ACIS, and the corporation’s transfer agent, American Century Services, LLC.
19
The fund was eligible to invest in a money market fund for temporary purposes, which is managed by J.P. Morgan Investment Management, Inc. (JPMIM). The fund had a mutual funds services agreement with J.P. Morgan Investor Services Co. (JPMIS). JPMorgan Chase Bank (JPMCB) was a custodian of the fund. JPMIM, JPMIS and JPMCB are wholly owned subsidiaries of JPMorgan Chase & Co. (JPM). Prior to August 31, 2011, JPM was an equity investor in ACC. The services provided to the fund by JPMIM, JPMIS and JPMCB terminated on July 31, 2011.
4. Investment Transactions
Purchases and sales of investment securities, excluding short-term investments, for the year ended November 30, 2011 were $7,869,673 and $7,970,367, respectively.
5. Capital Share Transactions
Transactions in shares of the fund were as follows:
| Year ended November 30, 2011 | Year ended November 30, 2010 | |||||||||||||||
| Shares | Amount | Shares | Amount | |||||||||||||
| Investor Class/Shares Authorized | 55,000,000 | 55,000,000 | ||||||||||||||
| Sold | 791,977 | $5,985,711 | 543,874 | $3,779,102 | ||||||||||||
| Issued in reinvestment of distributions | 17,606 | 134,337 | 38,587 | 273,798 | ||||||||||||
| Redeemed | (490,278 | ) | (3,574,371 | ) | (493,578 | ) | (3,480,623 | ) | ||||||||
| 319,305 | 2,545,677 | 88,883 | 572,277 | |||||||||||||
| Institutional Class/Shares Authorized | 55,000,000 | 55,000,000 | ||||||||||||||
| Sold | 43,605 | 319,246 | 68,030 | 462,329 | ||||||||||||
| Issued in reinvestment of distributions | 3,517 | 26,763 | 10,333 | 73,160 | ||||||||||||
| Redeemed | (222,380 | ) | (1,539,176 | ) | (89,177 | ) | (600,913 | ) | ||||||||
| (175,258 | ) | (1,193,167 | ) | (10,814 | ) | (65,424 | ) | |||||||||
| A Class/Shares Authorized | 45,000,000 | 45,000,000 | ||||||||||||||
| Sold | 491,689 | 3,631,313 | 899,755 | 6,485,839 | ||||||||||||
| Issued in reinvestment of distributions | 26,048 | 199,787 | 89,337 | 636,290 | ||||||||||||
| Redeemed | (759,310 | ) | (5,588,230 | ) | (1,254,749 | ) | (8,540,309 | ) | ||||||||
| (241,573 | ) | (1,757,130 | ) | (265,657 | ) | (1,418,180 | ) | |||||||||
| B Class/Shares Authorized | 5,000,000 | 5,000,000 | ||||||||||||||
| Sold | 2,377 | 17,568 | 2,489 | 16,165 | ||||||||||||
| Issued in reinvestment of distributions | 696 | 5,240 | 4,077 | 28,443 | ||||||||||||
| Redeemed | (141,146 | ) | (980,262 | ) | (78,840 | ) | (534,140 | ) | ||||||||
| (138,073 | ) | (957,454 | ) | (72,274 | ) | (489,532 | ) | |||||||||
| C Class/Shares Authorized | 10,000,000 | 10,000,000 | ||||||||||||||
| Sold | 50,831 | 372,349 | 68,338 | 488,852 | ||||||||||||
| Issued in reinvestment of distributions | 864 | 6,647 | 2,661 | 18,909 | ||||||||||||
| Redeemed | (36,127 | ) | (274,435 | ) | (40,306 | ) | (275,068 | ) | ||||||||
| 15,568 | 104,561 | 30,693 | 232,693 | |||||||||||||
| R Class/Shares Authorized | 5,000,000 | 5,000,000 | ||||||||||||||
| Sold | 10,643 | 78,636 | 32,079 | 225,622 | ||||||||||||
| Issued in reinvestment of distributions | 436 | 3,336 | 667 | 4,722 | ||||||||||||
| Redeemed | (16,501 | ) | (114,636 | ) | (10,043 | ) | (66,833 | ) | ||||||||
| (5,422 | ) | (32,664 | ) | 22,703 | 163,511 | |||||||||||
| Net increase (decrease) | (225,453 | ) | $(1,290,177 | ) | (206,466 | ) | $(1,004,655 | ) | ||||||||
20
6. Fair Value Measurements
The fund’s securities valuation process is based on several considerations and may use multiple inputs to determine the fair value of the positions held by the fund. In conformity with accounting principles generally accepted in the United States of America, the inputs used to determine a valuation are classified into three broad levels as follows:
| • | Level 1 valuation inputs consist of unadjusted quoted prices in an active market for identical securities; |
| • | Level 2 valuation inputs consist of direct or indirect observable market data (including quoted prices for similar securities, evaluations of subsequent market events, interest rates, prepayment speeds, credit risk, etc.); or |
| • | Level 3 valuation inputs consist of unobservable data (including a fund’s own assumptions). |
The level classification is based on the lowest level input that is significant to the fair valuation measurement. The valuation inputs are not necessarily an indication of the risks associated with investing in these securities or other financial instruments.
The following is a summary of the level classifications as of period end. The Schedule of Investments provides additional information on the fund’s portfolio holdings.
| Level 1 | Level 2 | Level 3 | ||||||||||
| Investment Securities | ||||||||||||
| Foreign Common Stocks | $1,465,880 | $23,171,183 | — | |||||||||
| Temporary Cash Investments | — | 110,783 | — | |||||||||
| Total Value of Investment Securities | $1,465,880 | $23,281,966 | — | |||||||||
7. Risk Factors
There are certain risks involved in investing in foreign securities. These risks include those resulting from future adverse political, social and economic developments, fluctuations in currency exchange rates, the possible imposition of exchange controls, and other foreign laws or restrictions. Investing in emerging markets may accentuate these risks.
8. Federal Tax Information
The tax character of distributions paid during the years ended November 30, 2011 and November 30, 2010 were as follows:
| 2011 | 2010 | |
| Distributions Paid From | ||
| Ordinary income | $385,911 | $1,052,308 |
| Long-term capital gains | — | — |
The book-basis character of distributions made during the year from net investment income or net realized gains may differ from their ultimate characterization for federal income tax purposes. These differences reflect the differing character of certain income items and net realized gains and losses for financial statement and tax purposes, and may result in reclassification among certain capital accounts on the financial statements.
21
As of November 30, 2011, the federal tax cost of investments and the components of distributable earnings on a tax-basis were as follows:
| Federal tax cost of investments | $24,712,355 | |||
| Gross tax appreciation of investments | $3,328,668 | |||
| Gross tax depreciation of investments | (3,293,177 | ) | ||
| Net tax appreciation (depreciation) of investments | $35,491 | |||
| Net tax appreciation (depreciation) on translation of assets and liabilities in foreign currencies | $10,543 | |||
| Net tax appreciation (depreciation) | $46,034 | |||
| Undistributed ordinary income | $439,674 | |||
| Accumulated capital losses | $(6,210,901 | ) |
The difference between book-basis and tax-basis cost and unrealized appreciation (depreciation) is attributable primarily to the tax deferral of losses on wash sales.
The accumulated capital losses represent net capital loss carryovers that may be used to offset future realized capital gains for federal income tax purposes. Future capital loss carryover utilization in any given year may be subject to Internal Revenue Code limitations. Capital loss carryovers expire in 2017.
On December 22, 2010, the Regulated Investment Company Modernization Act of 2010 (the “Act”) was enacted, which changed various technical rules governing the tax treatment of regulated investment companies. The changes are generally effective for taxable years beginning after the date of enactment. Under the Act, the fund will be permitted to carry forward capital losses incurred in taxable years beginning after the date of enactment for an unlimited period. However, any losses incurred during those future taxable years will be required to be utilized prior to the losses incurred in pre-enactment taxable years, which carry an expiration date. As a result of this ordering rule, pre-enactment capital loss carryforwards may be more likely to expire unused.
22
| For a Share Outstanding Throughout the Years Ended November 30 (except as noted) | |||||||||||||||||||||||||||||||||||||||||||
| Per-Share Data | Ratios and Supplemental Data | ||||||||||||||||||||||||||||||||||||||||||
| Income From Investment Operations: | Distributions From: | Ratio to Average Net Assets of: | |||||||||||||||||||||||||||||||||||||||||
Net Asset Value, Beginning of Period | Net Investment Income (Loss)(1) | Net Realized and Unrealized Gain (Loss) | Total From Investment Operations | Net Investment Income | Net Realized Gains | Total Distributions | Net Asset Value, End of Period | Total Return(2) | Operating Expenses | Operating Expenses (before expense waiver) | Net Investment Income (Loss) | Net Investment Income (Loss) (before expense waiver) | Portfolio Turnover Rate | Net Assets, End of Period (in thousands) | |||||||||||||||||||||||||||||
| Investor Class | |||||||||||||||||||||||||||||||||||||||||||
| 2011 | $6.91 | 0.14 | (0.09 | ) | 0.05 | (0.12 | ) | — | (0.12 | ) | $6.84 | 0.57 | % | 1.31 | % | 1.31 | % | 1.85 | % | 1.85 | % | 30 | % | $9,391 | |||||||||||||||||||
| 2010 | $7.33 | 0.11 | (0.24 | ) | (0.13 | ) | (0.29 | ) | — | (0.29 | ) | $6.91 | (1.82 | )% | 1.32 | % | 1.32 | % | 1.66 | % | 1.66 | % | 26 | % | $7,272 | ||||||||||||||||||
| 2009 | $5.47 | 0.11 | 1.88 | 1.99 | (0.13 | ) | — | (0.13 | ) | $7.33 | 36.98 | % | 1.31 | % | 1.31 | % | 2.34 | % | 2.34 | % | 16 | % | $7,062 | ||||||||||||||||||||
| 2008 | $11.48 | 0.19 | (5.18 | ) | (4.99 | ) | (0.24 | ) | (0.78 | ) | (1.02 | ) | $5.47 | (47.43 | )% | 1.31 | % | 1.31 | % | 2.20 | % | 2.20 | % | 4 | % | $2,512 | |||||||||||||||||
| 2007 | $14.36 | 0.22 | 2.09 | 2.31 | (0.47 | ) | (4.72 | ) | (5.19 | ) | $11.48 | 23.55 | % | 1.30 | % | 1.30 | % | 1.96 | % | 1.96 | % | 11 | % | $3,044 | |||||||||||||||||||
| Institutional Class | |||||||||||||||||||||||||||||||||||||||||||
| 2011 | $6.90 | 0.15 | (0.07 | ) | 0.08 | (0.14 | ) | — | (0.14 | ) | $6.84 | 0.92 | % | 1.11 | % | 1.11 | % | 2.05 | % | 2.05 | % | 30 | % | $244 | |||||||||||||||||||
| 2010 | $7.34 | 0.13 | (0.25 | ) | (0.12 | ) | (0.32 | ) | — | (0.32 | ) | $6.90 | (1.69 | )% | 1.12 | % | 1.12 | % | 1.86 | % | 1.86 | % | 26 | % | $1,456 | ||||||||||||||||||
| 2009 | $5.48 | 0.18 | 1.82 | 2.00 | (0.14 | ) | — | (0.14 | ) | $7.34 | 37.18 | % | 1.11 | % | 1.11 | % | 2.54 | % | 2.54 | % | 16 | % | $1,627 | ||||||||||||||||||||
| 2008 | $11.50 | 0.21 | (5.19 | ) | (4.98 | ) | (0.26 | ) | (0.78 | ) | (1.04 | ) | $5.48 | (47.32 | )% | 1.11 | % | 1.11 | % | 2.40 | % | 2.40 | % | 4 | % | $23,847 | |||||||||||||||||
| 2007 | $14.38 | 0.23 | 2.10 | 2.33 | (0.49 | ) | (4.72 | ) | (5.21 | ) | $11.50 | 23.77 | % | 1.10 | % | 1.10 | % | 2.16 | % | 2.16 | % | 11 | % | $45,262 | |||||||||||||||||||
| A Class | |||||||||||||||||||||||||||||||||||||||||||
| 2011 | $6.93 | 0.12 | (0.08 | ) | 0.04 | (0.10 | ) | — | (0.10 | ) | $6.87 | 0.45 | % | 1.56 | % | 1.56 | % | 1.60 | % | 1.60 | % | 30 | % | $13,981 | |||||||||||||||||||
| 2010 | $7.33 | 0.10 | (0.24 | ) | (0.14 | ) | (0.26 | ) | — | (0.26 | ) | $6.93 | (2.04 | )% | 1.57 | % | 1.57 | % | 1.41 | % | 1.41 | % | 26 | % | $15,783 | ||||||||||||||||||
| 2009 | $5.48 | 0.10 | 1.86 | 1.96 | (0.11 | ) | — | (0.11 | ) | $7.33 | 36.40 | % | 1.56 | % | 1.56 | % | 2.09 | % | 2.09 | % | 16 | % | $18,644 | ||||||||||||||||||||
| 2008 | $11.49 | 0.18 | (5.20 | ) | (5.02 | ) | (0.21 | ) | (0.78 | ) | (0.99 | ) | $5.48 | (47.53 | )% | 1.51 | % | 1.56 | % | 2.00 | % | 1.95 | % | 4 | % | $15,015 | |||||||||||||||||
| 2007 | $14.35 | 0.20 | 2.11 | 2.31 | (0.45 | ) | (4.72 | ) | (5.17 | ) | $11.49 | 23.44 | % | 1.40 | % | 1.55 | % | 1.86 | % | 1.71 | % | 11 | % | $24,558 | |||||||||||||||||||
23
| For a Share Outstanding Throughout the Years Ended November 30 (except as noted) | |||||||||||||||||||||||||||||||||||||||||||
| Per-Share Data | Ratios and Supplemental Data | ||||||||||||||||||||||||||||||||||||||||||
| Income From Investment Operations: | Distributions From: | Ratio to Average Net Assets of: | |||||||||||||||||||||||||||||||||||||||||
Net Asset Value, Beginning of Period | Net Investment Income (Loss)(1) | Net Realized and Unrealized Gain (Loss) | Total From Investment Operations | Net Investment Income | Net Realized Gains | Total Distributions | Net Asset Value, End of Period | Total Return(2) | Operating Expenses | Operating Expenses (before expense waiver) | Net Investment Income (Loss) | Net Investment Income (Loss) (before expense waiver) | Portfolio Turnover Rate | Net Assets, End of Period (in thousands) | |||||||||||||||||||||||||||||
| C Class | |||||||||||||||||||||||||||||||||||||||||||
| 2011 | $6.90 | 0.06 | (0.08 | ) | (0.02 | ) | (0.04 | ) | — | (0.04 | ) | $6.84 | (0.31 | )% | 2.31 | % | 2.31 | % | 0.85 | % | 0.85 | % | 30 | % | $1,137 | ||||||||||||||||||
| 2010 | $7.25 | 0.05 | (0.25 | ) | (0.20 | ) | (0.15 | ) | — | (0.15 | ) | $6.90 | (2.85 | )% | 2.32 | % | 2.32 | % | 0.66 | % | 0.66 | % | 26 | % | $1,039 | ||||||||||||||||||
| 2009 | $5.42 | 0.05 | 1.85 | 1.90 | (0.07 | ) | — | (0.07 | ) | $7.25 | 35.44 | % | 2.31 | % | 2.31 | % | 1.34 | % | 1.34 | % | 16 | % | $869 | ||||||||||||||||||||
| 2008 | $11.37 | 0.12 | (5.17 | ) | (5.05 | ) | (0.12 | ) | (0.78 | ) | (0.90 | ) | $5.42 | (47.93 | )% | 2.31 | % | 2.31 | % | 1.20 | % | 1.20 | % | 4 | % | $337 | |||||||||||||||||
| 2007 | $14.27 | 0.12 | 2.07 | 2.19 | (0.37 | ) | (4.72 | ) | (5.09 | ) | $11.37 | 22.28 | % | 2.30 | % | 2.30 | % | 0.96 | % | 0.96 | % | 11 | % | $222 | |||||||||||||||||||
| R Class | |||||||||||||||||||||||||||||||||||||||||||
| 2011 | $6.90 | 0.10 | (0.08 | ) | 0.02 | (0.08 | ) | — | (0.08 | ) | $6.84 | 0.20 | % | 1.81 | % | 1.81 | % | 1.35 | % | 1.35 | % | 30 | % | $234 | |||||||||||||||||||
| 2010 | $7.28 | 0.09 | (0.25 | ) | (0.16 | ) | (0.22 | ) | — | (0.22 | ) | $6.90 | (2.27 | )% | 1.82 | % | 1.82 | % | 1.16 | % | 1.16 | % | 26 | % | $273 | ||||||||||||||||||
| 2009 | $5.45 | 0.09 | 1.84 | 1.93 | (0.10 | ) | — | (0.10 | ) | $7.28 | 35.90 | % | 1.81 | % | 1.81 | % | 1.84 | % | 1.84 | % | 16 | % | $123 | ||||||||||||||||||||
| 2008 | $11.42 | 0.13 | (5.14 | ) | (5.01 | ) | (0.18 | ) | (0.78 | ) | (0.96 | ) | $5.45 | (47.61 | )% | 1.81 | % | 1.81 | % | 1.70 | % | 1.70 | % | 4 | % | $78 | |||||||||||||||||
| 2007 | $14.31 | 0.11 | 2.14 | 2.25 | (0.42 | ) | (4.72 | ) | (5.14 | ) | $11.42 | 22.91 | % | 1.80 | % | 1.80 | % | 1.46 | % | 1.46 | % | 11 | % | $202 | |||||||||||||||||||
Notes to Financial Highlights
| (1) | Computed using average shares outstanding throughout the period. |
| (2) | Total returns are calculated based on the net asset value of the last business day and do not reflect applicable sales charges, if any. Total returns for periods less than one year are not annualized. |
See Notes to Financial Statements.
24
The Board of Directors and Shareholders,
American Century World Mutual Funds, Inc.:
We have audited the accompanying statement of assets and liabilities, including the schedule of investments, of International Value Fund, one of the funds constituting American Century World Mutual Funds, Inc. (the “Corporation”), as of November 30, 2011, and the related statement of operations for the year then ended, the statements of changes in net assets for each of the two years in the period then ended, and the financial highlights for each of the five years in the period then ended. These financial statements and financial highlights are the responsibility of the Corporation’s management. Our responsibility is to express an opinion on these financial statements and financial highlights based on our audits.
We conducted our audits in accordance with the standards of the Public Company Accounting Oversight Board (United States). Those standards require that we plan and perform the audit to obtain reasonable assurance about whether the financial statements and financial highlights are free of material misstatement. The Corporation is not required to have, nor were we engaged to perform, an audit of its internal control over financial reporting. Our audits included consideration of internal control over financial reporting as a basis for designing audit procedures that are appropriate in the circumstances, but not for the purpose of expressing an opinion on the effectiveness of the Corporation’s internal control over financial reporting. Accordingly, we express no such opinion. An audit also includes examining, on a test basis, evidence supporting the amounts and disclosures in the financial statements, assessing the accounting principles used and significant estimates made by management, as well as evaluating the overall financial statement presentation. Our procedures included confirmation of securities owned as of November 30, 2011, by correspondence with the custodian and brokers; where replies were not received from brokers, we performed other auditing procedures. We believe that our audits provide a reasonable basis for our opinion.
In our opinion, the financial statements and financial highlights referred to above present fairly, in all material respects, the financial position of International Value Fund of American Century World Mutual Funds, Inc., as of November 30, 2011, the results of its operations for the year then ended, the changes in its net assets for each of the two years in the period then ended, and the financial highlights for each of the five years in the period then ended, in conformity with accounting principles generally accepted in the United States of America.
Deloitte & Touche LLP
Kansas City, Missouri
January 20, 2012
25
The individuals listed below serve as directors of the funds. Each director will continue to serve in this capacity until death, retirement, resignation or removal from office. The mandatory retirement age for directors who are not “interested persons,” as that term is defined in the Investment Company Act (independent directors), is 72. However, the mandatory retirement age for an individual director may be extended with the approval of the remaining independent directors.
Mr. Thomas is the only director who is an “interested person” because he currently serves as President and Chief Executive Officer of American Century Companies, Inc. (ACC), the parent company of American Century Investment Management, Inc. (ACIM or the advisor).
The other directors (more than three-fourths of the total number) are independent; that is, they have never been employees, directors or officers of, and have no financial interest in, ACC or any of its wholly owned, direct or indirect, subsidiaries, including ACIM, American Century Investment Services, Inc. (ACIS) and American Century Services, LLC (ACS). The directors serve in this capacity for seven (in the case of Mr. Thomas, 15) registered investment companies in the American Century Investments family of funds.
The following presents additional information about the directors. The mailing address for each director is 4500 Main Street, Kansas City, Missouri 64111.
Name (Year of Birth) | Position(s) Held with Funds | Length of Time Served | Principal Occupation(s) During Past 5 Years | Number of American Century Portfolios Overseen by Director | Other Directorships Held During Past 5 Years | |||||
| Independent Directors | ||||||||||
| Thomas A. Brown (1940) | Director | Since 1980 | Managing Member, Associated Investments, LLC (real estate investment company); Brown Cascade Properties, LLC (real estate investment company) (2001 to 2009) | 65 | None | |||||
| Andrea C. Hall (1945) | Director | Since 1997 | Retired as advisor to the President, Midwest Research Institute (not-for-profit research organization) (June 2006) | 65 | None | |||||
| Jan M. Lewis (1957) | Director | Since 2011 | President and Chief Executive Officer, Catholic Charities of Northeast Kansas (human services organization)(2006 to present); President, BUCON, Inc. (full-service design-build construction company) (2004 to 2006) | 65 | None | |||||
| James A. Olson (1942) | Director | Since 2007 | Member, Plaza Belmont LLC (private equity fund manager); Chief Financial Officer, Plaza Belmont LLC (September 1999 to September 2006) | 65 | Saia, Inc. and Entertainment Properties Trust | |||||
26
Name (Year of Birth) | Position(s) Held with Funds | Length of Time Served | Principal Occupation(s) During Past 5 Years | Number of American Century Portfolios Overseen by Director | Other Directorships Held During Past 5 Years | |||||
| Independent Directors | ||||||||||
| Donald H. Pratt (1937) | Director and Chairman of the Board | Since 1995 (Chairman since 2005) | Chairman and Chief Executive Officer, Western Investments, Inc. (real estate company) | 65 | None | |||||
M. Jeannine Strandjord (1945) | Director | Since 1994 | Retired | 65 | DST Systems Inc., Euronet Worldwide Inc., and Charming Shoppes, Inc. | |||||
| John R. Whitten (1946) | Director | Since 2008 | Project Consultant, Celanese Corp. (industrial chemical company) | 65 | Rudolph Technologies, Inc. | |||||
| Stephen E. Yates (1948) | Advisory Director | Since 2011 | Retired; Executive Vice President, Technology & Operations, KeyCorp. (computer services) (2004 to 2010) | 65 | Applied Industrial Technology (2001 to 2010) | |||||
| Interested Director | ||||||||||
Jonathan S. Thomas (1963) | Director and President | Since 2007 | President and Chief Executive Officer, ACC (March 2007 to present); Chief Administrative Officer, ACC (February 2006 to February 2007); Executive Vice President, ACC (November 2005 to February 2007). Also serves as: Chief Executive Officer and Manager, ACS; Executive Vice President, ACIM; Director, ACC, ACIM and other ACC subsidiaries | 106 | None | |||||
27
Officers
The following table presents certain information about the executive officers of the funds. Each officer serves as an officer for each of the 15 investment companies in the American Century family of funds, unless otherwise noted. No officer is compensated for his or her service as an officer of the funds. The listed officers are interested persons of the funds and are appointed or re-appointed on an annual basis. The mailing address for each officer listed below is 4500 Main Street, Kansas City, Missouri 64111.
Name (Year of Birth) | Offices with the Funds | Principal Occupation(s) During the Past Five Years | ||
Jonathan S. Thomas (1963) | Director and President since 2007 | President and Chief Executive Officer, ACC (March 2007 to present); Chief Administrative Officer, ACC (February 2006 to February 2007); Executive Vice President, ACC (November 2005 to February 2007). Also serves as: Chief Executive Officer and Manager, ACS; Executive Vice President, ACIM; Director, ACC, ACIM and other ACC subsidiaries | ||
Barry Fink (1955) | Executive Vice President since 2007 | Chief Operating Officer and Executive Vice President, ACC (September 2007 to present); President, ACS (October 2007 to present); Managing Director, Morgan Stanley (2000 to 2007); Global General Counsel, Morgan Stanley (2000 to 2006). Also serves as: Manager, ACS and Director, ACC and certain ACC subsidiaries | ||
Maryanne L. Roepke (1956) | Chief Compliance Officer since 2006 and Senior Vice President since 2000 | Chief Compliance Officer, American Century funds, ACIM and ACS (August 2006 to present); Assistant Treasurer, ACC (January 1995 to August 2006); and Treasurer and Chief Financial Officer, various American Century funds (July 2000 to August 2006). Also serves as: Senior Vice President, ACS | ||
| Charles A. Etherington (1957) | General Counsel since 2007 and Senior Vice President since 2006 | Attorney, ACC (February 1994 to present); Vice President, ACC (November 2005 to present), General Counsel, ACC (March 2007 to present); Also serves as General Counsel, ACIM, ACS, ACIS and other ACC subsidiaries; and Senior Vice President, ACIM and ACS | ||
| Robert J. Leach (1966) | Vice President, Treasurer and Chief Financial Officer since 2006 | Vice President, ACS (February 2000 to present); and Controller, various American Century funds (1997 to September 2006) | ||
| David H. Reinmiller (1963) | Vice President since 2000 | Attorney, ACC (January 1994 to present); Associate General Counsel, ACC (January 2001 to present). Also serves as Vice President, ACIM and ACS | ||
| Ward D. Stauffer (1960) | Secretary since 2005 | Attorney, ACC (June 2003 to present) |
The Statement of Additional Information has additional information about the fund’s directors and is available without charge, upon request, by calling 1-800-345-2021.
28
At a meeting held on June 9, 2011, the Fund’s Board of Directors unanimously approved the renewal of the management agreement pursuant to which American Century Investment Management, Inc. (the “Advisor”) acts as the investment advisor for the Fund. Under Section 15(c) of the Investment Company Act, contracts for investment advisory services are required to be reviewed, evaluated, and approved by a majority of a fund’s independent directors (the “Directors”) each year.
As a part of the approval process, the Board requested and reviewed extensive data and information compiled by the Advisor and certain independent providers of evaluation data concerning the Fund and the services provided to the Fund by the Advisor. This review was in addition to the oversight and evaluation undertaken by the Board and its committees on a continuous basis throughout the year and included, but was not limited to the following:
| • | the nature, extent, and quality of investment management, shareholder services, and other services provided by the Advisor to the Fund; |
| • | the wide range of other programs and services the Advisor provides to the Fund and its shareholders on a routine and non-routine basis; |
| • | the investment performance of the fund, including data comparing the Fund’s performance to appropriate benchmarks and/or a peer group of other mutual funds with similar investment objectives and strategies; |
| • | data comparing the cost of owning the Fund to the cost of owning similar funds; |
| • | the Advisor’s compliance policies, procedures, and regulatory experience; |
| • | financial data showing the cost of services provided to the Fund, the profitability of the Fund to the Advisor, and the overall profitability of the Advisor; |
| • | data comparing services provided and charges to other investment management clients of the Advisor; and |
| • | consideration of collateral benefits derived by the Advisor from the management of the Fund and any potential economies of scale relating thereto. |
In keeping with its practice, the Board held two in-person meetings and one telephonic meeting to review and discuss the information provided. The Directors also had the benefit of the advice of independent counsel throughout the period.
Factors Considered
The Directors considered all of the information provided by the Advisor, the independent data providers, and independent counsel, and evaluated such information for the Fund. In connection with their review, the Directors did not identify any single factor as being all-important or controlling, and each Director may have attributed different levels of importance to different factors. In deciding to renew the management agreement, the Board based its decision on a number of factors, including the following:
29
Nature, Extent and Quality of Services — Generally. Under the management agreement, the Advisor is responsible for providing or arranging for all services necessary for the operation of the Fund. The Board noted that under the management agreement, the Advisor provides or arranges at its own expense a wide variety of services including:
| • | constructing and designing the Fund |
| • | portfolio research and security selection |
| • | initial capitalization/funding |
| • | securities trading |
| • | Fund administration |
| • | custody of Fund assets |
| • | daily valuation of the Fund’s portfolio |
| • | shareholder servicing and transfer agency, including shareholder confirmations, recordkeeping, and communications |
| • | legal services |
| • | regulatory and portfolio compliance |
| • | financial reporting |
| • | marketing and distribution |
The Board noted that many of these services have expanded over time both in terms of quantity and complexity in response to shareholder demands, competition in the industry, changing distribution channels, and the changing regulatory environment.
Investment Management Services. The nature of the investment management services provided to the Fund is quite complex and allows Fund shareholders access to professional money management, instant diversification of their investments within an asset class, the opportunity to easily diversify among asset classes by investing in or exchanging among various American Century Investments funds, and liquidity. In evaluating investment performance, the Board expects the Advisor to manage the Fund in accordance with its investment objectives and approved strategies. Further, the Directors recognize that the Advisor has an obligation to monitor trading activities, and in particular to seek the best execution of fund trades, and to evaluate the use of and payment for research. In providing these services, the Advisor utilizes teams of investment professionals (portfolio managers, analysts, research assistants, and securities traders) who require extensive information technology, research, training, compliance and other systems to conduct their business. The Board, directly and through its Fund Performance Review Committee, regularly reviews investment performance information for the Fund, together with comparative information for appropriate benchmarks and/or peer groups of similarly-managed funds, over different
30
time horizons. The Directors also review detailed performance information during the management agreement approval process. If performance concerns are identified, the Fund receives special reviews until performance improves, during which the Board discusses with the Advisor the reasons for such results (e.g., market conditions, security selection) and any efforts being undertaken to improve performance. Taking all these factors into consideration, the Board found the investment management services provided by the Advisor to the Fund to meet or exceed industry standards. More detailed information about the Fund’s performance can be found in the Performance and Portfolio Commentary sections of this report.
Shareholder and Other Services. Under the management agreement, the Advisor provides the Fund with a comprehensive package of transfer agency, shareholder, and other services. The Board, directly and through various committees of the Board, regularly reviews reports and evaluations of such services at its regular meetings. These reports include, but are not limited to, information regarding the operational efficiency and accuracy of the shareholder and transfer agency services provided, staffing levels, shareholder satisfaction (as measured by external as well as internal sources), technology support, new products and services offered to Fund shareholders, securities trading activities, portfolio valuation services, auditing services, and legal and operational compliance activities. Certain aspects of shareholder and transfer agency service level efficiency and the quality of securities trading activities are measured by independent third party providers and are presented in comparison to other fund groups not managed by the Advisor. The Board found the services provided by the Advisor to the Fund under the management agreement to be competitive and of high quality.
Costs of Services and Profitability. The Advisor provides detailed information concerning its cost of providing various services to the Fund, its profitability in managing the Fund, its overall profitability, and its financial condition. The Directors have reviewed with the Advisor the methodology used to prepare this financial information. The financial information regarding the Advisor is considered in evaluating the Advisor’s financial condition, ability to continue to provide services under the management agreement, and the reasonableness of the current management fee. The Board concluded that the Advisor’s profits were reasonable in light of the services provided to the Fund.
Ethics. The Board generally considers the Advisor’s commitment to providing quality services to shareholders and to conducting its business ethically. They noted that the Advisor’s practices generally meet or exceed industry best practices.
Economies of Scale. The Board also reviewed information provided by the Advisor regarding the possible existence of economies of scale in connection with the management of the Fund. The Board concluded that economies of scale are difficult to measure and predict with precision, especially on a fund-by-fund basis. The Board concluded that the Advisor is appropriately sharing economies of scale through its competitive fee structure, offering competitive fees from fund inception, and through reinvestment in its business to provide shareholders additional content and services.
31
Comparison to Other Funds’ Fees. The management agreement provides that the Fund pay the Advisor a single, all-inclusive (or unified) management fee for providing all services necessary for the management and operation of the Fund, other than brokerage expenses, taxes, interest, extraordinary expenses, and the fees and expenses of the Fund’s independent directors (including their independent legal counsel) and expenses incurred in connection with the provision of shareholder services and distribution services under a plan adopted pursuant to Rule 12b-1 under the 1940 Act. Under the unified fee structure, the Advisor is responsible for providing all investment advisory, custody, audit, administrative, compliance, recordkeeping, marketing and shareholder services, or arranging and supervising third parties to provide such services. By contrast, most other funds are charged a variety of fees, including an investment advisory fee, a transfer agency fee, an administrative fee, distribution charges and other expenses. Other than their investment advisory fees and any applicable Rule 12b-1 distribution fees, all other components of the total fees charged by these other funds may be increased without shareholder approval. The Board believes the unified fee structure is a benefit to Fund shareholders because it clearly discloses to shareholders the cost of owning Fund shares, and, since the unified fee cannot be increased without a vote of Fund shareholders, it shifts to the Advisor the risk of increased costs of operating the Fund and provides a direct incentive to minimize administrative inefficiencies. Part of the Board’s analysis of fee levels involves reviewing certain evaluative data compiled by an independent provider and comparing the Fund’s unified fee to the total expense ratio of other funds in the Fund’s peer group. The Board concluded that the management fee paid by the Fund to the Advisor under the management agreement is reasonable in light of the services provided to the Fund.
Comparison to Fees and Services Provided to Other Clients of the Advisor. The Board also requested and received information from the Advisor concerning the nature of the services, fees, costs and profitability of its advisory services to advisory clients other than the Fund. They observed that these varying types of client accounts require different services and involve different regulatory and entrepreneurial risks than the management of the Fund. The Board analyzed this information and concluded that the fees charged and services provided to the Fund were reasonable by comparison.
Collateral or “Fall-Out” Benefits Derived by the Advisor. The Board considered the existence of collateral benefits the Advisor may receive as a result of its relationship with the Fund. They concluded that the Advisor’s primary business is managing mutual funds and it generally does not use fund or shareholder information to generate profits in other lines of business, and therefore does not derive any significant collateral benefits from them. The Board noted that the Advisor receives proprietary research from broker-dealers that execute fund portfolio transactions and concluded that this research is likely to benefit Fund shareholders. The Board also determined that the Advisor is able to provide investment management services to certain clients other than the Fund, at least in part, due to its existing infrastructure built to serve the fund complex. The Board concluded, however, that the assets of those other clients are not material to the analysis and, where applicable, may be included with the assets of the Fund to determine breakpoints in the management fee schedule.
32
Existing Relationship. The Board also considered whether there was any reason for not continuing the existing arrangement with the Advisor. In this regard, the Board was mindful of the potential disruptions of the Fund’s operations and various risks, uncertainties, and other effects that could occur as a result of a decision not to continue such relationship. In particular, the Board recognized that most shareholders have invested in the Fund on the strength of the Advisor’s industry standing and reputation and in the expectation that the Advisor will have a continuing role in providing advisory services to the Fund.
Conclusion of the Directors. As a result of this process, the Board, including all of the independent directors, taking into account all of the factors discussed above and the information provided by the Advisor and others, concluded that the management agreement between the Fund and the Advisor is fair and reasonable in light of the services provided and should be renewed.
33
As required by law, distributions you receive from certain IRAs, or 403(b), 457 and qualified plans are subject to federal income tax withholding, unless you elect not to have withholding apply. Tax will be withheld on the total amount withdrawn even though you may be receiving amounts that are not subject to withholding, such as nondeductible contributions. In such case, excess amounts of withholding could occur. You may adjust your withholding election so that a greater or lesser amount will be withheld.
If you don’t want us to withhold on this amount, you must notify us to not withhold the federal income tax. You may notify us in writing or in certain situations by telephone or through other electronic means. You have the right to revoke your withholding election at any time and any election you make may remain in effect until revoked by filing a new election.
Remember, even if you elect not to have income tax withheld, you are liable for paying income tax on the taxable portion of your withdrawal. If you elect not to have income tax withheld or you don’t have enough income tax withheld, you may be responsible for payment of estimated tax. You may incur penalties under the estimated tax rules if your withholding and estimated tax payments are not sufficient. You can reduce or defer the income tax on a distribution by directly or indirectly rolling such distribution over to another IRA or eligible plan. You should consult your tax advisor for additional information.
State tax will be withheld if, at the time of your distribution, your address is within one of the mandatory withholding states and you have federal income tax withheld. State taxes will be withheld from your distribution in accordance with the respective state rules.
Proxy Voting Guidelines
American Century Investment Management, Inc., the fund’s investment advisor, is responsible for exercising the voting rights associated with the securities purchased and/or held by the fund. A description of the policies and procedures the advisor uses in fulfilling this responsibility is available without charge, upon request, by calling 1-800-345-2021. It is also available on American Century Investments’ website at americancentury.com and on the Securities and Exchange Commission’s website at sec.gov. Information regarding how the investment advisor voted proxies relating to portfolio securities during the most recent 12-month period ended June 30 is available on the “About Us” page at americancentury.com. It is also available at sec.gov.
Quarterly Portfolio Disclosure
The fund files its complete schedule of portfolio holdings with the Securities and Exchange Commission (SEC) for the first and third quarters of each fiscal year on Form N-Q. The fund’s Forms N-Q are available on the SEC’s website at sec.gov, and may be reviewed and copied at the SEC’s Public Reference Room in Washington, DC. Information on the operation of the Public Reference Room may be obtained by calling 1-800-SEC-0330. The fund also makes its complete schedule of portfolio holdings for the most recent quarter of its fiscal year available on its website at americancentury.com and, upon request, by calling 1-800-345-2021.
34
Other Tax Information
The following information is provided pursuant to provisions of the Internal Revenue Code.
The fund hereby designates up to the maximum amount allowable as qualified dividend income for the fiscal year ended November 30, 2011.
For the fiscal year ended November 30, 2011, the fund intends to pass through to shareholders $67,154, or up to the maximum amount allowable, as a foreign tax credit which represents taxes paid on income derived from sources within foreign countries or possessions of the United States. During the fiscal year ended November 30, 2011, the fund earned $862,000 from income derived from foreign sources. Foreign source income and foreign tax expense per outstanding share on November 30, 2011 are $0.2366 and $0.0184, respectively.
35
| Contact Us | americancentury.com |
| Automated Information Line | 1-800-345-8765 |
| Investor Services Representative | 1-800-345-2021 or 816-531-5575 |
| Investors Using Advisors | 1-800-378-9878 |
| Business, Not-For-Profit, Employer-Sponsored Retirement Plans | 1-800-345-3533 |
| Banks and Trust Companies, Broker-Dealers, Financial Professionals, Insurance Companies | 1-800-345-6488 |
| Telecommunications Device for the Deaf | 1-800-634-4113 |
American Century World Mutual Funds, Inc.
Investment Advisor:
American Century Investment Management, Inc.
Kansas City, Missouri
This report and the statements it contains are submitted for the general information of our shareholders. The report is not authorized for distribution to prospective investors unless preceded or accompanied by an effective prospectus.
©2012 American Century Proprietary Holdings, Inc. All rights reserved.
CL-ANN-74137 1201
ANNUAL REPORT | NOVEMBER 30, 2011
| International Opportunities Fund |
| President’s Letter | 2 |
| Independent Chairman’s Letter | 3 |
| Market Perspective | 4 |
| Performance | 5 |
| Portfolio Commentary | 7 |
| Fund Characteristics | 9 |
| Shareholder Fee Example | 10 |
| Schedule of Investments | 12 |
| Statement of Assets and Liabilities | 15 |
| Statement of Operations | 16 |
| Statement of Changes in Net Assets | 17 |
| Notes to Financial Statements | 18 |
| Financial Highlights | 24 |
| Report of Independent Registered Public Accounting Firm | 26 |
| Management | 27 |
| Approval of Management Agreement | 30 |
| Additional Information | 35 |
Any opinions expressed in this report reflect those of the author as of the date of the report, and do not necessarily represent the opinions of American Century Investments® or any other person in the American Century Investments organization. Any such opinions are subject to change at any time based upon market or other conditions and American Century Investments disclaims any responsibility to update such opinions. These opinions may not be relied upon as investment advice and, because investment decisions made by American Century Investments funds are based on numerous factors, may not be relied upon as an indication of trading intent on behalf of any American Century Investments fund. Security examples are used for representational purposes only and are not intended as recommendations to purchase or sell securities. Performance information for comparative indices and securities is provided to American Century Investments by third party vendors. To the best of American Century Investments’ knowledge, such information is accurate at the time of printing.
Thank you for reviewing this annual report for the period ended November 30, 2011. Our report offers investment performance and portfolio information, presented with the expert perspective of our portfolio management team.
This report remains one of our most important vehicles for conveying information about fund returns, as well as market factors and strategies that affected fund performance. For additional, updated information, we encourage you to visit our website, americancentury.com. Click on the “Fund Performance” and “Insights & News” headings at the top of our Individual Investors site.
Reporting Period’s Divided Nature Resulted in Mixed Returns
The financial market performance that most U.S. investors experienced during the 12 months ended November 30, 2011 generally reflected the period’s divided nature. For the first six months, confidence in global economic growth, strong corporate earnings, and increased risk-taking generally ruled the markets. The MSCI EAFE Index and the S&P 500 Index advanced approximately 15% for the six months ended May 31, 2011, as stocks broadly outperformed high-quality bonds for that period.
However, the tables reversed sharply for the final six months. The risk-taking tide ebbed during the summer months, constrained by high fuel prices, federal budget management concerns in the U.S., and the worsening sovereign debt crisis in Europe. High-quality bonds, led by long-maturity U.S. Treasury securities, mostly outpaced stocks. The MSCI EAFE Index and the S&P 500 Index returned –16.56% and –6.25%, respectively, during the six months ended November 30, 2011, despite a significant market rebound in October.
As a result of this volatility, returns were mixed for the full 12-month period. U.S. and international bonds and U.S. stocks generally outperformed international stocks. The S&P 500 Index and the MSCI EAFE Index returned 7.83% and –4.12%, respectively, for the fiscal year.
Unfortunately, further volatility appears likely in 2012 as the markets wrestle with uncertainties regarding European debt, economic strength, government budget deficits, and the U.S. presidential election. We believe strongly in adhering to a disciplined, diversified, long-term investment approach during volatile periods, and we appreciate your continued trust in us during these unsettled times.
Sincerely,
Jonathan Thomas
President and Chief Executive Officer
American Century Investments
2
The board of directors of the fund was pleased at the announcement of a new strategic partner for the investment advisor to the American Century Investments funds. Canadian Imperial Bank of Commerce (CIBC), a leading Canadian financial institution, purchased the 41 percent economic interest in American Century Companies, the parent corporation of the advisor, previously held by JPMorgan Chase & Co. Based in Toronto, CIBC provides a full range of retail and wholesale banking services to almost 11 million clients through approximately 1,100 branches and offices in Canada, the U.S. and around the world. This transaction will benefit fund shareholders by bolstering the financial strength of the advisor and providing a strategic partner to help support its growth initiative to broaden non-U.S. distribution of its products and services.
The board also has been briefed throughout the year on the impact on fund performance of the European banking crisis, the U.S. deficit reduction debates, and the pace of economic growth. While the performance of all funds has been affected, the majority of American Century Investments funds overseen by the board are exceeding their benchmarks for the one-, three-, five-, and ten-year periods ended September 30, 2011. This is commendable performance,
particularly in these challenging market conditions.
We are completing another year of board oversight on your behalf. We appreciate any comments you would like to share with the board. Send them to me at dhpratt@fundboardchair.com. Thank you for your continued investment in American Century Investments funds.
Best regards,
Don Pratt
3
By Mark Kopinski, Chief Investment Officer, Global and Non-U.S. Equity
Stocks Struggled as Growth Slowed
Global stock markets kicked off the 12-month period in generally robust fashion, no easy feat considering investors had to weigh brightening economic outlooks against mounting inflationary pressures, ongoing sovereign debt concerns, and an onslaught of political unrest and natural disasters. Nevertheless, negative forces—primarily expanding sovereign debt problems in Europe and the United States—gradually tightened their hold on the worldwide economy, and market sentiment began to deteriorate. The downdraft culminated with a sharp global market selloff in the third calendar quarter of 2011, triggered primarily by Standard & Poor’s first-ever downgrade of the United States’ long-term credit rating and mounting fears of a default in Greece. Worried about the potential for another global recession, the International Monetary Fund (IMF) trimmed its global growth outlook for 2012.
Overall, emerging market stocks underperformed developed international markets for the 12-month period, as investors retreated from riskier investments. In addition, falling global growth prospects sparked stock slumps, particularly in export-heavy emerging-market economies of South Korea and China. Economic growth continued to moderate in China, but inflationary pressures continued to build, prompting IMF calls for China to allow its currency to appreciate to temper a surge in inflation.
Outlook Hinges on Fiscal Strategies
The period ended with the United States, Japan and China releasing relatively strong economic data, thereby diminishing concerns for a synchronized global recession. Yet, European Union countries continued to falter. As the eurozone crisis continues, global demand likely will decrease as a function of deleveraging, which should negatively influence export-driven markets. In addition, volatility in the financial markets may remain heightened, as investors react to European reform plans.
Ultimately, we believe the global economy can and will resume a strong growth trend. But to do so, each region and country will have to address its specific fiscal challenges. We believe these are solvable problems, as long as government policy supports the private sector and its role in driving economic output and employment based on the profit incentive.
| International Equity Total Returns | ||||
| For the 12 months ended November 30, 2011 (in U.S. dollars) | ||||
| MSCI EAFE Index | -4.12% | MSCI Europe Index | -2.08% | |
| MSCI EAFE Growth Index | -3.96% | MSCI World Index | 1.46% | |
| MSCI EAFE Value Index | -4.27% | MSCI Japan Index | -8.56% | |
| MSCI Emerging Markets Index | -11.54% | |||
4
| Total Returns as of November 30, 2011 | ||||||
| Average Annual Returns | ||||||
| Ticker Symbol | 1 year | 5 years | 10 years | Since Inception | Inception Date | |
| Investor Class | AIOIX | -4.57% | -0.76% | 12.52% | 11.61% | 6/1/01 |
MSCI All Country World ex-U.S. Small Cap Growth Index | — | -8.04% | -0.92% | 9.05% | 6.85%(1) | — |
| Institutional Class | ACIOX | -4.35% | -0.55% | — | 14.59% | 1/9/03 |
A Class No sales charge* With sales charge* | AIVOX | -4.81% -10.23% | — — | — — | 5.24% 1.70% | 3/1/10 |
| C Class | AIOCX | -5.56% | — | — | 4.49% | 3/1/10 |
| R Class | AIORX | -5.08% | — | — | 5.01% | 3/1/10 |
*Sales charges include initial sales charges and contingent deferred sales charges (CDSCs), as applicable. A Class shares have a 5.75% maximum initial sales charge and may be subject to a maximum CDSC of 1.00%. C Class shares redeemed within 12 months of purchase are subject to a maximum CDSC of 1.00%. The SEC requires that mutual funds provide performance information net of maximum sales charges in all cases where charges could be applied.
| (1) | Since 5/31/01, the date nearest the Investor Class’s inception for which data are available. |
Data presented reflect past performance. Past performance is no guarantee of future results. Current performance may be higher or lower than the performance shown. Investment return and principal value will fluctuate, and redemption value may be more or less than original cost. To obtain performance data current to the most recent month end, please call 1-800-345-2021 or visit americancentury.com. Historically, small company stocks have been more volatile than the stocks of larger, more established companies. The fund’s investment process may result in high portfolio turnover, which could mean high transaction costs, affecting both performance and capital gains tax liabilities to investors. International investing involves special risks, such as political instability and currency fluctuations. Investing in emerging markets may accentuate these risks.
Unless otherwise indicated, performance reflects Investor Class shares; performance for other share classes will vary due to differences in fee structure. For information about other share classes available, please consult the prospectus. Data assumes reinvestment of dividends and capital gains, and none of the charts reflect the deduction of taxes that a shareholder would pay on fund distributions or the redemption of fund shares. Returns for the index are provided for comparison. The fund’s total returns include operating expenses (such as transaction costs and management fees) that reduce returns, while the total returns of the index do not.
5
| Growth of $10,000 Over 10 Years |
| $10,000 investment made November 30, 2001 |
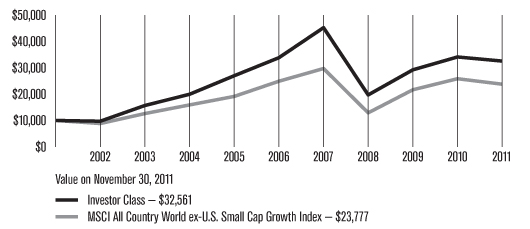
| Total Annual Fund Operating Expenses | ||||
| Investor Class | Institutional Class | A Class | C Class | R Class |
| 1.89% | 1.69% | 2.14% | 2.89% | 2.39% |
The total annual fund operating expenses shown is as stated in the fund’s prospectus current as of the date of this report. The prospectus may vary from the expense ratio shown elsewhere in this report because it is based on a different time period, includes acquired fund fees and expenses, and, if applicable, does not include fee waivers or expense reimbursements.
Data presented reflect past performance. Past performance is no guarantee of future results. Current performance may be higher or lower than the performance shown. Investment return and principal value will fluctuate, and redemption value may be more or less than original cost. To obtain performance data current to the most recent month end, please call 1-800-345-2021 or visit americancentury.com. Historically, small company stocks have been more volatile than the stocks of larger, more established companies. The fund’s investment process may result in high portfolio turnover, which could mean high transaction costs, affecting both performance and capital gains tax liabilities to investors. International investing involves special risks, such as political instability and currency fluctuations. Investing in emerging markets may accentuate these risks.
Unless otherwise indicated, performance reflects Investor Class shares; performance for other share classes will vary due to differences in fee structure. For information about other share classes available, please consult the prospectus. Data assumes reinvestment of dividends and capital gains, and none of the charts reflect the deduction of taxes that a shareholder would pay on fund distributions or the redemption of fund shares. Returns for the index are provided for comparison. The fund’s total returns include operating expenses (such as transaction costs and management fees) that reduce returns, while the total returns of the index do not.
6
Performance Summary
International Opportunities declined -4.57%* for the 12 months ended November 30, 2011, compared with its benchmark, the MSCI All Country World ex-U.S. Small Cap Growth Index, which declined -8.04%.
Global stocks generally struggled during the 12-month period, as investors grappled with the ongoing and expanding sovereign debt problems in several developed nations. In particular, fears of a default in Greece and contagion throughout the rest of the eurozone weighed on stocks. In addition, mounting inflationary pressures in China and other emerging markets, combined with fears that a global economic slowdown would stifle demand for their goods, drove down stocks in the developing world. Within the developed markets, large-cap stocks showed a slight performance advantage over their small-cap brethren.
The portfolio’s outperformance compared with the benchmark primarily was due to stock selection within several economically sensitive sectors, including consumer discretionary, information technology, and materials, and in the United Kingdom, Taiwan, and Australia. Stock selection generally lagged in most emerging markets and in the financial and energy sectors.
Australian Company was Top Contributor
An overweight position in Australia’s Campbell Brothers was the leading contributor to portfolio performance for the 12-month period. Shares of the commercial services company advanced due to strong growth in global mineral exploration activity, which boosted demand at the company’s analytical services testing division. Meanwhile, the company’s environmental division delivered strong revenue and profit gains, particularly within Australia and North America, and its coal division showed improved revenue and margin performance in South Africa and Canada.
In addition, an overweight position in the United Kingdom’s Rightmove plc, an operator of a residential property search website, was among the top contributors to performance. The company continued to show strong growth in revenue, earnings and cash generation, benefiting from its position as the United Kingdom’s leading property listing source. This position has enabled the company to consistently raise its advertising and listing prices, despite the sluggish U.K. real estate market.
An overweight position in Japan’s Anritsu Corp., an electronic equipment manufacturer, also was among the top contributors to the portfolio’s performance and drove results in the outperforming information technology sector. The company raised its revenue, profit and dividend outlooks, citing increased sales of measuring instruments for portable terminal manufacturing use.
*All fund returns referenced in this commentary are for Investor Class shares.
7
Companies in Brazil, China Led Detractors
Emerging market companies comprised the bulk of the portfolio’s largest detractors for the period. In particular, an overweight position in Brazil-based Mills Estruturas e Servicos de Engenharia, a provider of scaffolding and concrete forms for Brazil’s oil, shipbuilding and construction industries, was among the portfolio’s weakest holdings. More than any company-specific factor, a slowdown in Brazil’s economic growth rate, combined with worries about the overall health of the global economy, drove down stock prices throughout Brazil and other emerging markets.
In Hong Kong, an overweight position in Haier Electronics also was among the largest detractors to the portfolio’s relative performance. Shares of the home appliance maker tumbled on the pending expiration of a home appliance subsidiary program in China.
Additionally, an overweight position in Canada’s Legacy Oil + Gas was among the portfolio’s weakest holdings. Shares of the oil and natural gas exploration company declined, as spring weather-related factors forced a delay in drilling activity at several sites. In addition, the company experienced cost overruns due to its efforts to restore production at the sites as quickly as possible—a problem that plagued many companies in this industry.
Outlook
While bottom-up stock selection remains our focus, we will continue to look for opportunities to take advantage of prevailing global themes. In particular, the impact of demand from consumers in the emerging markets remains a positive factor for the banking industry and for increased consumption by the increasingly wealthier populations in these markets. The health care industry may be at the start of a new cycle with better growth from new product pipelines. In addition, health care companies have been diligent in reducing costs and gaining greater efficiencies in research and development spending. Here, too, we believe emerging economies should provide incremental growth with accelerating sales of pharmaceuticals and related products. We will continue to seek small-capitalization companies located around the world (excluding the United States) offering promising growth characteristics.
8
| NOVEMBER 30, 2011 | |
| Top Ten Holdings | % of net assets |
| Pirelli & C SpA | 2.7% |
| Ingenico | 2.6% |
| Spectris plc | 2.2% |
| Hyundai Marine & Fire Insurance Co. Ltd. | 2.2% |
| Dollarama, Inc. | 2.2% |
| CyberAgent, Inc. | 2.1% |
| Major Drilling Group International, Inc. | 2.0% |
| Aberdeen Asset Management plc | 1.8% |
| Ashtead Group plc | 1.8% |
| Telecity Group plc | 1.7% |
| Types of Investments in Portfolio | % of net assets |
| Foreign Common Stocks | 99.0% |
| Temporary Cash Investments | 1.5% |
| Other Assets and Liabilities | (0.5)% |
| Investments by Country | % of net assets |
| Japan | 16.9% |
| United Kingdom | 16.8% |
| Canada | 11.9% |
| Italy | 5.0% |
| South Korea | 4.9% |
| Australia | 4.4% |
| France | 4.2% |
| People’s Republic of China | 3.4% |
| Germany | 3.2% |
| Taiwan (Republic of China) | 3.2% |
| Norway | 2.8% |
| Hong Kong | 2.7% |
| India | 2.4% |
| Brazil | 2.1% |
| Other Countries | 15.1% |
| Cash and Equivalents* | 1.0% |
*Includes temporary cash investments and other assets and liabilities.
9
Fund shareholders may incur two types of costs: (1) transaction costs, including sales charges (loads) on purchase payments and redemption/exchange fees; and (2) ongoing costs, including management fees; distribution and service (12b-1) fees; and other fund expenses. This example is intended to help you understand your ongoing costs (in dollars) of investing in your fund and to compare these costs with the ongoing cost of investing in other mutual funds.
The example is based on an investment of $1,000 made at the beginning of the period and held for the entire period from June 1, 2011 to November 30, 2011.
Actual Expenses
The table provides information about actual account values and actual expenses for each class. You may use the information, together with the amount you invested, to estimate the expenses that you paid over the period. First, identify the share class you own. Then simply divide your account value by $1,000 (for example, an $8,600 account value divided by $1,000 = 8.6), then multiply the result by the number under the heading “Expenses Paid During Period” to estimate the expenses you paid on your account during this period.
If you hold Investor Class shares of any American Century Investments fund, or Institutional Class shares of the American Century Diversified Bond Fund, in an American Century Investments account (i.e., not a financial intermediary or retirement plan account), American Century Investments may charge you a $12.50 semiannual account maintenance fee if the value of those shares is less than $10,000. We will redeem shares automatically in one of your accounts to pay the $12.50 fee. In determining your total eligible investment amount, we will include your investments in all personal accounts (including American Century Investments Brokerage accounts) registered under your Social Security number. Personal accounts include individual accounts, joint accounts, UGMA/UTMA accounts, personal trusts, Coverdell Education Savings Accounts and IRAs (including traditional, Roth, Rollover, SEP-, SARSEP- and SIMPLE-IRAs), and certain other retirement accounts. If you have only business, business retirement, employer-sponsored or American Century Investments Brokerage accounts, you are currently not subject to this fee. We will not charge the fee as long as you choose to manage your accounts exclusively online. If you are subject to the Account Maintenance Fee, your account value could be reduced by the fee amount.
Hypothetical Example for Comparison Purposes
The table also provides information about hypothetical account values and hypothetical expenses based on the actual expense ratio of each class of your fund and an assumed rate of return of 5% per year before expenses, which is not the actual return of a fund’s share class. The hypothetical account values and expenses may not be used to estimate the actual ending account balance or expenses you paid for the period. You may use this information to compare the ongoing costs of investing in your fund and other funds. To do so, compare this 5% hypothetical example with the 5% hypothetical examples that appear in the shareholder reports of the other funds.
10
Please note that the expenses shown in the table are meant to highlight your ongoing costs only and do not reflect any transactional costs, such as sales charges (loads) or redemption/exchange fees. Therefore, the table is useful in comparing ongoing costs only, and will not help you determine the relative total costs of owning different funds. In addition, if these transactional costs were included, your costs would have been higher.
Beginning Account Value 6/1/11 | Ending Account Value 11/30/11 | Expenses Paid During Period(1) 6/1/11 – 11/30/11 | Annualized Expense Ratio(1) | |
| Actual | ||||
| Investor Class | $1,000 | $821.40 | $8.40 | 1.84% |
| Institutional Class | $1,000 | $823.80 | $7.50 | 1.64% |
| A Class | $1,000 | $821.40 | $9.59 | 2.10% |
| C Class | $1,000 | $818.40 | $12.95 | 2.84% |
| R Class | $1,000 | $820.30 | $10.68 | 2.34% |
| Hypothetical | ||||
| Investor Class | $1,000 | $1,015.84 | $9.30 | 1.84% |
| Institutional Class | $1,000 | $1,016.85 | $8.29 | 1.64% |
| A Class | $1,000 | $1,014.54 | $10.61 | 2.10% |
| C Class | $1,000 | $1,010.83 | $14.32 | 2.84% |
| R Class | $1,000 | $1,013.34 | $11.81 | 2.34% |
| (1) | Expenses are equal to the class’s annualized expense ratio listed in the table above, multiplied by the average account value over the period, multiplied by 183, the number of days in the most recent fiscal half-year, divided by 365, to reflect the one-half year period. |
11
| Shares | Value | |||||||
| Common Stocks — 99.0% | ||||||||
| AUSTRALIA — 4.4% | ||||||||
| Atlas Iron Ltd. | 143,561 | $450,502 | ||||||
Bandanna Energy Ltd.(1) | 353,426 | 227,509 | ||||||
| Campbell Brothers Ltd. | 29,789 | 1,530,971 | ||||||
| Medusa Mining Ltd. | 99,210 | 594,731 | ||||||
Mesoblast Ltd.(1) | 31,743 | 231,618 | ||||||
PanAust Ltd.(1) | 169,833 | 583,399 | ||||||
| SAI Global Ltd. | 112,334 | 537,233 | ||||||
| 4,155,963 | ||||||||
| AUSTRIA — 1.0% | ||||||||
| Schoeller-Bleckmann Oilfield Equipment AG | 10,569 | 936,965 | ||||||
| BERMUDA — 1.5% | ||||||||
| Golar LNG Ltd. | 22,662 | 988,063 | ||||||
| Lancashire Holdings Ltd. | 39,263 | 453,248 | ||||||
| 1,441,311 | ||||||||
| BRAZIL — 2.1% | ||||||||
| CETIP SA - Balcao Organizado de Ativos e Derivativos | 57,046 | 829,657 | ||||||
| Marcopolo SA Preference Shares | 109,100 | 492,303 | ||||||
| Mills Estruturas e Servicos de Engenharia SA | 79,300 | 701,634 | ||||||
| 2,023,594 | ||||||||
| CANADA — 11.9% | ||||||||
AuRico Gold, Inc.(1) | 88,634 | 888,121 | ||||||
| Canadian Western Bank | 35,761 | 965,244 | ||||||
Detour Gold Corp.(1) | 19,280 | 561,983 | ||||||
| Dollarama, Inc. | 52,644 | 2,060,443 | ||||||
Legacy Oil + Gas, Inc.(1) | 114,278 | 1,027,432 | ||||||
| Major Drilling Group International, Inc. | 146,277 | 1,936,114 | ||||||
New Gold, Inc.(1) | 88,359 | 989,323 | ||||||
SXC Health Solutions Corp.(1) | 21,361 | 1,262,455 | ||||||
| Trican Well Service Ltd. | 80,076 | 1,366,854 | ||||||
| Trilogy Energy Corp. | 6,478 | 236,903 | ||||||
| 11,294,872 | ||||||||
| COLOMBIA — 0.9% | ||||||||
| Petrominerales Ltd. | 40,781 | 811,662 | ||||||
| DENMARK — 1.6% | ||||||||
| Christian Hansen Holding A/S | 73,041 | 1,546,802 | ||||||
| FINLAND — 1.3% | ||||||||
| Outotec Oyj | 27,925 | 1,272,208 | ||||||
| FRANCE — 4.2% | ||||||||
| Eurofins Scientific | 10,831 | 905,057 | ||||||
| Ingenico | 62,212 | 2,441,982 | ||||||
| IPSOS | 4,957 | 140,904 | ||||||
| Zodiac Aerospace | 6,059 | 496,926 | ||||||
| 3,984,869 | ||||||||
| GERMANY — 3.2% | ||||||||
| Delticom AG | 4,896 | 462,057 | ||||||
| Gerry Weber International AG | 32,210 | 997,179 | ||||||
Gildemeister AG(1) | 44,361 | 601,086 | ||||||
KUKA AG(1) | 23,782 | 464,776 | ||||||
XING AG(1) | 8,190 | 554,408 | ||||||
| 3,079,506 | ||||||||
| HONG KONG — 2.7% | ||||||||
| China Overseas Grand Oceans Group Ltd. | 682,500 | 540,817 | ||||||
| Giordano International Ltd. | 1,072,000 | 823,291 | ||||||
| Luk Fook Holdings International Ltd. | 129,000 | 536,852 | ||||||
| Vinda International Holdings Ltd. | 471,000 | 621,444 | ||||||
| 2,522,404 | ||||||||
| INDIA — 2.4% | ||||||||
Eros International Media Ltd.(1) | 45,721 | 199,673 | ||||||
| Indian Bank | 123,903 | 455,621 | ||||||
Jubilant Foodworks Ltd.(1) | 14,027 | 212,575 | ||||||
| Petronet LNG Ltd. | 140,893 | 446,683 | ||||||
| TTK Prestige Ltd. | 12,277 | 638,126 | ||||||
| VIP Industries Ltd. | 123,270 | 284,683 | ||||||
| 2,237,361 | ||||||||
| INDONESIA — 0.5% | ||||||||
| PT Mitra Adiperkasa Tbk | 862,500 | 512,424 | ||||||
| IRELAND — 1.3% | ||||||||
Kenmare Resources plc(1) | 1,225,417 | 687,203 | ||||||
| Kentz Corp. Ltd. | 79,484 | 582,160 | ||||||
| 1,269,363 | ||||||||
| ISRAEL — 1.6% | ||||||||
Avner Oil Exploration LLP(1) | 405,981 | 236,397 | ||||||
Mellanox Technologies Ltd.(1) | 36,815 | 1,288,893 | ||||||
| 1,525,290 | ||||||||
| ITALY — 5.0% | ||||||||
| Banca Generali SpA | 102,985 | 1,009,782 | ||||||
| Pirelli & C SpA | 271,180 | 2,552,769 | ||||||
Salvatore Ferragamo Italia SpA(1) | 75,659 | 1,156,129 | ||||||
| 4,718,680 | ||||||||
12
| Shares | Value |
| JAPAN — 16.9% | ||||||||
| Anritsu Corp. | 126,000 | $1,429,404 | ||||||
| CyberAgent, Inc. | 589 | 1,967,788 | ||||||
| Dr Ci:Labo Co. Ltd. | 145 | 895,263 | ||||||
| Horiba Ltd. | 23,700 | 745,911 | ||||||
| Kakaku.com, Inc. | 34,400 | 1,323,870 | ||||||
| M3, Inc. | 254 | 1,261,722 | ||||||
| Makino Milling Machine Co. Ltd. | 93,000 | 655,064 | ||||||
| NET One Systems Co. Ltd. | 513 | 1,330,751 | ||||||
| Nihon Kohden Corp. | 43,200 | 1,004,068 | ||||||
| Sanrio Co. Ltd. | 28,900 | 1,513,718 | ||||||
| Ship Healthcare Holdings, Inc. | 27,600 | 658,399 | ||||||
| Start Today Co. Ltd. | 29,900 | 577,817 | ||||||
| Tamron Co. Ltd. | 59,000 | 1,583,170 | ||||||
| Tsubakimoto Chain Co. | 211,000 | 1,146,642 | ||||||
| 16,093,587 | ||||||||
| MEXICO — 1.7% | ||||||||
Genomma Lab Internacional SAB de CV Class B(1) | 751,129 | 1,596,922 | ||||||
| NETHERLANDS — 0.6% | ||||||||
| Aalberts Industries NV | 36,528 | 595,607 | ||||||
| NORWAY — 2.8% | ||||||||
Algeta ASA(1) | 15,238 | 440,874 | ||||||
Det Norske Oljeselskap ASA(1) | 30,891 | 456,085 | ||||||
| TGS Nopec Geophysical Co. ASA | 21,462 | 478,156 | ||||||
| Tomra Systems ASA | 180,441 | 1,253,764 | ||||||
| 2,628,879 | ||||||||
| PEOPLE’S REPUBLIC OF CHINA — 3.4% | ||||||||
21Vianet Group, Inc. ADR(1) | 20,292 | 200,079 | ||||||
51job, Inc. ADR(1) | 14,945 | 678,353 | ||||||
| Biostime International Holdings Ltd. | 560,500 | 935,265 | ||||||
| China Shanshui Cement Group Ltd. | 891,000 | 656,936 | ||||||
| Shenguan Holdings Group Ltd. | 1,338,000 | 748,574 | ||||||
| 3,219,207 | ||||||||
| PHILIPPINES — 0.2% | ||||||||
| International Container Terminal Services, Inc. | 168,600 | 212,735 | ||||||
| SINGAPORE — 1.0% | ||||||||
Biosensors International Group Ltd.(1) | 839,000 | 920,028 | ||||||
| SOUTH KOREA — 4.9% | ||||||||
| Handsome Co. Ltd. | 40,490 | $965,586 | ||||||
| Hyundai Marine & Fire Insurance Co. Ltd. | 69,290 | 2,079,167 | ||||||
| Mando Corp. | 9,080 | 1,652,504 | ||||||
| 4,697,257 | ||||||||
| SWEDEN — 0.5% | ||||||||
| Mekonomen AB | 13,262 | 471,819 | ||||||
| SWITZERLAND — 0.5% | ||||||||
Rieter Holding AG(1) | 2,555 | 500,796 | ||||||
| TAIWAN (REPUBLIC OF CHINA) — 3.2% | ||||||||
| Compal Communications, Inc. | 387,000 | 633,072 | ||||||
| E Ink Holdings, Inc. | 120,000 | 221,528 | ||||||
| PChome Online, Inc. | 114,000 | 729,372 | ||||||
| St. Shine Optical Co. Ltd. | 57,000 | 649,378 | ||||||
| Standard Foods Corp. | 51,000 | 180,187 | ||||||
| Yungtay Engineering Co. Ltd. | 422,000 | 642,410 | ||||||
| 3,055,947 | ||||||||
| TURKEY — 0.9% | ||||||||
| Bizim Toptan Satis Magazalari AS | 70,182 | 851,654 | ||||||
| UNITED KINGDOM — 16.8% | ||||||||
| Aberdeen Asset Management plc | 534,725 | 1,690,852 | ||||||
| Ashtead Group plc | 579,933 | 1,686,244 | ||||||
| Bellway plc | 105,890 | 1,213,961 | ||||||
| Bodycote plc | 126,564 | 550,492 | ||||||
| Croda International plc | 46,041 | 1,325,098 | ||||||
| Drax Group plc | 55,874 | 491,422 | ||||||
| Fenner plc | 127,817 | 789,581 | ||||||
Imagination Technologies Group plc(1) | 117,496 | 914,597 | ||||||
| John Wood Group plc | 54,018 | 555,159 | ||||||
London Mining plc(1) | 102,960 | 487,692 | ||||||
| Rightmove plc | 55,921 | 1,118,703 | ||||||
| Shaftesbury plc | 75,192 | 593,699 | ||||||
| Spectris plc | 107,850 | 2,123,737 | ||||||
| Spirax-Sarco Engineering plc | 26,001 | 780,202 | ||||||
Telecity Group plc(1) | 173,329 | 1,661,822 | ||||||
| 15,983,261 | ||||||||
TOTAL COMMON STOCKS (Cost $89,842,033) | 94,160,973 | |||||||
13
| Shares | Value |
| Temporary Cash Investments — 1.5% | |||
| Repurchase Agreement, Bank America Merrill Lynch, (collateralized by various U.S. Treasury obligations, 3.50%, 5/15/20, valued at $483,814), in a joint trading account at 0.06%, dated 11/30/11, due 12/1/11 (Delivery value $476,177) | $476,176 | ||
| Repurchase Agreement, Credit Suisse First Boston, Inc., (collateralized by various U.S. Treasury obligations, 5.00%, 5/15/37, valued at $484,930), in a joint trading account at 0.05%, dated 11/30/11, due 12/1/11 (Delivery value $476,177) | 476,176 | ||
| Repurchase Agreement, Goldman Sachs & Co., (collateralized by various U.S. Treasury obligations, 4.375%, 2/15/38, valued at $447,745), in a joint trading account at 0.04%, dated 11/30/11, due 12/1/11 (Delivery value $438,304) | 438,304 | ||
TOTAL TEMPORARY CASH INVESTMENTS (Cost $1,390,656) | 1,390,656 | ||
TOTAL INVESTMENT SECURITIES — 100.5% (Cost $91,232,689) | 95,551,629 | ||
| OTHER ASSETS AND LIABILITIES — (0.5)% | (495,204 | ) | |
| TOTAL NET ASSETS — 100.0% | $95,056,425 | ||
| Market Sector Diversification | |
| (as a % of net assets) | |
| Consumer Discretionary | 22.8% |
| Industrials | 16.8% |
| Information Technology | 16.4% |
| Materials | 11.2% |
| Health Care | 9.5% |
| Financials | 9.2% |
| Energy | 8.2% |
| Consumer Staples | 4.4% |
| Utilities | 0.5% |
| Cash and Equivalents* | 1.0% |
*Includes temporary cash investments and other assets and liabilities.
Notes to Schedule of Investments
ADR = American Depositary Receipt
| (1) | Non-income producing. |
See Notes to Financial Statements.
14
| NOVEMBER 30, 2011 | ||||
| Assets | ||||
| Investment securities, at value (cost of $91,232,689) | $95,551,629 | |||
| Receivable for investments sold | 997,987 | |||
| Receivable for capital shares sold | 69,331 | |||
| Dividends and interest receivable | 233,591 | |||
| Other assets | 55,056 | |||
| 96,907,594 | ||||
| Liabilities | ||||
| Foreign currency overdraft payable, at value (cost of $1,430) | 1,425 | |||
| Payable for investments purchased | 1,652,576 | |||
| Payable for capital shares redeemed | 53,394 | |||
| Accrued management fees | 142,766 | |||
| Distribution and service fees payable | 1,008 | |||
| 1,851,169 | ||||
| Net Assets | $95,056,425 | |||
| Net Assets Consist of: | ||||
| Capital (par value and paid-in surplus) | $116,956,750 | |||
| Accumulated net investment loss | (337,494 | ) | ||
| Accumulated net realized loss | (25,882,609 | ) | ||
| Net unrealized appreciation | 4,319,778 | |||
| $95,056,425 | ||||
| Net assets | Shares outstanding | Net asset value per share | |
| Investor Class, $0.01 Par Value | $89,707,553 | 14,995,220 | $5.98 |
| Institutional Class, $0.01 Par Value | $37,449 | 6,214 | $6.03 |
| A Class, $0.01 Par Value | $5,147,027 | 860,515 | $5.98* |
| C Class, $0.01 Par Value | $103,236 | 17,346 | $5.95 |
| R Class, $0.01 Par Value | $61,160 | 10,226 | $5.98 |
*Maximum offering price $6.34 (net asset value divided by 0.9425)
See Notes to Financial Statements.
15
| YEAR ENDED NOVEMBER 30, 2011 | ||||
| Investment Income (Loss) | ||||
| Income: | ||||
| Dividends (net of foreign taxes withheld of $121,064) | $1,779,017 | |||
| Interest | 144 | |||
| 1,779,161 | ||||
| Expenses: | ||||
| Management fees | 1,950,348 | |||
| Distribution and service fees: | ||||
| A Class | 2,358 | |||
| C Class | 1,121 | |||
| R Class | 313 | |||
| Directors’ fees and expenses | 4,556 | |||
| Other expenses | 1,722 | |||
| 1,960,418 | ||||
| Net investment income (loss) | (181,257 | ) | ||
| Realized and Unrealized Gain (Loss) | ||||
| Net realized gain (loss) on: | ||||
| Investment transactions (net of foreign tax expenses paid (refunded) of $(24,144)) | 7,939,108 | |||
| Foreign currency transactions (net of foreign tax expenses paid (refunded) of $54,264) | (121,922 | ) | ||
| 7,817,186 | ||||
| Change in net unrealized appreciation (depreciation) on: | ||||
| Investments (net of deferred foreign taxes of $(13,043)) | (12,012,731 | ) | ||
| Translation of assets and liabilities in foreign currencies | (2,146 | ) | ||
| (12,014,877 | ) | |||
| Net realized and unrealized gain (loss) | (4,197,691 | ) | ||
| Net Increase (Decrease) in Net Assets Resulting from Operations | $(4,378,948 | ) | ||
See Notes to Financial Statements.
16
| YEARS ENDED NOVEMBER 30, 2011 AND NOVEMBER 30, 2010 | ||||||||
| Increase (Decrease) in Net Assets | November 30, 2011 | November 30, 2010 | ||||||
| Operations | ||||||||
| Net investment income (loss) | $(181,257 | ) | $(513,047 | ) | ||||
| Net realized gain (loss) | 7,817,186 | 17,551,821 | ||||||
| Change in net unrealized appreciation (depreciation) | (12,014,877 | ) | (2,531,247 | ) | ||||
| Net increase (decrease) in net assets resulting from operations | (4,378,948 | ) | 14,507,527 | |||||
| Distributions to Shareholders | ||||||||
| From net investment income: | ||||||||
| Investor Class | (419,841 | ) | (1,832,216 | ) | ||||
| Institutional Class | (244 | ) | (787 | ) | ||||
| A Class | (287 | ) | (169 | ) | ||||
| R Class | — | (100 | ) | |||||
| Decrease in net assets from distributions | (420,372 | ) | (1,833,272 | ) | ||||
| Capital Share Transactions | ||||||||
| Net increase (decrease) in net assets from capital share transactions | (3,147,447 | ) | (2,744,539 | ) | ||||
| Redemption Fees | ||||||||
| Increase in net assets from redemption fees | 37,354 | 34,730 | ||||||
| Net increase (decrease) in net assets | (7,909,413 | ) | 9,964,446 | |||||
| Net Assets | ||||||||
| Beginning of period | 102,965,838 | 93,001,392 | ||||||
| End of period | $95,056,425 | $102,965,838 | ||||||
| Accumulated net investment loss | $(337,494 | ) | $(572,358 | ) | ||||
See Notes to Financial Statements.
17
1. Organization
American Century World Mutual Funds, Inc. (the corporation) is registered under the Investment Company Act of 1940, as amended (the 1940 Act), as an open-end management investment company and is organized as a Maryland corporation. International Opportunities Fund (the fund) is one fund in a series issued by the corporation. The fund is diversified as defined under the 1940 Act. The fund’s investment objective is to seek capital growth. The fund pursues its objective by investing primarily in equity securities of companies that are small-sized at the time of purchase and are located in foreign developed countries or emerging market countries.
The fund is authorized to issue the Investor Class, the Institutional Class, the A Class, the C Class and the R Class. The A Class may incur an initial sales charge. The A Class and C Class may be subject to a contingent deferred sales charge. The share classes differ principally in their respective sales charges and distribution and shareholder servicing expenses and arrangements. The Institutional Class is made available to institutional shareholders or through financial intermediaries whose clients do not require the same level of shareholder and administrative services as shareholders of other classes. As a result, the Institutional Class is charged a lower unified management fee. Sale of the A Class, C Class and R Class commenced on March 1, 2010.
2. Significant Accounting Policies
The following is a summary of significant accounting policies consistently followed by the fund in preparation of its financial statements. The financial statements are prepared in conformity with accounting principles generally accepted in the United States of America, which may require management to make certain estimates and assumptions at the date of the financial statements. Actual results could differ from these estimates.
Investment Valuations — The fund determines the fair value of its investments and computes its net asset value per share as of the close of regular trading (usually 4 p.m. Eastern time) on the New York Stock Exchange (NYSE) on each day the NYSE is open.
Equity securities that are listed or traded on a domestic securities exchange are valued at the last reported sales price or at the official closing price as provided by the exchange. Equity securities traded on foreign securities exchanges are typically valued at the closing price on the exchange where primarily traded or as of the close of the NYSE, if that is earlier. If no last sales price is reported, or if local convention or regulation so provides, the mean of the latest bid and asked prices is used. Depending on local convention or regulation, securities traded over-the-counter are valued at the mean of the latest bid and asked prices, the last sales price, or the official closing price. In its determination of fair value, the fund may review several factors including: market information specific to a security; news developments in U.S. and foreign markets; the performance of particular U.S. and foreign securities, indices, comparable securities, American Depositary Receipts, Exchange-Traded Funds, and other relevant market indicators.
Debt securities maturing within 60 days at the time of purchase may be valued at cost, plus or minus any amortized discount or premium or at the evaluated mean as provided by an independent pricing service. Evaluated mean prices are commonly derived through utilization of market models, which may consider, among other factors, trade data, quotations from dealers and active market makers, relevant yield curve and spread data, related sector levels, creditworthiness, and other relevant market information on the same or comparable securities.
Investments in open-end management investment companies are valued at the reported net asset value per share. Repurchase agreements are valued at cost.
The value of investments initially expressed in foreign currencies is translated into U.S. dollars at prevailing exchange rates.
18
If the fund determines that the market price for a portfolio security is not readily available or the valuation methods mentioned above do not reflect a security’s fair value, such security is valued as determined in good faith by the Board of Directors or its designee, in accordance with procedures adopted by the Board of Directors. Circumstances that may cause the fund to use these procedures to value a security include, but are not limited to: a security has been declared in default; trading in a security has been halted during the trading day; there is a foreign market holiday and no trading occurred; or an event occurred between the close of a foreign exchange and the NYSE that may affect the value of a security.
Security Transactions — Security transactions are accounted for as of the trade date. Net realized gains and losses are determined on the identified cost basis, which is also used for federal income tax purposes. Certain countries impose taxes on realized gains on the sale of securities registered in their country. The fund records the foreign tax expense, if any, on an accrual basis. The foreign tax expense on realized gains and unrealized appreciation reduces the net realized gain (loss) on investment transactions and net unrealized appreciation (depreciation) on investments, respectively.
Investment Income — Dividend income less foreign taxes withheld, if any, is recorded as of the ex-dividend date. Interest income is recorded on the accrual basis and includes accretion of discounts and amortization of premiums.
Foreign Currency Translations — All assets and liabilities initially expressed in foreign currencies are translated into U.S. dollars at prevailing exchange rates at period end. The fund may enter into spot foreign currency exchange contracts to facilitate transactions denominated in a foreign currency. Purchases and sales of investment securities, dividend and interest income, spot foreign currency exchange contracts, and expenses are translated at the rates of exchange prevailing on the respective dates of such transactions. Net realized and unrealized foreign currency exchange gains or losses related to investment securities are a component of net realized gain (loss) on investment transactions and change in net unrealized appreciation (depreciation) on investments, respectively. Certain countries impose taxes on the contract amount of purchases and sales of foreign currency contracts in their currency. The fund records the foreign tax expense, if any, as a reduction to the net realized gain (loss) on foreign currency transactions.
Repurchase Agreements — The fund may enter into repurchase agreements with institutions that American Century Investment Management, Inc. (ACIM) (the investment advisor) has determined are creditworthy pursuant to criteria adopted by the Board of Directors. The fund requires that the collateral, represented by securities, received in a repurchase transaction be transferred to the custodian in a manner sufficient to enable the fund to obtain those securities in the event of a default under the repurchase agreement. ACIM monitors, on a daily basis, the securities transferred to ensure the value, including accrued interest, of the securities under each repurchase agreement is equal to or greater than amounts owed to the fund under each repurchase agreement.
Joint Trading Account — Pursuant to an Exemptive Order issued by the Securities and Exchange Commission, the fund, along with certain other funds in the American Century Investments family of funds, may transfer uninvested cash balances into a joint trading account. These balances are invested in one or more repurchase agreements that are collateralized by U.S. Treasury or Agency obligations.
Income Tax Status — It is the fund’s policy to distribute substantially all net investment income and net realized gains to shareholders and to otherwise qualify as a regulated investment company under provisions of the Internal Revenue Code. The fund is no longer subject to examination by tax authorities for years prior to 2008. Additionally, non-U.S. tax returns filed by the fund due to investments in certain foreign securities remain subject to examination by the relevant taxing authority for seven years from the date of filing. At this time, management believes there are no uncertain tax positions which, based on their technical merit, would not be sustained upon examination and for which it is reasonably possible that the total amounts of unrecognized tax benefits will significantly change in the next twelve months. Accordingly, no provision has been made for federal or state income taxes.
19
Multiple Class — All shares of the fund represent an equal pro rata interest in the net assets of the class to which such shares belong, and have identical voting, dividend, liquidation and other rights and the same terms and conditions, except for class specific expenses and exclusive rights to vote on matters affecting only individual classes. Income, non-class specific expenses, and realized and unrealized capital gains and losses of the fund are allocated to each class of shares based on their relative net assets.
Distributions to Shareholders — Distributions from net investment income and net realized gains, if any, are generally declared and paid annually. The fund may make distributions on a more frequent basis to comply with the distribution requirements of the Internal Revenue Code, in all events in a manner consistent with provisions of the 1940 Act.
Redemption — The fund may impose a 2.00% redemption fee on shares held less than 60 days. The fee may not be applicable to all classes. The redemption fee is retained by the fund and helps cover transaction costs that long-term investors may bear when the fund sells securities to meet investor redemptions. Prior to November 14, 2011, the redemption fee applied to shares held less than 180 days.
Indemnifications — Under the corporation’s organizational documents, its officers and directors are indemnified against certain liabilities arising out of the performance of their duties to the fund. In addition, in the normal course of business, the fund enters into contracts that provide general indemnifications. The maximum exposure under these arrangements is unknown as this would involve future claims that may be made against a fund. The risk of material loss from such claims is considered by management to be remote.
3. Fees and Transactions with Related Parties
Management Fees — The corporation has entered into a management agreement with ACIM, under which ACIM provides the fund with investment advisory and management services in exchange for a single, unified management fee (the fee) per class. The agreement provides that all expenses of managing and operating the fund, except distribution and service fees, brokerage expenses, taxes, interest, fees and expenses of the independent directors (including legal counsel fees), and extraordinary expenses, will be paid by ACIM. The fee is computed and accrued daily based on each class’s daily net assets and paid monthly in arrears. The rate of the fee is determined by applying a fee rate calculation formula. This formula takes into account the fund’s assets as well as certain assets, if any, of other clients of the investment advisor outside the American Century Investments family of funds (such as subadvised funds and separate accounts) that have very similar investment teams and investment strategies (strategy assets). Effective August 1, 2011, the annual management fee schedule ranges from 1.40% to 2.00% for the Investor Class, A Class, C Class and R Class. Prior to August 1, 2011, the annual management fee schedule ranged from 1.60% to 2.00% for the Investor Class, A Class, C Class and R Class. The Institutional Class is 0.20% less at each point within the range. The effective annual management fee for each class for the year ended November 30, 2011 was 1.82% for the Investor Class, C Class and R Class, 1.84% for the A Class and 1.62% for the Institutional Class.
Distribution and Service Fees — The Board of Directors has adopted a separate Master Distribution and Individual Shareholder Services Plan for each of the A Class, C Class and R Class (collectively the plans), pursuant to Rule 12b-1 of the 1940 Act. The plans provide that the A Class will pay American Century Investment Services, Inc. (ACIS) an annual distribution and service fee of 0.25%. The plans provide that the C Class will pay ACIS an annual distribution and service fee of 1.00%, of which 0.25% is paid for individual shareholder services and 0.75% is paid for distribution services. The plans provide that the R Class will pay ACIS an annual distribution and service fee of 0.50%. The fees are computed and accrued daily based on each class’s daily net assets and paid monthly in arrears. The fees are used to pay financial intermediaries for distribution and individual shareholder services. Fees incurred under the plans during the year ended November 30, 2011 are detailed in the Statement of Operations.
20
Related Parties — Certain officers and directors of the corporation are also officers and/or directors of American Century Companies, Inc. (ACC), the parent of the corporation’s investment advisor, ACIM, the distributor of the corporation, ACIS, and the corporation’s transfer agent, American Century Services, LLC.
The fund was eligible to invest in a money market fund for temporary purposes, which is managed by J.P. Morgan Investment Management, Inc. (JPMIM). The fund had a securities lending agreement with JPMorgan Chase Bank (JPMCB) and a mutual funds services agreement with J.P. Morgan Investor Services Co. (JPMIS). JPMCB was a custodian of the fund. JPMIM, JPMIS and JPMCB are wholly owned subsidiaries of JPMorgan Chase & Co. (JPM). Prior to August 31, 2011, JPM was an equity investor in ACC. The services provided to the fund by JPMIM, JPMIS and JPMCB terminated on July 31, 2011.
4. Investment Transactions
Purchases and sales of investment securities, excluding short-term investments, for the year ended November 30, 2011 were $155,436,440 and $159,535,379, respectively.
5. Capital Share Transactions
Transactions in shares of the fund were as follows:
| Year ended November 30, 2011 | Year ended November 30, 2010(1) | |||||||||||||||
| Shares | Amount | Shares | Amount | |||||||||||||
| Investor Class/Shares Authorized | 100,000,000 | 100,000,000 | ||||||||||||||
| Sold | 2,482,073 | $16,630,637 | 2,531,933 | $14,684,338 | ||||||||||||
| Issued in reinvestment of distributions | 59,420 | 408,211 | 314,167 | 1,791,301 | ||||||||||||
| Redeemed | (3,876,170 | ) | (25,431,961 | ) | (3,437,697 | ) | (19,387,146 | ) | ||||||||
| (1,334,677 | ) | (8,393,113 | ) | (591,597 | ) | (2,911,507 | ) | |||||||||
| Institutional Class/Shares Authorized | 10,000,000 | 10,000,000 | ||||||||||||||
| Issued in reinvestment of distributions | 35 | 244 | 137 | 787 | ||||||||||||
| A Class/Shares Authorized | 10,000,000 | 10,000,000 | ||||||||||||||
| Sold | 966,727 | 5,889,154 | 15,078 | 85,679 | ||||||||||||
| Issued in reinvestment of distributions | 41 | 283 | 29 | 169 | ||||||||||||
| Redeemed | (120,894 | ) | (739,192 | ) | (466 | ) | (2,608 | ) | ||||||||
| 845,874 | 5,150,245 | 14,641 | 83,240 | |||||||||||||
| C Class/Shares Authorized | 10,000,000 | 10,000,000 | ||||||||||||||
| Sold | 22,245 | 150,515 | 6,991 | 38,671 | ||||||||||||
| Redeemed | (11,890 | ) | (69,692 | ) | — | — | ||||||||||
| 10,355 | 80,823 | 6,991 | 38,671 | |||||||||||||
| R Class/Shares Authorized | 10,000,000 | 10,000,000 | ||||||||||||||
| Sold | 7,603 | 54,226 | 8,134 | 44,170 | ||||||||||||
| Issued in reinvestment of distributions | — | — | 17 | 100 | ||||||||||||
| Redeemed | (5,528 | ) | (39,872 | ) | — | — | ||||||||||
| 2,075 | 14,354 | 8,151 | 44,270 | |||||||||||||
| Net increase (decrease) | (476,338 | ) | $(3,147,447 | ) | (561,677 | ) | $(2,744,539 | ) | ||||||||
| (1) | March 1, 2010 (commencement of sale) through November 30, 2010 for the A Class, C Class and R Class. |
21
6. Fair Value Measurements
The fund’s securities valuation process is based on several considerations and may use multiple inputs to determine the fair value of the positions held by the fund. In conformity with accounting principles generally accepted in the United States of America, the inputs used to determine a valuation are classified into three broad levels as follows:
| • | Level 1 valuation inputs consist of unadjusted quoted prices in an active market for identical securities; |
| • | Level 2 valuation inputs consist of direct or indirect observable market data (including quoted prices for similar securities, evaluations of subsequent market events, interest rates, prepayment speeds, credit risk, etc.); or |
• | Level 3 valuation inputs consist of unobservable data (including a fund’s own assumptions). |
The level classification is based on the lowest level input that is significant to the fair valuation measurement. The valuation inputs are not necessarily an indication of the risks associated with investing in these securities or other financial instruments.
The following is a summary of the level classifications as of period end. The Schedule of Investments provides additional information on the fund’s portfolio holdings.
| Level 1 | Level 2 | Level 3 | ||||||||||
| Investment Securities | ||||||||||||
| Foreign Common Stocks | $3,155,388 | $91,005,585 | — | |||||||||
| Temporary Cash Investments | — | 1,390,656 | — | |||||||||
| Total Value of Investment Securities | $3,155,388 | $92,396,241 | — | |||||||||
7. Risk Factors
There are certain risks involved in investing in foreign securities. These risks include those resulting from future adverse political, social and economic developments, fluctuations in currency exchange rates, the possible imposition of exchange controls, and other foreign laws or restrictions. Investing in emerging markets may accentuate these risks.
The fund concentrates its investments in common stocks of smaller companies. Because of this, the fund may be subject to greater risk and market fluctuations than a fund investing in larger, more established companies.
The fund’s investment process may result in high portfolio turnover, which could mean high transaction costs, affecting both performance and capital gains tax liabilities to investors.
22
8. Federal Tax Information
The tax character of distributions paid during the years ended November 30, 2011 and November 30, 2010 were as follows:
| 2011 | 2010 | |
| Distributions Paid From | ||
| Ordinary income | $420,372 | $1,833,272 |
| Long-term capital gains | — | — |
The book-basis character of distributions made during the year from net investment income or net realized gains may differ from their ultimate characterization for federal income tax purposes. These differences reflect the differing character of certain income items and net realized gains and losses for financial statement and tax purposes, and may result in reclassification among certain capital accounts on the financial statements.
As of November 30, 2011, the federal tax cost of investments and the components of distributable earnings on a tax-basis were as follows:
| Federal tax cost of investments | $91,837,872 | |||
| Gross tax appreciation of investments | $9,299,674 | |||
| Gross tax depreciation of investments | (5,585,917 | ) | ||
| Net tax appreciation (depreciation) of investments | $3,713,757 | |||
| Net tax appreciation (depreciation) on translation of assets and liabilities in foreign currencies | $(3,571 | ) | ||
| Net tax appreciation (depreciation) | $3,710,186 | |||
| Undistributed ordinary income | — | |||
| Accumulated capital losses | $(25,272,830 | ) | ||
| Capital loss deferral | $(337,681 | ) |
The difference between book-basis and tax-basis cost and unrealized appreciation (depreciation) is attributable primarily to the tax deferral of losses on wash sales and the realization for tax purposes of unrealized gains on certain foreign currency exchange contracts and investments in passive foreign investment companies.
The accumulated capital losses represent net capital loss carryovers that may be used to offset future realized capital gains for federal income tax purposes. Future capital loss carryover utilization in any given year may be subject to Internal Revenue Code limitations. Capital loss carryovers of $(13,497,473) and $(11,775,357) expire in 2016 and 2017, respectively.
The capital loss deferral represents net capital losses incurred in the one-month period ended November 30, 2011. The fund has elected to treat such losses as having been incurred in the following fiscal year for federal income tax purposes.
On December 22, 2010, the Regulated Investment Company Modernization Act of 2010 (the “Act”) was enacted, which changed various technical rules governing the tax treatment of regulated investment companies. The changes are generally effective for taxable years beginning after the date of enactment. Under the Act, the fund will be permitted to carry forward capital losses incurred in taxable years beginning after the date of enactment for an unlimited period. However, any losses incurred during those future taxable years will be required to be utilized prior to the losses incurred in pre-enactment taxable years, which carry an expiration date. As a result of this ordering rule, pre-enactment capital loss carryforwards may be more likely to expire unused.
23
Financial Highlights |
| For a Share Outstanding Throughout the Years Ended November 30 (except as noted) | ||||||||||||||||||||||||||||||||||||||
| Per-Share Data | Ratios and Supplemental Data | |||||||||||||||||||||||||||||||||||||
| Income From Investment Operations: | Distributions From: | Ratio to Average Net Assets of: | ||||||||||||||||||||||||||||||||||||
Net Asset Value, Beginning of Period | Net Investment Income (Loss)(1) | Net Realized and Unrealized Gain (Loss) | Total From Investment Operations | Net Investment Income | Net Realized Gains | Total Distributions | Net Asset Value, End of Period | Total Return(2) | Operating Expenses | Net Investment Income (Loss) | Portfolio Turnover Rate | Net Assets, End of Period (in thousands) | ||||||||||||||||||||||||||
| Investor Class | ||||||||||||||||||||||||||||||||||||||
| 2011 | $6.29 | (0.01 | ) | (0.27 | ) | (0.28 | ) | (0.03 | ) | — | (0.03 | ) | $5.98 | (4.57 | )% | 1.83 | % | (0.17 | )% | 146 | % | $89,708 | ||||||||||||||||
| 2010 | $5.49 | (0.03 | ) | 0.94 | 0.91 | (0.11 | ) | — | (0.11 | ) | $6.29 | 16.72 | % | 1.89 | % | (0.52 | )% | 209 | % | $102,739 | ||||||||||||||||||
| 2009 | $3.70 | (0.02 | ) | 1.81 | 1.79 | — | — | — | $5.49 | 48.38 | % | 1.95 | % | (0.52 | )% | 244 | % | $92,968 | ||||||||||||||||||||
| 2008 | $11.37 | 0.05 | (5.06 | ) | (5.01 | ) | (0.05 | ) | (2.61 | ) | (2.66 | ) | $3.70 | (56.46 | )% | 1.87 | % | 0.72 | % | 206 | % | $65,541 | ||||||||||||||||
| 2007 | $11.79 | 0.02 | 2.94 | 2.96 | — | (3) | (3.38 | ) | (3.38 | ) | $11.37 | 33.73 | % | 1.81 | % | 0.19 | % | 149 | % | $212,157 | ||||||||||||||||||
| Institutional Class | ||||||||||||||||||||||||||||||||||||||
| 2011 | $6.34 | — | (3) | (0.27 | ) | (0.27 | ) | (0.04 | ) | — | (0.04 | ) | $6.03 | (4.35 | )% | 1.63 | % | 0.03 | % | 146 | % | $37 | ||||||||||||||||
| 2010 | $5.54 | (0.02 | ) | 0.95 | 0.93 | (0.13 | ) | — | (0.13 | ) | $6.34 | 17.04 | % | 1.69 | % | (0.32 | )% | 209 | % | $39 | ||||||||||||||||||
| 2009 | $3.72 | (0.04 | ) | 1.86 | 1.82 | — | — | — | $5.54 | 48.92 | % | 1.75 | % | (0.32 | )% | 244 | % | $33 | ||||||||||||||||||||
| 2008 | $11.44 | 0.07 | (5.10 | ) | (5.03 | ) | (0.08 | ) | (2.61 | ) | (2.69 | ) | $3.72 | (56.44 | )% | 1.67 | % | 0.92 | % | 206 | % | $1,245 | ||||||||||||||||
| 2007 | $11.85 | 0.06 | 2.94 | 3.00 | (0.03 | ) | (3.38 | ) | (3.41 | ) | $11.44 | 33.97 | % | 1.61 | % | 0.39 | % | 149 | % | $4,513 | ||||||||||||||||||
| A Class | ||||||||||||||||||||||||||||||||||||||
| 2011 | $6.29 | (0.04 | ) | (0.26 | ) | (0.30 | ) | (0.01 | ) | — | (0.01 | ) | $5.98 | (4.81 | )% | 2.10 | % | (0.44 | )% | 146 | % | $5,147 | ||||||||||||||||
2010(4) | $5.51 | (0.02 | ) | 0.84 | 0.82 | (0.04 | ) | — | (0.04 | ) | $6.29 | 14.87 | % | 2.14 | %(5) | (0.45 | )%(5) | 209 | %(6) | $92 | ||||||||||||||||||
24
| For a Share Outstanding Throughout the Years Ended November 30 (except as noted) | |||||||||||||||||||||||||||||||||||||
| Per-Share Data | Ratios and Supplemental Data | ||||||||||||||||||||||||||||||||||||
| Income From Investment Operations: | Distributions From: | Ratio to Average Net Assets of: | |||||||||||||||||||||||||||||||||||
Net Asset Value, Beginning of Period | Net Investment Income (Loss)(1) | Net Realized and Unrealized Gain (Loss) | Total From Investment Operations | Net Investment Income | Net Realized Gains | Total Distributions | Net Asset Value, End of Period | Total Return(2) | Operating Expenses | Net Investment Income (Loss) | Portfolio Turnover Rate | Net Assets, End of Period (in thousands) | |||||||||||||||||||||||||
| C Class | |||||||||||||||||||||||||||||||||||||
| 2011 | $6.30 | (0.06 | ) | (0.29 | ) | (0.35 | ) | — | — | — | $5.95 | (5.56 | )% | 2.83 | % | (1.17 | )% | 146 | % | $103 | |||||||||||||||||
2010(4) | $5.51 | (0.05 | ) | 0.84 | 0.79 | — | — | — | $6.30 | 14.34 | % | 2.89 | %(5) | (1.19 | )%(5) | 209 | %(6) | $44 | |||||||||||||||||||
| R Class | |||||||||||||||||||||||||||||||||||||
| 2011 | $6.30 | (0.04 | ) | (0.28 | ) | (0.32 | ) | — | — | — | $5.98 | (5.08 | )% | 2.33 | % | (0.67 | )% | 146 | % | $61 | |||||||||||||||||
2010(4) | $5.51 | (0.03 | ) | 0.84 | 0.81 | (0.02 | ) | — | (0.02 | ) | $6.30 | 14.77 | % | 2.39 | %(5) | (0.69 | )%(5) | 209 | %(6) | $51 | |||||||||||||||||
Notes to Financial Highlights
| (1) | Computed using average shares outstanding throughout the period. |
| (2) | Total returns are calculated based on the net asset value of the last business day and do not reflect applicable sales charges, if any. Total returns for periods less than one year are not annualized. |
| (3) | Per-share amount was less than $0.005. |
| (4) | March 1, 2010 (commencement of sale) through November 30, 2010. |
| (5) | Annualized. |
| (6) | Portfolio turnover is calculated at the fund level. Percentage indicated was calculated for the year ended November 30, 2010. |
See Notes to Financial Statements.
25
American Century World Mutual Funds, Inc.:
We have audited the accompanying statement of assets and liabilities, including the schedule of investments, of International Opportunities Fund, one of the funds constituting American Century World Mutual Funds, Inc. (the “Corporation”), as of November 30, 2011, and the related statement of operations for the year then ended, the statements of changes in net assets for each of the two years in the period then ended, and the financial highlights for each of the five years in the period then ended. These financial statements and financial highlights are the responsibility of the Corporation’s management. Our responsibility is to express an opinion on these financial statements and financial highlights based on our audits.
We conducted our audits in accordance with the standards of the Public Company Accounting Oversight Board (United States). Those standards require that we plan and perform the audit to obtain reasonable assurance about whether the financial statements and financial highlights are free of material misstatement. The Corporation is not required to have, nor were we engaged to perform, an audit of its internal control over financial reporting. Our audits included consideration of internal control over financial reporting as a basis for designing audit procedures that are appropriate in the circumstances, but not for the purpose of expressing an opinion on the effectiveness of the Corporation’s internal control over financial reporting. Accordingly, we express no such opinion. An audit also includes examining, on a test basis, evidence supporting the amounts and disclosures in the financial statements, assessing the accounting principles used and significant estimates made by management, as well as evaluating the overall financial statement presentation. Our procedures included confirmation of securities owned as of November 30, 2011, by correspondence with the custodian and brokers; where replies were not received from brokers, we performed other auditing procedures. We believe that our audits provide a reasonable basis for our opinion.
In our opinion, the financial statements and financial highlights referred to above present fairly, in all material respects, the financial position of International Opportunities Fund of American Century World Mutual Funds, Inc., as of November 30, 2011, the results of its operations for the year then ended, the changes in its net assets for each of the two years in the period then ended, and the financial highlights for each of the five years in the period then ended, in conformity with accounting principles generally accepted in the United States of America.
Deloitte & Touche LLP
Kansas City, Missouri
January 20, 2012
26
The individuals listed below serve as directors of the funds. Each director will continue to serve in this capacity until death, retirement, resignation or removal from office. The mandatory retirement age for directors who are not “interested persons,” as that term is defined in the Investment Company Act (independent directors), is 72. However, the mandatory retirement age for an individual director may be extended with the approval of the remaining independent directors.
Mr. Thomas is the only director who is an “interested person” because he currently serves as President and Chief Executive Officer of American Century Companies, Inc. (ACC), the parent company of American Century Investment Management, Inc. (ACIM or the advisor).
The other directors (more than three-fourths of the total number) are independent; that is, they have never been employees, directors or officers of, and have no financial interest in, ACC or any of its wholly owned, direct or indirect, subsidiaries, including ACIM, American Century Investment Services, Inc. (ACIS) and American Century Services, LLC (ACS). The directors serve in this capacity for seven (in the case of Mr. Thomas, 15) registered investment companies in the American Century Investments family of funds.
The following presents additional information about the directors. The mailing address for each director is 4500 Main Street, Kansas City, Missouri 64111.
Name (Year of Birth) | Position(s) Held with Funds | Length of Time Served | Principal Occupation(s) During Past 5 Years | Number of American Century Portfolios Overseen by Director | Other Directorships Held During Past 5 Years | |||||
| Independent Directors | ||||||||||
| Thomas A. Brown (1940) | Director | Since 1980 | Managing Member, Associated Investments, LLC (real estate investment company); Brown Cascade Properties, LLC (real estate investment company) (2001 to 2009) | 65 | None | |||||
| Andrea C. Hall (1945) | Director | Since 1997 | Retired as advisor to the President, Midwest Research Institute (not-for-profit research organization) (June 2006) | 65 | None | |||||
| Jan M. Lewis (1957) | Director | Since 2011 | President and Chief Executive Officer, Catholic Charities of Northeast Kansas (human services organization) (2006 to present); President, BUCON, Inc. (full-service design-build construction company) (2004 to 2006) | 65 | None | |||||
| James A. Olson (1942) | Director | Since 2007 | Member, Plaza Belmont LLC (private equity fund manager); Chief Financial Officer, Plaza Belmont LLC (September 1999 to September 2006) | 65 | Saia, Inc. and Entertainment Properties Trust | |||||
27
Name (Year of Birth) | Position(s) Held with Funds | Length of Time Served | Principal Occupation(s) During Past 5 Years | Number of American Century Portfolios Overseen by Director | Other Directorships Held During Past 5 Years | |||||
| Independent Directors | ||||||||||
| Donald H. Pratt (1937) | Director and Chairman of the Board | Since 1995 (Chairman since 2005) | Chairman and Chief Executive Officer, Western Investments, Inc. (real estate company) | 65 | None | |||||
M. Jeannine Strandjord (1945) | Director | Since 1994 | Retired | 65 | DST Systems Inc., Euronet Worldwide Inc., and Charming Shoppes, Inc. | |||||
| John R. Whitten (1946) | Director | Since 2008 | Project Consultant, Celanese Corp. (industrial chemical company) | 65 | Rudolph Technologies, Inc. | |||||
| Stephen E. Yates (1948) | Advisory Director | Since 2011 | Retired; Executive Vice President, Technology & Operations, KeyCorp. (computer services) (2004 to 2010) | 65 | Applied Industrial Technology (2001 to 2010) | |||||
| Interested Director | ||||||||||
Jonathan S. Thomas (1963) | Director and President | Since 2007 | President and Chief Executive Officer, ACC (March 2007 to present); Chief Administrative Officer, ACC (February 2006 to February 2007); Executive Vice President, ACC (November 2005 to February 2007). Also serves as: Chief Executive Officer and Manager, ACS; Executive Vice President, ACIM; Director, ACC, ACIM and other ACC subsidiaries | 106 | None | |||||
28
Officers
The following table presents certain information about the executive officers of the funds. Each officer serves as an officer for each of the 15 investment companies in the American Century family of funds, unless otherwise noted. No officer is compensated for his or her service as an officer of the funds. The listed officers are interested persons of the funds and are appointed or re-appointed on an annual basis. The mailing address for each officer listed below is 4500 Main Street, Kansas City, Missouri 64111.
Name (Year of Birth) | Offices with the Funds | Principal Occupation(s) During the Past Five Years | |||
Jonathan S. Thomas (1963) | Director and President since 2007 | President and Chief Executive Officer, ACC (March 2007 to present); Chief Administrative Officer, ACC (February 2006 to February 2007); Executive Vice President, ACC (November 2005 to February 2007). Also serves as: Chief Executive Officer and Manager, ACS; Executive Vice President, ACIM; Director, ACC, ACIM and other ACC subsidiaries | |||
Barry Fink (1955) | Executive Vice President since 2007 | Chief Operating Officer and Executive Vice President, ACC (September 2007 to present); President, ACS (October 2007 to present); Managing Director, Morgan Stanley (2000 to 2007); Global General Counsel, Morgan Stanley (2000 to 2006). Also serves as: Manager, ACS and Director, ACC and certain ACC subsidiaries | |||
Maryanne L. Roepke (1956) | Chief Compliance Officer since 2006 and Senior Vice President since 2000 | Chief Compliance Officer, American Century funds, ACIM and ACS (August 2006 to present); Assistant Treasurer, ACC (January 1995 to August 2006); and Treasurer and Chief Financial Officer, various American Century funds (July 2000 to August 2006). Also serves as: Senior Vice President, ACS | |||
| Charles A. Etherington (1957) | General Counsel since 2007 and Senior Vice President since 2006 | Attorney, ACC (February 1994 to present); Vice President, ACC (November 2005 to present), General Counsel, ACC (March 2007 to present); Also serves as General Counsel, ACIM, ACS, ACIS and other ACC subsidiaries; and Senior Vice President, ACIM and ACS | |||
| Robert J. Leach (1966) | Vice President, Treasurer and Chief Financial Officer since 2006 | Vice President, ACS (February 2000 to present); and Controller, various American Century funds (1997 to September 2006) | |||
| David H. Reinmiller (1963) | Vice President since 2000 | Attorney, ACC (January 1994 to present); Associate General Counsel, ACC (January 2001 to present). Also serves as Vice President, ACIM and ACS | |||
| Ward D. Stauffer (1960) | Secretary since 2005 | Attorney, ACC (June 2003 to present) |
The Statement of Additional Information has additional information about the fund’s directors and is available without charge, upon request, by calling 1-800-345-2021.
29
At a meeting held on June 9, 2011, the Fund’s Board of Directors unanimously approved the renewal of the management agreement pursuant to which American Century Investment Management, Inc. (the “Advisor”) acts as the investment advisor for the Fund. Under Section 15(c) of the Investment Company Act, contracts for investment advisory services are required to be reviewed, evaluated, and approved by a majority of a fund’s independent directors (the “Directors”) each year.
As a part of the approval process, the Board requested and reviewed extensive data and information compiled by the Advisor and certain independent providers of evaluation data concerning the Fund and the services provided to the Fund by the Advisor. This review was in addition to the oversight and evaluation undertaken by the Board and its committees on a continuous basis throughout the year and included, but was not limited to the following:
• | the nature, extent, and quality of investment management, shareholder services, and other services provided by the Advisor to the Fund; |
• | the wide range of other programs and services the Advisor provides to the Fund and its shareholders on a routine and non-routine basis; |
• | the investment performance of the fund, including data comparing the Fund’s performance to appropriate benchmarks and/or a peer group of other mutual funds with similar investment objectives and strategies; |
• | data comparing the cost of owning the Fund to the cost of owning similar funds; |
• | the Advisor’s compliance policies, procedures, and regulatory experience; |
• | financial data showing the cost of services provided to the Fund, the profitability of the Fund to the Advisor, and the overall profitability of the Advisor; |
• | data comparing services provided and charges to other investment management clients of the Advisor; and |
• | consideration of collateral benefits derived by the Advisor from the management of the Fund and any potential economies of scale relating thereto. |
In keeping with its practice, the Board held two in-person meetings and one telephonic meeting to review and discuss the information provided. The Directors also had the benefit of the advice of independent counsel throughout the period.
Factors Considered
The Directors considered all of the information provided by the Advisor, the independent data providers, and independent counsel, and evaluated such information for the Fund. In connection with their review, the Directors did not identify any single factor as being all-important or controlling, and each Director may have attributed different levels of importance to different factors. In deciding to renew the management agreement, the Board based its decision on a number of factors, including the following:
30
Nature, Extent and Quality of Services — Generally. Under the management agreement, the Advisor is responsible for providing or arranging for all services necessary for the operation of the Fund. The Board noted that under the management agreement, the Advisor provides or arranges at its own expense a wide variety of services including:
• | constructing and designing the Fund |
• | portfolio research and security selection |
• | initial capitalization/funding |
• | securities trading |
• | Fund administration |
• | custody of Fund assets |
• | daily valuation of the Fund’s portfolio |
• | shareholder servicing and transfer agency, including shareholder confirmations, recordkeeping, and communications |
• | legal services |
• | regulatory and portfolio compliance |
• | financial reporting |
| • | marketing and distribution |
The Board noted that many of these services have expanded over time both in terms of quantity and complexity in response to shareholder demands, competition in the industry, changing distribution channels, and the changing regulatory environment.
Investment Management Services. The nature of the investment management services provided to the Fund is quite complex and allows Fund shareholders access to professional money management, instant diversification of their investments within an asset class, the opportunity to easily diversify among asset classes by investing in or exchanging among various American Century Investments funds, and liquidity. In evaluating investment performance, the Board expects the Advisor to manage the Fund in accordance with its investment objectives and approved strategies. Further, the Directors recognize that the Advisor has an obligation to monitor trading activities, and in particular to seek the best execution of fund trades, and to evaluate the use of and payment for research. In providing these services, the Advisor utilizes teams of investment professionals (portfolio managers, analysts, research assistants, and securities traders) who require extensive information technology, research, training, compliance and other systems to conduct their business. The Board, directly and through its Fund Performance Review Committee, regularly reviews investment performance information for the Fund, together with comparative information for appropriate benchmarks and/or peer groups of similarly-managed funds, over different time horizons.
31
The Directors also review detailed performance information during the management agreement approval process. If performance concerns are identified, the Fund receives special reviews until performance improves, during which the Board discusses with the Advisor the reasons for such results (e.g., market conditions, security selection) and any efforts being undertaken to improve performance. Taking all these factors into consideration, the Board found the investment management services provided by the Advisor to the Fund to meet or exceed industry standards. More detailed information about the Fund’s performance can be found in the Performance and Portfolio Commentary sections of this report.
Shareholder and Other Services. Under the management agreement, the Advisor provides the Fund with a comprehensive package of transfer agency, shareholder, and other services. The Board, directly and through various committees of the Board, regularly reviews reports and evaluations of such services at its regular meetings. These reports include, but are not limited to, information regarding the operational efficiency and accuracy of the shareholder and transfer agency services provided, staffing levels, shareholder satisfaction (as measured by external as well as internal sources), technology support, new products and services offered to Fund shareholders, securities trading activities, portfolio valuation services, auditing services, and legal and operational compliance activities. Certain aspects of shareholder and transfer agency service level efficiency and the quality of securities trading activities are measured by independent third party providers and are presented in comparison to other fund groups not managed by the Advisor. The Board found the services provided by the Advisor to the Fund under the management agreement to be competitive and of high quality.
Costs of Services and Profitability. The Advisor provides detailed information concerning its cost of providing various services to the Fund, its profitability in managing the Fund, its overall profitability, and its financial condition. The Directors have reviewed with the Advisor the methodology used to prepare this financial information. The financial information regarding the Advisor is considered in evaluating the Advisor’s financial condition, ability to continue to provide services under the management agreement, and the reasonableness of the current management fee. The Board concluded that the Advisor’s profits were reasonable in light of the services provided to the Fund.
Ethics. The Board generally considers the Advisor’s commitment to providing quality services to shareholders and to conducting its business ethically. They noted that the Advisor’s practices generally meet or exceed industry best practices.
Economies of Scale. The Board also reviewed information provided by the Advisor regarding the possible existence of economies of scale in connection with the management of the Fund. The Board concluded that economies of scale are difficult to measure and predict with precision, especially on a fund-by-fund basis. The Board concluded that the Advisor is appropriately sharing economies of scale through its competitive fee structure, offering competitive fees from fund inception, and through reinvestment in its business to provide shareholders additional content and services.
32
Comparison to Other Funds’ Fees. The management agreement provides that the Fund pay the Advisor a single, all-inclusive (or unified) management fee for providing all services necessary for the management and operation of the Fund, other than brokerage expenses, taxes, interest, extraordinary expenses, and the fees and expenses of the Fund’s independent directors (including their independent legal counsel) and expenses incurred in connection with the provision of shareholder services and distribution services under a plan adopted pursuant to Rule 12b-1 under the 1940 Act. Under the unified fee structure, the Advisor is responsible for providing all investment advisory, custody, audit, administrative, compliance, recordkeeping, marketing and shareholder services, or arranging and supervising third parties to provide such services. By contrast, most other funds are charged a variety of fees, including an investment advisory fee, a transfer agency fee, an administrative fee, distribution charges and other expenses. Other than their investment advisory fees and any applicable Rule 12b-1 distribution fees, all other components of the total fees charged by these other funds may be increased without shareholder approval. The Board believes the unified fee structure is a benefit to Fund shareholders because it clearly discloses to shareholders the cost of owning Fund shares, and, since the unified fee cannot be increased without a vote of Fund shareholders, it shifts to the Advisor the risk of increased costs of operating the Fund and provides a direct incentive to minimize administrative inefficiencies. Part of the Board’s analysis of fee levels involves reviewing certain evaluative data compiled by an independent provider and comparing the Fund’s unified fee to the total expense ratio of other funds in the Fund’s peer group. The Board concluded that the management fee paid by the Fund to the Advisor under the management agreement is reasonable in light of the services provided to the Fund.
Comparison to Fees and Services Provided to Other Clients of the Advisor. The Board also requested and received information from the Advisor concerning the nature of the services, fees, costs and profitability of its advisory services to advisory clients other than the Fund. They observed that these varying types of client accounts require different services and involve different regulatory and entrepreneurial risks than the management of the Fund. The Board analyzed this information and concluded that the fees charged and services provided to the Fund were reasonable by comparison.
Collateral or “Fall-Out” Benefits Derived by the Advisor. The Board considered the existence of collateral benefits the Advisor may receive as a result of its relationship with the Fund. They concluded that the Advisor’s primary business is managing mutual funds and it generally does not use fund or shareholder information to generate profits in other lines of business, and therefore does not derive any significant collateral benefits from them. The Board noted that the Advisor receives proprietary research from broker-dealers that execute fund portfolio transactions and concluded that this research is likely to benefit Fund shareholders. The Board also determined that the Advisor is able to provide investment management services to certain clients other than the Fund, at least in part, due to its existing infrastructure built to serve the fund complex. The Board concluded, however, that the assets of those other clients are not material to the analysis and, where applicable, may be included with the assets of the Fund to determine breakpoints in the management fee schedule.
33
Existing Relationship. The Board also considered whether there was any reason for not continuing the existing arrangement with the Advisor. In this regard, the Board was mindful of the potential disruptions of the Fund’s operations and various risks, uncertainties, and other effects that could occur as a result of a decision not to continue such relationship. In particular, the Board recognized that most shareholders have invested in the Fund on the strength of the Advisor’s industry standing and reputation and in the expectation that the Advisor will have a continuing role in providing advisory services to the Fund.
Conclusion of the Directors. As a result of this process, the Board, including all of the independent directors, taking into account all of the factors discussed above and the information provided by the Advisor and others, concluded that the management agreement between the Fund and the Advisor is fair and reasonable in light of the services provided and should be renewed.
34
As required by law, distributions you receive from certain IRAs, or 403(b), 457 and qualified plans are subject to federal income tax withholding, unless you elect not to have withholding apply. Tax will be withheld on the total amount withdrawn even though you may be receiving amounts that are not subject to withholding, such as nondeductible contributions. In such case, excess amounts of withholding could occur. You may adjust your withholding election so that a greater or lesser amount will be withheld.
If you don’t want us to withhold on this amount, you must notify us to not withhold the federal income tax. You may notify us in writing or in certain situations by telephone or through other electronic means. You have the right to revoke your withholding election at any time and any election you make may remain in effect until revoked by filing a new election.
Remember, even if you elect not to have income tax withheld, you are liable for paying income tax on the taxable portion of your withdrawal. If you elect not to have income tax withheld or you don’t have enough income tax withheld, you may be responsible for payment of estimated tax. You may incur penalties under the estimated tax rules if your withholding and estimated tax payments are not sufficient. You can reduce or defer the income tax on a distribution by directly or indirectly rolling such distribution over to another IRA or eligible plan. You should consult your tax advisor for additional information.
State tax will be withheld if, at the time of your distribution, your address is within one of the mandatory withholding states and you have federal income tax withheld. State taxes will be withheld from your distribution in accordance with the respective state rules.
Proxy Voting Guidelines
American Century Investment Management, Inc., the fund’s investment advisor, is responsible for exercising the voting rights associated with the securities purchased and/or held by the fund. A description of the policies and procedures the advisor uses in fulfilling this responsibility is available without charge, upon request, by calling 1-800-345-2021. It is also available on American Century Investments’ website at americancentury.com and on the Securities and Exchange Commission’s website at sec.gov. Information regarding how the investment advisor voted proxies relating to portfolio securities during the most recent 12-month period ended June 30 is available on the “About Us” page at americancentury.com. It is also available at sec.gov.
Quarterly Portfolio Disclosure
The fund files its complete schedule of portfolio holdings with the Securities and Exchange Commission (SEC) for the first and third quarters of each fiscal year on Form N-Q. The fund’s Forms N-Q are available on the SEC’s website at sec.gov, and may be reviewed and copied at the SEC’s Public Reference Room in Washington, DC. Information on the operation of the Public Reference Room may be obtained by calling 1-800-SEC-0330. The fund also makes its complete schedule of portfolio holdings for the most recent quarter of its fiscal year available on its website at americancentury.com and, upon request, by calling 1-800-345-2021.
35
Other Tax Information
The following information is provided pursuant to provisions of the Internal Revenue Code.
The fund hereby designates up to the maximum amount allowable as qualified dividend income for the fiscal year ended November 30, 2011.
For the fiscal year ended November 30, 2011, the fund intends to pass through to shareholders $121,063, or up to the maximum amount allowable, as a foreign tax credit which represents taxes paid on income derived from sources within foreign countries or possessions of the United States. During the fiscal year ended November 30, 2011, the fund earned $1,806,976 from income derived from foreign sources. Foreign source income and foreign tax expense per outstanding share on November 30, 2011 are $0.1137 and $0.0076, respectively.
36
| Contact Us | americancentury.com |
| Automated Information Line | 1-800-345-8765 |
| Investor Services Representative | 1-800-345-2021 or 816-531-5575 |
| Investors Using Advisors | 1-800-378-9878 |
| Business, Not-For-Profit, Employer-Sponsored Retirement Plans | 1-800-345-3533 |
| Banks and Trust Companies, Broker-Dealers, Financial Professionals, Insurance Companies | 1-800-345-6488 |
| Telecommunications Device for the Deaf | 1-800-634-4113 |
American Century World Mutual Funds, Inc.
Investment Advisor:
American Century Investment Management, Inc.
Kansas City, Missouri
This report and the statements it contains are submitted for the general information of our shareholders. The report is not authorized for distribution to prospective investors unless preceded or accompanied by an effective prospectus.
©2012 American Century Proprietary Holdings, Inc. All rights reserved.
CL-ANN-74140 1201
ITEM 2. CODE OF ETHICS.
| (a) | The registrant has adopted a Code of Ethics for Senior Financial Officers that applies to the registrant’s principal executive officer, principal financial officer, principal accounting officer, and persons performing similar functions. |
| (b) | No response required. |
| (c) | None. |
| (d) | None. |
| (e) | Not applicable. |
| (f) | The registrant’s Code of Ethics for Senior Financial Officers was filed as Exhibit 12 (a)(1) to American Century Asset Allocation Portfolios, Inc.’s Annual Certified Shareholder Report on Form N-CSR, File No. 811-21591, on September 29, 2005, and is incorporated herein by reference. |
ITEM 3. AUDIT COMMITTEE FINANCIAL EXPERT.
| (a)(1) | The registrant’s board has determined that the registrant has at least one audit committee financial expert serving on its audit committee. |
| (a)(2) | M. Jeannine Strandjord, James A. Olson and Andrea C. Hall are the registrant’s designated audit committee financial experts. They are “independent” as defined in Item 3 of Form N-CSR. |
| (a)(3) | Not applicable. |
| (b) | No response required. |
| (c) | No response required. |
| (d) | No response required. |
ITEM 4. PRINCIPAL ACCOUNTANT FEES AND SERVICES.
| (a) | Audit Fees. |
The aggregate fees billed for each of the last two fiscal years for professional services rendered by the principal accountant for the audit of the registrant’s annual financial statements or services that are normally provided by the accountant in connection with statutory and regulatory filings or engagements for those fiscal years were as follows:
FY 2010: $184,644
FY 2011: $178,400
| (b) | Audit-Related Fees. |
The aggregate fees billed in each of the last two fiscal years for assurance and related services by the principal accountant that are reasonably related to the performance of the audit of the registrant’s financial statements and are not reported under paragraph (a) of this Item were as follows:
| For services rendered to the registrant: |
FY 2010: $0 FY 2011: $0 |
Fees required to be approved pursuant to paragraph (c)(7)(ii) of Rule 2-01 of Regulation S-X (relating to certain engagements for non-audit services with the registrant’s investment adviser and its affiliates):
FY 2010: $0 FY 2011: $0 |
| (c) | Tax Fees. |
The aggregate fees billed in each of the last two fiscal years for professional services rendered by the principal accountant for tax compliance, tax advice, and tax planning were as follows:
| For services rendered to the registrant: |
FY 2010: $0
FY 2011: $0
Fees required to be approved pursuant to paragraph (c)(7)(ii) of Rule 2-01 of Regulation S-X (relating to certain engagements for non-audit services with the registrant’s investment adviser and its affiliates):
FY 2010: $0
FY 2011: $0
| (d) | All Other Fees. |
The aggregate fees billed in each of the last two fiscal years for products and services provided by the principal accountant, other than the services reported in paragraphs (a) through (c) of this Item were as follows:
| For services rendered to the registrant: |
FY 2010: $0 FY 2011: $0 |
Fees required to be approved pursuant to paragraph (c)(7)(ii) of Rule 2-01 of Regulation S-X (relating to certain engagements for non-audit services with the registrant’s investment adviser and its affiliates):
FY 2010: $0 FY 2011: $0 |
| (e)(1) | In accordance with paragraph (c)(7)(i)(A) of Rule 2-01 of Regulation S-X, before the accountant is engaged by the registrant to render audit or non-audit services, the engagement is approved by the registrant’s audit committee. Pursuant to paragraph (c)(7)(ii) of Rule 2-01 of Regulation S-X, the registrant’s audit committee also pre-approves its accountant’s engagements for non-audit services with the registrant’s investment adviser, its parent company, and any entity controlled by, or under common control with the investment adviser that provides ongoing services to the registrant, if the engagement relates directly to the operations and financial reporting of the registrant. |
| (e)(2) | All services described in each of paragraphs (b) through (d) of this Item were pre-approved before the engagement by the registrant’s audit committee pursuant to paragraph (c)(7)(i)(A) of Rule 2-01 of Regulation S-X. Consequently, none of such services were required to be approved by the audit committee pursuant to paragraph (c)(7)(i)(C). |
| (f) | The percentage of hours expended on the principal accountant’s engagement to audit the registrant’s financial statements for the most recent fiscal year that were attributed to work performed by persons other than the principal accountant’s full-time, permanent employees was less than 50%. |
| (g) | The aggregate non-audit fees billed by the registrant’s accountant for services rendered to the registrant, and rendered to the registrant’s investment adviser (not including any sub-adviser whose role is primarily portfolio management and is subcontracted with or overseen by another investment adviser), and any entity controlling, controlled by, or under common control with the adviser that provides ongoing services to the registrant for each of the last two fiscal years of the registrant were as follows: |
FY 2010: $59,174
FY 2011: $67,680
| (h) | The registrant’s investment adviser and accountant have notified the registrant’s audit committee of all non-audit services that were rendered by the registrant’s accountant to the registrant’s investment adviser, its parent company, and any entity controlled by, or under common control with the investment adviser that provides services to the registrant, which services were not required to be pre-approved pursuant to paragraph (c)(7)(ii) of Rule 2-01 of Regulation S-X. The notification provided to the registrant’s audit committee included sufficient details regarding such services to allow the registrant’s audit committee to consider the continuing independence of its principal accountant. |
ITEM 5. AUDIT COMMITTEE OF LISTED REGISTRANTS.
Not applicable.
ITEM 6. INVESTMENTS.
| (a) | The schedule of investments is included as part of the report to stockholders filed under Item 1 of this Form. |
| (b) | Not applicable. |
ITEM 7. DISCLOSURE OF PROXY VOTING POLICIES AND PROCEDURES FOR CLOSED-END MANAGEMENT INVESTMENT COMPANIES.
Not applicable.
ITEM 8. PORTFOLIO MANAGERS OF CLOSED-END MANAGEMENT INVESTMENT COMPANIES.
Not applicable.
ITEM 9. PURCHASES OF EQUITY SECURITIES BY CLOSED-END MANAGEMENT INVESTMENT COMPANY AND AFFILIATED PURCHASERS.
Not applicable.
ITEM 10. SUBMISSION OF MATTERS TO A VOTE OF SECURITY HOLDERS.
During the reporting period, there were no material changes to the procedures by which shareholders may recommend nominees to the registrant’s board.
ITEM 11. CONTROLS AND PROCEDURES.
| (a) | The registrant's principal executive officer and principal financial officer have concluded that the registrant's disclosure controls and procedures (as defined in Rule 30a-3(c) under the Investment Company Act of 1940) are effective based on their evaluation of these controls and procedures as of a date within 90 days of the filing date of this report. |
| (b) | There were no changes in the registrant's internal control over financial reporting (as defined in Rule 30a-3(d) under the Investment Company Act of 1940) that occurred during the registrant's second fiscal quarter of the period covered by this report that have materially affected, or are reasonably likely to materially affect, the registrant's internal control over financial reporting. |
ITEM 12. EXHIBITS.
| (a)(1) | Registrant’s Code of Ethics for Senior Financial Officers, which is the subject of the disclosure required by Item 2 of Form N-CSR, was filed as Exhibit 12(a)(1) to American Century Asset Allocation Portfolios, Inc.’s Certified Shareholder Report on Form N-CSR, File No. 811-21591, on September 29, 2005. |
| (a)(2) | Separate certifications by the registrant’s principal executive officer and principal financial officer, pursuant to Section 302 of the Sarbanes-Oxley Act of 2002 and Rule 30a-2(a) under the Investment Company Act of 1940, are filed and attached hereto as EX-99.CERT. |
| (a)(3) | Not applicable. |
| (b) | A certification by the registrant’s chief executive officer and chief financial officer, pursuant to Section 906 of the Sarbanes-Oxley Act of 2002, is furnished and attached hereto as EX-99.906CERT. |
| SIGNATURES |
Pursuant to the requirements of the Securities Exchange Act of 1934 and the Investment Company Act of 1940, the registrant has duly caused this report to be signed on its behalf by the undersigned, thereunto duly authorized.
| Registrant: | American Century World Mutual Funds, Inc. | |||
| By: | /s/ Jonathan S. Thomas | |||
| Name: | Jonathan S. Thomas | |||
| Title: | President | |||
| Date: | January 27, 2012 | |||
Pursuant to the requirements of the Securities Exchange Act of 1934 and the Investment Company Act of 1940, this report has been signed below by the following persons on behalf of the registrant and in the capacities and on the dates indicated.
| By: | /s/ Jonathan S. Thomas | ||
| Name: | Jonathan S. Thomas | ||
| Title: | President | ||
| (principal executive officer) | |||
| Date: | January 27, 2012 | ||
| By: | /s/ Robert J. Leach | ||
| Name: | Robert J. Leach | ||
| Title: | Vice President, Treasurer, and | ||
| Chief Financial Officer | |||
| (principal financial officer) | |||
| Date: | January 27, 2012 | ||