UNITED STATES
SECURITIES AND EXCHANGE COMMISSION
Washington, D.C. 20549
FORM N-CSR
CERTIFIED SHAREHOLDER REPORT OF REGISTERED
MANAGEMENT INVESTMENT COMPANIES
| Investment Company Act file number | 811-06247 | |||||
| AMERICAN CENTURY WORLD MUTUAL FUNDS, INC. | ||||||
| (Exact name of registrant as specified in charter) | ||||||
| 4500 MAIN STREET, KANSAS CITY, MISSOURI | 64111 | |||||
| (Address of principal executive offices) | (Zip Code) | |||||
CHARLES A. ETHERINGTON 4500 MAIN STREET, KANSAS CITY, MISSOURI 64111 | ||||||
| (Name and address of agent for service) | ||||||
| Registrant’s telephone number, including area code: | 816-531-5575 | |||||
| Date of fiscal year end: | 11-30 | |||||
| Date of reporting period: | 11-30-2012 | |||||
ITEM 1. REPORTS TO STOCKHOLDERS.
ANNUAL REPORT NOVEMBER 30, 2012


| Emerging Markets Fund |
| President’s Letter | 2 |
| Independent Chairman’s Letter | 3 |
| Market Perspective | 4 |
| Performance | 5 |
| Portfolio Commentary | 7 |
| Fund Characteristics | 9 |
| Shareholder Fee Example | 10 |
| Schedule of Investments | 12 |
| Statement of Assets and Liabilities | 15 |
| Statement of Operations | 16 |
| Statement of Changes in Net Assets | 17 |
| Notes to Financial Statements | 18 |
| Financial Highlights | 24 |
| Report of Independent Registered Public Accounting Firm | 26 |
| Management | 27 |
| Approval of Management Agreement | 30 |
| Additional Information | 35 |
Any opinions expressed in this report reflect those of the author as of the date of the report, and do not necessarily represent the opinions of American Century Investments® or any other person in the American Century Investments organization. Any such opinions are subject to change at any time based upon market or other conditions and American Century Investments disclaims any responsibility to update such opinions. These opinions may not be relied upon as investment advice and, because investment decisions made by American Century Investments funds are based on numerous factors, may not be relied upon as an indication of trading intent on behalf of any American Century Investments fund. Security examples are used for representational purposes only and are not intended as recommendations to purchase or sell securities. Performance information for comparative indices and securities is provided to American Century Investments by third party vendors. To the best of American Century Investments’ knowledge, such information is accurate at the time of printing.

Dear Investor:
Thank you for reviewing this annual report for the 12 months ended November 30, 2012. It offers investment performance, market analysis, and portfolio information, presented with the expert perspective of our portfolio management team.
Annual reports remain important vehicles for conveying information about fund returns, including key factors that affected fund performance. For additional, updated investment and market insights, we encourage you to visit our website, americancentury.com.
Favorable Fiscal-Year Returns for Most Major Stock and Bond Benchmarks
Despite a global economic slowdown, continued concerns about European financial system stability, and uncertainty about U.S. political and fiscal conditions in 2013, 12-month stock and bond returns were generally favorable, particularly for U.S. value stocks and high-yield bonds.
U.S. value stock indices outpaced the S&P 500 Index’s 16.13% return for the period, as did U.S. corporate and municipal high-yield benchmarks. U.S. growth and international index returns were generally lower, but still solid—the MSCI EAFE Index, for example, returned 12.61%.
With the exception of high-yield bond sectors, stocks generally outperformed bonds for the period, though bonds benefitted from economic stagnation, reduced inflation pressures, and low interest rates. The 10-year U.S. Treasury yield declined from 2.07% to 1.62% during the period, and the Barclays U.S. Aggregate Bond Index returned 5.51%. Related global bond indices also returned in roughly the mid-single digits.
Bucking the global trend, the U.S. economy showed signs of improvement during the fiscal year, particularly the long-depressed housing market. However, the outlook for 2013 remains guarded, as the fragile recovery remains vulnerable to fiscal and financial factors that could trigger further slowdowns and market volatility.
Under these conditions, we continue to believe in a disciplined, diversified, long-term investment approach, using both stocks and bonds—as appropriate—for meeting financial goals. We appreciate your continued trust in us in this challenging environment.
Sincerely,

Jonathan Thomas
President and Chief Executive Officer
American Century Investments
2

Dear Fellow Shareholders,
The board has once again completed its annual review of the advisory contract between the American Century Investments mutual funds overseen by the board and the funds’ advisor, American Century Investment Management, Inc. This process, often referred to as the 15(c) review, involves the independent directors considering all of the material monitored throughout the year and evaluating a wide range of factors to determine whether the management fee paid by each fund to the advisor is reasonable.
The independent directors’ rationale for this decision is provided in detail in this, or in a previous, report. However, there are several highlights that should be of interest to all shareholders.
| • | Fund performance and client service continue to be rated among the industry’s best. |
| • | Target date and other asset allocation products continue to successfully gather assets and industry acclaim. |
| • | Compliance programs continue to function successfully with no issues impacting shareholder interests. |
| • | Fees were found to be within an acceptable competitive range, with minor fee waivers being negotiated on five funds. |
Knowing that most shareholders are long term investors, the board was particularly pleased with our succession planning review. Talented professionals are being added within portfolio management and experienced managers have been added to the senior management team.
Overall it was a very positive review for the American Century Investments mutual funds during a challenging market environment.
Best personal regards,

Don Pratt
3
By Mark Kopinski, Chief Investment Officer, Global and Non-U.S. Equity
Central Bank Action Drove Global Stocks Higher
Despite a backdrop of weaker global economic growth and mounting sovereign debt problems in Europe and the United States, most global stock benchmarks advanced strongly for the 12-month period ended November 30, 2012. Investors generally overlooked the lackluster economic data, recession fears (which eventually turned to reality for Europe), and the instability of the eurozone’s banking system and currency. Instead, they focused on the optimism inspired by unprecedented central bank intervention.
In particular, the European Central Bank (ECB) launched several programs to help the eurozone’s troubled banks shore up their balance sheets and finance ongoing operations. The ECB also agreed to purchase the sovereign debt of financially strapped member nations that conform to the ECB’s fiscal reform measures. Meanwhile, in response to sluggish economic growth and high unemployment, the U.S. Federal Reserve (the Fed) announced its third—and most aggressive—quantitative easing program to date. The Bank of Japan also took action with an asset purchase program, while the People’s Bank of China eased its reserve requirements for commercial lenders.
Overall, developed markets outperformed emerging markets for the 12-month period, even as the emerging economies generally enjoyed higher absolute levels of growth, albeit slower growth than in previous periods. Strong stock market performance in Europe and the United States, where central bank stimulus was the greatest, primarily drove the better relative results in the developed markets.
Valuations, Stock Selection Remain Key Factors
Even though economic growth and corporate earnings in aggregate have been slowing, and sovereign debt issues have yet to be resolved, there are some positive factors at work for global equity investors. Stock valuations around the globe appear attractive relative to historical averages. Similarly, equity earnings yields are also compelling when measured against long-term averages and current bond yields. Most important, we believe through our rigorous, bottom-up stock selection process it’s still possible to find individual companies growing earnings, either from a new product launch, market share gains, secular changes, or
beneficial acquisitions.
| International Equity Total Returns | ||||
| For the 12 months ended November 30, 2012 (in U.S. dollars) | ||||
| MSCI EAFE Index | 12.61% | MSCI Europe Index | 14.07% | |
| MSCI EAFE Growth Index | 12.66% | MSCI World Index | 13.62% | |
| MSCI EAFE Value Index | 12.45% | MSCI Japan Index | 3.59% | |
| MSCI Emerging Markets Index | 11.35% | |||
4
| Total Returns as of November 30, 2012 | ||||||
| Average Annual Returns | ||||||
Ticker Symbol | 1 year | 5 years | 10 years | Since Inception | Inception Date | |
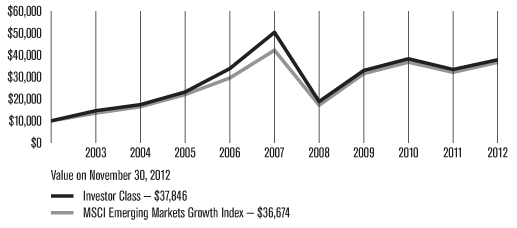
| Investor Class | TWMIX | 13.28% | -5.54% | 14.22% | 7.10% | 9/30/97 |
| MSCI Emerging Markets Growth Index | — | 14.21% | -2.76% | 13.88% | N/A(1) | — |
| Institutional Class | AMKIX | 13.43% | -5.37% | 14.43% | 11.09% | 1/28/99 |
A Class(2) No sales charge* With sales charge* | AEMMX | 12.99% 6.45% | -5.76% -6.87% | 13.94% 13.26% | 8.66% 8.19% | 5/12/99 |
| C Class | ACECX | 12.13% | -6.49% | 13.10% | 10.19% | 12/18/01 |
| R Class | AEMRX | 12.74% | -6.01% | — | -5.03% | 9/28/07 |
| * | Sales charges include initial sales charges and contingent deferred sales charges (CDSCs), as applicable. A Class shares have a 5.75% maximum initial sales charge and may be subject to a maximum CDSC of 1.00%. C Class shares redeemed within 12 months of purchase are subject to a maximum CDSC of 1.00%. The SEC requires that mutual funds provide performance information net of maximum sales charges in all cases where charges could be applied. |
| (1) | Benchmark data first available January 2001. |
| (2) | Prior to September 4, 2007, the A Class was referred to as the Advisor Class and did not have a front-end sales charge. Performance prior to that date has been adjusted to reflect this charge. |
Data presented reflect past performance. Past performance is no guarantee of future results. Current performance may be higher or lower than the performance shown. Investment return and principal value will fluctuate, and redemption value may be more or less than original cost. To obtain performance data current to the most recent month end, please call 1-800-345-2021 or visit americancentury.com. International investing involves special risks, such as political instability and currency fluctuations. Investing in emerging markets may accentuate these risks.
Unless otherwise indicated, performance reflects Investor Class shares; performance for other share classes will vary due to differences in fee structure. For information about other share classes available, please consult the prospectus. Data assumes reinvestment of dividends and capital gains, and none of the charts reflect the deduction of taxes that a shareholder would pay on fund distributions or the redemption of fund shares. Returns for the index are provided for comparison. The fund’s total returns include operating expenses (such as transaction costs and management fees) that reduce returns, while the total returns of the index do not.
5
| Growth of $10,000 Over 10 Years |
| $10,000 investment made November 30, 2002 |
| Total Annual Fund Operating Expenses | ||||
| Investor Class | Institutional Class | A Class | C Class | R Class |
| 1.72% | 1.52% | 1.97% | 2.72% | 2.22% |
The total annual fund operating expenses shown is as stated in the fund’s prospectus current as of the date of this report. The prospectus may vary from the expense ratio shown elsewhere in this report because it is based on a different time period, includes acquired fund fees and expenses, and, if applicable, does not include fee waivers or expense reimbursements.
Data presented reflect past performance. Past performance is no guarantee of future results. Current performance may be higher or lower than the performance shown. Investment return and principal value will fluctuate, and redemption value may be more or less than original cost. To obtain performance data current to the most recent month end, please call 1-800-345-2021 or visit americancentury.com. International investing involves special risks, such as political instability and currency fluctuations. Investing in emerging markets may accentuate these risks.
Unless otherwise indicated, performance reflects Investor Class shares; performance for other share classes will vary due to differences in fee structure. For information about other share classes available, please consult the prospectus. Data assumes reinvestment of dividends and capital gains, and none of the charts reflect the deduction of taxes that a shareholder would pay on fund distributions or the redemption of fund shares. Returns for the index are provided for comparison. The fund’s total returns include operating expenses (such as transaction costs and management fees) that reduce returns, while the total returns of the index do not.
6
| Portfolio Commentary |
Portfolio Managers: Patricia Ribeiro and Anthony Han
Performance Summary
Emerging Markets gained 13.28%* for the 12 months ended November 30, 2012, compared with its benchmark, the MSCI Emerging Markets Growth Index, which advanced 14.21%.
Emerging market growth stocks generally demonstrated robust performance during the 12-month period, even as key countries, including China and Brazil, experienced slowdowns in their economic growth rates. Unprecedented central bank intervention, particularly in Europe, the United States, and Japan, helped drive overall global stock market optimism. In general, emerging market stocks slightly lagged their developed market counterparts. But, in the growth stock universe, emerging market stocks outpaced developed market stocks.
The portfolio underperformed its benchmark for the period, primarily due to sector allocations, including an underweight position in health care and an overweight position in information technology. Overall, stock selection was a strong contributor, with holdings in the materials, consumer discretionary, and industrials sectors driving results. Stock selection was a detractor only in the information technology and energy sectors.
China Handset Maker was a Leading Detractor
From a regional perspective, stock selection hurt relative performance in China, which was among the portfolio’s largest performance detractors on a country basis. An overweight position in ZTE Corp., a cellular handset manufacturer, was among the top individual detractors. In October, the company reported its first quarterly loss, as weak sales drove margins to record lows. Mounting competition, revenue accounting changes, delayed orders in Africa, and a strategy of chasing market share in Europe through low-margin contracts accounted for the disappointing results. In addition, a U.S. Congressional committee named the company a potential security threat, a charge ZTE denied.
Another prominent China-based detractor included a position in Baidu, an Internet search provider. Late in the period, the company forecast its fourth-quarter revenue growth would slow to its weakest level in three years, which was below analysts’ expectations. In addition, reluctance from advertisers to purchase space on the company’s search pages for mobile phones, a slowdown in search revenue, and an analyst downgrade weighed on the company’s shares.
Mando, a South Korea-based parts supplier to automakers, also was among the portfolio’s leading individual detractors. The stock tumbled early in the period, as South Korean officials acknowledged the lackluster European economy hindered the country’s growth rate. Yet, the Bank of Korea refrained from lowering its key lending rate, citing inflationary concerns.
*All fund returns referenced in this commentary are for Investor Class shares.
7
Mexican Conglomerate was a Top Contributor
In terms of the portfolio’s favorable regional exposure, Mexico was among the top contributors for the 12-month period, driven by strong stock selection. In fact, one of the portfolio’s top individual contributors was Mexico’s Alfa SAB de CV, an industrial conglomerate operating in the petrochemical, food processing, automotive and telecommunication industries. The company reported strong quarterly results and favorable industry conditions and operating improvements in most of its business lines throughout the period. In addition, the company announced a 10-for-1 stock split in August to boost its market liquidity, sending its share prices to record highs.
South Africa also was among the portfolio’s top-performing countries, driven by strong stock selection. In particular, an overweight position in retailer Mr Price Group was among the portfolio’s top individual contributors for the period. During the second quarter of 2012, the company reported a 50% jump in full-year profits, as its total sales grew 12.9% during the fiscal period. Additionally, the company boosted its margins by slowing its store expansion efforts and tightening inventory controls. Then, in November, the company said it posted a 34% jump in first-half profit, aided by lower tax liabilities and debt-fuelled consumer spending. Overall, Mr Price and other South African retailers benefited from continued consumer spending due to above-inflation wage increases, low-cost borrowing, and government grants.
Stock selection in Indonesia also contributed favorably to portfolio performance, with cement producer Semen Gresik among the portfolio’s leading performance contributors. The company’s stock benefited from the booming cement demand in Indonesia’s property construction sector. The islands of Java and Sumatra account for nearly 85% of domestic demand. The company also maintained better-than-anticipated pricing.
Outlook
Looking ahead, the world’s macroeconomic landscape remains undermined by financial market, recession, and sovereign debt challenges in Europe and economic sluggishness in the U.S. and China. As a result, stock markets continued to be susceptible to bouts of volatility. Against this backdrop, our investment approach remained focused on companies located in emerging economies around the world that we believe are benefitting from secular tailwinds and not reliant upon broader economic developments.
8
| NOVEMBER 30, 2012 | |
| Top Ten Holdings | % of net assets |
| Samsung Electronics Co. Ltd. | 9.0% |
| Taiwan Semiconductor Manufacturing Co. Ltd. | 4.9% |
| Tencent Holdings Ltd. | 2.4% |
| China Overseas Land & Investment Ltd. | 2.0% |
| iShares MSCI Emerging Markets Index Fund | 2.0% |
| Ping An Insurance Group Co. H Shares | 1.8% |
| ITC Ltd. | 1.7% |
| CNOOC Ltd. | 1.7% |
| Hon Hai Precision Industry Co. Ltd. | 1.7% |
| Kunlun Energy Co. Ltd. | 1.6% |
| Types of Investments in Portfolio | % of net assets |
| Foreign Common Stocks | 96.5% |
| Exchange-Traded Funds | 2.0% |
| Total Equity Exposure | 98.5% |
| Temporary Cash Investments | 3.4% |
| Other Assets and Liabilities | (1.9)% |
| Investments by Country | % of net assets |
| China | 17.9% |
| South Korea | 15.2% |
| Brazil | 10.5% |
| Taiwan | 8.7% |
| Russia | 5.9% |
| India | 5.6% |
| Mexico | 5.2% |
| South Africa | 5.0% |
| Thailand | 4.2% |
| Turkey | 4.1% |
| Indonesia | 4.0% |
| United Kingdom | 2.2% |
| Peru | 2.0% |
| United States | 2.0% |
| Other Countries | 6.0% |
| Cash and Equivalents* | 1.5% |
*Includes temporary cash investments and other assets and liabilities.
9
Fund shareholders may incur two types of costs: (1) transaction costs, including sales charges (loads) on purchase payments and redemption/exchange fees; and (2) ongoing costs, including management fees; distribution and service (12b-1) fees; and other fund expenses. This example is intended to help you understand your ongoing costs (in dollars) of investing in your fund and to compare these costs with the ongoing cost of investing in other mutual funds.
The example is based on an investment of $1,000 made at the beginning of the period and held for the entire period from June 1, 2012 to November 30, 2012.
Actual Expenses
The table provides information about actual account values and actual expenses for each class. You may use the information, together with the amount you invested, to estimate the expenses that you paid over the period. First, identify the share class you own. Then simply divide your account value by $1,000 (for example, an $8,600 account value divided by $1,000 = 8.6), then multiply the result by the number under the heading “Expenses Paid During Period” to estimate the expenses you paid on your account during this period.
If you hold Investor Class shares of any American Century Investments fund, or Institutional Class shares of the American Century Diversified Bond Fund, in an American Century Investments account (i.e., not a financial intermediary or retirement plan account), American Century Investments may charge you a $12.50 semiannual account maintenance fee if the value of those shares is less than $10,000. We will redeem shares automatically in one of your accounts to pay the $12.50 fee. In determining your total eligible investment amount, we will include your investments in all personal accounts (including American Century Investments Brokerage accounts) registered under your Social Security number. Personal accounts include individual accounts, joint accounts, UGMA/UTMA accounts, personal trusts, Coverdell Education Savings Accounts and IRAs (including traditional, Roth, Rollover, SEP-, SARSEP- and SIMPLE-IRAs), and certain other retirement accounts. If you have only business, business retirement, employer-sponsored or American Century Investments Brokerage accounts, you are currently not subject to this fee. If you are subject to the Account Maintenance Fee, your account value could be reduced by the fee amount.
Hypothetical Example for Comparison Purposes
The table also provides information about hypothetical account values and hypothetical expenses based on the actual expense ratio of each class of your fund and an assumed rate of return of 5% per year before expenses, which is not the actual return of a fund’s share class. The hypothetical account values and expenses may not be used to estimate the actual ending account balance or expenses you paid for the period. You may use this information to compare the ongoing costs of investing in your fund and other funds. To do so, compare this 5% hypothetical example with the 5% hypothetical examples that appear in the shareholder reports of the other funds.
10
Please note that the expenses shown in the table are meant to highlight your ongoing costs only and do not reflect any transactional costs, such as sales charges (loads) or redemption/exchange fees. Therefore, the table is useful in comparing ongoing costs only, and will not help you determine the relative total costs of owning different funds. In addition, if these transactional costs were included, your costs would have been higher.
Beginning Account Value 6/1/12 | Ending Account Value 11/30/12 | Expenses Paid During Period(1) 6/1/12 – 11/30/12 | Annualized Expense Ratio(1) | |
| Actual | ||||
| Investor Class | $1,000 | $1,146.80 | $9.34 | 1.74% |
| Institutional Class | $1,000 | $1,147.50 | $8.27 | 1.54% |
| A Class | $1,000 | $1,144.30 | $10.67 | 1.99% |
| C Class | $1,000 | $1,139.70 | $14.66 | 2.74% |
| R Class | $1,000 | $1,143.10 | $12.00 | 2.24% |
| Hypothetical | ||||
| Investor Class | $1,000 | $1,016.30 | $8.77 | 1.74% |
| Institutional Class | $1,000 | $1,017.30 | $7.77 | 1.54% |
| A Class | $1,000 | $1,015.05 | $10.02 | 1.99% |
| C Class | $1,000 | $1,011.30 | $13.78 | 2.74% |
| R Class | $1,000 | $1,013.80 | $11.28 | 2.24% |
| (1) | Expenses are equal to the class’s annualized expense ratio listed in the table above, multiplied by the average account value over the period, multiplied by 183, the number of days in the most recent fiscal half-year, divided by 366, to reflect the one-half year period. |
11
NOVEMBER 30, 2012
| Shares | Value | |
| Common Stocks — 96.5% | ||
| BRAZIL — 10.5% | ||
| Anhanguera Educacional Participacoes SA | 167,700 | $ 2,532,609 |
| BR Malls Participacoes SA | 487,800 | 6,266,431 |
| BR Properties SA | 560,600 | 6,611,344 |
| Brazil Pharma SA | 420,000 | 2,604,362 |
| CCR SA | 447,200 | 3,842,471 |
| Cia de Bebidas das Americas Preference Shares ADR | 142,190 | 5,916,526 |
| Cia de Saneamento de Minas Gerais-COPASA | 151,967 | 3,200,353 |
| Grupo BTG Pactual | 170,500 | 2,393,766 |
Hypermarcas SA(1) | 339,000 | 2,443,186 |
| Klabin SA Preference Shares | 703,100 | 3,961,683 |
| Marcopolo SA Preference Shares | 465,400 | 2,735,597 |
| MRV Engenharia e Participacoes SA | 482,800 | 2,555,442 |
| Vale SA Preference Shares | 427,800 | 7,347,557 |
| 52,411,327 | ||
| CANADA — 0.4% | ||
| Pacific Rubiales Energy Corp. | 100,047 | 2,182,532 |
| CHILE — 1.3% | ||
| SACI Falabella | 396,411 | 3,964,522 |
| Sociedad Quimica y Minera de Chile SA ADR | 42,187 | 2,387,784 |
| 6,352,306 | ||
| CHINA — 17.9% | ||
| Belle International Holdings Ltd. | 2,075,000 | 4,358,726 |
Brilliance China Automotive Holdings Ltd.(1) | 3,674,000 | 4,470,313 |
| China Communications Construction Co. Ltd. H Shares | 5,023,000 | 4,575,673 |
| China Minsheng Banking Corp. Ltd. H Shares | 3,100,000 | 3,039,922 |
| China Overseas Land & Investment Ltd. | 3,356,000 | 9,937,834 |
| China Railway Construction Corp. Ltd. H Shares | 5,672,500 | 6,323,759 |
| China Shenhua Energy Co. Ltd. H Shares | 1,186,000 | 4,858,649 |
| CNOOC Ltd. | 3,964,000 | 8,480,184 |
| Focus Media Holding Ltd. ADR | 131,982 | 3,205,843 |
Haier Electronics Group Co. Ltd.(1) | 2,538,000 | 3,484,338 |
| Hengan International Group Co. Ltd. | 305,500 | 2,759,284 |
| Industrial & Commercial Bank of China Ltd. H Shares | 7,313,645 | 4,935,403 |
| Kunlun Energy Co. Ltd. | 3,864,000 | 7,867,400 |
| Ping An Insurance Group Co. H Shares | 1,155,000 | 8,740,516 |
| Tencent Holdings Ltd. | 372,500 | 12,169,621 |
| 89,207,465 | ||
| COLOMBIA — 0.6% | ||
| Almacenes Exito SA | 144,215 | 2,860,148 |
| HONG KONG — 0.7% | ||
| AAC Technologies Holdings, Inc. | 957,500 | 3,595,165 |
| INDIA — 5.6% | ||
| HDFC Bank Ltd. | 515,619 | 6,672,856 |
| ICICI Bank Ltd. ADR | 128,848 | 5,281,480 |
| ITC Ltd. | 1,573,194 | 8,633,117 |
| Tata Global Beverages Ltd. | 1,001,074 | 3,054,108 |
| Tata Motors Ltd. | 827,765 | 4,161,271 |
| 27,802,832 | ||
| INDONESIA — 4.0% | ||
| PT AKR Corporindo Tbk | 9,856,000 | 4,417,658 |
| PT Astra International Tbk | 4,153,000 | 3,138,505 |
| PT Bank Rakyat Indonesia (Persero) Tbk | 3,535,000 | 2,597,774 |
| PT Media Nusantara Citra Tbk | 7,818,500 | 2,180,069 |
| PT Semen Gresik (Persero) Tbk | 3,152,500 | 4,863,397 |
| PT XL Axiata Tbk | 4,780,500 | 2,566,277 |
| 19,763,680 | ||
| MALAYSIA — 1.3% | ||
| Axiata Group Bhd | 3,203,600 | 6,239,103 |
| MEXICO — 5.2% | ||
| Alfa SAB de CV, Series A | 2,831,910 | 5,896,597 |
Cemex SAB de CV ADR(1) | 318,501 | 2,834,659 |
| Fomento Economico Mexicano SAB de CV ADR | 43,549 | 4,271,286 |
| Grupo Aeroportuario del Sureste SAB de CV B Shares | 139,854 | 1,427,363 |
| Grupo Financiero Banorte SAB de CV | 687,568 | 3,923,887 |
| Mexichem SAB de CV | 923,598 | 4,784,575 |
| Wal-Mart de Mexico SAB de CV | 877,718 | 2,754,607 |
| 25,892,974 | ||
12
| Shares | Value |
| PERU — 2.0% | ||
| Credicorp Ltd. | 37,267 | $ 5,213,653 |
| Southern Copper Corp. | 136,513 | 4,955,422 |
| 10,169,075 | ||
| POLAND — 1.0% | ||
| Eurocash SA | 232,485 | 3,238,538 |
| Powszechny Zaklad Ubezpieczen SA | 11,821 | 1,480,509 |
| 4,719,047 | ||
| RUSSIA — 5.9% | ||
| Eurasia Drilling Co. Ltd. GDR | 109,175 | 3,553,646 |
| Magnit OJSC GDR | 201,161 | 7,096,960 |
| Mail.ru Group Ltd. GDR | 91,525 | 3,020,325 |
| Mobile Telesystems OJSC ADR | 194,641 | 3,392,593 |
| NovaTek OAO GDR | 43,692 | 4,793,012 |
| Sberbank of Russia | 2,540,543 | 7,469,197 |
| 29,325,733 | ||
| SOUTH AFRICA — 5.0% | ||
| Aspen Pharmacare Holdings Ltd. | 293,078 | 5,158,139 |
| Clicks Group Ltd. | 639,457 | 4,531,381 |
| Discovery Holdings Ltd. | 708,526 | 4,447,813 |
| Exxaro Resources Ltd. | 107,587 | 1,869,074 |
| Mr Price Group Ltd. | 153,306 | 2,293,451 |
| Naspers Ltd. N Shares | 111,153 | 6,863,920 |
| 25,163,778 | ||
| SOUTH KOREA — 15.2% | ||
| Hyundai Glovis Co. Ltd. | 25,814 | 5,625,991 |
| Hyundai Motor Co. | 7,349 | 1,530,405 |
| Hyundai Wia Corp. | 22,569 | 3,793,284 |
| LG Chem Ltd. | 9,657 | 2,782,457 |
LG Display Co. Ltd.(1) | 101,540 | 3,244,479 |
| LG Household & Health Care Ltd. | 8,716 | 5,199,738 |
| Orion Corp. | 6,247 | 6,478,627 |
| Paradise Co. Ltd. | 144,676 | 2,505,125 |
| Samsung Electronics Co. Ltd. | 34,452 | 44,733,354 |
| 75,893,460 | ||
| TAIWAN — 8.7% | ||
| Chailease Holding Co. Ltd. | 2,800,910 | 5,697,452 |
| Hon Hai Precision Industry Co. Ltd. | 2,631,232 | 8,440,518 |
| MediaTek, Inc. | 287,000 | 3,264,731 |
| Taiwan Semiconductor Manufacturing Co. Ltd. | 7,208,939 | 24,489,650 |
| TPK Holding Co. Ltd. | 99,000 | 1,581,056 |
| 43,473,407 | ||
| THAILAND — 4.2% | ||
| CP ALL PCL | 4,943,600 | 6,362,730 |
| Kasikornbank PCL NVDR | 914,100 | 5,569,785 |
| Minor International PCL | 5,728,900 | 3,602,730 |
| Siam Cement PCL NVDR | 423,200 | 5,446,856 |
| 20,982,101 | ||
| TURKEY — 4.1% | ||
| BIM Birlesik Magazalar AS | 56,317 | 2,560,795 |
| Koza Altin Isletmeleri AS | 163,210 | 4,073,742 |
TAV Havalimanlari Holding AS(1) | 683,560 | 3,397,047 |
| Tofas Turk Otomobil Fabrikasi | 516,049 | 3,147,961 |
| Turkiye Garanti Bankasi AS | 846,950 | 4,019,440 |
| Turkiye Halk Bankasi AS | 354,895 | 3,436,037 |
| 20,635,022 | ||
| TURKMENISTAN — 0.7% | ||
| Dragon Oil plc | 377,660 | 3,358,129 |
| UNITED KINGDOM — 2.2% | ||
| Antofagasta plc | 179,190 | 3,697,711 |
| Petrofac Ltd. | 171,716 | 4,478,845 |
| Tullow Oil plc | 132,450 | 2,922,061 |
| 11,098,617 | ||
TOTAL COMMON STOCKS (Cost $352,818,199) | 481,125,901 | |
| Exchange-Traded Funds — 2.0% | ||
| iShares MSCI Emerging Markets Index Fund (Cost $9,828,862) | 235,066 | 9,825,759 |
| Temporary Cash Investments — 3.4% | ||
| SSgA U.S. Government Money Market Fund (Cost $17,094,329) | 17,094,329 | 17,094,329 |
TOTAL INVESTMENT SECURITIES — 101.9% (Cost $379,741,390) | 508,045,989 | |
| OTHER ASSETS AND LIABILITIES — (1.9)% | (9,232,647) | |
| TOTAL NET ASSETS — 100.0% | $498,813,342 | |
13
| Market Sector Diversification | |
| (as a % of net assets) | |
| Information Technology | 20.9% |
| Financials | 19.6% |
| Consumer Staples | 13.2% |
| Consumer Discretionary | 12.4% |
| Materials | 10.0% |
| Energy | 8.6% |
| Industrials | 7.7% |
| Telecommunication Services | 2.5% |
| Diversified | 2.0% |
| Health Care | 1.0% |
| Utilities | 0.6% |
| Cash and Equivalents* | 1.5% |
*Includes temporary cash investments and other assets and liabilities.
Notes to Schedule of Investments
ADR = American Depositary Receipt
GDR = Global Depositary Receipt
MSCI = Morgan Stanley Capital International
NVDR = Non-Voting Depositary Receipt
OJSC = Open Joint Stock Company
| (1) | Non-income producing. |
See Notes to Financial Statements.
14
| NOVEMBER 30, 2012 | |||
| Assets | |||
| Investment securities, at value (cost of $379,741,390) | $508,045,989 | ||
| Receivable for capital shares sold | 1,340,336 | ||
| Dividends and interest receivable | 149,816 | ||
| 509,536,141 | |||
| Liabilities | |||
| Payable for investments purchased | 9,828,863 | ||
| Payable for capital shares redeemed | 203,204 | ||
| Accrued management fees | 684,871 | ||
| Distribution and service fees payable | 5,861 | ||
| 10,722,799 | |||
| Net Assets | $498,813,342 | ||
| Net Assets Consist of: | |||
| Capital (par value and paid-in surplus) | $502,805,816 | ||
| Undistributed net investment income | 757,588 | ||
| Accumulated net realized loss | (133,051,346 | ) | |
| Net unrealized appreciation | 128,301,284 | ||
| $498,813,342 | |||
| Net assets | Shares outstanding | Net asset value per share | |
| Investor Class, $0.01 Par Value | $452,331,427 | 54,109,568 | $8.36 |
| Institutional Class, $0.01 Par Value | $28,536,428 | 3,332,607 | $8.56 |
| A Class, $0.01 Par Value | $13,745,155 | 1,698,488 | $8.09* |
| C Class, $0.01 Par Value | $3,376,132 | 439,943 | $7.67 |
| R Class, $0.01 Par Value | $824,200 | 100,138 | $8.23 |
*Maximum offering price $8.58 (net asset value divided by 0.9425).
See Notes to Financial Statements.
15
| YEAR ENDED NOVEMBER 30, 2012 | |||
| Investment Income (Loss) | |||
| Income: | |||
| Dividends (net of foreign taxes withheld of $1,020,529) | $9,870,147 | ||
| Interest (net of foreign taxes withheld of $5,414) | 31,588 | ||
| 9,901,735 | |||
| Expenses: | |||
| Management fees | 8,400,410 | ||
| Distribution and service fees: | |||
| A Class | 35,475 | ||
| C Class | 36,775 | ||
| R Class | 3,757 | ||
| Directors’ fees and expenses | 17,635 | ||
| Other expenses | 10,195 | ||
| 8,504,247 | |||
| Net investment income (loss) | 1,397,488 | ||
| Realized and Unrealized Gain (Loss) | |||
| Net realized gain (loss) on: | |||
| Investment transactions | 14,209,069 | ||
| Foreign currency transactions | (675,478 | ) | |
| 13,533,591 | |||
| Change in net unrealized appreciation (depreciation) on: | |||
| Investments | 46,214,547 | ||
| Translation of assets and liabilities in foreign currencies | 19,489 | ||
| 46,234,036 | |||
| Net realized and unrealized gain (loss) | 59,767,627 | ||
| Net Increase (Decrease) in Net Assets Resulting from Operations | $61,165,115 | ||
See Notes to Financial Statements.
16
| YEARS ENDED NOVEMBER 30, 2012 AND NOVEMBER 30, 2011 | |||||||
| Increase (Decrease) in Net Assets | November 30, 2012 | November 30, 2011 | |||||
| Operations | |||||||
| Net investment income (loss) | $1,397,488 | $938,130 | |||||
| Net realized gain (loss) | 13,533,591 | 49,355,393 | |||||
| Change in net unrealized appreciation (depreciation) | 46,234,036 | (120,227,565 | ) | ||||
| Net increase (decrease) in net assets resulting from operations | 61,165,115 | (69,934,042 | ) | ||||
| Distributions to Shareholders | |||||||
| From net investment income: | |||||||
| Institutional Class | (51,371 | ) | — | ||||
| Capital Share Transactions | |||||||
| Net increase (decrease) in net assets from capital share transactions | (46,952,076 | ) | (106,484,925 | ) | |||
| Redemption Fees | |||||||
| Increase in net assets from redemption fees | 11,993 | 144,876 | |||||
| Net increase (decrease) in net assets | 14,173,661 | (176,274,091 | ) | ||||
| Net Assets | |||||||
| Beginning of period | 484,639,681 | 660,913,772 | |||||
| End of period | $498,813,342 | $484,639,681 | |||||
| Undistributed net investment income | $757,588 | $86,949 | |||||
See Notes to Financial Statements.
17
1. Organization
American Century World Mutual Funds, Inc. (the corporation) is registered under the Investment Company Act of 1940, as amended (the 1940 Act), as an open-end management investment company and is organized as a Maryland corporation. Emerging Markets Fund (the fund) is one fund in a series issued by the corporation. The fund is diversified as defined under the 1940 Act. The fund’s investment objective is to seek capital growth. The fund pursues its objective by investing at least 80% of its assets in equity securities of companies located in emerging market countries.
The fund offers the Investor Class, the Institutional Class, the A Class, the C Class and the R Class. The A Class may incur an initial sales charge. The A Class and C Class may be subject to a contingent deferred sales charge. The share classes differ principally in their respective sales charges and distribution and shareholder servicing expenses and arrangements. The Institutional Class is made available to institutional shareholders or through financial intermediaries whose clients do not require the same level of shareholder and administrative services as shareholders of other classes. As a result, the Institutional Class is charged a lower unified management fee. On October 21, 2011, all outstanding B Class shares were converted to A Class shares and the fund discontinued offering the B Class.
2. Significant Accounting Policies
The following is a summary of significant accounting policies consistently followed by the fund in preparation of its financial statements. The financial statements are prepared in conformity with accounting principles generally accepted in the United States of America, which may require management to make certain estimates and assumptions at the date of the financial statements. Actual results could differ from these estimates.
Investment Valuations — The fund determines the fair value of its investments and computes its net asset value per share as of the close of regular trading (usually 4 p.m. Eastern time) on the New York Stock Exchange (NYSE) on each day the NYSE is open.
Equity securities that are listed or traded on a domestic securities exchange are valued at the last reported sales price or at the official closing price as provided by the exchange. Equity securities traded on foreign securities exchanges are typically valued at the closing price on the exchange where primarily traded or as of the close of the NYSE, if that is earlier. If no last sales price is reported, or if local convention or regulation so provides, the mean of the latest bid and asked prices is used. Depending on local convention or regulation, securities traded over-the-counter are valued at the mean of the latest bid and asked prices, the last sales price, or the official closing price. In its determination of fair value, the fund may review several factors including: market information specific to a security; news developments in U.S. and foreign markets; the performance of particular U.S. and foreign securities, indices, comparable securities, American Depositary Receipts, Exchange-Traded Funds, and other relevant market indicators.
Debt securities maturing within 60 days at the time of purchase may be valued at cost, plus or minus any amortized discount or premium or at the evaluated mean as provided by an independent pricing service. Evaluated mean prices are commonly derived through utilization of market models, which may consider, among other factors, trade data, quotations from dealers and active market makers, relevant yield curve and spread data, related sector levels, creditworthiness, and other relevant market information on the same or comparable securities.
Investments in open-end management investment companies are valued at the reported net asset value per share. Repurchase agreements are valued at cost.
The value of investments initially expressed in foreign currencies is translated into U.S. dollars at prevailing exchange rates.
18
If the fund determines that the market price for a portfolio security is not readily available or the valuation methods mentioned above do not reflect a security’s fair value, such security is valued as determined in good faith by the Board of Directors or its designee, in accordance with procedures adopted by the Board of Directors. Circumstances that may cause the fund to use these procedures to value a security include, but are not limited to: a security has been declared in default; trading in a security has been halted during the trading day; there is a foreign market holiday and no trading occurred; or an event occurred between the close of a foreign exchange and the NYSE that may affect the value of a security.
Security Transactions — Security transactions are accounted for as of the trade date. Net realized gains and losses are determined on the identified cost basis, which is also used for federal income tax purposes.
Investment Income — Dividend income less foreign taxes withheld, if any, is recorded as of the ex-dividend date. Distributions received on securities that represent a return of capital or capital gain are recorded as a reduction of cost of investments and/or as a realized gain. The fund estimates the components of distributions received that may be considered nontaxable distributions or capital gain distributions for income tax purposes. Interest income less foreign taxes withheld, if any, is recorded on the accrual basis and includes accretion of discounts and amortization of premiums.
Foreign Currency Translations — All assets and liabilities initially expressed in foreign currencies are translated into U.S. dollars at prevailing exchange rates at period end. The fund may enter into spot foreign currency exchange contracts to facilitate transactions denominated in a foreign currency. Purchases and sales of investment securities, dividend and interest income, spot foreign currency exchange contracts, and expenses are translated at the rates of exchange prevailing on the respective dates of such transactions. Net realized and unrealized foreign currency exchange gains or losses related to investment securities are a component of net realized gain (loss) on investment transactions and change in net unrealized appreciation (depreciation) on investments, respectively.
Repurchase Agreements — The fund may enter into repurchase agreements with institutions that American Century Investment Management, Inc. (ACIM) (the investment advisor) has determined are creditworthy pursuant to criteria adopted by the Board of Directors. The fund requires that the collateral, represented by securities, received in a repurchase transaction be transferred to the custodian in a manner sufficient to enable the fund to obtain those securities in the event of a default under the repurchase agreement. ACIM monitors, on a daily basis, the securities transferred to ensure the value, including accrued interest, of the securities under each repurchase agreement is equal to or greater than amounts owed to the fund under each repurchase agreement.
Joint Trading Account — Pursuant to an Exemptive Order issued by the Securities and Exchange Commission, the fund, along with certain other funds in the American Century Investments family of funds, may transfer uninvested cash balances into a joint trading account. These balances are invested in one or more repurchase agreements that are collateralized by U.S. Treasury or Agency obligations.
Income Tax Status — It is the fund’s policy to distribute substantially all net investment income and net realized gains to shareholders and to otherwise qualify as a regulated investment company under provisions of the Internal Revenue Code. The fund is no longer subject to examination by tax authorities for years prior to 2009. Additionally, non-U.S. tax returns filed by the fund due to investments in certain foreign securities remain subject to examination by the relevant taxing authority for seven years from the date of filing. At this time, management believes there are no uncertain tax positions which, based on their technical merit, would not be sustained upon examination and for which it is reasonably possible that the total amounts of unrecognized tax benefits will significantly change in the next twelve months. Accordingly, no provision has been made for federal or state income taxes.
19
Multiple Class — All shares of the fund represent an equal pro rata interest in the net assets of the class to which such shares belong, and have identical voting, dividend, liquidation and other rights and the same terms and conditions, except for class specific expenses and exclusive rights to vote on matters affecting only individual classes. Income, non-class specific expenses, and realized and unrealized capital gains and losses of the fund are allocated to each class of shares based on their relative net assets.
Distributions to Shareholders — Distributions from net investment income and net realized gains, if any, are generally declared and paid annually. The fund may make distributions on a more frequent basis to comply with the distribution requirements of the Internal Revenue Code, in all events in a manner consistent with provisions of the 1940 Act.
Redemption — The fund may impose a 2.00% redemption fee on shares held less than 60 days. The fee may not be applicable to all classes. The redemption fee is retained by the fund and helps cover transaction costs that long-term investors may bear when the fund sells securities to meet investor redemptions. Prior to November 14, 2011, the redemption fee applied to shares held less than 180 days.
Indemnifications — Under the corporation’s organizational documents, its officers and directors are indemnified against certain liabilities arising out of the performance of their duties to the fund. In addition, in the normal course of business, the fund enters into contracts that provide general indemnifications. The maximum exposure under these arrangements is unknown as this would involve future claims that may be made against a fund. The risk of material loss from such claims is considered by management to be remote.
3. Fees and Transactions with Related Parties
Management Fees — The corporation has entered into a management agreement with ACIM, under which ACIM provides the fund with investment advisory and management services in exchange for a single, unified management fee (the fee) per class. The agreement provides that all expenses of managing and operating the fund, except distribution and service fees, brokerage expenses, taxes, interest, fees and expenses of the independent directors (including legal counsel fees), and extraordinary expenses, will be paid by ACIM. The fee is computed and accrued daily based on each class’s daily net assets and paid monthly in arrears. The rate of the fee is determined by applying a fee rate calculation formula. This formula takes into account the fund’s assets as well as certain assets, if any, of other clients of the investment advisor outside the American Century Investments family of funds (such as subadvised funds and separate accounts) that have very similar investment teams and investment strategies (strategy assets). The strategy assets of the fund include the assets of NT Emerging Markets Fund, one fund in a series issued by the corporation. The annual management fee schedule ranges from 1.25% to 1.85% for the Investor Class, A Class, C Class and R Class. The Institutional Class is 0.20% less at each point within the range. The effective annual management fee for each class for the year ended November 30, 2012 was 1.74% for the Investor Class, A Class, C Class and R Class and 1.54% for the Institutional Class.
Distribution and Service Fees — The Board of Directors has adopted a separate Master Distribution and Individual Shareholder Services Plan for each of the A Class, C Class and R Class (collectively the plans), pursuant to Rule 12b-1 of the 1940 Act. The plans provide that the A Class will pay American Century Investment Services, Inc. (ACIS) an annual distribution and service fee of 0.25%. The plans provide that the C Class will pay ACIS an annual distribution and service fee of 1.00%, of which 0.25% is paid for individual shareholder services and 0.75% is paid for distribution services. The plans provide that the R Class will pay ACIS an annual distribution and service fee of 0.50%. The fees are computed and accrued daily based on each class’s daily net assets and paid monthly in arrears. The fees are used to pay financial intermediaries for distribution and individual shareholder services. Fees incurred under the plans during the year ended November 30, 2012 are detailed in the Statement of Operations.
20
Related Parties — Certain officers and directors of the corporation are also officers and/or directors of American Century Companies, Inc., the parent of the corporation’s investment advisor, ACIM, the distributor of the corporation, ACIS, and the corporation’s transfer agent, American Century Services, LLC. Various funds issued by American Century Asset Allocation Portfolios, Inc. and American Century Strategic Asset Allocations, Inc. own, in aggregate, 20% of the shares of the fund. These funds do not invest in the fund for the purpose of exercising management or control.
4. Investment Transactions
Purchases and sales of investment securities, excluding short-term investments, for the year ended November 30, 2012 were $413,704,500 and $465,628,752, respectively.
5. Capital Share Transactions
Transactions in shares of the fund were as follows:
| Year ended November 30, 2012 | Year ended November 30, 2011 | ||||||||||||||
| Shares | Amount | Shares | Amount | ||||||||||||
| Investor Class/Shares Authorized | 235,000,000 | 235,000,000 | |||||||||||||
| Sold | 6,929,950 | $53,455,116 | 6,538,088 | $55,636,956 | |||||||||||
| Redeemed | (11,776,977 | ) | (91,432,663 | ) | (16,579,314 | ) | (141,943,249 | ) | |||||||
| (4,847,027 | ) | (37,977,547 | ) | (10,041,226 | ) | (86,306,293 | ) | ||||||||
| Institutional Class/Shares Authorized | 40,000,000 | 40,000,000 | |||||||||||||
| Sold | 765,815 | 6,099,475 | 814,282 | 7,001,115 | |||||||||||
| Issued in reinvestment of distributions | 6,334 | 51,366 | — | — | |||||||||||
| Redeemed | (1,368,338 | ) | (10,963,145 | ) | (1,621,034 | ) | (14,518,773 | ) | |||||||
| (596,189 | ) | (4,812,304 | ) | (806,752 | ) | (7,517,658 | ) | ||||||||
| A Class/Shares Authorized | 40,000,000 | 40,000,000 | |||||||||||||
| Sold | 275,763 | 2,115,216 | 2,314,402 | 20,284,532 | |||||||||||
| Redeemed | (718,945 | ) | (5,450,958 | ) | (3,764,042 | ) | (31,735,094 | ) | |||||||
| (443,182 | ) | (3,335,742 | ) | (1,449,640 | ) | (11,450,562 | ) | ||||||||
| B Class/Shares Authorized | N/A | 10,000,000 | |||||||||||||
| Sold | 2,549 | 21,664 | |||||||||||||
| Redeemed | (39,638 | ) | (294,160 | ) | |||||||||||
| (37,089 | ) | (272,496 | ) | ||||||||||||
| C Class/Shares Authorized | 5,000,000 | 5,000,000 | |||||||||||||
| Sold | 48,215 | 346,043 | 99,057 | 738,536 | |||||||||||
| Redeemed | (177,535 | ) | (1,274,469 | ) | (193,003 | ) | (1,533,169 | ) | |||||||
| (129,320 | ) | (928,426 | ) | (93,946 | ) | (794,633 | ) | ||||||||
| R Class/Shares Authorized | 10,000,000 | 10,000,000 | |||||||||||||
| Sold | 36,789 | 282,556 | 42,747 | 331,354 | |||||||||||
| Redeemed | (23,118 | ) | (180,613 | ) | (54,656 | ) | (474,637 | ) | |||||||
| 13,671 | 101,943 | (11,909 | ) | (143,283 | ) | ||||||||||
| Net increase (decrease) | (6,002,047 | ) | $(46,952,076 | ) | (12,440,562 | ) | $(106,484,925 | ) | |||||||
21
6. Fair Value Measurements
The fund’s securities valuation process is based on several considerations and may use multiple inputs to determine the fair value of the positions held by the fund. In conformity with accounting principles generally accepted in the United States of America, the inputs used to determine a valuation are classified into three broad levels as follows:
| • | Level 1 valuation inputs consist of unadjusted quoted prices in an active market for identical securities; |
| • | Level 2 valuation inputs consist of direct or indirect observable market data (including quoted prices for similar securities, evaluations of subsequent market events, interest rates, prepayment speeds, credit risk, etc.); or |
| • | Level 3 valuation inputs consist of unobservable data (including a fund’s own assumptions). |
The level classification is based on the lowest level input that is significant to the fair valuation measurement. The valuation inputs are not necessarily an indication of the risks associated with investing in these securities or other financial instruments.
The following is a summary of the level classifications as of period end. The Schedule of Investments provides additional information on the fund’s portfolio holdings.
| Level 1 | Level 2 | Level 3 | |
| Investment Securities | |||
| Foreign Common Stocks | $37,459,246 | $443,666,655 | — |
| Exchange-Traded Funds | 9,825,759 | — | — |
| Temporary Cash Investments | 17,094,329 | — | — |
| Total Value of Investment Securities | $64,379,334 | $443,666,655 | — |
7. Risk Factors
There are certain risks involved in investing in foreign securities. These risks include those resulting from future adverse political, social and economic developments, fluctuations in currency exchange rates, the possible imposition of exchange controls, and other foreign laws or restrictions. Investing in emerging markets may accentuate these risks.
22
8. Federal Tax Information
The tax character of distributions paid during the years ended November 30, 2012 and November 30, 2011 were as follows:
| 2012 | 2011 | |
| Distributions Paid From | ||
| Ordinary income | $51,371 | — |
| Long-term capital gains | — | — |
The book-basis character of distributions made during the year from net investment income or net realized gains may differ from their ultimate characterization for federal income tax purposes. These differences reflect the differing character of certain income items and net realized gains and losses for financial statement and tax purposes, and may result in reclassification among certain capital accounts on the financial statements.
As of November 30, 2012, the federal tax cost of investments and the components of distributable earnings on a tax-basis were as follows:
| Federal tax cost of investments | $382,600,625 |
| Gross tax appreciation of investments | $128,524,862 |
| Gross tax depreciation of investments | (3,079,498) |
| Net tax appreciation (depreciation) of investments | $125,445,364 |
| Net tax appreciation (depreciation) on translation of assets and liabilities in foreign currencies | $(3,315) |
| Net tax appreciation (depreciation) | $125,442,049 |
| Undistributed ordinary income | $778,609 |
| Accumulated short-term capital losses | $(129,636,164) |
| Post-October capital loss deferral | $(576,968) |
The difference between book-basis and tax-basis cost and unrealized appreciation (depreciation) is attributable primarily to the tax deferral of losses on wash sales and the realization to ordinary income for tax purposes of unrealized gains on investments in passive foreign investment companies.
Accumulated capital losses represent net capital loss carryovers that may be used to offset future realized capital gains for federal income tax purposes. Future capital loss carryover utilization in any given year may be subject to Internal Revenue Code limitations. Capital loss carryovers of $(12,429,763) and $(117,206,401) expire in 2016 and 2017, respectively.
Loss deferrals represent certain qualified losses that the fund has elected to treat as having been incurred in the following fiscal year for federal income tax purposes.
23
| For a Share Outstanding Throughout the Years Ended November 30 (except as noted) | ||||||||||||||
| Per-Share Data | Ratios and Supplemental Data | |||||||||||||
| Income From Investment Operations: | Distributions From: | Ratio to Average Net Assets of: | ||||||||||||
Net Asset Value, Beginning of Period | Net Investment Income (Loss)(1) | Net Realized and Unrealized Gain (Loss) | Total From Investment Operations | Net Investment Income | Net Realized Gains | Total Distributions | Redemption Fees(1) | Net Asset Value, End of Period | Total Return(2) | Operating Expenses | Net Investment Income (Loss) | Portfolio Turnover Rate | Net Assets, End of Period (in thousands) | |
| Investor Class | ||||||||||||||
| 2012 | $7.38 | 0.02 | 0.96 | 0.98 | — | — | — | —(3) | $8.36 | 13.28% | 1.74% | 0.29% | 85% | $452,331 |
| 2011 | $8.46 | 0.01 | (1.09) | (1.08) | — | — | — | —(3) | $7.38 | (12.77)% | 1.71% | 0.17% | 71% | $435,079 |
| 2010 | $7.28 | —(3) | 1.18 | 1.18 | — | — | — | —(3) | $8.46 | 16.21% | 1.72% | (0.02)% | 87% | $583,978 |
| 2009 | $4.17 | 0.01 | 3.13 | 3.14 | (0.03) | — | (0.03) | —(3) | $7.28 | 75.36% | 1.78% | 0.11% | 126% | $567,248 |
| 2008 | $12.69 | 0.09 | (7.21) | (7.12) | (0.10) | (1.31) | (1.41) | 0.01 | $4.17 | (62.66)% | 1.66% | 1.06% | 121% | $316,695 |
| Institutional Class | ||||||||||||||
| 2012 | $7.56 | 0.04 | 0.97 | 1.01 | (0.01) | — | (0.01) | —(3) | $8.56 | 13.43% | 1.54% | 0.49% | 85% | $28,536 |
| 2011 | $8.65 | 0.03 | (1.12) | (1.09) | — | — | — | —(3) | $7.56 | (12.60)% | 1.51% | 0.37% | 71% | $29,695 |
| 2010 | $7.43 | 0.02 | 1.20 | 1.22 | — | — | — | —(3) | $8.65 | 16.42% | 1.52% | 0.18% | 87% | $40,969 |
| 2009 | $4.26 | 0.02 | 3.18 | 3.20 | (0.03) | — | (0.03) | —(3) | $7.43 | 75.92% | 1.58% | 0.31% | 126% | $27,787 |
| 2008 | $12.92 | 0.12 | (7.35) | (7.23) | (0.13) | (1.31) | (1.44) | 0.01 | $4.26 | (62.63)% | 1.46% | 1.26% | 121% | $27,235 |
| A Class | ||||||||||||||
| 2012 | $7.16 | —(3) | 0.93 | 0.93 | — | — | — | —(3) | $8.09 | 12.99% | 1.99% | 0.04% | 85% | $13,745 |
| 2011 | $8.23 | (0.01) | (1.06) | (1.07) | — | — | — | —(3) | $7.16 | (13.00)% | 1.96% | (0.08)% | 71% | $15,339 |
| 2010 | $7.10 | (0.02) | 1.15 | 1.13 | — | — | — | —(3) | $8.23 | 15.92% | 1.97% | (0.27)% | 87% | $29,572 |
| 2009 | $4.07 | (0.01) | 3.06 | 3.05 | (0.02) | — | (0.02) | —(3) | $7.10 | 75.24% | 2.03% | (0.14)% | 126% | $23,260 |
| 2008 | $12.40 | 0.07 | (7.03) | (6.96) | (0.07) | (1.31) | (1.38) | 0.01 | $4.07 | (62.78)% | 1.91% | 0.81% | 121% | $17,105 |
24
| For a Share Outstanding Throughout the Years Ended November 30 (except as noted) | ||||||||||||||
| Per-Share Data | Ratios and Supplemental Data | |||||||||||||
| Income From Investment Operations: | Distributions From: | Ratio to Average Net Assets of: | ||||||||||||
Net Asset Value, Beginning of Period | Net Investment Income (Loss)(1) | Net Realized and Unrealized Gain (Loss) | Total From Investment Operations | Net Investment Income | Net Realized Gains | Total Distributions | Redemption Fees(1) | Net Asset Value, End of Period | Total Return(2) | Operating Expenses | Net Investment Income (Loss) | Portfolio Turnover Rate | Net Assets, End of Period (in thousands) | |
| C Class | ||||||||||||||
| 2012 | $6.84 | (0.05) | 0.88 | 0.83 | — | — | — | —(3) | $7.67 | 12.13% | 2.74% | (0.71)% | 85% | $3,376 |
| 2011 | $7.93 | (0.07) | (1.02) | (1.09) | — | — | — | —(3) | $6.84 | (13.75)% | 2.71% | (0.83)% | 71% | $3,896 |
| 2010 | $6.89 | (0.07) | 1.11 | 1.04 | — | — | — | —(3) | $7.93 | 15.09% | 2.72% | (1.02)% | 87% | $5,257 |
| 2009 | $3.96 | (0.05) | 2.98 | 2.93 | — | — | — | —(3) | $6.89 | 73.99% | 2.78% | (0.89)% | 126% | $5,372 |
| 2008 | $12.10 | 0.01 | (6.87) | (6.86) | — | (1.29) | (1.29) | 0.01 | $3.96 | (63.09)% | 2.66% | 0.06% | 121% | $3,217 |
| R Class | ||||||||||||||
| 2012 | $7.30 | (0.02) | 0.95 | 0.93 | — | — | — | —(3) | $8.23 | 12.74% | 2.24% | (0.21)% | 85% | $824 |
| 2011 | $8.42 | (0.03) | (1.09) | (1.12) | — | — | — | —(3) | $7.30 | (13.30)% | 2.21% | (0.33)% | 71% | $631 |
| 2010 | $7.28 | (0.04) | 1.18 | 1.14 | — | — | — | —(3) | $8.42 | 15.66% | 2.22% | (0.52)% | 87% | $828 |
| 2009 | $4.17 | (0.02) | 3.14 | 3.12 | (0.01) | — | (0.01) | —(3) | $7.28 | 74.94% | 2.28% | (0.39)% | 126% | $516 |
| 2008 | $12.68 | 0.05 | (7.22) | (7.17) | (0.04) | (1.31) | (1.35) | 0.01 | $4.17 | (62.92)% | 2.19% | 0.53% | 121% | $144 |
Notes to Financial Highlights
| (1) | Computed using average shares outstanding throughout the period. |
| (2) | Total returns are calculated based on the net asset value of the last business day and do not reflect applicable sales charges, if any. Total returns for periods less than one year are not annualized. |
| (3) | Per-share amount was less than $0.005. |
See Notes to Financial Statements.
25
The Board of Directors and Shareholders of
American Century World Mutual Funds, Inc.:
We have audited the accompanying statement of assets and liabilities, including the schedule of investments, of Emerging Markets Fund, one of the funds constituting American Century World Mutual Funds, Inc. (the “Corporation”) as of November 30, 2012, and the related statement of operations for the year then ended, the statement of changes in net assets for each of the two years in the period then ended, and the financial highlights for each of the five years in the period then ended. These financial statements and financial highlights are the responsibility of the Corporation’s management. Our responsibility is to express an opinion on these financial statements and financial highlights based on our audits.
We conducted our audits in accordance with the standards of the Public Company Accounting Oversight Board (United States). Those standards require that we plan and perform the audit to obtain reasonable assurance about whether the financial statements and financial highlights are free of material misstatement. The Corporation is not required to have, nor were we engaged to perform, an audit of its internal control over financial reporting. Our audits included consideration of internal control over financial reporting as a basis for designing audit procedures that are appropriate in the circumstances, but not for the purpose of expressing an opinion on the effectiveness of the Corporation’s internal control over financial reporting. Accordingly, we express no such opinion. An audit also includes examining, on a test basis, evidence supporting the amounts and disclosures in the financial statements, assessing the accounting principles used and significant estimates made by management, as well as evaluating the overall financial statement presentation. Our procedures included confirmation of securities owned as of November 30, 2012, by correspondence with the custodian and brokers; where replies were not received from brokers, we performed other auditing procedures. We believe that our audits provide a reasonable basis for our opinion.
In our opinion, the financial statements and financial highlights referred to above present fairly, in all material respects, the financial position of Emerging Markets Fund of American Century World Mutual Funds, Inc., as of November 30, 2012, the results of its operations for the year then ended, the changes in its net assets for each of the two years in the period then ended, and the financial highlights for each of the five years in the period then ended, in conformity with accounting principles generally accepted in the United States of America.
Deloitte & Touche LLP
Kansas City, Missouri
January 17, 2013
26
The Board of Directors
The individuals listed below serve as directors of the funds. Each director will continue to serve in this capacity until death, retirement, resignation or removal from office. The mandatory retirement age for directors who are not “interested persons,” as that term is defined in the Investment Company Act (independent directors), is 72. However, the mandatory retirement age for an individual director may be extended with the approval of the remaining independent directors.
Mr. Thomas is an “interested person” because he currently serves as President and Chief Executive Officer of American Century Companies, Inc. (ACC), the parent company of American Century Investment Management, Inc. (ACIM or the advisor). Mr. Fink is an “interested person” because he currently serves as Executive Vice President of ACC.
The other directors (more than three-fourths of the total number) are independent; that is, they have never been employees, directors or officers of, and have no financial interest in, ACC or any of its wholly owned, direct or indirect, subsidiaries, including ACIM, American Century Investment Services, Inc. (ACIS) and American Century Services, LLC (ACS). The directors serve in this capacity for seven (in the case of Mr. Thomas, 15) registered investment companies in the American Century Investments family of funds.
The following table presents additional information about the directors. The mailing address for each director is 4500 Main Street, Kansas City, Missouri 64111.
Name (Year of Birth) | Position(s) Held with Funds | Length of Time Served | Principal Occupation(s) During Past 5 Years | Number of American Century Portfolios Overseen by Director | Other Directorships Held During Past 5 Years | |
| Independent Directors | ||||||
Thomas A. Brown (1940) | Director | Since 1980 | Managing Member, Associated Investments, LLC (real estate investment company); Brown Cascade Properties, LLC (real estate investment company) (2001 to 2009) | 66 | None | |
Andrea C. Hall (1945) | Director | Since 1997 | Retired | 66 | None | |
Jan M. Lewis (1957) | Director | Since 2011 | President and Chief Executive Officer, Catholic Charities of Northeast Kansas (human services organization) | 66 | None | |
James A. Olson (1942) | Director | Since 2007 | Member, Plaza Belmont LLC (private equity fund manager) | 66 | Saia, Inc. (2002 to 2012) and Entertainment Properties Trust | |
Donald H. Pratt (1937) | Director and Chairman of the Board | Since 1995 (Chairman since 2005) | Chairman and Chief Executive Officer, Western Investments, Inc. (real estate company) | 66 | None | |
27
Name (Year of Birth) | Position(s) Held with Funds | Length of Time Served | Principal Occupation(s) During Past 5 Years | Number of American Century Portfolios Overseen by Director | Other Directorships Held During Past 5 Years | |
| Independent Directors | ||||||
M. Jeannine Strandjord (1945) | Director | Since 1994 | Retired | 66 | Euronet Worldwide Inc.; Charming Shoppes, Inc. (2006 to 2010); and DST Systems Inc. (1996 to 2012) | |
John R. Whitten (1946) | Director | Since 2008 | Retired | 66 | Rudolph Technologies, Inc. | |
Stephen E. Yates (1948) | Director | Since 2012 | Retired; Executive Vice President, Technology & Operations, KeyCorp. (computer services) (2004 to 2010) | 66 | Applied Industrial Technologies, Inc. (2001 to 2010) | |
| Interested Directors | ||||||
Barry Fink (1955) | Director and Executive Vice President | Since 2012 (Executive Vice President since 2007) | Executive Vice President, ACC (September 2007 to present); President, ACS (October 2007 to present); Chief Operating Officer, ACC (September 2007 to November 2012). Also serves as Manager, ACS | 66 | None | |
Jonathan S. Thomas (1963) | Director and President | Since 2007 | President and Chief Executive Officer, ACC (March 2007 to present). Also serves as Chief Executive Officer and Manager, ACS; Executive Vice President, ACIM; Director, ACC, ACIM and other ACC subsidiaries | 108 | None | |
28
Officers
The following table presents certain information about the executive officers of the funds. Each officer serves as an officer for each of the 15 investment companies in the American Century family of funds, unless otherwise noted. No officer is compensated for his or her service as an officer of the funds. The listed officers are interested persons of the funds and are appointed or re-appointed on an annual basis. The mailing address for each officer listed below is 4500 Main Street, Kansas City, Missouri 64111.
Name (Year of Birth) | Offices with the Funds | Principal Occupation(s) During the Past Five Years | |
Jonathan S. Thomas (1963) | Director and President since 2007 | President and Chief Executive Officer, ACC (March 2007 to present). Also serves as Chief Executive Officer and Manager, ACS; Executive Vice President, ACIM; Director, ACC, ACIM and other ACC subsidiaries | |
Barry Fink (1955) | Director since 2012 and Executive Vice President since 2007 | Executive Vice President, ACC (September 2007 to present); President, ACS (October 2007 to present); Chief Operating Officer, ACC (September 2007 to November 2012). Also serves as Manager, ACS | |
Maryanne L. Roepke (1956) | Chief Compliance Officer since 2006 and Senior Vice President since 2000 | Chief Compliance Officer, American Century funds, ACIM and ACS (August 2006 to present). Also serves as Senior Vice President, ACS | |
Charles A. Etherington (1957) | General Counsel since 2007 and Senior Vice President since 2006 | Attorney, ACC (February 1994 to present); Vice President, ACC (November 2005 to present), General Counsel, ACC (March 2007 to present). Also serves as General Counsel, ACIM, ACS, ACIS and other ACC subsidiaries; and Senior Vice President, ACIM and ACS | |
C. Jean Wade (1964) | Vice President, Treasurer and Chief Financial Officer since 2012 | Vice President, ACS (February 2000 to present) | |
Robert J. Leach (1966) | Vice President since 2006 and Assistant Treasurer since 2012 | Vice President, ACS (February 2000 to present) | |
David H. Reinmiller (1963) | Vice President since 2000 | Attorney, ACC (January 1994 to present); Associate General Counsel, ACC (January 2001 to present). Also serves as Vice President, ACIM and ACS | |
Ward D. Stauffer (1960) | Secretary since 2005 | Attorney, ACC (June 2003 to present) |
The Statement of Additional Information has additional information about the fund’s directors and is available without charge, upon request, by calling 1-800-345-2021.
29
At a meeting held on June 21, 2012, the Fund’s Board of Directors unanimously approved the renewal of the management agreement pursuant to which American Century Investment Management, Inc. (the “Advisor”) acts as the investment advisor for the Fund. Under Section 15(c) of the Investment Company Act, contracts for investment advisory services are required to be reviewed, evaluated, and approved by a majority of a fund’s independent directors (the “Directors”) each year.
As a part of the approval process, the Board requested and reviewed extensive data and information compiled by the Advisor and certain independent providers of evaluation data concerning the Fund and the services provided to the Fund by the Advisor. This review was in addition to the oversight and evaluation undertaken by the Board and its committees on a continuous basis throughout the year and included, but was not limited to the following:
| • | the nature, extent, and quality of investment management, shareholder services, and other services provided by the Advisor to the Fund; |
| • | the wide range of other programs and services the Advisor provides to the Fund and its shareholders on a routine and non-routine basis; |
| • | the investment performance of the fund, including data comparing the Fund’s performance to appropriate benchmarks and/or a peer group of other mutual funds with similar investment objectives and strategies; |
| • | data comparing the cost of owning the Fund to the cost of owning similar funds; |
| • | the Advisor’s compliance policies, procedures, and regulatory experience; |
| • | financial data showing the cost of services provided to the Fund, the profitability of the Fund to the Advisor, and the overall profitability of the Advisor; |
| • | data comparing services provided and charges to other investment management clients of the Advisor; and |
| • | consideration of collateral benefits derived by the Advisor from the management of the Fund and any potential economies of scale relating thereto. |
In keeping with its practice, the Board held two in-person meetings and one telephonic meeting to review and discuss the information provided. The Directors also had the benefit of the advice of independent counsel throughout the period.
Factors Considered
The Directors considered all of the information provided by the Advisor, the independent data providers, and independent counsel, and evaluated such information for the Fund. In connection with their review, the Directors did not identify any single factor as being all-important or controlling, and each Director may have attributed different levels of importance to different factors. In deciding to renew the management agreement, the Board based its decision on a number of factors, including the following:
30
Nature, Extent and Quality of Services — Generally. Under the management agreement, the Advisor is responsible for providing or arranging for all services necessary for the operation of the Fund. The Board noted that under the management agreement, the Advisor provides or arranges at its own expense a wide variety of services including:
| • | constructing and designing the Fund |
| • | portfolio research and security selection |
| • | initial capitalization/funding |
| • | securities trading |
| • | Fund administration |
| • | custody of Fund assets |
| • | daily valuation of the Fund’s portfolio |
| • | shareholder servicing and transfer agency, including shareholder confirmations, recordkeeping, and communications |
| • | legal services |
| • | regulatory and portfolio compliance |
| • | financial reporting |
| • | marketing and distribution |
The Board noted that many of these services have expanded over time both in terms of quantity and complexity in response to shareholder demands, competition in the industry, changing distribution channels, and the changing regulatory environment.
Investment Management Services. The nature of the investment management services provided to the Fund is quite complex and allows Fund shareholders access to professional money management, instant diversification of their investments within an asset class, the opportunity to easily diversify among asset classes by investing in or exchanging among various American Century Investments funds, and liquidity. In evaluating investment performance, the Board expects the Advisor to manage the Fund in accordance with its investment objectives and approved strategies. Further, the Directors recognize that the Advisor has an obligation to monitor trading activities, and in particular to seek the best execution of fund trades, and to evaluate the use of and payment for research. In providing these services, the Advisor utilizes teams of investment professionals (portfolio managers, analysts, research assistants, and securities traders) who require extensive information technology, research, training, compliance and other systems to conduct their business. The Board, directly and through its Fund Performance Review Committee, regularly reviews investment performance information for the Fund, together with comparative information for appropriate benchmarks and/or peer groups of similarly-managed funds, over different time horizons.
31
The Directors also review detailed performance information during the management agreement approval process. If performance concerns are identified, the Fund receives special reviews until performance improves, during which the Board discusses with the Advisor the reasons for such results (e.g., market conditions, security selection) and any efforts being undertaken to improve performance. Taking all these factors into consideration, the Board found the investment management services provided by the Advisor to the Fund to meet or exceed industry standards. More detailed information about the Fund’s performance can be found in the Performance and Portfolio Commentary sections of this report.
Shareholder and Other Services. Under the management agreement, the Advisor provides the Fund with a comprehensive package of transfer agency, shareholder, and other services. The Board, directly and through various committees of the Board, regularly reviews reports and evaluations of such services at its regular meetings. These reports include, but are not limited to, information regarding the operational efficiency and accuracy of the shareholder and transfer agency services provided, staffing levels, shareholder satisfaction (as measured by external as well as internal sources), technology support, new products and services offered to Fund shareholders, securities trading activities, portfolio valuation services, auditing services, and legal and operational compliance activities. Certain aspects of shareholder and transfer agency service level efficiency and the quality of securities trading activities are measured by independent third party providers and are presented in comparison to other fund groups not managed by the Advisor. The Board found the services provided by the Advisor to the Fund under the management agreement to be competitive and of high quality.
Costs of Services and Profitability. The Advisor provides detailed information concerning its cost of providing various services to the Fund, its profitability in managing the Fund, its overall profitability, and its financial condition. The Directors have reviewed with the Advisor the methodology used to prepare this financial information. The financial information regarding the Advisor is considered in evaluating the Advisor’s financial condition, ability to continue to provide services under the management agreement, and the reasonableness of the current management fee. The Board concluded that the Advisor’s profits were reasonable in light of the services provided to the Fund.
Ethics. The Board generally considers the Advisor’s commitment to providing quality services to shareholders and to conducting its business ethically. They noted that the Advisor’s practices generally meet or exceed industry best practices.
Economies of Scale. The Board also reviewed information provided by the Advisor regarding the possible existence of economies of scale in connection with the management of the Fund. The Board concluded that economies of scale are difficult to measure and predict with precision, especially on a fund-by-fund basis. The Board concluded that the Advisor is appropriately sharing economies of scale through its competitive fee structure, offering competitive fees from fund inception, and through reinvestment in its business to provide shareholders additional content and services.
32
Comparison to Other Funds’ Fees. The management agreement provides that the Fund pay the Advisor a single, all-inclusive (or unified) management fee for providing all services necessary for the management and operation of the Fund, other than brokerage expenses, taxes, interest, extraordinary expenses, and the fees and expenses of the Fund’s independent directors (including their independent legal counsel) and expenses incurred in connection with the provision of shareholder services and distribution services under a plan adopted pursuant to Rule 12b-1 under the 1940 Act. Under the unified fee structure, the Advisor is responsible for providing all investment advisory, custody, audit, administrative, compliance, recordkeeping, marketing and shareholder services, or arranging and supervising third parties to provide such services. By contrast, most other funds are charged a variety of fees, including an investment advisory fee, a transfer agency fee, an administrative fee, distribution charges and other expenses. Other than their investment advisory fees and any applicable Rule 12b-1 distribution fees, all other components of the total fees charged by these other funds may be increased without shareholder approval. The Board believes the unified fee structure is a benefit to Fund shareholders because it clearly discloses to shareholders the cost of owning Fund shares, and, since the unified fee cannot be increased without a vote of Fund shareholders, it shifts to the Advisor the risk of increased costs of operating the Fund and provides a direct incentive to minimize administrative inefficiencies. Part of the Board’s analysis of fee levels involves reviewing certain evaluative data compiled by an independent provider and comparing the Fund’s unified fee to the total expense ratio of other funds in the Fund’s peer group. The Board concluded that the management fee paid by the Fund to the Advisor under the management agreement is reasonable in light of the services provided to the Fund.
Comparison to Fees and Services Provided to Other Clients of the Advisor. The Board also requested and received information from the Advisor concerning the nature of the services, fees, costs and profitability of its advisory services to advisory clients other than the Fund. They observed that these varying types of client accounts require different services and involve different regulatory and entrepreneurial risks than the management of the Fund. The Board analyzed this information and concluded that the fees charged and services provided to the Fund were reasonable by comparison.
Collateral or “Fall-Out” Benefits Derived by the Advisor. The Board considered the existence of collateral benefits the Advisor may receive as a result of its relationship with the Fund. They concluded that the Advisor’s primary business is managing mutual funds and it generally does not use fund or shareholder information to generate profits in other lines of business, and therefore does not derive any significant collateral benefits from them. The Board noted that the Advisor receives proprietary research from broker-dealers that execute fund portfolio transactions and concluded that this research is likely to benefit Fund shareholders. The Board also determined that the Advisor is able to provide investment management services to certain clients other than the Fund, at least in part, due to its existing infrastructure built to serve the fund complex. The Board concluded, however, that the assets of those other clients are not material to the analysis and, where applicable, may be included with the assets of the Fund to determine breakpoints in the management fee schedule.
33
Existing Relationship. The Board also considered whether there was any reason for not continuing the existing arrangement with the Advisor. In this regard, the Board was mindful of the potential disruptions of the Fund’s operations and various risks, uncertainties, and other effects that could occur as a result of a decision not to continue such relationship. In particular, the Board recognized that most shareholders have invested in the Fund on the strength of the Advisor’s industry standing and reputation and in the expectation that the Advisor will have a continuing role in providing advisory services to the Fund.
Conclusion of the Directors. As a result of this process, the Board, including all of the independent directors, taking into account all of the factors discussed above and the information provided by the Advisor and others, concluded that the management agreement between the Fund and the Advisor is fair and reasonable in light of the services provided and should be renewed.
34
Retirement Account Information
As required by law, distributions you receive from certain IRAs, or 403(b), 457 and qualified plans are subject to federal income tax withholding, unless you elect not to have withholding apply. Tax will be withheld on the total amount withdrawn even though you may be receiving amounts that are not subject to withholding, such as nondeductible contributions. In such case, excess amounts of withholding could occur. You may adjust your withholding election so that a greater or lesser amount will be withheld.
If you don’t want us to withhold on this amount, you must notify us to not withhold the federal income tax. You may notify us in writing or in certain situations by telephone or through other electronic means. You have the right to revoke your withholding election at any time and any election you make may remain in effect until revoked by filing a new election.
Remember, even if you elect not to have income tax withheld, you are liable for paying income tax on the taxable portion of your withdrawal. If you elect not to have income tax withheld or you don’t have enough income tax withheld, you may be responsible for payment of estimated tax. You may incur penalties under the estimated tax rules if your withholding and estimated tax payments are not sufficient. You can reduce or defer the income tax on a distribution by directly or indirectly rolling such distribution over to another IRA or eligible plan. You should consult your tax advisor for additional information.
State tax will be withheld if, at the time of your distribution, your address is within one of the mandatory withholding states and you have federal income tax withheld. State taxes will be withheld from your distribution in accordance with the respective state rules.
Proxy Voting Guidelines
American Century Investment Management, Inc., the fund’s investment advisor, is responsible for exercising the voting rights associated with the securities purchased and/or held by the fund. A description of the policies and procedures the advisor uses in fulfilling this responsibility is available without charge, upon request, by calling 1-800-345-2021. It is also available on American Century Investments’ website at americancentury.com and on the Securities and Exchange Commission’s website at sec.gov. Information regarding how the investment advisor voted proxies relating to portfolio securities during the most recent 12-month period ended June 30 is available on the “About Us” page at americancentury.com. It is also available at sec.gov.
Quarterly Portfolio Disclosure
The fund files its complete schedule of portfolio holdings with the Securities and Exchange Commission (SEC) for the first and third quarters of each fiscal year on Form N-Q. The fund’s Forms N-Q are available on the SEC’s website at sec.gov, and may be reviewed and copied at the SEC’s Public Reference Room in Washington, DC. Information on the operation of the Public Reference Room may be obtained by calling 1-800-SEC-0330. The fund also makes its complete schedule of portfolio holdings for the most recent quarter of its fiscal year available on its website at americancentury.com and, upon request, by calling 1-800-345-2021.
35
Other Tax Information
The following information is provided pursuant to provisions of the Internal Revenue Code.
The fund hereby designates up to the maximum amount allowable as qualified dividend income for the fiscal year ended November 30, 2012.
For the fiscal year ended November 30, 2012, the fund intends to pass through to shareholders $1,019,962, or up to the maximum amount allowable, as a foreign tax credit which represents taxes paid on income derived from sources within foreign countries or possessions of the United States. During the fiscal year ended November 30, 2012, the fund earned $10,504,760 from income derived from foreign sources. Foreign source income and foreign tax expense per outstanding share on November 30, 2012 are $0.1760 and $0.0171, respectively.
36
| Contact Us | americancentury.com |
| Automated Information Line | 1-800-345-8765 |
| Investor Services Representative | 1-800-345-2021 or 816-531-5575 |
| Investors Using Advisors | 1-800-378-9878 |
Business, Not-For-Profit, Employer-Sponsored Retirement Plans | 1-800-345-3533 |
Banks and Trust Companies, Broker-Dealers, Financial Professionals, Insurance Companies | 1-800-345-6488 |
| Telecommunications Device for the Deaf | 1-800-634-4113 |
American Century World Mutual Funds, Inc.
Investment Advisor:
American Century Investment Management, Inc.
Kansas City, Missouri
This report and the statements it contains are submitted for the general information of our shareholders. The report is not authorized for distribution to prospective investors unless preceded or accompanied by an effective prospectus.
©2013 American Century Proprietary Holdings, Inc. All rights reserved.
CL-ANN-76976 1301
ANNUAL REPORT NOVEMBER 30, 2012
| Global Growth Fund |
| President’s Letter | 2 |
| Independent Chairman’s Letter | 3 |
| Market Perspective | 4 |
| Performance | 5 |
| Portfolio Commentary | 7 |
| Fund Characteristics | 9 |
| Shareholder Fee Example | 10 |
| Schedule of Investments | 12 |
| Statement of Assets and Liabilities | 15 |
| Statement of Operations | 16 |
| Statement of Changes in Net Assets | 17 |
| Notes to Financial Statements | 18 |
| Financial Highlights | 24 |
| Report of Independent Registered Public Accounting Firm | 26 |
| Management | 27 |
| Approval of Management Agreement | 30 |
| Additional Information | 35 |
Any opinions expressed in this report reflect those of the author as of the date of the report, and do not necessarily represent the opinions of American Century Investments® or any other person in the American Century Investments organization. Any such opinions are subject to change at any time based upon market or other conditions and American Century Investments disclaims any responsibility to update such opinions. These opinions may not be relied upon as investment advice and, because investment decisions made by American Century Investments funds are based on numerous factors, may not be relied upon as an indication of trading intent on behalf of any American Century Investments fund. Security examples are used for representational purposes only and are not intended as recommendations to purchase or sell securities. Performance information for comparative indices and securities is provided to American Century Investments by third party vendors. To the best of American Century Investments’ knowledge, such information is accurate at the time of printing.
Dear Investor:
Thank you for reviewing this annual report for the 12 months ended November 30, 2012. It offers investment performance, market analysis, and portfolio information, presented with the expert perspective of our portfolio management team.
Annual reports remain important vehicles for conveying information about fund returns, including key factors that affected fund performance. For additional, updated investment and market insights, we encourage you to visit our website, americancentury.com.
Favorable Fiscal-Year Returns for Most Major Stock and Bond Benchmarks
Despite a global economic slowdown, continued concerns about European financial system stability, and uncertainty about U.S. political and fiscal conditions in 2013, 12-month stock and bond returns were generally favorable, particularly for U.S. value stocks and high-yield bonds.
U.S. value stock indices outpaced the S&P 500 Index’s 16.13% return for the period, as did U.S. corporate and municipal high-yield benchmarks. U.S. growth and international index returns were generally lower, but still solid—the MSCI EAFE Index, for example, returned 12.61%.
With the exception of high-yield bond sectors, stocks generally outperformed bonds for the period, though bonds benefitted from economic stagnation, reduced inflation pressures, and low interest rates. The 10-year U.S. Treasury yield declined from 2.07% to 1.62% during the period, and the Barclays U.S. Aggregate Bond Index returned 5.51%. Related global bond indices also returned in roughly the mid-single digits.
Bucking the global trend, the U.S. economy showed signs of improvement during the fiscal year, particularly the long-depressed housing market. However, the outlook for 2013 remains guarded, as the fragile recovery remains vulnerable to fiscal and financial factors that could trigger further slowdowns and market volatility.
Under these conditions, we continue to believe in a disciplined, diversified, long-term investment approach, using both stocks and bonds—as appropriate—for meeting financial goals. We appreciate your continued trust in us in this challenging environment.
Sincerely,
Jonathan Thomas
President and Chief Executive Officer
American Century Investments
2
Dear Fellow Shareholders,
The board has once again completed its annual review of the advisory contract between the American Century Investments mutual funds overseen by the board and the funds’ advisor, American Century Investment Management, Inc. This process, often referred to as the 15(c) review, involves the independent directors considering all of the material monitored throughout the year and evaluating a wide range of factors to determine whether the management fee paid by each fund to the advisor is reasonable.
The independent directors’ rationale for this decision is provided in detail in this, or in a previous, report. However, there are several highlights that should be of interest to all shareholders.
| • | Fund performance and client service continue to be rated among the industry’s best. |
| • | Target date and other asset allocation products continue to successfully gather assets and industry acclaim. |
| • | Compliance programs continue to function successfully with no issues impacting shareholder interests. |
| • | Fees were found to be within an acceptable competitive range, with minor fee waivers being negotiated on five funds. |
Knowing that most shareholders are long term investors, the board was particularly pleased with our succession planning review. Talented professionals are being added within portfolio management and experienced managers have been added to the senior management team.
Overall it was a very positive review for the American Century Investments mutual funds during a challenging market environment.
Best personal regards,
Don Pratt
3
By Mark Kopinski, Chief Investment Officer, Global and Non-U.S. Equity
Central Bank Action Drove Global Stocks Higher
Despite a backdrop of weaker global economic growth and mounting sovereign debt problems in Europe and the United States, most global stock benchmarks advanced strongly for the 12-month period ended November 30, 2012. Investors generally overlooked the lackluster economic data, recession fears (which eventually turned to reality for Europe), and the instability of the eurozone’s banking system and currency. Instead, they focused on the optimism inspired by unprecedented central bank intervention.
In particular, the European Central Bank (ECB) launched several programs to help the eurozone’s troubled banks shore up their balance sheets and finance ongoing operations. The ECB also agreed to purchase the sovereign debt of financially strapped member nations that conform to the ECB’s fiscal reform measures. Meanwhile, in response to sluggish economic growth and high unemployment, the U.S. Federal Reserve (the Fed) announced its third—and most aggressive—quantitative easing program to date. The Bank of Japan also took action with an asset purchase program, while the People’s Bank of China eased its reserve requirements for commercial lenders.
Overall, developed markets outperformed emerging markets for the 12-month period, even as the emerging economies generally enjoyed higher absolute levels of growth, albeit slower growth than in previous periods. Strong stock market performance in Europe and the United States, where central bank stimulus was the greatest, primarily drove the better relative results in the developed markets.
Valuations, Stock Selection Remain Key Factors
Even though economic growth and corporate earnings in aggregate have been slowing, and sovereign debt issues have yet to be resolved, there are some positive factors at work for global equity investors. Stock valuations around the globe appear attractive relative to historical averages. Similarly, equity earnings yields are also compelling when measured against long-term averages and current bond yields. Most important, we believe through our rigorous, bottom-up stock selection process it’s still possible to find individual companies growing earnings, either from a new product launch, market share gains, secular changes, or beneficial acquisitions.
| International Equity Total Returns | ||||
| For the 12 months ended November 30, 2012 (in U.S. dollars) | ||||
| MSCI EAFE Index | 12.61% | MSCI Europe Index | 14.07% | |
| MSCI EAFE Growth Index | 12.66% | MSCI World Index | 13.62% | |
| MSCI EAFE Value Index | 12.45% | MSCI Japan Index | 3.59% | |
| MSCI Emerging Markets Index | 11.35% | |||
4
| Total Returns as of November 30, 2012 | ||||||
| Average Annual Returns | ||||||
Ticker Symbol | 1 year | 5 years | 10 years | Since Inception | Inception Date | |
| Investor Class | TWGGX | 13.37% | -1.48% | 8.50% | 7.44% | 12/1/98 |
| MSCI World Index | — | 13.62% | -1.80% | 6.77% | 3.11%(1) | — |
| Institutional Class | AGGIX | 13.71% | -1.27% | 8.74% | 2.69% | 8/1/00 |
A Class(2) No sales charge* With sales charge* | AGGRX | 13.16% 6.68% | -1.72% -2.88% | 8.24% 7.59% | 6.43% 5.97% | 2/5/99 |
| C Class | AGLCX | 12.20% | -2.47% | 7.43% | 5.54% | 3/1/02 |
| R Class | AGORX | 12.87% | -1.98% | — | 4.69% | 7/29/05 |
* | Sales charges include initial sales charges and contingent deferred sales charges (CDSCs), as applicable. A Class shares have a 5.75% maximum initial sales charge and may be subject to a maximum CDSC of 1.00%. C Class shares redeemed within 12 months of purchase are subject to a maximum CDSC of 1.00%. The SEC requires that mutual funds provide performance information net of maximum sales charges in all cases where charges could be applied. |
| (1) | Since 11/30/98, the date nearest the Investor Class’s inception for which data are available. |
| (2) | Prior to September 4, 2007, the A Class was referred to as the Advisor Class and did not have a front-end sales charge. Performance prior to that date has been adjusted to reflect this charge. |
Data presented reflect past performance. Past performance is no guarantee of future results. Current performance may be higher or lower than the performance shown. Investment return and principal value will fluctuate, and redemption value may be more or less than original cost. To obtain performance data current to the most recent month end, please call 1-800-345-2021 or visit americancentury.com. International investing involves special risks, such as political instability and currency fluctuations. Investing in emerging markets may accentuate these risks.
Unless otherwise indicated, performance reflects Investor Class shares; performance for other share classes will vary due to differences in fee structure. For information about other share classes available, please consult the prospectus. Data assumes reinvestment of dividends and capital gains, and none of the charts reflect the deduction of taxes that a shareholder would pay on fund distributions or the redemption of fund shares. Returns for the index are provided for comparison. The fund’s total returns include operating expenses (such as transaction costs and management fees) that reduce returns, while the total returns of the index do not.
5
| Growth of $10,000 Over 10 Years |
| $10,000 investment made November 30, 2002 |
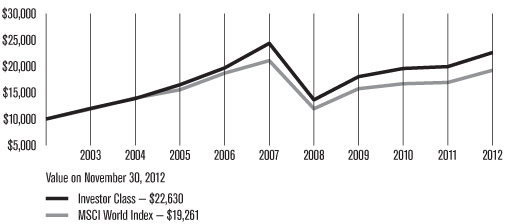
| Total Annual Fund Operating Expenses | ||||
| Investor Class | Institutional Class | A Class | C Class | R Class |
| 1.11% | 0.91% | 1.36% | 2.11% | 1.61% |
The total annual fund operating expenses shown is as stated in the fund’s prospectus current as of the date of this report. The prospectus may vary from the expense ratio shown elsewhere in this report because it is based on a different time period, includes acquired fund fees and expenses, and, if applicable, does not include fee waivers or expense reimbursements.
Data presented reflect past performance. Past performance is no guarantee of future results. Current performance may be higher or lower than the performance shown. Investment return and principal value will fluctuate, and redemption value may be more or less than original cost. To obtain performance data current to the most recent month end, please call 1-800-345-2021 or visit americancentury.com. International investing involves special risks, such as political instability and currency fluctuations. Investing in emerging markets may accentuate these risks.
Unless otherwise indicated, performance reflects Investor Class shares; performance for other share classes will vary due to differences in fee structure. For information about other share classes available, please consult the prospectus. Data assumes reinvestment of dividends and capital gains, and none of the charts reflect the deduction of taxes that a shareholder would pay on fund distributions or the redemption of fund shares. Returns for the index are provided for comparison. The fund’s total returns include operating expenses (such as transaction costs and management fees) that reduce returns, while the total returns of the index do not
6
| Portfolio Commentary |
Portfolio Managers: Keith Creveling and Brent Puff
Performance Summary
Global Growth returned 13.37%* for the 12 months ended November 30, 2012, compared with its benchmark, the MSCI World Index, which returned 13.62%.
Global stocks generally demonstrated robust performance during the 12-month period, even as weak growth and mounting sovereign debt problems weighed on many economies. Unprecedented central bank intervention, particularly the European Central Bank’s commitment to do “whatever it takes” to restore eurozone stability, helped drive stock market optimism. Developed markets generally outperformed emerging markets, and there was little difference in results between large- and small-cap stocks. Meanwhile, global stocks in the growth style showed a slight performance advantage over stocks in the value universe.
Overall, strong stock selection in the United States and Spain, along with an underweight in Canada, contributed favorably to the portfolio’s performance. Positions in emerging markets and stock selection in the United Kingdom and Australia dragged down the portfolio’s relative results.
Apple was a Top Contributor
In terms of sector performance, information technology was a top contributor to the portfolio’s relative results, buoyed by strong stock selection. In particular, an overweight position in U.S.-based personal technology developer Apple was among the portfolio’s leading contributors to performance. The company solidified its leadership position within two key segments of consumer technology—smartphones and tablets—with the successful launches of the iPhone 5, the new iPad Mini, and the latest generation iPad, which helped push shares higher during the period. In addition, Apple announced in March it would begin paying dividends, a milestone for the cash-rich company.
Also in the technology sector, an overweight position in U.S.-based Equinix, a data center operator, was among the portfolio’s top contributors. The company reported strong earnings and revenues throughout the period, continuing to benefit from the secular trend of IT outsourcing. The company said its annual sales have grown more than 40% in the last five years, and recently the company projected its earnings to grow more than 25% in each of the next five years.
Spain’s strong contribution to portfolio performance primarily was due to an overweight position in Grifols, a blood plasma processor. In addition to reporting strong results throughout the period, the company announced it was expanding its North American operations via the purchase of three plasma donation centers in the U.S. An improvement in pricing for the company’s blood plasma products also boosted the stock. In addition, Grifols benefited from the release of preliminary research findings that plasma-based drugs could help in the treatment of Alzheimer’s disease.
*All fund returns referenced in this commentary are for Investor Class shares.
7
Internet Search Provider was a Top Laggard
Weak relative performance in China primarily was due to positions in Baidu, an Internet search provider, and China Unicom, a wireless telecommunication services provider. Late in the period, Baidu forecast its fourth-quarter revenue growth would slow to its weakest level in three years, which was below analysts’ expectations. In addition, reluctance from advertisers to purchase space on the company’s search pages for mobile phones, a slowdown in search revenue, and an analyst downgrade weighed on the company’s shares.
China Unicom primarily accounted for lagging results in the telecommunication services sector and also was among the portfolio’s largest performance detractors for the period. Shares declined early in the period after China Telecom earned the right to sell Apple’s iPhones in China, stripping China Unicom of its exclusive deal. In addition, rising price competition hurt China Unicom’s stock price, while China Mobile, the largest operator, said it would accelerate the launch of its 4G service, compromising the growth of China Unicom. We ultimately exited the portfolio’s position in the company.
An overweight position in Rakuten, a Japan-based electronic commerce and Internet company, also was a prominent detractor, driving down performance in the portfolio’s consumer discretionary sector. The company reported disappointing results during the third quarter of 2012 due to higher costs stemming from the company’s rapid expansion overseas. Nevertheless, we believe underlying fundamentals support our thesis that e-commerce in Japan will continue to grow, despite the nation’s sluggish retail sales overall. We believe Rakuten remains well positioned in this industry.
Outlook
Recent evidence of slowing demand for high-end luxury goods, especially among emerging market consumers, led us to trim exposure in that segment. We also exited several industrial stocks we believe are weakening from slowing global growth trends. We prefer companies realizing cost savings that ultimately will translate into higher margins when they experience top-line improvements. We continue to invest in businesses we believe are beneficiaries of durable, long-lasting trends that will persist despite a weak macroeconomic backdrop. In particular, we believe such trends include deep-water oil and gas exploration, the proliferation of smartphones, a recovery in commercial aerospace, and a shift from “bricks and mortar” to online consumption.
8
| NOVEMBER 30, 2012 | |
| Top Ten Holdings | % of net assets |
| Apple, Inc. | 4.0% |
| Google, Inc., Class A | 2.4% |
| Precision Castparts Corp. | 2.2% |
| Home Depot, Inc. (The) | 2.1% |
| Unilever CVA | 2.0% |
| eBay, Inc. | 1.9% |
| Nestle SA | 1.9% |
| American Tower Corp. | 1.9% |
| Union Pacific Corp. | 1.8% |
| MasterCard, Inc., Class A | 1.7% |
| Types of Investments in Portfolio | % of net assets |
| Domestic Common Stocks | 59.3% |
| Foreign Common Stocks | 38.2% |
| Total Common Stocks | 97.5% |
| Temporary Cash Investments | 0.8% |
| Other Assets and Liabilities | 1.7% |
| Investments by Country | % of net assets |
| United States | 59.3% |
| United Kingdom | 7.2% |
| Switzerland | 6.1% |
| Japan | 4.7% |
| Netherlands | 3.0% |
| France | 2.0% |
| Other Countries | 15.2% |
| Cash and Equivalents* | 2.5% |
| * Includes temporary cash investments and other assets and liabilities. | |
9
Fund shareholders may incur two types of costs: (1) transaction costs, including sales charges (loads) on purchase payments and redemption/exchange fees; and (2) ongoing costs, including management fees; distribution and service (12b-1) fees; and other fund expenses. This example is intended to help you understand your ongoing costs (in dollars) of investing in your fund and to compare these costs with the ongoing cost of investing in other mutual funds.
The example is based on an investment of $1,000 made at the beginning of the period and held for the entire period from June 1, 2012 to November 30, 2012.
Actual Expenses
The table provides information about actual account values and actual expenses for each class. You may use the information, together with the amount you invested, to estimate the expenses that you paid over the period. First, identify the share class you own. Then simply divide your account value by $1,000 (for example, an $8,600 account value divided by $1,000 = 8.6), then multiply the result by the number under the heading “Expenses Paid During Period” to estimate the expenses you paid on your account during this period.
If you hold Investor Class shares of any American Century Investments fund, or Institutional Class shares of the American Century Diversified Bond Fund, in an American Century Investments account (i.e., not a financial intermediary or retirement plan account), American Century Investments may charge you a $12.50 semiannual account maintenance fee if the value of those shares is less than $10,000. We will redeem shares automatically in one of your accounts to pay the $12.50 fee. In determining your total eligible investment amount, we will include your investments in all personal accounts (including American Century Investments Brokerage accounts) registered under your Social Security number. Personal accounts include individual accounts, joint accounts, UGMA/UTMA accounts, personal trusts, Coverdell Education Savings Accounts and IRAs (including traditional, Roth, Rollover, SEP-, SARSEP- and SIMPLE-IRAs), and certain other retirement accounts. If you have only business, business retirement, employer-sponsored or American Century Investments Brokerage accounts, you are currently not subject to this fee. If you are subject to the Account Maintenance Fee, your account value could be reduced by the fee amount.
Hypothetical Example for Comparison Purposes
The table also provides information about hypothetical account values and hypothetical expenses based on the actual expense ratio of each class of your fund and an assumed rate of return of 5% per year before expenses, which is not the actual return of a fund’s share class. The hypothetical account values and expenses may not be used to estimate the actual ending account balance or expenses you paid for the period. You may use this information to compare the ongoing costs of investing in your fund and other funds. To do so, compare this 5% hypothetical example with the 5% hypothetical examples that appear in the shareholder reports of the other funds.
10
Please note that the expenses shown in the table are meant to highlight your ongoing costs only and do not reflect any transactional costs, such as sales charges (loads) or redemption/exchange fees. Therefore, the table is useful in comparing ongoing costs only, and will not help you determine the relative total costs of owning different funds. In addition, if these transactional costs were included, your costs would have been higher.
Beginning Account Value 6/1/12 | Ending Account Value 11/30/12 | Expenses Paid During Period(1) 6/1/12 — 11/30/12 | Annualized Expense Ratio(1) | |
| Actual | ||||
| Investor Class | $1,000 | $1,086.90 | $5.74 | 1.10% |
| Institutional Class | $1,000 | $1,088.40 | $4.70 | 0.90% |
| A Class | $1,000 | $1,085.80 | $7.04 | 1.35% |
| C Class | $1,000 | $1,080.80 | $10.92 | 2.10% |
| R Class | $1,000 | $1,083.50 | $8.33 | 1.60% |
| Hypothetical | ||||
| Investor Class | $1,000 | $1,019.50 | $5.55 | 1.10% |
| Institutional Class | $1,000 | $1,020.50 | $4.55 | 0.90% |
| A Class | $1,000 | $1,018.25 | $6.81 | 1.35% |
| C Class | $1,000 | $1,014.50 | $10.58 | 2.10% |
| R Class | $1,000 | $1,017.00 | $8.07 | 1.60% |
| (1) | Expenses are equal to the class’s annualized expense ratio listed in the table above, multiplied by the average account value over the period, multiplied by 183, the number of days in the most recent fiscal half-year, divided by 366, to reflect the one-half year period. |
11
NOVEMBER 30, 2012
| Shares | Value | |
| Common Stocks — 97.5% | ||
| AUSTRALIA — 1.7% | ||
| BHP Billiton Ltd. | 181,043 | $ 6,497,522 |
| CSL Ltd. | 28,188 | 1,520,858 |
| 8,018,380 | ||
| AUSTRIA — 0.1% | ||
Erste Group Bank AG(1) | 19,027 | 559,621 |
| BRAZIL — 0.5% | ||
| BR Malls Participacoes SA | 185,300 | 2,380,422 |
| CANADA — 1.8% | ||
| Bank of Nova Scotia | 72,249 | 4,073,030 |
| Canadian Pacific Railway Ltd. | 46,341 | 4,324,569 |
| 8,397,599 | ||
| CHINA — 0.8% | ||
Baidu, Inc. ADR(1) | 40,199 | 3,871,566 |
| DENMARK — 1.2% | ||
| Novo Nordisk A/S B Shares | 34,410 | 5,464,761 |
| FRANCE — 2.0% | ||
| L’Oreal SA | 21,828 | 2,962,332 |
| Pernod-Ricard SA | 32,091 | 3,633,534 |
| Sanofi | 30,110 | 2,688,697 |
| 9,284,563 | ||
| GERMANY — 1.6% | ||
| Fresenius Medical Care AG & Co. KGaA | 42,479 | 2,916,994 |
| Kabel Deutschland Holding AG | 26,871 | 1,943,059 |
| SAP AG ADR | 34,241 | 2,670,455 |
| 7,530,508 | ||
| INDONESIA — 0.4% | ||
| PT Bank Mandiri (Persero) Tbk | 1,997,631 | 1,717,877 |
| ISRAEL — 0.3% | ||
Check Point Software Technologies Ltd.(1) | 33,364 | 1,540,416 |
| ITALY — 1.9% | ||
| Pirelli & C SpA | 216,678 | 2,513,663 |
| Prada SpA | 272,600 | 2,251,090 |
| Saipem SpA | 84,572 | 3,764,964 |
| 8,529,717 | ||
| JAPAN — 4.7% | ||
| FANUC Corp. | 15,600 | 2,630,436 |
| ORIX Corp. | 42,630 | 4,276,704 |
| Rakuten, Inc. | 653,100 | 5,506,211 |
| Toyota Motor Corp. | 136,400 | 5,849,142 |
| Unicharm Corp. | 70,000 | 3,574,938 |
| 21,837,431 | ||
| NETHERLANDS — 3.0% | ||
| ASML Holding NV | 35,657 | 2,231,058 |
| Koninklijke Vopak NV | 29,908 | 2,209,731 |
| Unilever CVA | 243,740 | 9,248,366 |
| 13,689,155 | ||
| PERU — 0.4% | ||
| Credicorp Ltd. | 12,593 | 1,761,761 |
| PORTUGAL — 0.6% | ||
| Jeronimo Martins SGPS SA | 148,135 | 2,763,666 |
| RUSSIA — 0.7% | ||
| Sberbank of Russia ADR | 252,965 | 2,992,576 |
| SOUTH KOREA — 0.5% | ||
| Hyundai Motor Co. | 10,475 | 2,181,385 |
| SPAIN — 0.9% | ||
Grifols SA(1) | 133,466 | 4,269,183 |
| SWEDEN — 1.0% | ||
| Atlas Copco AB A Shares | 105,750 | 2,724,274 |
| SKF AB B Shares | 74,925 | 1,801,799 |
| 4,526,073 | ||
| SWITZERLAND — 6.1% | ||
| ABB Ltd. | 181,916 | 3,545,271 |
| Adecco SA | 46,112 | 2,278,481 |
| Nestle SA | 134,255 | 8,786,625 |
| Roche Holding AG | 25,576 | 5,034,059 |
| Syngenta AG | 14,907 | 5,975,991 |
| UBS AG | 173,267 | 2,711,095 |
| 28,331,522 | ||
| TURKEY — 0.8% | ||
| Turkiye Garanti Bankasi AS | 734,843 | 3,487,404 |
| UNITED KINGDOM — 7.2% | ||
| Aggreko plc | 77,022 | 2,754,307 |
| ARM Holdings plc | 77,280 | 958,322 |
| BG Group plc | 270,643 | 4,639,637 |
| Capita Group plc (The) | 361,880 | 4,420,871 |
| Compass Group plc | 393,094 | 4,540,828 |
| Croda International plc | 48,186 | 1,838,161 |
Lloyds Banking Group plc(1) | 3,660,780 | 2,726,988 |
| Petrofac Ltd. | 50,995 | 1,330,103 |
| Reckitt Benckiser Group plc | 47,059 | 2,959,278 |
| Rio Tinto plc | 60,015 | 2,974,495 |
| Standard Chartered plc | 168,409 | 3,925,832 |
| 33,068,822 | ||
| UNITED STATES — 59.3% | ||
| Aflac, Inc. | 81,243 | 4,305,067 |
Alexion Pharmaceuticals, Inc.(1) | 23,991 | 2,303,616 |
Alliance Data Systems Corp.(1) | 33,989 | 4,843,093 |
12
| Shares | Value |
| American Express Co. | 63,538 | $ 3,551,774 |
| American Tower Corp. | 117,038 | 8,769,657 |
| Apple, Inc. | 31,719 | 18,564,496 |
B/E Aerospace, Inc.(1) | 76,398 | 3,618,209 |
Biogen Idec, Inc.(1) | 16,799 | 2,504,563 |
BorgWarner, Inc.(1) | 50,970 | 3,379,311 |
Cameron International Corp.(1) | 70,908 | 3,825,487 |
Celgene Corp.(1) | 40,260 | 3,164,033 |
Cerner Corp.(1) | 48,775 | 3,766,406 |
| Charles Schwab Corp. (The) | 302,482 | 3,962,514 |
CIT Group, Inc.(1) | 171,479 | 6,353,297 |
| Colgate-Palmolive Co. | 44,181 | 4,793,638 |
Continental Resources, Inc.(1) | 26,329 | 1,808,802 |
| Costco Wholesale Corp. | 39,774 | 4,136,098 |
| Danaher Corp. | 80,782 | 4,359,805 |
eBay, Inc.(1) | 169,210 | 8,937,672 |
EMC Corp.(1) | 150,420 | 3,733,424 |
Equinix, Inc.(1) | 31,828 | 5,912,369 |
| Estee Lauder Cos., Inc. (The), Class A | 24,871 | 1,448,736 |
Express Scripts Holding Co.(1) | 94,460 | 5,086,671 |
Facebook, Inc. Class A(1) | 69,903 | 1,957,284 |
| FactSet Research Systems, Inc. | 19,545 | 1,805,763 |
| Family Dollar Stores, Inc. | 50,689 | 3,609,057 |
| FedEx Corp. | 17,903 | 1,602,856 |
Fortune Brands Home & Security, Inc.(1) | 81,422 | 2,441,846 |
Google, Inc., Class A(1) | 16,084 | 11,232,583 |
| Harley-Davidson, Inc. | 108,057 | 5,074,357 |
| Home Depot, Inc. (The) | 147,608 | 9,604,853 |
IntercontinentalExchange, Inc.(1) | 32,066 | 4,237,522 |
Intuitive Surgical, Inc.(1) | 9,344 | 4,942,976 |
Liberty Global, Inc. Class A(1) | 130,203 | 7,296,576 |
LKQ Corp.(1) | 79,308 | 1,738,431 |
| MasterCard, Inc., Class A | 16,316 | 7,973,303 |
Michael Kors Holdings Ltd.(1) | 55,609 | 2,955,618 |
| Mondelez International, Inc. Class A | 148,553 | 3,846,037 |
| Monsanto Co. | 60,810 | 5,569,588 |
| National Oilwell Varco, Inc. | 49,124 | 3,355,169 |
| Oceaneering International, Inc. | 58,362 | 3,074,510 |
| Pall Corp. | 72,627 | 4,319,854 |
| Precision Castparts Corp. | 55,006 | 10,087,550 |
priceline.com, Inc.(1) | 11,517 | 7,637,614 |
| QUALCOMM, Inc. | 106,910 | 6,801,614 |
| Schlumberger Ltd. | 82,135 | 5,882,509 |
| Starbucks Corp. | 107,667 | 5,584,687 |
Teradata Corp.(1) | 38,120 | 2,267,378 |
| Tractor Supply Co. | 33,325 | 2,986,587 |
| Union Pacific Corp. | 68,273 | 8,382,559 |
United Rentals, Inc.(1) | 62,727 | 2,605,052 |
Verisk Analytics, Inc. Class A(1) | 52,970 | 2,640,025 |
| Visa, Inc., Class A | 37,688 | 5,642,270 |
Waters Corp.(1) | 14,355 | 1,213,715 |
| Wells Fargo & Co. | 156,691 | 5,172,370 |
| Whole Foods Market, Inc. | 35,790 | 3,341,354 |
| Yum! Brands, Inc. | 45,608 | 3,059,385 |
| 273,071,590 | ||
TOTAL COMMON STOCKS (Cost $347,765,856) | 449,275,998 | |
| Temporary Cash Investments — 0.8% | ||
Repurchase Agreement, Bank of America Merrill Lynch, (collateralized by various U.S. Treasury obligations, 1.25% - 2.125%, 4/15/14 - 12/31/15, valued at $1,626,024), in a joint trading account at 0.18%, dated 11/30/12, due 12/3/12 (Delivery value $1,593,212) | 1,593,188 | |
Repurchase Agreement, Credit Suisse First Boston, Inc., (collateralized by various U.S. Treasury obligations, 0.25%, 9/15/15, valued at $1,625,297), in a joint trading account at 0.17%, dated 11/30/12, due 12/3/12 (Delivery value $1,593,211) | 1,593,188 | |
Repurchase Agreement, Goldman Sachs & Co., (collateralized by various U.S. Treasury obligations, 4.25%, 11/15/40, valued at $268,643), in a joint trading account at 0.15%, dated 11/30/12, due 12/3/12 (Delivery value $263,269) | 263,266 | |
| SSgA U.S. Government Money Market Fund | 9 | 9 |
TOTAL TEMPORARY CASH INVESTMENTS (Cost $3,449,651) | 3,449,651 | |
TOTAL INVESTMENT SECURITIES — 98.3% (Cost $351,215,507) | 452,725,649 | |
| OTHER ASSETS AND LIABILITIES — 1.7% | 7,987,342 | |
| TOTAL NET ASSETS — 100.0% | $460,712,991 | |
13
| Market Sector Diversification | |
| (as a % of net assets) | |
| Information Technology | 20.4% |
| Consumer Discretionary | 17.0% |
| Financials | 14.7% |
| Industrials | 14.6% |
| Consumer Staples | 11.0% |
| Health Care | 8.9% |
| Energy | 6.0% |
| Materials | 4.9% |
| Cash and Equivalents* | 2.5% |
| * Includes temporary cash investments and other assets and liabilities. | |
Notes to Schedule of Investments
ADR = American Depositary Receipt
CVA = Certificaten Van Aandelen
(1) Non-income producing.
See Notes to Financial Statements.
14
| NOVEMBER 30, 2012 | ||||
| Assets | ||||
| Investment securities, at value (cost of $351,215,507) | $452,725,649 | |||
| Foreign currency holdings, at value (cost of $77,430) | 77,656 | |||
| Receivable for investments sold | 1,130,920 | |||
| Receivable for capital shares sold | 8,054,990 | |||
| Dividends and interest receivable | 717,094 | |||
| Other assets | 16,110 | |||
| 462,722,419 | ||||
| Liabilities | ||||
| Payable for investments purchased | 814,510 | |||
| Payable for capital shares redeemed | 794,181 | |||
| Accrued management fees | 389,984 | |||
| Distribution and service fees payable | 10,753 | |||
| 2,009,428 | ||||
| Net Assets | $460,712,991 | |||
| Net Assets Consist of: | ||||
| Capital (par value and paid-in surplus) | $403,686,616 | |||
| Undistributed net investment income | 124,526 | |||
| Accumulated net realized loss | (44,637,627 | ) | ||
| Net unrealized appreciation | 101,539,476 | |||
| $460,712,991 | ||||
| Net assets | Shares outstanding | Net asset value per share | |
| Investor Class, $0.01 Par Value | $373,887,040 | 38,821,575 | $9.63 |
| Institutional Class, $0.01 Par Value | $47,203,364 | 4,852,199 | $9.73 |
| A Class, $0.01 Par Value | $33,937,946 | 3,576,897 | $9.49* |
| C Class, $0.01 Par Value | $4,097,962 | 463,820 | $8.84 |
| R Class, $0.01 Par Value | $1,586,679 | 167,507 | $9.47 |
| * Maximum offering price $10.07 (net asset value divided by 0.9425). | |||
See Notes to Financial Statements.
15
| YEAR ENDED NOVEMBER 30, 2012 | ||||
| Investment Income (Loss) | ||||
| Income: | ||||
| Dividends (net of foreign taxes withheld of $329,139) | $5,852,147 | |||
| Interest (net of foreign taxes withheld of $164) | 5,389 | |||
| 5,857,536 | ||||
| Expenses: | ||||
| Management fees | 4,576,992 | |||
| Distribution and service fees: | ||||
| A Class | 76,373 | |||
| C Class | 37,707 | |||
| R Class | 5,342 | |||
| Directors’ fees and expenses | 16,050 | |||
| Other expenses | 400 | |||
| 4,712,864 | ||||
| Net investment income (loss) | 1,144,672 | |||
| Realized and Unrealized Gain (Loss) | ||||
| Net realized gain (loss) on: | ||||
| Investment transactions | 18,772,378 | |||
| Foreign currency transactions | (32,771 | ) | ||
| 18,739,607 | ||||
| Change in net unrealized appreciation (depreciation) on: | ||||
| Investments | 32,940,116 | |||
| Translation of assets and liabilities in foreign currencies | (6,850 | ) | ||
| 32,933,266 | ||||
| Net realized and unrealized gain (loss) | 51,672,873 | |||
| Net Increase (Decrease) in Net Assets Resulting from Operations | $52,817,545 | |||
See Notes to Financial Statements.
16
| YEARS ENDED NOVEMBER 30, 2012 AND NOVEMBER 30, 2011 | |||||||
| Increase (Decrease) in Net Assets | November 30, 2012 | November 30, 2011 | |||||
| Operations | |||||||
| Net investment income (loss) | $1,144,672 | $1,153,182 | |||||
| Net realized gain (loss) | 18,739,607 | 28,046,131 | |||||
| Change in net unrealized appreciation (depreciation) | 32,933,266 | (18,766,487 | ) | ||||
| Net increase (decrease) in net assets resulting from operations | 52,817,545 | 10,432,826 | |||||
| Distributions to Shareholders | |||||||
| From net investment income: | |||||||
| Investor Class | (1,027,964 | ) | (1,819,577 | ) | |||
| Institutional Class | (195,280 | ) | (300,047 | ) | |||
| A Class | (13,556 | ) | (82,583 | ) | |||
| Decrease in net assets from distributions | (1,236,800 | ) | (2,202,207 | ) | |||
| Capital Share Transactions | |||||||
| Net increase (decrease) in net assets from capital share transactions | 19,357,020 | (48,395,004 | ) | ||||
| Redemption Fees | |||||||
| Increase in net assets from redemption fees | 10,829 | 13,588 | |||||
| Net increase (decrease) in net assets | 70,948,594 | (40,150,797 | ) | ||||
| Net Assets | |||||||
| Beginning of period | 389,764,397 | 429,915,194 | |||||
| End of period | $460,712,991 | $389,764,397 | |||||
| Undistributed net investment income | $124,526 | $211,799 | |||||
See Notes to Financial Statements.
17
NOVEMBER 30, 2012
1. Organization
American Century World Mutual Funds, Inc. (the corporation) is registered under the Investment Company Act of 1940, as amended (the 1940 Act), as an open-end management investment company and is organized as a Maryland corporation. Global Growth Fund (the fund) is one fund in a series issued by the corporation. The fund is diversified as defined under the 1940 Act. The fund’s investment objective is to seek capital growth. The fund pursues its objective by investing primarily in equity securities of issuers located in developed countries world-wide (including the United States).
The fund offers the Investor Class, the Institutional Class, the A Class, the C Class and the R Class. The A Class may incur an initial sales charge. The A Class and C Class may be subject to a contingent deferred sales charge. The share classes differ principally in their respective sales charges and distribution and shareholder servicing expenses and arrangements. The Institutional Class is made available to institutional shareholders or through financial intermediaries whose clients do not require the same level of shareholder and administrative services as shareholders of other classes. As a result, the Institutional Class is charged a lower unified management fee. On October 21, 2011, all outstanding B Class shares were converted to A Class shares and the fund discontinued offering the B Class.
2. Significant Accounting Policies
The following is a summary of significant accounting policies consistently followed by the fund in preparation of its financial statements. The financial statements are prepared in conformity with accounting principles generally accepted in the United States of America, which may require management to make certain estimates and assumptions at the date of the financial statements. Actual results could differ from these estimates.
Investment Valuations — The fund determines the fair value of its investments and computes its net asset value per share as of the close of regular trading (usually 4 p.m. Eastern time) on the New York Stock Exchange (NYSE) on each day the NYSE is open.
Equity securities that are listed or traded on a domestic securities exchange are valued at the last reported sales price or at the official closing price as provided by the exchange. Equity securities traded on foreign securities exchanges are typically valued at the closing price on the exchange where primarily traded or as of the close of the NYSE, if that is earlier. If no last sales price is reported, or if local convention or regulation so provides, the mean of the latest bid and asked prices is used. Depending on local convention or regulation, securities traded over-the-counter are valued at the mean of the latest bid and asked prices, the last sales price, or the official closing price. In its determination of fair value, the fund may review several factors including: market information specific to a security; news developments in U.S. and foreign markets; the performance of particular U.S. and foreign securities, indices, comparable securities, American Depositary Receipts, Exchange-Traded Funds, and other relevant market indicators.
Debt securities maturing within 60 days at the time of purchase may be valued at cost, plus or minus any amortized discount or premium or at the evaluated mean as provided by an independent pricing service. Evaluated mean prices are commonly derived through utilization of market models, which may consider, among other factors, trade data, quotations from dealers and active market makers, relevant yield curve and spread data, related sector levels, creditworthiness, and other relevant market information on the same or comparable securities.
Investments in open-end management investment companies are valued at the reported net asset value per share. Repurchase agreements are valued at cost.
The value of investments initially expressed in foreign currencies is translated into U.S. dollars at prevailing exchange rates.
18
If the fund determines that the market price for a portfolio security is not readily available or the valuation methods mentioned above do not reflect a security’s fair value, such security is valued as determined in good faith by the Board of Directors or its designee, in accordance with procedures adopted by the Board of Directors. Circumstances that may cause the fund to use these procedures to value a security include, but are not limited to: a security has been declared in default; trading in a security has been halted during the trading day; there is a foreign market holiday and no trading occurred; or an event occurred between the close of a foreign exchange and the NYSE that may affect the value of a security.
Security Transactions — Security transactions are accounted for as of the trade date. Net realized gains and losses are determined on the identified cost basis, which is also used for federal income tax purposes.
Investment Income — Dividend income less foreign taxes withheld, if any, is recorded as of the ex-dividend date. Distributions received on securities that represent a return of capital or capital gain are recorded as a reduction of cost of investments and/or as a realized gain. The fund estimates the components of distributions received that may be considered nontaxable distributions or capital gain distributions for income tax purposes. Interest income less foreign taxes withheld, if any, is recorded on the accrual basis and includes accretion of discounts and amortization of premiums.
Foreign Currency Translations — All assets and liabilities initially expressed in foreign currencies are translated into U.S. dollars at prevailing exchange rates at period end. The fund may enter into spot foreign currency exchange contracts to facilitate transactions denominated in a foreign currency. Purchases and sales of investment securities, dividend and interest income, spot foreign currency exchange contracts, and expenses are translated at the rates of exchange prevailing on the respective dates of such transactions. Net realized and unrealized foreign currency exchange gains or losses related to investment securities are a component of net realized gain (loss) on investment transactions and change in net unrealized appreciation (depreciation) on investments, respectively.
Repurchase Agreements — The fund may enter into repurchase agreements with institutions that American Century Investment Management, Inc. (ACIM) (the investment advisor) has determined are creditworthy pursuant to criteria adopted by the Board of Directors. The fund requires that the collateral, represented by securities, received in a repurchase transaction be transferred to the custodian in a manner sufficient to enable the fund to obtain those securities in the event of a default under the repurchase agreement. ACIM monitors, on a daily basis, the securities transferred to ensure the value, including accrued interest, of the securities under each repurchase agreement is equal to or greater than amounts owed to the fund under each repurchase agreement.
Joint Trading Account — Pursuant to an Exemptive Order issued by the Securities and Exchange Commission, the fund, along with certain other funds in the American Century Investments family of funds, may transfer uninvested cash balances into a joint trading account. These balances are invested in one or more repurchase agreements that are collateralized by U.S. Treasury or Agency obligations.
Income Tax Status — It is the fund’s policy to distribute substantially all net investment income and net realized gains to shareholders and to otherwise qualify as a regulated investment company under provisions of the Internal Revenue Code. The fund is no longer subject to examination by tax authorities for years prior to 2009. Additionally, non-U.S. tax returns filed by the fund due to investments in certain foreign securities remain subject to examination by the relevant taxing authority for seven years from the date of filing. At this time, management believes there are no uncertain tax positions which, based on their technical merit, would not be sustained upon examination and for which it is reasonably possible that the total amounts of unrecognized tax benefits will significantly change in the next twelve months. Accordingly, no provision has been made for federal or state income taxes.
19
Multiple Class — All shares of the fund represent an equal pro rata interest in the net assets of the class to which such shares belong, and have identical voting, dividend, liquidation and other rights and the same terms and conditions, except for class specific expenses and exclusive rights to vote on matters affecting only individual classes. Income, non-class specific expenses, and realized and unrealized capital gains and losses of the fund are allocated to each class of shares based on their relative net assets.
Distributions to Shareholders — Distributions from net investment income and net realized gains, if any, are generally declared and paid annually. The fund may make distributions on a more frequent basis to comply with the distribution requirements of the Internal Revenue Code, in all events in a manner consistent with provisions of the 1940 Act.
Redemption — The fund may impose a 2.00% redemption fee on shares held less than 60 days. The fee may not be applicable to all classes. The redemption fee is retained by the fund and helps cover transaction costs that long-term investors may bear when the fund sells securities to meet investor redemptions.
Indemnifications — Under the corporation’s organizational documents, its officers and directors are indemnified against certain liabilities arising out of the performance of their duties to the fund. In addition, in the normal course of business, the fund enters into contracts that provide general indemnifications. The maximum exposure under these arrangements is unknown as this would involve future claims that may be made against a fund. The risk of material loss from such claims is considered by management to be remote.
3. Fees and Transactions with Related Parties
Management Fees — The corporation has entered into a management agreement with ACIM, under which ACIM provides the fund with investment advisory and management services in exchange for a single, unified management fee (the fee) per class. The agreement provides that all expenses of managing and operating the fund, except distribution and service fees, brokerage expenses, taxes, interest, fees and expenses of the independent directors (including legal counsel fees), and extraordinary expenses, will be paid by ACIM. The fee is computed and accrued daily based on each class’s daily net assets and paid monthly in arrears. The rate of the fee is determined by applying a fee rate calculation formula. This formula takes into account the fund’s assets as well as certain assets, if any, of other clients of the investment advisor outside the American Century Investments family of funds (such as subadvised funds and separate accounts) that have very similar investment teams and investment strategies (strategy assets). The annual management fee schedule ranges from 1.05% to 1.30% for the Investor Class, A Class, C Class and R Class. The Institutional Class is 0.20% less at each point within the range. The effective annual management fee for each class for the year ended November 30, 2012 was 1.10% for the Investor Class, A Class, C Class and R Class and 0.90% for the Institutional Class.
Distribution and Service Fees — The Board of Directors has adopted a separate Master Distribution and Individual Shareholder Services Plan for each of the A Class, C Class and R Class (collectively the plans), pursuant to Rule 12b-1 of the 1940 Act. The plans provide that the A Class will pay American Century Investment Services, Inc. (ACIS) an annual distribution and service fee of 0.25%. The plans provide that the C Class will pay ACIS an annual distribution and service fee of 1.00%, of which 0.25% is paid for individual shareholder services and 0.75% is paid for distribution services. The plans provide that the R Class will pay ACIS an annual distribution and service fee of 0.50%. The fees are computed and accrued daily based on each class’s daily net assets and paid monthly in arrears. The fees are used to pay financial intermediaries for distribution and individual shareholder services. Fees incurred under the plans during the year ended November 30, 2012 are detailed in the Statement of Operations.
Related Parties — Certain officers and directors of the corporation are also officers and/or directors of American Century Companies, Inc., the parent of the corporation’s investment advisor, ACIM, the distributor of the corporation, ACIS, and the corporation’s transfer agent, American Century Services, LLC.
20
4. Investment Transactions
Purchases and sales of investment securities, excluding short-term investments, for the year ended November 30, 2012 were $237,646,902 and $225,851,532, respectively.
During the year ended November 30, 2012, the fund incurred purchases in kind of equity securities valued at $11,264,910. A purchase in kind occurs when a fund receives securities into its portfolio in lieu of cash as payment from a purchasing shareholder.
5. Capital Share Transactions
Transactions in shares of the fund were as follows:
| Year ended November 30, 2012 | Year ended November 30, 2011 | ||||||||||||||
| Shares | Amount | Shares | Amount | ||||||||||||
| Investor Class/Shares Authorized | 200,000,000 | 200,000,000 | |||||||||||||
| Sold | 6,257,701 | $57,448,175 | 2,343,841 | $20,895,594 | |||||||||||
| Issued in reinvestment of distributions | 109,431 | 1,003,479 | 162,223 | 1,481,093 | |||||||||||
| Redeemed | (5,428,463 | ) | (50,102,555 | ) | (5,653,429 | ) | (50,792,438 | ) | |||||||
| 938,669 | 8,349,099 | (3,147,365 | ) | (28,415,751 | ) | ||||||||||
| Institutional Class/Shares Authorized | 35,000,000 | 35,000,000 | |||||||||||||
| Sold | 1,641,641 | 15,564,429 | 423,252 | 3,859,467 | |||||||||||
| Issued in reinvestment of distributions | 21,111 | 195,280 | 32,478 | 299,125 | |||||||||||
| Redeemed | (993,715 | ) | (9,123,617 | ) | (1,625,818 | ) | (14,879,113 | ) | |||||||
| 669,037 | 6,636,092 | (1,170,088 | ) | (10,720,521 | ) | ||||||||||
| A Class/Shares Authorized | 35,000,000 | 35,000,000 | |||||||||||||
| Sold | 1,228,876 | 11,260,861 | 1,000,371 | 8,676,341 | |||||||||||
| Issued in reinvestment of distributions | 1,453 | 13,148 | 8,817 | 79,446 | |||||||||||
| Redeemed | (859,903 | ) | (7,847,244 | ) | (1,864,354 | ) | (16,217,606 | ) | |||||||
| 370,426 | 3,426,765 | (855,166 | ) | (7,461,819 | ) | ||||||||||
| B Class/Shares Authorized | N/A | 10,000,000 | |||||||||||||
| Sold | 3,403 | 30,316 | |||||||||||||
| Redeemed | (101,931 | ) | (836,156 | ) | |||||||||||
| (98,528 | ) | (805,840 | ) | ||||||||||||
| C Class/Shares Authorized | 10,000,000 | 10,000,000 | |||||||||||||
| Sold | 108,361 | 931,312 | 195,017 | 1,642,864 | |||||||||||
| Redeemed | (96,573 | ) | (823,539 | ) | (329,591 | ) | (2,780,205 | ) | |||||||
| 11,788 | 107,773 | (134,574 | ) | (1,137,341 | ) | ||||||||||
| R Class/Shares Authorized | 5,000,000 | 5,000,000 | |||||||||||||
| Sold | 138,905 | 1,261,029 | 50,734 | 453,279 | |||||||||||
| Redeemed | (47,198 | ) | (423,738 | ) | (34,078 | ) | (307,011 | ) | |||||||
| 91,707 | 837,291 | 16,656 | 146,268 | ||||||||||||
| Net increase (decrease) | 2,081,627 | $19,357,020 | (5,389,065 | ) | $(48,395,004 | ) | |||||||||
21
6. Fair Value Measurements
The fund’s securities valuation process is based on several considerations and may use multiple inputs to determine the fair value of the positions held by the fund. In conformity with accounting principles generally accepted in the United States of America, the inputs used to determine a valuation are classified into three broad levels as follows:
| • | Level 1 valuation inputs consist of unadjusted quoted prices in an active market for identical securities; |
| • | Level 2 valuation inputs consist of direct or indirect observable market data (including quoted prices for similar securities, evaluations of subsequent market events, interest rates, prepayment speeds, credit risk, etc.); or |
| • | Level 3 valuation inputs consist of unobservable data (including a fund’s own assumptions). |
The level classification is based on the lowest level input that is significant to the fair valuation measurement. The valuation inputs are not necessarily an indication of the risks associated with investing in these securities or other financial instruments.
The following is a summary of the level classifications as of period end. The Schedule of Investments provides additional information on the fund’s portfolio holdings.
| Level 1 | Level 2 | Level 3 | |
| Investment Securities | |||
| Domestic Common Stocks | $273,071,590 | — | — |
| Foreign Common Stocks | 12,075,256 | $164,129,152 | — |
| Temporary Cash Investments | 9 | 3,449,642 | — |
| Total Value of Investment Securities | $285,146,855 | $167,578,794 | — |
7. Risk Factors
There are certain risks involved in investing in foreign securities. These risks include those resulting from future adverse political, social and economic developments, fluctuations in currency exchange rates, the possible imposition of exchange controls, and other foreign laws or restrictions. Investing in emerging markets may accentuate these risks.
8. Federal Tax Information
The tax character of distributions paid during the years ended November 30, 2012 and November 30, 2011 were as follows:
| 2012 | 2011 | |
| Distributions Paid From | ||
| Ordinary income | $1,236,800 | $2,202,207 |
| Long-term capital gains | — | — |
The book-basis character of distributions made during the year from net investment income or net realized gains may differ from their ultimate characterization for federal income tax purposes. These differences reflect the differing character of certain income items and net realized gains and losses for financial statement and tax purposes, and may result in reclassification among certain capital accounts on the financial statements.
22
As of November 30, 2012, the federal tax cost of investments and the components of distributable earnings on a tax-basis were as follows:
| Federal tax cost of investments | $354,175,198 |
| Gross tax appreciation of investments | $103,121,085 |
| Gross tax depreciation of investments | (4,570,634) |
| Net tax appreciation (depreciation) of investments | $98,550,451 |
| Net tax appreciation (depreciation) on translation of assets and liabilities in foreign currencies | $27,715 |
| Net tax appreciation (depreciation) | $98,578,166 |
| Undistributed ordinary income | $1,814,898 |
| Accumulated short-term capital losses | $(42,873,929) |
| Post-October capital loss deferral | $(492,760) |
The difference between book-basis and tax-basis cost and unrealized appreciation (depreciation) is attributable primarily to the tax deferral of losses on wash sales and the realization to ordinary income for tax purposes of unrealized gains on investments in passive foreign investment companies.
Accumulated capital losses represent net capital loss carryovers that may be used to offset future realized capital gains for federal income tax purposes. Future capital loss carryover utilization in any given year may be subject to Internal Revenue Code limitations. Capital loss carryovers expire in 2017.
Loss deferrals represent certain qualified losses that the fund has elected to treat as having been incurred in the following fiscal year for federal income tax purposes.
23
| For a Share Outstanding Throughout the Years Ended November 30 (except as noted) | |||||||||||||
| Per-Share Data | Ratios and Supplemental Data | ||||||||||||
| Income From Investment Operations: | Distributions From: | Ratio to Average Net Assets of: | |||||||||||
Net Asset Value, Beginning of Period | Net Investment Income (Loss)(1) | Net Realized and Unrealized Gain (Loss) | Total From Investment Operations | Net Investment Income | Net Realized Gains | Total Distributions | Net Asset Value, End of Period | Total Return(2) | Operating Expenses | Net Investment Income (Loss) | Portfolio Turnover Rate | Net Assets, End of Period (in thousands) | |
| Investor Class | |||||||||||||
| 2012 | $8.52 | 0.03 | 1.11 | 1.14 | (0.03) | — | (0.03) | $9.63 | 13.37% | 1.10% | 0.28% | 54% | $373,887 |
| 2011 | $8.41 | 0.03 | 0.13 | 0.16 | (0.05) | — | (0.05) | $8.52 | 1.82% | 1.11% | 0.28% | 53% | $322,672 |
| 2010 | $7.80 | 0.03 | 0.64 | 0.67 | (0.06) | — | (0.06) | $8.41 | 8.61% | 1.16% | 0.33% | 100% | $344,950 |
| 2009 | $5.90 | 0.04 | 1.86 | 1.90 | —(3) | — | —(3) | $7.80 | 32.24% | 1.22% | 0.62% | 103% | $346,590 |
| 2008 | $12.69 | 0.04 | (4.75) | (4.71) | — | (2.08) | (2.08) | $5.90 | (44.01)% | 1.26% | 0.40% | 121% | $274,599 |
| Institutional Class | |||||||||||||
| 2012 | $8.60 | 0.05 | 1.13 | 1.18 | (0.05) | — | (0.05) | $9.73 | 13.71% | 0.90% | 0.48% | 54% | $47,203 |
| 2011 | $8.49 | 0.04 | 0.13 | 0.17 | (0.06) | — | (0.06) | $8.60 | 2.00% | 0.91% | 0.48% | 53% | $35,991 |
| 2010 | $7.90 | 0.04 | 0.64 | 0.68 | (0.09) | — | (0.09) | $8.49 | 8.68% | 0.96% | 0.53% | 100% | $45,459 |
| 2009 | $5.97 | 0.05 | 1.89 | 1.94 | (0.01) | — | (0.01) | $7.90 | 32.61% | 1.02% | 0.82% | 103% | $44,752 |
| 2008 | $12.79 | 0.07 | (4.81) | (4.74) | — | (2.08) | (2.08) | $5.97 | (43.88)% | 1.05% | 0.61% | 121% | $28,477 |
| A Class | |||||||||||||
| 2012 | $8.39 | —(3) | 1.10 | 1.10 | —(3) | — | —(3) | $9.49 | 13.16% | 1.35% | 0.03% | 54% | $33,938 |
| 2011 | $8.28 | —(3) | 0.13 | 0.13 | (0.02) | — | (0.02) | $8.39 | 1.58% | 1.36% | 0.03% | 53% | $26,908 |
| 2010 | $7.67 | 0.01 | 0.62 | 0.63 | (0.02) | — | (0.02) | $8.28 | 8.20% | 1.41% | 0.08% | 100% | $33,641 |
| 2009 | $5.81 | 0.02 | 1.84 | 1.86 | — | — | — | $7.67 | 32.01% | 1.47% | 0.37% | 103% | $34,744 |
| 2008 | $12.56 | 0.01 | (4.68) | (4.67) | — | (2.08) | (2.08) | $5.81 | (44.17)% | 1.51% | 0.15% | 121% | $22,447 |
24
| For a Share Outstanding Throughout the Years Ended November 30 (except as noted) | |||||||||||||
| Per-Share Data | Ratios and Supplemental Data | ||||||||||||
| Income From Investment Operations: | Distributions From: | Ratio to Average Net Assets of: | |||||||||||
Net Asset Value, Beginning of Period | Net Investment Income (Loss)(1) | Net Realized and Unrealized Gain (Loss) | Total From Investment Operations | Net Investment Income | Net Realized Gains | Total Distributions | Net Asset Value, End of Period | Total Return(2) | Operating Expenses | Net Investment Income (Loss) | Portfolio Turnover Rate | Net Assets, End of Period (in thousands) | |
| C Class | |||||||||||||
| 2012 | $7.87 | (0.06) | 1.03 | 0.97 | — | — | — | $8.84 | 12.20% | 2.10% | (0.72)% | 54% | $4,098 |
| 2011 | $7.81 | (0.06) | 0.12 | 0.06 | — | — | — | $7.87 | 0.77% | 2.11% | (0.72)% | 53% | $3,557 |
| 2010 | $7.27 | (0.05) | 0.59 | 0.54 | — | — | — | $7.81 | 7.43% | 2.16% | (0.67)% | 100% | $4,579 |
| 2009 | $5.54 | (0.02) | 1.75 | 1.73 | — | — | — | $7.27 | 31.23% | 2.22% | (0.38)% | 103% | $3,535 |
| 2008 | $12.16 | (0.05) | (4.49) | (4.54) | — | (2.08) | (2.08) | $5.54 | (44.64)% | 2.26% | (0.60)% | 121% | $2,382 |
| R Class | |||||||||||||
| 2012 | $8.39 | (0.02) | 1.10 | 1.08 | — | — | — | $9.47 | 12.87% | 1.60% | (0.22)% | 54% | $1,587 |
| 2011 | $8.29 | (0.02) | 0.12 | 0.10 | — | — | — | $8.39 | 1.21% | 1.61% | (0.22)% | 53% | $636 |
| 2010 | $7.67 | (0.01) | 0.63 | 0.62 | — | — | — | $8.29 | 8.08% | 1.66% | (0.17)% | 100% | $490 |
| 2009 | $5.82 | —(3) | 1.85 | 1.85 | — | — | — | $7.67 | 31.79% | 1.72% | 0.12% | 103% | $442 |
| 2008 | $12.62 | (0.01) | (4.71) | (4.72) | — | (2.08) | (2.08) | $5.82 | (44.40)% | 1.76% | (0.10)% | 121% | $253 |
Notes to Financial Highlights
| (1) | Computed using average shares outstanding throughout the period. |
| (2) | Total returns are calculated based on the net asset value of the last business day and do not reflect applicable sales charges, if any. Total returns for periods less than one year are not annualized. |
| (3) | Per-share amount was less than $0.005. |
See Notes to Financial Statements.
25
The Board of Directors and Shareholders of
American Century World Mutual Funds, Inc.:
We have audited the accompanying statement of assets and liabilities, including the schedule of investments, of Global Growth Fund, one of the funds constituting American Century World Mutual Funds, Inc. (the “Corporation”) as of November 30, 2012, and the related statement of operations for the year then ended, the statement of changes in net assets for each of the two years in the period then ended, and the financial highlights for each of the five years in the period then ended. These financial statements and financial highlights are the responsibility of the Corporation’s management. Our responsibility is to express an opinion on these financial statements and financial highlights based on our audits.
We conducted our audits in accordance with the standards of the Public Company Accounting Oversight Board (United States). Those standards require that we plan and perform the audit to obtain reasonable assurance about whether the financial statements and financial highlights are free of material misstatement. The Corporation is not required to have, nor were we engaged to perform, an audit of its internal control over financial reporting. Our audits included consideration of internal control over financial reporting as a basis for designing audit procedures that are appropriate in the circumstances, but not for the purpose of expressing an opinion on the effectiveness of the Corporation’s internal control over financial reporting. Accordingly, we express no such opinion. An audit also includes examining, on a test basis, evidence supporting the amounts and disclosures in the financial statements, assessing the accounting principles used and significant estimates made by management, as well as evaluating the overall financial statement presentation. Our procedures included confirmation of securities owned as of November 30, 2012, by correspondence with the custodian and brokers; where replies were not received from brokers, we performed other auditing procedures. We believe that our audits provide a reasonable basis for our opinion.
In our opinion, the financial statements and financial highlights referred to above present fairly, in all material respects, the financial position of Global Growth Fund of American Century World Mutual Funds, Inc., as of November 30, 2012, the results of its operations for the year then ended, the changes in its net assets for each of the two years in the period then ended, and the financial highlights for each of the five years in the period then ended, in conformity with accounting principles generally accepted in the United States of America.
Deloitte & Touche LLP
Kansas City, Missouri
January 17, 2013
26
The Board of Directors
The individuals listed below serve as directors of the funds. Each director will continue to serve in this capacity until death, retirement, resignation or removal from office. The mandatory retirement age for directors who are not “interested persons,” as that term is defined in the Investment Company Act (independent directors), is 72. However, the mandatory retirement age for an individual director may be extended with the approval of the remaining independent directors.
Mr. Thomas is an “interested person” because he currently serves as President and Chief Executive Officer of American Century Companies, Inc. (ACC), the parent company of American Century Investment Management, Inc. (ACIM or the advisor). Mr. Fink is an “interested person” because he currently serves as Executive Vice President of ACC.
The other directors (more than three-fourths of the total number) are independent; that is, they have never been employees, directors or officers of, and have no financial interest in, ACC or any of its wholly owned, direct or indirect, subsidiaries, including ACIM, American Century Investment Services, Inc. (ACIS) and American Century Services, LLC (ACS). The directors serve in this capacity for seven (in the case of Mr. Thomas, 15) registered investment companies in the American Century Investments family of funds.
The following table presents additional information about the directors. The mailing address for each director is 4500 Main Street, Kansas City, Missouri 64111.
Name (Year of Birth) | Position(s) Held with Funds | Length of Time Served | Principal Occupation(s) During Past 5 Years | Number of American Century Portfolios Overseen by Director | Other Directorships Held During Past 5 Years | |
| Independent Directors | ||||||
Thomas A. Brown (1940) | Director | Since 1980 | Managing Member, Associated Investments, LLC (real estate investment company); Brown Cascade Properties, LLC (real estate investment company) (2001 to 2009) | 66 | None | |
Andrea C. Hall (1945) | Director | Since 1997 | Retired | 66 | None | |
Jan M. Lewis (1957) | Director | Since 2011 | President and Chief Executive Officer, Catholic Charities of Northeast Kansas (human services organization) | 66 | None | |
James A. Olson (1942) | Director | Since 2007 | Member, Plaza Belmont LLC (private equity fund manager) | 66 | Saia, Inc. (2002 to 2012) and Entertainment Properties Trust | |
Donald H. Pratt (1937) | Director and Chairman of the Board | Since 1995 (Chairman since 2005) | Chairman and Chief Executive Officer, Western Investments, Inc. (real estate company) | 66 | None | |
27
Name (Year of Birth) | Position(s) Held with Funds | Length of Time Served | Principal Occupation(s) During Past 5 Years | Number of American Century Portfolios Overseen by Director | Other Directorships Held During Past 5 Years | |
| Independent Directors | ||||||
M. Jeannine Strandjord (1945) | Director | Since 1994 | Retired | 66 | Euronet Worldwide Inc.; Charming Shoppes, Inc. (2006 to 2010); and DST Systems Inc. (1996 to 2012) | |
John R. Whitten (1946) | Director | Since 2008 | Retired | 66 | Rudolph Technologies, Inc. | |
Stephen E. Yates (1948) | Director | Since 2012 | Retired; Executive Vice President, Technology & Operations, KeyCorp. (computer services)(2004 to 2010) | 66 | Applied Industrial Technologies, Inc. (2001 to 2010) | |
| Interested Directors | ||||||
Barry Fink (1955) | Director and Executive Vice President | Since 2012 (Executive Vice President since 2007) | Executive Vice President, ACC (September 2007 to present); President, ACS (October 2007 to present); Chief Operating Officer, ACC (September 2007 to November 2012). Also serves as Manager, ACS | 66 | None | |
Jonathan S. Thomas (1963) | Director and President | Since 2007 | President and Chief Executive Officer, ACC (March 2007 to present). Also serves as Chief Executive Officer and Manager, ACS; Executive Vice President, ACIM; Director, ACC, ACIM and other ACC subsidiaries | 108 | None | |
28
Officers
The following table presents certain information about the executive officers of the funds. Each officer serves as an officer for each of the 15 investment companies in the American Century family of funds, unless otherwise noted. No officer is compensated for his or her service as an officer of the funds. The listed officers are interested persons of the funds and are appointed or re-appointed on an annual basis. The mailing address for each officer listed below is 4500 Main Street, Kansas City, Missouri 64111.
Name (Year of Birth) | Offices with the Funds | Principal Occupation(s) During the Past Five Years |
Jonathan S. Thomas (1963) | Director and President since 2007 | President and Chief Executive Officer, ACC (March 2007 to present). Also serves as Chief Executive Officer and Manager, ACS; Executive Vice President, ACIM; Director, ACC, ACIM and other ACC subsidiaries |
Barry Fink (1955) | Director since 2012 and Executive Vice President since 2007 | Executive Vice President, ACC (September 2007 to present); President, ACS (October 2007 to present); Chief Operating Officer, ACC (September 2007 to November 2012). Also serves as Manager, ACS |
Maryanne L. Roepke (1956) | Chief Compliance Officer since 2006 and Senior Vice President since 2000 | Chief Compliance Officer, American Century funds, ACIM and ACS (August 2006 to present). Also serves as Senior Vice President, ACS |
Charles A. Etherington (1957) | General Counsel since 2007 and Senior Vice President since 2006 | Attorney, ACC (February 1994 to present); Vice President, ACC (November 2005 to present), General Counsel, ACC (March 2007 to present). Also serves as General Counsel, ACIM, ACS, ACIS and other ACC subsidiaries; and Senior Vice President, ACIM and ACS |
C. Jean Wade (1964) | Vice President, Treasurer and Chief Financial Officer since 2012 | Vice President, ACS (February 2000 to present) |
Robert J. Leach (1966) | Vice President since 2006 and Assistant Treasurer since 2012 | Vice President, ACS (February 2000 to present) |
David H. Reinmiller (1963) | Vice President since 2000 | Attorney, ACC (January 1994 to present); Associate General Counsel, ACC (January 2001 to present). Also serves as Vice President, ACIM and ACS |
Ward D. Stauffer (1960) | Secretary since 2005 | Attorney, ACC (June 2003 to present) |
The Statement of Additional Information has additional information about the fund’s directors and is available without charge, upon request, by calling 1-800-345-2021.
29
At a meeting held on June 21, 2012, the Fund’s Board of Directors unanimously approved the renewal of the management agreement pursuant to which American Century Investment Management, Inc. (the “Advisor”) acts as the investment advisor for the Fund. Under Section 15(c) of the Investment Company Act, contracts for investment advisory services are required to be reviewed, evaluated, and approved by a majority of a fund’s independent directors (the “Directors”) each year.
As a part of the approval process, the Board requested and reviewed extensive data and information compiled by the Advisor and certain independent providers of evaluation data concerning the Fund and the services provided to the Fund by the Advisor. This review was in addition to the oversight and evaluation undertaken by the Board and its committees on a continuous basis throughout the year and included, but was not limited to the following:
| • | the nature, extent, and quality of investment management, shareholder services, and other services provided by the Advisor to the Fund; |
| • | the wide range of other programs and services the Advisor provides to the Fund and its shareholders on a routine and non-routine basis; |
| • | the investment performance of the fund, including data comparing the Fund’s performance to appropriate benchmarks and/or a peer group of other mutual funds with similar investment objectives and strategies; |
| • | data comparing the cost of owning the Fund to the cost of owning similar funds; |
| • | the Advisor’s compliance policies, procedures, and regulatory experience; |
| • | financial data showing the cost of services provided to the Fund, the profitability of the Fund to the Advisor, and the overall profitability of the Advisor; |
| • | data comparing services provided and charges to other investment management clients of the Advisor; and |
| • | consideration of collateral benefits derived by the Advisor from the management of the Fund and any potential economies of scale relating thereto. |
In keeping with its practice, the Board held two in-person meetings and one telephonic meeting to review and discuss the information provided. The Directors also had the benefit of the advice of independent counsel throughout the period.
Factors Considered
The Directors considered all of the information provided by the Advisor, the independent data providers, and independent counsel, and evaluated such information for the Fund. In connection with their review, the Directors did not identify any single factor as being all-important or controlling, and each Director may have attributed different levels of importance to different factors. In deciding to renew the management agreement, the Board based its decision on a number of factors, including the following:
30
Nature, Extent and Quality of Services - Generally. Under the management agreement, the Advisor is responsible for providing or arranging for all services necessary for the operation of the Fund. The Board noted that under the management agreement, the Advisor provides or arranges at its own expense a wide variety of services including:
| • | constructing and designing the Fund |
| • | portfolio research and security selection |
| • | initial capitalization/funding |
| • | securities trading |
| • | Fund administration |
| • | custody of Fund assets |
| • | daily valuation of the Fund’s portfolio |
| • | shareholder servicing and transfer agency, including shareholder confirmations, recordkeeping, and communications |
| • | legal services |
| • | regulatory and portfolio compliance |
| • | financial reporting |
| • | marketing and distribution |
The Board noted that many of these services have expanded over time both in terms of quantity and complexity in response to shareholder demands, competition in the industry, changing distribution channels, and the changing regulatory environment.
Investment Management Services. The nature of the investment management services provided to the Fund is quite complex and allows Fund shareholders access to professional money management, instant diversification of their investments within an asset class, the opportunity to easily diversify among asset classes by investing in or exchanging among various American Century Investments funds, and liquidity. In evaluating investment performance, the Board expects the Advisor to manage the Fund in accordance with its investment objectives and approved strategies. Further, the Directors recognize that the Advisor has an obligation to monitor trading activities, and in particular to seek the best execution of fund trades, and to evaluate the use of and payment for research. In providing these services, the Advisor utilizes teams of investment professionals (portfolio managers, analysts, research assistants, and securities traders) who require extensive information technology, research, training, compliance and other systems to conduct their business. The Board, directly and through its Fund Performance Review Committee, regularly reviews investment performance information for the Fund, together with comparative information for appropriate
31
benchmarks and/or peer groups of similarly-managed funds, over different time horizons. The Directors also review detailed performance information during the management agreement approval process. If performance concerns are identified, the Fund receives special reviews until performance improves, during which the Board discusses with the Advisor the reasons for such results (e.g., market conditions, security selection) and any efforts being undertaken to improve performance. Taking all these factors into consideration, the Board found the investment management services provided by the Advisor to the Fund to meet or exceed industry standards. More detailed information about the Fund’s performance can be found in the Performance and Portfolio Commentary sections of this report.
Shareholder and Other Services. Under the management agreement, the Advisor provides the Fund with a comprehensive package of transfer agency, shareholder, and other services. The Board, directly and through various committees of the Board, regularly reviews reports and evaluations of such services at its regular meetings. These reports include, but are not limited to, information regarding the operational efficiency and accuracy of the shareholder and transfer agency services provided, staffing levels, shareholder satisfaction (as measured by external as well as internal sources), technology support, new products and services offered to Fund shareholders, securities trading activities, portfolio valuation services, auditing services, and legal and operational compliance activities. Certain aspects of shareholder and transfer agency service level efficiency and the quality of securities trading activities are measured by independent third party providers and are presented in comparison to other fund groups not managed by the Advisor. The Board found the services provided by the Advisor to the Fund under the management agreement to be competitive and of high quality.
Costs of Services and Profitability. The Advisor provides detailed information concerning its cost of providing various services to the Fund, its profitability in managing the Fund, its overall profitability, and its financial condition. The Directors have reviewed with the Advisor the methodology used to prepare this financial information. The financial information regarding the Advisor is considered in evaluating the Advisor’s financial condition, ability to continue to provide services under the management agreement, and the reasonableness of the current management fee. The Board concluded that the Advisor’s profits were reasonable in light of the services provided to the Fund.
Ethics. The Board generally considers the Advisor’s commitment to providing quality services to shareholders and to conducting its business ethically. They noted that the Advisor’s practices generally meet or exceed industry best practices.
Economies of Scale. The Board also reviewed information provided by the Advisor regarding the possible existence of economies of scale in connection with the management of the Fund. The Board concluded that economies of scale are difficult to measure and predict with precision, especially on a fund-by-fund basis. The Board concluded that the Advisor is appropriately sharing economies of scale through its competitive fee structure, offering competitive fees from fund inception, and through reinvestment in its business to provide shareholders additional content and services.
32
Comparison to Other Funds’ Fees. The management agreement provides that the Fund pay the Advisor a single, all-inclusive (or unified) management fee for providing all services necessary for the management and operation of the Fund, other than brokerage expenses, taxes, interest, extraordinary expenses, and the fees and expenses of the Fund’s independent directors (including their independent legal counsel) and expenses incurred in connection with the provision of shareholder services and distribution services under a plan adopted pursuant to Rule 12b-1 under the 1940 Act. Under the unified fee structure, the Advisor is responsible for providing all investment advisory, custody, audit, administrative, compliance, recordkeeping, marketing and shareholder services, or arranging and supervising third parties to provide such services. By contrast, most other funds are charged a variety of fees, including an investment advisory fee, a transfer agency fee, an administrative fee, distribution charges and other expenses. Other than their investment advisory fees and any applicable Rule 12b-1 distribution fees, all other components of the total fees charged by these other funds may be increased without shareholder approval. The Board believes the unified fee structure is a benefit to Fund shareholders because it clearly discloses to shareholders the cost of owning Fund shares, and, since the unified fee cannot be increased without a vote of Fund shareholders, it shifts to the Advisor the risk of increased costs of operating the Fund and provides a direct incentive to minimize administrative inefficiencies. Part of the Board’s analysis of fee levels involves reviewing certain evaluative data compiled by an independent provider and comparing the Fund’s unified fee to the total expense ratio of other funds in the Fund’s peer group. The Board concluded that the management fee paid by the Fund to the Advisor under the management agreement is reasonable in light of the services provided to the Fund.
Comparison to Fees and Services Provided to Other Clients of the Advisor. The Board also requested and received information from the Advisor concerning the nature of the services, fees, costs and profitability of its advisory services to advisory clients other than the Fund. They observed that these varying types of client accounts require different services and involve different regulatory and entrepreneurial risks than the management of the Fund. The Board analyzed this information and concluded that the fees charged and services provided to the Fund were reasonable by comparison.
Collateral or “Fall-Out” Benefits Derived by the Advisor. The Board considered the existence of collateral benefits the Advisor may receive as a result of its relationship with the Fund. They concluded that the Advisor’s primary business is managing mutual funds and it generally does not use fund or shareholder information to generate profits in other lines of business, and therefore does not derive any significant collateral benefits from them. The Board noted that the Advisor receives proprietary research from broker-dealers that execute fund portfolio transactions and concluded that this research is likely to benefit Fund shareholders. The Board also determined that the Advisor is able to provide investment management services to certain clients other than the Fund, at least in part, due to its existing infrastructure built to serve the fund complex. The Board concluded, however, that the assets of those other clients are not material to the analysis and, where applicable, may be included with the assets of the Fund to determine breakpoints in the management fee schedule.
33
Existing Relationship. The Board also considered whether there was any reason for not continuing the existing arrangement with the Advisor. In this regard, the Board was mindful of the potential disruptions of the Fund’s operations and various risks, uncertainties, and other effects that could occur as a result of a decision not to continue such relationship. In particular, the Board recognized that most shareholders have invested in the Fund on the strength of the Advisor’s industry standing and reputation and in the expectation that the Advisor will have a continuing role in providing advisory services to the Fund.
Conclusion of the Directors. As a result of this process, the Board, including all of the independent directors, taking into account all of the factors discussed above and the information provided by the Advisor and others, concluded that the management agreement between the Fund and the Advisor is fair and reasonable in light of the services provided and should be renewed.
34
Retirement Account Information
As required by law, distributions you receive from certain IRAs, or 403(b), 457 and qualified plans are subject to federal income tax withholding, unless you elect not to have withholding apply. Tax will be withheld on the total amount withdrawn even though you may be receiving amounts that are not subject to withholding, such as nondeductible contributions. In such case, excess amounts of withholding could occur. You may adjust your withholding election so that a greater or lesser amount will be withheld.
If you don’t want us to withhold on this amount, you must notify us to not withhold the federal income tax. You may notify us in writing or in certain situations by telephone or through other electronic means. You have the right to revoke your withholding election at any time and any election you make may remain in effect until revoked by filing a new election.
Remember, even if you elect not to have income tax withheld, you are liable for paying income tax on the taxable portion of your withdrawal. If you elect not to have income tax withheld or you don’t have enough income tax withheld, you may be responsible for payment of estimated tax. You may incur penalties under the estimated tax rules if your withholding and estimated tax payments are not sufficient. You can reduce or defer the income tax on a distribution by directly or indirectly rolling such distribution over to another IRA or eligible plan. You should consult your tax advisor for additional information.
State tax will be withheld if, at the time of your distribution, your address is within one of the mandatory withholding states and you have federal income tax withheld. State taxes will be withheld from your distribution in accordance with the respective state rules.
Proxy Voting Guidelines
American Century Investment Management, Inc., the fund’s investment advisor, is responsible for exercising the voting rights associated with the securities purchased and/or held by the fund. A description of the policies and procedures the advisor uses in fulfilling this responsibility is available without charge, upon request, by calling 1-800-345-2021. It is also available on American Century Investments’ website at americancentury.com and on the Securities and Exchange Commission’s website at sec.gov. Information regarding how the investment advisor voted proxies relating to portfolio securities during the most recent 12-month period ended June 30 is available on the “About Us” page at americancentury.com. It is also available at sec.gov.
Quarterly Portfolio Disclosure
The fund files its complete schedule of portfolio holdings with the Securities and Exchange Commission (SEC) for the first and third quarters of each fiscal year on Form N-Q. The fund’s Forms N-Q are available on the SEC’s website at sec.gov, and may be reviewed and copied at the SEC’s Public Reference Room in Washington, DC. Information on the operation of the Public Reference Room may be obtained by calling 1-800-SEC-0330. The fund also makes its complete schedule of portfolio holdings for the most recent quarter of its fiscal year available on its website at americancentury.com and, upon request, by calling 1-800-345-2021.
35
Other Tax Information
The following information is provided pursuant to provisions of the Internal
Revenue Code.
The fund hereby designates up to the maximum amount allowable as qualified dividend income for the fiscal year ended November 30, 2012.
For corporate taxpayers, the fund hereby designates $1,236,800, or up to the maximum amount allowable, of ordinary income distributions paid during the fiscal year ended November 30, 2012 as qualified for the corporate dividends received deduction.
36
| Contact Us | americancentury.com |
| Automated Information Line | 1-800-345-8765 |
| Investor Services Representative | 1-800-345-2021 or 816-531-5575 |
| Investors Using Advisors | 1-800-378-9878 |
Business, Not-For-Profit, Employer-Sponsored Retirement Plans | 1-800-345-3533 |
Banks and Trust Companies, Broker-Dealers, Financial Professionals, Insurance Companies | 1-800-345-6488 |
| Telecommunications Device for the Deaf | 1-800-634-4113 |
American Century World Mutual Funds, Inc.
Investment Advisor:
American Century Investment Management, Inc.
Kansas City, Missouri
This report and the statements it contains are submitted for the general information of our shareholders. The report is not authorized for distribution to prospective investors unless preceded or accompanied by an effective prospectus.
©2013 American Century Proprietary Holdings, Inc. All rights reserved.
CL-ANN-76974 1301
ANNUAL REPORT NOVEMBER 30, 2012
| International Growth Fund |
| President’s Letter | 2 |
| Independent Chairman’s Letter | 3 |
| Market Perspective | 4 |
| Performance | 5 |
| Portfolio Commentary | 7 |
| Fund Characteristics | 9 |
| Shareholder Fee Example | 10 |
| Schedule of Investments | 12 |
| Statement of Assets and Liabilities | 15 |
| Statement of Operations | 16 |
| Statement of Changes in Net Assets | 17 |
| Notes to Financial Statements | 18 |
| Financial Highlights | 24 |
| Report of Independent Registered Public Accounting Firm | 26 |
| Management | 27 |
| Approval of Management Agreement | 30 |
| Additional Information | 35 |
Any opinions expressed in this report reflect those of the author as of the date of the report, and do not necessarily represent the opinions of American Century Investments® or any other person in the American Century Investments organization. Any such opinions are subject to change at any time based upon market or other conditions and American Century Investments disclaims any responsibility to update such opinions. These opinions may not be relied upon as investment advice and, because investment decisions made by American Century Investments funds are based on numerous factors, may not be relied upon as an indication of trading intent on behalf of any American Century Investments fund. Security examples are used for representational purposes only and are not intended as recommendations to purchase or sell securities. Performance information for comparative indices and securities is provided to American Century Investments by third party vendors. To the best of American Century Investments’ knowledge, such information is accurate at the time of printing.
Dear Investor:
Thank you for reviewing this annual report for the 12 months ended November 30, 2012. It offers investment performance, market analysis, and portfolio information, presented with the expert perspective of our portfolio management team.
Annual reports remain important vehicles for conveying information about fund returns, including key factors that affected fund performance. For additional, updated investment and market insights, we encourage you to visit our website, americancentury.com.
Favorable Fiscal-Year Returns for Most Major Stock and Bond Benchmarks
Despite a global economic slowdown, continued concerns about European financial system stability, and uncertainty about U.S. political and fiscal conditions in 2013, 12-month stock and bond returns were generally favorable, particularly for U.S. value stocks and high-yield bonds.
U.S. value stock indices outpaced the S&P 500 Index’s 16.13% return for the period, as did U.S. corporate and municipal high-yield benchmarks. U.S. growth and international index returns were generally lower, but still solid—the MSCI EAFE Index, for example, returned 12.61%.
With the exception of high-yield bond sectors, stocks generally outperformed bonds for the period, though bonds benefitted from economic stagnation, reduced inflation pressures, and low interest rates. The 10-year U.S. Treasury yield declined from 2.07% to 1.62% during the period, and the Barclays U.S. Aggregate Bond Index returned 5.51%. Related global bond indices also returned in roughly the mid-single digits.
Bucking the global trend, the U.S. economy showed signs of improvement during the fiscal year, particularly the long-depressed housing market. However, the outlook for 2013 remains guarded, as the fragile recovery remains vulnerable to fiscal and financial factors that could trigger further slowdowns and market volatility.
Under these conditions, we continue to believe in a disciplined, diversified, long-term investment approach, using both stocks and bonds—as appropriate—for meeting financial goals. We appreciate your continued trust in us in this challenging environment.
Sincerely,
Jonathan Thomas
President and Chief Executive Officer
American Century Investments
2
Dear Fellow Shareholders,
The board has once again completed its annual review of the advisory contract between the American Century Investments mutual funds overseen by the board and the funds’ advisor, American Century Investment Management, Inc. This process, often referred to as the 15(c) review, involves the independent directors considering all of the material monitored throughout the year and evaluating a wide range of factors to determine whether the management fee paid by each fund to the advisor is reasonable.
The independent directors’ rationale for this decision is provided in detail in this, or in a previous, report. However, there are several highlights that should be of interest to all shareholders.
| • | Fund performance and client service continue to be rated among the industry’s best. |
| • | Target date and other asset allocation products continue to successfully gather assets and industry acclaim. |
| • | Compliance programs continue to function successfully with no issues impacting shareholder interests. |
| • | Fees were found to be within an acceptable competitive range, with minor fee waivers being negotiated on five funds. |
Knowing that most shareholders are long term investors, the board was particularly pleased with our succession planning review. Talented professionals are being added within portfolio management and experienced managers have been added to the senior management team.
Overall it was a very positive review for the American Century Investments mutual funds during a challenging market environment.
Best personal regards,
Don Pratt
3
By Mark Kopinski, Chief Investment Officer, Global and Non-U.S. Equity
Central Bank Action Drove Global Stocks Higher
Despite a backdrop of weaker global economic growth and mounting sovereign debt problems in Europe and the United States, most global stock benchmarks advanced strongly for the 12-month period ended November 30, 2012. Investors generally overlooked the lackluster economic data, recession fears (which eventually turned to reality for Europe), and the instability of the eurozone’s banking system and currency. Instead, they focused on the optimism inspired by unprecedented central bank intervention.
In particular, the European Central Bank (ECB) launched several programs to help the eurozone’s troubled banks shore up their balance sheets and finance ongoing operations. The ECB also agreed to purchase the sovereign debt of financially strapped member nations that conform to the ECB’s fiscal reform measures. Meanwhile, in response to sluggish economic growth and high unemployment, the U.S. Federal Reserve (the Fed) announced its third—and most aggressive—quantitative easing program to date. The Bank of Japan also took action with an asset purchase program, while the People’s Bank of China eased its reserve requirements for commercial lenders.
Overall, developed markets outperformed emerging markets for the 12-month period, even as the emerging economies generally enjoyed higher absolute levels of growth, albeit slower growth than in previous periods. Strong stock market performance in Europe and the United States, where central bank stimulus was the greatest, primarily drove the better relative results in the developed markets.
Valuations, Stock Selection Remain Key Factors
Even though economic growth and corporate earnings in aggregate have been slowing, and sovereign debt issues have yet to be resolved, there are some positive factors at work for global equity investors. Stock valuations around the globe appear attractive relative to historical averages. Similarly, equity earnings yields are also compelling when measured against long-term averages and current bond yields. Most important, we believe through our rigorous, bottom-up stock selection process it’s still possible to find individual companies growing earnings, either from a new product launch, market share gains, secular changes, or beneficial acquisitions.
| International Equity Total Returns | ||||
| For the 12 months ended November 30, 2012 (in U.S. dollars) | ||||
| MSCI EAFE Index | 12.61% | MSCI Europe Index | 14.07% | |
| MSCI EAFE Growth Index | 12.66% | MSCI World Index | 13.62% | |
| MSCI EAFE Value Index | 12.45% | MSCI Japan Index | 3.59% | |
| MSCI Emerging Markets Index | 11.35% | |||
4
| Total Returns as of November 30, 2012 | ||||||
| Average Annual Returns | ||||||
Ticker Symbol | 1 year | 5 years | 10 years | Since Inception | Inception Date | |
| Investor Class | TWIEX | 15.10% | -3.05% | 7.19% | 7.67% | 5/9/91 |
| MSCI EAFE Index | — | 12.61% | -4.73% | 7.51% | 5.00%(1) | — |
| MSCI EAFE Growth Index | — | 12.66% | -3.96% | 7.27% | 3.71%(1) | — |
| Institutional Class | TGRIX | 15.28% | -2.86% | 7.40% | 5.30% | 11/20/97 |
A Class(2) No sales charge* With sales charge* | TWGAX | 14.80% 8.15% | -3.29% -4.43% | 6.94% 6.30% | 5.82% 5.43% | 10/2/96 |
| C Class | AIWCX | 14.02% | -4.01% | 6.15% | 2.37% | 6/4/01 |
| R Class | ATGRX | 14.56% | -3.53% | — | 6.61% | 8/29/03 |
| * | Sales charges include initial sales charges and contingent deferred sales charges (CDSCs), as applicable. A Class shares have a 5.75% maximum initial sales charge and may be subject to a maximum CDSC of 1.00%. C Class shares redeemed within 12 months of purchase are subject to a maximum CDSC of 1.00%. The SEC requires that mutual funds provide performance information net of maximum sales charges in all cases where charges could be applied. |
| (1) | Since 4/30/91, the date nearest the Investor Class’s inception for which data are available. |
| (2) | Prior to December 3, 2007, the A Class was referred to as the Advisor Class and did not have a front-end sales charge. Performance prior to that date has been adjusted to reflect this charge. |
Data presented reflect past performance. Past performance is no guarantee of future results. Current performance may be higher or lower than the performance shown. Investment return and principal value will fluctuate, and redemption value may be more or less than original cost. To obtain performance data current to the most recent month end, please call 1-800-345-2021 or visit americancentury.com. International investing involves special risks, such as political instability and currency fluctuations. Investing in emerging markets may accentuate these risks. The fund’s investment process may result in high portfolio turnover, which could mean high transaction costs, affecting both performance and capital gains tax liabilities to investors.
Unless otherwise indicated, performance reflects Investor Class shares; performance for other share classes will vary due to differences in fee structure. For information about other share classes available, please consult the prospectus. Data assumes reinvestment of dividends and capital gains, and none of the charts reflect the deduction of taxes that a shareholder would pay on fund distributions or the redemption of fund shares. Returns for the indices are provided for comparison. The fund’s total returns include operating expenses (such as transaction costs and management fees) that reduce returns, while the total returns of the indices do not.
5
| Growth of $10,000 Over 10 Years |
| $10,000 investment made November 30, 2002 |
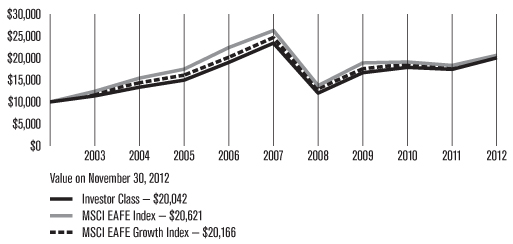
| Total Annual Fund Operating Expenses | ||||
| Investor Class | Institutional Class | A Class | C Class | R Class |
| 1.32% | 1.12% | 1.57% | 2.32% | 1.82% |
The total annual fund operating expenses shown is as stated in the fund’s prospectus current as of the date of this report. The prospectus may vary from the expense ratio shown elsewhere in this report because it is based on a different time period, includes acquired fund fees and expenses, and, if applicable, does not include fee waivers or expense reimbursements.
Data presented reflect past performance. Past performance is no guarantee of future results. Current performance may be higher or lower than the performance shown. Investment return and principal value will fluctuate, and redemption value may be more or less than original cost. To obtain performance data current to the most recent month end, please call 1-800-345-2021 or visit americancentury.com. International investing involves special risks, such as political instability and currency fluctuations. Investing in emerging markets may accentuate these risks. The fund’s investment process may result in high portfolio turnover, which could mean high transaction costs, affecting both performance and capital gains tax liabilities to investors.
Unless otherwise indicated, performance reflects Investor Class shares; performance for other share classes will vary due to differences in fee structure. For information about other share classes available, please consult the prospectus. Data assumes reinvestment of dividends and capital gains, and none of the charts reflect the deduction of taxes that a shareholder would pay on fund distributions or the redemption of fund shares. Returns for the indices are provided for comparison. The fund’s total returns include operating expenses (such as transaction costs and management fees) that reduce returns, while the total returns of the indices do not.
6
| Portfolio Commentary |
Portfolio Managers: Alex Tedder and Raj Gandhi
Performance Summary
International Growth advanced 15.10%* for the 12 months ended November 30, 2012, compared with its benchmark, the MSCI EAFE Index, which gained 12.61%.
Developed non-U.S. stocks generally demonstrated robust performance during the 12-month period, even as weak growth and mounting sovereign debt problems weighed on many economies. Unprecedented central bank intervention, particularly the European Central Bank’s commitment to do “whatever it takes” to restore eurozone stability, helped drive stock market optimism. Within the developed markets, there was little difference in results between growth and value stocks and large- and small-cap stocks.
Overall, stock selection, particularly in the materials, industrials, and information technology sectors, drove the portfolio’s outperformance relative to the benchmark. Our sector allocations, including an underweight position in the utilities sector and an overweight position in the consumer discretionary sector, also had an overall positive influence on the portfolio’s relative performance. Lagging sectors included consumer staples, where stock selection hurt, and financials, where an underweight position offset a strong contribution from stock selection.
From a regional perspective, stock selection in Spain, Japan, and France contributed favorably to the portfolio’s relative performance. At the opposite end of the spectrum, positions in China, along with stock selection in Australia and an overweight position in Canada, detracted from relative performance.
Plasma Company was a Top Contributor
Grifols, a Spain-based blood plasma processor, was a leading contributor to the portfolio’s relative performance. In addition to reporting strong results throughout the period and benefitting from an improvement in pricing for its blood plasma products, the company announced it was expanding its North American operations via the purchase of three plasma donation centers in the U.S. The stock also received a lift from the release of preliminary research findings that plasma-based drugs could help in the treatment of Alzheimer’s disease.
In addition, a position in South Korea’s Samsung Electronics drove results in the information technology sector and was among the portfolio’s top contributors to performance. Stock in the electronics manufacturer advanced on market share gains in the competitive global smartphone market, with sales of the Galaxy SIII boosting results.
In the top-performing industrials sector, an overweight position in Wolseley, a United Kingdom-based distributor of plumbing and heating products, was a leading contributor to performance. Investors reacted favorably to the company’s favorable revenue, earnings, and profits statements issued throughout the period. In particular, the company cited improving industrial and residential activity in North America as offsetting weak European markets.
*All fund returns referenced in this commentary are for Investor Class shares.
7
Wireless Company Detracted from Results
Among the portfolio’s leading performance detractors for the period was China Unicom, a wireless telecommunication services provider. Shares declined early in the period after China Telecom earned the right to sell Apple’s iPhones in China, stripping China Unicom of its exclusive deal. In addition, rising price competition hurt China Unicom’s stock price, while China Mobile, the largest operator, said it would accelerate the launch of its 4G service, compromising the growth of China Unicom.
Another prominent China-based detractor included a position in Baidu, an Internet search provider. Late in the period, the company forecast its fourth-quarter revenue growth would slow to its weakest level in three years, which was below analysts’ expectations. In addition, reluctance from advertisers to purchase space on the company’s search pages for mobile phones, a slowdown in search revenue, and an analyst downgrade weighed on the company’s shares.
An overweight position in Rakuten, a Japan-based electronic commerce and Internet company, also was a prominent detractor. The company reported disappointing results during the third quarter of 2012 due to higher costs stemming from the company’s rapid expansion overseas. Nevertheless, we believe underlying fundamentals support our thesis that e-commerce in Japan will continue to grow, despite the nation’s sluggish retail sales overall. We believe Rakuten remains well positioned in this industry.
Outlook
While markets generally reacted favorably to central bank actions during the period, the ultimate impact is unclear without substantial political progress on fiscal issues. At period end, we believed austerity measures in Europe and slowing global economic growth were likely to weigh on stocks in the medium term. Accordingly, we favor investment opportunities that we believe are less dependent on macro events and more reliant on secular changes where new technologies or company specific restructurings can drive earnings growth. We will continue to focus on finding companies located in developed countries around the world (excluding the United States) that we believe have sustainable growth characteristics and promising long-term outlooks.
8
| NOVEMBER 30, 2012 | |
| Top Ten Holdings | % of net assets |
| Roche Holding AG | 2.3% |
| Sanofi | 2.2% |
| Nestle SA | 2.1% |
| Syngenta AG | 1.8% |
| Unilever plc | 1.8% |
| BHP Billiton Ltd. | 1.7% |
| Muenchener Rueckversicherungs AG | 1.7% |
| Toyota Motor Corp. | 1.6% |
| Rio Tinto plc | 1.6% |
| Novo Nordisk A/S B Shares | 1.6% |
| Types of Investments in Portfolio | % of net assets |
| Foreign Common Stocks | 98.9% |
| Temporary Cash Investments | —* |
| Other Assets and Liabilities | 1.1% |
| *Category is less than 0.05% of total net assets. | |
| Investments by Country | % of net assets |
| United Kingdom | 16.4% |
| France | 12.7% |
| Japan | 12.6% |
| Switzerland | 8.9% |
| Germany | 7.8% |
| Australia | 4.9% |
| Italy | 4.1% |
| Sweden | 3.2% |
| Spain | 2.8% |
| Norway | 2.8% |
| Denmark | 2.7% |
| Netherlands | 2.1% |
| Belgium | 2.1% |
| Other Countries | 15.8% |
| Cash and Equivalents** | 1.1% |
**Includes temporary cash investments and other assets and liabilities.
9
Fund shareholders may incur two types of costs: (1) transaction costs, including sales charges (loads) on purchase payments and redemption/exchange fees; and (2) ongoing costs, including management fees; distribution and service (12b-1) fees; and other fund expenses. This example is intended to help you understand your ongoing costs (in dollars) of investing in your fund and to compare these costs with the ongoing cost of investing in other mutual funds.
The example is based on an investment of $1,000 made at the beginning of the period and held for the entire period from June 1, 2012 to November 30, 2012.
Actual Expenses
The table provides information about actual account values and actual expenses for each class. You may use the information, together with the amount you invested, to estimate the expenses that you paid over the period. First, identify the share class you own. Then simply divide your account value by $1,000 (for example, an $8,600 account value divided by $1,000 = 8.6), then multiply the result by the number under the heading “Expenses Paid During Period” to estimate the expenses you paid on your account during this period.
If you hold Investor Class shares of any American Century Investments fund, or Institutional Class shares of the American Century Diversified Bond Fund, in an American Century Investments account (i.e., not a financial intermediary or retirement plan account), American Century Investments may charge you a $12.50 semiannual account maintenance fee if the value of those shares is less than $10,000. We will redeem shares automatically in one of your accounts to pay the $12.50 fee. In determining your total eligible investment amount, we will include your investments in all personal accounts (including American Century Investments Brokerage accounts) registered under your Social Security number. Personal accounts include individual accounts, joint accounts, UGMA/UTMA accounts, personal trusts, Coverdell Education Savings Accounts and IRAs (including traditional, Roth, Rollover, SEP-, SARSEP- and SIMPLE-IRAs), and certain other retirement accounts. If you have only business, business retirement, employer-sponsored or American Century Investments Brokerage accounts, you are currently not subject to this fee. If you are subject to the Account Maintenance Fee, your account value could be reduced by the fee amount.
Hypothetical Example for Comparison Purposes
The table also provides information about hypothetical account values and hypothetical expenses based on the actual expense ratio of each class of your fund and an assumed rate of return of 5% per year before expenses, which is not the actual return of a fund’s share class. The hypothetical account values and expenses may not be used to estimate the actual ending account balance or expenses you paid for the period. You may use this information to compare the ongoing costs of investing in your fund and other funds. To do so, compare this 5% hypothetical example with the 5% hypothetical examples that appear in the shareholder reports of the other funds.
10
Please note that the expenses shown in the table are meant to highlight your ongoing costs only and do not reflect any transactional costs, such as sales charges (loads) or redemption/exchange fees. Therefore, the table is useful in comparing ongoing costs only, and will not help you determine the relative total costs of owning different funds. In addition, if these transactional costs were included, your costs would have been higher.
Beginning Account Value 6/1/12 | Ending Account Value 11/30/12 | Expenses Paid During Period(1) 6/1/12 – 11/30/12 | Annualized Expense Ratio(1) | |
| Actual | ||||
| Investor Class | $1,000 | $1,182.60 | $6.88 | 1.26% |
| Institutional Class | $1,000 | $1,183.40 | $5.79 | 1.06% |
| A Class | $1,000 | $1,181.60 | $8.24 | 1.51% |
| C Class | $1,000 | $1,177.60 | $12.30 | 2.26% |
| R Class | $1,000 | $1,179.90 | $9.59 | 1.76% |
| Hypothetical | ||||
| Investor Class | $1,000 | $1,018.70 | $6.36 | 1.26% |
| Institutional Class | $1,000 | $1,019.70 | $5.35 | 1.06% |
| A Class | $1,000 | $1,017.45 | $7.62 | 1.51% |
| C Class | $1,000 | $1,013.70 | $11.38 | 2.26% |
| R Class | $1,000 | $1,016.20 | $8.87 | 1.76% |
| (1) | Expenses are equal to the class’s annualized expense ratio listed in the table above, multiplied by the average account value over the period, multiplied by 183, the number of days in the most recent fiscal half-year, divided by 366, to reflect the one-half year period. |
11
NOVEMBER 30, 2012
| Shares | Value | |
| Common Stocks — 98.9% | ||
| AUSTRALIA — 4.9% | ||
| BHP Billiton Ltd. | 764,349 | $ 27,432,017 |
| Commonwealth Bank of Australia | 247,280 | 15,403,678 |
| CSL Ltd. | 182,127 | 9,826,497 |
| James Hardie Industries SE | 1,645,339 | 15,608,212 |
| Treasury Wine Estates Ltd. | 1,878,311 | 9,859,828 |
| 78,130,232 | ||
| AUSTRIA — 0.1% | ||
Erste Group Bank AG(1) | 38,287 | 1,126,096 |
| BELGIUM — 2.1% | ||
| Anheuser-Busch InBev NV | 248,703 | 21,797,355 |
| Umicore SA | 218,658 | 11,359,393 |
| 33,156,748 | ||
| BRAZIL — 0.4% | ||
| BR Malls Participacoes SA | 550,000 | 7,065,472 |
| CANADA — 1.5% | ||
| Bank of Nova Scotia | 168,705 | 9,510,726 |
| Canadian Pacific Railway Ltd. | 149,846 | 13,983,716 |
| 23,494,442 | ||
| CHINA — 1.7% | ||
Baidu, Inc. ADR(1) | 42,166 | 4,061,007 |
Brilliance China Automotive Holdings Ltd.(1) | 6,750,000 | 8,213,014 |
| China Communications Construction Co. Ltd. H Shares | 4,423,000 | 4,029,106 |
| China Unicom Ltd. ADR | 289,703 | 4,499,088 |
| Tencent Holdings Ltd. | 174,200 | 5,691,136 |
| 26,493,351 | ||
| DENMARK — 2.7% | ||
| Christian Hansen Holding A/S | 406,904 | 13,172,615 |
| Coloplast A/S B Shares | 24,517 | 5,722,899 |
| Novo Nordisk A/S B Shares | 157,425 | 25,001,164 |
| 43,896,678 | ||
| FINLAND — 0.6% | ||
| Kone Oyj | 134,794 | 10,097,651 |
| FRANCE — 12.7% | ||
| Air Liquide SA | 49,886 | 6,092,813 |
| BNP Paribas SA | 357,114 | 19,945,586 |
| Carrefour SA | 357,198 | 8,819,560 |
| Cie Generale d’Optique Essilor International SA | 124,678 | 12,039,643 |
| Dassault Systemes SA | 79,655 | 9,012,797 |
| Gemalto NV | 118,985 | 10,940,545 |
| L’Oreal SA | 41,225 | 5,594,747 |
| LVMH Moet Hennessy Louis Vuitton SA | 67,898 | 11,912,317 |
| Pernod-Ricard SA | 189,094 | 21,410,348 |
| Publicis Groupe SA | 110,854 | 6,270,729 |
| Sanofi | 400,823 | 35,791,817 |
| Schneider Electric SA | 157,538 | 11,072,049 |
| SES SA | 603,222 | 17,063,328 |
| Technip SA | 146,398 | 17,006,352 |
| Zodiac Aerospace | 109,538 | 12,237,291 |
| 205,209,922 | ||
| GERMANY — 7.8% | ||
| adidas AG | 81,197 | 7,140,727 |
| BASF SE | 224,198 | 20,089,923 |
| Continental AG | 61,796 | 6,839,388 |
| HeidelbergCement AG | 72,723 | 3,952,023 |
| Henkel AG & Co. KGaA Preference Shares | 76,463 | 6,389,278 |
| Kabel Deutschland Holding AG | 247,102 | 17,868,100 |
| Muenchener Rueckversicherungs AG | 157,616 | 26,904,624 |
| SAP AG | 214,716 | 16,766,114 |
| Volkswagen AG Preference Shares | 93,776 | 20,300,317 |
| 126,250,494 | ||
| HONG KONG — 1.6% | ||
| AIA Group Ltd. | 2,278,200 | 8,862,704 |
| Link Real Estate Investment Trust (The) | 1,881,127 | 10,206,368 |
| Sands China Ltd. | 1,436,000 | 6,123,687 |
| 25,192,759 | ||
| INDIA — 0.6% | ||
| HDFC Bank Ltd. ADR | 225,665 | 9,505,010 |
| INDONESIA — 0.8% | ||
| PT Bank Mandiri (Persero) Tbk | 15,661,452 | 13,468,179 |
| IRELAND — 0.6% | ||
| Ryanair Holdings plc ADR | 284,486 | 9,794,853 |
| ITALY — 4.1% | ||
| ENI SpA | 916,287 | 21,664,702 |
| Luxottica Group SpA | 224,712 | 9,220,467 |
| Prada SpA | 1,945,100 | 16,062,347 |
| Saipem SpA | 433,727 | 19,308,595 |
| 66,256,111 | ||
| JAPAN — 12.6% | ||
| Daikin Industries Ltd. | 151,400 | 4,760,463 |
| Daito Trust Construction Co. Ltd. | 133,400 | 12,929,775 |
12
| Shares | Value |
| FANUC Corp. | 62,900 | $ 10,606,053 |
| Fast Retailing Co. Ltd. | 35,300 | 8,016,207 |
| Hitachi Ltd. | 1,614,000 | 9,319,634 |
| Japan Tobacco, Inc. | 403,229 | 12,081,951 |
| KDDI Corp. | 151,803 | 11,233,072 |
| Kubota Corp. | 1,516,000 | 16,091,466 |
| Lawson, Inc. | 150,100 | 10,160,223 |
| Mitsubishi Corp. | 663,600 | 12,566,017 |
| Mitsubishi Estate Co. Ltd. | 803,000 | 15,478,462 |
| Mitsubishi Heavy Industries Ltd. | 1,607,000 | 7,466,258 |
| ORIX Corp. | 183,690 | 18,428,050 |
| Rakuten, Inc. | 930,004 | 7,840,757 |
| Sysmex Corp. | 141,600 | 6,398,496 |
| Toyota Motor Corp. | 600,200 | 25,737,939 |
| Unicharm Corp. | 276,900 | 14,141,432 |
| 203,256,255 | ||
| NETHERLANDS — 2.1% | ||
| ASML Holding NV | 256,590 | 16,031,348 |
| Koninklijke Vopak NV | 248,158 | 18,334,978 |
| 34,366,326 | ||
| NORWAY — 2.8% | ||
| Petroleum Geo-Services ASA | 483,345 | 8,102,041 |
| Statoil ASA | 871,607 | 21,311,437 |
| Telenor ASA | 734,599 | 14,913,873 |
| 44,327,351 | ||
| PERU — 0.6% | ||
| Credicorp Ltd. | 64,362 | 9,004,244 |
| PORTUGAL — 0.4% | ||
| Jeronimo Martins SGPS SA | 331,857 | 6,191,257 |
| RUSSIA — 1.5% | ||
| Magnit OJSC GDR | 486,209 | 17,153,453 |
| Sberbank of Russia | 2,588,639 | 7,610,599 |
| 24,764,052 | ||
| SINGAPORE — 0.7% | ||
| DBS Group Holdings Ltd. | 953,000 | 11,282,033 |
| SOUTH KOREA — 1.6% | ||
| Hyundai Motor Co. | 7,958 | 1,657,228 |
| Samsung Electronics Co. Ltd. | 18,876 | 24,509,079 |
| 26,166,307 | ||
| SPAIN — 2.8% | ||
| Banco Bilbao Vizcaya Argentaria SA | 986,696 | 8,371,911 |
Grifols SA(1) | 668,954 | 21,397,863 |
| Inditex SA | 107,646 | 14,755,904 |
| 44,525,678 | ||
| SWEDEN — 3.2% | ||
| Atlas Copco AB A Shares | 241,350 | 6,217,528 |
| Electrolux AB | 367,775 | 9,623,667 |
| Elekta AB B Shares | 219,270 | 3,168,751 |
| SKF AB B Shares | 236,997 | 5,699,312 |
| Svenska Cellulosa AB B Shares | 196,903 | 3,986,388 |
| Swedbank AB A Shares | 612,518 | 11,314,370 |
| Volvo AB B Shares | 784,672 | 11,115,504 |
| 51,125,520 | ||
| SWITZERLAND — 8.9% | ||
| Adecco SA | 223,753 | 11,056,059 |
| Cie Financiere Richemont SA | 107,533 | 8,290,960 |
| Nestle SA | 516,906 | 33,830,095 |
| Roche Holding AG | 186,066 | 36,622,897 |
| SGS SA | 3,788 | 8,498,167 |
| Syngenta AG | 72,331 | 28,996,403 |
| UBS AG | 540,695 | 8,460,211 |
| Zurich Financial Services AG | 32,544 | 8,305,445 |
| 144,060,237 | ||
| TAIWAN — 1.5% | ||
| Hon Hai Precision Industry Co. Ltd. | 2,743,300 | 8,800,013 |
| Taiwan Semiconductor Manufacturing Co. Ltd. ADR | 930,849 | 16,075,762 |
| 24,875,775 | ||
| THAILAND — 0.9% | ||
| Kasikornbank PCL NVDR | 2,489,800 | 15,170,824 |
| TURKEY — 0.7% | ||
| Turkiye Garanti Bankasi AS | 2,478,220 | 11,761,091 |
| UNITED KINGDOM — 16.4% | ||
| Aggreko plc | 247,663 | 8,856,430 |
| Antofagasta plc | 602,903 | 12,441,326 |
| ARM Holdings plc | 1,412,433 | 17,515,082 |
| BG Group plc | 654,673 | 11,223,068 |
| British American Tobacco plc | 308,540 | 16,184,285 |
| Burberry Group plc | 280,046 | 5,774,459 |
| Capita Group plc (The) | 882,178 | 10,777,039 |
| Carnival plc | 253,630 | 10,260,426 |
| Compass Group plc | 505,621 | 5,840,684 |
| Experian plc | 468,749 | 7,787,938 |
| HSBC Holdings plc (Hong Kong) | 1,719,782 | 17,474,753 |
Lloyds Banking Group plc(1) | 25,468,152 | 18,971,735 |
| Petrofac Ltd. | 219,467 | 5,724,361 |
| Rio Tinto plc | 506,487 | 25,102,779 |
| Rolls-Royce Holdings plc | 627,443 | 8,951,825 |
13
| Shares | Value |
| Rolls-Royce Holdings plc Preference Shares | 47,685,668 | $ 76,400 |
| Standard Chartered plc | 613,434 | 14,299,940 |
| Telecity Group plc | 473,901 | 6,506,865 |
| Unilever plc | 735,301 | 28,308,855 |
| Whitbread plc | 427,358 | 16,425,759 |
| Wolseley plc | 342,152 | 15,880,748 |
| 264,384,757 | ||
TOTAL COMMON STOCKS (Cost $1,246,614,864) | 1,594,399,705 | |
Temporary Cash Investments† | ||
Repurchase Agreement, Bank of America Merrill Lynch, (collateralized by various U.S. Treasury obligations, 1.25% - 2.125%, 4/15/14 - 12/31/15, valued at $106,701), in a joint trading account at 0.18%, dated 11/30/12, due 12/3/12 (Delivery value $104,548) | 104,546 | |
Repurchase Agreement, Credit Suisse First Boston, Inc., (collateralized by various U.S. Treasury obligations, 0.25%, 9/15/15, valued at $106,653), in a joint trading account at 0.17%, dated 11/30/12, due 12/3/12 (Delivery value $104,547) | 104,546 | |
Repurchase Agreement, Goldman Sachs & Co., (collateralized by various U.S. Treasury obligations, 4.25%, 11/15/40, valued at $17,629), in a joint trading account at 0.15%, dated 11/30/12, due 12/3/12 (Delivery value $17,275) | 17,275 | |
TOTAL TEMPORARY CASH INVESTMENTS (Cost $226,367) | 226,367 | |
TOTAL INVESTMENT SECURITIES — 98.9% (Cost $1,246,841,231) | 1,594,626,072 | |
| OTHER ASSETS AND LIABILITIES — 1.1% | 17,263,845 | |
| TOTAL NET ASSETS — 100.0% | $1,611,889,917 | |
| Market Sector Diversification | |
| (as a % of net assets) | |
| Financials | 19.3% |
| Consumer Discretionary | 15.0% |
| Industrials | 14.0% |
| Consumer Staples | 12.9% |
| Materials | 10.5% |
| Health Care | 9.7% |
| Information Technology | 9.1% |
| Energy | 6.4% |
| Telecommunication Services | 2.0% |
| Cash and Equivalents* | 1.1% |
| *Includes temporary cash investments and other assets and liabilities. | |
Notes to Schedule of Investments
ADR = American Depositary Receipt
GDR = Global Depositary Receipt
NVDR = Non-Voting Depositary Receipt
OJSC = Open Joint Stock Company
| † | Category is less than 0.05% of total net assets. |
| (1) | Non-income producing. |
See Notes to Financial Statements.
14
| NOVEMBER 30, 2012 | ||||
| Assets | ||||
| Investment securities, at value (cost of $1,246,841,231) | $1,594,626,072 | |||
| Foreign currency holdings, at value (cost of $908,912) | 907,665 | |||
| Receivable for investments sold | 28,705,255 | |||
| Receivable for capital shares sold | 2,031,381 | |||
| Dividends and interest receivable | 5,982,775 | |||
| Other assets | 1,135,487 | |||
| 1,633,388,635 | ||||
| Liabilities | ||||
| Disbursements in excess of demand deposit cash | 1,031,964 | |||
| Payable for investments purchased | 17,163,163 | |||
| Payable for capital shares redeemed | 1,685,556 | |||
| Accrued management fees | 1,575,695 | |||
| Distribution and service fees payable | 42,340 | |||
| 21,498,718 | ||||
| Net Assets | $1,611,889,917 | |||
| Net Assets Consist of: | ||||
| Capital (par value and paid-in surplus) | $1,462,376,313 | |||
| Undistributed net investment income | 17,202,739 | |||
| Accumulated net realized loss | (215,719,442 | ) | ||
| Net unrealized appreciation | 348,030,307 | |||
| $1,611,889,917 | ||||
| Net assets | Shares outstanding | Net asset value per share | |
| Investor Class, $0.01 Par Value | $1,268,250,707 | 112,488,919 | $11.27 |
| Institutional Class, $0.01 Par Value | $140,445,722 | 12,500,668 | $11.24 |
| A Class, $0.01 Par Value | $198,434,010 | 17,521,333 | $11.33* |
| C Class, $0.01 Par Value | $2,497,283 | 224,171 | $11.14 |
| R Class, $0.01 Par Value | $2,262,195 | 198,227 | $11.41 |
*Maximum offering price $12.02 (net asset value divided by 0.9425).
See Notes to Financial Statements.
15
| YEAR ENDED NOVEMBER 30, 2012 | ||||
| Investment Income (Loss) | ||||
| Income: | ||||
| Dividends (net of foreign taxes withheld of $3,950,909) | $41,223,381 | |||
| Interest | 3,519 | |||
| 41,226,900 | ||||
| Expenses: | ||||
| Management fees | 19,307,166 | |||
| Distribution and service fees: | ||||
| A Class | 461,127 | |||
| C Class | 25,234 | |||
| R Class | 12,783 | |||
| Directors’ fees and expenses | 59,440 | |||
| Other expenses | 61,950 | |||
| 19,927,700 | ||||
| Net investment income (loss) | 21,299,200 | |||
| Realized and Unrealized Gain (Loss) | ||||
| Net realized gain (loss) on: | ||||
| Investment transactions (net of foreign tax expenses paid (refunded) of $(50,354)) | 74,191,382 | |||
| Foreign currency transactions | (849,814 | ) | ||
| 73,341,568 | ||||
| Change in net unrealized appreciation (depreciation) on: | ||||
| Investments | 124,276,145 | |||
| Translation of assets and liabilities in foreign currencies | (17,447 | ) | ||
| 124,258,698 | ||||
| Net realized and unrealized gain (loss) | 197,600,266 | |||
| Net Increase (Decrease) in Net Assets Resulting from Operations | $218,899,466 | |||
See Notes to Financial Statements.
16
| YEARS ENDED NOVEMBER 30, 2012 AND NOVEMBER 30, 2011 | |||||||
| Increase (Decrease) in Net Assets | November 30, 2012 | November 30, 2011 | |||||
| Operations | |||||||
| Net investment income (loss) | $21,299,200 | $15,531,786 | |||||
| Net realized gain (loss) | 73,341,568 | 63,882,952 | |||||
| Change in net unrealized appreciation (depreciation) | 124,258,698 | (110,791,553 | ) | ||||
| Net increase (decrease) in net assets resulting from operations | 218,899,466 | (31,376,815 | ) | ||||
| Distributions to Shareholders | |||||||
| From net investment income: | |||||||
| Investor Class | (13,149,175 | ) | (19,326,387 | ) | |||
| Institutional Class | (1,737,113 | ) | (1,926,383 | ) | |||
| A Class | (1,045,144 | ) | (1,708,891 | ) | |||
| R Class | (2,865 | ) | (16,637 | ) | |||
| Decrease in net assets from distributions | (15,934,297 | ) | (22,978,298 | ) | |||
| Capital Share Transactions | |||||||
| Net increase (decrease) in net assets from capital share transactions | (72,934,859 | ) | (75,665,759 | ) | |||
| Redemption Fees | |||||||
| Increase in net assets from redemption fees | 25,535 | 44,407 | |||||
| Net increase (decrease) in net assets | 130,055,845 | (129,976,465 | ) | ||||
| Net Assets | |||||||
| Beginning of period | 1,481,834,072 | 1,611,810,537 | |||||
| End of period | $1,611,889,917 | $1,481,834,072 | |||||
| Undistributed net investment income | $17,202,739 | $12,578,355 | |||||
See Notes to Financial Statements.
17
NOVEMBER 30, 2012
1. Organization
American Century World Mutual Funds, Inc. (the corporation) is registered under the Investment Company Act of 1940, as amended (the 1940 Act), as an open-end management investment company and is organized as a Maryland corporation. International Growth Fund (the fund) is one fund in a series issued by the corporation. The fund is diversified as defined under the 1940 Act. The fund’s investment objective is to seek capital growth. The fund pursues its objective by investing primarily in equity securities of companies in at least three developed countries (excluding the United States).
The fund offers the Investor Class, the Institutional Class, the A Class, the C Class and the R Class. The A Class may incur an initial sales charge. The A Class and C Class may be subject to a contingent deferred sales charge. The share classes differ principally in their respective sales charges and distribution and shareholder servicing expenses and arrangements. The Institutional Class is made available to institutional shareholders or through financial intermediaries whose clients do not require the same level of shareholder and administrative services as shareholders of other classes. As a result, the Institutional Class is charged a lower unified management fee. On October 21, 2011, all outstanding B Class shares were converted to A Class shares and the fund discontinued offering the B Class.
2. Significant Accounting Policies
The following is a summary of significant accounting policies consistently followed by the fund in preparation of its financial statements. The financial statements are prepared in conformity with accounting principles generally accepted in the United States of America, which may require management to make certain estimates and assumptions at the date of the financial statements. Actual results could differ from these estimates.
Investment Valuations — The fund determines the fair value of its investments and computes its net asset value per share as of the close of regular trading (usually 4 p.m. Eastern time) on the New York Stock Exchange (NYSE) on each day the NYSE is open.
Equity securities that are listed or traded on a domestic securities exchange are valued at the last reported sales price or at the official closing price as provided by the exchange. Equity securities traded on foreign securities exchanges are typically valued at the closing price on the exchange where primarily traded or as of the close of the NYSE, if that is earlier. If no last sales price is reported, or if local convention or regulation so provides, the mean of the latest bid and asked prices is used. Depending on local convention or regulation, securities traded over-the-counter are valued at the mean of the latest bid and asked prices, the last sales price, or the official closing price. In its determination of fair value, the fund may review several factors including: market information specific to a security; news developments in U.S. and foreign markets; the performance of particular U.S. and foreign securities, indices, comparable securities, American Depositary Receipts, Exchange-Traded Funds, and other relevant market indicators.
Debt securities maturing within 60 days at the time of purchase may be valued at cost, plus or minus any amortized discount or premium or at the evaluated mean as provided by an independent pricing service. Evaluated mean prices are commonly derived through utilization of market models, which may consider, among other factors, trade data, quotations from dealers and active market makers, relevant yield curve and spread data, related sector levels, creditworthiness, and other relevant market information on the same or comparable securities.
Investments in open-end management investment companies are valued at the reported net asset value per share. Repurchase agreements are valued at cost.
The value of investments initially expressed in foreign currencies is translated into U.S. dollars at prevailing exchange rates.
18
If the fund determines that the market price for a portfolio security is not readily available or the valuation methods mentioned above do not reflect a security’s fair value, such security is valued as determined in good faith by the Board of Directors or its designee, in accordance with procedures adopted by the Board of Directors. Circumstances that may cause the fund to use these procedures to value a security include, but are not limited to: a security has been declared in default; trading in a security has been halted during the trading day; there is a foreign market holiday and no trading occurred; or an event occurred between the close of a foreign exchange and the NYSE that may affect the value of a security.
Security Transactions — Security transactions are accounted for as of the trade date. Net realized gains and losses are determined on the identified cost basis, which is also used for federal income tax purposes. Certain countries impose taxes on realized gains on the sale of securities registered in their country. The fund records the foreign tax expense, if any, on an accrual basis. The foreign tax expense on realized gains and unrealized appreciation reduces the net realized gain (loss) on investment transactions and net unrealized appreciation (depreciation) on investments, respectively.
Investment Income — Dividend income less foreign taxes withheld, if any, is recorded as of the ex-dividend date. Distributions received on securities that represent a return of capital or capital gain are recorded as a reduction of cost of investments and/or as a realized gain. The fund estimates the components of distributions received that may be considered nontaxable distributions or capital gain distributions for income tax purposes. Interest income is recorded on the accrual basis and includes accretion of discounts and amortization of premiums.
Foreign Currency Translations — All assets and liabilities initially expressed in foreign currencies are translated into U.S. dollars at prevailing exchange rates at period end. The fund may enter into spot foreign currency exchange contracts to facilitate transactions denominated in a foreign currency. Purchases and sales of investment securities, dividend and interest income, spot foreign currency exchange contracts, and expenses are translated at the rates of exchange prevailing on the respective dates of such transactions. Net realized and unrealized foreign currency exchange gains or losses related to investment securities are a component of net realized gain (loss) on investment transactions and change in net unrealized appreciation (depreciation) on investments, respectively.
Repurchase Agreements — The fund may enter into repurchase agreements with institutions that American Century Investment Management, Inc. (ACIM) (the investment advisor) has determined are creditworthy pursuant to criteria adopted by the Board of Directors. The fund requires that the collateral, represented by securities, received in a repurchase transaction be transferred to the custodian in a manner sufficient to enable the fund to obtain those securities in the event of a default under the repurchase agreement. ACIM monitors, on a daily basis, the securities transferred to ensure the value, including accrued interest, of the securities under each repurchase agreement is equal to or greater than amounts owed to the fund under each repurchase agreement.
Joint Trading Account — Pursuant to an Exemptive Order issued by the Securities and Exchange Commission, the fund, along with certain other funds in the American Century Investments family of funds, may transfer uninvested cash balances into a joint trading account. These balances are invested in one or more repurchase agreements that are collateralized by U.S. Treasury or Agency obligations.
Income Tax Status — It is the fund’s policy to distribute substantially all net investment income and net realized gains to shareholders and to otherwise qualify as a regulated investment company under provisions of the Internal Revenue Code. The fund is no longer subject to examination by tax authorities for years prior to 2009. Additionally, non-U.S. tax returns filed by the fund due to investments in certain foreign securities remain subject to examination by the relevant taxing authority for seven years from the date of filing. At this time, management believes there are no uncertain tax positions which, based on their technical merit, would not be sustained upon examination and for which it is reasonably possible that the total amounts of unrecognized tax benefits will significantly change in the next twelve months. Accordingly, no provision has been made for federal or state income taxes.
19
Multiple Class — All shares of the fund represent an equal pro rata interest in the net assets of the class to which such shares belong, and have identical voting, dividend, liquidation and other rights and the same terms and conditions, except for class specific expenses and exclusive rights to vote on matters affecting only individual classes. Income, non-class specific expenses, and realized and unrealized capital gains and losses of the fund are allocated to each class of shares based on their relative net assets.
Distributions to Shareholders — Distributions from net investment income and net realized gains, if any, are generally declared and paid annually. The fund may make distributions on a more frequent basis to comply with the distribution requirements of the Internal Revenue Code, in all events in a manner consistent with provisions of the 1940 Act.
Redemption — The fund may impose a 2.00% redemption fee on shares held less than 60 days. The fee may not be applicable to all classes. The redemption fee is retained by the fund and helps cover transaction costs that long-term investors may bear when the fund sells securities to meet investor redemptions.
Indemnifications — Under the corporation’s organizational documents, its officers and directors are indemnified against certain liabilities arising out of the performance of their duties to the fund. In addition, in the normal course of business, the fund enters into contracts that provide general indemnifications. The maximum exposure under these arrangements is unknown as this would involve future claims that may be made against a fund. The risk of material loss from such claims is considered by management to be remote.
3. Fees and Transactions with Related Parties
Management Fees — The corporation has entered into a management agreement with ACIM, under which ACIM provides the fund with investment advisory and management services in exchange for a single, unified management fee (the fee) per class. The agreement provides that all expenses of managing and operating the fund, except distribution and service fees, brokerage expenses, taxes, interest, fees and expenses of the independent directors (including legal counsel fees), and extraordinary expenses, will be paid by ACIM. The fee is computed and accrued daily based on each class’s daily net assets and paid monthly in arrears. The rate of the fee is determined by applying a fee rate calculation formula. This formula takes into account the fund’s assets as well as certain assets, if any, of other clients of the investment advisor outside the American Century Investments family of funds (such as subadvised funds and separate accounts) that have very similar investment teams and investment strategies (strategy assets). The strategy assets of the fund include the assets of NT International Growth Fund, one fund in a series issued by the corporation. The annual management fee schedule ranges from 1.10% to 1.50% for the Investor Class, A Class, C Class and R Class. The Institutional Class is 0.20% less at each point within the range. The effective annual management fee for each class for the year ended November 30, 2012 was 1.28% for the Investor Class, A Class, C Class and R Class and 1.08% for the Institutional Class.
Distribution and Service Fees — The Board of Directors has adopted a separate Master Distribution and Individual Shareholder Services Plan for each of the A Class, C Class and R Class (collectively the plans), pursuant to Rule 12b-1 of the 1940 Act. The plans provide that the A Class will pay American Century Investment Services, Inc. (ACIS) an annual distribution and service fee of 0.25%. The plans provide that the C Class will pay ACIS an annual distribution and service fee of 1.00%, of which 0.25% is paid for individual shareholder services and 0.75% is paid for distribution services. The plans provide that the R Class will pay ACIS an annual distribution and service fee of 0.50%. The fees are computed and accrued daily based on each class’s daily net assets and paid monthly in arrears. The fees are used to pay financial intermediaries for distribution and individual shareholder services. Fees incurred under the plans during the year ended November 30, 2012 are detailed in the Statement of Operations.
20
Related Parties — Certain officers and directors of the corporation are also officers and/or directors of American Century Companies, Inc., the parent of the corporation’s investment advisor, ACIM, the distributor of the corporation, ACIS, and the corporation’s transfer agent, American Century Services, LLC. Various funds issued by American Century Asset Allocation Portfolios, Inc. and American Century Strategic Asset Allocations, Inc. own, in aggregate, 16% of the shares of the fund. These funds do not invest in the fund for the purpose of exercising management or control.
4. Investment Transactions
Purchases and sales of investment securities, excluding short-term investments, for the year ended November 30, 2012 were $1,607,235,742 and $1,678,764,254, respectively.
For the year ended November 30, 2012, the fund incurred net realized gains of $2,024,508 from redemptions in kind. A redemption in kind occurs when a fund delivers securities from its portfolio in lieu of cash as payment to a redeeming shareholder.
5. Capital Share Transactions
Transactions in shares of the fund were as follows:
| Year ended November 30, 2012 | Year ended November 30, 2011 | ||||||||||||||
| Shares | Amount | Shares | Amount | ||||||||||||
| Investor Class/Shares Authorized | 1,050,000,000 | 1,050,000,000 | |||||||||||||
| Sold | 9,540,301 | $99,145,757 | 10,121,066 | $109,941,099 | |||||||||||
| Issued in reinvestment of distributions | 1,289,908 | 12,769,602 | 1,682,293 | 18,745,403 | |||||||||||
| Redeemed | (18,475,303 | ) | (191,498,787 | ) | (19,927,980 | ) | (217,005,403 | ) | |||||||
| (7,645,094 | ) | (79,583,428 | ) | (8,124,621 | ) | (88,318,901 | ) | ||||||||
| Institutional Class/Shares Authorized | 150,000,000 | 150,000,000 | |||||||||||||
| Sold | 3,648,208 | 37,988,069 | 3,306,762 | 34,650,632 | |||||||||||
| Issued in reinvestment of distributions | 174,599 | 1,721,641 | 171,269 | 1,903,792 | |||||||||||
| Redeemed | (2,828,496 | ) | (29,753,415 | ) | (1,541,029 | ) | (16,717,393 | ) | |||||||
| 994,311 | 9,956,295 | 1,937,002 | 19,837,031 | ||||||||||||
| A Class/Shares Authorized | 125,000,000 | 125,000,000 | |||||||||||||
| Sold | 3,603,895 | 36,787,526 | 7,748,808 | 81,672,620 | |||||||||||
| Issued in reinvestment of distributions | 102,434 | 1,020,551 | 93,927 | 1,049,896 | |||||||||||
| Redeemed | (3,616,301 | ) | (39,295,456 | ) | (8,287,690 | ) | (87,839,910 | ) | |||||||
| 90,028 | (1,487,379 | ) | (444,955 | ) | (5,117,394 | ) | |||||||||
| B Class/Shares Authorized | N/A | 10,000,000 | |||||||||||||
| Sold | 415 | 4,343 | |||||||||||||
| Redeemed | (121,378 | ) | (1,230,969 | ) | |||||||||||
| (120,963 | ) | (1,226,626 | ) | ||||||||||||
| C Class/Shares Authorized | 10,000,000 | 10,000,000 | |||||||||||||
| Sold | 11,788 | 123,154 | 57,636 | 635,001 | |||||||||||
| Redeemed | (66,460 | ) | (667,358 | ) | (44,445 | ) | (469,982 | ) | |||||||
| (54,672 | ) | (544,204 | ) | 13,191 | 165,019 | ||||||||||
| R Class/Shares Authorized | 5,000,000 | 5,000,000 | |||||||||||||
| Sold | 41,567 | 440,298 | 64,918 | 725,158 | |||||||||||
| Issued in reinvestment of distributions | 250 | 2,536 | 1,323 | 14,931 | |||||||||||
| Redeemed | (166,772 | ) | (1,718,977 | ) | (167,533 | ) | (1,744,977 | ) | |||||||
| (124,955 | ) | (1,276,143 | ) | (101,292 | ) | (1,004,888 | ) | ||||||||
| Net increase (decrease) | (6,740,382 | ) | $(72,934,859 | ) | (6,841,638 | ) | $(75,665,759 | ) | |||||||
21
6. Fair Value Measurements
The fund’s securities valuation process is based on several considerations and may use multiple inputs to determine the fair value of the positions held by the fund. In conformity with accounting principles generally accepted in the United States of America, the inputs used to determine a valuation are classified into three broad levels as follows:
| • | Level 1 valuation inputs consist of unadjusted quoted prices in an active market for identical securities; |
| • | Level 2 valuation inputs consist of direct or indirect observable market data (including quoted prices for similar securities, evaluations of subsequent market events, interest rates, prepayment speeds, credit risk, etc.); or |
| • | Level 3 valuation inputs consist of unobservable data (including a fund’s own assumptions). |
The level classification is based on the lowest level input that is significant to the fair valuation measurement. The valuation inputs are not necessarily an indication of the risks associated with investing in these securities or other financial instruments.
The following is a summary of the level classifications as of period end. The Schedule of Investments provides additional information on the fund’s portfolio holdings.
| Level 1 | Level 2 | Level 3 | |
| Investment Securities | |||
| Foreign Common Stocks | $52,939,964 | $1,541,459,741 | — |
| Temporary Cash Investments | — | 226,367 | — |
| Total Value of Investment Securities | $52,939,964 | $1,541,686,108 | — |
7. Risk Factors
There are certain risks involved in investing in foreign securities. These risks include those resulting from future adverse political, social and economic developments, fluctuations in currency exchange rates, the possible imposition of exchange controls, and other foreign laws or restrictions. Investing in emerging markets may accentuate these risks.
The fund’s investment process may result in high portfolio turnover, which could mean high transaction costs, affecting both performance and capital gains tax liabilities to investors.
8. Federal Tax Information
On December 18, 2012, the fund declared and paid the following per-share distributions from net investment income to shareholders of record on December 17, 2012:
| Investor | Institutional | A | C | R |
| $0.1341 | $0.1405 | $0.1260 | $0.1019 | $0.1180 |
The tax character of distributions paid during the years ended November 30, 2012 and November 30, 2011 were as follows:
| 2012 | 2011 | |
| Distributions Paid From | ||
| Ordinary income | $15,934,297 | $22,978,298 |
| Long-term capital gains | — | — |
22
The book-basis character of distributions made during the year from net investment income or net realized gains may differ from their ultimate characterization for federal income tax purposes. These differences reflect the differing character of certain income items and net realized gains and losses for financial statement and tax purposes, and may result in reclassification among certain capital accounts on the financial statements.
As of November 30, 2012, the federal tax cost of investments and the components of distributable earnings on a tax-basis were as follows:
| Federal tax cost of investments | $1,283,133,092 |
| Gross tax appreciation of investments | $326,387,905 |
| Gross tax depreciation of investments | (14,894,925) |
| Net tax appreciation (depreciation) of investments | $311,492,980 |
| Net tax appreciation (depreciation) on translation of assets and liabilities in foreign currencies | $ 253,872 |
| Net tax appreciation (depreciation) | $311,746,852 |
| Undistributed ordinary income | $25,983,059 |
| Accumulated short-term capital losses | $(188,216,307) |
The difference between book-basis and tax-basis cost and unrealized appreciation (depreciation) is attributable primarily to the tax deferral of losses on wash sales and the realization to ordinary income for tax purposes of unrealized gains on investments in passive foreign investment companies.
Accumulated capital losses represent net capital loss carryovers that may be used to offset future realized capital gains for federal income tax purposes. Future capital loss carryover utilization in any given year may be subject to Internal Revenue Code limitations. Capital loss carryovers of $(6,402,967) and $(181,813,340) expire in 2016 and 2017, respectively.
23
| For a Share Outstanding Throughout the Years Ended November 30 (except as noted) | |||||||||||||
| Per-Share Data | Ratios and Supplemental Data | ||||||||||||
| Income From Investment Operations: | Distributions From: | Ratio to Average Net Assets of: | |||||||||||
Net Asset Value, Beginning of Period | Net Investment Income (Loss)(1) | Net Realized and Unrealized Gain (Loss) | Total From Investment Operations | Net Investment Income | Net Realized Gains | Total Distributions | Net Asset Value, End of Period | Total Return(2) | Operating Expenses | Net Investment Income (Loss) | Portfolio Turnover Rate | Net Assets, End of Period (in thousands) | |
| Investor Class | |||||||||||||
| 2012 | $9.90 | 0.15 | 1.33 | 1.48 | (0.11) | — | (0.11) | $11.27 | 15.10% | 1.29% | 1.41% | 106% | $1,268,251 |
| 2011 | $10.30 | 0.10 | (0.35) | (0.25) | (0.15) | — | (0.15) | $9.90 | (2.57)% | 1.32% | 0.95% | 125% | $1,189,245 |
| 2010 | $9.75 | 0.09 | 0.61 | 0.70 | (0.15) | — | (0.15) | $10.30 | 7.28% | 1.35% | 0.87% | 130% | $1,320,906 |
| 2009 | $7.15 | 0.09 | 2.64 | 2.73 | (0.13) | — | (0.13) | $9.75 | 38.66% | 1.38% | 1.18% | 151% | $1,279,615 |
| 2008 | $14.87 | 0.14 | (6.96) | (6.82) | (0.11) | (0.79) | (0.90) | $7.15 | (48.67)% | 1.31% | 1.18% | 144% | $1,018,753 |
| Institutional Class | |||||||||||||
| 2012 | $9.89 | 0.17 | 1.33 | 1.50 | (0.15) | — | (0.15) | $11.24 | 15.28% | 1.09% | 1.61% | 106% | $140,446 |
| 2011 | $10.30 | 0.12 | (0.33) | (0.21) | (0.20) | — | (0.20) | $9.89 | (2.27)% | 1.12% | 1.15% | 125% | $113,741 |
| 2010 | $9.78 | 0.10 | 0.61 | 0.71 | (0.19) | — | (0.19) | $10.30 | 7.38% | 1.15% | 1.07% | 130% | $98,610 |
| 2009 | $7.17 | 0.11 | 2.64 | 2.75 | (0.14) | — | (0.14) | $9.78 | 38.96% | 1.18% | 1.38% | 151% | $66,920 |
| 2008 | $14.91 | 0.15 | (6.96) | (6.81) | (0.14) | (0.79) | (0.93) | $7.17 | (48.55)% | 1.11% | 1.38% | 144% | $37,160 |
A Class(3) | |||||||||||||
| 2012 | $9.92 | 0.12 | 1.35 | 1.47 | (0.06) | — | (0.06) | $11.33 | 14.80% | 1.54% | 1.16% | 106% | $198,434 |
| 2011 | $10.29 | 0.08 | (0.35) | (0.27) | (0.10) | — | (0.10) | $9.92 | (2.76)% | 1.57% | 0.70% | 125% | $172,901 |
| 2010 | $9.72 | 0.06 | 0.61 | 0.67 | (0.10) | — | (0.10) | $10.29 | 6.98% | 1.60% | 0.62% | 130% | $183,990 |
| 2009 | $7.13 | 0.07 | 2.63 | 2.70 | (0.11) | — | (0.11) | $9.72 | 38.30% | 1.63% | 0.93% | 151% | $177,804 |
| 2008 | $14.82 | 0.11 | (6.94) | (6.83) | (0.07) | (0.79) | (0.86) | $7.13 | (48.79)% | 1.56% | 0.93% | 144% | $140,798 |
24
| For a Share Outstanding Throughout the Years Ended November 30 (except as noted) | |||||||||||||
| Per-Share Data | Ratios and Supplemental Data | ||||||||||||
| Income From Investment Operations: | Distributions From: | Ratio to Average Net Assets of: | |||||||||||
Net Asset Value, Beginning of Period | Net Investment Income (Loss)(1) | Net Realized and Unrealized Gain (Loss) | Total From Investment Operations | Net Investment Income | Net Realized Gains | Total Distributions | Net Asset Value, End of Period | Total Return(2) | Operating Expenses | Net Investment Income (Loss) | Portfolio Turnover Rate | Net Assets, End of Period (in thousands) | |
| C Class | |||||||||||||
| 2012 | $9.77 | 0.04 | 1.33 | 1.37 | — | — | — | $11.14 | 14.02% | 2.29% | 0.41% | 106% | $2,497 |
| 2011 | $10.13 | —(4) | (0.36) | (0.36) | — | — | — | $9.77 | (3.55)% | 2.32% | (0.05)% | 125% | $2,725 |
| 2010 | $9.54 | (0.01) | 0.60 | 0.59 | — | — | — | $10.13 | 6.18% | 2.35% | (0.13)% | 130% | $2,691 |
| 2009 | $7.00 | 0.01 | 2.59 | 2.60 | (0.06) | — | (0.06) | $9.54 | 37.29% | 2.38% | 0.18% | 151% | $3,051 |
| 2008 | $14.60 | 0.02 | (6.83) | (6.81) | — | (0.79) | (0.79) | $7.00 | (49.18)% | 2.31% | 0.18% | 144% | $3,210 |
| R Class | |||||||||||||
| 2012 | $9.97 | 0.10 | 1.35 | 1.45 | (0.01) | — | (0.01) | $11.41 | 14.56% | 1.79% | 0.91% | 106% | $2,262 |
| 2011 | $10.32 | 0.05 | (0.36) | (0.31) | (0.04) | — | (0.04) | $9.97 | (3.05)% | 1.82% | 0.45% | 125% | $3,222 |
| 2010 | $9.72 | 0.03 | 0.62 | 0.65 | (0.05) | — | (0.05) | $10.32 | 6.75% | 1.85% | 0.37% | 130% | $4,381 |
| 2009 | $7.13 | 0.06 | 2.62 | 2.68 | (0.09) | — | (0.09) | $9.72 | 37.97% | 1.88% | 0.68% | 151% | $5,436 |
| 2008 | $14.81 | 0.09 | (6.96) | (6.87) | (0.02) | (0.79) | (0.81) | $7.13 | (48.92)% | 1.81% | 0.68% | 144% | $2,727 |
Notes to Financial Highlights
| (1) | Computed using average shares outstanding throughout the period. |
| (2) | Total returns are calculated based on the net asset value of the last business day and do not reflect applicable sales charges, if any. Total returns for periods less than one year are not annualized. |
| (3) | Prior to December 3, 2007, the A Class was referred to as the Advisor Class. |
| (4) | Per-share amount was less than $0.005. |
See Notes to Financial Statements.
25
The Board of Directors and Shareholders of
American Century World Mutual Funds, Inc.:
We have audited the accompanying statement of assets and liabilities, including the schedule of investments, of International Growth Fund, one of the funds constituting American Century World Mutual Funds, Inc. (the “Corporation”) as of November 30, 2012, and the related statement of operations for the year then ended, the statement of changes in net assets for each of the two years in the period then ended, and the financial highlights for each of the five years in the period then ended. These financial statements and financial highlights are the responsibility of the Corporation’s management. Our responsibility is to express an opinion on these financial statements and financial highlights based on our audits.
We conducted our audits in accordance with the standards of the Public Company Accounting Oversight Board (United States). Those standards require that we plan and perform the audit to obtain reasonable assurance about whether the financial statements and financial highlights are free of material misstatement. The Corporation is not required to have, nor were we engaged to perform, an audit of its internal control over financial reporting. Our audits included consideration of internal control over financial reporting as a basis for designing audit procedures that are appropriate in the circumstances, but not for the purpose of expressing an opinion on the effectiveness of the Corporation’s internal control over financial reporting. Accordingly, we express no such opinion. An audit also includes examining, on a test basis, evidence supporting the amounts and disclosures in the financial statements, assessing the accounting principles used and significant estimates made by management, as well as evaluating the overall financial statement presentation. Our procedures included confirmation of securities owned as of November 30, 2012, by correspondence with the custodian and brokers; where replies were not received from brokers, we performed other auditing procedures. We believe that our audits provide a reasonable basis for our opinion.
In our opinion, the financial statements and financial highlights referred to above present fairly, in all material respects, the financial position of International Growth Fund of American Century World Mutual Funds, Inc., as of November 30, 2012, the results of its operations for the year then ended, the changes in its net assets for each of the two years in the period then ended, and the financial highlights for each of the five years in the period then ended, in conformity with accounting
principles generally accepted in the United States of America.
Deloitte & Touche LLP
Kansas City, Missouri
January 17, 2013
26
The Board of Directors
The individuals listed below serve as directors of the funds. Each director will continue to serve in this capacity until death, retirement, resignation or removal from office. The mandatory retirement age for directors who are not “interested persons,” as that term is defined in the Investment Company Act (independent directors), is 72. However, the mandatory retirement age for an individual director may be extended with the approval of the remaining independent directors.
Mr. Thomas is an “interested person” because he currently serves as President and Chief Executive Officer of American Century Companies, Inc. (ACC), the parent company of American Century Investment Management, Inc. (ACIM or the advisor). Mr. Fink is an “interested person” because he currently serves as Executive Vice President of ACC.
The other directors (more than three-fourths of the total number) are independent; that is, they have never been employees, directors or officers of, and have no financial interest in, ACC or any of its wholly owned, direct or indirect, subsidiaries, including ACIM, American Century Investment Services, Inc. (ACIS) and American Century Services, LLC (ACS). The directors serve in this capacity for seven (in the case of Mr. Thomas, 15) registered investment companies in the American Century Investments family of funds.
The following table presents additional information about the directors. The mailing address for each director is 4500 Main Street, Kansas City, Missouri 64111.
Name (Year of Birth) | Position(s) Held with Funds | Length of Time Served | Principal Occupation(s) During Past 5 Years | Number of American Century Portfolios Overseen by Director | Other Directorships Held During Past 5 Years | ||
| Independent Directors | |||||||
Thomas A. Brown (1940) | Director | Since 1980 | Managing Member, Associated Investments, LLC (real estate investment company); Brown Cascade Properties, LLC (real estate investment company) (2001 to 2009) | 66 | None | ||
Andrea C. Hall (1945) | Director | Since 1997 | Retired | 66 | None | ||
Jan M. Lewis (1957) | Director | Since 2011 | President and Chief Executive Officer, Catholic Charities of Northeast Kansas (human services organization) | 66 | None | ||
James A. Olson (1942) | Director | Since 2007 | Member, Plaza Belmont LLC (private equity fund manager) | 66 | Saia, Inc. (2002 to 2012) and Entertainment Properties Trust | ||
Donald H. Pratt (1937) | Director and Chairman of the Board | Since 1995 (Chairman since 2005) | Chairman and Chief Executive Officer, Western Investments, Inc. (real estate company) | 66 | None | ||
27
Name (Year of Birth) | Position(s) Held with Funds | Length of Time Served | Principal Occupation(s) During Past 5 Years | Number of American Century Portfolios Overseen by Director | Other Directorships Held During Past 5 Years | ||
| Independent Directors | |||||||
M. Jeannine Strandjord (1945) | Director | Since 1994 | Retired | 66 | Euronet Worldwide Inc.; Charming Shoppes, Inc. (2006 to 2010); and DST Systems Inc. (1996 to 2012) | ||
John R. Whitten (1946) | Director | Since 2008 | Retired | 66 | Rudolph Technologies, Inc. | ||
Stephen E. Yates (1948) | Director | Since 2012 | Retired; Executive Vice President, Technology & Operations, KeyCorp. (computer services) (2004 to 2010) | 66 | Applied Industrial Technologies, Inc. (2001 to 2010) | ||
| Interested Directors | |||||||
Barry Fink (1955) | Director and Executive Vice President | Since 2012 (Executive Vice President since 2007) | Executive Vice President, ACC (September 2007 to present); President, ACS (October 2007 to present); Chief Operating Officer, ACC (September 2007 to November 2012). Also serves as Manager, ACS | 66 | None | ||
Jonathan S. Thomas (1963) | Director and President | Since 2007 | President and Chief Executive Officer, ACC (March 2007 to present). Also serves as Chief Executive Officer and Manager, ACS; Executive Vice President, ACIM; Director, ACC, ACIM and other ACC subsidiaries | 108 | None | ||
28
Officers
The following table presents certain information about the executive officers of the funds. Each officer serves as an officer for each of the 15 investment companies in the American Century family of funds, unless otherwise noted. No officer is compensated for his or her service as an officer of the funds. The listed officers are interested persons of the funds and are appointed or re-appointed on an annual basis. The mailing address for each officer listed below is 4500 Main Street, Kansas City, Missouri 64111.
Name (Year of Birth) | Offices with the Funds | Principal Occupation(s) During the Past Five Years | |
Jonathan S. Thomas (1963) | Director and President since 2007 | President and Chief Executive Officer, ACC (March 2007 to present). Also serves as Chief Executive Officer and Manager, ACS; Executive Vice President, ACIM; Director, ACC, ACIM and other ACC subsidiaries | |
Barry Fink (1955) | Director since 2012 and Executive Vice President since 2007 | Executive Vice President, ACC (September 2007 to present); President, ACS (October 2007 to present); Chief Operating Officer, ACC (September 2007 to November 2012). Also serves as Manager, ACS | |
Maryanne L. Roepke (1956) | Chief Compliance Officer since 2006 and Senior Vice President since 2000 | Chief Compliance Officer, American Century funds, ACIM and ACS (August 2006 to present). Also serves as Senior Vice President, ACS | |
Charles A. Etherington (1957) | General Counsel since 2007 and Senior Vice President since 2006 | Attorney, ACC (February 1994 to present); Vice President, ACC (November 2005 to present), General Counsel, ACC (March 2007 to present). Also serves as General Counsel, ACIM, ACS, ACIS and other ACC subsidiaries; and Senior Vice President, ACIM and ACS | |
C. Jean Wade (1964) | Vice President, Treasurer and Chief Financial Officer since 2012 | Vice President, ACS (February 2000 to present) | |
Robert J. Leach (1966) | Vice President since 2006 and Assistant Treasurer since 2012 | Vice President, ACS (February 2000 to present) | |
David H. Reinmiller (1963) | Vice President since 2000 | Attorney, ACC (January 1994 to present); Associate General Counsel, ACC (January 2001 to present). Also serves as Vice President, ACIM and ACS | |
Ward D. Stauffer (1960) | Secretary since 2005 | Attorney, ACC (June 2003 to present) |
The Statement of Additional Information has additional information about the fund’s directors and is available without charge, upon request, by calling 1-800-345-2021.
29
At a meeting held on June 21, 2012, the Fund’s Board of Directors unanimously approved the renewal of the management agreement pursuant to which American Century Investment Management, Inc. (the “Advisor”) acts as the investment advisor for the Fund. Under Section 15(c) of the Investment Company Act, contracts for investment advisory services are required to be reviewed, evaluated, and approved by a majority of a fund’s independent directors (the “Directors”) each year.
As a part of the approval process, the Board requested and reviewed extensive data and information compiled by the Advisor and certain independent providers of evaluation data concerning the Fund and the services provided to the Fund by the Advisor. This review was in addition to the oversight and evaluation undertaken by the Board and its committees on a continuous basis throughout the year and included, but was not limited to the following:
| • | the nature, extent, and quality of investment management, shareholder services, and other services provided by the Advisor to the Fund; |
| • | the wide range of other programs and services the Advisor provides to the Fund and its shareholders on a routine and non-routine basis; |
| • | the investment performance of the fund, including data comparing the Fund’s performance to appropriate benchmarks and/or a peer group of other mutual funds with similar investment objectives and strategies; |
| • | data comparing the cost of owning the Fund to the cost of owning similar funds; |
| • | the Advisor’s compliance policies, procedures, and regulatory experience; |
| • | financial data showing the cost of services provided to the Fund, the profitability of the Fund to the Advisor, and the overall profitability of the Advisor; |
| • | data comparing services provided and charges to other investment management clients of the Advisor; and |
| • | consideration of collateral benefits derived by the Advisor from the management of the Fund and any potential economies of scale relating thereto. |
In keeping with its practice, the Board held two in-person meetings and one telephonic meeting to review and discuss the information provided. The Directors also had the benefit of the advice of independent counsel throughout the period.
Factors Considered
The Directors considered all of the information provided by the Advisor, the independent data providers, and independent counsel, and evaluated such information for the Fund. In connection with their review, the Directors did not identify any single factor as being all-important or controlling, and each Director may have attributed different levels of importance to different factors. In deciding to renew the management agreement, the Board based its decision on a number of factors, including the following:
30
Nature, Extent and Quality of Services — Generally. Under the management agreement, the Advisor is responsible for providing or arranging for all services necessary for the operation of the Fund. The Board noted that under the management agreement, the Advisor provides or arranges at its own expense a wide variety of services including:
| • | constructing and designing the Fund |
| • | portfolio research and security selection |
| • | initial capitalization/funding |
| • | securities trading |
| • | Fund administration |
| • | custody of Fund assets |
| • | daily valuation of the Fund’s portfolio |
| • | shareholder servicing and transfer agency, including shareholder confirmations, recordkeeping, and communications |
| • | legal services |
| • | regulatory and portfolio compliance |
| • | financial reporting |
| • | marketing and distribution |
The Board noted that many of these services have expanded over time both in terms of quantity and complexity in response to shareholder demands, competition in the industry, changing distribution channels, and the changing regulatory environment.
Investment Management Services. The nature of the investment management services provided to the Fund is quite complex and allows Fund shareholders access to professional money management, instant diversification of their investments within an asset class, the opportunity to easily diversify among asset classes by investing in or exchanging among various American Century Investments funds, and liquidity. In evaluating investment performance, the Board expects the Advisor to manage the Fund in accordance with its investment objectives and approved strategies. Further, the Directors recognize that the Advisor has an obligation to monitor trading activities, and in particular to seek the best execution of fund trades, and to evaluate the use of and payment for research. In providing these services, the Advisor utilizes teams of investment professionals (portfolio managers, analysts, research assistants, and securities traders) who require extensive information technology, research, training, compliance and other systems to conduct their business. The Board, directly and through its Fund Performance Review Committee, regularly reviews investment performance information for the Fund, together with comparative information for appropriate benchmarks and/or peer groups of similarly-managed funds, over different time horizons. The
31
Directors also review detailed performance information during the management agreement approval process. If performance concerns are identified, the Fund receives special reviews until performance improves, during which the Board discusses with the Advisor the reasons for such results (e.g., market conditions, security selection) and any efforts being undertaken to improve performance. Taking all these factors into consideration, the Board found the investment management services provided by the Advisor to the Fund to meet or exceed industry standards. More detailed information about the Fund’s performance can be found in the Performance and Portfolio Commentary sections of this report.
Shareholder and Other Services. Under the management agreement, the Advisor provides the Fund with a comprehensive package of transfer agency, shareholder, and other services. The Board, directly and through various committees of the Board, regularly reviews reports and evaluations of such services at its regular meetings. These reports include, but are not limited to, information regarding the operational efficiency and accuracy of the shareholder and transfer agency services provided, staffing levels, shareholder satisfaction (as measured by external as well as internal sources), technology support, new products and services offered to Fund shareholders, securities trading activities, portfolio valuation services, auditing services, and legal and operational compliance activities. Certain aspects of shareholder and transfer agency service level efficiency and the quality of securities trading activities are measured by independent third party providers and are presented in comparison to other fund groups not managed by the Advisor. The Board found the services provided by the Advisor to the Fund under the management agreement to be competitive and of high quality.
Costs of Services and Profitability. The Advisor provides detailed information concerning its cost of providing various services to the Fund, its profitability in managing the Fund, its overall profitability, and its financial condition. The Directors have reviewed with the Advisor the methodology used to prepare this financial information. The financial information regarding the Advisor is considered in evaluating the Advisor’s financial condition, ability to continue to provide services under the management agreement, and the reasonableness of the current management fee. The Board concluded that the Advisor’s profits were reasonable in light of the services provided to the Fund.
Ethics. The Board generally considers the Advisor’s commitment to providing quality services to shareholders and to conducting its business ethically. They noted that the Advisor’s practices generally meet or exceed industry best practices.
Economies of Scale. The Board also reviewed information provided by the Advisor regarding the possible existence of economies of scale in connection with the management of the Fund. The Board concluded that economies of scale are difficult to measure and predict with precision, especially on a fund-by-fund basis. The Board concluded that the Advisor is appropriately sharing economies of scale through its competitive fee structure, offering competitive fees from fund inception, and through reinvestment in its business to provide shareholders additional content and services.
32
Comparison to Other Funds’ Fees. The management agreement provides that the Fund pay the Advisor a single, all-inclusive (or unified) management fee for providing all services necessary for the management and operation of the Fund, other than brokerage expenses, taxes, interest, extraordinary expenses, and the fees and expenses of the Fund’s independent directors (including their independent legal counsel) and expenses incurred in connection with the provision of shareholder services and distribution services under a plan adopted pursuant to Rule 12b-1 under the 1940 Act. Under the unified fee structure, the Advisor is responsible for providing all investment advisory, custody, audit, administrative, compliance, recordkeeping, marketing and shareholder services, or arranging and supervising third parties to provide such services. By contrast, most other funds are charged a variety of fees, including an investment advisory fee, a transfer agency fee, an administrative fee, distribution charges and other expenses. Other than their investment advisory fees and any applicable Rule 12b-1 distribution fees, all other components of the total fees charged by these other funds may be increased without shareholder approval. The Board believes the unified fee structure is a benefit to Fund shareholders because it clearly discloses to shareholders the cost of owning Fund shares, and, since the unified fee cannot be increased without a vote of Fund shareholders, it shifts to the Advisor the risk of increased costs of operating the Fund and provides a direct incentive to minimize administrative inefficiencies. Part of the Board’s analysis of fee levels involves reviewing certain evaluative data compiled by an independent provider and comparing the Fund’s unified fee to the total expense ratio of other funds in the Fund’s peer group. The Board concluded that the management fee paid by the Fund to the Advisor under the management agreement is reasonable in light of the services provided to the Fund.
Comparison to Fees and Services Provided to Other Clients of the Advisor. The Board also requested and received information from the Advisor concerning the nature of the services, fees, costs and profitability of its advisory services to advisory clients other than the Fund. They observed that these varying types of client accounts require different services and involve different regulatory and entrepreneurial risks than the management of the Fund. The Board analyzed this information and concluded that the fees charged and services provided to the Fund were reasonable by comparison.
Collateral or “Fall-Out” Benefits Derived by the Advisor. The Board considered the existence of collateral benefits the Advisor may receive as a result of its relationship with the Fund. They concluded that the Advisor’s primary business is managing mutual funds and it generally does not use fund or shareholder information to generate profits in other lines of business, and therefore does not derive any significant collateral benefits from them. The Board noted that the Advisor receives proprietary research from broker-dealers that execute fund portfolio transactions and concluded that this research is likely to benefit Fund shareholders. The Board also determined that the Advisor is able to provide investment management services to certain clients other than the Fund, at least in part, due to its existing infrastructure built to serve the fund complex. The Board concluded, however, that the assets of those other clients are not material to the analysis and, where applicable, may be included with the assets of the Fund to determine breakpoints in the management fee schedule.
33
Existing Relationship. The Board also considered whether there was any reason for not continuing the existing arrangement with the Advisor. In this regard, the Board was mindful of the potential disruptions of the Fund’s operations and various risks, uncertainties, and other effects that could occur as a result of a decision not to continue such relationship. In particular, the Board recognized that most shareholders have invested in the Fund on the strength of the Advisor’s industry standing and reputation and in the expectation that the Advisor will have a continuing role in providing advisory services to the Fund.
Conclusion of the Directors. As a result of this process, the Board, including all of the independent directors, taking into account all of the factors discussed above and the information provided by the Advisor and others, concluded that the management agreement between the Fund and the Advisor is fair and reasonable in light of the services provided and should be renewed.
34
Retirement Account Information
As required by law, distributions you receive from certain IRAs, or 403(b), 457 and qualified plans are subject to federal income tax withholding, unless you elect not to have withholding apply. Tax will be withheld on the total amount withdrawn even though you may be receiving amounts that are not subject to withholding, such as nondeductible contributions. In such case, excess amounts of withholding could occur. You may adjust your withholding election so that a greater or lesser amount will be withheld.
If you don’t want us to withhold on this amount, you must notify us to not withhold the federal income tax. You may notify us in writing or in certain situations by telephone or through other electronic means. You have the right to revoke your withholding election at any time and any election you make may remain in effect until revoked by filing a new election.
Remember, even if you elect not to have income tax withheld, you are liable for paying income tax on the taxable portion of your withdrawal. If you elect not to have income tax withheld or you don’t have enough income tax withheld, you may be responsible for payment of estimated tax. You may incur penalties under the estimated tax rules if your withholding and estimated tax payments are not sufficient. You can reduce or defer the income tax on a distribution by directly or indirectly rolling such distribution over to another IRA or eligible plan. You should consult your tax advisor for additional information.
State tax will be withheld if, at the time of your distribution, your address is within one of the mandatory withholding states and you have federal income tax withheld. State taxes will be withheld from your distribution in accordance with the respective state rules.
Proxy Voting Guidelines
American Century Investment Management, Inc., the fund’s investment advisor, is responsible for exercising the voting rights associated with the securities purchased and/or held by the fund. A description of the policies and procedures the advisor uses in fulfilling this responsibility is available without charge, upon request, by calling 1-800-345-2021. It is also available on American Century Investments’ website at americancentury.com and on the Securities and Exchange Commission’s website at sec.gov. Information regarding how the investment advisor voted proxies relating to portfolio securities during the most recent 12-month period ended June 30 is available on the “About Us” page at americancentury.com. It is also available at sec.gov.
Quarterly Portfolio Disclosure
The fund files its complete schedule of portfolio holdings with the Securities and Exchange Commission (SEC) for the first and third quarters of each fiscal year on Form N-Q. The fund’s Forms N-Q are available on the SEC’s website at sec.gov, and may be reviewed and copied at the SEC’s Public Reference Room in Washington, DC. Information on the operation of the Public Reference Room may be obtained by calling 1-800-SEC-0330. The fund also makes its complete schedule of portfolio holdings for the most recent quarter of its fiscal year available on its website at americancentury.com and, upon request, by calling 1-800-345-2021.
35
Other Tax Information
The following information is provided pursuant to provisions of the Internal Revenue Code.
The fund hereby designates up to the maximum amount allowable as qualified dividend income for the fiscal year ended November 30, 2012.
For corporate taxpayers, the fund hereby designates $10,157, or up to the maximum amount allowable, of ordinary income distributions paid during the fiscal year ended November 30, 2012 as qualified for the corporate dividends received deduction.
For the fiscal year ended November 30, 2012, the fund intends to pass through to shareholders $3,946,059, or up to the maximum amount allowable, as a foreign tax credit which represents taxes paid on income derived from sources within foreign countries or possessions of the United States. During the fiscal year ended November 30, 2012, the fund earned $44,059,694 from income derived from foreign sources. Foreign source income and foreign tax expense per outstanding share on November 30, 2012 are $0.3083 and $0.0276, respectively.
36
| Contact Us | americancentury.com |
| Automated Information Line | 1-800-345-8765 |
| Investor Services Representative | 1-800-345-2021 or 816-531-5575 |
| Investors Using Advisors | 1-800-378-9878 |
Business, Not-For-Profit, Employer-Sponsored Retirement Plans | 1-800-345-3533 |
Banks and Trust Companies, Broker-Dealers, Financial Professionals, Insurance Companies | 1-800-345-6488 |
| Telecommunications Device for the Deaf | 1-800-634-4113 |
American Century World Mutual Funds, Inc.
Investment Advisor:
American Century Investment Management, Inc.
Kansas City, Missouri
This report and the statements it contains are submitted for the general information of our shareholders. The report is not authorized for distribution to prospective investors unless preceded or accompanied by an effective prospectus.
©2013 American Century Proprietary Holdings, Inc. All rights reserved.
CL-ANN-76973 1301
ANNUAL REPORT NOVEMBER 30, 2012
| International Discovery Fund |
| President’s Letter | 2 |
| Independent Chairman’s Letter | 3 |
| Market Perspective | 4 |
| Performance | 5 |
| Portfolio Commentary | 7 |
| Fund Characteristics | 9 |
| Shareholder Fee Example | 10 |
| Schedule of Investments | 12 |
| Statement of Assets and Liabilities | 15 |
| Statement of Operations | 16 |
| Statement of Changes in Net Assets | 17 |
| Notes to Financial Statements | 18 |
| Financial Highlights | 24 |
| Report of Independent Registered Public Accounting Firm | 26 |
| Management | 27 |
| Approval of Management Agreement | 30 |
| Additional Information | 35 |
Any opinions expressed in this report reflect those of the author as of the date of the report, and do not necessarily represent the opinions of American Century Investments® or any other person in the American Century Investments organization. Any such opinions are subject to change at any time based upon market or other conditions and American Century Investments disclaims any responsibility to update such opinions. These opinions may not be relied upon as investment advice and, because investment decisions made by American Century Investments funds are based on numerous factors, may not be relied upon as an indication of trading intent on behalf of any American Century Investments fund. Security examples are used for representational purposes only and are not intended as recommendations to purchase or sell securities. Performance information for comparative indices and securities is provided to American Century Investments by third party vendors. To the best of American Century Investments’ knowledge, such information is accurate at the time of printing.
Dear Investor:
Thank you for reviewing this annual report for the 12 months ended November 30, 2012. It offers investment performance, market analysis, and portfolio information, presented with the expert perspective of our portfolio management team.
Annual reports remain important vehicles for conveying information about fund returns, including key factors that affected fund performance. For additional, updated investment and market insights, we encourage you to visit our website, americancentury.com.
Favorable Fiscal-Year Returns for Most Major Stock and Bond Benchmarks
Despite a global economic slowdown, continued concerns about European financial system stability, and uncertainty about U.S. political and fiscal conditions in 2013, 12-month stock and bond returns were generally favorable, particularly for U.S. value stocks and high-yield bonds.
U.S. value stock indices outpaced the S&P 500 Index’s 16.13% return for the period, as did U.S. corporate and municipal high-yield benchmarks. U.S. growth and international index returns were generally lower, but still solid—the MSCI EAFE Index, for example, returned 12.61%.
With the exception of high-yield bond sectors, stocks generally outperformed bonds for the period, though bonds benefitted from economic stagnation, reduced inflation pressures, and low interest rates. The 10-year U.S. Treasury yield declined from 2.07% to 1.62% during the period, and the Barclays U.S. Aggregate Bond Index returned 5.51%. Related global bond indices also returned in roughly the mid-single digits.
Bucking the global trend, the U.S. economy showed signs of improvement during the fiscal year, particularly the long-depressed housing market. However, the outlook for 2013 remains guarded, as the fragile recovery remains vulnerable to fiscal and financial factors that could trigger further slowdowns and market volatility.
Under these conditions, we continue to believe in a disciplined, diversified, long-term investment approach, using both stocks and bonds—as appropriate—for meeting financial goals. We appreciate your continued trust in us in this challenging environment.
Sincerely,
Jonathan Thomas
President and Chief Executive Officer
American Century Investments
2
Dear Fellow Shareholders,
The board has once again completed its annual review of the advisory contract between the American Century Investments mutual funds overseen by the board and the funds’ advisor, American Century Investment Management, Inc. This process, often referred to as the 15(c) review, involves the independent directors considering all of the material monitored throughout the year and evaluating a wide range of factors to determine whether the management fee paid by each fund to the advisor is reasonable.
The independent directors’ rationale for this decision is provided in detail in this, or in a previous, report. However, there are several highlights that should be of interest to all shareholders.
| • | Fund performance and client service continue to be rated among the industry’s best. |
| • | Target date and other asset allocation products continue to successfully gather assets and industry acclaim. |
| • | Compliance programs continue to function successfully with no issues impacting shareholder interests. |
| • | Fees were found to be within an acceptable competitive range, with minor fee waivers being negotiated on five funds. |
Knowing that most shareholders are long term investors, the board was particularly pleased with our succession planning review. Talented professionals are being added within portfolio management and experienced managers have been added to the senior management team.
Overall it was a very positive review for the American Century Investments mutual funds during a challenging market environment.
Best personal regards,
Don Pratt
3

By Mark Kopinski, Chief Investment Officer, Global and Non-U.S. Equity
Central Bank Action Drove Global Stocks Higher
Despite a backdrop of weaker global economic growth and mounting sovereign debt problems in Europe and the United States, most global stock benchmarks advanced strongly for the 12-month period ended November 30, 2012. Investors generally overlooked the lackluster economic data, recession fears (which eventually turned to reality for Europe), and the instability of the eurozone’s banking system and currency. Instead, they focused on the optimism inspired by unprecedented central bank intervention.
In particular, the European Central Bank (ECB) launched several programs to help the eurozone’s troubled banks shore up their balance sheets and finance ongoing operations. The ECB also agreed to purchase the sovereign debt of financially strapped member nations that conform to the ECB’s fiscal reform measures. Meanwhile, in response to sluggish economic growth and high unemployment, the U.S. Federal Reserve (the Fed) announced its third—and most aggressive—quantitative easing program to date. The Bank of Japan also took action with an asset purchase program, while the People’s Bank of China eased its reserve requirements for commercial lenders.
Overall, developed markets outperformed emerging markets for the 12-month period, even as the emerging economies generally enjoyed higher absolute levels of growth, albeit slower growth than in previous periods. Strong stock market performance in Europe and the United States, where central bank stimulus was the greatest, primarily drove the better relative results in the developed markets.
Valuations, Stock Selection Remain Key Factors
Even though economic growth and corporate earnings in aggregate have been slowing, and sovereign debt issues have yet to be resolved, there are some positive factors at work for global equity investors. Stock valuations around the globe appear attractive relative to historical averages. Similarly, equity earnings yields are also compelling when measured against long-term averages and current bond yields. Most important, we believe through our rigorous, bottom-up stock selection process it’s still possible to find individual companies growing earnings, either from a new product launch, market share gains, secular changes, or beneficial acquisitions.
| International Equity Total Returns | ||||
| For the 12 months ended November 30, 2012 (in U.S. dollars) | ||||
| MSCI EAFE Index | 12.61% | MSCI Europe Index | 14.07% | |
| MSCI EAFE Growth Index | 12.66% | MSCI World Index | 13.62% | |
| MSCI EAFE Value Index | 12.45% | MSCI Japan Index | 3.59% | |
| MSCI Emerging Markets Index | 11.35% | |||
4
| Total Returns as of November 30, 2012 | ||||||
| Average Annual Returns | ||||||
Ticker Symbol | 1 year | 5 years | 10 years | Since Inception | Inception Date | |
| Investor Class | TWEGX | 9.23% | -6.19% | 10.22% | 10.59% | 4/1/94 |
MSCI All Country World ex-U.S. Mid Cap Growth Index | — | 11.09% | -4.33% | 9.40% | N/A(1) | — |
| Institutional Class | TIDIX | 9.44% | -6.00% | 10.44% | 9.14% | 1/2/98 |
A Class(2) No sales charge* With sales charge* | ACIDX | 8.88% 2.62% | -6.42% -7.52% | 9.95% 9.31% | 7.30% 6.86% | 4/28/98 |
| C Class | TWECX | 8.14% | — | — | 5.42% | 3/1/10 |
| R Class | TWERX | 8.73% | — | — | 5.93% | 3/1/10 |
* | Sales charges include initial sales charges and contingent deferred sales charges (CDSCs), as applicable. A Class shares have a 5.75% maximum initial sales charge and may be subject to a maximum CDSC of 1.00%. C Class shares redeemed within 12 months of purchase are subject to a maximum CDSC of 1.00%. The SEC requires that mutual funds provide performance information net of maximum sales charges in all cases where charges could be applied. |
| (1) | Benchmark data first available June 1994. |
| (2) | Prior to March 1, 2010, the A Class was referred to as the Advisor Class and did not have a front-end sales charge. Performance prior to that date has been adjusted to reflect this charge. |
Data presented reflect past performance. Past performance is no guarantee of future results. Current performance may be higher or lower than the performance shown. Investment return and principal value will fluctuate, and redemption value may be more or less than original cost. To obtain performance data current to the most recent month end, please call 1-800-345-2021 or visit americancentury.com. Historically, small company stocks have been more volatile than the stocks of larger, more established companies. International investing involves special risks, such as political instability and currency fluctuations. Investing in emerging markets may accentuate these risks. The fund’s investment process may result in high portfolio turnover, which could mean high transaction costs, affecting both performance and capital gains tax liabilities to investors.
Unless otherwise indicated, performance reflects Investor Class shares; performance for other share classes will vary due to differences in fee structure. For information about other share classes available, please consult the prospectus. Data assumes reinvestment of dividends and capital gains, and none of the charts reflect the deduction of taxes that a shareholder would pay on fund distributions or the redemption of fund shares. Returns for the index are provided for comparison. The fund’s total returns include operating expenses (such as transaction costs and management fees) that reduce returns, while the total returns of the index do not.
5
| Growth of $10,000 Over 10 Years |
| $10,000 investment made November 30, 2002 |
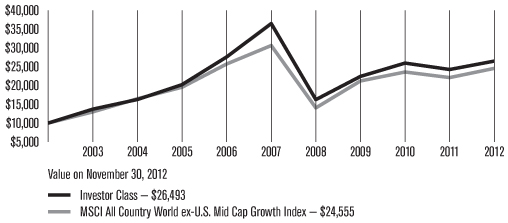
| Total Annual Fund Operating Expenses | ||||
| Investor Class | Institutional Class | A Class | C Class | R Class |
| 1.42% | 1.22% | 1.67% | 2.42% | 1.92% |
The total annual fund operating expenses shown is as stated in the fund’s prospectus current as of the date of this report. The prospectus may vary from the expense ratio shown elsewhere in this report because it is based on a different time period, includes acquired fund fees and expenses, and, if applicable, does not include fee waivers or expense reimbursements.
Data presented reflect past performance. Past performance is no guarantee of future results. Current performance may be higher or lower than the performance shown. Investment return and principal value will fluctuate, and redemption value may be more or less than original cost. To obtain performance data current to the most recent month end, please call 1-800-345-2021 or visit americancentury.com. Historically, small company stocks have been more volatile than the stocks of larger, more established companies. International investing involves special risks, such as political instability and currency fluctuations. Investing in emerging markets may accentuate these risks. The fund’s investment process may result in high portfolio turnover, which could mean high transaction costs, affecting both performance and capital gains tax liabilities to investors.
Unless otherwise indicated, performance reflects Investor Class shares; performance for other share classes will vary due to differences in fee structure. For information about other share classes available, please consult the prospectus. Data assumes reinvestment of dividends and capital gains, and none of the charts reflect the deduction of taxes that a shareholder would pay on fund distributions or the redemption of fund shares. Returns for the index are provided for comparison. The fund’s total returns include operating expenses (such as transaction costs and management fees) that reduce returns, while the total returns of the index do not.
6
| Portfolio Commentary |
Portfolio Managers: Mark Kopinski and Brian Brady
Performance Summary
International Discovery advanced 9.23%* for the 12 months ended November 30, 2012, compared with its benchmark, the MSCI All Country World ex-U.S. Mid Cap Growth Index, which gained 11.09%.
Non-U.S. stocks generally demonstrated robust performance during the 12-month period, even as weak growth and mounting sovereign debt problems weighed on many economies. Unprecedented central bank intervention, particularly the European Central Bank’s commitment to do “whatever it takes” to restore eurozone stability, helped drive stock market optimism. Overall, developed market stocks outpaced their emerging market counterparts, and within the mid-cap universe, value stocks slightly outperformed growth stocks for the period.
Earnings growth, which is an important component of the portfolio’s investment process, generally performed well during the 12-month period. Overall, stock selection detracted on a relative basis, while sector allocations, including an underweight in consumer staples and overweight in energy, lagged compared with the benchmark. Stock selection was strong in the information technology and materials sectors and weak in the consumer staples and consumer discretionary sectors.
Oil Exploration Company Detracted from Results
An overweight position in Sweden’s Lundin Petroleum, an oil and gas exploration company, was among the portfolio’s largest detractors for the period. Lundin was a massive outperformer during 2011, primarily due to the company’s major oil discovery off the coast of Norway. But, as Lundin continued to explore and drill in the area, some disappointments emerged. This led to reductions in the company’s original production estimates, which sent shares lower in early 2012. Nevertheless, the North Sea discovery remains a significant game changer for the company and should positively affect production for many years. As 2012 progressed, Lundin recovered much of its earlier share price weakness.
A position in Japan-based Sanrio, a maker of children’s toys and accessories, including the Hello Kitty line, also was a leading detractor to portfolio performance. The company, which operates in the specialty retail industry of the consumer discretionary sector, faced challenging economic conditions at home, as Japan remained on the verge of recession. We exited the portfolio’s position in the company in early 2012.
In addition, a position in Japan-based CyberAgent was among the top performance detractors. Shares of the Internet media and smartphone application developer declined after an analyst cut the company’s price target to reflect higher costs and a temporary slowdown in fees. We subsequently sold the portfolio’s CyberAgent shares.
*All fund returns referenced in this commentary are for Investor Class shares.
7
Technology Company was a Top Contributor
An overweight position in Israel’s Mellanox Technologies, a manufacturer of semiconductors and software that link servers with data storage systems, was among the portfolio’s top performers. In addition to reporting strong revenues and earnings during the period, the company remains the beneficiary of a mass transition to cloud-based technology, with products that facilitate data transmission in server warehouses.
An overweight position in France’s Gemalto, a provider of digital security products and services, also was a top performance contributor during the period. Gemalto makes SIM cards used in mobile phones and other devices. The company continued to advance due to growing mobile payment and other applications. In particular, the company is positioned to benefit from the increasing use of smartphones as “mobile wallets” and the growing importance of securing sensitive data on SIM cards used in passports and hotel card keys.
In addition, the United Kingdom’s Ashtead Group was among the portfolio’s leading contributors. The construction equipment rental company benefited from the housing market recovery in the United States and from the company’s United Kingdom- and United States-based customers preferring to lease rather than buy equipment in the challenging economic climate. In addition, the company reported strong quarterly results for the period ended in July. In particular, the company reported an 82% jump in pre-tax profit, a 21% gain in revenues, and a more robust full-year outlook.
Outlook
While we remain concerned about macroeconomic uncertainty, we continue to seek individual companies demonstrating quality earnings growth trends and the ability to outperform their peers. We will continue to look for opportunities to take advantage of several prevailing global themes, such as the proliferation of smartphones, continued capital spending on deep-water oil and gas projects, and increased demand for security as digital transactions grow. Overall, we will continue to seek small- to medium-sized companies located around the world (excluding the United States) offering promising growth characteristics.
8
| NOVEMBER 30, 2012 | |
| Top Ten Holdings | % of net assets |
| Gemalto NV | 2.9% |
| Ashtead Group plc | 2.9% |
| Iliad SA | 2.5% |
| ARM Holdings plc | 2.2% |
| Aker Solutions ASA | 2.0% |
| Global Logistic Properties Ltd. | 1.8% |
| Koninklijke Vopak NV | 1.7% |
| Wolseley plc | 1.7% |
| Petroleum Geo-Services ASA | 1.7% |
| Techtronic Industries Co. | 1.7% |
| Types of Investments in Portfolio | % of net assets |
| Foreign Common Stocks | 98.7% |
| Temporary Cash Investments | 1.1% |
| Other Assets and Liabilities | 0.2% |
| Investments by Country | % of net assets |
| United Kingdom | 21.1% |
| France | 9.4% |
| Canada | 8.7% |
| Japan | 7.9% |
| Sweden | 4.9% |
| China | 4.8% |
| Hong Kong | 4.3% |
| Norway | 4.2% |
| Australia | 4.1% |
| South Korea | 4.0% |
| Switzerland | 3.0% |
| Brazil | 2.9% |
| Taiwan | 2.9% |
| Denmark | 2.2% |
| Netherlands | 2.0% |
| Other Countries | 12.3% |
| Cash and Equivalents* | 1.3% |
| * | Includes temporary cash investments and other assets and liabilities. |
9
Fund shareholders may incur two types of costs: (1) transaction costs, including sales charges (loads) on purchase payments and redemption/exchange fees; and (2) ongoing costs, including management fees; distribution and service (12b-1) fees; and other fund expenses. This example is intended to help you understand your ongoing costs (in dollars) of investing in your fund and to compare these costs with the ongoing cost of investing in other mutual funds.
The example is based on an investment of $1,000 made at the beginning of the period and held for the entire period from June 1, 2012 to November 30, 2012.
Actual Expenses
The table provides information about actual account values and actual expenses for each class. You may use the information, together with the amount you invested, to estimate the expenses that you paid over the period. First, identify the share class you own. Then simply divide your account value by $1,000 (for example, an $8,600 account value divided by $1,000 = 8.6), then multiply the result by the number under the heading “Expenses Paid During Period” to estimate the expenses you paid on your account during this period.
If you hold Investor Class shares of any American Century Investments fund, or Institutional Class shares of the American Century Diversified Bond Fund, in an American Century Investments account (i.e., not a financial intermediary or retirement plan account), American Century Investments may charge you a $12.50 semiannual account maintenance fee if the value of those shares is less than $10,000. We will redeem shares automatically in one of your accounts to pay the $12.50 fee. In determining your total eligible investment amount, we will include your investments in all personal accounts (including American Century Investments Brokerage accounts) registered under your Social Security number. Personal accounts include individual accounts, joint accounts, UGMA/UTMA accounts, personal trusts, Coverdell Education Savings Accounts and IRAs (including traditional, Roth, Rollover, SEP-, SARSEP- and SIMPLE-IRAs), and certain other retirement accounts. If you have only business, business retirement, employer-sponsored or American Century Investments Brokerage accounts, you are currently not subject to this fee. If you are subject to the Account Maintenance Fee, your account value could be reduced by the fee amount.
Hypothetical Example for Comparison Purposes
The table also provides information about hypothetical account values and hypothetical expenses based on the actual expense ratio of each class of your fund and an assumed rate of return of 5% per year before expenses, which is not the actual return of a fund’s share class. The hypothetical account values and expenses may not be used to estimate the actual ending account balance or expenses you paid for the period. You may use this information to compare the ongoing costs of investing in your fund and other funds. To do so, compare this 5% hypothetical example with the 5% hypothetical examples that appear in the shareholder reports of the other funds.
10
Please note that the expenses shown in the table are meant to highlight your ongoing costs only and do not reflect any transactional costs, such as sales charges (loads) or redemption/exchange fees. Therefore, the table is useful in comparing ongoing costs only, and will not help you determine the relative total costs of owning different funds. In addition, if these transactional costs were included, your costs would have been higher.
Beginning Account Value 6/1/12 | Ending Account Value 11/30/12 | Expenses Paid During Period(1) 6/1/12 - 11/30/12 | Annualized Expense Ratio(1) | |
| Actual | ||||
| Investor Class | $1,000 | $1,148.10 | $8.16 | 1.52% |
| Institutional Class | $1,000 | $1,149.80 | $7.09 | 1.32% |
| A Class | $1,000 | $1,146.00 | $9.50 | 1.77% |
| C Class | $1,000 | $1,143.00 | $13.50 | 2.52% |
| R Class | $1,000 | $1,144.80 | $10.83 | 2.02% |
| Hypothetical | ||||
| Investor Class | $1,000 | $1,017.40 | $7.67 | 1.52% |
| Institutional Class | $1,000 | $1,018.40 | $6.66 | 1.32% |
| A Class | $1,000 | $1,016.15 | $8.92 | 1.77% |
| C Class | $1,000 | $1,012.40 | $12.68 | 2.52% |
| R Class | $1,000 | $1,014.90 | $10.18 | 2.02% |
| (1) | Expenses are equal to the class’s annualized expense ratio listed in the table above, multiplied by the average account value over the period, multiplied by 183, the number of days in the most recent fiscal half-year, divided by 366, to reflect the one-half year period. |
11
NOVEMBER 30, 2012
| Shares | Value | |
| Common Stocks — 98.7% | ||
| AUSTRALIA — 4.1% | ||
| Ansell Ltd. | 282,514 | $4,569,888 |
| James Hardie Industries SE | 758,955 | 7,199,690 |
Mesoblast Ltd.(1) | 363,860 | 2,278,345 |
| Oil Search Ltd. | 810,500 | 6,005,445 |
| Treasury Wine Estates Ltd. | 1,118,191 | 5,869,726 |
| 25,923,094 | ||
| BELGIUM — 0.9% | ||
| Umicore SA | 115,303 | 5,990,049 |
| BRAZIL — 2.9% | ||
| Anhanguera Educacional Participacoes SA | 469,300 | 7,087,379 |
| BR Properties SA | 404,100 | 4,765,687 |
Hypermarcas SA(1) | 948,500 | 6,835,876 |
| 18,688,942 | ||
| CANADA — 8.7% | ||
| Alimentation Couche Tard, Inc. B Shares | 133,538 | 6,596,577 |
Catamaran Corp.(1) | 173,813 | 8,531,859 |
| Dollarama, Inc. | 80,087 | 5,115,538 |
| First Quantum Minerals Ltd. | 304,853 | 6,260,634 |
| Franco-Nevada Corp. | 175,990 | 9,960,394 |
| Inmet Mining Corp. | 100,807 | 6,875,396 |
| West Fraser Timber Co. Ltd. | 71,205 | 4,994,063 |
| Yamana Gold, Inc. New York Shares | 368,271 | 6,923,495 |
| 55,257,956 | ||
| CHINA — 4.8% | ||
Brilliance China Automotive Holdings Ltd.(1) | 7,914,000 | 9,629,302 |
| China State Construction International Holdings Ltd. | 4,170,000 | 5,267,516 |
| Great Wall Motor Co. Ltd. H Shares | 786,500 | 2,572,550 |
| Hengdeli Holdings Ltd. | 5,708,000 | 2,032,732 |
| Longfor Properties Co. Ltd. | 3,606,500 | 6,914,994 |
| Zhuzhou CSR Times Electric Co. Ltd. H Shares | 1,313,000 | 3,981,252 |
| 30,398,346 | ||
| DENMARK — 2.2% | ||
| Christian Hansen Holding A/S | 183,249 | 5,932,280 |
| Coloplast A/S B Shares | 26,647 | 6,220,095 |
| Pandora A/S | 92,000 | 1,977,512 |
| 14,129,887 | ||
| FRANCE — 9.4% | ||
| Arkema SA | 41,934 | 4,289,358 |
| Edenred | 177,891 | 5,419,521 |
| Gemalto NV | 200,259 | 18,413,603 |
| Iliad SA | 89,933 | 16,000,461 |
| Publicis Groupe SA | 92,696 | 5,243,577 |
| Technip SA | 87,295 | 10,140,641 |
| 59,507,161 | ||
| GERMANY — 1.5% | ||
| GEA Group AG | 54,745 | 1,788,866 |
| Lanxess AG | 86,958 | 7,569,334 |
| 9,358,200 | ||
| HONG KONG — 4.3% | ||
| AAC Technologies Holdings, Inc. | 2,200,500 | 8,262,309 |
| Link Real Estate Investment Trust (The) | 1,127,000 | 6,114,726 |
Melco Crown Entertainment Ltd. ADR(1) | 143,821 | 2,194,708 |
| Techtronic Industries Co. | 5,388,500 | 10,609,857 |
| 27,181,600 | ||
| INDIA — 1.2% | ||
| HCL Technologies Ltd. | 336,383 | 4,059,848 |
| Shriram Transport Finance Co. Ltd. | 155,742 | 1,919,038 |
| Tata Global Beverages Ltd. | 560,776 | 1,710,833 |
| 7,689,719 | ||
| INDONESIA — 1.7% | ||
| PT Kalbe Farma Tbk | 34,338,500 | 3,686,731 |
| PT Semen Gresik (Persero) Tbk | 4,581,500 | 7,067,932 |
| 10,754,663 | ||
| IRELAND — 0.4% | ||
ICON plc ADR(1) | 91,886 | 2,535,135 |
| ISRAEL — 0.8% | ||
Mellanox Technologies Ltd.(1) | 67,978 | 4,954,237 |
| ITALY — 1.3% | ||
| Pirelli & C SpA | 287,892 | 3,339,810 |
| Prysmian SpA | 256,969 | 4,859,286 |
| 8,199,096 | ||
| JAPAN — 7.9% | ||
| Aeon Credit Service Co. Ltd. | 242,000 | 4,729,326 |
| Chiyoda Corp. | 118,000 | 1,697,677 |
| Daikin Industries Ltd. | 49,000 | 1,540,705 |
| Daito Trust Construction Co. Ltd. | 41,600 | 4,032,074 |
| Ebara Corp. | 363,000 | 1,395,900 |
12
| Shares | Value |
| Fuji Heavy Industries Ltd. | 415,000 | $4,656,699 |
| Internet Initiative Japan, Inc. | 187,400 | 4,612,538 |
| Kansai Paint Co. Ltd. | 119,000 | 1,270,334 |
| LIXIL Group Corp. | 215,100 | 4,555,888 |
| Makita Corp. | 126,500 | 5,332,535 |
| Park24 Co. Ltd. | 341,400 | 5,764,891 |
| Seven Bank Ltd. | 1,209,100 | 3,153,473 |
| Sysmex Corp. | 85,300 | 3,854,461 |
| Yokogawa Electric Corp. | 323,700 | 3,428,035 |
| 50,024,536 | ||
| NETHERLANDS — 2.0% | ||
| Koninklijke Vopak NV | 147,374 | 10,888,623 |
| Ziggo NV | 49,112 | 1,538,054 |
| 12,426,677 | ||
| NORWAY — 4.2% | ||
| Aker Solutions ASA | 684,818 | 12,887,677 |
| Fred Olsen Energy ASA | 73,847 | 3,261,838 |
| Petroleum Geo-Services ASA | 642,274 | 10,766,079 |
| 26,915,594 | ||
| SINGAPORE — 1.8% | ||
| Global Logistic Properties Ltd. | 4,843,000 | 11,149,295 |
| SOUTH AFRICA — 0.9% | ||
| Discovery Holdings Ltd. | 623,146 | 3,911,835 |
| Mr Price Group Ltd. | 109,479 | 1,637,801 |
| 5,549,636 | ||
| SOUTH KOREA — 4.0% | ||
| Daewoo International Corp. | 135,810 | 5,010,490 |
| Hyundai Glovis Co. Ltd. | 32,197 | 7,017,123 |
| Hyundai Wia Corp. | 23,129 | 3,887,407 |
| Orion Corp. | 7,425 | 7,700,305 |
Osstem Implant Co. Ltd.(1) | 63,668 | 1,746,262 |
| 25,361,587 | ||
| SPAIN — 1.8% | ||
Grifols SA(1) | 237,678 | 7,602,617 |
| Viscofan SA | 83,347 | 4,075,728 |
| 11,678,345 | ||
| SWEDEN — 4.9% | ||
| Electrolux AB | 326,532 | 8,544,451 |
| Hexagon AB B Shares | 415,187 | 10,271,484 |
Lundin Petroleum AB(1) | 379,358 | 8,963,166 |
| Svenska Cellulosa AB B Shares | 156,838 | 3,175,254 |
| 30,954,355 | ||
| SWITZERLAND — 3.0% | ||
| Clariant AG | 461,607 | 5,563,991 |
DKSH Holding AG(1) | 98,169 | 6,758,586 |
| GAM Holding AG | 523,243 | 6,719,102 |
| 19,041,679 | ||
| TAIWAN — 2.9% | ||
| Chailease Holding Co. Ltd. | 1,445,000 | 2,939,337 |
| Far EasTone Telecommunications Co. Ltd. | 646,000 | 1,618,669 |
| First Financial Holding Co. Ltd. | 2,082,000 | 1,271,959 |
| Largan Precision Co. Ltd. | 123,000 | 3,361,396 |
| Novatek Microelectronics Corp. | 1,257,000 | 5,061,919 |
| Radiant Opto-Electronics Corp. | 910,340 | 4,120,249 |
| 18,373,529 | ||
| UNITED KINGDOM — 21.1% | ||
| Aberdeen Asset Management plc | 1,468,413 | 7,951,852 |
| Aggreko plc | 243,149 | 8,695,009 |
| ARM Holdings plc | 1,148,128 | 14,237,530 |
| Ashtead Group plc | 2,982,686 | 18,312,027 |
ASOS plc(1) | 68,439 | 2,714,924 |
| Aveva Group plc | 56,257 | 1,845,006 |
| AZ Electronic Materials SA | 284,445 | 1,673,873 |
| Babcock International Group plc | 443,558 | 7,081,595 |
| Croda International plc | 184,337 | 7,031,942 |
| Experian plc | 75,780 | 1,259,032 |
| Inmarsat plc | 742,370 | 6,987,658 |
| InterContinental Hotels Group plc | 64,533 | 1,724,572 |
| Intertek Group plc | 106,886 | 5,291,547 |
| Johnson Matthey plc | 137,391 | 5,280,705 |
| Persimmon plc | 168,330 | 2,160,217 |
| Taylor Wimpey plc | 6,553,141 | 6,404,463 |
| Telecity Group plc | 353,098 | 4,848,188 |
| UBM plc | 735,458 | 8,672,395 |
| Weir Group plc (The) | 149,650 | 4,531,499 |
| Whitbread plc | 167,892 | 6,453,029 |
| Wolseley plc | 232,625 | 10,797,128 |
| 133,954,191 | ||
TOTAL COMMON STOCKS (Cost $525,394,248) | 625,997,509 | |
13
| Value | ||
| Temporary Cash Investments — 1.1% | ||
Repurchase Agreement, Bank of America Merrill Lynch, (collateralized by various U.S. Treasury obligations, 1.25% - 2.125%, 4/15/14 - 12/31/15, valued at $3,423,477), in a joint trading account at 0.18%, dated 11/30/12, due 12/3/12 (Delivery value $3,354,392) | $3,354,342 | |
Repurchase Agreement, Credit Suisse First Boston, Inc., (collateralized by various U.S. Treasury obligations, 0.25%, 9/15/15, valued at $3,421,946), in a joint trading account at 0.17%, dated 11/30/12, due 12/3/12 (Delivery value $3,354,390) | 3,354,342 | |
Repurchase Agreement, Goldman Sachs & Co., (collateralized by various U.S. Treasury obligations, 4.25%, 11/15/40, valued at $565,610), in a joint trading account at 0.15%, dated 11/30/12, due 12/3/12 (Delivery value $554,295) | 554,288 | |
TOTAL TEMPORARY CASH INVESTMENTS (Cost $7,262,972) | 7,262,972 | |
TOTAL INVESTMENT SECURITIES — 99.8% (Cost $532,657,220) | 633,260,481 | |
| OTHER ASSETS AND LIABILITIES — 0.2% | 1,085,874 | |
| TOTAL NET ASSETS — 100.0% | $634,346,355 | |
| Market Sector Diversification | |
| (as a % of net assets) | |
| Industrials | 21.9% |
| Materials | 15.3% |
| Consumer Discretionary | 15.1% |
| Information Technology | 12.0% |
| Financials | 10.4% |
| Energy | 8.2% |
| Health Care | 6.5% |
| Consumer Staples | 5.1% |
| Telecommunication Services | 4.2% |
| Cash and Equivalents* | 1.3% |
*Includes temporary cash investments and other assets and liabilities.
Notes to Schedule of Investments
ADR = American Depositary Receipt
(1) Non-income producing.
See Notes to Financial Statements.
14
| NOVEMBER 30, 2012 | ||||
| Assets | ||||
| Investment securities, at value (cost of $532,657,220) | $633,260,481 | |||
| Foreign currency holdings, at value (cost of $32,102) | 31,683 | |||
| Receivable for investments sold | 13,284,564 | |||
| Receivable for capital shares sold | 22,942 | |||
| Dividends and interest receivable | 738,750 | |||
| Other assets | 136,256 | |||
| 647,474,676 | ||||
| Liabilities | ||||
| Payable for investments purchased | 11,167,999 | |||
| Payable for capital shares redeemed | 1,175,321 | |||
| Accrued management fees | 784,232 | |||
| Distribution and service fees payable | 769 | |||
| 13,128,321 | ||||
| Net Assets | $634,346,355 | |||
| Net Assets Consist of: | ||||
| Capital (par value and paid-in surplus) | $864,356,415 | |||
| Undistributed net investment income | 3,383,141 | |||
| Accumulated net realized loss | (333,933,862 | ) | ||
| Net unrealized appreciation | 100,540,661 | |||
| $634,346,355 | ||||
| Net assets | Shares outstanding | Net asset value per share | |
| Investor Class, $0.01 Par Value | $582,330,799 | 57,786,095 | $10.08 |
| Institutional Class, $0.01 Par Value | $48,793,895 | 4,781,534 | $10.20 |
| A Class, $0.01 Par Value | $2,838,492 | 289,256 | $9.81* |
| C Class, $0.01 Par Value | $92,697 | 9,433 | $9.83 |
| R Class, $0.01 Par Value | $290,472 | 29,171 | $9.96 |
*Maximum offering price $10.41 (net asset value divided by 0.9425).
See Notes to Financial Statements.
15
| YEAR ENDED NOVEMBER 30, 2012 | ||||
| Investment Income (Loss) | ||||
| Income: | ||||
| Dividends (net of foreign taxes withheld of $1,114,846) | $12,944,217 | |||
| Interest | 9,484 | |||
| 12,953,701 | ||||
| Expenses: | ||||
| Management fees | 9,896,023 | |||
| Distribution and service fees: | ||||
| A Class | 7,035 | |||
| C Class | 956 | |||
| R Class | 1,353 | |||
| Directors’ fees and expenses | 23,720 | |||
| Other expenses | 34,043 | |||
| 9,963,130 | ||||
| Net investment income (loss) | 2,990,571 | |||
| Realized and Unrealized Gain (Loss) | ||||
| Net realized gain (loss) on: | ||||
| Investment transactions | 11,246,822 | |||
| Foreign currency transactions | (496,828 | ) | ||
| 10,749,994 | ||||
| Change in net unrealized appreciation (depreciation) on: | ||||
| Investments | 44,351,099 | |||
| Translation of assets and liabilities in foreign currencies | 6,284 | |||
| 44,357,383 | ||||
| Net realized and unrealized gain (loss) | 55,107,377 | |||
| Net Increase (Decrease) in Net Assets Resulting from Operations | $58,097,948 | |||
See Notes to Financial Statements.
16
| YEARS ENDED NOVEMBER 30, 2012 AND NOVEMBER 30, 2011 | |||||||
| Increase (Decrease) in Net Assets | November 30, 2012 | November 30, 2011 | |||||
| Operations | |||||||
| Net investment income (loss) | $2,990,571 | $1,621,324 | |||||
| Net realized gain (loss) | 10,749,994 | 47,818,057 | |||||
| Change in net unrealized appreciation (depreciation) | 44,357,383 | (110,079,679 | ) | ||||
| Net increase (decrease) in net assets resulting from operations | 58,097,948 | (60,640,298 | ) | ||||
| Distributions to Shareholders | |||||||
| From net investment income: | |||||||
| Investor Class | (127,731 | ) | — | ||||
| Institutional Class | (157,604 | ) | — | ||||
| Decrease in net assets from distributions | (285,335 | ) | — | ||||
| Capital Share Transactions | |||||||
| Net increase (decrease) in net assets from capital share transactions | (184,810,428 | ) | (158,780,647 | ) | |||
| Redemption Fees | |||||||
| Increase in net assets from redemption fees | 14,035 | 135,065 | |||||
| Net increase (decrease) in net assets | (126,983,780 | ) | (219,285,880 | ) | |||
| Net Assets | |||||||
| Beginning of period | 761,330,135 | 980,616,015 | |||||
| End of period | $634,346,355 | $761,330,135 | |||||
| Undistributed net investment income | $3,383,141 | $190,650 | |||||
See Notes to Financial Statements.
17
NOVEMBER 30, 2012
1. Organization
American Century World Mutual Funds, Inc. (the corporation) is registered under the Investment Company Act of 1940, as amended (the 1940 Act), as an open-end management investment company and is organized as a Maryland corporation. International Discovery Fund (the fund) is one fund in a series issued by the corporation. The fund is diversified as defined under the 1940 Act. The fund’s investment objective is to seek capital growth. The fund pursues its objective by investing primarily in equity securities of companies that are small- to medium-sized at the time of purchase and are located in foreign developed countries or emerging market countries.
The fund offers the Investor Class, the Institutional Class, the A Class, the C Class and the R Class. The A Class may incur an initial sales charge. The A Class and C Class may be subject to a contingent deferred sales charge. The share classes differ principally in their respective sales charges and distribution and shareholder servicing expenses and arrangements. The Institutional Class is made available to institutional shareholders or through financial intermediaries whose clients do not require the same level of shareholder and administrative services as shareholders of other classes. As a result, the Institutional Class is charged a lower unified management fee.
2. Significant Accounting Policies
The following is a summary of significant accounting policies consistently followed by the fund in preparation of its financial statements. The financial statements are prepared in conformity with accounting principles generally accepted in the United States of America, which may require management to make certain estimates and assumptions at the date of the financial statements. Actual results could differ from these estimates.
Investment Valuations — The fund determines the fair value of its investments and computes its net asset value per share as of the close of regular trading (usually 4 p.m. Eastern time) on the New York Stock Exchange (NYSE) on each day the NYSE is open.
Equity securities that are listed or traded on a domestic securities exchange are valued at the last reported sales price or at the official closing price as provided by the exchange. Equity securities traded on foreign securities exchanges are typically valued at the closing price on the exchange where primarily traded or as of the close of the NYSE, if that is earlier. If no last sales price is reported, or if local convention or regulation so provides, the mean of the latest bid and asked prices is used. Depending on local convention or regulation, securities traded over-the-counter are valued at the mean of the latest bid and asked prices, the last sales price, or the official closing price. In its determination of fair value, the fund may review several factors including: market information specific to a security; news developments in U.S. and foreign markets; the performance of particular U.S. and foreign securities, indices, comparable securities, American Depositary Receipts, Exchange-Traded Funds, and other relevant market indicators.
Debt securities maturing within 60 days at the time of purchase may be valued at cost, plus or minus any amortized discount or premium or at the evaluated mean as provided by an independent pricing service. Evaluated mean prices are commonly derived through utilization of market models, which may consider, among other factors, trade data, quotations from dealers and active market makers, relevant yield curve and spread data, related sector levels, creditworthiness, and other relevant market information on the same or comparable securities.
Investments in open-end management investment companies are valued at the reported net asset value per share. Repurchase agreements are valued at cost.
The value of investments initially expressed in foreign currencies is translated into U.S. dollars at prevailing exchange rates.
18
If the fund determines that the market price for a portfolio security is not readily available or the valuation methods mentioned above do not reflect a security’s fair value, such security is valued as determined in good faith by the Board of Directors or its designee, in accordance with procedures adopted by the Board of Directors. Circumstances that may cause the fund to use these procedures to value a security include, but are not limited to: a security has been declared in default; trading in a security has been halted during the trading day; there is a foreign market holiday and no trading occurred; or an event occurred between the close of a foreign exchange and the NYSE that may affect the value of a security.
Security Transactions — Security transactions are accounted for as of the trade date. Net realized gains and losses are determined on the identified cost basis, which is also used for federal income tax purposes.
Investment Income — Dividend income less foreign taxes withheld, if any, is recorded as of the ex-dividend date. Distributions received on securities that represent a return of capital or capital gain are recorded as a reduction of cost of investments and/or as a realized gain. The fund estimates the components of distributions received that may be considered nontaxable distributions or capital gain distributions for income tax purposes. Interest income is recorded on the accrual basis and includes accretion of discounts and amortization of premiums.
Foreign Currency Translations — All assets and liabilities initially expressed in foreign currencies are translated into U.S. dollars at prevailing exchange rates at period end. The fund may enter into spot foreign currency exchange contracts to facilitate transactions denominated in a foreign currency. Purchases and sales of investment securities, dividend and interest income, spot foreign currency exchange contracts, and expenses are translated at the rates of exchange prevailing on the respective dates of such transactions. Net realized and unrealized foreign currency exchange gains or losses related to investment securities are a component of net realized gain (loss) on investment transactions and change in net unrealized appreciation (depreciation) on investments, respectively.
Repurchase Agreements — The fund may enter into repurchase agreements with institutions that American Century Investment Management, Inc. (ACIM) (the investment advisor) has determined are creditworthy pursuant to criteria adopted by the Board of Directors. The fund requires that the collateral, represented by securities, received in a repurchase transaction be transferred to the custodian in a manner sufficient to enable the fund to obtain those securities in the event of a default under the repurchase agreement. ACIM monitors, on a daily basis, the securities transferred to ensure the value, including accrued interest, of the securities under each repurchase agreement is equal to or greater than amounts owed to the fund under each repurchase agreement.
Joint Trading Account — Pursuant to an Exemptive Order issued by the Securities and Exchange Commission, the fund, along with certain other funds in the American Century Investments family of funds, may transfer uninvested cash balances into a joint trading account. These balances are invested in one or more repurchase agreements that are collateralized by U.S. Treasury or Agency obligations.
Income Tax Status — It is the fund’s policy to distribute substantially all net investment income and net realized gains to shareholders and to otherwise qualify as a regulated investment company under provisions of the Internal Revenue Code. The fund is no longer subject to examination by tax authorities for years prior to 2009. Additionally, non-U.S. tax returns filed by the fund due to investments in certain foreign securities remain subject to examination by the relevant taxing authority for seven years from the date of filing. At this time, management believes there are no uncertain tax positions which, based on their technical merit, would not be sustained upon examination and for which it is reasonably possible that the total amounts of unrecognized tax benefits will significantly change in the next twelve months. Accordingly, no provision has been made for federal or state income taxes.
Multiple Class — All shares of the fund represent an equal pro rata interest in the net assets of the class to which such shares belong, and have identical voting, dividend, liquidation and other rights and the same terms and conditions, except for class specific expenses and
19
exclusive rights to vote on matters affecting only individual classes. Income, non-class specific expenses, and realized and unrealized capital gains and losses of the fund are allocated to each class of shares based on their relative net assets.
Distributions to Shareholders — Distributions from net investment income and net realized gains, if any, are generally declared and paid annually. The fund may make distributions on a more frequent basis to comply with the distribution requirements of the Internal Revenue Code, in all events in a manner consistent with provisions of the 1940 Act.
Redemption — The fund may impose a 2.00% redemption fee on shares held less than 60 days. The fee may not be applicable to all classes. The redemption fee is retained by the fund and helps cover transaction costs that long-term investors may bear when the fund sells securities to meet investor redemptions. Prior to November 14, 2011, the redemption fee applied to shares held less than 180 days.
Indemnifications — Under the corporation’s organizational documents, its officers and directors are indemnified against certain liabilities arising out of the performance of their duties to the fund. In addition, in the normal course of business, the fund enters into contracts that provide general indemnifications. The maximum exposure under these arrangements is unknown as this would involve future claims that may be made against a fund. The risk of material loss from such claims is considered by management to be remote.
3. Fees and Transactions with Related Parties
Management Fees — The corporation has entered into a management agreement with ACIM, under which ACIM provides the fund with investment advisory and management services in exchange for a single, unified management fee (the fee) per class. The agreement provides that all expenses of managing and operating the fund, except distribution and service fees, brokerage expenses, taxes, interest, fees and expenses of the independent directors (including legal counsel fees), and extraordinary expenses, will be paid by ACIM. The fee is computed and accrued daily based on each class’s daily net assets and paid monthly in arrears. The rate of the fee is determined by applying a fee rate calculation formula. This formula takes into account the fund’s assets as well as certain assets, if any, of other clients of the investment advisor outside the American Century Investments family of funds (such as subadvised funds and separate accounts) that have very similar investment teams and investment strategies (strategy assets). The annual management fee schedule ranges from 1.20% to 1.75% for the Investor Class, A Class, C Class and R Class. The Institutional Class is 0.20% less at each point within the range. The effective annual management fee for each class for the year ended November 30, 2012 was 1.49% for the Investor Class, A Class, C Class and R Class and 1.29% for the Institutional Class.
Distribution and Service Fees — The Board of Directors has adopted a separate Master Distribution and Individual Shareholder Services Plan for each of the A Class, C Class and R Class (collectively the plans), pursuant to Rule 12b-1 of the 1940 Act. The plans provide that the A Class will pay American Century Investment Services, Inc. (ACIS) an annual distribution and service fee of 0.25%. The plans provide that the C Class will pay ACIS an annual distribution and service fee of 1.00%, of which 0.25% is paid for individual shareholder services and 0.75% is paid for distribution services. The plans provide that the R Class will pay ACIS an annual distribution and service fee of 0.50%. The fees are computed and accrued daily based on each class’s daily net assets and paid monthly in arrears. The fees are used to pay financial intermediaries for distribution and individual shareholder services. Fees incurred under the plans during the year ended November 30, 2012 are detailed in the Statement of Operations.
Related Parties — Certain officers and directors of the corporation are also officers and/or directors of American Century Companies, Inc., the parent of the corporation’s investment advisor, ACIM, the distributor of the corporation, ACIS, and the corporation’s transfer agent, American Century Services, LLC.
20
4. Investment Transactions
Purchases and sales of investment securities, excluding short-term investments, for the year ended November 30, 2012 were $1,030,054,198 and $1,206,798,961, respectively.
5. Capital Share Transactions
Transactions in shares of the fund were as follows:
| Year ended November 30, 2012 | Year ended November 30, 2011 | ||||||||||||||
| Shares | Amount | Shares | Amount | ||||||||||||
| Investor Class/Shares Authorized | 400,000,000 | 400,000,000 | |||||||||||||
| Sold | 1,827,340 | $17,168,755 | 7,072,349 | $75,279,226 | |||||||||||
| Issued in reinvestment of distributions | 13,080 | 121,513 | — | — | |||||||||||
| Redeemed | (15,736,044 | ) | (147,750,250 | ) | (24,303,658 | ) | (240,508,259 | ) | |||||||
| (13,895,624 | ) | (130,459,982 | ) | (17,231,309 | ) | (165,229,033 | ) | ||||||||
| Institutional Class/Shares Authorized | 70,000,000 | 70,000,000 | |||||||||||||
| Sold | 486,509 | 4,595,111 | 3,483,268 | 35,787,791 | |||||||||||
| Issued in reinvestment of distributions | 16,519 | 155,111 | — | — | |||||||||||
| Redeemed | (6,115,536 | ) | (58,743,683 | ) | (2,818,293 | ) | (27,863,390 | ) | |||||||
| (5,612,508 | ) | (53,993,461 | ) | 664,975 | 7,924,401 | ||||||||||
| A Class/Shares Authorized | 10,000,000 | 10,000,000 | |||||||||||||
| Sold | 85,362 | 792,185 | 91,116 | 944,432 | |||||||||||
| Redeemed | (149,671 | ) | (1,381,498 | ) | (235,457 | ) | (2,458,608 | ) | |||||||
| (64,309 | ) | (589,313 | ) | (144,341 | ) | (1,514,176 | ) | ||||||||
| C Class/Shares Authorized | 10,000,000 | 10,000,000 | |||||||||||||
| Sold | 3,359 | 30,564 | 11,986 | 130,918 | |||||||||||
| Redeemed | (3,562 | ) | (32,134 | ) | (10,143 | ) | (92,757 | ) | |||||||
| (203 | ) | (1,570 | ) | 1,843 | 38,161 | ||||||||||
| R Class/Shares Authorized | 10,000,000 | 10,000,000 | |||||||||||||
| Sold | 34,192 | 304,860 | — | — | |||||||||||
| Redeemed | (7,962 | ) | (70,962 | ) | — | — | |||||||||
| 26,230 | 233,898 | — | — | ||||||||||||
| Net increase (decrease) | (19,546,414 | ) | $(184,810,428 | ) | (16,708,832 | ) | $(158,780,647 | ) | |||||||
6. Fair Value Measurements
The fund’s securities valuation process is based on several considerations and may use multiple inputs to determine the fair value of the positions held by the fund. In conformity with accounting principles generally accepted in the United States of America, the inputs used to determine a valuation are classified into three broad levels as follows:
| • | Level 1 valuation inputs consist of unadjusted quoted prices in an active market for identical securities; |
| • | Level 2 valuation inputs consist of direct or indirect observable market data (including quoted prices for similar securities, evaluations of subsequent market events, interest rates, prepayment speeds, credit risk, etc.); or |
| • | Level 3 valuation inputs consist of unobservable data (including a fund’s own assumptions). |
The level classification is based on the lowest level input that is significant to the fair valuation measurement. The valuation inputs are not necessarily an indication of the risks associated with investing in these securities or other financial instruments.
21
The following is a summary of the level classifications as of period end. The Schedule of Investments provides additional information on the fund’s portfolio holdings.
| Level 1 | Level 2 | Level 3 | |
| Investment Securities | |||
| Foreign Common Stocks | $16,607,575 | $609,389,934 | — |
| Temporary Cash Investments | — | 7,262,972 | — |
| Total Value of Investment Securities | $16,607,575 | $616,652,906 | — |
7. Risk Factors
There are certain risks involved in investing in foreign securities. These risks include those resulting from future adverse political, social and economic developments, fluctuations in currency exchange rates, the possible imposition of exchange controls, and other foreign laws or restrictions. Investing in emerging markets may accentuate these risks.
The fund invests in common stocks of small companies. Because of this, it may be subject to greater risk and market fluctuations than a fund investing in larger, more established companies.
The fund’s investment process may result in high portfolio turnover, which could mean high transaction costs, affecting both performance and capital gains tax liabilities to investors.
8. Federal Tax Information
The tax character of distributions paid during the years ended November 30, 2012 and November 30, 2011 were as follows:
| 2012 | 2011 | |
| Distributions Paid From | ||
| Ordinary income | $285,335 | — |
| Long-term capital gains | — | — |
The book-basis character of distributions made during the year from net investment income or net realized gains may differ from their ultimate characterization for federal income tax purposes. These differences reflect the differing character of certain income items and net realized gains and losses for financial statement and tax purposes, and may result in reclassification among certain capital accounts on the financial statements.
22
As of November 30, 2012, the federal tax cost of investments and the components of distributable earnings on a tax-basis were as follows:
| Federal tax cost of investments | $541,172,711 |
| Gross tax appreciation of investments | $97,249,185 |
| Gross tax depreciation of investments | (5,161,415) |
| Net tax appreciation (depreciation) of investments | $92,087,770 |
| Net tax appreciation (depreciation) on translation of assets and liabilities in foreign currencies | $(50,361) |
| Net tax appreciation (depreciation) | $92,037,409 |
| Undistributed ordinary income | $9,617,535 |
| Accumulated short-term capital losses | $(331,665,004) |
The difference between book-basis and tax-basis cost and unrealized appreciation (depreciation) is attributable primarily to the tax deferral of losses on wash sales and the realization to ordinary income for tax purposes of unrealized gains on investments in passive foreign investment companies.
Accumulated capital losses represent net capital loss carryovers that may be used to offset future realized capital gains for federal income tax purposes. Any unlimited losses will be required to be utilized prior to the losses which carry an expiration date. Future capital loss carryover utilization in any given year may be subject to Internal Revenue Code limitations. Capital loss carryovers expire as follows:
| 2016 | 2017 | Unlimited |
| $(84,373,986) | $(241,484,655) | $(5,806,363) |
23
| For a Share Outstanding Throughout the Years Ended November 30 (except as noted) | |||||||||||||
| Per-Share Data | Ratios and Supplemental Data | ||||||||||||
| Income From Investment Operations: | Distributions From: | Ratio to Average Net Assets of: | |||||||||||
Net Asset Value, Beginning of Period | Net Investment Income (Loss)(1) | Net Realized and Unrealized Gain (Loss) | Total From Investment Operations | Net Investment Income | Net Realized Gains | Total Distributions | Net Asset Value, End of Period | Total Return(2) | Operating Expenses | Net Investment Income (Loss) | Portfolio Turnover Rate | Net Assets, End of Period (in thousands) | |
| Investor Class | |||||||||||||
| 2012 | $9.22 | 0.04 | 0.82 | 0.86 | —(3) | — | —(3) | $10.08 | 9.23% | 1.50% | 0.42% | 154% | $582,331 |
| 2011 | $9.88 | 0.02 | (0.68) | (0.66) | — | — | — | $9.22 | (6.58)% | 1.42% | 0.14% | 167% | $660,971 |
| 2010 | $8.55 | —(3) | 1.35 | 1.35 | (0.02) | — | (0.02) | $9.88 | 15.80% | 1.43% | 0.00%(4) | 199% | $878,530 |
| 2009 | $6.26 | 0.01 | 2.34 | 2.35 | (0.06) | — | (0.06) | $8.55 | 38.06% | 1.48% | 0.13% | 207% | $872,865 |
| 2008 | $18.40 | 0.06 | (8.09) | (8.03) | (0.06) | (4.05) | (4.11) | $6.26 | (55.48)% | 1.37% | 0.51% | 175% | $713,764 |
| Institutional Class | |||||||||||||
| 2012 | $9.34 | 0.05 | 0.83 | 0.88 | (0.02) | — | (0.02) | $10.20 | 9.44% | 1.30% | 0.62% | 154% | $48,794 |
| 2011 | $9.99 | 0.03 | (0.68) | (0.65) | — | — | — | $9.34 | (6.41)% | 1.22% | 0.34% | 167% | $97,063 |
| 2010 | $8.66 | 0.02 | 1.36 | 1.38 | (0.05) | — | (0.05) | $9.99 | 16.06% | 1.23% | 0.20% | 199% | $97,167 |
| 2009 | $6.34 | 0.02 | 2.37 | 2.39 | (0.07) | — | (0.07) | $8.66 | 38.32% | 1.28% | 0.33% | 207% | $79,830 |
| 2008 | $18.59 | 0.08 | (8.18) | (8.10) | (0.10) | (4.05) | (4.15) | $6.34 | (55.37)% | 1.17% | 0.71% | 175% | $55,091 |
A Class(5) | |||||||||||||
| 2012 | $9.00 | 0.01 | 0.80 | 0.81 | — | — | — | $9.81 | 8.88% | 1.75% | 0.17% | 154% | $2,838 |
| 2011 | $9.67 | (0.02) | (0.65) | (0.67) | — | — | — | $9.00 | (6.83)% | 1.67% | (0.11)% | 167% | $3,182 |
| 2010 | $8.37 | (0.02) | 1.32 | 1.30 | — | — | — | $9.67 | 15.53% | 1.68% | (0.25)% | 199% | $4,814 |
| 2009 | $6.13 | —(3) | 2.29 | 2.29 | (0.05) | — | (0.05) | $8.37 | 37.71% | 1.73% | (0.12)% | 207% | $6,342 |
| 2008 | $18.08 | 0.06 | (7.95) | (7.89) | (0.01) | (4.05) | (4.06) | $6.13 | (55.56)% | 1.63% | 0.25% | 175% | $10,622 |
24
| For a Share Outstanding Throughout the Years Ended November 30 (except as noted) | |||||||||||||
| Per-Share Data | Ratios and Supplemental Data | ||||||||||||
| Income From Investment Operations: | Distributions From: | Ratio to Average Net Assets of: | |||||||||||
Net Asset Value, Beginning of Period | Net Investment Income (Loss)(1) | Net Realized and Unrealized Gain (Loss) | Total From Investment Operations | Net Investment Income | Net Realized Gains | Total Distributions | Net Asset Value, End of Period | Total Return(2) | Operating Expenses | Net Investment Income (Loss) | Portfolio Turnover Rate | Net Assets, End of Period (in thousands) | |
| C Class | |||||||||||||
| 2012 | $9.08 | (0.05) | 0.80 | 0.75 | — | — | — | $9.83 | 8.14% | 2.50% | (0.58)% | 154% | $93 |
| 2011 | $9.82 | (0.07) | (0.67) | (0.74) | — | — | — | $9.08 | (7.43)% | 2.42% | (0.86)% | 167% | $87 |
2010(6) | $8.50 | (0.05) | 1.37 | 1.32 | — | — | — | $9.82 | 15.53% | 2.43%(7) | (0.77)%(7) | 199%(8) | $77 |
| R Class | |||||||||||||
| 2012 | $9.15 | —(3) | 0.81 | 0.81 | — | — | — | $9.96 | 8.73% | 2.00% | (0.08)% | 154% | $290 |
| 2011 | $9.86 | (0.04) | (0.67) | (0.71) | — | — | — | $9.15 | (7.10)% | 1.92% | (0.36)% | 167% | $27 |
2010(6) | $8.50 | (0.01) | 1.37 | 1.36 | — | — | — | $9.86 | 16.00% | 1.93%(7) | (0.16)%(7) | 199%(8) | $29 |
Notes to Financial Highlights
| (1) | Computed using average shares outstanding throughout the period. |
| (2) | Total returns are calculated based on the net asset value of the last business day and do not reflect applicable sales charges, if any. Total returns for periods less than one year are not annualized. |
| (3) | Per-share amount was less than $0.005. |
| (4) | Ratio was less than 0.005%. |
| (5) | Prior to March 1, 2010, the A Class was referred to as the Advisor Class. |
| (6) | March 1, 2010 (commencement of sale) through November 30, 2010. |
| (7) | Annualized. |
| (8) | Portfolio turnover is calculated at the fund level. Percentage indicated was calculated for the year ended November 30, 2010. |
See Notes to Financial Statements.
25
The Board of Directors and Shareholders of
American Century World Mutual Funds, Inc.:
We have audited the accompanying statement of assets and liabilities, including the schedule of investments, of International Discovery Fund, one of the funds constituting American Century World Mutual Funds, Inc. (the “Corporation”) as of November 30, 2012, and the related statement of operations for the year then ended, the statement of changes in net assets for each of the two years in the period then ended, and the financial highlights for each of the five years in the period then ended. These financial statements and financial highlights are the responsibility of the Corporation’s management. Our responsibility is to express an opinion on these financial statements and financial highlights based on our audits.
We conducted our audits in accordance with the standards of the Public Company Accounting Oversight Board (United States). Those standards require that we plan and perform the audit to obtain reasonable assurance about whether the financial statements and financial highlights are free of material misstatement. The Corporation is not required to have, nor were we engaged to perform, an audit of its internal control over financial reporting. Our audits included consideration of internal control over financial reporting as a basis for designing audit procedures that are appropriate in the circumstances, but not for the purpose of expressing an opinion on the effectiveness of the Corporation’s internal control over financial reporting. Accordingly, we express no such opinion. An audit also includes examining, on a test basis, evidence supporting the amounts and disclosures in the financial statements, assessing the accounting principles used and significant estimates made by management, as well as evaluating the overall financial statement presentation. Our procedures included confirmation of securities owned as of November 30, 2012, by correspondence with the custodian and brokers; where replies were not received from brokers, we performed other auditing procedures. We believe that our audits provide a reasonable basis for our opinion.
In our opinion, the financial statements and financial highlights referred to above present fairly, in all material respects, the financial position of International Discovery Fund of American Century World Mutual Funds, Inc., as of November 30, 2012, the results of its operations for the year then ended, the changes in its net assets for each of the two years in the period then ended, and the financial highlights for each of the five years in the period then ended, in conformity with accounting principles generally accepted in the United States of America.
Deloitte & Touche LLP
Kansas City, Missouri
January 17, 2013
26
The Board of Directors
The individuals listed below serve as directors of the funds. Each director will continue to serve in this capacity until death, retirement, resignation or removal from office. The mandatory retirement age for directors who are not “interested persons,” as that term is defined in the Investment Company Act (independent directors), is 72. However, the mandatory retirement age for an individual director may be extended with the approval of the remaining independent directors.
Mr. Thomas is an “interested person” because he currently serves as President and Chief Executive Officer of American Century Companies, Inc. (ACC), the parent company of American Century Investment Management, Inc. (ACIM or the advisor). Mr. Fink is an “interested person” because he currently serves as Executive Vice President of ACC.
The other directors (more than three-fourths of the total number) are independent; that is, they have never been employees, directors or officers of, and have no financial interest in, ACC or any of its wholly owned, direct or indirect, subsidiaries, including ACIM, American Century Investment Services, Inc. (ACIS) and American Century Services, LLC (ACS). The directors serve in this capacity for seven (in the case of Mr. Thomas, 15) registered investment companies in the American Century Investments family of funds.
The following table presents additional information about the directors. The mailing address for each director is 4500 Main Street, Kansas City, Missouri 64111.
Name (Year of Birth) | Position(s) Held with Funds | Length of Time Served | Principal Occupation(s) During Past 5 Years | Number of American Century Portfolios Overseen by Director | Other Directorships Held During Past 5 Years | ||
| Independent Directors | |||||||
Thomas A. Brown (1940) | Director | Since 1980 | Managing Member, Associated Investments, LLC (real estate investment company); Brown Cascade Properties, LLC (real estate investment company) (2001 to 2009) | 66 | None | ||
Andrea C. Hall (1945) | Director | Since 1997 | Retired | 66 | None | ||
Jan M. Lewis (1957) | Director | Since 2011 | President and Chief Executive Officer, Catholic Charities of Northeast Kansas (human services organization) | 66 | None | ||
James A. Olson (1942) | Director | Since 2007 | Member, Plaza Belmont LLC (private equity fund manager) | 66 | Saia, Inc. (2002 to 2012) and Entertainment Properties Trust | ||
Donald H. Pratt (1937) | Director and Chairman of the Board | Since 1995 (Chairman since 2005) | Chairman and Chief Executive Officer, Western Investments, Inc. (real estate company) | 66 | None | ||
27
Name (Year of Birth) | Position(s) Held with Funds | Length of Time Served | Principal Occupation(s) During Past 5 Years | Number of American Century Portfolios Overseen by Director | Other Directorships Held During Past 5 Years | ||
| Independent Directors | |||||||
M. Jeannine Strandjord (1945) | Director | Since 1994 | Retired | 66 | Euronet Worldwide Inc.; Charming Shoppes, Inc. (2006 to 2010); and DST Systems Inc. (1996 to 2012) | ||
John R. Whitten (1946) | Director | Since 2008 | Retired | 66 | Rudolph Technologies, Inc. | ||
Stephen E. Yates (1948) | Director | Since 2012 | Retired; Executive Vice President, Technology & Operations, KeyCorp. (computer services) (2004 to 2010) | 66 | Applied Industrial Technologies, Inc. (2001 to 2010) | ||
| Interested Directors | |||||||
Barry Fink (1955) | Director and Executive Vice President | Since 2012 (Executive Vice President since 2007) | Executive Vice President, ACC (September 2007 to present); President, ACS (October 2007 to present); Chief Operating Officer, ACC (September 2007 to November 2012). Also serves as Manager, ACS | 66 | None | ||
Jonathan S. Thomas (1963) | Director and President | Since 2007 | President and Chief Executive Officer, ACC (March 2007 to present). Also serves as Chief Executive Officer and Manager, ACS; Executive Vice President, ACIM; Director, ACC, ACIM and other ACC subsidiaries | 108 | None | ||
28
Officers
The following table presents certain information about the executive officers of the funds. Each officer serves as an officer for each of the 15 investment companies in the American Century family of funds, unless otherwise noted. No officer is compensated for his or her service as an officer of the funds. The listed officers are interested persons of the funds and are appointed or re-appointed on an annual basis. The mailing address for each officer listed below is 4500 Main Street, Kansas City, Missouri 64111.
Name (Year of Birth) | Offices with the Funds | Principal Occupation(s) During the Past Five Years | |
Jonathan S. Thomas (1963) | Director and President since 2007 | President and Chief Executive Officer, ACC (March 2007 to present). Also serves as Chief Executive Officer and Manager, ACS; Executive Vice President, ACIM; Director, ACC, ACIM and other ACC subsidiaries | |
Barry Fink (1955) | Director since 2012 and Executive Vice President since 2007 | Executive Vice President, ACC (September 2007 to present); President, ACS (October 2007 to present); Chief Operating Officer, ACC (September 2007 to November 2012). Also serves as Manager, ACS | |
Maryanne L. Roepke (1956) | Chief Compliance Officer since 2006 and Senior Vice President since 2000 | Chief Compliance Officer, American Century funds, ACIM and ACS (August 2006 to present). Also serves as Senior Vice President, ACS | |
Charles A. Etherington (1957) | General Counsel since 2007 and Senior Vice President since 2006 | Attorney, ACC (February 1994 to present); Vice President, ACC (November 2005 to present), General Counsel, ACC (March 2007 to present). Also serves as General Counsel, ACIM, ACS, ACIS and other ACC subsidiaries; and Senior Vice President, ACIM and ACS | |
C. Jean Wade (1964) | Vice President, Treasurer and Chief Financial Officer since 2012 | Vice President, ACS (February 2000 to present) | |
Robert J. Leach (1966) | Vice President since 2006 and Assistant Treasurer since 2012 | Vice President, ACS (February 2000 to present) | |
David H. Reinmiller (1963) | Vice President since 2000 | Attorney, ACC (January 1994 to present); Associate General Counsel, ACC (January 2001 to present). Also serves as Vice President, ACIM and ACS | |
Ward D. Stauffer (1960) | Secretary since 2005 | Attorney, ACC (June 2003 to present) |
The Statement of Additional Information has additional information about the fund’s directors and is available without charge, upon request, by calling 1-800-345-2021.
29
At a meeting held on June 21, 2012, the Fund’s Board of Directors unanimously approved the renewal of the management agreement pursuant to which American Century Investment Management, Inc. (the “Advisor”) acts as the investment advisor for the Fund. Under Section 15(c) of the Investment Company Act, contracts for investment advisory services are required to be reviewed, evaluated, and approved by a majority of a fund’s independent directors (the “Directors”) each year.
As a part of the approval process, the Board requested and reviewed extensive data and information compiled by the Advisor and certain independent providers of evaluation data concerning the Fund and the services provided to the Fund by the Advisor. This review was in addition to the oversight and evaluation undertaken by the Board and its committees on a continuous basis throughout the year and included, but was not limited to the following:
| • | the nature, extent, and quality of investment management, shareholder services, and other services provided by the Advisor to the Fund; |
| • | the wide range of other programs and services the Advisor provides to the Fund and its shareholders on a routine and non-routine basis; |
| • | the investment performance of the fund, including data comparing the Fund’s performance to appropriate benchmarks and/or a peer group of other mutual funds with similar investment objectives and strategies; |
| • | data comparing the cost of owning the Fund to the cost of owning similar funds; |
| • | the Advisor’s compliance policies, procedures, and regulatory experience; |
| • | financial data showing the cost of services provided to the Fund, the profitability of the Fund to the Advisor, and the overall profitability of the Advisor; |
| • | data comparing services provided and charges to other investment management clients of the Advisor; and |
| • | consideration of collateral benefits derived by the Advisor from the management of the Fund and any potential economies of scale relating thereto. |
In keeping with its practice, the Board held two in-person meetings and one telephonic meeting to review and discuss the information provided. The Directors also had the benefit of the advice of independent counsel throughout the period.
Factors Considered
The Directors considered all of the information provided by the Advisor, the independent data providers, and independent counsel, and evaluated such information for the Fund. In connection with their review, the Directors did not identify any single factor as being all-important or controlling, and each Director may have attributed different levels of importance to different factors. In deciding to renew the management agreement, the Board based its decision on a number of factors, including the following:
30
Nature, Extent and Quality of Services - Generally. Under the management agreement, the Advisor is responsible for providing or arranging for all services necessary for the operation of the Fund. The Board noted that under the management agreement, the Advisor provides or arranges at its own expense a wide variety of services including:
| • | constructing and designing the Fund |
| • | portfolio research and security selection |
| • | initial capitalization/funding |
| • | securities trading |
| • | Fund administration |
| • | custody of Fund assets |
| • | daily valuation of the Fund’s portfolio |
| • | shareholder servicing and transfer agency, including shareholder confirmations, recordkeeping, and communications |
| • | legal services |
| • | regulatory and portfolio compliance |
| • | financial reporting |
| • | marketing and distribution |
The Board noted that many of these services have expanded over time both in terms of quantity and complexity in response to shareholder demands, competition in the industry, changing distribution channels, and the changing regulatory environment.
Investment Management Services. The nature of the investment management services provided to the Fund is quite complex and allows Fund shareholders access to professional money management, instant diversification of their investments within an asset class, the opportunity to easily diversify among asset classes by investing in or exchanging among various American Century Investments funds, and liquidity. In evaluating investment performance, the Board expects the Advisor to manage the Fund in accordance with its investment objectives and approved strategies. Further, the Directors recognize that the Advisor has an obligation to monitor trading activities, and in particular to seek the best execution of fund trades, and to evaluate the use of and payment for research. In providing these services, the Advisor utilizes teams of investment professionals (portfolio managers, analysts, research assistants, and securities traders) who require extensive information technology, research, training, compliance and other systems to conduct their business. The Board, directly and through its Fund Performance Review Committee, regularly reviews investment performance information for the Fund, together with comparative information for appropriate benchmarks and/or peer groups of similarly-managed funds, over different time horizons.
31
The Directors also review detailed performance information during the management agreement approval process. If performance concerns are identified, the Fund receives special reviews until performance improves, during which the Board discusses with the Advisor the reasons for such results (e.g., market conditions, security selection) and any efforts being undertaken to improve performance. Taking all these factors into consideration, the Board found the investment management services provided by the Advisor to the Fund to meet or exceed industry standards. More detailed information about the Fund’s performance can be found in the Performance and Portfolio Commentary sections of this report.
Shareholder and Other Services. Under the management agreement, the Advisor provides the Fund with a comprehensive package of transfer agency, shareholder, and other services. The Board, directly and through various committees of the Board, regularly reviews reports and evaluations of such services at its regular meetings. These reports include, but are not limited to, information regarding the operational efficiency and accuracy of the shareholder and transfer agency services provided, staffing levels, shareholder satisfaction (as measured by external as well as internal sources), technology support, new products and services offered to Fund shareholders, securities trading activities, portfolio valuation services, auditing services, and legal and operational compliance activities. Certain aspects of shareholder and transfer agency service level efficiency and the quality of securities trading activities are measured by independent third party providers and are presented in comparison to other fund groups not managed by the Advisor. The Board found the services provided by the Advisor to the Fund under the management agreement to be competitive and of high quality.
Costs of Services and Profitability. The Advisor provides detailed information concerning its cost of providing various services to the Fund, its profitability in managing the Fund, its overall profitability, and its financial condition. The Directors have reviewed with the Advisor the methodology used to prepare this financial information. The financial information regarding the Advisor is considered in evaluating the Advisor’s financial condition, ability to continue to provide services under the management agreement, and the reasonableness of the current management fee. The Board concluded that the Advisor’s profits were reasonable in light of the services provided to the Fund.
Ethics. The Board generally considers the Advisor’s commitment to providing quality services to shareholders and to conducting its business ethically. They noted that the Advisor’s practices generally meet or exceed industry best practices.
Economies of Scale. The Board also reviewed information provided by the Advisor regarding the possible existence of economies of scale in connection with the management of the Fund. The Board concluded that economies of scale are difficult to measure and predict with precision, especially on a fund-by-fund basis. The Board concluded that the Advisor is appropriately sharing economies of scale through its competitive fee structure, offering competitive fees from fund inception, and through reinvestment in its business to provide shareholders additional content and services.
32
Comparison to Other Funds’ Fees. The management agreement provides that the Fund pay the Advisor a single, all-inclusive (or unified) management fee for providing all services necessary for the management and operation of the Fund, other than brokerage expenses, taxes, interest, extraordinary expenses, and the fees and expenses of the Fund’s independent directors (including their independent legal counsel) and expenses incurred in connection with the provision of shareholder services and distribution services under a plan adopted pursuant to Rule 12b-1 under the 1940 Act. Under the unified fee structure, the Advisor is responsible for providing all investment advisory, custody, audit, administrative, compliance, recordkeeping, marketing and shareholder services, or arranging and supervising third parties to provide such services. By contrast, most other funds are charged a variety of fees, including an investment advisory fee, a transfer agency fee, an administrative fee, distribution charges and other expenses. Other than their investment advisory fees and any applicable Rule 12b-1 distribution fees, all other components of the total fees charged by these other funds may be increased without shareholder approval. The Board believes the unified fee structure is a benefit to Fund shareholders because it clearly discloses to shareholders the cost of owning Fund shares, and, since the unified fee cannot be increased without a vote of Fund shareholders, it shifts to the Advisor the risk of increased costs of operating the Fund and provides a direct incentive to minimize administrative inefficiencies. Part of the Board’s analysis of fee levels involves reviewing certain evaluative data compiled by an independent provider and comparing the Fund’s unified fee to the total expense ratio of other funds in the Fund’s peer group. The Board concluded that the management fee paid by the Fund to the Advisor under the management agreement is reasonable in light of the services provided to the Fund.
Comparison to Fees and Services Provided to Other Clients of the Advisor. The Board also requested and received information from the Advisor concerning the nature of the services, fees, costs and profitability of its advisory services to advisory clients other than the Fund. They observed that these varying types of client accounts require different services and involve different regulatory and entrepreneurial risks than the management of the Fund. The Board analyzed this information and concluded that the fees charged and services provided to the Fund were reasonable by comparison.
Collateral or “Fall-Out” Benefits Derived by the Advisor. The Board considered the existence of collateral benefits the Advisor may receive as a result of its relationship with the Fund. They concluded that the Advisor’s primary business is managing mutual funds and it generally does not use fund or shareholder information to generate profits in other lines of business, and therefore does not derive any significant collateral benefits from them. The Board noted that the Advisor receives proprietary research from broker-dealers that execute fund portfolio transactions and concluded that this research is likely to benefit Fund shareholders. The Board also determined that the Advisor is able to provide investment management services to certain clients other than the Fund, at least in part, due to its existing infrastructure built to serve the fund complex. The Board concluded, however, that the assets of those other clients are not material to the analysis and, where applicable, may be included with the assets of the Fund to determine breakpoints in the management fee schedule.
33
Existing Relationship. The Board also considered whether there was any reason for not continuing the existing arrangement with the Advisor. In this regard, the Board was mindful of the potential disruptions of the Fund’s operations and various risks, uncertainties, and other effects that could occur as a result of a decision not to continue such relationship. In particular, the Board recognized that most shareholders have invested in the Fund on the strength of the Advisor’s industry standing and reputation and in the expectation that the Advisor will have a continuing role in providing advisory services to the Fund.
Conclusion of the Directors. As a result of this process, the Board, including all of the independent directors, taking into account all of the factors discussed above and the information provided by the Advisor and others, concluded that the management agreement between the Fund and the Advisor is fair and reasonable in light of the services provided and should be renewed.
34
Retirement Account Information
As required by law, distributions you receive from certain IRAs, or 403(b), 457 and qualified plans are subject to federal income tax withholding, unless you elect not to have withholding apply. Tax will be withheld on the total amount withdrawn even though you may be receiving amounts that are not subject to withholding, such as nondeductible contributions. In such case, excess amounts of withholding could occur. You may adjust your withholding election so that a greater or lesser amount will be withheld.
If you don’t want us to withhold on this amount, you must notify us to not withhold the federal income tax. You may notify us in writing or in certain situations by telephone or through other electronic means. You have the right to revoke your withholding election at any time and any election you make may remain in effect until revoked by filing a new election.
Remember, even if you elect not to have income tax withheld, you are liable for paying income tax on the taxable portion of your withdrawal. If you elect not to have income tax withheld or you don’t have enough income tax withheld, you may be responsible for payment of estimated tax. You may incur penalties under the estimated tax rules if your withholding and estimated tax payments are not sufficient. You can reduce or defer the income tax on a distribution by directly or indirectly rolling such distribution over to another IRA or eligible plan. You should consult your tax advisor for additional information.
State tax will be withheld if, at the time of your distribution, your address is within one of the mandatory withholding states and you have federal income tax withheld. State taxes will be withheld from your distribution in accordance with the respective state rules.
Proxy Voting Guidelines
American Century Investment Management, Inc., the fund’s investment advisor, is responsible for exercising the voting rights associated with the securities purchased and/or held by the fund. A description of the policies and procedures the advisor uses in fulfilling this responsibility is available without charge, upon request, by calling 1-800-345-2021. It is also available on American Century Investments’ website at americancentury.com and on the Securities and Exchange Commission’s website at sec.gov. Information regarding how the investment advisor voted proxies relating to portfolio securities during the most recent 12-month period ended June 30 is available on the “About Us” page at americancentury.com. It is also available at sec.gov.
Quarterly Portfolio Disclosure
The fund files its complete schedule of portfolio holdings with the Securities and Exchange Commission (SEC) for the first and third quarters of each fiscal year on Form N-Q. The fund’s Forms N-Q are available on the SEC’s website at sec.gov, and may be reviewed and copied at the SEC’s Public Reference Room in Washington, DC. Information on the operation of the Public Reference Room may be obtained by calling 1-800-SEC-0330. The fund also makes its complete schedule of portfolio holdings for the most recent quarter of its fiscal year available on its website at americancentury.com and, upon request, by calling 1-800-345-2021.
35
Other Tax Information
The following information is provided pursuant to provisions of the Internal Revenue Code.
The fund hereby designates up to the maximum amount allowable as qualified dividend income for the fiscal year ended November 30, 2012.
For corporate taxpayers, the fund hereby designates $66,603, or up to the maximum amount allowable, of ordinary income distributions paid during the fiscal year ended November 30, 2012 as qualified for the corporate dividends received deduction.
For the fiscal year ended November 30, 2012, the fund intends to pass through to shareholders $1,114,130, or up to the maximum amount allowable, as a foreign tax credit which represents taxes paid on income derived from sources within foreign countries or possessions of the United States. During the fiscal year ended November 30, 2012, the fund earned $13,992,681 from income derived from foreign sources. Foreign source income and foreign tax expense per outstanding share on November 30, 2012 are $0.2225 and $0.0177, respectively.
36
| Contact Us | americancentury.com |
| Automated Information Line | 1-800-345-8765 |
| Investor Services Representative | 1-800-345-2021 or 816-531-5575 |
| Investors Using Advisors | 1-800-378-9878 |
Business, Not-For-Profit, Employer-Sponsored Retirement Plans | 1-800-345-3533 |
Banks and Trust Companies, Broker-Dealers, Financial Professionals, Insurance Companies | 1-800-345-6488 |
| Telecommunications Device for the Deaf | 1-800-634-4113 |
American Century World Mutual Funds, Inc.
Investment Advisor:
American Century Investment Management, Inc.
Kansas City, Missouri
This report and the statements it contains are submitted for the general information of our shareholders. The report is not authorized for distribution to prospective investors unless preceded or accompanied by an effective prospectus.
©2013 American Century Proprietary Holdings, Inc. All rights reserved.
CL-ANN-76977 1301
ANNUAL REPORT NOVEMBER 30, 2012
| International Opportunities Fund |
| President’s Letter | 2 |
| Independent Chairman’s Letter | 3 |
| Market Perspective | 4 |
| Performance | 5 |
| Portfolio Commentary | 7 |
| Fund Characteristics | 9 |
| Shareholder Fee Example | 10 |
| Schedule of Investments | 12 |
| Statement of Assets and Liabilities | 15 |
| Statement of Operations | 16 |
| Statement of Changes in Net Assets | 17 |
| Notes to Financial Statements | 18 |
| Financial Highlights | 24 |
| Report of Independent Registered Public Accounting Firm | 26 |
| Management | 27 |
| Approval of Management Agreement | 30 |
| Additional Information | 35 |
Any opinions expressed in this report reflect those of the author as of the date of the report, and do not necessarily represent the opinions of American Century Investments® or any other person in the American Century Investments organization. Any such opinions are subject to change at any time based upon market or other conditions and American Century Investments disclaims any responsibility to update such opinions. These opinions may not be relied upon as investment advice and, because investment decisions made by American Century Investments funds are based on numerous factors, may not be relied upon as an indication of trading intent on behalf of any American Century Investments fund. Security examples are used for representational purposes only and are not intended as recommendations to purchase or sell securities. Performance information for comparative indices and securities is provided to American Century Investments by third party vendors. To the best of American Century Investments’ knowledge, such information is accurate at the time of printing.
Dear Investor:
Thank you for reviewing this annual report for the 12 months ended November 30, 2012. It offers investment performance, market analysis, and portfolio information, presented with the expert perspective of our portfolio management team.
Annual reports remain important vehicles for conveying information about fund returns, including key factors that affected fund performance. For additional, updated investment and market insights, we encourage you to visit our website, americancentury.com.
Favorable Fiscal-Year Returns for Most Major Stock and Bond Benchmarks
Despite a global economic slowdown, continued concerns about European financial system stability, and uncertainty about U.S. political and fiscal conditions in 2013, 12-month stock and bond returns were generally favorable, particularly for U.S. value stocks and high-yield bonds.
U.S. value stock indices outpaced the S&P 500 Index’s 16.13% return for the period, as did U.S. corporate and municipal high-yield benchmarks. U.S. growth and international index returns were generally lower, but still solid—the MSCI EAFE Index, for example, returned 12.61%.
With the exception of high-yield bond sectors, stocks generally outperformed bonds for the period, though bonds benefitted from economic stagnation, reduced inflation pressures, and low interest rates. The 10-year U.S. Treasury yield declined from 2.07% to 1.62% during the period, and the Barclays U.S. Aggregate Bond Index returned 5.51%. Related global bond indices also returned in roughly the mid-single digits.
Bucking the global trend, the U.S. economy showed signs of improvement during the fiscal year, particularly the long-depressed housing market. However, the outlook for 2013 remains guarded, as the fragile recovery remains vulnerable to fiscal and financial factors that could trigger further slowdowns and market volatility.
Under these conditions, we continue to believe in a disciplined, diversified, long-term investment approach, using both stocks and bonds—as appropriate—for meeting financial goals. We appreciate your continued trust in us in this challenging environment.
Sincerely,
Jonathan Thomas
President and Chief Executive Officer
American Century Investments
2
Dear Fellow Shareholders,
The board has once again completed its annual review of the advisory contract between the American Century Investments mutual funds overseen by the board and the funds’ advisor, American Century Investment Management, Inc. This process, often referred to as the 15(c) review, involves the independent directors considering all of the material monitored throughout the year and evaluating a wide range of factors to determine whether the management fee paid by each fund to the advisor is reasonable.
The independent directors’ rationale for this decision is provided in detail in this, or in a previous, report. However, there are several highlights that should be of interest to all shareholders.
| • | Fund performance and client service continue to be rated among the industry’s best. |
| • | Target date and other asset allocation products continue to successfully gather assets and industry acclaim. |
| • | Compliance programs continue to function successfully with no issues impacting shareholder interests. |
| • | Fees were found to be within an acceptable competitive range, with minor fee waivers being negotiated on five funds. |
Knowing that most shareholders are long term investors, the board was particularly pleased with our succession planning review. Talented professionals are being added within portfolio management and experienced managers have been added to the senior management team.
Overall it was a very positive review for the American Century Investments mutual funds during a challenging market environment.
Best personal regards,
Don Pratt
3
By Mark Kopinski, Chief Investment Officer, Global and Non-U.S. Equity
Central Bank Action Drove Global Stocks Higher
Despite a backdrop of weaker global economic growth and mounting sovereign debt problems in Europe and the United States, most global stock benchmarks advanced strongly for the 12-month period ended November 30, 2012. Investors generally overlooked the lackluster economic data, recession fears (which eventually turned to reality for Europe), and the instability of the eurozone’s banking system and currency. Instead, they focused on the optimism inspired by unprecedented central bank intervention.
In particular, the European Central Bank (ECB) launched several programs to help the eurozone’s troubled banks shore up their balance sheets and finance ongoing operations. The ECB also agreed to purchase the sovereign debt of financially strapped member nations that conform to the ECB’s fiscal reform measures. Meanwhile, in response to sluggish economic growth and high unemployment, the U.S. Federal Reserve (the Fed) announced its third—and most aggressive—quantitative easing program to date. The Bank of Japan also took action with an asset purchase program, while the People’s Bank of China eased its reserve requirements for commercial lenders.
Overall, developed markets outperformed emerging markets for the 12-month period, even as the emerging economies generally enjoyed higher absolute levels of growth, albeit slower growth than in previous periods. Strong stock market performance in Europe and the United States, where central bank stimulus was the greatest, primarily drove the better relative results in the developed markets.
Valuations, Stock Selection Remain Key Factors
Even though economic growth and corporate earnings in aggregate have been slowing, and sovereign debt issues have yet to be resolved, there are some positive factors at work for global equity investors. Stock valuations around the globe appear attractive relative to historical averages. Similarly, equity earnings yields are also compelling when measured against long-term averages and current bond yields. Most important, we believe through our rigorous, bottom-up stock selection process it’s still possible to find individual companies growing earnings, either from a new product launch, market share gains, secular changes, or
beneficial acquisitions.
| International Equity Total Returns | ||||
| For the 12 months ended November 30, 2012 (in U.S. dollars) | ||||
| MSCI EAFE Index | 12.61% | MSCI Europe Index | 14.07% | |
| MSCI EAFE Growth Index | 12.66% | MSCI World Index | 13.62% | |
| MSCI EAFE Value Index | 12.45% | MSCI Japan Index | 3.59% | |
| MSCI Emerging Markets Index | 11.35% | |||
4
| Total Returns as of November 30, 2012 | ||||||
| Average Annual Returns | ||||||
Ticker Symbol | 1 year | 5 years | 10 years | Since Inception | Inception Date | |
| Investor Class | AIOIX | 19.40% | -2.98% | 14.86% | 12.27% | 6/1/01 |
MSCI All Country World ex-U.S. Small Cap Growth Index | — | 11.16% | -2.32% | 11.59% | 7.22%(1) | — |
| Institutional Class | ACIOX | 19.57% | -2.78% | — | 15.08% | 1/9/03 |
A Class No sales charge* With sales charge* | AIVOX | 19.06% 12.30% | — — | — — | 10.06% 7.69% | 3/1/10 |
| C Class | AIOCX | 18.15% | — | — | 9.25% | 3/1/10 |
| R Class | AIORX | 18.73% | — | — | 9.80% | 3/1/10 |
| * | Sales charges include initial sales charges and contingent deferred sales charges (CDSCs), as applicable. A Class shares have a 5.75% maximum initial sales charge and may be subject to a maximum CDSC of 1.00%. C Class shares redeemed within 12 months of purchase are subject to a maximum CDSC of 1.00%. The SEC requires that mutual funds provide performance information net of maximum sales charges in all cases where charges could be applied. |
| (1) | Since 5/31/01, the date nearest the Investor Class’s inception for which data are available. |
Data presented reflect past performance. Past performance is no guarantee of future results. Current performance may be higher or lower than the performance shown. Investment return and principal value will fluctuate, and redemption value may be more or less than original cost. To obtain performance data current to the most recent month end, please call 1-800-345-2021 or visit americancentury.com. Historically, small company stocks have been more volatile than the stocks of larger, more established companies. The fund’s investment process may result in high portfolio turnover, which could mean high transaction costs, affecting both performance and capital gains tax liabilities to investors. International investing involves special risks, such as political instability and currency fluctuations. Investing in emerging markets may accentuate these risks.
Unless otherwise indicated, performance reflects Investor Class shares; performance for other share classes will vary due to differences in fee structure. For information about other share classes available, please consult the prospectus. Data assumes reinvestment of dividends and capital gains, and none of the charts reflect the deduction of taxes that a shareholder would pay on fund distributions or the redemption of fund shares. Returns for the index are provided for comparison. The fund’s total returns include operating expenses (such as transaction costs and management fees) that reduce returns, while the total returns of the index do not.
5
| Growth of $10,000 Over 10 Years |
| $10,000 investment made November 30, 2002 |
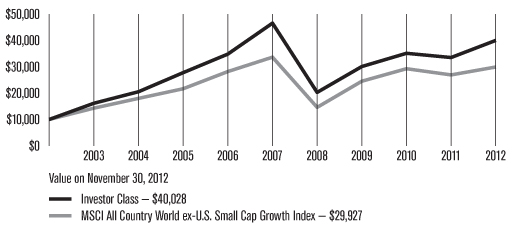
| Total Annual Fund Operating Expenses | ||||
| Investor Class | Institutional Class | A Class | C Class | R Class |
| 1.83% | 1.63% | 2.08% | 2.83% | 2.33% |
The total annual fund operating expenses shown is as stated in the fund’s prospectus current as of the date of this report. The prospectus may vary from the expense ratio shown elsewhere in this report because it is based on a different time period, includes acquired fund fees and expenses, and, if applicable, does not include fee waivers or expense reimbursements.
Data presented reflect past performance. Past performance is no guarantee of future results. Current performance may be higher or lower than the performance shown. Investment return and principal value will fluctuate, and redemption value may be more or less than original cost. To obtain performance data current to the most recent month end, please call 1-800-345-2021 or visit americancentury.com. Historically, small company stocks have been more volatile than the stocks of larger, more established companies. The fund’s investment process may result in high portfolio turnover, which could mean high transaction costs, affecting both performance and capital gains tax liabilities to investors. International investing involves special risks, such as political instability and currency fluctuations. Investing in emerging markets may accentuate these risks.
Unless otherwise indicated, performance reflects Investor Class shares; performance for other share classes will vary due to differences in fee structure. For information about other share classes available, please consult the prospectus. Data assumes reinvestment of dividends and capital gains, and none of the charts reflect the deduction of taxes that a shareholder would pay on fund distributions or the redemption of fund shares. Returns for the index are provided for comparison. The fund’s total returns include operating expenses (such as transaction costs and management fees) that reduce returns, while the total returns of the index do not.
6
| Portfolio Commentary |
Portfolio Managers: Mark Kopinski, Trevor Gurwich, and Indraneel Das
Performance Summary
International Opportunities advanced 19.40%* for the 12 months ended November 30, 2012, compared with its benchmark, the MSCI All Country World ex-U.S. Small Cap Growth Index, which gained 11.16%.
Non-U.S. stocks generally demonstrated robust performance during the 12-month period, even as weak growth and mounting sovereign debt problems weighed on many economies. Unprecedented central bank intervention, particularly the European Central Bank’s commitment to do “whatever it takes” to restore eurozone stability, helped drive stock market optimism. Overall, developed market stocks outpaced their emerging market counterparts, and within the small-cap universe, value stocks outperformed growth stocks for the period.
The portfolio’s outperformance compared with the benchmark primarily was due to favorable stock selection within several sectors, including materials, industrials, energy, financials, and information technology. Stock selection was slightly negative only in the telecommunication services sector. Overall, our sector allocations contributed positively to relative performance, particularly an underweight position in materials and energy and an overweight position in information technology. On a regional basis, exposure in the United Kingdom, Canada and Israel contributed favorably to relative results, while positions in Japan, Taiwan, and Mexico detracted from performance.
Construction Equipment Rental Company was a Top Contributor
An overweight position in the United Kingdom’s Ashtead Group was among the leading contributors to portfolio performance for the 12-month period. The construction equipment rental company benefitted overall from the recovering U.S. housing market and from its United Kingdom- and United States-based customers preferring to lease rather than buy equipment in the challenging economic climate. In addition, the company reported strong quarterly results for the period ended in July. Specifically, the company reported an 82% jump in pre-tax profit, a 21% gain in revenues, and a more robust full-year outlook.
An overweight position in another United Kingdom-based company, Aberdeen Asset Management, also was among the top contributors to the portfolio’s relative performance. The institutional asset manager reported higher profits and growing assets under management during the period. In particular, the company has realized strong equity flows into its high margin strategies, including emerging markets and global, and appears well positioned for growth in its core strategies.
An overweight position in Israel’s Mellanox Technologies, a manufacturer of semiconductors and software that link servers with data storage systems, also was among the portfolio’s top contributors. In addition to reporting strong revenues and earnings during the period, the company remains the beneficiary of a mass transition to cloud-based technology, with products that facilitate data transmission in server warehouses.
*All fund returns referenced in this commentary are for Investor Class shares.
7
Internet Media Company Detracted from Results
A position in Japan-based CyberAgent was among the top performance detractors for the 12-month period. Shares of the Internet media and smartphone application developer declined after an analyst cut the company’s price target to reflect higher costs and a temporary slowdown in fees. We exited the position.
A position in Japan-based Sanrio, a maker of children’s toys and accessories, including the Hello Kitty line, also was a leading detractor to portfolio performance. The company, which operates in the specialty retail industry of the consumer discretionary sector, faced challenging economic conditions at home, as Japan remained on the verge of recession. We exited the portfolio’s position in the company.
Mando, a South Korea-based parts supplier to automakers, also was among the portfolio’s largest individual detractors. The stock tumbled early in the period, as South Korean officials acknowledged the lackluster European economy hindered the country’s growth rate. Yet, the Bank of Korea refrained from lowering its key lending rate, citing inflationary concerns. We subsequently exited the position.
Outlook
While we remain concerned about macroeconomic uncertainty, we continue to seek individual companies demonstrating quality earnings growth trends and the ability to outperform their peers. We will continue to look for opportunities to take advantage of several prevailing global themes, such as the proliferation of smartphones, continued capital spending on deep-water oil and gas projects, and increased demand for security as digital transactions grow. We will continue to seek small-capitalization companies located around the world (excluding the United States) offering promising growth characteristics.
8
| NOVEMBER 30, 2012 | |
| Top Ten Holdings | % of net assets |
| Ashtead Group plc | 2.7% |
| Bellway plc | 2.0% |
| Telecity Group plc | 1.9% |
| Banca Generali SpA | 1.9% |
| Techtronic Industries Co. | 1.9% |
| Wirecard AG | 1.8% |
| Spectris plc | 1.6% |
| Fred Olsen Energy ASA | 1.6% |
| Christian Hansen Holding A/S | 1.6% |
| Petroleum Geo-Services ASA | 1.6% |
| Types of Investments in Portfolio | % of net assets |
| Foreign Common Stocks | 96.7% |
| Exchange-Traded Funds | 1.2% |
| Rights | —* |
| Total Equity Exposure | 97.9% |
| Temporary Cash Investments | 1.6% |
| Other Assets and Liabilities | 0.5% |
| *Category is less than 0.05% of total net assets. | |
| Investments by Country | % of net assets |
| United Kingdom | 20.8% |
| Japan | 13.4% |
| Germany | 6.6% |
| Canada | 4.4% |
| China | 4.4% |
| Taiwan | 4.3% |
| France | 4.1% |
| South Korea | 3.9% |
| Australia | 3.8% |
| Norway | 3.7% |
| Denmark | 3.5% |
| Brazil | 3.5% |
| Hong Kong | 2.8% |
| India | 2.7% |
| Italy | 2.3% |
| Other Countries | 13.7% |
| Cash and Equivalents* | 2.1% |
*Includes temporary cash investments and other assets and liabilities.
9
Fund shareholders may incur two types of costs: (1) transaction costs, including sales charges (loads) on purchase payments and redemption/exchange fees; and (2) ongoing costs, including management fees; distribution and service (12b-1) fees; and other fund expenses. This example is intended to help you understand your ongoing costs (in dollars) of investing in your fund and to compare these costs with the ongoing cost of investing in other mutual funds.
The example is based on an investment of $1,000 made at the beginning of the period and held for the entire period from June 1, 2012 to November 30, 2012.
Actual Expenses
The table provides information about actual account values and actual expenses for each class. You may use the information, together with the amount you invested, to estimate the expenses that you paid over the period. First, identify the share class you own. Then simply divide your account value by $1,000 (for example, an $8,600 account value divided by $1,000 = 8.6), then multiply the result by the number under the heading “Expenses Paid During Period” to estimate the expenses you paid on your account during this period.
If you hold Investor Class shares of any American Century Investments fund, or Institutional Class shares of the American Century Diversified Bond Fund, in an American Century Investments account (i.e., not a financial intermediary or retirement plan account), American Century Investments may charge you a $12.50 semiannual account maintenance fee if the value of those shares is less than $10,000. We will redeem shares automatically in one of your accounts to pay the $12.50 fee. In determining your total eligible investment amount, we will include your investments in all personal accounts (including American Century Investments Brokerage accounts) registered under your Social Security number. Personal accounts include individual accounts, joint accounts, UGMA/UTMA accounts, personal trusts, Coverdell Education Savings Accounts and IRAs (including traditional, Roth, Rollover, SEP-, SARSEP- and SIMPLE-IRAs), and certain other retirement accounts. If you have only business, business retirement, employer-sponsored or American Century Investments Brokerage accounts, you are currently not subject to this fee. If you are subject to the Account Maintenance Fee, your account value could be reduced by the fee amount.
Hypothetical Example for Comparison Purposes
The table also provides information about hypothetical account values and hypothetical expenses based on the actual expense ratio of each class of your fund and an assumed rate of return of 5% per year before expenses, which is not the actual return of a fund’s share class. The hypothetical account values and expenses may not be used to estimate the actual ending account balance or expenses you paid for the period. You may use this information to compare the ongoing costs of investing in your fund and other funds. To do so, compare this 5% hypothetical example with the 5% hypothetical examples that appear in the shareholder reports of the other funds.
10
Please note that the expenses shown in the table are meant to highlight your ongoing costs only and do not reflect any transactional costs, such as sales charges (loads) or redemption/exchange fees. Therefore, the table is useful in comparing ongoing costs only, and will not help you determine the relative total costs of owning different funds. In addition, if these transactional costs were included, your costs would have been higher.
Beginning Account Value 6/1/12 | Ending Account Value 11/30/12 | Expenses Paid During Period(1) 6/1/12 – 11/30/12 | Annualized Expense Ratio(1) | |
| Actual | ||||
| Investor Class | $1,000 | $1,172.40 | $10.10 | 1.86% |
| Institutional Class | $1,000 | $1,174.30 | $9.02 | 1.66% |
| A Class | $1,000 | $1,171.10 | $11.45 | 2.11% |
| C Class | $1,000 | $1,165.80 | $15.49 | 2.86% |
| R Class | $1,000 | $1,167.80 | $12.79 | 2.36% |
| Hypothetical | ||||
| Investor Class | $1,000 | $1,015.70 | $9.37 | 1.86% |
| Institutional Class | $1,000 | $1,016.70 | $8.37 | 1.66% |
| A Class | $1,000 | $1,014.45 | $10.63 | 2.11% |
| C Class | $1,000 | $1,010.70 | $14.38 | 2.86% |
| R Class | $1,000 | $1,013.20 | $11.88 | 2.36% |
| (1) | Expenses are equal to the class’s annualized expense ratio listed in the table above, multiplied by the average account value over the period, multiplied by 183, the number of days in the most recent fiscal half-year, divided by 366, to reflect the one-half year period. |
11
NOVEMBER 30, 2012
| Shares | Value | |
| Common Stocks — 96.7% | ||
| AUSTRALIA — 3.8% | ||
| Atlas Iron Ltd. | 287,268 | $ 415,213 |
| carsales.com Ltd. | 81,008 | 649,266 |
| Flight Centre Ltd. | 52,672 | 1,484,149 |
| McMillan Shakespeare Ltd. | 38,415 | 533,195 |
Regis Resources Ltd.(1) | 137,915 | 784,408 |
| 3,866,231 | ||
| BRAZIL — 3.5% | ||
| Brazil Pharma SA | 170,000 | 1,054,146 |
| Estacio Participacoes SA | 61,600 | 1,128,622 |
| Mills Estruturas e Servicos de Engenharia SA | 73,300 | 1,078,849 |
| QGEP Participacoes SA | 41,700 | 259,357 |
| 3,520,974 | ||
| CAMBODIA — 0.6% | ||
| NagaCorp Ltd. | 912,000 | 574,251 |
| CANADA — 4.4% | ||
Africa Oil Corp.(1) | 44,138 | 353,246 |
| Canadian Western Bank | 32,618 | 955,538 |
Detour Gold Corp.(1) | 26,396 | 653,689 |
| Dollarama, Inc. | 18,041 | 1,152,365 |
Norbord, Inc.(1) | 22,383 | 547,773 |
| West Fraser Timber Co. Ltd. | 12,340 | 865,483 |
| 4,528,094 | ||
| CHINA — 4.4% | ||
| Anton Oilfield Services Group | 1,388,000 | 560,558 |
| China Everbright International Ltd. | 1,047,000 | 498,494 |
| China Overseas Grand Oceans Group Ltd. | 1,120,750 | 1,207,487 |
| KWG Property Holding Ltd. | 1,627,000 | 1,173,509 |
| Sino Biopharmaceutical | 1,164,000 | 560,208 |
| Vinda International Holdings Ltd. | 319,000 | 444,530 |
| 4,444,786 | ||
| DENMARK — 3.5% | ||
| Christian Hansen Holding A/S | 49,691 | 1,608,636 |
| Pandora A/S | 69,855 | 1,501,512 |
| Rockwool International A/S B Shares | 4,779 | 502,785 |
| 3,612,933 | ||
| FINLAND — 0.9% | ||
| Huhtamaki Oyj | 58,840 | 956,555 |
| FRANCE — 4.1% | ||
Altran Technologies SA(1) | 135,347 | 904,244 |
| Eurofins Scientific | 6,936 | 1,067,139 |
| Ingenico | 15,667 | 833,979 |
| Rubis SCA | 12,793 | 797,623 |
| Teleperformance SA | 15,180 | 528,306 |
| 4,131,291 | ||
| GERMANY — 6.6% | ||
| Duerr AG | 6,614 | 551,378 |
| Gerry Weber International AG | 23,897 | 1,130,819 |
| Gildemeister AG | 31,766 | 611,437 |
| GSW Immobilien AG | 12,683 | 537,568 |
KUKA AG(1) | 15,461 | 525,216 |
| Symrise AG | 21,706 | 755,852 |
| TAG Immobilien AG | 65,186 | 788,433 |
| Wirecard AG | 73,117 | 1,796,295 |
| 6,696,998 | ||
| HONG KONG — 2.8% | ||
| Emperor Watch & Jewellery Ltd. | 2,159,867 | 259,178 |
| Man Wah Holdings Ltd. | 842,000 | 661,632 |
| Techtronic Industries Co. | 959,000 | 1,888,253 |
| 2,809,063 | ||
| INDIA — 2.7% | ||
| Apollo Hospitals Enterprise Ltd. | 35,041 | 527,596 |
| Ashok Leyland Ltd. | 1,073,737 | 560,605 |
| Mahindra & Mahindra Financial Services Ltd. | 30,617 | 562,977 |
| McLeod Russel India Ltd. | 80,921 | 522,539 |
Wockhardt Ltd.(1) | 20,129 | 592,880 |
| 2,766,597 | ||
| INDONESIA — 1.5% | ||
PT Erajaya Swasembada Tbk(1) | 1,889,500 | 566,249 |
| PT Jasa Marga | 800,000 | 475,322 |
| PT Mitra Adiperkasa Tbk | 702,000 | 519,539 |
| 1,561,110 | ||
| ISRAEL — 0.7% | ||
Mellanox Technologies Ltd.(1) | 9,173 | 668,528 |
| ITALY — 2.3% | ||
| Banca Generali SpA | 117,675 | 1,905,377 |
| Salvatore Ferragamo Italia SpA | 21,604 | 483,551 |
| 2,388,928 | ||
12
| Shares | Value |
| JAPAN — 13.4% | ||
| Aeon Credit Service Co. Ltd. | 36,500 | $ 713,307 |
| Aica Kogyo Co. Ltd. | 36,500 | 626,967 |
| Anritsu Corp. | 38,000 | 488,166 |
| Calbee, Inc. | 11,100 | 906,205 |
| FP Corp. | 7,700 | 534,288 |
| H2O Retailing Corp. | 54,000 | 514,223 |
| Japan Aviation Electronics Industry Ltd. | 62,000 | 512,938 |
| Jin Co. Ltd. | 22,000 | 854,006 |
| Kansai Paint Co. Ltd. | 61,000 | 651,180 |
| M3, Inc. | 262 | 482,778 |
| MISUMI Group, Inc. | 8,000 | 210,590 |
| MonotaRO Co. Ltd. | 28,540 | 832,640 |
| Nihon Kohden Corp. | 23,700 | 777,685 |
| Pigeon Corp. | 10,800 | 486,056 |
| Sanwa Holdings Corp. | 202,000 | 815,988 |
| Seria Co. Ltd. | 38,600 | 667,253 |
| Seven Bank Ltd. | 253,400 | 660,897 |
| Ship Healthcare Holdings, Inc. | 23,700 | 737,723 |
| Tatsuta Electric Wire and Cable Co. Ltd. | 61,000 | 588,282 |
| Tokyu Livable, Inc. | 22,600 | 319,939 |
| Toshiba Plant Systems & Services Corp. | 54,000 | 720,568 |
| United Arrows Ltd. | 19,100 | 490,504 |
| 13,592,183 | ||
| MEXICO — 0.6% | ||
| Compartamos SAB de CV | 432,500 | 653,092 |
| NETHERLANDS — 1.4% | ||
| Brunel International NV | 10,910 | 499,453 |
InterXion Holding NV(1) | 40,783 | 885,399 |
| 1,384,852 | ||
| NEW ZEALAND — 0.5% | ||
| Trade Me Ltd. | 149,645 | 518,432 |
| NORWAY — 3.7% | ||
Det Norske Oljeselskap ASA(1) | 36,244 | 521,478 |
| Fred Olsen Energy ASA | 36,899 | 1,629,837 |
| Petroleum Geo-Services ASA | 95,883 | 1,607,233 |
| 3,758,548 | ||
| PHILIPPINES — 0.5% | ||
| Universal Robina Corp. | 300,900 | 566,625 |
| SINGAPORE — 1.8% | ||
| Ezion Holdings Ltd. | 896,000 | 1,060,724 |
| OSIM International Ltd. | 545,000 | 776,913 |
| 1,837,637 | ||
| SOUTH KOREA — 3.9% | ||
| Cosmax, Inc. | 11,695 | 507,069 |
| Kolao Holdings | 36,650 | 665,071 |
| Partron Co. Ltd. | 29,057 | 509,843 |
| Soulbrain Co. Ltd. | 24,772 | 1,107,231 |
| Sung Kwang Bend Co. Ltd. | 50,178 | 1,160,788 |
| 3,950,002 | ||
| SWEDEN — 0.8% | ||
| AarhusKarlshamn AB | 19,850 | 804,042 |
| SWITZERLAND — 1.7% | ||
| AMS AG | 10,867 | 1,175,001 |
| Kaba Holding AG | 1,429 | 582,117 |
| 1,757,118 | ||
| TAIWAN — 4.3% | ||
| Chicony Electronics Co. Ltd. | 327,000 | 766,459 |
| Chipbond Technology Corp. | 666,000 | 1,290,556 |
| Ginko International Co. Ltd. | 121,425 | 1,521,260 |
| Radiant Opto-Electronics Corp. | 173,800 | 786,628 |
| 4,364,903 | ||
| THAILAND — 1.0% | ||
| Asian Property Development PCL | 1,918,400 | 553,204 |
| Home Product Center PCL | 1,261,760 | 468,689 |
| 1,021,893 | ||
| TURKEY — 0.5% | ||
| Bizim Toptan Satis Magazalari AS | 34,621 | 503,761 |
| UNITED KINGDOM — 20.8% | ||
| Aberdeen Asset Management plc | 238,729 | 1,292,782 |
| Anite plc | 230,633 | 515,834 |
| Ashtead Group plc | 442,303 | 2,715,493 |
ASOS plc(1) | 13,401 | 531,608 |
| AZ Electronic Materials SA | 123,881 | 729,003 |
Barratt Developments plc(1) | 250,361 | 782,577 |
| Bellway plc | 129,388 | 2,067,808 |
| Bodycote plc | 86,931 | 574,655 |
| Croda International plc | 11,464 | 437,320 |
| Elementis plc | 120,015 | 426,866 |
EnQuest plc(1) | 280,574 | 512,455 |
| Filtrona plc | 62,367 | 586,039 |
| Great Portland Estates plc | 134,105 | 1,010,900 |
| Howden Joinery Group plc | 249,730 | 671,376 |
| John Wood Group plc | 105,425 | 1,312,405 |
| Lancashire Holdings Ltd. | 75,175 | 959,318 |
| Rotork plc | 16,998 | 675,387 |
| Spectris plc | 53,700 | 1,654,463 |
13
| Shares | Value |
| Spirax-Sarco Engineering plc | 14,788 | $ 517,210 |
| Telecity Group plc | 142,119 | 1,951,355 |
| UBM plc | 99,993 | 1,179,100 |
| 21,103,954 | ||
TOTAL COMMON STOCKS (Cost $79,792,767) | 98,343,381 | |
| Exchange-Traded Funds — 1.2% | ||
| Market Vectors Junior Gold Miners ETF (Cost $1,304,737) | 57,719 | 1,244,422 |
Rights† | ||
GERMANY† | ||
TAG Immobilien AG(1) (Cost $—) | 65,186 | — |
| Temporary Cash Investments — 1.6% | ||
Repurchase Agreement, Bank of America Merrill Lynch, (collateralized by various U.S. Treasury obligations, 1.25% – 2.125%, 4/15/14 – 12/31/15, valued at $753,512), in a joint trading account at 0.18%, dated 11/30/12, due 12/3/12 (Delivery value $738,306) | 738,295 | |
Repurchase Agreement, Credit Suisse First Boston, Inc., (collateralized by various U.S. Treasury obligations, 0.25%, 9/15/15, valued at $753,175), in a joint trading account at 0.17%, dated 11/30/12, due 12/3/12 (Delivery value $738,305) | 738,295 | |
Repurchase Agreement, Goldman Sachs & Co., (collateralized by various U.S. Treasury obligations, 4.25%, 11/15/40, valued at $124,491), in a joint trading account at 0.15%, dated 11/30/12, due 12/3/12 (Delivery value $122,001) | 121,999 | |
TOTAL TEMPORARY CASH INVESTMENTS (Cost $1,598,589) | 1,598,589 | |
TOTAL INVESTMENT SECURITIES — 99.5% (Cost $82,696,093) | 101,186,392 | |
| OTHER ASSETS AND LIABILITIES — 0.5% | 466,614 | |
| TOTAL NET ASSETS — 100.0% | $101,653,006 | |
| Market Sector Diversification | |
| (as a % of net assets) | |
| Consumer Discretionary | 20.8% |
| Industrials | 16.1% |
| Information Technology | 15.6% |
| Financials | 13.0% |
| Materials | 12.0% |
| Energy | 7.8% |
| Health Care | 6.2% |
| Consumer Staples | 5.6% |
| Utilities | 0.8% |
| Cash and Equivalents* | 2.1% |
*Includes temporary cash investments and other assets and liabilities.
Notes to Schedule of Investments
ETF = Exchange-Traded Fund
† Category is less than 0.05% of total net assets.
(1) Non-income producing.
See Notes to Financial Statements.
14
| NOVEMBER 30, 2012 | ||||
| Assets | ||||
| Investment securities, at value (cost of $82,696,093) | $101,186,392 | |||
| Foreign currency holdings, at value (cost of $134,768) | 137,340 | |||
| Receivable for investments sold | 1,852,216 | |||
| Receivable for capital shares sold | 37,668 | |||
| Dividends and interest receivable | 192,635 | |||
| Other assets | 44,705 | |||
| 103,450,956 | ||||
| Liabilities | ||||
| Payable for investments purchased | 1,504,344 | |||
| Payable for capital shares redeemed | 94,789 | |||
| Accrued management fees | 150,532 | |||
| Distribution and service fees payable | 550 | |||
| Accrued foreign taxes | 47,735 | |||
| 1,797,950 | ||||
| Net Assets | $101,653,006 | |||
| Net Assets Consist of: | ||||
| Capital (par value and paid-in surplus) | $106,970,037 | |||
| Undistributed net investment income | 115,564 | |||
| Accumulated net realized loss | (23,867,072 | ) | ||
| Net unrealized appreciation | 18,434,477 | |||
| $101,653,006 | ||||
| Net assets | Shares outstanding | Net asset value per share | |
| Investor Class, $0.01 Par Value | $99,445,335 | 13,923,494 | $7.14 |
| Institutional Class, $0.01 Par Value | $44,800 | 6,214 | $7.21 |
| A Class, $0.01 Par Value | $1,931,073 | 271,097 | $7.12* |
| C Class, $0.01 Par Value | $122,519 | 17,413 | $7.04 |
| R Class, $0.01 Par Value | $109,279 | 15,382 | $7.10 |
*Maximum offering price $7.55 (net asset value divided by 0.9425).
See Notes to Financial Statements.
15
| YEAR ENDED NOVEMBER 30, 2012 | ||||
| Investment Income (Loss) | ||||
| Income: | ||||
| Dividends (net of foreign taxes withheld of $129,740) | $1,697,643 | |||
| Interest | 1,093 | |||
| 1,698,736 | ||||
| Expenses: | ||||
| Management fees | 1,727,064 | |||
| Distribution and service fees: | ||||
| A Class | 8,878 | |||
| C Class | 1,143 | |||
| R Class | 587 | |||
| Directors’ fees and expenses | 3,308 | |||
| Other expenses | 3,380 | |||
| 1,744,360 | ||||
| Net investment income (loss) | (45,624 | ) | ||
| Realized and Unrealized Gain (Loss) | ||||
| Net realized gain (loss) on: | ||||
| Investment transactions | 2,597,517 | |||
| Foreign currency transactions | (83,298 | ) | ||
| 2,514,219 | ||||
| Change in net unrealized appreciation (depreciation) on: | ||||
| Investments (includes (increase) decrease in accrued foreign taxes of $(47,735)) | 14,123,624 | |||
| Translation of assets and liabilities in foreign currencies | (8,925 | ) | ||
| 14,114,699 | ||||
| Net realized and unrealized gain (loss) | 16,628,918 | |||
| Net Increase (Decrease) in Net Assets Resulting from Operations | $16,583,294 | |||
See Notes to Financial Statements.
16
| YEARS ENDED NOVEMBER 30, 2012 AND NOVEMBER 30, 2011 | |||||||
| Increase (Decrease) in Net Assets | November 30, 2012 | November 30, 2011 | |||||
| Operations | |||||||
| Net investment income (loss) | $(45,624 | ) | $(181,257 | ) | |||
| Net realized gain (loss) | 2,514,219 | 7,817,186 | |||||
| Change in net unrealized appreciation (depreciation) | 14,114,699 | (12,014,877 | ) | ||||
| Net increase (decrease) in net assets resulting from operations | 16,583,294 | (4,378,948 | ) | ||||
| Distributions to Shareholders | |||||||
| From net investment income: | |||||||
| Investor Class | — | (419,841 | ) | ||||
| Institutional Class | — | (244 | ) | ||||
| A Class | — | (287 | ) | ||||
| Decrease in net assets from distributions | — | (420,372 | ) | ||||
| Capital Share Transactions | |||||||
| Net increase (decrease) in net assets from capital share transactions | (9,996,725 | ) | (3,147,447 | ) | |||
| Redemption Fees | |||||||
| Increase in net assets from redemption fees | 10,012 | 37,354 | |||||
| Net increase (decrease) in net assets | 6,596,581 | (7,909,413 | ) | ||||
| Net Assets | |||||||
| Beginning of period | 95,056,425 | 102,965,838 | |||||
| End of period | $101,653,006 | $95,056,425 | |||||
| Accumulated undistributed net investment income (loss) | $115,564 | $(337,494 | ) | ||||
See Notes to Financial Statements.
17
NOVEMBER 30, 2012
1. Organization
American Century World Mutual Funds, Inc. (the corporation) is registered under the Investment Company Act of 1940, as amended (the 1940 Act), as an open-end management investment company and is organized as a Maryland corporation. International Opportunities Fund (the fund) is one fund in a series issued by the corporation. The fund is diversified as defined under the 1940 Act. The fund’s investment objective is to seek capital growth. The fund pursues its objective by investing primarily in equity securities of companies that are small-sized at the time of purchase and are located in foreign developed countries or emerging market countries.
The fund offers the Investor Class, the Institutional Class, the A Class, the C Class and the R Class. The A Class may incur an initial sales charge. The A Class and C Class may be subject to a contingent deferred sales charge. The share classes differ principally in their respective sales charges and distribution and shareholder servicing expenses and arrangements. The Institutional Class is made available to institutional shareholders or through financial intermediaries whose clients do not require the same level of shareholder and administrative services as shareholders of other classes. As a result, the Institutional Class is charged a lower unified management fee.
2. Significant Accounting Policies
The following is a summary of significant accounting policies consistently followed by the fund in preparation of its financial statements. The financial statements are prepared in conformity with accounting principles generally accepted in the United States of America, which may require management to make certain estimates and assumptions at the date of the financial statements. Actual results could differ from these estimates.
Investment Valuations — The fund determines the fair value of its investments and computes its net asset value per share as of the close of regular trading (usually 4 p.m. Eastern time) on the New York Stock Exchange (NYSE) on each day the NYSE is open.
Equity securities that are listed or traded on a domestic securities exchange are valued at the last reported sales price or at the official closing price as provided by the exchange. Equity securities traded on foreign securities exchanges are typically valued at the closing price on the exchange where primarily traded or as of the close of the NYSE, if that is earlier. If no last sales price is reported, or if local convention or regulation so provides, the mean of the latest bid and asked prices is used. Depending on local convention or regulation, securities traded over-the-counter are valued at the mean of the latest bid and asked prices, the last sales price, or the official closing price. In its determination of fair value, the fund may review several factors including: market information specific to a security; news developments in U.S. and foreign markets; the performance of particular U.S. and foreign securities, indices, comparable securities, American Depositary Receipts, Exchange-Traded Funds, and other relevant market indicators.
Debt securities maturing within 60 days at the time of purchase may be valued at cost, plus or minus any amortized discount or premium or at the evaluated mean as provided by an independent pricing service. Evaluated mean prices are commonly derived through utilization of market models, which may consider, among other factors, trade data, quotations from dealers and active market makers, relevant yield curve and spread data, related sector levels, creditworthiness, and other relevant market information on the same or comparable securities.
Investments in open-end management investment companies are valued at the reported net asset value per share. Repurchase agreements are valued at cost.
The value of investments initially expressed in foreign currencies is translated into U.S. dollars at prevailing exchange rates.
18
If the fund determines that the market price for a portfolio security is not readily available or the valuation methods mentioned above do not reflect a security’s fair value, such security is valued as determined in good faith by the Board of Directors or its designee, in accordance with procedures adopted by the Board of Directors. Circumstances that may cause the fund to use these procedures to value a security include, but are not limited to: a security has been declared in default; trading in a security has been halted during the trading day; there is a foreign market holiday and no trading occurred; or an event occurred between the close of a foreign exchange and the NYSE that may affect the value of a security.
Security Transactions — Security transactions are accounted for as of the trade date. Net realized gains and losses are determined on the identified cost basis, which is also used for federal income tax purposes. Certain countries impose taxes on realized gains on the sale of securities registered in their country. The fund records the foreign tax expense, if any, on an accrual basis. The foreign tax expense on realized gains and unrealized appreciation reduces the net realized gain (loss) on investment transactions and net unrealized appreciation (depreciation) on investments, respectively.
Investment Income — Dividend income less foreign taxes withheld, if any, is recorded as of the ex-dividend date. Distributions received on securities that represent a return of capital or capital gain are recorded as a reduction of cost of investments and/or as a realized gain. The fund estimates the components of distributions received that may be considered nontaxable distributions or capital gain distributions for income tax purposes. Interest income is recorded on the accrual basis and includes accretion of discounts and amortization of premiums.
Foreign Currency Translations — All assets and liabilities initially expressed in foreign currencies are translated into U.S. dollars at prevailing exchange rates at period end. The fund may enter into spot foreign currency exchange contracts to facilitate transactions denominated in a foreign currency. Purchases and sales of investment securities, dividend and interest income, spot foreign currency exchange contracts, and expenses are translated at the rates of exchange prevailing on the respective dates of such transactions. Net realized and unrealized foreign currency exchange gains or losses related to investment securities are a component of net realized gain (loss) on investment transactions and change in net unrealized appreciation (depreciation) on investments, respectively.
Repurchase Agreements — The fund may enter into repurchase agreements with institutions that American Century Investment Management, Inc. (ACIM) (the investment advisor) has determined are creditworthy pursuant to criteria adopted by the Board of Directors. The fund requires that the collateral, represented by securities, received in a repurchase transaction be transferred to the custodian in a manner sufficient to enable the fund to obtain those securities in the event of a default under the repurchase agreement. ACIM monitors, on a daily basis, the securities transferred to ensure the value, including accrued interest, of the securities under each repurchase agreement is equal to or greater than amounts owed to the fund under each repurchase agreement.
Joint Trading Account — Pursuant to an Exemptive Order issued by the Securities and Exchange Commission, the fund, along with certain other funds in the American Century Investments family of funds, may transfer uninvested cash balances into a joint trading account. These balances are invested in one or more repurchase agreements that are collateralized by U.S. Treasury or Agency obligations.
Income Tax Status — It is the fund’s policy to distribute substantially all net investment income and net realized gains to shareholders and to otherwise qualify as a regulated investment company under provisions of the Internal Revenue Code. The fund is no longer subject to examination by tax authorities for years prior to 2009. Additionally, non-U.S. tax returns filed by the fund due to investments in certain foreign securities remain subject to examination by the relevant taxing authority for seven years from the date of filing. At this time, management believes there are no uncertain tax positions which, based on their technical merit, would not be sustained upon examination and for which it is reasonably possible that the total amounts of unrecognized tax benefits will significantly change in the next twelve months. Accordingly, no provision has been made for federal or state income taxes.
19
Multiple Class — All shares of the fund represent an equal pro rata interest in the net assets of the class to which such shares belong, and have identical voting, dividend, liquidation and other rights and the same terms and conditions, except for class specific expenses and exclusive rights to vote on matters affecting only individual classes. Income, non-class specific expenses, and realized and unrealized capital gains and losses of the fund are allocated to each class of shares based on their relative net assets.
Distributions to Shareholders — Distributions from net investment income and net realized gains, if any, are generally declared and paid annually. The fund may make distributions on a more frequent basis to comply with the distribution requirements of the Internal Revenue Code, in all events in a manner consistent with provisions of the 1940 Act.
Redemption — The fund may impose a 2.00% redemption fee on shares held less than 60 days. The fee may not be applicable to all classes. The redemption fee is retained by the fund and helps cover transaction costs that long-term investors may bear when the fund sells securities to meet investor redemptions. Prior to November 14, 2011, the redemption fee applied to shares held less than 180 days.
Indemnifications — Under the corporation’s organizational documents, its officers and directors are indemnified against certain liabilities arising out of the performance of their duties to the fund. In addition, in the normal course of business, the fund enters into contracts that provide general indemnifications. The maximum exposure under these arrangements is unknown as this would involve future claims that may be made against a fund. The risk of material loss from such claims is considered by management to be remote.
3. Fees and Transactions with Related Parties
Management Fees — The corporation has entered into a management agreement with ACIM, under which ACIM provides the fund with investment advisory and management services in exchange for a single, unified management fee (the fee) per class. The agreement provides that all expenses of managing and operating the fund, except distribution and service fees, brokerage expenses, taxes, interest, fees and expenses of the independent directors (including legal counsel fees), and extraordinary expenses, will be paid by ACIM. The fee is computed and accrued daily based on each class’s daily net assets and paid monthly in arrears. The rate of the fee is determined by applying a fee rate calculation formula. This formula takes into account the fund’s assets as well as certain assets, if any, of other clients of the investment advisor outside the American Century Investments family of funds (such as subadvised funds and separate accounts) that have very similar investment teams and investment strategies (strategy assets). The annual management fee schedule ranges from 1.40% to 2.00% for the Investor Class, A Class, C Class and R Class. The Institutional Class is 0.20% less at each point within the range. The effective annual management fee for each class for the year ended November 30, 2012 was 1.86% for the Investor Class, A Class, C Class and R Class and 1.66% for the Institutional Class.
Distribution and Service Fees — The Board of Directors has adopted a separate Master Distribution and Individual Shareholder Services Plan for each of the A Class, C Class and R Class (collectively the plans), pursuant to Rule 12b-1 of the 1940 Act. The plans provide that the A Class will pay American Century Investment Services, Inc. (ACIS) an annual distribution and service fee of 0.25%. The plans provide that the C Class will pay ACIS an annual distribution and service fee of 1.00%, of which 0.25% is paid for individual shareholder services and 0.75% is paid for distribution services. The plans provide that the R Class will pay ACIS an annual distribution and service fee of 0.50%. The fees are computed and accrued daily based on each class’s daily net assets and paid monthly in arrears. The fees are used to pay financial intermediaries for distribution and individual shareholder services. Fees incurred under the plans during the year ended November 30, 2012 are detailed in the Statement of Operations.
Related Parties — Certain officers and directors of the corporation are also officers and/or directors of American Century Companies, Inc., the parent of the corporation’s investment advisor, ACIM, the distributor of the corporation, ACIS, and the corporation’s transfer agent, American Century Services, LLC.
20
4. Investment Transactions
Purchases and sales of investment securities, excluding short-term investments, for the year ended November 30, 2012 were $117,188,642 and $128,654,102, respectively.
5. Capital Share Transactions
Transactions in shares of the fund were as follows:
| Year ended November 30, 2012 | Year ended November 30, 2011 | ||||||||||||||
| Shares | Amount | Shares | Amount | ||||||||||||
| Investor Class/Shares Authorized | 100,000,000 | 100,000,000 | |||||||||||||
| Sold | 2,109,432 | $14,203,067 | 2,482,073 | $16,630,637 | |||||||||||
| Issued in reinvestment of distributions | — | — | 59,420 | 408,211 | |||||||||||
| Redeemed | (3,181,158 | ) | (20,189,831 | ) | (3,876,170 | ) | (25,431,961 | ) | |||||||
| (1,071,726 | ) | (5,986,764 | ) | (1,334,677 | ) | (8,393,113 | ) | ||||||||
| Institutional Class/Shares Authorized | 10,000,000 | 10,000,000 | |||||||||||||
| Issued in reinvestment of distributions | — | — | 35 | 244 | |||||||||||
| A Class/Shares Authorized | 10,000,000 | 10,000,000 | |||||||||||||
| Sold | 1,026,155 | 6,432,614 | 966,727 | 5,889,154 | |||||||||||
| Issued in reinvestment of distributions | — | — | 41 | 283 | |||||||||||
| Redeemed | (1,615,573 | ) | (10,475,816 | ) | (120,894 | ) | (739,192 | ) | |||||||
| (589,418 | ) | (4,043,202 | ) | 845,874 | 5,150,245 | ||||||||||
| C Class/Shares Authorized | 10,000,000 | 10,000,000 | |||||||||||||
| Sold | 7,856 | 49,388 | 22,245 | 150,515 | |||||||||||
| Redeemed | (7,789 | ) | (47,347 | ) | (11,890 | ) | (69,692 | ) | |||||||
| 67 | 2,041 | 10,355 | 80,823 | ||||||||||||
| R Class/Shares Authorized | 10,000,000 | 10,000,000 | |||||||||||||
| Sold | 11,475 | 75,424 | 7,603 | 54,226 | |||||||||||
| Redeemed | (6,319 | ) | (44,224 | ) | (5,528 | ) | (39,872 | ) | |||||||
| 5,156 | 31,200 | 2,075 | 14,354 | ||||||||||||
| Net increase (decrease) | (1,655,921 | ) | $(9,996,725 | ) | (476,338 | ) | $(3,147,447 | ) | |||||||
6. Fair Value Measurements
The fund’s securities valuation process is based on several considerations and may use multiple inputs to determine the fair value of the positions held by the fund. In conformity with accounting principles generally accepted in the United States of America, the inputs used to determine a valuation are classified into three broad levels as follows:
| • | Level 1 valuation inputs consist of unadjusted quoted prices in an active market for identical securities; |
| • | Level 2 valuation inputs consist of direct or indirect observable market data (including quoted prices for similar securities, evaluations of subsequent market events, interest rates, prepayment speeds, credit risk, etc.); or |
| • | Level 3 valuation inputs consist of unobservable data (including a fund’s own assumptions). |
The level classification is based on the lowest level input that is significant to the fair valuation measurement. The valuation inputs are not necessarily an indication of the risks associated with investing in these securities or other financial instruments.
21
The following is a summary of the level classifications as of period end. The Schedule of Investments provides additional information on the fund’s portfolio holdings.
| Level 1 | Level 2 | Level 3 | |
| Investment Securities | |||
| Foreign Common Stocks | $1,553,927 | $96,789,454 | — |
| Exchange-Traded Funds | 1,244,422 | — | — |
| Rights | — | — | — |
| Temporary Cash Investments | — | 1,598,589 | — |
| Total Value of Investment Securities | $2,798,349 | $98,388,043 | — |
7. Risk Factors
There are certain risks involved in investing in foreign securities. These risks include those resulting from future adverse political, social and economic developments, fluctuations in currency exchange rates, the possible imposition of exchange controls, and other foreign laws or restrictions. Investing in emerging markets may accentuate these risks.
The fund concentrates its investments in common stocks of small companies. Because of this, the fund may be subject to greater risk and market fluctuations than a fund investing in larger, more established companies.
The fund’s investment process may result in high portfolio turnover, which could mean high transaction costs, affecting both performance and capital gains tax liabilities to investors.
8. Federal Tax Information
The tax character of distributions paid during the years ended November 30, 2012 and November 30, 2011 were as follows:
| 2012 | 2011 | |
| Distributions Paid From | ||
| Ordinary income | — | $420,372 |
| Long-term capital gains | — | — |
The book-basis character of distributions made during the year from net investment income or net realized gains may differ from their ultimate characterization for federal income tax purposes. These differences reflect the differing character of certain income items and net realized gains and losses for financial statement and tax purposes, and may result in reclassification among certain capital accounts on the financial statements.
22
As of November 30, 2012, the federal tax cost of investments and the components of distributable earnings on a tax-basis were as follows:
| Federal tax cost of investments | $83,954,597 |
| Gross tax appreciation of investments | $17,901,174 |
| Gross tax depreciation of investments | (669,379) |
| Net tax appreciation (depreciation) of investments | $17,231,795 |
| Net tax appreciation (depreciation) on translation of assets and liabilities in foreign currencies | $ (55,027) |
| Net tax appreciation (depreciation) | $17,176,768 |
| Undistributed ordinary income | $1,145,079 |
| Accumulated short-term capital losses | $(23,638,878) |
The difference between book-basis and tax-basis cost and unrealized appreciation (depreciation) is attributable primarily to the tax deferral of losses on wash sales and the realization to ordinary income for tax purposes of unrealized gains on investments in passive foreign investment companies.
Accumulated capital losses represent net capital loss carryovers that may be used to offset future realized capital gains for federal income tax purposes. Future capital loss carryover utilization in any given year may be subject to Internal Revenue Code limitations. Capital loss carryovers of $(11,863,521) and $(11,775,357) expire in 2016 and 2017, respectively.
23
| For a Share Outstanding Throughout the Years Ended November 30 (except as noted) | |||||||||||||
| Per-Share Data | Ratios and Supplemental Data | ||||||||||||
| Income From Investment Operations: | Distributions From: | Ratio to Average Net Assets of: | |||||||||||
Net Asset Value, Beginning of Period | Net Investment Income (Loss)(1) | Net Realized and Unrealized Gain (Loss) | Total From Investment Operations | Net Investment Income | Net Realized Gains | Total Distributions | Net Asset Value, End of Period | Total Return(2) | Operating Expenses | Net Investment Income (Loss) | Portfolio Turnover Rate | Net Assets, End of Period (in thousands) | |
| Investor Class | |||||||||||||
| 2012 | $5.98 | —(3) | 1.16 | 1.16 | — | — | — | $7.14 | 19.40% | 1.87% | (0.04)% | 127% | $99,445 |
| 2011 | $6.29 | (0.01) | (0.27) | (0.28) | (0.03) | — | (0.03) | $5.98 | (4.57)% | 1.83% | (0.17)% | 146% | $89,708 |
| 2010 | $5.49 | (0.03) | 0.94 | 0.91 | (0.11) | — | (0.11) | $6.29 | 16.72% | 1.89% | (0.52)% | 209% | $102,739 |
| 2009 | $3.70 | (0.02) | 1.81 | 1.79 | — | — | — | $5.49 | 48.38% | 1.95% | (0.52)% | 244% | $92,968 |
| 2008 | $11.37 | 0.05 | (5.06) | (5.01) | (0.05) | (2.61) | (2.66) | $3.70 | (56.46)% | 1.87% | 0.72% | 206% | $65,541 |
| Institutional Class | |||||||||||||
| 2012 | $6.03 | 0.01 | 1.17 | 1.18 | — | — | — | $7.21 | 19.57% | 1.67% | 0.16% | 127% | $45 |
| 2011 | $6.34 | —(3) | (0.27) | (0.27) | (0.04) | — | (0.04) | $6.03 | (4.35)% | 1.63% | 0.03% | 146% | $37 |
| 2010 | $5.54 | (0.02) | 0.95 | 0.93 | (0.13) | — | (0.13) | $6.34 | 17.04% | 1.69% | (0.32)% | 209% | $39 |
| 2009 | $3.72 | (0.04) | 1.86 | 1.82 | — | — | — | $5.54 | 48.92% | 1.75% | (0.32)% | 244% | $33 |
| 2008 | $11.44 | 0.07 | (5.10) | (5.03) | (0.08) | (2.61) | (2.69) | $3.72 | (56.44)% | 1.67% | 0.92% | 206% | $1,245 |
| A Class | |||||||||||||
| 2012 | $5.98 | (0.04) | 1.18 | 1.14 | — | — | — | $7.12 | 19.06% | 2.12% | (0.29)% | 127% | $1,931 |
| 2011 | $6.29 | (0.04) | (0.26) | (0.30) | (0.01) | — | (0.01) | $5.98 | (4.81)% | 2.10% | (0.44)% | 146% | $5,147 |
2010(4) | $5.51 | (0.02) | 0.84 | 0.82 | (0.04) | — | (0.04) | $6.29 | 14.87% | 2.14%(5) | (0.45)%(5) | 209%(6) | $92 |
24
| For a Share Outstanding Throughout the Years Ended November 30 (except as noted) | |||||||||||||
| Per-Share Data | Ratios and Supplemental Data | ||||||||||||
| Income From Investment Operations: | Distributions From: | Ratio to Average Net Assets of: | |||||||||||
Net Asset Value, Beginning of Period | Net Investment Income (Loss)(1) | Net Realized and Unrealized Gain (Loss) | Total From Investment Operations | Net Investment Income | Net Realized Gains | Total Distributions | Net Asset Value, End of Period | Total Return(2) | Operating Expenses | Net Investment Income (Loss) | Portfolio Turnover Rate | Net Assets, End of Period (in thousands) | |
| C Class | |||||||||||||
| 2012 | $5.95 | (0.06) | 1.15 | 1.09 | — | — | — | $7.04 | 18.15% | 2.87% | (1.04)% | 127% | $123 |
| 2011 | $6.30 | (0.06) | (0.29) | (0.35) | — | — | — | $5.95 | (5.56)% | 2.83% | (1.17)% | 146% | $103 |
2010(4) | $5.51 | (0.05) | 0.84 | 0.79 | — | — | — | $6.30 | 14.34% | 2.89%(5) | (1.19)%(5) | 209%(6) | $44 |
| R Class | |||||||||||||
| 2012 | $5.98 | (0.03) | 1.15 | 1.12 | — | — | — | $7.10 | 18.73% | 2.37% | (0.54)% | 127% | $109 |
| 2011 | $6.30 | (0.04) | (0.28) | (0.32) | — | — | — | $5.98 | (5.08)% | 2.33% | (0.67)% | 146% | $61 |
2010(4) | $5.51 | (0.03) | 0.84 | 0.81 | (0.02) | — | (0.02) | $6.30 | 14.77% | 2.39%(5) | (0.69)%(5) | 209%(6) | $51 |
Notes to Financial Highlights
| (1) | Computed using average shares outstanding throughout the period. |
| (2) | Total returns are calculated based on the net asset value of the last business day and do not reflect applicable sales charges, if any. Total returns for periods less than one year are not annualized. |
| (3) | Per-share amount was less than $0.005. |
| (4) | March 1, 2010 (commencement of sale) through November 30, 2010. |
| (5) | Annualized. |
| (6) | Portfolio turnover is calculated at the fund level. Percentage indicated was calculated for the year ended November 30, 2010. |
See Notes to Financial Statements.
25
The Board of Directors and Shareholders of
American Century World Mutual Funds, Inc.:
We have audited the accompanying statement of assets and liabilities, including the schedule of investments, of International Opportunities Fund, one of the funds constituting American Century World Mutual Funds, Inc. (the “Corporation”) as of November 30, 2012, and the related statement of operations for the year then ended, the statement of changes in net assets for each of the two years in the period then ended, and the financial highlights for each of the five years in the period then ended. These financial statements and financial highlights are the responsibility of the Corporation’s management. Our responsibility is to express an opinion on these financial statements and financial highlights based on our audits.
We conducted our audits in accordance with the standards of the Public Company Accounting Oversight Board (United States). Those standards require that we plan and perform the audit to obtain reasonable assurance about whether the financial statements and financial highlights are free of material misstatement. The Corporation is not required to have, nor were we engaged to perform, an audit of its internal control over financial reporting. Our audits included consideration of internal control over financial reporting as a basis for designing audit procedures that are appropriate in the circumstances, but not for the purpose of expressing an opinion on the effectiveness of the Corporation’s internal control over financial reporting. Accordingly, we express no such opinion. An audit also includes examining, on a test basis, evidence supporting the amounts and disclosures in the financial statements, assessing the accounting principles used and significant estimates made by management, as well as evaluating the overall financial statement presentation. Our procedures included confirmation of securities owned as of November 30, 2012, by correspondence with the custodian and brokers; where replies were not received from brokers, we performed other auditing procedures. We believe that our audits provide a reasonable basis for our opinion.
In our opinion, the financial statements and financial highlights referred to above present fairly, in all material respects, the financial position of International Opportunities Fund of American Century World Mutual Funds, Inc., as of November 30, 2012, the results of its operations for the year then ended, the changes in its net assets for each of the two years in the period then ended, and the financial highlights for each of the five years in the period then ended, in conformity with accounting principles generally accepted in the United States
of America.
Deloitte & Touche LLP
Kansas City, Missouri
January 17, 2013
26
The Board of Directors
The individuals listed below serve as directors of the funds. Each director will continue to serve in this capacity until death, retirement, resignation or removal from office. The mandatory retirement age for directors who are not “interested persons,” as that term is defined in the Investment Company Act (independent directors), is 72. However, the mandatory retirement age for an individual director may be extended with the approval of the remaining independent directors.
Mr. Thomas is an “interested person” because he currently serves as President and Chief Executive Officer of American Century Companies, Inc. (ACC), the parent company of American Century Investment Management, Inc. (ACIM or the advisor). Mr. Fink is an “interested person” because he currently serves as Executive Vice President of ACC.
The other directors (more than three-fourths of the total number) are independent; that is, they have never been employees, directors or officers of, and have no financial interest in, ACC or any of its wholly owned, direct or indirect, subsidiaries, including ACIM, American Century Investment Services, Inc. (ACIS) and American Century Services, LLC (ACS). The directors serve in this capacity for seven (in the case of Mr. Thomas, 15) registered investment companies in the American Century Investments family of funds.
The following table presents additional information about the directors. The mailing address for each director is 4500 Main Street, Kansas City, Missouri 64111.
Name (Year of Birth) | Position(s) Held with Funds | Length of Time Served | Principal Occupation(s) During Past 5 Years | Number of American Century Portfolios Overseen by Director | Other Directorships Held During Past 5 Years | |
| Independent Directors | ||||||
Thomas A. Brown (1940) | Director | Since 1980 | Managing Member, Associated Investments, LLC (real estate investment company); Brown Cascade Properties, LLC (real estate investment company) (2001 to 2009) | 66 | None | |
Andrea C. Hall (1945) | Director | Since 1997 | Retired | 66 | None | |
Jan M. Lewis (1957) | Director | Since 2011 | President and Chief Executive Officer, Catholic Charities of Northeast Kansas (human services organization) | 66 | None | |
James A. Olson (1942) | Director | Since 2007 | Member, Plaza Belmont LLC (private equity fund manager) | 66 | Saia, Inc. (2002 to 2012) and Entertainment Properties Trust | |
Donald H. Pratt (1937) | Director and Chairman of the Board | Since 1995 (Chairman since 2005) | Chairman and Chief Executive Officer, Western Investments, Inc. (real estate company) | 66 | None | |
27
Name (Year of Birth) | Position(s) Held with Funds | Length of Time Served | Principal Occupation(s) During Past 5 Years | Number of American Century Portfolios Overseen by Director | Other Directorships Held During Past 5 Years | |
| Independent Directors | ||||||
M. Jeannine Strandjord (1945) | Director | Since 1994 | Retired | 66 | Euronet Worldwide Inc.; Charming Shoppes, Inc. (2006 to 2010); and DST Systems Inc. (1996 to 2012) | |
John R. Whitten (1946) | Director | Since 2008 | Retired | 66 | Rudolph Technologies, Inc. | |
Stephen E. Yates (1948) | Director | Since 2012 | Retired; Executive Vice President, Technology & Operations, KeyCorp. (computer services) (2004 to 2010) | 66 | Applied Industrial Technologies, Inc. (2001 to 2010) | |
| Interested Directors | ||||||
Barry Fink (1955) | Director and Executive Vice President | Since 2012 (Executive Vice President since 2007) | Executive Vice President, ACC (September 2007 to present); President, ACS (October 2007 to present); Chief Operating Officer, ACC (September 2007 to November 2012). Also serves as Manager, ACS | 66 | None | |
Jonathan S. Thomas (1963) | Director and President | Since 2007 | President and Chief Executive Officer, ACC (March 2007 to present). Also serves as Chief Executive Officer and Manager, ACS; Executive Vice President, ACIM; Director, ACC, ACIM and other ACC subsidiaries | 108 | None | |
28
Officers
The following table presents certain information about the executive officers of the funds. Each officer serves as an officer for each of the 15 investment companies in the American Century family of funds, unless otherwise noted. No officer is compensated for his or her service as an officer of the funds. The listed officers are interested persons of the funds and are appointed or re-appointed on an annual basis. The mailing address for each officer listed below is 4500 Main Street, Kansas City, Missouri 64111.
Name (Year of Birth) | Offices with the Funds | Principal Occupation(s) During the Past Five Years | |
Jonathan S. Thomas (1963) | Director and President since 2007 | President and Chief Executive Officer, ACC (March 2007 to present). Also serves as Chief Executive Officer and Manager, ACS; Executive Vice President, ACIM; Director, ACC, ACIM and other ACC subsidiaries | |
Barry Fink (1955) | Director since 2012 and Executive Vice President since 2007 | Executive Vice President, ACC (September 2007 to present); President, ACS (October 2007 to present); Chief Operating Officer, ACC (September 2007 to November 2012). Also serves as Manager, ACS | |
Maryanne L. Roepke (1956) | Chief Compliance Officer since 2006 and Senior Vice President since 2000 | Chief Compliance Officer, American Century funds, ACIM and ACS (August 2006 to present). Also serves as Senior Vice President, ACS | |
Charles A. Etherington (1957) | General Counsel since 2007 and Senior Vice President since 2006 | Attorney, ACC (February 1994 to present); Vice President, ACC (November 2005 to present), General Counsel, ACC (March 2007 to present). Also serves as General Counsel, ACIM, ACS, ACIS and other ACC subsidiaries; and Senior Vice President, ACIM and ACS | |
C. Jean Wade (1964) | Vice President, Treasurer and Chief Financial Officer since 2012 | Vice President, ACS (February 2000 to present) | |
Robert J. Leach (1966) | Vice President since 2006 and Assistant Treasurer since 2012 | Vice President, ACS (February 2000 to present) | |
David H. Reinmiller (1963) | Vice President since 2000 | Attorney, ACC (January 1994 to present); Associate General Counsel, ACC (January 2001 to present). Also serves as Vice President, ACIM and ACS | |
Ward D. Stauffer (1960) | Secretary since 2005 | Attorney, ACC (June 2003 to present) |
The Statement of Additional Information has additional information about the fund’s directors and is available without charge, upon request, by calling 1-800-345-2021.
29
At a meeting held on June 21, 2012, the Fund’s Board of Directors unanimously approved the renewal of the management agreement pursuant to which American Century Investment Management, Inc. (the “Advisor”) acts as the investment advisor for the Fund. Under Section 15(c) of the Investment Company Act, contracts for investment advisory services are required to be reviewed, evaluated, and approved by a majority of a fund’s independent directors (the “Directors”) each year.
As a part of the approval process, the Board requested and reviewed extensive data and information compiled by the Advisor and certain independent providers of evaluation data concerning the Fund and the services provided to the Fund by the Advisor. This review was in addition to the oversight and evaluation undertaken by the Board and its committees on a continuous basis throughout the year and included, but was not limited to the following:
| • | the nature, extent, and quality of investment management, shareholder services, and other services provided by the Advisor to the Fund; |
| • | the wide range of other programs and services the Advisor provides to the Fund and its shareholders on a routine and non-routine basis; |
| • | the investment performance of the fund, including data comparing the Fund’s performance to appropriate benchmarks and/or a peer group of other mutual funds with similar investment objectives and strategies; |
| • | data comparing the cost of owning the Fund to the cost of owning similar funds; |
| • | the Advisor’s compliance policies, procedures, and regulatory experience; |
| • | financial data showing the cost of services provided to the Fund, the profitability of the Fund to the Advisor, and the overall profitability of the Advisor; |
| • | data comparing services provided and charges to other investment management clients of the Advisor; and |
| • | consideration of collateral benefits derived by the Advisor from the management of the Fund and any potential economies of scale relating thereto. |
In keeping with its practice, the Board held two in-person meetings and one telephonic meeting to review and discuss the information provided. The Directors also had the benefit of the advice of independent counsel throughout the period.
Factors Considered
The Directors considered all of the information provided by the Advisor, the independent data providers, and independent counsel, and evaluated such information for the Fund. In connection with their review, the Directors did not identify any single factor as being all-important or controlling, and each Director may have attributed different levels of importance to different factors. In deciding to renew the management agreement, the Board based its decision on a number of factors, including the following:
30
Nature, Extent and Quality of Services — Generally. Under the management agreement, the Advisor is responsible for providing or arranging for all services necessary for the operation of the Fund. The Board noted that under the management agreement, the Advisor provides or arranges at its own expense a wide variety of services including:
| • | constructing and designing the Fund |
| • | portfolio research and security selection |
| • | initial capitalization/funding |
| • | securities trading |
| • | Fund administration |
| • | custody of Fund assets |
| • | daily valuation of the Fund’s portfolio |
| • | shareholder servicing and transfer agency, including shareholder confirmations, recordkeeping, and communications |
| • | legal services |
| • | regulatory and portfolio compliance |
| • | financial reporting |
| • | marketing and distribution |
The Board noted that many of these services have expanded over time both in terms of quantity and complexity in response to shareholder demands, competition in the industry, changing distribution channels, and the changing regulatory environment.
Investment Management Services. The nature of the investment management services provided to the Fund is quite complex and allows Fund shareholders access to professional money management, instant diversification of their investments within an asset class, the opportunity to easily diversify among asset classes by investing in or exchanging among various American Century Investments funds, and liquidity. In evaluating investment performance, the Board expects the Advisor to manage the Fund in accordance with its investment objectives and approved strategies. Further, the Directors recognize that the Advisor has an obligation to monitor trading activities, and in particular to seek the best execution of fund trades, and to evaluate the use of and payment for research. In providing these services, the Advisor utilizes teams of investment professionals (portfolio managers, analysts, research assistants, and securities traders) who require extensive information technology, research, training, compliance and other systems to conduct their business. The •, directly and through its Fund Performance Review Committee, regularly reviews investment performance information for the Fund, together with comparative information for appropriate benchmarks and/or peer groups of similarly-managed funds, over different time horizons.
31
The Directors also review detailed performance information during the management agreement •process. If performance concerns are identified, the Fund receives special reviews until performance improves, during which the Board discusses with the Advisor the reasons for such results (e.g., market conditions, security selection) and any efforts being undertaken to improve performance. Taking all these factors into consideration, the Board •the investment management services provided by the Advisor to the Fund to meet or exceed industry standards. More detailed information about the Fund’s performance can be found in the Performance and Portfolio Commentary sections of this report.
Shareholder and Other Services. Under the management agreement, the Advisor provides the Fund with a comprehensive package of transfer agency, shareholder, and other services. The Board, directly and through various committees of the Board, regularly reviews reports and evaluations of such services at its regular meetings. These reports include, but are not limited to, information regarding the operational efficiency and accuracy of the shareholder and transfer agency services provided, staffing levels, shareholder satisfaction (as measured by external as well as internal sources), technology support, new products and services offered to Fund shareholders, securities trading activities, portfolio valuation services, auditing services, and legal and operational compliance activities. Certain aspects of shareholder and transfer agency service level efficiency and the quality of securities trading activities are measured by independent third party providers and are presented in comparison to other fund groups not managed by the Advisor. The Board found the services provided by the Advisor to the Fund under the management agreement to be competitive and of high quality.
Costs of Services and Profitability. The Advisor provides detailed information concerning its cost of providing various services to the Fund, its profitability in managing the Fund, its overall profitability, and its financial condition. The Directors have reviewed with the Advisor the methodology used to prepare this financial information. The financial information regarding the Advisor is considered in evaluating the Advisor’s financial condition, ability to continue to provide services under the management agreement, and the reasonableness of the current management fee. The Board concluded that the Advisor’s profits were reasonable in light of the services provided to the Fund.
Ethics. The Board generally considers the Advisor’s commitment to providing quality services to shareholders and to conducting its business ethically. They noted that the Advisor’s practices generally meet or exceed industry best practices.
Economies of Scale. The Board also reviewed information provided by the Advisor regarding the possible existence of economies of scale in connection with the management of the Fund. The Board concluded that economies of scale are difficult to measure and predict with precision, especially on a fund-by-fund basis. The Board concluded that the Advisor is appropriately sharing economies of scale through its competitive fee structure, offering competitive fees from fund inception, and through reinvestment in its business to provide shareholders additional content and services.
32
Comparison to Other Funds’ Fees. The management agreement provides that the Fund pay the Advisor a single, all-inclusive (or unified) management fee for providing all services necessary for the management and operation of the Fund, other than brokerage expenses, taxes, interest, extraordinary expenses, and the fees and expenses of the Fund’s independent directors (including their independent legal counsel) and expenses incurred in connection with the provision of shareholder services and distribution services under a plan adopted pursuant to Rule 12b-1 under the 1940 Act. Under the unified fee structure, the Advisor is responsible for providing all investment advisory, custody, audit, administrative, compliance, recordkeeping, marketing and shareholder services, or arranging and supervising third parties to provide such services. By contrast, most other funds are charged a variety of fees, including an investment advisory fee, a transfer agency fee, an administrative fee, distribution charges and other expenses. Other than their investment advisory fees and any applicable Rule 12b-1 distribution fees, all other components of the total fees charged by these other funds may be increased without shareholder approval. The Board believes the unified fee structure is a benefit to Fund shareholders because it clearly discloses to shareholders the cost of owning Fund shares, and, since the unified fee cannot be increased without a vote of Fund shareholders, it shifts to the Advisor the risk of increased costs of operating the Fund and provides a direct incentive to minimize administrative inefficiencies. Part of the Board’s analysis of fee levels involves reviewing certain evaluative data compiled by an independent provider and comparing the Fund’s unified fee to the total expense ratio of other funds in the Fund’s peer group. The Board concluded that the management fee paid by the Fund to the Advisor under the management agreement is reasonable in light of the services provided to the Fund.
Comparison to Fees and Services Provided to Other Clients of the Advisor. The Board also requested and received information from the Advisor concerning the nature of the services, fees, costs and profitability of its advisory services to advisory clients other than the Fund. They observed that these varying types of client accounts require different services and involve different regulatory and entrepreneurial risks than the management of the Fund. The Board analyzed this information and concluded that the fees charged and services provided to the Fund were reasonable by comparison.
Collateral or “Fall-Out” Benefits Derived by the Advisor. The Board considered the existence of collateral benefits the Advisor may receive as a result of its relationship with the Fund. They concluded that the Advisor’s primary business is managing mutual funds and it generally does not use fund or shareholder information to generate profits in other lines of business, and therefore does not derive any significant collateral benefits from them. The Board noted that the Advisor receives proprietary research from broker-dealers that execute fund portfolio transactions and concluded that this research is likely to benefit Fund shareholders. The Board also determined that the Advisor is able to provide investment management services to certain clients other than the Fund, at least in part, due to its existing infrastructure built to serve the fund complex. The Board concluded, however, that the assets of those other clients are not material to the analysis and, where applicable, may be included with the assets of the Fund to determine breakpoints in the management fee schedule.
33
Existing Relationship. The Board also considered whether there was any reason for not continuing the existing arrangement with the Advisor. In this regard, the Board was mindful of the potential disruptions of the Fund’s operations and various risks, uncertainties, and other effects that could occur as a result of a decision not to continue such relationship. In particular, the Board recognized that most shareholders have invested in the Fund on the strength of the Advisor’s industry standing and reputation and in the expectation that the Advisor will have a continuing role in providing advisory services to the Fund.
Conclusion of the Directors. As a result of this process, the Board, including all of the independent directors, taking into account all of the factors discussed above and the information provided by the Advisor and others, concluded that the management agreement between the Fund and the Advisor is fair and reasonable in light of the services provided and should be renewed.
34
Retirement Account Information
As required by law, distributions you receive from certain IRAs, or 403(b), 457 and qualified plans are subject to federal income tax withholding, unless you elect not to have withholding apply. Tax will be withheld on the total amount withdrawn even though you may be receiving amounts that are not subject to withholding, such as nondeductible contributions. In such case, excess amounts of withholding could occur. You may adjust your withholding election so that a greater or lesser amount will be withheld.
If you don’t want us to withhold on this amount, you must notify us to not withhold the federal income tax. You may notify us in writing or in certain situations by telephone or through other electronic means. You have the right to revoke your withholding election at any time and any election you make may remain in effect until revoked by filing a new election.
Remember, even if you elect not to have income tax withheld, you are liable for paying income tax on the taxable portion of your withdrawal. If you elect not to have income tax withheld or you don’t have enough income tax withheld, you may be responsible for payment of estimated tax. You may incur penalties under the estimated tax rules if your withholding and estimated tax payments are not sufficient. You can reduce or defer the income tax on a distribution by directly or indirectly rolling such distribution over to another IRA or eligible plan. You should consult your tax advisor for additional information.
State tax will be withheld if, at the time of your distribution, your address is within one of the mandatory withholding states and you have federal income tax withheld. State taxes will be withheld from your distribution in accordance with the respective state rules.
Proxy Voting Guidelines
American Century Investment Management, Inc., the fund’s investment advisor, is responsible for exercising the voting rights associated with the securities purchased and/or held by the fund. A description of the policies and procedures the advisor uses in fulfilling this responsibility is available without charge, upon request, by calling 1-800-345-2021. It is also available on American Century Investments’ website at americancentury.com and on the Securities and Exchange Commission’s website at sec.gov. Information regarding how the investment advisor voted proxies relating to portfolio securities during the most recent 12-month period ended June 30 is available on the “About Us” page at americancentury.com. It is also available at sec.gov.
Quarterly Portfolio Disclosure
The fund files its complete schedule of portfolio holdings with the Securities and Exchange Commission (SEC) for the first and third quarters of each fiscal year on Form N-Q. The fund’s Forms N-Q are available on the SEC’s website at sec.gov, and may be reviewed and copied at the SEC’s Public Reference Room in Washington, DC. Information on the operation of the Public Reference Room may be obtained by calling 1-800-SEC-0330. The fund also makes its complete schedule of portfolio holdings for the most recent quarter of its fiscal year available on its website at americancentury.com and, upon request, by calling 1-800-345-2021.
35
36
| Contact Us | americancentury.com |
| Automated Information Line | 1-800-345-8765 |
| Investor Services Representative | 1-800-345-2021 or 816-531-5575 |
| Investors Using Advisors | 1-800-378-9878 |
Business, Not-For-Profit, Employer-Sponsored Retirement Plans | 1-800-345-3533 |
Banks and Trust Companies, Broker-Dealers, Financial Professionals, Insurance Companies | 1-800-345-6488 |
| Telecommunications Device for the Deaf | 1-800-634-4113 |
American Century World Mutual Funds, Inc.
Investment Advisor:
American Century Investment Management, Inc.
Kansas City, Missouri
This report and the statements it contains are submitted for the general information of our shareholders. The report is not authorized for distribution to prospective investors unless preceded or accompanied by an effective prospectus.
©2013 American Century Proprietary Holdings, Inc. All rights reserved.
CL-ANN-76978 1301
ANNUAL REPORT NOVEMBER 30, 2012
| NT International Growth Fund |
| President’s Letter | 2 |
| Independent Chairman’s Letter | 3 |
| Market Perspective | 4 |
| Performance | 5 |
| Portfolio Commentary | 6 |
| Fund Characteristics | 8 |
| Shareholder Fee Example | 9 |
| Schedule of Investments | 11 |
| Statement of Assets and Liabilities | 14 |
| Statement of Operations | 15 |
| Statement of Changes in Net Assets | 16 |
| Notes to Financial Statements | 17 |
| Financial Highlights | 22 |
| Report of Independent Registered Public Accounting Firm | 23 |
| Management | 24 |
| Approval of Management Agreement | 27 |
| Additional Information | 32 |
Any opinions expressed in this report reflect those of the author as of the date of the report, and do not necessarily represent the opinions of American Century Investments® or any other person in the American Century Investments organization. Any such opinions are subject to change at any time based upon market or other conditions and American Century Investments disclaims any responsibility to update such opinions. These opinions may not be relied upon as investment advice and, because investment decisions made by American Century Investments funds are based on numerous factors, may not be relied upon as an indication of trading intent on behalf of any American Century Investments fund. Security examples are used for representational purposes only and are not intended as recommendations to purchase or sell securities. Performance information for comparative indices and securities is provided to American Century Investments by third party vendors. To the best of American Century Investments’ knowledge, such information is accurate at the time of printing.
Dear Investor:
Thank you for reviewing this annual report for the 12 months ended November 30, 2012. It offers investment performance, market analysis, and portfolio information, presented with the expert perspective of our portfolio management team.
Annual reports remain important vehicles for conveying information about fund returns, including key factors that affected fund performance. For additional, updated investment and market insights, we encourage you to visit our website, americancentury.com.
Favorable Fiscal-Year Returns for Most Major Stock and Bond Benchmarks
Despite a global economic slowdown, continued concerns about European financial system stability, and uncertainty about U.S. political and fiscal conditions in 2013, 12-month stock and bond returns were generally favorable, particularly for U.S. value stocks and high-yield bonds.
U.S. value stock indices outpaced the S&P 500 Index’s 16.13% return for the period, as did U.S. corporate and municipal high-yield benchmarks. U.S. growth and international index returns were generally lower, but still solid—the MSCI EAFE Index, for example, returned 12.61%.
With the exception of high-yield bond sectors, stocks generally outperformed bonds for the period, though bonds benefitted from economic stagnation, reduced inflation pressures, and low interest rates. The 10-year U.S. Treasury yield declined from 2.07% to 1.62% during the period, and the Barclays U.S. Aggregate Bond Index returned 5.51%. Related global bond indices also returned in roughly the mid-single digits.
Bucking the global trend, the U.S. economy showed signs of improvement during the fiscal year, particularly the long-depressed housing market. However, the outlook for 2013 remains guarded, as the fragile recovery remains vulnerable to fiscal and financial factors that could trigger further slowdowns and market volatility.
Under these conditions, we continue to believe in a disciplined, diversified, long-term investment approach, using both stocks and bonds—as appropriate—for meeting financial goals. We appreciate your continued trust in us in this challenging environment.
Sincerely,
Jonathan Thomas
President and Chief Executive Officer
American Century Investments
2
Dear Fellow Shareholders,
The board has once again completed its annual review of the advisory contract between the American Century Investments mutual funds overseen by the board and the funds’ advisor, American Century Investment Management, Inc. This process, often referred to as the 15(c) review, involves the independent directors considering all of the material monitored throughout the year and evaluating a wide range of factors to determine whether the management fee paid by each fund to the advisor is reasonable.
The independent directors’ rationale for this decision is provided in detail in this, or in a previous, report. However, there are several highlights that should be of interest to all shareholders.
| • | Fund performance and client service continue to be rated among the industry’s best. |
| • | Target date and other asset allocation products continue to successfully gather assets and industry acclaim. |
| • | Compliance programs continue to function successfully with no issues impacting shareholder interests. |
| • | Fees were found to be within an acceptable competitive range, with minor fee waivers being negotiated on five funds. |
Knowing that most shareholders are long term investors, the board was particularly pleased with our succession planning review. Talented professionals are being added within portfolio management and experienced managers have been added to the senior management team.
Overall it was a very positive review for the American Century Investments mutual funds during a challenging market environment.
Best personal regards,
Don Pratt
3
By Mark Kopinski, Chief Investment Officer, Global and Non-U.S. Equity
Central Bank Action Drove Global Stocks Higher
Despite a backdrop of weaker global economic growth and mounting sovereign debt problems in Europe and the United States, most global stock benchmarks advanced strongly for the 12-month period ended November 30, 2012. Investors generally overlooked the lackluster economic data, recession fears (which eventually turned to reality for Europe), and the instability of the eurozone’s banking system and currency. Instead, they focused on the optimism inspired by unprecedented central bank intervention.
In particular, the European Central Bank (ECB) launched several programs to help the eurozone’s troubled banks shore up their balance sheets and finance ongoing operations. The ECB also agreed to purchase the sovereign debt of financially strapped member nations that conform to the ECB’s fiscal reform measures. Meanwhile, in response to sluggish economic growth and high unemployment, the U.S. Federal Reserve (the Fed) announced its third—and most aggressive—quantitative easing program to date. The Bank of Japan also took action with an asset purchase program, while the People’s Bank of China eased its reserve requirements for commercial lenders.
Overall, developed markets outperformed emerging markets for the 12-month period, even as the emerging economies generally enjoyed higher absolute levels of growth, albeit slower growth than in previous periods. Strong stock market performance in Europe and the United States, where central bank stimulus was the greatest, primarily drove the better relative results in the developed markets.
Valuations, Stock Selection Remain Key Factors
Even though economic growth and corporate earnings in aggregate have been slowing, and sovereign debt issues have yet to be resolved, there are some positive factors at work for global equity investors. Stock valuations around the globe appear attractive relative to historical averages. Similarly, equity earnings yields are also compelling when measured against long-term averages and current bond yields. Most important, we believe through our rigorous, bottom-up stock selection process it’s still possible to find individual companies growing earnings, either from a new product launch, market share gains, secular changes, or beneficial acquisitions.
| International Equity Total Returns | ||||
| For the 12 months ended November 30, 2012 (in U.S. dollars) | ||||
| MSCI EAFE Index | 12.61% | MSCI Europe Index | 14.07% | |
| MSCI EAFE Growth Index | 12.66% | MSCI World Index | 13.62% | |
| MSCI EAFE Value Index | 12.45% | MSCI Japan Index | 3.59% | |
| MSCI Emerging Markets Index | 11.35% | |||
4
| Total Returns as of November 30, 2012 | |||||
| Average Annual Returns | |||||
Ticker Symbol | 1 year | 5 years | Since Inception | Inception Date | |
| Institutional Class | ACLNX | 15.13% | -3.22% | 1.22% | 5/12/06 |
| MSCI EAFE Index | — | 12.61% | -4.73% | -0.25%(1) | — |
| MSCI EAFE Growth Index | — | 12.66% | -3.96% | 0.65%(1) | — |
| (1) | Since 4/30/06, the date nearest the Institutional Class’s inception for which data are available. |
| Growth of $10,000 Over Life of Class |
| $10,000 investment made May 12, 2006 |
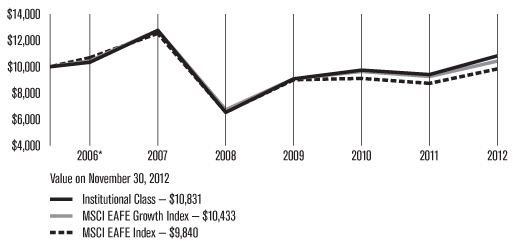
| * | From 5/12/06, the Institutional Class’s inception date. Index data from 4/30/06, the date nearest the Institutional Class’s inception for which data are available. Not annualized. |
| Total Annual Fund Operating Expenses |
Institutional Class 1.12% |
The total annual fund operating expenses shown is as stated in the fund’s prospectus current as of the date of this report. The prospectus may vary from the expense ratio shown elsewhere in this report because it is based on a different time period, includes acquired fund fees and expenses, and, if applicable, does not include fee waivers or expense reimbursements.
Data presented reflect past performance. Past performance is no guarantee of future results. Current performance may be higher or lower than the performance shown. Investment return and principal value will fluctuate, and redemption value may be more or less than original cost. To obtain performance data current to the most recent month end, please call 1-800-345-2021 or visit americancentury.com. International investing involves special risks, such as political instability and currency fluctuations. Investing in emerging markets may accentuate these risks.
Data assumes reinvestment of dividends and capital gains, and none of the charts reflect the deduction of taxes that a shareholder would pay on fund distributions or the redemption of fund shares. Returns for the indices are provided for comparison. The fund’s total returns include operating expenses (such as transaction costs and management fees) that reduce returns, while the total returns of the indices do not.
5
| Portfolio Commentary |
Portfolio Managers: Alex Tedder and Raj Gandhi
Performance Summary
NT International Growth advanced 15.13% for the 12 months ended November 30, 2012, compared with its benchmark, the MSCI EAFE Index, which gained 12.61%.
Developed non-U.S. stocks generally demonstrated robust performance during the 12-month period, even as weak growth and mounting sovereign debt problems weighed on many economies. Unprecedented central bank intervention, particularly the European Central Bank’s commitment to do “whatever it takes” to restore eurozone stability, helped drive stock market optimism. Within the developed markets, there was little difference in results between growth and value stocks and large- and small-cap stocks.
Overall, stock selection, particularly in the materials, industrials, and energy sectors, drove the portfolio’s outperformance relative to the benchmark. Our sector allocations, including an overweight position in the consumer discretionary sector and an underweight position in energy, also had an overall positive influence on the portfolio’s relative performance. Lagging sectors included consumer staples, where stock selection hurt, and financials, where an underweight position offset a strong contribution from stock selection.
From a regional perspective, stock selection in Spain, Japan, and France, along with underweight positions in Spain and Japan and an overweight in France, contributed favorably to the portfolio’s relative performance. At the opposite end of the spectrum, positions in China, along with stock selection in Australia and an overweight position in Canada, detracted from relative performance.
Plasma Company Was a Top Contributor
Grifols, a Spain-based blood plasma processor, was a leading contributor to the portfolio’s relative performance. In addition to reporting strong results throughout the period and benefitting from an improvement in pricing for its blood plasma products, the company announced it was expanding its North American operations via the purchase of three plasma donation centers in the U.S. The stock also received a lift from the release of preliminary research findings that plasma-based drugs could help in the treatment of Alzheimer’s disease.
In addition, a position in South Korea’s Samsung Electronics drove results in the information technology sector and was among the portfolio’s top contributors to performance. Stock in the electronics manufacturer advanced on market share gains in the competitive global smartphone market, with sales of the Galaxy SIII boosting results.
In the top-performing industrials sector, an overweight position in Wolseley, a United Kingdom-based distributor of plumbing and heating products, was a leading contributor to performance. Investors reacted favorably to the company’s favorable revenue, earnings, and profits statements issued throughout the period. In particular, the company cited improving industrial and residential activity in North America as offsetting weak European markets.
6
Wireless Company Detracted from Results
Among the portfolio’s leading performance detractors for the period was China Unicom, a wireless telecommunication services provider. Shares declined early in the period after China Telecom earned the right to sell Apple’s iPhones in China, stripping China Unicom of its exclusive deal. In addition, rising price competition hurt China Unicom’s stock price, while China Mobile, the largest operator, said it would accelerate the launch of its 4G service, compromising the growth of China Unicom.
Another prominent China-based detractor included a position in Baidu, an Internet search provider. Late in the period, the company forecast its fourth-quarter revenue growth would slow to its weakest level in three years, which was below analysts’ expectations. In addition, reluctance from advertisers to purchase space on the company’s search pages for mobile phones, a slowdown in search revenue, and an analyst downgrade weighed on the company’s shares.
An overweight position in Rakuten, a Japan-based electronic commerce and Internet company, also was among the portfolio’s largest detractors. The company reported disappointing results during the third quarter of 2012 due to higher costs stemming from the company’s rapid expansion overseas. Nevertheless, we believe underlying fundamentals support our thesis that e-commerce will continue to grow, and Rakuten remains well positioned in this industry.
Outlook
While markets generally reacted favorably to central bank actions during the period, the ultimate impact is unclear without substantial political progress on fiscal issues. At period-end, we believed austerity measures in Europe and slowing global economic growth were likely to weigh on stocks in the medium term. Accordingly, we favor investment opportunities that we believe are less dependent on macro events and more reliant on secular changes where new technologies or company specific restructurings can drive earnings growth. We will continue to focus on finding companies located in developed countries around the world (excluding the United States) that we believe have sustainable growth characteristics and promising long-term outlooks.
7
| NOVEMBER 30, 2012 | |
| Top Ten Holdings | % of net assets |
| Roche Holding AG | 2.2% |
| Sanofi | 2.2% |
| Nestle SA | 2.2% |
| Syngenta AG | 1.8% |
| Unilever plc | 1.7% |
| Muenchener Rueckversicherungs AG | 1.7% |
| BHP Billiton Ltd. | 1.7% |
| Toyota Motor Corp. | 1.6% |
| Samsung Electronics Co. Ltd. | 1.6% |
| Rio Tinto plc | 1.6% |
| Types of Investments in Portfolio | % of net assets |
| Foreign Common Stocks | 100.7% |
| Temporary Cash Investments | 1.1% |
| Other Assets and Liabilities | (1.8)% |
| Investments by Country | % of net assets |
| United Kingdom | 17.0% |
| France | 12.9% |
| Japan | 12.1% |
| Switzerland | 8.6% |
| Germany | 8.0% |
| Australia | 5.3% |
| Italy | 4.2% |
| Sweden | 3.4% |
| Denmark | 2.8% |
| Spain | 2.8% |
| Norway | 2.6% |
| Belgium | 2.2% |
| Netherlands | 2.1% |
| China | 2.0% |
| Other Countries | 14.7% |
| Cash and Equivalents* | (0.7)% |
| *Includes temporary cash investments and other assets and liabilities. | |
8
Fund shareholders may incur two types of costs: (1) transaction costs, including sales charges (loads) on purchase payments and redemption/exchange fees; and (2) ongoing costs, including management fees; distribution and service (12b-1) fees; and other fund expenses. This example is intended to help you understand your ongoing costs (in dollars) of investing in your fund and to compare these costs with the ongoing cost of investing in other mutual funds.
The example is based on an investment of $1,000 made at the beginning of the period and held for the entire period from June 1, 2012 to November 30, 2012.
Actual Expenses
The table provides information about actual account values and actual expenses for each class. You may use the information, together with the amount you invested, to estimate the expenses that you paid over the period. First, identify the share class you own. Then simply divide your account value by $1,000 (for example, an $8,600 account value divided by $1,000 = 8.6), then multiply the result by the number under the heading “Expenses Paid During Period” to estimate the expenses you paid on your account during this period.
If you hold Investor Class shares of any American Century Investments fund, or Institutional Class shares of the American Century Diversified Bond Fund, in an American Century Investments account (i.e., not a financial intermediary or retirement plan account), American Century Investments may charge you a $12.50 semiannual account maintenance fee if the value of those shares is less than $10,000. We will redeem shares automatically in one of your accounts to pay the $12.50 fee. In determining your total eligible investment amount, we will include your investments in all personal accounts (including American Century Investments Brokerage accounts) registered under your Social Security number. Personal accounts include individual accounts, joint accounts, UGMA/UTMA accounts, personal trusts, Coverdell Education Savings Accounts and IRAs (including traditional, Roth, Rollover, SEP-, SARSEP- and SIMPLE-IRAs), and certain other retirement accounts. If you have only business, business retirement, employer-sponsored or American Century Investments Brokerage accounts, you are currently not subject to this fee. If you are subject to the Account Maintenance Fee, your account value could be reduced by the fee amount.
Hypothetical Example for Comparison Purposes
The table also provides information about hypothetical account values and hypothetical expenses based on the actual expense ratio of each class of your fund and an assumed rate of return of 5% per year before expenses, which is not the actual return of a fund’s share class. The hypothetical account values and expenses may not be used to estimate the actual ending account balance or expenses you paid for the period. You may use this information to compare the ongoing costs of investing in your fund and other funds. To do so, compare this 5% hypothetical example with the 5% hypothetical examples that appear in the shareholder reports of the other funds.
9
Please note that the expenses shown in the table are meant to highlight your ongoing costs only and do not reflect any transactional costs, such as sales charges (loads) or redemption/exchange fees. Therefore, the table is useful in comparing ongoing costs only, and will not help you determine the relative total costs of owning different funds. In addition, if these transactional costs were included, your costs would have been higher.
Beginning Account Value 6/1/12 | Ending Account Value 11/30/12 | Expenses Paid During Period(1) 6/1/12 – 11/30/12 | Annualized Expense Ratio(1) | |
| Actual | ||||
| Institutional Class | $1,000 | $1,179.10 | $5.77 | 1.06% |
| Hypothetical | ||||
| Institutional Class | $1,000 | $1,019.70 | $5.35 | 1.06% |
| (1) | Expenses are equal to the class’s annualized expense ratio listed in the table above, multiplied by the average account value over the period, multiplied by 183, the number of days in the most recent fiscal half-year, divided by 366, to reflect the one-half year period. |
10
NOVEMBER 30, 2012
| Shares | Value | |
| Common Stocks — 100.7% | ||
| AUSTRALIA — 5.3% | ||
| BHP Billiton Ltd. | 229,559 | $ 8,238,732 |
| Coca-Cola Amatil Ltd. | 222,606 | 3,191,960 |
| Commonwealth Bank of Australia | 67,575 | 4,209,413 |
| CSL Ltd. | 56,353 | 3,040,475 |
| James Hardie Industries SE | 459,760 | 4,361,430 |
| Treasury Wine Estates Ltd. | 559,225 | 2,935,543 |
| 25,977,553 | ||
| AUSTRIA — 0.1% | ||
Erste Group Bank AG(1) | 9,654 | 283,943 |
| BELGIUM — 2.2% | ||
| Anheuser-Busch InBev NV | 74,445 | 6,524,666 |
| Umicore SA | 75,865 | 3,941,225 |
| 10,465,891 | ||
| BRAZIL — 0.5% | ||
| BR Malls Participacoes SA | 183,200 | 2,353,444 |
| CANADA — 1.4% | ||
| Bank of Nova Scotia | 46,195 | 2,604,238 |
| Canadian Pacific Railway Ltd. | 45,058 | 4,204,839 |
| 6,809,077 | ||
| CHINA — 2.0% | ||
Baidu, Inc. ADR(1) | 13,050 | 1,256,845 |
Brilliance China Automotive Holdings Ltd.(1) | 2,088,000 | 2,540,559 |
| China Communications Construction Co. Ltd. H Shares | 1,784,000 | 1,625,125 |
| China Unicom Ltd. ADR | 87,289 | 1,355,598 |
| Tencent Holdings Ltd. | 89,300 | 2,917,442 |
| 9,695,569 | ||
| DENMARK — 2.8% | ||
| Christian Hansen Holding A/S | 122,590 | 3,968,580 |
| Coloplast A/S B Shares | 8,486 | 1,980,851 |
| Novo Nordisk A/S B Shares | 48,010 | 7,624,620 |
| 13,574,051 | ||
| FINLAND — 0.6% | ||
| Kone Oyj | 40,521 | 3,035,498 |
| FRANCE — 12.9% | ||
| Air Liquide SA | 14,853 | 1,814,067 |
| BNP Paribas SA | 115,635 | 6,458,464 |
| Carrefour SA | 113,238 | 2,795,954 |
| Cie Generale d’Optique Essilor International SA | 32,750 | 3,162,533 |
| Dassault Systemes SA | 23,957 | 2,710,685 |
| Gemalto NV | 36,824 | 3,385,928 |
| L’Oreal SA | 14,454 | 1,961,588 |
| LVMH Moet Hennessy Louis Vuitton SA | 22,699 | 3,982,410 |
| Pernod-Ricard SA | 58,509 | 6,624,737 |
| Publicis Groupe SA | 33,100 | 1,872,383 |
| Sanofi | 120,796 | 10,786,577 |
| Schneider Electric SA | 52,010 | 3,655,355 |
| SES SA | 181,736 | 5,140,762 |
| Technip SA | 46,833 | 5,440,365 |
| Zodiac Aerospace | 29,244 | 3,267,061 |
| 63,058,869 | ||
| GERMANY — 8.0% | ||
| adidas AG | 30,037 | 2,641,551 |
| BASF SE | 60,582 | 5,428,629 |
| Continental AG | 22,832 | 2,526,974 |
| HeidelbergCement AG | 22,111 | 1,201,590 |
| Henkel AG & Co. KGaA Preference Shares | 23,664 | 1,977,373 |
| Kabel Deutschland Holding AG | 73,642 | 5,325,099 |
| Muenchener Rueckversicherungs AG | 48,471 | 8,273,868 |
| SAP AG | 67,497 | 5,270,508 |
| Volkswagen AG Preference Shares | 29,022 | 6,282,586 |
| 38,928,178 | ||
| HONG KONG — 1.6% | ||
| AIA Group Ltd. | 684,100 | 2,661,301 |
| Link Real Estate Investment Trust (The) | 624,607 | 3,388,909 |
| Sands China Ltd. | 431,600 | 1,840,518 |
| 7,890,728 | ||
| INDIA — 0.5% | ||
| HDFC Bank Ltd. ADR | 58,701 | 2,472,486 |
| INDONESIA — 0.9% | ||
| PT Bank Mandiri (Persero) Tbk | 4,987,250 | 4,288,822 |
| IRELAND — 0.6% | ||
| Ryanair Holdings plc ADR | 87,240 | 3,003,673 |
| ITALY — 4.2% | ||
| ENI SpA | 278,990 | 6,596,443 |
| Luxottica Group SpA | 71,719 | 2,942,801 |
| Prada SpA | 614,400 | 5,073,624 |
| Saipem SpA | 130,434 | 5,806,642 |
| 20,419,510 | ||
11
| Shares | Value |
| JAPAN — 12.1% | ||
| Daikin Industries Ltd. | 55,700 | $ 1,751,373 |
| Daito Trust Construction Co. Ltd. | 40,000 | 3,876,994 |
| FANUC Corp. | 17,800 | 3,001,395 |
| Fast Retailing Co. Ltd. | 9,900 | 2,248,171 |
| Hitachi Ltd. | 590,000 | 3,406,805 |
| KDDI Corp. | 46,636 | 3,450,956 |
| Kubota Corp. | 463,000 | 4,914,478 |
| Lawson, Inc. | 54,500 | 3,689,088 |
| Mitsubishi Corp. | 199,400 | 3,775,865 |
| Mitsubishi Estate Co. Ltd. | 239,000 | 4,606,915 |
| Mitsubishi Heavy Industries Ltd. | 498,000 | 2,313,750 |
| ORIX Corp. | 50,850 | 5,101,347 |
| Rakuten, Inc. | 354,027 | 2,984,761 |
| Sysmex Corp. | 42,300 | 1,911,415 |
| Toyota Motor Corp. | 185,700 | 7,963,238 |
| Unicharm Corp. | 74,900 | 3,825,183 |
| 58,821,734 | ||
| NETHERLANDS — 2.1% | ||
| ASML Holding NV | 77,062 | 4,814,715 |
| Koninklijke Vopak NV | 76,432 | 5,647,124 |
| 10,461,839 | ||
| NORWAY — 2.6% | ||
| Petroleum Geo-Services ASA | 174,061 | 2,917,687 |
| Statoil ASA | 247,718 | 6,056,889 |
| Telenor ASA | 186,228 | 3,780,812 |
| 12,755,388 | ||
| PERU — 0.7% | ||
| Credicorp Ltd. | 23,575 | 3,298,143 |
| PORTUGAL — 0.4% | ||
| Jeronimo Martins SGPS SA | 106,147 | 1,980,321 |
| RUSSIA — 1.5% | ||
| Magnit OJSC GDR | 146,376 | 5,164,145 |
| Sberbank of Russia | 800,092 | 2,352,271 |
| 7,516,416 | ||
| SINGAPORE — 0.7% | ||
| DBS Group Holdings Ltd. | 296,000 | 3,504,178 |
| SOUTH KOREA — 1.7% | ||
| Hyundai Motor Co. | 2,794 | 581,841 |
| Samsung Electronics Co. Ltd. | 6,024 | 7,821,715 |
| 8,403,556 | ||
| SPAIN — 2.8% | ||
| Banco Bilbao Vizcaya Argentaria SA | 264,125 | 2,241,046 |
Grifols SA(1) | 206,023 | 6,590,067 |
| Inditex SA | 34,180 | 4,685,328 |
| 13,516,441 | ||
| SWEDEN — 3.4% | ||
| Atlas Copco AB A Shares | 71,701 | 1,847,122 |
| Electrolux AB | 101,371 | 2,652,602 |
| Elekta AB B Shares | 66,015 | 954,007 |
| SKF AB B Shares | 83,124 | 1,998,969 |
| Svenska Cellulosa AB B Shares | 85,681 | 1,734,650 |
| Swedbank AB A Shares | 207,395 | 3,830,979 |
| Volvo AB B Shares | 240,867 | 3,412,073 |
| 16,430,402 | ||
| SWITZERLAND — 8.6% | ||
| Adecco SA | 75,997 | 3,755,155 |
| Cie Financiere Richemont SA | 40,265 | 3,104,494 |
| Nestle SA | 160,402 | 10,497,876 |
| Roche Holding AG | 55,693 | 10,961,911 |
| Syngenta AG | 21,712 | 8,704,012 |
| UBS AG | 162,898 | 2,548,852 |
| Zurich Financial Services AG | 10,008 | 2,554,108 |
| 42,126,408 | ||
| TAIWAN — 1.5% | ||
| Hon Hai Precision Industry Co. Ltd. | 824,900 | 2,646,131 |
| Taiwan Semiconductor Manufacturing Co. Ltd. ADR | 259,533 | 4,482,135 |
| 7,128,266 | ||
| THAILAND — 1.3% | ||
| CP ALL PCL | 1,264,600 | 1,627,622 |
| Kasikornbank PCL NVDR | 807,000 | 4,917,204 |
| 6,544,826 | ||
| TURKEY — 0.7% | ||
| Turkiye Garanti Bankasi AS | 690,451 | 3,276,730 |
| UNITED KINGDOM — 17.0% | ||
| Aggreko plc | 98,096 | 3,507,913 |
| Antofagasta plc | 195,463 | 4,033,516 |
| ARM Holdings plc | 444,785 | 5,515,622 |
| BG Group plc | 215,122 | 3,687,839 |
| Burberry Group plc | 106,748 | 2,201,110 |
| Capita Group plc (The) | 334,911 | 4,091,406 |
| Carnival plc | 69,602 | 2,815,701 |
| Compass Group plc | 151,855 | 1,754,154 |
| Experian plc | 178,820 | 2,970,970 |
| HSBC Holdings plc (Hong Kong) | 482,276 | 4,900,420 |
12
| Shares | Value |
| Intertek Group plc | 93,228 | $ 4,615,388 |
Lloyds Banking Group plc(1) | 8,368,727 | 6,234,032 |
| Petrofac Ltd. | 77,319 | 2,016,712 |
| Rio Tinto plc | 156,750 | 7,768,927 |
| Rolls-Royce Holdings plc | 186,495 | 2,660,753 |
| Rolls-Royce Holdings plcPreference Shares | 14,173,620 | 22,708 |
| Standard Chartered plc | 183,561 | 4,279,044 |
| Telecity Group plc | 173,647 | 2,384,248 |
| Unilever plc | 221,367 | 8,522,559 |
| Whitbread plc | 129,115 | 4,962,612 |
| Wolseley plc | 90,853 | 4,216,879 |
| 83,162,513 | ||
TOTAL COMMON STOCKS (Cost $408,632,317) | 491,184,453 | |
| Temporary Cash Investments — 1.1% | ||
Repurchase Agreement, Bank of America Merrill Lynch, (collateralized by various U.S. Treasury obligations, 1.25% - 2.125%, 4/15/14 - 12/31/15, valued at $2,543,847), in a joint trading account at 0.18%, dated 11/30/12, due 12/3/12 (Delivery value $2,492,512) | 2,492,475 | |
Repurchase Agreement, Credit Suisse First Boston, Inc., (collateralized by various U.S. Treasury obligations, 0.25%, 9/15/15, valued at $2,542,708), in a joint trading account at 0.17%, dated 11/30/12, due 12/3/12 (Delivery value $2,492,510) | 2,492,475 | |
Repurchase Agreement, Goldman Sachs & Co., (collateralized by various U.S. Treasury obligations, 4.25%, 11/15/40, valued at $420,281), in a joint trading account at 0.15%, dated 11/30/12, due 12/3/12 (Delivery value $411,874) | 411,869 | |
| Value | ||
TOTAL TEMPORARY CASH INVESTMENTS (Cost $5,396,819) | $ 5,396,819 | |
TOTAL INVESTMENT SECURITIES — 101.8% (Cost $414,029,136) | 496,581,272 | |
| OTHER ASSETS AND LIABILITIES — (1.8)% | (8,616,873) | |
| TOTAL NET ASSETS — 100.0% | $487,964,399 | |
| Market Sector Diversification | |
| (as a % of net assets) | |
| Financials | 19.4% |
| Consumer Discretionary | 15.5% |
| Industrials | 14.9% |
| Consumer Staples | 12.6% |
| Materials | 10.6% |
| Information Technology | 9.7% |
| Health Care | 9.5% |
| Energy | 6.7% |
| Telecommunication Services | 1.8% |
| Cash and Equivalents* | (0.7)% |
*Includes temporary cash investments and other assets and liabilities.
Notes to Schedule of Investments
ADR = American Depositary Receipt
GDR = Global Depositary Receipt
NVDR = Non-Voting Depositary Receipt
OJSC = Open Joint Stock Company
| (1) | Non-income producing. |
See Notes to Financial Statements.
13
| NOVEMBER 30, 2012 | ||||
| Assets | ||||
| Investment securities, at value (cost of $414,029,136) | $496,581,272 | |||
| Foreign currency holdings, at value (cost of $238,971) | 239,015 | |||
| Receivable for investments sold | 6,890,756 | |||
| Dividends and interest receivable | 1,290,914 | |||
| Other assets | 13,841 | |||
| 505,015,798 | ||||
| Liabilities | ||||
| Disbursements in excess of demand deposit cash | 215,282 | |||
| Payable for investments purchased | 5,380,660 | |||
| Payable for capital shares redeemed | 11,043,547 | |||
| Accrued management fees | 411,910 | |||
| 17,051,399 | ||||
| Net Assets | $487,964,399 | |||
| Institutional Class Capital Shares, $0.01 Par Value | ||||
| Shares authorized | 100,000,000 | |||
| Shares outstanding | 49,066,493 | |||
| Net Asset Value Per Share | $9.94 | |||
| Net Assets Consist of: | ||||
| Capital (par value and paid-in surplus) | $419,447,615 | |||
| Undistributed net investment income | 5,464,358 | |||
| Accumulated net realized loss | (19,507,171 | ) | ||
| Net unrealized appreciation | 82,559,597 | |||
| $487,964,399 | ||||
See Notes to Financial Statements.
14
| YEAR ENDED NOVEMBER 30, 2012 | ||||
| Investment Income (Loss) | ||||
| Income: | ||||
| Dividends (net of foreign taxes withheld of $1,118,582) | $10,908,400 | |||
| Interest | 6,085 | |||
| 10,914,485 | ||||
| Expenses: | ||||
| Management fees | 4,611,385 | |||
| Directors’ fees and expenses | 14,729 | |||
| Other expenses | 1,868 | |||
| 4,627,982 | ||||
| Net investment income (loss) | 6,286,503 | |||
| Realized and Unrealized Gain (Loss) | ||||
| Net realized gain (loss) on: | ||||
| Investment transactions (net of foreign tax expenses paid (refunded) of $(10,520)) | (345,718 | ) | ||
| Foreign currency transactions | (291,756 | ) | ||
| (637,474 | ) | |||
| Change in net unrealized appreciation (depreciation) on: | ||||
| Investments | 56,975,722 | |||
| Translation of assets and liabilities in foreign currencies | (17,090 | ) | ||
| 56,958,632 | ||||
| Net realized and unrealized gain (loss) | 56,321,158 | |||
| Net Increase (Decrease) in Net Assets Resulting from Operations | $62,607,661 | |||
See Notes to Financial Statements.
15
| YEARS ENDED NOVEMBER 30, 2012 AND NOVEMBER 30, 2011 | |||||||
| Increase (Decrease) in Net Assets | November 30, 2012 | November 30, 2011 | |||||
| Operations | |||||||
| Net investment income (loss) | $6,286,503 | $3,240,776 | |||||
| Net realized gain (loss) | (637,474 | ) | (7,431,146 | ) | |||
| Change in net unrealized appreciation (depreciation) | 56,958,632 | (10,586,156 | ) | ||||
| Net increase (decrease) in net assets resulting from operations | 62,607,661 | (14,776,526 | ) | ||||
| Distributions to Shareholders | |||||||
| From net investment income | (3,008,478 | ) | (2,574,499 | ) | |||
| Capital Share Transactions | |||||||
| Proceeds from shares sold | 163,598,680 | 125,698,997 | |||||
| Proceeds from reinvestment of distributions | 3,008,478 | 2,574,499 | |||||
| Payments for shares redeemed | (83,476,339 | ) | (15,905,615 | ) | |||
| Net increase (decrease) in net assets from capital share transactions | 83,130,819 | 112,367,881 | |||||
| Net increase (decrease) in net assets | 142,730,002 | 95,016,856 | |||||
| Net Assets | |||||||
| Beginning of period | 345,234,397 | 250,217,541 | |||||
| End of period | $487,964,399 | $345,234,397 | |||||
| Undistributed net investment income | $5,464,358 | $2,456,478 | |||||
| Transactions in Shares of the Fund | |||||||
| Sold | 18,127,301 | 13,582,598 | |||||
| Issued in reinvestment of distributions | 361,162 | 266,500 | |||||
| Redeemed | (9,060,882 | ) | (1,689,808 | ) | |||
| Net increase (decrease) in shares of the fund | 9,427,581 | 12,159,290 | |||||
See Notes to Financial Statements.
16
NOVEMBER 30, 2012
1. Organization
American Century World Mutual Funds, Inc. (the corporation) is registered under the Investment Company Act of 1940, as amended (the 1940 Act), as an open-end management investment company and is organized as a Maryland corporation. NT International Growth Fund (the fund) is one fund in a series issued by the corporation. The fund is diversified as defined under the 1940 Act. The fund’s investment objective is to seek capital growth. The fund pursues its objective by investing primarily in equity securities of companies in at least three developed countries (excluding the United States). The fund is not permitted to invest in any securities issued by companies assigned by the Global Industry Classification Standard to the tobacco industry.
2. Significant Accounting Policies
The following is a summary of significant accounting policies consistently followed by the fund in preparation of its financial statements. The financial statements are prepared in conformity with accounting principles generally accepted in the United States of America, which may require management to make certain estimates and assumptions at the date of the financial statements. Actual results could differ from these estimates.
Investment Valuations — The fund determines the fair value of its investments and computes its net asset value per share as of the close of regular trading (usually 4 p.m. Eastern time) on the New York Stock Exchange (NYSE) on each day the NYSE is open.
Equity securities that are listed or traded on a domestic securities exchange are valued at the last reported sales price or at the official closing price as provided by the exchange. Equity securities traded on foreign securities exchanges are typically valued at the closing price on the exchange where primarily traded or as of the close of the NYSE, if that is earlier. If no last sales price is reported, or if local convention or regulation so provides, the mean of the latest bid and asked prices is used. Depending on local convention or regulation, securities traded over-the-counter are valued at the mean of the latest bid and asked prices, the last sales price, or the official closing price. In its determination of fair value, the fund may review several factors including: market information specific to a security; news developments in U.S. and foreign markets; the performance of particular U.S. and foreign securities, indices, comparable securities, American Depositary Receipts, Exchange-Traded Funds, and other relevant market indicators.
Debt securities maturing within 60 days at the time of purchase may be valued at cost, plus or minus any amortized discount or premium or at the evaluated mean as provided by an independent pricing service. Evaluated mean prices are commonly derived through utilization of market models, which may consider, among other factors, trade data, quotations from dealers and active market makers, relevant yield curve and spread data, related sector levels, creditworthiness, and other relevant market information on the same or comparable securities.
Investments in open-end management investment companies are valued at the reported net asset value per share. Repurchase agreements are valued at cost.
The value of investments initially expressed in foreign currencies is translated into U.S. dollars at prevailing exchange rates.
If the fund determines that the market price for a portfolio security is not readily available or the valuation methods mentioned above do not reflect a security’s fair value, such security is valued as determined in good faith by the Board of Directors or its designee, in accordance with procedures adopted by the Board of Directors. Circumstances that may cause the fund to use these procedures to value a security include, but are not limited to: a security has been declared in default; trading in a security has been halted during the trading day; there is a foreign market holiday and no trading occurred; or an event occurred between the close of a foreign exchange and the NYSE that may affect the value of a security.
17
Security Transactions — Security transactions are accounted for as of the trade date. Net realized gains and losses are determined on the identified cost basis, which is also used for federal income tax purposes. Certain countries impose taxes on realized gains on the sale of securities registered in their country. The fund records the foreign tax expense, if any, on an accrual basis. The foreign tax expense on realized gains and unrealized appreciation reduces the net realized gain (loss) on investment transactions and net unrealized appreciation (depreciation) on investments, respectively.
Investment Income — Dividend income less foreign taxes withheld, if any, is recorded as of the ex-dividend date. Distributions received on securities that represent a return of capital or capital gain are recorded as a reduction of cost of investments and/or as a realized gain. The fund estimates the components of distributions received that may be considered nontaxable distributions or capital gain distributions for income tax purposes. Interest income is recorded on the accrual basis and includes accretion of discounts and amortization of premiums.
Foreign Currency Translations — All assets and liabilities initially expressed in foreign currencies are translated into U.S. dollars at prevailing exchange rates at period end. The fund may enter into spot foreign currency exchange contracts to facilitate transactions denominated in a foreign currency. Purchases and sales of investment securities, dividend and interest income, spot foreign currency exchange contracts, and expenses are translated at the rates of exchange prevailing on the respective dates of such transactions. Net realized and unrealized foreign currency exchange gains or losses related to investment securities are a component of net realized gain (loss) on investment transactions and change in net unrealized appreciation (depreciation) on investments, respectively.
Repurchase Agreements — The fund may enter into repurchase agreements with institutions that American Century Investment Management, Inc. (ACIM) (the investment advisor) has determined are creditworthy pursuant to criteria adopted by the Board of Directors. The fund requires that the collateral, represented by securities, received in a repurchase transaction be transferred to the custodian in a manner sufficient to enable the fund to obtain those securities in the event of a default under the repurchase agreement. ACIM monitors, on a daily basis, the securities transferred to ensure the value, including accrued interest, of the securities under each repurchase agreement is equal to or greater than amounts owed to the fund under each repurchase agreement.
Joint Trading Account — Pursuant to an Exemptive Order issued by the Securities and Exchange Commission, the fund, along with certain other funds in the American Century Investments family of funds, may transfer uninvested cash balances into a joint trading account. These balances are invested in one or more repurchase agreements that are collateralized by U.S. Treasury or Agency obligations.
Income Tax Status — It is the fund’s policy to distribute substantially all net investment income and net realized gains to shareholders and to otherwise qualify as a regulated investment company under provisions of the Internal Revenue Code. The fund is no longer subject to examination by tax authorities for years prior to 2009. Additionally, non-U.S. tax returns filed by the fund due to investments in certain foreign securities remain subject to examination by the relevant taxing authority for seven years from the date of filing. At this time, management believes there are no uncertain tax positions which, based on their technical merit, would not be sustained upon examination and for which it is reasonably possible that the total amounts of unrecognized tax benefits will significantly change in the next twelve months. Accordingly, no provision has been made for federal or state income taxes.
Distributions to Shareholders — Distributions from net investment income and net realized gains, if any, are generally declared and paid annually. The fund may make distributions on a more frequent basis to comply with the distribution requirements of the Internal Revenue Code, in all events in a manner consistent with provisions of the 1940 Act.
18
Indemnifications — Under the corporation’s organizational documents, its officers and directors are indemnified against certain liabilities arising out of the performance of their duties to the fund. In addition, in the normal course of business, the fund enters into contracts that provide general indemnifications. The maximum exposure under these arrangements is unknown as this would involve future claims that may be made against a fund. The risk of material loss from such claims is considered by management to be remote.
3. Fees and Transactions with Related Parties
Management Fees —The corporation has entered into a management agreement with ACIM, under which ACIM provides the fund with investment advisory and management services in exchange for a single, unified management fee (the fee). The agreement provides that all expenses of managing and operating the fund, except distribution and service fees, brokerage expenses, taxes, interest, fees and expenses of the independent directors (including legal counsel fees), and extraordinary expenses, will be paid by ACIM. The fee is computed and accrued daily based on the daily net assets of the fund and paid monthly in arrears. The rate of the fee is determined by applying a fee rate calculation formula. This formula takes into account the fund’s assets as well as certain assets, if any, of other clients of the investment advisor outside the American Century Investments family of funds (such as subadvised funds and separate accounts) that have very similar investment teams and investment strategies (strategy assets). The strategy assets of the fund include the assets of International Growth Fund, one fund in a series issued by the corporation. The annual management fee schedule ranges from 0.90% to 1.30%. The effective annual management fee for the year ended November 30, 2012 was 1.08%.
Related Parties — Certain officers and directors of the corporation are also officers and/or directors of American Century Companies, Inc., the parent of the corporation’s investment advisor, ACIM, the distributor of the corporation, American Century Investment Services, Inc., and the corporation’s transfer agent, American Century Services, LLC. Various funds issued by American Century Asset Allocation Portfolios, Inc. own, in aggregate, 100% of the shares of the fund. These funds do not invest in the fund for the purpose of exercising management or control.
4. Investment Transactions
Purchases and sales of investment securities, excluding short-term investments, for the year ended November 30, 2012 were $486,151,803 and $391,976,747, respectively.
5. Fair Value Measurements
The fund’s securities valuation process is based on several considerations and may use multiple inputs to determine the fair value of the positions held by the fund. In conformity with accounting principles generally accepted in the United States of America, the inputs used to determine a valuation are classified into three broad levels as follows:
| • | Level 1 valuation inputs consist of unadjusted quoted prices in an active market for identical securities; |
| • | Level 2 valuation inputs consist of direct or indirect observable market data (including quoted prices for similar securities, evaluations of subsequent market events, interest rates, prepayment speeds, credit risk, etc.); or |
| • | Level 3 valuation inputs consist of unobservable data (including a fund’s own assumptions). |
The level classification is based on the lowest level input that is significant to the fair valuation measurement. The valuation inputs are not necessarily an indication of the risks associated with investing in these securities or other financial instruments.
19
The following is a summary of the level classifications as of period end. The Schedule of Investments provides additional information on the fund’s portfolio holdings.
| Level 1 | Level 2 | Level 3 | |
| Investment Securities | |||
| Foreign Common Stocks | $15,868,880 | $475,315,573 | — |
| Temporary Cash Investments | — | 5,396,819 | — |
| Total Value of Investment Securities | $15,868,880 | $480,712,392 | — |
6. Risk Factors
There are certain risks involved in investing in foreign securities. These risks include those resulting from future adverse political, social and economic developments, fluctuations in currency exchange rates, the possible imposition of exchange controls, and other foreign laws or restrictions. Investing in emerging markets may accentuate these risks.
7. Federal Tax Information
On December 18, 2012, the fund declared and paid a $0.1485 per-share distribution from net investment income to shareholders of record on December 17, 2012.
The tax character of distributions paid during the years ended November 30, 2012 and November 30, 2011 were as follows:
| 2012 | 2011 | |
| Distributions Paid From | ||
| Ordinary income | $3,008,478 | $2,574,499 |
| Long-term capital gains | — | — |
The book-basis character of distributions made during the year from net investment income or net realized gains may differ from their ultimate characterization for federal income tax purposes. These differences reflect the differing character of certain income items and net realized gains and losses for financial statement and tax purposes, and may result in reclassification among certain capital accounts on the financial statements.
As of November 30, 2012, the federal tax cost of investments and the components of distributable earnings on a tax-basis were as follows:
| Federal tax cost of investments | $421,917,362 |
| Gross tax appreciation of investments | $78,073,505 |
| Gross tax depreciation of investments | (3,409,595) |
| Net tax appreciation (depreciation) of investments | $74,663,910 |
Net tax appreciation (depreciation) on translation of assets and liabilities in foreign currencies | $(4,175) |
| Net tax appreciation (depreciation) | $74,659,735 |
| Undistributed ordinary income | $7,489,263 |
| Accumulated short-term capital losses | $(13,632,214) |
The difference between book-basis and tax-basis cost and unrealized appreciation (depreciation) is attributable primarily to the tax deferral of losses on wash sales and the realization to ordinary income for tax purposes of unrealized gains on investments in passive foreign investment companies.
20
Accumulated capital losses represent net capital loss carryovers that may be used to offset future realized capital gains for federal income tax purposes. Any unlimited losses will be required to be utilized prior to the losses which carry an expiriation date. Future capital loss carryover utilization in any given year may be subject to Internal Revenue Code limitations. Capital loss carryovers of $(8,278,098) expire in 2017 and the remaining losses are unlimited.
21
| For a Share Outstanding Throughout the Years Ended November 30 (except as noted) | |||||||||||||
| Per-Share Data | Ratios and Supplemental Data | ||||||||||||
| Income From Investment Operations: | Distributions From: | Ratio to Average Net Assets of: | |||||||||||
Net Asset Value, Beginning of Period | Net Investment Income (Loss)(1) | Net Realized and Unrealized Gain (Loss) | Total From Investment Operations | Net Investment Income | Net Realized Gains | Total Distributions | Net Asset Value, End of Period | Total Return(2) | Operating Expenses | Net Investment Income (Loss) | Portfolio Turnover Rate | Net Assets, End of Period (in thousands) | |
| Institutional Class | |||||||||||||
| 2012 | $8.71 | 0.13 | 1.17 | 1.30 | (0.07) | — | (0.07) | $9.94 | 15.13% | 1.08% | 1.47% | 93% | $487,964 |
| 2011 | $9.11 | 0.10 | (0.41) | (0.31) | (0.09) | — | (0.09) | $8.71 | (3.47)% | 1.12% | 1.04% | 77% | $345,234 |
| 2010 | $8.61 | 0.08 | 0.54 | 0.62 | (0.12) | — | (0.12) | $9.11 | 7.28% | 1.14% | 0.95% | 85% | $250,218 |
| 2009 | $6.29 | 0.10 | 2.33 | 2.43 | (0.11) | — | (0.11) | $8.61 | 39.09% | 1.18% | 1.41% | 132% | $163,476 |
| 2008 | $12.72 | 0.16 | (6.18) | (6.02) | (0.12) | (0.29) | (0.41) | $6.29 | (48.82)% | 1.12% | 1.62% | 119% | $55,860 |
Notes to Financial Highlights
| (1) | Computed using average shares outstanding throughout the period. |
| (2) | Total returns are calculated based on the net asset value of the last business day. Total returns for periods less than one year are not annualized. |
See Notes to Financial Statements.
22
The Board of Directors and Shareholders of
American Century World Mutual Funds, Inc.:
We have audited the accompanying statement of assets and liabilities, including the schedule of investments, of NT International Growth Fund, one of the funds constituting American Century World Mutual Funds, Inc. (the “Corporation”) as of November 30, 2012, and the related statement of operations for the year then ended, the statement of changes in net assets for each of the two years in the period then ended, and the financial highlights for each of the five years in the period then ended. These financial statements and financial highlights are the responsibility of the Corporation’s management. Our responsibility is to express an opinion on these financial statements and financial highlights based on our audits.
We conducted our audits in accordance with the standards of the Public Company Accounting Oversight Board (United States). Those standards require that we plan and perform the audit to obtain reasonable assurance about whether the financial statements and financial highlights are free of material misstatement. The Corporation is not required to have, nor were we engaged to perform, an audit of its internal control over financial reporting. Our audits included consideration of internal control over financial reporting as a basis for designing audit procedures that are appropriate in the circumstances, but not for the purpose of expressing an opinion on the effectiveness of the Corporation’s internal control over financial reporting. Accordingly, we express no such opinion. An audit also includes examining, on a test basis, evidence supporting the amounts and disclosures in the financial statements, assessing the accounting principles used and significant estimates made by management, as well as evaluating the overall financial statement presentation. Our procedures included confirmation of securities owned as of November 30, 2012, by correspondence with the custodian and brokers; where replies were not received from brokers, we performed other auditing procedures. We believe that our audits provide a reasonable basis for our opinion.
In our opinion, the financial statements and financial highlights referred to above present fairly, in all material respects, the financial position of NT International Growth Fund of American Century World Mutual Funds, Inc., as of November 30, 2012, the results of its operations for the year then ended, the changes in its net assets for each of the two years in the period then ended, and the financial highlights for each of the five years in the period then ended, in conformity with accounting principles generally accepted in the United States of America.
Deloitte & Touche LLP
Kansas City, Missouri
January 17, 2013
23
The Board of Directors
The individuals listed below serve as directors of the funds. Each director will continue to serve in this capacity until death, retirement, resignation or removal from office. The mandatory retirement age for directors who are not “interested persons,” as that term is defined in the Investment Company Act (independent directors), is 72. However, the mandatory retirement age for an individual director may be extended with the approval of the remaining independent directors.
Mr. Thomas is an “interested person” because he currently serves as President and Chief Executive Officer of American Century Companies, Inc. (ACC), the parent company of American Century Investment Management, Inc. (ACIM or the advisor). Mr. Fink is an “interested person” because he currently serves as Executive Vice President of ACC.
The other directors (more than three-fourths of the total number) are independent; that is, they have never been employees, directors or officers of, and have no financial interest in, ACC or any of its wholly owned, direct or indirect, subsidiaries, including ACIM, American Century Investment Services, Inc. (ACIS) and American Century Services, LLC (ACS). The directors serve in this capacity for seven (in the case of Mr. Thomas, 15) registered investment companies in the American Century Investments family of funds.
The following table presents additional information about the directors. The mailing address for each director is 4500 Main Street, Kansas City, Missouri 64111.
Name (Year of Birth) | Position(s) Held with Funds | Length of Time Served | Principal Occupation(s) During Past 5 Years | Number of American Century Portfolios Overseen by Director | Other Directorships Held During Past 5 Years | |
| Independent Directors | ||||||
Thomas A. Brown (1940) | Director | Since 1980 | Managing Member, Associated Investments, LLC (real estate investment company); Brown Cascade Properties, LLC (real estate investment company) (2001 to 2009) | 66 | None | |
Andrea C. Hall (1945) | Director | Since 1997 | Retired | 66 | None | |
Jan M. Lewis (1957) | Director | Since 2011 | President and Chief Executive Officer, Catholic Charities of Northeast Kansas (human services organization) | 66 | None | |
James A. Olson (1942) | Director | Since 2007 | Member, Plaza Belmont LLC (private equity fund manager) | 66 | Saia, Inc. (2002 to 2012) and Entertainment Properties Trust | |
Donald H. Pratt (1937) | Director and Chairman of the Board | Since 1995 (Chairman since 2005) | Chairman and Chief Executive Officer, Western Investments, Inc. (real estate company) | 66 | None | |
24
Name (Year of Birth) | Position(s) Held with Funds | Length of Time Served | Principal Occupation(s) During Past 5 Years | Number of American Century Portfolios Overseen by Director | Other Directorships Held During Past 5 Years | |
| Independent Directors | ||||||
M. Jeannine Strandjord (1945) | Director | Since 1994 | Retired | 66 | Euronet Worldwide Inc.; Charming Shoppes, Inc. (2006 to 2010); and DST Systems Inc. (1996 to 2012) | |
John R. Whitten (1946) | Director | Since 2008 | Retired | 66 | Rudolph Technologies, Inc. | |
Stephen E. Yates (1948) | Director | Since 2012 | Retired; Executive Vice President, Technology & Operations, KeyCorp. (computer services)(2004 to 2010) | 66 | Applied Industrial Technologies, Inc. (2001 to 2010) | |
| Interested Directors | ||||||
Barry Fink (1955) | Director and Executive Vice President | Since 2012 (Executive Vice President since 2007) | Executive Vice President, ACC (September 2007 to present); President, ACS (October 2007 to present); Chief Operating Officer, ACC (September 2007 to November 2012). Also serves as Manager, ACS | 66 | None | |
Jonathan S. Thomas (1963) | Director and President | Since 2007 | President and Chief Executive Officer, ACC (March 2007 to present). Also serves as Chief Executive Officer and Manager, ACS; Executive Vice President, ACIM; Director, ACC, ACIM and other ACC subsidiaries | 108 | None | |
25
Officers
The following table presents certain information about the executive officers of the funds. Each officer serves as an officer for each of the 15 investment companies in the American Century family of funds, unless otherwise noted. No officer is compensated for his or her service as an officer of the funds. The listed officers are interested persons of the funds and are appointed or re-appointed on an annual basis. The mailing address for each officer listed below is 4500 Main Street, Kansas City, Missouri 64111.
Name (Year of Birth) | Offices with the Funds | Principal Occupation(s) During the Past Five Years | |
Jonathan S. Thomas (1963) | Director and President since 2007 | President and Chief Executive Officer, ACC (March 2007 to present). Also serves as Chief Executive Officer and Manager, ACS; Executive Vice President, ACIM; Director, ACC, ACIM and other ACC subsidiaries | |
Barry Fink (1955) | Director since 2012 and Executive Vice President since 2007 | Executive Vice President, ACC (September 2007 to present); President, ACS (October 2007 to present); Chief Operating Officer, ACC (September 2007 to November 2012). Also serves as Manager, ACS | |
Maryanne L. Roepke (1956) | Chief Compliance Officer since 2006 and Senior Vice President since 2000 | Chief Compliance Officer, American Century funds, ACIM and ACS (August 2006 to present). Also serves as Senior Vice President, ACS | |
Charles A. Etherington (1957) | General Counsel since 2007 and Senior Vice President since 2006 | Attorney, ACC (February 1994 to present); Vice President, ACC (November 2005 to present), General Counsel, ACC (March 2007 to present). Also serves as General Counsel, ACIM, ACS, ACIS and other ACC subsidiaries; and Senior Vice President, ACIM and ACS | |
C. Jean Wade (1964) | Vice President, Treasurer and Chief Financial Officer since 2012 | Vice President, ACS (February 2000 to present) | |
Robert J. Leach (1966) | Vice President since 2006 and Assistant Treasurer since 2012 | Vice President, ACS (February 2000 to present) | |
David H. Reinmiller (1963) | Vice President since 2000 | Attorney, ACC (January 1994 to present); Associate General Counsel, ACC (January 2001 to present). Also serves as Vice President, ACIM and ACS | |
Ward D. Stauffer (1960) | Secretary since 2005 | Attorney, ACC (June 2003 to present) |
The Statement of Additional Information has additional information about the fund’s directors and is available without charge, upon request, by calling 1-800-345-2021.
26
At a meeting held on June 21, 2012, the Fund’s Board of Directors unanimously approved the renewal of the management agreement pursuant to which American Century Investment Management, Inc. (the “Advisor”) acts as the investment advisor for the Fund. Under Section 15(c) of the Investment Company Act, contracts for investment advisory services are required to be reviewed, evaluated, and approved by a majority of a fund’s independent directors (the “Directors”) each year.
As a part of the approval process, the Board requested and reviewed extensive data and information compiled by the Advisor and certain independent providers of evaluation data concerning the Fund and the services provided to the Fund by the Advisor. This review was in addition to the oversight and evaluation undertaken by the Board and its committees on a continuous basis throughout the year and included, but was not limited to the following:
| • | the nature, extent, and quality of investment management, shareholder services, and other services provided by the Advisor to the Fund; |
| • | the wide range of other programs and services the Advisor provides to the Fund and its shareholders on a routine and non-routine basis; |
| • | the investment performance of the fund, including data comparing the Fund’s performance to appropriate benchmarks and/or a peer group of other mutual funds with similar investment objectives and strategies; |
| • | data comparing the cost of owning the Fund to the cost of owning similar funds; |
| • | the Advisor’s compliance policies, procedures, and regulatory experience; |
| • | financial data showing the cost of services provided to the Fund, the profitability of the Fund to the Advisor, and the overall profitability of the Advisor; |
| • | data comparing services provided and charges to other investment management clients of the Advisor; and |
| • | consideration of collateral benefits derived by the Advisor from the management of the Fund and any potential economies of scale relating thereto. |
In keeping with its practice, the Board held two in-person meetings and one telephonic meeting to review and discuss the information provided. The Directors also had the benefit of the advice of independent counsel throughout the period.
Factors Considered
The Directors considered all of the information provided by the Advisor, the independent data providers, and independent counsel, and evaluated such information for the Fund. In connection with their review, the Directors did not identify any single factor as being all-important or controlling, and each Director may have attributed different levels of importance to different factors. In deciding to renew the management agreement, the Board based its decision on a number of factors, including the following:
27
Nature, Extent and Quality of Services - Generally. Under the management agreement, the Advisor is responsible for providing or arranging for all services necessary for the operation of the Fund. The Board noted that under the management agreement, the Advisor provides or arranges at its own expense a wide variety of services including:
| • | constructing and designing the Fund |
| • | portfolio research and security selection |
| • | initial capitalization/funding |
| • | securities trading |
| • | Fund administration |
| • | custody of Fund assets |
| • | daily valuation of the Fund’s portfolio |
| • | shareholder servicing and transfer agency, including shareholder confirmations, recordkeeping, and communications |
| • | legal services |
| • | regulatory and portfolio compliance |
| • | financial reporting |
| • | marketing and distribution |
The Board noted that many of these services have expanded over time both in terms of quantity and complexity in response to shareholder demands, competition in the industry, changing distribution channels, and the changing regulatory environment.
Investment Management Services. The nature of the investment management services provided to the Fund is quite complex and allows Fund shareholders access to professional money management, instant diversification of their investments within an asset class, the opportunity to easily diversify among asset classes by investing in or exchanging among various American Century Investments funds, and liquidity. In evaluating investment performance, the Board expects the Advisor to manage the Fund in accordance with its investment objectives and approved strategies. Further, the Directors recognize that the Advisor has an obligation to monitor trading activities, and in particular to seek the best execution of fund trades, and to evaluate the use of and payment for research. In providing these services, the Advisor utilizes teams of investment professionals (portfolio managers, analysts, research assistants, and securities traders) who require extensive information technology, research, training, compliance and other systems to conduct their business. The Board, directly and through its Fund Performance Review Committee, regularly reviews investment performance information for the Fund, together with comparative information for appropriate
28
benchmarks and/or peer groups of similarly-managed funds, over different time horizons. The Directors also review detailed performance information during the management agreement approval process. If performance concerns are identified, the Fund receives special reviews until performance improves, during which the Board discusses with the Advisor the reasons for such results (e.g., market conditions, security selection) and any efforts being undertaken to improve performance. Taking all these factors into consideration, the Board found the investment management services provided by the Advisor to the Fund to meet or exceed industry standards. More detailed information about the Fund’s performance can be found in the Performance and Portfolio Commentary sections of this report.
Shareholder and Other Services. Under the management agreement, the Advisor provides the Fund with a comprehensive package of transfer agency, shareholder, and other services. The Board, directly and through various committees of the Board, regularly reviews reports and evaluations of such services at its regular meetings. These reports include, but are not limited to, information regarding the operational efficiency and accuracy of the shareholder and transfer agency services provided, staffing levels, shareholder satisfaction (as measured by external as well as internal sources), technology support, new products and services offered to Fund shareholders, securities trading activities, portfolio valuation services, auditing services, and legal and operational compliance activities. Certain aspects of shareholder and transfer agency service level efficiency and the quality of securities trading activities are measured by independent third party providers and are presented in comparison to other fund groups not managed by the Advisor. The Board found the services provided by the Advisor to the Fund under the management agreement to be competitive and of high quality.
Costs of Services and Profitability. The Advisor provides detailed information concerning its cost of providing various services to the Fund, its profitability in managing the Fund, its overall profitability, and its financial condition. The Directors have reviewed with the Advisor the methodology used to prepare this financial information. The financial information regarding the Advisor is considered in evaluating the Advisor’s financial condition, ability to continue to provide services under the management agreement, and the reasonableness of the current management fee. The Board concluded that the Advisor’s profits were reasonable in light of the services provided to the Fund.
Ethics. The Board generally considers the Advisor’s commitment to providing quality services to shareholders and to conducting its business ethically. They noted that the Advisor’s practices generally meet or exceed industry best practices.
Economies of Scale. The Board also reviewed information provided by the Advisor regarding the possible existence of economies of scale in connection with the management of the Fund. The Board concluded that economies of scale are difficult to measure and predict with precision, especially on a fund-by-fund basis. The Board concluded that the Advisor is appropriately sharing economies of scale through its competitive fee structure, offering competitive fees from fund inception, and through reinvestment in its business to provide shareholders additional content and services.
29
Comparison to Other Funds’ Fees. The management agreement provides that the Fund pay the Advisor a single, all-inclusive (or unified) management fee for providing all services necessary for the management and operation of the Fund, other than brokerage expenses, taxes, interest, extraordinary expenses, and the fees and expenses of the Fund’s independent directors (including their independent legal counsel) and expenses incurred in connection with the provision of shareholder services and distribution services under a plan adopted pursuant to Rule 12b-1 under the 1940 Act. Under the unified fee structure, the Advisor is responsible for providing all investment advisory, custody, audit, administrative, compliance, recordkeeping, marketing and shareholder services, or arranging and supervising third parties to provide such services. By contrast, most other funds are charged a variety of fees, including an investment advisory fee, a transfer agency fee, an administrative fee, distribution charges and other expenses. Other than their investment advisory fees and any applicable Rule 12b-1 distribution fees, all other components of the total fees charged by these other funds may be increased without shareholder approval. The Board believes the unified fee structure is a benefit to Fund shareholders because it clearly discloses to shareholders the cost of owning Fund shares, and, since the unified fee cannot be increased without a vote of Fund shareholders, it shifts to the Advisor the risk of increased costs of operating the Fund and provides a direct incentive to minimize administrative inefficiencies. Part of the Board’s analysis of fee levels involves reviewing certain evaluative data compiled by an independent provider and comparing the Fund’s unified fee to the total expense ratio of other funds in the Fund’s peer group. The Board concluded that the management fee paid by the Fund to the Advisor under the management agreement is reasonable in light of the services provided to the Fund.
Comparison to Fees and Services Provided to Other Clients of the Advisor. The Board also requested and received information from the Advisor concerning the nature of the services, fees, costs and profitability of its advisory services to advisory clients other than the Fund. They observed that these varying types of client accounts require different services and involve different regulatory and entrepreneurial risks than the management of the Fund. The Board analyzed this information and concluded that the fees charged and services provided to the Fund were reasonable by comparison.
Collateral or “Fall-Out” Benefits Derived by the Advisor. The Board considered the existence of collateral benefits the Advisor may receive as a result of its relationship with the Fund. They concluded that the Advisor’s primary business is managing mutual funds and it generally does not use fund or shareholder information to generate profits in other lines of business, and therefore does not derive any significant collateral benefits from them. The Board noted that the Advisor receives proprietary research from broker-dealers that execute fund portfolio transactions and concluded that this research is likely to benefit Fund shareholders. The Board also determined that the Advisor is able to provide investment management services to certain clients other than the Fund, at least in part, due to its existing infrastructure built to serve the fund complex. The Board concluded, however, that the assets of those other clients are not material to the analysis and, where applicable, may be included with the assets of the Fund to determine breakpoints in the management fee schedule.
30
Existing Relationship. The Board also considered whether there was any reason for not continuing the existing arrangement with the Advisor. In this regard, the Board was mindful of the potential disruptions of the Fund’s operations and various risks, uncertainties, and other effects that could occur as a result of a decision not to continue such relationship. In particular, the Board recognized that most shareholders have invested in the Fund on the strength of the Advisor’s industry standing and reputation and in the expectation that the Advisor will have a continuing role in providing advisory services to the Fund.
Conclusion of the Directors. As a result of this process, the Board, including all of the independent directors, taking into account all of the factors discussed above and the information provided by the Advisor and others, concluded that the management agreement between the Fund and the Advisor is fair and reasonable in light of the services provided and should be renewed.
31
Retirement Account Information
As required by law, distributions you receive from certain IRAs, or 403(b), 457 and qualified plans are subject to federal income tax withholding, unless you elect not to have withholding apply. Tax will be withheld on the total amount withdrawn even though you may be receiving amounts that are not subject to withholding, such as nondeductible contributions. In such case, excess amounts of withholding could occur. You may adjust your withholding election so that a greater or lesser amount will be withheld.
If you don’t want us to withhold on this amount, you must notify us to not withhold the federal income tax. You may notify us in writing or in certain situations by telephone or through other electronic means. You have the right to revoke your withholding election at any time and any election you make may remain in effect until revoked by filing a new election.
Remember, even if you elect not to have income tax withheld, you are liable for paying income tax on the taxable portion of your withdrawal. If you elect not to have income tax withheld or you don’t have enough income tax withheld, you may be responsible for payment of estimated tax. You may incur penalties under the estimated tax rules if your withholding and estimated tax payments are not sufficient. You can reduce or defer the income tax on a distribution by directly or indirectly rolling such distribution over to another IRA or eligible plan. You should consult your tax advisor for additional information.
State tax will be withheld if, at the time of your distribution, your address is within one of the mandatory withholding states and you have federal income tax withheld. State taxes will be withheld from your distribution in accordance with the respective state rules.
Proxy Voting Guidelines
American Century Investment Management, Inc., the fund’s investment advisor, is responsible for exercising the voting rights associated with the securities purchased and/or held by the fund. A description of the policies and procedures the advisor uses in fulfilling this responsibility is available without charge, upon request, by calling 1-800-345-2021. It is also available on American Century Investments’ website at americancentury.com and on the Securities and Exchange Commission’s website at sec.gov. Information regarding how the investment advisor voted proxies relating to portfolio securities during the most recent 12-month period ended June 30 is available on the “About Us” page at americancentury.com. It is also available at sec.gov.
Quarterly Portfolio Disclosure
The fund files its complete schedule of portfolio holdings with the Securities and Exchange Commission (SEC) for the first and third quarters of each fiscal year on Form N-Q. The fund’s Forms N-Q are available on the SEC’s website at sec.gov, and may be reviewed and copied at the SEC’s Public Reference Room in Washington, DC. Information on the operation of the Public Reference Room may be obtained by calling 1-800-SEC-0330. The fund also makes its complete schedule of portfolio holdings for the most recent quarter of its fiscal year available on its website at americancentury.com and, upon request, by calling 1-800-345-2021.
32
Other Tax Information
The following information is provided pursuant to provisions of the Internal Revenue Code.
The fund hereby designates up to the maximum amount allowable as qualified dividend income for the fiscal year ended November 30, 2012.
For corporate taxpayers, the fund hereby designates $2,964, or up to the maximum amount allowable, of ordinary income distributions paid during the fiscal year ended November 30, 2012 as qualified for the corporate dividends received deduction.
For the fiscal year ended November 30, 2012, the fund intends to pass through to shareholders $1,118,167, or up to the maximum amount allowable, as a foreign tax credit which represents taxes paid on income derived from sources within foreign countries or possessions of the United States. During the fiscal year ended November 30, 2012, the fund earned $12,023,630 from income derived from foreign sources. Foreign source income and foreign tax expense per outstanding share on November 30, 2012 are $0.2450 and $0.0228, respectively.
33
34
35
36
| Contact Us | americancentury.com |
| Automated Information Line | 1-800-345-8765 |
| Investor Services Representative | 1-800-345-2021 or 816-531-5575 |
| Investors Using Advisors | 1-800-378-9878 |
Business, Not-For-Profit, Employer-Sponsored Retirement Plans | 1-800-345-3533 |
Banks and Trust Companies, Broker-Dealers, Financial Professionals, Insurance Companies | 1-800-345-6488 |
| Telecommunications Device for the Deaf | 1-800-634-4113 |
American Century World Mutual Funds, Inc.
Investment Advisor:
American Century Investment Management, Inc.
Kansas City, Missouri
This report and the statements it contains are submitted for the general information of our shareholders. The report is not authorized for distribution to prospective investors unless preceded or accompanied by an effective prospectus.
©2013 American Century Proprietary Holdings, Inc. All rights reserved.
CL-ANN-76972 1301
ANNUAL REPORT NOVEMBER 30, 2012
| NT Emerging Markets Fund |
| President’s Letter | 2 |
| Independent Chairman’s Letter | 3 |
| Market Perspective | 4 |
| Performance | 5 |
| Portfolio Commentary | 6 |
| Fund Characteristics | 8 |
| Shareholder Fee Example | 9 |
| Schedule of Investments | 11 |
| Statement of Assets and Liabilities | 14 |
| Statement of Operations | 15 |
| Statement of Changes in Net Assets | 16 |
| Notes to Financial Statements | 17 |
| Financial Highlights | 22 |
| Report of Independent Registered Public Accounting Firm | 23 |
| Management | 24 |
| Approval of Management Agreement | 27 |
| Additional Information | 32 |
Any opinions expressed in this report reflect those of the author as of the date of the report, and do not necessarily represent the opinions of American Century Investments® or any other person in the American Century Investments organization. Any such opinions are subject to change at any time based upon market or other conditions and American Century Investments disclaims any responsibility to update such opinions. These opinions may not be relied upon as investment advice and, because investment decisions made by American Century Investments funds are based on numerous factors, may not be relied upon as an indication of trading intent on behalf of any American Century Investments fund. Security examples are used for representational purposes only and are not intended as recommendations to purchase or sell securities. Performance information for comparative indices and securities is provided to American Century Investments by third party vendors. To the best of American Century Investments’ knowledge, such information is accurate at the time of printing.
Thank you for reviewing this annual report for the 12 months ended November 30, 2012. It offers investment performance, market analysis, and portfolio information, presented with the expert perspective of our portfolio management team.
Annual reports remain important vehicles for conveying information about fund returns, including key factors that affected fund performance. For additional, updated investment and market insights, we encourage you to visit our website, americancentury.com.
Favorable Fiscal-Year Returns for Most Major Stock and Bond Benchmarks
Despite a global economic slowdown, continued concerns about European financial system stability, and uncertainty about U.S. political and fiscal conditions in 2013, 12-month stock and bond returns were generally favorable, particularly for U.S. value stocks and high-yield bonds.
U.S. value stock indices outpaced the S&P 500 Index’s 16.13% return for the period, as did U.S. corporate and municipal high-yield benchmarks. U.S. growth and international index returns were generally lower, but still solid—the MSCI EAFE Index, for example, returned 12.61%.
With the exception of high-yield bond sectors, stocks generally outperformed bonds for the period, though bonds benefitted from economic stagnation, reduced inflation pressures, and low interest rates. The 10-year U.S. Treasury yield declined from 2.07% to 1.62% during the period, and the Barclays U.S. Aggregate Bond Index returned 5.51%. Related global bond indices also returned in roughly the mid-single digits.
Bucking the global trend, the U.S. economy showed signs of improvement during the fiscal year, particularly the long-depressed housing market. However, the outlook for 2013 remains guarded, as the fragile recovery remains vulnerable to fiscal and financial factors that could trigger further slowdowns and market volatility.
Under these conditions, we continue to believe in a disciplined, diversified, long-term investment approach, using both stocks and bonds—as appropriate—for meeting financial goals. We appreciate your continued trust in us in this challenging environment.
Sincerely,
Jonathan Thomas
President and Chief Executive Officer
American Century Investments
2
The board has once again completed its annual review of the advisory contract between the American Century Investments mutual funds overseen by the board and the funds’ advisor, American Century Investment Management, Inc. This process, often referred to as the 15(c) review, involves the independent directors considering all of the material monitored throughout the year and evaluating a wide range of factors to determine whether the management fee paid by each fund to the advisor is reasonable.
The independent directors’ rationale for this decision is provided in detail in this, or in a previous, report. However, there are several highlights that should be of interest to all shareholders.
| • | Fund performance and client service continue to be rated among the industry’s best. |
| • | Target date and other asset allocation products continue to successfully gather assets and industry acclaim. |
| • | Compliance programs continue to function successfully with no issues impacting shareholder interests. |
| • | Fees were found to be within an acceptable competitive range, with minor fee waivers being negotiated on five funds. |
Knowing that most shareholders are long term investors, the board was particularly pleased with our succession planning review. Talented professionals are being added within portfolio management and experienced managers have been added to the senior management team.
Overall it was a very positive review for the American Century Investments mutual funds during a challenging market environment.
Best personal regards,
Don Pratt
3
By Mark Kopinski, Chief Investment Officer, Global and Non-U.S. Equity
Central Bank Action Drove Global Stocks Higher
Despite a backdrop of weaker global economic growth and mounting sovereign debt problems in Europe and the United States, most global stock benchmarks advanced strongly for the 12-month period ended November 30, 2012. Investors generally overlooked the lackluster economic data, recession fears (which eventually turned to reality for Europe), and the instability of the eurozone’s banking system and currency. Instead, they focused on the optimism inspired by unprecedented central bank intervention.
In particular, the European Central Bank (ECB) launched several programs to help the eurozone’s troubled banks shore up their balance sheets and finance ongoing operations. The ECB also agreed to purchase the sovereign debt of financially strapped member nations that conform to the ECB’s fiscal reform measures. Meanwhile, in response to sluggish economic growth and high unemployment, the U.S. Federal Reserve (the Fed) announced its third—and most aggressive—quantitative easing program to date. The Bank of Japan also took action with an asset purchase program, while the People’s Bank of China eased its reserve requirements for commercial lenders.
Overall, developed markets outperformed emerging markets for the 12-month period, even as the emerging economies generally enjoyed higher absolute levels of growth, albeit slower growth than in previous periods. Strong stock market performance in Europe and the United States, where central bank stimulus was the greatest, primarily drove the better relative results in the developed markets.
Valuations, Stock Selection Remain Key Factors
Even though economic growth and corporate earnings in aggregate have been slowing, and sovereign debt issues have yet to be resolved, there are some positive factors at work for global equity investors. Stock valuations around the globe appear attractive relative to historical averages. Similarly, equity earnings yields are also compelling when measured against long-term averages and current bond yields. Most important, we believe through our rigorous, bottom-up stock selection process it’s still possible to find individual companies growing earnings, either from a new product launch, market share gains, secular changes, or beneficial acquisitions.
| International Equity Total Returns | ||||
| For the 12 months ended November 30, 2012 (in U.S. dollars) | ||||
| MSCI EAFE Index | 12.61% | MSCI Europe Index | 14.07% | |
| MSCI EAFE Growth Index | 12.66% | MSCI World Index | 13.62% | |
| MSCI EAFE Value Index | 12.45% | MSCI Japan Index | 3.59% | |
| MSCI Emerging Markets Index | 11.35% | |||
4
| Total Returns as of November 30, 2012 | |||||
| Average Annual Returns | |||||
| Ticker Symbol | 1 year | 5 years | Since Inception | Inception Date | |
| Institutional Class | ACLKX | 12.51% | -5.43% | 3.26% | 5/12/06 |
| MSCI Emerging Markets Growth Index | — | 14.21% | -2.76% | 4.32%(1) | — |
| (1) | Since 4/30/06, the date nearest the Institutional Class’s inception for which data are available. |
| Growth of $10,000 Over Life of Class |
| $10,000 investment made May 12, 2006 |
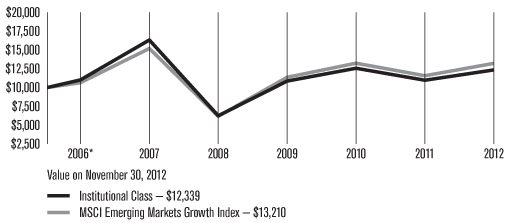
*From 5/12/06, the Institutional Class’s inception date. Index data from 4/30/06, the date nearest the fund’s inception for which data are available. Not annualized.
| Total Annual Fund Operating Expenses |
Institutional Class 1.52% |
The total annual fund operating expenses shown is as stated in the fund’s prospectus current as of the date of this report. The prospectus may vary from the expense ratio shown elsewhere in this report because it is based on a different time period, includes acquired fund fees and expenses, and, if applicable, does not include fee waivers or expense reimbursements.
Data presented reflect past performance. Past performance is no guarantee of future results. Current performance may be higher or lower than the performance shown. Investment return and principal value will fluctuate, and redemption value may be more or less than original cost. To obtain performance data current to the most recent month end, please call 1-800-345-2021 or visit americancentury.com. International investing involves special risks, such as political instability and currency fluctuations. Investing in emerging markets may accentuate these risks. The fund’s investment process may result in high portfolio turnover, which could mean high transaction costs, affecting both performance and capital gains tax liabilities to investors.
Data assumes reinvestment of dividends and capital gains, and none of the charts reflect the deduction of taxes that a shareholder would pay on fund distributions or the redemption of fund shares. Returns for the index are provided for comparison. The fund’s total returns include operating expenses (such as transaction costs and management fees) that reduce returns, while the total returns of the index do not.
5
| Portfolio Commentary |
Portfolio Managers: Patricia Ribeiro and Anthony Han
Performance Summary
NT Emerging Markets gained 12.51% for the 12 months ended November 30, 2012, compared with its benchmark, the MSCI Emerging Markets Growth Index, which advanced 14.21%.
Emerging market growth stocks generally demonstrated robust performance during the 12-month period, even as key countries, including China and Brazil, experienced slowdowns in their economic growth rates. Unprecedented central bank intervention, particularly in Europe, the United States, and Japan, helped drive overall global stock market optimism. In general, emerging market stocks slightly lagged their developed market counterparts. But, in the growth stock universe, emerging market stocks outpaced developed market stocks.
The portfolio underperformed its benchmark for the period, primarily due to sector allocations, including an overweight position in information technology and an underweight position in health care. Overall, stock selection had a positive influence on performance, with stock selection in the materials, consumer discretionary, and industrials sectors driving the strong results. Stock selection was a detractor only in the information technology and energy sectors.
China Handset Maker was a Leading Detractor
From a regional perspective, stock selection hurt relative performance in China, which was among the portfolio’s largest performance detractors on a country basis. An overweight position in ZTE Corp., a cellular handset manufacturer, was among the top individual detractors. In October, the company reported its first quarterly loss, as weak sales drove margins to record lows. Mounting competition, revenue accounting changes, delayed orders in Africa, and a strategy of chasing market share in Europe through low-margin contracts accounted for the disappointing results. In addition, a U.S. Congressional committee named the company a potential security threat, a charge ZTE denied.
Another prominent China-based detractor included a position in Baidu, an Internet search provider. Late in the period, the company forecast its fourth-quarter revenue growth would slow to its weakest level in three years, which was below analysts’ expectations. In addition, reluctance from advertisers to purchase space on the company’s search pages for mobile phones, a slowdown in search revenue, and an analyst downgrade weighed on the company’s shares.
Mando, a South Korea-based parts supplier to automakers, also was among the portfolio’s leading individual detractors. The stock tumbled early in the period, as South Korean officials acknowledged the lackluster European economy hindered the country’s growth rate. Yet, the Bank of Korea refrained from lowering its key lending rate, citing inflationary concerns.
6
Mexican Conglomerate was a Top Contributor
In terms of the portfolio’s favorable regional exposure, Mexico was a top contributor for the 12-month period, driven by strong stock selection. In fact, one of the portfolio’s top individual contributors was Mexico’s Alfa SAB de CV, an industrial conglomerate operating in the petrochemical, food processing, automotive and telecommunication industries. The company reported strong quarterly results and favorable industry conditions and operating improvements in most of its business lines throughout the period. In addition, the company announced a 10-for-1 stock split in August to boost its market liquidity, sending its share prices to record highs.
South Africa also was among the portfolio’s top-performing countries, driven by strong stock selection. In particular, an overweight position in retailer Mr Price Group was among the portfolio’s top individual contributors for the period. During the second quarter of 2012, the company reported a 50% jump in full-year profits, as its total sales grew 12.9% during the fiscal period. Additionally, the company boosted its margins by slowing its store expansion efforts and tightening inventory controls. Then, in November, the company said it posted a 34% jump in first-half profit, aided by lower tax liabilities and debt-fuelled consumer spending. Overall, Mr Price and other South African retailers benefited from continued consumer spending due to above-inflation wage increases, low-cost borrowing, and government grants.
Stock selection in Indonesia also contributed favorably to portfolio performance, with cement producer Semen Gresik among the portfolio’s leading performance contributors. The company’s stock benefited from the booming cement demand in Indonesia’s property construction sector. The islands of Java and Sumatra account for nearly 85% of domestic demand. The company also maintained better-than-anticipated pricing.
Outlook
Looking ahead, the world’s macroeconomic landscape remains undermined by financial market, recession, and sovereign debt challenges in Europe and economic sluggishness in the U.S. and China. As a result, stock markets continued to be susceptible to bouts of volatility. Against this backdrop, our investment approach remained focused on companies located in emerging economies around the world that we believe are benefitting from secular tailwinds and not reliant upon broader economic developments.
7
| NOVEMBER 30, 2012 | |
| Top Ten Holdings | % of net assets |
| Samsung Electronics Co. Ltd. | 9.1% |
| Taiwan Semiconductor Manufacturing Co. Ltd. | 5.0% |
| iShares MSCI Emerging Markets Index Fund | 3.7% |
| Tencent Holdings Ltd. | 2.4% |
| China Overseas Land & Investment Ltd. | 2.0% |
| Ping An Insurance Group Co. H Shares | 1.8% |
| CNOOC Ltd. | 1.7% |
| Hon Hai Precision Industry Co. Ltd. | 1.7% |
| Kunlun Energy Co. Ltd. | 1.6% |
| Sberbank of Russia | 1.5% |
| Types of Investments in Portfolio | % of net assets |
| Foreign Common Stocks | 96.6% |
| Exchange-Traded Funds | 3.7% |
| Total Equity Exposure | 100.3% |
| Temporary Cash Investments | 3.1% |
| Other Assets and Liabilities | (3.4)% |
| Investments by Country | % of net assets |
| China | 18.2% |
| South Korea | 15.5% |
| Brazil | 10.8% |
| Taiwan | 8.9% |
| Russia | 6.0% |
| Mexico | 5.3% |
| South Africa | 5.2% |
| Thailand | 4.2% |
| Turkey | 4.1% |
| Indonesia | 4.0% |
| India | 3.9% |
| United States | 3.7% |
| United Kingdom | 2.3% |
| Peru | 2.1% |
| Other Countries | 6.1% |
| Cash and Equivalents* | (0.3)% |
*Includes temporary cash investments and other assets and liabilities.
8
Fund shareholders may incur two types of costs: (1) transaction costs, including sales charges (loads) on purchase payments and redemption/exchange fees; and (2) ongoing costs, including management fees; distribution and service (12b-1) fees; and other fund expenses. This example is intended to help you understand your ongoing costs (in dollars) of investing in your fund and to compare these costs with the ongoing cost of investing in other mutual funds.
The example is based on an investment of $1,000 made at the beginning of the period and held for the entire period from June 1, 2012 to November 30, 2012.
Actual Expenses
The table provides information about actual account values and actual expenses for each class. You may use the information, together with the amount you invested, to estimate the expenses that you paid over the period. First, identify the share class you own. Then simply divide your account value by $1,000 (for example, an $8,600 account value divided by $1,000 = 8.6), then multiply the result by the number under the heading “Expenses Paid During Period” to estimate the expenses you paid on your account during this period.
If you hold Investor Class shares of any American Century Investments fund, or Institutional Class shares of the American Century Diversified Bond Fund, in an American Century Investments account (i.e., not a financial intermediary or retirement plan account), American Century Investments may charge you a $12.50 semiannual account maintenance fee if the value of those shares is less than $10,000. We will redeem shares automatically in one of your accounts to pay the $12.50 fee. In determining your total eligible investment amount, we will include your investments in all personal accounts (including American Century Investments Brokerage accounts) registered under your Social Security number. Personal accounts include individual accounts, joint accounts, UGMA/UTMA accounts, personal trusts, Coverdell Education Savings Accounts and IRAs (including traditional, Roth, Rollover, SEP-, SARSEP- and SIMPLE-IRAs), and certain other retirement accounts. If you have only business, business retirement, employer-sponsored or American Century Investments Brokerage accounts, you are currently not subject to this fee. If you are subject to the Account Maintenance Fee, your account value could be reduced by the fee amount.
Hypothetical Example for Comparison Purposes
The table also provides information about hypothetical account values and hypothetical expenses based on the actual expense ratio of each class of your fund and an assumed rate of return of 5% per year before expenses, which is not the actual return of a fund’s share class. The hypothetical account values and expenses may not be used to estimate the actual ending account balance or expenses you paid for the period. You may use this information to compare the ongoing costs of investing in your fund and other funds. To do so, compare this 5% hypothetical example with the 5% hypothetical examples that appear in the shareholder reports of the other funds.
9
Please note that the expenses shown in the table are meant to highlight your ongoing costs only and do not reflect any transactional costs, such as sales charges (loads) or redemption/exchange fees. Therefore, the table is useful in comparing ongoing costs only, and will not help you determine the relative total costs of owning different funds. In addition, if these transactional costs were included, your costs would have been higher.
Beginning Account Value 6/1/12 | Ending Account Value 11/30/12 | Expenses Paid During Period(1) 6/1/12 - 11/30/12 | Annualized Expense Ratio(1) | |
| Actual | ||||
| Institutional Class | $1,000 | $1,138.20 | $8.23 | 1.54% |
| Hypothetical | ||||
| Institutional Class | $1,000 | $1,017.30 | $7.77 | 1.54% |
| (1) | Expenses are equal to the class’s annualized expense ratio listed in the table above, multiplied by the average account value over the period, multiplied by 183, the number of days in the most recent fiscal half-year, divided by 366, to reflect the one-half year period. |
10
NOVEMBER 30, 2012
| Shares | Value | |||||||
| Common Stocks — 96.6% | ||||||||
| BRAZIL — 10.8% | ||||||||
| Anhanguera Educacional Participacoes SA | 58,300 | $880,448 | ||||||
| BR Malls Participacoes SA | 167,700 | 2,154,326 | ||||||
| BR Properties SA | 196,900 | 2,322,108 | ||||||
| Brazil Pharma SA | 170,000 | 1,054,146 | ||||||
| CCR SA | 155,400 | 1,335,241 | ||||||
| Cia de Bebidas das Americas Preference Shares ADR | 48,880 | 2,033,897 | ||||||
| Cia de Saneamento de Minas Gerais-COPASA | 52,251 | 1,100,381 | ||||||
| Grupo BTG Pactual | 60,100 | 843,785 | ||||||
Hypermarcas SA(1) | 119,000 | 857,638 | ||||||
| Klabin SA Preference Shares | 246,600 | 1,389,491 | ||||||
| Marcopolo SA Preference Shares | 158,100 | 929,304 | ||||||
| MRV Engenharia e Participacoes SA | 166,000 | 878,632 | ||||||
| Vale SA Preference Shares | 146,700 | 2,519,604 | ||||||
| 18,299,001 | ||||||||
| CANADA — 0.5% | ||||||||
| Pacific Rubiales Energy Corp. | 34,860 | 760,473 | ||||||
| CHILE — 1.3% | ||||||||
| SACI Falabella | 134,113 | 1,341,269 | ||||||
| Sociedad Quimica y Minera de Chile SA ADR | 14,596 | 826,134 | ||||||
| 2,167,403 | ||||||||
| CHINA — 18.2% | ||||||||
| Belle International Holdings Ltd. | 717,000 | 1,506,124 | ||||||
Brilliance China Automotive Holdings Ltd.(1) | 1,246,000 | 1,516,062 | ||||||
| China Communications Construction Co. Ltd. H Shares | 1,747,000 | 1,591,420 | ||||||
| China Minsheng Banking Corp. Ltd. H Shares | 1,078,500 | 1,057,599 | ||||||
| China Overseas Land & Investment Ltd. | 1,166,000 | 3,452,775 | ||||||
| China Railway Construction Corp. Ltd. H Shares | 1,973,000 | 2,199,520 | ||||||
| China Shenhua Energy Co. Ltd. H Shares | 412,000 | 1,687,827 | ||||||
| CNOOC Ltd. | 1,374,000 | 2,939,398 | ||||||
| Focus Media Holding Ltd. ADR | 44,573 | 1,082,678 | ||||||
Haier Electronics Group Co. Ltd.(1) | 875,000 | 1,201,259 | ||||||
| Hengan International Group Co. Ltd. | 106,000 | 957,395 | ||||||
| Industrial & Commercial Bank of China Ltd. H Shares | 2,550,095 | 1,720,858 | ||||||
| Kunlun Energy Co. Ltd. | 1,356,000 | 2,760,920 | ||||||
| Ping An Insurance Group Co. H Shares | 399,000 | 3,019,451 | ||||||
| Tencent Holdings Ltd. | 124,200 | 4,057,629 | ||||||
| 30,750,915 | ||||||||
| COLOMBIA — 0.6% | ||||||||
| Almacenes Exito SA | 53,617 | 1,063,361 | ||||||
| HONG KONG — 0.7% | ||||||||
| AAC Technologies Holdings, Inc. | 336,000 | 1,261,593 | ||||||
| INDIA — 3.9% | ||||||||
| HDFC Bank Ltd. | 176,151 | 2,279,649 | ||||||
| ICICI Bank Ltd. ADR | 44,983 | 1,843,853 | ||||||
| Tata Global Beverages Ltd. | 348,282 | 1,062,550 | ||||||
| Tata Motors Ltd. | 288,018 | 1,447,900 | ||||||
| 6,633,952 | ||||||||
| INDONESIA — 4.0% | ||||||||
| PT AKR Corporindo Tbk | 3,375,000 | 1,512,743 | ||||||
| PT Astra International Tbk | 1,429,500 | 1,080,302 | ||||||
| PT Bank Rakyat Indonesia (Persero) Tbk | 1,199,500 | 881,480 | ||||||
| PT Media Nusantara Citra Tbk | 2,695,000 | 751,459 | ||||||
| PT Semen Gresik (Persero) Tbk | 1,091,000 | 1,683,098 | ||||||
| PT XL Axiata Tbk | 1,689,500 | 906,960 | ||||||
| 6,816,042 | ||||||||
| MALAYSIA — 1.3% | ||||||||
| Axiata Group Bhd | 1,111,400 | 2,164,483 | ||||||
| MEXICO — 5.3% | ||||||||
| Alfa SAB de CV, Series A | 970,480 | 2,020,731 | ||||||
Cemex SAB de CV ADR(1) | 110,809 | 986,200 | ||||||
| Fomento Economico Mexicano SAB de CV ADR | 15,151 | 1,486,010 | ||||||
| Grupo Aeroportuario del Sureste SAB de CV B Shares | 49,445 | 504,640 | ||||||
| Grupo Financiero Banorte SAB de CV | 237,923 | 1,357,805 | ||||||
| Mexichem SAB de CV | 313,598 | 1,624,552 | ||||||
| Wal-Mart de Mexico SAB de CV | 310,316 | 973,888 | ||||||
| 8,953,826 | ||||||||
| PERU — 2.1% | ||||||||
| Credicorp Ltd. | 12,966 | 1,813,943 | ||||||
| Southern Copper Corp. | 47,500 | 1,724,250 | ||||||
| 3,538,193 | ||||||||
11
| Shares | Value | |||||||
| POLAND — 1.0% | ||||||||
| Eurocash SA | 81,180 | $1,130,845 | ||||||
| Powszechny Zaklad Ubezpieczen SA | 4,179 | 523,395 | ||||||
| 1,654,240 | ||||||||
| RUSSIA — 6.0% | ||||||||
| Eurasia Drilling Co. Ltd. GDR | 37,983 | 1,236,347 | ||||||
| Magnit OJSC GDR | 69,511 | 2,452,348 | ||||||
| Mail.ru Group Ltd. GDR | 31,780 | 1,048,740 | ||||||
| Mobile Telesystems OJSC ADR | 65,460 | 1,140,968 | ||||||
| NovaTek OAO GDR | 15,200 | 1,667,440 | ||||||
| Sberbank of Russia | 873,347 | 2,567,640 | ||||||
| 10,113,483 | ||||||||
| SOUTH AFRICA — 5.2% | ||||||||
| Aspen Pharmacare Holdings Ltd. | 101,385 | 1,784,364 | ||||||
| Clicks Group Ltd. | 218,323 | 1,547,101 | ||||||
| Discovery Holdings Ltd. | 246,148 | 1,545,208 | ||||||
| Exxaro Resources Ltd. | 37,223 | 646,663 | ||||||
| Mr Price Group Ltd. | 52,843 | 790,529 | ||||||
| Naspers Ltd. N Shares | 39,172 | 2,418,950 | ||||||
| 8,732,815 | ||||||||
| SOUTH KOREA — 15.5% | ||||||||
| Hyundai Glovis Co. Ltd. | 8,874 | 1,934,030 | ||||||
| Hyundai Motor Co. | 2,543 | 529,571 | ||||||
| Hyundai Wia Corp. | 7,979 | 1,341,070 | ||||||
| LG Chem Ltd. | 3,414 | 983,671 | ||||||
LG Display Co. Ltd.(1) | 35,320 | 1,128,570 | ||||||
| LG Household & Health Care Ltd. | 3,044 | 1,815,971 | ||||||
| Orion Corp. | 2,170 | 2,250,459 | ||||||
| Paradise Co. Ltd. | 50,041 | 866,481 | ||||||
| Samsung Electronics Co. Ltd. | 11,900 | 15,451,263 | ||||||
| 26,301,086 | ||||||||
| TAIWAN — 8.9% | ||||||||
| Chailease Holding Co. Ltd. | 983,456 | 2,000,490 | ||||||
| Hon Hai Precision Industry Co. Ltd. | 910,408 | 2,920,425 | ||||||
| MediaTek, Inc. | 99,000 | 1,126,162 | ||||||
| Taiwan Semiconductor Manufacturing Co. Ltd. | 2,495,774 | 8,478,450 | ||||||
| TPK Holding Co. Ltd. | 35,000 | 558,959 | ||||||
| 15,084,486 | ||||||||
| THAILAND — 4.2% | ||||||||
| CP ALL PCL | 1,702,200 | 2,190,841 | ||||||
| Kasikornbank PCL NVDR | 308,400 | 1,879,140 | ||||||
| Minor International PCL | 2,012,300 | 1,265,474 | ||||||
| Siam Cement PCL NVDR | 143,900 | 1,852,085 | ||||||
| 7,187,540 | ||||||||
| TURKEY — 4.1% | ||||||||
| BIM Birlesik Magazalar AS | 19,360 | 880,320 | ||||||
| Koza Altin Isletmeleri AS | 55,393 | 1,382,616 | ||||||
TAV Havalimanlari Holding AS(1) | 227,992 | 1,133,038 | ||||||
| Tofas Turk Otomobil Fabrikasi | 175,558 | 1,070,925 | ||||||
| Turkiye Garanti Bankasi AS | 290,526 | 1,378,773 | ||||||
| Turkiye Halk Bankasi AS | 121,242 | 1,173,846 | ||||||
| 7,019,518 | ||||||||
| TURKMENISTAN — 0.7% | ||||||||
| Dragon Oil plc | 129,547 | 1,151,924 | ||||||
| UNITED KINGDOM — 2.3% | ||||||||
| Antofagasta plc | 62,324 | 1,286,099 | ||||||
| Petrofac Ltd. | 60,289 | 1,572,519 | ||||||
| Tullow Oil plc | 46,118 | 1,017,438 | ||||||
| 3,876,056 | ||||||||
TOTAL COMMON STOCKS (Cost $127,706,788) | 163,530,390 | |||||||
| Exchange-Traded Funds — 3.7% | ||||||||
iShares MSCI Emerging Markets Index Fund (Cost $6,120,016) | 149,715 | 6,258,087 | ||||||
| Temporary Cash Investments — 3.1% | ||||||||
Repurchase Agreement, Bank of America Merrill Lynch, (collateralized by various U.S. Treasury obligations, 1.25% - 2.125%, 4/15/14 - 12/31/15, valued at $2,497,925), in a joint trading account at 0.18%, dated 11/30/12, due 12/3/12 (Delivery value $2,447,517) | 2,447,480 | |||||||
Repurchase Agreement, Credit Suisse First Boston, Inc., (collateralized by various U.S. Treasury obligations, 0.25%, 9/15/15, valued at $2,496,807), in a joint trading account at 0.17%, dated 11/30/12, due 12/3/12 (Delivery value $2,447,515) | 2,447,480 | |||||||
Repurchase Agreement, Goldman Sachs & Co., (collateralized by various U.S. Treasury obligations, 4.25%, 11/15/40, valued at $412,694), in a joint trading account at 0.15%, dated 11/30/12, due 12/3/12 (Delivery value $404,439) | 404,434 | |||||||
TOTAL TEMPORARY CASH INVESTMENTS (Cost $5,299,394) | 5,299,394 | |||||||
TOTAL INVESTMENT SECURITIES — 103.4% (Cost $139,126,198) | 175,087,871 | |||||||
| OTHER ASSETS AND LIABILITIES — (3.4)% | (5,810,692 | ) | ||||||
| TOTAL NET ASSETS — 100.0% | $169,277,179 | |||||||
12
| Market Sector Diversification | |
| (as a % of net assets) | |
| Information Technology | 21.2% |
| Financials | 20.0% |
| Consumer Discretionary | 12.6% |
| Consumer Staples | 12.0% |
| Materials | 10.0% |
| Energy | 8.7% |
| Industrials | 7.8% |
| Diversified | 3.7% |
| Telecommunication Services | 2.5% |
| Health Care | 1.1% |
| Utilities | 0.7% |
| Cash and Equivalents* | (0.3)% |
*Includes temporary cash investments and other assets and liabilities.
Notes to Schedule of Investments
ADR = American Depositary Receipt
GDR = Global Depositary Receipt
MSCI = Morgan Stanley Capital International
NVDR = Non-Voting Depositary Receipt
OJSC = Open Joint Stock Company
| (1) | Non-income producing. |
See Notes to Financial Statements.
13
| NOVEMBER 30, 2012 | ||||
| Assets | ||||
| Investment securities, at value (cost of $139,126,198) | $175,087,871 | |||
| Foreign currency holdings, at value (cost of $3,197) | 3,184 | |||
| Receivable for capital shares sold | 32,047 | |||
| Dividends and interest receivable | 27,503 | |||
| Other assets | 14,163 | |||
| 175,164,768 | ||||
| Liabilities | ||||
| Payable for investments purchased | 3,389,563 | |||
| Payable for capital shares redeemed | 2,264,576 | |||
| Accrued management fees | 209,723 | |||
| Accrued foreign taxes | 23,727 | |||
| 5,887,589 | ||||
| Net Assets | $169,277,179 | |||
| Institutional Class Capital Shares, $0.01 Par Value | ||||
| Shares authorized | 100,000,000 | |||
| Shares outstanding | 16,849,363 | |||
| Net Asset Value Per Share | $10.05 | |||
| Net Assets Consist of: | ||||
| Capital (par value and paid-in surplus) | $145,211,409 | |||
| Undistributed net investment income | 559,625 | |||
| Accumulated net realized loss | (12,428,148 | ) | ||
| Net unrealized appreciation | 35,934,293 | |||
| $169,277,179 | ||||
See Notes to Financial Statements.
14
| YEAR ENDED NOVEMBER 30, 2012 | ||||
| Investment Income (Loss) | ||||
| Income: | ||||
| Dividends (net of foreign taxes withheld of $313,010) | $3,029,080 | |||
| Interest | 3,246 | |||
| 3,032,326 | ||||
| Expenses: | ||||
| Management fees | 2,278,704 | |||
| Directors’ fees and expenses | 5,111 | |||
| Other expenses | 1,442 | |||
| 2,285,257 | ||||
| Net investment income (loss) | 747,069 | |||
| Realized and Unrealized Gain (Loss) | ||||
| Net realized gain (loss) on: | ||||
| Investment transactions | (6,537,819 | ) | ||
| Foreign currency transactions | (195,988 | ) | ||
| (6,733,807 | ) | |||
| Change in net unrealized appreciation (depreciation) on: | ||||
| Investments (includes (increase) decrease in accrued foreign taxes of $(23,727)) | 24,065,209 | |||
| Translation of assets and liabilities in foreign currencies | 212 | |||
| 24,065,421 | ||||
| Net realized and unrealized gain (loss) | 17,331,614 | |||
| Net Increase (Decrease) in Net Assets Resulting from Operations | $18,078,683 | |||
See Notes to Financial Statements.
15
| YEARS ENDED NOVEMBER 30, 2012 AND NOVEMBER 30, 2011 | ||||||||
| Increase (Decrease) in Net Assets | November 30, 2012 | November 30, 2011 | ||||||
| Operations | ||||||||
| Net investment income (loss) | $747,069 | $414,293 | ||||||
| Net realized gain (loss) | (6,733,807 | ) | (2,837,788 | ) | ||||
| Change in net unrealized appreciation (depreciation) | 24,065,421 | (12,475,619 | ) | |||||
| Net increase (decrease) in net assets resulting from operations | 18,078,683 | (14,899,114 | ) | |||||
| Distributions to Shareholders | ||||||||
| From net investment income | (117,035 | ) | — | |||||
| Capital Share Transactions | ||||||||
| Proceeds from shares sold | 53,518,080 | 47,150,673 | ||||||
| Proceeds from reinvestment of distributions | 117,035 | — | ||||||
| Payments for shares redeemed | (22,001,108 | ) | (3,679,600 | ) | ||||
| Net increase (decrease) in net assets from capital share transactions | 31,634,007 | 43,471,073 | ||||||
| Net increase (decrease) in net assets | 49,595,655 | 28,571,959 | ||||||
| Net Assets | ||||||||
| Beginning of period | 119,681,524 | 91,109,565 | ||||||
| End of period | $169,277,179 | $119,681,524 | ||||||
| Undistributed net investment income | $559,625 | $125,579 | ||||||
| Transactions in Shares of the Fund | ||||||||
| Sold | 5,791,249 | 4,848,404 | ||||||
| Issued in reinvestment of distributions | 12,216 | — | ||||||
| Redeemed | (2,338,214 | ) | (360,351 | ) | ||||
| Net increase (decrease) in shares of the fund | 3,465,251 | 4,488,053 | ||||||
See Notes to Financial Statements.
16
1. Organization
American Century World Mutual Funds, Inc. (the corporation) is registered under the Investment Company Act of 1940, as amended (the 1940 Act), as an open-end management investment company and is organized as a Maryland corporation. NT Emerging Markets Fund (the fund) is one fund in a series issued by the corporation. The fund is diversified as defined under the 1940 Act. The fund’s investment objective is to seek capital growth. The fund pursues its objective by investing at least 80% of its assets in equity securities of companies located in emerging market countries. The fund is not permitted to invest in any securities issued by companies assigned by the Global Industry Classification Standard to the tobacco industry.
2. Significant Accounting Policies
The following is a summary of significant accounting policies consistently followed by the fund in preparation of its financial statements. The financial statements are prepared in conformity with accounting principles generally accepted in the United States of America, which may require management to make certain estimates and assumptions at the date of the financial statements. Actual results could differ from these estimates.
Investment Valuations — The fund determines the fair value of its investments and computes its net asset value per share as of the close of regular trading (usually 4 p.m. Eastern time) on the New York Stock Exchange (NYSE) on each day the NYSE is open.
Equity securities that are listed or traded on a domestic securities exchange are valued at the last reported sales price or at the official closing price as provided by the exchange. Equity securities traded on foreign securities exchanges are typically valued at the closing price on the exchange where primarily traded or as of the close of the NYSE, if that is earlier. If no last sales price is reported, or if local convention or regulation so provides, the mean of the latest bid and asked prices is used. Depending on local convention or regulation, securities traded over-the-counter are valued at the mean of the latest bid and asked prices, the last sales price, or the official closing price. In its determination of fair value, the fund may review several factors including: market information specific to a security; news developments in U.S. and foreign markets; the performance of particular U.S. and foreign securities, indices, comparable securities, American Depositary Receipts, Exchange-Traded Funds, and other relevant market indicators.
Debt securities maturing within 60 days at the time of purchase may be valued at cost, plus or minus any amortized discount or premium or at the evaluated mean as provided by an independent pricing service. Evaluated mean prices are commonly derived through utilization of market models, which may consider, among other factors, trade data, quotations from dealers and active market makers, relevant yield curve and spread data, related sector levels, creditworthiness, and other relevant market information on the same or comparable securities.
Investments in open-end management investment companies are valued at the reported net asset value per share. Repurchase agreements are valued at cost.
The value of investments initially expressed in foreign currencies is translated into U.S. dollars at prevailing exchange rates.
If the fund determines that the market price for a portfolio security is not readily available or the valuation methods mentioned above do not reflect a security’s fair value, such security is valued as determined in good faith by the Board of Directors or its designee, in accordance with procedures adopted by the Board of Directors. Circumstances that may cause the fund to use these procedures to value a security include, but are not limited to: a security has been declared in default; trading in a security has been halted during the trading day; there is a foreign market holiday and no trading occurred; or an event occurred between the close of a foreign exchange and the NYSE that may affect the value of a security.
17
Security Transactions — Security transactions are accounted for as of the trade date. Net realized gains and losses are determined on the identified cost basis, which is also used for federal income tax purposes. Certain countries impose taxes on realized gains on the sale of securities registered in their country. The fund records the foreign tax expense, if any, on an accrual basis. The foreign tax expense on realized gains and unrealized appreciation reduces the net realized gain (loss) on investment transactions and net unrealized appreciation (depreciation) on investments, respectively.
Investment Income — Dividend income less foreign taxes withheld, if any, is recorded as of the ex-dividend date. Distributions received on securities that represent a return of capital or capital gain are recorded as a reduction of cost of investments and/or as a realized gain. The fund estimates the components of distributions received that may be considered nontaxable distributions or capital gain distributions for income tax purposes. Interest income is recorded on the accrual basis and includes accretion of discounts and amortization of premiums.
Foreign Currency Translations — All assets and liabilities initially expressed in foreign currencies are translated into U.S. dollars at prevailing exchange rates at period end. The fund may enter into spot foreign currency exchange contracts to facilitate transactions denominated in a foreign currency. Purchases and sales of investment securities, dividend and interest income, spot foreign currency exchange contracts, and expenses are translated at the rates of exchange prevailing on the respective dates of such transactions. Net realized and unrealized foreign currency exchange gains or losses related to investment securities are a component of net realized gain (loss) on investment transactions and change in net unrealized appreciation (depreciation) on investments, respectively.
Repurchase Agreements — The fund may enter into repurchase agreements with institutions that American Century Investment Management, Inc. (ACIM) (the investment advisor) has determined are creditworthy pursuant to criteria adopted by the Board of Directors. The fund requires that the collateral, represented by securities, received in a repurchase transaction be transferred to the custodian in a manner sufficient to enable the fund to obtain those securities in the event of a default under the repurchase agreement. ACIM monitors, on a daily basis, the securities transferred to ensure the value, including accrued interest, of the securities under each repurchase agreement is equal to or greater than amounts owed to the fund under each repurchase agreement.
Joint Trading Account — Pursuant to an Exemptive Order issued by the Securities and Exchange Commission, the fund, along with certain other funds in the American Century Investments family of funds, may transfer uninvested cash balances into a joint trading account. These balances are invested in one or more repurchase agreements that are collateralized by U.S. Treasury or Agency obligations.
Income Tax Status — It is the fund’s policy to distribute substantially all net investment income and net realized gains to shareholders and to otherwise qualify as a regulated investment company under provisions of the Internal Revenue Code. The fund is no longer subject to examination by tax authorities for years prior to 2009. Additionally, non-U.S. tax returns filed by the fund due to investments in certain foreign securities remain subject to examination by the relevant taxing authority for seven years from the date of filing. At this time, management believes there are no uncertain tax positions which, based on their technical merit, would not be sustained upon examination and for which it is reasonably possible that the total amounts of unrecognized tax benefits will significantly change in the next twelve months. Accordingly, no provision has been made for federal or state income taxes.
Distributions to Shareholders — Distributions from net investment income and net realized gains, if any, are generally declared and paid annually. The fund may make distributions on a more frequent basis to comply with the distribution requirements of the Internal Revenue Code, in all events in a manner consistent with provisions of the 1940 Act.
18
Indemnifications — Under the corporation’s organizational documents, its officers and directors are indemnified against certain liabilities arising out of the performance of their duties to the fund. In addition, in the normal course of business, the fund enters into contracts that provide general indemnifications. The maximum exposure under these arrangements is unknown as this would involve future claims that may be made against a fund. The risk of material loss from such claims is considered by management to be remote.
3. Fees and Transactions with Related Parties
Management Fees — The corporation has entered into a management agreement with ACIM, under which ACIM provides the fund with investment advisory and management services in exchange for a single, unified management fee (the fee). The agreement provides that all expenses of managing and operating the fund, except distribution and service fees, brokerage expenses, taxes, interest, fees and expenses of the independent directors (including legal counsel fees), and extraordinary expenses, will be paid by ACIM. The fee is computed and accrued daily based on the daily net assets of the fund and paid monthly in arrears. The rate of the fee is determined by applying a fee rate calculation formula. This formula takes into account the fund’s assets as well as certain assets, if any, of other clients of the investment advisor outside the American Century Investments family of funds (such as subadvised funds and separate accounts) that have very similar investment teams and investment strategies (strategy assets). The strategy assets of the fund include the assets of Emerging Markets Fund, one fund in a series issued by the corporation. The annual management fee schedule ranges from 1.05% to 1.65%. The effective annual management fee for the year ended November 30, 2012 was 1.54%.
Related Parties — Certain officers and directors of the corporation are also officers and/or directors of American Century Companies, Inc., the parent of the corporation’s investment advisor, ACIM, the distributor of the corporation, American Century Investment Services, Inc., and the corporation’s transfer agent, American Century Services, LLC. Various funds issued by American Century Asset Allocation Portfolios, Inc. own, in aggregate, 100% of the shares of the fund. These funds do not invest in the fund for the purpose of exercising management or control.
4. Investment Transactions
Purchases and sales of investment securities, excluding short-term investments, for the year ended November 30, 2012 were $181,438,997 and $147,213,802, respectively.
5. Fair Value Measurements
The fund’s securities valuation process is based on several considerations and may use multiple inputs to determine the fair value of the positions held by the fund. In conformity with accounting principles generally accepted in the United States of America, the inputs used to determine a valuation are classified into three broad levels as follows:
| • | Level 1 valuation inputs consist of unadjusted quoted prices in an active market for identical securities; |
| • | Level 2 valuation inputs consist of direct or indirect observable market data (including quoted prices for similar securities, evaluations of subsequent market events, interest rates, prepayment speeds, credit risk, etc.); or |
| • | Level 3 valuation inputs consist of unobservable data (including a fund’s own assumptions). |
The level classification is based on the lowest level input that is significant to the fair valuation measurement. The valuation inputs are not necessarily an indication of the risks associated with investing in these securities or other financial instruments.
19
The following is a summary of the level classifications as of period end. The Schedule of Investments provides additional information on the fund’s portfolio holdings.
| Level 1 | Level 2 | Level 3 | ||||||||||
| Investment Securities | ||||||||||||
| Foreign Common Stocks | $12,937,933 | $150,592,457 | — | |||||||||
| Exchange-Traded Funds | 6,258,087 | — | — | |||||||||
| Temporary Cash Investments | — | 5,299,394 | — | |||||||||
| Total Value of Investment Securities | $19,196,020 | $155,891,851 | — | |||||||||
6. Risk Factors
There are certain risks involved in investing in foreign securities. These risks include those resulting from future adverse political, social and economic developments, fluctuations in currency exchange rates, the possible imposition of exchange controls, and other foreign laws or restrictions. Investing in emerging markets may accentuate these risks.
The fund’s investment process may result in high portfolio turnover, which could mean high transaction costs, affecting both performance and capital gains tax liabilities to investors.
7. Federal Tax Information
The tax character of distributions paid during the years ended November 30, 2012 and November 30, 2011 were as follows:
| 2012 | 2011 | |||||||
| Distributions Paid From | ||||||||
| Ordinary income | $117,035 | — | ||||||
| Long-term capital gains | — | — | ||||||
The book-basis character of distributions made during the year from net investment income or net realized gains may differ from their ultimate characterization for federal income tax purposes. These differences reflect the differing character of certain income items and net realized gains and losses for financial statement and tax purposes, and may result in reclassification among certain capital accounts on the financial statements.
As of November 30, 2012, the federal tax cost of investments and the components of distributable earnings on a tax-basis were as follows:
| Federal tax cost of investments | $140,829,075 | |||
| Gross tax appreciation of investments | $35,373,465 | |||
| Gross tax depreciation of investments | (1,114,669 | ) | ||
| Net tax appreciation (depreciation) of investments | $34,258,796 | |||
Net tax appreciation (depreciation) on translation of assets and liabilities in foreign currencies | $(27,381 | ) | ||
| Net tax appreciation (depreciation) | $34,231,415 | |||
| Undistributed ordinary income | $577,128 | |||
| Accumulated short-term capital losses | $(10,431,868 | ) | ||
| Post-October capital loss deferral | $(310,905 | ) |
20
The difference between book-basis and tax-basis cost and unrealized appreciation (depreciation) is attributable primarily to the tax deferral of losses on wash sales and the realization to ordinary income for tax purposes of unrealized gains on investments in passive foreign investment companies.
Accumulated capital losses represent net capital loss carryovers that may be used to offset future realized capital gains for federal income tax purposes. Any unlimited losses will be required to be utilized prior to the losses which carry an expiration date. Future capital loss carryover utilization in any given year may be subject to Internal Revenue Code limitations. Capital loss carryovers of $(1,146,451) expire in 2017 and the remaining losses are unlimited.
Loss deferrals represent certain qualified losses that the fund has elected to treat as having been incurred in the following fiscal year for federal income tax purposes.
21
| For a Share Outstanding Throughout the Years Ended November 30 (except as noted) | |||||||||||||||||||||||||||||||
| Per-Share Data | Ratios and Supplemental Data | ||||||||||||||||||||||||||||||
| Income From Investment Operations: | Distributions From: | Ratio to Average Net Assets of: | |||||||||||||||||||||||||||||
Net Asset Value, Beginning of Period | Net Investment Income (Loss)(1) | Net Realized and Unrealized Gain (Loss) | Total From Investment Operations | Net Investment Income | Net Realized Gains | Total Distributions | Net Asset Value, End of Period | Total Return(2) | Operating Expenses | Net Investment Income (Loss) | Portfolio Turnover Rate | Net Assets, End of Period (in thousands) | |||||||||||||||||||
| Institutional Class | |||||||||||||||||||||||||||||||
| 2012 | $8.94 | 0.05 | 1.07 | 1.12 | (0.01 | ) | — | (0.01 | ) | $10.05 | 12.51 | % | 1.54 | % | 0.50 | % | 101 | % | $169,277 | ||||||||||||
| 2011 | $10.24 | 0.04 | (1.34 | ) | (1.30 | ) | — | — | — | $8.94 | (12.70 | )% | 1.52 | % | 0.37 | % | 87 | % | $119,682 | ||||||||||||
| 2010 | $8.86 | 0.02 | 1.37 | 1.39 | (0.01 | ) | — | (0.01 | ) | $10.24 | 15.73 | % | 1.52 | % | 0.19 | % | 94 | % | $91,110 | ||||||||||||
| 2009 | $5.12 | 0.02 | 3.74 | 3.76 | (0.02 | ) | — | (0.02 | ) | $8.86 | 73.87 | % | 1.57 | % | 0.36 | % | 158 | % | $60,311 | ||||||||||||
| 2008 | $16.19 | 0.11 | (8.52 | ) | (8.41 | ) | (0.20 | ) | (2.46 | ) | (2.66 | ) | $5.12 | (61.75 | )% | 1.52 | % | 1.17 | % | 157 | % | $20,715 | |||||||||
Notes to Financial Highlights
| (1) | Computed using average shares outstanding throughout the period. |
| (2) | Total returns are calculated based on the net asset value of the last business day. Total returns for periods less than one year are not annualized. |
See Notes to Financial Statements.
22
American Century World Mutual Funds, Inc.:
We have audited the accompanying statement of assets and liabilities, including the schedule of investments, of NT Emerging Markets Fund, one of the funds constituting American Century World Mutual Funds, Inc. (the “Corporation”) as of November 30, 2012, and the related statement of operations for the year then ended, the statement of changes in net assets for each of the two years in the period then ended, and the financial highlights for each of the five years in the period then ended. These financial statements and financial highlights are the responsibility of the Corporation’s management. Our responsibility is to express an opinion on these financial statements and financial highlights based on our audits.
We conducted our audits in accordance with the standards of the Public Company Accounting Oversight Board (United States). Those standards require that we plan and perform the audit to obtain reasonable assurance about whether the financial statements and financial highlights are free of material misstatement. The Corporation is not required to have, nor were we engaged to perform, an audit of its internal control over financial reporting. Our audits included consideration of internal control over financial reporting as a basis for designing audit procedures that are appropriate in the circumstances, but not for the purpose of expressing an opinion on the effectiveness of the Corporation’s internal control over financial reporting. Accordingly, we express no such opinion. An audit also includes examining, on a test basis, evidence supporting the amounts and disclosures in the financial statements, assessing the accounting principles used and significant estimates made by management, as well as evaluating the overall financial statement presentation. Our procedures included confirmation of securities owned as of November 30, 2012, by correspondence with the custodian and brokers; where replies were not received from brokers, we performed other auditing procedures. We believe that our audits provide a reasonable basis for our opinion.
In our opinion, the financial statements and financial highlights referred to above present fairly, in all material respects, the financial position of NT Emerging Markets Fund of American Century World Mutual Funds, Inc., as of November 30, 2012, the results of its operations for the year then ended, the changes in its net assets for each of the two years in the period then ended, and the financial highlights for each of the five years in the period then ended, in conformity with accounting principles generally accepted in the United States of America.
Deloitte & Touche LLP
Kansas City, Missouri
January 17, 2013
23
The individuals listed below serve as directors of the funds. Each director will continue to serve in this capacity until death, retirement, resignation or removal from office. The mandatory retirement age for directors who are not “interested persons,” as that term is defined in the Investment Company Act (independent directors), is 72. However, the mandatory retirement age for an individual director may be extended with the approval of the remaining independent directors.
Mr. Thomas is an “interested person” because he currently serves as President and Chief Executive Officer of American Century Companies, Inc. (ACC), the parent company of American Century Investment Management, Inc. (ACIM or the advisor). Mr. Fink is an “interested person” because he currently serves as Executive Vice President of ACC.
The other directors (more than three-fourths of the total number) are independent; that is, they have never been employees, directors or officers of, and have no financial interest in, ACC or any of its wholly owned, direct or indirect, subsidiaries, including ACIM, American Century Investment Services, Inc. (ACIS) and American Century Services, LLC (ACS). The directors serve in this capacity for seven (in the case of Mr. Thomas, 15) registered investment companies in the American Century Investments family of funds.
The following table presents additional information about the directors. The mailing address for each director is 4500 Main Street, Kansas City, Missouri 64111.
Name (Year of Birth) | Position(s) Held with Funds | Length of Time Served | Principal Occupation(s) During Past 5 Years | Number of American Century Portfolios Overseen by Director | Other Directorships Held During Past 5 Years | ||
| Independent Directors | |||||||
Thomas A. Brown (1940) | Director | Since 1980 | Managing Member, Associated Investments, LLC (real estate investment company); Brown Cascade Properties, LLC (real estate investment company) (2001 to 2009) | 66 | None | ||
Andrea C. Hall (1945) | Director | Since 1997 | Retired | 66 | None | ||
Jan M. Lewis (1957) | Director | Since 2011 | President and Chief Executive Officer, Catholic Charities of Northeast Kansas (human services organization) | 66 | None | ||
James A. Olson (1942) | Director | Since 2007 | Member, Plaza Belmont LLC (private equity fund manager) | 66 | Saia, Inc. (2002 to 2012) and Entertainment Properties Trust | ||
Donald H. Pratt (1937) | Director and Chairman of the Board | Since 1995 (Chairman since 2005) | Chairman and Chief Executive Officer, Western Investments, Inc. (real estate company) | 66 | None | ||
24
Name (Year of Birth) | Position(s) Held with Funds | Length of Time Served | Principal Occupation(s) During Past 5 Years | Number of American Century Portfolios Overseen by Director | Other Directorships Held During Past 5 Years | ||
| Independent Directors | |||||||
M. Jeannine Strandjord (1945) | Director | Since 1994 | Retired | 66 | Euronet Worldwide Inc.; Charming Shoppes, Inc. (2006 to 2010); and DST Systems Inc. (1996 to 2012) | ||
John R. Whitten (1946) | Director | Since 2008 | Retired | 66 | Rudolph Technologies, Inc. | ||
Stephen E. Yates (1948) | Director | Since 2012 | Retired; Executive Vice President, Technology & Operations, KeyCorp. (computer services) (2004 to 2010) | 66 | Applied Industrial Technologies, Inc. (2001 to 2010) | ||
| Interested Directors | |||||||
Barry Fink (1955) | Director and Executive Vice President | Since 2012 (Executive Vice President since 2007) | Executive Vice President, ACC (September 2007 to present); President, ACS (October 2007 to present); Chief Operating Officer, ACC (September 2007 to November 2012). Also serves as Manager, ACS | 66 | None | ||
Jonathan S. Thomas (1963) | Director and President | Since 2007 | President and Chief Executive Officer, ACC (March 2007 to present). Also serves as Chief Executive Officer and Manager, ACS; Executive Vice President, ACIM; Director, ACC, ACIM and other ACC subsidiaries | 108 | None | ||
25
Officers
The following table presents certain information about the executive officers of the funds. Each officer serves as an officer for each of the 15 investment companies in the American Century family of funds, unless otherwise noted.
No officer is compensated for his or her service as an officer of the funds. The listed officers are interested persons of the funds and are appointed or re-appointed on an annual basis. The mailing address for each officer listed below is 4500 Main Street, Kansas City, Missouri 64111.
Name (Year of Birth) | Offices with the Funds | Principal Occupation(s) During the Past Five Years | ||
Jonathan S. Thomas (1963) | Director and President since 2007 | President and Chief Executive Officer, ACC (March 2007 to present). Also serves as Chief Executive Officer and Manager, ACS; Executive Vice President, ACIM; Director, ACC, ACIM and other ACC subsidiaries | ||
Barry Fink (1955) | Director since 2012 and Executive Vice President since 2007 | Executive Vice President, ACC (September 2007 to present); President, ACS (October 2007 to present); Chief Operating Officer, ACC (September 2007 to November 2012). Also serves as Manager, ACS | ||
Maryanne L. Roepke (1956) | Chief Compliance Officer since 2006 and Senior Vice President since 2000 | Chief Compliance Officer, American Century funds, ACIM and ACS (August 2006 to present). Also serves as Senior Vice President, ACS | ||
Charles A. Etherington (1957) | General Counsel since 2007 and Senior Vice President since 2006 | Attorney, ACC (February 1994 to present); Vice President, ACC (November 2005 to present), General Counsel, ACC (March 2007 to present). Also serves as General Counsel, ACIM, ACS, ACIS and other ACC subsidiaries; and Senior Vice President, ACIM and ACS | ||
C. Jean Wade (1964) | Vice President, Treasurer and Chief Financial Officer since 2012 | Vice President, ACS (February 2000 to present) | ||
Robert J. Leach (1966) | Vice President since 2006 and Assistant Treasurer since 2012 | Vice President, ACS (February 2000 to present) | ||
David H. Reinmiller (1963) | Vice President since 2000 | Attorney, ACC (January 1994 to present); Associate General Counsel, ACC (January 2001 to present). Also serves as Vice President, ACIM and ACS | ||
Ward D. Stauffer (1960) | Secretary since 2005 | Attorney, ACC (June 2003 to present) |
The Statement of Additional Information has additional information about the fund’s directors and is available without charge, upon request, by calling 1-800-345-2021.
26
At a meeting held on June 21, 2012, the Fund’s Board of Directors unanimously approved the renewal of the management agreement pursuant to which American Century Investment Management, Inc. (the “Advisor”) acts as the investment advisor for the Fund. Under Section 15(c) of the Investment Company Act, contracts for investment advisory services are required to be reviewed, evaluated, and approved by a majority of a fund’s independent directors (the “Directors”) each year.
As a part of the approval process, the Board requested and reviewed extensive data and information compiled by the Advisor and certain independent providers of evaluation data concerning the Fund and the services provided to the Fund by the Advisor. This review was in addition to the oversight and evaluation undertaken by the Board and its committees on a continuous basis throughout the year and included, but was not limited to the following:
| • | the nature, extent, and quality of investment management, shareholder services, and other services provided by the Advisor to the Fund; |
| • | the wide range of other programs and services the Advisor provides to the Fund and its shareholders on a routine and non-routine basis; |
| • | the investment performance of the fund, including data comparing the Fund’s performance to appropriate benchmarks and/or a peer group of other mutual funds with similar investment objectives and strategies; |
| • | data comparing the cost of owning the Fund to the cost of owning similar funds; |
| • | the Advisor’s compliance policies, procedures, and regulatory experience; |
| • | financial data showing the cost of services provided to the Fund, the profitability of the Fund to the Advisor, and the overall profitability of the Advisor; |
| • | data comparing services provided and charges to other investment management clients of the Advisor; and |
| • | consideration of collateral benefits derived by the Advisor from the management of the Fund and any potential economies of scale relating thereto. |
In keeping with its practice, the Board held two in-person meetings and one telephonic meeting to review and discuss the information provided. The Directors also had the benefit of the advice of independent counsel throughout the period.
Factors Considered
The Directors considered all of the information provided by the Advisor, the independent data providers, and independent counsel, and evaluated such information for the Fund. In connection with their review, the Directors did not identify any single factor as being all-important or controlling, and each Director may have attributed different levels of importance to different factors. In deciding to renew the management agreement, the Board based its decision on a number of factors, including the following:
27
Nature, Extent and Quality of Services - Generally. Under the management agreement, the Advisor is responsible for providing or arranging for all services necessary for the operation of the Fund. The Board noted that under the management agreement, the Advisor provides or arranges at its own expense a wide variety of services including:
| • | constructing and designing the Fund |
| • | portfolio research and security selection |
| • | initial capitalization/funding |
| • | securities trading |
| • | Fund administration |
| • | custody of Fund assets |
| • | daily valuation of the Fund’s portfolio |
| • | shareholder servicing and transfer agency, including shareholder confirmations, recordkeeping, and communications |
| • | legal services |
| • | regulatory and portfolio compliance |
| • | financial reporting |
| • | marketing and distribution |
The Board noted that many of these services have expanded over time both in terms of quantity and complexity in response to shareholder demands, competition in the industry, changing distribution channels, and the changing regulatory environment.
Investment Management Services. The nature of the investment management services provided to the Fund is quite complex and allows Fund shareholders access to professional money management, instant diversification of their investments within an asset class, the opportunity to easily diversify among asset classes by investing in or exchanging among various American Century Investments funds, and liquidity. In evaluating investment performance, the Board expects the Advisor to manage the Fund in accordance with its investment objectives and approved strategies. Further, the Directors recognize that the Advisor has an obligation to monitor trading activities, and in particular to seek the best execution of fund trades, and to evaluate the use of and payment for research. In providing these services, the Advisor utilizes teams of investment professionals (portfolio managers, analysts, research assistants, and securities traders) who require extensive information technology, research, training, compliance and other systems to conduct their business. The Board, directly and through its Fund Performance Review Committee, regularly reviews investment performance information for the Fund, together with comparative information for appropriate benchmarks and/or peer groups of similarly-managed funds, over different time horizons.
28
The Directors also review detailed performance information during the management agreement approval process. If performance concerns are identified, the Fund receives special reviews until performance improves, during which the Board discusses with the Advisor the reasons for such results (e.g., market conditions, security selection) and any efforts being undertaken to improve performance. Taking all these factors into consideration, the Board found the investment management services provided by the Advisor to the Fund to meet or exceed industry standards. More detailed information about the Fund’s performance can be found in the Performance and Portfolio Commentary sections of this report.
Shareholder and Other Services. Under the management agreement, the Advisor provides the Fund with a comprehensive package of transfer agency, shareholder, and other services. The Board, directly and through various committees of the Board, regularly reviews reports and evaluations of such services at its regular meetings. These reports include, but are not limited to, information regarding the operational efficiency and accuracy of the shareholder and transfer agency services provided, staffing levels, shareholder satisfaction (as measured by external as well as internal sources), technology support, new products and services offered to Fund shareholders, securities trading activities, portfolio valuation services, auditing services, and legal and operational compliance activities. Certain aspects of shareholder and transfer agency service level efficiency and the quality of securities trading activities are measured by independent third party providers and are presented in comparison to other fund groups not managed by the Advisor. The Board found the services provided by the Advisor to the Fund under the management agreement to be competitive and of high quality.
Costs of Services and Profitability. The Advisor provides detailed information concerning its cost of providing various services to the Fund, its profitability in managing the Fund, its overall profitability, and its financial condition. The Directors have reviewed with the Advisor the methodology used to prepare this financial information. The financial information regarding the Advisor is considered in evaluating the Advisor’s financial condition, ability to continue to provide services under the management agreement, and the reasonableness of the current management fee. The Board concluded that the Advisor’s profits were reasonable in light of the services provided to the Fund.
Ethics. The Board generally considers the Advisor’s commitment to providing quality services to shareholders and to conducting its business ethically. They noted that the Advisor’s practices generally meet or exceed industry best practices.
Economies of Scale. The Board also reviewed information provided by the Advisor regarding the possible existence of economies of scale in connection with the management of the Fund. The Board concluded that economies of scale are difficult to measure and predict with precision, especially on a fund-by-fund basis. The Board concluded that the Advisor is appropriately sharing economies of scale through its competitive fee structure, offering competitive fees from fund inception, and through reinvestment in its business to provide shareholders additional content and services.
29
Comparison to Other Funds’ Fees. The management agreement provides that the Fund pay the Advisor a single, all-inclusive (or unified) management fee for providing all services necessary for the management and operation of the Fund, other than brokerage expenses, taxes, interest, extraordinary expenses, and the fees and expenses of the Fund’s independent directors (including their independent legal counsel) and expenses incurred in connection with the provision of shareholder services and distribution services under a plan adopted pursuant to Rule 12b-1 under the 1940 Act. Under the unified fee structure, the Advisor is responsible for providing all investment advisory, custody, audit, administrative, compliance, recordkeeping, marketing and shareholder services, or arranging and supervising third parties to provide such services. By contrast, most other funds are charged a variety of fees, including an investment advisory fee, a transfer agency fee, an administrative fee, distribution charges and other expenses. Other than their investment advisory fees and any applicable Rule 12b-1 distribution fees, all other components of the total fees charged by these other funds may be increased without shareholder approval. The Board believes the unified fee structure is a benefit to Fund shareholders because it clearly discloses to shareholders the cost of owning Fund shares, and, since the unified fee cannot be increased without a vote of Fund shareholders, it shifts to the Advisor the risk of increased costs of operating the Fund and provides a direct incentive to minimize administrative inefficiencies. Part of the Board’s analysis of fee levels involves reviewing certain evaluative data compiled by an independent provider and comparing the Fund’s unified fee to the total expense ratio of other funds in the Fund’s peer group. The Board concluded that the management fee paid by the Fund to the Advisor under the management agreement is reasonable in light of the services provided to the Fund.
Comparison to Fees and Services Provided to Other Clients of the Advisor. The Board also requested and received information from the Advisor concerning the nature of the services, fees, costs and profitability of its advisory services to advisory clients other than the Fund. They observed that these varying types of client accounts require different services and involve different regulatory and entrepreneurial risks than the management of the Fund. The Board analyzed this information and concluded that the fees charged and services provided to the Fund were reasonable by comparison.
Collateral or “Fall-Out” Benefits Derived by the Advisor. The Board considered the existence of collateral benefits the Advisor may receive as a result of its relationship with the Fund. They concluded that the Advisor’s primary business is managing mutual funds and it generally does not use fund or shareholder information to generate profits in other lines of business, and therefore does not derive any significant collateral benefits from them. The Board noted that the Advisor receives proprietary research from broker-dealers that execute fund portfolio transactions and concluded that this research is likely to benefit Fund shareholders. The Board also determined that the Advisor is able to provide investment management services to certain clients other than the Fund, at least in part, due to its existing infrastructure built to serve the fund complex. The Board concluded, however, that the assets of those other clients are not material to the analysis and, where applicable, may be included with the assets of the Fund to determine breakpoints in the management fee schedule.
30
Existing Relationship. The Board also considered whether there was any reason for not continuing the existing arrangement with the Advisor. In this regard, the Board was mindful of the potential disruptions of the Fund’s operations and various risks, uncertainties, and other effects that could occur as a result of a decision not to continue such relationship. In particular, the Board recognized that most shareholders have invested in the Fund on the strength of the Advisor’s industry standing and reputation and in the expectation that the Advisor will have a continuing role in providing advisory services to the Fund.
Conclusion of the Directors. As a result of this process, the Board, including all of the independent directors, taking into account all of the factors discussed above and the information provided by the Advisor and others, concluded that the management agreement between the Fund and the Advisor is fair and reasonable in light of the services provided and should be renewed.
31
As required by law, distributions you receive from certain IRAs, or 403(b), 457 and qualified plans are subject to federal income tax withholding, unless you elect not to have withholding apply. Tax will be withheld on the total amount withdrawn even though you may be receiving amounts that are not subject to withholding, such as nondeductible contributions. In such case, excess amounts of withholding could occur. You may adjust your withholding election so that a greater or lesser amount will be withheld.
If you don’t want us to withhold on this amount, you must notify us to not withhold the federal income tax. You may notify us in writing or in certain situations by telephone or through other electronic means. You have the right to revoke your withholding election at any time and any election you make may remain in effect until revoked by filing a new election.
Remember, even if you elect not to have income tax withheld, you are liable for paying income tax on the taxable portion of your withdrawal. If you elect not to have income tax withheld or you don’t have enough income tax withheld, you may be responsible for payment of estimated tax. You may incur penalties under the estimated tax rules if your withholding and estimated tax payments are not sufficient. You can reduce or defer the income tax on a distribution by directly or indirectly rolling such distribution over to another IRA or eligible plan. You should consult your tax advisor for additional information.
State tax will be withheld if, at the time of your distribution, your address is within one of the mandatory withholding states and you have federal income tax withheld. State taxes will be withheld from your distribution in accordance with the respective state rules.
Proxy Voting Guidelines
American Century Investment Management, Inc., the fund’s investment advisor, is responsible for exercising the voting rights associated with the securities purchased and/or held by the fund. A description of the policies and procedures the advisor uses in fulfilling this responsibility is available without charge, upon request, by calling 1-800-345-2021. It is also available on American Century Investments’ website at americancentury.com and on the Securities and Exchange Commission’s website at sec.gov. Information regarding how the investment advisor voted proxies relating to portfolio securities during the most recent 12-month period ended June 30 is available on the “About Us” page at americancentury.com. It is also available at sec.gov.
Quarterly Portfolio Disclosure
The fund files its complete schedule of portfolio holdings with the Securities and Exchange Commission (SEC) for the first and third quarters of each fiscal year on Form N-Q. The fund’s Forms N-Q are available on the SEC’s website at sec.gov, and may be reviewed and copied at the SEC’s Public Reference Room in Washington, DC. Information on the operation of the Public Reference Room may be obtained by calling 1-800-SEC-0330. The fund also makes its complete schedule of portfolio holdings for the most recent quarter of its fiscal year available on its website at americancentury.com and, upon request, by calling 1-800-345-2021.
32
Other Tax Information
The following information is provided pursuant to provisions of the Internal Revenue Code.
The fund hereby designates up to the maximum amount allowable as qualified dividend income for the fiscal year ended November 30, 2012.
For the fiscal year ended November 30, 2012, the fund intends to pass through to shareholders $310,810, or up to the maximum amount allowable, as a foreign tax credit which represents taxes paid on income derived from sources within foreign countries or possessions of the United States. During the fiscal year ended November 30, 2012, the fund earned $3,179,751 from income derived from foreign sources. Foreign source income and foreign tax expense per outstanding share on November 30, 2012 are $0.1887 and $0.0184, respectively.
33
34
35
36
| Contact Us | americancentury.com |
| Automated Information Line | 1-800-345-8765 |
| Investor Services Representative | 1-800-345-2021 or 816-531-5575 |
| Investors Using Advisors | 1-800-378-9878 |
| Business, Not-For-Profit, Employer-Sponsored Retirement Plans | 1-800-345-3533 |
| Banks and Trust Companies, Broker-Dealers, Financial Professionals, Insurance Companies | 1-800-345-6488 |
| Telecommunications Device for the Deaf | 1-800-634-4113 |
American Century World Mutual Funds, Inc.
Investment Advisor:
American Century Investment Management, Inc.
Kansas City, Missouri
This report and the statements it contains are submitted for the general information of our shareholders. The report is not authorized for distribution to prospective investors unless preceded or accompanied by an effective prospectus.
©2013 American Century Proprietary Holdings, Inc. All rights reserved.
CL-ANN-76971 1301
ANNUAL REPORT NOVEMBER 30, 2012
| International Value Fund |
| President’s Letter | 2 |
| Independent Chairman’s Letter | 3 |
| Market Perspective | 4 |
| Performance | 5 |
| Portfolio Commentary | 7 |
| Fund Characteristics | 9 |
| Shareholder Fee Example | 10 |
| Schedule of Investments | 12 |
| Statement of Assets and Liabilities | 15 |
| Statement of Operations | 16 |
| Statement of Changes in Net Assets | 17 |
| Notes to Financial Statements | 18 |
| Financial Highlights | 24 |
| Report of Independent Registered Public Accounting Firm | 26 |
| Management | 27 |
| Approval of Management Agreement | 30 |
| Additional Information | 35 |
Any opinions expressed in this report reflect those of the author as of the date of the report, and do not necessarily represent the opinions of American Century Investments® or any other person in the American Century Investments organization. Any such opinions are subject to change at any time based upon market or other conditions and American Century Investments disclaims any responsibility to update such opinions. These opinions may not be relied upon as investment advice and, because investment decisions made by American Century Investments funds are based on numerous factors, may not be relied upon as an indication of trading intent on behalf of any American Century Investments fund. Security examples are used for representational purposes only and are not intended as recommendations to purchase or sell securities. Performance information for comparative indices and securities is provided to American Century Investments by third party vendors. To the best of American Century Investments’ knowledge, such information is accurate at the time of printing.
Thank you for reviewing this annual report for the 12 months ended November 30, 2012. It offers investment performance, market analysis, and portfolio information, presented with the expert perspective of our portfolio management team.
Annual reports remain important vehicles for conveying information about fund returns, including key factors that affected fund performance. For additional, updated investment and market insights, we encourage you to visit our website, americancentury.com.
Favorable Fiscal-Year Returns for Most Major Stock and Bond Benchmarks
Despite a global economic slowdown, continued concerns about European financial system stability, and uncertainty about U.S. political and fiscal conditions in 2013, 12-month stock and bond returns were generally favorable, particularly for U.S. value stocks and high-yield bonds.
U.S. value stock indices outpaced the S&P 500 Index’s 16.13% return for the period, as did U.S. corporate and municipal high-yield benchmarks. U.S. growth and international index returns were generally lower, but still solid—the MSCI EAFE Index, for example, returned 12.61%.
With the exception of high-yield bond sectors, stocks generally outperformed bonds for the period, though bonds benefitted from economic stagnation, reduced inflation pressures, and low interest rates. The 10-year U.S. Treasury yield declined from 2.07% to 1.62% during the period, and the Barclays U.S. Aggregate Bond Index returned 5.51%. Related global bond indices also returned in roughly the mid-single digits.
Bucking the global trend, the U.S. economy showed signs of improvement during the fiscal year, particularly the long-depressed housing market. However, the outlook for 2013 remains guarded, as the fragile recovery remains vulnerable to fiscal and financial factors that could trigger further slowdowns and market volatility.
Under these conditions, we continue to believe in a disciplined, diversified, long-term investment approach, using both stocks and bonds—as appropriate—for meeting financial goals. We appreciate your continued trust in us in this challenging environment.
Sincerely,
Jonathan Thomas
President and Chief Executive Officer
American Century Investments
2
The board has once again completed its annual review of the advisory contract between the American Century Investments mutual funds overseen by the board and the funds’ advisor, American Century Investment Management, Inc. This process, often referred to as the 15(c) review, involves the independent directors considering all of the material monitored throughout the year and evaluating a wide range of factors to determine whether the management fee paid by each fund to the advisor is reasonable.
The independent directors’ rationale for this decision is provided in detail in this, or in a previous, report. However, there are several highlights that should be of interest to all shareholders.
| • | Fund performance and client service continue to be rated among the industry’s best. |
| • | Target date and other asset allocation products continue to successfully gather assets and industry acclaim. |
| • | Compliance programs continue to function successfully with no issues impacting shareholder interests. |
| • | Fees were found to be within an acceptable competitive range, with minor fee waivers being negotiated on five funds. |
Knowing that most shareholders are long term investors, the board was particularly pleased with our succession planning review. Talented professionals are being added within portfolio management and experienced managers have been added to the senior management team.
Overall it was a very positive review for the American Century Investments mutual funds during a challenging market environment.
Best personal regards,
Don Pratt
3
By Mark Kopinski, Chief Investment Officer, Global and Non-U.S. Equity
Central Bank Action Drove Global Stocks Higher
Despite a backdrop of weaker global economic growth and mounting sovereign debt problems in Europe and the United States, most global stock benchmarks advanced strongly for the 12-month period ended November 30, 2012. Investors generally overlooked the lackluster economic data, recession fears (which eventually turned to reality for Europe), and the instability of the eurozone’s banking system and currency. Instead, they focused on the optimism inspired by unprecedented central bank intervention.
In particular, the European Central Bank (ECB) launched several programs to help the eurozone’s troubled banks shore up their balance sheets and finance ongoing operations. The ECB also agreed to purchase the sovereign debt of financially strapped member nations that conform to the ECB’s fiscal reform measures. Meanwhile, in response to sluggish economic growth and high unemployment, the U.S. Federal Reserve (the Fed) announced its third—and most aggressive—quantitative easing program to date. The Bank of Japan also took action with an asset purchase program, while the People’s Bank of China eased its reserve requirements for commercial lenders.
Overall, developed markets outperformed emerging markets for the 12-month period, even as the emerging economies generally enjoyed higher absolute levels of growth, albeit slower growth than in previous periods. Strong stock market performance in Europe and the United States, where central bank stimulus was the greatest, primarily drove the better relative results in the developed markets.
Valuations, Stock Selection Remain Key Factors
Even though economic growth and corporate earnings in aggregate have been slowing, and sovereign debt issues have yet to be resolved, there are some positive factors at work for global equity investors. Stock valuations around the globe appear attractive relative to historical averages. Similarly, equity earnings yields are also compelling when measured against long-term averages and current bond yields. Most important, we believe through our rigorous, bottom-up stock selection process it’s still possible to find individual companies growing earnings, either from a new product launch, market share gains, secular changes, or beneficial acquisitions.
| International Equity Total Returns | ||||
| For the 12 months ended November 30, 2012 (in U.S. dollars) | ||||
| MSCI EAFE Index | 12.61% | MSCI Europe Index | 14.07% | |
| MSCI EAFE Growth Index | 12.66% | MSCI World Index | 13.62% | |
| MSCI EAFE Value Index | 12.45% | MSCI Japan Index | 3.59% | |
| MSCI Emerging Markets Index | 11.35% | |||
4
| Total Returns as of November 30, 2012 | ||||||
| Average Annual Returns | ||||||
Ticker Symbol | 1 year | 5 years | 10 years | Since Inception | Inception Date | |
A Class No sales charge* With sales charge* | MEQAX | 9.91% 3.58% | -4.98% -6.10% | 7.12%(1) 6.49%(1) | 3.50%(1) 3.11%(1) | 3/31/97 |
| MSCI EAFE Value Index | — | 12.45% | -5.55% | 7.66% | 5.07% | — |
| Investor Class | ACEVX | 10.25% | -4.75% | — | 1.19% | 4/3/06 |
| Institutional Class | ACVUX | 10.33% | -4.57% | — | 1.38% | 4/3/06 |
| C Class | ACCOX | 9.10% | -5.71% | — | 0.18% | 4/3/06 |
| R Class | ACVRX | 9.67% | -5.22% | — | 0.69% | 4/3/06 |
*Sales charges include initial sales charges and contingent deferred sales charges (CDSCs), as applicable. A Class shares have a 5.75% maximum initial sales charge and may be subject to a maximum CDSC of 1.00%. C Class shares redeemed within 12 months of purchase are subject to a maximum CDSC of 1.00%. The SEC requires that mutual funds provide performance information net of maximum sales charges in all cases where charges could be applied.
International Value acquired all the net assets of the Mason Street International Equity Fund on March 31, 2006, pursuant to a plan of reorganization approved by the acquired fund’s shareholders on March 15, 2006. Performance information prior to April 1, 2006, is that of the Mason Street International Equity Fund.
| (1) | Returns would have been lower if a portion of the fees had not been waived. |
Data presented reflect past performance. Past performance is no guarantee of future results. Current performance may be higher or lower than the performance shown. Investment return and principal value will fluctuate, and redemption value may be more or less than original cost. To obtain performance data current to the most recent month end, please call 1-800-345-2021 or visit americancentury.com. International investing involves special risks, such as political instability and currency fluctuations. Investing in emerging markets may accentuate these risks. The fund’s investment process may result in high portfolio turnover, which could mean high transaction costs, affecting both performance and capital gains tax liabilities to investors.
Unless otherwise indicated, performance reflects A Class shares; performance for other share classes will vary due to differences in fee structure. For information about other share classes available, please consult the prospectus. Data assumes reinvestment of dividends and capital gains, and none of the charts reflect the deduction of taxes that a shareholder would pay on fund distributions or the redemption of fund shares. Returns for the index are provided for comparison. The fund’s total returns include operating expenses (such as transaction costs and management fees) that reduce returns, while the total returns of the index do not.
5
| Growth of $10,000 Over 10 Years |
| $10,000 investment made November 30, 2002* |
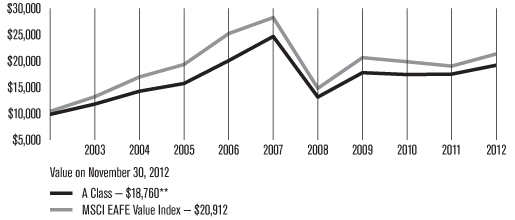
*The A Class’s initial investment is $9,425 to reflect the maximum 5.75% initial sales charge.
** Ending value would have been lower if a portion of the fees had not been waived.
| Total Annual Fund Operating Expenses | ||||
| Investor Class | Institutional Class | A Class | C Class | R Class |
| 1.31% | 1.11% | 1.56% | 2.31% | 1.81% |
The total annual fund operating expenses shown is as stated in the fund’s prospectus current as of the date of this report. The prospectus may vary from the expense ratio shown elsewhere in this report because it is based on a different time period, includes acquired fund fees and expenses, and, if applicable, does not include fee waivers or expense reimbursements.
Data presented reflect past performance. Past performance is no guarantee of future results. Current performance may be higher or lower than the performance shown. Investment return and principal value will fluctuate, and redemption value may be more or less than original cost. To obtain performance data current to the most recent month end, please call 1-800-345-2021 or visit americancentury.com. International investing involves special risks, such as political instability and currency fluctuations. Investing in emerging markets may accentuate these risks. The fund’s investment process may result in high portfolio turnover, which could mean high transaction costs, affecting both performance and capital gains tax liabilities to investors.
Unless otherwise indicated, performance reflects A Class shares; performance for other share classes will vary due to differences in fee structure. For information about other share classes available, please consult the prospectus. Data assumes reinvestment of dividends and capital gains, and none of the charts reflect the deduction of taxes that a shareholder would pay on fund distributions or the redemption of fund shares. Returns for the index are provided for comparison. The fund’s total returns include operating expenses (such as transaction costs and management fees) that reduce returns, while the total returns of the index do not.
6
| Portfolio Commentary |
Portfolio Managers: Armando Lacayo and Elizabeth Xie
Performance Summary
International Value returned 9.91%* for the fiscal year ended November 30, 2012, compared with the 12.45% return of its benchmark, the MSCI EAFE Value Index.
The robust gains for both International Value and its benchmark index reflected a broad advance in global equity markets (see page 4 for more details). The fund’s underperformance of its benchmark resulted mainly from stock selection in the financials and energy sectors. From a country perspective, stock choices in Belgium, Germany, and Hong Kong contributed favorably to performance versus the benchmark, while the fund’s holdings in the U.K., Singapore, and Sweden detracted from relative results.
Financials, Health Care Drove Absolute Performance
On an absolute basis, the financials and health care sectors of the portfolio posted the best returns for the 12-month period, with both sectors gaining more than 20%. The fund’s holdings in the industrials, consumer discretionary, and consumer staples sectors also generated double-digit gains for the reporting period. Many of the leading individual contributors were financial companies, including British financial services firm HSBC Holdings, Australian commercial banks Commonwealth Bank of Australia and Westpac Banking, and Belgian financial services provider KBC Groep.
On the downside, three sectors within the portfolio declined for the reporting period—information technology, energy, and utilities. A slowdown in demand weighed on the technology sector, while the energy and utilities sectors struggled with declining energy prices. Among the most significant individual detractors from absolute performance were European electric and gas provider E.ON, South Korean bank holding company Hana Financial Group, and two telecommunication services companies—Telefonica of Spain and France Telecom of France.
Financials Detracted from Relative Results
Although the fund’s financials stocks posted strong absolute returns, they lagged their counterparts in the MSCI EAFE Value Index and were one of the primary reasons why the fund underperformed the index for the 12-month period. Stock selection among commercial banks and capital markets firms produced the lion’s share of the underperformance in this sector.
Banks comprised many of the most significant individual detractors in the financials sector, including South Korean bank Hana Financial Group, British bank Lloyds Banking Group, and Japanese regional bank Hachijuni Bank. Hana faced a government probe regarding possible collusion on certificate of deposit rates; Lloyds took charges related to mis-selling payment protection insurance; and Hachijuni reported weaker-than-expected profits.
*All fund returns referenced in this commentary are for A Class shares and are not reduced by sales charges. A Class shares are subject to a maximum sales charge of 5.75%. Had the sales charge been applied, returns would have been lower than those shown.
7
Energy Also Lagged
The fund’s holdings in the energy sector also detracted from performance compared with the benchmark index. While stock selection among energy equipment and services companies was modestly positive, stock choices among oil and gas producers weighed on overall results, led by Japanese oil producers INPEX and TonenGeneral Sekiyu. Both companies faced declining domestic consumption, along with higher operating costs stemming from a government order to upgrade production plants to increase efficiency.
Other notable detractors for the reporting period included Japanese chemicals company Asahi Kasei and European power and gas utility E.ON. Asahi Kasei took on significant debt to acquire a U.S. medical device company, while E.ON struggled with declining demand and lower power prices across southern Europe.
Telecom, Industrials Added Value
On the positive side, International Value’s holdings in the telecommunication services and industrials sectors outperformed their counterparts in the MSCI EAFE Value Index for the 12-month period. Stock selection in the telecom services sector added value across the board, with both wireless providers and more traditional diversified carriers generating a similar margin of outperformance. One of the leading contributors was Japanese telecom provider SOFTBANK, which posted strong earnings and agreed to acquire U.S. wireless provider Sprint Nextel. The fund also benefited from avoiding Dutch telecom company Royal KPN, which reported disappointing profits and eliminated its dividend amid high debt levels and increased competition.
In the industrials sector, construction and engineering firms and air freight companies contributed to the outperformance. Top contributors included Japanese engineering company JGC, which won several development projects in the Middle East, and German shipping company Deutsche Post, which benefited from strong growth in Asia.
Other leading contributors in the portfolio for the reporting period included Belgian financial services provider KBC Groep, German broadcasting company ProSiebenSat.1 Media, and Swiss drug maker Roche Holding. KBC’s profits outpaced expectations thanks to favorable results in its core European markets; ProSiebenSat.1 benefited from strong results in its digital businesses and the pending sale of assets in Scandinavia; and Roche produced healthy earnings and promising results in its drug development pipeline.
A Look Ahead
As we move into 2013, the most important factor that is likely to impact the global stock markets in the near term is uncertainty—about the global economic outlook, the “fiscal cliff,” the sovereign debt situation in Europe, and the pace of growth in emerging economies. Consequently, we expect to see continued financial market volatility in the coming year. We believe that our disciplined investment approach is particularly beneficial during periods of volatility, as we adhere to our process regardless of the market environment, which we believe allows us to take advantage of opportunities presented by market inefficiencies.
8
| NOVEMBER 30, 2012 | |
| Top Ten Holdings | % of net assets |
HSBC Holdings plc(1) | 4.8% |
| Royal Dutch Shell plc B Shares | 3.2% |
| Sanofi | 3.0% |
| Commonwealth Bank of Australia | 3.0% |
| Total S.A. | 2.9% |
| Westpac Banking Corp. | 2.5% |
| Banco Santander SA | 2.5% |
| Australia & New Zealand Banking Group Ltd. | 2.4% |
| ENI SpA | 2.2% |
| Zurich Financial Services AG | 1.7% |
(1)Includes shares traded on all exchanges. | |
| Types of Investments in Portfolio | % of net assets |
| Foreign Common Stocks | 98.8% |
| Temporary Cash Investments | 0.4% |
| Other Assets and Liabilities | 0.8% |
| Investments by Country | % of net assets |
| United Kingdom | 20.9% |
| Japan | 17.7% |
| France | 11.1% |
| Australia | 10.2% |
| Germany | 7.8% |
| Switzerland | 7.4% |
| Spain | 5.5% |
| Italy | 4.6% |
| Hong Kong | 3.4% |
| Other Countries | 10.2% |
Cash and Equivalents(2) | 1.2% |
| (2) | Includes temporary cash investments and other assets and liabilities. |
9
Fund shareholders may incur two types of costs: (1) transaction costs, including sales charges (loads) on purchase payments and redemption/exchange fees; and (2) ongoing costs, including management fees; distribution and service (12b-1) fees; and other fund expenses. This example is intended to help you understand your ongoing costs (in dollars) of investing in your fund and to compare these costs with the ongoing cost of investing in other mutual funds.
The example is based on an investment of $1,000 made at the beginning of the period and held for the entire period from June 1, 2012 to November 30, 2012.
Actual Expenses
The table provides information about actual account values and actual expenses for each class. You may use the information, together with the amount you invested, to estimate the expenses that you paid over the period. First, identify the share class you own. Then simply divide your account value by $1,000 (for example, an $8,600 account value divided by $1,000 = 8.6), then multiply the result by the number under the heading “Expenses Paid During Period” to estimate the expenses you paid on your account during this period.
If you hold Investor Class shares of any American Century Investments fund, or Institutional Class shares of the American Century Diversified Bond Fund, in an American Century Investments account (i.e., not a financial intermediary or retirement plan account), American Century Investments may charge you a $12.50 semiannual account maintenance fee if the value of those shares is less than $10,000. We will redeem shares automatically in one of your accounts to pay the $12.50 fee. In determining your total eligible investment amount, we will include your investments in all personal accounts (including American Century Investments Brokerage accounts) registered under your Social Security number. Personal accounts include individual accounts, joint accounts, UGMA/UTMA accounts, personal trusts, Coverdell Education Savings Accounts and IRAs (including traditional, Roth, Rollover, SEP-, SARSEP- and SIMPLE-IRAs), and certain other retirement accounts. If you have only business, business retirement, employer-sponsored or American Century Investments Brokerage accounts, you are currently not subject to this fee. If you are subject to the Account Maintenance Fee, your account value could be reduced by the fee amount.
Hypothetical Example for Comparison Purposes
The table also provides information about hypothetical account values and hypothetical expenses based on the actual expense ratio of each class of your fund and an assumed rate of return of 5% per year before expenses, which is not the actual return of a fund’s share class. The hypothetical account values and expenses may not be used to estimate the actual ending account balance or expenses you paid for the period. You may use this information to compare the ongoing costs of investing in your fund and other funds. To do so, compare this 5% hypothetical example with the 5% hypothetical examples that appear in the shareholder reports of the other funds.
10
Please note that the expenses shown in the table are meant to highlight your ongoing costs only and do not reflect any transactional costs, such as sales charges (loads) or redemption/exchange fees. Therefore, the table is useful in comparing ongoing costs only, and will not help you determine the relative total costs of owning different funds. In addition, if these transactional costs were included, your costs would have been higher.
Beginning Account Value 6/1/12 | Ending Account Value 11/30/12 | Expenses Paid During Period(1) 6/1/12 - 11/30/12 | Annualized Expense Ratio(1) | |
| Actual | ||||
| Investor Class | $1,000 | $1,201.30 | $7.21 | 1.31% |
| Institutional Class | $1,000 | $1,201.60 | $6.11 | 1.11% |
| A Class | $1,000 | $1,200.30 | $8.58 | 1.56% |
| C Class | $1,000 | $1,195.50 | $12.68 | 2.31% |
| R Class | $1,000 | $1,199.40 | $9.95 | 1.81% |
| Hypothetical | ||||
| Investor Class | $1,000 | $1,018.45 | $6.61 | 1.31% |
| Institutional Class | $1,000 | $1,019.45 | $5.60 | 1.11% |
| A Class | $1,000 | $1,017.20 | $7.87 | 1.56% |
| C Class | $1,000 | $1,013.45 | $11.63 | 2.31% |
| R Class | $1,000 | $1,015.95 | $9.12 | 1.81% |
| (1) | Expenses are equal to the class’s annualized expense ratio listed in the table above, multiplied by the average account value over the period, multiplied by 183, the number of days in the most recent fiscal half-year, divided by 366, to reflect the one-half year period. |
11
NOVEMBER 30, 2012
| Shares | Value | |||||||
| Common Stocks — 98.8% | ||||||||
| AUSTRALIA — 10.2% | ||||||||
| Australia & New Zealand Banking Group Ltd. | 24,700 | $627,925 | ||||||
| Commonwealth Bank of Australia | 12,700 | 791,114 | ||||||
| National Australia Bank Ltd. | 14,608 | 370,451 | ||||||
| Telstra Corp. Ltd. | 54,647 | 245,798 | ||||||
| Westpac Banking Corp. | 25,200 | 670,617 | ||||||
| 2,705,905 | ||||||||
| AUSTRIA — 0.9% | ||||||||
| Oesterreichische Post AG | 2,400 | 96,542 | ||||||
| Raiffeisen Bank International AG | 3,550 | 146,196 | ||||||
| 242,738 | ||||||||
| BELGIUM — 0.6% | ||||||||
| KBC Groep NV | 5,000 | 150,636 | ||||||
| DENMARK — 1.0% | ||||||||
| Novo Nordisk A/S B Shares | 1,700 | 269,983 | ||||||
| FINLAND — 0.5% | ||||||||
| Metso Oyj | 1,000 | 37,599 | ||||||
| UPM-Kymmene Oyj | 7,250 | 81,561 | ||||||
| 119,160 | ||||||||
| FRANCE — 11.1% | ||||||||
| CNP Assurances | 12,420 | 180,912 | ||||||
| Euler Hermes SA | 1,900 | 150,734 | ||||||
| France Telecom SA | 9,767 | 103,385 | ||||||
| GDF Suez | 4,150 | 93,346 | ||||||
| Plastic Omnium SA | 3,150 | 90,149 | ||||||
| Sanofi | 8,863 | 791,429 | ||||||
| Total S.A. | 15,330 | 767,093 | ||||||
UbiSoft Entertainment SA(1) | 8,800 | 88,263 | ||||||
| Valeo SA | 5,200 | 246,506 | ||||||
| Veolia Environnement SA | 6,950 | 75,565 | ||||||
| Vivendi SA | 16,014 | 344,062 | ||||||
| 2,931,444 | ||||||||
| GERMANY — 7.8% | ||||||||
| Allianz SE | 3,000 | 389,970 | ||||||
| BASF SE | 2,919 | 261,566 | ||||||
| Bayer AG | 850 | 76,885 | ||||||
| Deutsche Boerse AG | 3,700 | 208,409 | ||||||
| Deutsche Post AG | 11,140 | 231,231 | ||||||
| Deutsche Telekom AG | 10,750 | 118,418 | ||||||
| E.ON AG | 14,320 | 257,941 | ||||||
| Leoni AG | 1,800 | 62,446 | ||||||
| ProSiebenSat.1 Media AG Preference Shares | 10,560 | 309,080 | ||||||
| Rheinmetall AG | 550 | 25,461 | ||||||
| Siemens AG | 1,280 | 132,011 | ||||||
| 2,073,418 | ||||||||
| GREECE — 0.2% | ||||||||
| OPAP SA | 9,800 | 63,727 | ||||||
| HONG KONG — 3.4% | ||||||||
| BOC Hong Kong Holdings Ltd. | 100,000 | 307,089 | ||||||
| Cheung Kong Holdings Ltd. | 7,300 | 111,428 | ||||||
| Hysan Development Co., Ltd. | 6,000 | 28,916 | ||||||
| Link Real Estate Investment Trust (The) | 12,500 | 67,821 | ||||||
| MGM China Holdings Ltd. | 103,600 | 193,827 | ||||||
| Wharf Holdings Ltd. | 21,000 | 161,628 | ||||||
| Wheelock & Co. Ltd. | 8,000 | 38,812 | ||||||
| 909,521 | ||||||||
| ISRAEL — 1.3% | ||||||||
Bank Hapoalim BM(1) | 49,500 | 203,945 | ||||||
| Delek Group Ltd. | 200 | 44,897 | ||||||
| Israel Chemicals Ltd. | 8,300 | 102,239 | ||||||
| 351,081 | ||||||||
| ITALY — 4.6% | ||||||||
| Assicurazioni Generali SpA | 2,300 | 38,587 | ||||||
| Enel SpA | 104,900 | 397,551 | ||||||
| ENI SpA | 24,680 | 583,534 | ||||||
| Mediaset SpA | 102,800 | 169,795 | ||||||
| Telecom Italia SpA | 39,800 | 36,259 | ||||||
| 1,225,726 | ||||||||
| JAPAN — 17.7% | ||||||||
| Central Japan Railway Co. | 100 | 7,921 | ||||||
| Chiba Bank Ltd. (The) | 9,000 | 53,715 | ||||||
| Chiyoda Corp. | 15,000 | 215,806 | ||||||
| COMSYS Holdings Corp. | 3,000 | 35,264 | ||||||
| Daihatsu Motor Co. Ltd. | 15,000 | 266,210 | ||||||
| Daikyo, Inc. | 93,000 | 223,376 | ||||||
| Daito Trust Construction Co. Ltd. | 700 | 67,847 | ||||||
| FamilyMart Co. Ltd. | 2,200 | 97,544 | ||||||
| Fujitsu Ltd. | 37,000 | 140,038 | ||||||
| INPEX Corp. | 44 | 235,919 | ||||||
| Japan Tobacco, Inc. | 6,000 | 179,778 | ||||||
| JGC Corp. | 9,000 | 296,415 | ||||||
| KDDI Corp. | 4,600 | 340,390 | ||||||
| Konica Minolta Holdings, Inc. | 9,500 | 67,763 | ||||||
| Lawson, Inc. | 3,200 | 216,607 | ||||||
| Mitsubishi Shokuhin Co. Ltd. | 2,000 | 49,785 | ||||||
| Mitsubishi UFJ Financial Group, Inc. | 8,000 | 36,586 | ||||||
12
| Shares | Value | |||||||
| Namco Bandai Holdings, Inc. | 6,000 | $84,212 | ||||||
| Nippon Telegraph & Telephone Corp. | 7,600 | 339,734 | ||||||
| NTT Data Corp. | 66 | 191,191 | ||||||
| Oracle Corp. Japan | 5,000 | 209,862 | ||||||
| Resona Holdings, Inc. | 66,700 | 279,147 | ||||||
| SOFTBANK Corp. | 6,800 | 254,892 | ||||||
| Sohgo Security Services Co. Ltd. | 5,000 | 65,749 | ||||||
| Sumitomo Metal Mining Co. Ltd. | 13,000 | 178,043 | ||||||
| Suzuken Co. Ltd. | 9,000 | 268,029 | ||||||
| T&D Holdings, Inc. | 7,000 | 75,235 | ||||||
| Tokyo Ohka Kogyo Co. Ltd. | 1,300 | 26,194 | ||||||
| Toyoda Gosei Co. Ltd. | 2,000 | 41,827 | ||||||
| TS Tech Co. Ltd. | 8,500 | 150,852 | ||||||
| 4,695,931 | ||||||||
| NETHERLANDS — 1.3% | ||||||||
ING Groep NV CVA(1) | 39,686 | 356,650 | ||||||
| NORWAY — 0.4% | ||||||||
| TGS Nopec Geophysical Co. ASA | 3,200 | 101,404 | ||||||
| PORTUGAL — 0.6% | ||||||||
| EDP - Energias de Portugal SA | 66,500 | 168,303 | ||||||
| SINGAPORE — 1.7% | ||||||||
| STX OSV Holdings Ltd. | 205,000 | 232,611 | ||||||
| Suntec Real Estate Investment Trust | 68,000 | 90,251 | ||||||
| United Overseas Bank Ltd. | 8,000 | 122,694 | ||||||
| 445,556 | ||||||||
| SPAIN — 5.5% | ||||||||
| Banco Santander SA | 85,106 | 654,589 | ||||||
| Endesa SA | 11,600 | 235,498 | ||||||
| Grupo Catalana Occidente SA | 5,500 | 86,409 | ||||||
| Mapfre SA | 100,068 | 281,370 | ||||||
| Tecnicas Reunidas SA | 900 | 41,904 | ||||||
| Telefonica SA | 12,100 | 158,783 | ||||||
| 1,458,553 | ||||||||
| SWEDEN — 1.7% | ||||||||
| Electrolux AB | 1,500 | 39,251 | ||||||
| Intrum Justitia AB | 17,100 | 240,308 | ||||||
| Modern Times Group AB B Shares | 4,800 | 160,809 | ||||||
| 440,368 | ||||||||
| SWITZERLAND — 7.4% | ||||||||
| Helvetia Holding AG | 650 | 234,974 | ||||||
| Nestle SA | 1,500 | 98,171 | ||||||
| Novartis AG | 7,400 | 457,958 | ||||||
| OC Oerlikon Corp. AG | 1,950 | 20,874 | ||||||
| Roche Holding AG | 1,610 | 316,892 | ||||||
| Swiss Life Holding AG | 2,300 | 307,759 | ||||||
| Swiss Re AG | 907 | 65,331 | ||||||
| Zurich Financial Services AG | 1,800 | 459,372 | ||||||
| 1,961,331 | ||||||||
| UNITED KINGDOM — 20.9% | ||||||||
Afren plc(1) | 54,200 | 118,532 | ||||||
| AstraZeneca plc | 3,000 | 142,583 | ||||||
| Berendsen plc | 5,800 | 53,896 | ||||||
| BHP Billiton plc | 6,800 | 213,753 | ||||||
| Bodycote plc | 23,300 | 154,024 | ||||||
| BP plc | 58,140 | 402,031 | ||||||
| Centrica plc | 28,700 | 149,855 | ||||||
| Evraz plc | 67,800 | 254,402 | ||||||
| Firstgroup plc | 87,000 | 260,096 | ||||||
| GlaxoSmithKline plc | 4,175 | 89,264 | ||||||
| HSBC Holdings plc | 104,700 | 1,069,711 | ||||||
| HSBC Holdings plc (Hong Kong) | 21,200 | 215,414 | ||||||
| Investec plc | 46,000 | 281,309 | ||||||
| London Stock Exchange Group plc | 15,700 | 245,878 | ||||||
| Marks & Spencer Group plc | 10,640 | 66,585 | ||||||
| Micro Focus International plc | 5,000 | 45,902 | ||||||
| Mondi plc | 19,054 | 195,833 | ||||||
| Royal Dutch Shell plc B Shares | 24,725 | 853,466 | ||||||
| Standard Chartered plc | 13,300 | 310,040 | ||||||
| Vodafone Group plc | 156,579 | 404,266 | ||||||
| 5,526,840 | ||||||||
TOTAL COMMON STOCKS (Cost $23,651,993) | 26,198,275 | |||||||
13
| Value | ||||
| Temporary Cash Investments — 0.4% | ||||
Repurchase Agreement, Bank of America Merrill Lynch, (collateralized by various U.S. Treasury obligations, 1.25% - 2.125%, 4/15/14 - 12/31/15, valued at $46,653), in a joint trading account at 0.18%, dated 11/30/12, due 12/3/12 (Delivery value $45,712) | $45,711 | |||
Repurchase Agreement, Credit Suisse First Boston, Inc., (collateralized by various U.S. Treasury obligations, 0.25%, 9/15/15, valued at $46,633), in a joint trading account at 0.17%, dated 11/30/12, due 12/3/12 (Delivery value $45,712) | 45,711 | |||
Repurchase Agreement, Goldman Sachs & Co., (collateralized by various U.S. Treasury obligations, 4.25%, 11/15/40, valued at $7,708), in a joint trading account at 0.15%, dated 11/30/12, due 12/3/12 (Delivery value $7,554) | 7,554 | |||
TOTAL TEMPORARY CASH INVESTMENTS (Cost $98,976) | 98,976 | |||
TOTAL INVESTMENT SECURITIES — 99.2% (Cost $23,750,969) | 26,297,251 | |||
| OTHER ASSETS AND LIABILITIES — 0.8% | 210,636 | |||
| TOTAL NET ASSETS — 100.0% | $26,507,887 | |||
| Market Sector Diversification | |
| (as a % of net assets) | |
| Financials | 38.3% |
| Energy | 11.7% |
| Health Care | 9.0% |
| Consumer Discretionary | 8.5% |
| Industrials | 8.2% |
| Telecommunication Services | 7.5% |
| Utilities | 5.3% |
| Materials | 5.0% |
| Information Technology | 2.8% |
| Consumer Staples | 2.5% |
| Cash and Equivalents* | 1.2% |
*Includes temporary cash investments and other assets and liabilities.
Notes to Schedule of Investments
CVA = Certificaten Van Aandelen
| (1) | Non-income producing. |
See Notes to Financial Statements.
14
| NOVEMBER 30, 2012 | ||||
| Assets | ||||
| Investment securities, at value (cost of $23,750,969) | $26,297,251 | |||
| Foreign currency holdings, at value (cost of $19,095) | 18,965 | |||
| Receivable for capital shares sold | 22,289 | |||
| Dividends and interest receivable | 211,538 | |||
| 26,550,043 | ||||
| Liabilities | ||||
| Payable for capital shares redeemed | 10,483 | |||
| Accrued management fees | 27,576 | |||
| Distribution and service fees payable | 4,097 | |||
| 42,156 | ||||
| Net Assets | $26,507,887 | |||
| Net Assets Consist of: | ||||
| Capital (par value and paid-in surplus) | $30,412,992 | |||
| Undistributed net investment income | 755,142 | |||
| Accumulated net realized loss | (7,214,608 | ) | ||
| Net unrealized appreciation | 2,554,361 | |||
| $26,507,887 | ||||
| Net assets | Shares outstanding | Net asset value per share | |
| Investor Class, $0.01 Par Value | $10,423,179 | 1,408,857 | $7.40 |
| Institutional Class, $0.01 Par Value | $234,781 | 31,754 | $7.39 |
| A Class, $0.01 Par Value | $14,154,653 | 1,905,779 | $7.43* |
| C Class, $0.01 Par Value | $1,411,838 | 190,786 | $7.40 |
| R Class, $0.01 Par Value | $283,436 | 38,324 | $7.40 |
| * | Maximum offering price $7.88 (net asset value divided by 0.9425). |
See Notes to Financial Statements.
15
| YEAR ENDED NOVEMBER 30, 2012 | ||||
| Investment Income (Loss) | ||||
| Income: | ||||
| Dividends (net of foreign taxes withheld of $81,865) | $1,095,718 | |||
| Interest | 97 | |||
| 1,095,815 | ||||
| Expenses: | ||||
| Management fees | 333,835 | |||
| Distribution and service fees: | ||||
| A Class | 35,563 | |||
| C Class | 12,352 | |||
| R Class | 1,276 | |||
| Directors’ fees and expenses | 1,472 | |||
| Other expenses | 713 | |||
| 385,211 | ||||
| Net investment income (loss) | 710,604 | |||
| Realized and Unrealized Gain (Loss) | ||||
| Net realized gain (loss) on: | ||||
| Investment transactions | (693,680 | ) | ||
| Foreign currency transactions | (7,290 | ) | ||
| (700,970 | ) | |||
| Change in net unrealized appreciation (depreciation) on: | ||||
| Investments | 2,254,231 | |||
| Translation of assets and liabilities in foreign currencies | (2,464 | ) | ||
| 2,251,767 | ||||
| Net realized and unrealized gain (loss) | 1,550,797 | |||
| Net Increase (Decrease) in Net Assets Resulting from Operations | $2,261,401 | |||
See Notes to Financial Statements.
16
| YEARS ENDED NOVEMBER 30, 2012 AND NOVEMBER 30, 2011 | ||||||||
| Increase (Decrease) in Net Assets | November 30, 2012 | November 30, 2011 | ||||||
| Operations | ||||||||
| Net investment income (loss) | $710,604 | $457,476 | ||||||
| Net realized gain (loss) | (700,970 | ) | 1,899,009 | |||||
| Change in net unrealized appreciation (depreciation) | 2,251,767 | (2,457,396 | ) | |||||
| Net increase (decrease) in net assets resulting from operations | 2,261,401 | (100,911 | ) | |||||
| Distributions to Shareholders | ||||||||
| From net investment income: | ||||||||
| Investor Class | (189,634 | ) | (140,866 | ) | ||||
| Institutional Class | (5,151 | ) | (26,763 | ) | ||||
| A Class | (231,826 | ) | (203,043 | ) | ||||
| B Class | — | (5,247 | ) | |||||
| C Class | (10,018 | ) | (6,656 | ) | ||||
| R Class | (3,397 | ) | (3,336 | ) | ||||
| Decrease in net assets from distributions | (440,026 | ) | (385,911 | ) | ||||
| Capital Share Transactions | ||||||||
| Net increase (decrease) in net assets from capital share transactions | (300,716 | ) | (1,290,177 | ) | ||||
| Redemption Fees | ||||||||
| Increase in net assets from redemption fees | 1,578 | 4,942 | ||||||
| Net increase (decrease) in net assets | 1,522,237 | (1,772,057 | ) | |||||
| Net Assets | ||||||||
| Beginning of period | 24,985,650 | 26,757,707 | ||||||
| End of period | $26,507,887 | $24,985,650 | ||||||
| Undistributed net investment income | $755,142 | $439,674 | ||||||
See Notes to Financial Statements.
17
1. Organization
American Century World Mutual Funds, Inc. (the corporation) is registered under the Investment Company Act of 1940, as amended (the 1940 Act), as an open-end management investment company and is organized as a Maryland corporation. International Value Fund (the fund) is one fund in a series issued by the corporation. The fund is diversified as defined under the 1940 Act. The fund’s investment objective is to seek long-term capital growth. The fund pursues its objective by investing at least 80% of its assets in equity securities and at least 65% of its assets in securities from a minimum of three countries outside the United States that have characteristics similar to those of the companies that comprise the MSCI EAFE Value Index. Additionally, the fund invests primarily in securities issued by companies located in developed countries.
The fund offers the Investor Class, the Institutional Class, the A Class, the C Class and the R Class. The A Class may incur an initial sales charge. The A Class and C Class may be subject to a contingent deferred sales charge. The share classes differ principally in their respective sales charges and distribution and shareholder servicing expenses and arrangements. The Institutional Class is made available to institutional shareholders or through financial intermediaries whose clients do not require the same level of shareholder and administrative services as shareholders of other classes. As a result, the Institutional Class is charged a lower unified management fee. On October 21, 2011, all outstanding B Class shares were converted to A Class shares and the fund discontinued offering the B Class.
2. Significant Accounting Policies
The following is a summary of significant accounting policies consistently followed by the fund in preparation of its financial statements. The financial statements are prepared in conformity with accounting principles generally accepted in the United States of America, which may require management to make certain estimates and assumptions at the date of the financial statements. Actual results could differ from these estimates.
Investment Valuations — The fund determines the fair value of its investments and computes its net asset value per share as of the close of regular trading (usually 4 p.m. Eastern time) on the New York Stock Exchange (NYSE) on each day the NYSE is open.
Equity securities that are listed or traded on a domestic securities exchange are valued at the last reported sales price or at the official closing price as provided by the exchange. Equity securities traded on foreign securities exchanges are typically valued at the closing price on the exchange where primarily traded or as of the close of the NYSE, if that is earlier. If no last sales price is reported, or if local convention or regulation so provides, the mean of the latest bid and asked prices is used. Depending on local convention or regulation, securities traded over-the-counter are valued at the mean of the latest bid and asked prices, the last sales price, or the official closing price. In its determination of fair value, the fund may review several factors including: market information specific to a security; news developments in U.S. and foreign markets; the performance of particular U.S. and foreign securities, indices, comparable securities, American Depositary Receipts, Exchange-Traded Funds, and other relevant market indicators.
Debt securities maturing within 60 days at the time of purchase may be valued at cost, plus or minus any amortized discount or premium or at the evaluated mean as provided by an independent pricing service. Evaluated mean prices are commonly derived through utilization of market models, which may consider, among other factors, trade data, quotations from dealers and active market makers, relevant yield curve and spread data, related sector levels, creditworthiness, and other relevant market information on the same or comparable securities.
Investments in open-end management investment companies are valued at the reported net asset value per share. Repurchase agreements are valued at cost.
The value of investments initially expressed in foreign currencies is translated into U.S. dollars at prevailing exchange rates.
18
If the fund determines that the market price for a portfolio security is not readily available or the valuation methods mentioned above do not reflect a security’s fair value, such security is valued as determined in good faith by the Board of Directors or its designee, in accordance with procedures adopted by the Board of Directors. Circumstances that may cause the fund to use these procedures to value a security include, but are not limited to: a security has been declared in default; trading in a security has been halted during the trading day; there is a foreign market holiday and no trading occurred; or an event occurred between the close of a foreign exchange and the NYSE that may affect the value of a security.
Security Transactions — Security transactions are accounted for as of the trade date. Net realized gains and losses are determined on the identified cost basis, which is also used for federal income tax purposes.
Investment Income — Dividend income less foreign taxes withheld, if any, is recorded as of the ex-dividend date. Distributions received on securities that represent a return of capital or capital gain are recorded as a reduction of cost of investments and/or as a realized gain. The fund estimates the components of distributions received that may be considered nontaxable distributions or capital gain distributions for income tax purposes. Interest income is recorded on the accrual basis and includes accretion of discounts and amortization of premiums.
Foreign Currency Translations — All assets and liabilities initially expressed in foreign currencies are translated into U.S. dollars at prevailing exchange rates at period end. The fund may enter into spot foreign currency exchange contracts to facilitate transactions denominated in a foreign currency. Purchases and sales of investment securities, dividend and interest income, spot foreign currency exchange contracts, and expenses are translated at the rates of exchange prevailing on the respective dates of such transactions. Net realized and unrealized foreign currency exchange gains or losses related to investment securities are a component of net realized gain (loss) on investment transactions and change in net unrealized appreciation (depreciation) on investments, respectively.
Repurchase Agreements — The fund may enter into repurchase agreements with institutions that American Century Investment Management, Inc. (ACIM) (the investment advisor) has determined are creditworthy pursuant to criteria adopted by the Board of Directors. The fund requires that the collateral, represented by securities, received in a repurchase transaction be transferred to the custodian in a manner sufficient to enable the fund to obtain those securities in the event of a default under the repurchase agreement. ACIM monitors, on a daily basis, the securities transferred to ensure the value, including accrued interest, of the securities under each repurchase agreement is equal to or greater than amounts owed to the fund under each repurchase agreement.
Joint Trading Account — Pursuant to an Exemptive Order issued by the Securities and Exchange Commission, the fund, along with certain other funds in the American Century Investments family of funds, may transfer uninvested cash balances into a joint trading account. These balances are invested in one or more repurchase agreements that are collateralized by U.S. Treasury or Agency obligations.
Income Tax Status — It is the fund’s policy to distribute substantially all net investment income and net realized gains to shareholders and to otherwise qualify as a regulated investment company under provisions of the Internal Revenue Code. The fund is no longer subject to examination by tax authorities for years prior to 2009. At this time, management believes there are no uncertain tax positions which, based on their technical merit, would not be sustained upon examination and for which it is reasonably possible that the total amounts of unrecognized tax benefits will significantly change in the next twelve months. Accordingly, no provision has been made for federal or state income taxes.
Multiple Class — All shares of the fund represent an equal pro rata interest in the net assets of the class to which such shares belong, and have identical voting, dividend, liquidation and other rights and the same terms and conditions, except for class specific expenses and exclusive rights to vote on matters affecting only individual classes. Income, non-class specific expenses, and realized and unrealized capital gains and losses of the fund are allocated to each class of shares based on their relative net assets.
19
Distributions to Shareholders — Distributions from net investment income and net realized gains, if any, are generally declared and paid annually. The fund may make distributions on a more frequent basis to comply with the distribution requirements of the Internal Revenue Code, in all events in a manner consistent with provisions of the 1940 Act.
Redemption — The fund may impose a 2.00% redemption fee on shares held less than 60 days. The fee may not be applicable to all classes. The redemption fee is retained by the fund and helps cover transaction costs that long-term investors may bear when the fund sells securities to meet investor redemptions.
Indemnifications — Under the corporation’s organizational documents, its officers and directors are indemnified against certain liabilities arising out of the performance of their duties to the fund. In addition, in the normal course of business, the fund enters into contracts that provide general indemnifications. The maximum exposure under these arrangements is unknown as this would involve future claims that may be made against a fund. The risk of material loss from such claims is considered by management to be remote.
3. Fees and Transactions with Related Parties
Management Fees — The corporation has entered into a management agreement with ACIM, under which ACIM provides the fund with investment advisory and management services in exchange for a single, unified management fee (the fee) per class. The agreement provides that all expenses of managing and operating the fund, except distribution and service fees, brokerage expenses, taxes, interest, fees and expenses of the independent directors (including legal counsel fees), and extraordinary expenses, will be paid by ACIM. The fee is computed and accrued daily based on each class’s daily net assets and paid monthly in arrears. The rate of the fee is determined by applying a fee rate calculation formula. This formula takes into account the fund’s assets as well as certain assets, if any, of other clients of the investment advisor outside the American Century Investments family of funds (such as subadvised funds and separate accounts) that have very similar investment teams and investment strategies (strategy assets). The annual management fee schedule ranges from 1.10% to 1.30% for the Investor Class, A Class,
C Class and R Class. The Institutional Class is 0.20% less at each point within the range. The effective annual management fee for each class for the year ended November 30, 2012 was 1.30% for the Investor Class, A Class, C Class and R Class and 1.10% for the Institutional Class.
Distribution and Service Fees — The Board of Directors has adopted a separate Master Distribution and Individual Shareholder Services Plan for each of the A Class, C Class and R Class (collectively the plans), pursuant to Rule 12b-1 of the 1940 Act. The plans provide that the A Class will pay American Century Investment Services, Inc. (ACIS) an annual distribution and service fee of 0.25%. The plans provide that the C Class will pay ACIS an annual distribution and service fee of 1.00%, of which 0.25% is paid for individual shareholder services and 0.75% is paid for distribution services. The plans provide that the R Class will pay ACIS an annual distribution and service fee of 0.50%. The fees are computed and accrued daily based on each class’s daily net assets and paid monthly in arrears. The fees are used to pay financial intermediaries for distribution and individual shareholder services. Fees incurred under the plans during the year ended November 30, 2012 are detailed in the Statement of Operations.
Related Parties — Certain officers and directors of the corporation are also officers and/or directors of American Century Companies, Inc., the parent of the corporation’s investment advisor, ACIM, the distributor of the corporation, ACIS, and the corporation’s transfer agent, American Century Services, LLC.
4. Investment Transactions
Purchases and sales of investment securities, excluding short-term investments, for the year ended November 30, 2012 were $31,868,746 and $31,873,986, respectively.
20
5. Capital Share Transactions
Transactions in shares of the fund were as follows:
| Year ended November 30, 2012 | Year ended November 30, 2011 | |||||||||||||||
| Shares | Amount | Shares | Amount | |||||||||||||
| Investor Class/Shares Authorized | 55,000,000 | 55,000,000 | ||||||||||||||
| Sold | 436,979 | $3,041,176 | 791,977 | $5,985,711 | ||||||||||||
| Issued in reinvestment of distributions | 26,559 | 184,322 | 17,606 | 134,337 | ||||||||||||
| Redeemed | (426,926 | ) | (2,919,238 | ) | (490,278 | ) | (3,574,371 | ) | ||||||||
| 36,612 | 306,260 | 319,305 | 2,545,677 | |||||||||||||
| Institutional Class/Shares Authorized | 55,000,000 | 55,000,000 | ||||||||||||||
| Sold | 23,213 | 160,070 | 43,605 | 319,246 | ||||||||||||
| Issued in reinvestment of distributions | 744 | 5,151 | 3,517 | 26,763 | ||||||||||||
| Redeemed | (27,852 | ) | (184,191 | ) | (222,380 | ) | (1,539,176 | ) | ||||||||
| (3,895 | ) | (18,970 | ) | (175,258 | ) | (1,193,167 | ) | |||||||||
| A Class/Shares Authorized | 45,000,000 | 45,000,000 | ||||||||||||||
| Sold | 433,036 | 3,041,411 | 491,689 | 3,631,313 | ||||||||||||
| Issued in reinvestment of distributions | 32,778 | 228,789 | 26,048 | 199,787 | ||||||||||||
| Redeemed | (595,050 | ) | (4,063,386 | ) | (759,310 | ) | (5,588,230 | ) | ||||||||
| (129,236 | ) | (793,186 | ) | (241,573 | ) | (1,757,130 | ) | |||||||||
| B Class/Shares Authorized | N/A | 5,000,000 | ||||||||||||||
| Sold | 2,377 | 17,568 | ||||||||||||||
| Issued in reinvestment of distributions | 696 | 5,240 | ||||||||||||||
| Redeemed | (141,146 | ) | (980,262 | ) | ||||||||||||
| (138,073 | ) | (957,454 | ) | |||||||||||||
| C Class/Shares Authorized | 10,000,000 | 10,000,000 | ||||||||||||||
| Sold | 53,195 | 372,895 | 50,831 | 372,349 | ||||||||||||
| Issued in reinvestment of distributions | 1,418 | 9,913 | 864 | 6,647 | ||||||||||||
| Redeemed | (29,947 | ) | (208,734 | ) | (36,127 | ) | (274,435 | ) | ||||||||
| 24,666 | 174,074 | 15,568 | 104,561 | |||||||||||||
| R Class/Shares Authorized | 5,000,000 | 5,000,000 | ||||||||||||||
| Sold | 13,662 | 96,454 | 10,643 | 78,636 | ||||||||||||
| Issued in reinvestment of distributions | 488 | 3,397 | 436 | 3,336 | ||||||||||||
| Redeemed | (9,996 | ) | (68,745 | ) | (16,501 | ) | (114,636 | ) | ||||||||
| 4,154 | 31,106 | (5,422 | ) | (32,664 | ) | |||||||||||
| Net increase (decrease) | (67,699 | ) | $(300,716 | ) | (225,453 | ) | $(1,290,177 | ) | ||||||||
21
6. Fair Value Measurements
The fund’s securities valuation process is based on several considerations and may use multiple inputs to determine the fair value of the positions held by the fund. In conformity with accounting principles generally accepted in the United States of America, the inputs used to determine a valuation are classified into three broad levels as follows:
| • | Level 1 valuation inputs consist of unadjusted quoted prices in an active market for identical securities; |
| • | Level 2 valuation inputs consist of direct or indirect observable market data (including quoted prices for similar securities, evaluations of subsequent market events, interest rates, prepayment speeds, credit risk, etc.); or |
| • | Level 3 valuation inputs consist of unobservable data (including a fund’s own assumptions). |
The level classification is based on the lowest level input that is significant to the fair valuation measurement. The valuation inputs are not necessarily an indication of the risks associated with investing in these securities or other financial instruments.
The following is a summary of the level classifications as of period end. The Schedule of Investments provides additional information on the fund’s portfolio holdings.
| Level 1 | Level 2 | Level 3 | ||||||||||
| Investment Securities | ||||||||||||
| Foreign Common Stocks | — | $26,198,275 | — | |||||||||
| Temporary Cash Investments | — | 98,976 | — | |||||||||
| Total Value of Investment Securities | — | $26,297,251 | — | |||||||||
7. Risk Factors
There are certain risks involved in investing in foreign securities. These risks include those resulting from future adverse political, social and economic developments, fluctuations in currency exchange rates, the possible imposition of exchange controls, and other foreign laws or restrictions. Investing in emerging markets may accentuate these risks.
The fund’s investment process may result in high portfolio turnover, which could mean high transaction costs, affecting both performance and capital gains tax liabilities to investors.
8. Federal Tax Information
The tax character of distributions paid during the years ended November 30, 2012 and November 30, 2011 were as follows:
| 2012 | 2011 | |||||||
| Distributions Paid From | ||||||||
| Ordinary income | $440,026 | $385,911 | ||||||
| Long-term capital gains | — | — | ||||||
The book-basis character of distributions made during the year from net investment income or net realized gains may differ from their ultimate characterization for federal income tax purposes. These differences reflect the differing character of certain income items and net realized gains and losses for financial statement and tax purposes, and may result in reclassification among certain capital accounts on the financial statements.
22
As of November 30, 2012, the federal tax cost of investments and the components of distributable earnings on a tax-basis were as follows:
| Federal tax cost of investments | $23,933,428 | |||
| Gross tax appreciation of investments | $2,898,993 | |||
| Gross tax depreciation of investments | (535,170 | ) | ||
| Net tax appreciation (depreciation) of investments | $2,363,823 | |||
Net tax appreciation (depreciation) on translation of assets and liabilities in foreign currencies | $8,079 | |||
| Net tax appreciation (depreciation) | $2,371,902 | |||
| Undistributed ordinary income | $780,867 | |||
| Accumulated short-term capital losses | $(7,057,874 | ) |
The difference between book-basis and tax-basis cost and unrealized appreciation (depreciation) is attributable primarily to the tax deferral of losses on wash sales and the realization to ordinary income for tax purposes of unrealized gains on investments in passive foreign investment companies.
Accumulated capital losses represent net capital loss carryovers that may be used to offset future realized capital gains for federal income tax purposes. Any unlimited losses will be required to be utilized prior to the losses which carry an expiration date. Future capital loss carryover utilization in any given year may be subject to Internal Revenue Code limitations. Capital loss carryovers of $(6,210,901) expire in 2017 and the remaining losses are unlimited.
23
| For a Share Outstanding Throughout the Years Ended November 30 (except as noted) | ||||||||||||||||||||||||||||||||||||||||||
| Per-Share Data | Ratios and Supplemental Data | |||||||||||||||||||||||||||||||||||||||||
| Income From Investment Operations: | Distributions From: | Ratio to Average Net Assets of: | ||||||||||||||||||||||||||||||||||||||||
Net Asset Value, Beginning of Period | Net Investment Income (Loss)(1) | Net Realized and Unrealized Gain (Loss) | Total From Investment Operations | Net Investment Income | Net Realized Gains | Total Distributions | Net Asset Value, End of Period | Total Return(2) | Operating Expenses | Operating Expenses (before expense waiver) | Net Investment Income (Loss) | Net Investment Income (Loss) (before expense waiver) | Portfolio Turnover Rate | Net Assets, End of Period (in thousands) | ||||||||||||||||||||||||||||
| Investor Class | ||||||||||||||||||||||||||||||||||||||||||
| 2012 | $6.84 | 0.20 | 0.49 | 0.69 | (0.13 | ) | — | (0.13 | ) | $7.40 | 10.25 | % | 1.31 | % | 1.31 | % | 2.95 | % | 2.95 | % | 125 | % | $10,423 | |||||||||||||||||||
| 2011 | $6.91 | 0.14 | (0.09 | ) | 0.05 | (0.12 | ) | — | (0.12 | ) | $6.84 | 0.57 | % | 1.31 | % | 1.31 | % | 1.85 | % | 1.85 | % | 30 | % | $9,391 | ||||||||||||||||||
| 2010 | $7.33 | 0.11 | (0.24 | ) | (0.13 | ) | (0.29 | ) | — | (0.29 | ) | $6.91 | (1.82 | )% | 1.32 | % | 1.32 | % | 1.66 | % | 1.66 | % | 26 | % | $7,272 | |||||||||||||||||
| 2009 | $5.47 | 0.11 | 1.88 | 1.99 | (0.13 | ) | — | (0.13 | ) | $7.33 | 36.98 | % | 1.31 | % | 1.31 | % | 2.34 | % | 2.34 | % | 16 | % | $7,062 | |||||||||||||||||||
| 2008 | $11.48 | 0.19 | (5.18 | ) | (4.99 | ) | (0.24 | ) | (0.78 | ) | (1.02 | ) | $5.47 | (47.43 | )% | 1.31 | % | 1.31 | % | 2.20 | % | 2.20 | % | 4 | % | $2,512 | ||||||||||||||||
| Institutional Class | ||||||||||||||||||||||||||||||||||||||||||
| 2012 | $6.84 | 0.23 | 0.47 | 0.70 | (0.15 | ) | — | (0.15 | ) | $7.39 | 10.33 | % | 1.11 | % | 1.11 | % | 3.15 | % | 3.15 | % | 125 | % | $235 | |||||||||||||||||||
| 2011 | $6.90 | 0.15 | (0.07 | ) | 0.08 | (0.14 | ) | — | (0.14 | ) | $6.84 | 0.92 | % | 1.11 | % | 1.11 | % | 2.05 | % | 2.05 | % | 30 | % | $244 | ||||||||||||||||||
| 2010 | $7.34 | 0.13 | (0.25 | ) | (0.12 | ) | (0.32 | ) | — | (0.32 | ) | $6.90 | (1.69 | )% | 1.12 | % | 1.12 | % | 1.86 | % | 1.86 | % | 26 | % | $1,456 | |||||||||||||||||
| 2009 | $5.48 | 0.18 | 1.82 | 2.00 | (0.14 | ) | — | (0.14 | ) | $7.34 | 37.18 | % | 1.11 | % | 1.11 | % | 2.54 | % | 2.54 | % | 16 | % | $1,627 | |||||||||||||||||||
| 2008 | $11.50 | 0.21 | (5.19 | ) | (4.98 | ) | (0.26 | ) | (0.78 | ) | (1.04 | ) | $5.48 | (47.32 | )% | 1.11 | % | 1.11 | % | 2.40 | % | 2.40 | % | 4 | % | $23,847 | ||||||||||||||||
| A Class | ||||||||||||||||||||||||||||||||||||||||||
| 2012 | $6.87 | 0.19 | 0.48 | 0.67 | (0.11 | ) | — | (0.11 | ) | $7.43 | 9.91 | % | 1.56 | % | 1.56 | % | 2.70 | % | 2.70 | % | 125 | % | $14,155 | |||||||||||||||||||
| 2011 | $6.93 | 0.12 | (0.08 | ) | 0.04 | (0.10 | ) | — | (0.10 | ) | $6.87 | 0.45 | % | 1.56 | % | 1.56 | % | 1.60 | % | 1.60 | % | 30 | % | $13,981 | ||||||||||||||||||
| 2010 | $7.33 | 0.10 | (0.24 | ) | (0.14 | ) | (0.26 | ) | — | (0.26 | ) | $6.93 | (2.04 | )% | 1.57 | % | 1.57 | % | 1.41 | % | 1.41 | % | 26 | % | $15,783 | |||||||||||||||||
| 2009 | $5.48 | 0.10 | 1.86 | 1.96 | (0.11 | ) | — | (0.11 | ) | $7.33 | 36.40 | % | 1.56 | % | 1.56 | % | 2.09 | % | 2.09 | % | 16 | % | $18,644 | |||||||||||||||||||
| 2008 | $11.49 | 0.18 | (5.20 | ) | (5.02 | ) | (0.21 | ) | (0.78 | ) | (0.99 | ) | $5.48 | (47.53 | )% | 1.51 | % | 1.56 | % | 2.00 | % | 1.95 | % | 4 | % | $15,015 | ||||||||||||||||
24
| For a Share Outstanding Throughout the Years Ended November 30 (except as noted) | ||||||||||||||||||||||||||||||||||||||||||
| Per-Share Data | Ratios and Supplemental Data | |||||||||||||||||||||||||||||||||||||||||
| Income From Investment Operations: | Distributions From: | Ratio to Average Net Assets of: | ||||||||||||||||||||||||||||||||||||||||
Net Asset Value, Beginning of Period | Net Investment Income (Loss)(1) | Net Realized and Unrealized Gain (Loss) | Total From Investment Operations | Net Investment Income | Net Realized Gains | Total Distributions | Net Asset Value, End of Period | Total Return(2) | Operating Expenses | Operating Expenses (before expense waiver) | Net Investment Income (Loss) | Net Investment Income (Loss) (before expense waiver) | Portfolio Turnover Rate | Net Assets, End of Period (in thousands) | ||||||||||||||||||||||||||||
| C Class | ||||||||||||||||||||||||||||||||||||||||||
| 2012 | $6.84 | 0.13 | 0.49 | 0.62 | (0.06 | ) | — | (0.06 | ) | $7.40 | 9.10 | % | 2.31 | % | 2.31 | % | 1.95 | % | 1.95 | % | 125 | % | $1,412 | |||||||||||||||||||
| 2011 | $6.90 | 0.06 | (0.08 | ) | (0.02 | ) | (0.04 | ) | — | (0.04 | ) | $6.84 | (0.31 | )% | 2.31 | % | 2.31 | % | 0.85 | % | 0.85 | % | 30 | % | $1,137 | |||||||||||||||||
| 2010 | $7.25 | 0.05 | (0.25 | ) | (0.20 | ) | (0.15 | ) | — | (0.15 | ) | $6.90 | (2.85 | )% | 2.32 | % | 2.32 | % | 0.66 | % | 0.66 | % | 26 | % | $1,039 | |||||||||||||||||
| 2009 | $5.42 | 0.05 | 1.85 | 1.90 | (0.07 | ) | — | (0.07 | ) | $7.25 | 35.44 | % | 2.31 | % | 2.31 | % | 1.34 | % | 1.34 | % | 16 | % | $869 | |||||||||||||||||||
| 2008 | $11.37 | 0.12 | (5.17 | ) | (5.05 | ) | (0.12 | ) | (0.78 | ) | (0.90 | ) | $5.42 | (47.93 | )% | 2.31 | % | 2.31 | % | 1.20 | % | 1.20 | % | 4 | % | $337 | ||||||||||||||||
| R Class | ||||||||||||||||||||||||||||||||||||||||||
| 2012 | $6.84 | 0.17 | 0.49 | 0.66 | (0.10 | ) | — | (0.10 | ) | $7.40 | 9.67 | % | 1.81 | % | 1.81 | % | 2.45 | % | 2.45 | % | 125 | % | $283 | |||||||||||||||||||
| 2011 | $6.90 | 0.10 | (0.08 | ) | 0.02 | (0.08 | ) | — | (0.08 | ) | $6.84 | 0.20 | % | 1.81 | % | 1.81 | % | 1.35 | % | 1.35 | % | 30 | % | $234 | ||||||||||||||||||
| 2010 | $7.28 | 0.09 | (0.25 | ) | (0.16 | ) | (0.22 | ) | — | (0.22 | ) | $6.90 | (2.27 | )% | 1.82 | % | 1.82 | % | 1.16 | % | 1.16 | % | 26 | % | $273 | |||||||||||||||||
| 2009 | $5.45 | 0.09 | 1.84 | 1.93 | (0.10 | ) | — | (0.10 | ) | $7.28 | 35.90 | % | 1.81 | % | 1.81 | % | 1.84 | % | 1.84 | % | 16 | % | $123 | |||||||||||||||||||
| 2008 | $11.42 | 0.13 | (5.14 | ) | (5.01 | ) | (0.18 | ) | (0.78 | ) | (0.96 | ) | $5.45 | (47.61 | )% | 1.81 | % | 1.81 | % | 1.70 | % | 1.70 | % | 4 | % | $78 | ||||||||||||||||
Notes to Financial Highlights
| (1) | Computed using average shares outstanding throughout the period. |
| (2) | Total returns are calculated based on the net asset value of the last business day and do not reflect applicable sales charges, if any. Total returns for periods less than one year are not annualized. |
See Notes to Financial Statements.
25
The Board of Directors and Shareholders of
American Century World Mutual Funds, Inc.:
We have audited the accompanying statement of assets and liabilities, including the schedule of investments, of International Value Fund, one of the funds constituting American Century World Mutual Funds, Inc. (the “Corporation”) as of November 30, 2012, and the related statement of operations for the year then ended, the statement of changes in net assets for each of the two years in the period then ended, and the financial highlights for each of the five years in the period then ended. These financial statements and financial highlights are the responsibility of the Corporation’s management. Our responsibility is to express an opinion on these financial statements and financial highlights based on our audits.
We conducted our audits in accordance with the standards of the Public Company Accounting Oversight Board (United States). Those standards require that we plan and perform the audit to obtain reasonable assurance about whether the financial statements and financial highlights are free of material misstatement. The Corporation is not required to have, nor were we engaged to perform, an audit of its internal control over financial reporting. Our audits included consideration of internal control over financial reporting as a basis for designing audit procedures that are appropriate in the circumstances, but not for the purpose of expressing an opinion on the effectiveness of the Corporation’s internal control over financial reporting. Accordingly, we express no such opinion. An audit also includes examining, on a test basis, evidence supporting the amounts and disclosures in the financial statements, assessing the accounting principles used and significant estimates made by management, as well as evaluating the overall financial statement presentation. Our procedures included confirmation of securities owned as of November 30, 2012, by correspondence with the custodian and brokers; where replies were not received from brokers, we performed other auditing procedures. We believe that our audits provide a reasonable basis for our opinion.
In our opinion, the financial statements and financial highlights referred to above present fairly, in all material respects, the financial position of International Value Fund of American Century World Mutual Funds, Inc., as of November 30, 2012, the results of its operations for the year then ended, the changes in its net assets for each of the two years in the period then ended, and the financial highlights for each of the five years in the period then ended, in conformity with accounting principles generally accepted in the United States of America.
Deloitte & Touche LLP
Kansas City, Missouri
January 17, 2013
26
The Board of Directors
The individuals listed below serve as directors of the funds. Each director will continue to serve in this capacity until death, retirement, resignation or removal from office. The mandatory retirement age for directors who are not “interested persons,” as that term is defined in the Investment Company Act (independent directors), is 72. However, the mandatory retirement age for an individual director may be extended with the approval of the remaining independent directors.
Mr. Thomas is an “interested person” because he currently serves as President and Chief Executive Officer of American Century Companies, Inc. (ACC), the parent company of American Century Investment Management, Inc. (ACIM or the advisor). Mr. Fink is an “interested person” because he currently serves as Executive Vice President of ACC.
The other directors (more than three-fourths of the total number) are independent; that is, they have never been employees, directors or officers of, and have no financial interest in, ACC or any of its wholly owned, direct or indirect, subsidiaries, including ACIM, American Century Investment Services, Inc. (ACIS) and American Century Services, LLC (ACS). The directors serve in this capacity for seven (in the case of Mr. Thomas, 15) registered investment companies in the American Century Investments family of funds.
The following table presents additional information about the directors. The mailing address for each director is 4500 Main Street, Kansas City, Missouri 64111.
Name (Year of Birth) | Position(s) Held with Funds | Length of Time Served | Principal Occupation(s) During Past 5 Years | Number of American Century Portfolios Overseen by Director | Other Directorships Held During Past 5 Years | |
| Independent Directors | ||||||
Thomas A. Brown (1940) | Director | Since 1980 | Managing Member, Associated Investments, LLC (real estate investment company); Brown Cascade Properties, LLC (real estate investment company) (2001 to 2009) | 66 | None | |
Andrea C. Hall (1945) | Director | Since 1997 | Retired | 66 | None | |
Jan M. Lewis (1957) | Director | Since 2011 | President and Chief Executive Officer, Catholic Charities of Northeast Kansas (human services organization) | 66 | None | |
James A. Olson (1942) | Director | Since 2007 | Member, Plaza Belmont LLC (private equity fund manager) | 66 | Saia, Inc. (2002 to 2012) and Entertainment Properties Trust | |
Donald H. Pratt (1937) | Director and Chairman of the Board | Since 1995 (Chairman since 2005) | Chairman and Chief Executive Officer, Western Investments, Inc. (real estate company) | 66 | None | |
27
Name (Year of Birth) | Position(s) Held with Funds | Length of Time Served | Principal Occupation(s) During Past 5 Years | Number of American Century Portfolios Overseen by Director | Other Directorships Held During Past 5 Years | |
| Independent Directors | ||||||
M. Jeannine Strandjord (1945) | Director | Since 1994 | Retired | 66 | Euronet Worldwide Inc.; Charming Shoppes, Inc. (2006 to 2010); and DST Systems Inc. (1996 to 2012) | |
John R. Whitten (1946) | Director | Since 2008 | Retired | 66 | Rudolph Technologies, Inc. | |
Stephen E. Yates (1948) | Director | Since 2012 | Retired; Executive Vice President, Technology & Operations, KeyCorp. (computer services) (2004 to 2010) | 66 | Applied Industrial Technologies, Inc. (2001 to 2010) | |
| Interested Directors | ||||||
Barry Fink (1955) | Director and Executive Vice President | Since 2012 (Executive Vice President since 2007) | Executive Vice President, ACC (September 2007 to present); President, ACS (October 2007 to present); Chief Operating Officer, ACC (September 2007 to November 2012). Also serves as Manager, ACS | 66 | None | |
Jonathan S. Thomas (1963) | Director and President | Since 2007 | President and Chief Executive Officer, ACC (March 2007 to present). Also serves as Chief Executive Officer and Manager, ACS; Executive Vice President, ACIM; Director, ACC, ACIM and other ACC subsidiaries | 108 | None | |
28
Officers
The following table presents certain information about the executive officers of the funds. Each officer serves as an officer for each of the 15 investment companies in the American Century family of funds, unless otherwise noted.
No officer is compensated for his or her service as an officer of the funds. The listed officers are interested persons of the funds and are appointed or re-appointed on an annual basis. The mailing address for each officer listed below is 4500 Main Street, Kansas City, Missouri 64111.
Name (Year of Birth) | Offices with the Funds | Principal Occupation(s) During the Past Five Years | ||
Jonathan S. Thomas (1963) | Director and President since 2007 | President and Chief Executive Officer, ACC (March 2007 to present). Also serves as Chief Executive Officer and Manager, ACS; Executive Vice President, ACIM; Director, ACC, ACIM and other ACC subsidiaries | ||
Barry Fink (1955) | Director since 2012 and Executive Vice President since 2007 | Executive Vice President, ACC (September 2007 to present); President, ACS (October 2007 to present); Chief Operating Officer, ACC (September 2007 to November 2012). Also serves as Manager, ACS | ||
Maryanne L. Roepke (1956) | Chief Compliance Officer since 2006 and Senior Vice President since 2000 | Chief Compliance Officer, American Century funds, ACIM and ACS (August 2006 to present). Also serves as Senior Vice President, ACS | ||
Charles A. Etherington (1957) | General Counsel since 2007 and Senior Vice President since 2006 | Attorney, ACC (February 1994 to present); Vice President, ACC (November 2005 to present), General Counsel, ACC (March 2007 to present). Also serves as General Counsel, ACIM, ACS, ACIS and other ACC subsidiaries; and Senior Vice President, ACIM and ACS | ||
C. Jean Wade (1964) | Vice President, Treasurer and Chief Financial Officer since 2012 | Vice President, ACS (February 2000 to present) | ||
Robert J. Leach (1966) | Vice President since 2006 and Assistant Treasurer since 2012 | Vice President, ACS (February 2000 to present) | ||
David H. Reinmiller (1963) | Vice President since 2000 | Attorney, ACC (January 1994 to present); Associate General Counsel, ACC (January 2001 to present). Also serves as Vice President, ACIM and ACS | ||
Ward D. Stauffer (1960) | Secretary since 2005 | Attorney, ACC (June 2003 to present) |
The Statement of Additional Information has additional information about the fund’s directors and is available without charge, upon request, by calling 1-800-345-2021.
29
At a meeting held on June 21, 2012, the Fund’s Board of Directors unanimously approved the renewal of the management agreement pursuant to which American Century Investment Management, Inc. (the “Advisor”) acts as the investment advisor for the Fund. Under Section 15(c) of the Investment Company Act, contracts for investment advisory services are required to be reviewed, evaluated, and approved by a majority of a fund’s independent directors (the “Directors”) each year.
As a part of the approval process, the Board requested and reviewed extensive data and information compiled by the Advisor and certain independent providers of evaluation data concerning the Fund and the services provided to the Fund by the Advisor. This review was in addition to the oversight and evaluation undertaken by the Board and its committees on a continuous basis throughout the year and included, but was not limited to the following:
| • | the nature, extent, and quality of investment management, shareholder services, and other services provided by the Advisor to the Fund; |
| • | the wide range of other programs and services the Advisor provides to the Fund and its shareholders on a routine and non-routine basis; |
| • | the investment performance of the fund, including data comparing the Fund’s performance to appropriate benchmarks and/or a peer group of other mutual funds with similar investment objectives and strategies; |
| • | data comparing the cost of owning the Fund to the cost of owning similar funds; |
| • | the Advisor’s compliance policies, procedures, and regulatory experience; |
| • | financial data showing the cost of services provided to the Fund, the profitability of the Fund to the Advisor, and the overall profitability of the Advisor; |
| • | data comparing services provided and charges to other investment management clients of the Advisor; and |
| • | consideration of collateral benefits derived by the Advisor from the management of the Fund and any potential economies of scale relating thereto. |
In keeping with its practice, the Board held two in-person meetings and one telephonic meeting to review and discuss the information provided. The Directors also had the benefit of the advice of independent counsel throughout the period.
Factors Considered
The Directors considered all of the information provided by the Advisor, the independent data providers, and independent counsel, and evaluated such information for the Fund. In connection with their review, the Directors did not identify any single factor as being all-important or controlling, and each Director may have attributed different levels of importance to different factors. In deciding to renew the management agreement, the Board based its decision on a number of factors, including the following:
30
Nature, Extent and Quality of Services - Generally. Under the management agreement, the Advisor is responsible for providing or arranging for all services necessary for the operation of the Fund. The Board noted that under the management agreement, the Advisor provides or arranges at its own expense a wide variety of services including:
| • | constructing and designing the Fund |
| • | portfolio research and security selection |
| • | initial capitalization/funding |
| • | securities trading |
| • | Fund administration |
| • | custody of Fund assets |
| • | daily valuation of the Fund’s portfolio |
| • | shareholder servicing and transfer agency, including shareholder confirmations, recordkeeping, and communications |
| • | legal services |
| • | regulatory and portfolio compliance |
| • | financial reporting |
| • | marketing and distribution |
The Board noted that many of these services have expanded over time both in terms of quantity and complexity in response to shareholder demands, competition in the industry, changing distribution channels, and the changing regulatory environment.
Investment Management Services. The nature of the investment management services provided to the Fund is quite complex and allows Fund shareholders access to professional money management, instant diversification of their investments within an asset class, the opportunity to easily diversify among asset classes by investing in or exchanging among various American Century Investments funds, and liquidity. In evaluating investment performance, the Board expects the Advisor to manage the Fund in accordance with its investment objectives and approved strategies. Further, the Directors recognize that the Advisor has an obligation to monitor trading activities, and in particular to seek the best execution of fund trades, and to evaluate the use of and payment for research. In providing these services, the Advisor utilizes teams of investment professionals (portfolio managers, analysts, research assistants, and securities traders) who require extensive information technology, research, training, compliance and other systems to conduct their business. The Board, directly and through its Fund Performance Review Committee, regularly reviews investment performance information for the Fund, together with comparative information for appropriate benchmarks and/or peer groups of similarly-managed funds, over different time horizons.
31
The Directors also review detailed performance information during the management agreement approval process. If performance concerns are identified, the Fund receives special reviews until performance improves, during which the Board discusses with the Advisor the reasons for such results (e.g., market conditions, security selection) and any efforts being undertaken to improve performance. Taking all these factors into consideration, the Board found the investment management services provided by the Advisor to the Fund to meet or exceed industry standards. More detailed information about the Fund’s performance can be found in the Performance and Portfolio Commentary sections of this report.
Shareholder and Other Services. Under the management agreement, the Advisor provides the Fund with a comprehensive package of transfer agency, shareholder, and other services. The Board, directly and through various committees of the Board, regularly reviews reports and evaluations of such services at its regular meetings. These reports include, but are not limited to, information regarding the operational efficiency and accuracy of the shareholder and transfer agency services provided, staffing levels, shareholder satisfaction (as measured by external as well as internal sources), technology support, new products and services offered to Fund shareholders, securities trading activities, portfolio valuation services, auditing services, and legal and operational compliance activities. Certain aspects of shareholder and transfer agency service level efficiency and the quality of securities trading activities are measured by independent third party providers and are presented in comparison to other fund groups not managed by the Advisor. The Board found the services provided by the Advisor to the Fund under the management agreement to be competitive and of high quality.
Costs of Services and Profitability. The Advisor provides detailed information concerning its cost of providing various services to the Fund, its profitability in managing the Fund, its overall profitability, and its financial condition. The Directors have reviewed with the Advisor the methodology used to prepare this financial information. The financial information regarding the Advisor is considered in evaluating the Advisor’s financial condition, ability to continue to provide services under the management agreement, and the reasonableness of the current management fee. The Board concluded that the Advisor’s profits were reasonable in light of the services provided to the Fund.
Ethics. The Board generally considers the Advisor’s commitment to providing quality services to shareholders and to conducting its business ethically. They noted that the Advisor’s practices generally meet or exceed industry best practices.
Economies of Scale. The Board also reviewed information provided by the Advisor regarding the possible existence of economies of scale in connection with the management of the Fund. The Board concluded that economies of scale are difficult to measure and predict with precision, especially on a fund-by-fund basis. The Board concluded that the Advisor is appropriately sharing economies of scale through its competitive fee structure, offering competitive fees from fund inception, and through reinvestment in its business to provide shareholders additional content and services.
32
Comparison to Other Funds’ Fees. The management agreement provides that the Fund pay the Advisor a single, all-inclusive (or unified) management fee for providing all services necessary for the management and operation of the Fund, other than brokerage expenses, taxes, interest, extraordinary expenses, and the fees and expenses of the Fund’s independent directors (including their independent legal counsel) and expenses incurred in connection with the provision of shareholder services and distribution services under a plan adopted pursuant to Rule 12b-1 under the 1940 Act. Under the unified fee structure, the Advisor is responsible for providing all investment advisory, custody, audit, administrative, compliance, recordkeeping, marketing and shareholder services, or arranging and supervising third parties to provide such services. By contrast, most other funds are charged a variety of fees, including an investment advisory fee, a transfer agency fee, an administrative fee, distribution charges and other expenses. Other than their investment advisory fees and any applicable Rule 12b-1 distribution fees, all other components of the total fees charged by these other funds may be increased without shareholder approval. The Board believes the unified fee structure is a benefit to Fund shareholders because it clearly discloses to shareholders the cost of owning Fund shares, and, since the unified fee cannot be increased without a vote of Fund shareholders, it shifts to the Advisor the risk of increased costs of operating the Fund and provides a direct incentive to minimize administrative inefficiencies. Part of the Board’s analysis of fee levels involves reviewing certain evaluative data compiled by an independent provider and comparing the Fund’s unified fee to the total expense ratio of other funds in the Fund’s peer group. The Board concluded that the management fee paid by the Fund to the Advisor under the management agreement is reasonable in light of the services provided to the Fund.
Comparison to Fees and Services Provided to Other Clients of the Advisor. The Board also requested and received information from the Advisor concerning the nature of the services, fees, costs and profitability of its advisory services to advisory clients other than the Fund. They observed that these varying types of client accounts require different services and involve different regulatory and entrepreneurial risks than the management of the Fund. The Board analyzed this information and concluded that the fees charged and services provided to the Fund were reasonable by comparison.
Collateral or “Fall-Out” Benefits Derived by the Advisor. The Board considered the existence of collateral benefits the Advisor may receive as a result of its relationship with the Fund. They concluded that the Advisor’s primary business is managing mutual funds and it generally does not use fund or shareholder information to generate profits in other lines of business, and therefore does not derive any significant collateral benefits from them. The Board noted that the Advisor receives proprietary research from broker-dealers that execute fund portfolio transactions and concluded that this research is likely to benefit Fund shareholders. The Board also determined that the Advisor is able to provide investment management services to certain clients other than the Fund, at least in part, due to its existing infrastructure built to serve the fund complex. The Board concluded, however, that the assets of those other clients are not material to the analysis and, where applicable, may be included with the assets of the Fund to determine breakpoints in the management fee schedule.
33
Existing Relationship. The Board also considered whether there was any reason for not continuing the existing arrangement with the Advisor. In this regard, the Board was mindful of the potential disruptions of the Fund’s operations and various risks, uncertainties, and other effects that could occur as a result of a decision not to continue such relationship. In particular, the Board recognized that most shareholders have invested in the Fund on the strength of the Advisor’s industry standing and reputation and in the expectation that the Advisor will have a continuing role in providing advisory services to the Fund.
Conclusion of the Directors. As a result of this process, the Board, including all of the independent directors, taking into account all of the factors discussed above and the information provided by the Advisor and others, concluded that the management agreement between the Fund and the Advisor is fair and reasonable in light of the services provided and should be renewed.
34
Retirement Account Information
As required by law, distributions you receive from certain IRAs, or 403(b), 457 and qualified plans are subject to federal income tax withholding, unless you elect not to have withholding apply. Tax will be withheld on the total amount withdrawn even though you may be receiving amounts that are not subject to withholding, such as nondeductible contributions. In such case, excess amounts of withholding could occur. You may adjust your withholding election so that a greater or lesser amount will be withheld.
If you don’t want us to withhold on this amount, you must notify us to not withhold the federal income tax. You may notify us in writing or in certain situations by telephone or through other electronic means. You have the right to revoke your withholding election at any time and any election you make may remain in effect until revoked by filing a new election.
Remember, even if you elect not to have income tax withheld, you are liable for paying income tax on the taxable portion of your withdrawal. If you elect not to have income tax withheld or you don’t have enough income tax withheld, you may be responsible for payment of estimated tax. You may incur penalties under the estimated tax rules if your withholding and estimated tax payments are not sufficient. You can reduce or defer the income tax on a distribution by directly or indirectly rolling such distribution over to another IRA or eligible plan. You should consult your tax advisor for additional information.
State tax will be withheld if, at the time of your distribution, your address is within one of the mandatory withholding states and you have federal income tax withheld. State taxes will be withheld from your distribution in accordance with the respective state rules.
Proxy Voting Guidelines
American Century Investment Management, Inc., the fund’s investment advisor, is responsible for exercising the voting rights associated with the securities purchased and/or held by the fund. A description of the policies and procedures the advisor uses in fulfilling this responsibility is available without charge, upon request, by calling 1-800-345-2021. It is also available on American Century Investments’ website at americancentury.com and on the Securities and Exchange Commission’s website at sec.gov. Information regarding how the investment advisor voted proxies relating to portfolio securities during the most recent 12-month period ended June 30 is available on the “About Us” page at americancentury.com. It is also available at sec.gov.
Quarterly Portfolio Disclosure
The fund files its complete schedule of portfolio holdings with the Securities and Exchange Commission (SEC) for the first and third quarters of each fiscal year on Form N-Q. The fund’s Forms N-Q are available on the SEC’s website at sec.gov, and may be reviewed and copied at the SEC’s Public Reference Room in Washington, DC. Information on the operation of the Public Reference Room may be obtained by calling 1-800-SEC-0330. The fund also makes its complete schedule of portfolio holdings for the most recent quarter of its fiscal year available on its website at americancentury.com and, upon request, by calling 1-800-345-2021.
35
Other Tax Information
The following information is provided pursuant to provisions of the Internal Revenue Code.
The fund hereby designates up to the maximum amount allowable as qualified dividend income for the fiscal year ended November 30, 2012.
For the fiscal year ended November 30, 2012, the fund intends to pass through to shareholders $81,865, or up to the maximum amount allowable, as a foreign tax credit which represents taxes paid on income derived from sources within foreign countries or possessions of the United States. During the fiscal year ended November 30, 2012, the fund earned $1,173,820 from income derived from foreign sources. Foreign source income and foreign tax expense per outstanding share on November 30, 2012 are $0.3283 and $0.0229, respectively.
36
| Contact Us | americancentury.com |
| Automated Information Line | 1-800-345-8765 |
| Investor Services Representative | 1-800-345-2021 or 816-531-5575 |
| Investors Using Advisors | 1-800-378-9878 |
| Business, Not-For-Profit, Employer-Sponsored Retirement Plans | 1-800-345-3533 |
| Banks and Trust Companies, Broker-Dealers, Financial Professionals, Insurance Companies | 1-800-345-6488 |
| Telecommunications Device for the Deaf | 1-800-634-4113 |
American Century World Mutual Funds, Inc.
Investment Advisor:
American Century Investment Management, Inc.
Kansas City, Missouri
This report and the statements it contains are submitted for the general information of our shareholders. The report is not authorized for distribution to prospective investors unless preceded or accompanied by an effective prospectus.
©2013 American Century Proprietary Holdings, Inc. All rights reserved.
CL-ANN-76975 1301
ITEM 2. CODE OF ETHICS.
| (a) | The registrant has adopted a Code of Ethics for Senior Financial Officers that applies to the registrant’s principal executive officer, principal financial officer, principal accounting officer, and persons performing similar functions. |
| (b) | No response required. |
| (c) | None. |
| (d) | None. |
| (e) | Not applicable. |
| (f) | The registrant’s Code of Ethics for Senior Financial Officers was filed as Exhibit 12 (a)(1) to American Century Asset Allocation Portfolios, Inc.’s Annual Certified Shareholder Report on Form N-CSR, File No. 811-21591, on September 29, 2005, and is incorporated herein by reference. |
ITEM 3. AUDIT COMMITTEE FINANCIAL EXPERT.
| (a)(1) | The registrant’s board has determined that the registrant has at least one audit committee financial expert serving on its audit committee. |
| (a)(2) | M. Jeannine Strandjord, James A. Olson, Andrea C. Hall and Stephen E. Yates are the registrant’s designated audit committee financial experts. They are “independent” as defined in Item 3 of Form N-CSR. |
| (a)(3) | Not applicable. |
| (b) | No response required. |
| (c) | No response required. |
| (d) | No response required. |
ITEM 4. PRINCIPAL ACCOUNTANT FEES AND SERVICES.
| (a) | Audit Fees. |
The aggregate fees billed for each of the last two fiscal years for professional services rendered by the principal accountant for the audit of the registrant’s annual financial statements or services that are normally provided by the accountant in connection with statutory and regulatory filings or engagements for those fiscal years were as follows:
FY 2011: $178,400
FY 2012: $195,444
| (b) | Audit-Related Fees. |
The aggregate fees billed in each of the last two fiscal years for assurance and related services by the principal accountant that are reasonably related to the performance of the audit of the registrant’s financial statements and are not reported under paragraph (a) of this Item were as follows:
| For services rendered to the registrant: |
FY 2011: $0 FY 2012: $0 |
Fees required to be approved pursuant to paragraph (c)(7)(ii) of Rule 2-01 of Regulation S-X (relating to certain engagements for non-audit services with the registrant’s investment adviser and its affiliates):
FY 2011: $0 FY 2012: $0 |
| (c) | Tax Fees. |
The aggregate fees billed in each of the last two fiscal years for professional services rendered by the principal accountant for tax compliance, tax advice, and tax planning were as follows:
| For services rendered to the registrant: |
FY 2011: $0
FY 2012: $0
Fees required to be approved pursuant to paragraph (c)(7)(ii) of Rule 2-01 of Regulation S-X (relating to certain engagements for non-audit services with the registrant’s investment adviser and its affiliates):
FY 2011: $0
FY 2012: $0
| (d) | All Other Fees. |
The aggregate fees billed in each of the last two fiscal years for products and services provided by the principal accountant, other than the services reported in paragraphs (a) through (c) of this Item were as follows:
| For services rendered to the registrant: |
FY 2011: $0 FY 2012: $0 |
Fees required to be approved pursuant to paragraph (c)(7)(ii) of Rule 2-01 of Regulation S-X (relating to certain engagements for non-audit services with the registrant’s investment adviser and its affiliates):
FY 2011: $0 FY 2012: $0 |
| (e)(1) | In accordance with paragraph (c)(7)(i)(A) of Rule 2-01 of Regulation S-X, before the accountant is engaged by the registrant to render audit or non-audit services, the engagement is approved by the registrant’s audit committee. Pursuant to paragraph (c)(7)(ii) of Rule 2-01 of Regulation S-X, the registrant’s audit committee also pre-approves its accountant’s engagements for non-audit services with the registrant’s investment adviser, its parent company, and any entity controlled by, or under common control with the investment adviser that provides ongoing services to the registrant, if the engagement relates directly to the operations and financial reporting of the registrant. |
| (e)(2) | All services described in each of paragraphs (b) through (d) of this Item were pre-approved before the engagement by the registrant’s audit committee pursuant to paragraph (c)(7)(i)(A) of Rule 2-01 of Regulation S-X. Consequently, none of such services were required to be approved by the audit committee pursuant to paragraph (c)(7)(i)(C). |
| (f) | The percentage of hours expended on the principal accountant’s engagement to audit the registrant’s financial statements for the most recent fiscal year that were attributed to work performed by persons other than the principal accountant’s full-time, permanent employees was less than 50%. |
| (g) | The aggregate non-audit fees billed by the registrant’s accountant for services rendered to the registrant, and rendered to the registrant’s investment adviser (not including any sub-adviser whose role is primarily portfolio management and is subcontracted with or overseen by another investment adviser), and any entity controlling, controlled by, or under common control with the adviser that provides ongoing services to the registrant for each of the last two fiscal years of the registrant were as follows: |
FY 2011: $67,680
FY 2012: $68,768
| (h) | The registrant’s investment adviser and accountant have notified the registrant’s audit committee of all non-audit services that were rendered by the registrant’s accountant to the registrant’s investment adviser, its parent company, and any entity controlled by, or under common control with the investment adviser that provides services to the registrant, which services were not required to be pre-approved pursuant to paragraph (c)(7)(ii) of Rule 2-01 of Regulation S-X. The notification provided to the registrant’s audit committee included sufficient details regarding such services to allow the registrant’s audit committee to consider the continuing independence of its principal accountant. |
ITEM 5. AUDIT COMMITTEE OF LISTED REGISTRANTS.
Not applicable.
ITEM 6. INVESTMENTS.
| (a) | The schedule of investments is included as part of the report to stockholders filed under Item 1 of this Form. |
| (b) | Not applicable. |
ITEM 7. DISCLOSURE OF PROXY VOTING POLICIES AND PROCEDURES FOR CLOSED-END MANAGEMENT INVESTMENT COMPANIES.
Not applicable.
ITEM 8. PORTFOLIO MANAGERS OF CLOSED-END MANAGEMENT INVESTMENT COMPANIES.
Not applicable.
ITEM 9. PURCHASES OF EQUITY SECURITIES BY CLOSED-END MANAGEMENT INVESTMENT COMPANY AND AFFILIATED PURCHASERS.
Not applicable.
ITEM 10. SUBMISSION OF MATTERS TO A VOTE OF SECURITY HOLDERS.
During the reporting period, there were no material changes to the procedures by which shareholders may recommend nominees to the registrant’s board.
ITEM 11. CONTROLS AND PROCEDURES.
| (a) | The registrant's principal executive officer and principal financial officer have concluded that the registrant's disclosure controls and procedures (as defined in Rule 30a-3(c) under the Investment Company Act of 1940) are effective based on their evaluation of these controls and procedures as of a date within 90 days of the filing date of this report. |
| (b) | There were no changes in the registrant's internal control over financial reporting (as defined in Rule 30a-3(d) under the Investment Company Act of 1940) that occurred during the registrant's second fiscal quarter of the period covered by this report that have materially affected, or are reasonably likely to materially affect, the registrant's internal control over financial reporting. |
ITEM 12. EXHIBITS.
| (a)(1) | Registrant’s Code of Ethics for Senior Financial Officers, which is the subject of the disclosure required by Item 2 of Form N-CSR, was filed as Exhibit 12(a)(1) to American Century Asset Allocation Portfolios, Inc.’s Certified Shareholder Report on Form N-CSR, File No. 811-21591, on September 29, 2005. |
| (a)(2) | Separate certifications by the registrant’s principal executive officer and principal financial officer, pursuant to Section 302 of the Sarbanes-Oxley Act of 2002 and Rule 30a-2(a) under the Investment Company Act of 1940, are filed and attached hereto as EX-99.CERT. |
| (a)(3) | Not applicable. |
| (b) | A certification by the registrant’s chief executive officer and chief financial officer, pursuant to Section 906 of the Sarbanes-Oxley Act of 2002, is furnished and attached hereto as EX-99.906CERT. |
| SIGNATURES |
Pursuant to the requirements of the Securities Exchange Act of 1934 and the Investment Company Act of 1940, the registrant has duly caused this report to be signed on its behalf by the undersigned, thereunto duly authorized.
| Registrant: | AMERICAN CENTURY WORLD MUTUAL FUNDS, INC. | |||
| By: | /s/ Jonathan S. Thomas | |||
| Name: | Jonathan S. Thomas | |||
| Title: | President | |||
| Date: | January 29, 2013 | |||
Pursuant to the requirements of the Securities Exchange Act of 1934 and the Investment Company Act of 1940, this report has been signed below by the following persons on behalf of the registrant and in the capacities and on the dates indicated.
| By: | /s/ Jonathan S. Thomas | ||
| Name: | Jonathan S. Thomas | ||
| Title: | President | ||
| (principal executive officer) | |||
| Date: | January 29, 2013 | ||
| By: | /s/ C. Jean Wade | ||
| Name: | C. Jean Wade | ||
| Title: | Vice President, Treasurer, and | ||
| Chief Financial Officer | |||
| (principal financial officer) | |||
| Date: | January 29, 2013 | ||