UNITED STATES
SECURITIES AND EXCHANGE COMMISSION
Washington, D.C. 20549
FORM N-CSR
CERTIFIED SHAREHOLDER REPORT OF REGISTERED MANAGEMENT
INVESTMENT COMPANIES
Investment Company Act file number 811- 6395
DREYFUS NEW YORK MUNICIPAL CASH MANAGEMENT
(Exact name of Registrant as specified in charter)
c/o The Dreyfus Corporation
200 Park Avenue
New York, New York 10166
(Address of principal executive offices) (Zip code)
Michael A. Rosenberg, Esq.
200 Park Avenue
New York, New York 10166
(Name and address of agent for service)
| | |
| Registrant's telephone number, including area code: | (212) 922-6000 |
| Date of fiscal year end: | 1/31 | |
| Date of reporting period: | 1/31/10 | |
FORM N-CSR
Item 1. Reports to Stockholders.
| |
| Contents | |
| |
| The Funds | |
| Letter to Shareholders (Taxable) | 3 |
| Letter to Shareholders (Tax-Exempt) | 5 |
| Understanding Your Fund’s Expenses | 7 |
| Comparing Your Fund’s Expenses | |
| With Those of Other Funds | 9 |
| Statements of Investments | 11 |
| Statements of Assets and Liabilities | 59 |
| Statements of Operations | 62 |
| Statements of Changes in Net Assets | 64 |
| Financial Highlights | 70 |
| Notes to Financial Statements | 81 |
| Report of Independent Registered | |
| Public Accounting Firm | 93 |
| Important Tax Information | 94 |
| Proxy Results | 95 |
| Board Members Information | 96 |
| Officers of the Funds | 97 |
| For More Information | |
| Back cover | |
The views expressed in this report reflect those of the portfolio manager only through the end of the period covered and do not necessarily represent the views of Dreyfus or any other person in the Dreyfus organization. Any such views are subject to change at any time based upon market or other conditions and Dreyfus disclaims any responsibility to update such views. These views may not be relied on as investment advice and, because investment decisions for a Dreyfus fund are based on numerous factors, may not be relied on as an indication of trading intent on behalf of any Dreyfus fund.

Dreyfus Cash Management Funds
The Funds

LETTER TO
SHAREHOLDERS
Dear Shareholders:
We present to you this annual report for Dreyfus Cash Management Funds (Taxable). For the 12-month period ended January 31, 2010, the six Dreyfus Cash Management Funds (Taxable) listed below produced the following yields and, taking into account the effects of compounding, the following effective yields:1,2
| | |
| | | Effective |
| | Yield (%) | Yield (%) |
| Dreyfus Cash Management | | |
| Institutional Shares | 0.41 | 0.41 |
| Investor Shares | 0.21 | 0.21 |
| Administrative Shares | 0.31 | 0.32 |
| Participant Shares | 0.14 | 0.14 |
| Agency Shares | 0.35 | 0.35 |
| Dreyfus Cash Management Plus, Inc. | |
| Institutional Shares | 0.36 | 0.36 |
| Investor Shares | 0.17 | 0.17 |
| Administrative Shares | 0.27 | 0.27 |
| Participant Shares | 0.10 | 0.10 |
| Service Shares | 0.06 | 0.06 |
| Select Shares | 0.02 | 0.02 |
| Agency Shares | 0.30 | 0.30 |
| Dreyfus Government Cash Management | |
| Institutional Shares | 0.17 | 0.17 |
| Investor Shares | 0.03 | 0.03 |
| Administrative Shares | 0.10 | 0.10 |
| Participant Shares | 0.01 | 0.01 |
| Agency Shares | 0.13 | 0.13 |
| Dreyfus Government Prime Cash Management | |
| Institutional Shares | 0.11 | 0.11 |
| Investor Shares | 0.00 | 0.00 |
| Administrative Shares | 0.03 | 0.03 |
| Participant Shares | 0.00 | 0.00 |
| Agency Shares | 0.06 | 0.06 |
| Dreyfus Treasury & Agency Cash Management | |
| Institutional Shares | 0.07 | 0.07 |
| Investor Shares | 0.00 | 0.00 |
| Administrative Shares | 0.02 | 0.02 |
| Participant Shares | 0.00 | 0.00 |
| Service Shares | 0.00 | 0.00 |
| Select Shares | 0.00 | 0.00 |
| Agency Shares | 0.03 | 0.03 |
| Premier Shares | 0.00 | 0.00 |
| Dreyfus Treasury Prime Cash Management | |
| Institutional Shares | 0.02 | 0.02 |
| Investor Shares | 0.00 | 0.00 |
| Administrative Shares | 0.00 | 0.00 |
| Participant Shares | 0.00 | 0.00 |
| Agency Shares | 0.00 | 0.00 |
Money Market Yields Remained Near
Record Lows
The reporting period began in the midst of a global financial crisis and severe recession. In response, the Federal Reserve Board (the “Fed”) already had pumped liquidity into the banking system and eased monetary policy aggressively, driving the overnight federal funds rate to an unprecedented low range of between 0% and 0.25%. As a result, money market yields began 2009 at historical lows and remained there throughout the year.
The U.S. government responded with a number of its own remedial measures, including the Temporary Guarantee Program for Money Market Funds, which remained in effect through most of the reporting period before ending on September 18, 2009. This measure was designed to promote liquidity in the commercial paper market.
Although economic conditions continued to deteriorate in early 2009 as housing prices plummeted and job losses mounted, investor sentiment began to improve in March when evidence emerged that credit markets were recovering. Still, the U.S. economy sent mixed signals in the spring. Existing home sales and prices increased in May, but the unemployment rate hit a 26-year high.The U.S. economy contracted at a –0.7% annualized rate between April and June, a much milder decline than the previous quarter’s –5.5% annualized rate, lending credence to forecasts that the recession was nearing an end.
Residential construction improved in July, and August saw the first expansion of manufacturing activity in more than 18 months. Consumer spending increased in August by 1.3%, the largest gain in more than seven years, due in part to the U.S. government’s Cash for Clunkers automobile purchasing program.
October also experienced gradual economic improvement. Positive news included a return to growth for the U.S. economy, with U.S. GDP expanding at a 2.2% annualized rate in the third quarter, its first quarterly
The Funds 3
LETTER TO SHAREHOLDERS (continued)
gain in more than a year. While pending home sales reached their highest level in almost three years, distressed sales accounted for more than 30% of those transactions.The unemployment rate moved to 10.2% in October, its highest level since the early 1980s.
In November, investors were encouraged by a slight dip in the unemployment rate to 10.0%. The manufacturing sector expanded, and foreclosure activity in the housing sector moderated, with each indicator showing improvement for the fourth straight month. Manufacturing activity expanded for the fifth consecutive month in December, and new orders increased for the sixth straight month, providing further evidence of a mending economy. Retail sales in December were almost 3% higher than one year earlier, suggesting that consumers were spending more freely. While the unemployment rate remained at 10%, monthly job losses moderated in December to 85,000, down from an average of 691,000 per month during the first quarter.
January 2010 brought more encouraging news, including the announcement that U.S. GDP grew at an estimated 5.7% annualized rate during the fourth quarter of 2009. Although inventory rebuilding accounted for more than half of the gain in economic growth, economists were encouraged in January by the sixth consecutive monthly increase in manufacturing activity and a better-than-expected improvement in retail sales. In addition, the unemployment rate fell to 9.7% and job losses moderated in January.
Quality and Liquidity Still Our Priority
Since yield spreads remained relatively flat along the money market maturity spectrum, most money market funds maintained relatively defensive footings throughout 2009, and the industry’s average weighted maturity remained substantially shorter than historical averages. The funds were no exception; we set each fund’s weighted average maturity in a position that was roughly in line with their respective industry averages for most of 2009.We also focused exclusively on money market instruments meeting our stringent credit-quality criteria.
Despite continued signs of economic improvement, the Fed at its January 2010 meeting indicated once again that “economic conditions are likely to warrant exceptionally low levels of the federal funds rate for an extended period.” In addition, the Treasury Department’s extension of the Troubled Asset Relief Program (“TARP”) until October 2010 suggests that policymakers remain concerned regarding the possibility of unforeseen problems in the banking system. As always, we intend to maintain the funds’ focus on credit quality and liquidity.
| |
| | An investment in the fund is not insured or guaranteed by the FDIC or |
| | any other government agency. Although the fund seeks to preserve the value |
| | of your investment at $1.00 per share, it is possible to lose money by |
| | investing in the fund. |
| 1 | Effective yield is based upon dividends declared daily and reinvested |
| | monthly. Past performance is no guarantee of future results.Yields fluctuate. |
| 2 | Yields provided reflect the absorption of certain fund expenses by The |
| | Dreyfus Corporation pursuant to an undertaking, which is voluntary and |
| | temporary, not contractual, and can be terminated at any time without |
| | notice. Had these expenses not been absorbed, fund yields would have been |
| | lower, and in some cases 7-day yields during the reporting period would |
| | have been negative absent the expense absorption. |
4

LETTER TO
SHAREHOLDERS
Dear Shareholder:
We are pleased to present the annual report for Dreyfus Cash Management Funds (Tax Exempt). For the 12-month period ended January 31, 2010, the five tax-exempt money market portfolios that comprise Dreyfus Cash Management Funds (Tax Exempt) produced the following yields and effective yields:1,2
| | |
| | | Effective |
| | Yield (%) | Yield (%) |
| Dreyfus Municipal Cash Management Plus | |
| Institutional Shares | 0.49 | 0.49 |
| Investor Shares | 0.27 | 0.27 |
| Administrative Shares | 0.39 | 0.39 |
| Participant Shares | 0.18 | 0.18 |
| Agency Shares | 0.42 | 0.42 |
| Dreyfus New York Municipal Cash Management | |
| Institutional Shares | 0.45 | 0.45 |
| Investor Shares | 0.23 | 0.24 |
| Administrative Shares | 0.35 | 0.35 |
| Participant Shares | 0.15 | 0.15 |
| Agency Shares | 0.39 | 0.39 |
| Dreyfus Tax Exempt Cash Management | |
| Institutional Shares | 0.37 | 0.37 |
Recession, Supply-and-Demand Dynamics Kept Yields Low
The reporting period began in the midst of a severe recession as U.S. housing markets continued to struggle, job losses mounted and consumer confidence
plummeted. In addition, the failures of major financial institutions had sparked a global financial crisis that punished dealers and insurers of municipal securities over the final months of 2008. These developments caused dislocations among a wide variety of financial assets, including some money market instruments.
In response, the Federal Reserve Board (the “Fed”) had reduced the overnight federal funds rate to an unprecedented low range of between 0% and 0.25%. The U.S. Department of the Treasury also had initiated several remedial measures, including theTemporary Guarantee Program for Money Market Funds, which remained in effect over much of the reporting period before expiring on September 18, 2009.
In the municipal securities market, tighter lending restrictions, credit-rating downgrades, industry consolidation and the dislocation of the municipal bond insurance industry led to a decrease in the supply of eligible variable-rate demand notes and tender option bonds. Due to the high cost of short-term funding, states and municipalities instead issued more long-term bonds, including taxable securities through the government-supported Build America Bonds program, which was enacted as part of the economic stimulus package. These factors effectively limited the available supply of municipal money market instruments.
Meanwhile, demand for tax-exempt money market instruments remained relatively robust. In addition to demand from individuals concerned about potential tax increases, the tax-exempt market saw rising participation among institutional investors seeking competitive yields compared with taxable money market instruments. The combination of limited supply and robust demand put additional downward pressure on already low tax-exempt money market yields; however, yields remained attractive to comparable taxable securities.
Finally, many states and municipalities struggled throughout the reporting period with deteriorating fiscal conditions due to reduced tax collections and intensifying demands on social services.These devel-
The Funds 5
LETTER TO SHAREHOLDERS (continued)
opments were particularly severe in California and NewYork, where political infighting has complicated attempts to balance each state’s operating budget.The resulting credit deterioration has further limited the supply of instruments meeting our investment criteria nationally, as well as California and NewYork.
In-House Research Supported Credit Quality
In this highly challenging market environment, we focused on direct, high-quality municipal obligations. Our credit analysts conduct in-depth, independent research into the fiscal health of the issuers we consider, a process that helped the funds avoid some of the market’s more severe credit-related problems. We favored instruments—including commercial paper and municipal notes with maturities of six months or less—backed by pledged tax appropriations or revenues from facilities providing essential services.We generally shied away from instruments issued by entities that depend heavily on state aid, focusing on issuers in strong fiscal positions which could withstand revenue declines.
With interest rates hovering near historical lows throughout the reporting period and because yield differences have remained relatively flat throughout the maturity range, municipal money market funds generally have maintained short weighted average maturities compared to historical norms. The funds were no exception, as we set their weighted average maturities in ranges that generally were in line with industry averages. This conservative strategy did not detract materially from the funds’ performance.
Safety and Liquidity Are Paramount
The Fed has repeatedly indicated that it is likely to keep short-term interest rates near historical lows for an extended period, suggesting that municipal money market yields are unlikely to rise significantly anytime soon. In addition, the industry expects new regula-
tions from the U.S. government in the wake of the financial crisis. Therefore, despite the apparent onset of an economic recovery, we believe the prudent course continues to be a conservative credit selection strategy with an emphasis on preservation of capital and liquidity. This will enable the fund to react to changes in monetary policy quickly and efficiently.
| |
| | An investment in each fund is not insured or guaranteed by the FDIC or |
| | any other government agency. Although each fund seeks to preserve the |
| | value of your investment at $1.00 per share, it is possible to lose money |
| | by investing in the funds. |
| 1 | Effective yield is based upon dividends declared daily and reinvested |
| | monthly. Past performance is no guarantee of future results.Yields fluctuate. |
| | For the national funds, income may be subject to state and local taxes. For |
| | the NewYork and California funds, income may be subject to state and |
| | local taxes for out-of-state residents. For each non-AMT-Free fund, some |
| | income may be subject to the federal alternative minimum tax (AMT). |
| 2 | Yields provided reflect the absorption of certain fund expenses by The |
| | Dreyfus Corporation pursuant to an undertaking, which is voluntary and |
| | temporary, not contractual, and can be terminated at any time without |
| | notice. Had these expenses not been absorbed, fund yields would have been |
| | lower, and in some cases 7-day yields during the reporting period would |
| | have been negative absent the expense absorption. |
6
UNDERSTANDING YOUR FUND’S EXPENSES (Unaudited)
As a mutual fund investor, you pay ongoing expenses, such as management fees and other expenses. Using the information below, you can estimate how these expenses affect your investment and compare them with the expenses of other funds.You also may pay one-time transaction expenses, including sales charges (loads) and redemptions fees, which are not shown in this section and would have resulted in higher total expenses. For more information, see your fund’s prospectus or talk to your financial adviser.
Review your fund’s expenses
The table below shows the expenses you would have paid on a $1,000 investment in each class of each fund from August 1, 2009 to January 31, 2010. It also shows how much a $1,000 investment would be worth at the close of the period, assuming actual returns and expenses.
| | | | | | | | | |
| Expenses and Value of a $1,000 Investment | | | | | | | |
| assuming actual returns for the six months ended January 31, 2010 | | | | | | |
| | Institutional | Investor | Administrative | Participant | Service | Select | Agency | Premier | Classic |
| Dreyfus Cash | | | | | | | | | |
| Management | | | | | | | | | |
| Expenses paid | | | | | | | | | |
| per $1,000† | $ 1.06 | $ 1.81 | $ 1.56 | $ 1.92 | — | — | $ 1.36 | — | — |
| Ending value | | | | | | | | | |
| (after expenses) | $1,000.80 | $1,000.00 | $1,000.30 | $1,000.00 | — | — | $1,000.50 | — | — |
| Dreyfus Cash | | | | | | | | | |
| Management | | | | | | | | | |
| Plus, Inc. | | | | | | | | | |
| Expenses paid | | | | | | | | | |
| per $1,000† | $ 1.16 | $ 1.92 | $ 1.66 | $ 1.97 | $ 2.07 | $ 1.97 | $ 1.46 | — | — |
| Ending value | | | | | | | | | |
| (after expenses) | $1,000.70 | $1,000.00 | $1,000.20 | $1,000.00 | $1,000.00 | $1,000.00 | $1,000.40 | — | — |
| Dreyfus | | | | | | | | | |
| Government Cash | | | | | | | | | |
| Management | | | | | | | | | |
| Expenses paid | | | | | | | | | |
| per $1,000† | $ 1.06 | $ 1.31 | $ 1.26 | $ 1.31 | — | — | $ 1.21 | — | — |
| Ending value | | | | | | | | | |
| (after expenses) | $1,000.30 | $1,000.00 | $1,000.00 | $1,000.00 | — | — | $1,000.10 | — | — |
| Dreyfus | | | | | | | | | |
| Government Prime | | | | | | | | | |
| Cash Management | | | | | | | | | |
| Expenses paid | | | | | | | | | |
| per $1,000† | $ 1.01 | $ 1.31 | $ 1.21 | $ 1.26 | — | — | $ 1.16 | — | — |
| Ending value | | | | | | | | | |
| (after expenses) | $1,000.20 | $1,000.00 | $1,000.00 | $1,000.00 | — | — | $1,000.10 | — | — |
| Dreyfus Treasury & | | | | | | | | | |
| Agency Cash | | | | | | | | | |
| Management | | | | | | | | | |
| Expenses paid | | | | | | | | | |
| per $1,000† | $ .96 | $ 1.06 | $ 1.06 | $ 1.01 | $ 1.01 | $ 1.01 | $ 1.06 | $ 1.01 | |
| Ending value | | | | | | | | | |
| (after expenses) | $1,000.10 | $1,000.00 | $1,000.00 | $1,000.00 | $1,000.00 | $1,000.00 | $1,000.00 | $1,000.00 | |
| Dreyfus | | | | | | | | | |
| Treasury Prime | | | | | | | | | |
| Cash Management | | | | | | | | | |
| Expenses paid | | | | | | | | | |
| per $1,000† | $ .76 | $ .81 | $ .81 | $ .81 | — | — | $ .66 | — | — |
| Ending value | | | | | | | | | |
| (after expenses) | $1,000.00 | $1,000.00 | $1,000.00 | $1,000.00 | — | — | $1,000.00 | — | — |
| Dreyfus | | | | | | | | | |
| Municipal Cash | | | | | | | | | |
| Management Plus | | | | | | | | | |
| Expenses paid | | | | | | | | | |
| per $1,000† | $ 1.11 | $ 2.12 | $ 1.61 | $ 2.32 | — | — | $ 1.46 | — | — |
| Ending value | | | | | | | | | |
| (after expenses) | $1,001.10 | $1,000.20 | $1,000.60 | $1,000.00 | — | — | $1,000.70 | — | — |
The Funds 7
UNDERSTANDING YOUR FUND’S EXPENSES (Unaudited) (continued)
Expenses and Value of a $1,000 Investment (continued)
assuming actual returns for the six months ended January 31, 2010
| | | | | | | | | |
| | Institutional | Investor | Administrative | Participant | Service | Select | Agency | Premier | Classic |
| Dreyfus | | | | | | | | | |
| New York | | | | | | | | | |
| Municipal Cash | | | | | | | | | |
| Management | | | | | | | | | |
| Expenses paid | | | | | | | | | |
| per $1,000† | $ 1.16 | $ 2.07 | $ 1.61 | $ 2.27 | — | — | $ 1.41 | — | — |
| Ending value | | | | | | | | | |
| (after expenses) | $1,001.00 | $1,000.10 | $1,000.60 | $1,000.00 | — | — | $1,000.70 | — | — |
| Dreyfus | | | | | | | | | |
| Tax Exempt Cash | | | | | | | | | |
| Management | | | | | | | | | |
| Expenses paid | | | | | | | | | |
| per $1,000† | $ 1.11 | $ 1.71 | $ 1.56 | $ 1.76 | — | — | $ 1.41 | — | — |
| Ending value | | | | | | | | | |
| (after expenses) | $1,000.60 | $1,000.00 | $1,000.20 | $1,000.00 | — | — | $1,000.30 | — | — |
| Dreyfus California | | | | | | | | | |
| AMT-Free | | | | | | | | | |
| Municipal Cash | | | | | | | | | |
| Management | | | | | | | | | |
| Expenses paid | | | | | | | | | |
| per $1,000† | $ 1.11 | $ 1.81 | $ 1.61 | $ 1.76 | — | — | $ 1.36 | — | — |
| Ending value | | | | | | | | | |
| (after expenses) | $1,000.70 | $1,000.00 | $1,000.20 | $1,000.00 | — | — | $1,000.40 | — | — |
| Dreyfus New York | | | | | | | | | |
| AMT-Free | | | | | | | | | |
| Municipal Cash | | | | | | | | | |
| Management | | | | | | | | | |
| Expenses paid | | | | | | | | | |
| per $1,000† | $ 1.11 | $ 1.81 | $ 1.56 | $ 1.97 | — | — | — | — | $ 1.97 |
| Ending value | | | | | | | | | |
| (after expenses) | $1,000.90 | $1,000.20 | $1,000.50 | $1,000.00 | — | — | — | — | $1,000.00 |
|
| † Expenses are equal to Dreyfus Cash Management’s annualized expense ratio of .21% for Institutional Shares, .36% for Investor Shares, .31% for Administrative Shares, .38% for |
| Participant Shares and .27% for Agency Shares, Dreyfus Cash Management Plus, Inc 23% for Institutional Shares, .38% for Investor Shares, .33% for Administrative Shares, ..39% |
| for Participant Shares, .41% for Service Shares, .39% for Select Shares and .29% for Agency Shares, Dreyfus Government Cash Management .21% for Institutional Shares, .26% for |
| Investor Shares, .25% for Administrative Shares, .26% for Participant Shares and .24% for Agency Shares, Dreyfus Government Prime Cash Management .20% for Institutional |
| Shares, .26% for Investor Shares, .24% for Administrative Shares, .25% for Participant Shares and .23% for Agency Shares, Dreyfus Treasury & Agency Cash Management .19% for |
| Institutional Shares, .21% for Investor Shares, .21% for Administrative Shares, .20% for Participant Shares, .20% for Service Shares, .20% for Select Shares, .21% for Agency Shares |
| and .20% for Premier Shares, Dreyfus Treasury Prime Cash Management .15% for Institutional Shares, .16% for Investor Shares, .16% for Administrative Shares, .16% for |
| Participant Shares and .13% for Agency Shares, Dreyfus Municipal Cash Management Plus .22% for Institutional Shares, .42% for Investor Shares, .32% for Administrative Shares, |
| .46% for Participant Shares and .29% for Agency Shares, Dreyfus NewYork Municipal Cash Management .23% for Institutional Shares, .41% for Investor Shares, .32% for |
| Administrative Shares, .45% for Participant Shares and .28% for Agency Shares, Dreyfus Tax Exempt Cash Management .22% for Institutional Shares, .34% for Investor Shares, |
| .31% for Administrative Shares, .35% for Participant Shares and .28% for Agency Shares, Dreyfus California AMT-Free Municipal Cash Management .22% for Institutional Shares, |
| .36% for Investor Shares, .32% for Administrative Shares, .35% for Participant Shares and .27% for Agency Shares, Dreyfus NewYork AMT-Free Municipal Cash Management |
| .22% for Institutional Shares, .36% for Investor Shares, .31% for Administrative Shares, .39% for Participant Shares and .39% for Classic shares; multiplied by the respective fund’s |
| average account value over the period, multiplied by 184/365 (to reflect the one-half year period). |
8
COMPARING YOUR FUND’S EXPENSES
WITH THOSE OF OTHER FUNDS (Unaudited)
Using the SEC’s method to compare expenses
The Securities and Exchange Commission (SEC) has established guidelines to help investors assess fund expenses. Per these guidelines, the table below shows your fund’s expenses based on a $1,000 investment, assuming a hypothetical 5% annualized return.You can use this information to compare the ongoing expenses (but not transaction expenses or total cost) of investing in the fund with those of other funds. All mutual fund shareholder reports will provide this information to help you make this comparison. Please note that you cannot use this information to estimate your actual ending account balance and expenses paid during the period.
| | | | | | | | | |
| Expenses and Value of a $1,000 Investment | | | | | | | |
| assuming a hypothetical 5% annualized return for the six months ended January 31, 2010 | | | | |
| | Institutional | Investor | Administrative | Participant | Service | Select | Agency | Premier | Classic |
| Dreyfus Cash | | | | | | | | | |
| Management | | | | | | | | | |
| Expenses paid | | | | | | | | | |
| per $1,000† | $ 1.07 | $ 1.84 | $ 1.58 | $ 1.94 | — | — | $ 1.38 | — | — |
| Ending value | | | | | | | | | |
| (after expenses) | $1,024.15 | $1,023.39 | $1,023.64 | $1,023.29 | — | — | $1,023.84 | — | — |
| Dreyfus Cash | | | | | | | | | |
| Management | | | | | | | | | |
| Plus, Inc. | | | | | | | | | |
| Expenses paid | | | | | | | | | |
| per $1,000† | $ 1.17 | $ 1.94 | $ 1.68 | $ 1.99 | $ 2.09 | $ 1.99 | $ 1.48 | — | — |
| Ending value | | | | | | | | | |
| (after expenses) | $1,024.05 | $1,023.29 | $1,023.54 | $1,023.24 | $1,023.14 | $1,023.24 | $1,023.74 | — | — |
| Dreyfus | | | | | | | | | |
| Government Cash | | | | | | | | | |
| Management | | | | | | | | | |
| Expenses paid | | | | | | | | | |
| per $1,000† | $ 1.07 | $ 1.33 | $ 1.28 | $ 1.33 | — | — | $ 1.22 | — | — |
| Ending value | | | | | | | | | |
| (after expenses) | $1,024.15 | $1,023.89 | $1,023.95 | $1,023.89 | — | — | $1,024.00 | — | — |
| Dreyfus | | | | | | | | | |
| Government Prime | | | | | | | | | |
| Cash Management | | | | | | | | | |
| Expenses paid | | | | | | | | | |
| per $1,000† | $ 1.02 | $ 1.33 | $ 1.22 | $ 1.28 | — | — | $ 1.17 | — | — |
| Ending value | | | | | | | | | |
| (after expenses) | $1,024.20 | $1,023.89 | $1,024.00 | $1,023.95 | — | — | $1,024.05 | — | — |
| Dreyfus Treasury & | | | | | | | | | |
| Agency Cash | | | | | | | | | |
| Management | | | | | | | | | |
| Expenses paid | | | | | | | | | |
| per $1,000† | $ .97 | $ 1.07 | $ 1.07 | $ 1.02 | $ 1.02 | $ 1.02 | $ 1.07 | $ 1.02 | |
| Ending value | | | | | | | | | |
| (after expenses) | $1,024.25 | $1,024.15 | $1,024.15 | $1,024.20 | $1,024.20 | $1,024.20 | $1,024.15 | $1,024.20 | |
| Dreyfus | | | | | | | | | |
| Treasury Prime | | | | | | | | | |
| Cash Management | | | | | | | | | |
| Expenses paid | | | | | | | | | |
| per $1,000† | $ .77 | $ .82 | $ .82 | $ .82 | — | — | $ .66 | — | — |
| Ending value | | | | | | | | | |
| (after expenses) | $1,024.45 | $1,024.40 | $1,024.40 | $1,024.40 | — | — | $1,024.55 | — | — |
| Dreyfus | | | | | | | | | |
| Municipal Cash | | | | | | | | | |
| Management Plus | | | | | | | | | |
| Expenses paid | | | | | | | | | |
| per $1,000† | $ 1.12 | $ 2.14 | $ 1.63 | $ 2.35 | — | — | $ 1.48 | — | — |
| Ending value | | | | | | | | | |
| (after expenses) | $1,024.10 | $1,023.09 | $1,023.59 | $1,022.89 | — | — | $1,023.74 | — | — |
The Funds 9
COMPARING YOUR FUND’S EXPENSES WITH THOSE OF OTHER FUNDS (Unaudited) (continued)
Expenses and Value of a $1,000 Investment (continued)
assuming a hypothetical 5% annualized return for the six months ended January 31, 2010
| | | | | | | | | |
| | Institutional | Investor | Administrative | Participant | Service | Select | Agency | Premier | Classic |
| Dreyfus | | | | | | | | | |
| New York | | | | | | | | | |
| Municipal Cash | | | | | | | | | |
| Management | | | | | | | | | |
| Expenses paid | | | | | | | | | |
| per $1,000† | $ 1.17 | $ 2.09 | $ 1.63 | $ 2.29 | — | — | $ 1.43 | — | — |
| Ending value | | | | | | | | | |
| (after expenses) | $1,024.05 | $1,023.14 | $1,023.59 | $1,022.94 | — | — | $1,023.79 | — | — |
| Dreyfus | | | | | | | | | |
| Tax Exempt Cash | | | | | | | | | |
| Management | | | | | | | | | |
| Expenses paid | | | | | | | | | |
| per $1,000† | $ 1.12 | $ 1.73 | $ 1.58 | $ 1.79 | — | — | $ 1.43 | — | — |
| Ending value | | | | | | | | | |
| (after expenses) | $1,024.10 | $1,023.49 | $1,023.64 | $1,023.44 | — | — | $1,023.79 | — | — |
| Dreyfus California | | | | | | | | | |
| AMT-Free | | | | | | | | | |
| Municipal Cash | | | | | | | | | |
| Management | | | | | | | | | |
| Expenses paid | | | | | | | | | |
| per $1,000† | $ 1.12 | $ 1.84 | $ 1.63 | $ 1.79 | — | — | $ 1.38 | — | — |
| Ending value | | | | | | | | | |
| (after expenses) | $1,024.10 | $1,023.39 | $1,023.59 | $1,023.44 | — | — | $1,023.84 | — | — |
| Dreyfus New York | | | | | | | | | |
| AMT-Free | | | | | | | | | |
| Municipal Cash | | | | | | | | | |
| Management | | | | | | | | | |
| Expenses paid | | | | | | | | | |
| per $1,000† | $ 1.12 | $ 1.84 | $ 1.58 | $ 1.99 | — | — | — | — | $ 1.99 |
| Ending value | | | | | | | | | |
| (after expenses) | $1,024.10 | $1,023.39 | $1,023.64 | $1,023.24 | — | — | — | — | $1,023.24 |
|
| † Expenses are equal to Dreyfus Cash Management’s annualized expense ratio of .21% for Institutional Shares, .36% for Investor Shares, .31% for Administrative Shares, .38% for |
| Participant Shares and .27% for Agency Shares, Dreyfus Cash Management Plus, Inc 23% for Institutional Shares, .38% for Investor Shares, .33% for Administrative Shares, ..39% |
| for Participant Shares, .41% for Service Shares, .39% for Select Shares and .29% for Agency Shares, Dreyfus Government Cash Management .21% for Institutional Shares, .26% for |
| Investor Shares, .25% for Administrative Shares, .26% for Participant Shares and .24% for Agency Shares, Dreyfus Government Prime Cash Management .20% for Institutional |
| Shares, .26% for Investor Shares, .24% for Administrative Shares, .25% for Participant Shares and .23% for Agency Shares, Dreyfus Treasury & Agency Cash Management .19% for |
| Institutional Shares, .21% for Investor Shares, .21% for Administrative Shares, .20% for Participant Shares, .20% for Service Shares, .20% for Select Shares, .21% for Agency Shares |
| and .20% for Premier Shares, Dreyfus Treasury Prime Cash Management .15% for Institutional Shares, .16% for Investor Shares, .16% for Administrative Shares, .16% for |
| Participant Shares and .13% for Agency Shares, Dreyfus Municipal Cash Management Plus .22% for Institutional Shares, .42% for Investor Shares, .32% for Administrative Shares, |
| .46% for Participant Shares and .29% for Agency Shares, Dreyfus NewYork Municipal Cash Management .23% for Institutional Shares, .41% for Investor Shares, .32% for |
| Administrative Shares, .45% for Participant Shares and .28% for Agency Shares, Dreyfus Tax Exempt Cash Management .22% for Institutional Shares, .34% for Investor Shares, |
| .31% for Administrative Shares, .35% for Participant Shares and .28% for Agency Shares, Dreyfus California AMT-Free Municipal Cash Management .22% for Institutional Shares, |
| .36% for Investor Shares, .32% for Administrative Shares, .35% for Participant Shares and .27% for Agency Shares, Dreyfus NewYork AMT-Free Municipal Cash Management |
| .22% for Institutional Shares, .36% for Investor Shares, .31% for Administrative Shares, .39% for Participant Shares and .39% for Classic shares; multiplied by the respective fund’s |
| average account value over the period, multiplied by 184/365 (to reflect the one-half year period). |
10
STATEMENT OF INVESTMENTS
January 31, 2010
| | |
| | Principal | |
| Dreyfus Cash Management | Amount ($) | Value ($) |
| |
| Negotiable Bank Certificates of Deposit—60.8% | | |
| Allied Irish Banks (Yankee) | | |
| 0.56%—0.75%, 2/3/10—4/6/10 | 1,225,000,000 | 1,225,000,000 |
| Banco Bilbao Vizcaya Argentaria | | |
| 0.32%, 2/17/10 | 55,000,000 a | 55,000,000 |
| Banco Bilbao Vizcaya Argentaria (Yankee) | | |
| 0.24%—0.35%, 3/4/10—7/6/10 | 1,780,000,000 | 1,780,011,415 |
| Bank of Ireland (Yankee) | | |
| 0.62%, 3/23/10 | 700,000,000 b | 700,000,000 |
| Bank of Nova Scotia (Yankee) | | |
| 0.09%—0.30%, 2/1/10—7/6/10 | 1,250,000,000 | 1,250,000,000 |
| Bank of Tokyo-Mitsubishi Ltd. (Yankee) | | |
| 0.21%—0.25%, 2/12/10—4/1/10 | 1,750,000,000 | 1,750,000,000 |
| Barclays Bank PLC (Yankee) | | |
| 0.42%—0.71%, 2/5/10—5/12/10 | 1,525,000,000 | 1,525,000,000 |
| Calyon NA (Yankee) | | |
| 0.33%—0.60%, 2/5/10—7/2/10 | 1,200,000,000 | 1,200,000,000 |
| Credit Industriel et Commercial (London) (Yankee) | | |
| 0.17%—0.37%, 2/1/10—2/8/10 | 1,910,000,000 | 1,910,001,369 |
| DZ Bank AG (Yankee) | | |
| 0.21%—0.24%, 2/26/10—4/7/10 | 950,000,000 | 950,000,000 |
| Fortis Bank (Yankee) | | |
| 0.31%, 5/5/10—5/6/10 | 750,000,000 | 750,000,000 |
| HSBC USA Inc. (London) | | |
| 0.32%, 3/29/10 | 100,000,000 | 100,000,000 |
| ING Bank N.V. (London) | | |
| 0.27%, 2/12/10 | 500,000,000 | 500,000,000 |
| Intesa Sanpaolo SpA (Yankee) | | |
| 0.32%—1.08%, 4/5/10—5/21/10 | 350,000,000 | 350,000,000 |
| Lloyds TSB Bank PLC (Yankee) | | |
| 0.13%, 2/1/10 | 75,000,000 | 75,000,000 |
| Mizuho Corporate Bank (Yankee) | | |
| 0.24%, 2/16/10 | 100,000,000 | 100,000,000 |
| Natixis (Yankee) | | |
| 0.28%—0.30%, 2/22/10—4/5/10 | 1,000,000,000 | 1,000,000,000 |
| Rabobank Nederland (Yankee) | | |
| 0.30%—0.31%, 3/29/10—7/7/10 | 1,850,000,000 | 1,850,000,000 |
| Royal Bank of Scotland PLC (Yankee) | | |
| 0.28%, 2/11/10—2/16/10 | 1,500,000,000 | 1,500,000,000 |
| Societe Generale (Yankee) | | |
| 0.23%, 3/1/10 | 950,000,000 | 950,000,000 |
| Sumitomo Mitsui Banking Corporation (Yankee) | | |
| 0.24%—0.25%, 2/3/10—2/12/10 | 1,100,000,000 | 1,100,000,389 |
| UBS AG (Yankee) | | |
| 0.32%—0.38%, 7/12/10—7/22/10 | 1,100,000,000 | 1,100,000,000 |
| Unicredit Bank AG (Yankee) | | |
| 0.34%—0.45%, 2/5/10—3/8/10 | 1,870,000,000 | 1,870,000,000 |
| Unicredit SPA (Yankee) | | |
| 0.34%, 3/8/10 | 150,000,000 | 150,000,000 |
The Funds 11
STATEMENT OF INVESTMENTS (continued)
| | |
| | Principal | |
| Dreyfus Cash Management (continued) | Amount ($) | Value ($) |
| |
| Negotiable Bank Certificates of Deposit (continued) | | |
| Westpac Capital Corp. | | |
| 0.29%, 2/12/10 | 250,000,000 a | 250,000,000 |
| Total Negotiable Bank Certificates of Deposit | | |
| (cost $23,990,013,173) | | 23,990,013,173 |
| |
| Commercial Paper—12.4% | | |
| Abbey National North America LLC | | |
| 0.12%, 2/1/10 | 1,000,000,000 | 1,000,000,000 |
| Banco Bilbao Vizcaya Argentaria | | |
| 0.34%, 5/5/10 | 200,000,000 | 199,824,333 |
| General Electric Capital Corp. | | |
| 0.11%—0.29%, 2/1/10—6/23/10 | 1,075,000,000 | 1,074,688,139 |
| Natixis US Finance Company LLC | | |
| 0.30%, 2/1/10—2/5/10 | 1,000,000,000 | 999,983,333 |
| Societe Generale N.A. Inc. | | |
| 0.23%—0.24%, 3/4/10—4/7/10 | 950,000,000 | 949,647,153 |
| UBS Finance Delaware LLC | | |
| 0.11%, 2/1/10 | 500,000,000 | 500,000,000 |
| U.S. Bank NA | | |
| 0.20%, 3/30/10 | 170,000,000 | 169,946,167 |
| Total Commercial Paper | | |
| (cost $4,894,089,125) | | 4,894,089,125 |
| |
| Asset-Backed Commercial Paper—2.8% | | |
| Atlantis One Funding Corp. | | |
| 0.32%, 3/25/10 | 125,000,000 b | 124,942,222 |
| Cancara Asset Securitisation Ltd. | | |
| 0.21%—0.27%, 2/8/10—2/16/10 | 400,000,000 b | 399,976,500 |
| CHARTA LLC | | |
| 0.37%, 4/6/10 | 250,000,000 b | 249,835,556 |
| Govco Inc. | | |
| 0.24%, 3/2/10 | 150,000,000 b | 149,971,000 |
| LMA Americas LLC | | |
| 0.25%, 3/1/10 | 173,000,000 b | 172,966,361 |
| Total Asset-Backed Commercial Paper | | |
| (cost $1,097,691,639) | | 1,097,691,639 |
| |
| Corporate Notes—4.9% | | |
| Bank of America Securities LLC | | |
| 0.28%, 2/1/10 | 1,050,000,000 | 1,050,000,000 |
| Barclays Bank PLC | | |
| 0.68%, 2/26/10 | 400,000,000 a | 400,000,000 |
| Credit Suisse | | |
| 0.31%, 2/10/10 | 500,000,000 a | 500,000,000 |
| Total Corporate Notes | | |
| (cost $1,950,000,000) | | 1,950,000,000 |
12
| | |
| | Principal | |
| Dreyfus Cash Management (continued) | Amount ($) | Value ($) |
| |
| Short-Term Bank Notes—2.0% | | |
| Bank of America N.A. | | |
| 0.31%, 7/6/10—7/12/10 | | |
| (cost $800,000,000) | 800,000,000 | 800,000,000 |
| |
| |
| U.S. Government Agencies—4.9% | | |
| Federal Home Loan Bank | | |
| 0.65%-0.66%, 5/11/10 | 454,000,000 | 453,989,829 |
| Federal Home Loan Mortgage Corp. | | |
| 0.23%, 4/16/10 | 1,000,000,000 a,c | 1,000,000,000 |
| Federal Home Loan Mortgage Corp. | | |
| 0.10%-0.18%, 5/4/10—6/28/10 | 473,150,000 c | 472,943,012 |
| Federal National Mortgage Association | | |
| 0.17%-0.18%, 6/23/10-6/30/10 | 29,905,000 c | 29,883,655 |
| Total U.S. Government Agencies | | |
| (cost $1,956,816,496) | | 1,956,816,496 |
| |
| |
| Time Deposits—7.6% | | |
| BNP Paribas (Grand Cayman) | | |
| 0.11%, 2/1/10 | 500,000,000 | 500,000,000 |
| Commerzbank AG (Grand Cayman) | | |
| 0.13%, 2/1/10 | 700,000,000 | 700,000,000 |
| DZ Bank AG (Grand Cayman) | | |
| 0.13%, 2/1/10 | 272,000,000 | 272,000,000 |
| KBC Bank N.V. (Grand Cayman) | | |
| 0.11%, 2/1/10 | 1,527,000,000 | 1,527,000,000 |
| Total Time Deposits | | |
| (cost $2,999,000,000) | | 2,999,000,000 |
| |
| |
| Repurchase Agreements—4.6% | | |
| Calyon Securities (USA) | | |
| 0.10%, dated 1/29/10, due 2/1/10 in the amount of $200,001,667 | | |
| (fully collateralized by $126,600,000 Federal Home Loan Bank, | | |
| 0.70%-3.625%, due 4/30/10-10/18/13, value $129,029,645 | | |
| and $75,071,000 Federal National Mortgage Association, | | |
| 0%, due 9/20/10, value $74,973,408) | 200,000,000 | 200,000,000 |
| Deutsche Bank Securities | | |
| 0.11%-0.19%, dated 1/29/10, due 2/1/10 in the amount | | |
| of $550,006,708 (fully collateralized by $2,000,000 Asian | | |
| Development Bank, 4.50%, due 9/4/12, value $2,181,950, | | |
| $300,442,625 Commercial Paper, 0%, due 2/1/10-2/26/10, | | |
| value $299,983,645, $100,000,000 International Bank for | | |
| Reconstruction and Development Notes, 0%, due 3/4/10, | | |
| value $99,990,000, $69,683,000 U.S. Treasury Notes, | | |
| 3.75%, due 11/15/18, value $71,395,065 | | |
| and $128,339,097 U.S. Treasury Strips, | | |
| due 5/15/16-8/15/25, value $87,449,340) | 550,000,000 | 550,000,000 |
The Funds 13
STATEMENT OF INVESTMENTS (continued)
| | |
| | Principal | |
| Dreyfus Cash Management (continued) | Amount ($) | Value ($) |
| |
| Repurchase Agreements (continued) | | |
| Morgan Stanley | | |
| 0.11%, dated 1/29/10, due 2/1/10 in the amount of $300,002,750 | | |
| (fully collateralized by $101,000,000 Federal Agricultural Mortgage Corp., | | |
| 4.875%-5.125%, due 1/14/11-4/19/17, value $106,948,747, $72,725,000 | | |
| Federal Home Loan Bank, 0%-1.375%, due 10/19/11-8/20/24, | | |
| value $73,238,357, $19,000,000 Federal Home Loan Mortgage Corp., | | |
| 0%, due 6/3/24-11/25/24, value $18,863,018, $125,100,000 | | |
| Resolution Funding Corp., 0%, due 10/15/10-10/15/19, | | |
| value $81,951,984 and $23,075,000 Tennessee Valley Authority, | | |
| 4.375%-7.125%, due 5/23/12-4/1/56, value $25,630,982) | 300,000,000 | 300,000,000 |
| RBC Capital Markets | | |
| 0.255%, dated 1/29/10, due 2/1/10 in the amount of $735,015,619 | | |
| (fully collateralized by $1,824,014,166 Corporate Notes, 0%-13.25%, | | |
| due 2/1/10-5/25/47, value $757,020,377 and $54,000 | | |
| Federal Home Loan Mortgage Corp., 5.50%-6%, | | |
| due 6/15/33-11/15/35, value $51,437) | 735,000,000 | 735,000,000 |
| RBS Securities | | |
| 0.28%, dated 1/29/10, due 2/1/10 in the amount of $50,001,167 | | |
| (fully collateralized by $662,752,172 Corporate Notes, 0%-7.75%, | | |
| due 3/17/14-3/17/51, value $50,900,415 and $1,300,000 | | |
| Federal Home Loan Mortgage Corp., 4.50%, | | |
| due 10/1/19, value $593,892) | 50,000,000 | 50,000,000 |
| Total Repurchase Agreements | | |
| (cost $1,835,000,000) | | 1,835,000,000 |
| |
| Total Investments (cost $39,522,610,433) | 100.0% | 39,522,610,433 |
| |
| Cash and Receivables (Net) | .0% | 18,584,558 |
| |
| Net Assets | 100.0% | 39,541,194,991 |
| a | Variable rate security—interest rate subject to periodic change. |
| b | Securities exempt from registration under Rule 144A of the Securities Act of 1933.These securities may be resold in transactions exempt from registration, normally to qualified institutional buyers. At January 31, 2010, these securities amounted to $1,797,691,639 or 4.5% of net assets. |
| c | On September 7, 2008, the Federal Housing Finance Agency (FHFA) placed Federal National Mortgage Association and Federal Home Loan Mortgage Corporation into conservatorship with FHFA as the conservator. As such, the FHFA will oversee the continuing affairs of these companies. |
| | | |
| Portfolio Summary (Unaudited)† | | | |
| |
| | Value (%) | | Value (%) |
| Banking | 84.4 | Foreign/Governmental | 1.8 |
| U.S. Government Agencies | 4.9 | Asset-Backed/Multi-Seller Programs | 1.6 |
| Repurchase Agreements | 4.6 | | |
| Finance | 2.7 | | 100.0 |
| |
| † Based on net assets. | | | |
| See notes to financial statements. | | | |
14
| | |
| STATEMENT OF INVESTMENTS | | |
| January 31, 2010 | | |
| |
| |
| |
| |
| | Principal | |
| Dreyfus Cash Management Plus, Inc. | Amount ($) | Value ($) |
| |
| Negotiable Bank Certificates of Deposit—53.0% | | |
| Allied Irish Banks (Yankee) | | |
| 0.55%—0.56%, 4/6/10—4/20/10 | 250,000,000 | 250,000,000 |
| Bank of Ireland (Yankee) | | |
| 0.60%—0.62%, 3/23/10—4/8/10 | 265,000,000 a | 265,000,000 |
| Bank of Tokyo-Mitsubishi Ltd. (Yankee) | | |
| 0.24%, 2/26/10 | 250,000,000 | 250,000,000 |
| BNP Paribas (Yankee) | | |
| 0.21%, 4/21/10 | 50,000,000 | 50,000,000 |
| Calyon NA (Yankee) | | |
| 0.22%, 4/19/10 | 250,000,000 | 250,000,000 |
| Credit Industriel et Commercial (Yankee) | | |
| 0.27%—0.33%, 2/8/10—3/17/10 | 300,000,000 | 300,000,048 |
| DZ Bank AG (Yankee) | | |
| 0.21%, 4/15/10 | 250,000,000 | 250,000,000 |
| Fortis Bank (Yankee) | | |
| 0.24%, 2/12/10 | 50,000,000 | 50,000,000 |
| ING Bank N.V. (London) | | |
| 0.27%, 2/16/10 | 250,000,000 | 250,000,000 |
| Mizuho Corporate Bank (Yankee) | | |
| 0.24%, 2/16/10 | 75,000,000 | 75,000,000 |
| Natixis (Yankee) | | |
| 0.28%, 4/5/10 | 250,000,000 | 250,000,000 |
| Royal Bank of Scotland PLC (Yankee) | | |
| 0.22%—0.28%, 2/11/10—4/16/10 | 250,000,000 | 250,000,000 |
| Societe Generale (Yankee) | | |
| 0.23%, 4/14/10 | 100,000,000 | 100,000,000 |
| UBS AG (Yankee) | | |
| 0.24%, 2/16/10 | 150,000,000 | 150,000,000 |
| Unicredit Bank AG (Yankee) | | |
| 0.45%, 2/5/10 | 40,000,000 | 40,000,000 |
| Unicredit SPA (Yankee) | | |
| 0.34%, 3/8/10 | 225,000,000 | 225,000,000 |
| Total Negotiable Bank Certificates of Deposit | | |
| (cost $3,005,000,048) | | 3,005,000,048 |
| |
| Commercial Paper—14.6% | | |
| CBA (Delaware) Finance Inc. | | |
| 0.21%, 2/17/10 | 80,000,000 | 79,992,711 |
| DnB NOR Bank ASA | | |
| 0.22%, 2/9/10 | 267,516,000 a | 267,503,219 |
| Fortis Funding LLC | | |
| 0.23%, 2/17/10 | 64,092,000 a | 64,085,448 |
| NRW Bank | | |
| 0.21%, 4/13/10 | 50,000,000 | 49,979,292 |
| Scotiabanc, Inc. | | |
| 0.15%, 4/1/10 | 150,000,000 a | 149,963,125 |
The Funds 15
STATEMENT OF INVESTMENTS (continued)
| | |
| | Principal | |
| Dreyfus Cash Management Plus, Inc. (continued) | Amount ($) | Value ($) |
| |
| Commercial Paper (continued) | | |
| Societe Generale N.A. Inc. | | |
| 0.24%, 4/12/10 | 150,000,000 | 149,930,000 |
| Westpac Banking Corp. | | |
| 0.21%, 2/16/10 | 70,000,000 a | 69,994,021 |
| Total Commercial Paper | | |
| (cost $831,447,816) | | 831,447,816 |
| |
| Asset-Backed Commercial Paper—9.1% | | |
| Atlantis One Funding Corp. | | |
| 0.23%, 2/11/10 | 250,000,000 a | 249,984,028 |
| Grampian Funding Ltd. | | |
| 0.26%, 4/27/10 | 265,000,000 a | 264,837,319 |
| Total Asset-Backed Commercial Paper | | |
| (cost $514,821,347) | | 514,821,347 |
| |
| Corporate Note—4.6% | | |
| Bank of America Securities LLC | | |
| 0.28%, 2/1/10 | | |
| (cost $260,000,000) | 260,000,000 | 260,000,000 |
| |
| Time Deposit—1.1% | | |
| State Street Bank and Trust Co. (Grand Cayman) | | |
| 0.10%, 2/1/10 | | |
| (cost $64,000,000) | 64,000,000 | 64,000,000 |
| |
| Repurchase Agreements—17.6% | | |
| Barclays Financial LLC | | |
| 0.23%-0.28%, dated 1/29/10, due 2/1/10 in the amount of $201,004,273 | | |
| (fully collateralized by $102,011,255 Commercial Paper, 0%, due 2/19/10-3/1/10, | | |
| value $102,000,001 and $99,934,019 Corporate Bonds, 0%-12.50%, | | |
| due 6/1/11-6/15/68, value $104,030,000) | 201,000,000 | 201,000,000 |
| Citigroup Global Markets Holdings Inc. | | |
| 0.28%, dated 1/29/10, due 2/1/10 in the amount of $250,005,833 | | |
| (fully collateralized by $316,092,106 Corporate Bonds, 0%-9.31%, | | |
| due 10/27/12-12/20/37, value $257,500,000) | 250,000,000 | 250,000,000 |
| HSBC USA Inc. | | |
| 0.28%, dated 1/29/10, due 2/1/10 in the amount of $100,002,333 | | |
| (fully collateralized by $116,236,995 Corporate Bonds, 0%-7.35%, | | |
| due 2/1/11-3/25/38, value $104,793,526) | 100,000,000 | 100,000,000 |
16
| | |
| | Principal | |
| Dreyfus Cash Management Plus, Inc. (continued) | Amount ($) | Value ($) |
| |
| Repurchase Agreements (continued) | | |
| Morgan Stanley | | |
| 0.23%, dated 1/29/10, due 2/1/10 in the amount of $201,003,853 | | |
| (fully collateralized by $103,122,000 Commercial Paper, 0%, | | |
| due 2/16/10-5/20/10, value $103,020,767 and $102,945,148 | | |
| Corporate Bonds, 0%-7.38%, due 4/28/10-1/14/38, | | |
| value $103,404,081) | 201,000,000 | 201,000,000 |
| RBC Capital Markets | | |
| 0.26%, dated 1/29/10, due 2/1/10 in the amount of $250,005,313 | | |
| (fully collateralized by $694,761,818 Corporate Bonds, | | |
| 0%-7%, due 1/25/35-5/25/47, value $257,500,000) | 250,000,000 | 250,000,000 |
| Total Repurchase Agreements | | |
| (cost $1,002,000,000) | | 1,002,000,000 |
| |
| Total Investments (cost $5,677,269,211) | 100.0% | 5,677,269,211 |
| |
| Cash and Receivables (Net) | .0% | 584,920 |
| |
| Net Assets | 100.0% | 5,677,854,131 |
| a | Securities exempt from registration under Rule 144A of the Securities Act of 1933.These securities may be resold in transactions exempt from registration, normally to qualified institutional buyers. At January 31, 2010, these securities amounted to $1,331,367,160 or 23.4% of net assets. |
| | | |
| Portfolio Summary (Unaudited)† | | | |
| | Value (%) | | Value (%) |
| Banking | 77.7 | Foreign/Governmental | 4.7 |
| Repurchase Agreements | 17.6 | | 100.0 |
| † Based on net assets. | | | |
| See notes to financial statements. | | | |
The Funds 17
STATEMENT OF INVESTMENTS
January 31, 2010
| | | |
| | Annualized | | |
| | Yield on | | |
| | Date of | Principal | |
| Dreyfus Government Cash Management | Purchase (%) | Amount ($) | Value ($) |
| |
| U.S. Government Agencies—65.5% | | | |
| Federal Farm Credit Bank | | | |
| 3/9/10 | 0.48 | 200,000,000 a | 200,000,000 |
| Federal Home Loan Bank: | | | |
| 2/1/10 | 0.32 | 197,500,000 a | 197,500,000 |
| 2/1/10 | 0.37 | 500,000,000 a | 500,000,000 |
| 2/1/10 | 0.40 | 67,220,000 | 67,220,000 |
| 2/4/10 | 0.31 | 134,320,000 | 134,350,384 |
| 2/4/10 | 0.40 | 50,000,000 | 49,998,333 |
| 2/5/10 | 0.30 | 200,000,000 | 200,000,064 |
| 2/5/10 | 0.50 | 402,350,000 | 402,349,530 |
| 2/10/10 | 0.22 | 500,000,000 a | 499,997,562 |
| 2/10/10 | 0.38 | 394,624,000 | 394,586,967 |
| 2/12/10 | 0.06 | 82,138,000 | 82,136,494 |
| 2/17/10 | 0.06 | 506,508,000 | 506,494,404 |
| 2/18/10 | 0.42 | 2,300,000 | 2,300,635 |
| 2/19/10 | 0.06 | 200,000,000 | 199,994,000 |
| 2/22/10 | 0.07 | 40,000,000 | 39,998,483 |
| 2/22/10 | 0.11 | 971,250,000 a | 971,097,778 |
| 2/26/10 | 0.42 | 22,950,000 | 22,949,225 |
| 3/3/10 | 0.08 | 561,206,000 | 561,168,586 |
| 4/15/10 | 0.16 | 650,000,000 a | 649,522,640 |
| 4/16/10 | 0.20 | 1,000,000,000 a | 1,000,000,000 |
| 4/30/10 | 0.70 | 128,000,000 | 127,997,500 |
| 5/12/10 | 0.16 | 25,000,000 | 24,988,889 |
| 5/21/10 | 0.17 | 139,000,000 | 138,930,558 |
| 6/11/10 | 0.26 | 400,000,000 | 403,894,772 |
| 10/15/10 | 0.45 | 32,900,000 | 32,891,779 |
| 10/28/10 | 0.07 | 100,000,000 | 100,071,424 |
| 11/15/10 | 0.47 | 50,000,000 | 50,224,216 |
| 1/18/11 | 0.43 | 200,000,000 | 200,612,827 |
| 5/25/11 | 0.25 | 560,000,000 a | 560,000,000 |
| 5/27/11 | 0.25 | 500,000,000 a | 500,000,000 |
| Federal Home Loan Mortgage Corp.: | | | |
| 2/1/10 | 0.29 | 48,591,000 b | 48,591,000 |
| 2/8/10 | 0.35 | 1,054,870,000 b | 1,054,798,084 |
| 2/16/10 | 0.06 | 308,752,000 b | 308,744,281 |
| 2/18/10 | 0.07 | 304,360,000 b | 304,349,939 |
| 2/22/10 | 0.40 | 88,079,000 b | 88,058,448 |
| 3/23/10 | 0.25 | 275,000,000 b | 274,906,424 |
| 4/6/10 | 0.23 | 217,760,000 b | 217,670,960 |
| 4/7/10 | 0.22 | 250,000,000 b | 249,900,694 |
| 4/12/10 | 0.23 | 300,000,000 b | 299,865,833 |
| 4/19/10 | 0.17 | 347,883,000 b | 347,756,506 |
| 4/20/10 | 0.17 | 111,183,000 b | 111,142,048 |
| 4/26/10 | 0.17 | 48,000,000 b | 47,980,960 |
| 5/3/10 | 0.24 | 149,000,000 b | 148,909,607 |
| 5/17/10 | 0.43 | 750,000,000 b | 749,059,375 |
| 6/1/10 | 0.19 | 106,075,000 b | 106,009,587 |
| 6/7/10 | 0.18 | 274,650,000 b | 274,474,358 |
| 6/14/10 | 0.16 | 250,000,000 b | 249,852,222 |
18
| | | |
| | Annualized | | |
| | Yield on | | |
| | Date of | Principal | |
| Dreyfus Government Cash Management (continued) | Purchase (%) | Amount ($) | Value ($) |
| |
| U.S. Government Agencies (continued) | | | |
| Federal Home Loan Mortgage Corp. (continued): | | | |
| 9/1/10 | 0.27 | 380,000,000 b | 379,395,800 |
| 10/26/10 | 0.26 | 266,410,000 b | 265,902,911 |
| 11/2/10 | 0.27 | 321,000,000 b | 320,352,561 |
| Federal National Mortgage Association: | | | |
| 2/3/10 | 0.29 | 356,700,000 b | 356,694,313 |
| 2/4/10 | 0.31 | 75,000,000 b | 75,016,966 |
| 2/10/10 | 0.29 | 158,575,000 b | 158,563,702 |
| 2/22/10 | 0.43 | 1,162,752,000 b | 1,162,460,125 |
| 4/1/10 | 0.22 | 15,000,000 b | 14,994,592 |
| 6/2/10 | 0.18 | 155,000,000 b | 154,906,225 |
| 6/9/10 | 0.18 | 143,950,000 b | 143,857,872 |
| 6/17/10 | 0.16 | 200,000,000 b | 199,879,111 |
| 9/1/10 | 0.30 | 1,000,000,000 b | 998,233,334 |
| Total U.S. Government Agencies | | | |
| (cost $17,933,604,888) | | | 17,933,604,888 |
| |
| |
| U.S. Treasury Note—2.3% | | | |
| 6/1/10 | | | |
| (cost $629,808,038) | 0.27 | 625,000,000 | 629,808,038 |
| |
| |
| Asset-Backed Commercial Paper—3.6% | | | |
| Straight-A Funding LLC: | | | |
| 2/3/10 | 0.13 | 125,000,000 c | 124,999,097 |
| 3/8/10 | 0.18 | 98,446,000 c | 98,428,772 |
| 3/15/10 | 0.18 | 149,827,000 c | 149,795,536 |
| 3/16/10 | 0.18 | 70,405,000 c | 70,389,863 |
| 3/16/10 | 0.18 | 100,466,000 c | 100,444,400 |
| 3/16/10 | 0.18 | 60,000,000 c | 59,987,100 |
| 3/17/10 | 0.18 | 75,000,000 c | 74,983,500 |
| 4/7/10 | 0.17 | 100,000,000 c | 99,969,306 |
| 4/16/10 | 0.17 | 50,072,000 c | 50,054,503 |
| 4/19/10 | 0.17 | 168,549,000 c | 168,487,714 |
| Total Asset-Backed Commercial Paper | | | |
| (cost $997,539,791) | | | 997,539,791 |
| |
| |
| Repurchase Agreements—28.6% | | | |
| Banc of America Securities LLC | | | |
| dated 1/29/10, due 2/1/10 in the amount of $250,002,083 (fully collateralized | | | |
| by $171,424,000 Federal Home Loan Bank, 0%-2.88%, due 4/5/10-6/12/15, | | | |
| value $171,708,252 and $82,995,000 Federal Home Loan Mortgage Corp., | | | |
| 2.38%, due 1/28/13, value $83,292,618) | 0.10 | 250,000,000 | 250,000,000 |
| Barclays Financial LLC | | | |
| dated 1/29/10, due 2/1/10 in the amount of $1,142,009,517 (fully collateralized by | | | |
| $335,721,600 U.S. Treasury Bills, due 10/21/10, value $335,221,375 and $827,066,000 | | |
| U.S. Treasury Notes, 2.38%-4.50%, due 8/31/10-5/15/19, value $829,618,706) | 0.10 | 1,142,000,000 | 1,142,000,000 |
The Funds 19
STATEMENT OF INVESTMENTS (continued)
| | | |
| | Annualized | | |
| | Yield on | | |
| | Date of | Principal | |
| Dreyfus Government Cash Management (continued) | Purchase (%) | Amount ($) | Value ($) |
| |
| Repurchase Agreements (continued) | | | |
| BNP Paribas | | | |
| dated 1/29/10, due 2/1/10 in the amount of $600,005,000 (fully collateralized by | | | |
| $212,527,600 U.S. Treasury Bonds, 3.50%-8.13%, due 8/15/19-2/15/39, | | | |
| value $243,456,812 and $355,056,400 U.S. Treasury Notes, 3.75%-4.63%, | | | |
| due 5/15/10-11/15/18, value $368,543,271) | 0.10 | 600,000,000 | 600,000,000 |
| Calyon Securities (USA) | | | |
| dated 1/29/10, due 2/1/10 in the amount of $1,500,012,500 (fully collateralized | | | |
| by $214,000,000 Treasury Inflation Protected Securities, 2%, due 7/15/14, | | | |
| value $262,648,977, $25,490,600 U.S. Treasury Bonds, 4.38%, due 11/15/39, | | | |
| value $24,917,169 and $1,234,070,700 U.S. Treasury Notes, 1%-4.88%, | | | |
| due 8/31/11-12/31/13, value $1,242,433,945) | 0.10 | 1,500,000,000 | 1,500,000,000 |
| Credit Suisse (USA) Inc. | | | |
| dated 1/29/10, due 2/1/10 in the amount of $200,001,667 (fully collateralized | | | |
| by $198,715,000 U.S. Treasury Notes, 2.75%, due 7/31/10, value $204,002,928) | 0.10 | 200,000,000 | 200,000,000 |
| Credit Suisse (USA) Inc. | | | |
| dated 1/29/10, due 2/1/10 in the amount of $300,002,750 (fully collateralized by | | | |
| $12,259,200 U.S. Treasury Bills, due 3/4/10-1/13/11, value $12,253,797 and | | | |
| $289,427,300 U.S. Treasury Notes, 3.63%, due 8/15/19, value $293,746,555) | 0.11 | 300,000,000 | 300,000,000 |
| Deutsche Bank Securities | | | |
| dated 1/29/10, due 2/1/10 in the amount of $1,100,009,167 (fully collateralized | | | |
| by $714,059,500 Treasury Inflation Protected Securities, 1.38%-3.63%, | | | |
| due 7/15/16-4/15/28, value $911,480,857, $192,904,700 U.S. Treasury Notes, | | | |
| 1.88%-3.88%, due 10/31/12-2/28/14, value $198,503,975 and $20,644,243 | | | |
| U.S. Treasury Strips, 11/15/19-5/15/26, value $12,015,182) | 0.10 | 1,100,000,000 | 1,100,000,000 |
| HSBC USA Inc. | | | |
| dated 1/29/10, due 2/1/10 in the amount of $200,001,500 | | | |
| (fully collateralized by $202,455,000 U.S. Treasury Notes, 1.38%-3.13%, | | | |
| due 11/15/12-10/31/16, value $204,002,462) | 0.09 | 200,000,000 | 200,000,000 |
| HSBC USA Inc. | | | |
| dated 1/29/10, due 2/1/10 in the amount of $400,003,333 (fully collateralized | | | |
| by $166,888,000 U.S. Treasury Bonds, 4.38%, due 2/15/38, value $165,690,405 | | | |
| and $238,955,000 U.S. Treasury Notes, 2.63%. due 12/31/14, value $242,313,003) | 0.10 | 400,000,000 | 400,000,000 |
| JP Morgan Chase & Co. | | | |
| dated 1/29/10, due 2/1/10 in the amount of $1,000,007,500 (fully | | | |
| collateralized by $658,663,000 Treasury Protected Inflation Securities, | | | |
| 2%-2.38%, due 1/15/25-1/15/27, value $767,270,966 and $474,275,600 | | | |
| U.S. Treasury Strips, due 2/15/10-11/15/39, value $252,730,337) | 0.09 | 1,000,000,000 | 1,000,000,000 |
| Morgan Stanley | | | |
| dated 1/29/10, due 2/1/10 in the amount of $100,000,833 (fully | | | |
| collateralized by $98,203,600 U.S. Treasury Notes, 2%-4.25%, | | | |
| due 9/30/10-10/15/10, value $102,177,015) | 0.10 | 100,000,000 | 100,000,000 |
| RBC Capital Markets | | | |
| dated 1/29/10, due 2/1/10 in the amount of $250,002,292 (fully collateralized | | | |
| by $54,453,000 Federal Farm Credit Bank, 3.25%, due 12/7/15, value $54,351,415, | | | |
| $128,980,000 Federal Home Loan Bank, 0%-2%, due 4/5/10-1/29/15, | | | |
| value $129,055,214, $27,241,000 Federal Home Loan Mortgage Corp., 0%-5%, | | | |
| due 6/20/11-1/29/25, value $27,350,749 and $44,169,000 Federal National | | | |
| Mortgage Association, 2%-3%, due 12/30/14-1/29/20, value $44,243,507) | 0.11 | 250,000,000 | 250,000,000 |
20
| | | |
| | Annualized | | |
| | Yield on | | |
| | Date of | Principal | |
| Dreyfus Government Cash Management (continued) | Purchase (%) | Amount ($) | Value ($) |
| |
| Repurchase Agreements (continued) | | | |
| RBS Securities | | | |
| dated 1/29/10, due 2/1/10 in the amount of $400,003,333 (fully collateralized by | | | |
| $124,153,500 U.S. Treasury Bonds, 6.88%, due 8/15/25, value $164,593,897 | | | |
| and $241,190,000 U.S. Treasury Notes, 0.88%, due 2/28/11, value $243,408,914) | 0.10 | 400,000,000 | 400,000,000 |
| Societe Generale | | | |
| dated 1/29/10, due 2/1/10 in the amount of $300,002,500 (fully collateralized | | | |
| by $29,259,000 Federal Agricultural Mortgage Corp., 6.71%, due 7/28/14, | | | |
| value $34,516,737, $305,000,000 Federal Home Loan Mortgage Corp., | | | |
| 6.27%-6.97%, due 8/15/35-7/15/36, value $22,930,598, $270,278,333 | | | |
| Federal National Mortgage Association, 0%-6.44%, due 10/25/35-11/1/39, | | | |
| value $36,479,372, $172,956,158 Government National Mortgage Association, | | | |
| 4.03%-6.93%, due 2/15/30-1/15/52, value $172,780,960 and $39,000,400 | | | |
| U.S. Treasury Note, 0.88%, due 4/30/11, value $39,292,334) | 0.10 | 300,000,000 | 300,000,000 |
| UBS Securities LLC | | | |
| dated 1/29/10, due 2/1/10 in the amount of $100,000,917 (fully | | | |
| collateralized by $209,777,000 Federal Home Loan Mortgage Corp., | | | |
| 0%-5.88%, due 3/15/10-6/15/39, value $102,001,557) | 0.11 | 100,000,000 | 100,000,000 |
| Total Repurchase Agreements | | | |
| (cost $7,842,000,000) | | | 7,842,000,000 |
| |
| Total Investments (cost $27,402,952,717) | | 100.0% | 27,402,952,717 |
| |
| Cash and Receivables (Net) | | .0% | 10,315,517 |
| |
| Net Assets | | 100.0% | 27,413,268,234 |
| a | Variable rate security—interest rate subject to periodic change. |
| b | On September 7, 2008, the Federal Housing Finance Agency (FHFA) placed Federal National Mortgage Association and Federal Home Loan Mortgage Corporation into conservatorship with FHFA as the conservator. As such, the FHFA will oversee the continuing affairs of these companies. |
| c | Securities exempt from registration under Rule 144A of the Securities Act of 1933.These securities may be resold in transactions exempt from registration, normally to qualified institutional buyers. At January 31, 2010, these securities amounted to $997,539,791 or 3.6% of net assets. |
| | | |
| Portfolio Summary (Unaudited)† | | | |
| |
| | Value (%) | | Value (%) |
| Federal Home Loan Bank | 31.6 | Asset-Backed/Commercial Paper | 3.6 |
| Repurchase Agreements | 28.6 | U.S. Treasury Note | 2.3 |
| Federal Home Loan Mortgage Corp | 21.3 | Federal Farm Credit Bank | .7 |
| Federal National Mortgage Association | 11.9 | | 100.0 |
| |
| † Based on net assets. | | | |
| See notes to financial statements. | | | |
The Funds 21
STATEMENT OF INVESTMENTS
January 31, 2010
| | | |
| | Annualized | | |
| | Yield on | | |
| | Date of | Principal | |
| Dreyfus Government Prime Cash Management | Purchase (%) | Amount ($) | Value ($) |
| |
| U.S. Government Agencies—81.4% | | | |
| Federal Farm Credit Bank: | | | |
| 2/5/10 | 0.29 | 328,000,000 a | 328,108,413 |
| 2/28/10 | 0.24 | 412,000,000 a | 411,961,403 |
| 3/12/10 | 0.95 | 50,000,000 a | 49,968,212 |
| 3/15/10 | 0.08 | 85,000,000 | 84,992,067 |
| 3/22/10 | 0.08 | 25,000,000 | 24,997,278 |
| 3/30/10 | 0.08 | 99,129,000 | 99,116,444 |
| 4/1/10 | 0.09 | 19,300,000 | 19,297,153 |
| 4/12/10 | 0.11 | 33,000,000 | 32,993,262 |
| 5/4/10 | 0.47 | 19,000,000 | 19,109,395 |
| 5/7/10 | 0.53 | 15,571,000 | 15,744,608 |
| 5/7/10 | 0.55 | 15,288,000 | 15,457,619 |
| 12/17/10 | 0.21 | 25,500,000 a | 25,497,749 |
| 1/5/11 | 0.21 | 30,000,000 a | 29,997,193 |
| Federal Home Loan Bank: | | | |
| 2/1/10 | 0.37 | 250,000,000 a | 250,000,000 |
| 2/3/10 | 0.09 | 263,000,000 | 262,998,685 |
| 2/19/10 | 0.07 | 398,200,000 | 398,186,063 |
| 2/24/10 | 0.07 | 300,000,000 | 299,986,583 |
| 2/26/10 | 0.07 | 99,091,000 | 99,086,183 |
| 3/3/10 | 0.08 | 167,000,000 | 166,988,867 |
| 3/5/10 | 0.07 | 12,000,000 | 11,999,253 |
| 3/12/10 | 0.57 | 10,000,000 | 10,022,242 |
| 3/17/10 | 0.53 | 14,070,000 | 14,135,422 |
| 3/19/10 | 0.07 | 261,000,000 | 260,977,486 |
| 3/26/10 | 0.11 | 350,000,000 | 349,943,320 |
| 4/1/10 | 0.09 | 58,345,000 | 58,336,394 |
| 5/11/10 | 0.46 | 50,000,000 | 50,002,013 |
| 5/12/10 | 0.47 | 4,450,000 | 4,451,866 |
| 5/12/10 | 0.50 | 32,500,000 | 32,857,384 |
| 5/14/10 | 0.54 | 39,950,000 | 40,517,609 |
| 5/14/10 | 0.55 | 15,000,000 | 15,183,981 |
| 5/21/10 | 0.16 | 57,700,000 | 57,672,047 |
| 5/26/10 | 0.16 | 49,292,000 | 49,267,806 |
| 6/4/10 | 0.18 | 75,500,000 | 75,453,567 |
| 6/11/10 | 0.26 | 45,000,000 | 45,438,237 |
| 7/14/10 | 0.17 | 110,888,000 | 110,802,894 |
| 7/16/10 | 0.17 | 50,000,000 | 49,961,042 |
| 7/21/10 | 0.17 | 228,768,000 | 228,585,891 |
| Total U.S. Government Agencies | | | |
| (cost $4,100,095,631) | | | 4,100,095,631 |
22
| | | | | |
| | | | Annualized | | |
| | | | Yield on | | |
| | | | Date of | Principal | |
| Dreyfus Government Prime Cash Management (continued) | Purchase (%) | Amount ($) | Value ($) |
| |
| U.S. Treasury Bills—11.9% | | | | | |
| 6/3/10 | | | 0.17 | 400,000,000 | 399,769,555 |
| 6/10/10 | | | 0.17 | 200,000,000 | 199,881,750 |
| Total U.S. Treasury Bills | | | | | |
| (cost $599,651,305) | | | | | 599,651,305 |
| |
| U.S. Treasury Notes—5.9% | | | | | |
| 2/16/10 | | | 0.28 | 195,000,000 | 195,255,243 |
| 3/1/10 | | | 0.03 | 100,000,000 | 100,149,800 |
| Total U.S. Treasury Notes | | | | | |
| (cost $295,405,043) | | | | | 295,405,043 |
| |
| Total Investments (cost $4,995,151,979) | | | | 99.2% | 4,995,151,979 |
| Cash and Receivables (Net) | | | | .8% | 38,113,905 |
| Net Assets | | | | 100.0% | 5,033,265,884 |
| a Variable rate security—interest rate subject to periodic change. | | | | | |
| |
| |
| |
| Portfolio Summary (Unaudited)† | | | | | |
| | Value (%) | | | | Value (%) |
| Federal Home Loan Bank | 58.4 | U.S. Treasury Notes | | 5.9 |
| Federal Farm Credit Bank | 23.0 | | | | |
| U.S. Treasury Bills | 11.9 | | | | 99.2 |
| |
| † Based on net assets. | | | | | |
| See notes to financial statements. | | | | | |
The Funds 23
STATEMENT OF INVESTMENTS
January 31, 2010
| | | |
| | Annualized | | |
| | Yield on | | |
| | Date of | Principal | |
| Dreyfus Treasury & Agency Cash Management | Purchase (%) | Amount ($) | Value ($) |
| |
| U.S. Treasury Bills—17.4% | | | |
| 2/4/10 | 0.27 | 200,000,000 | 199,995,500 |
| 4/1/10 | 0.34 | 340,000,000 | 339,812,511 |
| 4/22/10 | 0.17 | 400,000,000 | 399,848,889 |
| 5/6/10 | 0.52 | 100,000,000 | 99,864,222 |
| 6/10/10 | 0.16 | 650,000,000 | 649,629,125 |
| 6/17/10 | 0.30 | 550,000,000 | 549,377,612 |
| 6/24/10 | 0.19 | 430,000,000 | 429,684,010 |
| Total U.S. Treasury Bills | | | |
| (cost $2,668,211,869) | | | 2,668,211,869 |
| |
| U.S. Treasury Notes—19.6% | | | |
| 2/1/10 | 0.29 | 150,000,000 | 150,000,000 |
| 2/16/10 | 0.38 | 175,000,000 | 175,311,514 |
| 2/16/10 | 0.42 | 238,000,000 | 238,589,376 |
| 3/1/10 | 0.35 | 158,100,000 | 158,300,430 |
| 3/31/10 | 0.36 | 70,000,000 | 70,153,820 |
| 5/17/10 | 0.54 | 75,000,000 | 75,848,820 |
| 6/1/10 | 0.27 | 250,000,000 | 251,923,373 |
| 6/30/10 | 0.17 | 200,000,000 | 202,226,089 |
| 8/2/10 | 0.13 | 205,000,000 | 207,594,161 |
| 8/16/10 | 0.17 | 240,000,000 | 244,990,106 |
| 8/31/10 | 0.29 | 350,000,000 | 354,137,126 |
| 9/15/10 | 0.32 | 225,000,000 | 229,971,287 |
| 9/30/10 | 0.34 | 200,000,000 | 202,178,711 |
| 11/1/10 | 0.34 | 100,000,000 | 100,871,218 |
| 11/30/10 | 0.32 | 130,000,000 | 130,993,699 |
| 12/15/10 | 0.33 | 200,000,000 | 207,001,490 |
| Total U.S. Treasury Notes | | | |
| (cost $3,000,091,220) | | | 3,000,091,220 |
| |
| Repurchase Agreements—62.8% | | | |
| Banc of America Securities LLC | | | |
| dated 1/29/10, due 2/1/10 in the amount of $230,001,917 (fully | | | |
| collateralized by $346,719,032 Government National Mortgage Association, | | | |
| 3.625%-8%, due 10/15/11-1/15/52, value $234,600,001) | 0.10 | 230,000,000 | 230,000,000 |
| Barclays Financial LLC | | | |
| dated 1/29/10, due 2/1/10 in the amount of $1,182,009,850 (fully | | | |
| collateralized by $797,254,256 Government National Mortgage Association, | | | |
| 4%-6.50%, due 3/15/18-1/15/40, value $510,000,001 and $688,131,500 | | | |
| U.S. Treasury Notes, 1%-4.50%, due 8/31/11-11/15/15, value $695,640,078) | 0.10 | 1,182,000,000 | 1,182,000,000 |
| BNP Paribas | | | |
| dated 1/29/10, due 2/1/10 in the amount of $1,700,014,167 (fully | | | |
| collateralized by $380,107,500 U.S. Treasury Bills, due 5/6/10, value | | | |
| $380,023,876 and $1,333,009,900 U.S. Treasury Notes, 0.875%-3.875%, | | | |
| due 12/31/10-5/15/18, value $1,353,976,169) | 0.10 | 1,700,000,000 | 1,700,000,000 |
24
| | | |
| | Annualized | | |
| | Yield on | | |
| | Date of | Principal | |
| Dreyfus Treasury & Agency Cash Management (continued) | Purchase (%) | Amount ($) | Value ($) |
| |
| Repurchase Agreements (continued) | | | |
| Calyon Securities (USA) | | | |
| dated 1/29/10, due 2/1/10 in the amount of $800,006,667 (fully collateralized | | | |
| by $100,000,000 Treasury Inflation Protected Securities, 3.375%, due 1/15/12, | | | |
| value $131,078,817, $151,000,000 U.S. Treasury Bills, due 2/4/10, value | | | |
| $151,000,000, $2,165,000 U.S. Treasury Bonds, 4.50%, due 8/15/39, | | | |
| value $2,185,202 and $492,734,300 U.S. Treasury Notes, 0.875%-4.875%, | | | |
| due 4/30/11-8/15/16, value $531,736,035) | 0.10 | 800,000,000 | 800,000,000 |
| Credit Suisse (USA) Inc. | | | |
| dated 1/29/10, due 2/1/10 in the amount of $450,003,750 | | | |
| (fully collateralized by $332,645,000 U.S. Treasury Bonds, 4.50%, | | | |
| due 8/15/39, value $335,667,615 and $122,091,000 U.S. Treasury | | | |
| Notes, 1.38%, due 5/15/12, value $123,334,948) | 0.10 | 450,000,000 | 450,000,000 |
| Credit Suisse (USA) Inc. | | | |
| dated 1/29/10, due 2/1/10 in the amount of $400,003,667 (fully | | | |
| collateralized by $508,690,000 Government National Mortgage Association, | | | |
| 4.50%-5.50%, due 6/15/18-9/15/39, value $408,001,296) | 0.11 | 400,000,000 | 400,000,000 |
| Deutsche Bank Securities | | | |
| dated 1/29/10, due 2/1/10 in the amount of $300,002,500 (fully collateralized | | | |
| by $18,666,800 Treasury Inflation Protected Securities, 1.25%, due 4/15/14, | | | |
| value $19,922,454, $39,965,400 U.S. Treasury Bonds, 8.75%, due 8/15/20, | | | |
| value $58,837,377, $134,269,100 U.S. Treasury Notes, 2.625%, | | | |
| due 6/30/14, value $137,383,190 and $342,273,200 | | | |
| U.S. Treasury Strips, due 5/15/38, value $89,856,983) | 0.10 | 300,000,000 | 300,000,000 |
| Deutsche Bank Securities | | | |
| dated 1/29/10, due 2/1/10 in the amount of $450,004,125 (fully | | | |
| collateralized by $629,192,600 Government National Mortgage | | | |
| Association, 5%-7%, due 7/20/37-8/15/39, value $459,000,000) | 0.11 | 450,000,000 | 450,000,000 |
| Goldman, Sachs & Co. | | | |
| dated 1/29/10, due 2/1/10 in the amount of $100,001,000 (fully | | | |
| collateralized by $297,986,340 Government National Mortgage Association, | | | |
| 4.50%-7.50%, due 10/15/23-1/15/40, value $102,000,000) | 0.12 | 100,000,000 | 100,000,000 |
| HSBC USA Inc. | | | |
| dated 1/29/10, due 2/1/10 in the amount of $600,004,500 | | | |
| (fully collateralized by $242,800,000 U.S. Treasury Bonds, | | | |
| 5.50%-8.75%, due 8/15/20-8/15/28, value $337,792,875 | | | |
| and $253,335,000 U.S. Treasury Notes, 3.13%-4.25%, | | | |
| due 8/15/14-10/31/16, value $274,207,477) | 0.09 | 600,000,000 | 600,000,000 |
| JP Morgan Chase & Co. | | | |
| dated 1/29/10, due 2/1/10 in the amount of $800,006,000 (fully collateralized | | | |
| by $614,493,500 Treasury Inflation Protected Securities, 0.87%-3.88%, | | | |
| due 4/15/10-4/15/32, value $816,000,015) | 0.09 | 800,000,000 | 800,000,000 |
| JP Morgan Chase & Co. | | | |
| dated 1/29/10, due 2/1/10 in the amount of $600,005,000 (fully | | | |
| collateralized by $936,407,558 Government National Mortgage Association, | | | |
| 3.50%-12.50%, due 1/15/10-9/15/51, value $612,003,365) | 0.10 | 600,000,000 | 600,000,000 |
| Morgan Stanley | | | |
| dated 1/29/10, due 2/1/10 in the amount of $400,003,333 (fully | | | |
| collateralized by $404,839,900 U.S. Treasury Notes, 0.875%-4.375%, | | | |
| due 11/30/10-1/31/11, value $408,586,907) | 0.10 | 400,000,000 | 400,000,000 |
The Funds 25
STATEMENT OF INVESTMENTS (continued)
| | | |
| | Annualized | | |
| | Yield on | | |
| | Date of | Principal | |
| Dreyfus Treasury & Agency Cash Management (continued) | Purchase (%) | Amount ($) | Value ($) |
| |
| Repurchase Agreements (continued) | | | |
| RBS Securities | | | |
| dated 1/29/10, due 2/1/10 in the amount of $500,004,167, (fully | | | |
| collateralized by $266,440,000 U.S. Treasury Bonds, 6.88%, due 8/15/25, | | | |
| value $353,227,238 and $159,453,300 U.S. Treasury Notes, 2.75%, | | | |
| due 11/30/16, value $156,774,962) | 0.10 | 500,000,000 | 500,000,000 |
| Societe Generale | | | |
| dated 1/29/10, due 2/1/10 in the amount of $600,005,000 (fully | | | |
| collateralized by $151,544,000 U.S. Treasury Bonds, 7.25%-8.125%, | | | |
| due 5/15/21-8/15/22, value $209,704,185, $270,326,500 | | | |
| U.S. Treasury Notes, 1.375%-3.875%, due 9/15/12-2/15/19, | | | |
| value $276,251,240 and $207,000,000 U.S. Treasury Strips, | | | |
| due 5/15/18-2/15/25, value $126,044,670) | 0.10 | 600,000,000 | 600,000,000 |
| Societe Generale | | | |
| dated 1/29/10, due 2/1/10 in the amount of $500,004,583 (fully | | | |
| collateralized by $10,485,221,289 Government National Mortgage | | | |
| Association, 3.625%-8.50%, due 3/15/12-2/20/59, value $510,000,000) | 0.11 | 500,000,000 | 500,000,000 |
| Total Repurchase Agreements | | | |
| (cost $9,612,000,000) | | | 9,612,000,000 |
| |
| Total Investments (cost $15,280,303,089) | | 99.8% | 15,280,303,089 |
| |
| Cash and Receivables (Net) | | .2% | 33,164,442 |
| |
| Net Assets | | 100.0% | 15,313,467,531 |
| | | |
| Portfolio Summary (Unaudited)† | | | |
| | Value (%) | | Value (%) |
| Repurchase Agreements | 62.8 | U.S. Treasury Bills | 17.4 |
| U.S. Treasury Notes | 19.6 | | 99.8 |
| † Based on net assets. | | | |
| See notes to financial statements. | | | |
26
STATEMENT OF INVESTMENTS
January 31, 2010
| | | |
| | Annualized | | |
| | Yield on | | |
| | Date of | Principal | |
| Dreyfus Treasury Prime Cash Management | Purchase (%) | Amount ($) | Value ($) |
| |
| U.S. Treasury Bills—78.6% | | | |
| 2/4/10 | 0.04 | 393,000,000 | 392,998,675 |
| 2/11/10 | 0.15 | 2,490,000,000 | 2,489,894,882 |
| 2/18/10 | 0.03 | 2,743,000,000 | 2,742,960,727 |
| 2/25/10 | 0.02 | 2,717,000,000 | 2,716,964,970 |
| 3/4/10 | 0.12 | 933,000,000 | 932,904,778 |
| 3/11/10 | 0.04 | 880,000,000 | 879,964,977 |
| 3/18/10 | 0.04 | 676,000,000 | 675,962,931 |
| 3/25/10 | 0.05 | 1,065,000,000 | 1,064,930,479 |
| 4/1/10 | 0.20 | 1,460,000,000 | 1,459,517,011 |
| 4/8/10 | 0.43 | 690,000,000 | 689,456,966 |
| 4/15/10 | 0.07 | 1,255,000,000 | 1,254,810,910 |
| 4/22/10 | 0.11 | 1,350,000,000 | 1,349,683,889 |
| 4/29/10 | 0.10 | 1,055,000,000 | 1,054,752,533 |
| 5/6/10 | 0.15 | 585,000,000 | 584,764,739 |
| 6/10/10 | 0.09 | 305,000,000 | 304,905,579 |
| 6/17/10 | 0.09 | 300,000,000 | 299,903,667 |
| 6/24/10 | 0.18 | 5,000,000 | 4,996,425 |
| 7/1/10 | 0.18 | 15,000,000 | 14,988,750 |
| 7/8/10 | 0.16 | 900,000,000 | 899,361,097 |
| 7/15/10 | 0.13 | 500,000,000 | 499,703,889 |
| 7/22/10 | 0.13 | 700,000,000 | 699,563,000 |
| 7/29/10 | 0.16 | 400,000,000 | 399,683,556 |
| Total U.S. Treasury Bills | | | |
| (cost $21,412,674,430) | | | 21,412,674,430 |
| |
| U.S. Treasury Notes—20.9% | | | |
| 2/1/10 | 0.16 | 558,000,000 | 558,000,000 |
| 2/16/10 | 0.10 | 604,600,000 | 606,163,548 |
| 2/16/10 | 0.11 | 975,000,000 | 976,344,198 |
| 2/16/10 | 0.14 | 734,000,000 | 735,376,085 |
| 3/1/10 | 0.03 | 1,379,000,000 | 1,381,076,132 |
The Funds 27
STATEMENT OF INVESTMENTS (continued)
| | | | | |
| | | | Annualized | | |
| | | | Yield on | | |
| | | | Date of | Principal | |
| Dreyfus Treasury Prime Cash Management (continued) | Purchase (%) | Amount ($) | Value ($) |
| |
| U.S. Treasury Notes (continued) | | | | | |
| 3/15/10 | | | 0.05 | 115,000,000 | 115,527,376 |
| 3/31/10 | | | 0.07 | 700,000,000 | 701,877,624 |
| 4/15/10 | | | 0.05 | 200,000,000 | 201,583,699 |
| 4/30/10 | | | 0.20 | 300,000,000 | 301,415,169 |
| 6/1/10 | | | 0.08 | 100,000,000 | 100,832,117 |
| Total U.S. Treasury Notes | | | | | |
| (cost $5,678,195,948) | | | | | 5,678,195,948 |
| |
| Total Investments (cost $27,090,870,378) | | | | 99.5% | 27,090,870,378 |
| Cash and Receivables (Net) | | | | .5% | 133,739,552 |
| Net Assets | | | | 100.0% | 27,224,609,930 |
| |
| |
| |
| |
| Portfolio Summary (Unaudited)† | | | | | |
| | Value (%) | | | | Value (%) |
| U.S. Treasury Bills | 78.6 | U.S. Treasury Notes | | 20.9 |
| | | | | | 99.5 |
| |
| † Based on net assets. | | | | | |
| See notes to financial statements. | | | | | |
28
STATEMENT OF INVESTMENTS
January 31, 2010
| | | | |
| | Coupon | Maturity | Principal | |
| Dreyfus Municipal Cash Management Plus | Rate (%) | Date | Amount ($) | Value ($) |
| |
| Short-Term Investments—101.0% | | | | |
| Alabama—1.7% | | | | |
| Evergreen Industrial Development Board, Industrial Revenue, | | | | |
| Refunding (Tenax Manufacturing Project) (LOC; San Paolo Bank) | 0.28 | 2/7/10 | 2,200,000 a | 2,200,000 |
| Macon Trust Various Certificates (Spanish Fort Redevelopment | | | | |
| Authority—Spanish Fort Town Center) (Liquidity Facility; | | | | |
| Bank of America and LOC; Bank of America) | 0.20 | 2/7/10 | 20,750,000 a,b | 20,750,000 |
| Arizona—2.0% | | | | |
| Arizona Health Facilities Authority, Revenue | | | | |
| (La Loma Village) (LOC; Banco Santander) | 0.25 | 2/7/10 | 9,700,000 a | 9,700,000 |
| JPMorgan Chase Putters and Drivers Trust (Salt River Project | | | | |
| Agricultural Improvement and Power District, Salt River Project | | | | |
| Electric System Revenue) (Liquidity Facility; JPMorgan Chase Bank) | 0.20 | 2/7/10 | 8,500,000 a,b | 8,500,000 |
| Maricopa County Industrial Development Authority, MFHR | | | | |
| (San Clemente Apartments Project) (Liquidity Facility; | | | | |
| FNMA and LOC; FNMA) | 0.29 | 2/7/10 | 1,010,000 a | 1,010,000 |
| Maricopa County Industrial Development Authority, MFHR, | | | | |
| Refunding (San Clemente Apartments Project) (Liquidity Facility; | | | | |
| FNMA and LOC; FNMA) | 0.25 | 2/7/10 | 7,600,000 a | 7,600,000 |
| Arkansas—.0% | | | | |
| Morgan Keegan Municipal Products Inc. (Arkansas Development | | | | |
| Finance Authority, SFMR (Warehouse Program)) (Liquidity Facility; | | | | |
| Lloyds TSB Bank PLC and LOC; Lloyds TSB Bank PLC) | 0.40 | 2/7/10 | 185,000 a,b | 185,000 |
| California—1.5% | | | | |
| California Statewide Communities Development Authority, Revenue, | | | | |
| CP (Kaiser Permanente) | 0.32 | 5/6/10 | 5,000,000 | 5,000,000 |
| Puttable Floating Option Tax Exempt Receipts (San Jose | | | | |
| Redevelopment Agency, MFHR (101 San Fernando Apartments)) | | | | |
| (Liquidity Facility; FHLMC and LOC; FHLMC) | 0.35 | 2/7/10 | 15,995,000 a,b | 15,995,000 |
| Colorado—3.3% | | | | |
| CollegeInvest, Education Loan Revenue (LOC; Lloyds TSB Bank PLC) | 0.24 | 2/7/10 | 8,100,000 a | 8,100,000 |
| Colorado, Revenue, TRAN (Education Loan Program) | 1.50 | 8/12/10 | 21,000,000 | 21,133,733 |
| Colorado Housing and Finance Authority, EDR | | | | |
| (Monaco LLC Project) (LOC; JPMorgan Chase Bank) | 0.50 | 2/7/10 | 2,940,000 a | 2,940,000 |
| Colorado Housing and Finance Authority, EDR | | | | |
| (Popiel Properties, LLC Project) (LOC; Wells Fargo Bank) | 0.45 | 2/7/10 | 3,065,000 a | 3,065,000 |
| Colorado Housing and Finance Authority, EDR | | | | |
| (Wanco Inc. Project) (LOC; U.S. Bank NA) | 0.50 | 2/7/10 | 2,635,000 a | 2,635,000 |
| Erie, COP (Lease Purchase Agreement) (LOC; Key Bank) | 1.85 | 2/7/10 | 4,070,000 a | 4,070,000 |
| Southglenn Metropolitan District, Special Revenue (LOC; BNP Paribas) | 0.20 | 2/7/10 | 2,950,000 a | 2,950,000 |
| Connecticut—1.8% | | | | |
| Connecticut, GO Notes, BAN | 2.00 | 4/28/10 | 12,000,000 | 12,045,857 |
| Connecticut Health and Educational Facilities Authority, Revenue | | | | |
| (Yale University Issue) (Liquidity Facility; Wells Fargo Bank) | 0.20 | 2/7/10 | 7,300,000 a,b | 7,300,000 |
| New Haven, GO Notes, BAN | 1.25 | 2/15/10 | 5,000,000 | 5,000,752 |
| District of Columbia—5.4% | | | | |
| District of Columbia, Revenue (American Public Health | | | | |
| Association Issue) (LOC; Bank of America) | 0.21 | 2/7/10 | 6,565,000 a | 6,565,000 |
| District of Columbia, Revenue, CP (National Academy of Sciences) | | | | |
| (LOC; Bank of America) | 0.25 | 2/8/10 | 13,200,000 | 13,200,000 |
The Funds 29
STATEMENT OF INVESTMENTS (continued)
| | | | |
| Dreyfus Municipal | Coupon | Maturity | Principal | |
| Cash Management Plus (continued) | Rate (%) | Date | Amount ($) | Value ($) |
| |
| Short-Term Investments (continued) | | | | |
| District of Columbia (continued) | | | | |
| Metropolitan Washington Airports Authority, Airport System | | | | |
| Revenue (Liquidity Facility; Landesbank Baden-Wurttemberg) | 0.35 | 2/7/10 | 15,000,000 a | 15,000,000 |
| Metropolitan Washington Airports Authority, Airport System | | | | |
| Revenue (Liquidity Facility; Landesbank Baden-Wurttemberg) | 0.35 | 2/7/10 | 25,000,000 a | 25,000,000 |
| Metropolitan Washington Airports Authority, Airport System | | | | |
| Revenue (LOC; Wachovia Bank) | 0.28 | 2/7/10 | 14,700,000 a | 14,700,000 |
| Florida—8.4% | | | | |
| Broward County Housing Finance Authority, MFHR | | | | |
| (Cypress Grove Apartments Project) (LOC; FNMA) | 0.25 | 2/7/10 | 13,230,000 a | 13,230,000 |
| Florida Local Government Finance Commission, | | | | |
| Pooled Loan Program Revenue, CP (LOC; Wachovia Bank) | 0.45 | 3/8/10 | 13,130,000 | 13,130,000 |
| Florida Local Government Finance Commission, | | | | |
| Pooled Loan Program Revenue, CP (LOC; Wachovia Bank) | 0.32 | 6/10/10 | 13,151,000 | 13,151,000 |
| Greater Orlando Aviation Authority, Airport Facility | | | | |
| Revenue (FlightSafety International Inc. Project) | | | | |
| (Insured; Berkshire Hathaway Assurance Corporation) | 0.33 | 2/7/10 | 6,700,000 a | 6,700,000 |
| Kissimmee Utility Authority, CP (Liquidity Facility; JPMorgan Chase Bank) | 0.37 | 4/8/10 | 20,000,000 | 20,000,000 |
| Manatee County School District, GO Notes, TAN | 1.00 | 5/1/10 | 14,000,000 | 14,020,475 |
| Miami-Dade County Industrial Development Authority, IDR | | | | |
| (Fine Art Lamps Project) (LOC; SunTrust Bank) | 0.40 | 2/7/10 | 4,050,000 a | 4,050,000 |
| Palm Beach County School District, Revenue, TAN | 0.75 | 2/1/10 | 31,000,000 | 31,000,000 |
| Georgia—2.9% | | | | |
| DeKalb County Hospital Authority, RAC | | | | |
| (DeKalb Medical Center, Inc. Project) (LOC; SunTrust Bank) | 0.25 | 2/7/10 | 33,850,000 a | 33,850,000 |
| Gwinnett County Development Authority, IDR | | | | |
| (Suzanna’s Kitchen, Inc. Project) (LOC; Wachovia Bank) | 0.38 | 2/7/10 | 5,200,000 a | 5,200,000 |
| Illinois—3.3% | | | | |
| Illinois Finance Authority, IDR (Fitzpatrick Brothers, Inc. Project) | | | | |
| (Liquidity Facility; Northern Trust Company) | 0.21 | 2/7/10 | 5,000,000 a | 5,000,000 |
| Lombard, Revenue (Elmhurst Memorial Healthcare Project) | | | | |
| (LOC; Fifth Third Bank) | 0.39 | 2/7/10 | 6,482,000 a | 6,482,000 |
| Oak Forest, Revenue (Homewood Pool—South Suburban Mayors and | | | | |
| Managers Association Program) (LOC; Fifth Third Bank) | 0.39 | 2/7/10 | 25,650,000 a | 25,650,000 |
| Upper Illinois River Valley Development Authority, SWDR | | | | |
| (Exolon-ESK Company Project) (LOC; Bank of America) | 0.30 | 2/7/10 | 8,405,000 a | 8,405,000 |
| Indiana—2.8% | | | | |
| Elkhart County, EDR (Four Seasons Manufacturing Project) | | | | |
| (LOC; National City Bank) | 0.29 | 2/7/10 | 3,255,000 a | 3,255,000 |
| Fort Wayne, EDR (Park Center Project) (LOC; National City Bank) | 0.24 | 2/7/10 | 2,295,000 a | 2,295,000 |
| Indiana Finance Authority, EDR (JRL Leasing, Inc. and LaSarre Co., | | | | |
| LLC Project) (LOC; National City Bank) | 0.29 | 2/7/10 | 3,395,000 a | 3,395,000 |
| Indiana Finance Authority, Environmental Revenue, Refunding | | | | |
| (Duke Energy Indiana, Inc. Project) (LOC; Bank of America) | 0.25 | 2/7/10 | 3,300,000 a | 3,300,000 |
| Indiana Finance Authority, Environmental Revenue, Refunding | | | | |
| (Duke Energy Indiana, Inc. Project) (LOC; Bank of America) | 0.26 | 2/7/10 | 6,000,000 a | 6,000,000 |
30
| | | | |
| Dreyfus Municipal | Coupon | Maturity | Principal | |
| Cash Management Plus (continued) | Rate (%) | Date | Amount ($) | Value ($) |
| |
| Short-Term Investments (continued) | | | | |
| Indiana (continued) | | | | |
| Indiana Health and Educational Facility Financing Authority, | | | | |
| Educational Facilities Revenue (University of Evansville Project) | | | | |
| (LOC; Fifth Third Bank) | 0.39 | 2/7/10 | 14,825,000 a | 14,825,000 |
| Saint Joseph County, EDR (Logan Community Resources, Inc. Project) | | | | |
| (LOC; Fifth Third Bank) | 0.39 | 2/7/10 | 5,730,000 a | 5,730,000 |
| Iowa—.7% | | | | |
| Iowa Higher Education Loan Authority, Revenue, BAN | | | | |
| (William Penn University Project) | 1.50 | 12/1/10 | 5,000,000 | 5,020,586 |
| Ringgold County Hospital, HR, BAN (Ringgold County Hospital Project) | 1.50 | 10/1/10 | 5,000,000 | 5,016,463 |
| Kansas—.6% | | | | |
| Kansas Development Finance Authority, MFHR | | | | |
| (Tree House Apartments) (LOC; Bank of America) | 0.26 | 2/7/10 | 8,760,000 a | 8,760,000 |
| Kentucky—1.5% | | | | |
| Jefferson County, Retirement Home Revenue (Nazareth Literary and | | | | |
| Benevolent Institution Project) (LOC; JPMorgan Chase Bank) | 0.25 | 2/7/10 | 9,320,000 a | 9,320,000 |
| Kentucky Economic Development Finance Authority, Industrial | | | | |
| Building Revenue (Republic Services, Inc. Project) (LOC; Bank One) | 0.35 | 2/7/10 | 6,100,000 a | 6,100,000 |
| Kentucky Rural Water Finance Corporation, | | | | |
| Public Projects Construction Notes | 1.25 | 1/1/11 | 5,000,000 | 5,024,939 |
| Maine—.8% | | | | |
| Maine Finance Authority, Revenue (Waynflete School Issue) | | | | |
| (LOC; JPMorgan Chase Bank) | 0.22 | 2/7/10 | 11,090,000 a | 11,090,000 |
| Maryland—3.2% | | | | |
| Anne Arundel County, EDR (Atlas Container Corporation Project) | | | | |
| (LOC; M&T Bank) | 0.32 | 2/7/10 | 6,875,000 a | 6,875,000 |
| Baltimore County Revenue Authority, Golf System Revenue | | | | |
| (LOC; M&T Bank) | 0.23 | 2/7/10 | 5,975,000 a | 5,975,000 |
| Frederick County, Revenue (Homewood, Inc. Facility) (LOC; M&T Bank) | 0.20 | 2/7/10 | 2,700,000 a | 2,700,000 |
| Maryland Health and Higher Educational Facilities Authority, Revenue | | | | |
| (Charles County Nursing Center) (Liquidity Facility; M&T Bank) | 0.25 | 2/7/10 | 3,775,000 a | 3,775,000 |
| Maryland Health and Higher Educational Facilities Authority, | | | | |
| Revenue, CP (Johns Hopkins Health System) | | | | |
| (Liquidity Facility; Bank of America) | 0.28 | 4/6/10 | 20,000,000 | 20,000,000 |
| Maryland Health and Higher Educational Facilities Authority, | | | | |
| Revenue, CP (Johns Hopkins Health System) | | | | |
| (Liquidity Facility; Wachovia Bank) | 0.23 | 4/7/10 | 5,000,000 | 5,000,000 |
| Massachusetts—3.4% | | | | |
| Macon Trust Various Certificates (Massachusetts Health and | | | | |
| Educational Facilities Authority—Harvard Vanguard | | | | |
| Medical Associates Issue) (Liquidity Facility; | | | | |
| Bank of America and LOC; Bank of America) | 0.20 | 2/7/10 | 10,250,000 a,b | 10,250,000 |
| Massachusetts, GO Notes, RAN | 2.50 | 4/29/10 | 22,000,000 | 22,113,005 |
| Massachusetts Development Finance Agency, Multifamily Revenue | | | | |
| (Kennedy Lofts Project) (Liquidity Facility; | | | | |
| FHLMC and LOC; FHLMC) | 0.35 | 2/7/10 | 4,000,000 a,b | 4,000,000 |
The Funds 31
STATEMENT OF INVESTMENTS (continued)
| | | | |
| Dreyfus Municipal | Coupon | Maturity | Principal | |
| Cash Management Plus (continued) | Rate (%) | Date | Amount ($) | Value ($) |
| |
| Short-Term Investments (continued) | | | | |
| Massachusetts (continued) | | | | |
| Massachusetts Development Finance Agency, Revenue | | | | |
| (The Brimmer and May School Issue) (LOC; Comerica Bank) | 0.23 | 2/7/10 | 9,675,000 a | 9,675,000 |
| Michigan—7.6% | | | | |
| Kent Hospital Finance Authority, LOR (Pine Rest Christian | | | | |
| Mental Health Services Project) (LOC; Fifth Third Bank) | 0.39 | 2/7/10 | 45,000 a | 45,000 |
| Michigan, GO Notes | 2.00 | 9/30/10 | 20,000,000 | 20,193,292 |
| Michigan Hospital Finance Authority, Revenue (Healthcare Equipment | | | | |
| Loan Program) (LOC; Fifth Third Bank) | 0.39 | 2/7/10 | 6,500,000 a | 6,500,000 |
| Michigan Hospital Finance Authority, Revenue, CP (Trinity Health System) | 0.28 | 6/11/10 | 20,000,000 | 20,000,000 |
| Michigan Housing Development Authority, Rental Housing Revenue | | | | |
| (Liquidity Facility; Landesbank Hessen-Thuringen Girozentrale) | 0.23 | 2/7/10 | 6,000,000 a | 6,000,000 |
| Michigan Housing Development Authority, SFMR (LOC: FHLMC and FNMA) | 0.20 | 2/7/10 | 20,000,000 a | 20,000,000 |
| Michigan Strategic Fund, LOR (Diocese of Grand Rapids Educational and | | | | |
| Cathedral Square Project) (LOC; Fifth Third Bank) | 0.39 | 2/7/10 | 7,050,000 a | 7,050,000 |
| Michigan Strategic Fund, LOR, Refunding (Goodwill Industries of | | | | |
| Greater Grand Rapids, Inc. Project) (LOC; Fifth Third Bank) | 0.39 | 2/7/10 | 7,475,000 a | 7,475,000 |
| Oakland County Economic Development Corporation, LOR | | | | |
| (Michigan Seamless Tube LLC Project) (LOC; ABN-AMRO) | 0.40 | 2/7/10 | 2,200,000 a | 2,200,000 |
| Pittsfield Township Economic Development Corporation, LOR, | | | | |
| Refunding (Arbor Project) (LOC; Comerica Bank) | 0.30 | 2/7/10 | 4,355,000 a | 4,355,000 |
| Waterford Charter Township Economic Development Corporation, LOR, | | | | |
| Refunding (Canterbury Health Care, Inc. Project) (LOC; FHLB) | 0.25 | 2/7/10 | 10,460,000 a | 10,460,000 |
| Minnesota—1.2% | | | | |
| Minnesota Housing Finance Agency, Residential Housing | | | | |
| Finance Revenue (Liquidity Facility; FHLB) | 0.22 | 2/7/10 | 7,000,000 a | 7,000,000 |
| Southern Minnesota Municipal Power Agency, Power Supply | | | | |
| System Revenue, CP (Liquidity Facility; | | | | |
| Landesbank Hessen-Thuringen Girozentrale) | 0.36 | 4/9/10 | 10,000,000 | 10,000,000 |
| Missouri—1.2% | | | | |
| Missouri Development Finance Board, LR, CP (LOC; U.S. Bank NA) | 0.30 | 2/25/10 | 6,571,000 | 6,571,000 |
| Missouri Development Finance Board, LR, CP (LOC; U.S. Bank NA) | 0.30 | 2/25/10 | 10,000,000 | 10,000,000 |
| Nevada—2.8% | | | | |
| Clark County, Airport System Subordinate Lien Revenue | | | | |
| (LOC; Landesbank Baden-Wurttemberg) | 0.27 | 2/7/10 | 16,100,000 a | 16,100,000 |
| Clark County, Airport System Subordinate Lien Revenue | | | | |
| (LOC; Landesbank Baden-Wurttemberg) | 0.27 | 2/7/10 | 6,600,000 a | 6,600,000 |
| Director of Nevada Department of Business and Industry, | | | | |
| Revenue (Nevada Cancer Institute Project) (LOC; Bank of America) | 0.21 | 2/7/10 | 5,450,000 a | 5,450,000 |
| Las Vegas Valley Water District, CP (Liquidity Facility; | | | | |
| JPMorgan Chase Bank) | 0.35 | 4/8/10 | 10,000,000 | 10,000,000 |
| New Hampshire—.4% | | | | |
| New Hampshire Health and Education Facilities Authority, Revenue | | | | |
| (Kimball Union Academy) (LOC; RBS Citizens NA) | 0.45 | 2/7/10 | 5,000,000 a | 5,000,000 |
| New Jersey—.6% | | | | |
| New Jersey Turnpike Authority, Turnpike Revenue (Insured; Assured | | | | |
| Guaranty Municipal Corp. and Liquidity Facility; Dexia Credit Locale) | 0.25 | 2/7/10 | 8,275,000 a | 8,275,000 |
32
| | | | |
| Dreyfus Municipal | Coupon | Maturity | Principal | |
| Cash Management Plus (continued) | Rate (%) | Date | Amount ($) | Value ($) |
| |
| Short-Term Investments (continued) | | | | |
| New York—3.7% | | | | |
| New York City Housing Development Corporation, MFMR | | | | |
| (Beekman Tower Project) (LOC; RBS Citizens NA) | 0.25 | 2/7/10 | 15,000,000 a | 15,000,000 |
| New York Liberty Development Corporation, Multi-Modal Liberty | | | | |
| Revenue (World Trade Center Project) | 0.50 | 1/18/11 | 10,000,000 | 10,000,000 |
| New York Local Government Assistance Corporation, GO Notes | | | | |
| (LOC: Bayerische Landesbank and Westdeutsche Landesbank) | 0.23 | 2/7/10 | 26,000,000 a | 26,000,000 |
| North Carolina—4.4% | | | | |
| Board of Governers of the University of North Carolina, CP | 0.23 | 2/16/10 | 10,000,000 | 10,000,000 |
| North Carolina Education Assistance Authority, Student Loan | | | | |
| Revenue, Refunding (LOC; Royal Bank of Canada) | 0.24 | 2/7/10 | 30,000,000 a | 30,000,000 |
| Raleigh-Durham Airport Authority, Airport Revenue, Refunding | | | | |
| (LOC; Wachovia Bank) | 0.28 | 2/7/10 | 19,600,000 a | 19,600,000 |
| Ohio—8.0% | | | | |
| Akron, Bath and Copley Joint Township Hospital District, Health Care | | | | |
| Facilities Revenue (Sumner on Ridgewood Project) (LOC; KBC Bank) | 0.28 | 2/7/10 | 5,055,000 a | 5,055,000 |
| Bellevue City School District, School Facilities Construction and | | | | |
| Improvement Unlimited Tax GO Notes | 1.45 | 6/2/10 | 3,000,000 | 3,007,939 |
| Cleveland, COP, Refunding (Cleveland Stadium Project) | | | | |
| (LOC; Wachovia Bank) | 0.18 | 2/7/10 | 50,000,000 a | 50,000,000 |
| Lorain County, IDR (Cutting Dynamics, Inc. Project) | | | | |
| (LOC; National City Bank) | 0.34 | 2/7/10 | 2,005,000 a | 2,005,000 |
| Marion County, Health Care Facility Revenue | | | | |
| (United Church Homes, Inc. Project) (LOC; Allied Irish Banks) | 1.00 | 2/7/10 | 6,265,000 a,c | 6,265,000 |
| Ohio Higher Educational Facilities, Revenue | | | | |
| (Cedarville University Project) (LOC; Key Bank) | 0.49 | 2/7/10 | 4,600,000 a | 4,600,000 |
| Ohio Higher Educational Facility, Revenue | | | | |
| (Ashland University Project) (LOC; Key Bank) | 1.00 | 2/7/10 | 4,100,000 a | 4,100,000 |
| Ohio Water Development Authority, PCR, Refunding (FirstEnergy | | | | |
| Nuclear Generation Corporation Project) (LOC; Bank of Nova Scotia) | 0.27 | 2/7/10 | 15,000,000 a | 15,000,000 |
| Ohio Water Development Authority, PCR, Refunding (FirstEnergy | | | | |
| Nuclear Generation Corporation Project) (LOC; Barclays Bank PLC) | 0.28 | 2/7/10 | 9,700,000 a | 9,700,000 |
| Xenia Community City School District, School Facilities | | | | |
| Construction and Improvement Unlimited Tax GO Notes | 1.50 | 7/29/10 | 8,870,000 | 8,917,665 |
| Oklahoma—.5% | | | | |
| Oklahoma Water Resources Board, State Loan Program Revenue | | | | |
| (Liquidity Facility; State Street Bank and Trust Co.) | 0.80 | 3/1/10 | 6,500,000 | 6,500,000 |
| Pennsylvania—5.6% | | | | |
| Blair County Industrial Development Authority, Revenue | | | | |
| (Hollidaysburg Area YMCA Project) (LOC; Citizens Bank of Pennsylvania) | 0.75 | 2/7/10 | 3,020,000 a | 3,020,000 |
| Chester County Health and Education Facilities Authority, Mortgage | | | | |
| Revenue (Tel Hai Obligated Group Project) (LOC; M&T Bank) | 0.25 | 2/7/10 | 10,720,000 a | 10,720,000 |
| Haverford Township School District, GO Notes (LOC; TD Bank) | 0.20 | 2/7/10 | 3,500,000 a | 3,500,000 |
| Horizon Hospital System Authority, Senior Health and Housing | | | | |
| Facilities Revenue (Saint Paul Homes Project) (LOC; M&T Bank) | 0.25 | 2/7/10 | 7,400,000 a | 7,400,000 |
| Pennsylvania Economic Development Financing Authority, Revenue | | | | |
| (Evergreen Community Power Facility) (LOC; M&T Bank) | 0.35 | 2/7/10 | 16,000,000 a | 16,000,000 |
The Funds 33
STATEMENT OF INVESTMENTS (continued)
| | | | |
| Dreyfus Municipal | Coupon | Maturity | Principal | |
| Cash Management Plus (continued) | Rate (%) | Date | Amount ($) | Value ($) |
| |
| Short-Term Investments (continued) | | | | |
| Pennsylvania (continued) | | | | |
| Pennsylvania Housing Finance Agency, SFMR (Liquidity Facility; | | | | |
| Landesbank Hessen-Thuringen Girozentrale) | 0.20 | 2/7/10 | 15,000,000 a | 15,000,000 |
| Philadelphia, GO Notes, TRAN | 2.50 | 6/30/10 | 13,000,000 | 13,093,989 |
| Philadelphia Authority for Industrial Development, Revenue | | | | |
| (The Pennsylvania School for the Deaf) | | | | |
| (LOC; Citizens Bank of Pennsylvania) | 0.75 | 2/7/10 | 2,400,000 a | 2,400,000 |
| University of Pittsburgh of the Commonwealth | | | | |
| System of Higher Education, CP | 0.30 | 3/3/10 | 5,000,000 | 5,000,000 |
| South Carolina—.7% | | | | |
| Charleston County School District, GO Notes, TAN | 2.00 | 4/1/10 | 10,000,000 | 10,025,311 |
| South Dakota—.1% | | | | |
| South Dakota Housing Development Authority, Homeownership | | | | |
| Mortgage Revenue (Liquidity Facility; Citigroup) | 0.24 | 2/7/10 | 1,835,000 a,b | 1,835,000 |
| Tennessee—1.6% | | | | |
| Cleveland Health and Educational Facilities Board, Revenue | | | | |
| (Lee University Project) (LOC; Branch Banking and Trust Co.) | 0.20 | 2/7/10 | 3,800,000 a | 3,800,000 |
| Hendersonville Industrial Development Board, Tax Increment | | | | |
| Revenue (LOC; Fifth Third Bank) | 0.51 | 2/7/10 | 7,500,000 a | 7,500,000 |
| Metropolitan Government of Nashville and Davidson County | | | | |
| Health and Educational Facilities Board, Health Facilities Revenue, | | | | |
| Refunding (MUC-CI Homes, Inc. Project) (LOC; Fifth Third Bank) | 0.39 | 2/7/10 | 7,465,000 a | 7,465,000 |
| Sevier County Public Building Authority, Public Project Construction | | | | |
| Notes (Taud Interim Loan Program) | 1.25 | 3/1/11 | 3,000,000 c | 3,017,400 |
| Texas—12.3% | | | | |
| Calhoun Port Authority, Environmental Facilities Revenue (Formosa | | | | |
| Plastics Corporation, Texas Project) (LOC; Bank of America) | 0.28 | 2/7/10 | 10,000,000 a | 10,000,000 |
| Collin County, Unlimited Tax Road GO Notes, Refunding | 2.00 | 2/15/10 | 2,320,000 | 2,321,320 |
| Collin County Housing Finance Corporation, Multifamily Revenue | | | | |
| (Carpenter-Oxford Development Housing) (Liquidity Facility; | | | | |
| FHLMC and LOC; FHLMC) | 0.25 | 2/7/10 | 5,000,000 a,b | 5,000,000 |
| Dallas, CP (Liquidity Facility; Bank of America) | 0.36 | 4/7/10 | 14,384,000 | 14,384,000 |
| DeSoto Industrial Development Authority, IDR, Refunding | | | | |
| (National Service Industries Inc. Project) (LOC; Wachovia Bank) | 0.28 | 2/7/10 | 3,660,000 a | 3,660,000 |
| Harris County, GO Notes, TAN | 1.50 | 2/25/10 | 10,000,000 | 10,007,210 |
| Harris County, GO Notes, TAN | 2.00 | 2/25/10 | 20,000,000 | 20,021,497 |
| Port of Port Arthur Navigation District, Revenue, CP (BASF AG) | 0.65 | 2/16/10 | 10,000,000 | 10,000,000 |
| San Antonio, Electric and Gas System Revenue, CP (Liquidity Facility: | | | | |
| Bank of America and State Street Bank and Trust Co.) | 0.27 | 3/1/10 | 5,500,000 | 5,500,000 |
| San Antonio, Electric and Gas Systems Revenue, Refunding | 5.50 | 2/1/10 | 3,000,000 | 3,000,000 |
| Texas, GO Notes (Veterans’ Housing Assistance Program) | | | | |
| (Liquidity Facility; State Street Bank and Trust Co.) | 0.24 | 2/7/10 | 16,000,000 a | 16,000,000 |
| Texas, TRAN | 2.50 | 8/31/10 | 18,000,000 | 18,212,913 |
| Texas Department of Housing and Community Affairs, SFMR | 0.25 | 2/7/10 | 29,100,000 a | 29,100,000 |
| Texas Municipal Power Agency, Revenue, CP (Liquidity Facility: | | | | |
| Bank of America and Bayerische Landesbank) | 0.26 | 2/17/10 | 20,000,000 | 20,000,000 |
34
| | | | |
| Dreyfus Municipal | Coupon | Maturity | Principal | |
| Cash Management Plus (continued) | Rate (%) | Date | Amount ($) | Value ($) |
| |
| Short-Term Investments (continued) | | | | |
| Vermont—.8% | | | | |
| Vermont Economic Development Authority, Revenue, CP | | | | |
| (Economic Development Capital Program) (LOC; Calyon) | 0.45 | 3/2/10 | 10,500,000 | 10,500,000 |
| Virginia—2.2% | | | | |
| Lynchburg Redevelopment and Housing Authority, Housing Revenue | | | | |
| (KHM Properties-Lynchburg, LLC Project) (LOC; M&T Bank) | 0.30 | 2/7/10 | 13,520,000 a | 13,520,000 |
| Norfolk Redevelopment and Housing Authority, First Mortgage Revenue | | | | |
| (Fort Norfolk Retirement Community, Inc.— Harbor’s Edge Project) | | | | |
| (LOC; HSH Nordbank AG) | 0.43 | 2/7/10 | 16,300,000 a | 16,300,000 |
| Washington—1.0% | | | | |
| Pierce County Economic Development Corporation, Multi-Mode | | | | |
| Industrial Revenue (SeaTac Packaging Project) | | | | |
| (LOC; HSBC Bank USA) | 0.36 | 2/7/10 | 4,960,000 a | 4,960,000 |
| Tacoma Housing Authority, Revenue (Crown Assisted Living Project) | | | | |
| (LOC; Key Bank) | 0.49 | 2/7/10 | 600,000 a | 600,000 |
| Washington Economic Development Finance Authority, SWDR | | | | |
| (CleanScapes, Inc. Project) (LOC; Bank of the West) | 0.26 | 2/7/10 | 7,895,000 a | 7,895,000 |
| Wisconsin—2.6% | | | | |
| Wisconsin Health and Educational Facilities Authority, Revenue | | | | |
| (Mequon Jewish Campus, Inc. Project) (LOC; Bank One) | 0.30 | 2/7/10 | 6,365,000 a | 6,365,000 |
| Wisconsin Housing and Economic Development Authority, | | | | |
| Home Ownership Revenue (Liquidity Facility; Fortis Bank) | 0.25 | 2/7/10 | 22,030,000 a | 22,030,000 |
| Wisconsin Rural Water Construction Loan Program | | | | |
| Commission, Revenue, BAN | 1.50 | 11/15/10 | 7,000,000 | 7,040,913 |
| Wyoming—.4% | | | | |
| Wyoming Student Loan Corporation, Student Loan Revenue, | | | | |
| Refunding (Senior Series) (LOC; Royal Bank of Canada) | 0.24 | 2/7/10 | 5,000,000 a | 5,000,000 |
| |
| Total Investments (cost $1,380,228,259) | | | 101.0% | 1,380,228,259 |
| Liabilities, Less Cash and Receivables | | | (1.0%) | (13,837,350) |
| Net Assets | | | 100.0% | 1,366,390,909 |
| |
| See footnotes on page 58. | | | | |
| See notes to financial statements. | | | | |
The Funds 35
STATEMENT OF INVESTMENTS
January 31, 2010
| | | | |
| Dreyfus New York | Coupon | Maturity | Principal | |
| Municipal Cash Management | Rate (%) | Date | Amount ($) | Value ($) |
| |
| Short-Term Investments—100.0% | | | | |
| Albany County Airport Authority, Airport Revenue, | | | | |
| Refunding (LOC; Bank of America) | 0.25 | 2/7/10 | 7,560,000 a | 7,560,000 |
| Albany Industrial Development Agency, Civic Facility Revenue | | | | |
| (Albany Medical Center Hospital Project) (LOC; Bank of America) | 0.19 | 2/7/10 | 2,800,000 a | 2,800,000 |
| Albany Industrial Development Agency, Civic Facility Revenue | | | | |
| (Albany Medical Center Hospital Project) (LOC; Key Bank) | 0.34 | 2/7/10 | 5,000,000 a | 5,000,000 |
| Cattaraugus County Industrial Development Agency, | | | | |
| Civic Facility Revenue (Young Men’s Christian | | | | |
| Association of Olean, N.Y. Project) (LOC; Key Bank) | 0.49 | 2/7/10 | 3,330,000 a | 3,330,000 |
| Chautauqua County Industrial Development Agency, Civic Facility | | | | |
| Revenue (Gerry Homes Project) (LOC; HSBC Bank USA) | 0.40 | 2/7/10 | 11,900,000 a | 11,900,000 |
| Chemung County Industrial Development Agency, IDR | | | | |
| (MMARS 2nd Program) (LOC; HSBC Bank USA) | 0.40 | 2/7/10 | 835,000 a | 835,000 |
| Clinton County Industrial Development Agency, Civic Facility | | | | |
| Revenue (Champlain Valley Physicians Hospital Medical | | | | |
| Center Project) (Liquidity Facility; Key Bank) | 0.34 | 2/7/10 | 7,700,000 a | 7,700,000 |
| Clinton County Industrial Development Agency, Civic Facility | | | | |
| Revenue (Champlain Valley Physicians Hospital | | | | |
| Medical Center Project) (LOC; Key Bank) | 0.34 | 2/7/10 | 10,305,000 a | 10,305,000 |
| Columbia County Industrial Development Agency, Civic Facility Revenue | | | | |
| (The Columbia Memorial Hospital Project) (LOC; Key Bank) | 0.34 | 2/7/10 | 5,570,000 a | 5,570,000 |
| Dutchess County Industrial Development Agency, Civic Facility Revenue | | | | |
| (Anderson Foundation for Autism, Inc. Project) (LOC; M&T Bank) | 0.25 | 2/7/10 | 8,325,000 a | 8,325,000 |
| Dutchess County Industrial Development Agency, | | | | |
| Civic Facility Revenue (Anderson Foundation | | | | |
| for Autism, Inc. Project) (LOC; M&T Bank) | 0.25 | 2/7/10 | 9,445,000 a | 9,445,000 |
| Dutchess County Industrial Development Agency, Civic Facility | | | | |
| Revenue (Arbor Ridge Brookmeade Inc.) (LOC; M&T Bank) | 0.25 | 2/7/10 | 15,255,000 a | 15,255,000 |
| Dutchess County Industrial Development Agency, Civic | | | | |
| Facility Revenue, Refunding (Lutheran Center at | | | | |
| Poughkeepsie, Inc. Project) (LOC; Key Bank) | 0.34 | 2/7/10 | 3,655,000 a | 3,655,000 |
| East Hampton Union Free School District, GO Notes, TAN | 1.00 | 6/30/10 | 5,610,000 | 5,624,164 |
| East Rochester Housing Authority, Housing Revenue (Park Ridge | | | | |
| Nursing Home, Inc. Project) (LOC; JPMorgan Chase Bank) | 0.20 | 2/7/10 | 5,000,000 a | 5,000,000 |
| Elmira City School District, GO Notes, BAN | 1.50 | 6/30/10 | 5,745,000 | 5,765,008 |
| Erie County Fiscal Stability Authority, GO Notes, BAN | 1.25 | 7/30/10 | 6,165,000 | 6,185,511 |
| Erie County Industrial Development Agency, Civic Facility | | | | |
| Revenue (Heritage Center Project) (LOC; Key Bank) | 0.54 | 2/7/10 | 1,670,000 a | 1,670,000 |
| Erie County Industrial Development Agency, Civic Facility Revenue | | | | |
| (YMCA of Greater Buffalo Project) (LOC; HSBC Bank USA) | 0.40 | 2/7/10 | 450,000 a | 450,000 |
| Erie County Industrial Development Agency, Civic Facility Revenue | | | | |
| (YMCA of Greater Buffalo Project) (LOC; HSBC Bank USA) | 0.40 | 2/7/10 | 3,365,000 a | 3,365,000 |
| Erie County Industrial Development Agency, IDR | | | | |
| (Hydro-Air Components Inc. Project) (LOC; HSBC Bank USA) | 0.36 | 2/7/10 | 3,100,000 a | 3,100,000 |
| Erie Tobacco Asset Securitization Corporation, Tobacco | | | | |
| Settlement Asset-Backed Bonds (Prerefunded) | 6.25 | 7/15/10 | 18,265,000 d | 18,924,871 |
36
| | | | |
| Dreyfus New York | Coupon | Maturity | Principal | |
| Municipal Cash Management (continued) | Rate (%) | Date | Amount ($) | Value ($) |
| |
| Short-Term Investments (continued) | | | | |
| Fishkill, GO Notes, BAN | 2.00 | 4/30/10 | 3,826,775 | 3,835,984 |
| Hempstead Industrial Development Agency, IDR | | | | |
| (FCD Lynbrook LLC Facility) (Liquidity Facility; | | | | |
| Goldman Sachs Group and LOC; Goldman Sachs Group) | 0.19 | 2/7/10 | 6,350,000 a,b | 6,350,000 |
| Herkimer County Industrial Development Agency, IDR (F.E. Hale | | | | |
| Manufacturing Company Facility) (LOC; HSBC Bank USA) | 0.40 | 2/7/10 | 1,800,000 a | 1,800,000 |
| Heuvelton Central School District, GO Notes, BAN | 1.50 | 6/30/10 | 1,800,000 | 1,806,239 |
| Lancaster Industrial Development Agency, IDR | | | | |
| (Sealing Devices Inc. Project) (LOC; HSBC Bank USA) | 0.36 | 2/7/10 | 2,255,000 a | 2,255,000 |
| Long Island Power Authority, CP (Long Island Lighting | | | | |
| Company) (LOC; JPMorgan Chase Bank) | 0.35 | 6/10/10 | 20,000,000 | 20,000,000 |
| Long Island Power Authority, CP (Long Island Lighting | | | | |
| Company) (LOC; State Street Bank and Trust Co.) | 0.27 | 4/9/10 | 14,000,000 | 14,000,000 |
| Long Island Power Authority, Electric System General | | | | |
| Revenue (Insured; Assured Guaranty Municipal Corp. | | | | |
| and Liquidity Facility; Dexia Credit Locale) | 0.20 | 2/7/10 | 17,000,000 a | 17,000,000 |
| Long Island Power Authority, Electric System General | | | | |
| Revenue (Insured; Assured Guaranty Municipal Corp. | | | | |
| and Liquidity Facility; Dexia Credit Locale) | 0.22 | 2/7/10 | 23,200,000 a | 23,200,000 |
| Long Island Power Authority, Electric System General Revenue | | | | |
| (Long Island Lighting Company) (Insured; Assured Guaranty | | | | |
| Municipal Corp. and Liquidity Facility; Dexia Credit Locale) | 0.21 | 2/7/10 | 16,000,000 a | 16,000,000 |
| Long Island Power Authority, Electric System Subordinated Revenue | | | | |
| (LOC: JPMorgan Chase Bank and Landesbank Baden-Wurttemberg) | 0.25 | 2/7/10 | 15,000,000 a | 15,000,000 |
| Long Island Power Authority, Electric System Subordinated | | | | |
| Revenue (LOC; Westdeutsche Landesbank) | 0.20 | 2/1/10 | 5,000,000 a | 5,000,000 |
| Metropolitan Transportation Authority, Dedicated Tax Fund | | | | |
| Revenue (Insured; Assured Guaranty Municipal Corp. | | | | |
| and Liquidity Facility; Dexia Credit Locale) | 0.25 | 2/7/10 | 8,000,000 a | 8,000,000 |
| Metropolitan Transportation Authority, Dedicated Tax Fund | | | | |
| Revenue, Refunding (Insured; Assured Guaranty Municipal | | | | |
| Corp. and Liquidity Facility; Dexia Credit Locale) | 0.23 | 2/7/10 | 34,900,000 a | 34,900,000 |
| Metropolitan Transportation Authority, | | | | |
| Transportation Revenue (LOC; Fortis Bank) | 0.20 | 2/7/10 | 25,000,000 a | 25,000,000 |
| Metropolitan Transportation Authority, Transportation | | | | |
| Revenue (LOC; Landesbank Hessen-Thuringen Girozentale) | 0.20 | 2/1/10 | 12,000,000 a | 12,000,000 |
| Metropolitan Transportation Authority, Transportation | | | | |
| Revenue, Refunding (Insured; Assured Guaranty Municipal | | | | |
| Corp. and Liquidity Facility; Dexia Credit Locale) | 0.23 | 2/7/10 | 19,860,000 a | 19,860,000 |
| Metropolitan Transportation Authority, Transportation | | | | |
| Revenue, Refunding (Insured; Assured Guaranty Municipal | | | | |
| Corp. and Liquidity Facility; Westdeutsche Landesbank) | 0.30 | 2/7/10 | 10,310,000 a | 10,310,000 |
| Monroe County Industrial Development Agency, Civic Facility | | | | |
| Revenue (DePaul Properties, Inc. Project) (LOC; Key Bank) | 0.34 | 2/7/10 | 2,910,000 a | 2,910,000 |
| Monroe County Industrial Development Agency, Civic Facility | | | | |
| Revenue (YMCA of Greater Rochester Project) (LOC; M&T Bank) | 0.25 | 2/7/10 | 2,280,000 a | 2,280,000 |
The Funds 37
STATEMENT OF INVESTMENTS (continued)
| | | | |
| Dreyfus New York | Coupon | Maturity | Principal | |
| Municipal Cash Management (continued) | Rate (%) | Date | Amount ($) | Value ($) |
| |
| Short-Term Investments (continued) | | | | |
| Monroe County Industrial Development Agency, IDR | | | | |
| (Chaney Enterprise) (LOC; M&T Bank) | 0.40 | 2/7/10 | 2,100,000 a | 2,100,000 |
| Monroe County Industrial Development Agency, IDR | | | | |
| (Genesee Metal Stampings Inc. Facility) (LOC; HSBC Bank USA) | 0.40 | 2/7/10 | 450,000 a | 450,000 |
| Monroe County Industrial Development Agency, | | | | |
| Revenue (HDF-RWC Project 1, LLC— Robert | | | | |
| Weslayan College Project) (LOC; M&T Bank) | 0.27 | 2/7/10 | 2,600,000 a | 2,600,000 |
| Nassau County Industrial Development Agency, Continuing | | | | |
| Care Retirement Community Revenue (Amsterdam at | | | | |
| Harborside Project) (LOC; ABN AMRO) | 0.19 | 2/7/10 | 27,200,000 a | 27,200,000 |
| New York City, GO Notes | 5.00 | 8/1/10 | 3,000,000 | 3,067,643 |
| New York City, GO Notes (Insured; Assured Guaranty | | | | |
| Municipal Corp. and Liquidity Facility; Dexia Credit Locale) | 0.21 | 2/1/10 | 6,080,000 a | 6,080,000 |
| New York City, GO Notes (LOC; Bank of Nova Scotia) | 0.18 | 2/7/10 | 6,785,000 a | 6,785,000 |
| New York City, GO Notes (LOC; JPMorgan Chase Bank) | 0.21 | 2/1/10 | 1,300,000 a | 1,300,000 |
| New York City Housing Development Corporation, | | | | |
| MFHR (Liquidity Facility; JPMorgan Chase Bank) | 0.25 | 2/7/10 | 6,900,000 a | 6,900,000 |
| New York City Housing Development Corporation, MFMR | | | | |
| (Beekman Tower Project) (LOC; RBS Citizens NA) | 0.25 | 2/7/10 | 20,345,000 a | 20,345,000 |
| New York City Housing Development Corporation, MFMR (The | | | | |
| Crest Project) (LOC; Landesbank Hessen-Thuringen Girozentrale) | 0.20 | 2/7/10 | 8,000,000 a | 8,000,000 |
| New York City Industrial Development Agency, Civic Facility Revenue | | | | |
| (American Society for Technion Project) (LOC; Allied Irish Banks) | 0.30 | 2/7/10 | 9,210,000 a | 9,210,000 |
| New York City Industrial Development Agency, Civic Facility Revenue | | | | |
| (Birch Wathen Lenox School Project) (LOC; Allied Irish Banks) | 0.32 | 2/7/10 | 7,505,000 a | 7,505,000 |
| New York City Industrial Development Agency, | | | | |
| Civic Facility Revenue (Columbia Grammar and | | | | |
| Preparatory School Project) (LOC; Allied Irish Banks) | 0.32 | 2/7/10 | 5,115,000 a | 5,115,000 |
| New York City Industrial Development Agency, | | | | |
| Civic Facility Revenue (French Institute-Alliance | | | | |
| Francaise de New York—Federation of French Alliances | | | | |
| in the United States Project) (LOC; M&T Bank) | 0.32 | 2/7/10 | 1,865,000 a | 1,865,000 |
| New York City Industrial Development Agency, | | | | |
| Civic Facility Revenue (Jewish Community Center | | | | |
| on the Upper West Side, Inc. Project) (LOC; M&T Bank) | 0.25 | 2/7/10 | 5,000,000 a | 5,000,000 |
| New York City Industrial Development Agency, Civic Facility Revenue | | | | |
| (Sephardic Community Youth Center, Inc. Project) (LOC; M&T Bank) | 0.25 | 2/7/10 | 3,100,000 a | 3,100,000 |
| New York City Industrial Development Agency, Civic Facility | | | | |
| Revenue (Spence-Chapin, Services to Families and | | | | |
| Children Project) (LOC; Allied Irish Banks) | 0.32 | 2/7/10 | 5,510,000 a | 5,510,000 |
| New York City Industrial Development Agency, Civic Facility Revenue | | | | |
| (The Allen-Stevenson School Project) (LOC; Allied Irish Banks) | 0.32 | 2/7/10 | 2,960,000 a | 2,960,000 |
| New York City Industrial Development Agency, Civic Facility Revenue | | | | |
| (Village Community School Project) (LOC; M&T Bank) | 0.32 | 2/7/10 | 2,400,000 a | 2,400,000 |
| New York City Municipal Water Finance Authority, CP (Liquidity | | | | |
| Facility: Bayerische Landesbank and Westdeutsche Landesbank) | 0.29 | 3/3/10 | 20,000,000 | 20,000,000 |
38
| | | | |
| Dreyfus New York | Coupon | Maturity | Principal | |
| Municipal Cash Management (continued) | Rate (%) | Date | Amount ($) | Value ($) |
| |
| Short-Term Investments (continued) | | | | |
| New York City Municipal Water Finance Authority, CP (Liquidity | | | | |
| Facility: Bayerische Landesbank and Westdeutsche Landesbank) | 0.30 | 3/3/10 | 5,000,000 | 5,000,000 |
| New York City Municipal Water Finance Authority, | | | | |
| Water and Sewer System Revenue (Putters Program) | | | | |
| (Liquidity Facility; JPMorgan Chase Bank) | 0.20 | 2/7/10 | 2,095,000 a,b | 2,095,000 |
| New York Liberty Development Corporation, Multi-Modal | | | | |
| Liberty Revenue (World Trade Center Project) | 0.50 | 1/18/11 | 15,000,000 | 15,000,000 |
| New York Local Government Assistance Corporation, GO Notes | | | | |
| (LOC: Bayerische Landesbank and Westdeutsche Landesbank) | 0.23 | 2/7/10 | 46,000,000 a | 46,000,000 |
| New York Local Government Assistance Corporation, GO Notes | | | | |
| (LOC: Bayerische Landesbank and Westdeutsche Landesbank) | 0.28 | 2/7/10 | 7,800,000 a | 7,800,000 |
| New York Local Government Assistance Corporation, | | | | |
| Senior Lien Revenue, Refunding | 5.00 | 4/1/10 | 1,300,000 | 1,309,825 |
| New York Local Government Assistance Corporation, Subordinate | | | | |
| Lien Revenue, Refunding (Insured; Assured Guaranty Municipal | | | | |
| Corp. and Liquidity Facility; Westdeutsche Landesbank) | 0.28 | 2/7/10 | 14,350,000 a | 14,350,000 |
| New York State, GO Notes | 4.00 | 3/1/10 | 1,000,000 | 1,002,756 |
| New York State Dormitory Authority, Consolidated | | | | |
| Service Contract Revenue, Refunding | 1.50 | 7/1/10 | 10,200,000 | 10,246,501 |
| New York State Dormitory Authority, Insured Revenue | | | | |
| (The Culinary Institute of America) (LOC; TD Bank) | 0.18 | 2/7/10 | 6,925,000 a | 6,925,000 |
| New York State Dormitory Authority, Revenue (Catholic | | | | |
| Health System Obligated Group) (LOC; HSBC Bank USA) | 0.17 | 2/7/10 | 2,470,000 a | 2,470,000 |
| New York State Dormitory Authority, Revenue (Park Ridge | | | | |
| Hospital, Inc.) (LOC; JPMorgan Chase Bank) | 0.20 | 2/7/10 | 2,785,000 a | 2,785,000 |
| New York State Dormitory Authority, Revenue | | | | |
| (Samaritan Medical Center) (LOC; HSBC Bank USA) | 0.19 | 2/7/10 | 3,300,000 a | 3,300,000 |
| New York State Dormitory Authority, Revenue | | | | |
| (Samaritan Medical Center) (LOC; Key Bank) | 0.34 | 2/7/10 | 8,000,000 a | 8,000,000 |
| New York State Dormitory Authority, Revenue | | | | |
| (The College of New Rochelle) (LOC; RBS Citizens NA) | 0.42 | 2/7/10 | 4,000,000 a | 4,000,000 |
| New York State Dormitory Authority, | | | | |
| State Personal Income Tax Revenue (Education) | 3.00 | 3/15/10 | 1,000,000 | 1,003,030 |
| New York State Dormitory Authority, State Personal | | | | |
| Income Tax Revenue (Education) (Liquidity Facility; Citibank NA) | 0.19 | 2/7/10 | 7,095,000 a,b | 7,095,000 |
| New York State Housing Finance Agency, | | | | |
| Housing Revenue (70 Battery Place) (LOC; FNMA) | 0.19 | 2/7/10 | 20,600,000 a | 20,600,000 |
| New York State Housing Finance Agency, Housing | | | | |
| Revenue (350 West 37th Street) (LOC; Wachovia Bank) | 0.20 | 2/7/10 | 9,000,000 a | 9,000,000 |
| New York State Housing Finance Agency, Housing Revenue | | | | |
| (Historic Front Street) (LOC; Landesbank | | | | |
| Hessen-Thuringen Girozentrale) | 0.18 | 2/7/10 | 24,300,000 a | 24,300,000 |
| New York State Urban Development Corporation, Service | | | | |
| Contract Revenue, Refunding (Insured; Assured Guaranty | | | | |
| Municipal Corp. and Liquidity Facility; JPMorgan Chase Bank) | 0.22 | 2/7/10 | 5,000,000 a | 5,000,000 |
The Funds 39
STATEMENT OF INVESTMENTS (continued)
| | | | |
| Dreyfus New York | Coupon | Maturity | Principal | |
| Municipal Cash Management (continued) | Rate (%) | Date | Amount ($) | Value ($) |
| |
| Short-Term Investments (continued) | | | | |
| Newburgh Industrial Development Agency, Civic Facility | | | | |
| Revenue (Community Development Properties Dubois | | | | |
| Street II, Inc. Project) (LOC; Key Bank) | 0.34 | 2/7/10 | 3,200,000 a | 3,200,000 |
| Oneida County Industrial Development Agency, Civic Facility | | | | |
| Revenue (Preswick Glen Civic Facility) (LOC; Banco Santander) | 0.15 | 2/7/10 | 6,500,000 a | 6,500,000 |
| Onondaga County Industrial Development Agency, IDR (General Super | | | | |
| Plating Company, Inc. Project) (LOC; Citizens Bank of Pennsylvania) | 0.71 | 2/7/10 | 1,910,000 a | 1,910,000 |
| Onondaga County Industrial Development Agency, IDR | | | | |
| (ICM Controls Corporation Project) (LOC; M&T Bank) | 0.35 | 2/7/10 | 2,250,000 a | 2,250,000 |
| Ontario County Industrial Development Agency, Civic Facility Revenue | | | | |
| (CHF-Finger Lakes, L.L.C. Civic Facility) (LOC; RBS Citizens NA) | 0.42 | 2/7/10 | 3,900,000 a | 3,900,000 |
| Ontario County Industrial Development Agency, | | | | |
| Civic Facility Revenue (Friends of the Finger Lakes | | | | |
| Performing Arts Center, Inc. Civic Facility) (LOC; FHLB) | 0.40 | 2/7/10 | 6,455,000 a | 6,455,000 |
| Ontario County Industrial Development Agency, IDR (Dixit | | | | |
| Enterprises/Newtex Industries, Inc. Facility) (LOC; HSBC Bank USA) | 0.40 | 2/7/10 | 2,540,000 a | 2,540,000 |
| Orange County Industrial Development Agency, Civic Facility Revenue | | | | |
| (Saint Luke’s Cornwall Hospital Project) (LOC; Key Bank) | 0.34 | 2/7/10 | 3,800,000 a | 3,800,000 |
| Otsego County Industrial Development Agency, Civic Facility | | | | |
| Revenue (Templeton Foundation Project) (LOC; Key Bank) | 0.49 | 2/7/10 | 3,040,000 a | 3,040,000 |
| Port Authority of New York and New Jersey, CP (Liquidity | | | | |
| Facility; Landesbank Hessen-Thuringen Girozentrale) | 0.30 | 4/9/10 | 33,000,000 | 33,000,000 |
| Port Authority of New York and New Jersey, Equipment Notes | 0.26 | 2/7/10 | 10,500,000 a | 10,500,000 |
| Port Authority of New York and New Jersey, Special Obligation Revenue | | | | |
| (Versatile Structure Obligations) (LOC; Bayerische Landesbank) | 0.23 | 2/1/10 | 9,000,000 a | 9,000,000 |
| Putnam County Industrial Development Agency, Civic Facility | | | | |
| Revenue (United Cerebral Palsy of Putnam and Southern | | | | |
| Dutchess Project) (LOC; Commerce Bank NA) | 0.18 | 2/7/10 | 3,595,000 a | 3,595,000 |
| Saint Lawrence County Industrial Development Agency, | | | | |
| Civic Facility Revenue, Refunding (Claxton-Hepburn | | | | |
| Medical Center Project) (LOC; Key Bank) | 0.34 | 2/7/10 | 3,500,000 a | 3,500,000 |
| Schenectady Industrial Development Agency, Civic Facility | | | | |
| Revenue (Union Graduate College Project) (LOC; M&T Bank) | 0.25 | 2/7/10 | 5,535,000 a | 5,535,000 |
| Smithtown Central School District, GO Notes, TAN | 1.00 | 6/25/10 | 10,865,000 | 10,889,380 |
| South Jefferson Central School District, GO Notes, BAN | 1.50 | 7/2/10 | 1,800,000 | 1,805,983 |
| Syracuse Industrial Development Agency, | | | | |
| Civic Facility Revenue (Community Development | | | | |
| Properties-Larned Project) (LOC; M&T Bank) | 0.27 | 2/7/10 | 2,780,000 a | 2,780,000 |
| Syracuse Industrial Development Agency, Civic Facility Revenue | | | | |
| (Crouse Health Hospital, Inc. Project) (LOC; Key Bank) | 0.34 | 2/7/10 | 2,730,000 a | 2,730,000 |
| Syracuse Industrial Development Agency, Housing Revenue | | | | |
| (Masonic Lofts LLC Project) (LOC; Key Bank) | 0.64 | 2/7/10 | 4,050,000 a | 4,050,000 |
| Three Village Central School District, GO Notes, TAN | 1.00 | 6/30/10 | 7,935,000 | 7,953,097 |
40
| | | | |
| Dreyfus New York | Coupon | Maturity | Principal | |
| Municipal Cash Management (continued) | Rate (%) | Date | Amount ($) | Value ($) |
| |
| Short-Term Investments (continued) | | | | |
| Ulster County Industrial Development Agency, IDR | | | | |
| (Selux Corporation Project) (LOC; M&T Bank) | 0.35 | 2/7/10 | 1,205,000 a | 1,205,000 |
| Valhalla Union Free School District, GO Notes, TAN | 1.00 | 2/2/10 | 2,000,000 | 2,000,019 |
| Westchester County, GO Notes, BAN | 1.00 | 4/28/10 | 6,000,000 | 6,000,000 |
| Westchester County Health Care Corporation, CP (Liquidity Facility; | | | | |
| JPMorgan Chase Bank and LOC; Westchester County) | 0.55 | 2/10/10 | 20,000,000 | 20,000,000 |
| Westchester County Industrial Development Agency, Civic Facility | | | | |
| Revenue (The Masters School Civic Facility) (LOC; Allied Irish Banks) | 0.32 | 2/7/10 | 15,305,000 a | 15,305,000 |
| Westchester County Industrial Development Agency, Civic Facility | | | | |
| Revenue (The Rye YMCA Project) (LOC; Allied Irish Banks) | 0.70 | 2/7/10 | 2,000,000 a | 2,000,000 |
| Westchester County Industrial Development Agency, | | | | |
| Continuing Care Retirement Community Mortgage | | | | |
| Revenue (Kendal on Hudson Project) (LOC; Natixis) | 0.17 | 2/7/10 | 15,000,000 a | 15,000,000 |
| Yonkers Industrial Development Agency, MFHR (Main Street | | | | |
| Lofts Yonkers LLC Project) (LOC; M&T Bank) | 0.35 | 2/7/10 | 30,000,000 a | 30,000,000 |
| Yonkers Industrial Development Agency, Revenue | | | | |
| (Merlots Program) (11-23 Saint Casimir Avenue, LP | | | | |
| Project) (Liquidity Facility; Wachovia Bank and LOC; GNMA) | 0.28 | 2/7/10 | 4,215,000 a,b | 4,215,000 |
| |
| Total Investments (cost $952,705,011) | | | 100.0% | 952,705,011 |
| Cash and Receivables (Net) | | | .0% | 26,522 |
| Net Assets | | | 100.0% | 952,731,533 |
| |
| See footnotes on page 58. | | | | |
| See notes to financial statements. | | | | |
The Funds 41
STATEMENT OF INVESTMENTS
January 31, 2010
| | | | |
| Dreyfus Tax Exempt | Coupon | Maturity | Principal | |
| Cash Management | Rate (%) | Date | Amount ($) | Value ($) |
| |
| Short-Term Investments—101.8% | | | | |
| Arizona—1.0% | | | | |
| Arizona Health Facilities Authority, HR (Phoenix Children’s | | | | |
| Hospital) (Liquidity Facility; BNP Paribas and LOC; BNP Paribas) | 0.30 | 2/7/10 | 12,435,000 a,b,e | 12,435,000 |
| Arizona Health Facilities Authority, HR (Phoenix Children’s Hospital) | | | | |
| (Liquidity Facility; Merrill Lynch Capital Services and LOC; Merrill Lynch) | 1.05 | 2/7/10 | 9,620,000 a,b,e | 9,620,000 |
| Arizona Health Facilities Authority, Revenue | | | | |
| (La Loma Village) (LOC; Banco Santander) | 0.25 | 2/7/10 | 18,300,000 a,e | 18,300,000 |
| California—2.4% | | | | |
| California Statewide Communities Development | | | | |
| Authority, Revenue, CP (Kaiser Permanente) | 0.32 | 5/6/10 | 14,500,000 e | 14,500,000 |
| California Statewide Communities Development | | | | |
| Authority, Revenue, CP (Kaiser Permanente) | 0.32 | 5/6/10 | 10,000,000 e | 10,000,000 |
| Southern California Public Power Authority, Transmission | | | | |
| Project Revenue, Refunding (Southern Transmission Project) | | | | |
| (Insured; Assured Guaranty Municipal Corp. and Liquidity | | | | |
| Facility; Westdeutsche Landesbank) | 0.20 | 2/7/10 | 70,000,000 a | 70,000,000 |
| Colorado—4.1% | | | | |
| Colorado, Revenue, TRAN (Education Loan Program) | 1.50 | 8/12/10 | 52,000,000 | 52,332,583 |
| Denver City and County, CP (LOC; Wachovia Bank) | 0.30 | 6/9/10 | 18,000,000 | 18,000,000 |
| Denver Urban Renewal Authority, Stapleton Senior | | | | |
| Tax Increment Revenue (LOC; U.S. Bank NA) | 0.20 | 2/7/10 | 9,900,000 a | 9,900,000 |
| Mountain Village Housing Authority, Housing Facilities Revenue | | | | |
| (Village Court Apartments Project) (LOC; U.S. Bank NA) | 0.20 | 2/7/10 | 6,500,000 a | 6,500,000 |
| RBC Municipal Products Inc. Trust (Meridian Village Metropolitan | | | | |
| District Number One, Improvement Revenue) (Liquidity Facility; | | | | |
| Royal Bank of Canada and LOC; Royal Bank of Canada) | 0.23 | 2/7/10 | 17,600,000 a,b | 17,600,000 |
| Southern Ute Indian Tribe of the Southern | | | | |
| Ute Indian Reservation, Revenue | 0.20 | 2/7/10 | 46,000,000 a | 46,000,000 |
| Southglenn Metropolitan District, Special Revenue (LOC; BNP Paribas) | 0.20 | 2/7/10 | 8,000,000 a | 8,000,000 |
| Connecticut—1.2% | | | | |
| Connecticut, GO Notes, BAN | 2.00 | 4/28/10 | 20,000,000 | 20,076,428 |
| Connecticut Health and Educational Facilities Authority, | | | | |
| Revenue (The Jerome Home Issue) (LOC; Bank of America) | 0.21 | 2/7/10 | 4,670,000 a,e | 4,670,000 |
| Connecticut Health and Educational Facilities Authority, Revenue | | | | |
| (Yale University Issue) (Liquidity Facility; Citibank NA) | 0.19 | 2/7/10 | 11,850,000 a,b | 11,850,000 |
| New Haven, GO Notes, BAN | 1.25 | 2/15/10 | 9,000,000 | 9,001,285 |
| Delaware—.7% | | | | |
| Delaware Economic Development Authority, MFHR | | | | |
| (School House Project) (LOC; HSBC Bank USA) | 0.40 | 2/7/10 | 11,900,000 a | 11,900,000 |
| Delaware Economic Development Authority, Revenue (Connections | | | | |
| Community Support Programs, Inc. Project) (LOC; PNC Bank NA) | 0.19 | 2/7/10 | 6,635,000 a | 6,635,000 |
| Delaware Health Facilities Authority, Revenue | | | | |
| (Christiana Care Health Services) | 0.16 | 2/7/10 | 8,325,000 a,e | 8,325,000 |
| District of Columbia—.4% | | | | |
| District of Columbia, Revenue (American Legacy Foundation Issue) | 0.18 | 2/7/10 | 14,000,000 a | 14,000,000 |
| Florida—6.6% | | | | |
| Alachua County Health Facilities Authority, Revenue, CP | | | | |
| (Shands Healthcare) (LOC; Bank of America) | 0.25 | 4/8/10 | 30,000,000 e | 30,000,000 |
42
| | | | |
| Dreyfus Tax Exempt | Coupon | Maturity | Principal | |
| Cash Management (continued) | Rate (%) | Date | Amount ($) | Value ($) |
| |
| Short-Term Investments (continued) | | | | |
| Florida (continued) | | | | |
| Broward County Health Facilities Authority, Revenue, Refunding | | | | |
| (John Knox Village of Florida, Inc. Project) (LOC; Wachovia Bank) | 0.18 | 2/7/10 | 30,315,000 a,e | 30,315,000 |
| Capital Trust Agency, MFHR (Brittany Bay Apartments— | | | | |
| Waterman’s Crossing) (Liquidity Facility; FHLMC and LOC; FHLMC) | 0.25 | 2/7/10 | 23,350,000 a,b | 23,350,000 |
| Collier County Health Facilities Authority, Health Facility Revenue | | | | |
| (The Moorings, Inc. Project) (LOC; Wachovia Bank) | 0.18 | 2/7/10 | 34,820,000 a,e | 34,820,000 |
| Florida Local Government Finance Commission, Pooled Loan | | | | |
| Program Revenue, CP (LOC; Wachovia Bank) | 0.32 | 6/10/10 | 30,000,000 | 30,000,000 |
| Highlands County Health Facilities Authority, HR | | | | |
| (Adventist Health System/Sunbelt Obligated Group) | 0.16 | 2/7/10 | 14,500,000 a,e | 14,500,000 |
| Jacksonville, Transportation Revenue (LOC; Wachovia Bank) | 0.18 | 2/7/10 | 10,600,000 a | 10,600,000 |
| Orlando-Orange County Expressway Authority, Revenue | | | | |
| (Insured; Assured Guaranty Municipal Corp. and | | | | |
| Liquidity Faciity; Dexia Credit Locale) | 0.20 | 2/7/10 | 12,645,000 a | 12,645,000 |
| Port Orange, Revenue (Palmer College of Chiropractic | | | | |
| Florida Project) (LOC; ABN-AMRO) | 0.21 | 2/7/10 | 3,870,000 a | 3,870,000 |
| Sunshine State Governmental Financing Commission, | | | | |
| Revenue (LOC; Dexia Credit Locale) | 0.30 | 2/7/10 | 15,100,000 a | 15,100,000 |
| Tohopekaliga Water Authority, Utility System Revenue | | | | |
| (LOC; Landesbank Hessen-Thuringen Girozentrale) | 0.20 | 2/7/10 | 44,525,000 a | 44,525,000 |
| Wells Fargo Stage Trust (Saint Petersburg Health Facilities | | | | |
| Authority, Health Facilities Revenue, Refunding (All Children’s | | | | |
| Hospital, Obligated Group)) (Liquidity Facility; Wells | | | | |
| Fargo Bank and LOC; Wells Fargo Bank) | 0.18 | 2/7/10 | 7,765,000 a,b,e | 7,765,000 |
| Georgia—2.0% | | | | |
| Floyd County Development Authority, Revenue | | | | |
| (Berry College Project) (LOC; FHLB) | 0.17 | 2/7/10 | 11,000,000 a | 11,000,000 |
| Fulton County Development Authority, Educational Facilities | | | | |
| Revenue (Catholic Education of North Georgia, Inc. | | | | |
| Project) (LOC; Wachovia Bank) | 0.18 | 2/7/10 | 14,405,000 a | 14,405,000 |
| Fulton County Housing Authority, MFHR | | | | |
| (Liquidity Facility; FHLMC and LOC; FHLMC) | 0.25 | 2/7/10 | 25,365,000 a,b | 25,365,000 |
| Metropolitan Atlanta Rapid Transit Authority, Sales Tax | | | | |
| Revenue, CP (Liquidity Facility; Dexia Credit Locale) | 0.23 | 2/2/10 | 20,000,000 | 20,000,000 |
| Thomasville Hospital Authority, RAC (John D. Archbold Memorial | | | | |
| Hospital, Inc. Project) (LOC; Branch Banking and Trust Co.) | 0.20 | 2/7/10 | 7,840,000 a,e | 7,840,000 |
| Idaho—.0% | | | | |
| Idaho Health Facilities Authority, Health Care Facilities | | | | |
| Revenue (Aces-Pooled Financing Program) (LOC; U.S. Bank NA) | 0.21 | 2/7/10 | 1,550,000 a,e | 1,550,000 |
| Illinois—5.7% | | | | |
| Channahon, Revenue, Refunding (Morris Hospital) | | | | |
| (LOC; U.S. Bank NA) | 0.20 | 2/7/10 | 3,465,000 a,e | 3,465,000 |
| Chicago O’Hare International Airport, Revenue (Insured; Assured | | | | |
| Guaranty Municipal Corp. and Liquidity Facility; Citibank NA) | 0.25 | 2/7/10 | 5,470,000 a,b | 5,470,000 |
| Illinois Educational Facilities Authority, Revenue, CP | | | | |
| (Pooled Finance Program) (LOC; Northern Trust Company) | 0.35 | 2/22/10 | 81,200,000 | 81,200,000 |
| Illinois Finance Authority, Revenue (Hospice of | | | | |
| Northeastern Illinois Project) (LOC; Harris NA) | 0.20 | 2/7/10 | 8,500,000 a,e | 8,500,000 |
The Funds 43
STATEMENT OF INVESTMENTS (continued)
| | | | |
| Dreyfus Tax Exempt | Coupon | Maturity | Principal | |
| Cash Management (continued) | Rate (%) | Date | Amount ($) | Value ($) |
| |
| Short-Term Investments (continued) | | | | |
| Illinois (continued) | | | | |
| Illinois Finance Authority, Revenue (Riverside Health | | | | |
| System) (LOC; JPMorgan Chase Bank) | 0.20 | 2/7/10 | 4,295,000 a,e | 4,295,000 |
| Illinois Finance Authority, Revenue (The Landing at | | | | |
| Plymouth Place Project) (LOC; Lloyds TSB Bank PLC) | 0.18 | 2/7/10 | 10,000,000 a | 10,000,000 |
| Illinois Health Facilities Authority, Revenue (Revolving Fund | | | | |
| Pooled Financing Program) (LOC; JPMorgan Chase Bank) | 0.25 | 2/7/10 | 4,450,000 a,e | 4,450,000 |
| Illinois Toll Highway Authority, Toll Highway Senior Priority | | | | |
| Revenue (Liquidity Facility; Dexia Credit Locale) | 0.23 | 2/7/10 | 80,000,000 a | 80,000,000 |
| Illinois Toll Highway Authority, Toll Highway Senior Revenue, | | | | |
| Refunding (Insured; Assured Guaranty Municipal Corp. | | | | |
| and Liquidity Facility; Dexia Credit Locale) | 0.23 | 2/7/10 | 23,000,000 a | 23,000,000 |
| Lake County, MFHR (Whispering Oaks | | | | |
| Apartments Project) (LOC; FHLMC) | 0.21 | 2/7/10 | 3,250,000 a | 3,250,000 |
| Indiana—3.5% | | | | |
| Indiana Bond Bank, State Revolving Fund Program Revenue | 5.25 | 2/1/10 | 3,765,000 | 3,765,000 |
| Indiana Finance Authority, HR (Community Health | | | | |
| Network Project) (LOC; Bank of America) | 0.22 | 2/7/10 | 15,000,000 a,e | 15,000,000 |
| Indiana Finance Authority, Revenue | | | | |
| (Ascension Health Senior Credit Group) | 0.33 | 6/15/10 | 6,490,000 e | 6,490,000 |
| Indiana Finance Authority, Revenue | | | | |
| (Ascension Health Senior Credit Group) | 0.33 | 6/15/10 | 6,725,000 e | 6,725,000 |
| Indiana Finance Authority, Revenue | | | | |
| (Ascension Health Senior Credit Group) | 0.33 | 6/15/10 | 8,090,000 e | 8,090,000 |
| Indiana Finance Authority, Revenue, | | | | |
| Refunding (Trinity Health Credit Group) | 0.16 | 2/7/10 | 14,600,000 a,e | 14,600,000 |
| Indiana Health and Educational Facility Financing Authority, | | | | |
| Revenue (Ascension Health Senior Credit Group) | | | | |
| (Liquidity Facility; Citibank NA) | 0.19 | 2/7/10 | 59,000,000 a,b,e | 59,000,000 |
| Indianapolis Local Public Improvement Bond Bank, Notes | 0.37 | 8/6/10 | 10,000,000 | 10,000,000 |
| Indianapolis Local Public Improvement Bond Bank, Notes | 0.37 | 8/6/10 | 6,250,000 | 6,250,000 |
| Indianapolis Local Public Improvement Bond Bank, Notes | 0.37 | 8/6/10 | 6,350,000 | 6,350,000 |
| Kentucky—.6% | | | | |
| Kentucky Property and Buildings Commission, Revenue, | | | | |
| Refunding (Project Number 84) (Liquidity Facility; | | | | |
| Dexia Credit Locale and LOC; Dexia Credit Locale) | 0.45 | 2/7/10 | 16,395,000 a,b | 16,395,000 |
| Madisonville, HR (Trover Clinic Foundation, Inc.) | | | | |
| (Insured; Assured Guaranty Municipal Corp. | | | | |
| and Liquidity Facility; JPMorgan Chase Bank) | 0.25 | 2/7/10 | 6,695,000 a,e | 6,695,000 |
| Louisiana—2.6% | | | | |
| Ascension Parish Industrial Development Board, Revenue | | | | |
| (International Matex Tank Terminals—Geismar Project) (LOC; FHLB) | 0.17 | 2/7/10 | 17,000,000 a | 17,000,000 |
| Louisiana Local Government Environmental Facilities and Community | | | | |
| Development Authority, Healthcare Facilities Revenue, Refunding | | | | |
| (Saint James Place of Baton Rouge Project) (LOC; ABN-AMRO) | 0.25 | 2/7/10 | 11,520,000 a,e | 11,520,000 |
| Louisiana Municipal Natural Gas Purchasing and Distribution Authority, | | | | |
| Revenue (Putters Program) (Gas Project Number 1) (Liquidity | | | | |
| Facility; JPMorgan Chase Bank and LOC; JPMorgan Chase Bank) | 0.20 | 2/7/10 | 20,929,000 a,b | 20,929,000 |
44
| | | | |
| Dreyfus Tax Exempt | Coupon | Maturity | Principal | |
| Cash Management (continued) | Rate (%) | Date | Amount ($) | Value ($) |
| |
| Short-Term Investments (continued) | | | | |
| Louisiana (continued) | | | | |
| Louisiana Public Facilities Authority, HR (Touro Infirmary Project) | | | | |
| (Liquidity Facility; Merrill Lynch Bank and LOC; Merrill Lynch) | 1.05 | 2/7/10 | 34,045,000 a,b,e | 34,045,000 |
| Louisiana Public Facilities Authority, Revenue | | | | |
| (Tiger Athletic Foundation Project) (LOC; FHLB) | 0.19 | 2/7/10 | 15,750,000 a | 15,750,000 |
| Maryland—3.5% | | | | |
| Baltimore County Revenue Authority, | | | | |
| Golf System Revenue (LOC; M&T Bank) | 0.23 | 2/7/10 | 3,500,000 a | 3,500,000 |
| Frederick County, Revenue (Homewood, Inc. Facility) (LOC; M&T Bank) | 0.20 | 2/7/10 | 12,900,000 a | 12,900,000 |
| Frederick County, Revenue, Refunding | | | | |
| (Manekin-Frederick Associates Facility) (LOC; M&T Bank) | 0.32 | 2/7/10 | 2,230,000 a | 2,230,000 |
| Maryland Department of Transportation, | | | | |
| Consolidated Transportation Revenue | 5.50 | 2/1/10 | 5,125,000 | 5,125,000 |
| Maryland Economic Development Corporation, | | | | |
| Revenue (Easter Seals Facility) (LOC; M&T Bank) | 0.25 | 2/7/10 | 6,780,000 a | 6,780,000 |
| Maryland Economic Development Corporation, Revenue | | | | |
| (Legal Aid Bureau, Inc. Facility) (LOC; M&T Bank) | 0.27 | 2/7/10 | 2,100,000 a | 2,100,000 |
| Maryland Health and Higher Educational Facilities | | | | |
| Authority, Revenue (Dematha Catholic High School) | | | | |
| (LOC; Branch Banking and Trust Co.) | 0.20 | 2/7/10 | 9,865,000 a | 9,865,000 |
| Maryland Health and Higher Educational Facilities Authority, | | | | |
| Revenue (Upper Chesapeake Hospitals Issue) | | | | |
| (LOC; Branch Banking and Trust Co.) | 0.19 | 2/7/10 | 5,700,000 a,e | 5,700,000 |
| Maryland Health and Higher Educational Facilities Authority, | | | | |
| Revenue, CP (Johns Hopkins Health System) | | | | |
| (Liquidity Facility; Bank of America) | 0.28 | 4/6/10 | 20,000,000 e | 20,000,000 |
| Maryland Health and Higher Educational Facilities Authority, Revenue, | | | | |
| CP (Johns Hopkins Health System) (LOC; Bank of America) | 0.28 | 2/1/10 | 21,500,000 e | 21,500,000 |
| Maryland Health and Higher Educational Facility Authority, Revenue, | | | | |
| Refunding (Adventist HealthCare Issue) (LOC; M&T Bank) | 0.18 | 2/7/10 | 23,425,000 a,e | 23,425,000 |
| Montgomery County, EDR (Riderwood | | | | |
| Village, Inc. Project) (LOC; M&T Bank) | 0.18 | 2/7/10 | 21,775,000 a | 21,775,000 |
| Massachusetts—2.9% | | | | |
| Massachusetts, GO Notes, RAN | 2.50 | 4/29/10 | 52,000,000 | 52,267,102 |
| Massachusetts, GO Notes, RAN | 2.50 | 5/27/10 | 25,000,000 | 25,170,521 |
| Massachusetts, GO Notes, Refunding (Liquidity Facility; Citibank NA) | 0.20 | 2/7/10 | 4,675,000 a | 4,675,000 |
| Massachusetts, GO Notes, Refunding (Liquidity Facility; | | | | |
| Landesbank Hessen-Thuringen Girozentrale) | 0.25 | 2/7/10 | 20,000,000 a | 20,000,000 |
| Massachusetts Health and Educational Facilities Authority, Revenue | | | | |
| (Cape Cod Healthcare Obligated Group Issue) (Insured; Assured | | | | |
| Guaranty Municipal Corp. and Liquidity Facility; Bank of America) | 0.25 | 2/7/10 | 11,300,000 a,e | 11,300,000 |
| Michigan—9.2% | | | | |
| Jackson County Hospital Finance Authority, HR, Refunding | | | | |
| (W.A. Foote Memorial Hospital) (Insured; Assured Guaranty | | | | |
| Municipal Corp. and Liquidity Facility; Comerica Bank) | 0.34 | 2/7/10 | 8,000,000 a,e | 8,000,000 |
| Michigan, GO Notes | 2.00 | 9/30/10 | 80,000,000 | 80,773,167 |
| Michigan Higher Education Facilities Authority, Revenue, | | | | |
| Refunding (Walsh College Project) (LOC; Commerce Bank) | 0.25 | 2/7/10 | 8,135,000 a | 8,135,000 |
The Funds 45
STATEMENT OF INVESTMENTS (continued)
| | | | |
| Dreyfus Tax Exempt | Coupon | Maturity | Principal | |
| Cash Management (continued) | Rate (%) | Date | Amount ($) | Value ($) |
| |
| Short-Term Investments (continued) | | | | |
| Michigan (continued) | | | | |
| Michigan Hospital Finance Authority, Revenue | | | | |
| (Ascension Health Credit Group) | 0.28 | 5/4/10 | 10,000,000 e | 10,000,000 |
| Michigan Hospital Finance Authority, Revenue | | | | |
| (Ascension Health Senior Credit Group) | 0.18 | 2/7/10 | 11,000,000 a,e | 11,000,000 |
| Michigan Hospital Finance Authority, Revenue | | | | |
| (Trinity Health Credit Group) | 0.14 | 2/7/10 | 7,700,000 a,e | 7,700,000 |
| Michigan Hospital Finance Authority, Revenue, CP (Trinity Health System) | 0.23 | 4/7/10 | 75,000,000 e | 75,000,000 |
| Michigan Hospital Finance Authority, Revenue, CP (Trinity Health System) | 0.25 | 5/5/10 | 25,000,000 e | 25,000,000 |
| Michigan Hospital Finance Authority, Revenue, CP (Trinity Health System) | 0.25 | 5/5/10 | 50,000,000 e | 50,000,000 |
| Michigan Hospital Finance Authority, Revenue, CP (Trinity Health System) | 0.28 | 6/11/10 | 15,000,000 e | 15,000,000 |
| Michigan Housing Development Authority, Rental Housing Revenue | | | | |
| (Liquidity Facility; Landesbank Hessen-Thuringen Girozentrale) | 0.23 | 2/7/10 | 16,395,000 a | 16,395,000 |
| Michigan Housing Development Authority, SFMR | | | | |
| (Liquidity Facility: FHLMC and FNMA) | 0.15 | 2/7/10 | 11,600,000 a | 11,600,000 |
| Michigan Municipal Bond Authority, State Aid | | | | |
| Revenue Notes (LOC; Bank of Nova Scotia) | 1.50 | 8/23/10 | 5,000,000 c | 5,026,150 |
| University of Michigan, CP | 0.27 | 2/18/10 | 12,880,000 | 12,880,000 |
| University of Michigan Regents, General Revenue | | | | |
| (Liquidity Facility; JPMorgan Chase Bank) | 0.17 | 2/7/10 | 20,000,000 a,e | 20,000,000 |
| Minnesota—.7% | | | | |
| Rochester, Health Care Facilities Revenue, CP (Mayo Clinic) | 0.35 | 2/16/10 | 9,000,000 e | 9,000,000 |
| Rochester, Health Care Facilities Revenue, CP (Mayo Clinic) | 0.25 | 3/18/10 | 10,000,000 e | 10,000,000 |
| Southern Minnesota Municipal Power Agency, Power Supply | | | | |
| System Revenue, CP (Liquidity Facility; Landesbank | | | | |
| Hessen-Thuringen Girozentrale) | 0.36 | 4/9/10 | 8,000,000 | 8,000,000 |
| Mississippi—.4% | | | | |
| Mississippi Business Finance Corporation, Health Care Facilities | | | | |
| Revenue (Rush Medical Foundation Project) (LOC; U.S. Bank NA) | 0.15 | 2/7/10 | 7,000,000 a,e | 7,000,000 |
| Mississippi Business Finance Corporation, Revenue, Refunding | | | | |
| (Renaissance at Colony Park, LLC Refunding Project) (LOC; FHLB) | 0.27 | 2/7/10 | 10,000,000 a | 10,000,000 |
| Missouri—1.1% | | | | |
| Kansas City Industrial Development Authority, Revenue (Kansas City | | | | |
| Downtown Redevelopment District) (LOC; JPMorgan Chase Bank) | 0.25 | 2/7/10 | 25,800,000 a | 25,800,000 |
| Missouri Health and Educational Facilities Authority, Health Facilities | | | | |
| Revenue (Lutheran Senior Services) (LOC; U.S. Bank NA) | 0.18 | 2/7/10 | 9,000,000 a,e | 9,000,000 |
| Missouri Health and Educational Facilities Authority, Health Facilities | | | | |
| Revenue (The Children’s Mercy Hospital) (LOC; UBS AG) | 0.20 | 2/7/10 | 7,300,000 a,e | 7,300,000 |
| Nebraska—.6% | | | | |
| Lancaster County Hospital Authority Number 1, HR, Refunding | | | | |
| (BryanLGH Medical Center) (LOC; U.S. Bank NA) | 0.20 | 2/7/10 | 24,820,000 a,e | 24,820,000 |
| Nevada—1.2% | | | | |
| Austin Trust (Clark County, GO Bond Bank Bonds) | | | | |
| (Liquidity Facility; Bank of America) | 0.18 | 2/7/10 | 9,770,000 a,b | 9,770,000 |
| Las Vegas Convention and Visitors Authority, | | | | |
| Revenue, CP (LOC: Bank of Nova Scotia, | | | | |
| Fortis Bank and State Street Bank and Trust Co.) | 0.25 | 4/7/10 | 15,000,000 | 15,000,000 |
46
| | | | |
| Dreyfus Tax Exempt | Coupon | Maturity | Principal | |
| Cash Management (continued) | Rate (%) | Date | Amount ($) | Value ($) |
| |
| Short-Term Investments (continued) | | | | |
| Nevada (continued) | | | | |
| Las Vegas Valley Water District, CP | | | | |
| (Liquidity Facility; JPMorgan Chase Bank) | 0.35 | 4/8/10 | 20,000,000 | 20,000,000 |
| New Hampshire—.9% | | | | |
| New Hampshire Business Finance Authority, Revenue | | | | |
| (The Mark H. Wentworth Home Issue) (LOC; TD Bank) | 0.18 | 2/7/10 | 11,745,000 a,e | 11,745,000 |
| New Hampshire Health and Education Facilities | | | | |
| Authority, HR (Catholic Medical Center Issue) (LOC; FHLB) | 0.19 | 2/7/10 | 8,840,000 a,e | 8,840,000 |
| New Hampshire Health and Education Facilities Authority, | | | | |
| Revenue (University System of New Hampshire Issue) | 0.20 | 2/1/10 | 4,600,000 a | 4,600,000 |
| New Hampshire Higher Educational and Health Facilities Authority, | | | | |
| Revenue (Hunt Community Issue) (LOC; Bank of America) | 0.17 | 2/7/10 | 10,150,000 a,e | 10,150,000 |
| New Jersey—4.6% | | | | |
| New Jersey Economic Development Authority, School Facilities | | | | |
| Construction Revenue, Refunding (LOC; Dexia Credit Locale) | 0.25 | 2/7/10 | 82,745,000 a | 82,745,000 |
| New Jersey Health Care Facilities Financing Authority, Revenue | | | | |
| (Meridian Health System Obligated Group Issue) (Insured; Assured | | | | |
| Guaranty Municipal Corp. and Liquidity Facility; Bank of America) | 0.20 | 2/7/10 | 18,000,000 a,e | 18,000,000 |
| New Jersey Health Care Facilities Financing Authority, Revenue, Refunding | | | | |
| (Christian Health Care Center Issue) (LOC; Valley National Bank) | 0.18 | 2/7/10 | 5,505,000 a,e | 5,505,000 |
| New Jersey Turnpike Authority, Turnpike Revenue (Insured; Assured | | | | |
| Guaranty Municipal Corp. and Liquidity Facility; Dexia Credit Locale) | 0.25 | 2/7/10 | 61,050,000 a | 61,050,000 |
| New Jersey Turnpike Authority, Turnpike Revenue | | | | |
| (Insured; Assured Guaranty Municipal Corp. and | | | | |
| Liquidity Facility; Westdeutsche Landesbank) | 0.30 | 2/7/10 | 10,000,000 a,c | 10,000,000 |
| New Mexico—.2% | | | | |
| Dona Ana County, Industrial Revenue (Foamex | | | | |
| Products, Inc. Project) (LOC; Wachovia Bank) | 0.22 | 2/7/10 | 6,000,000 a | 6,000,000 |
| New York—2.6% | | | | |
| Long Island Power Authority, Electric System General Revenue | | | | |
| (Long Island Lighting Company) (Insured; Assured Guaranty | | | | |
| Municipal Corp. and Liquidity Facility; Dexia Credit Locale) | 0.21 | 2/7/10 | 14,240,000 a | 14,240,000 |
| Metropolitan Transportation Authority, Dedicated Tax Fund | | | | |
| Revenue (Insured; Assured Guaranty Municipal Corp. and | | | | |
| Liquidity Facility; Dexia Credit Locale) | 0.25 | 2/7/10 | 22,305,000 a | 22,305,000 |
| New York Liberty Development Corporation, | | | | |
| Multi-Modal Liberty Revenue (World Trade Center Project) | 0.50 | 1/18/11 | 15,000,000 | 15,000,000 |
| New York State Housing Finance Agency, Housing Revenue | | | | |
| (Normandie Court I Project) (LOC; Landesbank | | | | |
| Hessen-Thuringen Girozentrale) | 0.20 | 2/7/10 | 34,400,000 a | 34,400,000 |
| Westchester County Health Care Corporation, CP (Liquidity | | | | |
| Facility; JPMorgan Chase Bank and LOC; Westchester County) | 0.55 | 2/10/10 | 16,600,000 e | 16,600,000 |
| North Carolina—1.0% | | | | |
| Board of Governers of the University of North Carolina, CP | 0.23 | 2/16/10 | 7,800,000 | 7,800,000 |
| North Carolina, GO Notes, Refunding | 5.00 | 3/1/10 | 7,175,000 | 7,200,751 |
| North Carolina Capital Facilities Finance | | | | |
| Agency, CP (Duke University Project) | 0.23 | 2/3/10 | 6,190,000 | 6,190,000 |
The Funds 47
STATEMENT OF INVESTMENTS (continued)
| | | | |
| Dreyfus Tax Exempt | Coupon | Maturity | Principal | |
| Cash Management (continued) | Rate (%) | Date | Amount ($) | Value ($) |
| |
| Short-Term Investments (continued) | | | | |
| North Carolina (continued) | | | | |
| North Carolina Medical Care Commission, Health Care Facilities | | | | |
| First Mortgage Revenue (Deerfield Episcopal Retirement | | | | |
| Community) (LOC; Branch Banking and Trust Co.) | 0.20 | 2/7/10 | 5,000,000 a,e | 5,000,000 |
| North Carolina Medical Care Commission, Health Care | | | | |
| Facilities Revenue (WakeMed) (LOC; Wachovia Bank) | 0.18 | 2/7/10 | 9,300,000 a,e | 9,300,000 |
| Piedmont Triad Airport Authority, Airport | | | | |
| Revenue (LOC; Branch Banking and Trust Co.) | 0.21 | 2/7/10 | 3,400,000 a | 3,400,000 |
| Ohio—4.0% | | | | |
| Akron, Bath and Copley Joint Township Hospital District, | | | | |
| Health Care Facilities Revenue (Sumner on | | | | |
| Ridgewood Project) (LOC; KBC Bank) | 0.28 | 2/7/10 | 5,200,000 a,e | 5,200,000 |
| Cleveland, Airport System Revenue (LOC; KBC Bank) | 0.30 | 2/7/10 | 8,500,000 a | 8,500,000 |
| Cleveland, Water Revenue (LOC; Allied Irish Banks) | 0.29 | 2/7/10 | 13,000,000 a | 13,000,000 |
| Franklin County, Hospital Facilities Revenue, Refunding | | | | |
| (OhioHealth Corporation) (Liquidity Facility; | | | | |
| Landesbank Hessen-Thuringen Girozentrale) | 0.20 | 2/7/10 | 79,400,000 a,e | 79,400,000 |
| Ohio Higher Educational Facility Commission, Revenue, CP | | | | |
| (Cleveland Clinic Health System Obligated Group) | 0.50 | 2/9/10 | 17,500,000 e | 17,500,000 |
| Ohio Higher Educational Facility Commission, Revenue, CP | | | | |
| (Cleveland Clinic Health System Obligated Group) | 0.38 | 2/22/10 | 13,000,000 e | 13,000,000 |
| Ohio Higher Educational Facility Commission, Revenue, CP | | | | |
| (Cleveland Clinic Health System Obligated Group) | 0.25 | 5/18/10 | 20,000,000 e | 20,000,000 |
| Oklahoma—1.2% | | | | |
| Oklahoma Development Finance Authority, Continuing | | | | |
| Care Retirement Community Revenue, Refunding | | | | |
| (Inverness Village Project) (LOC; KBC Bank) | 0.20 | 2/7/10 | 22,600,000 a,e | 22,600,000 |
| Oklahoma Development Finance Authority, Health System | | | | |
| Revenue, Refunding (INTEGRIS Baptist Medical Center, Inc., | | | | |
| INTEGRIS South Oklahoma City Hospital Corporation and | | | | |
| INTEGRIS Rural Health, Inc.) (Insured; Assured Guaranty | | | | |
| Municipal Corp. and Liquidity Facility; JPMorgan Chase Bank) | 0.20 | 2/7/10 | 16,735,000 a,e | 16,735,000 |
| Oklahoma Development Finance Authority, | | | | |
| Revenue, CP (Integris Baptist Medical) | 0.30 | 2/16/10 | 8,450,000 e | 8,450,000 |
| Oregon—.4% | | | | |
| Salem Hospital Facility Authority, Revenue | | | | |
| (Capital Manor, Inc. Project) (LOC; Bank of America) | 0.25 | 2/7/10 | 5,370,000 a,e | 5,370,000 |
| Salem Hospital Facility Authority, Revenue, Refunding | | | | |
| (Capital Manor, Inc. Project) (LOC; Bank of America) | 0.25 | 2/7/10 | 8,680,000 a,e | 8,680,000 |
| Pennsylvania—14.8% | | | | |
| Allegheny County, TRAN | 1.00 | 4/5/10 | 45,000,000 | 45,052,650 |
| Beaver County Industrial Development Authority, PCR, | | | | |
| Refunding (FirstEnergy Nuclear Generation | | | | |
| Corporation Project) (LOC; Citibank NA) | 0.18 | 2/7/10 | 7,000,000 a | 7,000,000 |
| Berks County Industrial Development Authority, Student Housing | | | | |
| Revenue (CHF-Kutztown, LLC Project Servicing Kutztown | | | | |
| University of Pennsylvania) (LOC; Citibank NA) | 0.25 | 2/7/10 | 5,000,000 a | 5,000,000 |
48
| | | | |
| Dreyfus Tax Exempt | Coupon | Maturity | Principal | |
| Cash Management (continued) | Rate (%) | Date | Amount ($) | Value ($) |
| |
| Short-Term Investments (continued) | | | | |
| Pennsylvania (continued) | | | | |
| Bucks County Industrial Development Authority, | | | | |
| Revenue (Pennswood Village Project) | | | | |
| (LOC; Bank of America) | 0.23 | 2/7/10 | 7,300,000 a,e | 7,300,000 |
| Chester County Health and Education Facilities Authority, | | | | |
| Retirement Community Revenue (Kendal-Crosslands | | | | |
| Communities Project) (LOC; Wachovia Bank) | 0.18 | 2/7/10 | 21,495,000 a,e | 21,495,000 |
| Delaware County Industrial Development | | | | |
| Authority, PCR, CP (British Petroleum PLC) | 0.30 | 2/4/10 | 6,000,000 | 6,000,000 |
| East Hempfield Township Industrial | | | | |
| Development Authority, Revenue | | | | |
| (The Mennonite Home Project) (LOC; M&T Bank) | 0.25 | 2/7/10 | 11,600,000 a | 11,600,000 |
| East Hempfield Township Industrial Development Authority, | | | | |
| Revenue (The Mennonite Home Project) (LOC; M&T Bank) | 0.25 | 2/7/10 | 7,240,000 a,e | 7,240,000 |
| Emmaus General Authority (Pennsylvania Variable Rate Loan | | | | |
| Program) (Insured; Assured Guaranty Municipal Corp. | | | | |
| and Liquidity Facility; Wachovia Bank) | 0.28 | 2/7/10 | 65,075,000 a | 65,075,000 |
| Emmaus General Authority, Local Government Revenue | | | | |
| (Bond Pool Program) (LOC; U.S. Bank NA) | 0.20 | 2/7/10 | 9,200,000 a | 9,200,000 |
| Emmaus General Authority, Local Government Revenue | | | | |
| (Bond Pool Program) (LOC; U.S. Bank NA) | 0.20 | 2/7/10 | 10,500,000 a | 10,500,000 |
| Emmaus General Authority, Local Government Revenue | | | | |
| (Bond Pool Program) (LOC; U.S. Bank NA) | 0.20 | 2/7/10 | 11,200,000 a | 11,200,000 |
| Emmaus General Authority, Local Government Revenue | | | | |
| (Bond Pool Program) (LOC; U.S. Bank NA) | 0.20 | 2/7/10 | 5,850,000 a | 5,850,000 |
| Emmaus General Authority, Local Government Revenue | | | | |
| (Bond Pool Program) (LOC; U.S. Bank NA) | 0.20 | 2/7/10 | 13,700,000 a | 13,700,000 |
| Emmaus General Authority, Local Government Revenue | | | | |
| (Bond Pool Program) (LOC; U.S. Bank NA) | 0.20 | 2/7/10 | 16,600,000 a | 16,600,000 |
| Emmaus General Authority, Local Government Revenue | | | | |
| (Bond Pool Program) (LOC; U.S. Bank NA) | 0.20 | 2/7/10 | 12,500,000 a | 12,500,000 |
| Emmaus General Authority, Local Government Revenue | | | | |
| (Bond Pool Program) (LOC; U.S. Bank NA) | 0.20 | 2/7/10 | 9,300,000 a | 9,300,000 |
| Emmaus General Authority, Local Government Revenue | | | | |
| (Bond Pool Program) (LOC; U.S. Bank NA) | 0.20 | 2/7/10 | 12,300,000 a | 12,300,000 |
| Emmaus General Authority, Local Government Revenue | | | | |
| (Bond Pool Program) (LOC; U.S. Bank NA) | 0.20 | 2/7/10 | 10,000,000 a | 10,000,000 |
| Emmaus General Authority, Local Government Revenue | | | | |
| (Bond Pool Program) (LOC; U.S. Bank NA) | 0.20 | 2/7/10 | 9,500,000 a | 9,500,000 |
| Emmaus General Authority, Local Government Revenue | | | | |
| (Bond Pool Program) (LOC; U.S. Bank NA) | 0.20 | 2/7/10 | 6,400,000 a | 6,400,000 |
| Emmaus General Authority, Local Government Revenue | | | | |
| (Bond Pool Program) (LOC; U.S. Bank NA) | 0.20 | 2/7/10 | 4,300,000 a | 4,300,000 |
| Emmaus General Authority, Local Government Revenue | | | | |
| (Bond Pool Program) (LOC; U.S. Bank NA) | 0.20 | 2/7/10 | 10,000,000 a | 10,000,000 |
| Emmaus General Authority, Local Government Revenue | | | | |
| (Bond Pool Program) (LOC; U.S. Bank NA) | 0.20 | 2/7/10 | 3,100,000 a | 3,100,000 |
The Funds 49
STATEMENT OF INVESTMENTS (continued)
| | | | |
| Dreyfus Tax Exempt | Coupon | Maturity | Principal | |
| Cash Management (continued) | Rate (%) | Date | Amount ($) | Value ($) |
| |
| Short-Term Investments (continued) | | | | |
| Pennsylvania (continued) | | | | |
| General Authority of South Central Pennsylvania, | | | | |
| Revenue (Lutheran Social Services of South Central | | | | |
| Pennsylvania Project) (LOC; M&T Bank) | 0.25 | 2/7/10 | 16,610,000 a | 16,610,000 |
| Lancaster County Hospital Authority, Health Center | | | | |
| Revenue (LUTHERCARE Project) (LOC; M&T Bank) | 0.20 | 2/7/10 | 34,215,000 a,e | 34,215,000 |
| Lancaster County Hospital Authority, Revenue | | | | |
| (Landis Home Retirement Community Project) (LOC; M&T Bank) | 0.25 | 2/7/10 | 7,970,000 a,e | 7,970,000 |
| Montgomery County Higher Education and Health Authority, | | | | |
| Revenue (Pennsylvania Higher Education and | | | | |
| Health Loan Program) (LOC; M&T Bank) | 0.25 | 2/7/10 | 5,985,000 a | 5,985,000 |
| Montgomery County Industrial Development Authority, | | | | |
| Revenue (Abington Friends School Project) (LOC; Wachovia Bank) | 0.18 | 2/7/10 | 8,710,000 a | 8,710,000 |
| Pennsylvania Economic Development Financing Authority, | | | | |
| Exempt Facilities Revenue, CP (Pennsylvania Power and | | | | |
| Light Project Electric Utilities Project) (LOC; Wachovia Bank) | 0.50 | 4/1/10 | 4,000,000 | 4,000,000 |
| Pennsylvania Economic Development Financing Authority, | | | | |
| Exempt Facilities Revenue, CP (Pennsylvania Power | | | | |
| and Light Utilities Project) (LOC; Wachovia Bank) | 0.62 | 9/1/10 | 12,000,000 | 12,000,000 |
| Pennsylvania Intergovernmental Cooperation Authority, | | | | |
| Special Tax Revenue, Refunding (City of Philadelphia Funding | | | | |
| Program) (Insured; Assured Guaranty Municipal Corp. | | | | |
| and Liquidity Facility; JPMorgan Chase Bank) | 0.20 | 2/7/10 | 30,340,000 a | 30,340,000 |
| Philadelphia, GO Notes, TRAN | 2.50 | 6/30/10 | 26,000,000 | 26,187,979 |
| Philadelphia, Water and Wastewater Revenue, | | | | |
| Refunding (LOC; Bank of America) | 0.19 | 2/7/10 | 27,800,000 a | 27,800,000 |
| Philadelphia School District, GO Notes, | | | | |
| Refunding (LOC; Wachovia Bank) | 0.18 | 2/7/10 | 30,400,000 a | 30,400,000 |
| Pottstown Borough Authority, Educational Facilities | | | | |
| Revenue (The Hill School Project) (LOC; M&T Bank) | 0.20 | 2/7/10 | 7,000,000 a | 7,000,000 |
| Ridley School District, GO Notes (LOC; TD Bank) | 0.20 | 2/7/10 | 3,000,000 a | 3,000,000 |
| University of Pittsburgh of the Commonwealth | | | | |
| System of Higher Education, CP | 0.30 | 3/3/10 | 10,000,000 | 10,000,000 |
| University of Pittsburgh of the Commonwealth | | | | |
| System of Higher Education, CP | 0.25 | 4/8/10 | 20,000,000 | 20,000,000 |
| Wallingford-Swarthmore School District, GO Notes | | | | |
| (Insured; Assured Guaranty Municipal Corp. | | | | |
| and Liquidity Facility; Dexia Credit Locale) | 0.34 | 2/7/10 | 10,000,000 a | 10,000,000 |
| York General Authority, Revenue (Strand-Capitol | | | | |
| Performing Arts Center Project) (LOC; M&T Bank) | 0.25 | 2/7/10 | 3,985,000 a | 3,985,000 |
| South Carolina—2.4% | | | | |
| Saint Peters Parish/Jasper County Public Facilities Corporation, | | | | |
| Installment Purchase Revenue BAN (County Office Building Projects) | 2.00 | 2/1/10 | 6,500,000 | 6,500,000 |
| South Carolina Jobs-Economic Development Authority, | | | | |
| Health Facilities Revenue, Refunding (The Episcopal | | | | |
| Church Home) (Liquidity Facility; Wachovia Bank) | 0.18 | 2/7/10 | 15,810,000 a,e | 15,810,000 |
| South Carolina Jobs-Economic Development Authority, HR | | | | |
| (Conway Hospital, Inc.) (Insured; Assured Guaranty Municipal | | | | |
| Corp. and Liquidity Facility; Branch Banking and Trust Co.) | 0.23 | 2/7/10 | 44,800,000 a,e | 44,800,000 |
50
| | | | |
| Dreyfus Tax Exempt | Coupon | Maturity | Principal | |
| Cash Management (continued) | Rate (%) | Date | Amount ($) | Value ($) |
| |
| Short-Term Investments (continued) | | | | |
| South Carolina (continued) | | | | |
| South Carolina Jobs-Economic Development Authority, HR | | | | |
| (Oconee Memorial Hospital, Inc. Project) (Liquidity | | | | |
| Facility; Wachovia Bank and LOC; Wachovia Bank) | 0.20 | 2/7/10 | 27,000,000 a,e | 27,000,000 |
| Tennessee—6.8% | | | | |
| Blount County Public Building Authority, Local | | | | |
| Government Public Improvement Revenue (Liquidity | | | | |
| Facility; Branch Banking and Trust Co.) | 0.20 | 2/7/10 | 50,300,000 a | 50,300,000 |
| Blount County Public Building Authority, Local Government | | | | |
| Public Improvement Revenue (LOC; Branch Banking and Trust Co.) | 0.20 | 2/7/10 | 10,000,000 a | 10,000,000 |
| Blount County Public Building Authority, Local Government | | | | |
| Public Improvement Revenue (LOC; Branch Banking and Trust Co.) | 0.20 | 2/7/10 | 6,245,000 a | 6,245,000 |
| Blount County Public Building Authority, Local Government | | | | |
| Public Improvement Revenue (LOC; Branch Banking and Trust Co.) | 0.20 | 2/7/10 | 6,000,000 a | 6,000,000 |
| Blount County Public Building Authority, Local Government | | | | |
| Public Improvement Revenue (LOC; Branch Banking and Trust Co.) | 0.20 | 2/7/10 | 48,875,000 a | 48,875,000 |
| Metropolitan Government of Nashville and Davidson County | | | | |
| Health and Educational Facilities Board, Revenue (The Vanderbilt | | | | |
| University) (Liquidity Facility: Bayerische Landesbank and | | | | |
| Landesbank Hessen-Thuringen Girozentrale) | 0.20 | 2/7/10 | 18,925,000 a | 18,925,000 |
| Sevier County Public Building Authority, Local Government | | | | |
| Public Improvement Revenue (LOC; Allied Irish Banks) | 0.50 | 2/7/10 | 25,495,000 a | 25,495,000 |
| Sevier County Public Building Authority, Local Government | | | | |
| Public Improvement Revenue (LOC; Allied Irish Banks) | 0.50 | 2/7/10 | 9,315,000 a | 9,315,000 |
| Shelby County Health, Educational and Housing Facility Board, | | | | |
| Revenue (Trezevant Manor Project) (LOC; ABN-AMRO) | 0.20 | 2/7/10 | 7,000,000 a,e | 7,000,000 |
| Tennergy Corporation, Gas Revenue (Putters Program) | | | | |
| (Liquidity Facility; JPMorgan Chase Bank) | 0.20 | 2/7/10 | 17,110,000 a,b | 17,110,000 |
| Tennergy Corporation, Gas Revenue | | | | |
| (Putters Program) (LOC; BNP Paribas) | 0.20 | 2/7/10 | 63,575,000 a,b | 63,575,000 |
| Texas—9.1% | | | | |
| Crawford Education Facilities Corporation, Revenue | | | | |
| (Hyde Park Baptist School Project) (LOC; JPMorgan Chase Bank) | 0.18 | 2/7/10 | 12,600,000 a | 12,600,000 |
| Dallas, Waterworks and Sewer System Revenue, CP | | | | |
| (Liquidity Facility; Bank of America) | 0.36 | 4/7/10 | 28,703,000 | 28,703,000 |
| Dallas, Waterworks and Sewer System Revenue, CP | | | | |
| (Liquidity Facility; Bank of America) | 0.37 | 4/8/10 | 10,500,000 | 10,500,000 |
| El Paso, Water and Sewer Revenue, CP | | | | |
| (Liquidity Facility; JPMorgan Chase Bank) | 0.25 | 2/1/10 | 9,500,000 | 9,500,000 |
| El Paso Independent School District, Unlimited Tax School | | | | |
| Building Bonds (Liquidity Facility; JPMorgan Chase | | | | |
| Bank and LOC; Permanent School Fund Guarantee Program) | 0.45 | 6/10/10 | 17,000,000 | 17,000,000 |
| Fort Worth, Water and Sewer System Revenue | 5.00 | 2/15/10 | 8,010,000 | 8,023,998 |
| Harris County, GO Notes, TAN | 2.00 | 2/25/10 | 40,000,000 | 40,042,877 |
| Harris County Cultural Education Facilities Finance | | | | |
| Corporation, Revenue, CP (Methodist Healthcare) | 0.35 | 6/30/10 | 22,500,000 e | 22,500,000 |
| Harris County Metropolitan Transit Authority, CP | | | | |
| (Liquidity Facility; JPMorgan Chase Bank) | 0.30 | 3/11/10 | 13,250,000 | 13,250,000 |
The Funds 51
STATEMENT OF INVESTMENTS (continued)
| | | | |
| Dreyfus Tax Exempt | Coupon | Maturity | Principal | |
| Cash Management (continued) | Rate (%) | Date | Amount ($) | Value ($) |
| |
| Short-Term Investments (continued) | | | | |
| Texas (continued) | | | | |
| Harris County Metropolitan Transit Authority, CP | | | | |
| (Liquidity Facility; JPMorgan Chase Bank) | 0.39 | 4/13/10 | 30,000,000 | 30,000,000 |
| Houston, GO Notes, Refunding (Public Improvement) | 5.00 | 3/1/10 | 4,000,000 | 4,014,527 |
| Houston Higher Education Finance Corporation, Higher | | | | |
| Education Revenue, CP (Rice University) | 0.35 | 2/16/10 | 5,000,000 | 5,000,000 |
| Kendall County Health Facilities Development Corporation, Health Care | | | | |
| Revenue (Morningside Ministries Project) (LOC; Allied Irish Banks) | 0.39 | 2/7/10 | 6,360,000 a,e | 6,360,000 |
| San Antonio, Electric and Gas Systems | | | | |
| Revenue (LOC; FNMA) (Prerefunded) | 5.75 | 2/1/10 | 8,000,000 d | 8,000,000 |
| Tarrant County Cultural Education Facilities Finance | | | | |
| Corporation, Revenue (Texas Health Resources System) | 0.20 | 2/7/10 | 6,500,000 a,e | 6,500,000 |
| Texas, TRAN | 2.50 | 8/31/10 | 38,000,000 | 38,448,259 |
| Texas Public Finance Authority, CP | 0.25 | 2/16/10 | 8,450,000 | 8,450,000 |
| Texas Water Development Board, State Revolving | | | | |
| Fund Subordinate Lien Revenue (Liquidity Facility; Citibank NA) | 0.19 | 2/7/10 | 10,940,000 a,b | 10,940,000 |
| University of Texas, University Revenue, CP | 0.33 | 2/17/10 | 24,000,000 | 24,000,000 |
| University of Texas, University Revenue, CP | 0.25 | 3/8/10 | 35,500,000 | 35,500,000 |
| University of Texas, University Revenue, CP | 0.27 | 4/6/10 | 14,700,000 | 14,700,000 |
| Utah—2.7% | | | | |
| Central Utah Water Conservancy District Revenue, Refunding | | | | |
| (Liquidity Facility; Landesbank Hessen-Thuringen Girozentrale) | 0.22 | 2/7/10 | 39,800,000 a | 39,800,000 |
| Intermountain Power Agency, Power Supply Revenue, CP | | | | |
| (Liquidity Facility; JPMorgan Chase Bank) | 0.32 | 2/12/10 | 28,500,000 | 28,500,000 |
| Murray City, HR (IHC Health Services, Inc.) | 0.20 | 2/7/10 | 32,000,000 a,e | 32,000,000 |
| Utah Housing Finance Agency, MFHR, Refunding (Candlestick | | | | |
| Apartments Project) (Liquidity Facility; FNMA and LOC; FNMA) | 0.24 | 2/7/10 | 6,400,000 a | 6,400,000 |
| Virginia—.2% | | | | |
| Fairfax County Economic Development Authority, Educational Facilities | | | | |
| Revenue (Trinity Christian School Project) (LOC; Wachovia Bank) | 0.28 | 2/7/10 | 9,000,000 a | 9,000,000 |
| Washington—.2% | | | | |
| Puttable Floating Option Tax Exempt Receipts (Washington, | | | | |
| Various Purpose GO, Refunding) (Liquidity Facility; Bank of America) | 0.20 | 2/7/10 | 6,060,000 a,b | 6,060,000 |
| Wisconsin—.3% | | | | |
| Byron, IDR, Refunding (Ocean Spray | | | | |
| Cranberries, Inc. Project) (LOC; Bank of America) | 0.28 | 2/7/10 | 6,500,000 a | 6,500,000 |
| Milwaukee Redevelopment Authority, Redevelopment LR (University | | | | |
| of Wisconsin-Milwaukee Kenilworth Project) (LOC; U.S. Bank NA) | 0.27 | 2/7/10 | 6,375,000 a | 6,375,000 |
| |
| Total Investments (cost $3,962,580,277) | | | 101.8% | 3,962,580,277 |
| Liabilities, Less Cash and Receivables | | | (1.8%) | (71,404,281) |
| Net Assets | | | 100.0% | 3,891,175,996 |
| |
| See footnotes on page 58. | | | | |
| See notes to financial statements. | | | | |
52
STATEMENT OF INVESTMENTS
January 31, 2010
| | | | |
| Dreyfus California AMT-Free | Coupon | Maturity | Principal | |
| Municipal Cash Management | Rate (%) | Date | Amount ($) | Value ($) |
| |
| Short-Term Investments—91.5% | | | | |
| California—88.1% | | | | |
| ABAG Finance Authority for Nonprofit Corporations, Revenue | | | | |
| (Eskaton Village-Roseville) (LOC; KBC Bank) | 0.18 | 2/7/10 | 14,670,000 a,e | 14,670,000 |
| ABAG Finance Authority for Nonprofit Corporations, Revenue | | | | |
| (Northbay Healthcare Group) (LOC; JPMorgan Chase Bank) | 0.18 | 2/7/10 | 14,200,000 a,e | 14,200,000 |
| ABAG Finance Authority for Nonprofit Corporations, Revenue, Refunding | | | | |
| (Eskaton Properties, Inc.) (LOC; Bank of America) | 0.18 | 2/7/10 | 11,560,000 a | 11,560,000 |
| Alameda-Contra Costa Schools Financing Authority, COP | | | | |
| (Capital Improvement Financing Projects) (LOC; KBC Bank) | 0.29 | 2/7/10 | 185,000 a | 185,000 |
| California, Economic Recovery Bonds (Insured; Assured Guaranty | | | | |
| Municipal Corp. and Liquidity Facility; Dexia Credit Locale) | 0.20 | 2/7/10 | 7,900,000 a | 7,900,000 |
| California, GO Notes (LOC; FNMA) (Prerefunded) | 5.25 | 9/1/10 | 1,015,000 d | 1,043,298 |
| California, GO Notes (LOC; FNMA) (Prerefunded) | 5.25 | 9/1/10 | 2,550,000 d | 2,621,093 |
| California Department of Water Resources, Power Supply Revenue | | | | |
| (Insured; Assured Guaranty Municipal Corp. and Liquidity Facility; | | | | |
| JPMorgan Chase Bank) | 0.22 | 2/7/10 | 1,300,000 a | 1,300,000 |
| California Educational Facilities Authority, Revenue, CP (Stanford University) | 0.40 | 2/25/10 | 2,900,000 | 2,900,000 |
| California Educational Facilities Authority, Revenue, CP (Stanford University) | 0.30 | 3/11/10 | 5,700,000 | 5,700,000 |
| California Enterprise Development Authority, IDR (Tri Tool Inc. Project) | | | | |
| (LOC; Comerica Bank) | 0.35 | 2/7/10 | 10,000,000 a | 10,000,000 |
| California Infrastructure and Economic Development Bank, IDR | | | | |
| (Kennfoods USA, LLC Project) (LOC; Bank of the West) | 0.23 | 2/7/10 | 2,500,000 a | 2,500,000 |
| California Infrastructure and Economic Development Bank, Revenue | | | | |
| (Saint Margaret’s Episcopal School) (LOC; Allied Irish Banks) | 0.70 | 2/7/10 | 3,400,000 a | 3,400,000 |
| California Infrastructure and Economic Development Bank, Revenue | | | | |
| (Southern California Public Radio Project) (LOC; Allied Irish Banks) | 0.33 | 2/1/10 | 1,710,000 a | 1,710,000 |
| California Pollution Control Financing Authority, SWDR | | | | |
| (Garden City Sanitation, Inc. Project) (LOC; Union Bank of California) | 0.25 | 2/7/10 | 3,000,000 a | 3,000,000 |
| California Statewide Communities Development Authority, Revenue | | | | |
| (Azusa Pacific University Project) (LOC; Allied Irish Banks) | 0.40 | 2/7/10 | 9,500,000 a | 9,500,000 |
| California Statewide Communities Development Authority, Revenue | | | | |
| (Rady Children’s Hospital— San Diego) (LOC; Allied Irish Banks) | 0.40 | 2/7/10 | 5,000,000 a,e | 5,000,000 |
| California Statewide Communities Development Authority, | | | | |
| Revenue, CP (Kaiser Permanente) | 0.32 | 5/6/10 | 16,000,000 e | 16,000,000 |
| Concord, MFMR (Arcadian Apartments) (LOC; FNMA) | 0.18 | 2/7/10 | 3,700,000 a | 3,700,000 |
| Deutsche Bank Spears/Lifers Trust (Anaheim Redevelopment Agency, | | | | |
| Tax Allocation Revenue, Refunding (Anaheim Merged Redevelopment | | | | |
| Project Area)) (Liquidity Facility; Deutsche Bank AG and LOC; | | | | |
| Deutsche Bank AG) | 0.20 | 2/7/10 | 2,100,000 a,b | 2,100,000 |
| Eastern Municipal Water District, Water and Sewer Revenue, COP | | | | |
| (Installment Sale Agreement with Eastern Municipal Water | | | | |
| District Facilities Corporation) (Liquidity Facility; Citibank NA) | 0.18 | 2/7/10 | 3,495,000 a,b | 3,495,000 |
| Fresno, Sewer System Revenue (Insured; Assured Guaranty | | | | |
| Municipal Corp. and Liquidity Facility; Citibank NA) | 0.25 | 2/7/10 | 2,170,000 a,b | 2,170,000 |
| Golden State Tobacco Securitization Corporation, Enhanced Tobacco | | | | |
| Settlement Asset-Backed Bonds (Insured; Berkshire Hathaway | | | | |
| Assurance Corporation and Liquidity Facility; Citibank NA) | 0.21 | 2/7/10 | 14,750,000 a,b | 14,750,000 |
The Funds 53
STATEMENT OF INVESTMENTS (continued)
| | | | |
| Dreyfus California AMT-Free | Coupon | Maturity | Principal | |
| Municipal Cash Management (continued) | Rate (%) | Date | Amount ($) | Value ($) |
| |
| Short-Term Investments (continued) | | | | |
| California (continued) | | | | |
| Kern County, GO Notes, TRAN | 2.50 | 6/30/10 | 11,700,000 | 11,780,820 |
| Long Beach, GO Notes, TRAN | 2.50 | 9/30/10 | 1,400,000 | 1,418,374 |
| Los Angeles County Capital Asset Leasing Corporation, LR, CP | | | | |
| (LOC: Bayerische Landesbank, JPMorgan Chase Bank and | | | | |
| Westdeutsche Landesbank) | 0.45 | 2/8/10 | 19,950,000 e | 19,950,000 |
| Puttable Floating Option Tax Exempt Receipts (California Statewide | | | | |
| Communities Development Authority, MFHR (La Mision Village | | | | |
| Apartments Project)) (Liquidity Facility; FHLMC and LOC; FHLMC) | 0.40 | 2/7/10 | 1,240,000 a,b | 1,240,000 |
| Puttable Floating Option Tax Exempt Receipts (California Statewide | | | | |
| Communities Development Authority, Revenue (Japanese American | | | | |
| National Museum)) (Liquidity Facility; Merrill Lynch Capital | | | | |
| Services and LOC; Merrill Lynch Capital Services) | 1.05 | 2/7/10 | 4,400,000 a,b | 4,400,000 |
| Richmond, Wastewater Revenue, Refunding (LOC; Union Bank of California) | 0.20 | 2/7/10 | 5,260,000 a | 5,260,000 |
| Riverside County Transportation Commission, Sales Tax Revenue | | | | |
| (Liquidity Facility; JPMorgan Chase Bank) | 0.20 | 2/7/10 | 8,600,000 a | 8,600,000 |
| Sacramento County Housing Authority, MFHR, Refunding | | | | |
| (Stonebridge Apartments) (LOC; FNMA) | 0.17 | 2/7/10 | 2,200,000 a | 2,200,000 |
| Sausalito, MFHR (Rotary Village Senior Housing Project) | | | | |
| (LOC; Bank of the West) | 0.22 | 2/7/10 | 2,230,000 a | 2,230,000 |
| Southern California Public Power Authority, Transmission Project Revenue, | | | | |
| Refunding (Southern Transmission Project) (Insured; Assured Guaranty | | | | |
| Municipal Corp. and Liquidity Facility; Westdeutsche Landesbank) | 0.20 | 2/7/10 | 12,210,000 a | 12,210,000 |
| University of California, Revenue, CP | 0.32 | 2/12/10 | 4,000,000 | 4,000,000 |
| University of California, Revenue, CP | 0.30 | 3/12/10 | 5,000,000 | 5,000,000 |
| Victorville Joint Powers Financing Authority, LR (Cogeneration Facility | | | | |
| Project) (LOC; Fortis Bank) | 0.45 | 2/7/10 | 14,000,000 a | 14,000,000 |
| U.S. Related—3.4% | | | | |
| Puerto Rico Sales Tax Financing Corporation, Sales Tax Revenue | | | | |
| (Liquidity Facility; Citibank NA) | 0.21 | 2/7/10 | 9,000,000 a,b | 9,000,000 |
| |
| Total Investments (cost $240,693,585) | | | 91.5% | 240,693,585 |
| Cash and Receivables (Net) | | | 8.5% | 22,248,666 |
| Net Assets | | | 100.0% | 262,942,251 |
| |
| See footnotes on page 58. | | | | |
| See notes to financial statements. | | | | |
54
STATEMENT OF INVESTMENTS
January 31, 2010
| | | | |
| Dreyfus New York AMT-Free | Coupon | Maturity | Principal | |
| Municipal Cash Management | Rate (%) | Date | Amount ($) | Value ($) |
| |
| Short-Term Investments—97.3% | | | | |
| New York—90.6% | | | | |
| Broome County Industrial Development Agency, Continuing | | | | |
| Care Retirement Community Revenue (Good Shepherd | | | | |
| Village at Endwell, Inc. Project) (LOC; M&T Bank) | 0.25 | 2/7/10 | 3,250,000 a | 3,250,000 |
| Campbell-Savona Central School District, GO Notes, BAN | 2.00 | 6/24/10 | 1,450,000 | 1,455,953 |
| Cold Spring Harbor Central School District, GO Notes, TAN | 2.00 | 6/30/10 | 1,290,000 | 1,297,881 |
| Dutchess County Industrial Development Agency, Civic Facility Revenue | | | | |
| (Anderson Foundation for Autism, Inc. Project) (LOC; M&T Bank) | 0.25 | 2/7/10 | 4,700,000 a | 4,700,000 |
| East Farmingdale Volunteer Fire Company Inc., | | | | |
| Volunteer Fire Department Revenue (LOC; Citibank NA) | 0.21 | 2/7/10 | 4,395,000 a | 4,395,000 |
| East Hampton Union Free School District, GO Notes, TAN | 1.00 | 6/30/10 | 1,335,000 | 1,338,371 |
| Elmira City School District, GO Notes, BAN | 1.50 | 6/30/10 | 1,600,000 | 1,605,572 |
| Erie County Fiscal Stability Authority, GO Notes, BAN | 1.25 | 7/30/10 | 1,420,000 | 1,424,724 |
| Fishkill, GO Notes, BAN | 2.00 | 4/30/10 | 1,000,000 | 1,002,406 |
| Fort Plain Central School District, GO Notes, BAN | 2.00 | 6/24/10 | 1,000,000 | 1,005,288 |
| Franklin County Industrial Development Agency, Multi-Mode Civic | | | | |
| Facility Revenue (Paul Smith’s College Project) (LOC; U.S. Bank NA) | 0.36 | 2/7/10 | 490,000 a | 490,000 |
| Heuvelton Central School District, GO Notes, BAN | 1.50 | 6/30/10 | 1,000,000 | 1,003,466 |
| Long Island Power Authority, CP (Long Island | | | | |
| Lighting Company) (LOC; JPMorgan Chase Bank) | 0.35 | 6/10/10 | 1,900,000 | 1,900,000 |
| Long Island Power Authority, CP (Long Island Lighting | | | | |
| Company) (LOC; State Street Bank and Trust Co.) | 0.30 | 3/12/10 | 8,000,000 | 8,000,000 |
| Long Island Power Authority, Electric System General | | | | |
| Revenue (Insured; Assured Guaranty Municipal Corp. | | | | |
| and Liquidity Facility; Dexia Credit Locale) | 0.28 | 2/7/10 | 4,100,000 a | 4,100,000 |
| Long Island Power Authority, Electric System Subordinated Revenue | | | | |
| (LOC: JPMorgan Chase Bank and Landesbank Baden-Wurttemberg) | 0.25 | 2/7/10 | 10,000,000 a | 10,000,000 |
| Metropolitan Transportation Authority, Dedicated Tax Fund | | | | |
| Revenue (Insured; Assured Guaranty Municipal Corp. | | | | |
| and Liquidity Facility; Dexia Credit Locale) | 0.25 | 2/7/10 | 3,000,000 a | 3,000,000 |
| Metropolitan Transportation Authority, | | | | |
| Transportation Revenue (LOC; Fortis Bank) | 0.20 | 2/7/10 | 5,000,000 a | 5,000,000 |
| Metropolitan Transportation Authority, Transportation Revenue, | | | | |
| Refunding (Insured; Assured Guaranty Municipal Corp. | | | | |
| and Liquidity Facility; Westdeutsche Landesbank) | 0.30 | 2/7/10 | 16,780,000 a | 16,780,000 |
| Monroe County Industrial Development Agency, Civic Facility Revenue | | | | |
| (Association for the Blind and Visually Impaired—Goodwill Industries | | | | |
| of Greater Rochester, Inc. Project) (LOC; JPMorgan Chase Bank) | 0.25 | 2/7/10 | 435,000 a | 435,000 |
| New York City, GO Notes | 5.00 | 8/1/10 | 1,475,000 | 1,508,258 |
| New York City, GO Notes (Liquidity Facility; Calyon) | 0.16 | 2/7/10 | 5,000,000 a | 5,000,000 |
| New York City, GO Notes (LOC; Bank of America) | 0.18 | 2/7/10 | 3,700,000 a | 3,700,000 |
| New York City, GO Notes (LOC; JPMorgan Chase Bank) | 0.21 | 2/1/10 | 1,475,000 a | 1,475,000 |
| New York City, GO Notes (LOC; JPMorgan Chase Bank) | 0.21 | 2/1/10 | 900,000 a | 900,000 |
| New York City, GO Notes (LOC; JPMorgan Chase Bank) | 0.21 | 2/1/10 | 1,000,000 a | 1,000,000 |
| New York City Housing Development Corporation, MFMR (The Crest | | | | |
| Project) (LOC; Landesbank Hessen-Thuringen Girozentrale) | 0.20 | 2/7/10 | 3,200,000 a | 3,200,000 |
The Funds 55
STATEMENT OF INVESTMENTS (continued)
| | | | |
| Dreyfus New York AMT-Free | Coupon | Maturity | Principal | |
| Municipal Cash Management (continued) | Rate (%) | Date | Amount ($) | Value ($) |
| |
| Short-Term Investments (continued) | | | | |
| New York (continued) | | | | |
| New York City Industrial Development Agency, | | | | |
| Civic Facility Revenue (Abraham Joshua Heschel | | | | |
| High School Project) (LOC; Allied Irish Banks) | 0.33 | 2/7/10 | 3,700,000 a | 3,700,000 |
| New York City Industrial Development Agency, Civic Facility | | | | |
| Revenue (Ateret Torah Center Project) (LOC; Wachovia Bank) | 0.20 | 2/7/10 | 12,715,000 a | 12,715,000 |
| New York City Industrial Development Agency, Civic Facility | | | | |
| Revenue (New York Law School Project) (LOC; Allied Irish Banks) | 0.23 | 2/7/10 | 1,200,000 a | 1,200,000 |
| New York City Industrial Development Agency, Civic Facility Revenue | | | | |
| (The Allen-Stevenson School Project) (LOC; Allied Irish Banks) | 0.32 | 2/7/10 | 15,740,000 a | 15,740,000 |
| New York City Municipal Water Finance Authority, CP (Liquidity | | | | |
| Facility: Bayerische Landesbank and Westdeutsche Landesbank) | 0.29 | 3/3/10 | 5,000,000 | 5,000,000 |
| New York City Transitional Finance Authority, | | | | |
| Future Tax Secured Revenue | 5.50 | 2/1/10 | 500,000 | 500,000 |
| New York Liberty Development Corporation, | | | | |
| Multi-Modal Liberty Revenue (World Trade Center Project) | 0.50 | 1/18/11 | 5,000,000 | 5,000,000 |
| New York Local Government Assistance Corporation, GO Notes | | | | |
| (LOC: Bayerische Landesbank and Westdeutsche Landesbank) | 0.23 | 2/7/10 | 8,000,000 a | 8,000,000 |
| New York State Dormitory Authority, | | | | |
| Consolidated Service Contract Revenue, Refunding | 1.50 | 7/1/10 | 1,760,000 | 1,768,024 |
| New York State Dormitory Authority, Revenue (Catholic | | | | |
| Health System Obligated Group) (LOC; HSBC Bank USA) | 0.17 | 2/7/10 | 4,400,000 a | 4,400,000 |
| New York State Dormitory Authority, Revenue | | | | |
| (D’Youville College) (LOC; Key Bank) | 0.34 | 2/7/10 | 5,340,000 a | 5,340,000 |
| New York State Dormitory Authority, Revenue | | | | |
| (Northern Westchester Hospital Association) (LOC; TD Bank) | 0.16 | 2/7/10 | 2,750,000 a | 2,750,000 |
| New York State Dormitory Authority, Revenue | | | | |
| (Park Ridge Hospital, Inc.) (LOC; JPMorgan Chase Bank) | 0.20 | 2/7/10 | 11,000,000 a | 11,000,000 |
| New York State Dormitory Authority, Revenue | | | | |
| (Saint John Fisher College) (LOC; FHLB) | 0.17 | 2/7/10 | 4,345,000 a,c | 4,345,000 |
| New York State Dormitory Authority, | | | | |
| State Personal Income Tax Revenue (Education) | 5.00 | 3/15/10 | 5,885,000 | 5,916,619 |
| New York State Dormitory Authority, | | | | |
| State Personal Income Tax Revenue (Education) | 5.25 | 3/15/10 | 1,000,000 | 1,005,588 |
| New York State Housing Finance Agency, Housing Revenue (Normandie | | | | |
| Court I Project) (LOC; Landesbank Hessen-Thuringen Girozentrale) | 0.20 | 2/7/10 | 4,650,000 a | 4,650,000 |
| Oneida County Industrial Development Agency, Civic Facility | | | | |
| Revenue (Cedarbrook Village, Inc. Project) (LOC; Key Bank) | 0.34 | 2/7/10 | 3,000,000 a | 3,000,000 |
| Orange County Industrial Development Agency, Civic Facility | | | | |
| Revenue (Tuxedo Park School Project) (LOC; M&T Bank) | 0.25 | 2/7/10 | 1,000,000 a | 1,000,000 |
| Ossining, GO Notes, TAN | 1.00 | 5/14/10 | 2,000,000 | 2,003,503 |
56
| | | | |
| Dreyfus New York AMT-Free | Coupon | Maturity | Principal | |
| Municipal Cash Management (continued) | Rate (%) | Date | Amount ($) | Value ($) |
| |
| Short-Term Investments (continued) | | | | |
| New York (continued) | | | | |
| Port Authority of New York and New Jersey, Equipment Notes | 0.26 | 2/7/10 | 2,800,000 a | 2,800,000 |
| Smithtown Central School District, GO Notes, TAN | 1.00 | 6/25/10 | 2,615,000 | 2,620,868 |
| South Jefferson Central School District, GO Notes, BAN | 1.50 | 7/2/10 | 1,000,000 | 1,003,324 |
| Suffolk County Industrial Development Agency, Civic Facility | | | | |
| Revenue (Huntington Hospital Project) (LOC; Bank of America) | 0.16 | 2/7/10 | 5,400,000 a | 5,400,000 |
| Susquehanna Valley Central School District, GO Notes, BAN | 1.50 | 7/30/10 | 1,000,000 | 1,003,919 |
| Syracuse Industrial Development Agency, | | | | |
| Civic Facility Revenue (Community Development | | | | |
| Properties-Larned Project) (LOC; M&T Bank) | 0.27 | 2/7/10 | 1,900,000 a | 1,900,000 |
| Three Village Central School District, GO Notes, TAN | 1.00 | 6/30/10 | 1,825,000 | 1,829,162 |
| Westchester County, GO Notes, BAN | 1.00 | 4/28/10 | 2,110,000 | 2,110,000 |
| Westchester County Health Care Corporation, CP (Liquidity Facility; | | | | |
| JPMorgan Chase Bank and LOC; Westchester County) | 0.55 | 2/10/10 | 5,000,000 | 5,000,000 |
| Westchester County Industrial Development Agency, | | | | |
| Civic Facility Revenue (Catharine Field Home/The Seabury | | | | |
| at Field Home Civic Facility) (LOC; Comerica Bank) | 0.20 | 2/7/10 | 8,370,000 a | 8,370,000 |
| Westchester County Industrial Development Agency, | | | | |
| Continuing Care Retirement Community Mortgage | | | | |
| Revenue (Kendal on Hudson Project) (LOC; Natixis) | 0.17 | 2/7/10 | 7,850,000 a | 7,850,000 |
| U.S. Related—6.7% | | | | |
| Puerto Rico Commonwealth, Public Improvement | | | | |
| GO Notes, Refunding (LOC; Wachovia Bank) | 0.14 | 2/7/10 | 5,600,000 a | 5,600,000 |
| Puerto Rico Sales Tax Financing Corporation, | | | | |
| Sales Tax Revenue (Liquidity Facility; Citibank NA) | 0.21 | 2/7/10 | 5,250,000 a,b | 5,250,000 |
| Puerto Rico Sales Tax Financing Corporation, | | | | |
| Sales Tax Revenue (Liquidity Facility; Citibank NA) | 0.21 | 2/7/10 | 6,000,000 a,b | 6,000,000 |
| |
| Total Investments (cost $244,737,926) | | | 97.3% | 244,737,926 |
| Cash and Receivables (Net) | | | 2.7% | 6,797,833 |
| Net Assets | | | 100.0% | 251,535,759 |
| |
| See footnotes on page 58. | | | | |
| See notes to financial statements. | | | | |
The Funds 57
STATEMENT OF INVESTMENTS (continued)
| | | |
| Summary of Abbreviations | | |
| |
| |
| ABAG | Association of Bay Area Governments | ACA | American Capital Access |
| AGC | ACE Guaranty Corporation | AGIC | Asset Guaranty Insurance Company |
| AMBAC | American Municipal Bond Assurance Corporation | ARRN | Adjustable Rate Receipt Notes |
| BAN | Bond Anticipation Notes | BPA | Bond Purchase Agreement |
| CIFG | CDC Ixis Financial Guaranty | COP | Certificate of Participation |
| CP | Commercial Paper | EDR | Economic Development Revenue |
| EIR | Environmental Improvement Revenue | FGIC | Financial Guaranty Insurance Company |
| FHA | Federal Housing Administration | FHLB | Federal Home Loan Bank |
| FHLMC | Federal Home Loan Mortgage Corporation | FNMA | Federal National Mortgage Association |
| GAN | Grant Anticipation Notes | GIC | Guaranteed Investment Contract |
| GNMA | Government National Mortgage Association | GO | General Obligation |
| HR | Hospital Revenue | IDB | Industrial Development Board |
| IDC | Industrial Development Corporation | IDR | Industrial Development Revenue |
| LOC | Letter of Credit | LOR | Limited Obligation Revenue |
| LR | Lease Revenue | MFHR | Multi-Family Housing Revenue |
| MFMR | Multi-Family Mortgage Revenue | PCR | Pollution Control Revenue |
| PILOT | Payment in Lieu of Taxes | RAC | Revenue Anticipation Certificates |
| RAN | Revenue Anticipation Notes | RAW | Revenue Anticipation Warrants |
| RRR | Resources Recovery Revenue | SAAN | State Aid Anticipation Notes |
| SBPA | Standby Bond Purchase Agreement | SFHR | Single Family Housing Revenue |
| SFMR | Single Family Mortgage Revenue | SONYMA | State of New York Mortgage Agency |
| SWDR | Solid Waste Disposal Revenue | TAN | Tax Anticipation Notes |
| TAW | Tax Anticipation Warrants | TRAN | Tax and Revenue Anticipation Notes |
| XLCA | XL Capital Assurance | | |
| | | | | | | | | |
| Summary of Combined Ratings (Unaudited) | | | | | |
| | | | | | | | Value (%)† | | |
| | | | | | | | | Dreyfus | Dreyfus |
| | | | | | Dreyfus | Dreyfus | Dreyfus | California | New York |
| | | | | | Municipal Cash | New York | Tax Exempt | AMT-Free | AMT-Free |
| | | | | | Management | Municipal Cash | Cash | Municipal Cash Municipal Cash |
| Fitch | or | Moody’s | or | Standard & Poor’s | Plus | Management | Management | Management | Management |
| F1+, F1 | VMIG1, MIG1, P1 | SP1+, SP1, A1+, A1 | 90.5 | 84.4 | 97.2 | 98.5 | 85.4 |
| AAA, AA, Af | Aaa, Aa, Af | | AAA, AA, Af | 5.2 | 7.9 | 2.8 | 1.5 | 4.4 |
| Not Ratedg | Not Ratedg | | Not Ratedg | 4.3 | 7.7 | — | — | 10.2 |
| | | | | | 100.0 | 100.0 | 100.0 | 100.0 | 100.0 |
|
| † Based on total investments. |
| a Variable rate demand note—rate shown is the interest rate in effect at January 31, 2010. Maturity date represents the next demand date, or the ultimate maturity date if earlier. |
| b Securities exempt from registration under Rule 144A of the Securities Act of 1933.These securities may be resold in transactions exempt from registration, normally to qualified |
| institutional buyers. At January 31, 2010, Dreyfus Municipal Cash Management Plus amounted to $73,815,000 or 5.4%, Dreyfus NewYork Municipal Cash Management |
| amounted to $19,755,000 or 2.1%, Dreyfus Tax Exempt Cash Management amounted to $351,279,000 or 9.0%, Dreyfus California AMT-Free Municipal Cash Management |
| amounted to $37,155,000 or 14.1% and Dreyfus NewYork AMT-Free Municipal Cash Management amounted to $11,250,000 or 4.5% of net assets. |
| c Purchased on a delayed delivery basis. |
| d These securities are prerefunded; the date shown represents the prerefunded date. Bonds which are prerefunded are collateralized by U.S. Government securities which are held in escrow |
| and are used to pay principal and interest on the municipal issue and to retire the bonds in full at the earliest refunding date. |
| e At January 31, 2010, Dreyfus Tax Exempt Cash Management had $1,280,525,000 or 32.9% and Dreyfus California AMT-Free Municipal Cash Management had $69,820,000 |
| or 26.6% of net assets invested in securities whose payment of principal and interest is dependent upon revenues generated from health care. |
| f Notes which are not F, MIG or SP rated are represented by bond ratings of the issuers. |
| g Securities which, while not rated by Fitch, Moody’s and Standard & Poor's, have been determined by the Manager to be of comparable quality to those rated securities in which the fund |
| may invest. |
See notes to financial statements.
58
STATEMENT OF ASSETS AND LIABILITIES
(amounts in thousands, except Net Asset Value Per Share)
January 31, 2010
| | | | | | |
| | | Dreyfus | Dreyfus | Dreyfus | Dreyfus | Dreyfus |
| | Dreyfus | Cash | Government | Government | Treasury & | Treasury |
| | Cash | Management | Cash | Prime Cash | Agency Cash | Prime Cash |
| | Management | Plus, Inc. | Management | Management | Management | Management |
| Assets ($): | | | | | | |
| Investments at value—Note 1(a,b)† | 39,522,610a | 5,677,269a | 27,402,953a | 4,995,152 | 15,280,303a | 27,090,870 |
| Cash | 11,953 | 789 | 11,195 | 58,446 | 1,488 | 69,091 |
| Interest receivable | 21,007 | 1,152 | 11,806 | 6,400 | 34,093 | 78,028 |
| Prepaid expenses and other assets | 80 | 121 | 205 | 167 | 75 | 144 |
| | 39,555,650 | 5,679,331 | 27,426,159 | 5,060,165 | 15,315,959 | 27,238,133 |
| Liabilities ($): | | | | | | |
| Due to The Dreyfus Corporation | | | | | | |
| and affiliates—Note 2(c) | 7,395 | 831 | 4,635 | 705 | 1,844 | 2,125 |
| Payable for shares of Beneficial | | | | | | |
| Interest/Common Stock redeemed | 6,562 | 461 | 7,811 | 26,067 | 475 | 11,259 |
| Accrued expenses | 498 | 185 | 445 | 127 | 172 | 139 |
| | 14,455 | 1,477 | 12,891 | 26,899 | 2,491 | 13,523 |
| Net Assets ($) | 39,541,195 | 5,677,854 | 27,413,268 | 5,033,266 | 15,313,468 | 27,224,610 |
| Composition of Net Assets ($): | | | | | | |
| Paid-in capital | 39,541,197 | 5,696,190 | 27,413,131 | 5,033,253 | 15,313,449 | 27,224,508 |
| Accumulated net realized | | | | | | |
| gain (loss) on investments | (2) | (18,336) | 137 | 13 | 19 | 102 |
| Net Assets ($) | 39,541,195 | 5,677,854 | 27,413,268 | 5,033,266 | 15,313,468 | 27,224,610 |
| Net Asset Value Per Share | | | | | | |
| Institutional Shares | | | | | | |
| Net Assets ($) | 34,290,865 | 3,790,472 | 23,962,908 | 3,147,456 | 12,015,056 | 18,750,792 |
| Shares Outstanding | 34,290,866 | 3,802,735 | 23,962,816 | 3,147,448 | 12,015,039 | 18,750,725 |
| Net Asset Value Per Share ($) | 1.00 | 1.00 | 1.00 | 1.00 | 1.00 | 1.00 |
| Investor Shares | | | | | | |
| Net Assets ($) | 3,456,883 | 919,418 | 2,209,219 | 593,334 | 1,921,626 | 4,221,920 |
| Shares Outstanding | 3,456,887 | 922,373 | 2,209,210 | 593,332 | 1,921,625 | 4,221,905 |
| Net Asset Value Per Share ($) | 1.00 | 1.00 | 1.00 | 1.00 | 1.00 | 1.00 |
The Funds 59
STATEMENT OF ASSETS AND LIABILITIES (continued)
(amounts in thousands, except Net Asset Value Per Share)
January 31, 2010
| | | | | | |
| | | Dreyfus | Dreyfus | Dreyfus | Dreyfus | Dreyfus |
| | Dreyfus | Cash | Government | Government | Treasury & | Treasury |
| | Cash | Management | Cash | Prime Cash | Agency Cash | Prime Cash |
| | Management | Plus, Inc. | Management | Management | Management | Management |
| Net Asset Value Per Share (continued) | | | | | | |
| Administrative Shares | | | | | | |
| Net Assets ($) | 1,112,854 | 634,682 | 829,122 | 496,500 | 694,527 | 1,271,669 |
| Shares Outstanding | 1,112,856 | 636,726 | 829,119 | 496,499 | 694,528 | 1,271,663 |
| Net Asset Value Per Share ($) | 1.00 | 1.00 | 1.00 | 1.00 | 1.00 | 1.00 |
| Participant Shares | | | | | | |
| Net Assets ($) | 590,699 | 326,663 | 339,368 | 705,788 | 520,324 | 2,598,811 |
| Shares Outstanding | 590,695 | 327,717 | 339,367 | 705,785 | 520,323 | 2,598,798 |
| Net Asset Value Per Share ($) | 1.00 | 1.00 | 1.00 | 1.00 | 1.00 | 1.00 |
| Service Shares | | | | | | |
| Net Assets ($) | — | 1,848 | — | — | 5,259 | — |
| Shares Outstanding | — | 1,854 | — | — | 5,259 | — |
| Net Asset Value Per Share ($) | — | 1.00 | — | — | 1.00 | — |
| Select Shares | | | | | | |
| Net Assets ($) | — | 4,770 | — | — | 24,810 | — |
| Shares Outstanding | — | 4,784 | — | — | 24,810 | — |
| Net Asset Value Per Share ($) | — | 1.00 | — | — | 1.00 | — |
| Agency Shares | | | | | | |
| Net Assets ($) | 89,894 | 1 | 72,651 | 90,188 | 70,775 | 381,418 |
| Shares Outstanding | 89,893 | 1 | 72,650 | 90,188 | 70,775 | 381,417 |
| Net Asset Value Per Share ($) | 1.00 | 1.00 | 1.00 | 1.00 | 1.00 | 1.00 |
| Premier Shares | | | | | | |
| Net Assets ($) | — | — | — | — | 61,091 | — |
| Shares Outstanding | — | — | — | — | 61,090 | — |
| Net Asset Value Per Share ($) | — | — | — | — | 1.00 | — |
| † Investments at cost ($) | 39,522,610 | 5,677,269 | 27,402,953 | 4,995,152 | 15,280,303 | 27,090,870 |
| a | Amount includes repurchase agreements of $1,835,000, $1,002,000, $7,842,000 and $9,612,000 for Dreyfus Cash Management, Dreyfus Cash Management Plus, Inc., Dreyfus Government Cash Management and Dreyfus Treasury & Agency Cash Management, respectively, See Note 1(c). |
See notes to financial statements.
60
| | | | | |
| | | | | Dreyfus | Dreyfus |
| | Dreyfus | Dreyfus | Dreyfus | California | New York |
| Municipal Cash | New York | Tax Exempt | AMT-Free | AMT-Free |
| Management | Municipal Cash | Cash Municipal Cash | Municipal Cash |
| | Plus | Management | Management | Management | Management |
| Assets ($): | | | | | |
| Investments at value—Note 1(a,b)† | 1,380,228 | 952,705 | 3,962,580 | 240,694 | 244,738 |
| Cash | 2,876 | 186 | — | 175 | — |
| Receivable for investment securites sold | — | — | — | 21,810 | 14,438 |
| Interest receivable | 1,968 | 539 | 4,653 | 348 | 298 |
| Prepaid expenses and other assets | 62 | 16 | 94 | 2 | — |
| | 1,385,134 | 953,446 | 3,967,327 | 263,029 | 259,474 |
| Liabilities ($): | | | | | |
| Due to The Dreyfus Corporation and affiliates—Note 2(c) | 318 | 164 | 746 | 46 | 54 |
| Cash overdraft due to Custodian | — | — | 30,047 | — | 3,004 |
| Payable for investment securities purchased | 18,348 | — | 45,241 | — | 4,345 |
| Payable for shares of Beneficial Interest redeemed | 13 | 492 | 76 | 1 | 535 |
| Accrued expenses | 64 | 58 | 41 | 40 | — |
| | 18,743 | 714 | 76,151 | 87 | 7,938 |
| Net Assets ($) | 1,366,391 | 952,732 | 3,891,176 | 262,942 | 251,536 |
| Composition of Net Assets ($): | | | | | |
| Paid-in capital | 1,366,388 | 952,701 | 3,890,861 | 262,942 | 251,528 |
| Accumulated net realized gain (loss) on investments | 3 | 31 | 315 | — | 8 |
| Net Assets ($) | 1,366,391 | 952,732 | 3,891,176 | 262,942 | 251,536 |
| Net Asset Value Per Share | | | | | |
| Instititutional Shares | | | | | |
| Net Assets ($) | 359,880 | 589,008 | 3,383,106 | 138,938 | 110,283 |
| Shares Outstanding | 359,797 | 588,992 | 3,382,832 | 138,932 | 110,282 |
| Net Asset Value Per Share ($) | 1.00 | 1.00 | 1.00 | 1.00 | 1.00 |
| Investor Shares | | | | | |
| Net Assets ($) | 400,598 | 281,863 | 353,790 | 63,745 | 73,518 |
| Shares Outstanding | 400,511 | 281,855 | 353,762 | 63,742 | 73,514 |
| Net Asset Value Per Share ($) | 1.00 | 1.00 | 1.00 | 1.00 | 1.00 |
| Administrative Shares | | | | | |
| Net Assets ($) | 581,754 | 69,647 | 120,148 | 4,189 | 8,144 |
| Shares Outstanding | 581,626 | 69,645 | 120,138 | 4,189 | 8,144 |
| Net Asset Value Per Share ($) | 1.00 | 1.00 | 1.00 | 1.00 | 1.00 |
| Participant Shares | | | | | |
| Net Assets ($) | 23,013 | 12,213 | 27,084 | 56,069 | 10 |
| Shares Outstanding | 23,008 | 12,212 | 27,082 | 56,067 | 10 |
| Net Asset Value Per Share ($) | 1.00 | 1.00 | 1.00 | 1.00 | 1.00 |
| Agency Shares | | | | | |
| Net Assets ($) | 1,146 | 1 | 7,048 | 1 | — |
| Shares Outstanding | 1,146 | 1 | 7,047 | 1 | — |
| Net Asset Value Per Share ($) | 1.00 | 1.00 | 1.00 | 1.00 | — |
| Classic Shares | | | | | |
| Net Assets ($) | — | — | — | — | 59,581 |
| Shares Outstanding | — | — | — | — | 59,578 |
| Net Asset Value Per Share ($) | — | — | — | — | 1.00 |
| † Investments at cost ($) | 1,380,228 | 952,705 | 3,962,580 | 240,694 | 244,738 |
| |
| See notes to financial statements. | | | | | |
The Funds 61
STATEMENT OF OPERATIONS
(amounts in thousands)
Year Ended January 31, 2010
| | | | | | |
| | | Dreyfus | Dreyfus | Dreyfus | Dreyfus | Dreyfus |
| | Dreyfus | Cash | Government | Government | Treasury & | Treasury |
| | Cash | Management | Cash | Prime Cash | Agency Cash | Prime Cash |
| Management | Plus, Inc. | Management | Management | Management | Management |
| Investment Income ($): | | | | | | |
| Interest Income | 256,820 | 44,041 | 134,546 | 21,996 | 49,753 | 68,143 |
| Expenses: | | | | | | |
| Management fee—Note 2(a) | 82,718 | 13,833 | 68,493 | 13,310 | 34,883 | 63,531 |
| Distribution fees—Note 2(b) | 17,317 | 6,465 | 11,151 | 5,792 | 9,079 | 27,792 |
| Treasury insurance expense—Note 1(g) | 7,128 | 3,379 | 2,549 | 732 | 2,191 | 2,880 |
| Registration fees | 948 | 296 | 742 | 323 | 563 | 902 |
| Custodian fees—Note 2(c) | 791 | 194 | 619 | 159 | 365 | 489 |
| Shareholder servicing costs—Note 2(c) | 603 | 249 | 464 | 145 | 510 | 584 |
| Prospectus and shareholders’ reports | 113 | 135 | 84 | 52 | 47 | 108 |
| Trustees’/Directors’ fees and expenses—Note 2(d) | 101 | 22 | 88 | 18 | 42 | 84 |
| Professional fees | 100 | 100 | 98 | 60 | 100 | 99 |
| Miscellaneous | 459 | 112 | 491 | 175 | 306 | 554 |
| Total Expenses | 110,278 | 24,785 | 84,779 | 20,766 | 48,086 | 97,023 |
| Less—reduction in expenses | | | | | | |
| due to undertaking—Note 2(a) | (3,182) | (1,200) | (4,200) | (3,704) | (7,804) | (32,312) |
| Less—reduction in management fees | | | | | | |
| due to undertaking—Note 2(a) | (2,086) | (746) | (1,815) | (665) | (1,296) | (2,046) |
| Less—reduction in fees | | | | | | |
| due to earnings credits—Note 1(b) | (51) | (22) | (8) | (11) | (22) | (22) |
| Net Expenses | 104,959 | 22,817 | 78,756 | 16,386 | 38,964 | 62,643 |
| Investment Income—Net | 151,861 | 21,224 | 55,790 | 5,610 | 10,789 | 5,500 |
| Net Realized and Unrealized Gain | | | | | | |
| (Loss) on Investments—Note 1(b) ($) | | | | | | |
| Net realized gain (loss) on investments | 231 | (81,757) | 138 | 13 | 136 | 102 |
| Net unrealized appreciation | | | | | | |
| (depreciation) on investments | — | 32,337 | — | — | — | — |
| Net Realized and Unrealized | | | | | | |
| Gain (Loss) on Investments | 231 | (49,420) | 138 | 13 | 136 | 102 |
| Net Increase from Payment by Affiliate | — | 68,407 | — | — | — | — |
| Net Increase in Net Assets | | | | | | |
| Resulting from Operations | 152,092 | 40,211 | 55,928 | 5,623 | 10,925 | 5,602 |
| |
| See notes to financial statements. | | | | | | |
62
| | | | | |
| | | | | Dreyfus | Dreyfus |
| | Dreyfus | Dreyfus | Dreyfus | California | New York |
| | Municipal Cash | New York | Tax Exempt | AMT-Free | AMT-Free |
| | Management | Municipal Cash | Cash | Municipal Cash | Municipal Cash |
| | Plus | Management | Management | Management | Management |
| Investment Income ($): | | | | | |
| Interest Income | 14,477 | 6,898 | 39,152 | 1,601 | 1,512 |
| Expenses: | | | | | |
| Management fee—Note 2(a) | 4,081 | 2,046 | 12,431 | 552 | 449 |
| Distribution fees—Note 2(b) | 1,743 | 1,073 | 2,192 | 447 | 555 |
| Treasury insurance expense—Note 1(g) | 396 | 249 | 1,391 | 109 | 55 |
| Registration fees | 291 | 60 | 265 | 30 | — |
| Custodian fees—Note 2(c) | 100 | 70 | 161 | 33 | — |
| Professional fees | 71 | 69 | 81 | 43 | — |
| Shareholder servicing costs—Note 2(c) | 49 | 36 | 387 | 4 | — |
| Prospectus and shareholders’ reports | 34 | 6 | 21 | 3 | — |
| Trustees’ fees and expenses—Note 2(d) | 6 | 4 | 15 | 1 | — |
| Miscellaneous | 57 | 44 | 186 | 21 | — |
| Total Expenses | 6,828 | 3,657 | 17,130 | 1,243 | 1,059 |
| Less—reduction in expenses | | | | | |
| due to undertaking—Note 2(a) | (137) | (131) | (402) | (128) | (133) |
| Less—reduction in management fees | | | | | |
| due to undertaking—Note 2(a) | (452) | (216) | (779) | (90) | — |
| Less—reduction in management fee | | | | | |
| due to undertaking—Note 2(a) | — | — | — | (98) | — |
| Less—reduction in fees | | | | | |
| due to earnings credits—Note 1(b) | (54) | (4) | (69) | (2) | — |
| Net Expenses | 6,185 | 3,306 | 15,880 | 925 | 926 |
| Investment Income—Net | 8,292 | 3,592 | 23,272 | 676 | 586 |
| Net Realized Gain (Loss) on | | | | | |
| Investments—Note 1(b) ($) | 3 | 31 | 315 | — | 8 |
| Net Increase in Net Assets | | | | | |
| Resulting from Operations | 8,295 | 3,623 | 23,587 | 676 | 594 |
| |
| See notes to financial statements. | | | | | |
The Funds 63
STATEMENTS OF CHANGES IN NET ASSETS
(amounts in thousands)
| | | | |
| | Dreyfus Cash Management | Dreyfus Cash Management Plus, Inc. |
| | Year Ended January 31, | Year Ended January 31, |
| | 2010 | 2009 | 2010 | 2009 |
| Operations ($): | | | | |
| Investment income—net | 151,861 | 773,401 | 21,224 | 344,691 |
| Net realized gain (loss) on investments | 231 | (193) | (81,757) | 1,780 |
| Net unrealized appreciation (depreciation) on investments | — | — | 32,337 | (32,337) |
| Net Increase from payment by affiliate | — | — | 68,407 | — |
| Net Increase (Decrease) in Net Assets | | | | |
| Resulting from Operations | 152,092 | 773,208 | 40,211 | 314,134 |
| Dividends to Shareholders from ($): | | | | |
| Investment income—net: | | | | |
| Institutional Shares | (134,824) | (636,249) | (14,894) | (226,894) |
| Investor Shares | (10,304) | (86,866) | (2,497) | (41,297) |
| Administrative Shares | (4,339) | (35,678) | (3,054) | (46,098) |
| Participant Shares | (1,690) | (12,715) | (771) | (28,385) |
| Service Shares | — | — | (3) | (1,644) |
| Select Shares | — | — | (5) | (356) |
| Agency Shares | (704) | (1,893) | —a | (17) |
| Total Dividends | (151,861) | (773,401) | (21,224) | (344,691) |
| Beneficial Interest/Capital Stock | | | | |
| Transactions ($1.00 per share): | | | | |
| Net proceeds from shares sold: | | | | |
| Institutional Shares | 205,919,725 | 186,740,823 | 18,044,547 | 71,235,558 |
| Investor Shares | 15,180,824 | 21,517,623 | 2,315,173 | 4,373,540 |
| Administrative Shares | 3,832,973 | 4,931,910 | 2,041,658 | 5,949,446 |
| Participant Shares | 4,130,178 | 4,274,633 | 1,684,262 | 4,863,282 |
| Service Shares | — | — | 45,157 | 242,535 |
| Select Shares | — | — | 24,034 | 70,971 |
| Agency Shares | 317,162 | 574,176 | — | 38,228 |
| Net assets received in connection | | | | |
| with reorganization—Note 1 | — | 783,343 | — | — |
| Dividends reinvested: | | | | |
| Institutional Shares | 34,050 | 168,644 | 6,598 | 77,673 |
| Investor Shares | 1,925 | 20,318 | 2,121 | 36,374 |
| Administrative Shares | 1,264 | 8,814 | 2,588 | 39,392 |
| Participant Shares | 358 | 3,619 | 717 | 27,126 |
| Service Shares | — | — | —a | 157 |
| Select Shares | — | — | — | 20 |
| Agency Shares | 335 | 1 | —a | —a |
| Cost of shares redeemed: | | | | |
| Institutional Shares | (203,484,505) | (174,070,720) | (18,089,064) | (76,990,767) |
| Investor Shares | (16,619,109) | (19,838,830) | (2,889,192) | (4,718,014) |
| Administrative Shares | (3,897,228) | (5,186,524) | (2,503,691) | (7,171,225) |
| Participant Shares | (4,592,274) | (3,616,149) | (2,396,803) | (5,114,883) |
| Service Shares | — | — | (49,976) | (306,236) |
| Select Shares | — | — | (47,374) | (43,293) |
| Agency Shares | (326,276) | (494,498) | — | (38,228) |
| Increase (Decrease) in Net Assets from Beneficial | | | | |
| Interest/Capital Stock Transactions | 499,402 | 15,817,183 | (1,809,245) | (7,428,344) |
| Total Increase (Decrease) In Net Assets | 499,633 | 15,816,990 | (1,790,258) | (7,458,901) |
| Net Assets ($): | | | | |
| Beginning of Period | 39,041,562 | 23,224,572 | 7,468,112 | 14,927,013 |
| End of Period | 39,541,195 | 39,041,562 | 5,677,854 | 7,468,112 |
| |
| a Amount represents less than $1,000. | | | | |
| See notes to financial statements. | | | | |
64
| | | | |
| | Dreyfus Government | Dreyfus Government |
| | Cash Management | Prime Cash Management |
| | Year Ended January 31, | Year Ended January 31, |
| | 2010 | 2009 | 2010 | 2009 |
| Operations ($): | | | | |
| Investment income—net | 55,790 | 364,171 | 5,610 | 100,451 |
| Net realized gain (loss) on investments | 138 | 2,836 | 13 | 19 |
| Net Increase (Decrease) in Net Assets | | | | |
| Resulting from Operations | 55,928 | 367,007 | 5,623 | 100,470 |
| Dividends to Shareholders from ($): | | | | |
| Investment income—net: | | | | |
| Institutional Shares | (52,625) | (281,591) | (5,334) | (67,482) |
| Investor Shares | (1,261) | (44,651) | (30) | (10,951) |
| Administrative Shares | (1,737) | (26,146) | (238) | (9,100) |
| Participant Shares | (56) | (9,680) | (1) | (12,254) |
| Agency Shares | (111) | (2,103) | (26) | (666) |
| Total Dividends | (55,790) | (364,171) | (5,629) | (100,453) |
| Beneficial Interest Transactions ($1.00 per share): | | | | |
| Net proceeds from shares sold: | | | | |
| Institutional Shares | 164,894,102 | 143,182,998 | 19,903,414 | 24,434,863 |
| Investor Shares | 7,738,977 | 12,562,114 | 2,096,688 | 2,843,963 |
| Administrative Shares | 3,193,172 | 7,389,922 | 5,145,416 | 5,977,471 |
| Participant Shares | 2,203,530 | 4,126,713 | 1,568,552 | 3,265,428 |
| Agency Shares | 231,624 | 1,190,425 | 190,988 | 262,921 |
| Dividends reinvested: | | | | |
| Institutional Shares | 14,771 | 105,370 | 1,794 | 35,987 |
| Investor Shares | 735 | 26,359 | 13 | 6,013 |
| Administrative Shares | 1,361 | 19,035 | 209 | 7,663 |
| Participant Shares | 29 | 5,350 | 1 | 10,713 |
| Agency Shares | —a | 338 | —a | —a |
| Cost of shares redeemed: | | | | |
| Institutional Shares | (174,661,061) | (118,878,645) | (23,196,803) | (20,358,570) |
| Investor Shares | (9,588,829) | (10,269,095) | (2,681,628) | (2,234,543) |
| Administrative Shares | (4,623,225) | (5,843,987) | (5,342,373) | (5,599,022) |
| Participant Shares | (2,526,210) | (3,915,680) | (2,208,938) | (2,641,115) |
| Agency Shares | (244,894) | (1,106,544) | (142,069) | (231,653) |
| Increase (Decrease) in Net Assets from | | | | |
| Beneficial Interest Transactions | (13,365,918) | 28,594,673 | (4,664,736) | 5,780,119 |
| Total Increase (Decrease) In Net Assets | (13,365,780) | 28,597,509 | (4,664,742) | 5,780,136 |
| Net Assets ($): | | | | |
| Beginning of Period | 40,779,048 | 12,181,539 | 9,698,008 | 3,917,872 |
| End of Period | 27,413,268 | 40,779,048 | 5,033,266 | 9,698,008 |
| |
| a Amount represents less than $1,000. | | | | |
| See notes to financial statements. | | | | |
The Funds 65
STATEMENT OF CHANGES IN NET ASSETS (continued)
(amounts in thousands)
| | | | |
| | Dreyfus Treasury & | Dreyfus Treasury |
| | Agency Cash Management | Prime Cash Management |
| | Year Ended January 31, | Year Ended January 31, |
| | 2010 | 2009 | 2010 | 2009 |
| Operations ($): | | | | |
| Investment income—net | 10,789 | 202,411 | 5,500 | 199,425 |
| Net realized gain (loss) on investments | 136 | 984 | 102 | 668 |
| Net Increase (Decrease) in Net Assets | | | | |
| Resulting from Operations | 10,925 | 203,395 | 5,602 | 200,093 |
| Dividends to Shareholders from ($): | | | | |
| Investment income—net: | | | | |
| Institutional Shares | (10,543) | (142,784) | (5,594) | (127,056) |
| Investor Shares | (5) | (33,210) | (9) | (43,949) |
| Administrative Shares | (214) | (19,966) | (11) | (9,190) |
| Participant Shares | (1) | (4,440) | (6) | (15,378) |
| Service Shares | —a | (323) | — | — |
| Select Shares | —a | (415) | — | — |
| Agency Shares | (26) | (947) | (13) | (3,852) |
| Premier Shares | —a | (326) | — | — |
| Total Dividends | (10,789) | (202,411) | (5,633) | (199,425) |
| Beneficial Interest Transactions ($1.00 per share): | | | | |
| Net proceeds from shares sold: | | | | |
| Institutional Shares | 68,033,436 | 75,007,689 | 60,299,612 | 94,609,837 |
| Investor Shares | 11,174,580 | 17,741,257 | 9,985,602 | 19,385,467 |
| Administrative Shares | 4,043,353 | 9,506,204 | 4,671,129 | 7,243,860 |
| Participant Shares | 2,139,953 | 3,422,940 | 11,299,483 | 17,271,629 |
| Service Shares | 5,379 | 544,153 | — | — |
| Select Shares | 69,667 | 115,831 | — | — |
| Agency Shares | 208,593 | 545,413 | 666,934 | 1,535,777 |
| Premier Shares | 886,267 | 440,976 | — | — |
| Dividends reinvested: | | | | |
| Institutional Shares | 3,198 | 58,212 | 2,210 | 71,888 |
| Investor Shares | 1 | 3,880 | 5 | 19,562 |
| Administrative Shares | 135 | 14,282 | 6 | 6,542 |
| Participant Shares | —a | 1,188 | 5 | 11,922 |
| Service Shares | —a | —a | — | — |
| Select Shares | —a | 200 | — | — |
| Agency Shares | —a | —a | 10 | 3,377 |
| Premier Shares | —a | —a | — | — |
| Cost of shares redeemed: | | | | |
| Institutional Shares | (72,482,785) | (71,496,288) | (72,138,346) | (69,468,590) |
| Investor Shares | (12,569,809) | (17,911,593) | (13,286,181) | (14,456,010) |
| Administrative Shares | (4,703,968) | (8,923,463) | (5,925,054) | (5,162,606) |
| Participant Shares | (2,063,624) | (3,268,446) | (14,137,635) | (12,821,119) |
| Service Shares | (5,553) | (594,881) | — | — |
| Select Shares | (77,569) | (177,501) | — | — |
| Agency Shares | (201,117) | (482,115) | (694,755) | (1,129,927) |
| Premier Shares | (860,009) | (435,424) | — | — |
| Increase (Decrease) in Net Assets from | | | | |
| Beneficial Interest Transactions | (6,399,872) | 4,112,514 | (19,256,975) | 37,121,609 |
| Total Increase (Decrease) In Net Assets | (6,399,736) | 4,113,498 | (19,257,006) | 37,122,277 |
| Net Assets ($): | | | | |
| Beginning of Period | 21,713,204 | 17,599,706 | 46,481,616 | 9,359,339 |
| End of Period | 15,313,468 | 21,713,204 | 27,224,610 | 46,481,616 |
| |
| a Amount represents less than $1,000. | | | | |
| See notes to financial statements. | | | | |
66
| | | | |
| | Dreyfus Municipal | Dreyfus New York Municipal |
| | Cash Management Plus | Cash Management |
| | Year Ended January 31, | Year Ended January 31, |
| | 2010 | 2009 | 2010 | 2009 |
| Operations ($): | | | | |
| Investment income—net | 8,292 | 33,984 | 3,592 | 16,959 |
| Net realized gain (loss) on investments | 3 | 175 | 31 | 88 |
| Net Increase (Decrease) in Net Assets | | | | |
| Resulting from Operations | 8,295 | 34,159 | 3,623 | 17,047 |
| Dividends to Shareholders from ($): | | | | |
| Investment income—net: | | | | |
| Institutional Shares | (4,713) | (17,038) | (2,573) | (9,642) |
| Investor Shares | (835) | (7,833) | (851) | (5,199) |
| Administrative Shares | (2,815) | (8,324) | (202) | (1,297) |
| Participant Shares | (96) | (886) | (54) | (828) |
| Agency Shares | (8) | —a | —a | —a |
| Total Dividends | (8,467) | (34,081) | (3,680) | (16,966) |
| Beneficial Interest Transactions ($1.00 per share): | | | | |
| Net proceeds from shares sold: | | | | |
| Institutional Shares | 6,300,589 | 8,498,054 | 1,100,157 | 1,346,480 |
| Investor Shares | 703,488 | 942,362 | 889,613 | 746,092 |
| Administrative Shares | 1,559,147 | 1,651,865 | 90,472 | 119,808 |
| Participant Shares | 62,395 | 128,642 | 91,910 | 181,551 |
| Agency Shares | 14,601 | — | — | — |
| Dividends reinvested: | | | | |
| Institutional Shares | 2,833 | 6,404 | 444 | 1,792 |
| Investor Shares | 801 | 7,349 | 731 | 4,676 |
| Administrative Shares | 2,711 | 7,938 | 197 | 1,209 |
| Participant Shares | 96 | 877 | 54 | 827 |
| Agency Shares | 6 | —a | —a | —a |
| Cost of shares redeemed: | | | | |
| Institutional Shares | (6,532,452) | (9,701,968) | (1,055,760) | (1,262,094) |
| Investor Shares | (596,560) | (1,128,929) | (982,328) | (739,579) |
| Administrative Shares | (1,604,890) | (1,329,222) | (82,764) | (133,573) |
| Participant Shares | (100,239) | (105,308) | (130,790) | (177,886) |
| Agency Shares | (13,462) | — | — | — |
| Increase (Decrease) in Net Assets from | | | | |
| Beneficial Interest Transactions | (200,936) | (1,021,936) | (78,064) | 89,303 |
| Total Increase (Decrease) In Net Assets | (201,108) | (1,021,858) | (78,121) | 89,384 |
| Net Assets ($): | | | | |
| Beginning of Period | 1,567,499 | 2,589,357 | 1,030,853 | 941,469 |
| End of Period | 1,366,391 | 1,567,499 | 952,732 | 1,030,853 |
| |
| a Amount represents less than $1,000. | | | | |
| See notes to financial statements. | | | | |
The Funds 67
STATEMENT OF CHANGES IN NET ASSETS (continued)
(amounts in thousands)
| | | | |
| | Dreyfus Tax Exempt | Dreyfus California AMT-Free |
| | Cash Management | Municipal Cash Management |
| | Year Ended January 31, | Year Ended January 31, |
| | 2010 | 2009 | 2010 | 2009 |
| Operations ($): | | | | |
| Investment income—net | 23,272 | 118,001 | 676 | 5,530 |
| Net realized gain (loss) on investments | 315 | 140 | — | 15 |
| Net Increase (Decrease) in Net Assets | | | | |
| Resulting from Operations | 23,587 | 118,141 | 676 | 5,545 |
| Dividends to Shareholders from ($): | | | | |
| Investment income—net: | | | | |
| Institutional Shares | (20,448) | (98,791) | (462) | (2,624) |
| Investor Shares | (1,122) | (8,945) | (86) | (1,074) |
| Administrative Shares | (1,629) | (9,616) | (28) | (25) |
| Participant Shares | (189) | (698) | (115) | (1,828) |
| Agency Shares | (24) | (48) | —a | —a |
| Total Dividends | (23,412) | (118,098) | (691) | (5,551) |
| Beneficial Interest Transactions ($1.00 per share): | | | | |
| Net proceeds from shares sold: | | | | |
| Institutional Shares | 17,954,303 | 25,420,986 | 331,375 | 434,112 |
| Investor Shares | 870,127 | 1,561,565 | 181,355 | 312,402 |
| Administrative Shares | 779,288 | 2,917,935 | 76,700 | 7,203 |
| Participant Shares | 227,547 | 372,600 | 85,895 | 197,632 |
| Agency Shares | 28,927 | 4,689 | — | —a |
| Dividends reinvested: | | | | |
| Institutional Shares | 10,310 | 44,543 | 409 | 2,439 |
| Investor Shares | 883 | 6,525 | 86 | 982 |
| Administrative Shares | 1,381 | 8,442 | 28 | 20 |
| Participant Shares | 1 | 197 | 115 | 1,819 |
| Agency Shares | 21 | 48 | —a | —a |
| Cost of shares redeemed: | | | | |
| Institutional Shares | (19,772,464) | (24,644,410) | (284,010) | (460,094) |
| Investor Shares | (1,082,483) | (1,559,021) | (141,488) | (295,483) |
| Administrative Shares | (1,305,085) | (2,540,898) | (72,589) | (7,230) |
| Participant Shares | (334,628) | (293,178) | (126,545) | (244,762) |
| Agency Shares | (26,239) | (400) | — | —a |
| Increase (Decrease) in Net Assets from | | | | |
| Beneficial Interest Transactions | (2,648,111) | 1,299,623 | 51,331 | (50,960) |
| Total Increase (Decrease) In Net Assets | (2,647,936) | 1,299,666 | 51,316 | (50,966) |
| Net Assets ($): | | | | |
| Beginning of Period | 6,539,112 | 5,239,446 | 211,626 | 262,592 |
| End of Period | 3,891,176 | 6,539,112 | 262,942 | 211,626 |
| |
| a Amount represents less than $1,000. | | | | |
| See notes to financial statements. | | | | |
68
| | | |
| | Dreyfus New York AMT-Free |
| | Municipal Cash Management |
| | Year Ended | One Month Ended | Year Ended |
| | January 31, | January 31, | December 31, |
| | 2010 | 2009a | 2008b,c |
| Operations ($): | | | |
| Investment income—net | 586 | 82 | 4,284 |
| Net realized gain (loss) on investments | 8 | — | 12 |
| Net Increase (Decrease) in Net Assets | | | |
| Resulting from Operations | 594 | 82 | 4,296 |
| Dividends to Shareholders from ($): | | | |
| Investment income—net: | | | |
| Institutional Shares | (247) | (30) | (1,207) |
| Investor Shares | (236) | (39) | (1,914) |
| Administrative Shares | (2) | —d | —d |
| Participant Shares | —d | —d | —d |
| Classic Shares | (101) | (13) | (1,163) |
| Net realized gain on investments: | | | |
| Institutional Shares | — | — | (2) |
| Investor Shares | — | — | (4) |
| Classic Shares | — | — | (3) |
| Total Dividends | (586) | (82) | (4,293) |
| Beneficial Interest Transactions ($1.00 per share): | | | |
| Net proceeds from shares sold: | | | |
| Institutional Shares | 196,310 | 29,278 | 172,559 |
| Investor Shares | 193,259 | 24,669 | 384,961 |
| Administrative Shares | 31,044 | — | 10 |
| Participant Shares | —d | — | 10 |
| Classic Shares | 304,233 | 35,258 | 378,913 |
| Dividends reinvested: | | | |
| Institutional Shares | 52 | 2 | 159 |
| Investor Shares | 62 | 8 | 481 |
| Administrative Shares | 2 | — | — |
| Classic Shares | 101 | 13 | 1,163 |
| Cost of shares redeemed: | | | |
| Institutional Shares | (135,412) | (29,050) | (187,569) |
| Investor Shares | (221,786) | (22,523) | (424,300) |
| Administrative Shares | (22,912) | — | — |
| Participant Shares | —d | — | — |
| Classic Shares | (321,100) | (31,891) | (386,352) |
| Increase (Decrease) in Net Assets from | | | |
| Beneficial Interest Transactions | 23,853 | 5,764 | (59,965) |
| Total Increase (Decrease) In Net Assets | 23,861 | 5,764 | (59,962) |
| Net Assets ($): | | | |
| Beginning of Period | 227,675 | 221,911 | 281,873 |
| End of Period | 251,536 | 227,675 | 221,911 |
| a | The fund has changed its fiscal year end from December 31 to January 31. |
| b | The fund commenced offering five classes of shares on the close of business September 12, 2008. The existing shares were redesignated and the fund added Administrative and Participant shares. |
| c | Represents information for the fund’s predecessor, BNY Hamilton NewYork AMT-Free Money Market Fund through September 12, 2008. |
| d | Amount represents less than $1,000. |
See notes to financial statements.
The Funds 69
FINANCIAL HIGHLIGHTS
The following tables describe the performance for each share class for the fiscal periods indicated. All information reflects financial results for a single fund share.Total return shows how much your investment in the fund would have increased (or decreased) during each period, assuming you had reinvested all dividends and distributions. These figures have been derived from the fund’s financial statements. Please note that the financial highlights information in the following tables for Dreyfus New York AMT-Free Municipal Cash Management’s Institutional, Investor and Classic shares represents the financial highlights of Dreyfus New York AMT-Free Municipal Cash Management’s predecessor, BNY Hamilton New York AMT-Free Municipal Money Fund (New York AMT-Free Municipal Money Fund), before Dreyfus NewYork AMT-Free Municipal Cash Management commenced operations as of the close of business on September 12, 2008, and re presents the performance of Dreyfus NewYork AMT-Free Municipal Cash Management’s Institutional, Investor and Classic shares thereafter. Before Dreyfus New York AMT-Free Municipal Cash Management commenced operations, all of the assets of the New York AMT-Free Municipal Money Fund were transferred to Dreyfus New York AMT-Free Municipal Cash Management in exchange for Institutional, Investor and Classic shares of the fund in a tax-free reorganization.Total return shows how much your investment in Dreyfus New York AMT-Free Municipal Cash Management would have increased (or decreased) during each period, assuming you had reinvested all dividends and distributions. These figures have been derived from Dreyfus NewYork AMT-Free Municipal Cash Management’s predecessor’s financial statements.
| | | | | | | | | |
| | | Per Share Data ($) | | | Ratios/Supplemental Data (%) | |
| | | | | | | | | Ratio of Net | |
| | Net Asset | | Dividends Net Asset | | Ratio of | Ratio of | Investment Net Assets |
| | Value | Net | from Net | Value | | Total Expenses Net Expenses Income to | End of |
| | Beginning Investment Investment | End | Total | to Average | to Average | Average | Period |
| | of Period | Income | Income | of Period Return (%) Net Assets | Net Assets Net Assets ($ x1,000,000) |
| |
| Dreyfus Cash Management | | | | | | | | | |
| Institutional Shares | | | | | | | | | |
| Year Ended January 31, | | | | | | | | | |
| 2010 | 1.00 | .004 | (.004) | 1.00 | .41 | .22 | .22a | .40 | 34,291 |
| 2009 | 1.00 | .026 | (.026) | 1.00 | 2.65 | .21 | .21 | 2.56 | 31,821 |
| 2008 | 1.00 | .051 | (.051) | 1.00 | 5.18 | .20 | .20 | 5.03 | 18,983 |
| 2007 | 1.00 | .050 | (.050) | 1.00 | 5.07 | .20 | .20 | 4.98 | 11,063 |
| 2006 | 1.00 | .032 | (.032) | 1.00 | 3.28 | .20 | .20 | 3.24 | 9,484 |
| Investor Shares | | | | | | | | | |
| Year Ended January 31, | | | | | | | | | |
| 2010 | 1.00 | .002 | (.002) | 1.00 | .21 | .47 | .43 | .23 | 3,457 |
| 2009 | 1.00 | .024 | (.024) | 1.00 | 2.40 | .47 | .47 | 2.30 | 4,893 |
| 2008 | 1.00 | .048 | (.048) | 1.00 | 4.92 | .45 | .45 | 4.78 | 3,194 |
| 2007 | 1.00 | .047 | (.047) | 1.00 | 4.80 | .45 | .45 | 4.73 | 1,590 |
| 2006 | 1.00 | .030 | (.030) | 1.00 | 3.03 | .45 | .45 | 2.99 | 1,238 |
| Administrative Shares | | | | | | | | | |
| Year Ended January 31, | | | | | | | | | |
| 2010 | 1.00 | .003 | (.003) | 1.00 | .32 | .32 | .32a | .31 | 1,113 |
| 2009 | 1.00 | .025 | (.025) | 1.00 | 2.55 | .31 | .31 | 2.46 | 1,176 |
| 2008 | 1.00 | .050 | (.050) | 1.00 | 5.08 | .30 | .30 | 4.93 | 638 |
| 2007 | 1.00 | .049 | (.049) | 1.00 | 4.96 | .30 | .30 | 4.88 | 315 |
| 2006 | 1.00 | .031 | (.031) | 1.00 | 3.18 | .30 | .30 | 3.14 | 251 |
| Participant Shares | | | | | | | | | |
| Year Ended January 31, | | | | | | | | | |
| 2010 | 1.00 | .001 | (.001) | 1.00 | .14 | .63 | .52 | .15 | 591 |
| 2009 | 1.00 | .022 | (.022) | 1.00 | 2.24 | .62 | .62 | 2.15 | 1,052 |
| 2008 | 1.00 | .047 | (.047) | 1.00 | 4.77 | .60 | .60 | 4.63 | 390 |
| 2007 | 1.00 | .046 | (.046) | 1.00 | 4.65 | .60 | .60 | 4.58 | 206 |
| 2006 | 1.00 | .028 | (.028) | 1.00 | 2.87 | .60 | .60 | 2.84 | 210 |
| Agency Shares | | | | | | | | | |
| Year Ended January 31, | | | | | | | | | |
| 2010 | 1.00 | .004 | (.004) | 1.00 | .35 | .29 | .28 | .42 | 90 |
| 2009 | 1.00 | .026 | (.026) | 1.00 | 2.59 | .28 | .28 | 2.49 | 99 |
| 2008b | 1.00 | .016 | (.016) | 1.00 | 4.84c | .26c | .26c | 4.97c | 19 |
| |
| a | Expense waivers and/or reimbursements amounted to less than .01%. |
| b | From October 1, 2007 (commencement of initial offering) to January 31, 2008. |
| c | Annualized. |
See notes to financial statements.
70
| | | | | | | | | |
| | | Per Share Data ($) | | | Ratios/Supplemental Data (%) | |
| | | | | | | | | Ratio of Net | |
| | Net Asset | | Dividends Net Asset | | Ratio of | Ratio of | Investment Net Assets |
| | Value | Net | from Net | Value | | Total Expenses Net Expenses | Income | End of |
| | Beginning Investment Investment | End | Total | to Average | to Average | to Average | Period |
| | of Period | Income | Income | of Period Return (%) Net Assets | Net Assets Net Assets ($ x1,000,000) |
| |
| Dreyfus Cash Management Plus, Inc. | | | | | | | | |
| Institutional Shares | | | | | | | | | |
| Year Ended January 31, | | | | | | | | | |
| 2010 | 1.00 | .004 | (.004) | 1.00 | .36a | .27 | .25 | .36 | 3,790 |
| 2009 | 1.00 | .026 | (.026) | 1.00 | 2.66 | .21 | .21 | 2.80 | 3,822 |
| 2008 | 1.00 | .051 | (.051) | 1.00 | 5.18 | .20 | .20 | 5.04 | 9,513 |
| 2007 | 1.00 | .049 | (.049) | 1.00 | 5.06 | .20 | .20 | 4.95 | 6,495 |
| 2006 | 1.00 | .032 | (.032) | 1.00 | 3.29 | .20 | .20 | 3.23 | 5,908 |
| Investor Shares | | | | | | | | | |
| Year Ended January 31, | | | | | | | | | |
| 2010 | 1.00 | .002 | (.002) | 1.00 | .17a | .51 | .46 | .20 | 919 |
| 2009 | 1.00 | .024 | (.024) | 1.00 | 2.40 | .47 | .47 | 2.54 | 1,487 |
| 2008 | 1.00 | .048 | (.048) | 1.00 | 4.92 | .45 | .45 | 4.79 | 1,802 |
| 2007 | 1.00 | .047 | (.047) | 1.00 | 4.80 | .45 | .45 | 4.70 | 1,658 |
| 2006 | 1.00 | .030 | (.030) | 1.00 | 3.03 | .45 | .45 | 2.98 | 1,275 |
| Administrative Shares | | | | | | | | | |
| Year Ended January 31, | | | | | | | | | |
| 2010 | 1.00 | .003 | (.003) | 1.00 | .27a | .36 | .35 | .31 | 635 |
| 2009 | 1.00 | .025 | (.025) | 1.00 | 2.55 | .32 | .32 | 2.69 | 1,091 |
| 2008 | 1.00 | .050 | (.050) | 1.00 | 5.08 | .30 | .30 | 4.94 | 2,278 |
| 2007 | 1.00 | .048 | (.048) | 1.00 | 4.95 | .30 | .30 | 4.85 | 1,148 |
| 2006 | 1.00 | .031 | (.031) | 1.00 | 3.19 | .30 | .30 | 3.13 | 793 |
| Participant Shares | | | | | | | | | |
| Year Ended January 31, | | | | | | | | | |
| 2010 | 1.00 | .001 | (.001) | 1.00 | .10a | .67 | .55 | .14 | 327 |
| 2009 | 1.00 | .022 | (.022) | 1.00 | 2.25 | .62 | .62 | 2.39 | 1,034 |
| 2008 | 1.00 | .047 | (.047) | 1.00 | 4.76 | .60 | .60 | 4.64 | 1,264 |
| 2007 | 1.00 | .045 | (.045) | 1.00 | 4.64 | .60 | .60 | 4.55 | 941 |
| 2006 | 1.00 | .028 | (.028) | 1.00 | 2.88 | .60 | .60 | 2.83 | 700 |
| Service Shares | | | | | | | | | |
| Year Ended January 31, | | | | | | | | | |
| 2010 | 1.00 | .001 | (.001) | 1.00 | .06a | .78 | .63 | .07 | 2 |
| 2009 | 1.00 | .021 | (.021) | 1.00 | 2.14 | .72 | .72 | 2.29 | 7 |
| 2008b | 1.00 | .027 | (.027) | 1.00 | 3.82c | .70c | .70c | 4.54c | 70 |
| Select Shares | | | | | | | | | |
| Year Ended January 31, | | | | | | | | | |
| 2010 | 1.00 | .000d | (.000)d | 1.00 | .02a | 1.07 | .75 | .06 | 5 |
| 2009 | 1.00 | .018 | (.018) | 1.00 | 1.84 | 1.04 | 1.04 | 1.97 | 28 |
| 2008b | 1.00 | .025 | (.025) | 1.00 | 3.57c | 1.00c | 1.00c | 4.24c | —e |
| Agency Shares | | | | | | | | | |
| Year Ended January 31, | | | | | | | | | |
| 2010 | 1.00 | .003 | (.003) | 1.00 | .30a | .33 | .31 | .30 | —e |
| 2009 | 1.00 | .026 | (.026) | 1.00 | 2.60 | .26 | .26 | 2.75 | —e |
| 2008f | 1.00 | .016 | (.016) | 1.00 | 4.81c | .26c | .26c | 4.98c | —e |
| a | If payment pursuant to the Capital Support Agreement was not made, total return would have been (1.65)% for Institutional Shares, (1.83)% for Investor Shares, (1.74)% for Administrative Shares, (1.90)% for Participant Shares, (1.94)% for Service Shares, (1.98)% for Select Shares and (1.71)% for Agency Shares. |
| b | From June 29, 2007 (commencement of initial offering) to January 31, 2008. |
| c | Annualized. |
| d | Amount represents less than $.001 per share. |
| e | Amount represents less than $1 million. |
| f | From October 1, 2007 (commencement of initial offering) to January 31, 2008. |
See notes to financial statements.
The Funds 71
FINANCIAL HIGHLIGHTS (continued)
| | | | | | | | | |
| | | Per Share Data ($) | | | Ratios/Supplemental Data (%) | |
| | | | | | | | | Ratio of Net | |
| | Net Asset | | Dividends Net Asset | | Ratio of | Ratio of | Investment Net Assets |
| | Value | Net | from Net | Value | | Total Expenses Net Expenses | Income | End of |
| | Beginning Investment Investment | End | Total | to Average | to Average to Average | Period |
| | of Period | Income | Income | of Period Return (%) Net Assets | Net Assets Net Assets ($ x1,000,000) |
| |
| Dreyfus Government Cash Management | | | | | | | | |
| Institutional Shares | | | | | | | | | |
| Year Ended January 31, | | | | | | | | | |
| 2010 | 1.00 | .002 | (.002) | 1.00 | .17 | .22 | .21 | .18 | 23,963 |
| 2009 | 1.00 | .020 | (.020) | 1.00 | 2.01 | .22 | .22 | 1.63 | 33,715 |
| 2008 | 1.00 | .048 | (.048) | 1.00 | 4.93 | .20 | .20 | 4.73 | 9,303 |
| 2007 | 1.00 | .049 | (.049) | 1.00 | 4.99 | .20 | .20 | 4.89 | 3,118 |
| 2006 | 1.00 | .032 | (.032) | 1.00 | 3.23 | .20 | .20 | 3.15 | 2,842 |
| Investor Shares | | | | | | | | | |
| Year Ended January 31, | | | | | | | | | |
| 2010 | 1.00 | .000a | (.000)a | 1.00 | .03 | .46 | .37 | .04 | 2,209 |
| 2009 | 1.00 | .017 | (.017) | 1.00 | 1.76 | .46 | .46 | 1.39 | 4,058 |
| 2008 | 1.00 | .046 | (.046) | 1.00 | 4.67 | .45 | .45 | 4.48 | 1,738 |
| 2007 | 1.00 | .046 | (.046) | 1.00 | 4.72 | .45 | .45 | 4.64 | 909 |
| 2006 | 1.00 | .029 | (.029) | 1.00 | 2.97 | .45 | .45 | 2.90 | 1,050 |
| Administrative Shares | | | | | | | | | |
| Year Ended January 31, | | | | | | | | | |
| 2010 | 1.00 | .001 | (.001) | 1.00 | .10 | .32 | .29 | .13 | 829 |
| 2009 | 1.00 | .019 | (.019) | 1.00 | 1.91 | .31 | .31 | 1.54 | 2,258 |
| 2008 | 1.00 | .047 | (.047) | 1.00 | 4.83 | .30 | .30 | 4.63 | 693 |
| 2007 | 1.00 | .048 | (.048) | 1.00 | 4.88 | .30 | .30 | 4.79 | 320 |
| 2006 | 1.00 | .031 | (.031) | 1.00 | 3.12 | .30 | .30 | 3.05 | 240 |
| Participant Shares | | | | | | | | | |
| Year Ended January 31, | | | | | | | | | |
| 2010 | 1.00 | .000a | (.000)a | 1.00 | .01 | .62 | .41 | .01 | 339 |
| 2009 | 1.00 | .016 | (.016) | 1.00 | 1.60 | .61 | .61 | 1.24 | 662 |
| 2008 | 1.00 | .044 | (.044) | 1.00 | 4.51 | .60 | .60 | 4.33 | 445 |
| 2007 | 1.00 | .045 | (.045) | 1.00 | 4.57 | .60 | .60 | 4.49 | 196 |
| 2006 | 1.00 | .028 | (.028) | 1.00 | 2.81 | .60 | .60 | 2.75 | 244 |
| Agency Shares | | | | | | | | | |
| Year Ended January 31, | | | | | | | | | |
| 2010 | 1.00 | .001 | (.001) | 1.00 | .13 | .27 | .26 | .13 | 73 |
| 2009 | 1.00 | .019 | (.019) | 1.00 | 1.96 | .27 | .27 | 1.58 | 86 |
| 2008b | 1.00 | .014 | (.014) | 1.00 | 4.30c | .26c | .26c | 4.67c | 2 |
| a | Amount represents less than $.001 per share. |
| b | From October 1, 2007 (commencement of initial offering) to January 31, 2008. |
| c | Annualized. |
See notes to financial statements.
72
| | | | | | | | | |
| | | Per Share Data ($) | | | Ratios/Supplemental Data (%) | |
| | | | | | | | | Ratio of Net | |
| | Net Asset | | Dividends Net Asset | | Ratio of | Ratio of | Investment Net Assets |
| | Value | Net | from Net | Value | | Total Expenses Net Expenses Income to | End of |
| | Beginning Investment Investment | End | Total | to Average | to Average | Average | Period |
| | of Period | Income | Income | of Period Return (%) Net Assets | Net Assets Net Assets ($ x1,000,000) |
| |
| Dreyfus Government Prime Cash Management | | | | | | | |
| Institutional Shares | | | | | | | | | |
| Year Ended January 31, | | | | | | | | | |
| 2010 | 1.00 | .001 | (.001) | 1.00 | .11 | .23 | .21 | .12 | 3,147 |
| 2009 | 1.00 | .019 | (.019) | 1.00 | 1.91 | .22 | .22 | 1.64 | 6,439 |
| 2008 | 1.00 | .048 | (.048) | 1.00 | 4.91 | .20 | .20 | 4.67 | 2,327 |
| 2007 | 1.00 | .048 | (.048) | 1.00 | 4.95 | .20 | .20 | 4.86 | 1,005 |
| 2006 | 1.00 | .031 | (.031) | 1.00 | 3.18 | .20 | .20 | 3.21 | 773 |
| Investor Shares | | | | | | | | | |
| Year Ended January 31, | | | | | | | | | |
| 2010 | 1.00 | .000a | (.000)a | 1.00 | .00b | .48 | .33 | .00b | 593 |
| 2009 | 1.00 | .016 | (.016) | 1.00 | 1.66 | .47 | .47 | 1.39 | 1,178 |
| 2008 | 1.00 | .046 | (.046) | 1.00 | 4.65 | .45 | .45 | 4.42 | 563 |
| 2007 | 1.00 | .046 | (.046) | 1.00 | 4.69 | .45 | .45 | 4.61 | 275 |
| 2006 | 1.00 | .029 | (.029) | 1.00 | 2.92 | .45 | .45 | 2.96 | 242 |
| Administrative Shares | | | | | | | | | |
| Year Ended January 31, | | | | | | | | | |
| 2010 | 1.00 | .000a | (.000)a | 1.00 | .04 | .33 | .29 | .04 | 497 |
| 2009 | 1.00 | .018 | (.018) | 1.00 | 1.81 | .32 | .32 | 1.54 | 693 |
| 2008 | 1.00 | .047 | (.047) | 1.00 | 4.80 | .30 | .30 | 4.57 | 307 |
| 2007 | 1.00 | .047 | (.047) | 1.00 | 4.85 | .30 | .30 | 4.76 | 314 |
| 2006 | 1.00 | .030 | (.030) | 1.00 | 3.08 | .30 | .30 | 3.11 | 210 |
| Participant Shares | | | | | | | | | |
| Year Ended January 31, | | | | | | | | | |
| 2010 | 1.00 | .000a | (.000)a | 1.00 | .00b | .62 | .33 | .00b | 706 |
| 2009 | 1.00 | .015 | (.015) | 1.00 | 1.51 | .62 | .61 | 1.25 | 1,346 |
| 2008 | 1.00 | .044 | (.044) | 1.00 | 4.49 | .60 | .60 | 4.27 | 711 |
| 2007 | 1.00 | .044 | (.044) | 1.00 | 4.53 | .60 | .60 | 4.46 | 341 |
| 2006 | 1.00 | .027 | (.027) | 1.00 | 2.77 | .60 | .60 | 2.81 | 208 |
| Agency Shares | | | | | | | | | |
| Year Ended January 31, | | | | | | | | | |
| 2010 | 1.00 | .001 | (.001) | 1.00 | .06 | .29 | .26 | .06 | 90 |
| 2009 | 1.00 | .018 | (.018) | 1.00 | 1.85 | .28 | .28 | 1.58 | 41 |
| 2008c | 1.00 | .015 | (.015) | 1.00 | 4.33d | .26d | .26d | 4.61d | 10 |
| a | Amount represents less than $.001 per share. |
| b | Amount represents less than .01%. |
| c | From October 1, 2007 (commencement of initial offering) to January 31, 2008. |
| d | Annualized. |
See notes to financial statements.
The Funds 73
FINANCIAL HIGHLIGHTS (continued)
| | | | | | | | | |
| | | Per Share Data ($) | | | Ratios/Supplemental Data (%) | |
| | | | | | | | | Ratio of Net | |
| | Net Asset | | Dividends Net Asset | | Ratio of | Ratio of | Investment Net Assets |
| | Value | Net | from Net | Value | | Total Expenses Net Expenses Income to | End of |
| | Beginning Investment Investment | End | Total | to Average | to Average | Average | Period |
| | of Period | Income | Income | of Period Return (%) Net Assets | Net Assets Net Assets ($ x1,000,000) |
| |
| Dreyfus Treasury & Agency | | | | | | | | | |
| Cash Management | | | | | | | | | |
| Institutional Shares | | | | | | | | | |
| Year Ended January 31, | | | | | | | | | |
| 2010 | 1.00 | .001 | (.001) | 1.00 | .07 | .22 | .21 | .08 | 12,015 |
| 2009 | 1.00 | .013 | (.013) | 1.00 | 1.27 | .22 | .22 | 1.09 | 16,461 |
| 2008 | 1.00 | .046 | (.046) | 1.00 | 4.71 | .20 | .20 | 4.30 | 12,891 |
| 2007 | 1.00 | .048 | (.048) | 1.00 | 4.89 | .20 | .20 | 4.80 | 3,429 |
| 2006 | 1.00 | .031 | (.031) | 1.00 | 3.10 | .20 | .20 | 3.08 | 3,017 |
| Investor Shares | | | | | | | | | |
| Year Ended January 31, | | | | | | | | | |
| 2010 | 1.00 | .000a | (.000)a | 1.00 | .00b | .47 | .29 | .00b | 1,922 |
| 2009 | 1.00 | .010 | (.010) | 1.00 | 1.04 | .47 | .45 | .86 | 3,317 |
| 2008 | 1.00 | .044 | (.044) | 1.00 | 4.45 | .45 | .45 | 4.05 | 3,483 |
| 2007 | 1.00 | .045 | (.045) | 1.00 | 4.63 | .45 | .45 | 4.55 | 1,471 |
| 2006 | 1.00 | .028 | (.028) | 1.00 | 2.84 | .45 | .45 | 2.83 | 1,320 |
| Administrative Shares | | | | | | | | | |
| Year Ended January 31, | | | | | | | | | |
| 2010 | 1.00 | .000a | (.000)a | 1.00 | .02 | .33 | .27 | .03 | 695 |
| 2009 | 1.00 | .012 | (.012) | 1.00 | 1.17 | .31 | .31 | 1.00 | 1,355 |
| 2008 | 1.00 | .045 | (.045) | 1.00 | 4.61 | .30 | .30 | 4.20 | 758 |
| 2007 | 1.00 | .047 | (.047) | 1.00 | 4.79 | .30 | .30 | 4.70 | 141 |
| 2006 | 1.00 | .030 | (.030) | 1.00 | 3.00 | .30 | .30 | 2.98 | 87 |
| Participant Shares | | | | | | | | | |
| Year Ended January 31, | | | | | | | | | |
| 2010 | 1.00 | .000a | (.000)a | 1.00 | .00b | .62 | .28 | .00b | 520 |
| 2009 | 1.00 | .009 | (.009) | 1.00 | .93 | .62 | .54 | .77 | 444 |
| 2008 | 1.00 | .042 | (.042) | 1.00 | 4.30 | .60 | .60 | 3.90 | 288 |
| 2007 | 1.00 | .044 | (.044) | 1.00 | 4.47 | .60 | .60 | 4.40 | 257 |
| 2006 | 1.00 | .027 | (.027) | 1.00 | 2.69 | .60 | .60 | 2.68 | 219 |
| Service Shares | | | | | | | | | |
| Year Ended January 31, | | | | | | | | | |
| 2010 | 1.00 | .000a | (.000)a | 1.00 | .00b | .72 | .28 | .00b | 5 |
| 2009 | 1.00 | .009 | (.009) | 1.00 | .86 | .71 | .66 | .65 | 5 |
| 2008c | 1.00 | .023 | (.023) | 1.00 | 3.15d | .70d | .70d | 3.80d | 56 |
| Select Shares | | | | | | | | | |
| Year Ended January 31, | | | | | | | | | |
| 2010 | 1.00 | .000a | (.000)a | 1.00 | .00b | 1.02 | .28 | .00b | 25 |
| 2009 | 1.00 | .007 | (.007) | 1.00 | .66 | 1.01 | .87 | .44 | 33 |
| 2008c | 1.00 | .021 | (.021) | 1.00 | 2.89d | 1.00d | 1.00d | 3.50d | 94 |
| Agency Shares | | | | | | | | | |
| Year Ended January 31, | | | | | | | | | |
| 2010 | 1.00 | .000a | (.000)a | 1.00 | .03 | .28 | .24 | .03 | 71 |
| 2009 | 1.00 | .012 | (.012) | 1.00 | 1.21 | .27 | .27 | 1.04 | 63 |
| 2008e | 1.00 | .013 | (.013) | 1.00 | 3.92d | .26d | .26d | 4.24d | —f |
| Premier Shares | | | | | | | | | |
| Year Ended January 31, | | | | | | | | | |
| 2010 | 1.00 | .000a | —a | 1.00 | .00b | .53 | .27 | .00b | 61 |
| 2009 | 1.00 | .010 | (.010) | 1.00 | 1.00 | .53 | .48 | .83 | 35 |
| 2008e | 1.00 | .012 | (.012) | 1.00 | 3.68d | .51d | .51d | 3.99d | 29 |
| a | Amount represents less than $.001 per share. |
| b | Amount represents less than .01%. |
| c | From June 29, 2007 (commencement of initial offering) to January 31, 2008. |
| d | Annualized. |
| e | From October 1, 2007 (commencement of initial offering) to January 31, 2008. |
| f | Amount represents less than $1 million. |
See notes to financial statements.
74
| | | | | | | | | |
| | | Per Share Data ($) | | | Ratios/Supplemental Data (%) | |
| | | | | | | | | Ratio of Net | |
| | Net Asset | | Dividends Net Asset | | Ratio of | Ratio of | Investment Net Assets |
| | Value | Net | from Net | Value | | Total Expenses Net Expenses Income to | End of |
| | Beginning Investment Investment | End | Total | to Average | to Average | Average | Period |
| | of Period | Income | Income | of Period Return (%) Net Assets | Net Assets Net Assets ($ x1,000,000) |
| |
| Dreyfus Treasury | | | | | | | | | |
| Prime Cash Management | | | | | | | | | |
| Institutional Shares | | | | | | | | | |
| Year Ended January 31, | | | | | | | | | |
| 2010 | 1.00 | .000a | (.000)a | 1.00 | .02 | .22 | .19 | .03 | 18,751 |
| 2009 | 1.00 | .012 | (.012) | 1.00 | 1.24 | .22 | .22 | .78 | 30,587 |
| 2008 | 1.00 | .042 | (.042) | 1.00 | 4.28 | .20 | .20 | 3.81 | 5,373 |
| 2007 | 1.00 | .046 | (.046) | 1.00 | 4.68 | .20 | .20 | 4.57 | 1,043 |
| 2006 | 1.00 | .029 | (.029) | 1.00 | 2.96 | .20 | .20 | 2.93 | 1,487 |
| Investor Shares | | | | | | | | | |
| Year Ended January 31, | | | | | | | | | |
| 2010 | 1.00 | .000a | (.000)a | 1.00 | .00b | .47 | .22 | .00b | 4,222 |
| 2009 | 1.00 | .010 | (.010) | 1.00 | 1.01 | .46 | .44 | .56 | 7,522 |
| 2008 | 1.00 | .039 | (.039) | 1.00 | 4.02 | .45 | .45 | 3.56 | 2,573 |
| 2007 | 1.00 | .043 | (.043) | 1.00 | 4.43 | .45 | .45 | 4.32 | 615 |
| 2006 | 1.00 | .027 | (.027) | 1.00 | 2.70 | .45 | .45 | 2.68 | 651 |
| Administrative Shares | | | | | | | | | |
| Year Ended January 31, | | | | | | | | | |
| 2010 | 1.00 | .000a | (.000)a | 1.00 | .00b | .32 | .21 | .00b | 1,272 |
| 2009 | 1.00 | .011 | (.011) | 1.00 | 1.15 | .32 | .31 | .69 | 2,526 |
| 2008 | 1.00 | .041 | (.041) | 1.00 | 4.18 | .30 | .30 | 3.71 | 438 |
| 2007 | 1.00 | .045 | (.045) | 1.00 | 4.59 | .30 | .30 | 4.47 | 5 |
| 2006 | 1.00 | .028 | (.028) | 1.00 | 2.86 | .30 | .30 | 2.83 | 26 |
| Participant Shares | | | | | | | | | |
| Year Ended January 31, | | | | | | | | | |
| 2010 | 1.00 | .000a | (.000)a | 1.00 | .00b | .62 | .22 | .00b | 2,599 |
| 2009 | 1.00 | .009 | (.009) | 1.00 | .89 | .62 | .53 | .47 | 5,437 |
| 2008 | 1.00 | .038 | (.038) | 1.00 | 3.87 | .60 | .60 | 3.41 | 975 |
| 2007 | 1.00 | .042 | (.042) | 1.00 | 4.27 | .60 | .60 | 4.17 | 121 |
| 2006 | 1.00 | .025 | (.025) | 1.00 | 2.55 | .60 | .60 | 2.53 | 352 |
| Agency Shares | | | | | | | | | |
| Year Ended January 31, | | | | | | | | | |
| 2010 | 1.00 | .000a | (.000)a | 1.00 | .00b | .28 | .19 | .01 | 381 |
| 2009 | 1.00 | .012 | (.012) | 1.00 | 1.18 | .27 | .27 | .73 | 409 |
| 2008c | 1.00 | .011 | (.011) | 1.00 | 3.38d | .26d | .26d | 3.75d | —e |
| a | Amount represents less than $.001 per share. |
| b | Amount represents less than .01%. |
| c | From October 1, 2007 (commencement of initial offering) to January 31, 2008. |
| d | Annualized. |
| e | Amount represents less than $1 million. |
See notes to financial statements.
The Funds 75
FINANCIAL HIGHLIGHTS (continued)
| | | | | | | | | |
| | | Per Share Data ($) | | | Ratios/Supplemental Data (%) | |
| | | | | | | | | Ratio of Net | |
| | Net Asset | | Dividends Net Asset | | Ratio of | Ratio of | Investment Net Assets |
| | Value | Net | from Net | Value | | Total Expenses Net Expenses Income to | End of |
| | Beginning Investment Investment | End | Total | to Average | to Average | Average | Period |
| | of Period | Income | Income | of Period Return (%) Net Assets | Net Assets Net Assets ($ x1,000,000) |
| |
| Dreyfus Municipal Cash Management Plus | | | | | | | | |
| Institutional Shares | | | | | | | | | |
| Year Ended January 31, | | | | | | | | | |
| 2010 | 1.00 | .005 | (.005) | 1.00 | .49 | .25 | .23 | .50 | 360 |
| 2009 | 1.00 | .021 | (.021) | 1.00 | 2.17 | .21 | .21 | 2.14 | 589 |
| 2008 | 1.00 | .034 | (.034) | 1.00 | 3.50 | .20 | .20 | 3.42 | 1787 |
| 2007 | 1.00 | .033 | (.033) | 1.00 | 3.37 | .20 | .20 | 3.33 | 596 |
| 2006 | 1.00 | .024 | (.024) | 1.00 | 2.39 | .20 | .20 | 2.34 | 638 |
| Investor Shares | | | | | | | | | |
| Year Ended January 31, | | | | | | | | | |
| 2010 | 1.00 | .003 | (.003) | 1.00 | .27 | .50 | .44 | .29 | 401 |
| 2009 | 1.00 | .019 | (.019) | 1.00 | 1.91 | .46 | .46 | 1.89 | 293 |
| 2008 | 1.00 | .032 | (.032) | 1.00 | 3.25 | .45 | .45 | 3.17 | 472 |
| 2007 | 1.00 | .031 | (.031) | 1.00 | 3.11 | .45 | .45 | 3.08 | 206 |
| 2006 | 1.00 | .021 | (.021) | 1.00 | 2.13 | .45 | .45 | 2.09 | 180 |
| Administrative Shares | | | | | | | | | |
| Year Ended January 31, | | | | | | | | | |
| 2010 | 1.00 | .004 | (.004) | 1.00 | .39 | .35 | .32 | .41 | 582 |
| 2009 | 1.00 | .020 | (.020) | 1.00 | 2.07 | .31 | .31 | 2.04 | 625 |
| 2008 | 1.00 | .033 | (.033) | 1.00 | 3.40 | .30 | .30 | 3.32 | 294 |
| 2007 | 1.00 | .032 | (.032) | 1.00 | 3.27 | .30 | .30 | 3.23 | 291 |
| 2006 | 1.00 | .023 | (.023) | 1.00 | 2.29 | .30 | .30 | 2.24 | 137 |
| Participant Shares | | | | | | | | | |
| Year Ended January 31, | | | | | | | | | |
| 2010 | 1.00 | .002 | (.002) | 1.00 | .18 | .65 | .56 | .17 | 23 |
| 2009 | 1.00 | .017 | (.017) | 1.00 | 1.76 | .61 | .61 | 1.74 | 61 |
| 2008 | 1.00 | .030 | (.030) | 1.00 | 3.09 | .60 | .60 | 3.02 | 37 |
| 2007 | 1.00 | .029 | (.029) | 1.00 | 2.96 | .60 | .60 | 2.93 | 23 |
| 2006 | 1.00 | .020 | (.020) | 1.00 | 1.98 | .60 | .60 | 1.94 | 25 |
| Agency Shares | | | | | | | | | |
| Year Ended January 31, | | | | | | | | | |
| 2010 | 1.00 | .004 | (.004) | 1.00 | .42 | .32 | .29 | .44 | 1 |
| 2009 | 1.00 | .021 | (.021) | 1.00 | 2.10 | .27 | .27 | 2.08 | —a |
| 2008b | 1.00 | .011 | (.011) | 1.00 | 3.20c | .26c | .26c | 3.36c | —a |
| a | Amount represents less than $1 million. |
| b | From October 1, 2007 (commencement of initial offering) to January 31, 2008. |
| c | Annualized. |
See notes to financial statements.
76
| | | | | | | | | |
| | | Per Share Data ($) | | | Ratios/Supplemental Data (%) | |
| | | | | | | | | Ratio of Net | |
| | Net Asset | | Dividends Net Asset | | Ratio of | Ratio of | Investment Net Assets |
| | Value | Net | from Net | Value | | Total Expenses Net Expenses Income to | End of |
| | Beginning Investment Investment | End | Total | to Average | to Average | Average | Period |
| | of Period | Income | Income | of Period Return (%) Net Assets | Net Assets Net Assets ($ x1,000,000) |
| |
| Dreyfus New York Municipal Cash Management | | | | | | | |
| Institutional Shares | | | | | | | | | |
| Year Ended January 31, | | | | | | | | | |
| 2010 | 1.00 | .004 | (.004) | 1.00 | .45 | .25 | .23 | .44 | 589 |
| 2009 | 1.00 | .020 | (.020) | 1.00 | 1.99 | .22 | .22 | 1.95 | 544 |
| 2008 | 1.00 | .034 | (.034) | 1.00 | 3.47 | .20 | .20 | 3.41 | 458 |
| 2007 | 1.00 | .033 | (.033) | 1.00 | 3.36 | .20 | .20 | 3.31 | 377 |
| 2006 | 1.00 | .023 | (.023) | 1.00 | 2.36 | .20 | .20 | 2.33 | 343 |
| Investor Shares | | | | | | | | | |
| Year Ended January 31, | | | | | | | | | |
| 2010 | 1.00 | .002 | (.002) | 1.00 | .23 | .50 | .45 | .22 | 282 |
| 2009 | 1.00 | .017 | (.017) | 1.00 | 1.74 | .47 | .47 | 1.70 | 374 |
| 2008 | 1.00 | .032 | (.032) | 1.00 | 3.21 | .45 | .45 | 3.16 | 363 |
| 2007 | 1.00 | .031 | (.031) | 1.00 | 3.10 | .45 | .45 | 3.06 | 120 |
| 2006 | 1.00 | .021 | (.021) | 1.00 | 2.11 | .45 | .45 | 2.08 | 125 |
| Administrative Shares | | | | | | | | | |
| Year Ended January 31, | | | | | | | | | |
| 2010 | 1.00 | .004 | (.004) | 1.00 | .35 | .35 | .33 | .34 | 70 |
| 2009 | 1.00 | .019 | (.019) | 1.00 | 1.89 | .32 | .32 | 1.85 | 62 |
| 2008 | 1.00 | .033 | (.033) | 1.00 | 3.37 | .30 | .30 | 3.31 | 74 |
| 2007 | 1.00 | .032 | (.032) | 1.00 | 3.25 | .30 | .30 | 3.21 | 36 |
| 2006 | 1.00 | .022 | (.022) | 1.00 | 2.26 | .30 | .30 | 2.23 | 8 |
| Participant Shares | | | | | | | | | |
| Year Ended January 31, | | | | | | | | | |
| 2010 | 1.00 | .001 | (.001) | 1.00 | .15 | .65 | .57 | .10 | 12 |
| 2009 | 1.00 | .016 | (.016) | 1.00 | 1.59 | .62 | .62 | 1.55 | 51 |
| 2008 | 1.00 | .030 | (.030) | 1.00 | 3.06 | .60 | .60 | 3.01 | 47 |
| 2007 | 1.00 | .029 | (.029) | 1.00 | 2.94 | .60 | .60 | 2.91 | 40 |
| 2006 | 1.00 | .019 | (.019) | 1.00 | 1.95 | .60 | .60 | 1.93 | 3 |
| Agency Shares | | | | | | | | | |
| Year Ended January 31, | | | | | | | | | |
| 2010 | 1.00 | .004 | (.004) | 1.00 | .39 | .31 | .29 | .38 | —a |
| 2009 | 1.00 | .019 | (.019) | 1.00 | 1.93 | .28 | .28 | 1.89 | —a |
| 2008b | 1.00 | .011 | (.011) | 1.00 | 3.18c | .26c | .26c | 3.35c | —a |
| a | Amount represents less than $1 million. |
| b | From October 1, 2007 (commencement of initial offering) to January 31, 2008. |
| c | Annualized. |
See notes to financial statements.
The Funds 77
FINANCIAL HIGHLIGHTS (continued)
| | | | | | | | | |
| | | Per Share Data ($) | | | Ratios/Supplemental Data (%) | |
| | | | | | | | | Ratio of Net | |
| | Net Asset | | Dividends Net Asset | | Ratio of | Ratio of | Investment Net Assets |
| | Value | Net | from Net | Value | | Total Expenses Net Expenses Income to | End of |
| | Beginning Investment Investment | End | Total | to Average | to Average | Average | Period |
| | of Period | Income | Income | of Period Return (%) Net Assets | Net Assets Net Assets ($ x1,000,000) |
| |
| Dreyfus Tax Exempt Cash Management | | | | | | | | |
| Institutional Shares | | | | | | | | | |
| Year Ended January 31, | | | | | | | | | |
| 2010 | 1.00 | .004 | (.004) | 1.00 | .37 | .24 | .23 | .40 | 3,383 |
| 2009 | 1.00 | .021 | (.021) | 1.00 | 2.11 | .21 | .21 | 2.06 | 5,191 |
| 2008 | 1.00 | .034 | (.034) | 1.00 | 3.47 | .20 | .20 | 3.39 | 4,370 |
| 2007 | 1.00 | .033 | (.033) | 1.00 | 3.34 | .20 | .20 | 3.29 | 2,333 |
| 2006 | 1.00 | .023 | (.023) | 1.00 | 2.36 | .20 | .20 | 2.35 | 2,645 |
| Investor Shares | | | | | | | | | |
| Year Ended January 31, | | | | | | | | | |
| 2010 | 1.00 | .002 | (.002) | 1.00 | .19 | .49 | .42 | .21 | 354 |
| 2009 | 1.00 | .018 | (.018) | 1.00 | 1.86 | .46 | .46 | 1.81 | 565 |
| 2008 | 1.00 | .032 | (.032) | 1.00 | 3.21 | .45 | .45 | 3.14 | 556 |
| 2007 | 1.00 | .030 | (.030) | 1.00 | 3.08 | .45 | .45 | 3.04 | 288 |
| 2006 | 1.00 | .021 | (.021) | 1.00 | 2.11 | .45 | .45 | 2.10 | 255 |
| Administrative Shares | | | | | | | | | |
| Year Ended January 31, | | | | | | | | | |
| 2010 | 1.00 | .003 | (.003) | 1.00 | .28 | .34 | .32 | .31 | 120 |
| 2009 | 1.00 | .020 | (.020) | 1.00 | 2.01 | .31 | .31 | 1.96 | 645 |
| 2008 | 1.00 | .033 | (.033) | 1.00 | 3.36 | .30 | .30 | 3.29 | 259 |
| 2007 | 1.00 | .032 | (.032) | 1.00 | 3.24 | .30 | .30 | 3.19 | 213 |
| 2006 | 1.00 | .022 | (.022) | 1.00 | 2.26 | .30 | .30 | 2.25 | 105 |
| Participant Shares | | | | | | | | | |
| Year Ended January 31, | | | | | | | | | |
| 2010 | 1.00 | .001 | (.001) | 1.00 | .12 | .64 | .53 | .10 | 27 |
| 2009 | 1.00 | .017 | (.017) | 1.00 | 1.70 | .61 | .61 | 1.66 | 134 |
| 2008 | 1.00 | .030 | (.030) | 1.00 | 3.06 | .60 | .60 | 2.99 | 55 |
| 2007 | 1.00 | .029 | (.029) | 1.00 | 2.93 | .60 | .60 | 2.89 | 30 |
| 2006 | 1.00 | .019 | (.019) | 1.00 | 1.96 | .60 | .60 | 1.95 | 42 |
| Agency Shares | | | | | | | | | |
| Year Ended January 31, | | | | | | | | | |
| 2010 | 1.00 | .003 | (.003) | 1.00 | .32 | .30 | .29 | .34 | 7 |
| 2009 | 1.00 | .020 | (.020) | 1.00 | 2.05 | .27 | .27 | 2.00 | 4 |
| 2008a | 1.00 | .011 | (.011) | 1.00 | 3.18b | .26b | .26b | 3.33b | —c |
| a | From October 1, 2007 (commencement of initial offering) to January 31, 2008. |
| b | Annualized. |
| c | Amount represents less than $1 million. |
See notes to financial statements.
78
| | | | | | | | | |
| | | Per Share Data ($) | | | Ratios/Supplemental Data (%) | |
| | | | | | | | | Ratio of Net | |
| | Net Asset | | Dividends Net Asset | | Ratio of | Ratio of | Investment Net Assets |
| | Value | Net | from Net | Value | | Total Expenses Net Expenses Income to | End of |
| | Beginning Investment Investment | End | Total | to Average | to Average | Average | Period |
| | of Period | Income | Income | of Period Return (%) Net Assets | Net Assets Net Assets ($ x1,000,000) |
| |
| Dreyfus California AMT-Free | | | | | | | | | |
| Municipal Cash Management | | | | | | | | | |
| Institutional Shares | | | | | | | | | |
| Year Ended January 31, | | | | | | | | | |
| 2010 | 1.00 | .004 | (.004) | 1.00 | .40 | .29 | .22 | .34 | 139 |
| 2009 | 1.00 | .019 | (.019) | 1.00 | 1.88 | .22 | .17 | 1.93 | 91 |
| 2008a | 1.00 | .017 | (.017) | 1.00 | 3.29b | .20b | .15b | 3.15b | 115 |
| Investor Shares | | | | | | | | | |
| Year Ended January 31, | | | | | | | | | |
| 2010 | 1.00 | .002 | (.002) | 1.00 | .21 | .54 | .40 | .16 | 64 |
| 2009 | 1.00 | .016 | (.016) | 1.00 | 1.63 | .47 | .42 | 1.68 | 24 |
| 2008a | 1.00 | .015 | (.015) | 1.00 | 3.05b | .45b | .40b | 2.90b | 6 |
| Administrative Shares | | | | | | | | | |
| Year Ended January 31, | | | | | | | | | |
| 2010 | 1.00 | .003 | (.003) | 1.00 | .30 | .40 | .32 | .24 | 4 |
| 2009 | 1.00 | .018 | (.018) | 1.00 | 1.78 | .32 | .27 | 1.83 | —c |
| 2008a | 1.00 | .016 | (.016) | 1.00 | 3.19b | .30b | .25b | 3.05b | —c |
| Participant Shares | | | | | | | | | |
| Year Ended January 31, | | | | | | | | | |
| 2010 | 1.00 | .001 | (.001) | 1.00 | .13 | .69 | .50 | .06 | 56 |
| 2009 | 1.00 | .015 | (.015) | 1.00 | 1.48 | .62 | .57 | 1.53 | 97 |
| 2008a | 1.00 | .014 | (.014) | 1.00 | 2.90b | .60b | .55b | 2.75b | 142 |
| Agency Shares | | | | | | | | | |
| Year Ended January 31, | | | | | | | | | |
| 2010 | 1.00 | .003 | (.003) | 1.00 | .34 | .35 | .28 | .28 | —c |
| 2009 | 1.00 | .018 | (.018) | 1.00 | 1.82 | .28 | .23 | 1.87 | —c |
| 2008d | 1.00 | .010 | (.010) | 1.00 | 3.09b | .26b | .21b | 3.09b | —c |
| a | From August 1, 2007 (commencement of operations) to January 31, 2008. |
| b | Annualized. |
| c | Amount represents less than $1 million. |
| d | From October 1, 2007 (commencement of initial offering) to January 31, 2008. |
See notes to financial statements.
The Funds 79
FINANCIAL HIGHLIGHTS (continued)
| | | | | | | | | | | |
| | | | Per Share Data ($) | | | | | Ratios/Supplemental Data (%) | |
| | | | | Dividends | | | | | | Ratio of Net | |
| Net Asset | | Dividends from Net | | Net Asset | | Ratio of | Ratio of | Investment Net Assets |
| | Value | Net | from Net | Realized | | Value | | Total Expenses Net Expenses Income to | End of |
| Beginning Investment Investment Gain on | Total | End | Total | to Average | to Average | Average | Period |
| of Period | Income | Income | Investments Distributions of Period Return (%) Net Assets | Net Assets Net Assets ($ x1,000,000) |
| |
| Dreyfus New York AMT-Free | | | | | | | | | |
| Municipal Cash Management | | | | | | | | | |
| Institutional Shares† | | | | | | | | | | |
| Year Ended | | | | | | | | | | | |
| January 31, | | | | | | | | | | | |
| 2010 | 1.00 | .005 | (.005) | — | (.005) | 1.00 | .47 | .22 | .22 | .47 | 110 |
| One Month Ended | | | | | | | | | | | |
| January 31, | | | | | | | | | | | |
| 2009a | 1.00 | .001 | (.001) | — | (.001) | 1.00 | .06b | .24c | .24c | .70c | 49 |
| Year Ended | | | | | | | | | | | |
| December 31, | | | | | | | | | | | |
| 2008 | 1.00 | .021 | (.021) | (.000)d | (.021) | 1.00 | 2.08 | .25 | .24 | 2.08 | 49 |
| 2007 | 1.00 | .034 | (.034) | — | (.034) | 1.00 | 3.42 | .25 | .25e | 3.38 | 64 |
| 2006 | 1.00 | .032 | (.032) | — | (.032) | 1.00 | 3.24 | .26 | .25 | 3.20 | 64 |
| 2005 | 1.00 | .021 | (.021) | — | (.021) | 1.00 | 2.16 | .27 | .25 | 2.14 | 67 |
| Investor Shares† | | | | | | | | | | | |
| Year Ended | | | | | | | | | | | |
| January 31, | | | | | | | | | | | |
| 2010 | 1.00 | .003 | (.003) | — | (.003) | 1.00 | .27 | .47 | .43 | .26 | 74 |
| One Month Ended | | | | | | | | | | | |
| January 31, | | | | | | | | | | | |
| 2009a | 1.00 | .000d | (.000)d | — | (.000)d | 1.00 | .04b | .49c | .49c,e | .45c | 102 |
| Year Ended | | | | | | | | | | | |
| December 31, | | | | | | | | | | | |
| 2008 | 1.00 | .018 | (.018) | (.000)d | (.018) | 1.00 | 1.83 | .50 | .49 | 1.80 | 100 |
| 2007 | 1.00 | .031 | (.031) | — | (.031) | 1.00 | 3.16 | .50 | .50e | 3.12 | 139 |
| 2006 | 1.00 | .029 | (.029) | — | (.029) | 1.00 | 2.98 | .51 | .50 | 2.94 | 209 |
| 2005 | 1.00 | .019 | (.019) | — | (.019) | 1.00 | 1.91 | .51 | .50 | 1.85 | 141 |
| Administrative Shares | | | | | | | | | | |
| Year Ended | | | | | | | | | | | |
| January 31, | | | | | | | | | | | |
| 2010 | 1.00 | .004 | (.004) | — | (.004) | 1.00 | .37 | .32 | .31 | .38 | 8 |
| One Month Ended | | | | | | | | | | | |
| January 31, | | | | | | | | | | | |
| 2009a | 1.00 | .001 | (.001) | — | (.001) | 1.00 | .05b | .34c | .34c | .60c | —f |
| Year Ended | | | | | | | | | | | |
| December 31, | | | | | | | | | | | |
| 2008g | 1.00 | .006 | (.006) | — | (.006) | 1.00 | .62c | .33c | .33c,e | 2.02c | —f |
| Participant Shares | | | | | | | | | | |
| Year Ended | | | | | | | | | | | |
| January 31, | | | | | | | | | | | |
| 2010 | 1.00 | .002 | (.002) | — | (.002) | 1.00 | .18 | .62 | .51 | .18 | —f |
| One Month Ended | | | | | | | | | | | |
| January 31, | | | | | | | | | | | |
| 2009a | 1.00 | .000d | (.000)d | — | (.000)d | 1.00 | .03b | .64c | .64c | .30c | —f |
| Year Ended | | | | | | | | | | | |
| December 31, | | | | | | | | | | | |
| 2008g | 1.00 | .005 | (.005) | — | (.005) | 1.00 | .53c | .63c | .63c,e | 1.73c | —f |
| Classic Shares† | | | | | | | | | | | |
| Year Ended | | | | | | | | | | | |
| January 31, | | | | | | | | | | | |
| 2010 | 1.00 | .001 | (.001) | — | (.001) | 1.00 | .13 | .72 | .59 | .10 | 60 |
| One Month Ended | | | | | | | | | | | |
| January 31, | | | | | | | | | | | |
| 2009a | 1.00 | .000d | (.000)d | — | (.000)d | 1.00 | .02b | .74c | .73c | .21c | 76 |
| Year Ended | | | | | | | | | | | |
| December 31, | | | | | | | | | | | |
| 2008 | 1.00 | .016 | (.016) | (.000)d | (.016) | 1.00 | 1.58 | .75 | .74 | 1.55 | 73 |
| 2007 | 1.00 | .029 | (.029) | — | (.029) | 1.00 | 2.90 | .75 | .75e | 2.78 | 79 |
| 2006 | 1.00 | .027 | (.027) | — | (.027) | 1.00 | 2.73 | .76 | .75 | 2.68 | 29 |
| 2005 | 1.00 | .016 | (.016) | — | (.016) | 1.00 | 1.66 | .77 | .75 | 1.61 | 12 |
|
| † Represents information for the fund’s predecessor, BNY Hamilton NewYork AMT-Free Money Market Fund through September 12, 2008. |
| a The fund has changed its fiscal year end from December 31 to January 31. |
| b Not annualized. |
| c Annualized. |
| d Amount represents less than $.001 per share. |
| e Expense waivers and/or reimbursements amounted to less than .01%. |
| f Amount represents less than $1 million. |
| g From September 13, 2008 (commencement of initial offering) to December 31, 2008. |
See notes to financial statements.
80
NOTES TO FINANCIAL STATEMENTS
NOTE 1—Significant Accounting Policies:
Dreyfus Cash Management, Dreyfus Cash Management Plus, Inc., Dreyfus Government Cash Management, Dreyfus Government Prime Cash Management, Dreyfus Treasury & Agency Cash Management, Dreyfus Treasury Prime Cash Management, Dreyfus Municipal Cash Management Plus, Dreyfus New York Municipal Cash Management, Dreyfus Tax Exempt Cash Management, Dreyfus California AMT-Free Municipal Cash Management and Dreyfus New York AMT-Free Municipal Cash Management (each, a “fund” and collectively, the “funds”) are open-end management investment companies registered under the Investment Company Act of 1940, as amended (the “Act”). Each fund, other than Dreyfus New York Municipal Cash Management, Dreyfus California AMT-Free Municipal Cash Management and Dreyfus New York AMT-Free Municipal Cash Management is diversified. Dreyfus New York Municipal Cash Management, Dreyfus California AMT-Free Municipal Cash Managem ent and Dreyfus New York AMT-Free Municipal Cash Management are non-diversified. Dreyfus Government Cash Management and Dreyfus Government Prime Cash Management are each a separate series of Dreyfus Government Cash Management Funds (the “Company”) and Dreyfus Tax Exempt Cash Management, Dreyfus California AMT-Free Municipal Cash Management and Dreyfus New York AMT-Free Municipal Cash Management are separate series of Dreyfus Tax Exempt Cash Management Funds (the “Trust”). Each fund’s investment objective is to provide investors with as high a level of current income as is consistent with the preservation of capital and the maintenance of liquidity and, in the case of Dreyfus Municipal Cash Management Plus and Dreyfus Tax Exempt Cash Management only, which are exempt from federal income tax; in the case of Dreyfus New York Municipal Cash Management and Dreyfus NewYork AMT-Free Municipal Cash Management, which is exempt from federal, NewYork state and NewYork city personal income taxes , and in the case of Dreyfus California AMT-Free Municipal Cash Management only, which is exempt from federal and California state personal income taxes.The Dreyfus Corporation (the “Manager” or “Dreyfus”), a wholly-owned subsidiary of The Bank of
NewYork Mellon Corporation (“BNY Mellon”), serves as each fund’s investment adviser.
As of the close of business on August 6, 2008, pursuant to an Agreement and Plan of Reorganization previously approved by Dreyfus Cash Management’s Board of Trustees, all of the assets, subject to the liabilities, of Dreyfus Institutional Prime Money Market Fund, were transferred to Dreyfus Cash Management. Shareholders of Dreyfus Institutional Prime Money Market Fund voted affirmatively to approve the reorganization and subsequently received Administrative shares of Dreyfus Cash Management in an amount equal to the aggregate net asset value of the investment in Dreyfus Institutional Prime Money Market Fund at the time of the exchange. The net asset value of Dreyfus Cash Management’s Administrative shares at the close of business on August 6, 2008, after the reorganization, was $1.00 per share, and a total of $783,342,509 Administrative shares representing net assets of $783,342,371, were issued to Dreyfus Institution al Prime Money Market Fund shareholders in the exchange. The exchange was a tax-free event to shareholders.
MBSC Securities Corporation (the “Distributor”), a wholly-owned subsidiary of the Manager, is the distributor of the funds’ shares, which are sold to the public without a sales charge. Each fund offers Institutional Shares, Investor Shares, Administrative Shares, Participant Shares and Agency Shares (with the exception of Dreyfus New York AMT-Free Municipal Cash Management which does not offer Agency Shares). In addition, Dreyfus Cash Management Plus, Inc.and Dreyfus Treasury & Agency Cash Management also offer Service Shares and Select Shares, Dreyfus Treasury & Agency Cash Management also offers Premier Shares and Dreyfus New York AMT-Free Municipal Cash Management also offers Classic Shares. Each share class, except Institutional Shares, are subject to a Service Plan adopted pursuant to Rule 12b-1 under the act. Other differences between the classes include the services offered (by service agents recei ving Rule 12b-1 fees) to and the expenses borne by each class and certain voting rights. Income, expenses (other than expenses attributable to a specific class), and realized and unrealized gains or losses on investments are allocated to each class of shares based on its relative net assets.
The Funds 81
NOTES TO FINANCIAL STATEMENTS (continued)
As of January 31, 2010, MBC Investments Corp., an indirect subsidiary of BNY Mellon held the following shares:
| |
| Dreyfus Cash Management Plus, Inc., | |
| Agency Shares | 1,045 |
| |
| Dreyfus Municipal Cash | |
| Management Plus, Agency Shares | 1,036 |
| |
| Dreyfus New York Municipal Cash | |
| Management, Agency Shares | 1,034 |
| |
| Dreyfus California AMT-Free | |
| Municipal Cash Management, | |
| Agency Shares | 1,032 |
| |
| Dreyfus New York AMT-Free | |
| Municipal Cash Management, | |
| Participant Shares | 10,000 |
It is each fund’s policy to maintain a continuous net asset value per share of $1.00; each fund has adopted certain investment, portfolio valuation and dividend and distribution policies to enable it to do so. There is no assurance, however, that any fund will be able to maintain a stable net asset value per share of $1.00.
The Company and the Trust account separately for the assets, liabilities and operations of each series. Expenses directly attributable to each series are charged to that series’ operations; expenses which are applicable to all series are allocated among them on a pro rata basis.
The Financial Accounting Standards Board (“FASB”) Accounting Standards Codification (“ASC”) has become the exclusive reference of authoritative U.S. generally accepted accounting principles (“GAAP”) recognized by the FASB to be applied by nongovernmental entities. Rules and interpretive releases of the Securities and Exchange Commission (“SEC”) under authority of federal laws are also sources of authoritative GAAP for SEC registrants.The ASC has superseded all existing non-SEC accounting and reporting standards. Each fund’s financial statements are prepared in accordance with GAAP, which may require the use of management estimates and assumptions. Actual results could differ from those estimates.
The funds enter into contracts that contain a variety of indemnifications. The funds’ maximum exposure under these arrangements is unknown. The funds do not anticipate recognizing any loss related to these arrangements.
(a) Portfolio valuation: Investments in securities are valued at amortized cost (other than those securities covered by a Capital Support Agreement, as described in Note 1(f) below, which are carried at market value based upon valuations provided by an independent pricing service approved by the Board of Trustees/Directors) in accordance with Rule 2a-7 of the Act, which has been determined by the Board members to represent the fair value of each fund’s investments.
The fair value of a financial instrument is the amount that would be received to sell an asset or paid to transfer a liability in an orderly transaction between market participants at the measurement date (i.e. the exit price). GAAP establishes a fair value hierarchy that prioritizes the inputs of valuation techniques used to measure fair value. This hierarchy gives the highest priority to unadjusted quoted prices in active markets for identical assets or liabilities (Level 1 measurements) and the lowest priority to unobservable inputs (Level 3 measurements).
Additionally, GAAP provides guidance on determining whether the volume and activity in a market has decreased significantly and whether such a decrease in activity results in transactions that are not orderly. GAAP requires enhanced disclosures around valuation inputs and techniques used during annual and interim periods.
Various inputs are used in determining the value of the each fund’s investments relating to fair value measurements. These inputs are summarized in the three broad levels listed below:
Level 1—unadjusted quoted prices in active markets for
identical investments.
Level 2—other significant observable inputs (including
quoted prices for similar investments, interest rates, pre-
payment speeds, credit risk, etc.).
Level 3—significant unobservable inputs (including the
funds’ own assumptions in determining the fair value of
investments).
The inputs or methodology used for valuing securities are not necessarily an indication of the risk associated with investing in those securities. For example, money market securities are valued using amortized cost, in accordance
82
with rules under the Act. Generally, amortized cost approximates the current fair value of a security, but since the value is not obtained from a quoted price in an active market, such securities are reflected as Level 2.
Table 1 summarizes the inputs used as of January 31, 2010 in valuing each fund’s investments.
(b) Securities transactions and investment income:
Securities transactions are recorded on a trade date basis. Realized gains and losses from securities transactions are recorded on the identified cost basis. Interest income, adjusted for accretion of discount and amortization of premium on investments, is earned from settlement date and recognized on the accrual basis. Cost of investments represents amortized cost.
The funds have arrangements with the custodian and cash management bank whereby the funds may receive earnings credits when positive cash balances are maintained, which are used to offset custody and cash management fees. For financial reporting purposes, the funds include net earnings credits as an expense offset in the Statement of Operations.
Dreyfus New York Municipal Cash Management, Dreyfus California AMT-Free Municipal Cash Management and Dreyfus NewYork AMT-Free Municipal Cash Management
follow an investment policy of investing primarily in municipal obligations of one state. Economic changes affecting the state and certain of its public bodies and municipalities may affect the ability of issuers within the state to pay interest on, or repay principal of, municipal obligations held by the fund.
(c) Repurchase Agreements: Dreyfus Cash Management, Dreyfus Cash Management Plus, Inc., Dreyfus Government Cash Management and Dreyfus Treasury & Agency Cash Management may enter into repurchase agreements with financial institutions, deemed to be creditworthy by the Manager, subject to the seller’s agreement to repurchase and the fund’s agreement to resell such securities at a mutually agreed upon price. Securities purchased subject to repurchase agreements are deposited with the funds’ custodians and, pursuant to the terms of the repurchase agreement, must have an aggregate market value greater than or equal to the repurchase price plus accrued interest at all times. If the value of the underlying securities falls below the value of the repurchase price plus accrued interest, the fund will require the seller to deposit additional c ollateral by the next business day. If the request for additional collateral is not met, or the seller defaults on its repurchase obligation, the fund maintains the right to sell the underlying securities at market value and may claim any resulting loss against the seller.
| | | | |
| Table 1. | | | | |
| |
| | | Short-Term Investments ($)† | |
| Level 1—Unadjusted Quoted | Level 2—Other Significant | Level 3—Significant | |
| | Prices | Observable Inputs | Unobservable Inputs | Total |
| Dreyfus Cash Management | — | 39,522,610,433 | — | 39,522,610,433 |
| Dreyfus Cash Management Plus, Inc. | — | 5,677,269,211 | — | 5,677,269,211 |
| Dreyfus Government Cash Management | — | 27,402,952,717 | — | 27,402,952,717 |
| Dreyfus Government Prime Cash Management | — | 4,995,151,979 | — | 4,995,151,979 |
| Dreyfus Treasury & Agency Cash Management | — | 15,280,303,089 | — | 15,280,303,089 |
| Dreyfus Treasury Prime Cash Management | — | 27,090,870,378 | — | 27,090,870,378 |
| Dreyfus Municipal Cash Management Plus | — | 1,380,228,259 | — | 1,380,228,259 |
| Dreyfus New York Municipal Cash Management | — | 952,705,011 | — | 952,705,011 |
| Dreyfus Tax Exempt Cash Management | — | 3,962,580,277 | — | 3,962,580,277 |
| Dreyfus California AMT-Free Municipal Cash Management | — | 240,693,585 | — | 240,693,585 |
| Dreyfus New York AMT-Free Municipal Cash Management | — | 244,737,926 | — | 244,737,926 |
| |
| † | See Statement of Investments for additional categorizations. |
The Funds 83
NOTES TO FINANCIAL STATEMENTS (continued)
(d) Dividends to shareholders: It is the policy of each fund to declare dividends from investment income-net on each business day. Such dividends are paid monthly. Dividends from net realized capital gains, if any, are normally declared and paid annually, but each fund may make distributions on a more frequent basis to comply with the distribution requirements of the Internal Revenue Code of 1986, as amended (the “Code”).To the extent that net realized capital gains can be offset by capital loss carryovers, it is the policy of each fund not to distribute such gains.
(e) Federal income taxes: It is the policy of Dreyfus Cash Management, Dreyfus Cash Management Plus, Inc., Dreyfus Government Cash Management, Dreyfus Government Prime Cash Management, Dreyfus Treasury & Agency Cash Management and DreyfusTreasury Prime Cash Management to continue to qualify as a regulated investment company if such qualification is in the best interests of its shareholders, by complying with the applicable provisions of the Code and to make distributions of taxable income sufficient to relieve it from substantially all federal income and excise taxes.
It is the policy of Dreyfus Municipal Cash Management Plus, Dreyfus New York Municipal Cash Management, Dreyfus Tax Exempt Cash Management, Dreyfus California AMT-Free Municipal Cash Management and Dreyfus New York AMT-Free Municipal Cash Management to continue to qualify as a regulated investment company, which can distribute tax exempt dividends, by complying with the applicable provisions of the Code and to make distributions of income and net realized gain sufficient to relieve it from substantially all federal income and excise taxes.
As of and during the period ended January 31, 2010, the funds did not have any liabilities for any uncertain tax posi-tions.The funds recognize interest and penalties, if any, related to uncertain tax positions as income tax expense in the
Statement of Operations. During the period, the funds did not incur any interest or penalties.
Each of the tax years in the four-year period ended January 31, 2010 remains subject to examination by the Internal Revenue Service and state taxing authorities.
At January 31, 2010, the components of accumulated earnings on a tax basis were substantially the same as for financial reporting purposes.
Table 2 summarizes each relevant fund’s accumulated capital loss carryover available for federal income tax purposes to be applied against future net securities profits, if any, realized subsequent to January 31, 2010.
The tax character of each relevant fund’s distributions paid to shareholders (except for Dreyfus Municipal Cash Management Plus, Dreyfus New York Municipal Cash Management, Dreyfus Tax Exempt Cash Management, Dreyfus California AMT-Free Municipal Cash Management and Dreyfus New York AMT-Free Municipal Cash Management) during the fiscal periods ended January 31, 2010 and January 31, 2009, were all ordinary income.
Table 3 summarizes the tax character of distributions paid to shareholders of Dreyfus Municipal Cash Management Plus, Dreyfus New York Municipal Cash Management, Dreyfus Tax Exempt Cash Management, Dreyfus California AMT-Free Municipal Cash Management and Dreyfus New York AMT-Free Municipal Cash Management during the fiscal periods ended January 31, 2010 and January 31, 2009.
During the period ended January 31, 2010, as a result of permanent book to tax differences, primarily due to dividend reclassification, Dreyfus Government Prime Cash Management increased accumulated undistributed investment income-net by $19,600 and decreased accumulated
| | | | | | |
| Table 2. | | | | | | |
| |
| | Expiring in fiscal: | | ($ x 1,000) | |
| | 2014† | 2015† | 2016† | 2017† | 2018† | Total |
| Dreyfus Cash Management | — | — | — | 2 | — | 2 |
| Dreyfus Cash Management Plus, Inc. | 4,986 | — | — | — | 13,350 | 18,336 |
| |
| † | If not applied, the carryovers expire in the above years. |
84
net realized gain (loss) on investments by the same amount. Net assets and net asset value per share were not affected by this reclassification.
During the period ended January 31, 2010, as a result of permanent book to tax differences, primarily due to dividend reclassification, Dreyfus Treasury Prime Cash Management increased accumulated undistributed investment income-net by $133,110 and decreased accumulated net realized gain (loss) on investments by the same amount. Net assets and net asset value per share were not affected by this reclassification.
During the period ended January 31, 2010, as a result of permanent book to tax differences, primarily due to dividend reclassification, Dreyfus Municipal Cash Management Plus increased accumulated undistributed investment income-net by $175,168 and decreased accumulated net realized gain (loss) on investments by the same amount. Net assets and net asset value per share were not affected by this reclassification.
During the period ended January 31, 2010, as a result of permanent book to tax differences, primarily due to dividend reclassification, Dreyfus New York Municipal Cash Management increased accumulated undistributed investment income-net by $87,576 and decreased accumulated net realized gain (loss) on investments by the same amount. Net assets and net asset value per share were not affected by this reclassification.
During the period ended January 31, 2010, as a result of permanent book to tax differences, primarily due to dividend
Table 3.
reclassification, Dreyfus Tax Exempt Cash Management increased accumulated undistributed investment income-net by $140,395 and decreased accumulated net realized gain (loss) on investments by the same amount. Net assets and net asset value per share were not affected by this reclassification.
During the period ended January 31, 2010, as a result of permanent book to tax differences, primarily due to dividend reclassification, Dreyfus California AMT-Free Municipal Cash Management increased accumulated undistributed investment income-net by $14,569 and decreased accumulated net realized gain (loss) on investments by the same amount. Net assets and net asset value per share were not affected by this reclassification.
At January 31, 2010, the cost of investments for federal income tax purposes was substantially the same as the cost for financial reporting purposes (see the Statements of Investments).
(f) Capital Support Agreement: Dreyfus Cash Management Plus, Inc., held notes (the “Notes”) issued by Lehman Brothers Holdings, Inc. (“Lehman”). In order to mitigate the negative impact of holding these securities in light of the bankruptcy of Lehman, on September 16, 2008, the fund entered into a Capital Support Agreement (the “Agreement”) with BNY Mellon, the parent company of the fund’s adviser. Pursuant to the Agreement, BNY Mellon had agreed to provide capital support to the fund, subject to a maximum amount of $97.2 million (the “Maximum
| | | | | | |
| Tax Character of Distributions Paid ($ x 1,000) | | 2010 | | | 2009 | |
| | | | Long-Term | | | Long-Term |
| | Tax-Exempt | Ordinary | Capital | Tax-Exempt | Ordinary | Capital |
| | Income | Income | Gains | Income | Income | Gains |
| Dreyfus Municipal Cash Management Plus | 8,292 | 175 | — | 33,984 | 73 | 24 |
| Dreyfus New York Municipal Cash Management | 3,592 | 3 | 85 | 16,959 | —a | 7 |
| Dreyfus Tax Exempt Cash Management | 23,272 | 97 | 43 | 118,001 | 60 | 37 |
| Dreyfus California AMT-Free Municipal Cash Management | 676 | 15 | — | 5,530 | 21 | — |
| Dreyfus New York AMT-Free Municipal Cash Management | 586 | — | — | 82 | — | — |
| a | Amount represents less than $1,000. |
The Funds 85
NOTES TO FINANCIAL STATEMENTS (continued)
Capital Support Payment”), if any of the following events resulted in the fund’s net asset value falling below $0.9950:
(i) Any final sale or other final liquidation of the Notes
by the fund for cash in an amount, after deduction of
costs, which is less than the amortized cost value of
the Notes as of the date such sale or liquidation is
consummated;
(ii) Receipt by the fund of final payment on the Notes
in cash in an amount less than the amortized cost
value of the Notes less costs in respect thereof, as of
the date such final payment is received; and
(iii) The date upon which a court of competent jurisdic-
tion over the matter discharges Lehman from liabili-
ty in respect of the Notes, and such discharge results
in the receipt of aggregate payments on the Notes in
an amount less than the amortized cost value of the
Notes, less costs in respect thereof, as of the date such
final payment is received.
On September 9, 2009, the fund sold the Notes it held in Lehman, which obligated BNY Mellon to make payments to the fund pursuant to the terms of the Agreement. The fund received payments amounting to $68,406,721 and the Agreement was terminated.
(g) Treasury’s Temporary Guarantee Program: Each fund entered into a Guarantee Agreement with the United States Department of the Treasury (the “Treasury”) to participate in the Treasury’s Temporary Guarantee Program for Money Market Funds (the “Program”).
Under the Program, the Treasury guaranteed the share price of shares of the fund held by shareholders as of September 19, 2008 at $1.00 per share if the fund’s net asset value per share fell below $0.995 (a “Guarantee Event”) and the fund liquidated. Recovery under the Program was subject to certain conditions and limitations.
Fund shares acquired by investors after September 19, 2008 that increased the number of fund shares the investor held at the close of business on September 19, 2008 were not eligible for protection under the Program. In addition, fund shares acquired by investors who did not hold fund shares at the close of business on September 19, 2008 were not eligible for protection under the Program.
For Dreyfus Cash Management, Dreyfus Cash Management Plus, Inc., Dreyfus Municipal Cash Management Plus, Dreyfus New York Municipal Cash Management, Dreyfus Tax Exempt Cash Management, Dreyfus California AMT-Free Municipal Cash Management and Dreyfus New York AMT-Free Municipal Cash Management, the Program, which was originally set to expire on December 18, 2008, was initially extended by the Treasury until April 30, 2009 and had been further extended by the Treasury until September 18, 2009, at which time the Secretary of the Treasury terminated the Program. As such, the above mentioned funds are no longer eligible to participate under the Program. Participation in the initial term and the extended periods of the Program required payments to the Treasury in the amounts of .01%, .015% and .015% except for Dreyfus Cash Management Plus, Inc., which was .015%, .022% and .023%, respectively, of the funds’ shares outstanding as of September 19, 2008 (valued at $1.00 per share). These expenses were borne by each fund in their respective amounts without regard to any expense limitation in effect.
Dreyfus Government Cash Management, Dreyfus Government Prime Cash Management, Dreyfus Treasury & Agency Cash Management and DreyfusTreasury Prime Cash Management terminated their participation in the Program on May 1, 2009. As a result, shareholder assets in the above mentioned funds that were covered under the Program beginning September 19, 2008 were no longer covered effective May 1, 2009. Participation in the initial term and the April 30, 2009 extension period of the Program required payments to the Treasury in the amounts of .01% and .015%, respectively, of the funds’ shares outstanding as of September 19, 2008 (valued at $1.00 per share). These expenses were borne by each fund in their respective amounts without regard to any expense limitation in effect.
NOTE 2—Management Fee and Other Transactions with Affiliates:
(a) Pursuant to separate management agreements with the Manager, the management fee of each fund is computed at the annual rate of .20% of the value of such fund’s average daily net assets and is payable monthly.
86
The Manager has undertaken to reimburse expenses in the event that current yields drop below a certain level. Such limitation may fluctuate daily, is voluntary and not contractual and may be terminated at any time. Table 4 summarizes the reduction in expenses for each relevant class of shares of each fund pursuant to the undertaking during the period ended January 31, 2010.
From February 1, 2009 through September 30, 2009, the Manager limited certain funds’ operating expenses or assumed all or a part of the expenses of the funds. These expense limitations and waivers were voluntary, not contractual, and could be terminated at any time.As of October 1, 2009, these expense limitations terminated and the funds began to absorb all their expenses. Table 5 summarizes the amount each fund were reimbursed pursuant to the undertaking through September 30, 2009.
As to Dreyfus Cash Management Plus,Inc.,effective February 10, 2010, the Manager has agreed to waive a portion of the
expenses so that annual fund operating expenses (exclusive of Rule 12b-1 Service Plan expenses) be limited to .15% of the value of the fund’s average daily net assets.This undertaking is voluntary,not contractual,and may be terminated at any time.
As to Dreyfus California AMT-Free Municipal Cash Management, the Manager waived receipt of a portion of the management fee, in the amount of .05% of the value of the fund’s average daily net assets from February 1, 2009 through August 5, 2009, and .03% of the value of the fund’s average daily net assets from August 6, 2009 through December 13, 2009. The reduction in management fee, pursuant to the undertaking, amounted to $98,027 during the period ended January 31, 2010. This agreement was terminated on December 13, 2009.
As to Dreyfus New York AMT-Free Municipal Cash Management, the Manager has agreed that until September 30, 2010, the Manager, and not the fund, will be liable for fund expenses (exclusive of taxes, brokerage fees, interest on
| | | | | | |
| Table 4. | | | | | | |
| |
| | | Dreyfus | Dreyfus | Dreyfus | Dreyfus | Dreyfus |
| | | Cash | Government | Government | Treasury & | Treasury |
| | Dreyfus Cash | Management | Cash | Prime Cash | Agency Cash | Prime Cash |
| | Management | Plus, Inc. | Management | Management | Management | Management |
| Institutional Shares ($) | — | — | 58,124 | 138,537 | 1,378,833 | 4,864,320 |
| Investor Shares ($) | 2,028,509 | 566,697 | 2,826,284 | 933,128 | 4,328,422 | 12,682,419 |
| Administrative Shares ($) | 17,011 | 27,703 | 266,185 | 177,703 | 397,552 | 1,688,928 |
| Participant Shares ($) | 1,136,282 | 574,555 | 1,039,553 | 2,447,327 | 1,334,230 | 12,895,299 |
| Agency Shares ($) | — | — | 9,394 | 7,520 | 23,842 | 181,275 |
| Service Shares ($) | — | 5,003 | — | — | 175,787 | — |
| Select Shares ($) | — | 25,404 | — | — | 26,591 | — |
| Premier Shares ($) | — | — | — | — | 138,455 | — |
| |
| |
| |
| | | Dreyfus | Dreyfus | | Dreyfus | Dreyfus |
| | | Municipal | New York | Dreyfus | California | New York |
| | | Cash | Municipal | Tax Exempt | AMT-Free | AMT-Free |
| | | Management | Cash | Cash | Municipal Cash | Municipal Cash |
| Table 4. (continued) | | Plus | Management | Management | Management | Management |
| Institutional Shares ($) | | — | — | 2,155 | — | — |
| Investor Shares ($) | | 108,216 | 109,869 | 282,671 | 41,901 | 42,221 |
| Administrative Shares ($) | | 4,082 | 2,281 | 8,524 | 343 | 329 |
| Participant Shares ($) | | 25,120 | 19,339 | 108,516 | 86,099 | 11 |
| Agency Shares ($) | | — | — | 110 | — | — |
| Classic Shares ($) | | — | — | — | — | 90,803 |
The Funds 87
NOTES TO FINANCIAL STATEMENTS (continued)
borrowings and extraordinary expenses) other than the following expenses, which will be borne by the fund: the management fee, and with respect to the fund’s Investor Shares, Administrative Shares, Participant Shares, and Classic Shares, Rule 12b-1 Service Plan expenses from February 1, 2009 through September 30, 2010.
(b) Under each fund’s Service Plan adopted pursuant to Rule 12b-1 under the Act, with respect to each fund’s Investor Shares, Administrative Shares, Participant Shares and Agency Shares (with the exception of Dreyfus New York AMT-Free Municipal Cash Management which does not offer Agency Shares), Dreyfus Cash Management Plus’, Service Shares and Select Shares, Dreyfus Treasury & Agency Cash Management’s, Service Shares, Select Shares and Premier Shares and Dreyfus New York AMT-Free Municipal Cash Management’s Classic Shares, each fund pays the Distributor for distributing such classes of shares, for advertising and marketing and for providing certain services relating to shareholders of the respective class of
shares. These services include answering shareholder inquiries regarding the fund and providing reports and other information and services related to the maintenance of shareholder accounts (“Servicing”). Under the Service Plan, as to each relevant class, the Distributor may make payments to Service Agents in respect to these services. Generally, the Service Agent may provide holders of Investor,Administrative, Participant,Agency, Service, Select, Premier and Classic Shares a consolidated statement. The Service Agent generally also will provide the holders of Investor, Participant, Premier, Service and/or Select Shares, automated teller check writing privileges and, in the case of Participant, Premier, Service or Select Shares, automated teller machine access, and bill paying services.The amount paid under the Service Plan for Servicing is intended to be a “service fee” as defined under the Conduct Rules of the Financial Industry Regulatory Authority (“FINRA”), and at no time will such amount exceed the maximum amount permitted to be paid under the FINRA Conduct Rules as
| | | | | | |
| Table 5. | | | | | | |
| |
| | | Dreyfus | Dreyfus | Dreyfus | Dreyfus | Dreyfus |
| | | Cash | Government | Government | Treasury & | Treasury |
| | Dreyfus Cash | Management | Cash | Prime Cash | Agency Cash | Prime Cash |
| | Management | Plus, Inc. | Management | Management | Management | Management |
| Institutional Shares ($) | 1,832,113 | 468,451 | 1,606,121 | 473,372 | 1,027,514 | 1,548,059 |
| Investor Shares ($) | 151,400 | 118,813 | 118,737 | 56,208 | 151,361 | 205,930 |
| Administrative Shares ($) | 50,661 | 91,011 | 52,106 | 69,054 | 85,638 | 66,646 |
| Participant Shares ($) | 46,254 | 66,581 | 33,644 | 63,298 | 20,266 | 222,415 |
| Agency Shares ($) | 5,295 | 133 | 4,714 | 2,975 | 415 | 2,845 |
| Service Shares ($) | — | 658 | — | — | 1,287 | — |
| Select Shares ($) | — | 495 | — | — | 6,510 | — |
| Premier Shares ($) | — | — | — | — | 2,855 | — |
| |
| |
| | | Dreyfus | Dreyfus | | Dreyfus | Dreyfus |
| | | Municipal | New York | Dreyfus | California | New York |
| | | Cash | Municipal | Tax Exempt | AMT-Free | AMT-Free |
| | | Management | Cash | Cash | Municipal Cash | Municipal Cash |
| Table 5. (continued) | | Plus | Management | Management | Management | Management |
| Institutional Shares ($) | | 223,374 | 128,206 | 685,138 | 45,233 | — |
| Investor Shares ($) | | 68,850 | 69,137 | 44,978 | 19,813 | — |
| Administrative Shares ($) | | 150,244 | 12,538 | 37,744 | 2,870 | — |
| Participant Shares ($) | | 9,055 | 6,260 | 10,222 | 22,320 | — |
| Agency Shares ($) | | 654 | 18 | 746 | 19 | — |
| Classic Shares ($) | | — | — | — | — | — |
88
a service fee. The fees payable under the Service Plan are payable without regard to actual expenses incurred. Table 6 summarizes the amount each fund was charged pursuant to the Service Plan during the period ended January 31, 2010.
(c) Each fund (except for Dreyfus New York AMT-Free Municipal Cash Management) has adopted a Shareholder Services Plan (the “Plan”), with respect to their Institutional shares. Each fund reimburses the Distributor an amount not to exceed an annual rate of .25% of the value of the fund’s average daily net assets attributable to Institutional Shares
for certain allocated expenses of providing personal services and/or maintaining shareholder accounts. The services provided may include personal services relating to shareholder accounts, such as answering shareholder inquiries regarding the fund, providing reports and other information and services related to the maintenance of shareholder accounts. Table 7 summarizes the amount each fund was charged pursuant to the Plan during the period ended January 31, 2010.
| | | | | | | | |
| Table 6. | | | | | | | | |
| |
| | Investor | Administrative | Participant | Service | Select | Agency | Premier | Classic |
| | Shares ($) | Shares ($) | Shares ($) | Shares ($) | Shares ($) | Shares ($) | Shares ($) | Shares ($) |
| Dreyfus Cash Management | 11,328,819 | 1,408,077 | 4,479,245 | — | — | 100,625 | — | — |
| Dreyfus Cash Management Plus, Inc. | 3,159,519 | 995,114 | 2,226,366 | 20,043 | 64,110 | 1 | — | — |
| Dreyfus Government Cash Management | 7,665,745 | 1,345,903 | 2,086,541 | — | — | 53,028 | — | — |
| Dreyfus Government Prime | | | | | | | | |
| Cash Management | 1,690,326 | 597,327 | 3,476,948 | — | — | 27,582 | — | — |
| Dreyfus Treasury & Agency | | | | | | | | |
| Cash Management | 6,223,353 | 819,979 | 1,595,876 | 27,432 | 190,959 | 50,011 | 171,019 | — |
| Dreyfus Treasury Prime | | | | | | | | |
| Cash Management | 12,829,251 | 1,695,607 | 13,135,065 | — | — | 132,095 | — | — |
| Dreyfus Municipal Cash | | | | | | | | |
| Management Plus | 847,004 | 726,826 | 168,015 | — | — | 1,674 | — | — |
| Dreyfus New York Municipal | | | | | | | | |
| Cash Management | 890,529 | 64,651 | 118,156 | — | — | 1 | — | — |
| Dreyfus Tax Exempt Cash Management | 1,299,037 | 419,930 | 468,633 | — | — | 4,721 | — | — |
| Dreyfus California AMT-Free | | | | | | | | |
| Municipal Cash Management | 148,041 | 8,469 | 290,567 | — | — | 1 | — | — |
| Dreyfus New York AMT-Free | | | | | | | | |
| Municipal Cash Management | 216,486 | 3,108 | 40 | — | — | — | — | 335,675 |
| |
| Table 7. | |
| |
| | Institutional |
| | Shares ($) |
| Dreyfus Cash Management | 478,394 |
| Dreyfus Cash Management Plus, Inc. | 99,486 |
| Dreyfus Government Cash Management | 333,350 |
| Dreyfus Government Prime Cash Management | 54,892 |
| Dreyfus Treasury & Agency Cash Management | 410,975 |
| Dreyfus Treasury Prime Cash Management | 300,842 |
| Dreyfus Municipal Cash Management Plus | 34,684 |
| Dreyfus New York Municipal Cash Management | 22,604 |
| Dreyfus Tax Exempt Cash Management | 350,865 |
| Dreyfus California AMT-Free Municipal Cash Management | 146 |
The Funds 89
NOTES TO FINANCIAL STATEMENTS (continued)
The funds (except for Dreyfus New York AMT-Free ing cash management services related to fund subscriptions Municipal Cash Management) compensate DreyfusTransfer, and redemptions. Table 9 summarizes the amount each Inc., a wholly-owned subsidiary of the Manager, under a fund was charged during the period ended January 31, transfer agency agreement for providing personnel and facil- 2010, pursuant to the cash management agreement, which ities to perform transfer agency services for the funds. is included in Shareholder servicing costs in the Statements Table 8 summarizes the amount each fund was charged of Operations. These fees were offset by earnings credit s during the period ended January 31, 2010, pursuant to the pursuant to the cash management agreement. transfer agency agreement, which is included in Shareholder The funds (except for Dreyfus New York AMT-Free servicing costs in the Statements of Operations.
Municipal Cash Management) also compensate The Bank of The funds (except Dreyfus NewYork AMT-Free Municipal NewYork Mellon under a custody agreement for providing Cash Management) compensate The Bank of New York custodial services for each fund. Table 10 summarizes the Mellon, a subsidiary of BNY Mellon and an affiliate of amount each fund was charged during the period ended Dreyfus, under a cash management agreement for perform- January 31, 2010, pursuant to the custody agreement.
| |
| Table 8. | |
| |
| | Transfer Agency |
| | Fees ($) |
| Dreyfus Cash Management | 71,869 |
| Dreyfus Cash Management Plus, Inc. | 80,643 |
| Dreyfus Government Cash Management | 60,386 |
| Dreyfus Government Prime Cash Management | 54,810 |
| Dreyfus Treasury & Agency Cash Management | 58,468 |
| Dreyfus Treasury Prime Cash Management | 171,283 |
| Dreyfus Municipal Cash Management Plus | 5,555 |
| Dreyfus New York Municipal Cash Management | 8,239 |
| Dreyfus Tax Exempt Cash Management | 21,529 |
| Dreyfus California AMT-Free Municipal Cash Management | 1,603 |
| |
| Table 9. | |
| |
| | Cash Management |
| | Fees ($) |
| Dreyfus Cash Management | 5,951 |
| Dreyfus Cash Management Plus, Inc. | 7,768 |
| Dreyfus Government Cash Management | 8,268 |
| Dreyfus Government Prime Cash Management | 7,132 |
| Dreyfus Treasury & Agency Cash Management | 7,547 |
| Dreyfus Treasury Prime Cash Management | 19,925 |
| Dreyfus Municipal Cash Management Plus | 332 |
| Dreyfus New York Municipal Cash Management | 583 |
| Dreyfus Tax Exempt Cash Management | 1,419 |
| Dreyfus California AMT-Free Municipal Cash Management | 52 |
90
During the period ended January 31, 2010, each fund (except for Dreyfus New York AMT-Free Municipal Cash Management) was charged $6,681 for services performed by the Chief Compliance Officer.
Table 11 summarizes the components of “Due to The Dreyfus Corporation and affiliates” in the Statements of Assets and Liabilities for each fund.
(d) Each Board member also serves as a Board member of other funds within the Dreyfus complex. Annual retainer fees are allocated to each fund based on net assets, and each fund pays its Board members an attendance fee of $500 per meeting.
| |
| Table 10. | |
| |
| |
| | Custody |
| | Fees ($) |
| Dreyfus Cash Management | 791,154 |
| Dreyfus Cash Management Plus, Inc. | 193,710 |
| Dreyfus Government Cash Management | 618,901 |
| Dreyfus Government Prime Cash Management | 158,985 |
| Dreyfus Treasury & Agency Cash Management | 365,257 |
| Dreyfus Treasury Prime Cash Management | 488,671 |
| Dreyfus Municipal Cash Management Plus | 99,650 |
| Dreyfus New York Municipal Cash Management | 69,538 |
| Dreyfus Tax Exempt Cash Management | 160,964 |
| Dreyfus California AMT-Free Municipal Cash Management | 33,198 |
| | | | | | | |
| Table 11. | | | | | | | |
| |
| | | Rule 12b-1 | | | Chief | | |
| | | Distribution | Shareholder | | Compliance | Transfer | |
| | Management | Plan | Services Plan | Custodian | Officer | Agency | Less Expense |
| | Fees ($) | Fees ($) | Fees ($) | Fees ($) | Fees ($) | Fees ($) | Reimbursement ($) |
| |
| Dreyfus Cash Management | 6,632,974 | 1,130,928 | — | 316,452 | 5,568 | 10,680 | 701,921 |
| Dreyfus Cash | | | | | | | |
| Management Plus, Inc. | 646,606 | 374,095 | — | 63,188 | 5,568 | 12,044 | 270,659 |
| Dreyfus Government | | | | | | | |
| Cash Management | 4,377,360 | 652,242 | — | 228,969 | 5,568 | 6,925 | 635,680 |
| Dreyfus Government Prime | | | | | | | |
| Cash Management | 835,081 | 409,982 | — | 52,764 | 5,568 | 4,697 | 603,197 |
| Dreyfus Treasury & Agency | | | | | | | |
| Cash Management | 2,583,918 | 624,081 | — | 124,445 | 5,568 | 4,239 | 1,498,520 |
| Dreyfus Treasury Prime | | | | | | | |
| Cash Management | 4,618,097 | 1,821,500 | — | 193,520 | 5,568 | 12,680 | 4,526,681 |
| Dreyfus Municipal | | | | | | | |
| Cash Management Plus | 195,901 | 137,381 | — | 34,294 | 5,568 | 1,255 | 56,645 |
| Dreyfus New York Municipal | | | | | | | |
| Cash Management | 115,648 | 69,244 | 200 | 21,493 | 5,568 | 1,698 | 50,308 |
| Dreyfus Tax Exempt | | | | | | | |
| Cash Management | 657,935 | 96,261 | — | 60,500 | 5,568 | 4,536 | 78,331 |
| Dreyfus California AMT-Free | | | | | | | |
| Municipal Cash Management | 24,573 | 34,058 | — | 9,859 | 5,568 | 438 | 28,450 |
| Dreyfus New York AMT-Free | | | | | | | |
| Municipal Cash Management | 45,042 | 40,699 | — | — | — | — | 31,868 |
The Funds 91
NOTES TO FINANCIAL STATEMENTS (continued)
NOTE 3—Capital Share Transactions:
Each fund (except for Dreyfus Cash Management Plus, Inc.) is authorized to issue an unlimited number of $.001 par value shares of Beneficial Interest. Dreyfus Cash Management Plus, Inc. is authorized to issue 120 billion shares of $.001 par value Common Stock.
NOTE 4—Reverse Repurchase Agreements:
Dreyfus Cash Management and Dreyfus Cash Management Plus, Inc. may enter into reverse repurchase agreements with banks, brokers or dealers. This form of borrowing involves the transfer by the fund of an underlying debt instrument in return for cash proceeds based on a percentage of value of the security.The funds retain the right to receive interest and
principal payments on the security.At an agreed upon future date, the funds repurchase the security at principal plus accrued interest. Reverse repurchase agreements may subject the funds to interest rate risk and counterparty credit risk. During the period ended January 31, 2010, neither fund entered into reverse repurchase agreements.
NOTE 5—Subsequent Events Evaluation:
Dreyfus has evaluated the need for disclosures and/or adjustments resulting from subsequent events through the date the financial statements were issued.This evaluation did not result in any subsequent events that necessitated disclosures and/or adjustments.
92
REPORT OF INDEPENDENT REGISTERED PUBLIC ACCOUNTING FIRM
Shareholders and Board of Trustees/Directors
Dreyfus Cash Management
Dreyfus Cash Management Plus, Inc.
Dreyfus Government Cash Management
Dreyfus Government Prime Cash Management
Dreyfus Treasury & Agency Cash Management
Dreyfus Treasury Prime Cash Management
Dreyfus Municipal Cash Management Plus
Dreyfus New York Municipal Cash Management
Dreyfus Tax Exempt Cash Management
Dreyfus California AMT-Free Municipal
Cash Management
Dreyfus New York AMT-Free Municipal
Cash Management
We have audited the accompanying statements of assets and liabilities, including the statements of investments, of Dreyfus Cash Management, Dreyfus Cash Management Plus, Inc., Dreyfus Government Cash Management, Dreyfus Government Prime Cash Management, Dreyfus Treasury & Agency Cash Management, Dreyfus Treasury Prime Cash Management, Dreyfus Municipal Cash Management Plus, Dreyfus NewYork Municipal Cash Management,DreyfusTax Exempt Cash Management, Dreyfus California AMT-Free Municipal Cash Management and Dreyfus New York AMT-Free Municipal Cash Management (the “Funds”) as of January 31, 2010, and the related statements of operations for the year then ended, the statements of changes in net assets for each of the two years in the period then ended and financial highlights for each of the periods indicated therein, except for the financial highlights for the years ended December 31, 2007, 2006, and 2005 for Dreyfu s New York AMT-Free Municipal Cash Management, which were audited by other auditors whose report dated February 28, 2008, expressed an unqualified opinion on such financial highlights. These financial statements and financial highlights are the responsibility of the Funds’ management. Our
responsibility is to express an opinion on these financial statements and financial highlights based on our audits.
We conducted our audits in accordance with the standards of the Public Company Accounting Oversight Board (United States). Those standards require that we plan and perform the audit to obtain reasonable assurance about whether the financial statements and financial highlights are free of material misstatement.We were not engaged to perform an audit of the Funds’ internal control over financial reporting. Our audits included consideration of internal control over financial reporting as a basis for designing audit procedures that are appropriate in the circumstances, but not for the purpose of expressing an opinion on the effectiveness of the Funds’ internal control over financial report-ing.Accordingly, we express no such opinion.An audit also includes examining, on a test basis, evidence supporting the amounts and disclosures in the financial statements and financial highlights, assessing the accounting principles use d and significant estimates made by management, and evaluating the overall financial statement presentation. Our procedures included confirmation of securities owned as of January 31, 2010 by correspondence with the custodian and others or by other appropriate auditing procedures where replies from others were not received.We believe that our audits provide a reasonable basis for our opinion.
In our opinion, the financial statements and financial highlights referred to above and audited by us present fairly, in all material respects, the financial position of the Funds at January 31, 2010, the results of their operations for the year then ended, the changes in their net assets for each of the two years in the period then ended, and the financial highlights for each of the indicated periods, in conformity with U.S. generally accepted accounting principles.
New York, New York
March 29, 2010
The Funds 93
IMPORTANT TAX INFORMATION (Unaudited)
In accordance with Federal tax law,DreyfusTax Exempt Cash Management, Dreyfus Municipal Cash Management Plus, Dreyfus New York Municipal Cash Management, Dreyfus California AMT-Free Municipal Cash Management and Dreyfus NewYork AMT-Free Municipal Cash Management hereby make the following designations regarding the dividends paid from investment income-net during their fiscal year ended January 31, 2010:
For state individual income tax purposes Dreyfus Government Prime Cash Management and Dreyfus Treasury Prime Cash Management hereby designate the following percentage of ordinary dividends paid during the fiscal year ended January 31, 2010 as attributable to interest income from direct obligations of the United States. Such dividends are currently exempt from taxation for income tax purposes in most states, including New York, California and the District of Columbia:
| |
| Dreyfus Government Prime | |
| Cash Management | 100% |
| Dreyfus Treasury Prime | |
| Cash Management | 100% |
The funds below designate the following percentage of ordinary income dividends paid during the fiscal year ended January 31, 2010 as qualifying “interest related dividends”:
| |
| Dreyfus Cash Management | 95.95% |
| Dreyfus Government Cash Management | 100% |
| Dreyfus Government Prime | |
| Cash Management | 100% |
| Dreyfus Treasury & Agency | |
| Cash Management | 100% |
| Dreyfus Cash | |
| Management Plus, Inc. | 95.62% |
| Dreyfus Treasury Prime | |
| Cash Management | 100% |
94
PROXY RESULTS (Unaudited)
Dreyfus Cash Management Plus, Inc. held a meeting of shareholders on January 4, 2010.The proposals considered at the meeting, and the results, are as follows:
| | | |
| | | Shares | |
| | Votes For | Authority Withheld | Abstain |
| 1. To approve changes to the fundamental policies and investment | | | |
| restrictions relating to borrowing and/or lending as follows: | | | |
| A. To approve amending the fund’s policy regarding borrowing. | 3,205,950,459 | 351,290,905 | 219,876,153 |
| B. To approve the fund’s policy regarding lending. | 3,204,060,136 | 350,443,272 | 222,614,109 |
| 2. To approve changes to the fundamental policies | | | |
| and investment restrictions as follows: | | | |
| A. To permit investment in additional money market instruments. | 3,003,574,865 | 554,248,871 | 219,293,781 |
| B. To permit investment in other investment companies. | 2,908,793,791 | 584,915,566 | 283,408,160 |
The Funds 95
BOARD MEMBERS INFORMATION (Unaudited)

96
OFFICERS OF THE FUND (Unaudited)
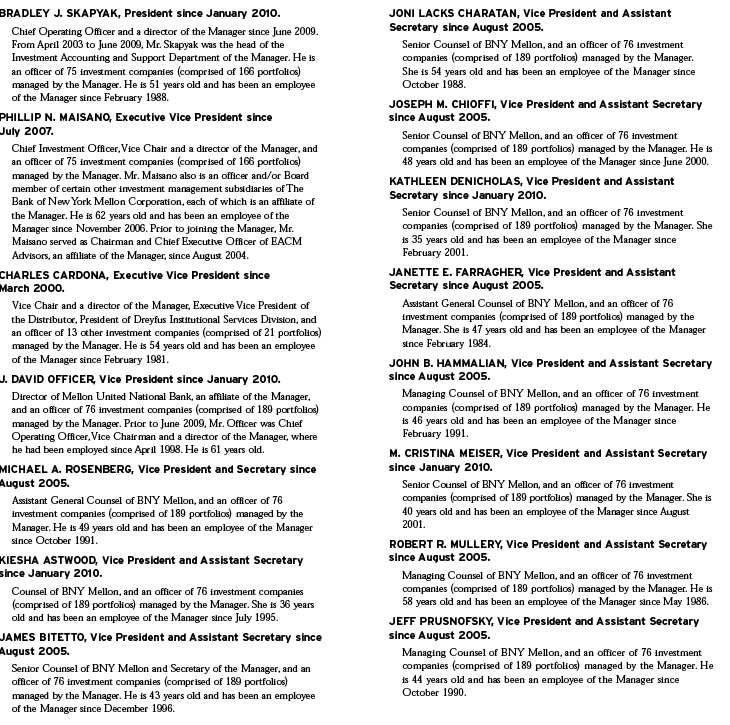
The Funds 97
OFFICERS OF THE FUND (Unaudited) (continued)
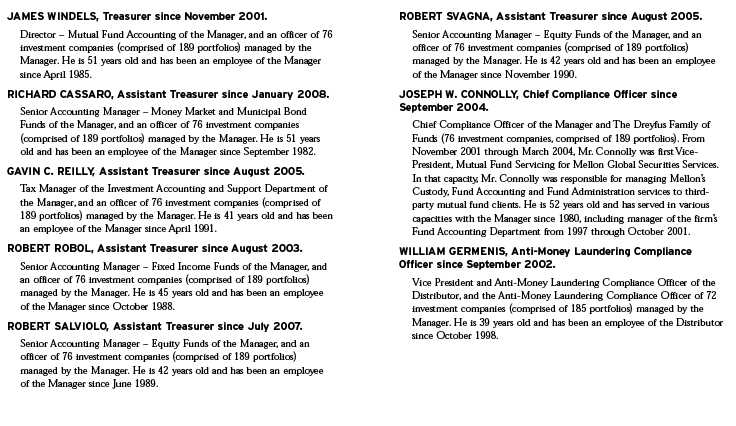
98
For More Information

Item 2. Code of Ethics.
The Registrant has adopted a code of ethics that applies to the Registrant's principal executive officer, principal financial officer, principal accounting officer or controller, or persons performing similar functions. There have been no amendments to, or waivers in connection with, the Code of Ethics during the period covered by this Report.
Item 3. Audit Committee Financial Expert.
The Registrant's Board has determined that Joseph S. DiMartino, a member of the Audit Committee of the Board, is an audit committee financial expert as defined by the Securities and Exchange Commission (the "SEC"). Mr. DiMartino is "independent" as defined by the SEC for purposes of audit committee financial expert determinations.
Item 4. Principal Accountant Fees and Services.
(a) Audit Fees. The aggregate fees billed for each of the last two fiscal years (the "Reporting Periods") for professional services rendered by the Registrant's principal accountant (the "Auditor") for the audit of the Registrant's annual financial statements or services that are normally provided by the Auditor in connection with the statutory and regulatory filings or engagements for the Reporting Periods, were $25,421 in 2009 and $25,422 in 2010.
(b) Audit-Related Fees. The aggregate fees billed in the Reporting Periods for assurance and related services by the Auditor that are reasonably related to the performance of the audit of the Registrant's financial statements and are not reported under paragraph (a) of this Item 4 were $10,552 in 2009 and $5,276 in 2010. These services consisted of one or more of the following: (i) agreed upon procedures related to compliance with Internal Revenue Code section 817(h), (ii) security counts required by Rule 17f-2 under the Investment Company Act of 1940, as amended, (iii) advisory services as to the accounting or disclosure treatment of Registrant transactions or events and (iv) advisory services to the accounting or disclosure treatment of the actual or potential imp act to the Registrant of final or proposed rules, standards or interpretations by the Securities and Exchange Commission, the Financial Accounting Standards Boards or other regulatory or standard-setting bodies.
The aggregate fees billed in the Reporting Periods for non-audit assurance and related services by the Auditor to the Registrant's investment adviser (not including any sub-investment adviser whose role is primarily portfolio management and is subcontracted with or overseen by another investment adviser), and any entity controlling, controlled by or under common control with the investment adviser that provides ongoing services to the Registrant ("Service Affiliates"), that were reasonably related to the performance of the annual audit of the Service Affiliate, which required pre-approval by the Audit Committee were $0 in 2009 and $0 in 2010.
(c) Tax Fees. The aggregate fees billed in the Reporting Periods for professional services rendered by the Auditor for tax compliance, tax advice, and tax planning ("Tax Services") were $3,013 in 2009 and $4,033 in 2010. These services consisted of: (i) review or preparation of U.S. federal, state, local and excise tax returns; (ii) U.S. federal, state and local tax planning, advice and assistance regarding statutory, regulatory or administrative developments; (iii) tax advice regarding tax qualification matters and/or treatment of various financial instruments held or proposed to be acquired or held.
The aggregate fees billed in the Reporting Periods for Tax Services by the Auditor to Service Affiliates, which required pre-approval by the Audit Committee were $0 in 2009 and $0 in 2010.
(d) All Other Fees. The aggregate fees billed in the Reporting Periods for products and services provided by the Auditor, other than the services reported in paragraphs (a) through (c) of this Item, were $277 in 2009 and $0 in 2010. These services consisted of a review of the Registrant's anti-money laundering program.
The aggregate fees billed in the Reporting Periods for Non-Audit Services by the Auditor to Service Affiliates, other than the services reported in paragraphs (b) through (c) of this Item, which required pre-approval by the Audit Committee, were $0 in 2009 and $0 in 2010.
(e)(1) Audit Committee Pre-Approval Policies and Procedures. The Registrant's Audit Committee has established policies and procedures (the "Policy") for pre-approval (within specified fee limits) of the Auditor's engagements for non-audit services to the Registrant and Service Affiliates without specific case-by-case consideration. The pre-approved services in the Policy can include pre-approved audit services, pre-approved audit-related services, pre-approved tax services and pre-approved all other services. Pre-approval considerations include whether the proposed services are compatible with maintaining the Auditor's independence. Pre-approvals pursuant to the Policy are considered annually.
(e)(2) None of the services described in paragraphs (b) through (d) of this Item 4 were approved by the Audit Committee pursuant to paragraph (c)(7)(i)(C) of Rule 2-01 of Regulation S-X.
(f) None of the hours expended on the principal accountant's engagement to audit the registrant's financial statements for the most recent fiscal year were attributed to work performed by persons other than the principal account's full-time, permanent employees.
Non-Audit Fees. The aggregate non-audit fees billed by the Auditor for services rendered to the Registrant, and rendered to Service Affiliates, for the Reporting Periods were $13,421,561 in 2009 and $26,379,755 in 2010.
Auditor Independence. The Registrant's Audit Committee has considered whether the provision of non-audit services that were rendered to Service Affiliates, which were not pre-approved (not requiring pre-approval), is compatible with maintaining the Auditor's independence.
Item 5. Audit Committee of Listed Registrants.
Not applicable. [CLOSED-END FUNDS ONLY]
Item 6. Investments.
(a) Not applicable.
Item 7. Disclosure of Proxy Voting Policies and Procedures for Closed-End Management Investment Companies.
Not applicable. [CLOSED-END FUNDS ONLY]
Item 8. Portfolio Managers of Closed-End Management Investment Companies.
Not applicable. [CLOSED-END FUNDS ONLY, beginning with reports for periods ended on and after December 31, 2005]
Item 9. Purchases of Equity Securities by Closed-End Management Investment Companies and Affiliated Purchasers.
Not applicable. [CLOSED-END FUNDS ONLY]
Item 10. Submission of Matters to a Vote of Security Holders.
There have been no material changes to the procedures applicable to Item 10.
Item 11. Controls and Procedures.
(a) The Registrant's principal executive and principal financial officers have concluded, based on their evaluation of the Registrant's disclosure controls and procedures as of a date within 90 days of the filing date of this report, that the Registrant's disclosure controls and procedures are reasonably designed to ensure that information required to be disclosed by the Registrant on Form N-CSR is recorded, processed, summarized and reported within the required time periods and that information required to be disclosed by the Registrant in the reports that it files or submits on Form N-CSR is accumulated and communicated to the Registrant's management, including its principal executive and principal financial officers, as appropriate to allow timely decisions regarding required disclosure.
(b) There were no changes to the Registrant's internal control over financial reporting that occurred during the second fiscal quarter of the period covered by this report that have materially affected, or are reasonably likely to materially affect, the Registrant's internal control over financial reporting.
Item 12. Exhibits.
(a)(1) Code of ethics referred to in Item 2.
(a)(2) Certifications of principal executive and principal financial officers as required by Rule 30a-2(a) under the Investment Company Act of 1940.
(a)(3) Not applicable.
(b) Certification of principal executive and principal financial officers as required by Rule 30a-2(b) under the Investment Company Act of 1940.
SIGNATURES
Pursuant to the requirements of the Securities Exchange Act of 1934 and the Investment Company Act of 1940, the Registrant has duly caused this Report to be signed on its behalf by the undersigned, thereunto duly authorized.
Dreyfus New York Municipal Cash Management
| |
| By: | /s/ Bradley J. Skapyak |
| | Bradley J. Skapyak, |
| | President |
| |
| Date: | March 23, 2010 |
Pursuant to the requirements of the Securities Exchange Act of 1934 and the Investment Company Act of 1940, this Report has been signed below by the following persons on behalf of the Registrant and in the capacities and on the dates indicated.
| |
| By: | /s/ Bradley J. Skapyak |
| | Bradley J. Skapyak, |
| | President |
| |
| Date: | March 23, 2010 |
| |
| By: | /s/ James Windels |
| | James Windels, |
| | Treasurer |
| |
| Date: | March 23, 2010 |
EXHIBIT INDEX
(a)(1) Code of ethics referred to in Item 2.
(a)(2) Certifications of principal executive and principal financial officers as required by Rule 30a-2(a) under the Investment Company Act of 1940. (EX-99.CERT)
(b) Certification of principal executive and principal financial officers as required by Rule 30a-2(b) under the Investment Company Act of 1940. (EX-99.906CERT)