UNITED STATES
SECURITIES AND EXCHANGE COMMISSION
Washington, D.C. 20549
FORM N-CSR
CERTIFIED SHAREHOLDER REPORT OF REGISTERED MANAGEMENT
INVESTMENT COMPANIES
Investment Company Act file number | 811- 6395 |
| |
| DREYFUS NEW YORK MUNICIPAL CASH MANAGEMENT | |
| (Exact name of Registrant as specified in charter) | |
| | |
| c/o The Dreyfus Corporation 200 Park Avenue New York, New York 10166 | |
| (Address of principal executive offices) (Zip code) | |
| | |
| Janette E. Farragher, Esq. 200 Park Avenue New York, New York 10166 | |
| (Name and address of agent for service) | |
|
Registrant's telephone number, including area code: | (212) 922-6000 |
| |
Date of fiscal year end: | 1/31 | |
Date of reporting period: | 1/31/12 | |
| | | | | | | |
FORM N-CSR
Item 1. Reports to Stockholders.
| | |
| Contents | |
| |
| The Funds | |
| Letter to Shareholders (Taxable) | 3 |
| Letter to Shareholders (Tax-Exempt) | 5 |
| Understanding Your Fund’s Expenses | 7 |
| Comparing Your Fund’s Expenses | |
| With Those of Other Funds | 9 |
| Statements of Investments | 11 |
| Statements of Assets and Liabilities | 53 |
| Statements of Operations | 56 |
| Statements of Changes in Net Assets | 58 |
| Financial Highlights | 63 |
| Notes to Financial Statements | 74 |
| Report of Independent Registered | |
| Public Accounting Firm | 85 |
| Important Tax Information | 86 |
| Board Members Information | 87 |
| Officers of the Funds | 88 |
| For More Information | |
| Back cover | |
The views expressed in this report reflect those of the portfolio manager only through the end of the period covered and do not necessarily represent the views of Dreyfus or any other person in the Dreyfus organization. Any such views are subject to change at any time based upon market or other conditions and Dreyfus disclaims any responsibility to update such views. These views may not be relied on as investment advice and, because investment decisions for a Dreyfus fund are based on numerous factors, may not be relied on as an indication of trading intent on behalf of any Dreyfus fund.

Dreyfus Cash Management Funds
The Funds

LETTER TO
SHAREHOLDERS
Dear Shareholders:
This annual report for Dreyfus Cash Management Funds (Taxable) covers the 12-month period ended January 31, 2012. Over the reporting period, the five Dreyfus Cash Management Funds (Taxable) listed below produced the following yields and, taking into account the effects of compounding, the following effective yields:1,2
| | | | | |
| | | Effective |
| | Yield (%) | Yield (%) |
| Dreyfus Cash Management | | |
| Institutional Shares | 0.07% | 0.07% |
| Investor Shares | 0.00% | 0.00% |
| Administrative Shares | 0.01% | 0.01% |
| Participant Shares | 0.00% | 0.00% |
| Agency Shares | 0.02% | 0.02% |
| Dreyfus Government Cash Management | |
| Institutional Shares | 0.00% | 0.00% |
| Investor Shares | 0.00% | 0.00% |
| Administrative Shares | 0.00% | 0.00% |
| Participant Shares | 0.00% | 0.00% |
| Agency Shares | 0.00% | 0.00% |
| Dreyfus Government Prime Cash Management | |
| Institutional Shares | 0.00% | 0.00% |
| Investor Shares | 0.00% | 0.00% |
| Administrative Shares | 0.00% | 0.00% |
| Participant Shares | 0.00% | 0.00% |
| Agency Shares | 0.00% | 0.00% |
| Dreyfus Treasury & Agency Cash Management | |
| Institutional Shares | 0.01% | 0.01% |
| Investor Shares | 0.01% | 0.01% |
| Administrative Shares | 0.01% | 0.01% |
| Participant Shares | 0.01% | 0.01% |
| Service Shares | 0.01% | 0.01% |
| Select Shares | 0.01% | 0.01% |
| Agency Shares | 0.01% | 0.01% |
| Premier Shares | 0.01% | 0.01% |
| Dreyfus Treasury Prime Cash Management | |
| Institutional Shares | 0.00% | 0.00% |
| Investor Shares | 0.00% | 0.00% |
| Administrative Shares | 0.00% | 0.00% |
| Participant Shares | 0.00% | 0.00% |
| Agency Shares | 0.00% | 0.00% |
Please note, as of August 25, 2011, Dreyfus Cash Management Plus, Inc. merged into Dreyfus Cash Management.
Global Economic Developments Roiled Financial Markets
Although a U.S. economic recovery seemed to gain momentum at the start of the reporting period, economic headwinds intensified in February when energy prices surged higher amid unrest in the Middle East, and in March when natural and nuclear disasters in Japan disrupted the global industrial supply chain. These factors helped produce an annualized U.S. GDP growth rate of just 0.4% for the first quarter of the year.
In late April, a European sovereign debt crisis worsened as Greece teetered on the brink of default and financial instability spread to other nations in the region. Meanwhile, a contentious political debate about government spending and borrowing dominated headlines in the United States. Industrial production picked up in May, but the unemployment rate climbed to 9.1%, and the U.S. housing market posted declines in existing home sales and housing starts.
The Federal Reserve Board (the “Fed”) ended its second quantitative easing program in June with relatively little impact on the financial markets. Meanwhile, energy prices moderated, and manufacturing activity increased. These positive developments were largely offset by declining consumer confidence, weak housing markets and sluggish job creation.The unemployment rate crept higher to 9.2% in June, and it later was announced that U.S. gross domestic product grew at a sluggish 1.3% annualized rate during the second quarter of 2011.
July saw heightened turmoil in the financial markets when Greece moved closer to insolvency and an unprecedented default on U.S. government debt loomed. Some of these worries came to a head in early
The Funds 3
LETTER TO SHAREHOLDERS (continued)
August, when Standard & Poor’s downgraded its credit rating on long-term U.S. debt securities.The rating on short-term government debt, including securities purchased by many money market funds, was unchanged.
September brought more market turbulence when investors feared that the U.S. economy was headed for recession. However, the data seemed to tell a different story, as the unemployment rate moderated to 9.0%, existing-home sales moved higher and U.S. households reduced their debt-service burdens to a level not seen since 1994. U.S. GDP grew at an annualized 1.8% rate during the third quarter.
Economic sentiment changed dramatically in October, when the U.S. economy continued to show resilience and European officials moved closer to agreement on measures to address the debt crisis.The U.S. industrial and manufacturing sectors continued to improve, and housing starts surged to their highest level in nearly 18 months. These developments sparked strong rebounds among investments that had been severely punished during the summer downturn. November brought more positive economic news, most notably a steep decline in the unemployment rate from 9.0% to 8.6%. In addition, early data from retailers during the holiday season suggested that consumers were spending more freely, while orders and production in the manufacturing sector accelerated. December witnessed more economic improvement, including an unemployment rate that inched lower to 8.5%, the measure’s lowest reading in nearly three years, and consumer confidence climbed to an eight-month high. It later was estimated that the U.S. economy grew at a 2.8% annualized rate during the fourth quarter of 2011.
The upward trend in economic data persisted in January 2012. Most notably, the unemployment rate fell to 8.3% amid a net gain of 243,000 jobs. Even the long-depressed housing market showed signs of life, as it was announced that existing home sales posted a 5% gain in December 2011.
Rates Likely to Stay Low
Yields of money market instruments remained near zero percent throughout the reporting period, and yield differences along the market’s maturity spectrum remained relatively narrow, so it made little sense to incur the additional risks that longer-dated securities typically entail. Therefore, as we have for some time, we maintained the weighted average maturity of the funds in a range that was roughly in line with industry averages.
Despite recently encouraging signs of economic improvement, the Fed recently stated its intention to keep short-term interest rates near historical lows at least through late 2014, which represented a significant extension of the Fed’s previous time frame of mid-2013. Consequently, we intend to maintain the funds’ focus on quality and liquidity.
| | An investment in the funds is not insured or guaranteed by the FDIC or any other government agency.Although the funds seek to preserve the value of your investment at $1.00 per share, it is possible to lose money by investing in the funds. |
| | Short-term corporate, asset-backed securities holdings and municipal securities holdings (as applicable), while rated in the highest rating category by one or more NRSRO (or unrated, if deemed of comparable quality by Dreyfus), involve credit and liquidity risks and risk of principal loss. |
| 1 | Effective yield is based upon dividends declared daily and reinvested monthly. Past performance is no guarantee of future results.Yields fluctuate. |
| 2 | Yields provided reflect the absorption of certain fund expenses by The Dreyfus Corporation pursuant to an undertaking, which is voluntary and temporary, not contractual, and can be terminated at any time without notice. Had these expenses not been absorbed, fund yields would have been lower, and in some cases, 7-day yields during the reporting period would have been negative absent the expense absorption. |
4

LETTER TO
SHAREHOLDERS
Dear Shareholder:
We are pleased to present the annual report for Dreyfus Cash Management Funds (Tax Exempt). For the 12-month period ended January 31, 2012, the five tax-exempt money market portfolios that comprise Dreyfus Cash Management Funds (Tax Exempt) produced the following yields and effective yields:1,2
| | | | | |
| | | Effective |
| | Yield (%) | Yield (%) |
| Dreyfus Municipal Cash Management Plus | |
| Institutional Shares | 0.03% | 0.03% |
| Investor Shares | 0.00% | 0.00% |
| Administrative Shares | 0.00% | 0.00% |
| Participant Shares | 0.00% | 0.00% |
| Agency Shares | 0.01% | 0.01% |
| Dreyfus New York Municipal Cash Management | |
| Institutional Shares | 0.03% | 0.03% |
| Investor Shares | 0.00% | 0.00% |
| Administrative Shares | 0.00% | 0.00% |
| Participant Shares | 0.00% | 0.00% |
| Agency Shares | 0.01% | 0.01% |
| Dreyfus Tax Exempt Cash Management | |
| Institutional Shares | 0.03% | 0.03% |
| Investor Shares | 0.00% | 0.00% |
| Administrative Shares | 0.00% | 0.00% |
| Participant Shares | 0.00% | 0.00% |
| Dreyfus California AMT-Free Municipal Cash Management |
| Institutional Shares | 0.05% | 0.05% |
| Investor Shares | 0.00% | 0.00% |
| Administrative Shares | 0.01% | 0.01% |
| Participant Shares | 0.00% | 0.00% |
| Agency Shares | 0.02% | 0.02% |
| Dreyfus New York AMT-Free Municipal Cash Management |
| Institutional Shares | 0.02% | 0.02% |
| Investor Shares | 0.00% | 0.00% |
| Administrative Shares | 0.00% | 0.00% |
| Participant Shares | 0.00% | 0.00% |
| Classic Shares | 0.00% | 0.00% |
Please note, as of December 8, 2011, Agency shares of Dreyfus Tax Exempt Cash Management are no longer offered by the fund and were terminated as a separately designated class of the fund.
Yields Steady Despite Shifting Economic Sentiment
Although a U.S. economic recovery seemed to gain momentum at the start of the reporting period, economic headwinds intensified in February when energy prices surged higher amid unrest in the Middle East, and in March when natural and nuclear disasters in Japan disrupted the global industrial supply chain. In late April, a European sovereign debt crisis worsened as Greece teetered on the brink of default and financial instability spread to other nations in the region. Meanwhile, a contentious political debate about government spending and borrowing dominated headlines in the United States.
Volatility in the financial markets was especially severe over the summer of 2011, particularly after Standard & Poor’s downgraded its credit rating on long-term U.S. debt securities. Ironically, U.S. government securities rallied strongly during a “flight to quality” in the wake of the downgrade. The final months of the reporting period saw a partial reversal of this trend, as riskier securities that were punished in late summer rebounded and traditional safe havens gave back some of their previous gains when some macroeconomic concerns seemed to ease.
Throughout the reporting period, and as it has since December 2008, the Federal Reserve Board (the “Fed”) maintained an aggressively accommodative policy stance, leaving the overnight federal funds rate in a range between 0% and 0.25%. Consequently, municipal money market yields remained near zero percent.
The supply of newly issued municipal money market instruments remained relatively meager during the reporting period, in part due to a glut of issuance at the end of 2010 in advance of the expiration of federal subsidies. Subsequently, political pressure to reduce government spending and borrowing also dampened
The Funds 5
LETTER TO SHAREHOLDERS (continued)
issuance volumes. Although the European debt crisis reduced the availability of the bank letters of credit that typically support short-term municipal borrowing, a rising volume of variable rate demand notes (VRDNs) has picked up much of the slack, providing municipalities with long-term financing at short-term rates. Meanwhile, demand remained robust from individuals and institutional investors, enabling yields on tax-exempt money market instruments to remain attractive relative to taxable instruments with comparable maturities.
From a credit-quality perspective, state general funds have achieved consecutive quarters of growth in personal income tax and sales tax revenues. In NewYork, newly enacted tax reforms helped cut a projected state budget deficit in half for the next fiscal year. In contrast, California has continued to struggle with financial pressures, including cash shortfalls that may require additional short-term borrowing.
A Credit-Conscious Investment Posture
In this environment, we maintained a careful and well-researched approach to credit selection.We emphasized state general obligation bonds; essential service revenue bonds issued by water, sewer and electric enterprises; and certain local credits with strong financial positions and stable tax bases. We generally shied away from instruments issued by localities that depend heavily on state aid, and we maintained the weighted average maturity of the funds in a range that is roughly in line with industry averages.
Outlook Clouded by Economic Uncertainty
We are cautiously optimistic regarding the prospects for economic growth in 2012.The U.S. economy appears to have gained some momentum, particularly with
respect to a recovering labor market. However, the outlook remains cloudy due to the persistence of the European debt crisis and uncertainty regarding the potential impact of recent international banking agreements on municipal financing costs. In addition, the Fed has signaled that it is prepared to maintain short-term interest rates near current levels through late 2014.With money market yields likely to remain near historical lows, we believe that the prudent course continues to be an emphasis on preservation of capital and liquidity.

| | An investment in the funds is not insured or guaranteed by the FDIC or any other government agency.Although the funds seek to preserve the value of your investment at $1.00 per share, it is possible to lose money by investing in the funds. |
| | Short-term corporate, asset-backed securities holdings and municipal securities holdings (as applicable), while rated in the highest rating category by one or more NRSRO (or unrated, if deemed of comparable quality by Dreyfus), involve credit and liquidity risks and risk of principal loss. |
| 1 | Effective yield is based upon dividends declared daily and reinvested monthly. Past performance is no guarantee of future results.Yields fluctuate. |
| | For the national funds, income may be subject to state and local taxes. For the NewYork and California funds, income may be subject to state and local taxes for out-of-state residents. For each non-AMT-Free fund, some income may be subject to the federal alternative minimum tax (AMT). |
| 2 | Yields provided reflect the absorption of certain fund expenses by The Dreyfus Corporation pursuant to an undertaking, which is voluntary and temporary, not contractual, and can be terminated at any time without notice. Had these expenses not been absorbed, fund yields would have been lower, and in some cases, 7-day yields during the reporting period would have been negative absent the expense absorption. |
6
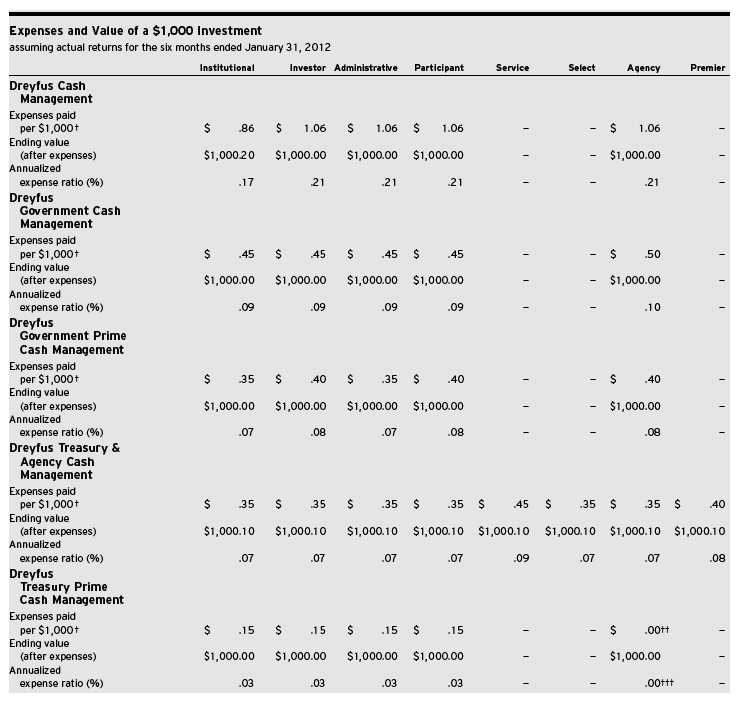
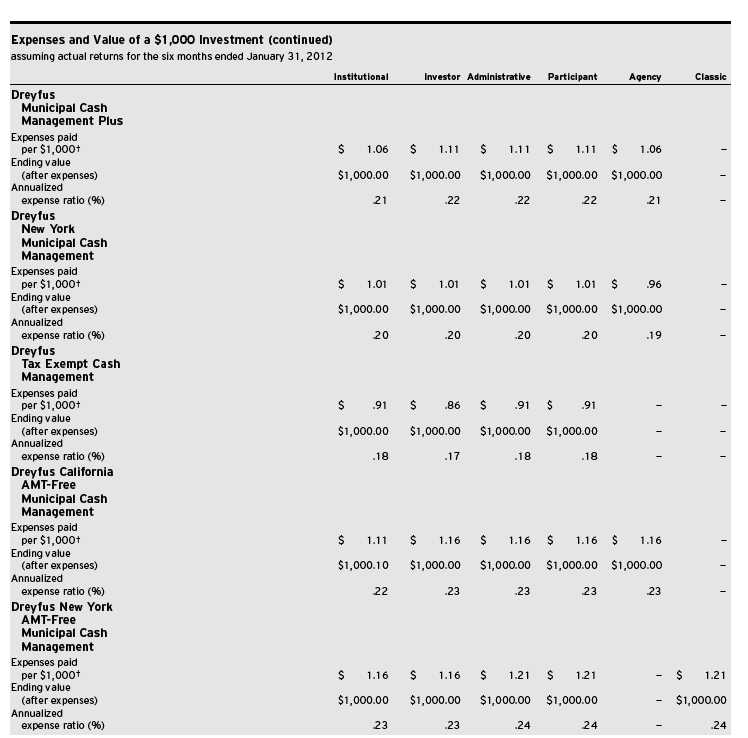
UNDERSTANDING YOUR FUND’S EXPENSES (Unaudited)
As a mutual fund investor, you pay ongoing expenses, such as management fees and other expenses. Using the information below, you can estimate how these expenses affect your investment and compare them with the expenses of other funds.You also may pay one-time transaction expenses, including sales charges (loads) and redemption fees, which are not shown in this section and would have resulted in higher total expenses. For more information, see your fund’s prospectus or talk to your financial adviser.
Review your fund’s expenses
The table below shows the expenses you would have paid on a $1,000 investment in each class of each fund from August 1, 2011 to January 31, 2012. It also shows how much a $1,000 investment would be worth at the close of the period, assuming actual returns and expenses.
The Funds 7
UNDERSTANDING YOUR FUND’S EXPENSES (Unaudited) (continued)
| | |
| † | Expenses are equal to each fund’s annualized expense ratios as shown above, multiplied by the average account value over the period, multiplied by 184/365 (to reflect the one-half year period). |
| †† | Amount represents less than $.01. |
| ††† Amount represents less than .01%. |
8
COMPARING YOUR FUND’S EXPENSES
WITH THOSE OF OTHER FUNDS (Unaudited)
Using the SEC’s method to compare expenses
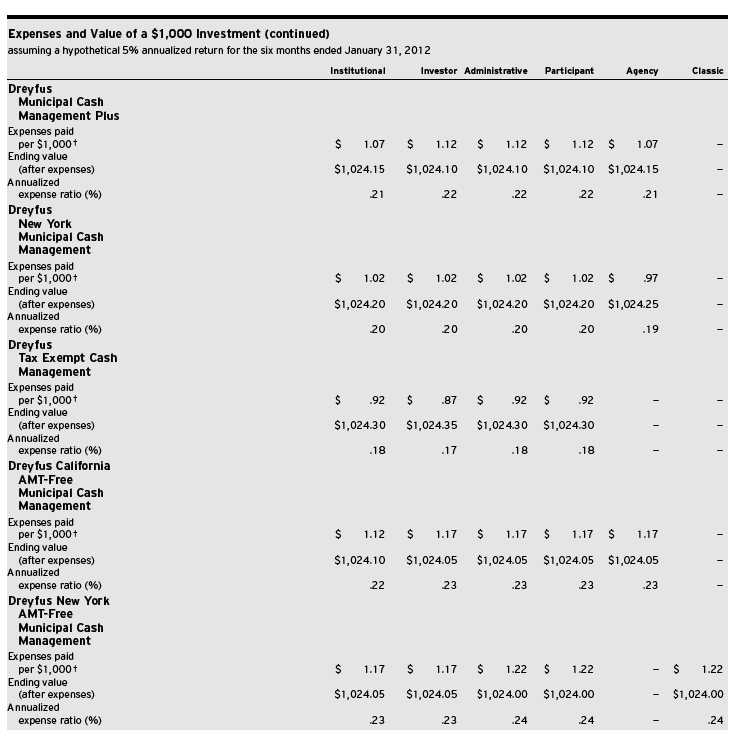
The Securities and Exchange Commission (SEC) has established guidelines to help investors assess fund expenses. Per these guidelines, the table below shows your fund’s expenses based on a $1,000 investment, assuming a hypothetical 5% annualized return.You can use this information to compare the ongoing expenses (but not transaction expenses or total cost) of investing in the fund with those of other funds. All mutual fund shareholder reports will provide this information to help you make this comparison. Please note that you cannot use this information to estimate your actual ending account balance and expenses paid during the period.
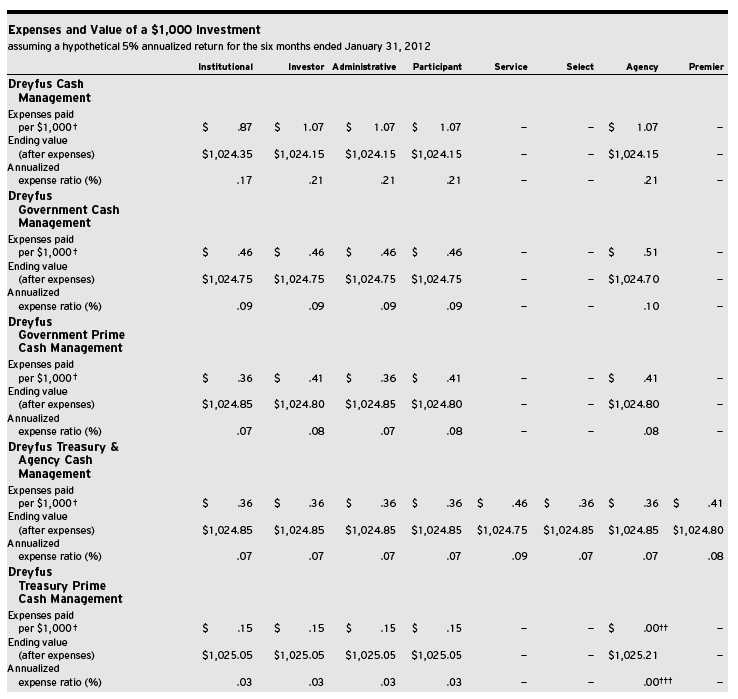
The Funds 9
COMPARING YOUR FUND’S EXPENSES WITH THOSE OF OTHER FUNDS (Unaudited) (continued)
| | |
| † | Expenses are equal to each fund’s annualized expense ratios as shown above, multiplied by the average account value over the period, multiplied by 184/365 (to reflect the one-half year period). |
| †† | Amount represents less than $.01. |
| ††† Amount represents less than .01%. |
10
STATEMENT OF INVESTMENTS
January 31, 2012
| | | | |
| | Principal | | |
| Dreyfus Cash Management | Amount ($) | | Value ($) |
| |
| Negotiable Bank Certificates of Deposit—35.5% | | | |
| Bank of Nova Scotia | | | |
| 0.51%, 2/1/12 | 500,000,000 | a | 500,000,000 |
| Bank of Tokyo-Mitsubishi Ltd. (Yankee) | | | |
| 0.50%, 4/4/12 | 800,000,000 | | 800,000,000 |
| Barclays Bank (Yankee) | | | |
| 0.60%—0.70%, 2/1/12—6/1/12 | 1,291,000,000 | a | 1,291,000,000 |
| Credit Suisse (Yankee) | | | |
| 0.40%—0.60%, 4/3/12—4/12/12 | 1,305,000,000 | | 1,305,000,000 |
| Lloyds TSB Bank (Yankee) | | | |
| 0.21%, 2/29/12 | 500,000,000 | | 500,000,000 |
| Mitsubishi Trust and Banking Corp. (Yankee) | | | |
| 0.51%, 3/9/12 | 500,000,000 | | 500,000,000 |
| Mizuho Corporate Bank (Yankee) | | | |
| 0.42%—0.50%, 2/2/12—3/5/12 | 1,155,000,000 | | 1,155,000,000 |
| Nordea Bank Finland (Yankee) | | | |
| 0.42%—0.46%, 2/10/12—4/9/12 | 1,300,000,000 | | 1,300,000,000 |
| Rabobank Nederland (Yankee) | | | |
| 0.37%, 5/29/12—5/31/12 | 200,000,000 | | 199,996,707 |
| Sumitomo Mitsui Banking Corporation (Yankee) | | | |
| 0.45%, 4/19/12 | 500,000,000 | b | 500,000,000 |
| Sumitomo Trust and Banking Co. (Yankee) | | | |
| 0.44%—0.45%, 2/3/12—2/14/12 | 610,000,000 | | 610,000,397 |
| Svenska Handelsbanken (Yankee) | | | |
| 0.30%, 4/23/12 | 244,350,000 | | 244,349,999 |
| UBS (Yankee) | | | |
| 0.52%, 4/27/12 | 600,000,000 | | 600,000,000 |
| Westpac Banking Corp. | | | |
| 0.56%, 2/27/12 | 300,000,000 | a | 300,000,000 |
| Total Negotiable Bank Certificates of Deposit | | | |
| (cost $9,805,347,103) | | | 9,805,347,103 |
| |
| Commercial Paper—16.4% | | | |
| Bank of Nova Scotia | | | |
| 0.05%, 2/1/12 | 250,000,000 | | 250,000,000 |
| Barclays U.S. Funding | | | |
| 0.60%, 4/9/12 | 100,000,000 | | 99,886,667 |
| DnB Bank | | | |
| 0.42%—0.58%, 2/13/12—5/14/12 | 1,000,000,000 | b | 999,100,278 |
| General Electric Capital Corp. | | | |
| 0.34%, 7/24/12 | 200,000,000 | | 199,671,333 |
| Mizuho Funding LLC | | | |
| 0.47%, 4/16/12 | 125,000,000 | b | 124,877,604 |
| Skandinaviska Enskilda Banken | | | |
| 0.63%, 4/5/12 | 500,000,000 | b | 499,444,444 |
| Sumitomo Mitsui Banking Corporation | | | |
| 0.40%, 4/25/12 | 700,000,000 | b | 699,346,666 |
| Svenska Handelsbanken Inc. | | | |
| 0.20%, 3/28/12—3/29/12 | 70,000,000 | | 69,978,167 |
The Funds 11
STATEMENT OF INVESTMENTS (continued)
| | | | | |
| | | Principal | | |
| | Dreyfus Cash Management (continued) | Amount ($) | | Value ($) |
| |
| | Commercial Paper (continued) | | | |
| | UBS Finance Delaware Inc. | | | |
| | 0.56%—0.60%, 4/11/12—4/12/12 | 600,000,000 | | 599,336,042 |
| | Westpac Banking Corp. | | | |
| | 0.25%, 3/2/12—3/5/12 | 1,000,000,000 | b | 999,785,375 |
| | Total Commercial Paper | | | |
| | (cost $4,541,426,576) | | | 4,541,426,576 |
| |
| | Asset-Backed Commercial Paper—2.9% | | | |
| | Govco | | | |
| | 0.30%, 4/25/12 | 150,000,000 | b | 149,895,000 |
| | Northern Pines Funding LLC | | | |
| | 0.50%, 2/28/12 | 300,000,000 | b | 299,887,500 |
| | Solitaire Funding Ltd. | | | |
| | 0.43%, 2/13/12—2/14/12 | 350,000,000 | b | 349,946,847 |
| | Total Asset-Backed Commercial Paper | | | |
| | (cost $799,729,347) | | | 799,729,347 |
| |
| | Time Deposits—16.1% | | | |
| | Bank of America N.A. (Grand Cayman) | | | |
| | 0.01%, 2/1/12 | 1,134,000,000 | | 1,134,000,000 |
| | Lloyds TSB Bank (London) | | | |
| | 0.10%, 2/1/12 | 400,000,000 | | 400,000,000 |
| | Royal Bank of Canada (Toronto) | | | |
| | 0.06%, 2/1/12 | 700,000,000 | | 700,000,000 |
| | Skandinaviska Enskilda Banken (Grand Cayman) | | | |
| | 0.10%, 2/1/12 | 800,000,000 | | 800,000,000 |
| | Svenska Handelsbanken (Grand Cayman) | | | |
| | 0.11%, 2/1/12 | 600,000,000 | | 600,000,000 |
| | Swedbank (Grand Cayman) | | | |
| | 0.10%, 2/1/12 | 800,000,000 | | 800,000,000 |
| | Total Time Deposits | | | |
| | (cost $4,434,000,000) | | | 4,434,000,000 |
| |
| | U.S. Government Agencies—8.6% | | | |
| | Federal Home Loan Bank | | | |
| | 0.005%-0.28%, 2/1/12—3/30/12 | 1,245,400,000 | a | 1,245,314,613 |
| | Federal Home Loan Mortgage Corp. | | | |
| | 0.31%-0.32%, 2/1/12 | 700,000,000 | a,c | 699,790,728 |
| | Federal National Mortgage Association | | | |
| | 0.01%-0.31%, 2/1/12—3/2/12 | 425,000,000 | a,c | 424,937,650 |
| | Total U.S. Government Agencies | | | |
| | (cost $2,370,042,991) | | | 2,370,042,991 |
12
| | | |
| | Principal | |
| Dreyfus Cash Management (continued) | Amount ($) | Value ($) |
| |
| U.S. Treasury Bills—.9% | | |
| 0.02%, 2/23/12 | | |
| (cost $249,996,944) | 250,000,000 | 249,996,944 |
| |
| |
| U.S. Treasury Notes—.7% | | |
| 0.05%, 2/29/12 | | |
| (cost $200,127,460) | 200,000,000 | 200,127,460 |
| |
| |
| Repurchase Agreements—18.9% | | |
| ABN AMRO Bank N.V. | | |
| 0.18%, dated 1/31/12, due 2/1/12 in the amount of $2,000,010,000 | | |
| (fully collateralized by $145,000,000 U.S. Treasury Bills, due 5/10/12, | | |
| value $144,976,800, $257,000,000 U.S. Treasury Bonds, 4.25%-4.38%, | | |
| due 5/15/40-11/15/40, value $328,108,174, $916,200,000 | | |
| U.S. Treasury Inflation Protected Securities, 0.50%-2.50%, | | |
| due 7/15/13-2/15/41, value $1,207,698,158 and $334,439,200 | | |
| U.S. Treasury Notes, 0.25%-3.63%, due 6/30/12-2/15/20, | | |
| value $359,216,967) | 2,000,000,000 | 2,000,000,000 |
| Citigroup Global Markets Holdings Inc. | | |
| 0.19%, dated 1/31/12, due 2/1/12 in the amount of $150,000,792 | | |
| (fully collateralized by $118,870,100 U.S. Treasury Inflation Protected | | |
| Securities, 1.88%-2%, due 1/15/16-7/15/19, value $153,000,036) | 150,000,000 | 150,000,000 |
| Credit Suisse Securities LLC | | |
| 0.19%, dated 1/31/12, due 2/1/12 in the amount of $900,004,750 | | |
| (fully collateralized by $866,844,853 Government National Mortgage | | |
| Association, 0%-6%, due 12/15/19-1/20/42, value $706,592,669 | | |
| and $187,574,000 U.S. Treasury Notes, 3.13%, due 5/15/21, | | |
| value $211,411,009) | 900,000,000 | 900,000,000 |
| Deutsche Bank Securities Inc. | | |
| 0.25%, dated 1/31/12, due 2/1/12 in the amount of $200,001,389 | | |
| (fully collateralized by $204,510,358 Commercial Paper, 0%, | | |
| due 2/1/12-9/1/26, value $204,000,000) | 200,000,000 | 200,000,000 |
| HSBC USA Inc. | | |
| 0.18%, dated 1/31/12, due 2/1/12 in the amount of $400,002,000 | | |
| (fully collateralized by $140,000,000 International Finance Corp., 0%, | | |
| due 2/6/12-3/9/12, value $140,917,711 and $267,305,000 | | |
| U.S. Treasury Notes, 0.13%, due 9/30/13, value $267,083,154) | 400,000,000 | 400,000,000 |
| JPMorgan Chase & Co. | | |
| 0.24%, dated 1/31/12, due 2/1/12 in the amount of $750,005,000 | | |
| (fully collateralized by $808,778,637 Federal Home Loan Mortgage Corp., | | |
| 3%-5%, due 1/1/26-1/1/42, value $765,002,968) | 750,000,000 | 750,000,000 |
| Merrill Lynch & Co. Inc. | | |
| 0.17%-0.19%, dated 1/31/12, due 2/1/12 in the amount of $445,002,213 | | |
| (fully collateralized by $433,983,600 U.S. Treasury Notes, 0.88%-2.38%, | | |
| due 1/31/17-6/30/18, value $453,900,115) | 445,000,000 | 445,000,000 |
The Funds 13
STATEMENT OF INVESTMENTS (continued)
| | | | |
| | Principal | |
| Dreyfus Cash Management (continued) | Amount ($) | Value ($) |
| |
| Repurchase Agreements (continued) | | |
| RBC Capital Markets | | |
| 0.14%-0.225%, dated 1/31/12, due 2/1/12 in the amount of $381,001,909 | | |
| (fully collateralized by $475,000 African Development Bank, 6.88%, due 10/15/15, | | |
| value $561,304, $40,632,158 Certificates of Deposit, 0%, due 1/31/13, | | |
| value $40,632,158, $10,382,742 Commercial Paper, 0%, due 2/10/12-6/5/12, | | |
| value $10,367,843, $259,853,240 Corporate Bonds, 0%-5.63%, due 2/20/15-10/15/54, | | |
| value $134,930,000, $99,846,000 Federal Home Loan Bank, 0%, due 3/28/12, | | |
| value $99,843,005, $109,000 International Bank for Reconstruction and Development, | | |
| 0%, due 10/15/13-2/15/16, value $105,708 and $103,651,900 U.S. Treasury Notes, | | |
| 1.25%, due 1/31/19, value $103,489,996) | 381,000,000 | 381,000,000 |
| Total Repurchase Agreements | | |
| (cost $5,226,000,000) | | 5,226,000,000 |
| |
| Total Investments (cost $27,626,670,421) | 100.0% | 27,626,670,421 |
| |
| Cash and Receivables (Net) | .0% | 12,593,953 |
| |
| Net Assets | 100.0% | 27,639,264,374 |
| |
| a Variable rate security—interest rate subject to periodic change. |
| b Securities exempt from registration under Rule 144A of the Securities Act of 1933.These securities may be resold in transactions exempt from registration, normally to qualified |
| institutional buyers.At January 31, 2012, these securities amounted to $4,622,283,714 or 16.7% of net assets. |
| c The Federal Housing Finance Agency (“FHFA”) placed Federal Home Loan Mortgage Corporation and Federal National Mortgage Association into conservatorship with FHFA as the |
| conservator.As such, the FHFA oversees the continuing affairs of these companies. |
| | | | |
| Portfolio Summary (Unaudited)† | | | |
| |
| | Value (%) | | Value (%) |
| Banking | 67.3 | Asset—Backed/Banking | 2.9 |
| Repurchase Agreements | 18.9 | Finance | .7 |
| U.S. Government/Agencies | 10.2 | | 100.0 |
| |
| † Based on net assets. | | | |
| See notes to financial statements. | | | |
14
STATEMENT OF INVESTMENTS
January 31, 2012
| | | | | |
| | Annualized | | | |
| | Yield on | | | |
| | Date of | Principal | | |
| Dreyfus Government Cash Management | Purchase (%) | Amount ($) | | Value ($) |
| |
| U.S. Government Agencies—41.2% | | | | |
| Federal Farm Credit Bank: | | | | |
| 2/6/12 | 0.44 | 80,000,000 | a | 79,998,988 |
| 3/29/12 | 0.35 | 50,000,000 | a | 49,998,421 |
| 6/18/12 | 0.10 | 30,000,000 | | 30,230,000 |
| Federal Home Loan Bank: | | | | |
| 2/1/12 | 0.27 | 400,000,000 | a | 399,918,292 |
| 2/13/12 | 0.01 | 75,000,000 | | 75,002,768 |
| 2/17/12 | 0.01 | 281,000,000 | | 280,999,376 |
| 2/22/12 | 0.01 | 130,000,000 | | 129,999,242 |
| 2/22/12 | 0.07 | 200,000,000 | | 200,006,600 |
| 3/14/12 | 0.02 | 76,500,000 | | 76,498,215 |
| 3/16/12 | 0.02 | 355,000,000 | | 354,991,322 |
| 3/21/12 | 0.02 | 72,000,000 | | 71,998,040 |
| 4/13/12 | 0.04 | 99,000,000 | | 98,992,080 |
| 5/16/12 | 0.07 | 813,225,000 | | 813,048,577 |
| 5/18/12 | 0.08 | 240,740,000 | | 240,684,035 |
| 6/8/12 | 0.09 | 50,010,000 | | 50,234,224 |
| 6/19/12 | 0.08 | 23,406,000 | | 23,399,222 |
| 6/20/12 | 0.25 | 76,445,000 | | 76,915,792 |
| 6/22/12 | 0.06 | 59,000,000 | | 58,986,037 |
| 6/22/12 | 0.09 | 30,000,000 | | 29,998,676 |
| 6/29/12 | 0.11 | 602,960,000 | | 603,304,536 |
| 6/29/12 | 0.11 | 10,000,000 | | 10,005,714 |
| 7/11/12 | 0.10 | 77,500,000 | | 77,550,734 |
| 8/15/12 | 0.16 | 233,690,000 | | 239,231,465 |
| 8/22/12 | 0.18 | 248,235,000 | | 250,377,430 |
| Federal Home Loan Mortgage Corp.: | | | | |
| 7/12/12 | 0.07 | 200,000,000 | b | 199,937,000 |
| 7/16/12 | 0.16 | 146,026,000 | b | 149,343,963 |
| 10/19/12 | 0.18 | 300,000,000 | b | 299,608,500 |
| Federal National Mortgage Association: | | | | |
| 2/1/12 | 0.28 | 287,445,000 | a,b | 287,516,412 |
| 2/1/12 | 0.31 | 601,485,000 | a,b | 601,385,288 |
| 3/21/12 | 0.02 | 66,667,000 | b | 66,665,185 |
| 4/16/12 | 0.03 | 250,000,000 | b | 249,984,375 |
| 4/27/12 | 0.04 | 600,000,000 | b | 599,942,667 |
| 6/13/12 | 0.08 | 268,913,000 | b | 268,838,489 |
| 6/22/12 | 0.10 | 67,665,000 | b | 67,964,841 |
| 6/25/12 | 0.06 | 659,000,000 | b | 658,840,742 |
| 7/12/12 | 0.06 | 600,000,000 | b | 599,838,000 |
| 10/15/12 | 0.18 | 300,000,000 | b | 299,614,500 |
| Total U.S. Government Agencies | | | | |
| ost $8,671,849,748) | | | | 8,671,849,748 |
The Funds 15
STATEMENT OF INVESTMENTS (continued)
| | | | |
| | Annualized | | |
| | Yield on | | |
| | Date of | Principal | |
| Dreyfus Government Cash Management (continued) | Purchase (%) | Amount ($) | Value ($) |
| |
| U.S. Treasury Bills—7.6% | | | |
| 2/2/12 | 0.02 | 262,000,000 | 261,999,854 |
| 2/9/12 | 0.03 | 250,000,000 | 249,998,333 |
| 2/16/12 | 0.02 | 850,000,000 | 849,991,354 |
| 3/1/12 | 0.04 | 200,000,000 | 199,994,260 |
| 3/22/12 | 0.04 | 50,000,000 | 49,997,222 |
| Total U.S. Treasury Bills | | | |
| (cost $1,611,981,023) | | | 1,611,981,023 |
| |
| |
| U.S. Treasury Notes—2.0% | | | |
| 2/29/12 | 0.28 | 100,000,000 | 100,045,084 |
| 6/15/12 | 0.22 | 50,000,000 | 50,303,189 |
| 7/16/12 | 0.14 | 100,000,000 | 100,623,374 |
| 8/31/12 | 0.14 | 162,000,000 | 162,221,423 |
| Total U.S. Treasury Notes | | | |
| (cost $413,193,070) | | | 413,193,070 |
| |
| |
| Repurchase Agreements—49.2% | | | |
| ABN AMRO Bank N.V. | | | |
| dated 1/31/12, due 2/1/12 in the amount of $600,003,000 (fully | | | |
| collateralized by $50,000,000 Federal Home Loan Bank, 2%, due 9/14/12, | | | |
| value $50,943,556, $125,000,000 Federal Home Loan Mortgage Corp., | | | |
| 0.50%-1.38%, due 2/8/13-2/25/14, value $126,321,625 and $423,396,000 | | | |
| Federal National Mortgage Association, 0%-5.25%, due 3/1/12-10/26/16, | | | |
| value $434,735,657) | 0.18 | 600,000,000 | 600,000,000 |
| ABN AMRO Bank N.V. | | | |
| dated 1/31/12, due 2/1/12 in the amount of $600,003,167 (fully | | | |
| collateralized by $194,422,100 U.S. Treasury Inflation Protected Securities, | | | |
| 0.13%-2.50%, due 4/15/16-1/15/28, value $232,728,704 and $354,019,000 | | | |
| U.S. Treasury Notes, 0.63%-3.50%, due 3/31/12-5/15/20, value $379,271,323) | 0.19 | 600,000,000 | 600,000,000 |
| Barclays Capital, Inc. | | | |
| dated 1/31/12, due 2/1/12 in the amount of $122,000,610 | | | |
| (fully collateralized by $124,061,700 U.S. Treasury Notes, 0.38%, | | | |
| due 6/30/13, value $124,440,010) | 0.18 | 122,000,000 | 122,000,000 |
| Barclays Capital, Inc. | | | |
| dated 1/31/12, due 2/1/12 in the amount of $325,001,806 | | | |
| (fully collateralized by $523,352,252 Government National Mortgage | | | |
| Association, 3%-7%, due 7/15/20-12/20/41, value $331,500,000) | 0.20 | 325,000,000 | 325,000,000 |
| Credit Agricole CIB | | | |
| dated 1/31/12, due 2/1/12 in the amount of $2,163,010,815 | | | |
| (fully collateralized by $386,313,300 U.S. Treasury Bonds, 8.13%-9%, | | | |
| due 11/15/18-5/15/20, value $593,717,516 and $1,564,982,100 | | | |
| U.S. Treasury Notes, 0.50%-4.63%, due 5/15/12-2/15/17, | | | |
| value $1,612,542,524) | 0.18 | 2,163,000,000 | 2,163,000,000 |
16
| | | | |
| | Annualized | | |
| | Yield on | | |
| | Date of | Principal | |
| Dreyfus Government Cash Management (continued) | Purchase (%) | Amount ($) | Value ($) |
| |
| Repurchase Agreements (continued) | | | |
| Credit Agricole CIB | | | |
| dated 1/31/12, due 2/1/12 in the amount of $800,004,889 | | | |
| (fully collateralized by $100,000,000 Federal Farm Credit Bank, | | | |
| 4.50%, due 10/17/12, value $104,325,000, $89,740,000 | | | |
| Federal Home Loan Mortgage Corp., 1%-2.13%, | | | |
| due 3/23/12-8/28/12, value $90,522,679 and | | | |
| $591,965,293 Federal National Mortgage Association, | | | |
| 0.63%-4.63%, due 6/22/12-10/15/14, value $621,152,322) | 0.22 | 800,000,000 | 800,000,000 |
| Credit Suisse Securities LLC | | | |
| dated 1/31/12, due 2/1/12 in the amount of $210,001,050 | | | |
| (fully collateralized by $516,151,000 U.S. Treasury Strips, | | | |
| due 11/15/39-2/15/40, value $214,201,822) | 0.18 | 210,000,000 | 210,000,000 |
| Deutsche Bank Securities Inc. | | | |
| dated 1/31/12, due 2/1/12 in the amount of $275,001,528 | | | |
| (fully collateralized by $200,210,800 U.S. Treasury Bonds, 5%, | | | |
| due 5/15/37, value $280,378,593 and $119,900 U.S. Treasury | | | |
| Notes, 0.75%, due 6/15/14, value $121,448) | 0.20 | 275,000,000 | 275,000,000 |
| Deutsche Bank Securities Inc. | | | |
| dated 1/31/12, due 2/1/12 in the amount of $525,003,208 | | | |
| (fully collateralized by $33,387,000 Federal Farm Credit Bank, | | | |
| 0%-2.98%, due 8/6/12-11/15/21, value $33,703,244, | | | |
| $92,135,000 Federal Home Loan Bank, 0.22%-1%, | | | |
| due 9/12/12-8/8/14, value $92,313,780, $144,851,000 | | | |
| Federal Home Loan Mortgage Corp., 0%-5.86%, | | | |
| due 3/5/12-1/14/27, value $156,087,583 and | | | |
| $245,881,000 Federal National Mortgage Association, | | | |
| 0.70%-5%, due 12/12/14-12/19/31, value $253,398,970) | 0.22 | 525,000,000 | 525,000,000 |
| HSBC USA Inc. | | | |
| dated 1/31/12, due 2/1/12 in the amount of $925,004,368 | | | |
| (fully collateralized by $944,931,000 U.S. Treasury Notes, | | | |
| 0.13%-1.25%, due 9/30/13-1/31/19, value $943,501,983) | 0.17 | 925,000,000 | 925,000,000 |
| Merrill Lynch & Co. Inc. | | | |
| dated 1/31/12, due 2/1/12 in the amount of $400,001,889 | | | |
| (fully collateralized by $172,354,900 U.S. Treasury Bonds, | | | |
| 4.38%, due 11/15/39, value $222,102,523 and $175,337,600 | | | |
| U.S. Treasury Notes, 1.75%-3.13%, due 12/31/15-5/15/21, | | | |
| value $185,897,579) | 0.17 | 400,000,000 | 400,000,000 |
| Merrill Lynch & Co. Inc. | | | |
| dated 1/31/12, due 2/1/12 in the amount of $400,002,111 | | | |
| (fully collateralized by $84,298,600 U.S. Treasury Bonds, 4.63%, | | | |
| due 2/15/40, value $113,828,384 and $293,965,900 U.S. Treasury | | | |
| Notes, 0.25%, due 1/31/14, value $294,171,676) | 0.19 | 400,000,000 | 400,000,000 |
| RBC Capital Markets | | | |
| dated 1/31/12, due 2/1/12 in the amount of $950,003,431 | | | |
| (fully collateralized by $926,961,800 U.S. Treasury Notes, | | | |
| 0.25%-3.13%, due 1/15/15-5/15/21, value $969,000,029) | 0.13 | 950,000,000 | 950,000,000 |
The Funds 17
STATEMENT OF INVESTMENTS (continued)
| | | | |
| | Annualized | | |
| | Yield on | | |
| | Date of | Principal | |
| Dreyfus Government Cash Management (continued) | Purchase (%) | Amount ($) | Value ($) |
| |
| Repurchase Agreements (continued) | | | |
| RBC Capital Markets | | | |
| dated 1/31/12, due 2/1/12 in the amount of $200,000,778 | | | |
| (fully collateralized by $15,117,000 Federal Farm Credit Bank, | | | |
| 0.54%-5%, due 3/5/12-12/23/41, value $15,425,221, $34,286,000 | | | |
| Federal Home Loan Bank, 0%-3%, due 3/28/12-1/27/27, value | | | |
| $34,364,395, $810,000 Federal Home Loan Mortgage Corp., | | | |
| 2.25%-3%, due 1/30/24-1/25/27, value $813,653, $149,531,000 | | | |
| Federal National Mortgage Association, 0.63%-3.97%, | | | |
| due 3/30/16-11/23/26, value $153,314,715, $42,000 | | | |
| Financing Corp., 0%, due 11/30/13-8/3/15, value $40,910 | | | |
| and $35,000 Tennessee Valley Authority, 3.88%-8.25%, | | | |
| due 12/15/17-4/15/42, value $41,667) | 0.14 | 200,000,000 | 200,000,000 |
| RBS Securities, Inc. | | | |
| dated 1/31/12, due 2/1/12 in the amount of $126,000,630 | | | |
| (fully collateralized by $115,169,100 U.S. Treasury Notes, | | | |
| 2.75%-3%, due 2/28/17-12/31/17, value $128,523,454) | 0.18 | 126,000,000 | 126,000,000 |
| RBS Securities, Inc. | | | |
| dated 1/31/12, due 2/1/12 in the amount of $400,002,222 | | | |
| (fully collateralized by $382,854,200 U.S. Treasury Notes, | | | |
| 1.38%-3.13%, due 9/15/12-9/30/18, value $408,003,781) | 0.20 | 400,000,000 | 400,000,000 |
| Societe Generale | | | |
| dated 1/31/12, due 2/1/12 in the amount of $850,004,722 | | | |
| (fully collateralized by $91,846,600 U.S. Treasury Bonds, 8%, | | | |
| due 11/15/21, value $145,394,369, $181,300,000 U.S. Treasury | | | |
| Inflation Protected Securities, 1.88%-3.63%, due 7/15/19-4/15/28, | | | |
| value $284,695,113 and $425,944,600 U.S. Treasury Notes, | | | |
| 0.25%-2.75%, due 6/30/13-8/31/17, value $436,910,568) | 0.20 | 850,000,000 | 850,000,000 |
| Societe Generale | | | |
| dated 1/31/12, due 2/1/12 in the amount of $200,001,167 | | | |
| (fully collateralized by $70,294,000 Federal National Mortgage | | | |
| Association, 4.75%, due 11/19/12, value $73,530,336 and | | | |
| $160,029,000 Resolution Funding Corp., 0%, due 1/15/21, | | | |
| value $130,470,043) | 0.21 | 200,000,000 | 200,000,000 |
18
| | | | | |
| | Annualized | | |
| | Yield on | | |
| | Date of | Principal | |
| Dreyfus Government Cash Management (continued) | Purchase (%) | Amount ($) | Value ($) |
| |
| Repurchase Agreements (continued) | | | |
| UBS Securities LLC | | | |
| dated 1/31/12, due 2/1/12 in the amount of $300,001,750 | | | |
| (fully collateralized by $25,020,000 Federal Agricultural Mortgage | | | |
| Corp., 0%-6.71%, due 2/1/12-7/28/14, value $25,023,035, $45,850,000 | | | |
| Federal Home Loan Bank, 0.10%-2.85%, due 1/30/13-1/30/24, | | | |
| value $46,000,396, $79,796,000 Federal Home Loan Mortgage Corp., | | | |
| 0%-3.25%, due 9/12/14-12/22/26, value $79,843,622, $73,222,000 | | | |
| Federal National Mortgage Association, 0.50%-1.25%, due 10/9/15-12/28/16, | | | |
| value $73,320,450, $89,286,000 Resolution Funding Corp., 0%, | | | |
| due 10/15/16-1/15/20, value $81,038,145 and $1,060,000 Student | | | |
| Loan Marketing Association, 0%, due 10/3/22, value $774,616) | 0.21 | 300,000,000 | 300,000,000 |
| Total Repurchase Agreements | | | |
| (cost $10,371,000,000) | | | 10,371,000,000 |
| |
| Total Investments (cost $21,068,023,841) | | 100.0% | 21,068,023,841 |
| |
| Cash and Receivables (Net) | | .0% | 1,203,200 |
| |
| Net Assets | | 100.0% | 21,069,227,041 |
| |
| a Variable rate security—interest rate subject to periodic change. |
| b The Federal Housing Finance Agency (“FHFA”) placed Federal Home Loan Mortgage Corporation and Federal National Mortgage Association into conservatorship with FHFA as the |
| conservator.As such, the FHFA oversees the continuing affairs of these companies. |
| | | | |
| Portfolio Summary (Unaudited)† | | | |
| |
| | Value (%) | | Value (%) |
| Repurchase Agreements | 49.2 | Federal Home Loan Mortgage Corp | 3.1 |
| Federal Home Loan Bank | 19.7 | U.S. Treasury Notes | 2.0 |
| Federal National Mortgage Association | 17.6 | Federal Farm Credit Bank | .8 |
| U.S. Treasury Bills | 7.6 | | 100.0 |
| |
| † Based on net assets. | | | |
| See notes to financial statements. | | | |
The Funds 19
STATEMENT OF INVESTMENTS
January 31, 2012
| | | | | |
| | Annualized | | | |
| | Yield on | | | |
| | Date of | Principal | | |
| Dreyfus Government Prime Cash Management | Purchase (%) | Amount ($) | | Value ($) |
| |
| U.S. Government Agencies—54.6% | | | | |
| Federal Farm Credit Bank: | | | | |
| 2/6/12 | 0.44 | 75,000,000 | a | 74,999,051 |
| 2/23/12 | 0.29 | 74,500,000 | a | 74,492,887 |
| 5/14/12 | 0.05 | 77,478,000 | | 77,467,775 |
| 5/24/12 | 0.31 | 50,000,000 | a | 49,998,430 |
| 5/30/12 | 0.04 | 50,000,000 | | 49,993,389 |
| 7/25/12 | 0.33 | 225,000,000 | a | 224,978,178 |
| 8/17/12 | 0.32 | 82,500,000 | a | 82,536,111 |
| Federal Home Loan Bank: | | | | |
| 2/1/12 | 0.03 | 4,000,000 | | 4,000,000 |
| 2/3/12 | 0.01 | 200,000,000 | | 199,999,889 |
| 2/10/12 | 0.03 | 300,000,000 | | 299,997,750 |
| 2/15/12 | 0.03 | 25,000,000 | | 24,999,757 |
| 2/17/12 | 0.02 | 233,532,000 | | 233,529,537 |
| 2/22/12 | 0.03 | 193,837,000 | | 193,833,498 |
| 2/29/12 | 0.01 | 85,900,000 | | 85,899,332 |
| 3/14/12 | 0.03 | 310,000,000 | | 309,988,555 |
| 4/25/12 | 0.08 | 25,000,000 | | 24,995,333 |
| 5/2/12 | 0.08 | 100,000,000 | | 99,981,042 |
| 5/8/12 | 0.06 | 25,848,000 | | 25,843,821 |
| 5/9/12 | 0.08 | 146,000,000 | | 145,970,192 |
| 5/18/12 | 0.14 | 50,000,000 | | 50,144,159 |
| 7/18/12 | 0.08 | 338,000,000 | | 337,881,700 |
| Total U.S. Government Agencies | | | | |
| (cost $2,671,530,386) | | | | 2,671,530,386 |
| |
| |
| U.S. Treasury Bills—20.7% | | | | |
| 3/15/12 | 0.00 | 250,000,000 | | 250,000,000 |
| 3/22/12 | 0.002 | 259,265,000 | | 259,264,100 |
| 3/29/12 | 0.02 | 185,000,000 | | 184,994,894 |
| 4/5/12 | 0.01 | 210,000,000 | | 209,997,689 |
| 4/26/12 | 0.04 | 111,000,000 | | 110,990,827 |
| Total U.S. Treasury Bills | | | | |
| (cost $1,015,247,510) | | | | 1,015,247,510 |
20
| | | | | |
| | Annualized | | |
| | Yield on | | |
| | Date of | Principal | |
| Dreyfus Government Prime Cash Management (continued) | Purchase (%) | Amount ($) | Value ($) |
| |
| U.S. Treasury Notes—24.2% | | | |
| 2/15/12 | 0.03 | 275,000,000 | 275,141,139 |
| 3/15/12 | 0.03 | 320,000,000 | 320,508,836 |
| 4/2/12 | 0.05 | 60,000,000 | 60,092,055 |
| 4/2/12 | 0.06 | 474,000,000 | 477,407,806 |
| 6/15/12 | 0.22 | 50,000,000 | 50,303,189 |
| Total U.S. Treasury Notes | | | |
| (cost $1,183,453,025) | | | 1,183,453,025 |
| Total Investments (cost $4,870,230,921) | | 99.5% | 4,870,230,921 |
| Cash and Receivables (Net) | | .5% | 24,710,806 |
| Net Assets | | 100.0% | 4,894,941,727 |
a Variable rate security—interest rate subject to periodic change.
| | | | |
| Portfolio Summary (Unaudited)† | | | |
| |
| | Value (%) | | Value (%) |
| Federal Home Loan Bank | 41.6 | Federal Farm Credit Bank | 13.0 |
| U.S. Treasury Notes | 24.2 | | |
| U.S. Treasury Bills | 20.7 | | 99.5 |
† Based on net assets.
See notes to financial statements.
The Funds 21
STATEMENT OF INVESTMENTS
January 31, 2012
| | | | |
| | Annualized | | |
| | Yield on | | |
| | Date of | Principal | |
| Dreyfus Treasury & Agency Cash Management | Purchase (%) | Amount ($) | Value ($) |
| |
| U.S. Treasury Bills—12.7% | | | |
| 2/2/12 | 0.00 | 70,000,000 | 70,000,000 |
| 2/9/12 | 0.02 | 36,000,000 | 35,999,860 |
| 2/16/12 | 0.02 | 200,000,000 | 199,998,542 |
| 2/23/12 | 0.01 | 450,000,000 | 449,996,181 |
| 3/1/12 | 0.00 | 500,000,000 | 500,000,000 |
| 3/22/12 | 0.003 | 792,000,000 | 791,996,757 |
| 3/29/12 | 0.002 | 388,000,000 | 387,998,860 |
| 4/5/12 | 0.03 | 148,000,000 | 147,992,107 |
| Total U.S. Treasury Bills | | | |
| (cost $2,583,982,307) | | | 2,583,982,307 |
| |
| U.S. Treasury Notes—28.7% | | | |
| 2/15/12 | 0.03 | 175,000,000 | 175,089,487 |
| 2/15/12 | 0.19 | 275,000,000 | 275,488,886 |
| 2/29/12 | 0.01 | 100,000,000 | 100,066,448 |
| 2/29/12 | 0.07 | 464,000,000 | 465,623,607 |
| 3/15/12 | 0.12 | 400,000,000 | 400,589,446 |
| 4/2/12 | 0.05 | 825,000,000 | 826,288,314 |
| 4/30/12 | 0.02 | 84,000,000 | 84,919,984 |
| 4/30/12 | 0.18 | 285,000,000 | 285,570,831 |
| 5/15/12 | 0.23 | 500,000,000 | 501,622,701 |
| 5/31/12 | 0.05 | 30,000,000 | 30,462,294 |
| 5/31/12 | 0.08 | 500,000,000 | 501,095,082 |
| 6/15/12 | 0.10 | 1,400,000,000 | 1,409,167,710 |
| 7/16/12 | 0.06 | 80,000,000 | 80,526,175 |
| 7/31/12 | 0.06 | 300,000,000 | 300,834,809 |
| 8/15/12 | 0.09 | 150,000,000 | 151,326,905 |
| 10/1/12 | 0.10 | 250,000,000 | 250,438,983 |
| Total U.S. Treasury Notes | | | |
| (cost $5,839,111,662) | | | 5,839,111,662 |
| | | | |
| Repurchase Agreements—58.4% | | | |
| ABN AMRO Bank N.V. | | | |
| dated 1/31/12, due 2/1/12 in the amount of $1,850,009,250 | | | |
| (fully collateralized by $37,000,000 U.S. Treasury Bills, | | | |
| due 2/23/12-4/5/12, value $36,997,216, $211,136,300 | | | |
| U.S. Treasury Bonds, 3.50%-7.25%, due 5/15/16-2/15/41, | | | |
| value $280,606,834, $270,300,000 U.S. Treasury Inflation | | | |
| Protected Securities, 0.63%-2.13%, due 4/15/12-7/15/21, | | | |
| value $330,567,792 and $1,147,282,000 U.S. Treasury Notes, | | | |
| 0.38%-4.75%, due 4/15/12-11/15/21, value $1,238,828,250) | 0.18 | 1,850,000,000 | 1,850,000,000 |
| Barclays Capital, Inc. | | | |
| dated 1/31/12, due 2/1/12 in the amount of $176,000,880 | | | |
| (fully collateralized by $172,771,600 U.S. Treasury Notes, | | | |
| 1.50%, due 7/31/16, value $179,520,059) | 0.18 | 176,000,000 | 176,000,000 |
22
| | | | |
| | Annualized | | |
| | Yield on | | |
| | Date of | Principal | |
| Dreyfus Treasury & Agency Cash Management (continued) | Purchase (%) | Amount ($) | Value ($) |
| |
| Repurchase Agreements (continued) | | | |
| Barclays Capital, Inc. | | | |
| dated 1/31/12, due 2/1/12 in the amount of $1,000,005,000 | | | |
| (fully collateralized by $772,559,000 U.S. Treasury Bonds, | | | |
| 4.50%, due 8/15/39, value $1,035,957,630) | 0.18 | 1,000,000,000 | 1,000,000,000 |
| Credit Agricole CIB | | | |
| dated 1/31/12, due 2/1/12 in the amount of $625,003,125 | | | |
| (fully collateralized by $270,195,100 U.S. Treasury Inflation | | | |
| Protected Securities, 3.38%, due 4/15/32, value $546,275,593 | | | |
| and $82,603,000 U.S. Treasury Notes, 2.75%, due 12/31/17, | | | |
| value $91,224,443) | 0.18 | 625,000,000 | 625,000,000 |
| Credit Suisse Securities LLC | | | |
| dated 1/31/12, due 2/1/12 in the amount of $900,004,500 | | | |
| (fully collateralized by $1,543,218,875 U.S. Treasury Strips, | | | |
| due 2/15/12-2/15/41, value $918,001,481) | 0.18 | 900,000,000 | 900,000,000 |
| Deutsche Bank Securities Inc. | | | |
| dated 1/31/12, due 2/1/12 in the amount of $50,000,278 | | | |
| (fully collateralized by $50,068,500 U.S. Treasury Notes, | | | |
| 2%, due 11/15/21, value $51,000,063) | 0.20 | 50,000,000 | 50,000,000 |
| HSBC USA Inc. | | | |
| dated 1/31/12, due 2/1/12 in the amount of $530,002,503 | | | |
| (fully collateralized by $1,240,884,000 U.S. Treasury Strips, | | | |
| due 2/15/12-2/15/41, value $540,600,965) | 0.17 | 530,000,000 | 530,000,000 |
| Merrill Lynch & Co. Inc. | | | |
| dated 1/31/12, due 2/1/12 in the amount of $70,000,331 | | | |
| (fully collateralized by $63,447,100 U.S. Treasury Notes, | | | |
| 3.25%, due 12/31/16, value $71,400,058) | 0.17 | 70,000,000 | 70,000,000 |
| RBC Capital Markets | | | |
| dated 1/31/12, due 2/1/12 in the amount of $1,050,003,792 | | | |
| (fully collateralized by $93,680,019 Government National Mortgage | | | |
| Association, 1.63%-6%, due 9/20/33-3/15/39, value $36,900,011, | | | |
| $239,030,400 U.S. Treasury Inflation Protected Securities, | | | |
| 0.13%-2.38%, due 7/15/14-1/15/25, value $314,142,060, | | | |
| $427,808,400 U.S. Treasury Notes, 0.88%, due 1/31/17, | | | |
| value $430,815,893 and $384,154,900 U.S. Treasury | | | |
| Strips, due 8/15/12-8/15/39, value $289,142,036) | 0.13 | 1,050,000,000 | 1,050,000,000 |
| RBS Securities, Inc. | | | |
| dated 1/31/12, due 2/1/12 in the amount of $1,750,008,750 | | | |
| (fully collateralized by $205,236,100 U.S. Treasury Bonds, | | | |
| 3.75%-4.50%, due 5/15/38-8/15/41, value $256,316,340 | | | |
| and $1,450,054,021 U.S. Treasury Notes, 0.50%-5.13%, | | | |
| due 3/31/12-8/15/20, value $1,528,686,973) | 0.18 | 1,750,000,000 | 1,750,000,000 |
| SG Americas Securities, LLC | | | |
| dated 1/31/12, due 2/1/12 in the amount of $1,400,007,778 (fully | | | |
| collateralized by $187,323,000 U.S. Treasury Bills, due 2/9/12-1/10/13, | | | |
| value $187,209,985, $84,878,600 U.S. Treasury Bonds, 3.50%-8.75%, | | | |
| due 8/15/19-5/15/41, value $118,082,227, $59,000,000 U.S. Treasury | | | |
| Inflation Protected Securities, 0.13%-2.38%, due 4/15/12-1/15/25, | | | |
| value $66,047,983, $972,749,100 U.S. Treasury Notes, 0.13%-5.13%, | | | |
| due 2/15/12-8/15/21, value $1,037,498,686 and $33,187,000 | | | |
| U.S. Treasury Strips, due 5/15/22-11/15/30, value $19,161,176) | 0.20 | 1,400,000,000 | 1,400,000,000 |
The Funds 23
STATEMENT OF INVESTMENTS (continued)
| | | | | |
| | Annualized | | | |
| | Yield on | | | |
| | Date of | Principal | | |
| Dreyfus Treasury & Agency Cash Management (continued) | Purchase (%) | Amount ($) | | Value ($) |
| |
| Repurchase Agreements (continued) | | | | |
| Societe Generale | | | | |
| dated 1/31/12, due 2/1/12 in the amount of $750,004,167 | | | | |
| (fully collateralized by $352,576,000 U.S. Treasury Bonds, | | | | |
| 4.38%-7.25%, due 8/15/22-5/15/41, value $496,897,765, | | | | |
| $228,000,000 U.S. Treasury Notes, 0.63%, due 1/31/13, | | | | |
| value $229,068,864 and $40,344,200 U.S. Treasury Strips, | | | | |
| due 11/15/16, value $39,033,417) | 0.20 | 750,000,000 | | 750,000,000 |
| TD Securities (USA) LLC | | | | |
| dated 1/31/12, due 2/1/12 in the amount of $1,350,006,375 | | | | |
| (fully collateralized by $776,502,200 U.S. Treasury Inflation | | | | |
| Protected Securities, 2.13%-3.88%, due 4/15/29-2/15/41, | | | | |
| value $1,377,000,097) | 0.17 | 1,350,000,000 | | 1,350,000,000 |
| UBS Securities LLC | | | | |
| dated 1/31/12, due 2/1/12 in the amount of $350,001,944 | | | | |
| (fully collateralized by $214,035,800 U.S. Treasury Inflation | | | | |
| Protected Securities, 2%-2.13%, due 1/15/14-2/15/41, | | | | |
| value $299,163,506 and $55,677,900 U.S. Treasury Notes, | | | | |
| 1.75%, due 3/31/14, value $57,836,596) | 0.20 | 350,000,000 | | 350,000,000 |
| Total Repurchase Agreements | | | | |
| (cost $11,851,000,000) | | | | 11,851,000,000 |
| |
| Total Investments (cost $20,274,093,969) | | 99.8 | % | 20,274,093,969 |
| |
| Cash and Receivables (Net) | | .2 | % | 48,780,693 |
| |
| Net Assets | | 100.0 | % | 20,322,874,662 |
| | | | |
| Portfolio Summary (Unaudited)† | | | |
| | Value (%) | | Value (%) |
| Repurchase Agreements | 58.4 | U.S. Treasury Bills | 12.7 |
| U.S. Treasury Notes | 28.7 | | 99.8 |
† Based on net assets.
See notes to financial statements.
24
STATEMENT OF INVESTMENTS
January 31, 2012
| | | | |
| | Annualized | | |
| | Yield on | | |
| | Date of | Principal | |
| Dreyfus Treasury Prime Cash Management | Purchase (%) | Amount ($) | Value ($) |
| |
| U.S. Treasury Bills—75.8% | | | |
| 2/2/12 | 0.00 | 553,375,000 | 553,374,998 |
| 2/9/12 | 0.00 | 1,624,900,000 | 1,624,898,435 |
| 2/16/12 | 0.01 | 2,332,022,000 | 2,332,013,656 |
| 2/23/12 | 0.01 | 2,288,000,000 | 2,287,984,291 |
| 3/1/12 | 0.02 | 935,000,000 | 934,982,046 |
| 3/8/12 | 0.01 | 1,588,000,000 | 1,587,986,180 |
| 3/15/12 | 0.01 | 1,039,000,000 | 1,038,988,927 |
| 3/22/12 | 0.003 | 1,207,000,000 | 1,206,994,597 |
| 3/29/12 | 0.02 | 1,572,000,000 | 1,571,959,954 |
| 4/5/12 | 0.01 | 892,545,000 | 892,524,323 |
| 4/12/12 | 0.03 | 1,027,000,000 | 1,026,956,148 |
| 4/19/12 | 0.03 | 1,880,000,000 | 1,879,876,717 |
| 4/26/12 | 0.04 | 891,000,000 | 890,912,786 |
| 5/3/12 | 0.05 | 605,000,000 | 604,922,239 |
| 5/10/12 | 0.02 | 300,000,000 | 299,983,500 |
| 5/17/12 | 0.04 | 430,000,000 | 429,949,356 |
| 5/24/12 | 0.05 | 400,000,000 | 399,943,500 |
| 6/21/12 | 0.04 | 55,000,000 | 54,991,383 |
| 7/5/12 | 0.06 | 500,000,000 | 499,868,144 |
| Total U.S. Treasury Bills | | | |
| (cost $20,119,111,180) | | | 20,119,111,180 |
| |
| U.S. Treasury Notes—26.6% | | | |
| 2/15/12 | 0.02 | 287,000,000 | 287,529,983 |
| 2/15/12 | 0.05 | 1,300,000,000 | 1,300,656,999 |
| 2/29/12 | 0.01 | 122,000,000 | 122,433,411 |
| 2/29/12 | 0.03 | 2,316,000,000 | 2,317,500,751 |
| 3/15/12 | 0.03 | 426,000,000 | 426,678,983 |
| 4/2/12 | 0.04 | 1,062,000,000 | 1,063,673,854 |
| 4/2/12 | 0.04 | 122,000,000 | 122,893,838 |
The Funds 25
STATEMENT OF INVESTMENTS (continued)
| | | | | | |
| | Annualized | | |
| | Yield on | | |
| | Date of | Principal | |
| Dreyfus Treasury Prime Cash Management (continued) | Purchase (%) | Amount ($) | Value ($) |
| |
| U.S. Treasury Notes (continued) | | | |
| 4/16/12 | 0.07 | 200,000,000 | 200,528,995 |
| 4/30/12 | 0.01 | 200,000,000 | 200,482,233 |
| 4/30/12 | 0.06 | 477,528,000 | 482,712,305 |
| 5/31/12 | 0.07 | 313,000,000 | 317,802,321 |
| 7/2/12 | 0.06 | 100,000,000 | 101,987,039 |
| 7/16/12 | 0.08 | 100,000,000 | 100,648,437 |
| Total U.S. Treasury Notes | | | |
| (cost $7,045,529,149) | | | 7,045,529,149 |
| Total Investments (cost $27,164,640,329) | | 102.4% | 27,164,640,329 |
| Liabilities, Less Cash and Receivables | | (2.4%) | (629,225,387) |
| Net Assets | | 100.0% | 26,535,414,942 |
| | | | |
| Portfolio Summary (Unaudited)† | | | |
| | Value (%) | | Value (%) |
| U.S. Treasury Bills | 75.8 | U.S. Treasury Notes | 26.6 |
| | | | 102.4 |
† Based on net assets.
See notes to financial statements.
26
STATEMENT OF INVESTMENTS
January 31, 2012
| | | | | | |
| | Coupon | Maturity | Principal | | |
| Dreyfus Municipal Cash Management Plus | Rate (%) | Date | Amount ($) | | Value ($) |
| |
| Short-Term Investments—100.0% | | | | | |
| Arizona—1.0% | | | | | |
| Maricopa County Industrial Development Authority, | | | | | |
| MFHR (San Clemente Apartments Project) | | | | | |
| (Liquidity Facility; FNMA and LOC; FNMA) | 0.11 | 2/7/12 | 1,010,000 | a | 1,010,000 |
| Maricopa County Industrial Development Authority, MFHR, | | | | | |
| Refunding (San Clemente Apartments Project) | | | | | |
| (Liquidity Facility; FNMA and LOC; FNMA) | 0.09 | 2/7/12 | 7,600,000 | a | 7,600,000 |
| California—4.4% | | | | | |
| California Pollution Control Financing Authority, SWDR | | | | | |
| (Rainbow Disposal Company Inc. Project) (LOC; Union Bank NA) | 0.15 | 2/7/12 | 17,815,000 | a | 17,815,000 |
| California Statewide Communities Development Authority, | | | | | |
| MFHR (P-FLOATS Series MT-381) (Liquidity | | | | | |
| Facility; FHLMC and LOC; FHLMC) | 0.28 | 2/7/12 | 13,995,000 a,b,c | | 13,995,000 |
| California Statewide Communities Development | | | | | |
| Authority, Revenue, CP (Kaiser Permanente) | 0.23 | 3/27/12 | 5,000,000 | | 5,000,000 |
| Colorado—6.5% | | | | | |
| Colorado, Education Loan Program Revenue, TRAN | 2.00 | 6/29/12 | 7,000,000 | | 7,053,205 |
| Colorado Housing and Finance Authority, EDR | | | | | |
| (Popiel Properties, LLC Project) (LOC; Wells Fargo Bank) | 0.28 | 2/7/12 | 2,560,000 | a | 2,560,000 |
| Colorado Housing and Finance Authority, EDR | | | | | |
| (Wanco, Inc. Project) (LOC; U.S. Bank NA) | 0.28 | 2/7/12 | 2,235,000 | a | 2,235,000 |
| Colorado Housing and Finance Authority, SFMR | | | | | |
| (Liquidity Facility; Royal Bank of Canada) | 0.09 | 2/7/12 | 13,500,000 | a | 13,500,000 |
| JPMorgan Chase Putters/Drivers Trust (Colorado, | | | | | |
| General Fund TRAN) (Liquidity Facility; JPMorgan Chase Bank) | 0.08 | 2/1/12 | 14,500,000 a,b,c | | 14,500,000 |
| RBC Municipal Products Inc. Trust (Denver City and County, | | | | | |
| Aviation Airport System Revenue) (Liquidity Facility; | | | | | |
| Royal Bank of Canada and LOC; Royal Bank of Canada) | 0.11 | 2/7/12 | 15,000,000 a,b,c | | 15,000,000 |
| Florida—4.0% | | | | | |
| Broward County Housing Finance Authority, MFHR | | | | | |
| (Cypress Grove Apartments Project) (LOC; FNMA) | 0.12 | 2/7/12 | 13,230,000 | a | 13,230,000 |
| Florida Local Government Finance Commission, | | | | | |
| Pooled Loan Program Revenue, CP (LOC; JPMorgan Chase Bank) | 0.09 | 2/3/12 | 7,000,000 | | 7,000,000 |
| Greater Orlando Aviation Authority, Airport Facility | | | | | |
| Revenue (FlightSafety International Inc. Project) | | | | | |
| (Insured; Berkshire Hathaway Assurance Corporation) | 0.07 | 2/7/12 | 6,105,000 | a | 6,105,000 |
| Palm Beach County, Revenue, Refunding (Pine Crest | | | | | |
| Preparatory School, Inc. Project) (LOC; Bank of America) | 0.13 | 2/7/12 | 7,565,000 | a | 7,565,000 |
| Georgia—3.2% | | | | | |
| Atlanta, Airport Revenue, CP (LOC; Wells Fargo Bank) | 0.20 | 2/7/12 | 20,000,000 | | 20,000,000 |
| Georgia, GO Notes | 5.00 | 9/1/12 | 1,500,000 | | 1,541,576 |
| Georgia Municipal Gas Authority, | | | | | |
| Gas Revenue (Gas Portfolio III Project) | 2.00 | 11/13/12 | 5,400,000 | | 5,469,312 |
The Funds 27
STATEMENT OF INVESTMENTS (continued)
| | | | | | |
| Dreyfus Municipal | Coupon | Maturity | Principal | | |
| Cash Management Plus (continued) | Rate (%) | Date | Amount ($) | | Value ($) |
| |
| Short-Term Investments (continued) | | | | | |
| Illinois—.8% | | | | | |
| Illinois Toll Highway Authority, Toll Highway Senior Revenue, | | | | | |
| Refunding (Insured; Assured Guaranty Municipal Corp. | | | | | |
| and Liquidity Facility; JPMorgan Chase Bank) | 0.10 | 2/7/12 | 6,500,000 | a | 6,500,000 |
| Indiana—3.6% | | | | | |
| Elkhart County, EDR (Four Seasons Manufacturing | | | | | |
| Project) (LOC; National City Bank) | 0.12 | 2/7/12 | 2,750,000 | a | 2,750,000 |
| Fort Wayne, EDR (Park Center Project) (LOC; National City Bank) | 0.11 | 2/7/12 | 1,975,000 | a | 1,975,000 |
| Indiana Bond Bank, Advance Funding Program Notes | 1.25 | 1/3/13 | 2,950,000 | | 2,974,318 |
| Indiana Finance Authority, EDR (JRL Leasing, Inc. | | | | | |
| and LaSarre Co., LLC Project) (LOC; National City Bank) | 0.12 | 2/7/12 | 3,000,000 | a | 3,000,000 |
| Indiana Health Facility Financing Authority, Hospital | | | | | |
| Improvement Revenue, Refunding (Community Hospitals | | | | | |
| Projects) (P-FLOATS Series MT-662) (Liquidity Facility; | | | | | |
| Bank of America and LOC; Bank of America) | 0.39 | 2/7/12 | 20,000,000 a,b,c | | 20,000,000 |
| Kansas—1.0% | | | | | |
| Kansas Development Finance Authority, MFHR | | | | | |
| (Tree House Apartments) (LOC; U.S. Bank NA) | 0.11 | 2/7/12 | 8,270,000 | a | 8,270,000 |
| Kentucky—.9% | | | | | |
| Jefferson County, Retirement Home Revenue (Nazareth Literary | | | | | |
| and Benevolent Institution Project) (LOC; JPMorgan Chase Bank) | 0.16 | 2/7/12 | 7,965,000 | a | 7,965,000 |
| Louisiana—2.7% | | | | | |
| Ascension Parish, Revenue, CP (BASF SE) | 0.36 | 2/10/12 | 5,000,000 | | 5,000,000 |
| Louisiana Local Government Environmental Facilities and | | | | | |
| Community Development Authority, Revenue (Nicholls | | | | | |
| State University Student Housing/Nicholls State University | | | | | |
| Facilities Corporation Project) (Insured; Assured | | | | | |
| Guaranty Municipal Corp. and LOC; FHLB) | 0.18 | 2/7/12 | 10,000,000 | a | 10,000,000 |
| Louisiana Public Facilities Authority, Revenue | | | | | |
| (Air Products and Chemicals Project) | 0.05 | 2/1/12 | 7,500,000 | a | 7,500,000 |
| Maryland—1.7% | | | | | |
| Anne Arundel County, EDR (Atlas Container | | | | | |
| Corporation Project) (LOC; M&T Trust) | 0.19 | 2/7/12 | 6,075,000 | a | 6,075,000 |
| Baltimore County Revenue Authority, | | | | | |
| Golf System Revenue (LOC; M&T Trust) | 0.11 | 2/7/12 | 5,440,000 | a | 5,440,000 |
| Frederick County, Revenue | | | | | |
| (Homewood, Inc. Facility) (LOC; M&T Trust) | 0.08 | 2/7/12 | 2,500,000 | a | 2,500,000 |
| Massachusetts—2.8% | | | | | |
| Beverly, GO Notes, BAN | 1.00 | 2/22/12 | 3,700,000 | | 3,701,573 |
| Massachusetts Development Finance Agency, Multifamily | | | | | |
| Revenue (Kennedy Lofts Project) (P-FLOATS Series | | | | | |
| MT-319) (Liquidity Facility; FHLMC and LOC; FHLMC) | 0.28 | 2/7/12 | 15,440,000 a,b,c | | 15,440,000 |
| Northampton, GO Notes, BAN | 1.50 | 2/10/12 | 4,000,000 | | 4,000,827 |
28
| | | | | | |
| Dreyfus Municipal | Coupon | Maturity | Principal | | |
| Cash Management Plus (continued) | Rate (%) | Date | Amount ($) | | Value ($) |
| |
| Short-Term Investments (continued) | | | | | |
| Michigan—2.8% | | | | | |
| Michigan Finance Authority, Unemployment Obligation | | | | | |
| Assessment Revenue (LOC; Citibank NA) | 0.11 | 2/7/12 | 20,000,000 | a | 20,000,000 |
| Pittsfield Township Economic Development Corporation, | | | | | |
| LOR, Refunding (Arbor Project) (LOC; Comerica Bank) | 0.13 | 2/7/12 | 3,795,000 | a | 3,795,000 |
| Minnesota—2.0% | | | | | |
| Minneapolis and Saint Paul Housing and Redevelopment | | | | | |
| Authority, Health Care Facilities Revenue (Children’s Hospitals | | | | | |
| and Clinics) (Insured; Assured Guaranty Municipal Corp. | | | | | |
| and Liquidity Facility; U.S. Bank NA) | 0.06 | 2/1/12 | 4,800,000 | a | 4,800,000 |
| Minnesota Housing Finance Agency, Residential Housing | | | | | |
| Finance Revenue (Liquidity Facility; FHLB) | 0.10 | 2/7/12 | 7,000,000 | a | 7,000,000 |
| University of Minnesota, CP | 0.08 | 2/8/12 | 5,000,000 | | 5,000,000 |
| Mississippi—2.5% | | | | | |
| Mississippi Business Finance Corporation, | | | | | |
| Gulf Opportunity Zone IDR (Chevron U.S.A. Inc. Project) | 0.04 | 2/1/12 | 21,115,000 | a | 21,115,000 |
| Missouri—1.4% | | | | | |
| Missouri Development Finance Board, LR, CP (LOC; U.S. Bank NA) | 0.10 | 2/28/12 | 12,000,000 | | 12,000,000 |
| Nevada—2.6% | | | | | |
| Las Vegas Valley Water District, CP | | | | | |
| (Liquidity Facility; JPMorgan Chase Bank) | 0.18 | 2/14/12 | 17,000,000 | | 17,000,000 |
| Las Vegas Valley Water District, CP (LOC; Wells Fargo Bank) | 0.18 | 2/9/12 | 5,000,000 | | 5,000,000 |
| New Hampshire—.6% | | | | | |
| New Hampshire Health and Education Facilities Authority, | | | | | |
| Revenue (Kimball Union Academy) (LOC; RBS Citizens NA) | 0.13 | 2/7/12 | 4,900,000 | a | 4,900,000 |
| New Jersey—.7% | | | | | |
| Woodbridge Township Board of Education, Temporary Notes | 1.00 | 2/6/13 | 6,100,000 | | 6,130,256 |
| New York—6.1% | | | | | |
| Dutchess County Industrial Development Agency, | | | | | |
| Civic Facility Revenue (Arbor Ridge at | | | | | |
| Brookmeade Project) (LOC; M&T Trust) | 0.13 | 2/7/12 | 10,530,000 | a | 10,530,000 |
| Erie County Fiscal Stability Authority, Revenue, BAN | 1.50 | 7/31/12 | 10,000,000 | | 10,056,842 |
| Harborfields Central School District of Greenlawn, GO Notes, TAN | 1.00 | 6/22/12 | 5,000,000 | | 5,011,786 |
| New York City Housing Development Corporation, | | | | | |
| MFMR (1405 Fifth Avenue Apartments) (LOC; Citibank NA) | 0.10 | 2/7/12 | 9,500,000 | a | 9,500,000 |
| New York State Housing Finance Agency, Housing | | | | | |
| Revenue (25 Washington Street) (LOC; M&T Trust) | 0.11 | 2/7/12 | 7,800,000 | a | 7,800,000 |
| New York State Thruway Authority, General Revenue, BAN | 2.00 | 7/12/12 | 8,700,000 | | 8,763,288 |
| North Carolina—.4% | | | | | |
| North Carolina Capital Facilities Finance Agency, | | | | | |
| Educational Facilities Revenue (The Raleigh School | | | | | |
| Project) (LOC; Branch Banking and Trust Co.) | 0.07 | 2/7/12 | 3,500,000 | a | 3,500,000 |
The Funds 29
STATEMENT OF INVESTMENTS (continued)
| | | | | | |
| Dreyfus Municipal | Coupon | Maturity | Principal | | |
| Cash Management Plus (continued) | Rate (%) | Date | Amount ($) | | Value ($) |
| |
| Short-Term Investments (continued) | | | | | |
| Ohio—3.1% | | | | | |
| Hamilton County, Hospital Facilities Revenue | | | | | |
| (University Hospital) (P-FLOATS Series MT-640) (Liquidity | | | | | |
| Facility; Bank of America and LOC; Bank of America) | 0.49 | 2/7/12 | 21,155,000 a,b,c | | 21,155,000 |
| Lorain County, IDR (Cutting Dynamics, Inc. | | | | | |
| Project) (LOC; National City Bank) | 0.13 | 2/7/12 | 1,790,000 | a | 1,790,000 |
| Union Township, GO Notes, BAN (Various Purpose) | 1.13 | 9/12/12 | 3,000,000 | | 3,008,653 |
| Oklahoma—.5% | | | | | |
| Oklahoma Water Resources Board, State Loan Program | | | | | |
| Revenue (Liquidity Facility; State Street Bank and Trust Co.) | 0.50 | 2/3/12 | 4,400,000 | | 4,400,000 |
| Pennsylvania—9.0% | | | | | |
| Allegheny County, GO Notes, TRAN | 2.00 | 7/16/12 | 10,800,000 | | 10,887,560 |
| Blair County Industrial Development Authority, | | | | | |
| Revenue (Hollidaysburg Area YMCA Project) | | | | | |
| (LOC; Citizens Bank of Pennsylvania) | 0.25 | 2/7/12 | 2,820,000 | a | 2,820,000 |
| Chester County Health and Education Facilities | | | | | |
| Authority, Mortgage Revenue (Tel Hai Obligated | | | | | |
| Group Project) (LOC; M&T Trust) | 0.07 | 2/7/12 | 10,045,000 | a | 10,045,000 |
| Emmaus General Authority, Local Government Revenue | | | | | |
| (Bond Pool Program) (LOC; U.S. Bank NA) | 0.06 | 2/7/12 | 14,700,000 | a | 14,700,000 |
| Horizon Hospital System Authority, Senior Health and Housing | | | | | |
| Facilities Revenue (Saint Paul Homes Project) (LOC; M&T Trust) | 0.13 | 2/7/12 | 7,195,000 | a | 7,195,000 |
| Pennsylvania Economic Development Financing Authority, | | | | | |
| Revenue (Evergreen Community Power Facility) (LOC; M&T Trust) | 0.23 | 2/7/12 | 16,000,000 | a | 16,000,000 |
| Philadelphia Authority for Industrial Development, | | | | | |
| Revenue (The Pennsylvania School for the Deaf) | | | | | |
| (LOC; Citizens Bank of Pennsylvania) | 0.25 | 2/7/12 | 2,400,000 | a | 2,400,000 |
| RBC Municipal Products Inc. Trust (Allegheny County Hospital | | | | | |
| Development Authority, Revenue (University of Pittsburgh | | | | | |
| Medical Center)) (Liquidity Facility; Royal Bank of | | | | | |
| Canada and LOC; Royal Bank of Canada) | 0.08 | 2/7/12 | 7,000,000 a,b,c | | 7,000,000 |
| Union County Industrial Development Authority, Revenue | | | | | |
| (Stabler Companies Inc. Project) (LOC; M&T Trust) | 0.23 | 2/7/12 | 4,675,000 | a | 4,675,000 |
| South Carolina—3.0% | | | | | |
| Charleston County School District, GO Notes, TAN | 2.50 | 4/1/12 | 8,000,000 | | 8,030,470 |
| South Carolina Association of Governmental Organizations, COP | 1.50 | 4/13/12 | 11,200,000 | | 11,227,846 |
| Spartanburg County School District Number 002, GO Notes | 3.00 | 4/1/12 | 5,600,000 | | 5,625,023 |
| Tennessee—2.1% | | | | | |
| Cleveland Health and Educational Facilities Board, Revenue | | | | | |
| (Lee University Project) (LOC; Branch Banking and Trust Co.) | 0.07 | 2/7/12 | 3,000,000 | a | 3,000,000 |
| Metropolitan Government of Nashville and Davidson County | | | | | |
| Health and Educational Facilities Board, Revenue, | | | | | |
| Refunding (Belmont University Project) (LOC; FHLB) | 0.06 | 2/7/12 | 6,100,000 | a | 6,100,000 |
| Shelby County Health Educational and Housing | | | | | |
| Facility Board, Educational Facilities Revenue | | | | | |
| (Rhodes College) (LOC; Bank of America) | 0.10 | 2/7/12 | 8,520,000 | a | 8,520,000 |
30
| | | | | | |
| Dreyfus Municipal | Coupon | Maturity | Principal | | |
| Cash Management Plus (continued) | Rate (%) | Date | Amount ($) | | Value ($) |
| |
| Short-Term Investments (continued) | | | | | |
| Texas—22.7% | | | | | |
| Calhoun Port Authority, Environmental Facilities | | | | | |
| Revenue (Formosa Plastics Corporation, | | | | | |
| Texas Project) (LOC; Bank of America) | 0.11 | 2/7/12 | 10,000,000 | a | 10,000,000 |
| DeSoto Industrial Development Authority, IDR, Refunding | | | | | |
| (National Service Industries Inc. Project) (LOC; Wells Fargo Bank) | 0.17 | 2/7/12 | 3,660,000 | a | 3,660,000 |
| El Paso Independent School District, Unlimited Tax School Building | | | | | |
| Bonds (Liquidity Facility; JPMorgan Chase Bank and LOC; | | | | | |
| Permanent School Fund Guarantee Program) | 0.20 | 3/7/12 | 13,000,000 | | 13,000,000 |
| Harris County, GO Notes, TAN | 1.50 | 2/29/12 | 14,900,000 | | 14,915,326 |
| Harris County Health Facilities Development Corporation, | | | | | |
| HR (Baylor College of Medicine) (LOC; Wells Fargo Bank) | 0.06 | 2/1/12 | 2,805,000 | a | 2,805,000 |
| Harris County Health Facilities Development Corporation, | | | | | |
| Revenue, Refunding (The Methodist Hospital System) | 0.04 | 2/1/12 | 3,000,000 | a | 3,000,000 |
| Jefferson County Industrial Development Corporation, | | | | | |
| Hurricane Ike Disaster Area Revenue (Jefferson | | | | | |
| Refinery, L.L.C. Project) (LOC; Branch Banking and Trust Co.) | 0.35 | 2/28/12 | 2,000,000 | | 2,000,000 |
| Jefferson County Industrial Development Corporation, | | | | | |
| Hurricane Ike Disaster Area Revenue (Jefferson | | | | | |
| Refinery, L.L.C. Project) (LOC; Branch Banking and Trust Co.) | 0.50 | 3/29/12 | 17,300,000 | | 17,300,000 |
| North Texas Higher Education Authority, Inc., Student Loan | | | | | |
| Revenue (LOC: Bank of America and Lloyds TSB Bank LLC) | 0.17 | 2/7/12 | 18,000,000 | a | 18,000,000 |
| Port of Port Arthur Navigation District, Revenue, CP (BASF SE) | 0.36 | 2/10/12 | 5,000,000 | | 5,000,000 |
| RBC Municipal Products Inc. Trust (Harris County Health Facilities | | | | | |
| Development Corporation, HR, Refunding (Memorial Hermann | | | | | |
| Healthcare System)) (Liquidity Facility; Royal Bank of | | | | | |
| Canada and LOC; Royal Bank of Canada) | 0.08 | 2/7/12 | 5,000,000 a,b,c | | 5,000,000 |
| Texas, GO Notes (Veterans’ Housing Assistance Program) | | | | | |
| (Liquidity Facility; State Street Bank and Trust Co.) | 0.09 | 2/7/12 | 16,000,000 | a | 16,000,000 |
| Texas Department of Housing and Community Affairs, SFMR | 0.08 | 2/7/12 | 24,350,000 | a | 24,350,000 |
| Texas Municipal Power Agency, Revenue, CP | | | | | |
| (LOC: Bank of America and JPMorgan Chase Bank) | 0.12 | 2/21/12 | 12,900,000 | | 12,900,000 |
| Texas Municipal Power Agency, Revenue, CP | | | | | |
| (LOC: Bank of America and JPMorgan Chase Bank) | 0.12 | 3/12/12 | 10,000,000 | | 10,000,000 |
| Texas Public Finance Authority, CP | | | | | |
| (Liquidity Facility; Wells Fargo Bank) | 0.10 | 3/6/12 | 12,000,000 | | 12,000,000 |
| Texas Public Finance Authority, Revenue, CP | | | | | |
| (Liquidity Facility; Barclays Bank PLC) | 0.10 | 2/1/12 | 15,000,000 | | 15,000,000 |
| Wells Fargo Stage Trust (Klein Independent School District, | | | | | |
| Unlimited Tax Schoolhouse Bonds) (Liquidity Facility; | | | | | |
| Wells Fargo Bank and LOC; Permanent School | | | | | |
| Fund Guarantee Program) | 0.08 | 2/7/12 | 5,000,000 a,b,c | | 5,000,000 |
| Utah—1.6% | | | | | |
| Murray City, HR (Intermountain Health Care Health Services, Inc.) | 0.04 | 2/1/12 | 3,500,000 | a | 3,500,000 |
| Utah State Board of Regents, Student Loan | | | | | |
| Revenue (LOC; Royal Bank of Canada) | 0.10 | 2/7/12 | 10,000,000 | a | 10,000,000 |
The Funds 31
STATEMENT OF INVESTMENTS (continued)
| | | | | | | |
| Dreyfus Municipal | Coupon | Maturity | Principal | | | |
| Cash Management Plus (continued) | Rate (%) | Date | Amount ($) | | Value ($) | |
| |
| Short-Term Investments (continued) | | | | | | |
| Vermont—1.1% | | | | | | |
| Vermont Economic Development Authority, Revenue, CP (Economic | | | | | | |
| Development Capital Program) (LOC; JPMorgan Chase Bank) | 0.17 | 2/7/12 | 9,100,000 | | 9,100,000 | |
| Virginia—1.6% | | | | | | |
| Lynchburg Redevelopment and Housing Authority, | | | | | | |
| Housing Revenue (KHM Properties-Lynchburg, LLC | | | | | | |
| Project) (LOC; M&T Trust) | 0.18 | 2/7/12 | 13,520,000 | a | 13,520,000 | |
| Washington—2.9% | | | | | | |
| Pierce County Economic Development Corporation, Industrial | | | | | | |
| Revenue (SeaTac Packaging Project) (LOC; HSBC Bank USA) | 0.15 | 2/7/12 | 4,555,000 | a | 4,555,000 | |
| Wells Fargo Stage Trust (Washington Health Care Facilities | | | | | | |
| Authority, Revenue (PeaceHealth)) (Liquidity Facility; | | | | | | |
| Wells Fargo Bank and LOC; Wells Fargo Bank) | 0.08 | 2/7/12 | 19,995,000 a,b,c | | 19,995,000 | |
| Wisconsin—.7% | | | | | | |
| Wisconsin Health and Educational Facilities Authority, | | | | | | |
| Revenue (Mequon Jewish Campus, Inc. Project) | | | | | | |
| (LOC; JPMorgan Chase Bank) | 0.13 | 2/7/12 | 6,145,000 | a | 6,145,000 | |
| |
| Total Investments (cost $841,497,861) | | | 100.0 | % | 841,497,861 | |
| Liabilities, Less Cash and Receivables | | | (.0 | %) | (75,009 | ) |
| Net Assets | | | 100.0 | % | 841,422,852 | |
| |
| See footnotes on page 52. | | | | | | |
| See notes to financial statements. | | | | | | |
32
STATEMENT OF INVESTMENTS
January 31, 2012
| | | | | | |
| Dreyfus New York | Coupon | Maturity | Principal | |
| Municipal Cash Management | Rate (%) | Date | Amount ($) | Value ($) |
| |
| Short-Term Investments—99.4% | | | | |
| New York—94.4% | | | | |
| Addison Central School District, GO Notes, BAN | 1.50 | 6/15/12 | 3,500,000 | 3,510,306 |
| Albany County, GO Notes, TAN | 1.00 | 5/10/12 | 8,700,000 | 8,716,033 |
| Albany Industrial Development Agency, Civic Facility Revenue | | | | |
| (Albany Medical Center Hospital Project) (LOC; Bank of America) | 0.10 | 2/7/12 | 2,500,000a | 2,500,000 |
| Brewster Central School District, GO Notes, BAN | 1.00 | 2/14/12 | 8,000,000�� | 8,001,890 |
| Chautauqua County Industrial Development Agency, Civic Facility | | | | |
| Revenue (Gerry Homes Project) (LOC; HSBC Bank USA) | 0.40 | 2/7/12 | 10,740,000a | 10,740,000 |
| Chemung County Industrial Development Agency, IDR (MMARS | | | | |
| 2nd Program) (Trayer Products, Inc. Project) (LOC; HSBC Bank USA) | 0.40 | 2/7/12 | 555,000a | 555,000 |
| Columbia County Capital Resource Corporation, Civic Facility Revenue | | | | |
| (The Columbia Memorial Hospital Project) (LOC; HSBC Bank USA) | 0.06 | 2/7/12 | 6,945,000a | 6,945,000 |
| Columbia County Industrial Development Agency, Civic Facility Revenue | | | | |
| (The Columbia Memorial Hospital Project) (LOC; HSBC Bank USA) | 0.06 | 2/7/12 | 5,030,000a | 5,030,000 |
| Dutchess County Industrial Development Agency, Civic Facility Revenue | | | | |
| (Anderson Foundation for Autism, Inc. Project) (LOC; M&T Trust) | 0.13 | 2/7/12 | 7,105,000a | 7,105,000 |
| Dutchess County Industrial Development Agency, Civic Facility Revenue | | | | |
| (Anderson Foundation for Autism, Inc. Project) (LOC; M&T Trust) | 0.13 | 2/7/12 | 8,500,000a | 8,500,000 |
| Erie County Fiscal Stability Authority, Revenue, BAN | 1.50 | 7/31/12 | 6,500,000 | 6,536,948 |
| Erie County Industrial Development Agency, IDR | | | | |
| (Hydro-Air Components Inc. Project) (LOC; HSBC Bank USA) | 0.15 | 2/7/12 | 2,600,000a | 2,600,000 |
| Harborfields Central School District of Greenlawn, GO Notes, TAN | 1.00 | 6/22/12 | 8,000,000 | 8,018,857 |
| Herkimer County Industrial Development Agency, IDR | | | | |
| (F.E. Hale Manufacturing Company Facility) (LOC; HSBC Bank USA) | 0.40 | 2/7/12 | 1,610,000a | 1,610,000 |
| JPMorgan Chase Putters/Drivers Trust (New York State | | | | |
| Dormitory Authority, State Personal Income Tax Revenue | | | | |
| (Education)) (Liquidity Facility; JPMorgan Chase Bank) | 0.08 | 2/7/12 | 8,000,000 a,b,c | 8,000,000 |
| Lancaster Industrial Development Agency, IDR | | | | |
| (Sealing Devices Inc. Project) (LOC; HSBC Bank USA) | 0.15 | 2/7/12 | 2,080,000a | 2,080,000 |
| Medina Central School District, GO Notes, BAN | 1.50 | 6/22/12 | 7,800,000 | 7,819,474 |
| Metropolitan Transportation Authority, | | | | |
| Transportation Revenue, CP (LOC; Citibank NA) | 0.08 | 2/16/12 | 5,000,000 | 5,000,000 |
| Metropolitan Transportation Authority, | | | | |
| Transportation Revenue, CP (LOC; Citibank NA) | 0.11 | 4/5/12 | 25,000,000 | 25,000,000 |
| Monroe County Industrial Development Agency, Civic Facility | | | | |
| Revenue (YMCA of Greater Rochester Project) (LOC; M&T Trust) | 0.13 | 2/7/12 | 2,175,000a | 2,175,000 |
| Monroe County Industrial Development Agency, IDR | | | | |
| (Chaney Enterprises, LLC Project) (LOC; M&T Trust) | 0.28 | 2/7/12 | 1,800,000a | 1,800,000 |
| Monroe County Industrial Development Agency, IDR | | | | |
| (Genesee Metal Stampings Inc. Facility) (LOC; HSBC Bank USA) | 0.40 | 2/7/12 | 160,000a | 160,000 |
| Monroe County Industrial Development Corporation, Revenue | | | | |
| (Saint Ann’s Home for the Aged Project) (LOC; HSBC Bank USA) | 0.08 | 2/7/12 | 8,000,000a | 8,000,000 |
| New York City, GO Notes | 5.00 | 8/1/12 | 4,680,000 | 4,792,466 |
| New York City, GO Notes (Citigroup ROCS, | | | | |
| Series RR II R-14000X) (Liquidity Facility; Citibank NA) | 0.08 | 2/7/12 | 1,300,000 a,b,c | 1,300,000 |
The Funds 33
STATEMENT OF INVESTMENTS (continued)
| | | | | | |
| Dreyfus New York | Coupon | Maturity | Principal | | |
| Municipal Cash Management (continued) | Rate (%) | Date | Amount ($) | | Value ($) |
| |
| Short-Term Investments (continued) | | | | | |
| New York (continued) | | | | | |
| New York City, GO Notes (Liquidity Facility; Bank of Nova Scotia) | 0.06 | 2/7/12 | 5,000,000 | a | 5,000,000 |
| New York City, GO Notes (LOC; Bank of America) | 0.07 | 2/1/12 | 12,000,000 | a | 12,000,000 |
| New York City, GO Notes (LOC; Bank of America) | 0.10 | 2/7/12 | 3,000,000 | a | 3,000,000 |
| New York City, GO Notes (LOC; Mizuho Corporate Bank Ltd.) | 0.05 | 2/7/12 | 15,000,000 | a | 15,000,000 |
| New York City Capital Resource Corporation, Recovery Zone | | | | | |
| Facility Revenue (WytheHotel Project) (LOC; M&T Trust) | 0.14 | 2/7/12 | 3,800,000 | a | 3,800,000 |
| New York City Housing Development Corporation, MFHR (Citigroup | | | | | |
| ROCS, Series RR II R-13100) (Liquidity Facility; Citibank NA) | 0.10 | 2/7/12 | 8,790,000 a,b,c | | 8,790,000 |
| New York City Industrial Development Agency, Civic Facility | | | | | |
| Revenue (Children’s Oncology Society of New York, Inc. | | | | | |
| Project) (LOC; JPMorgan Chase Bank) | 0.08 | 2/7/12 | 7,300,000 | a | 7,300,000 |
| New York City Industrial Development Agency, Civic Facility | | | | | |
| Revenue (French Institute-Alliance Francaise de New York—Federation | | | | | |
| of French Alliances in the United States Project) (LOC; M&T Trust) | 0.14 | 2/7/12 | 3,360,000 | a | 3,360,000 |
| New York City Industrial Development Agency, Civic Facility | | | | | |
| Revenue (Jewish Community Center on the Upper | | | | | |
| West Side, Inc. Project) (LOC; M&T Trust) | 0.13 | 2/7/12 | 4,800,000 | a | 4,800,000 |
| New York City Industrial Development Agency, Civic Facility Revenue | | | | | |
| (Sephardic Community Youth Center, Inc. Project) (LOC; M&T Trust) | 0.13 | 2/7/12 | 3,100,000 | a | 3,100,000 |
| New York City Industrial Development Agency, Civic Facility | | | | | |
| Revenue (Spence-Chapin, Services to Families and | | | | | |
| Children Project) (LOC; TD Bank) | 0.16 | 2/7/12 | 5,875,000 | a | 5,875,000 |
| New York City Industrial Development Agency, Civic Facility | | | | | |
| Revenue (The Allen-Stevenson School Project) | | | | | |
| (LOC; JPMorgan Chase Bank) | 0.10 | 2/7/12 | 7,505,000 | a | 7,505,000 |
| New York City Industrial Development Agency, Civic Facility | | | | | |
| Revenue (Village Community School Project) (LOC; TD Bank) | 0.20 | 2/7/12 | 2,355,000 | a | 2,355,000 |
| New York City Municipal Water Finance Authority, CP | | | | | |
| (Liquidity Facility; JPMorgan Chase Bank) | 0.16 | 2/28/12 | 15,000,000 | | 15,000,000 |
| New York City Municipal Water Finance Authority, Water and Sewer | | | | | |
| System Revenue (Liquidity Facility; Mizuho Corporate Bank Ltd.) | 0.03 | 2/1/12 | 8,500,000 | a | 8,500,000 |
| New York City Municipal Water Finance Authority, Water and Sewer | | | | | |
| System Revenue (Liquidity Facility; Royal Bank of Canada) | 0.04 | 2/7/12 | 6,000,000 | a | 6,000,000 |
| New York City Municipal Water Finance Authority, Water and Sewer | | | | | |
| System Revenue (Liquidity Facility; Royal Bank of Canada) | 0.04 | 2/7/12 | 5,000,000 | a | 5,000,000 |
| New York City Municipal Water Finance Authority, Water and | | | | | |
| Sewer System Second General Resolution Revenue | | | | | |
| (Liquidity Facility; Bank of America) | 0.06 | 2/7/12 | 16,000,000 | a | 16,000,000 |
| New York City Municipal Water Finance Authority, Water and | | | | | |
| Sewer System Second General Resolution Revenue | | | | | |
| (Liquidity Facility; California State Teachers Retirement System) | 0.04 | 2/1/12 | 1,200,000 | a | 1,200,000 |
| New York City Transitional Finance Authority, Future Tax Secured | | | | | |
| Senior Revenue, Refunding (LOC; Bank of Tokyo-Mitsubishi UFJ) | 0.06 | 2/1/12 | 5,000,000 | a | 5,000,000 |
| New York City Transitional Finance Authority, Revenue | | | | | |
| (New York City Recovery) (Liquidity Facility; Wells Fargo Bank) | 0.03 | 2/1/12 | 1,345,000 | a | 1,345,000 |
| New York State GO Notes, Refunding | 3.00 | 2/1/12 | 1,000,000 | | 1,000,000 |
34
| | | | | | |
| Dreyfus New York | Coupon | Maturity | Principal | |
| Municipal Cash Management (continued) | Rate (%) | Date | Amount ($) | Value ($) |
| |
| Short-Term Investments (continued) | | | | |
| New York (continued) | | | | |
| New York State Dormitory Authority, Insured Revenue | | | | |
| (The Culinary Institute of America) (LOC; TD Bank) | 0.05 | 2/7/12 | 6,925,000a | 6,925,000 |
| New York State Dormitory Authority, Revenue | | | | |
| (Long Island University) (LOC; TD Bank) | 0.06 | 2/7/12 | 7,000,000a | 7,000,000 |
| New York State Dormitory Authority, Revenue | | | | |
| (Long Island University) (LOC; TD Bank) | 0.06 | 2/7/12 | 2,300,000a | 2,300,000 |
| New York State Dormitory Authority, Revenue | | | | |
| (Oxford University Press, Inc.) (LOC; Barclays Bank PLC) | 0.03 | 2/1/12 | 4,000,000a | 4,000,000 |
| New York State Dormitory Authority, Revenue | | | | |
| (The College of New Rochelle) (LOC; RBS Citizens NA) | 0.19 | 2/7/12 | 4,000,000a | 4,000,000 |
| New York State Dormitory Authority, | | | | |
| Revenue (The Rockefeller University) | 0.07 | 2/7/12 | 10,175,000a | 10,175,000 |
| New York State Dormitory Authority, | | | | |
| Revenue, CP (Cornell University) | 0.14 | 6/6/12 | 6,500,000 | 6,500,000 |
| New York State Dormitory Authority, | | | | |
| State Personal Income Tax Revenue (General Purpose) | 3.00 | 2/15/12 | 1,150,000 | 1,151,213 |
| New York State Energy Research and Development Authority, | | | | |
| Facilities Revenue (Consolidated Edison Company of | | | | |
| New York, Inc. Project) (LOC; Mizuho Corporate Bank Ltd.) | 0.06 | 2/7/12 | 12,800,000a | 12,800,000 |
| New York State Housing Finance Agency, Housing Revenue | | | | |
| (2180 Broadway Housing Project) (LOC; Wells Fargo Bank) | 0.06 | 2/7/12 | 24,100,000a | 24,100,000 |
| New York State Housing Finance Agency, Housing Revenue | | | | |
| (350 West 37th Street) (LOC; Wells Fargo Bank) | 0.07 | 2/7/12 | 9,000,000a | 9,000,000 |
| New York State Housing Finance Agency, Service Contract | | | | |
| Revenue, Refunding (LOC; Bank of America) | 0.08 | 2/7/12 | 4,200,000a | 4,200,000 |
| New York State Mortgage Agency, Homeowner Mortgage | | | | |
| Revenue (Liquidity Facility; Bank of America) | 0.09 | 2/7/12 | 17,700,000a | 17,700,000 |
| New York State Thruway Authority, General Revenue, BAN | 2.00 | 7/12/12 | 5,000,000 | 5,036,372 |
| Newark Central School District, GO Notes, BAN | 1.50 | 6/25/12 | 1,000,000 | 1,003,763 |
| Onondaga County Industrial Development Agency, IDR | | | | |
| (ICM Controls Corporation Project) (LOC; M&T Trust) | 0.23 | 2/7/12 | 1,985,000a | 1,985,000 |
| Patchogue-Medford Union Free School District, GO Notes, TAN | 1.50 | 6/21/12 | 5,000,000 | 5,014,365 |
| Port Authority of New York and New Jersey, CP | 0.17 | 2/23/12 | 21,015,000 | 21,015,000 |
| Port Authority of New York and New Jersey, CP | 0.09 | 3/29/12 | 15,055,000 | 15,055,000 |
| Port Authority of New York and New Jersey, CP | 0.10 | 5/10/12 | 15,930,000 | 15,930,000 |
| Port Authority of New York and New Jersey, Equipment Notes | 0.14 | 2/7/12 | 10,500,000a | 10,500,000 |
| Putnam County Industrial Development Agency, Civic Facility | | | | |
| Revenue (United Cerebral Palsy of Putnam and | | | | |
| Southern Dutchess Project) (LOC; TD Bank) | 0.05 | 2/7/12 | 3,455,000a | 3,455,000 |
| Schenectady Industrial Development Agency, | | | | |
| Civic Facility Revenue (Union Graduate | | | | |
| College Project) (LOC; M&T Trust) | 0.13 | 2/7/12 | 5,335,000a | 5,335,000 |
| Triborough Bridge and Tunnel Authority, General Revenue | | | | |
| (MTA Bridges and Tunnels) (LOC; California Public | | | | |
| Employees Retirement System) | 0.07 | 2/1/12 | 4,000,000a | 4,000,000 |
The Funds 35
STATEMENT OF INVESTMENTS (continued)
| | | | | | |
| Dreyfus New York | Coupon | Maturity | Principal | | |
| Municipal Cash Management | Rate (%) | Date | Amount ($) | | Value ($) |
| |
| Short-Term Investments (continued) | | | | | |
| New York (continued) | | | | | |
| Triborough Bridge and Tunnel Authority, General Revenue | | | | | |
| (MTA Bridges and Tunnels) (LOC; California State | | | | | |
| Teachers Retirement System) | 0.05 | 2/1/12 | 31,000,000 | a | 31,000,000 |
| Triborough Bridge and Tunnel Authority, General Revenue | | | | | |
| (MTA Bridges and Tunnels) (LOC; California State | | | | | |
| Teachers Retirement System) | 0.06 | 2/7/12 | 6,850,000 | a | 6,850,000 |
| Ulster County Industrial Development Agency, IDR | | | | | |
| (Selux Corporation Project) (LOC; M&T Trust) | 0.23 | 2/7/12 | 845,000 | a | 845,000 |
| Wells Fargo Stage Trust (Monroe County Industrial Development | | | | | |
| Corporation, Revenue (University of Rochester Project)) | | | | | |
| (Liquidity Facility; Wells Fargo Bank and LOC; Wells Fargo Bank) | 0.08 | 2/7/12 | 7,515,000 a,b,c | | 7,515,000 |
| Wells Fargo Stage Trust (New York State Dormitory Authority, | | | | | |
| State Personal Income Tax Revenue (General Purpose)) | | | | | |
| (Liquidity Facility; Wells Fargo Bank) | 0.08 | 2/7/12 | 7,770,000 a,b,c | | 7,770,000 |
| Wells Fargo Stage Trust (New York State Urban Development | | | | | |
| Corporation, State Personal Income Tax Revenue | | | | | |
| (General Purpose)) (Liquidity Facility; Wells Fargo Bank) | 0.07 | 2/7/12 | 8,910,000 a,b,c | | 8,910,000 |
| Westchester County Industrial Development Agency, | | | | | |
| Civic Facility Revenue (The Masters School | | | | | |
| Civic Facility) (LOC; JPMorgan Chase Bank) | 0.10 | 2/7/12 | 5,400,000 | a | 5,400,000 |
| Yonkers Industrial Development Agency, MFHR | | | | | |
| (Main Street Lofts Yonkers LLC Project) (LOC; M&T Trust) | 0.22 | 2/7/12 | 30,000,000 | a | 30,000,000 |
| U.S. Related—5.0% | | | | | |
| Puerto Rico Commonwealth, Public Improvement GO Notes, | | | | | |
| Refunding (Insured; Assured Guaranty Municipal Corp. | | | | | |
| and Liquidity Facility; JPMorgan Chase Bank) | 0.08 | 2/7/12 | 15,000,000 | a | 15,000,000 |
| Puerto Rico Sales Tax Financing Corporation, Sales Tax | | | | | |
| Revenue (Citigroup ROCS, Series RR II R-11765) | | | | | |
| (Liquidity Facility; Citibank NA) | 0.08 | 2/7/12 | 10,000,000 a,b,c | | 10,000,000 |
| Puerto Rico Sales Tax Financing Corporation, Sales Tax | | | | | |
| Revenue (Citigroup ROCS, Series RR II R-11996X) | | | | | |
| (Liquidity Facility; Citibank NA) | 0.09 | 2/7/12 | 6,100,000 a,b,c | | 6,100,000 |
| |
| Total Investments (cost $614,996,687) | | | 99.4 | % | 614,996,687 |
| |
| Cash and Receivables (Net) | | | .6 | % | 3,925,454 |
| |
| Net Assets | | | 100.0 | % | 618,922,141 |
| |
| See footnotes on page 52. | | | | | |
| See notes to financial statements. | | | | | |
36
STATEMENT OF INVESTMENTS
January 31, 2012
| | | | | | |
| Dreyfus Tax Exempt | Coupon | Maturity | Principal | | |
| Cash Management | Rate (%) | Date | Amount ($) | | Value ($) |
| |
| Short-Term Investments—100.2% | | | | | |
| Alabama—3.7% | | | | | |
| Chatom Industrial Development Board, Gulf Opportunity Zone | | | | | |
| Revenue (PowerSouth Energy Cooperative Projects) | 0.24 | 2/7/12 | 15,000,000 | a | 15,000,000 |
| Columbia Industrial Development Board, PCR, | | | | | |
| Refunding (Alabama Power Company Project) | 0.07 | 2/1/12 | 17,500,000 | a | 17,500,000 |
| Eutaw Industrial Development Board, PCR, | | | | | |
| Refunding (Alabama Power Company Project) | 0.05 | 2/1/12 | 9,600,000 | a | 9,600,000 |
| Mobile Industrial Development Board, PCR | | | | | |
| (Alabama Power Company Barry Plant Project) | 0.08 | 2/1/12 | 8,800,000 | a | 8,800,000 |
| Tuscaloosa County Industrial Development Authority, Gulf Opportunity | | | | | |
| Zone Revenue (Hunt Refining Project) (LOC; Bank of Nova Scotia) | 0.07 | 2/7/12 | 15,000,000 | a | 15,000,000 |
| Tuscaloosa County Industrial Development Authority, Gulf Opportunity | | | | | |
| Zone Revenue (Hunt Refining Project) (LOC; Bank of Nova Scotia) | 0.07 | 2/7/12 | 20,000,000 | a | 20,000,000 |
| Tuscaloosa County Industrial Development Authority, Gulf Opportunity | | | | | |
| Zone Revenue (Hunt Refining Project) (LOC; JPMorgan Chase Bank) | 0.12 | 2/7/12 | 10,000,000 | a | 10,000,000 |
| Alaska—.2% | | | | | |
| North Slope Borough, GO Notes | 2.00 | 6/30/12 | 4,550,000 | | 4,581,219 |
| California—2.7% | | | | | |
| California Statewide Communities Development Authority, | | | | | |
| Revenue, CP (Kaiser Permanente) | 0.18 | 3/5/12 | 13,000,000 | | 13,000,000 |
| California Statewide Communities Development Authority, | | | | | |
| Revenue, CP (Kaiser Permanente) | 0.23 | 3/27/12 | 12,000,000 | | 12,000,000 |
| California Statewide Communities Development Authority, | | | | | |
| Revenue, CP (Kaiser Permanente) | 0.22 | 4/5/12 | 12,500,000 | | 12,500,000 |
| California Statewide Communities Development Authority, | | | | | |
| Revenue, CP (Kaiser Permanente) | 0.25 | 5/24/12 | 15,000,000 | | 15,000,000 |
| Los Angeles Department of Airports, Airport Revenue, CP | | | | | |
| (LOC: Citibank NA and State Street Bank and Trust Co.) | 0.09 | 2/15/12 | 17,500,000 | | 17,500,000 |
| Colorado—5.4% | | | | | |
| Colorado, Education Loan Program Revenue, TRAN | 2.00 | 6/29/12 | 9,000,000 | | 9,068,407 |
| Denver Urban Renewal Authority, Stapleton Senior Tax | | | | | |
| Increment Revenue (LOC; U.S. Bank NA) | 0.08 | 2/7/12 | 9,400,000 | a | 9,400,000 |
| Jefferson County School District Number R-1, Revenue, TAN | 1.50 | 6/29/12 | 14,750,000 | | 14,825,121 |
| JPMorgan Chase Putters/Drivers Trust (Colorado, | | | | | |
| General Fund TRAN) (Liquidity Facility; JPMorgan Chase Bank) | 0.08 | 2/1/12 | 12,000,000 a,b,c | | 12,000,000 |
| RBC Municipal Products Inc. Trust (Meridian Village Metropolitan | | | | | |
| District Number One, Improvement Revenue) (Liquidity Facility; | | | | | |
| Royal Bank of Canada and LOC; Royal Bank of Canada) | 0.08 | 2/7/12 | 17,600,000 a,b,c | | 17,600,000 |
| Sheridan Redevelopment Agency, Tax Increment Revenue, | | | | | |
| Refunding (South Santa Fe Drive Corridor Redevelopment | | | | | |
| Project) (LOC; JPMorgan Chase Bank) | 0.13 | 2/7/12 | 10,000,000 | a | 10,000,000 |
| Southern Ute Indian Tribe of the Southern Ute | | | | | |
| Indian Reservation, Revenue | 0.08 | 2/7/12 | 65,300,000 | a | 65,300,000 |
| Connecticut—.7% | | | | | |
| Bridgeport, GO Notes, TAN | 2.00 | 2/10/12 | 18,000,000 | | 18,007,182 |
The Funds 37
STATEMENT OF INVESTMENTS (continued)
| | | | | | |
| Dreyfus Tax Exempt | Coupon | Maturity | Principal | | |
| Cash Management (continued) | Rate (%) | Date | Amount ($) | | Value ($) |
| |
| Short-Term Investments (continued) | | | | | |
| Delaware—1.7% | | | | | |
| Delaware Health Facilities Authority, Revenue | | | | | |
| (Christiana Care Health Services) | 0.05 | 2/7/12 | 8,525,000 | a | 8,525,000 |
| Delaware Health Facilities Authority, Revenue | | | | | |
| (Christiana Care Health Services) | 0.06 | 2/7/12 | 25,000,000 | a | 25,000,000 |
| Delaware Health Facilities Authority, Revenue, CP | | | | | |
| (Christiana Care Health Services) | 0.11 | 2/21/12 | 10,000,000 | | 10,000,000 |
| District of Columbia—2.6% | | | | | |
| Anacostia Waterfront Corporation, PILOT Revenue | | | | | |
| (MERLOTS-Series F02) (Liquidity Facility; Wells Fargo | | | | | |
| Bank and LOC; Wells Fargo Bank) | 0.08 | 2/7/12 | 46,575,000 a,b,c | | 46,575,000 |
| District of Columbia, Revenue (American Legacy Foundation Issue) | 0.07 | 2/7/12 | 14,000,000 | a | 14,000,000 |
| District of Columbia, Revenue (American Public Health | | | | | |
| Association Issue) (LOC; Bank of America) | 0.25 | 2/7/12 | 6,025,000 | a | 6,025,000 |
| Florida—3.1% | | | | | |
| Highlands County Health Facilities Authority, HR | | | | | |
| (Adventist Health System/Sunbelt Obligated Group) | 0.05 | 2/7/12 | 2,500,000 | a | 2,500,000 |
| Hillsborough County Industrial Development Authority, Revenue | | | | | |
| (Tampa Metropolitan Area YMCA Project) (LOC; Bank of America) | 0.13 | 2/7/12 | 10,000,000 | a | 10,000,000 |
| North Broward Hospital District, Revenue, | | | | | |
| Refunding (LOC; Wells Fargo Bank) | 0.05 | 2/7/12 | 45,000,000 | a | 45,000,000 |
| Sunshine State Governmental Financing Commission, | | | | | |
| Revenue, CP (Liquidity Facility; JPMorgan Chase Bank) | 0.20 | 2/16/12 | 12,580,000 | | 12,580,000 |
| Sunshine State Governmental Financing Commission, | | | | | |
| Revenue, CP (Liquidity Facility; JPMorgan Chase Bank) | 0.20 | 2/17/12 | 8,510,000 | | 8,510,000 |
| Georgia—1.5% | | | | | |
| Atlanta, Airport General Revenue, Refunding (Citigroup ROCS, | | | | | |
| Series RR II R-11893) (Insured; Assured Guaranty Municipal | | | | | |
| Corp. and Liquidity Facility; Citibank NA) | 0.20 | 2/7/12 | 10,000,000 a,b,c | | 10,000,000 |
| Georgia Municipal Gas Authority, Gas Revenue, | | | | | |
| Refunding (Gas Portfolio III Project) | 2.00 | 5/23/12 | 11,250,000 | | 11,297,907 |
| Georgia Municipal Gas Authority, Gas Revenue, | | | | | |
| Refunding (Gas Portfolio III Project) | 2.00 | 11/13/12 | 12,000,000 | | 12,147,529 |
| Thomasville Hospital Authority, RAC (John D. Archbold Memorial | | | | | |
| Hospital, Inc. Project) (LOC; Branch Banking and Trust Co.) | 0.07 | 2/7/12 | 5,040,000 | a | 5,040,000 |
| Illinois—3.8% | | | | | |
| Illinois Educational Facilities Authority, Revenue, CP | | | | | |
| (Pooled Finance Program) (LOC; Northern Trust Company) | 0.18 | 2/14/12 | 81,200,000 | | 81,200,000 |
| Illinois Finance Authority, IDR (Fitzpatrick Brothers, Inc. Project) | | | | | |
| (Liquidity Facility; Northern Trust Company) | 0.08 | 2/7/12 | 4,730,000 | a | 4,730,000 |
| Illinois Finance Authority, Revenue (Hospice of Northeastern | | | | | |
| Illinois Project) (LOC; BMO Harris Bank NA) | 0.10 | 2/7/12 | 3,500,000 | a | 3,500,000 |
| Illinois Finance Authority, Revenue (Southern Illinois Healthcare | | | | | |
| Enterprises, Inc.) (LOC; JPMorgan Chase Bank) | 0.06 | 2/7/12 | 200,000 | a | 200,000 |
| Illinois Health Facilities Authority, Revenue (Northwestern Memorial | | | | | |
| Hospital) (Liquidity Facility; Northern Trust Company) | 0.06 | 2/1/12 | 4,000,000 | a | 4,000,000 |
38
| | | | | | |
| Dreyfus Tax Exempt | Coupon | Maturity | Principal | | |
| Cash Management (continued) | Rate (%) | Date | Amount ($) | | Value ($) |
| |
| Short-Term Investments (continued) | | | | | |
| Illinois (continued) | | | | | |
| Lake County, MFHR (Whispering Oaks | | | | | |
| Apartments Project) (LOC; FHLMC) | 0.06 | 2/7/12 | 3,250,000 | a | 3,250,000 |
| Indiana—1.7% | | | | | |
| Indiana Bond Bank, Advance Funding Program Notes | 1.25 | 1/3/13 | 8,000,000 | | 8,065,946 |
| Indiana Finance Authority, HR (Parkview Health | | | | | |
| System Obligated Group) (LOC; Wells Fargo Bank) | 0.05 | 2/7/12 | 22,590,000 | a | 22,590,000 |
| Indiana Finance Authority, Revenue | | | | | |
| (Ascension Health Senior Credit Group) | 0.06 | 2/7/12 | 5,000,000 | a | 5,000,000 |
| Indiana Finance Authority, Revenue, | | | | | |
| Refunding (Trinity Health Credit Group) | 0.04 | 2/7/12 | 5,500,000 | a | 5,500,000 |
| Saint Joseph County, Educational Facilities | | | | | |
| Revenue (University of Notre Dame Du Lac Project) | 3.88 | 3/1/12 | 1,700,000 | | 1,704,780 |
| Kentucky—.2% | | | | | |
| Kentucky Rural Water Finance Corporation, | | | | | |
| Public Projects Revenue (Flexible Term Program) | 1.25 | 2/1/12 | 4,000,000 | | 4,000,000 |
| Louisiana—4.1% | | | | | |
| Louisiana Public Facilities Authority, HR (Touro Infirmary | | | | | |
| Project) (P-FLOATS Series MT-202) (Liquidity Facility; | | | | | |
| Bank of America and LOC; Bank of America) | 0.39 | 2/7/12 | 30,840,000 a,b,c | | 30,840,000 |
| Louisiana Public Facilities Authority, Revenue | | | | | |
| (Air Products and Chemicals Project) | 0.04 | 2/7/12 | 50,000,000 | a | 50,000,000 |
| Louisiana Public Facilities Authority, Revenue | | | | | |
| (Tiger Athletic Foundation Project) (LOC; FHLB) | 0.08 | 2/7/12 | 15,225,000 | a | 15,225,000 |
| Port of New Orleans Board of Commissioners, | | | | | |
| Subordinate Lien Revenue, Refunding (LOC; FHLB) | 0.08 | 2/7/12 | 8,875,000 | a | 8,875,000 |
| Maine—.4% | | | | | |
| Maine Finance Authority, Revenue (Waynflete | | | | | |
| School Issue) (LOC; JPMorgan Chase Bank) | 0.08 | 2/7/12 | 10,870,000 | a | 10,870,000 |
| Maryland—3.8% | | | | | |
| Anne Arundel County, CP (LOC; State Street Bank and Trust Co.) | 0.10 | 3/5/12 | 26,000,000 | | 26,000,000 |
| Baltimore County Revenue Authority, | | | | | |
| Golf System Revenue (LOC; M&T Trust) | 0.11 | 2/7/12 | 2,700,000 | a | 2,700,000 |
| Frederick County, Revenue | | | | | |
| (Homewood, Inc. Facility) (LOC; M&T Trust) | 0.08 | 2/7/12 | 11,350,000 | a | 11,350,000 |
| Frederick County, Revenue, Refunding | | | | | |
| (Manekin-Frederick Associates Facility) (LOC; M&T Trust) | 0.20 | 2/7/12 | 1,880,000 | a | 1,880,000 |
| Maryland, GO Notes, Refunding (State and Local Facilities Loan) | 5.25 | 2/15/12 | 4,500,000 | | 4,508,624 |
| Maryland Economic Development Corporation, | | | | | |
| Revenue (Easter Seals Facility) (LOC; M&T Trust) | 0.13 | 2/7/12 | 6,525,000 | a | 6,525,000 |
| Maryland Economic Development Corporation, Revenue | | | | | |
| (Legal Aid Bureau, Inc. Facility) (LOC; M&T Trust) | 0.15 | 2/7/12 | 1,825,000 | a | 1,825,000 |
| Maryland Health and Higher Educational Facilities Authority, | | | | | |
| Revenue (Charles County Nursing and Rehabilitation | | | | | |
| Center Issue) (Liquidity Facility; M&T Trust) | 0.13 | 2/7/12 | 3,635,000 | a | 3,635,000 |
The Funds 39
STATEMENT OF INVESTMENTS (continued)
| | | | | | |
| Dreyfus Tax Exempt | Coupon | Maturity | Principal | | |
| Cash Management (continued) | Rate (%) | Date | Amount ($) | | Value ($) |
| |
| Short-Term Investments (continued) | | | | | |
| Maryland (continued) | | | | | |
| Maryland Health and Higher Educational Facilities Authority, | | | | | |
| Revenue (De Matha Catholic High School Issue) | | | | | |
| (LOC; Branch Banking and Trust Co.) | 0.08 | 2/7/12 | 9,505,000 | a | 9,505,000 |
| Maryland Industrial Development Financing Authority, | | | | | |
| Recovery Zone Facility Revenue (Wexford Maryland | | | | | |
| BioPark 3, LLC Facility) (LOC; M&T Trust) | 0.13 | 2/7/12 | 20,000,000 | a | 20,000,000 |
| Maryland Stadium Authority, Sports Facilities LR, | | | | | |
| Refunding (Football Stadium Issue) (Liquidity | | | | | |
| Facility; Sumitomo Mitsui Banking Corp.) | 0.05 | 2/7/12 | 10,500,000 | a | 10,500,000 |
| Massachusetts—.8% | | | | | |
| Massachusetts Health and Educational Facilities Authority, | | | | | |
| Revenue (Partners HealthCare System Issue) | 0.03 | 2/7/12 | 20,200,000 | a | 20,200,000 |
| Michigan—1.1% | | | | | |
| Board of Trustees of the Michigan State University, CP | 0.08 | 2/7/12 | 9,000,000 | | 9,000,000 |
| Board of Trustees of the Michigan State University, CP | 0.09 | 3/12/12 | 10,000,000 | | 10,000,000 |
| Waterford Charter Township Economic Development Corporation, | | | | | |
| LOR, Refunding (Canterbury Health Care, Inc. Project) (LOC; FHLB) | 0.08 | 2/7/12 | 10,065,000 | a | 10,065,000 |
| Minnesota—1.0% | | | | | |
| University of Minnesota, CP | 0.08 | 2/8/12 | 15,000,000 | | 15,000,000 |
| University of Minnesota, CP | 0.09 | 2/13/12 | 11,000,000 | | 11,000,000 |
| Mississippi—.6% | | | | | |
| Mississippi Business Finance Corporation, Gulf Opportunity | | | | | |
| Zone IDR (Chevron U.S.A. Inc. Project) | 0.04 | 2/1/12 | 16,500,000 | a | 16,500,000 |
| Missouri—2.0% | | | | | |
| Missouri Health and Educational Facilities Authority, | | | | | |
| Health Facilities Revenue (SSM Health Care) | | | | | |
| (Liquidity Facility; Citibank NA) | 0.08 | 2/7/12 | 46,750,000 | a | 46,750,000 |
| University of Missouri, CP | 0.08 | 3/13/12 | 3,500,000 | | 3,500,000 |
| Nebraska—1.0% | | | | | |
| Nebraska Investment Finance Authority, | | | | | |
| SFHR (Liquidity Facility; FHLB) | 0.06 | 2/7/12 | 24,700,000 | a | 24,700,000 |
| Nevada—3.0% | | | | | |
| Austin Trust (Clark County, GO Bond Bank Bonds) | | | | | |
| (Liquidity Facility; Bank of America) | 0.14 | 2/7/12 | 9,770,000 a,b,c | | 9,770,000 |
| Clark County, Airport System Subordinate | | | | | |
| Lien Revenue (LOC; Citibank NA) | 0.08 | 2/7/12 | 8,100,000 | a | 8,100,000 |
| Las Vegas Valley Water District, CP | | | | | |
| (Liquidity Facility; JPMorgan Chase Bank) | 0.18 | 2/14/12 | 40,000,000 | | 40,000,000 |
| Las Vegas Valley Water District, CP (LOC; Wells Fargo Bank) | 0.18 | 2/9/12 | 20,000,000 | | 20,000,000 |
| New Jersey—.2% | | | | | |
| Egg Harbor Township, GO Notes, BAN | 1.00 | 9/13/12 | 5,430,000 | | 5,438,249 |
| New Mexico—.3% | | | | | |
| Alamogordo, Hospital Improvement Revenue, | | | | | |
| Refunding (Gerald Champion Regional Medical | | | | | |
| Center Project) (LOC; Bank of America) | 0.12 | 2/7/12 | 8,000,000 | a | 8,000,000 |
40
| | | | | | |
| Dreyfus Tax Exempt | Coupon | Maturity | Principal | | |
| Cash Management (continued) | Rate (%) | Date | Amount ($) | | Value ($) |
| |
| Short-Term Investments (continued) | | | | | |
| New York—3.9% | | | | | |
| Metropolitan Transportation Authority, | | | | | |
| Transportation Revenue, CP (LOC; Citibank NA) | 0.11 | 4/5/12 | 15,000,000 | | 15,000,000 |
| Nassau County Interim Finance Authority, Sales Tax | | | | | |
| Secured Revenue (Liquidity Facility; Bank of America) | 0.10 | 2/7/12 | 15,000,000 | a | 15,000,000 |
| New York City, GO Notes (LOC; Mizuho Corporate Bank Ltd.) | 0.05 | 2/7/12 | 17,000,000 | a | 17,000,000 |
| New York City Municipal Water Finance Authority, CP | | | | | |
| (Liquidity Facility; JPMorgan Chase Bank) | 0.16 | 2/28/12 | 20,000,000 | | 20,000,000 |
| New York State Thruway Authority, General Revenue, BAN | 2.00 | 7/12/12 | 23,000,000 | | 23,167,313 |
| Tompkins County Industrial Development Agency, | | | | | |
| Civic Facility Revenue (Community Development | | | | | |
| Properties Ithaca, Inc. Project) (LOC; M&T Trust) | 0.18 | 2/7/12 | 9,700,000 | a | 9,700,000 |
| North Carolina—.6% | | | | | |
| North Carolina Medical Care Commission, Health Care Facilities | | | | | |
| First Mortgage Revenue (Deerfield Episcopal Retirement | | | | | |
| Community) (LOC; Branch Banking and Trust Co.) | 0.07 | 2/7/12 | 15,035,000 | a | 15,035,000 |
| Ohio—1.3% | | | | | |
| Akron, GO Notes, BAN (Various Purpose) | 1.13 | 11/15/12 | 10,000,000 | | 10,040,985 |
| Montgomery County, Revenue (Catholic Health | | | | | |
| Initiatives) (Liquidity Facility; U.S. Bank NA) | 0.04 | 2/7/12 | 10,000,000 | a | 10,000,000 |
| Ohio Higher Educational Facility Commission, | | | | | |
| Revenue, CP (Cleveland Clinic Health System) | 0.20 | 2/16/12 | 13,000,000 | | 13,000,000 |
| Oregon—.2% | | | | | |
| Oregon, GO Notes (Veterans’ Welfare Bonds) | | | | | |
| (Liquidity Facility; Bank of Tokyo-Mitsubishi UFJ) | 0.06 | 2/7/12 | 5,250,000 | a | 5,250,000 |
| Pennsylvania—10.9% | | | | | |
| Allegheny County, GO Notes, TRAN | 2.00 | 7/16/12 | 33,300,000 | | 33,568,449 |
| Berks County Municipal Authority, Revenue | | | | | |
| (The Reading Hospital and Medical Center Project) | 0.24 | 8/2/12 | 4,800,000 | | 4,800,000 |
| Bucks County Industrial Development Authority, Revenue | | | | | |
| (Pennswood Village Project) (LOC; Bank of America) | 0.13 | 2/7/12 | 8,400,000 | a | 8,400,000 |
| Butler County Industrial Development Authority, | | | | | |
| Revenue, Refunding (Concordia Lutheran Health | | | | | |
| and Human Care) (LOC; JPMorgan Chase Bank) | 0.07 | 2/7/12 | 7,200,000 | a | 7,200,000 |
| Chester County Health and Education Facilities Authority, | | | | | |
| Mortgage Revenue (Tel Hai Obligated Group | | | | | |
| Project) (LOC; M&T Trust) | 0.07 | 2/7/12 | 6,430,000 | a | 6,430,000 |
| Chester County Industrial Development Authority, Revenue | | | | | |
| (Archdiocese of Philadelphia) (LOC; PNC Bank NA) | 0.06 | 2/7/12 | 12,675,000 | a | 12,675,000 |
| East Hempfield Township Industrial Development Authority, | | | | | |
| Revenue (The Mennonite Home Project) (LOC; M&T Trust) | 0.13 | 2/7/12 | 10,745,000 | a | 10,745,000 |
| East Hempfield Township Industrial Development Authority, | | | | | |
| Revenue (The Mennonite Home Project) (LOC; M&T Trust) | 0.13 | 2/7/12 | 5,655,000 | a | 5,655,000 |
| Emmaus General Authority (Pennsylvania Variable Rate Loan | | | | | |
| Program) (Insured; Assured Guaranty Municipal Corp. | | | | | |
| and Liquidity Facility; Wells Fargo Bank) | 0.12 | 2/7/12 | 49,970,000 | a | 49,970,000 |
The Funds 41
STATEMENT OF INVESTMENTS (continued)
| | | | | | |
| Dreyfus Tax Exempt | Coupon | Maturity | Principal | |
| Cash Management (continued) | Rate (%) | Date | Amount ($) | Value ($) |
| |
| Short-Term Investments (continued) | | | | |
| Pennsylvania (continued) | | | | |
| Emmaus General Authority, Local Government Revenue | | | | |
| (Bond Pool Program) (LOC; U.S. Bank NA) | 0.06 | 2/7/12 | 10,000,000a | 10,000,000 |
| Emmaus General Authority, Local Government Revenue | | | | |
| (Bond Pool Program) (LOC; U.S. Bank NA) | 0.06 | 2/7/12 | 11,100,000a | 11,100,000 |
| Emmaus General Authority, Local Government Revenue | | | | |
| (Bond Pool Program) (LOC; U.S. Bank NA) | 0.06 | 2/7/12 | 12,100,000a | 12,100,000 |
| Emmaus General Authority, Local Government | | | | |
| Revenue (Bond Pool Program) (LOC; U.S. Bank NA) | 0.06 | 2/7/12 | 10,000,000a | 10,000,000 |
| Emmaus General Authority, Local Government | | | | |
| Revenue (Bond Pool Program) (LOC; U.S. Bank NA) | 0.06 | 2/7/12 | 9,300,000a | 9,300,000 |
| Emmaus General Authority, Local Government | | | | |
| Revenue (Bond Pool Program) (LOC; U.S. Bank NA) | 0.06 | 2/7/12 | 10,000,000a | 10,000,000 |
| General Authority of South Central Pennsylvania, | | | | |
| Revenue (Lutheran Social Services of South Central | | | | |
| Pennsylvania Project) (LOC; M&T Trust) | 0.13 | 2/7/12 | 15,985,000a | 15,985,000 |
| Horizon Hospital System Authority, Senior Health | | | | |
| and Housing Facilities Revenue (Saint Paul | | | | |
| Homes Project) (LOC; M&T Trust) | 0.13 | 2/7/12 | 9,500,000a | 9,500,000 |
| Lancaster County Hospital Authority, Health Center | | | | |
| Revenue (LUTHERCARE Project) (LOC; M&T Trust) | 0.08 | 2/7/12 | 32,606,000a | 32,606,000 |
| Lancaster County Hospital Authority, Revenue (Landis Home | | | | |
| Retirement Community Project) (LOC; M&T Trust) | 0.13 | 2/7/12 | 7,970,000a | 7,970,000 |
| Philadelphia, GO Notes, | | | | |
| Refunding (LOC; Royal Bank of Canada) | 0.05 | 2/7/12 | 7,000,000a | 7,000,000 |
| Ridley School District, GO Notes (LOC; TD Bank) | 0.08 | 2/7/12 | 2,700,000a | 2,700,000 |
| York General Authority, Revenue (Strand-Capitol | | | | |
| Performing Arts Center Project) (LOC; M&T Trust) | 0.13 | 2/7/12 | 2,840,000a | 2,840,000 |
| Rhode Island—.8% | | | | |
| Rhode Island State and Providence Plantations, GO Notes, TAN | 2.00 | 6/29/12 | 20,000,000 | 20,138,098 |
| South Carolina—2.1% | | | | |
| Charleston County School District, GO Notes, TAN | 2.50 | 4/1/12 | 31,450,000 | 31,570,951 |
| Lancaster County School District, GO Notes | 1.00 | 3/1/12 | 7,540,000 | 7,544,907 |
| Lexington County School District Number 1, GO Notes | 2.00 | 2/1/12 | 5,500,000 | 5,500,000 |
| Newberry County School District, GO Notes | 2.00 | 3/1/12 | 6,200,000 | 6,207,595 |
| York County, GO Notes (Fort Mill School District Number 4) | 1.25 | 3/1/12 | 3,930,000 | 3,933,105 |
| Tennessee—7.5% | | | | |
| Blount County Public Building Authority, Local Government Public | | | | |
| Improvement Revenue (LOC; Branch Banking and Trust Co.) | 0.07 | 2/7/12 | 9,420,000a | 9,420,000 |
| Blount County Public Building Authority, Local Government Public | | | | |
| Improvement Revenue (LOC; Branch Banking and Trust Co.) | 0.07 | 2/7/12 | 3,045,000a | 3,045,000 |
| Blount County Public Building Authority, Local Government Public | | | | |
| Improvement Revenue (LOC; Branch Banking and Trust Co.) | 0.07 | 2/7/12 | 6,000,000a | 6,000,000 |
| Blount County Public Building Authority, Local Government Public | | | | |
| Improvement Revenue (LOC; Branch Banking and Trust Co.) | 0.07 | 2/7/12 | 48,010,000a | 48,010,000 |
| Metropolitan Government of Nashville and Davidson | | | | |
| County Health and Educational Facilities Board, | | | | |
| Revenue (The Vanderbilt University) | 0.03 | 2/7/12 | 24,455,000a | 24,455,000 |
42
| | | | | | |
| Dreyfus Tax Exempt | Coupon | Maturity | Principal | | |
| Cash Management (continued) | Rate (%) | Date | Amount ($) | | Value ($) |
| |
| Short-Term Investments (continued) | | | | | |
| Tennessee (continued) | | | | | |
| Metropolitan Government of Nashville and Davidson | | | | | |
| County Health and Educational Facilities Board, | | | | | |
| Revenue (The Vanderbilt University) | 0.03 | 2/7/12 | 17,970,000 | a | 17,970,000 |
| Metropolitan Government of Nashville and Davidson | | | | | |
| County Health and Educational Facilities Board, | | | | | |
| Revenue (The Vanderbilt University) | 0.03 | 2/7/12 | 26,245,000 | a | 26,245,000 |
| Metropolitan Government of Nashville and Davidson | | | | | |
| County Health and Educational Revenue, | | | | | |
| Refunding (The Vanderbilt University) | 0.03 | 2/7/12 | 15,035,000 | a | 15,035,000 |
| Sevier County Public Building Authority, Local Government | | | | | |
| Public Improvement Revenue (LOC; Bank of America) | 0.12 | 2/7/12 | 17,900,000 | a | 17,900,000 |
| Shelby County Health, Educational and Housing Facility Board, | | | | | |
| Revenue (Methodist Le Bonheur Healthcare) (Insured; Assured | | | | | |
| Guaranty Municipal Corp. and Liquidity Facility; U.S. Bank NA) | 0.08 | 2/7/12 | 25,000,000 | a | 25,000,000 |
| Texas—16.2% | | | | | |
| Brazos County Health Facilities Development Corporation, | | | | | |
| Revenue (Franciscan Services Corporation Obligated Group) | | | | | |
| (P-FLOATS Series MT-635) (Liquidity Facility; | | | | | |
| Bank of America and LOC; Bank of America) | 0.34 | 2/7/12 | 7,000,000 a,b,c | | 7,000,000 |
| Dallas, GO Notes, Refunding | 5.00 | 2/15/12 | 2,295,000 | | 2,299,177 |
| Dallas, Waterworks and Sewer System Revenue, CP | | | | | |
| (Liquidity Facility: Bank of America and JPMorgan Chase Bank) | 0.14 | 3/6/12 | 11,150,000 | | 11,150,000 |
| Harris County, GO Notes, TAN | 1.50 | 2/29/12 | 33,000,000 | | 33,033,852 |
| Harris County, GO Notes, TAN | 2.50 | 2/29/12 | 7,000,000 | | 7,012,442 |
| Harris County Cultural Education Facilities Finance | | | | | |
| Corporation, Revenue (The Methodist Hospital System) | 0.04 | 2/1/12 | 6,400,000 | a | 6,400,000 |
| Harris County Health Facilities Development Corporation, Revenue | | | | | |
| (Saint Luke’s Episcopal Hospital) (Liquidity Facility: Bank of | | | | | |
| America, JPMorgan Chase Bank and Northern Trust Co.) | 0.07 | 2/1/12 | 29,900,000 | a | 29,900,000 |
| Harris County Health Facilities Development Corporation, | | | | | |
| Revenue, Refunding (The Methodist Hospital System) | 0.04 | 2/1/12 | 4,700,000 | a | 4,700,000 |
| Harris County Industrial Development Corporation, Marine Terminal | | | | | |
| Revenue (HFOTCO LLC Project) (LOC; Bank of America) | 0.10 | 2/7/12 | 25,000,000 | a | 25,000,000 |
| Harris County Metropolitan Transportation Authority, | | | | | |
| CP (Liquidity Facility; JPMorgan Chase Bank) | 0.19 | 2/9/12 | 3,250,000 | | 3,250,000 |
| Jefferson County Industrial Development Corporation, | | | | | |
| Hurricane Ike Disaster Area Revenue (Jefferson | | | | | |
| Refinery, L.L.C. Project) (LOC; Branch Banking and Trust Co.) | 0.35 | 2/28/12 | 5,800,000 | | 5,800,000 |
| Jefferson County Industrial Development Corporation, | | | | | |
| Hurricane Ike Disaster Area Revenue (Jefferson | | | | | |
| Refinery, L.L.C. Project) (LOC; Branch Banking and Trust Co.) | 0.50 | 3/29/12 | 50,300,000 | | 50,300,000 |
| JPMorgan Chase Putters/Drivers Trust (Texas, GO Notes, | | | | | |
| TRAN) (Liquidity Facility; JPMorgan Chase Bank) | 0.08 | 2/1/12 | 39,000,000 a,b,c | | 39,000,000 |
| North Texas Tollway Authority, Revenue, CP (LOC; Bank of America) | 0.13 | 2/1/12 | 23,000,000 | | 23,000,000 |
| RBC Municipal Products Inc. Trust (Harris County Health Facilities | | | | | |
| Development Corporation, HR, Refunding (Memorial Hermann | | | | | |
| Healthcare System)) (Liquidity Facility; Royal Bank of | | | | | |
| Canada and LOC; Royal Bank of Canada) | 0.08 | 2/7/12 | 10,000,000 a,b,c | | 10,000,000 |
The Funds 43
STATEMENT OF INVESTMENTS (continued)
| | | | | | |
| Dreyfus Tax Exempt | Coupon | Maturity | Principal | | |
| Cash Management (continued) | Rate (%) | Date | Amount ($) | | Value ($) |
| |
| Short-Term Investments (continued) | | | | | |
| Texas (continued) | | | | | |
| San Antonio, Water System Revenue, CP (Liquidity Facility: | | | | | |
| Bank of America, State Street Bank and Trust Co. and U.S. Bank NA) | 0.14 | 2/15/12 | 8,600,000 | | 8,600,000 |
| Tarrant County Cultural Education Facilities | | | | | |
| Finance Corporation, HR (Baylor Health Care | | | | | |
| System Project) (LOC; Northern Trust Company) | 0.06 | 2/7/12 | 3,500,000 | a | 3,500,000 |
| Tarrant County Cultural Education Facilities Finance | | | | | |
| Corporation, Revenue (Texas Health Resources System) | 0.05 | 2/7/12 | 6,500,000 | a | 6,500,000 |
| Texas, CP | 0.20 | 2/22/12 | 24,000,000 | | 24,000,000 |
| Texas Municipal Power Agency, Revenue, CP | | | | | |
| (LOC: Bank of America and JPMorgan Chase Bank) | 0.11 | 2/13/12 | 16,100,000 | | 16,100,000 |
| Texas Municipal Power Agency, Revenue, CP | | | | | |
| (LOC: Bank of America and JPMorgan Chase Bank) | 0.12 | 2/21/12 | 22,000,000 | | 22,000,000 |
| Texas Municipal Power Agency, Revenue, CP | | | | | |
| (LOC: Bank of America and JPMorgan Chase Bank) | 0.12 | 3/12/12 | 20,000,000 | | 20,000,000 |
| Texas Public Finance Authority, CP (Liquidity Facility; Wells Fargo Bank) | 0.10 | 3/6/12 | 12,000,000 | | 12,000,000 |
| Texas Public Finance Authority, Revenue, CP | | | | | |
| (Liquidity Facility; Barclays Bank PLC) | 0.10 | 2/1/12 | 15,000,000 | | 15,000,000 |
| Texas Water Development Board, State Revolving Fund | | | | | |
| Subordinate Lien Revenue (Citigroup ROCS, | | | | | |
| Series RR II R-11746) (Liquidity Facility; Citibank NA) | 0.07 | 2/7/12 | 10,940,000 a,b,c | | 10,940,000 |
| Upper Trinity Regional Water District, | | | | | |
| Revenue, CP (LOC; Bank of America) | 0.16 | 4/10/12 | 15,350,000 | | 15,350,000 |
| Utah—1.5% | | | | | |
| Murray City, HR (Intermountain Health Care Health Services, Inc.) | 0.03 | 2/7/12 | 32,000,000 | a | 32,000,000 |
| Murray City, HR (Intermountain Health Care Health Services, Inc.) | 0.03 | 2/7/12 | 100,000 | a | 100,000 |
| Utah Housing Finance Agency, MFHR, Refunding (Candlestick | | | | | |
| Apartments Project) (Liquidity Facility; FNMA and LOC; FNMA) | 0.09 | 2/7/12 | 6,400,000 | a | 6,400,000 |
| Virginia—2.3% | | | | | |
| Harrisonburg Industrial Development Authority, Revenue, | | | | | |
| Refunding (Virginia Mennonite Retirement Community) | | | | | |
| (LOC; Branch Banking and Trust Co.) | 0.07 | 2/7/12 | 6,835,000 | a | 6,835,000 |
| Richmond, CP (Liquidity Facility; Bank of America) | 0.12 | 2/21/12 | 26,000,000 | | 26,000,000 |
| Roanoke Industrial Development Authority, HR (Carilion Health | | | | | |
| System Obligated Group) (Insured; Assured Guaranty | | | | | |
| Municipal Corp. and Liquidity Facility; Wells Fargo Bank) | 0.06 | 2/1/12 | 17,000,000 | a | 17,000,000 |
| Virginia College Building Authority, Educational Facilities | | | | | |
| Revenue (21st Century College and Equipment | | | | | |
| Programs) (Liquidity Facility; Wells Fargo Bank) | 0.06 | 2/1/12 | 2,340,000 | a | 2,340,000 |
| Virginia Commonwealth University Health System Authority, | | | | | |
| General Revenue (LOC; Wells Fargo Bank) | 0.06 | 2/1/12 | 8,000,000 | a | 8,000,000 |
44
| | | | | | | |
| Dreyfus Tax Exempt | Coupon | Maturity | Principal | | | |
| Cash Management (continued) | Rate (%) | Date | Amount ($) | | Value ($) | |
| |
| Short-Term Investments (continued) | | | | | | |
| Washington—2.2% | | | | | | |
| University of Washington, University Revenue, CP | 0.08 | 2/13/12 | 16,000,000 | | 16,000,000 | |
| Washington, Various Purpose GO, Refunding | | | | | | |
| (P-FLOATS Series PT-4658) (Liquidity Facility; Bank of America) | 0.14 | 2/7/12 | 18,185,000 a,b,c | | 18,185,000 | |
| Washington Health Care Facilities Authority, Revenue | | | | | | |
| (Swedish Health Services) (LOC; Citibank NA) | 0.08 | 2/7/12 | 13,000,000 | a | 13,000,000 | |
| Washington Housing Finance Commission, Nonprofit | | | | | | |
| Revenue (Seattle Art Museum Project) (LOC; U.S. Bank NA) | 0.05 | 2/7/12 | 10,000,000 | a | 10,000,000 | |
| Wisconsin—3.3% | | | | | | |
| Byron, IDR, Refunding (Ocean Spray | | | | | | |
| Cranberries, Inc. Project) (LOC; Bank of America) | 0.17 | 2/7/12 | 6,500,000 | a | 6,500,000 | |
| Milwaukee Redevelopment Authority, Redevelopment LR | | | | | | |
| (University of Wisconsin-Milwaukee Kenilworth | | | | | | |
| Project) (LOC; U.S. Bank NA) | 0.08 | 2/7/12 | 6,170,000 | a | 6,170,000 | |
| Milwaukee Redevelopment Authority, Revenue, Refunding | | | | | | |
| (Yankee Hill Apartments Project) (LOC; Wells Fargo Bank) | 0.07 | 2/7/12 | 13,150,000 | a | 13,150,000 | |
| Wisconsin Health and Educational Facilities Authority, | | | | | | |
| Revenue (Aurora Health Care, Inc.) (LOC; JPMorgan Chase Bank) | 0.20 | 7/5/12 | 60,000,000 | | 60,000,000 | |
| Wyoming—1.2% | | | | | | |
| Wyoming Student Loan Corporation, Student Loan | | | | | | |
| Revenue, Refunding (LOC; Royal Bank of Canada) | 0.07 | 2/7/12 | 30,000,000 | a | 30,000,000 | |
| U.S. Related—.6% | | | | | | |
| Puerto Rico Sales Tax Financing Corporation, Sales Tax Revenue | | | | | | |
| (Citigroup ROCS, Series RR II R-11765) (Liquidity Facility; Citibank NA) | 0.08 | 2/7/12 | 14,815,000 a,b,c | | 14,815,000 | |
| |
| Total Investments (cost $2,569,927,838) | | | 100.2 | % | 2,569,927,838 | |
| Liabilities, Less Cash and Receivables | | | (.2 | %) | (5,656,394 | ) |
| Net Assets | | | 100.0 | % | 2,564,271,444 | |
| |
| See footnotes on page 52. | | | | | | |
| See notes to financial statements. | | | | | | |
The Funds 45
STATEMENT OF INVESTMENTS
January 31, 2012
| | | | | | |
| Dreyfus California AMT-Free | Coupon | Maturity | Principal | | |
| Municipal Cash Management | Rate (%) | Date | Amount ($) | | Value ($) |
| |
| Short-Term Investments—97.0% | | | | | |
| California—94.4% | | | | | |
| ABAG Finance Authority for Nonprofit Corporations, Revenue | | | | | |
| (Northbay Healthcare Group) (LOC; JPMorgan Chase Bank) | 0.08 | 2/7/12 | 12,600,000 | a | 12,600,000 |
| ABAG Finance Authority for Nonprofit Corporations, Revenue | | | | | |
| (Santa Cruz Montessori School) (LOC; Comerica Bank) | 0.16 | 2/7/12 | 765,000 | a | 765,000 |
| ABAG Finance Authority for Nonprofit Corporations, Revenue, | | | | | |
| Refunding (Eskaton Properties, Inc.) (LOC; U.S. Bank NA) | 0.08 | 2/7/12 | 14,920,000 | a | 14,920,000 |
| Alameda County Industrial Development Authority, Recovery Zone | | | | | |
| Facility Revenue (Dale Hardware, Inc. Project) (LOC; Comerica Bank) | 0.11 | 2/7/12 | 2,670,000 | a | 2,670,000 |
| Alameda County Industrial Development Authority, | | | | | |
| Revenue (Santini Foods, Inc. Project) (LOC; Comerica Bank) | 0.11 | 2/7/12 | 2,900,000 | a | 2,900,000 |
| California, GO Notes (Kindergarten-University) (LOC: California | | | | | |
| State Teachers Retirement System and Citibank NA) | 0.04 | 2/1/12 | 16,100,000 | a | 16,100,000 |
| California, GO Notes (Kindergarten-University) (LOC: California | | | | | |
| State Teachers Retirement System and Citibank NA) | 0.04 | 2/1/12 | 4,400,000 | a | 4,400,000 |
| California, GO Notes (Kindergarten-University) (LOC: California | | | | | |
| State Teachers Retirement System and Citibank NA) | 0.06 | 2/1/12 | 6,050,000 | a | 6,050,000 |
| California Economic Development Financing Authority, Revenue, | | | | | |
| Refunding (KQED, Inc. Project) (LOC; Wells Fargo Bank) | 0.19 | 2/7/12 | 200,000 | a | 200,000 |
| California Enterprise Development Authority, | | | | | |
| IDR (JBR, Inc. Project) (LOC; U.S. Bank NA) | 0.09 | 2/7/12 | 4,000,000 | a | 4,000,000 |
| California Enterprise Development Authority, IDR | | | | | |
| (Tri Tool Inc. Project) (LOC; Comerica Bank) | 0.18 | 2/7/12 | 10,000,000 | a | 10,000,000 |
| California Enterprise Development Authority, Recovery Zone | | | | | |
| Facility Revenue (Regional Properties, Inc. Project) (LOC; FHLB) | 0.07 | 2/7/12 | 13,400,000 | a | 13,400,000 |
| California Infrastructure and Economic Development Bank, Revenue | | | | | |
| (Orange County Performing Arts Center) (LOC; Bank of America) | 0.10 | 2/7/12 | 16,265,000 | a | 16,265,000 |
| California Infrastructure and Economic Development Bank, | | | | | |
| Revenue (Saddleback Valley Christian Schools Project) (LOC; FHLB) | 0.07 | 2/7/12 | 5,000,000 | a | 5,000,000 |
| California Infrastructure and Economic Development Bank, | | | | | |
| Revenue (The Westmark School Project) (LOC; U.S. Bank NA) | 0.06 | 2/7/12 | 6,570,000 | a | 6,570,000 |
| California Infrastructure and Economic Development Bank, | | | | | |
| Revenue, Refunding (Los Angeles County Museum of | | | | | |
| Natural History Foundation) (LOC; Wells Fargo Bank) | 0.04 | 2/1/12 | 2,200,000 | a | 2,200,000 |
| California Municipal Finance Authority, Revenue | | | | | |
| (Notre Dame High School, San Jose) (LOC; Comerica Bank) | 0.16 | 2/7/12 | 1,100,000 | a | 1,100,000 |
| California Municipal Finance Authority, Revenue | | | | | |
| (Trinity School) (LOC; Comerica Bank) | 0.16 | 2/7/12 | 715,000 | a | 715,000 |
| California Pollution Control Financing Authority, EIR | | | | | |
| (Air Products and Chemicals, Inc./Wilmington Facility) | 0.04 | 2/1/12 | 1,000,000 | a | 1,000,000 |
| California Pollution Control Financing Authority, EIR | | | | | |
| (Air Products Manufacturing Corporation Project) | 0.04 | 2/1/12 | 1,050,000 | a | 1,050,000 |
| California Pollution Control Financing Authority, PCR, Refunding | | | | | |
| (Pacific Gas and Electric Company) (LOC; JPMorgan Chase Bank) | 0.04 | 2/1/12 | 4,000,000 | a | 4,000,000 |
| California Pollution Control Financing Authority, PCR, Refunding | | | | | |
| (Pacific Gas and Electric Company) (LOC; JPMorgan Chase Bank) | 0.04 | 2/1/12 | 3,400,000 | a | 3,400,000 |
| California Pollution Control Financing Authority, SWDR | | | | | |
| (Athens Services Project) (LOC; Wells Fargo Bank) | 0.08 | 2/7/12 | 22,365,000 | a | 22,365,000 |
| California Pollution Control Financing Authority, SWDR | | | | | |
| (Big Bear Disposal, Inc. Project) (LOC; Union Bank NA) | 0.11 | 2/7/12 | 2,425,000 | a | 2,425,000 |
46
| | | | | | |
| Dreyfus California AMT-Free | Coupon | Maturity | Principal | | |
| Municipal Cash Management (continued) | Rate (%) | Date | Amount ($) | | Value ($) |
| |
| Short-Term Investments (continued) | | | | | |
| California (continued) | | | | | |
| California Pollution Control Financing Authority, SWDR | | | | | |
| (Garden City Sanitation, Inc. Project) (LOC; Comerica Bank) | 0.11 | 2/7/12 | 2,635,000 | a | 2,635,000 |
| California Pollution Control Financing Authority, SWDR | | | | | |
| (Garden City Sanitation, Inc. Project) (LOC; Union Bank NA) | 0.11 | 2/7/12 | 8,450,000 | a | 8,450,000 |
| California Pollution Control Financing Authority, SWDR | | | | | |
| (Mission Trail Waste Systems, Inc. Project) (LOC; Comerica Bank) | 0.11 | 2/7/12 | 2,840,000 | a | 2,840,000 |
| California Pollution Control Financing Authority, SWDR | | | | | |
| (South Bay Recycling Project) (LOC; Union Bank NA) | 0.11 | 2/7/12 | 3,150,000 | a | 3,150,000 |
| California Pollution Control Financing Authority, SWDR, Refunding | | | | | |
| (BLT Enterprises of Fremont LLC Project) (LOC; Union Bank NA) | 0.11 | 2/7/12 | 9,255,000 | a | 9,255,000 |
| California Pollution Control Financing Authority, SWDR, Refunding | | | | | |
| (MarBorg Industries Project) (LOC; Union Bank NA) | 0.11 | 2/7/12 | 3,345,000 | a | 3,345,000 |
| California School Cash Reserve Program Authority, Revenue | 2.00 | 2/1/12 | 9,100,000 | | 9,100,000 |
| California Statewide Communities Development Authority, | | | | | |
| MFHR (La Mision Village Apartments Project) (P-FLOATS | | | | | |
| Series PT-4184) (Liquidity Facility; FHLMC and LOC; FHLMC) | 0.32 | 2/7/12 | 1,240,000 a,b,c | | 1,240,000 |
| California Statewide Communities Development Authority, | | | | | |
| PCR, Refunding (Chevron U.S.A. Inc. Project) | 0.03 | 2/1/12 | 8,900,000 | a | 8,900,000 |
| California Statewide Communities Development Authority, | | | | | |
| Revenue (John Muir Health) (LOC; Wells Fargo Bank) | 0.06 | 2/1/12 | 5,300,000 | a | 5,300,000 |
| California Statewide Communities Development Authority, | | | | | |
| Revenue (Metropolitan Area Advisory Committee | | | | | |
| Project) (LOC; Bank of America) | 0.31 | 2/7/12 | 1,915,000 | a | 1,915,000 |
| California Statewide Communities Development Authority, | | | | | |
| Revenue (The Pegasus School) (LOC; Bank of America) | 0.31 | 2/7/12 | 1,140,000 | a | 1,140,000 |
| California Statewide Communities Development Authority, Revenue | | | | | |
| (Tiger Woods Learning Center Foundation) (LOC; Bank of America) | 0.46 | 2/7/12 | 350,000 | a | 350,000 |
| California Statewide Communities Development Authority, | | | | | |
| Revenue (Trinity Children and Family Services Project) | | | | | |
| (LOC; California State Teachers Retirement System) | 0.19 | 2/7/12 | 500,000 | a | 500,000 |
| California Statewide Communities Development Authority, | | | | | |
| Revenue, CP (Kaiser Permanente) | 0.26 | 2/16/12 | 8,000,000 | | 8,000,000 |
| California Statewide Communities Development Authority, | | | | | |
| Revenue, CP (Kaiser Permanente) | 0.30 | 2/16/12 | 2,200,000 | | 2,200,000 |
| California Statewide Communities Development Authority, | | | | | |
| Revenue, CP (Kaiser Permanente) | 0.25 | 5/24/12 | 24,000,000 | | 24,000,000 |
| Golden State Tobacco Securitization Corporation, Enhanced | | | | | |
| Tobacco Settlement Asset-Backed Bonds (Citigroup ROCS, | | | | | |
| Series RR II R-11674) (Insured; Berkshire Hathaway | | | | | |
| Assurance Corporation and Liquidity Facility; Citibank NA) | 0.09 | 2/7/12 | 4,450,000 a,b,c | | 4,450,000 |
| Irvine Assessment District Number 97-17, Limited Obligation | | | | | |
| Improvement Bonds (LOC: California State Teachers | | | | | |
| Retirement System and State Street Bank and Trust Co.) | 0.06 | 2/1/12 | 2,200,000 | a | 2,200,000 |
| Irvine Reassessment District Number 05-21, Limited Obligation | | | | | |
| Improvement Bonds (LOC: California State Teachers | | | | | |
| Retirement System and U.S. Bank NA) | 0.06 | 2/1/12 | 29,510,000 | a | 29,510,000 |
| Lake Elsinore Recreation Authority, Revenue, Refunding | | | | | |
| (Public Facilities Project) (LOC; California State | | | | | |
| Teachers Retirement System) | 0.06 | 2/7/12 | 8,505,000 | a | 8,505,000 |
The Funds 47
STATEMENT OF INVESTMENTS (continued)
| | | | | | |
| Dreyfus California AMT-Free | Coupon | Maturity | Principal | | |
| Municipal Cash Management (continued) | Rate (%) | Date | Amount ($) | | Value ($) |
| |
| Short-Term Investments (continued) | | | | | |
| California (continued) | | | | | |
| Los Angeles, COP (Kadima Hebrew Academy) (LOC; U.S. Bank NA) | 0.06 | 2/7/12 | 1,800,000 | a | 1,800,000 |
| Los Angeles County Capital Asset Leasing | | | | | |
| Corporation, LR, CP (LOC; Bank of America) | 0.17 | 2/10/12 | 21,000,000 | | 21,000,000 |
| Menlo Park Community Development Agency, Tax Allocation | | | | | |
| Revenue, Refunding (Las Pulgas Community Development | | | | | |
| Project) (LOC; State Street Bank and Trust Co.) | 0.06 | 2/1/12 | 14,100,000 | a | 14,100,000 |
| Pittsburg Redevelopment Agency, Subordinate Tax Allocation | | | | | |
| Revenue (Los Medanos Community Development Project) | | | | | |
| (Liquidity Facility: California State Teachers Retirement | | | | | |
| System and State Street Bank and Trust Co.) | 0.06 | 2/1/12 | 13,700,000 | a | 13,700,000 |
| Riverside County Transportation Commission, Sales Tax | | | | | |
| Revenue (Liquidity Facility; JPMorgan Chase Bank) | 0.07 | 2/7/12 | 9,500,000 | a | 9,500,000 |
| Sacramento City Financing Authority, Revenue, Refunding | | | | | |
| (Master Lease Program Facilities) (P-FLOATS Series PT-4698) | | | | | |
| (Liquidity Facility; Bank of America and LOC; Bank of America) | 0.34 | 2/7/12 | 12,995,000 a,b,c | | 12,995,000 |
| Sacramento County Housing Authority, MFHR, | | | | | |
| Refunding (Stonebridge Apartments) (LOC; FNMA) | 0.18 | 2/7/12 | 4,100,000 | a | 4,100,000 |
| San Diego County, COP (Museum of Contemporary Art | | | | | |
| San Diego) (LOC; Northern Trust Company) | 0.08 | 2/7/12 | 3,050,000 | a | 3,050,000 |
| San Diego County and San Diego County School Districts, | | | | | |
| Program Note Participations, TRAN | 2.00 | 4/30/12 | 14,000,000 | | 14,048,446 |
| San Jose Redevelopment Agency, MFHR (101 San Fernando | | | | | |
| Apartments) (Citigroup ROCS, Series RR II R-13102CE) | | | | | |
| (Liquidity Facility; Citibank NA and LOC; Citibank NA) | 0.18 | 2/7/12 | 13,000,000 a,b,c | | 13,000,000 |
| San Pablo Redevelopment Agency, Subordinate Tax Allocation Revenue | | | | | |
| (Tenth Township Redevelopment Project) (LOC; Union Bank NA) | 0.06 | 2/1/12 | 10,220,000 | a | 10,220,000 |
| Southern California Public Power Authority, Revenue (Mead-Adelanto | | | | | |
| Project) (Liquidity Facility; JPMorgan Chase Bank) | 0.05 | 2/1/12 | 5,400,000 | a | 5,400,000 |
| West Covina Public Financing Authority, LR, Refunding (Public Facilities | | | | | |
| Project) (LOC; California State Teachers Retirement System) | 0.07 | 2/7/12 | 1,480,000 | a | 1,480,000 |
| Western Placer Unified School District, GO Notes, TRAN | 2.00 | 10/4/12 | 1,000,000 | | 1,009,146 |
| U.S. Related—2.6% | | | | | |
| Puerto Rico Sales Tax Financing Corporation, Sales Tax | | | | | |
| Revenue (Citigroup ROCS, Series RR II R-11764) | | | | | |
| (Liquidity Facility; Citibank NA) | 0.08 | 2/7/12 | 2,825,000 a,b,c | | 2,825,000 |
| Puerto Rico Sales Tax Financing Corporation, Sales Tax | | | | | |
| Revenue (Citigroup ROCS, Series RR II R-11765) | | | | | |
| (Liquidity Facility; Citibank NA) | 0.08 | 2/7/12 | 8,715,000 a,b,c | | 8,715,000 |
| |
| Total Investments (cost $428,022,592) | | | 97.0 | % | 428,022,592 |
| Cash and Receivables (Net) | | | 3.0 | % | 13,227,540 |
| Net Assets | | | 100.0 | % | 441,250,132 |
| |
| See footnotes on page 52. | | | | | |
| See notes to financial statements. | | | | | |
48
STATEMENT OF INVESTMENTS
January 31, 2012
| | | | | | |
| Dreyfus New York AMT-Free | Coupon | Maturity | Principal | |
| Municipal Cash Management | Rate (%) | Date | Amount ($) | Value ($) |
| |
| Short-Term Investments—101.6% | | | | |
| New York—96.4% | | | | |
| Addison Central School District, GO Notes, BAN | 1.50 | 6/15/12 | 1,000,000 | 1,002,945 |
| Albany Industrial Development Agency, Civic Facility Revenue | | | | |
| (The College of Saint Rose Project) (LOC; Bank of America) | 0.10 | 2/7/12 | 2,700,000a | 2,700,000 |
| Albany Industrial Development Agency, Civic Facility Revenue | | | | |
| (The College of Saint Rose Project) (LOC; Bank of America) | 0.10 | 2/7/12 | 3,000,000a | 3,000,000 |
| Albany Industrial Development Agency, Civic Faclility Revenue | | | | |
| (Living Resources Corporation Project) (LOC; HSBC Bank USA) | 0.05 | 2/7/12 | 3,000,000a | 3,000,000 |
| Broome County Industrial Development Agency, Continuing Care | | | | |
| Retirement Community Revenue (Good Shepherd Village | | | | |
| at Endwell, Inc. Project) (LOC; M&T Trust) | 0.13 | 2/7/12 | 3,250,000a | 3,250,000 |
| Cayuga County, GO Notes, BAN | 1.50 | 2/10/12 | 3,500,000 | 3,500,424 |
| Cortland Enlarged City School District, GO Notes, BAN | 1.50 | 7/27/12 | 2,400,000 | 2,410,416 |
| Dutchess County Industrial Development Agency, Civic Facility Revenue | | | | |
| (Anderson Foundation for Autism, Inc. Project) (LOC; M&T Trust) | 0.13 | 2/7/12 | 4,285,000a | 4,285,000 |
| East Farmingdale Volunteer Fire Company Inc., | | | | |
| Volunteer Fire Department Revenue (LOC; Citibank NA) | 0.51 | 2/7/12 | 4,005,000a | 4,005,000 |
| East Quogue Union Free School District, GO Notes, TAN | 1.25 | 6/27/12 | 1,100,000 | 1,102,859 |
| Elmira City School District, GO Notes, BAN | 1.75 | 2/15/12 | 1,000,000 | 1,000,226 |
| Evans-Brant Central School District, GO Notes, BAN | 1.50 | 6/29/12 | 2,000,000 | 2,007,300 |
| Franklin County Industrial Development Agency, Civic Facility | | | | |
| Revenue (Paul Smith's College Project) (LOC; U.S. Bank NA) | 0.13 | 2/7/12 | 935,000a | 935,000 |
| Franklin County Industrial Development Agency, Civic Facility | | | | |
| Revenue (Trudeau Institute, Inc. Project) (LOC; HSBC Bank USA) | 0.24 | 2/7/12 | 1,925,000a | 1,925,000 |
| Franklin County Industrial Development Agency, Civic Facility | | | | |
| Revenue (Trudeau Institute, Inc. Project) (LOC; HSBC Bank USA) | 0.24 | 2/7/12 | 265,000a | 265,000 |
| Lancaster Industrial Development Agency, Civic Facility | | | | |
| Revenue (GreenField Manor, Inc. Project) (LOC; M&T Trust) | 0.12 | 2/7/12 | 1,900,000a | 1,900,000 |
| Medina Central School District, GO Notes, BAN | 1.50 | 6/22/12 | 2,050,000 | 2,055,118 |
| Metropolitan Transportation Authority, Dedicated Tax Fund | | | | |
| Revenue, Refunding (LOC; Bank of Tokyo-Mitsubishi UFJ) | 0.04 | 2/7/12 | 4,900,000a | 4,900,000 |
| Monroe County Industrial Development Agency, Civic Facility Revenue | | | | |
| (Association for the Blind and Visually Impaired—Goodwill Industries of | | | | |
| Greater Rochester, Inc. Project) (LOC; JPMorgan Chase Bank) | 0.08 | 2/7/12 | 3,705,000a | 3,705,000 |
| Monroe County Industrial Development Agency, Civic Facility Revenue | | | | |
| (Saint Ann's Home for the Aged Project) (LOC; HSBC Bank USA) | 0.07 | 2/7/12 | 3,575,000a | 3,575,000 |
| New York City, GO Notes (Citigroup ROCS, | | | | |
| Series RR II R-11685) (Liquidity Facility; Citibank NA) | 0.09 | 2/7/12 | 7,000,000 a,b,c | 7,000,000 |
| New York City, GO Notes (Liquidity Facility; Bank of Nova Scotia) | 0.04 | 2/7/12 | 7,000,000a | 7,000,000 |
| New York City, GO Notes (LOC; Bank of America) | 0.07 | 2/1/12 | 1,850,000a | 1,850,000 |
| New York City, GO Notes (LOC; California Public | | | | |
| Employees Retirement System) | 0.05 | 2/1/12 | 14,000,000a | 14,000,000 |
| New York City, GO Notes (LOC; JPMorgan Chase Bank) | 0.05 | 2/1/12 | 1,000,000a | 1,000,000 |
| New York City Capital Resource Corporation, Revenue | | | | |
| (Loan Enhanced Assistance Program— Cobble Hill | | | | |
| Health Center, Inc. Project) (LOC; Bank of America) | 0.20 | 2/7/12 | 1,000,000a | 1,000,000 |
The Funds 49
STATEMENT OF INVESTMENTS (continued)
| | | | | | |
| Dreyfus New York AMT-Free | Coupon | Maturity | Principal | | |
| Municipal Cash Management (continued) | Rate (%) | Date | Amount ($) | | Value ($) |
| |
| Short-Term Investments (continued) | | | | | |
| New York (continued) | | | | | |
| New York City Capital Resource Corporation, Revenue | | | | | |
| (Loan Enhanced Assistance Program— Poly Prep Country | | | | | |
| Day School Project) (LOC; Bank of America) | 0.17 | 2/7/12 | 1,595,000 | a | 1,595,000 |
| New York City Capital Resource Corporation, Revenue | | | | | |
| (Loan Enhanced Assistance Program— Village Center | | | | | |
| for Care Project) (LOC; Bank of America) | 0.17 | 2/7/12 | 1,025,000 | a | 1,025,000 |
| New York City Industrial Development Agency, Civic Facility | | | | | |
| Revenue (Birch Wathen Lenox School Project) (LOC; TD Bank) | 0.16 | 2/7/12 | 4,200,000 | a | 4,200,000 |
| New York City Industrial Development Agency, Civic Facility Revenue | | | | | |
| (Sephardic Community Youth Center, Inc. Project) (LOC; M&T Trust) | 0.13 | 2/7/12 | 4,700,000 | a | 4,700,000 |
| New York City Industrial Development Agency, Civic Facility | | | | | |
| Revenue (Spence-Chapin, Services to Families and | | | | | |
| Children Project) (LOC; TD Bank) | 0.16 | 2/7/12 | 3,100,000 | a | 3,100,000 |
| New York City Municipal Water Finance Authority, Water and Sewer | | | | | |
| System Revenue (Liquidity Facility; Mizuho Corporate Bank Ltd.) | 0.03 | 2/1/12 | 3,235,000 | a | 3,235,000 |
| New York City Municipal Water Finance Authority, | | | | | |
| Water and Sewer System Second General Resolution | | | | | |
| Revenue (Liquidity Facility; Bank of America) | 0.05 | 2/1/12 | 300,000 | a | 300,000 |
| New York City Municipal Water Finance Authority, Water and | | | | | |
| Sewer System Second General Resolution Revenue (Liquidity | | | | | |
| Facility; California State Teachers Retirement System) | 0.04 | 2/1/12 | 7,100,000 | a | 7,100,000 |
| New York City Municipal Water Finance Authority, | | | | | |
| Water and Sewer System Second General Resolution | | | | | |
| Revenue (Liquidity Facility; U.S. Bank NA) | 0.03 | 2/1/12 | 1,600,000 | a | 1,600,000 |
| New York City Trust for Cultural Resources, Revenue, | | | | | |
| Refunding (American Museum of Natural History) | | | | | |
| (Liquidity Facility; Wells Fargo Bank) | 0.04 | 2/7/12 | 3,000,000 | a | 3,000,000 |
| New York Liberty Development Corporation, Liberty Revenue, | | | | | |
| Refunding (World Trade Center Project Towers 3-4) | | | | | |
| (LOC; JPMorgan Chase Bank) | 0.08 | 2/7/12 | 1,035,000 | a | 1,035,000 |
| New York Liberty Development Corporation, Recovery Zone Revenue | | | | | |
| (3 World Trade Center Project) (LOC; JPMorgan Chase Bank) | 0.08 | 2/7/12 | 585,000 | a | 585,000 |
| New York State Dormitory Authority, HR, | | | | | |
| Refunding (Interfaith Medical Center) | 4.75 | 2/15/12 | 700,000 | | 701,062 |
| New York State Dormitory Authority, Revenue | | | | | |
| (Catholic Health System Obligated Group) (LOC; HSBC Bank USA) | 0.06 | 2/7/12 | 3,885,000 | a | 3,885,000 |
| New York State Dormitory Authority, Revenue | | | | | |
| (Mental Health Services Facilities Improvement) | 5.00 | 2/15/12 | 665,000 | | 666,072 |
| New York State Housing Finance Agency, Housing Revenue | | | | | |
| (2180 Broadway Housing Project) (LOC; Wells Fargo Bank) | 0.06 | 2/7/12 | 3,000,000 | a | 3,000,000 |
| New York State Housing Finance Agency, Housing Revenue | | | | | |
| (Baisley Park Gardens) (LOC; Citibank NA) | 0.07 | 2/7/12 | 2,200,000 | a | 2,200,000 |
| New York State Thruway Authority, Second General Highway | | | | | |
| and Bridges Trust Fund Revenue (Citigroup ROCS, | | | | | |
| Series RR II R-11997) (Liquidity Facility; Citibank NA) | 0.08 | 2/7/12 | 1,500,000 a,b,c | | 1,500,000 |
| New York State Urban Development Corporation, State Personal | | | | | |
| Income Tax Revenue (State Facilities and Equipment) | 5.25 | 3/15/12 | 275,000 | | 276,533 |
| Newark Central School District, GO Notes, BAN | 1.50 | 6/25/12 | 1,000,000 | | 1,003,762 |
50
| | | | | | | |
| Dreyfus New York AMT-Free | Coupon | Maturity | Principal | | | |
| Municipal Cash Management (continued) | Rate (%) | Date | Amount ($) | | Value ($) | |
| |
| Short-Term Investments (continued) | | | | | | |
| New York (continued) | | | | | | |
| Niagara Area Development Corporation, Revenue (Niagara Falls | | | | | | |
| Memorial Medical Center Project) (LOC; HSBC Bank USA) | 0.05 | 2/7/12 | 1,000,000 | a | 1,000,000 | |
| Orange County Industrial Development Agency, Civic Facility | | | | | | |
| Revenue (Tuxedo Park School Project) (LOC; M&T Trust) | 0.13 | 2/7/12 | 1,000,000 | a | 1,000,000 | |
| Patchogue-Medford Union Free School District, GO Notes, TAN | 1.50 | 6/21/12 | 3,500,000 | | 3,510,056 | |
| Port Authority of New York and New Jersey, Equipment Notes | 0.14 | 2/7/12 | 2,800,000 | a | 2,800,000 | |
| Port Jefferson Union Free School District, GO Notes, TAN | 1.50 | 6/28/12 | 1,800,000 | | 1,807,623 | |
| Putnam County Industrial Development Agency, Civic Facility | | | | | | |
| Revenue (United Cerebral Palsy of Putnam and | | | | | | |
| Southern Dutchess Project) (LOC; TD Bank) | 0.05 | 2/7/12 | 3,600,000 | a | 3,600,000 | |
| RBC Municipal Products Inc. Trust (New York City Municipal Water | | | | | | |
| Finance Authority, Water and Sewer System Second General | | | | | | |
| Resolution Revenue) (Liquidity Facility; Royal Bank of Canada) | 0.05 | 2/7/12 | 1,600,000 a,b,c | | 1,600,000 | |
| Riverhead Industrial Development Agency, Civic Facility Revenue | | | | | | |
| (Central Suffolk Hospital Project) (LOC; HSBC Bank USA) | 0.06 | 2/7/12 | 2,500,000 | a | 2,500,000 | |
| Salina, GO Notes, BAN | 1.50 | 6/22/12 | 1,493,000 | | 1,497,194 | |
| Syracuse Industrial Development Agency, | | | | | | |
| Civic Facility Revenue (Community Development | | | | | | |
| Properties—Vanderbilt/Larned Project) (LOC; M&T Trust) | 0.10 | 2/7/12 | 1,600,000 | a | 1,600,000 | |
| Triborough Bridge and Tunnel Authority, General | | | | | | |
| Revenue (MTA Bridges and Tunnels) (Citigroup ROCS, | | | | | | |
| Series RR II R-11934) (Liquidity Facility; Citibank NA) | 0.08 | 2/7/12 | 1,100,000 a,b,c | | 1,100,000 | |
| Triborough Bridge and Tunnel Authority, General Revenue (MTA Bridges | | | | | | |
| and Tunnels) (LOC; California State Teachers Retirement System) | 0.06 | 2/7/12 | 3,200,000 | a | 3,200,000 | |
| Triborough Bridge and Tunnel Authority, General Revenue | | | | | | |
| (MTA Bridges and Tunnels) (LOC; State Street Bank and Trust Co.) | 0.04 | 2/7/12 | 3,750,000 | a | 3,750,000 | |
| Westchester County Industrial Development Agency, | | | | | | |
| Civic Facility Revenue (The Masters School Civic | | | | | | |
| Facility) (LOC; JPMorgan Chase Bank) | 0.10 | 2/7/12 | 1,850,000 | a | 1,850,000 | |
| U.S. Related—5.2% | | | | | | |
| Puerto Rico Electric Power Authority, Power Revenue | | | | | | |
| (P-FLOATS Series MT-677) (Liquidity Facility; | | | | | | |
| Bank of America and LOC; Bank of America) | 0.44 | 2/7/12 | 2,935,000 a,b,c | | 2,935,000 | |
| Puerto Rico Sales Tax Financing Corporation, Sales Tax | | | | | | |
| Revenue (Citigroup ROCS, Series RR II R-11762) | | | | | | |
| (Liquidity Facility; Citibank NA) | 0.08 | 2/7/12 | 4,095,000 a,b,c | | 4,095,000 | |
| Puerto Rico Sales Tax Financing Corporation, Sales Tax | | | | | | |
| Revenue (Citigroup ROCS, Series RR II R-11765) | | | | | | |
| (Liquidity Facility; Citibank NA) | 0.08 | 2/7/12 | 1,500,000 a,b,c | | 1,500,000 | |
| |
| Total Investments (cost $166,426,590) | | | 101.6 | % | 166,426,590 | |
| Liabilities, Less Cash and Receivables | | | (1.6 | %) | (2,599,830 | ) |
| Net Assets | | | 100.0 | % | 163,826,760 | |
| |
| See footnotes on page 52. | | | | | | |
| See notes to financial statements. | | | | | | |
The Funds 51
STATEMENT OF INVESTMENTS (continued)
| | | | |
| Summary of Abbreviations | | |
| |
| |
| ABAG | Association of Bay Area Governments | ACA | American Capital Access |
| AGC | ACE Guaranty Corporation | AGIC | Asset Guaranty Insurance Company |
| AMBAC | American Municipal Bond Assurance Corporation | ARRN | Adjustable Rate Receipt Notes |
| BAN | Bond Anticipation Notes | BPA | Bond Purchase Agreement |
| CIFG | CDC Ixis Financial Guaranty | COP | Certificate of Participation |
| CP | Commercial Paper | DRIVERS | Derivative Inverse Tax-Exempt Receipts |
| EDR | Economic Development Revenue | EIR | Environmental Improvement Revenue |
| FGIC | Financial Guaranty Insurance Company | FHA | Federal Housing Administration |
| FHLB | Federal Home Loan Bank | FHLMC | Federal Home Loan Mortgage Corporation |
| FNMA | Federal National Mortgage Association | GAN | Grant Anticipation Notes |
| GIC | Guaranteed Investment Contract | GNMA | Government National Mortgage Association |
| GO | General Obligation | HR | Hospital Revenue |
| IDB | Industrial Development Board | IDC | Industrial Development Corporation |
| IDR | Industrial Development Revenue | LOC | Letter of Credit |
| LOR | Limited Obligation Revenue | LR | Lease Revenue |
| MERLOTS | Municipal Exempt Receipt Liquidity Option Tender | MFHR | Multi-Family Housing Revenue |
| MFMR | Multi-Family Mortgage Revenue | PCR | Pollution Control Revenue |
| PILOT | Payment in Lieu of Taxes | P-FLOATS | Puttable Floating Option Tax-Exempt Receipts |
| PUTTERS | Puttable Tax-Exempt Receipts | RAC | Revenue Anticipation Certificates |
| RAN | Revenue Anticipation Notes | RAW | Revenue Anticipation Warrants |
| ROCS | Reset Options Certificates | RRR | Resources Recovery Revenue |
| SAAN | State Aid Anticipation Notes | SBPA | Standby Bond Purchase Agreement |
| SFHR | Single Family Housing Revenue | SFMR | Single Family Mortgage Revenue |
| SONYMA | State of New York Mortgage Agency | SWDR | Solid Waste Disposal Revenue |
| TAN | Tax Anticipation Notes | TAW | Tax Anticipation Warrants |
| TRAN | Tax and Revenue Anticipation Notes | XLCA | XL Capital Assurance |

| |
| † Based on total investments. |
| a Variable rate demand note—rate shown is the interest rate in effect at January 31, 2012. Maturity date represents the next demand date, or the ultimate maturity date if earlier. |
| b Securities exempt from registration under Rule 144A of the Securities Act of 1933.These securities may be resold in transactions exempt from registration, normally to qualified |
| institutional buyers. At January 31, 2012, the amount of these securities for each fund was as follows: |
| Dreyfus Municipal Cash Management Plus—$137,085,000 or 16.3% of net assets |
| Dreyfus NewYork Municipal Cash Management—$58,385,000 or 9.4% of net assets |
| Dreyfus Tax Exempt Cash Management—$226,725,000 or 8.8% of net assets |
| Dreyfus California AMT-Free Municipal Cash Management—$43,225,000 or 9.8% of net assets |
| Dreyfus NewYork AMT-Free Municipal Cash Management—$19,730,000 or 12.0% of net assets |
| c The fund does not directly own the municipal security indicated; the fund owns an interest in a special purpose entity that, in turn, owns the underlying municipal security.The special |
| purpose entity permits the fund to own interests in underlying assets, but in a manner structured to provide certain advantages not inherent in the underlying bonds (e.g., enhanced |
| liquidity, yields linked to short-term rates). |
| d Notes which are not F, MIG or SP rated are represented by bond ratings of the issuers. |
| e Securities which, while not rated by Fitch, Moody’s and Standard & Poor’s, have been determined by the Manager to be of comparable quality to those rated securities in which the fund |
| may invest. |
See notes to financial statements.
52
STATEMENT OF ASSETS AND LIABILITIES
(amounts in thousands, except Net Asset Value Per Share)
January 31, 2012
| | | | | | | | | | | |
| | | Dreyfus | Dreyfus | Dreyfus | Dreyfus |
| | Dreyfus | Government | Government | Treasury & | Treasury |
| | Cash | Cash | Prime Cash | Agency Cash | Prime Cash |
| | Management | Management | Management | Management | Management |
| Assets ($): | | | | | |
| Investments at value—Note 1(a,b)† | 27,626,670a | 21,068,024a | 4,870,231 | 20,274,094a | 27,164,640 |
| Cash | 18,130 | 5,026 | 16,251 | 19,727 | 32,768 |
| Interest receivable | 5,892 | 9,466 | 11,259 | 30,768 | 43,196 |
| Prepaid expenses and other assets | 151 | 128 | 90 | 61 | 126 |
| | 27,650,843 | 21,082,644 | 4,897,831 | 20,324,650 | 27,240,730 |
| Liabilities ($): | | | | | |
| Due to The Dreyfus Corporation and affiliates—Note 2(c) | 4,929 | 1,708 | 267 | 1,120 | 512 |
| Payable for shares of Beneficial Interest redeemed | 6,517 | 11,544 | 2,524 | 509 | 99,696 |
| Payable for investment securities purchased | — | — | — | — | 604,922 |
| Accrued expenses | 133 | 165 | 98 | 146 | 185 |
| | 11,579 | 13,417 | 2,889 | 1,775 | 705,315 |
| Net Assets ($) | 27,639,264 | 21,069,227 | 4,894,942 | 20,322,875 | 26,535,415 |
| Composition of Net Assets ($): | | | | | |
| Paid-in capital | 27,639,282 | 21,069,210 | 4,894,990 | 20,322,860 | 26,535,666 |
| Accumulated distributions in excess of | | | | | |
| investment income—net | (2) | — | — | — | — |
| Accumulated net realized gain (loss) on investments | (16) | 17 | (48) | 15 | (251) |
| Net Assets ($) | 27,639,264 | 21,069,227 | 4,894,942 | 20,322,875 | 26,535,415 |
| Net Asset Value Per Share | | | | | |
| Institutional Shares | | | | | |
| Net Assets ($) | 22,695,256 | 18,081,580 | 3,543,443 | 16,546,587 | 18,888,211 |
| Shares Outstanding | 22,695,268 | 18,081,596 | 3,543,476 | 16,546,577 | 18,888,382 |
| Net Asset Value Per Share ($) | 1.00 | 1.00 | 1.00 | 1.00 | 1.00 |
| Investor Shares | | | | | |
| Net Assets ($) | 2,990,647 | 1,510,010 | 482,094 | 2,176,009 | 4,150,220 |
| Shares Outstanding | 2,990,654 | 1,510,010 | 482,101 | 2,176,007 | 4,150,267 |
| Net Asset Value Per Share ($) | 1.00 | 1.00 | 1.00 | 1.00 | 1.00 |
The Funds 53
STATEMENT OF ASSETS AND LIABILITIES (continued)
(amounts in thousands, except Net Asset Value Per Share)
January 31, 2012
| | | | | | |
| | | Dreyfus | Dreyfus | Dreyfus | Dreyfus |
| | Dreyfus | Government | Government | Treasury & | Treasury |
| | Cash | Cash | Prime Cash | Agency Cash | Prime Cash |
| | Management | Management | Management | Management | Management |
| Net Asset Value Per Share (continued) | | | | | |
| Administrative Shares | | | | | |
| Net Assets ($) | 941,381 | 1,102,838 | 632,286 | 602,077 | 609,825 |
| Shares Outstanding | 941,384 | 1,102,836 | 632,292 | 602,076 | 609,831 |
| Net Asset Value Per Share ($) | 1.00 | 1.00 | 1.00 | 1.00 | 1.00 |
| Participant Shares | | | | | |
| Net Assets ($) | 825,875 | 289,269 | 225,557 | 888,881 | 2,866,413 |
| Shares Outstanding | 825,871 | 289,269 | 225,562 | 888,880 | 2,866,440 |
| Net Asset Value Per Share ($) | 1.00 | 1.00 | 1.00 | 1.00 | 1.00 |
| Service Shares | | | | | |
| Net Assets ($) | — | — | — | 31,920 | — |
| Shares Outstanding | — | — | — | 31,918 | — |
| Net Asset Value Per Share ($) | — | — | — | 1.00 | — |
| Select Shares | | | | | |
| Net Assets ($) | — | — | — | 23,804 | — |
| Shares Outstanding | — | — | — | 23,804 | — |
| Net Asset Value Per Share ($) | — | — | — | 1.00 | — |
| Agency Shares | | | | | |
| Net Assets ($) | 186,105 | 85,530 | 11,562 | 22,797 | 20,746 |
| Shares Outstanding | 186,105 | 85,530 | 11,563 | 22,797 | 20,746 |
| Net Asset Value Per Share ($) | 1.00 | 1.00 | 1.00 | 1.00 | 1.00 |
| Premier Shares | | | | | |
| Net Assets ($) | — | — | — | 30,800 | — |
| Shares Outstanding | — | — | — | 30,801 | — |
| Net Asset Value Per Share ($) | — | — | — | 1.00 | — |
| † Investments at cost ($) | 27,626,670 | 21,068,024 | 4,870,231 | 20,274,094 | 27,164,640 |
| |
| a Amount includes repurchase agreements of $5,226,000,000, $10,371,000,000 and $11,851,000,000 for Dreyfus Cash Management, Dreyfus Government Cash Management and |
| Dreyfus Treasury & Agency Cash Management, respectively, See Note 1(c). |
See notes to financial statements.
54
| | | | | | | | |
| | | | | Dreyfus | Dreyfus |
| | Dreyfus | Dreyfus | Dreyfus | California | New York |
| Municipal Cash | New York | Tax Exempt | AMT-Free | AMT-Free |
| Management | Municipal Cash | Cash Municipal Cash | Municipal Cash |
| | Plus | Management | Management | Management | Management |
| Assets ($): | | | | | |
| Investments at value—Note 1(a,b)† | 841,498 | 614,997 | 2,569,928 | 428,023 | 166,427 |
| Cash | 5,351 | 3,527 | 7,157 | 93 | 5,415 |
| Interest receivable | 849 | 494 | 2,274 | 353 | 190 |
| Receivable for investment securites sold | — | — | 52,800 | 13,165 | — |
| Prepaid expenses | 42 | 18 | 49 | 8 | 66 |
| | 847,740 | 619,036 | 2,632,208 | 441,642 | 172,098 |
| Liabilities ($): | | | | | |
| Due to The Dreyfus Corporation and affiliates—Note 2(c) | 109 | 58 | 258 | 66 | 14 |
| Payable for investment securities purchased | 6,130 | — | 67,590 | — | 8,101 |
| Payable for shares of Beneficial Interest redeemed | 20 | 8 | —a | 270 | 110 |
| Accrued expenses | 58 | 48 | 89 | 56 | 46 |
| | 6,317 | 114 | 67,937 | 392 | 8,271 |
| Net Assets ($) | 841,423 | 618,922 | 2,564,271 | 441,250 | 163,827 |
| Composition of Net Assets ($): | | | | | |
| Paid-in capital | 841,433 | 618,922 | 2,564,274 | 441,250 | 163,825 |
| Accumulated net realized gain (loss) on investments | (10) | — | (3) | — | 2 |
| Net Assets ($) | 841,423 | 618,922 | 2,564,271 | 441,250 | 163,827 |
| Net Asset Value Per Share | | | | | |
| Instititutional Shares | | | | | |
| Net Assets ($) | 346,483 | 320,277 | 2,081,780 | 174,160 | 102,229 |
| Shares Outstanding | 346,367 | 320,279 | 2,081,782 | 174,157 | 102,205 |
| Net Asset Value Per Share ($) | 1.00 | 1.00 | 1.00 | 1.00 | 1.00 |
| Investor Shares | | | | | |
| Net Assets ($) | 257,005 | 266,591 | 379,559 | 203,459 | 48,642 |
| Shares Outstanding | 256,914 | 266,592 | 379,560 | 203,453 | 48,631 |
| Net Asset Value Per Share ($) | 1.00 | 1.00 | 1.00 | 1.00 | 1.00 |
| Administrative Shares | | | | | |
| Net Assets ($) | 212,930 | 21,442 | 75,666 | 1,979 | 12,675 |
| Shares Outstanding | 212,855 | 21,442 | 75,666 | 1,979 | 12,672 |
| Net Asset Value Per Share ($) | 1.00 | 1.00 | 1.00 | 1.00 | 1.00 |
| Participant Shares | | | | | |
| Net Assets ($) | 24,990 | 10,611 | 27,266 | 61,651 | 10 |
| Shares Outstanding | 24,981 | 10,611 | 27,266 | 61,649 | 10 |
| Net Asset Value Per Share ($) | 1.00 | 1.00 | 1.00 | 1.00 | 1.00 |
| Agency Shares | | | | | |
| Net Assets ($) | 15 | 1 | —b | 1 | — |
| Shares Outstanding | 15 | 1 | —b | 1 | — |
| Net Asset Value Per Share ($) | 1.00 | 1.00 | —b | 1.00 | — |
| Classic Shares | | | | | |
| Net Assets ($) | — | — | — | — | 271 |
| Shares Outstanding | — | — | — | — | 271 |
| Net Asset Value Per Share ($) | — | — | — | — | 1.00 |
| † Investments at cost ($) | 841,498 | 614,997 | 2,569,928 | 428,023 | 166,427 |
| |
| a Amount represents less than $1,000. |
| b Effective December 8, 2011, Dreyfus Tax Exempt Cash Management had terminated its Agency Shares |
| See notes to financial statements. |
The Funds 55
STATEMENT OF OPERATIONS
(amounts in thousands)
Year Ended January 31, 2012
| | | | | | | | | | | |
| | | Dreyfus | Dreyfus | Dreyfus | Dreyfus |
| | Dreyfus | Government | Government | Treasury & | Treasury |
| | Cash | Cash | Prime Cash | Agency Cash | Prime Cash |
| | Management | Management | Management | Management | Management |
| Investment Income ($): | | | | | |
| Interest Income | 74,797 | 28,493 | 5,078 | 14,766 | 14,470 |
| Expenses: | | | | | |
| Management fee—Note 2(a) | 56,960 | 42,669 | 8,805 | 30,865 | 47,240 |
| Distribution fees—Note 2(b) | 11,986 | 7,466 | 3,497 | 8,271 | 20,696 |
| Custodian fees—Note 2(c) | 904 | 642 | 174 | 475 | 626 |
| Shareholder servicing costs—Note 2(c) | 562 | 273 | 181 | 517 | 1,768 |
| Registration fees | 179 | 165 | 148 | 210 | 177 |
| Trustees’ fees and expenses—Note 2(d) | 162 | 110 | 23 | 70 | 113 |
| Prospectus and shareholders’ reports | 159 | 131 | 48 | 63 | 209 |
| Professional fees | 100 | 99 | 54 | 87 | 102 |
| Miscellaneous | 437 | 305 | 100 | 212 | 300 |
| Total Expenses | 71,449 | 51,860 | 13,030 | 40,770 | 71,231 |
| Less—reduction in expenses | | | | | |
| due to undertaking—Note 2(a) | (13,984) | (23,456) | (7,952) | (27,358) | (56,764) |
| Less—reduction in fees due to | | | | | |
| earnings credits—Note 2(c) | (49) | (9) | (1) | (1) | (5) |
| Net Expenses | 57,416 | 28,395 | 5,077 | 13,411 | 14,462 |
| Investment Income—Net | 17,381 | 98 | 1 | 1,355 | 8 |
| Realized and Unrealized Gain (Loss) on | | | | | |
| Investments—Note 1(b) ($) | 5 | 41 | (48) | 192 | (251) |
| Net Increase (Decrease) in Net Assets | | | | | |
| Resulting from Operations | 17,386 | 139 | (47) | 1,547 | (243) |
| |
| See notes to financial statements. | | | | | |
56
| | | | | | | | | | | |
| | | | | Dreyfus | Dreyfus |
| | Dreyfus | Dreyfus | Dreyfus | California | New York |
| | Municipal Cash | New York | Tax Exempt | AMT-Free | AMT-Free |
| | Management | Municipal Cash | Cash | Municipal Cash | Municipal Cash |
| | Plus | Management | Management | Management | Management |
| Investment Income ($): | | | | | |
| Interest Income | 2,347 | 1,769 | 6,440 | 1,049 | 426 |
| Expenses: | | | | | |
| Management fee—Note 2(a) | 1,827 | 1,407 | 5,630 | 767 | 313 |
| Distribution fees—Note 2(b) | 1,056 | 722 | 987 | 509 | 178 |
| Registration fees | 92 | 48 | 142 | 47 | 64 |
| Professional fees | 80 | 85 | 86 | 35 | 48 |
| Custodian fees—Note 2(c) | 70 | 56 | 131 | 32 | 19 |
| Shareholder servicing costs—Note 2(c) | 26 | 18 | 621 | 11 | 7 |
| Prospectus and shareholders’ reports | 24 | 17 | 25 | 4 | 1 |
| Trustees’ fees and expenses—Note 2(d) | 6 | 5 | 16 | 2 | 1 |
| Miscellaneous | 70 | 64 | 134 | 27 | 31 |
| Total Expenses | 3,251 | 2,422 | 7,772 | 1,434 | 662 |
| Less—reduction in expenses | | | | | |
| due to undertakings—Note 2(a) | (1,020) | (805) | (2,012) | (482) | (252) |
| Less—reduction in fees due to | | | | | |
| earnings credits—Note 2(c) | —a | —a | —a | —a | —a |
| Net Expenses | 2,231 | 1,617 | 5,760 | 952 | 410 |
| Investment Income—Net | 116 | 152 | 680 | 97 | 16 |
| Net Realized Gain (Loss) on | | | | | |
| Investments—Note 1(b) ($) | — | — | 8 | 1 | 2 |
| Net Increase in Net Assets | | | | | |
| Resulting from Operations | 116 | 152 | 688 | 98 | 18 |
| |
| a Amount represents less than $1,000. | | | | | |
| See notes to financial statements. | | | | | |
The Funds 57
STATEMENTS OF CHANGES IN NET ASSETS
(amounts in thousands)
| | | | | | | | | |
| | | | Dreyfus Government |
| | Dreyfus Cash Management | Cash Management |
| | Year Ended January 31, | Year Ended January 31, |
| | 2012 | 2011 | 2012 | 2011 |
| Operations ($): | | | | |
| Investment income—net | 17,381 | 38,190 | 98 | 8,965 |
| Net realized gain (loss) on investments | 5 | 120 | 41 | (22) |
| Net Increase (Decrease) in Net Assets | | | | |
| Resulting from Operations | 17,386 | 38,310 | 139 | 8,943 |
| Dividends to Shareholders from ($): | | | | |
| Investment income—net: | | | | |
| Institutional Shares | (17,442) | (37,737) | (99) | (9,081) |
| Investor Shares | (7) | (7) | (1) | (12) |
| Administrative Shares | (47) | (380) | —a | (4) |
| Participant Shares | (3) | —a | —a | (2) |
| Agency Shares | (23) | (66) | —a | (3) |
| Total Dividends | (17,522) | (38,190) | (100) | (9,102) |
| Beneficial Interest Transactions ($1.00 per share): | | | | |
| Net proceeds from shares sold: | | | | |
| Institutional Shares | 109,929,147 | 123,589,162 | 113,164,798 | 139,127,297 |
| Investor Shares | 10,284,538 | 12,189,202 | 5,582,368 | 5,745,617 |
| Administrative Shares | 2,292,757 | 2,512,448 | 4,552,439 | 4,181,614 |
| Participant Shares | 2,152,712 | 2,622,489 | 2,294,304 | 2,053,947 |
| Agency Shares | 840,749 | 97,436 | 194,307 | 260,474 |
| Net assets received in connection | | | | |
| with reorganization—Note 1 | 4,064,792 | — | — | — |
| Dividends reinvested: | | | | |
| Institutional Shares | 3,200 | 7,089 | 27 | 1,834 |
| Investor Shares | 3 | 1 | —a | 8 |
| Administrative Shares | 12 | 158 | —a | 3 |
| Participant Shares | 2 | —a | —a | 1 |
| Agency Shares | —a | 1 | — | —a |
| Cost of shares redeemed: | | | | |
| Institutional Shares | (115,129,031) | (133,375,106) | (115,612,213) | (142,562,963) |
| Investor Shares | (10,382,079) | (12,697,257) | (5,776,907) | (6,250,286) |
| Administrative Shares | (2,516,455) | (2,833,493) | (4,540,881) | (3,919,457) |
| Participant Shares | (2,115,132) | (2,597,285) | (2,535,843) | (1,862,507) |
| Agency Shares | (714,801) | (127,174) | (239,102) | (202,800) |
| Increase (Decrease) in Net Assets from | | | | |
| Beneficial Interest Transactions | (1,289,586) | (10,612,329) | (2,916,703) | (3,427,218) |
| Total Increase (Decrease) In Net Assets | (1,289,722) | (10,612,209) | (2,916,664) | (3,427,377) |
| Net Assets ($): | | | | |
| Beginning of Period | 28,928,986 | 39,541,195 | 23,985,891 | 27,413,268 |
| End of Period | 27,639,264 | 28,928,986 | 21,069,227 | 23,985,891 |
| Accumulated distributions in excess of | | | | |
| investment income—net | (2) | — | — | — |
| |
| a Amount represents less than $1,000. | | | | |
| See notes to financial statements. | | | | |
58
| | | | | | | | | |
| | Dreyfus Government | Dreyfus Treasury & |
| | Prime Cash Management | Agency Cash Management |
| | Year Ended January 31, | Year Ended January 31, |
| | 2012 | 2011 | 2012 | 2011 |
| Operations ($): | | | | |
| Investment income—net | 1 | 401 | 1,355 | 508 |
| Net realized gain (loss) on investments | (48) | 28 | 192 | 45 |
| Net Increase (Decrease) in Net Assets | | | | |
| Resulting from Operations | (47) | 429 | 1,547 | 553 |
| Dividends to Shareholders from ($): | | | | |
| Investment income—net: | | | | |
| Institutional Shares | (1) | (429) | (1,223) | (549) |
| Investor Shares | —a | (6) | (199) | (8) |
| Administrative Shares | —a | (6) | (51) | (2) |
| Participant Shares | —a | (5) | (59) | (2) |
| Service Shares | — | — | (1) | —a |
| Select Shares | — | — | (2) | —a |
| Agency Shares | —a | —a | (3) | —a |
| Premier Shares | — | — | (4) | (1) |
| Total Dividends | (1) | (446) | (1,542) | (562) |
| Beneficial Interest Transactions ($1.00 per share): | | | | |
| Net proceeds from shares sold: | | | | |
| Institutional Shares | 12,249,844 | 14,494,310 | 69,411,956 | 49,934,745 |
| Investor Shares | 1,309,992 | 1,678,809 | 9,318,248 | 10,365,713 |
| Administrative Shares | 4,394,882 | 5,019,327 | 2,103,860 | 2,395,745 |
| Participant Shares | 688,559 | 1,163,525 | 3,087,091 | 1,832,518 |
| Service Shares | — | — | 36,339 | 3,015 |
| Select Shares | — | — | 46,006 | 63,744 |
| Agency Shares | 106,658 | 122,994 | 37,483 | 41,114 |
| Premier Shares | — | — | 384,613 | 421,004 |
| Dividends reinvested: | | | | |
| Institutional Shares | —a | 57 | 342 | 88 |
| Investor Shares | —a | 3 | 38 | 1 |
| Administrative Shares | —a | 5 | 29 | 1 |
| Participant Shares | —a | 4 | 32 | 1 |
| Service Shares | — | — | —a | —a |
| Agency Shares | — | —a | — | —a |
| Cost of shares redeemed: | | | | |
| Institutional Shares | (11,498,089) | (14,850,094) | (60,809,846) | (54,005,747) |
| Investor Shares | (1,384,843) | (1,715,192) | (8,965,283) | (10,464,335) |
| Administrative Shares | (4,323,871) | (4,954,550) | (1,924,122) | (2,667,965) |
| Participant Shares | (939,334) | (1,392,977) | (2,616,381) | (1,934,704) |
| Service Shares | — | — | (9,591) | (3,104) |
| Select Shares | — | — | (41,310) | (69,446) |
| Agency Shares | (150,808) | (157,470) | (52,966) | (73,609) |
| Premier Shares | — | — | (405,988) | (429,918) |
| Increase (Decrease) in Net Assets from | | | | |
| Beneficial Interest Transactions | 452,990 | (591,249) | 9,600,550 | (4,591,139) |
| Total Increase (Decrease) In Net Assets | 452,942 | (591,266) | 9,600,555 | (4,591,148) |
| Net Assets ($): | | | | |
| Beginning of Period | 4,442,000 | 5,033,266 | 10,722,320 | 15,313,468 |
| End of Period | 4,894,942 | 4,442,000 | 20,322,875 | 10,722,320 |
| |
| a Amount represents less than $1,000. | | | | |
| See notes to financial statements. | | | | |
The Funds 59
STATEMENT OF CHANGES IN NET ASSETS (continued)
(amounts in thousands)
| | | | | | | | | |
| | Dreyfus Treasury | Dreyfus Municipal |
| | Prime Cash Management | Cash Management Plus |
| | Year Ended January 31, | Year Ended January 31, |
| | 2012 | 2011 | 2012 | 2011 |
| Operations ($): | | | | |
| Investment income—net | 8 | 15 | 116 | 725 |
| Net realized gain (loss) on investments | (251) | 58 | — | (10) |
| Net Increase (Decrease) in Net Assets | | | | |
| Resulting from Operations | (243) | 73 | 116 | 715 |
| Dividends to Shareholders from ($): | | | | |
| Investment income—net: | | | | |
| Institutional Shares | (46) | (78) | (100) | (552) |
| Investor Shares | (10) | (20) | —a | (1) |
| Administrative Shares | (3) | (6) | (16) | (175) |
| Participant Shares | (7) | (13) | —a | —a |
| Agency Shares | —a | —a | —a | —a |
| Total Dividends | (66) | (117) | (116) | (728) |
| Beneficial Interest Transactions ($1.00 per share): | | | | |
| Net proceeds from shares sold: | | | | |
| Institutional Shares | 64,662,447 | 55,449,345 | 1,287,413 | 2,409,687 |
| Investor Shares | 16,084,217 | 9,217,693 | 428,316 | 453,364 |
| Administrative Shares | 3,489,224 | 3,143,989 | 709,023 | 812,902 |
| Participant Shares | 12,420,251 | 10,611,292 | 44,217 | 52,866 |
| Agency Shares | 156,869 | 117,080 | —a | —a |
| Dividends reinvested: | | | | |
| Institutional Shares | 12 | 24 | 66 | 391 |
| Investor Shares | 5 | 10 | —a | 1 |
| Administrative Shares | 1 | 3 | 15 | 172 |
| Participant Shares | 5 | 10 | —a | —a |
| Agency Shares | —a | —a | —a | —a |
| Cost of shares redeemed: | | | | |
| Institutional Shares | (60,789,778) | (59,184,393) | (1,303,879) | (2,407,108) |
| Investor Shares | (15,148,673) | (10,224,890) | (430,017) | (595,260) |
| Administrative Shares | (3,933,307) | (3,361,742) | (872,745) | (1,018,138) |
| Participant Shares | (11,717,225) | (11,046,691) | (41,746) | (53,364) |
| Agency Shares | (157,506) | (477,114) | — | (1,131) |
| Increase (Decrease) in Net Assets from | | | | |
| Beneficial Interest Transactions | 5,066,542 | (5,755,384) | (179,337) | (345,618) |
| Total Increase (Decrease) In Net Assets | 5,066,233 | (5,755,428) | (179,337) | (345,631) |
| Net Assets ($): | | | | |
| Beginning of Period | 21,469,182 | 27,224,610 | 1,020,760 | 1,366,391 |
| End of Period | 26,535,415 | 21,469,182 | 841,423 | 1,020,760 |
| |
| a Amount represents less than $1,000. | | | | |
| See notes to financial statements. | | | | |
60
| | | | | | | | | |
| | Dreyfus New York Municipal | Dreyfus Tax Exempt |
| | Cash Management | Cash Management |
| | Year Ended January 31, | Year Ended January 31, |
| | 2012 | 2011 | 2012 | 2011 |
| Operations ($): | | | | |
| Investment income—net | 152 | 630 | 680 | 2,768 |
| Net realized gain (loss) on investments | — | 3 | 8 | — |
| Net Increase (Decrease) in Net Assets | | | | |
| Resulting from Operations | 152 | 633 | 688 | 2,768 |
| Dividends to Shareholders from ($): | | | | |
| Investment income—net: | | | | |
| Institutional Shares | (152) | (633) | (687) | (3,027) |
| Investor Shares | (1) | (10) | (2) | (34) |
| Administrative Shares | (2) | (18) | (2) | (20) |
| Participant Shares | —a | —a | —a | (2) |
| Agency Shares | — | —a | —a,b | —a |
| Total Dividends | (155) | (661) | (691) | (3,083) |
| Beneficial Interest Transactions ($1.00 per share): | | | | |
| Net proceeds from shares sold: | | | | |
| Institutional Shares | 546,920 | 958,580 | 8,627,380 | 13,739,366 |
| Investor Shares | 431,943 | 588,954 | 529,699 | 582,597 |
| Administrative Shares | 28,998 | 70,541 | 105,246 | 121,922 |
| Participant Shares | 39,049 | 49,114 | 87,588 | 85,284 |
| Agency Shares | — | — | 417b | 514 |
| Dividends reinvested: | | | | |
| Institutional Shares | 39 | 155 | 262 | 1,294 |
| Investor Shares | 1 | 9 | 1 | 20 |
| Administrative Shares | 2 | 17 | 2 | 16 |
| Participant Shares | —a | —a | —a | —a |
| Agency Shares | — | —a | —b | —a |
| Cost of shares redeemed: | | | | |
| Institutional Shares | (686,027) | (1,088,380) | (9,376,532) | (14,292,820) |
| Investor Shares | (464,579) | (571,590) | (494,321) | (592,198) |
| Administrative Shares | (54,912) | (92,849) | (102,001) | (169,657) |
| Participant Shares | (50,235) | (39,529) | (69,254) | (103,434) |
| Agency Shares | — | — | (461)b | (7,517) |
| Increase (Decrease) in Net Assets from | | | | |
| Beneficial Interest Transactions | (208,801) | (124,978) | (691,974) | (634,613) |
| Total Increase (Decrease) In Net Assets | (208,804) | (125,006) | (691,977) | (634,928) |
| Net Assets ($): | | | | |
| Beginning of Period | 827,726 | 952,732 | 3,256,248 | 3,891,176 |
| End of Period | 618,922 | 827,726 | 2,564,271 | 3,256,248 |
| |
| a Amount represents less than $1,000. |
| b Effective December 8, 2011, Dreyfus Tax Exempt Cash Management had terminated its Agency Shares. |
See notes to financial statements.
The Funds 61
STATEMENT OF CHANGES IN NET ASSETS (continued)
(amounts in thousands)
| | | | | | | | | |
| | Dreyfus California AMT-Free | Dreyfus New York AMT-Free |
| | Municipal Cash Management | Municipal Cash Management |
| | Year Ended January 31, | Year Ended January 31, |
| | 2012 | 2011 | 2012 | 2011 |
| Operations ($): | | | | |
| Investment income—net | 97 | 234 | 16 | 157 |
| Net realized gain (loss) on investments | 1 | —a | 2 | — |
| Net Increase (Decrease) in Net Assets | | | | |
| Resulting from Operations | 98 | 234 | 18 | 157 |
| Dividends to Shareholders from ($): | | | | |
| Investment income—net: | | | | |
| Institutional Shares | (97) | (230) | (16) | (158) |
| Investor Shares | —a | —a | —a | (3) |
| Administrative Shares | (1) | (4) | —a | (4) |
| Participant Shares | —a | —a | —a | —a |
| Agency Shares | —a | —a | — | — |
| Classic Shares | — | — | —a | —a |
| Total Dividends | (98) | (234) | (16) | (165) |
| Beneficial Interest Transactions ($1.00 per share): | | | | |
| Net proceeds from shares sold: | | | | |
| Institutional Shares | 271,328 | 494,406 | 181,955 | 167,755 |
| Investor Shares | 518,998 | 80,508 | 165,569 | 136,935 |
| Administrative Shares | 23,002 | 117,701 | 21,288 | 20,770 |
| Participant Shares | 140,330 | 81,166 | — | — |
| Agency Shares | — | — | — | — |
| Classic Shares | — | — | 118,607 | 179,313 |
| Dividends reinvested: | | | | |
| Institutional Shares | 88 | 225 | 12 | 110 |
| Investor Shares | —a | —a | —a | 1 |
| Administrative Shares | 1 | 3 | —a | 3 |
| Participant Shares | —a | —a | — | — |
| Agency Shares | — | —a | — | — |
| Classic Shares | — | — | —a | —a |
| Cost of shares redeemed: | | | | |
| Institutional Shares | (232,587) | (498,235) | (160,271) | (197,638) |
| Investor Shares | (371,657) | (88,138) | (167,059) | (160,329) |
| Administrative Shares | (34,592) | (108,325) | (16,575) | (20,958) |
| Participant Shares | (126,459) | (89,455) | — | — |
| Agency Shares | — | — | — | — |
| Classic Shares | — | — | (127,569) | (229,658) |
| Increase (Decrease) in Net Assets from | | | | |
| Beneficial Interest Transactions | 188,452 | (10,144) | 15,957 | (103,696) |
| Settlement payment from unaffiliated third party† | — | — | — | 36 |
| Total Increase (Decrease) In Net Assets | 188,452 | (10,144) | 15,959 | (103,668) |
| Net Assets ($): | | | | |
| Beginning of Period | 252,798 | 262,942 | 147,868 | 251,536 |
| End of Period | 441,250 | 252,798 | 163,827 | 147,868 |
| | |
| † | See Note 5. |
| a | Amount represents less than $1,000. |
See notes to financial statements.
62
FINANCIAL HIGHLIGHTS (Unaudited)
The following tables describe the performance for each share class of each fund for the fiscal periods indicated.All information reflects financial results for a single fund share.Total return shows how much your investment in each fund would have increased (or decreased) during each period, assuming you had reinvested all dividends and distributions.These figures have been derived from the funds’ financial statements. Please note that the financial highlights information in the following tables for Dreyfus NewYork AMT-Free Municipal Cash Management’s Institutional, Investor and Classic shares represents the financial highlights of Dreyfus New York AMT-Free Municipal Cash Management’s predecessor, BNY Hamilton New York AMT-Free Municipal Money Fund (New York AMT-Free Municipal Money Fund), before Dreyfus New York AMT-Free Municipal Cash Management commenced operations as of the close of business on September 12, 2008, and represents the performance of Dreyfus NewYork AMT-Free Municipal Cash Management’s Institutional, Investor and Classic shares thereafter. Before Dreyfus NewYork AMT-Free Municipal Cash Management commenced operations, all of the assets of the New York AMT-Free Municipal Money Fund were transferred to Dreyfus New York AMT-Free Municipal Cash Management in exchange for Institutional, Investor and Classic shares of the fund in a tax-free reorganization.Total return shows how much your investment in Dreyfus NewYork AMT-Free Municipal Cash Management would have increased (or decreased) during each period, assuming you had reinvested all dividends and distributions.These figures have been derived from Dreyfus NewYork AMT-Free Municipal Cash Management’s predecessor’s financial statements.
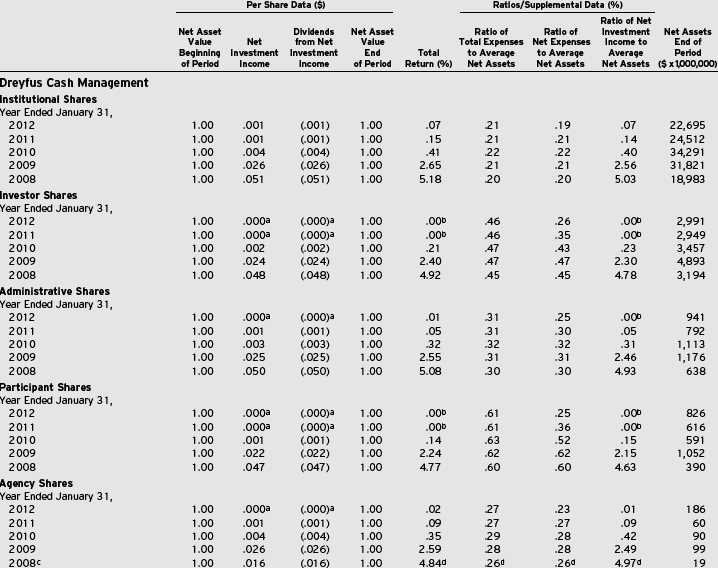
| | |
| a | Amount represents less than $.001 per share. |
| b | Amount represents less than .01%. |
| c | From October 1, 2007 (commencement of initial offering) to January 31, 2008. |
| d | Annualized. |
See notes to financial statements.
The Funds 63
FINANCIAL HIGHLIGHTS (continued)

| | |
| a | Amount represents less than $.001 per share. |
| b | Amount represents less than .01%. |
| c | From October 1, 2007 (commencement of initial offering) to January 31, 2008. |
| d | Annualized. |
See notes to financial statements.
64
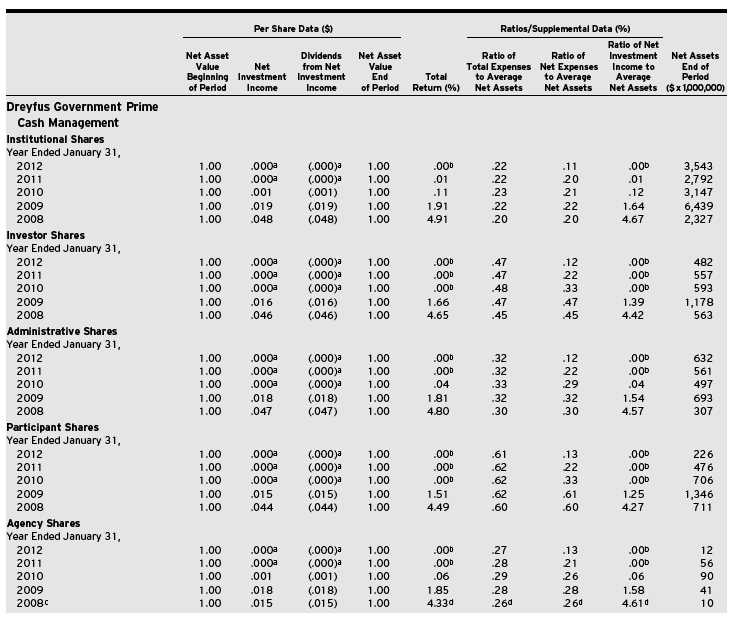
| | |
| a | Amount represents less than $.001 per share. |
| b | Amount represents less than .01%. |
| c | From October 1, 2007 (commencement of initial offering) to January 31, 2008. |
| d | Annualized. |
See notes to financial statements.
The Funds 65
FINANCIAL HIGHLIGHTS (continued)

| | |
| a | Amount represents less than $.001 per share. |
| b | Amount represents less than .01%. |
| c | From June 29, 2007 (commencement of initial offering) to January 31, 2008. |
| d | Annualized. |
| e | From October 1, 2007 (commencement of initial offering) to January 31, 2008. |
| f | Amount represents less than $1 million. |
See notes to financial statements.
66
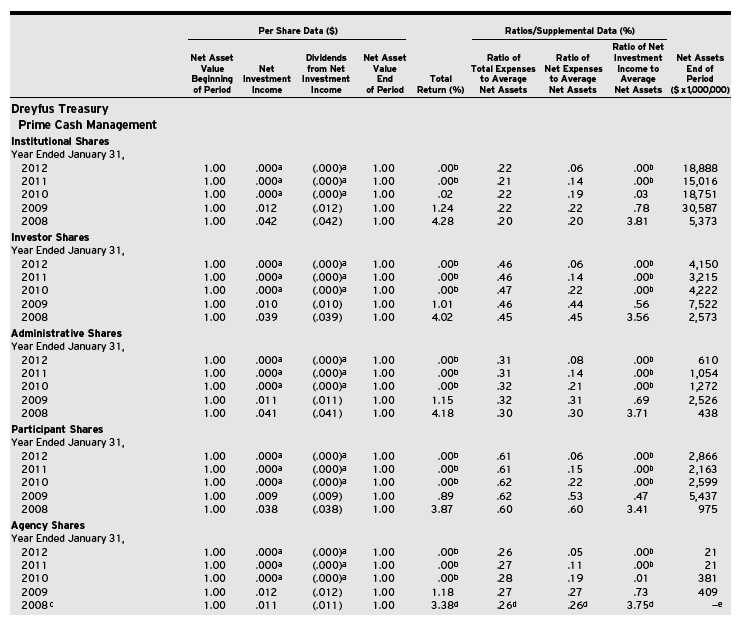
| | |
| a | Amount represents less than $.001 per share. |
| b | Amount represents less than .01%. |
| c | From October 1, 2007 (commencement of initial offering) to January 31, 2008. |
| d | Annualized. |
| e | Amount represents less than $1 million. |
See notes to financial statements.
The Funds 67
FINANCIAL HIGHLIGHTS (continued)

| | |
| a | Amount represents less than $.001 per share. |
| b | Amount represents less than .01%. |
| c | Amount represents less than $1 million. |
| d | From October 1, 2007 (commencement of initial offering) to January 31, 2008. |
| e | Annualized. |
See notes to financial statements.
68
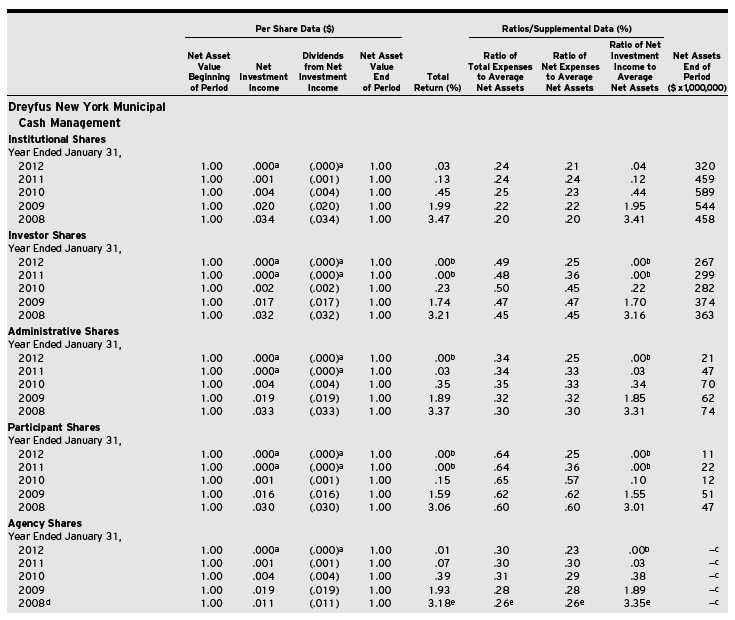
| | |
| a | Amount represents less than $.001 per share. |
| b | Amount represents less than .01%. |
| c | Amount represents less than $1 million. |
| d | From October 1, 2007 (commencement of initial offering) to January 31, 2008. |
| e | Annualized. |
See notes to financial statements.
The Funds 69
FINANCIAL HIGHLIGHTS (continued)

| | |
| a | Amount represents less than $.001 per share. |
| b | Amount represents less than .01%. |
See notes to financial statements.
70
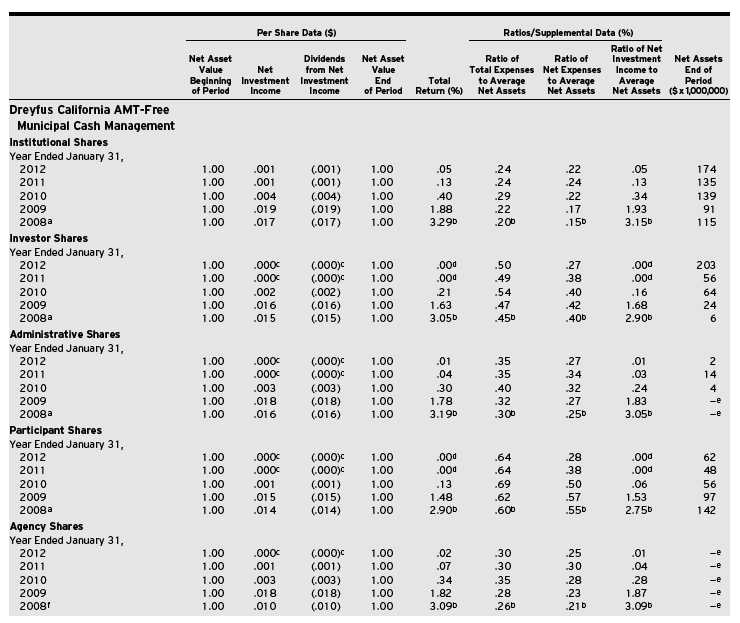
| | |
| a | From August 1, 2007 (commencement of operations) to January 31, 2008. |
| b | Annualized. |
| c | Amount represents less than $.001 per share. |
| d | Amount represents less than .01%. |
| e | Amount represents less than $1 million. |
| f | From October 1, 2007 (commencement of initial offering) to January 31, 2008. |
See notes to financial statements.
The Funds 71
FINANCIAL HIGHLIGHTS (continued)

72
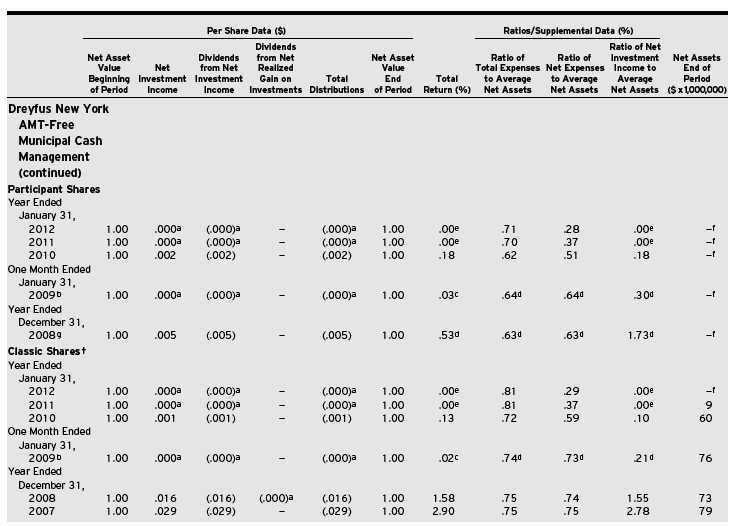
| |
| † Represents information for the fund’s predecessor, BNY Hamilton NewYork AMT-Free Money Market Fund through September 12, 2008. |
| a Amount represents less than $.001 per share. |
| b The fund has changed its fiscal year end from December 31 to January 31. |
| c Not annualized. |
| d Annualized. |
| e Amount represents less than .01%. |
| f Amount represents less than $1 million. |
| g From September 13, 2008 (commencement of initial offering) to December 31, 2008. |
See notes to financial statements.
The Funds 73
NOTES TO FINANCIAL STATEMENTS
NOTE 1—Significant Accounting Policies:
Dreyfus Cash Management, Dreyfus Government Cash Management, Dreyfus Government Prime Cash Management, Dreyfus Treasury & Agency Cash Management, Dreyfus Treasury Prime Cash Management, Dreyfus Municipal Cash Management Plus, Dreyfus New York Municipal Cash Management, Dreyfus Tax Exempt Cash Management, Dreyfus California AMT-Free Municipal Cash Management and Dreyfus New York AMT-Free Municipal Cash Management (each, a “fund” and collectively, the “funds”) are open-end management investment companies registered under the Investment Company Act of 1940, as amended (the Act). Each fund, other than Dreyfus New York Municipal Cash Management, Dreyfus California AMT-Free Municipal Cash Management and Dreyfus New York AMT-Free Municipal Cash Management is diversified. Dreyfus New York Municipal Cash Management, Dreyfus California AMT-Free Municipal Cash Management and Dreyfus New York AMT-Free Municipal Cash Management are non-diversified. Dreyfus Government Cash Management and Dreyfus Government Prime Cash Management are each a separate series of Dreyfus Government Cash Management Funds (the “Company”) and Dreyfus Tax Exempt Cash Management, Dreyfus California AMT-Free Municipal Cash Management and Dreyfus New York AMT-Free Municipal Cash Management are separate series of Dreyfus Tax Exempt Cash Management Funds (the “Trust”). Each fund’s investment objective is to provide investors with as high a level of current income as is consistent with the preservation of capital and the maintenance of liquidity and, in the case of Dreyfus Municipal Cash Management Plus and Dreyfus Tax Exempt Cash Management only, which are exempt from federal income tax; in the case of Dreyfus New York Municipal Cash Management and Dreyfus New York AMT-Free Municipal Cash Management, which is exempt from federal, NewYork state and New York city personal income taxes, and in the case of Dreyfus California AMT-Free Municipal Cash Management only, which is exempt from federal and California state personal income taxes. The Dreyfus Corporation (the “Manager” or “Dreyfus”), a wholly-owned subsidiary of The Bank of New York Mellon Corporation (“BNY Mellon”), serves as each fund’s investment adviser.
As of the close of business on August 25, 2011, pursuant to an Agreement and Plan of Reorganization previously approved by Dreyfus Cash Management’s Board of Trustees, all of the assets, subject to the liabilities, of Dreyfus Cash Management Plus were transferred to Dreyfus Cash Management. Shareholders of Dreyfus Cash Management Plus received Institutional Shares, Investor Shares, Administrative Shares, Participant Shares and Agency Shares of Dreyfus Cash Management, in an amount equal to the aggregate net asset value of their investment in Dreyfus Cash Management Plus at the time of the exchange. The net asset value of Dreyfus Cash Management’s shares at the close of business on August 25, 2011, after the reorganization, was $1.00 per share, and a total of 3,379,940,833 Institutional Shares, 139,359,013 Investor Shares, 373,101,182 Administrative Shares, 172,390,108 Participant Shares and 1,046 Agency Shares representing net assets of $4,064,792,182, were issued to Dreyfus Cash Management Plus shareholders in the exchange. The exchange was a tax-free event to shareholders.
The net assets immediately before the acquisition were as follows:
| | |
| | Net Assets ($) |
| Dreyfus Cash Management | |
| Plus—Target Fund | 4,064,792,182 |
| Dreyfus Cash Management— | |
| Acquiring Fund | 25,256,415,404 |
| Total | 29,321,207,586 |
Assuming the acquisition had been completed on February 1, 2011, the acquiring fund’s pro forma results in the Statement of Operations during the period ended January 31, 2012 were as follows:
| | | |
| Net investment income (loss) | $ | 19,175,1861 |
| |
| Net realized and unrealized | | |
| gain (loss) on investments | | 1,156,1562 |
| |
| Net increase (decrease) in net assets | | |
| resulting from operations | $ | 20,331,342 |
| | |
| 1 | $17,380,709 as reported in the Statement of Operations plus $1,794,477 |
| | Dreyfus Cash Management Plus pre-merger. |
| 2 | $4,907 as reported in the Statement of Operations plus $1,151,249 Dreyfus |
| | Cash Management Plus pre-merger. |
74
Because the combined funds have been managed as a single integrated fund since the acquisition was completed, it is not practicable to separate the amounts of revenue and earnings of Dreyfus Cash Management Plus that have been included in Dreyfus Cash Management’s Statement of Operations since August 25, 2011.
At the Board meeting held on December 7, 2011, the Board ofTrustees approved, effective December 8, 2011, the termination of Dreyfus Tax Exempt Cash Management’s Agency Shares. On December 8, 2011, no Agency Shares of the fund were outstanding.
MBSC Securities Corporation (the “Distributor”), a wholly-owned subsidiary of the Manager, is the distributor of the funds’ shares, which are sold to the public without a sales charge. Each fund offers Institutional Shares, Investor Shares, Administrative Shares, Participant Shares and Agency Shares (with the exception of Dreyfus Tax Exempt Cash Management and Dreyfus New York AMT-Free Municipal Cash Management which does not offer Agency Shares). In addition, Dreyfus Treasury & Agency Cash Management also offers Service Shares, Select Shares and Premier Shares and Dreyfus NewYork AMT-Free Municipal Cash Management also offers Classic Shares. Each share class, except Institutional Shares, is subject to a Service Plan adopted pursuant to Rule 12b-1 under the act. Other differences between the classes include the services offered (by service agents receiving Rule 12b-1 fees) to and the expenses borne by each class and certain voting rights. Income, expenses (other than expenses attributable to a specific class), and realized and unrealized gains or losses on investments are allocated to each class of shares based on its relative net assets.
As of January 31, 2012, MBC Investments Corp., an indirect subsidiary of BNY Mellon, held the following shares:
| | |
| Dreyfus Municipal Cash | |
| Management Plus, Agency Shares | 1,036 |
| |
| Dreyfus New York Municipal Cash | |
| Management, Agency Shares | 1,034 |
| |
| Dreyfus California AMT-Free Municipal | |
| Cash Management, Agency Shares | 1,032 |
| |
| Dreyfus New York AMT-Free Municipal | |
| Cash Management, Participant Shares | 10,000 |
It is each fund’s policy to maintain a continuous net asset value per share of $1.00; each fund has adopted certain investment, portfolio valuation and dividend and distribution policies to enable it to do so. There is no assurance, however, that any fund will be able to maintain a stable net asset value per share of $1.00.
The Company and the Trust account separately for the assets, liabilities and operations of each series. Expenses directly attributable to each series are charged to that series’ operations; expenses which are applicable to all series are allocated among them on a pro rata basis.
The Financial Accounting Standards Board (“FASB”) Accounting Standards Codification (“ASC”) is the exclusive reference of authoritative U.S. generally accepted accounting principles (“GAAP”) recognized by the FASB to be applied by nongovernmental entities. Rules and interpretive releases of the Securities and Exchange Commission (“SEC”) under authority of federal laws are also sources of authoritative GAAP for SEC registrants. Each fund’s financial statements are prepared in accordance with GAAP, which may require the use of management estimates and assumptions. Actual results could differ from those estimates.
The funds enter into contracts that contain a variety of indemnifications. The funds’ maximum exposure under these arrangements is unknown. The funds do not anticipate recognizing any loss related to these arrangements.
(a) Portfolio valuation: Investments in securities are valued at amortized cost in accordance with Rule 2a-7 of the Act, which has been determined by the Board of Trustees to represent the fair value of each fund’s investments.
The fair value of a financial instrument is the amount that would be received to sell an asset or paid to transfer a liability in an orderly transaction between market participants at the measurement date (i.e. the exit price). GAAP establishes a fair value hierarchy that prioritizes the inputs of valuation techniques used to measure fair value.This hierarchy gives the highest priority to unadjusted quoted prices in active markets for identical assets or liabilities (Level 1 measurements) and the lowest priority to unobservable inputs (Level 3 measurements).
The Funds 75
NOTES TO FINANCIAL STATEMENTS (continued)
Additionally, GAAP provides guidance on determining whether the volume and activity in a market has decreased significantly and whether such a decrease in activity results in transactions that are not orderly. GAAP requires enhanced disclosures around valuation inputs and techniques used during annual and interim periods.
Various inputs are used in determining the value of the each fund’s investments relating to fair value measurements.These inputs are summarized in the three broad levels listed below:
Level 1—unadjusted quoted prices in active markets for identical investments.
Level 2—other significant observable inputs (including quoted prices for similar investments, interest rates, prepayment speeds, credit risk, etc.).
Level 3—significant unobservable inputs (including the funds’ own assumptions in determining the fair value of investments).
The inputs or methodology used for valuing securities are not necessarily an indication of the risk associated with investing in those securities. For example, money market securities are valued using amortized cost, in accordance with rules under the Act. Generally, amortized cost approximates the current fair value of a security, but since the value is not obtained from a quoted price in an active market, such securities are reflected within Level 2 of the fair value hierarchy.
Table 1 summarizes the inputs used as of January 31, 2012 in valuing each fund’s investments.
In May 2011, FASB issued Accounting Standards Update (“ASU”) No. 2011-04 “Amendments to Achieve Common Fair Value Measurement and Disclosure Requirements in GAAP and International Financial Reporting Standards (“IFRS”)” (“ASU 2011-04”). ASU 2011-04 includes common requirements for measurement of and disclosure about fair value between GAAP and IFRS. ASU 2011-04 will require reporting entities to disclose the following information for fair value measurements categorized within Level 3 of the fair value hierarchy: quantitative information about the unobservable inputs used in the fair value measurement, the valuation processes used by the reporting entity and a narrative description of the sensitivity of the fair value measurement to changes in unobservable inputs and the interrelationships between those unobservable inputs. In addition,ASU 2011-04 will require reporting entities to make disclosures about amounts and reasons for all transfers in and out of Level 1 and Level 2 fair value measurements.The new and revised disclosures are effective for interim and annual reporting periods beginning after December 15, 2011.At this time, management is evaluating the implications of ASU 2011-04 and its impact on the financial statements.
| | | | | |
| Table 1—Fair Value Measurements | | | | |
| |
| | | Short-Term Investments ($)† | |
| | Level 1—Unadjusted | Level 2—Other Significant | Level 3—Significant | |
| | Quoted Prices | Observable Inputs | Unobservable Inputs | Total |
| Dreyfus Cash Management | — | 27,626,670,421 | — | 27,626,670,421 |
| Dreyfus Government Cash Management | — | 21,068,023,841 | — | 21,068,023,841 |
| Dreyfus Government Prime Cash Management | — | 4,870,230,921 | — | 4,870,230,921 |
| Dreyfus Treasury & Agency Cash Management | — | 20,274,093,969 | — | 20,274,093,969 |
| Dreyfus Treasury Prime Cash Management | — | 27,164,640,329 | — | 27,164,640,329 |
| Dreyfus Municipal Cash Management Plus | — | 841,497,861 | — | 841,497,861 |
| Dreyfus New York Municipal Cash Management | — | 614,996,687 | — | 614,996,687 |
| Dreyfus Tax Exempt Cash Management | — | 2,569,927,838 | — | 2,569,927,838 |
| Dreyfus California AMT—Free Municipal Cash Management | — | 428,022,592 | — | 428,022,592 |
| Dreyfus New York AMT—Free Municipal Cash Management | — | 166,426,590 | — | 166,426,590 |
† See Statements of Investments for additional detailed categorizations.
76
(b) Securities transactions and investment income:
Securities transactions are recorded on a trade date basis. Realized gains and losses from securities transactions are recorded on the identified cost basis. Interest income, adjusted for accretion of discount and amortization of premium on investments, is earned from settlement date and recognized on the accrual basis. Cost of investments represents amortized cost.
Dreyfus New York Municipal Cash Management, Dreyfus California AMT-Free Municipal Cash Management and Dreyfus NewYork AMT-Free Municipal Cash Management follow an investment policy of investing primarily in municipal obligations of one state. Economic changes affecting the state and certain of its public bodies and municipalities may affect the ability of issuers within the state to pay interest on, or repay principal of, municipal obligations held by the fund.
(c) Repurchase Agreements: Dreyfus Cash Management, Dreyfus Government Cash Management and Dreyfus Treasury & Agency Cash Management may enter into repurchase agreements with financial institutions, deemed to be creditworthy by the Manager, subject to the seller’s agreement to repurchase and the fund’s agreement to resell such securities at a mutually agreed upon price. Securities purchased subject to repurchase agreements are deposited with the funds’ custodian and, pursuant to the terms of the repurchase agreement, must have an aggregate market value greater than or equal to the repurchase price plus accrued interest at all times. If the value of the underlying securities falls below the value of the repurchase price plus accrued interest, each fund will require the seller to deposit additional collateral by the next business day. If the request for additional collateral is not met, or the seller defaults on its repurchase obligation, each fund maintains its right to sell the underlying securities at market value and may claim any resulting loss against the seller.
(d) Dividends to shareholders: It is the policy of each fund to declare dividends from investment income-net, if any, on each business day. Such dividends, if any, are paid monthly. Dividends from net realized capital gains, if any, are normally declared and paid annually, but each fund may make distributions on a more frequent basis to comply with the distri-
bution requirements of the Internal Revenue Code of 1986, as amended (the “Code”). To the extent that net realized capital gains can be offset by capital loss carryovers, it is the policy of each fund not to distribute such gains.
(e) Federal income taxes: It is the policy of Dreyfus Cash Management, Dreyfus Government Cash Management, Dreyfus Government Prime Cash Management, Dreyfus Treasury & Agency Cash Management and Dreyfus Treasury Prime Cash Management to continue to qualify as a regulated investment company if such qualification is in the best interests of its shareholders, by complying with the applicable provisions of the Code and to make distributions of taxable income sufficient to relieve it from substantially all federal income and excise taxes.
It is the policy of Dreyfus Municipal Cash Management Plus, Dreyfus New York Municipal Cash Management, Dreyfus Tax Exempt Cash Management, Dreyfus California AMT-Free Municipal Cash Management and Dreyfus New York AMT-Free Municipal Cash Management to continue to qualify as a regulated investment company, which can distribute tax exempt dividends, by complying with the applicable provisions of the Code and to make distributions of income and net realized capital gain sufficient to relieve it from substantially all federal income and excise taxes.
As of and during the period ended January 31, 2012, the funds did not have any liabilities for any uncertain tax positions. The funds recognize interest and penalties, if any, related to uncertain tax positions as income tax expense in the Statements of Operations. During the period, the funds did not incur any interest or penalties.
Each of the tax years in the four-year period ended January 31, 2012 remains subject to examination by the Internal Revenue Service and state taxing authorities.
At January 31, 2012, the components of accumulated earnings on a tax basis were substantially the same as for financial reporting purposes. Dreyfus Cash Management and Dreyfus Tax Exempt Cash Management had $16,552 and $2,622, respectively, of capital losses realized after October 31, 2011, which were deferred for tax purposes to the first day of the following fiscal year.
The Funds 77
NOTES TO FINANCIAL STATEMENTS (continued)
Under the Regulated Investment Company Modernization Act of 2010 (the “2010 Act”), the fund will be permitted to carry forward capital losses incurred in taxable years beginning after December 22, 2010 (“post-enactment losses”) for an unlimited period. Furthermore, post-enactment capital loss carryovers will retain their character as either short-term or long-term capital losses rather than short-term as they were under previous statute.The 2010 Act requires post-enactment losses to be utilized before the utilization of losses incurred in taxable years prior to the effective date of the 2010 Act (“pre-enactment losses”). As a result of this ordering rule, pre-enactment losses may be more likely to expire unused.
Table 2 summarizes each relevant fund’s accumulated capital loss carryover available for federal income tax purposes to be applied against future net securities profits, if any, realized subsequent to January 31, 2012.
The tax character of distributions paid to shareholders for each fund (except for Dreyfus Municipal Cash Management
Plus, Dreyfus New York Municipal Cash Management, Dreyfus Tax Exempt Cash Management, Dreyfus California AMT-Free Municipal Cash Management and Dreyfus New York AMT-Free Municipal Cash Management) during the fiscal periods ended January 31, 2012 and January 31, 2011 were all ordinary income.
Table 3 summarizes the tax character of distributions paid to shareholders of Dreyfus Municipal Cash Management Plus, Dreyfus New York Municipal Cash Management, Dreyfus Tax Exempt Cash Management, Dreyfus California AMT-Free Municipal Cash Management and Dreyfus New York AMT-Free Municipal Cash Management during the fiscal periods ended January 31, 2012 and January 31, 2011.
During the period ended January 31, 2012, as a result of permanent book to tax differences, primarily due to the tax treatment for dividend reclassification, Dreyfus Cash Management increased accumulated undistributed investment income-net by $139,261 and decreased accumulated
| | | | | | | | |
| Table 2—Capital Loss Carryover | | | | | | |
| |
| | | | | ($ x 1,000) | |
| | | | | Post-Enactment | |
| | | | | 2019† | Losses†† | Total |
| Dreyfus Municipal Cash Management Plus | | | | 10 | — | 10 |
| Dreyfus Government Prime Cash Management | | | | — | 48 | 48 |
| Dreyfus Treasury Prime Cash Management | | | | — | 251 | 251 |
| |
| † If not applied, the carryovers expire in the above years. | | | | | | |
| †† Post-enactment short-term capital losses that can be carried forward for an unlimited period. | | | | | | |
| |
| |
| Table 3—Tax Character of Distributions Paid | | | | | | |
| |
| Tax Character of Distributions Paid ($ x 1,000) | | 2012 | | | 2011 | |
| | | | Long-Term | | | Long-Term |
| | Tax-Exempt | Ordinary | Capital | Tax-Exempt | Ordinary | Capital |
| | Income | Income | Gains | Income | Income | Gains |
| Dreyfus Municipal Cash Management Plus | 116 | — | — | 726 | — | 2 |
| Dreyfus New York Municipal Cash Management | 152 | — | 3 | 630 | 31 | — |
| Dreyfus Tax Exempt Cash Management | 680 | — | 11 | 2,768 | 170 | 145 |
| Dreyfus California AMT-Free Municipal Cash Management | 97 | 1 | — | 234 | — | — |
| Dreyfus New York AMT-Free Municipal Cash Management | 16 | —† | — | 157 | 8 | — |
† Amount represents less than $1,000.
78
net realized gain (loss) on investments by the same amount. Net assets and net asset value per share were not affected by this reclassification.
During the period ended January 31, 2012, as a result of permanent book to tax differences, primarily due to the tax treatment for dividend reclassification, Dreyfus Government Cash Management increased accumulated undistributed investment income-net by $1,740 and decreased accumulated net realized gain (loss) on investments by the same amount. Net assets and net asset value per share were not affected by this reclassification.
During the period ended January 31, 2012, as a result of permanent book to tax differences, primarily due to the tax treatment for dividend reclassification, Dreyfus Treasury & Agency Cash Management increased accumulated undistributed investment income-net by $186,907 and decreased accumulated net realized gain (loss) on investments by the same amount. Net assets and net asset value per share were not affected by this reclassification.
During the period ended January 31, 2012, as a result of permanent book to tax differences, primarily due to the tax treatment for dividend reclassification, Dreyfus Treasury Prime Cash Management increased accumulated undistributed investment income-net by $57,867 and decreased accumulated net realized gain (loss) on investments by the same amount. Net assets and net asset value per share were not affected by this reclassification.
During the period ended January 31, 2012, as a result of permanent book to tax differences, primarily due to the tax treatment for dividend reclassification, Dreyfus New York Municipal Cash Management increased accumulated undistributed investment income-net by $2,632 and decreased accumulated net realized gain (loss) on investments by the same amount. Net assets and net asset value per share were not affected by this reclassification.
During the period ended January 31, 2012, as a result of permanent book to tax differences, primarily due to the tax
treatment for dividend reclassification, Dreyfus Tax Exempt Cash Management increased accumulated undistributed investment income-net by $10,774 and decreased accumulated net realized gain (loss) on investments by the same amount. Net assets and net asset value per share were not affected by this reclassification.
During the period ended January 31, 2012, as a result of permanent book to tax differences, primarily due to the tax treatment for dividend reclassification, Dreyfus California AMT-Free Municipal Cash Management increased accumulated undistributed investment income-net by $516 and decreased accumulated net realized gain (loss) on investments by the same amount. Net assets and net asset value per share were not affected by this reclassification.
During the period ended January 31, 2012, as a result of permanent book to tax differences, primarily due to the tax treatment for dividend reclassification, Dreyfus New York AMT-Free Municipal Cash Management increased accumulated undistributed investment income-net by $193 and decreased accumulated net realized gain (loss) on investments by the same amount. Net assets and net asset value per share were not affected by this reclassification.
At January 31, 2012, the cost of investments for federal income tax purposes was substantially the same as the cost for financial reporting purposes (see the Statements of Investments).
NOTE 2—Management Fee and Other Transactions with Affiliates:
(a) Pursuant to separate management agreements with the Manager, the management fee of each fund is computed at the annual rate of .20% of the value of such fund’s average daily net assets and is payable monthly.
The Manager has undertaken to waive receipt of the management fees and/or reimburse operating expenses in order to facilitate a daily yield at or above a certain level which may change from time to time.These undertakings are voluntary
The Funds 79
NOTES TO FINANCIAL STATEMENTS (continued)
and not contractual, and may be terminated at any time. Table 4 summarizes the reduction in expenses for each relevant class of shares of each fund pursuant to these undertakings during the period ended January 31, 2012.
(b) Under each fund’s Service Plan adopted pursuant to Rule 12b-1 under the Act, with respect to each fund’s Investor Shares, Administrative Shares, Participant Shares and Agency Shares (with the exception of Dreyfus New York AMT-Free Municipal Cash Management which does not offer Agency Shares), Dreyfus Treasury & Agency Cash Management’s Service Shares, Select Shares and Premier Shares and Dreyfus New York AMT-Free Municipal Cash Management’s Classic Shares, each fund pays the Distributor for distributing such classes of shares, for advertising and marketing and for providing certain services relating to shareholders of the respective class of shares. These services include answering shareholder inquiries
regarding the fund and providing reports and other information and services related to the maintenance of shareholder accounts (“Servicing”). Under the Service Plan, as to each relevant class, the Distributor may make payments to Service Agents in respect to these services. Generally, the Service Agent may provide holders of Investor, Administrative, Participant, Service, Select, Agency, Premier and Classic Shares a consolidated statement. The Service Agent will generally also provide the holders of Investor, Participant, Service, Select and/or Premier Shares, automated teller check writing privileges and, in the case of Participant, Service, Select or Premier Shares, automated teller machine access, and bill paying services.The amount paid under the Service Plan for Servicing is intended to be a “service fee” as defined under the Conduct Rules of the Financial Industry Regulatory Authority (“FINRA”), and at no time will such amount exceed the maximum amount
Table 4—Expense Reductions
| | | | | | | |
| | | Dreyfus | Dreyfus | Dreyfus | Dreyfus |
| | | Government | Government | Treasury & | Treasury |
| | Dreyfus Cash | Cash | Prime Cash | Agency Cash | Prime Cash |
| | Management | Management | Management | Management | Management |
| Institutional Shares ($) | 4,295,250 | 13,357,335 | 2,934,603 | 15,237,182 | 25,305,318 |
| Investor Shares ($) | 6,254,257 | 6,377,765 | 2,119,560 | 7,394,083 | 15,592,041 |
| Administrative Shares ($) | 523,950 | 1,846,758 | 1,138,634 | 1,168,387 | 1,673,578 |
| Participant Shares ($) | 2,833,789 | 1,747,655 | 1,710,334 | 3,107,093 | 14,169,333 |
| Service Shares ($) | — | — | — | 72,451 | — |
| Select Shares ($) | — | — | — | 155,799 | — |
| Agency Shares ($) | 76,622 | 126,231 | 48,680 | 50,667 | 23,792 |
| Premier Shares ($) | — | — | — | 172,252 | — |
| |
| Table 4. (continued) | | | | | |
| |
| | Dreyfus | Dreyfus | | Dreyfus | Dreyfus |
| | Municipal | New York | Dreyfus | California | New York |
| | Cash | Municipal | Tax Exempt | AMT-Free | AMT-Free |
| | Management | Cash | Cash | Municipal Cash | Municipal Cash |
| | Plus | Management | Management | Management | Management |
| Institutional Shares ($) | 71,516 | 114,878 | 1,025,327 | 29,766 | 55,763 |
| Investor Shares ($) | 587,323 | 612,195 | 845,714 | 286,425 | 131,466 |
| Administrative Shares ($) | 262,964 | 29,001 | 73,769 | 3,784 | 9,364 |
| Participant Shares ($) | 97,731 | 49,319 | 67,244 | 162,308 | 44 |
| Agency Shares ($) | 10 | 1 | 211a | — | — |
| Classic Shares ($) | — | — | — | — | 54,895 |
a Effective December 8, 2011, Dreyfus Tax Exempt Cash Management had terminated its Agency Shares.
80
permitted to be paid under the FINRA Conduct Rules as a service fee. The fees payable under the Service Plan are payable without regard to actual expenses incurred.
Table 5 summarizes the amount each fund was charged pursuant to the Service Plan during the period ended January 31, 2012.
(c) Each fund has adopted a Shareholder Services Plan (the “Plan”), with respect to their Institutional Shares. Each fund reimburses the Distributor an amount not to exceed an annu-
Table 5—12b-1 Service Plan Fees
al rate of .25% of the value of the fund’s average daily net assets attributable to Institutional Shares for certain allocated expenses of providing personal services and/or maintaining shareholder accounts.The services provided may include personal services relating to shareholder accounts, such as answering shareholder inquiries regarding the fund, providing reports and other information and services related to the maintenance of shareholder accounts. Table 6 summarizes the amount each fund’s Institutional Shares were charged pursuant to the Plan during the period ended January 31, 2012.
| | | | | | | | | | |
| | Investor | Administrative | Participant | Service | Select | Agency | | Premier | Classic |
| | Shares ($) | Shares ($) | Shares ($) | Shares ($) | Shares ($) | Shares ($) | | Shares ($) | Shares ($) |
| Dreyfus Cash Management | 7,808,169 | 870,139 | 3,199,620 | — | — | 108,206 | | — | — |
| Dreyfus Government Cash Management | 4,876,964 | 1,057,541 | 1,473,271 | — | — | 57,862 | | — | — |
| Dreyfus Government | | | | | | | | | |
| Prime Cash Management | 1,517,704 | 551,276 | 1,407,425 | — | — | 20,866 | | — | — |
| Dreyfus Treasury & Agency | | | | | | | | | |
| Cash Management | 5,045,611 | 517,722 | 2,369,414 | 56,779 | 135,704 | 17,748 | | 127,662 | — |
| Dreyfus Treasury | | | | | | | | | |
| Prime Cash Management | 9,662,689 | 732,365 | 10,294,428 | — | — | 6,836 | | — | — |
| Dreyfus Municipal | | | | | | | | | |
| Cash Management Plus | 622,348 | 333,204 | 100,225 | — | — | 9 | | — | — |
| Dreyfus New York | | | | | | | | | |
| Municipal Cash Management | 634,186 | 35,617 | 52,305 | — | — | 1 | | — | — |
| Dreyfus Tax Exempt Cash Management | 850,353 | 71,657 | 64,650 | — | — | 131 | a | — | — |
| Dreyfus California AMT-Free | | | | | | | | | |
| Municipal Cash Management | 318,999 | 6,626 | 182,970 | — | — | 1 | | — | — |
| Dreyfus New York AMT-Free | | | | | | | | | |
| Municipal Cash Management | 117,587 | 6,599 | 40 | — | — | — | | — | 53,494 |
| |
| a Effective December 8, 2011, Dreyfus Tax Exempt Cash Management had terminated its Agency Shares. | | | | | | |
| |
| Table 6—Shareholder Services Plan Fees | | | | | | | | | |
| |
| | | | | | Institutional | | | | |
| | | | | | Shares ($) | | | | |
| Dreyfus Cash Management | | | | | 427,766 | | | | |
| Dreyfus Government Cash Management | | | | | 85,505 | | | | |
| Dreyfus Government Prime Cash Management | | | | | 60,144 | | | | |
| Dreyfus Treasury & Agency Cash Management | | | | | 433,967 | | | | |
| Dreyfus Treasury Prime Cash Management | | | | | 1,256,139 | | | | |
| Dreyfus Municipal Cash Management Plus | | | | | 14,016 | | | | |
| Dreyfus New York Municipal Cash Management | | | | | 7,475 | | | | |
| Dreyfus Tax Exempt Cash Management | | | | | 594,050 | | | | |
| Dreyfus California AMT-Free Municipal Cash Management | | | | 4,660 | | | | |
| Dreyfus New York AMT-Free Municipal Cash Management | | | | 1,864 | | | | |
The Funds 81
NOTES TO FINANCIAL STATEMENTS (continued)
Each fund compensates Dreyfus Transfer, Inc., a wholly-owned subsidiary of the Manager, under a transfer agency agreement for providing personnel and facilities to perform transfer agency services for the funds. Table 7 summarizes the amount each fund was charged during the period ended January 31, 2012, pursuant to the transfer agency agreement, which is included in Shareholder servicing costs in the Statements of Operations.
Each fund has an arrangement with the custodian and cash management bank whereby the funds may receive earnings credits when positive cash balances are maintained, which are used to offset custody and cash management fees. For
financial reporting purposes, the funds include net earnings credits as an expense offset in the Statements of Operations.
Each fund compensates The Bank of New York Mellon, a subsidiary of BNY Mellon and an affiliate of Dreyfus, under a cash management agreement for performing cash management services related to fund subscriptions and redemptions. Table 8 summarizes the amount each fund was charged during the period ended January 31, 2012, pursuant to the cash management agreement, which is included in Shareholder servicing costs in the Statements of Operations. These fees were partially offset by earnings credits pursuant to the cash management agreement, also summarized in Table 8.
| | | | |
| Table 7—Transfer Agency Agreement Fees | | |
| |
| | Transfer Agency | |
| | Fees ($) | |
| Dreyfus Cash Management | 85,756 | |
| Dreyfus Government Cash Management | 120,404 | |
| Dreyfus Government Prime Cash Management | 89,414 | |
| Dreyfus Treasury & Agency Cash Management | 57,596 | |
| Dreyfus Treasury Prime Cash Management | 359,925 | |
| Dreyfus Municipal Cash Management Plus | 5,517 | |
| Dreyfus New York Municipal Cash Management | 7,467 | |
| Dreyfus Tax Exempt Cash Management | 16,888 | |
| Dreyfus California AMT-Free Municipal Cash Management | 2,333 | |
| Dreyfus New York AMT-Free Municipal Cash Management | 3,369 | |
| |
| |
| |
| Table 8—Cash Management Agreement Fees | | |
| |
| | Cash Management | |
| | Fees ($) | Earnings Credits ($) |
| Dreyfus Cash Management | 5,778 | (121) |
| Dreyfus Government Cash Management | 9,553 | (215) |
| Dreyfus Government Prime Cash Management | 7,206 | (165) |
| Dreyfus Treasury & Agency Cash Management | 4,716 | (111) |
| Dreyfus Treasury Prime Cash Management | 33,674 | (553) |
| Dreyfus Municipal Cash Management Plus | 189 | (4) |
| Dreyfus New York Municipal Cash Management | 508 | (12) |
| Dreyfus Tax Exempt Cash Management | 874 | (21) |
| Dreyfus California AMT-Free Municipal Cash Management | 57 | (1) |
| Dreyfus New York AMT-Free Municipal Cash Management | 205 | (5) |
82
Each fund also compensates The Bank of NewYork Mellon under a custody agreement for providing custodial services for each fund. These fees were partially offset by earnings credits pursuant to the custody agreement for each relevant fund, also summarized in Table 9.
During the period ended January 31, 2012, each fund was charged $6,590 for services performed by the Chief Compliance Officer.
Table 10 summarizes the components of “Due to The Dreyfus Corporation and affiliates” in the Statements of Assets and Liabilities for each fund.
(d) Each Board member also serves as a Board member of other funds within the Dreyfus complex. Annual retainer fees are allocated to each fund based on net assets, and each fund pays its Board members an attendance fee of $500 per meeting.
| | | | | | | | |
| Table 9—Custody Agreement Fees | | | | | | |
| |
| | | | | Custody | | |
| | | | | Fees ($) | Earnings Credits ($) |
| Dreyfus Cash Management | | | | 904,403 | | (49,289) |
| Dreyfus Government Cash Management | | | | 641,959 | | (8,761) |
| Dreyfus Government Prime Cash Management | | | | 174,431 | | (755) |
| Dreyfus Treasury & Agency Cash Management | | | | 475,049 | | (600) |
| Dreyfus Treasury Prime Cash Management | | | | 625,711 | | (3,952) |
| Dreyfus Municipal Cash Management Plus | | | | 70,187 | | — |
| Dreyfus New York Municipal Cash Management | | | | 56,497 | | — |
| Dreyfus Tax Exempt Cash Management | | | | 130,801 | | — |
| Dreyfus California AMT-Free Municipal Cash Management | | | 32,476 | | — |
| Dreyfus New York AMT-Free Municipal Cash Management | | | 19,012 | | — |
| |
| Table 10—Due to The Dreyfus Corporation and Affiliates | | | | | |
| |
| | | Rule 12b-1 | | Chief | | |
| | | Distribution | | Compliance | Transfer | |
| | Management | Plan | Custodian | Officer | Agency | Less Expense |
| | Fees ($) | Fees ($) | Fees ($) | Fees ($) | Fees ($) | Reimbursement ($) |
| Dreyfus Cash Management | 4,696,226 | 1,029,944 | 310,650 | 2,227 | 18,666 | (1,128,383) |
| Dreyfus Government | | | | | | |
| Cash Management | 3,727,128 | 526,173 | 234,757 | 2,227 | 21,550 | (2,803,425) |
| Dreyfus Government | | | | | | |
| Prime Cash Management | 854,326 | 256,813 | 59,988 | 2,227 | 12,007 | (918,198) |
| Dreyfus Treasury & Agency | | | | | | |
| Cash Management | 3,393,621 | 835,914 | 160,154 | 2,227 | 8,696 | (3,281,084) |
| Dreyfus Treasury | | | | | | |
| Prime Cash Management | 4,719,660 | 1,971,043 | 196,117 | 2,227 | 81,723 | (6,459,266) |
| Dreyfus Municipal | | | | | | |
| Cash Management Plus | 145,124 | 83,763 | 22,577 | 2,227 | 2,452 | (147,108) |
| Dreyfus New York | | | | | | |
| Municipal Cash Management | 99,758 | 55,999 | 18,131 | 2,227 | 1,747 | (119,834) |
| Dreyfus Tax Exempt | | | | | | |
| Cash Management | 446,914 | 94,365 | 41,922 | 2,227 | 5,592 | (333,300) |
| Dreyfus California AMT-Free | | | | | | |
| Municipal Cash Management | 76,280 | 65,102 | 12,833 | 2,227 | 851 | (91,497) |
| Dreyfus New York AMT-Free | | | | | | |
| Municipal Cash Management | 26,547 | 11,613 | 5,518 | 2,227 | 1,856 | (33,482) |
The Funds 83
NOTES TO FINANCIAL STATEMENTS (continued)
NOTE 3—Beneficial Interest Transactions:
Each fund is authorized to issue an unlimited number of $.001 par value shares of Beneficial Interest.
NOTE 4—Securities Transactions:
The funds are permitted to purchase or sell securities from or to certain affiliated funds under specified conditions outlined in procedures adopted by the Board of Trustees.The procedures have been designed to ensure that any purchase or sale of securities by the funds from or to another fund or portfolio that are, or could be, considered an affiliate by virtue of having a common investment adviser (or affiliated investment adviser), common Trustees and/or common officers, complies with Rule 17a-7 of the Act. Table 11
summarizes the amounts of purchases and sales of securities engaged in by each relevant fund pursuant to Rule 17a-7 of the Act during the period ended January 31, 2012.
NOTE 5—Other:
During the period ended January 31, 2011, Dreyfus New York AMT-Free Municipal Cash Management received regulatory settlement payments of $35,059 from an unaffiliated third party which are included in the fund’s Statement of Changes in Net Assets. The impact of these payments amounted to less than $.001 per share and the impact on total return amounted to less than .01% for each class of shares of the fund.
Table 11—Affiliate Portfolio Holdings Transactions
| | | |
| | Purchases ($) | Sales ($) |
| Dreyfus Municipal Cash Management Plus | 760,295,000 | 971,020,000 |
| Dreyfus New York Municipal Cash Management | 474,555,000 | 444,325,000 |
| Dreyfus Tax Exempt Cash Management | 1,319,555,000 | 1,344,345,000 |
| Dreyfus California AMT—Free Municipal Cash Management | 443,665,000 | 323,725,000 |
| Dreyfus New York AMT—Free Municipal Cash Management | 113,595,000 | 100,785,000 |
84
REPORT OF INDEPENDENT REGISTERED PUBLIC ACCOUNTING FIRM
Shareholders and Board of Trustees/Directors
Dreyfus Cash Management
Dreyfus Government Cash Management
Dreyfus Government Prime Cash Management
Dreyfus Treasury & Agency Cash Management
Dreyfus Treasury Prime Cash Management
Dreyfus Municipal Cash Management Plus
Dreyfus New York Municipal Cash Management
Dreyfus Tax Exempt Cash Management
Dreyfus California AMT-Free
Municipal Cash Management
Dreyfus New York AMT-Free
Municipal Cash Management
We have audited the accompanying statements of assets and liabilities, including the statements of investments, of Dreyfus Cash Management, Dreyfus Government Cash Management, Dreyfus Government Prime Cash Management, Dreyfus Treasury & Agency Cash Management, Dreyfus Treasury Prime Cash Management, Dreyfus Municipal Cash Management Plus, Dreyfus New York Municipal Cash Management, Dreyfus Tax Exempt Cash Management, Dreyfus California AMT-Free Municipal Cash Management and Dreyfus New York AMT-Free Municipal Cash Management (the “Funds”) as of January 31, 2012, and the related statements of operations for the year then ended, the statements of changes in net assets for each of the two years in the period then ended, and financial highlights for each of the periods indicated therein, except for the financial highlights for the year ended December 31, 2007 for Dreyfus New York AMT-Free Municipal Cash Management, which were audited by other auditors whose report dated February 28, 2008, expressed an unqualified opinion on such financial highlights. These financial statements and financial highlights are the responsibility of the Funds’ management. Our responsibility is to express an opinion on these financial statements and financial highlights based on our audits.
We conducted our audits in accordance with the standards of the Public Company Accounting Oversight Board (United States). Those standards require that we plan and perform the audit to obtain reasonable assurance about whether the financial statements and financial highlights are free of material misstatement.We were not engaged to perform an audit of the Fund’s internal control over financial reporting. Our audits included consideration of internal control over financial reporting as a basis for designing audit procedures that are appropriate in the circumstances, but not for the purpose of expressing an opinion on the effectiveness of the Funds’ internal control over financial reporting. Accordingly, we express no such opinion. An audit also includes examining, on a test basis, evidence supporting the amounts and disclosures in the financial statements and financial highlights, assessing the accounting principles used and significant estimates made by management, and evaluating the overall financial statement presentation. Our procedures included confirmation of securities owned as of January 31, 2012 by correspondence with the custodian and others or by other appropriate auditing procedures where replies from others were not received.We believe that our audits provide a reasonable basis for our opinion.
In our opinion, the financial statements and financial highlights referred to above present fairly, in all material respects, the financial position of the Funds at January 31, 2012, the results of their operations for the year then ended, the changes in their net assets for each of the two years in the period then ended, and the financial highlights for each of the indicated periods, in conformity with U.S. generally accepted accounting principles.

New York, New York
March 28, 2012
The Funds 85
IMPORTANT TAX INFORMATION (Unaudited)
In accordance with federal tax law, DreyfusTax Exempt Cash Management, Dreyfus Municipal Cash Management Plus, Dreyfus New York Municipal Cash Management, Dreyfus California AMT-Free Municipal Cash Management and Dreyfus NewYork AMT-Free Municipal Cash Management hereby make the following designations regarding the dividends paid from investment income-net during their fiscal year ended January 31, 2012:
— all the dividends paid from investment income-net are
“exempt-interest dividends” (not generally subject to
regular federal income taxes).
— except $2,632 of Dreyfus New York Municipal Cash
Management’s exempt-interest dividends that is being
designated as a long-term capital gain distribution for
reporting purposes.
— except $10,774 of Dreyfus Tax Exempt Cash
Management’s exempt-interest dividends that is being
designated as a long-term capital gain distribution for
reporting purposes.
— except $516 of Dreyfus California AMT-Free
Municipal Cash Management’s exempt-interest divi-
dends that is being designated as an ordinary income
distribution for reporting purposes.
— except $193 of Dreyfus New York AMT-Free
Municipal Cash Management’s exempt-interest divi-
dends that is being designated as an ordinary income
distribution for reporting purposes.
— for individuals who are residents of New York,
“exempt-interest dividends” paid by Dreyfus New
York Municipal Cash Management and Dreyfus New
York AMT-Free Municipal Cash Management are
also not subject to NewYork state and NewYork city
personal income tax.
— for individuals who are residents of California,
“exempt-interest dividends” paid by Dreyfus California
AMT-Free Municipal Cash Management are also not
subject to California personal income tax.
For state individual income tax purposes Dreyfus Government Prime Cash Management and DreyfusTreasury Prime Cash Management hereby designate the following percentage of ordinary dividends paid during the fiscal year ended January 31, 2012 as attributable to interest income from direct obligations of the United States. Such dividends are currently exempt from taxation for income tax purposes in most states, including New York, California and the District of Columbia:
| | | |
| Dreyfus Government Prime | |
| Cash Management | 100% |
| Dreyfus Treasury Prime | |
| Cash Management | 100% |
The funds below designate the following percentage of ordinary income dividends paid during the fiscal year ended January 31, 2012 as qualifying “interest related dividends”:
| | | |
| Dreyfus Cash Management | 90.77% |
| Dreyfus Government Cash Management | 100% |
| Dreyfus Government | |
| Prime Cash Management | 100% |
| Dreyfus Treasury & Agency | |
| Cash Management | 100% |
| Dreyfus Treasury Prime | |
| Cash Management | 100% |
86
BOARD MEMBERS INFORMATION (Unaudited)
The Funds 87
OFFICERS OF THE FUND (Unaudited)

88
The Funds 89
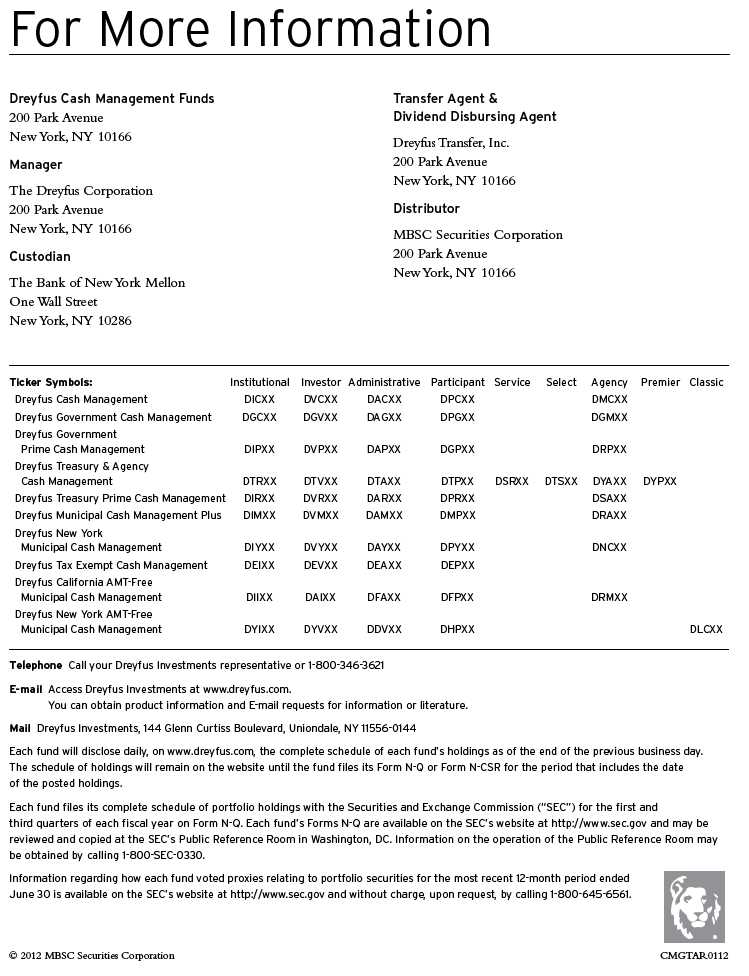
Item 2. Code of Ethics.
The Registrant has adopted a code of ethics that applies to the Registrant's principal executive officer, principal financial officer, principal accounting officer or controller, or persons performing similar functions. There have been no amendments to, or waivers in connection with, the Code of Ethics during the period covered by this Report.
Item 3. Audit Committee Financial Expert.
The Registrant's Board has determined that Joseph S. DiMartino, a member of the Audit Committee of the Board, is an audit committee financial expert as defined by the Securities and Exchange Commission (the "SEC"). Mr. DiMartino is "independent" as defined by the SEC for purposes of audit committee financial expert determinations.
Item 4. Principal Accountant Fees and Services.
(a) Audit Fees. The aggregate fees billed for each of the last two fiscal years (the "Reporting Periods") for professional services rendered by the Registrant's principal accountant (the "Auditor") for the audit of the Registrant's annual financial statements or services that are normally provided by the Auditor in connection with the statutory and regulatory filings or engagements for the Reporting Periods, were $30,312 in 2011 and $30,857 in 2012.
(b) Audit-Related Fees. The aggregate fees billed in the Reporting Periods for assurance and related services by the Auditor that are reasonably related to the performance of the audit of the Registrant's financial statements and are not reported under paragraph (a) of this Item 4 were $6,000 in 2011and $6,000 in 2012. These services consisted of one or more of the following: (i) agreed upon procedures related to compliance with Internal Revenue Code section 817(h), (ii) security counts required by Rule 17f-2 under the Investment Company Act of 1940, as amended, (iii) advisory services as to the accounting or disclosure treatment of Registrant transactions or events and (iv) advisory services to the accounting or disclosure treatment of the actual or potential impact to the Registrant of final or proposed rules, standards or interpretations by the Securities and Exchange Commission, the Financial Accounting Standards Boards or other regulatory or standard-setting bodies.
The aggregate fees billed in the Reporting Periods for non-audit assurance and related services by the Auditor to the Registrant's investment adviser (not including any sub-investment adviser whose role is primarily portfolio management and is subcontracted with or overseen by another investment adviser), and any entity controlling, controlled by or under common control with the investment adviser that provides ongoing services to the Registrant ("Service Affiliates"), that were reasonably related to the performance of the annual audit of the Service Affiliate, which required pre-approval by the Audit Committee were $0 in 2011 and $0 in 2012.
(c) Tax Fees. The aggregate fees billed in the Reporting Periods for professional services rendered by the Auditor for tax compliance, tax advice, and tax planning ("Tax Services") were $2,853 in 2011 and 3,508 in 2012. These services consisted of: (i) review or preparation of U.S. federal, state, local and excise tax returns; (ii) U.S. federal, state and local tax planning, advice and assistance regarding statutory, regulatory or administrative developments; (iii) tax advice regarding tax qualification matters and/or treatment of various financial instruments held or proposed to be acquired or held.The aggregate fees billed in the Reporting Periods for Tax Services by the Auditor to Service Affiliates, which required pre-approval by the Audit Committee were $0 in 2011 and $0 in 2012.
(d) All Other Fees. The aggregate fees billed in the Reporting Periods for products and services provided by the Auditor, other than the services reported in paragraphs (a) through (c) of this Item, were $277 in 2011 and $240 in 2012. [These services consisted of a review of the Registrant's anti-money laundering program].
The aggregate fees billed in the Reporting Periods for Non-Audit Services by the Auditor to Service Affiliates, other than the services reported in paragraphs (b) through (c) of this Item, which required pre-approval by the Audit Committee, were $0 in 2011 and $0 in 2012.
(e)(1) Audit Committee Pre-Approval Policies and Procedures. The Registrant's Audit Committee has established policies and procedures (the "Policy") for pre-approval (within specified fee limits) of the Auditor's engagements for non-audit services to the Registrant and Service Affiliates without specific case-by-case consideration. The pre-approved services in the Policy can include pre-approved audit services, pre-approved audit-related services, pre-approved tax services and pre-approved all other services. Pre-approval considerations include whether the proposed services are compatible with maintaining the Auditor's independence. Pre-approvals pursuant to the Policy are considered annually.
(e)(2) Note: None of the services described in paragraphs (b) through (d) of this Item 4 were approved by the Audit Committee pursuant to paragraph (c)(7)(i)(C) of Rule 2-01 of Regulation S-X.
(f) None of the hours expended on the principal accountant's engagement to audit the registrant's financial statements for the most recent fiscal year were attributed to work performed by persons other than the principal account's full-time, permanent employees.
Non-Audit Fees. The aggregate non-audit fees billed by the Auditor for services rendered to the Registrant, and rendered to Service Affiliates, for the Reporting Periods were $44,393,135 in 2011 and $22,644,299 in 2012.
Auditor Independence. The Registrant's Audit Committee has considered whether the provision of non-audit services that were rendered to Service Affiliates, which were not pre-approved (not requiring pre-approval), is compatible with maintaining the Auditor's independence.
Item 5. Audit Committee of Listed Registrants.
Not applicable. [CLOSED-END FUNDS ONLY]
Item 6. Investments.
(a) Not applicable.
Item 7. Disclosure of Proxy Voting Policies and Procedures for Closed-End Management Investment Companies.
Not applicable. [CLOSED-END FUNDS ONLY]
Item 8. Portfolio Managers of Closed-End Management Investment Companies.
Not applicable. [CLOSED-END FUNDS ONLY, beginning with reports for periods ended on and after December 31, 2005]
Item 9. Purchases of Equity Securities by Closed-End Management Investment Companies and Affiliated Purchasers.
Not applicable. [CLOSED-END FUNDS ONLY]
Item 10. Submission of Matters to a Vote of Security Holders.
There have been no material changes to the procedures applicable to Item 10.
Item 11. Controls and Procedures.
(a) The Registrant's principal executive and principal financial officers have concluded, based on their evaluation of the Registrant's disclosure controls and procedures as of a date within 90 days of the filing date of this report, that the Registrant's disclosure controls and procedures are reasonably designed to ensure that information required to be disclosed by the Registrant on Form N-CSR is recorded, processed, summarized and reported within the required time periods and that information required to be disclosed by the Registrant in the reports that it files or submits on Form N-CSR is accumulated and communicated to the Registrant's management, including its principal executive and principal financial officers, as appropriate to allow timely decisions regarding required disclosure.
(b) There were no changes to the Registrant's internal control over financial reporting that occurred during the second fiscal quarter of the period covered by this report that have materially affected, or are reasonably likely to materially affect, the Registrant's internal control over financial reporting.
Item 12. Exhibits.
(a)(1) Code of ethics referred to in Item 2.
(a)(2) Certifications of principal executive and principal financial officers as required by Rule 30a-2(a) under the Investment Company Act of 1940.
(a)(3) Not applicable.
(b) Certification of principal executive and principal financial officers as required by Rule 30a-2(b) under the Investment Company Act of 1940.
SIGNATURES
Pursuant to the requirements of the Securities Exchange Act of 1934 and the Investment Company Act of 1940, the Registrant has duly caused this Report to be signed on its behalf by the undersigned, thereunto duly authorized.
DREYFUS NEW YORK MUNICIPAL CASH MANAGEMENT
By: /s/Bradley J. Skapyak |
Bradley J. Skapyak, President |
Date: | March 27, 2012 |
|
Pursuant to the requirements of the Securities Exchange Act of 1934 and the Investment Company Act of 1940, this Report has been signed below by the following persons on behalf of the Registrant and in the capacities and on the dates indicated. |
|
By: /s/Bradley J. Skapyak |
Bradley J. Skapyak, President |
Date: | March 27, 2012 |
|
By: /s/James Windels |
James Windels, Treasurer |
Date: | March 27, 2012 |
|
EXHIBIT INDEX
(a)(1) Code of ethics referred to in Item 2.
(a)(2) Certifications of principal executive and principal financial officers as required by Rule 30a-2(a) under the Investment Company Act of 1940. (EX-99.CERT)
(b) Certification of principal executive and principal financial officers as required by Rule 30a-2(b) under the Investment Company Act of 1940. (EX-99.906CERT)