UNITED STATES
SECURITIES AND EXCHANGE COMMISSION
Washington, D.C. 20549
FORM N-CSR
CERTIFIED SHAREHOLDER REPORT OF REGISTERED MANAGEMENT
INVESTMENT COMPANIES
Investment Company Act file number | 811- 6395 |
| |
| DREYFUS NEW YORK MUNICIPAL CASH MANAGEMENT | |
| (Exact name of Registrant as specified in charter) | |
| | |
| c/o The Dreyfus Corporation 200 Park Avenue New York, New York 10166 | |
| (Address of principal executive offices) (Zip code) | |
| | |
| John Pak, Esq. 200 Park Avenue New York, New York 10166 | |
| (Name and address of agent for service) | |
|
Registrant's telephone number, including area code: | (212) 922-6000 |
| |
Date of fiscal year end: | 1/31 | |
Date of reporting period: | 1/31/14 | |
| | | | | | | |
FORM N-CSR
Item 1. Reports to Stockholders.

| | |
| Contents | |
| |
| The Funds | |
| Letter to Shareholders (Taxable) | 3 |
| Letter to Shareholders (Tax-Exempt) | 5 |
| Understanding Your Fund’s Expenses | 7 |
| Comparing Your Fund’s Expenses | |
| With Those of Other Funds | 9 |
| Statements of Investments | 11 |
| Statements of Assets and Liabilities | 54 |
| Statements of Operations | 57 |
| Statements of Changes in Net Assets | 59 |
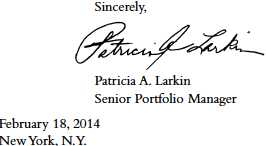
| Financial Highlights | 64 |
| Notes to Financial Statements | 74 |
| Report of Independent Registered | |
| Public Accounting Firm | 83 |
| Important Tax Information | 84 |
| Proxy Results | 85 |
| Board Members Information | 89 |
| Officers of the Funds | 91 |
| For More Information | |
| Back cover | |
The views expressed in this report reflect those of the portfolio manager only through the end of the period covered and do not necessarily represent the views of Dreyfus or any other person in the Dreyfus organization. Any such views are subject to change at any time based upon market or other conditions and Dreyfus disclaims any responsibility to update such views. These views may not be relied on as investment advice and, because investment decisions for a Dreyfus fund are based on numerous factors, may not be relied on as an indication of trading intent on behalf of any Dreyfus fund.
| |
| • Not FDIC-Insured • Not Bank-Guaranteed • May Lose Value |
Dreyfus Cash Management Funds
The Funds

LETTER TO
SHAREHOLDERS
Dear Shareholders:
This annual report for the several Dreyfus Cash Management Funds (Taxable) covers the 12-month period ended January 31, 2014. Over the reporting period, these funds achieved the following yields and, taking into account the effects of compounding, the following effective yields:1,2
| | | |
| | | Effective |
| | Yield (%) | Yield (%) |
| Dreyfus Cash Management | | |
| Institutional Shares | 0.04 | 0.04 |
| Investor Shares | 0.00 | 0.00 |
| Administrative Shares | 0.00 | 0.00 |
| Participant Shares | 0.00 | 0.00 |
| Agency Shares | 0.00 | 0.00 |
| Dreyfus Government | | |
| Cash Management | | |
| Institutional Shares | 0.01 | 0.01 |
| Investor Shares | 0.01 | 0.01 |
| Administrative Shares | 0.01 | 0.01 |
| Participant Shares | 0.01 | 0.01 |
| Agency Shares | 0.01 | 0.01 |
| Dreyfus Government | | |
| Prime Cash Management | | |
| Institutional Shares | 0.00 | 0.00 |
| Investor Shares | 0.00 | 0.00 |
| Administrative Shares | 0.00 | 0.00 |
| Participant Shares | 0.00 | 0.00 |
| Agency Shares | 0.00 | 0.00 |
| Dreyfus Treasury & Agency | | |
| Cash Management | | |
| Institutional Shares | 0.01 | 0.01 |
| Investor Shares | 0.01 | 0.01�� |
| Administrative Shares | 0.01 | 0.01 |
| Participant Shares | 0.01 | 0.01 |
| Service Shares | 0.01 | 0.01 |
| Select Shares | 0.01 | 0.01 |
| Agency Shares | 0.01 | 0.01 |
| Premier Shares | 0.01 | 0.01 |
| Dreyfus Treasury | | |
| Prime Cash Management | | |
| Institutional Shares | 0.00 | 0.00 |
| Investor Shares | 0.00 | 0.00 |
| Administrative Shares | 0.00 | 0.00 |
| Participant Shares | 0.00 | 0.00 |
| Agency Shares | 0.00 | 0.00 |
Although long-term interest rates climbed amid a recovering U.S. economy over the reporting period, short-term rates and money market yields remained anchored by an unchanged federal funds rate between 0% and 0.25%.
U.S. Economic Recovery Gained Traction
A mild U.S. economic recovery appeared to gain momentum in February 2013, when the unemployment rate declined from 7.9% to 7.7% and 236,000 new jobs were created.The unemployment rate continued to edge lower in March to 7.6%, but just 88,000 new jobs were added during the month.The economy grew at a lackluster 1.1% annualized rate during the first quarter of 2013.
The gradual recovery continued in April when the unemployment rate ticked down to 7.5%. In May, the Federal Reserve Board (the “Fed”) signaled that it would begin to curtail its quantitative easing program sooner than expected despite subsequent releases of data showing reduced manufacturing activity and an increase in the unemployment rate to 7.6%. Investors responded to the Fed’s hawkish remarks by driving long-term interest rates higher in June amid robust increases in home and automobile sales, the creation of 195,000 jobs, and an unchanged unemployment rate. For the second quarter, the U.S. economy grew at a more respectable 2.5% annualized rate.
July brought welcome evidence of market stabilization when investors realized that imminent increases in short-term rates were unlikely, even as the unemployment rate slid to 7.4%. In August, the manufacturing sector expanded at its fastest pace since June 2011, and the unemployment rate dipped to 7.3%. Financial markets rallied in September when the Fed unexpectedly refrained from tapering its quantitative easing program, manufacturing activity expanded, and the service sector continued to grow. Yet, only 146,000 jobs were added in September even as the unemployment rate fell to 7.2%. It later was
LETTER TO SHAREHOLDERS (continued)
announced that U.S. economic activity accelerated to a robust 4.1% annualized growth rate during the third quarter.
October saw 204,000 new jobs, but furloughs of government workers during a U.S. government shutdown drove the unemployment rate to 7.3%, and the Fed again refrained from reducing its bond purchases. However, economic data for November showed a more robust recovery, including 274,000 new jobs and an unemployment rate of 7.0%.
Manufacturing activity accelerated in December, as new orders reached their highest level in four years.The Fed responded to more robust economic data by modestly reducing its monthly bond purchases, marking the first of what is expected to be a series of cuts. However, only 75,000 new jobs were created in December, the lowest monthly gain in three years. The unemployment rate slid to 6.7% as workers left the labor force. The U.S. economy grew at an estimated 3.2% annualized GDP growth rate during the fourth quarter.
In January 2014, investors worried that ongoing downturns in the emerging markets could dampen the U.S. economic recovery. However, corporate earnings growth generally remained strong, and the unemployment rate declined to 6.6% with the addition of 113,000 jobs. As expected, the Fed announced an additional reduction in quantitative easing after its January meeting.
No Change Expected for Short-Term Rates
Despite higher long-term interest rates in an accelerating recovery, money market yields remained near zero percent, and yield differences along the market’s maturity spectrum stayed relatively narrow. In addition, monetary policymakers appear unlikely to raise short-term interest rates this year, and we expect regulators to issue changes to the rules governing some money market funds over the coming months.
Therefore, as we have for some time, we have maintained the fund’s weighted average maturity in a market-neutral position, and we remained focused on well-established issuers with good liquidity characteristics.
| | |
| | An investment in the funds is not insured or guaranteed by the FDIC or |
| | any other government agency.Although the funds seek to preserve the value |
| | of your investment at $1.00 per share, it is possible to lose money by |
| | investing in the funds. |
| | Short-term corporate, asset-backed securities holdings and municipal |
| | securities holdings (as applicable), while rated in the highest rating category |
| | by one or more NRSRO (or unrated, if deemed of comparable quality by |
| | Dreyfus), involve credit and liquidity risks and risk of principal loss. |
| 1 | Effective yield is based upon dividends declared daily and reinvested |
| | monthly. Past performance is no guarantee of future results.Yields fluctuate. |
| 2 | Yields provided reflect the absorption of certain fund expenses by The |
| | Dreyfus Corporation pursuant to an undertaking, which is voluntary and |
| | temporary, not contractual, and can be terminated at any time without |
| | notice. Had these expenses not been absorbed, fund yields would have been |
| | lower, and in some cases, 7-day yields during the reporting period would |
| | have been negative absent the expense absorption. |
4

LETTER TO
SHAREHOLDERS
Dear Shareholder:
We are pleased to present the annual report for the several Dreyfus Cash Management Funds (Tax Exempt). For the 12-month period ended January 31, 2014, these tax-exempt money market funds achieved the following yields and effective yields:1,2
| | | |
| | | Effective |
| | Yield (%) | Yield (%) |
| Dreyfus Municipal | | |
| Cash Management Plus | | |
| Institutional Shares | 0.00 | 0.00 |
| Investor Shares | 0.00 | 0.00 |
| Administrative Shares | 0.00 | 0.00 |
| Participant Shares | 0.00 | 0.00 |
| Agency Shares | 0.00 | 0.00 |
| Dreyfus New York | | |
| Municipal Cash Management | | |
| Institutional Shares | 0.00 | 0.00 |
| Investor Shares | 0.00 | 0.00 |
| Administrative Shares | 0.00 | 0.00 |
| Participant Shares | 0.00 | 0.00 |
| Dreyfus Tax Exempt | | |
| Cash Management | | |
| Institutional Shares | 0.00 | 0.00 |
| Investor Shares | 0.00 | 0.00 |
| Administrative Shares | 0.00 | 0.00 |
| Participant Shares | 0.00 | 0.00 |
| Dreyfus California AMT-Free | | |
| Municipal Cash Management | | |
| Institutional Shares | 0.00 | 0.00 |
| Investor Shares | 0.00 | 0.00 |
| Administrative Shares | 0.00 | 0.00 |
| Participant Shares | 0.00 | 0.00 |
| Dreyfus New York AMT-Free | | |
| Municipal Cash Management | | |
| Institutional Shares | 0.00 | 0.00 |
| Investor Shares | 0.00 | 0.00 |
| Administrative Shares | 0.00 | 0.00 |
| Classic Shares | 0.00 | 0.00 |
Long-Term Rates Climbed in Economic Recovery
Economic conditions continued to improve over the reporting period as U.S. GDP accelerated from 2.5% during the second quarter of the year to a more robust 4.1% for the third quarter and 3.2% in the fourth quarter amid falling unemployment, rebounding housing markets, increased manufacturing activity, and a massive quantitative easing program from the Federal Reserve Board (the “Fed”). Longer term interest rates climbed as the recovery progressed, but the Fed left short-term interest rates unchanged near historical lows.
Investors were surprised in May 2013, when the Fed appeared ready to back away from its longstanding, aggressively accommodative monetary policy stance. Relatively hawkish remarks by Fed Chairman Ben Bernanke were interpreted as a signal that U.S. monetary policymakers would begin to curtail their quantitative easing program sooner than most analysts had expected. This development sent long-term rates sharply higher, and yield differences widened along the bond market’s maturity spectrum. Although long-term rates declined somewhat when the Fed unexpectedly refrained from tapering its bonds purchases in the fall, subsequent releases of robust economic data sent rates higher over the reporting period’s final months.
The municipal money markets also were influenced by supply-and-demand factors. Demand remained strong for a limited supply of tax-exempt securities, including from nontraditional buyers, such as intermediate bond funds and taxable money market funds seeking attractive tax-exempt yields compared to similar maturity taxable securities. However, individual investors
LETTER TO SHAREHOLDERS (continued)
remained focused on longer term municipal bonds with higher yields. In this environment, yields of high-quality, one-year municipal notes remained low, and rates on variable rate demand notes (“VRDNs”) stayed steady amid steady demand from taxable money market funds seeking to comply with more stringent liquidity requirements.
Despite a bankruptcy filing by the city of Detroit over the summer and media reports detailing Puerto Rico’s economic and fiscal woes in September, municipal credit quality generally continued to improve as tax revenues increased for most states and municipalities. California’s finances continued to benefit from stronger tax revenues in the wake of tax increases on higher income residents. The State of New York also fared relatively well, supported by balanced budgets enacted on time, improved finances, better spending controls, and well-funded pension liabilities.
Credit Selection Remained Paramount
Most municipal money market funds have maintained short weighted average maturities compared to historical averages due to narrow yield differences along the money market’s maturity range and ongoing regulatory uncertainty.The funds were no exception, as we generally maintained their weighted average maturities in a position that was consistent with industry averages.
Well-researched credit selection remained paramount during the reporting period. We continued to favor state general obligation bonds; essential service revenue bonds backed by water, sewer, and electric facilities; certain local credits with strong financial positions and stable tax bases; and health care and education issuers with stable credit characteristics.
Low Rates Likely to Persist
The Fed made modest cuts in its monthly bond purchases in December and January, marking the start of what is expected to be a series of measured reductions in its quantitative easing program. However, the Fed also has made clear that short-term interest rates are likely to remain low for some time to come. Consequently, in our judgment, the prudent course continues to be an emphasis on preservation of capital and liquidity.

| | |
| | An investment in the funds is not insured or guaranteed by the FDIC or |
| | any other government agency.Although the funds seek to preserve the |
| | value of your investment at $1.00 per share, it is possible to lose money |
| | by investing in the funds. |
| | Short-term corporate, asset-backed securities holdings and municipal |
| | securities holdings (as applicable), while rated in the highest rating category |
| | by one or more NRSRO (or unrated, if deemed of comparable quality by |
| | Dreyfus), involve credit and liquidity risks and risk of principal loss. |
| 1 | Effective yield is based upon dividends declared daily and reinvested |
| | monthly. Past performance is no guarantee of future results.Yields fluctuate. |
| | For the national funds, income may be subject to state and local taxes. For |
| | the NewYork and California funds, income may be subject to state and |
| | local taxes for out-of-state residents. For each non-AMT-Free fund, some |
| | income may be subject to the federal alternative minimum tax (AMT). |
| 2 | Yields provided reflect the absorption of certain fund expenses by The |
| | Dreyfus Corporation pursuant to an undertaking, which is voluntary and |
| | temporary, not contractual, and can be terminated at any time without |
| | notice. Had these expenses not been absorbed, the funds’ yields would |
| | have been lower, and in some cases, 7-day yields during the reporting |
| | period would have been negative absent the expense absorption. |
6
UNDERSTANDING YOUR FUND’S EXPENSES (Unaudited)
As a mutual fund investor, you pay ongoing expenses, such as management fees and other expenses. Using the information below, you can estimate how these expenses affect your investment and compare them with the expenses of other funds.You also may pay one-time transaction expenses, including sales charges (loads) and redemption fees, which are not shown in this section and would have resulted in higher total expenses. For more information, see your fund’s prospectus or talk to your financial adviser.
Review your fund’s expenses
The table below shows the expenses you would have paid on a $1,000 investment in each class of each fund from August 1, 2013 to January 31, 2014. It also shows how much a $1,000 investment would be worth at the close of the period, assuming actual returns and expenses.
| | | | | | | | | | | | | | | | | | | |
| Expenses and Value of a $1,000 Investment | | | | | | | | | | | | | |
| assuming actual returns for the six months ended January 31, 2014 | | | | | | | | | | | |
| |
| | | Institutional | | Investor | | Administrative | | Participant | | Service | | Select | | Agency | | Premier |
| Dreyfus Cash | | | | | | | | | | | | | | | | | | |
| Management | | | | | | | | | | | | | | | | | | |
| Expenses paid | | | | | | | | | | | | | | | | | | |
| per $1,000† | | $ | .66 | $ | .86 | | $ | .86 | $ | .86 | | — | | — | $ | .86 | | — |
| Ending value | | | | | | | | | | | | | | | | | | |
| (after expenses) | | $ | 1,000.20 | $ | 1,000.00 | | $ | 1,000.00 | $ | 1,000.00 | | — | | — | $ | 1,000.00 | | — |
| Annualized | | | | | | | | | | | | | | | | | | |
| expense ratio (%) | | | .13 | | .17 | | | .17 | | .17 | | — | | — | | .17 | | — |
| Dreyfus | | | | | | | | | | | | | | | | | | |
| Government Cash | | | | | | | | | | | | | | | | | | |
| Management | | | | | | | | | | | | | | | | | | |
| Expenses paid | | | | | | | | | | | | | | | | | | |
| per $1,000† | | $ | .35 | $ | .35 | | $ | .35 | $ | .35 | | — | | — | $ | .35 | | — |
| Ending value | | | | | | | | | | | | | | | | | | |
| (after expenses) | | $ | 1,000.10 | $ | 1,000.10 | | $ | 1,000.10 | $ | 1,000.10 | | — | | — | $ | 1,000.10 | | — |
| | | | | | | | | | | | | | | | | |
| Annualized | | | | | | | | | | | | | | | | | | |
| expense ratio (%) | | | .07 | | .07 | | | .07 | | .07 | | — | | — | | .07 | | — |
| Dreyfus | | | | | | | | | | | | | | | | | | |
| Government Prime | | | | | | | | | | | | | | | | | | |
| Cash Management | | | | | | | | | | | | | | | | | | |
| Expenses paid | | | | | | | | | | | | | | | | | | |
| per $1,000† | | $ | .35 | $ | .35 | | $ | .35 | $ | .35 | | — | | — | $ | .35 | | — |
| Ending value | | | | | | | | | | | | | | | | | | |
| (after expenses) | $ | 1,000.00 | $ | 1,000.00 | $ | 1,000.00 | $ | 1,000.00 | | — | | — | $ | 1,000.00 | | — |
| Annualized | | | | | | | | | | | | | | | | | | |
| expense ratio (%) | | | .07 | | .07 | | | .07 | | .07 | | — | | — | | .07 | | — |
| Dreyfus Treasury & | | | | | | | | | | | | | | | | | | |
| Agency Cash | | | | | | | | | | | | | | | | | | |
| Management | | | | | | | | | | | | | | | | | | |
| Expenses paid | | | | | | | | | | | | | | | | | | |
| per $1,000† | | $ | .30 | $ | .30 | | $ | .30 | $ | .30 | $ | .25 | $ | .30 | $ | .30 | $ | .25 |
| Ending value | | | | | | | | | | | | | | | | | | |
| (after expenses) | | $ | 1,000.10 | $ | 1,000.10 | | $ | 1,000.10 | $ | 1,000.10 | $ | 1,000.10 | $ | 1,000.10 | $ | 1,000.10 | $ | 1,000.10 |
| | | | | | | | | | | | | | | | | |
| Annualized | | | | | | | | | | | | | | | | | | |
| expense ratio (%) | | | .06 | | .06 | | | .06 | | .06 | | .05 | | .06 | | .06 | | .05 |
| Dreyfus | | | | | | | | | | | | | | | | | | |
| Treasury Prime | | | | | | | | | | | | | | | | | | |
| Cash Management | | | | | | | | | | | | | | | | | | |
| Expenses paid | | | | | | | | | | | | | | | | | | |
| per $1,000† | | $ | .25 | $ | .20 | | $ | .20 | $ | .20 | | — | | — | $ | .20 | | — |
| Ending value | | | | | | | | | | | | | | | | | | |
| (after expenses) | | $ | 1,000.00 | $ | 1,000.00 | | $ | 1,000.00 | $ | 1,000.00 | | — | | — | $ | 1,000.00 | | — |
| Annualized | | | | | | | | | | | | | | | | | | |
| expense ratio (%) | | | .05 | | .04 | | | .04 | | .04 | | — | | — | | .04 | | — |
| |
| UNDERSTANDING YOUR FUND’S EXPENSES (Unaudited) (continued) |
| |
| † Expenses are equal to each fund’s annualized expense ratios as shown above, multiplied by the average account value over the period, multiplied by 184/365 (to reflect the one-half |
| year period). |
| | | | | | | | | | | | | | |
| Expenses and Value of a $1,000 Investment (continued) | | | | | | | | |
| assuming actual returns for the six months ended January 31, 2014 | | | | | | | | |
| |
| | | Institutional | | Investor | | Administrative | | Participant | | Agency | | Classic |
| Dreyfus | | | | | | | | | | | | | |
| Municipal Cash | | | �� | | | | | | | | | | |
| Management Plus | | | | | | | | | | | | | |
| Expenses paid | | | | | | | | | | | | | |
| per $1,000† | | $ | .81 | $ | .81 | $ | .81 | $ | .81 | $ | .86 | | — |
| Ending value | | | | | | | | | | | | | |
| (after expenses) | | $ | 1,000.00 | $ | 1,000.00 | $ | 1,000.00 | $ | 1,000.00 | $ | 1,000.00 | | — |
| Annualized | | | | | | | | | | | | | |
| expense ratio (%) | | | .16 | | .16 | | .16 | | .16 | | .17 | | — |
| Dreyfus | | | | | | | | | | | | | |
| New York | | | | | | | | | | | | | |
| Municipal Cash | | | | | | | | | | | | | |
| Management | | | | | | | | | | | | | |
| Expenses paid | | | | | | | | | | | | | |
| per $1,000† | | $ | .81 | $ | .76 | $ | .81 | $ | .81 | | — | | — |
| Ending value | | | | | | | | | | | | | |
| (after expenses) | | $ | 1,000.00 | $ | 1,000.00 | $ | 1,000.00 | $ | 1,000.00 | | — | | — |
| Annualized | | | | | | | | | | | | | |
| expense ratio (%) | | | .16 | | .15 | | .16 | | .16 | | — | | — |
| Dreyfus | | | | | | | | | | | | | |
| Tax Exempt Cash | | | | | | | | | | | | | |
| Management | | | | | | | | | | | | | |
| Expenses paid | | | | | | | | | | | | | |
| per $1,000† | | $ | .55 | $ | .55 | $ | .55 | $ | .55 | | — | | |
| Ending value | | | | | | | | | | | | | |
| (after expenses) | | $ | 1,000.00 | $ | 1,000.00 | $ | 1,000.00 | $ | 1,000.00 | | — | | — |
| Annualized | | | | | | | | | | | | | |
| expense ratio (%) | | | .11 | | .11 | | .11 | | .11 | | — | | — |
| Dreyfus California | | | | | | | | | | | | | |
| AMT-Free | | | | | | | | | | | | | |
| Municipal Cash | | | | | | | | | | | | | |
| Management | | | | | | | | | | | | | |
| Expenses paid | | | | | | | | | | | | | |
| per $1,000† | | $ | .50 | $ | .50 | $ | .55 | $ | .50 | | — | | — |
| Ending value | | | | | | | | | | | | | |
| (after expenses) | | $ | 1,000.00 | | 1,000.00 | $ | 1,000.00 | $ | 1,000.00 | | — | | — |
| Annualized | | | | | | | | | | | | | |
| expense ratio (%) | | | .10 | | .10 | | .11 | | .10 | | — | | — |
| Dreyfus New York | | | | | | | | | | | | | |
| AMT-Free | | | | | | | | | | | | | |
| Municipal Cash | | | | | | | | | | | | | |
| Management | | | | | | | | | | | | | |
| Expenses paid | | | | | | | | | | | | | |
| per $1,000† | | $ | .81 | $ | .81 | $ | .81 | | — | | — | $ | .81 |
| Ending value | | | | | | | | | | | | | |
| (after expenses) | | $ | 1,000.00 | $ | 1,000.00 | $ | 1,000.00 | | — | | — | $ | 1,000.00 |
| Annualized | | | | | | | | | | | | | |
| expense ratio (%) | | | .16 | | .16 | | .16 | | — | | — | | .16 |
8
COMPARING YOUR FUND’S EXPENSES
WITH THOSE OF OTHER FUNDS (Unaudited)
Using the SEC’s method to compare expenses
The Securities and Exchange Commission (SEC) has established guidelines to help investors assess fund expenses. Per these guidelines, the table below shows your fund’s expenses based on a $1,000 investment, assuming a hypothetical 5% annualized return.You can use this information to compare the ongoing expenses (but not transaction expenses or total cost) of investing in the fund with those of other funds. All mutual fund shareholder reports will provide this information to help you make this comparison. Please note that you cannot use this information to estimate your actual ending account balance and expenses paid during the period.
| | | | | | | | | | | | | | | | | | | | | | |
| Expenses and Value of a $1,000 Investment | | | | | | | | | | | | | | | |
| assuming a hypothetical 5% annualized return for the six months ended January 31, 2014 | | | | | | | | |
| |
| | | Institutional | | | Investor | | Administrative | | | Participant | | Service | | Select | | Agency | | Premier |
| Dreyfus Cash | | | | | | | | | | | | | | | | | | | | | |
| Management | | | | | | | | | | | | | | | | | | | | | |
| Expenses paid | | | | | | | | | | | | | | | | | | | | | |
| per $1,000† | | $ | .66 | | $ | .87 | | $ | .87 | | | $ | .87 | | — | | — | $ | .87 | | — |
| Ending value | | | | | | | | | | | | | | | | | | | | | |
| (after expenses) | | $ | 1,024.55 | | $ | 1,024.35 | | $ | 1,024.35 | | | $ | 1,024.35 | | — | | — | $ | 1,024.35 | | — |
| Annualized | | | | | | | | | | | | | | | | | | | | | |
| expense ratio (%) | | | .13 | | | .17 | | | .17 | | | | .17 | | — | | — | | .17 | | — |
| Dreyfus | | | | | | | | | | | | | | | | | | | | | |
| Government Cash | | | | | | | | | | | | | | | | | | | | | |
| Management | | | | | | | | | | | | | | | | | | | | | |
| Expenses paid | | | | | | | | | | | | | | | | | | | | | |
| per $1,000† | | $ | .36 | | $ | .36 | | $ | .36 | | | $ | .36 | | — | | — | $ | .36 | | — |
| Ending value | | | | | | | | | | | | | | | | | | | | | |
| (after expenses) | | $ | 1,024.85 | | $ | 1,024.85 | | $ | 1,024.85 | | | $ | 1,024.85 | | — | | — | $ | 1,024.85 | | — |
| Annualized | | | | | | | | | | | | | | | | | | | | | |
| expense ratio (%) | | | .07 | | | .07 | | | .07 | | | | .07 | | — | | — | | .07 | | — |
| Dreyfus | | | | | | | | | | | | | | | | | | | | | |
| Government Prime | | | | | | | | | | | | | | | | | | | | | |
| Cash Management | | | | | | | | | | | | | | | | | | | | | |
| Expenses paid | | | | | | | | | | | | | | | | | | | | | |
| per $1,000† | | $ | .36 | | $ | .36 | | $ | .36 | | | $ | .36 | | — | | — | $ | .36 | | — |
| Ending value | | | | | | | | | | | | | | | | | | | | | |
| (after expenses) | | $ | ,024.85 | | $ | 1,024.85 | | $ | 1,024.85 | | | $ | 1,024.85 | | — | | — | $ | 1,024.85 | | — |
| Annualized | | | | | | | | | | | | | | | | | | | | | |
| expense ratio (%) | | | .07 | | | .07 | | | .07 | | | | .07 | | — | | — | | .07 | | — |
| Dreyfus Treasury & | | | | | | | | | | | | | | | | | | | | | |
| Agency Cash | | | | | | | | | | | | | | | | | | | | | |
| Management | | | | | | | | | | | | | | | | | | | | | |
| Expenses paid | | | | | | | | | | | | | | | | | | | | | |
| per $1,000† | | $ | .31 | | $ | .31 | | $ | .31 | | | $ | .31 | $ | .26 | $ | .31 | $ | .31 | $ | .26 |
| Ending value | | | | | | | | | | | | | | | | | | | | | |
| (after expenses) | | $ | 1,024.90 | | $ | 1,024.90 | | $ | 1,024.90 | | | $ | 1,024.90 | $ | 1,024.95 | $ | 1,024.90 | $ | 1,024.90 | $ | 1,024.95 |
| | | | | | | | | | | | | | | | | | |
| Annualized | | | | | | | | | | | | | | | | | | | | | |
| expense ratio (%) | | | .06 | | | .06 | | | .06 | | | | .06 | | .05 | | .06 | | .06 | | .05 |
| Dreyfus | | | | | | | | | | | | | | | | | | | | | |
| Treasury Prime | | | | | | | | | | | | | | | | | | | | | |
| Cash Management | | | | | | | | | | | | | | | | | | | | | |
| Expenses paid | | | | | | | | | | | | | | | | | | | | | |
| per $1,000† | | $ | .26 | | $ | 0.20 | | $ | 0.20 | | | $ | 0.20 | | — | | — | $ | .20 | | — |
| Ending value | | | | | | | | | | | | | | | | | | | | | |
| (after expenses) | | $ | ,024.95 | | $ | 1,025.00 | | $ | 1,025.00 | | | $ | 1,025.00 | | — | | — | $ | 1,025.00 | | — |
| Annualized | | | | | | | | | | | | | | | | | | | | | |
| expense ratio (%) | | | .05 | | | .04 | | | .04 | | | | .04 | | — | | — | | .04 | | — |
COMPARING YOUR FUND’S EXPENSES WITH THOSE OF OTHER FUNDS (Unaudited) (continued)
| | | | | | | | | | | | | | | |
| Expenses and Value of a $1,000 Investment (continued) | | | | | | | | | |
| assuming a hypothetical 5% annualized return for the six months ended January 31, 2014 | | | | | | |
| |
| | | Institutional | | Investor | | Administrative | | Participant | | Agency | | Classic |
| Dreyfus | | | | | | | | | | | | | | |
| Municipal Cash | | | | | | | | | | | | | | |
| Management Plus | | | | | | | | | | | | | | |
| Expenses paid | | | | | | | | | | | | | | |
| per $1,000† | | $ | .82 | $ | .82 | | $ | .82 | $ | .82 | $ | .87 | | — |
| Ending value | | | | | | | | | | | | | | |
| (after expenses) | | $ | 1,024.40 | $ | 1,024.40 | | $ | 1,024.40 | $ | 1,024.40 | $ | 1,024.35 | | — |
| Annualized | | | | | | | | | | | | | | |
| expense ratio (%) | | | .16 | | .16 | | | .16 | | .16 | | .17 | | — |
| Dreyfus | | | | | | | | | | | | | | |
| New York | | | | | | | | | | | | | | |
| Municipal Cash | | | | | | | | | | | | | | |
| Management | | | | | | | | | | | | | | |
| Expenses paid | | | | | | | | | | | | | | |
| per $1,000† | | $ | .82 | $ | .77 | | $ | .82 | $ | .82 | | — | | — |
| Ending value | | | | | | | | | | | | | | |
| (after expenses) | | $ | 1,024.40 | $ | 1,024.45 | | $ | 1,024.40 | $ | 1,024.40 | | — | | — |
| | | | | | | | | | | | | |
| | | | | | | | | | | | | |
| Annualized | | | | | | | | | | | | | | |
| expense ratio (%) | | | .16 | | .15 | | | .16 | | .16 | | — | | — |
| Dreyfus | | | | | | | | | | | | | | |
| Tax Exempt Cash | | | | | | | | | | | | | | |
| Management | | | | | | | | | | | | | | |
| Expenses paid | | | | | | | | | | | | | | |
| per $1,000† | | $ | .56 | $ | .56 | | $ | .56 | $ | .56 | | — | | — |
| Ending value | | | | | | | | | | | | | | |
| (after expenses) | | $ | 1,024.65 | $ | 1,024.65 | | $ | 1,024.65 | $ | 1,024.65 | | — | | — |
| Annualized | | | | | | | | | | | | | | |
| expense ratio (%) | | | .11 | | .11 | | | .11 | | .11 | | — | | — |
| Dreyfus California | | | | | | | | | | | | | | |
| AMT-Free | | | | | | | | | | | | | | |
| Municipal Cash | | | | | | | | | | | | | | |
| Management | | | | | | | | | | | | | | |
| Expenses paid | | | | | | | | | | | | | | |
| per $1,000† | | $ | .51 | $ | .51 | | $ | .56 | $ | .51 | | — | | — |
| Ending value | | | | | | | | | | | | | | |
| (after expenses) | | $ | 1,024.70 | $ | 1,024.70 | | $ | 1,024.65 | $ | 1,024.70 | | — | | — |
| Annualized | | | | | | | | | | | | | | |
| expense ratio (%) | | | .10 | | .10 | | | .11 | | .10 | | — | | — |
| Dreyfus New York | | | | | | | | | | | | | | |
| AMT-Free | | | | | | | | | | | | | | |
| Municipal Cash | | | | | | | | | | | | | | |
| Management | | | | | | | | | | | | | | |
| Expenses paid | | | | | | | | | | | | | | |
| per $1,000† | | $ | .82 | $ | .82 | | $ | .82 | | — | | — | $ | .82 |
| Ending value | | | | | | | | | | | | | | |
| (after expenses) | | $ | 1,024.40 | $ | 1,024.40 | | $ | 1,024.40 | | — | | — | $ | 1,024.40 |
| Annualized | | | | | | | | | | | | | | |
| expense ratio (%) | | | .16 | | .16 | | | .16 | | — | | — | | .16 |
| |
| † Expenses are equal to each fund’s annualized expense ratios as shown above, multiplied by the average account value over the period, multiplied by 184/365 (to reflect the one-half |
| year period). |
10
STATEMENT OF INVESTMENTS
January 31, 2014
| | | | |
| | Principal | | |
| Dreyfus Cash Management | Amount ($) | | Value ($) |
| |
| Negotiable Bank Certificates of Deposit—38.7% | | | |
| Bank of Montreal (Yankee) | | | |
| 0.15%—0.18%, 3/12/14—3/17/14 | 850,000,000 | | 850,000,000 |
| Bank of Nova Scotia (Yankee) | | | |
| 0.23%—0.25%, 2/3/14 | 950,000,000 | a | 949,985,480 |
| Bank of Tokyo-Mitsubishi Ltd. (Yankee) | | | |
| 0.20%—0.25%, 2/3/14—4/28/14 | 1,100,000,000 | | 1,100,000,000 |
| Credit Industriel et Commercial (Yankee) | | | |
| 0.16%, 3/3/14 | 300,000,000 | | 300,000,000 |
| Credit Suisse New York (Yankee) | | | |
| 0.19%—0.20%, 2/3/14—3/10/14 | 900,000,000 | | 900,000,000 |
| Deutsche Bank AG (Yankee) | | | |
| 0.20%, 3/31/14 | 200,000,000 | | 200,000,000 |
| JPMorgan Chase Bank, N.A. | | | |
| 0.25%, 4/21/14—4/25/14 | 430,000,000 | | 430,000,000 |
| Mitsubishi UFJ Trust and Banking Corp. (Yankee) | | | |
| 0.20%, 4/30/14 | 100,000,000 | | 100,000,000 |
| Mizuho Bank (Yankee) | | | |
| 0.21%, 3/14/14—4/30/14 | 1,250,000,000 | | 1,250,000,000 |
| Nordea Bank Finland (Yankee) | | | |
| 0.20%—0.24%, 2/26/14—7/16/14 | 850,000,000 | | 849,997,399 |
| Norinchukin Bank (Yankee) | | | |
| 0.21%—0.22%, 2/12/14—4/8/14 | 772,000,000 | | 771,998,168 |
| Rabobank Nederland (Yankee) | | | |
| 0.22%, 6/2/14 | 250,000,000 | | 250,000,000 |
| Royal Bank of Canada (Yankee) | | | |
| 0.29%, 2/3/14 | 50,000,000 | a | 50,000,000 |
| Sumitomo Mitsui Banking Corp. (Yankee) | | | |
| 0.21%—0.25%, 2/13/14—6/2/14 | 1,200,000,000 | b | 1,200,000,000 |
| Sumitomo Mitsui Trust Bank (Yankee) | | | |
| 0.21%, 2/27/14—3/12/14 | 500,000,000 | b | 500,000,000 |
| Svenska Handelsbanken (Yankee) | | | |
| 0.20%—0.21%, 7/21/14 | 350,000,000 | b | 350,008,255 |
| Toronto Dominion Bank NY (Yankee) | | | |
| 0.22%—0.24%, 2/18/14—10/22/14 | 700,000,000 | | 700,000,000 |
| UBS AG (Yankee) | | | |
| 0.17%, 3/14/14 | 150,000,000 | | 150,000,000 |
| Wells Fargo Bank, NA | | | |
| 0.20%—0.24%, 2/3/14—6/9/14 | 455,000,000 | a | 455,000,000 |
| Total Negotiable Bank Certificates of Deposit | | | |
| (cost $11,356,989,302) | | | 11,356,989,302 |
| |
| Commercial Paper—20.8% | | | |
| ANZ International Ltd. | | | |
| 0.21%—0.28%, 2/10/14—7/31/14 | 200,000,000 | a,b | 199,895,000 |
| Australia and New Zealand Banking Group Ltd. | | | |
| 0.24%, 2/28/14 | 100,000,000 | a,b | 100,000,000 |
| Bank of Nova Scotia | | | |
| 0.19%, 2/3/14 | 250,000,000 | | 249,997,361 |
STATEMENT OF INVESTMENTS (continued)
| | | | | |
| | | Principal | | |
| | Dreyfus Cash Management (continued) | Amount ($) | | Value ($) |
| |
| | Commercial Paper (continued) | | | |
| | Commonwealth Bank of Australia | | | |
| | 0.21%—0.26%, 2/4/14—5/6/14 | 730,000,000 | a,b | 729,929,826 |
| | Erste Abwicklungsanstalt | | | |
| | 0.15%—0.17%, 2/19/14—5/20/14 | 575,000,000 | | 574,852,208 |
| | General Electric Capital Corp. | | | |
| | 0.23%, 2/5/14 | 100,000,000 | | 99,997,444 |
| | HSBC Bank PLC | | | |
| | 0.23%—0.25%, 2/3/14—2/19/14 | 400,000,000 | a,b | 400,000,000 |
| | JPMorgan Securities LLC | | | |
| | 0.36%, 2/10/14 | 75,000,000 | a,b | 75,000,000 |
| | National Australia Funding (DE) Inc. | | | |
| | 0.20%, 7/14/14—8/1/14 | 581,000,000 | b | 580,448,872 |
| | Nordea Bank AB | | | |
| | 0.22%, 4/17/14 | 149,450,000 | b | 149,381,502 |
| | NRW Bank | | | |
| | 0.11%—0.12%, 2/14/14 | 650,000,000 | b | 649,973,729 |
| | Rabobank USA Financial Corp. | | | |
| | 0.22%, 4/30/14—7/10/14 | 690,000,000 | | 689,411,989 |
| | Toyota Motor Credit Corp. | | | |
| | 0.21%—0.23%, 2/3/14—3/24/14 | 545,000,000 | a | 544,922,946 |
| | Westpac Banking Corp. | | | |
| | 0.22%—0.28%, 2/3/14—2/17/14 | 1,025,000,000 | a,b | 1,025,000,000 |
| | Total Commercial Paper | | | |
| | (cost $6,068,810,877) | | | 6,068,810,877 |
| |
| | Asset-Backed Commercial Paper—3.2% | | | |
| | Bedford Row Funding | | | |
| | 0.30%, 4/30/14 | 91,300,000 | b | 91,233,047 |
| | CAFCO | | | |
| | 0.17%, 3/12/14 | 50,000,000 | b | 49,990,792 |
| | CIESCO LLC | | | |
| | 0.17%, 3/10/14 | 50,000,000 | b | 49,991,264 |
| | Collateralized Commercial Paper II Co., LLC | | | |
| | 0.28%, 3/11/14 | 333,390,000 | b | 333,291,465 |
| | Collateralized Commercial Paper Program Co., LLC | | | |
| | 0.28%, 4/1/14—7/8/14 | 400,000,000 | | 399,664,000 |
| | Total Asset-Backed Commercial Paper | | | |
| | (cost $924,170,568) | | | 924,170,568 |
| |
| | Time Deposits—20.4% | | | |
| | Canadian Imperial Bank of Commerce (Grand Cayman) | | | |
| | 0.04%, 2/3/14 | 150,000,000 | | 150,000,000 |
| | Credit Agricole (Grand Cayman) | | | |
| | 0.09%, 2/3/14 | 1,000,000,000 | | 1,000,000,000 |
| | DnB Bank (Grand Cayman) | | | |
| | 0.03%—0.04%, 2/3/14 | 900,000,000 | | 900,000,000 |
12
| | | | |
| | | Principal | |
| | Dreyfus Cash Management (continued) | Amount ($) | Value ($) |
| |
| | Time Deposits (continued) | | |
| | Landesbank Hessen-Thuringen Girozentrale (Grand Cayman) | | |
| | 0.04%, 2/3/14 | 150,000,000 | 150,000,000 |
| | Lloyds Bank (London) | | |
| | 0.06%, 2/3/14 | 1,000,000,000 | 1,000,000,000 |
| | Natixis New York (Grand Cayman) | | |
| | 0.10%, 2/3/14 | 587,000,000 | 587,000,000 |
| | Skandinaviska Enskilda Banken (Grand Cayman) | | |
| | 0.04%, 2/3/14 | 993,000,000 | 993,000,000 |
| | Swedbank (Grand Cayman) | | |
| | 0.05%, 2/3/14 | 578,000,000 | 578,000,000 |
| | U.S. Bank NA (Grand Cayman) | | |
| | 0.10%, 2/3/14 | 600,000,000 | 600,000,000 |
| | Total Time Deposits | | |
| | (cost $5,958,000,000) | | 5,958,000,000 |
| |
| | U.S. Government Agencies—.6% | | |
| | Federal Farm Credit Bank | | |
| | 0.01%, 2/3/14 | 35,000,000 | 34,999,981 |
| | Federal Home Loan Bank | | |
| | 0.06%, 2/20/14 | 131,700,000 | 131,696,177 |
| | Total U.S. Government Agencies | | |
| | (cost $166,696,158) | | 166,696,158 |
| |
| | U.S. Treasury Bills—.5% | | |
| | 0.06%, 2/6/14 | | |
| | (cost $149,998,750) | 150,000,000 | 149,998,750 |
| |
| | U.S. Treasury Notes—4.9% | | |
| | 0.06%—0.22%, 2/15/14—6/30/14 | | |
| | (cost $1,423,370,203) | 1,419,000,000 | 1,423,370,203 |
| |
| | Repurchase Agreements—10.9% | | |
| | ABN AMRO Bank N.V. | | |
| | 0.02%, dated 1/31/14, due 2/3/14 in the amount of $780,001,300 (fully collateralized by | | |
| | $146,681,866 U.S. Treasury Bills, due 7/10/14, value $146,649,010 and $653,649,151 | | |
| | U.S. Treasury Notes, 0.25%-1.75%, due 6/30/14-10/31/20, value $648,951,013) | 780,000,000 | 780,000,000 |
| | Barclays Capital, Inc. | | |
| | 0.02%, dated 1/31/14, due 2/3/14 in the amount of $663,001,105 (fully collateralized by | | |
| | $376,000,852 U.S. Treasury Inflation Protected Securities, 0.13%, due 4/15/16-1/15/23, | | |
| | value $390,701,951, $26,619,900 U.S. Treasury Notes, 2.13%, due 1/31/21, value $26,520,075 | | |
| | and $417,418,627 U.S. Treasury Strips, due 2/15/17-11/15/43, value $259,038,065) | 663,000,000 | 663,000,000 |
| | BNP Paribas | | |
| | 0.02%, dated 1/31/14, due 2/3/14 in the amount of $10,000,017 (fully | | |
| | collateralized by $9,805,900 U.S. Treasury Inflation Protected Securities, | | |
| | 0.13%, due 4/15/18, value $10,200,053) | 10,000,000 | 10,000,000 |
STATEMENT OF INVESTMENTS (continued)
| | | | |
| | Principal | | |
| Dreyfus Cash Management (continued) | Amount ($) | | Value ($) |
| |
| Repurchase Agreements (continued) | | | |
| Credit Agricole CIB | | | |
| 0.02%-0.03%, dated 1/31/14, due 2/3/14 in the amount of $1,240,002,400 (fully | | | |
| collateralized by $259,801,895 Federal Home Loan Mortgage Corp., 1.88%-7.50%, | | | |
| due 3/1/27-11/1/43, value $52,283,074, $888,683,047 Federal National Mortgage | | | |
| Association, 0%-6.50%, due 9/1/15-3/1/50, value $292,507,553, $237,755,186 | | | |
| Government National Mortgage Association, 0.96%-7%, due 7/20/30-12/20/63, | | | |
| value $63,019,377, $526,533,217 U.S. Treasury Inflation Protected Securities, | | | |
| 0.13%-2%, due 7/15/14-4/15/17, value $620,695,210 and $227,951,539 | | | |
| U.S. Treasury Notes, 0.88%-3.38%, due 3/31/14-11/15/19, value $236,294,790) | 1,240,000,000 | | 1,240,000,000 |
| Deutsche Bank Securities Inc. | | | |
| 0.03%, dated 1/31/14, due 2/3/14 in the amount of $200,000,500 (fully | | | |
| collateralized by $205,877,800 U.S. Treasury Notes, 0.25%-1.13%, | | | |
| due 12/31/15-5/31/19, value $204,000,043) | 200,000,000 | | 200,000,000 |
| TD Securities (USA) LLC | | | |
| 0.02%, dated 1/31/14, due 2/3/14 in the amount of $300,000,500 (fully | | | |
| collateralized by cash, value $56,671,808, $78,292,412 U.S. Treasury Bills, | | | |
| due 2/27/14-7/17/14, value $78,289,886, $6,432,300 U.S. Treasury Bonds, | | | |
| 2.75%-7.63%, due 11/15/22-11/15/42, value $7,191,220, $2,255,300 | | | |
| U.S. Treasury Inflation Protected Securities, 0.75%-2.13%, due 2/15/40-2/15/42, | | | |
| value $2,089,128, $146,936,100 U.S. Treasury Notes, 0.25%-4.50%, | | | |
| due 2/28/14-11/15/23, value $150,797,699 and $27,700,000 | | | |
| U.S. Treasury Strips, due 11/15/39-11/15/43, value $9,826,823) | 300,000,000 | | 300,000,000 |
| Total Repurchase Agreements | | | |
| (cost $3,193,000,000) | | | 3,193,000,000 |
| |
| Total Investments (cost $29,241,035,858) | 100.0 | % | 29,241,035,858 |
| |
| Cash and Receivables (Net) | .0 | % | 1,507,432 |
| |
| Net Assets | 100.0 | % | 29,242,543,290 |
| |
| a Variable rate security—interest rate subject to periodic change. |
| b Securities exempt from registration pursuant to Rule 144A under the Securities Act of 1933.These securities may be resold in transactions exempt from registration, normally to qualified |
| institutional buyers.At January 31, 2014, these securities amounted to $6,484,143,752 or 22.2% of net assets. |
| | | | |
| Portfolio Summary (Unaudited)† | | | |
| |
| | Value (%) | | Value (%) |
| Banking | 77.7 | Finance | 2.2 |
| Repurchase Agreements | 10.9 | Asset-Backed/Multi-Seller Programs | .4 |
| U.S. Government/Agencies | 6.0 | | |
| Asset-Backed/Banking | 2.8 | | 100.0 |
| |
| † Based on net assets. | | | |
| See notes to financial statements. | | | |
14
STATEMENT OF INVESTMENTS
January 31, 2014
| | | | | |
| | Annualized | | | |
| | Yield on | | | |
| | Date of | Principal | | |
| Dreyfus Government Cash Management | Purchase (%) | Amount ($) | | Value ($) |
| |
| U.S. Government Agencies—64.9% | | | | |
| Federal Farm Credit Bank: | | | | |
| 2/7/14 | 0.04 | 50,000,000 | | 49,999,667 |
| 2/18/14 | 0.05 | 150,000,000 | | 149,996,458 |
| 4/1/14 | 0.03 | 50,000,000 | | 49,997,542 |
| 4/17/14 | 0.09 | 10,000,000 | | 9,998,125 |
| 6/6/14 | 0.11 | 65,000,000 | | 64,975,174 |
| Federal Home Loan Bank: | | | | |
| 2/3/14 | 0.12 | 500,000,000 | a | 500,000,000 |
| 2/6/14 | 0.06 | 300,000,000 | | 299,997,500 |
| 2/7/14 | 0.06 | 250,000,000 | | 249,997,500 |
| 2/10/14 | 0.06 | 250,000,000 | | 249,996,250 |
| 2/10/14 | 0.13 | 100,000,000 | | 99,999,686 |
| 2/11/14 | 0.06 | 150,000,000 | | 149,997,500 |
| 2/12/14 | 0.10 | 300,000,000 | | 299,990,833 |
| 2/14/14 | 0.10 | 100,000,000 | | 99,996,389 |
| 2/26/14 | 0.05 | 270,000,000 | | 269,990,625 |
| 3/4/14 | 0.05 | 250,000,000 | | 249,989,236 |
| 3/6/14 | 0.06 | 250,000,000 | | 249,986,250 |
| 3/7/14 | 0.08 | 486,200,000 | | 486,162,744 |
| 3/12/14 | 0.06 | 150,000,000 | | 149,990,250 |
| 3/13/14 | 0.04 | 500,000,000 | | 499,977,778 |
| 3/14/14 | 0.04 | 49,000,000 | | 48,997,768 |
| 3/19/14 | 0.04 | 505,900,000 | | 505,874,143 |
| 3/21/14 | 0.05 | 135,000,000 | | 134,991,900 |
| 3/21/14 | 0.12 | 100,000,000 | | 100,006,457 |
| 3/25/14 | 0.04 | 100,000,000 | | 99,994,222 |
| 4/1/14 | 0.05 | 200,000,000 | | 199,984,167 |
| 4/11/14 | 0.05 | 355,200,000 | | 355,164,251 |
| 4/14/14 | 0.05 | 200,000,000 | | 199,980,555 |
| 4/16/14 | 0.14 | 40,000,000 | | 39,999,021 |
| 4/25/14 | 0.07 | 541,300,000 | | 541,218,204 |
| 5/2/14 | 0.07 | 200,000,000 | | 199,965,000 |
| 5/16/14 | 0.11 | 205,000,000 | | 204,934,855 |
| 5/27/14 | 0.12 | 48,000,000 | | 48,000,000 |
| 5/28/14 | 0.06 | 69,000,000 | | 68,986,660 |
| 7/1/14 | 0.09 | 250,000,000 | | 249,906,250 |
| 7/16/14 | 0.09 | 250,000,000 | | 249,902,604 |
| 7/22/14 | 0.11 | 250,000,000 | | 249,981,606 |
| 7/22/14 | 0.11 | 200,000,000 | | 199,994,728 |
| 8/5/14 | 0.10 | 50,000,000 | | 49,974,305 |
| 1/16/15 | 0.17 | 56,800,000 | | 56,797,277 |
| 1/27/15 | 0.17 | 150,000,000 | | 149,992,603 |
STATEMENT OF INVESTMENTS (continued)
| | | | | | |
| | | Annualized | | | |
| | | Yield on | | | |
| | | Date of | Principal | | |
| | Dreyfus Government Cash Management (continued) | Purchase (%) | Amount ($) | | Value ($) |
| |
| | U.S. Government Agencies (continued) | | | | |
| | Federal Home Loan Mortgage Corp.: | | | | |
| | 2/25/14 | 0.15 | 500,000,000 | a,b | 500,000,000 |
| | 2/26/14 | 0.12 | 250,000,000 | b | 249,979,167 |
| | 2/27/14 | 0.12 | 250,000,000 | b | 249,978,333 |
| | 3/13/14 | 0.12 | 100,000,000 | b | 99,986,667 |
| | 3/26/14 | 0.04 | 121,025,000 | b | 121,017,873 |
| | 5/12/14 | 0.11 | 65,000,000 | b | 64,981,042 |
| | 6/18/14 | 0.12 | 550,000,000 | b | 549,748,833 |
| | Federal National Mortgage Association: | | | | |
| | 4/21/14 | 0.10 | 500,000,000 | b | 499,890,278 |
| | 4/23/14 | 0.09 | 200,000,000 | b | 199,959,500 |
| | 8/18/14 | 0.13 | 500,000,000 | b | 499,642,500 |
| | Total U.S. Government Agencies | | | | |
| | (cost $11,170,870,276) | | | | 11,170,870,276 |
| |
| |
| | U.S. Treasury Bills—1.7% | | | | |
| | 2/6/14 | | | | |
| | (cost $299,996,875) | 0.08 | 300,000,000 | | 299,996,875 |
| |
| |
| | U.S. Treasury Notes—7.3% | | | | |
| | 3/15/14 | 0.09 | 250,000,000 | | 250,345,145 |
| | 3/31/14 | 0.10 | 150,000,000 | | 150,035,824 |
| | 3/31/14 | 0.10 | 400,000,000 | | 401,050,444 |
| | 7/31/14 | 0.14 | 200,000,000 | | 199,988,463 |
| | 9/30/14 | 0.17 | 250,000,000 | | 253,647,990 |
| | Total U.S. Treasury Notes | | | | |
| | (cost $1,255,067,866) | | | | 1,255,067,866 |
| |
| |
| | Repurchase Agreements—28.4% | | �� | | |
| | Bank of Nova Scotia | | | | |
| | dated 1/31/14, due 2/3/14 in the amount of $500,000,833 (fully | | | | |
| | collateralized by $282,719,880 Federal Home Loan Bank, 1%-5.40%, | | | | |
| | due 3/10/14-12/7/27, value $268,417,849, $27,108,434 Federal | | | | |
| | Home Loan Mortgage Corp., 1%, due 8/20/14, value $27,357,078, | | | | |
| | $163,556,024 Federal National Mortgage Association, 0.55%-6.25%, | | | | |
| | due 9/28/16-5/15/29, value $163,882,374 and $50,360,482 U.S. Treasury | | | | |
| | Notes, 0.25%-0.38%, due 1/31/16-5/15/16, value $50,342,757) | 0.02 | 500,000,000 | | 500,000,000 |
16
| | | | |
| | Annualized | | |
| | Yield on | | |
| | Date of | Principal | |
| Dreyfus Government Cash Management (continued) | Purchase (%) | Amount ($) | Value ($) |
| |
| Repurchase Agreements (continued) | | | |
| Barclays Capital, Inc. | | | |
| dated 1/31/14, due 2/3/14 in the amount of $85,000,142 | | | |
| (fully collateralized by $50,212,830 U.S. Treasury Inflation | | | |
| Protected Securities, 0.13%, due 4/15/16-1/15/23, | | | |
| value $52,134,483 and $55,699,503 U.S. Treasury Strips, | | | |
| due 2/15/17-11/15/43, value $34,565,519) | 0.02 | 85,000,000 | 85,000,000 |
| Citigroup Global Markets Holdings Inc. | | | |
| dated 1/31/14, due 2/3/14 in the amount of $135,000,225 | | | |
| (fully collateralized by $815,000 Federal Farm Credit Bank, 1.89%, | | | |
| due 4/29/21, value $773,614, $75,896,100 Federal Home Loan Bank, | | | |
| 0%-2.53%, due 7/30/14-4/10/28, value $60,631,034, $40,819,000 | | | |
| Federal National Mortgage Association, 2%-3%, due 3/13/14-9/6/23, | | | |
| value $40,048,290 and $27,455,600 U.S. Treasury Inflation Protected | | | |
| Securities, 2.38%-2.50%, due 1/15/17-1/15/29, value $36,247,120) | 0.02 | 135,000,000 | 135,000,000 |
| Deutsche Bank Securities Inc. | | | |
| dated 1/31/14, due 2/3/14 in the amount of $55,000,092 (fully | | | |
| collateralized by $2,366,000 Federal Agricultural Mortgage Corp., | | | |
| 5.13%, due 4/19/17, value $2,688,985, $15,512,909 Federal Home | | | |
| Loan Bank, 0%-5.38%, due 2/7/14-7/25/33, value $16,396,790, | | | |
| $11,100,000 Federal Home Loan Mortgage Corp., 3.54%, due 7/19/28, | | | |
| value $10,836,708 and $35,453,000 Federal National Mortgage | | | |
| Association, 0%-3.03%, due 2/5/14-5/15/30, value $26,177,683) | 0.02 | 55,000,000 | 55,000,000 |
| Federal Reserve Bank of New York, | | | |
| dated 1/31/14, due 2/3/14 in the amount of $2,000,005,000 (fully | | | |
| collateralized by $2,158,941,500 U.S. Treasury Bonds, 3.13%, | | | |
| due 2/15/42, value $2,000,005,026) | 0.03 | 2,000,000,000 | 2,000,000,000 |
| JPMorgan Chase & Co. | | | |
| dated 1/31/14, due 2/3/14 in the amount of $150,000,500 | | | |
| (fully collateralized by $1,312,810,889 Federal National | | | |
| Mortgage Association, 5.61%-6.89%, due 6/25/29-12/25/43, | | | |
| value $153,000,640) | 0.04 | 150,000,000 | 150,000,000 |
| RBC Capital Markets | | | |
| dated 1/31/14, due 2/3/14 in the amount of $550,000,458 (fully | | | |
| collateralized by $7,659,000 Federal Farm Credit Bank, 0.50%-7.32%, | | | |
| due 2/5/14-12/17/36, value $7,598,730, $243,638,000 Federal Home | | | |
| Loan Bank, 0%-7%, due 3/21/14-2/15/30, value $235,493,758, | | | |
| $101,872,000 Federal Home Loan Mortgage Corp., 0%-6.25%, | | | |
| due 2/25/14-7/15/32, value $101,491,024 and $224,190,000 | | | |
| Federal National Mortgage Association, 0.38%-8.20%, | | | |
| due 2/5/14-4/29/33, value $216,417,337) | 0.01 | 550,000,000 | 550,000,000 |
STATEMENT OF INVESTMENTS (continued)
| | | | | | |
| | Annualized | | | | |
| | Yield on | | | | |
| | Date of | Principal | | | |
| Dreyfus Government Cash Management (continued) | Purchase (%) | Amount ($) | | Value ($) | |
| |
| Repurchase Agreements (continued) | | | | | |
| Societe Generale | | | | | |
| dated 1/31/14, due 2/3/14 in the amount of $1,425,003,563 (fully | | | | | |
| collateralized by $90,507,000 Federal Farm Credit Bank, 0.59%-1.50%, | | | | | |
| due 11/16/15-6/27/16, value $92,727,039, $312,405,000 Federal Home | | | | | |
| Loan Bank, 0.50%-1.38%, due 5/28/14-11/20/17, value $313,032,330, | | | | | |
| $206,001,000 Federal National Mortgage Association, 0.50%-2.13%, | | | | | |
| due 10/21/15-7/10/18, value $206,242,912, $80,000,000 U.S. Treasury | | | | | |
| Bills, due 7/3/14- 9/18/14, value $79,977,300, $289,118,700 | | | | | |
| U.S. Treasury Bonds, 7.13%-7.50%, due 2/15/23—11/15/24, | | | | | |
| value $416,746,025 and $349,844,400 U.S. Treasury Notes, | | | | | |
| 0.25%-2.13%, due 2/15/15-8/31/20, value $344,776,775) | 0.03 | 1,425,000,000 | | 1,425,000,000 | |
| Total Repurchase Agreements | | | | | |
| (cost $4,900,000,000) | | | | 4,900,000,000 | |
| |
| Total Investments (cost $17,625,935,017) | | 102.3 | % | 17,625,935,017 | |
| |
| Liabilities, Less Cash and Receivables | | (2.3 | %) | (394,292,512 | ) |
| |
| Net Assets | | 100.0 | % | 17,231,642,505 | |
| |
| a Variable rate security—interest rate subject to periodic change. |
| b The Federal Housing Finance Agency (“FHFA”) placed the Federal Home Loan Mortgage Corporation and Federal National Mortgage Association into conservatorship with FHFA as |
| the conservator.As such, the FHFA oversees the continuing affairs of these companies. |
| | | | |
| Portfolio Summary (Unaudited)† | | | |
| |
| | Value (%) | | Value (%) |
| Federal Home Loan Bank | 45.3 | Federal National Mortgage Association | 7.0 |
| Repurchase Agreements | 28.4 | Federal Farm Credit Bank | 1.9 |
| Federal Home Loan Mortgage Corp. | 10.7 | U.S. Treasury Bills | 1.7 |
| U.S. Treasury Notes | 7.3 | | 102.3 |
| |
| † Based on net assets. | | | |
| See notes to financial statements. | | | |
18
STATEMENT OF INVESTMENTS
January 31, 2014
| | | | | |
| | Annualized | | | |
| | Yield on | | | |
| | Date of | Principal | | |
| Dreyfus Government Prime Cash Management | Purchase (%) | Amount ($) | | Value ($) |
| |
| U.S. Government Agencies—77.3% | | | | |
| Federal Farm Credit Bank: | | | | |
| 2/3/14 | 0.01 | 100,000,000 | | 99,999,917 |
| 2/5/14 | 0.02 | 25,000,000 | | 24,999,944 |
| 2/10/14 | 0.03 | 25,000,000 | | 24,999,812 |
| 2/12/14 | 0.01 | 15,000,000 | | 14,999,954 |
| 2/12/14 | 0.10 | 50,000,000 | a | 50,008,075 |
| 2/14/14 | 0.09 | 90,000,000 | | 89,997,075 |
| 2/19/14 | 0.16 | 100,000,000 | a | 99,999,507 |
| 2/20/14 | 0.02 | 30,000,000 | | 29,999,683 |
| 2/27/14 | 0.02 | 15,000,000 | | 14,999,783 |
| 3/12/14 | 0.07 | 80,000,000 | | 79,993,933 |
| 3/19/14 | 0.03 | 50,000,000 | | 49,998,083 |
| 3/21/14 | 0.03 | 40,000,000 | | 39,998,400 |
| 3/25/14 | 0.05 | 22,200,000 | | 22,198,237 |
| 3/31/14 | 0.05 | 100,000,000 | | 99,991,944 |
| 4/10/14 | 0.07 | 5,000,000 | | 4,999,339 |
| 4/11/14 | 0.05 | 75,000,000 | | 74,992,812 |
| 4/17/14 | 0.09 | 40,000,000 | | 40,209,796 |
| 4/24/14 | 0.09 | 25,000,000 | | 24,994,875 |
| 4/28/14 | 0.08 | 5,000,000 | | 4,999,044 |
| 5/19/14 | 0.04 | 15,000,000 | | 14,998,217 |
| 5/30/14 | 0.05 | 50,000,000 | | 49,991,806 |
| 6/3/14 | 0.08 | 50,000,000 | | 49,986,444 |
| 6/4/14 | 0.06 | 75,000,000 | | 74,984,625 |
| 6/6/14 | 0.06 | 25,000,000 | | 24,994,792 |
| 6/19/14 | 0.12 | 50,000,000 | | 49,977,000 |
| 6/27/14 | 0.08 | 45,000,000 | | 44,984,792 |
| 7/18/14 | 0.08 | 19,499,000 | | 19,491,764 |
| 8/11/14 | 0.08 | 20,000,000 | | 19,991,511 |
| 8/15/14 | 0.08 | 15,000,000 | | 14,993,500 |
| Federal Home Loan Bank: | | | | |
| 2/3/14 | 0.01 | 100,000,000 | | 99,999,944 |
| 2/3/14 | 0.12 | 50,000,000 | a | 50,000,000 |
| 2/6/14 | 0.11 | 100,000,000 | a | 99,998,661 |
| 2/12/14 | 0.02 | 383,702,000 | | 383,699,981 |
| 2/14/14 | 0.02 | 150,000,000 | | 149,998,917 |
| 2/19/14 | 0.02 | 5,000,000 | | 4,999,950 |
| 2/21/14 | 0.04 | 187,000,000 | | 186,995,589 |
| 2/26/14 | 0.07 | 297,650,000 | | 297,635,531 |
STATEMENT OF INVESTMENTS (continued)
| | | | |
| | Annualized | | |
| | Yield on | | |
| | Date of | Principal | |
| Dreyfus Government Prime Cash Management (continued) | Purchase (%) | Amount ($) | Value ($) |
| |
| U.S. Government Agencies (continued) | | | |
| Federal Home Loan Bank (continued): | | | |
| 2/28/14 | 0.06 | 97,863,000 | 97,858,312 |
| 3/6/14 | 0.06 | 100,000,000 | 99,994,500 |
| 3/7/14 | 0.07 | 25,000,000 | 24,998,347 |
| 3/13/14 | 0.04 | 100,000,000 | 99,995,556 |
| 4/7/14 | 0.09 | 15,000,000 | 14,997,563 |
| 4/25/14 | 0.11 | 50,000,000 | 49,987,896 |
| 5/1/14 | 0.05 | 10,000,000 | 9,998,888 |
| 5/28/14 | 0.12 | 99,196,000 | 99,157,644 |
| 6/2/14 | 0.13 | 153,200,000 | 153,183,614 |
| 6/4/14 | 0.13 | 48,800,000 | 48,779,158 |
| 6/6/14 | 0.13 | 25,000,000 | 24,988,715 |
| 6/13/14 | 0.13 | 24,992,000 | 24,980,270 |
| 6/18/14 | 0.13 | 9,000,000 | 8,995,616 |
| 6/25/14 | 0.13 | 47,404,000 | 47,379,654 |
| 6/27/14 | 0.13 | 75,000,000 | 74,961,067 |
| Tennessee Valley Authority: | | | |
| 2/13/14 | 0.02 | 225,000,000 | 224,998,633 |
| 2/20/14 | 0.02 | 235,539,000 | 235,536,514 |
| 2/27/14 | 0.01 | 117,648,000 | 117,647,087 |
| Total U.S. Government Agencies | | | |
| (cost $3,988,542,271) | | | 3,988,542,271 |
| |
| |
| U.S. Treasury Bills—7.9% | | | |
| 2/6/14 | 0.01 | 80,000,000 | 79,999,944 |
| 4/24/14 | 0.03 | 80,000,000 | 79,995,444 |
| 5/1/14 | 0.01 | 250,000,000 | 249,993,819 |
| Total U.S. Treasury Bills | | | |
| (cost $409,989,207) | | | 409,989,207 |
| |
| |
| U.S. Treasury Notes—14.8% | | | |
| 2/15/14 | 0.14 | 100,000,000 | 100,050,328 |
| 3/15/14 | 0.04 | 50,000,000 | 50,072,624 |
| 3/31/14 | 0.09 | 165,000,000 | 165,043,112 |
| 4/30/14 | 0.07 | 120,000,000 | 120,052,141 |
20
| | | | | |
| | Annualized | | | |
| | Yield on | | | |
| | Date of | Principal | | |
| Dreyfus Government Prime Cash Management (continued) | Purchase (%) | Amount ($) | | Value ($) |
| |
| U.S. Treasury Notes (continued) | | | | |
| 5/15/14 | 0.08 | 50,000,000 | | 50,664,047 |
| 5/31/14 | 0.14 | 50,000,000 | | 50,349,365 |
| 6/15/14 | 0.06 | 125,000,000 | | 125,312,603 |
| 6/30/14 | 0.11 | 100,000,000 | | 100,057,172 |
| Total U.S. Treasury Notes | | | | |
| (cost $761,601,392) | | | | 761,601,392 |
| |
| Total Investments (cost $5,160,132,870) | | 100.0 | % | 5,160,132,870 |
| Cash and Receivables (Net) | | .0 | % | 1,994,785 |
| Net Assets | | 100.0 | % | 5,162,127,655 |
| | |
| a | Variable rate security—interest rate subject to periodic change. |
| | | | |
| Portfolio Summary (Unaudited)† | | | |
| |
| | Value (%) | | Value (%) |
| Federal Home Loan Bank | 41.7 | Tennessee Valley Authority | 11.2 |
| Federal Farm Credit Bank | 24.4 | U.S. Treasury Bills | 7.9 |
| U.S. Treasury Notes | 14.8 | | 100.0 |
| |
| † Based on net assets. | | | |
| See notes to financial statements. | | | |
STATEMENT OF INVESTMENTS
January 31, 2014
| | | | |
| | Annualized | | |
| | Yield on | | |
| | Date of | Principal | |
| Dreyfus Treasury & Agency Cash Management | Purchase (%) | Amount ($) | Value ($) |
| |
| U.S. Treasury Bills—13.8% | | | |
| 2/6/14 | 0.00 | 164,000,000 | 164,000,000 |
| 4/10/14 | 0.04 | 1,726,510,000 | 1,726,376,750 |
| 4/17/14 | 0.09 | 125,000,000 | 124,977,865 |
| 5/29/14 | 0.10 | 500,000,000 | 499,835,469 |
| Total U.S. Treasury Bills | | | |
| (cost $2,515,190,084) | | | 2,515,190,084 |
| U.S. Treasury Notes—36.2% | | | |
| 2/15/14 | 0.08 | 275,000,000 | 275,145,125 |
| 2/28/14 | 0.13 | 200,000,000 | 200,018,081 |
| 2/28/14 | 0.14 | 640,000,000 | 640,838,708 |
| 3/15/14 | 0.10 | 905,000,000 | 906,246,903 |
| 3/31/14 | 0.05 | 100,000,000 | 100,270,369 |
| 3/31/14 | 0.09 | 300,000,000 | 300,075,968 |
| 4/15/14 | 0.06 | 600,000,000 | 601,430,184 |
| 4/30/14 | 0.09 | 444,420,000 | 444,593,087 |
| 4/30/14 | 0.09 | 302,165,000 | 303,475,187 |
| 5/15/14 | 0.11 | 276,000,000 | 279,641,315 |
| 5/31/14 | 0.10 | 700,000,000 | 700,343,447 |
| 5/31/14 | 0.14 | 465,000,000 | 468,254,788 |
| 6/15/14 | 0.08 | 250,000,000 | 250,614,800 |
| 7/31/14 | 0.14 | 200,000,000 | 199,988,463 |
| 8/15/14 | 0.14 | 280,000,000 | 280,512,787 |
| 9/30/14 | 0.17 | 250,000,000 | 253,647,990 |
| 11/15/14 | 0.20 | 287,000,000 | 296,251,191 |
| 11/30/14 | 0.11 | 100,000,000 | 101,638,322 |
| Total U.S. Treasury Notes | | | |
| (cost $6,602,986,715) | | | 6,602,986,715 |
| Repurchase Agreements—49.9% | | | |
| ABN AMRO Bank N.V. | | | |
| dated 1/31/14, due 2/3/14 in the amount of $700,001,167 | | | |
| (fully collateralized by $231,542,175 Government National | | | |
| Mortgage Association, 4%-4.50%, due 9/20/41-6/15/42, | | | |
| value $162,578,358, $37,610,735 U.S. Treasury Bills, | | | |
| due 7/10/14, value $37,602,310, $5,037,900 U.S. Treasury | | | |
| Bonds, 4.63%, due 2/15/40, value $6,080,064, $7,594,200 | | | |
| U.S. Treasury Inflation Protected Securities, 2.38%, due 1/15/17, | | | |
| value $9,708,184 and $471,449,046 U.S. Treasury Notes, | | | |
| 0.25%-4.63%, due 6/30/14-11/15/23, value $498,031,142) | 0.02 | 700,000,000 | 700,000,000 |
22
| | | | |
| | Annualized | | |
| | Yield on | | |
| | Date of | Principal | |
| Dreyfus Treasury & Agency Cash Management (continued) | Purchase (%) | Amount ($) | Value ($) |
| |
| Repurchase Agreements (continued) | | | |
| Bank of Nova Scotia | | | |
| dated 1/31/14, due 2/3/14 in the amount of $200,000,333 | | | |
| (fully collateralized by $167,460 U.S. Treasury Bills, due 5/15/14, | | | |
| value $167,440, $33,115,440 U.S. Treasury Bonds, 2.75%-7.88%, | | | |
| due 2/15/21-8/15/42, value $37,811,873, $26,916,300 | | | |
| U.S. Treasury Inflation Protected Securities, 1.13%-2.50%, | | | |
| due 1/15/16-1/15/29, value $33,344,044 and $130,961,411 | | | |
| U.S. Treasury Notes, 0.25%-4.50%, due 2/15/14-5/15/22, | | | |
| value $132,676,648) | 0.02 | 200,000,000 | 200,000,000 |
| Barclays Capital, Inc. | | | |
| dated 1/31/14, due 2/3/14 in the amount of $374,000,623 | | | |
| (fully collateralized by $220,936,450 U.S. Treasury Inflation | | | |
| Protected Securities, 0.13%, due 4/15/16-1/15/23, value | | | |
| $229,391,726 and $245,077,812 U.S. Treasury Strips, | | | |
| due 2/15/17-11/15/43, value $152,088,283) | 0.02 | 374,000,000 | 374,000,000 |
| Citigroup Global Markets Holdings Inc. | | | |
| dated 1/31/14, due 2/3/14 in the amount of $140,000,117 | | | |
| (fully collateralized by $13,509,900 U.S. Treasury Inflation | | | |
| Protected Securities, 0.38%, due 7/15/23, value $13,448,641 | | | |
| and $130,828,300 U.S. Treasury Notes, 1%-1.38%, | | | |
| due 3/31/17-1/31/20, value $129,351,457) | 0.01 | 140,000,000 | 140,000,000 |
| Credit Agricole CIB | | | |
| dated 1/31/14, due 2/3/14 in the amount of $2,115,003,525 | | | |
| (fully collateralized by $1,325,735,422 U.S. Treasury Inflation | | | |
| Protected Securities, 0.13%-2%, due 7/15/14-4/15/17, | | | |
| value $1,562,821,868 and $573,487,383 U.S. Treasury Notes, | | | |
| 0.88%-3.38%, due 3/31/14-11/15/19, value $594,478,143) | 0.02 | 2,115,000,000 | 2,115,000,000 |
| Credit Suisse Securities LLC | | | |
| dated 1/31/14, due 2/3/14 in the amount of $250,000,417 (fully | | | |
| collateralized by $269,825,136 Government National Mortgage | | | |
| Association, 2.18%-6.50%, due 7/20/27-3/15/55, value $255,001,983) | 0.02 | 250,000,000 | 250,000,000 |
| Deutsche Bank Securities Inc. | | | |
| dated 1/31/14, due 2/3/14 in the amount of $125,000,208 | | | |
| (fully collateralized by $445,066,376 Government National Mortgage | | | |
| Association, 2.28%-8%, due 3/15/25-8/15/55, value $127,500,000) | 0.02 | 125,000,000 | 125,000,000 |
| Federal Reserve Bank of New York, | | | |
| dated 1/31/14, due 2/3/14 in the amount of $2,850,007,125 | | | |
| (fully collateralized by $2,681,296,600 U.S. Treasury Notes, | | | |
| 2.63%, due 4/30/18, value $2,850,007,189) | 0.03 | 2,850,000,000 | 2,850,000,000 |
| Merrill Lynch & Co. Inc. | | | |
| dated 1/31/14, due 2/3/14 in the amount of $120,000,200 | | | |
| (fully collateralized by $1,896,294,988 Government National Mortgage | | | |
| Association, 1.63%-13%, due 6/15/14-3/15/55, value $122,400,000) | 0.02 | 120,000,000 | 120,000,000 |
STATEMENT OF INVESTMENTS (continued)
| | | | | |
| | Annualized | | | |
| | Yield on | | | |
| | Date of | Principal | | |
| Dreyfus Treasury & Agency Cash Management (continued) | Purchase (%) | Amount ($) | | Value ($) |
| |
| Repurchase Agreements (continued) | | | | |
| RBC Capital Markets | | | | |
| dated 1/31/14, due 2/3/14 in the amount of $400,000,033 (fully | | | | |
| collateralized by $66,236,600 U.S. Treasury Bills, due 7/17/14-7/31/14, | | | | |
| value $66,218,075, $16,676,000 U.S. Treasury Bonds, 4.50%-8.75%, | | | | |
| due 2/15/20-8/15/39, value $19,777,487, $9,425,100 U.S. Treasury | | | | |
| Inflation Protected Securities, 1.13%-2.63%, due 1/15/17-1/15/21, | | | | |
| value $11,279,093 and $311,475,400 U.S. Treasury Notes, 0.75%-4.13%, | | | | |
| due 2/15/15-11/15/21, value $310,725,418) | 0.001 | 400,000,000 | | 400,000,000 |
| Societe Generale | | | | |
| dated 1/31/14, due 2/3/14 in the amount of $1,425,003,563 (fully | | | | |
| collateralized by $42,373,000 U.S. Treasury Bills, due 3/27/14-5/29/14, | | | | |
| value $42,369,683, $268,131,900 U.S. Treasury Bonds, 2.75%-11.25%, | | | | |
| due 2/15/15-11/15/42, value $262,465,716, $1,054,965,541 | | | | |
| U.S. Treasury Notes, 0.25%-4.25%, due 8/15/14-9/30/20, | | | | |
| value $1,070,244,972 and $171,434,489 U.S. Treasury Strips, | | | | |
| due 11/15/18-8/15/43, value $78,419,640) | 0.03 | 1,425,000,000 | | 1,425,000,000 |
| TD Securities (USA) LLC | | | | |
| dated 1/31/14, due 2/3/14 in the amount of $425,000,708 (fully | | | | |
| collateralized by $13,685,400 U.S. Treasury Bonds, 4.50%-11.25%, | | | | |
| due 2/15/15-8/15/39, value $17,509,354, $313,369,700 U.S. Treasury | | | | |
| Inflation Protected Securities, 0.13%-3.88%, due 4/15/14-2/15/42, | | | | |
| value $367,120,210, $45,836,900 U.S. Treasury Notes, 0.25%-4.50%, | | | | |
| due 4/15/14-6/30/20, value $46,903,134 and $5,400,000 U.S. Treasury | | | | |
| Strips, due 11/15/39-2/15/42, value $1,967,336) | 0.02 | 425,000,000 | | 425,000,000 |
| Total Repurchase Agreements | | | | |
| (cost $9,124,000,000) | | | | 9,124,000,000 |
| |
| Total Investments (cost $18,242,176,799) | | 99.9 | % | 18,242,176,799 |
| |
| Cash and Receivables (Net) | | .1 | % | 16,388,268 |
| |
| Net Assets | | 100.0 | % | 18,258,565,067 |
| | | | |
| Portfolio Summary (Unaudited)† | | | |
| | Value (%) | | Value (%) |
| Repurchase Agreements | 49.9 | U.S. Treasury Bills | 13.8 |
| U.S. Treasury Notes | 36.2 | | 99.9 |
| † Based on net assets. | | | |
| See notes to financial statements. | | | |
24
STATEMENT OF INVESTMENTS
January 31, 2014
| | | | |
| | Annualized | | |
| | Yield on | | |
| | Date of | Principal | |
| Dreyfus Treasury Prime Cash Management | Purchase (%) | Amount ($) | Value ($) |
| |
| U.S. Treasury Bills—89.0% | | | |
| 2/6/14 | 0.01 | 7,378,000,000 | 7,377,985,489 |
| 2/13/14 | 0.01 | 5,325,000,000 | 5,324,979,271 |
| 2/20/14 | 0.03 | 1,369,000,000 | 1,368,978,399 |
| 2/27/14 | 0.05 | 450,000,000 | 449,983,028 |
| 4/3/14 | 0.03 | 4,977,000,000 | 4,976,749,748 |
| 4/10/14 | 0.03 | 5,184,000,000 | 5,183,667,508 |
| 4/17/14 | 0.03 | 2,735,000,000 | 2,734,831,813 |
| 4/24/14 | 0.03 | 2,120,000,000 | 2,119,837,014 |
| 5/1/14 | 0.08 | 326,000,000 | 325,938,565 |
| 5/8/14 | 0.08 | 425,000,000 | 424,912,167 |
| 5/15/14 | 0.07 | 713,000,000 | 712,849,062 |
| 5/22/14 | 0.08 | 301,000,000 | 300,923,069 |
| 6/5/14 | 0.10 | 500,000,000 | 499,827,778 |
| 6/12/14 | 0.09 | 2,600,000,000 | 2,599,157,597 |
| 7/3/14 | 0.09 | 466,000,000 | 465,828,084 |
| 7/24/14 | 0.07 | 750,000,000 | 749,765,729 |
| Total U.S. Treasury Bills | | | |
| (cost $35,616,214,321) | | | 35,616,214,321 |
| |
| U.S. Treasury Notes—11.0% | | | |
| 2/15/14 | 0.00 | 1,136,600,000 | 1,138,368,622 |
| 2/15/14 | 0.09 | 435,000,000 | 435,228,568 |
| 2/28/14 | 0.06 | 67,000,000 | 67,009,267 |
| 2/28/14 | 0.21 | 50,000,000 | 50,063,017 |
| 3/15/14 | 0.08 | 100,000,000 | 100,141,026 |
| 3/31/14 | 0.10 | 230,000,000 | 230,603,372 |
| 4/15/14 | 0.06 | 402,000,000 | 402,962,161 |
| 4/30/14 | 0.09 | 450,000,000 | 450,177,447 |
| 4/30/14 | 0.10 | 425,000,000 | 426,829,894 |
| 5/31/14 | 0.13 | 234,000,000 | 235,643,123 |
STATEMENT OF INVESTMENTS (continued)
| | | | | |
| | Annualized | | | |
| | Yield on | | | |
| | Date of | Principal | | |
| Dreyfus Treasury Prime Cash Management (continued) | Purchase (%) | Amount ($) | | Value ($) |
| |
| U.S. Treasury Notes (continued) | | | | |
| 6/15/14 | 0.10 | 600,000,000 | | 601,431,539 |
| 6/30/14 | 0.12 | 250,000,000 | | 250,137,852 |
| Total U.S. Treasury Notes | | | | |
| (cost $4,388,595,888) | | | | 4,388,595,888 |
| Total Investments (cost $40,004,810,209) | | 100.0 | % | 40,004,810,209 |
| Cash and Receivables (Net) | | .0 | % | 1,467,116 |
| Net Assets | | 100.0 | % | 40,006,277,325 |
| | | | |
| Portfolio Summary (Unaudited)† | | | |
| | Value (%) | | Value (%) |
| U.S. Treasury Bills | 89.0 | U.S. Treasury Notes | 11.0 |
| | | | 100.0 |
| † Based on net assets. | | | |
| See notes to financial statements. | | | |
26
STATEMENT OF INVESTMENTS
January 31, 2014
| | | | | | |
| | Coupon | Maturity | Principal | | |
| Dreyfus Municipal Cash Management Plus | Rate (%) | Date | Amount ($) | | Value ($) |
| |
| Short-Term Investments—100.9% | | | | | |
| Alabama—.6% | | | | | |
| Mobile County Industrial Development Authority, Gulf Opportunity | | | | | |
| Zone Revenue (SSAB Alabama Inc.) (LOC; Swedbank) | 0.07 | 2/7/14 | 2,000,000 | a | 2,000,000 |
| Arizona—2.2% | | | | | |
| Maricopa County Industrial Development Authority, MFHR | | | | | |
| (San Clemente Apartments Project) (Liquidity Facility; | | | | | |
| FNMA and LOC; FNMA) | 0.08 | 2/7/14 | 1,010,000 | a | 1,010,000 |
| Mesa Unified School District Number 4 of Maricopa County, | | | | | |
| GO Notes (School Improvement Bonds) | 4.25 | 7/1/14 | 2,000,000 | | 2,033,448 |
| Phoenix Civic Improvement Corporation, Water System | | | | | |
| Revenue, CP (LOC; Royal Bank of Canada) | 0.12 | 3/10/14 | 4,000,000 | | 4,000,000 |
| Arkansas—1.6% | | | | | |
| Arkansas Development Finance Authority, | | | | | |
| MFHR (Capri Apartments Project) (LOC; FHLB) | 0.09 | 2/7/14 | 5,200,000 | a | 5,200,000 |
| California—6.0% | | | | | |
| Alameda County Industrial Development Authority, Revenue | | | | | |
| (Oakland Pallet Company, Inc. Project) (LOC; Comerica Bank) | 0.09 | 2/7/14 | 1,850,000 | a | 1,850,000 |
| Alameda County Industrial Development Authority, Revenue | | | | | |
| (Tool Family Partnership Project) (LOC; Wells Fargo Bank) | 0.06 | 2/7/14 | 1,512,000 | a | 1,512,000 |
| California Pollution Control Financing Authority, SWDR | | | | | |
| (Bay Counties Waste Services, Inc. Project) (LOC; Comerica Bank) | 0.10 | 2/7/14 | 2,300,000 | a | 2,300,000 |
| California Pollution Control Financing Authority, SWDR | | | | | |
| (Rainbow Disposal Company Inc. Project) (LOC; Comerica Bank) | 0.10 | 2/7/14 | 13,815,000 | a | 13,815,000 |
| Colorado—2.8% | | | | | |
| City and County of Denver, GO Notes | | | | | |
| (Justice System Facilities and Zoo Bonds) | 5.00 | 8/1/14 | 450,000 | | 460,704 |
| Colorado Housing and Finance Authority, EDR | | | | | |
| (Wanco, Inc. Project) (LOC; U.S. Bank NA) | 0.19 | 2/7/14 | 1,835,000 | a | 1,835,000 |
| Deutsche Bank Spears/Lifers Trust (Series DBE-1129 X) | | | | | |
| (City and County of Denver, Airport System Revenue) | | | | | |
| (Liquidity Facility; Deutsche Bank AG and LOC; Deutsche Bank AG) | 0.11 | 2/7/14 | 7,000,000 a,b,c | | 7,000,000 |
| Florida—9.9% | | | | | |
| Branch Banking and Trust Co. Municipal Trust (Series 2042) | | | | | |
| (Collier County School Board, COP, Refunding (Master | | | | | |
| Lease-Purchase Agreement)) (Liquidity Facility; Branch | | | | | |
| Banking and Trust Co. and LOC; Branch Banking and Trust Co.) | 0.08 | 2/7/14 | 4,975,000 a,b,c | | 4,975,000 |
| Branch Banking and Trust Co. Municipal Trust (Series 2057) | | | | | |
| (Miami-Dade County, Aviation Revenue (Miami International | | | | | |
| Airport)) (Liquidity Facility; Branch Banking and Trust Co. | | | | | |
| and LOC; Branch Banking and Trust Co.) | 0.07 | 2/7/14 | 10,060,000 a,b,c | | 10,060,000 |
| Kissimmee Utility Authority, CP | | | | | |
| (Liquidity Facility; JPMorgan Chase Bank) | 0.14 | 2/10/14 | 5,750,000 | | 5,750,000 |
| Miami-Dade County, Aviation Revenue (Miami-Dade International | | | | | |
| Airport) (Eagle 2013-0016) (Liquidity Facility; Citibank NA) | 0.07 | 2/7/14 | 5,000,000 a,b,c | | 5,000,000 |
STATEMENT OF INVESTMENTS (continued)
| | | | | | |
| Dreyfus Municipal | Coupon | Maturity | Principal | | |
| Cash Management Plus (continued) | Rate (%) | Date | Amount ($) | | Value ($) |
| |
| Short-Term Investments (continued) | | | | | |
| Florida (continued) | | | | | |
| Saint Lucie County School District, TAN | 2.00 | 3/1/14 | 2,000,000 | | 2,002,924 |
| Sunshine State Governmental Financing Commission, | | | | | |
| Revenue, CP (Liquidity Facility; JPMorgan Chase Bank) | 0.15 | 3/14/14 | 3,000,000 | | 3,000,000 |
| Sunshine State Governmental Financing Commission, | | | | | |
| Revenue, CP (Liquidity Facility; JPMorgan Chase Bank) | 0.13 | 4/9/14 | 1,625,000 | | 1,625,000 |
| Georgia—1.2% | | | | | |
| Fayette County Hospital Authority, RAC | | | | | |
| (Fayette Community Hospital Project) (LOC; FHLB) | 0.03 | 2/7/14 | 4,000,000 | a | 4,000,000 |
| Idaho—.5% | | | | | |
| Deutsche Bank Spears/Lifers Trust (Series DBE-1102) | | | | | |
| (Idaho Health Facilities Authority, Revenue (Saint Luke's | | | | | |
| Health System Project)) (Liquidity Facility; | | | | | |
| Deutsche Bank AG and LOC; Deutsche Bank AG) | 0.09 | 2/7/14 | 1,500,000 a,b,c | | 1,500,000 |
| Indiana—2.6% | | | | | |
| Indiana Finance Authority, EDR (JRL Leasing, Inc. and | | | | | |
| LaSarre Co., LLC Project) (LOC; PNC Bank NA) | 0.11 | 2/7/14 | 2,585,000 | a | 2,585,000 |
| Lawrence, Fort Harrison Reuse Authority, Tax Increment Revenue | | | | | |
| (Fort Harrison Military Base Reuse District) (LOC; PNC Bank NA) | 0.06 | 2/7/14 | 5,960,000 | a | 5,960,000 |
| Iowa—1.4% | | | | | |
| Iowa Finance Authority, Revenue (YMCA and Rehabilitation | | | | | |
| Center Project) (LOC; Bank of America) | 0.07 | 2/7/14 | 4,685,000 | a | 4,685,000 |
| Kansas—2.5% | | | | | |
| Kansas Development Finance Authority, MFHR | | | | | |
| (Tree House Apartments) (LOC; U.S. Bank NA) | 0.06 | 2/7/14 | 8,105,000 | a | 8,105,000 |
| Louisiana—1.5% | | | | | |
| Ascension Parish, Revenue, CP (BASF SE) | 0.27 | 4/24/14 | 5,000,000 | | 5,000,000 |
| Maryland—1.6% | | | | | |
| Anne Arundel County, EDR (Atlas Container | | | | | |
| Corporation Project) (LOC; M&T Trust) | 0.16 | 2/7/14 | 5,275,000 | a | 5,275,000 |
| Massachusetts—4.0% | | | | | |
| Massachusetts Health and Educational Facilities Authority, Revenue | | | | | |
| (Museum of Fine Arts Issue) (Liquidity Facility; Bank of America) | 0.06 | 2/3/14 | 10,700,000 | a | 10,700,000 |
| Springfield, GO Notes, BAN | 1.00 | 2/14/14 | 2,500,000 | | 2,500,544 |
| Michigan—.9% | | | | | |
| Pittsfield Township Economic Development Corporation, | | | | | |
| LOR, Refunding (Arbor Project) (LOC; Comerica Bank) | 0.09 | 2/7/14 | 2,995,000 | a | 2,995,000 |
| Minnesota—2.9% | | | | | |
| Minnesota Rural Water Finance Authority, | | | | | |
| Public Projects Construction Notes | 1.00 | 2/1/14 | 4,600,000 | | 4,600,174 |
| RBC Municipal Products Inc. Trust (Series E-19) (Minneapolis, | | | | | |
| Health Care System Revenue (Fairview Health Services)) (Liquidity | | | | | |
| Facility; Royal Bank of Canada and LOC; Royal Bank of Canada) | 0.04 | 2/7/14 | 5,000,000 a,b,c | | 5,000,000 |
28
| | | | | | |
| Dreyfus Municipal | Coupon | Maturity | Principal | | |
| Cash Management Plus (continued) | Rate (%) | Date | Amount ($) | | Value ($) |
| |
| Short-Term Investments (continued) | | | | | |
| Missouri—.9% | | | | | |
| Rockwood R-6 School District, GO Notes, Refunding | 5.00 | 2/1/14 | 2,905,000 | | 2,905,743 |
| Nebraska—2.1% | | | | | |
| Nebraska Investment Finance Authority, | | | | | |
| SFHR (Liquidity Facility; FHLB) | 0.05 | 2/7/14 | 6,865,000 | a | 6,865,000 |
| New Hampshire—2.0% | | | | | |
| New Hampshire Health and Education Facilities Authority, | | | | | |
| Revenue (University System of New Hampshire Issue) | | | | | |
| (Liquidity Facility; U.S. Bank NA) | 0.05 | 2/3/14 | 6,500,000 | a | 6,500,000 |
| New Jersey—.9% | | | | | |
| Monroe Township, GO Notes, BAN | 1.00 | 2/6/15 | 3,000,000 | | 3,022,740 |
| Ohio—1.6% | | | | | |
| Lorain County, IDR (Cutting Dynamics, Inc. Project) | | | | | |
| (LOC; PNC Bank NA) | 0.11 | 2/7/14 | 1,535,000 | a | 1,535,000 |
| Ohio Higher Educational Facility Commission, HR | | | | | |
| (Cleveland Clinic Health System Obligated Group) | 5.00 | 1/1/15 | 400,000 | | 416,785 |
| Union Township, GO Notes, BAN (Various Purpose) | 1.50 | 9/10/14 | 3,200,000 | | 3,220,245 |
| Pennsylvania—12.1% | | | | | |
| Beaver County Industrial Development Authority, EIR | | | | | |
| (BASF Corporation Project) | 0.20 | 2/7/14 | 1,200,000 | a | 1,200,000 |
| Bradford County Industrial Development Authority, Revenue | | | | | |
| (State Aggregates Inc. Project) (LOC; M&T Trust) | 0.24 | 2/7/14 | 775,000 | a | 775,000 |
| Deutsche Bank Spears/Lifers Trust (Series DBE-495) | | | | | |
| (Philadelphia, Airport Revenue) (Liquidity Facility; | | | | | |
| Deutsche Bank AG and LOC; Deutsche Bank AG) | 0.11 | 2/7/14 | 5,645,000 a,b,c | | 5,645,000 |
| Pennsylvania Economic Development Financing Authority, | | | | | |
| Revenue (Evergreen Community Power Facility) (LOC; M&T Trust) | 0.19 | 2/7/14 | 16,000,000 | a | 16,000,000 |
| Philadelphia Authority for Industrial Development, | | | | | |
| Revenue (The Philadelphia Protestant Home | | | | | |
| Project) (LOC; Bank of America) | 0.17 | 2/7/14 | 8,400,000 | a | 8,400,000 |
| Telford Industrial Development Authority, IDR | | | | | |
| (Ridgetop Associates Project) (LOC; Bank of America) | 0.13 | 2/7/14 | 3,620,000 | a | 3,620,000 |
| Union County Industrial Development Authority, | | | | | |
| Revenue (Stabler Companies, Inc. Project) (LOC; M&T Trust) | 0.19 | 2/7/14 | 3,825,000 | a | 3,825,000 |
| South Carolina—1.6% | | | | | |
| South Carolina Public Service Authority, Revenue, CP | | | | | |
| (Santee Cooper) (Liquidity Facility; Barclays Bank PLC) | 0.11 | 3/17/14 | 5,052,000 | | 5,052,000 |
| Tennessee—8.0% | | | | | |
| Clarksville Public Building Authority, Pooled Financing Revenue | | | | | |
| (Tennessee Municipal Bond Fund) (LOC; Bank of America) | 0.08 | 2/7/14 | 8,700,000 | a | 8,700,000 |
| Franklin County, GO Notes, Refunding | 2.00 | 6/1/14 | 1,360,000 | | 1,368,075 |
| Memphis, CP (Liquidity Facility; Mizuho Bank, Ltd.) | 0.07 | 2/5/14 | 5,000,000 | | 5,000,000 |
| Memphis, GO Notes (General Improvement) | 5.00 | 4/1/14 | 250,000 | | 251,939 |
STATEMENT OF INVESTMENTS (continued)
| | | | | | |
| Dreyfus Municipal | Coupon | Maturity | Principal | | |
| Cash Management Plus (continued) | Rate (%) | Date | Amount ($) | | Value ($) |
| |
| Short-Term Investments (continued) | | | | | |
| Tennessee (continued) | | | | | |
| Montgomery County Public Building Authority, Pooled Financing | | | | | |
| Revenue (Tennessee County Loan Pool) (LOC; Bank of America) | 0.07 | 2/3/14 | 4,100,000 | a | 4,100,000 |
| Sevier County Public Building Authority, Local Government | | | | | |
| Public Improvement Revenue (LOC; Bank of America) | 0.06 | 2/7/14 | 6,650,000 | a | 6,650,000 |
| Texas—14.4% | | | | | |
| Dallas, GO Notes | 5.00 | 2/15/15 | 325,000 | | 340,636 |
| DeSoto Industrial Development Authority, IDR, Refunding | | | | | |
| (National Service Industries, Inc. Project) (LOC; Wells Fargo Bank) | 0.15 | 2/7/14 | 3,660,000 | a | 3,660,000 |
| Garland, Electric Utility System Revenue, CP (LOC; Wells Fargo Bank) | 0.13 | 2/19/14 | 5,000,000 | | 5,000,000 |
| Gulf Coast Waste Disposal Authority, SWDR (Air Products Project) | 0.05 | 2/7/14 | 3,000,000 | a | 3,000,000 |
| Jefferson County Industrial Development Corporation, | | | | | |
| Hurricane Ike Disaster Area Revenue (Jefferson | | | | | |
| Refinery, L.L.C. Project) (LOC; Branch Banking and Trust Co.) | 0.65 | 4/15/14 | 5,350,000 | | 5,350,000 |
| Port of Port Arthur Navigation District, Revenue, CP (BASF SE) | 0.27 | 4/24/14 | 5,000,000 | | 5,000,000 |
| Red River Education Finance Corporation, Higher Education | | | | | |
| Revenue (Texas Christian University Project) | 0.04 | 2/7/14 | 7,500,000 | a | 7,500,000 |
| San Antonio, General Improvement GO Notes, Refunding | 4.00 | 2/1/14 | 1,555,000 | | 1,555,309 |
| Texas, TRAN | 2.00 | 8/28/14 | 15,500,000 | | 15,661,204 |
| Utah—4.8% | | | | | |
| Utah State Board of Regents, Student Loan | | | | | |
| Revenue (LOC; Royal Bank of Canada) | 0.05 | 2/7/14 | 6,400,000 | a | 6,400,000 |
| Wells Fargo Stage Trust (Series 33 C) (Riverton, HR, Refunding | | | | | |
| (Intermountain Health Care Health Services, Inc.)) (Liquidity | | | | | |
| Facility; Wells Fargo Bank and LOC; Wells Fargo Bank) | 0.06 | 2/7/14 | 9,400,000 a,b,c | | 9,400,000 |
| Virginia—.1% | | | | | |
| Virginia, GO Notes | 4.00 | 6/1/14 | 360,000 | | 364,356 |
| Washington—2.2% | | | | | |
| Pierce County Economic Development Corporation, Industrial | | | | | |
| Revenue (SeaTac Packaging Project) (LOC; HSBC Bank USA) | 0.11 | 2/7/14 | 3,925,000 | a | 3,925,000 |
| Port of Tacoma, CP (LOC; Bank of America) | 0.09 | 2/11/14 | 3,085,000 | | 3,085,000 |
| Wisconsin—7.7% | | | | | |
| Dane County, GO Promissory Notes | 1.50 | 6/1/14 | 1,875,000 | | 1,882,731 |
| Sheboygan Falls, Note Anticipation Notes | 2.00 | 6/3/14 | 1,500,000 | | 1,504,560 |
| Wisconsin Health and Educational Facilities Authority, | | | | | |
| Revenue, CP (Aurora Health Care) (LOC; JPMorgan Chase Bank) | 0.20 | 2/5/14 | 8,000,000 | | 8,000,000 |
30
| | | | | | | |
| Dreyfus Municipal | Coupon | Maturity | Principal | | | |
| Cash Management Plus (continued) | Rate (%) | Date | Amount ($) | | Value ($) | |
| |
| Short-Term Investments (continued) | | | | | | |
| Wisconsin (continued) | | | | | | |
| Wisconsin Health and Educational Facilities Authority, Revenue, | | | | | | |
| CP (Aurora Health Care) (LOC; JPMorgan Chase Bank) | 0.15 | 8/5/14 | 10,000,000 | | 10,000,000 | |
| Wisconsin School Districts, Cash Flow | | | | | | |
| Administration Program Participation Notes | 1.00 | 10/10/14 | 3,625,000 | | 3,642,381 | |
| U.S. Related—.3% | | | | | | |
| Puerto Rico Public Finance Corporation, Revenue | 5.38 | 6/1/14 | 1,000,000 | | 1,016,329 | |
| |
| Total Investments (cost $329,674,827) | | | 100.9 | % | 329,674,827 | |
| Liabilities, Less Cash and Receivables | | | (.9 | %) | (2,910,664 | ) |
| Net Assets | | | 100.0 | % | 326,764,163 | |
| |
| a Variable rate demand note—rate shown is the interest rate in effect at January 31, 2014. Maturity date represents the next demand date, or the ultimate maturity date if earlier. |
| b Securities exempt from registration pursuant to Rule 144A under the Securities Act of 1933.These securities may be resold in transactions exempt from registration, normally to qualified |
| institutional buyers.At January 31, 2014, these securities amounted to $48,580,000 or 14.9% of net assets. |
| c The fund does not directly own the municipal security indicated; the fund owns an interest in a special purpose entity that, in turn, owns the underlying municipal security.The special |
| purpose entity permits the fund to own interests in underlying assets, but in a manner structured to provide certain advantages not inherent in the underlying bonds (e.g., enhanced |
| liquidity, yields linked to short-term rates). |
| | | | |
| Portfolio Summary (Unaudited)† | | | |
| |
| | Value (%) | | Value (%) |
| Health Care | 15.7 | City | 3.4 |
| Industrial | 13.8 | Resource Recovery | 2.6 |
| Education | 10.4 | Utility-Water and Sewer | 2.6 |
| Utility-Electric | 9.8 | Special Tax | 2.4 |
| Transportation Services | 9.4 | Lease | .8 |
| Housing | 7.2 | Prerefunded | .3 |
| Pollution Control | 4.9 | Other | 9.2 |
| State/Territory | 4.9 | | |
| County | 3.5 | | 100.9 |
| |
| † Based on net assets. | | | |
| See notes to financial statements. | | | |
STATEMENT OF INVESTMENTS
January 31, 2014
| | | | | | |
| Dreyfus New York | Coupon | Maturity | Principal | | |
| Municipal Cash Management | Rate (%) | Date | Amount ($) | | Value ($) |
| |
| Short-Term Investments—99.8% | | | | | |
| Albany Industrial Development Agency, Civic Facility Revenue | | | | | |
| (Albany Medical Center Hospital Project) (LOC; Bank of America) | 0.08 | 2/7/14 | 2,300,000 | a | 2,300,000 |
| Amherst, GO Notes, BAN | 1.00 | 11/13/14 | 15,645,702 | | 15,734,507 |
| Ausable Valley Central School District, GO Notes, BAN | 1.00 | 6/26/14 | 12,000,000 | | 12,021,880 |
| Chautauqua County Industrial Development Agency, Civic Facility | | | | | |
| Revenue (Gerry Homes Project) (LOC; HSBC Bank USA) | 0.20 | 2/7/14 | 9,440,000 | a | 9,440,000 |
| Chemung County Industrial Development Agency, IDR | | | | | |
| (Trayer Products, Inc. Project) (LOC; HSBC Bank USA) | 0.20 | 2/7/14 | 270,000 | a | 270,000 |
| Columbia County Capital Resource Corporation, | | | | | |
| Civic Facility Revenue (The Columbia Memorial | | | | | |
| Hospital Project) (LOC; HSBC Bank USA) | 0.05 | 2/7/14 | 5,320,000 | a | 5,320,000 |
| Columbia County Industrial Development Agency, | | | | | |
| Civic Facility Revenue (The Columbia Memorial | | | | | |
| Hospital Project) (LOC; HSBC Bank USA) | 0.05 | 2/7/14 | 4,570,000 | a | 4,570,000 |
| Deutsche Bank Spears/Lifers Trust (Series DBE-1152) (TSASC, Inc., | | | | | |
| Tobacco Settlement Asset-Backed Bonds) (Liquidity Facility: | | | | | |
| Deutsche Bank AG and LOC; Deutsche Bank AG) | 0.14 | 2/7/14 | 8,000,000 a,b,c | | 8,000,000 |
| Deutsche Bank Spears/Lifers Trust (Series DBE-1162) (Westchester | | | | | |
| County Industrial Development Agency, IDR (Ardsley Housing | | | | | |
| Associates, LLC Facility)) (Liquidity Facility; Deutsche Bank AG | | | | | |
| and LOC; Deutsche Bank AG) | 0.24 | 2/7/14 | 23,900,000 a,b,c,d | | 23,900,000 |
| Erie County Industrial Development Agency, IDR | | | | | |
| (Hydro-Air Components Inc. Project) (LOC; HSBC Bank USA) | 0.11 | 2/7/14 | 1,990,000 | a | 1,990,000 |
| Franklin County Civic Development Corporation, Revenue | | | | | |
| (Alice Hyde Medical Center Project) (LOC; HSBC Bank USA) | 0.05 | 2/7/14 | 4,400,000 | a | 4,400,000 |
| Hamburg Central School District, GO Notes, BAN | 2.00 | 6/13/14 | 15,000,000 | | 15,082,021 |
| Herkimer County Industrial Development Agency, IDR | | | | | |
| (F.E. Hale Manufacturing Company Facility) (LOC; HSBC Bank USA) | 0.20 | 2/7/14 | 1,390,000 | a | 1,390,000 |
| Holley Central School District, GO Notes, BAN | 1.25 | 6/19/14 | 3,600,000 | | 3,609,734 |
| Lancaster Industrial Development Agency, IDR | | | | | |
| (Sealing Devices Inc. Project) (LOC; HSBC Bank USA) | 0.11 | 2/7/14 | 1,895,000 | a | 1,895,000 |
| Metropolitan Transportation Authority, Dedicated Tax Fund Revenue | 3.00 | 11/1/14 | 500,000 | | 510,258 |
| Metropolitan Transportation Authority, | | | | | |
| Transportation Revenue, CP (LOC; TD Bank) | 0.09 | 2/10/14 | 14,000,000 | | 14,000,000 |
| Middletown, GO Notes, BAN | 1.00 | 2/21/14 | 3,826,651 | | 3,827,798 |
| Monroe County Industrial Development Agency, Civic Facility | | | | | |
| Revenue (YMCA of Greater Rochester Project) (LOC; M&T Trust) | 0.09 | 2/7/14 | 1,890,000 | a,d | 1,890,000 |
| Monroe County Industrial Development Agency, Revenue | | | | | |
| (HDF-RWC Project 1, LLC—Robert Weslayan | | | | | |
| College Project) (LOC; M&T Trust) | 0.08 | 2/7/14 | 2,600,000 | a | 2,600,000 |
| Monroe County Industrial Development Corporation, Revenue | | | | | |
| (Saint Ann's Home for the Aged Project) (LOC; HSBC Bank USA) | 0.06 | 2/7/14 | 8,000,000 | a | 8,000,000 |
| Nassau County Industrial Development Agency, Continuing Care | | | | | |
| Retirement Community Revenue (Amsterdam at | | | | | |
| Harborside Project) (LOC; Bank of America) | 0.25 | 2/7/14 | 15,100,000 | a | 15,100,000 |
32
| | | | | | |
| Dreyfus New York | Coupon | Maturity | Principal | | |
| Municipal Cash Management (continued) | Rate (%) | Date | Amount ($) | | Value ($) |
| |
| Short-Term Investments (continued) | | | | | |
| New York City, GO Notes (Citigroup ROCS, | | | | | |
| Series RR II R-14045) (Liquidity Facility; Citibank NA) | 0.04 | 2/7/14 | 3,000,000 a,b,c | | 3,000,000 |
| New York City, GO Notes (LOC; Bank of America) | 0.08 | 2/7/14 | 3,000,000 | a | 3,000,000 |
| New York City, GO Notes (LOC; Bayerische Landesbank) | 0.06 | 2/7/14 | 11,400,000 | a | 11,400,000 |
| New York City, GO Notes (LOC; JPMorgan Chase Bank) | 0.05 | 2/3/14 | 2,200,000 | a | 2,200,000 |
| New York City, GO Notes | | | | | |
| (LOC; Landesbank Hessen-Thuringen Girozentrale) | 0.10 | 2/7/14 | 1,800,000 | a | 1,800,000 |
| New York City, GO Notes (LOC; Sumitomo Mitsui Banking Corp.) | 0.04 | 2/7/14 | 11,000,000 | a�� | 11,000,000 |
| New York City, GO Notes (SBPA; Wells Fargo Bank) | 0.04 | 2/3/14 | 3,000,000 | a | 3,000,000 |
| New York City Capital Resource Corporation, Recovery Zone | | | | | |
| Facility Revenue (WytheHotel Project) (LOC; M&T Trust) | 0.10 | 2/7/14 | 3,800,000 | a | 3,800,000 |
| New York City Housing Development Corporation, | | | | | |
| MFHR (Liquidity Facility; JPMorgan Chase Bank) | 0.04 | 2/7/14 | 22,670,000 | a,d | 22,670,000 |
| New York City Housing Development Corporation, | | | | | |
| MFHR (Liquidity Facility; Wells Fargo Bank) | 0.03 | 2/7/14 | 3,000,000 | a,d | 3,000,000 |
| New York City Housing Development Corporation, | | | | | |
| MFMR (1405 Fifth Avenue Apartments) (LOC; Citibank NA) | 0.06 | 2/7/14 | 9,500,000 | a,d | 9,500,000 |
| New York City Housing Development Corporation, | | | | | |
| MFMR (Las Casas Development) (LOC; Bank of America) | 0.08 | 2/7/14 | 1,500,000 | a,d | 1,500,000 |
| New York City Housing Development Corporation, | | | | | |
| MFMR (Susan's Court) (LOC; Citibank NA) | 0.05 | 2/7/14 | 3,000,000 | a,d | 3,000,000 |
| New York City Industrial Development Agency, | | | | | |
| Civic Facility Revenue (Jewish Community Center | | | | | |
| on the Upper West Side, Inc. Project) (LOC; M&T Trust) | 0.09 | 2/7/14 | 4,650,000 | a,d | 4,650,000 |
| New York City Industrial Development Agency, | | | | | |
| Civic Facility Revenue (Spence-Chapin, Services | | | | | |
| to Families and Children Project) (LOC; TD Bank) | 0.11 | 2/7/14 | 5,755,000 | a | 5,755,000 |
| New York City Industrial Development Agency, Civic Facility Revenue | | | | | |
| (The Allen-Stevenson School Project) (LOC; JPMorgan Chase Bank) | 0.07 | 2/7/14 | 4,170,000 | a | 4,170,000 |
| New York City Industrial Development Agency, Civic Facility | | | | | |
| Revenue (Village Community School Project) (LOC; TD Bank) | 0.16 | 2/7/14 | 2,340,000 | a | 2,340,000 |
| New York City Municipal Water Finance Authority, CP | | | | | |
| (Liquidity Facility; JPMorgan Chase Bank) | 0.07 | 2/6/14 | 15,000,000 | | 15,000,000 |
| New York City Municipal Water Finance Authority, | | | | | |
| Water and Sewer System Second General Resolution | | | | | |
| Revenue (Liquidity Facility; Bank of Nova Scotia) | 0.05 | 2/3/14 | 4,500,000 | a | 4,500,000 |
| New York City Municipal Water Finance Authority, | | | | | |
| Water and Sewer System Second General Resolution Revenue | | | | | |
| (Liquidity Facility; Landesbank Hessen-Thuringen Girozentrale) | 0.06 | 2/3/14 | 6,000,000 | a | 6,000,000 |
| New York City Municipal Water Finance Authority, | | | | | |
| Water and Sewer System Second General Resolution | | | | | |
| Revenue (Liquidity Facility; Mizuho Bank, Ltd.) | 0.05 | 2/3/14 | 2,000,000 | a | 2,000,000 |
| New York City Transitional Finance Authority, | | | | | |
| Building Aid Revenue (Citigroup ROCS, | | | | | |
| Series RR II R-14076) (Liquidity Facility; Citibank NA) | 0.05 | 2/7/14 | 6,250,000 a,b,c | | 6,250,000 |
STATEMENT OF INVESTMENTS (continued)
| | | | | | |
| Dreyfus New York | Coupon | Maturity | Principal | | |
| Municipal Cash Management (continued) | Rate (%) | Date | Amount ($) | | Value ($) |
| |
| Short-Term Investments (continued) | | | | | |
| New York City Transitional Finance Authority, | | | | | |
| Future Tax Secured Subordinate Revenue | 5.00 | 11/1/14 | 205,000 | | 212,296 |
| New York City Trust for Cultural Resources, Revenue, | | | | | |
| Refunding (American Museum of Natural History) | | | | | |
| (Liquidity Facility; JPMorgan Chase Bank) | 0.05 | 2/3/14 | 9,315,000 | a | 9,315,000 |
| New York State Dormitory Authority, | | | | | |
| Mental Health Services Facilities Improvement Revenue | 5.00 | 2/15/14 | 870,000 | | 871,841 |
| New York State Dormitory Authority, Revenue | | | | | |
| (Blythedale Children's Hospital) (LOC; TD Bank) | 0.05 | 2/7/14 | 2,600,000 | a | 2,600,000 |
| New York State Dormitory Authority, Revenue | | | | | |
| (Catholic Health System Obligated Group) (LOC; HSBC Bank USA) | 0.05 | 2/7/14 | 7,305,000 | a | 7,305,000 |
| New York State Dormitory Authority, Revenue (The Rockefeller | | | | | |
| University) (Liquidity Facility; JPMorgan Chase Bank) | 0.05 | 2/7/14 | 18,000,000 | a | 18,000,000 |
| New York State Dormitory Authority, Revenue, CP (Cornell University) | 0.11 | 3/3/14 | 5,750,000 | | 5,750,000 |
| New York State Dormitory Authority, | | | | | |
| State Personal Income Tax Revenue (General Purpose) | 5.00 | 2/15/14 | 3,200,000 | | 3,206,998 |
| New York State Housing Finance Agency, Affordable Housing Revenue | 1.20 | 11/1/14 | 200,000 | d | 201,343 |
| New York State Housing Finance Agency, | | | | | |
| Housing Revenue (25 Washington Street) (LOC; M&T Trust) | 0.09 | 2/7/14 | 1,800,000 | a,d | 1,800,000 |
| New York State Housing Finance Agency, | | | | | |
| Housing Revenue (80 DeKalb Avenue) | | | | | |
| (LOC; Landesbank Hessen-Thuringen Girozentrale) | 0.06 | 2/7/14 | 6,000,000 | a,d | 6,000,000 |
| New York State Housing Finance Agency, Housing Revenue | | | | | |
| (316 Eleventh Avenue) (Liquidity Facility; FNMA and LOC; FNMA) | 0.03 | 2/7/14 | 11,000,000 | a,d | 11,000,000 |
| New York State Housing Finance Agency, | | | | | |
| Housing Revenue (505 West 37th Street) | | | | | |
| (LOC; Landesbank Hessen-Thuringen Girozentrale) | 0.07 | 2/3/14 | 8,700,000 | a,d | 8,700,000 |
| New York State Housing Finance Agency, | | | | | |
| Housing Revenue (505 West 37th Street) | | | | | |
| (LOC; Landesbank Hessen-Thuringen Girozentrale) | 0.07 | 2/3/14 | 4,200,000 | a,d | 4,200,000 |
| New York State Housing Finance Agency, Housing Revenue (Capitol | | | | | |
| Green Apartments) (Liquidity Facility; FNMA and LOC; FNMA) | 0.06 | 2/7/14 | 7,000,000 | a,d | 7,000,000 |
| New York State Housing Finance Agency, | | | | | |
| Service Contract Revenue, Refunding (LOC; Bank of America) | 0.08 | 2/7/14 | 3,855,000 | a,d | 3,855,000 |
| New York State Mortgage Agency, Homeowner Mortgage | | | | | |
| Revenue (Liquidity Facility; Bank of America) | 0.04 | 2/7/14 | 15,000,000 | a,d | 15,000,000 |
| New York State Mortgage Agency, Homeowner Mortgage | | | | | |
| Revenue (Liquidity Facility; Barclays Bank PLC) | 0.04 | 2/7/14 | 17,300,000 | a,d | 17,300,000 |
| Northern Adirondack Central | | | | | |
| School District at Ellenburg, GO Notes, BAN | 2.00 | 6/26/14 | 5,000,000 | | 5,029,088 |
| Onondaga County Industrial Development Agency, IDR | | | | | |
| (ICM Controls Corporation Project) (LOC; M&T Trust) | 0.19 | 2/7/14 | 1,695,000 | a | 1,695,000 |
| Port Authority of New York and New Jersey, Equipment Notes | 0.09 | 2/7/14 | 10,500,000 | a | 10,500,000 |
| Rockland County Industrial Development Agency, IDR | | | | | |
| (Intercos America, Inc. Project) (LOC; HSBC Bank USA) | 0.20 | 2/7/14 | 2,150,000 | a | 2,150,000 |
34
| | | | | | |
| Dreyfus New York | Coupon | Maturity | Principal | | |
| Municipal Cash Management (continued) | Rate (%) | Date | Amount ($) | | Value ($) |
| |
| Short-Term Investments (continued) | | | | | |
| Saratoga County Capital Resource Corporation, Revenue | | | | | |
| (The Saratoga Hospital Project) (LOC; HSBC Bank USA) | 0.05 | 2/7/14 | 3,125,000 | a | 3,125,000 |
| South Jefferson Central School District, GO Notes, BAN | 1.50 | 6/20/14 | 6,000,000 | | 6,025,020 |
| Triborough Bridge and Tunnel Authority, General Revenue | | | | | |
| (MTA Bridges and Tunnels) (LOC; California | | | | | |
| Public Employees Retirement System) | 0.04 | 2/7/14 | 14,510,000 | a | 14,510,000 |
| Triborough Bridge and Tunnel Authority, General Revenue, | | | | | |
| Refunding (MTA Bridges and Tunnels) (Liquidity Facility; | | | | | |
| Landesbank Hessen-Thuringen Girozentrale) | 0.07 | 2/3/14 | 26,400,000 | a | 26,400,000 |
| Ulster County Industrial Development Agency, IDR | | | | | |
| (Selux Corporation Project) (LOC; M&T Trust) | 0.19 | 2/7/14 | 685,000 | a | 685,000 |
| Wallkill, GO Notes, BAN | 1.25 | 1/16/15 | 1,971,000 | | 1,982,798 |
| Yonkers Industrial Development Agency, MFHR | | | | | |
| (Main Street Lofts Yonkers LLC Project) (LOC; M&T Trust) | 0.19 | 2/7/14 | 30,000,000 | a,d | 30,000,000 |
| |
| Total Investments (cost $509,805,582) | | | 99.8 | % | 509,805,582 |
| Cash and Receivables (Net) | | | .2 | % | 857,246 |
| Net Assets | | | 100.0 | % | 510,662,828 |
| |
| a Variable rate demand note—rate shown is the interest rate in effect at January 31, 2014. Maturity date represents the next demand date, or the ultimate maturity date if earlier. |
| b Securities exempt from registration pursuant to Rule 144A under the Securities Act of 1933.These securities may be resold in transactions exempt from registration, normally to qualified |
| institutional buyers.At January 31, 2014, these securities amounted to $41,150,000 or 8.1% of net assets. |
| c The fund does not directly own the municipal security indicated; the fund owns an interest in a special purpose entity that, in turn, owns the underlying municipal security.The special |
| purpose entity permits the fund to own interests in underlying assets, but in a manner structured to provide certain advantages not inherent in the underlying bonds (e.g., enhanced |
| liquidity, yields linked to short-term rates). |
| d At January 31, 2014, the fund had $175,166,343 or 34.3% of net assets invested in securities whose payment of principal and interest is dependent upon revenues generated from housing. |
| | | | |
| Portfolio Summary (Unaudited)† | | | |
| |
| | Value (%) | | Value (%) |
| Housing | 34.3 | Industrial | 6.2 |
| Education | 12.9 | Utility-Water and Sewer | 5.4 |
| Transportation Services | 12.9 | Special Tax | 1.9 |
| City | 12.3 | Other | 3.4 |
| Health Care | 10.5 | | 99.8 |
| |
| † Based on net assets. | | | |
| See notes to financial statements. | | | |
STATEMENT OF INVESTMENTS
January 31, 2014
| | | | | | |
| Dreyfus Tax Exempt | Coupon | Maturity | Principal | | |
| Cash Management | Rate (%) | Date | Amount ($) | | Value ($) |
| |
| Short-Term Investments—99.9% | | | | | |
| Alabama—5.0% | | | | | |
| Birmingham, GO Notes, Refunding Warrants | 5.00 | 2/1/14 | 3,535,000 | | 3,535,896 |
| Chatom Industrial Development Board, Gulf Opportunity Zone | | | | | |
| Revenue (PowerSouth Energy Cooperative Projects) | | | | | |
| (LOC; National Rural Utilities Cooperative Finance Corporation) | 0.19 | 2/7/14 | 15,000,000 | a | 15,000,000 |
| Columbia Industrial Development Board, PCR, | | | | | |
| Refunding (Alabama Power Company Project) | 0.06 | 2/3/14 | 9,700,000 | a | 9,700,000 |
| Columbia Industrial Development Board, PCR, | | | | | |
| Refunding (Alabama Power Company Project) | 0.07 | 2/3/14 | 13,500,000 | a | 13,500,000 |
| Eutaw Industrial Development Board, PCR, | | | | | |
| Refunding (Alabama Power Company Project) | 0.04 | 2/3/14 | 7,800,000 | a | 7,800,000 |
| Mobile County Industrial Development Authority, Gulf Opportunity | | | | | |
| Zone Revenue (SSAB Alabama Inc.) (LOC; Swedbank) | 0.07 | 2/7/14 | 14,000,000 | a | 14,000,000 |
| Tuscaloosa County Industrial Development Authority, Gulf Opportunity | | | | | |
| Zone Revenue (Hunt Refining Project) (LOC; Bank of Nova Scotia) | 0.04 | 2/7/14 | 15,000,000 | a | 15,000,000 |
| Tuscaloosa County Industrial Development Authority, Gulf Opportunity | | | | | |
| Zone Revenue (Hunt Refining Project) (LOC; Bank of Nova Scotia) | 0.04 | 2/7/14 | 20,000,000 | a | 20,000,000 |
| Tuscaloosa County Industrial Development Authority, | | | | | |
| Gulf Opportunity Zone Revenue (Hunt Refining Project) | | | | | |
| (LOC; Sumitomo Mitsui Banking Corporation) | 0.04 | 2/7/14 | 20,000,000 | a | 20,000,000 |
| Arizona—4.0% | | | | | |
| Arizona, Unemployment Insurance TAN | 1.50 | 5/21/14 | 12,000,000 | | 12,047,132 |
| Arizona Health Facilities Authority, Revenue, Refunding | | | | | |
| (Phoenix Children's Hospital) (P-FLOATS Series MT-836) | | | | | |
| (Liquidity Facility; Bank of America and LOC; Bank of America) | 0.24 | 2/7/14 | 10,495,000 a,b,c | | 10,495,000 |
| Deutsche Bank Spears/Lifers Trust (Series DBE-1082) (Arizona Health | | | | | |
| Facilities Authority, Revenue (Catholic Healthcare West)) | | | | | |
| (Liquidity Facility; Deutsche Bank AG and LOC; Deutsche Bank AG) | 0.09 | 2/7/14 | 18,250,000 a,b,c | | 18,250,000 |
| Deutsche Bank Spears/Lifers Trust (Series DBE-1086) (Phoenix Industrial | | | | | |
| Development Authority, LR (Rowan University Project)) (Liquidity | | | | | |
| Facility; Deutsche Bank AG and LOC; Deutsche Bank AG) | 0.09 | 2/7/14 | 37,220,000 a,b,c | | 37,220,000 |
| Phoenix Civic Improvement Corporation, | | | | | |
| Water System Revenue, CP (LOC; Royal Bank of Canada) | 0.12 | 3/10/14 | 17,000,000 | | 17,000,000 |
| California—3.4% | | | | | |
| California Statewide Communities Development | | | | | |
| Authority, Revenue, CP (Kaiser Permanente) | 0.14 | 5/12/14 | 27,000,000 | | 27,000,000 |
| California Statewide Communities Development | | | | | |
| Authority, Revenue, CP (Kaiser Permanente) | 0.14 | 5/19/14 | 15,865,000 | | 15,865,000 |
| Foothill Eastern Transportation Corridor Agency, | | | | | |
| Toll Road Revenue, Refunding (Prerefunded) | 5.88 | 2/1/14 | 17,000,000 | d | 17,174,941 |
| Sacramento City Financing Authority, Revenue, Refunding | | | | | |
| (Master Lease Program Facilities) (P-FLOATS Series PT-4698) | | | | | |
| (Liquidity Facility; Deutsche Bank AG and LOC; Deutsche Bank AG) | 0.12 | 2/7/14 | 20,835,000 a,b,c | | 20,835,000 |
36
| | | | | | |
| Dreyfus Tax Exempt | Coupon | Maturity | Principal | | |
| Cash Management (continued) | Rate (%) | Date | Amount ($) | | Value ($) |
| |
| Short-Term Investments (continued) | | | | | |
| Colorado—3.0% | | | | | |
| Colorado Educational and Cultural Facilities Authority, | | | | | |
| Revenue, Refunding (The Nature Conservancy Project) | 0.05 | 2/7/14 | 16,200,000 | a | 16,200,000 |
| Sheridan Redevelopment Agency, Tax Increment Revenue, | | | | | |
| Refunding (South Santa Fe Drive Corridor Redevelopment | | | | | |
| Project) (LOC; JPMorgan Chase Bank) | 0.08 | 2/7/14 | 10,000,000 | a | 10,000,000 |
| Southern Ute Indian Tribe of the | | | | | |
| Southern Ute Indian Reservation, Revenue | 0.04 | 2/7/14 | 45,000,000 | a | 45,000,000 |
| Connecticut—1.6% | | | | | |
| Bridgeport, GO Notes, TAN | 1.00 | 2/18/14 | 35,000,000 | | 35,013,019 |
| Connecticut Housing Finance Authority, | | | | | |
| Revenue (Housing Mortgage Finance Program) | 0.80 | 6/19/14 | 3,590,000 | | 3,590,937 |
| Delaware—1.1% | | | | | |
| Delaware Health Facilities Authority, | | | | | |
| Revenue (Christiana Care Health Services) | 0.03 | 2/7/14 | 25,000,000 | a | 25,000,000 |
| District of Columbia—1.2% | | | | | |
| District of Columbia, Revenue (American Legacy Foundation Issue) | 0.03 | 2/7/14 | 22,000,000 | a | 22,000,000 |
| District of Columbia Water and Sewer Authority, Public Utility | | | | | |
| Subordinated Lien Revenue (Eagle 2013-0012 | | | | | |
| Program) (Liquidity Facility; Citibank NA) | 0.07 | 2/7/14 | 7,000,000 a,b,c | | 7,000,000 |
| Florida—2.2% | | | | | |
| Collier County Health Facilities Authority, | | | | | |
| Revenue, CP (Cleveland Clinic Health System) | 0.15 | 2/13/14 | 24,000,000 | | 24,000,000 |
| Hillsborough County, GO Notes (Environmental | | | | | |
| Lands Acquistion and Protection Program) | 5.00 | 7/1/14 | 1,250,000 | | 1,275,027 |
| Jacksonsville Electric Authority, Electric System | | | | | |
| Revenue, CP (Liquidity Facililty; U.S. Bank NA) | 0.08 | 2/6/14 | 10,000,000 | | 10,000,000 |
| Sunshine State Governmental Financing Commission, | | | | | |
| Revenue, CP (Liquidity Facility; JPMorgan Chase Bank) | 0.15 | 3/14/14 | 7,000,000 | | 7,000,000 |
| Sunshine State Governmental Financing Commission, | | | | | |
| Revenue, CP (Liquidity Facility; JPMorgan Chase Bank) | 0.13 | 4/9/14 | 10,000,000 | | 10,000,000 |
| Georgia—1.6% | | | | | |
| Cobb County Hospital Authority, RAC | | | | | |
| (Equipment Pool Project) (LOC; Wells Fargo Bank) | 0.04 | 2/7/14 | 11,300,000 | a | 11,300,000 |
| Fulton County Development Authority, Revenue | | | | | |
| (Children's Healthcare of Atlanta, Inc. Project) (Liquidity | | | | | |
| Facility; Landesbank Hessen-Thuringen Girozentrale) | 0.08 | 2/7/14 | 4,985,000 | a | 4,985,000 |
| Georgia, GO Notes | 2.00 | 2/1/14 | 5,285,000 | | 5,285,518 |
| Monroe County Development Authority, PCR (Oglethorpe Power | | | | | |
| Corporation Scherer Project) (LOC; Bank of Montreal) | 0.03 | 2/7/14 | 15,000,000 | a | 15,000,000 |
| Hawaii—.1% | | | | | |
| Hawaii, GO Notes, Refunding | 5.75 | 2/1/14 | 3,160,000 | | 3,160,907 |
STATEMENT OF INVESTMENTS (continued)
| | | | | | |
| Dreyfus Tax Exempt | Coupon | Maturity | Principal | | |
| Cash Management (continued) | Rate (%) | Date | Amount ($) | | Value ($) |
| |
| Short-Term Investments (continued) | | | | | |
| Idaho—.3% | | | | | |
| Idaho Building Authority, State Building | | | | | |
| Revenue (Idaho State Capitol Project) | 5.00 | 9/1/14 | 6,885,000 | | 7,076,538 |
| Illinois—1.3% | | | | | |
| Deutsche Bank Spears/Lifers Trust (Series DBE-502) (Chicago, | | | | | |
| General Airport Third Lien Revenue (Chicago O'Hare | | | | | |
| International Airport)) (Liquidity Facility; Deutsche | | | | | |
| Bank AG and LOC; Deutsche Bank AG) | 0.06 | 2/7/14 | 16,460,000 a,b,c | | 16,460,000 |
| Illinois Educational Facilities Authority, Revenue | | | | | |
| (Saint Xavier University Project) (LOC; Bank of America) | 0.06 | 2/7/14 | 8,105,000 | a | 8,105,000 |
| Illinois Finance Authority, IDR (Fitzpatrick Brothers, Inc. | | | | | |
| Project) (Liquidity Facility; Northern Trust Company) | 0.05 | 2/7/14 | 3,990,000 | a | 3,990,000 |
| Lake County, MFHR (Whispering Oaks | | | | | |
| Apartments Project) (LOC; FHLMC) | 0.03 | 2/7/14 | 3,250,000 | a | 3,250,000 |
| Indiana—.8% | | | | | |
| Deutsche Bank Spears/Lifers Trust (Series DBE-549) | | | | | |
| (Boone County Hospital Association, LR, Refunding) (Liquidity | | | | | |
| Facility; Deutsche Bank AG and LOC; Deutsche Bank AG) | 0.12 | 2/7/14 | 8,345,000 a,b,c | | 8,345,000 |
| Indiana Bond Bank, Advance Funding Program Notes | | | | | |
| (Liquidity Facility; JPMorgan Chase Bank) | 1.25 | 1/6/15 | 10,000,000 | | 10,092,554 |
| Kansas—.1% | | | | | |
| Kansas Turnpike Authority, Turnpike Revenue, Refunding | 2.00 | 9/1/14 | 1,630,000 | | 1,646,932 |
| Louisiana—2.0% | | | | | |
| Louisiana Public Facilities Authority, Revenue | | | | | |
| (Air Products and Chemicals Project) | 0.04 | 2/7/14 | 13,100,000 | a | 13,100,000 |
| Louisiana Public Facilities Authority, Revenue | | | | | |
| (Air Products and Chemicals Project) | 0.04 | 2/7/14 | 11,000,000 | a | 11,000,000 |
| Louisiana Public Facilities Authority, Revenue | | | | | |
| (Tiger Athletic Foundation Project) (LOC; FHLB) | 0.04 | 2/7/14 | 14,330,000 | a | 14,330,000 |
| Port of New Orleans Board of Commissioners, | | | | | |
| Subordinate Lien Revenue, Refunding (LOC; FHLB) | 0.04 | 2/7/14 | 8,510,000 | a | 8,510,000 |
| Maine—2.4% | | | | | |
| Maine Health and Higher Educational Facilities Authority, | | | | | |
| Revenue (Maine Medical Center) (LOC; JPMorgan Chase Bank) | 0.05 | 2/7/14 | 55,430,000 | a | 55,430,000 |
| Maryland—2.9% | | | | | |
| Baltimore County, GO Notes | | | | | |
| (Baltimore County Metropolitan District) | 5.00 | 2/1/14 | 3,230,000 | | 3,230,822 |
| Frederick County, Revenue | | | | | |
| (Homewood, Inc. Facility) (LOC; M&T Trust) | 0.04 | 2/7/14 | 9,600,000 | a | 9,600,000 |
| Frederick County, Revenue, Refunding | | | | | |
| (Manekin-Frederick Associates Facility) (LOC; M&T Trust) | 0.16 | 2/7/14 | 1,490,000 | a | 1,490,000 |
| Maryland Department of Transportation, | | | | | |
| Consolidated Transportation Revenue | 5.00 | 5/1/14 | 900,000 | | 910,799 |
| Maryland Economic Development Corporation, | | | | | |
| Revenue (Easter Seals Facility) (LOC; M&T Trust) | 0.09 | 2/7/14 | 6,245,000 | a | 6,245,000 |
| Maryland Health and Higher Educational Facilities Authority, | | | | | |
| Revenue (De Matha Catholic High School Issue) | | | | | |
| (LOC; Branch Banking and Trust Co.) | 0.04 | 2/7/14 | 9,115,000 | a | 9,115,000 |
38
| | | | | | |
| Dreyfus Tax Exempt | Coupon | Maturity | Principal | | |
| Cash Management (continued) | Rate (%) | Date | Amount ($) | | Value ($) |
| |
| Short-Term Investments (continued) | | | | | |
| Maryland (continued) | | | | | |
| Maryland Stadium Authority, Sports Facilities LR, | | | | | |
| Refunding (Football Stadium Issue) (Liquidity | | | | | |
| Facility; Sumitomo Mitsui Banking Corp.) | 0.04 | 2/7/14 | 16,900,000 | a | 16,900,000 |
| Montgomery County, CP (Liquidity Facility; JPMorgan Chase Bank) | 0.10 | 4/7/14 | 9,105,000 | | 9,105,000 |
| Montgomery County, Revenue (CHE Trinity Health Credit Group) | 0.12 | 3/3/14 | 11,000,000 | | 11,000,000 |
| Massachusetts—2.7% | | | | | |
| Massachusetts, GO Notes (Central Artery/Ted Williams | | | | | |
| Tunnel Infrastructure Loan Act of 2000) | | | | | |
| (Liquidity Facility; Bank of America) | 0.04 | 2/3/14 | 9,000,000 | a | 9,000,000 |
| Massachusetts Bay Transportation Authority, | | | | | |
| General Transportation System Revenue | | | | | |
| (Liquidity Facility; Bank of America) | 0.04 | 2/7/14 | 55,635,000 | a | 55,635,000 |
| Michigan—1.4% | | | | | |
| Michigan Housing Development Authority, | | | | | |
| SFMR (Liquidity Facility; FHLB) | 0.04 | 2/7/14 | 20,000,000 | a | 20,000,000 |
| RBC Municipal Products Inc. Trust (Series E-49) (Michigan Finance | | | | | |
| Authority, HR (CHE Trinity Health Credit Group)) (Liquidity | | | | | |
| Facility; Royal Bank of Canada and LOC; Royal Bank of Canada) | 0.04 | 2/7/14 | 12,000,000 a,b,c | | 12,000,000 |
| Minnesota—3.4% | | | | | |
| Deutsche Bank Spears/Lifers Trust (Series DBE-1214) | | | | | |
| (Saint Paul Housing and Redevelopment Authority, | | | | | |
| District Cooling Revenue, Refunding) (Liquidity Facility; | | | | | |
| Deutsche Bank AG and LOC; Deutsche Bank AG) | 0.12 | 2/7/14 | 10,235,000 a,b,c | | 10,235,000 |
| Hennepin County, GO Notes (Liquidity Facility; U.S. Bank NA) | 0.03 | 2/7/14 | 25,000,000 | a | 25,000,000 |
| RBC Municipal Products Inc. Trust (Series E-19) | | | | | |
| (Minneapolis, Health Care System Revenue | | | | | |
| (Fairview Health Services)) (Liquidity Facility; | | | | | |
| Royal Bank of Canada and LOC; Royal Bank of Canada) | 0.04 | 2/7/14 | 10,000,000 a,b,c | | 10,000,000 |
| Southern Minnesota Municipal Power Agency, Power Supply | | | | | |
| System Revenue, CP (Liquidity Facility; U.S. Bank NA) | 0.09 | 3/12/14 | 24,000,000 | | 24,000,000 |
| Southern Minnesota Municipal Power Agency, Power Supply | | | | | |
| System Revenue, CP (Liquidity Facility; U.S. Bank NA) | 0.11 | 4/3/14 | 11,000,000 | | 11,000,000 |
| Mississippi—.4% | | | | | |
| Mississippi Business Finance Corporation, | | | | | |
| Gulf Opportunity Zone IDR (Chevron U.S.A. Inc. Project) | 0.04 | 2/3/14 | 10,420,000 | a | 10,420,000 |
| Missouri—2.8% | | | | | |
| Missouri Health and Educational Facilities Authority, | | | | | |
| Revenue (Ascension Health Senior Health Group) | 0.04 | 2/7/14 | 7,100,000 | a | 7,100,000 |
| RBC Municipal Products Inc. Trust (Series E-47) (Missouri Health | | | | | |
| and Educational Facilities Authority, Health Facilities Revenue | | | | | |
| (BJC Health System)) (Liquidity Facility; Royal Bank of | | | | | |
| Canada and LOC; Royal Bank of Canada) | 0.04 | 2/7/14 | 25,000,000 a,b,c | | 25,000,000 |
| Saint Louis, Airport Revenue, Refunding (Lambert-Saint Louis | | | | | |
| International Airport) (Spears Trust Series DB-161) (Liquidity | | | | | |
| Facility; Deutsche Bank AG and LOC; Deutsche Bank AG) | 0.06 | 2/7/14 | 29,800,000 a,b,c | | 29,800,000 |
| Saint Louis Regional Convention and Sports Complex Authority, | | | | | |
| Convention and Sports Facility Revenue, Refunding | 2.00 | 8/15/14 | 3,565,000 | | 3,595,375 |
STATEMENT OF INVESTMENTS (continued)
| | | | | | |
| Dreyfus Tax Exempt | Coupon | Maturity | Principal | | |
| Cash Management (continued) | Rate (%) | Date | Amount ($) | | Value ($) |
| |
| Short-Term Investments (continued) | | | | | |
| Nebraska—3.6% | | | | | |
| Lincoln, Electric System Revenue, CP | | | | | |
| (Liquidity Facility; Bank of Tokyo-Mitsubishi UFJ) | 0.08 | 3/4/14 | 15,000,000 | | 15,000,000 |
| Nebraska Investment Finance Authority, | | | | | |
| SFHR (Liquidity Facility; FHLB) | 0.04 | 2/7/14 | 19,300,000 | a | 19,300,000 |
| Public Power Generation Agency of Nebraska, Revenue (Whelan | | | | | |
| Energy Center Unit Number 2) (Eagle Series 2013-0007) | | | | | |
| (Liquidity Facility; Citibank NA and LOC; Berkshire | | | | | |
| Hathaway Assurance Corporation) | 0.06 | 2/7/14 | 51,470,000 a,b,c | | 51,470,000 |
| Nevada—.7% | | | | | |
| Clark County, Airport System Junior Subordinate Lien Revenue | 2.00 | 7/1/14 | 7,900,000 | | 7,953,406 |
| Clark County, Airport System Subordinate Lien | | | | | |
| Revenue (LOC; Wells Fargo Bank NA) | 0.05 | 2/7/14 | 8,100,000 | a | 8,100,000 |
| New Hampshire—1.0% | | | | | |
| New Hampshire Health and Education Facilities Authority, | | | | | |
| Revenue (University System of New Hampshire Issue) | | | | | |
| (Liquidity Facility; U.S. Bank NA) | 0.05 | 2/3/14 | 16,900,000 | a | 16,900,000 |
| New Hampshire Health and Education Facilities Authority, | | | | | |
| Revenue (University System of New Hampshire Issue) | | | | | |
| (Liquidity Facility; Wells Fargo Bank) | 0.05 | 2/3/14 | 6,200,000 | a | 6,200,000 |
| New Mexico—.0% | | | | | |
| New Mexico Finance Authority, Public Project | | | | | |
| Revolving Fund Revenue (Prerefunded) | 5.25 | 6/1/14 | 1,000,000 | d | 1,016,521 |
| New York—2.8% | | | | | |
| Dutchess County Industrial Development Agency, | | | | | |
| Civic Facility Revenue (Anderson Foundation for | | | | | |
| Autism, Inc. Project) (LOC; M&T Trust) | 0.09 | 2/7/14 | 8,000,000 | a | 8,000,000 |
| Dutchess County Industrial Development Agency, Civic Facility | | | | | |
| Revenue (Arbor Ridge at Brookmeade Project) (LOC; M&T Trust) | 0.09 | 2/7/14 | 8,935,000 | a | 8,935,000 |
| Hammondsport Central School District, GO Notes, BAN | 1.25 | 6/20/14 | 5,000,000 | | 5,016,100 |
| Lancaster Industrial Development Agency, Civic Facility | | | | | |
| Revenue (GreenField Manor, Inc. Project) (LOC; M&T Trust) | 0.09 | 2/7/14 | 5,665,000 | a | 5,665,000 |
| New York City Municipal Water Finance Authority, Water and | | | | | |
| Sewer System Second General Resolution Revenue (Liquidity | | | | | |
| Facility; Landesbank Hessen-Thuringen Girozentrale) | 0.06 | 2/3/14 | 3,715,000 | a | 3,715,000 |
| South Jefferson Central School District, GO Notes, BAN | 1.50 | 6/20/14 | 3,915,000 | | 3,931,326 |
| Tompkins County Industrial Development Agency, | | | | | |
| Civic Facility Revenue (Community Development | | | | | |
| Properties Ithaca, Inc. Project) (LOC; M&T Trust) | 0.14 | 2/7/14 | 8,975,000 | a | 8,975,000 |
| Triborough Bridge and Tunnel Authority, General Revenue, | | | | | |
| Refunding (MTA Bridges and Tunnels) (Liquidity Facility; | | | | | |
| Landesbank Hessen-Thuringen Girozentrale) | 0.07 | 2/3/14 | 20,600,000 | a | 20,600,000 |
| North Carolina—1.9% | | | | | |
| Guilford County, GO Notes (Liquidity Facility; | | | | | |
| Branch Banking and Trust Co.) | 0.04 | 2/7/14 | 11,600,000 | a | 11,600,000 |
40
| | | | | | |
| Dreyfus Tax Exempt | Coupon | Maturity | Principal | | |
| Cash Management (continued) | Rate (%) | Date | Amount ($) | | Value ($) |
| |
| Short-Term Investments (continued) | | | | | |
| North Carolina (continued) | | | | | |
| North Carolina Capital Facilities Finance Agency, | | | | | |
| CP (Duke University Project) | 0.12 | 2/12/14 | 10,000,000 | | 10,000,000 |
| Winston-Salem, Water and Sewer System Revenue | | | | | |
| (Liquidity Facility; Branch Banking and Trust Co.) | 0.04 | 2/7/14 | 6,900,000 | a | 6,900,000 |
| Winston-Salem, Water and Sewer System Revenue | | | | | |
| (Liquidity Facility; Branch Banking and Trust Co.) | 0.04 | 2/7/14 | 16,120,000 | a | 16,120,000 |
| Ohio—2.6% | | | | | |
| Akron, Health Benefit Claims, BAN | | | | | |
| (Special Obligations—Income Tax Supported) | 1.13 | 3/13/14 | 1,600,000 | | 1,601,266 |
| Akron, Income Tax Revenue, BAN (Various Purpose) | 1.00 | 11/12/14 | 6,180,000 | | 6,215,006 |
| Akron, Bath and Copley Joint Township Hospital District, | | | | | |
| Hospital Facilities Revenue (Summa Health System | | | | | |
| Obligated Group) (LOC; JPMorgan Chase Bank) | 0.05 | 2/7/14 | 25,400,000 | a | 25,400,000 |
| Allen County, Hospital Facilities Revenue, (Catholic Health Partners) | 0.03 | 2/7/14 | 17,500,000 | a | 17,500,000 |
| Lucas County, GO Notes, BAN (Various Purpose Improvement) | 1.00 | 7/16/14 | 2,600,000 | | 2,608,427 |
| Ohio Higher Educational Facility Commission, HR (Cleveland Clinic | | | | | |
| Health System Obligated Group) (Liquidity Facility; Wells Fargo Bank) | 0.04 | 2/3/14 | 7,990,000 | a | 7,990,000 |
| Oklahoma—.1% | | | | | |
| Oklahoma Water Resource Board, Revenue | | | | | |
| (Liquidity Facility; State Street Bank and Trust Co.) | 0.30 | 3/3/14 | 3,370,000 | | 3,370,000 |
| Oregon—.9% | | | | | |
| Oregon, GO Notes, TAN | 1.50 | 7/31/14 | 20,000,000 | | 20,130,931 |
| Pennsylvania—6.5% | | | | | |
| Adams County Industrial Development Authority, Revenue | | | | | |
| (The Brethren Home Community Project) (LOC; PNC Bank NA) | 0.05 | 2/7/14 | 3,000,000 | a | 3,000,000 |
| Deutsche Bank Spears/Lifers Trust (Series DBE-1021) | | | | | |
| (Pennsylvania Higher Education Facilities Authority, | | | | | |
| Revenue (Student Association, Inc. Student Housing Project | | | | | |
| at California University of Pennsylvania)) (Liquidity Facility; | | | | | |
| Deutsche Bank AG and LOC; Deutsche Bank AG) | 0.14 | 2/7/14 | 32,160,000 a,b,c | | 32,160,000 |
| East Hempfield Township Industrial Development Authority, | | | | | |
| Revenue (The Mennonite Home Project) (LOC; M&T Trust) | 0.09 | 2/7/14 | 10,365,000 | a | 10,365,000 |
| East Hempfield Township Industrial Development Authority, | | | | | |
| Revenue (The Mennonite Home Project) (LOC; M&T Trust) | 0.09 | 2/7/14 | 3,915,000 | a | 3,915,000 |
| Emmaus General Authority, Local Government Revenue | | | | | |
| (Bond Pool Program) (LOC; U.S. Bank NA) | 0.04 | 2/7/14 | 9,500,000 | a | 9,500,000 |
| General Authority of South Central Pennsylvania, | | | | | |
| Revenue (Lutheran Social Services of South Central | | | | | |
| Pennsylvania Project) (LOC; M&T Trust) | 0.09 | 2/7/14 | 15,295,000 | a | 15,295,000 |
| Horizon Hospital System Authority, Senior Health and Housing | | | | | |
| Facilities Revenue (Saint Paul Homes Project) (LOC; M&T Trust) | 0.09 | 2/7/14 | 15,895,000 | a | 15,895,000 |
| Lancaster County Hospital Authority, Health Center | | | | | |
| Revenue (LUTHERCARE Project) (LOC; M&T Trust) | 0.04 | 2/7/14 | 32,180,000 | a | 32,180,000 |
STATEMENT OF INVESTMENTS (continued)
| | | | | | |
| Dreyfus Tax Exempt | Coupon | Maturity | Principal | | |
| Cash Management (continued) | Rate (%) | Date | Amount ($) | | Value ($) |
| |
| Short-Term Investments (continued) | | | | | |
| Pennsylvania (continued) | | | | | |
| Lancaster County Hospital Authority, Revenue (Landis Home | | | | | |
| Retirement Community Project) (LOC; M&T Trust) | 0.09 | 2/7/14 | 7,810,000 | a | 7,810,000 |
| Mars Area School District, GO Notes | 1.00 | 2/28/14 | 7,175,000 | | 7,179,066 |
| North Penn Water Authority, Water Revenue (LOC; U.S. Bank NA) | 0.04 | 2/7/14 | 11,700,000 | a | 11,700,000 |
| Ridley School District, GO Notes (LOC; TD Bank) | 0.04 | 2/7/14 | 2,500,000 | a | 2,500,000 |
| York General Authority, Revenue (Strand-Capitol | | | | | |
| Performing Arts Center Project) (LOC; M&T Trust) | 0.09 | 2/7/14 | 1,445,000 | a | 1,445,000 |
| South Carolina—2.8% | | | | | |
| Charleston County School District, GO Notes | 1.50 | 3/1/14 | 50,385,000 | | 50,441,579 |
| Georgetown County School District, GO Notes, Refunding | 5.00 | 3/1/14 | 3,590,000 | | 3,604,228 |
| Richland County, GO Notes | 4.00 | 3/1/14 | 2,000,000 | | 2,006,282 |
| South Carolina Public Service Authority, Revenue, CP | | | | | |
| (Santee Cooper) (Liquidity Facility; Barclays Bank PLC) | 0.11 | 3/17/14 | 10,000,000 | | 10,000,000 |
| Tennessee—6.4% | | | | | |
| Blount County Public Building Authority, Local Government Public | | | | | |
| Improvement Revenue (LOC; Branch Banking and Trust Co.) | 0.05 | 2/7/14 | 3,045,000 | a | 3,045,000 |
| Blount County Public Building Authority, Local Government Public | | | | | |
| Improvement Revenue (LOC; Branch Banking and Trust Co.) | 0.05 | 2/7/14 | 9,510,000 | a | 9,510,000 |
| Blount County Public Building Authority, Local Government Public | | | | | |
| Improvement Revenue (LOC; Branch Banking and Trust Co.) | 0.05 | 2/7/14 | 8,685,000 | a | 8,685,000 |
| Industrial Development Board of Blount County and the | | | | | |
| Cities of Alcoa and Maryville, Local Government Public | | | | | |
| Improvement Revenue (Maryville Civic Arts Center Project) | | | | | |
| (LOC; Branch Banking and Trust Co.) | 0.05 | 2/7/14 | 2,000,000 | a | 2,000,000 |
| Memphis, CP (Liquidity Facility; Mizuho Bank, Ltd.) | 0.07 | 2/5/14 | 40,500,000 | | 40,500,000 |
| Memphis, CP (Liquidity Facility; Mizuho Bank, Ltd.) | 0.12 | 3/19/14 | 12,000,000 | | 12,000,000 |
| Metropolitan Government of Nashville and Davidson County, CP | | | | | |
| (Liquidity Facility: California Public Employees Retirement | | | | | |
| System, California State Teachers Retirement System | | | | | |
| and State Street Bank and Trust Co.) | 0.09 | 4/7/14 | 22,500,000 | | 22,500,000 |
| Sevier County Public Building Authority, Local Government | | | | | |
| Public Improvement Revenue (LOC; FHLB) | 0.07 | 2/7/14 | 5,030,000 | a | 5,030,000 |
| Sevierville Public Building Authority, | | | | | |
| Local Government Public Improvement Revenue | 5.00 | 6/1/14 | 2,250,000 | | 2,285,883 |
| Shelby County Health Educational and Housing | | | | | |
| Facility Board, Educational Facilities Revenue | | | | | |
| (Rhodes College) (LOC; Wells Fargo Bank) | 0.04 | 2/7/14 | 7,730,000 | a | 7,730,000 |
| Tennessee, CP (Liquidity Facility; | | | | | |
| Tennessee Consolidated Retirement System) | 0.11 | 2/11/14 | 15,000,000 | | 15,000,000 |
| Tennessee, CP (Liquidity Facility; | | | | | |
| Tennessee Consolidated Retirement System) | 0.09 | 4/3/14 | 7,000,000 | | 7,000,000 |
| Tennessee, CP (Liquidity Facility; | | | | | |
| Tennessee Consolidated Retirement System) | 0.09 | 4/7/14 | 15,000,000 | | 15,000,000 |
42
| | | | | | |
| Dreyfus Tax Exempt | Coupon | Maturity | Principal | | |
| Cash Management (continued) | Rate (%) | Date | Amount ($) | | Value ($) |
| |
| Short-Term Investments (continued) | | | | | |
| Texas—16.8% | | | | | |
| Allen Independent School District, GO Notes, Refunding | 3.00 | 2/15/14 | 2,120,000 | | 2,122,712 |
| Dallas, Waterworks and Sewer System Revenue, CP | | | | | |
| (Liquidity Facility: California State Teachers Retirement | | | | | |
| System and State Street Bank and Trust Co.) | 0.08 | 3/11/14 | 10,000,000 | | 10,000,000 |
| El Paso, Water and Sewer Revenue, CP | | | | | |
| (Liquidity Facility; JPMorgan Chase Bank) | 0.12 | 4/8/14 | 5,000,000 | | 5,000,000 |
| El Paso Independent School District, Unlimited Tax School Building | | | | | |
| Bonds (Liquidity Facility; JPMorgan Chase Bank and LOC; | | | | | |
| Permanent School Fund Guarantee Program) | 0.12 | 4/8/14 | 10,000,000 | | 10,000,000 |
| Fort Worth, Water and Sewer System Revenue, Refunding | 5.00 | 2/15/14 | 4,700,000 | | 4,710,288 |
| Garland, Electric Utility System Revenue, CP | | | | | |
| (LOC; Sumitomo Mitsui Banking Corporation) | 0.13 | 2/19/14 | 22,000,000 | | 22,000,000 |
| Garland, Electric Utility System Revenue, CP (LOC; Wells Fargo Bank) | 0.13 | 2/19/14 | 5,000,000 | | 5,000,000 |
| Garland Independent School District, GO Notes, Refunding | 5.00 | 2/15/14 | 2,000,000 | | 2,004,401 |
| Gregg County Health Facilities Development Corporation, HR | | | | | |
| (Good Shepherd Medical Center Project) (LOC; JPMorgan Chase Bank) | 0.08 | 2/7/14 | 7,160,000 | a | 7,160,000 |
| Gulf Coast Waste Disposal Authority, | | | | | |
| Environmental Facilities Revenue (Air Products Project) | 0.04 | 2/7/14 | 10,500,000 | a | 10,500,000 |
| Harris County, GO Notes, TAN | 2.00 | 2/28/14 | 15,000,000 | | 15,020,507 |
| Harris County, Toll Road Senior Lien Revenue, Refunding | 5.00 | 8/15/14 | 1,675,000 | | 1,718,045 |
| Harris County Cultural Education Facilities Finance Corporation, | | | | | |
| Medical Facilities Mortgage Revenue, Refunding | | | | | |
| (Baylor College of Medicine) (LOC; Barclays Bank PLC) | 0.03 | 2/7/14 | 13,800,000 | a | 13,800,000 |
| Houston Independent School District, GO Notes, Refunding | 5.00 | 7/15/14 | 1,500,000 | | 1,532,567 |
| Jefferson County Industrial Development Corporation, | | | | | |
| Hurricane Ike Disaster Area Revenue (Jefferson | | | | | |
| Refinery, L.L.C. Project) (LOC; Branch Banking and Trust Co.) | 0.65 | 4/15/14 | 14,935,000 | | 14,935,000 |
| Jefferson County Industrial Development Corporation, | | | | | |
| Hurricane Ike Disaster Area Revenue (Jefferson | | | | | |
| Refinery, L.L.C. Project) (LOC; Branch Banking and Trust Co.) | 0.65 | 4/15/14 | 25,700,000 | | 25,700,000 |
| Lower Colorado River Authority, Revenue, CP (Lower Colorado | | | | | |
| River Authority Transportation Services Corporation) | | | | | |
| (Liquidity Facility; JPMorgan Chase Bank) | 0.11 | 4/7/14 | 3,175,000 | | 3,175,000 |
| Lower Colorado River Authority, Revenue, CP (Lower Colorado | | | | | |
| River Authority Transportation Services Corporation) | | | | | |
| (Liquidity Facility; JPMorgan Chase Bank) | 0.11 | 4/7/14 | 11,400,000 | | 11,400,000 |
| Lubbock Independent School District, Unlimited Tax School | | | | | |
| Building Bonds (Liquidity Facility; Bank of America and LOC; | | | | | |
| Permanent School Fund Guarantee Program) | 0.07 | 2/7/14 | 4,300,000 | a | 4,300,000 |
| RBC Municipal Products Inc. Trust (Series E-27) (Harris County | | | | | |
| Health Facilities Development Corporation, HR, Refunding | | | | | |
| (Memorial Hermann Healthcare System)) (Liquidity Facility; | | | | | |
| Royal Bank of Canada and LOC; Royal Bank of Canada) | 0.04 | 2/7/14 | 15,000,000 a,b,c | | 15,000,000 |
STATEMENT OF INVESTMENTS (continued)
| | | | | | |
| Dreyfus Tax Exempt | Coupon | Maturity | Principal | | |
| Cash Management (continued) | Rate (%) | Date | Amount ($) | | Value ($) |
| |
| Short-Term Investments (continued) | | | | | |
| Texas (continued) | | | | | |
| Red River Education Finance Corporation, Higher Education | | | | | |
| Revenue (Texas Christian University Project) | 0.04 | 2/7/14 | 23,000,000 | a | 23,000,000 |
| Rockwall Independent School District, Unlimited Tax School | | | | | |
| Building Bonds (Liquidity Facility; Wells Fargo Bank and | | | | | |
| LOC; Permanent School Fund Guarantee Program) | 0.05 | 2/7/14 | 9,000,000 | a | 9,000,000 |
| San Antonio, Electric and Gas Revenue, CP | | | | | |
| (Liquidity Facility; JPMorgan Chase Bank) | 0.12 | 3/5/14 | 15,000,000 | | 15,000,000 |
| San Antonio, GO Notes | 2.00 | 2/1/14 | 3,355,000 | | 3,355,333 |
| Texas, TRAN | 2.00 | 8/28/14 | 91,000,000 | | 91,941,128 |
| Texas Public Finance Authority, CP | 0.11 | 2/11/14 | 12,100,000 | | 12,100,000 |
| Texas Public Finance Authority, CP | 0.09 | 4/8/14 | 14,000,000 | | 14,000,000 |
| Texas Water Development Board, State Revolving Fund | | | | | |
| Subordinate Lien Revenue (Citigroup ROCS, | | | | | |
| Series RR II R-11746) (Liquidity Facility; Citibank NA) | 0.04 | 2/7/14 | 10,940,000 a,b,c | | 10,940,000 |
| University of Texas System Board of Regents, | | | | | |
| Financing System Revenue, Refunding | 0.03 | 2/7/14 | 29,800,000 | a | 29,800,000 |
| Utah—3.8% | | | | | |
| Intermountain Power Agency, Power Supply Revenue, CP | | | | | |
| (Liquidity Facility; JPMorgan Chase Bank) | 0.10 | 6/10/14 | 36,000,000 | | 36,000,000 |
| Intermountain Power Agency, Power Supply Revenue, CP | | | | | |
| (Liquidity Facility; JPMorgan Chase Bank) | 0.11 | 6/13/14 | 15,200,000 | | 15,200,000 |
| Murray City, HR (Intermountain Health Care Health Services, Inc.) | 0.03 | 2/7/14 | 100,000 | a | 100,000 |
| Murray City, HR (Intermountain Health Care Health Services, Inc.) | 0.04 | 2/7/14 | 32,000,000 | a | 32,000,000 |
| Utah Housing Finance Agency, MFHR, Refunding | | | | | |
| (Candlestick Apartments Project) (Liquidity | | | | | |
| Facility; FNMA and LOC; FNMA) | 0.06 | 2/7/14 | 6,400,000 | a | 6,400,000 |
| Virginia—.5% | | | | | |
| Harrisonburg Industrial Development Authority, Revenue, | | | | | |
| Refunding (Virginia Mennonite Retirement Community) | | | | | |
| (LOC; Branch Banking and Trust Co.) | 0.05 | 2/7/14 | 6,685,000 | a | 6,685,000 |
| Virginia College Building Authority, Educational Facilities | | | | | |
| Revenue (21st Century College and Equipment Programs) | | | | | |
| (Liquidity Facility; Wells Fargo Bank) | 0.05 | 2/3/14 | 4,240,000 | a | 4,240,000 |
| Washington—1.3% | | | | | |
| King County Housing Authority, Pooled Housing Revenue, | | | | | |
| Refunding (Liquidity Facility; FHLMC and LOC; FHLMC) | 0.03 | 2/7/14 | 24,365,000 | a | 24,365,000 |
| Washington, Various Purpose GO, Refunding | | | | | |
| (P-FLOATS Series PT-4658) (Liquidity Facility; Bank of America) | 0.05 | 2/7/14 | 7,250,000 a,b,c | | 7,250,000 |
| Wisconsin—4.5% | | | | | |
| Milwaukee Redevelopment Authority, Redevelopment LR | | | | | |
| (University of Wisconsin-Milwaukee Kenilworth | | | | | |
| Project) (LOC; U.S. Bank NA) | 0.04 | 2/7/14 | 5,730,000 | a | 5,730,000 |
44
| | | | | | |
| Dreyfus Tax Exempt | Coupon | Maturity | Principal | | |
| Cash Management (continued) | Rate (%) | Date | Amount ($) | | Value ($) |
| |
| Short-Term Investments (continued) | | | | | |
| Wisconsin (continued) | | | | | |
| Oneida Tribe of Indians of Wisconsin, | | | | | |
| Health Facilities Revenue (LOC; Bank of America) | 0.08 | 2/7/14 | 11,090,000 | a | 11,090,000 |
| Wisconsin Health and Educational Facilities Authority, Revenue | | | | | |
| (Ascension Health Senior Credit Group) (Eclipse Funding Trust, | | | | | |
| Series 0029) (Liquidity Facility; U.S. Bank NA and LOC; U.S. Bank NA) | 0.04 | 2/7/14 | 22,820,000 a,b,c | | 22,820,000 |
| Wisconsin Health and Educational Facilities Authority, Revenue | | | | | |
| (Mequon Jewish Campus, Inc. Project) (LOC; JPMorgan Chase Bank) | 0.08 | 2/7/14 | 5,935,000 | a | 5,935,000 |
| Wisconsin Health and Educational Facilities Authority, Revenue, CP | | | | | |
| (Aurora Health Care) (LOC; JPMorgan Chase Bank) | 0.20 | 2/5/14 | 10,000,000 | | 10,000,000 |
| Wisconsin Health and Educational Facilities Authority, Revenue, CP | | | | | |
| (Aurora Health Care) (LOC; JPMorgan Chase Bank) | 0.17 | 6/4/14 | 29,000,000 | | 29,000,000 |
| Wisconsin Health and Educational Facilities Authority, Revenue, CP | | | | | |
| (Aurora Health Care) (LOC; JPMorgan Chase Bank) | 0.15 | 8/5/14 | 22,000,000 | | 22,000,000 |
| |
| Total Investments (cost $2,354,476,399) | | | 99.9 | % | 2,354,476,399 |
| Cash and Receivables (Net) | | | .1 | % | 2,599,591 |
| Net Assets | | | 100.0 | % | 2,357,075,990 |
| |
| a Variable rate demand note—rate shown is the interest rate in effect at January 31, 2014. Maturity date represents the next demand date, or the ultimate maturity date if earlier. |
| b Securities exempt from registration pursuant to Rule 144A under the Securities Act of 1933.These securities may be resold in transactions exempt from registration, normally to qualified |
| institutional buyers.At January 31, 2014, these securities amounted to $345,280,000 or 14.6% of net assets. |
| c The fund does not directly own the municipal security indicated; the fund owns an interest in a special purpose entity that, in turn, owns the underlying municipal security.The special |
| purpose entity permits the fund to own interests in underlying assets, but in a manner structured to provide certain advantages not inherent in the underlying bonds (e.g., enhanced |
| liquidity, yields linked to short-term rates). |
| d These securities are prerefunded; the date shown represents the prerefunded date. Bonds which are prerefunded are collateralized by U.S. Government securities which are held in escrow |
| and are used to pay principal and interest on the municipal issue and to retire the bonds in full at the earliest refunding date. |
| | | | |
| Portfolio Summary (Unaudited)† | | | |
| |
| | Value (%) | | Value (%) |
| Health Care | 21.7 | County | 3.9 |
| Education | 12.3 | Lease | 2.9 |
| Utility-Electric | 10.8 | Special Tax | 2.4 |
| State/Territory | 9.8 | Resource Recovery | 1.7 |
| Industrial | 8.1 | Prerefunded | .8 |
| Transportation Services | 5.9 | Pollution Control | .6 |
| City | 5.6 | Other | 5.0 |
| Housing | 4.2 | | |
| Utility-Water and Sewer | 4.2 | | 99.9 |
| |
| † Based on net assets. | | | |
| See notes to financial statements. | | | |
STATEMENT OF INVESTMENTS
January 31, 2014
| | | | | | |
| Dreyfus California AMT-Free | Coupon | Maturity | Principal | | |
| Municipal Cash Management | Rate (%) | Date | Amount ($) | | Value ($) |
| |
| Short-Term Investments—99.8% | | | | | |
| ABAG Finance Authority for Nonprofit Corporations, Revenue | | | | | |
| (California Alumni Association Project) (LOC; Bank of America) | 0.08 | 2/7/14 | 4,100,000 | a | 4,100,000 |
| ABAG Finance Authority for Nonprofit Corporations, | | | | | |
| Revenue (Jewish Community Center of Orange | | | | | |
| County Project) (LOC; Bank of America) | 0.08 | 2/7/14 | 2,395,000 | a | 2,395,000 |
| Alameda County Industrial Development Authority, Recovery Zone | | | | | |
| Facility Revenue (Dale Hardware, Inc. Project) (LOC; Comerica Bank) | 0.06 | 2/7/14 | 2,490,000 | a | 2,490,000 |
| Alameda County Industrial Development Authority, Revenue | | | | | |
| (Santini Foods, Inc. Project) (LOC; Comerica Bank) | 0.06 | 2/7/14 | 2,900,000 | a | 2,900,000 |
| Alameda Public Financing Authority, Revenue | | | | | |
| (Alameda Point Improvement Project) | | | | | |
| (LOC; California State Teachers Retirement System) | 0.04 | 2/7/14 | 4,800,000 | a | 4,800,000 |
| Branch Banking and Trust Co. Municipal Trust (Series 2000) | | | | | |
| (California, GO Notes, Refunding) (Liquidity Facility; Branch | | | | | |
| Banking and Trust Co. and LOC; Branch Banking and Trust Co.) | 0.08 | 2/7/14 | 11,060,000 a,b,c | | 11,060,000 |
| California, GO Notes (LOC; Bank of America) | 0.04 | 2/7/14 | 28,500,000 | a | 28,500,000 |
| California Educational Facilities Authority, Revenue | | | | | |
| (University of San Francisco) (LOC; JPMorgan Chase Bank) | 0.05 | 2/7/14 | 140,000 | a | 140,000 |
| California Enterprise Development Authority, IDR | | | | | |
| (Tri Tool Inc. Project) (LOC; Comerica Bank) | 0.09 | 2/7/14 | 9,320,000 | a | 9,320,000 |
| California Enterprise Development Authority, Recovery Zone | | | | | |
| Facility Revenue (Regional Properties, Inc. Project) (LOC; FHLB) | 0.05 | 2/7/14 | 15,000,000 | a | 15,000,000 |
| California Health Facilities Financing Authority, | | | | | |
| Revenue, CP (Kaiser Permanente) | 0.15 | 5/16/14 | 15,000,000 | | 15,000,000 |
| California Health Facilities Financing Authority, | | | | | |
| Revenue, CP (Kaiser Permanente) | 0.19 | 8/5/14 | 30,973,000 | | 30,973,000 |
| California Infrastructure and Economic Development Bank, | | | | | |
| Revenue (Goodwill Industries of Orange County, California) | | | | | |
| (LOC; Wells Fargo Bank) | 0.10 | 2/7/14 | 1,385,000 | a | 1,385,000 |
| California Infrastructure and Economic Development Bank, | | | | | |
| Revenue (Southern California Public Radio Project) | | | | | |
| (LOC; JPMorgan Chase Bank) | 0.06 | 2/3/14 | 2,445,000 | a | 2,445,000 |
| California Infrastructure and Economic Development Bank, | | | | | |
| Revenue (SRI International) (LOC; Wells Fargo Bank) | 0.05 | 2/7/14 | 2,535,000 | a | 2,535,000 |
| California Infrastructure and Economic Development Bank, | | | | | |
| Revenue (The Westmark School Project) (LOC; U.S. Bank NA) | 0.05 | 2/7/14 | 6,240,000 | a | 6,240,000 |
| California Municipal Finance Authority, Recovery Zone | | | | | |
| Facility Revenue (Chevron U.S.A. Inc. Project) | 0.03 | 2/3/14 | 4,335,000 | a | 4,335,000 |
| California Municipal Finance Authority, Revenue | | | | | |
| (Notre Dame High School, San Jose) (LOC; Comerica Bank) | 0.05 | 2/7/14 | 1,050,000 | a | 1,050,000 |
| California Pollution Control Financing Authority, SWDR | | | | | |
| (Athens Services Project) (LOC; Wells Fargo Bank) | 0.05 | 2/7/14 | 31,065,000 | a | 31,065,000 |
| California Pollution Control Financing Authority, SWDR | | | | | |
| (Big Bear Disposal, Inc. Project) (LOC; Union Bank NA) | 0.06 | 2/7/14 | 2,215,000 | a | 2,215,000 |
46
| | | | | | |
| Dreyfus California AMT-Free | Coupon | Maturity | Principal | | |
| Municipal Cash Management (continued) | Rate (%) | Date | Amount ($) | | Value ($) |
| |
| Short-Term Investments (continued) | | | | | |
| California Pollution Control Financing Authority, SWDR | | | | | |
| (Crown Disposal Company, Inc. Project) (LOC; Union Bank NA) | 0.06 | 2/7/14 | 2,825,000 | a | 2,825,000 |
| California Pollution Control Financing Authority, SWDR | | | | | |
| (Garden City Sanitation, Inc. Project) (LOC; Union Bank NA) | 0.06 | 2/7/14 | 8,130,000 | a | 8,130,000 |
| California Pollution Control Financing Authority, SWDR | | | | | |
| (Mission Trail Waste Systems, Inc. Project) (LOC; Comerica Bank) | 0.07 | 2/7/14 | 2,345,000 | a | 2,345,000 |
| California Pollution Control Financing Authority, SWDR | | | | | |
| (South Bay Recycling Project) (LOC; Union Bank NA) | 0.06 | 2/7/14 | 2,150,000 | a | 2,150,000 |
| California Pollution Control Financing Authority, SWDR, Refunding | | | | | |
| (BLT Enterprises of Fremont LLC Project) (LOC; Union Bank NA) | 0.06 | 2/7/14 | 8,740,000 | a | 8,740,000 |
| California Pollution Control Financing Authority, SWDR, Refunding | | | | | |
| (MarBorg Industries Project) (LOC; Union Bank NA) | 0.06 | 2/7/14 | 2,750,000 | a | 2,750,000 |
| California School Cash Reserve Program Authority, Revenue | 2.00 | 4/1/14 | 6,300,000 | | 6,318,270 |
| California School Cash Reserve Program Authority, | | | | | |
| Subordinate Revenue | 2.00 | 6/2/14 | 1,750,000 | | 1,759,522 |
| California Statewide Communities Development Authority, | | | | | |
| Revenue (Goodwill of Santa Cruz) (LOC; Wells Fargo Bank) | 0.10 | 2/7/14 | 1,555,000 | a | 1,555,000 |
| California Statewide Communities Development Authority, | | | | | |
| Revenue (John Muir Health) (LOC; Wells Fargo Bank) | 0.03 | 2/3/14 | 1,000,000 | a | 1,000,000 |
| California Statewide Communities Development Authority, | | | | | |
| Revenue (Metropolitan Area Advisory Committee | | | | | |
| Project) (LOC; Bank of America) | 0.13 | 2/7/14 | 3,190,000 | a | 3,190,000 |
| California Statewide Communities Development Authority, | | | | | |
| Revenue (Trinity Children and Family Services Project) | | | | | |
| (LOC; California State Teachers Retirement System) | 0.07 | 2/7/14 | 4,100,000 | a | 4,100,000 |
| Deutsche Bank Spears/Lifers Trust (Series DBE-525) | | | | | |
| (Golden State Tobacco Securitization Corporation, | | | | | |
| Enhanced Tobacco Settlement Asset-Backed Bonds) | | | | | |
| (Liquidity Facility; Deutsche Bank AG and LOC; Deutsche Bank AG) | 0.12 | 2/7/14 | 5,000,000 a,b,c | | 5,000,000 |
| Deutsche Bank Spears/Lifers Trust (Series DBE-561) | | | | | |
| (Azusa Public Financing Authority, Parity Revenue | | | | | |
| (Water System Capital Improvements Program) (Liquidity | | | | | |
| Facility; Deutsche Bank AG and LOC; Deutsche Bank AG) | 0.12 | 2/7/14 | 5,085,000 a,b,c | | 5,085,000 |
| Deutsche Bank Spears/Lifers Trust (Series DBE-575) | | | | | |
| (Elk Grove Finance Authority, Special Tax Revenue) (Liquidity | | | | | |
| Facility; Deutsche Bank AG and LOC; Deutsche Bank AG) | 0.12 | 2/7/14 | 4,670,000 a,b,c | | 4,670,000 |
| Deutsche Bank Spears/Lifers Trust (Series DBE-1013) | | | | | |
| (Fontana Public Financing Authority, Tax Allocation Revenue | | | | | |
| (North Fontana Redevelopment Project)) (Liquidity Facility; | | | | | |
| Deutsche Bank AG and LOC; Deutsche Bank AG) | 0.17 | 2/7/14 | 5,200,000 a,b,c | | 5,200,000 |
| Deutsche Bank Spears/Lifers Trust (Series DBE-1083) | | | | | |
| (California Health Facilities Financing Authority, Revenue | | | | | |
| (Catholic Healthcare West)) (Liquidity Facility; | | | | | |
| Deutsche Bank AG and LOC; Deutsche Bank AG) | 0.10 | 2/7/14 | 3,000,000 a,b,c | | 3,000,000 |
STATEMENT OF INVESTMENTS (continued)
| | | | | | |
| Dreyfus California AMT-Free | Coupon | Maturity | Principal | | |
| Municipal Cash Management (continued) | Rate (%) | Date | Amount ($) | | Value ($) |
| |
| Short-Term Investments (continued) | | | | | |
| Deutsche Bank Spears/Lifers Trust (Series DBE-1211) | | | | | |
| (Golden State Tobacco Securitization Corporation, | | | | | |
| Enhanced Tobacco Settlement Asset-Backed Bonds) (Liquidity | | | | | |
| Facility; Deutsche Bank AG and LOC; Deutsche Bank AG) | 0.09 | 2/7/14 | 24,160,000 a,b,c | | 24,160,000 |
| Golden State Tobacco Securitization Corporation, | | | | | |
| Tobacco Settlement Revenue (Eagle 2013-0013) | | | | | |
| (Liquidity Facility; Citibank NA) | 0.14 | 2/7/14 | 9,900,000 a,b,c | | 9,900,000 |
| Hillsborough, COP (Water and Sewer Systems Projects) | | | | | |
| (Liquidity Facility; JPMorgan Chase Bank) | 0.10 | 2/7/14 | 5,900,000 | a | 5,900,000 |
| Manteca Redevelopment Agency, Subordinate Tax Allocation | | | | | |
| Revenue, Refunding (Amended Merged Project Area) | | | | | |
| (LOC; State Street Bank and Trust Co.) | 0.04 | 2/3/14 | 12,140,000 | a | 12,140,000 |
| Menlo Park Community Development Agency, Tax Allocation | | | | | |
| Revenue, Refunding (Las Pulgas Community Development | | | | | |
| Project) (LOC; State Street Bank and Trust Co.) | 0.04 | 2/3/14 | 11,600,000 | a | 11,600,000 |
| Orange County, Apartment Development Revenue, | | | | | |
| Refunding (Villa La Paz Issue) (LOC; FNMA) | 0.04 | 2/7/14 | 550,000 | a | 550,000 |
| Orange County, Apartment Development Revenue, | | | | | |
| Refunding (WLCO LF Partners) (LOC; FNMA) | 0.05 | 2/7/14 | 5,000,000 | a | 5,000,000 |
| Pittsburg Redevelopment Agency, Subordinate Tax Allocation | | | | | |
| Revenue (Los Medanos Community Development Project) | | | | | |
| (Liquidity Facility: California State Teachers Retirement | | | | | |
| System and State Street Bank and Trust Co.) | 0.04 | 2/3/14 | 33,400,000 | a | 33,400,000 |
| Ravenswood City School District, GO Notes, TRAN | 1.00 | 3/3/14 | 1,400,000 | | 1,400,514 |
| Riverside County Transportation Commission, | | | | | |
| Sales Tax Revenue (Liquidity Facility; JPMorgan Chase Bank) | 0.04 | 2/7/14 | 400,000 | a | 400,000 |
| Riverside County Transportation Commission, Sales Tax | | | | | |
| Revenue (Liquidity Facility; JPMorgan Chase Bank) | 0.06 | 2/7/14 | 8,800,000 | a | 8,800,000 |
| Sacramento County Housing Authority, MFHR, Refunding | | | | | |
| (Stonebridge Apartments) (LOC; FNMA) | 0.06 | 2/7/14 | 8,000,000 | a | 8,000,000 |
| San Bernardino County, MFHR, Refunding | | | | | |
| (Rosewood Apartments) (LOC; FNMA) | 0.09 | 2/7/14 | 2,725,000 | a | 2,725,000 |
| San Bernardino County, MFHR, Refunding (Somerset Apartments) | | | | | |
| (Liquidity Facility; FNMA and LOC; FNMA) | 0.09 | 2/7/14 | 1,800,000 | a | 1,800,000 |
| San Diego County, COP (Museum of Contemporary Art San Diego) | | | | | |
| (LOC; Northern Trust Company) | 0.04 | 2/7/14 | 1,450,000 | a | 1,450,000 |
| San Diego County, COP (San Diego Museum of Art) | | | | | |
| (LOC; Wells Fargo Bank) | 0.10 | 2/7/14 | 300,000 | a | 300,000 |
| San Diego County and San Diego County School Districts, GO Notes, | | | | | |
| Tax and Revenue Anticipation Note Program (Note Participations) | 2.00 | 4/30/14 | 5,000,000 | | 5,021,419 |
| San Pablo Redevelopment Agency, Subordinate Tax | | | | | |
| Allocation Revenue (Tenth Township Redevelopment | | | | | |
| Project) (LOC; Union Bank NA) | 0.04 | 2/3/14 | 16,600,000 | a | 16,600,000 |
48
| | | | | | |
| Dreyfus California AMT-Free | Coupon | Maturity | Principal | | |
| Municipal Cash Management (continued) | Rate (%) | Date | Amount ($) | | Value ($) |
| |
| Short-Term Investments (continued) | | | | | |
| Santa Clara County Financing Authority, LR, Refunding | | | | | |
| (Multiple Facilities Projects) (LOC; Bank of America) | 0.05 | 2/7/14 | 750,000 | a | 750,000 |
| School Project for Utility Rate Reduction, GO Notes, RAN | | | | | |
| (Natural Gas Purchase Program for Member California | | | | | |
| School Districts and Community Colleges and | | | | | |
| Other Non-Member Affiliated Public Entities) | 0.42 | 8/1/14 | 2,000,000 | | 2,000,000 |
| Tracy, MFHR, Refunding (Sycamore Village Apartments) (LOC; FHLMC) | 0.04 | 2/7/14 | 1,700,000 | a | 1,700,000 |
| West Basin Municipal Water District, Revenue, Refunding | | | | | |
| COP (Liquidity Facility; Citibank NA) | 0.06 | 2/7/14 | 7,845,000 | a | 7,845,000 |
| Yolo County, MFHR (Primero Grove Student Apartments Project) | | | | | |
| (LOC; California State Teachers Retirement System) | 0.14 | 2/7/14 | 955,000 | a | 955,000 |
| |
| Total Investments (cost $408,162,725) | | | 99.8 | % | 408,162,725 |
| Cash and Receivables (Net) | | | .2 | % | 812,071 |
| Net Assets | | | 100.0 | % | 408,974,796 |
| |
| a Variable rate demand note—rate shown is the interest rate in effect at January 31, 2014. Maturity date represents the next demand date, or the ultimate maturity date if earlier. |
| b Securities exempt from registration pursuant to Rule 144A under the Securities Act of 1933.These securities may be resold in transactions exempt from registration, normally to qualified |
| institutional buyers.At January 31, 2014, these securities amounted to $68,075,000 or 16.6% of net assets. |
| c The fund does not directly own the municipal security indicated; the fund owns an interest in a special purpose entity that, in turn, owns the underlying municipal security.The special |
| purpose entity permits the fund to own interests in underlying assets, but in a manner structured to provide certain advantages not inherent in the underlying bonds (e.g., enhanced |
| liquidity, yields linked to short-term rates). |
| | | | |
| Portfolio Summary (Unaudited)† | | | |
| |
| | Value (%) | | Value (%) |
| Special Tax | 15.1 | Transportation Services | 2.2 |
| Pollution Control | 14.2 | Lease | 1.5 |
| Industrial | 12.9 | Resource Recovery | 1.1 |
| State/Territory | 9.7 | Health Care | 1.0 |
| Utility-Water and Sewer | 5.6 | Utility-Electric | .5 |
| Education | 5.4 | Other | 25.5 |
| Housing | 5.1 | | 99.8 |
| |
| † Based on net assets. | | | |
| See notes to financial statements. | | | |
STATEMENT OF INVESTMENTS
January 31, 2014
| | | | | | |
| Dreyfus New York AMT-Free | Coupon | Maturity | Principal | | |
| Municipal Cash Management | Rate (%) | Date | Amount ($) | | Value ($) |
| |
| Short-Term Investments—99.6% | | | | | |
| Ausable Valley Central School District, GO Notes, BAN | 1.00 | 6/26/14 | 2,800,000 | | 2,805,105 |
| Broome County Industrial Development Agency, | | | | | |
| Continuing Care Retirement Community Revenue | | | | | |
| (Good Shepherd Village at Endwell, Inc. Project) (LOC; M&T Trust) | 0.09 | 2/7/14 | 3,160,000 | a | 3,160,000 |
| Deutsche Bank Spears/Lifers Trust (Series DBE-1152) | | | | | |
| (TSASC, Inc., Tobacco Settlement Asset-Backed Bonds) | | | | | |
| (Liquidity Facility: Deutsche Bank AG and LOC; Deutsche Bank AG) | 0.14 | 2/7/14 | 3,000,000 a,b,c | | 3,000,000 |
| Dutchess County Industrial Development Agency, | | | | | |
| Civic Facility Revenue (Anderson Foundation for | | | | | |
| Autism, Inc. Project) (LOC; M&T Trust) | 0.09 | 2/7/14 | 3,425,000 | a | 3,425,000 |
| Franklin County Industrial Development Agency, | | | | | |
| Civic Facility Revenue (Paul Smith's College | | | | | |
| Project) (LOC; U.S. Bank NA) | 0.06 | 2/7/14 | 830,000 | a | 830,000 |
| Franklin County Industrial Development Agency, | | | | | |
| Civic Facility Revenue (Trudeau Institute, Inc. | | | | | |
| Project) (LOC; HSBC Bank USA) | 0.14 | 2/7/14 | 1,545,000 | a | 1,545,000 |
| Gloversville City School District, GO Notes, BAN | 1.50 | 1/16/15 | 1,000,000 | | 1,009,703 |
| Hamburg Central School District, GO Notes, BAN | 2.00 | 6/13/14 | 4,600,000 | | 4,625,153 |
| Holley Central School District, GO Notes, BAN | 1.25 | 6/19/14 | 1,100,000 | | 1,102,974 |
| Middletown, GO Notes, BAN | 1.00 | 2/21/14 | 1,400,000 | | 1,400,420 |
| Monroe County Industrial Development Agency, | | | | | |
| Civic Facility Revenue (Monroe Community College | | | | | |
| Association, Inc. Project) (LOC; JPMorgan Chase Bank) | 0.04 | 2/7/14 | 500,000 | a | 500,000 |
| Monroe County Industrial Development Agency, | | | | | |
| Civic Facility Revenue (The Glen at Cherry | | | | | |
| Ridge, LLC Project) (LOC; HSBC Bank USA) | 0.06 | 2/7/14 | 4,600,000 | a | 4,600,000 |
| Nassau County Industrial Development Agency, Continuing | | | | | |
| Care Retirement Community Revenue (Amsterdam at | | | | | |
| Harborside Project) (LOC; Bank of America) | 0.25 | 2/7/14 | 4,300,000 | a | 4,300,000 |
| Nassau County Interim Finance Authority, Sales Tax Secured | | | | | |
| Revenue (Liquidity Facility; Sumitomo Mitsui Banking Corporation) | 0.04 | 2/7/14 | 1,000,000 | a | 1,000,000 |
| New York City, GO Notes (Liquidity Facility; | | | | | |
| Landesbank Hessen-Thuringen Girozentrale) | 0.07 | 2/7/14 | 1,000,000 | a | 1,000,000 |
| New York City, GO Notes (LOC; Bayerische Landesbank) | 0.06 | 2/7/14 | 2,700,000 | a | 2,700,000 |
| New York City, GO Notes (SBPA; Wells Fargo Bank) | 0.04 | 2/3/14 | 2,500,000 | a | 2,500,000 |
| New York City Capital Resource Corporation, Revenue | | | | | |
| (Loan Enhanced Assistance Program— Cobble Hill Health | | | | | |
| Center, Inc. Project) (LOC; Bank of America) | 0.14 | 2/7/14 | 2,400,000 | a | 2,400,000 |
| New York City Industrial Development Agency, Civic Facility | | | | | |
| Revenue (Birch Wathen Lenox School Project) (LOC; TD Bank) | 0.11 | 2/7/14 | 3,785,000 | a | 3,785,000 |
| New York City Industrial Development Agency, Civic Facility | | | | | |
| Revenue (Children's Oncology Society of New York, Inc. | | | | | |
| Project) (LOC; JPMorgan Chase Bank) | 0.06 | 2/7/14 | 2,100,000 | a | 2,100,000 |
| New York City Industrial Development Agency, Civic Facility | | | | | |
| Revenue (Sephardic Community Youth Center, Inc. | | | | | |
| Project) (LOC; M&T Trust) | 0.09 | 2/7/14 | 4,700,000 | a | 4,700,000 |
50
| | | | | | |
| Dreyfus New York AMT-Free | Coupon | Maturity | Principal | | |
| Municipal Cash Management (continued) | Rate (%) | Date | Amount ($) | | Value ($) |
| |
| Short-Term Investments (continued) | | | | | |
| New York City Industrial Development Agency, Civic Facility | | | | | |
| Revenue (Spence-Chapin, Services to Families and | | | | | |
| Children Project) (LOC; TD Bank) | 0.11 | 2/7/14 | 2,800,000 | a | 2,800,000 |
| New York City Municipal Water Finance Authority, | | | | | |
| Water and Sewer System Revenue (Liquidity Facility; | | | | | |
| California Public Employees Retirement System) | 0.04 | 2/3/14 | 2,000,000 | a | 2,000,000 |
| New York City Municipal Water Finance Authority, | | | | | |
| Water and Sewer System Second General Resolution | | | | | |
| Revenue (Liquidity Facility; Bank of Nova Scotia) | 0.05 | 2/3/14 | 7,030,000 | a | 7,030,000 |
| New York City Municipal Water Finance Authority, | | | | | |
| Water and Sewer System Second General Resolution | | | | | |
| Revenue (Liquidity Facility; Mizuho Bank, Ltd.) | 0.05 | 2/3/14 | 4,000,000 | a | 4,000,000 |
| New York City Transitional Finance Authority, Revenue | | | | | |
| (New York City Recovery) (Liquidity Facility; Royal Bank of Canada) | 0.04 | 2/3/14 | 2,600,000 | a | 2,600,000 |
| New York Liberty Development Corporation, Liberty Revenue, | | | | | |
| Refunding (World Trade Center Project—Towers 3-4) | | | | | |
| (LOC; JPMorgan Chase Bank) | 0.07 | 2/7/14 | 1,035,000 | a | 1,035,000 |
| New York Liberty Development Corporation, Liberty Revenue, | | | | | |
| Refunding (World Trade Center Project—Towers 3-4) | | | | | |
| (LOC; JPMorgan Chase Bank) | 0.07 | 2/7/14 | 180,000 | a | 180,000 |
| New York Liberty Development Corporation, Recovery Zone Revenue | | | | | |
| (3 World Trade Center Project) (LOC; JPMorgan Chase Bank) | 0.07 | 2/7/14 | 585,000 | a | 585,000 |
| New York Liberty Development Corporation, Recovery Zone Revenue | | | | | |
| (3 World Trade Center Project) (LOC; JPMorgan Chase Bank) | 0.07 | 2/7/14 | 515,000 | a | 515,000 |
| New York Local Government Assistance Corporation, Subordinate Lien | | | | | |
| Revenue, Refunding (Liquidity Facility; Bank of America) | 0.05 | 2/7/14 | 1,200,000 | a | 1,200,000 |
| New York State Dormitory Authority, Revenue | | | | | |
| (Le Moyne College) (LOC; TD Bank) | 0.05 | 2/7/14 | 1,100,000 | a | 1,100,000 |
| New York State Housing Finance Agency, Housing | | | | | |
| Revenue (505 West 37th Street) (LOC; Landesbank | | | | | |
| Hessen-Thuringen Girozentrale) | 0.07 | 2/3/14 | 7,800,000 | a | 7,800,000 |
| New York State Housing Finance Agency, | | | | | |
| Housing Revenue (Baisley Park Gardens) (LOC; Citibank NA) | 0.06 | 2/7/14 | 6,335,000 | a | 6,335,000 |
| Northern Adirondack Central School | | | | | |
| District at Ellenburg, GO Notes, BAN | 2.00 | 6/26/14 | 3,000,000 | | 3,017,453 |
| Orange County Industrial Development Agency, Civic Facility | | | | | |
| Revenue (Tuxedo Park School Project) (LOC; M&T Trust) | 0.09 | 2/7/14 | 200,000 | a | 200,000 |
| Port Authority of New York and New Jersey, Equipment Notes | 0.09 | 2/7/14 | 2,800,000 | a | 2,800,000 |
| Putnam County Industrial Development Agency, Civic Facility | | | | | |
| Revenue (United Cerebral Palsy of Putnam and | | | | | |
| Southern Dutchess Project) (LOC; TD Bank) | 0.05 | 2/7/14 | 1,400,000 | a | 1,400,000 |
| Rome, GO Notes, BAN | 1.00 | 9/5/14 | 1,325,000 | | 1,328,124 |
| Syracuse Industrial Development Agency, Civic Facility Revenue | | | | | |
| (Crouse Health Hospital, Inc. Project) (LOC; HSBC Bank USA) | 0.05 | 2/7/14 | 1,065,000 | a | 1,065,000 |
| Triborough Bridge and Tunnel Authority, General Revenue (MTA Bridges | | | | | |
| and Tunnels) (Liquidity Facility; JPMorgan Chase Bank) | 0.05 | 2/7/14 | 1,590,000 | a | 1,590,000 |
STATEMENT OF INVESTMENTS (continued)
| | | | | | |
| Dreyfus New York AMT-Free | Coupon | Maturity | Principal | | |
| Municipal Cash Management (continued) | Rate (%) | Date | Amount ($) | | Value ($) |
| |
| Short-Term Investments (continued) | | | | | |
| Triborough Bridge and Tunnel Authority, General | | | | | |
| Revenue, Refunding (MTA Bridges and Tunnels) | | | | | |
| (LOC; California Public Employees Retirement System) | 0.05 | 2/3/14 | 2,200,000 | a | 2,200,000 |
| Wallkill, GO Notes, BAN | 1.25 | 8/6/14 | 1,200,000 | | 1,204,707 |
| Wallkill, GO Notes, BAN | 1.25 | 1/16/15 | 1,000,000 | | 1,005,986 |
| |
| Total Investments (cost $105,479,625) | | | 99.6 | % | 105,479,625 |
| Cash and Receivables (Net) | | | .4 | % | 386,598 |
| Net Assets | | | 100.0 | % | 105,866,223 |
| |
| a Variable rate demand note—rate shown is the interest rate in effect at January 31, 2014. Maturity date represents the next demand date, or the ultimate maturity date if earlier. |
| b Security exempt from registration pursuant to Rule 144A under the Securities Act of 1933.This security may be resold in transactions exempt from registration, normally to qualified |
| institutional buyers.At January 31, 2014, this security amounted to $3,000,000 or 2.8% of net assets. |
| c The fund does not directly own the municipal security indicated; the fund owns an interest in a special purpose entity that, in turn, owns the underlying municipal security.The special |
| purpose entity permits the fund to own interests in underlying assets, but in a manner structured to provide certain advantages not inherent in the underlying bonds (e.g., enhanced |
| liquidity, yields linked to short-term rates). |
| | | | |
| Portfolio Summary (Unaudited)† | | | |
| |
| | Value (%) | | Value (%) |
| Education | 17.9 | Industrial | 6.3 |
| Health Care | 16.6 | Transportation Services | 6.2 |
| Housing | 13.4 | Special Tax | 2.1 |
| Utility-Water and Sewer | 12.3 | Other | 6.6 |
| City | 10.5 | | |
| Lease | 7.7 | | 99.6 |
| |
| † Based on net assets. | | | |
| See notes to financial statements. | | | |
52
| | | | |
| Summary of Abbreviations | | |
| |
| |
| ABAG | Association of Bay Area Governments | ACA | American Capital Access |
| AGC | ACE Guaranty Corporation | AGIC | Asset Guaranty Insurance Company |
| AMBAC | American Municipal Bond Assurance Corporation | ARRN | Adjustable Rate Receipt Notes |
| BAN | Bond Anticipation Notes | BPA | Bond Purchase Agreement |
| CIFG | CDC Ixis Financial Guaranty | COP | Certificate of Participation |
| CP | Commercial Paper | DRIVERS | Derivative Inverse Tax-Exempt Receipts |
| EDR | Economic Development Revenue | EIR | Environmental Improvement Revenue |
| FGIC | Financial Guaranty Insurance Company | FHA | Federal Housing Administration |
| FHLB | Federal Home Loan Bank | FHLMC | Federal Home Loan Mortgage Corporation |
| FNMA | Federal National Mortgage Association | GAN | Grant Anticipation Notes |
| GIC | Guaranteed Investment Contract | GNMA | Government National Mortgage Association |
| GO | General Obligation | HR | Hospital Revenue |
| IDB | Industrial Development Board | IDC | Industrial Development Corporation |
| IDR | Industrial Development Revenue | LIFERS | Long Inverse Floating Exempt Receipts |
| LOC | Letter of Credit | LOR | Limited Obligation Revenue |
| LR | Lease Revenue | MERLOTS | Municipal Exempt Receipts Liquidity Option Tender |
| MFHR | Multi-Family Housing Revenue | MFMR | Multi-Family Mortgage Revenue |
| PCR | Pollution Control Revenue | P-FLOATS | Puttable Floating Option Tax-Exempt Receipts |
| PILOT | Payment in Lieu of Taxes | PUTTERS | Puttable Tax-Exempt Receipts |
| RAC | Revenue Anticipation Certificates | RAN | Revenue Anticipation Notes |
| RAW | Revenue Anticipation Warrants | RIB | Residual Interest Bonds |
| ROCS | Reset Options Certificates | RRR | Resources Recovery Revenue |
| SAAN | State Aid Anticipation Notes | SBPA | Standby Bond Purchase Agreement |
| SFHR | Single Family Housing Revenue | SFMR | Single Family Mortgage Revenue |
| SONYMA | State of New York Mortgage Agency | SPEARS | Short Puttable Exempt Adjustable Receipts |
| SWDR | Solid Waste Disposal Revenue | TAN | Tax Anticipation Notes |
| TAW | Tax Anticipation Warrants | TRAN | Tax and Revenue Anticipation Notes |
| XLCA | XL Capital Assurance | | |
| |
| See notes to financial statements. | | |
STATEMENT OF ASSETS AND LIABILITIES
(amounts in thousands, except Net Asset Value Per Share)
January 31, 2014
| | | | | | | | | | | |
| | | | Dreyfus | | Dreyfus | | Dreyfus | | Dreyfus | |
| | Dreyfus | | Government | | Government | | Treasury & | | Treasury | |
| | Cash | | Cash | | Prime Cash | | Agency Cash | | Prime Cash | |
| | Management | | Management | | Management | | Management | | Management | |
| Assets ($): | | | | | | | | | | |
| Investments at value—Note 1(a,b)† | 29,241,036 | a | 17,625,935 | a | 5,160,133 | | 18,242,177 | a | 40,004,810 | |
| Cash | 3,618 | | 939 | | 73 | | 678 | | 1,484 | |
| Interest receivable | 9,845 | | 5,972 | | 2,249 | | 26,791 | | 31,122 | |
| Receivable for shares of | | | | | | | | | | |
| Beneficial Interest subscribed | 21 | | — | | — | | — | | — | |
| Prepaid expenses and other assets | 152 | | 126 | | 136 | | 124 | | 179 | |
| | 29,254,672 | | 17,632,972 | | 5,162,591 | | 18,269,770 | | 40,037,595 | |
| Liabilities ($): | | | | | | | | | | |
| Due to The Dreyfus Corporation | | | | | | | | | | |
| and affiliates—Note 2(c) | 3,270 | | 1,034 | | 338 | | 844 | | 1,715 | |
| Payable for investment securities purchased | — | | 399,965 | | — | | — | | — | |
| Payable for shares of Beneficial Interest redeemed | 8,474 | | 20 | | — | | 10,000 | | 29,289 | |
| Accrued expenses | 385 | | 310 | | 125 | | 361 | | 314 | |
| | 12,129 | | 401,329 | | 463 | | 11,205 | | 31,318 | |
| Net Assets ($) | 29,242,543 | | 17,231,643 | | 5,162,128 | | 18,258,565 | | 40,006,277 | |
| Composition of Net Assets ($): | | | | | | | | | | |
| Paid-in capital | 29,242,562 | | 17,231,756 | | 5,162,156 | | 18,258,713 | | 40,006,995 | |
| Accumulated net realized | | | | | | | | | | |
| gain (loss) on investments | (19 | ) | (113 | ) | (28 | ) | (148 | ) | (718 | ) |
| Net Assets ($) | 29,242,543 | | 17,231,643 | | 5,162,128 | | 18,258,565 | | 40,006,277 | |
| Net Asset Value Per Share | | | | | | | | | | |
| Institutional Shares | | | | | | | | | | |
| Net Assets ($) | 24,356,373 | | 14,577,411 | | 3,911,061 | | 15,067,833 | | 32,447,753 | |
| Shares Outstanding | 24,356,385 | | 14,577,536 | | 3,911,080 | | 15,067,956 | | 32,448,298 | |
| Net Asset Value Per Share ($) | 1.00 | | 1.00 | | 1.00 | | 1.00 | | 1.00 | |
| Investor Shares | | | | | | | | | | |
| Net Assets ($) | 2,228,079 | | 1,863,099 | | 514,728 | | 2,069,648 | | 3,354,045 | |
| Shares Outstanding | 2,228,084 | | 1,863,112 | | 514,733 | | 2,069,666 | | 3,354,137 | |
| Net Asset Value Per Share ($) | 1.00 | | 1.00 | | 1.00 | | 1.00 | | 1.00 | |
54
| | | | | | |
| | | Dreyfus | Dreyfus | Dreyfus | Dreyfus |
| | Dreyfus | Government | Government | Treasury & | Treasury |
| | Cash | Cash | Prime Cash | Agency Cash | Prime Cash |
| | Management | Management | Management | Management | Management |
| Net Asset Value Per Share (continued) | | | | | |
| Administrative Shares | | | | | |
| Net Assets ($) | 1,422,803 | 515,103 | 512,991 | 561,598 | 698,523 |
| Shares Outstanding | 1,422,808 | 515,106 | 512,995 | 561,602 | 698,536 |
| Net Asset Value Per Share ($) | 1.00 | 1.00 | 1.00 | 1.00 | 1.00 |
| Participant Shares | | | | | |
| Net Assets ($) | 1,049,170 | 174,370 | 213,359 | 512,744 | 3,463,773 |
| Shares Outstanding | 1,049,166 | 174,371 | 213,363 | 512,747 | 3,463,840 |
| Net Asset Value Per Share ($) | 1.00 | 1.00 | 1.00 | 1.00 | 1.00 |
| Service Shares | | | | | |
| Net Assets ($) | — | — | — | 8,118 | — |
| Shares Outstanding | — | — | — | 8,118 | — |
| Net Asset Value Per Share ($) | — | — | — | 1.00 | — |
| Select Shares | | | | | |
| Net Assets ($) | — | — | — | 3,816 | — |
| Shares Outstanding | — | — | — | 3,816 | — |
| Net Asset Value Per Share ($) | — | — | — | 1.00 | — |
| Agency Shares | | | | | |
| Net Assets ($) | 186,118 | 101,660 | 9,989 | 22,394 | 42,183 |
| Shares Outstanding | 186,119 | 101,661 | 9,989 | 22,394 | 42,184 |
| Net Asset Value Per Share ($) | 1.00 | 1.00 | 1.00 | 1.00 | 1.00 |
| Premier Shares | | | | | |
| Net Assets ($) | — | — | — | 12,414 | — |
| Shares Outstanding | — | — | — | 12,414 | — |
| Net Asset Value Per Share ($) | — | — | — | 1.00 | — |
| † Investments at cost ($) | 29,241,036 | 17,625,935 | 5,160,133 | 18,242,177 | 40,004,810 |
| |
| a Amount includes repurchase agreements of $3,193,000, $4,900,000 and $9,124,000 for Dreyfus Cash Management, Dreyfus Government Cash Management and Dreyfus Treasury |
| & Agency Cash Management, respectively, See Note 1(c). |
| See notes to financial statements. |
STATEMENT OF ASSETS AND LIABILITIES (continued)
(amounts in thousands, except Net Asset Value Per Share)
January 31, 2014
| | | | | | | | |
| | | | | | | Dreyfus | Dreyfus |
| | Dreyfus | | Dreyfus | Dreyfus | | California | New York |
| | Municipal Cash | | New York | Tax Exempt | | AMT-Free | AMT-Free |
| | Management | | Municipal Cash | Cash Municipal Cash | Municipal Cash |
| | Plus | | Management | Management | | Management | Management |
| Assets ($): | | | | | | | |
| Investments at value—Note 1(a,b)† | 329,675 | | 509,806 | 2,354,476 | | 408,163 | 105,480 |
| Cash | 101 | | 372 | 9,178 | | 695 | 278 |
| Interest receivable | 415 | | 585 | 2,694 | | 211 | 128 |
| Prepaid expenses and other assets | 50 | | 22 | 61 | | 6 | 40 |
| | 330,241 | | 510,785 | 2,366,409 | | 409,075 | 105,926 |
| Liabilities ($): | | | | | | | |
| Due to The Dreyfus Corporation | | | | | | | |
| and affiliates—Note 2(c) | 37 | | 62 | 249 | | 42 | 11 |
| Payable for investment securities purchased | 3,371 | | — | 9,000 | | — | — |
| Payable for shares of | | | | | | | |
| Beneficial Interest redeemed | 11 | | — | — | | — | — |
| Accrued expenses | 58 | | 60 | 84 | | 58 | 49 |
| | 3,477 | | 122 | 9,333 | | 100 | 60 |
| Net Assets ($) | 326,764 | | 510,663 | 2,357,076 | | 408,975 | 105,866 |
| Composition of Net Assets ($): | | | | | | | |
| Paid-in capital | 326,774 | | 510,663 | 2,357,093 | | 408,975 | 105,866 |
| Accumulated net realized | | | | | | | |
| gain (loss) on investments | (10 | ) | — | (17 | ) | — | — |
| Net Assets ($) | 326,764 | | 510,663 | 2,357,076 | | 408,975 | 105,866 |
| Net Asset Value Per Share | | | | | | | |
| Instititutional Shares | | | | | | | |
| Net Assets ($) | 89,617 | | 141,968 | 1,849,687 | | 144,855 | 72,239 |
| Shares Outstanding | 89,538 | | 141,970 | 1,849,700 | | 144,850 | 72,214 |
| Net Asset Value Per Share ($) | 1.00 | | 1.00 | 1.00 | | 1.00 | 1.00 |
| Investor Shares | | | | | | | |
| Net Assets ($) | 152,336 | | 355,539 | 408,593 | | 236,729 | 25,117 |
| Shares Outstanding | 152,198 | | 355,540 | 408,596 | | 236,723 | 25,108 |
| Net Asset Value Per Share ($) | 1.00 | | 1.00 | 1.00 | | 1.00 | 1.00 |
| Administrative Shares | | | | | | | |
| Net Assets ($) | 76,562 | | 9,914 | 54,612 | | 3,234 | 3,686 |
| Shares Outstanding | 76,496 | | 9,914 | 54,613 | | 3,234 | 3,686 |
| Net Asset Value Per Share ($) | 1.00 | | 1.00 | 1.00 | | 1.00 | 1.00 |
| Participant Shares | | | | | | | |
| Net Assets ($) | 8,248 | | 3,242 | 44,184 | | 24,157 | — |
| Shares Outstanding | 8,240 | | 3,242 | 44,184 | | 24,157 | — |
| Net Asset Value Per Share ($) | 1.00 | | 1.00 | 1.00 | | 1.00 | — |
| Agency Shares | | | | | | | |
| Net Assets ($) | 1 | | — | — | | — | — |
| Shares Outstanding | 1 | | — | — | | — | — |
| Net Asset Value Per Share ($) | 1.00 | | — | — | | — | — |
| Classic Shares | | | | | | | |
| Net Assets ($) | — | | — | — | | — | 4,824 |
| Shares Outstanding | — | | — | — | | — | 4,824 |
| Net Asset Value Per Share ($) | — | | — | — | | — | 1.00 |
| † Investments at cost ($) | 329,675 | | 509,806 | 2,354,476 | | 408,163 | 105,480 |
| |
| See notes to financial statements. | | | | | | | |
56
STATEMENT OF OPERATIONS
(amounts in thousands)
Year Ended January 31, 2014
| | | | | | | | | | | |
| | | | Dreyfus | | Dreyfus | | Dreyfus | | Dreyfus | |
| | Dreyfus | | Government | | Government | | Treasury & | | Treasury | |
| | Cash | | Cash | | Prime Cash | | Agency Cash | | Prime Cash | |
| | Management | | Management | | Management | | Management | | Management | |
| Investment Income ($): | | | | | | | | | | |
| Interest Income | 51,554 | | 17,047 | | 3,936 | | 15,187 | | 20,632 | |
| Expenses: | | | | | | | | | | |
| Management fee—Note 2(a) | 53,249 | | 32,868 | | 9,397 | | 36,556 | | 68,997 | |
| Service plan fees—Note 2(b) | 10,755 | | 6,226 | | 2,770 | | 8,826 | | 22,107 | |
| Prospectus and shareholders' reports | 941 | | 207 | | 144 | | 108 | | 565 | |
| Custodian fees—Note 2(c) | 866 | | 506 | | 176 | | 557 | | 961 | |
| Shareholder servicing costs—Note 2(c) | 481 | | 315 | | 148 | | 231 | | 662 | |
| Registration fees | 219 | | 191 | | 162 | | 180 | | 479 | |
| Trustees' fees and expenses—Note 2(d) | 124 | | 77 | | 22 | | 84 | | 157 | |
| Professional fees | 87 | | 81 | | 53 | | 71 | | 91 | |
| Miscellaneous | 407 | | 252 | | 102 | | 325 | | 429 | |
| Total Expenses | 67,129 | | 40,723 | | 12,974 | | 46,938 | | 94,448 | |
| Less—reduction in expenses | | | | | | | | | | |
| due to undertakings—Note 2(a) | (25,314 | ) | (25,316 | ) | (9,039 | ) | (33,495 | ) | (73,823 | ) |
| Less—reduction in fees | | | | | | | | | | |
| due to earnings credits—Note 2(c) | (10 | ) | (6 | ) | (1 | ) | (4 | ) | (5 | ) |
| Net Expenses | 41,805 | | 15,401 | | 3,934 | | 13,439 | | 20,620 | |
| Investment Income—Net | 9,749 | | 1,646 | | 2 | | 1,748 | | 12 | |
| Net Realized Gain (Loss) on | | | | | | | | | | |
| Investments—Note 1(b) ($) | (19 | ) | (81 | ) | (4 | ) | (67 | ) | (580 | ) |
| Net Increase (Decrease) in Net Assets | | | | | | | | | | |
| Resulting from Operations | 9,730 | | 1,565 | | (2 | ) | 1,681 | | (568 | ) |
| |
| See notes to financial statements. | | | | | | | | | | |
STATEMENT OF OPERATIONS (continued)
(amounts in thousands)
Year Ended January 31, 2014
| | | | | | | | | | | |
| | | | | | | | Dreyfus | | Dreyfus | |
| | Dreyfus | | Dreyfus | | Dreyfus | | California | | New York | |
| | Municipal Cash | | New York | | Tax Exempt | | AMT-Free | | AMT-Free | |
| | Management | | Municipal Cash | | Cash | | Municipal Cash | | Municipal Cash | |
| | Plus | | Management | | Management | | Management | | Management | |
| Investment Income ($): | | | | | | | | | | |
| Interest Income | 813 | | 762 | | 2,973 | | 593 | | 211 | |
| Expenses: | | | | | | | | | | |
| Management fee—Note 2(a) | 851 | | 860 | | 4,419 | | 919 | | 225 | |
| Service plan fees—Note 2(b) | 600 | | 769 | | 1,273 | | 737 | | 89 | |
| Registration fees | 88 | | 41 | | 155 | | 14 | | 63 | |
| Professional fees | 76 | | 77 | | 78 | | 50 | | 44 | |
| Custodian fees—Note 2(c) | 43 | | 40 | | 126 | | 45 | | 17 | |
| Prospectus and shareholders' reports | 29 | | 27 | | 50 | | 23 | | 20 | |
| Shareholder servicing costs—Note 2(c) | 9 | | 5 | | 342 | | 1 | | 2 | |
| Trustees' fees and expenses—Note 2(d) | 2 | | 2 | | 10 | | 2 | | —a | |
| Miscellaneous | 62 | | 47 | | 105 | | 34 | | 35 | |
| Total Expenses | 1,760 | | 1,868 | | 6,558 | | 1,825 | | 495 | |
| Less—reduction in expenses | | | | | | | | | | |
| due to undertakings—Note 2(a) | (948 | ) | (1,107 | ) | (3,586 | ) | (1,233 | ) | (284 | ) |
| Less—reduction in fees due to | | | | | | | | | | |
| earnings credits—Note 2(c) | —a | | —a | | —a | | —a | | —a | |
| Net Expenses | 812 | | 761 | | 2,972 | | 592 | | 211 | |
| Investment Income—Net | 1 | | 1 | | 1 | | 1 | | —a | |
| Net Realized Gain (Loss) on | | | | | | | | | | |
| Investments—Note 1(b) ($) | — | | 13 | | (14 | ) | — | | — | |
| Net Increase (Decrease) in Net Assets | | | | | | | | | | |
| Resulting from Operations | 1 | | 14 | | (13 | ) | 1 | | —a | |
| |
| a Amount represents less than $1,000. | | | | | | | | | | |
| See notes to financial statements. | | | | | | | | | | |
58
STATEMENTS OF CHANGES IN NET ASSETS
(amounts in thousands)
| | | | | | | | | |
| | | | | | Dreyfus Government | |
| | Dreyfus Cash Management | | Cash Management | |
| | Year Ended January 31, | | Year Ended January 31, | |
| | 2014 | | 2013 | | 2014 | | 2013 | |
| Operations ($): | | | | | | | | |
| Investment income—net | 9,749 | | 18,114 | | 1,646 | | 1,329 | |
| Net realized gain (loss) on investments | (19 | ) | 245 | | (81 | ) | (32 | ) |
| Net Increase (Decrease) in Net Assets | | | | | | | | |
| Resulting from Operations | 9,730 | | 18,359 | | 1,565 | | 1,297 | |
| Dividends to Shareholders from ($): | | | | | | | | |
| Investment income—net: | | | | | | | | |
| Institutional Shares | (9,748 | ) | (18,209 | ) | (1,358 | ) | (1,106 | ) |
| Investor Shares | (2 | ) | (26 | ) | (185 | ) | (127 | ) |
| Administrative Shares | (1 | ) | (42 | ) | (73 | ) | (79 | ) |
| Participant Shares | —a | | (6 | ) | (20 | ) | (16 | ) |
| Agency Shares | —a | | (56 | ) | (10 | ) | (18 | ) |
| Total Dividends | (9,751 | ) | (18,339 | ) | (1,646 | ) | (1,346 | ) |
| Beneficial Interest Transactions ($1.00 per share): | | | | | | | | |
| Net proceeds from shares sold: | | | | | | | | |
| Institutional Shares | 86,438,068 | | 92,476,479 | | 84,705,848 | | 81,658,018 | |
| Investor Shares | 6,773,654 | | 8,945,378 | | 5,603,225 | | 5,945,485 | |
| Administrative Shares | 11,697,322 | | 5,118,256 | | 2,188,894 | | 2,673,619 | |
| Participant Shares | 1,968,289 | | 1,719,835 | | 1,587,553 | | 1,444,028 | |
| Agency Shares | 786,384 | | 1,082,358 | | 773,169 | | 1,145,107 | |
| Dividends reinvested: | | | | | | | | |
| Institutional Shares | 2,023 | | 2,843 | | 290 | | 229 | |
| Investor Shares | 1 | | 9 | | 119 | | 85 | |
| Administrative Shares | —a | | 24 | | 53 | | 65 | |
| Participant Shares | —a | | 6 | | 15 | | 12 | |
| Agency Shares | —a | | 2 | | —a | | —a | |
| Cost of shares redeemed: | | | | | | | | |
| Institutional Shares | (85,276,908 | ) | (91,981,388 | ) | (83,356,925 | ) | (86,511,520 | ) |
| Investor Shares | (7,237,577 | ) | (9,244,035 | ) | (5,506,384 | ) | (5,689,428 | ) |
| Administrative Shares | (11,545,694 | ) | (4,788,484 | ) | (2,652,807 | ) | (2,797,553 | ) |
| Participant Shares | (1,687,602 | ) | (1,777,233 | ) | (1,700,519 | ) | (1,445,987 | ) |
| Agency Shares | (728,052 | ) | (1,140,678 | ) | (750,032 | ) | (1,152,113 | ) |
| Increase (Decrease) in Net Assets from | | | | | | | | |
| Beneficial Interest Transactions | 1,189,908 | | 413,372 | | 892,499 | | (4,729,953 | ) |
| Total Increase (Decrease) In Net Assets | 1,189,887 | | 413,392 | | 892,418 | | (4,730,002 | ) |
| Net Assets ($): | | | | | | | | |
| Beginning of Period | 28,052,656 | | 27,639,264 | | 16,339,225 | | 21,069,227 | |
| End of Period | 29,242,543 | | 28,052,656 | | 17,231,643 | | 16,339,225 | |
| |
| a Amount represents less than $1,000. | | | | | | | | |
| See notes to financial statements. | | | | | | | | |
STATEMENT OF CHANGES IN NET ASSETS (continued)
(amounts in thousands)
| | | | | | | | | |
| | Dreyfus Government | | Dreyfus Treasury & | |
| | Prime Cash Management | | Agency Cash Management | |
| | Year Ended January 31, | | Year Ended January 31, | |
| | 2014 | | 2013 | | 2014 | | 2013 | |
| Operations ($): | | | | | | | | |
| Investment income—net | 2 | | 2 | | 1,748 | | 1,862 | |
| Net realized gain (loss) on investments | (4 | ) | 24 | | (67 | ) | (1 | ) |
| Net Increase (Decrease) in Net Assets | | | | | | | | |
| Resulting from Operations | (2 | ) | 26 | | 1,681 | | 1,861 | |
| Dividends to Shareholders from ($): | | | | | | | | |
| Investment income—net: | | | | | | | | |
| Institutional Shares | (2 | ) | (2 | ) | (1,470 | ) | (1,499 | ) |
| Investor Shares | —a | | —a | | (235 | ) | (231 | ) |
| Administrative Shares | —a | | —a | | (62 | ) | (61 | ) |
| Participant Shares | —a | | —a | | (53 | ) | (77 | ) |
| Service Shares | — | | — | | (1 | ) | (2 | ) |
| Select Shares | — | | — | | (1 | ) | (1 | ) |
| Agency Shares | —a | | —a | | (3 | ) | (3 | ) |
| Premier Shares | — | | — | | (3 | ) | (3 | ) |
| Total Dividends | (2 | ) | (2 | ) | (1,828 | ) | (1,877 | ) |
| Beneficial Interest Transactions ($1.00 per share): | | | | | | | | |
| Net proceeds from shares sold: | | | | | | | | |
| Institutional Shares | 8,706,498 | | 9,240,101 | | 69,938,115 | | 61,008,789 | |
| Investor Shares | 1,656,875 | | 1,278,337 | | 8,194,430 | | 8,759,746 | |
| Administrative Shares | 4,396,854 | | 3,740,470 | | 1,512,809 | | 1,849,288 | |
| Participant Shares | 648,154 | | 395,043 | | 2,974,319 | | 3,336,778 | |
| Service Shares | — | | — | | 10,694 | | 11,154 | |
| Select Shares | — | | — | | 18,551 | | 21,388 | |
| Agency Shares | 12,402 | | 53,125 | | 83,331 | | 94,825 | |
| Premier Shares | — | | — | | 441,359 | | 351,697 | |
| Dividends reinvested: | | | | | | | | |
| Institutional Shares | —a | | —a | | 389 | | 444 | |
| Investor Shares | —a | | —a | | 80 | | 60 | |
| Administrative Shares | —a | | —a | | 43 | | 40 | |
| Participant Shares | —a | | —a | | 26 | | 49 | |
| Service Shares | — | | — | | —a | | —a | |
| Cost of shares redeemed: | | | | | | | | |
| Institutional Shares | (8,314,032 | ) | (9,264,963 | ) | (69,369,396 | ) | (63,056,962 | ) |
| Investor Shares | (1,595,742 | ) | (1,306,838 | ) | (8,394,862 | ) | (8,665,795 | ) |
| Administrative Shares | (4,451,597 | ) | (3,805,024 | ) | (1,571,690 | ) | (1,830,964 | ) |
| Participant Shares | (664,268 | ) | (391,128 | ) | (3,064,754 | ) | (3,622,551 | ) |
| Service Shares | — | | — | | (17,969 | ) | (27,679 | ) |
| Select Shares | — | | — | | (21,053 | ) | (38,874 | ) |
| Agency Shares | (39,282 | ) | (27,819 | ) | (88,989 | ) | (89,570 | ) |
| Premier Shares | — | | — | | (454,099 | ) | (357,344 | ) |
| Increase (Decrease) in Net Assets from | | | | | | | | |
| Beneficial Interest Transactions | 355,862 | | (88,696 | ) | 191,334 | | (2,255,481 | ) |
| Total Increase (Decrease) In Net Assets | 355,858 | | (88,672 | ) | 191,187 | | (2,255,497 | ) |
| Net Assets ($): | | | | | | | | |
| Beginning of Period | 4,806,270 | | 4,894,942 | | 18,067,378 | | 20,322,875 | |
| End of Period | 5,162,128 | | 4,806,270 | | 18,258,565 | | 18,067,378 | |
| |
| a Amount represents less than $1,000. | | | | | | | | |
| See notes to financial statements. | | | | | | | | |
60
| | | | | | | | | |
| | Dreyfus Treasury | | Dreyfus Municipal | |
| | Prime Cash Management | | Cash Management Plus | |
| | Year Ended January 31, | | Year Ended January 31, | |
| | 2014 | | 2013 | | 2014 | | 2013 | |
| Operations ($): | | | | | | | | |
| Investment income—net | 12 | | 10 | | 1 | | 42 | |
| Net realized gain (loss) on investments | (580 | ) | 113 | | — | | —a | |
| Net Increase (Decrease) in Net Assets | | | | | | | | |
| Resulting from Operations | (568 | ) | 123 | | 1 | | 42 | |
| Dividends to Shareholders from ($): | | | | | | | | |
| Investment income—net: | | | | | | | | |
| Institutional Shares | (10 | ) | (8 | ) | (1 | ) | (42 | ) |
| Investor Shares | (1 | ) | (1 | ) | —a | | —a | |
| Administrative Shares | —a | | —a | | —a | | —a | |
| Participant Shares | (1 | ) | (1 | ) | —a | | —a | |
| Agency Shares | —a | | —a | | — | | —a | |
| Total Dividends | (12 | ) | (10 | ) | (1 | ) | (42 | ) |
| Beneficial Interest Transactions ($1.00 per share): | | | | | | | | |
| Net proceeds from shares sold: | | | | | | | | |
| Institutional Shares | 66,673,501 | | 55,332,002 | | 649,422 | | 1,526,121 | |
| Investor Shares | 15,423,051 | | 16,548,074 | | 276,772 | | 367,112 | |
| Administrative Shares | 1,549,314 | | 2,286,789 | | 163,227 | | 411,224 | |
| Participant Shares | 12,764,817 | | 12,306,117 | | 43,618 | | 48,715 | |
| Agency Shares | 342,832 | | 351,699 | | — | | — | |
| Dividends reinvested: | | | | | | | | |
| Institutional Shares | 2 | | 1 | | —a | | 18 | |
| Investor Shares | 1 | | 1 | | —a | | —a | |
| Administrative Shares | —a | | —a | | —a | | —a | |
| Participant Shares | 1 | | 1 | | —a | | —a | |
| Agency Shares | —a | | —a | | — | | —a | |
| Cost of shares redeemed: | | | | | | | | |
| Institutional Shares | (58,807,242 | ) | (49,638,348 | ) | (912,265 | ) | (1,520,125 | ) |
| Investor Shares | (16,136,440 | ) | (16,630,817 | ) | (335,021 | ) | (413,579 | ) |
| Administrative Shares | (1,600,438 | ) | (2,146,960 | ) | (294,846 | ) | (415,964 | ) |
| Participant Shares | (12,975,204 | ) | (11,498,332 | ) | (55,894 | ) | (53,180 | ) |
| Agency Shares | (324,799 | ) | (348,294 | ) | (14 | ) | —a | |
| Increase (Decrease) in Net Assets from | | | | | | | | |
| Beneficial Interest Transactions | 6,909,396 | | 6,561,933 | | (465,001 | ) | (49,658 | ) |
| Total Increase (Decrease) In Net Assets | 6,908,816 | | 6,562,046 | | (465,001 | ) | (49,658 | ) |
| Net Assets ($): | | | | | | | | |
| Beginning of Period | 33,097,461 | | 26,535,415 | | 791,765 | | 841,423 | |
| End of Period | 40,006,277 | | 33,097,461 | | 326,764 | | 791,765 | |
| |
| a Amount represents less than $1,000. | | | | | | | | |
| See notes to financial statements. | | | | | | | | |
STATEMENT OF CHANGES IN NET ASSETS (continued)
(amounts in thousands)
| | | | | | | | | |
| | Dreyfus New York Municipal | | Dreyfus Tax Exempt | |
| | Cash Management | | Cash Management | |
| | Year Ended January 31, | | Year Ended January 31, | |
| | 2014 | | 2013 | | 2014 | | 2013 | |
| Operations ($): | | | | | | | | |
| Investment income—net | 1 | | 27 | | 1 | | 18 | |
| Net realized gain (loss) on investments | 13 | | 1 | | (14 | ) | — | |
| Net Increase (Decrease) in Net Assets | | | | | | | | |
| Resulting from Operations | 14 | | 28 | | (13 | ) | 18 | |
| Dividends to Shareholders from ($): | | | | | | | | |
| Investment income—net: | | | | | | | | |
| Institutional Shares | (5 | ) | (27 | ) | (1 | ) | (18 | ) |
| Investor Shares | (10 | ) | —a | | —a | | —a | |
| Administrative Shares | —a | | —a | | —a | | —a | |
| Participant Shares | —a | | —a | | —a | | —a | |
| Agency Shares | — | | —a,b | | — | | — | |
| Total Dividends | (15 | ) | (27 | ) | (1 | ) | (18 | ) |
| Beneficial Interest Transactions ($1.00 per share): | | | | | | | | |
| Net proceeds from shares sold: | | | | | | | | |
| Institutional Shares | 187,747 | | 319,114 | | 6,699,608 | | 7,995,575 | |
| Investor Shares | 738,921 | | 504,289 | | 834,672 | | 788,328 | |
| Administrative Shares | 50,765 | | 60,139 | | 91,837 | | 58,951 | |
| Participant Shares | 22,171 | | 54,830 | | 138,819 | | 89,293 | |
| Agency Shares | — | | —b | | — | | — | |
| Dividends reinvested: | | | | | | | | |
| Institutional Shares | 1 | | 4 | | —a | | 6 | |
| Investor Shares | 9 | | —a | | —a | | —a | |
| Administrative Shares | —a | | —a | | —a | | —a | |
| Participant Shares | —a | | —a | | —a | | — | |
| Cost of shares redeemed: | | | | | | | | |
| Institutional Shares | (179,055 | ) | (506,120 | ) | (6,625,438 | ) | (8,301,833 | ) |
| Investor Shares | (583,274 | ) | (570,997 | ) | (868,701 | ) | (725,263 | ) |
| Administrative Shares | (50,987 | ) | (71,445 | ) | (103,640 | ) | (68,201 | ) |
| Participant Shares | (32,113 | ) | (52,257 | ) | (130,940 | ) | (80,254 | ) |
| Agency Shares | — | | (1) | b | — | | — | |
| Increase (Decrease) in Net Assets from | | | | | | | | |
| Beneficial Interest Transactions | 154,185 | | (262,444 | ) | 36,217 | | (243,398 | ) |
| Total Increase (Decrease) In Net Assets | 154,184 | | (262,443 | ) | 36,203 | | (243,398 | ) |
| Net Assets ($): | | | | | | | | |
| Beginning of Period | 356,479 | | 618,922 | | 2,320,873 | | 2,564,271 | |
| End of Period | 510,663 | | 356,479 | | 2,357,076 | | 2,320,873 | |
| |
| a Amount represents less than $1,000. |
| b Effective September 14, 2012, Dreyfus NewYork Municipal Cash Management terminated its Agency Shares. |
See notes to financial statements.
62
| | | | | | | | | |
| | Dreyfus California AMT-Free | | Dreyfus New York AMT-Free | |
| | Municipal Cash Management | | Municipal Cash Management | |
| | Year Ended January 31, | | Year Ended January 31, | |
| | 2014 | | 2013 | | 2014 | | 2013 | |
| Operations ($): | | | | | | | | |
| Investment income—net | 1 | | 24 | | —a | | 1 | |
| Net realized gain (loss) on investments | — | | 212 | | — | | — | |
| Net Increase (Decrease) in Net Assets | | | | | | | | |
| Resulting from Operations | 1 | | 236 | | —a | | 1 | |
| Dividends to Shareholders from ($): | | | | | | | | |
| Investment income—net: | | | | | | | | |
| Institutional Shares | (1 | ) | (112 | ) | —a | | (2 | ) |
| Investor Shares | —a | | (106 | ) | —a | | (1 | ) |
| Administrative Shares | —a | | (2 | ) | —a | | —a | |
| Participant Shares | —a | | (16 | ) | — | | —a,b | |
| Agency Shares | — | | —a,c | | — | | — | |
| Classic Shares | — | | — | | —a | | —a | |
| Total Dividends | (1 | ) | (236 | ) | —a | | (3 | ) |
| Beneficial Interest Transactions ($1.00 per share): | | | | | | | | |
| Net proceeds from shares sold: | | | | | | | | |
| Institutional Shares | 195,745 | | 229,485 | | 114,910 | | 103,391 | |
| Investor Shares | 732,249 | | 760,107 | | 88,971 | | 123,695 | |
| Administrative Shares | 11,182 | | 28,990 | | 12,736 | | 16,538 | |
| Participant Shares | 161,138 | | 135,835 | | — | | —b | |
| Classic Shares | — | | — | | 106,521 | | 110,790 | |
| Dividends reinvested: | | | | | | | | |
| Institutional Shares | 1 | | 102 | | —a | | 1 | |
| Investor Shares | —a | | 97 | | —a | | —a | |
| Administrative Shares | —a | | 1 | | —a | | —a | |
| Participant Shares | —a | | 16 | | — | | —b | |
| Classic Shares | — | | — | | —a | | —a | |
| Cost of shares redeemed: | | | | | | | | |
| Institutional Shares | (249,383 | ) | (205,257 | ) | (125,739 | ) | (122,554 | ) |
| Investor Shares | (707,129 | ) | (752,054 | ) | (100,507 | ) | (135,682 | ) |
| Administrative Shares | (9,318 | ) | (29,600 | ) | (15,138 | ) | (23,124 | ) |
| Participant Shares | (170,510 | ) | (163,971 | ) | — | | (10 | )b |
| Agency Shares | — | | (1 | )c | — | | — | |
| Classic Shares | — | | — | | (102,761 | ) | (109,997 | ) |
| Increase (Decrease) in Net Assets from | | | | | | | | |
| Beneficial Interest Transactions | (36,025 | ) | 3,750 | | (21,007 | ) | (36,952 | ) |
| Total Increase (Decrease) In Net Assets | (36,025 | ) | 3,750 | | (21,007 | ) | (36,954 | ) |
| Net Assets ($): | | | | | | | | |
| Beginning of Period | 445,000 | | 441,250 | | 126,873 | | 163,827 | |
| End of Period | 408,975 | | 445,000 | | 105,866 | | 126,873 | |
| |
| a Amount represents less than $1,000. |
| b Effective September 14, 2012, Dreyfus NewYork AMT-Free Municipal Cash Management terminated its Participant Shares. |
| c Effective September 14, 2012, Dreyfus California AMT-Free Municipal Cash Management terminated its Agency Shares. |
See notes to financial statements.
FINANCIAL HIGHLIGHTS
The following tables describe the performance for each share class of each fund for the fiscal periods indicated. All information reflects financial results for a single fund share.Total return shows how much your investment in each fund would have increased (or decreased) during each period, assuming you had reinvested all dividends and distributions. These figures have been derived from the funds’ financial statements.
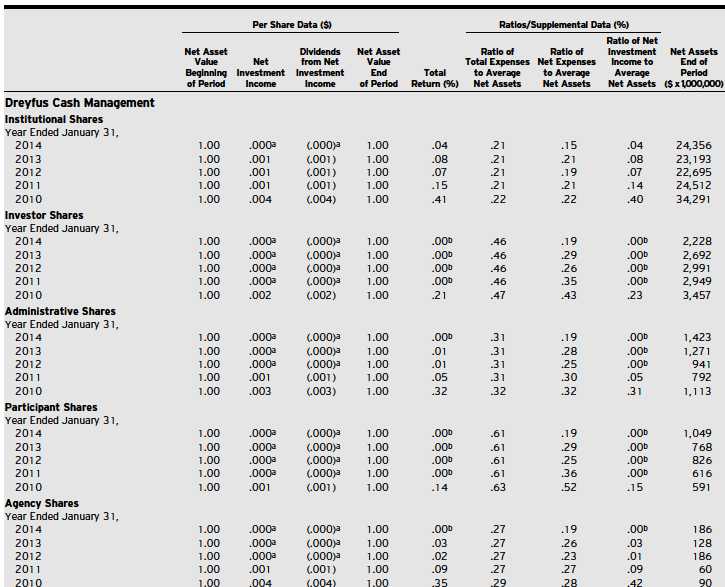
| | |
| a | Amount represents less than $.001 per share. |
| b | Amount represents less than .01%. |
See notes to financial statements.
64
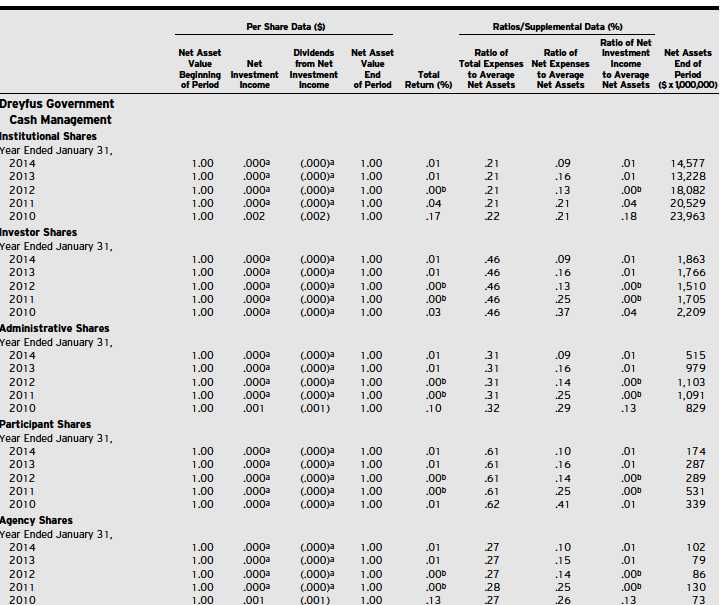
| | |
| a | Amount represents less than $.001 per share. |
| b | Amount represents less than .01%. |
See notes to financial statements.
FINANCIAL HIGHLIGHTS (continued)
| | |
| a | Amount represents less than $.001 per share. |
| b | Amount represents less than .01%. |
See notes to financial statements.
66
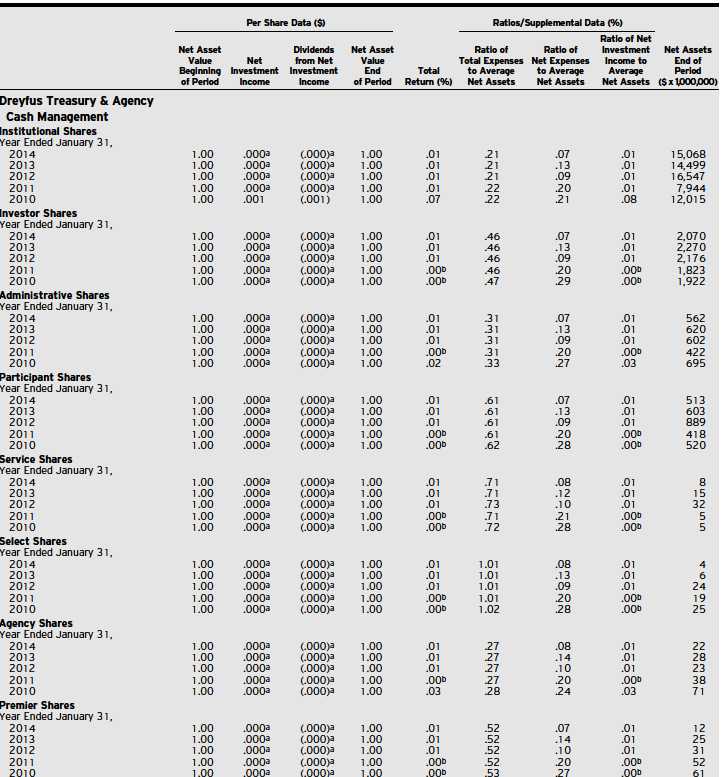
| | |
| a | Amount represents less than $.001 per share. |
| b | Amount represents less than .01%. |
See notes to financial statements.
FINANCIAL HIGHLIGHTS (continued)
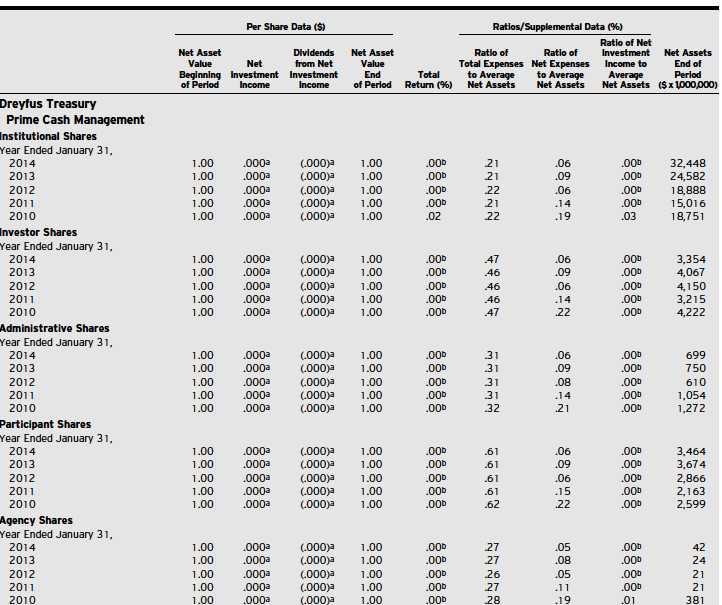
| | |
| a | Amount represents less than $.001 per share. |
| b | Amount represents less than .01%. |
See notes to financial statements.
68

| | |
| a | Amount represents less than $.001 per share. |
| b | Amount represents less than .01%. |
| c | Amount represents less than $1 million. |
See notes to financial statements.
FINANCIAL HIGHLIGHTS (continued)

| | |
| a | Amount represents less than $.001 per share. |
| b | Amount represents less than .01%. |
See notes to financial statements.
70

| | |
| a | Amount represents less than $.001 per share. |
| b | Amount represents less than .01%. |
See notes to financial statements.
FINANCIAL HIGHLIGHTS (continued)
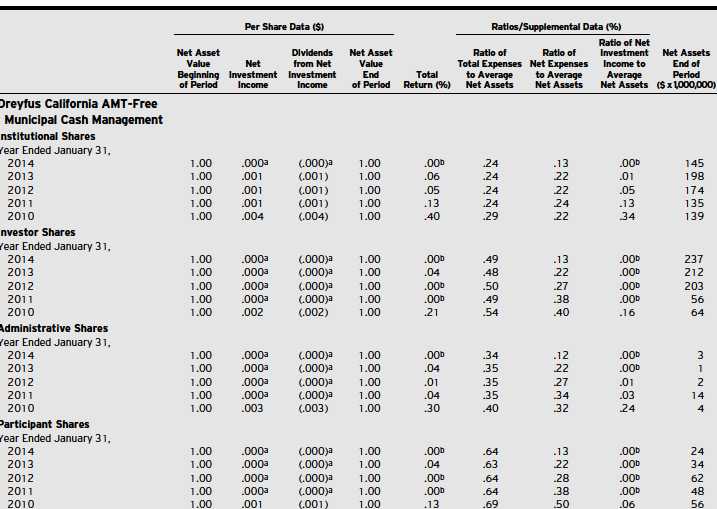
| | |
| a | Amount represents less than $.001 per share. |
| b | Amount represents less than .01%. |
See notes to financial statements.
72
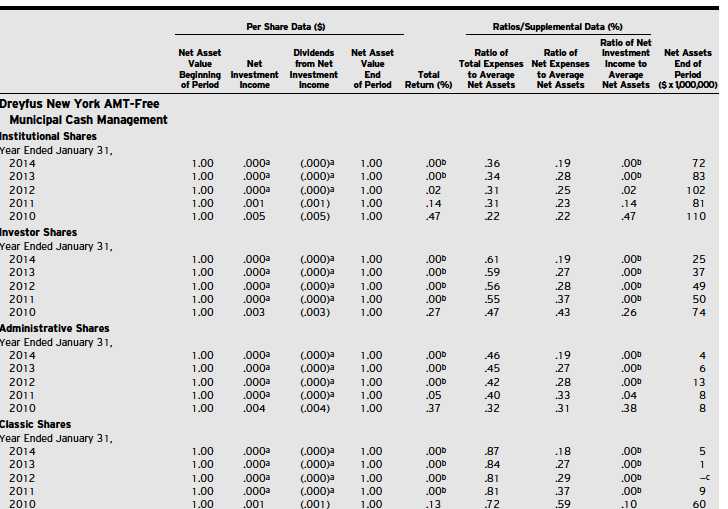
| | |
| a | Amount represents less than $.001 per share. |
| b | Amount represents less than .01%. |
| c | Amount represents less than $1 million. |
See notes to financial statements.
NOTES TO FINANCIAL STATEMENTS
NOTE 1—Significant Accounting Policies:
Dreyfus Cash Management, Dreyfus Government Cash Management, Dreyfus Government Prime Cash Management, DreyfusTreasury & Agency Cash Management, Dreyfus Treasury Prime Cash Management, Dreyfus Municipal Cash Management Plus, Dreyfus New York Municipal Cash Management, Dreyfus Tax Exempt Cash Management, Dreyfus California AMT-Free Municipal Cash Management and Dreyfus New York AMT-Free Municipal Cash Management (each, a “fund” and collectively, the “funds”) are open-end management investment companies registered under the Investment Company Act of 1940, as amended (the “Act”). Dreyfus Cash Management, Dreyfus Government Cash Management, Dreyfus Government Prime Cash Management, Dreyfus Treasury & Agency Cash Management, Dreyfus Treasury Prime Cash Management, Dreyfus Municipal Cash Management Plus and Dreyfus Tax Exempt Cash Management are diversified funds. Dreyfus New York Municipal Cash Management, Dreyfus California AMT-Free Municipal Cash Management and Dreyfus New York AMT-Free Municipal Cash Management are non-diversified. Dreyfus Government Cash Management and Dreyfus Government Prime Cash Management are each a separate series of Dreyfus Government Cash Management Funds (the “Company”) and Dreyfus Tax Exempt Cash Management, Dreyfus California AMT-Free Municipal Cash Management and Dreyfus New York AMT-Free Municipal Cash Management are separate series of Dreyfus Tax Exempt Cash Management Funds (the “Trust”).
Each fund’s investment objective is to provide investors with as high a level of current income as is consistent with the preservation of capital and the maintenance of liquidity and, in the case of Dreyfus Municipal Cash Management Plus and Dreyfus Tax Exempt Cash Management only, which is exempt from federal income tax; in the case of Dreyfus New York Municipal Cash Management and Dreyfus New York AMT-Free Municipal Cash Management, which is exempt from federal, New York state and New York city personal income taxes, and in the case of Dreyfus California AMT-Free Municipal Cash Management only, which is exempt
from federal and California state personal income taxes.The Dreyfus Corporation (the “Manager” or “Dreyfus”), a wholly-owned subsidiary of The Bank of New York Mellon Corporation (“BNY Mellon”), serves as each fund’s investment adviser.
MBSC Securities Corporation (the “Distributor”), a wholly-owned subsidiary of the Manager, is the distributor of the funds’ shares, which are sold to the public without a sales charge. Each fund is authorized to issue an unlimited number of $.001 par value shares of Beneficial Interest. Each fund offers Institutional Shares, Investor Shares, Administrative Shares, Participant Shares and Agency Shares with the exception of Dreyfus New York Municipal Cash Management, Dreyfus Tax Exempt Cash Management, Dreyfus California AMT-Free Municipal Cash Management and Dreyfus New York AMT-Free Municipal Cash Management which do not offer Agency Shares. Dreyfus NewYork AMT-Free Municipal Cash Management also does not offer Participant Shares. In addition, Dreyfus Treasury & Agency Cash Management offers Service Shares, Select Shares and Premier Shares and Dreyfus NewYork AMT-Free Municipal Cash Management offers Classic Shares. Each share class, except Institutional Shares, is subject to a Service Plan adopted pursuant to Rule 12b-1 under the Act. Other differences between the classes include the services offered (by service agents receiving Rule 12b-1 fees) to and the expenses borne by each class, the allocation of certain transfer agency costs, and certain voting rights. Income, expenses (other than expenses attributable to a specific class), and realized and unrealized gains or losses on investments are allocated to each class of shares based on its relative net assets.
It is each fund’s policy to maintain a continuous net asset value per share of $1.00; the funds have adopted certain investment, portfolio valuation and dividend and distribution policies to enable it to do so. There is no assurance, however, that the funds will be able to maintain a stable net asset value per share of $1.00.
As of January 31, 2014, MBC Investments Corp., an indirect subsidiary of BNY Mellon, held all of the outstanding Agency Shares of Dreyfus Municipal Cash Management Plus.
74
The Company and the Trust account separately for the assets, liabilities and operations of each series. Expenses directly attributable to each series are charged to that series’ operations; expenses which are applicable to all series are allocated among them on a pro rata basis.
The Financial Accounting Standards Board (“FASB”) Accounting Standards Codification is the exclusive reference of authoritative U.S. generally accepted accounting principles (“GAAP”) recognized by the FASB to be applied by nongovernmental entities. Rules and interpretive releases of the Securities and Exchange Commission (“SEC”) under authority of federal laws are also sources of authoritative GAAP for SEC registrants. The funds’ financial statements are prepared in accordance with GAAP, which may require the use of management estimates and assumptions. Actual results could differ from those estimates.
The funds enter into contracts that contain a variety of indemnifications. The funds’ maximum exposure under these arrangements is unknown.The funds do not anticipate recognizing any loss related to these arrangements.
(a) Portfolio valuation: Investments in securities are valued at amortized cost in accordance with Rule 2a-7 under the Act. If amortized cost is determined not to approximate market value, the fair value of the portfolio securities will be determined by procedures established by and under the general supervision of the funds’ Boards of Trustees (the “Boards”).
The fair value of a financial instrument is the amount that would be received to sell an asset or paid to transfer a liability in an orderly transaction between market participants at the measurement date (i.e., the exit price). GAAP establishes a fair value hierarchy that prioritizes the inputs of valuation techniques used to measure fair value.This hierarchy gives the highest priority to unadjusted quoted prices in active markets for identical assets or liabilities (Level 1 measurements) and the lowest priority to unobservable inputs (Level 3 measurements).
Additionally, GAAP provides guidance on determining whether the volume and activity in a market has decreased significantly and whether such a decrease in activity results in transactions that are not orderly. GAAP requires enhanced disclosures around valuation inputs and techniques used during annual and interim periods.
Various inputs are used in determining the value of each fund’s investments relating to fair value measurements.These inputs are summarized in the three broad levels listed below:
Level 1—unadjusted quoted prices in active markets for identical investments.
Level 2—other significant observable inputs (including quoted prices for similar investments, interest rates, prepayment speeds, credit risk, etc.).
Level 3—significant unobservable inputs (including the funds’ own assumptions in determining the fair value of investments).
The inputs or methodology used for valuing securities are not necessarily an indication of the risk associated with investing in those securities. For example, money market securities are valued using amortized cost, in accordance with rules under the Act. Generally, amortized cost approximates the current fair value of a security, but since the value is not obtained from a quoted price in an active market, such securities are reflected within Level 2 of the fair value hierarchy.
At January 31, 2014, all of the securities in each fund were considered Level 2 of the fair value hierarchy.
At January 31, 2014, there were no transfers between Level 1 and Level 2 of the fair value hierarchy.
(b) Securities transactions and investment income:
Securities transactions are recorded on a trade date basis. Interest income, adjusted for accretion of discount and amortization of premium on investments, is earned from settlement date and is recognized on the accrual basis. Realized gains and losses from securities transactions are recorded on the identified cost basis. Cost of investments represents amortized cost.
NOTES TO FINANCIAL STATEMENTS (continued)
Dreyfus New York Municipal Cash Management, Dreyfus California AMT-Free Municipal Cash Management and Dreyfus NewYork AMT-Free Municipal Cash Management follow an investment policy of investing primarily in municipal obligations of one state. Economic changes affecting the state and certain of its public bodies and municipalities may affect the ability of issuers within the state to pay interest on, or repay principal of, municipal obligations held by the funds.
(c) Repurchase Agreements: Dreyfus Cash Management, Dreyfus Government Cash Management and Dreyfus Treasury & Agency Cash Management may enter into repurchase agreements with financial institutions, deemed to be creditworthy by the Manager, subject to the seller’s agreement to repurchase and the funds’ agreement to resell such securities at a mutually agreed upon price. Pursuant to the terms of the repurchase agreements, such securities must have an aggregate market value greater than or equal to the terms of the repurchase price plus accrued interest at all times. If the value of the underlying securities falls below the value of the repurchase price plus accrued interest, each fund will require the seller to deposit additional collateral by the next business day. If the request for additional collateral is not met, or the seller defaults on its repurchase obligation, each fund maintains its right to sell the underlying securities at market value and may claim any resulting loss against the seller.These funds may also jointly enter into one or more repurchase agreements with other Dreyfus-managed funds in accordance with an exemptive order granted by the SEC pursuant to section 17(d) and Rule 17d-1 under the Act. Any joint repurchase agreements must be collateralized fully by U.S. Government securities.
(d) Dividends to shareholders: It is the policy of each fund to declare dividends daily from investment income-net. Such dividends are paid monthly. Dividends from net realized capital gains, if any, are normally declared and paid annually, but each fund may make distributions on a more frequent basis to comply with the distribution requirements of the Internal Revenue Code of 1986, as amended (the “Code”).To the extent that net realized capital gains can be offset by capital loss carryovers, it is the policy of each fund
not to distribute such gains. Income and capital gain distributions are determined in accordance with income tax regulations, which may differ from GAAP.
(e) Federal income taxes: It is the policy of Dreyfus Cash Management, Dreyfus Government Cash Management, Dreyfus Government Prime Cash Management, Dreyfus Treasury & Agency Cash Management and Dreyfus Treasury Prime Cash Management to continue to qualify as a regulated investment company if such qualification is in the best interests of its shareholders, by complying with the applicable provisions of the Code and to make distributions of taxable income sufficient to relieve it from substantially all federal income and excise taxes.
It is the policy of Dreyfus Municipal Cash Management Plus, Dreyfus New York Municipal Cash Management, Dreyfus Tax Exempt Cash Management, Dreyfus California AMT-Free Municipal Cash Management and Dreyfus New York AMT-Free Municipal Cash Management to continue to qualify as a regulated investment company, which can distribute tax-exempt dividends, by complying with the applicable provisions of the Code and to make distributions of income and net realized capital gain sufficient to relieve it from substantially all federal income and excise taxes.
As of and during the period ended January 31, 2014, the funds did not have any liabilities for any uncertain tax positions.The funds recognize interest and penalties, if any, related to uncertain tax positions as income tax expense in the Statements of Operations. During the period ended January 31, 2014, the funds did not incur any interest or penalties.
Each tax year in the four-year period ended January 31, 2014 remains subject to examination by the Internal Revenue Service and state taxing authorities.
At January 31, 2014, the components of accumulated earnings on a tax basis were substantially the same as for financial reporting purposes. In addition, Dreyfus Treasury & Agency Cash Management had $148,184 of capital losses realized after October 31, 2013, which were deferred for tax purposes to the first day of the following fiscal year.
76
Under the Regulated Investment Company Modernization Act of 2010 (the “2010 Act”), the funds are permitted to carry forward capital losses incurred in taxable years beginning after December 22, 2010 (“post-enactment losses”) for an unlimited period. Furthermore, post-enactment capital loss carryovers retain their character as either short-term or long-term capital losses rather than short-term as they were under previous statute.The 2010 Act requires post-enactment losses to be utilized before the utilization of losses incurred in taxable years prior to the effective date of the 2010 Act (“pre-enactment losses”). As a result of this ordering rule, pre-enactment losses may be more likely to expire unused.
Table 1 summarizes each relevant fund’s accumulated capital loss carryover available for federal income tax purposes to be applied against future net realized capital gains, if any, realized subsequent to January 31, 2014.
The tax character of distributions paid to shareholders of Dreyfus Cash Management, Dreyfus Government Cash Management, Dreyfus Government Prime Cash Management, Dreyfus Treasury & Agency Cash Management and Dreyfus Treasury Prime Cash Management during the fiscal periods ended January 31, 2014 and January 31, 2013 were all ordinary income.
Table 2 summarizes the tax character of distributions paid to shareholders of Dreyfus Municipal Cash Management Plus, Dreyfus New York Municipal Cash Management, Dreyfus Tax Exempt Cash Management, Dreyfus California AMT-Free Municipal Cash Management and Dreyfus New York AMT-Free Municipal Cash Management during the fiscal periods ended January 31, 2014 and January 31, 2013.
Table 1—Capital Loss Carryover
| | | | | |
| | | | ($ x 1,000) | |
| | | | Post-Enactment | |
| | | | Short-Term | |
| | 2019($)† | | Losses ($)†† | Total($) |
| Dreyfus Cash Management | — | | 19 | 19 |
| Dreyfus Government Cash Management | — | | 113 | 113 |
| Dreyfus Government Prime Cash Management | — | | 28 | 28 |
| Dreyfus Treasury Prime Cash Management | — | | 718 | 718 |
| Dreyfus Municipal Cash Management Plus | 10 | | — | 10 |
| Dreyfus Tax Exempt Cash Management | — | | 17 | 17 |
| |
| † If not applied, the carryover expires in the above fiscal year. |
| †† Post-enactment short-term capital losses can be carried forward for an unlimited period. |
Table 2—Tax Character of Distributions Paid
| | | | | | |
| Tax Character of Distributions Paid ($ x 1,000) | 2014 | | | 2013 | |
| | | | | | Long-Term |
| | Tax-Exempt | Ordinary | Tax-Exempt | Ordinary | Capital |
| | Income ($) | Income ($) | Income ($) | Income ($) | Gains ($) |
| Dreyfus Municipal Cash Management Plus | 1 | — | 42 | — | — |
| Dreyfus New York Municipal Cash Management | 1 | 14 | 27 | —† | — |
| Dreyfus Tax Exempt Cash Management | 1 | — | 18 | — | — |
| Dreyfus California AMT-Free Municipal Cash Management | 1 | — | 24 | 121 | 91 |
| Dreyfus New York AMT-Free Municipal Cash Management | —† | — | 1 | 2 | — |
| | |
| † | Amount represents less than $1,000. |
The Funds 77
NOTES TO FINANCIAL STATEMENTS (continued)
During the period ended January 31, 2014, as a result of permanent book to tax differences, primarily due to dividend reclassification, each relevant fund increased accumulated undistributed investment income-net and decreased accumulated net realized gain (loss) on investments, as summarized in Table 3. Net assets and net asset value per share were not affected by this reclassification.
At January 31, 2014, the cost of investments for federal income tax purposes was substantially the same as the cost for financial reporting purposes (see the Statements of Investments).
NOTE 2—Management Fee and Other Transactions with Affiliates:
(a) Pursuant to separate management agreements with the Manager, the management fee of each fund is computed at the annual rate of .20% of the value of each fund’s average daily net assets and is payable monthly.
The Manager has undertaken to waive receipt of the management fee and/or reimburse operating expenses in order to facilitate a daily yield at or above a certain level which may
change from time to time.These undertakings are voluntary and not contractual, and may be terminated at any time. Table 4 summarizes the reduction in expenses for each class of shares of each fund, pursuant to these undertakings, during the period ended January 31, 2014.
(b) Under each fund’s Service Plan adopted pursuant to Rule 12b-1 under the Act, with respect to each fund’s applicable Investor Shares,Administrative Shares, Participant Shares, Service Shares, Select Shares,Agency Shares, Premier Shares and Classic Shares, each fund pays the Distributor for distributing such classes of shares, for advertising and marketing and for providing certain services relating to shareholders of the respective class of shares. Investor Shares, Administrative Shares, Participant Shares, Service Shares, Select Shares, Agency Shares, Premier Shares and Classic Shares pay the Distributor at annual rates of .25%, .10%, .40%, .50%, .80%, .06%, .31%, and .50%, respectively, of the value of the applicable share class’ average daily net assets. These services include answering shareholder inquiries regarding the funds and providing reports and other information and services related to the maintenance of share-
| | | | | | | |
| Table 3—Reclassification of Components of Net Assets | | | | | |
| |
| | | | Accumulated | Accumulated | |
| | | | Undistributed | | Net Realized | |
| | | Investment Income—Net ($) | Gain (Loss) ($) | |
| Dreyfus Cash Management | | | 2,137 | | (2,137 | ) |
| Dreyfus Treasury & Agency Cash Management | | | 80,401 | | (80,401 | ) |
| Dreyfus New York Municipal Cash Management | | | 14,153 | | (14,153 | ) |
| |
| Table 4—Expense Reductions | | | | | | |
| |
| | | Dreyfus | Dreyfus | Dreyfus | Dreyfus | |
| | | Government | Government | Treasury & | Treasury | |
| | Dreyfus Cash | Cash | Prime Cash | Agency Cash | Prime Cash | |
| | Management ($) | Management ($) | Management ($) | Management ($) | Management ($) | |
| Institutional Shares | 13,719,795 | 15,707,910 | 4,472,138 | 19,869,438 | 40,371,475 | |
| Investor Shares | 6,436,450 | 6,809,758 | 2,106,908 | 9,004,968 | 15,107,014 | |
| Administrative Shares | 1,535,501 | 1,577,436 | 1,309,081 | 1,476,552 | 1,602,198 | |
| Participant Shares | 3,499,373 | 1,050,043 | 1,124,185 | 2,840,252 | 16,670,464 | |
| Service Shares | — | — | — | 77,983 | — | |
| Select Shares | — | — | — | 50,130 | — | |
| Agency Shares | 122,654 | 170,655 | 26,407 | 54,842 | 71,370 | |
| Premier Shares | — | — | — | 120,448 | — | |
78
holder accounts (“Servicing”). Under the Service Plan, as to each class, the Distributor may make payments to Service Agents in respect to these services. Generally, the Service Agent may provide holders of Investor Shares, Administrative Shares, Participant Shares, Service Shares, Select Shares, Agency Shares, Premier Shares and Classic Shares a consolidated statement. The Service Agent will generally also provide the holders of Investor Shares, Participant Shares, Service Shares, Select Shares and/or Premier Shares automated teller check writing privileges and, in the case of Participant Shares, Service Shares, and
Premier Shares, automated teller machine access, and bill paying services. The amount paid under the Service Plan for Servicing is intended to be a “service fee” as defined under the Conduct Rules of the Financial Industry Regulatory Authority (“FINRA”), and at no time will such amount exceed the maximum amount permitted to be paid under the FINRA Conduct Rules as a service fee.The fees payable under the Service Plan are payable without regard to actual expenses incurred. Table 5 summarizes the amount each fund was charged pursuant to the Service Plan during the period ended January 31, 2014.
| | | | | | |
| Table 4—Expense Reductions (continued) | | | | | |
| |
| | Dreyfus | Dreyfus | | Dreyfus | Dreyfus |
| | Municipal | New York | Dreyfus | California | New York |
| | Cash | Municipal | Tax Exempt | AMT-Free | AMT-Free |
| | Management | Cash | Cash | Municipal Cash | Municipal Cash |
| | Plus ($) | Management ($) | Management ($) | Management ($) | Management ($) |
| Institutional Shares | 109,230 | 95,175 | 1,846,482 | 198,829 | 130,998 |
| Investor Shares | 617,277 | 979,441 | 1,449,776 | 850,822 | 130,892 |
| Administrative Shares | 144,197 | 14,098 | 117,318 | 5,787 | 11,886 |
| Participant Shares | 77,063 | 18,371 | 171,949 | 177,276 | — |
| Agency Shares | 2 | — | — | — | — |
| Classic Shares | — | — | — | — | 10,646 |
| | | | | | | | | |
| Table 5—Service Plan Fees | | | | | | | | |
| |
| | Investor | Administrative | Participant | Service | Select | Agency | Premier | Classic |
| | Shares ($) | Shares ($) | Shares ($) | Shares ($) | Shares ($) | Shares ($) | Shares ($) | Shares ($) |
| Dreyfus Cash Management | 6,043,006 | 1,291,822 | 3,324,827 | — | — | 95,158 | — | — |
| Dreyfus Government Cash Management | 4,630,846 | 724,388 | 810,420 | — | — | 60,607 | — | — |
| Dreyfus Government | | | | | | | | |
| Prime Cash Management | 1,373,911 | 541,836 | 845,794 | — | — | 8,429 | — | — |
| Dreyfus Treasury & Agency | | | | | | | | |
| Cash Management | 5,867,098 | 623,288 | 2,130,107 | 61,577 | 43,241 | 17,134 | 83,326 | — |
| Dreyfus Treasury Prime | | | | | | | | |
| Cash Management | 9,305,973 | 650,716 | 12,130,658 | — | — | 19,493 | — | — |
| Dreyfus Municipal | | | | | | | | |
| Cash Management Plus | 459,852 | 75,923 | 64,122 | — | — | 1 | — | — |
| Dreyfus New York | | | | | | | | |
| Municipal Cash Management | 745,370 | 8,605 | 15,447 | — | — | — | — | — |
| Dreyfus Tax Exempt Cash Management | 1,069,560 | 64,080 | 139,775 | — | — | — | — | — |
| Dreyfus California AMT-Free | | | | | | | | |
| Municipal Cash Management | 593,871 | 2,666 | 140,337 | — | — | — | — | — |
| Dreyfus New York AMT-Free | | | | | | | | |
| Municipal Cash Management | 77,027 | 4,421 | — | — | — | — | — | 7,803 |
NOTES TO FINANCIAL STATEMENTS (continued)
(c) Each fund has adopted a Shareholder Services Plan with respect to its Institutional Shares. Each fund reimburses the Distributor an amount not to exceed an annual rate of .25% of the value of each fund’s average daily net assets attributable to Institutional Shares for certain allocated expenses of providing personal services and/or maintaining shareholder accounts. The services provided may include personal services relating to shareholder accounts, such as answering shareholder inquiries regarding the funds, providing reports and other information, and services related to the maintenance of shareholder accounts. Table 6 summarizes the amount each fund’s Institutional Shares were charged pursuant to the Shareholder Services Plan during the period ended January 31, 2014.
The funds have arrangements with the transfer agent and the custodian whereby the funds may receive earnings cred-
its when positive cash balances are maintained, which are used to offset transfer agency and custody fees. For financial reporting purposes, the funds include net earnings credits as expense offsets in the Statements of Operations.
Each fund compensates Dreyfus Transfer Inc., a wholly-owned subsidiary of the Manager, under a transfer agency agreement for providing transfer agency and cash management services for the funds.The majority of transfer agency fees are comprised of amounts paid on a per account basis, while cash management fees are related to fund subscriptions and redemptions. Table 7 summarizes the amount each fund was charged during the period ended January 31, 2014 for transfer agency services, which is included in Shareholder servicing costs in the Statements of Operations. Table 9 summarizes the amount each fund was charged during the period ended January 31, 2014 for cash management services, which
| | |
| Table 6—Shareholder Services Plan Fees | |
| |
| | Institutional |
| | Shares ($) |
| Dreyfus Cash Management | 352,179 |
| Dreyfus Government Cash Management | 219,714 |
| Dreyfus Government Prime Cash Management | 44,222 |
| Dreyfus Treasury & Agency Cash Management | 191,367 |
| Dreyfus Treasury Prime Cash Management | 27,884 |
| Dreyfus Municipal Cash Management Plus | 7,032 |
| Dreyfus New York Municipal Cash Management | 2,343 |
| Dreyfus Tax Exempt Cash Management | 336,638 |
| Dreyfus California AMT-Free Municipal Cash Management | 221 |
| Dreyfus New York AMT-Free Municipal Cash Management | 308 |
| |
| |
| Table 7—Transfer Agency Agreement Fees | |
| |
| | Transfer Agency |
| | Fees ($) |
| Dreyfus Cash Management | 120,354 |
| Dreyfus Government Cash Management | 85,778 |
| Dreyfus Government Prime Cash Management | 94,517 |
| Dreyfus Treasury & Agency Cash Management | 38,176 |
| Dreyfus Treasury Prime Cash Management | 578,704 |
| Dreyfus Municipal Cash Management Plus | 1,523 |
| Dreyfus New York Municipal Cash Management | 2,735 |
| Dreyfus Tax Exempt Cash Management | 4,661 |
| Dreyfus California AMT-Free Municipal Cash Management | 691 |
| Dreyfus New York AMT-Free Municipal Cash Management | 1,654 |
80
is included in Shareholder servicing costs in the Statements of Operations. Cash management fees were partially offset by earnings credits, also summarized in Table 9.
Each fund compensates The Bank of New York Mellon, a subsidiary of BNY Mellon and an affiliate of Dreyfus, under a custody agreement for providing custodial services for each fund. These fees are determined based on net assets, geographic region and transaction activity. Table 8 summarizes the amount each fund was charged during the period ended January 31, 2014 pursuant to the custody agreement. These fees were partially offset by earnings credits for each relevant fund, also summarized in Table 8.
Each fund compensated The Bank of New York Mellon under a cash management agreement that was in effect until
September 30, 2013 for performing certain cash management services related to fund subscriptions and redemptions. Table 9 summarizes the amount each fund was charged during the period ended January 31, 2014, pursuant to the cash management agreement, which is included in Shareholder servicing costs in the Statements of Operations. These fees were partially offset by earnings credits for each relevant fund, also summarized in Table 9.
During the period ended January 31, 2014, each fund was charged $9,101 for services performed by the Chief Compliance Officer and his staff.
| | | | | | | |
| Table 8—Custody Agreement Fees | | | | | | |
| |
| | | Custody Fees ($) | Earnings Credits ($) | |
| Dreyfus Cash Management | | | | 865,877 | (9,473 | ) |
| Dreyfus Government Cash Management | | | | 506,349 | (5,297 | ) |
| Dreyfus Government Prime Cash Management | | | | 175,651 | (155 | ) |
| Dreyfus Treasury & Agency Cash Management | | | | 556,698 | (3,666 | ) |
| Dreyfus Treasury Prime Cash Management | | | | 961,052 | (3,038 | ) |
| Dreyfus Municipal Cash Management Plus | | | | 42,927 | — | |
| Dreyfus New York Municipal Cash Management | | | | 39,547 | — | |
| Dreyfus Tax Exempt Cash Management | | | | 126,458 | — | |
| Dreyfus California AMT-Free Municipal Cash Management | | | | 45,257 | — | |
| Dreyfus New York AMT-Free Municipal Cash Management | | | | 17,186 | — | |
| |
| |
| Table 9—Cash Management Agreement Fees | | | | | | |
| |
| | | | | The Bank of | The Bank of | |
| | Dreyfus Transfer Inc. | Dreyfus Transfer Inc. | | New York Mellon Cash | New York Mellon | |
| Cash Management Fees ($) | Earnings Credits ($) | | Management Fees ($) Earnings Credits ($) | |
| Dreyfus Cash Management | 2,760 | (288 | ) | 828 | (1 | ) |
| Dreyfus Government Cash Management | 3,526 | (366 | ) | 1,042 | (1 | ) |
| Dreyfus Government Prime Cash Management | 3,456 | (358 | ) | 1,028 | (1 | ) |
| Dreyfus Treasury & Agency Cash Management | 1,919 | (199 | ) | 569 | — | |
| Dreyfus Treasury Prime Cash Management | 21,454 | (2,224 | ) | 6,359 | (4 | ) |
| Dreyfus Municipal Cash Management Plus | 66 | (7 | ) | 21 | — | |
| Dreyfus New York Municipal Cash Management | 105 | (11 | ) | 31 | — | |
| Dreyfus Tax Exempt Cash Management | 209 | (22 | ) | 64 | — | |
| Dreyfus California AMT-Free Municipal Cash Management | 24 | (2 | ) | 7 | — | |
| Dreyfus New York AMT-Free Municipal Cash Management | 73 | (8 | ) | 22 | — | |
NOTES TO FINANCIAL STATEMENTS (continued)
Table 10 summarizes the components of “Due to The Dreyfus Corporation and affiliates” in the Statements of Assets and Liabilities for each fund.
(d) Each Board member also serves as a Board member of other funds within the Dreyfus complex. Annual retainer fees and attendance fees are allocated to each fund based on net assets.
NOTE 3—Securities Transactions:
The funds are permitted to purchase or sell securities from or to certain affiliated funds under specified conditions out-
lined in procedures adopted by the Boards.The procedures have been designed to ensure that any purchase or sale of securities by the funds from or to another fund or portfolio that are, or could be, considered an affiliate by virtue of having a common investment adviser (or affiliated investment adviser), common Trustees and/or common officers, complies with Rule 17a-7 under the Act. Table 11 summarizes the amounts of purchases and sales of securities engaged in by each relevant fund pursuant to Rule 17a-7 under the Act during the period ended January 31, 2014.
| | | | | | | | | |
| Table 10—Due to The Dreyfus Corporation and Affiliates | | | | | | |
| |
| |
| | | | | | Chief | | | |
| | | | Shareholder | | Compliance | Transfer | | |
| | Management | Service Plan | Services Plan | Custodian | Officer | Agency | Less Expense | |
| | Fees ($) | Fees ($) | Fees ($) | Fees ($) | Fees ($) | Fees ($) | Reimbursement ($) | |
| |
| Dreyfus Cash Management | 4,752,759 | 974,570 | 34,196 | 360,000 | 3,023 | 21,366 | (2,875,635 | ) |
| Dreyfus Government | | | | | | | | |
| Cash Management | 3,035,192 | 514,569 | 13,000 | 203,005 | 3,023 | 23,532 | (2,758,620 | ) |
| Dreyfus Government | | | | | | | | |
| Prime Cash Management | 851,472 | 248,936 | 2,000 | 72,500 | 3,023 | 24,220 | (864,181 | ) |
| Dreyfus Treasury & Agency | | | | | | | | |
| Cash Management | 3,187,154 | 705,753 | 23,000 | 240,000 | 3,023 | 13,497 | (3,328,509 | ) |
| Dreyfus Treasury Prime | | | | | | | | |
| Cash Management | 6,603,172 | 1,934,772 | 12,000 | 408,499 | 3,023 | 142,416 | (7,388,675 | ) |
| Dreyfus Municipal | | | | | | | | |
| Cash Management Plus | 55,510 | 44,953 | — | 16,811 | 3,023 | 15 | (83,434 | ) |
| Dreyfus New York Municipal | | | | | | | | |
| Cash Management | 85,391 | 75,744 | — | 17,372 | 3,023 | 20 | (119,377 | ) |
| Dreyfus Tax Exempt | | | | | | | | |
| Cash Management | 418,017 | 110,454 | 39,000 | 54,971 | 3,023 | 48 | (376,077 | ) |
| Dreyfus California AMT-Free | | | | | | | | |
| Municipal Cash Management | 76,807 | 68,227 | — | 19,873 | 3,023 | 17 | (126,368 | ) |
| Dreyfus New York AMT-Free | | | | | | | | |
| Municipal Cash Management | 17,744 | 6,200 | — | 7,000 | 3,023 | 18 | (23,122 | ) |
| | | |
| Table 11—Affiliated Portfolio Holdings Transactions | | |
| |
| |
| | Purchases ($) | Sales ($) |
| Dreyfus Municipal Cash Management Plus | 287,215,000 | 610,030,000 |
| Dreyfus New York Municipal Cash Management | 366,535,000 | 329,750,000 |
| Dreyfus Tax Exempt Cash Management | 942,015,000 | 857,865,000 |
| Dreyfus California AMT—Free Municipal Cash Management | 113,955,000 | 199,185,000 |
| Dreyfus New York AMT-Free Municipal Cash Management | 33,685,000 | 56,640,000 |
82
REPORT OF INDEPENDENT REGISTERED PUBLIC ACCOUNTING FIRM
Shareholders and Board of Trustees
Dreyfus Cash Management
Dreyfus Government Cash Management
Dreyfus Government Prime Cash Management
Dreyfus Treasury & Agency Cash Management
Dreyfus Treasury Prime Cash Management
Dreyfus Municipal Cash Management Plus
Dreyfus New York Municipal
Cash Management
Dreyfus Tax Exempt Cash Management
Dreyfus California AMT-Free
Municipal Cash Management
Dreyfus New York AMT-Free
Municipal Cash Management
We have audited the accompanying statements of assets and liabilities, including the statements of investments, of Dreyfus Cash Management, Dreyfus Government Cash Management, Dreyfus Government Prime Cash Management, Dreyfus Treasury & Agency Cash Management, Dreyfus Treasury Prime Cash Management, Dreyfus Municipal Cash Management Plus, Dreyfus New York Municipal Cash Management, Dreyfus Tax Exempt Cash Management, Dreyfus California AMT-Free Municipal Cash Management and Dreyfus New York AMT-Free Municipal Cash Management (the “Funds”) as of January 31, 2014, and the related statements of operations for the year then ended, the statements of changes in net assets for each of the two years in the period then ended, and the financial highlights for each of the five years in the period then ended.These financial statements and financial highlights are the responsibility of the Funds’ management. Our responsibility is to express an opinion on these financial statements and financial highlights based on our audits.
We conducted our audits in accordance with the standards of the Public Company Accounting Oversight Board (United States). Those standards require that we plan and perform the audit to obtain reasonable assurance about whether the financial statements and financial highlights are free of material misstatement.We were not engaged to perform an audit of the Funds’ internal control over financial reporting. Our audits included consideration of internal control over financial reporting as a basis for designing audit procedures that are appropriate in the circumstances, but not for the purpose of expressing an opinion on the effectiveness of the Funds’ internal control over financial report-ing.Accordingly, we express no such opinion.An audit also includes examining, on a test basis, evidence supporting the amounts and disclosures in the financial statements and financial highlights, assessing the accounting principles used and significant estimates made by management, and evaluating the overall financial statement presentation. Our procedures included confirmation of securities owned as of January 31, 2014 by correspondence with the custodian and others.We believe that our audits provide a reasonable basis for our opinion.
In our opinion, the financial statements and financial highlights referred to above present fairly, in all material respects, the financial position of the Funds at January 31, 2014, the results of their operations for the year then ended, the changes in their net assets for each of the two years in the period then ended, and the financial highlights for each of the five years in the period then ended, in conformity with U.S. generally accepted accounting principles.

New York, New York
March 26, 2014
IMPORTANT TAX INFORMATION (Unaudited)
In accordance with federal tax law, Dreyfus Municipal Cash Management Plus, Dreyfus New York Municipal Cash Management, Dreyfus Tax Exempt Cash Management, Dreyfus California AMT-Free Municipal Cash Management and Dreyfus New York AMT-Free Municipal Cash Management hereby make the following designations regarding the dividends paid from investment income-net during their fiscal year ended January 31, 2014:
all the dividends paid from investment income-net are “exempt-interest dividends” (not generally subject to regular federal income taxes), except $14,153 of Dreyfus New York Municipal Cash Management’s exempt- interest dividends that are being designated as an ordinary income distribution for reporting purposes.
for individuals who are residents of New York, “exempt-interest dividends” paid by Dreyfus New York Municipal Cash Management and Dreyfus New York AMT-Free Municipal Cash Management are also not subject to NewYork state and NewYork city personal income tax.
for individuals who are residents of California, “exempt-interest dividends” paid by Dreyfus California AMT-Free Municipal Cash Management are also not subject to California personal income tax.
For state individual income tax purposes, Dreyfus Government Prime Cash Management and Dreyfus Treasury Prime
Cash Management hereby report the following percentage of ordinary dividends paid during the fiscal year ended January 31, 2014 as attributable to interest income from direct obligations of the United States. Such dividends are currently exempt from taxation for income tax purposes in most states, including NewYork, Connecticut, California and the District of Columbia:
| | | |
| Dreyfus Government Prime | | |
| Cash Management | 100 | % |
| Dreyfus Treasury Prime | | |
| Cash Management | 100 | % |
The funds below report the following percentage of ordinary income dividends paid during the fiscal year ended January 31, 2014 as qualifying interest-related dividends:
| | | |
| Dreyfus Cash Management | 90.37 | % |
| Dreyfus Government | | |
| Cash Management | 100 | % |
| Dreyfus Government | | |
| Prime Cash Management | 100 | % |
| Dreyfus Treasury & Agency | | |
| Cash Management | 100 | % |
| Dreyfus Treasury | | |
| Prime Cash Management | 100 | % |
84
PROXY RESULTS (Unaudited)
Dreyfus Cash Management Fund
The fund held a special meeting of shareholders on December 6, 2013.The proposal considered at the meeting, and the results, are as follows:
| | | | |
| | | Shares | |
| | Votes For | | Authority Withheld |
| To elect additional Board Members: | | | |
| Gordon J. Davis† | 9,275,493,817 | | 55,536,450 |
| Whitney I. Gerard† | 9,281,744,847 | | 49,285,420 |
| Robin A. Melvin† | 9,241,195,187 | | 89,835,080 |
| Nathan Leventhal† | 9,281,777,726 | | 49,252,541 |
| Roslyn M. Watson† | 9,224,158,892 | | 106,871,375 |
| |
| † Each of the above Board Members were duly elected by shareholders at the fund’s December 6, 2013 shareholder meeting.The election of Gordon J. Davis,Whitney I. Gerard and |
| Nathan Leventhal became effective January 1, 2014. Robin A. Melvin and Roslyn M.Watson were existing Board members previously having been elected by the fund’s Board. In |
| addition, Joseph S. DiMartino, Isabel P. Dunst and Benaree Pratt Wiley continue as Board Members of the fund. |
Dreyfus Government Cash Management Funds
The Company held a special meeting of shareholders on December 6, 2013. The proposal considered at the meeting, and the results, are as follows:
| | | | |
| | | Shares | |
| | Votes For | | Authority Withheld |
| To elect additional Board Members: | | | |
| Gordon J. Davis† | 8,952,733,476 | | 251,316,312 |
| Whitney I. Gerard† | 8,942,581,254 | | 261,468,534 |
| Robin A. Melvin† | 8,933,732,878 | | 270,316,910 |
| Nathan Leventhal† | 8,942,569,057 | | 261,480,731 |
| Roslyn M. Watson† | 8,911,823,712 | | 292,226,076 |
| |
| † Each of the above Board Members were duly elected by shareholders at the Company’s December 6, 2013 shareholder meeting. The election of Gordon J. Davis,Whitney I. Gerard |
| and Nathan Leventhal became effective January 1, 2014. Robin A. Melvin and Roslyn M. Watson were existing Board members previously having been elected by the Company’s |
| Board. In addition, Joseph S. DiMartino, Isabel P. Dunst and Benaree Pratt Wiley continue as Board Members of the Company. |
PROXY RESULTS (Unaudited) (continued)
Dreyfus Treasury & Agency Cash Management Fund
The fund held a special meeting of shareholders on December 6, 2013.The proposal considered at the meeting, and the results, are as follows:
| | | | |
| | | Shares | |
| | Votes For | | Authority Withheld |
| To elect additional Board Members: | | | |
| Gordon J. Davis† | 7,562,395,056 | | 14,922,011 |
| Whitney I. Gerard† | 7,557,308,594 | | 20,008,473 |
| Robin A. Melvin† | 7,554,796,378 | | 22,520,689 |
| Nathan Leventhal† | 7,557,308,594 | | 20,008,473 |
| Roslyn M. Watson† | 7,554,796,378 | | 22,520,689 |
| |
| † Each of the above Board Members were duly elected by shareholders at the fund’s December 6, 2013 shareholder meeting.The election of Gordon J. Davis,Whitney I. Gerard and |
| Nathan Leventhal became effective January 1, 2014. Robin A. Melvin and Roslyn M.Watson were existing Board members previously having been elected by the fund’s Board. In |
| addition, Joseph S. DiMartino, Isabel P. Dunst and Benaree Pratt Wiley continue as Board Members of the fund. |
Dreyfus Treasury Prime Cash Management Fund
The fund held a special meeting of shareholders on December 6, 2013.The proposal considered at the meeting, and the results, are as follows:
| | | | |
| | | Shares | |
| | Votes For | | Authority Withheld |
| To elect additional Board Members: | | | |
| Gordon J. Davis† | 15,636,955,393 | | 84,845,169 |
| Whitney I. Gerard† | 15,623,043,609 | | 98,756,953 |
| Robin A. Melvin† | 15,536,124,585 | | 185,675,977 |
| Nathan Leventhal† | 15,562,431,023 | | 159,369,539 |
| Roslyn M. Watson† | 15,536,284,410 | | 185,516,152 |
| |
| † Each of the above Board Members were duly elected by shareholders at the fund’s December 6, 2013 shareholder meeting.The election of Gordon J. Davis,Whitney I. Gerard and |
| Nathan Leventhal became effective January 1, 2014. Robin A. Melvin and Roslyn M.Watson were existing Board members previously having been elected by the fund’s Board. In |
| addition, Joseph S. DiMartino, Isabel P. Dunst and Benaree Pratt Wiley continue as Board Members of the fund. |
86
Dreyfus Municipal Cash Management Plus Fund
The fund held a special meeting of shareholders on December 6, 2013.The proposal considered at the meeting, and the results, are as follows:
| | | | |
| | | Shares | |
| | Votes For | | Authority Withheld |
| To elect additional Board Members: | | | |
| Gordon J. Davis† | 253,506,096 | | 1,211,150 |
| Whitney I. Gerard† | 253,506,096 | | 1,211,150 |
| Robin A. Melvin† | 253,506,096 | | 1,211,150 |
| Nathan Leventhal† | 253,506,096 | | 1,211,150 |
| Roslyn M. Watson† | 253,499,404 | | 1,217,842 |
| |
| † Each of the above Board Members were duly elected by shareholders at the fund’s December 6, 2013 shareholder meeting. The election of Gordon J. Davis,Whitney I. Gerard and |
| Nathan Leventhal became effective January 1, 2014. Robin A. Melvin and Roslyn M.Watson were existing Board members previously having been elected by the fund’s Board. In |
| addition, Joseph S. DiMartino, Isabel P. Dunst and Benaree Pratt Wiley continue as Board Members of the fund. |
Dreyfus New York Municipal Cash Management Fund
The fund held a special meeting of shareholders on December 6, 2013.The proposal considered at the meeting, and the results, are as follows:
| | | | |
| | | Shares | |
| | Votes For | | Authority Withheld |
| To elect additional Board Members: | | | |
| Gordon J. Davis† | 338,498,256 | | 5,881,549 |
| Whitney I. Gerard† | 338,498,256 | | 5,881,549 |
| Robin A. Melvin† | 338,498,856 | | 5,880,949 |
| Nathan Leventhal† | 338,498,856 | | 5,880,949 |
| Roslyn M. Watson† | 338,498,856 | | 5,880,949 |
| |
| † Each of the above Board Members were duly elected by shareholders at the fund’s December 6, 2013 shareholder meeting.The election of Gordon J. Davis,Whitney I. Gerard and |
| Nathan Leventhal became effective January 1, 2014. Robin A. Melvin and Roslyn M.Watson were existing Board members previously having been elected by the fund’s Board. In |
| addition, Joseph S. DiMartino, Isabel P. Dunst and Benaree Pratt Wiley continue as Board Members of the fund. |
PROXY RESULTS (Unaudited) (continued)
Dreyfus Tax Exempt Cash Management Funds
The Trust held a special meeting of shareholders on December 6, 2013.The proposal considered at the meeting, and the results, are as follows:
| | | | |
| | | Shares | |
| | Votes For | | Authority Withheld |
| To elect additional Board Members: | | | |
| Gordon J. Davis† | 1,365,022,306 | | 8,652,176 |
| Whitney I. Gerard† | 1,364,219,816 | | 9,454,666 |
| Robin A. Melvin† | 1,364,936,842 | | 8,737,640 |
| Nathan Leventhal† | 1,365,031,018 | | 8,643,464 |
| Roslyn M. Watson† | 1,364,936,842 | | 8,737,640 |
| |
| † Each of the above Board Members were duly elected by shareholders at the Trust’s December 6, 2013 shareholder meeting.The election of Gordon J. Davis,Whitney I. Gerard and |
| Nathan Leventhal became effective January 1, 2014. Robin A. Melvin and Roslyn M.Watson were existing Board members previously having been elected by the Trust’s Board. In |
| addition, Joseph S. DiMartino, Isabel P. Dunst and Benaree Pratt Wiley continue as Board Members of the Trust. |
88
BOARD MEMBERS INFORMATION (Unaudited)
INDEPENDENT BOARD MEMBERS
| | |
| Joseph S. DiMartino (70) | Robin A. Melvin (50) |
| Chairman of the Board (1995) | Board Member (2010) |
| Principal Occupation During Past 5Years: | Principal Occupation During Past 5Years: |
| • Corporate Director and Trustee | • Board Member, Illinois Mentoring Partnership, non-profit |
| Other Public Company Board Memberships During Past 5Years: | organization dedicated to increasing the quantity and quality of |
| • CBIZ (formerly, Century Business Services, Inc.), a provider of | mentoring services in Illinois (2013-present) |
| outsourcing functions for small and medium size companies, | • Director, Boisi Family Foundation, a private family foundation that |
| Director (1997-present) | supports youth-serving organizations that promote the self |
| • The Newark Group, a provider of a national market of paper | sufficiency of youth from disadvantaged circumstances (1995-2012) |
| recovery facilities, paperboard mills and paperboard converting | No. of Portfolios for which Board Member Serves: 115 |
| plants, Director (2000-2010) | |
| | ——————— |
| • Sunair Services Corporation, a provider of certain outdoor-related | |
| services to homes and businesses, Director (2005-2009) | Roslyn M. Watson (64) |
| No. of Portfolios for which Board Member Serves: 141 | Board Member (2010) |
| | Principal Occupation During Past 5Years: |
| ——————— | |
| | • Principal,Watson Ventures, Inc., a real estate investment company |
| Whitney I. Gerard (79) | (1993-present) |
| Board Member (2014)† | No. of Portfolios for which Board Member Serves: 61 |
| Principal Occupation During Past 5Years: | |
| | ——————— |
| • Partner in the law firm of Chadbourne & Parke LLP | |
| No. of Portfolios for which Board Member Serves: 35 | Benaree Pratt Wiley (67) |
| | Board Member (2007) |
| ——————— | |
| | Principal Occupation During Past 5Years: |
| Nathan Leventhal (70) | • Principal,The Wiley Group, a firm specializing in strategy and |
| Board Member (2014)† | business development (2005-present) |
| Principal Occupation During Past 5Years: | Other Public Company Board Memberships During Past 5Years: |
| • Chairman of the Avery-Fisher Artist Program (1997-present) | • CBIZ (formerly, Century Business Services, Inc.), a provider of |
| • Commissioner, NYC Planning Commission (2007-2011) | outsourcing functions for small and medium size companies, |
| Other Public Company Board Memberships During Past 5Years: | Director (2008-present) |
| • Movado Group, Inc., Director (2003-present) | No. of Portfolios for which Board Member Serves: 61 |
| No. of Portfolios for which Board Member Serves: 49 | |
BOARD MEMBERS INFORMATION (Unaudited) (continued)
INTERESTED BOARD MEMBERS
| | |
| Charles Cardona (58) | Isabel P. Dunst (66) |
| Board Member (2014) | Board Member (1991) |
| Principal Occupation During Past 5Years: | Principal Occupation During Past 5Years: |
| • President and a Director of The Dreyfus Corporation | • Partner, Hogan Lovells LLP |
| |
| • Executive Vice President of MBSC Securities Corporation | No. of Portfolios for which Board Member Serves: 35 |
| • President of Dreyfus Institutional Services Division | |
| | Isabel P. Dunst is deemed to be an “interest person” (as defined in the Act) of the |
| No. of Portfolios for which Board Member Serves: 19 | fund as a result of her affiliation with Hogan Lovells LLP, which provides legal |
| Charles Cardona is deemed to be an “interested person” (as defined in the Act) of | services to BNY Mellon and certain of its affiliates. |
| the funds as a result of his affiliation with The Dreyfus Corporation, this became | |
| | ——————— |
| effective February 27, 2014. | |
| | † Whitney I. Gerard, Nathan Leventhal and Gordon J. Davis were elected as Board |
| ——————— | Member of the funds as of December 6, 2013, effective January 1, 2014. |
| Gordon J. Davis (72) | Once elected all Board Members serve for an indefinite term, but achieve Emeritus |
| Board Member (2014)† | status upon reaching age 80.The address of the Board Members and Officers is c/o |
| | The Dreyfus Corporation, 200 Park Avenue, NewYork, NewYork 10166. |
| Principal Occupation During Past 5Years: | Additional information about the Board Members is available in the fund’s Statement |
| • Partner in the law firm of Venable LLP (2012-present) | of Additional Information which can be obtained from Dreyfus free of charge by calling |
| • Partner in the law firm of Dewey & LeBoeuf LLP (1994-2012) | this toll free number: 1-800-DREYFUS. |
| Other Public Company Board Memberships During Past 5Years: | David W. Burke, Emeritus Board Member |
| • Consolidated Edison, Inc., a utility company, Director (1997-present) | Lyle E. Gramley, Emeritus Board Member |
| • The Phoenix Companies, Inc., a life insurance company, Director | Philip L.Toia, Emeritus Board Member |
| (2000-present) | |
| |
| No. of Portfolios for which Board Member Serves: 59 | |
| Gordon J. Davis is deemed to be an “interested person” (as defined in the Act) of | |
| the fund as a result of his affiliation with Venable LLP, which provides legal services | |
| to the funds. | |
90
OFFICERS OF THE FUND (Unaudited)
BRADLEY J. SKAPYAK, President since January 2010.
Chief Operating Officer and a director of the Manager since June 2009, Chairman of Dreyfus Transfer, Inc., an affiliate of the Manager and the transfer agent of the funds, since May 2011 and Executive Vice President of the Distributor since June 2007. From April 2003 to June 2009, Mr. Skapyak was the head of the Investment Accounting and Support Department of the Manager. He is an officer of 68 investment companies (comprised of 141 portfolios) managed by the Manager. He is 55 years old and has been an employee of the Manager since February 1988.
CHARLES CARDONA, Executive Vice President since November 2001.
President and a Director of the Manager, Executive Vice President of the Distributor, President of Dreyfus Institutional Services Division, and an officer of 12 other investment companies (comprised of 19 portfolios) managed by the Manager. He is 58 years old and has been an employee of the Manager since February 1981.
JOHN PAK, Chief Legal Officer since March 2013.
Chief Legal Officer of the Manager and Associate General Counsel and Managing Director of BNY Mellon since August 2012; from March 2005 to July 2012, Managing Director of Deutsche Bank, Deputy Global Head of Deutsche Asset Management Legal and Regional Head of Deutsche Asset Management Americas Legal. He is an officer of 69 investment companies (comprised of 166 portfolios) managed by the Manager. He is 45 years old and has been an employee of the Manager since August 2012.
JANETTE E. FARRAGHER, Vice President and Secretary since December 2011.
Assistant General Counsel of BNY Mellon, and an officer of 69 investment companies (comprised of 166 portfolios) managed by the Manager. She is 51 years old and has been an employee of the Manager since February 1984.
KIESHA ASTWOOD, Vice President and Assistant Secretary since January 2010.
Counsel of BNY Mellon, and an officer of 69 investment companies (comprised of 166 portfolios) managed by the Manager. She is 40 years old and has been an employee of the Manager since July 1995.
JAMES BITETTO, Vice President and Assistant Secretary since August 2005.
Senior Counsel of BNY Mellon and Secretary of the Manager, and an officer of 69 investment companies (comprised of 166 portfolios) managed by the Manager. He is 47 years old and has been an employee of the Manager since December 1996.
JONI LACKS CHARATAN, Vice President and Assistant Secretary since August 2005.
Senior Counsel of BNY Mellon, and an officer of 69 investment companies (comprised of 166 portfolios) managed by the Manager. She is 58 years old and has been an employee of the Manager since October 1988.
JOSEPH M. CHIOFFI, Vice President and Assistant Secretary since August 2005.
Senior Counsel of BNY Mellon, and an officer of 69 investment companies (comprised of 166 portfolios) managed by the Manager. He is 52 years old and has been an employee of the Manager since June 2000.
JOHN B. HAMMALIAN, Vice President and Assistant Secretary since August 2005.
Senior Managing Counsel of BNY Mellon, and an officer of 69 investment companies (comprised of 166 portfolios) managed by the Manager. He is 50 years old and has been an employee of the Manager since February 1991.
ROBERT R. MULLERY, Vice President and Assistant Secretary since August 2005.
Managing Counsel of BNY Mellon, and an officer of 69 investment companies (comprised of 166 portfolios) managed by the Manager. He is 62 years old and has been an employee of the Manager since May 1986.
JEFF PRUSNOFSKY, Vice President and Assistant Secretary since August 2005.
Senior Managing Counsel of BNY Mellon, and an officer of 69 investment companies (comprised of 166 portfolios) managed by the Manager. He is 48 years old and has been an employee of the Manager since October 1990.
JAMES WINDELS, Treasurer since November 2001.
Director – Mutual Fund Accounting of the Manager, and an officer of 69 investment companies (comprised of 166 portfolios) managed by the Manager. He is 55 years old and has been an employee of the Manager since April 1985.
RICHARD CASSARO, Assistant Treasurer since January 2008.
Senior Accounting Manager – Money Market and Municipal Bond Funds of the Manager, and an officer of 69 investment companies (comprised of 166 portfolios) managed by the Manager. He is 55 years old and has been an employee of the Manager since September 1982.
OFFICERS OF THE FUND (Unaudited) (continued)
GAVIN C. REILLY, Assistant Treasurer since August 2005.
Tax Manager of the Investment Accounting and Support Department of the Manager, and an officer of 69 investment companies (comprised of 166 portfolios) managed by the Manager. He is 45 years old and has been an employee of the Manager since April 1991.
ROBERT S. ROBOL, Assistant Treasurer since August 2003.
Senior Accounting Manager – Fixed Income Funds of the Manager, and an officer of 69 investment companies (comprised of 166 portfolios) managed by the Manager. He is 49 years old and has been an employee of the Manager since October 1988.
ROBERT SALVIOLO, Assistant Treasurer since July 2007.
Senior Accounting Manager – Equity Funds of the Manager, and an officer of 69 investment companies (comprised of 166 portfolios) managed by the Manager. He is 46 years old and has been an employee of the Manager since June 1989.
ROBERT SVAGNA, Assistant Treasurer since August 2005.
Senior Accounting Manager – Equity Funds of the Manager, and an officer of 69 investment companies (comprised of 166 portfolios) managed by the Manager. He is 46 years old and has been an employee of the Manager since November 1990.
JOSEPH W. CONNOLLY, Chief Compliance Officer since September 2004.
Chief Compliance Officer of the Manager and The Dreyfus Family of Funds (69 investment companies, comprised of 166 portfolios). He is 56 years old and has served in various capacities with the Manager since 1980, including manager of the firm’s Fund Accounting Department from 1997 through October 2001.
MATTHEW D. CONNOLLY, Anti-Money Laundering Compliance Officer since April 2012.
Anti-Money Laundering Compliance Officer of the Distributor since October 2011; from March 2010 to September 2011, Global Head, KYC Reviews and Director, UBS Investment Bank; until March 2010, AML Compliance Officer and Senior Vice President, Citi Global Wealth Management. He is an officer of 64 investment companies (comprised of 161 portfolios) managed by the Manager. He is 41 years old and has been an employee of the Distributor since October 2011.
92
For More Information
Item 2. Code of Ethics.
The Registrant has adopted a code of ethics that applies to the Registrant's principal executive officer, principal financial officer, principal accounting officer or controller, or persons performing similar functions. There have been no amendments to, or waivers in connection with, the Code of Ethics during the period covered by this Report.
Item 3. Audit Committee Financial Expert.
The Registrant's Board has determined that Joseph S. DiMartino, a member of the Audit Committee of the Board, is an audit committee financial expert as defined by the Securities and Exchange Commission (the "SEC"). Mr. DiMartino is "independent" as defined by the SEC for purposes of audit committee financial expert determinations.
Item 4. Principal Accountant Fees and Services.
(a) Audit Fees. The aggregate fees billed for each of the last two fiscal years (the "Reporting Periods") for professional services rendered by the Registrant's principal accountant (the "Auditor") for the audit of the Registrant's annual financial statements or services that are normally provided by the Auditor in connection with the statutory and regulatory filings or engagements for the Reporting Periods, were $31,594 in 2013 and $32,226 in 2014.
(b) Audit-Related Fees. The aggregate fees billed in the Reporting Periods for assurance and related services by the Auditor that are reasonably related to the performance of the audit of the Registrant's financial statements and are not reported under paragraph (a) of this Item 4 were $6,000 in 2013 and $6,000 in 2014. These services consisted of one or more of the following: (i) agreed upon procedures related to compliance with Internal Revenue Code section 817(h), (ii) security counts required by Rule 17f-2 under the Investment Company Act of 1940, as amended, (iii) advisory services as to the accounting or disclosure treatment of Registrant transactions or events and (iv) advisory services to the accounting or disclosure treatment of the actual or potential impact to the Registrant of final or proposed rules, standards or interpretations by the Securities and Exchange Commission, the Financial Accounting Standards Boards or other regulatory or standard-setting bodies.
The aggregate fees billed in the Reporting Periods for non-audit assurance and related services by the Auditor to the Registrant's investment adviser (not including any sub-investment adviser whose role is primarily portfolio management and is subcontracted with or overseen by another investment adviser), and any entity controlling, controlled by or under common control with the investment adviser that provides ongoing services to the Registrant ("Service Affiliates"), that were reasonably related to the performance of the annual audit of the Service Affiliate, which required pre-approval by the Audit Committee were $0 in 2013 and $0 in 2014.
(c) Tax Fees. The aggregate fees billed in the Reporting Periods for professional services rendered by the Auditor for tax compliance, tax advice, and tax planning ("Tax Services") were $3,778 in 2013 and $3,397 in 2014. These services consisted of: (i) review or preparation of U.S. federal, state, local and excise tax returns; (ii) U.S. federal, state and local tax planning, advice and assistance regarding statutory, regulatory or administrative developments; (iii) tax advice regarding tax qualification matters and/or treatment of various financial instruments held or proposed to be acquired or held. The aggregate fees billed in the Reporting Periods for Tax Services by the Auditor to Service Affiliates, which required pre-approval by the Audit Committee were $0 in 2013 and $0 in 2014.
(d) All Other Fees. The aggregate fees billed in the Reporting Periods for products and services provided by the Auditor, other than the services reported in paragraphs (a) through (c) of this Item, were $21 in 2013 and $12 in 2014. [These services consisted of a review of the Registrant's anti-money laundering program].
The aggregate fees billed in the Reporting Periods for Non-Audit Services by the Auditor to Service Affiliates, other than the services reported in paragraphs (b) through (c) of this Item, which required pre-approval by the Audit Committee, were $200,000 in 2013 and $0 in 2014.
(e)(1) Audit Committee Pre-Approval Policies and Procedures. The Registrant's Audit Committee has established policies and procedures (the "Policy") for pre-approval (within specified fee limits) of the Auditor's engagements for non-audit services to the Registrant and Service Affiliates without specific case-by-case consideration. The pre-approved services in the Policy can include pre-approved audit services, pre-approved audit-related services, pre-approved tax services and pre-approved all other services. Pre-approval considerations include whether the proposed services are compatible with maintaining the Auditor's independence. Pre-approvals pursuant to the Policy are considered annually.
(e)(2) Note: None of the services described in paragraphs (b) through (d) of this Item 4 were approved by the Audit Committee pursuant to paragraph (c)(7)(i)(C) of Rule 2-01 of Regulation S-X.
(f) None of the hours expended on the principal accountant's engagement to audit the registrant's financial statements for the most recent fiscal year were attributed to work performed by persons other than the principal account's full-time, permanent employees.
Non-Audit Fees. The aggregate non-audit fees billed by the Auditor for services rendered to the Registrant, and rendered to Service Affiliates, for the Reporting Periods were $46,989,773 in 2013 and $51,723,391 in 2014.
Auditor Independence. The Registrant's Audit Committee has considered whether the provision of non-audit services that were rendered to Service Affiliates, which were not pre-approved (not requiring pre-approval), is compatible with maintaining the Auditor's independence.
Item 5. Audit Committee of Listed Registrants.
Not applicable. [CLOSED-END FUNDS ONLY]
Item 6. Investments.
(a) Not applicable.
Item 7. Disclosure of Proxy Voting Policies and Procedures for Closed-End Management Investment Companies.
Not applicable. [CLOSED-END FUNDS ONLY]
Item 8. Portfolio Managers of Closed-End Management Investment Companies.
Not applicable. [CLOSED-END FUNDS ONLY, beginning with reports for periods ended on and after December 31, 2005]
Item 9. Purchases of Equity Securities by Closed-End Management Investment Companies and Affiliated Purchasers.
Not applicable. [CLOSED-END FUNDS ONLY]
Item 10. Submission of Matters to a Vote of Security Holders.
There have been no material changes to the procedures applicable to Item 10.
Item 11. Controls and Procedures.
(a) The Registrant's principal executive and principal financial officers have concluded, based on their evaluation of the Registrant's disclosure controls and procedures as of a date within 90 days of the filing date of this report, that the Registrant's disclosure controls and procedures are reasonably designed to ensure that information required to be disclosed by the Registrant on Form N-CSR is recorded, processed, summarized and reported within the required time periods and that information required to be disclosed by the Registrant in the reports that it files or submits on Form N-CSR is accumulated and communicated to the Registrant's management, including its principal executive and principal financial officers, as appropriate to allow timely decisions regarding required disclosure.
(b) There were no changes to the Registrant's internal control over financial reporting that occurred during the second fiscal quarter of the period covered by this report that have materially affected, or are reasonably likely to materially affect, the Registrant's internal control over financial reporting.
Item 12. Exhibits.
(a)(1) Code of ethics referred to in Item 2.
(a)(2) Certifications of principal executive and principal financial officers as required by Rule 30a-2(a) under the Investment Company Act of 1940.
(a)(3) Not applicable.
(b) Certification of principal executive and principal financial officers as required by Rule 30a-2(b) under the Investment Company Act of 1940.
SIGNATURES
Pursuant to the requirements of the Securities Exchange Act of 1934 and the Investment Company Act of 1940, the Registrant has duly caused this Report to be signed on its behalf by the undersigned, thereunto duly authorized.
DREYFUS NEW YORK MUNICIPAL CASH MANAGEMENT
By: /s/ Bradley J. Skapyak |
Bradley J. Skapyak, President |
Date: | March 25, 2014 |
|
Pursuant to the requirements of the Securities Exchange Act of 1934 and the Investment Company Act of 1940, this Report has been signed below by the following persons on behalf of the Registrant and in the capacities and on the dates indicated. |
|
By: /s/ Bradley J. Skapyak |
Bradley J. Skapyak, President |
Date: | March 25, 2014 |
|
By: /s James Windels |
James Windels, Treasurer |
Date: | March 25, 2014 |
|
EXHIBIT INDEX
(a)(1) Code of ethics referred to in Item 2.
(a)(2) Certifications of principal executive and principal financial officers as required by Rule 30a-2(a) under the Investment Company Act of 1940. (EX-99.CERT)
(b) Certification of principal executive and principal financial officers as required by Rule 30a-2(b) under the Investment Company Act of 1940. (EX-99.906CERT)