UNITED STATES
SECURITIES AND EXCHANGE COMMISSION
Washington, D.C. 20549
FORM N-CSR
CERTIFIED SHAREHOLDER REPORT OF REGISTERED MANAGEMENT
INVESTMENT COMPANIES
Investment Company Act file number | 811- 6395 |
| |
| DREYFUS NEW YORK MUNICIPAL CASH MANAGEMENT | |
| (Exact name of Registrant as specified in charter) | |
| | |
| c/o The Dreyfus Corporation 200 Park Avenue New York, New York 10166 | |
| (Address of principal executive offices) (Zip code) | |
| | |
| Michael A. Rosenberg, Esq. 200 Park Avenue New York, New York 10166 | |
| (Name and address of agent for service) | |
|
Registrant's telephone number, including area code: | (212) 922-6000 |
| |
Date of fiscal year end: | 1/31 | |
Date of reporting period: | 1/31/11 | |
| | | | | | | |
FORM N-CSR
Item 1. Reports to Stockholders.
| | |
| Contents | |
| |
| The Funds | |
| Letter to Shareholders (Taxable) | 3 |
| Letter to Shareholders (Tax-Exempt) | 5 |
| Understanding Your Fund’s Expenses | 7 |
| Comparing Your Fund’s Expenses | |
| With Those of Other Funds | 9 |
| Statements of Investments | 11 |
| Statements of Assets and Liabilities | 58 |
| Statements of Operations | 61 |
| Statements of Changes in Net Assets | 63 |
| Financial Highlights | 69 |
| Notes to Financial Statements | 81 |
| Report of Independent Registered | |
| Public Accounting Firm | 92 |
| Important Tax Information | 93 |
| Board Members Information | 94 |
| Officers of the Funds | 95 |
| For More Information | |
| Back cover | |
The views expressed in this report reflect those of the portfolio manager only through the end of the period covered and do not necessarily represent the views of Dreyfus or any other person in the Dreyfus organization. Any such views are subject to change at any time based upon market or other conditions and Dreyfus disclaims any responsibility to update such views. These views may not be relied on as investment advice and, because investment decisions for a Dreyfus fund are based on numerous factors, may not be relied on as an indication of trading intent on behalf of any Dreyfus fund.

Dreyfus Cash Management Funds
The Funds

LETTER TO
SHAREHOLDERS
Dear Shareholders:
This annual report for Dreyfus Cash Management Funds (Taxable) covers the 12-month period ended January 31, 2011. Over the reporting period, the six Dreyfus Cash Management Funds (Taxable) listed below produced the following yields and, taking into account the effects of compounding, the following effective yields:1,2
| | | |
| | | Effective |
| | Yield (%) | Yield (%) |
| Dreyfus Cash Management | | |
| Institutional Shares | 0.15 | 0.15 |
| Investor Shares | 0.00 | 0.00 |
| Administrative Shares | 0.05 | 0.05 |
| Participant Shares | 0.00 | 0.00 |
| Agency Shares | 0.09 | 0.09 |
| Dreyfus Cash Management Plus, Inc. | |
| Institutional Shares | 0.19 | 0.19 |
| Investor Shares | 0.00 | 0.00 |
| Administrative Shares | 0.09 | 0.09 |
| Participant Shares | 0.00 | 0.00 |
| Service Shares | 0.00 | 0.00 |
| Select Shares | 0.00 | 0.00 |
| Agency Shares | 0.13 | 0.13 |
| Dreyfus Government Cash Management | |
| Institutional Shares | 0.04 | 0.04 |
| Investor Shares | 0.00 | 0.00 |
| Administrative Shares | 0.00 | 0.00 |
| Participant Shares | 0.00 | 0.00 |
| Agency Shares | 0.00 | 0.00 |
| Dreyfus Government Prime Cash Management | |
| Institutional Shares | 0.02 | 0.02 |
| Investor Shares | 0.00 | 0.00 |
| Administrative Shares | 0.00 | 0.00 |
| Participant Shares | 0.00 | 0.00 |
| Agency Shares | 0.00 | 0.00 |
| Dreyfus Treasury & Agency Cash Management | |
| Institutional Shares | 0.01 | 0.01 |
| Investor Shares | 0.00 | 0.00 |
| Administrative Shares | 0.00 | 0.00 |
| Participant Shares | 0.00 | 0.00 |
| Service Shares | 0.00 | 0.00 |
| Select Shares | 0.00 | 0.00 |
| Agency Shares | 0.00 | 0.00 |
| Premier Shares | 0.00 | 0.00 |
| | | |
| | | Effective |
| | Yield (%) | Yield (%) |
| Dreyfus Treasury Prime Cash Management | |
| Institutional Shares | 0.00 | 0.00 |
| Investor Shares | 0.00 | 0.00 |
| Administrative Shares | 0.00 | 0.00 |
| Participant Shares | 0.00 | 0.00 |
| Agency Shares | 0.00 | 0.00 |
Monetary Policy Unchanged in Muted Recovery
The reporting period began in the midst of an economic recovery fueled, in part, by an overnight federal funds rate that has remained unchanged since December 2008 in a range between 0% and 0.25%. The economy expanded in the first quarter of 2010 at a 3.7% annualized rate, which was encouraging news for investors eager to see an end to recession. In addition, job creation began to improve after many months of losses.
However, the economic outlook took a turn for the worse in the spring, when a resurgent sovereign debt crisis in Europe rattled investors. U.S. industrial production moderated in June, and private-sector job growth proved more anemic than many analysts expected. U.S. GDP moderated to an annualized 1.7% rate during the second quarter, seeming to confirm investors’ concerns.
Although the manufacturing and service sectors of the U.S. economy continued to expand in July, total non-farm payroll employment fell by 131,000 jobs. Sales of new homes fell to a 47-year low in August, while purchases of existing homes plummeted to a 15-year low. The unemployment rate rose to 9.6%, as only 67,000 jobs were created in the private sector during August. Economic data released in September appeared to confirm that the economic recovery, while intact, remained tenuous as employment and housing data showed few signs of improvement. U.S. GDP grew at a 2.6% annualized rate in the third quarter of 2010.
In response to the sluggish rebound, the Federal Reserve Board announced in September that it would
LETTER TO SHAREHOLDERS (continued)
embark on a second round of quantitative easing of monetary policy by purchasing $600 billion of U.S. Treasury securities. This move was designed to fight deflationary forces by injecting more cash into the financial system. Indeed, October brought better economic news. The private sector added 159,000 jobs, with much of the gain coming from the services sector.
Economic data remained encouraging in November, except for one critical measure: the unemployment rate climbed to 9.8% after the economy created only 39,000 jobs during the month. Yet, the manufacturing and service sectors continued to improve, and even the housing market posted better sales data. December continued to show signs of improvement, including better data from the labor market as new unemployment claims declined and the unemployment rate eased to 9.4%. The manufacturing sector expanded for the 17th consecutive month, and the holiday season proved to be a relatively healthy one for retailers, bolstering the services sector.
January 2011 brought more good news, as existing home sales climbed to its highest level since May 2010. Amid these signs of more robust growth, food and fuel prices rose sharply, but core inflation remained tame.
An Unwavering Focus on Quality
The low federal funds rate kept money market yields near zero percent, and with narrow yield differences along the market’s maturity spectrum, it continued to make little sense to incur the additional credit and interest-rate risks that longer-dated instruments typically entail. Therefore, we maintained each fund’s weighted average maturity in a range that was roughly in line with industry averages. As always, we focused exclusively on money market instruments meeting our stringent credit-quality criteria.
| | |
| | An investment in the fund is not insured or guaranteed by the FDIC or |
| | any other government agency.Although the fund seeks to preserve the value |
| | of your investment at $1.00 per share, it is possible to lose money by |
| | investing in the fund. |
| | Short-term corporate, asset-backed securities holdings and municipal |
| | securities holdings (as applicable), while rated in the highest rating category |
| | by one or more NRSRO (or unrated, if deemed of comparable quality by |
| | Dreyfus), involve credit and liquidity risks and risk of principal loss. |
| 1 | Effective yield is based upon dividends declared daily and reinvested |
| | monthly. Past performance is no guarantee of future results.Yields fluctuate. |
| 2 | Yields provided reflect the absorption of certain fund expenses by The |
| | Dreyfus Corporation pursuant to an undertaking, which is voluntary and |
| | temporary, not contractual, and can be terminated at any time without |
| | notice. Had these expenses not been absorbed, fund yields would have been |
| | lower, and in some cases, 7-day yields during the reporting period would |
| | have been negative absent the expense absorption. |
4

LETTER TO
SHAREHOLDERS
Dear Shareholders:
We are pleased to present the annual report for Dreyfus Cash Management Funds (Tax Exempt). For the 12-month period ended January 31, 2011, the five tax-exempt money market portfolios that comprise Dreyfus Cash Management Funds (Tax Exempt) produced the following yields and effective yields:1,2
| | | |
| | | Effective |
| | Yield (%) | Yield (%) |
| Dreyfus Municipal Cash Management Plus | |
| Institutional Shares | 0.13 | 0.13 |
| Investor Shares | 0.00 | 0.00 |
| Administrative Shares | 0.04 | 0.04 |
| Participant Shares | 0.00 | 0.00 |
| Agency Shares | 0.06 | 0.06 |
| Dreyfus New York Municipal Cash Management | |
| Institutional Shares | 0.12 | 0.12 |
| Investor Shares | 0.00 | 0.00 |
| Administrative Shares | 0.03 | 0.03 |
| Participant Shares | 0.00 | 0.00 |
| Agency Shares | 0.06 | 0.06 |
| Dreyfus Tax Exempt Cash Management | |
| Institutional Shares | 0.10 | 0.10 |
| Investor Shares | 0.01 | 0.01 |
| Administrative Shares | 0.02 | 0.02 |
| Participant Shares | 0.01 | 0.01 |
| Agency Shares | 0.04 | 0.04 |
| Dreyfus California AMT-Free Municipal Cash Management |
| Institutional Shares | 0.13 | 0.13 |
| Investor Shares | 0.00 | 0.00 |
| Administrative Shares | 0.03 | 0.03 |
| Participant Shares | 0.00 | 0.00 |
| Agency Shares | 0.07 | 0.07 |
| Dreyfus New York AMT-Free Municipal Cash Management |
| Institutional Shares | 0.14 | 0.14 |
| Investor Shares | 0.00 | 0.00 |
| Administrative Shares | 0.05 | 0.05 |
| Participant Shares | 0.00 | 0.00 |
| Classic Shares | 0.00 | 0.00 |
Low Yields Persisted in a Subpar Recovery
The U.S. economy continued to recover from recession over the reporting period as manufacturing activity rebounded amid robust demand from developing overseas markets. However, the recovery proved volatile when Europe was roiled by a sovereign debt crisis, which led to fiscal austerity measures that threatened the region’s economic growth. In the United States, unemployment remained stubbornly high and many regional housing markets had not improved meaningfully, sparking worries of a potential double-dip recession over the spring and summer of 2010.
Fortunately, economic data improved in the fall as consumer spending and corporate earnings increased, and fears of a return to recession subsided. In fact, the U.S. Department of Commerce later estimated that U.S. GDP expanded at a 3.2% annualized rate during the fourth quarter of 2010, up from a 2.6% annualized rate during the third quarter.
In this still-sluggish economic environment, and as it has since December 2008, the Fed maintained its target for the overnight federal funds rate in a range between 0% and 0.25%. In addition, the Fed announced a new round of quantitative easing for the fall, which was designed to stimulate credit markets through the purchase of $600 billion of U.S. Treasury securities. Although longer-term financial assets generally rallied on this news, money market yields remained anchored by the historically low federal funds rate. Consequently, tax-exempt money market instruments continued to provide yields of little more than zero percent.
Supply-and-demand influences generally remained favorable during the reporting period. Despite heavier borrowing needs nationally, the supply of newly issued municipal money market instruments remained relatively low, primarily due to the federally subsidized Build America Bonds program, which shifted a portion of municipal issuance to the taxable bond market. Meanwhile, demand for municipal money market instruments was robust, including from non-traditional investors seeking alternatives to taxable money market instruments. This supply-and-demand dynamic began to change near year-end as the expiration of the Build America Bonds program approached, sparking heightened volatility among longer-term municipal bonds.
LETTER TO SHAREHOLDERS (continued)
Most states and municipalities, including NewYork and California, continued to confront intensifying fiscal pressures during the reporting period. However, we believe that concerns regarding potential defaults are overstated.Although tax revenues remain below prere-cession levels, receipts have trended up for the past three quarters, and many states and local governments have been cutting expenditures. In addition, several banks have initiated programs providing municipal issuers with credit over the past several months, a positive development that we believe is likely to continue.
Focus on Liquidity and Capital Preservation
Throughout the reporting period, we maintained a conservative investment posture, emphasizing direct, high-quality municipal obligations and commercial paper that were deemed creditworthy by our analysts. We also favored instruments backed by pledged tax appropriations or dedicated revenues. We generally shied away from general obligation debt and instruments issued by localities that depend heavily on state aid. Finally, we maintained the fund’s weighted average maturity in a range that was roughly in line with industry averages.
Increased Supply Could Lift Yields
Despite ongoing signs of economic recovery, inflation has been negligible, and the Fed appears set to maintain its aggressively accommodative monetary policy for some time to come.Therefore, we believe the prudent course continues to be an emphasis on preservation of capital and liquidity. However, the expiration of the Build America Bonds program is likely to boost the supply of newly issued tax-exempt money market instruments in 2011, which could support higher yields. As always, we are prepared to adjust each fund’s strategies should economic and market conditions change.

| | |
| | An investment in the funds is not insured or guaranteed by the FDIC or |
| | any other government agency.Although the funds seek to preserve the |
| | value of your investment at $1.00 per share, it is possible to lose money |
| | by investing in the funds. |
| | Short-term corporate, asset-backed securities holdings and municipal |
| | securities holdings (as applicable), while rated in the highest rating category |
| | by one or more NRSRO (or unrated, if deemed of comparable quality by |
| | Dreyfus), involve credit and liquidity risks and risk of principal loss. |
| 1 | Effective yield is based upon dividends declared daily and reinvested |
| | monthly. Past performance is no guarantee of future results.Yields fluctuate. |
| | For the national funds, income may be subject to state and local taxes. For |
| | the NewYork and California funds, income may be subject to state and |
| | local taxes for out-of-state residents. For each non-AMT-Free fund, some |
| | income may be subject to the federal alternative minimum tax (AMT). |
| 2 | Yields provided reflect the absorption of certain fund expenses by The |
| | Dreyfus Corporation pursuant to an undertaking, which is voluntary and |
| | temporary, not contractual, and can be terminated at any time without |
| | notice. Had these expenses not been absorbed, fund yields would have been |
| | lower, and in some cases, 7-day yields during the reporting period would |
| | have been negative absent the expense absorption. |
6
UNDERSTANDING YOUR FUND’S EXPENSES (Unaudited)
As a mutual fund investor, you pay ongoing expenses, such as management fees and other expenses. Using the information below, you can estimate how these expenses affect your investment and compare them with the expenses of other funds.You also may pay one-time transaction expenses, including sales charges (loads) and redemptions fees, which are not shown in this section and would have resulted in higher total expenses. For more information, see your fund’s prospectus or talk to your financial adviser.
Review your fund’s expenses
The table below shows the expenses you would have paid on a $1,000 investment in each class of each fund from August 1, 2010 to January 31, 2011. It also shows how much a $1,000 investment would be worth at the close of the period, assuming actual returns and expenses.
| | | | | | | | | | |
| Expenses and Value of a $1,000 Investment | | | | | | | |
| assuming actual returns for the six months ended January 31, 2011 | | | | | | |
| |
| | Institutional | Investor | Administrative | Participant | Service | Select | Agency | Premier | Classic |
| | | | | | | | | | |
| Dreyfus Cash | | | | | | | | | |
| Management | | | | | | | | | |
| Expenses paid | | | | | | | | | |
| per $1,000† | $ 1.06 | $ 1.92 | $ 1.56 | $ 1.92 | — | — | $ 1.36 | — | — |
| Ending value | | | | | | | | | |
| (after expenses) | $1,000.90 | $1,000.00 | $1,000.40 | $1,000.00 | — | — | $1,000.60 | — | — |
| Annualized | | | | | | | | | |
| expense ratio (%) | .21 | .38 | .31 | .38 | — | — | .27 | — | — |
| Dreyfus Cash | | | | | | | | | |
| Management | | | | | | | | | |
| Plus, Inc. | | | | | | | | | |
| Expenses paid | | | | | | | | | |
| per $1,000† | $ .81 | $ 1.92 | $ 1.31 | $ 1.92 | $ 1.61 | $ 1.92 | $ 1.11 | — | — |
| Ending value | | | | | | | | | |
| (after expenses) | $1,001.10 | $1,000.00 | $1,000.60 | $1,000.00 | $1,000.00 | $1,000.00 | $1,000.80 | — | — |
| Annualized | | | | | | | | | |
| expense ratio (%) | .16 | .38 | .26 | .38 | .32 | .38 | .22 | — | — |
| Dreyfus | | | | | | | | | |
| Government Cash | | | | | | | | | |
| Management | | | | | | | | | |
| Expenses paid | | | | | | | | | |
| per $1,000† | $ 1.06 | $ 1.31 | $ 1.26 | $ 1.26 | — | — | $ 1.31 | — | — |
| Ending value | | | | | | | | | |
| (after expenses) | $1,000.30 | $1,000.00 | $1,000.00 | $1,000.00 | — | — | $1,000.00 | — | — |
| Annualized | | | | | | | | | |
| expense ratio (%) | .21 | .26 | .25 | .25 | — | — | .26 | — | — |
| Dreyfus | | | | | | | | | |
| Government Prime | | | | | | | | | |
| Cash Management | | | | | | | | | |
| Expenses paid | | | | | | | | | |
| per $1,000† | $ 1.01 | $ 1.11 | $ 1.16 | $ 1.16 | — | — | $ 1.11 | — | — |
| Ending value | | | | | | | | | |
| (after expenses) | $1,000.10 | $1,000.00 | $1,000.00 | $1,000.00 | — | — | $1,000.00 | — | — |
| Annualized | | | | | | | | | |
| expense ratio (%) | .20 | .22 | .23 | .23 | — | — | .22 | — | — |
| Dreyfus Treasury & | | | | | | | | | |
| Agency Cash | | | | | | | | | |
| Management | | | | | | | | | |
| Expenses paid | | | | | | | | | |
| per $1,000† | $ 1.01 | $ 1.06 | $ 1.06 | $ 1.06 | $ 1.11 | $ 1.06 | $ 1.11 | $ 1.06 | — |
| Ending value | | | | | | | | | |
| (after expenses) | $1,000.10 | $1,000.00 | $1,000.00 | $1,000.00 | $1,000.00 | $1,000.00 | $1,000.00 | $1,000.00 | — |
| Annualized | | | | | | | | | |
| expense ratio (%) | .20 | .21 | .21 | .21 | .22 | .21 | .22 | .21 | — |
| Dreyfus | | | | | | | | | |
| Treasury Prime | | | | | | | | | |
| Cash Management | | | | | | | | | |
| Expenses paid | | | | | | | | | |
| per $1,000† | $ .81 | $ .81 | $ .81 | $ .81 | — | — | $ .76 | — | — |
| Ending value | | | | | | | | | |
| (after expenses) | $1,000.00 | $1,000.00 | $1,000.00 | $1,000.00 | — | — | $1,000.00 | — | — |
| Annualized | | | | | | | | | |
| expense ratio (%) | .16 | .16 | .16 | .16 | — | — | .15 | — | — |
UNDERSTANDING YOUR FUND’S EXPENSES (Unaudited) (continued)
| | | | | | | | | | |
| Expenses and Value of a $1,000 Investment (continued) | | | | | | |
| assuming actual returns for the six months ended January 31, 2011 | | | | | | |
| |
| |
| | Institutional | Investor | Administrative | Participant | Service | Select | Agency | Premier | Classic |
| | | | | | | | | | |
| Dreyfus | | | | | | | | | |
| Municipal Cash | | | | | | | | | |
| Management Plus | | | | | | | | | |
| Expenses paid | | | | | | | | | |
| per $1,000† | $ 1.26 | $ 1.87 | $ 1.71 | $ 1.87 | — | — | $ 1.56 | — | — |
| Ending value | | | | | | | | | |
| (after expenses) | $1,000.60 | $1,000.00 | $1,000.20 | $1,000.00 | — | — | $1,000.30 | — | — |
| Annualized | | | | | | | | | |
| expense ratio (%) | .25 | .37 | .34 | .37 | — | — | .31 | — | — |
| Dreyfus | | | | | | | | | |
| New York | | | | | | | | | |
| Municipal Cash | | | | | | | | | |
| Management | | | | | | | | | |
| Expenses paid | | | | | | | | | |
| per $1,000† | $ 1.21 | $ 1.81 | $ 1.71 | $ 1.81 | — | — | $ 1.51 | — | — |
| Ending value | | | | | | | | | |
| (after expenses) | $1,000.60 | $1,000.00 | $1,000.10 | $1,000.00 | — | — | $1,000.30 | — | — |
| Annualized | | | | | | | | | |
| expense ratio (%) | .24 | .36 | .34 | .36 | — | — | .30 | — | — |
| Dreyfus | | | | | | | | | |
| Tax Exempt Cash | | | | | | | | | |
| Management | | | | | | | | | |
| Expenses paid | | | | | | | | | |
| per $1,000† | $ 1.21 | $ 1.66 | $ 1.61 | $ 1.66 | — | — | $ 1.46 | — | — |
| Ending value | | | | | | | | | |
| (after expenses) | $1,000.50 | $1,000.00 | $1,000.10 | $1,000.00 | — | — | $1,000.20 | — | — |
| Annualized | | | | | | | | | |
| expense ratio (%) | .24 | .33 | .32 | .33 | — | — | .29 | — | — |
| Dreyfus California | | | | | | | | | |
| AMT-Free | | | | | | | | | |
| Municipal Cash | | | | | | | | | |
| Management | | | | | | | | | |
| Expenses paid | | | | | | | | | |
| per $1,000† | $ 1.21 | $ 1.87 | $ 1.71 | $ 1.87 | — | — | $ 1.51 | — | — |
| Ending value | | | | | | | | | |
| (after expenses) | $1,000.60 | $1,000.00 | $1,000.20 | $1,000.00 | — | — | $1,000.30 | — | — |
| Annualized | | | | | | | | | |
| expense ratio (%) | .24 | .37 | .34 | .37 | — | — | .30 | — | — |
| Dreyfus New York | | | | | | | | | |
| AMT-Free | | | | | | | | | |
| Municipal Cash | | | | | | | | | |
| Management | | | | | | | | | |
| Expenses paid | | | | | | | | | |
| per $1,000† | $ 1.36 | $ 2.02 | $ 1.81 | $ 2.02 | — | — | — | — | $ 2.02 |
| Ending value | | | | | | | | | |
| (after expenses) | $1,000.60 | $1,000.00 | $1,000.20 | $1,000.00 | — | — | — | — | $1,000.00 |
| Annualized | | | | | | | | | |
| expense ratio (%) | .27 | .40 | .36 | .40 | — | — | — | — | .40 |
| |
| † Expenses are equal to each fund’s annualized expense ratios as shown above, multiplied by the average account value over the period, multiplied by 184/365 (to reflect the one-half year period). |
8
COMPARING YOUR FUND’S EXPENSES
WITH THOSE OF OTHER FUNDS (Unaudited)
Using the SEC’s method to compare expenses
The Securities and Exchange Commission (SEC) has established guidelines to help investors assess fund expenses. Per these guidelines, the table below shows your fund’s expenses based on a $1,000 investment, assuming a hypothetical 5% annualized return.You can use this information to compare the ongoing expenses (but not transaction expenses or total cost) of investing in the fund with those of other funds. All mutual fund shareholder reports will provide this information to help you make this comparison. Please note that you cannot use this information to estimate your actual ending account balance and expenses paid during the period.
| | | | | | | | | | |
| Expenses and Value of a $1,000 Investment | | | | | | | |
| assuming a hypothetical 5% annualized return for the six months ended January 31, 2011 | | | | |
| |
| | Institutional | Investor | Administrative | Participant | Service | Select | Agency | Premier | Classic |
| | | | | | | | | | |
| Dreyfus Cash | | | | | | | | | |
| Management | | | | | | | | | |
| Expenses paid | | | | | | | | | |
| per $1,000† | $ 1.07 | $ 1.94 | $ 1.58 | $ 1.94 | — | — | $ 1.38 | — | — |
| Ending value | | | | | | | | | |
| (after expenses) | $1,024.15 | $1,023.29 | $1,023.64 | $1,023.29 | — | — | $1,023.84 | — | — |
| Annualized | | | | | | | | | |
| expense ratio (%) | .21 | .38 | .31 | .38 | — | — | .27 | — | — |
| Dreyfus Cash | | | | | | | | | |
| Management | | | | | | | | | |
| Plus, Inc. | | | | | | | | | |
| Expenses paid | | | | | | | | | |
| per $1,000† | $ .82 | $ 1.94 | $ 1.33 | $ 1.94 | $ 1.63 | $ 1.94 | $ 1.12 | — | — |
| Ending value | | | | | | | | | |
| (after expenses) | $1,024.40 | $1,023.29 | $1,023.89 | $1,023.29 | $1,023.59 | $1,023.29 | $1,024.10 | — | — |
| Annualized | | | | | | | | | |
| expense ratio (%) | .16 | .38 | .26 | .38 | .32 | .38 | .22 | — | — |
| Dreyfus | | | | | | | | | |
| Government Cash | | | | | | | | | |
| Management | | | | | | | | | |
| Expenses paid | | | | | | | | | |
| per $1,000† | $ 1.07 | $ 1.33 | $ 1.28 | $ 1.28 | — | — | $ 1.33 | — | — |
| Ending value | | | | | | | | | |
| (after expenses) | $1,024.15 | $1,023.89 | $1,023.95 | $1,023.95 | — | — | $1,023.89 | — | — |
| Annualized | | | | | | | | | |
| expense ratio (%) | .21 | .26 | .25 | .25 | — | — | .26 | — | — |
| Dreyfus | | | | | | | | | |
| Government Prime | | | | | | | | | |
| Cash Management | | | | | | | | | |
| Expenses paid | | | | | | | | | |
| per $1,000† | $ 1.02 | $ 1.12 | $ 1.17 | $ 1.17 | — | — | $ 1.12 | — | — |
| Ending value | | | | | | | | | |
| (after expenses) | $1,024.20 | $1,024.10 | $1,024.05 | $1,024.05 | — | — | $1,024.10 | — | — |
| Annualized | | | | | | | | | |
| expense ratio (%) | .20 | .22 | .23 | .23 | — | — | .22 | — | — |
| Dreyfus Treasury & | | | | | | | | | |
| Agency Cash | | | | | | | | | |
| Management | | | | | | | | | |
| Expenses paid | | | | | | | | | |
| per $1,000† | $ 1.02 | $ 1.07 | $ 1.07 | $ 1.07 | $ 1.12 | $ 1.07 | $ 1.12 | $ 1.07 | — |
| Ending value | | | | | | | | | |
| (after expenses) | $1,024.20 | $1,024.15 | $1,024.15 | $1,024.15 | $1,024.10 | $1,024.15 | $1,024.10 | $1,024.15 | — |
| Annualized | | | | | | | | | |
| expense ratio (%) | .20 | .21 | .21 | .21 | .22 | .21 | .22 | .21 | — |
| Dreyfus | | | | | | | | | |
| Treasury Prime | | | | | | | | | |
| Cash Management | | | | | | | | | |
| Expenses paid | | | | | | | | | |
| per $1,000† | $ .82 | $ .82 | $ .82 | $ .82 | — | — | $ .77 | — | — |
| Ending value | | | | | | | | | |
| (after expenses) | $1,024.40 | $1,024.40 | $1,024.40 | $1,024.40 | — | — | $1,024.45 | — | — |
| Annualized | | | | | | | | | |
| expense ratio (%) | .16 | .16 | .16 | .16 | — | — | .15 | — | — |
ClassicCOMPARING YOUR FUND’S EXPENSES WITH THOSE OF OTHER FUNDS (Unaudited) (continued)
| | | | | | | | | | |
| Expenses and Value of a $1,000 Investment (continued) | | | | | | |
| assuming a hypothetical 5% annualized return for the six months ended January 31, 2011 | | | | |
| |
| | Institutional | Investor | Administrative | Participant | Service | Select | Agency | Premier | Classic |
| | | | | | | | | | |
| Dreyfus | | | | | | | | | |
| Municipal Cash | | | | | | | | | |
| Management Plus | | | | | | | | | |
| Expenses paid | | | | | | | | | |
| per $1,000† | $ 1.28 | $ 1.89 | $ 1.73 | $ 1.89 | — | — | $ 1.58 | — | — |
| Ending value | | | | | | | | | |
| (after expenses) | $1,023.95 | $1,023.34 | $1,023.49 | $1,023.34 | — | — | $1,023.64 | — | — |
| Annualized | | | | | | | | | |
| expense ratio (%) | .25 | .37 | .34 | .37 | — | — | .31 | — | — |
| Dreyfus | | | | | | | | | |
| New York | | | | | | | | | |
| Municipal Cash | | | | | | | | | |
| Management | | | | | | | | | |
| Expenses paid | | | | | | | | | |
| per $1,000† | $ 1.22 | $ 1.84 | $ 1.73 | $ 1.84 | — | — | $ 1.53 | — | — |
| Ending value | | | | | | | | | |
| (after expenses) | $1,024.00 | $1,023.39 | $1,023.49 | $1,023.39 | — | — | $1,023.69 | — | — |
| Annualized | | | | | | | | | |
| expense ratio (%) | .24 | .36 | .34 | .36 | — | — | .30 | — | — |
| Dreyfus | | | | | | | | | |
| Tax Exempt Cash | | | | | | | | | |
| Management | | | | | | | | | |
| Expenses paid | | | | | | | | | |
| per $1,000† | $ 1.22 | $ 1.68 | $ 1.63 | $ 1.68 | — | — | $ 1.48 | — | — |
| Ending value | | | | | | | | | |
| (after expenses) | $1,024.00 | $1,023.54 | $1,023.59 | $1,023.54 | — | — | $1,023.74 | — | — |
| Annualized | | | | | | | | | |
| expense ratio (%) | .24 | .33 | .32 | .33 | — | — | .29 | — | — |
| Dreyfus California | | | | | | | | | |
| AMT-Free | | | | | | | | | |
| Municipal Cash | | | | | | | | | |
| Management | | | | | | | | | |
| Expenses paid | | | | | | | | | |
| per $1,000† | $ 1.22 | $ 1.89 | $ 1.73 | $ 1.89 | — | — | $ 1.53 | — | — |
| Ending value | | | | | | | | | |
| (after expenses) | $1,024.00 | $1,023.34 | $1,023.49 | $1,023.34 | — | — | $1,023.69 | — | — |
| Annualized | | | | | | | | | |
| expense ratio (%) | .24 | .37 | .34 | .37 | — | — | .30 | — | — |
| Dreyfus New York | | | | | | | | | |
| AMT-Free | | | | | | | | | |
| Municipal Cash | | | | | | | | | |
| Management | | | | | | | | | |
| Expenses paid | | | | | | | | | |
| per $1,000† | $ 1.38 | $ 2.04 | $ 1.84 | $ 2.04 | — | — | — | — | $ 2.04 |
| Ending value | | | | | | | | | |
| (after expenses) | $1,023.84 | $1,023.19 | $1,023.39 | $1,023.19 | — | — | — | — | $1,023.19 |
| Annualized | | | | | | | | | |
| expense ratio (%) | .27 | .40 | .36 | .40 | — | — | — | — | .40 |
| |
| † Expenses are equal to each fund’s annualized expense ratios as shown above, multiplied by the average account value over the period, multiplied by 184/365 (to reflect the one-half year period). |
10
STATEMENT OF INVESTMENTS
January 31, 2011
| | | |
| | Principal | |
| Dreyfus Cash Management | Amount ($) | Value ($) |
| |
| Negotiable Bank Certificates of Deposit—47.1% | | |
| Abbey National Treasury Services (Yankee) | | |
| 0.40%, 2/15/11 | 200,000,000 | 200,000,000 |
| Bank of Montreal (Yankee) | | |
| 0.27%, 3/3/11 | 25,000,000 | 25,000,000 |
| Bank of Tokyo-Mitsubishi Ltd. (Yankee) | | |
| 0.38%—0.41%, 2/16/11—7/11/11 | 1,300,000,000 | 1,300,000,000 |
| Barclays Bank | | |
| 0.72%—0.81%, 2/9/11—2/28/11 | 950,000,000 a | 950,000,000 |
| BNP Paribas (Yankee) | | |
| 0.55%, 8/1/11 | 800,000,000 | 800,000,000 |
| Citibank N.A. | | |
| 0.36%, 2/24/11 | 500,000,000 | 500,000,000 |
| Credit Agricole CIB (Yankee) | | |
| 0.29%—0.39%, 2/9/11—4/25/11 | 900,000,000 | 900,000,000 |
| Credit Industriel et Commercial (Yankee) | | |
| 0.34%, 2/3/11 | 300,000,000 | 300,000,000 |
| Deutsche Bank AG | | |
| 0.42%, 2/1/11 | 750,000,000 a | 750,000,000 |
| DZ Bank AG (Yankee) | | |
| 0.40%—0.43%, 4/6/11—4/26/11 | 595,000,000 | 595,000,000 |
| Fortis Bank SA/NV (Yankee) | | |
| 0.40%—0.52%, 2/14/11—4/4/11 | 450,500,000 | 450,500,000 |
| ING Bank (London) | | |
| 0.29%, 2/18/11 | 665,000,000 | 665,000,000 |
| Intesa Sanpaolo SpA (Yankee) | | |
| 0.32%, 2/10/11 | 380,000,000 | 380,000,000 |
| Lloyds TSB Bank (Yankee) | | |
| 0.43%, 5/23/11 | 1,000,000,000 | 1,000,000,000 |
| Mizuho Corporate Bank (Yankee) | | |
| 0.28%—0.38%, 2/4/11—4/26/11 | 500,000,000 | 500,000,000 |
| Natixis (Yankee) | | |
| 0.43%, 4/11/11 | 500,000,000 | 500,000,000 |
| Royal Bank of Canada | | |
| 0.37%, 2/1/11 | 400,000,000 a | 400,000,000 |
| Royal Bank of Scotland PLC (Yankee) | | |
| 0.47%, 7/11/11 | 500,000,000 | 500,000,000 |
| Societe Generale (Yankee) | | |
| 0.41%—0.46%, 2/8/11—4/18/11 | 900,000,000 | 900,000,000 |
| Svenska Handelsbanken (Yankee) | | |
| 0.30%, 3/28/11 | 325,000,000 | 325,004,948 |
| UBS (Yankee) | | |
| 0.43%—0.61%, 2/7/11—8/12/11 | 1,150,000,000 | 1,150,000,000 |
| Unicredit Bank AG (Yankee) | | |
| 0.46%, 2/3/11 | 290,500,000 | 290,500,000 |
| Westpac Banking Corp. | | |
| 0.30%, 2/16/11 | 250,000,000 a | 250,000,000 |
| Total Negotiable Bank Certificates of Deposit | | |
| (cost $13,631,004,948) | | 13,631,004,948 |
STATEMENT OF INVESTMENTS (continued)
| | | |
| | Principal | |
| Dreyfus Cash Management (continued) | Amount ($) | Value ($) |
| |
| Commercial Paper—14.7% | | |
| Banco Bilbao Vizcaya Argentaria | | |
| 0.45%, 2/10/11 | 800,000,000 b | 799,910,000 |
| Bank of Nova Scotia | | |
| 0.15%, 2/1/11 | 690,000,000 | 690,000,000 |
| Deutsche Bank Financial LLC | | |
| 0.40%, 2/14/11 | 300,000,000 | 299,956,667 |
| DnB NOR Bank ASA | | |
| 0.27%, 3/4/11 | 250,000,000 b | 249,941,875 |
| ING (US) Funding LLC | | |
| 0.31%, 5/4/11 | 200,000,000 | 199,841,555 |
| JPMorgan Chase & Co. | | |
| 0.35%, 2/1/11 | 525,000,000 b | 525,000,000 |
| Nationwide Building Society | | |
| 0.32%, 2/15/11 | 100,000,000 b | 99,987,555 |
| NRW Bank | | |
| 0.32%—0.36%, 3/8/11—4/1/11 | 415,500,000 b | 415,359,438 |
| Societe Generale N.A. Inc. | | |
| 0.40%, 4/6/11—5/5/11 | 300,000,000 | 299,738,333 |
| Unicredit Delaware Inc. | | |
| 0.47%, 2/17/11 | 250,000,000 b | 249,947,778 |
| Unicredit U.S. Finance Inc. | | |
| 0.51%, 2/1/11 | 292,500,000 b | 292,500,000 |
| Westpac Banking Corp. | | |
| 0.40%, 2/7/11 | 125,000,000 a,b | 125,002,320 |
| Total Commercial Paper | | |
| (cost $4,247,185,521) | | 4,247,185,521 |
| |
| Asset-Backed Commercial Paper—6.4% | | |
| Amsterdam Funding Corp. | | |
| 0.27%, 2/16/11 | 300,000,000 b | 299,966,250 |
| Atlantis One Funding Corp. | | |
| 0.32%, 5/9/11 | 500,000,000 b | 499,568,889 |
| Cancara Asset Securitization | | |
| 0.31%—0.46%, 4/18/11—7/20/11 | 750,000,000 b | 748,756,667 |
| FCAR Owner Trust, Ser. I | | |
| 0.35%, 4/28/11 | 210,000,000 | 209,824,417 |
| Govco | | |
| 0.40%, 6/17/11 | 101,000,000 b | 100,847,378 |
| Total Asset-Backed Commercial Paper | | |
| (cost $1,858,963,601) | | 1,858,963,601 |
| |
| Corporate Notes—3.5% | | |
| Credit Suisse | | |
| 0.60%, 2/22/11 | 500,000,000 a | 500,000,000 |
| Merrill Lynch & Co. Inc. | | |
| 0.35%, 2/1/11 | 500,000,000 | 500,000,000 |
| Total Corporate Notes | | |
| (cost $1,000,000,000) | | 1,000,000,000 |
12
| | | |
| | Principal | |
| Dreyfus Cash Management (continued) | Amount ($) | Value ($) |
| |
| Time Deposits—12.7% | | |
| Branch Banking & Trust Co. (Grand Cayman) | | |
| 0.15%, 2/1/11 | 100,000,000 | 100,000,000 |
| Citibank N.A. (Nassau) | | |
| 0.20%, 2/1/11 | 200,000,000 | 200,000,000 |
| Commerzbank (Grand Cayman) | | |
| 0.17%, 2/1/11 | 1,200,000,000 | 1,200,000,000 |
| Dexia Credit Local (Grand Cayman) | | |
| 0.21%, 2/1/11 | 1,200,000,000 | 1,200,000,000 |
| KBC Bank (Grand Cayman) | | |
| 0.18%, 2/1/11 | 485,000,000 | 485,000,000 |
| Nordea Bank Finland (Grand Cayman) | | |
| 0.17%, 2/1/11 | 400,000,000 | 400,000,000 |
| Northern Trust Co. (Grand Cayman) | | |
| 0.17%, 2/1/11 | 100,000,000 | 100,000,000 |
| Total Time Deposits | | |
| (cost $3,685,000,000) | | 3,685,000,000 |
| |
| |
| U.S. Government Agencies—5.7% | | |
| Federal Home Loan Bank | | |
| 0.30%-0.35%, 2/1/11—8/19/11 | 900,000,000 a | 899,797,058 |
| Federal Home Loan Mortgage Corp. | | |
| 0.39%, 2/1/11 | 500,000,000 a,c | 499,706,604 |
| Federal National Mortgage Association | | |
| 0.39%, 2/1/11 | 250,000,000 a,c | 249,907,451 |
| Total U.S. Government Agencies | | |
| (cost $1,649,411,113) | | 1,649,411,113 |
| |
| |
| Repurchase Agreements—9.8% | | |
| Barclays Capital, Inc. | | |
| 0.21%, dated 1/31/11, due 2/1/11 in the amount of | | |
| $234,001,365 (fully collateralized by $225,444,400 | | |
| U.S. Treasury Notes, 2.75%, due 10/31/13, | | |
| value $238,680,004) | 234,000,000 | 234,000,000 |
| BNP Paribas | | |
| 0.20%, dated 1/31/11, due 2/1/11 in the amount of | | |
| $575,003,194 (fully collateralized by $568,846,100 | | |
| U.S. Treasury Notes, 3.50%, due 5/15/20, | | |
| value $586,500,097) | 575,000,000 | 575,000,000 |
| Citigroup Global Markets Holdings Inc. | | |
| 0.35%, dated 1/31/11, due 2/1/11 in the amount of | | |
| $150,001,458 (fully collateralized by $413,699,598 | | |
| Corporate Bonds, 0%-5.81%, due 12/20/11-10/25/37, | | |
| value $154,500,001) | 150,000,000 | 150,000,000 |
| Credit Suisse Securities LLC | | |
| 0.21%, dated 1/31/11, due 2/1/11 in the amount of | | |
| $240,001,400 (fully collateralized by $415,978,000 | | |
| U.S. Treasury Strips, due 11/15/16-5/15/30, | | |
| value $244,801,422) | 240,000,000 | 240,000,000 |
STATEMENT OF INVESTMENTS (continued)
| | | |
| | Principal | |
| Dreyfus Cash Management (continued) | Amount ($) | Value ($) |
| |
| Repurchase Agreements (continued) | | |
| Deutsche Bank Securities Inc. | | |
| 0.21%, dated 1/31/11, due 2/1/11 in the amount of $500,002,917 | | |
| (fully collateralized by $2,580,000 Asian Development Bank, 1.625%-4.50%, | | |
| due 9/4/12-7/15/13, value $2,747,945, $218,130,000 Federal National | | |
| Mortgage Association, 1%, due 9/23/13, value $218,890,304, $6,792,000 | | |
| Financing Corp., 0%, due 9/26/18-9/26/19, value $5,039,475 and $433,925,000 | | |
| Resolution Funding Corp., 0%, due 10/15/16-10/15/29, value $283,322,685) | 500,000,000 | 500,000,000 |
| HSBC USA Inc. | | |
| 0.32%, dated 1/31/11, due 2/1/11 in the amount of $150,001,333 | | |
| (fully collateralized by $142,512,000 Corporate Bonds, 0%-9.625%, | | |
| due 2/15/11-5/1/40, value $154,500,961) | 150,000,000 | 150,000,000 |
| RBC Capital Markets | | |
| 0.21%-0.325%, dated 1/31/11, due 2/1/11 in the amount of $590,004,208 | | |
| (fully collateralized by $222,251,169 Corporate Bonds, 0%-13%, due 2/2/11-5/15/99, | | |
| value $226,524,740, $22,358,173 Federal National Mortgage Association, 0%, | | |
| due 10/25/32, value $24,435,695 and $333,328,500 U.S. Treasury Notes, | | |
| 0.625%-3.125%, due 1/31/13-9/30/13, value $357,000,088) | 590,000,000 | 590,000,000 |
| Societe Generale | | |
| 0.20%, dated 1/31/11, due 2/1/11 in the amount of $400,002,222 | | |
| (fully collateralized by $145,837,400 U.S. Treasury Bills, due 7/14/11, | | |
| value $145,735,897 and $258,092,200 U.S. Treasury Notes, 1.375%, | | |
| due 5/15/12, value $262,264,189) | 400,000,000 | 400,000,000 |
| Total Repurchase Agreements | | |
| (cost $2,839,000,000) | | 2,839,000,000 |
| |
| Total Investments (cost $28,910,565,183) | 99.9% | 28,910,565,183 |
| |
| Cash and Receivables (Net) | .1% | 18,420,832 |
| |
| Net Assets | 100.0% | 28,928,986,015 |
| |
| a Variable rate security—interest rate subject to periodic change. |
| b Securities exempt from registration under Rule 144A of the Securities Act of 1933.These securities may be resold in transactions exempt from registration, normally to qualified |
| institutional buyers.At January 31, 2011, these securities amounted to $4,406,788,150 or 15.2% of net assets. |
| c The Federal Housing Finance Agency (“FHFA”) placed Federal Home Loan Mortgage Corporation and Federal National Mortgage Association into conservatorship with FHFA as the |
| conservator.As such, the FHFA oversees the continuing affairs of these companies. |
| | | | |
| Portfolio Summary (Unaudited)† | | | |
| |
| | Value (%) | | Value (%) |
| Banking | 78.0 | Asset-Backed/Banking | 2.1 |
| Repurchase Agreements | 9.8 | Asset-Backed/Single-Seller | .7 |
| U.S. Government Agencies | 5.7 | | |
| Asset-Backed/Multi-Seller Programs | 3.6 | | 99.9 |
| |
| † Based on net assets. | | | |
| See notes to financial statements. | | | |
14
STATEMENT OF INVESTMENTS
January 31, 2011
| | | |
| | Principal | |
| Dreyfus Cash Management Plus, Inc. | Amount ($) | Value ($) |
| |
| Negotiable Bank Certificates of Deposit—38.9% | | |
| Abbey National Treasury Services (Yankee) | | |
| 0.40%, 2/15/11 | 100,000,000 | 100,000,000 |
| Bank of Tokyo-Mitsubishi Ltd. (Yankee) | | |
| 0.40%, 7/11/11 | 250,000,000 | 250,000,000 |
| Barclays Bank | | |
| 0.76%—0.81%, 2/9/11—2/28/11 | 300,000,000 a | 300,000,000 |
| Citibank N.A. | | |
| 0.36%, 2/24/11 | 50,000,000 | 50,000,000 |
| Credit Industriel et Commercial (Yankee) | | |
| 0.45%, 4/8/11 | 25,000,000 | 25,002,289 |
| Fortis Bank SA/NV (Yankee) | | |
| 0.39%, 4/22/11 | 100,000,000 | 100,000,000 |
| HSBC Bank PLC (London) | | |
| 0.30%, 5/9/11 | 250,000,000 | 250,001,681 |
| ING Bank (London) | | |
| 0.29%, 2/18/11 | 50,000,000 | 50,000,000 |
| Lloyds TSB Bank (Yankee) | | |
| 0.34%—0.43%, 2/14/11—5/23/11 | 150,000,000 | 150,000,000 |
| Mizuho Corporate Bank (Yankee) | | |
| 0.28%, 2/4/11 | 150,000,000 | 150,000,000 |
| Natixis (Yankee) | | |
| 0.43%, 4/11/11 | 200,000,000 | 200,000,000 |
| Nordea Bank Finland (Yankee) | | |
| 0.29%, 4/7/11 | 190,000,000 | 190,000,000 |
| Royal Bank of Scotland PLC (Yankee) | | |
| 0.47%—0.48%, 4/26/11—7/11/11 | 350,000,000 | 350,000,000 |
| Skandinaviska Enskilda Banken (Yankee) | | |
| 0.35%, 4/11/11 | 50,000,000 b | 50,000,000 |
| Societe Generale (Yankee) | | |
| 0.41%, 4/18/11 | 75,000,000 | 75,000,000 |
| UBS (Yankee) | | |
| 0.43%, 8/12/11 | 200,000,000 | 200,000,000 |
| Total Negotiable Bank Certificates of Deposit | | |
| (cost $2,490,003,970) | | 2,490,003,970 |
| |
| Commercial Paper—25.6% | | |
| Banco Bilbao Vizcaya Argentaria | | |
| 0.45%, 2/10/11 | 80,000,000 b | 79,991,000 |
| Bank of Nova Scotia | | |
| 0.15%, 2/1/11 | 300,000,000 | 300,000,000 |
| Deutsche Bank Financial LLC | | |
| 0.40%, 2/14/11 | 100,000,000 | 99,985,556 |
| DnB NOR Bank ASA | | |
| 0.29%, 3/29/11 | 210,000,000 b | 209,905,267 |
| Fortis Funding LLC | | |
| 0.48%, 6/13/11 | 150,000,000 b | 149,736,000 |
STATEMENT OF INVESTMENTS (continued)
| | | |
| | Principal | |
| Dreyfus Cash Management Plus, Inc. (continued) | Amount ($) | Value ($) |
| |
| Commercial Paper (continued) | | |
| General Electric Capital Corp. | | |
| 0.25%, 3/17/11 | 200,000,000 | 199,938,889 |
| Intesa Funding LLC | | |
| 0.35%, 2/16/11 | 250,000,000 | 249,963,542 |
| JPMorgan Chase & Co. | | |
| 0.35%, 2/1/11 | 250,000,000 b | 250,000,000 |
| Societe Generale N.A. Inc. | | |
| 0.40%, 5/5/11 | 100,000,000 | 99,896,667 |
| Total Commercial Paper | | |
| (cost $1,639,416,921) | | 1,639,416,921 |
| |
| Asset-Backed Commercial Paper—11.7% | | |
| Argento Variable Funding LLC | | |
| 0.32%, 2/2/11 | 65,000,000 b | 64,999,422 |
| Atlantis One Funding Corp. | | |
| 0.32%, 5/9/11 | 200,000,000 b | 199,827,555 |
| CHARTA | | |
| 0.55%, 2/3/11 | 65,000,000 b | 64,998,014 |
| CIESCO LLC | | |
| 0.55%, 2/3/11 | 194,000,000 b | 193,994,072 |
| Govco | | |
| 0.37%, 4/27/11 | 75,000,000 b | 74,934,479 |
| Solitaire Funding Ltd. | | |
| 0.30%, 4/6/11 | 50,000,000 b | 49,973,333 |
| Windmill Funding Corp. | | |
| 0.27%, 2/16/11 | 100,000,000 b | 99,988,750 |
| Total Asset-Backed Commercial Paper | | |
| (cost $748,715,625) | | 748,715,625 |
| |
| Corporate Note—3.9% | | |
| Merrill Lynch & Co. Inc. | | |
| 0.35%, 2/1/11 | | |
| (cost $250,000,000) | 250,000,000 | 250,000,000 |
| |
| U.S. Government Agencies—4.7% | | |
| Federal Home Loan Mortgage Corp. | | |
| 0.39%, 2/1/11 | 200,000,000 a,c | 199,882,642 |
| Federal National Mortgage Association | | |
| 0.39%, 2/1/11 | 100,000,000 a,c | 99,962,980 |
| Total U.S. Government Agencies | | |
| (cost $299,845,622) | | 299,845,622 |
16
| | | |
| | Principal | |
| Dreyfus Cash Management Plus, Inc. (continued) | Amount ($) | Value ($) |
| |
| Repurchase Agreements—15.1% | | |
| Barclays Capital, Inc. | | |
| 0.21%, dated 1/31/11, due 2/1/11 in the amount of $370,002,158 | | |
| (fully collateralized by $338,255,700 U.S. Treasury Notes, 4.13%, | | |
| due 5/15/15, value $377,400,061) | 370,000,000 | 370,000,000 |
| BNP Paribas | | |
| 0.20%, dated 1/31/11, due 2/1/11 in the amount of $350,001,944 | | |
| (fully collateralized by $310,948,600 U.S. Treasury Bonds, 4.38%-6.13%, | | |
| due 8/15/29-5/15/40, value $357,000,098) | 350,000,000 | 350,000,000 |
| Citigroup Global Markets Holdings Inc. | | |
| 0.35%, dated 1/31/11, due 2/1/11 in the amount of $100,000,972 | | |
| (fully collateralized by $168,540,943 Federal National Mortgage Association, | | |
| 6%-6.42%, due 11/25/30-1/25/41, value $23,216,073 and $604,185,852 | | |
| Government National Mortgage Association, 2.50%-6.42%, | | |
| due 2/20/35-9/16/40, value $78,783,928) | 100,000,000 | 100,000,000 |
| RBC Capital Markets | | |
| 0.325%, dated 1/31/11, due 2/1/11 in the amount of $150,001,354 | | |
| (fully collateralized by $236,403,325 Corporate Bonds, 0%-6.13%, | | |
| due 12/1/35-7/1/47, value $154,500,000) | 150,000,000 | 150,000,000 |
| Total Repurchase Agreements | | |
| (cost $970,000,000) | | 970,000,000 |
| |
| Total Investments (cost $6,397,982,138) | 99.9% | 6,397,982,138 |
| |
| Cash and Receivables (Net) | .1% | 6,069,829 |
| |
| Net Assets | 100.0% | 6,404,051,967 |
| |
| a Variable rate security—interest rate subject to periodic change. |
| b Securities exempt from registration under Rule 144A of the Securities Act of 1933.These securities may be resold in transactions exempt from registration, normally to qualified |
| institutional buyers.At January 31, 2011, these securities amounted to $1,488,347,892 or 23.2% of net assets. |
| c The Federal Housing Finance Agency (“FHFA”) placed Federal Home Loan Mortgage Corporation and Federal National Mortgage Association into conservatorship with FHFA as the |
| conservator.As such, the FHFA oversees the continuing affairs of these companies. |
| | | | |
| Portfolio Summary (Unaudited)† | | | |
| |
| | Value (%) | | Value (%) |
| Banking | 65.3 | Asset-Backed/Banking | 4.3 |
| Repurchase Agreements | 15.1 | Finance | 3.1 |
| Asset-Backed/Multi-Seller Programs | 7.4 | | |
| U.S. Government Agencies | 4.7 | | 99.9 |
| |
| † Based on net assets. | | | |
| See notes to financial statements. | | | |
STATEMENT OF INVESTMENTS
January 31, 2011
| | | | | |
| | Annualized | | | |
| | Yield on | | | |
| | Date of | Principal | | |
| Dreyfus Government Cash Management | Purchase (%) | Amount ($) | | Value ($) |
| |
| U.S. Government Agencies—56.1% | | | | |
| Federal Farm Credit Bank: | | | | |
| 2/2/11 | 0.06 | 65,000,000 | | 64,999,892 |
| 9/14/11 | 0.24 | 150,000,000 | | 149,775,000 |
| 10/3/11 | 0.26 | 10,700,000 | | 10,933,024 |
| 11/1/11 | 0.25 | 85,000,000 | | 84,998,087 |
| 11/4/11 | 0.40 | 25,000,000 | a | 24,967,546 |
| 2/6/12 | 0.44 | 80,000,000 | a | 79,925,126 |
| 3/29/12 | 0.35 | 50,000,000 | a | 49,988,312 |
| Federal Home Loan Bank: | | | | |
| 2/1/11 | 0.31 | 180,000,000 | a | 180,000,000 |
| 2/1/11 | 0.35 | 400,000,000 | a | 399,797,058 |
| 3/16/11 | 0.16 | 85,000,000 | | 84,983,756 |
| 4/15/11 | 0.19 | 112,275,000 | | 112,231,743 |
| 4/15/11 | 0.21 | 650,000,000 | a | 649,852,010 |
| 5/24/11 | 0.27 | 39,575,000 | | 39,607,739 |
| 5/25/11 | 0.25 | 560,000,000 | a | 560,000,000 |
| 5/27/11 | 0.25 | 500,000,000 | a | 500,000,000 |
| 6/1/11 | 0.21 | 125,000,000 | | 124,912,500 |
| 6/3/11 | 0.21 | 100,000,000 | | 99,928,833 |
| 6/8/11 | 0.20 | 65,000,000 | | 64,954,139 |
| 6/15/11 | 0.21 | 130,000,000 | | 129,898,383 |
| 7/28/11 | 0.22 | 250,000,000 | | 249,973,108 |
| 8/17/11 | 0.30 | 500,000,000 | a | 499,945,464 |
| 9/29/11 | 0.27 | 200,000,000 | | 200,048,906 |
| 9/30/11 | 0.29 | 250,000,000 | a | 250,000,000 |
| 11/15/11 | 0.31 | 50,000,000 | | 49,974,870 |
| 11/17/11 | 0.30 | 250,000,000 | | 249,912,904 |
| 11/23/11 | 0.30 | 75,000,000 | | 74,973,329 |
| 11/29/11 | 0.32 | 37,930,000 | | 38,078,582 |
| Federal Home Loan Mortgage Corp.: | | | | |
| 2/14/11 | 0.25 | 199,488,000 | b | 199,469,991 |
| 2/19/11 | 0.30 | 305,810,000 | a,b | 305,654,196 |
| 2/22/11 | 0.22 | 990,483,000 | b | 990,357,938 |
| 2/23/11 | 0.25 | 485,292,000 | b | 485,217,858 |
| 3/16/11 | 0.16 | 25,000,000 | b | 24,995,222 |
| 3/21/11 | 0.16 | 100,000,000 | b | 99,978,667 |
| 4/26/11 | 0.20 | 250,000,000 | b | 249,883,333 |
| 5/25/11 | 0.25 | 250,000,000 | b | 249,803,819 |
| 5/26/11 | 0.25 | 520,000,000 | b | 519,588,333 |
| 5/27/11 | 0.25 | 190,000,000 | b | 189,848,264 |
| 6/21/11 | 0.22 | 100,000,000 | b | 99,914,444 |
| 6/27/11 | 0.21 | 50,000,000 | b | 49,957,417 |
| 7/12/11 | 0.21 | 175,000,000 | b | 174,835,646 |
| 7/19/11 | 0.24 | 188,000,000 | b | 187,789,440 |
| 7/26/11 | 0.24 | 150,000,000 | b | 149,825,000 |
| 9/14/11 | 0.24 | 400,000,000 | b | 399,404,687 |
| 9/29/11 | 0.24 | 250,000,000 | b | 249,600,000 |
18
| | | | | |
| | Annualized | | | |
| | Yield on | | | |
| | Date of | Principal | | |
| Dreyfus Government Cash Management (continued) | Purchase (%) | Amount ($) | | Value ($) |
| |
| U.S. Government Agencies (continued) | | | | |
| Federal National Mortgage Association: | | | | |
| 2/1/11 | 0.36 | 287,445,000 | a,b | 287,632,258 |
| 2/1/11 | 0.39 | 601,485,000 | a,b | 601,262,333 |
| 2/17/11 | 0.11 | 500,000,000 | b | 499,975,556 |
| 3/15/11 | 0.24 | 245,908,000 | b | 247,406,481 |
| 6/1/11 | 0.21 | 85,714,000 | b | 85,654,000 |
| 8/1/11 | 0.21 | 500,000,000 | b | 499,472,083 |
| 9/6/11 | 0.25 | 250,000,000 | b | 249,623,264 |
| 11/15/11 | 0.28 | 72,242,000 | b | 75,137,655 |
| 11/23/11 | 0.28 | 100,000,000 | b | 100,586,179 |
| Straight-A Funding LLC: | | | | |
| 2/2/11 | 0.25 | 68,383,000 | c | 68,382,525 |
| 2/2/11 | 0.25 | 92,878,000 | c | 92,877,355 |
| 2/2/11 | 0.25 | 7,622,000 | c | 7,621,947 |
| 2/15/11 | 0.25 | 100,000,000 | c | 99,990,278 |
| 3/1/11 | 0.25 | 150,000,000 | c | 149,970,833 |
| 3/4/11 | 0.25 | 194,000,000 | c | 193,958,236 |
| 3/7/11 | 0.25 | 136,247,000 | c | 136,214,831 |
| 4/18/11 | 0.25 | 400,000,000 | c | 399,788,889 |
| Total U.S. Government Agencies | | | | |
| (cost $13,446,339,269) | | | | 13,446,339,269 |
| |
| |
| U.S. Treasury Bills—1.7% | | | | |
| 2/3/11 | | | | |
| (cost $399,997,222) | 0.13 | 400,000,000 | | 399,997,222 |
| |
| |
| U.S. Treasury Notes—3.4% | | | | |
| 8/1/11 | 0.26 | 100,000,000 | | 100,358,349 |
| 8/31/11 | 0.28 | 204,000,000 | | 209,153,087 |
| 9/30/11 | 0.27 | 500,000,000 | | 502,396,133 |
| Total U.S. Treasury Notes | | | | |
| (cost $811,907,569) | | | | 811,907,569 |
| |
| |
| Repurchase Agreements—38.8% | | | | |
| Barclays Capital, Inc. | | | | |
| dated 1/31/11, due 2/1/11 in the amount of $338,001,972 | | | | |
| (fully collateralized by $334,859,200 U.S. Treasury Notes, 1.75%, | | | | |
| due 4/15/13, value $344,760,085) | 0.21 | 338,000,000 | | 338,000,000 |
| BNP Paribas | | | | |
| dated 1/31/11, due 2/1/11 in the amount of $950,005,278 | | | | |
| (fully collateralized by $97,288,300 U.S. Treasury Bills, | | | | |
| due 2/17/11-9/22/11, value $97,231,274 and | | | | |
| $813,646,100 U.S. Treasury Notes, 0.63%-5.13%, | | | | |
| due 2/28/11-9/30/17, value $871,768,838) | 0.20 | 950,000,000 | | 950,000,000 |
STATEMENT OF INVESTMENTS (continued)
| | | | |
| | Annualized | | |
| | Yield on | | |
| | Date of | Principal | |
| Dreyfus Government Cash Management (continued) | Purchase (%) | Amount ($) | Value ($) |
| |
| Repurchase Agreements (continued) | | | |
| Credit Agricole Securities (USA) Inc. | | | |
| dated 1/31/11, due 2/1/11 in the amount of $1,700,010,389 | | | |
| (fully collateralized by $500,000,000 Federal Home Loan Bank, | | | |
| 0.35%-0.55%, due 4/12/11-7/6/11, value $501,819,875, $37,719,000 | | | |
| Federal Home Loan Mortgage Corp., 4.75%, due 11/17/15, value $42,642,608, | | | |
| $600,000,000 Federal National Mortgage Association, 1.13%-5%, | | | |
| due 7/30/12-3/15/16, value $671,984,743 and $360,700,200 | | | |
| U.S. Treasury Bonds, 8.75%, due 5/15/17-5/15/20, value $517,552,840) | 0.22 | 1,700,000,000 | 1,700,000,000 |
| Credit Suisse Securities LLC | | | |
| dated 1/31/11, due 2/1/11 in the amount of $1,090,006,358 | | | |
| (fully collateralized by $2,466,116,875 U.S. Treasury Strips, | | | |
| due 2/15/11-11/15/40, value $1,111,803,663) | 0.21 | 1,090,000,000 | 1,090,000,000 |
| Deutsche Bank Securities Inc. | | | |
| dated 1/31/11, due 2/1/11 in the amount of $900,005,250 | | | |
| (fully collateralized by $888,786,700 U.S. Treasury Notes, 0.50%-4%, | | | |
| due 7/31/12-2/15/14, value $918,000,064) | 0.21 | 900,000,000 | 900,000,000 |
| HSBC USA Inc. | | | |
| dated 1/31/11, due 2/1/11 in the amount of $1,000,005,556 | | | |
| (fully collateralized by $291,243,400 U.S. Treasury Bonds, 3.88%-4.50%, | | | |
| due 5/15/38-8/15/40, value $281,977,370, $519,196,500 | | | |
| U.S. Treasury Notes, 1.38%-4.88%, due 7/31/11-5/15/19, | | | |
| value $543,216,816 and $784,555,000 U.S. Treasury Strips, | | | |
| due 11/15/39-11/15/40, value $194,808,268) | 0.20 | 1,000,000,000 | 1,000,000,000 |
| JPMorgan Chase & Co. | | | |
| dated 1/31/11, due 2/1/11 in the amount of $250,001,667 | | | |
| (fully collateralized by $3,385,643,656 Federal National Mortgage | | | |
| Association 0.02%-16.10%, due 12/25/16-11/25/49, value $255,000,271) | 0.24 | 250,000,000 | 250,000,000 |
| Merrill Lynch & Co. Inc. | | | |
| dated 1/31/11, due 2/1/11 in the amount of $375,002,188 | | | |
| (fully collateralized by $238,820,700 U.S. Treasury Bills, due 6/23/11, | | | |
| value $238,675,497 and $142,748,700 U.S. Treasury Notes, 1%, | | | |
| due 12/31/11, value $143,824,505) | 0.21 | 375,000,000 | 375,000,000 |
| Morgan Stanley | | | |
| dated 1/31/11, due 2/1/11 in the amount of $315,001,750 | | | |
| (fully collateralized by $285,127,500 U.S. Treasury Inflation Protected | | | |
| Securities, 0.50%-3.38%, due 4/15/12-4/15/32, value $321,300,124) | 0.20 | 315,000,000 | 315,000,000 |
20
| | | | |
| | Annualized | | |
| | Yield on | | |
| | Date of | Principal | |
| Dreyfus Government Cash Management (continued) | Purchase (%) | Amount ($) | Value ($) |
| |
| Repurchase Agreements (continued) | | | |
| RBC Capital Markets | | | |
| dated 1/31/11, due 2/1/11 in the amount of $1,000,005,833 | | | |
| (fully collateralized by $553,449,000 U.S. Treasury Bills, | | | |
| due 2/17/11-6/23/11, value $553,220,526, $22,706,200 | | | |
| U.S. Treasury Bonds, 7.50%, due 11/15/24, value $31,973,577 | | | |
| and $435,811,200 U.S. Treasury Notes, 1.13%-2%, | | | |
| due 1/15/12-10/31/15, value $434,805,954) | 0.21 | 1,000,000,000 | 1,000,000,000 |
| RBS Securities, Inc. | | | |
| dated 1/31/11, due 2/1/11 in the amount of $1,150,006,708 | | | |
| (fully collateralized by $1,173,727,000 U.S. Treasury Bills, | | | |
| due 3/17/11-1/12/12, value $1,173,003,799) | 0.21 | 1,150,000,000 | 1,150,000,000 |
| UBS Securities LLC | | | |
| dated 1/31/11, due 2/1/11 in the amount of $250,001,458 | | | |
| (fully collateralized by $255,075,600 U.S. Treasury Notes, | | | |
| due 4/14/11, value $255,000,098) | 0.21 | 250,000,000 | 250,000,000 |
| Total Repurchase Agreements | | | |
| (cost $9,318,000,000) | | | 9,318,000,000 |
| |
| Total Investments (cost $23,976,244,060) | | 100.0% | 23,976,244,060 |
| |
| Cash and Receivables (Net) | | .0% | 9,646,704 |
| |
| Net Assets | | 100.0% | 23,985,890,764 |
| |
| a Variable rate security—interest rate subject to periodic change. |
| b The Federal Housing Finance Agency (“FHFA”) placed Federal Home Loan Mortgage Corporation and Federal National Mortgage Association into conservatorship with FHFA as the |
| conservator.As such, the FHFA oversees the continuing affairs of these companies. |
| c Securities exempt from registration under Rule 144A of the Securities Act of 1933.These securities may be resold in transactions exempt from registration, normally to qualified |
| institutional buyers.At January 31, 2011, these securities amounted to $1,148,804,894 or 4.8% of net assets. |
| | | | |
| Portfolio Summary (Unaudited)† | | | |
| |
| | Value (%) | | Value (%) |
| Repurchase Agreements | 38.8 | U.S. Treasury Notes | 3.4 |
| Federal Home Loan Mortgage Corp. | 19.3 | Federal Farm Credit Bank | 1.9 |
| Federal Home Loan Bank | 19.0 | U.S. Treasury Bills | 1.7 |
| Federal National Mortgage Association | 11.0 | | |
| Straight-A Funding LLC | 4.9 | | 100.0 |
| |
| † Based on net assets. | | | |
| See notes to financial statements. | | | |
STATEMENT OF INVESTMENTS
January 31, 2011
| | | | | |
| | Annualized | | | |
| | Yield on | | | |
| | Date of | Principal | | |
| Dreyfus Government Prime Cash Management | Purchase (%) | Amount ($) | | Value ($) |
| |
| U.S. Government Agencies—61.2% | | | | |
| Federal Farm Credit Bank: | | | | |
| 2/2/11 | 0.06 | 50,000,000 | | 49,999,917 |
| 2/23/11 | 0.25 | 100,000,000 | a | 99,956,626 |
| 3/28/11 | 0.20 | 65,000,000 | | 64,980,139 |
| 4/5/11 | 0.21 | 50,000,000 | | 49,982,062 |
| 6/27/11 | 0.21 | 50,000,000 | | 49,957,417 |
| 7/8/11 | 0.25 | 40,000,000 | | 39,956,389 |
| 7/23/11 | 0.27 | 74,500,000 | a | 74,477,879 |
| 2/6/12 | 0.44 | 75,000,000 | a | 74,929,806 |
| 5/24/12 | 0.31 | 50,000,000 | a | 49,993,359 |
| 7/25/12 | 0.33 | 225,000,000 | a | 224,932,662 |
| Federal Home Loan Bank: | | | | |
| 2/11/11 | 0.16 | 300,000,000 | | 299,986,667 |
| 2/25/11 | 0.17 | 79,000,000 | | 78,991,047 |
| 3/4/11 | 0.17 | 84,087,000 | | 84,074,690 |
| 3/11/11 | 0.21 | 50,000,000 | | 49,988,917 |
| 3/18/11 | 0.20 | 80,000,000 | | 79,980,000 |
| 3/21/11 | 0.20 | 5,000,000 | | 4,998,667 |
| 3/23/11 | 0.18 | 489,595,000 | | 489,473,874 |
| 4/27/11 | 0.18 | 150,000,000 | | 149,936,250 |
| 4/29/11 | 0.18 | 100,000,000 | | 99,957,708 |
| 5/11/11 | 0.19 | 290,000,000 | | 289,846,000 |
| 5/12/11 | 0.20 | 50,000,000 | | 49,972,222 |
| 5/18/11 | 0.20 | 10,535,000 | | 10,528,796 |
| 7/28/11 | 0.22 | 250,000,000 | | 249,973,108 |
| Total U.S. Government Agencies | | | | |
| (cost $2,716,874,202) | | | | 2,716,874,202 |
| |
| |
| U.S. Treasury Bills—27.0% | | | | |
| 2/10/11 | 0.14 | 221,000,000 | | 220,992,403 |
| 2/17/11 | 0.14 | 300,000,000 | | 299,981,067 |
| 2/24/11 | 0.10 | 277,000,000 | | 276,983,187 |
| 3/10/11 | 0.16 | 400,000,000 | | 399,936,278 |
| Total U.S. Treasury Bills | | | | |
| (cost $1,197,892,935) | | | | 1,197,892,935 |
22
| | | | | | |
| | | | Annualized | | |
| | | | Yield on | | |
| | | | Date of | Principal | |
| Dreyfus Government Prime Cash Management (continued) | Purchase (%) | Amount ($) | Value ($) |
| |
| U.S. Treasury Notes—12.1% | | | | | |
| 2/28/11 | | | 0.16 | 260,000,000 | 260,138,351 |
| 8/1/11 | | | 0.19 | 125,000,000 | 125,492,110 |
| 8/1/11 | | | 0.19 | 150,000,000 | 153,446,964 |
| Total U.S. Treasury Notes | | | | | |
| (cost $539,077,425) | | | | | 539,077,425 |
| Total Investments (cost $4,453,844,562) | | | | 100.3% | 4,453,844,562 |
| Liabilities, Less Cash and Receivables | | | | (.3%) | (11,844,831) |
| Net Assets | | | | 100.0% | 4,441,999,731 |
| |
| a Variable rate security—interest rate subject to periodic change. | | | | | |
| |
| |
| |
| |
| Portfolio Summary (Unaudited)† | | | | | |
| | Value (%) | | | | Value (%) |
| Federal Home Loan Bank | 43.6 | U.S. Treasury Notes | | 12.1 |
| U.S. Treasury Bills | 27.0 | | | | |
| Federal Farm Credit Bank | 17.6 | | | | 100.3 |
| |
| † Based on net assets. | | | | | |
| See notes to financial statements. | | | | | |
STATEMENT OF INVESTMENTS
January 31, 2011
| | | | |
| | Annualized | | |
| | Yield on | | |
| | Date of | Principal | |
| Dreyfus Treasury & Agency Cash Management | Purchase (%) | Amount ($) | Value ($) |
| |
| U.S. Treasury Bills—.9% | | | |
| 2/3/11 | | | |
| (cost $99,999,681) | 0.06 | 100,000,000 | 99,999,681 |
| |
| U.S. Treasury Notes—26.6% | | | |
| 3/31/11 | 0.22 | 100,000,000 | 100,719,535 |
| 5/2/11 | 0.26 | 300,000,000 | 300,455,720 |
| 5/2/11 | 0.27 | 150,000,000 | 151,702,390 |
| 5/31/11 | 0.23 | 550,000,000 | 558,323,276 |
| 8/1/11 | 0.25 | 550,000,000 | 562,512,847 |
| 9/30/11 | 0.27 | 100,000,000 | 100,481,097 |
| 9/30/11 | 0.28 | 200,000,000 | 205,563,137 |
| 10/31/11 | 0.25 | 200,000,000 | 201,118,239 |
| 10/31/11 | 0.23 | 250,000,000 | 258,140,845 |
| 11/30/11 | 0.26 | 100,000,000 | 100,401,464 |
| 11/30/11 | 0.31 | 300,000,000 | 310,385,935 |
| Total U.S. Treasury Notes | | | |
| (cost $2,849,804,485) | | | 2,849,804,485 |
| |
| U.S. Treasury Strips—.6% | | | |
| U.S. Treasury Strips | | | |
| 8/1/11 | | | |
| (cost $62,108,663) | 0.27 | 62,193,000 | 62,108,663 |
| |
| Repurchase Agreements—71.7% | | | |
| Barclays Capital, Inc. | | | |
| dated 1/31/11, due 2/1/11 in the amount of $778,004,538 | | | |
| (fully collateralized by $122,456,600 U.S. Treasury Bills, due 5/19/11, | | | |
| value $122,400,025 and $661,084,100 U.S. Treasury Notes, | | | |
| 0.38%-3.25%, due 8/31/12-6/30/17, value $671,160,067) | 0.21 | 778,000,000 | 778,000,000 |
| BNP Paribas dated 1/31/11, due 2/1/11 in the amount of $500,002,778 | | | |
| (fully collateralized by $504,852,900 U.S. Treasury Notes, | | | |
| 1%-1.38%, due 9/15/12-1/15/14, value $510,000,072) | 0.20 | 500,000,000 | 500,000,000 |
| Credit Agricole Securities (USA) Inc. dated 1/31/11, due 2/1/11 in the amount of | | | |
| $500,003,056 (fully collateralized by $342,076,600 U.S. Treasury Bonds, | | | |
| 7.63%-8.75%, due 5/15/20-11/15/22, value $510,000,001) | 0.22 | 500,000,000 | 500,000,000 |
24
| | | | |
| | Annualized | | |
| | Yield on | | |
| | Date of | Principal | |
| Dreyfus Treasury & Agency Cash Management (continued) | Purchase (%) | Amount ($) | Value ($) |
| |
| Repurchase Agreements (continued) | | | |
| Credit Suisse Securities LLC dated 1/31/11, due 2/1/11 in the amount of | | | |
| $420,002,450 (fully collateralized by $428,505,000 U.S. Treasury Bills, | | | |
| due 3/24/11-4/7/11, value $428,404,074) | 0.21 | 420,000,000 | 420,000,000 |
| Deutsche Bank Securities Inc. dated 1/31/11, due 2/1/11 in the amount of | | | |
| $350,002,042 (fully collateralized by $304,191,700 U.S. Treasury Bonds, | | | |
| 5%-6%, due 2/15/26-5/15/37, value $357,000,067) | 0.21 | 350,000,000 | 350,000,000 |
| Goldman, Sachs & Co. dated 1/31/11, due 2/1/11 in the amount of | | | |
| $100,000,583 (fully collateralized by $307,396,627 Government National | | | |
| Mortgage Association, 4%-7%, due 6/20/31-1/20/41, value $102,000,000) | 0.21 | 100,000,000 | 100,000,000 |
| HSBC USA Inc. dated 1/31/11, due 2/1/11 in the amount of $700,003,889 | | | |
| (fully collateralized by $283,302,500 U.S. Treasury Bonds, 4.75%-8%, | | | |
| due 11/15/16-2/15/37, value $379,751,098 and $327,120,200 U.S. Treasury | | | |
| Notes, 0.88%-3.38%, due 4/30/11-11/15/19, value $334,249,202) | 0.20 | 700,000,000 | 700,000,000 |
| JPMorgan Chase & Co. dated 1/31/11, due 2/1/11 in the amount of | | | |
| $760,004,222 (fully collateralized by $701,861,200 U.S. Treasury Notes, | | | |
| 2.75%-4.88%, due 8/15/16-2/15/19, value $775,202,836) | 0.20 | 760,000,000 | 760,000,000 |
| JPMorgan Chase & Co. dated 1/31/11, due 2/1/11 in the amount of | | | |
| $110,000,642 (fully collateralized by $113,439,491 Government National | | | |
| Mortgage Association, 0%-5.50%, due 9/15/39-1/15/52, value $112,200,278) | 0.21 | 110,000,000 | 110,000,000 |
| Merrill Lynch & Co. Inc. dated 1/31/11, due 2/1/11 in the amount of | | | |
| $160,000,933 (fully collateralized by $163,906,183 Government | | | |
| National Mortgage Association, 2.50%-6.50%, due 4/20/35-11/15/51, | | | |
| value $91,800,000 and $70,178,300 U.S. Treasury Notes, 1.38%, | | | |
| due 2/15/12, value $71,400,002) | 0.21 | 160,000,000 | 160,000,000 |
| RBC Capital Markets dated 1/31/11, due 2/1/11 in the amount of | | | |
| $1,100,006,417 (fully collateralized by $307,654,000 | | | |
| U.S. Treasury Bills, due 3/24/11, value $307,588,162, | | | |
| $168,000,000 U.S. Treasury Bonds, 7.88%, due 2/15/21, | | | |
| value $240,304,694 and $567,823,400 U.S. Treasury Notes, | | | |
| 0.63%-2%, due 1/31/13-1/31/16, value $574,107,224) | 0.21 | 1,100,000,000 | 1,100,000,000 |
| RBS Securities, Inc. dated 1/31/11, due 2/1/11 in the amount of | | | |
| $350,002,042 (fully collateralized by $357,096,000 | | | |
| U.S. Treasury Bills, due 3/24/11-4/28/11, value $357,004,785) | 0.21 | 350,000,000 | 350,000,000 |
| Societe Generale dated 1/31/11, due 2/1/11 in the amount of | | | |
| $500,002,778 (fully collateralized by $323,500,000 U.S. Treasury | | | |
| Inflation Protected Securities, 2%-3.63%, due 1/15/26-4/15/28, | | | |
| value $391,202,448 and $116,907,800 U.S. Treasury Notes, 1.38%, | | | |
| due 5/15/12, value $118,797,582) | 0.20 | 500,000,000 | 500,000,000 |
STATEMENT OF INVESTMENTS (continued)
| | | | |
| | Annualized | | |
| | Yield on | | |
| | Date of | Principal | |
| Dreyfus Treasury & Agency Cash Management (continued) | Purchase (%) | Amount ($) | Value ($) |
| |
| Repurchase Agreements (continued) | | | |
| Societe Generale dated 1/31/11, due 2/1/11 in the amount of $370,002,158 | | | |
| (fully collateralized by $654,395,303 Government National Mortgage Association, | | | |
| 4.50%-6.50%, due 4/15/36-12/20/40, value $377,400,000) | 0.21 | 370,000,000 | 370,000,000 |
| TD Securities (USA) LLC dated 1/31/11, due 2/1/11 in the amount | | | |
| of $995,006,081 (fully collateralized by $154,653,500 U.S. Treasury Bills, | | | |
| due 3/17/11-11/17/11, value $154,509,618, $266,647,400 U.S. Treasury | | | |
| Inflation Protected Securities, 1.25%-2.50%, due 7/15/13-1/15/29, | | | |
| value $299,625,648, $449,162,600 U.S. Treasury Notes, 0.63%-5.13%, | | | |
| due 6/30/11-11/15/20, value $452,927,386 and $291,104,000 | | | |
| U.S. Treasury Strips, due 5/15/21-11/15/39, value $107,837,435) | 0.22 | 995,000,000 | 995,000,000 |
| Total Repurchase Agreements | | | |
| (cost $7,693,000,000) | | | 7,693,000,000 |
| |
| Total Investments (cost $10,704,912,829) | | 99.8% | 10,704,912,829 |
| |
| Cash and Receivables (Net) | | .2% | 17,406,941 |
| |
| Net Assets | | 100.0% | 10,722,319,770 |
| | | | |
| Portfolio Summary (Unaudited)† | | | |
| |
| | Value (%) | | Value (%) |
| Repurchase Agreements | 71.7 | U.S. Treasury Strips | .6 |
| U.S. Treasury Notes | 26.6 | | |
| U.S. Treasury Bills | .9 | | 99.8 |
| |
| † Based on net assets. | | | |
| See notes to financial statements. | | | |
26
STATEMENT OF INVESTMENTS
January 31, 2011
| | | | |
| | Annualized | | |
| | Yield on | | |
| | Date of | Principal | |
| Dreyfus Treasury Prime Cash Management | Purchase (%) | Amount ($) | Value ($) |
| |
| U.S. Treasury Bills—80.1% | | | |
| 2/3/11 | 0.12 | 1,530,000,000 | 1,529,990,083 |
| 2/10/11 | 0.12 | 2,624,174,000 | 2,624,098,560 |
| 2/17/11 | 0.14 | 1,967,000,000 | 1,966,877,289 |
| 2/24/11 | 0.14 | 2,345,000,000 | 2,344,790,930 |
| 3/3/11 | 0.15 | 834,000,000 | 833,894,642 |
| 3/10/11 | 0.14 | 1,987,000,000 | 1,986,712,823 |
| 3/17/11 | 0.14 | 250,000,000 | 249,958,750 |
| 3/24/11 | 0.13 | 1,428,000,000 | 1,427,733,461 |
| 3/31/11 | 0.16 | 1,130,000,000 | 1,129,717,814 |
| 4/14/11 | 0.15 | 700,000,000 | 699,797,000 |
| 4/28/11 | 0.17 | 300,000,000 | 299,878,167 |
| 5/26/11 | 0.19 | 225,000,000 | 224,864,625 |
| 6/16/11 | 0.19 | 250,000,000 | 249,826,563 |
| 6/23/11 | 0.18 | 500,000,000 | 499,645,000 |
| 7/7/11 | 0.18 | 80,000,000 | 79,937,600 |
| 7/14/11 | 0.18 | 800,000,000 | 799,366,111 |
| 7/28/11 | 0.19 | 250,000,000 | 249,772,604 |
| Total U.S. Treasury Bills | | | |
| (cost $17,196,862,022) | | | 17,196,862,022 |
| |
| U.S. Treasury Notes—22.9% | | | |
| 2/28/11 | 0.15 | 591,550,000 | 591,867,986 |
| 2/28/11 | 0.15 | 258,641,000 | 259,479,460 |
| 3/31/11 | 0.20 | 755,000,000 | 760,468,305 |
| 3/31/11 | 0.21 | 500,000,000 | 500,527,652 |
| 5/2/11 | 0.16 | 1,392,000,000 | 1,394,376,204 |
| 5/2/11 | 0.27 | 300,000,000 | 303,406,000 |
STATEMENT OF INVESTMENTS (continued)
| | | | | | |
| | | | Annualized | | |
| | | | Yield on | | |
| | | | Date of | Principal | |
| Dreyfus Treasury Prime Cash Management (continued) | Purchase (%) | Amount ($) | Value ($) |
| |
| U.S. Treasury Notes (continued) | | | | | |
| 5/31/11 | | | 0.19 | 300,000,000 | 304,582,753 |
| 6/30/11 | | | 0.18 | 300,000,000 | 301,159,357 |
| 9/30/11 | | | 0.23 | 200,000,000 | 201,010,346 |
| 9/30/11 | | | 0.24 | 300,000,000 | 308,428,512 |
| Total U.S. Treasury Notes | | | | | |
| (cost $4,925,306,575) | | | | | 4,925,306,575 |
| Total Investments (cost $22,122,168,597) | | | | 103.0% | 22,122,168,597 |
| Liabilities, Less Cash and Receivables | | | | (3.0%) | (652,987,042) |
| Net Assets | | | | 100.0% | 21,469,181,555 |
| |
| |
| |
| |
| Portfolio Summary (Unaudited)† | | | | | |
| | Value (%) | | | | Value (%) |
| U.S. Treasury Bills | 80.1 | U.S. Treasury Notes | | 22.9 |
| | | | | | 103.0 |
| |
| † Based on net assets. | | | | | |
| See notes to financial statements. | | | | | |
28
STATEMENT OF INVESTMENTS
January 31, 2011
| | | | | |
| | Coupon | Maturity | Principal | |
| Dreyfus Municipal Cash Management Plus | Rate (%) | Date | Amount ($) | Value ($) |
| |
| Short-Term Investments—100.5% | | | | |
| Arizona—1.7% | | | | |
| JPMorgan Chase Putters and Drivers Trust (Salt River Project | | | | |
| Agricultural Improvement and Power District, Salt River Project | | | | |
| Electric System Revenue) (Liquidity Facility; JPMorgan Chase Bank) | 0.29 | 2/7/11 | 8,500,000 a,b | 8,500,000 |
| Maricopa County Industrial Development Authority, | | | | |
| MFHR (San Clemente Apartments Project) | | | | |
| (Liquidity Facility; FNMA and LOC; FNMA) | 0.35 | 2/7/11 | 1,010,000 a | 1,010,000 |
| Maricopa County Industrial Development Authority, | | | | |
| MFHR, Refunding (San Clemente Apartments Project) | | | | |
| (Liquidity Facility; FNMA and LOC; FNMA) | 0.30 | 2/7/11 | 7,600,000 a | 7,600,000 |
| California—2.0% | | | | |
| California Statewide Communities Development Authority, | | | | |
| MFHR (Liquidity Facility; FHLMC and LOC; FHLMC) | 0.38 | 2/7/11 | 13,995,000 a,b | 13,995,000 |
| Irvine Assessment District Number 07-22, Limited | | | | |
| Obligation Improvement Revenue (LOC; KBC Bank) | 0.30 | 2/1/11 | 6,600,000 a | 6,600,000 |
| Colorado—.8% | | | | |
| Colorado Housing and Finance Authority, EDR | | | | |
| (Popiel Properties, LLC Project) (LOC; Wells Fargo Bank) | 0.49 | 2/7/11 | 2,765,000 a | 2,765,000 |
| Colorado Housing and Finance Authority, EDR | | | | |
| (Wanco Inc. Project) (LOC; U.S. Bank NA) | 0.49 | 2/7/11 | 2,435,000 a | 2,435,000 |
| Southglenn Metropolitan District, Special Revenue (LOC; BNP Paribas) | 0.31 | 2/7/11 | 2,940,000 a | 2,940,000 |
| Connecticut—2.0% | | | | |
| Connecticut Health and Educational Facilities Authority, Revenue | | | | |
| (Yale University Issue) (Liquidity Facility; Wells Fargo Bank) | 0.29 | 2/7/11 | 7,300,000 a,b | 7,300,000 |
| Hamden, GO Notes, BAN | 2.00 | 8/24/11 | 13,000,000 | 13,095,379 |
| Delaware—1.8% | | | | |
| Delaware Health Facilities Authority, Revenue | | | | |
| (Christiana Care Health Services) | 0.25 | 2/7/11 | 10,000,000 a | 10,000,000 |
| Delaware Health Facilities Authority, Revenue | | | | |
| (Christiana Care Health Services) | 0.26 | 2/7/11 | 8,525,000 a | 8,525,000 |
| District of Columbia—3.3% | | | | |
| District of Columbia, Revenue (Carnegie Endowment for | | | | |
| International Peace Issue) (LOC; Wells Fargo Bank) | 0.28 | 2/7/11 | 13,000,000 a | 13,000,000 |
| District of Columbia, Revenue, CP (National Academy | | | | |
| of Sciences) (LOC; Bank of America) | 0.30 | 2/4/11 | 10,000,000 | 10,000,000 |
| Metropolitan Washington Airports Authority, Airport System | | | | |
| Revenue (Liquidity Facility; Landesbank Baden-Wurttemberg) | 0.32 | 2/7/11 | 10,715,000 a | 10,715,000 |
| Florida—6.6% | | | | |
| Broward County Housing Finance Authority, MFHR | | | | |
| (Cypress Grove Apartments Project) (LOC; FNMA) | 0.38 | 2/7/11 | 13,230,000 a | 13,230,000 |
| Citizens Property Insurance Corporation, | | | | |
| High-Risk Account Senior Secured Revenue | 2.00 | 4/21/11 | 20,000,000 | 20,030,768 |
STATEMENT OF INVESTMENTS (continued)
| | | | | |
| Dreyfus Municipal | Coupon | Maturity | Principal | |
| Cash Management Plus (continued) | Rate (%) | Date | Amount ($) | Value ($) |
| |
| Short-Term Investments (continued) | | | | |
| Florida (continued) | | | | |
| Florida Local Government Finance Commission, Pooled Loan | | | | |
| Program Revenue, CP (LOC; Bank of America) | 0.37 | 2/8/11 | 6,025,000 | 6,025,000 |
| Florida Local Government Finance Commission, Pooled Loan | | | | |
| Program Revenue, CP (LOC; Bank of America) | 0.30 | 3/11/11 | 17,140,000 | 17,140,000 |
| Greater Orlando Aviation Authority, Airport Facility | | | | |
| Revenue (FlightSafety International Inc. Project) | | | | |
| (Insured; Berkshire Hathaway Assurance Corporation) | 0.28 | 2/7/11 | 6,700,000 a | 6,700,000 |
| Halifax Hospital Medical Center, Hospital Improvement | | | | |
| Revenue, Refunding (LOC; JPMorgan Chase Bank) | 0.29 | 2/7/11 | 4,000,000 a | 4,000,000 |
| Georgia—3.9% | | | | |
| Atlanta, Airport Revenue, CP (LOC; Wells Fargo Bank) | 0.35 | 5/25/11 | 10,000,000 | 10,000,000 |
| Gwinnett County Development Authority, IDR | | | | |
| (Suzanna’s Kitchen, Inc. Project) (LOC; Wells Fargo Bank) | 0.46 | 2/7/11 | 5,000,000 a | 5,000,000 |
| Henry County School District, GO Notes | 5.00 | 4/1/11 | 5,600,000 | 5,643,037 |
| Metropolitan Atlanta Rapid Transit Authority, Sales Tax | | | | |
| Revenue, CP (Liquidity Facility; Wells Fargo Bank) | 0.31 | 3/10/11 | 10,000,000 | 10,000,000 |
| Municipal Electric Authority of Georgia, CP | | | | |
| (Project One) (LOC; Wells Fargo Bank) | 0.28 | 2/9/11 | 8,922,000 | 8,922,000 |
| Illinois—1.7% | | | | |
| Illinois Finance Authority, IDR (Fitzpatrick Brothers, Inc. | | | | |
| Project) (Liquidity Facility; Northern Trust Company) | 0.29 | 2/7/11 | 5,000,000 a | 5,000,000 |
| Illinois Toll Highway Authority, Toll Highway Senior Revenue, | | | | |
| Refunding (Insured; Assured Guaranty Municipal Corp. | | | | |
| and Liquidity Facility; Dexia Credit Locale) | 0.30 | 2/7/11 | 3,700,000 a | 3,700,000 |
| Upper Illinois River Valley Development Authority, SWDR | | | | |
| (Exolon-ESK Company Project) (LOC; Bank of America) | 0.33 | 2/7/11 | 8,405,000 a | 8,405,000 |
| Indiana—2.4% | | | | |
| Elkhart County, EDR (Four Seasons Manufacturing | | | | |
| Project) (LOC; National City Bank) | 0.38 | 2/7/11 | 3,005,000 a | 3,005,000 |
| Fort Wayne, EDR (Park Center Project) (LOC; National City Bank) | 0.31 | 2/7/11 | 2,135,000 a | 2,135,000 |
| Indiana Finance Authority, EDR (JRL Leasing, Inc. | | | | |
| and LaSarre Co., LLC Project) (LOC; National City Bank) | 0.38 | 2/7/11 | 3,200,000 a | 3,200,000 |
| Indiana Finance Authority, Environmental Revenue, Refunding | | | | |
| (Duke Energy Indiana, Inc. Project) (LOC; Bank of America) | 0.33 | 2/7/11 | 6,000,000 a | 6,000,000 |
| Puttable Floating Option Tax Exempt Receipts (Indiana Health | | | | |
| Facility Financing Authority, Hospital Improvement Revenue, | | | | |
| Refunding (Community Hospitals Projects)) (Liquidity Facility; | | | | |
| Bank of America and LOC; Bank of America) | 0.44 | 2/7/11 | 10,000,000 a,b | 10,000,000 |
| Iowa—.4% | | | | |
| Iowa Higher Education Loan Authority, Revenue, | | | | |
| BAN (William Penn University Project) | 1.50 | 12/1/11 | 4,000,000 | 4,029,737 |
30
| | | | | |
| Dreyfus Municipal | Coupon | Maturity | Principal | |
| Cash Management Plus (continued) | Rate (%) | Date | Amount ($) | Value ($) |
| |
| Short-Term Investments (continued) | | | | |
| Kansas—.8% | | | | |
| Kansas Development Finance Authority, MFHR | | | | |
| (Tree House Apartments) (LOC; U.S. Bank NA) | 0.32 | 2/7/11 | 8,450,000 a | 8,450,000 |
| Kentucky—1.8% | | | | |
| Jefferson County, Retirement Home Revenue (Nazareth Literary | | | | |
| and Benevolent Institution Project) (LOC; JPMorgan Chase Bank) | 0.30 | 2/7/11 | 8,630,000 a | 8,630,000 |
| Kentucky Rural Water Finance Corporation, | | | | |
| Public Projects Construction Notes | 1.50 | 12/1/11 | 10,000,000 | 10,070,191 |
| Louisiana—3.0% | | | | |
| Ascension Parish, Revenue, CP (BASF SE) | 0.49 | 3/17/11 | 9,000,000 | 9,000,000 |
| Lake Charles Harbor and Terminal District, | | | | |
| Revenue (Lake Charles Cogeneration LLC Project) | 0.37 | 5/31/11 | 12,000,000 | 12,000,000 |
| Louisiana Local Government Environmental Facilities and Community | | | | |
| Development Authority, Revenue (Nicholls State University Student | | | | |
| Housing/Nicholls State University Facilities Corporation Project) | | | | |
| (Insured; Assured Guaranty Municipal Corp and LOC; FHLB) | 0.33 | 2/7/11 | 10,000,000 a | 10,000,000 |
| Maryland—1.8% | | | | |
| Anne Arundel County, EDR (Atlas Container | | | | |
| Corporation Project) (LOC; M&T Trust) | 0.39 | 2/7/11 | 6,475,000 a | 6,475,000 |
| Baltimore County Revenue Authority, | | | | |
| Golf System Revenue (LOC; M&T Trust) | 0.32 | 2/7/11 | 5,675,000 a | 5,675,000 |
| Frederick County, Revenue | | | | |
| (Homewood, Inc. Facility) (LOC; M&T Trust) | 0.27 | 2/7/11 | 2,700,000 a | 2,700,000 |
| Maryland Health and Higher Educational Facilities | | | | |
| Authority, Revenue (Charles County Nursing Center) | | | | |
| (Liquidity Facility; M&T Trust) | 0.34 | 2/7/11 | 3,705,000 a | 3,705,000 |
| Massachusetts—4.5% | | | | |
| Macon Trust Various Certificates (Massachusetts Health and Educational | | | | |
| Facilities Authority—Harvard Vanguard Medical Associates Issue) | | | | |
| (Liquidity Facility; Bank of America and LOC; Bank of America) | 0.41 | 2/7/11 | 9,975,000 a,b | 9,975,000 |
| Massachusetts, GO Notes, RAN | 2.00 | 5/26/11 | 13,000,000 | 13,068,834 |
| Massachusetts Development Finance Agency, Multifamily Revenue | | | | |
| (Kennedy Lofts Project) (Liquidity Facility; FHLMC and LOC; FHLMC) | 0.39 | 2/7/11 | 15,440,000 a,b | 15,440,000 |
| Massachusetts Housing Finance Agency, SFHR (Insured; Assured | | | | |
| Guaranty Municipal Corp. and Liquidity Facility; Dexia Credit Locale) | 0.35 | 2/7/11 | 7,380,000 a | 7,380,000 |
| Michigan—4.6% | | | | |
| Michigan, GO Notes | 2.00 | 9/30/11 | 8,000,000 | 8,082,729 |
| Michigan Hospital Finance Authority, | | | | |
| Revenue, CP (Trinity Health System) | 0.32 | 4/6/11 | 4,000,000 | 4,000,000 |
| Michigan Strategic Fund, LOR (The Kroger Company Recovery Zone | | | | |
| Facilities Bond Project) (LOC; Bank of Tokyo-Mitsubishi UFJ, Limited) | 0.30 | 2/7/11 | 9,500,000 a | 9,500,000 |
STATEMENT OF INVESTMENTS (continued)
| | | | | |
| Dreyfus Municipal | Coupon | Maturity | Principal | |
| Cash Management Plus (continued) | Rate (%) | Date | Amount ($) | Value ($) |
| |
| Short-Term Investments (continued) | | | | |
| Michigan (continued) | | | | |
| Oakland County Economic Development Corporation, LOR | | | | |
| (Michigan Seamless Tube LLC Project) (LOC; Bank of America) | 0.44 | 2/7/11 | 1,900,000 a | 1,900,000 |
| Pittsfield Township Economic Development Corporation, LOR, | | | | |
| Refunding (Arbor Project) (LOC; Comerica Bank) | 0.34 | 2/7/11 | 4,180,000 a | 4,180,000 |
| University of Michigan, CP | 0.28 | 2/16/11 | 8,795,000 | 8,795,000 |
| Waterford Charter Township Economic Development Corporation, | | | | |
| LOR, Refunding (Canterbury Health Care, Inc. Project) (LOC; FHLB) | 0.30 | 2/7/11 | 10,270,000 a | 10,270,000 |
| Minnesota—1.8% | | | | |
| Minnesota Housing Finance Agency, Residential Housing | | | | |
| Finance Revenue (Liquidity Facility; FHLB) | 0.30 | 2/7/11 | 7,000,000 a | 7,000,000 |
| Minnesota Housing Finance Agency, Residential Housing | | | | |
| Finance Revenue (Liquidity Facility; Lloyds TSB Bank PLC) | 0.31 | 2/7/11 | 3,150,000 a | 3,150,000 |
| University of Minnesota, CP | 0.29 | 4/6/11 | 7,837,000 | 7,837,000 |
| Nebraska—1.9% | | | | |
| Nebraska Investment Finance Authority, | | | | |
| SFHR (Liquidity Facility; FHLB) | 0.30 | 2/7/11 | 19,720,000 a | 19,720,000 |
| Nevada—2.8% | | | | |
| Clark County, Airport System Subordinate Lien Revenue | | | | |
| (LOC; Landesbank Baden-Wurttemberg) | 0.31 | 2/7/11 | 16,100,000 a | 16,100,000 |
| Clark County, Airport System Subordinate Lien Revenue | | | | |
| (LOC; Landesbank Baden-Wurttemberg) | 0.31 | 2/7/11 | 6,600,000 a | 6,600,000 |
| Director of Nevada Department of Business and Industry, | | | | |
| Revenue (Nevada Cancer Institute Project) (LOC; Bank of America) | 0.35 | 2/7/11 | 5,450,000 a | 5,450,000 |
| New Hampshire—.5% | | | | |
| New Hampshire Health and Education Facilities Authority, | | | | |
| Revenue (Kimball Union Academy) (LOC; RBS Citizens NA) | 0.42 | 2/7/11 | 5,000,000 a | 5,000,000 |
| New Jersey—2.3% | | | | |
| East Brunswick Township, GO Notes, BAN | 2.50 | 4/27/11 | 10,500,000 | 10,546,924 |
| New Brunswick Parking Authority, City-Guaranteed | | | | |
| Subordinated Project Notes (Transit Village Parking Project) | 2.00 | 3/1/11 | 3,000,000 | 3,001,957 |
| New Jersey Turnpike Authority, Turnpike Revenue | | | | |
| (Insured; Assured Guaranty Municipal Corp. and | | | | |
| Liquidity Facility; Westdeutsche Landesbank) | 0.31 | 2/7/11 | 10,000,000 a | 10,000,000 |
| New York—3.8% | | | | |
| New York Liberty Development Corporation, | | | | |
| Liberty Revenue (World Trade Center Project) | 0.35 | 8/4/11 | 25,000,000 | 25,000,000 |
| New York Local Government Assistance Corporation, Subordinate | | | | |
| Lien Revenue, Refunding (Liquidity Facility; Bank of America) | 0.30 | 2/7/11 | 9,000,000 a | 9,000,000 |
| Port Authority of New York and New Jersey, Special Obligation Revenue | | | | |
| (Versatile Structure Obligations) (LOC; Bayerische Landesbank) | 0.32 | 2/1/11 | 4,300,000 a | 4,300,000 |
32
| | | | | |
| Dreyfus Municipal | Coupon | Maturity | Principal | |
| Cash Management Plus (continued) | Rate (%) | Date | Amount ($) | Value ($) |
| |
| Short-Term Investments (continued) | | | | |
| North Carolina—3.5% | | | | |
| North Carolina Education Assistance Authority, Student Loan | | | | |
| Revenue, Refunding (LOC; Royal Bank of Canada) | 0.31 | 2/7/11 | 29,600,000 a | 29,600,000 |
| Union County, GO Notes (Liquidity Facility; | | | | |
| Branch Banking and Trust Co.) | 0.27 | 2/7/11 | 6,200,000 a | 6,200,000 |
| Ohio—3.3% | | | | |
| Akron, Bath and Copley Joint Township Hospital District, Health Care | | | | |
| Facilities Revenue (Sumner on Ridgewood Project) (LOC; KBC Bank) | 0.31 | 2/7/11 | 5,055,000 a | 5,055,000 |
| Lorain County, IDR (Cutting Dynamics, Inc. | | | | |
| Project) (LOC; National City Bank) | 0.39 | 2/7/11 | 1,905,000 a | 1,905,000 |
| Montgomery County, Revenue, CP (Miami Valley Hospital) | 0.45 | 2/18/11 | 10,000,000 | 10,000,000 |
| Puttable Floating Option Tax Exempt Receipts (Hamilton County, | | | | |
| Hospital Facilities Revenue (University Hospital)) (Liquidity | | | | |
| Facility; Bank of America and LOC; Bank of America) | 0.41 | 2/7/11 | 7,870,000 a,b | 7,870,000 |
| Union Township, GO Notes, BAN (Various Purpose) | 1.25 | 9/13/11 | 9,000,000 | 9,027,360 |
| Oklahoma—.6% | | | | |
| Oklahoma Water Resources Board, State Loan Program | | | | |
| Revenue (Liquidity Facility; State Street Bank and Trust Co.) | 0.75 | 3/1/11 | 6,000,000 | 6,000,000 |
| Pennsylvania—5.9% | | | | |
| Blair County Industrial Development Authority, Revenue (Hollidaysburg | | | | |
| Area YMCA Project) (LOC; Citizens Bank of Pennsylvania) | 0.46 | 2/7/11 | 2,920,000 a | 2,920,000 |
| Chester County Health and Education Facilities Authority, Mortgage | | | | |
| Revenue (Tel Hai Obligated Group Project) (LOC; M&T Trust) | 0.29 | 2/7/11 | 10,405,000 a | 10,405,000 |
| Haverford Township School District, GO Notes (LOC; TD Bank) | 0.27 | 2/7/11 | 3,500,000 a | 3,500,000 |
| Horizon Hospital System Authority, Senior Health and Housing | | | | |
| Facilities Revenue (Saint Paul Homes Project) (LOC; M&T Trust) | 0.34 | 2/7/11 | 7,300,000 a | 7,300,000 |
| Pennsylvania Economic Development Financing Authority, Revenue | | | | |
| (Evergreen Community Power Facility) (LOC; M&T Trust) | 0.44 | 2/7/11 | 16,000,000 a | 16,000,000 |
| Philadelphia Authority for Industrial Development, | | | | |
| Revenue (The Pennsylvania School for the Deaf) | | | | |
| (LOC; Citizens Bank of Pennsylvania) | 0.46 | 2/7/11 | 2,400,000 a | 2,400,000 |
| Union County Industrial Development Authority, | | | | |
| Revenue (Stabler Companies Inc. Project) (LOC; M&T Trust) | 0.44 | 2/7/11 | 5,100,000 a | 5,100,000 |
| University of Pittsburgh of the Commonwealth | | | | |
| System of Higher Education, CP | 0.29 | 3/7/11 | 10,000,000 | 10,000,000 |
| York County, GO Notes, TRAN | 1.00 | 4/29/11 | 3,000,000 | 3,004,335 |
| South Carolina—4.4% | | | | |
| Charleston County School District, GO Notes, TAN | 2.00 | 4/1/11 | 20,000,000 | 20,054,700 |
| South Carolina Association of Governmental Organizations, COP | | | | |
| (Evidencing Undivided Proportionate Interests in Tax Anticipation | | | | |
| Notes (General Obligations) of Certain South Carolina School Districts) | 2.00 | 4/15/11 | 25,000,000 | 25,080,924 |
STATEMENT OF INVESTMENTS (continued)
| | | | | |
| Dreyfus Municipal | Coupon | Maturity | Principal | |
| Cash Management Plus (continued) | Rate (%) | Date | Amount ($) | Value ($) |
| |
| Short-Term Investments (continued) | | | | |
| Tennessee—1.5% | | | | |
| Clarksville Public Building Authority, Pooled Financing Revenue | | | | |
| (Tennessee Municipal Bond Fund) (LOC; Bank of America) | 0.30 | 2/1/11 | 2,900,000 a | 2,900,000 |
| Cleveland Health and Educational Facilities Board, Revenue | | | | |
| (Lee University Project) (LOC; Branch Banking and Trust Co.) | 0.30 | 2/7/11 | 3,400,000 a | 3,400,000 |
| Metropolitan Government of Nashville and Davidson County | | | | |
| Health and Educational Facilities Board, Revenue, Refunding | | | | |
| (Belmont University Project) (LOC; FHLB) | 0.27 | 2/7/11 | 6,200,000 a | 6,200,000 |
| Sevier County Public Building Authority, Public Project | | | | |
| Construction Notes (Tennessee Association of | | | | |
| Utility Districts Interim Loan Program) | 1.25 | 3/1/11 | 3,000,000 | 3,001,265 |
| Texas—16.4% | | | | |
| Calhoun Port Authority, Environmental Facilities Revenue (Formosa | | | | |
| Plastics Corporation, Texas Project) (LOC; Bank of America) | 0.41 | 2/7/11 | 10,000,000 a | 10,000,000 |
| Cypress-Fairbanks Independent School District, TAN | 1.50 | 2/15/11 | 10,000,000 | 10,004,169 |
| DeSoto Industrial Development Authority, IDR, Refunding | | | | |
| (National Service Industries Inc. Project) (LOC; Wells Fargo Bank) | 0.39 | 2/7/11 | 3,660,000 a | 3,660,000 |
| El Paso Independent School District, Unlimited Tax School Building | | | | |
| Bonds (Liquidity Facility; JPMorgan Chase Bank and LOC; | | | | |
| Permanent School Fund Guarantee Program) | 0.35 | 4/5/11 | 13,000,000 | 13,000,000 |
| Harris County, GO Notes, TAN | 2.00 | 2/28/11 | 10,000,000 | 10,012,317 |
| Houston, Utility System Revenue, CP (LOC; Barclays Bank PLC) | 0.29 | 3/17/11 | 5,000,000 | 5,000,000 |
| Jefferson County Industrial Development Corporation, | | | | |
| Hurricane Ike Disaster Area Revenue (Jefferson Refinery, LLC | | | | |
| Project) (LOC; Branch Banking and Trust Co.) | 0.55 | 3/30/11 | 20,000,000 | 20,000,000 |
| North Texas Tollway Authority, Revenue, CP (LOC; Bank of America) | 0.34 | 3/8/11 | 7,300,000 | 7,300,000 |
| Port of Port Arthur Navigation District, Revenue, CP (BASF) | 0.49 | 3/17/11 | 5,000,000 | 5,000,000 |
| San Antonio, Sales Tax Revenue, CP (LOC; Bank of America) | 0.29 | 2/17/11 | 5,000,000 | 5,000,000 |
| Texas, GO Notes (Veterans’ Housing Assistance Program) | | | | |
| (Liquidity Facility; State Street Bank and Trust Co.) | 0.31 | 2/7/11 | 16,000,000 a | 16,000,000 |
| Texas, TRAN | 2.00 | 8/31/11 | 10,000,000 | 10,095,206 |
| Texas Department of Housing and Community Affairs, SFMR | 0.30 | 2/7/11 | 52,600,000 a | 52,600,000 |
| Utah—.9% | | | | |
| Murray City, HR (Intermountain Health Care Health Services, Inc.) | 0.25 | 2/7/11 | 7,300,000 a | 7,300,000 |
| Utah Housing Corporation, SFMR (LOC; Royal Bank of Canada) | 0.45 | 3/22/11 | 1,800,000 | 1,800,000 |
34
| | | | | |
| Dreyfus Municipal | Coupon | Maturity | Principal | |
| Cash Management Plus (continued) | Rate (%) | Date | Amount ($) | Value ($) |
| |
| Short-Term Investments (continued) | | | | |
| Vermont—.9% | | | | |
| Vermont Economic Development Authority, Revenue, CP (Economic | | | | |
| Development Capital Program) (LOC; JPMorgan Chase Bank) | 0.38 | 3/10/11 | 9,000,000 | 9,000,000 |
| Virginia—1.3% | | | | |
| Lynchburg Redevelopment and Housing Authority, Housing | | | | |
| Revenue (KHM Properties-Lynchburg, LLC Project) (LOC; M&T Trust) | 0.39 | 2/7/11 | 13,520,000 a | 13,520,000 |
| Washington—1.3% | | | | |
| Pierce County Economic Development Corporation, Multi-Mode Industrial | | | | |
| Revenue (SeaTac Packaging Project) (LOC; HSBC Bank USA) | 0.41 | 2/7/11 | 4,960,000 a | 4,960,000 |
| Washington Economic Development Finance Authority, SWDR | | | | |
| (CleanScapes, Inc. Project) (LOC; Bank of the West) | 0.35 | 2/7/11 | 7,895,000 a | 7,895,000 |
| Wisconsin—2.5% | | | | |
| Wisconsin Health and Educational Facilities Authority, Revenue | | | | |
| (Mequon Jewish Campus, Inc. Project) (LOC; JPMorgan Chase Bank) | 0.40 | 2/7/11 | 6,250,000 a | 6,250,000 |
| Wisconsin Housing and Economic Development Authority, | | | | |
| Home Ownership Revenue (Liquidity Facility; Fortis Bank) | 0.33 | 2/7/11 | 19,660,000 a | 19,660,000 |
| Wyoming—1.5% | | | | |
| Wyoming Student Loan Corporation, Student Loan | | | | |
| Revenue, Refunding (LOC; Royal Bank of Canada) | 0.29 | 2/7/11 | 15,000,000 a | 15,000,000 |
| U.S. Related—.3% | | | | |
| Puerto Rico Commonwealth, Public Improvement GO Notes, | | | | |
| Refunding (Insured; Assured Guaranty Municipal Corp. | | | | |
| and Liquidity Facility; Dexia Credit Locale) | 0.29 | 2/7/11 | 3,320,000 a | 3,320,000 |
| |
| Total Investments (cost $1,025,948,832) | | | 100.5% | 1,025,948,832 |
| Liabilities, Less Cash and Receivables | | | (.5%) | (5,189,055) |
| Net Assets | | | 100.0% | 1,020,759,777 |
| |
| See footnotes on page 57. | | | | |
| See notes to financial statements. | | | | |
STATEMENT OF INVESTMENTS
January 31, 2011
| | | | | |
| Dreyfus New York | Coupon | Maturity | Principal | |
| Municipal Cash Management | Rate (%) | Date | Amount ($) | Value ($) |
| |
| Short-Term Investments—100.0% | | | | |
| New York—97.6% | | | | |
| Albany Industrial Development Agency, Civic Facility Revenue | | | | |
| (Albany Medical Center Hospital Project) (LOC; Bank of America) | 0.30 | 2/7/11 | 2,700,000 a | 2,700,000 |
| Attica, GO Notes, BAN | 1.25 | 5/19/11 | 1,850,000 | 1,851,356 |
| Babylon, GO Notes, BAN | 1.50 | 4/15/11 | 4,000,000 | 4,008,425 |
| Chautauqua County Industrial Development Agency, Civic Facility | | | | |
| Revenue (Gerry Homes Project) (LOC; HSBC Bank USA) | 0.45 | 2/7/11 | 11,340,000 a | 11,340,000 |
| Chemung County Industrial Development Agency, IDR (MMARS | | | | |
| 2nd Program) (Trayer Products, Inc. Project) (LOC; HSBC Bank USA) | 0.45 | 2/7/11 | 655,000 a | 655,000 |
| Columbia County Capital Resource Corporation, Civic Facility Revenue | | | | |
| (The Columbia Memorial Hospital Project) (LOC; HSBC Bank USA) | 0.28 | 2/7/11 | 6,945,000 a | 6,945,000 |
| Columbia County Industrial Development Agency, Civic Facility Revenue | | | | |
| (The Columbia Memorial Hospital Project) (LOC; HSBC Bank USA) | 0.28 | 2/7/11 | 5,245,000 a | 5,245,000 |
| Dutchess County Industrial Development Agency, Civic Facility Revenue | | | | |
| (Anderson Foundation for Autism, Inc. Project) (LOC; M&T Trust) | 0.34 | 2/7/11 | 7,645,000 a | 7,645,000 |
| Dutchess County Industrial Development Agency, Civic Facility Revenue | | | | |
| (Anderson Foundation for Autism, Inc. Project) (LOC; M&T Trust) | 0.34 | 2/7/11 | 9,065,000 a | 9,065,000 |
| Dutchess County Industrial Development Agency, Civic Facility | | | | |
| Revenue (Arbor Ridge Brookmeade Inc.) (LOC; M&T Trust) | 0.34 | 2/7/11 | 13,330,000 a | 13,330,000 |
| Elmira City School District, GO Notes, BAN | 1.50 | 6/30/11 | 8,500,000 | 8,512,006 |
| Erie County Industrial Development Agency, Civic Facility Revenue | | | | |
| (YMCA of Greater Buffalo Project) (LOC; HSBC Bank USA) | 0.45 | 2/7/11 | 225,000 a | 225,000 |
| Erie County Industrial Development Agency, Civic Facility Revenue | | | | |
| (YMCA of Greater Buffalo Project) (LOC; HSBC Bank USA) | 0.45 | 2/7/11 | 3,185,000 a | 3,185,000 |
| Erie County Industrial Development Agency, IDR | | | | |
| (Hydro-Air Components Inc. Project) (LOC; HSBC Bank USA) | 0.41 | 2/7/11 | 2,900,000 a | 2,900,000 |
| Evans, GO Notes, BAN | 1.25 | 10/6/11 | 2,125,000 | 2,127,833 |
| Forestville Central School District, GO Notes, BAN | 2.00 | 7/14/11 | 4,700,000 | 4,718,046 |
| Fort Ann, GO Notes, BAN | 1.50 | 8/26/11 | 3,000,000 | 3,005,858 |
| Herkimer County Industrial Development Agency, IDR (F.E. Hale | | | | |
| Manufacturing Company Facility) (LOC; HSBC Bank USA) | 0.45 | 2/7/11 | 1,710,000 a | 1,710,000 |
| JPMorgan Chase Putters/Drivers Trust (New York State | | | | |
| Dormitory Authority, State Personal Income Tax Revenue | | | | |
| (Education)) (Liquidity Facility; JPMorgan Chase Bank) | 0.29 | 2/7/11 | 7,000,000 a,b | 7,000,000 |
| Lancaster Industrial Development Agency, IDR | | | | |
| (Sealing Devices Inc. Project) (LOC; HSBC Bank USA) | 0.41 | 2/7/11 | 2,170,000 a | 2,170,000 |
| Long Island Power Authority, CP (Long Island Lighting | | | | |
| Company) (LOC; JPMorgan Chase Bank) | 0.29 | 4/6/11 | 30,900,000 | 30,900,000 |
| Long Island Power Authority, CP (Long Island Lighting | | | | |
| Company) (LOC; State Street Bank and Trust Co.) | 0.30 | 3/8/11 | 18,800,000 | 18,800,000 |
| Long Island Power Authority, Electric System General | | | | |
| Revenue (Insured; Assured Guaranty Municipal Corp. | | | | |
| and Liquidity Facility; Dexia Credit Locale) | 0.30 | 2/7/11 | 20,000,000 a | 20,000,000 |
| Long Island Power Authority, Electric System | | | | |
| Subordinated Revenue (LOC; Westdeutsche Landesbank) | 0.26 | 2/1/11 | 4,000,000 a | 4,000,000 |
36
| | | | | |
| Dreyfus New York | Coupon | Maturity | Principal | |
| Municipal Cash Management (continued) | Rate (%) | Date | Amount ($) | Value ($) |
| |
| Short-Term Investments (continued) | | | | |
| New York (continued) | | | | |
| Metropolitan Transportation Authority, Dedicated Tax Fund | | | | |
| Revenue (Insured; Assured Guaranty Municipal Corp. | | | | |
| and Liquidity Facility; Dexia Credit Locale) | 0.32 | 2/7/11 | 10,000,000 a | 10,000,000 |
| Metropolitan Transportation Authority, Dedicated Tax Fund | | | | |
| Revenue, Refunding (Insured; Assured Guaranty | | | | |
| Municipal Corp. and Liquidity Facility; Dexia Credit Locale) | 0.33 | 2/7/11 | 34,700,000 a | 34,700,000 |
| Metropolitan Transportation Authority, | | | | |
| Transportation Revenue, CP (LOC; Citibank NA) | 0.32 | 3/8/11 | 15,000,000 | 15,000,000 |
| Metropolitan Transportation Authority, | | | | |
| Transportation Revenue, CP (LOC; Citibank NA) | 0.29 | 4/6/11 | 10,000,000 | 10,000,000 |
| Metropolitan Transportation Authority, Transportation Revenue, | | | | |
| Refunding (Insured; Assured Guaranty Municipal Corp. | | | | |
| and Liquidity Facility; Westdeutsche Landesbank) | 0.34 | 2/7/11 | 14,310,000 a | 14,310,000 |
| Monroe County Industrial Development Agency, Civic Facility | | | | |
| Revenue (YMCA of Greater Rochester Project) (LOC; M&T Trust) | 0.34 | 2/7/11 | 2,175,000 a | 2,175,000 |
| Monroe County Industrial Development Agency, IDR | | | | |
| (Chaney Enterprise) (LOC; M&T Trust) | 0.49 | 2/7/11 | 1,950,000 a | 1,950,000 |
| Monroe County Industrial Development Agency, IDR | | | | |
| (Genesee Metal Stampings Inc. Facility) (LOC; HSBC Bank USA) | 0.45 | 2/7/11 | 310,000 a | 310,000 |
| Monroe County Industrial Development Agency, Revenue (HDF-RWC | | | | |
| Project 1, LLC— Robert Weslayan College Project) (LOC; M&T Trust) | 0.35 | 2/7/11 | 2,600,000 a | 2,600,000 |
| Monroe County Industrial Development Corporation, Revenue | | | | |
| (Saint Ann’s Home for the Aged Project) (LOC; HSBC Bank USA) | 0.34 | 2/7/11 | 8,000,000 a | 8,000,000 |
| New York City, GO Notes | 5.00 | 8/1/11 | 7,360,000 | 7,528,223 |
| New York City, GO Notes (Liquidity Facility; Bank of America) | 0.28 | 2/1/11 | 1,800,000 a | 1,800,000 |
| New York City, GO Notes (LOC; Bank of America) | 0.24 | 2/7/11 | 7,895,000 a | 7,895,000 |
| New York City, GO Notes (LOC; Bank of Nova Scotia) | 0.28 | 2/7/11 | 6,785,000 a | 6,785,000 |
| New York City, GO Notes (LOC; JPMorgan Chase Bank) | 0.24 | 2/1/11 | 4,000,000 a | 4,000,000 |
| New York City, GO Notes (LOC; Westdeutsche Landesbank) | 0.32 | 2/1/11 | 7,950,000 a | 7,950,000 |
| New York City Capital Resource Corporation, Recovery Zone | | | | |
| Facility Revenue (WytheHotel Project) (LOC; M&T Trust) | 0.37 | 2/7/11 | 3,800,000 a | 3,800,000 |
| New York City Housing Development Corporation, | | | | |
| MFHR (Liquidity Facility; Citibank NA) | 0.31 | 2/7/11 | 10,000,000 a,b | 10,000,000 |
| New York City Housing Development Corporation, MFMR (The Crest | | | | |
| Project) (LOC; Landesbank Hessen-Thuringen Girozentrale) | 0.34 | 2/7/11 | 8,000,000 a | 8,000,000 |
| New York City Industrial Development Agency, Civic Facility | | | | |
| Revenue (Children’s Oncology Society of New York, Inc. | | | | |
| Project) (LOC; JPMorgan Chase Bank) | 0.30 | 2/7/11 | 8,200,000 a | 8,200,000 |
| New York City Industrial Development Agency, Civic Facility | | | | |
| Revenue (French Institute-Alliance Francaise de New York—Federation | | | | |
| of French Alliances in the United States Project) (LOC; M&T Trust) | 0.37 | 2/7/11 | 3,475,000 a | 3,475,000 |
| New York City Industrial Development Agency, | | | | |
| Civic Facility Revenue (Jewish Community Center | | | | |
| on the Upper West Side, Inc. Project) (LOC; M&T Trust) | 0.34 | 2/7/11 | 4,900,000 a | 4,900,000 |
STATEMENT OF INVESTMENTS (continued)
| | | | | |
| Dreyfus New York | Coupon | Maturity | Principal | |
| Municipal Cash Management (continued) | Rate (%) | Date | Amount ($) | Value ($) |
| |
| Short-Term Investments (continued) | | | | |
| New York (continued) | | | | |
| New York City Industrial Development Agency, Civic Facility Revenue | | | | |
| (Sephardic Community Youth Center, Inc. Project) (LOC; M&T Trust) | 0.34 | 2/7/11 | 3,100,000 a | 3,100,000 |
| New York City Industrial Development Agency, Civic Facility | | | | |
| Revenue (Spence-Chapin, Services to Families | | | | |
| and Children Project) (LOC; TD Bank) | 0.34 | 2/7/11 | 5,970,000 a | 5,970,000 |
| New York City Industrial Development Agency, Civic Facility Revenue | | | | |
| (The Allen-Stevenson School Project) (LOC; JPMorgan Chase Bank) | 0.32 | 2/7/11 | 9,470,000 a | 9,470,000 |
| New York City Industrial Development Agency, Civic Facility | | | | |
| Revenue (Village Community School Project) (LOC; M&T Trust) | 0.47 | 2/7/11 | 2,400,000 a | 2,400,000 |
| New York City Municipal Water Finance Authority, Water and | | | | |
| Sewer System Revenue (Liquidity Facility; BNP Paribas) | 0.26 | 2/7/11 | 6,000,000 a | 6,000,000 |
| New York City Municipal Water Finance Authority, Water and | | | | |
| Sewer System Revenue (Liquidity Facility; Wells Fargo Bank) | 0.25 | 2/7/11 | 15,000,000 a | 15,000,000 |
| New York City Transitional Finance Authority, Future Tax Secured | | | | |
| Revenue (Liquidity Facility; Westdeutsche Landesbank) | 0.26 | 2/7/11 | 9,000,000 a | 9,000,000 |
| New York City Transitional Finance Authority, Revenue | | | | |
| (New York City Recovery) (Liquidity Facility; Dexia Credit Locale) | 0.29 | 2/1/11 | 6,500,000 a | 6,500,000 |
| New York Job Development Authority, | | | | |
| State-Guaranteed Special Purpose Bonds | 5.00 | 3/1/11 | 1,200,000 | 1,203,949 |
| New York Liberty Development Corporation, | | | | |
| Liberty Revenue (World Trade Center Project) | 0.35 | 8/4/11 | 35,000,000 | 35,000,000 |
| New York Liberty Development Corporation, | | | | |
| Recovery Zone Revenue (3 World Trade Center Project) | 0.42 | 1/19/12 | 21,500,000 | 21,500,000 |
| New York Local Government Assistance Corporation, Subordinate | | | | |
| Lien Revenue, Refunding (Liquidity Facility; Bank of America) | 0.30 | 2/7/11 | 35,000,000 a | 35,000,000 |
| New York Local Government Assistance Corporation, Subordinate | | | | |
| Lien Revenue, Refunding (Liquidity Facility; JPMorgan Chase Bank) | 0.25 | 2/7/11 | 5,000,000 a | 5,000,000 |
| New York State Dormitory Authority, Insured Revenue | | | | |
| (The Culinary Institute of America) (LOC; TD Bank) | 0.26 | 2/7/11 | 6,925,000 a | 6,925,000 |
| New York State Dormitory Authority, Revenue | | | | |
| (F.F.T. Senior Communities, Inc.) (LOC; KBC Bank) | 0.29 | 2/7/11 | 4,420,000 a | 4,420,000 |
| New York State Dormitory Authority, Revenue | | | | |
| (Saint John’s University) (LOC; JPMorgan Chase Bank) | 0.28 | 2/7/11 | 10,315,000 a | 10,315,000 |
| New York State Dormitory Authority, Revenue | | | | |
| (The College of New Rochelle) (LOC; RBS Citizens NA) | 0.28 | 2/7/11 | 4,000,000 a | 4,000,000 |
| New York State Dormitory Authority, | | | | |
| Revenue (The Rockefeller University) | 0.27 | 2/7/11 | 10,175,000 a | 10,175,000 |
| New York State Housing Finance Agency, | | | | |
| Housing Revenue (250 West 93rd Street) | | | | |
| (LOC; Landesbank Hessen-Thuringen Girozentrale) | 0.28 | 2/7/11 | 23,400,000 a | 23,400,000 |
| New York State Housing Finance Agency, Housing | | | | |
| Revenue (350 West 37th Street) (LOC; Wells Fargo Bank) | 0.28 | 2/7/11 | 9,000,000 a | 9,000,000 |
| New York State Housing Finance Agency, Service | | | | |
| Contract Revenue, Refunding (LOC; Bank of America) | 0.27 | 2/7/11 | 4,200,000 a | 4,200,000 |
| New York State Mortgage Agency, Homeowner Mortgage | | | | |
| Revenue (Liquidity Facility; Bank of America) | 0.30 | 2/7/11 | 17,700,000 a | 17,700,000 |
38
| | | | | |
| Dreyfus New York | Coupon | Maturity | Principal | |
| Municipal Cash Management (continued) | Rate (%) | Date | Amount ($) | Value ($) |
| |
| Short-Term Investments (continued) | | | | |
| New York (continued) | | | | |
| New York State Thruway Authority, General Revenue, BAN | 2.50 | 7/15/11 | 4,595,000 | 4,637,800 |
| New York State Thruway Authority, General Revenue, BAN | 4.00 | 7/15/11 | 14,975,000 | 15,217,986 |
| New York State Thruway Authority, Second General | | | | |
| Highway and Bridge Trust Fund Bonds | 5.00 | 4/1/11 | 1,000,000 | 1,007,589 |
| New York State Urban Development Corporation, | | | | |
| State Personal Income Tax Revenue (General Purpose) | 2.00 | 3/15/11 | 15,345,000 | 15,375,829 |
| Onondaga County Industrial Development Agency, IDR | | | | |
| (ICM Controls Corporation Project) (LOC; M&T Trust) | 0.44 | 2/7/11 | 2,120,000 a | 2,120,000 |
| Ontario County Industrial Development Agency, | | | | |
| Civic Facility Revenue (Friends of the Finger Lakes | | | | |
| Performing Arts Center, Inc. Civic Facility) (LOC; FHLB) | 0.49 | 2/7/11 | 6,345,000 a | 6,345,000 |
| Ontario County Industrial Development Agency, IDR | | | | |
| (Dixit Enterprises/Newtex Industries, Inc. | | | | |
| Facility) (LOC; HSBC Bank USA) | 0.45 | 2/7/11 | 2,400,000 a | 2,400,000 |
| Port Authority of New York and New Jersey, CP | 0.32 | 3/7/11 | 25,000,000 | 25,000,000 |
| Port Authority of New York and New Jersey, CP | 0.32 | 3/14/11 | 5,000,000 | 5,000,000 |
| Port Authority of New York and New Jersey, CP | 0.33 | 4/29/11 | 5,010,000 | 5,010,000 |
| Port Authority of New York and New Jersey, CP | 0.33 | 5/5/11 | 20,000,000 | 20,000,000 |
| Port Authority of New York and New Jersey, CP | 0.34 | 6/8/11 | 15,890,000 | 15,890,000 |
| Port Authority of New York and New Jersey, Equipment Notes | 0.35 | 2/7/11 | 10,500,000 a | 10,500,000 |
| Port Authority of New York and New Jersey, Special Obligation | | | | |
| Revenue (Versatile Structure Obligations) (Liquidity | | | | |
| Facility; Landesbank Hessen-Thuringen Girozentrale) | 0.30 | 2/1/11 | 5,200,000 a | 5,200,000 |
| Port Authority of New York and New Jersey, | | | | |
| Special Obligation Revenue (Versatile Structure | | | | |
| Obligations) (LOC; Bayerische Landesbank) | 0.32 | 2/1/11 | 19,900,000 a | 19,900,000 |
| Putnam County Industrial Development Agency, Civic Facility | | | | |
| Revenue (United Cerebral Palsy of Putnam and Southern | | | | |
| Dutchess Project) (LOC; Commerce Bank NA) | 0.26 | 2/7/11 | 3,480,000 a | 3,480,000 |
| Schenectady, GO Notes, BAN | 1.50 | 5/20/11 | 5,000,000 | 5,003,635 |
| Schenectady Industrial Development Agency, Civic Facility | | | | |
| Revenue (Union Graduate College Project) (LOC; M&T Trust) | 0.34 | 2/7/11 | 5,435,000 a | 5,435,000 |
| South Country Central School District | | | | |
| at Brookhaven, GO Notes, TAN | 1.50 | 6/30/11 | 3,500,000 | 3,507,799 |
| Syracuse Industrial Development Agency, | | | | |
| Civic Facility Revenue (Community Development | | | | |
| Properties-Larned Project) (LOC; M&T Trust) | 0.35 | 2/7/11 | 2,410,000 a | 2,410,000 |
| Ticonderoga Central School District, GO Notes, BAN | 2.00 | 6/24/11 | 7,300,000 | 7,323,979 |
| Ulster County Industrial Development Agency, | | | | |
| IDR (Selux Corporation Project) (LOC; M&T Trust) | 0.44 | 2/7/11 | 1,025,000 a | 1,025,000 |
| Westchester County Industrial Development Agency, | | | | |
| Civic Facility Revenue (The Masters School | | | | |
| Civic Facility) (LOC; JPMorgan Chase Bank) | 0.32 | 2/7/11 | 5,400,000 a | 5,400,000 |
| Yonkers Industrial Development Agency, MFHR | | | | |
| (Main Street Lofts Yonkers LLC Project) (LOC; M&T Trust) | 0.44 | 2/7/11 | 30,000,000 a | 30,000,000 |
STATEMENT OF INVESTMENTS (continued)
| | | | | |
| Dreyfus New York | Coupon | Maturity | Principal | |
| Municipal Cash Management (continued) | Rate (%) | Date | Amount ($) | Value ($) |
| |
| Short-Term Investments (continued) | | | | |
| U.S. Related—2.4% | | | | |
| Puerto Rico Commonwealth Public Improvement GO Notes, | | | | |
| Refunding (Insured; Assured Guaranty Municipal Corp. | | | | |
| and Liquidity Facility; Dexia Credit Locale) | 0.26 | 2/7/11 | 6,200,000 a | 6,200,000 |
| Puerto Rico Commonwealth, Public Improvement GO Notes, | | | | |
| Refunding (Insured; Assured Guaranty Municipal Corp. | | | | |
| and Liquidity Facility; Dexia Credit Locale) | 0.29 | 2/7/11 | 6,800,000 a | 6,800,000 |
| Puerto Rico Sales Tax Financing Corporation, | | | | |
| Sales Tax Revenue (Liquidity Facility; Citibank NA) | 0.30 | 2/7/11 | 7,000,000 a,b | 7,000,000 |
| |
| Total Investments (cost $827,885,313) | | | 100.0% | 827,885,313 |
| Liabilities, Less Cash and Receivables | | | (.0%) | (159,626) |
| Net Assets | | | 100.0% | 827,725,687 |
| |
| See footnotes on page 57. | | | | |
| See notes to financial statements. | | | | |
40
STATEMENT OF INVESTMENTS
January 31, 2011
| | | | | |
| Dreyfus Tax Exempt | Coupon | Maturity | Principal | |
| Cash Management | Rate (%) | Date | Amount ($) | Value ($) |
| |
| Short-Term Investments—100.4% | | | | |
| Alabama—.8% | | | | |
| University of Alabama Board of Trustees, Revenue (University of | | | | |
| Alabama at Birmingham Hospital) (LOC; Bank of America) | 0.33 | 2/7/11 | 25,000,000 a | 25,000,000 |
| Arizona—.7% | | | | |
| Arizona Health Facilities Authority, HR (Phoenix Children’s Hospital) | | | | |
| (Liquidity Facility; Bank of America and LOC; Bank of America) | 0.48 | 2/7/11 | 9,875,000 a,b | 9,875,000 |
| Arizona Health Facilities Authority, HR (Phoenix Children’s Hospital) | | | | |
| (Liquidity Facility; BNP Paribas and LOC; BNP Paribas) | 0.39 | 2/7/11 | 12,395,000 a,b | 12,395,000 |
| California—1.1% | | | | |
| Irvine Assessment District Number 07-22, Limited | | | | |
| Obligation Improvement Revenue (LOC; KBC Bank) | 0.30 | 2/1/11 | 12,475,000 a | 12,475,000 |
| Los Angeles Department of Airports, Airport Revenue, CP | | | | |
| (LOC: Citibank NA and State Street Bank and Trust Co.) | 0.31 | 3/9/11 | 17,500,000 | 17,500,000 |
| Orange County Sanitation District, COP, | | | | |
| Refunding (Liquidity Facility; Lloyds TSB Bank PLC) | 0.30 | 2/1/11 | 4,300,000 a | 4,300,000 |
| Colorado—3.3% | | | | |
| Colorado Educational and Cultural Facilities Authority, Revenue, | | | | |
| Refunding (YMCA of the Rockies Project) (LOC; Bank of America) | 0.32 | 2/1/11 | 8,000,000 a | 8,000,000 |
| Denver Urban Renewal Authority, Stapleton | | | | |
| Senior Tax Increment Revenue (LOC; U.S. Bank NA) | 0.29 | 2/7/11 | 9,700,000 a | 9,700,000 |
| RBC Municipal Products Inc. Trust (Meridian Village Metropolitan | | | | |
| District Number One, Improvement Revenue) (Liquidity Facility; | | | | |
| Royal Bank of Canada and LOC; Royal Bank of Canada) | 0.29 | 2/7/11 | 17,600,000 a,b | 17,600,000 |
| Southern Ute Indian Tribe of the | | | | |
| Southern Ute Indian Reservation, Revenue | 0.30 | 2/7/11 | 65,300,000 a | 65,300,000 |
| Southglenn Metropolitan District, | | | | |
| Special Revenue (LOC; BNP Paribas) | 0.31 | 2/7/11 | 7,900,000 a | 7,900,000 |
| Connecticut—.5% | | | | |
| Connecticut Health and Educational Facilities Authority, | | | | |
| Revenue (The Jerome Home Issue) (LOC; Bank of America) | 0.36 | 2/7/11 | 4,560,000 a | 4,560,000 |
| Connecticut Health and Educational Facilities Authority, | | | | |
| Revenue (Yale University Issue) (Liquidity Facility; Citibank NA) | 0.29 | 2/7/11 | 11,850,000 a,b | 11,850,000 |
| Delaware—.6% | | | | |
| Delaware Economic Development Authority, Multi-Family | | | | |
| Revenue (School House Trust Project) (LOC; HSBC Bank USA) | 0.45 | 2/7/11 | 11,500,000 a | 11,500,000 |
| Delaware Health Facilities Authority, Revenue, CP | | | | |
| (Christiana Care Health Services) | 0.28 | 2/14/11 | 8,000,000 | 8,000,000 |
| District of Columbia—2.8% | | | | |
| Anacostia Waterfront Corporation, PILOT Revenue (Merlots Program) | | | | |
| (Liquidity Facility; Wells Fargo Bank and LOC; Wells Fargo Bank) | 0.29 | 2/7/11 | 50,000,000 a,b | 50,000,000 |
| District of Columbia, Revenue (American Legacy Foundation Issue) | 0.28 | 2/7/11 | 14,000,000 a | 14,000,000 |
| District of Columbia, Revenue (American Public Health | | | | |
| Association Issue) (LOC; Bank of America) | 0.54 | 2/7/11 | 6,350,000 a | 6,350,000 |
| District of Columbia, Revenue (Carnegie Endowment for | | | | |
| International Peace Issue) (LOC; Wells Fargo Bank) | 0.28 | 2/7/11 | 20,250,000 a | 20,250,000 |
STATEMENT OF INVESTMENTS (continued)
| | | | | |
| Dreyfus Tax Exempt | Coupon | Maturity | Principal | |
| Cash Management (continued) | Rate (%) | Date | Amount ($) | Value ($) |
| |
| Short-Term Investments (continued) | | | | |
| Florida—5.9% | | | | |
| Capital Trust Agency, MFHR (Brittany Bay Apartments—Waterman’s | | | | |
| Crossing) (Liquidity Facility; FHLMC and LOC; FHLMC) | 0.32 | 2/7/11 | 22,925,000 a,b | 22,925,000 |
| Citizens Property Insurance Corporation, High-Risk | | | | |
| Account Senior Secured Revenue | 2.00 | 4/21/11 | 77,150,000 | 77,281,428 |
| Florida Local Governmental Finance Commission, | | | | |
| Pooled Loan Program Revenue, CP (LOC; Wells Fargo Bank) | 0.30 | 3/11/11 | 16,895,000 | 16,895,000 |
| Highlands County Health Facilities Authority, HR | | | | |
| (Adventist Health System/Sunbelt Obligated Group) | 0.26 | 2/7/11 | 2,500,000 a | 2,500,000 |
| Sunshine State Government Financing Commission, | | | | |
| Revenue, CP (Liquidity Facility; JPMorgan Chase Bank) | 0.32 | 5/5/11 | 12,050,000 | 12,050,000 |
| Sunshine State Governmental Financing Commission, | | | | |
| Revenue (LOC; Dexia Credit Locale) | 0.35 | 2/7/11 | 9,300,000 a | 9,300,000 |
| Tohopekaliga Water Authority, Utility System Revenue | | | | |
| (LOC; Landesbank Hessen-Thuringen Girozentrale) | 0.30 | 2/7/11 | 51,430,000 a | 51,430,000 |
| Georgia—2.9% | | | | |
| Atlanta, Airport General Revenue, Refunding (Insured; Assured | | | | |
| Guaranty Municipal Corp. and Liquidity Facility; Citibank NA) | 0.33 | 2/7/11 | 10,000,000 a,b | 10,000,000 |
| Douglas County School District, GO Notes | 5.00 | 4/1/11 | 3,000,000 | 3,023,010 |
| Fulton County Development Authority, Educational | | | | |
| Facilities Revenue (Catholic Education of | | | | |
| North Georgia, Inc. Project) (LOC; Wells Fargo Bank) | 0.29 | 2/7/11 | 14,200,000 a | 14,200,000 |
| Fulton County Housing Authority, MFHR | | | | |
| (Liquidity Facility; FHLMC and LOC; FHLMC) | 0.32 | 2/7/11 | 25,365,000 a,b | 25,365,000 |
| Georgia, GO Notes | 5.00 | 3/1/11 | 3,345,000 | 3,357,488 |
| Georgia, GO Notes | 6.80 | 3/1/11 | 7,500,000 | 7,538,020 |
| Henry County School District, GO Notes | 5.00 | 4/1/11 | 6,900,000 | 6,953,254 |
| Municipal Electric Authority of Georgia, CP | | | | |
| (Project One) (LOC; Wells Fargo Bank) | 0.28 | 2/9/11 | 20,000,000 | 20,000,000 |
| Thomasville Hospital Authority, RAC (John D. Archbold Memorial | | | | |
| Hospital, Inc. Project) (LOC; Branch Banking and Trust Co.) | 0.30 | 2/7/11 | 5,040,000 a | 5,040,000 |
| Illinois—3.5% | | | | |
| Illinois Educational Facilities Authority, Revenue, CP | | | | |
| (Pooled Finance Program) (LOC; Northern Trust Company) | 0.32 | 3/8/11 | 81,200,000 | 81,200,000 |
| Illinois Finance Authority, Revenue (Hospice of | | | | |
| Northeastern Illinois Project) (LOC; Harris NA) | 0.30 | 2/7/11 | 5,500,000 a | 5,500,000 |
| Illinois Health Facilities Authority, Revenue (Revolving Fund | | | | |
| Pooled Financing Program) (LOC; JPMorgan Chase Bank) | 0.30 | 2/7/11 | 2,300,000 a | 2,300,000 |
| Illinois Toll Highway Authority, Toll Highway Senior Revenue, | | | | |
| Refunding (Insured; Assured Guaranty Municipal Corp. | | | | |
| and Liquidity Facility; Dexia Credit Locale) | 0.31 | 2/7/11 | 23,000,000 a | 23,000,000 |
| Lake County, MFHR (Whispering Oaks | | | | |
| Apartments Project) (LOC; FHLMC) | 0.35 | 2/7/11 | 3,250,000 a | 3,250,000 |
42
| | | | | |
| Dreyfus Tax Exempt | Coupon | Maturity | Principal | |
| Cash Management (continued) | Rate (%) | Date | Amount ($) | Value ($) |
| |
| Short-Term Investments (continued) | | | | |
| Indiana—1.2% | | | | |
| Indiana Finance Authority, HR (Community | | | | |
| Health Network Project) (LOC; Bank of America) | 0.33 | 2/7/11 | 15,000,000 a | 15,000,000 |
| Indiana Finance Authority, Revenue | | | | |
| (Ascension Health Senior Credit Group) | 0.26 | 2/7/11 | 5,000,000 a | 5,000,000 |
| Indiana Finance Authority, Revenue, | | | | |
| Refunding (Trinity Health Credit Group) | 0.22 | 2/7/11 | 5,800,000 a | 5,800,000 |
| Puttable Floating Option Tax Exempt Receipts (Indiana Health | | | | |
| Facility Financing Authority, Hospital Improvement Revenue, | | | | |
| Refunding (Community Hospitals Projects)) (Liquidity Facility; | | | | |
| Bank of America and LOC; Bank of America) | 0.44 | 2/7/11 | 13,000,000 a,b | 13,000,000 |
| Iowa—.1% | | | | |
| Tobacco Settlement Authority of Iowa, | | | | |
| Tobacco Settlement Asset-Backed Bonds (Prerefunded) | 5.30 | 6/1/11 | 4,225,000 c | 4,334,372 |
| Kentucky—.5% | | | | |
| Kentucky Property and Buildings Commission, Revenue, | | | | |
| Refunding (Project Number 84) (Liquidity Facility; | | | | |
| Dexia Credit Locale and LOC; Dexia Credit Locale) | 0.43 | 2/7/11 | 16,305,000 a,b | 16,305,000 |
| Louisiana—2.1% | | | | |
| Louisiana Local Government Environmental Facilities and | | | | |
| Community Development Authority, Healthcare Facilities | | | | |
| Revenue, Refunding (Saint James Place of Baton | | | | |
| Rouge Project) (LOC; Bank of America) | 0.34 | 2/7/11 | 11,520,000 a | 11,520,000 |
| Louisiana Public Facilities Authority, HR (Touro Infirmary Project) | | | | |
| (Liquidity Facility; Merrill Lynch Bank and LOC; Bank of America) | 0.48 | 2/7/11 | 30,840,000 a,b | 30,840,000 |
| Louisiana Public Facilities Authority, Revenue | | | | |
| (Tiger Athletic Foundation Project) (LOC; FHLB) | 0.28 | 2/7/11 | 15,575,000 a | 15,575,000 |
| Port of New Orleans Board of Commissioners, | | | | |
| Subordinate Lien Revenue, Refunding (LOC; FHLB) | 0.29 | 2/7/11 | 9,090,000 a | 9,090,000 |
| Maine—1.3% | | | | |
| Falmouth, GO Notes, BAN | 1.00 | 6/1/11 | 30,000,000 | 30,066,240 |
| Maine Finance Authority, Revenue (Waynflete | | | | |
| School Issue) (LOC; JPMorgan Chase Bank) | 0.30 | 2/7/11 | 11,090,000 a | 11,090,000 |
| Maryland—1.7% | | | | |
| Baltimore County Revenue Authority, | | | | |
| Golf System Revenue (LOC; M&T Trust) | 0.32 | 2/7/11 | 3,200,000 a | 3,200,000 |
| Frederick County, Revenue (Homewood, Inc. Facility) (LOC; M&T Trust) | 0.27 | 2/7/11 | 12,100,000 a | 12,100,000 |
| Frederick County, Revenue, Refunding (Manekin-Frederick | | | | |
| Associates Facility) (LOC; M&T Trust) | 0.41 | 2/7/11 | 2,060,000 a | 2,060,000 |
| Maryland Economic Development Corporation, | | | | |
| Revenue (Easter Seals Facility) (LOC; M&T Trust) | 0.34 | 2/7/11 | 6,655,000 a | 6,655,000 |
| Maryland Economic Development Corporation, Revenue | | | | |
| (Legal Aid Bureau, Inc. Facility) (LOC; M&T Trust) | 0.36 | 2/7/11 | 1,965,000 a | 1,965,000 |
STATEMENT OF INVESTMENTS (continued)
| | | | | |
| Dreyfus Tax Exempt | Coupon | Maturity | Principal | |
| Cash Management (continued) | Rate (%) | Date | Amount ($) | Value ($) |
| |
| Short-Term Investments (continued) | | | | |
| Maryland (continued) | | | | |
| Maryland Health and Higher Educational Facilities Authority, | | | | |
| Revenue (De Matha Catholic High School Issue) | | | | |
| (LOC; Branch Banking and Trust Co.) | 0.29 | 2/7/11 | 9,690,000 a | 9,690,000 |
| Maryland Industrial Development Financing Authority, | | | | |
| Recovery Zone Facility Revenue (Wexford Maryland | | | | |
| Bio Park 3, LLC Facility) (LOC; M&T Trust) | 0.34 | 2/7/11 | 20,000,000 a | 20,000,000 |
| Massachusetts—3.7% | | | | |
| Massachusetts, GO Notes, RAN | 2.00 | 4/28/11 | 20,000,000 | 20,079,441 |
| Massachusetts, GO Notes, RAN | 2.00 | 5/26/11 | 36,000,000 | 36,190,618 |
| Massachusetts Bay Transportation Authority, GO Notes (General | | | | |
| Transportation System) (Liquidity Facility; Dexia Credit Locale) | 0.31 | 2/7/11 | 19,150,000 a | 19,150,000 |
| Massachusetts Development Finance Agency, Revenue (The Marine | | | | |
| Biological Laboratory Issue) (LOC; JPMorgan Chase Bank) | 0.30 | 2/7/11 | 10,100,000 a | 10,100,000 |
| Massachusetts Health and Educational Facilities Authority, | | | | |
| Revenue (Partners HealthCare System Issue) | | | | |
| (Liquidity Facility; Bank of America) | 0.30 | 2/7/11 | 35,690,000 a | 35,690,000 |
| Michigan—6.6% | | | | |
| Board of Trustees of the Michigan State University, CP | 0.27 | 2/22/11 | 16,000,000 | 16,000,000 |
| Deutsche Bank Spears/Lifers Trust (Royal Oak Hospital | | | | |
| Finance Authority, HR, Refunding (William Beaumont | | | | |
| Hospital Obligated Group)) (Liquidity Facility; | | | | |
| Deutsche Bank AG and LOC; Deutsche Bank AG) | 0.29 | 2/7/11 | 16,705,000 a,b | 16,705,000 |
| Michigan, GO Notes | 2.00 | 9/30/11 | 55,000,000 | 55,568,760 |
| Michigan Finance Authority, State Aid Revenue Notes | 2.00 | 8/19/11 | 15,000,000 | 15,097,340 |
| Michigan Hospital Finance Authority, | | | | |
| Revenue, CP (Trinity Health System) | 0.30 | 2/3/11 | 37,500,000 | 37,500,000 |
| Michigan Hospital Finance Authority, | | | | |
| Revenue, CP (Trinity Health System) | 0.30 | 4/6/11 | 38,840,000 | 38,840,000 |
| Michigan Hospital Finance Authority, | | | | |
| Revenue, CP (Trinity Health System) | 0.31 | 4/6/11 | 15,000,000 | 15,000,000 |
| Michigan Hospital Finance Authority, | | | | |
| Revenue, CP (Trinity Health System) | 0.32 | 4/6/11 | 13,000,000 | 13,000,000 |
| University of Michigan, CP | 0.29 | 3/7/11 | 8,305,000 | 8,305,000 |
| Minnesota—1.8% | | | | |
| RBC Municipal Products Inc. Trust (Minneapolis, Health Care | | | | |
| System Revenue (Fairview Health Services)) (Liquidity | | | | |
| Facility; Royal Bank of Canada and LOC; Royal Bank of Canada) | 0.29 | 2/7/11 | 10,000,000 a,b | 10,000,000 |
| University of Minnesota, CP | 0.27 | 2/22/11 | 18,000,000 | 18,000,000 |
| University of Minnesota, CP | 0.27 | 2/22/11 | 12,000,000 | 12,000,000 |
| University of Minnesota, CP | 0.28 | 2/23/11 | 15,175,000 | 15,175,000 |
| University of Minnesota, CP | 0.29 | 4/6/11 | 4,250,000 | 4,250,000 |
| Missouri—.8% | | | | |
| Kansas City Industrial Development Authority, Revenue (Kansas City | | | | |
| Downtown Redevelopment District) (LOC; JPMorgan Chase Bank) | 0.30 | 2/7/11 | 25,100,000 a | 25,100,000 |
44
| | | | | |
| Dreyfus Tax Exempt | Coupon | Maturity | Principal | |
| Cash Management (continued) | Rate (%) | Date | Amount ($) | Value ($) |
| |
| Short-Term Investments (continued) | | | | |
| Nebraska—.8% | | | | |
| Nebraska Investment Finance Authority, | | | | |
| SFHR (Liquidity Facility; FHLB) | 0.28 | 2/7/11 | 25,000,000 a | 25,000,000 |
| Nevada—1.8% | | | | |
| Austin Trust (Clark County, GO Bond Bank Bonds) | | | | |
| (Liquidity Facility; Bank of America) | 0.36 | 2/7/11 | 9,770,000 a,b | 9,770,000 |
| Las Vegas Valley Water District, CP (LOC; BNP Paribas) | 0.32 | 2/2/11 | 47,600,000 | 47,600,000 |
| New Hampshire—.3% | | | | |
| New Hampshire Higher Educational and Health Facilities | | | | |
| Authority, Revenue (Hunt Community Issue) (LOC; TD Bank) | 0.26 | 2/7/11 | 9,795,000 a | 9,795,000 |
| New Jersey—2.5% | | | | |
| New Jersey Economic Development Authority, School Facilities | | | | |
| Construction Revenue, Refunding (LOC; Dexia Credit Locale) | 0.33 | 2/7/11 | 82,745,000 a | 82,745,000 |
| New Mexico—.2% | | | | |
| Dona Ana County, Industrial Revenue (Foamex | | | | |
| Products, Inc. Project) (LOC; Wells Fargo Bank) | 0.36 | 2/7/11 | 6,000,000 a | 6,000,000 |
| New York—6.5% | | | | |
| Long Island Power Authority, Electric System General | | | | |
| Revenue (Insured; Assured Guaranty Municipal Corp. | | | | |
| and Liquidity Facility; Dexia Credit Locale) | 0.30 | 2/7/11 | 23,150,000 a | 23,150,000 |
| Long Island Power Authority, Electric System General | | | | |
| Revenue (Insured; Assured Guaranty Municipal Corp. | | | | |
| and Liquidity Facility; Dexia Credit Locale) | 0.30 | 2/7/11 | 14,615,000 a | 14,615,000 |
| Metropolitan Transportation Authority, Dedicated Tax Fund | | | | |
| Revenue (Insured; Assured Guaranty Municipal Corp. | | | | |
| and Liquidity Facility; Dexia Credit Locale) | 0.32 | 2/7/11 | 13,500,000 a | 13,500,000 |
| Metropolitan Transportation Authority, Transportation Revenue, | | | | |
| Refunding (Insured; Assured Guaranty Municipal Corp. | | | | |
| and Liquidity Facility; Dexia Credit Locale) | 0.32 | 2/7/11 | 35,720,000 a | 35,720,000 |
| Metropolitan Transportation Authority, Transportation Revenue, | | | | |
| Refunding (Insured; Assured Guaranty Municipal Corp. and | | | | |
| Liquidity Facility; Westdeutsche Landesbank) | 0.34 | 2/7/11 | 26,000,000 a | 26,000,000 |
| New York Liberty Development Corporation, | | | | |
| Liberty Revenue (World Trade Center Project) | 0.35 | 8/4/11 | 70,000,000 | 70,000,000 |
| New York Liberty Development Corporation, Recovery | | | | |
| Zone Revenue (3 World Trade Center Project) | 0.42 | 1/19/12 | 10,000,000 | 10,000,000 |
| New York Local Government Assistance Corporation, Subordinate | | | | |
| Lien Revenue, Refunding (Liquidity Facility; Bank of America) | 0.30 | 2/7/11 | 10,000,000 a | 10,000,000 |
| Tompkins County Industrial Development Agency, | | | | |
| Civic Facility Revenue (Community Development | | | | |
| Properties Ithaca Inc. Project) (LOC; M&T Trust) | 0.39 | 2/7/11 | 10,000,000 a | 10,000,000 |
| North Carolina—.9% | | | | |
| North Carolina Medical Care Commission, Health Care | | | | |
| Facilities First Mortgage Revenue (Deerfield Episcopal | | | | |
| Retirement Community) (LOC; Branch Banking and Trust Co.) | 0.30 | 2/7/11 | 5,000,000 a | 5,000,000 |
STATEMENT OF INVESTMENTS (continued)
| | | | | |
| Dreyfus Tax Exempt | Coupon | Maturity | Principal | |
| Cash Management (continued) | Rate (%) | Date | Amount ($) | Value ($) |
| |
| Short-Term Investments (continued) | | | | |
| North Carolina (continued) | | | | |
| Piedmont Triad Airport Authority, Airport | | | | |
| Revenue (LOC; Branch Banking and Trust Co.) | 0.36 | 2/7/11 | 3,400,000 a | 3,400,000 |
| Union County, GO Notes, Refunding (Liquidity | | | | |
| Facility; Branch Banking and Trust Co.) | 0.27 | 2/7/11 | 19,505,000 a | 19,505,000 |
| Ohio—3.8% | | | | |
| Akron, GO Notes, BAN (Various Purpose) | 1.13 | 12/8/11 | 4,715,000 | 4,735,864 |
| Akron, Bath and Copley Joint Township Hospital District, Health Care | | | | |
| Facilities Revenue (Sumner on Ridgewood Project) (LOC; KBC Bank) | 0.31 | 2/7/11 | 5,200,000 a | 5,200,000 |
| Cleveland, Airport System Revenue (LOC; KBC Bank) | 0.32 | 2/7/11 | 8,000,000 a | 8,000,000 |
| Franklin County, Hospital Facilities Revenue, Refunding | | | | |
| (OhioHealth Corporation) (Liquidity Facility; | | | | |
| Landesbank Hessen-Thuringen Girozentrale) | 0.32 | 2/7/11 | 59,400,000 a | 59,400,000 |
| Ohio Higher Educational Facility Commission, | | | | |
| Revenue, CP (Cleveland Clinic Health System) | 0.32 | 3/1/11 | 13,000,000 | 13,000,000 |
| Ohio Higher Educational Facility Commission, | | | | |
| Revenue, CP (Cleveland Clinic Health System) | 0.35 | 8/9/11 | 20,000,000 | 20,000,000 |
| Puttable Floating Option Tax Exempt Receipts (Hamilton | | | | |
| County, Hospital Facilities Revenue (University Hospital)) | | | | |
| (Liquidity Facility; Bank of America and LOC; Bank of America) | 0.41 | 2/7/11 | 14,300,000 a,b | 14,300,000 |
| Oklahoma—1.4% | | | | |
| Oklahoma Development Finance Authority, Continuing | | | | |
| Care Retirement Community Revenue, Refunding | | | | |
| (Inverness Village Project) (LOC; KBC Bank) | 0.30 | 2/7/11 | 22,300,000 a | 22,300,000 |
| Oklahoma Development Finance Authority, | | | | |
| Revenue, CP (Integris Baptist Medical Center) | 0.32 | 3/17/11 | 23,650,000 | 23,650,000 |
| Oregon—.4% | | | | |
| Salem Hospital Facility Authority, Revenue | | | | |
| (Capital Manor, Inc. Project) (LOC; Bank of America) | 0.31 | 2/7/11 | 5,370,000 a | 5,370,000 |
| Salem Hospital Facility Authority, Revenue, Refunding | | | | |
| (Capital Manor, Inc. Project) (LOC; Bank of America) | 0.31 | 2/7/11 | 8,475,000 a | 8,475,000 |
| Pennsylvania—14.0% | | | | |
| Berks County Municipal Authority, Revenue | | | | |
| (The Reading Hospital and Medical Center Project) | 0.49 | 7/13/11 | 5,000,000 | 5,000,000 |
| Bucks County Industrial Development Authority, Revenue | | | | |
| (Pennswood Village Project) (LOC; Bank of America) | 0.32 | 2/7/11 | 8,600,000 a | 8,600,000 |
| East Hempfield Township Industrial Development Authority, | | | | |
| Revenue (The Mennonite Home Project) (LOC; M&T Trust) | 0.34 | 2/7/11 | 11,190,000 a | 11,190,000 |
| East Hempfield Township Industrial Development Authority, | | | | |
| Revenue (The Mennonite Home Project) (LOC; M&T Trust) | 0.34 | 2/7/11 | 6,465,000 a | 6,465,000 |
| Emmaus General Authority (Pennsylvania Variable Rate Loan | | | | |
| Program) (Insured; Assured Guaranty Municipal Corp. | | | | |
| and Liquidity Facility; Wells Fargo Bank) | 0.34 | 2/7/11 | 92,475,000 a | 92,475,000 |
| Emmaus General Authority, Local Government | | | | |
| Revenue (Bond Pool Program) (LOC; U.S. Bank NA) | 0.30 | 2/7/11 | 8,600,000 a | 8,600,000 |
| Emmaus General Authority, Local Government | | | | |
| Revenue (Bond Pool Program) (LOC; U.S. Bank NA) | 0.30 | 2/7/11 | 10,500,000 a | 10,500,000 |
46
| | | | | |
| Dreyfus Tax Exempt | Coupon | Maturity | Principal | |
| Cash Management (continued) | Rate (%) | Date | Amount ($) | Value ($) |
| |
| Short-Term Investments (continued) | | | | |
| Pennsylvania (continued) | | | | |
| Emmaus General Authority, Local Government | | | | |
| Revenue (Bond Pool Program) (LOC; U.S. Bank NA) | 0.30 | 2/7/11 | 10,600,000 a | 10,600,000 |
| Emmaus General Authority, Local Government | | | | |
| Revenue (Bond Pool Program) (LOC; U.S. Bank NA) | 0.30 | 2/7/11 | 5,850,000 a | 5,850,000 |
| Emmaus General Authority, Local Government | | | | |
| Revenue (Bond Pool Program) (LOC; U.S. Bank NA) | 0.30 | 2/7/11 | 15,700,000 a | 15,700,000 |
| Emmaus General Authority, Local Government | | | | |
| Revenue (Bond Pool Program) (LOC; U.S. Bank NA) | 0.30 | 2/7/11 | 11,800,000 a | 11,800,000 |
| Emmaus General Authority, Local Government | | | | |
| Revenue (Bond Pool Program) (LOC; U.S. Bank NA) | 0.30 | 2/7/11 | 9,200,000 a | 9,200,000 |
| Emmaus General Authority, Local Government | | | | |
| Revenue (Bond Pool Program) (LOC; U.S. Bank NA) | 0.30 | 2/7/11 | 12,200,000 a | 12,200,000 |
| Emmaus General Authority, Local Government | | | | |
| Revenue (Bond Pool Program) (LOC; U.S. Bank NA) | 0.30 | 2/7/11 | 10,000,000 a | 10,000,000 |
| Emmaus General Authority, Local Government | | | | |
| Revenue (Bond Pool Program) (LOC; U.S. Bank NA) | 0.30 | 2/7/11 | 9,400,000 a | 9,400,000 |
| Emmaus General Authority, Local Government | | | | |
| Revenue (Bond Pool Program) (LOC; U.S. Bank NA) | 0.30 | 2/7/11 | 10,000,000 a | 10,000,000 |
| General Authority of South Central Pennsylvania, | | | | |
| Revenue (Lutheran Social Services of South Central | | | | |
| Pennsylvania Project) (LOC; M&T Trust) | 0.34 | 2/7/11 | 16,305,000 a | 16,305,000 |
| Horizon Hospital System Authority, Senior Health and Housing | | | | |
| Facilities Revenue (Saint Paul Homes Project) (LOC; M&T Trust) | 0.34 | 2/7/11 | 9,700,000 a | 9,700,000 |
| Lancaster County Hospital Authority, Health Center | | | | |
| Revenue (LUTHERCARE Project) (LOC; M&T Trust) | 0.29 | 2/7/11 | 33,406,000 a | 33,406,000 |
| Lancaster County Hospital Authority, Revenue (Landis | | | | |
| Home Retirement Community Project) (LOC; M&T Trust) | 0.34 | 2/7/11 | 7,970,000 a | 7,970,000 |
| Montgomery County Higher Education and Health | | | | |
| Authority, Revenue (Pennsylvania Higher Education | | | | |
| and Health Loan Program) (LOC; M&T Trust) | 0.34 | 2/7/11 | 595,000 a | 595,000 |
| Pennsylvania Housing Finance Agency, SFMR | 0.45 | 9/22/11 | 8,000,000 | 8,000,000 |
| Pennsylvania Turnpike Commission, Registration Fee Revenue, | | | | |
| Refunding (Insured; Assured Guaranty Municipal Corp. | | | | |
| and Liquidity Facility; JPMorgan Chase Bank) | 0.30 | 2/7/11 | 19,550,000 a | 19,550,000 |
| Philadelphia, GO Notes, TRAN | 2.00 | 6/30/11 | 52,000,000 | 52,274,054 |
| Ridley School District, GO Notes (LOC; TD Bank) | 0.29 | 2/7/11 | 2,900,000 a | 2,900,000 |
| Schuylkill County Industrial Development Authority, RRR, | | | | |
| Refunding (WPS Westwood Generation, LLC Project) | | | | |
| (LOC; JPMorgan Chase Bank) | 0.29 | 2/7/11 | 22,000,000 a | 22,000,000 |
| University of Pittsburgh of the Commonwealth | | | | |
| System of Higher Education, CP | 0.29 | 3/7/11 | 15,000,000 | 15,000,000 |
| University of Pittsburgh of the Commonwealth | | | | |
| System of Higher Education, CP | 0.29 | 4/8/11 | 20,000,000 | 20,000,000 |
| Wallingford-Swarthmore School District, GO Notes | | | | |
| (Insured; Assured Guaranty Municipal Corp. and | | | | |
| Liquidity Facility; Dexia Credit Locale) | 0.40 | 2/7/11 | 10,000,000 a | 10,000,000 |
STATEMENT OF INVESTMENTS (continued)
| | | | | |
| Dreyfus Tax Exempt | Coupon | Maturity | Principal | |
| Cash Management (continued) | Rate (%) | Date | Amount ($) | Value ($) |
| |
| Short-Term Investments (continued) | | | | |
| Pennsylvania (continued) | | | | |
| York General Authority, Revenue (Strand-Capitol | | | | |
| Performing Arts Center Project) (LOC; M&T Trust) | 0.34 | 2/7/11 | 3,765,000 a | 3,765,000 |
| South Carolina—2.8% | | | | |
| Charleston County School District, GO Notes | 1.50 | 3/1/11 | 40,500,000 | 40,538,672 |
| Saint Peters Parish/Jasper County Public Facilities Corporation, | | | | |
| Installment Purchase Revenue, BAN (County Office Building Projects) | 2.00 | 11/1/11 | 5,000,000 | 5,027,850 |
| South Carolina Jobs-Economic Development Authority, HR | | | | |
| (Conway Hospital, Inc.) (Insured; Assured Guaranty Municipal Corp. | | | | |
| and Liquidity Facility; Branch Banking and Trust Co.) | 0.30 | 2/7/11 | 44,625,000 a | 44,625,000 |
| Tennessee—8.4% | | | | |
| Blount County Public Building Authority, Local Government | | | | |
| Public Improvement Revenue (Liquidity Facility; | | | | |
| Branch Banking and Trust Co.) | 0.30 | 2/7/11 | 49,425,000 a | 49,425,000 |
| Blount County Public Building Authority, Local Government Public | | | | |
| Improvement Revenue (LOC; Branch Banking and Trust Co.) | 0.30 | 2/7/11 | 9,690,000 a | 9,690,000 |
| Blount County Public Building Authority, Local Government Public | | | | |
| Improvement Revenue (LOC; Branch Banking and Trust Co.) | 0.30 | 2/7/11 | 3,045,000 a | 3,045,000 |
| Blount County Public Building Authority, Local Government Public | | | | |
| Improvement Revenue (LOC; Branch Banking and Trust Co.) | 0.30 | 2/7/11 | 6,000,000 a | 6,000,000 |
| Blount County Public Building Authority, Local Government Public | | | | |
| Improvement Revenue (LOC; Branch Banking and Trust Co.) | 0.30 | 2/7/11 | 48,225,000 a | 48,225,000 |
| Metropolitan Government of Nashville and Davidson County Health | | | | |
| and Educational Facilities Board, Revenue (The Vanderbilt University) | 0.22 | 2/7/11 | 25,355,000 a | 25,355,000 |
| Metropolitan Government of Nashville and Davidson County | | | | |
| Health and Educational Facilities Board, Revenue (The Vanderbilt | | | | |
| University) (Liquidity Facility: Bayerische Landesbank and | | | | |
| Landesbank Hessen-Thuringen Girozentrale) | 0.22 | 2/7/11 | 18,460,000 a | 18,460,000 |
| Sevier County Public Building Authority, Local Government | | | | |
| Public Improvement Revenue (LOC; Bank of America) | 0.33 | 2/7/11 | 18,000,000 a | 18,000,000 |
| Tennergy Corporation, Gas Revenue (Putters Program) | | | | |
| (Liquidity Facility; JPMorgan Chase Bank) | 0.34 | 2/7/11 | 14,640,000 a,b | 14,640,000 |
| Tennergy Corporation, Gas Revenue (Putters Program) | | | | |
| (LOC; BNP Paribas) | 0.34 | 2/7/11 | 53,990,000 a,b | 53,990,000 |
| Tennessee, CP | 0.29 | 3/9/11 | 25,810,000 | 25,810,000 |
| Texas—9.7% | | | | |
| Gregg County Health Facilities Development Corporation, HR (Good | | | | |
| Shepherd Medical Center Project) (LOC; JPMorgan Chase Bank) | 0.31 | 2/1/11 | 5,450,000 a | 5,450,000 |
| Harris County, GO Notes, TAN | 2.00 | 2/28/11 | 32,000,000 | 32,039,416 |
| Harris County Cultural Education Facilities Finance | | | | |
| Corporation, Revenue, CP (Methodist Healthcare) | 0.37 | 8/4/11 | 22,500,000 | 22,500,000 |
| Harris County Metropolitan Transportation Authority, CP | | | | |
| (Liquidity Facility; JPMorgan Chase Bank) | 0.30 | 3/9/11 | 13,250,000 | 13,250,000 |
48
| | | | | |
| Dreyfus Tax Exempt | Coupon | Maturity | Principal | |
| Cash Management (continued) | Rate (%) | Date | Amount ($) | Value ($) |
| |
| Short-Term Investments (continued) | | | | |
| Texas (continued) | | | | |
| Houston, Utility System Revenue, CP (LOC; Bank of Nova Scotia) | 0.33 | 3/15/11 | 10,000,000 | 10,000,000 |
| Jefferson County Industrial Development Corporation, | | | | |
| Hurricane Ike Disaster Area Revenue (Jefferson Refinery, LLC | | | | |
| Project) (LOC; Branch Banking and Trust Co.) | 0.55 | 3/30/11 | 55,000,000 | 55,000,000 |
| JPMorgan Chase Putters/Drivers Trust (Texas, TRAN) | | | | |
| (Liquidity Facility; JPMorgan Chase Bank) | 0.27 | 2/1/11 | 3,000,000 a,b | 3,000,000 |
| North Texas Tollway Authority, Revenue, CP (LOC; Bank of America) | 0.34 | 3/8/11 | 20,000,000 | 20,000,000 |
| Puttable Floating Option Tax Exempt Receipts (Brazos County | | | | |
| Health Facilities Development Corporation, Revenue (Franciscan | | | | |
| Services Corporation Obligated Group)) (Liquidity Facility; | | | | |
| Bank of America and LOC; Bank of America) | 0.41 | 2/7/11 | 7,000,000 a,b | 7,000,000 |
| RBC Municipal Products Inc. Trust (Harris County Cultural | | | | |
| Education Facilities Finance Corporation, HR, Refunding | | | | |
| (Memorial Hermann Healthcare System)) (Liquidity Facility; | | | | |
| Royal Bank of Canada and LOC; Royal Bank of Canada) | 0.29 | 2/7/11 | 17,000,000 a,b | 17,000,000 |
| RBC Municipal Products Inc. Trust (Houston, Combined Utility | | | | |
| System First Lien Revenue, Refunding) (Liquidity Facility; | | | | |
| Royal Bank of Canada and LOC; Royal Bank of Canada) | 0.29 | 2/7/11 | 21,000,000 a,b | 21,000,000 |
| Tarrant County Cultural Education Facilities Finance | | | | |
| Corporation, Revenue (Texas Health Resources System) | 0.25 | 2/7/11 | 6,500,000 a | 6,500,000 |
| Texas, TRAN | 2.00 | 8/31/11 | 61,000,000 | 61,583,049 |
| Texas A&M University Board of Regents, Revenue, CP | 0.30 | 6/9/11 | 4,500,000 | 4,500,000 |
| Texas Transportation Commission, GO Mobility Fund Bonds | | | | |
| (Liquidity Facility: California Public Employees Retirement | | | | |
| System and State Street Bank and Trust Co.) | 0.28 | 2/7/11 | 26,180,000 a | 26,180,000 |
| Texas Water Development Board, State Revolving Fund | | | | |
| Subordinate Lien Revenue (Liquidity Facility; Citibank NA) | 0.28 | 2/7/11 | 10,940,000 a,b | 10,940,000 |
| Utah—2.2% | | | | |
| Central Utah Water Conservancy District Revenue, Refunding | | | | |
| (Liquidity Facility; Landesbank Hessen-Thuringen Girozentrale) | 0.32 | 2/7/11 | 39,600,000 a | 39,600,000 |
| Murray City, HR (Intermountain Health Care Health Services, Inc.) | 0.25 | 2/7/11 | 24,700,000 a | 24,700,000 |
| Utah Housing Finance Agency, MFHR, Refunding (Candlestick | | | | |
| Apartments Project) (Liquidity Facility; FNMA and LOC; FNMA) | 0.30 | 2/7/11 | 6,400,000 a | 6,400,000 |
| Virginia—.4% | | | | |
| Richmond, CP (Liquidity Facility; Bank of America) | 0.34 | 2/10/11 | 12,000,000 | 12,000,000 |
| Washington—.2% | | | | |
| Puttable Floating Option Tax Exempt Receipts | | | | |
| (Washington, Various Purpose GO, Refunding) | | | | |
| (Liquidity Facility; Bank of America) | 0.36 | 2/7/11 | 6,060,000 a,b | 6,060,000 |
| Wisconsin—.4% | | | | |
| Byron, IDR, Refunding (Ocean Spray | | | | |
| Cranberries, Inc. Project) (LOC; Bank of America) | 0.39 | 2/7/11 | 6,500,000 a | 6,500,000 |
STATEMENT OF INVESTMENTS (continued)
| | | | | |
| Dreyfus Tax Exempt | Coupon | Maturity | Principal | |
| Cash Management (continued) | Rate (%) | Date | Amount ($) | Value ($) |
| |
| Short-Term Investments (continued) | | | | |
| Wisconsin (continued) | | | | |
| Milwaukee Redevelopment Authority, Redevelopment LR (University | | | | |
| of Wisconsin-Milwaukee Kenilworth Project) (LOC; U.S. Bank NA) | 0.29 | 2/7/11 | 6,340,000 a | 6,340,000 |
| U.S. Related—1.8% | | | | |
| Puerto Rico Commonwealth, Public Improvement GO Notes, | | | | |
| Refunding (Insured; Assured Guaranty Municipal Corp. | | | | |
| and Liquidity Facility; Dexia Credit Locale) | 0.29 | 2/7/11 | 40,000,000 a | 40,000,000 |
| Puerto Rico Sales Tax Financing Corporation, | | | | |
| Sales Tax Revenue (Liquidity Facility; Citibank NA) | 0.30 | 2/7/11 | 18,815,000 a,b | 18,815,000 |
| |
| Total Investments (cost $3,269,169,876) | | | 100.4% | 3,269,169,876 |
| Liabilities, Less Cash and Receivables | | | (.4%) | (12,921,684) |
| Net Assets | | | 100.0% | 3,256,248,192 |
| |
| See footnotes on page 57. | | | | |
| See notes to financial statements. | | | | |
50
STATEMENT OF INVESTMENTS
January 31, 2011
| | | | | |
| Dreyfus California AMT-Free | Coupon | Maturity | Principal | |
| Municipal Cash Management | Rate (%) | Date | Amount ($) | Value ($) |
| Short-Term Investments—100.4% | | | | |
| California—97.3% | | | | |
| ABAG Finance Authority for Nonprofit Corporations, | | | | |
| Revenue (Eskaton Village-Roseville) (LOC; KBC Bank) | 0.32 | 2/7/11 | 14,485,000 a | 14,485,000 |
| ABAG Finance Authority for Nonprofit Corporations, Revenue | | | | |
| (Northbay Healthcare Group) (LOC; JPMorgan Chase Bank) | 0.30 | 2/7/11 | 13,400,000 a | 13,400,000 |
| ABAG Finance Authority for Nonprofit Corporations, Revenue | | | | |
| (Santa Cruz Montessori School) (LOC; Comerica Bank) | 0.38 | 2/7/11 | 765,000 a | 765,000 |
| ABAG Finance Authority for Nonprofit Corporations, Revenue, | | | | |
| Refunding (Eskaton Properties, Inc.) (LOC; Bank of America) | 0.34 | 2/7/11 | 15,290,000 a | 15,290,000 |
| Alameda County Industrial Development Authority, Recovery Zone | | | | |
| Facility Revenue (Dale Hardware, Inc. Project) (LOC; Comerica Bank) | 0.35 | 2/7/11 | 2,670,000 a | 2,670,000 |
| Alameda County Industrial Development Authority, | | | | |
| Revenue (Santini Foods, Inc. Project) (LOC; Comerica Bank) | 0.35 | 2/7/11 | 2,900,000 a | 2,900,000 |
| Alameda Unified School District, GO Notes, TRAN | 2.00 | 6/30/11 | 2,600,000 | 2,610,504 |
| California Department of Water Resources, Power Supply Revenue | 5.50 | 5/1/11 | 2,000,000 | 2,025,150 |
| California Economic Development Financing Authority, Revenue, | | | | |
| Refunding (KQED, Inc. Project) (LOC; Wells Fargo Bank) | 0.61 | 2/7/11 | 200,000 a | 200,000 |
| California Enterprise Development Authority, IDR | | | | |
| (JBR, Inc. Project) (LOC; U.S. Bank NA) | 0.32 | 2/7/11 | 4,000,000 a | 4,000,000 |
| California Enterprise Development Authority, IDR (Ramar | | | | |
| International Corporation Project) (LOC; Bank of the West) | 0.32 | 2/7/11 | 4,220,000 a | 4,220,000 |
| California Enterprise Development Authority, IDR | | | | |
| (Tri Tool Inc. Project) (LOC; Comerica Bank) | 0.37 | 2/7/11 | 10,000,000 a | 10,000,000 |
| California Enterprise Development Authority, Recovery Zone | | | | |
| Facility Revenue (Regional Properties, Inc. Project) (LOC; FHLB) | 0.32 | 2/7/11 | 10,000,000 a | 10,000,000 |
| California Health Facilities Financing Authority, Health Facility Revenue | | | | |
| (Catholic Healthcare West Loan Program) (LOC; Bank of America) | 0.30 | 2/7/11 | 1,800,000 a | 1,800,000 |
| California Infrastructure and Economic Development Bank, | | | | |
| IDR (Kennfoods USA, LLC Project) (LOC; Bank of the West) | 0.32 | 2/7/11 | 2,440,000 a | 2,440,000 |
| California Infrastructure and Economic Development Bank, Revenue | | | | |
| (Saddleback Valley Christian Schools Project) (LOC; FHLB) | 0.32 | 2/7/11 | 5,000,000 a | 5,000,000 |
| California Municipal Finance Authority, Revenue | | | | |
| (Notre Dame High School, San Jose) (LOC; Comerica Bank) | 0.38 | 2/7/11 | 1,000,000 a | 1,000,000 |
| California Municipal Finance Authority, Revenue | | | | |
| (Trinity School) (LOC; Comerica Bank) | 0.38 | 2/7/11 | 670,000 a | 670,000 |
| California Pollution Control Financing Authority, SWDR | | | | |
| (Athens Services Project) (LOC; Wells Fargo Bank) | 0.29 | 2/7/11 | 9,700,000 a | 9,700,000 |
| California Pollution Control Financing Authority, SWDR | | | | |
| (Big Bear Disposal, Inc. Project) (LOC; Union Bank NA) | 0.32 | 2/7/11 | 1,125,000 a | 1,125,000 |
STATEMENT OF INVESTMENTS (continued)
| | | | | |
| Dreyfus California AMT-Free | Coupon | Maturity | Principal | |
| Municipal Cash Management (continued) | Rate (%) | Date | Amount ($) | Value ($) |
| |
| Short-Term Investments (continued) | | | | |
| California (continued) | | | | |
| California Pollution Control Financing Authority, SWDR | | | | |
| (Garden City Sanitation, Inc. Project) (LOC; Comerica Bank) | 0.35 | 2/7/11 | 2,745,000 a | 2,745,000 |
| California Pollution Control Financing Authority, SWDR | | | | |
| (Garden City Sanitation, Inc. Project) (LOC; Union Bank NA) | 0.32 | 2/7/11 | 10,010,000 a | 10,010,000 |
| California Pollution Control Financing Authority, SWDR | | | | |
| (Mission Trail Waste Systems, Inc. Project) (LOC; Comerica Bank) | 0.35 | 2/7/11 | 3,140,000 a | 3,140,000 |
| California Pollution Control Financing Authority, SWDR, Refunding | | | | |
| (BLT Enterprises of Fremont LLC Project) (LOC; Union Bank NA) | 0.32 | 2/7/11 | 9,415,000 a | 9,415,000 |
| California Pollution Control Financing Authority, SWDR, Refunding | | | | |
| (MarBorg Industries Project) (LOC; Union Bank NA) | 0.32 | 2/7/11 | 3,640,000 a | 3,640,000 |
| California School Cash Reserve Program Authority, Revenue | 2.00 | 6/1/11 | 7,545,000 | 7,571,684 |
| California Statewide Communities Development | | | | |
| Authority, Revenue, CP (Kaiser Permanente) | 0.37 | 7/8/11 | 2,200,000 | 2,200,000 |
| California Statewide Communities Development | | | | |
| Authority, Revenue, CP (Kaiser Permanente) | 0.38 | 7/18/11 | 7,000,000 | 7,000,000 |
| California Statewide Communities Development | | | | |
| Authority, TRAN (County of Yolo) | 2.00 | 6/30/11 | 5,400,000 | 5,421,817 |
| Deutsche Bank Spears/Lifers Trust (Anaheim Redevelopment | | | | |
| Agency, Tax Allocation Revenue, Refunding (Anaheim | | | | |
| Merged Redevelopment Project Area)) (Liquidity Facility; | | | | |
| Deutsche Bank AG and LOC; Deutsche Bank AG) | 0.29 | 2/7/11 | 9,255,000 a,b | 9,255,000 |
| Golden State Tobacco Securitization Corporation, Enhanced Tobacco | | | | |
| Settlement Asset-Backed Bonds (Insured; Berkshire Hathaway | | | | |
| Assurance Corporation and Liquidity Facility; Citibank NA) | 0.29 | 2/7/11 | 3,450,000 a,b | 3,450,000 |
| Irvine Assessment District Number 05-21, Limited Obligation | | | | |
| Improvement Bonds (LOC: California State Teachers | | | | |
| Retirement System and U.S. Bank NA) | 0.29 | 2/1/11 | 3,300,000 a | 3,300,000 |
| Irvine Assessment District Number 97-17, Limited Obligation | | | | |
| Improvement Bonds (LOC; State Street Bank and Trust Co.) | 0.29 | 2/1/11 | 1,400,000 a | 1,400,000 |
| Los Angeles, GO Notes, TRAN | 2.00 | 6/30/11 | 16,400,000 | 16,491,785 |
| Los Angeles, Wastewater System Subordinate Revenue, Refunding | 5.00 | 6/1/11 | 975,000 | 989,515 |
| Menlo Park Community Development Agency, Tax Allocation | | | | |
| Revenue, Refunding (Las Pulgas Community Development | | | | |
| Project) (LOC; State Street Bank and Trust Co.) | 0.29 | 2/1/11 | 5,800,000 a | 5,800,000 |
52
| | | | | |
| Dreyfus California AMT-Free | Coupon | Maturity | Principal | |
| Municipal Cash Management (continued) | Rate (%) | Date | Amount ($) | Value ($) |
| |
| Short-Term Investments (continued) | | | | |
| California (continued) | | | | |
| Poway Unified School District Public Financing Authority, LR | | | | |
| (Insured; Assured Guaranty Municipal Corp. and | | | | |
| Liquidity Facility; Dexia Credit Locale) | 0.50 | 2/7/11 | 18,600,000 a | 18,600,000 |
| Puttable Floating Option Tax Exempt Receipts (California Statewide | | | | |
| Communities Development Authority, MFHR (La Mision Village | | | | |
| Apartments Project)) (Liquidity Facility; FHLMC and LOC; FHLMC) | 0.45 | 2/7/11 | 1,240,000 a,b | 1,240,000 |
| Puttable Floating Option Tax Exempt Receipts (California Statewide | | | | |
| Communities Development Authority, Revenue (Japanese American | | | | |
| National Museum)) (Liquidity Facility; Merrill Lynch Capital Services | | | | |
| and LOC; Merrill Lynch Capital Services) | 0.60 | 2/7/11 | 4,215,000 a,b | 4,215,000 |
| Ravenswood City School District, GO Notes, TRAN | 1.75 | 7/1/11 | 2,000,000 | 2,005,688 |
| Riverside County Transportation Commission, | | | | |
| Sales Tax Revenue (Liquidity Facility; JPMorgan Chase Bank) | 0.29 | 2/7/11 | 5,900,000 a | 5,900,000 |
| Roseville Joint Union High School District, COP (Insured; Assured | | | | |
| Guaranty Municipal Corp. and Liquidity Facility; Dexia Credit Locale) | 0.50 | 2/7/11 | 1,235,000 a | 1,235,000 |
| San Jose Redevelopment Agency, MFHR (101 San Fernando | | | | |
| Apartments) (Liquidity Facility; Citibank NA and LOC; Citibank NA) | 0.37 | 2/7/11 | 13,000,000 a,b | 13,000,000 |
| Sausalito, MFHR (Rotary Village Senior Housing | | | | |
| Project) (LOC; Bank of the West) | 0.29 | 2/7/11 | 2,185,000 a | 2,185,000 |
| West Covina Public Financing Authority, LR, Refunding (Public Facilities | | | | |
| Project) (LOC; California State Teachers Retirement System) | 0.35 | 2/7/11 | 1,480,000 a | 1,480,000 |
| U.S. Related—3.1% | | | | |
| Puerto Rico Sales Tax Financing Corporation, | | | | |
| Sales Tax Revenue (Liquidity Facility; Citibank NA) | 0.30 | 2/7/11 | 7,815,000 a,b | 7,815,000 |
| |
| Total Investments (cost $253,806,143) | | | 100.4% | 253,806,143 |
| Liabilities, Less Cash and Receivables | | | (.4%) | (1,008,546) |
| Net Assets | | | 100.0% | 252,797,597 |
| |
| See footnotes on page 57. | | | | |
| See notes to financial statements. | | | | |
STATEMENT OF INVESTMENTS
January 31, 2011
| | | | | |
| Dreyfus New York AMT-Free | Coupon | Maturity | Principal | |
| Municipal Cash Management | Rate (%) | Date | Amount ($) | Value ($) |
| |
| Short-Term Investments—100.2% | | | | |
| New York—97.8% | | | | |
| Babylon, GO Notes, BAN | 1.50 | 4/15/11 | 1,600,000 | 1,603,370 |
| Bayville, GO Notes, BAN | 1.50 | 3/24/11 | 1,814,500 | 1,816,136 |
| Broome County Industrial Development Agency, Continuing Care | | | | |
| Retirement Community Revenue (Good Shepherd Village | | | | |
| at Endwell, Inc. Project) (LOC; M&T Trust) | 0.34 | 2/7/11 | 3,250,000 a | 3,250,000 |
| Dutchess County Industrial Development Agency, Civic Facility Revenue | | | | |
| (Anderson Foundation for Autism, Inc. Project) (LOC; M&T Trust) | 0.34 | 2/7/11 | 4,400,000 a | 4,400,000 |
| East Farmingdale Volunteer Fire Company Inc., | | | | |
| Volunteer Fire Department Revenue (LOC; Citibank NA) | 0.53 | 2/7/11 | 4,255,000 a | 4,255,000 |
| Elmira City School District, GO Notes, BAN | 1.50 | 6/30/11 | 2,260,000 d | 2,263,192 |
| Franklin County Industrial Development Agency, Civic Facility | | | | |
| Revenue (Paul Smith’s College Project) (LOC; U.S. Bank NA) | 0.35 | 2/7/11 | 460,000 a | 460,000 |
| Franklin County Industrial Development Agency, Civic Facility | | | | |
| Revenue (Trudeau Institute, Inc. Project) (LOC; HSBC Bank USA) | 0.47 | 2/7/11 | 2,130,000 a | 2,130,000 |
| Long Island Power Authority, Electric System Subordinated Revenue | | | | |
| (LOC: Bayerische Landesbank and Westdeutsche Landesbank) | 0.29 | 2/1/11 | 2,895,000 a | 2,895,000 |
| Monroe County Industrial Development Agency, Civic Facility Revenue | | | | |
| (Saint Ann’s Home for the Aged Project) (LOC; HSBC Bank USA) | 0.34 | 2/7/11 | 1,130,000 a | 1,130,000 |
| Monroe County Industrial Development Agency, Revenue | | | | |
| (Collegiate Housing Foundation —Rochester, L.L.C.—Rochester | | | | |
| Institute of Technology Project) (LOC; Wells Fargo Bank) | 0.29 | 2/7/11 | 3,500,000 a,d | 3,500,000 |
| New York City Capital Resource Corporation, Revenue | | | | |
| (Loan Enhanced Assistance Program) (LOC; Bank of America) | 0.51 | 2/7/11 | 1,445,000 a,d | 1,445,000 |
| New York City Capital Resource Corporation, Revenue (Loan Enhanced | | | | |
| Assistance Program) (Village Center for Care) (LOC; Bank of America) | 0.35 | 2/7/11 | 2,620,000 a | 2,620,000 |
| New York City Housing Development Corporation, | | | | |
| Residential Revenue (Queens College Residences) (LOC; FHLB) | 0.27 | 2/7/11 | 14,900,000 a,d | 14,900,000 |
| New York City Industrial Development Agency, Civic Facility | | | | |
| Revenue (Ateret Torah Center Project) (LOC; Wells Fargo Bank) | 0.29 | 2/7/11 | 12,480,000 a,d | 12,480,000 |
| New York City Industrial Development Agency, Civic Facility | | | | |
| Revenue (Birch Wathen Lenox School Project) (LOC; TD Bank) | 0.33 | 2/7/11 | 4,450,000 a,d | 4,450,000 |
| New York City Industrial Development Agency, Civic Facility Revenue | | | | |
| (Sephardic Community Youth Center, Inc. Project) (LOC; M&T Trust) | 0.34 | 2/7/11 | 4,400,000 a | 4,400,000 |
| New York City Industrial Development Agency, | | | | |
| Civic Facility Revenue (Spence-Chapin, Services to | | | | |
| Families and Children Project) (LOC; TD Bank) | 0.34 | 2/7/11 | 3,200,000 a | 3,200,000 |
| New York City Municipal Water Finance Authority, Water and | | | | |
| Sewer System Revenue (Liquidity Facility; BNP Paribas) | 0.26 | 2/7/11 | 3,500,000 a | 3,500,000 |
| New York City Municipal Water Finance Authority, Water and | | | | |
| Sewer System Second General Resolution Revenue (Liquidity | | | | |
| Facility; Landesbank Hessen-Thuringen Girozentrale) | 0.26 | 2/1/11 | 3,100,000 a | 3,100,000 |
54
| | | | | |
| Dreyfus New York AMT-Free | Coupon | Maturity | Principal | |
| Municipal Cash Management (continued) | Rate (%) | Date | Amount ($) | Value ($) |
| |
| Short-Term Investments (continued) | | | | |
| New York (continued) | | | | |
| New York City Municipal Water Finance Authority, Water and Sewer | | | | |
| System Second General Resolution Revenue (Liquidity Facility; | | | | |
| Landesbank Hessen-Thuringen Girozentrale) | 0.31 | 2/1/11 | 2,000,000 a | 2,000,000 |
| New York City Transitional Finance Authority, Revenue (New York | | | | |
| City Recovery) (Liquidity Facility; JPMorgan Chase Bank) | 0.27 | 2/1/11 | 1,000,000 a | 1,000,000 |
| New York Liberty Development Corporation, | | | | |
| Liberty Revenue (World Trade Center Project) | 0.35 | 8/4/11 | 6,000,000 | 6,000,000 |
| New York Local Government Assistance Corporation, | | | | |
| GO Notes (LOC; Landesbank Hessen-Thuringen Girozentrale) | 0.27 | 2/7/11 | 6,000,000 a | 6,000,000 |
| New York State Dormitory Authority, Revenue | | | | |
| (F.F.T. Senior Communities, Inc.) (LOC; KBC Bank) | 0.29 | 2/7/11 | 3,915,000 a | 3,915,000 |
| New York State Dormitory Authority, | | | | |
| Revenue (Long Island University) (LOC; FHLB) | 0.26 | 2/7/11 | 3,100,000 a,d | 3,100,000 |
| New York State Dormitory Authority, | | | | |
| Revenue (Saint John Fisher College) (LOC; FHLB) | 0.27 | 2/7/11 | 5,625,000 a,d | 5,625,000 |
| New York State Dormitory Authority, Revenue | | | | |
| (Samaritan Medical Center) (LOC; HSBC Bank USA) | 0.26 | 2/7/11 | 6,600,000 a | 6,600,000 |
| New York State Environmental Facilities Corporation, | | | | |
| State Clean Water and Drinking Water Revolving Funds | | | | |
| Revenue (New York City Municipal Water Finance | | | | |
| Authority Projects) (Liquidity Facility; Citibank NA) | 0.29 | 2/7/11 | 4,300,000 a,b | 4,300,000 |
| New York State Environmental Facilities Corporation, | | | | |
| State Clean Water and Drinking Water Revolving | | | | |
| Funds Revenue (Pooled Financing Program) | 4.50 | 3/15/11 | 500,000 | 502,238 |
| New York State Housing Finance Agency, Housing | | | | |
| Revenue (Baisley Park Gardens) (LOC; Citibank NA) | 0.28 | 2/7/11 | 2,300,000 a | 2,300,000 |
| New York State Thruway Authority, General Revenue, BAN | 2.50 | 7/15/11 | 200,000 | 201,751 |
| New York State Thruway Authority, General Revenue, BAN | 3.00 | 7/15/11 | 400,000 | 404,228 |
| New York State Thruway Authority, General Revenue, BAN | 4.00 | 7/15/11 | 1,590,000 | 1,613,482 |
| New York State Urban Development Corporation, State Personal | | | | |
| Income Tax Revenue (State Facilities and Equipment) | 5.00 | 3/15/11 | 500,000 | 502,582 |
| Olean, GO Notes, BAN | 1.50 | 8/11/11 | 1,500,000 | 1,501,503 |
| Orange County Industrial Development Agency, Civic Facility | | | | |
| Revenue (Tuxedo Park School Project) (LOC; M&T Trust) | 0.34 | 2/7/11 | 1,000,000 a | 1,000,000 |
| Port Authority of New York and New Jersey | | | | |
| (Consolidated Bonds, 164th Series) | 5.00 | 9/1/11 | 500,000 | 513,082 |
| Port Authority of New York and New Jersey, Equipment Notes | 0.35 | 2/7/11 | 2,800,000 a | 2,800,000 |
| Ramapo, GO Notes, BAN | 2.00 | 12/13/11 | 2,500,000 | 2,526,762 |
| Sag Harbor Union Free School District, GO Notes, TAN | 1.50 | 6/23/11 | 1,200,000 d | 1,201,843 |
| Schenectady, GO Notes, BAN | 1.50 | 5/20/11 | 5,600,000 | 5,604,072 |
STATEMENT OF INVESTMENTS (continued)
| | | | | |
| Dreyfus New York AMT-Free | Coupon | Maturity | Principal | |
| Municipal Cash Management (continued) | Rate (%) | Date | Amount ($) | Value ($) |
| |
| Short-Term Investments (continued) | | | | |
| New York (continued) | | | | |
| Springs Union Free School District, GO Notes, TAN | 1.50 | 6/30/11 | 1,100,000 d | 1,104,028 |
| Sullivan County, GO Notes, TAN | 1.00 | 3/10/11 | 1,500,000 | 1,500,761 |
| Syracuse Industrial Development Agency, | | | | |
| Civic Facility Revenue (Community Development | | | | |
| Properties-Larned Project) (LOC; M&T Trust) | 0.35 | 2/7/11 | 1,800,000 a | 1,800,000 |
| Ticonderoga Central School District, GO Notes, BAN | 2.00 | 6/24/11 | 1,228,175 d | 1,232,209 |
| Westchester County Industrial Development Agency, | | | | |
| Civic Facility Revenue (The Masters School Civic | | | | |
| Facility) (LOC; JPMorgan Chase Bank) | 0.32 | 2/7/11 | 2,055,000 a,d | 2,055,000 |
| U.S. Related—2.4% | | | | |
| Puttable Floating Option Tax Exempt Receipts (Puerto Rico | | | | |
| Electric Power Authority, Power Revenue) (Liquidity Facility; | | | | |
| Bank of America and LOC; Bank of America) | 0.40 | 2/7/11 | 3,480,000 a,b | 3,480,000 |
| |
| Total Investments (cost $148,181,239) | | | 100.2% | 148,181,239 |
| Liabilities, Less Cash and Receivables | | | (.2%) | (313,179) |
| Net Assets | | | 100.0% | 147,868,060 |
| |
| See footnotes on page 57. | | | | |
| See notes to financial statements. | | | | |
56
| | | | | | | | | | | |
| Summary of Abbreviations | | | | | | | |
| |
| |
| ABAG | Association of Bay Area Governments | | ACA | American Capital Access | |
| AGC | | ACE Guaranty Corporation | | AGIC | Asset Guaranty Insurance Company | |
| AMBAC | American Municipal Bond Assurance Corporation | ARRN | Adjustable Rate Receipt Notes | |
| BAN | | Bond Anticipation Notes | | BPA | Bond Purchase Agreement | |
| CIFG | | CDC Ixis Financial Guaranty | | COP | Certificate of Participation | |
| CP | | Commercial Paper | | | EDR | Economic Development Revenue | |
| EIR | | Environmental Improvement Revenue | | FGIC | Financial Guaranty Insurance Company | |
| FHA | | Federal Housing Administration | | FHLB | Federal Home Loan Bank | |
| FHLMC | Federal Home Loan Mortgage Corporation | | FNMA | Federal National Mortgage Association | |
| GAN | | Grant Anticipation Notes | | GIC | Guaranteed Investment Contract | |
| GNMA | Government National Mortgage Association | | GO | General Obligation | | |
| HR | | Hospital Revenue | | | IDB | Industrial Development Board | |
| IDC | | Industrial Development Corporation | | IDR | Industrial Development Revenue | |
| LOC | | Letter of Credit | | | LOR | Limited Obligation Revenue | |
| LR | | Lease Revenue | | | MFHR | Multi-Family Housing Revenue | |
| MFMR | Multi-Family Mortgage Revenue | | PCR | Pollution Control Revenue | |
| PILOT | Payment in Lieu of Taxes | | PUTTERS | Puttable Tax-Exempt Receipts | |
| RAC | | Revenue Anticipation Certificates | | RAN | Revenue Anticipation Notes | |
| RAW | | Revenue Anticipation Warrants | | RRR | Resources Recovery Revenue | |
| SAAN | State Aid Anticipation Notes | | SBPA | Standby Bond Purchase Agreement | |
| SFHR | | Single Family Housing Revenue | | SFMR | Single Family Mortgage Revenue | |
| SONYMA | State of New York Mortgage Agency | | SWDR | Solid Waste Disposal Revenue | |
| TAN | | Tax Anticipation Notes | | | TAW | Tax Anticipation Warrants | |
| TRAN | Tax and Revenue Anticipation Notes | | XLCA | XL Capital Assurance | | |
| |
| |
| |
| Summary of Combined Ratings (Unaudited) | | | | | | |
| | | | | | | | | Value (%)† | | |
| | | | | | | | | | Dreyfus | Dreyfus |
| | | | | | Dreyfus | Dreyfus | | Dreyfus | California | New York |
| | | | | | Municipal Cash | New York | Tax Exempt | AMT-Free | AMT-Free |
| | | | | | Management Municipal Cash | Cash | Municipal Cash Municipal Cash |
| Fitch | or Moody’s | or Standard & Poor’s | Plus | Management | Management | Management | Management |
| F1+, F1 | VMIG1, MIG1, P1 | SP1+, SP1, A1+, A1 | 89.8 | 80.5 | | 92.2 | 98.1 | 83.8 |
| AAA, AA, Ae | Aaa, Aa, Ae | | AAA, AA, Ae | 4.9 | 15.4 | | 7.6 | 1.9 | 1.0 |
| Not Ratedf | Not Ratedf | | Not Ratedf | 5.3 | 4.1 | | .2 | — | 15.2 |
| | | | | | 100.0 | 100.0 | | 100.0 | 100.0 | 100.0 |
| |
| † Based on total investments. |
| a Variable rate demand note—rate shown is the interest rate in effect at January 31, 2011. Maturity date represents the next demand date, or the ultimate maturity date if earlier. |
| b Securities exempt from registration under Rule 144A of the Securities Act of 1933.These securities may be resold in transactions exempt from registration, normally to qualified |
| institutional buyers.At January 31, 2011, Dreyfus Municipal Cash Management Plus amounted to $73,080,000 or 7.2%, Dreyfus NewYork Municipal Cash Management |
| amounted to $24,000,000 or 2.9%, Dreyfus Tax Exempt Cash Management amounted to $423,375,000 or 13.0%, Dreyfus California AMT-Free Municipal Cash Management |
| amounted to $38,975,000 or 15.4% and Dreyfus NewYork AMT-Free Municipal Cash Management amounted to $7,780,000 or 5.3% of net assets. |
| c This security is prerefunded; the date shown represents the prerefunded date. Bonds which are prerefunded are collateralized by U.S. Government securities which are held in escrow and |
| are used to pay principal and interest on the municipal issue and to retire the bonds in full at the earliest refunding date. |
| d At January 31, 2011, Dreyfus NewYork AMT-Free Municipal Cash Management had $53,356,272 or 36.1% of net assets invested in securities whose payment of principal and |
| interest is dependent upon revenues generated from education. |
| e Notes which are not F, MIG or SP rated are represented by bond ratings of the issuers. |
| f Securities which, while not rated by Fitch, Moody’s and Standard & Poor’s, have been determined by the Manager to be of comparable quality to those rated securities in which the fund |
| may invest. |
See notes to financial statements.
STATEMENT OF ASSETS AND LIABILITIES
(amounts in thousands, except Net Asset Value Per Share)
January 31, 2011
| | | | | | | |
| | | Dreyfus | Dreyfus | Dreyfus | Dreyfus | Dreyfus |
| | Dreyfus | Cash | Government | Government | Treasury & | Treasury |
| | Cash | Management | Cash | Prime Cash | Agency Cash | Prime Cash |
| | Management | Plus, Inc. | Management | Management | Management | Management |
| Assets ($): | | | | | | |
| Investments at value—Note 1(a,b)† | 28,910,565a | 6,397,982a | 23,976,244a | 4,453,845 | 10,704,913a | 22,122,169 |
| Cash | 18,017 | 15,765 | 29,970 | 22,419 | 4,874 | 40,140 |
| Interest receivable | 13,321 | 1,463 | 14,536 | 1,112 | 18,207 | 35,823 |
| Prepaid expenses and other assets | 93 | 157 | 111 | 105 | 80 | 120 |
| | 28,941,996 | 6,415,367 | 24,020,861 | 4,477,481 | 10,728,074 | 22,198,252 |
| Liabilities ($): | | | | | | |
| Due to The Dreyfus Corporation | | | | | | |
| and affiliates—Note 2(c) | 6,075 | 1,343 | 4,709 | 705 | 1,889 | 3,045 |
| Payable for investment securities purchased | — | — | — | — | — | 652,679 |
| Payable for shares of Beneficial | | | | | | |
| Interest/Common Stock redeemed | 6,777 | 9,924 | 30,085 | 34,668 | 3,752 | 73,266 |
| Accrued expenses | 158 | 48 | 176 | 108 | 113 | 80 |
| | 13,010 | 11,315 | 34,970 | 35,481 | 5,754 | 729,070 |
| Net Assets ($) | 28,928,986 | 6,404,052 | 23,985,891 | 4,442,000 | 10,722,320 | 21,469,182 |
| Composition of Net Assets ($): | | | | | | |
| Paid-in capital | 28,928,868 | 6,405,204 | 23,985,913 | 4,442,000 | 10,722,310 | 21,469,124 |
| Accumulated net realized | | | | | | |
| gain (loss) on investments | 118 | (1,152) | (22) | — | 10 | 58 |
| Net Assets ($) | 28,928,986 | 6,404,052 | 23,985,891 | 4,442,000 | 10,722,320 | 21,469,182 |
| Net Asset Value Per Share | | | | | | |
| Institutional Shares | | | | | | |
| Net Assets ($) | 24,512,113 | 4,741,039 | 20,528,937 | 2,791,718 | 7,944,134 | 15,015,741 |
| Shares Outstanding | 24,512,011 | 4,741,892 | 20,528,984 | 2,791,721 | 7,944,125 | 15,015,701 |
| Net Asset Value Per Share ($) | 1.00 | 1.00 | 1.00 | 1.00 | 1.00 | 1.00 |
| Investor Shares | | | | | | |
| Net Assets ($) | 2,948,841 | 735,171 | 1,704,545 | 556,952 | 1,823,005 | 3,214,724 |
| Shares Outstanding | 2,948,833 | 735,302 | 1,704,549 | 556,952 | 1,823,004 | 3,214,718 |
| Net Asset Value Per Share ($) | 1.00 | 1.00 | 1.00 | 1.00 | 1.00 | 1.00 |
58
| | | | | | | |
| | | Dreyfus | Dreyfus | Dreyfus | Dreyfus | Dreyfus |
| | Dreyfus | Cash | Government | Government | Treasury & | Treasury |
| | Cash | Management | Cash | Prime Cash | Agency Cash | Prime Cash |
| | Management | Plus, Inc. | Management | Management | Management | Management |
| Net Asset Value Per Share (continued) | | | | | | |
| Administrative Shares | | | | | | |
| Net Assets ($) | 791,969 | 693,485 | 1,091,277 | 561,280 | 422,308 | 1,053,916 |
| Shares Outstanding | 791,969 | 693,610 | 1,091,278 | 561,281 | 422,309 | 1,053,913 |
| Net Asset Value Per Share ($) | 1.00 | 1.00 | 1.00 | 1.00 | 1.00 | 1.00 |
| Participant Shares | | | | | | |
| Net Assets ($) | 615,906 | 225,043 | 530,807 | 476,337 | 418,139 | 2,163,418 |
| Shares Outstanding | 615,899 | 225,084 | 530,808 | 476,337 | 418,138 | 2,163,409 |
| Net Asset Value Per Share ($) | 1.00 | 1.00 | 1.00 | 1.00 | 1.00 | 1.00 |
| Service Shares | | | | | | |
| Net Assets ($) | — | 4,138 | — | — | 5,170 | — |
| Shares Outstanding | — | 4,139 | — | — | 5,170 | — |
| Net Asset Value Per Share ($) | — | 1.00 | — | — | 1.00 | — |
| Select Shares | | | | | | |
| Net Assets ($) | — | 5,175 | — | — | 19,108 | — |
| Shares Outstanding | — | 5,176 | — | — | 19,108 | — |
| Net Asset Value Per Share ($) | — | 1.00 | — | — | 1.00 | — |
| Agency Shares | | | | | | |
| Net Assets ($) | 60,157 | 1 | 130,325 | 55,713 | 38,280 | 21,383 |
| Shares Outstanding | 60,156 | 1 | 130,325 | 55,712 | 38,280 | 21,383 |
| Net Asset Value Per Share ($) | 1.00 | 1.00 | 1.00 | 1.00 | 1.00 | 1.00 |
| Premier Shares | | | | | | |
| Net Assets ($) | — | — | — | — | 52,176 | — |
| Shares Outstanding | — | — | — | — | 52,176 | — |
| Net Asset Value Per Share ($) | — | — | — | — | 1.00 | — |
| † Investments at cost ($) | 28,910,565 | 6,397,982 | 23,976,244 | 4,453,845 | 10,704,913 | 22,122,169 |
| |
| a Amount includes repurchase agreements of $2,839,000, $970,000, $9,318,000 and $7,693,000 for Dreyfus Cash Management, Dreyfus Cash Management Plus, Inc., Dreyfus |
| Government Cash Management and Dreyfus Treasury & Agency Cash Management, respectively, See Note 1(c). |
See notes to financial statements.
STATEMENT OF ASSETS AND LIABILITIES (continued)
(amounts in thousands, except Net Asset Value Per Share)
January 31, 2011
| | | | | | |
| | | | | Dreyfus | Dreyfus |
| | Dreyfus | Dreyfus | Dreyfus | California | New York |
| Municipal Cash | New York | Tax Exempt | AMT-Free | AMT-Free |
| Management | Municipal Cash | Cash Municipal Cash | Municipal Cash |
| | Plus | Management | Management | Management | Management |
| Assets ($): | | | | | |
| Investments at value—Note 1(a,b)† | 1,025,949 | 827,885 | 3,269,170 | 253,806 | 148,181 |
| Cash | 9,991 | 2,587 | 3,949 | — | 3,898 |
| Interest receivable | 2,153 | 887 | 5,250 | 523 | 214 |
| Prepaid expenses | 45 | 30 | 79 | 6 | 10 |
| | 1,038,138 | 831,389 | 3,278,448 | 254,335 | 152,303 |
| Liabilities ($): | | | | | |
| Due to The Dreyfus Corporation and affiliates—Note 2(c) | 301 | 214 | 771 | 76 | 43 |
| Cash overdraft due to Custodian | — | — | — | 1,416 | — |
| Payable for shares of Beneficial Interest redeemed | 9,898 | 3,404 | 3,071 | — | 902 |
| Payable for investment securities purchased | 7,126 | — | 18,262 | — | 3,480 |
| Accrued expenses | 53 | 45 | 96 | 45 | 10 |
| | 17,378 | 3,663 | 22,200 | 1,537 | 4,435 |
| Net Assets ($) | 1,020,760 | 827,726 | 3,256,248 | 252,798 | 147,868 |
| Composition of Net Assets ($): | | | | | |
| Paid-in capital | 1,020,770 | 827,723 | 3,256,248 | 252,798 | 147,868 |
| Accumulated net realized gain (loss) on investments | (10) | 3 | — | —a | — |
| Net Assets ($) | 1,020,760 | 827,726 | 3,256,248 | 252,798 | 147,868 |
| Net Asset Value Per Share | | | | | |
| Instititutional Shares | | | | | |
| Net Assets ($) | 362,874 | 459,347 | 2,830,672 | 135,333 | 80,529 |
| Shares Outstanding | 362,767 | 459,347 | 2,830,672 | 135,328 | 80,509 |
| Net Asset Value Per Share ($) | 1.00 | 1.00 | 1.00 | 1.00 | 1.00 |
| Investor Shares | | | | | |
| Net Assets ($) | 258,689 | 299,227 | 344,181 | 56,114 | 50,133 |
| Shares Outstanding | 258,615 | 299,227 | 344,181 | 56,112 | 50,121 |
| Net Asset Value Per Share ($) | 1.00 | 1.00 | 1.00 | 1.00 | 1.00 |
| Administrative Shares | | | | | |
| Net Assets ($) | 376,666 | 47,354 | 72,419 | 13,569 | 7,961 |
| Shares Outstanding | 376,562 | 47,354 | 72,419 | 13,568 | 7,959 |
| Net Asset Value Per Share ($) | 1.00 | 1.00 | 1.00 | 1.00 | 1.00 |
| Participant Shares | | | | | |
| Net Assets ($) | 22,516 | 21,797 | 8,932 | 47,781 | 10 |
| Shares Outstanding | 22,510 | 21,797 | 8,932 | 47,778 | 10 |
| Net Asset Value Per Share ($) | 1.00 | 1.00 | 1.00 | 1.00 | 1.00 |
| Agency Shares | | | | | |
| Net Assets ($) | 15 | 1 | 44 | 1 | — |
| Shares Outstanding | 15 | 1 | 44 | 1 | — |
| Net Asset Value Per Share ($) | 1.00 | 1.00 | 1.00 | 1.00 | — |
| Classic Shares | | | | | |
| Net Assets ($) | — | — | — | — | 9,235 |
| Shares Outstanding | — | — | — | — | 9,233 |
| Net Asset Value Per Share ($) | — | — | — | — | 1.00 |
| † Investments at cost ($) | 1,025,949 | 827,885 | 3,269,170 | 253,806 | 148,181 |
| |
| a Amount represents less than $1,000. | | | | | |
| See notes to financial statements. | | | | | |
60
STATEMENT OF OPERATIONS
(amounts in thousands)
Year Ended January 31, 2011
| | | | | | | |
| | | Dreyfus | Dreyfus | Dreyfus | Dreyfus | Dreyfus |
| | Dreyfus | Cash | Government | Government | Treasury & | Treasury |
| | Cash | Management | Cash | Prime Cash | Agency Cash | Prime Cash |
| | Management | Plus, Inc. | Management | Management | Management | Management |
| Investment Income ($): | | | | | | |
| Interest Income | 109,611 | 22,454 | 64,490 | 10,107 | 26,755 | 31,827 |
| Expenses: | | | | | | |
| Management fee—Note 2(a) | 62,187 | 12,684 | 52,231 | 9,262 | 26,343 | 44,204 |
| Distribution fees—Note 2(b) | 11,648 | 4,317 | 7,531 | 3,967 | 7,500 | 19,873 |
| Custodian fees—Note 2(c) | 981 | 295 | 854 | 184 | 495 | 617 |
| Shareholder servicing costs—Note 2(c) | 672 | 278 | 321 | 151 | 672 | 545 |
| Registration fees | 177 | 231 | 272 | 259 | 173 | 212 |
| Trustees’/Directors’ fees | | | | | | |
| and expenses—Note 2(d) | 129 | 22 | 112 | 21 | 59 | 94 |
| Professional fees | 89 | 72 | 81 | 45 | 80 | 82 |
| Prospectus and shareholders’ reports | 34 | 78 | 154 | 69 | 81 | 186 |
| Miscellaneous | 677 | 97 | 493 | 135 | 298 | 447 |
| Total Expenses | 76,594 | 18,074 | 62,049 | 14,093 | 35,701 | 66,260 |
| Less—reduction in expenses | | | | | | |
| due to undertaking—Note 2(a) | (5,173) | (1,362) | (6,521) | (4,387) | (9,447) | (34,440) |
| Less—reduction in management fee | | | | | | |
| due to undertaking—Note 2(a) | — | (3,701) | — | — | — | — |
| Less—reduction in fees | | | | | | |
| due to earnings credits—Note 2(c) | — | (8) | (3) | — | (7) | (8) |
| Net Expenses | 71,421 | 13,003 | 55,525 | 9,706 | 26,247 | 31,812 |
| Investment Income—Net | 38,190 | 9,451 | 8,965 | 401 | 508 | 15 |
| Net Realized Gain (Loss) on | | | | | | |
| Investments—Note 1(b) ($) | 120 | 391 | (22) | 28 | 45 | 58 |
| Net Increase in Net Assets | | | | | | |
| Resulting from Operations | 38,310 | 9,842 | 8,943 | 429 | 553 | 73 |
| |
| a Amount represents less than $1,000. | | | | | | |
| See notes to financial statements. | | | | | | |
STATEMENT OF OPERATIONS (continued)
(amounts in thousands)
Year Ended January 31, 2011 (Unaudited)
| | | | | | |
| | | | | Dreyfus | Dreyfus |
| | Dreyfus | Dreyfus | Dreyfus | California | New York |
| | Municipal Cash | New York | Tax Exempt | AMT-Free | AMT-Free |
| | Management | Municipal Cash | Cash | Municipal Cash | Municipal Cash |
| | Plus | Management | Management | Management | Management |
| Investment Income ($): | | | | | |
| Interest Income | 4,498 | 3,112 | 11,579 | 1,122 | 791 |
| Expenses: | | | | | |
| Management fee—Note 2(a) | 2,446 | 1,733 | 7,179 | 600 | 424 |
| Distribution fees—Note 2(b) | 1,307 | 831 | 1,138 | 355 | 319 |
| Registration fees | 121 | 55 | 197 | 14 | 75 |
| Custodian fees—Note 2(c) | 98 | 91 | 153 | 36 | 25 |
| Professional fees | 69 | 70 | 76 | 40 | 40 |
| Shareholder servicing costs—Note 2(c) | 60 | 31 | 507 | 8 | 13 |
| Prospectus and shareholders’ reports | 39 | 38 | 44 | 7 | 17 |
| Trustees’ fees and expenses—Note 2(d) | 6 | 4 | 17 | 1 | 1 |
| Miscellaneous | 52 | 37 | 132 | 23 | 51 |
| Total Expenses | 4,198 | 2,890 | 9,443 | 1,084 | 965 |
| Less—reduction in management fee | | | | | |
| due to undertaking—Note 2(a) | — | — | — | — | (149) |
| Less—reduction in expenses | | | | | |
| due to undertaking—Note 2(a) | (425) | (408) | (632) | (196) | (182) |
| Less—reduction in fees due | | | | | |
| to earnings credits—Note 2(c) | —a | —a | —a | —a | —a |
| Net Expenses | 3,773 | 2,482 | 8,811 | 888 | 634 |
| Investment Income—Net | 725 | 630 | 2,768 | 234 | 157 |
| Net Realized Gain (Loss) on | | | | | |
| Investments—Note 1(b) ($) | (10) | 3 | — | —a | — |
| Net Increase in Net Assets | | | | | |
| Resulting from Operations | 715 | 633 | 2,768 | 234 | 157 |
| |
| a Amount represents less than $1,000. | | | | | |
| See notes to financial statements. | | | | | |
62
STATEMENTS OF CHANGES IN NET ASSETS
(amounts in thousands)
| | | | | |
| | Dreyfus Cash Management | Dreyfus Cash Management Plus, Inc. |
| | Year Ended January 31, | Year Ended January 31, |
| | 2011 | 2010 | 2011 | 2010 |
| Operations ($): | | | | |
| Investment income—net | 38,190 | 151,861 | 9,451 | 21,224 |
| Net realized gain (loss) on investments | 120 | 231 | 391 | (81,757) |
| Net unrealized appreciation (depreciation) on investments | — | — | — | 32,337 |
| Net Increase from payment by affiliate—Note 1(f) | — | — | — | 68,407 |
| Net Increase (Decrease) in Net Assets | | | | |
| Resulting from Operations | 38,310 | 152,092 | 9,842 | 40,211 |
| Dividends to Shareholders from ($): | | | | |
| Investment income—net: | | | | |
| Institutional Shares | (37,737) | (134,824) | (8,750) | (14,894) |
| Investor Shares | (7) | (10,304) | (45) | (2,497) |
| Administrative Shares | (380) | (4,339) | (656) | (3,054) |
| Participant Shares | —a | (1,690) | —a | (771) |
| Service Shares | — | — | —a | (3) |
| Select Shares | — | — | —a | (5) |
| Agency Shares | (66) | (704) | —a | —a |
| Total Dividends | (38,190) | (151,861) | (9,451) | (21,224) |
| Beneficial Interest/Capital Stock | | | | |
| Transactions ($1.00 per share): | | | | |
| Net proceeds from shares sold: | | | | |
| Institutional Shares | 123,589,162 | 205,919,725 | 23,476,122 | 18,044,547 |
| Investor Shares | 12,189,202 | 15,180,824 | 1,216,590 | 2,315,173 |
| Administrative Shares | 2,512,448 | 3,832,973 | 2,161,668 | 2,041,658 |
| Participant Shares | 2,622,489 | 4,130,178 | 1,299,319 | 1,684,262 |
| Service Shares | — | — | 3,995,609 | 45,157 |
| Select Shares | — | — | 17,251 | 24,034 |
| Agency Shares | 97,436 | 317,162 | — | — |
| Capital contribution from affiliate—Note 2(e): | | | | |
| Institutional Shares | — | — | 11,794 | — |
| Investor Shares | — | — | 1,998 | — |
| Administrative Shares | — | — | 1,942 | — |
| Participant Shares | — | — | 996 | — |
| Service Shares | — | — | 43 | — |
| Select Shares | — | — | 20 | — |
| Agency Shares | — | — | —a | — |
| Dividends reinvested: | | | | |
| Institutional Shares | 7,089 | 34,050 | 3,128 | 6,598 |
| Investor Shares | 1 | 1,925 | 42 | 2,121 |
| Administrative Shares | 158 | 1,264 | 510 | 2,588 |
| Participant Shares | —a | 358 | —a | 717 |
| Service Shares | — | — | — | —a |
| Agency Shares | 1 | 335 | —a | —a |
| Cost of shares redeemed: | | | | |
| Institutional Shares | (133,375,106) | (203,484,505) | (22,540,093) | (18,089,064) |
| Investor Shares | (12,697,257) | (16,619,109) | (1,403,703) | (2,889,192) |
| Administrative Shares | (2,833,493) | (3,897,228) | (2,105,294) | (2,503,691) |
| Participant Shares | (2,597,285) | (4,592,274) | (1,401,952) | (2,396,803) |
| Service Shares | — | — | (3,993,324) | (49,976) |
| Select Shares | — | — | (16,859) | (47,374) |
| Agency Shares | (127,174) | (326,276) | — | — |
| Increase (Decrease) in Net Assets from | | | | |
| Beneficial Interest/Capital Stock Transactions | (10,612,329) | 499,402 | 725,807 | (1,809,245) |
| Total Increase (Decrease) In Net Assets | (10,612,209) | 499,633 | 726,198 | (1,790,258) |
| Net Assets ($): | | | | |
| Beginning of Period | 39,541,195 | 39,041,562 | 5,677,854 | 7,468,112 |
| End of Period | 28,928,986 | 39,541,195 | 6,404,052 | 5,677,854 |
| |
| a Amount represents less than $1,000. |
| See notes to financial statements. |
STATEMENT OF CHANGES IN NET ASSETS (continued)
(amounts in thousands)
| | | | | |
| | Dreyfus Government | Dreyfus Government |
| | Cash Management | Prime Cash Management |
| | Year Ended January 31, | Year Ended January 31, |
| | 2011 | 2010 | 2011 | 2010 |
| Operations ($): | | | | |
| Investment income—net | 8,965 | 55,790 | 401 | 5,610 |
| Net realized gain (loss) on investments | (22) | 138 | 28 | 13 |
| Net Increase (Decrease) in Net Assets | | | | |
| Resulting from Operations | 8,943 | 55,928 | 429 | 5,623 |
| Dividends to Shareholders from ($): | | | | |
| Investment income—net: | | | | |
| Institutional Shares | (9,081) | (52,625) | (429) | (5,334) |
| Investor Shares | (12) | (1,261) | (6) | (30) |
| Administrative Shares | (4) | (1,737) | (6) | (238) |
| Participant Shares | (2) | (56) | (5) | (1) |
| Agency Shares | (3) | (111) | —a | (26) |
| Total Dividends | (9,102) | (55,790) | (446) | (5,629) |
| Beneficial Interest Transactions ($1.00 per share): | | | | |
| Net proceeds from shares sold: | | | | |
| Institutional Shares | 139,127,297 | 164,894,102 | 14,494,310 | 19,903,414 |
| Investor Shares | 5,745,617 | 7,738,977 | 1,678,809 | 2,096,688 |
| Administrative Shares | 4,181,614 | 3,193,172 | 5,019,327 | 5,145,416 |
| Participant Shares | 2,053,947 | 2,203,530 | 1,163,525 | 1,568,552 |
| Agency Shares | 260,474 | 231,624 | 122,994 | 190,988 |
| Dividends reinvested: | | | | |
| Institutional Shares | 1,834 | 14,771 | 57 | 1,794 |
| Investor Shares | 8 | 735 | 3 | 13 |
| Administrative Shares | 3 | 1,361 | 5 | 209 |
| Participant Shares | 1 | 29 | 4 | 1 |
| Agency Shares | —a | —a | —a | —a |
| Cost of shares redeemed: | | | | |
| Institutional Shares | (142,562,963) | (174,661,061) | (14,850,094) | (23,196,803) |
| Investor Shares | (6,250,286) | (9,588,829) | (1,715,192) | (2,681,628) |
| Administrative Shares | (3,919,457) | (4,623,225) | (4,954,550) | (5,342,373) |
| Participant Shares | (1,862,507) | (2,526,210) | (1,392,977) | (2,208,938) |
| Agency Shares | (202,800) | (244,894) | (157,470) | (142,069) |
| Increase (Decrease) in Net Assets from | | | | |
| Beneficial Interest Transactions | (3,427,218) | (13,365,918) | (591,249) | (4,664,736) |
| Total Increase (Decrease) In Net Assets | (3,427,377) | (13,365,780) | (591,266) | (4,664,742) |
| Net Assets ($): | | | | |
| Beginning of Period | 27,413,268 | 40,779,048 | 5,033,266 | 9,698,008 |
| End of Period | 23,985,891 | 27,413,268 | 4,442,000 | 5,033,266 |
| |
| a Amount represents less than $1,000. | | | | |
| See notes to financial statements. | | | | |
64
| | | | | |
| | Dreyfus Treasury & | Dreyfus Treasury |
| | Agency Cash Management | Prime Cash Management |
| | Year Ended January 31, | Year Ended January 31, |
| | 2011 | 2010 | 2011 | 2010 |
| Operations ($): | | | | |
| Investment income—net | 508 | 10,789 | 15 | 5,500 |
| Net realized gain (loss) on investments | 45 | 136 | 58 | 102 |
| Net Increase (Decrease) in Net Assets | | | | |
| Resulting from Operations | 553 | 10,925 | 73 | 5,602 |
| Dividends to Shareholders from ($): | | | | |
| Investment income—net: | | | | |
| Institutional Shares | (549) | (10,543) | (78) | (5,594) |
| Investor Shares | (8) | (5) | (20) | (9) |
| Administrative Shares | (2) | (214) | (6) | (11) |
| Participant Shares | (2) | (1) | (13) | (6) |
| Service Shares | —a | —a | — | — |
| Select Shares | —a | —a | — | — |
| Agency Shares | —a | (26) | —a | (13) |
| Premier Shares | (1) | —a | — | — |
| Total Dividends | (562) | (10,789) | (117) | (5,633) |
| Beneficial Interest Transactions ($1.00 per share): | | | | |
| Net proceeds from shares sold: | | | | |
| Institutional Shares | 49,934,745 | 68,033,436 | 55,449,345 | 60,299,612 |
| Investor Shares | 10,365,713 | 11,174,580 | 9,217,693 | 9,985,602 |
| Administrative Shares | 2,395,745 | 4,043,353 | 3,143,989 | 4,671,129 |
| Participant Shares | 1,832,518 | 2,139,953 | 10,611,292 | 11,299,483 |
| Service Shares | 3,015 | 5,379 | — | — |
| Select Shares | 63,744 | 69,667 | — | — |
| Agency Shares | 41,114 | 208,593 | 117,080 | 666,934 |
| Premier Shares | 421,004 | 886,267 | — | — |
| Dividends reinvested: | | | | |
| Institutional Shares | 88 | 3,198 | 24 | 2,210 |
| Investor Shares | 1 | 1 | 10 | 5 |
| Administrative Shares | 1 | 135 | 3 | 6 |
| Participant Shares | 1 | —a | 10 | 5 |
| Service Shares | —a | —a | — | — |
| Select Shares | — | —a | — | — |
| Agency Shares | —a | —a | —a | 10 |
| Premier Shares | — | —a | — | — |
| Cost of shares redeemed: | | | | |
| Institutional Shares | (54,005,747) | (72,482,785) | (59,184,393) | (72,138,346) |
| Investor Shares | (10,464,335) | (12,569,809) | (10,224,890) | (13,286,181) |
| Administrative Shares | (2,667,965) | (4,703,968) | (3,361,742) | (5,925,054) |
| Participant Shares | (1,934,704) | (2,063,624) | (11,046,691) | (14,137,635) |
| Service Shares | (3,104) | (5,553) | — | — |
| Select Shares | (69,446) | (77,569) | — | — |
| Agency Shares | (73,609) | (201,117) | (477,114) | (694,755) |
| Premier Shares | (429,918) | (860,009) | — | — |
| Increase (Decrease) in Net Assets from | | | | |
| Beneficial Interest Transactions | (4,591,139) | (6,399,872) | (5,755,384) | (19,256,975) |
| Total Increase (Decrease) In Net Assets | (4,591,148) | (6,399,736) | (5,755,428) | (19,257,006) |
| Net Assets ($): | | | | |
| Beginning of Period | 15,313,468 | 21,713,204 | 27,224,610 | 46,481,616 |
| End of Period | 10,722,320 | 15,313,468 | 21,469,182 | 27,224,610 |
| |
| a Amount represents less than $1,000. | | | | |
| See notes to financial statements. | | | | |
STATEMENT OF CHANGES IN NET ASSETS (continued)
(amounts in thousands)
| | | | | |
| | Dreyfus Municipal | Dreyfus New York Municipal |
| | Cash Management Plus | Cash Management |
| | Year Ended January 31, | Year Ended January 31, |
| | 2011 | 2010 | 2011 | 2010 |
| Operations ($): | | | | |
| Investment income—net | 725 | 8,292 | 630 | 3,592 |
| Net realized gain (loss) on investments | (10) | 3 | 3 | 31 |
| Net Increase (Decrease) in Net Assets | | | | |
| Resulting from Operations | 715 | 8,295 | 633 | 3,623 |
| Dividends to Shareholders from ($): | | | | |
| Investment income—net: | | | | |
| Institutional Shares | (552) | (4,713) | (633) | (2,573) |
| Investor Shares | (1) | (835) | (10) | (851) |
| Administrative Shares | (175) | (2,815) | (18) | (202) |
| Participant Shares | —a | (96) | —a | (54) |
| Agency Shares | —a | (8) | —a | —a |
| Total Dividends | (728) | (8,467) | (661) | (3,680) |
| Beneficial Interest Transactions ($1.00 per share): | | | | |
| Net proceeds from shares sold: | | | | |
| Institutional Shares | 2,409,687 | 6,300,589 | 958,580 | 1,100,157 |
| Investor Shares | 453,364 | 703,488 | 588,954 | 889,613 |
| Administrative Shares | 812,902 | 1,559,147 | 70,541 | 90,472 |
| Participant Shares | 52,866 | 62,395 | 49,114 | 91,910 |
| Agency Shares | —a | 14,601 | — | — |
| Dividends reinvested: | | | | |
| Institutional Shares | 391 | 2,833 | 155 | 444 |
| Investor Shares | 1 | 801 | 9 | 731 |
| Administrative Shares | 172 | 2,711 | 17 | 197 |
| Participant Shares | —a | 96 | —a | 54 |
| Agency Shares | —a | 6 | —a | —a |
| Cost of shares redeemed: | | | | |
| Institutional Shares | (2,407,108) | (6,532,452) | (1,088,380) | (1,055,760) |
| Investor Shares | (595,260) | (596,560) | (571,590) | (982,328) |
| Administrative Shares | (1,018,138) | (1,604,890) | (92,849) | (82,764) |
| Participant Shares | (53,364) | (100,239) | (39,529) | (130,790) |
| Agency Shares | (1,131) | (13,462) | — | — |
| Increase (Decrease) in Net Assets from | | | | |
| Beneficial Interest Transactions | (345,618) | (200,936) | (124,978) | (78,064) |
| Total Increase (Decrease) In Net Assets | (345,631) | (201,108) | (125,006) | (78,121) |
| Net Assets ($): | | | | |
| Beginning of Period | 1,366,391 | 1,567,499 | 952,732 | 1,030,853 |
| End of Period | 1,020,760 | 1,366,391 | 827,726 | 952,732 |
| |
| a Amount represents less than $1,000. | | | | |
| See notes to financial statements. | | | | |
66
| | | | | |
| | Dreyfus Tax Exempt | Dreyfus California AMT-Free |
| | Cash Management | Municipal Cash Management |
| | Year Ended January 31, | Year Ended January 31, |
| | 2011 | 2010 | 2011 | 2010 |
| Operations ($): | | | | |
| Investment income—net | 2,768 | 23,272 | 234 | 676 |
| Net realized gain (loss) on investments | — | 315 | —a | — |
| Net Increase (Decrease) in Net Assets | | | | |
| Resulting from Operations | 2,768 | 23,587 | 234 | 676 |
| Dividends to Shareholders from ($): | | | | |
| Investment income—net: | | | | |
| Institutional Shares | (3,027) | (20,448) | (230) | (462) |
| Investor Shares | (34) | (1,122) | —a | (86) |
| Administrative Shares | (20) | (1,629) | (4) | (28) |
| Participant Shares | (2) | (189) | —a | (115) |
| Agency Shares | —a | (24) | —a | —a |
| Total Dividends | (3,083) | (23,412) | (234) | (691) |
| Beneficial Interest Transactions ($1.00 per share): | | | | |
| Net proceeds from shares sold: | | | | |
| Institutional Shares | 13,739,366 | 17,954,303 | 494,406 | 331,375 |
| Investor Shares | 582,597 | 870,127 | 80,508 | 181,355 |
| Administrative Shares | 121,922 | 779,288 | 117,701 | 76,700 |
| Participant Shares | 85,284 | 227,547 | 81,166 | 85,895 |
| Agency Shares | 514 | 28,927 | — | — |
| Dividends reinvested: | | | | |
| Institutional Shares | 1,294 | 10,310 | 225 | 409 |
| Investor Shares | 20 | 883 | —a | 86 |
| Administrative Shares | 16 | 1,381 | 3 | 28 |
| Participant Shares | —a | 1 | —a | 115 |
| Agency Shares | —a | 21 | —a | —a |
| Cost of shares redeemed: | | | | |
| Institutional Shares | (14,292,820) | (19,772,464) | (498,235) | (284,010) |
| Investor Shares | (592,198) | (1,082,483) | (88,138) | (141,488) |
| Administrative Shares | (169,657) | (1,305,085) | (108,325) | (72,589) |
| Participant Shares | (103,434) | (334,628) | (89,455) | (126,545) |
| Agency Shares | (7,517) | (26,239) | — | — |
| Increase (Decrease) in Net Assets from | | | | |
| Beneficial Interest Transactions | (634,613) | (2,648,111) | (10,144) | 51,331 |
| Total Increase (Decrease) In Net Assets | (634,928) | (2,647,936) | (10,144) | 51,316 |
| Net Assets ($): | | | | |
| Beginning of Period | 3,891,176 | 6,539,112 | 262,942 | 211,626 |
| End of Period | 3,256,248 | 3,891,176 | 252,798 | 262,942 |
| |
| a Amount represents less than $1,000. | | | | |
| See notes to financial statements. | | | | |
STATEMENT OF CHANGES IN NET ASSETS (continued)
(amounts in thousands)
| | | |
| | Dreyfus New York AMT-Free |
| | Municipal Cash Management |
| | Year Ended January 31, |
| | 2011 | 2010 |
| Operations ($): | | |
| Investment income—net | 157 | 586 |
| Net realized gain (loss) on investments | — | 8 |
| Net Increase (Decrease) in Net Assets Resulting from Operations | 157 | 594 |
| Dividends to Shareholders from ($): | | |
| Investment income—net: | | |
| Institutional Shares | (158) | (247) |
| Investor Shares | (3) | (236) |
| Administrative Shares | (4) | (2) |
| Participant Shares | —a | —a |
| Classic Shares | —a | (101) |
| Total Dividends | (165) | (586) |
| Beneficial Interest Transactions ($1.00 per share): | | |
| Net proceeds from shares sold: | | |
| Institutional Shares | 167,755 | 196,310 |
| Investor Shares | 136,935 | 193,259 |
| Administrative Shares | 20,770 | 31,044 |
| Participant Shares | — | —a |
| Classic Shares | 179,313 | 304,233 |
| Dividends reinvested: | | |
| Institutional Shares | 110 | 52 |
| Investor Shares | 1 | 62 |
| Administrative Shares | 3 | 2 |
| Classic Shares | —a | 101 |
| Cost of shares redeemed: | | |
| Institutional Shares | (197,638) | (135,412) |
| Investor Shares | (160,329) | (221,786) |
| Administrative Shares | (20,958) | (22,912) |
| Participant Shares | — | —a |
| Classic Shares | (229,658) | (321,100) |
| Increase (Decrease) in Net Assets from | | |
| Beneficial Interest Transactions | (103,696) | 23,853 |
| Settlement payment from unaffiliated third party† | 36 | — |
| Total Increase (Decrease) In Net Assets | (103,668) | 23,861 |
| Net Assets ($): | | |
| Beginning of Period | 251,536 | 227,675 |
| End of Period | 147,868 | 251,536 |
| | |
| † | See Note 6. |
| a | Amount represents less than $1,000. |
See notes to financial statements.
68
FINANCIAL HIGHLIGHTS
The following tables describe the performance for each share class for the fiscal periods indicated.All information reflects financial results for a single fund share.Total return shows how much your investment in the fund would have increased (or decreased) during each period, assuming you had reinvested all dividends and distributions.These figures have been derived from the funds’ financial statements. Please note that the financial highlights information in the following tables for Dreyfus NewYork AMT-Free Municipal Cash Management’s Institutional, Investor and Classic shares represents the financial highlights of Dreyfus New York AMT-Free Municipal Cash Management’s predecessor, BNY Hamilton NewYork AMT-Free Municipal Money Fund (NewYork AMT-Free Municipal Money Fund), before Dreyfus NewYork AMT-Free Municipal Cash Management commenced operations as of the close of business on September 12, 2008, and represents the performance of Dreyfus NewYork AMT-Free Municipal Cash Management’s Institutional, Investor and Classic shares thereafter. Before Dreyfus NewYork AMT-Free Municipal Cash Management commenced operations, all of the assets of the NewYork AMT-Free Municipal Money Fund were transferred to Dreyfus NewYork AMT-Free Municipal Cash Management in exchange for Institutional, Investor and Classic shares of the fund in a tax-free reorganization.Total return shows how much your investment in Dreyfus NewYork AMT-Free Municipal Cash Management would have increased (or decreased) during each period, assuming you had reinvested all dividends and distributions.These figures have been derived from Dreyfus New York AMT-Free Municipal Cash Management’s predecessor’s financial statements.
| | | | | | | | | | |
| | | Per Share Data ($) | | | Ratios/Supplemental Data (%) | |
| | | | | | | | | Ratio of Net | |
| | Net Asset | | Dividends | Net Asset | | Ratio of | Ratio of | Investment | Net ssets |
| | Value | Net | from Net | Value | | Total Expenses | Net Expenses | Income to | End of |
| | Beginning | Investment | Investment | End | Total | to Average | to Average | Average | Period |
| | of Period | Income | Income | of Period | Return (%) | Net Assets | Net Assets | Net Assets | ($ ,000,000) |
| | | | | | | | | | |
| Dreyfus Cash Management | | | | | | | | | |
| Institutional Shares | | | | | | | | | |
| Year Ended January 31, | | | | | | | | | |
| 2011 | 1.00 | .001 | (.001) | 1.00 | .15 | .21 | .21 | .14 | 24,512 |
| 2010 | 1.00 | .004 | (.004) | 1.00 | .41 | .22 | .22 | .40 | 34,291 |
| 2009 | 1.00 | .026 | (.026) | 1.00 | 2.65 | .21 | .21 | 2.56 | 31,821 |
| 2008 | 1.00 | .051 | (.051) | 1.00 | 5.18 | .20 | .20 | 5.03 | 18,983 |
| 2007 | 1.00 | .050 | (.050) | 1.00 | 5.07 | .20 | .20 | 4.98 | 11,063 |
| Investor Shares | | | | | | | | | |
| Year Ended January 31, | | | | | | | | | |
| 2011 | 1.00 | .000a | (.000)a | 1.00 | .00b | .46 | .35 | .00b | 2,949 |
| 2010 | 1.00 | .002 | (.002) | 1.00 | .21 | .47 | .43 | .23 | 3,457 |
| 2009 | 1.00 | .024 | (.024) | 1.00 | 2.40 | .47 | .47 | 2.30 | 4,893 |
| 2008 | 1.00 | .048 | (.048) | 1.00 | 4.92 | .45 | .45 | 4.78 | 3,194 |
| 2007 | 1.00 | .047 | (.047) | 1.00 | 4.80 | .45 | .45 | 4.73 | 1,590 |
| Administrative Shares | | | | | | | | | |
| Year Ended January 31, | | | | | | | | | |
| 2011 | 1.00 | .001 | (.001) | 1.00 | .05 | .31 | .30 | .05 | 792 |
| 2010 | 1.00 | .003 | (.003) | 1.00 | .32 | .32 | .32 | .31 | 1,113 |
| 2009 | 1.00 | .025 | (.025) | 1.00 | 2.55 | .31 | .31 | 2.46 | 1,176 |
| 2008 | 1.00 | .050 | (.050) | 1.00 | 5.08 | .30 | .30 | 4.93 | 638 |
| 2007 | 1.00 | .049 | (.049) | 1.00 | 4.96 | .30 | .30 | 4.88 | 315 |
| Participant Shares | | | | | | | | | |
| Year Ended January 31, | | | | | | | | | |
| 2011 | 1.00 | .000a | (.000)a | 1.00 | .00b | .61 | .36 | .00b | 616 |
| 2010 | 1.00 | .001 | (.001) | 1.00 | .14 | .63 | .52 | .15 | 591 |
| 2009 | 1.00 | .022 | (.022) | 1.00 | 2.24 | .62 | .62 | 2.15 | 1,052 |
| 2008 | 1.00 | .047 | (.047) | 1.00 | 4.77 | .60 | .60 | 4.63 | 390 |
| 2007 | 1.00 | .046 | (.046) | 1.00 | 4.65 | .60 | .60 | 4.58 | 206 |
| Agency Shares | | | | | | | | | |
| Year Ended January 31, | | | | | | | | | |
| 2011 | 1.00 | .001 | (.001) | 1.00 | .09 | .27 | .27 | .09 | 60 |
| 2010 | 1.00 | .004 | (.004) | 1.00 | .35 | .29 | .28 | .42 | 90 |
| 2009 | 1.00 | .026 | (.026) | 1.00 | 2.59 | .28 | .28 | 2.49 | 99 |
| 2008c | 1.00 | .016 | (.016) | 1.00 | 4.84d | .26d | .26d | 4.97d | 19 |
| | |
| a | Amount represents less than $.001 per share. |
| b | Amount represents less than .01%. |
| c | From October 1, 2007 (commencement of initial offering) to January 31, 2008. |
| d | Annualized. |
See notes to financial statements.
FINANCIAL HIGHLIGHTS (continued)
| | | | | | | | | | |
| | | Per Share Data ($) | | | Ratios/Supplemental Data (%) | |
| | | | | | | | | RatIio of Net | |
| | Net Asset | | Dividends | Net Asset | | Ratio of | Ratio of | Investment | Net Assets |
| | Value | Net | from Net | Value | | Total Expenses | Net Expenses | Income to | End of |
| | Beginning | Investment | Investment | End | Total | to Average | to Average | Average | Period |
| | of Period | Income | Income | of Period | Return (%) | Net Assets | Net Assets | Net Expenses | ($x 1,000,000) |
| | | | | | | | | |
| Dreyfus Cash Management Plus, Inc. | | | | | | | | |
| Institutional Shares | | | | | | | | | |
| Year Ended January 31, | | | | | | | | | |
| 2011 | 1.00 | .002 | (.002) | 1.00 | .19 | .22 | .16 | .20 | 4,741 |
| 2010 | 1.00 | .004 | (.004) | 1.00 | .36a | .27 | .25 | .36 | 3,790 |
| 2009 | 1.00 | .026 | (.026) | 1.00 | 2.66 | .21 | .21 | 2.80 | 3,822 |
| 2008 | 1.00 | .051 | (.051) | 1.00 | 5.18 | .20 | .20 | 5.04 | 9,513 |
| 2007 | 1.00 | .049 | (.049) | 1.00 | 5.06 | .20 | .20 | 4.95 | 6,495 |
| Investor Shares | | | | | | | | | |
| Year Ended January 31, | | | | | | | | | |
| 2011 | 1.00 | .000b | (.000)b | 1.00 | .01 | .47 | .35 | .01 | 735 |
| 2010 | 1.00 | .002 | (.002) | 1.00 | .17a | .51 | .46 | .20 | 919 |
| 2009 | 1.00 | .024 | (.024) | 1.00 | 2.40 | .47 | .47 | 2.54 | 1,487 |
| 2008 | 1.00 | .048 | (.048) | 1.00 | 4.92 | .45 | .45 | 4.79 | 1,802 |
| 2007 | 1.00 | .047 | (.047) | 1.00 | 4.80 | .45 | .45 | 4.70 | 1,658 |
| Administrative Shares | | | | | | | | | |
| Year Ended January 31, | | | | | | | | | |
| 2011 | 1.00 | .001 | (.001) | 1.00 | .09 | .32 | .26 | .10 | 693 |
| 2010 | 1.00 | .003 | (.003) | 1.00 | .27a | .36 | .35 | .31 | 635 |
| 2009 | 1.00 | .025 | (.025) | 1.00 | 2.55 | .32 | .32 | 2.69 | 1,091 |
| 2008 | 1.00 | .050 | (.050) | 1.00 | 5.08 | .30 | .30 | 4.94 | 2,278 |
| 2007 | 1.00 | .048 | (.048) | 1.00 | 4.95 | .30 | .30 | 4.85 | 1,148 |
| Participant Shares | | | | | | | | | |
| Year Ended January 31, | | | | | | | | | |
| 2011 | 1.00 | .000b | (.000)b | 1.00 | .00c | .62 | .35 | .00c | 225 |
| 2010 | 1.00 | .001 | (.001) | 1.00 | .10a | .67 | .55 | .14 | 327 |
| 2009 | 1.00 | .022 | (.022) | 1.00 | 2.25 | .62 | .62 | 2.39 | 1,034 |
| 2008 | 1.00 | .047 | (.047) | 1.00 | 4.76 | .60 | .60 | 4.64 | 1,264 |
| 2007 | 1.00 | .045 | (.045) | 1.00 | 4.64 | .60 | .60 | 4.55 | 941 |
| Service Shares | | | | | | | | | |
| Year Ended January 31, | | | | | | | | | |
| 2011 | 1.00 | .000b | (.000)b | 1.00 | .00c | .71 | .32 | .00c | 4 |
| 2010 | 1.00 | .001 | (.001) | 1.00 | .06a | .78 | .63 | .07 | 2 |
| 2009 | 1.00 | .021 | (.021) | 1.00 | 2.14 | .72 | .72 | 2.29 | 7 |
| 2008d | 1.00 | .027 | (.027) | 1.00 | 3.82e | .70e | .70e | 4.54e | 70 |
| Select Shares | | | | | | | | | |
| Year Ended January 31, | | | | | | | | | |
| 2011 | 1.00 | .000b | (.000)b | 1.00 | .00c | 1.01 | .35 | .00c | 5 |
| 2010 | 1.00 | .000b | (.000)b | 1.00 | .02a | 1.07 | .75 | .06 | 5 |
| 2009 | 1.00 | .018 | (.018) | 1.00 | 1.84 | 1.04 | 1.04 | 1.97 | 28 |
| 2008d | 1.00 | .025 | (.025) | 1.00 | 3.57e | 1.00e | 1.00e | 4.24e | —f |
| Agency Shares | | | | | | | | | |
| Year Ended January 31, | | | | | | | | | |
| 2011 | 1.00 | .001 | (.001) | 1.00 | .13 | .28 | .26 | .10 | —f |
| 2010 | 1.00 | .003 | (.003) | 1.00 | .30a | .33 | .31 | .30 | —f |
| 2009 | 1.00 | .026 | (.026) | 1.00 | 2.60 | .26 | .26 | 2.75 | —f |
| 2008g | 1.00 | .016 | (.016) | 1.00 | 4.81e | .26e | .26e | 4.98e | —f |
| |
| a If payment pursuant to the Capital Support Agreement was not made, total return would have been (1.65)% for Institutional Shares, (1.83)% for Investor Shares, (1.74)% for |
| Administrative Shares, (1.90)% for Participant Shares, (1.94)% for Service Shares, (1.98)% for Select Shares and (1.71)% for Agency Shares. |
| b Amount represents less than $.001 per share. |
| c Amount represents less than .01%. |
| d From June 29, 2007 (commencement of initial offering) to January 31, 2008. |
| e Annualized. |
| f Amount represents less than $1 million. |
| g From October 1, 2007 (commencement of initial offering) to January 31, 2008. |
See notes to financial statements.
70
| | | | | | | | | | |
| | | Per Share Data ($) | | | Ratios/Supplemental Data (%) | |
| | | | | | | | | Ratio of Net | |
| | Net Asset | | Dividends | Net Asset | | Ratio of | Ratio of | Investment | Net Assets |
| | Value | Net | from Net | Value | | Total Expenses | Net Expenses | Income | End of |
| | Beginning | Investment | Investment | End | Total | to Average | to Average | to Average | Period |
| | of Period | Income | Income | of Period | Return (%) | Net Assets | Net Assets | Net Assets | ($ x1,000,000) |
| | | | | | | | | | |
| Dreyfus Government | | | | | | | | | |
| Cash Management | | | | | | | | | |
| Institutional Shares | | | | | | | | | |
| Year Ended January 31, | | | | | | | | | |
| 2011 | 1.00 | .000a | (.000)a | 1.00 | .04 | .21 | .21 | .04 | 20,529 |
| 2010 | 1.00 | .002 | (.002) | 1.00 | .17 | .22 | .21 | .18 | 23,963 |
| 2009 | 1.00 | .020 | (.020) | 1.00 | 2.01 | .22 | .22 | 1.63 | 33,715 |
| 2008 | 1.00 | .048 | (.048) | 1.00 | 4.93 | .20 | .20 | 4.73 | 9,303 |
| 2007 | 1.00 | .049 | (.049) | 1.00 | 4.99 | .20 | .20 | 4.89 | 3,118 |
| Investor Shares | | | | | | | | | |
| Year Ended January 31, | | | | | | | | | |
| 2011 | 1.00 | .000a | (.000)a | 1.00 | .00b | .46 | .25 | .00b | 1,705 |
| 2010 | 1.00 | .000a | (.000)a | 1.00 | .03 | .46 | .37 | .04 | 2,209 |
| 2009 | 1.00 | .017 | (.017) | 1.00 | 1.76 | .46 | .46 | 1.39 | 4,058 |
| 2008 | 1.00 | .046 | (.046) | 1.00 | 4.67 | .45 | .45 | 4.48 | 1,738 |
| 2007 | 1.00 | .046 | (.046) | 1.00 | 4.72 | .45 | .45 | 4.64 | 909 |
| Administrative Shares | | | | | | | | | |
| Year Ended January 31, | | | | | | | | | |
| 2011 | 1.00 | .000a | (.000)a | 1.00 | .00b | .31 | .25 | .00b | 1,091 |
| 2010 | 1.00 | .001 | (.001) | 1.00 | .10 | .32 | .29 | .13 | 829 |
| 2009 | 1.00 | .019 | (.019) | 1.00 | 1.91 | .31 | .31 | 1.54 | 2,258 |
| 2008 | 1.00 | .047 | (.047) | 1.00 | 4.83 | .30 | .30 | 4.63 | 693 |
| 2007 | 1.00 | .048 | (.048) | 1.00 | 4.88 | .30 | .30 | 4.79 | 320 |
| Participant Shares | | | | | | | | | |
| Year Ended January 31, | | | | | | | | | |
| 2011 | 1.00 | .000a | (.000)a | 1.00 | .00b | .61 | .25 | .00b | 531 |
| 2010 | 1.00 | .000a | (.000)a | 1.00 | .01 | .62 | .41 | .01 | 339 |
| 2009 | 1.00 | .016 | (.016) | 1.00 | 1.60 | .61 | .61 | 1.24 | 662 |
| 2008 | 1.00 | .044 | (.044) | 1.00 | 4.51 | .60 | .60 | 4.33 | 445 |
| 2007 | 1.00 | .045 | (.045) | 1.00 | 4.57 | .60 | .60 | 4.49 | 196 |
| Agency Shares | | | | | | | | | |
| Year Ended January 31, | | | | | | | | | |
| 2011 | 1.00 | .000a | (.000)a | 1.00 | .00b | .28 | .25 | .00b | 130 |
| 2010 | 1.00 | .001 | (.001) | 1.00 | .13 | .27 | .26 | .13 | 73 |
| 2009 | 1.00 | .019 | (.019) | 1.00 | 1.96 | .27 | .27 | 1.58 | 86 |
| 2008c | 1.00 | .014 | (.014) | 1.00 | 4.30d | .26d | .26d | 4.67d | 2 |
| | |
| a | Amount represents less than $.001 per share. |
| b | Amount represents less than .01%. |
| c | From October 1, 2007 (commencement of initial offering) to January 31, 2008. |
| d | Annualized. |
See notes to financial statements.
FINANCIAL HIGHLIGHTS (continued)
| | | | | | | | | | |
| | | Per Share Data ($) | | | Ratios/Supplemental Data (%) | |
| | | | | | | | | Ratio of Net | |
| | Net Asset | | Dividends Net Asset | | Ratio of | Ratio of | Investment Net Assets |
| | Value | Net | from Net | Value | | Total Expenses Net Expenses I ncome to | End of |
| | Beginning Investment Investment | End | Total | to Average | to Average | Average | Period |
| | of Period | Income | Income | of Period Return (%) Net Assets | Net Assets Net Assets ($ x1,000,000) |
| |
| Dreyfus Government Prime | | | | | | | | | |
| Cash Management | | | | | | | | | |
| Institutional Shares | | | | | | | | | |
| Year Ended January 31, | | | | | | | | | |
| 2011 | 1.00 | .000a | (.000)a | 1.00 | .01 | .22 | .20 | .01 | 2,792 |
| 2010 | 1.00 | .001 | (.001) | 1.00 | .11 | .23 | .21 | .12 | 3,147 |
| 2009 | 1.00 | .019 | (.019) | 1.00 | 1.91 | .22 | .22 | 1.64 | 6,439 |
| 2008 | 1.00 | .048 | (.048) | 1.00 | 4.91 | .20 | .20 | 4.67 | 2,327 |
| 2007 | 1.00 | .048 | (.048) | 1.00 | 4.95 | .20 | .20 | 4.86 | 1,005 |
| Investor Shares | | | | | | | | | |
| Year Ended January 31, | | | | | | | | | |
| 2011 | 1.00 | .000a | (.000)a | 1.00 | .00b | .47 | .22 | .00b | 557 |
| 2010 | 1.00 | .000a | (.000)a | 1.00 | .00b | .48 | .33 | .00b | 593 |
| 2009 | 1.00 | .016 | (.016) | 1.00 | 1.66 | .47 | .47 | 1.39 | 1,178 |
| 2008 | 1.00 | .046 | (.046) | 1.00 | 4.65 | .45 | .45 | 4.42 | 563 |
| 2007 | 1.00 | .046 | (.046) | 1.00 | 4.69 | .45 | .45 | 4.61 | 275 |
| Administrative Shares | | | | | | | | | |
| Year Ended January 31, | | | | | | | | | |
| 2011 | 1.00 | .000a | (.000)a | 1.00 | .00b | .32 | .22 | .00b | 561 |
| 2010 | 1.00 | .000a | (.000)a | 1.00 | .04 | .33 | .29 | .04 | 497 |
| 2009 | 1.00 | .018 | (.018) | 1.00 | 1.81 | .32 | .32 | 1.54 | 693 |
| 2008 | 1.00 | .047 | (.047) | 1.00 | 4.80 | .30 | .30 | 4.57 | 307 |
| 2007 | 1.00 | .047 | (.047) | 1.00 | 4.85 | .30 | .30 | 4.76 | 314 |
| Participant Shares | | | | | | | | | |
| Year Ended January 31, | | | | | | | | | |
| 2011 | 1.00 | .000a | (.000)a | 1.00 | .00b | .62 | .22 | .00b | 476 |
| 2010 | 1.00 | .000a | (.000)a | 1.00 | .00b | .62 | .33 | .00b | 706 |
| 2009 | 1.00 | .015 | (.015) | 1.00 | 1.51 | .62 | .61 | 1.25 | 1,346 |
| 2008 | 1.00 | .044 | (.044) | 1.00 | 4.49 | .60 | .60 | 4.27 | 711 |
| 2007 | 1.00 | .044 | (.044) | 1.00 | 4.53 | .60 | .60 | 4.46 | 341 |
| Agency Shares | | | | | | | | | |
| Year Ended January 31, | | | | | | | | | |
| 2011 | 1.00 | .000a | (.000)a | 1.00 | .00b | .28 | .21 | .00b | 56 |
| 2010 | 1.00 | .001 | (.001) | 1.00 | .06 | .29 | .26 | .06 | 90 |
| 2009 | 1.00 | .018 | (.018) | 1.00 | 1.85 | .28 | .28 | 1.58 | 41 |
| 2008c | 1.00 | .015 | (.015) | 1.00 | 4.33d | .26d | .26d | 4.61d | 10 |
| | |
| a | Amount represents less than $.001 per share. |
| b | Amount represents less than .01%. |
| c | From October 1, 2007 (commencement of initial offering) to January 31, 2008. |
| d | Annualized. |
See notes to financial statements.
72
| | | | | | | | | | |
| | | Per Share Data ($) | | | Ratios/Supplemental Data (%) | |
| | | | | | | | | Ratio of Net | |
| | Net Asset | | Dividends Net Asset | | Ratio of | Ratio of | Investment Net Assets |
| | Value | Net | from Net | Value | | Total Expenses Net Expenses Income to | End of |
| | Beginning Investment Investment | End | Total | to Average | to Average | Average | Period |
| | of Period | Income | Income | of Period Return (%) Net Assets | Net Assets Net Assets ($ x1,000,000) |
| |
| Dreyfus Treasury & Agency | | | | | | | | | |
| Cash Management | | | | | | | | | |
| Institutional Shares | | | | | | | | | |
| Year Ended January 31, | | | | | | | | | |
| 2011 | 1.00 | .000a | (.000)a | 1.00 | .01 | .22 | .20 | .01 | 7,944 |
| 2010 | 1.00 | .001 | (.001) | 1.00 | .07 | .22 | .21 | .08 | 12,015 |
| 2009 | 1.00 | .013 | (.013) | 1.00 | 1.27 | .22 | .22 | 1.09 | 16,461 |
| 2008 | 1.00 | .046 | (.046) | 1.00 | 4.71 | .20 | .20 | 4.30 | 12,891 |
| 2007 | 1.00 | .048 | (.048) | 1.00 | 4.89 | .20 | .20 | 4.80 | 3,429 |
| Investor Shares | | | | | | | | | |
| Year Ended January 31, | | | | | | | | | |
| 2011 | 1.00 | .000a | (.000)a | 1.00 | .00b | .46 | .20 | .00b | 1,823 |
| 2010 | 1.00 | .000a | (.000)a | 1.00 | .00b | .47 | .29 | .00b | 1,922 |
| 2009 | 1.00 | .010 | (.010) | 1.00 | 1.04 | .47 | .45 | .86 | 3,317 |
| 2008 | 1.00 | .044 | (.044) | 1.00 | 4.45 | .45 | .45 | 4.05 | 3,483 |
| 2007 | 1.00 | .045 | (.045) | 1.00 | 4.63 | .45 | .45 | 4.55 | 1,471 |
| Administrative Shares | | | | | | | | | |
| Year Ended January 31, | | | | | | | | | |
| 2011 | 1.00 | .000a | (.000)a | 1.00 | .00b | .31 | .20 | .00b | 422 |
| 2010 | 1.00 | .000a | (.000)a | 1.00 | .02 | .33 | .27 | .03 | 695 |
| 2009 | 1.00 | .012 | (.012) | 1.00 | 1.17 | .31 | .31 | 1.00 | 1,355 |
| 2008 | 1.00 | .045 | (.045) | 1.00 | 4.61 | .30 | .30 | 4.20 | 758 |
| 2007 | 1.00 | .047 | (.047) | 1.00 | 4.79 | .30 | .30 | 4.70 | 141 |
| Participant Shares | | | | | | | | | |
| Year Ended January 31, | | | | | | | | | |
| 2011 | 1.00 | .000a | (.000)a | 1.00 | .00b | .61 | .20 | .00b | 418 |
| 2010 | 1.00 | .000a | (.000)a | 1.00 | .00b | .62 | .28 | .00b | 520 |
| 2009 | 1.00 | .009 | (.009) | 1.00 | .93 | .62 | .54 | .77 | 444 |
| 2008 | 1.00 | .042 | (.042) | 1.00 | 4.30 | .60 | .60 | 3.90 | 288 |
| 2007 | 1.00 | .044 | (.044) | 1.00 | 4.47 | .60 | .60 | 4.40 | 257 |
| Service Shares | | | | | | | | | |
| Year Ended January 31, | | | | | | | | | |
| 2011 | 1.00 | .000a | (.000)a | 1.00 | .00b | .71 | .21 | .00b | 5 |
| 2010 | 1.00 | .000a | (.000)a | 1.00 | .00b | .72 | .28 | .00b | 5 |
| 2009 | 1.00 | .009 | (.009) | 1.00 | .86 | .71 | .66 | .65 | 5 |
| 2008c | 1.00 | .023 | (.023) | 1.00 | 3.15d | .70d | .70d | 3.80d | 56 |
| Select Shares | | | | | | | | | |
| Year Ended January 31, | | | | | | | | | |
| 2011 | 1.00 | .000a | (.000)a | 1.00 | .00b | 1.01 | .20 | .00b | 19 |
| 2010 | 1.00 | .000a | (.000)a | 1.00 | .00b | 1.02 | .28 | .00b | 25 |
| 2009 | 1.00 | .007 | (.007) | 1.00 | .66 | 1.01 | .87 | .44 | 33 |
| 2008c | 1.00 | .021 | (.021) | 1.00 | 2.89d | 1.00d | 1.00d | 3.50d | 94 |
| Agency Shares | | | | | | | | | |
| Year Ended January 31, | | | | | | | | | |
| 2011 | 1.00 | .000a | (.000)a | 1.00 | .00b | .27 | .20 | .00b | 38 |
| 2010 | 1.00 | .000a | (.000)a | 1.00 | .03 | .28 | .24 | .03 | 71 |
| 2009 | 1.00 | .012 | (.012) | 1.00 | 1.21 | .27 | .27 | 1.04 | 63 |
| 2008e | 1.00 | .013 | (.013) | 1.00 | 3.92d | .26d | .26d | 4.24d | —f |
| Premier Shares | | | | | | | | | |
| Year Ended January 31, | | | | | | | | | |
| 2011 | 1.00 | .000a | (.000)a | 1.00 | .00b | .52 | .20 | .00b | 52 |
| 2010 | 1.00 | .000a | (.000)a | 1.00 | .00b | .53 | .27 | .00b | 61 |
| 2009 | 1.00 | .010 | (.010) | 1.00 | 1.00 | .53 | .48 | .83 | 35 |
| 2008e | 1.00 | .012 | (.012) | 1.00 | 3.68d | .51d | .51d | 3.99d | 29 |
| | |
| a | Amount represents less than $.001 per share. |
| b | Amount represents less than .01%. |
| c | From June 29, 2007 (commencement of initial offering) to January 31, 2008. |
| d | Annualized. |
| e | From October 1, 2007 (commencement of initial offering) to January 31, 2008. |
| f | Amount represents less than $1 million. |
See notes to financial statements.
FINANCIAL HIGHLIGHTS (continued)
| | | | | | | | | | |
| | | Per Share Data ($) | | | Ratios/Supplemental Data (%) | |
| | | | | | | | | Ratio of Net | |
| | Net Asset | | Dividends Net Asset | | Ratio of | Ratio of | Investment Net Assets |
| | Value | Net | from Net | Value | | Total Expenses Net Expenses Income to | End of |
| | Beginning Investment Investment | End | Total | to Average | to Average | Average | Period |
| | of Period | Income | Income | of Period Return (%) Net Assets | Net Assets Net Assets ($ x1,000,000) |
| |
| Dreyfus Treasury | | | | | | | | | |
| Prime Cash Management | | | | | | | | | |
| Institutional Shares | | | | | | | | | |
| Year Ended January 31, | | | | | | | | | |
| 2011 | 1.00 | .000a | (.000)a | 1.00 | .00b | .21 | .14 | .00b | 15,016 |
| 2010 | 1.00 | .000a | (.000)a | 1.00 | .02 | .22 | .19 | .03 | 18,751 |
| 2009 | 1.00 | .012 | (.012) | 1.00 | 1.24 | .22 | .22 | .78 | 30,587 |
| 2008 | 1.00 | .042 | (.042) | 1.00 | 4.28 | .20 | .20 | 3.81 | 5,373 |
| 2007 | 1.00 | .046 | (.046) | 1.00 | 4.68 | .20 | .20 | 4.57 | 1,043 |
| Investor Shares | | | | | | | | | |
| Year Ended January 31, | | | | | | | | | |
| 2011 | 1.00 | .000a | (.000)a | 1.00 | .00b | .46 | .14 | .00b | 3,215 |
| 2010 | 1.00 | .000a | (.000)a | 1.00 | .00b | .47 | .22 | .00b | 4,222 |
| 2009 | 1.00 | .010 | (.010) | 1.00 | 1.01 | .46 | .44 | .56 | 7,522 |
| 2008 | 1.00 | .039 | (.039) | 1.00 | 4.02 | .45 | .45 | 3.56 | 2,573 |
| 2007 | 1.00 | .043 | (.043) | 1.00 | 4.43 | .45 | .45 | 4.32 | 615 |
| Administrative Shares | | | | | | | | | |
| Year Ended January 31, | | | | | | | | | |
| 2011 | 1.00 | .000a | (.000)a | 1.00 | .00b | .31 | .14 | .00b | 1,054 |
| 2010 | 1.00 | .000a | (.000)a | 1.00 | .00b | .32 | .21 | .00b | 1,272 |
| 2009 | 1.00 | .011 | (.011) | 1.00 | 1.15 | .32 | .31 | .69 | 2,526 |
| 2008 | 1.00 | .041 | (.041) | 1.00 | 4.18 | .30 | .30 | 3.71 | 438 |
| 2007 | 1.00 | .045 | (.045) | 1.00 | 4.59 | .30 | .30 | 4.47 | 5 |
| Participant Shares | | | | | | | | | |
| Year Ended January 31, | | | | | | | | | |
| 2011 | 1.00 | .000a | (.000)a | 1.00 | .00b | .61 | .15 | .00b | 2,163 |
| 2010 | 1.00 | .000a | (.000)a | 1.00 | .00b | .62 | .22 | .00b | 2,599 |
| 2009 | 1.00 | .009 | (.009) | 1.00 | .89 | .62 | .53 | .47 | 5,437 |
| 2008 | 1.00 | .038 | (.038) | 1.00 | 3.87 | .60 | .60 | 3.41 | 975 |
| 2007 | 1.00 | .042 | (.042) | 1.00 | 4.27 | .60 | .60 | 4.17 | 121 |
| Agency Shares | | | | | | | | | |
| Year Ended January 31, | | | | | | | | | |
| 2011 | 1.00 | .000a | (.000)a | 1.00 | .00b | .27 | .11 | .00b | 21 |
| 2010 | 1.00 | .000a | (.000)a | 1.00 | .00b | .28 | .19 | .01 | 381 |
| 2009 | 1.00 | .012 | (.012) | 1.00 | 1.18 | .27 | .27 | .73 | 409 |
| 2008c | 1.00 | .011 | (.011) | 1.00 | 3.38d | .26d | .26d | 3.75d | —e |
| | |
| a | Amount represents less than $.001 per share. |
| b | Amount represents less than .01%. |
| c | From October 1, 2007 (commencement of initial offering) to January 31, 2008. |
| d | Annualized. |
| e | Amount represents less than $1 million. |
See notes to financial statements.
74
| | | | | | | | | | |
| | | Per Share Data ($) | | | Ratios/Supplemental Data (%) | |
| | | | | | | | | Ratio of Net | |
| | Net Asset | | Dividends Net Asset | | Ratio of | Ratio of | Investment Net Assets |
| | Value | Net | from Net | Value | | Total Expenses Net Expenses Income to | End of |
| | Beginning Investment Investment | End | Total | to Average | to Average | Average | Period |
| | of Period | Income | Income | of Period Return (%) Net Assets | Net Assets Net Assets ($ x1,000,000) |
| |
| Dreyfus Municipal | | | | | | | | | |
| Cash Management Plus | | | | | | | | | |
| Institutional Shares | | | | | | | | | |
| Year Ended January 31, | | | | | | | | | |
| 2011 | 1.00 | .001 | (.001) | 1.00 | .13 | .24 | .24 | .13 | 363 |
| 2010 | 1.00 | .005 | (.005) | 1.00 | .49 | .25 | .23 | .50 | 360 |
| 2009 | 1.00 | .021 | (.021) | 1.00 | 2.17 | .21 | .21 | 2.14 | 589 |
| 2008 | 1.00 | .034 | (.034) | 1.00 | 3.50 | .20 | .20 | 3.42 | 1,787 |
| 2007 | 1.00 | .033 | (.033) | 1.00 | 3.37 | .20 | .20 | 3.33 | 596 |
| Investor Shares | | | | | | | | | |
| Year Ended January 31, | | | | | | | | | |
| 2011 | 1.00 | .000a | (.000)a | 1.00 | .00b | .48 | .37 | .00b | 259 |
| 2010 | 1.00 | .003 | (.003) | 1.00 | .27 | .50 | .44 | .29 | 401 |
| 2009 | 1.00 | .019 | (.019) | 1.00 | 1.91 | .46 | .46 | 1.89 | 293 |
| 2008 | 1.00 | .032 | (.032) | 1.00 | 3.25 | .45 | .45 | 3.17 | 472 |
| 2007 | 1.00 | .031 | (.031) | 1.00 | 3.11 | .45 | .45 | 3.08 | 206 |
| Administrative Shares | | | | | | | | | |
| Year Ended January 31, | | | | | | | | | |
| 2011 | 1.00 | .000a | (.000)a | 1.00 | .04 | .33 | .33 | .04 | 377 |
| 2010 | 1.00 | .004 | (.004) | 1.00 | .39 | .35 | .32 | .41 | 582 |
| 2009 | 1.00 | .020 | (.020) | 1.00 | 2.07 | .31 | .31 | 2.04 | 625 |
| 2008 | 1.00 | .033 | (.033) | 1.00 | 3.40 | .30 | .30 | 3.32 | 294 |
| 2007 | 1.00 | .032 | (.032) | 1.00 | 3.27 | .30 | .30 | 3.23 | 291 |
| Participant Shares | | | | | | | | | |
| Year Ended January 31, | | | | | | | | | |
| 2011 | 1.00 | .000a | (.000)a | 1.00 | .00b | .63 | .37 | .00b | 23 |
| 2010 | 1.00 | .002 | (.002) | 1.00 | .18 | .65 | .56 | .17 | 23 |
| 2009 | 1.00 | .017 | (.017) | 1.00 | 1.76 | .61 | .61 | 1.74 | 61 |
| 2008 | 1.00 | .030 | (.030) | 1.00 | 3.09 | .60 | .60 | 3.02 | 37 |
| 2007 | 1.00 | .029 | (.029) | 1.00 | 2.96 | .60 | .60 | 2.93 | 23 |
| Agency Shares | | | | | | | | | |
| Year Ended January 31, | | | | | | | | | |
| 2011 | 1.00 | .001 | (.001) | 1.00 | .06 | .30 | .30 | .06 | —c |
| 2010 | 1.00 | .004 | (.004) | 1.00 | .42 | .32 | .29 | .44 | 1 |
| 2009 | 1.00 | .021 | (.021) | 1.00 | 2.10 | .27 | .27 | 2.08 | —c |
| 2008d | 1.00 | .011 | (.011) | 1.00 | 3.20e | .26e | .26e | 3.36e | —c |
| | |
| a | Amount represents less than $.001 per share. |
| b | Amount represents less than .01%. |
| c | Amount represents less than $1 million. |
| d | From October 1, 2007 (commencement of initial offering) to January 31, 2008. |
| e | Annualized. |
See notes to financial statements.
FINANCIAL HIGHLIGHTS (continued)
| | | | | | | | | | |
| | | Per Share Data ($) | | | Ratios/Supplemental Data (%) | |
| | | | | | | | | Ratio of Net | |
| | Net Asset | | Dividends Net Asset | | Ratio of | Ratio of | Investment Net Assets |
| | Value | Net | from Net | Value | | Total Expenses Net Expenses Income to | End of |
| | Beginning Investment Investment | End | Total | to Average | to Average | Average | Period |
| | of Period | Income | Income | of Period Return (%) Net Assets | Net Assets Net Assets ($ x1,000,000) |
| |
| Dreyfus New York Municipal | | | | | | | | | |
| Cash Management | | | | | | | | | |
| Institutional Shares | | | | | | | | | |
| Year Ended January 31, | | | | | | | | | |
| 2011 | 1.00 | .001 | (.001) | 1.00 | .13 | .24 | .24 | .12 | 459 |
| 2010 | 1.00 | .004 | (.004) | 1.00 | .45 | .25 | .23 | .44 | 589 |
| 2009 | 1.00 | .020 | (.020) | 1.00 | 1.99 | .22 | .22 | 1.95 | 544 |
| 2008 | 1.00 | .034 | (.034) | 1.00 | 3.47 | .20 | .20 | 3.41 | 458 |
| 2007 | 1.00 | .033 | (.033) | 1.00 | 3.36 | .20 | .20 | 3.31 | 377 |
| Investor Shares | | | | | | | | | |
| Year Ended January 31, | | | | | | | | | |
| 2011 | 1.00 | .000a | (.000)a | 1.00 | .00b | .48 | .36 | .00b | 299 |
| 2010 | 1.00 | .002 | (.002) | 1.00 | .23 | .50 | .45 | .22 | 282 |
| 2009 | 1.00 | .017 | (.017) | 1.00 | 1.74 | .47 | .47 | 1.70 | 374 |
| 2008 | 1.00 | .032 | (.032) | 1.00 | 3.21 | .45 | .45 | 3.16 | 363 |
| 2007 | 1.00 | .031 | (.031) | 1.00 | 3.10 | .45 | .45 | 3.06 | 120 |
| Administrative Shares | | | | | | | | | |
| Year Ended January 31, | | | | | | | | | |
| 2011 | 1.00 | .000a | (.000)a | 1.00 | .03 | .34 | .33 | .03 | 47 |
| 2010 | 1.00 | .004 | (.004) | 1.00 | .35 | .35 | .33 | .34 | 70 |
| 2009 | 1.00 | .019 | (.019) | 1.00 | 1.89 | .32 | .32 | 1.85 | 62 |
| 2008 | 1.00 | .033 | (.033) | 1.00 | 3.37 | .30 | .30 | 3.31 | 74 |
| 2007 | 1.00 | .032 | (.032) | 1.00 | 3.25 | .30 | .30 | 3.21 | 36 |
| Participant Shares | | | | | | | | | |
| Year Ended January 31, | | | | | | | | | |
| 2011 | 1.00 | .000a | (.000)a | 1.00 | .00b | .64 | .36 | .00b | 22 |
| 2010 | 1.00 | .001 | (.001) | 1.00 | .15 | .65 | .57 | .10 | 12 |
| 2009 | 1.00 | .016 | (.016) | 1.00 | 1.59 | .62 | .62 | 1.55 | 51 |
| 2008 | 1.00 | .030 | (.030) | 1.00 | 3.06 | .60 | .60 | 3.01 | 47 |
| 2007 | 1.00 | .029 | (.029) | 1.00 | 2.94 | .60 | .60 | 2.91 | 40 |
| Agency Shares | | | | | | | | | |
| Year Ended January 31, | | | | | | | | | |
| 2011 | 1.00 | .001 | (.001) | 1.00 | .07 | .30 | .30 | .03 | —c |
| 2010 | 1.00 | .004 | (.004) | 1.00 | .39 | .31 | .29 | .38 | —c |
| 2009 | 1.00 | .019 | (.019) | 1.00 | 1.93 | .28 | .28 | 1.89 | —c |
| 2008d | 1.00 | .011 | (.011) | 1.00 | 3.18e | .26e | .26e | 3.35e | —c |
| | |
| a | Amount represents less than $.001 per share. |
| b | Amount represents less than .01%. |
| c | Amount represents less than $1 million. |
| d | From October 1, 2007 (commencement of initial offering) to January 31, 2008. |
| e | Annualized. |
See notes to financial statements.
76
| | | | | | | | | | |
| | | Per Share Data ($) | | | Ratios/Supplemental Data (%) | |
| | | | | | | | | Ratio of Net | |
| | Net Asset | | Dividends Net Asset | | Ratio of | Ratio of | Investment Net Assets |
| | Value | Net | from Net | Value | | Total Expenses Net Expenses Income to | End of |
| | Beginning Investment Investment | End | Total | to Average | to Average | Average | Period |
| | of Period | Income | Income | of Period Return (%) Net Assets | Net Assets Net Assets ($ x1,000,000) |
| |
| Dreyfus Tax Exempt | | | | | | | | | |
| Cash Management | | | | | | | | | |
| Institutional Shares | | | | | | | | | |
| Year Ended January 31, | | | | | | | | | |
| 2011 | 1.00 | .001 | (.001) | 1.00 | .10 | .23 | .23 | .09 | 2,831 |
| 2010 | 1.00 | .004 | (.004) | 1.00 | .37 | .24 | .23 | .40 | 3,383 |
| 2009 | 1.00 | .021 | (.021) | 1.00 | 2.11 | .21 | .21 | 2.06 | 5,191 |
| 2008 | 1.00 | .034 | (.034) | 1.00 | 3.47 | .20 | .20 | 3.39 | 4,370 |
| 2007 | 1.00 | .033 | (.033) | 1.00 | 3.34 | .20 | .20 | 3.29 | 2,333 |
| Investor Shares | | | | | | | | | |
| Year Ended January 31, | | | | | | | | | |
| 2011 | 1.00 | .000a | (.000)a | 1.00 | .01 | .47 | .32 | .00b | 344 |
| 2010 | 1.00 | .002 | (.002) | 1.00 | .19 | .49 | .42 | .21 | 354 |
| 2009 | 1.00 | .018 | (.018) | 1.00 | 1.86 | .46 | .46 | 1.81 | 565 |
| 2008 | 1.00 | .032 | (.032) | 1.00 | 3.21 | .45 | .45 | 3.14 | 556 |
| 2007 | 1.00 | .030 | (.030) | 1.00 | 3.08 | .45 | .45 | 3.04 | 288 |
| Administrative Shares | | | | | | | | | |
| Year Ended January 31, | | | | | | | | | |
| 2011 | 1.00 | .000a | (.000)a | 1.00 | .02 | .32 | .31 | .01 | 72 |
| 2010 | 1.00 | .003 | (.003) | 1.00 | .28 | .34 | .32 | .31 | 120 |
| 2009 | 1.00 | .020 | (.020) | 1.00 | 2.01 | .31 | .31 | 1.96 | 645 |
| 2008 | 1.00 | .033 | (.033) | 1.00 | 3.36 | .30 | .30 | 3.29 | 259 |
| 2007 | 1.00 | .032 | (.032) | 1.00 | 3.24 | .30 | .30 | 3.19 | 213 |
| Participant Shares | | | | | | | | | |
| Year Ended January 31, | | | | | | | | | |
| 2011 | 1.00 | .000a | (.000)a | 1.00 | .01 | .62 | .32 | .00b | 9 |
| 2010 | 1.00 | .001 | (.001) | 1.00 | .12 | .64 | .53 | .10 | 27 |
| 2009 | 1.00 | .017 | (.017) | 1.00 | 1.70 | .61 | .61 | 1.66 | 134 |
| 2008 | 1.00 | .030 | (.030) | 1.00 | 3.06 | .60 | .60 | 2.99 | 55 |
| 2007 | 1.00 | .029 | (.029) | 1.00 | 2.93 | .60 | .60 | 2.89 | 30 |
| Agency Shares | | | | | | | | | |
| Year Ended January 31, | | | | | | | | | |
| 2011 | 1.00 | .000a | (.000)a | 1.00 | .04 | .28 | .27 | .01 | —c |
| 2010 | 1.00 | .003 | (.003) | 1.00 | .32 | .30 | .29 | .34 | 7 |
| 2009 | 1.00 | .020 | (.020) | 1.00 | 2.05 | .27 | .27 | 2.00 | 4 |
| 2008d | 1.00 | .011 | (.011) | 1.00 | 3.18e | .26e | .26e | 3.33e | —c |
| | |
| a | Amount represents less than $.001 per share. |
| b | Amount represents less than .01%. |
| c | Amount represents less than $1 million. |
| d | From October 1, 2007 (commencement of initial offering) to January 31, 2008. |
| e | Annualized. |
See notes to financial statements.
FINANCIAL HIGHLIGHTS (continued)
| | | | | | | | | | |
| | | Per Share Data ($) | | | Ratios/Supplemental Data (%) | |
| | | | | | | | | Ratio of Net | |
| | Net Asset | | Dividends Net Asset | | Ratio of | Ratio of | Investment Net Assets |
| | Value | Net | from Net | Value | | Total Expenses Net Expenses Income to | End of |
| | Beginning Investment Investment | End | Total | to Average | to Average | Average | Period |
| | of Period | Income | Income | of Period Return (%) Net Assets | Net Assets Net Assets ($ x1,000,000) |
| |
| Dreyfus California AMT-Free | | | | | | | | | |
| Municipal Cash Management | | | | | | | | | |
| Institutional Shares | | | | | | | | | |
| Year Ended January 31, | | | | | | | | | |
| 2011 | 1.00 | .001 | (.001) | 1.00 | .13 | .24 | .24 | .13 | 135 |
| 2010 | 1.00 | .004 | (.004) | 1.00 | .40 | .29 | .22 | .34 | 139 |
| 2009 | 1.00 | .019 | (.019) | 1.00 | 1.88 | .22 | .17 | 1.93 | 91 |
| 2008a | 1.00 | .017 | (.017) | 1.00 | 3.29b | .20b | .15b | 3.15b | 115 |
| Investor Shares | | | | | | | | | |
| Year Ended January 31, | | | | | | | | | |
| 2011 | 1.00 | .000c | (.000)c | 1.00 | .00d | .49 | .38 | .00d | 56 |
| 2010 | 1.00 | .002 | (.002) | 1.00 | .21 | .54 | .40 | .16 | 64 |
| 2009 | 1.00 | .016 | (.016) | 1.00 | 1.63 | .47 | .42 | 1.68 | 24 |
| 2008a | 1.00 | .015 | (.015) | 1.00 | 3.05b | .45b | .40b | 2.90b | 6 |
| Administrative Shares | | | | | | | | | |
| Year Ended January 31, | | | | | | | | | |
| 2011 | 1.00 | .000c | (.000)c | 1.00 | .04 | .35 | .34 | .03 | 14 |
| 2010 | 1.00 | .003 | (.003) | 1.00 | .30 | .40 | .32 | .24 | 4 |
| 2009 | 1.00 | .018 | (.018) | 1.00 | 1.78 | .32 | .27 | 1.83 | —e |
| 2008a | 1.00 | .016 | (.016) | 1.00 | 3.19b | .30b | .25b | 3.05b | —e |
| Participant Shares | | | | | | | | | |
| Year Ended January 31, | | | | | | | | | |
| 2011 | 1.00 | .000c | (.000)c | 1.00 | .00d | .64 | .38 | .00d | 48 |
| 2010 | 1.00 | .001 | (.001) | 1.00 | .13 | .69 | .50 | .06 | 56 |
| 2 009 | 1.00 | .015 | (.015) | 1.00 | 1.48 | .62 | .57 | 1.53 | 97 |
| 2008a | 1.00 | .014 | (.014) | 1.00 | 2.90b | .60b | .55b | 2.75b | 142 |
| Agency Shares | | | | | | | | | |
| Year Ended January 31, | | | | | | | | | |
| 2011 | 1.00 | .001 | (.001) | 1.00 | .07 | .30 | .30 | .04 | —e |
| 2010 | 1.00 | .003 | (.003) | 1.00 | .34 | .35 | .28 | .28 | —e |
| 2009 | 1.00 | .018 | (.018) | 1.00 | 1.82 | .28 | .23 | 1.87 | —e |
| 2008f | 1.00 | .010 | (.010) | 1.00 | 3.09b | .26b | .21b | 3.09b | —e |
| | |
| a | From August 1, 2007 (commencement of operations) to January 31, 2008. |
| b | Annualized. |
| c | Amount represents less than $.001 per share. |
| d | Amount represents less than .01%. |
| e | Amount represents less than $1 million. |
| f | From October 1, 2007 (commencement of initial offering) to January 31, 2008. |
See notes to financial statements.
78
| | | | | | | | | | | | |
| | | | Per Share Data ($) | | | | Ratios/Supplemental Data (%) | |
| | | | | Dividends | | | | | | Ratio of Net | |
| Net Asset | | Dividends from Net | | Net Asset | | Ratio of | Ratio of | Investment Net Assets |
| | Value | Net | from Net | Realized | | Value | | Total Expenses Net Expenses Income to | End of |
| Beginning Investment Investment Gain on | Total | End | Total | to Average | to Average | Average | Period |
| of Period | Income | Income Investments Distributions of Period Return (%) Net Assets | Net Assets Net Assets ($ x1,000,000) |
| |
| Dreyfus New York | | | | | | | | | | |
| AMT-Free | | | | | | | | | | | |
| Municipal Cash | | | | | | | | | | |
| Management | | | | | | | | | | | |
| Institutional Shares† | | | | | | | | | | |
| Year Ended | | | | | | | | | | | |
| January 31, | | | | | | | | | | | |
| 2011 | 1.00 | .001 | (.001) | — | (.001) | 1.00 | .14 | .31 | .23 | .14 | 81 |
| 2010 | 1.00 | .005 | (.005) | — | (.005) | 1.00 | .47 | .22 | .22 | .47 | 110 |
| One Month Ended | | | | | | | | | | | |
| January 31, | | | | | | | | | | | |
| 2009a | 1.00 | .001 | (.001) | — | (.001) | 1.00 | .06b | .24c | .24c | .70c | 49 |
| Year Ended | | | | | | | | | | | |
| December 31, | | | | | | | | | | | |
| 2008 | 1.00 | .021 | (.021) | (.000)d | (.021) | 1.00 | 2.08 | .25 | .24 | 2.08 | 49 |
| 2007 | 1.00 | .034 | (.034) | — | (.034) | 1.00 | 3.42 | .25 | .25 | 3.38 | 64 |
| 2006 | 1.00 | .032 | (.032) | — | (.032) | 1.00 | 3.24 | .26 | .25 | 3.20 | 64 |
| Investor Shares† | | | | | | | | | | | |
| Year Ended | | | | | | | | | | | |
| January 31, | | | | | | | | | | | |
| 2011 | 1.00 | .000d | (.000)d | — | (.000)d | 1.00 | .00e | .55 | .37 | .00e | 50 |
| 2010 | 1.00 | .003 | (.003) | — | (.003) | 1.00 | .27 | .47 | .43 | .26 | 74 |
| One Month Ended | | | | | | | | | | | |
| January 31, | | | | | | | | | | | |
| 2009a | 1.00 | .000d | (.000)d | — | (.000)d | 1.00 | .04b | .49c | .49c | .45c | 102 |
| Year Ended | | | | | | | | | | | |
| December 31, | | | | | | | | | | | |
| 2008 | 1.00 | .018 | (.018) | (.000)d | (.018) | 1.00 | 1.83 | .50 | .49 | 1.80 | 100 |
| 2007 | 1.00 | .031 | (.031) | — | (.031) | 1.00 | 3.16 | .50 | .50 | 3.12 | 139 |
| 2006 | 1.00 | .029 | (.029) | — | (.029) | 1.00 | 2.98 | .51 | .50 | 2.94 | 209 |
| Administrative | | | | | | | | | | | |
| Shares | | | | | | | | | | | |
| Year Ended | | | | | | | | | | | |
| January 31, | | | | | | | | | | | |
| 2011 | 1.00 | .000d | (.000)d | — | (.000)d | 1.00 | .05 | .40 | .33 | .04 | 8 |
| 2010 | 1.00 | .004 | (.004) | — | (.004) | 1.00 | .37 | .32 | .31 | .38 | 8 |
| One Month Ended | | | | | | | | | | | |
| January 31, | | | | | | | | | | | |
| 2009a | 1.00 | .001 | (.001) | — | (.001) | 1.00 | .05b | .34c | .34c | .60c | —f |
| Year Ended | | | | | | | | | | | |
| December 31, | | | | | | | | | | | |
| 2008g | 1.00 | .006 | (.006) | — | (.006) | 1.00 | .62c | .33c | .33c | 2.02c | —f |
FINANCIAL HIGHLIGHTS (continued)
| | | | | | | | | | | | |
| | | | Per Share Data ($) | | | | Ratios/Supplemental Data (%) | |
| | | | | Dividends | | | | | | Ratio of Net | |
| Net Asset | | Dividends from Net | | Net Asset | | Ratio of | Ratio of | Investment Net Assets |
| Value | Net | from Net | Realized | | Value | | Total Expenses Net Expenses Income to | End of |
| Beginning Investment Investment Gain on | Total | End | Total | to Average | to Average | Average | Period |
| of Period | Income | Income Investments Distributions of Period Return (%) Net Assets | Net Assets Net Assets ($ x1,000,000) |
| |
| Dreyfus New York | | | | | | | | | | |
| AMT-Free | | | | | | | | | | | |
| Municipal Cash | | | | | | | | | | | |
| Management | | | | | | | | | | | |
| (continued) | | | | | | | | | | | |
| Participant Shares | | | | | | | | | | | |
| Year Ended | | | | | | | | | | | |
| January 31, | | | | | | | | | | | |
| 2011 | 1.00 | .000d | (.000)d | — | (.000)d | 1.00 | .00e | .70 | .37 | .00e | —f |
| 2010 | 1.00 | .002 | (.002) | — | (.002) | 1.00 | .18 | .62 | .51 | .18 | —f |
| One Month Ended | | | | | | | | | | | |
| January 31, | | | | | | | | | | | |
| 2009a | 1.00 | .000d | (.000)d | — | (.000)d | 1.00 | .03b | .64c | .64c | .30c | —f |
| Year Ended | | | | | | | | | | | |
| December 31, | | | | | | | | | | | |
| 2008g | 1.00 | .005 | (.005) | — | (.005) | 1.00 | .53c | .63c | .63c | 1.73c | —f |
| Classic Shares† | | | | | | | | | | | |
| Year Ended | | | | | | | | | | | |
| January 31, | | | | | | | | | | | |
| 2011 | 1.00 | .000d | (.000)d | — | (.000)d | 1.00 | .00e | .81 | .37 | .00e | 9 |
| 2010 | 1.00 | .001 | (.001) | — | (.001) | 1.00 | .13 | .72 | .59 | .10 | 60 |
| One Month Ended | | | | | | | | | | | |
| January 31, | | | | | | | | | | | |
| 2009a | 1.00 | .000d | (.000)d | — | (.000)d | 1.00 | .02b | .74c | .73c | .21c | 76 |
| Year Ended | | | | | | | | | | | |
| December 31, | | | | | | | | | | | |
| 2008 | 1.00 | .016 | (.016) | (.000)d | (.016) | 1.00 | 1.58 | .75 | .74 | 1.55 | 73 |
| 2007 | 1.00 | .029 | (.029) | — | (.029) | 1.00 | 2.90 | .75 | .75 | 2.78 | 79 |
| 2006 | 1.00 | .027 | (.027) | — | (.027) | 1.00 | 2.73 | .76 | .75 | 2.68 | 29 |
| |
| † Represents information for the fund’s predecessor, BNY Hamilton NewYork AMT-Free Money Market Fund through September 12, 2008. |
| a The fund has changed its fiscal year end from December 31 to January 31. |
| b Not annualized. |
| c Annualized. |
| d Amount represents less than $.001 per share. |
| e Amount represents less than .01%. |
| f Amount represents less than $1 million. |
| g From September 13, 2008 (commencement of initial offering) to December 31, 2008. |
See notes to financial statements.
80
NOTES TO FINANCIAL STATEMENTS
NOTE 1—Significant Accounting Policies:
Dreyfus Cash Management, Dreyfus Cash Management Plus, Inc., Dreyfus Government Cash Management, Dreyfus Government Prime Cash Management, Dreyfus Treasury & Agency Cash Management, Dreyfus Treasury Prime Cash Management, Dreyfus Municipal Cash Management Plus, Dreyfus New York Municipal Cash Management, Dreyfus Tax Exempt Cash Management, Dreyfus California AMT-Free Municipal Cash Management and Dreyfus New York AMT-Free Municipal Cash Management (each, a “fund” and collectively, the “funds”) are open-end management investment companies registered under the Investment Company Act of 1940, as amended (the “Act”). Each fund, other than Dreyfus New York Municipal Cash Management, Dreyfus California AMT-Free Municipal Cash Management and Dreyfus New York AMT-Free Municipal Cash Management is diversified. Dreyfus New York Municipal Cash Management, Dreyfus California AMT-Free Municipal Cash Management and Dreyfus New York AMT-Free Municipal Cash Management are non-diversified. Dreyfus Government Cash Management and Dreyfus Government Prime Cash Management are each a separate series of Dreyfus Government Cash Management Funds (the “Company”) and Dreyfus Tax Exempt Cash Management, Dreyfus California AMT-Free Municipal Cash Management and Dreyfus New York AMT-Free Municipal Cash Management are separate series of Dreyfus Tax Exempt Cash Management Funds (the “Trust”). Each fund’s investment objective is to provide investors with as high a level of current income as is consistent with the preservation of capital and the maintenance of liquidity and, in the case of Dreyfus Municipal Cash Management Plus and Dreyfus Tax Exempt Cash Management only, which are exempt from federal income tax; in the case of Dreyfus NewYork Municipal Cash Management and Dreyfus New York AMT-Free Municipal Cash Management, which is exempt from federal, New York state and New York city personal income taxes, and in the case of Dreyfus California AMT-Free Municipal Cash Management only, which is exempt from federal and California state personal income taxes. The Dreyfus Corporation (the “Manager” or “Dreyfus”), a wholly-owned subsidiary of The Bank of NewYork Mellon Corporation (“BNY Mellon”), serves as each fund’s investment adviser.
MBSC Securities Corporation (the “Distributor”), a wholly-owned subsidiary of the Manager, is the distributor of the funds’ shares, which are sold to the public without a sales charge. Each fund offers Institutional Shares, Investor Shares, Administrative Shares, Participant Shares and Agency Shares (with the exception of Dreyfus New York AMT-Free Municipal Cash Management which does not offer Agency Shares). In addition, Dreyfus Cash Management Plus, Inc. and Dreyfus Treasury & Agency Cash Management also offer Service Shares and Select Shares, Dreyfus Treasury & Agency Cash Management also offers Premier Shares and Dreyfus New York AMT-Free Municipal Cash Management also offers Classic Shares. Each share class, except Institutional Shares, are subject to a Service Plan adopted pursuant to Rule 12b-1 under the Act. Other differences between the classes include the services offered (by service agents receiving Rule 12b-1 fees) to and the expenses borne by each class and certain voting rights. Income, expenses (other than expenses attributable to a specific class), and realized and unrealized gains or losses on investments are allocated to each class of shares based on its relative net assets.
As of January 31, 2011, MBC Investments Corp., an indirect subsidiary of BNY Mellon, held the following shares:
| | |
| Dreyfus Cash Management | |
| Plus, Inc., Agency Shares | 1,046 |
| |
| Dreyfus Municipal Cash | |
| Management Plus, Agency Shares | 1,036 |
| |
| Dreyfus New York Municipal | |
| Cash Management, Agency Shares | 1,034 |
| |
| Dreyfus California AMT-Free | |
| Municipal Cash Management, | |
| Agency Shares | 1,032 |
| |
| Dreyfus New York AMT-Free | |
| Municipal Cash Management, | |
| Participant Shares | 10,000 |
It is each fund’s policy to maintain a continuous net asset value per share of $1.00; each fund has adopted certain investment, portfolio valuation and dividend and distribution policies to enable it to do so. There is no assurance, however, that any fund will be able to maintain a stable net asset value per share of $1.00.
NOTES TO FINANCIAL STATEMENTS (continued)
The Company and the Trust account separately for the assets, liabilities and operations of each series. Expenses directly attributable to each series are charged to that series’ operations; expenses which are applicable to all series are allocated among them on a pro rata basis.
The Financial Accounting Standards Board (“FASB”) Accounting Standards Codification (“ASC”) is the exclusive reference of authoritative U.S. generally accepted accounting principles (“GAAP”) recognized by the FASB to be applied by nongovernmental entities. Rules and interpretive releases of the Securities and Exchange Commission (“SEC”) under authority of federal laws are also sources of authoritative GAAP for SEC registrants. Each fund’s financial statements are prepared in accordance with GAAP, which may require the use of management estimates and assumptions. Actual results could differ from those estimates.
The funds enter into contracts that contain a variety of indemnifications. The funds’ maximum exposure under these arrangements is unknown.The funds do not anticipate recognizing any loss related to these arrangements.
(a) Portfolio valuation: Investments in securities are valued at amortized cost in accordance with Rule 2a-7 of the Act, which has been determined by the Board of Trustees/Directors to represent the fair value of each fund’s investments.
The fair value of a financial instrument is the amount that would be received to sell an asset or paid to transfer a liability in an orderly transaction between market participants at the measurement date (i.e. the exit price). GAAP establishes a fair value hierarchy that prioritizes the inputs of valuation techniques used to measure fair value.This hierarchy gives the highest priority to unadjusted quoted prices in active markets for identical assets or liabilities (Level 1 measurements) and the lowest priority to unobservable inputs (Level 3 measurements).
Additionally, GAAP provides guidance on determining whether the volume and activity in a market has decreased significantly and whether such a decrease in activity results in transactions that are not orderly. GAAP requires enhanced disclosures around valuation inputs and techniques used during annual and interim periods.
Various inputs are used in determining the value of each fund’s investments relating to fair value measurements.These inputs are summarized in the three broad levels listed below:
Level 1—unadjusted quoted prices in active markets for identical investments.
Level 2—other significant observable inputs (including quoted prices for similar investments, interest rates, prepayment speeds, credit risk, etc.).
Level 3—significant unobservable inputs (including the funds’ own assumptions in determining the fair value of investments).
The inputs or methodology used for valuing securities are not necessarily an indication of the risk associated with investing in those securities. For example, money market securities are valued using amortized cost, in accordance with rules under the Act. Generally, amortized cost approximates the current fair value of a security, but since the value is not obtained from a quoted price in an active market, such securities are reflected as Level 2.
Table 1 summarizes the inputs used as of January 31, 2011 in valuing each fund’s investments.
(b) Securities transactions and investment income:
Securities transactions are recorded on a trade date basis. Realized gains and losses from securities transactions are recorded on the identified cost basis. Interest income, adjusted for accretion of discount and amortization of premium on investments, is earned from settlement date and recognized on the accrual basis. Cost of investments represents amortized cost.
Dreyfus New York Municipal Cash Management, Dreyfus California AMT-Free Municipal Cash Management and Dreyfus NewYork AMT-Free Municipal Cash Management follow an investment policy of investing primarily in municipal obligations of one state. Economic changes affecting the state and certain of its public bodies and municipalities may affect the ability of issuers within the state to pay interest on, or repay principal of, municipal obligations held by the fund.
82
(c) Repurchase Agreements: Dreyfus Cash Management, Dreyfus Cash Management Plus, Inc., Dreyfus Government Cash Management and Dreyfus Treasury & Agency Cash Management may enter into repurchase agreements with financial institutions, deemed to be creditworthy by the Manager, subject to the seller’s agreement to repurchase and the fund’s agreement to resell such securities at a mutually agreed upon price. Securities purchased subject to repurchase agreements are deposited with the funds’ custodian and, pursuant to the terms of the repurchase agreement, must have an aggregate market value greater than or equal to the repurchase price plus accrued interest at all times. If the value of the underlying securities falls below the value of the repurchase price plus accrued interest, the fund will require the seller to deposit additional collateral by the next business day. If the request for additional collateral is not met, or the seller defaults on its repurchase obligation, the fund maintains its right to sell the underlying securities at market value and may claim any resulting loss against the seller.
(d) Dividends to shareholders: It is the policy of each fund to declare dividends from investment income-net on each business day. Such dividends are paid monthly. Dividends from net realized capital gains, if any, are normally declared and paid annually, but each fund may make distributions on a more frequent basis to comply with the distribution requirements of the Internal Revenue Code of 1986, as amended (the “Code”). To the extent that net realized capital gains can be offset by capital loss carryovers, it is the policy of each fund not to distribute such gains.
(e) Federal income taxes: It is the policy of each of Dreyfus Cash Management, Dreyfus Cash Management Plus, Inc., Dreyfus Government Cash Management, Dreyfus Government Prime Cash Management, Dreyfus Treasury & Agency Cash Management and Dreyfus Treasury Prime Cash Management to continue to qualify as a regulated investment company if such qualification is in the best interests of its shareholders, by complying with the applicable provisions of the Code and to make distributions of taxable income sufficient to relieve it from substantially all federal income and excise taxes.
It is the policy of each of Dreyfus Municipal Cash Management Plus, Dreyfus New York Municipal Cash Management, Dreyfus Tax Exempt Cash Management, Dreyfus California AMT-Free Municipal Cash Management and Dreyfus New York AMT-Free Municipal Cash Management to continue to qualify as a regulated investment company, which can distribute tax exempt dividends,
| | | | | |
| Table 1—Fair Value Measurements | | | | |
| |
| | | Short-Term Investments ($)† | |
| | Level 1—Unadjusted | Level 2—Other Significant | Level 3—Significant | |
| | Quoted Prices | Observable Inputs | Unobservable Inputs | Total |
| Dreyfus Cash Management | — | 28,910,565,183 | — | 28,910,565,183 |
| Dreyfus Cash Management Plus, Inc. | — | 6,397,982,138 | — | 6,397,982,138 |
| Dreyfus Government Cash Management | — | 23,976,244,060 | — | 23,976,244,060 |
| Dreyfus Government Prime Cash Management | — | 4,453,844,562 | — | 4,453,844,562 |
| Dreyfus Treasury & Agency Cash Management | — | 10,704,912,829 | — | 10,704,912,829 |
| Dreyfus Treasury Prime Cash Management | — | 22,122,168,597 | — | 22,122,168,597 |
| Dreyfus Municipal Cash Management Plus | — | 1,025,948,832 | — | 1,025,948,832 |
| Dreyfus New York Municipal Cash Management | — | 827,885,313 | — | 827,885,313 |
| Dreyfus Tax Exempt Cash Management | — | 3,269,169,876 | — | 3,269,169,876 |
| Dreyfus California AMT—Free Municipal Cash Management | — | 253,806,143 | — | 253,806,143 |
| Dreyfus New York AMT—Free Municipal Cash Management | — | 148,181,239 | — | 148,181,239 |
| | |
| † | See Statements of Investments for additional detailed categorizations. |
NOTES TO FINANCIAL STATEMENTS (continued)
by complying with the applicable provisions of the Code and to make distributions of income and net realized gain sufficient to relieve it from substantially all federal income and excise taxes.
As of and during the period ended January 31, 2011, the funds did not have any liabilities for any uncertain tax posi-tions.The funds recognize interest and penalties, if any, related to uncertain tax positions as income tax expense in the Statements of Operations. During the period, the funds did not incur any interest or penalties.
Each of the tax years in the four-year period ended January 31, 2011 remains subject to examination by the Internal Revenue Service and state taxing authorities.
At January 31, 2011, the components of accumulated earnings on a tax basis were substantially the same as for financial reporting purposes.
Table 2 summarizes each relevant fund’s accumulated capital loss carryover available for federal income tax purposes to be applied against future net securities profits, if any, realized subsequent to January 31, 2011.
The tax character of distributions paid to shareholders for each fund (except for Dreyfus Municipal Cash Management Plus, Dreyfus New York Municipal Cash Management, Dreyfus Tax Exempt Cash Management, Dreyfus California AMT-Free Municipal Cash Management and Dreyfus New York AMT-Free Municipal Cash Management) during the fiscal periods ended January 31, 2011 and January 31, 2010, were all ordinary income.
Table 3 summarizes the tax character of distributions paid to shareholders of Dreyfus Municipal Cash Management Plus, Dreyfus New York Municipal Cash Management, Dreyfus Tax Exempt Cash Management, Dreyfus California AMT-Free Municipal Cash Management and Dreyfus New York AMT-Free Municipal Cash Management during the fiscal periods ended January 31, 2011 and January 31, 2010.
During the period ended January 31, 2011, as a result of permanent book to tax differences, primarily due to capital contributions by an affiliate, Dreyfus Cash Management Plus, Inc. increased accumulated net realized gain (loss) on investments by $16,792,692 and decreased paid-in capital by the same amount. Net assets and net asset value per share were not affected by this reclassification.
During the period ended January 31, 2011, as a result of permanent book to tax differences, primarily due to dividend reclassification, Dreyfus Government Cash Management increased accumulated undistributed investment income-net by $137,215 and decreased accumulated net realized gain (loss) on investments by the same amount. Net assets and net asset value per share were not affected by this reclassification.
| | | | | | | |
| Table 2—Capital Loss Carryover | | | | | | |
| |
| | | | | Expiring in fiscal: ($ x 1,000) |
| | | | | 2018 | 2019 | Total |
| Dreyfus Cash Management Plus, Inc. | | | | 1,152 | — | 1,152 |
| Dreyfus Government Cash Management | | | | — | 22 | 22 |
| Dreyfus Municipal Cash Management Plus | | | | — | 10 | 10 |
| |
| Table 3—Tax Character of Distributions Paid | | | | | | |
| |
| Tax Character of Distributions Paid ($ x 1,000) | | 2011 | | | 2010 | |
| | | | Long-Term | | | Long-Term |
| | Tax-Exempt | Ordinary | Capital | Tax-Exempt | Ordinary | Capital |
| | Income | Income | Gains | Income | Income | Gains |
| Dreyfus Municipal Cash Management Plus | 726 | — | 2 | 8,292 | 175 | — |
| Dreyfus New York Municipal Cash Management | 630 | 31 | — | 3,592 | 3 | 85 |
| Dreyfus Tax Exempt Cash Management | 2,768 | 170 | 145 | 23,272 | 97 | 43 |
| Dreyfus California AMT-Free Municipal Cash Management | 234 | — | — | 676 | 15 | — |
| Dreyfus New York AMT-Free Municipal Cash Management | 157 | 8 | — | 586 | — | — |
84
During the period ended January 31, 2011, as a result of permanent book to tax differences, primarily due to dividend reclassification, Dreyfus Government Prime Cash Management increased accumulated undistributed investment income-net by $44,964, decreased accumulated net realized gain (loss) on investments by $41,162 and decreased paid-in capital by $3,802. Net assets and net asset value per share were not affected by this reclassification.
During the period ended January 31, 2011, as a result of permanent book to tax differences, primarily due to dividend reclassification, Dreyfus Treasury & Agency Cash Management increased accumulated undistributed investment income-net by $53,468 and decreased accumulated net realized gain (loss) on investments by the same amount. Net assets and net asset value per share were not affected by this reclassification.
During the period ended January 31, 2011, as a result of permanent book to tax differences, primarily due to dividend reclassification, Dreyfus Treasury Prime Cash Management increased accumulated undistributed investment income-net by $102,189 and decreased accumulated net realized gain (loss) on investments by the same amount. Net assets and net asset value per share were not affected by this reclassification.
During the period ended January 31, 2011, as a result of permanent book to tax differences, primarily due to dividend reclassification, Dreyfus Municipal Cash Management Plus increased accumulated undistributed investment income-net by $2,500 and decreased accumulated net realized gain (loss) on investments by the same amount. Net assets and net asset value per share were not affected by this reclassification.
During the period ended January 31, 2011, as a result of permanent book to tax differences, primarily due to dividend reclassification, Dreyfus New York Municipal Cash Management increased accumulated undistributed investment income-net by $30,811 and decreased accumulated net realized gain (loss) on investments by the same amount. Net assets and net asset value per share were not affected by this reclassification.
During the period ended January 31, 2011, as a result of permanent book to tax differences, primarily due to dividend reclassification, Dreyfus Tax Exempt Cash Management increased accumulated undistributed investment income-net by $315,196 and decreased accumulated net realized gain (loss) on investments by the same amount. Net assets and net asset value per share were not affected by this reclassification.
During the period ended January 31, 2011, as a result of permanent book to tax differences, primarily due to dividend reclassification, Dreyfus New York AMT-Free Municipal Cash Management increased accumulated undistributed investment income-net by $7,861 and decreased accumulated net realized gain (loss) on investments by the same amount. Net assets and net asset value per share were not affected by this reclassification.
At January 31, 2011, the cost of investments for federal income tax purposes was substantially the same as the cost for financial reporting purposes (see the Statements of Investments).
(f) Capital Support Agreement: Dreyfus Cash Management Plus, Inc., held notes (the “Notes”) issued by Lehman Brothers Holdings, Inc. (“Lehman”). In order to mitigate the negative impact of holding these securities in light of the bankruptcy of Lehman, on September 16, 2008, the fund entered into a Capital Support Agreement (the “Agreement”) with BNY Mellon, the parent company of the fund’s adviser. Pursuant to the Agreement, BNY Mellon had agreed to provide capital support to the fund, subject to a maximum amount of $97.2 million (the “Maximum Capital Support Payment”), if any of the following events resulted in the fund’s net asset value falling below $0.9950:
| (i) | Any final sale or other final liquidation of the Notes by the fund for cash in an amount, after deduction of costs, which is less than the amortized cost value of the Notes as of the date such sale or liquidation is consummated; |
| (ii) | Receipt by the fund of final payment on the Notes in cash in an amount less than the amortized cost value of the Notes less costs in respect thereof, as of the date such final payment is received; and |
| (iii) | The date upon which a court of competent jurisdic- tion over the matter discharges Lehman from liabil- ity in respect of the Notes, and such discharge results in the receipt of aggregate payments on the Notes in an amount less than the amortized cost value of the Notes, less costs in respect thereof, as of the date such final payment is received. |
NOTES TO FINANCIAL STATEMENTS (continued)
On September 9, 2009, the fund sold the Notes it held in Lehman, which obligated BNY Mellon to make payments to the fund pursuant to the terms of the Agreement. The fund received payments amounting to $68,406,721 and the Agreement was terminated.
NOTE 2—Management Fee and Other Transactions with Affiliates:
(a) Pursuant to separate management agreements with the Manager, the management fee of each fund is computed at the annual rate of .20% of the value of such fund’s average daily net assets and is payable monthly.
The Manager has undertaken to reimburse expenses in the event that current yields drop below a certain level. Such expense limitations may fluctuate daily, are voluntary and not contractual and may be terminated at any time. Table 4 summarizes the reduction in expenses for each relevant class of shares of each fund pursuant to these undertakings during the period ended January 31, 2011.
As to Dreyfus Cash Management Plus, Inc., the Manager had agreed from February 10, 2010 through November 4, 2010 to waive a portion of the expenses so that annual fund operating expenses (exclusive of Rule 12b-1 Service Plan expenses) were limited to .15% of the value of the fund’s average daily net assets.The Manager had further agreed from November 5, 2010 through January 31, 2011 to waive a portion of the expenses so that annual fund operating expenses (exclusive of Rule 12b-1 Service Plan expenses) were limited to .18% of the value of the fund’s average daily net assets.This undertaking is voluntary, not contractual, and may be terminated at any time. The reduction in management fee for Dreyfus Cash Management Plus, Inc., pursuant to the undertaking, amounted to $3,700,529 during the period ending January 31, 2011.
As to Dreyfus New York AMT-Free Municipal Cash Management, the Manager had contractually agreed from February 1, 2010 until September 30, 2010, that the Manager, and not the fund, was liable for fund expenses
| | | | | | | |
| Table 4—Yield Floor Expense Reimbursement | | | | | |
| |
| | | Dreyfus | Dreyfus | Dreyfus | Dreyfus | Dreyfus |
| | | Cash | Government | Government | Treasury & | Treasury |
| | Dreyfus Cash | Management | Cash | Prime Cash | Agency Cash | Prime Cash |
| | Management | Plus, Inc. | Management | Management | Management | Management |
| Institutional Shares ($) | — | — | 257,503 | 425,452 | 1,708,423 | 9,849,033 |
| Investor Shares ($) | 3,475,693 | 514,145 | 4,325,429 | 1,306,410 | 4,833,009 | 11,054,303 |
| Administrative Shares ($) | 42,056 | 5,144 | 540,868 | 574,686 | 493,300 | 1,990,765 |
| Participant Shares ($) | 1,655,514 | 626,936 | 1,377,249 | 2,054,141 | 2,006,436 | 11,444,957 |
| Service Shares ($) | — | 177,938 | — | — | 24,885 | — |
| Select Shares ($) | — | 38,068 | — | — | 151,069 | — |
| Agency Shares ($) | — | — | 19,292 | 26,576 | 37,571 | 101,338 |
| Premier Shares ($) | — | — | — | — | 192,255 | — |
| |
| Table 4. (continued) | | | | | | |
| |
| | | Dreyfus | Dreyfus | | Dreyfus | Dreyfus |
| | | Municipal | New York | Dreyfus | California | New York |
| | | Cash | Municipal | Tax Exempt | AMT-Free | AMT-Free |
| | | Management | Cash | Cash | Municipal Cash | Municipal Cash |
| | | Plus | Management | Management | Management | Management |
| Investor Shares ($) | | 352,578 | 351,329 | 549,349 | 68,513 | 72,302 |
| Administrative Shares ($) | | 9,238 | 2,104 | 10,589 | 1,142 | 453 |
| Participant Shares ($) | | 63,247 | 55,021 | 71,568 | 126,033 | 26 |
| Agency Shares ($) | | 4 | — | 143 | — | — |
| Classic Shares ($) | | — | — | — | — | 108,787 |
86
(exclusive of taxes, brokerage fees, interest on borrowings and extraordinary expenses) other than the following expenses, which currently are borne by the fund: the management fee, and with respect to the fund’s Investor Shares, Administrative Shares, Participant Shares, and Classic Shares, Rule 12b-1 Service Plan expenses. Effective October 1, 2010, the fund is liable for its own expenses.The reduction in management fee, pursuant to the undertaking, amounted to $149,199 during the period ended January 31, 2011.
(b) Under each fund’s Service Plan adopted pursuant to Rule 12b-1 under the Act, with respect to each fund’s Investor Shares, Administrative Shares, Participant Shares and Agency Shares (with the exception of Dreyfus New York AMT-Free Municipal Cash Management which does not offer Agency Shares), Dreyfus Cash Management Plus, Inc.’s Service Shares and Select Shares, Dreyfus Treasury & Agency Cash Management’s Service Shares, Select Shares and Premier Shares and Dreyfus New York AMT-Free Municipal Cash Management’s Classic Shares, each fund pays the Distributor for distributing such classes of shares, for advertising and marketing and for providing certain services relating to shareholders of the respective class of shares. These services include answering shareholder inquiries regarding the fund and providing reports and other information and services related to the maintenance of shareholder accounts (“Servicing”). Under the Service Plan, as to each relevant class, the Distributor may make payments to Service Agents in respect to these services. Generally, the Service Agent may provide holders of Investor,Administrative, Participant, Service, Select,Agency, Premier and Classic Shares a consolidated statement. The Service Agent will generally also provide the holders of Investor, Participant, Service, Select and/or Premier Shares, automated teller check writing privileges and, in the case of Participant, Service, Select or Premier Shares, automated teller machine access, and bill paying services.The amount paid under the Service Plan for Servicing is intended to be a “service fee” as defined under the Conduct Rules of the Financial Industry Regulatory Authority (“FINRA”), and at no time will such amount exceed the maximum amount permitted to be paid under the FINRA Conduct Rules as a service fee. The fees payable under the Service Plan are payable without regard to actual expenses incurred. Table 5 summarizes the amount each fund was charged pursuant to the Service Plan during the period ended January 31, 2011.
| | | | | | | | | |
| Table 5—12b-1 Service Plan Fees | | | | | | | | |
| |
| | Investor | Administrative | Participant | Service | Select | Agency | Premier | Classic |
| | Shares ($) | Shares ($) | Shares ($) | Shares ($) | Shares ($) | Shares ($) | Shares ($) | Shares ($) |
| Dreyfus Cash Management | 8,159,958 | 824,992 | 2,617,185 | — | — | 45,878 | — | — |
| Dreyfus Cash Management Plus, Inc. | 2,116,532 | 677,912 | 1,183,756 | 288,705 | 50,349 | 1 | — | — |
| Dreyfus Government Cash Management | 5,130,426 | 843,322 | 1,513,711 | — | — | 43,094 | — | — |
| Dreyfus Government | | | | | | | | |
| Prime Cash Management | 1,311,303 | 572,435 | 2,058,943 | — | — | 23,959 | — | — |
| Dreyfus Treasury & Agency | | | | | | | | |
| Cash Management | 4,708,874 | 439,153 | 1,956,678 | 24,642 | 149,642 | 33,513 | 187,318 | — |
| Dreyfus Treasury Prime | | | | | | | | |
| Cash Management | 8,791,192 | 1,213,213 | 9,829,181 | — | — | 39,182 | — | — |
| Dreyfus Municipal Cash | | | | | | | | |
| Management Plus | 754,204 | 456,897 | 95,294 | — | — | 252 | — | — |
| Dreyfus New York Municipal | | | | | | | | |
| Cash Management | 695,176 | 56,389 | 79,417 | — | — | 1 | — | — |
| Dreyfus Tax Exempt Cash Management | 952,069 | 90,278 | 95,149 | — | — | 659 | — | — |
| Dreyfus California AMT-Free | | | | | | | | |
| Municipal Cash Management | 150,899 | 14,074 | 190,377 | — | — | 1 | — | — |
| Dreyfus New York AMT-Free | | | | | | | | |
| Municipal Cash Management | 164,207 | 7,376 | 40 | — | — | — | — | 147,525 |
NOTES TO FINANCIAL STATEMENTS (continued)
(c) Each fund has adopted a Shareholder Services Plan (the “Plan”), with respect to their Institutional shares. Each fund reimburses the Distributor an amount not to exceed an annual rate of .25% of the value of the fund’s average daily net assets attributable to Institutional Shares for certain allocated expenses of providing personal services and/or maintaining shareholder accounts. The services provided may include personal services relating to shareholder accounts, such as answering shareholder inquiries regarding the fund, providing reports and other information and services related to the maintenance of shareholder accounts.Table 6 summarizes the amount each fund was charged pursuant to the Plan during the period ended January 31, 2011.
The funds compensate Dreyfus Transfer, Inc., a wholly-owned subsidiary of the Manager, under a transfer agency agreement for providing personnel and facilities to perform transfer agency services for the funds.Table 7 summarizes the amount each fund was charged during the period ended January 31, 2011, pursuant to the transfer agency agreement, which is included in Shareholder servicing costs in the Statements of Operations.
| | |
| Table 6—Shareholder Service Plan Fees | |
| |
| | Institutional |
| | Shares ($) |
| Dreyfus Cash Management | 511,157 |
| Dreyfus Cash Management Plus, Inc. | 93,615 |
| Dreyfus Government Cash Management | 140,081 |
| Dreyfus Government Prime Cash Management | 55,126 |
| Dreyfus Treasury & Agency Cash Management | 606,433 |
| Dreyfus Treasury Prime Cash Management | 342,681 |
| Dreyfus Municipal Cash Management Plus | 38,276 |
| Dreyfus New York Municipal Cash Management | 12,562 |
| Dreyfus Tax Exempt Cash Management | 460,137 |
| Dreyfus California AMT-Free Municipal Cash Management | 4,975 |
| Dreyfus New York AMT-Free Municipal Cash Management | 5,394 |
| |
| |
| Table 7—Transfer Agency Agreement Fees | |
| |
| | Transfer Agency |
| | Fees ($) |
| Dreyfus Cash Management | 60,257 |
| Dreyfus Cash Management Plus, Inc. | 68,373 |
| Dreyfus Government Cash Management | 51,387 |
| Dreyfus Government Prime Cash Management | 41,348 |
| Dreyfus Treasury & Agency Cash Management | 30,141 |
| Dreyfus Treasury Prime Cash Management | 86,286 |
| Dreyfus Municipal Cash Management Plus | 4,548 |
| Dreyfus New York Municipal Cash Management | 8,239 |
| Dreyfus Tax Exempt Cash Management | 18,526 |
| Dreyfus California AMT-Free Municipal Cash Management | 1,874 |
| Dreyfus New York AMT-Free Municipal Cash Management | 5,737 |
88
The funds have arrangements with the custodian and cash management bank whereby the funds may receive earnings credits when positive cash balances are maintained, which are used to offset custody and cash management fees. For financial reporting purposes, the funds include net earnings credits as an expense offset in the Statements of Operations.
The funds compensate The Bank of New York Mellon, a subsidiary of BNY Mellon and an affiliate of Dreyfus, under a cash management agreement for performing cash management services related to fund subscriptions and redemptions. Table 8 summarizes the amount each fund was charged during the period ended January 31, 2011, pursuant to the cash management agreement, which is included in Shareholder servicing costs in the Statements of Operations. These fees were partially offset by earnings credits pursuant to the cash management agreement, also summarized in Table 8.
The funds also compensate The Bank of NewYork Mellon under a custody agreement for providing custodial services for each fund. These fees were partially offset by earnings credits pursuant to the custody agreement, also summarized in Table 9 for each relevant fund.
| | | |
| Table 8—Cash Management Agreement Fees | | |
| |
| | Cash Management | |
| | Fees ($) | Earnings Credits ($) |
| Dreyfus Cash Management | 5,045 | (332) |
| Dreyfus Cash Management Plus, Inc. | 6,558 | (430) |
| Dreyfus Government Cash Management | 9,531 | (627) |
| Dreyfus Government Prime Cash Management | 7,240 | (477) |
| Dreyfus Treasury & Agency Cash Management | 5,511 | (362) |
| Dreyfus Treasury Prime Cash Management | 14,852 | (976) |
| Dreyfus Municipal Cash Management Plus | 237 | (15) |
| Dreyfus New York Municipal Cash Management | 610 | (40) |
| Dreyfus Tax Exempt Cash Management | 1,175 | (77) |
| Dreyfus California AMT-Free Municipal Cash Management | 54 | (4) |
| Dreyfus New York AMT-Free Municipal Cash Management | 311 | (20) |
| |
| |
| Table 9—Custody Agreement Fees | | |
| |
| | Custody | |
| | Fees ($) | Earnings Credits ($) |
| Dreyfus Cash Management | 980,640 | — |
| Dreyfus Cash Management Plus, Inc. | 294,484 | (7,999) |
| Dreyfus Government Cash Management | 853,818 | (2,688) |
| Dreyfus Government Prime Cash Management | 184,462 | — |
| Dreyfus Treasury & Agency Cash Management | 494,989 | (6,966) |
| Dreyfus Treasury Prime Cash Management | 616,548 | (6,920) |
| Dreyfus Municipal Cash Management Plus | 97,622 | — |
| Dreyfus New York Municipal Cash Management | 90,697 | — |
| Dreyfus Tax Exempt Cash Management | 153,122 | — |
| Dreyfus California AMT-Free Municipal Cash Management | 36,385 | — |
| Dreyfus New York AMT-Free Municipal Cash Management | 24,927 | — |
NOTES TO FINANCIAL STATEMENTS (continued)
During the period ended January 31, 2011, each fund (except for Dreyfus New York AMT-Free Municipal Cash Management) was charged $6,355 for services performed by the Chief Compliance Officer. Dreyfus NewYork AMT-Free Municipal Cash Management was charged $2,304 for services performed by the Chief Compliance Officer.
Table 10 summarizes the components of “Due to The Dreyfus Corporation and affiliates” in the Statements of Assets and Liabilities for each fund.
(d) Each Board member also serves as a Board member of other funds within the Dreyfus complex. Annual retainer fees are allocated to each fund based on net assets, and each fund pays its Board members an attendance fee of $500 per meeting.
(e) During the period ended January 31, 2011, BNY Mellon made voluntary capital contributions of $16,792,692 to Dreyfus Cash Management Plus, Inc. These contributions were made to reimburse Dreyfus Cash Management Plus, Inc. for previous realized losses experienced by Dreyfus Cash Management Plus, Inc.
NOTE 3—Capital Share Transactions:
Each fund (except for Dreyfus Cash Management Plus, Inc.) is authorized to issue an unlimited number of $.001 par value shares of Beneficial Interest. Dreyfus Cash Management Plus, Inc. is authorized to issue 120 billion shares of $.001 par value Common Stock.
| | | | | | | | |
| Table 10—Due to The Dreyfus Corporation and Affiliates | | | | | |
| |
| |
| | | Rule 12b-1 | | | Chief | | |
| | | Distribution | Shareholder | | Compliance | Transfer | |
| | Management | Plan | Services Plan | Custodian | Officer | Agency | Less Expense |
| | Fees ($) | Fees ($) | Fees ($) | Fees ($) | Fees ($) | Fees ($) | Reimbursement ($) |
| |
| Dreyfus Cash Management | 5,060,090 | 936,553 | 75,000 | 404,646 | 2,304 | 11,280 | (414,984) |
| Dreyfus Cash | | | | | | | |
| Management Plus, Inc. | 1,174,268 | 363,154 | 15,000 | 126,264 | 2,304 | 16,283 | (354,653) |
| Dreyfus Government | | | | | | | |
| Cash Management | 4,292,058 | 656,745 | 13,000 | 362,213 | 2,304 | 10,476 | (628,286) |
| Dreyfus Government | | | | | | | |
| Prime Cash Management | 801,695 | 346,325 | 14,183 | 72,993 | 2,304 | 8,550 | (540,885) |
| Dreyfus Treasury & Agency | | | | | | | |
| Cash Management | 1,922,458 | 605,280 | 41,000 | 187,702 | 2,304 | 6,790 | (876,428) |
| Dreyfus Treasury Prime | | | | | | | |
| Cash Management | 3,769,430 | 1,561,350 | 71,000 | 250,853 | 2,304 | 18,252 | (2,627,976) |
| Dreyfus Municipal | | | | | | | |
| Cash Management Plus | 191,487 | 99,042 | 4,000 | 41,235 | 2,304 | 937 | (37,677) |
| Dreyfus New York Municipal | | | | | | | |
| Cash Management | 142,282 | 74,682 | 1,000 | 34,979 | 2,304 | 1,914 | (42,758) |
| Dreyfus Tax Exempt | | | | | | | |
| Cash Management | 565,571 | 83,995 | 96,000 | 63,618 | 2,304 | 3,961 | (44,716) |
| Dreyfus California AMT-Free | | | | | | | |
| Municipal Cash Management | 42,061 | 27,592 | 2,000 | 16,303 | 2,304 | 414 | (14,357) |
| Dreyfus New York AMT-Free | | | | | | | |
| Municipal Cash Management | 27,631 | 17,547 | — | 7,161 | 2,304 | 1,660 | (12,808) |
90
NOTE 4—Reverse Repurchase Agreements:
Dreyfus Cash Management and Dreyfus Cash Management Plus, Inc. may enter into reverse repurchase agreements with banks, brokers or dealers. This form of borrowing involves the transfer by the fund of an underlying debt instrument in return for cash proceeds based on a percentage of value of the security.The funds retain the right to receive interest and principal payments on the security.At an agreed upon future date, the funds repurchase the security at principal plus accrued interest. Reverse repurchase agreements may subject the funds to interest rate risk and counterparty credit risk. During the period ended January 31, 2011, neither fund entered into reverse repurchase agreements.
NOTE 5—Securities Transactions:
The funds are permitted to purchase or sell securities from or to certain affiliated funds under specified conditions outlined in procedures adopted by the Board of Trustees/Directors.
The procedures have been designed to ensure that any purchase or sale of securities by the funds from or to another fund or portfolio that are, or could be, considered an affiliate by virtue of having a common investment adviser (or affiliated investment adviser), common Trustee/Director and/or common officers, complies with Rule 17a-7 of the Act. Table 11 summarizes the amounts of purchases and sales of securities engaged in by each relevant fund pursuant to Rule 17a-7 of the Act during the period ended January 31, 2011.
NOTE 6—Other:
During the period ended January 31, 2011, Dreyfus New York AMT-Free Municipal Cash Management received regulatory settlement payments of $35,059 from an unaffiliated third party which are included in the Statements of Changes in Net Assets.The impact of these payments amounted to less than $.001 per share and the impact on total return amounted to less than .01% for each class of shares of the fund.
| | | |
| Table 11—Rule 17a-7 of the Act | | |
| |
| |
| | Purchases ($) | Sales ($) |
| Dreyfus Municipal Cash Management Plus | 1,229,075,000 | 1,031,875,000 |
| Dreyfus New York Municipal Cash Management | 439,000,000 | 406,480,000 |
| Dreyfus Tax Exempt Cash Management | 1,161,880,000 | 1,915,710,000 |
| Dreyfus California AMT—Free Municipal Cash Management | 208,025,000 | 264,549,000 |
| Dreyfus New York AMT—Free Municipal Cash Management | 81,295,000 | 69,745,000 |
REPORT OF INDEPENDENT REGISTERED PUBLIC ACCOUNTING FIRM
Shareholders and Board of Trustees/Directors
Dreyfus Cash Management
Dreyfus Cash Management Plus, Inc. Dreyfus Government Cash Management Dreyfus Government Prime Cash Management Dreyfus Treasury & Agency Cash Management Dreyfus Treasury Prime Cash Management Dreyfus Municipal Cash Management Plus Dreyfus New York Municipal Cash Management Dreyfus Tax Exempt Cash Management
Dreyfus California AMT-Free Municipal Cash Management
Dreyfus New York AMT-Free Municipal Cash Management
We have audited the accompanying statements of assets and liabilities, including the statements of investments, of Dreyfus Cash Management, Dreyfus Cash Management Plus, Inc., Dreyfus Government Cash Management, Dreyfus Government Prime Cash Management, Dreyfus Treasury & Agency Cash Management, Dreyfus Treasury Prime Cash Management, Dreyfus Municipal Cash Management Plus, Dreyfus New York Municipal Cash Management, Dreyfus Tax Exempt Cash Management, Dreyfus California AMT-Free Municipal Cash Management and Dreyfus New York AMT-Free Municipal Cash Management (the “Funds”) as of January 31, 2011, and the related statements of operations for the year then ended, the statements of changes in net assets for each of the two years in the period then ended, and financial highlights for each of the periods indicated therein, except for the financial highlights for the years ended December 31, 2007 and 2006 for Dreyfus NewYork AMT-Free Municipal Cash Management, which were audited by other auditors whose report dated February 28, 2008, expressed an unqualified opinion on such financial highlights. These financial statements and financial highlights are the responsibility of the Funds’ management. Our responsibility is to express an opinion on these financial statements and financial highlights based on our audits.
We conducted our audits in accordance with the standards of the Public Company Accounting Oversight Board (United States).Those standards require that we plan and perform the audit to obtain reasonable assurance about whether the financial statements and financial highlights are free of material misstatement.We were not engaged to perform an audit of the Fund’s internal control over financial reporting. Our audits included consideration of internal control over financial reporting as a basis for designing audit procedures that are appropriate in the circumstances, but not for the purpose of expressing an opinion on the effectiveness of the Funds’ internal control over financial reporting. Accordingly, we express no such opinion. An audit also includes examining, on a test basis, evidence supporting the amounts and disclosures in the financial statements and financial highlights, assessing the accounting principles used and significant estimates made by management, and evaluating the overall financial statement presentation. Our procedures included confirmation of securities owned as of January 31, 2011 by correspondence with the custodian and others.We believe that our audits provide a reasonable basis for our opinion.
In our opinion, the financial statements and financial highlights referred to above present fairly, in all material respects, the financial position of the Funds at January 31, 2011, the results of their operations for the year then ended, the changes in their net assets for each of the two years in the period then ended, and the financial highlights for each of the indicated periods, in conformity with U.S. generally accepted accounting principles.

New York, New York
March 30, 2011
92
IMPORTANT TAX INFORMATION (Unaudited)
In accordance with federal tax law, Dreyfus Municipal Cash Management Plus, Dreyfus New York Municipal Cash Management, Dreyfus Tax Exempt Cash Management, Dreyfus California AMT-Free Municipal Cash Management and Dreyfus New York AMT-Free Municipal Cash Management hereby make the following designations regarding the dividends paid from investment income-net during the fiscal year ended January 31, 2011:
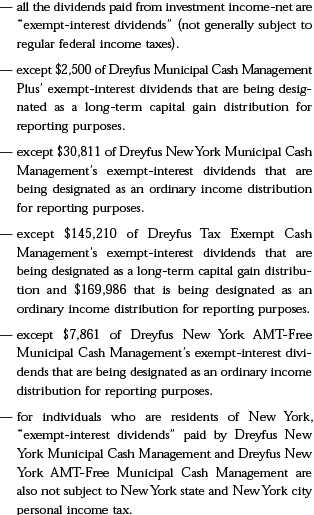
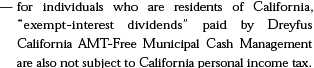
For state individual income tax purposes Dreyfus Government Prime Cash Management and Dreyfus Treasury Prime Cash Management hereby designate the following percentage of ordinary dividends paid during the fiscal year ended January 31, 2011 as attributable to interest income from direct obligations of the United States. Such dividends are currently exempt from taxation for income tax purposes in most states, including NewYork, California and the District of Columbia:
| | |
| Dreyfus Government Prime | |
| Cash Management | 100% |
| Dreyfus Treasury Prime | |
| Cash Management | 100% |
The Funds below designate the following percentage of ordinary income dividends paid during the fiscal year ended January 31, 2011 as qualifying “interest related dividends”:
| | |
| Dreyfus Cash Management | 88.93% |
| Dreyfus Cash Management Plus, Inc. | 90.30% |
| Dreyfus Government Cash Management | 100% |
| Dreyfus Government Prime | |
| Cash Management | 100% |
| Dreyfus Treasury & Agency | |
| Cash Management | 100% |
| Dreyfus Treasury Prime | |
| Cash Management | 100% |
BOARD MEMBERS INFORMATION (Unaudited)
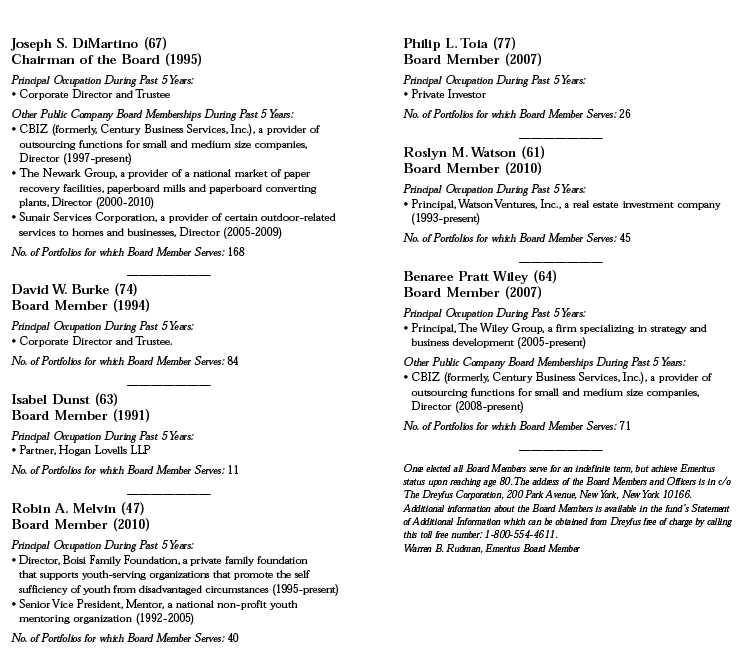
94
OFFICERS OF THE FUND (Unaudited)
| |
| BRADLEY J. SKAPYAK, President since January 2010. |
Chief Operating Officer and a director of the Manager since June 2009. From April 2003 to June 2009, Mr. Skapyak was the head of the Investment Accounting and Support Department of the Manager. He is an officer of 76 investment companies (comprised of 168 portfolios) managed by the Manager. He is 52 years old and has been an employee of the Manager since February 1988.
| |
| PHILLIP N. MAISANO, Executive Vice President since |
| July 2007. |
Chief Investment Officer,Vice Chair and a director of the Manager, and an officer of 76 investment companies (comprised of 168 portfolios) managed by the Manager. Mr. Maisano also is an officer and/or Board member of certain other investment management subsidiaries of The Bank of New York Mellon Corporation, each of which is an affiliate of the Manager. He is 63 years old and has been an employee of the Manager since November 2006. Prior to joining the Manager, Mr. Maisano served as Chairman and Chief Executive Officer of EACM
| |
| CHARLES CARDONA, Executive Vice President since |
| March 2000. |
Vice Chair and a Director of the Manager, Executive Vice President of the Distributor, President of Dreyfus Institutional Services Division, and an officer of 13 other investment companies (comprised of 21 portfolios) managed by the Manager. He is 55 years old and has been an employee of the Manager since February 1981.
| |
| MICHAEL A. ROSENBERG, Vice President and Secretary since |
| August 2005. |
Assistant General Counsel of BNY Mellon, and an officer of 77 investment companies (comprised of 193 portfolios) managed by the Manager. He is 50 years old and has been an employee of the Manager since October 1991.
| |
| KIESHA ASTWOOD, Vice President and Assistant Secretary |
| since January 2010. |
Counsel of BNY Mellon, and an officer of 77 investment companies (comprised of 193 portfolios) managed by the Manager. She is 37 years old and has been an employee of the Manager since July 1995.
| |
| JAMES BITETTO, Vice President and Assistant Secretary since |
| August 2005. |
Senior Counsel of BNY Mellon and Secretary of the Manager, and an officer of 77 investment companies (comprised of 193 portfolios) managed by the Manager. He is 44 years old and has been an employee of the Manager since December 1996.
| |
| JONI LACKS CHARATAN, Vice President and Assistant |
| Secretary since August 2005. |
Senior Counsel of BNY Mellon, and an officer of 77 investment companies (comprised of 193 portfolios) managed by the Manager. She is 55 years old and has been an employee of the Manager since October 1988.
| |
| JOSEPH M. CHIOFFI, Vice President and Assistant Secretary |
| since August 2005. |
Senior Counsel of BNY Mellon, and an officer of 77 investment companies (comprised of 193 portfolios) managed by the Manager. He is 49 years old and has been an employee of the Manager since June 2000.
| |
| KATHLEEN DENICHOLAS, Vice President and Assistant |
| Secretary since January 2010. |
Senior Counsel of BNY Mellon, and an officer of 77 investment companies (comprised of 193 portfolios) managed by the Manager. She is 36 years old and has been an employee of the Manager since February 2001.
| |
| JANETTE E. FARRAGHER, Vice President and Assistant |
| Secretary since August 2005. |
Assistant General Counsel of BNY Mellon, and an officer of 77 investment companies (comprised of 193 portfolios) managed by the Manager. She is 48 years old and has been an employee of the Manager since February 1984.
| |
| JOHN B. HAMMALIAN, Vice President and Assistant Secretary |
| since August 2005. |
Managing Counsel of BNY Mellon, and an officer of 77 investment companies (comprised of 193 portfolios) managed by the Manager. He is 47 years old and has been an employee of the Manager since February 1991.
| |
| M. CRISTINA MEISER, Vice President and Assistant Secretary |
| since January 2010. |
Senior Counsel of BNY Mellon, and an officer of 77 investment companies (comprised of 193 portfolios) managed by the Manager. She is 40 years old and has been an employee of the Manager since August 2001.
| |
| ROBERT R. MULLERY, Vice President and Assistant Secretary |
| since August 2005. |
Managing Counsel of BNY Mellon, and an officer of 77 investment companies (comprised of 193 portfolios) managed by the Manager. He is 59 years old and has been an employee of the Manager since May 1986.
OFFICERS OF THE FUND (Unaudited) (continued)
| |
| JEFF PRUSNOFSKY, Vice President and Assistant Secretary |
| since August 2005. |
Managing Counsel of BNY Mellon, and an officer of 77 investment companies (comprised of 193 portfolios) managed by the Manager. He is 45 years old and has been an employee of the Manager since October 1990.
| |
| JAMES WINDELS, Treasurer since November 2001. |
Director – Mutual Fund Accounting of the Manager, and an officer of 77 investment companies (comprised of 193 portfolios) managed by the Manager. He is 52 years old and has been an employee of the Manager since April 1985.
| |
| RICHARD CASSARO, Assistant Treasurer since January 2008. |
Senior Accounting Manager – Money Market and Municipal Bond Funds of the Manager, and an officer of 77 investment companies (comprised of 193 portfolios) managed by the Manager. He is 52 years old and has been an employee of the Manager since September 1982.
| |
| GAVIN C. REILLY, Assistant Treasurer since August 2005. |
Tax Manager of the Investment Accounting and Support Department of the Manager, and an officer of 77 investment companies (comprised of 193 portfolios) managed by the Manager. He is 42 years old and has been an employee of the Manager since April 1991.
| |
| ROBERT ROBOL, Assistant Treasurer since August 2003. |
Senior Accounting Manager – Fixed Income Funds of the Manager, and an officer of 77 investment companies (comprised of 193 portfolios) managed by the Manager. He is 46 years old and has been an employee of the Manager since October 1988.
| |
| ROBERT SALVIOLO, Assistant Treasurer since July 2007. |
Senior Accounting Manager – Equity Funds of the Manager, and an officer of 77 investment companies (comprised of 193 portfolios) managed by the Manager. He is 43 years old and has been an employee of the Manager since June 1989.
| |
| ROBERT SVAGNA, Assistant Treasurer since August 2005. |
Senior Accounting Manager – Equity Funds of the Manager, and an officer of 77 investment companies (comprised of 193 portfolios) managed by the Manager. He is 43 years old and has been an employee of the Manager since November 1990.
| |
| JOSEPH W. CONNOLLY, Chief Compliance Officer since |
| September 2004. |
Chief Compliance Officer of the Manager and The Dreyfus Family of Funds (77 investment companies, comprised of 193 portfolios). From November 2001 through March 2004, Mr. Connolly was first Vice-President, Mutual Fund Servicing for Mellon Global Securities Services. In that capacity, Mr. Connolly was responsible for managing Mellon’s Custody, Fund Accounting and Fund Administration services to third-party mutual fund clients. He is 53 years old and has served in various capacities with the Manager since 1980, including manager of the firm’s Fund Accounting Department from 1997 through October 2001.
| |
| NATALIA GRIBAS, Anti-Money Laundering Compliance Officer |
| since July 2010. |
Anti-Money Laundering Compliance Officer of the Distributor, and the Anti-Money Laundering Compliance Officer of 73 investment companies (comprised of 189 portfolios) managed by the Manager. She is 40 years old and has been an employee of the Distributor since September 2008.
96
For More Information
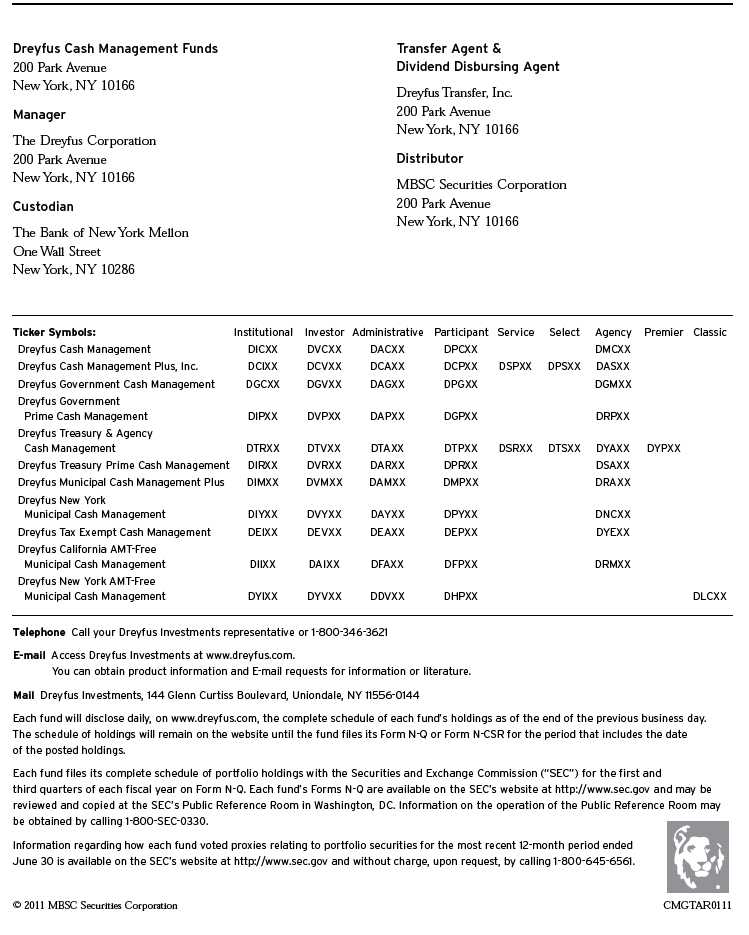
Item 2. Code of Ethics.
The Registrant has adopted a code of ethics that applies to the Registrant's principal executive officer, principal financial officer, principal accounting officer or controller, or persons performing similar functions. There have been no amendments to, or waivers in connection with, the Code of Ethics during the period covered by this Report.
Item 3. Audit Committee Financial Expert.
The Registrant's Board has determined that Joseph S. DiMartino, a member of the Audit Committee of the Board, is an audit committee financial expert as defined by the Securities and Exchange Commission (the "SEC"). Mr. DiMartino is "independent" as defined by the SEC for purposes of audit committee financial expert determinations.
Item 4. Principal Accountant Fees and Services.
(a) Audit Fees. The aggregate fees billed for each of the last two fiscal years (the "Reporting Periods") for professional services rendered by the Registrant's principal accountant (the "Auditor") for the audit of the Registrant's annual financial statements or services that are normally provided by the Auditor in connection with the statutory and regulatory filings or engagements for the Reporting Periods, were $25,422 in 2010 and $30,312 in 2011.
(b) Audit-Related Fees. The aggregate fees billed in the Reporting Periods for assurance and related services by the Auditor that are reasonably related to the performance of the audit of the Registrant's financial statements and are not reported under paragraph (a) of this Item 4 were $5,276 in 2010 and $6,000 in 2011. These services consisted of one or more of the following: (i) agreed upon procedures related to compliance with Internal Revenue Code section 817(h), (ii) security counts required by Rule 17f-2 under the Investment Company Act of 1940, as amended, (iii) advisory services as to the accounting or disclosure treatment of Registrant transactions or events and (iv) advisory services to the accounting or disclosure treatment of the actual or potential impact to the Registrant of final or proposed rules, standards or interpretations by the Securities and Exchange Commission, the Financial Accounting Standards Boards or other regulatory or standard-setting bodies.
The aggregate fees billed in the Reporting Periods for non-audit assurance and related services by the Auditor to the Registrant's investment adviser (not including any sub-investment adviser whose role is primarily portfolio management and is subcontracted with or overseen by another investment adviser), and any entity controlling, controlled by or under common control with the investment adviser that provides ongoing services to the Registrant ("Service Affiliates"), that were reasonably related to the performance of the annual audit of the Service Affiliate, which required pre-approval by the Audit Committee were $0 in 2010 and $0 in 2011.
(c) Tax Fees. The aggregate fees billed in the Reporting Periods for professional services rendered by the Auditor for tax compliance, tax advice, and tax planning ("Tax Services") were $4,033 in 2010 and $2,853 in 2011. These services consisted of: (i) review or preparation of U.S. federal, state, local and excise tax returns; (ii) U.S. federal, state and local tax planning, advice and assistance regarding statutory, regulatory or administrative developments; (iii) tax advice regarding tax qualification matters and/or treatment of various financial instruments held or proposed to be acquired or held, and (iv) determination of Passive Foreign Investment Companies. The aggregate fees billed in the Reporting Periods for Tax Services by the Auditor to Service Affiliates, which required pre-approval by the Audit Committee were $0 in 2010 and $0 in 2011.
(d) All Other Fees. The aggregate fees billed in the Reporting Periods for products and services provided by the Auditor, other than the services reported in paragraphs (a) through (c) of this Item, were $0 in 2010 and $277 in 2011. [These services consisted of a review of the Registrant's anti-money laundering program].
The aggregate fees billed in the Reporting Periods for Non-Audit Services by the Auditor to Service Affiliates, other than the services reported in paragraphs (b) through (c) of this Item, which required pre-approval by the Audit Committee, were $0 in 2010 and $0 in 2011.
(e)(1) Audit Committee Pre-Approval Policies and Procedures. The Registrant's Audit Committee has established policies and procedures (the "Policy") for pre-approval (within specified fee limits) of the Auditor's engagements for non-audit services to the Registrant and Service Affiliates without specific case-by-case consideration. The pre-approved services in the Policy can include pre-approved audit services, pre-approved audit-related services, pre-approved tax services and pre-approved all other services. Pre-approval considerations include whether the proposed services are compatible with maintaining the Auditor's independence. Pre-approvals pursuant to the Policy are considered annually.
(e)(2) Note: None of the services described in paragraphs (b) through (d) of this Item 4 were approved by the Audit Committee pursuant to paragraph (c)(7)(i)(C) of Rule 2-01 of Regulation S-X.
(f) None of the hours expended on the principal accountant's engagement to audit the registrant's financial statements for the most recent fiscal year were attributed to work performed by persons other than the principal account's full-time, permanent employees.
Non-Audit Fees. The aggregate non-audit fees billed by the Auditor for services rendered to the Registrant, and rendered to Service Affiliates, for the Reporting Periods were $26,379,755 in 2010 and $44,393,135 in 2011.
Auditor Independence. The Registrant's Audit Committee has considered whether the provision of non-audit services that were rendered to Service Affiliates, which were not pre-approved (not requiring pre-approval), is compatible with maintaining the Auditor's independence.
Item 5. Audit Committee of Listed Registrants.
Not applicable. [CLOSED-END FUNDS ONLY]
Item 6. Investments.
(a) Not applicable.
Item 7. Disclosure of Proxy Voting Policies and Procedures for Closed-End Management Investment Companies.
Not applicable. [CLOSED-END FUNDS ONLY]
Item 8. Portfolio Managers of Closed-End Management Investment Companies.
Not applicable. [CLOSED-END FUNDS ONLY, beginning with reports for periods ended on and after December 31, 2005]
Item 9. Purchases of Equity Securities by Closed-End Management Investment Companies and Affiliated Purchasers.
Not applicable. [CLOSED-END FUNDS ONLY]
Item 10. Submission of Matters to a Vote of Security Holders.
There have been no material changes to the procedures applicable to Item 10.
Item 11. Controls and Procedures.
(a) The Registrant's principal executive and principal financial officers have concluded, based on their evaluation of the Registrant's disclosure controls and procedures as of a date within 90 days of the filing date of this report, that the Registrant's disclosure controls and procedures are reasonably designed to ensure that information required to be disclosed by the Registrant on Form N-CSR is recorded, processed, summarized and reported within the required time periods and that information required to be disclosed by the Registrant in the reports that it files or submits on Form N-CSR is accumulated and communicated to the Registrant's management, including its principal executive and principal financial officers, as appropriate to allow timely decisions regarding required disclosure.
(b) There were no changes to the Registrant's internal control over financial reporting that occurred during the second fiscal quarter of the period covered by this report that have materially affected, or are reasonably likely to materially affect, the Registrant's internal control over financial reporting.
Item 12. Exhibits.
(a)(1) Code of ethics referred to in Item 2.
(a)(2) Certifications of principal executive and principal financial officers as required by Rule 30a-2(a) under the Investment Company Act of 1940.
(a)(3) Not applicable.
(b) Certification of principal executive and principal financial officers as required by Rule 30a-2(b) under the Investment Company Act of 1940.
SIGNATURES
Pursuant to the requirements of the Securities Exchange Act of 1934 and the Investment Company Act of 1940, the Registrant has duly caused this Report to be signed on its behalf by the undersigned, thereunto duly authorized.
DREYFUS NEW YORK MUNICIPAL CASH MANAGEMENT
By: /s/Bradley J. Skapyak |
Bradley J. Skapyak, President |
Date: | March 25, 2011 |
|
Pursuant to the requirements of the Securities Exchange Act of 1934 and the Investment Company Act of 1940, this Report has been signed below by the following persons on behalf of the Registrant and in the capacities and on the dates indicated. |
|
By: /s/Bradley J. Skapyak |
Bradley J. Skapyak, President |
Date: | March 25, 2011 |
|
By: /s/James Windels |
James Windels, Treasurer |
Date: | March 25, 2011 |
|
EXHIBIT INDEX
(a)(1) Code of ethics referred to in Item 2.
(a)(2) Certifications of principal executive and principal financial officers as required by Rule 30a-2(a) under the Investment Company Act of 1940. (EX-99.CERT)
(b) Certification of principal executive and principal financial officers as required by Rule 30a-2(b) under the Investment Company Act of 1940. (EX-99.906CERT)