UNITED STATES
SECURITIES AND EXCHANGE COMMISSION
Washington, D.C. 20549
FORM N-CSR
CERTIFIED SHAREHOLDER REPORT OF REGISTERED MANAGEMENT
INVESTMENT COMPANIES
Investment Company Act file number | 811- 6395 |
| |
| DREYFUS NEW YORK MUNICIPAL CASH MANAGEMENT | |
| (Exact name of Registrant as specified in charter) | |
| | |
| c/o The Dreyfus Corporation 200 Park Avenue New York, New York 10166 | |
| (Address of principal executive offices) (Zip code) | |
| | |
| Janette E. Farragher, Esq. 200 Park Avenue New York, New York 10166 | |
| (Name and address of agent for service) | |
|
Registrant's telephone number, including area code: | (212) 922-6000 |
| |
Date of fiscal year end: | 1/31 | |
Date of reporting period: | 1/31/13 | |
| | | | | | | |
FORM N-CSR
Item 1. Reports to Stockholders.

| | |
| Contents | |
| |
| The Funds | |
| Letter to Shareholders (Taxable) | 3 |
| Letter to Shareholders (Tax-Exempt) | 5 |
| Understanding Your Fund’s Expenses | 7 |
| Comparing Your Fund’s Expenses | |
| With Those of Other Funds | 9 |
| Statements of Investments | 11 |
| Statements of Assets and Liabilities | 54 |
| Statements of Operations | 57 |
| Statements of Changes in Net Assets | 59 |
| Financial Highlights | 64 |
| Notes to Financial Statements | 75 |
| Report of Independent Registered | |
| Public Accounting Firm | 85 |
| Important Tax Information | 86 |
| Board Members Information | 87 |
| Officers of the Funds | 88 |
| For More Information | |
| Back cover | |
The views expressed in this report reflect those of the portfolio manager only through the end of the period covered and do not necessarily represent the views of Dreyfus or any other person in the Dreyfus organization. Any such views are subject to change at any time based upon market or other conditions and Dreyfus disclaims any responsibility to update such views. These views may not be relied on as investment advice and, because investment decisions for a Dreyfus fund are based on numerous factors, may not be relied on as an indication of trading intent on behalf of any Dreyfus fund.
| |
| • Not FDIC-Insured • Not Bank-Guaranteed • May Lose Value |
Dreyfus Cash Management Funds
The Funds

LETTER TO
SHAREHOLDERS
Dear Shareholders:
This annual report for the several Dreyfus Cash Management Funds (Taxable) covers the 12-month period ended January 31, 2013. Over the reporting period, these funds achieved the following yields and, taking into account the effects of compounding, the following effective yields:1,2
| | | |
| | | Effective |
| | Yield (%) | Yield (%) |
| Dreyfus Cash Management | | |
| Institutional Shares | 0.08 | 0.08 |
| Investor Shares | 0.00 | 0.00 |
| Administrative Shares | 0.00 | 0.00 |
| Participant Shares | 0.00 | 0.00 |
| Agency Shares | 0.03 | 0.03 |
| Dreyfus Government | | |
| Cash Management | | |
| Institutional Shares | 0.01 | 0.01 |
| Investor Shares | 0.01 | 0.01 |
| Administrative Shares | 0.01 | 0.01 |
| Participant Shares | 0.01 | 0.01 |
| Agency Shares | 0.01 | 0.01 |
| Dreyfus Government | | |
| Prime Cash Management | | |
| Institutional Shares | 0.00 | 0.00 |
| Investor Shares | 0.00 | 0.00 |
| Administrative Shares | 0.00 | 0.00 |
| Participant Shares | 0.00 | 0.00 |
| Agency Shares | 0.00 | 0.00 |
| Dreyfus Treasury & Agency | | |
| Cash Management | | |
| Institutional Shares | 0.01 | 0.01 |
| Investor Shares | 0.01 | 0.01 |
| Administrative Shares | 0.01 | 0.01 |
| Participant Shares | 0.01 | 0.01 |
| Service Shares | 0.01 | 0.01 |
| Select Shares | 0.01 | 0.01 |
| Agency Shares | 0.01 | 0.01 |
| Premier Shares | 0.01 | 0.01 |
| Dreyfus Treasury | | |
| Prime Cash Management | | |
| Institutional Shares | 0.00 | 0.00 |
| Investor Shares | 0.00 | 0.00 |
| Administrative Shares | 0.00 | 0.00 |
| Participant Shares | 0.00 | 0.00 |
| Agency Shares | 0.00 | 0.00 |
Yields of money market instruments remained near zero percent throughout the reporting period as the Federal Reserve Board (the “Fed”) left short-term interest rates unchanged despite evidence of more robust economic growth.
U.S. Economic Recovery Gained Momentum
The reporting period began in the midst of a recovery from steep market declines stemming from adverse macroeconomic developments in the United States, Europe, and China. The economy appeared to strengthen further in February 2012, when the labor market gained 233,000 jobs and the unemployment rate stood at 8.3% after several months of declines. Despite a decrease to 120,000 new jobs in March, the unemployment rate inched lower to 8.2%. However, GDP grew at only a 2.0% annualized rate over the first quarter of 2012, mainly due to cuts in government spending.
The economic expansion moderated in April. The unemployment rate fell to 8.1%, but only 77,000 jobs were added. May brought another month of subpar job creation and an uptick in the unemployment rate to 8.2%.The manufacturing sector contracted in June for the first time in three years, but U.S. housing prices climbed for the first time in seven months. For the second quarter of 2012, U.S. economic growth slowed to a disappointing 1.3% annualized rate.
The economy added 181,000 jobs in July, but the unemployment rate rose to 8.3% as more people entered the workforce.August saw improved conditions in U.S. housing markets, an 8.1% unemployment rate, and higher personal income and expenditures.The economic recovery seemed to gain traction in September with the addition of 148,000 new jobs and a sharp drop in the unemployment rate to 7.8%, its lowest level since January 2009. The manufacturing sector rebounded after three months of modest declines, and the service sector posted its 33rd consecutive month of expansion. In the housing market, sales prices reached five-year highs. The U.S. economy grew at a respectable 3.1% annualized rate during the third quarter.
LETTER TO SHAREHOLDERS (continued)
The unemployment rate ticked higher in October to 7.9% as more workers joined the labor force. Manufacturing activity increased at a faster rate in October than in September, and home prices posted modest gains. In November, the unemployment rate remained steady while 146,000 new jobs were added. Home prices rose for the sixth straight month, and pending home sales reached their highest level in more than five years. However, manufacturing activity contracted slightly.
December saw the addition of 164,000 jobs to the labor force and a mild rebound in manufacturing activity. However, consumer confidence declined somewhat, and retailers reported relatively sluggish sales during the 2012 holiday season. Many analysts were surprised when the U.S. Department of Commerce estimated that U.S. GDP contracted at a 0.1% annualized rate during the fourth quarter, which was attributed mainly to reductions in federal spending, particularly on defense. Other indicators proved somewhat more encouraging, including gains in personal consumption, durable goods purchases, and housing market activity. Data released in January 2013 also portrayed a sluggish economic recovery, as the economy added 157,000 jobs, but the unemployment rate inched upwards to 7.9%.
Focusing on Quality and Liquidity
Money market yields remained near zero percent throughout the year, and yield differences along the market’s maturity spectrum stayed relatively narrow. Therefore, we maintained the fund’s weighted average maturity in a position that was roughly in line with market averages, and we continued to focus on
well-established issuers that historically have demonstrated good liquidity characteristics, including banks in Australia, Canada and Japan, but relatively few in Europe.
The Fed has maintained an aggressively accommodative monetary policy, including an open-ended quantitative easing program and a stated intention to leave short-term interest rates near current levels until mid-2015. Therefore, as we have for some time, we intend to maintain the fund’s focus on quality and liquidity.

| | |
| | An investment in the funds is not insured or guaranteed by the FDIC or |
| | any other government agency.Although the funds seek to preserve the value |
| | of your investment at $1.00 per share, it is possible to lose money by |
| | investing in the funds. |
| | Short-term corporate, asset-backed securities holdings and municipal |
| | securities holdings (as applicable), while rated in the highest rating category |
| | by one or more NRSRO (or unrated, if deemed of comparable quality by |
| | Dreyfus), involve credit and liquidity risks and risk of principal loss. |
| 1 | Effective yield is based upon dividends declared daily and reinvested |
| | monthly. Past performance is no guarantee of future results.Yields fluctuate. |
| 2 | Yields provided reflect the absorption of certain fund expenses by The |
| | Dreyfus Corporation pursuant to an undertaking, which is voluntary and |
| | temporary, not contractual, and can be terminated at any time without |
| | notice. Had these expenses not been absorbed, fund yields would have been |
| | lower, and in some cases, 7-day yields during the reporting period would |
| | have been negative absent the expense absorption. |
4

LETTER TO SHAREHOLDERS
Dear Shareholder:
We are pleased to present the annual report for the several Dreyfus Cash Management Funds (Tax Exempt). For the 12-month period ended January 31, 2013, these tax-exempt money market funds achieved the following yields and effective yields:1,2
| | | |
| | | Effective |
| | Yield (%) | Yield (%) |
| Dreyfus Municipal | | |
| Cash Management Plus | | |
| Institutional Shares | 0.01 | 0.01 |
| Investor Shares | 0.00 | 0.00 |
| Administrative Shares | 0.00 | 0.00 |
| Participant Shares | 0.00 | 0.00 |
| Agency Shares | 0.00 | 0.00 |
| Dreyfus New York | | |
| Municipal Cash Management | | |
| Institutional Shares | 0.01 | 0.01 |
| Investor Shares | 0.00 | 0.00 |
| Administrative Shares | 0.00 | 0.00 |
| Participant Shares | 0.00 | 0.00 |
| Dreyfus Tax Exempt | | |
| Cash Management | | |
| Institutional Shares | 0.00 | 0.00 |
| Investor Shares | 0.00 | 0.00 |
| Administrative Shares | 0.00 | 0.00 |
| Participant Shares | 0.00 | 0.00 |
| Dreyfus California AMT-Free | | |
| Municipal Cash Management | | |
| Institutional Shares | 0.06 | 0.06 |
| Investor Shares | 0.04 | 0.04 |
| Administrative Shares | 0.04 | 0.04 |
| Participant Shares | 0.04 | 0.04 |
| Dreyfus New York AMT-Free | | |
| Municipal Cash Management | | |
| Institutional Shares | 0.00 | 0.00 |
| Investor Shares | 0.00 | 0.00 |
| Administrative Shares | 0.00 | 0.00 |
| Classic Shares | 0.00 | 0.00 |
Yields of tax-exempt money market instruments stayed near historical lows throughout the reporting period, as short-term interest rates remained anchored by a federal funds rate between 0% and 0.25%.
Economic Recovery Gained Traction
Despite occasional bouts of heightened volatility, the reporting period saw a generally improving economic environment. At the start of the reporting period, economists were encouraged by U.S. employment gains and increased manufacturing activity. Although these positive influences were called into question during the spring, investors responded positively over the summer to better employment numbers and an extension of the Federal Reserve Board’s (the “Fed”) Operation Twist. Later, the Fed embarked on a third round of quantitative easing and extended its forecast for low interest rates through mid-2015.
These aggressively accommodative monetary policy actions appeared to be effective, as U.S. GDP growth climbed from an annualized rate of 1.3% for the second quarter of 2012 to 3.1% for the third quarter. Many analysts were surprised when the U.S. Department of Commerce estimated that U.S. GDP contracted at a 0.1% annualized rate during the fourth quarter, which was attributed mainly to reductions in federal spending, particularly on defense. Other economic indicators proved somewhat more encouraging, including gains in personal consumption, durable goods purchases, and housing market activity. Data released in January 2013 also portrayed a sustained, but sluggish, economic recovery.
With short-term interest rates near historical lows, demand from individual investors shifted to the municipal bond market, where yields were incrementally higher. However, any reduction in demand for shorter-term, tax-exempt money market instruments stemming from individual investors was offset by the effects of higher rates on short-term repurchase agreements, which helped to boost yields of variable rate demand notes (VRDNs). As a result, municipal money market instruments generally provided higher yields than comparable U.S. Treasury obligations,
LETTER TO SHAREHOLDERS (continued)
sparking increased demand from non-traditional investors, including institutional investors. Non-traditional investors also favored municipal money market instruments due to regulatory changes affecting funds’ liquidity requirements.
Municipal credit quality continued to improve over the reporting period as most states and many local governments recovered gradually from the recession. For example, the credit rating on California’s general obligation debt received an upgrade after voters approved increases in sales and income taxes in order to shore up the state’s fiscal condition, and NewYork has continued to bolster its credit fundamentals by making the difficult decisions required to balance its budget and reform its tax code.
Focusing on Quality and Liquidity
Most tax-exempt money market funds have maintained relatively short weighted average maturities compared to historical averages. Due to narrow yield differences along the money market’s maturity spectrum, as well as ongoing regulatory uncertainty, it has made little sense for fund managers to extend weighted average maturities. The funds were no exception to these considerations, and we maintained their weighted average maturities in ranges that were consistent with industry averages.
Moreover, careful and well-researched credit selection has remained paramount. As we have for some time, we continued to favor state general obligation bonds; essential service revenue bonds backed by revenues from water, sewer and electric facilities; and certain local credits with strong financial positions and stable tax bases. We generally continued to shy away from instruments issued by localities that depend heavily on state aid.
Rates Likely to Stay Low
We are cautiously optimistic regarding U.S. economic prospects.While the Fed expects moderate economic growth and a gradually declining unemployment rate, it also has made clear that short-term interest rates are likely to remain low until the unemployment rate drops well below current levels. Consequently, we believe that the prudent course continues to be an emphasis on preservation of capital and liquidity.

| | |
| | An investment in the funds is not insured or guaranteed by the FDIC or |
| | any other government agency.Although the funds seek to preserve the |
| | value of your investment at $1.00 per share, it is possible to lose money |
| | by investing in the funds. |
| | Short-term corporate, asset-backed securities holdings and municipal |
| | securities holdings (as applicable), while rated in the highest rating category |
| | by one or more NRSRO (or unrated, if deemed of comparable quality by |
| | Dreyfus), involve credit and liquidity risks and risk of principal loss. |
| 1 | Effective yield is based upon dividends declared daily and reinvested |
| | monthly. Past performance is no guarantee of future results.Yields fluctuate. |
| | For the national funds, income may be subject to state and local taxes. For |
| | the NewYork and California funds, income may be subject to state and |
| | local taxes for out-of-state residents. For each non-AMT-Free fund, some |
| | income may be subject to the federal alternative minimum tax (AMT). |
| 2 | Yields provided reflect the absorption of certain fund expenses by The |
| | Dreyfus Corporation pursuant to an undertaking, which is voluntary and |
| | temporary, not contractual, and can be terminated at any time without |
| | notice. Had these expenses not been absorbed, the funds’ yields would |
| | have been lower, and in some cases, 7-day yields during the reporting |
| | period would have been negative absent the expense absorption. |
6
UNDERSTANDING YOUR FUND’S EXPENSES (Unaudited)
As a mutual fund investor, you pay ongoing expenses, such as management fees and other expenses. Using the information below, you can estimate how these expenses affect your investment and compare them with the expenses of other funds.You also may pay one-time transaction expenses, including sales charges (loads) and redemption fees, which are not shown in this section and would have resulted in higher total expenses. For more information, see your fund’s prospectus or talk to your financial adviser.
Review your fund’s expenses
The table below shows the expenses you would have paid on a $1,000 investment in each class of each fund from August 1, 2012 to January 31, 2013. It also shows how much a $1,000 investment would be worth at the close of the period, assuming actual returns and expenses.
| | | | | | | | | | | |
| Expenses and Value of a $1,000 Investment | | | | | | | |
| assuming actual returns for the six months ended January 31, 2013 | | | | | | |
| |
| | | | | | | | |
| | | | | | | | | | | |
| | | Institutional | Investor | Administrative | Participant | Service | Select | Agency | Premier |
| Dreyfus Cash | | | | | | | | | | |
| Management | | | | | | | | | | |
| Expenses paid | | | | | | | | | | |
| per $1,000† | | | $1.06 | $1.36 | $1.36 | $1.36 | — | — | $1.31 | — |
| Ending value | | | | | | | | | | |
| (after expenses) | | $1,000.30 | $1,000.00 | $1,000.00 | $1,000.00 | — | — | $1,000.10 | — |
| Annualized | | | | | | | | | | |
| expense ratio (%) | | | .21 | .27 | .27 | .27 | — | — | .26 | — |
| Dreyfus | | | | | | | | | | |
| Government Cash | | | | | | | | | | |
| Management | | | | | | | | | | |
| Expenses paid | | | | | | | | | | |
| per $1,000† | | | $.85 | $.85 | $.85 | $.85 | — | — | $.70 | — |
| Ending value | | | | | | | | | | |
| (after expenses) | | $1,000.10 | $1,000.10 | $1,000.10 | $1,000.10 | — | — | $1,000.10 | — |
| Annualized | | | | | | | | | | |
| expense ratio (%) | | | .17 | .17 | .17 | .17 | — | — | .14 | — |
| Dreyfus | | | | | | | | | | |
| Government Prime | | | | | | | | | | |
| Cash Management | | | | | | | | | | |
| Expenses paid | | | | | | | | | | |
| per $1,000† | | | $.65 | $.65 | $.65 | $.65 | — | — | $.65 | — |
| Ending value | | | | | | | | | | |
| (after expenses) | | $1,000.00 | $1,000.00 | $1,000.00 | $1,000.00 | — | — | $1,000.00 | — |
| Annualized | | | | | | | | | | |
| expense ratio (%) | | | .13 | .13 | .13 | .13 | — | — | .13 | — |
| Dreyfus Treasury & | | | | | | | | | | |
| Agency Cash | | | | | | | | | | |
| Management | | | | | | | | | | |
| Expenses paid | | | | | | | | | | |
| per $1,000† | | | $.75 | $.75 | $.75 | $.75 | $.75 | $.75 | $.75 | $.75 |
| Ending value | | | | | | | | | | |
| (after expenses) | | $1,000.10 | $1,000.10 | $1,000.10 | $1,000.10 | $1,000.10 | $1,000.10 | $1,000.10 | $1,000.10 |
| Annualized | | | | | | | | | | |
| expense ratio (%) | | | .15 | .15 | .15 | .15 | .15 | .15 | .15 | .15 |
| Dreyfus | | | | | | | | | | |
| Treasury Prime | | | | | | | | | | |
| Cash Management | | | | | | | | | | |
| Expenses paid | | | | | | | | | | |
| per $1,000† | | | $.50 | $.50 | $.50 | $.50 | — | — | $.35 | — |
| Ending value | | | | | | | | | | |
| (after expenses) | | $1,000.00 | $1,000.00 | $1,000.00 | $1,000.00 | — | — | $1,000.00 | — |
| Annualized | | | | | | | | | | |
| expense ratio (%) | | | .10 | .10 | .10 | .10 | — | — | .07 | — |
UNDERSTANDING YOUR FUND’S EXPENSES (Unaudited) (continued)
| | | | | | | | |
| Expenses and Value of a $1,000 Investment (continued) | | | | | |
| assuming actual returns for the six months ended January 31, 2013 | | | | | |
| |
| | | Institutional | Investor | Administrative | Participant | Agency | Classic |
| Dreyfus | | | | | | | |
| Municipal Cash | | | | | | | |
| Management Plus | | | | | | | |
| Expenses paid | | | | | | | |
| per $1,000† | | $1.16 | $1.21 | $1.21 | $1.21 | $1.21 | — |
| Ending value | | | | | | | |
| (after expenses) | | $1,000.00 | $1,000.00 | $1,000.00 | $1,000.00 | $1,000.00 | — |
| Annualized | | | | | | | |
| expense ratio (%) | | .23 | .24 | .24 | .24 | .24 | — |
| Dreyfus | | | | | | | |
| New York | | | | | | | |
| Municipal Cash | | | | | | | |
| Management | | | | | | | |
| Expenses paid | | | | | | | |
| per $1,000† | | $1.21 | $1.21 | $1.26 | $1.26 | — | — |
| Ending value | | | | | | | |
| (after expenses) | | $1,000.00 | $1,000.00 | $1,000.00 | $1,000.00 | — | — |
| Annualized | | | | | | | |
| expense ratio (%) | | .24 | .24 | .25 | .25 | — | — |
| Dreyfus | | | | | | | |
| Tax Exempt Cash | | | | | | | |
| Management | | | | | | | |
| Expenses paid | | | | | | | |
| per $1,000† | | $1.01 | $1.01 | $1.01 | $.96 | — | — |
| Ending value | | | | | | | |
| (after expenses) | | $1,000.00 | $1,000.00 | $1,000.00 | $1,000.00 | — | — |
| Annualized | | | | | | | |
| expense ratio (%) | | .20 | .20 | .20 | .19 | — | — |
| Dreyfus California | | | | | | | |
| AMT-Free | | | | | | | |
| Municipal Cash | | | | | | | |
| Management | | | | | | | |
| Expenses paid | | | | | | | |
| per $1,000† | | $1.06 | $$1.06 | $1.01 | $1.06 | — | — |
| Ending value | | | | | | | |
| (after expenses) | | $1,000.50 | $1,000.40 | $1,000.40 | $1,000.40 | — | — |
| Annualized | | | | | | | |
| expense ratio (%) | | .21 | .21 | .20 | .21 | — | — |
| Dreyfus New York | | | | | | | |
| AMT-Free | | | | | | | |
| Municipal Cash | | | | | | | |
| Management | | | | | | | |
| Expenses paid | | | | | | | |
| per $1,000† | | $1.41 | $1.41 | $1.41 | — | — | $1.36 |
| Ending value | | | | | | | |
| (after expenses) | | $1,000.00 | $1,000.00 | $1,000.00 | — | — | $1,000.00 |
| Annualized | | | | | | | |
| expense ratio (%) | | .28 | .28 | .28 | — | — | .27 |
| |
| † Expenses are equal to each fund’s annualized expense ratios as shown above, multiplied by the average account value over the period, multiplied by 184/366 (to reflect the one-half |
| year period). |
8
COMPARING YOUR FUND’S EXPENSES
WITH THOSE OF OTHER FUNDS (Unaudited)
Using the SEC’s method to compare expenses
The Securities and Exchange Commission (SEC) has established guidelines to help investors assess fund expenses. Per these guidelines, the table below shows your fund’s expenses based on a $1,000 investment, assuming a hypothetical 5% annualized return.You can use this information to compare the ongoing expenses (but not transaction expenses or total cost) of investing in the fund with those of other funds. All mutual fund shareholder reports will provide this information to help you make this comparison. Please note that you cannot use this information to estimate your actual ending account balance and expenses paid during the period.
| | | | | | | | | | | |
| Expenses and Value of a $1,000 Investment | | | | | | | |
| assuming a hypothetical 5% annualized return for the six months ended January 31, 2013 | | | | |
| |
| | | Institutional | Investor | Administrative | Participant | Service | Select | Agency | Premier |
| Dreyfus Cash | | | | | | | | | | |
| Management | | | | | | | | | | |
| Expenses paid | | | | | | | | | | |
| per $1,000† | | | $1.07 | $1.37 | $1.37 | $1.37 | — | — | $1.32 | — |
| Ending value | | | | | | | | | | |
| (after expenses) | | $1,024.08 | $1,023.78 | $1,023.78 | $1,023.78 | — | — | $1,023.83 | — |
| Annualized | | | | | | | | | | |
| expense ratio (%) | | | .21 | .27 | .27 | .27 | — | — | .26 | — |
| Dreyfus | | | | | | | | | | |
| Government Cash | | | | | | | | | | |
| Management | | | | | | | | | | |
| Expenses paid | | | | | | | | | | |
| per $1,000† | | | $.87 | $.87 | $.87 | $.87 | — | — | $.71 | — |
| Ending value | | | | | | | | | | |
| (after expenses) | | $1,024.28 | $1,024.28 | $1,024.28 | $1,024.28 | — | — | $1,024.43 | — |
| Annualized | | | | | | | | | | |
| expense ratio (%) | | | .17 | .17 | .17 | .17 | — | — | .14 | — |
| Dreyfus | | | | | | | | | | |
| Government Prime | | | | | | | | | | |
| Cash Management | | | | | | | | | | |
| Expenses paid | | | | | | | | | | |
| per $1,000† | | | $.66 | $.66 | $.66 | .66 | — | — | $.66 | — |
| Ending value | | | | | | | | | | |
| (after expenses) | | $1,024.48 | $1,024.48 | $1,024.48 | 1,024.48 | — | — | $1,024.48 | — |
| Annualized | | | | | | | | | | |
| expense ratio (%) | | | .13 | .13 | .13 | .13 | — | — | .13 | — |
| Dreyfus Treasury & | | | | | | | | | | |
| Agency Cash | | | | | | | | | | |
| Management | | | | | | | | | | |
| Expenses paid | | | | | | | | | | |
| per $1,000† | | | $.76 | $.76 | $.76 | $.76 | $.76 | $.76 | $.76 | $.76 |
| Ending value | | | | | | | | | | |
| (after expenses) | | $1,024.38 | $1,024.38 | $1,024.38 | $1,024.38 | $1,024.38 | $1,024.38 | $1,024.38 | $1,024.38 |
| Annualized | | | | | | | | | | |
| expense ratio (%) | | | .15 | .15 | .15 | .15 | .15 | .15 | .15 | .15 |
| Dreyfus | | | | | | | | | | |
| Treasury Prime | | | | | | | | | | |
| Cash Management | | | | | | | | | | |
| Expenses paid | | | | | | | | | | |
| per $1,000† | | | $.51 | $.51 | $.51 | $.51 | — | — | $.36 | — |
| Ending value | | | | | | | | | | |
| (after expenses) | | $1,024.63 | $1,024.63 | $1,024.63 | $1,024.63 | — | — | $1,024.78 | — |
| Annualized | | | | | | | | | | |
| expense ratio (%) | | | .10 | .10 | .10 | .10 | — | — | .07 | — |
COMPARING YOUR FUND’S EXPENSES WITH THOSE OF OTHER FUNDS (Unaudited) (continued)
| | | | | | | | |
| Expenses and Value of a $1,000 Investment (continued) | | | | | |
| assuming a hypothetical 5% annualized return for the six months ended January 31, 2013 | | | | |
| |
| | Institutional | Investor | Administrative | Participant | Agency | Classic |
| Dreyfus | | | | | | | |
| Municipal Cash | | | | | | | |
| Management Plus | | | | | | | |
| Expenses paid | | | | | | | |
| per $1,000† | | $1.17 | $1.22 | $1.22 | $1.22 | $1.22 | — |
| Ending value | | | | | | | |
| (after expenses) | $1,023.98 | $1,023.93 | $1,023.93 | $1,023.93 | $1,023.93 | — |
| Annualized | | | | | | | |
| expense ratio (%) | | .23 | .24 | .24 | .24 | .24 | — |
| Dreyfus | | | | | | | |
| New York | | | | | | | |
| Municipal Cash | | | | | | | |
| Management | | | | | | | |
| Expenses paid | | | | | | | |
| per $1,000† | | $1.22 | $1.22 | $1.27 | $1.27 | — | — |
| Ending value | | | | | | | |
| (after expenses) | $1,023.93 | $1,023.93 | $1,023.88 | $1,023.88 | — | — |
| Annualized | | | | | | | |
| expense ratio (%) | | .24 | .24 | .25 | .25 | — | — |
| Dreyfus | | | | | | | |
| Tax Exempt Cash | | | | | | | |
| Management | | | | | | | |
| Expenses paid | | | | | | | |
| per $1,000† | | $1.02 | $1.02 | $1.02 | $.97 | — | — |
| Ending value | | | | | | | |
| (after expenses) | $1,024.13 | $1,024.13 | $1,024.13 | $1,024.18 | — | — |
| Annualized | | | | | | | |
| expense ratio (%) | | .20 | .20 | .20 | .19 | — | — |
| Dreyfus California | | | | | | | |
| AMT-Free | | | | | | | |
| Municipal Cash | | | | | | | |
| Management | | | | | | | |
| Expenses paid | | | | | | | |
| per $1,000† | | $1.07 | $1.07 | $1.02 | $1.07 | — | — |
| Ending value | | | | | | | |
| (after expenses) | $1,024.08 | $1,024.08 | $1,024.13 | $1,024.08 | — | — |
| Annualized | | | | | | | |
| expense ratio (%) | | .21 | .21 | .20 | .21 | — | — |
| Dreyfus New York | | | | | | | |
| AMT-Free | | | | | | | |
| Municipal Cash | | | | | | | |
| Management | | | | | | | |
| Expenses paid | | | | | | | |
| per $1,000† | | $1.42 | $1.42 | $1.42 | — | — | $1.37 |
| Ending value | | | | | | | |
| (after expenses) | $1,023.73 | $1,023.73 | $1,023.73 | — | — | $1,023.78 |
| Annualized | | | | | | | |
| expense ratio (%) | | .28 | .28 | .28 | — | — | .27 |
| |
| † Expenses are equal to each fund’s annualized expense ratios as shown above, multiplied by the average account value over the period, multiplied by 184/366 (to reflect the one-half |
| year period). |
10
STATEMENT OF INVESTMENTS
January 31, 2013
| | | | |
| | Principal | | |
| Dreyfus Cash Management | Amount ($) | | Value ($) |
| |
| Negotiable Bank Certificates of Deposit—37.8% | | | |
| Bank of Montreal (Yankee) | | | |
| 0.23%—0.36%, 2/15/13—3/19/13 | 250,000,000 | a | 250,000,000 |
| Bank of Nova Scotia (Yankee) | | | |
| 0.22%—0.28%, 2/1/13 | 550,000,000 | a | 550,000,000 |
| Bank of Tokyo-Mitsubishi Ltd. (Yankee) | | | |
| 0.17%—0.23%, 2/1/13—2/7/13 | 650,000,000 | | 650,000,000 |
| Canadian Imperial Bank of Commerce (Yankee) | | | |
| 0.32%, 2/1/13 | 400,000,000 | a | 400,000,000 |
| Chase Bank USA | | | |
| 0.20%, 2/20/13 | 100,000,000 | | 100,000,000 |
| Credit Suisse New York (Yankee) | | | |
| 0.33%, 4/2/13 | 595,000,000 | | 595,000,000 |
| Deutsche Bank AG (Yankee) | | | |
| 0.18%, 2/26/13 | 400,000,000 | | 400,000,000 |
| DnB Bank (Yankee) | | | |
| 0.24%—0.30%, 2/20/13—3/28/13 | 800,000,000 | b | 800,000,000 |
| Mitsubishi UFJ Trust and Banking Corp. (Yankee) | | | |
| 0.25%, 4/9/13 | 500,000,000 | | 500,000,000 |
| Mizuho Corporate Bank (Yankee) | | | |
| 0.25%—0.27%, 3/8/13—4/16/13 | 1,004,000,000 | | 1,004,000,000 |
| National Australia Bank (Yankee) | | | |
| 0.48%, 2/4/13 | 250,000,000 | a | 250,000,000 |
| Nordea Bank Finland (Yankee) | | | |
| 0.36%, 2/19/13 | 1,000,000,000 | | 1,000,000,000 |
| Norinchukin Bank (Yankee) | | | |
| 0.27%—0.28%, 4/4/13—4/26/13 | 1,045,000,000 | | 1,045,000,000 |
| Rabobank Nederland (Yankee) | | | |
| 0.21%, 2/11/13—2/19/13 | 60,000,000 | | 60,003,993 |
| Royal Bank of Canada (Yankee) | | | |
| 0.35%—0.52%, 2/1/13 | 340,000,000 | a | 340,000,000 |
| Skandinaviska Enskilda Banken (Yankee) | | | |
| 0.35%, 2/5/13 | 250,000,000 | a,b | 250,000,000 |
| Sumitomo Mitsui Trust Bank (Yankee) | | | |
| 0.26%—0.27%, 2/20/13—3/5/13 | 550,000,000 | b | 550,000,000 |
| Svenska Handelsbanken (Yankee) | | | |
| 0.23%—0.30%, 3/25/13—5/28/13 | 700,000,000 | b | 700,003,605 |
| Toronto Dominion Bank (Yankee) | | | |
| 0.24%—0.28%, 3/25/13—6/19/13 | 1,150,000,000 | | 1,150,000,000 |
| Total Negotiable Bank Certificates of Deposit | | | |
| (cost $10,594,007,598) | | | 10,594,007,598 |
| |
| Commercial Paper—24.7% | | | |
| ANZ International Ltd. | | | |
| 0.35%, 5/1/13 | 100,000,000 | a,b | 100,000,000 |
| ASB Finance Ltd. | | | |
| 0.40%—0.47%, 2/11/13—2/27/13 | 175,000,000 | a,b | 175,000,000 |
| Commonwealth Bank of Australia | | | |
| 0.36%, 2/15/13 | 350,000,000 | a,b | 350,000,000 |
STATEMENT OF INVESTMENTS (continued)
| | | | | |
| | | Principal | | |
| | Dreyfus Cash Management (continued) | Amount ($) | | Value ($) |
| |
| | Commercial Paper (continued) | | | |
| | Credit Suisse New York | | | |
| | 0.30%, 7/5/13 | 250,000,000 | | 249,679,167 |
| | Deutsche Bank Financial LLC | | | |
| | 0.16%, 2/1/13 | 300,000,000 | | 300,000,000 |
| | General Electric Capital Corp. | | | |
| | 0.25%—0.27%, 3/26/13—7/12/13 | 650,000,000 | | 649,491,944 |
| | General Electric Co. | | | |
| | 0.11%, 2/1/13 | 250,000,000 | | 250,000,000 |
| | HSBC Bank PLC | | | |
| | 0.41%—0.43%, 2/19/13—3/19/13 | 600,000,000 | a,b | 600,000,000 |
| | Mizuho Funding LLC | | | |
| | 0.23%, 3/20/13 | 16,518,000 | b | 16,513,040 |
| | National Australia Bank | | | |
| | 0.31%, 2/11/13 | 500,000,000 | a | 500,000,000 |
| | NRW Bank | | | |
| | 0.20%, 3/18/13 | 500,000,000 | b | 499,875,000 |
| | Rabobank USA Financial Corp. | | | |
| | 0.26%, 7/31/13 | 300,000,000 | | 299,610,000 |
| | Sumitomo Mitsui Banking Corp. | | | |
| | 0.25%, 2/5/13 | 1,000,000,000 | b | 999,972,222 |
| | Toyota Motor Credit Corp. | | | |
| | 0.27%—0.35%, 2/22/13—3/27/13 | 745,000,000 | | 744,761,603 |
| | Westpac Banking Corp. | | | |
| | 0.33%—0.56%, 2/1/13 | 1,200,000,000 | a,b | 1,200,000,000 |
| | Total Commercial Paper | | | |
| | (cost $6,934,902,976) | | | 6,934,902,976 |
| | Asset-Backed Commercial Paper—5.8% | | | |
| | Alpine Securitization Corp. | | | |
| | 0.35%, 3/18/13 | 225,415,000 | b | 225,316,381 |
| | Atlantis One Funding Corp. | | | |
| | 0.12%—0.21%, 2/1/13—3/18/13 | 875,000,000 | b | 874,886,542 |
| | Bedford Row Funding | | | |
| | 0.21%—0.32%, 4/22/13—7/15/13 | 158,000,000 | b | 157,827,156 |
| | Collateralized Commercial Paper II Co., LLC | | | |
| | 0.28%, 4/16/13 | 150,000,000 | b | 149,913,667 |
| | Collateralized Commercial Paper Program Co., LLC | | | |
| | 0.40%, 7/10/13 | 200,000,000 | | 199,646,667 |
| | Metlife Short Term Funding LLC | | | |
| | 0.21%, 3/27/13 | 10,000,000 | b | 9,996,850 |
| | Total Asset-Backed Commercial Paper | | | |
| | (cost $1,617,587,263) | | | 1,617,587,263 |
| |
| | Time Deposits—17.9% | | | |
| | Commonwealth Bank of Australia (Grand Cayman) | | | |
| | 0.14%, 2/1/13 | 200,000,000 | | 200,000,000 |
12
| | | | | |
| | | Principal | | |
| Dreyfus Cash Management (continued) | | Amount ($) | | Value ($) |
| |
| Time Deposits (continued) | | | | |
| DnB Bank (Grand Cayman) | | | | |
| 0.15%, 2/1/13 | | 500,000,000 | | 500,000,000 |
| Lloyds TSB Bank (London) | | | | |
| 0.12%, 2/1/13 | | 1,000,000,000 | | 1,000,000,000 |
| Royal Bank of Canada (Toronto) | | | | |
| 0.13%, 2/1/13 | | 700,000,000 | | 700,000,000 |
| Skandinaviska Enskilda Banken (Grand Cayman) | | | | |
| 0.16%, 2/1/13 | | 1,000,000,000 | | 1,000,000,000 |
| Swedbank (Grand Cayman) | | | | |
| 0.16%, 2/1/13 | | 1,100,000,000 | | 1,100,000,000 |
| U.S. Bank NA (Grand Cayman) | | | | |
| 0.15%, 2/1/13 | | 520,000,000 | | 520,000,000 |
| Total Time Deposits | | | | |
| (cost $5,020,000,000) | | | | 5,020,000,000 |
| |
| |
| U.S. Government Agencies—1.4% | | | | |
| Federal Farm Credit Bank | | | | |
| 0.24%, 11/18/13 | | 150,000,000 | a | 149,987,961 |
| Federal National Mortgage Association | | | | |
| 0.16%, 6/26/13 | | 237,922,000 | c | 239,190,353 |
| Total U.S. Government Agencies | | | | |
| (cost $389,178,314) | | | | 389,178,314 |
| |
| |
| U.S. Treasury Notes—2.8% | | | | |
| 0.19%—0.22%, 4/15/13—5/15/13 | | | | |
| (cost $783,608,818) | | 780,500,000 | | 783,608,818 |
| |
| |
| Repurchase Agreements—10.0% | | | | |
| ABN AMRO Bank N.V. | | | | |
| 0.12%, dated 1/31/13, due 2/1/13 in the amount of $1,295,004,317 | | | | |
| (fully collateralized by $1,308,554,400 U.S. Treasury Notes, 0.25%-2%, | | | | |
| due 11/15/13-4/30/16, value $1,320,900,081) | | 1,295,000,000 | | 1,295,000,000 |
| Credit Suisse Securities LLC | | | | |
| 0.13%, dated 1/31/13, due 2/1/13 in the amount of $120,000,433 | | | | |
| (fully collateralized by $313,700,000 U.S. Treasury Strips, | | | | |
| due 2/15/13-11/15/42, value $122,401,926) | | 120,000,000 | | 120,000,000 |
| HSBC USA Inc. | | | | |
| 0.13%, dated 1/31/13, due 2/1/13 in the amount of $600,002,167 | | | | |
| (fully collateralized by $65,445,900 U.S. Treasury Bonds, 4.50%, | | | | |
| due 2/15/36, value $83,865,370 and $528,680,000 U.S. Treasury Notes, | | | | |
| 0.25%-0.88%, due 8/15/15-1/31/18, value $528,136,588) | | 600,000,000 | | 600,000,000 |
| RBC Capital Markets | | | | |
| 0.14%, dated 1/31/13, due 2/1/13 in the amount of | | | | |
| $450,001,750 (fully collateralized by $722,053,821 | | | | |
| Government National Mortgage Association, 4%-6%, | | | | |
| due 3/15/39-10/20/41, value $459,000,000) | | 450,000,000 | | 450,000,000 |
STATEMENT OF INVESTMENTS (continued)
| | | | | |
| | Principal | | | |
| Dreyfus Cash Management (continued) | Amount ($) | | Value ($) | |
| |
| Repurchase Agreements (continued) | | | | |
| Royal Bank of Scotland | | | | |
| 0.12%, dated 1/31/13, due 2/1/13 in the amount of $100,000,333 | | | | |
| (fully collateralized by $97,980,000 U.S. Treasury Notes, 2.63%-2.75%, | | | | |
| due 10/31/13-12/31/14, value $102,002,229) | 100,000,000 | | 100,000,000 | |
| TD Securities (USA) LLC | | | | |
| 0.11%, dated 1/31/13, due 2/1/13 in the amount of $250,000,764 | | | | |
| (fully collateralized by $242,750,600 U.S. Treasury Notes, 2.13%-2.63%, | | | | |
| due 12/31/14-12/31/15, value $255,000,006) | 250,000,000 | | 250,000,000 | |
| Total Repurchase Agreements | | | | |
| (cost $2,815,000,000) | | | 2,815,000,000 | |
| |
| Total Investments (cost $28,154,284,969) | 100.4 | % | 28,154,284,969 | |
| Liabilities, Less Cash and Receivables | (.4 | %) | (101,628,589 | ) |
| Net Assets | 100.0 | % | 28,052,656,380 | |
| |
| a Variable rate security—interest rate subject to periodic change. |
| b Securities exempt from registration pursuant to Rule 144A under the Securities Act of 1933.These securities may be resold in transactions exempt from registration, normally to qualified |
| institutional buyers.At January 31, 2013, these securities amounted to $7,659,304,463 or 27.3% of net assets. |
| c The Federal Housing Finance Agency (“FHFA”) placed Federal Home Loan Mortgage Corporation and Federal National Mortgage Association into conservatorship with FHFA as the |
| conservator.As such, the FHFA oversees the continuing affairs of these companies. |
| | | | |
| Portfolio Summary (Unaudited)† | | | |
| |
| | Value (%) | | Value (%) |
| Banking | 74.5 | U.S. Government/Agencies | 4.2 |
| Repurchase Agreements | 10.0 | Asset-Backed/Insurance | .1 |
| Finance | 5.9 | | |
| Asset-Backed/Banking | 5.7 | | 100.4 |
| |
| † Based on net assets. | | | |
| See notes to financial statements. | | | |
14
STATEMENT OF INVESTMENTS
January 31, 2013
| | | | | |
| | Annualized | | | |
| | Yield on | | | |
| | Date of | Principal | | |
| Dreyfus Government Cash Management | Purchase (%) | Amount ($) | | Value ($) |
| |
| U.S. Government Agencies—49.3% | | | | |
| Federal Farm Credit Bank | | | | |
| 1/23/14 | 0.25 | 200,000,000 | a | 199,980,546 |
| Federal Home Loan Bank: | | | | |
| 2/1/13 | 0.17 | 50,000,000 | a | 50,020,604 |
| 2/1/13 | 0.17 | 72,175,000 | a | 72,191,562 |
| 2/1/13 | 0.18 | 100,000,000 | a | 99,988,810 |
| 2/1/13 | 0.25 | 669,000,000 | a | 668,744,781 |
| 2/6/13 | 0.21 | 200,000,000 | | 199,998,371 |
| 2/7/13 | 0.02 | 300,000,000 | | 299,999,000 |
| 2/8/13 | 0.19 | 119,500,000 | | 119,499,473 |
| 2/8/13 | 0.21 | 30,500,000 | | 30,499,767 |
| 3/1/13 | 0.19 | 111,350,000 | | 111,350,696 |
| 3/8/13 | 0.11 | 58,400,000 | | 58,393,754 |
| 3/13/13 | 0.11 | 482,600,000 | | 482,538,890 |
| 3/15/13 | 0.11 | 250,000,000 | | 249,967,187 |
| 3/27/13 | 0.16 | 58,000,000 | | 57,986,515 |
| 4/3/13 | 0.16 | 32,000,000 | | 31,991,596 |
| 4/17/13 | 0.17 | 119,720,000 | | 119,677,599 |
| 4/19/13 | 0.17 | 55,600,000 | | 55,579,783 |
| 4/24/13 | 0.17 | 250,000,000 | | 249,903,194 |
| 4/25/13 | 0.07 | 144,000,000 | a | 144,000,000 |
| 5/3/13 | 0.21 | 10,000,000 | | 9,997,939 |
| 5/8/13 | 0.16 | 100,000,000 | | 99,958,667 |
| 5/8/13 | 0.23 | 250,000,000 | | 250,000,000 |
| 5/14/13 | 0.18 | 64,010,000 | | 64,040,059 |
| 5/16/13 | 0.21 | 20,000,000 | | 20,005,824 |
| 5/17/13 | 0.16 | 101,000,000 | | 100,954,340 |
| 5/21/13 | 0.21 | 41,940,000 | | 41,944,047 |
| 5/21/13 | 0.21 | 65,000,000 | | 65,004,414 |
| 5/21/13 | 0.25 | 250,000,000 | | 249,984,493 |
| 5/22/13 | 0.16 | 178,000,000 | | 177,915,560 |
| 5/24/13 | 0.16 | 50,000,000 | | 49,975,889 |
| 5/24/13 | 0.21 | 27,700,000 | | 27,699,396 |
| 5/29/13 | 0.16 | 145,000,000 | | 144,924,600 |
| 7/12/13 | 0.12 | 200,000,000 | | 199,892,667 |
| 7/19/13 | 0.17 | 15,125,000 | | 15,130,480 |
| 7/24/13 | 0.11 | 100,000,000 | | 99,947,139 |
| 9/27/13 | 0.16 | 212,000,000 | | 211,984,387 |
STATEMENT OF INVESTMENTS (continued)
| | | | | |
| | Annualized | | | |
| | Yield on | | | |
| | Date of | Principal | | |
| Dreyfus Government Cash Management (continued) | Purchase (%) | Amount ($) | | Value ($) |
| |
| U.S. Government Agencies (continued) | | | | |
| Federal Home Loan Mortgage Corp.: | | | | |
| 2/25/13 | 0.16 | 142,858,000 | b | 142,843,238 |
| 2/28/13 | 0.14 | 251,000,000 | b | 250,973,645 |
| 3/19/13 | 0.15 | 250,000,000 | b | 249,952,083 |
| 3/21/13 | 0.11 | 200,000,000 | b | 199,970,667 |
| 3/28/13 | 0.12 | 15,129,000 | b | 15,143,550 |
| 4/1/13 | 0.16 | 100,000,000 | b | 99,974,597 |
| 4/2/13 | 0.15 | 500,000,000 | b | 499,875,000 |
| 4/15/13 | 0.20 | 200,000,000 | b | 200,568,721 |
| 6/18/13 | 0.17 | 200,000,000 | b | 199,870,611 |
| 9/27/13 | 0.25 | 51,658,000 | b | 52,996,217 |
| 11/27/13 | 0.16 | 100,000,000 | b | 100,173,928 |
| Federal National Mortgage Association: | | | | |
| 2/27/13 | 0.16 | 300,000,000 | b | 299,966,417 |
| 3/20/13 | 0.16 | 48,379,000 | b | 48,368,894 |
| 4/3/13 | 0.16 | 99,750,000 | b | 99,723,802 |
| 4/17/13 | 0.17 | 45,000,000 | b | 44,984,062 |
| 5/29/13 | 0.16 | 192,000,000 | b | 191,901,980 |
| 6/24/13 | 0.10 | 200,000,000 | b | 199,920,556 |
| 8/20/13 | 0.17 | 18,587,000 | b | 18,694,875 |
| 9/30/13 | 0.15 | 7,100,000 | b | 7,145,449 |
| Total U.S. Government Agencies | | | | |
| (cost $8,054,720,321) | | | | 8,054,720,321 |
| |
| |
| U.S. Treasury Bills—3.1% | | | | |
| 8/1/13 | | | | |
| (cost $499,736,042) | 0.11 | 500,000,000 | | 499,736,042 |
| |
| |
| U.S. Treasury Notes—18.2% | | | | |
| 2/15/13 | 0.19 | 200,000,000 | | 200,089,882 |
| 3/15/13 | 0.14 | 359,000,000 | | 359,511,765 |
| 4/1/13 | 0.18 | 800,000,000 | | 802,991,766 |
| 4/15/13 | 0.17 | 810,000,000 | | 812,562,806 |
| 5/15/13 | 0.22 | 95,000,000 | | 95,311,259 |
| 6/17/13 | 0.21 | 300,000,000 | | 301,025,972 |
| 7/1/13 | 0.21 | 100,000,000 | | 101,301,126 |
16
| | | | | | |
| | | | Annualized | | |
| | | | Yield on | | |
| | | | Date of | Principal | |
| | Dreyfus Government Cash Management (continued) | | Purchase (%) | Amount ($) | Value ($) |
| |
| | U.S. Treasury Notes (continued) | | | | |
| | 10/31/13 | | 0.18 | 250,000,000 | 254,815,322 |
| | 11/15/13 | | 0.16 | 50,000,000 | 50,134,496 |
| | Total U.S. Treasury Notes | | | | |
| | (cost $2,977,744,394) | | | | 2,977,744,394 |
| |
| |
| | Repurchase Agreements—29.3% | | | | |
| | ABN AMRO Bank N.V. | | | | |
| | dated 1/31/13, due 2/1/13 in the amount of | | | | |
| | $499,001,663 (fully collateralized by $299,191,900 | | | | |
| | U.S. Treasury Bills, due 6/6/13, value $299,097,056 | | | | |
| | and $199,103,000 U.S. Treasury Notes, 2%, due | | | | |
| | 4/30/16, value $209,883,009) | | 0.12 | 499,000,000 | 499,000,000 |
| | Bank of Nova Scotia | | | | |
| | dated 1/31/13, due 2/1/13 in the amount of | | | | |
| | $530,001,914 (fully collateralized by $79,960,000 | | | | |
| | Federal Farm Credit Bank, 0.15%-5.88%, due | | | | |
| | 2/1/13-12/7/28, value $82,450,940, $172,450,000 | | | | |
| | Federal Home Loan Bank, 0.17%-6.63%, due | | | | |
| | 2/1/13-7/15/36, value $180,899,872, $205,906,000 | | | | |
| | Federal Home Loan Mortgage Corp., 0.30%-6.75%, due | | | | |
| | 3/28/13-1/14/37, value $219,015,769 and $55,184,000 | | | | |
| | Federal National Mortgage Association, 0.38%-6.25%, | | | | |
| | due 8/28/14-4/18/36, value $58,237,950) | | 0.13 | 530,000,000 | 530,000,000 |
| | Credit Agricole CIB | | | | |
| | dated 1/31/13, due 2/1/13 in the amount of | | | | |
| | $545,002,119 (fully collateralized by $430,122,700 | | | | |
| | U.S. Treasury Inflation Protected Securities, 2%, due | | | | |
| | 1/15/14, value $555,900,104) | | 0.14 | 545,000,000 | 545,000,000 |
| | Credit Suisse Securities LLC | | | | |
| | dated 1/31/13, due 2/1/13 in the amount of | | | | |
| | $475,001,715 (fully collateralized by $792,948,437 | | | | |
| | U.S. Treasury Strips, due 2/15/15-8/15/40, | | | | |
| | value $484,502,061) | | 0.13 | 475,000,000 | 475,000,000 |
| | HSBC USA Inc. | | | | |
| | dated 1/31/13, due 2/1/13 in the amount of | | | | |
| | $100,000,333 (fully collateralized by $101,875,000 | | | | |
| | U.S. Treasury Notes, 1.38%, due 1/31/20, value $102,002,347) | | 0.12 | 100,000,000 | 100,000,000 |
STATEMENT OF INVESTMENTS (continued)
| | | | | |
| | | Annualized | | |
| | | Yield on | | |
| | | Date of | Principal | |
| | Dreyfus Government Cash Management (continued) | Purchase (%) | Amount ($) | Value ($) |
| |
| | Repurchase Agreements (continued) | | | |
| | HSBC USA Inc. | | | |
| | dated 1/31/13, due 2/1/13 in the amount of | | | |
| | $175,000,632 (fully collateralized by $182,445,000 | | | |
| | U.S. Treasury Notes, 1.63%, due 8/15/22, | | | |
| | value $178,504,665) | 0.13 | 175,000,000 | 175,000,000 |
| | JPMorgan Chase & Co. | | | |
| | dated 1/31/13, due 2/1/13 in the amount of | | | |
| | $650,003,069 (fully collateralized by $2,190,323,757 | | | |
| | Federal National Mortgage Association, 0.50%-7.80%, | | | |
| | due 11/25/32-5/25/40, value $99,034,357 and | | | |
| | $2,351,580,432 Government National Mortgage | | | |
| | Association, 0.01%-11.79%, due 6/20/33-12/20/42, | | | |
| | value $563,965,752) | 0.17 | 650,000,000 | 650,000,000 |
| | Merrill Lynch & Co. Inc. | | | |
| | dated 1/31/13, due 2/1/13 in the amount of $155,000,560, | | | |
| | (fully collateralized by $152,195,800 U.S. Treasury | | | |
| | Notes, 1.88%, due 6/30/15, value $158,100,033) | 0.13 | 155,000,000 | 155,000,000 |
| | RBC Capital Markets | | | |
| | dated 1/31/13, due 2/1/13 in the amount of | | | |
| | $60,000,183 (fully collateralized by $59,219,900 U.S. | | | |
| | Treasury Notes, 1.50%, due 7/31/16, value $61,200,095) | 0.11 | 60,000,000 | 60,000,000 |
| | RBC Capital Markets | | | |
| | dated 1/31/13, due 2/1/13 in the amount of | | | |
| | $550,001,833 (fully collateralized by $222,105,000 | | | |
| | Federal Home Loan Bank, 0.28%-2.38%, due 8/9/13-1/28/28, | | | |
| | value $221,935,936 and $297,999,000 Federal National | | | |
| | Mortgage Association, 0.50%-5%, due 2/5/13-7/16/32, | | | |
| | value $339,065,453) | 0.12 | 550,000,000 | 550,000,000 |
| | RBS Securities, Inc. | | | |
| | dated 1/31/13, due 2/1/13 in the amount of | | | |
| | $300,001,000 (fully collateralized by $307,495,000 | | | |
| | U.S. Treasury Notes, 0.63%, due 8/31/17, value | | | |
| | $306,001,074) | 0.12 | 300,000,000 | 300,000,000 |
| | SG Americas Securities, LLC | | | |
| | dated 1/31/13, due 2/1/13 in the amount of | | | |
| | $200,000,833 (fully collateralized by $204,109,900 | | | |
| | U.S. Treasury Bills, due 7/25/13, value $204,000,089) | 0.15 | 200,000,000 | 200,000,000 |
18
| | | | | |
| | Annualized | | | |
| | Yield on | | | |
| | Date of | Principal | | |
| Dreyfus Government Cash Management (continued) | Purchase (%) | Amount ($) | | Value ($) |
| |
| Repurchase Agreements (continued) | | | | |
| Societe Generale | | | | |
| dated 1/31/13, due 2/1/13 in the amount of | | | | |
| $250,001,111 (fully collateralized by $193,274,000 | | | | |
| Federal Home Loan Mortgage Corp., 1.10%, due 10/3/17, | | | | |
| value $193,443,222 and $72,260,000 Resolution Funding | | | | |
| Corp., 0%, due 1/15/21, value $61,557,572) | 0.16 | 250,000,000 | | 250,000,000 |
| TD Securities (USA) LLC | | | | |
| dated 1/31/13, due 2/1/13 in the amount of | | | | |
| $300,000,917 (fully collateralized by $292,194,500 | | | | |
| U.S. Treasury Notes, 2.63%, due 12/31/14, | | | | |
| value $306,000,085) | 0.11 | 300,000,000 | | 300,000,000 |
| Total Repurchase Agreements | | | | |
| (cost $4,789,000,000) | | | | 4,789,000,000 |
| |
| Total Investments (cost $16,321,200,757) | | 99.9 | % | 16,321,200,757 |
| |
| Cash and Receivables (Net) | | .1 | % | 18,024,449 |
| |
| Net Assets | | 100.0 | % | 16,339,225,206 |
| |
| a Variable rate security—interest rate subject to periodic change. |
| b The Federal Housing Finance Agency (“FHFA”) placed Federal Home Loan Mortgage Corporation and Federal National Mortgage Association into conservatorship with FHFA as the |
| conservator.As such, the FHFA oversees the continuing affairs of these companies. |
| | | | |
| Portfolio Summary (Unaudited)† | | | |
| |
| | Value (%) | | Value (%) |
| Federal Home Loan Bank | 30.2 | Federal National Mortgage Association | 5.6 |
| Repurchase Agreements | 29.3 | U.S. Treasury Bills | 3.1 |
| U.S. Treasury Notes | 18.2 | Federal Farm Credit Bank | 1.2 |
| Federal Home Loan Mortgage Corp. | 12.3 | | 99.9 |
| |
| † Based on net assets. | | | |
| See notes to financial statements. | | | |
STATEMENT OF INVESTMENTS
January 31, 2013
| | | | | |
| | Annualized | | | |
| | Yield on | | | |
| | Date of | Principal | | |
| Dreyfus Government Prime Cash Management | Purchase (%) | Amount ($) | | Value ($) |
| |
| U.S. Government Agencies—73.3% | | | | |
| Federal Farm Credit Bank: | | | | |
| 2/1/13 | 0.12 | 100,000,000 | a | 99,998,229 |
| 2/12/13 | 0.09 | 100,000,000 | | 99,997,250 |
| 2/19/13 | 0.07 | 24,000,000 | | 23,999,160 |
| 3/7/13 | 0.07 | 75,000,000 | | 74,995,042 |
| 3/13/13 | 0.19 | 20,000,000 | | 20,000,169 |
| 3/28/13 | 0.09 | 100,000,000 | | 99,986,250 |
| 4/10/13 | 0.08 | 25,000,000 | | 24,996,222 |
| 4/15/13 | 0.20 | 95,000,000 | a | 95,009,553 |
| 7/10/13 | 0.13 | 150,000,000 | | 149,913,875 |
| 8/26/13 | 0.12 | 25,000,000 | | 24,982,833 |
| 1/23/14 | 0.25 | 75,000,000 | a | 74,992,705 |
| Federal Home Loan Bank: | | | | |
| 2/1/13 | 0.18 | 150,000,000 | a | 149,983,214 |
| 2/6/13 | 0.12 | 717,725,000 | | 717,712,963 |
| 2/20/13 | 0.03 | 255,000,000 | | 254,995,303 |
| 2/27/13 | 0.10 | 798,630,000 | | 798,570,901 |
| 3/6/13 | 0.13 | 85,000,000 | | 84,990,260 |
| 3/8/13 | 0.08 | 60,000,000 | | 59,995,450 |
| 3/13/13 | 0.08 | 100,000,000 | | 99,991,667 |
| 3/27/13 | 0.15 | 100,000,000 | | 99,977,200 |
| 4/1/13 | 0.10 | 40,000,000 | | 39,993,444 |
| 4/12/13 | 0.09 | 65,215,000 | | 65,203,079 |
| 4/17/13 | 0.10 | 97,510,000 | | 97,489,685 |
| 4/26/13 | 0.07 | 150,000,000 | | 149,975,500 |
| 5/17/13 | 0.09 | 55,000,000 | | 54,985,563 |
| Tennessee Valley Authority: | | | | |
| 2/7/13 | 0.12 | 50,000,000 | | 49,999,000 |
| 3/15/13 | 0.29 | 11,058,000 | | 11,131,875 |
| Total U.S. Government Agencies | | | | |
| (cost $3,523,866,392) | | | | 3,523,866,392 |
| |
| |
| U.S. Treasury Bills—18.4% | | | | |
| 2/7/13 | 0.01 | 5,000,000 | | 4,999,992 |
| 2/14/13 | 0.09 | 136,000,000 | | 135,995,826 |
| 2/28/13 | 0.07 | 96,000,000 | | 95,994,960 |
| 3/7/13 | 0.03 | 16,000,000 | | 15,999,547 |
| 3/28/13 | 0.07 | 171,000,000 | | 170,982,270 |
| 4/11/13 | 0.07 | 160,000,000 | | 159,978,533 |
| 5/16/13 | 0.14 | 100,000,000 | | 99,961,000 |
| 6/27/13 | 0.12 | 200,000,000 | | 199,902,667 |
| Total U.S. Treasury Bills | | | | |
| (cost $883,814,795) | | | | 883,814,795 |
20
| | | | | |
| | Annualized | | | |
| | Yield on | | | |
| | Date of | Principal | | |
| Dreyfus Government Prime Cash Management (continued) | Purchase (%) | Amount ($) | | Value ($) |
| |
| U.S. Treasury Notes—8.3% | | | | |
| 2/28/13 | 0.04 | 50,000,000 | | 50,101,216 |
| 4/1/13 | 0.14 | 150,000,000 | | 150,148,159 |
| 4/30/13 | 0.15 | 75,000,000 | | 75,086,238 |
| 4/30/13 | 0.16 | 21,000,000 | | 21,150,987 |
| 6/17/13 | 0.19 | 100,000,000 | | 100,348,760 |
| Total U.S. Treasury Notes | | | | |
| (cost $396,835,360) | | | | 396,835,360 |
| Total Investments (cost $4,804,516,547) | | 100.0 | % | 4,804,516,547 |
| Cash and Receivables (Net) | | .0 | % | 1,753,712 |
| Net Assets | | 100.0 | % | 4,806,270,259 |
| | |
| a | Variable rate security—interest rate subject to periodic change. |
| | | | |
| Portfolio Summary (Unaudited)† | | | |
| |
| | Value (%) | | Value (%) |
| Federal Home Loan Bank | 55.6 | U.S. Treasury Notes | 8.3 |
| U.S. Treasury Bills | 18.4 | Tennessee Valley Authority | 1.3 |
| Federal Farm Credit Bank | 16.4 | | 100.0 |
| |
| † Based on net assets. |
| See notes to financial statements. |
STATEMENT OF INVESTMENTS
January 31, 2013
| | | | |
| | Annualized | | |
| | Yield on | | |
| | Date of | Principal | |
| Dreyfus Treasury & Agency Cash Management | Purchase (%) | Amount ($) | Value ($) |
| |
| U.S. Treasury Bills—22.3% | | | |
| 2/28/13 | 0.07 | 1,200,000,000 | 1,199,938,500 |
| 3/14/13 | 0.03 | 130,000,000 | 129,996,299 |
| 3/28/13 | 0.14 | 850,000,000 | 849,823,542 |
| 5/2/13 | 0.07 | 500,000,000 | 499,918,750 |
| 5/30/13 | 0.13 | 500,000,000 | 499,786,944 |
| 7/5/13 | 0.12 | 350,000,000 | 349,817,660 |
| 7/25/13 | 0.10 | 300,000,000 | 299,855,000 |
| 8/1/13 | 0.11 | 200,000,000 | 199,894,417 |
| Total U.S. Treasury Bills | | | |
| (cost $4,029,031,112) | | | 4,029,031,112 |
| |
| U.S. Treasury Notes—29.4% | | | |
| 2/15/13 | 0.14 | 90,000,000 | 90,127,506 |
| 2/15/13 | 0.17 | 791,000,000 | 791,359,238 |
| 2/28/13 | 0.05 | 300,000,000 | 300,127,583 |
| 3/15/13 | 0.15 | 90,000,000 | 90,128,258 |
| 4/1/13 | 0.17 | 190,000,000 | 190,177,955 |
| 4/1/13 | 0.21 | 200,000,000 | 200,739,442 |
| 4/15/13 | 0.14 | 580,000,000 | 581,872,827 |
| 4/30/13 | 0.20 | 310,000,000 | 310,319,661 |
| 5/31/13 | 0.19 | 250,000,000 | 250,252,273 |
| 5/31/13 | 0.22 | 281,500,000 | 284,508,616 |
| 6/17/13 | 0.20 | 830,000,000 | 832,869,619 |
| 9/3/13 | 0.20 | 200,000,000 | 203,443,865 |
| 9/30/13 | 0.17 | 315,000,000 | 321,102,763 |
| 10/31/13 | 0.18 | 150,000,000 | 152,886,583 |
| 11/15/13 | 0.19 | 250,000,000 | 258,019,798 |
| 12/2/13 | 0.16 | 150,000,000 | 150,110,165 |
| 12/2/13 | 0.18 | 200,000,000 | 203,032,233 |
| 12/31/13 | 0.18 | 105,000,000 | 106,267,701 |
| Total U.S. Treasury Notes | | | |
| (cost $5,317,346,086) | | | 5,317,346,086 |
| |
| Repurchase Agreements—48.2% | | | |
| ABN AMRO Bank N.V. | | | |
| dated 1/31/13, due 2/1/13 in the amount of $1,831,006,103 | | | |
| (fully collateralized by $843,808,100 U.S. Treasury Bills, | | | |
| due 6/6/13-7/25/13, value $843,434,533 and $1,018,233,600 | | | |
| U.S. Treasury Notes, 0.25%-1%, due 1/31/15-9/30/17, | | | |
| value $1,024,185,486) | 0.12 | 1,831,000,000 | 1,831,000,000 |
22
| | | | |
| | Annualized | | |
| | Yield on | | |
| | Date of | Principal | |
| Dreyfus Treasury & Agency Cash Management (continued) | Purchase (%) | Amount ($) | Value ($) |
| |
| Repurchase Agreements (continued) | | | |
| Bank of Nova Scotia | | | |
| dated 1/31/13, due 2/1/13 in the amount of $900,003,000 | | | |
| (fully collateralized by $133,000 U.S. Treasury Inflation Protected | | | |
| Securities, 1.88%, due 7/15/13, value $170,628 and $899,160,200 | | | |
| U.S. Treasury Notes, 0.38%-2.38%, due 9/30/14-11/15/14, | | | |
| value $917,832,443) | 0.12 | 900,000,000 | 900,000,000 |
| Citigroup Global Markets Holdings Inc. | | | |
| dated 1/31/13, due 2/1/13 in the amount of $185,000,617 (fully | | | |
| collateralized by $182,373,465 U.S. Treasury Notes, 1.75%, | | | |
| due 7/31/15, value $188,700,001) | 0.12 | 185,000,000 | 185,000,000 |
| Credit Agricole CIB | | | |
| dated 1/31/13, due 2/1/13 in the amount of $880,003,178 (fully | | | |
| collateralized by $48,753,000 U.S. Treasury Bonds, 11.25%, | | | |
| due 2/15/15, value $62,119,337 and $818,352,600 U.S. Treasury | | | |
| Notes, 0.25%-2.75%, due 9/30/14-2/28/18, value $835,480,718) | 0.13 | 880,000,000 | 880,000,000 |
| Credit Suisse Securities LLC | | | |
| dated 1/31/13, due 2/1/13 in the amount of $500,001,944 | | | |
| (fully collateralized by $33,777,333 Government National Mortgage | | | |
| Association, 2.50%-3.50%, due 1/20/43-11/15/50, value $33,638,727 | | | |
| and $476,479,100 U.S. Treasury Bills, due 4/25/13-7/11/13, | | | |
| value $476,364,294) | 0.14 | 500,000,000 | 500,000,000 |
| Deutsche Bank Securities Inc. | | | |
| dated 1/31/13, due 2/1/13 in the amount of $200,000,833 | | | |
| (fully collateralized by $813,918,328 Government National Mortgage | | | |
| Association, 3%-9.50%, due 5/15/17-1/20/43, value $102,012,233 | | | |
| and $102,207,600 U.S. Treasury Notes, 1.38%, due 1/31/20, | | | |
| value $102,000,016) | 0.15 | 200,000,000 | 200,000,000 |
| Goldman, Sachs & Co. | | | |
| dated 1/31/13, due 2/1/13 in the amount of $260,000,506 | | | |
| (fully collateralized by $246,046,655 U.S. Treasury Inflation | | | |
| Protected Securities, 0.13%, due 7/15/22, value $265,200,001) | 0.07 | 260,000,000 | 260,000,000 |
| HSBC USA Inc. | | | |
| dated 1/31/13, due 2/1/13 in the amount of $585,001,950 (fully | | | |
| collateralized by $419,529,500 U.S. Treasury Bonds, 3.13%-6.38%, | | | |
| due 8/15/27-11/15/41, value $458,134,232 and $138,786,000 | | | |
| U.S. Treasury Notes, 0.25%, due 8/15/15, value $138,566,445) | 0.12 | 585,000,000 | 585,000,000 |
| Merrill Lynch & Co. Inc. | | | |
| dated 1/31/13, due 2/1/13 in the amount of $120,000,467 (fully | | | |
| collateralized by $437,982,953 Government National Mortgage Association, | | | |
| 1.75%-7.50%, due 7/15/14-5/15/52, value $122,400,000) | 0.14 | 120,000,000 | 120,000,000 |
| RBC Capital Markets | | | |
| dated 1/31/13, due 2/1/13 in the amount of $1,015,003,101 (fully | | | |
| collateralized by $182,232,800 U.S. Treasury Bills, due 6/6/13-7/25/13, | | | |
| value $182,179,483 and $836,987,200 U.S. Treasury Notes, 0.13%-3.50%, | | | |
| due 5/31/13-5/15/21, value $853,120,580) | 0.11 | 1,015,000,000 | 1,015,000,000 |
STATEMENT OF INVESTMENTS (continued)
| | | | | |
| | Annualized | | | |
| | Yield on | | | |
| | Date of | Principal | | |
| Dreyfus Treasury & Agency Cash Management (continued) | Purchase (%) | Amount ($) | | Value ($) |
| |
| Repurchase Agreements (continued) | | | | |
| RBS Securities, Inc. | | | | |
| dated 1/31/13, due 2/1/13 in the amount of $149,000,497 (fully | | | | |
| collateralized by $148,390,000 U.S. Treasury Notes, 1.50%, | | | | |
| due 3/31/19, value $151,982,324) | 0.12 | 149,000,000 | | 149,000,000 |
| Royal Bank of Scotland | | | | |
| dated 1/31/13, due 2/1/13 in the amount of $151,000,503 (fully | | | | |
| collateralized by $145,505,000 U.S. Treasury Notes, 1.38%-4%, | | | | |
| due 2/15/15-8/15/20, value $154,020,363) | 0.12 | 151,000,000 | | 151,000,000 |
| SG Americas Securities, LLC | | | | |
| dated 1/31/13, due 2/1/13 in the amount of $1,100,004,583 (fully | | | | |
| collateralized by $40,194,800 U.S. Treasury Bills, due 2/7/13-12/12/13, | | | | |
| value $40,185,730, $202,484,900 U.S. Treasury Bonds, 3.13%-11.25%, | | | | |
| due 2/15/15-2/15/42, value $274,547,286, $9,500,000 U.S. Treasury | | | | |
| Inflation Protected Securities, 0.13%-0.63%, due 4/15/16-7/15/21, | | | | |
| value $10,365,923, $756,838,400 U.S. Treasury Notes, 0.13%-5.13%, | | | | |
| due 2/15/13-5/15/22, value $794,169,520 and $4,198,000 | | | | |
| U.S. Treasury Strips, due 5/15/22-11/15/41, value $2,731,562) | 0.15 | 1,100,000,000 | | 1,100,000,000 |
| Societe Generale | | | | |
| dated 1/31/13, due 2/1/13 in the amount of $600,002,667 (fully | | | | |
| collateralized by $1,115,603,247 Government National Mortgage | | | | |
| Association, 1.95%-8%, due 3/20/16-1/15/54, value $612,000,001) | 0.16 | 600,000,000 | | 600,000,000 |
| TD Securities (USA) LLC | | | | |
| dated 1/31/13, due 2/1/13 in the amount of $220,000,672 (fully | | | | |
| collateralized by $213,471,400 U.S. Treasury Notes, 2.13%, | | | | |
| due 12/31/15, value $224,400,015) | 0.11 | 220,000,000 | | 220,000,000 |
| Total Repurchase Agreements | | | | |
| (cost $8,696,000,000) | | | | 8,696,000,000 |
| |
| Total Investments (cost $18,042,377,198) | | 99.9 | % | 18,042,377,198 |
| |
| Cash and Receivables (Net) | | .1 | % | 25,000,613 |
| |
| Net Assets | | 100.0 | % | 18,067,377,811 |
| | | | |
| Portfolio Summary (Unaudited)† | | | |
| | Value (%) | | Value (%) |
| Repurchase Agreements | 48.2 | U.S. Treasury Bills | 22.3 |
| U.S. Treasury Notes | 29.4 | | 99.9 |
| |
| † Based on net assets. |
| See notes to financial statements. |
24
STATEMENT OF INVESTMENTS
January 31, 2013
| | | | |
| | Annualized | | |
| | Yield on | | |
| | Date of | Principal | |
| Dreyfus Treasury Prime Cash Management | Purchase (%) | Amount ($) | Value ($) |
| |
| U.S. Treasury Bills—81.7% | | | |
| 2/7/13 | 0.06 | 2,277,775,000 | 2,277,751,330 |
| 2/14/13 | 0.09 | 3,542,000,000 | 3,541,881,393 |
| 2/21/13 | 0.07 | 2,395,000,000 | 2,394,901,489 |
| 2/28/13 | 0.08 | 2,207,000,000 | 2,206,871,109 |
| 3/7/13 | 0.08 | 1,011,000,000 | 1,010,919,146 |
| 3/14/13 | 0.07 | 1,901,870,000 | 1,901,721,372 |
| 3/21/13 | 0.06 | 640,000,000 | 639,949,040 |
| 3/28/13 | 0.08 | 1,485,000,000 | 1,484,823,924 |
| 4/4/13 | 0.08 | 1,975,000,000 | 1,974,722,292 |
| 4/11/13 | 0.07 | 2,150,000,000 | 2,149,706,509 |
| 4/18/13 | 0.08 | 1,000,000,000 | 999,841,667 |
| 4/25/13 | 0.09 | 1,417,440,000 | 1,417,149,106 |
| 5/2/13 | 0.07 | 1,780,000,000 | 1,779,709,000 |
| 5/9/13 | 0.07 | 120,000,000 | 119,976,558 |
| 5/16/13 | 0.08 | 150,000,000 | 149,967,500 |
| 5/23/13 | 0.12 | 1,105,000,000 | 1,104,591,844 |
| 5/30/13 | 0.08 | 286,000,000 | 285,929,692 |
| 6/6/13 | 0.08 | 110,000,000 | 109,967,882 |
| 6/27/13 | 0.10 | 30,000,000 | 29,988,442 |
| 7/5/13 | 0.12 | 975,000,000 | 974,501,639 |
| 7/25/13 | 0.10 | 500,000,000 | 499,770,417 |
| Total U.S. Treasury Bills | | | |
| (cost $27,054,641,351) | | | 27,054,641,351 |
| |
| U.S. Treasury Notes—18.2% | | | |
| 2/15/13 | 0.12 | 300,000,000 | 300,142,841 |
| 2/28/13 | 0.08 | 1,165,000,000 | 1,167,321,189 |
| 2/28/13 | 0.09 | 1,064,000,000 | 1,064,423,301 |
| 3/15/13 | 0.07 | 65,000,000 | 65,098,732 |
| 4/1/13 | 0.13 | 730,000,000 | 730,724,578 |
| 4/1/13 | 0.15 | 291,000,000 | 292,102,886 |
STATEMENT OF INVESTMENTS (continued)
| | | | | |
| | Annualized | | | |
| | Yield on | | | |
| | Date of | Principal | | |
| Dreyfus Treasury Prime Cash Management (continued) | Purchase (%) | Amount ($) | | Value ($) |
| |
| U.S. Treasury Notes (continued) | | | | |
| 4/15/13 | 0.07 | 193,000,000 | | 193,648,816 |
| 4/30/13 | 0.11 | 578,500,000 | | 579,216,783 |
| 5/15/13 | 0.08 | 275,000,000 | | 276,016,102 |
| 5/15/13 | 0.08 | 250,000,000 | | 252,522,910 |
| 5/31/13 | 0.07 | 150,000,000 | | 150,210,405 |
| 6/17/13 | 0.12 | 300,000,000 | | 301,110,795 |
| 7/1/13 | 0.10 | 150,000,000 | | 150,169,035 |
| 7/31/13 | 0.12 | 6,000,000 | | 6,097,085 |
| 8/15/13 | 0.09 | 325,000,000 | | 332,150,463 |
| 9/3/13 | 0.15 | 150,000,000 | | 149,979,359 |
| Total U.S. Treasury Notes | | | | |
| (cost $6,010,935,280) | | | | 6,010,935,280 |
| Total Investments (cost $33,065,576,631) | | 99.9 | % | 33,065,576,631 |
| Cash and Receivables (Net) | | .1 | % | 31,884,604 |
| Net Assets | | 100.0 | % | 33,097,461,235 |
| | | | |
| Portfolio Summary (Unaudited)† | | | |
| | Value (%) | | Value (%) |
| U.S. Treasury Bills | 81.7 | U.S. Treasury Notes | 18.2 |
| | | | 99.9 |
| |
| † Based on net assets. |
| See notes to financial statements. |
26
STATEMENT OF INVESTMENTS
January 31, 2013
| | | | | | |
| | Coupon | Maturity | Principal | | |
| Dreyfus Municipal Cash Management Plus | Rate (%) | Date | Amount ($) | | Value ($) |
| |
| Short-Term Investments—99.6% | | | | | |
| Alabama—.6% | | | | | |
| Columbia Industrial Development Board, PCR, | | | | | |
| Refunding (Alabama Power Company Project) | 0.11 | 2/1/13 | 4,500,000 | a | 4,500,000 |
| Arizona—.1% | | | | | |
| Maricopa County Industrial Development Authority, | | | | | |
| MFHR (San Clemente Apartments Project) | | | | | |
| (Liquidity Facility; FNMA and LOC; FNMA) | 0.13 | 2/7/13 | 1,010,000 | a | 1,010,000 |
| California—4.2% | | | | | |
| California Pollution Control Financing Authority, SWDR | | | | | |
| (Rainbow Disposal Company Inc. Project) (LOC; Comerica Bank) | 0.16 | 2/7/13 | 15,815,000 | a | 15,815,000 |
| California Statewide Communities Development | | | | | |
| Authority, Revenue (Kaiser Permanente) | 0.09 | 2/7/13 | 13,500,000 | a | 13,500,000 |
| California Statewide Communities Development | | | | | |
| Authority, Revenue, CP (Kaiser Permanente) | 0.15 | 5/1/13 | 4,000,000 | | 4,000,000 |
| Colorado—5.4% | | | | | |
| Colorado Housing and Finance Authority, EDR | | | | | |
| (Popiel Properties, LLC Project) (LOC; Wells Fargo Bank) | 0.25 | 2/7/13 | 2,345,000 | a | 2,345,000 |
| Colorado Housing and Finance Authority, EDR | | | | | |
| (Wanco, Inc. Project) (LOC; U.S. Bank NA) | 0.25 | 2/7/13 | 2,035,000 | a | 2,035,000 |
| Colorado Housing and Finance Authority, SFMR | | | | | |
| (Liquidity Facility; Royal Bank of Canada) | 0.12 | 2/7/13 | 13,500,000 | a | 13,500,000 |
| Deutsche Bank Spears/Lifers Trust (Series DBE-1129X) | | | | | |
| (City and County of Denver, Airport System Revenue) (Liquidity | | | | | |
| Facility; Deutsche Bank AG and LOC; Deutsche Bank AG) | 0.17 | 2/7/13 | 9,500,000 a,b,c | | 9,500,000 |
| RBC Municipal Products Inc. Trust (Series E-25) (Denver City and | | | | | |
| County, Aviation Airport System Revenue) (Liquidity Facility; | | | | | |
| Royal Bank of Canada and LOC; Royal Bank of Canada) | 0.13 | 2/7/13 | 15,000,000 a,b,c | | 15,000,000 |
| District of Columbia—2.3% | | | | | |
| Wells Fargo Stage Trust (Series 106C) (Anacostia Waterfront | | | | | |
| Corporation, PILOT Revenue (Waterfront Project)) (Liquidity | | | | | |
| Facility; Wells Fargo Bank and LOC; Wells Fargo Bank) | 0.10 | 2/7/13 | 18,000,000 a,b,c | | 18,000,000 |
| Florida—3.3% | | | | | |
| Branch Banking and Trust Co. Municipal Trust (Series 2057) | | | | | |
| (Miami-Dade County, Aviation Revenue (Miami International | | | | | |
| Airport)) (Liquidity Facility; Branch Banking and Trust Co. | | | | | |
| and LOC; Branch Banking and Trust Co.) | 0.12 | 2/7/13 | 10,075,000 a,b,c | | 10,075,000 |
| Broward County Housing Finance Authority, MFHR | | | | | |
| (Cypress Grove Apartments Project) (LOC; FNMA) | 0.15 | 2/7/13 | 13,230,000 | a | 13,230,000 |
| Sunshine State Government Financing Commission, | | | | | |
| Revenue, CP (Liquidity Facility; JPMorgan Chase Bank) | 0.19 | 6/7/13 | 3,000,000 | | 3,000,000 |
| Illinois—2.1% | | | | | |
| Deutsche Bank Spears/Lifers Trust (Series DB-483) | | | | | |
| (Northern Illinois Municipal Power Agency, Power Project | | | | | |
| Revenue (Prairie State Project)) (Liquidity Facility; | | | | | |
| Deutsche Bank AG and LOC; Deutsche Bank AG) | 0.11 | 2/7/13 | 16,965,000 a,b,c | | 16,965,000 |
STATEMENT OF INVESTMENTS (continued)
| | | | | | |
| Dreyfus Municipal | Coupon | Maturity | Principal | | |
| Cash Management Plus (continued) | Rate (%) | Date | Amount ($) | | Value ($) |
| |
| Short-Term Investments (continued) | | | | | |
| Indiana—2.1% | | | | | |
| Fort Wayne, EDR (Park Center Project) (LOC; PNC Bank NA) | 0.13 | 2/7/13 | 1,800,000 | a | 1,800,000 |
| Indiana Finance Authority, EDR (JRL Leasing, Inc. and | | | | | |
| LaSarre Co., LLC Project) (LOC; PNC Bank NA) | 0.20 | 2/7/13 | 2,800,000 | a | 2,800,000 |
| Indiana Finance Authority, IDR (Midwest Fertilizer Corporation Project) | 0.20 | 7/1/13 | 12,000,000 | | 12,000,000 |
| Iowa—1.3% | | | | | |
| Iowa Finance Authority, Midwestern Disaster Area | | | | | |
| Revenue (Iowa Fertilizer Company Project) | 0.18 | 4/12/13 | 10,000,000 | | 10,000,000 |
| Kansas—1.2% | | | | | |
| Kansas Development Finance Authority, MFHR | | | | | |
| (Tree House Apartments) (LOC; U.S. Bank NA) | 0.12 | 2/7/13 | 8,105,000 | a | 8,105,000 |
| Kansas Development Finance Authority, Revenue | | | | | |
| (Kansas Department of Commerce Impact Program) | 3.00 | 6/1/13 | 1,100,000 | | 1,109,739 |
| Kentucky—.3% | | | | | |
| Kentucky Rural Water Finance Corporation, | | | | | |
| Public Projects Construction Notes | 1.00 | 10/1/13 | 2,500,000 | | 2,511,247 |
| Louisiana—.6% | | | | | |
| Ascension Parish, Revenue, CP (BASF SE) | 0.38 | 2/14/13 | 5,000,000 | | 5,000,000 |
| Maryland—4.2% | | | | | |
| Anne Arundel County, EDR (Atlas Container | | | | | |
| Corporation Project) (LOC; M&T Trust) | 0.22 | 2/7/13 | 5,675,000 | a | 5,675,000 |
| Baltimore County Revenue Authority, | | | | | |
| Golf System Revenue (LOC; M&T Trust) | 0.13 | 2/7/13 | 4,880,000 | a | 4,880,000 |
| Frederick County, Revenue (Homewood, Inc. Facility) (LOC; M&T Trust) | 0.10 | 2/7/13 | 2,400,000 | a | 2,400,000 |
| Montgomery County, CP (Liquidity Facility; JPMorgan Chase Bank) | 0.18 | 3/13/13 | 10,000,000 | | 10,000,000 |
| Montgomery County, CP (Liquidity Facility; JPMorgan Chase Bank) | 0.17 | 5/8/13 | 10,000,000 | | 10,000,000 |
| Michigan—1.8% | | | | | |
| Board of Trustees of the Michigan State University, CP | 0.14 | 2/19/13 | 10,650,000 | | 10,650,000 |
| Pittsfield Township Economic Development Corporation, | | | | | |
| LOR, Refunding (Arbor Project) (LOC; Comerica Bank) | 0.15 | 2/7/13 | 3,400,000 | a | 3,400,000 |
| Minnesota—4.5% | | | | | |
| Minnesota Housing Finance Agency, Residential Housing | | | | | |
| Finance Revenue (Liquidity Facility; FHLB) | 0.12 | 2/7/13 | 7,000,000 | a | 7,000,000 |
| Minnesota Rural Water Finance Authority, | | | | | |
| Public Projects Construction Notes | 1.25 | 3/1/13 | 3,500,000 | | 3,502,274 |
| Minnesota Rural Water Finance Authority, | | | | | |
| Public Projects Construction Notes | 1.00 | 2/1/14 | 4,600,000 | | 4,632,021 |
| Southern Minnesota Municipal Power Agency, Power Supply | | | | | |
| System Revenue, CP (Liquidity Facility; U.S. Bank NA) | 0.14 | 3/18/13 | 5,000,000 | | 5,000,000 |
| University of Minnesota, CP | 0.12 | 2/11/13 | 15,150,000 | | 15,150,000 |
| Mississippi—1.4% | | | | | |
| Mississippi Business Finance Corporation, Gulf Opportunity | | | | | |
| Zone IDR (Chevron U.S.A. Inc. Project) | 0.10 | 2/1/13 | 10,950,000 | a | 10,950,000 |
28
| | | | | | |
| Dreyfus Municipal | Coupon | Maturity | Principal | | |
| Cash Management Plus (continued) | Rate (%) | Date | Amount ($) | | Value ($) |
| |
| Short-Term Investments (continued) | | | | | |
| Nevada—3.4% | | | | | |
| Clark County, Airport System Junior Subordinate Lien Revenue | 2.00 | 7/1/13 | 19,000,000 | | 19,123,877 |
| Clark County, IDR (Southwest Gas Corporation | | | | | |
| Project) (LOC; JPMorgan Chase Bank) | 0.15 | 2/7/13 | 8,000,000 | a | 8,000,000 |
| New Hampshire—1.8% | | | | | |
| New Hampshire Health and Education Facilities Authority, | | | | | |
| Revenue (Kimball Union Academy) (LOC; RBS Citizens NA) | 0.17 | 2/7/13 | 4,790,000 | a | 4,790,000 |
| New Hampshire Health and Education Facilities Authority, | | | | | |
| Revenue (University System of New Hampshire Issue) | | | | | |
| (Liquidity Facility; Wells Fargo Bank) | 0.11 | 2/1/13 | 9,500,000 | a | 9,500,000 |
| New Jersey—1.8% | | | | | |
| Monroe Township, GO Notes, BAN | 1.00 | 2/6/13 | 5,000,000 | | 5,000,508 |
| Paterson, GO Notes, BAN (General Improvement and Tax Appeal) | 1.50 | 6/6/13 | 3,500,000 | | 3,502,949 |
| Woodbridge Township Board of Education, Temporary Notes | 1.00 | 2/6/13 | 6,100,000 | | 6,100,415 |
| New York—4.9% | | | | | |
| Amsterdam Enlarged City School District, GO Notes, BAN | 1.25 | 6/28/13 | 7,100,000 | | 7,117,042 |
| Dutchess County Industrial Development Agency, Civic Facility | | | | | |
| Revenue (Arbor Ridge at Brookmeade Project) (LOC; M&T Trust) | 0.15 | 2/7/13 | 9,020,000 | a | 9,020,000 |
| Eastchester Union Free School District, GO Notes, TAN | 1.00 | 2/28/13 | 5,000,000 | | 5,002,860 |
| Erie County Fiscal Stability Authority, Revenue, BAN | 1.00 | 7/31/13 | 5,000,000 | | 5,018,246 |
| New York State Housing Finance Agency, Housing | | | | | |
| Revenue (25 Washington Street) (LOC; M&T Trust) | 0.15 | 2/7/13 | 7,800,000 | a | 7,800,000 |
| New York State Mortgage Agency, Homeowner | | | | | |
| Mortgage Revenue (Liquidity Facility; Barclays Bank PLC) | 0.11 | 2/7/13 | 5,000,000 | a | 5,000,000 |
| North Carolina—3.9% | | | | | |
| Deutsche Bank Spears/Lifers Trust (Series DBE-1066) (North Carolina | | | | | |
| Medical Care Commission, Health Care Facilities Revenue | | | | | |
| (Novant Health Obligated Group)) (Liquidity Facility; | | | | | |
| Deutsche Bank AG and LOC; Deutsche Bank AG) | 0.15 | 2/7/13 | 8,360,000 a,b,c | | 8,360,000 |
| North Carolina Capital Facilities Finance Agency, | | | | | |
| Educational Facilities Revenue (High Point University | | | | | |
| Project) (LOC; Branch Banking and Trust Co.) | 0.10 | 2/7/13 | 2,500,000 | a | 2,500,000 |
| North Carolina Capital Facilities Finance Agency, | | | | | |
| Educational Facilities Revenue (The Raleigh School | | | | | |
| Project) (LOC; Branch Banking and Trust Co.) | 0.10 | 2/7/13 | 3,400,000 | a | 3,400,000 |
| North Carolina Medical Care Commission, Health Care Facilities | | | | | |
| First Mortgage Revenue (Deerfield Episcopal Retirement | | | | | |
| Community) (LOC; Branch Banking and Trust Co.) | 0.10 | 2/7/13 | 15,035,000 | a | 15,035,000 |
| University of North Carolina Board of Governers, Revenue | | | | | |
| (University of North Carolina Hospitals at Chapel Hill) | 4.00 | 2/1/13 | 1,605,000 | | 1,605,000 |
| Ohio—.8% | | | | | |
| Lorain County, IDR (Cutting Dynamics, Inc. Project) (LOC; PNC Bank NA) | 0.20 | 2/7/13 | 1,670,000 | a | 1,670,000 |
| Union Township, GO Notes, Refunding, BAN (Various Purpose) | 1.00 | 9/11/13 | 5,000,000 | | 5,016,650 |
STATEMENT OF INVESTMENTS (continued)
| | | | | | |
| Dreyfus Municipal | Coupon | Maturity | Principal | | |
| Cash Management Plus (continued) | Rate (%) | Date | Amount ($) | | Value ($) |
| |
| Short-Term Investments (continued) | | | | | |
| Pennsylvania—10.1% | | | | | |
| Blair County Industrial Development Authority, Revenue | | | | | |
| (Hollidaysburg Area YMCA Project) (LOC; RBS Citizens NA) | 0.21 | 2/7/13 | 2,720,000 | a | 2,720,000 |
| Bradford County Industrial Development Authority, Revenue | | | | | |
| (State Aggregates Inc. Project) (LOC; M&T Trust) | 0.30 | 2/7/13 | 1,140,000 | a | 1,140,000 |
| Deutsche Bank Spears/Lifers Trust (Series DBE-495) | | | | | |
| (Philadelphia, Airport Revenue) (Liquidity Facility; | | | | | |
| Deutsche Bank AG and LOC; Deutsche Bank AG) | 0.19 | 2/7/13 | 5,670,000 a,b,c | | 5,670,000 |
| Emmaus General Authority, Local Government Revenue | | | | | |
| (Bond Pool Program) (LOC; U.S. Bank NA) | 0.09 | 2/7/13 | 8,300,000 | a | 8,300,000 |
| Horizon Hospital System Authority, Senior Health and Housing | | | | | |
| Facilities Revenue (Saint Paul Homes Project) (LOC; M&T Trust) | 0.15 | 2/7/13 | 7,010,000 | a | 7,010,000 |
| Pennsylvania Economic Development Financing Authority, | | | | | |
| Revenue (Evergreen Community Power Facility) (LOC; M&T Trust) | 0.25 | 2/7/13 | 16,000,000 | a | 16,000,000 |
| Philadelphia, GO Notes, TRAN | 1.00 | 6/28/13 | 15,000,000 | | 15,046,524 |
| Philadelphia Authority for Industrial Development, | | | | | |
| Revenue (The Philadelphia Protestant Home | | | | | |
| Project) (LOC; Bank of America) | 0.27 | 2/7/13 | 9,000,000 | a | 9,000,000 |
| RBC Municipal Products Inc. Trust (Series E-29) (Allegheny County | | | | | |
| Hospital Development Authority, Revenue (University of | | | | | |
| Pittsburgh Medical Center)) (Liquidity Facility; Royal Bank | | | | | |
| of Canada and LOC; Royal Bank of Canada) | 0.10 | 2/7/13 | 7,000,000 a,b,c | | 7,000,000 |
| Telford Industrial Development Authority, IDR (Ridgetop | | | | | |
| Associates Project) (LOC; Bank of America) | 0.26 | 2/7/13 | 3,920,000 | a | 3,920,000 |
| Union County Industrial Development Authority, Revenue | | | | | |
| (Stabler Companies, Inc. Project) (LOC; M&T Trust) | 0.25 | 2/7/13 | 4,250,000 | a | 4,250,000 |
| Rhode Island—1.5% | | | | | |
| Rhode Island Health and Educational Building Corporation, | | | | | |
| Educational Institution Revenue (Saint George’s School | | | | | |
| Issue) (Liquidity Facility, Wells Fargo Bank) | 0.13 | 2/7/13 | 12,140,000 | a | 12,140,000 |
| South Carolina—1.3% | | | | | |
| South Carolina Association of Governmental Organizations, COP | | | | | |
| (Evidencing Undivided Proportionate Interests in General | | | | | |
| Obligation Debt of Certain South Carolina School Districts) | 1.75 | 3/1/13 | 10,000,000 | | 10,012,009 |
| Tennessee—5.1% | | | | | |
| Clarksville Public Building Authority, Pooled Financing Revenue | | | | | |
| (Tennessee Municipal Bond Fund) (LOC; Bank of America) | 0.19 | 2/1/13 | 7,600,000 | a | 7,600,000 |
| Clarksville Public Building Authority, Pooled Financing Revenue | | | | | |
| (Tennessee Municipal Bond Fund) (LOC; Bank of America) | 0.13 | 2/7/13 | 9,800,000 | a | 9,800,000 |
| Cleveland Health and Educational Facilities Board, Revenue | | | | | |
| (Lee University Project) (LOC; Branch Banking and Trust Co.) | 0.10 | 2/7/13 | 2,600,000 | a | 2,600,000 |
| Metropolitan Government of Nashville and | | | | | |
| Davidson County, GO Notes, Refunding | 5.00 | 7/1/13 | 1,000,000 | | 1,019,604 |
| Sevier County Public Building Authority, Local Government | | | | | |
| Public Improvement Revenue (LOC; Bank of America) | 0.15 | 2/7/13 | 6,775,000 | a | 6,775,000 |
| Sevier County Public Building Authority, Public Projects | | | | | |
| Construction Notes (Tennessee Association of | | | | | |
| Utility Districts Interim Loan Program) | 1.25 | 4/1/13 | 4,100,000 | | 4,105,280 |
30
| | | | | | |
| Dreyfus Municipal | Coupon | Maturity | Principal | | |
| Cash Management Plus (continued) | Rate (%) | Date | Amount ($) | | Value ($) |
| |
| Short-Term Investments (continued) | | | | | |
| Tennessee (continued) | | | | | |
| Shelby County Health Educational and Housing Facility | | | | | |
| Board, Educational Facilities Revenue | | | | | |
| (Rhodes College) (LOC; Wells Fargo Bank) | 0.10 | 2/7/13 | 8,215,000 | a | 8,215,000 |
| Texas—17.4% | | | | | |
| Calhoun Port Authority, Environmental Facilities Revenue (Formosa | | | | | |
| Plastics Corporation, Texas Project) (LOC; Bank of America) | 0.13 | 2/7/13 | 10,000,000 | a | 10,000,000 |
| DeSoto Industrial Development Authority, IDR, Refunding | | | | | |
| (National Service Industries Inc. Project) (LOC; Wells Fargo Bank) | 0.20 | 2/7/13 | 3,660,000 | a | 3,660,000 |
| Deutsche Bank Spears/Lifers Trust (Series DBE-626) (North Texas | | | | | |
| Tollway Authority, First Tier System Revenue, Refunding) | | | | | |
| (Liquidity Facility; Deutsche Bank AG and LOC; Deutsche Bank AG) | 0.11 | 2/7/13 | 15,390,000 a,b,c | | 15,390,000 |
| El Paso Independent School District, Unlimited Tax School Building | | | | | |
| Bonds (Liquidity Facility; JPMorgan Chase Bank and LOC; | | | | | |
| Permanent School Fund Guarantee Program) | 0.22 | 4/4/13 | 12,000,000 | | 12,000,000 |
| Gulf Coast Waste Disposal Authority, Environmental | | | | | |
| Facilities Revenue (ExxonMobil Project) | 0.12 | 2/1/13 | 4,500,000 | a | 4,500,000 |
| Gulf Coast Waste Disposal Authority, SWDR (Air Products Project) | 0.14 | 2/7/13 | 5,000,000 | a | 5,000,000 |
| Harris County, CP (Liquidity Facility; Bank of Tokyo-Mitsubishi UFJ) | 0.13 | 3/18/13 | 8,000,000 | | 8,000,000 |
| Harris County Health Facilities Development Corporation, | | | | | |
| HR, Refunding (Texas Children’s Hospital Project) | | | | | |
| (Liquidity Facility; Bank of America) | 0.14 | 2/1/13 | 8,940,000 | a | 8,940,000 |
| Jefferson County Industrial Development Corporation, | | | | | |
| Hurricane Ike Disaster Area Revenue (Jefferson | | | | | |
| Refinery, L.L.C. Project) (LOC; Branch Banking and Trust Co.) | 0.45 | 3/15/13 | 17,300,000 | | 17,300,000 |
| Jefferson County Industrial Development Corporation, | | | | | |
| Hurricane Ike Disaster Area Revenue (Jefferson | | | | | |
| Refinery, L.L.C. Project) (LOC; Branch Banking and Trust Co.) | 0.45 | 3/15/13 | 1,700,000 | | 1,700,000 |
| JPMorgan Chase Putters/Drivers Trust (Series 4264) | | | | | |
| (Texas, TRAN) (Liquidity Facility; JPMorgan Chase Bank) | 0.12 | 2/1/13 | 15,000,000 a,b,c | | 15,000,000 |
| Port of Port Authur Navigation District, Revenue, CP (BASF SE) | 0.38 | 2/14/13 | 5,000,000 | | 5,000,000 |
| RBC Municipal Products Inc. Trust (Series E-27) (Harris County | | | | | |
| Health Facilities Development Corporation, HR, Refunding | | | | | |
| (Memorial Hermann Healthcare System)) (Liquidity Facility; | | | | | |
| Royal Bank of Canada and LOC; Royal Bank of Canada) | 0.10 | 2/7/13 | 5,000,000 a,b,c | | 5,000,000 |
| Texas, GO Notes (Veterans’ Housing Assistance Program) | | | | | |
| (Liquidity Facility; State Street Bank and Trust Co.) | 0.12 | 2/7/13 | 16,000,000 | a | 16,000,000 |
| Texas, TRAN | 2.50 | 8/30/13 | 5,500,000 | | 5,571,966 |
| Wells Fargo Stage Trust (Series 51-C) (Klein Independent | | | | | |
| School District, Unlimited Tax Schoolhouse Bonds) | | | | | |
| (Liquidity Facility; Wells Fargo Bank and LOC; | | | | | |
| Permanent School Fund Guarantee Program) | 0.10 | 2/7/13 | 5,000,000 a,b,c | | 5,000,000 |
| Utah—4.2% | | | | | |
| Utah State Board of Regents, Student Loan | | | | | |
| Revenue (LOC; Royal Bank of Canada) | 0.13 | 2/7/13 | 8,300,000 | a | 8,300,000 |
| Wells Fargo Stage Trust (Series 33C) (Riverton, HR, Refunding | | | | | |
| (Intermountain Health Care Health Services, Inc.)) (Liquidity | | | | | |
| Facility; Wells Fargo Bank and LOC; Wells Fargo Bank) | 0.10 | 2/7/13 | 25,000,000 a,b,c | | 25,000,000 |
STATEMENT OF INVESTMENTS (continued)
| | | | | | |
| Dreyfus Municipal | Coupon | Maturity | Principal | | |
| Cash Management Plus (continued) | Rate (%) | Date | Amount ($) | | Value ($) |
| |
| Short-Term Investments (continued) | | | | | |
| Virginia—3.8% | | | | | |
| Fairfax County Redevelopment and Housing Authority, | | | | | |
| Revenue, BAN (Affordable Housing Acquisition) | 4.00 | 3/1/13 | 6,725,000 | | 6,744,960 |
| Lynchburg Redevelopment and Housing Authority, Housing | | | | | |
| Revenue (KHM Properties-Lynchburg, LLC Project) (LOC; M&T Trust) | 0.20 | 2/7/13 | 13,520,000 | a | 13,520,000 |
| University of Virginia, University Revenue, CP | 0.09 | 2/12/13 | 10,000,000 | | 10,000,000 |
| Washington—1.2% | | | | | |
| Pierce County Economic Development Corporation, Industrial | | | | | |
| Revenue (SeaTac Packaging Project) (LOC; HSBC Bank USA) | 0.17 | 2/7/13 | 4,280,000 | a | 4,280,000 |
| Wells Fargo Stage Trust (Series 36C) (Washington Health Care | | | | | |
| Facilities Authority, Revenue (PeaceHealth)) (Liquidity | | | | | |
| Facility; Wells Fargo Bank and LOC; Wells Fargo Bank) | 0.10 | 2/7/13 | 4,995,000 a,b,c | | 4,995,000 |
| Wisconsin—3.0% | | | | | |
| Kenosha School District Number 1, GO Notes, TRAN | 1.50 | 2/26/13 | 3,000,000 | | 3,002,445 |
| Wisconsin Health and Educational Facilities Authority, | | | | | |
| Revenue (Aurora Health Care, Inc.) (LOC; JPMorgan Chase Bank) | 0.27 | 2/5/13 | 15,000,000 | | 15,000,000 |
| Wisconsin Health and Educational Facilities Authority, Revenue | | | | | |
| (Mequon Jewish Campus, Inc. Project) (LOC; JPMorgan Chase Bank) | 0.16 | 2/7/13 | 6,045,000 | a | 6,045,000 |
| |
| Total Investments (cost $788,875,616) | | | 99.6 | % | 788,875,616 |
| Cash and Receivables (Net) | | | .4 | % | 2,889,038 |
| Net Assets | | | 100.0 | % | 791,764,654 |
| |
| a Variable rate demand note—rate shown is the interest rate in effect at January 31, 2013. Maturity date represents the next demand date, or the ultimate maturity date if earlier. |
| b Securities exempt from registration pursuant to Rule 144A under the Securities Act of 1933.These securities may be resold in transactions exempt from registration, normally to qualified |
| institutional buyers.At January 31, 2013, these securities amounted to $160,955,000 or 20.3% of net assets. |
| c The fund does not directly own the municipal security indicated; the fund owns an interest in a special purpose entity that, in turn, owns the underlying municipal security.The special |
| purpose entity permits the fund to own interests in underlying assets, but in a manner structured to provide certain advantages not inherent in the underlying bonds (e.g., enhanced |
| liquidity, yields linked to short-term rates). |
| | | | | | | |
| Summary of Combined Ratings (Unaudited) | | | |
| |
| Fitch | | or | Moody’s | or | Standard & Poor’s | Value (%)† |
| F1+,F1 | | | VMIG1,MIG1,P1 | | SP1+,SP1,A1+,A1 | 87.3 |
| F2 | | | VMIG2,MIG2,P2 | | SP2,A2 | 4.3 |
| AAA,AA,Ad | | | Aaa,Aa,Ad | | AAA,AA,Ad | 4.2 |
| Not Ratede | | | Not Ratede | | Not Ratede | 4.2 |
| | | | | | | 100.0 |
| |
| † Based on total investments. |
| d Notes which are not F, MIG and SP rated are represented by bond ratings of the issuers. |
| e Securities which, while not rated by Fitch, Moody’s and Standard & Poor’s, have been determined by the Manager to be of comparable quality to those rated securities in which the fund |
| may invest. |
See notes to financial statements.
32
STATEMENT OF INVESTMENTS
January 31, 2013
| | | | | | |
| Dreyfus New York | Coupon | Maturity | Principal | | |
| Municipal Cash Management | Rate (%) | Date | Amount ($) | | Value ($) |
| |
| Short-Term Investments—99.8% | | | | | |
| Albany Industrial Development Agency, | | | | | |
| Civic Facility Revenue (Albany Medical Center | | | | | |
| Hospital Project) (LOC; Bank of America) | 0.16 | 2/7/13 | 2,400,000 | a | 2,400,000 |
| Auburn, GO Notes, BAN | 1.00 | 5/31/13 | 6,000,000 | | 6,009,799 |
| Ausable Valley Central School District, GO Notes, BAN | 1.50 | 4/5/13 | 3,000,000 | | 3,003,904 |
| Ausable Valley Central School District, GO Notes, BAN | 1.50 | 4/5/13 | 5,400,000 | | 5,407,131 |
| Campbell-Savona Central School District, GO Notes, BAN | 1.50 | 6/21/13 | 2,800,000 | | 2,808,849 |
| Chautauqua County Industrial Development Agency, Civic Facility | | | | | |
| Revenue (Gerry Homes Project) (LOC; HSBC Bank USA) | 0.40 | 2/7/13 | 10,110,000 | a | 10,110,000 |
| Chemung County Industrial Development Agency, IDR | | | | | |
| (Trayer Products, Inc. Project) (LOC; HSBC Bank USA) | 0.40 | 2/7/13 | 450,000 | a | 450,000 |
| Columbia County Capital Resource Corporation, | | | | | |
| Civic Facility Revenue (The Columbia Memorial | | | | | |
| Hospital Project) (LOC; HSBC Bank USA) | 0.11 | 2/7/13 | 5,750,000 | a | 5,750,000 |
| Columbia County Industrial Development Agency, | | | | | |
| Civic Facility Revenue (The Columbia Memorial | | | | | |
| Hospital Project) (LOC; HSBC Bank USA) | 0.11 | 2/7/13 | 4,850,000 | a | 4,850,000 |
| East Moriches Union Free School District, GO Notes, TAN | 1.50 | 6/20/13 | 3,900,000 | | 3,912,533 |
| Eastchester Union Free School District, GO Notes, TAN | 1.00 | 2/28/13 | 5,000,000 | | 5,002,860 |
| Erie County Industrial Development Agency, IDR | | | | | |
| (Hydro-Air Components Inc. Project) (LOC; HSBC Bank USA) | 0.17 | 2/7/13 | 2,300,000 | a | 2,300,000 |
| Hamburg Central School District, GO Notes, BAN | 1.50 | 6/14/13 | 10,000,000 | | 10,031,118 |
| Herkimer County Industrial Development Agency, IDR (F.E. Hale | | | | | |
| Manufacturing Company Facility) (LOC; HSBC Bank USA) | 0.40 | 2/7/13 | 1,500,000 | a | 1,500,000 |
| Lancaster Industrial Development Agency, IDR | | | | | |
| (Sealing Devices Inc. Project) (LOC; HSBC Bank USA) | 0.17 | 2/7/13 | 1,990,000 | a | 1,990,000 |
| Monroe County Industrial Development Agency, Civic Facility | | | | | |
| Revenue (YMCA of Greater Rochester Project) (LOC; M&T Trust) | 0.15 | 2/7/13 | 2,030,000 | a | 2,030,000 |
| Monroe County Industrial Development Corporation, Revenue | | | | | |
| (Saint Ann’s Home for the Aged Project) (LOC; HSBC Bank USA) | 0.12 | 2/7/13 | 8,000,000 | a | 8,000,000 |
| Naples Central School District, GO Notes, BAN | 1.00 | 6/28/13 | 3,700,000 | | 3,706,230 |
| New York City, GO Notes | 5.00 | 8/1/13 | 1,830,000 | | 1,873,629 |
| New York City, GO Notes | 5.00 | 8/1/13 | 1,860,000 | | 1,904,344 |
| New York City, GO Notes (Citigroup ROCS, | | | | | |
| Series RR II R-14045) (Liquidity Facility; Citibank NA) | 0.11 | 2/7/13 | 3,000,000 a,b,c | | 3,000,000 |
STATEMENT OF INVESTMENTS (continued)
| | | | | | |
| Dreyfus New York | Coupon | Maturity | Principal | | |
| Municipal Cash Management (continued) | Rate (%) | Date | Amount ($) | | Value ($) |
| |
| Short-Term Investments (continued) | | | | | |
| New York City, GO Notes (LOC; Bank of America) | 0.14 | 2/7/13 | 3,000,000 | a | 3,000,000 |
| New York City, GO Notes (LOC; California | | | | | |
| Public Employees Retirement System) | 0.13 | 2/1/13 | 12,300,000 | a | 12,300,000 |
| New York City, GO Notes (LOC; Sumitomo Mitsui Banking Corp.) | 0.10 | 2/7/13 | 20,500,000 | a | 20,500,000 |
| New York City, GO Notes (LOC; Sumitomo Mitsui Banking Corp.) | 0.10 | 2/7/13 | 22,700,000 | a | 22,700,000 |
| New York City Capital Resource Corporation, Recovery Zone | | | | | |
| Facility Revenue (WytheHotel Project) (LOC; M&T Trust) | 0.16 | 2/7/13 | 3,800,000 | a | 3,800,000 |
| New York City Housing Development Corporation, MFHR | 0.27 | 2/1/13 | 835,000 | | 835,000 |
| New York City Housing Development Corporation, MFMR | | | | | |
| (1405 Fifth Avenue Apartments) (LOC; Citibank NA) | 0.12 | 2/7/13 | 9,500,000 | a | 9,500,000 |
| New York City Housing Development Corporation, | | | | | |
| Multi-Family Rental Housing Revenue (Related 96th Street | | | | | |
| Associates L.P.—Monterey Project) (LOC; FNMA) | 0.08 | 2/7/13 | 5,000,000 | a | 5,000,000 |
| New York City Industrial Development Agency, | | | | | |
| Civic Facility Revenue (French Institute-Alliance | | | | | |
| Francaise de New York—Federation of French Alliances | | | | | |
| in the United States Project) (LOC; M&T Trust) | 0.16 | 2/7/13 | 3,325,000 | a | 3,325,000 |
| New York City Industrial Development Agency, | | | | | |
| Civic Facility Revenue (Jewish Community Center | | | | | |
| on the Upper West Side, Inc. Project) (LOC; M&T Trust) | 0.15 | 2/7/13 | 4,700,000 | a | 4,700,000 |
| New York City Industrial Development Agency, | | | | | |
| Civic Facility Revenue (Sephardic Community | | | | | |
| Youth Center, Inc. Project) (LOC; M&T Trust) | 0.15 | 2/7/13 | 3,100,000 | a | 3,100,000 |
| New York City Industrial Development Agency, | | | | | |
| Civic Facility Revenue (Spence-Chapin, Services | | | | | |
| to Families and Children Project) (LOC; TD Bank) | 0.18 | 2/7/13 | 5,770,000 | a | 5,770,000 |
| New York City Industrial Development Agency, | | | | | |
| Civic Facility Revenue (The Allen-Stevenson | | | | | |
| School Project) (LOC; JPMorgan Chase Bank) | 0.14 | 2/7/13 | 5,930,000 | a | 5,930,000 |
| New York City Industrial Development Agency, | | | | | |
| Civic Facility Revenue (Village Community | | | | | |
| School Project) (LOC; TD Bank) | 0.22 | 2/7/13 | 2,350,000 | a | 2,350,000 |
| New York City Industrial Development Agency, | | | | | |
| Special Facility Revenue (Air Express International | | | | | |
| Corporation Project) (LOC; Citibank NA) | 0.10 | 2/7/13 | 5,000,000 | a | 5,000,000 |
| New York City Municipal Water Finance Authority, | | | | | |
| Water and Sewer System Revenue (Liquidity | | | | | |
| Facility; State Street Bank and Trust Co.) | 0.10 | 2/1/13 | 2,100,000 | a | 2,100,000 |
34
| | | | | | |
| Dreyfus New York | Coupon | Maturity | Principal | | |
| Municipal Cash Management (continued) | Rate (%) | Date | Amount ($) | | Value ($) |
| |
| Short-Term Investments (continued) | | | | | |
| New York City Municipal Water Finance Authority, Water and | | | | | |
| Sewer System Second General Resolution Revenue | | | | | |
| (Liquidity Facility; Landesbank Hessen-Thuringen Girozentrale) | 0.14 | 2/1/13 | 22,000,000 | a | 22,000,000 |
| New York City Transitional Finance Authority, | | | | | |
| Future Tax Secured Revenue (Liquidity | | | | | |
| Facility; JPMorgan Chase Bank) | 0.10 | 2/7/13 | 5,000,000 | a | 5,000,000 |
| New York City Transitional Finance Authority, Revenue | | | | | |
| (New York City Recovery) (Liquidity Facility; | | | | | |
| Landesbank Baden-Wurttemberg) | 0.15 | 2/1/13 | 7,000,000 | a | 7,000,000 |
| New York State Dormitory Authority, Revenue | | | | | |
| (Blythedale Children’s Hospital) (LOC; TD Bank) | 0.11 | 2/7/13 | 2,900,000 | a | 2,900,000 |
| New York State Dormitory Authority, Revenue | | | | | |
| (Memorial Sloan-Kettering Cancer Center) | 4.00 | 7/1/13 | 675,000 | | 685,125 |
| New York State Dormitory Authority, Revenue | | | | | |
| (The College of New Rochelle) (LOC; RBS Citizens NA) | 0.18 | 2/7/13 | 3,915,000 | a | 3,915,000 |
| New York State Environmental Facilities Corporation, | | | | | |
| State Revolving Funds Revenue (Master Financing Program) | 3.00 | 2/15/13 | 1,670,000 | | 1,671,811 |
| New York State Mortgage Agency, Homeowner Mortgage Revenue | 0.23 | 5/1/13 | 6,000,000 | | 6,000,000 |
| New York State Mortgage Agency, Homeowner Mortgage Revenue | 0.23 | 5/1/13 | 4,000,000 | | 4,000,000 |
| New York State Mortgage Agency, Homeowner | | | | | |
| Mortgage Revenue (Liquidity Facility; Barclays Bank PLC) | 0.12 | 2/7/13 | 5,000,000 | a | 5,000,000 |
| New York State Mortgage Agency, Homeowner | | | | | |
| Mortgage Revenue (P-FLOATS Series MT-763) | | | | | |
| (Liquidity Facility; Bank of America) | 0.14 | 2/7/13 | 12,480,000 a,b,c | | 12,480,000 |
| Odessa-Montour Central School District, GO Notes, BAN | 1.50 | 6/14/13 | 3,600,000 | | 3,611,071 |
| Onondaga County Industrial Development Agency, IDR | | | | | |
| (ICM Controls Corporation Project) (LOC; M&T Trust) | 0.25 | 2/7/13 | 1,840,000 | a | 1,840,000 |
| Port Authority of New York and New Jersey, Equipment Notes | 0.15 | 2/7/13 | 10,500,000 | a | 10,500,000 |
| Sullivan County, GO Notes, TAN | 1.25 | 3/15/13 | 4,000,000 | | 4,003,434 |
| Triborough Bridge and Tunnel Authority, General Revenue, | | | | | |
| Refunding (MTA Bridges and Tunnels) (Liquidity Facility; | | | | | |
| Landesbank Hessen-Thuringen Girozentrale) | 0.15 | 2/1/13 | 8,900,000 | a | 8,900,000 |
| Ulster County Industrial Development Agency, IDR | | | | | |
| (Selux Corporation Project) (LOC; M&T Trust) | 0.25 | 2/7/13 | 765,000 | a | 765,000 |
| Wells Fargo Stage Trust (Series 1C) (New York State Urban | | | | | |
| Development Corporation, State Personal Income Tax Revenue | | | | | |
| (General Purpose)) (Liquidity Facility; Wells Fargo Bank) | 0.10 | 2/7/13 | 8,910,000 a,b,c | | 8,910,000 |
STATEMENT OF INVESTMENTS (continued)
| | | | | | |
| Dreyfus New York | Coupon | Maturity | Principal | | |
| Municipal Cash Management (continued) | Rate (%) | Date | Amount ($) | | Value ($) |
| |
| Short-Term Investments (continued) | | | | | |
| Wells Fargo Stage Trust (Series 98C) (Monroe County | | | | | |
| Industrial Development Corporation, Revenue | | | | | |
| (University of Rochester Project)) (Liquidity Facility; | | | | | |
| Wells Fargo Bank and LOC; Wells Fargo Bank) | 0.10 | 2/7/13 | 7,505,000 a,b,c | | 7,505,000 |
| Wells Fargo Stage Trust (Series 127C) (New York State | | | | | |
| Dormitory Authority, State Personal Income Tax Revenue | | | | | |
| (General Purpose)) (Liquidity Facility; Wells Fargo Bank) | 0.10 | 2/7/13 | 7,700,000 a,b,c | | 7,700,000 |
| Westchester County Industrial Development Agency, | | | | | |
| Civic Facility Revenue (The Masters School Civic | | | | | |
| Facility) (LOC; JPMorgan Chase Bank) | 0.14 | 2/7/13 | 5,400,000 | a | 5,400,000 |
| Yonkers Industrial Development Agency, MFHR (Main Street | | | | | |
| Lofts Yonkers LLC Project) (LOC; M&T Trust) | 0.25 | 2/7/13 | 30,000,000 | a | 30,000,000 |
| |
| Total Investments (cost $355,736,838) | | | 99.8 | % | 355,736,838 |
| Cash and Receivables (Net) | | | .2 | % | 741,871 |
| Net Assets | | | 100.0 | % | 356,478,709 |
| |
| a Variable rate demand note—rate shown is the interest rate in effect at January 31, 2013. Maturity date represents the next demand date, or the ultimate maturity date if earlier. |
| b Securities exempt from registration pursuant to Rule 144A under the Securities Act of 1933.These securities may be resold in transactions exempt from registration, normally to qualified |
| institutional buyers.At January 31, 2013, these securities amounted to $39,595,000 or 11.1% of net assets. |
| c The fund does not directly own the municipal security indicated; the fund owns an interest in a special purpose entity that, in turn, owns the underlying municipal security.The special |
| purpose entity permits the fund to own interests in underlying assets, but in a manner structured to provide certain advantages not inherent in the underlying bonds (e.g., enhanced |
| liquidity, yields linked to short-term rates). |
| | | | | | | |
| Summary of Combined Ratings (Unaudited) | | | |
| |
| Fitch | | or | Moody’s | or | Standard & Poor’s | Value (%)† |
| F1+,F1 | | | VMIG1,MIG1,P1 | | SP1+,SP1,A1+,A1 | 73.3 |
| F2 | | | VMIG2,MIG2,P2 | | SP2,A2 | 5.3 |
| AAA,AA,Ad | | | Aaa,Aa,Ad | | AAA,AA,Ad | 5.1 |
| Not Ratede | | | Not Ratede | | Not Ratede | 16.3 |
| | | | | | | 100.0 |
| |
| † Based on total investments. |
| d Notes which are not F, MIG and SP rated are represented by bond ratings of the issuers. |
| e Securities which, while not rated by Fitch, Moody’s and Standard & Poor’s, have been determined by the Manager to be of comparable quality to those rated securities in which the fund |
| may invest. |
See notes to financial statements.
36
STATEMENT OF INVESTMENTS
January 31, 2013
| | | | | | |
| Dreyfus Tax Exempt | Coupon | Maturity | Principal | | |
| Cash Management | Rate (%) | Date | Amount ($) | | Value ($) |
| |
| Short-Term Investments—99.9% | | | | | |
| Alabama—3.7% | | | | | |
| Chatom Industrial Development Board, Gulf Opportunity | | | | | |
| Zone Revenue (PowerSouth Energy Cooperative Projects) | 0.25 | 2/7/13 | 15,000,000 | a | 15,000,000 |
| Columbia Industrial Development Board, PCR, | | | | | |
| Refunding (Alabama Power Company Project) | 0.12 | 2/1/13 | 7,000,000 | a | 7,000,000 |
| Columbia Industrial Development Board, PCR, | | | | | |
| Refunding (Alabama Power Company Project) | 0.15 | 2/1/13 | 10,500,000 | a | 10,500,000 |
| Eutaw Industrial Development Board, PCR, | | | | | |
| Refunding (Alabama Power Company Project) | 0.09 | 2/1/13 | 7,600,000 | a | 7,600,000 |
| Tuscaloosa County Industrial Development Authority, Gulf Opportunity | | | | | |
| Zone Revenue (Hunt Refining Project) (LOC; Bank of Nova Scotia) | 0.10 | 2/7/13 | 15,000,000 | a | 15,000,000 |
| Tuscaloosa County Industrial Development Authority, Gulf Opportunity | | | | | |
| Zone Revenue (Hunt Refining Project) (LOC; Bank of Nova Scotia) | 0.10 | 2/7/13 | 20,000,000 | a | 20,000,000 |
| Tuscaloosa County Industrial Development Authority, Gulf Opportunity | | | | | |
| Zone Revenue (Hunt Refining Project) (LOC; JPMorgan Chase Bank) | 0.15 | 2/7/13 | 10,000,000 | a | 10,000,000 |
| Arizona—2.4% | | | | | |
| Deutsche Bank Spears/Lifers Trust (Series DBE-1082) (Arizona Health | | | | | |
| Facilities Authority, Revenue (Catholic Healthcare West)) (Liquidity | | | | | |
| Facility; Deutsche Bank AG and LOC; Deutsche Bank AG) | 0.15 | 2/7/13 | 18,250,000 a,b,c | | 18,250,000 |
| Deutsche Bank Spears/Lifers Trust (Series DBE-1086) (Phoenix | | | | | |
| Industrial Development Authority, LR (Rowan University Project)) | | | | | |
| (Liquidity Facility; Deutsche Bank AG and LOC; Deutsche Bank AG) | 0.15 | 2/7/13 | 38,050,000 a,b,c | | 38,050,000 |
| California—3.6% | | | | | |
| California Statewide Communities Development | | | | | |
| Authority, Revenue (Kaiser Permanente) | 0.10 | 2/7/13 | 35,000,000 | a | 35,000,000 |
| California Statewide Communities Development | | | | | |
| Authority, Revenue, CP (Kaiser Permanente) | 0.15 | 5/1/13 | 14,000,000 | | 14,000,000 |
| California Statewide Communities Development | | | | | |
| Authority, Revenue, CP (Kaiser Permanente) | 0.25 | 5/7/13 | 12,500,000 | | 12,500,000 |
| Sacramento City Financing Authority, Revenue, Refunding | | | | | |
| (Master Lease Program Facilities) (P-FLOATS Series PT-4698) | | | | | |
| (Liquidity Facility; Deutsche Bank AG and LOC; Deutsche Bank AG) | 0.18 | 2/7/13 | 21,200,000 a,b,c | | 21,200,000 |
| Colorado—6.3% | | | | | |
| Colorado Educational and Cultural Facilities Authority, | | | | | |
| Revenue, Refunding (The Nature Conservancy Project) | 0.08 | 2/7/13 | 16,600,000 | a | 16,600,000 |
| Denver Urban Renewal Authority, Stapleton | | | | | |
| Senior Tax Increment Revenue (LOC; U.S. Bank NA) | 0.10 | 2/7/13 | 9,000,000 | a | 9,000,000 |
| Deutsche Bank Spears/Lifers Trust (Series DBE-1130X) | | | | | |
| (City and County of Denver, Airport System Revenue) | | | | | |
| (Liquidity Facility; Deutsche Bank AG and LOC; Deutsche Bank AG) | 0.15 | 2/7/13 | 14,200,000 a,b,c | | 14,200,000 |
| Jefferson County School District, Number R-1, Revenue, TAN | 1.50 | 6/28/13 | 14,250,000 | | 14,323,642 |
| RBC Municipal Products Inc. Trust (Series C-11) (Meridian Village | | | | | |
| Metropolitan District Number One, Improvement Revenue) (Liquidity | | | | | |
| Facility; Royal Bank of Canada and LOC; Royal Bank of Canada) | 0.10 | 2/7/13 | 17,600,000 a,b,c | | 17,600,000 |
| Sheridan Redevelopment Agency, Tax Increment | | | | | |
| Revenue, Refunding (South Santa Fe Drive Corridor | | | | | |
| Redevelopment Project) (LOC; JPMorgan Chase Bank) | 0.16 | 2/7/13 | 10,000,000 | a | 10,000,000 |
STATEMENT OF INVESTMENTS (continued)
| | | | | | |
| Dreyfus Tax Exempt | Coupon | Maturity | Principal | | |
| Cash Management (continued) | Rate (%) | Date | Amount ($) | | Value ($) |
| |
| Short-Term Investments (continued) | | | | | |
| Colorado (continued) | | | | | |
| Southern Ute Indian Tribe of the | | | | | |
| Southern Ute Indian Reservation, Revenue | 0.10 | 2/7/13 | 65,300,000 | a | 65,300,000 |
| Connecticut—1.2% | | | | | |
| Bridgeport, GO Notes, TAN | 1.25 | 2/12/13 | 28,730,000 | | 28,738,102 |
| Delaware—1.1% | | | | | |
| Delaware Health Facilities Authority, | | | | | |
| Revenue (Christiana Care Health Services) | 0.09 | 2/7/13 | 25,000,000 | a | 25,000,000 |
| District of Columbia—.9% | | | | | |
| District of Columbia, Revenue (American Legacy Foundation Issue) | 0.09 | 2/7/13 | 22,000,000 | a | 22,000,000 |
| Florida—1.6% | | | | | |
| Collier County Health Facilities Authority, | | | | | |
| Revenue, CP (Cleveland Clinic Health System) | 0.14 | 5/21/13 | 20,000,000 | | 20,000,000 |
| Sunshine State Government Financing Commission, | | | | | |
| Revenue, CP (Liquidity Facility; JPMorgan Chase Bank) | 0.18 | 5/9/13 | 10,000,000 | | 10,000,000 |
| Sunshine State Government Financing Commission, | | | | | |
| Revenue, CP (Liquidity Facility; JPMorgan Chase Bank) | 0.19 | 6/7/13 | 7,000,000 | | 7,000,000 |
| Georgia—1.4% | | | | | |
| DeKalb County School District, GO Notes | 5.00 | 2/1/13 | 4,000,000 | | 4,000,000 |
| Municipal Gas Authority of Georgia, Gas Revenue, | | | | | |
| Refunding (Gas Portfolio III Project) | 2.00 | 5/22/13 | 13,000,000 | | 13,065,596 |
| Municipal Gas Authority of Georgia, Gas Revenue, | | | | | |
| Refunding (Gas Portfolio III Project) | 2.00 | 10/1/13 | 10,800,000 | | 10,921,341 |
| Thomasville Hospital Authority, RAC (John D. Archbold Memorial | | | | | |
| Hospital, Inc. Project) (LOC; Branch Banking and Trust Co.) | 0.10 | 2/7/13 | 5,040,000 | a | 5,040,000 |
| Idaho—.5% | | | | | |
| Deutsche Bank Spears/Lifers Trust (Series DBE-1102) | | | | | |
| (Idaho Health Facilities Authority, Revenue (Saint Luke’s | | | | | |
| Health System Project)) (Liquidity Facility; Deutsche | | | | | |
| Bank AG and LOC; Deutsche Bank AG) | 0.15 | 2/7/13 | 10,490,000 a,b,c | | 10,490,000 |
| Illinois—2.6% | | | | | |
| Deutsche Bank Spears/Lifers Trust (Series DBE-502) | | | | | |
| (Chicago, General Airport Third Lien Revenue (Chicago O’Hare | | | | | |
| International Airport)) (Liquidity Facility; Deutsche Bank AG | | | | | |
| and LOC; Deutsche Bank AG) | 0.11 | 2/7/13 | 16,560,000 a,b,c | | 16,560,000 |
| Illinois Educational Facilities Authority, Revenue | | | | | |
| (Saint Xavier University Project) (LOC; Bank of America) | 0.11 | 2/7/13 | 8,205,000 | a | 8,205,000 |
| Illinois Finance Authority, IDR (Fitzpatrick Brothers, Inc. | | | | | |
| Project) (Liquidity Facility; Northern Trust Company) | 0.11 | 2/7/13 | 4,360,000 | a | 4,360,000 |
| Illinois Finance Authority, Revenue, CP (Hospital Sisters Services Inc.) | 0.15 | 4/4/13 | 25,000,000 | | 25,000,000 |
| Lake County, MFHR (Whispering Oaks | | | | | |
| Apartments Project) (LOC; FHLMC) | 0.09 | 2/7/13 | 3,250,000 | a | 3,250,000 |
| Romeoville, Revenue (Lewis University) (LOC; Wells Fargo Bank) | 0.11 | 2/1/13 | 3,500,000 | a | 3,500,000 |
38
| | | | | | |
| Dreyfus Tax Exempt | Coupon | Maturity | Principal | | |
| Cash Management (continued) | Rate (%) | Date | Amount ($) | | Value ($) |
| |
| Short-Term Investments (continued) | | | | | |
| Indiana—1.7% | | | | | |
| Deutsche Bank Spears/Lifers Trust (Series DBE-549) (Boone County | | | | | |
| Hospital Association, LR, Refunding) (Liquidity Facility; | | | | | |
| Deutsche Bank AG and LOC; Deutsche Bank AG) | 0.20 | 2/7/13 | 8,440,000 a,b,c | | 8,440,000 |
| Indiana Finance Authority, IDR (Midwest Fertilizer Corporation Project) | 0.20 | 7/1/13 | 30,000,000 | | 30,000,000 |
| Iowa—1.5% | | | | | |
| Iowa Finance Authority, Midwestern Disaster Area | | | | | |
| Revenue (Iowa Fertilizer Company Project) | 0.18 | 4/12/13 | 35,000,000 | | 35,000,000 |
| Kansas—.1% | | | | | |
| Olathe, Health Facilities Revenue (Olathe Medical | | | | | |
| Center) (LOC; Bank of America) | 0.14 | 2/1/13 | 1,900,000 | a | 1,900,000 |
| Louisiana—1.5% | | | | | |
| Louisiana Public Facilities Authority, Revenue | | | | | |
| (Air Products and Chemicals Project) | 0.10 | 2/1/13 | 12,300,000 | a | 12,300,000 |
| Louisiana Public Facilities Authority, Revenue | | | | | |
| (Tiger Athletic Foundation Project) (LOC; FHLB) | 0.10 | 2/7/13 | 14,680,000 | a | 14,680,000 |
| Port of New Orleans Board of Commissioners, | | | | | |
| Subordinate Lien Revenue, Refunding (LOC; FHLB) | 0.10 | 2/7/13 | 8,650,000 | a | 8,650,000 |
| Maine—.5% | | | | | |
| Maine Finance Authority, Revenue | | | | | |
| (Waynflete School Issue) (LOC; JPMorgan Chase Bank) | 0.11 | 2/7/13 | 10,640,000 | a | 10,640,000 |
| Maryland—4.6% | | | | | |
| Anne Arundel County, GO Notes (Consolidated General Improvements) | 5.00 | 4/1/13 | 2,305,000 | | 2,322,915 |
| Baltimore County Revenue Authority, | | | | | |
| Golf System Revenue (LOC; M&T Trust) | 0.13 | 2/7/13 | 2,500,000 | a | 2,500,000 |
| Frederick County, Revenue (Homewood, Inc. Facility) (LOC; M&T Trust) | 0.10 | 2/7/13 | 10,500,000 | a | 10,500,000 |
| Frederick County, Revenue, Refunding | | | | | |
| (Manekin-Frederick Associates Facility) (LOC; M&T Trust) | 0.22 | 2/7/13 | 1,690,000 | a | 1,690,000 |
| Maryland Economic Development Corporation, | | | | | |
| Revenue (Easter Seals Facility) (LOC; M&T Trust) | 0.15 | 2/7/13 | 6,390,000 | a | 6,390,000 |
| Maryland Health and Higher Educational Facilities | | | | | |
| Authority, Revenue (De Matha Catholic High School | | | | | |
| Issue) (LOC; Branch Banking and Trust Co.) | 0.10 | 2/7/13 | 9,315,000 | a | 9,315,000 |
| Maryland Industrial Development Financing Authority, | | | | | |
| Recovery Zone Facility Revenue (Wexford Maryland | | | | | |
| BioPark 3, LLC Facility) (LOC; M&T Trust) | 0.15 | 2/7/13 | 20,000,000 | a | 20,000,000 |
| Montgomery County, CP (Liquidity Facility; | | | | | |
| State Street Bank and Trust Co.) | 0.15 | 4/10/13 | 13,450,000 | | 13,450,000 |
| Montgomery County, CP (Liquidity Facility; JPMorgan Chase Bank) | 0.18 | 3/13/13 | 20,000,000 | | 20,000,000 |
| Montgomery County, CP (Liquidity Facility; JPMorgan Chase Bank) | 0.17 | 5/8/13 | 20,000,000 | | 20,000,000 |
| Massachusetts—3.1% | | | | | |
| Lawrence, GO Notes, BAN (State Qualified Deficit Financing) | 1.50 | 6/1/13 | 8,262,450 | | 8,290,774 |
STATEMENT OF INVESTMENTS (continued)
| | | | | | |
| Dreyfus Tax Exempt | Coupon | Maturity | Principal | | |
| Cash Management (continued) | Rate (%) | Date | Amount ($) | | Value ($) |
| |
| Short-Term Investments (continued) | | | | | |
| Massachusetts (continued) | | | | | |
| Massachusetts Bay Transportation Authority, General Transportation | | | | | |
| System Revenue (Liquidity Facility; Bank of America) | 0.18 | 2/7/13 | 3,150,000 | a | 3,150,000 |
| Massachusetts Bay Transportation Authority, Sales Tax | | | | | |
| Revenue, CP (Liquidity Facility; State Street Bank and Trust Co.) | 0.17 | 2/13/13 | 12,000,000 | | 12,000,000 |
| Massachusetts Development Finance Agency, Revenue | | | | | |
| (Brooksby Village, Inc. Project) (LOC; Bank of America) | 0.10 | 2/7/13 | 16,000,000 | a | 16,000,000 |
| Massachusetts Health and Educational Facilities Authority, | | | | | |
| Revenue (Partners HealthCare System Issue) | 0.09 | 2/7/13 | 12,750,000 | a | 12,750,000 |
| Massachusetts Health and Educational Facilities Authority, | | | | | |
| Revenue (Partners HealthCare System, Capital Asset | | | | | |
| Program Issue) (Liquidity Facility; JPMorgan Chase Bank) | 0.09 | 2/7/13 | 10,000,000 | a | 10,000,000 |
| Massachusetts Industrial Finance Agency, Revenue | | | | | |
| (The New England College of Optometry Issue) (LOC; FHLB) | 0.10 | 2/7/13 | 4,865,000 | a | 4,865,000 |
| Southbridge, GO Notes, BAN | 1.50 | 5/15/13 | 5,500,000 | | 5,517,273 |
| Michigan—3.4% | | | | | |
| Board of Trustees of the Michigan State University, CP | 0.12 | 2/11/13 | 27,800,000 | | 27,800,000 |
| Board of Trustees of the Michigan State University, CP | 0.14 | 2/19/13 | 10,000,000 | | 10,000,000 |
| Michigan Finance Authority, State Aid Revenue Notes | 2.00 | 8/20/13 | 10,000,000 | | 10,087,288 |
| University of Michigan, General Revenue, CP | 0.12 | 2/11/13 | 20,200,000 | | 20,200,000 |
| Waterford Charter Township Economic Development Corporation, | | | | | |
| LOR, Refunding (Canterbury Health Care, Inc. Project) (LOC; FHLB) | 0.10 | 2/7/13 | 9,850,000 | a | 9,850,000 |
| Minnesota—1.1% | | | | | |
| Southern Minnesota Municipal Power Agency, Power Supply | | | | | |
| System Revenue, CP (Liquidity Facility; U.S. Bank NA) | 0.14 | 3/18/13 | 11,000,000 | | 11,000,000 |
| University of Minnesota, CP | 0.12 | 2/11/13 | 15,000,000 | | 15,000,000 |
| Mississippi—.2% | | | | | |
| Mississippi Business Finance Corporation, | | | | | |
| Gulf Opportunity Zone IDR (Chevron U.S.A. Inc. Project) | 0.10 | 2/1/13 | 4,050,000 | a | 4,050,000 |
| Missouri—2.4% | | | | | |
| Missouri Health and Educational Facilities Authority, Health Facilities | | | | | |
| Revenue (SSM Health Care) (Liquidity Facility; Citibank NA) | 0.10 | 2/7/13 | 28,750,000 | a | 28,750,000 |
| Missouri Health and Educational Facilities Authority, | | | | | |
| Revenue (Ascension Health Senior Health Group) | 0.10 | 2/7/13 | 7,100,000 | a | 7,100,000 |
| Saint Louis, General Revenue Fund, TRAN | 2.00 | 5/30/13 | 20,000,000 | | 20,115,004 |
| Nebraska—1.9% | | | | | |
| Lincoln, Electric System Revenue, CP | | | | | |
| (Liquidity Facility; Bank of Tokyo-Mitsubishi UFJ) | 0.13 | 3/18/13 | 20,000,000 | | 20,000,000 |
| Nebraska Investment Finance Authority, | | | | | |
| SFHR (Liquidity Facility; FHLB) | 0.10 | 2/7/13 | 24,300,000 | a | 24,300,000 |
| Nevada—2.3% | | | | | |
| Austin Trust (Series 1171) (Clark County, GO Bond | | | | | |
| Bank Bonds) (Liquidity Facility; Bank of America) | 0.10 | 2/7/13 | 9,770,000 a,b,c | | 9,770,000 |
| Clark County, Airport System Junior Subordinate Lien Revenue | 2.00 | 7/1/13 | 36,000,000 | | 36,243,445 |
| Clark County, Airport System Subordinate | | | | | |
| Lien Revenue (LOC; Citibank NA) | 0.11 | 2/7/13 | 8,100,000 | a | 8,100,000 |
40
| | | | | | |
| Dreyfus Tax Exempt | Coupon | Maturity | Principal | | |
| Cash Management (continued) | Rate (%) | Date | Amount ($) | | Value ($) |
| |
| Short-Term Investments (continued) | | | | | |
| New Hampshire—.2% | | | | | |
| New Hampshire Health and Education Facilities Authority, | | | | | |
| Revenue (University System of New Hampshire Issue) | | | | | |
| (Liquidity Facility; U.S. Bank NA) | 0.11 | 2/1/13 | 5,100,000 | a | 5,100,000 |
| New Jersey—1.1% | | | | | |
| Monroe Township, GO Notes, BAN | 1.00 | 2/6/13 | 25,000,000 | | 25,002,541 |
| New York—4.6% | | | | | |
| Dutchess County Industrial Development Agency, | | | | | |
| Civic Facility Revenue (Anderson Foundation for | | | | | |
| Autism, Inc. Project) (LOC; M&T Trust) | 0.15 | 2/7/13 | 8,200,000 | a | 8,200,000 |
| JPMorgan Chase Putters/Drivers Trust (Series 4072) | | | | | |
| (Metropolitan Transportation Authority, | | | | | |
| Transportation Revenue) (Liquidity Facility; | | | | | |
| JPMorgan Chase Bank and LOC; JPMorgan Chase Bank) | 0.12 | 2/1/13 | 30,995,000 a,b,c | | 30,995,000 |
| Lancaster Industrial Development Agency, Civic Facility Revenue | | | | | |
| (GreenField Manor, Inc. Project) (LOC; M&T Trust) | 0.15 | 2/7/13 | 5,765,000 | a | 5,765,000 |
| New York City, GO Notes (LOC; Sumitomo Mitsui Banking Corp.) | 0.10 | 2/7/13 | 10,000,000 | a | 10,000,000 |
| New York State Housing Finance Agency, Service Contract | | | | | |
| Revenue, Refunding (LOC; Bank of America) | 0.16 | 2/7/13 | 4,310,000 | a | 4,310,000 |
| Tompkins County Industrial Development Agency, | | | | | |
| Civic Facility Revenue (Community Development | | | | | |
| Properties Ithaca, Inc. Project) (LOC; M&T Trust) | 0.20 | 2/7/13 | 9,350,000 | a | 9,350,000 |
| Triborough Bridge and Tunnel Authority, General Revenue, | | | | | |
| Refunding (MTA Bridges and Tunnels) (Liquidity Facility; | | | | | |
| Landesbank Hessen-Thuringen Girozentrale) | 0.15 | 2/1/13 | 39,100,000 | a | 39,100,000 |
| Ohio—1.4% | | | | | |
| Allen County, Hospital Facilities | | | | | |
| Revenue, (Catholic Health Partners) | 0.09 | 2/7/13 | 17,500,000 | a | 17,500,000 |
| Lucas County, GO Notes, BAN | | | | | |
| (Various Purpose Improvement Notes) | 1.00 | 7/18/13 | 2,550,000 | | 2,557,315 |
| Ohio Higher Educational Facility Commission, | | | | | |
| Revenue, CP (Cleveland Clinic Health System) | 0.20 | 2/7/13 | 13,000,000 | | 13,000,000 |
| Oklahoma—.2% | | | | | |
| Oklahoma Water Resource Board, Revenue | | | | | |
| (Liquidity Facility; State Street Bank and Trust Co.) | 0.30 | 3/1/13 | 4,040,000 | | 4,040,000 |
| Oregon—1.1% | | | | | |
| Medford Hospital Facilities Authority, Revenue | | | | | |
| (Rogue Valley Manor Project) (LOC; Bank of America) | 0.14 | 2/1/13 | 19,600,000 | a | 19,600,000 |
| Oregon, GO Notes (Veterans’ Welfare Bonds) | | | | | |
| (Liquidity Facility; Bank of Tokyo-Mitsubishi UFJ) | 0.09 | 2/7/13 | 5,250,000 | a | 5,250,000 |
| Pennsylvania—9.0% | | | | | |
| Bucks County Industrial Development Authority, | | | | | |
| Revenue (Pennswood Village Project) (LOC; Bank of America) | 0.14 | 2/7/13 | 8,200,000 | a | 8,200,000 |
| Cumberland County Municipal Authority, Revenue | | | | | |
| (Presbyterian Homes, Inc. Project) (LOC; M&T Trust) | 0.12 | 2/7/13 | 7,840,000 | a | 7,840,000 |
| East Hempfield Township Industrial Development Authority, | | | | | |
| Revenue (The Mennonite Home Project) (LOC; M&T Trust) | 0.15 | 2/7/13 | 10,870,000 | a | 10,870,000 |
STATEMENT OF INVESTMENTS (continued)
| | | | | | |
| Dreyfus Tax Exempt | Coupon | Maturity | Principal | | |
| Cash Management (continued) | Rate (%) | Date | Amount ($) | | Value ($) |
| |
| Short-Term Investments (continued) | | | | | |
| Pennsylvania (continued) | | | | | |
| East Hempfield Township Industrial Development Authority, | | | | | |
| Revenue (The Mennonite Home Project) (LOC; M&T Trust) | 0.15 | 2/7/13 | 4,805,000 | a | 4,805,000 |
| Emmaus General Authority, Local Government Revenue | | | | | |
| (Bond Pool Program) (LOC; U.S. Bank NA) | 0.09 | 2/7/13 | 5,400,000 | a | 5,400,000 |
| Emmaus General Authority, Local Government Revenue | | | | | |
| (Bond Pool Program) (LOC; U.S. Bank NA) | 0.09 | 2/7/13 | 10,400,000 | a | 10,400,000 |
| Emmaus General Authority, Local Government Revenue | | | | | |
| (Bond Pool Program) (LOC; U.S. Bank NA) | 0.09 | 2/7/13 | 10,000,000 | a | 10,000,000 |
| Emmaus General Authority, Local Government Revenue | | | | | |
| (Bond Pool Program) (LOC; U.S. Bank NA) | 0.09 | 2/7/13 | 8,200,000 | a | 8,200,000 |
| Emmaus General Authority, Local Government Revenue | | | | | |
| (Bond Pool Program) (LOC; U.S. Bank NA) | 0.09 | 2/7/13 | 10,000,000 | a | 10,000,000 |
| General Authority of South Central Pennsylvania, | | | | | |
| Revenue (Lutheran Social Services of South Central | | | | | |
| Pennsylvania Project) (LOC; M&T Trust) | 0.15 | 2/7/13 | 15,650,000 | a | 15,650,000 |
| Horizon Hospital System Authority, Senior Health and Housing | | | | | |
| Facilities Revenue (Saint Paul Homes Project) (LOC; M&T Trust) | 0.15 | 2/7/13 | 9,300,000 | a | 9,300,000 |
| Lancaster County Hospital Authority, Health Center | | | | | |
| Revenue (LUTHERCARE Project) (LOC; M&T Trust) | 0.10 | 2/7/13 | 33,253,000 | a | 33,253,000 |
| Lancaster County Hospital Authority, Revenue | | | | | |
| (Landis Home Retirement Community Project) (LOC; M&T Trust) | 0.15 | 2/7/13 | 7,970,000 | a | 7,970,000 |
| Mars Area School District, GO Notes | 1.00 | 3/1/13 | 2,275,000 | | 2,275,347 |
| North Penn Water Authority, Water Revenue (LOC; U.S. Bank NA) | 0.10 | 2/7/13 | 11,800,000 | a | 11,800,000 |
| Pennsylvania Economic Development Financing Authority, | | | | | |
| Unemployment Compensation Revenue (LOC; PNC Bank NA) | 0.11 | 2/7/13 | 13,500,000 | a | 13,500,000 |
| Philadelphia, GO Notes, TRAN | 1.00 | 6/28/13 | 33,000,000 | | 33,102,354 |
| Pittsburgh Water and Sewer Authority, Water and Sewer | | | | | |
| System Subordinate Revenue, Refunding (LOC; FHLB) | 0.40 | 9/1/13 | 2,000,000 | | 1,999,969 |
| Ridley School District, GO Notes (LOC; TD Bank) | 0.10 | 2/7/13 | 2,600,000 | a | 2,600,000 |
| York General Authority, Revenue (Strand-Capitol | | | | | |
| Performing Arts Center Project) (LOC; M&T Trust) | 0.15 | 2/7/13 | 2,025,000 | a | 2,025,000 |
| Tennessee—4.4% | | | | | |
| Blount County Public Building Authority, Local Government Public | | | | | |
| Improvement Revenue (LOC; Branch Banking and Trust Co.) | 0.10 | 2/7/13 | 3,045,000 | a | 3,045,000 |
| Blount County Public Building Authority, Local Government Public | | | | | |
| Improvement Revenue (LOC; Branch Banking and Trust Co.) | 0.10 | 2/7/13 | 6,000,000 | a | 6,000,000 |
| Blount County Public Building Authority, Local Government Public | | | | | |
| Improvement Revenue (LOC; Branch Banking and Trust Co.) | 0.10 | 2/7/13 | 47,210,000 | a | 47,210,000 |
| Blount County Public Building Authority, Local Government Public | | | | | |
| Improvement Revenue (LOC; Branch Banking and Trust Co.) | 0.10 | 2/7/13 | 9,085,000 | a | 9,085,000 |
| Metropolitan Government of Nashville and Davidson | | | | | |
| County, CP (Liquidity Facility: California Public Employee | | | | | |
| Retirement System, California State Teachers Retirement | | | | | |
| System and State Street Bank and Trust Co.) | 0.14 | 3/5/13 | 17,000,000 | | 17,000,000 |
42
| | | | | | |
| Dreyfus Tax Exempt | Coupon | Maturity | Principal | | |
| Cash Management (continued) | Rate (%) | Date | Amount ($) | | Value ($) |
| |
| Short-Term Investments (continued) | | | | | |
| Tennessee (continued) | | | | | |
| Tennessee, CP (Liquidity Facility; Tennessee | | | | | |
| Consolidated Retirement System) | 0.14 | 3/4/13 | 20,000,000 | | 20,000,000 |
| Texas—17.6% | | | | | |
| Dallas, Waterworks and Sewer System Revenue, CP | | | | | |
| (Liquidity Facility: California State Teacher Retirement | | | | | |
| System and State Street Bank and Trust Co.) | 0.14 | 4/5/13 | 8,600,000 | | 8,600,000 |
| Dallas Independent School District, Maintenance Tax Notes | 5.00 | 2/15/13 | 2,720,000 | | 2,724,795 |
| Harris County, CP (Liquidity Facility; Bank of Tokyo-Mitsubishi UFJ) | 0.13 | 3/18/13 | 20,000,000 | | 20,000,000 |
| Harris County Cultural Education Facilities Finance Corporation, | | | | | |
| Medical Facilities Mortgage Revenue, Refunding (Baylor | | | | | |
| College of Medicine) (LOC; Barclays Bank PLC) | 0.10 | 2/7/13 | 13,800,000 | a | 13,800,000 |
| Harris County Health Facilities Development Corporation, | | | | | |
| HR, Refunding (Texas Children’s Hospital Project) | | | | | |
| (Liquidity Facility; Bank of America) | 0.14 | 2/1/13 | 34,845,000 | a | 34,845,000 |
| Jefferson County Industrial Development Corporation, | | | | | |
| Hurricane Ike Disaster Area Revenue (Jefferson | | | | | |
| Refinery, L.L.C. Project) (LOC; Branch Banking and Trust Co.) | 0.45 | 3/15/13 | 50,300,000 | | 50,300,000 |
| Jefferson County Industrial Development Corporation, | | | | | |
| Hurricane Ike Disaster Area Revenue (Jefferson | | | | | |
| Refinery, L.L.C. Project) (LOC; Branch Banking and Trust Co.) | 0.45 | 3/15/13 | 5,665,000 | | 5,665,000 |
| JPMorgan Chase Putters/Drivers Trust (Series 4264) | | | | | |
| (Texas, TRAN) (Liquidity Facility; JPMorgan Chase Bank) | 0.12 | 2/1/13 | 20,000,000 a,b,c | | 20,000,000 |
| Lower Colorado River Authority, CP (Transmission | | | | | |
| Service Corporation) (LOC: JPMorgan Chase and | | | | | |
| State Street Bank and Trust Co.) | 0.14 | 3/11/13 | 10,000,000 | | 10,000,000 |
| North Central Texas Health Facilities Development | | | | | |
| Corporation, HR (Baylor Health Care System Project) | | | | | |
| (Liquidity Facility; Wells Fargo Bank) | 0.10 | 2/7/13 | 14,770,000 | a | 14,770,000 |
| North Texas Tollway Authority, | | | | | |
| Revenue, CP (LOC; JPMorgan Chase Bank) | 0.14 | 3/12/13 | 15,000,000 | | 15,000,000 |
| North Texas Tollway Authority, Revenue, | | | | | |
| CP (LOC; JPMorgan Chase Bank) | 0.15 | 3/13/13 | 12,000,000 | | 12,000,000 |
| RBC Municipal Products Inc. Trust (Series E-27) (Harris County | | | | | |
| Health Facilities Development Corporation, HR, Refunding | | | | | |
| (Memorial Hermann Healthcare System)) (Liquidity Facility; | | | | | |
| Royal Bank of Canada and LOC; Royal Bank of Canada) | 0.10 | 2/7/13 | 10,000,000 a,b,c | | 10,000,000 |
| Red River Education Finance Corporation, Higher Education | | | | | |
| Revenue (Texas Christian University Project) | 0.09 | 2/7/13 | 26,000,000 | a | 26,000,000 |
| San Antonio, Electric and Gas Revenue, CP | | | | | |
| (Liquidity Facility; Bank of Tokyo-Mitsubishi UFJ) | 0.15 | 4/9/13 | 12,000,000 | | 12,000,000 |
| San Antonio, Water System Revenue, CP | | | | | |
| (LOC; Bank of Tokyo-Mitsubishi UFJ Ltd.) | 0.17 | 3/14/13 | 7,500,000 | | 7,500,000 |
| Tarrant County Health Facilities Development | | | | | |
| Corporation, HR (Cook Children’s Medical Center Project) | 0.09 | 2/7/13 | 36,300,000 | a | 36,300,000 |
STATEMENT OF INVESTMENTS (continued)
| | | | | | |
| Dreyfus Tax Exempt | Coupon | Maturity | Principal | | |
| Cash Management (continued) | Rate (%) | Date | Amount ($) | | Value ($) |
| |
| Short-Term Investments (continued) | | | | | |
| Texas (continued) | | | | | |
| Tarrant Regional Water District, | | | | | |
| Water Improvement Revenue, Refunding | 5.00 | 3/1/13 | 1,800,000 | | 1,806,444 |
| Texas, TRAN | 2.50 | 8/30/13 | 40,000,000 | | 40,523,331 |
| Texas Municipal Power Agency, Revenue, CP | | | | | |
| (LOC: Bank of America and JPMorgan Chase Bank) | 0.14 | 2/19/13 | 10,000,000 | | 10,000,000 |
| Texas Public Finance Authority, Revenue, CP | 0.12 | 3/18/13 | 28,000,000 | | 28,000,000 |
| Texas Transportation Commission, GO Notes (Mobility Fund) | | | | | |
| (Liquidity Facility; Royal Bank of Canada) | 0.10 | 2/7/13 | 14,320,000 | a | 14,320,000 |
| Texas Water Development Board, State Revolving Fund | | | | | |
| Subordinate Lien Revenue (Citigroup ROCS, | | | | | |
| Series RR II R-11746) (Liquidity Facility; Citibank NA) | 0.10 | 2/7/13 | 10,940,000 a,b,c | | 10,940,000 |
| Utah—2.3% | | | | | |
| Murray City, HR (Intermountain Health Care Health Services, Inc.) | 0.09 | 2/7/13 | 32,000,000 | a | 32,000,000 |
| Murray City, HR (Intermountain Health Care Health Services, Inc.) | 0.09 | 2/7/13 | 100,000 | a | 100,000 |
| Utah County, HR (Intermountain Health Care Health | | | | | |
| Services, Inc.) (Liquidity Facility; U.S. Bank NA) | 0.10 | 2/7/13 | 10,000,000 | a | 10,000,000 |
| Utah Housing Finance Agency, MFHR, Refunding (Candlestick | | | | | |
| Apartments Project) (Liquidity Facility; FNMA and LOC; FNMA) | 0.14 | 2/7/13 | 6,400,000 | a | 6,400,000 |
| Weber County, HR (Intermountain Health Care Health | | | | | |
| Services, Inc.) (Liquidity Facility; U.S. Bank NA) | 0.11 | 2/7/13 | 5,000,000 | a | 5,000,000 |
| Virginia—1.3% | | | | | |
| Harrisonburg Industrial Development Authority, Revenue, | | | | | |
| Refunding (Virginia Mennonite Retirement Community) | | | | | |
| (LOC; Branch Banking and Trust Co.) | 0.10 | 2/7/13 | 1,000,000 | a | 1,000,000 |
| University of Virginia, University Revenue, CP | 0.09 | 2/12/13 | 18,300,000 | | 18,300,000 |
| Virginia College Building Authority, Educational Facilities | | | | | |
| Revenue (21st Century College and Equipment Programs) | | | | | |
| (Liquidity Facility; Wells Fargo Bank) | 0.11 | 2/1/13 | 11,970,000 | a | 11,970,000 |
| Washington—1.0% | | | | | |
| Washington, Various Purpose GO, Refunding (P-FLOATS | | | | | |
| Series PT-4658) (Liquidity Facility; Bank of America) | 0.10 | 2/7/13 | 18,185,000 a,b,c | | 18,185,000 |
| Wells Fargo Stage Trust (Series 36C) (Washington Health Care | | | | | |
| Facilities Authority, Revenue (PeaceHealth)) (Liquidity | | | | | |
| Facility; Wells Fargo Bank and LOC; Wells Fargo Bank) | 0.10 | 2/7/13 | 6,000,000 a,b,c | | 6,000,000 |
| Wisconsin—4.2% | | | | | |
| Milwaukee Redevelopment Authority, Redevelopment LR (University | | | | | |
| of Wisconsin-Milwaukee Kenilworth Project) (LOC; U.S. Bank NA) | 0.10 | 2/7/13 | 5,950,000 | a | 5,950,000 |
| Saint Croix Central School District, Note Anticipation Notes | 2.25 | 6/1/13 | 4,700,000 | | 4,711,390 |
44
| | | | | | |
| Dreyfus Tax Exempt | Coupon | Maturity | Principal | | |
| Cash Management (continued) | Rate (%) | Date | Amount ($) | | Value ($) |
| |
| Short-Term Investments (continued) | | | | | |
| Wisconsin (continued) | | | | | |
| Wisconsin Health and Educational Facilities Authority, Revenue | | | | | |
| (Ascension Health Senior Credit Group) (Eclipse Funding Trust, | | | | | |
| Series 0029) (Liquidity Facility; U.S. Bank NA and LOC; U.S. Bank NA) | 0.10 | 2/7/13 | 22,955,000 a,b,c | | 22,955,000 |
| Wisconsin Health and Educational Facilities Authority, | | | | | |
| Revenue (Aurora Health Care, Inc.) (LOC; JPMorgan Chase Bank) | 0.27 | 2/5/13 | 60,000,000 | | 60,000,000 |
| Wisconsin Health and Educational Facilities Authority, | | | | | |
| Revenue (Fort Healthcare, Inc.) (LOC; JPMorgan Chase Bank) | 0.13 | 2/1/13 | 3,525,000 | a | 3,525,000 |
| Wyoming—1.3% | | | | | |
| Wyoming Student Loan Corporation, Student Loan | | | | | |
| Revenue, Refunding (LOC; Royal Bank of Canada) | 0.10 | 2/7/13 | 30,000,000 | a | 30,000,000 |
| U.S. Related—.6% | | | | | |
| Puerto Rico Sales Tax Financing Corporation, Sales Tax | | | | | |
| Revenue (Citigroup ROCS, Series RR II R-11765) | | | | | |
| (Liquidity Facility; Citibank NA) | 0.13 | 2/7/13 | 14,815,000 a,b,c | | 14,815,000 |
| |
| Total Investments (cost $2,318,276,866) | | | 99.9 | % | 2,318,276,866 |
| Cash and Receivables (Net) | | | .1 | % | 2,596,481 |
| Net Assets | | | 100.0 | % | 2,320,873,347 |
| |
| a Variable rate demand note—rate shown is the interest rate in effect at January 31, 2013. Maturity date represents the next demand date, or the ultimate maturity date if earlier. |
| b Securities exempt from registration pursuant to Rule 144A under the Securities Act of 1933.These securities may be resold in transactions exempt from registration, normally to qualified |
| institutional buyers.At January 31, 2013, these securities amounted to $288,450,000 or 12.4% of net assets. |
| c The fund does not directly own the municipal security indicated; the fund owns an interest in a special purpose entity that, in turn, owns the underlying municipal security.The special |
| purpose entity permits the fund to own interests in underlying assets, but in a manner structured to provide certain advantages not inherent in the underlying bonds (e.g., enhanced |
| liquidity, yields linked to short-term rates). |
| | | | | | | |
| Summary of Combined Ratings (Unaudited) | | | |
| |
| Fitch | | or | Moody’s | or | Standard & Poor’s | Value (%)† |
| F1+, F1 | | | VMIG1,MIG1,P1 | | SP1+,SP1,A1+,A1 | 95.7 |
| AAA,AA,Ad | | | Aaa,Aa,Ad | | AAA,AA,Ad | 4.3 |
| | | | | | | 100.0 |
| | |
| † | Based on total investments. |
| d | Notes which are not F, MIG and SP rated are represented by bond ratings of the issuers. |
See notes to financial statements.
STATEMENT OF INVESTMENTS
January 31, 2013
| | | | | | |
| Dreyfus California AMT-Free | Coupon | Maturity | Principal | | |
| Municipal Cash Management | Rate (%) | Date | Amount ($) | | Value ($) |
| |
| Short-Term Investments—99.8% | | | | | |
| California—94.8% | | | | | |
| ABAG Finance Authority for Nonprofit Corporations, Revenue | | | | | |
| (California Alumni Association Project) (LOC; Bank of America) | 0.13 | 2/7/13 | 3,500,000 | a | 3,500,000 |
| ABAG Finance Authority for Nonprofit Corporations, Revenue | | | | | |
| (Santa Cruz Montessori School) (LOC; Comerica Bank) | 0.15 | 2/7/13 | 665,000 | a | 665,000 |
| ABAG Finance Authority for Nonprofit Corporations, Revenue, | | | | | |
| Refunding (Eskaton Properties, Inc.) (LOC; U.S. Bank NA) | 0.10 | 2/7/13 | 14,625,000 | a | 14,625,000 |
| Alameda County Industrial Development Authority, | | | | | |
| Recovery Zone Facility Revenue (Dale Hardware, Inc. | | | | | |
| Project) (LOC; Comerica Bank) | 0.12 | 2/7/13 | 2,580,000 | a | 2,580,000 |
| Alameda County Industrial Development Authority, | | | | | |
| Revenue (Santini Foods, Inc. Project) (LOC; Comerica Bank) | 0.12 | 2/7/13 | 2,900,000 | a | 2,900,000 |
| California, GO Notes (LOC; JPMorgan Chase Bank) | 0.10 | 2/1/13 | 19,510,000 | a | 19,510,000 |
| California Enterprise Development Authority, IDR | | | | | |
| (Tri Tool Inc. Project) (LOC; Comerica Bank) | 0.15 | 2/7/13 | 10,000,000 | a | 10,000,000 |
| California Enterprise Development Authority, | | | | | |
| Recovery Zone Facility Revenue (Regional | | | | | |
| Properties, Inc. Project) (LOC; FHLB) | 0.11 | 2/7/13 | 15,000,000 | a | 15,000,000 |
| California Infrastructure and Economic Development Bank, | | | | | |
| Revenue (Goodwill Industries of Orange County, | | | | | |
| California) (LOC; Wells Fargo Bank) | 0.15 | 2/7/13 | 1,100,000 | a | 1,100,000 |
| California Infrastructure and Economic Development Bank, | | | | | |
| Revenue (Southern California Public Radio | | | | | |
| Project) (LOC; JPMorgan Chase Bank) | 0.13 | 2/1/13 | 2,685,000 | a | 2,685,000 |
| California Infrastructure and Economic Development Bank, | | | | | |
| Revenue (SRI International) (LOC; Wells Fargo Bank) | 0.11 | 2/7/13 | 2,610,000 | a | 2,610,000 |
| California Infrastructure and Economic Development Bank, | | | | | |
| Revenue, Refunding (Pacific Gas and Electric | | | | | |
| Company) (LOC; Mizuho Corporate Bank) | 0.10 | 2/1/13 | 10,800,000 | a | 10,800,000 |
| California Municipal Finance Authority, Revenue | | | | | |
| (Notre Dame High School, San Jose) (LOC; Comerica Bank) | 0.15 | 2/7/13 | 1,000,000 | a | 1,000,000 |
| California Municipal Finance Authority, | | | | | |
| Revenue (Trinity School) (LOC; Comerica Bank) | 0.15 | 2/7/13 | 680,000 | a | 680,000 |
| California Pollution Control Financing Authority, EIR | | | | | |
| (Air Products and Chemicals, Inc./Wilmington Facility) | 0.10 | 2/1/13 | 21,100,000 | a | 21,100,000 |
| California Pollution Control Financing Authority, EIR | | | | | |
| (Air Products Manufacturing Corporation Project) | 0.10 | 2/1/13 | 1,000,000 | a | 1,000,000 |
| California Pollution Control Financing Authority, PCR, Refunding | | | | | |
| (Pacific Gas and Electric Company) (LOC; JPMorgan Chase Bank) | 0.08 | 2/1/13 | 2,700,000 | a | 2,700,000 |
| California Pollution Control Financing Authority, SWDR | | | | | |
| (Athens Services Project) (LOC; Wells Fargo Bank) | 0.10 | 2/7/13 | 25,365,000 | a | 25,365,000 |
| California Pollution Control Financing Authority, SWDR | | | | | |
| (Big Bear Disposal, Inc. Project) (LOC; Union Bank NA) | 0.11 | 2/7/13 | 2,325,000 | a | 2,325,000 |
| California Pollution Control Financing Authority, SWDR | | | | | |
| (Crown Disposal Company, Inc. Project) (LOC; Union Bank NA) | 0.11 | 2/7/13 | 2,825,000 | a | 2,825,000 |
46
| | | | | | |
| Dreyfus California AMT-Free | Coupon | Maturity | Principal | | |
| Municipal Cash Management (continued) | Rate (%) | Date | Amount ($) | | Value ($) |
| |
| Short-Term Investments (continued) | | | | | |
| California (continued) | | | | | |
| California Pollution Control Financing Authority, SWDR | | | | | |
| (Garden City Sanitation, Inc. Project) (LOC; Comerica Bank) | 0.12 | 2/7/13 | 1,770,000 | a | 1,770,000 |
| California Pollution Control Financing Authority, SWDR | | | | | |
| (Garden City Sanitation, Inc. Project) (LOC; Union Bank NA) | 0.11 | 2/7/13 | 8,130,000 | a | 8,130,000 |
| California Pollution Control Financing Authority, SWDR | | | | | |
| (Mission Trail Waste Systems, Inc. Project) (LOC; Comerica Bank) | 0.12 | 2/7/13 | 2,550,000 | a | 2,550,000 |
| California Pollution Control Financing Authority, SWDR | | | | | |
| (South Bay Recycling Project) (LOC; Union Bank NA) | 0.11 | 2/7/13 | 2,450,000 | a | 2,450,000 |
| California Pollution Control Financing Authority, SWDR, Refunding | | | | | |
| (BLT Enterprises of Fremont LLC Project) (LOC; Union Bank NA) | 0.11 | 2/7/13 | 9,065,000 | a | 9,065,000 |
| California Pollution Control Financing Authority, SWDR, | | | | | |
| Refunding (MarBorg Industries Project) (LOC; Union Bank NA) | 0.11 | 2/7/13 | 3,035,000 | a | 3,035,000 |
| California School Cash Reserve Program Authority, Revenue | 2.00 | 2/1/13 | 11,480,000 | | 11,480,000 |
| California School Cash Reserve Program Authority, Revenue | 2.00 | 4/26/13 | 17,700,000 | | 17,761,667 |
| California School Cash Reserve Program Authority, Revenue | 2.00 | 4/26/13 | 3,500,000 | | 3,512,194 |
| California School Cash Reserve Program Authority, Revenue | 2.00 | 6/3/13 | 2,000,000 | | 2,009,964 |
| California School Cash Reserve Program Authority, Revenue | 2.00 | 10/1/13 | 5,900,000 | | 5,970,399 |
| California School Cash Reserve Program Authority, Revenue | 2.00 | 10/1/13 | 1,530,000 | | 1,547,742 |
| California Statewide Communities Development Authority, | | | | | |
| Revenue (Goodwill of Santa Cruz) (LOC; Wells Fargo Bank) | 0.15 | 2/7/13 | 1,640,000 | a | 1,640,000 |
| California Statewide Communities Development Authority, | | | | | |
| Revenue (Metropolitan Area Advisory Committee | | | | | |
| Project) (LOC; Bank of America) | 0.20 | 2/7/13 | 3,190,000 | a | 3,190,000 |
| California Statewide Communities Development Authority, Revenue | | | | | |
| (Tiger Woods Learning Center Foundation) (LOC; Bank of America) | 0.19 | 2/7/13 | 4,725,000 | a | 4,725,000 |
| Deutsche Bank Spears/Lifers Trust (Series DBE-525) | | | | | |
| (Golden State Tobacco Securitization Corporation, Enhanced | | | | | |
| Tobacco Settlement Asset-Backed Bonds) (Liquidity Facility; | | | | | |
| Deutsche Bank AG and LOC; Deutsche Bank AG) | 0.20 | 2/7/13 | 5,010,000 a,b,c | | 5,010,000 |
| Deutsche Bank Spears/Lifers Trust (Series DBE-561) | | | | | |
| (Azusa Public Financing Authority, Parity Revenue | | | | | |
| (Water System Capital Improvements Program) (Liquidity | | | | | |
| Facility; Deutsche Bank AG and LOC; Deutsche Bank AG) | 0.20 | 2/7/13 | 5,115,000 a,b,c | | 5,115,000 |
| Deutsche Bank Spears/Lifers Trust (Series DBE-575) | | | | | |
| (Elk Grove Finance Authority, Special Tax Revenue) (Liquidity | | | | | |
| Facility; Deutsche Bank AG and LOC; Deutsche Bank AG) | 0.20 | 2/7/13 | 5,020,000 a,b,c,d | | 5,020,000 |
| Deutsche Bank Spears/Lifers Trust (Series DBE-1013) | | | | | |
| (Fontana Public Financing Authority, Tax Allocation | | | | | |
| Revenue (North Fontana Redevelopment Project)) (Liquidity | | | | | |
| Facility; Deutsche Bank AG and LOC; Deutsche Bank AG) | 0.25 | 2/7/13 | 5,200,000 a,b,c | | 5,200,000 |
| Deutsche Bank Spears/Lifers Trust (Series DBE-1083) | | | | | |
| (California Health Facilities Financing Authority, Revenue | | | | | |
| (Catholic Healthcare West)) (Liquidity Facility; | | | | | |
| Deutsche Bank AG and LOC; Deutsche Bank AG) | 0.16 | 2/7/13 | 3,000,000 a,b,c | | 3,000,000 |
STATEMENT OF INVESTMENTS (continued)
| | | | | | |
| Dreyfus California AMT-Free | Coupon | Maturity | Principal | | |
| Municipal Cash Management (continued) | Rate (%) | Date | Amount ($) | | Value ($) |
| |
| Short-Term Investments (continued) | | | | | |
| California (continued) | | | | | |
| Irvine Assessment District Number 97-17, Limited Obligation | | | | | |
| Improvement Bonds (LOC: California State Teachers | | | | | |
| Retirement System and State Street Bank and Trust Co.) | 0.10 | 2/1/13 | 4,000,000 | a | 4,000,000 |
| Irvine Reassessment District Number 05-21, Limited Obligation | | | | | |
| Improvement Bonds (LOC: California State Teachers | | | | | |
| Retirement System and U.S. Bank NA) | 0.07 | 2/1/13 | 30,000,000 | a,d | 30,000,000 |
| Loma Linda, HR (Loma Linda University | | | | | |
| Medical Center) (LOC; Bank of America) | 0.13 | 2/7/13 | 24,800,000 | a | 24,800,000 |
| Los Angeles County Metropolitan Transportation Authority, | | | | | |
| Proposition C Sales Tax Revenue, Refunding | | | | | |
| (Liquidity Facility; Mizuho Corporate Bank) | 0.10 | 2/1/13 | 8,300,000 | a | 8,300,000 |
| Los Angeles Municipal Improvement Corporation, | | | | | |
| LR, CP (LOC; Wells Fargo Bank) | 0.20 | 3/6/13 | 3,000,000 | | 3,000,000 |
| Manteca Redevelopment Agency, Subordinate Tax Allocation | | | | | |
| Revenue, Refunding (Amended Merged Project Area) | | | | | |
| (LOC; State Street Bank and Trust Co.) | 0.09 | 2/1/13 | 12,785,000 | a,d | 12,785,000 |
| Menlo Park Community Development Agency, Tax Allocation | | | | | |
| Revenue, Refunding (Las Pulgas Community Development | | | | | |
| Project) (LOC; State Street Bank and Trust Co.) | 0.09 | 2/1/13 | 19,400,000 | a,d | 19,400,000 |
| Pittsburg Redevelopment Agency, Subordinate Tax Allocation | | | | | |
| Revenue (Los Medanos Community Development Project) | | | | | |
| (Liquidity Facility: California State Teachers Retirement | | | | | |
| System and State Street Bank and Trust Co.) | 0.09 | 2/1/13 | 24,050,000 | a,d | 24,050,000 |
| Ravenswood City School District, GO Notes, TRAN | 1.00 | 2/4/13 | 1,000,000 | | 1,000,053 |
| Riverside County Transportation Commission, | | | | | |
| Sales Tax Revenue (Liquidity Facility; JPMorgan Chase Bank) | 0.10 | 2/7/13 | 9,200,000 | a | 9,200,000 |
| Sacramento County Housing Authority, MFHR, | | | | | |
| Refunding (Stonebridge Apartments) (LOC; FNMA) | 0.20 | 2/7/13 | 8,000,000 | a | 8,000,000 |
| San Bernardino County, MFHR, Refunding (Somerset | | | | | |
| Apartments) (Liquidity Facility; FNMA and LOC; FNMA) | 0.19 | 2/7/13 | 1,800,000 | a | 1,800,000 |
| San Diego County, COP (Museum of Contemporary Art | | | | | |
| San Diego) (LOC; Northern Trust Company) | 0.10 | 2/7/13 | 1,850,000 | a | 1,850,000 |
| San Diego County and San Diego County School | | | | | |
| Districts, TRAN, Program Note Participations | 2.00 | 4/30/13 | 4,700,000 | | 4,719,215 |
| San Pablo Redevelopment Agency, Subordinate Tax | | | | | |
| Allocation Revenue (Tenth Township Redevelopment | | | | | |
| Project) (LOC; Union Bank NA) | 0.09 | 2/1/13 | 20,170,000 | a | 20,170,000 |
| Tahoe Forest Hospital District, Revenue (LOC; U.S. Bancorp) | 0.09 | 2/1/13 | 3,655,000 | a | 3,655,000 |
| Vacaville, MFMR (Quail Run Apartments) | | | | | |
| (Liquidity Facility; FNMA and LOC; FNMA) | 0.10 | 2/7/13 | 400,000 | a | 400,000 |
48
| | | | | | |
| Dreyfus California AMT-Free | Coupon | Maturity | Principal | | |
| Municipal Cash Management (continued) | Rate (%) | Date | Amount ($) | | Value ($) |
| |
| Short-Term Investments (continued) | | | | | |
| U.S. Related—5.0% | | | | | |
| Puerto Rico Sales Tax Financing Corporation, | | | | | |
| Sales Tax Revenue (Citigroup ROCS, Series | | | | | |
| RR II R-11765) (Liquidity Facility; Citibank NA) | 0.13 | 2/7/13 | 19,000,000 a,b,c,d | | 19,000,000 |
| Puerto Rico Sales Tax Financing Corporation, | | | | | |
| Sales Tax Revenue (Citigroup ROCS, Series | | | | | |
| RR II R-11996X) (Liquidity Facility; Citibank NA) | 0.12 | 2/7/13 | 3,045,000 a,b,c,d | | 3,045,000 |
| |
| Total Investments (cost $444,326,234) | | | 99.8 | % | 444,326,234 |
| Cash and Receivables (Net) | | | .2 | % | 673,310 |
| Net Assets | | | 100.0 | % | 444,999,544 |
| |
| a Variable rate demand note—rate shown is the interest rate in effect at January 31, 2013. Maturity date represents the next demand date, or the ultimate maturity date if earlier. |
| b Securities exempt from registration pursuant to Rule 144A under the Securities Act of 1933.These securities may be resold in transactions exempt from registration, normally to qualified |
| institutional buyers.At January 31, 2013, these securities amounted to $45,390,000 or 10.2% of net assets. |
| c The fund does not directly own the municipal security indicated; the fund owns an interest in a special purpose entity that, in turn, owns the underlying municipal security.The special |
| purpose entity permits the fund to own interests in underlying assets, but in a manner structured to provide certain advantages not inherent in the underlying bonds (e.g., enhanced |
| liquidity, yields linked to short-term rates). |
| d At January 31, 2013, the fund had $113,300,000 or 25.5% of net assets invested in securities whose payment of principal and interest is dependent upon revenues generated from |
| special tax. |
| | | | | | | |
| Summary of Combined Ratings (Unaudited) | | | |
| |
| Fitch | | or | Moody’s | or | Standard & Poor’s | Value (%)† |
| F1 +, F1 | | | VMIG1,MIG1,P1 | | SP1+,SP1,A1+,A1 | 97.4 |
| F2 | | | VMIG2,MIG2, P2 | | SP2, A2 | 2.6 |
| | | | | | | 100.0 |
| |
| † Based on total investments. | | | | |
| See notes to financial statements. | | | | |
STATEMENT OF INVESTMENTS
January 31, 2013
| | | | | | |
| Dreyfus New York AMT-Free | Coupon | Maturity | Principal | | |
| Municipal Cash Management | Rate (%) | Date | Amount ($) | | Value ($) |
| |
| Short-Term Investments—99.7% | | | | | |
| New York—97.3% | | | | | |
| Albany Industrial Development Agency, Civic Facility Revenue | | | | | |
| (The College of Saint Rose Project) (LOC; Wells Fargo Bank) | 0.10 | 2/7/13 | 2,500,000 | a,b | 2,500,000 |
| Albany Industrial Development Agency, Civic Facility Revenue | | | | | |
| (The College of Saint Rose Project) (LOC; Wells Fargo Bank) | 0.10 | 2/7/13 | 2,800,000 | a,b | 2,800,000 |
| Auburn, GO Notes, BAN | 1.00 | 5/31/13 | 1,500,000 | | 1,502,450 |
| Auburn City School District, GO Notes, BAN | 1.00 | 6/26/13 | 2,000,000 | b | 2,003,719 |
| Ausable Valley Central School District, GO Notes, BAN | 1.50 | 4/5/13 | 1,500,000 | b | 1,501,981 |
| Broome County Industrial Development Agency, Continuing Care | | | | | |
| Retirement Community Revenue (Good Shepherd Village | | | | | |
| at Endwell, Inc. Project) (LOC; M&T Trust) | 0.15 | 2/7/13 | 3,250,000 | a | 3,250,000 |
| Campbell-Savona Central School District, GO Notes, BAN | 1.50 | 6/21/13 | 1,000,000 | b | 1,003,161 |
| Cayuga County, GO Notes, BAN | 1.25 | 2/8/13 | 1,000,000 | | 1,000,124 |
| Dutchess County Industrial Development Agency, | | | | | |
| Civic Facility Revenue (Anderson Foundation for | | | | | |
| Autism, Inc. Project) (LOC; M&T Trust) | 0.15 | 2/7/13 | 3,905,000 | a | 3,905,000 |
| Dutchess County Industrial Development Agency, Revenue | | | | | |
| (Trinity-Pawling School Corporation Civic Facility) (LOC; PNC Bank NA) | 0.11 | 2/7/13 | 1,000,000 | a,b | 1,000,000 |
| East Farmingdale Volunteer Fire Company Inc., | | | | | |
| Volunteer Fire Department Revenue (LOC; Citibank NA) | 0.44 | 2/7/13 | 3,740,000 | a | 3,740,000 |
| Franklin County Industrial Development Agency, Civic Facility | | | | | |
| Revenue (Paul Smith’s College Project) (LOC; U.S. Bank NA) | 0.12 | 2/7/13 | 935,000 | a,b | 935,000 |
| Franklin County Industrial Development Agency, Civic Facility | | | | | |
| Revenue (Trudeau Institute, Inc. Project) (LOC; HSBC Bank USA) | 0.16 | 2/7/13 | 1,715,000 | a | 1,715,000 |
| Franklin County Industrial Development Agency, Civic Facility | | | | | |
| Revenue (Trudeau Institute, Inc. Project) (LOC; HSBC Bank USA) | 0.16 | 2/7/13 | 130,000 | a | 130,000 |
| Hamburg Central School District, GO Notes, BAN | 1.50 | 6/14/13 | 2,900,000 | b | 2,909,024 |
| Hamburg Village, GO Notes, BAN | 1.00 | 7/18/13 | 2,400,000 | | 2,404,360 |
| Hornell City School District, GO Notes, BAN | 1.25 | 6/28/13 | 1,500,000 | b | 1,503,298 |
| Monroe County Industrial Development Agency, Civic Facility Revenue | | | | | |
| (The Glen at Cherry Ridge, LLC Project) (LOC; HSBC Bank USA) | 0.12 | 2/7/13 | 4,800,000 | a | 4,800,000 |
| Naples Central School District, GO Notes, BAN | 1.00 | 6/28/13 | 1,450,000 | b | 1,452,442 |
| New York City, GO Notes (Citigroup ROCS, | | | | | |
| Series RR II R-14045) (Liquidity Facility; Citibank NA) | 0.11 | 2/7/13 | 1,500,000 a,c,d | | 1,500,000 |
| New York City, GO Notes (LOC; California | | | | | |
| Public Employees Retirement System) | 0.13 | 2/1/13 | 4,850,000 | a | 4,850,000 |
| New York City, GO Notes (LOC; Mizuho Corporate Bank Ltd) | 0.12 | 2/1/13 | 1,400,000 | a | 1,400,000 |
| New York City Capital Resource Corporation, Revenue | | | | | |
| (Loan Enhanced Assistance Program—Cobble Hill Health | | | | | |
| Center, Inc. Project) (LOC; Bank of America) | 0.17 | 2/7/13 | 2,600,000 | a | 2,600,000 |
| New York City Capital Resource Corporation, Revenue | | | | | |
| (Loan Enhanced Assistance Program—Natural Resources | | | | | |
| Defense Council, Inc. Project) (LOC; Bank of America) | 0.17 | 2/7/13 | 4,000,000 | a | 4,000,000 |
| New York City Capital Resource Corporation, Revenue | | | | | |
| (Loan Enhanced Assistance Program—Poly Prep Country | | | | | |
| Day School Project) (LOC; Bank of America) | 0.17 | 2/7/13 | 3,195,000 | a,b | 3,195,000 |
| New York City Capital Resource Corporation, Revenue | | | | | |
| (Loan Enhanced Assistance Program—Village Center | | | | | |
| for Care Project) (LOC; Bank of America) | 0.17 | 2/7/13 | 1,175,000 | a | 1,175,000 |
50
| | | | | | |
| Dreyfus New York AMT-Free | Coupon | Maturity | Principal | | |
| Municipal Cash Management (continued) | Rate (%) | Date | Amount ($) | | Value ($) |
| |
| Short-Term Investments (continued) | | | | | |
| New York (continued) | | | | | |
| New York City Housing Development Corporation, | | | | | |
| Multi-Family Rental Housing (Queenswood Housing | | | | | |
| Revenue (Queenswood Apartments Project) | | | | | |
| (Liquidity Facility; FHLMC and LOC; FHLMC) | 0.09 | 2/7/13 | 3,425,000 | a | 3,425,000 |
| New York City Industrial Development Agency, Civic Facility | | | | | |
| Revenue (Birch Wathen Lenox School Project) (LOC; TD Bank) | 0.18 | 2/7/13 | 3,985,000 | a,b | 3,985,000 |
| New York City Industrial Development Agency, Civic Facility | | | | | |
| Revenue (Children’s Oncology Society of New York, Inc. | | | | | |
| Project) (LOC; JPMorgan Chase Bank) | 0.12 | 2/7/13 | 2,600,000 | a | 2,600,000 |
| New York City Industrial Development Agency, | | | | | |
| Civic Facility Revenue (Sephardic Community | | | | | |
| Youth Center, Inc. Project) (LOC; M&T Trust) | 0.15 | 2/7/13 | 4,700,000 | a | 4,700,000 |
| New York City Industrial Development Agency, Civic Facility | | | | | |
| Revenue (Spence-Chapin, Services to Families and | | | | | |
| Children Project) (LOC; TD Bank) | 0.18 | 2/7/13 | 3,000,000 | a | 3,000,000 |
| New York City Municipal Water Finance Authority, Water and | | | | | |
| Sewer System Second General Resolution Revenue | | | | | |
| (Liquidity Facility; Bank of Nova Scotia) | 0.10 | 2/1/13 | 3,500,000 | a | 3,500,000 |
| New York City Transitional Finance Authority, Future Tax | | | | | |
| Secured Subordinate Revenue (Liquidity Facility; | | | | | |
| California State Teachers Retirement System) | 0.11 | 2/1/13 | 3,600,000 | a | 3,600,000 |
| New York Liberty Development Corporation, Liberty Revenue, | | | | | |
| Refunding (World Trade Center Project—Towers 3-4) | | | | | |
| (LOC; JPMorgan Chase Bank) | 0.13 | 2/7/13 | 1,035,000 | a | 1,035,000 |
| New York Liberty Development Corporation, Liberty Revenue, | | | | | |
| Refunding (World Trade Center Project—Towers 3-4) | | | | | |
| (LOC; JPMorgan Chase Bank) | 0.13 | 2/7/13 | 180,000 | a | 180,000 |
| New York Liberty Development Corporation, Recovery Zone Revenue | | | | | |
| (3 World Trade Center Project) (LOC; JPMorgan Chase Bank) | 0.13 | 2/7/13 | 585,000 | a | 585,000 |
| New York Liberty Development Corporation, Recovery Zone Revenue | | | | | |
| (3 World Trade Center Project) (LOC; JPMorgan Chase Bank) | 0.13 | 2/7/13 | 515,000 | a | 515,000 |
| New York State Dormitory Authority, Revenue | | | | | |
| (Beverwyck, Inc.) (LOC; Bank of America) | 0.14 | 2/7/13 | 1,600,000 | a | 1,600,000 |
| New York State Environmental Facilities Corporation, | | | | | |
| State Clean Water and Drinking Water Revolving Funds | | | | | |
| Revenue (New York City Municipal Water Finance | | | | | |
| Authority Projects—Second Resolution Bonds) | 2.00 | 6/15/13 | 150,000 | | 150,883 |
| New York State Housing Finance Agency, Housing | | | | | |
| Revenue (160 West 62nd Street) (LOC; Wells Fargo Bank) | 0.10 | 2/7/13 | 6,000,000 | a | 6,000,000 |
| New York State Housing Finance Agency, Housing | | | | | |
| Revenue (Baisley Park Gardens) (LOC; Citibank NA) | 0.19 | 2/7/13 | 6,000,000 | a | 6,000,000 |
| Niagara Area Development Corporation, Revenue, | | | | | |
| Refunding (Niagara University Project) (LOC; HSBC Bank USA) | 0.11 | 2/7/13 | 2,005,000 | a,b | 2,005,000 |
| Niagara Wheatfield Central School District, | | | | | |
| GO Notes, BAN (Various Improvements) | 1.50 | 3/27/13 | 1,000,000 | b | 1,001,249 |
| Odessa-Montour Central School District, GO Notes, BAN | 1.50 | 6/14/13 | 1,100,000 | b | 1,103,383 |
| Orange County Industrial Development Agency, Civic Facility | | | | | |
| Revenue (Tuxedo Park School Project) (LOC; M&T Trust) | 0.15 | 2/7/13 | 1,000,000 | a,b | 1,000,000 |
| Port Authority of New York and New Jersey, Equipment Notes | 0.15 | 2/7/13 | 2,800,000 | a | 2,800,000 |
STATEMENT OF INVESTMENTS (continued)
| | | | | | |
| Dreyfus New York AMT-Free | Coupon | Maturity | Principal | | |
| Municipal Cash Management (continued) | Rate (%) | Date | Amount ($) | | Value ($) |
| |
| Short-Term Investments (continued) | | | | | |
| New York (continued) | | | | | |
| Suffolk County Industrial Development Agency, Civic Facility Revenue | | | | | |
| (Hampton Day School Civic Facility) (LOC; JPMorgan Chase Bank) | 0.15 | 2/7/13 | 1,000,000 | a,b | 1,000,000 |
| Sullivan County, GO Notes, BAN | 1.25 | 3/8/13 | 1,200,000 | | 1,200,743 |
| Sullivan County, GO Notes, BAN | 1.50 | 3/8/13 | 1,000,000 | | 1,000,810 |
| Sullivan County, GO Notes, TAN | 1.25 | 3/15/13 | 1,000,000 | | 1,000,858 |
| Syracuse Industrial Development Agency, Civic | | | | | |
| Facility Revenue (Community Development | | | | | |
| Properties—Vanderbilt/Larned Project) (LOC; M&T Trust) | 0.14 | 2/7/13 | 1,400,000 | a | 1,400,000 |
| Triborough Bridge and Tunnel Authority, General Revenue (MTA Bridges | | | | | |
| and Tunnels) (LOC; California Public Employees Retirement System) | 0.11 | 2/1/13 | 900,000 | a | 900,000 |
| Triborough Bridge and Tunnel Authority, General Revenue, | | | | | |
| Refunding (MTA Bridges and Tunnels) (Liquidity Facility; | | | | | |
| Landesbank Hessen-Thuringen Girozentrale) | 0.15 | 2/1/13 | 5,100,000 | a | 5,100,000 |
| West Seneca Central School District, GO Notes, BAN | 1.00 | 11/27/13 | 2,615,000 | b | 2,623,508 |
| Westchester County Industrial Development Agency, Civic Facility Revenue | | | | | |
| (The Masters School Civic Facility) (LOC; JPMorgan Chase Bank) | 0.14 | 2/7/13 | 1,635,000 | a,b | 1,635,000 |
| U.S. Related—2.4% | | | | | |
| Puerto Rico Commonwealth, Public Improvement | | | | | |
| GO Notes, Refunding (LOC; Barclays Bank PLC) | 0.10 | 2/7/13 | 2,000,000 | a | 2,000,000 |
| Puerto Rico Sales Tax Financing Corporation, Sales Tax Revenue | | | | | |
| (Citigroup ROCS, Series RR II R-11762) (Liquidity Facility; Citibank NA) | 0.13 | 2/7/13 | 1,000,000 a,c,d | | 1,000,000 |
| |
| Total Investments (cost $126,421,993) | | | 99.7 | % | 126,421,993 |
| Cash and Receivables (Net) | | | .3 | % | 451,136 |
| Net Assets | | | 100.0 | % | 126,873,129 |
| |
| a Variable rate demand note—rate shown is the interest rate in effect at January 31, 2013. Maturity date represents the next demand date, or the ultimate maturity date if earlier. |
| b At January 31, 2013, the fund had $35,156,765 or 27.7% of net assets invested in securities whose payment of principal and interest is dependent upon revenues generated from education. |
| c Securities exempt from registration pursuant to Rule 144A under the Securities Act of 1933.These securities may be resold in transactions exempt from registration, normally to qualified |
| institutional buyers.At January 31, 2013, these securities amounted to $2,500,000 or 2.0% of net assets. |
| d The fund does not directly own the municipal security indicated; the fund owns an interest in a special purpose entity that, in turn, owns the underlying municipal security.The special |
| purpose entity permits the fund to own interests in underlying assets, but in a manner structured to provide certain advantages not inherent in the underlying bonds (e.g., enhanced |
| liquidity, yields linked to short-term rates). |
| | | | | | | |
| Summary of Combined Ratings (Unaudited) | | | |
| |
| Fitch | | or | Moody’s | or | Standard & Poor’s | Value (%)† |
| F1+,F1 | | | VMIG1,MIG1,P1 | | SP1+,SP1,A1+,A1 | 61.2 |
| F2 | | | VMIG2,MIG2,P2 | | SP2,A2 | 13.4 |
| AAA,AA,Ae | | | Aaa,Aa,Ae | | AAA,AA,Ae | 3.0 |
| Not Ratedf | | | Not Ratedf | | Not Ratedf | 22.4 |
| | | | | | | 100.0 |
| |
| † Based on total investments. |
| e Notes which are not F, MIG and SP rated are represented by bond ratings of the issuers. |
| f Securities which, while not rated by Fitch, Moody’s and Standard & Poor’s, have been determined by the Manager to be of comparable quality to those rated securities in which the |
| fund may invest. |
See notes to financial statements.
52
| | | | |
| Summary of Abbreviations | | |
| |
| |
| ABAG | Association of Bay Area Governments | ACA | American Capital Access |
| AGC | ACE Guaranty Corporation | AGIC | Asset Guaranty Insurance Company |
| AMBAC | American Municipal Bond Assurance Corporation | ARRN | Adjustable Rate Receipt Notes |
| BAN | Bond Anticipation Notes | BPA | Bond Purchase Agreement |
| CIFG | CDC Ixis Financial Guaranty | COP | Certificate of Participation |
| CP | Commercial Paper | DRIVERS | Derivative Inverse Tax-Exempt Receipts |
| EDR | Economic Development Revenue | EIR | Environmental Improvement Revenue |
| FGIC | Financial Guaranty Insurance Company | FHA | Federal Housing Administration |
| FHLB | Federal Home Loan Bank | FHLMC | Federal Home Loan Mortgage Corporation |
| FNMA | Federal National Mortgage Association | GAN | Grant Anticipation Notes |
| GIC | Guaranteed Investment Contract | GNMA | Government National Mortgage Association |
| GO | General Obligation | HR | Hospital Revenue |
| IDB | Industrial Development Board | IDC | Industrial Development Corporation |
| IDR | Industrial Development Revenue | LIFERS | Long Inverse Floating Exempt Receipts |
| LOC | Letter of Credit | LOR | Limited Obligation Revenue |
| LR | Lease Revenue | MERLOTS | Municipal Exempt Receipt Liquidity Option Tender |
| MFHR | Multi-Family Housing Revenue | MFMR | Multi-Family Mortgage Revenue |
| PCR | Pollution Control Revenue | P-FLOATS | Puttable Floating Option Tax-Exempt Receipts |
| PILOT | Payment in Lieu of Taxes | PUTTERS | Puttable Tax-Exempt Receipts |
| RAC | Revenue Anticipation Certificates | RAN | Revenue Anticipation Notes |
| RAW | Revenue Anticipation Warrants | ROCS | Reset Options Certificates |
| RRR | Resources Recovery Revenue | SAAN | State Aid Anticipation Notes |
| SBPA | Standby Bond Purchase Agreement | SFHR | Single Family Housing Revenue |
| SFMR | Single Family Mortgage Revenue | SONYMA | State of New York Mortgage Agency |
| SPEARS | Short Puttable Exempt Adjustable Receipts | SWDR | Solid Waste Disposal Revenue |
| TAN | Tax Anticipation Notes | TAW | Tax Anticipation Warrants |
| TRAN | Tax and Revenue Anticipation Notes | XLCA | XL Capital Assurance |
STATEMENT OF ASSETS AND LIABILITIES
(amounts in thousands, except Net Asset Value Per Share)
January 31, 2013
| | | | | | | | | | | |
| | | | Dreyfus | | Dreyfus | | Dreyfus | | Dreyfus | |
| | Dreyfus | | Government | | Government | | Treasury & | | Treasury | |
| | Cash | | Cash | | Prime Cash | | Agency Cash | | Prime Cash | |
| | Management | | Management | | Management | | Management | | Management | |
| Assets ($): | | | | | | | | | | |
| Investments at value—Note 1(a,b)† | 28,154,285 | a | 16,321,201 | a | 4,804,516 | | 18,042,377 | a | 33,065,577 | |
| Cash | — | | 17 | | 480 | | — | | 1,664 | |
| Interest receivable | 12,393 | | 20,193 | | 1,781 | | 26,993 | | 34,813 | |
| Receivable for shares of Beneficial Interest subscribed | 55 | | — | | — | | — | | — | |
| Prepaid expenses and other assets | 111 | | 99 | | 90 | | 72 | | 125 | |
| | 28,166,844 | | 16,341,510 | | 4,806,867 | | 18,069,442 | | 33,102,179 | |
| Liabilities ($): | | | | | | | | | | |
| Due to The Dreyfus Corporation | | | | | | | | | | |
| and affiliates—Note 2(c) | 5,054 | | 2,060 | | 480 | | 1,660 | | 2,494 | |
| Cash overdraft due to Custodian | 54 | | — | | — | | 257 | | — | |
| Payable for investment securities purchased | 100,000 | | — | | — | | — | | — | |
| Payable for shares of Beneficial | | | | | | | | | | |
| Interest redeemed | 8,888 | | 25 | | — | | — | | 2,038 | |
| Accrued expenses | 192 | | 200 | | 117 | | 147 | | 186 | |
| | 114,188 | | 2,285 | | 597 | | 2,064 | | 4,718 | |
| Net Assets ($) | 28,052,656 | | 16,339,225 | | 4,806,270 | | 18,067,378 | | 33,097,461 | |
| Composition of Net Assets ($): | | | | | | | | | | |
| Paid-in capital | 28,052,654 | | 16,339,257 | | 4,806,294 | | 18,067,379 | | 33,097,599 | |
| Accumulated net realized gain (loss) on investments | 2 | | (32 | ) | (24 | ) | (1 | ) | (138 | ) |
| Net Assets ($) | 28,052,656 | | 16,339,225 | | 4,806,270 | | 18,067,378 | | 33,097,461 | |
| Net Asset Value Per Share | | | | | | | | | | |
| Institutional Shares | | | | | | | | | | |
| Net Assets ($) | 23,193,207 | | 13,228,266 | | 3,518,598 | | 14,498,847 | | 24,581,949 | |
| Shares Outstanding | 23,193,202 | | 13,228,323 | | 3,518,614 | | 14,498,848 | | 24,582,037 | |
| Net Asset Value Per Share ($) | 1.00 | | 1.00 | | 1.00 | | 1.00 | | 1.00 | |
| Investor Shares | | | | | | | | | | |
| Net Assets ($) | 2,692,003 | | 1,766,148 | | 453,596 | | 2,270,017 | | 4,067,494 | |
| Shares Outstanding | 2,692,006 | | 1,766,152 | | 453,600 | | 2,270,018 | | 4,067,525 | |
| Net Asset Value Per Share ($) | 1.00 | | 1.00 | | 1.00 | | 1.00 | | 1.00 | |
54
| | | | | | |
| | | Dreyfus | Dreyfus | Dreyfus | Dreyfus |
| | Dreyfus | Government | Government | Treasury & | Treasury |
| | Cash | Cash | Prime Cash | Agency Cash | Prime Cash |
| | Management | Management | Management | Management | Management |
| Net Asset Value Per Share (continued) | | | | | |
| Administrative Shares | | | | | |
| Net Assets ($) | 1,271,175 | 978,966 | 567,735 | 620,440 | 749,657 |
| Shares Outstanding | 1,271,180 | 978,967 | 567,738 | 620,440 | 749,660 |
| Net Asset Value Per Share ($) | 1.00 | 1.00 | 1.00 | 1.00 | 1.00 |
| Participant Shares | | | | | |
| Net Assets ($) | 768,484 | 287,322 | 229,473 | 603,156 | 3,674,210 |
| Shares Outstanding | 768,479 | 287,322 | 229,477 | 603,156 | 3,674,226 |
| Net Asset Value Per Share ($) | 1.00 | 1.00 | 1.00 | 1.00 | 1.00 |
| Service Shares | | | | | |
| Net Assets ($) | — | — | — | 15,393 | — |
| Shares Outstanding | — | — | — | 15,393 | — |
| Net Asset Value Per Share ($) | — | — | — | 1.00 | — |
| Select Shares | | | | | |
| Net Assets ($) | — | — | — | 6,319 | — |
| Shares Outstanding | — | — | — | 6,318 | — |
| Net Asset Value Per Share ($) | — | — | — | 1.00 | — |
| Agency Shares | | | | | |
| Net Assets ($) | 127,787 | 78,523 | 36,868 | 28,052 | 24,151 |
| Shares Outstanding | 127,787 | 78,524 | 36,869 | 28,052 | 24,151 |
| Net Asset Value Per Share ($) | 1.00 | 1.00 | 1.00 | 1.00 | 1.00 |
| Premier Shares | | | | | |
| Net Assets ($) | — | — | — | 25,154 | — |
| Shares Outstanding | — | — | — | 25,154 | — |
| Net Asset Value Per Share ($) | — | — | — | 1.00 | — |
| † Investments at cost ($) | 28,154,285 | 16,321,201 | 4,804,516 | 18,042,377 | 33,065,577 |
| |
| a Amount includes repurchase agreements of $2,815,000,000, $4,789,000,000 and $8,696,000,000 for Dreyfus Cash Management, Dreyfus Government Cash Management and |
| Dreyfus Treasury & Agency Cash Management, respectively, See Note 1(c). |
See notes to financial statements.
STATEMENT OF ASSETS AND LIABILITIES (continued)
(amounts in thousands, except Net Asset Value Per Share)
January 31, 2013
| | | | | | | | |
| | | | | | | Dreyfus | Dreyfus |
| | Dreyfus | | Dreyfus | Dreyfus | | California | New York |
| Municipal Cash | | New York | Tax Exempt | | AMT-Free | AMT-Free |
| Management | | Municipal Cash | Cash Municipal Cash | Municipal Cash |
| | Plus | | Management | Management | | Management | Management |
| Assets ($): | | | | | | | |
| Investments at value—Note 1(a,b)† | 788,876 | | 355,737 | 2,318,277 | | 444,326 | 126,422 |
| Cash | 6,951 | | 515 | 811 | | 343 | 278 |
| Interest receivable | 780 | | 575 | 2,160 | | 532 | 184 |
| Prepaid expenses | 36 | | 17 | 101 | | 8 | 49 |
| | 796,643 | | 356,844 | 2,321,349 | | 445,209 | 126,933 |
| Liabilities ($): | | | | | | | |
| Due to The Dreyfus Corporation and affiliates—Note 2(c) | 127 | | 57 | 284 | | 52 | 19 |
| Payable for investment securities purchased | 4,632 | | — | — | | 100 | — |
| Payable for shares of Beneficial Interest redeemed | 59 | | 246 | 93 | | 7 | — |
| Accrued expenses | 60 | | 62 | 99 | | 50 | 41 |
| | 4,878 | | 365 | 476 | | 209 | 60 |
| Net Assets ($) | 791,765 | | 356,479 | 2,320,873 | | 445,000 | 126,873 |
| Composition of Net Assets ($): | | | | | | | |
| Paid-in capital | 791,775 | | 356,478 | 2,320,876 | | 445,000 | 126,873 |
| Accumulated net realized gain (loss) on investments | (10 | ) | 1 | (3 | ) | — | — |
| Net Assets ($) | 791,765 | | 356,479 | 2,320,873 | | 445,000 | 126,873 |
| Net Asset Value Per Share | | | | | | | |
| Instititutional Shares | | | | | | | |
| Net Assets ($) | 352,511 | | 133,276 | 1,775,527 | | 198,492 | 83,067 |
| Shares Outstanding | 352,381 | | 133,277 | 1,775,530 | | 198,487 | 83,043 |
| Net Asset Value Per Share ($) | 1.00 | | 1.00 | 1.00 | | 1.00 | 1.00 |
| Investor Shares | | | | | | | |
| Net Assets ($) | 210,525 | | 199,883 | 442,625 | | 211,609 | 36,653 |
| Shares Outstanding | 210,447 | | 199,884 | 442,625 | | 211,603 | 36,644 |
| Net Asset Value Per Share ($) | 1.00 | | 1.00 | 1.00 | | 1.00 | 1.00 |
| Administrative Shares | | | | | | | |
| Net Assets ($) | 208,190 | | 10,136 | 66,416 | | 1,369 | 6,088 |
| Shares Outstanding | 208,115 | | 10,136 | 66,416 | | 1,370 | 6,086 |
| Net Asset Value Per Share ($) | 1.00 | | 1.00 | 1.00 | | 1.00 | 1.00 |
| Participant Shares | | | | | | | |
| Net Assets ($) | 20,524 | | 13,184 | 36,305 | | 33,530 | —a |
| Shares Outstanding | 20,516 | | 13,184 | 36,305 | | 33,529 | —a |
| Net Asset Value Per Share ($) | 1.00 | | 1.00 | 1.00 | | 1.00 | —a |
| Agency Shares | | | | | | | |
| Net Assets ($) | 15 | | —b | — | | —c | — |
| Shares Outstanding | 15 | | —b | — | | —c | — |
| Net Asset Value Per Share ($) | 1.00 | | —b | — | | —c | — |
| Classic Shares | | | | | | | |
| Net Assets ($) | — | | — | — | | — | 1,065 |
| Shares Outstanding | — | | — | — | | — | 1,064 |
| Net Asset Value Per Share ($) | — | | — | — | | — | 1.00 |
| † Investments at cost ($) | 788,876 | | 355,737 | 2,318,277 | | 444,326 | 126,422 |
| |
| a Effective September 14, 2012, Dreyfus NewYork AMT-Free Municipal Cash Management had terminated its Participant Shares. |
| b Effective September 14, 2012, Dreyfus NewYork Municipal Cash Management had terminated its Agency Shares. |
| c Effective September 14, 2012, Dreyfus California AMT-Free Municipal Cash Management had terminated its Agency Shares. |
See notes to financial statements.
56
STATEMENT OF OPERATIONS
(amounts in thousands)
Year Ended January 31, 2013
| | | | | | | | | | | |
| | | | Dreyfus | | Dreyfus | | Dreyfus | | Dreyfus | |
| | Dreyfus | | Government | | Government | | Treasury & | | Treasury | |
| | Cash | | Cash | | Prime Cash | | Agency Cash | | Prime Cash | |
| | Management | | Management | | Management | | Management | | Management | |
| Investment Income ($): | | | | | | | | | | |
| Interest Income | 78,981 | | 30,570 | | 5,602 | | 26,835 | | 25,488 | |
| Expenses: | | | | | | | | | | |
| Management fee—Note 2(a) | 54,439 | | 36,716 | | 9,442 | | 37,434 | | 57,035 | |
| Service plan fees—Note 2(b) | 12,197 | | 6,348 | | 2,698 | | 9,739 | | 23,146 | |
| Custodian fees—Note 2(c) | 816 | | 560 | | 179 | | 643 | | 846 | |
| Shareholder servicing costs—Note 2(c) | 599 | | 288 | | 134 | | 449 | | 1,175 | |
| Registration fees | 220 | | 191 | | 159 | | 164 | | 208 | |
| Trustees’ fees and expenses—Note 2(d) | 171 | | 111 | | 28 | | 114 | | 166 | |
| Prospectus and shareholders’ reports | 156 | | 107 | | 50 | | 36 | | 183 | |
| Professional fees | 57 | | 61 | | 50 | | 81 | | 67 | |
| Miscellaneous | 461 | | 317 | | 142 | | 324 | | 401 | |
| Total Expenses | 69,116 | | 44,699 | | 12,882 | | 48,984 | | 83,227 | |
| Less—reduction in expenses | | | | | | | | | | |
| due to undertaking—Note 2(a) | (8,239 | ) | (15,424 | ) | (7,281 | ) | (24,009 | ) | (57,747 | ) |
| Less—reduction in fees due to | | | | | | | | | | |
| earnings credits—Note 2(c) | (10 | ) | (34 | ) | (1 | ) | (2 | ) | (2 | ) |
| Net Expenses | 60,867 | | 29,241 | | 5,600 | | 24,973 | | 25,478 | |
| Investment Income—Net | 18,114 | | 1,329 | | 2 | | 1,862 | | 10 | |
| Net Realized Gain (Loss) on | | | | | | | | | | |
| Investments—Note 1(b) ($) | 245 | | (32 | ) | 24 | | (1 | ) | 113 | |
| Net Increase in Net Assets | | | | | | | | | | |
| Resulting from Operations | 18,359 | | 1,297 | | 26 | | 1,861 | | 123 | |
| |
| See notes to financial statements. | | | | | | | | | | |
STATEMENT OF OPERATIONS (continued)
(amounts in thousands)
Year Ended January 31, 2013
| | | | | | | | | | | |
| | | | | | | | Dreyfus | | Dreyfus | |
| | Dreyfus | | Dreyfus | | Dreyfus | | California | | New York | |
| | Municipal Cash | | New York | | Tax Exempt | | AMT-Free | | AMT-Free | |
| | Management | | Municipal Cash | | Cash | | Municipal Cash | | Municipal Cash | |
| | Plus | | Management | | Management | | Management | | Management | |
| Investment Income ($): | | | | | | | | | | |
| Interest Income | 1,890 | | 1,182 | | 5,100 | | 1,005 | | 394 | |
| Expenses: | | | | | | | | | | |
| Management fee—Note 2(a) | 1,532 | | 987 | | 4,939 | | 898 | | 286 | |
| Service plan fees—Note 2(b) | 871 | | 599 | | 1,126 | | 749 | | 130 | |
| Registration fees | 101 | | 43 | | 113 | | 17 | | 84 | |
| Professional fees | 75 | | 79 | | 77 | | 49 | | 43 | |
| Custodian fees—Note 2(c) | 66 | | 42 | | 121 | | 42 | | 18 | |
| Prospectus and shareholders’ reports | 12 | | 12 | | 17 | | 9 | | 11 | |
| Shareholder servicing costs—Note 2(c) | 9 | | 16 | | 489 | | 7 | | 9 | |
| Trustees’ fees and expenses—Note 2(d) | 5 | | 3 | | 15 | | 3 | | 1 | |
| Miscellaneous | 64 | | 57 | | 138 | | 35 | | 37 | |
| Total Expenses | 2,735 | | 1,838 | | 7,035 | | 1,809 | | 619 | |
| Less—reduction in expenses | | | | | | | | | | |
| due to undertakings—Note 2(a) | (887 | ) | (683 | ) | (1,953 | ) | (828 | ) | (226 | ) |
| Less—reduction in fees | | | | | | | | | | |
| due to earnings credits—Note 2(c) | —a | | —a | | —a | | —a | | —a | |
| Net Expenses | 1,848 | | 1,155 | | 5,082 | | 981 | | 393 | |
| Investment Income—Net | 42 | | 27 | | 18 | | 24 | | 1 | |
| Net Realized Gain (Loss) on | | | | | | | | | | |
| Investments—Note 1(b) ($) | —a | | 1 | | — | | 212 | | — | |
| Net Increase in Net Assets | | | | | | | | | | |
| Resulting from Operations | 42 | | 28 | | 18 | | 236 | | 1 | |
| a Amount represents less than $1,000. | | | | | | | | | | |
| See notes to financial statements. | | | | | | | | | | |
58
STATEMENTS OF CHANGES IN NET ASSETS
(amounts in thousands)
| | | | | | | | | |
| | | | | | Dreyfus Government | |
| | Dreyfus Cash Management | | Cash Management | |
| | Year Ended January 31, | | Year Ended January 31, | |
| | 2013 | | 2012 | | 2013 | | 2012 | |
| Operations ($): | | | | | | | | |
| Investment income—net | 18,114 | | 17,381 | | 1,329 | | 98 | |
| Net realized gain (loss) on investments | 245 | | 5 | | (32 | ) | 41 | |
| Net Increase (Decrease) in Net Assets | | | | | | | | |
| Resulting from Operations | 18,359 | | 17,386 | | 1,297 | | 139 | |
| Dividends to Shareholders from ($): | | | | | | | | |
| Investment income—net: | | | | | | | | |
| Institutional Shares | (18,209 | ) | (17,442 | ) | (1,106 | ) | (99 | ) |
| Investor Shares | (26 | ) | (7 | ) | (127 | ) | (1 | ) |
| Administrative Shares | (42 | ) | (47 | ) | (79 | ) | —a | |
| Participant Shares | (6 | ) | (3 | ) | (16 | ) | —a | |
| Agency Shares | (56 | ) | (23 | ) | (18 | ) | —a | |
| Total Dividends | (18,339 | ) | (17,522 | ) | (1,346 | ) | (100 | ) |
| Beneficial Interest Transactions ($1.00 per share): | | | | | | | | |
| Net proceeds from shares sold: | | | | | | | | |
| Institutional Shares | 92,476,479 | | 109,929,147 | | 81,658,018 | | 113,164,798 | |
| Investor Shares | 8,945,378 | | 10,284,538 | | 5,945,485 | | 5,582,368 | |
| Administrative Shares | 5,118,256 | | 2,292,757 | | 2,673,619 | | 4,552,439 | |
| Participant Shares | 1,719,835 | | 2,152,712 | | 1,444,028 | | 2,294,304 | |
| Agency Shares | 1,082,358 | | 840,749 | | 1,145,107 | | 194,307 | |
| Net assets received in connection | | | | | | | | |
| with reorganization—Note 1 | — | | 4,064,792 | | — | | — | |
| Dividends reinvested: | | | | | | | | |
| Institutional Shares | 2,843 | | 3,200 | | 229 | | 27 | |
| Investor Shares | 9 | | 3 | | 85 | | —a | |
| Administrative Shares | 24 | | 12 | | 65 | | —a | |
| Participant Shares | 6 | | 2 | | 12 | | —a | |
| Agency Shares | 2 | | —a | | —a | | — | |
| Cost of shares redeemed: | | | | | | | | |
| Institutional Shares | (91,981,388 | ) | (115,129,031 | ) | (86,511,520 | ) | (115,612,213 | ) |
| Investor Shares | (9,244,035 | ) | (10,382,079 | ) | (5,689,428 | ) | (5,776,907 | ) |
| Administrative Shares | (4,788,484 | ) | (2,516,455 | ) | (2,797,553 | ) | (4,540,881 | ) |
| Participant Shares | (1,777,233 | ) | (2,115,132 | ) | (1,445,987 | ) | (2,535,843 | ) |
| Agency Shares | (1,140,678 | ) | (714,801 | ) | (1,152,113 | ) | (239,102 | ) |
| Increase (Decrease) in Net Assets from | | | | | | | | |
| Beneficial Interest Transactions | 413,372 | | (1,289,586 | ) | (4,729,953 | ) | (2,916,703 | ) |
| Total Increase (Decrease) In Net Assets | 413,392 | | (1,289,722 | ) | (4,730,002 | ) | (2,916,664 | ) |
| Net Assets ($): | | | | | | | | |
| Beginning of Period | 27,639,264 | | 28,928,986 | | 21,069,227 | | 23,985,891 | |
| End of Period | 28,052,656 | | 27,639,264 | | 16,339,225 | | 21,069,227 | |
| Accumulated distributions in excess of | | | | | | | | |
| investment income—net | — | | (2 | ) | — | | — | |
| |
| a Amount represents less than $1,000. | | | | | | | | |
| See notes to financial statements. | | | | | | | | |
STATEMENT OF CHANGES IN NET ASSETS (continued)
(amounts in thousands)
| | | | | | | | | |
| | Dreyfus Government | | Dreyfus Treasury & | |
| | Prime Cash Management | | Agency Cash Management | |
| | Year Ended January 31, | | Year Ended January 31, | |
| | 2013 | | 2012 | | 2013 | | 2012 | |
| Operations ($): | | | | | | | | |
| Investment income—net | 2 | | 1 | | 1,862 | | 1,355 | |
| Net realized gain (loss) on investments | 24 | | (48 | ) | (1 | ) | 192 | |
| Net Increase (Decrease) in Net Assets | | | | | | | | |
| Resulting from Operations | 26 | | (47 | ) | 1,861 | | 1,547 | |
| Dividends to Shareholders from ($): | | | | | | | | |
| Investment income—net: | | | | | | | | |
| Institutional Shares | (2 | ) | (1 | ) | (1,499 | ) | (1,223 | ) |
| Investor Shares | —a | | —a | | (231 | ) | (199 | ) |
| Administrative Shares | —a | | —a | | (61 | ) | (51 | ) |
| Participant Shares | —a | | —a | | (77 | ) | (59 | ) |
| Service Shares | — | | — | | (2 | ) | (1 | ) |
| Select Shares | — | | — | | (1 | ) | (2 | ) |
| Agency Shares | —a | | —a | | (3 | ) | (3 | ) |
| Premier Shares | — | | — | | (3 | ) | (4 | ) |
| Total Dividends | (2 | ) | (1 | ) | (1,877 | ) | (1,542 | ) |
| Beneficial Interest Transactions ($1.00 per share): | | | | | | | | |
| Net proceeds from shares sold: | | | | | | | | |
| Institutional Shares | 9,240,101 | | 12,249,844 | | 61,008,789 | | 69,411,956 | |
| Investor Shares | 1,278,337 | | 1,309,992 | | 8,759,746 | | 9,318,248 | |
| Administrative Shares | 3,740,470 | | 4,394,882 | | 1,849,288 | | 2,103,860 | |
| Participant Shares | 395,043 | | 688,559 | | 3,336,778 | | 3,087,091 | |
| Service Shares | — | | — | | 11,154 | | 36,339 | |
| Select Shares | — | | — | | 21,388 | | 46,006 | |
| Agency Shares | 53,125 | | 106,658 | | 94,825 | | 37,483 | |
| Premier Shares | — | | — | | 351,697 | | 384,613 | |
| Dividends reinvested: | | | | | | | | |
| Institutional Shares | —a | | —a | | 444 | | 342 | |
| Investor Shares | —a | | —a | | 60 | | 38 | |
| Administrative Shares | —a | | —a | | 40 | | 29 | |
| Participant Shares | —a | | —a | | 49 | | 32 | |
| Service Shares | — | | — | | —a | | —a | |
| Cost of shares redeemed: | | | | | | | | |
| Institutional Shares | (9,264,963 | ) | (11,498,089 | ) | (63,056,962 | ) | (60,809,846 | ) |
| Investor Shares | (1,306,838 | ) | (1,384,843 | ) | (8,665,795 | ) | (8,965,283 | ) |
| Administrative Shares | (3,805,024 | ) | (4,323,871 | ) | (1,830,964 | ) | (1,924,122 | ) |
| Participant Shares | (391,128 | ) | (939,334 | ) | (3,622,551 | ) | (2,616,381 | ) |
| Service Shares | — | | — | | (27,679 | ) | (9,591 | ) |
| Select Shares | — | | — | | (38,874 | ) | (41,310 | ) |
| Agency Shares | (27,819 | ) | (150,808 | ) | (89,570 | ) | (52,966 | ) |
| Premier Shares | — | | — | | (357,344 | ) | (405,988 | ) |
| Increase (Decrease) in Net Assets from | | | | | | | | |
| Beneficial Interest Transactions | (88,696 | ) | 452,990 | | (2,255,481 | ) | 9,600,550 | |
| Total Increase (Decrease) In Net Assets | (88,672 | ) | 452,942 | | (2,255,497 | ) | 9,600,555 | |
| Net Assets ($): | | | | | | | | |
| Beginning of Period | 4,894,942 | | 4,442,000 | | 20,322,875 | | 10,722,320 | |
| End of Period | 4,806,270 | | 4,894,942 | | 18,067,378 | | 20,322,875 | |
| |
| a Amount represents less than $1,000. | | | | | | | | |
| See notes to financial statements. | | | | | | | | |
60
| | | | | | | | | |
| | Dreyfus Treasury | | Dreyfus Municipal | |
| | Prime Cash Management | | Cash Management Plus | |
| | Year Ended January 31, | | Year Ended January 31, | |
| | 2013 | | 2012 | | 2013 | | 2012 | |
| Operations ($): | | | | | | | | |
| Investment income—net | 10 | | 8 | | 42 | | 116 | |
| Net realized gain (loss) on investments | 113 | | (251 | ) | —a | | — | |
| Net Increase (Decrease) in Net Assets | | | | | | | | |
| Resulting from Operations | 123 | | (243 | ) | 42 | | 116 | |
| Dividends to Shareholders from ($): | | | | | | | | |
| Investment income—net: | | | | | | | | |
| Institutional Shares | (8 | ) | (46 | ) | (42 | ) | (100 | ) |
| Investor Shares | (1 | ) | (10 | ) | —a | | —a | |
| Administrative Shares | —a | | (3 | ) | —a | | (16 | ) |
| Participant Shares | (1 | ) | (7 | ) | —a | | —a | |
| Agency Shares | —a | | —a | | —a | | —a | |
| Total Dividends | (10 | ) | (66 | ) | (42 | ) | (116 | ) |
| Beneficial Interest Transactions ($1.00 per share): | | | | | | | | |
| Net proceeds from shares sold: | | | | | | | | |
| Institutional Shares | 55,332,002 | | 64,662,447 | | 1,526,121 | | 1,287,413 | |
| Investor Shares | 16,548,074 | | 16,084,217 | | 367,112 | | 428,316 | |
| Administrative Shares | 2,286,789 | | 3,489,224 | | 411,224 | | 709,023 | |
| Participant Shares | 12,306,117 | | 12,420,251 | | 48,715 | | 44,217 | |
| Agency Shares | 351,699 | | 156,869 | | — | | —a | |
| Dividends reinvested: | | | | | | | | |
| Institutional Shares | 1 | | 12 | | 18 | | 66 | |
| Investor Shares | 1 | | 5 | | —a | | —a | |
| Administrative Shares | —a | | 1 | | —a | | 15 | |
| Participant Shares | 1 | | 5 | | —a | | —a | |
| Agency Shares | —a | | —a | | —a | | —a | |
| Cost of shares redeemed: | | | | | | | | |
| Institutional Shares | (49,638,348 | ) | (60,789,778 | ) | (1,520,125 | ) | (1,303,879 | ) |
| Investor Shares | (16,630,817 | ) | (15,148,673 | ) | (413,579 | ) | (430,017 | ) |
| Administrative Shares | (2,146,960 | ) | (3,933,307 | ) | (415,964 | ) | (872,745 | ) |
| Participant Shares | (11,498,332 | ) | (11,717,225 | ) | (53,180 | ) | (41,746 | ) |
| Agency Shares | (348,294 | ) | (157,506 | ) | —a | | — | |
| Increase (Decrease) in Net Assets from | | | | | | | | |
| Beneficial Interest Transactions | 6,561,933 | | 5,066,542 | | (49,658 | ) | (179,337 | ) |
| Total Increase (Decrease) In Net Assets | 6,562,046 | | 5,066,233 | | (49,658 | ) | (179,337 | ) |
| Net Assets ($): | | | | | | | | |
| Beginning of Period | 26,535,415 | | 21,469,182 | | 841,423 | | 1,020,760 | |
| End of Period | 33,097,461 | | 26,535,415 | | 791,765 | | 841,423 | |
| |
| a Amount represents less than $1,000. | | | | | | | | |
| See notes to financial statements. | | | | | | | | |
STATEMENT OF CHANGES IN NET ASSETS (continued)
(amounts in thousands)
| | | | | | | | | |
| | Dreyfus New York Municipal | | Dreyfus Tax Exempt | |
| | Cash Management | | Cash Management | |
| | Year Ended January 31, | | Year Ended January 31, | |
| | 2013 | | 2012 | | 2013 | | 2012 | |
| Operations ($): | | | | | | | | |
| Investment income—net | 27 | | 152 | | 18 | | 680 | |
| Net realized gain (loss) on investments | 1 | | — | | — | | 8 | |
| Net Increase (Decrease) in Net Assets | | | | | | | | |
| Resulting from Operations | 28 | | 152 | | 18 | | 688 | |
| Dividends to Shareholders from ($): | | | | | | | | |
| Investment income—net: | | | | | | | | |
| Institutional Shares | (27 | ) | (152 | ) | (18 | ) | (687 | ) |
| Investor Shares | —a | | (1 | ) | —a | | (2 | ) |
| Administrative Shares | —a | | (2 | ) | —a | | (2 | ) |
| Participant Shares | —a | | —a | | —a | | —a | |
| Agency Shares | —a,b | | — | | — | | —a,c | |
| Total Dividends | (27 | ) | (155 | ) | (18 | ) | (691 | ) |
| Beneficial Interest Transactions ($1.00 per share): | | | | | | | | |
| Net proceeds from shares sold: | | | | | | | | |
| Institutional Shares | 319,114 | | 546,920 | | 7,995,575 | | 8,627,380 | |
| Investor Shares | 504,289 | | 431,943 | | 788,328 | | 529,699 | |
| Administrative Shares | 60,139 | | 28,998 | | 58,951 | | 105,246 | |
| Participant Shares | 54,830 | | 39,049 | | 89,293 | | 87,588 | |
| Agency Shares | —b | | — | | — | | 417 | c |
| Dividends reinvested: | | | | | | | | |
| Institutional Shares | 4 | | 39 | | 6 | | 262 | |
| Investor Shares | —a | | 1 | | —a | | 1 | |
| Administrative Shares | —a | | 2 | | —a | | 2 | |
| Participant Shares | —a | | —a | | — | | —a | |
| Cost of shares redeemed: | | | | | | | | |
| Institutional Shares | (506,120 | ) | (686,027 | ) | (8,301,833 | ) | (9,376,532 | ) |
| Investor Shares | (570,997 | ) | (464,579 | ) | (725,263 | ) | (494,321 | ) |
| Administrative Shares | (71,445 | ) | (54,912 | ) | (68,201 | ) | (102,001 | ) |
| Participant Shares | (52,257 | ) | (50,235 | ) | (80,254 | ) | (69,254 | ) |
| Agency Shares | (1 | )b | — | | — | | (461 | )c |
| Increase (Decrease) in Net Assets from | | | | | | | | |
| Beneficial Interest Transactions | (262,444 | ) | (208,801 | ) | (243,398 | ) | (691,974 | ) |
| Total Increase (Decrease) In Net Assets | (262,443 | ) | (208,804 | ) | (243,398 | ) | (691,977 | ) |
| Net Assets ($): | | | | | | | | |
| Beginning of Period | 618,922 | | 827,726 | | 2,564,271 | | 3,256,248 | |
| End of Period | 356,479 | | 618,922 | | 2,320,873 | | 2,564,271 | |
| |
| a Amount represents less than $1,000. |
| b Effective September 14, 2012, Dreyfus NewYork Municipal Cash Management had terminated its Agency Shares. |
| c Effective December 8, 2011, Dreyfus Tax Exempt Cash Management had terminated its Agency Shares. |
See notes to financial statements.
62
| | | | | | | | | |
| | Dreyfus California AMT-Free | | Dreyfus New York AMT-Free | |
| | Municipal Cash Management | | Municipal Cash Management | |
| | Year Ended January 31, | | Year Ended January 31, | |
| | 2013 | | 2012 | | 2013 | | 2012 | |
| Operations ($): | | | | | | | | |
| Investment income—net | 24 | | 97 | | 1 | | 16 | |
| Net realized gain (loss) on investments | 212 | | 1 | | — | | 2 | |
| Net Increase (Decrease) in Net Assets | | | | | | | | |
| Resulting from Operations | 236 | | 98 | | 1 | | 18 | |
| Dividends to Shareholders from ($): | | | | | | | | |
| Investment income—net: | | | | | | | | |
| Institutional Shares | (112 | ) | (97 | ) | (2 | ) | (16 | ) |
| Investor Shares | (106 | ) | —a | | (1 | ) | —a | |
| Administrative Shares | (2 | ) | (1 | ) | —a | | —a | |
| Participant Shares | (16 | ) | —a | | —a,b | | —a | |
| Agency Shares | —a,c | | —a | | — | | — | |
| Classic Shares | — | | — | | —a | | — | |
| Total Dividends | (236 | ) | (98 | ) | (3 | ) | (16 | ) |
| Beneficial Interest Transactions ($1.00 per share): | | | | | | | | |
| Net proceeds from shares sold: | | | | | | | | |
| Institutional Shares | 229,485 | | 271,328 | | 103,391 | | 181,955 | |
| Investor Shares | 760,107 | | 518,998 | | 123,695 | | 165,569 | |
| Administrative Shares | 28,990 | | 23,002 | | 16,538 | | 21,288 | |
| Participant Shares | 135,835 | | 140,330 | | —b | | — | |
| Classic Shares | — | | — | | 110,790 | | 118,607 | |
| Dividends reinvested: | | | | | | | | |
| Institutional Shares | 102 | | 88 | | 1 | | 12 | |
| Investor Shares | 97 | | —a | | —a | | —a | |
| Administrative Shares | 1 | | 1 | | —a | | —a | |
| Participant Shares | 16 | | —a | | —b | | — | |
| Classic Shares | — | | — | | —a | | —a | |
| Cost of shares redeemed: | | | | | | | | |
| Institutional Shares | (205,257 | ) | (232,587 | ) | (122,554 | ) | (160,271 | ) |
| Investor Shares | (752,054 | ) | (371,657 | ) | (135,682 | ) | (167,059 | ) |
| Administrative Shares | (29,600 | ) | (34,592 | ) | (23,124 | ) | (16,575 | ) |
| Participant Shares | (163,971 | ) | (126,459 | ) | (10 | )b | — | |
| Agency Shares | (1 | )c | — | | — | | — | |
| Classic Shares | — | | — | | (109,997 | ) | (127,569 | ) |
| Increase (Decrease) in Net Assets from | | | | | | | | |
| Beneficial Interest Transactions | 3,750 | | 188,452 | | (36,952 | ) | 15,957 | |
| Total Increase (Decrease) In Net Assets | 3,750 | | 188,452 | | (36,954 | ) | 15,959 | |
| Net Assets ($): | | | | | | | | |
| Beginning of Period | 441,250 | | 252,798 | | 163,827 | | 147,868 | |
| End of Period | 445,000 | | 441,250 | | 126,873 | | 163,827 | |
| |
| a Amount represents less than $1,000. |
| b Effective September 14, 2012, Dreyfus NewYork AMT-Free Municipal Cash Management had terminated its Participant Shares. |
| c Effective September 14, 2012, Dreyfus California AMT-Free Municipal Cash Management had terminated its Agency Shares. |
See notes to financial statements.
FINANCIAL HIGHLIGHTS
The following tables describe the performance for each share class of each fund for the fiscal periods indicated.All information reflects financial results for a single fund share.Total return shows how much your investment in each fund would have increased (or decreased) during each period, assuming you had reinvested all dividends and distributions.These figures have been derived from the funds’ financial statements. Please note that the financial highlights information in the following tables for Dreyfus New York AMT-Free Municipal Cash Management’s Institutional, Investor and Classic shares represents the financial highlights of Dreyfus New York AMT-Free Municipal Cash Management’s predecessor, BNY Hamilton New York AMT-Free Municipal Money Fund (New York AMT-Free Municipal Money Fund), before Dreyfus NewYork AMT-Free Municipal Cash Management commenced operations as of the close of business on September 12, 2008, and represents the performance of Dreyfus NewYork AMT-Free Municipal Cash Management’s Institutional, Investor and Classic shares thereafter. Before Dreyfus New York AMT-Free Municipal Cash Management commenced operations, all of the assets of the New York AMT-Free Municipal Money Fund were transferred to Dreyfus New York AMT-Free Municipal Cash Management in exchange for Institutional, Investor and Classic shares of the fund in a tax-free reorganization.Total return shows how much your investment in Dreyfus New York AMT-Free Municipal Cash Management would have increased (or decreased) during each period, assuming you had reinvested all dividends and distributions. These figures have been derived from Dreyfus NewYork AMT-Free Municipal Cash Management’s predecessor’s financial statements.
| | | | | | | | | | | | | | |
| | | Per Share Data ($) | | | | | Ratios/Supplemental Data (%) | | |
| | | | | | | | | | | | Ratio of Net | | |
| | Net Asset | | | Dividends | | Net Asset | | | Ratio of | Ratio of | Investment | | Net Assets |
| | Value | Net | | from Net | | Value | | | Total Expenses | Net Expenses | Income to | | End of |
| | Beginning | Investment | | Investment | | End | Total | | to Average | to Average | Average | | Period |
| | of Period | Income | | Income | | of Period | Return (%) | | Net Assets | Net Assets | Net Assets | | ($ x1,000,000) |
| |
| Dreyfus Cash Management | | | | | | | | | | | | | |
| Institutional Shares | | | | | | | | | | | | | |
| Year Ended January 31, | | | | | | | | | | | | | |
| 2013 | 1.00 | .001 | | (.001 | ) | 1.00 | .08 | | .21 | .21 | .08 | | 23,193 |
| 2012 | 1.00 | .001 | | (.001 | ) | 1.00 | .07 | | .21 | .19 | .07 | | 22,695 |
| 2011 | 1.00 | .001 | | (.001 | ) | 1.00 | .15 | | .21 | .21 | .14 | | 24,512 |
| 2010 | 1.00 | .004 | | (.004 | ) | 1.00 | .41 | | .22 | .22 | .40 | | 34,291 |
| 2009 | 1.00 | .026 | | (.026 | ) | 1.00 | 2.65 | | .21 | .21 | 2.56 | | 31,821 |
| Investor Shares | | | | | | | | | | | | | |
| Year Ended January 31, | | | | | | | | | | | | | |
| 2013 | 1.00 | .000 | a | (.000 | )a | 1.00 | .00 | b | .46 | .29 | .00 | b | 2,692 |
| 2012 | 1.00 | .000 | a | (.000 | )a | 1.00 | .00 | b | .46 | .26 | .00 | b | 2,991 |
| 2011 | 1.00 | .000 | a | (.000 | )a | 1.00 | .00 | b | .46 | .35 | .00 | b | 2,949 |
| 2010 | 1.00 | .002 | | (.002 | ) | 1.00 | .21 | | .47 | .43 | .23 | | 3,457 |
| 2009 | 1.00 | .024 | | (.024 | ) | 1.00 | 2.40 | | .47 | .47 | 2.30 | | 4,893 |
| Administrative Shares | | | | | | | | | | | | | |
| Year Ended January 31, | | | | | | | | | | | | | |
| 2013 | 1.00 | .000 | a | (.000 | )a | 1.00 | .01 | | .31 | .28 | .00 | b | 1,271 |
| 2012 | 1.00 | .000 | a | (.000 | )a | 1.00 | .01 | | .31 | .25 | .00 | b | 941 |
| 2011 | 1.00 | .001 | | (.001 | ) | 1.00 | .05 | | .31 | .30 | .05 | | 792 |
| 2010 | 1.00 | .003 | | (.003 | ) | 1.00 | .32 | | .32 | .32 | .31 | | 1,113 |
| 2009 | 1.00 | .025 | | (.025 | ) | 1.00 | 2.55 | | .31 | .31 | 2.46 | | 1,176 |
| Participant Shares | | | | | | | | | | | | | |
| Year Ended January 31, | | | | | | | | | | | | | |
| 2013 | 1.00 | .000 | a | (.000 | )a | 1.00 | .00 | b | .61 | .29 | .00 | b | 768 |
| 2012 | 1.00 | .000 | a | (.000 | )a | 1.00 | .00 | b | .61 | .25 | .00 | b | 826 |
| 2011 | 1.00 | .000 | a | (.000 | )a | 1.00 | .00 | b | .61 | .36 | .00 | b | 616 |
| 2010 | 1.00 | .001 | | (.001 | ) | 1.00 | .14 | | .63 | .52 | .15 | | 591 |
| 2009 | 1.00 | .022 | | (.022 | ) | 1.00 | 2.24 | | .62 | .62 | 2.15 | | 1,052 |
| Agency Shares | | | | | | | | | | | | | |
| Year Ended January 31, | | | | | | | | | | | | | |
| 2013 | 1.00 | .000 | a | (.000 | )a | 1.00 | .03 | | .27 | .26 | .03 | | 128 |
| 2012 | 1.00 | .000 | a | (.000 | )a | 1.00 | .02 | | .27 | .23 | .01 | | 186 |
| 2011 | 1.00 | .001 | | (.001 | ) | 1.00 | .09 | | .27 | .27 | .09 | | 60 |
| 2010 | 1.00 | .004 | | (.004 | ) | 1.00 | .35 | | .29 | .28 | .42 | | 90 |
| 2009 | 1.00 | .026 | | (.026 | ) | 1.00 | 2.59 | | .28 | .28 | 2.49 | | 99 |
| | |
| a | Amount represents less than $.001 per share. |
| b | Amount represents less than .01%. |
See notes to financial statements.
64
| | | | | | | | | | | | | | |
| | | Per Share Data ($) | | | | | Ratios/Supplemental Data (%) | | |
| | | | | | | | | | | | Ratio of Net | | |
| | Net Asset | | | Dividends | | Net Asset | | | Ratio of | Ratio of | Investment | | Net Assets |
| | Value | Net | | from Net | | Value | | | Total Expenses | Net Expenses | Income | | End of |
| | Beginning | Investment | | Investment | | End | Total | | to Average | to Average | to Average | | Period |
| | of Period | Income | | Income | | of Period | Return (%) | | Net Assets | Net Assets | Net Assets | | ($ x1,000,000) |
| |
| Dreyfus Government | | | | | | | | | | | | | |
| Cash Management | | | | | | | | | | | | | |
| Institutional Shares | | | | | | | | | | | | | |
| Year Ended January 31, | | | | | | | | | | | | | |
| 2013 | 1.00 | .000 | a | (.000 | )a | 1.00 | .01 | | .21 | .16 | .01 | | 13,228 |
| 2012 | 1.00 | .000 | a | (.000 | )a | 1.00 | .00 | b | .21 | .13 | .00 | b | 18,082 |
| 2011 | 1.00 | .000 | a | (.000 | )a | 1.00 | .04 | | .21 | .21 | .04 | | 20,529 |
| 2010 | 1.00 | .002 | | (.002 | ) | 1.00 | .17 | | .22 | .21 | .18 | | 23,963 |
| 2009 | 1.00 | .020 | | (.020 | ) | 1.00 | 2.01 | | .22 | .22 | 1.63 | | 33,715 |
| Investor Shares | | | | | | | | | | | | | |
| Year Ended January 31, | | | | | | | | | | | | | |
| 2013 | 1.00 | .000 | a | (.000 | )a | 1.00 | .01 | | .46 | .16 | .01 | | 1,766 |
| 2012 | 1.00 | .000 | a | (.000 | )a | 1.00 | .00 | b | .46 | .13 | .00 | b | 1,510 |
| 2011 | 1.00 | .000 | a | (.000 | )a | 1.00 | .00 | b | .46 | .25 | .00 | b | 1,705 |
| 2010 | 1.00 | .000 | a | (.000 | )a | 1.00 | .03 | | .46 | .37 | .04 | | 2,209 |
| 2009 | 1.00 | .017 | | (.017 | ) | 1.00 | 1.76 | | .46 | .46 | 1.39 | | 4,058 |
| Administrative Shares | | | | | | | | | | | | | |
| Year Ended January 31, | | | | | | | | | | | | | |
| 2013 | 1.00 | .000 | a | (.000 | )a | 1.00 | .01 | | .31 | .16 | .01 | | 979 |
| 2012 | 1.00 | .000 | a | (.000 | )a | 1.00 | .00 | b | .31 | .14 | .00 | b | 1,103 |
| 2011 | 1.00 | .000 | a | (.000 | )a | 1.00 | .00 | b | .31 | .25 | .00 | b | 1,091 |
| 2010 | 1.00 | .001 | | (.001 | ) | 1.00 | .10 | | .32 | .29 | .13 | | 829 |
| 2009 | 1.00 | .019 | | (.019 | ) | 1.00 | 1.91 | | .31 | .31 | 1.54 | | 2,258 |
| Participant Shares | | | | | | | | | | | | | |
| Year Ended January 31, | | | | | | | | | | | | | |
| 2013 | 1.00 | .000 | a | (.000 | )a | 1.00 | .01 | | .61 | .16 | .01 | | 287 |
| 2012 | 1.00 | .000 | a | (.000 | )a | 1.00 | .00 | b | .61 | .14 | .00 | b | 289 |
| 2011 | 1.00 | .000 | a | (.000 | )a | 1.00 | .00 | b | .61 | .25 | .00 | b | 531 |
| 2010 | 1.00 | .000 | a | (.000 | )a | 1.00 | .01 | | .62 | .41 | .01 | | 339 |
| 2009 | 1.00 | .016 | | (.016 | ) | 1.00 | 1.60 | | .61 | .61 | 1.24 | | 662 |
| Agency Shares | | | | | | | | | | | | | |
| Year Ended January 31, | | | | | | | | | | | | | |
| 2013 | 1.00 | .000 | a | (.000 | )a | 1.00 | .01 | | .27 | .15 | .01 | | 79 |
| 2012 | 1.00 | .000 | a | (.000 | )a | 1.00 | .00 | b | .27 | .14 | .00 | b | 86 |
| 2011 | 1.00 | .000 | a | (.000 | )a | 1.00 | .00 | b | .28 | .25 | .00 | b | 130 |
| 2010 | 1.00 | .001 | | (.001 | ) | 1.00 | .13 | | .27 | .26 | .13 | | 73 |
| 2009 | 1.00 | .019 | | (.019 | ) | 1.00 | 1.96 | | .27 | .27 | 1.58 | | 86 |
| | |
| a | Amount represents less than $.001 per share. |
| b | Amount represents less than .01%. |
See notes to financial statements.
FINANCIAL HIGHLIGHTS (continued)
| | | | | | | | | | | | | | |
| | | Per Share Data ($) | | | | | Ratios/Supplemental Data (%) | | |
| | | | | | | | | | | | Ratio of Net | | |
| | Net Asset | | | Dividends | | Net Asset | | | Ratio of | Ratio of | Investment | | Net Assets |
| | Value | Net | | from Net | | Value | | | Total Expenses | Net Expenses | Income to | | End of |
| | Beginning | Investment | | Investment | | End | Total | | to Average | to Average | Average | | Period |
| | of Period | Income | | Income | | of Period | Return (%) | | Net Assets | Net Assets | Net Assets | | ($ 1,000,000) |
| | | | | | | | |
| Dreyfus Government Prime | | | | | | | | | | | | | |
| Cash Management | | | | | | | | | | | | | |
| Institutional Shares | | | | | | | | | | | | | |
| Year Ended January 31, | | | | | | | | | | | | | |
| 2013 | 1.00 | .000 | a | (.000 | )a | 1.00 | .00 | b | .21 | .12 | .00 | b | 3,519 |
| 2012 | 1.00 | .000 | a | (.000 | )a | 1.00 | .00 | b | .22 | .11 | .00 | b | 3,543 |
| 2011 | 1.00 | .000 | a | (.000 | )a | 1.00 | .01 | | .22 | .20 | .01 | | 2,792 |
| 2010 | 1.00 | .001 | | (.001 | ) | 1.00 | .11 | | .23 | .21 | .12 | | 3,147 |
| 2009 | 1.00 | .019 | | (.019 | ) | 1.00 | 1.91 | | .22 | .22 | 1.64 | | 6,439 |
| Investor Shares | | | | | | | | | | | | | |
| Year Ended January 31, | | | | | | | | | | | | | |
| 2013 | 1.00 | .000 | a | (.000 | )a | 1.00 | .00 | b | .47 | .12 | .00 | b | 454 |
| 2012 | 1.00 | .000 | a | (.000 | )a | 1.00 | .00 | b | .47 | .12 | .00 | b | 482 |
| 2011 | 1.00 | .000 | a | (.000 | )a | 1.00 | .00 | b | .47 | .22 | .00 | b | 557 |
| 2010 | 1.00 | .000 | a | (.000 | )a | 1.00 | .00 | b | .48 | .33 | .00 | b | 593 |
| 2009 | 1.00 | .016 | | (.016 | ) | 1.00 | 1.66 | | .47 | .47 | 1.39 | | 1,178 |
| Administrative Shares | | | | | | | | | | | | | |
| Year Ended January 31, | | | | | | | | | | | | | |
| 2013 | 1.00 | .000 | a | (.000 | )a | 1.00 | .00 | b | .32 | .12 | .00 | b | 568 |
| 2012 | 1.00 | .000 | a | (.000 | )a | 1.00 | .00 | b | .32 | .12 | .00 | b | 632 |
| 2011 | 1.00 | .000 | a | (.000 | )a | 1.00 | .00 | b | .32 | .22 | .00 | b | 561 |
| 2010 | 1.00 | .000 | a | (.000 | )a | 1.00 | .04 | | .33 | .29 | .04 | | 497 |
| 2009 | 1.00 | .018 | | (.018 | ) | 1.00 | 1.81 | | .32 | .32 | 1.54 | | 693 |
| Participant Shares | | | | | | | | | | | | | |
| Year Ended January 31, | | | | | | | | | | | | | |
| 2013 | 1.00 | .000 | a | (.000 | )a | 1.00 | .00 | b | .61 | .12 | .00 | b | 229 |
| 2012 | 1.00 | .000 | a | (.000 | )a | 1.00 | .00 | b | .61 | .13 | .00 | b | 226 |
| 2011 | 1.00 | .000 | a | (.000 | )a | 1.00 | .00 | b | .62 | .22 | .00 | b | 476 |
| 2010 | 1.00 | .000 | a | (.000 | )a | 1.00 | .00 | b | .62 | .33 | .00 | b | 706 |
| 2009 | 1.00 | .015 | | (.015 | ) | 1.00 | 1.51 | | .62 | .61 | 1.25 | | 1,346 |
| Agency Shares | | | | | | | | | | | | | |
| Year Ended January 31, | | | | | | | | | | | | | |
| 2013 | 1.00 | .000 | a | (.000 | )a | 1.00 | .00 | b | .27 | .12 | .00 | b | 37 |
| 2012 | 1.00 | .000 | a | (.000 | )a | 1.00 | .00 | b | .27 | .13 | .00 | b | 12 |
| 2011 | 1.00 | .000 | a | (.000 | )a | 1.00 | .00 | b | .28 | .21 | .00 | b | 56 |
| 2010 | 1.00 | .001 | | (.001 | ) | 1.00 | .06 | | .29 | .26 | .06 | | 90 |
| 2009 | 1.00 | .018 | | (.018 | ) | 1.00 | 1.85 | | .28 | .28 | 1.58 | | 41 |
| | |
| a | Amount represents less than $.001 per share. |
| b | Amount represents less than .01%. |
See notes to financial statements.
66
| | | | | | | | | | | | | | |
| | | Per Share Data ($) | | | | | Ratios/Supplemental Data (%) | | |
| | | | | | | | | | | | Ratio of Net | | |
| | Net Asset | | | Dividends | | Net Asset | | | Ratio of | Ratio of | Investment | | Net Assets |
| | Value | Net | | from Net | | Value | | | Total Expenses | Net Assets | Income | | End of |
| | Beginning | Investment | | Investment | | End | Total | | to Average | to Average | to Average | | Period |
| | of Period | Income | | Income | | of Period | Return (%) | | Net Expenses | Net Assets | Net Assets | | ($ x1,000,000) |
| |
| Dreyfus Treasury & Agency | | | | | | | | | | | | | |
| Cash Management | | | | | | | | | | | | | |
| Institutional Shares | | | | | | | | | | | | | |
| Year Ended January 31, | | | | | | | | | | | | | |
| 2013 | 1.00 | .000 | a | (.000 | )a | 1.00 | .01 | | .21 | .13 | .01 | | 14,499 |
| 2012 | 1.00 | .000 | a | (.000 | )a | 1.00 | .01 | | .21 | .09 | .01 | | 16,547 |
| 2011 | 1.00 | .000 | a | (.000 | )a | 1.00 | .01 | | .22 | .20 | .01 | | 7,944 |
| 2010 | 1.00 | .001 | | (.001 | ) | 1.00 | .07 | | .22 | .21 | .08 | | 12,015 |
| 2009 | 1.00 | .013 | | (.013 | ) | 1.00 | 1.27 | | .22 | .22 | 1.09 | | 16,461 |
| Investor Shares | | | | | | | | | | | | | |
| Year Ended January 31, | | | | | | | | | | | | | |
| 2013 | 1.00 | .000 | a | (.000 | )a | 1.00 | .01 | | .46 | .13 | .01 | | 2,270 |
| 2012 | 1.00 | .000 | a | (.000 | )a | 1.00 | .01 | | .46 | .09 | .01 | | 2,176 |
| 2011 | 1.00 | .000 | a | (.000 | )a | 1.00 | .00 | b | .46 | .20 | .00 | b | 1,823 |
| 2010 | 1.00 | .000 | a | (.000 | )a | 1.00 | .00 | b | .47 | .29 | .00 | b | 1,922 |
| 2009 | 1.00 | .010 | | (.010 | ) | 1.00 | 1.04 | | .47 | .45 | .86 | | 3,317 |
| Administrative Shares | | | | | | | | | | | | | |
| Year Ended January 31, | | | | | | | | | | | | | |
| 2013 | 1.00 | .000 | a | (.000 | )a | 1.00 | .01 | | .31 | .13 | .01 | | 620 |
| 2012 | 1.00 | .000 | a | (.000 | )a | 1.00 | .01 | | .31 | .09 | .01 | | 602 |
| 2011 | 1.00 | .000 | a | (.000 | )a | 1.00 | .00 | b | .31 | .20 | .00 | b | 422 |
| 2010 | 1.00 | .000 | a | (.000 | )a | 1.00 | .02 | | .33 | .27 | .03 | | 695 |
| 2009 | 1.00 | .012 | | (.012 | ) | 1.00 | 1.17 | | .31 | .31 | 1.00 | | 1,355 |
| Participant Shares | | | | | | | | | | | | | |
| Year Ended January 31, | | | | | | | | | | | | | |
| 2013 | 1.00 | .000 | a | (.000 | )a | 1.00 | .01 | | .61 | .13 | .01 | | 603 |
| 2012 | 1.00 | .000 | a | (.000 | )a | 1.00 | .01 | | .61 | .09 | .01 | | 889 |
| 2011 | 1.00 | .000 | a | (.000 | )a | 1.00 | .00 | b | .61 | .20 | .00 | b | 418 |
| 2010 | 1.00 | .000 | a | (.000 | )a | 1.00 | .00 | b | .62 | .28 | .00 | b | 520 |
| 2009 | 1.00 | .009 | | (.009 | ) | 1.00 | .93 | | .62 | .54 | .77 | | 444 |
| Service Shares | | | | | | | | | | | | | |
| Year Ended January 31, | | | | | | | | | | | | | |
| 2013 | 1.00 | .000 | a | (.000 | )a | 1.00 | .01 | | .71 | .12 | .01 | | 15 |
| 2012 | 1.00 | .000 | a | (.000 | )a | 1.00 | .01 | | .73 | .10 | .01 | | 32 |
| 2011 | 1.00 | .000 | a | (.000 | )a | 1.00 | .00 | b | .71 | .21 | .00 | b | 5 |
| 2010 | 1.00 | .000 | a | (.000 | )a | 1.00 | .00 | b | .72 | .28 | .00 | b | 5 |
| 2009 | 1.00 | .009 | | (.009 | ) | 1.00 | .86 | | .71 | .66 | .65 | | 5 |
| Select Shares | | | | | | | | | | | | | |
| Year Ended January 31, | | | | | | | | | | | | | |
| 2013 | 1.00 | .000 | a | (.000 | )a | 1.00 | .01 | | 1.01 | .13 | .01 | | 6 |
| 2012 | 1.00 | .000 | a | (.000 | )a | 1.00 | .01 | | 1.01 | .09 | .01 | | 24 |
| 2011 | 1.00 | .000 | a | (.000 | )a | 1.00 | .00 | b | 1.01 | .20 | .00 | b | 19 |
| 2010 | 1.00 | .000 | a | (.000 | )a | 1.00 | .00 | b | 1.02 | .28 | .00 | b | 25 |
| 2009 | 1.00 | .007 | | (.007 | ) | 1.00 | .66 | | 1.01 | .87 | .44 | | 33 |
| Agency Shares | | | | | | | | | | | | | |
| Year Ended January 31, | | | | | | | | | | | | | |
| 2013 | 1.00 | .000 | a | (.000 | )a | 1.00 | .01 | | .27 | .14 | .01 | | 28 |
| 2012 | 1.00 | .000 | a | (.000 | )a | 1.00 | .01 | | .27 | .10 | .01 | | 23 |
| 2011 | 1.00 | .000 | a | (.000 | )a | 1.00 | .00 | b | .27 | .20 | .00 | b | 38 |
| 2010 | 1.00 | .000 | a | (.000 | )a | 1.00 | .03 | | .28 | .24 | .03 | | 71 |
| 2009 | 1.00 | .012 | | (.012 | ) | 1.00 | 1.21 | | .27 | .27 | 1.04 | | 63 |
| Premier Shares | | | | | | | | | | | | | |
| Year Ended January 31, | | | | | | | | | | | | | |
| 2013 | 1.00 | .000 | a | (.000 | )a | 1.00 | .01 | | .52 | .14 | .01 | | 25 |
| 2012 | 1.00 | .000 | a | (.000 | )a | 1.00 | .01 | | .52 | .10 | .01 | | 31 |
| 2011 | 1.00 | .000 | a | (.000 | )a | 1.00 | .00 | b | .52 | .20 | .00 | b | 52 |
| 2010 | 1.00 | .000 | a | (.000 | )a | 1.00 | .00 | b | .53 | .27 | .00 | b | 61 |
| 2009 | 1.00 | .010 | | (.010 | ) | 1.00 | 1.00 | | .53 | .48 | .83 | | 35 |
| | |
| a | Amount represents less than $.001 per share. |
| b | Amount represents less than .01%. |
See notes to financial statements.
FINANCIAL HIGHLIGHTS (continued)
| | | | | | | | | | | | | | |
| | | Per Share Data ($) | | | | | Ratios/Supplemental Data (%) | | |
| | | | | | | | | | | | Ratio of Net | | |
| | Net Asset | | | Dividends | | Net Asset | | | Ratio of | Ratio of | Investment | | Net Assets |
| | Value | Net | | from Net | | Value | | | Total Expenses | Net Expenses | Income to | | End of |
| | Beginning | Investment | | Investment | | End | Total | | to Average | to Average | Average | | Period |
| | of Period | Income | | Income | | of Period | Return (%) | | Net Assets | Net Assets | Net Assets | | ($ x1,000,000) |
| |
| Dreyfus Treasury | | | | | | | | | | | | | |
| Prime Cash Management | | | | | | | | | | | | | |
| Institutional Shares | | | | | | | | | | | | | |
| Year Ended January 31, | | | | | | | | | | | | | |
| 2013 | 1.00 | .000 | a | (.000 | )a | 1.00 | .00 | b | .21 | .09 | .00 | b | 24,582 |
| 2012 | 1.00 | .000 | a | (.000 | )a | 1.00 | .00 | b | .22 | .06 | .00 | b | 18,888 |
| 2011 | 1.00 | .000 | a | (.000 | )a | 1.00 | .00 | b | .21 | .14 | .00 | b | 15,016 |
| 2010 | 1.00 | .000 | a | (.000 | )a | 1.00 | .02 | | .22 | .19 | .03 | | 18,751 |
| 2009 | 1.00 | .012 | | (.012 | ) | 1.00 | 1.24 | | .22 | .22 | .78 | | 30,587 |
| Investor Shares | | | | | | | | | | | | | |
| Year Ended January 31, | | | | | | | | | | | | | |
| 2013 | 1.00 | .000 | a | (.000 | )a | 1.00 | .00 | b | .46 | .09 | .00 | b | 4,067 |
| 2012 | 1.00 | .000 | a | (.000 | )a | 1.00 | .00 | b | .46 | .06 | .00 | b | 4,150 |
| 2011 | 1.00 | .000 | a | (.000 | )a | 1.00 | .00 | b | .46 | .14 | .00 | b | 3,215 |
| 2010 | 1.00 | .000 | a | (.000 | )a | 1.00 | .00 | b | .47 | .22 | .00 | b | 4,222 |
| 2009 | 1.00 | .010 | | (.010 | ) | 1.00 | 1.01 | | .46 | .44 | .56 | | 7,522 |
| Administrative Shares | | | | | | | | | | | | | |
| Year Ended January 31, | | | | | | | | | | | | | |
| 2013 | 1.00 | .000 | a | (.000 | )a | 1.00 | .00 | b | .31 | .09 | .00 | b | 750 |
| 2012 | 1.00 | .000 | a | (.000 | )a | 1.00 | .00 | b | .31 | .08 | .00 | b | 610 |
| 2011 | 1.00 | .000 | a | (.000 | )a | 1.00 | .00 | b | .31 | .14 | .00 | b | 1,054 |
| 2010 | 1.00 | .000 | a | (.000 | )a | 1.00 | .00 | b | .32 | .21 | .00 | b | 1,272 |
| 2009 | 1.00 | .011 | | (.011 | ) | 1.00 | 1.15 | | .32 | .31 | .69 | | 2,526 |
| Participant Shares | | | | | | | | | | | | | |
| Year Ended January 31, | | | | | | | | | | | | | |
| 2013 | 1.00 | .000 | a | (.000 | )a | 1.00 | .00 | b | .61 | .09 | .00 | b | 3,674 |
| 2012 | 1.00 | .000 | a | (.000 | )a | 1.00 | .00 | b | .61 | .06 | .00 | b | 2,866 |
| 2011 | 1.00 | .000 | a | (.000 | )a | 1.00 | .00 | b | .61 | .15 | .00 | b | 2,163 |
| 2010 | 1.00 | .000 | a | (.000 | )a | 1.00 | .00 | b | .62 | .22 | .00 | b | 2,599 |
| 2009 | 1.00 | .009 | | (.009 | ) | 1.00 | .89 | | .62 | .53 | .47 | | 5,437 |
| Agency Shares | | | | | | | | | | | | | |
| Year Ended January 31, | | | | | | | | | | | | | |
| 2013 | 1.00 | .000 | a | (.000 | )a | 1.00 | .00 | b | .27 | .08 | .00 | b | 24 |
| 2012 | 1.00 | .000 | a | (.000 | )a | 1.00 | .00 | b | .26 | .05 | .00 | b | 21 |
| 2011 | 1.00 | .000 | a | (.000 | )a | 1.00 | .00 | b | .27 | .11 | .00 | b | 21 |
| 2010 | 1.00 | .000 | a | (.000 | )a | 1.00 | .00 | b | .28 | .19 | .01 | | 381 |
| 2009 | 1.00 | .012 | | (.012 | ) | 1.00 | 1.18 | | .27 | .27 | .73 | | 409 |
| | |
| a | Amount represents less than $.001 per share. |
| b | Amount represents less than .01%. |
See notes to financial statements.
68
| | | | | | | | | | | | | | |
| | | Per Share Data ($) | | | | | Ratios/Supplemental Data (%) | | |
| | | | | | | | | | | | Ratio of Net | | |
| | Net Asset | | | Dividends | | Net Asset | | | Ratio of | Ratio of | Investment | | Net Assets |
| | Value | Net | | from Net | | Value | | | Total Expenses | Net Expenses | Income to | | End of |
| | Beginning | Investment | | Investment | | End | Total | | to Average | to Average | Average | | Period |
| | of Period | Income | | Income | | of Period | Return (%) | | Net Assets | Net Assets | Net Assets | | ($ x1,000,000) |
| |
| Dreyfus Municipal | | | | | | | | | | | | | |
| Cash Management Plus | | | | | | | | | | | | | |
| Institutional Shares | | | | | | | | | | | | | |
| Year Ended January 31, | | | | | | | | | | | | | |
| 2013 | 1.00 | .000 | a | (.000 | )a | 1.00 | .01 | | .24 | .23 | .01 | | 353 |
| 2012 | 1.00 | .000 | a | (.000 | )a | 1.00 | .03 | | .24 | .22 | .03 | | 346 |
| 2011 | 1.00 | .001 | | (.001 | ) | 1.00 | .13 | | .24 | .24 | .13 | | 363 |
| 2010 | 1.00 | .005 | | (.005 | ) | 1.00 | .49 | | .25 | .23 | .50 | | 360 |
| 2009 | 1.00 | .021 | | (.021 | ) | 1.00 | 2.17 | | .21 | .21 | 2.14 | | 589 |
| Investor Shares | | | | | | | | | | | | | |
| Year Ended January 31, | | | | | | | | | | | | | |
| 2013 | 1.00 | .000 | a | (.000 | )a | 1.00 | .00 | b | .49 | .25 | .00 | b | 211 |
| 2012 | 1.00 | .000 | a | (.000 | )a | 1.00 | .00 | b | .49 | .25 | .00 | b | 257 |
| 2011 | 1.00 | .000 | a | (.000 | )a | 1.00 | .00 | b | .48 | .37 | .00 | b | 259 |
| 2010 | 1.00 | .003 | | (.003 | ) | 1.00 | .27 | | .50 | .44 | .29 | | 401 |
| 2009 | 1.00 | .019 | | (.019 | ) | 1.00 | 1.91 | | .46 | .46 | 1.89 | | 293 |
| Administrative Shares | | | | | | | | | | | | | |
| Year Ended January 31, | | | | | | | | | | | | | |
| 2013 | 1.00 | .000 | a | (.000 | )a | 1.00 | .00 | b | .34 | .25 | .00 | b | 208 |
| 2012 | 1.00 | .000 | a | (.000 | )a | 1.00 | .00 | b | .34 | .26 | .00 | b | 213 |
| 2011 | 1.00 | .000 | a | (.000 | )a | 1.00 | .04 | | .33 | .33 | .04 | | 377 |
| 2010 | 1.00 | .004 | | (.004 | ) | 1.00 | .39 | | .35 | .32 | .41 | | 582 |
| 2009 | 1.00 | .020 | | (.020 | ) | 1.00 | 2.07 | | .31 | .31 | 2.04 | | 625 |
| Participant Shares | | | | | | | | | | | | | |
| Year Ended January 31, | | | | | | | | | | | | | |
| 2013 | 1.00 | .000 | a | (.000 | )a | 1.00 | .00 | b | .65 | .25 | .00 | b | 21 |
| 2012 | 1.00 | .000 | a | (.000 | )a | 1.00 | .00 | b | .64 | .25 | .00 | b | 25 |
| 2011 | 1.00 | .000 | a | (.000 | )a | 1.00 | .00 | b | .63 | .37 | .00 | b | 23 |
| 2010 | 1.00 | .002 | | (.002 | ) | 1.00 | .18 | | .65 | .56 | .17 | | 23 |
| 2009 | 1.00 | .017 | | (.017 | ) | 1.00 | 1.76 | | .61 | .61 | 1.74 | | 61 |
| Agency Shares | | | | | | | | | | | | | |
| Year Ended January 31, | | | | | | | | | | | | | |
| 2013 | 1.00 | .000 | a | (.000 | )a | 1.00 | .00 | b | .30 | .25 | .00 | b | —c |
| 2012 | 1.00 | .000 | a | (.000 | )a | 1.00 | .01 | | .30 | .24 | .01 | | —c |
| 2011 | 1.00 | .001 | | (.001 | ) | 1.00 | .06 | | .30 | .30 | .06 | | —c |
| 2010 | 1.00 | .004 | | (.004 | ) | 1.00 | .42 | | .32 | .29 | .44 | | 1 |
| 2009 | 1.00 | .021 | | (.021 | ) | 1.00 | 2.10 | | .27 | .27 | 2.08 | | —c |
| | |
| a | Amount represents less than $.001 per share. |
| b | Amount represents less than .01%. |
| c | Amount represents less than $1 million. |
See notes to financial statements.
FINANCIAL HIGHLIGHTS (continued)
| | | | | | | | | | | | | | |
| | | Per Share Data ($) | | | | | Ratios/Supplemental Data (%) | | |
| | | | | | | | | | | | Ratio of Net | | |
| | Net Asset | | | Dividends | | Net Asset | | | Ratio of | Ratio of | Investment | | Net Assets |
| | Value | Net | | from Net | | Value | | | Total Expenses | Net Expenses | Income to | | End of |
| | Beginning | Investment | | Investment | | End | Total | | to Average | to Average | Average | | Period |
| | of Period | Income | | Income | | of Period | Return (%) | | Net Assets | Net Assets | Net Assets | | ($ 1,000,000) |
| |
| Dreyfus New York Municipal | | | | | | | | | | | | | |
| Cash Management | | | | | | | | | | | | | |
| Institutional Shares | | | | | | | | | | | | | |
| Year Ended January 31, | | | | | | | | | | | | | |
| 2013 | 1.00 | .000 | a | (.000 | )a | 1.00 | .01 | | .25 | .23 | .01 | | 133 |
| 2012 | 1.00 | .000 | a | (.000 | )a | 1.00 | .03 | | .24 | .21 | .04 | | 320 |
| 2011 | 1.00 | .001 | | (.001 | ) | 1.00 | .13 | | .24 | .24 | .12 | | 459 |
| 2010 | 1.00 | .004 | | (.004 | ) | 1.00 | .45 | | .25 | .23 | .44 | | 589 |
| 2009 | 1.00 | .020 | | (.020 | ) | 1.00 | 1.99 | | .22 | .22 | 1.95 | | 544 |
| Investor Shares | | | | | | | | | | | | | |
| Year Ended January 31, | | | | | | | | | | | | | |
| 2013 | 1.00 | .000 | a | (.000 | )a | 1.00 | .00 | b | .50 | .24 | .00 | b | 200 |
| 2012 | 1.00 | .000 | a | (.000 | )a | 1.00 | .00 | b | .49 | .25 | .00 | b | 267 |
| 2011 | 1.00 | .000 | a | (.000 | )a | 1.00 | .00 | b | .48 | .36 | .00 | b | 299 |
| 2010 | 1.00 | .002 | | (.002 | ) | 1.00 | .23 | | .50 | .45 | .22 | | 282 |
| 2009 | 1.00 | .017 | | (.017 | ) | 1.00 | 1.74 | | .47 | .47 | 1.70 | | 374 |
| Administrative Shares | | | | | | | | | | | | | |
| Year Ended January 31, | | | | | | | | | | | | | |
| 2013 | 1.00 | .000 | a | (.000 | )a | 1.00 | .00 | b | .35 | .25 | .00 | b | 10 |
| 2012 | 1.00 | .000 | a | (.000 | )a | 1.00 | .00 | b | .34 | .25 | .00 | b | 21 |
| 2011 | 1.00 | .000 | a | (.000 | )a | 1.00 | .03 | | .34 | .33 | .03 | | 47 |
| 2010 | 1.00 | .004 | | (.004 | ) | 1.00 | .35 | | .35 | .33 | .34 | | 70 |
| 2009 | 1.00 | .019 | | (.019 | ) | 1.00 | 1.89 | | .32 | .32 | 1.85 | | 62 |
| Participant Shares | | | | | | | | | | | | | |
| Year Ended January 31, | | | | | | | | | | | | | |
| 2013 | 1.00 | .000 | a | (.000 | )a | 1.00 | .00 | b | .66 | .25 | .00 | b | 13 |
| 2012 | 1.00 | .000 | a | (.000 | )a | 1.00 | .00 | b | .64 | .25 | .00 | b | 11 |
| 2011 | 1.00 | .000 | a | (.000 | )a | 1.00 | .00 | b | .64 | .36 | .00 | b | 22 |
| 2010 | 1.00 | .001 | | (.001 | ) | 1.00 | .15 | | .65 | .57 | .10 | | 12 |
| 2009 | 1.00 | .016 | | (.016 | ) | 1.00 | 1.59 | | .62 | .62 | 1.55 | | 51 |
| | |
| a | Amount represents less than $.001 per share. |
| b | Amount represents less than .01%. |
See notes to financial statements.
70
| | | | | | | | | | | | | | |
| | | Per Share Data ($) | | | | | Ratios/Supplemental Data (%) | | |
| | | | | | | | | | | | Ratio of Net | | |
| | Net Asset | | | Dividends | | Net Asset | | | Ratio of | Ratio of | Investment | | Net Assets |
| | Value | Net | | from Net | | Value | | | Total Expenses | Net Assets | Income to | | End of |
| | Beginning | Investment | | Investment | | End | Total | | to Average | to Average | Average | | Period |
| | of Period | Income | | Income | | of Period | Return (%) | | Net Assets | Net Expenses | Net Assets | | ($ x1,000,000) |
| |
| Dreyfus Tax Exempt | | | | | | | | | | | | | |
| Cash Management | | | | | | | | | | | | | |
| Institutional Shares | | | | | | | | | | | | | |
| Year Ended January 31, | | | | | | | | | | | | | |
| 2013 | 1.00 | .000 | a | (.000 | )a | 1.00 | .00 | b | .24 | .21 | .00 | b | 1,776 |
| 2012 | 1.00 | .000 | a | (.000 | )a | 1.00 | .03 | | .24 | .20 | .03 | | 2,082 |
| 2011 | 1.00 | .001 | | (.001 | ) | 1.00 | .10 | | .23 | .23 | .09 | | 2,831 |
| 2010 | 1.00 | .004 | | (.004 | ) | 1.00 | .37 | | .24 | .23 | .40 | | 3,383 |
| 2009 | 1.00 | .021 | | (.021 | ) | 1.00 | 2.11 | | .21 | .21 | 2.06 | | 5,191 |
| Investor Shares | | | | | | | | | | | | | |
| Year Ended January 31, | | | | | | | | | | | | | |
| 2013 | 1.00 | .000 | a | (.000 | )a | 1.00 | .00 | b | .47 | .21 | .00 | b | 443 |
| 2012 | 1.00 | .000 | a | (.000 | )a | 1.00 | .00 | b | .47 | .22 | .00 | b | 380 |
| 2011 | 1.00 | .000 | a | (.000 | )a | 1.00 | .01 | | .47 | .32 | .00 | b | 344 |
| 2010 | 1.00 | .002 | | (.002 | ) | 1.00 | .19 | | .49 | .42 | .21 | | 354 |
| 2009 | 1.00 | .018 | | (.018 | ) | 1.00 | 1.86 | | .46 | .46 | 1.81 | | 565 |
| Administrative Shares | | | | | | | | | | | | | |
| Year Ended January 31, | | | | | | | | | | | | | |
| 2013 | 1.00 | .000 | a | (.000 | )a | 1.00 | .00 | b | .32 | .21 | .00 | b | 66 |
| 2012 | 1.00 | .000 | a | (.000 | )a | 1.00 | .00 | b | .32 | .22 | .00 | b | 76 |
| 2011 | 1.00 | .000 | a | (.000 | )a | 1.00 | .02 | | .32 | .31 | .01 | | 72 |
| 2010 | 1.00 | .003 | | (.003 | ) | 1.00 | .28 | | .34 | .32 | .31 | | 120 |
| 2009 | 1.00 | .020 | | (.020 | ) | 1.00 | 2.01 | | .31 | .31 | 1.96 | | 645 |
| Participant Shares | | | | | | | | | | | | | |
| Year Ended January 31, | | | | | | | | | | | | | |
| 2013 | 1.00 | .000 | a | (.000 | )a | 1.00 | .00 | b | .62 | .20 | .00 | b | 36 |
| 2012 | 1.00 | .000 | a | (.000 | )a | 1.00 | .00 | b | .62 | .21 | .00 | b | 27 |
| 2011 | 1.00 | .000 | a | (.000 | )a | 1.00 | .01 | | .62 | .32 | .00 | b | 9 |
| 2010 | 1.00 | .001 | | (.001 | ) | 1.00 | .12 | | .64 | .53 | .10 | | 27 |
| 2009 | 1.00 | .017 | | (.017 | ) | 1.00 | 1.70 | | .61 | .61 | 1.66 | | 134 |
| | |
| a | Amount represents less than $.001 per share. |
| b | Amount represents less than .01%. |
See notes to financial statements.
FINANCIAL HIGHLIGHTS (continued)
| | | | | | | | | | | | | | |
| | | Per Share Data ($) | | | | | Ratios/Supplemental Data (%) | | |
| | | | | | | | | | | | Ratio of Net | | |
| | Net Asset | | | Dividends | | Net Asset | | | Ratio of | Ratio of | Investment | | Net Assets |
| | Value | Net | | from Net | | Value | | | Total Expenses | Net Expenses | Income to | | End of |
| | Beginning | Investment | | Investment | | End | Total | | to Average | to Average | Average | | Period |
| | of Period | Income | | Income | | of Period | Return | (%) | Net Assets | Net Assets | Net Assets | | ($ x1,000,000) |
| |
| Dreyfus California AMT-Free | | | | | | | | | | | | | |
| Municipal Cash Management | | | | | | | | | | | | | |
| Institutional Shares | | | | | | | | | | | | | |
| Year Ended January 31, | | | | | | | | | | | | | |
| 2013 | 1.00 | .001 | | (.001 | ) | 1.00 | .06 | | .24 | .22 | .01 | | 198 |
| 2012 | 1.00 | .001 | | (.001 | ) | 1.00 | .05 | | .24 | .22 | .05 | | 174 |
| 2011 | 1.00 | .001 | | (.001 | ) | 1.00 | .13 | | .24 | .24 | .13 | | 135 |
| 2010 | 1.00 | .004 | | (.004 | ) | 1.00 | .40 | | .29 | .22 | .34 | | 139 |
| 2009 | 1.00 | .019 | | (.019 | ) | 1.00 | 1.88 | | .22 | .17 | 1.93 | | 91 |
| Investor Shares | | | | | | | | | | | | | |
| Year Ended January 31, | | | | | | | | | | | | | |
| 2013 | 1.00 | .000 | a | (.000 | )a | 1.00 | .04 | | .48 | .22 | .00 | b | 212 |
| 2012 | 1.00 | .000 | a | (.000 | )a | 1.00 | .00 | b | .50 | .27 | .00 | b | 203 |
| 2011 | 1.00 | .000 | a | (.000 | )a | 1.00 | .00 | b | .49 | .38 | .00 | b | 56 |
| 2010 | 1.00 | .002 | | (.002 | ) | 1.00 | .21 | | .54 | .40 | .16 | | 64 |
| 2009 | 1.00 | .016 | | (.016 | ) | 1.00 | 1.63 | | .47 | .42 | 1.68 | | 24 |
| Administrative Shares | | | | | | | | | | | | | |
| Year Ended January 31, | | | | | | | | | | | | | |
| 2013 | 1.00 | .000 | a | (.000 | )a | 1.00 | .04 | | .35 | .22 | .00 | b | 1 |
| 2012 | 1.00 | .000 | a | (.000 | )a | 1.00 | .01 | | .35 | .27 | .01 | | 2 |
| 2011 | 1.00 | .000 | a | (.000 | )a | 1.00 | .04 | | .35 | .34 | .03 | | 14 |
| 2010 | 1.00 | .003 | | (.003 | ) | 1.00 | .30 | | .40 | .32 | .24 | | 4 |
| 2009 | 1.00 | .018 | | (.018 | ) | 1.00 | 1.78 | | .32 | .27 | 1.83 | | —c |
| Participant Shares | | | | | | | | | | | | | |
| Year Ended January 31, | | | | | | | | | | | | | |
| 2013 | 1.00 | .000 | a | (.000 | )a | 1.00 | .04 | | .63 | .22 | .00 | b | 34 |
| 2012 | 1.00 | .000 | a | (.000 | )a | 1.00 | .00 | b | .64 | .28 | .00 | b | 62 |
| 2011 | 1.00 | .000 | a | (.000 | )a | 1.00 | .00 | b | .64 | .38 | .00 | b | 48 |
| 2010 | 1.00 | .001 | | (.001 | ) | 1.00 | .13 | | .69 | .50 | .06 | | 56 |
| 2009 | 1.00 | .015 | | (.015 | ) | 1.00 | 1.48 | | .62 | .57 | 1.53 | | 97 |
| | |
| a | Amount represents less than $.001 per share. |
| b | Amount represents less than .01%. |
| c | Amount represents less than $1 million. |
See notes to financial statements.
72
| | | | | | | | | | | | | | | | | | | | | |
| | | | | | Per Share Data ($) | | | | | | | Ratios/Supplemental Data (%) | | |
| | | | | | | | Dividends | | | | | | | | | | | Ratio of Net | | |
| | | Net Asset | | | Dividends | | from Net | | | | Net Asset | | | Ratio of | | Ratio of | | Investment | | Net Assets |
| | | Value | Net | | from Net | | Realized | | | | Value | | | Total Expenses | | Net Expenses | | Income to | | End of |
| | | Beginning | Investment | | Investments | | Gain on | | Total | | End | Total | | to Average | | to Average | | Average | | Period |
| | | of Period | Income | | Income | | Investment | | Distributions | | of Period | Return (%) | | Net Assets | | Net Assets | | Net Assets | | ($ x1,000,000) |
| |
| Dreyfus New York | | | | | | | | | | | | | | | | | | |
| AMT-Free | | | | | | | | | | | | | | | | | | | | |
| Municipal Cash | | | | | | | | | | | | | | | | | | |
| Management | | | | | | | | | | | | | | | | | | | | |
| Institutional Shares† | | | | | | | | | | | | | | | | | | |
| Year Ended | | | | | | | | | | | | | | | | | | | | |
| January 31, | | | | | | | | | | | | | | | | | | | | |
| 2013 | | 1.00 | .000 | a | (.000 | )a | — | | (.000 | )a | 1.00 | .00 | b | .34 | | .28 | | .00 | b | 83 |
| 2012 | | 1.00 | .000 | a | (.000 | )a | — | | (.000 | )a | 1.00 | .02 | | .31 | | .25 | | .02 | | 102 |
| 2011 | | 1.00 | .001 | | (.001 | ) | — | | (.001 | ) | 1.00 | .14 | | .31 | | .23 | | .14 | | 81 |
| 2010 | | 1.00 | .005 | | (.005 | ) | — | | (.005 | ) | 1.00 | .47 | | .22 | | .22 | | .47 | | 110 |
| One Month Ended | | | | | | | | | | | | | | | | | | | | |
| January 31, | | | | | | | | | | | | | | | | | | | | |
| 2009c | | 1.00 | .001 | | (.001 | ) | — | | (.001 | ) | 1.00 | .06 | d | .24 | e | .24 | e | .70 | e | 49 |
| Year Ended | | | | | | | | | | | | | | | | | | | | |
| December 31, | | | | | | | | | | | | | | | | | | | | |
| 2008 | | 1.00 | .021 | | (.021 | ) | (.000 | )a | (.021 | ) | 1.00 | 2.08 | | .25 | | .24 | | 2.08 | | 49 |
| Investor Shares† | | | | | | | | | | | | | | | | | | | | |
| Year Ended | | | | | | | | | | | | | | | | | | | | |
| January 31, | | | | | | | | | | | | | | | | | | | | |
| 2013 | | 1.00 | .000 | a | (.000 | )a | — | | (.000 | )a | 1.00 | .00 | b | .59 | | .27 | | .00 | b | 37 |
| 2012 | | 1.00 | .000 | a | (.000 | )a | — | | (.000 | )a | 1.00 | .00 | b | .56 | | .28 | | .00 | b | 49 |
| 2011 | | 1.00 | .000 | a | (.000 | )a | — | | (.000 | )a | 1.00 | .00 | b | .55 | | .37 | | .00 | b | 50 |
| 2010 | | 1.00 | .003 | | (.003 | ) | — | | (.003 | ) | 1.00 | .27 | | .47 | | .43 | | .26 | | 74 |
| One Month Ended | | | | | | | | | | | | | | | | | | | | |
| January 31, | | | | | | | | | | | | | | | | | | | | |
| 2009c | | 1.00 | .000 | a | (.000 | )a | — | | (.000 | )a | 1.00 | .04 | d | .49 | e | .49 | e | .45 | e | 102 |
| Year Ended | | | | | | | | | | | | | | | | | | | | |
| December 31, | | | | | | | | | | | | | | | | | | | | |
| 2008 | | 1.00 | .018 | | (.018 | ) | (.000 | )a | (.018 | ) | 1.00 | 1.83 | | .50 | | .49 | | 1.80 | | 100 |
| Administrative | | | | | | | | | | | | | | | | | | | | |
| Shares | | | | | | | | | | | | | | | | | | | | |
| Year Ended | | | | | | | | | | | | | | | | | | | | |
| January 31, | | | | | | | | | | | | | | | | | | | | |
| 2013 | | 1.00 | .000 | a | (.000 | )a | — | | (.000 | )a | 1.00 | .00 | b | .45 | | .27 | | .00 | b | 6 |
| 2012 | | 1.00 | .000 | a | (.000 | )a | — | | (.000 | )a | 1.00 | .00 | b | .42 | | .28 | | .00 | b | 13 |
| 2011 | | 1.00 | .000 | a | (.000 | )a | — | | (.000 | )a | 1.00 | .05 | | .40 | | .33 | | .04 | | 8 |
| 2010 | | 1.00 | .004 | | (.004 | ) | — | | (.004 | ) | 1.00 | .37 | | .32 | | .31 | | .38 | | 8 |
| One Month Ended | | | | | | | | | | | | | | | | | | | | |
| January 31, | | | | | | | | | | | | | | | | | | | | |
| 2009c | | 1.00 | .001 | | (.001 | ) | — | | (.001 | ) | 1.00 | .05 | d | .34 | e | .34 | e | .60 | e | —f |
| Year Ended | | | | | | | | | | | | | | | | | | | | |
| December 31, | | | | | | | | | | | | | | | | | | | | |
| 2008g | | 1.00 | .006 | | (.006 | ) | — | | (.006 | ) | 1.00 | .62 | e | .33 | e | .33 | e | 2.02 | e | —f |
FINANCIAL HIGHLIGHTS (continued)
| | | | | | | | | | | | | | | | | | | | | |
| | | | | | Per Share Data ($) | | | | | | | Ratios/Supplemental Data (%) | | |
| | | | | | | | Dividends | | | | | | | | | | | Ratio of Net | | |
| | | Net Asset | | | Dividends | | from Net | | | | Net Asset | | | Ratio of | | Ratio of | | Investment | | Net Assets |
| | | Value | Net | | from Net | | Realized | | | | Value | | | Total Expenses | | Net Expenses | | Income to | | End of |
| | | Beginning | Investment | | Investments | | Gain on | | Total | | End | Total | | to Average | | to Average | | Average | | Period |
| | | of Period | Income | | Income | | Investment | | Distributions | | of Period | Return (%) | | Net Assets | | Net Assets | | Net Assets | | ($ x1,000,000) |
| | | | | | | | |
| |
| Dreyfus New York | | | | | | | | | | | | | | | | | | |
| AMT-Free | | | | | | | | | | | | | | | | | | | | |
| Municipal Cash | | | | | | | | | | | | | | | | | | |
| Management | | | | | | | | | | | | | | | | | | |
| (continued) | | | | | | | | | | | | | | | | | | | | |
| Classic Shares† | | | | | | | | | | | | | | | | | | | | |
| Year Ended | | | | | | | | | | | | | | | | | | | | |
| January 31, | | | | | | | | | | | | | | | | | | | | |
| 2013 | | 1.00 | .000 | a | (.000 | )a | — | | (.000 | )a | 1.00 | .00 | b | .84 | | .27 | | .00 | b | 1 |
| 2012 | | 1.00 | .000 | a | (.000 | )a | — | | (.000 | )a | 1.00 | .00 | b | .81 | | .29 | | .00 | b | —f |
| 2011 | | 1.00 | .000 | a | (.000 | )a | — | | (.000 | )a | 1.00 | .00 | b | .81 | | .37 | | .00 | b | 9 |
| 2010 | | 1.00 | .001 | | (.001 | ) | — | | (.001 | ) | 1.00 | .13 | | .72 | | .59 | | .10 | | 60 |
| One Month Ended | | | | | | | | | | | | | | | | | | |
| January 31, | | | | | | | | | | | | | | | | | | | | |
| 2009c | | 1.00 | .000 | a | (.000 | )a | — | | (.000 | )a | 1.00 | .02 | d | .74 | e | .73 | e | .21 | e | 76 |
| Year Ended | | | | | | | | | | | | | | | | | | | | |
| December 31, | | | | | | | | | | | | | | | | | | | | |
| 2008 | | 1.00 | .016 | | (.016 | ) | (.000 | )a | (.016 | ) | 1.00 | 1.58 | | .75 | | .74 | | 1.55 | | 73 |
| |
| † Represents information for the fund’s predecessor, NewYork AMT-Free Municipal Money Fund through September 12, 2008. |
| a Amount represents less than $.001 per share. |
| b Amount represents less than .01%. |
| c The fund has changed its fiscal year end from December 31 to January 31. |
| d Not annualized. |
| e Annualized. |
| f Amount represents less than $1 million. |
| g From September 13, 2008 (commencement of initial offering) to December 31, 2008. |
See notes to financial statements.
74
NOTES TO FINANCIAL STATEMENTS
NOTE 1—Significant Accounting Policies:
Dreyfus Cash Management, Dreyfus Government Cash Management, Dreyfus Government Prime Cash Management, DreyfusTreasury & Agency Cash Management, Dreyfus Treasury Prime Cash Management, Dreyfus Municipal Cash Management Plus, Dreyfus New York Municipal Cash Management, Dreyfus Tax Exempt Cash Management, Dreyfus California AMT-Free Municipal Cash Management and Dreyfus New York AMT-Free Municipal Cash Management (each, a “fund” and collectively, the “funds”) are open-end management investment companies registered under the Investment Company Act of 1940, as amended (the “Act”). Each fund, other than Dreyfus New York Municipal Cash Management, Dreyfus California AMT-Free Municipal Cash Management and Dreyfus New York AMT-Free Municipal Cash Management is diversified. Dreyfus New York Municipal Cash Management, Dreyfus California AMT-Free Municipal Cash Management and Dreyfus New York AMT-Free Municipal Cash Management are non-diversified. Dreyfus Government Cash Management and Dreyfus Government Prime Cash Management are each a separate series of Dreyfus Government Cash Management Funds (the “Company”) and Dreyfus Tax Exempt Cash Management, Dreyfus California AMT-Free Municipal Cash Management and Dreyfus New York AMT-Free Municipal Cash Management are separate series of Dreyfus Tax Exempt Cash Management Funds (the “Trust”). Each fund’s investment objective is to provide investors with as high a level of current income as is consistent with the preservation of capital and the maintenance of liquidity and, in the case of Dreyfus Municipal Cash Management Plus and Dreyfus Tax Exempt Cash Management only, which are exempt from federal income tax; in the case of Dreyfus New York Municipal Cash Management and Dreyfus New York AMT-Free Municipal Cash Management, which is exempt from federal, NewYork state and New York city personal income taxes, and in the case of Dreyfus California AMT-Free Municipal Cash Management only, which is exempt from federal and California state personal income taxes. The Dreyfus Corporation (the “Manager” or “Dreyfus”), a wholly-owned subsidiary of The Bank of New York Mellon Corporation (“BNY Mellon”), serves as each fund’s investment adviser.
Effective September 14, 2012, Agency Shares of Dreyfus New York Municipal Cash Management and Dreyfus California AMT-Free Municipal Cash Management were terminated. Participant Shares of Dreyfus New York AMT-Free Municipal Cash Management were also terminated, effective September 14, 2012.
As of the close of business on August 25, 2011, pursuant to an Agreement and Plan of Reorganization previously approved by Dreyfus Cash Management’s Board of Trustees (the “Board”), all of the assets, subject to the liabilities, of Dreyfus Cash Management Plus were transferred to Dreyfus Cash Management. Shareholders of Dreyfus Cash Management Plus received Institutional Shares, Investor Shares, Administrative Shares, Participant Shares and Agency Shares of Dreyfus Cash Management, in an amount equal to the aggregate net asset value of their investment in Dreyfus Cash Management Plus at the time of the exchange.The net asset value of Dreyfus Cash Management’s shares at the close of business on August 25, 2011, after the reorganization, was $1.00 per share, and a total of 3,379,940,833 Institutional Shares, 139,359,013 Investor Shares, 373,101,182 Administrative Shares, 172,390,108 Participant Shares and 1,046 Agency Shares representing net assets of $4,064,792,182, were issued to Dreyfus Cash Management Plus shareholders in the exchange.The exchange was a tax-free event to shareholders.
MBSC Securities Corporation (the “Distributor”), a wholly-owned subsidiary of the Manager, is the distributor of the funds’ shares, which are sold to the public without a sales charge. Each fund offers Institutional Shares, Investor Shares, Administrative Shares, Participant Shares and Agency Shares with the exception of Dreyfus New York Municipal Cash Management, Dreyfus Tax Exempt Cash Management, Dreyfus California AMT-Free Municipal Cash Management and Dreyfus New York AMT-Free Municipal Cash Management which do not offer Agency Shares. Dreyfus New York AMT-Free Municipal Cash Management also
NOTES TO FINANCIAL STATEMENTS (continued)
does not offer Participant Shares. In addition, Dreyfus Treasury & Agency Cash Management offers Service Shares, Select Shares and Premier Shares and Dreyfus New York AMT-Free Municipal Cash Management offers Classic Shares. Each share class, except Institutional Shares, is subject to a Service Plan adopted pursuant to Rule 12b-1 under the Act. Other differences between the classes include the services offered (by service agents receiving Rule 12b-1 fees) to and the expenses borne by each class and certain voting rights. Income, expenses (other than expenses attributable to a specific class), and realized and unrealized gains or losses on investments are allocated to each class of shares based on its relative net assets.
As of January 31, 2013, MBC Investments Corp., an indirect subsidiary of BNY Mellon, held the following shares:
| | |
| Dreyfus Municipal Cash | |
| Management Plus, Agency Shares | 1,036 |
It is each fund’s policy to maintain a continuous net asset value per share of $1.00; the funds have adopted certain investment, portfolio valuation and dividend and distribution policies to enable it to do so. There is no assurance, however, that the funds will be able to maintain a stable net asset value per share of $1.00.
The Company and the Trust account separately for the assets, liabilities and operations of each series. Expenses directly attributable to each series are charged to that series’ operations; expenses which are applicable to all series are allocated among them on a pro rata basis.
The Financial Accounting Standards Board (“FASB”) Accounting Standards Codification is the exclusive reference of authoritative U.S. generally accepted accounting principles (“GAAP”) recognized by the FASB to be applied by nongovernmental entities. Rules and interpretive releases of the Securities and Exchange Commission (“SEC”) under authority of federal laws are also sources of authoritative GAAP for SEC registrants. The funds’ financial statements are prepared in accordance with GAAP, which may require the use of management estimates and assumptions. Actual results could differ from those estimates.
The funds enter into contracts that contain a variety of indemnifications. The funds’ maximum exposure under these arrangements is unknown. The funds do not anticipate recognizing any loss related to these arrangements.
(a) Portfolio valuation: Investments in securities are valued at amortized cost in accordance with Rule 2a-7 under the Act. If amortized cost is determined not to approximate market value, the fair value of the portfolio securities will be determined by procedures established by and under the general supervision of the Board.
The fair value of a financial instrument is the amount that would be received to sell an asset or paid to transfer a liability in an orderly transaction between market participants at the measurement date (i.e., the exit price). GAAP establishes a fair value hierarchy that prioritizes the inputs of valuation techniques used to measure fair value. This hierarchy gives the highest priority to unadjusted quoted prices in active markets for identical assets or liabilities (Level 1 measurements) and the lowest priority to unobservable inputs (Level 3 measurements).
Additionally, GAAP provides guidance on determining whether the volume and activity in a market has decreased significantly and whether such a decrease in activity results in transactions that are not orderly. GAAP requires enhanced disclosures around valuation inputs and techniques used during annual and interim periods.
Various inputs are used in determining the value of each fund’s investments relating to fair value measurements.These inputs are summarized in the three broad levels listed below:
Level 1—unadjusted quoted prices in active markets for identical investments.
Level 2—other significant observable inputs (including quoted prices for similar investments, interest rates, prepayment speeds, credit risk, etc.).
Level 3—significant unobservable inputs (including the funds’ own assumptions in determining the fair value of investments).
76
The inputs or methodology used for valuing securities are not necessarily an indication of the risk associated with investing in those securities. For example, money market securities are valued using amortized cost, in accordance with rules under the Act. Generally, amortized cost approximates the current fair value of a security, but since the value is not obtained from a quoted price in an active market, such securities are reflected within Level 2 of the fair value hierarchy.
At January 31, 2013, all of the securities in each fund were considered Level 2 of the fair value hierarchy.
At January 31, 2013, there were no transfers between Level 1 and Level 2 of the fair value hierarchy.
(b) Securities transactions and investment income:
Securities transactions are recorded on a trade date basis. Realized gains and losses from securities transactions are recorded on the identified cost basis. Interest income, adjusted for accretion of discount and amortization of premium on investments, is earned from settlement date and is recognized on the accrual basis. Cost of investments represents amortized cost.
Dreyfus New York Municipal Cash Management, Dreyfus California AMT-Free Municipal Cash Management and Dreyfus NewYork AMT-Free Municipal Cash Management follow an investment policy of investing primarily in municipal obligations of one state. Economic changes affecting the state and certain of its public bodies and municipalities may affect the ability of issuers within the state to pay interest on, or repay principal of, municipal obligations held by the funds.
(c) Repurchase Agreements: Dreyfus Cash Management, Dreyfus Government Cash Management and Dreyfus Treasury & Agency Cash Management may enter into repurchase agreements with financial institutions, deemed to be creditworthy by the Manager, subject to the seller’s agreement to repurchase and the funds’ agreement to resell such securities at a mutually agreed upon price. Pursuant to the terms of the repurchase agreements, such securities must have an aggregate market value greater than or equal to the repurchase price plus accrued interest at all times. If the value of the underlying securities falls below the value of the repurchase price plus accrued interest, each fund will require the seller to deposit additional collateral by the next business day. If the request for additional collateral is not met, or the seller defaults on its repurchase obligation, each fund maintains its right to sell the underlying securities at market value and may claim any resulting loss against the seller.
(d) Dividends to shareholders: It is the policy of each fund to declare dividends from investment income-net. Such dividends are paid monthly. Dividends from net realized capital gains, if any, are normally declared and paid annually, but each fund may make distributions on a more frequent basis to comply with the distribution requirements of the Internal Revenue Code of 1986, as amended (the “Code”). To the extent that net realized capital gains can be offset by capital loss carryovers, it is the policy of each fund not to distribute such gains. Income and capital gain distributions are determined in accordance with income tax regulations, which may differ from GAAP.
(e) Federal income taxes: It is the policy of Dreyfus Cash Management, Dreyfus Government Cash Management, Dreyfus Government Prime Cash Management, Dreyfus Treasury & Agency Cash Management and Dreyfus Treasury Prime Cash Management to continue to qualify as a regulated investment company if such qualification is in the best interests of its shareholders, by complying with the applicable provisions of the Code and to make distributions of taxable income sufficient to relieve it from substantially all federal income and excise taxes.
It is the policy of Dreyfus Municipal Cash Management Plus, Dreyfus New York Municipal Cash Management, Dreyfus Tax Exempt Cash Management, Dreyfus California AMT-Free Municipal Cash Management and Dreyfus New York AMT-Free Municipal Cash Management to continue to qualify as a regulated investment company, which can
NOTES TO FINANCIAL STATEMENTS (continued)
distribute tax-exempt dividends, by complying with the applicable provisions of the Code and to make distributions of income and net realized capital gain sufficient to relieve it from substantially all federal income and excise taxes.
As of and during the period ended January 31, 2013, the funds did not have any liabilities for any uncertain tax positions. The funds recognize interest and penalties, if any, related to uncertain tax positions as income tax expense in the Statements of Operations. During the period, the funds did not incur any interest or penalties.
Each of the tax years in the four-year period ended January 31, 2013 remains subject to examination by the Internal Revenue Service and state taxing authorities.
At January 31, 2013, the components of accumulated earnings on a tax basis were substantially the same as for financial reporting purposes.
Under the Regulated Investment Company Modernization Act of 2010 (the “2010 Act”), the funds are permitted to carry forward capital losses incurred in taxable years beginning after December 22, 2010 (“post-enactment losses”) for an unlimited period. Furthermore, post-enactment capital loss carryovers retain their character as either short-term or long-term capital losses rather than short-term as they were under previous statute. The 2010 Act
requires post-enactment losses to be utilized before the utilization of losses incurred in taxable years prior to the effective date of the 2010 Act (“pre-enactment losses”).As a result of this ordering rule, pre-enactment losses may be more likely to expire unused.
Table 1 summarizes each relevant fund’s accumulated capital loss carryover available for federal income tax purposes to be applied against future net realized capital gains, if any, realized subsequent to January 31, 2013.
The tax character of distributions paid to shareholders of Dreyfus Cash Management, Dreyfus Government Cash Management, Dreyfus Government Prime Cash Management, Dreyfus Treasury & Agency Cash Management and Dreyfus Treasury Prime Cash Management during the fiscal periods ended January 31, 2013 and January 31, 2012 were all ordinary income.
Table 2 summarizes the tax character of distributions paid to shareholders of Dreyfus Municipal Cash Management Plus, Dreyfus New York Municipal Cash Management, Dreyfus Tax Exempt Cash Management, Dreyfus California AMT-Free Municipal Cash Management and Dreyfus New York AMT-Free Municipal Cash Management during the fiscal periods ended January 31, 2013 and January 31, 2012.
Table 1—Capital Loss Carryover
| | | | | |
| | | | ($ x 1,000) | |
| | | | Post-Enactment | |
| | | | Short-Term | |
| | 2019 | ($)† | Losses ($)†† | Total |
| Dreyfus Government Cash Management | — | | 32 | 32 |
| Dreyfus Government Prime Cash Mangement | — | | 24 | 24 |
| Dreyfus Treasury & Agency Cash Management | — | | 1 | 1 |
| Dreyfus Treasury Prime Cash Management | — | | 138 | 138 |
| Dreyfus Municipal Cash Management Plus | 10 | | — | 10 |
| Dreyfus Tax Exempt Cash Management | — | | 3 | 3 |
| |
| † If not applied, the carryover expires in the above fiscal year. |
| †† Post-enactment short-term capital losses that can be carried forward for an unlimited period. |
78
During the period ended January 31, 2013, as a result of permanent book to tax differences, primarily due to dividend reclassification, each relevant fund increased accumulated undistributed investment income-net and decreased accumulated net realized gain (loss) on investments, as summarized in Table 3. Net assets and net asset value per share were not affected by this reclassification.
At January 31, 2013, the cost of investments for federal income tax purposes was substantially the same as the cost for financial reporting purposes (see the Statements of Investments).
NOTE 2—Management Fee and Other Transactions with Affiliates:
(a) Pursuant to separate management agreements with the Manager, the management fee of each fund is computed at the annual rate of .20% of the value of such fund’s average daily net assets and is payable monthly.
The Manager has undertaken to waive receipt of the management fee and/or reimburse operating expenses in order to facilitate a daily yield at or above a certain level which may change from time to time.These undertakings are vol-
| | | | | | | | |
| Table 2—Tax Character of Distributions Paid | | | | | | | |
| |
| Tax Character of Distributions Paid ($ x 1,000) | | 2013 | | | 2012 | | |
| | | | Long-Term | | | Long-Term | |
| | Tax-Exempt | Ordinary | Capital | Tax-Exempt | Ordinary | Capital | |
| | Income ($) | Income ($) | Gains ($) | Income ($) | Income ($) | Gains ($) | |
| Dreyfus Municipal Cash Management Plus | 42 | — | — | 116 | — | — | |
| Dreyfus New York Municipal Cash Management | 27 | —† | — | 152 | — | 3 | |
| Dreyfus Tax Exempt Cash Management | 18 | — | — | 680 | — | 11 | |
| Dreyfus California AMT-Free Municipal Cash Management | 24 | 121 | 91 | 97 | 1 | — | |
| Dreyfus New York AMT-Free Municipal Cash Management | 1 | 2 | — | 16 | —† | — | |
| |
| † Amount represents less than $1,000. | | | | | | | |
| |
| |
| Table 3—Reclassification of Components of Net Assets | | | | | | | |
| |
| | | | Accumulated | | Accumulated | |
| | | | Undistributed | | Net Realized | |
| | | Investment Income—Net ($) | Gain (Loss) ($) | |
| Dreyfus Cash Management | | | 226,818 | | (226,818 | ) |
| Dreyfus Government Cash Management | | | 16,776 | | (16,776 | ) |
| Dreyfus Treasury & Agency Cash Management | | | 14,459 | | (14,459 | ) |
| Dreyfus New York Municipal Cash Management | | | 97 | | | (97 | ) |
| Dreyfus California AMT-Free Municipal Cash Management | | | 212,086 | | (212,086 | ) |
| Dreyfus New York AMT-Free Municipal Cash Management | | | 1,889 | | (1,889 | ) |
NOTES TO FINANCIAL STATEMENTS (continued)
untary and not contractual, and may be terminated at any time. Table 4 summarizes the reduction in expenses for each relevant class of shares of each fund pursuant to these undertakings during the period ended January 31, 2013.
(b) Under each fund’s Service Plan adopted pursuant to Rule 12b-1 under the Act, with respect to each fund’s applicable Investor Shares, Administrative Shares, Participant Shares, Service Shares, Select Shares,Agency Shares, Premier Shares and Classic Shares, each fund pays the Distributor for distributing such classes of shares, for advertising and marketing and for providing certain services relating to shareholders of the respective class of shares. These services include answering shareholder inquiries regarding the funds and providing reports and other information and services related to the maintenance of shareholder accounts (“Servicing”). Under the Service Plan, as it pertains to each
relevant class, the Distributor may make payments to Service Agents with respect to these services. Generally, the Service Agent may provide holders of Investor Shares, Administrative Shares, Participant Shares, Service Shares, Select Shares, Agency Shares, Premier Shares and Classic Shares a consolidated statement.The Service Agent will generally also provide the holders of Investor Shares, Participant Shares, Service Shares, Select Shares and Premier Shares automated teller check writing privileges and, in the case of Participant Shares, Service Shares, Select Shares and Premier Shares, automated teller machine access, and bill paying serv-ices.The amount paid under the Service Plan for Servicing is intended to be a “service fee” as defined under the Conduct Rules of the Financial Industry Regulatory Authority (“FINRA”), and at no time will such amount exceed the maximum amount permitted to be paid under
| | | | | | | |
| Table 4—Expense Reductions | | | | | | |
| |
| | | Dreyfus | Dreyfus | Dreyfus | Dreyfus | |
| | | Government | Government | Treasury & | Treasury | |
| | Dreyfus Cash | Cash | Prime Cash | Agency Cash | Prime Cash | |
| | Management ($) | Management ($) | Management ($) | Management ($) | Management ($) | |
| Institutional Shares | 158,936 | 7,450,009 | 3,236,994 | 11,462,643 | 24,856,103 | |
| Investor Shares | 5,350,010 | 4,973,619 | 1,741,027 | 7,441,453 | 15,490,143 | |
| Administrative Shares | 235,133 | 1,612,078 | 1,242,646 | 1,081,514 | 1,518,502 | |
| Participant Shares | 2,487,825 | 1,044,272 | 1,018,193 | 3,626,524 | 15,849,730 | |
| Service Shares | — | — | — | 138,810 | — | |
| Select Shares | — | — | — | 99,907 | — | |
| Agency Shares | 7,278 | 344,033 | 42,459 | 41,570 | 32,234 | |
| Premier Shares | — | — | — | 116,881 | — | |
| |
| Table 4. (continued) | | | | | | |
| |
| | Dreyfus | Dreyfus | | Dreyfus | Dreyfus | |
| | Municipal | New York | Dreyfus | California | New York | |
| | Cash | Municipal | Tax Exempt | AMT-Free | AMT-Free | |
| | Management | Cash | Cash | Municipal Cash | Municipal Cash | |
| | Plus ($) | Management ($) | Management ($) | Management ($) | Management ($) | |
| Institutional Shares | 35,243 | 58,690 | 757,969 | 40,721 | 60,238 | |
| Investor Shares | 567,160 | 555,178 | 1,036,188 | 608,532 | 129,454 | |
| Administrative Shares | 190,386 | 24,356 | 80,871 | 3,494 | 13,155 | |
| Participant Shares | 94,495 | 44,916 | 77,596 | 175,521 | 29 | a |
| Agency Shares | 8 | —b | — | —c | — | |
| Classic Shares | — | — | — | — | 23,376 | |
| |
| a Effective September 14, 2012, Dreyfus NewYork AMT-Free Municipal Cash Management had terminated its Participant Shares. |
| b Effective September 14, 2012, Dreyfus NewYork Municipal Cash Management had terminated its Agency Shares. |
| c Effective September 14, 2012, Dreyfus California AMT-Free Municipal Cash Management had terminated its Agency Shares. |
80
the FINRA Conduct Rules as a service fee.The fees payable under the Service Plan are payable without regard to actual expenses incurred.
Table 5 summarizes the amount each fund was charged pursuant to the Service Plan during the period ended January 31, 2013.
(c) Each fund has adopted a Shareholder Services Plan with respect to their Institutional Shares. Each fund reimburses the Distributor an amount not to exceed an annual rate of
.25% of the value of each fund’s average daily net assets attributable to Institutional Shares for certain allocated expenses of providing personal services and/or maintaining shareholder accounts. The services provided may include personal services relating to shareholder accounts, such as answering shareholder inquiries regarding the funds, providing reports and other information, and services related to the maintenance of shareholder accounts. Table 6 summarizes the amount each fund’s Institutional Shares were
| | | | | | | | | | |
| Table 5—12b-1 Service Plan Fees | | | | | | | | | |
| |
| | Investor | Administrative | Participant | | Service | Select | Agency | Premier | Classic |
| | Shares ($) | Shares ($) | Shares ($) | | Shares ($) | Shares ($) | Shares ($) | Shares ($) | Shares ($) |
| Dreyfus Cash Management | 7,990,666 | 965,311 | 3,121,279 | | — | — | 120,217 | — | — |
| Dreyfus Government Cash Management | 4,179,464 | 1,078,106 | 917,533 | | — | — | 172,508 | — | — |
| Dreyfus Government | | | | | | | | | |
| Prime Cash Management | 1,252,381 | 606,962 | 822,125 | | — | — | 16,948 | — | — |
| Dreyfus Treasury & Agency | | | | | | | | | |
| Cash Management | 5,755,707 | 607,673 | 3,053,034 | | 117,719 | 90,552 | 18,977 | 95,091 | — |
| Dreyfus Treasury | | | | | | | | | |
| Prime Cash Management | 10,301,487 | 696,590 | 12,138,292 | | — | — | 9,992 | — | — |
| Dreyfus Municipal Cash Management Plus | 576,704 | 199,030 | 95,211 | | — | — | 9 | — | — |
| Dreyfus New York | | | | | | | | | |
| Municipal Cash Management | 532,229 | 23,290 | 43,932 | | — | — | —a | — | — |
| Dreyfus Tax Exempt Cash Management | 981,445 | 71,124 | 72,947 | | — | — | — | — | — |
| Dreyfus California AMT-Free | | | | | | | | | |
| Municipal Cash Management | 574,625 | 2,820 | 171,547 | | — | — | —b | — | — |
| Dreyfus New York AMT-Free | | | | | | | | | |
| Municipal Cash Management | 101,482 | 7,654 | 25 | c | — | — | — | — | 20,484 |
| |
| a Effective September 14, 2012, Dreyfus NewYork Municipal Cash Management had terminated its Agency Shares. |
| b Effective September 14, 2012, Dreyfus California AMT-Free Municipal Cash Management had terminated its Agency Shares. |
| c Effective September 14, 2012, Dreyfus NewYork AMT-Free Municipal Cash Management had terminated its Participant Shares. |
| | |
| Table 6—Shareholder Services Plan Fees | |
| |
| | Institutional |
| | Shares ($) |
| Dreyfus Cash Management | 431,037 |
| Dreyfus Government Cash Management | 158,081 |
| Dreyfus Government Prime Cash Management | 25,474 |
| Dreyfus Treasury & Agency Cash Management | 370,736 |
| Dreyfus Treasury Prime Cash Management | 620,067 |
| Dreyfus Municipal Cash Management Plus | 3,057 |
| Dreyfus New York Municipal Cash Management | 8,723 |
| Dreyfus Tax Exempt Cash Management | 470,897 |
| Dreyfus California AMT-Free Municipal Cash Management | 4,557 |
| Dreyfus New York AMT-Free Municipal Cash Management | 319 |
NOTES TO FINANCIAL STATEMENTS (continued)
charged pursuant to the Shareholder Services Plan during the period ended January 31, 2013.
The funds have arrangements with the transfer agent and the custodian whereby the funds may receive earnings credits when positive cash balances are maintained, which are used to offset transfer agency and custody fees. For financial reporting purposes, the funds include net earnings credits as expense offsets in the Statements of Operations.
Each fund compensates Dreyfus Transfer, Inc. (“DTI”), a wholly-owned subsidiary of the Manager, under a transfer agency agreement for providing transfer agency services for the funds and, since May 29, 2012, cash management services related to the funds’ subscriptions and redemptions. Table 7 summarizes the amount each fund was charged during the period ended January 31, 2013, pursuant to the transfer agency agreement, which is included in Shareholder
servicing costs in the Statements of Operations. Table 9 summarizes the amount each fund was charged during the period ended January 31, 2013 for cash management services which is included in Shareholder servicing costs in the Statements of Operations.These fees were partially offset by earnings credits, also summarized in Table 9.
Each fund compensates The Bank of New York Mellon (“BNY”), a subsidiary of BNY Mellon and an affiliate of Dreyfus, under a custody agreement for providing custodial services for each fund. Table 8 summarizes the amount each fund was charged during the period ended January 31, 2013 pursuant to the custody agreement. These fees were partially offset by earnings credits for each relevant fund, also summarized in Table 8.
Prior to May 29, 2012, each fund compensated BNY under a cash management agreement for performing cash man-
| | | | |
| Table 7—Transfer Agency Agreement Fees | | | |
| |
| | Transfer Agency | | |
| | Fees ($) | | |
| Dreyfus Cash Management | 73,789 | | |
| Dreyfus Government Cash Management | 97,455 | | |
| Dreyfus Government Prime Cash Management | 89,089 | | |
| Dreyfus Treasury & Agency Cash Management | 44,126 | | |
| Dreyfus Treasury Prime Cash Management | 479,067 | | |
| Dreyfus Municipal Cash Management Plus | 2,850 | | |
| Dreyfus New York Municipal Cash Management | 5,972 | | |
| Dreyfus Tax Exempt Cash Management | 8,060 | | |
| Dreyfus California AMT-Free Municipal Cash Management | 1,014 | | |
| Dreyfus New York AMT-Free Municipal Cash Management | 2,162 | | |
| |
| Table 8—Custody Agreement Fees | | | |
| |
| | Custody Fees ($) | Earnings Credits ($) | |
| Dreyfus Cash Management | 816,101 | (9,839 | ) |
| Dreyfus Government Cash Management | 560,108 | (33,537 | ) |
| Dreyfus Government Prime Cash Management | 179,037 | (521 | ) |
| Dreyfus Treasury & Agency Cash Management | 643,476 | (1,570 | ) |
| Dreyfus Treasury Prime Cash Management | 845,680 | — | |
| Dreyfus Municipal Cash Management Plus | 65,773 | — | |
| Dreyfus New York Municipal Cash Management | 41,819 | — | |
| Dreyfus Tax Exempt Cash Management | 121,183 | — | |
| Dreyfus California AMT-Free Municipal Cash Management | 42,124 | — | |
| Dreyfus New York AMT-Free Municipal Cash Management | 17,920 | — | |
82
agement services related to fund subscriptions and redemptions. Table 9 summarizes the amount each fund was charged during the period ended January 31, 2013, pursuant to the cash management agreement, which is included in Shareholder servicing costs in the Statements of Operations. These fees were partially offset by earnings credits, also summarized in Table 9.
During the period ended January 31, 2013, each fund was charged $8,828 for services performed by the Chief Compliance Officer and his staff.
Table 10 summarizes the components of “Due to The Dreyfus Corporation and affiliates” in the Statements of Assets and Liabilities for each fund.
| | | | | | | |
| Table 9—Cash Management Agreement Fees | | | | | | |
| |
| DTI Cash Management | DTI Earnings Credits | | BNY Cash Management | BNY Earnings Credits | |
| | Fees Charged Since | Received Since | | Fees Charged Prior | Received Prior to | |
| | May 29, 2012 ($) | May 29, 2012 ($) | | to May 29, 2012 ($) | May 29, 2012 ($) | |
| Dreyfus Cash Management | 1,611 | (197 | ) | 2,998 | (124 | ) |
| Dreyfus Government Cash Management | 2,409 | (296 | )�� | 4,323 | (178 | ) |
| Dreyfus Government Prime Cash Management | 1,890 | (232 | ) | 3,384 | (137 | ) |
| Dreyfus Treasury & Agency Cash Management | 1,062 | (130 | ) | 1,947 | (80 | ) |
| Dreyfus Treasury Prime Cash Management | 11,831 | (1,454 | ) | 20,529 | (829 | ) |
| Dreyfus Municipal Cash Management Plus | 41 | (5 | ) | 78 | (3 | ) |
| Dreyfus New York Municipal Cash Management | 65 | (8 | ) | 174 | (8 | ) |
| Dreyfus Tax Exempt Cash Management | 138 | (17 | ) | 290 | (12 | ) |
| Dreyfus California AMT-Free Municipal Cash Management | 13 | (2 | ) | 24 | (1 | ) |
| Dreyfus New York AMT-Free Municipal Cash Management | 44 | (6 | ) | 82 | (3 | ) |
| | | | | | | | |
| Table 10—Due to The Dreyfus Corporation and Affiliates | | | | | | |
| |
| |
| | | | | Chief | | | |
| | | | | Compliance | Transfer | | |
| | Management | Service Plan | Custodian | Officer | Agency | Less Expense | |
| | Fees ($) | Fees ($) | Fees ($) | Fees ($) | Fees ($) | Reimbursement ($) | |
| |
| Dreyfus Cash Management | 4,798,314 | 1,002,076 | 209,624 | 4,645 | 20,146 | (981,086 | ) |
| Dreyfus Government | | | | | | | |
| Cash Management | 3,049,633 | 562,379 | 119,617 | 4,645 | 27,076 | (1,702,983 | ) |
| Dreyfus Government | | | | | | | |
| Prime Cash Management | 842,199 | 245,337 | 43,520 | 4,645 | 22,887 | (678,830 | ) |
| Dreyfus Treasury & Agency | | | | | | | |
| Cash Management | 2,987,640 | 776,011 | 151,332 | 4,645 | 11,923 | (2,271,694 | ) |
| Dreyfus Treasury Prime | | | | | | | |
| Cash Management | 5,650,002 | 2,171,595 | 210,162 | 4,645 | 134,182 | (5,676,301 | ) |
| Dreyfus Municipal | | | | | | | |
| Cash Management Plus | 138,825 | 72,171 | 17,534 | 4,645 | 1,527 | (108,152 | ) |
| Dreyfus New York Municipal | | | | | | | |
| Cash Management | 63,002 | 47,917 | 9,058 | 4,645 | 2,672 | (70,515 | ) |
| Dreyfus Tax Exempt | | | | | | | |
| Cash Management | 412,397 | 111,643 | 29,248 | 4,645 | 4,692 | (278,936 | ) |
| Dreyfus California AMT-Free | | | | | | | |
| Municipal Cash Management | 78,089 | 60,549 | 11,303 | 4,645 | 773 | (103,470 | ) |
| Dreyfus New York AMT-Free | | | | | | | |
| Municipal Cash Management | 21,926 | 9,526 | 3,930 | 4,645 | 867 | (21,712 | ) |
NOTES TO FINANCIAL STATEMENTS (continued)
(d) Each Board member also serves as a Board member of other funds within the Dreyfus complex. Annual retainer fees are allocated to each fund based on net assets, and each fund pays its Board members an attendance fee of $500 per meeting.
NOTE 3—Beneficial Interest Transactions:
Each fund is authorized to issue an unlimited number of $.001 par value shares of Beneficial Interest.
NOTE 4—Securities Transactions:
The funds are permitted to purchase or sell securities from or to certain affiliated funds under specified conditions
outlined in procedures adopted by the Board. The procedures have been designed to ensure that any purchase or sale of securities by the funds from or to another fund or portfolio that are, or could be, considered an affiliate by virtue of having a common investment adviser (or affiliated investment adviser), common Board members and/or common officers, complies with Rule 17a-7 under the Act. Table 11 summarizes the amounts of purchases and sales of securities engaged in by each relevant fund pursuant to Rule 17a-7 under the Act during the period ended January 31, 2013.
| | | |
| Table 11—Affiliated Portfolio Holdings Transactions | | |
| |
| |
| | Purchases ($) | Sales ($) |
| Dreyfus Municipal Cash Management Plus | 722,440,000 | 792,485,000 |
| Dreyfus New York Municipal Cash Management | 328,995,000 | 475,580,000 |
| Dreyfus Tax Exempt Cash Management | 978,434,450 | 1,563,395,000 |
| Dreyfus California AMT—Free Municipal Cash Management | 259,845,000 | 205,523,000 |
| Dreyfus New York AMT—Free Municipal Cash Management | 84,430,000 | 68,275,000 |
84
REPORT OF INDEPENDENT REGISTERED PUBLIC ACCOUNTING FIRM
Shareholders and Board of Trustees
Dreyfus Cash Management
Dreyfus Government Cash Management
Dreyfus Government Prime Cash Management
Dreyfus Treasury & Agency Cash Management
Dreyfus Treasury Prime Cash Management
Dreyfus Municipal Cash Management Plus
Dreyfus New York Municipal Cash Management
Dreyfus Tax Exempt Cash Management
Dreyfus California AMT-Free
Municipal Cash Management
Dreyfus New York AMT-Free
Municipal Cash Management
We have audited the accompanying statements of assets and liabilities, including the statements of investments, of Dreyfus Cash Management, Dreyfus Government Cash Management, Dreyfus Government Prime Cash Management, Dreyfus Treasury & Agency Cash Management, Dreyfus Treasury Prime Cash Management, Dreyfus Municipal Cash Management Plus, Dreyfus New York Municipal Cash Management, Dreyfus Tax Exempt Cash Management, Dreyfus California AMT-Free Municipal Cash Management and Dreyfus New York AMT-Free Municipal Cash Management (the “Funds”) as of January 31, 2013, and the related statements of operations for the year then ended, the statements of changes in net assets for each of the two years in the period then ended, and the financial highlights for each of the periods indicated therein. These financial statements and financial highlights are the responsibility of the Funds’ management. Our responsibility is to express an opinion on these financial statements and financial highlights based on our audits.
We conducted our audits in accordance with the standards of the Public Company Accounting Oversight Board (United
States).Those standards require that we plan and perform the audit to obtain reasonable assurance about whether the financial statements and financial highlights are free of material misstatement.We were not engaged to perform an audit of the Funds’ internal control over financial reporting. Our audits included consideration of internal control over financial reporting as a basis for designing audit procedures that are appropriate in the circumstances, but not for the purpose of expressing an opinion on the effectiveness of the Funds’ internal control over financial reporting. Accordingly, we express no such opinion. An audit also includes examining, on a test basis, evidence supporting the amounts and disclosures in the financial statements and financial highlights, assessing the accounting principles used and significant estimates made by management, and evaluating the overall financial statement presentation. Our procedures included confirmation of securities owned as of January 31, 2013 by correspondence with the custodian and others. We believe that our audits provide a reasonable basis for our opinion.
In our opinion, the financial statements and financial highlights referred to above present fairly, in all material respects, the financial position of the Funds at January 31, 2013, the results of their operations for the year then ended, the changes in their net assets for each of the two years in the period then ended, and the financial highlights for each of the indicated periods, in conformity with U.S. generally accepted accounting principles.
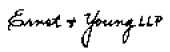
New York, New York
March 27, 2013
IMPORTANT TAX INFORMATION (Unaudited)
In accordance with federal tax law, Dreyfus Municipal Cash Management Plus, Dreyfus New York Municipal Cash Management, Dreyfus Tax Exempt Cash Management, Dreyfus California AMT-Free Municipal Cash Management and Dreyfus New York AMT-Free Municipal Cash Management hereby make the following designations regarding the dividends paid from investment income-net during their fiscal year ended January 31, 2013:
| |
| — all the dividends paid from investment income-net are |
| “exempt-interest dividends” (not generally subject to |
| regular federal income taxes). |
| |
| — except $120,851 of Dreyfus California AMT-Free |
| Municipal Cash Management's exempt-interest div- |
| idends that is being designated as an ordinary |
| income distribution and $91,235 that is being desig- |
| nated as a long-term capital gain distribution for |
| reporting purposes. |
| |
| — except $1,889 of Dreyfus New York AMT-Free |
| Municipal Cash Management's exempt-interest divi- |
| dends that is being designated as an ordinary income |
| distribution for reporting purposes. |
| |
| — except $97 of Dreyfus New York Municipal Cash |
| Management's exempt-interest dividends that is being |
| designated as an ordinary income distribution for |
| reporting purposes. |
| |
| — for individuals who are residents of New York, |
| “exempt-interest dividends” paid by Dreyfus New |
| York Municipal Cash Management and Dreyfus New |
| York AMT-Free Municipal Cash Management are |
| also not subject to NewYork state and NewYork city |
| personal income tax. |
| |
| — for individuals who are residents of California, |
| “exempt-interest dividends” paid by Dreyfus California |
| AMT-Free Municipal Cash Management are also not |
| subject to California personal income tax. |
For state individual income tax purposes, Dreyfus Government Prime Cash Management and DreyfusTreasury Prime Cash Management hereby report the following percentage of ordinary dividends paid during the fiscal year ended January 31, 2013 as attributable to interest income from direct obligations of the United States. Such dividends are currently exempt from taxation for income tax purposes in most states, including New York, California, Connecticut and the District of Columbia:
| | | |
| Dreyfus Government Prime | | |
| Cash Management | 100 | % |
| Dreyfus Treasury Prime | | |
| Cash Management | 100 | % |
The funds below report the following percentage of ordinary income dividends paid during the fiscal year ended January 31, 2013 as qualifying “interest-related dividends”:
| | | |
| Dreyfus Cash Management | 93.68 | % |
| Dreyfus Government Cash Management | 100 | % |
| Dreyfus Government | | |
| Prime Cash Management | 100 | % |
| Dreyfus Treasury & Agency | | |
| Cash Management | 100 | % |
| Dreyfus Treasury Prime | | |
| Cash Management | 100 | % |
86
BOARD MEMBERS INFORMATION (Unaudited)
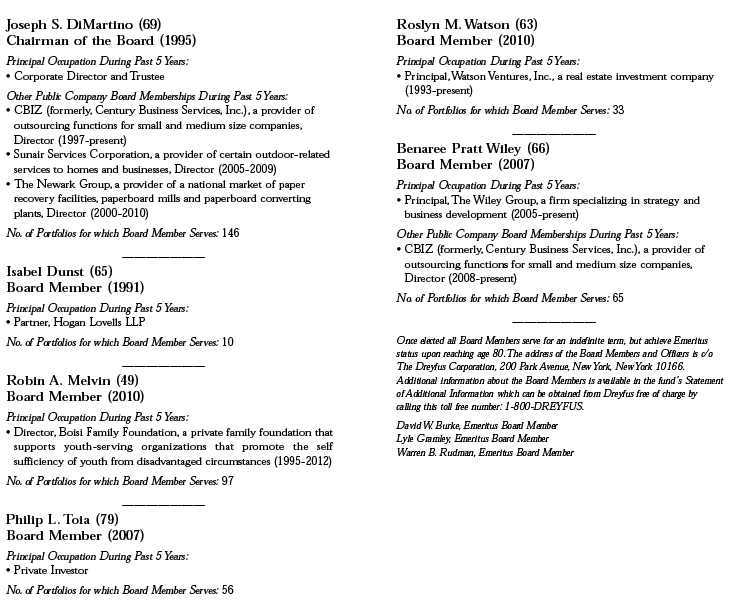
OFFICERS OF THE FUND (Unaudited)
BRADLEY J. SKAPYAK, President since January 2010.
Chief Operating Officer and a director of the Manager since June 2009; from April 2003 to June 2009, Mr. Skapyak was the head of the Investment Accounting and Support Department of the Manager. He is an officer of 69 investment companies (comprised of 145 portfolios) managed by the Manager. He is 54 years old and has been an employee of the Manager since February 1988.
CHARLES CARDONA, Executive Vice President since November 2001.
Vice Chair and a Director of the Manager, Executive Vice President of the Distributor, President of Dreyfus Institutional Services Division, and an officer of 12 other investment companies (comprised of 19 portfolios) managed by the Manager. He is 57 years old and has been an employee of the Manager since February 1981.
JANETTE E. FARRAGHER, Vice President and Secretary since December 2011.
Assistant General Counsel of BNY Mellon, and an officer of 70 investment companies (comprised of 172 portfolios) managed by the Manager. She is 50 years old and has been an employee of the Manager since February 1984.
KIESHA ASTWOOD, Vice President and Assistant Secretary since January 2010.
Counsel of BNY Mellon, and an officer of 70 investment companies (comprised of 172 portfolios) managed by the Manager. She is 39 years old and has been an employee of the Manager since July 1995.
JAMES BITETTO, Vice President and Assistant Secretary since August 2005.
Senior Counsel of BNY Mellon and Secretary of the Manager, and an officer of 70 investment companies (comprised of 172 portfolios) managed by the Manager. He is 46 years old and has been an employee of the Manager since December 1996.
JONI LACKS CHARATAN, Vice President and Assistant Secretary since August 2005.
Senior Counsel of BNY Mellon, and an officer of 70 investment companies (comprised of 172 portfolios) managed by the Manager. She is 57 years old and has been an employee of the Manager since October 1988.
JOSEPH M. CHIOFFI, Vice President and Assistant Secretary since August 2005.
Senior Counsel of BNY Mellon, and an officer of 70 investment companies (comprised of 172 portfolios) managed by the Manager. He is 51 years old and has been an employee of the Manager since June 2000.
JOHN B. HAMMALIAN, Vice President and Assistant Secretary since August 2005.
Senior Managing Counsel of BNY Mellon, and an officer of 70 investment companies (comprised of 172 portfolios) managed by the Manager. He is 49 years old and has been an employee of the Manager since February 1991.
ROBERT R. MULLERY, Vice President and Assistant Secretary since August 2005.
Managing Counsel of BNY Mellon, and an officer of 70 investment companies (comprised of 172 portfolios) managed by the Manager. He is 61 years old and has been an employee of the Manager since May 1986.
JEFF PRUSNOFSKY, Vice President and Assistant Secretary since August 2005.
Senior Managing Counsel of BNY Mellon, and an officer of 70 investment companies (comprised of 172 portfolios) managed by the Manager. He is 47 years old and has been an employee of the Manager since October 1990.
88
JAMES WINDELS, Treasurer since November 2001.
Director – Mutual Fund Accounting of the Manager, and an officer of 70 investment companies (comprised of 172 portfolios) managed by the Manager. He is 54 years old and has been an employee of the Manager since April 1985.
RICHARD CASSARO, Assistant Treasurer since January 2008.
Senior Accounting Manager – Money Market and Municipal Bond Funds of the Manager, and an officer of 70 investment companies (comprised of 172 portfolios) managed by the Manager. He is 54 years old and has been an employee of the Manager since September 1982.
GAVIN C. REILLY, Assistant Treasurer since August 2005.
Tax Manager of the Investment Accounting and Support Department of the Manager, and an officer of 70 investment companies (comprised of 172 portfolios) managed by the Manager. He is 44 years old and has been an employee of the Manager since April 1991.
ROBERT S. ROBOL, Assistant Treasurer since August 2003.
Senior Accounting Manager – Fixed Income Funds of the Manager, and an officer of 70 investment companies (comprised of 172 portfolios) managed by the Manager. He is 48 years old and has been an employee of the Manager since October 1988.
ROBERT SALVIOLO, Assistant Treasurer since July 2007.
Senior Accounting Manager – Equity Funds of the Manager, and an officer of 70 investment companies (comprised of 172 portfolios) managed by the Manager. He is 45 years old and has been an employee of the Manager since June 1989.
ROBERT SVAGNA, Assistant Treasurer since August 2005.
Senior Accounting Manager – Equity Funds of the Manager, and an officer of 70 investment companies (comprised of 172 portfolios) managed by the Manager. He is 45 years old and has been an employee of the Manager since November 1990.
JOSEPH W. CONNOLLY, Chief Compliance Officer since September 2004.
Chief Compliance Officer of the Manager and The Dreyfus Family of Funds (70 investment companies, comprised of 172 portfolios). He is 55 years old and has served in various capacities with the Manager since 1980, including manager of the firm’s Fund Accounting Department from 1997 through October 2001.
MATTHEW D. CONNOLLY, Anti-Money Laundering Compliance Officer since April 2012.
Anti-Money Laundering Compliance Officer of the Distributor since October 2011; from March 2010 to September 2011, Global Head, KYC Reviews and Director, UBS Investment Bank; until March 2010,AML Compliance Officer and Senior Vice President, Citi Global Wealth Management. He is an officer of 66 investment companies (comprised of 168 portfolios) managed by the Manager. He is 40 years old and has been an employee of the Distributor since October 2011.
For More Information
Item 2. Code of Ethics.
The Registrant has adopted a code of ethics that applies to the Registrant's principal executive officer, principal financial officer, principal accounting officer or controller, or persons performing similar functions. There have been no amendments to, or waivers in connection with, the Code of Ethics during the period covered by this Report.
Item 3. Audit Committee Financial Expert.
The Registrant's Board has determined that Joseph S. DiMartino, a member of the Audit Committee of the Board, is an audit committee financial expert as defined by the Securities and Exchange Commission (the "SEC"). Mr. DiMartino is "independent" as defined by the SEC for purposes of audit committee financial expert determinations.
Item 4. Principal Accountant Fees and Services.
(a) Audit Fees. The aggregate fees billed for each of the last two fiscal years (the "Reporting Periods") for professional services rendered by the Registrant's principal accountant (the "Auditor") for the audit of the Registrant's annual financial statements or services that are normally provided by the Auditor in connection with the statutory and regulatory filings or engagements for the Reporting Periods, were $30,857 in 2012 and $31,594 in 2013.
(b) Audit-Related Fees. The aggregate fees billed in the Reporting Periods for assurance and related services by the Auditor that are reasonably related to the performance of the audit of the Registrant's financial statements and are not reported under paragraph (a) of this Item 4 were $6,000 in 2012 and $6,000 in 2013. These services consisted of one or more of the following: (i) agreed upon procedures related to compliance with Internal Revenue Code section 817(h), (ii) security counts required by Rule 17f-2 under the Investment Company Act of 1940, as amended, (iii) advisory services as to the accounting or disclosure treatment of Registrant transactions or events and (iv) advisory services to the accounting or disclosure treatment of the actual or potential impact to the Registrant of final or proposed rules, standards or interpretations by the Securities and Exchange Commission, the Financial Accounting Standards Boards or other regulatory or standard-setting bodies.
The aggregate fees billed in the Reporting Periods for non-audit assurance and related services by the Auditor to the Registrant's investment adviser (not including any sub-investment adviser whose role is primarily portfolio management and is subcontracted with or overseen by another investment adviser), and any entity controlling, controlled by or under common control with the investment adviser that provides ongoing services to the Registrant ("Service Affiliates"), that were reasonably related to the performance of the annual audit of the Service Affiliate, which required pre-approval by the Audit Committee were $0 in 2012 and $0 in 2013.
(c) Tax Fees. The aggregate fees billed in the Reporting Periods for professional services rendered by the Auditor for tax compliance, tax advice, and tax planning ("Tax Services") were $3,508 in 2012 and $3,778 in 2013. These services consisted of: (i) review or preparation of U.S. federal, state, local and excise tax returns; (ii) U.S. federal, state and local tax planning, advice and assistance regarding statutory, regulatory or administrative developments; (iii) tax advice regarding tax qualification matters and/or treatment of various financial instruments held or proposed to be acquired or held.The aggregate fees billed in the Reporting Periods for Tax Services by the Auditor to Service Affiliates, which required pre-approval by the Audit Committee were $0 in 2012 and $0 in 2013.
(d) All Other Fees. The aggregate fees billed in the Reporting Periods for products and services provided by the Auditor, other than the services reported in paragraphs (a) through (c) of this Item, were $240 in 2012 and $21 in 2013. [These services consisted of a review of the Registrant's anti-money laundering program].
The aggregate fees billed in the Reporting Periods for Non-Audit Services by the Auditor to Service Affiliates, other than the services reported in paragraphs (b) through (c) of this Item, which required pre-approval by the Audit Committee, were $0 in 2012 and $200,000 in 2013.
(e)(1) Audit Committee Pre-Approval Policies and Procedures. The Registrant's Audit Committee has established policies and procedures (the "Policy") for pre-approval (within specified fee limits) of the Auditor's engagements for non-audit services to the Registrant and Service Affiliates without specific case-by-case consideration. The pre-approved services in the Policy can include pre-approved audit services, pre-approved audit-related services, pre-approved tax services and pre-approved all other services. Pre-approval considerations include whether the proposed services are compatible with maintaining the Auditor's independence. Pre-approvals pursuant to the Policy are considered annually.
(e)(2) Note: None of the services described in paragraphs (b) through (d) of this Item 4 were approved by the Audit Committee pursuant to paragraph (c)(7)(i)(C) of Rule 2-01 of Regulation S-X.
(f) None of the hours expended on the principal accountant's engagement to audit the registrant's financial statements for the most recent fiscal year were attributed to work performed by persons other than the principal account's full-time, permanent employees.
Non-Audit Fees. The aggregate non-audit fees billed by the Auditor for services rendered to the Registrant, and rendered to Service Affiliates, for the Reporting Periods were $24,056,830 in 2012 and $46,989,773 in 2013.
Auditor Independence. The Registrant's Audit Committee has considered whether the provision of non-audit services that were rendered to Service Affiliates, which were not pre-approved (not requiring pre-approval), is compatible with maintaining the Auditor's independence.
Item 5. Audit Committee of Listed Registrants.
Not applicable. [CLOSED-END FUNDS ONLY]
Item 6. Investments.
(a) Not applicable.
Item 7. Disclosure of Proxy Voting Policies and Procedures for Closed-End Management Investment Companies.
Not applicable. [CLOSED-END FUNDS ONLY]
Item 8. Portfolio Managers of Closed-End Management Investment Companies.
Not applicable. [CLOSED-END FUNDS ONLY, beginning with reports for periods ended on and after December 31, 2005]
Item 9. Purchases of Equity Securities by Closed-End Management Investment Companies and Affiliated Purchasers.
Not applicable. [CLOSED-END FUNDS ONLY]
Item 10. Submission of Matters to a Vote of Security Holders.
There have been no material changes to the procedures applicable to Item 10.
Item 11. Controls and Procedures.
(a) The Registrant's principal executive and principal financial officers have concluded, based on their evaluation of the Registrant's disclosure controls and procedures as of a date within 90 days of the filing date of this report, that the Registrant's disclosure controls and procedures are reasonably designed to ensure that information required to be disclosed by the Registrant on Form N-CSR is recorded, processed, summarized and reported within the required time periods and that information required to be disclosed by the Registrant in the reports that it files or submits on Form N-CSR is accumulated and communicated to the Registrant's management, including its principal executive and principal financial officers, as appropriate to allow timely decisions regarding required disclosure.
(b) There were no changes to the Registrant's internal control over financial reporting that occurred during the second fiscal quarter of the period covered by this report that have materially affected, or are reasonably likely to materially affect, the Registrant's internal control over financial reporting.
Item 12. Exhibits.
(a)(1) Code of ethics referred to in Item 2.
(a)(2) Certifications of principal executive and principal financial officers as required by Rule 30a-2(a) under the Investment Company Act of 1940.
(a)(3) Not applicable.
(b) Certification of principal executive and principal financial officers as required by Rule 30a-2(b) under the Investment Company Act of 1940.
SIGNATURES
Pursuant to the requirements of the Securities Exchange Act of 1934 and the Investment Company Act of 1940, the Registrant has duly caused this Report to be signed on its behalf by the undersigned, thereunto duly authorized.
DREYFUS NEW YORK MUNICIPAL CASH MANAGEMENT
By: /s/ Bradley J. Skapyak |
Bradley J. Skapyak, President |
Date: | March 25, 2013 |
|
Pursuant to the requirements of the Securities Exchange Act of 1934 and the Investment Company Act of 1940, this Report has been signed below by the following persons on behalf of the Registrant and in the capacities and on the dates indicated. |
|
By: /s/ Bradley J. Skapyak |
Bradley J. Skapyak, President |
Date: | March 25, 2013 |
|
By: /s/ James Windels |
James Windels, Treasurer |
Date: | March 25, 2013 |
|
EXHIBIT INDEX
(a)(1) Code of ethics referred to in Item 2.
(a)(2) Certifications of principal executive and principal financial officers as required by Rule 30a-2(a) under the Investment Company Act of 1940. (EX-99.CERT)
(b) Certification of principal executive and principal financial officers as required by Rule 30a-2(b) under the Investment Company Act of 1940. (EX-99.906CERT)