Scott C. Goebel, Secretary
82 Devonshire St.
Item 1. Reports to Stockholders
The turnaround in global capital markets that marked most of 2009 slowed in early 2010, as investors considered the risks to a sustained recovery, including increased political uncertainty, high unemployment, weak consumer spending and potential inflation on the horizon. Financial markets are always unpredictable, of course, but there also are several time-tested investment principles that can help put the odds in your favor.
One of the basic tenets is to invest for the long term. Over time, riding out the markets' inevitable ups and downs has proven much more effective than selling into panic or chasing the hottest trend. Even missing only a few of the markets' best days can significantly diminish investor returns. Patience also affords the benefits of compounding - of earning interest on additional income or reinvested dividends and capital gains. There can be tax advantages and cost benefits to consider as well. While staying the course doesn't eliminate risk, it can considerably lessen the effect of short-term declines.
You can further manage your investing risk through diversification. And today, more than ever, geographic diversification should be taken into account. Studies indicate that asset allocation is the single most important determinant of a portfolio's long-term success. The right mix of stocks, bonds and cash - aligned to your particular risk tolerance and investment objective - is very important. Age-appropriate rebalancing is also an essential aspect of asset allocation. For younger investors, an emphasis on equities - which historically have been the best-performing asset class over time - is encouraged. As investors near their specific goal, such as retirement or sending a child to college, consideration may be given to replacing volatile assets (e.g. common stocks) with more-stable fixed investments (bonds or savings plans).
A third principle - investing regularly - can help lower the average cost of your purchases. Investing a certain amount of money each month or quarter helps ensure you won't pay for all your shares at market highs. This strategy - known as dollar cost averaging - also reduces "emotion" from investing, helping shareholders avoid selling weak performers just prior to an upswing, or chasing a hot performer just before a correction.
We invite you to contact us via the Internet, through our Investor Centers or by phone. It is our privilege to provide you the information you need to make the investments that are right for you.
Abigail P. Johnson
As a shareholder of the Fund, you incur two types of costs: (1) transaction costs, and (2) ongoing costs, including management fees and other Fund expenses. This Example is intended to help you understand your ongoing costs (in dollars) of investing in the Fund and to compare these costs with the ongoing costs of investing in other mutual funds.
The Example is based on an investment of $1,000 invested at the beginning of the period and held for the entire period (September 1, 2009 to February 28, 2010).
The first line of the accompanying table provides information about actual account values and actual expenses. You may use the information in this line, together with the amount you invested, to estimate the expenses that you paid over the period. Simply divide your account value by $1,000.00 (for example, an $8,600 account value divided by $1,000.00 = 8.6), then multiply the result by the number in the first line under the heading entitled "Expenses Paid During Period" to estimate the expenses you paid on your account during this period. A small balance maintenance fee of $12.00 that is charged once a year may apply for certain accounts with a value of less than $2,000. This fee is not included in the table below. If it was, the estimate of expenses you paid during the period would be higher, and your ending account value lower, by this amount. In addition, the Fund, as a shareholder in the underlying Fidelity Central Funds, will indirectly bear its pro-rata share of the fees and expenses incurred by the underlying Fidelity Central Funds. These fees and expenses are not included in the Fund's annualized expense ratio used to calculate the expense estimate in the table below.
The second line of the accompanying table provides information about hypothetical account values and hypothetical expenses based on the Fund's actual expense ratio and an assumed rate of return of 5% per year before expenses, which is not the Fund's actual return. The hypothetical account values and expenses may not be used to estimate the actual ending account balance or expenses you paid for the period. You may use this information to compare the ongoing costs of investing in the Fund and other funds. To do so, compare this 5% hypothetical example with the 5% hypothetical examples that appear in the shareholder reports of the other funds. A small balance maintenance fee of $12.00 that is charged once a year may apply for certain accounts with a value of less than $2,000. This fee is not included in the table below. If it was, the estimate of expenses you paid during the period would be higher, and your ending account value lower, by this amount. In addition, the Fund, as a shareholder in the underlying Fidelity Central Funds, will indirectly bear its pro-rata share of the fees and expenses incurred by the underlying Fidelity Central Funds. These fees and expenses are not included in the Fund's annualized expense ratio used to calculate the expense estimate in the table below.
Please note that the expenses shown in the table are meant to highlight your ongoing costs only and do not reflect any transaction costs. Therefore, the second line of the table is useful in comparing ongoing costs only, and will not help you determine the relative total costs of owning different funds.
Municipal Securities - 100.1% |
| Principal Amount (000s) | | Value (000s) |
Alabama - 0.7% |
Daphne-Villa Mercy Spl. Care Facilities Fing. Auth. Rev. (Mercy Med. Hosp. Proj.) 0.18%, LOC Wachovia Bank NA, VRDN (a) | $ 12,400 | | $ 12,400 |
Mobile Spl. Care Facilities Fing. Auth. Rev. (Infirmary Health Sys., Inc.) Series 2010 B, 0.16%, LOC Deutsche Bank Ag New York Bnch, VRDN (a) | 3,000 | | 3,000 |
| | 15,400 |
Alaska - 1.2% |
Valdez Marine Term. Rev. (ConocoPhillips Proj.): | | | |
Series 1994 A, 0.2%, VRDN (a) | 21,000 | | 21,000 |
Series 1994 B, 0.18% (ConocoPhillips Guaranteed), VRDN (a) | 4,100 | | 4,100 |
| | 25,100 |
Arizona - 2.3% |
Arizona Health Facilities Auth. Rev.: | | | |
(Banner Health Sys. Proj.): | | | |
Series 2008 B, 0.18%, LOC Bank of Nova Scotia New York Branch, VRDN (a) | 4,800 | | 4,800 |
Series 2008 C, 0.17%, LOC Bank of Nova Scotia New York Branch, VRDN (a) | 2,810 | | 2,810 |
Series 2008 E, 0.23%, LOC Landesbank Baden-Wuert, VRDN (a) | 8,100 | | 8,100 |
(Catholic Healthcare West Proj.) Series 2005 B, 0.17%, LOC JPMorgan Chase Bank, VRDN (a) | 3,780 | | 3,780 |
Arizona Health Facilities Auth. Sr. Living Rev. (Royal Oaks Life Care Cmnty. Proj.) Series 2008, 0.18%, LOC Bank of America NA, VRDN (a) | 4,150 | | 4,150 |
Chandler Gen. Oblig. Participating VRDN Series GS 07 49TP, 0.23% (Liquidity Facility Wells Fargo & Co.) (a)(d) | 10,695 | | 10,695 |
Glendale Indl. Dev. Auth. (Midwestern Univ. Proj.) Series 2008, 0.2%, LOC Bank of America NA, VRDN (a) | 1,200 | | 1,200 |
Phoenix Indl. Dev. Auth. Multi-family Hsg. Rev. (Del Mar Terrance Apts. Proj.) Series 1999 A, 0.22%, LOC Freddie Mac, VRDN (a) | 6,100 | | 6,100 |
Pima County Ctfs. of Prtn. Bonds Series 2009, 3% 6/1/10 | 1,000 | | 1,004 |
Salt River Proj. Agricultural Impt. & Pwr. District Elec. Sys. Rev. Participating VRDN: | | | |
Series Putters 3467, 0.2% (Liquidity Facility JPMorgan Chase Bank) (a)(d) | 2,115 | | 2,115 |
Municipal Securities - continued |
| Principal Amount (000s) | | Value (000s) |
Arizona - continued |
Salt River Proj. Agricultural Impt. & Pwr. District Elec. Sys. Rev. Participating VRDN: - continued | | | |
Series ROC II R 11712, 0.2% (Liquidity Facility Citibank NA) (a)(d) | $ 1,000 | | $ 1,000 |
Tempe Indl. Dev. Auth. Rev. (ASUF Brickyard Proj.) Series 2004 A, 0.2%, LOC Bank of America NA, VRDN (a) | 3,500 | | 3,500 |
| | 49,254 |
California - 4.5% |
Bay Area Toll Auth. San Francisco Bay Toll Bridge Rev. Participating VRDN Series EGL 07 0053, 0.2% (Liquidity Facility Citibank NA) (a)(d) | 3,465 | | 3,465 |
California Gen. Oblig.: | | | |
Series 2003 A1, 0.14%, LOC JPMorgan Chase Bank, VRDN (a) | 1,000 | | 1,000 |
Series 2004 A4, 0.14%, LOC Citibank NA, LOC California Teachers Retirement Sys., VRDN (a) | 3,000 | | 3,000 |
Series 2004 A5, 0.1%, LOC Citibank NA, LOC California Teachers Retirement Sys., VRDN (a) | 1,500 | | 1,500 |
0.32% 3/2/10, LOC Dexia Cr. Local de France, LOC Royal Bank of Canada, CP | 3,800 | | 3,800 |
California Infrastructure & Econ. Dev. Bank Rev. (Pacific Gas and Elec. Co. Proj.) Series 2009 A, 0.1%, LOC Wells Fargo Bank NA, San Francisco, VRDN (a) | 1,000 | | 1,000 |
East Bay Muni. Util. District Wtr. Sys. Rev.: | | | |
Participating VRDN Series ROC II R 10397, 0.2% (Liquidity Facility Citibank NA) (a)(d) | 3,980 | | 3,980 |
Series 2008 B3, 0.21% (Liquidity Facility Landesbank Baden-Wuert), VRDN (a) | 3,600 | | 3,600 |
Los Angeles County Gen. Oblig. TRAN 2.5% 6/30/10 | 31,100 | | 31,274 |
Los Angeles Gen. Oblig. TRAN Series 2009, 2.5% 4/28/10 | 13,600 | | 13,644 |
Los Angeles Unified School District TRAN Series A, 2% 8/12/10 | 6,100 | | 6,138 |
Menlo Park Cmnty. Dev. Agcy. Tax (Las Pulgas Cmnty. Dev. Proj.) Series 2006, 0.13%, LOC State Street Bank & Trust Co., Boston, VRDN (a) | 4,000 | | 4,000 |
Metropolitan Wtr. District of Southern California Wtrwks. Rev. Participating VRDN Series EGL 07 0044, 0.2% (Liquidity Facility Citibank NA) (a)(d) | 9,430 | | 9,430 |
Orange County Apt. Dev. Rev. (Larkspur Canyon Apts. Proj.) Series 1997 A, 0.18%, LOC Fannie Mae, VRDN (a) | 200 | | 200 |
Orange County Sanitation District Ctfs. of Prtn. Participating VRDN Series ROC II R 11304, 0.21% (Liquidity Facility Citibank NA) (a)(d) | 6,990 | | 6,990 |
Municipal Securities - continued |
| Principal Amount (000s) | | Value (000s) |
California - continued |
San Francisco Bay Area Rapid Transit Fing. Auth. Participating VRDN Series ROC II R 11251, 0.2% (Liquidity Facility Citibank NA) (a)(d) | $ 2,880 | | $ 2,880 |
San Francisco City and County Fin. Corp. Lease Rev. (Moscone Ctr. Expansion Proj.) Series 2008 2, 0.17%, LOC State Street Bank & Trust Co., Boston, VRDN (a) | 1,250 | | 1,250 |
| | 97,151 |
Colorado - 2.0% |
Adams County Rev. (Adams Mental Health Foundation Prog.) Series 1997, 0.51%, LOC JPMorgan Chase Bank, VRDN (a) | 1,045 | | 1,045 |
Colorado Health Facilities Auth. Retirement Hsg. Rev. Participating VRDN Series Putters 1390, 0.2% (Liquidity Facility JPMorgan Chase Bank) (a)(d) | 1,685 | | 1,685 |
Colorado Health Facilities Auth. Rev.: | | | |
Participating VRDN Series Putters 2999, 0.25% (Liquidity Facility JPMorgan Chase Bank) (a)(d) | 6,245 | | 6,245 |
(Catholic Health Initiatives Proj.) Series 2004 B: | | | |
0.18% (Liquidity Facility Landesbank Hessen-Thuringen), VRDN (a) | 2,600 | | 2,600 |
0.22% (Liquidity Facility Landesbank Hessen-Thuringen), VRDN (a) | 3,600 | | 3,600 |
Colorado Reg'l. Trans. District Sales Tax Rev.: | | | |
Participating VRDN Series EGL 07 0040, 0.21% (Liquidity Facility Citibank NA) (a)(d) | 3,700 | | 3,700 |
0.22% 3/31/10, LOC Wells Fargo Bank NA, CP | 6,665 | | 6,665 |
Colorado Springs Utils. Rev. Series 2000 A, 0.19%, VRDN (a) | 7,225 | | 7,225 |
Mesa County Econ. Dev. Rev. (Leitner-Poma of America, Inc. Proj.) Series 2009, 0.28%, LOC Wells Fargo Bank NA, VRDN (a) | 8,000 | | 8,000 |
Univ. of Colorado Hosp. Auth. Rev. Series 2008 B, 0.18%, LOC Wachovia Bank NA, VRDN (a) | 2,500 | | 2,500 |
| | 43,265 |
Connecticut - 2.1% |
Connecticut Dev. Auth. Poll. Cont. Rev. Bonds (New England Pwr. Co. Proj.) Series 1999, 0.85% tender 3/11/10, CP mode | 5,000 | | 5,000 |
Connecticut Gen. Oblig.: | | | |
BAN Series 2009 A, 2% 4/28/10 | 6,100 | | 6,115 |
Series 2004 A, 0.21% (Liquidity Facility Landesbank Hessen-Thuringen), VRDN (a) | 4,000 | | 4,000 |
Municipal Securities - continued |
| Principal Amount (000s) | | Value (000s) |
Connecticut - continued |
Connecticut Health & Edl. Facilities Auth. Rev.: | | | |
Participating VRDN Series EGL 7 05 3031, 0.2% (Liquidity Facility Citibank NA) (a)(d) | $ 4,300 | | $ 4,300 |
(Trinity College Proj.) Series L, 0.17%, LOC JPMorgan Chase Bank, VRDN (a) | 1,900 | | 1,900 |
(Wesleyan Univ. Proj.) Series D, 0.21% (Liquidity Facility Bank of America NA), VRDN (a) | 1,000 | | 1,000 |
(Yale Univ. Proj.) Series X2, 0.15%, VRDN (a) | 5,500 | | 5,500 |
Connecticut Hsg. Fin. Auth. (Hsg. Mtg. Fin. Prog.): | | | |
Series 2005 D4, 0.21% (Liquidity Facility Fed. Home Ln. Bank of Boston), VRDN (a) | 3,915 | | 3,915 |
Series 2005 D6, 0.21% (Liquidity Facility Fed. Home Ln. Bank of Boston), VRDN (a) | 1,380 | | 1,380 |
Series 2005 E4, 0.21% (Liquidity Facility Fed. Home Ln. Bank of Boston), VRDN (a) | 4,180 | | 4,180 |
Danbury Gen. Oblig. BAN Series 2009, 2% 7/29/10 | 7,300 | | 7,347 |
| | 44,637 |
Delaware - 0.5% |
Delaware Health Facilities Auth. Rev. (Bayhealth Med. Ctr. Proj.): | | | |
Series 2009 B, 0.17%, LOC PNC Bank NA, Pittsburgh, VRDN (a) | 2,515 | | 2,515 |
Series 2009 C, 0.13%, LOC Wachovia Bank NA, VRDN (a) | 2,900 | | 2,900 |
Wilmington Adjustable Rate Demand Rev. (Delaware Art Museum, Inc. Proj.) 0.21%, LOC Wachovia Bank NA, VRDN (a) | 5,000 | | 5,000 |
| | 10,415 |
District Of Columbia - 2.1% |
District of Columbia Gen. Oblig. Series 2001 C, 0.18%, LOC JPMorgan Chase Bank, VRDN (a) | 1,600 | | 1,600 |
District of Columbia Rev.: | | | |
(Ctr. For Strategic & Int'l. Studies Proj.) Series 2008, 0.17%, LOC PNC Bank NA, Pittsburgh, VRDN (a) | 6,730 | | 6,730 |
(The AARP Foundation Proj.) Series 2004, 0.2%, LOC Bank of America NA, VRDN (a) | 1,600 | | 1,600 |
(The Pew Charitable Trust Proj.) Series 2008 A, 0.17%, LOC PNC Bank NA, Pittsburgh, VRDN (a) | 15,000 | | 15,000 |
(The Phillips Collection Issue Proj.) Series 2003, 0.2%, LOC Bank of America NA, VRDN (a) | 4,035 | | 4,035 |
Municipal Securities - continued |
| Principal Amount (000s) | | Value (000s) |
District Of Columbia - continued |
District of Columbia Rev.: - continued | | | |
(The Washington Ctr. for Internships and Academic Seminars Proj.) Series 2009, 0.19%, LOC Branch Banking & Trust Co., VRDN (a) | $ 4,900 | | $ 4,900 |
District of Columbia Univ. Rev. (American Univ. Proj.) Series 2003, 0.2%, LOC Bank of America NA, VRDN (a) | 11,400 | | 11,400 |
| | 45,265 |
Florida - 7.8% |
Alachua County Health Facilities Auth. Health Facilities Rev. Bonds (Shands Teaching Hospitals & Clinics, Inc. Proj.) Series 2008 B, 0.2% tender 3/3/10, LOC Bank of America NA, CP mode | 6,200 | | 6,200 |
Florida Board of Ed. Lottery Rev. Bonds Series 2007 A, 5% 7/1/10 | 2,735 | | 2,776 |
Florida Gen. Oblig. Participating VRDN Series PZ 130, 0.21% (Liquidity Facility Wells Fargo & Co.) (a)(d) | 3,310 | | 3,310 |
Florida Hsg. Fin. Corp. Multi-family Mtg. Rev. (Victoria Park Apts. Proj.) Series 2002 J, 0.19%, LOC Fannie Mae, VRDN (a) | 1,100 | | 1,100 |
Florida Hurricane Catastrophe Fund Fin. Corp. Rev. Bonds Series 2006 A, 5% 7/1/10 | 5,000 | | 5,074 |
Jacksonville Econ. Dev. Commission Rev. (YMCA of Florida's First Coast Proj.) 0.2%, LOC Bank of America NA, VRDN (a) | 9,335 | | 9,335 |
Jacksonville Elec. Auth. Elec. Sys. Rev. Bonds Series F, 0.29% tender 3/3/10 (Liquidity Facility Landesbank Hessen-Thuringen), CP mode | 15,000 | | 15,000 |
Jacksonville Hsg. Fin. Auth. Multi-family Hsg. Rev. (Augustine Apts. Proj.) 0.2%, LOC Fannie Mae, VRDN (a) | 2,650 | | 2,650 |
JEA Saint Johns River Pwr. Park Sys. Rev. Bonds Series 17 Issue 2, 5.25% 10/1/10 | 6,050 | | 6,215 |
JEA Wtr. & Swr. Sys. Rev. Bonds Series 2009 B, 3% 10/1/10 | 4,130 | | 4,190 |
Manatee County Poll. Cont. Rev. (Florida Pwr. & Lt. Co. Proj.) Series 1994, 0.19%, VRDN (a) | 2,000 | | 2,000 |
Nassau County Poll. Cont. Rev. (Rayonier Proj.) 0.22%, LOC Bank of America NA, VRDN (a) | 4,400 | | 4,400 |
Orange County Health Facilities Auth. Rev. (Presbyterian Retirement Cmnty., Inc. Proj.) Series 2006 B, 0.18%, LOC Branch Banking & Trust Co., VRDN (a) | 6,905 | | 6,905 |
Palm Beach County Rev.: | | | |
(Benjamin Private School Proj.) 0.2%, LOC Bank of America NA, VRDN (a) | 16,300 | | 16,300 |
(Hanley Ctr. Proj.) Series 2006, 0.2%, LOC Bank of America NA, VRDN (a) | 7,455 | | 7,455 |
Municipal Securities - continued |
| Principal Amount (000s) | | Value (000s) |
Florida - continued |
Palm Beach County Rev.: - continued | | | |
(King's Academy, Inc. Proj.) Series 2006, 0.18%, LOC Wachovia Bank NA, VRDN (a) | $ 1,600 | | $ 1,600 |
(Morse Oblig. Group Proj.) Series 2003, 0.18%, LOC TD Banknorth, NA, VRDN (a) | 6,345 | | 6,345 |
(Saint Andrew's School of Boca Raton, Inc. Proj.) Series 2007, 0.2%, LOC Bank of America NA, VRDN (a) | 2,200 | | 2,200 |
Palm Beach County School District RAN Series 2009, 0.85% 3/10/10 | 9,200 | | 9,200 |
Pasco County School Board Ctfs. of Prtn.: | | | |
Series 2008 A, 0.18%, LOC Wachovia Bank NA, VRDN (a) | 5,100 | | 5,100 |
Series 2008 C, 0.2%, LOC Bank of America NA, VRDN (a) | 5,100 | | 5,100 |
Pinellas County Health Facilities Auth. Rev.: | | | |
(BayCare Health Sys. Proj.) Series 2009 A3, 0.18%, LOC Wachovia Bank NA, VRDN (a) | 1,000 | | 1,000 |
(Suncoast Hospice Proj.) Series 2004, 0.18%, LOC Wachovia Bank NA, VRDN (a) | 1,000 | | 1,000 |
Pinellas County School District TAN Series 2009, 1.5% 6/30/10 | 4,300 | | 4,316 |
Putnam County Dev. Auth. Poll. Cont. Rev. (Florida Pwr. & Lt. Co. Proj.) Series 1994, 0.19%, VRDN (a) | 1,600 | | 1,600 |
Saint Petersburg Health Facilities Auth. Rev.: | | | |
(All Children's Hosp. Proj.) Series 2005 A1, 0.18%, LOC Wachovia Bank NA, VRDN (a) | 8,000 | | 8,000 |
(Presbyterian Retirement Cmntys. Proj.) Series 2009, 0.18%, LOC Branch Banking & Trust Co., VRDN (a) | 3,400 | | 3,400 |
Santa Rosa County Health Facilities Rev. (Baptists Hosp., Inc. Proj.) 0.2%, LOC Bank of America NA, VRDN (a) | 10,580 | | 10,580 |
Sunshine State Govt. Fing. Commission Rev. Series L, 0.23% 3/2/10, LOC Dexia Cr. Local de France, CP | 10,300 | | 10,300 |
Tampa Bay Wtr. Reg'l. Wtr. Supply Auth. Util. Sys. Rev. Participating VRDN Series Putters 3324, 0.2% (Liquidity Facility JPMorgan Chase Bank) (a)(d) | 1,000 | | 1,000 |
Volusia County Hsg. Fin. Auth. Multi-family Hsg. Rev. (Fisherman's Landing Apts. Proj.) 0.2%, LOC Fannie Mae, VRDN (a) | 1,050 | | 1,050 |
Winter Haven Util. Sys. Impt. & Rfdg. Rev. Participating VRDN Series Solar 06 54, 0.2% (Liquidity Facility U.S. Bank NA, Minnesota) (a)(d) | 4,670 | | 4,670 |
| | 169,371 |
Georgia - 1.3% |
Atlanta Tax Allocation (Westside Proj.) Series 2008, 0.18%, LOC Wachovia Bank NA, VRDN (a) | 4,700 | | 4,700 |
Municipal Securities - continued |
| Principal Amount (000s) | | Value (000s) |
Georgia - continued |
Bartow County Dev. Auth. Poll. Cont. Rev. (Georgia Pwr. Co. Plant Bowen Proj.) First Series 2009, 0.13%, VRDN (a) | $ 2,700 | | $ 2,700 |
DeKalb County Hsg. Auth. Multi-family Hsg. Rev. (Timber Trace Apts. Proj.) Series 2003, 0.2%, LOC Freddie Mac, VRDN (a) | 5,225 | | 5,225 |
Fulton County Dev. Auth. (Pace Academy, Inc. Proj.) Series 2008, 0.2%, LOC Bank of America NA, VRDN (a) | 4,300 | | 4,300 |
Georgia Road & Thruway Auth. Rev. Bonds Series 2009 A, 2.5% 6/1/10 | 2,000 | | 2,010 |
Muni. Elec. Auth. of Georgia: | | | |
BAN (Plant Vogtle Additional Units Non-PPA Proj.) Series 2009 A, 1.25% 5/7/10 | 3,400 | | 3,402 |
Series 1985 B, 0.2%, LOC Landesbank Hessen-Thuringen, VRDN (a) | 3,800 | | 3,800 |
Smyrna Hsg. Fin. Auth. Multi-family Hsg. Rev. (The Hills of Post Village Proj.) Series 1995, 0.19%, LOC Fannie Mae, VRDN (a) | 2,100 | | 2,100 |
| | 28,237 |
Hawaii - 0.2% |
Honolulu City & County Gen. Oblig. Participating VRDN Series Putters 3391, 0.2% (Liquidity Facility JPMorgan Chase Bank) (a)(d) | 5,000 | | 5,000 |
Illinois - 4.3% |
Chicago Board of Ed. Series 2009 A1, 0.19%, LOC Harris NA, VRDN (a) | 5,000 | | 5,000 |
Chicago Metropolitan Wtr. Reclamation District Greater Chicago Participating VRDN Series Putters 3448, 0.2% (Liquidity Facility JPMorgan Chase Bank) (a)(d) | 2,805 | | 2,805 |
Chicago O'Hare Int'l. Arpt. Rev. Series 2005 C, 0.24%, LOC Landesbank Baden-Wuert, VRDN (a) | 2,200 | | 2,200 |
DuPage County Rev. (Morton Arboretum Proj.) 0.2%, LOC Bank of America NA, VRDN (a) | 10,500 | | 10,500 |
Illinois Fin. Auth. Rev.: | | | |
(Chicago Historical Society Proj.) Series 2006, 0.2%, LOC JPMorgan Chase Bank, VRDN (a) | 18,900 | | 18,900 |
(Children's Memorial Hosp. Proj.) Series 2008 C, 0.2%, LOC JPMorgan Chase Bank, VRDN (a) | 19,200 | | 19,200 |
(Clare Oaks Proj.) Series C, 0.18%, LOC Banco Santander SA, VRDN (a) | 11,300 | | 11,300 |
(Edward Hosp. Obligated Group Proj.) Series 2008 B2, 0.19%, LOC JPMorgan Chase Bank, VRDN (a) | 1,000 | | 1,000 |
Municipal Securities - continued |
| Principal Amount (000s) | | Value (000s) |
Illinois - continued |
Illinois Fin. Auth. Rev.: - continued | | | |
(Northwest Cmnty. Hosp. Proj.) Series 2008 B, 0.2%, LOC Wells Fargo Bank NA, VRDN (a) | $ 1,100 | | $ 1,100 |
(OSF Healthcare Sys. Proj.) Series 2009 D, 0.19%, LOC JPMorgan Chase Bank, VRDN (a) | 5,000 | | 5,000 |
(Saint Xavier Univ. Proj.) Series 2008, 0.2%, LOC Bank of America NA, VRDN (a) | 3,900 | | 3,900 |
Illinois Reg'l. Trans. Auth. Participating VRDN Series GS 06 40TP, 0.23% (Liquidity Facility Wells Fargo & Co.) (a)(d) | 6,000 | | 6,000 |
Lisle Village Multi-family Hsg. Rev. (Four Lakes Phase V-Lisle) Series 1996, 0.22%, LOC Bank of America NA, VRDN (a) | 7,180 | | 7,180 |
| | 94,085 |
Indiana - 3.5% |
Indiana Dev. Fin. Auth. Rev. (Indianapolis Museum of Art, Inc. Proj.) Series 2001, 0.21%, LOC JPMorgan Chase Bank, VRDN (a) | 5,200 | | 5,200 |
Indiana Fin. Auth. Health Sys. Rev. (Sisters of Saint Francis Health Svcs., Inc. Obligated Group Proj.): | | | |
Series 2008 A, 0.19%, LOC JPMorgan Chase Bank, VRDN (a) | 10,000 | | 10,000 |
Series 2008 F, 0.18%, LOC Bank of New York, New York, VRDN (a) | 7,140 | | 7,140 |
Series 2008 G, 0.18%, LOC Bank of New York, New York, VRDN (a) | 6,250 | | 6,250 |
Series 2008 J, 0.18%, LOC Wells Fargo Bank NA, VRDN (a) | 1,425 | | 1,425 |
Indiana Fin. Auth. Hosp. Rev.: | | | |
(Cmnty. Foundation of Northwest Indiana Proj.) Series 2008, 0.18%, LOC Harris NA, VRDN (a) | 6,800 | | 6,800 |
(Cmnty. Health Network Proj.) Series 2009 B, 0.17%, LOC Nat'l. City Bank Cleveland, VRDN (a) | 9,000 | | 9,000 |
Indiana Fin. Auth. Rev. (DePauw Univ. Proj.) Series 2008 B, 0.2%, LOC Harris NA, VRDN (a) | 16,600 | | 16,600 |
Lawrenceburg Poll. Cont. Rev. (Indiana Michigan Pwr. Co. Proj.) Series 2008 H, 0.21%, LOC Royal Bank of Scotland PLC, VRDN (a) | 8,400 | | 8,400 |
Marion Econ. Dev. Rev. (Indiana Wesleyan Univ. Proj.) Series 2001, 0.2%, LOC Bank of America NA, VRDN (a) | 5,540 | | 5,540 |
| | 76,355 |
Municipal Securities - continued |
| Principal Amount (000s) | | Value (000s) |
Iowa - 1.0% |
Iowa Fin. Auth. Poll. Cont. Facility Rev. (MidAmerican Energy Proj.) Series 2008 B, 0.29%, VRDN (a) | $ 15,000 | | $ 15,000 |
Iowa Fin. Auth. Rev. (Trinity Health Sys. Proj.) Series 2000 D, 0.18%, VRDN (a) | 6,915 | | 6,915 |
| | 21,915 |
Kansas - 0.1% |
Kansas Dept. of Trans. Hwy. Rev. Series 2002 D, 0.18% (Liquidity Facility Dexia Cr. Local de France), VRDN (a) | 305 | | 305 |
Wyandotte County/Kansas City Unified Govt. Gen. Oblig. BAN Series 2010 I, 0.625% 3/1/11 | 2,900 | | 2,904 |
| | 3,209 |
Louisiana - 1.3% |
Louisiana Gas & Fuel Tax Rev. Participating VRDN Series Solar 06 150, 0.19% (Liquidity Facility U.S. Bank NA, Minnesota) (a)(d) | 20,670 | | 20,670 |
Louisiana Pub. Facilities Auth. Rev. (CommCare Corp. Proj.) Series 2008 A, 0.19%, LOC JPMorgan Chase Bank, VRDN (a) | 7,940 | | 7,940 |
| | 28,610 |
Maine - 0.7% |
Maine Health & Higher Ed. Facilities Auth. Rev.: | | | |
Series 2008 A, 0.21%, LOC KBC Bank NV, VRDN (a) | 5,760 | | 5,760 |
Series 2008 B, 0.21%, LOC KBC Bank NV, VRDN (a) | 2,000 | | 2,000 |
Maine Health Student Finl. Auth. Participating VRDN Series Solar 06 122, 0.19% (Liquidity Facility U.S. Bank NA, Minnesota) (a)(d) | 7,020 | | 7,020 |
| | 14,780 |
Maryland - 3.2% |
Baltimore County Econ. Dev. Rev.: | | | |
(Blue Circle, Inc. Proj.) Series 1992, 0.21%, LOC BNP Paribas SA, VRDN (a) | 6,100 | | 6,100 |
(The Bais Yaakov School for Girls Proj.) Series 2003, 0.2%, LOC Bank of America NA, VRDN (a) | 1,000 | | 1,000 |
Carroll County Rev. (Fairhaven and Copper Ridge Proj.) Series 2004 A, 0.18%, LOC Branch Banking & Trust Co., VRDN (a) | 8,435 | | 8,435 |
Maryland Cmnty. Dev. Administration Multi-family Dev. Rev. (Avalon Lea Apt. Proj.) Series 1997, 0.23%, LOC Fannie Mae, VRDN (a) | 1,200 | | 1,200 |
Maryland Econ. Dev. Corp. Rev. (Constellation Energy Group, Inc. Proj.) Series 2006 A, 0.19%, LOC Wachovia Bank NA, VRDN (a) | 1,500 | | 1,500 |
Municipal Securities - continued |
| Principal Amount (000s) | | Value (000s) |
Maryland - continued |
Maryland Health & Higher Edl. Facilities Auth. Rev.: | | | |
(Adventist Healthcare Proj.) Series 2005 A, 0.18%, LOC Bank of America NA, VRDN (a) | $ 13,900 | | $ 13,900 |
(Howard County Gen. Hosp. Proj.) Series 2008, 0.17%, LOC PNC Bank NA, Pittsburgh, VRDN (a) | 9,250 | | 9,250 |
(Mercy Med. Ctr. Proj.): | | | |
Series 2007 B, 0.2%, LOC Bank of America NA, VRDN (a) | 3,500 | | 3,500 |
Series 2007 D, 0.18%, LOC Wachovia Bank NA, VRDN (a) | 3,100 | | 3,100 |
(Univ. of Maryland Med. Sys. Proj.) Series 2008 B, 0.18%, LOC Bank of America NA, VRDN (a) | 18,250 | | 18,250 |
Montgomery County Econ. Dev. Rev. (Georgetown Preparatory School, Inc. Proj.) Series 2005, 0.2%, LOC Bank of America NA, VRDN (a) | 2,330 | | 2,330 |
Washington Suburban San. District Bonds (Sewage Disp. Proj.) Series 2005, 5% 6/1/10 | 2,000 | | 2,023 |
| | 70,588 |
Massachusetts - 3.1% |
Massachusetts Bay Trans. Auth. Sales Tax Rev.: | | | |
Series 2008 A1, 0.22% (Liquidity Facility JPMorgan Chase Bank), VRDN (a) | 10,000 | | 10,000 |
Series 2008 A2, 0.2% (Liquidity Facility JPMorgan Chase Bank), VRDN (a) | 3,700 | | 3,700 |
Massachusetts Dev. Fin. Agcy. Rev. (Childrens Museum Proj.) Series 2006, 0.16%, LOC RBS Citizens NA, VRDN (a) | 1,000 | | 1,000 |
Massachusetts Gen. Oblig.: | | | |
Participating VRDN: | | | |
Series DCL 08 42, 0.3% (Liquidity Facility Dexia Cr. Local de France) (a)(d) | 3,000 | | 3,000 |
Series SG 126, 0.17% (Liquidity Facility Societe Generale) (a)(d) | 2,000 | | 2,000 |
Series 2001 B, 0.19% (Liquidity Facility Landesbank Hessen-Thuringen), VRDN (a) | 4,200 | | 4,200 |
Series 2001 C, 0.19% (Liquidity Facility State Street Bank & Trust Co., Boston), VRDN (a) | 4,115 | | 4,115 |
Series 2005 A, 0.19% (Liquidity Facility Citibank NA), VRDN (a) | 18,635 | | 18,635 |
Series 2006 A, 0.17% (Liquidity Facility Dexia Cr. Local de France), VRDN (a) | 3,200 | | 3,200 |
Massachusetts Health & Edl. Facilities Auth. Rev. (Stonehill College Proj.) Series 2008 K, 0.14%, LOC Bank of America NA, VRDN (a) | 1,100 | | 1,100 |
Municipal Securities - continued |
| Principal Amount (000s) | | Value (000s) |
Massachusetts - continued |
Massachusetts Indl. Fin. Agcy. Poll. Cont. Rev. Bonds (New England Pwr. Co. Proj.) Series 1993 A, 0.8% tender 3/1/10, CP mode | $ 3,100 | | $ 3,100 |
Massachusetts School Bldg. Auth. Dedicated Sales Tax Rev. Participating VRDN: | | | |
Series BA 08 1082, 0.21% (Liquidity Facility Bank of America NA) (a)(d) | 6,680 | | 6,680 |
Series EGL 07 0031, 0.2% (Liquidity Facility Citibank NA) (a)(d) | 1,000 | | 1,000 |
Series Putters 2479Z, 0.2% (Liquidity Facility JPMorgan Chase Bank) (a)(d) | 3,100 | | 3,100 |
Massachusetts Wtr. Resources Auth. Wtr. & Swr. Rev. Series 2008 C, 0.28% (Liquidity Facility Bayerische Landesbank), VRDN (a) | 1,700 | | 1,700 |
| | 66,530 |
Michigan - 1.3% |
Kent Hosp. Fin. Auth. Hosp. Facilities Rev. (Spectrum Health Sys. Proj.) Series 2008 B1, 0.38%, LOC RBS Citizens NA, VRDN (a) | 9,700 | | 9,700 |
Michigan Bldg. Auth. Rev.: | | | |
Series 2007 I, 0.18%, LOC JPMorgan Chase Bank, VRDN (a) | 2,000 | | 2,000 |
Series 5, 0.25% 3/25/10, LOC Bank of New York, New York, LOC State Street Bank & Trust Co., Boston, CP | 3,670 | | 3,670 |
Michigan Hosp. Fin. Auth. Rev. Bonds (Ascension Health Cr. Group Proj.) Series 1999 B2, 0.24%, tender 4/27/10 (a) | 3,700 | | 3,700 |
Michigan State Univ. Revs. 0.15% (Liquidity Facility Landesbank Hessen-Thuringen), VRDN (a) | 1,500 | | 1,500 |
Michigan Strategic Fund Ltd. Oblig. Rev.: | | | |
(Grand Rapids Art Museum Proj.) Series 2006 A, 0.2%, LOC Bank of America NA, VRDN (a) | 1,900 | | 1,900 |
(Van Andel Research Institute Proj.) Series 2008, 0.18%, LOC Bank of America NA, VRDN (a) | 1,100 | | 1,100 |
Waterford Econ. Dev. Corp. Ltd. Oblig. Rev. (Canterbury Health Care, Inc. Proj.) Series 2009, 0.23%, LOC Fed. Home Ln. Bank of Boston, VRDN (a) | 4,300 | | 4,300 |
| | 27,870 |
Minnesota - 0.5% |
Oak Park Heights Multi-Fam Rev. 0.26%, LOC Freddie Mac, VRDN (a) | 3,265 | | 3,265 |
Municipal Securities - continued |
| Principal Amount (000s) | | Value (000s) |
Minnesota - continued |
St. Paul City Port Auth. District Heating Rev. Series 2009 7Q, 0.2%, LOC Deutsche Bank AG, VRDN (a) | $ 1,300 | | $ 1,300 |
Univ. of Minnesota Series 2001 C, 0.23% (Liquidity Facility JPMorgan Chase Bank), VRDN (a) | 6,250 | | 6,250 |
| | 10,815 |
Mississippi - 0.2% |
Mississippi Bus. Fin. Corp. Rev. (Jackson Med. Mall Foundation Prog.) Series 2008 A, 0.21%, LOC JPMorgan Chase Bank, VRDN (a) | 4,800 | | 4,800 |
Missouri - 1.3% |
Cape Girardeau County Indl. Dev. Auth. (St. Francis Med. Ctr. Proj.) Series 2009 B, 0.2%, LOC Wells Fargo Bank NA, VRDN (a) | 4,200 | | 4,200 |
Kansas City Indl. Dev. Auth. Student Hsg. Facilities Rev. (Oak Street West Proj.) Series 2006, 0.17%, LOC Bank of America NA, VRDN (a) | 13,205 | | 13,205 |
Missouri Health & Edl. Facilities Auth. Edl. Facilities Rev. (Saint Louis Univ. Proj.) Series 2008 A2, 0.12%, LOC Wells Fargo Bank NA, VRDN (a) | 6,660 | | 6,660 |
Missouri Health & Edl. Facilities Auth. Health Facilities Rev. (Cox Health Sys. Proj.) Series 2008 C, 0.2%, LOC Bank of America NA, VRDN (a) | 5,000 | | 5,000 |
| | 29,065 |
Nebraska - 0.3% |
Central Plains Energy Proj. Rev. (Nebraska Gas Proj.) Series 2009, 0.19% (Liquidity Facility Royal Bank of Canada), VRDN (a) | 5,600 | | 5,600 |
Nevada - 1.1% |
Clark County Arpt. Rev.: | | | |
Series 2008 D1, 0.24%, LOC Landesbank Baden-Wuert, VRDN (a) | 11,420 | | 11,420 |
Series 2008 D2, 0.24%, LOC Landesbank Baden-Wuert, VRDN (a) | 2,800 | | 2,800 |
Clark County Fuel Tax: | | | |
Participating VRDN Series ROC II R 11507, 0.2% (Liquidity Facility Citibank NA) (a)(d) | 2,800 | | 2,800 |
Series 2008 A: | | | |
0.27% 5/6/10, LOC California Teachers Retirement Sys., LOC State Street Bank & Trust Co., Boston, CP | 3,700 | | 3,700 |
0.45% 3/10/10, LOC BNP Paribas SA, CP | 4,000 | | 4,000 |
| | 24,720 |
Municipal Securities - continued |
| Principal Amount (000s) | | Value (000s) |
New Hampshire - 0.2% |
New Hampshire Health & Ed. Facilities Auth. Rev. (Univ. Sys. of New Hampshire Proj.) Series 2005 A2, 0.14%, VRDN (a) | $ 4,000 | | $ 4,000 |
New Jersey - 1.1% |
New Jersey Econ. Dev. Auth. School Facilities Construction Rev. Series 2008 V5, 0.17%, LOC Wachovia Bank NA, VRDN (a) | 2,100 | | 2,100 |
New Jersey Gen. Oblig. TRAN Series 2010 B, 2.5% 6/24/10 | 20,600 | | 20,727 |
| | 22,827 |
New Mexico - 0.4% |
New Mexico Fin. Auth. Trans. Rev. Series 2008 B1, 0.18%, LOC State Street Bank & Trust Co., Boston, VRDN (a) | 3,400 | | 3,400 |
New Mexico Muni. Energy Acquisition Auth. Gas Supply Rev. Series 2009, 0.19% (Liquidity Facility Royal Bank of Canada), VRDN (a) | 4,500 | | 4,500 |
| | 7,900 |
New York - 1.7% |
New York City Gen. Oblig. Series 2004 H3, 0.17%, LOC Bank of New York, New York, VRDN (a) | 3,480 | | 3,480 |
New York City Muni. Wtr. Fin. Auth. Wtr. & Swr. Sys. Rev.: | | | |
Series 2008 B2, 0.14% (Liquidity Facility Lloyds TSB Bank PLC), VRDN (a) | 1,990 | | 1,990 |
Series 7, 0.3% 5/3/10, CP | 3,300 | | 3,300 |
Series 8, 0.3% 5/13/10, CP | 3,900 | | 3,900 |
New York City Trust Cultural Resources Rev. (Lincoln Ctr. for the Performing Arts, Inc. Proj.) Series 2008 B1, 0.17%, LOC U.S. Bank NA, Minnesota, VRDN (a) | 1,000 | | 1,000 |
New York Dorm. Auth. Revs. Participating VRDN: | | | |
Series EGL 06 47 Class A, 0.2% (Liquidity Facility Citibank NA) (a)(d) | 4,500 | | 4,500 |
Series EGL 07 0003, 0.2% (Liquidity Facility Citibank NA) (a)(d) | 15,000 | | 15,000 |
New York Hsg. Fin. Agcy. Rev. (505 West 37th Street Proj.) Series 2009 B, 0.23%, LOC Landesbank Hessen-Thuringen, VRDN (a) | 1,600 | | 1,600 |
New York Metropolitan Trans. Auth. Rev. Series C, 0.35% 5/4/10, LOC ABN-AMRO Bank NV, CP | 1,600 | | 1,600 |
| | 36,370 |
North Carolina - 2.7% |
Charlotte Wtr. & Swr. Sys. Rev. Series 2006 B, 0.18% (Liquidity Facility Wachovia Bank NA), VRDN (a) | 7,000 | | 7,000 |
Municipal Securities - continued |
| Principal Amount (000s) | | Value (000s) |
North Carolina - continued |
Greensboro Combined Enterprise Sys. Rev.: | | | |
Bonds Series 2009 C, 2% 6/1/10 | $ 1,465 | | $ 1,470 |
Series 2005 B, 0.2% (Liquidity Facility Bank of America NA), VRDN (a) | 2,550 | | 2,550 |
Guilford County Gen. Oblig. Series 2007 B, 0.18% (Liquidity Facility Branch Banking & Trust Co.), VRDN (a) | 6,180 | | 6,180 |
New Hanover County Hosp. Rev. (New Hanover Reg'l. Med. Ctr. Proj.) Series 2008 B, 0.19%, LOC RBC Centura Bank, Rocky Mount, VRDN (a) | 1,000 | | 1,000 |
North Carolina Cap. Facilities Fin. Agcy. Rev. (Elon Univ. Proj.) Series 2006, 0.22%, LOC Bank of America NA, VRDN (a) | 3,800 | | 3,800 |
North Carolina Med. Care Commission Health Care Facilities Rev.: | | | |
(Cape Fear Valley Health Sys. Proj.) Series 2008 A2, 0.18%, LOC Branch Banking & Trust Co., VRDN (a) | 3,000 | | 3,000 |
(Deerfield Episcopal Retirement Cmnty. Proj.) Series 2008 B, 0.19%, LOC Branch Banking & Trust Co., VRDN (a) | 5,000 | | 5,000 |
(Friends Homes, Inc. Proj.) Series 2003, 0.22%, LOC Bank of America NA, VRDN (a) | 6,275 | | 6,275 |
Orange Wtr. & Swr. Auth. Series 2004 B, 0.2% (Liquidity Facility Bank of America NA), VRDN (a) | 3,100 | | 3,100 |
Raleigh Combined Enterprise Sys. Rev. Participating VRDN Series EGL 07 0010, 0.2% (Liquidity Facility Citibank NA) (a)(d) | 9,900 | | 9,900 |
Wake County Gen. Oblig.: | | | |
Series 2003 B, 0.18% (Liquidity Facility Lloyds TSB Bank PLC), VRDN (a) | 2,100 | | 2,100 |
Series 2003 C, 0.19% (Liquidity Facility Lloyds TSB Bank PLC), VRDN (a) | 1,685 | | 1,685 |
Series 2007 B, 0.19%, VRDN (a) | 5,400 | | 5,400 |
| | 58,460 |
Ohio - 3.6% |
Cleveland Wtrwks. Rev. Series 2008 Q, 0.18%, LOC Bank of America NA, VRDN (a) | 5,300 | | 5,300 |
Columbus Gen. Oblig. Participating VRDN Series Putters 2365, 0.2% (Liquidity Facility JPMorgan Chase Bank) (a)(d) | 4,360 | | 4,360 |
Delaware Gen. Oblig. BAN 1.5% 4/28/10 | 3,685 | | 3,689 |
Franklin County Health Care Facilities Rev. (Friendship Village of Dublin, Ohio, Inc. Proj.) Series 2004 B, 0.18%, LOC Nat'l. City Bank Cleveland, VRDN (a) | 1,995 | | 1,995 |
Fulton County Gen. Oblig. Rev. (Fulton County Health Ctr. Proj.) Series 2005, 0.18%, LOC JPMorgan Chase Bank, VRDN (a) | 7,000 | | 7,000 |
Municipal Securities - continued |
| Principal Amount (000s) | | Value (000s) |
Ohio - continued |
Hamilton County Hosp. Facilities Rev.: | | | |
(Childrens Hosp. Med. Ctr. Proj.) Series 2000, 0.2%, LOC JPMorgan Chase Bank, VRDN (a) | $ 1,410 | | $ 1,410 |
(Elizabeth Gamble Deaconess Home Assoc. Proj.) Series 2002 A, 0.21%, LOC JPMorgan Chase Bank, VRDN (a) | 3,000 | | 3,000 |
Lake County Hosp. Facilities Rev. (Lake Hosp. Sys., Inc. Proj.) Series 2008 B, 0.18%, LOC JPMorgan Chase Bank, VRDN (a) | 28,750 | | 28,750 |
Ohio Air Quality Dev. Auth. Rev.: | | | |
(Cincinnati Gas & Elec. Co. Proj.) Series A, 0.3%, VRDN (a) | 2,000 | | 2,000 |
(FirstEnergy Corp. Proj.) Series 2006 B, 0.18%, LOC Wachovia Bank NA, VRDN (a) | 3,000 | | 3,000 |
Ohio Higher Edl. Facility Commission Rev. Bonds (Cleveland Clinic Proj.) Series 2008 B6, 0.26% tender 5/6/10, CP mode | 9,200 | | 9,200 |
Ohio Hosp. Facilities Rev. Participating VRDN Series Putters 3591, 0.14% (Liquidity Facility JPMorgan Chase Bank) (a)(d) | 1,495 | | 1,495 |
Ohio Hsg. Fin. Agcy. Residential Mtg. Rev. Participating VRDN Series BC 09 35W, 0.16% (Liquidity Facility Barclays Bank PLC) (a)(d) | 8,000 | | 8,000 |
| | 79,199 |
Oklahoma - 0.0% |
Oklahoma City Ind. & Cultural Facilities (Oklahoma City Univ. Proj.) Series 2005 B, 0.2%, LOC Bank of America NA, VRDN (a) | 1,000 | | 1,000 |
Oregon - 1.2% |
Clackamas County Hosp. Facility Auth. Bonds (Providence Health Sys. Proj.): | | | |
Class F, 0.38% tender 6/8/10, CP mode | 5,000 | | 5,000 |
Series 2003 D, 0.35% tender 8/6/10, CP mode | 4,000 | | 4,000 |
Series F, 0.35% tender 7/14/10, CP mode | 10,000 | | 10,000 |
Oregon Facilities Auth. Rev. (PeaceHealth Proj.) Series 2008 B, 0.16%, LOC U.S. Bank NA, Minnesota, VRDN (a) | 1,000 | | 1,000 |
Salem Hosp. Facility Auth. Rev. (Salem Hosp. Proj.) Series 2008 B, 0.18%, LOC U.S. Bank NA, Minnesota, VRDN (a) | 5,000 | | 5,000 |
| | 25,000 |
Pennsylvania - 7.6% |
Berks County Muni. Auth. Rev. (Phoebe-Devitt Homes Obligated Group Proj.) Series 2008 A, 0.18%, LOC Banco Santander SA, VRDN (a) | 2,600 | | 2,600 |
Municipal Securities - continued |
| Principal Amount (000s) | | Value (000s) |
Pennsylvania - continued |
Butler County Indl. Dev. Auth. Rev. (Concordia Lutheran Health & Human Care Proj.) Series 2008 A, 0.18%, LOC Bank of America NA, VRDN (a) | $ 7,300 | | $ 7,300 |
Cambria County Indl. Dev. Auth. Rev. (American Nat'l. Red Cross Proj.) Series 2008, 0.17%, LOC JPMorgan Chase Bank, VRDN (a) | 6,500 | | 6,500 |
Chester County Indl. Dev. Auth. Student Hsg. Rev. Series 2008 A, 0.17%, LOC Fed. Home Ln. Bank Pittsburgh, VRDN (a) | 10,000 | | 10,000 |
Crawford County Indl. Dev. Auth. College Rev. (Allegheny College Proj.) Series 2009 B, 0.19%, LOC PNC Bank NA, Pittsburgh, VRDN (a) | 2,000 | | 2,000 |
Delaware County Auth. Rev.: | | | |
(Riddle Village Proj.) Series 2006, 0.18%, LOC Banco Santander SA, VRDN (a) | 3,300 | | 3,300 |
(White Horse Village Proj.) Series 2006 B, 0.23%, LOC Citizens Bank of Pennsylvania, VRDN (a) | 1,800 | | 1,800 |
Delaware County Indl. Dev. Auth. Rev. (Academy of Notre Dame de Namur Proj.) Series 2007, 0.38%, LOC Citizens Bank of Pennsylvania, VRDN (a) | 200 | | 200 |
Doylestown Hosp. Auth. Hosp. Rev. Series 2008 B, 0.17%, LOC PNC Bank NA, Pittsburgh, VRDN (a) | 3,700 | | 3,700 |
Lancaster Indl. Dev. Auth. Rev. (United Zion Retirement Cmnty. Proj.) 0.39%, LOC Citizens Bank of Pennsylvania, VRDN (a) | 4,795 | | 4,795 |
Lower Merion School District Series 2009 B, 0.18%, LOC U.S. Bank NA, Minnesota, VRDN (a) | 4,300 | | 4,300 |
Luzerne County Indl. Dev. Auth. Rev. (United Methodist Homes Proj.) Series 2003, 0.2%, LOC Banco Santander SA, VRDN (a) | 4,125 | | 4,125 |
Montgomery County Higher Ed. & Health Auth. Rev. (William Penn Charter School Proj.) Series 2001, 0.19%, LOC PNC Bank NA, Pittsburgh, VRDN (a) | 2,585 | | 2,585 |
Montgomery County Indl. Dev. Auth. Rev. (Archdiocese of Philadelphia Proj.) Series 2008 A, 0.17%, LOC PNC Bank NA, Pittsburgh, VRDN (a) | 5,000 | | 5,000 |
Montgomery County Redev. Auth. Multi-family Hsg. Rev. (Forge Gate Apts. Proj.) Series 2001 A, 0.2%, LOC Fannie Mae, VRDN (a) | 4,990 | | 4,990 |
Northeastern Pennsylvania Hosp. and Ed. Auth. Rev. (The Commonwealth Med. College Proj.) Series 2009, 0.17%, LOC PNC Bank NA, Pittsburgh, VRDN (a) | 5,700 | | 5,700 |
Pennsylvania Econ. Dev. Fing. Auth. Indl. Dev. Rev. Series 2004 E1, 0.19%, LOC PNC Bank NA, Pittsburgh, VRDN (a) | 2,835 | | 2,835 |
Pennsylvania Gen. Oblig. TAN 1.5% 6/30/10 | 24,000 | | 24,096 |
Municipal Securities - continued |
| Principal Amount (000s) | | Value (000s) |
Pennsylvania - continued |
Pennsylvania Higher Edl. Facilities Auth. Rev.: | | | |
(California Univ. of Pennsylvania Student Hsg. Proj.) Series 2006 A, 0.17%, LOC Fed. Home Ln. Bank Pittsburgh, VRDN (a) | $ 6,640 | | $ 6,640 |
(Indiana Univ. of Pennsylvania Student Hsg. Proj.) Series 2008, 0.17%, LOC Fed. Home Ln. Bank Pittsburgh, VRDN (a) | 6,300 | | 6,300 |
(Mercyhurst College Proj.) Series 12, 0.19%, LOC PNC Bank NA, Pittsburgh, VRDN (a) | 2,170 | | 2,170 |
Pennsylvania Tpk. Commission Tpk. Rev.: | | | |
Series 2008 B1, 0.18%, LOC Bank of America NA, VRDN (a) | 5,500 | | 5,500 |
Series 2008 B5, 0.2%, LOC Bank of America NA, VRDN (a) | 6,900 | | 6,900 |
Philadelphia Gas Works Rev. (1998 Gen. Ordinance Proj.) Eighth Series B, 0.16%, LOC Wachovia Bank NA, VRDN (a) | 3,700 | | 3,700 |
Philadelphia School District Series 2008 B3, 0.18%, LOC Wachovia Bank NA, VRDN (a) | 4,600 | | 4,600 |
Scranton-Lackawanna Health & Welfare Auth. Rev. Series 2002, 0.19%, LOC PNC Bank NA, Pittsburgh, VRDN (a) | 3,815 | | 3,815 |
Somerset County Gen. Oblig. Series 2009 A, 0.19%, LOC PNC Bank NA, Pittsburgh, VRDN (a) | 3,450 | | 3,450 |
South Fork Muni. Auth. Hosp. Rev. (Conemaugh Health Ctr. Proj.) Series 2005 C, 0.19%, LOC Nat'l. City Bank Cleveland, VRDN (a) | 12,465 | | 12,465 |
Southeastern Pennsylvania Trans. Auth. Rev. Series 2007, 0.17%, LOC PNC Bank NA, Pittsburgh, VRDN (a) | 14,200 | | 14,200 |
| | 165,566 |
South Carolina - 5.9% |
Charleston Wtrwks. & Swr. Rev.: | | | |
Series 2006 B, 0.18% (Liquidity Facility Wachovia Bank NA), VRDN (a) | 7,700 | | 7,700 |
Series A, 0.19% (Liquidity Facility Bank of America NA), VRDN (a) | 4,000 | | 4,000 |
Greenville County School District Bonds Series D, 2% 6/1/10 | 17,000 | | 17,066 |
Greenville Hosp. Sys. Facilities Rev. Series 2008 E, 0.18%, LOC Wachovia Bank NA, VRDN (a) | 9,000 | | 9,000 |
South Carolina Assoc. of Governmental Organizations Ctfs. of Prtn. Bonds Series 2009 A, 1.5% 4/15/10 | 10,900 | | 10,914 |
South Carolina Edl. Facilities Auth. for Private Nonprofit Institutions of Higher Learning Edl. Facilities Rev. (Claflin Univ. Proj.) 0.2%, LOC Bank of America NA, VRDN (a) | 7,731 | | 7,731 |
South Carolina Jobs-Econ. Dev. Auth. (Palmetto Health Proj.) Series 2008 A, 0.2%, LOC Bank of America NA, VRDN (a) | 4,805 | | 4,805 |
Municipal Securities - continued |
| Principal Amount (000s) | | Value (000s) |
South Carolina - continued |
South Carolina Jobs-Econ. Dev. Auth. Econ. Dev. Rev.: | | | |
(Carolina Piedmont Foundation Proj.) 0.25%, LOC Bank of America NA, VRDN (a) | $ 3,600 | | $ 3,600 |
(Institute for Bus. and Home Safety Proj.) Series 2009, 0.19%, LOC Branch Banking & Trust Co., VRDN (a) | 4,500 | | 4,500 |
South Carolina Pub. Svc. Auth. Rev.: | | | |
Participating VRDN: | | | |
Series ROC II R 11426, 0.21% (Liquidity Facility Citibank NA) (a)(d) | 3,900 | | 3,900 |
Series Solar 07 70, 0.19% (Liquidity Facility U.S. Bank NA, Minnesota) (a)(d) | 20,505 | | 20,505 |
0.19% 3/10/10, CP | 4,148 | | 4,148 |
0.27% 3/4/10, CP | 2,642 | | 2,642 |
0.28% 4/7/10, CP | 6,924 | | 6,924 |
South Carolina Trans. Infrastructure Bank Rev. Series 2003 B1, 0.19%, LOC Bank of America NA, VRDN (a) | 2,000 | | 2,000 |
Spartanburg County School District #1 Bonds Series Solar 06 152, 0.19%, tender 3/5/10 (Liquidity Facility U.S. Bank NA, Minnesota) (a)(d) | 10,560 | | 10,560 |
Sumter County Gen. Oblig. BAN Series 2009, 1.5% 6/2/10 | 5,200 | | 5,212 |
York County Poll. Cont. Rev. Bonds (Duke Energy Corp. Proj.) 0.9% tender 3/1/10, CP mode | 3,750 | | 3,750 |
| | 128,957 |
Tennessee - 1.2% |
Blount County Pub. Bldg. Auth. (Local Govt. Pub. Impt. Proj.) Series 2008 E1A, 0.19%, LOC Branch Banking & Trust Co., VRDN (a) | 5,600 | | 5,600 |
Clarksville Pub. Bldg. Auth. Rev. (Tennessee Muni. Bond Fund Proj.) Series 1994, 0.24%, LOC Bank of America NA, VRDN (a) | 7,100 | | 7,100 |
Knox County Health Edl. & Hsg. Facilities Board Hosp. Facilities Rev. (Catholic Healthcare Partners Proj.) Series 2008 A, 0.22%, LOC Landesbank Baden-Wuert, VRDN (a) | 4,300 | | 4,300 |
Montgomery County Pub. Bldg. Auth. Pooled Fing. Rev. (Tennessee County Ln. Pool Prog.) Series 1999, 0.24%, LOC Bank of America NA, VRDN (a) | 8,920 | | 8,920 |
| | 25,920 |
Texas - 12.4% |
Austin Independent School District Participating VRDN Series Putters 3554, 0.2% (Liquidity Facility JPMorgan Chase Bank) (a)(d) | 7,045 | | 7,045 |
Municipal Securities - continued |
| Principal Amount (000s) | | Value (000s) |
Texas - continued |
Comal Independent School District Participating VRDN Series Solar 06 36, 0.19% (Liquidity Facility U.S. Bank NA, Minnesota) (a)(d) | $ 13,170 | | $ 13,170 |
Fort Bend Independent School District Participating VRDN Series PZ 124, 0.21% (Liquidity Facility Wells Fargo & Co.) (a)(d) | 10,140 | | 10,140 |
Galena Park Independent School District Participating VRDN Series SG 154, 0.23% (Liquidity Facility Societe Generale) (a)(d) | 9,900 | | 9,900 |
Grand Prairie Independent School District Participating VRDN Series ROC II R 11161, 0.2% (Liquidity Facility Citibank NA) (a)(d) | 7,955 | | 7,955 |
Harris County Cultural Ed. Facilities Fin. Corp. Spl. Facilities Rev. (Texas Med. Ctr. Proj.) Series 2008 B2, 0.21%, LOC Compass Bank, VRDN (a) | 9,370 | | 9,370 |
Harris County Health Facilities Dev. Corp. Hosp. Rev. (Baylor College of Medicine Proj.) Series 2008 A, 0.38%, LOC Compass Bank, VRDN (a) | 3,600 | | 3,600 |
Houston Gen. Oblig. TRAN Series 2009, 2% 6/30/10 | 4,000 | | 4,020 |
Houston Higher Ed. Fin. Corp. Higher Ed. Rev. (Rice Univ. Proj.) Series 2006 A, 0.18% (Liquidity Facility JPMorgan Chase Bank), VRDN (a) | 7,150 | | 7,150 |
Houston Util. Sys. Rev.: | | | |
Participating VRDN Series Solar 06 70, 0.17% (Liquidity Facility U.S. Bank NA, Minnesota) (a)(d) | 4,000 | | 4,000 |
Series 2004 B3, 0.19%, LOC Dexia Cr. Local de France, LOC Bank of America NA, VRDN (a) | 2,165 | | 2,165 |
Series 2008 A1, 0.19%, LOC Bank of America NA, VRDN (a) | 22,100 | | 22,100 |
Series B1, 0.23% 3/9/10, LOC JPMorgan Chase Bank, CP | 4,000 | | 4,000 |
Judson Independent School District Participating VRDN Series MS 06 1859, 0.19% (Liquidity Facility Wells Fargo & Co.) (a)(d) | 3,940 | | 3,940 |
Lovejoy Independent School District Participating VRDN Series DB 514, 0.23% (Liquidity Facility Deutsche Bank AG) (a)(d) | 6,095 | | 6,095 |
Lower Neches Valley Auth. Indl. Dev. Corp. Exempt Facilities Rev. (ExxonMobil Proj.) Series 2001 A, 0.11% (Exxon Mobil Corp. Guaranteed), VRDN (a) | 1,100 | | 1,100 |
Mansfield Independent School District Participating VRDN Series PT 4627, 0.2% (Liquidity Facility Deutsche Postbank AG) (a)(d) | 10,825 | | 10,825 |
North East Texas Independent School District Participating VRDN Series Putters 2355, 0.2% (Liquidity Facility JPMorgan Chase Bank) (a)(d) | 4,460 | | 4,460 |
Municipal Securities - continued |
| Principal Amount (000s) | | Value (000s) |
Texas - continued |
Plano Gen. Oblig. Participating VRDN Series MS 06 1862, 0.19% (Liquidity Facility Wells Fargo & Co.) (a)(d) | $ 2,920 | | $ 2,920 |
Princeton Independent School District Participating VRDN Series SGB 02 41A, 0.18% (Liquidity Facility Societe Generale) (a)(d) | 3,500 | | 3,500 |
San Antonio Elec. & Gas Sys. Rev.: | | | |
Participating VRDN Series Putters 3344, 0.2% (Liquidity Facility JPMorgan Chase Bank) (a)(d) | 3,215 | | 3,215 |
Series 2003, 0.23% (Liquidity Facility Bank of America NA), VRDN (a) | 8,500 | | 8,500 |
Series A: | | | |
0.27% 3/4/10, CP | 12,660 | | 12,660 |
0.28% 4/6/10, CP | 5,300 | | 5,300 |
0.29% 3/4/10, CP | 4,200 | | 4,200 |
San Antonio Gen. Oblig. Series A, 0.23% 4/8/10, LOC Bank of America NA, CP | 4,830 | | 4,830 |
San Antonio Wtr. Sys. Rev. Series 2001 A, 0.28% 4/6/10, CP | 1,418 | | 1,418 |
Spring Branch Independent School District Participating VRDN Series Putters 3377, 0.2% (Liquidity Facility JPMorgan Chase Bank) (a)(d) | 2,245 | | 2,245 |
Tarrant County Cultural Ed. Facilities Fin. Corp. Hosp. Rev. (Scott and White Memorial Hosp. and Scott, Sherwood and Brindley Foundation Proj.) Series 2008 3, 0.24%, LOC Compass Bank, VRDN (a) | 9,225 | | 9,225 |
Tarrant County Cultural Ed. Facilities Fin. Corp. Rev. (Texas Health Resources Proj.) Series 2008 A, 0.18%, VRDN (a) | 5,430 | | 5,430 |
Texas Gen. Oblig. TRAN Series 2009, 2.5% 8/31/10 | 40,000 | | 40,405 |
Texas Wtr. Dev. Board Rev. Participating VRDN Series SGA 00 104, 0.21% (Liquidity Facility Societe Generale) (a)(d) | 10,470 | | 10,470 |
Travis County Health Facilities Dev. (Longhorn Village Proj.) Series 2008 B, 0.16%, LOC Bank of Scotland PLC, VRDN (a) | 19,730 | | 19,730 |
Univ. of Texas Permanent Univ. Fund Rev. Participating VRDN Series ROC II R 11266, 0.2% (Liquidity Facility Citibank NA) (a)(d) | 3,680 | | 3,680 |
| | 268,763 |
Utah - 0.4% |
Emery County Poll. Cont. Rev. (PacifiCorp Proj.) Series 1994, 0.18%, LOC Wells Fargo Bank NA, VRDN (a) | 1,000 | | 1,000 |
Intermountain Pwr. Agcy. Pwr. Supply Rev.: | | | |
Bonds Series 2009 A, 3% 7/1/10 | 1,200 | | 1,211 |
Municipal Securities - continued |
| Principal Amount (000s) | | Value (000s) |
Utah - continued |
Intermountain Pwr. Agcy. Pwr. Supply Rev.: - continued | | | |
Series 1997 B1, 0.3% 4/9/10 (Liquidity Facility Bank of Nova Scotia), CP | $ 4,400 | | $ 4,400 |
Series 1997 B2, 0.32% 6/7/10 (Liquidity Facility Bank of Nova Scotia), CP | 2,800 | | 2,800 |
| | 9,411 |
Virginia - 2.9% |
Albemarle County Indl. Dev. Auth. Health Srv 0.18%, LOC Wachovia Bank NA, VRDN (a) | 3,815 | | 3,815 |
Fairfax County Econ. Dev. Auth. Rev. (Smithsonian Institution Proj.) Series A, 0.2% (Liquidity Facility Bank of America NA), VRDN (a) | 1,535 | | 1,535 |
Fairfax County Indl. Dev. Auth. Bonds (Inova Health Sys. Proj.) Series 2009 B1, 0.55%, tender 3/8/10 (a) | 11,500 | | 11,500 |
Norfolk Econ. Dev. Auth. Hosp. Facilities Rev. (Sentara Healthcare Proj.) Series 2009 C, 0.16%, VRDN (a) | 2,000 | | 2,000 |
Norfolk Econ. Dev. Auth. Rev. (Bon Secours Health Sys. Proj.) Series 2008 D1, 0.24%, LOC Landesbank Baden-Wuert, VRDN (a) | 5,900 | | 5,900 |
Richmond Pub. Util. Rev. Participating VRDN: | | | |
Series ROC II R 10410, 0.21% (Liquidity Facility Citibank NA) (a)(d) | 3,930 | | 3,930 |
Series ROC II R 11262, 0.21% (Liquidity Facility Citibank NA) (a)(d) | 4,880 | | 4,880 |
Univ. of Virginia Gen. Rev. Participating VRDN Series EGL 06 17 Class A, 0.2% (Liquidity Facility Citibank NA) (a)(d) | 17,200 | | 17,200 |
Virginia College Bldg. Auth. Edl. Facilities Rev. Participating VRDN Series PZ 161, 0.21% (Liquidity Facility Wells Fargo & Co.) (a)(d) | 3,860 | | 3,860 |
Virginia Resources Auth. Clean Wtr. Rev. Participating VRDN Series MS 06 1860, 0.19% (Liquidity Facility Wells Fargo & Co.) (a)(d) | 4,720 | | 4,720 |
Virginia Small Bus. Fing. Auth. Health Care Facilities Rev. Participating VRDN Series Putters 3651, 0.2% (Liquidity Facility JPMorgan Chase Bank) (a)(d) | 4,225 | | 4,225 |
| | 63,565 |
Washington - 2.1% |
Cascade Wtr. Alliance Wtr. Sys. Rev. Participating VRDN Series Solar 06 73 0.17% (Liquidity Facility U.S. Bank NA, Minnesota) (a)(d) | 8,615 | | 8,615 |
Central Puget Sound Reg'l. Trans. Auth. Sales & Use Tax Rev. Participating VRDN Series Putters 2866, 0.2% (Liquidity Facility JPMorgan Chase Bank) (a)(d) | 1,000 | | 1,000 |
Municipal Securities - continued |
| Principal Amount (000s) | | Value (000s) |
Washington - continued |
Energy Northwest Elec. Rev. Bonds Series 2008 D, 5% 7/1/10 | $ 4,610 | | $ 4,680 |
King County Swr. Rev.: | | | |
Participating VRDN Series ROC II R 11717, 0.2% (Liquidity Facility Citibank NA) (a)(d) | 5,645 | | 5,645 |
Series A, 0.35% 3/4/10 (Liquidity Facility Bayerische Landesbank Girozentrale), CP | 3,000 | | 3,000 |
Pierce County Econ. Dev. Corp. Spl. Rev. (Weyerhaeuser Real Estate Proj.) Series 1997 A, 0.22%, LOC Bank of America NA, VRDN (a) | 1,100 | | 1,100 |
Seattle Muni. Lt. & Pwr. Rev. Bonds Series 2008, 5% 4/1/10 | 2,160 | | 2,168 |
Seattle Wtr. Sys. Rev. Participating VRDN Series MS 06 2170, 0.19% (Liquidity Facility Wells Fargo & Co.) (a)(d) | 2,510 | | 2,510 |
Snohomish County Pub. Util. District #1 Elec. Rev. RAN Series 2009 B, 2% 8/5/10 | 11,595 | | 11,671 |
Washington Health Care Facilities Auth. Rev. (Childrens Hosp. Reg'l. Med. Ctr. Proj.) Series 2008 B, 0.19%, LOC Bank of America NA, VRDN (a) | 3,150 | | 3,150 |
Washington Hsg. Fin. Commission Nonprofit Rev. (United Way King County Proj.) 0.5%, LOC Bank of America NA, VRDN (a) | 1,560 | | 1,560 |
Washington Pub. Pwr. Supply Sys. Nuclear Proj. #1 Rev. Series 1993 1 A2, 0.17%, LOC Bank of America NA, VRDN (a) | 1,200 | | 1,200 |
| | 46,299 |
West Virginia - 0.5% |
West Virginia Hosp. Fin. Auth. Hosp. Rev. (West Virginia United Health Sys. Proj.) Series 2008 D, 0.22%, LOC Bank of America NA, VRDN (a) | 10,810 | | 10,810 |
Wisconsin - 2.1% |
Univ. of Wisconsin Hosp. & Clinics Auth. Series 2009 A, 0.16%, LOC U.S. Bank NA, Minnesota, VRDN (a) | 4,870 | | 4,870 |
Wisconsin Ctr. District Tax Rev. Series 2001 A, 0.21%, LOC U.S. Bank NA, Minnesota, VRDN (a) | 7,300 | | 7,300 |
Wisconsin Gen. Oblig.: | | | |
Bonds Series 1992, 6.25% 5/1/10 | 3,765 | | 3,801 |
Series 2005 A, 0.25% 4/6/10 (Liquidity Facility State Street Bank & Trust Co., Boston) (Liquidity Facility California Teachers Retirement Sys.), CP | 4,700 | | 4,700 |
Wisconsin Health & Edl. Facilities Auth. Rev. Bonds (Alexian Brothers Health Sys. Proj.) 0.27% tender 3/1/10, LOC JPMorgan Chase Bank, CP mode | 3,200 | | 3,200 |
Municipal Securities - continued |
| Principal Amount (000s) | | Value (000s) |
Wisconsin - continued |
Wisconsin Trans. Rev.: | | | |
Series 1997, 0.25% 4/7/10 (Liquidity Facility State Street Bank & Trust Co., Boston) (Liquidity Facility California Teachers Retirement Sys.), CP | $ 10,884 | | $ 10,884 |
Series 2006 A: | | | |
0.28% 4/6/10 (Liquidity Facility State Street Bank & Trust Co., Boston) (Liquidity Facility California Teachers Retirement Sys.), CP | 7,500 | | 7,500 |
0.32% 3/1/10 (Liquidity Facility State Street Bank & Trust Co., Boston) (Liquidity Facility California Teachers Retirement Sys.), CP | 3,000 | | 3,000 |
| | 45,255 |
| Shares | | |
Other - 7.5% |
Fidelity Tax-Free Cash Central Fund, 0.16% (b)(c) | 162,860,900 | | 162,861 |
TOTAL INVESTMENT PORTFOLIO - 100.1% (Cost $2,174,200) | | 2,174,200 |
NET OTHER ASSETS - (0.1)% | | (1,529) |
NET ASSETS - 100% | $ 2,172,671 |
Fidelity AMT Tax-Free Money Fund (the Fund) is a fund of Fidelity Union Street Trust II (the trust) and is authorized to issue an unlimited number of shares. The trust is registered under the Investment Company Act of 1940, as amended (the 1940 Act), as an open-end management investment company organized as a Delaware statutory trust.
The Fund may invest in Fidelity Central Funds, which are open-end investment companies available only to other investment companies and accounts managed by Fidelity Management & Research Company (FMR) and its affiliates. The Fund's Schedule of Investments lists each of the Fidelity Central Funds held as of period end, if any, as an investment of the Fund, but does not include the underlying holdings of each Fidelity Central Fund. As an Investing Fund, the Fund indirectly bears its proportionate share of the expenses of the underlying Fidelity Central Funds.
The Money Market Central Funds seek preservation of capital and current income and are managed by Fidelity Investments Money Management, Inc. (FIMM), an affiliate of FMR.
A complete unaudited list of holdings for each Fidelity Central Fund is available upon request or at the Securities and Exchange Commission (the SEC) web site at www.sec.gov. In addition, the financial statements of the Fidelity Central Funds are available on the SEC web site or upon request.
The financial statements have been prepared in conformity with accounting principles generally accepted in the United States of America, which require management to make certain estimates and assumptions at the date of the financial statements. Actual results could differ from those estimates. The following summarizes the significant accounting policies of the Fund:
Level 2 - other significant observable inputs (including quoted prices for similar investments, interest rates, prepayment speeds, etc.)
Level 3 - unobservable inputs (including the fund's own assumptions based on the best information available)
As permitted by compliance with certain conditions under Rule 2a-7 of the 1940 Act, securities are valued at amortized cost, which approximates value and are categorized as Level 2 in the hierarchy.
The Fund participated in the U.S. Treasury Department's Temporary Guarantee Program for Money Market Funds (the "Program") through September 18, 2009. The Fund paid the U.S. Treasury Department fees equal to 0.04% based on the number of shares outstanding as of September 19, 2008 to participate in the Program through September 18, 2009. The expense was borne by the Fund without regard to any expense limitation in effect for the Fund.
Dividends are declared daily and paid monthly from net investment income. Distributions from realized gains, if any, are recorded on the ex-dividend date. Income and capital gain distributions are determined in accordance with income tax regulations, which may differ from generally accepted accounting principles. In addition, the Fund claimed a portion of the payment made to redeeming shareholders as a distribution for income tax purposes.
Capital accounts within the financial statements are adjusted for permanent book-tax differences. These adjustments have no impact on net assets or the results of operations. Temporary book-tax differences will reverse in a subsequent period.
Book-tax differences are primarily due to deferred trustees compensation.
The Fund purchases municipal securities whose interest, in the opinion of the issuer, is free from federal income tax. There is no assurance that the IRS will agree with this opinion. In the event the IRS determines that the issuer does not comply with relevant tax requirements, interest payments from a security could become federally taxable, possibly retroactively to the date the security was issued.
The federal tax cost of investment securities and unrealized appreciation (depreciation) as of period end were as follows:
FMR voluntarily agreed to reimburse the Fund to the extent annual operating expenses exceeded .33% of average net assets. Some expenses, for example interest expense and the fee for participating in the U.S. Treasury Department's Temporary Guarantee Program, are excluded from this reimbursement. During the period this reimbursement reduced the Fund's expenses by $1,193.
FMR or its affiliates voluntarily agreed to waive certain fees during the period. The amount of the waiver is $478.
In addition, through arrangements with the Fund's custodian, credits realized as a result of uninvested cash balances were used to reduce the Fund's management fee. During the period, these credits reduced the Fund's expenses by One Hundred and Sixty Five dollars.
The Fund's organizational documents provide former and current trustees and officers with a limited indemnification against liabilities arising in connection with the performance of their duties to the Fund. In the normal course of business, the Fund may also enter into contracts that provide general indemnifications. The Fund's maximum exposure under these arrangements is unknown as this would be dependent on future claims that may be made against the Fund. The risk of material loss from such claims is considered remote.
Each year, the Board of Trustees, including the Independent Trustees (together, the Board), votes on the renewal of the management contract and sub-advisory agreements (together, the Advisory Contracts) for the fund. The Board, assisted by the advice of fund counsel and Independent Trustees' counsel, requests and considers a broad range of information throughout the year.
The Board meets regularly and considers at each of its meetings factors that are relevant to its annual consideration of the renewal of the fund's Advisory Contracts, including the services and support provided to the fund and its shareholders. The Board has established three standing committees, each composed of Independent Trustees with varying backgrounds, to which the Board has assigned specific subject matter responsibilities in order to enhance effective decision-making by the Board. The Operations Committee meets regularly throughout the year and, among other matters, considers matters specifically related to the annual consideration of the renewal of the fund's Advisory Contracts. The Board, acting directly and through its Committees, requests and receives information concerning the annual consideration of the renewal of the fund's Advisory Contracts. The Board also meets as needed to consider matters specifically related to the Board's annual consideration of the renewal of Advisory Contracts.
At its September 2009 meeting, the Board of Trustees, including the Independent Trustees, unanimously determined to renew the fund's Advisory Contracts. In reaching its determination, the Board considered all factors it believed relevant, including (i) the nature, extent, and quality of the services to be provided to the fund and its shareholders (including the investment performance of the fund); (ii) the competitiveness of the fund's management fee and total expenses; (iii) the total costs of the services to be provided by and the profits to be realized by Fidelity from its relationship with the fund; (iv) the extent to which economies of scale would be realized as the fund grows; and (v) whether fee levels reflect these economies of scale, if any, for the benefit of fund shareholders.
In considering whether to renew the Advisory Contracts for the fund, the Board ultimately reached a determination, with the assistance of fund counsel and Independent Trustees' counsel and through the exercise of its business judgment, that the renewal of the Advisory Contracts and the compensation to be received by Fidelity under the management contract is consistent with Fidelity's fiduciary duty under applicable law. The Board's decision to renew the Advisory Contracts was not based on any single factor noted above, but rather was based on a comprehensive consideration of all the information provided to the Board at its meetings throughout the year. The Board, in reaching its determination to renew the Advisory Contracts, is aware that shareholders in the fund have a broad range of investment choices available to them, including a wide choice among mutual funds offered by competitors to Fidelity, and that the fund's shareholders, with the opportunity to review and weigh the disclosure provided by the fund in its prospectus and other public disclosures, have chosen to invest in this fund, managed by Fidelity.
The Board noted that the growth of fund assets over time across the complex allows Fidelity to reinvest in the development of services designed to enhance the value or convenience of the Fidelity funds as investment vehicles. These services include 24-hour access to account information and market information through phone representatives and over the Internet, and investor education materials and asset allocation tools.
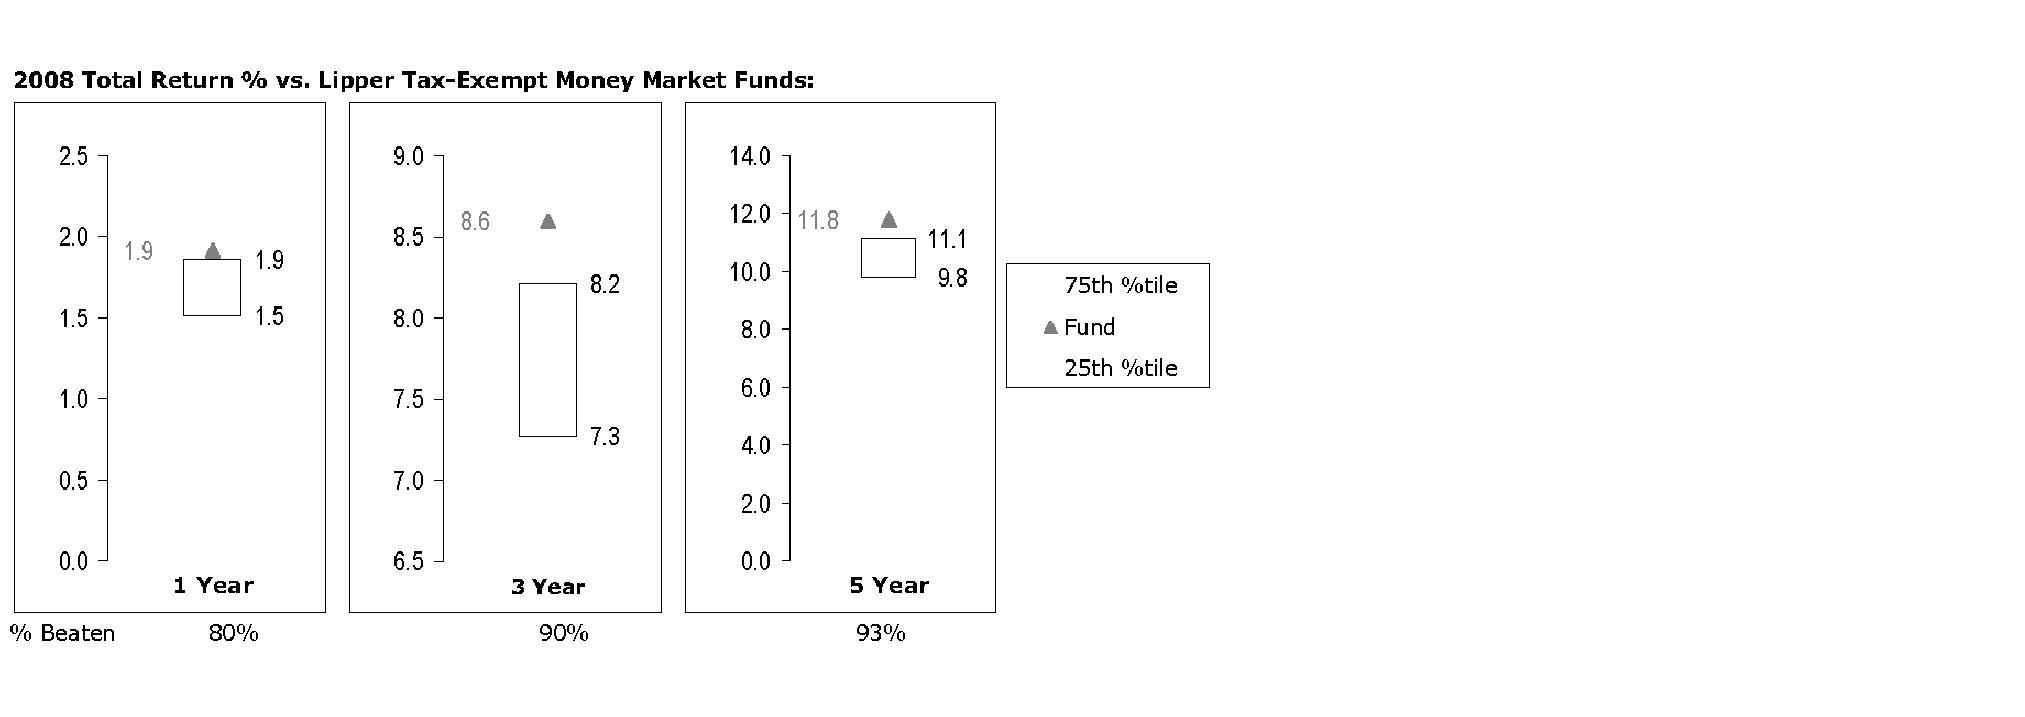
The Board reviewed the fund's relative investment performance against its peer group and stated that the performance of the fund was in the first quartile for all the periods shown. The Board also reviewed the fund's performance during 2009.
Based on its review, and giving particular weight to the nature and quality of the resources dedicated by the Investment Advisers to maintain and improve relative performance and factoring in the unprecedented recent market events, the Board concluded that the nature, extent, and quality of the services provided to the fund will benefit the fund's shareholders, particularly in light of the Board's view that the fund's shareholders benefit from investing in a fund that is part of a large family of funds offering a variety of investment disciplines and services.
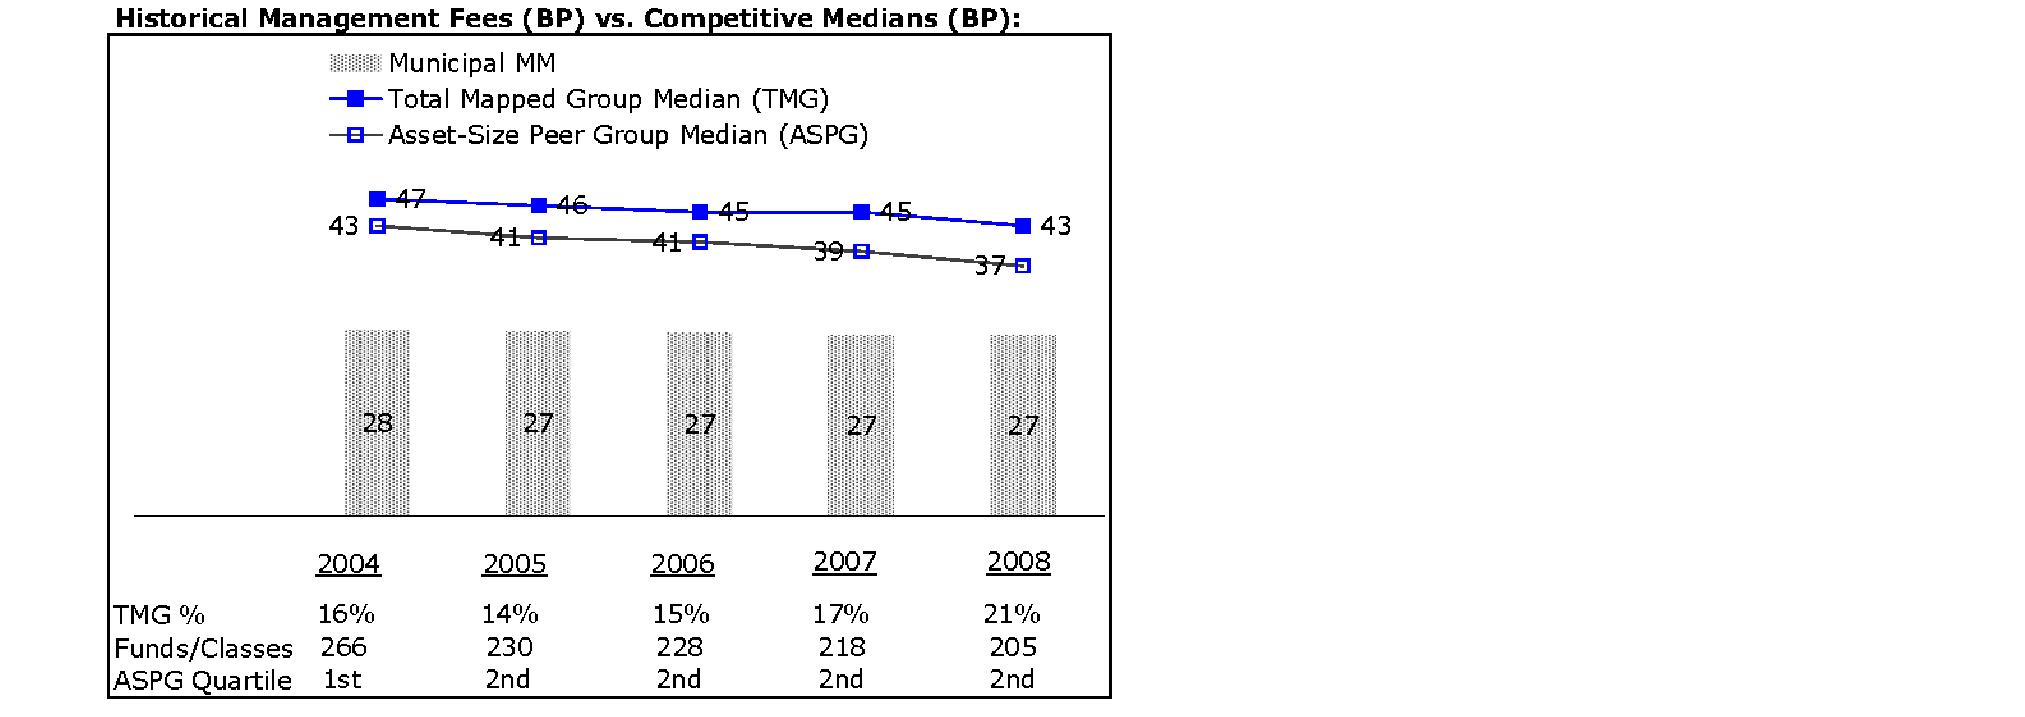
The Board considered two proprietary management fee comparisons for the 12-month periods shown in the chart below. The group of Lipper funds used by the Board for management fee comparisons is referred to below as the "Total Mapped Group" and, for the reasons explained above, is broader than the Lipper peer group used by the Board for performance comparisons. The Total Mapped Group comparison focuses on a fund's standing relative to the total universe of comparable funds available to investors, in terms of gross management fees before expense reimbursements or caps. "TMG %" represents the percentage of funds in the Total Mapped Group that had management fees that were lower than the fund's. For example, a TMG % of 26% means that 74% of the funds in the Total Mapped Group had higher management fees than the fund. The "Asset-Size Peer Group" (ASPG) comparison focuses on a fund's standing relative to non-Fidelity funds similar in size to the fund within the Total Mapped Group. The ASPG represents at least 15% of the funds in the Total Mapped Group with comparable asset size and management fee characteristics, subject to a minimum of 50 funds (or all funds in the Total Mapped Group if fewer than 50). Additional information, such as the ASPG quartile in which the fund's management fee ranked, is also included in the chart and considered by the Board. For a more meaningful comparison of management fees, the fund is compared on the basis of a hypothetical "net management fee," which is derived by subtracting payments made by FMR for non-management expenses (including transfer agent fees, pricing and bookkeeping fees, and custody fees) from the fund's all-inclusive fee. In this regard, the Board realizes that net management fees can vary from year to year because of differences in non-management expenses.
The Board noted that the fund's hypothetical net management fee ranked below the median of its Total Mapped Group and below the median of its ASPG for 2008.
Based on its review, the Board concluded that the fund's management fee was fair and reasonable in light of the services that the fund receives and the other factors considered.
In its review of the fund's total expenses, the Board considered the fund's hypothetical net management fee as well as the fund's all-inclusive fee. The Board also considered other expenses, such as transfer agent fees, pricing and bookkeeping fees, and custodial, legal, and audit fees, paid by FMR under the all-inclusive arrangement. The Board also noted the effects of any waivers and reimbursements on fees and expenses. As part of its review, the Board also considered current and historical total expenses of the fund compared to competitive fund median expenses. The fund is compared to those funds and classes in the Total Mapped Group (used by the Board for management fee comparisons) that have a similar sales load structure.
The Board noted that the fund's total expenses ranked below its competitive median for 2008.
In its review, the Board also considered Fidelity fee structures and other information on clients that FMR and its affiliates service in other competitive markets, such as other mutual funds advised or subadvised by FMR or its affiliates, pension plan clients, and other institutional clients.
Based on its review, the Board concluded that the fund's total expenses were reasonable in light of the services that the fund and its shareholders receive and the other factors considered.
On an annual basis, FMR presents to the Board Fidelity's profitability for the fund. Fidelity calculates the profitability for each fund, as well as aggregate profitability for groups of Fidelity funds and all Fidelity funds, using a series of detailed revenue and cost allocation methodologies which originate with the audited books and records of Fidelity. The Audit Committee of the Board reviews any significant changes from the prior year's methodologies.
PricewaterhouseCoopers LLP (PwC), independent registered public accounting firm and auditor to Fidelity and certain Fidelity funds, has been engaged annually by the Board as part of the Board's assessment of Fidelity's profitability analysis. PwC's engagement includes the review and assessment of Fidelity's methodologies used in determining the revenues and expenses attributable to Fidelity's mutual fund business, and completion of agreed-upon procedures surrounding the mathematical accuracy of fund profitability and its conformity to allocation methodologies. After considering PwC's reports issued under the engagement and information provided by Fidelity, the Board believes that while other allocation methods may also be reasonable, Fidelity's profitability methodologies are reasonable in all material respects.
The Board has also reviewed Fidelity's non-fund businesses and any fall-out benefits related to the mutual fund business as well as cases where Fidelity's affiliates may benefit from or be related to the fund's business.
The Board considered the costs of the services provided by and the profits realized by Fidelity in connection with the operation of the fund and determined that the amount of profit is a fair entrepreneurial profit for the management of the fund.
In February 2009, the Board created an Ad Hoc Committee (the "Committee") to analyze economies of scale. The Committee was formed to consider whether FMR attains economies of scale in respect of the management and servicing of the Fidelity funds, whether the Fidelity funds have appropriately benefited from such economies of scale, and whether there is potential for realization of any further economies of scale.
The Board concluded, considering the findings of the Committee, that any potential economies of scale are being shared between fund shareholders and Fidelity in an appropriate manner.
Based on its evaluation of all of the conclusions noted above, and after considering all material factors, the Board ultimately concluded that the advisory fee structures are fair and reasonable, and that the fund's Advisory Contracts should be renewed.
Fidelity offers several ways to conveniently manage your personal investments via your telephone or PC. You can access your account information, conduct trades and research your investments 24 hours a day.
Fidelity Automated Service Telephone provides a single toll-free number to access account balances, positions, quotes and trading. It's easy to navigate the service, and on your first call, the system will help you create a personal identification number (PIN) for security.
Fidelity's web site on the Internet provides a wide range of information, including daily financial news, fund performance, interactive planning tools and news about Fidelity products and services.
Citibank, N.A.
New York, NY
Fidelity Investments Institutional Operations Company, Inc.
Fidelity Service Company, Inc.
Citibank, N.A.
The turnaround in global capital markets that marked most of 2009 slowed in early 2010, as investors considered the risks to a sustained recovery, including increased political uncertainty, high unemployment, weak consumer spending and potential inflation on the horizon. Financial markets are always unpredictable, of course, but there also are several time-tested investment principles that can help put the odds in your favor.
One of the basic tenets is to invest for the long term. Over time, riding out the markets' inevitable ups and downs has proven much more effective than selling into panic or chasing the hottest trend. Even missing only a few of the markets' best days can significantly diminish investor returns. Patience also affords the benefits of compounding - of earning interest on additional income or reinvested dividends and capital gains. There can be tax advantages and cost benefits to consider as well. While staying the course doesn't eliminate risk, it can considerably lessen the effect of short-term declines.
You can further manage your investing risk through diversification. And today, more than ever, geographic diversification should be taken into account. Studies indicate that asset allocation is the single most important determinant of a portfolio's long-term success. The right mix of stocks, bonds and cash - aligned to your particular risk tolerance and investment objective - is very important. Age-appropriate rebalancing is also an essential aspect of asset allocation. For younger investors, an emphasis on equities - which historically have been the best-performing asset class over time - is encouraged. As investors near their specific goal, such as retirement or sending a child to college, consideration may be given to replacing volatile assets (e.g. common stocks) with more-stable fixed investments (bonds or savings plans).
A third principle - investing regularly - can help lower the average cost of your purchases. Investing a certain amount of money each month or quarter helps ensure you won't pay for all your shares at market highs. This strategy - known as dollar cost averaging - also reduces "emotion" from investing, helping shareholders avoid selling weak performers just prior to an upswing, or chasing a hot performer just before a correction.
We invite you to contact us via the Internet, through our Investor Centers or by phone. It is our privilege to provide you the information you need to make the investments that are right for you.
Abigail P. Johnson
As a shareholder of a Fund, you incur two types of costs: (1) transaction costs, including redemption fees, and (2) ongoing costs, including management fees and other Fund expenses. This Example is intended to help you understand your ongoing costs (in dollars) of investing in the Funds and to compare these costs with the ongoing costs of investing in other mutual funds.
The Example is based on an investment of $1,000 invested at the beginning of the period and held for the entire period (September 1, 2009 to February 28, 2010).
The first line of the accompanying table for each fund provides information about actual account values and actual expenses. You may use the information in this line, together with the amount you invested, to estimate the expenses that you paid over the period. Simply divide your account value by $1,000.00 (for example, an $8,600 account value divided by $1,000.00 = 8.6), then multiply the result by the number in the first line for a fund under the heading entitled "Expenses Paid During Period" to estimate the expenses you paid on your account during this period. A small balance maintenance fee of $12.00 that is charged once a year may apply for certain accounts with a value of less than $2,000. This fee is not included in the table below. If it was, the estimate of expenses you paid during the period would be higher, and your ending account value lower, by this amount. In addition, each Fund, as a shareholder in the underlying Fidelity Central Funds, will indirectly bear its pro-rata share of the fees and expenses incurred by the underlying Fidelity Central Funds. These fees and expenses are not included in the Fund's annualized expense ratio used to calculate the expense estimate in the table below.
The second line of the accompanying table for each fund provides information about hypothetical account values and hypothetical expenses based on a fund's actual expense ratio and an assumed rate of return of 5% per year before expenses, which is not the Fund's actual return. The hypothetical account values and expenses may not be used to estimate the actual ending account balance or expenses you paid for the period. You may use this information to compare the ongoing costs of investing in the Fund and other funds. To do so, compare this 5% hypothetical example with the 5% hypothetical examples that appear in the shareholder reports of the other funds. A small balance maintenance fee of $12.00 that is charged once a year may apply for certain accounts with a value of less than $2,000. This fee is not included in the table below. If it was, the estimate of expenses you paid during the period would be higher, and your ending account value lower, by this amount. In addition, each Fund, as a shareholder in the underlying Fidelity Central Funds, will indirectly bear its pro-rata share of the fees and expenses incurred by the underlying Fidelity Central Funds. These fees and expenses are not included in the Fund's annualized expense ratio used to calculate the expense estimate in the table below.
Please note that the expenses shown in the table are meant to highlight your ongoing costs only and do not reflect any transaction costs. Therefore, the second line of the table is useful in comparing ongoing costs only, and will not help you determine the relative total costs of owning different funds. In addition, if these transactional costs were included, your costs would have been higher.
Fidelity Arizona Municipal Income Fund (the Income Fund) is a fund of Fidelity Union Street Trust. Fidelity Arizona Municipal Money Market Fund (the Money Market Fund) is a fund of Fidelity Union Street Trust II. Each trust is registered under the Investment Company Act of 1940, as amended (the 1940 Act), as an open-end management investment company. Fidelity Union Street Trust and Fidelity Union Street Trust II (the trusts) are organized as a Massachusetts business trust and a Delaware statutory trust, respectively. The Income Fund is a non-diversified fund. Each Fund is authorized to issue an unlimited number of shares. Each Fund may be affected by economic and political developments in the state of Arizona.
The Funds may invest in Fidelity Central Funds, which are open-end investment companies available only to other investment companies and accounts managed by Fidelity Management & Research Company (FMR) and its affiliates. The Funds' Schedules of Investments list each of the Fidelity Central Funds held as of period end, if any, as an investment of each Fund, but does not include the underlying holdings of each Fidelity Central Fund. As an Investing Fund, the Funds indirectly bear their proportionate share of the expenses of the underlying Fidelity Central Funds.
The Money Market Central Funds seek preservation of capital and current income and are managed by Fidelity Investments Money Management, Inc. (FIMM), an affiliate of FMR.
A complete unaudited list of holdings for each Fidelity Central Fund is available upon request or at the Securities and Exchange Commission (the SEC) web site at www.sec.gov. In addition, the financial statements of the Fidelity Central Funds are available on the SEC web site or upon request.
The financial statements have been prepared in conformity with accounting principles generally accepted in the United States of America, which require management to make certain estimates and assumptions at the date of the financial statements. Actual results could differ from those estimates. The following summarizes the significant accounting policies of the Funds:
interest rates and credit quality. The frequency with which these procedures are used cannot be predicted and may be utilized to a significant extent. The value used for net asset value (NAV) calculation under these procedures may differ from published prices for the same securities.
Each Fund categorizes the inputs to valuation techniques used to value their investments into a disclosure hierarchy consisting of three levels as shown below.
Level 2 - other significant observable inputs (including quoted prices for similar investments, interest rates, prepayment speeds, etc.)
Level 3 - unobservable inputs (including the fund's own assumptions based on the best information available)
For the Income Fund, changes in valuation techniques may result in transfers in or out of an assigned level within the disclosure hierarchy. The aggregate value of investments by input level, as of February 28, 2010, for each Fund's investments is included at the end of each Fund's Schedule of Investments. Valuation techniques used to value each Fund's investments by major category are as follows.
For the Income Fund, debt securities, including restricted securities, are valued based on evaluated quotations received from independent pricing services or from dealers who make markets in such securities. For municipal securities, pricing services utilize matrix pricing which considers yield or price of bonds of comparable quality, coupon, maturity and type as well as dealer supplied prices and are generally categorized as Level 2 in the hierarchy. Short-term securities with remaining maturities of sixty days or less for which quotations are not readily available are valued at amortized cost, which approximates value and are categorized as level 2 in the hierarchy.
When independent prices are unavailable or unreliable, debt securities may be valued utilizing pricing matrices which consider similar factors that would be used by independent pricing services. These are generally categorized as Level 2 in the hierarchy but may be Level 3 depending on the circumstances.
As permitted by compliance with certain conditions under Rule 2a-7 of the 1940 Act, securities owned by the Money Market Fund are valued at amortized cost which approximates value and are categorized as Level 2 in the hierarchy.
The Money Market Fund participated in the U.S. Treasury Department's Temporary Guarantee Program for Money Market Funds (the "Program") through September 18, 2009. The Money Market Fund paid the U.S. Treasury Department fees equal to 0.04% based on the number of shares outstanding as of September 19, 2008 to participate in the Program through September 18, 2009. The expense was borne by the Money Market Fund without regard to any expense limitation in effect for the Money Market Fund.
Dividends are declared daily and paid monthly from net investment income. Distributions from realized gains, if any, are recorded on the ex-dividend date. Income and capital gain distributions are determined in accordance with income tax regulations, which may differ from generally accepted accounting principles.
Capital accounts within the financial statements are adjusted for permanent book-tax differences. These adjustments have no impact on net assets or the results of operations. Temporary book-tax differences will reverse in a subsequent period.
Book-tax differences are primarily due to futures transactions, market discount, deferred trustees compensation, capital loss carryforwards and losses deferred due to excise tax regulations.
The Funds purchase municipal securities whose interest, in the opinion of the issuer, is free from federal income tax. There is no assurance that the IRS will agree with this opinion. In the event the IRS determines that the issuer does not comply with relevant tax requirements, interest payments from a security could become federally taxable, possibly retroactively to the date the security was issued.
The federal tax cost of investment securities and unrealized appreciation (depreciation) as of period end were as follows for each Fund:
Purchases and sales of securities, other than short-term securities, for the Income Fund aggregated $14,833,153 and $4,878,815, respectively.
The Income Fund participates with other funds managed by FMR in a $3.5 billion credit facility (the "line of credit") to be utilized for temporary or emergency purposes to fund shareholder redemptions or for other short-term liquidity purposes. The participating funds have agreed to pay commitment fees on their pro-rata portion of the line of credit, which is reflected in Miscellaneous Expense on the Statement of Operations, and is as follows:
During the period, there were no borrowings on this line of credit.
FMR or its affiliates voluntarily agreed to waive certain fees during the period for the Money Market fund. The amount of the waiver is $327,760.
In addition, through arrangements with each applicable Fund's custodian, credits realized as a result of uninvested cash balances were used to reduce each applicable Fund's management fee. During the period, these credits reduced management fee by the following amounts:
The Funds' organizational documents provide former and current trustees and officers with a limited indemnification against liabilities arising in connection with the performance of their duties to the Funds. In the normal course of business, the Funds may also enter into contracts that provide general indemnifications. The Funds' maximum exposure under these arrangements is unknown as this would be dependent on future claims that may be made against the Funds. The risk of material loss from such claims is considered remote.
The supply of municipal money market securities has fluctuated significantly due to market volatility. As a result, the Money Market Fund's cash position may be significant during the period.
Each year, the Board of Trustees, including the Independent Trustees (together, the Board), votes on the renewal of the management contract and sub-advisory agreements (together, the Advisory Contracts) for each fund. The Board, assisted by the advice of fund counsel and Independent Trustees' counsel, requests and considers a broad range of information throughout the year.
The Board meets regularly and considers at each of its meetings factors that are relevant to its annual consideration of the renewal of each fund's Advisory Contracts, including the services and support provided to each fund and its shareholders. The Board has established three standing committees, each composed of Independent Trustees with varying backgrounds, to which the Board has assigned specific subject matter responsibilities in order to enhance effective decision-making by the Board. The Operations Committee meets regularly throughout the year and, among other matters, considers matters specifically related to the annual consideration of the renewal of each fund's Advisory Contracts. The Board, acting directly and through its Committees, requests and receives information concerning the annual consideration of the renewal of each fund's Advisory Contracts. The Board also meets as needed to consider matters specifically related to the Board's annual consideration of the renewal of Advisory Contracts.
At its September 2009 meeting, the Board of Trustees, including the Independent Trustees, unanimously determined to renew each fund's Advisory Contracts. In reaching its determination, the Board considered all factors it believed relevant, including (i) the nature, extent, and quality of the services to be provided to each fund and its shareholders (including the investment performance of each fund); (ii) the competitiveness of each fund's management fee and total expenses; (iii) the total costs of the services to be provided by and the profits to be realized by Fidelity from its relationship with each fund; (iv) the extent to which economies of scale would be realized as each fund grows; and (v) whether fee levels reflect these economies of scale, if any, for the benefit of fund shareholders.
In considering whether to renew the Advisory Contracts for each fund, the Board ultimately reached a determination, with the assistance of fund counsel and Independent Trustees' counsel and through the exercise of its business judgment, that the renewal of the Advisory Contracts and the compensation to be received by Fidelity under the management contracts is consistent with Fidelity's fiduciary duty under applicable law. The Board's decision to renew the Advisory Contracts was not based on any single factor noted above, but rather was based on a comprehensive consideration of all the information provided to the Board at its meetings throughout the year. The Board, in reaching its determination to renew the Advisory Contracts, is aware that shareholders in each fund have a broad range of investment choices available to them, including a wide choice among mutual funds offered by competitors to Fidelity, and that each fund's shareholders, with the opportunity to review and weigh the disclosure provided by the fund in its prospectus and other public disclosures, have chosen to invest in that fund, managed by Fidelity.
The Board noted that the growth of fund assets over time across the complex allows Fidelity to reinvest in the development of services designed to enhance the value or convenience of the Fidelity funds as investment vehicles. These services include 24-hour access to account information and market information through phone representatives and over the Internet, and investor education materials and asset allocation tools.
The Board reviewed the fund's relative investment performance against its peer group and stated that the performance of the fund was in the first quartile for all the periods shown. The Board also stated that the investment performance of the fund was lower than its benchmark for all the periods shown. The Board also reviewed the fund's performance during 2009. The Board discussed with FMR actions that have been taken by FMR to improve the fund's below-benchmark performance.
The Board reviewed the fund's relative investment performance against its peer group and stated that the performance of the fund was in the second quartile for all the periods shown. The Board noted that FMR does not consider that Lipper peer group to be a particularly meaningful comparison for the fund, however, because the peer group combines tax-exempt money market funds from several different states. The Board also reviewed the fund's performance during 2009.
Based on its review, and giving particular weight to the nature and quality of the resources dedicated by the Investment Advisers to maintain and improve relative performance and factoring in the unprecedented recent market events, the Board concluded that the nature, extent, and quality of the services provided to each fund will benefit each fund's shareholders, particularly in light of the Board's view that each fund's shareholders benefit from investing in a fund that is part of a large family of funds offering a variety of investment disciplines and services.
The Board considered two proprietary management fee comparisons for the 12-month periods shown in the charts below. The group of Lipper funds used by the Board for management fee comparisons is referred to below as the "Total Mapped Group" and, for the reasons explained above, is broader than the Lipper peer group used by the Board for performance comparisons. The Total Mapped Group comparison focuses on a fund's standing relative to the total universe of comparable funds available to investors, in terms of gross management fees before expense reimbursements or caps. "TMG %" represents the percentage of funds in the Total Mapped Group that had management fees that were lower than a fund's. For example, a TMG % of 26% would mean that 74% of the funds in the Total Mapped Group had higher management fees than a fund. The "Asset-Size Peer Group" (ASPG) comparison focuses on a fund's standing relative to non-Fidelity funds similar in size to the fund within the Total Mapped Group. The ASPG represents at least 15% of the funds in the Total Mapped Group with comparable asset size and management fee characteristics, subject to a minimum of 50 funds (or all funds in the Total Mapped Group if fewer than 50). Additional information, such as the ASPG quartile in which a fund's management fee ranked, is also included in the charts and considered by the Board. For a more meaningful comparison of management fees, each fund is compared on the basis of a hypothetical "net management fee," which is derived by subtracting payments made by FMR for non-management expenses (including transfer agent fees, pricing and bookkeeping fees, and custody fees) from the fund's all-inclusive fee. In this regard, the Board realizes that net management fees can vary from year to year because of differences in non-management expenses.
The Board noted that each fund's hypothetical net management fee ranked below the median of its Total Mapped Group and below the median of its ASPG for 2008.
Based on its review, the Board concluded that each fund's management fee was fair and reasonable in light of the services that the fund receives and the other factors considered.
In its review of each fund's total expenses, the Board considered the fund's hypothetical net management fee as well as the fund's all-inclusive fee. The Board also considered other expenses, such as transfer agent fees, pricing and bookkeeping fees, and custodial, legal, and audit fees, paid by FMR under the all-inclusive arrangement. The Board also noted the effects of any waivers and reimbursements on fees and expenses. As part of its review, the Board also considered current and historical total expenses of each fund compared to competitive fund median expenses. Each fund is compared to those funds and classes in the Total Mapped Group (used by the Board for management fee comparisons) that have a similar sales load structure.
The Board noted that Arizona Municipal Income Fund's total expenses ranked above its competitive median for 2008.
The Board noted that Arizona Municipal Money Market Fund's total expenses ranked below its competitive median for 2008. The Board considered that Fidelity has been voluntarily waiving part or all of the transfer agent fees and management fees to maintain a minimum yield for Fidelity Arizona Municipal Money Market Fund.
In its review, the Board also considered Fidelity fee structures and other information on clients that FMR and its affiliates service in other competitive markets, such as other mutual funds advised or subadvised by FMR or its affiliates, pension plan clients, and other institutional clients.
Based on its review, the Board concluded that each fund's total expenses were reasonable, although in the case of Arizona Municipal Income Fund above the median of the universe presented for comparison, in light of the services that the fund and its shareholders receive and the other factors considered.
On an annual basis, FMR presents to the Board Fidelity's profitability for each fund. Fidelity calculates the profitability for each fund, as well as aggregate profitability for groups of Fidelity funds and all Fidelity funds, using a series of detailed revenue and cost allocation methodologies which originate with the audited books and records of Fidelity. The Audit Committee of the Board reviews any significant changes from the prior year's methodologies.
PricewaterhouseCoopers LLP (PwC), independent registered public accounting firm and auditor to Fidelity and certain Fidelity funds, has been engaged annually by the Board as part of the Board's assessment of Fidelity's profitability analysis. PwC's engagement includes the review and assessment of Fidelity's methodologies used in determining the revenues and expenses attributable to Fidelity's mutual fund business, and completion of agreed-upon procedures surrounding the mathematical accuracy of fund profitability and its conformity to allocation methodologies. After considering PwC's reports issued under the engagement and information provided by Fidelity, the Board believes that while other allocation methods may also be reasonable, Fidelity's profitability methodologies are reasonable in all material respects.
The Board has also reviewed Fidelity's non-fund businesses and any fall-out benefits related to the mutual fund business as well as cases where Fidelity's affiliates may benefit from or be related to the funds' business.
The Board considered the costs of the services provided by and the profits realized by Fidelity in connection with the operation of each fund and determined that the amount of profit is a fair entrepreneurial profit for the management of each fund.
In February 2009, the Board created an Ad Hoc Committee (the "Committee") to analyze economies of scale. The Committee was formed to consider whether FMR attains economies of scale in respect of the management and servicing of the Fidelity funds, whether the Fidelity funds have appropriately benefited from such economies of scale, and whether there is potential for realization of any further economies of scale.
The Board concluded, considering the findings of the Committee, that any potential economies of scale are being shared between fund shareholders and Fidelity in an appropriate manner.
Based on its evaluation of all of the conclusions noted above, and after considering all material factors, the Board ultimately concluded that the advisory fee structures are fair and reasonable, and that each fund's Advisory Contracts should be renewed.
Citibank, N.A.
Fidelity Investments Institutional Operations Company, Inc.
Fidelity Service Company, Inc.
Citibank, N.A.
The turnaround in global capital markets that marked most of 2009 slowed in early 2010, as investors considered the risks to a sustained recovery, including increased political uncertainty, high unemployment, weak consumer spending and potential inflation on the horizon. Financial markets are always unpredictable, of course, but there also are several time-tested investment principles that can help put the odds in your favor.
One of the basic tenets is to invest for the long term. Over time, riding out the markets' inevitable ups and downs has proven much more effective than selling into panic or chasing the hottest trend. Even missing only a few of the markets' best days can significantly diminish investor returns. Patience also affords the benefits of compounding - of earning interest on additional income or reinvested dividends and capital gains. There can be tax advantages and cost benefits to consider as well. While staying the course doesn't eliminate risk, it can considerably lessen the effect of short-term declines.
You can further manage your investing risk through diversification. And today, more than ever, geographic diversification should be taken into account. Studies indicate that asset allocation is the single most important determinant of a portfolio's long-term success. The right mix of stocks, bonds and cash - aligned to your particular risk tolerance and investment objective - is very important. Age-appropriate rebalancing is also an essential aspect of asset allocation. For younger investors, an emphasis on equities - which historically have been the best-performing asset class over time - is encouraged. As investors near their specific goal, such as retirement or sending a child to college, consideration may be given to replacing volatile assets (e.g. common stocks) with more-stable fixed investments (bonds or savings plans).
A third principle - investing regularly - can help lower the average cost of your purchases. Investing a certain amount of money each month or quarter helps ensure you won't pay for all your shares at market highs. This strategy - known as dollar cost averaging - also reduces "emotion" from investing, helping shareholders avoid selling weak performers just prior to an upswing, or chasing a hot performer just before a correction.
We invite you to contact us via the Internet, through our Investor Centers or by phone. It is our privilege to provide you the information you need to make the investments that are right for you.
Abigail P. Johnson
As a shareholder of the Fund, you incur two types of costs: (1) transaction costs, and (2) ongoing costs, including management fees and other Fund expenses. This Example is intended to help you understand your ongoing costs (in dollars) of investing in the Fund and to compare these costs with the ongoing costs of investing in other mutual funds.
The Example is based on an investment of $1,000 invested at the beginning of the period and held for the entire period (September 1, 2009 to February 28, 2010).
The first line of the accompanying table provides information about actual account values and actual expenses. You may use the information in this line, together with the amount you invested, to estimate the expenses that you paid over the period. Simply divide your account value by $1,000.00 (for example, an $8,600 account value divided by $1,000.00 = 8.6), then multiply the result by the number in the first line under the heading entitled "Expenses Paid During Period" to estimate the expenses you paid on your account during this period. A small balance maintenance fee of $12.00 that is charged once a year may apply for certain accounts with a value of less than $2,000. This fee is not included in the table below. If it was, the estimate of expenses you paid during the period would be higher, and your ending account value lower, by this amount. In addition, the Fund, as a shareholder in the underlying Fidelity Central Funds, will indirectly bear its pro-rata share of the fees and expenses incurred by the underlying Fidelity Central Funds. These fees and expenses are not included in the Fund's annualized expense ratio used to calculate the expense estimate in the table below.
The second line of the accompanying table provides information about hypothetical account values and hypothetical expenses based on the Fund's actual expense ratio and an assumed rate of return of 5% per year before expenses, which is not the Fund's actual return. The hypothetical account values and expenses may not be used to estimate the actual ending account balance or expenses you paid for the period. You may use this information to compare the ongoing costs of investing in the Fund and other funds. To do so, compare this 5% hypothetical example with the 5% hypothetical examples that appear in the shareholder reports of the other funds. A small balance maintenance fee of $12.00 that is charged once a year may apply for certain accounts with a value of less than $2,000. This fee is not included in the table below. If it was, the estimate of expenses you paid during the period would be higher, and your ending account value lower, by this amount. In addition, the Fund, as a shareholder in the underlying Fidelity Central Funds, will indirectly bear its pro-rata share of the fees and expenses incurred by the underlying Fidelity Central Funds. These fees and expenses are not included in the Fund's annualized expense ratio used to calculate the expense estimate in the table below.
Please note that the expenses shown in the table are meant to highlight your ongoing costs only and do not reflect any transaction costs. Therefore, the second line of the table is useful in comparing ongoing costs only, and will not help you determine the relative total costs of owning different funds.
Municipal Securities - 100.2% |
| Principal Amount (000s) | | Value (000s) |
Alabama - 0.3% |
Alabama Hsg. Fin. Auth. Single Family Mtg. Rev. Participating VRDN Series Merlots 01 A38, 0.25% (Liquidity Facility Wachovia Bank NA) (c)(f)(g) | $ 4,710 | | $ 4,710 |
Auburn Indl. Dev. Board Indl. Dev. Rev. (Donaldson Co., Inc. Proj.) Series 1999, 0.32%, LOC Bank of America NA, VRDN (c)(f) | 4,875 | | 4,875 |
Auburn Univ. Gen. Fee Rev. Participating VRDN Series WF 08 55C, 0.18% (Liquidity Facility Wells Fargo & Co.) (a)(c)(g) | 23,595 | | 23,595 |
Birmingham Spl. Care Facilities Auth. Rev. (Methodist Home for the Aging Proj.) Series 2010, 0.19%, LOC Branch Banking & Trust Co., VRDN (c) | 5,725 | | 5,725 |
Courtland Indl. Dev. Board Rev. (Specialty Minerals, Inc. Proj.) 0.35%, LOC Wachovia Bank NA, VRDN (c)(f) | 8,000 | | 8,000 |
Decatur Indl. Dev. Board Exempt Facilities Rev. (Nucor Steel Decatur LLC Proj.) Series 2003 A, 0.26%, VRDN (c)(f) | 25,500 | | 25,500 |
| | 72,405 |
Alaska - 0.3% |
Alaska Indl. Dev. & Export Auth. Rev. (Greater Fairbanks Cmnty. Hosp. Foundation Proj.) Series 2009 A, 0.2%, LOC Union Bank of California, VRDN (c) | 21,100 | | 21,100 |
Alaska Int'l. Arpts. Revs. Series 2009 A, 0.2%, LOC State Street Bank & Trust Co., Boston, VRDN (c)(f) | 13,000 | | 13,000 |
Anchorage Wastewtr. Rev. Participating VRDN Series Solar 07 97, 0.19% (Liquidity Facility U.S. Bank NA, Minnesota) (c)(g) | 24,730 | | 24,730 |
Valdez Marine Term. Rev. (ConocoPhillips Proj.) Series 1994 C, 0.36% (ConocoPhillips Guaranteed), VRDN (c) | 3,000 | | 3,000 |
| | 61,830 |
Arizona - 1.6% |
Arizona Health Facilities Auth. Rev.: | | | |
(Banner Health Sys. Proj.): | | | |
Series 2008 C, 0.17%, LOC Bank of Nova Scotia New York Branch, VRDN (c) | 7,100 | | 7,100 |
Series 2008 E, 0.23%, LOC Landesbank Baden-Wuert, VRDN (c) | 44,100 | | 44,100 |
Series 2008 G, 0.17%, LOC U.S. Bank NA, Minnesota, VRDN (c) | 49,190 | | 49,190 |
(Catholic Healthcare West Proj.) Series 2008 A, 0.17%, LOC JPMorgan Chase Bank, VRDN (c) | 19,500 | | 19,500 |
Arizona Trans. Board Hwy. Rev. Participating VRDN Series PT 4605, 0.2% (Liquidity Facility Deutsche Postbank AG) (c)(g) | 16,460 | | 16,460 |
Glendale Indl. Dev. Auth. (Midwestern Univ. Proj.) Series 2008, 0.2%, LOC Bank of America NA, VRDN (c) | 9,600 | | 9,600 |
Municipal Securities - continued |
| Principal Amount (000s) | | Value (000s) |
Arizona - continued |
Maricopa County Indl. Dev. Auth. Multi-family Hsg. Rev.: | | | |
(Ranchwood Apts. Proj.) Series 2001 A, 0.25%, LOC Fannie Mae, VRDN (c)(f) | $ 9,000 | | $ 9,000 |
(San Angelin Apts. Proj.) Series 2004, 0.23%, LOC Fannie Mae, VRDN (c)(f) | 14,900 | | 14,900 |
(San Clemente Apts. Proj.) 0.23%, LOC Fannie Mae, VRDN (c)(f) | 10,600 | | 10,600 |
(San Fernando Apts. Proj.) Series 2004, 0.24%, LOC Fannie Mae, VRDN (c)(f) | 6,750 | | 6,750 |
(San Lucas Apts. Proj.) Series 2003, 0.24%, LOC Fannie Mae, VRDN (c)(f) | 12,000 | | 12,000 |
(San Martin Apts. Proj.): | | | |
Series A1, 0.24%, LOC Fannie Mae, VRDN (c)(f) | 5,000 | | 5,000 |
Series A2, 0.27%, LOC Fannie Mae, VRDN (c)(f) | 4,300 | | 4,300 |
(San Miguel Apts. Proj.) Series 2003, 0.23%, LOC Fannie Mae, VRDN (c)(f) | 14,900 | | 14,900 |
(Sands Apts. Proj.) Series 2001 A, 0.25%, LOC Fannie Mae, VRDN (c)(f) | 7,000 | | 7,000 |
(Village Square Apts. Proj.) Series 2004, 0.27%, LOC Fannie Mae, VRDN (c)(f) | 2,500 | | 2,500 |
Maricopa County Indl. Dev. Auth. Rev. (Clayton Homes, Inc. Proj.) Series 1998, 0.5%, LOC U.S. Bank NA, Minnesota, VRDN (c)(f) | 4,200 | | 4,200 |
Phoenix Civic Impt. Corp. Series 2009, 0.27% 3/10/10, LOC Bank of America NA, CP | 20,000 | | 20,000 |
Phoenix Indl. Dev. Auth. Multi-family Hsg. Rev. (Paradise Lakes Apt. Proj.) Series 2007 B, 0.19%, LOC Wachovia Bank NA, VRDN (c)(f) | 13,200 | | 13,200 |
Phoenix Indl. Dev. Auth. Rev.: | | | |
(Desert Botanical Garden Proj.) Series 2000, 0.21%, LOC JPMorgan Chase Bank, VRDN (c) | 800 | | 800 |
(Plastican Proj.) Series 1997, 0.5%, LOC Bank of America NA, VRDN (c)(f) | 2,005 | | 2,005 |
Pima County Indl. Dev. Auth. Multi-family Hsg. Rev. (Cimarron Place Apts. Proj.) 0.25%, LOC Fannie Mae, VRDN (c)(f) | 4,500 | | 4,500 |
Salt River Proj. Agricultural Impt. & Pwr. District Elec. Sys. Rev. Participating VRDN: | | | |
Series MS 3078, 0.22% (Liquidity Facility Morgan Stanley) (c)(g) | 5,100 | | 5,100 |
Series Putters 3242, 0.2% (Liquidity Facility JPMorgan Chase Bank) (c)(g) | 4,300 | | 4,300 |
Series Putters 3467, 0.2% (Liquidity Facility JPMorgan Chase Bank) (c)(g) | 4,000 | | 4,000 |
Municipal Securities - continued |
| Principal Amount (000s) | | Value (000s) |
Arizona - continued |
Show Low Indl. Dev. Auth. Solid Waste Disp. Rev. (Snowflake White Mountain Pwr. LLC Proj.) Series 2006, 0.29%, LOC JPMorgan Chase Bank, VRDN (c)(f) | $ 24,750 | | $ 24,750 |
Yuma Indl. Dev. Auth. Hosp. Rev. (Yuma Reg'l. Med. Ctr. Proj.) Series 2008, 0.19%, LOC JPMorgan Chase Bank, VRDN (c) | 48,900 | | 48,900 |
| | 364,655 |
Arkansas - 0.6% |
Arkansas Dev. Auth. Indl. Dev. Rev. (Stratton Seed Co. Proj.) Series 1999, 0.5%, LOC Bank of America NA, VRDN (c)(f) | 1,300 | | 1,300 |
Arkansas Dev. Fin. Auth. Multi-family Hsg. Rev. (Kiehl Partners LP Proj.) Series 2004 A, 0.31%, LOC Fannie Mae, VRDN (c)(f) | 7,600 | | 7,600 |
Arkansas Dev. Fin. Auth. Single Family Mtg. Rev. Participating VRDN Series ROC II R 121, 0.27% (Liquidity Facility Citibank NA) (c)(f)(g) | 1,395 | | 1,395 |
Blytheville Indl. Dev. Rev. (Nucor Corp. Proj.) Series 2002, 0.31%, VRDN (c)(f) | 34,400 | | 34,400 |
Osceola Solid Waste Disp. Rev. (Plum Point Energy Associates, LLC Proj.) 0.21%, LOC Royal Bank of Scotland PLC, VRDN (c)(f) | 95,000 | | 95,000 |
| | 139,695 |
California - 5.5% |
ABAG Fin. Auth. for Nonprofit Corps. Multi-family Hsg. Rev. (Miramar Apts. Proj.) Series 2000 A, 0.17%, LOC Fannie Mae, VRDN (c)(f) | 15,000 | | 15,000 |
Anaheim Pub. Fing. Auth. Rev. Participating VRDN Series ROC II R 861, 0.21% (Liquidity Facility Citibank NA) (c)(g) | 15,825 | | 15,825 |
California Dept. of Wtr. Resources Pwr. Supply Rev. Series 2002 C11, 0.16%, LOC KBC Bank NV, LOC Bank of Nova Scotia New York Branch, VRDN (c) | 47,200 | | 47,200 |
California Gen. Oblig. 0.32% 3/2/10, LOC Dexia Cr. Local de France, LOC Royal Bank of Canada, CP | 40,965 | | 40,965 |
California Hsg. Fin. Agcy. Multifamily Hsg. Rev.: | | | |
Series 2007 C, 0.26% (Liquidity Facility Fannie Mae) (Liquidity Facility Freddie Mac), VRDN (c)(f) | 14,080 | | 14,080 |
Series 2008 B: | | | |
0.18% (Liquidity Facility Fannie Mae) (Liquidity Facility Freddie Mac), VRDN (c)(f) | 6,920 | | 6,920 |
0.18% (Liquidity Facility Fannie Mae) (Liquidity Facility Freddie Mac), VRDN (c)(f) | 23,655 | | 23,655 |
Series 2008 C, 0.18% (Liquidity Facility Fannie Mae) (Liquidity Facility Freddie Mac), VRDN (c)(f) | 15,300 | | 15,300 |
Municipal Securities - continued |
| Principal Amount (000s) | | Value (000s) |
California - continued |
California Hsg. Fin. Agcy. Rev.: | | | |
(Home Mtg. Prog.): | | | |
Series 2000 N, 0.17% (Liquidity Facility Fannie Mae) (Liquidity Facility Freddie Mac), VRDN (c)(f) | $ 23,790 | | $ 23,790 |
Series 2001 J, 0.18% (Liquidity Facility Fannie Mae) (Liquidity Facility Freddie Mac), VRDN (c)(f) | 44,370 | | 44,370 |
Series 2001 U, 0.17% (Liquidity Facility Fannie Mae) (Liquidity Facility Freddie Mac), VRDN (c)(f) | 22,315 | | 22,315 |
Series 2003 F, 0.17% (Liquidity Facility Fannie Mae) (Liquidity Facility Freddie Mac), VRDN (c)(f) | 33,700 | | 33,700 |
Series 2003 M, 0.17% (Liquidity Facility Fannie Mae) (Liquidity Facility Freddie Mac), VRDN (c)(f) | 29,300 | | 29,300 |
Series 2004 E1, 0.19% (Liquidity Facility Fannie Mae) (Liquidity Facility Freddie Mac), VRDN (c)(f) | 22,575 | | 22,575 |
Series 2005 A, 0.18% (Liquidity Facility Fannie Mae) (Liquidity Facility Freddie Mac), VRDN (c)(f) | 11,400 | | 11,400 |
Series 2005 B1, 0.19% (Liquidity Facility Fannie Mae) (Liquidity Facility Freddie Mac), VRDN (c)(f) | 15,075 | | 15,075 |
Series 2005 D, 0.17% (Liquidity Facility Fannie Mae) (Liquidity Facility Freddie Mac), VRDN (c)(f) | 8,775 | | 8,775 |
Series 2005 F, 0.19% (Liquidity Facility Fannie Mae) (Liquidity Facility Freddie Mac), VRDN (c)(f) | 2,905 | | 2,905 |
Series 2006 F1, 0.15% (Liquidity Facility Fannie Mae) (Liquidity Facility Freddie Mac), VRDN (c)(f) | 17,250 | | 17,250 |
Series 2007 K, 0.15% (Liquidity Facility Fannie Mae) (Liquidity Facility Freddie Mac), VRDN (c)(f) | 25,000 | | 25,000 |
Series 2008 D, 0.15% (Liquidity Facility Fannie Mae) (Liquidity Facility Freddie Mac), VRDN (c)(f) | 23,885 | | 23,885 |
Series 2008 E, 0.15% (Liquidity Facility Fannie Mae) (Liquidity Facility Freddie Mac), VRDN (c)(f) | 37,815 | | 37,815 |
Series 2008 F, 0.15% (Liquidity Facility Fannie Mae) (Liquidity Facility Freddie Mac), VRDN (c)(f) | 2,400 | | 2,400 |
(Multifamily Hsg. Prog.): | | | |
Series 2000 A, 0.26% (Liquidity Facility Fannie Mae) (Liquidity Facility Freddie Mac), VRDN (c)(f) | 17,760 | | 17,760 |
Series 2000 C, 0.26% (Liquidity Facility Fannie Mae) (Liquidity Facility Freddie Mac), VRDN (c)(f) | 15,000 | | 15,000 |
Series 2002 C: | | | |
0.26% (Liquidity Facility Fannie Mae) (Liquidity Facility Freddie Mac), VRDN (c)(f) | 13,600 | | 13,600 |
0.26% (Liquidity Facility Fannie Mae) (Liquidity Facility Freddie Mac), VRDN (c)(f) | 16,030 | | 16,030 |
Municipal Securities - continued |
| Principal Amount (000s) | | Value (000s) |
California - continued |
California Hsg. Fin. Agcy. Rev.: - continued | | | |
(Multifamily Hsg. Prog.): | | | |
Series 2002 E, 0.18% (Liquidity Facility Fannie Mae) (Liquidity Facility Freddie Mac), VRDN (c)(f) | $ 19,800 | | $ 19,800 |
Series 2005 D, 0.26% (Liquidity Facility Fannie Mae) (Liquidity Facility Freddie Mac), VRDN (c)(f) | 31,060 | | 31,060 |
Series 2003 D, 0.15% (Liquidity Facility Fannie Mae) (Liquidity Facility Freddie Mac), VRDN (c)(f) | 46,710 | | 46,710 |
Series 2003 K, 0.19% (Liquidity Facility Fannie Mae) (Liquidity Facility Freddie Mac), VRDN (c)(f) | 6,100 | | 6,100 |
California Infrastructure & Econ. Dev. Bank Rev. (Nelson Name Plate Co. Proj.) Series 1999, 0.5%, LOC Bank of America NA, VRDN (c)(f) | 835 | | 835 |
California Statewide Cmntys. Dev. Auth. Rev. (Los Angeles County Museum of Art Proj.) Series 2008 B, 0.18%, LOC Wells Fargo Bank NA, VRDN (c) | 21,800 | | 21,800 |
Dublin San Ramon Svcs. District and East Bay Muni. Util. District Series 2004 A, 0.2% 3/10/10, LOC JPMorgan Chase Bank, CP | 21,000 | | 21,000 |
East Bay Muni. Util. District Wtr. Sys. Rev. Series 2008 B3, 0.21% (Liquidity Facility Landesbank Baden-Wuert), VRDN (c) | 17,500 | | 17,500 |
Los Angeles County Gen. Oblig. TRAN 2.5% 6/30/10 | 292,900 | | 294,539 |
Los Angeles Gen. Oblig. TRAN Series 2009, 2.5% 4/28/10 | 129,100 | | 129,519 |
Los Angeles Unified School District TRAN Series A, 2% 8/12/10 | 59,000 | | 59,363 |
Los Angeles Wastewtr. Sys. Rev. Participating VRDN Series EGL 7 05 3003, 0.21% (Liquidity Facility Citibank NA) (c)(g) | 40,000 | | 40,000 |
Santa Cruz Redev. Agcy. Multi-family Rev. (1010 Pacific Ave. Apts. Proj.) Series B, 0.17%, LOC Fannie Mae, VRDN (c)(f) | 21,650 | | 21,650 |
Southern California Home Fing. Auth. Single Family Rev. Series 2004 B, 0.19% (Liquidity Facility Fannie Mae) (Liquidity Facility Freddie Mac), VRDN (c)(f) | 29,000 | | 29,000 |
| | 1,300,766 |
Colorado - 2.6% |
Adams County Hsg. Auth. (Semper Village Apts. Proj.) Series 2004 A, 0.24%, LOC Fannie Mae, VRDN (c)(f) | 14,000 | | 14,000 |
Aurora Hsg. Auth. Multi-Family Hsg. Rev. (Liberty Creek Proj.) 0.29%, LOC Fannie Mae, VRDN (c)(f) | 28,000 | | 28,000 |
Aurora Multi-family Hsg. Rev. (Aurora Meadows Apts. Proj.) Series 1996, 0.29%, LOC Fannie Mae, VRDN (c)(f) | 13,400 | | 13,400 |
CollegeInvest Rev. Series 2008 IA, 0.22%, LOC Lloyds TSB Bank PLC, VRDN (c)(f) | 34,800 | | 34,800 |
Municipal Securities - continued |
| Principal Amount (000s) | | Value (000s) |
Colorado - continued |
Colorado Edl. & Cultural Facilities Auth. Rev. (Clyfford Still Museum Proj.) Series 2008, 0.18%, LOC Wells Fargo Bank NA, VRDN (c) | $ 4,000 | | $ 4,000 |
Colorado Health Facilities Auth. Rev.: | | | |
Participating VRDN Series BA 08 1090, 0.21% (Liquidity Facility Bank of America NA) (c)(g) | 14,900 | | 14,900 |
(Boulder Cmnty. Hosp. Proj.) Series 2000, 0.25%, LOC JPMorgan Chase Bank, VRDN (c) | 14,145 | | 14,145 |
(Catholic Health Initiatives Proj.) Series 2004 B, 0.18% (Liquidity Facility Landesbank Hessen-Thuringen), VRDN (c) | 4,275 | | 4,275 |
(NCMC, Inc. Proj.) Series 2008 A, 0.18%, LOC Compass Bank, VRDN (c) | 32,350 | | 32,350 |
Colorado Hsg. & Fin. Auth. Series 2002 C3, 0.26% (Liquidity Facility Fannie Mae) (Liquidity Facility Freddie Mac), VRDN (c)(f) | 4,000 | | 4,000 |
Colorado Hsg. & Fin. Auth. Solid Waste Rev.: | | | |
(Waste Mgmt., Inc. Proj.) 0.3%, LOC Wachovia Bank NA, VRDN (c)(f) | 7,000 | | 7,000 |
(Waste Mgmt., Inc. Proj.) 0.2%, LOC JPMorgan Chase Bank, VRDN (c)(f) | 14,160 | | 14,160 |
Colorado Hsg. Fin. Auth. Single Family Mtg. Rev.: | | | |
Series 2003 B3, 0.21% (Liquidity Facility Fed. Home Ln. Bank Topeka), VRDN (c)(f) | 30,000 | | 30,000 |
Series 2008 A3, 0.19% (Liquidity Facility Fannie Mae) (Liquidity Facility Freddie Mac), VRDN (c)(f) | 6,500 | | 6,500 |
Colorado Reg'l. Trans. District Sales Tax Rev. Participating VRDN: | | | |
Series EGL 07 0036, 0.21% (Liquidity Facility Citibank NA) (c)(g) | 29,700 | | 29,700 |
Series EGL 07 0037, 0.21% (Liquidity Facility Citibank NA) (c)(g) | 16,830 | | 16,830 |
Series EGL 07 0038, 0.21% (Liquidity Facility Citibank NA) (c)(g) | 18,080 | | 18,080 |
Series EGL 07 0040, 0.21% (Liquidity Facility Citibank NA) (c)(g) | 30,610 | | 30,610 |
Colorado Springs Utils. Rev.: | | | |
Series 2000 A, 0.19%, VRDN (c) | 26,500 | | 26,500 |
Series 2009 C, 0.17% (Liquidity Facility Bank of Nova Scotia New York Branch), VRDN (c) | 11,000 | | 11,000 |
Denver City & County Arpt. Rev.: | | | |
Series 2008 C1, 0.3%, LOC KBC Bank NV, VRDN (c)(f) | 38,800 | | 38,800 |
Series 2008 C2, 0.24%, LOC Landesbank Baden-Wuert, VRDN (c)(f) | 40,000 | | 40,000 |
Municipal Securities - continued |
| Principal Amount (000s) | | Value (000s) |
Colorado - continued |
Denver City & County Arpt. Rev.: - continued | | | |
Series 2008 C3, 0.24%, LOC Landesbank Baden-Wuert, VRDN (c)(f) | $ 30,000 | | $ 30,000 |
Series 2009 C, 0.19%, LOC JPMorgan Chase Bank, VRDN (c) | 20,000 | | 20,000 |
Denver City & County Ctfs. of Prtn. Series A, 0.3% 6/9/10, LOC Wachovia Bank NA, CP | 18,000 | | 18,000 |
Denver City & County Indl. Dev. Rev. (Brass Smith/Kevry Proj.) Series 2009, 0.35%, LOC Wells Fargo Bank NA, VRDN (c)(f) | 5,340 | | 5,340 |
Denver Urban Renewal Auth. Tax Increment Rev. Series 2008 A2, 0.2%, LOC U.S. Bank NA, Minnesota, VRDN (c) | 14,700 | | 14,700 |
Fort Collins Indl. Dev. Rev. (Phelps-Tointon Millwork Proj.) Series 1993, 1.75%, LOC JPMorgan Chase Bank, VRDN (c)(f) | 410 | | 410 |
Lakewood Hsg. Auth. Multi-family Rev.: | | | |
(Ridgemoor Apts. Proj.) Series 2003 A, 0.23%, LOC Fannie Mae, VRDN (c)(f) | 13,325 | | 13,325 |
(Timberleaf Apts. Proj.) 0.24%, LOC Fannie Mae, VRDN (c)(f) | 11,165 | | 11,165 |
Lowry Econ. Redev. Auth. Rev. Series 2008 A, 0.64%, LOC Compass Bank, VRDN (c) | 17,415 | | 17,415 |
Univ. of Colorado Hosp. Auth. Rev. Series 2008 B, 0.18%, LOC Wachovia Bank NA, VRDN (c) | 39,700 | | 39,700 |
Westminster County Multi-family Hsg. Rev. (Lakeview Apts. Proj.) Series 1997, 0.29%, LOC Fannie Mae, VRDN (c)(f) | 7,110 | | 7,110 |
| | 610,215 |
Connecticut - 0.8% |
Connecticut Gen. Oblig.: | | | |
BAN Series 2009 A, 2% 4/28/10 | 57,040 | | 57,178 |
Series 2004 A, 0.21% (Liquidity Facility Landesbank Hessen-Thuringen), VRDN (c) | 15,250 | | 15,250 |
Connecticut Health & Edl. Facilities Auth. Rev.: | | | |
(Greenwich Hosp. Proj.) Series C, 0.18%, LOC Bank of America NA, VRDN (c) | 19,005 | | 19,005 |
(Health Care Cap. Asset Prog.) Series A1, 0.18%, LOC Bank of America NA, VRDN (c) | 14,880 | | 14,880 |
(St. Francis Hosp. & Med. Ctr. Proj.) Series F, 0.2%, LOC JPMorgan Chase Bank, VRDN (c) | 12,110 | | 12,110 |
(Wesleyan Univ. Proj.) Series D, 0.21% (Liquidity Facility Bank of America NA), VRDN (c) | 25,850 | | 25,850 |
(Yale-New Haven Hosp. Proj.) Series L1, 0.18%, LOC Bank of America NA, VRDN (c) | 10,300 | | 10,300 |
Municipal Securities - continued |
| Principal Amount (000s) | | Value (000s) |
Connecticut - continued |
Connecticut Hsg. Fin. Auth. (Hsg. Mtg. Fin. Prog.): | | | |
Series 1989 D, 0.26% (Liquidity Facility Fed. Home Ln. Bank of Boston), VRDN (c)(f) | $ 6,395 | | $ 6,395 |
Series 2005 D5, 0.26% (Liquidity Facility Fed. Home Ln. Bank of Boston), VRDN (c)(f) | 5,065 | | 5,065 |
Stamford Hsg. Auth. Multi-family Rev. (Fairfield Apts. Proj.) Series 1998, 0.23%, LOC Bank of America NA, VRDN (c)(f) | 11,900 | | 11,900 |
| | 177,933 |
Delaware - 0.5% |
Delaware Econ. Dev. Auth. Rev. (Delmarva Pwr. & Lt. Co. Proj.): | | | |
Series 1987, 0.4%, VRDN (c)(f) | 8,000 | | 8,000 |
Series 1988, 0.4%, VRDN (c)(f) | 13,550 | | 13,550 |
Series 1993 C, 0.35%, VRDN (c) | 4,500 | | 4,500 |
Series 1994, 0.4%, VRDN (c)(f) | 24,700 | | 24,700 |
Series 1999 A, 0.35%, VRDN (c) | 9,830 | | 9,830 |
Series 1999 B, 0.4%, VRDN (c)(f) | 9,900 | | 9,900 |
Delaware Hsg. Auth. Rev. Participating VRDN: | | | |
Series BC 2010 11W, 0.2% (Liquidity Facility Barclays Bank PLC) (c)(f)(g) | 3,860 | | 3,860 |
Series Merlots 07 C103, 0.25% (Liquidity Facility Wachovia Bank NA) (c)(f)(g) | 5,430 | | 5,430 |
Series Merlots 07 C66, 0.25% (Liquidity Facility Wachovia Bank NA) (c)(f)(g) | 7,795 | | 7,795 |
Series Putter 1513, 0.35% (Liquidity Facility JPMorgan Chase & Co.) (c)(f)(g) | 4,815 | | 4,815 |
Series ROC II R 11651, 0.27% (Liquidity Facility Citibank NA) (c)(f)(g) | 7,660 | | 7,660 |
Wilmington Adjustable Rate Demand Rev. (Delaware Art Museum, Inc. Proj.) 0.21%, LOC Wachovia Bank NA, VRDN (c) | 14,800 | | 14,800 |
| | 114,840 |
District Of Columbia - 1.5% |
District of Columbia Gen. Oblig. Series 2001 D, 0.17%, LOC Bank of America NA, VRDN (c) | 50,795 | | 50,795 |
District of Columbia Hsg. Fin. Agcy. Multi-family Hsg. Rev. (Trenton Park Apts. Proj.) Series 2001, 0.3%, LOC Bank of America NA, VRDN (c)(f) | 3,005 | | 3,005 |
District of Columbia Income Tax Rev. Participating VRDN Series MS 3057, 0.22% (Liquidity Facility Morgan Stanley) (c)(g) | 7,990 | | 7,990 |
Municipal Securities - continued |
| Principal Amount (000s) | | Value (000s) |
District Of Columbia - continued |
District of Columbia Rev.: | | | |
Bonds (Nat'l. Academy of Sciences Proj.) 0.24% tender 3/5/10, LOC Bank of America NA, CP mode | $ 10,000 | | $ 10,000 |
(Fort Lincoln New Town/Premium Distributors LLC Proj.) Series 2000, 0.35%, LOC Wachovia Bank NA, VRDN (c)(f) | 7,520 | | 7,520 |
(George Washington Univ. Proj.): | | | |
Series 1999 B, 0.16%, LOC Bank of America NA, VRDN (c) | 1,600 | | 1,600 |
Series 1999 C, 0.16%, LOC Bank of America NA, VRDN (c) | 12,000 | | 12,000 |
(Medlantic/Helix Proj.): | | | |
Series 1998 A Tranche II, 0.18%, LOC Bank of America NA, VRDN (c) | 30,450 | | 30,450 |
Series 1998 A Tranche III, 0.18%, LOC Bank of America NA, VRDN (c) | 16,000 | | 16,000 |
(The AARP Foundation Proj.) Series 2004, 0.2%, LOC Bank of America NA, VRDN (c) | 8,600 | | 8,600 |
District of Columbia Univ. Rev. (American Univ. Proj.): | | | |
Series 2003, 0.2%, LOC Bank of America NA, VRDN (c) | 10,800 | | 10,800 |
Series 2006 A, 0.2%, LOC Bank of America NA, VRDN (c) | 33,000 | | 33,000 |
Metropolitan Washington DC Arpts. Auth. Sys. Rev.: | | | |
Participating VRDN: | | | |
ROC II R 11815, 0.26% (Liquidity Facility Citibank NA) (c)(f)(g) | 6,000 | | 6,000 |
Series BBT 2040, 0.2% (Liquidity Facility Branch Banking & Trust Co.) (c)(f)(g) | 4,920 | | 4,920 |
Series BBT 2054, 0.2% (Liquidity Facility Branch Banking & Trust Co.) (c)(f)(g) | 5,000 | | 5,000 |
Series DB 505, 0.26% (Liquidity Facility Deutsche Bank AG) (c)(f)(g) | 7,570 | | 7,570 |
Series DB 677, 0.26% (Liquidity Facility Deutsche Bank AG) (c)(f)(g) | 7,802 | | 7,802 |
Series DB 679, 0.26% (Liquidity Facility Deutsche Bank AG) (c)(f)(g) | 10,000 | | 10,000 |
Series MS 3140, 0.23% (Liquidity Facility Morgan Stanley) (c)(f)(g) | 21,985 | | 21,985 |
Series Putters 1691, 0.3% (Liquidity Facility JPMorgan Chase Bank) (c)(f)(g) | 10,985 | | 10,985 |
Series Putters 2855, 0.35% (Liquidity Facility JPMorgan Chase Bank) (c)(f)(g) | 4,895 | | 4,895 |
Series ROC II R 11798, 0.26% (Liquidity Facility Citibank NA) (c)(f)(g) | 15,000 | | 15,000 |
Municipal Securities - continued |
| Principal Amount (000s) | | Value (000s) |
District Of Columbia - continued |
Metropolitan Washington DC Arpts. Auth. Sys. Rev.: - continued | | | |
Participating VRDN: | | | |
Series ROC II R 54, 0.26% (Liquidity Facility Citibank NA) (c)(f)(g) | $ 2,495 | | $ 2,495 |
Series 2003 D1, 0.25%, LOC Wachovia Bank NA, VRDN (c)(f) | 38,855 | | 38,855 |
Series 2003 D2, 0.25%, LOC Wachovia Bank NA, VRDN (c)(f) | 20,100 | | 20,100 |
Series 2009 D1, 0.18%, LOC Bank of America NA, VRDN (c) | 9,075 | | 9,075 |
| | 356,442 |
Florida - 6.5% |
Brevard County Hsg. Fin. Auth. (Manatee Cove Apts. Proj.) 0.27%, LOC Citibank NA, VRDN (c)(f) | 11,095 | | 11,095 |
Brevard County School Board RAN 1.5% 4/23/10 | 20,000 | | 20,028 |
Brevard County School District TAN Series 2009, 2% 6/30/10 | 30,000 | | 30,154 |
Broward County Fin. Auth. Multi-family Hsg. Rev.: | | | |
(Pinnacle Village Apts. Proj.) 0.25%, LOC Citibank NA, VRDN (c)(f) | 6,800 | | 6,800 |
(Sanctuary Apts Proj.) Series A, 0.22%, LOC Fannie Mae, VRDN (c)(f) | 16,030 | | 16,030 |
Broward County Port Facilities Rev. (Port Everglades Proj.) Series 2008, 0.18%, LOC Bank of Nova Scotia New York Branch, VRDN (c)(f) | 29,985 | | 29,985 |
Cape Coral Gen. Oblig. 0.22% 4/5/10, LOC Bank of America NA, CP | 15,569 | | 15,569 |
Charlotte County Hsg. Fin. Multi-family Rev. (Murdock Circle Apt. Proj.) Series 2000, 0.25%, LOC Bank of America NA, VRDN (c)(f) | 6,330 | | 6,330 |
Clay County Hsg. Fin. Auth. Multi-family Hsg. Rev. (Nassau Club Apts. Proj.) 0.24%, LOC Fannie Mae, VRDN (c)(f) | 9,905 | | 9,905 |
Coconut Creek Indl. Dev. Rev. (Elite Aluminum Corp. Proj.) Series 2002, 0.5%, LOC Bank of America NA, VRDN (c)(f) | 1,540 | | 1,540 |
Collier County Hsg. Fin. Auth. Multi-family Rev.: | | | |
(Sawgrass Pines Apts. Proj.) 0.22%, LOC Fannie Mae, VRDN (c)(f) | 6,800 | | 6,800 |
(Summer Lakes Phase II Apts. Proj.) 0.27%, LOC Citibank NA, VRDN (c)(f) | 19,045 | | 19,045 |
Dade County Multi-family Hsg. Rev. (Biscayne View Apts. Proj.) Series 1993, 0.3% (Monumental Life Ins. Co. Guaranteed), VRDN (c)(f) | 28,475 | | 28,475 |
Municipal Securities - continued |
| Principal Amount (000s) | | Value (000s) |
Florida - continued |
Florida Board of Ed. Pub. Ed. Cap. Outlay: | | | |
Bonds: | | | |
Series 2009 C, 2% 6/1/10 | $ 8,215 | | $ 8,247 |
Series 2009 D, 2.5% 6/1/10 | 7,810 | | 7,851 |
Participating VRDN: | | | |
Series BA 08 1059, 0.18% (Liquidity Facility Bank of America NA) (c)(g) | 4,165 | | 4,165 |
Series BA 08 1068, 0.18% (Liquidity Facility Bank of America NA) (c)(g) | 9,585 | | 9,585 |
Series BA 08 1083, 0.18% (Liquidity Facility Bank of America NA) (c)(g) | 18,920 | | 18,920 |
Florida Dept. of Trans. Tpk. Rev.: | | | |
Bonds Series 2009 A, 2% 7/1/10 | 5,635 | | 5,663 |
Participating VRDN: | | | |
Series Putters 2539, 0.2% (Liquidity Facility JPMorgan Chase Bank) (c)(g) | 3,550 | | 3,550 |
Series Solar 07 30, 0.2% (Liquidity Facility U.S. Bank NA, Minnesota) (c)(g) | 15,000 | | 15,000 |
Florida Hsg. Fin. Agcy. Rev.: | | | |
(Ashley Lake Park II Proj.) Series J, 0.2%, LOC Freddie Mac, VRDN (c)(f) | 24,000 | | 24,000 |
(Bainbridge Club Apt. Proj.) Series M, 0.2%, LOC Fannie Mae, VRDN (c)(f) | 5,770 | | 5,770 |
(Banyan Bay Apts. Proj.) 0.2%, LOC Fannie Mae, VRDN (c)(f) | 9,150 | | 9,150 |
Florida Hsg. Fin. Corp. Participating VRDN Series Clipper 05 40, 0.32% (Liquidity Facility State Street Bank & Trust Co., Boston) (c)(f)(g) | 31,930 | | 31,930 |
Florida Hsg. Fin. Corp. Multi-family Mtg. Rev.: | | | |
(Avalon Reserve Apts. Proj.) Series 2003 R1, 0.22%, LOC Fannie Mae, VRDN (c)(f) | 14,900 | | 14,900 |
(Clascona Groves Apts. Proj.) Series A, 0.23%, LOC Citibank NA, VRDN (c)(f) | 9,100 | | 9,100 |
(Collins Cove Sr. Apts. Proj.) Series 2003 W, 0.23%, LOC Citibank NA, VRDN (c)(f) | 5,600 | | 5,600 |
(Grande Court at North Port Apts. Proj.) Series 2004 E, 0.22%, LOC Fannie Mae, VRDN (c)(f) | 5,900 | | 5,900 |
(Hunters Run Apts. Proj.) Series G, 0.2%, LOC Fannie Mae, VRDN (c)(f) | 7,900 | | 7,900 |
(Lynn Lake Apts. Proj.) Series B1, 0.25%, LOC Freddie Mac, VRDN (c)(f) | 20,210 | | 20,210 |
(Mill Creek Apts. Proj.) 0.22%, LOC Fannie Mae, VRDN (c)(f) | 15,200 | | 15,200 |
Municipal Securities - continued |
| Principal Amount (000s) | | Value (000s) |
Florida - continued |
Florida Hsg. Fin. Corp. Multi-family Mtg. Rev.: - continued | | | |
(Pinnacle Grove Apts. Proj.) Series 2003 A, 0.22%, LOC Fannie Mae, VRDN (c)(f) | $ 7,850 | | $ 7,850 |
(Riverwalk I Apts. Proj.) Series 2008 E, 0.22%, LOC Freddie Mac, VRDN (c)(f) | 5,075 | | 5,075 |
(Savannah Springs Apts. Proj.) Series G, 0.3%, LOC Citibank NA, VRDN (c)(f) | 7,200 | | 7,200 |
(Sterling Palms Apts. Proj.) Series F, 0.22%, LOC Fannie Mae, VRDN (c)(f) | 14,170 | | 14,170 |
Florida Hsg. Fin. Corp. Rev.: | | | |
Participating VRDN: | | | |
Series BA 07 1034, 0.25% (Liquidity Facility Bank of America NA) (c)(f)(g) | 7,220 | | 7,220 |
Series BA 08 1191, 0.25% (Liquidity Facility Bank of America NA) (c)(f)(g) | 8,170 | | 8,170 |
Series Merlots 06 B17, 0.25% (Liquidity Facility Wachovia Bank NA) (c)(f)(g) | 4,435 | | 4,435 |
Series Merlots 07 C64, 0.25% (Liquidity Facility Wachovia Bank NA) (c)(f)(g) | 13,905 | | 13,905 |
Series Putters 1336 B, 0.33% (Liquidity Facility JPMorgan Chase & Co.) (c)(f)(g) | 2,635 | | 2,635 |
Series ROC II R 11688, 0.27% (Liquidity Facility Citibank NA) (c)(f)(g) | 5,290 | | 5,290 |
(Riverside Apts. Proj.) Series 2000 1, 0.27%, LOC Bank of America NA, VRDN (c)(f) | 12,940 | | 12,940 |
(Tuscany Lakes Apts. Proj.) Series 2002 K1, 0.25%, LOC Fannie Mae, VRDN (c)(f) | 4,000 | | 4,000 |
(Valencia Village Apts. Proj.) Series G, 0.24%, LOC Fannie Mae, VRDN (c)(f) | 11,755 | | 11,755 |
(Waterford Pointe Apts. Proj.) Series 2000 E1, 0.22%, LOC Fannie Mae, VRDN (c)(f) | 8,155 | | 8,155 |
Florida Hurricane Catastrophe Fund Fin. Corp. Rev. Bonds Series 2006 A, 5% 7/1/10 | 7,000 | | 7,107 |
Florida Local Govt. Fin. Commission Auth. Rev. Series A: | | | |
0.32% 6/9/10, LOC Wachovia Bank NA, CP | 21,104 | | 21,104 |
0.38% 3/9/10, LOC Wachovia Bank NA, CP | 18,270 | | 18,270 |
Fort Myers Util. Sys. Rev. Series 2009, 0.2%, LOC Bank of America NA, VRDN (c) | 13,895 | | 13,895 |
Gainesville Utils. Sys. Rev. 0.35% 3/9/10, CP | 31,000 | | 31,000 |
Highlands County Health Facilities Auth. Rev. (Adventist Health Sys./Sunbelt, Inc. Prog.) Series 2005 F, 0.18%, LOC Wachovia Bank NA, VRDN (c) | 30,300 | | 30,300 |
Municipal Securities - continued |
| Principal Amount (000s) | | Value (000s) |
Florida - continued |
Hillsborough County Hsg. Fin. Auth. Multi-family Rev.: | | | |
(Claymore Crossings Apt. Proj.) 0.27%, LOC Citibank NA, VRDN (c)(f) | $ 9,735 | | $ 9,735 |
(Grande Oaks Apts. Proj.) Series A, 0.22%, LOC Fannie Mae, VRDN (c)(f) | 7,200 | | 7,200 |
(Hunters Run Apts. Proj.) Series 2002 A, 0.24%, LOC Fannie Mae, VRDN (c)(f) | 8,980 | | 8,980 |
(Lakewood Shores Apt. Proj.) Series 2000 A, 0.27%, LOC Bank of America NA, VRDN (c)(f) | 6,790 | | 6,790 |
(Meridian Pointe Apts. Proj.) 0.27%, LOC Citibank NA, VRDN (c)(f) | 12,630 | | 12,630 |
(Mobley Park Apts. Proj.) Series A, 0.22%, LOC Freddie Mac, VRDN (c)(f) | 8,000 | | 8,000 |
(Morgan Creek Apts. Proj.) 0.22%, LOC Fannie Mae, VRDN (c)(f) | 12,700 | | 12,700 |
(Royal Palm Key Apts. Proj.) 0.24%, LOC Fannie Mae, VRDN (c)(f) | 8,780 | | 8,780 |
Hillsborough County Indl. Dev. Auth. Indl. Dev. Rev. (Vigo Importing Co. Proj.) 0.63%, LOC Bank of America NA, VRDN (c)(f) | 500 | | 500 |
Indian River County Hosp. District Hosp. Rev. Bonds Series 1990, 0.4% tender 5/3/10, LOC Wachovia Bank NA, CP mode | 15,100 | | 15,100 |
Jacksonville Econ. Dev. Commission Indl. Dev. Rev. (STI Proj.) Series 2002, 0.3%, LOC Bank of America NA, VRDN (c)(f) | 7,350 | | 7,350 |
Jacksonville Elec. Auth. Elec. Sys. Rev.: | | | |
Participating VRDN Series BA 09 1209X, 0.18% (Liquidity Facility Bank of America NA) (c)(g) | 5,310 | | 5,310 |
Series Three 2008 B1, 0.18%, LOC Wachovia Bank NA, VRDN (c) | 11,900 | | 11,900 |
Series Three 2008 B4, 0.18%, LOC Wachovia Bank NA, VRDN (c) | 7,700 | | 7,700 |
Jacksonville Health Facilities Auth. Hosp. Rev. (Baptist Med. Ctr. Proj.) Series 2007 B, 0.18%, LOC Branch Banking & Trust Co., VRDN (c) | 11,095 | | 11,095 |
Jacksonville Hsg. Fin. Auth. Multi-family Hsg. Rev. (Brookwood Forest Apts. Proj.) 0.24%, LOC Fannie Mae, VRDN (c)(f) | 9,600 | | 9,600 |
Jacksonville Port Auth. Rev. (Mitsui O.S.K. Lines Ltd. Proj.) 0.24%, LOC Sumitomo Mitsui Banking Corp., VRDN (c)(f) | 74,405 | | 74,405 |
Lee County Hsg. Fin. Auth. Multi-family Hsg. Rev. (Univ. Club Apts. Proj.) Series A, 0.23%, LOC Fannie Mae, VRDN (c)(f) | 7,500 | | 7,500 |
Municipal Securities - continued |
| Principal Amount (000s) | | Value (000s) |
Florida - continued |
Manatee County Hsg. Fin. Auth. Multi-family Hsg. Rev. (Sabal Palm Harbour Apt. Proj.): | | | |
Series 2000 A, 0.25%, LOC Bank of America NA, VRDN (c)(f) | $ 3,070 | | $ 3,070 |
Series 2000 B, 0.25%, LOC Bank of America NA, VRDN (c)(f) | 2,970 | | 2,970 |
Manatee County Poll. Cont. Rev. (Florida Pwr. & Lt. Co. Proj.) Series 1994, 0.19%, VRDN (c) | 13,700 | | 13,700 |
Miami-Dade County Hsg. Fin. Auth. Multi-family Mtg. Rev. (22nd Avenue Apts., 183rd Street Apts. & 187th Street Apts. Proj.) Series 2003 3, 0.27%, LOC Citibank NA, VRDN (c)(f) | 16,765 | | 16,765 |
Miami-Dade County Indl. Dev. Auth. Rev. (Tarmac America Proj.) Series 2004, 0.3%, LOC Bank of America NA, VRDN (c)(f) | 10,600 | | 10,600 |
Ocean Hwy. & Port Auth. Rev.: | | | |
Series 1990, 0.31%, LOC Wachovia Bank NA, VRDN (c)(f) | 100 | | 100 |
0.31%, LOC Wachovia Bank NA, VRDN (c)(f) | 8,900 | | 8,900 |
Orange County Health Facilities Auth. Rev. (Orlando Reg'l. Health Care Sys. Proj.) Series 2008 E, 0.2%, LOC Branch Banking & Trust Co., VRDN (c) | 9,000 | | 9,000 |
Orange County Hsg. Fin. Auth. Multi-family Rev.: | | | |
(Alta Westgate Apts. Proj.) Series C, 0.27%, LOC Citibank NA, VRDN (c)(f) | 13,515 | | 13,515 |
(Osprey Ridge Apts. Proj.) Series 2000 H, 0.22%, LOC Fannie Mae, VRDN (c)(f) | 7,860 | | 7,860 |
(West Point Villas Apts. Proj.) Series 2000 F, 0.22%, LOC Fannie Mae, VRDN (c)(f) | 11,500 | | 11,500 |
Orange County Indl. Dev. Auth. Indl. Dev. Rev.: | | | |
(Advanced Drainage Sys., Inc. Proj.) 0.31%, LOC Nat'l. City Bank Cleveland, VRDN (c)(f) | 1,025 | | 1,025 |
(Central Florida YMCA Proj.) Series 2005, 0.2%, LOC Bank of America NA, VRDN (c) | 300 | | 300 |
Orlando & Orange County Expressway Auth. Rev. Series 2008 B1, 0.2%, LOC Bank of America NA, VRDN (c) | 64,165 | | 64,165 |
Osceola County Hsg. Fin. Auth. Multi-family Rev. (Regatta Bay Apts. Proj.) Series A, 0.24%, LOC Fannie Mae, VRDN (c)(f) | 12,920 | | 12,920 |
Palm Beach County Edl. Facilities Auth. (Lynn Univ. Proj.) Series 2001, 0.2%, LOC Bank of America NA, VRDN (c) | 11,170 | | 11,170 |
Palm Beach County Hsg. Fin. Auth. Multi-family Hsg. Rev. (Renaissance Apts. Proj.) 0.24%, LOC Fannie Mae, VRDN (c)(f) | 18,400 | | 18,400 |
Palm Beach County Rev.: | | | |
(Hanley Ctr. Proj.) Series 2006, 0.2%, LOC Bank of America NA, VRDN (c) | 1,600 | | 1,600 |
Municipal Securities - continued |
| Principal Amount (000s) | | Value (000s) |
Florida - continued |
Palm Beach County Rev.: - continued | | | |
(King's Academy, Inc. Proj.) Series 2006, 0.18%, LOC Wachovia Bank NA, VRDN (c) | $ 15,880 | | $ 15,880 |
(Saint Andrew's School of Boca Raton, Inc. Proj.) Series 2007, 0.2%, LOC Bank of America NA, VRDN (c) | 6,930 | | 6,930 |
Panama City Beach Participating VRDN Series Solar 2006 129, 0.19% (Liquidity Facility U.S. Bank NA, Minnesota) (c)(g) | 7,990 | | 7,990 |
Pasco County Indl. Dev. Rev. (Pacific Med., Inc. Proj.) Series 1999, 0.5%, LOC Bank of America NA, VRDN (c)(f) | 1,435 | | 1,435 |
Pasco County School Board Ctfs. of Prtn.: | | | |
Series 2008 A, 0.18%, LOC Wachovia Bank NA, VRDN (c) | 53,100 | | 53,100 |
Series 2008 C, 0.2%, LOC Bank of America NA, VRDN (c) | 31,535 | | 31,535 |
Pinellas County Health Facilities Auth. Rev. (Suncoast Hospice Proj.) Series 2004, 0.18%, LOC Wachovia Bank NA, VRDN (c) | 16,070 | | 16,070 |
Pinellas County School District TAN Series 2009, 1.5% 6/30/10 | 43,100 | | 43,257 |
Polk County Hsg. Fin. Auth. Multi-family Hsg. Rev. (Cambridge Cove Apts. Proj.) Series 2001, 0.24%, LOC Fannie Mae, VRDN (c)(f) | 8,300 | | 8,300 |
Saint Petersburg Health Facilities Auth. Rev. (All Children's Hosp. Proj.) Series 2005 A2, 0.18%, LOC Wachovia Bank NA, VRDN (c) | 50,615 | | 50,615 |
Santa Rosa County Health Facilities Rev. (Baptists Hosp., Inc. Proj.) 0.2%, LOC Bank of America NA, VRDN (c) | 4,035 | | 4,035 |
South Miami Health Facilities Auth. Hosp. Rev. Participating VRDN: | | | |
Series BA 07 1030, 0.18% (Liquidity Facility Bank of America NA) (c)(g) | 6,970 | | 6,970 |
Series Putters 2407, 0.2% (Liquidity Facility JPMorgan Chase Bank) (c)(g) | 31,495 | | 31,495 |
Sunshine State Govt. Fing. Commission Rev. Series L: | | | |
0.23% 3/2/10, LOC Dexia Cr. Local de France, CP | 45,600 | | 45,600 |
0.24% 3/3/10, LOC Dexia Cr. Local de France, CP | 9,108 | | 9,108 |
0.27% 3/3/10, LOC Dexia Cr. Local de France, CP (f) | 85,645 | | 85,645 |
Tampa Bay Wtr. Util. Sys. Rev. 0.3%, LOC Bank of America NA, VRDN (c)(f) | 19,950 | | 19,950 |
| | 1,529,623 |
Georgia - 2.0% |
Atlanta Tax Allocation (Westside Proj.): | | | |
Series 2008, 0.18%, LOC Wachovia Bank NA, VRDN (c) | 29,400 | | 29,400 |
Series A, 0.18%, LOC Wachovia Bank NA, VRDN (c) | 28,590 | | 28,590 |
Municipal Securities - continued |
| Principal Amount (000s) | | Value (000s) |
Georgia - continued |
Atlanta Urban Residential Fin. Auth. Multi-family Hsg. Rev.: | | | |
(Capitol Gateway Apts. Proj.) 0.25%, LOC Fannie Mae, VRDN (c)(f) | $ 8,475 | | $ 8,475 |
(Carver Redev. Proj.) Series 2000, 0.42%, LOC Fannie Mae, VRDN (c)(f) | 4,015 | | 4,015 |
(Collegetown at Harris Homes Phase I Proj.) 0.25%, LOC Fannie Mae, VRDN (c)(f) | 7,230 | | 7,230 |
Bulloch County Dev. Auth. Indl. Dev. Rev. (Gold Kist, Inc. Proj.) Series 1995, 0.35%, LOC Wachovia Bank NA, VRDN (c)(f) | 4,000 | | 4,000 |
Canton Hsg. Auth. Multi-family Hsg. Rev.: | | | |
(Alta Ridgewalk Apts. Proj.) Series 2003, 0.25%, LOC Freddie Mac, VRDN (c)(f) | 20,450 | | 20,450 |
(Canton Mill Lofts Proj.) Series 1999, 0.29%, LOC Branch Banking & Trust Co., VRDN (c)(f) | 14,085 | | 14,085 |
Clarke County Hosp. Auth. Rev. Participating VRDN Series Solar 07 31, 0.2% (Liquidity Facility U.S. Bank NA, Minnesota) (c)(g) | 16,725 | | 16,725 |
Cobb County Kennestone Hosp. Auth. Rev. (WellStar Health Sys. Proj.) Series 2005 A, 0.2%, LOC Bank of America NA, VRDN (c) | 25,000 | | 25,000 |
Covington Hsg. Auth. Multi-family Rev. (Wellington Ridge Apt. Proj.) 0.24%, LOC Freddie Mac, VRDN (c)(f) | 9,635 | | 9,635 |
DeKalb County Hsg. Auth. Multi-family Hsg. Rev. (Eagles Trace Apts. Proj.) Series 1996, 0.24%, LOC Fannie Mae, VRDN (c)(f) | 7,950 | | 7,950 |
Georgia Gen. Oblig. Participating VRDN Series WF 08 12C, 0.18% (Liquidity Facility Wells Fargo & Co.) (c)(g) | 13,410 | | 13,410 |
Georgia Road & Thruway Auth. Rev. Bonds Series 2008 A, 5% 6/1/10 | 8,290 | | 8,385 |
Glynn-Brunswick Memorial Hosp. Auth. Rev. (Southeast Georgia Health Sys. Proj.) Series 2008 B, 0.18%, LOC Branch Banking & Trust Co., VRDN (c) | 12,380 | | 12,380 |
Gwinnett County Dev. Auth. Indl. Dev. Rev. (Curtis 1000, Inc. Proj.) Series 1996, 0.33%, LOC Wells Fargo Bank NA, VRDN (c)(f) | 6,460 | | 6,460 |
Gwinnett County Hsg. Auth. Multi-family Hsg. Rev. (Herrington Woods Apt. Proj.) Series 1996 A, 0.24%, LOC Fannie Mae, VRDN (c)(f) | 11,835 | | 11,835 |
Henry County Dev. Auth. Solid Waste Rev. (Atlas Roofing Corp. Proj.) Series 1997, 0.34%, LOC Bank of America NA, VRDN (c)(f) | 7,350 | | 7,350 |
Kennesaw Dev. Auth. Multifamily Hsg. Rev. (Alta Ridenour Apts. Proj.) Series 2008, 0.25%, LOC Freddie Mac, VRDN (c)(f) | 7,350 | | 7,350 |
Municipal Securities - continued |
| Principal Amount (000s) | | Value (000s) |
Georgia - continued |
Loganville Hsg. Auth. Multi-family Hsg. Rev. (Alexander Crossing Apt. Proj.) 0.31%, LOC Freddie Mac, VRDN (c)(f) | $ 15,555 | | $ 15,555 |
Muni. Elec. Auth. of Georgia: | | | |
(Combustion Turbine Proj.) Series 2008 B, 0.3%, LOC Bayerische Landesbank, VRDN (c) | 18,730 | | 18,730 |
BAN: | | | |
(Plant Vogtle Additional Units Non-PPA Proj.) Series 2009 A, 1.25% 5/7/10 | 31,900 | | 31,923 |
Series 2009 A, 1.5% 5/25/10 | 28,140 | | 28,199 |
Newnan Dev. Auth. Multi-family Hsg. Rev. (The Club at Newnan Crossing Proj.) 0.23%, LOC Fannie Mae, VRDN (c)(f) | 8,915 | | 8,915 |
Roswell Hsg. Auth. Multi-family Hsg. Rev. (Walton Centennial Proj.) Series A, 0.25%, LOC Wachovia Bank NA, VRDN (c)(f) | 19,200 | | 19,200 |
Savannah Econ. Dev. Auth. Rev.: | | | |
(Home Depot, Inc. Proj.) Series 1995 A, 1.25%, VRDN (c)(f) | 57,400 | | 57,400 |
(Kaolin Terminals, Inc. Proj.) 0.3%, LOC Bank of America NA, VRDN (c)(f) | 34,510 | | 34,510 |
Sugar Hill Hsg. Auth. Multi-family Rev. (Level Creek Apts. Proj.) Series 1997, 0.23%, LOC Citibank NA, VRDN (c)(f) | 11,290 | | 11,290 |
Worth County Indl. Dev. Auth. Indl. Dev. Rev. (Seabrook Enterprises, Inc. Proj.) Series 1996 A, 0.29%, LOC Harris NA, VRDN (c) | 3,850 | | 3,850 |
| | 472,297 |
Hawaii - 0.0% |
Hawaii Dept. of Budget & Fin. Spl. Purp. Rev. (Hawaii Pacific Health Proj.) Series 2009 A: | | | |
0.18%, LOC Union Bank of California, VRDN (c) | 3,800 | | 3,800 |
0.18%, LOC Union Bank of California, VRDN (c) | 3,000 | | 3,000 |
| | 6,800 |
Illinois - 3.2% |
Aurora Single Family Mtg. Rev. Participating VRDN Series DB 616, 0.26% (Liquidity Facility Deutsche Bank AG) (c)(f)(g) | 8,500 | | 8,500 |
Belvidere Indl. Dev. Rev. (R&D Thiel, Inc. Proj.) Series 1996, 0.32%, LOC Bank of America NA, VRDN (c)(f) | 2,180 | | 2,180 |
Carol Stream Multi-family Rev. (Saint Charles Square Proj.) Series 1997, 0.25%, LOC Fannie Mae, VRDN (c)(f) | 1,900 | | 1,900 |
Chicago Arpt. Spl. Facilities Rev. (Centerpoint O'Hare Proj.) 0.31%, LOC JPMorgan Chase Bank, VRDN (c)(f) | 39,300 | | 39,300 |
Chicago Board of Ed. Series 2009 A2, 0.2%, LOC Northern Trust Co., Chicago, VRDN (c) | 7,220 | | 7,220 |
Municipal Securities - continued |
| Principal Amount (000s) | | Value (000s) |
Illinois - continued |
Chicago Indl. Dev. Rev. (Chicago Scenic Studios, Inc. Proj.) Series 2000, 0.47%, LOC Harris NA, VRDN (c)(f) | $ 3,045 | | $ 3,045 |
Chicago Metropolitan Wtr. Reclamation District Greater Chicago Participating VRDN Series Solar 06 75, 0.2% (Liquidity Facility U.S. Bank NA, Minnesota) (c)(g) | 20,000 | | 20,000 |
Chicago O'Hare Int'l. Arpt. Rev. Series 2005 C, 0.24%, LOC Landesbank Baden-Wuert, VRDN (c) | 186,200 | | 186,200 |
Chicago Wtr. Rev.: | | | |
Series 2004 A1, 0.2%, LOC California Pub. Employees' Retirement Sys., VRDN (c) | 54,625 | | 54,625 |
Series 2004 A2, 0.2%, LOC California Pub. Employees' Retirement Sys., VRDN (c) | 52,140 | | 52,140 |
Series 2004 A3, 0.2%, LOC State Street Bank & Trust Co., Boston, VRDN (c) | 4,195 | | 4,195 |
City of Rolling Meadows Solid Waste Disp. Rev. (BFI Waste Sys. of North America Proj.) Series 1999, 0.28%, LOC JPMorgan Chase Bank, VRDN (c)(f) | 19,580 | | 19,580 |
Cook County Gen. Oblig. Series 2002 B, 0.2% (Liquidity Facility Landesbank Hessen-Thuringen), VRDN (c) | 4,000 | | 4,000 |
DuPage County Gen. Oblig. Participating VRDN Series Merlots 00 A9, 0.18% (Liquidity Facility Wachovia Bank NA) (c)(g) | 9,725 | | 9,725 |
Hodgkins Indl. Dev. Rev. (Central Blacktop Co., Inc. Proj.) 0.45%, LOC Harris NA, VRDN (c)(f) | 2,680 | | 2,680 |
Illinois Dev. Fin. Auth. Indl. Dev. Rev.: | | | |
(Camcraft Proj.) Series 1993, 1.96%, LOC JPMorgan Chase Bank, VRDN (c)(f) | 100 | | 100 |
(Delta-Unibus Corp. Proj.) Series 2001, 0.5%, LOC Bank of America NA, VRDN (c)(f) | 4,800 | | 4,800 |
(Mapes & Sprowl Steel Ltd. Proj.) Series 1996 A, 0.5%, LOC Harris NA, VRDN (c)(f) | 791 | | 791 |
(R&R Enterprises 2nd Proj.) Series 1999 A, 0.47%, LOC Harris NA, VRDN (c)(f) | 3,400 | | 3,400 |
Illinois Dev. Fin. Auth. Rev. (Rich Prods. Corp. Proj.) Series 1998, 0.44%, LOC HSBC Bank USA, NA, VRDN (c)(f) | 7,825 | | 7,825 |
Illinois Dev. Fin. Auth. Solid Waste Disp. Rev. (Waste Mgmt., Inc. Proj.) 0.2%, LOC JPMorgan Chase Bank, VRDN (c)(f) | 15,000 | | 15,000 |
Illinois Edl. Facilities Auth. Revs.: | | | |
Participating VRDN Series ROC II R 12278, 0.2% (Liquidity Facility Citibank NA) (c)(g) | 10,395 | | 10,395 |
(Chicago Children's Museum Proj.) Series 1994, 0.21%, LOC JPMorgan Chase Bank, VRDN (c) | 4,300 | | 4,300 |
Municipal Securities - continued |
| Principal Amount (000s) | | Value (000s) |
Illinois - continued |
Illinois Fin. Auth. Indl. Dev. Rev. (Bohler Uddeholm Corp. Proj.) 0.25%, LOC Bayerische Hypo-und Vereinsbank AG, VRDN (c)(f) | $ 10,000 | | $ 10,000 |
Illinois Fin. Auth. Poll. Cont. Rev. (Commonwealth Edison Co. Proj.): | | | |
Series 2008 D, 0.19%, LOC JPMorgan Chase Bank, VRDN (c) | 7,800 | | 7,800 |
Series 2008 F, 0.16%, LOC JPMorgan Chase Bank, VRDN (c) | 10,100 | | 10,100 |
Illinois Fin. Auth. Rev.: | | | |
Participating VRDN: | | | |
Series BA 08 1137, 0.18% (Liquidity Facility Bank of America NA) (c)(g) | 12,855 | | 12,855 |
Series DB 601, 0.23% (Liquidity Facility Deutsche Bank AG) (c)(g) | 15,180 | | 15,180 |
Series Putters 3174, 0.18% (Liquidity Facility JPMorgan Chase Bank) (c)(g) | 15,620 | | 15,620 |
Series Putters 3378, 0.2% (Liquidity Facility JPMorgan Chase Bank) (c)(g) | 11,200 | | 11,200 |
Series Putters 3435, 0.2% (Liquidity Facility JPMorgan Chase Bank) (c)(g) | 2,105 | | 2,105 |
(Alexian Brothers Health Sys. Proj.) Series 2004, 0.19%, LOC JPMorgan Chase Bank, VRDN (c) | 1,000 | | 1,000 |
(Chicago Symphony Orchestra Proj.) Series 2008, 0.2%, LOC U.S. Bank NA, Minnesota, VRDN (c) | 15,115 | | 15,115 |
(Children's Memorial Hosp. Proj.) Series 2008 C, 0.2%, LOC JPMorgan Chase Bank, VRDN (c) | 8,900 | | 8,900 |
(Edward Hosp. Oblig. Group) Series 2009 A, 0.17%, LOC JPMorgan Chase Bank, VRDN (c) | 14,500 | | 14,500 |
(Edward Hosp. Obligated Group Proj.) Series 2008 B1, 0.17%, LOC JPMorgan Chase Bank, VRDN (c) | 17,620 | | 17,620 |
(Little Co. of Mary Hosp. Proj.) Series 2008 A, 0.19%, LOC JPMorgan Chase Bank, VRDN (c) | 29,185 | | 29,185 |
(Museum of Science & Industry Proj.): | | | |
Series 2009 C, 0.2%, LOC Harris NA, VRDN (c) | 5,500 | | 5,500 |
Series 2009 D, 0.19%, LOC Northern Trust Co., Chicago, VRDN (c) | 16,000 | | 16,000 |
(Rush Univ. Med. Ctr. Proj.) Series 2008 A, 0.2%, LOC Northern Trust Co., Chicago, VRDN (c) | 11,000 | | 11,000 |
(Saint Xavier Univ. Proj.) Series 2008, 0.2%, LOC Bank of America NA, VRDN (c) | 3,960 | | 3,960 |
Illinois Fin. Auth. Solid Waste Rev. (Republic Svcs., Inc. Proj.) Series 2004, 0.31%, LOC JPMorgan Chase Bank, VRDN (c)(f) | 18,000 | | 18,000 |
Municipal Securities - continued |
| Principal Amount (000s) | | Value (000s) |
Illinois - continued |
Illinois Hsg. Dev. Auth. Multi-family Hsg. Rev. (Valley View Apts. Proj.) 0.22%, LOC U.S. Bank NA, Minnesota, VRDN (c)(f) | $ 11,200 | | $ 11,200 |
Lake County Solid Waste Disp. Facilities Rev. (Countryside Landfill, Inc. Proj.) Series B, 0.5%, LOC JPMorgan Chase Bank, VRDN (c)(f) | 4,320 | | 4,320 |
Lisle Village Multi-family Hsg. Rev. (Devonshire of Lisle Proj.) Series 1991, 0.25%, LOC Freddie Mac, VRDN (c)(f) | 6,000 | | 6,000 |
Palos Hills Multi-family Hsg. Rev. (Green Oaks Proj.) Series 1998, 0.25%, LOC Fannie Mae, VRDN (c)(f) | 14,300 | | 14,300 |
Saint Charles Indl. Dev. Rev. (Pier 1 Imports-Midwest, Inc. Proj.) Series 1986, 0.23%, LOC JPMorgan Chase Bank, VRDN (c)(f) | 9,500 | | 9,500 |
Univ. of Illinois Rev. (UIC South Campus Dev. Proj.) Series 2008, 0.21%, LOC JPMorgan Chase Bank, VRDN (c) | 9,500 | | 9,500 |
Yorkville Svc. Area 2004-106 Tax (MPI Grande Reserve Proj.) 0.2%, LOC Bank of America NA, VRDN (c) | 7,205 | | 7,205 |
| | 749,566 |
Indiana - 1.8% |
Anderson Econ. Dev. Auth. Rev. (AppleCreek Commons Proj.) 0.26%, LOC Fed. Home Ln. Bank, Indianapolis, VRDN (c)(f) | 5,260 | | 5,260 |
Crawford County Econ. Dev. Rev. (Jasper Engine Exchange Proj.) Series 1997, 0.28%, LOC PNC Bank NA, Pittsburgh, VRDN (c)(f) | 1,600 | | 1,600 |
Elkhart County Hosp. Auth. Rev. (Elkhart Gen. Hosp. Proj.) Series 2008, 0.19%, LOC JPMorgan Chase Bank, VRDN (c) | 2,000 | | 2,000 |
Elkhart County Multi-family Hsg. Rev. (Pedcor Investments Proj.) Series 2000, 0.26%, LOC Fed. Home Ln. Bank, Indianapolis, VRDN (c)(f) | 7,669 | | 7,669 |
Hammond Swr. & Solid Waste Disp. Rev. (Cargill, Inc. Proj.) 0.3%, VRDN (c)(f) | 39,000 | | 39,000 |
Indiana Dev. Fin. Auth. Envir. Rev.: | | | |
(Duke Energy Indiana, Inc. Proj.): | | | |
Series 2009 A2, 0.23%, LOC Bank of America NA, VRDN (c)(f) | 13,100 | | 13,100 |
Series 2009 A3, 0.18%, LOC Bank of America NA, VRDN (c) | 20,625 | | 20,625 |
(Mittal Steel Co. Proj.) 0.31%, LOC Banco Bilbao Vizcaya Argentaria SA, VRDN (c)(f) | 34,750 | | 34,750 |
(Republic Svcs., Inc. Proj.) Series 2001, 0.22%, LOC JPMorgan Chase Bank, VRDN (c)(f) | 5,000 | | 5,000 |
Series 2005, 0.18%, LOC Royal Bank of Scotland PLC, VRDN (c) | 8,200 | | 8,200 |
Municipal Securities - continued |
| Principal Amount (000s) | | Value (000s) |
Indiana - continued |
Indiana Dev. Fin. Auth. Indl. Dev. Rev. (Republic Svcs., Inc. Proj.) Series 2001, 0.22%, LOC JPMorgan Chase Bank, VRDN (c)(f) | $ 7,050 | | $ 7,050 |
Indiana Dev. Fin. Auth. Rev. (Indianapolis Museum of Art, Inc. Proj.) Series 2001, 0.21%, LOC JPMorgan Chase Bank, VRDN (c) | 20,000 | | 20,000 |
Indiana Dev. Fin. Auth. Solid Waste Disp. Rev. (Waste Mgmt., Inc. Proj.): | | | |
Series 2002 A, 0.2%, LOC JPMorgan Chase Bank, VRDN (c)(f) | 25,000 | | 25,000 |
Series 2002 B, 0.33%, LOC JPMorgan Chase Bank, VRDN (c)(f) | 7,000 | | 7,000 |
Indiana Fin. Auth. Health Sys. Rev. (Sisters of Saint Francis Health Svcs., Inc. Obligated Group Proj.) Series 2008 A, 0.19%, LOC JPMorgan Chase Bank, VRDN (c) | 36,595 | | 36,595 |
Indiana Fin. Auth. Hosp. Rev.: | | | |
(Clarian Health Partners, Inc. Obligated Group Proj.) Series 2008 A, 0.19%, LOC Branch Banking & Trust Co., VRDN (c) | 7,600 | | 7,600 |
(Cmnty. Health Network Proj.) Series 2009 A, 0.2%, LOC Bank of America NA, VRDN (c) | 25,000 | | 25,000 |
Indiana Fin. Auth. Rev.: | | | |
Bonds (Ascension Health Proj.) Series 2008 E8, 0.33%, tender 6/15/10 (c) | 6,725 | | 6,725 |
(DePauw Univ. Proj.) Series 2008 B, 0.2%, LOC Harris NA, VRDN (c) | 16,555 | | 16,555 |
Indiana Hsg. & Cmnty. Dev. Auth. Single Family Mtg. Rev.: | | | |
Participating VRDN Series Merlots 07 C52, 0.25% (Liquidity Facility Wachovia Bank NA) (c)(f)(g) | 5,275 | | 5,275 |
Series 2008 A2, 0.2% (Liquidity Facility Fannie Mae) (Liquidity Facility Freddie Mac), VRDN (c)(f) | 21,140 | | 21,140 |
Indiana Trans. Fin. Auth. Hwy. Rev. Participating VRDN Series BA 08 1157, 0.18% (Liquidity Facility Bank of America NA) (c)(g) | 7,500 | | 7,500 |
Indianapolis Econ. Dev. Rev. (Pine Glen Apts. Proj.) 0.25%, LOC Fed. Home Ln. Bank, Cincinnati, VRDN (c)(f) | 6,205 | | 6,205 |
Indianapolis Gas Util. Sys. Rev.: | | | |
0.85% 3/10/10, CP | 25,000 | | 25,000 |
0.85% 3/17/10, CP | 25,000 | | 25,000 |
IPS Multi-School Bldg. Corp. Participating VRDN Series Solar 07 26, 0.19% (Liquidity Facility U.S. Bank NA, Minnesota) (c)(g) | 13,435 | | 13,435 |
Knox Econ. Dev. Rev. (Toll IN LLC Proj.) 0.3%, LOC Bank of America NA, VRDN (c)(f) | 9,435 | | 9,435 |
Municipal Securities - continued |
| Principal Amount (000s) | | Value (000s) |
Indiana - continued |
Marion Econ. Dev. Rev. (Indiana Wesleyan Univ. Proj.) Series 2000, 0.2%, LOC Bank of America NA, VRDN (c) | $ 3,655 | | $ 3,655 |
Warrick County Poll. Cont. Rev. (Southern Indiana Gas and Elec. Co. Proj.) Series 1985 A, 0.21%, LOC JPMorgan Chase Bank, VRDN (c) | 9,775 | | 9,775 |
| | 415,149 |
Iowa - 0.3% |
Iowa Fin. Auth.: | | | |
Series 2003 F, 0.2% (Liquidity Facility Wells Fargo Bank NA), VRDN (c)(f) | 12,080 | | 12,080 |
Series 2005 C, 0.21% (Liquidity Facility State Street Bank & Trust Co., Boston), VRDN (c)(f) | 12,000 | | 12,000 |
Iowa Fin. Auth. Poll. Cont. Facility Rev. (MidAmerican Energy Proj.) Series 2008 B, 0.29%, VRDN (c) | 13,325 | | 13,325 |
Iowa Fin. Auth. Single Family Rev.: | | | |
Participating VRDN Series Putters 1205, 0.35% (Liquidity Facility JPMorgan Chase & Co.) (c)(f)(g) | 2,330 | | 2,330 |
(Mtg. Backed Securities Prog.) Series 2004 G, 0.21% (Liquidity Facility State Street Bank & Trust Co., Boston), VRDN (c)(f) | 15,500 | | 15,500 |
Iowa Fin. Auth. Wellness Facilities Rev. (Cmnty. Y of Marshalltown Proj.) Series 2001, 0.2%, LOC Bank of America NA, VRDN (c) | 6,200 | | 6,200 |
| | 61,435 |
Kansas - 0.5% |
Chanute Indl. Dev. Rev. (Ash Grove Cement Co. Proj.) Series 2000, 0.3%, LOC Bank of America NA, VRDN (c)(f) | 25,100 | | 25,100 |
Kansas Dept. of Trans. Hwy. Rev. Series 2002 D, 0.18% (Liquidity Facility Dexia Cr. Local de France), VRDN (c) | 3,205 | | 3,205 |
Lenexa Multi-family Hsg. Rev. (Meadows Apts. Proj.) Series A, 0.25%, LOC Fannie Mae, VRDN (c)(f) | 12,200 | | 12,200 |
Olathe Gen. Oblig. Bonds Series 2009 B, 1.5% 6/1/10 | 32,385 | | 32,475 |
Wichita Gen. Oblig. BAN Series 236, 0.625% 3/3/11 (b) | 7,705 | | 7,708 |
Wyandotte County/Kansas City Unified Govt. Gen. Oblig. BAN Series 2010 I, 0.625% 3/1/11 | 30,820 | | 30,863 |
| | 111,551 |
Kentucky - 2.5% |
Boyle County Hosp. Rev. (Ephraim McDowell Health Proj.) Series 2006, 0.18%, LOC Branch Banking & Trust Co., VRDN (c) | 8,000 | | 8,000 |
Municipal Securities - continued |
| Principal Amount (000s) | | Value (000s) |
Kentucky - continued |
Carroll County Envir. Facilities Rev.: | | | |
(Kentucky Utils. Co. Proj.): | | | |
Series 2006 B, 0.29%, LOC Commerzbank AG, VRDN (c)(f) | $ 47,200 | | $ 47,200 |
Series 2008 A, 0.29%, LOC Commerzbank AG, VRDN (c)(f) | 70,347 | | 70,347 |
Series 2004 A, 0.23%, LOC Commerzbank AG, VRDN (c)(f) | 38,500 | | 38,500 |
Carroll County Solid Waste Disp. Rev. (North American Stainless LP Proj.) Series 2000, 0.31%, LOC Banco Bilbao Vizcaya Argentaria SA, VRDN (c)(f) | 10,000 | | 10,000 |
Daviess County Exempt Facilities Rev. (Kimberly-Clark Tissue Co. Proj.) Series 1999, 0.3% (Kimberly-Clark Corp. Guaranteed), VRDN (c)(f) | 4,770 | | 4,770 |
Daviess County Solid Waste Disp. Facilities Rev. (Scott Paper Co. Proj.): | | | |
Series 1993 A, 0.3% (Kimberly-Clark Corp. Guaranteed), VRDN (c)(f) | 67,250 | | 67,250 |
Series 1993 B, 0.3% (Kimberly-Clark Corp. Guaranteed), VRDN (c)(f) | 37,700 | | 37,700 |
Elizabethtown Indl. Bldg. Rev. (Altec Industries, Inc. Proj.) Series 1997, 0.29%, LOC Wachovia Bank NA, VRDN (c)(f) | 4,000 | | 4,000 |
Henderson County Indl. Dev. Auth. (Pittsburg Tank & Tower Co. Proj.) 0.31%, LOC U.S. Bank NA, Minnesota, VRDN (c)(f) | 100 | | 100 |
Jefferson County Indl. Bldg. Rev. (Wynn Starr Foods Proj.) Series 1996, 1.75%, LOC JPMorgan Chase Bank, VRDN (c)(f) | 270 | | 270 |
Kentucky Econ. Dev. Fin. Auth. Participating VRDN Series MS 3125, 0.2% (Liquidity Facility Morgan Stanley) (c)(g) | 11,250 | | 11,250 |
Kentucky Econ. Dev. Fin. Auth. Hosp. Rev. (Baptist Healthcare Sys. Proj.) Series 2009 B4, 0.18%, LOC Branch Banking & Trust Co., VRDN (c) | 8,000 | | 8,000 |
Kentucky Econ. Dev. Fin. Auth. Indl. Bldg. Rev. (Republic Svcs., Inc. Proj.) Series 2000, 0.21%, LOC Bank of America NA, VRDN (c)(f) | 5,000 | | 5,000 |
Kentucky Econ. Dev. Fin. Auth. Rev. (Ashland Hosp. Corp./King's Daughters Med. Ctr. Proj.) Series 2008 A, 0.2%, LOC Branch Banking & Trust Co., VRDN (c) | 15,000 | | 15,000 |
Kentucky Econ. Dev. Fin. Auth. Solid Waste Disp. Rev. (Republic Svcs., Inc. Proj.) Series 2005, 0.31%, LOC JPMorgan Chase Bank, VRDN (c)(f) | 12,000 | | 12,000 |
Kentucky Higher Ed. Student Ln. Corp. Rev.: | | | |
Series 2008 A1, 0.23%, LOC State Street Bank & Trust Co., Boston, LOC Bank of America NA, VRDN (c)(f) | 135,225 | | 135,225 |
Municipal Securities - continued |
| Principal Amount (000s) | | Value (000s) |
Kentucky - continued |
Kentucky Higher Ed. Student Ln. Corp. Rev.: - continued | | | |
Series 2008 A2, 0.3%, LOC State Street Bank & Trust Co., Boston, LOC Bank of America NA, VRDN (c)(f) | $ 41,700 | | $ 41,700 |
Kentucky Hsg. Corp. Conduit Multi-family Mtg. Rev. (Gleneagles Apts. Proj.) 0.3%, LOC Fannie Mae, VRDN (c)(f) | 9,900 | | 9,900 |
Kentucky Hsg. Corp. Hsg. Rev. Participating VRDN Series Clipper 05 35, 0.32% (Liquidity Facility State Street Bank & Trust Co., Boston) (c)(f)(g) | 9,000 | | 9,000 |
Kentucky Hsg. Corp. Multi-family Rev. (Canterbury Southgate Hsg. Proj.) 0.24%, LOC Freddie Mac, VRDN (c)(f) | 13,880 | | 13,880 |
Larue County Indl. Dev. Rev. (CMH Hodgenville, Inc. Proj.) Series 2000, 0.5%, LOC U.S. Bank NA, Minnesota, VRDN (c)(f) | 6,000 | | 6,000 |
Louisville & Jefferson County Reg'l. Arpt. Auth. Spl. Facilities Rev. (UPS Worldwide Forwarding, Inc. Proj.) Series 1999 B, 0.22% (United Parcel Svc. of America Guaranteed), VRDN (c)(f) | 12,900 | | 12,900 |
Mercer County Solid Waste Disp. Facility Rev. (Kentucky Utils. Co. Proj.) Series 2000 A, 0.16%, LOC Commerzbank AG, VRDN (c)(f) | 12,900 | | 12,900 |
Minor Lane Heights Solid Waste Disp. Rev. (Waste Mgmt. of Kentucky, LLC Proj. D) Series 2003, 0.23%, LOC PNC Bank NA, Pittsburgh, VRDN (c)(f) | 6,000 | | 6,000 |
| | 586,892 |
Louisiana - 0.8% |
Lake Charles Hbr. & Term. District Dock & Wharf Rev. (Conoco, Inc. Proj.) Series 2000, 0.32%, VRDN (c)(f) | 34,100 | | 34,100 |
Louisiana Gas & Fuel Tax Rev.: | | | |
Participating VRDN Series Putters 2378, 0.25% (Liquidity Facility JPMorgan Chase Bank) (c)(g) | 14,415 | | 14,415 |
Series 2009 A1, 0.19%, LOC JPMorgan Chase Bank, VRDN (c) | 20,000 | | 20,000 |
Louisiana Gen. Oblig. Bonds Series 2009 A, 2% 5/1/10 | 7,060 | | 7,079 |
Louisiana Hsg. Fin. Agcy. Mtg. Rev. Participating VRDN Series Clipper 05 11, 0.32% (Liquidity Facility State Street Bank & Trust Co., Boston) (c)(f)(g) | 5,921 | | 5,921 |
Louisiana Pub. Facilities Auth. Hosp. Rev. (Franciscan Missionaries of Our Lady Health Sys. Proj.): | | | |
Series 2005 B, 0.18%, LOC JPMorgan Chase Bank, VRDN (c) | 10,000 | | 10,000 |
Series 2008 A, 0.19%, LOC JPMorgan Chase Bank, VRDN (c) | 23,915 | | 23,915 |
Municipal Securities - continued |
| Principal Amount (000s) | | Value (000s) |
Louisiana - continued |
Louisiana Pub. Facilities Auth. Rev. (Air Products & Chemicals, Inc. Proj.): | | | |
Series 2002, 0.5%, VRDN (c)(f) | $ 14,000 | | $ 14,000 |
Series 2004, 0.5%, VRDN (c)(f) | 6,250 | | 6,250 |
Port New Orleans Board Commerce Rev. 0.25%, LOC BNP Paribas SA, VRDN (c)(f) | 18,425 | | 18,425 |
South Louisiana Port Commission Port Facilities Rev. (Holnam, Inc. Proj.) 0.25%, LOC Wachovia Bank NA, VRDN (c)(f) | 22,000 | | 22,000 |
| | 176,105 |
Maine - 0.4% |
Maine Fin. Auth. Solid Waste Disposable Rev. (Casella Waste Systems, Inc. Proj.) 0.3%, LOC Bank of America NA, VRDN (c)(f) | 25,000 | | 25,000 |
Maine Health & Higher Ed. Facilities Auth. Rev. Series 2008 A, 0.21%, LOC KBC Bank NV, VRDN (c) | 15,000 | | 15,000 |
Maine Hsg. Auth. Multi-family Dev. Rev. (Park Village Apts. Proj.) 0.26%, LOC Fannie Mae, VRDN (c)(f) | 23,100 | | 23,100 |
Maine Pub. Util. Fin. Pub. Util. Rev. (Maine Pub. Svc. Co. Proj.): | | | |
Series 1996, 0.3%, LOC Bank of America NA, VRDN (c)(f) | 13,600 | | 13,600 |
Series 2000, 0.25%, LOC Bank of America NA, VRDN (c)(f) | 9,000 | | 9,000 |
| | 85,700 |
Maryland - 0.8% |
Chestertown Econ. Dev. Rev. (Washington College Proj.) Series 2008 A, 0.55%, LOC RBS Citizens NA, VRDN (c) | 13,300 | | 13,300 |
Maryland Cmnty. Dev. Administration Dept. of Hsg. & Cmnty. Dev. (Barrington Apts. Proj.) Series A, 0.2%, LOC Fannie Mae, VRDN (c)(f) | 12,190 | | 12,190 |
Maryland Econ. Dev. Auth. Rev. (Associated Projs.) Series A, 0.2%, LOC Bank of America NA, VRDN (c) | 15,715 | | 15,715 |
Maryland Health & Higher Edl. Facilities Auth. Rev.: | | | |
(Adventist Healthcare Proj.) Series 2005 A, 0.18%, LOC Bank of America NA, VRDN (c) | 6,000 | | 6,000 |
(Mercy Med. Ctr. Proj.): | | | |
Series 2007 B, 0.2%, LOC Bank of America NA, VRDN (c) | 20,000 | | 20,000 |
Series 2007 D, 0.18%, LOC Wachovia Bank NA, VRDN (c) | 28,300 | | 28,300 |
(Univ. of Maryland Med. Sys. Proj.) Series 2008 A, 0.4%, LOC Citizens Bank of Pennsylvania, VRDN (c) | 22,300 | | 22,300 |
(Upper Chesapeake Hosp. Proj.) Series 2008 B, 0.19%, LOC Branch Banking & Trust Co., VRDN (c) | 11,290 | | 11,290 |
Municipal Securities - continued |
| Principal Amount (000s) | | Value (000s) |
Maryland - continued |
Maryland Health & Higher Edl. Facilities Auth. Rev.: - continued | | | |
(Villa Julie College, Inc. Proj.) Series 2005, 0.19%, LOC Bank of America NA, VRDN (c) | $ 1,200 | | $ 1,200 |
Series E, 0.2% 3/3/10, LOC Bank of America NA, CP | 41,100 | | 41,100 |
Maryland Trans. Auth. Trans. Facility Projects Rev. Participating VRDN Series BA 08 1077, 0.21% (Liquidity Facility Bank of America NA) (c)(g) | 5,055 | | 5,055 |
Montgomery County Econ. Dev. Rev. (Georgetown Preparatory School, Inc. Proj.) Series 2005, 0.2%, LOC Bank of America NA, VRDN (c) | 7,900 | | 7,900 |
Montgomery County Hsg. Opportunities Commission Hsg. Rev. (The Grand Proj.) Series 1997 1, 0.2%, LOC Fannie Mae, VRDN (c)(f) | 2,000 | | 2,000 |
Univ. Sys. of Maryland Rev. Bonds Series 2003 A, 0.55%, tender 6/1/10 (c) | 5,560 | | 5,560 |
| | 191,910 |
Massachusetts - 1.0% |
Clipper Tax-Exempt Trust Participating VRDN Series Clipper 05 36, 0.2% (Liquidity Facility State Street Bank & Trust Co., Boston) (c)(g) | 11,835 | | 11,835 |
Massachusetts Participating VRDN Series Clipper 06 11, 0.23% (Liquidity Facility State Street Bank & Trust Co., Boston) (c)(g) | 59,605 | | 59,605 |
Massachusetts Dev. Fin. Agcy. Electrical Utils. Rev. (Nantucket Elec. Co. Proj.) Bonds Series 2005, 0.9% tender 3/1/10, CP mode (f) | 22,500 | | 22,500 |
Massachusetts Gen. Oblig.: | | | |
Participating VRDN Series Clipper 07 39, 0.23% (Liquidity Facility State Street Bank & Trust Co., Boston) (c)(g) | 11,000 | | 11,000 |
Series 2001 C, 0.19% (Liquidity Facility State Street Bank & Trust Co., Boston), VRDN (c) | 43,600 | | 43,600 |
Massachusetts Indl. Fin. Agcy. Poll. Cont. Rev. Bonds (New England Pwr. Co. Proj.): | | | |
Series 1993 A, 0.8% tender 3/1/10, CP mode | 20,000 | | 20,000 |
Series 1993 B, 0.7% tender 3/10/10, CP mode | 17,550 | | 17,550 |
Massachusetts School Bldg. Auth. Dedicated Sales Tax Rev. Participating VRDN: | | | |
Series EGL 07 0031, 0.2% (Liquidity Facility Citibank NA) (c)(g) | 31,500 | | 31,500 |
Series MS 30911, 0.22% (Liquidity Facility Morgan Stanley) (c)(g) | 6,665 | | 6,665 |
Municipal Securities - continued |
| Principal Amount (000s) | | Value (000s) |
Massachusetts - continued |
Massachusetts State Dev. Fin. Agcy. Elec. Util. Rev. Bonds (Nantucket Elec. Co. Proj.) Series 2007, 0.8% tender 3/4/10, CP mode (f) | $ 1,000 | | $ 1,000 |
Massachusetts Wtr. Resources Auth. Wtr. & Swr. Rev.: | | | |
Series 2008 C, 0.28% (Liquidity Facility Bayerische Landesbank), VRDN (c) | 7,850 | | 7,850 |
Series 2008 D, 0.28% (Liquidity Facility Bayerische Landesbank), VRDN (c) | 4,800 | | 4,800 |
| | 237,905 |
Michigan - 1.5% |
Kent Hosp. Fin. Auth. Hosp. Facilities Rev. (Spectrum Health Sys. Proj.) Series 2008 B1, 0.38%, LOC RBS Citizens NA, VRDN (c) | 43,500 | | 43,500 |
Michigan Bldg. Auth. Rev. Series 5, 0.25% 3/25/10, LOC Bank of New York, New York, LOC State Street Bank & Trust Co., Boston, CP | 2,890 | | 2,890 |
Michigan Hosp. Fin. Auth. Rev. Bonds: | | | |
(Ascension Health Cr. Group Proj.) Series 1999 B1, 0.28%, tender 5/4/10 (c) | 3,500 | | 3,500 |
(Trinity Health Sys. Proj.): | | | |
Series 2008 C: | | | |
0.21% tender 3/3/10, CP mode | 13,300 | | 13,300 |
0.23% tender 4/7/10, CP mode | 7,440 | | 7,440 |
0.27% tender 6/10/10, CP mode | 5,560 | | 5,560 |
0.3% tender 7/7/10, CP mode | 18,000 | | 18,000 |
0.3% tender 7/12/10, CP mode | 34,000 | | 34,000 |
Series B, 0.23% tender 3/5/10, CP mode | 20,000 | | 20,000 |
Michigan Hsg. Dev. Auth. Multi-family Hsg. Rev.: | | | |
Bonds Series 1988 A, 0.32% tender 4/8/10, LOC Landesbank Hessen-Thuringen, CP mode (f) | 6,700 | | 6,700 |
(Lexington Place Apts. Proj.) Series 1999 A, 0.22%, LOC Bank of America NA, VRDN (c)(f) | 6,975 | | 6,975 |
Michigan Hsg. Dev. Auth. Single Family Mtg. Rev. Series 2007 B, 0.26% (Liquidity Facility Fannie Mae) (Liquidity Facility Freddie Mac), VRDN (c)(f) | 11,000 | | 11,000 |
Michigan Muni. Bond Auth. Rev. RAN Series 2009 C3, 2.5% 8/20/10, LOC Bank of Nova Scotia New York Branch | 15,700 | | 15,821 |
Michigan Strategic Fund Ltd. Oblig. Rev. (Orchestra Place Renewal Proj.) Series 2000, 0.22%, LOC Bank of America NA, VRDN (c) | 2,900 | | 2,900 |
Wayne County Arpt. Auth. Rev.: | | | |
(Detroit Metropolitan Wayne County Arpt. Proj.) Series 2008 B, 0.25%, LOC Landesbank Baden-Wuert, VRDN (c)(f) | 143,650 | | 143,650 |
Municipal Securities - continued |
| Principal Amount (000s) | | Value (000s) |
Michigan - continued |
Wayne County Arpt. Auth. Rev.: - continued | | | |
Series 2008 E, 0.31%, LOC JPMorgan Chase Bank, VRDN (c)(f) | $ 5,540 | | $ 5,540 |
Series 2008 F, 0.19%, LOC JPMorgan Chase Bank, VRDN (c)(f) | 6,300 | | 6,300 |
| | 347,076 |
Minnesota - 0.4% |
Dakota County Cmnty. Dev. Agcy. Multi-family Hsg. Rev. (Brentwood Hills Apts. Proj.) Series A, 0.23%, LOC Bank of America NA, VRDN (c)(f) | 22,195 | | 22,195 |
Eagan Multi-family Rev. (Thomas Lake Place Apts. Proj.) Series 2003 A1, 0.29%, LOC Fannie Mae, VRDN (c)(f) | 6,525 | | 6,525 |
Hennepin County Hsg. & Redev. Auth. Multi-family Rev. (Stone Arch Apts. Proj.) 0.25%, LOC Fannie Mae, VRDN (c)(f) | 9,800 | | 9,800 |
Minneapolis Multi-family Rev. (Gateway Real Estate Proj.) 0.3%, LOC Bank of America NA, VRDN (c)(f) | 3,710 | | 3,710 |
Minnesota Hsg. Fin. Agcy. Participating VRDN Series Putters 1207, 0.33% (Liquidity Facility JPMorgan Chase & Co.) (c)(f)(g) | 1,915 | | 1,915 |
Minnesota Office of Higher Ed. Series 2008 B, 0.22%, LOC U.S. Bank NA, Minnesota, VRDN (c)(f) | 9,300 | | 9,300 |
Richfield Multi-family Hsg. Rev. (Lynwood Partners LLC Proj.) 0.3%, LOC Bank of America NA, VRDN (c)(f) | 15,320 | | 15,320 |
Saint Paul Hsg. & Redev. Auth. Rev. (River Pointe Lofts Proj.) Series 2007 A, 0.3%, LOC Bank of America NA, VRDN (c)(f) | 16,885 | | 16,885 |
St. Paul City Port Auth. District Heating Rev. Series 2009 5O, 0.2%, LOC Deutsche Bank AG, VRDN (c) | 1,700 | | 1,700 |
St. Paul Port Auth. District Cooling Rev. Series 2009 12EE, 0.28%, LOC Deutsche Bank AG, VRDN (c)(f) | 1,100 | | 1,100 |
| | 88,450 |
Mississippi - 0.4% |
Mississippi Bus. Fin. Corp. Solid Waste Disp. Rev. (Waste Mgmt., Inc. Proj.) 0.34%, LOC Bank of America NA, VRDN (c)(f) | 5,000 | | 5,000 |
Mississippi Dev. Bank Spl. Oblig.: | | | |
Bonds Series Solar 06 0153, 0.19%, tender 3/5/10 (Liquidity Facility U.S. Bank NA, Minnesota) (c)(g) | 6,200 | | 6,200 |
(East Mississippi Correctional Facility Proj.) Series 2008 B, 0.2%, LOC Bank of America NA, VRDN (c) | 12,000 | | 12,000 |
(Walnut Grove Youth Correctional Facilities Proj.) Series 2008 A, 0.2%, LOC Bank of America NA, VRDN (c) | 20,390 | | 20,390 |
Municipal Securities - continued |
| Principal Amount (000s) | | Value (000s) |
Mississippi - continued |
Mississippi Gen. Oblig. Series 2007, 0.22% (Liquidity Facility Bank of America NA), VRDN (c) | $ 23,300 | | $ 23,300 |
Mississippi Home Corp. Multi-family Hsg. Rev. (Bristol Park Apts. Proj.) Series 2001 1, 0.39%, LOC Wachovia Bank NA, VRDN (c)(f) | 7,700 | | 7,700 |
Mississippi Hosp. Equip. & Facilities Auth. Bonds (Baptist Memorial Health Care Proj.) Series 2004 B2, 0.27%, tender 6/3/10 (c)(h) | 9,000 | | 9,000 |
| | 83,590 |
Missouri - 2.0% |
Bi-State Dev. Agcy. Missouri Illinois Metropolitan District Rev.: | | | |
(MetroLink Cross County Extension Proj.) Series 2005 A, 0.19%, LOC JPMorgan Chase Bank, VRDN (c) | 24,000 | | 24,000 |
Series 2005 A, 0.19%, LOC JPMorgan Chase Bank, VRDN (c) | 18,000 | | 18,000 |
Grandview Indl. Dev. Auth. Multi-family Hsg. Rev. (Briarwood Apts. Proj.) 0.24%, LOC Fannie Mae, VRDN (c)(f) | 12,600 | | 12,600 |
Jefferson County Indl. Dev. Auth. Multi-family Hsg. Rev. (Pevely Pointe Apts. Proj.) 0.25%, LOC Freddie Mac, VRDN (c)(f) | 13,900 | | 13,900 |
Kansas City Indl. Dev. Auth. Air Cargo Facility Rev. (Kansas City Air Cargo Svcs. Proj.) 0.26%, LOC JPMorgan Chase Bank, VRDN (c)(f) | 7,300 | | 7,300 |
Kansas City Indl. Dev. Auth. Student Hsg. Facilities Rev. (Oak Street West Proj.) Series 2006, 0.17%, LOC Bank of America NA, VRDN (c) | 8,500 | | 8,500 |
Missouri Health & Edl. Facilities Auth. Edl. Facilities Rev.: | | | |
Participating VRDN: | | | |
Series Putters 3546, 0.18% (Liquidity Facility JPMorgan Chase Bank) (c)(g) | 11,300 | | 11,300 |
Series Putters 3605, 0.18% (Liquidity Facility JPMorgan Chase Bank) (c)(g) | 22,495 | | 22,495 |
(Lutheran High School Assoc. Proj.) Series 2002, 0.4%, LOC U.S. Bank NA, Minnesota, VRDN (c) | 3,800 | | 3,800 |
Missouri Health & Edl. Facilities Auth. Health Facilities Rev.: | | | |
Bonds (Cox Health Proj.) Series B: | | | |
0.18% tender 3/3/10, LOC Bank of Nova Scotia New York Branch, CP mode | 13,000 | | 13,000 |
0.24% tender 4/6/10, LOC Bank of Nova Scotia New York Branch, CP mode | 30,000 | | 30,000 |
Participating VRDN Series Putters 2587, 0.2% (Liquidity Facility JPMorgan Chase Bank) (c)(g) | 7,955 | | 7,955 |
Municipal Securities - continued |
| Principal Amount (000s) | | Value (000s) |
Missouri - continued |
Missouri Health & Edl. Facilities Auth. Health Facilities Rev.: - continued | | | |
(Cox Health Sys. Proj.) Series 2008 C, 0.2%, LOC Bank of America NA, VRDN (c) | $ 28,000 | | $ 28,000 |
(SSM Health Care Sys. Proj.) Series 2005 C2, 0.2%, LOC Bank of America NA, VRDN (c) | 7,600 | | 7,600 |
Missouri Health & Edl. Facilities Auth. Rev. Bonds (Ascension Health Proj.) Series 2008 C4, 0.39%, tender 5/17/10 (c) | 12,500 | | 12,500 |
Missouri Higher Ed. Ln. Auth. Student Ln. Rev.: | | | |
Series 1990 B, 0.23%, LOC Bank of America NA, VRDN (c)(f) | 33,100 | | 33,100 |
Series 2008 A1, 0.23%, LOC Bank of America NA, VRDN (c)(f) | 37,500 | | 37,500 |
Series 2008 A2, 0.23%, LOC Bank of America NA, VRDN (c)(f) | 105,700 | | 105,700 |
Missouri Hsg. Dev. Commission Single Family Mtg. Rev. Participating VRDN: | | | |
Series Putters 1208, 0.35% (Liquidity Facility JPMorgan Chase & Co.) (c)(f)(g) | 2,690 | | 2,690 |
Series Putters 1514, 0.35% (Liquidity Facility JPMorgan Chase & Co.) (c)(f)(g) | 3,905 | | 3,905 |
Saint Louis Gen. Fund Rev. TRAN 2% 6/30/10 | 18,400 | | 18,485 |
Saint Louis Indl. Dev. Auth. (Metropolitan Lofts Apts. Proj.) Series 2003 A, 0.21%, LOC Fannie Mae, VRDN (c)(f) | 28,300 | | 28,300 |
Springfield Pub. Util. Rev. Participating VRDN Series Solar 06 156, 0.2% (Liquidity Facility U.S. Bank NA, Minnesota) (c)(g) | 30,370 | | 30,370 |
| | 481,000 |
Montana - 0.0% |
Montana Board of Hsg. Participating VRDN: | | | |
Series Clipper 2006 2, 0.32% (Liquidity Facility State Street Bank & Trust Co., Boston) (c)(f)(g) | 10,080 | | 10,080 |
Series Merlots 02 A19, 0.25% (Liquidity Facility Wachovia Bank NA) (c)(f)(g) | 1,080 | | 1,080 |
| | 11,160 |
Nebraska - 1.5% |
Central Plains Energy Proj. Rev. (Nebraska Gas Proj.) Series 2009, 0.19% (Liquidity Facility Royal Bank of Canada), VRDN (c) | 53,600 | | 53,600 |
Douglas County Solid Waste Disp. Rev. (Waste Mgmt., Inc. Proj.) Series A, 0.3%, LOC Bank of America NA, VRDN (c)(f) | 8,600 | | 8,600 |
Municipal Securities - continued |
| Principal Amount (000s) | | Value (000s) |
Nebraska - continued |
Nebraska Invt. Fin. Auth. Single Family Hsg. Rev.: | | | |
Participating VRDN Series Putters 1352, 0.3% (Liquidity Facility JPMorgan Chase & Co.) (c)(f)(g) | $ 4,185 | | $ 4,185 |
Series 2001 E, 0.24% (Liquidity Facility Fed. Home Ln. Bank Topeka), VRDN (c)(f) | 9,390 | | 9,390 |
Series 2002 F, 0.24% (Liquidity Facility Fed. Home Ln. Bank Topeka), VRDN (c)(f) | 13,100 | | 13,100 |
Series 2003 B, 0.24% (Liquidity Facility Fed. Home Ln. Bank Topeka), VRDN (c)(f) | 7,410 | | 7,410 |
Series 2003 E, 0.24% (Liquidity Facility Fed. Home Ln. Bank Topeka), VRDN (c)(f) | 6,230 | | 6,230 |
Series 2004 B, 0.24% (Liquidity Facility Fed. Home Ln. Bank Topeka), VRDN (c)(f) | 3,715 | | 3,715 |
Series 2004 G, 0.24% (Liquidity Facility Fed. Home Ln. Bank Topeka), VRDN (c)(f) | 7,000 | | 7,000 |
Series 2005 B, 0.24% (Liquidity Facility Fed. Home Ln. Bank Topeka), VRDN (c)(f) | 11,710 | | 11,710 |
Series 2005 D, 0.24% (Liquidity Facility Fed. Home Ln. Bank Topeka), VRDN (c)(f) | 16,000 | | 16,000 |
Series 2006 B, 0.24% (Liquidity Facility Fed. Home Ln. Bank Topeka), VRDN (c)(f) | 14,890 | | 14,890 |
Series 2006 G, 0.24% (Liquidity Facility Fed. Home Ln. Bank Topeka), VRDN (c)(f) | 8,970 | | 8,970 |
Series 2007 B, 0.24% (Liquidity Facility Fed. Home Ln. Bank Topeka), VRDN (c)(f) | 33,910 | | 33,910 |
Series 2007 D, 0.24% (Liquidity Facility Fed. Home Ln. Bank Topeka), VRDN (c)(f) | 1,375 | | 1,375 |
Series 2007 F, 0.24% (Liquidity Facility Fed. Home Ln. Bank Topeka), VRDN (c)(f) | 23,600 | | 23,600 |
Series 2007 H, 0.24% (Liquidity Facility Fed. Home Ln. Bank Topeka), VRDN (c)(f) | 46,500 | | 46,500 |
Series 2007 J, 0.24% (Liquidity Facility Fed. Home Ln. Bank Topeka), VRDN (c)(f) | 1,750 | | 1,750 |
Series 2008 D, 0.24% (Liquidity Facility Fed. Home Ln. Bank Topeka), VRDN (c)(f) | 12,500 | | 12,500 |
Series 2008 H, 0.24% (Liquidity Facility Fed. Home Ln. Bank Topeka), VRDN (c)(f) | 13,660 | | 13,660 |
Nebraska Pub. Pwr. District Rev. Series A, 0.25% 4/6/10, CP | 10,000 | | 10,000 |
Municipal Securities - continued |
| Principal Amount (000s) | | Value (000s) |
Nebraska - continued |
Nebraska Pub. Pwr. Generation Agcy. Rev. Participating VRDN Series Solar 07 20, 0.2% (Liquidity Facility U.S. Bank NA, Minnesota) (c)(g) | $ 19,700 | | $ 19,700 |
Omaha Pub. Pwr. District Elec. Rev. 0.38% 3/4/10 (Liquidity Facility JPMorgan Chase Bank), CP | 28,000 | | 28,000 |
| | 355,795 |
Nevada - 2.5% |
Clark County Arpt. Rev.: | | | |
Series 2008 C2, 0.25%, LOC Landesbank Baden-Wuert, VRDN (c)(f) | 56,050 | | 56,050 |
Series 2008 C3, 0.24%, LOC Landesbank Baden-Wuert, VRDN (c)(f) | 64,550 | | 64,550 |
Series 2008 D1, 0.24%, LOC Landesbank Baden-Wuert, VRDN (c) | 15,800 | | 15,800 |
Series 2008 D2, 0.24%, LOC Landesbank Baden-Wuert, VRDN (c) | 65,205 | | 65,205 |
Clark County Fuel Tax: | | | |
Participating VRDN Series Putters 3158, 0.2% (Liquidity Facility JPMorgan Chase Bank) (c)(g) | 32,110 | | 32,110 |
Series 2008 A: | | | |
0.27% 5/6/10, LOC California Teachers Retirement Sys., LOC State Street Bank & Trust Co., Boston, CP | 700 | | 700 |
0.45% 3/10/10, LOC BNP Paribas SA, CP | 2,400 | | 2,400 |
Clark County Indl. Dev. Rev. (Southwest Gas Corp. Proj.): | | | |
Series 2003 A, 0.31%, LOC Bank of America NA, VRDN (c)(f) | 45,100 | | 45,100 |
Series 2008 A, 0.2%, LOC JPMorgan Chase Bank, VRDN (c)(f) | 50,000 | | 50,000 |
Series 2009 A, 0.19%, LOC JPMorgan Chase Bank, VRDN (c) | 2,000 | | 2,000 |
Clark County Passenger Facility Charge Rev. McCarran Int'l. Arpt.: | | | |
Series 2005 A1, 0.26%, LOC Bayerische Landesbank, VRDN (c)(f) | 40,000 | | 40,000 |
Series 2005 A2, 0.26%, LOC Bayerische Landesbank, VRDN (c)(f) | 85,500 | | 85,500 |
Clark County School District Participating VRDN Series BA 08 1153, 0.18% (Liquidity Facility Bank of America NA) (c)(g) | 32,600 | | 32,600 |
Clark County Wtr. Reclamation District Participating VRDN Series Putters 3355, 0.2% (Liquidity Facility JPMorgan Chase Bank) (c)(g) | 7,500 | | 7,500 |
Municipal Securities - continued |
| Principal Amount (000s) | | Value (000s) |
Nevada - continued |
Las Vegas New Convention & Visitors Auth. Rev. Series 2006 B, 0.3% 3/1/10, LOC Bank of Nova Scotia New York Branch, LOC Fortis Banque SA, CP | $ 32,000 | | $ 32,000 |
Las Vegas Valley Wtr. District Wtr. Impt. Gen. Oblig. Participating VRDN Series Solar 06 93, 0.17% (Liquidity Facility U.S. Bank NA, Minnesota) (c)(g) | 14,000 | | 14,000 |
Nevada Dept. of Bus. & Industry: | | | |
(LVE Energy Partners LLC Proj.) 0.36%, LOC Sumitomo Mitsui Banking Corp., VRDN (c)(f) | 29,700 | | 29,700 |
(Republic Svcs., Inc. Proj.) 0.3%, LOC Bank of America NA, VRDN (c)(f) | 2,000 | | 2,000 |
Nevada Hsg. Division (Horizon Apt. Hsg. Proj.) Series 2000 A, 0.24%, LOC Fannie Mae, VRDN (c)(f) | 7,410 | | 7,410 |
Reno Cap. Impt. Rev. Series 2005 A, 0.2%, LOC Bank of America NA, VRDN (c) | 13,500 | | 13,500 |
| | 598,125 |
New Hampshire - 0.9% |
Manchester Arpt. Rev. Series 2008, 0.34%, LOC RBS Citizens NA, VRDN (c)(f) | 23,935 | | 23,935 |
New Hampshire Bus. Fin. Auth. Exempt Facilities Rev. (Waste Mgmt. of New Hampshire, Inc. Proj.) 0.25%, LOC Wachovia Bank NA, VRDN (c)(f) | 20,000 | | 20,000 |
New Hampshire Bus. Fin. Auth. Ind. Dev. Rev. (Wiggins Airways Proj.) Series 1998, 0.5%, LOC Bank of America NA, VRDN (c)(f) | 4,200 | | 4,200 |
New Hampshire Bus. Fin. Auth. Poll. Cont. Rev. Bonds (New England Pwr. Co. Proj.): | | | |
Series 1990 A, 0.85% tender 3/11/10, CP mode (f) | 20,000 | | 20,000 |
Series 1990 B, 0.7% tender 3/10/10, CP mode | 50,600 | | 50,600 |
New Hampshire Bus. Fin. Auth. Resource Recovery Rev. (Wheelabrator Concord Co. LP Proj.) Series 1997 A, 0.21%, LOC Wachovia Bank NA, VRDN (c) | 13,800 | | 13,800 |
New Hampshire Bus. Fin. Auth. Rev. (Luminescent Sys., Inc. Proj.) Series 1998, 0.4%, LOC HSBC Bank USA, NA, VRDN (c)(f) | 2,150 | | 2,150 |
New Hampshire Bus. Fin. Auth. Solid Waste Disp. Rev.: | | | |
(Lonza Biologics, Inc. Proj.) Series 2005, 0.3%, LOC Landesbank Hessen-Thuringen, VRDN (c)(f) | 25,000 | | 25,000 |
(Lonza Biologies, Inc. Proj.) Series 1998, 0.3%, LOC Landesbank Hessen-Thuringen, VRDN (c)(f) | 20,000 | | 20,000 |
New Hampshire Health & Ed. Facilities Auth. Rev.: | | | |
Participating VRDN 0.2% (Liquidity Facility Morgan Stanley) (c)(g) | 7,000 | | 7,000 |
Municipal Securities - continued |
| Principal Amount (000s) | | Value (000s) |
New Hampshire - continued |
New Hampshire Health & Ed. Facilities Auth. Rev.: - continued | | | |
(Frisbie Memorial Hosp. Proj.) Series 2006, 0.19%, LOC TD Banknorth, NA, VRDN (c) | $ 11,700 | | $ 11,700 |
New Hampshire Hsg. Fin. Auth. Multi-family Rev. (Pheasant Run Proj.) 0.2%, LOC Fannie Mae, VRDN (c)(f) | 16,300 | | 16,300 |
| | 214,685 |
New Jersey - 0.7% |
New Jersey Gen. Oblig. TRAN Series 2010 B, 2.5% 6/24/10 | 146,300 | | 147,203 |
Union County Gen. Oblig. BAN 1.75% 7/1/10 | 23,500 | | 23,593 |
| | 170,796 |
New Mexico - 1.7% |
New Mexico Edl. Assistance Foundation: | | | |
Series 2003 A2, 0.23%, LOC Royal Bank of Canada, VRDN (c)(f) | 1,000 | | 1,000 |
Series 2004 A1, 0.23%, LOC Royal Bank of Canada, VRDN (c)(f) | 1,450 | | 1,450 |
Series 2004 A2, 0.23%, LOC Royal Bank of Canada, VRDN (c)(f) | 10,000 | | 10,000 |
Series 2004 A3, 0.23%, LOC Royal Bank of Canada, VRDN (c)(f) | 10,000 | | 10,000 |
Series 2008 A1, 0.23%, LOC Bank of America NA, VRDN (c)(f) | 193,000 | | 193,000 |
Series 2008 A2, 0.23%, LOC Royal Bank of Canada, VRDN (c)(f) | 41,000 | | 41,000 |
Series 2008 A3, 0.23%, LOC Lloyds TSB Bank PLC, VRDN (c)(f) | 56,275 | | 56,275 |
Series 2009 A, 0.23%, LOC Royal Bank of Canada, VRDN (c)(f) | 4,000 | | 4,000 |
New Mexico Hosp. Equip. Ln. Council Rev. Participating VRDN: | | | |
Series MS 3131, 0.2% (Liquidity Facility Morgan Stanley) (c)(g) | 7,000 | | 7,000 |
Series ROC II R 11788, 0.2% (Liquidity Facility Citibank NA) (c)(g) | 9,100 | | 9,100 |
New Mexico Muni. Energy Acquisition Auth. Gas Supply Rev. Series 2009, 0.19% (Liquidity Facility Royal Bank of Canada), VRDN (c) | 45,500 | | 45,500 |
Univ. of New Mexico Univ. Revs. Participating VRDN Series Putters 2533, 0.25% (Liquidity Facility JPMorgan Chase Bank) (c)(g) | 9,990 | | 9,990 |
| | 388,315 |
Municipal Securities - continued |
| Principal Amount (000s) | | Value (000s) |
New York - 5.5% |
Huntington Union Free School District TAN 1.5% 6/25/10 | $ 25,000 | | $ 25,084 |
New York City Gen. Oblig.: | | | |
Participating VRDN Series Putters 3196, 0.19% (Liquidity Facility JPMorgan Chase Bank) (c)(g) | 8,425 | | 8,425 |
Series 2008 J11, 0.19% (Liquidity Facility KBC Bank NV), VRDN (c) | 45,700 | | 45,700 |
Series 2008 J7, 0.23%, LOC Landesbank Baden-Wuert, VRDN (c) | 20,750 | | 20,750 |
New York City Hsg. Dev. Corp. Multi-family Hsg. Mtg. Rev.: | | | |
(Beekman Tower Proj.) Series 2008 A, 0.22%, LOC RBS Citizens NA, VRDN (c) | 45,235 | | 45,235 |
(The Crest Proj.) Series 2005 A, 0.2%, LOC Landesbank Hessen-Thuringen, VRDN (c) | 3,900 | | 3,900 |
(Villa Avenue Apts. Proj.) Series 2006 A, 0.17%, LOC Fannie Mae, VRDN (c)(f) | 5,990 | | 5,990 |
New York City Hsg. Dev. Corp. Multi-family Mtg. Rev.: | | | |
(Morris Ave. Apts. Proj.) Series A, 0.17%, LOC Fannie Mae, VRDN (c)(f) | 14,700 | | 14,700 |
(Related-Upper East Proj.) Series A, 0.31%, LOC Landesbank Baden-Wuert, VRDN (c)(f) | 10,000 | | 10,000 |
(Spring Creek Hsg. Proj.) Series 2006 A, 0.22%, LOC Freddie Mac, VRDN (c)(f) | 3,000 | | 3,000 |
(State Renaissance Court Proj.) Series A, 0.17%, LOC Freddie Mac, VRDN (c)(f) | 8,700 | | 8,700 |
New York City Hsg. Dev. Corp. Multi-family Rental Hsg. Rev.: | | | |
(Brittany Dev. Proj.) Series A, 0.19%, LOC Fannie Mae, VRDN (c)(f) | 8,000 | | 8,000 |
(One Columbus Place Dev. Proj.) Series A, 0.19%, LOC Fannie Mae, VRDN (c)(f) | 28,915 | | 28,915 |
(Rivereast Apts. Proj.) Series A, 0.17%, LOC Freddie Mac, VRDN (c)(f) | 4,150 | | 4,150 |
(West 43rd Street Proj.) Series 1999 A, 0.19%, LOC Fannie Mae, VRDN (c)(f) | 5,000 | | 5,000 |
(West End Towers Proj.) Series 2004 A, 0.19%, LOC Fannie Mae, VRDN (c)(f) | 11,000 | | 11,000 |
(Westport Dev. Proj.) Series 2004 A, 0.19%, LOC Fannie Mae, VRDN (c)(f) | 61,000 | | 61,000 |
Series 2001 A, 0.19%, LOC Fannie Mae, VRDN (c)(f) | 58,235 | | 58,235 |
New York City Muni. Wtr. Fin. Auth. Wtr. & Swr. Sys. Rev.: | | | |
Participating VRDN: | | | |
Series Putters 3156, 0.19% (Liquidity Facility JPMorgan Chase Bank) (c)(g) | 13,280 | | 13,280 |
Municipal Securities - continued |
| Principal Amount (000s) | | Value (000s) |
New York - continued |
New York City Muni. Wtr. Fin. Auth. Wtr. & Swr. Sys. Rev.: - continued | | | |
Participating VRDN: | | | |
Series Putters 3200, 0.19% (Liquidity Facility JPMorgan Chase Bank) (c)(g) | $ 7,495 | | $ 7,495 |
Series 7, 0.3% 5/3/10, CP | 36,100 | | 36,100 |
Series 8, 0.3% 5/5/10, CP | 42,100 | | 42,100 |
New York City Trust Cultural Resources Rev. (Alvin Ailey Dance Foundation, Inc. Proj.) Series 2003, 0.18%, LOC Citibank NA, VRDN (c) | 1,200 | | 1,200 |
New York Dorm. Auth. Revs. Participating VRDN Series EGL 07 0066, 0.2% (Liquidity Facility Citibank NA) (c)(g) | 31,025 | | 31,025 |
New York Hsg. Fin. Agcy. Rev.: | | | |
(101 West End Hsg. Proj.): | | | |
Series 1998 A, 0.18%, LOC Fannie Mae, VRDN (c)(f) | 9,000 | | 9,000 |
Series 1999 A, 0.18%, LOC Fannie Mae, VRDN (c)(f) | 52,850 | | 52,850 |
(150 East 44th Street Hsg. Proj.): | | | |
Series 2000 A, 0.18%, LOC Fannie Mae, VRDN (c)(f) | 37,200 | | 37,200 |
Series 2001 A, 0.19%, LOC Fannie Mae, VRDN (c)(f) | 2,400 | | 2,400 |
(1500 Lexington Avenue Proj.) Series A, 0.27%, LOC Fannie Mae, VRDN (c)(f) | 18,125 | | 18,125 |
(240 East 39th Street Hsg. Proj.) Series 1997 A, 0.19%, LOC Fannie Mae, VRDN (c)(f) | 20,000 | | 20,000 |
(250 West 50th Street Hsg. Proj.) Series 1997 A, 0.19%, LOC Fannie Mae, VRDN (c)(f) | 8,100 | | 8,100 |
(330 Riverdale Avenue Apts. Proj.) Series 2008 A, 0.18%, LOC Bank of America NA, VRDN (c) | 10,000 | | 10,000 |
(350 West 43rd Street Hsg. Proj.): | | | |
Series 2001 A, 0.21%, LOC Landesbank Hessen-Thuringen, VRDN (c)(f) | 4,000 | | 4,000 |
Series 2002 A, 0.21%, LOC Landesbank Hessen-Thuringen, VRDN (c)(f) | 14,700 | | 14,700 |
(360 West 43rd Street Hsg. Proj.) Series A, 0.2%, LOC Fannie Mae, VRDN (c)(f) | 9,900 | | 9,900 |
(455 West 37th Street Hsg. Proj.) Series A, 0.21%, LOC Landesbank Hessen-Thuringen, VRDN (c)(f) | 45,000 | | 45,000 |
(505 West 37th Street Proj.) Series 2009 B, 0.23%, LOC Landesbank Hessen-Thuringen, VRDN (c) | 12,200 | | 12,200 |
(55 West 25th Street Hsg. Proj.) Series 2005 A, 0.19%, LOC Fannie Mae, VRDN (c)(f) | 105,400 | | 105,400 |
(66 West 38th Street Hsg. Proj.) Series A, 0.18%, LOC Fannie Mae, VRDN (c)(f) | 14,000 | | 14,000 |
(900 Eighth Avenue Hsg. Proj.) Series 2002 A, 0.17%, LOC Fannie Mae, VRDN (c)(f) | 7,000 | | 7,000 |
Municipal Securities - continued |
| Principal Amount (000s) | | Value (000s) |
New York - continued |
New York Hsg. Fin. Agcy. Rev.: - continued | | | |
(Avalon Chrystie Place I Hsg. Proj.) Series 2004 A, 0.17%, LOC Freddie Mac, VRDN (c)(f) | $ 18,500 | | $ 18,500 |
(Avalon Chrystie Place I Hsg. Proj.) Series 2004 B, 0.17%, LOC Freddie Mac, VRDN (c)(f) | 7,100 | | 7,100 |
(Chelsea Apts. Proj.) Series A, 0.27%, LOC Fannie Mae, VRDN (c)(f) | 29,330 | | 29,330 |
(Kew Garden Hills Apts. Hsg. Proj.) Series 2003 A, 0.19%, LOC Fannie Mae, VRDN (c)(f) | 11,000 | | 11,000 |
(Parkledge Apts. Hsg. Proj.) Series A, 0.18%, LOC Freddie Mac, VRDN (c)(f) | 8,800 | | 8,800 |
(Related-42nd & 10th Street Proj.) Series 2007 A, 0.2%, LOC Landesbank Baden-Wuert, VRDN (c)(f) | 5,300 | | 5,300 |
(Reverend Polite Ave. Apt. Hsg. Proj.) Series 2005 A, 0.23%, LOC Fannie Mae, VRDN (c)(f) | 7,435 | | 7,435 |
(Sea Park West Hsg. Proj.) Series 2004 A, 0.23%, LOC Freddie Mac, VRDN (c)(f) | 13,900 | | 13,900 |
(South Cove Plaza Proj.) Series A, 0.27%, LOC Freddie Mac, VRDN (c)(f) | 12,700 | | 12,700 |
(Theatre Row Tower Hsg. Proj.) Series 2000 A, 0.2%, LOC Freddie Mac, VRDN (c)(f) | 50,000 | | 50,000 |
(Tower 31 Hsg. Proj.) Series 2005 A, 0.2%, LOC Freddie Mac, VRDN (c)(f) | 53,000 | | 53,000 |
(West 20th Street Proj.) Series A: | | | |
0.17%, LOC Fannie Mae, VRDN (c)(f) | 28,775 | | 28,775 |
0.17%, LOC Fannie Mae, VRDN (c)(f) | 48,800 | | 48,800 |
(West 23rd Street Hsg. Proj.): | | | |
0.18%, LOC Fannie Mae, VRDN (c)(f) | 22,800 | | 22,800 |
0.18%, LOC Fannie Mae, VRDN (c)(f) | 12,900 | | 12,900 |
(West 33rd Street Hsg. Proj.) Series A, 0.19%, LOC Fannie Mae, VRDN (c)(f) | 8,700 | | 8,700 |
(West 38th Street Hsg. Proj.) Series A, 0.18%, LOC Fannie Mae, VRDN (c)(f) | 33,700 | | 33,700 |
New York Metropolitan Trans. Auth. Dedicated Tax Fund Rev. Series 2008 B4, 0.21%, LOC KBC Bank NV, VRDN (c) | 3,245 | | 3,245 |
New York Metropolitan Trans. Auth. Rev.: | | | |
Series A, 0.3% 5/6/10, LOC ABN-AMRO Bank NV, CP | 15,000 | | 15,000 |
Series C, 0.35% 5/4/10, LOC ABN-AMRO Bank NV, CP | 14,900 | | 14,900 |
Municipal Securities - continued |
| Principal Amount (000s) | | Value (000s) |
New York - continued |
New York Pwr. Auth. Series 1: | | | |
0.3% 5/3/10, CP | $ 15,500 | | $ 15,500 |
0.3% 5/3/10, CP | 2,130 | | 2,130 |
| | 1,292,374 |
New York & New Jersey - 0.6% |
Port Auth. of New York & New Jersey Participating VRDN Series EGL 06 107 Class A, 0.25% (Liquidity Facility Citibank NA) (c)(f)(g) | 151,450 | | 151,450 |
Non State Specific - 0.1% |
Missouri, Indiana and Texas Hsg. Authorities Participating VRDN Series Clipper 05 14, 0.35% (Liquidity Facility State Street Bank & Trust Co., Boston) (c)(f)(g) | 15,824 | | 15,824 |
North Carolina - 3.3% |
Charlotte Int'l. Arpt. Rev. (Charlotte Douglas Int'l. Arpt. Proj.) Series 2008 D, 0.21%, LOC Bank of America NA, VRDN (c) | 14,000 | | 14,000 |
Charlotte Wtr. & Swr. Sys. Rev.: | | | |
Series 2002 B, 0.18% (Liquidity Facility Wachovia Bank NA), VRDN (c) | 15,000 | | 15,000 |
Series 2006 B, 0.18% (Liquidity Facility Wachovia Bank NA), VRDN (c) | 37,000 | | 37,000 |
Charlotte-Mecklenburg Hosp. Auth. Health Care Sys. Rev. Series 2007 G, 0.18%, LOC Bank of America NA, VRDN (c) | 21,000 | | 21,000 |
Gaston County Indl. Facilities & Poll. Cont. Fing. Auth. Rev. (Duke Energy Corp. Proj.) Series 1999, 0.19%, VRDN (c)(f) | 20,000 | | 20,000 |
Greensboro Combined Enterprise Sys. Rev. Series 2009 B, 0.2% (Liquidity Facility Bank of America NA), VRDN (c) | 10,000 | | 10,000 |
Mecklenburg County Multi-family Hsg. Rev. (Sycamore Green Apts. Proj.) 0.3%, LOC Bank of America NA, VRDN (c)(f) | 5,930 | | 5,930 |
New Hanover County Hosp. Rev. (New Hanover Reg'l. Med. Ctr. Proj.): | | | |
Series 2008 A, 0.2%, LOC RBC Centura Bank, Rocky Mount, VRDN (c) | 4,900 | | 4,900 |
Series 2008 B, 0.19%, LOC RBC Centura Bank, Rocky Mount, VRDN (c) | 2,950 | | 2,950 |
North Carolina Cap. Facilities Fin. Agcy. Exempt Facilities Rev. (Republic Svcs., Inc. Proj.) Series 2007, 0.19%, LOC Bank of America NA, VRDN (c) | 18,000 | | 18,000 |
North Carolina Cap. Facilities Fin. Agcy. Rev.: | | | |
Participating VRDN: | | | |
Series GS 08 9TP, 0.23% (Liquidity Facility Wells Fargo & Co.) (c)(g) | 14,625 | | 14,625 |
Series Putters 4640, 0.2% (Liquidity Facility Deutsche Postbank AG) (c)(g) | 15,565 | | 15,565 |
Municipal Securities - continued |
| Principal Amount (000s) | | Value (000s) |
North Carolina - continued |
North Carolina Cap. Facilities Fin. Agcy. Rev.: - continued | | | |
(Duke Energy Corp. Proj.): | | | |
Series 2008 A, 0.2%, LOC Wells Fargo Bank NA, VRDN (c)(f) | $ 22,700 | | $ 22,700 |
Series 2008 B, 0.32%, LOC Wells Fargo Bank NA, VRDN (c)(f) | 37,000 | | 37,000 |
(Elon Univ. Proj.) Series 2006, 0.22%, LOC Bank of America NA, VRDN (c) | 4,975 | | 4,975 |
Series 2008 A, 0.23%, LOC Bank of America NA, VRDN (c)(f) | 13,325 | | 13,325 |
North Carolina Hsg. Fin. Agcy. Home Ownership Rev.: | | | |
Participating VRDN: | | | |
Series Clipper 05 8, 0.32% (Liquidity Facility State Street Bank & Trust Co., Boston) (c)(f)(g) | 14,265 | | 14,265 |
Series Merlots 06 B12, 0.25% (Liquidity Facility Wachovia Bank NA) (c)(f)(g) | 32,440 | | 32,440 |
Series 15 C, 0.19% (Liquidity Facility Fannie Mae) (Liquidity Facility Freddie Mac), VRDN (c)(f) | 4,015 | | 4,015 |
Series 16C, 0.19% (Liquidity Facility Fannie Mae) (Liquidity Facility Freddie Mac), VRDN (c)(f) | 16,355 | | 16,355 |
Series 17 C, 0.19% (Liquidity Facility Fannie Mae) (Liquidity Facility Freddie Mac), VRDN (c)(f) | 20,000 | | 20,000 |
Series 18 C, 0.19% (Liquidity Facility Fannie Mae) (Liquidity Facility Freddie Mac), VRDN (c)(f) | 20,000 | | 20,000 |
North Carolina Infrastructure Fin. Corp. Ctfs. of Prtn. Participating VRDN Series BA 08 1073, 0.21% (Liquidity Facility Bank of America NA) (c)(g) | 9,760 | | 9,760 |
North Carolina Med. Care Cmnty. Health Participating VRDN Series BA 08 3509, 0.18% (Liquidity Facility Bank of America NA) (c)(g) | 4,000 | | 4,000 |
North Carolina Med. Care Commission Health Care Facilities Rev.: | | | |
Participating VRDN Series ROC II R 11808, 0.2% (Liquidity Facility Citibank NA) (c)(g) | 8,000 | | 8,000 |
(Cape Fear Valley Health Sys. Proj.): | | | |
Series 2008 A1, 0.18%, LOC Branch Banking & Trust Co., VRDN (c) | 76,000 | | 76,000 |
Series 2008 A2, 0.18%, LOC Branch Banking & Trust Co., VRDN (c) | 72,600 | | 72,600 |
(Friends Homes, Inc. Proj.) Series 2003, 0.22%, LOC Bank of America NA, VRDN (c) | 12,800 | | 12,800 |
(Univ. Health Systems of Eastern Carolina) Series 2008 A2, 0.22%, LOC Bank of America NA, VRDN (c) | 11,170 | | 11,170 |
Municipal Securities - continued |
| Principal Amount (000s) | | Value (000s) |
North Carolina - continued |
North Carolina Med. Care Commission Health Care Facilities Rev.: - continued | | | |
(Wake Forest Univ. Proj.) Series 2008 C, 0.2%, LOC Bank of America NA, VRDN (c) | $ 5,000 | | $ 5,000 |
(WakeMed Proj.): | | | |
Series 2009 B, 0.18%, LOC Wachovia Bank NA, VRDN (c) | 9,400 | | 9,400 |
Series 2009 C, 0.18%, LOC Wachovia Bank NA, VRDN (c) | 16,660 | | 16,660 |
(Watauga Med. Ctr. Proj.) Series 2005, 0.18%, LOC Wachovia Bank NA, VRDN (c) | 16,565 | | 16,565 |
North Carolina Med. Care Commission Retirement Facilities Rev. (Carolina Village Proj.) Series 2008 B, 0.23%, LOC Wells Fargo Bank NA, VRDN (c) | 10,000 | | 10,000 |
North Carolina State Ed. Assistance Auth. Student Ln. Rev.: | | | |
Series 2008 2A1, 0.22%, LOC Royal Bank of Canada, VRDN (c)(f) | 37,200 | | 37,200 |
Series 2008 3A2, 0.28%, LOC Bank of America NA, VRDN (c)(f) | 45,200 | | 45,200 |
Series 2008 A2, 0.22%, LOC Royal Bank of Canada, VRDN (c)(f) | 3,855 | | 3,855 |
Series 2008-5, 0.27%, LOC Branch Banking & Trust Co., VRDN (c)(f) | 15,900 | | 15,900 |
Orange Wtr. & Swr. Auth. Series 2004 B, 0.2% (Liquidity Facility Bank of America NA), VRDN (c) | 2,560 | | 2,560 |
Piedmont Triad Arpt. Auth.: | | | |
Series 2008 A, 0.2%, LOC Branch Banking & Trust Co., VRDN (c) | 3,500 | | 3,500 |
Series 2008 B, 0.3%, LOC Branch Banking & Trust Co., VRDN (c)(f) | 5,700 | | 5,700 |
Rockingham County Indl. Facilities & Poll. Cont. Fing. Auth. Rev. (Pine Brick Co., Inc. Proj.) Series 2000, 0.35%, LOC Wachovia Bank NA, VRDN (c)(f) | 5,700 | | 5,700 |
Sampson County Indl. Facilities & Poll. Cont. Fing. Auth. Envir. Facilities Rev. (Sampson County Disp., Inc. Proj.) 0.25%, LOC Wachovia Bank NA, VRDN (c)(f) | 30,855 | | 30,855 |
Union County Indl. Facilities & Poll. Cont. Fing. Auth. Indl. Dev. Rev. (Greiner Vacuette NA Proj.) 0.35%, LOC Wachovia Bank NA, VRDN (c)(f) | 3,900 | | 3,900 |
Wake County Gen. Oblig. Series 2007 A, 0.19% (Liquidity Facility Bank of America NA), VRDN (c) | 4,900 | | 4,900 |
| | 775,270 |
Municipal Securities - continued |
| Principal Amount (000s) | | Value (000s) |
North Dakota - 0.5% |
Cass County Solid Waste Disp. Rev. (Tharaldson Ethanol Plant I, LLC Proj.) Series 2007, 0.3%, LOC Bank of America NA, VRDN (c)(f) | $ 58,000 | | $ 58,000 |
Hebron Indl. Dev. Rev. (Dacco, Inc. Proj.) 0.33%, LOC U.S. Bank NA, Minnesota, VRDN (c)(f) | 3,305 | | 3,305 |
North Dakota Hsg. Fin. Agcy. Rev. (Home Mtg. Fin. Prog.): | | | |
Series 2004 C, 0.21% (Liquidity Facility Fed. Home Ln. Bank-Des Moines), VRDN (c)(f) | 16,645 | | 16,645 |
Series 2005 A, 0.22% (Liquidity Facility Lloyds TSB Bank PLC), VRDN (c)(f) | 19,600 | | 19,600 |
Series 2008 A, 0.22% (Liquidity Facility Lloyds TSB Bank PLC), VRDN (c)(f) | 13,700 | | 13,700 |
| | 111,250 |
Ohio - 3.4% |
Cuyahoga County Cultural Facilities Rev. (Maltz Museum of Jewish Heritage Proj.) 0.24%, LOC Bank of New York, New York, VRDN (c) | 6,300 | | 6,300 |
Dayton Montgomery County Port Auth. Spl. Arpt. Facilities Rev. (Wilmington Air Park, Inc. Proj.): | | | |
Series 2007 A, 4% (Deutsche Post AG Guaranteed), VRDN (c)(f) | 66,100 | | 66,100 |
Series 2007 C, 4% (Deutsche Post AG Guaranteed), VRDN (c)(f) | 72,800 | | 72,800 |
Fulton County Gen. Oblig. Rev. (Fulton County Health Ctr. Proj.) Series 2005, 0.18%, LOC JPMorgan Chase Bank, VRDN (c) | 5,300 | | 5,300 |
Hamilton County Hosp. Facilities Rev. (Childrens Hosp. Med. Ctr. Proj.): | | | |
Series 1997 A, 0.2%, LOC PNC Bank NA, Pittsburgh, VRDN (c) | 6,115 | | 6,115 |
Series 2000, 0.2%, LOC JPMorgan Chase Bank, VRDN (c) | 23,760 | | 23,760 |
Series 2007 N, 0.2%, LOC JPMorgan Chase Bank, VRDN (c) | 7,500 | | 7,500 |
Lancaster Port Auth. Gas Rev. 0.19% (Liquidity Facility Royal Bank of Canada), VRDN (c) | 49,830 | | 49,830 |
Montgomery County Rev. Participating VRDN Series MS 3126X, 0.22% (Liquidity Facility Morgan Stanley) (c)(g) | 2,600 | | 2,600 |
Ohio Air Quality Dev. Auth. Rev.: | | | |
(Cincinnati Gas & Elec. Co. Proj.) Series A, 0.3%, VRDN (c) | 13,700 | | 13,700 |
(Dayton Pwr. & Lt. Co. Proj.) Series 2008 B, 0.19%, LOC JPMorgan Chase Bank, VRDN (c)(f) | 3,000 | | 3,000 |
(FirstEnergy Corp. Proj.) Series A, 0.22%, LOC Barclays Bank PLC, VRDN (c)(f) | 1,000 | | 1,000 |
Municipal Securities - continued |
| Principal Amount (000s) | | Value (000s) |
Ohio - continued |
Ohio Higher Edl. Facility Commission Rev. Bonds (Cleveland Clinic Proj.): | | | |
Series 2008 B5: | | | |
0.26% tender 5/6/10, CP mode | $ 7,200 | | $ 7,200 |
0.37% tender 6/15/10, CP mode | 10,000 | | 10,000 |
Series 2008 B6: | | | |
0.26% tender 5/6/10, CP mode | 8,600 | | 8,600 |
0.37% tender 6/15/10, CP mode | 8,800 | | 8,800 |
0.4% tender 3/4/10, CP mode | 18,650 | | 18,650 |
Ohio Hosp. Facilities Rev. Participating VRDN Series Putters 3558, 0.2% (Liquidity Facility JPMorgan Chase Bank) (c)(g) | 12,800 | | 12,800 |
Ohio Hsg. Fin. Agcy. Mtg. Rev.: | | | |
Participating VRDN Series Putters 1334, 0.35% (Liquidity Facility JPMorgan Chase & Co.) (c)(f)(g) | 1,905 | | 1,905 |
(Mtg.-Backed Securities Prog.): | | | |
Series 2005 B1, 0.21% (Liquidity Facility Fed. Home Ln. Bank, Cincinnati), VRDN (c)(f) | 26,500 | | 26,500 |
Series 2005 B2, 0.18% (Liquidity Facility Fed. Home Ln. Bank, Cincinnati), VRDN (c)(f) | 8,575 | | 8,575 |
Series 2005 F, 0.18% (Liquidity Facility Fed. Home Ln. Bank, Cincinnati), VRDN (c)(f) | 32,000 | | 32,000 |
Series B, 0.18% (Liquidity Facility Citibank NA), VRDN (c)(f) | 29,750 | | 29,750 |
Series 2007 E, 0.2% (Liquidity Facility KBC Bank NV), VRDN (c)(f) | 90,600 | | 90,600 |
Series H, 0.2% (Liquidity Facility KBC Bank NV), VRDN (c)(f) | 26,630 | | 26,630 |
Ohio Hsg. Fin. Agcy. Multi-family Hsg. Rev. (Club at Spring Valley Apts. Proj.) Series 1996 A, 0.8%, LOC RBS Citizens NA, VRDN (c)(f) | 3,800 | | 3,800 |
Ohio Hsg. Fin. Agcy. Residential Mtg. Rev.: | | | |
Series 2006 I, 0.18% (Liquidity Facility Citibank NA), VRDN (c)(f) | 7,400 | | 7,400 |
Series 2006 J, 0.18% (Liquidity Facility State Street Bank & Trust Co., Boston), VRDN (c)(f) | 58,800 | | 58,800 |
Series 2006 N, 0.18% (Liquidity Facility State Street Bank & Trust Co., Boston), VRDN (c)(f) | 53,405 | | 53,405 |
Series 2007 J, 0.24% (Liquidity Facility KBC Bank NV), VRDN (c)(f) | 31,000 | | 31,000 |
Series 2008 B, 0.19% (Liquidity Facility Fed. Home Ln. Bank, Cincinnati), VRDN (c)(f) | 30,100 | | 30,100 |
Ohio Solid Waste Rev. (Republic Svcs., Inc. Proj.) 0.21%, LOC JPMorgan Chase Bank, VRDN (c)(f) | 30,000 | | 30,000 |
Ohio State Univ. Gen. Receipts Bonds Series B, 0.75% 3/1/10 | 5,060 | | 5,060 |
Municipal Securities - continued |
| Principal Amount (000s) | | Value (000s) |
Ohio - continued |
Ohio Wtr. Dev. Auth. (Waste Mgmt., Inc. Proj.) Series B, 0.22%, LOC Bank of America NA, VRDN (c)(f) | $ 8,100 | | $ 8,100 |
Ohio Wtr. Dev. Auth. Poll. Cont. Facilities Rev. (FirstEnergy Corp. Proj.) Series A, 0.21%, LOC Barclays Bank PLC, VRDN (c)(f) | 7,000 | | 7,000 |
Portage County Hosp. Rev. (Robinson Memorial Hosp. Proj.) Series 2008, 0.23%, LOC JPMorgan Chase Bank, VRDN (c) | 22,200 | | 22,200 |
Westlake Health Facilities Rev. (Lutheran Home Proj.) Series 2005, 0.55%, LOC RBS Citizens NA, VRDN (c) | 7,900 | | 7,900 |
| | 804,780 |
Oklahoma - 0.8% |
Oklahoma City Indl. and Cultural Facilities Trust Edl. Facility Rev. (Oklahoma City Univ. Proj.) Series 2006, 0.2%, LOC Bank of America NA, VRDN (c) | 6,685 | | 6,685 |
Oklahoma Dev. Fin. Auth. Rev.: | | | |
(ConocoPhillips Co. Proj.): | | | |
Series 2002 B, 0.24%, VRDN (c)(f) | 2,500 | | 2,500 |
Series 2002, 0.24%, VRDN (c)(f) | 10,000 | | 10,000 |
(Shawnee Fdg. LP Proj.) Series 1996, 0.34%, LOC Bank of Nova Scotia New York Branch, VRDN (c)(f) | 4,700 | | 4,700 |
Oklahoma Hsg. Fin. Agcy. Single Family Mtg. Rev. Participating VRDN: | | | |
Series Clipper 04 3, 0.32% (Liquidity Facility State Street Bank & Trust Co., Boston) (c)(f)(g) | 24,069 | | 24,069 |
Series Putters 1380, 0.35% (Liquidity Facility JPMorgan Chase & Co.) (c)(f)(g) | 6,770 | | 6,770 |
Oklahoma Student Ln. Auth. Rev. Series 2008 A1, 0.23%, LOC Bank of America NA, VRDN (c)(f) | 117,700 | | 117,700 |
Tulsa Arpts. Impt. Trust Spl. Facility Rev. 0.21%, LOC Landesbank Hessen-Thuringen, VRDN (c)(f) | 10,120 | | 10,120 |
| | 182,544 |
Oregon - 0.7% |
Clackamas County Hosp. Facility Auth. Bonds (Providence Health Sys. Proj.): | | | |
Series 2003 D, 0.42% tender 3/8/10, CP mode | 12,500 | | 12,500 |
Series 2003 E: | | | |
0.35% tender 7/9/10, CP mode | 6,000 | | 6,000 |
0.35% tender 7/20/10, CP mode | 8,000 | | 8,000 |
0.35% tender 8/6/10, CP mode | 8,000 | | 8,000 |
Series F, 0.28% tender 6/11/10, CP mode | 10,000 | | 10,000 |
Municipal Securities - continued |
| Principal Amount (000s) | | Value (000s) |
Oregon - continued |
Oregon Econ. & Cmnty. Econ. Dev. Rev. (American Bridge Co. Proj.) Series 205, 0.31%, LOC Nat'l. City Bank Cleveland, VRDN (c)(f) | $ 2,540 | | $ 2,540 |
Oregon State Dept. of Administrative Svcs. Lottery Rev. Bonds: | | | |
Series 2009 A, 2% 4/1/10 | 13,095 | | 13,111 |
Series 2009 C, 2% 4/1/10 | 12,080 | | 12,094 |
Port of Portland Arpt. Rev. Series Eighteen A, 0.18%, LOC Lloyds TSB Bank PLC, VRDN (c)(f) | 46,925 | | 46,925 |
Portland Econ. Dev. Rev. (Columbia Aluminum Recycling Proj.) 0.35%, LOC U.S. Bank NA, Minnesota, VRDN (c)(f) | 1,900 | | 1,900 |
Portland Gen. Oblig. TAN (Fire and Police Disability and Retirement Fund Proj.) Series 2009, 2.5% 6/24/10 | 13,830 | | 13,918 |
Portland Hsg. Auth. Rev.: | | | |
(New Columbia - Cecelia Proj.) Series 2004, 0.5%, LOC Bank of America NA, VRDN (c)(f) | 1,500 | | 1,500 |
(New Columbia - Trouton Proj.) 0.3%, LOC Bank of America NA, VRDN (c)(f) | 6,170 | | 6,170 |
Portland Multi-family Hsg. Rev. (The Village at Lovejoy Fountain Proj.) Series 2009, 0.25%, LOC Freddie Mac, VRDN (c)(f) | 15,000 | | 15,000 |
Salem-Keizer School District #24J Participating VRDN Series WF 09 4Z, 0.18% (Liquidity Facility Wells Fargo & Co.) (c)(g) | 14,465 | | 14,465 |
| | 172,123 |
Pennsylvania - 4.2% |
Allegheny County Indl. Dev. Auth. Rev. (United Jewish Federation Proj.) Series 1996 A, 0.19%, LOC PNC Bank NA, Pittsburgh, VRDN (c) | 5,500 | | 5,500 |
Bucks County Indl. Dev. Auth. Rev. Series 2007 B, 0.35%, LOC Citizens Bank of Pennsylvania, VRDN (c) | 3,765 | | 3,765 |
Cambria County Ind. Dev. Auth. (Cambria Cogen Co. Proj.): | | | |
Series 1998 A1, 0.3%, LOC Bayerische Hypo-und Vereinsbank AG, VRDN (c)(f) | 90,550 | | 90,550 |
Series 1998 A2, 0.3%, LOC Bayerische Hypo-und Vereinsbank AG, VRDN (c)(f) | 12,805 | | 12,805 |
Chester County Health & Ed. Auth. Rev. (Jenner's Pond Proj.) Series 2006, 0.38%, LOC Citizens Bank of Pennsylvania, VRDN (c) | 23,640 | | 23,640 |
Clarion County Indl. Dev. Auth. Energy Dev. Rev. (Piney Creek Proj.) Series 1990, 0.21%, LOC Landesbank Hessen-Thuringen, VRDN (c)(f) | 15,715 | | 15,715 |
Cumberland County Muni. Auth. Rev. (Presbyterian Homes Proj.) Series 2008 B, 0.18%, LOC Bank of America NA, VRDN (c) | 16,600 | | 16,600 |
Municipal Securities - continued |
| Principal Amount (000s) | | Value (000s) |
Pennsylvania - continued |
Delaware County Auth. Rev.: | | | |
(Riddle Village Proj.) Series 2006, 0.18%, LOC Banco Santander SA, VRDN (c) | $ 8,000 | | $ 8,000 |
(White Horse Village Proj.) Series 2006 B, 0.23%, LOC Citizens Bank of Pennsylvania, VRDN (c) | 19,400 | | 19,400 |
Franklin County Indl. Dev. Auth. (Menno Haven Proj.) Series 2008, 0.22%, LOC Wachovia Bank NA, VRDN (c) | 8,735 | | 8,735 |
Geisinger Auth. Health Sys. Rev. Participating VRDN: | | | |
Series Putters 3462, 0.19% (Liquidity Facility JPMorgan Chase Bank) (c)(g) | 11,245 | | 11,245 |
Series Putters 3490Z, 0.19% (Liquidity Facility JPMorgan Chase Bank) (c)(g) | 4,995 | | 4,995 |
Harveys Lake Gen. Muni. Auth. (Misericordia Univ. Proj.) 0.19%, LOC PNC Bank NA, Pittsburgh, VRDN (c) | 7,300 | | 7,300 |
Lehigh County Indl. Dev. Auth. Rev. (Mancor Industries, Inc. Proj.) 0.41%, LOC PNC Bank NA, Pittsburgh, VRDN (c)(f) | 500 | | 500 |
Lower Merion School District Series 2009 A, 0.18%, LOC State Street Bank & Trust Co., Boston, VRDN (c) | 5,000 | | 5,000 |
Montgomery County Indl. Dev. Auth. Rev.: | | | |
(Foulkeways at Gwynedd Proj.) Series 2006 B, 0.38%, LOC Citizens Bank of Pennsylvania, VRDN (c) | 12,995 | | 12,995 |
(Haverford School Proj.) Series 2008, 0.2%, LOC Citizens Bank of Pennsylvania, VRDN (c) | 32,345 | | 32,345 |
Pennsylvania Econ. Dev. Fing. Auth. Exempt Facilities Rev.: | | | |
(Amtrak Proj.) Series 2001 B, 0.21%, LOC JPMorgan Chase Bank, VRDN (c)(f) | 5,000 | | 5,000 |
(FirstEnergy Corp. Proj.) Series A, 0.2%, LOC PNC Bank NA, Pittsburgh, VRDN (c)(f) | 21,200 | | 21,200 |
(Shippingport Proj.) Series A, 0.2%, LOC PNC Bank NA, Pittsburgh, VRDN (c)(f) | 13,800 | | 13,800 |
Pennsylvania Econ. Dev. Fing. Auth. Indl. Dev. Rev.: | | | |
Series 1996 D5, 0.26%, LOC PNC Bank NA, Pittsburgh, VRDN (c)(f) | 1,200 | | 1,200 |
Series 1997 B1, 0.41%, LOC PNC Bank NA, Pittsburgh, VRDN (c)(f) | 600 | | 600 |
Series 1997 B4, 0.41%, LOC PNC Bank NA, Pittsburgh, VRDN (c)(f) | 600 | | 600 |
Series 1997 B8, 0.41%, LOC PNC Bank NA, Pittsburgh, VRDN (c)(f) | 400 | | 400 |
Series 1997 B9, 0.41%, LOC PNC Bank NA, Pittsburgh, VRDN (c)(f) | 200 | | 200 |
Pennsylvania Econ. Dev. Fing. Auth. Manufacturing Facility Rev. (Dodge Realty Partners Proj.) 0.23%, LOC PNC Bank NA, Pittsburgh, VRDN (c)(f) | 2,800 | | 2,800 |
Municipal Securities - continued |
| Principal Amount (000s) | | Value (000s) |
Pennsylvania - continued |
Pennsylvania Econ. Dev. Fing. Auth. Wastewtr. Treatment Rev. (Sunoco, Inc. (R&M) Proj.) Series 2009 A, 0.2% (Sunoco, Inc. Guaranteed), LOC JPMorgan Chase Bank, VRDN (c) | $ 7,900 | | $ 7,900 |
Pennsylvania Energy Dev. Auth. Rev. (Piney Creek Proj.) Series 1986 A, 0.21%, LOC Landesbank Hessen-Thuringen, VRDN (c)(f) | 3,020 | | 3,020 |
Pennsylvania Gen. Oblig.: | | | |
Bonds Second Series 2006, 5% 3/1/10 | 5,105 | | 5,105 |
Participating VRDN: | | | |
Series Putters 3350, 0.19% (Liquidity Facility JPMorgan Chase Bank) (c)(g) | 7,045 | | 7,045 |
Series Putters 3352Z, 0.19% (Liquidity Facility JPMorgan Chase Bank) (c)(g) | 2,200 | | 2,200 |
Pennsylvania Higher Edl. Facilities Auth. Rev.: | | | |
(California Univ. of Pennsylvania Student Hsg. Proj.) Series 2006 A, 0.17%, LOC Fed. Home Ln. Bank Pittsburgh, VRDN (c) | 60,490 | | 60,490 |
(Drexel Univ. Proj.) Series B, 0.21%, LOC Landesbank Hessen-Thuringen, VRDN (c) | 17,665 | | 17,665 |
(Indiana Univ. of Pennsylvania Student Hsg. Proj.) Series 2008, 0.17%, LOC Fed. Home Ln. Bank Pittsburgh, VRDN (c) | 28,595 | | 28,595 |
(St. Joseph's Univ. Proj.) Series 2008 B, 0.2%, LOC Citizens Bank of Pennsylvania, VRDN (c) | 27,500 | | 27,500 |
Pennsylvania Hsg. Fin. Agcy. Single Family Mtg. Rev.: | | | |
Participating VRDN: | | | |
Series BA 08 1108, 0.25% (Liquidity Facility Bank of America NA) (c)(f)(g) | 6,750 | | 6,750 |
Series BA 08 1118, 0.25% (Liquidity Facility Bank of America NA) (c)(f)(g) | 3,250 | | 3,250 |
Series Putters 3212, 0.19% (Liquidity Facility JPMorgan Chase Bank) (c)(g) | 9,030 | | 9,030 |
Series 2002 74A, 0.3% (Liquidity Facility Lloyds TSB Bank PLC), VRDN (c)(f) | 21,900 | | 21,900 |
Series 2002 75A, 0.3% (Liquidity Facility Lloyds TSB Bank PLC), VRDN (c)(f) | 21,900 | | 21,900 |
Series 2003 77B, 0.3% (Liquidity Facility BNP Paribas SA), VRDN (c)(f) | 14,975 | | 14,975 |
Series 2003 77C, 0.3% (Liquidity Facility BNP Paribas SA), VRDN (c)(f) | 7,490 | | 7,490 |
Series 2003 79B, 0.3% (Liquidity Facility BNP Paribas SA), VRDN (c)(f) | 20,900 | | 20,900 |
Series 2004 81B, 0.3% (Liquidity Facility Lloyds TSB Bank PLC), VRDN (c)(f) | 8,975 | | 8,975 |
Municipal Securities - continued |
| Principal Amount (000s) | | Value (000s) |
Pennsylvania - continued |
Pennsylvania Hsg. Fin. Agcy. Single Family Mtg. Rev.: - continued | | | |
Series 2004 81C, 0.3% (Liquidity Facility Lloyds TSB Bank PLC), VRDN (c)(f) | $ 54,600 | | $ 54,600 |
Series 2004 84D, 0.19% (Liquidity Facility Fannie Mae) (Liquidity Facility Freddie Mac), VRDN (c)(f) | 1,825 | | 1,825 |
Series 2004 85B, 0.18% (Liquidity Facility Fannie Mae) (Liquidity Facility Freddie Mac), VRDN (c)(f) | 12,800 | | 12,800 |
Series 2004 86B, 0.19% (Liquidity Facility Fannie Mae) (Liquidity Facility Freddie Mac), VRDN (c)(f) | 32,000 | | 32,000 |
Series 2005 90C, 0.18% (Liquidity Facility Fannie Mae) (Liquidity Facility Freddie Mac), VRDN (c)(f) | 3,400 | | 3,400 |
Series 2005-89, 0.19% (Liquidity Facility Fannie Mae) (Liquidity Facility Freddie Mac), VRDN (c)(f) | 2,315 | | 2,315 |
Series 2005-91B, 0.19% (Liquidity Facility Fannie Mae) (Liquidity Facility Freddie Mac), VRDN (c)(f) | 9,900 | | 9,900 |
Series 2006 92B, 0.3% (Liquidity Facility Landesbank Hessen-Thuringen), VRDN (c)(f) | 12,600 | | 12,600 |
Series 2006 93B, 0.22% (Liquidity Facility Dexia Cr. Local de France), VRDN (c)(f) | 31,225 | | 31,225 |
Series 2006 94B, 0.21% (Liquidity Facility Dexia Cr. Local de France), VRDN (c)(f) | 25,165 | | 25,165 |
Pennsylvania Pub. School Bldg. Auth. School Rev. (Harrisburg School District Proj.) Series 2009 D, 0.18%, LOC Wachovia Bank NA, VRDN (c) | 42,710 | | 42,710 |
Pennsylvania Tpk. Commission Tpk. Rev.: | | | |
Series 2008 B2, 0.18%, LOC Bank of America NA, VRDN (c) | 5,900 | | 5,900 |
Series 2008 B5, 0.2%, LOC Bank of America NA, VRDN (c) | 12,800 | | 12,800 |
Philadelphia Arpt. Rev. Series 2005 C, 0.16%, LOC TD Banknorth, NA, VRDN (c)(f) | 21,865 | | 21,865 |
Philadelphia School District: | | | |
Series 2008 A1, 0.18%, LOC Bank of America NA, VRDN (c) | 14,800 | | 14,800 |
Series 2008 B1, 0.18%, LOC Wachovia Bank NA, VRDN (c) | 32,800 | | 32,800 |
Series 2008 B2, 0.18%, LOC Wachovia Bank NA, VRDN (c) | 28,200 | | 28,200 |
Philadelphia State Pub. School Participating VRDN Series Solar 06 161, 0.17% (Liquidity Facility U.S. Bank NA, Minnesota) (c)(g) | 26,625 | | 26,625 |
Philadelphia Wtr. & Wastewtr. Rev.: | | | |
Series 1997 B, 0.18%, LOC Bank of America NA, VRDN (c) | 3,385 | | 3,385 |
Series 2005 B, 0.18%, LOC Bank of America NA, VRDN (c) | 13,650 | | 13,650 |
Southeastern Pennsylvania Trans. Auth. Rev. Series 2007, 0.17%, LOC PNC Bank NA, Pittsburgh, VRDN (c) | 300 | | 300 |
Municipal Securities - continued |
| Principal Amount (000s) | | Value (000s) |
Pennsylvania - continued |
Washington County Hosp. Auth. Rev. (Washington Hosp. Proj.) Series 2007 B, 0.19%, LOC Wachovia Bank NA, VRDN (c) | $ 4,900 | | $ 4,900 |
Wilkes Barre Gen. Oblig. Series 2004 B, 0.19%, LOC PNC Bank NA, Pittsburgh, VRDN (c) | 2,415 | | 2,415 |
| | 995,760 |
Rhode Island - 0.2% |
Narragansett Bay Commission Wastewtr. Sys. Rev. Series 2008 A, 0.21%, LOC RBS Citizens NA, VRDN (c) | 3,250 | | 3,250 |
Rhode Island Indl. Facilities Corp. Indl. Dev. Rev. (NFA Corp. Proj.) 0.3%, LOC Bank of America NA, VRDN (c)(f) | 5,000 | | 5,000 |
Rhode Island Student Ln. Auth. Student Ln. Rev.: | | | |
Series 2008 B1, 0.2%, LOC State Street Bank & Trust Co., Boston, VRDN (c)(f) | 10,000 | | 10,000 |
Series 2008 B2, 0.2%, LOC State Street Bank & Trust Co., Boston, VRDN (c)(f) | 20,000 | | 20,000 |
Series 2008 B3, 0.2%, LOC State Street Bank & Trust Co., Boston, VRDN (c)(f) | 7,000 | | 7,000 |
| | 45,250 |
South Carolina - 2.0% |
Anderson County School District #5 Participating VRDN Series BA 08 1181, 0.23% (Liquidity Facility Bank of America NA) (c)(g) | 14,650 | | 14,650 |
Charleston Wtrwks. & Swr. Rev.: | | | |
Series 2006 B, 0.18% (Liquidity Facility Wachovia Bank NA), VRDN (c) | 10,575 | | 10,575 |
Series A, 0.19% (Liquidity Facility Bank of America NA), VRDN (c) | 13,000 | | 13,000 |
Darlington County Indl. Dev. Rev. (Nucor Corp. Proj.) Series 2003 A, 0.26%, VRDN (c)(f) | 8,100 | | 8,100 |
Greenville County School District Bonds Series 2009 A, 1.5% 6/1/10 | 24,295 | | 24,357 |
Greenville Hosp. Sys. Facilities Rev. Series 2008 E, 0.18%, LOC Wachovia Bank NA, VRDN (c) | 41,900 | | 41,900 |
Lexington County and Richland County School District #5 Bonds Series 2009 A, 2% 3/1/10 | 18,740 | | 18,740 |
South Carolina Assoc. of Governmental Organizations Ctfs. of Prtn. Bonds Series 2009 A, 1.5% 4/15/10 | 103,915 | | 104,051 |
South Carolina Gen. Oblig. Participating VRDN Series ROC II R 692W, 0.2% (Liquidity Facility Wells Fargo & Co.) (c)(g) | 2,125 | | 2,125 |
South Carolina Jobs-Econ. Dev. Auth.: | | | |
(AnMed Health Proj.) Series 2009 D, 0.18%, LOC Branch Banking & Trust Co., VRDN (c) | 3,355 | | 3,355 |
Municipal Securities - continued |
| Principal Amount (000s) | | Value (000s) |
South Carolina - continued |
South Carolina Jobs-Econ. Dev. Auth.: - continued | | | |
(Palmetto Health Proj.): | | | |
Series 2008 A, 0.2%, LOC Bank of America NA, VRDN (c) | $ 13,000 | | $ 13,000 |
Series 2008 B, 0.2%, LOC Bank of America NA, VRDN (c) | 32,665 | | 32,665 |
South Carolina Jobs-Econ. Dev. Auth. Econ. Dev. Rev.: | | | |
(Alfmeier Corp. Proj.) 0.35%, LOC Bayerische Landesbank Girozentrale, VRDN (c)(f) | 1,000 | | 1,000 |
(Carolina Piedmont Foundation Proj.) 0.25%, LOC Bank of America NA, VRDN (c) | 5,530 | | 5,530 |
(Giant Cement Holding, Inc. Proj.) 0.25%, LOC Citibank NA, VRDN (c)(f) | 2,000 | | 2,000 |
(Keys Printing Co. Proj.) 0.35%, LOC JPMorgan Chase Bank, VRDN (c)(f) | 200 | | 200 |
(Waste Mgmt. of South Carolina, Inc. Proj.) Series 2003 A, 0.32%, LOC Wachovia Bank NA, VRDN (c)(f) | 15,000 | | 15,000 |
South Carolina Jobs-Econ. Dev. Auth. Indl. Rev. (South Carolina Generating Co., Inc. Proj.) Series 2008, 0.26%, LOC Branch Banking & Trust Co., VRDN (c)(f) | 12,400 | | 12,400 |
South Carolina Pub. Svc. Auth. Rev.: | | | |
Participating VRDN: | | | |
Series ROC II R 11426, 0.21% (Liquidity Facility Citibank NA) (c)(g) | 33,000 | | 33,000 |
Series ROC II R 11528, 0.2% (Liquidity Facility Citibank NA) (c)(g) | 17,820 | | 17,820 |
0.19% 3/10/10, CP | 14,760 | | 14,760 |
South Carolina Trans. Infrastructure Bank Rev.: | | | |
Series 2003 B1, 0.19%, LOC Bank of America NA, VRDN (c) | 22,320 | | 22,320 |
Series 2003 B2, 0.18%, LOC Branch Banking & Trust Co., VRDN (c) | 38,800 | | 38,800 |
York County Poll. Cont. Rev. Bonds (Duke Energy Corp. Proj.) 0.9% tender 3/1/10, CP mode | 20,850 | | 20,850 |
| | 470,198 |
South Dakota - 0.2% |
South Dakota Conservancy District Rev. BAN 2% 9/10/10 | 27,500 | | 27,705 |
South Dakota Hsg. Dev. Auth.: | | | |
(Harmony Heights Proj.) Series 2001, 0.29%, LOC Fannie Mae, VRDN (c)(f) | 6,500 | | 6,500 |
(Homeownership Mtg. Proj.) Series 2003 F, 0.36% (Liquidity Facility Landesbank Hessen-Thuringen), VRDN (c)(f) | 10,000 | | 10,000 |
| | 44,205 |
Municipal Securities - continued |
| Principal Amount (000s) | | Value (000s) |
Tennessee - 1.3% |
Chattanooga Indl. Dev. Board Indl. Rev. (Burner Systems Int'l., Inc. Proj.) 0.5%, LOC JPMorgan Chase Bank, VRDN (c)(f) | $ 4,500 | | $ 4,500 |
Jackson Indl. Dev. Board Solid Waste Disp. Rev. (Florida Steel Corp. Proj.) Series 1995, 0.3%, LOC Bank of America NA, VRDN (c)(f) | 17,000 | | 17,000 |
Knox County Health Edl. & Hsg. Facilities Board Hosp. Facilities Rev. (Catholic Healthcare Partners Proj.): | | | |
Series 2008 A, 0.22%, LOC Landesbank Baden-Wuert, VRDN (c) | 4,300 | | 4,300 |
Series 2008 B, 0.24%, LOC Landesbank Baden-Wuert, VRDN (c) | 4,000 | | 4,000 |
Loudon County Indl. Dev. Board Exempt Facilities Rev. (Kimberly-Clark Corp. Proj.) 0.3%, VRDN (c)(f) | 11,600 | | 11,600 |
Loudon Indl. Dev. Board Solid Waste Disp. Rev. (Tate & Lyle Ingredients Americas, Inc. Proj.) Series 2006, 0.21%, LOC Rabobank Nederland, VRDN (c)(f) | 42,100 | | 42,100 |
Memphis Health, Edl. & Hsg. Facilities Board (Ashland Lakes Apts. Proj.) Series A, 0.22%, LOC U.S. Bank NA, Minnesota, VRDN (c)(f) | 10,000 | | 10,000 |
Metropolitan Govt. Nashville & Davidson County Health & Edl. Facilities Board (Whispering Oaks Apts. Proj.) 0.25%, LOC Fannie Mae, VRDN (c)(f) | 15,000 | | 15,000 |
Montgomery County Pub. Bldg. Auth. Pooled Fing. Rev. (Tennessee County Ln. Pool Prog.) Series 1999, 0.24%, LOC Bank of America NA, VRDN (c) | 32,740 | | 32,740 |
Nashville and Davidson County Metropolitan Govt. Gen. Oblig. Participating VRDN Series Putters 2631, 0.2% (Liquidity Facility JPMorgan Chase Bank) (c)(g) | 67,475 | | 67,475 |
Sevier County Pub. Bldg. Auth. Rev. Series V-A-1, 0.3%, LOC Branch Banking & Trust Co., VRDN (c)(f) | 13,500 | | 13,500 |
Shelby County Gen. Oblig.: | | | |
Series 2004 B, 0.21% (Liquidity Facility Landesbank Hessen-Thuringen), VRDN (c) | 1,400 | | 1,400 |
Series 2006 C, 0.2% (Liquidity Facility Dexia Cr. Local de France), VRDN (c) | 13,085 | | 13,085 |
Shelby County Health Edl. & Hsg. Facilities Board Rev. (Trezevant Manor Proj.): | | | |
Series 2007 B, 0.2%, LOC Bank of America NA, VRDN (c) | 6,000 | | 6,000 |
Series A, 0.2%, LOC Bank of America NA, VRDN (c) | 36,125 | | 36,125 |
Municipal Securities - continued |
| Principal Amount (000s) | | Value (000s) |
Tennessee - continued |
Tennessee Hsg. Participating VRDN Series Clipper 05 10, 0.32% (Liquidity Facility State Street Bank & Trust Co., Boston) (c)(f)(g) | $ 20,575 | | $ 20,575 |
White County Indl. Dev. Board Indl. Dev. Rev. (Genlyte Thomas Group LLC Proj.) Series 2001, 0.34%, LOC Bank of America NA, VRDN (c)(f) | 5,000 | | 5,000 |
| | 304,400 |
Texas - 11.0% |
Austin Util. Sys. Rev. Series A: | | | |
0.4% 3/11/10, LOC JPMorgan Chase Bank, LOC State Street Bank & Trust Co., Boston, CP | 36,900 | | 36,900 |
0.4% 3/12/10, LOC JPMorgan Chase Bank, LOC State Street Bank & Trust Co., Boston, CP | 38,000 | | 38,000 |
0.5% 3/4/10, LOC JPMorgan Chase Bank, LOC State Street Bank & Trust Co., Boston, CP | 13,400 | | 13,400 |
0.5% 3/4/10, LOC JPMorgan Chase Bank, LOC State Street Bank & Trust Co., Boston, CP | 13,010 | | 13,010 |
0.6% 3/5/10, LOC JPMorgan Chase Bank, LOC State Street Bank & Trust Co., Boston, CP | 13,655 | | 13,655 |
Bexar County Gen. Oblig. Participating VRDN Series ROC II R 11791PB, 0.22% (Liquidity Facility Deutsche Postbank AG) (c)(g) | 19,010 | | 19,010 |
Brazos River Auth. Poll. Cont. Rev.: | | | |
(Texas Utils. Elec. Co. Proj.) Series 2001 D2, 0.22%, LOC Citibank NA, VRDN (c)(f) | 96,400 | | 96,400 |
(Texas Utils. Energy Co. Proj.) Series 2002 A, 0.22%, LOC Citibank NA, VRDN (c)(f) | 16,300 | | 16,300 |
Brownsville Indl. Dev. Corp. Rev. (Rich-Seapak Corp. Proj.) Series 1997, 0.44%, LOC HSBC Bank USA, NA, VRDN (c)(f) | 6,250 | | 6,250 |
Brownsville Util. Sys. Rev. Participating VRDN Series Solar 06 68, 0.17% (Liquidity Facility U.S. Bank NA, Minnesota) (c)(g) | 20,000 | | 20,000 |
Calhoun County Navigation District Envir. Facilities Rev. (Formosa Plastics Corp. Proj.) 0.28%, LOC Bank of America NA, VRDN (c)(f) | 13,775 | | 13,775 |
Calhoun County Navigation District Poll. Cont. Rev. (Formosa Plastics Corp., Texas Proj.) 0.28%, LOC Bank of America NA, VRDN (c)(f) | 10,000 | | 10,000 |
Calhoun County Navigation District Port Rev. (Formosa Plastics Corp. Proj.) Series 2000, 0.3%, LOC Bank of America NA, VRDN (c)(f) | 5,500 | | 5,500 |
Calhoun County Navigation Indl. Dev. Auth. Port Rev. (Formosa Plastics Corp. Proj.) Series 1994, 0.22%, LOC Bank of America NA, VRDN (c)(f) | 29,300 | | 29,300 |
Municipal Securities - continued |
| Principal Amount (000s) | | Value (000s) |
Texas - continued |
Calhoun County Solid Waste Disp. Rev. (Formosa Plastics Corp. Proj.): | | | |
Series 2000, 0.28%, LOC Bank of America NA, VRDN (c)(f) | $ 25,000 | | $ 25,000 |
0.28%, LOC Bank of America NA, VRDN (c)(f) | 25,000 | | 25,000 |
Calhoun Port Auth. Envir. Facilities Rev. (Formosa Plastics Corp. Texas Proj.): | | | |
Series 2007 A, 0.28%, LOC PNC Bank NA, Pittsburgh, VRDN (c)(f) | 47,300 | | 47,300 |
Series 2008, 0.28%, LOC Bank of America NA, VRDN (c)(f) | 20,000 | | 20,000 |
Cap. Area Hsg. Fin. Corp. Multi-family Hsg. Rev. (Marble Falls Vistas Apts. Proj.) 0.25%, LOC Fannie Mae, VRDN (c)(f) | 5,900 | | 5,900 |
Comal Independent School District Participating VRDN Series Merlots K10, 0.18% (Liquidity Facility Wachovia Bank NA) (c)(g) | 12,870 | | 12,870 |
Cypress-Fairbanks Independent School District: | | | |
Participating VRDN Series DB 597, 0.23% (Liquidity Facility Deutsche Bank AG) (c)(g) | 7,490 | | 7,490 |
TAN Series 2009, 1.5% 6/24/10 | 36,000 | | 36,118 |
Dallas Area Rapid Transit Sales Tax Rev. Participating VRDN Series WF 09 60C, 0.18% (Liquidity Facility Wells Fargo & Co.) (c)(g) | 13,775 | | 13,775 |
Dallas Hsg. Fin. Corp. Multi-family Hsg. Rev. (The Masters Apts. Proj.) 0.25%, LOC Fannie Mae, VRDN (c)(f) | 7,480 | | 7,480 |
Dallas Wtr. & Swr. Sys. Rev.: | | | |
Series B, 0.23% 3/2/10 (Liquidity Facility Bank of America NA), CP | 4,291 | | 4,291 |
Series C, 0.27% 6/4/10, CP | 10,000 | | 10,000 |
0.27% 6/3/10, CP | 10,000 | | 10,000 |
Denton Independent School District Participating VRDN Series Putters 2603, 0.2% (Liquidity Facility JPMorgan Chase Bank) (c)(g) | 7,385 | | 7,385 |
Dublin Econ. Dev. Corp. Indl. Dev. Auth. Rev. (Universal Blanchers LLC Proj.) 0.47%, LOC Harris NA, VRDN (c)(f) | 4,200 | | 4,200 |
Eagle Mountain & Saginaw Independent School District Participating VRDN Series SGA 03 141, 0.2% (Liquidity Facility Societe Generale) (c)(g) | 4,000 | | 4,000 |
El Paso County Hosp. District Combination Tax and Rev. Participating VRDN Series Solar 06 32, 0.19% (Liquidity Facility U.S. Bank NA, Minnesota) (c)(g) | 19,940 | | 19,940 |
Gilmer Indl. Dev. Corp. (Duoline Technologies LP Proj.) Series 2008 A, 0.25%, LOC Wells Fargo Bank NA, VRDN (c)(f) | 10,000 | | 10,000 |
Municipal Securities - continued |
| Principal Amount (000s) | | Value (000s) |
Texas - continued |
Greater East Texas Higher Ed. Auth. Student Ln. Rev.: | | | |
Series 1992 B, 0.22%, LOC State Street Bank & Trust Co., Boston, VRDN (c)(f) | $ 35,200 | | $ 35,200 |
Series 1993 B: | | | |
0.22%, LOC State Street Bank & Trust Co., Boston, VRDN (c)(f) | 15,000 | | 15,000 |
0.22%, LOC State Street Bank & Trust Co., Boston, VRDN (c)(f) | 17,000 | | 17,000 |
Series 1995 A, 0.22%, LOC State Street Bank & Trust Co., Boston, VRDN (a)(c)(f) | 46,700 | | 46,700 |
Series 1995 B, 0.22%, LOC State Street Bank & Trust Co., Boston, VRDN (c)(f) | 26,000 | | 26,000 |
Greater Texas Student Ln. Corp. Student Ln. Rev.: | | | |
Series 1998 A, 0.22%, LOC State Street Bank & Trust Co., Boston, VRDN (a)(c)(f) | 24,750 | | 24,750 |
Series 2000 A, 0.22%, LOC State Street Bank & Trust Co., Boston, VRDN (c)(f) | 35,000 | | 35,000 |
Gulf Coast Indl. Dev. Auth. 0.35%, LOC Wells Fargo Bank NA, VRDN (c)(f) | 5,280 | | 5,280 |
Gulf Coast Waste Disp. Auth. Envir. Facilities Rev. (Air Products Proj.): | | | |
Series 2004, 0.5% (Air Products & Chemicals, Inc. Guaranteed), VRDN (c)(f) | 15,000 | | 15,000 |
Series 2005, 0.5% (Air Products & Chemicals, Inc. Guaranteed), VRDN (c)(f) | 19,000 | | 19,000 |
Gulf Coast Waste Disp. Auth. Solid Waste Disp. Rev. (Waste Mgmt., Inc. Proj.) Series A, 0.2%, LOC JPMorgan Chase Bank, VRDN (c)(f) | 23,700 | | 23,700 |
Harlandale Independent School District Participating VRDN Series SGA 100, 0.21% (Liquidity Facility Societe Generale) (c)(g) | 7,480 | | 7,480 |
Harris County Cultural Ed. Facilities Fin. Corp. Rev.: | | | |
(Memorial Hermann Healthcare Sys. Proj.): | | | |
Series 2008 D1, 0.18%, LOC JPMorgan Chase Bank, VRDN (c) | 8,500 | | 8,500 |
Series 2008 D3, 0.21%, LOC Compass Bank, VRDN (c) | 22,750 | | 22,750 |
(YMCA of the Greater Houston Area Proj.) Series 2008 D, 0.2%, LOC Compass Bank, VRDN (c) | 25,000 | | 25,000 |
Harris County Cultural Ed. Facilities Fin. Corp. Spl. Facilities Rev. (Texas Med. Ctr. Proj.) Series 2008 B2, 0.21%, LOC Compass Bank, VRDN (c) | 8,145 | | 8,145 |
Harris County Gen. Oblig. Participating VRDN Series ROC II R 718 PB, 0.23% (Liquidity Facility Deutsche Postbank AG) (c)(g) | 8,360 | | 8,360 |
Municipal Securities - continued |
| Principal Amount (000s) | | Value (000s) |
Texas - continued |
Harris County Health Facilities Dev. Corp. Hosp. Rev. (Baylor College of Medicine Proj.): | | | |
Series 2008 A, 0.38%, LOC Compass Bank, VRDN (c) | $ 26,200 | | $ 26,200 |
Series 2008 C, 0.2%, LOC Commerzbank AG, VRDN (c) | 19,100 | | 19,100 |
Harris County Health Facilities Dev. Corp. Rev. (Seven Acres Jewish Sr. Care Svcs. Proj.) Series 2004, 0.23%, LOC JPMorgan Chase Bank, VRDN (c) | 18,210 | | 18,210 |
Harris County Hsg. Fin. Corp. Multi-family Hsg. Rev.: | | | |
(Lafayette Village Apts. Proj.) Series 2006, 0.24%, LOC Fannie Mae, VRDN (c)(f) | 6,715 | | 6,715 |
(Louetta Village Apts. Proj.) 0.25%, LOC Fannie Mae, VRDN (c)(f) | 6,895 | | 6,895 |
(Primrose Aldine Bender Apt. Proj.) 0.25%, LOC Fannie Mae, VRDN (c)(f) | 10,000 | | 10,000 |
(Primrose at Bammel Apts. Proj.) 0.25%, LOC Fannie Mae, VRDN (c)(f) | 8,480 | | 8,480 |
(Quail Chase Apts. Proj.) Series 1999, 0.32%, LOC Gen. Elec. Cap. Corp., VRDN (c)(f) | 11,110 | | 11,110 |
(Wellington Park Apts. Proj.) 0.24%, LOC Fannie Mae, VRDN (c)(f) | 12,850 | | 12,850 |
Houston Hsg. Fin. Corp. Multi-family Hsg. Rev.: | | | |
(Fairlake Cove Apts. Proj.) 0.23%, LOC Citibank NA, VRDN (c)(f) | 9,700 | | 9,700 |
(Little Nell Apts. Proj.) 0.24%, LOC Fannie Mae, VRDN (c)(f) | 13,100 | | 13,100 |
(Mayfair Park Apts. Proj.) 0.25%, LOC Fannie Mae, VRDN (c)(f) | 5,900 | | 5,900 |
Houston Indl. Dev. Corp. Rev. (Aero Houston East LP Proj.) Series 2003 A, 0.31%, LOC JPMorgan Chase Bank, VRDN (c)(f) | 3,100 | | 3,100 |
Houston Util. Sys. Rev.: | | | |
Participating VRDN: | | | |
Series ROC II R 11133, 0.21% (Liquidity Facility Citibank NA) (c)(g) | 15,190 | | 15,190 |
Series ROC II R 11411, 0.21% (Liquidity Facility Citibank NA) (c)(g) | 9,290 | | 9,290 |
Series ROC II R 12267, 0.23% (Liquidity Facility Citibank NA) (c)(g) | 16,795 | | 16,795 |
Series Solar 06 70, 0.17% (Liquidity Facility U.S. Bank NA, Minnesota) (c)(g) | 22,315 | | 22,315 |
Series 2004 B1, 0.18%, LOC Dexia Cr. Local de France, LOC Bank of America NA, VRDN (c) | 78,250 | | 78,250 |
Series 2008 A1, 0.19%, LOC Bank of America NA, VRDN (c) | 48,500 | | 48,500 |
Series B1, 0.27% 3/3/10, LOC JPMorgan Chase Bank, CP | 10,750 | | 10,750 |
Municipal Securities - continued |
| Principal Amount (000s) | | Value (000s) |
Texas - continued |
Houston Util. Sys. Rev.: - continued | | | |
Series B2, 0.25% 3/2/10, LOC Wells Fargo Bank NA, San Francisco, CP | $ 8,000 | | $ 8,000 |
Humble Independent School District Participating VRDN Series Solar 06 20, 0.19% (Liquidity Facility U.S. Bank NA, Minnesota) (c)(g) | 14,500 | | 14,500 |
Jewett Econ. Dev. Corp. Indl. Dev. Rev. (Nucor Corp. Proj.) 0.26%, VRDN (c)(f) | 12,600 | | 12,600 |
Lamar Consolidated Independent School District Participating VRDN Series DB 512, 0.23% (Liquidity Facility Deutsche Bank AG) (c)(g) | 3,180 | | 3,180 |
Lower Colorado River Auth. Rev. Series A, 0.15% 3/4/10 (Liquidity Facility JPMorgan Chase Bank), CP | 10,000 | | 10,000 |
Lower Neches Valley Auth. Indl. Dev. Corp. Exempt Facilities Rev. (Onyx Envir. Svcs. Proj.) Series 2003, 0.3%, LOC Bank of America NA, VRDN (c)(f) | 11,950 | | 11,950 |
Mansfield Independent School District Participating VRDN Series SGA 129, 0.21% (Liquidity Facility Societe Generale) (c)(g) | 5,000 | | 5,000 |
Midlothian Indl. Dev. Corp. Envir. Facilities Rev. (Holnam Texas LP Proj.) Series 1999, 0.23%, LOC JPMorgan Chase Bank, VRDN (c)(f) | 15,100 | | 15,100 |
Mineral Wells Ind. Dev. Corp. Rev. (Ameron Int'l. Corp. Proj.) 0.5%, LOC Bank of America NA, VRDN (c)(f) | 7,200 | | 7,200 |
Mission Econ. Dev. Corp. Solid Waste Disp. Rev. (Allied Waste North America, Inc. Proj.) Series 2008 A, 0.3%, LOC Bank of America NA, VRDN (c)(f) | 42,000 | | 42,000 |
Montgomery County Hsg. Fin. Corp. Multi-family Hsg. Rev. (Conroe Lodge at Silverdale Apt. Homes Proj.) 0.22%, LOC PNC Bank NA, Pittsburgh, VRDN (c)(f) | 7,820 | | 7,820 |
North East Texas Independent School District Participating VRDN Series DCL 08 002, 0.3% (Liquidity Facility Dexia Cr. Local de France) (c)(g) | 11,370 | | 11,370 |
North Texas Higher Ed. Auth. Student Ln. Rev.: | | | |
Series 2005 C, 0.2%, LOC Bank of America NA, LOC Lloyds TSB Bank PLC, VRDN (c)(f) | 98,800 | | 98,800 |
Series 2007 A, 0.2%, LOC Bank of America NA, LOC Lloyds TSB Bank PLC, VRDN (c)(f) | 5,500 | | 5,500 |
Port Arthur Navigation District Envir. Facilities Rev. (Motiva Enterprises LLC Proj.): | | | |
Series 2004, 0.29%, VRDN (c)(f) | 94,790 | | 94,790 |
0.34%, VRDN (c)(f) | 13,000 | | 13,000 |
Riesel Indl. Dev. Corp. (Sandy Creek Energy Assoc. Proj.): | | | |
0.26%, LOC Cr. Suisse Group, VRDN (c)(f) | 46,500 | | 46,500 |
Municipal Securities - continued |
| Principal Amount (000s) | | Value (000s) |
Texas - continued |
Riesel Indl. Dev. Corp. (Sandy Creek Energy Assoc. Proj.): - continued | | | |
0.26%, LOC Cr. Suisse Group, VRDN (c)(f) | $ 50,000 | | $ 50,000 |
Round Rock Independent School District Participating VRDN Series SGA 133, 0.21% (Liquidity Facility Societe Generale) (c)(g) | 12,615 | | 12,615 |
San Antonio Elec. & Gas Participating VRDN Series DB 602, 0.23% (Liquidity Facility Deutsche Bank AG) (c)(g) | 8,245 | | 8,245 |
San Antonio Elec. & Gas Sys. Rev.: | | | |
Bonds 3.625%, tender 12/1/10 (c) | 11,500 | | 11,761 |
Participating VRDN: | | | |
Series MS 3064, 0.2% (Liquidity Facility Morgan Stanley) (c)(g) | 7,000 | | 7,000 |
Series Putters 3560, 0.2% (Liquidity Facility JPMorgan Chase Bank) (c)(g) | 9,260 | | 9,260 |
Series 2003, 0.23% (Liquidity Facility Bank of America NA), VRDN (c) | 675 | | 675 |
Series A: | | | |
0.27% 3/4/10, CP | 5,340 | | 5,340 |
0.28% 4/6/10, CP | 50,350 | | 50,350 |
0.29% 3/4/10, CP | 8,700 | | 8,700 |
San Antonio Gen. Oblig. Series A, 0.2% 3/11/10, LOC Bank of America NA, CP | 12,250 | | 12,250 |
San Antonio Indl. Dev. Auth. Indl. Dev. Rev.: | | | |
(LGC Bldg. & KLN Steel Proj.) Series 1998, 0.35%, LOC Bank of America NA, VRDN (c)(f) | 5,500 | | 5,500 |
(Tindall Corp. Proj.) Series 2008 A, 0.25%, LOC Wachovia Bank NA, VRDN (c)(f) | 3,250 | | 3,250 |
San Antonio Wtr. Sys. Rev.: | | | |
Participating VRDN: | | | |
Series EGL 06 5 Class A, 0.2% (Liquidity Facility Citibank NA) (c)(g) | 36,000 | | 36,000 |
Series SG 02 159, 0.23% (Liquidity Facility Societe Generale) (c)(g) | 22,500 | | 22,500 |
Series 2001 A: | | | |
0.2% 3/2/10, CP | 10,000 | | 10,000 |
0.27% 4/13/10, CP | 20,000 | | 20,000 |
0.28% 4/6/10, CP | 39,933 | | 39,933 |
0.3% 4/9/10, CP | 30,000 | | 30,000 |
Spring Independent School District Participating VRDN Series DB 603, 0.23% (Liquidity Facility Deutsche Bank AG) (c)(g) | 3,795 | | 3,795 |
Municipal Securities - continued |
| Principal Amount (000s) | | Value (000s) |
Texas - continued |
Tarrant County Cultural Ed. Facilities Fin. Corp. Hosp. Rev.: | | | |
(Methodist Hospitals of Dallas Proj.) Series 2008, 0.19%, LOC JPMorgan Chase Bank, VRDN (c) | $ 96,200 | | $ 96,200 |
(Scott and White Memorial Hosp. and Scott, Sherwood and Brindley Foundation Proj.) Series 2008 3, 0.24%, LOC Compass Bank, VRDN (c) | 9,400 | | 9,400 |
Tarrant County Cultural Ed. Facilities Fin. Corp. Rev. (Christus Health Proj.) Series 2008 C2, 0.2%, LOC Bank of America NA, VRDN (c) | 17,675 | | 17,675 |
Tarrant County Health Facilities Dev. Corp. Hosp. Rev. (Cook Children's Med. Ctr. Proj.): | | | |
Series 2010 B, 0.16%, VRDN (c) | 18,900 | | 18,900 |
Series 2010 C, 0.18%, VRDN (c) | 12,000 | | 12,000 |
Texas Dept. of Hsg. & Cmnty. Affairs Multi-family Hsg. Rev.: | | | |
(Bristol Apts. Proj.) 0.24%, LOC Fannie Mae, VRDN (c)(f) | 3,800 | | 3,800 |
(Chisholm Trail Proj.) 0.24%, LOC Fannie Mae, VRDN (c)(f) | 5,600 | | 5,600 |
(Pinnacle Apts. Proj.) 0.22%, LOC Fannie Mae, VRDN (c)(f) | 7,165 | | 7,165 |
(Post Oak East Apts. Proj.) Series A, 0.24%, LOC Fannie Mae, VRDN (c)(f) | 8,000 | | 8,000 |
(Residences at Sunset Pointe Proj.) 0.31%, LOC Fannie Mae, VRDN (c)(f) | 15,000 | | 15,000 |
(St. Augustine Estate Proj.) Series 2005, 0.25%, LOC Fannie Mae, VRDN (c)(f) | 7,150 | | 7,150 |
(Windshire Apts. Proj.) 0.24%, LOC Fannie Mae, VRDN (c)(f) | 14,000 | | 14,000 |
Texas Dept. of Hsg. & Cmnty. Affairs Single Family Hsg. Rev. Participating VRDN Series BA 1048, 0.25% (Liquidity Facility Bank of America NA) (c)(f)(g) | 3,230 | | 3,230 |
Texas Dept. of Hsg. & Cmnty. Affairs Single Family Mtg. Rev. Participating VRDN Series ROC II R 11215 WF, 0.25% (Liquidity Facility Wells Fargo & Co.) (c)(f)(g) | 12,120 | | 12,120 |
Texas Gen. Oblig.: | | | |
Bonds (College Student Ln. Prog.) Series 2004: | | | |
0.4%, tender 3/1/10 (Liquidity Facility Landesbank Hessen-Thuringen) (c)(f) | 14,925 | | 14,925 |
0.4%, tender 3/1/10 (Liquidity Facility Landesbank Hessen-Thuringen) (c)(f) | 3,110 | | 3,110 |
0.4%, tender 3/1/10 (Liquidity Facility Landesbank Hessen-Thuringen) (c)(f) | 3,670 | | 3,670 |
0.4%, tender 3/1/10 (Liquidity Facility Landesbank Hessen-Thuringen) (c)(f) | 5,565 | | 5,565 |
0.4%, tender 3/1/10 (Liquidity Facility Landesbank Hessen-Thuringen) (c)(f) | 4,975 | | 4,975 |
Municipal Securities - continued |
| Principal Amount (000s) | | Value (000s) |
Texas - continued |
Texas Gen. Oblig.: - continued | | | |
Participating VRDN: | | | |
Series DB 448, 0.26% (Liquidity Facility Deutsche Bank AG) (c)(f)(g) | $ 3,365 | | $ 3,365 |
Series Putters 3478, 0.2% (Liquidity Facility JPMorgan Chase Bank) (c)(g) | 4,995 | | 4,995 |
Series Putters 3479, 0.2% (Liquidity Facility JPMorgan Chase Bank) (c)(g) | 11,325 | | 11,325 |
Series Putters 3532, 0.2% (Liquidity Facility JPMorgan Chase Bank) (c)(g) | 7,845 | | 7,845 |
Series ROC II R 11087, 0.25% (Liquidity Facility Citibank NA) (c)(f)(g) | 15,680 | | 15,680 |
(Veterans Land Proj.) Series A, 0.16%, VRDN (c)(f) | 25,180 | | 25,180 |
(Veterans' Hsg. Assistance Prog.): | | | |
Fund II Series 2002 A2: | | | |
0.21%, VRDN (c)(f) | 7,100 | | 7,100 |
0.21%, VRDN (c)(f) | 11,650 | | 11,650 |
Fund II Series 2005 B, 0.22% (Liquidity Facility State Street Bank & Trust Co., Boston), VRDN (c)(f) | 41,720 | | 41,720 |
Fund II Series 2007 A, 0.22% (Liquidity Facility State Street Bank & Trust Co., Boston), VRDN (c)(f) | 15,200 | | 15,200 |
TRAN Series 2009, 2.5% 8/31/10 | 75,000 | | 75,759 |
Texas Pub. Fin. Auth. Rev. Series 2008, 0.3% 4/9/10, CP | 8,450 | | 8,450 |
Travis County Hsg. Fin. Corp. (Rosemont at Old Manor Apts.) 0.25%, LOC Fannie Mae, VRDN (c)(f) | 4,985 | | 4,985 |
Univ. of Texas Board of Regents Sys. Rev. Series 2002 A: | | | |
0.19% 3/10/10 (Liquidity Facility Univ. of Texas Invt. Mgmt. Co.), CP | 7,200 | | 7,200 |
0.27% 4/6/10 (Liquidity Facility Univ. of Texas Invt. Mgmt. Co.), CP | 10,500 | | 10,500 |
Weslaco Health Facilities Dev. Corp. Rev. (Knapp Med. Ctr. Proj.) Series 2008 A, 0.43%, LOC Compass Bank, VRDN (c) | 4,780 | | 4,780 |
| | 2,570,267 |
Utah - 2.1% |
Carbon County Poll. Cont. Rev. (PacifiCorp Proj.) Series 1994, 0.2%, LOC Wells Fargo Bank NA, VRDN (c) | 1,900 | | 1,900 |
Central Utah Wtr. Conservancy District Wtr. Rev. BAN Series 2009 A, 2% 7/22/10 | 9,000 | | 9,028 |
Emery County Poll. Cont. Rev. (PacifiCorp Proj.) Series 1994, 0.18%, LOC Wells Fargo Bank NA, VRDN (c) | 22,000 | | 22,000 |
Municipal Securities - continued |
| Principal Amount (000s) | | Value (000s) |
Utah - continued |
Intermountain Pwr. Agcy. Pwr. Supply Rev.: | | | |
Series 1997 B1, 0.3% 4/9/10 (Liquidity Facility Bank of Nova Scotia), CP | $ 45,150 | | $ 45,150 |
Series 1997 B2, 0.32% 6/7/10 (Liquidity Facility Bank of Nova Scotia), CP | 26,200 | | 26,200 |
Series 1997 B3: | | | |
0.23% 3/12/10 (Liquidity Facility JPMorgan Chase Bank), CP | 8,000 | | 8,000 |
0.25% 4/6/10 (Liquidity Facility JPMorgan Chase Bank), CP | 28,500 | | 28,500 |
Series 1998 B4: | | | |
0.23% 3/3/10 (Liquidity Facility JPMorgan Chase Bank), CP | 23,500 | | 23,500 |
0.33% 3/4/10 (Liquidity Facility JPMorgan Chase Bank), CP | 25,000 | | 25,000 |
0.33% 3/4/10 (Liquidity Facility JPMorgan Chase Bank), CP | 25,000 | | 25,000 |
Riverton Hosp. Rev. Participating VRDN Series Putters 1762, 0.2% (Liquidity Facility JPMorgan Chase & Co.) (c)(g) | 63,015 | | 63,015 |
Salt Lake City Sales Tax Rev. 0.21% (Liquidity Facility State Street Bank & Trust Co., Boston), VRDN (c) | 8,915 | | 8,915 |
Utah Board of Regents Student Ln. Rev. Series 2008 A, 0.25%, LOC Wells Fargo Bank NA, VRDN (c)(f) | 57,400 | | 57,400 |
Utah Hsg. Corp. Multi-family Hsg. Rev. (Springwood Apts. Proj.) 0.23%, LOC Fannie Mae, VRDN (c)(f) | 8,485 | | 8,485 |
Utah Hsg. Corp. Single Family Mtg. Rev.: | | | |
Series 2002 A, 0.26% (Liquidity Facility Fannie Mae) (Liquidity Facility Freddie Mac), VRDN (c)(f) | 7,115 | | 7,115 |
Series 2002 B, 0.26% (Liquidity Facility Fannie Mae) (Liquidity Facility Freddie Mac), VRDN (c)(f) | 10,375 | | 10,375 |
Series 2002 D, 0.26% (Liquidity Facility Fannie Mae) (Liquidity Facility Freddie Mac), VRDN (c)(f) | 6,740 | | 6,740 |
Series 2003 B, 0.26% (Liquidity Facility Fannie Mae) (Liquidity Facility Freddie Mac), VRDN (c)(f) | 10,740 | | 10,740 |
Series 2003 C, 0.26% (Liquidity Facility Fannie Mae) (Liquidity Facility Freddie Mac), VRDN (c)(f) | 8,185 | | 8,185 |
Series 2003 E, 0.26% (Liquidity Facility Fannie Mae) (Liquidity Facility Freddie Mac), VRDN (c)(f) | 8,810 | | 8,810 |
Series 2003 F, 0.26% (Liquidity Facility Fannie Mae) (Liquidity Facility Freddie Mac), VRDN (c)(f) | 6,360 | | 6,360 |
Series 2003 G, 0.26% (Liquidity Facility Fannie Mae) (Liquidity Facility Freddie Mac), VRDN (c)(f) | 6,060 | | 6,060 |
Municipal Securities - continued |
| Principal Amount (000s) | | Value (000s) |
Utah - continued |
Utah Hsg. Corp. Single Family Mtg. Rev.: - continued | | | |
Series 2004 G, 0.26% (Liquidity Facility Fannie Mae) (Liquidity Facility Freddie Mac), VRDN (c)(f) | $ 15,190 | | $ 15,190 |
Series 2005 D, 0.26% (Liquidity Facility Fannie Mae) (Liquidity Facility Freddie Mac), VRDN (c)(f) | 16,715 | | 16,715 |
Series 2005 E, 0.26% (Liquidity Facility Fannie Mae) (Liquidity Facility Freddie Mac), VRDN (c)(f) | 4,940 | | 4,940 |
Series 2005 H, 0.26% (Liquidity Facility Fannie Mae) (Liquidity Facility Freddie Mac), VRDN (c)(f) | 9,170 | | 9,170 |
Series 2006 F, 0.26% (Liquidity Facility Fannie Mae) (Liquidity Facility Freddie Mac), VRDN (c)(f) | 2,000 | | 2,000 |
Utah Transit Auth. Sales Tax Rev. Participating VRDN: | | | |
Series DCL 021, 0.3% (Liquidity Facility Dexia Cr. Local de France) (c)(g) | 22,740 | | 22,740 |
Series Putters 3642, 0.2% (Liquidity Facility JPMorgan Chase Bank) (c)(g) | 2,600 | | 2,600 |
| | 489,833 |
Vermont - 0.0% |
Vermont Indl. Dev. Auth. Indl. Dev. Rev. (Ryegate Proj.) Series 1990, 0.3%, LOC ABN-AMRO Bank NV, VRDN (c)(f) | 9,600 | | 9,600 |
Virginia - 2.4% |
Albemarle County Econ. Dev. Auth. Hosp. Rev. (Martha Jefferson Hosp. Proj.) Series 2008 B, 0.18%, LOC Branch Banking & Trust Co., VRDN (c) | 19,585 | | 19,585 |
Alexandria Redev. & Hsg. Auth. Multi-family Hsg. Rev. (Fairfield Village Square Proj.) Series A, 0.23%, LOC Fannie Mae, VRDN (c)(f) | 21,720 | | 21,720 |
Arlington County Indl. Dev. Auth. Multi-family Hsg. Rev. (Gates of Ballston Apts.) 0.55%, LOC RBC Centura Bank, Rocky Mount, VRDN (c)(f) | 14,300 | | 14,300 |
Cap. Beltway Fdg. Corp. Toll Rev. (I-495 Hot Lanes Proj.): | | | |
Series 2008 C, 0.2%, LOC Nat'l. Australia Bank Ltd., VRDN (c)(f) | 70,000 | | 70,000 |
Series 2008 D, 0.2%, LOC Bank of Nova Scotia New York Branch, VRDN (c)(f) | 58,000 | | 58,000 |
Charles City County Econ. Dev. Auth. Solid Waste Disp. Rev. (Waste Mgmt., Inc. Proj.) Series A, 0.3%, LOC JPMorgan Chase Bank, VRDN (c)(f) | 7,000 | | 7,000 |
Chesapeake Bay Bridge and Tunnel District Gen. Resolution Rev. Series 2008 A, 0.19%, LOC Branch Banking & Trust Co., VRDN (c) | 7,250 | | 7,250 |
Municipal Securities - continued |
| Principal Amount (000s) | | Value (000s) |
Virginia - continued |
Fairfax County Econ. Dev. Auth. Rev. (Smithsonian Institution Proj.) Series A, 0.2% (Liquidity Facility Bank of America NA), VRDN (c) | $ 1,500 | | $ 1,500 |
Fairfax County Indl. Dev. Auth.: | | | |
Bonds (Inova Health Sys. Proj.) 0.32%, tender 10/4/10 (b)(c) | 18,000 | | 18,000 |
Participating VRDN Series Putters 3590, 0.2% (Liquidity Facility JPMorgan Chase Bank) (c)(g) | 9,495 | | 9,495 |
Halifax County Indl. Dev. Auth. Poll. Cont. Rev. Bonds (Virginia Elec. & Pwr. Co. Proj.) Series 1992, 1.4% tender 3/4/10, CP mode (f) | 13,200 | | 13,200 |
Hampton Indl. Dev. Auth. Exempt Facilities Rev. (USA Waste of Virginia Landfills, Inc. Proj.) Series 2000, 0.25%, LOC Wachovia Bank NA, VRDN (c)(f) | 9,000 | | 9,000 |
Hampton Redev. & Hsg. Auth. Multi-family Hsg. Rev. (Avalon Pointe Proj.) Series 1996, 0.27%, LOC Fannie Mae, VRDN (c)(f) | 6,387 | | 6,387 |
Henrico County Econ. Dev. Auth. Rev. (Bon Secours Health Sys. Proj.) Series 2008 D, 0.24%, LOC Landesbank Baden-Wuert, VRDN (c) | 23,625 | | 23,625 |
King George County Indl. Dev. Auth. Exempt Facilities Rev. (Birchwood Pwr. Partners Proj.) Series 1994 B, 0.18%, LOC Bank of Nova Scotia New York Branch, VRDN (c)(f) | 8,250 | | 8,250 |
Norfolk Econ. Dev. Auth. Hosp. Facilities Rev. Bonds (Sentara Healthcare Proj.): | | | |
Series 2009 A, 0.23%, tender 5/5/10 (c) | 9,000 | | 9,000 |
Series 2010 B, 0.32%, tender 9/29/10 (c) | 14,355 | | 14,355 |
Norfolk Econ. Dev. Auth. Rev. (Bon Secours Health Sys. Proj.): | | | |
Series 2008 D1, 0.24%, LOC Landesbank Baden-Wuert, VRDN (c) | 10,740 | | 10,740 |
Series 2008 D2, 0.17%, LOC Bank of America NA, VRDN (c) | 4,400 | | 4,400 |
Prince William County Indl. Dev. Auth. Poll. Cont. Rev. Bonds (Virginia Elec. & Pwr. Co. Proj.) 1.35% tender 3/4/10, CP mode | 11,200 | | 11,200 |
Prince William County Indl. Dev. Auth. Sewage Disp. Facilities Rev. (Dale Svc. Corp. Proj.): | | | |
Series 2000, 0.25%, LOC Wachovia Bank NA, VRDN (c)(f) | 5,890 | | 5,890 |
Series 2001, 0.25%, LOC Wachovia Bank NA, VRDN (c)(f) | 6,000 | | 6,000 |
Series 2006, 0.25%, LOC Wachovia Bank NA, VRDN (c)(f) | 6,400 | | 6,400 |
Richmond Pub. Util. Rev. Participating VRDN Series ROC II R 11262, 0.21% (Liquidity Facility Citibank NA) (c)(g) | 4,875 | | 4,875 |
Sussex County Indl. Dev. Auth. Solid Waste Disp. Rev. (Atlantic Waste Disp. Proj.) 0.23%, LOC JPMorgan Chase Bank, VRDN (c)(f) | 10,000 | | 10,000 |
Municipal Securities - continued |
| Principal Amount (000s) | | Value (000s) |
Virginia - continued |
Virginia College Bldg. Auth. Edl. Facilities Rev.: | | | |
Bonds (Univ. of Richmond Proj.) Series 2009 A, 0.8%, tender 3/1/11 (c) | $ 10,500 | | $ 10,500 |
Participating VRDN Series Putters 3276, 0.2% (Liquidity Facility JPMorgan Chase & Co.) (c)(g) | 4,055 | | 4,055 |
Virginia Hsg. Dev. Auth. Participating VRDN: | | | |
Series Merlots 06 B16, 0.25% (Liquidity Facility Wachovia Bank NA) (c)(f)(g) | 11,385 | | 11,385 |
Series Merlots 06 C3, 0.25% (Liquidity Facility Wachovia Bank NA) (c)(f)(g) | 4,190 | | 4,190 |
Virginia Hsg. Dev. Auth. Commonwealth Mtg. Rev. Participating VRDN: | | | |
Series BA 1046, 0.25% (Liquidity Facility Bank of America NA) (c)(f)(g) | 36,960 | | 36,960 |
Series BA 1047, 0.25% (Liquidity Facility Bank of America NA) (c)(f)(g) | 22,080 | | 22,080 |
Series Merlots 06 07, 0.25% (Liquidity Facility Wachovia Bank NA) (c)(f)(g) | 3,785 | | 3,785 |
Series Merlots 06 B18, 0.25% (Liquidity Facility Wachovia Bank NA) (c)(f)(g) | 20,865 | | 20,865 |
Series Merlots 06 B21, 0.25% (Liquidity Facility Wachovia Bank NA) (c)(f)(g) | 8,285 | | 8,285 |
Series Merlots 07 C42, 0.25% (Liquidity Facility Wachovia Bank NA) (c)(f)(g) | 6,340 | | 6,340 |
Series Merlots B20, 0.25% (Liquidity Facility Wachovia Bank NA) (c)(f)(g) | 6,285 | | 6,285 |
Series Putters 2904Z, 0.25% (Liquidity Facility JPMorgan Chase Bank) (c)(g) | 10,995 | | 10,995 |
Virginia Pub. School Auth. Participating VRDN Series CTE 05 38, 0.2% (Liquidity Facility State Street Bank & Trust Co., Boston) (c)(g) | 17,955 | | 17,955 |
Virginia Resources Auth. Clean Wtr. Rev. Participating VRDN: | | | |
Series BBT 08 48, 0.19% (Liquidity Facility Branch Banking & Trust Co.) (c)(g) | 2,985 | | 2,985 |
Series PT 4634, 0.2% (Liquidity Facility Deutsche Postbank AG) (c)(g) | 11,975 | | 11,975 |
Virginia Small Bus. Fing. (Children's Hosp. of The King's Daughters, Inc. Proj.) Series 2006, 0.19%, LOC Bank of America NA, VRDN (c) | 18,000 | | 18,000 |
| | 566,812 |
Municipal Securities - continued |
| Principal Amount (000s) | | Value (000s) |
Washington - 4.0% |
Central Puget Sound Reg'l. Trans. Auth. Sales & Use Tax Rev. Participating VRDN Series Putters 2866, 0.2% (Liquidity Facility JPMorgan Chase Bank) (c)(g) | $ 8,280 | | $ 8,280 |
Chelan County Pub. Util. District #1 Rev. Participating VRDN Series Merlots 01 B1, 0.25% (Liquidity Facility Wachovia Bank NA) (c)(f)(g) | 27,055 | | 27,055 |
Energy Northwest Elec. Rev. Bonds (Columbia Generating Station Proj.) Series 2003 A, 5.5% 7/1/10 | 4,180 | | 4,249 |
Everett Indl. Dev. Corp. Exempt Facilities Rev. 0.3%, VRDN (c)(f) | 12,800 | | 12,800 |
King County Gen. Oblig. Participating VRDN Series DB 598, 0.23% (Liquidity Facility Deutsche Bank AG) (c)(g) | 3,525 | | 3,525 |
King County Hsg. Auth. Rev. (Overlake TOD Hsg. Proj.) 0.3%, LOC Bank of America NA, VRDN (c)(f) | 11,330 | | 11,330 |
Pierce County Econ. Dev. Corp. Spl. Rev. (Weyerhaeuser Real Estate Proj.) Series 1997 A, 0.22%, LOC Bank of America NA, VRDN (c) | 19,505 | | 19,505 |
Port of Seattle Gen. Oblig.: | | | |
Participating VRDN Series Floaters 2993, 0.23% (Liquidity Facility Morgan Stanley) (c)(f)(g) | 10,000 | | 10,000 |
Series 2002 B2: | | | |
0.37% 3/1/10, LOC Bayerische Landesbank Girozentrale, CP (f) | 9,000 | | 9,000 |
0.37% 3/1/10, LOC Bayerische Landesbank Girozentrale, CP (f) | 1,865 | | 1,865 |
Port of Seattle Rev.: | | | |
Participating VRDN: | | | |
Series Putters 2020, 0.35% (Liquidity Facility JPMorgan Chase Bank) (c)(f)(g) | 7,470 | | 7,470 |
Series Putters 2553Z, 0.35% (Liquidity Facility JPMorgan Chase Bank) (c)(f)(g) | 5,135 | | 5,135 |
Series 1997, 0.21%, LOC Fortis Banque SA, VRDN (c)(f) | 17,500 | | 17,500 |
Series 2001 B1, 0.37% 5/4/10, LOC Bank of America NA, CP (f) | 21,265 | | 21,265 |
Series 2005, 0.28%, LOC Fortis Banque SA, VRDN (c)(f) | 21,800 | | 21,800 |
Series 2008, 0.21%, LOC Landesbank Hessen-Thuringen, VRDN (c)(f) | 190,715 | | 190,715 |
Seattle Wtr. Sys. Rev. Participating VRDN: | | | |
Series MS 06 2170, 0.19% (Liquidity Facility Wells Fargo & Co.) (c)(g) | 2,530 | | 2,530 |
Series ROC II R 11144, 0.2% (Liquidity Facility Citibank NA) (c)(g) | 11,740 | | 11,740 |
Snohomish County Pub. Util. District #1 Elec. Rev.: | | | |
Bonds Series 2009 A, 2% 5/26/10 | 30,400 | | 30,503 |
Municipal Securities - continued |
| Principal Amount (000s) | | Value (000s) |
Washington - continued |
Snohomish County Pub. Util. District #1 Elec. Rev.: - continued | | | |
RAN Series 2009 B, 2% 8/5/10 | $ 11,000 | | $ 11,072 |
Vancouver Hsg. Auth. Rev. (Anthem Park at Uptown Village Proj.) 0.5%, LOC Bank of America NA, VRDN (c)(f) | 2,300 | | 2,300 |
Washington Econ. Dev. Fin. Auth. Econ. Dev. Rev.: | | | |
(Mount Ainstar Resort Proj.) Series 2003 C, 0.23%, LOC U.S. Bank NA, Minnesota, VRDN (c)(f) | 17,895 | | 17,895 |
(Puget Sound Blood Ctr. Proj.) Series 2008 D, 0.18%, LOC Wells Fargo Bank NA, VRDN (c) | 7,300 | | 7,300 |
Washington Econ. Dev. Fin. Auth. Solid Waste Disp. Rev. (Waste Mgmt., Inc. Proj.): | | | |
Series D: | | | |
0.2%, LOC JPMorgan Chase Bank, VRDN (c)(f) | 8,000 | | 8,000 |
0.3%, LOC PNC Bank NA, Pittsburgh, VRDN (c)(f) | 9,000 | | 9,000 |
Series E, 0.2%, LOC JPMorgan Chase Bank, VRDN (c)(f) | 20,000 | | 20,000 |
Washington Gen. Oblig. Participating VRDN: | | | |
Series DB 599, 0.23% (Liquidity Facility Deutsche Bank AG) (c)(g) | 4,885 | | 4,885 |
Series DB 606, 0.23% (Liquidity Facility Deutsche Bank AG) (c)(g) | 6,110 | | 6,110 |
Series Putters 3501Z, 0.2% (Liquidity Facility JPMorgan Chase Bank) (c)(g) | 11,660 | | 11,660 |
Series Putters 3539, 0.2% (Liquidity Facility JPMorgan Chase Bank) (c)(g) | 10,000 | | 10,000 |
Series Solar 06 13, 0.17% (Liquidity Facility U.S. Bank NA, Minnesota) (c)(g) | 33,860 | | 33,860 |
Washington Health Care Facilities Auth. Rev.: | | | |
Participating VRDN Series Solar 07 66, 0.17% (Liquidity Facility U.S. Bank NA, Minnesota) (c)(g) | 19,775 | | 19,775 |
(Childrens Hosp. Reg'l. Med. Ctr. Proj.): | | | |
Series 2008 A, 0.2%, LOC Bank of America NA, VRDN (c) | 10,700 | | 10,700 |
Series 2008 B, 0.19%, LOC Bank of America NA, VRDN (c) | 34,705 | | 34,705 |
Washington Hsg. Fin. Commission Participating VRDN Series BC 10 10W, 0.2% (Liquidity Facility Barclays Bank PLC) (c)(f)(g) | 9,845 | | 9,845 |
Washington Hsg. Fin. Commission Multi-family Hsg. Rev.: | | | |
(Avalon Ridge Apts. Proj.) 0.25%, LOC Fannie Mae, VRDN (c)(f) | 18,755 | | 18,755 |
(Ballard Landmark Inn Proj.) Series A, 0.22%, LOC Fannie Mae, VRDN (c)(f) | 31,590 | | 31,590 |
Municipal Securities - continued |
| Principal Amount (000s) | | Value (000s) |
Washington - continued |
Washington Hsg. Fin. Commission Multi-family Hsg. Rev.: - continued | | | |
(Cedar Ridge Retirement Proj.) Series 2005 A, 0.22%, LOC Wells Fargo Bank NA, VRDN (c)(f) | $ 4,550 | | $ 4,550 |
(Crestview Apts. Proj.) 0.22%, LOC Fannie Mae, VRDN (c)(f) | 14,000 | | 14,000 |
(Echo Lake Sr. Apts. Proj.) 0.23%, LOC Fannie Mae, VRDN (c)(f) | 17,970 | | 17,970 |
(Fairwinds Redmond Proj.) Series A, 0.25%, LOC Bank of America NA, VRDN (c)(f) | 11,750 | | 11,750 |
(Gardens Univ. Village Apt. Proj.) Series A, 0.25%, LOC Bank of America NA, VRDN (c)(f) | 53,900 | | 53,900 |
(Highland Park Apts. Proj.) Series A, 0.25%, LOC Fannie Mae, VRDN (c)(f) | 9,040 | | 9,040 |
(Merrill Gardens at Renton Centre Proj.) Series A, 0.23%, LOC Fannie Mae, VRDN (c)(f) | 20,790 | | 20,790 |
(Pinehurst Apts. Proj.) Series A, 0.25%, LOC Fannie Mae, VRDN (c)(f) | 12,000 | | 12,000 |
(Seaport Landing Retirement Proj.) Series A, 0.25%, LOC Bank of America NA, VRDN (c)(f) | 11,880 | | 11,880 |
(Silver Creek Apts. Proj.) Series A, 0.24%, LOC Fannie Mae, VRDN (c)(f) | 8,150 | | 8,150 |
(The Vintage at Everett Sr. Living Proj.) Series 2004 A, 0.23%, LOC Fannie Mae, VRDN (c)(f) | 15,750 | | 15,750 |
(The Vintage at Richland Sr. Living Proj.) Series 2004 A, 0.25%, LOC Fannie Mae, VRDN (c)(f) | 7,535 | | 7,535 |
(Vintage Mount Vernon Proj.) Series A, 0.25%, LOC Fannie Mae, VRDN (c)(f) | 7,500 | | 7,500 |
Washington Hsg. Fin. Commission Nonprofit Hsg. Rev. (Horizon House Proj.) Series 2005, 0.19%, LOC Bank of America NA, VRDN (c) | 43,250 | | 43,250 |
Washington Hsg. Fin. Commission Nonprofit Rev. (Judson Park Proj.) Series 2007, 0.18%, LOC Banco Santander SA, VRDN (c) | 7,500 | | 7,500 |
| | 929,284 |
West Virginia - 1.0% |
Grant County Poll. Cont. Rev. Bonds (Virginia Elec. & Pwr. Co. Proj.) Series 1986, 1.4% tender 3/4/10, CP mode (f) | 7,400 | | 7,400 |
Harrison County Commission Solid Waste Disp. Rev. (Waste Mgmt., Inc. Proj.) Series A, 0.3%, LOC Bank of America NA, VRDN (c)(f) | 8,420 | | 8,420 |
Marion County Solid Waste Disp. Rev. (Grant Town Cogeneration Proj.): | | | |
Series 1990 A, 0.21%, LOC Deutsche Bank AG, VRDN (c)(f) | 8,430 | | 8,430 |
Municipal Securities - continued |
| Principal Amount (000s) | | Value (000s) |
West Virginia - continued |
Marion County Solid Waste Disp. Rev. (Grant Town Cogeneration Proj.): - continued | | | |
Series 1990 B, 0.21%, LOC Deutsche Bank AG, VRDN (c)(f) | $ 9,700 | | $ 9,700 |
Series 1990 C, 0.21%, LOC Deutsche Bank AG, VRDN (c)(f) | 800 | | 800 |
Series 1990 D, 0.21%, LOC Deutsche Bank AG, VRDN (c)(f) | 9,700 | | 9,700 |
West Virginia Econ. Dev. Auth. Poll. Cont. Rev. (Ohio Pwr. Co. - Kammer Proj.) Series 2008 B, 0.16%, LOC Royal Bank of Scotland PLC, VRDN (c) | 13,330 | | 13,330 |
West Virginia Econ. Dev. Auth. Solid Waste Disp. Facilities Rev.: | | | |
(Appalachian Pwr. Co. - Mountaineer Proj.) Series 2008 A, 0.23%, LOC Royal Bank of Scotland PLC, VRDN (c)(f) | 75,000 | | 75,000 |
(Ohio Pwr. Co. - Mitchell Proj.) Series 2008 A, 0.21%, LOC Royal Bank of Scotland PLC, VRDN (c)(f) | 65,000 | | 65,000 |
(Ohio Pwr. Co. -Sporn Proj.) Series 2008 C, 0.18%, LOC JPMorgan Chase Bank, VRDN (c) | 34,000 | | 34,000 |
West Virginia Hosp. Fin. Auth. Hosp. Rev. (West Virginia United Health Sys. Proj.) Series 2009 A, 0.18%, LOC Branch Banking & Trust Co., VRDN (c) | 8,000 | | 8,000 |
West Virginia Hosp. Fin. Auth. Rev. (Charleston Area Med. Ctr., Inc. Proj.) Series 2008 A, 0.18%, LOC Branch Banking & Trust Co., VRDN (c) | 1,080 | | 1,080 |
| | 240,860 |
Wisconsin - 0.6% |
Hartford Cmnty. Dev. Auth. Indl. Dev. Rev. (TNT/Larpen Supply Proj.) 1.75%, LOC JPMorgan Chase Bank, VRDN (c)(f) | 140 | | 140 |
River Falls Indl. Dev. Rev. (Quadion Corp. Proj.) 0.5%, LOC U.S. Bank NA, Minnesota, VRDN (c)(f) | 1,605 | | 1,605 |
Sturgeon Bay Indl. Dev. Rev. (Marine Travelift Proj.) Series 1996, 0.5%, LOC Wells Fargo Bank NA, VRDN (c)(f) | 1,080 | | 1,080 |
Wisconsin Gen. Oblig.: | | | |
Participating VRDN: | | | |
Series Putters 2774, 0.2% (Liquidity Facility JPMorgan Chase & Co.) (c)(g) | 2,175 | | 2,175 |
Series Solar 07 4, 0.19% (Liquidity Facility U.S. Bank NA, Minnesota) (c)(g) | 24,275 | | 24,275 |
Series 2006 A, 0.25% 4/6/10 (Liquidity Facility State Street Bank & Trust Co., Boston) (Liquidity Facility California Teachers Retirement Sys.), CP | 20,000 | | 20,000 |
Wisconsin Health & Edl. Facilities Auth. Rev.: | | | |
(Gundersen Lutheran Proj.): | | | |
Series 2009 A, 0.19%, LOC JPMorgan Chase Bank, VRDN (c) | 17,000 | | 17,000 |
Municipal Securities - continued |
| Principal Amount (000s) | | Value (000s) |
Wisconsin - continued |
Wisconsin Health & Edl. Facilities Auth. Rev.: - continued | | | |
(Gundersen Lutheran Proj.): | | | |
Series 2009 B, 0.19%, LOC JPMorgan Chase Bank, VRDN (c) | $ 13,000 | | $ 13,000 |
(Wausau Hosp., Inc. Proj.) Series 1998 B, 0.18%, LOC JPMorgan Chase Bank, VRDN (c) | 6,650 | | 6,650 |
Wisconsin Hsg. and Econ. Dev. Auth. Multifamily Hsg. Rev.: | | | |
Series 2007 A, 0.23% (Liquidity Facility Fannie Mae) (Liquidity Facility Freddie Mac), VRDN (c)(f) | 7,420 | | 7,420 |
Series 2008 A, 0.2% (Liquidity Facility Fannie Mae) (Liquidity Facility Freddie Mac), VRDN (c) | 10,785 | | 10,785 |
Wisconsin Trans. Rev.: | | | |
Series 1997 A: | | | |
0.28% 4/6/10 (Liquidity Facility State Street Bank & Trust Co., Boston) (Liquidity Facility California Teachers Retirement Sys.), CP | 19,149 | | 19,149 |
0.3% 3/12/10 (Liquidity Facility State Street Bank & Trust Co., Boston) (Liquidity Facility California Teachers Retirement Sys.), CP | 14,499 | | 14,499 |
Series 2006 A, 0.25% 4/6/10 (Liquidity Facility State Street Bank & Trust Co., Boston) (Liquidity Facility California Teachers Retirement Sys.), CP | 7,500 | | 7,500 |
| | 145,278 |
Wyoming - 0.2% |
Laramie County Indl. Dev. Rev. (Cheyenne Lt., Fuel & Pwr. Co. Proj.) Series 2009 A, 0.25%, LOC Wells Fargo Bank NA, San Francisco, VRDN (c)(f) | 5,000 | | 5,000 |
Wyoming Cmnty. Dev. Auth. Hsg. Rev.: | | | |
Series 2003-4, 0.23% (Liquidity Facility Fannie Mae) (Liquidity Facility Freddie Mac), VRDN (c)(f) | 5,000 | | 5,000 |
Series 2004-3, 0.23% (Liquidity Facility Fannie Mae) (Liquidity Facility Freddie Mac), VRDN (c)(f) | 5,000 | | 5,000 |
Series 2005-4, 0.23% (Liquidity Facility Fannie Mae) (Liquidity Facility Freddie Mac), VRDN (c)(f) | 8,000 | | 8,000 |
Series 2006-2, 0.23% (Liquidity Facility Fannie Mae) (Liquidity Facility Freddie Mac), VRDN (c)(f) | 8,000 | | 8,000 |
Series 2008-2, 0.23% (Liquidity Facility Fannie Mae) (Liquidity Facility Freddie Mac), VRDN (c)(f) | 13,000 | | 13,000 |
| | 44,000 |
Municipal Securities - continued |
| Shares | | Value (000s) |
Other - 11.0% |
Fidelity Municipal Cash Central Fund, 0.19% (d)(e) | 2,573,196,134 | | $ 2,573,196 |
TOTAL INVESTMENT PORTFOLIO - 100.2% (Cost $23,497,264) | | 23,497,264 |
NET OTHER ASSETS - (0.2)% | | (38,018) |
NET ASSETS - 100% | $ 23,459,246 |
Fidelity Municipal Money Market Fund (the Fund) is a fund of Fidelity Union Street Trust II (the trust) and is authorized to issue an unlimited number of shares. The trust is registered under the Investment Company Act of 1940, as amended (the 1940 Act), as an open-end management investment company organized as a Delaware statutory trust.
The Fund may invest in Fidelity Central Funds, which are open-end investment companies available only to other investment companies and accounts managed by Fidelity Management & Research Company (FMR) and its affiliates. The Fund's Schedule of Investments lists each of the Fidelity Central Funds held as of period end, if any, as an investment of the Fund, but does not include the underlying holdings of each Fidelity Central Fund. As an Investing Fund, the Fund indirectly bears its proportionate share of the expenses of the underlying Fidelity Central Funds.
The Money Market Central Funds seek preservation of capital and current income and are managed by Fidelity Investments Money Management, Inc. (FIMM), an affiliate of FMR.
A complete unaudited list of holdings for each Fidelity Central Fund is available upon request or at the Securities and Exchange Commission (the SEC) web site at www.sec.gov. In addition, the financial statements of the Fidelity Central Funds are available on the SEC web site or upon request.
The financial statements have been prepared in conformity with accounting principles generally accepted in the United States of America, which require management to make certain estimates and assumptions at the date of the financial statements. Actual results could differ from those estimates. The following summarizes the significant accounting policies of the Fund:
Level 2 - other significant observable inputs (including quoted prices for similar investments, interest rates, prepayment speeds, etc.)
Level 3 - unobservable inputs (including the fund's own assumptions based on the best information available)
As permitted by compliance with certain conditions under Rule 2a-7 of the 1940 Act, securities are valued at amortized cost, which approximates value and are categorized as Level 2 in the hierarchy.
The Fund participated in the U.S. Treasury Department's Temporary Guarantee Program for Money Market Funds (the "Program") through September 18, 2009. The Fund paid the U.S. Treasury Department fees equal to 0.04% based on the number of shares outstanding as of September 19, 2008 to participate in the Program through September 18, 2009. The expense was borne by the Fund without regard to any expense limitation in effect for the Fund.
Dividends are declared daily and paid monthly from net investment income. Distributions from realized gains, if any, are recorded on the ex-dividend date. Income and capital gain distributions are determined in accordance with income tax regulations, which may differ from generally accepted accounting principles.
Capital accounts within the financial statements are adjusted for permanent book-tax differences. These adjustments have no impact on net assets or the results of operations. Temporary book-tax differences will reverse in a subsequent period.
Book-tax differences are primarily due to deferred trustees compensation.
The Fund purchases municipal securities whose interest, in the opinion of the issuer, is free from federal income tax. There is no assurance that the IRS will agree with this opinion. In the event the IRS determines that the issuer does not comply with relevant tax requirements, interest payments from a security could become federally taxable, possibly retroactively to the date the security was issued.
The federal tax cost of investment securities and unrealized appreciation (depreciation) as of period end were as follows:
Citibank also has a sub-arrangement with Fidelity Service Company, Inc. (FSC), an affiliate of FMR, under which FSC maintains the Fund's accounting records. The fee is based on the level of average net assets for the month.
FMR or its affiliates voluntarily agreed to waive certain fees during the period. The amount of the waiver is $9,976.
In addition, through an arrangement with the Fund's custodian, credits realized as a result of uninvested cash balances were used to reduce the Fund's expenses. During the period, these credits reduced the Fund's custody expenses by $3.
The Fund's organizational documents provide former and current trustees and officers with a limited indemnification against liabilities arising in connection with the performance of their duties to the Fund. In the normal course of business, the Fund may also enter into contracts that provide general indemnifications. The Fund's maximum exposure under these arrangements is unknown as this would be dependent on future claims that may be made against the Fund. The risk of material loss from such claims is considered remote.
The supply of municipal money market securities has fluctuated significantly due to market volatility. As a result, the Fund's cash position may be significant during the period.
Each year, the Board of Trustees, including the Independent Trustees (together, the Board), votes on the renewal of the management contract and sub-advisory agreements (together, the Advisory Contracts) for the fund. The Board, assisted by the advice of fund counsel and Independent Trustees' counsel, requests and considers a broad range of information throughout the year.
The Board meets regularly and considers at each of its meetings factors that are relevant to its annual consideration of the renewal of the fund's Advisory Contracts, including the services and support provided to the fund and its shareholders. The Board has established three standing committees, each composed of Independent Trustees with varying backgrounds, to which the Board has assigned specific subject matter responsibilities in order to enhance effective decision-making by the Board. The Operations Committee meets regularly throughout the year and, among other matters, considers matters specifically related to the annual consideration of the renewal of the fund's Advisory Contracts. The Board, acting directly and through its Committees, requests and receives information concerning the annual consideration of the renewal of the fund's Advisory Contracts. The Board also meets as needed to consider matters specifically related to the Board's annual consideration of the renewal of Advisory Contracts.
At its September 2009 meeting, the Board of Trustees, including the Independent Trustees, unanimously determined to renew the fund's Advisory Contracts. In reaching its determination, the Board considered all factors it believed relevant, including (i) the nature, extent, and quality of the services to be provided to the fund and its shareholders (including the investment performance of the fund); (ii) the competitiveness of the fund's management fee and total expenses; (iii) the total costs of the services to be provided by and the profits to be realized by Fidelity from its relationship with the fund; (iv) the extent to which economies of scale would be realized as the fund grows; and (v) whether fee levels reflect these economies of scale, if any, for the benefit of fund shareholders.
In considering whether to renew the Advisory Contracts for the fund, the Board ultimately reached a determination, with the assistance of fund counsel and Independent Trustees' counsel and through the exercise of its business judgment, that the renewal of the Advisory Contracts and the compensation to be received by Fidelity under the management contract is consistent with Fidelity's fiduciary duty under applicable law. The Board's decision to renew the Advisory Contracts was not based on any single factor noted above, but rather was based on a comprehensive consideration of all the information provided to the Board at its meetings throughout the year. The Board, in reaching its determination to renew the Advisory Contracts, is aware that shareholders in the fund have a broad range of investment choices available to them, including a wide choice among mutual funds offered by competitors to Fidelity, and that the fund's shareholders, with the opportunity to review and weigh the disclosure provided by the fund in its prospectus and other public disclosures, have chosen to invest in this fund, managed by Fidelity.
The Board noted that the growth of fund assets over time across the complex allows Fidelity to reinvest in the development of services designed to enhance the value or convenience of the Fidelity funds as investment vehicles. These services include 24-hour access to account information and market information through phone representatives and over the Internet, and investor education materials and asset allocation tools.
The Board reviewed the fund's relative investment performance against its peer group and stated that the performance of the fund was in the first quartile for all the periods shown. The Board also reviewed the fund's performance during 2009.
Based on its review, and giving particular weight to the nature and quality of the resources dedicated by the Investment Advisers to maintain and improve relative performance and factoring in the unprecedented recent market events, the Board concluded that the nature, extent, and quality of the services provided to the fund will benefit the fund's shareholders, particularly in light of the Board's view that the fund's shareholders benefit from investing in a fund that is part of a large family of funds offering a variety of investment disciplines and services.
The Board considered two proprietary management fee comparisons for the 12-month periods shown in the chart below. The group of Lipper funds used by the Board for management fee comparisons is referred to below as the "Total Mapped Group" and, for the reasons explained above, is broader than the Lipper peer group used by the Board for performance comparisons. The Total Mapped Group comparison focuses on a fund's standing relative to the total universe of comparable funds available to investors, in terms of gross management fees before expense reimbursements or caps. "TMG %" represents the percentage of funds in the Total Mapped Group that had management fees that were lower than the fund's. For example, a TMG % of 21% means that 79% of the funds in the Total Mapped Group had higher management fees than the fund. The "Asset-Size Peer Group" (ASPG) comparison focuses on a fund's standing relative to non-Fidelity funds similar in size to the fund within the Total Mapped Group. The ASPG represents at least 15% of the funds in the Total Mapped Group with comparable asset size and management fee characteristics, subject to a minimum of 50 funds (or all funds in the Total Mapped Group if fewer than 50). Additional information, such as the ASPG quartile in which the fund's management fee ranked, is also included in the chart and considered by the Board.
The Board noted that the fund's management fee ranked below the median of its Total Mapped Group and below the median of its ASPG for 2008.
Based on its review, the Board concluded that the fund's management fee was fair and reasonable in light of the services that the fund receives and the other factors considered.
In its review of the fund's total expenses, the Board considered the fund's management fee as well as other fund expenses, such as transfer agent fees, pricing and bookkeeping fees, and custodial, legal, and audit fees. The Board also noted the effects of any waivers and reimbursements on fees and expenses. As part of its review, the Board also considered current and historical total expenses of the fund compared to competitive fund median expenses. The fund is compared to those funds and classes in the Total Mapped Group (used by the Board for management fee comparisons) that have a similar sales load structure.
The Board noted that the fund's total expenses ranked below its competitive median for 2008.
In its review, the Board also considered Fidelity fee structures and other information on clients that FMR and its affiliates service in other competitive markets, such as other mutual funds advised or subadvised by FMR or its affiliates, pension plan clients, and other institutional clients.
Based on its review, the Board concluded that the fund's total expenses were reasonable in light of the services that the fund and its shareholders receive and the other factors considered.
On an annual basis, FMR presents to the Board Fidelity's profitability for the fund. Fidelity calculates the profitability for each fund, as well as aggregate profitability for groups of Fidelity funds and all Fidelity funds, using a series of detailed revenue and cost allocation methodologies which originate with the audited books and records of Fidelity. The Audit Committee of the Board reviews any significant changes from the prior year's methodologies.
PricewaterhouseCoopers LLP (PwC), independent registered public accounting firm and auditor to Fidelity and certain Fidelity funds, has been engaged annually by the Board as part of the Board's assessment of Fidelity's profitability analysis. PwC's engagement includes the review and assessment of Fidelity's methodologies used in determining the revenues and expenses attributable to Fidelity's mutual fund business, and completion of agreed-upon procedures surrounding the mathematical accuracy of fund profitability and its conformity to allocation methodologies. After considering PwC's reports issued under the engagement and information provided by Fidelity, the Board believes that while other allocation methods may also be reasonable, Fidelity's profitability methodologies are reasonable in all material respects.
The Board has also reviewed Fidelity's non-fund businesses and any fall-out benefits related to the mutual fund business as well as cases where Fidelity's affiliates may benefit from or be related to the fund's business.
The Board considered the costs of the services provided by and the profits realized by Fidelity in connection with the operation of the fund and determined that the amount of profit is a fair entrepreneurial profit for the management of the fund.
In February 2009, the Board created an Ad Hoc Committee (the "Committee") to analyze economies of scale. The Committee was formed to consider whether FMR attains economies of scale in respect of the management and servicing of the Fidelity funds, whether the Fidelity funds have appropriately benefited from such economies of scale, and whether there is potential for realization of any further economies of scale.
The Board recognized that the fund's management contract incorporates a "group fee" structure, which provides for lower group fee rates as total fund assets under FMR's management increase, and for higher group fee rates as total fund assets under FMR's management decrease. FMR determines the group fee rates based on a tiered asset "breakpoint" schedule that varies based on asset class. The Board considered that the group fee is designed to deliver the benefits of economies of scale to fund shareholders when total fund assets increase, even if assets of any particular fund are unchanged or have declined, because some portion of Fidelity's costs are attributable to services provided to all Fidelity funds, and all funds benefit if those costs can be allocated among more assets. The Board concluded that, given the group fee structure, fund shareholders will achieve a certain level of economies of scale as assets under FMR's management increase at the fund complex level, regardless of whether Fidelity achieves any such economies of scale.
Based on its evaluation of all of the conclusions noted above, and after considering all material factors, the Board ultimately concluded that the advisory fee structures are fair and reasonable, and that the fund's Advisory Contracts should be renewed.
Fidelity offers several ways to conveniently manage your personal investments via your telephone or PC. You can access your account information, conduct trades and research your investments 24 hours a day.
Fidelity Automated Service Telephone provides a single toll-free number to access account balances, positions, quotes and trading. It's easy to navigate the service, and on your first call, the system will help you create a personal identification number (PIN) for security.
Fidelity's web site on the Internet provides a wide range of information, including daily financial news, fund performance, interactive planning tools and news about Fidelity products and services.
Item 2. Code of Ethics
Not applicable.
Item 3. Audit Committee Financial Expert
Not applicable.
Item 4. Principal Accountant Fees and Services
Not applicable.
Item 5. Audit Committee of Listed Registrants
Not applicable.
Item 6. Investments
(a) Not applicable.
Not applicable.
Not applicable.
Item 9. Purchase of Equity Securities by Closed-End Management Investment Company and Affiliated Purchasers
Not applicable.
There were no material changes to the procedures by which shareholders may recommend nominees to the Fidelity Union Street Trust II's Board of Trustees.
(a)(i) The President and Treasurer and the Chief Financial Officer have concluded that the Fidelity Union Street Trust II's (the "Trust") disclosure controls and procedures (as defined in Rule 30a-3(c) under the Investment Company Act) provide reasonable assurances that material information relating to the Trust is made known to them by the appropriate persons, based on their evaluation of these controls and procedures as of a date within 90 days of the filing date of this report.
(a)(ii) There was no change in the Trust's internal control over financial reporting (as defined in Rule 30a-3(d) under the Investment Company Act) that occurred during the second fiscal quarter of the period covered by this report that has materially affected, or is reasonably likely to materially affect, the Trust's internal control over financial reporting.
Pursuant to the requirements of the Securities Exchange Act of 1934 and the Investment Company Act of 1940, the registrant has duly caused this report to be signed on its behalf by the undersigned, thereunto duly authorized.
Pursuant to the requirements of the Securities Exchange Act of 1934 and the Investment Company Act of 1940, this report has been signed below by the following persons on behalf of the registrant and in the capacities and on the dates indicated.


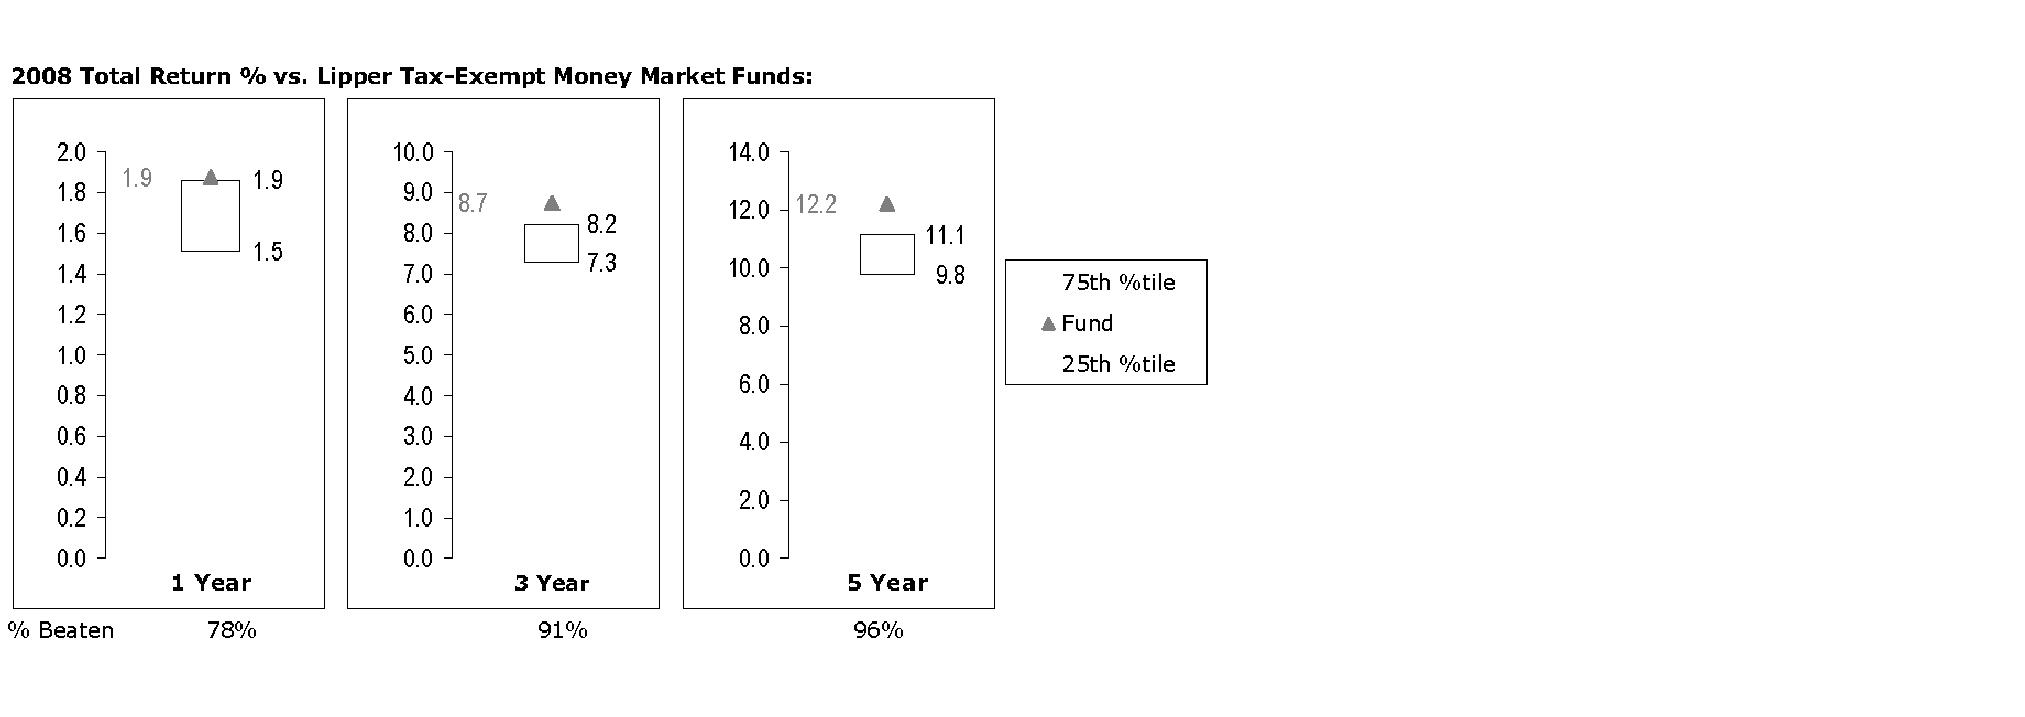
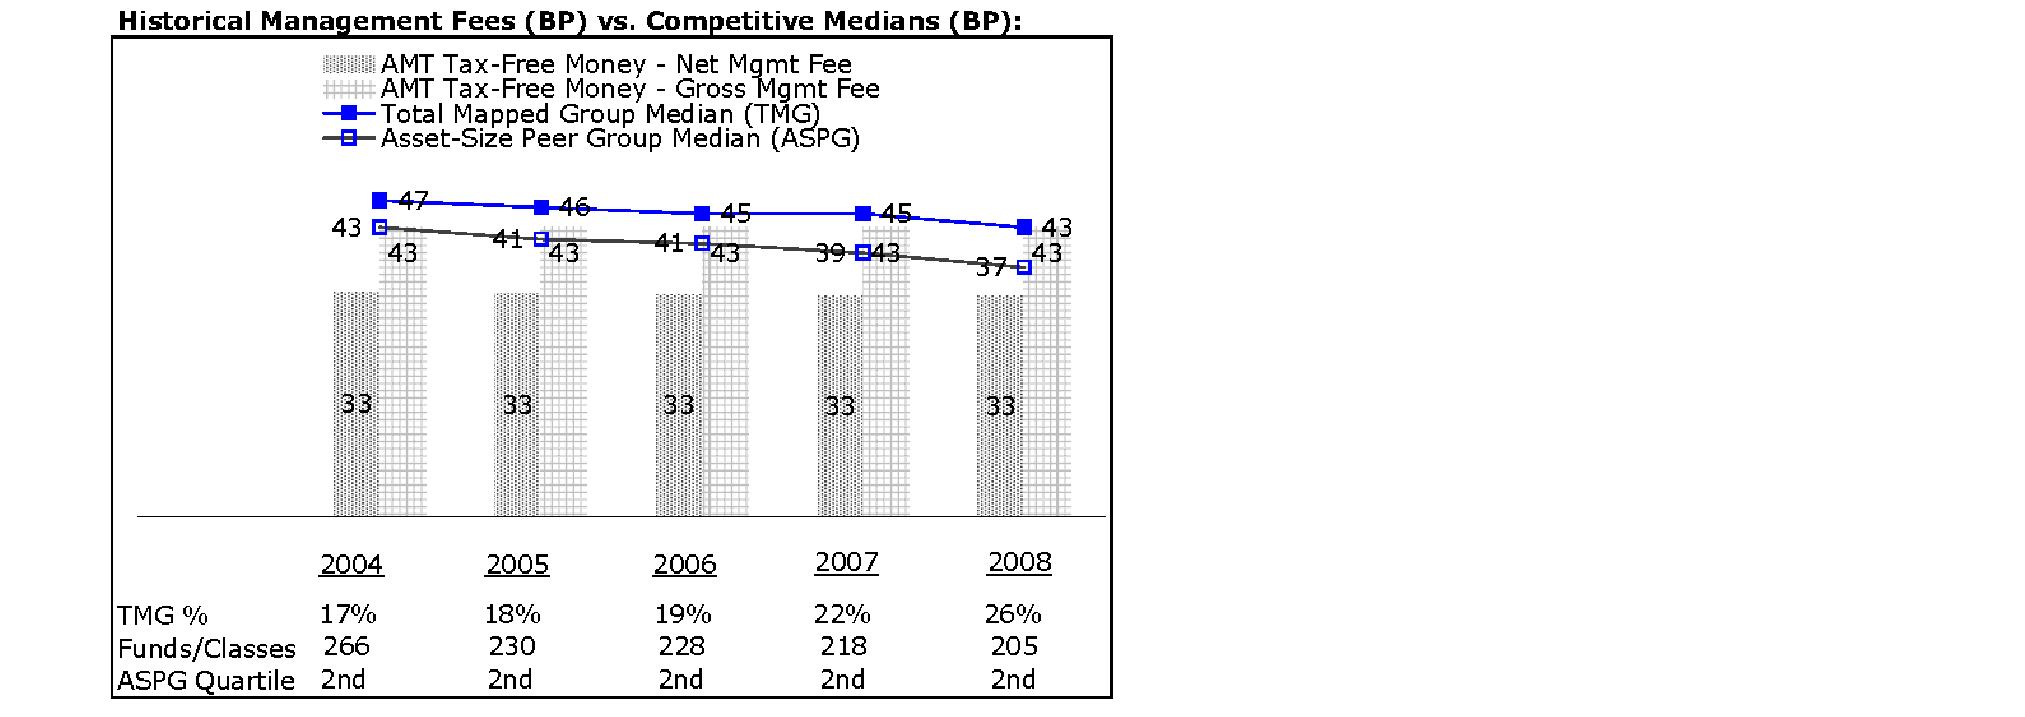
 For mutual fund and brokerage trading.
 For quotes.*
 For account balances and holdings.
 To review orders and mutual
 To change your PIN.
 To speak to a Fidelity representative.
 1-800-544-5555