Scott C. Goebel, Secretary
82 Devonshire St.
Item 1. Reports to Stockholders
As a shareholder of the Fund, you incur two types of costs: (1) transaction costs, and (2) ongoing costs, including management fees and other Fund expenses. This Example is intended to help you understand your ongoing costs (in dollars) of investing in the Fund and to compare these costs with the ongoing costs of investing in other mutual funds.
The Example is based on an investment of $1,000 invested at the beginning of the period and held for the entire period (September 1, 2011 to February 29, 2012).
The first line of the accompanying table provides information about actual account values and actual expenses. You may use the information in this line, together with the amount you invested, to estimate the expenses that you paid over the period. Simply divide your account value by $1,000.00 (for example, an $8,600 account value divided by $1,000.00 = 8.6), then multiply the result by the number in the first line under the heading entitled "Expenses Paid During Period" to estimate the expenses you paid on your account during this period. A small balance maintenance fee of $12.00 that is charged once a year may apply for certain accounts with a value of less than $2,000. This fee is not included in the table below. If it was, the estimate of expenses you paid during the period would be higher, and your ending account value lower, by this amount. In addition, the Fund, as a shareholder in the underlying Fidelity Central Funds, will indirectly bear its pro-rata share of the fees and expenses incurred by the underlying Fidelity Central Funds. These fees and expenses are not included in the Fund's annualized expense ratio used to calculate the expense estimate in the table below.
The second line of the accompanying table provides information about hypothetical account values and hypothetical expenses based on the Fund's actual expense ratio and an assumed rate of return of 5% per year before expenses, which is not the Fund's actual return. The hypothetical account values and expenses may not be used to estimate the actual ending account balance or expenses you paid for the period. You may use this information to compare the ongoing costs of investing in the Fund and other funds. To do so, compare this 5% hypothetical example with the 5% hypothetical examples that appear in the shareholder reports of the other funds. A small balance maintenance fee of $12.00 that is charged once a year may apply for certain accounts with a value of less than $2,000. This fee is not included in the table below. If it was, the estimate of expenses you paid during the period would be higher, and your ending account value lower, by this amount. In addition, the Fund, as a shareholder in the underlying Fidelity Central Funds, will indirectly bear its pro-rata share of the fees and expenses incurred by the underlying Fidelity Central Funds. These fees and expenses are not included in the Fund's annualized expense ratio used to calculate the expense estimate in the table below.
Please note that the expenses shown in the table are meant to highlight your ongoing costs only and do not reflect any transaction costs. Therefore, the second line of the table is useful in comparing ongoing costs only, and will not help you determine the relative total costs of owning different funds.
Fidelity AMT Tax-Free Money Fund (the Fund) is a fund of Fidelity Union Street Trust II (the Trust) and is authorized to issue an unlimited number of shares. The Trust is registered under the Investment Company Act of 1940, as amended (the 1940 Act), as an open-end management investment company organized as a Delaware statutory trust.
The Fund invests in Fidelity Central Funds, which are open-end investment companies available only to other investment companies and accounts managed by Fidelity Management & Research Company (FMR) and its affiliates. The Fund's Schedule of Investments lists each of the Fidelity Central Funds held as of period end, if any, as an investment of the Fund, but does not include the underlying holdings of each Fidelity Central Fund. As an Investing Fund, the Fund indirectly bears its proportionate share of the expenses of the underlying Fidelity Central Funds.
The Money Market Central Funds seek preservation of capital and current income and are managed by Fidelity Investments Money Management, Inc. (FIMM), an affiliate of FMR.
A complete unaudited list of holdings for each Fidelity Central Fund is available upon request or at the Securities and Exchange Commission (the SEC) web site at www.sec.gov. In addition, the financial statements of the Fidelity Central Funds are available on the SEC web site or upon request.
The financial statements have been prepared in conformity with accounting principles generally accepted in the United States of America (GAAP), which require management to make certain estimates and assumptions at the date of the financial statements. Actual results could differ from those estimates. Subsequent events, if any, through the date that the financial statements were issued have been evaluated in the preparation of the financial statements. The following summarizes the significant accounting policies of the Fund:
Level 2 - other significant observable inputs (including quoted prices for similar investments, interest rates, prepayment speeds, etc.)
Level 3 - unobservable inputs (including the Fund's own assumptions based on the best information available)
As permitted by compliance with certain conditions under Rule 2a-7 of the 1940 Act, securities are valued at amortized cost, which approximates fair value. The amortized cost of an instrument is determined by valuing it at its original cost and thereafter amortizing any discount or premium from its face value at a constant rate until maturity. Securities held by a money market fund are generally high quality and liquid; however, they are reflected as Level 2 because the inputs used to determine fair value are not quoted prices in an active market.
Dividends are declared and recorded daily and paid monthly from net investment income. Distributions from realized gains, if any, are declared and recorded on the ex-dividend date. Income and capital gain distributions are determined in accordance with income tax regulations, which may differ from GAAP.
Capital accounts within the financial statements are adjusted for permanent book-tax differences. These adjustments have no impact on net assets or the results of operations. Temporary book-tax differences will reverse in a subsequent period.
Book-tax differences are primarily due to deferred trustee compensation.
The Fund purchases municipal securities whose interest, in the opinion of the issuer, is free from federal income tax. There is no assurance that the IRS will agree with this opinion. In the event the IRS determines that the issuer does not comply with relevant tax requirements, interest payments from a security could become federally taxable, possibly retroactively to the date the security was issued.
The federal tax cost of investment securities and unrealized appreciation (depreciation) as of period end were as follows:
FMR voluntarily agreed to reimburse the Fund to the extent annual operating expenses exceeded .33% of average net assets. During the period this reimbursement reduced the Fund's expenses by $655.
Additionally, FMR or its affiliates voluntarily agreed to waive certain fees in order to maintain a minimum annualized yield of .01%. Such arrangements may be discontinued by FMR at any time. For the period, the amount of the waiver was $1,131.
In addition, through arrangements with the Fund's custodian, credits realized as a result of uninvested cash balances were used to reduce the Fund's management fee. During the period, these credits reduced the Fund's management fee by three hundred ninety two dollars.
The Fund's organizational documents provide former and current trustees and officers with a limited indemnification against liabilities arising in connection with the performance of their duties to the Fund. In the normal course of business, the Fund may also enter into contracts that provide general indemnifications. The Fund's maximum exposure under these arrangements is unknown as this would be dependent on future claims that may be made against the Fund. The risk of material loss from such claims is considered remote.
Each year, the Board of Trustees, including the Independent Trustees (together, the Board), votes on the renewal of the management contract and sub-advisory agreements (together, the Advisory Contracts) for the fund. The Board, assisted by the advice of fund counsel and Independent Trustees' counsel, requests and considers a broad range of information relevant to the renewal of the Advisory Contracts throughout the year.
The Board meets regularly and considers at each of its meetings factors that are relevant to its annual consideration of the renewal of the fund's Advisory Contracts, including the services and support provided to the fund and its shareholders. The Board has established three standing committees, Operations, Audit, and Nominating and Governance, each composed of Independent Trustees with varying backgrounds, to which the Board has assigned specific subject matter responsibilities in order to enhance effective decision-making by the Board. The Operations Committee, of which all of the Independent Trustees are members, meets regularly throughout the year and, among other matters, considers matters specifically related to the annual consideration of the renewal of the fund's Advisory Contracts. The Board, acting directly and through its Committees, requests and receives information concerning the annual consideration of the renewal of the fund's Advisory Contracts. The Board also meets as needed to consider matters specifically related to the Board's annual consideration of the renewal of Advisory Contracts. Members of the Board may also meet with trustees of other Fidelity funds through ad hoc joint committees to discuss certain matters relevant to the Fidelity funds.
At its September 2011 meeting, the Board of Trustees, including the Independent Trustees, unanimously determined to renew the fund's Advisory Contracts. In reaching its determination, the Board considered all factors it believed relevant, including (i) the nature, extent, and quality of the services to be provided to the fund and its shareholders (including the investment performance of the fund); (ii) the competitiveness of the fund's management fee and total expense ratio; (iii) the total costs of the services to be provided by and the profits to be realized by Fidelity from its relationship with the fund; (iv) the extent to which economies of scale would be realized as the fund grows; and (v) whether fee levels reflect these economies of scale, if any, for the benefit of fund shareholders.
In considering whether to renew the Advisory Contracts for the fund, the Board reached a determination, with the assistance of fund counsel and Independent Trustees' counsel and through the exercise of its business judgment, that the renewal of the Advisory Contracts is in the best interests of the fund and its shareholders and that the compensation payable under the Advisory Contracts is fair and reasonable. The Board's decision to renew the Advisory Contracts was not based on any single factor, but rather was based on a comprehensive consideration of all the information provided to the Board at its meetings throughout the year. The Board, in reaching its determination to renew the Advisory Contracts, is aware that shareholders in the fund have a broad range of investment choices available to them, including a wide choice among mutual funds offered by Fidelity's competitors, and that the fund's shareholders, who have the opportunity to review and weigh the disclosure provided by the fund in its prospectus and other public disclosures, have chosen to invest in this fund, managed by Fidelity.
The Board noted that the growth of fund assets over time across the complex allows Fidelity to reinvest in the development of services designed to enhance the value or convenience of the Fidelity funds as investment vehicles. These services include 24-hour access to account information and market information through telephone representatives and over the Internet, investor education materials and asset allocation tools, and the expanded availability of Fidelity Investor Centers, with 35 new branches opening since 2010.
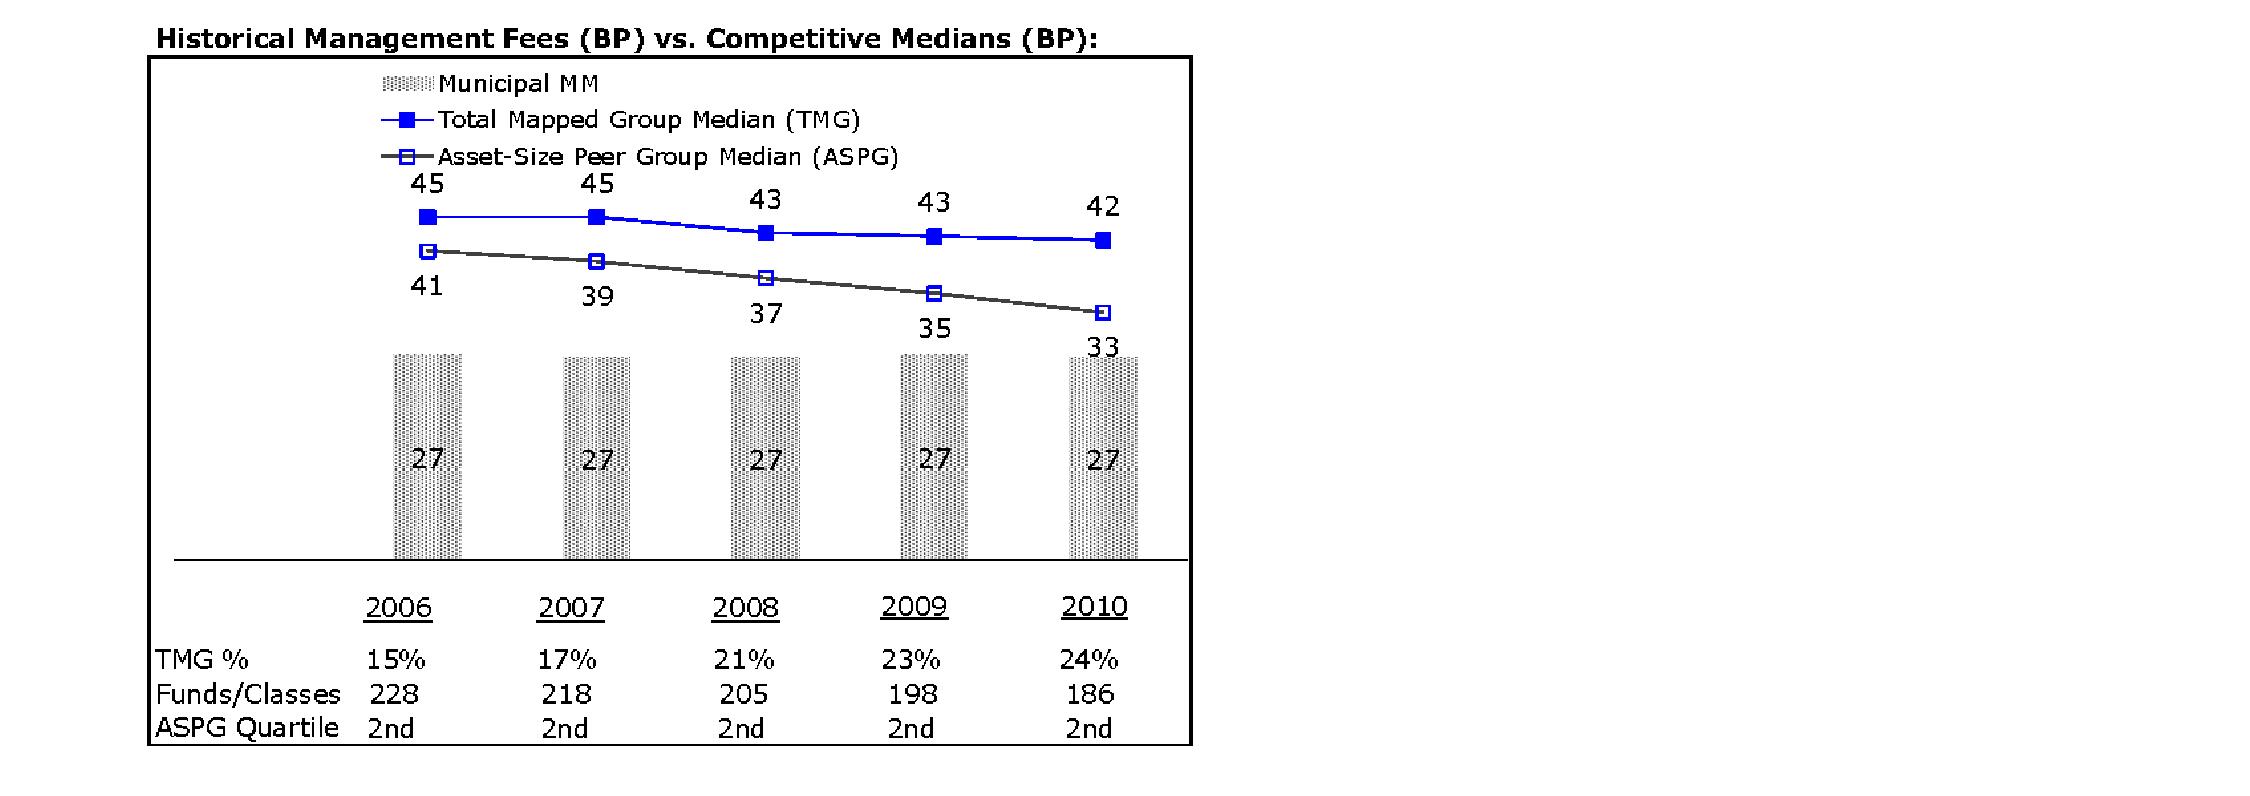
The Board noted that the fund's hypothetical net management fee ranked below the median of its Total Mapped Group and below the median of its ASPG for 2010.
Based on its review, the Board concluded that the fund's management fee is fair and reasonable in light of the services that the fund receives and the other factors considered.
The Board noted that the fund's total expense ratio ranked below its competitive median for 2010. The Board considered that Fidelity has been voluntarily waiving part or all of the management fees to maintain a minimum yield, and also noted that Fidelity retains the ability to be repaid in certain circumstances.
Based on its review of total expense ratios and fees charged to other Fidelity clients, the Board concluded that the fund's total expense ratio was reasonable in light of the services that the fund and its shareholders receive and the other factors considered, including the findings of the Committee.
PricewaterhouseCoopers LLP (PwC), independent registered public accounting firm and auditor to Fidelity and certain Fidelity funds, has been engaged annually by the Board as part of the Board's assessment of Fidelity's profitability analysis. PwC's engagement includes the review and assessment of Fidelity's methodologies used in determining the revenues and expenses attributable to Fidelity's mutual fund business, and completion of agreed-upon procedures surrounding the mathematical accuracy of fund profitability and its conformity to allocation methodologies. After considering PwC's reports issued under the engagement and information provided by Fidelity, the Board concluded that while other allocation methods may also be reasonable, Fidelity's profitability methodologies are reasonable in all material respects.
The Board also reviewed Fidelity's non-fund businesses and fall-out benefits related to the mutual fund business as well as cases where Fidelity's affiliates may benefit from or be related to the fund's business.
The Board considered the costs of the services provided by and the profits realized by Fidelity in connection with the operation of the fund and was satisfied that the profitability was not excessive in the circumstances.
Based on its evaluation of all of the conclusions noted above, and after considering all factors it believed relevant, the Board ultimately concluded that the advisory fee structures are fair and reasonable, and that the fund's Advisory Contracts should be renewed.
Fidelity offers several ways to conveniently manage your personal investments via your telephone or PC. You can access your account information, conduct trades and research your investments 24 hours a day.
Fidelity Automated Service Telephone provides a single toll-free number to access account balances, positions, quotes and trading. It's easy to navigate the service, and on your first call, the system will help you create a personal identification number (PIN) for security.
1 For mutual fund and brokerage trading.
2 For quotes.*
3 For account balances and holdings.
5 To change your PIN.
*0 To speak to a Fidelity representative.
Fidelity's web site on the Internet provides a wide range of information, including daily financial news, fund performance, interactive planning tools and news about Fidelity products and services.
We'll give your correspondence immediate attention and send you written confirmation upon completion of your request.
Citibank, N.A.
New York, NY
Fidelity Investments Institutional Operations Company, Inc.
Fidelity Service Company, Inc.
Citibank, N.A.
As a shareholder of a Fund, you incur two types of costs: (1) transaction costs, including redemption fees, and (2) ongoing costs, including management fees and other Fund expenses. This Example is intended to help you understand your ongoing costs (in dollars) of investing in the Funds and to compare these costs with the ongoing costs of investing in other mutual funds.
The Example is based on an investment of $1,000 invested at the beginning of the period and held for the entire period (September 1, 2011 to February 29, 2012).
The first line of the accompanying table for each fund provides information about actual account values and actual expenses. You may use the information in this line, together with the amount you invested, to estimate the expenses that you paid over the period. Simply divide your account value by $1,000.00 (for example, an $8,600 account value divided by $1,000.00 = 8.6), then multiply the result by the number in the first line for a fund under the heading entitled "Expenses Paid During Period" to estimate the expenses you paid on your account during this period. A small balance maintenance fee of $12.00 that is charged once a year may apply for certain accounts with a value of less than $2,000. This fee is not included in the table below. If it was, the estimate of expenses you paid during the period would be higher, and your ending account value lower, by this amount. In addition, each Fund, as a shareholder in the underlying Fidelity Central Funds, will indirectly bear its pro-rata share of the fees and expenses incurred by the underlying Fidelity Central Funds. These fees and expenses are not included in the Fund's annualized expense ratio used to calculate the expense estimate in the table below.
The second line of the accompanying table for each fund provides information about hypothetical account values and hypothetical expenses based on a fund's actual expense ratio and an assumed rate of return of 5% per year before expenses, which is not the Fund's actual return. The hypothetical account values and expenses may not be used to estimate the actual ending account balance or expenses you paid for the period. You may use this information to compare the ongoing costs of investing in the Fund and other funds. To do so, compare this 5% hypothetical example with the 5% hypothetical examples that appear in the shareholder reports of the other funds. A small balance maintenance fee of $12.00 that is charged once a year may apply for certain accounts with a value of less than $2,000. This fee is not included in the table below. If it was, the estimate of expenses you paid during the period would be higher, and your ending account value lower, by this amount. In addition, each Fund, as a shareholder in the underlying Fidelity Central Funds, will indirectly bear its pro-rata share of the fees and expenses incurred by the underlying Fidelity Central Funds. These fees and expenses are not included in the Fund's annualized expense ratio used to calculate the expense estimate in the table below.
Please note that the expenses shown in the table are meant to highlight your ongoing costs only and do not reflect any transaction costs. Therefore, the second line of the table is useful in comparing ongoing costs only, and will not help you determine the relative total costs of owning different funds. In addition, if these transactional costs were included, your costs would have been higher.
Fidelity Arizona Municipal Income Fund (the Income Fund) is a fund of Fidelity Union Street Trust. Fidelity Arizona Municipal Money Market Fund (the Money Market Fund)is a fund of Fidelity Union Street Trust II. Each Trust is registered under the Investment Company Act of 1940, as amended (the 1940 Act), as an open-end management investment company. Fidelity Union Street Trust and Fidelity Union Street Trust II (the Trusts) are organized as a Massachusetts business trust and a Delaware statutory trust, respectively. The Income Fund is a non-diversified fund. Each Fund is authorized to issue an unlimited number of shares. Each Fund may be affected by economic and political developments in the state of Arizona.
The Funds may invest in Fidelity Central Funds, which are open-end investment companies available only to other investment companies and accounts managed by Fidelity Management & Research Company (FMR) and its affiliates. The Funds' Schedules of Investments list each of the Fidelity Central Funds held as of period end, if any, as an investment of each Fund, but do not include the underlying holdings of each Fidelity Central Fund. As an Investing Fund, each Fund indirectly bears its proportionate share of the expenses of the underlying Fidelity Central Funds.
The Money Market Central Funds seek preservation of capital and current income and are managed by Fidelity Investments Money Management, Inc. (FIMM), an affiliate of FMR.
A complete unaudited list of holdings for each Fidelity Central Fund is available upon request or at the Securities and Exchange Commission (the SEC) web site at www.sec.gov. In addition, the financial statements of the Fidelity Central Funds are available on the SEC web site or upon request.
The financial statements have been prepared in conformity with accounting principles generally accepted in the United States of America (GAAP), which require management to make certain estimates and assumptions at the date of the financial statements. Actual results could differ from those estimates. Subsequent events, if any, through the date that the financial statements were issued have been evaluated in the preparation of the financial statements. The following summarizes the significant accounting policies of the Funds:
Each Fund categorizes the inputs to valuation techniques used to value their investments into a disclosure hierarchy consisting of three levels as shown below:
Level 2 - other significant observable inputs (including quoted prices for similar investments, interest rates, prepayment speeds, etc.)
Level 3 - unobservable inputs (including the Fund's own assumptions based on the best information available)
For the Income Fund, changes in valuation techniques may result in transfers in or out of an assigned level within the disclosure hierarchy. Valuation techniques used to value each Fund's investments by major category are as follows:
For the Income Fund, debt securities, including restricted securities, are valued based on evaluated prices received from independent pricing services or from dealers who make markets in such securities. For municipal securities, pricing services utilize matrix pricing which considers yield or price of bonds of comparable quality, coupon, maturity and type as well as dealer supplied prices and are generally categorized as Level 2 in the hierarchy. When independent prices are unavailable or unreliable, debt securities may be valued utilizing pricing matrices which consider similar factors that would be used by independent pricing services. These are generally categorized as Level 2 in the hierarchy but may be Level 3 depending on the circumstances.
For the Money Market Fund, as permitted by compliance with certain conditions under Rule 2a-7 of the 1940 Act, securities are valued at amortized cost, which approximates fair value. The amortized cost of an instrument is determined by valuing it at its original cost and thereafter amortizing any discount or premium from its face value at a constant rate until maturity. Securities held by a money market fund are generally high quality and liquid; however, they are reflected as Level 2 because the inputs used to determine fair value are not quoted prices in an active market.
Dividends are declared and recorded daily and paid monthly from net investment income. Distributions from realized gains, if any, are declared and recorded on the ex-dividend date. Income and capital gain distributions are determined in accordance with income tax regulations, which may differ from GAAP.
Capital accounts within the financial statements are adjusted for permanent book-tax differences. These adjustments have no impact on net assets or the results of operations. Temporary book-tax differences will reverse in a subsequent period.
Book-tax differences are primarily due to market discount, deferred trustees compensation, capital loss carryforwards and losses deferred due to excise tax regulations.
The Funds purchase municipal securities whose interest, in the opinion of the issuer, is free from federal income tax. There is no assurance that the IRS will agree with this opinion. In the event the IRS determines that the issuer does not comply with relevant tax requirements, interest payments from a security could become federally taxable, possibly retroactively to the date the security was issued.
The federal tax cost of investment securities and unrealized appreciation (depreciation) as of period end were as follows for each Fund:
Capital loss carryforwards are only available to offset future capital gains of the Funds to the extent provided by regulations and may be limited. Under the Regulated Investment Company Modernization Act of 2010 (the Act), the Funds are permitted to carry forward capital losses incurred in taxable years beginning after December 22, 2010 for an unlimited period and such capital losses are required to be used prior to any losses that expire. At August 31, 2011, capital loss carryforwards were as follows:
of Investments. The Funds may receive compensation for interest forgone in the purchase of a delayed delivery or when-issued security. With respect to purchase commitments, each applicable Fund identifies securities as segregated in its records with a value at least equal to the amount of the commitment. Losses may arise due to changes in the value of the underlying securities or if the counterparty does not perform under the contract's terms, or if the issuer does not issue the securities due to political, economic, or other factors.
Purchases and sales of securities, other than short-term securities, for the Income Fund aggregated $14,138,571 and $5,047,998, respectively.
The Income Fund participates with other funds managed by FMR or an affiliate in a $4.0 billion credit facility (the "line of credit") to be utilized for temporary or emergency purposes to fund shareholder redemptions or for other short-term liquidity purposes. The participating funds have agreed to pay commitment fees on their pro-rata portion of the line of credit, which are reflected in Miscellaneous expenses on the Statement of Operations, and are as follows:
During the period, there were no borrowings on this line of credit.
FMR or its affiliates voluntarily agreed to waive certain fees for the Money Market Fund in order to maintain a minimum annualized yield of .01%. Such arrangements may be discontinued by FMR at any time. For the period, the amount of the waiver was $613,970.
In addition, through arrangements with each applicable Fund's custodian, credits realized as a result of uninvested cash balances were used to reduce each applicable Fund's management fee. During the period, these credits reduced management fee by the following amounts:
The Funds' organizational documents provide former and current trustees and officers with a limited indemnification against liabilities arising in connection with the performance of their duties to the Funds. In the normal course of business, the Funds may also enter into contracts that provide general indemnifications. The Funds' maximum exposure under these arrangements is unknown as this would be dependent on future claims that may be made against the Funds. The risk of material loss from such claims is considered remote.
Each year, the Board of Trustees, including the Independent Trustees (together, the Board), votes on the renewal of the management contract and sub-advisory agreements (together, the Advisory Contracts) for each fund. The Board, assisted by the advice of fund counsel and Independent Trustees' counsel, requests and considers a broad range of information relevant to the renewal of the Advisory Contracts throughout the year.
The Board meets regularly and considers at each of its meetings factors that are relevant to its annual consideration of the renewal of each fund's Advisory Contracts, including the services and support provided to each fund and its shareholders. The Board has established three standing committees, Operations, Audit, and Nominating and Governance, each composed of Independent Trustees with varying backgrounds, to which the Board has assigned specific subject matter responsibilities in order to enhance effective decision-making by the Board. The Operations Committee, of which all of the Independent Trustees are members, meets regularly throughout the year and, among other matters, considers matters specifically related to the annual consideration of the renewal of each fund's Advisory Contracts. The Board, acting directly and through its Committees, requests and receives information concerning the annual consideration of the renewal of each fund's Advisory Contracts. The Board also meets as needed to consider matters specifically related to the Board's annual consideration of the renewal of Advisory Contracts. Members of the Board may also meet with trustees of other Fidelity funds through ad hoc joint committees to discuss certain matters relevant to the Fidelity funds.
At its September 2011 meeting, the Board of Trustees, including the Independent Trustees, unanimously determined to renew each fund's Advisory Contracts. In reaching its determination, the Board considered all factors it believed relevant, including (i) the nature, extent, and quality of the services to be provided to each fund and its shareholders (including the investment performance of each fund); (ii) the competitiveness of each fund's management fee and total expense ratio; (iii) the total costs of the services to be provided by and the profits to be realized by Fidelity from its relationship with each fund; (iv) the extent to which economies of scale would be realized as each fund grows; and (v) whether fee levels reflect these economies of scale, if any, for the benefit of fund shareholders.
In considering whether to renew the Advisory Contracts for each fund, the Board reached a determination, with the assistance of fund counsel and Independent Trustees' counsel and through the exercise of its business judgment, that the renewal of the Advisory Contracts is in the best interests of each fund and its shareholders and that the compensation payable under the Advisory Contracts is fair and reasonable. The Board's decision to renew the Advisory Contracts was not based on any single factor, but rather was based on a comprehensive consideration of all the information provided to the Board at its meetings throughout the year. The Board, in reaching its determination to renew the Advisory Contracts, is aware that shareholders in each fund have a broad range of investment choices available to them, including a wide choice among mutual funds offered by Fidelity's competitors, and that each fund's shareholders, who have the opportunity to review and weigh the disclosure provided by the fund in its prospectus and other public disclosures, have chosen to invest in that fund, managed by Fidelity.
The Board noted that the growth of fund assets over time across the complex allows Fidelity to reinvest in the development of services designed to enhance the value or convenience of the Fidelity funds as investment vehicles. These services include 24-hour access to account information and market information through telephone representatives and over the Internet, investor education materials and asset allocation tools, and the expanded availability of Fidelity Investor Centers, with 35 new branches opening since 2010.
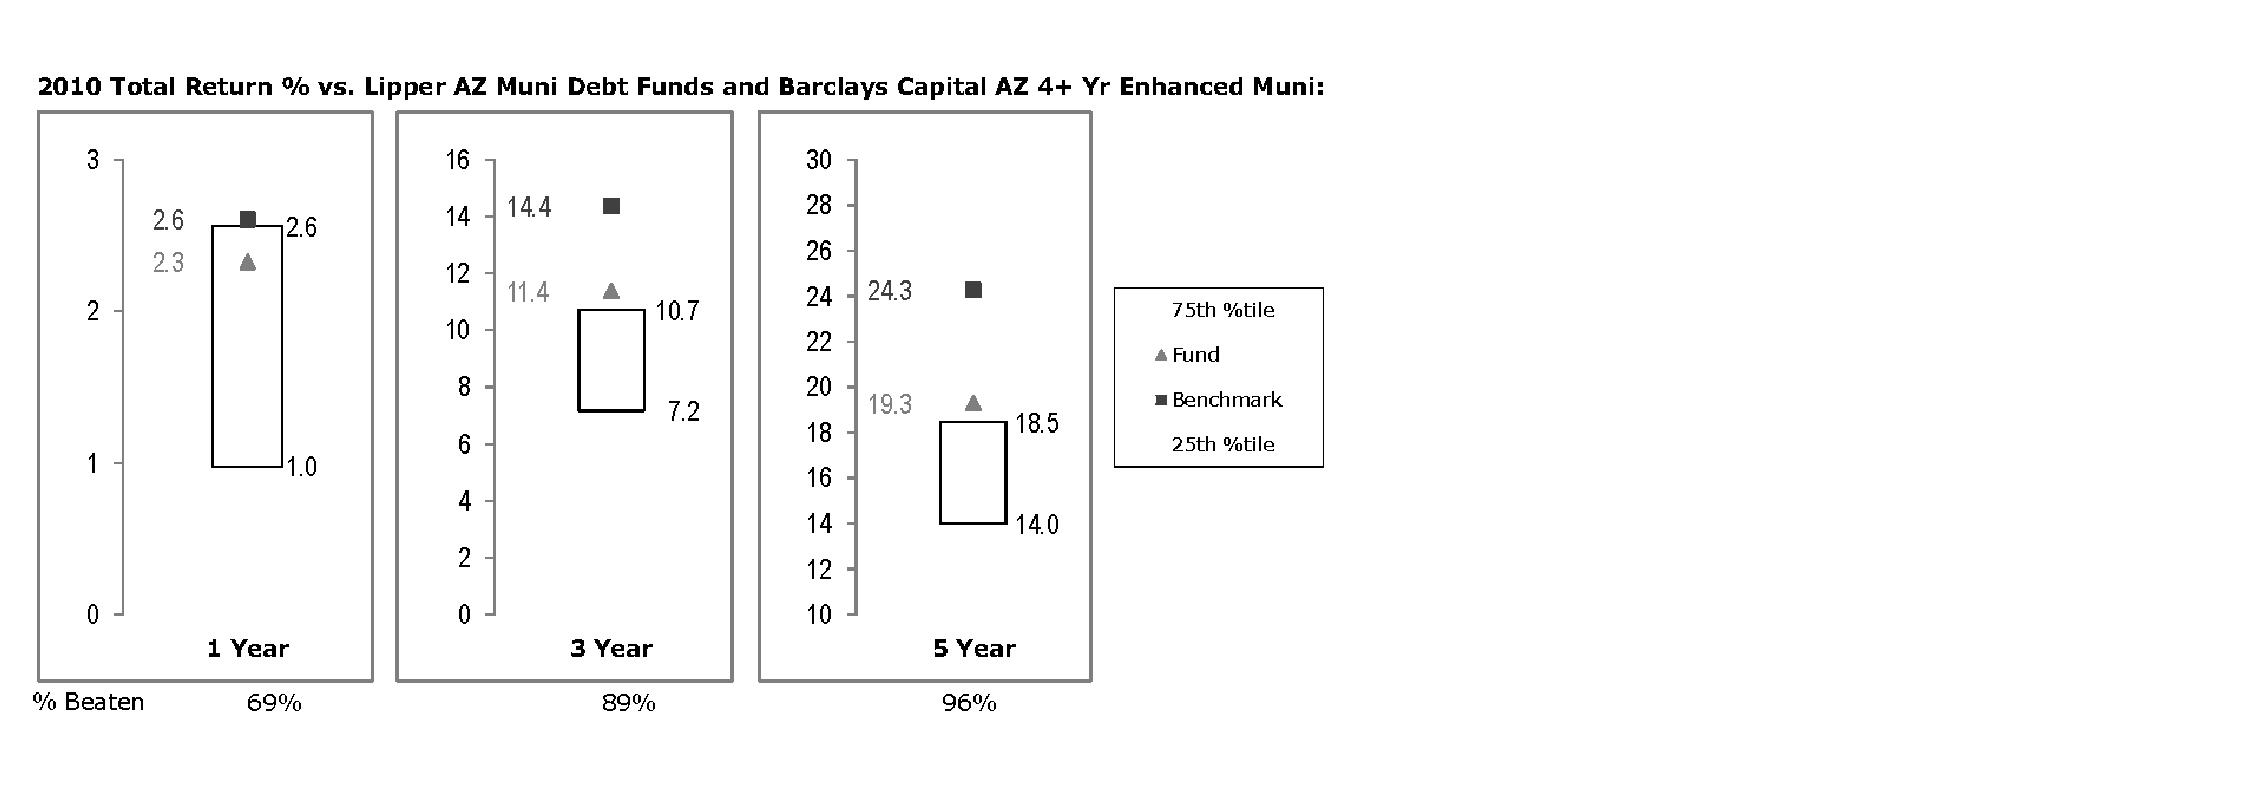
The Board reviewed the fund's relative investment performance against its peer group and noted that the performance of the fund was in the second quartile for the one-year period and the first quartile for the three- and five-year periods. The Board also noted that the investment performance of the fund was lower than its benchmark for all the periods shown. The Board discussed with FMR actions to improve the fund's below-benchmark performance. The Board also reviewed the fund's performance since inception as well as performance in the current year.
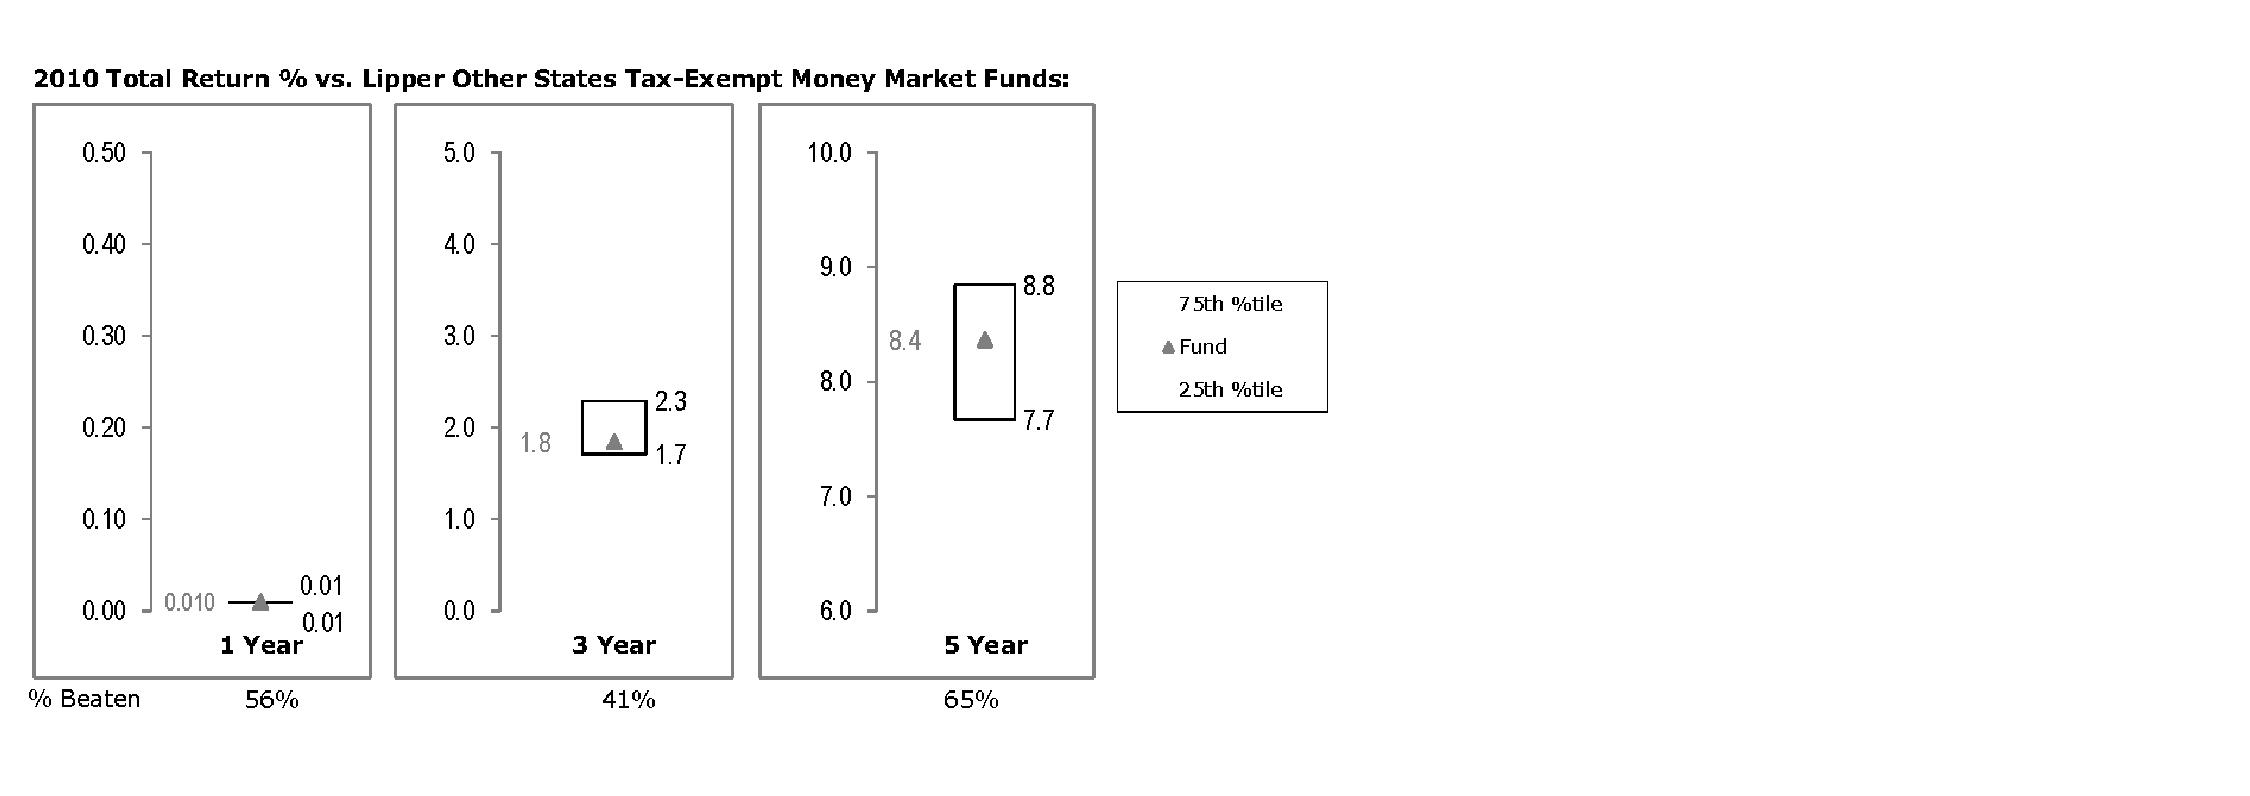
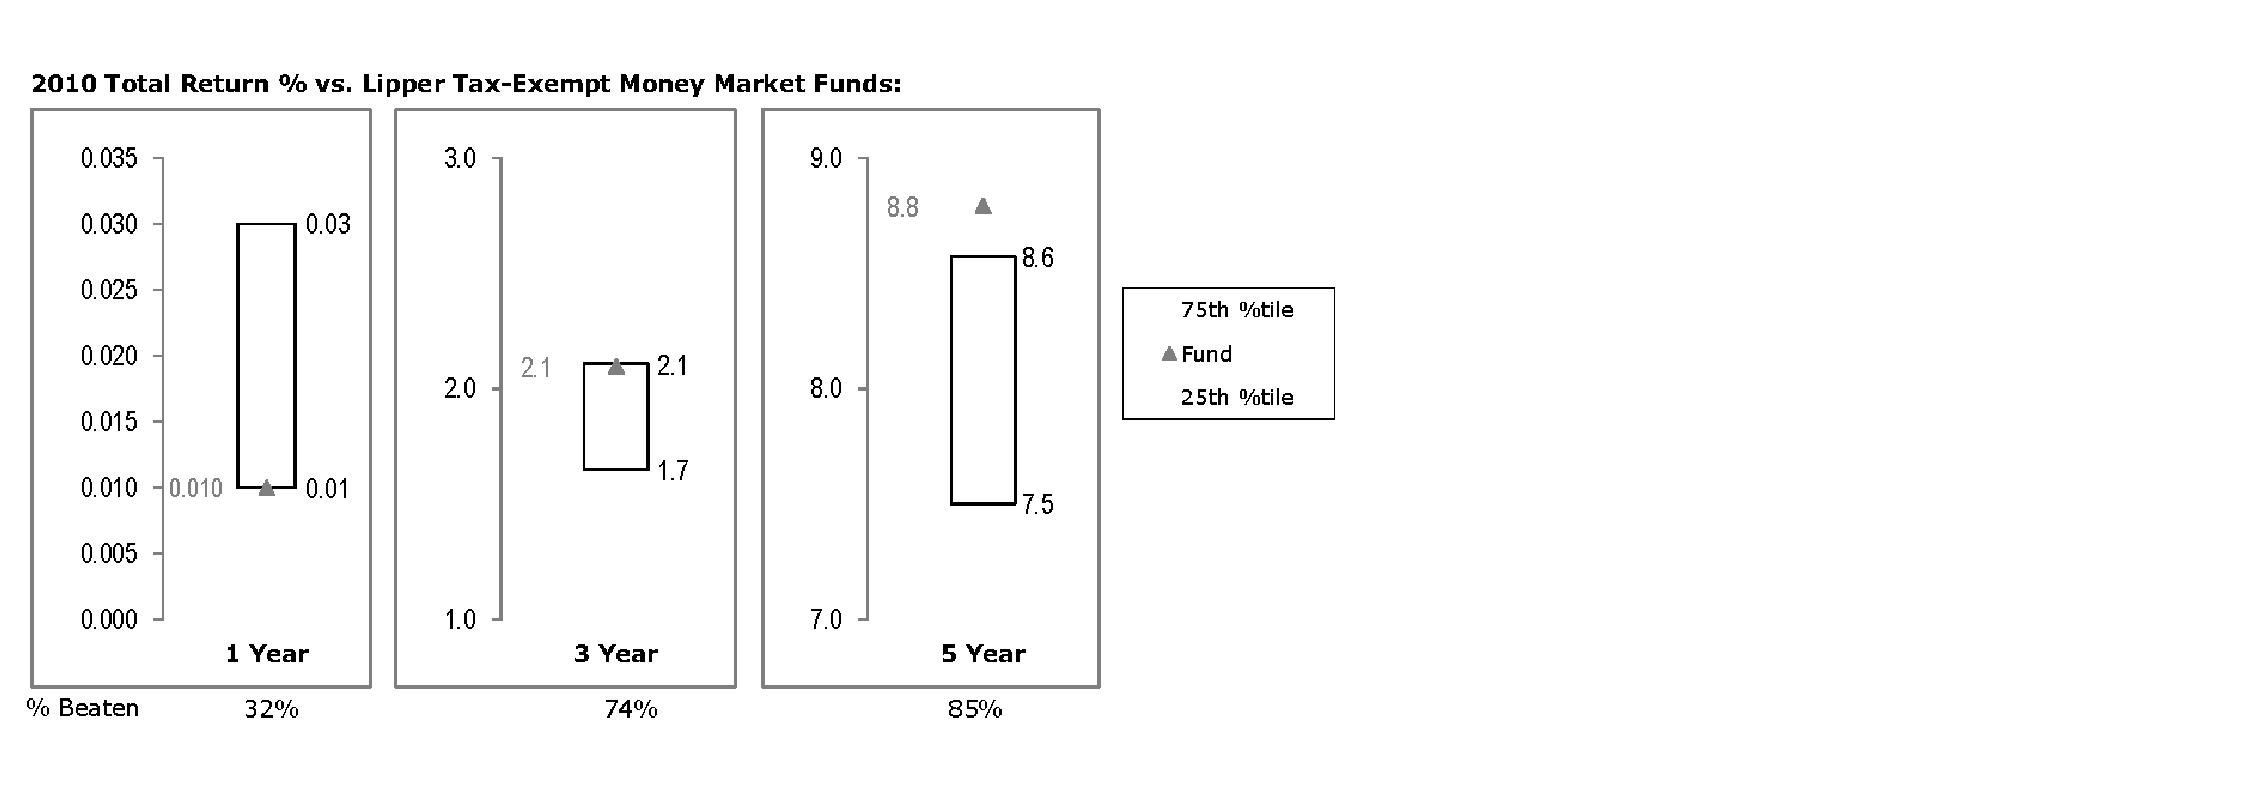
The Board reviewed the fund's relative investment performance against its peer group and noted that the performance of the fund was in the second quartile for the one- and five-year periods and the third quartile for the three-year period. The Board considered that FMR had taken steps to provide shareholders with stability of principal and to enhance safety and liquidity. The Board also reviewed the fund's performance since inception as well as performance in the current year.
Based on its review, the Board concluded that the nature, extent, and quality of services provided to each fund under the Advisory Contracts should benefit each fund's shareholders.
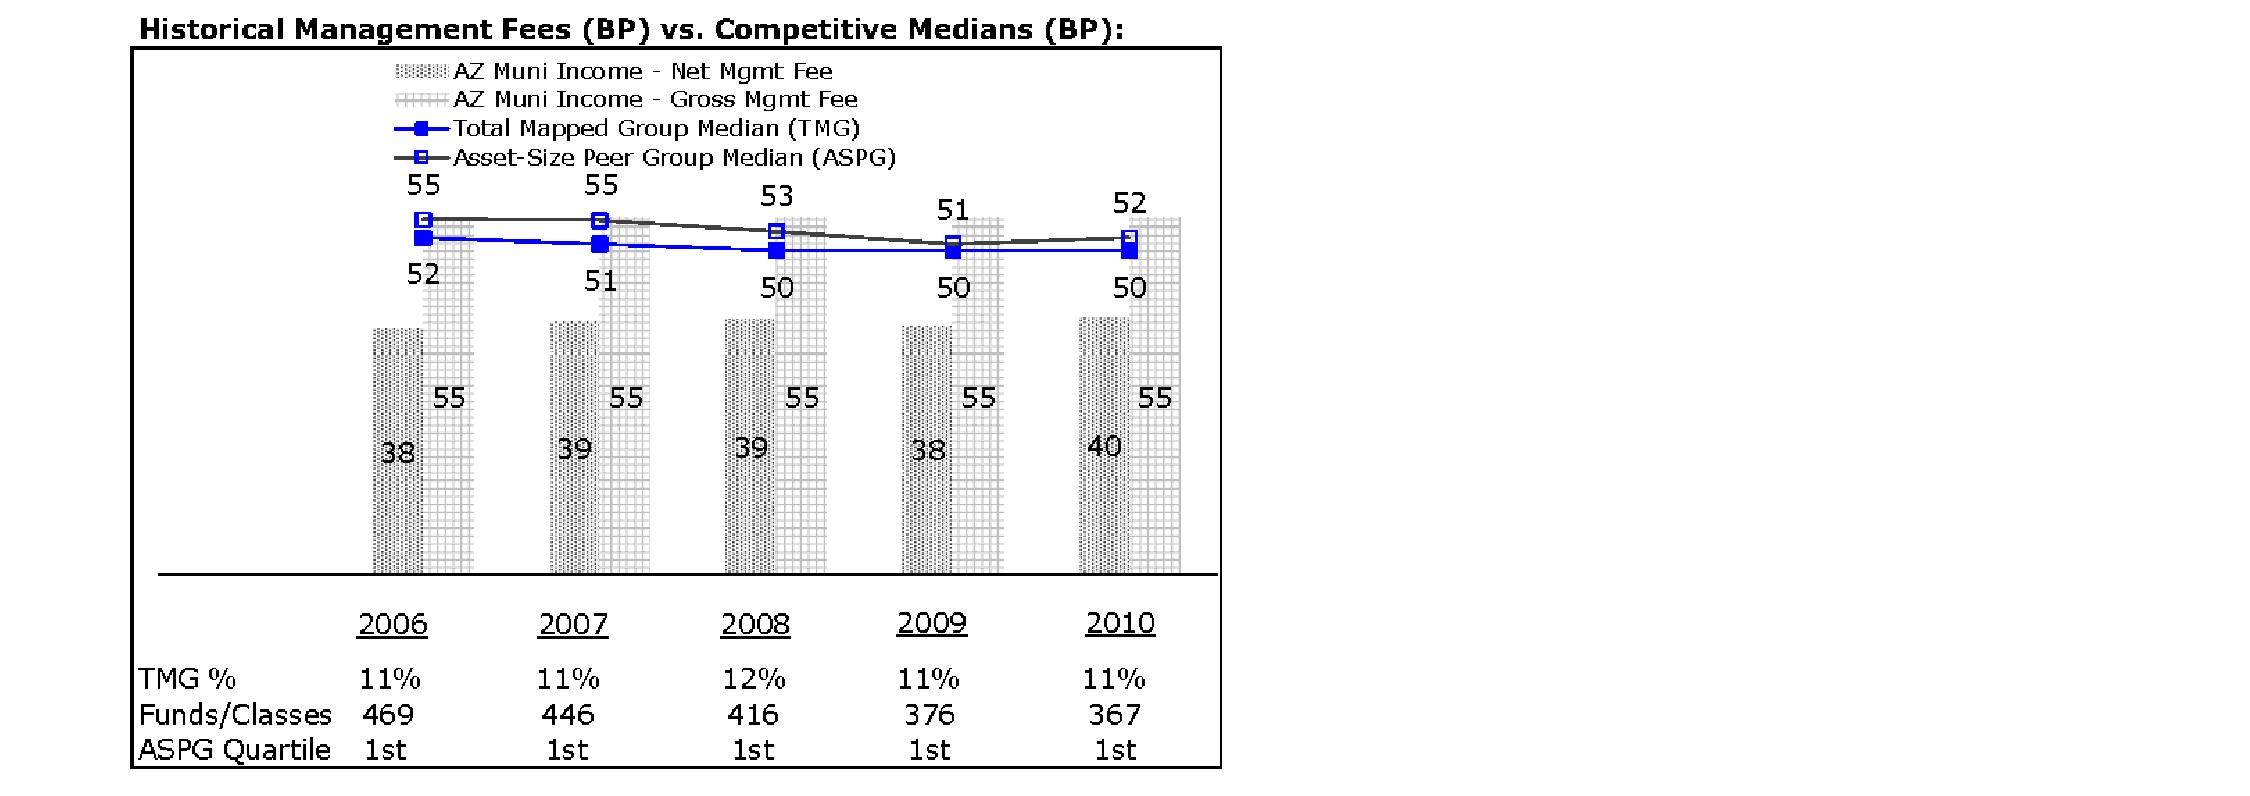
The Board noted that each fund's hypothetical net management fee ranked below the median of its Total Mapped Group and below the median of its ASPG for 2010.
Based on its review, the Board concluded that each fund's management fee is fair and reasonable in light of the services that the fund receives and the other factors considered.
The Board noted that Arizona Municipal Income Fund's total expense ratio ranked equal to its competitive median for 2010.
The Board noted that Arizona Municipal Money Market Fund's total expense ratio ranked below its competitive median for 2010. The Board considered that Fidelity has been voluntarily waiving part or all of the management fees to maintain a minimum yield for Fidelity Arizona Municipal Money Market Fund, and also noted that Fidelity retains the ability to be repaid by the fund in certain circumstances.
Based on its review of total expense ratios and fees charged to other Fidelity clients, the Board concluded that each fund's total expense ratio was reasonable in light of the services that the fund and its shareholders receive and the other factors considered, including the findings of the Committee.
On an annual basis, FMR presents to the Board Fidelity's profitability for each fund. Fidelity calculates the profitability for each fund, as well as aggregate profitability for groups of Fidelity funds and all Fidelity funds, using a series of detailed revenue and cost allocation methodologies which originate with the books and records of Fidelity on which Fidelity's audited financial statements are based. The Audit Committee of the Board reviews any significant changes from the prior year's methodologies.
PricewaterhouseCoopers LLP (PwC), independent registered public accounting firm and auditor to Fidelity and certain Fidelity funds, has been engaged annually by the Board as part of the Board's assessment of Fidelity's profitability analysis. PwC's engagement includes the review and assessment of Fidelity's methodologies used in determining the revenues and expenses attributable to Fidelity's mutual fund business, and completion of agreed-upon procedures surrounding the mathematical accuracy of fund profitability and its conformity to allocation methodologies. After considering PwC's reports issued under the engagement and information provided by Fidelity, the Board concluded that while other allocation methods may also be reasonable, Fidelity's profitability methodologies are reasonable in all material respects.
The Board also reviewed Fidelity's non-fund businesses and fall-out benefits related to the mutual fund business as well as cases where Fidelity's affiliates may benefit from or be related to the funds' business.
The Board considered the costs of the services provided by and the profits realized by Fidelity in connection with the operation of each fund and was satisfied that the profitability was not excessive in the circumstances.
The Board concluded, taking into account the analysis of the Economies of Scale Committee, that any potential economies of scale are being appropriately shared between fund shareholders and Fidelity.
Based on its evaluation of all of the conclusions noted above, and after considering all factors it believed relevant, the Board ultimately concluded that the advisory fee structures are fair and reasonable, and that each fund's Advisory Contracts should be renewed.
Fidelity offers several ways to conveniently manage your personal investments via your telephone or PC. You can access your account information, conduct trades and research your investments 24 hours a day.
Fidelity Automated Service Telephone provides a single toll-free number to access account balances, positions, quotes and trading. It's easy to navigate the service, and on your first call, the system will help you create a personal identification number (PIN) for security.
1 For mutual fund and brokerage trading.
2 For quotes.*
3 For account balances and holdings.
5 To change your PIN.
*0 To speak to a Fidelity representative.
Fidelity's web site on the Internet provides a wide range of information, including daily financial news, fund performance, interactive planning tools and news about Fidelity products and services.
We'll give your correspondence immediate attention and send you written confirmation upon completion of your request.
Citibank, N.A.
Fidelity Investments Institutional Operations Company, Inc.
Fidelity Service Company, Inc.
Citibank, N.A.
As a shareholder of the Fund, you incur two types of costs: (1) transaction costs, and (2) ongoing costs, including management fees and other Fund expenses. This Example is intended to help you understand your ongoing costs (in dollars) of investing in the Fund and to compare these costs with the ongoing costs of investing in other mutual funds.
The Example is based on an investment of $1,000 invested at the beginning of the period and held for the entire period (September 1, 2011 to February 29, 2012).
The first line of the accompanying table provides information about actual account values and actual expenses. You may use the information in this line, together with the amount you invested, to estimate the expenses that you paid over the period. Simply divide your account value by $1,000.00 (for example, an $8,600 account value divided by $1,000.00 = 8.6), then multiply the result by the number in the first line under the heading entitled "Expenses Paid During Period" to estimate the expenses you paid on your account during this period. A small balance maintenance fee of $12.00 that is charged once a year may apply for certain accounts with a value of less than $2,000. This fee is not included in the table below. If it was, the estimate of expenses you paid during the period would be higher, and your ending account value lower, by this amount. In addition, the Fund, as a shareholder in the underlying Fidelity Central Funds, will indirectly bear its pro-rata share of the fees and expenses incurred by the underlying Fidelity Central Funds. These fees and expenses are not included in the Fund's annualized expense ratio used to calculate the expense estimate in the table below.
The second line of the accompanying table provides information about hypothetical account values and hypothetical expenses based on the Fund's actual expense ratio and an assumed rate of return of 5% per year before expenses, which is not the Fund's actual return. The hypothetical account values and expenses may not be used to estimate the actual ending account balance or expenses you paid for the period. You may use this information to compare the ongoing costs of investing in the Fund and other funds. To do so, compare this 5% hypothetical example with the 5% hypothetical examples that appear in the shareholder reports of the other funds. A small balance maintenance fee of $12.00 that is charged once a year may apply for certain accounts with a value of less than $2,000. This fee is not included in the table below. If it was, the estimate of expenses you paid during the period would be higher, and your ending account value lower, by this amount. In addition, the Fund, as a shareholder in the underlying Fidelity Central Funds, will indirectly bear its pro-rata share of the fees and expenses incurred by the underlying Fidelity Central Funds. These fees and expenses are not included in the Fund's annualized expense ratio used to calculate the expense estimate in the table below.
Please note that the expenses shown in the table are meant to highlight your ongoing costs only and do not reflect any transaction costs. Therefore, the second line of the table is useful in comparing ongoing costs only, and will not help you determine the relative total costs of owning different funds.
Municipal Securities - 100.4% |
| Principal Amount (000s) | | Value (000s) |
Alabama - 0.8% |
Alabama Pub. School & College Auth. Rev. Participating VRDN Series MT 719, 0.22% 3/7/12 (Liquidity Facility Bank of America NA) (c)(g) | $ 5,810 | | $ 5,810 |
Auburn Univ. Gen. Fee Rev. Participating VRDN Series WF 08 55C, 0.17% 3/7/12 (Liquidity Facility Wells Fargo & Co.) (c)(g) | 23,540 | | 23,540 |
Courtland Indl. Dev. Board Rev. (Specialty Minerals, Inc. Proj.) 0.24% 3/7/12, LOC Wells Fargo Bank NA, VRDN (c)(f) | 8,000 | | 8,000 |
Decatur Indl. Dev. Board Exempt Facilities Rev. (Nucor Steel Decatur LLC Proj.) Series 2003 A, 0.16% 3/7/12, VRDN (c)(f) | 23,800 | | 23,800 |
Mobile Indl. Dev. Board Dock & Wharf Rev. (Holnam, Inc. Proj.) Series 1999 B, 0.13% 3/7/12, LOC Wells Fargo Bank NA, VRDN (c) | 25,165 | | 25,165 |
Mobile Indl. Dev. Board Exempt Facilities Rev. Series 1997, 0.13% 3/7/12 (Kimberly-Clark Corp. Guaranteed), VRDN (c) | 14,800 | | 14,800 |
Univ. of Alabama at Birmingham Hosp. Rev. Series 2008 B, 0.22% 3/7/12, LOC Bank of America NA, VRDN (c) | 49,930 | | 49,930 |
Walker County Econ. & Indl. Dev. Auth. Solid Waste Disp. Rev. (Alabama Pwr. Co. Plant Gorgas Proj.) Series 2007, 0.16% 3/1/12, VRDN (c)(f) | 1,000 | | 1,000 |
Washington County Indl. Dev. Auth. Idr (Sempra Energy Proj.) Series 2007, 0.14% 3/7/12, LOC UBS AG, VRDN (c) | 33,895 | | 33,895 |
West Jefferson Indl. Dev. Board Solid Waste Disp. Rev. (Alabama Pwr. Co. Miller Plant Proj.) Series 2008, 0.16% 3/1/12, VRDN (c)(f) | 9,100 | | 9,100 |
| | 195,040 |
Alaska - 0.5% |
Alaska Indl. Dev. & Export Auth. Rev.: | | | |
(Greater Fairbanks Cmnty. Hosp. Foundation Proj.) Series 2009 A, 0.16% 3/7/12, LOC Union Bank of California, VRDN (c) | 15,000 | | 15,000 |
Participating VRDN Series Putters 4722, 0.24% 3/7/12 (Liquidity Facility Bank of America NA) (c)(g) | 16,665 | | 16,665 |
Alaska Int'l. Arpts. Revs. Series 2009 A, 0.1% 3/7/12, LOC State Street Bank & Trust Co., Boston, VRDN (c) | 2,000 | | 2,000 |
Anchorage Gen. Oblig. Series 2008 A: | | | |
0.15% 6/15/12, LOC U.S. Bank NA, Cincinnati, CP (f) | 20,000 | | 20,000 |
0.17% 3/19/12, LOC U.S. Bank NA, Cincinnati, CP (f) | 20,000 | | 20,000 |
North Slope Borough Gen. Oblig. Bonds Series 2010 A, 3% 6/30/12 | 1,575 | | 1,590 |
Municipal Securities - continued |
| Principal Amount (000s) | | Value (000s) |
Alaska - continued |
Valdez Marine Term. Rev.: | | | |
(ConocoPhillips Proj.) Series 1994 A, 0.12% 3/7/12 (ConocoPhillips Guaranteed), VRDN (c) | $ 15,920 | | $ 15,920 |
(Phillips Trans. Alaska, Inc. Proj.): | | | |
Series 1994 B, 0.15% 3/7/12 (ConocoPhillips Guaranteed), VRDN (c) | 26,000 | | 26,000 |
Series 1994 C, 0.19% 3/7/12 (ConocoPhillips Guaranteed), VRDN (c) | 3,000 | | 3,000 |
| | 120,175 |
Arizona - 2.0% |
Arizona Health Facilities Auth. Rev.: | | | |
(Banner Health Sys. Proj.) Series 2008 F, 0.13% 3/7/12, LOC JPMorgan Chase Bank, VRDN (c) | 22,210 | | 22,210 |
(Catholic Healthcare West Proj.): | | | |
Series 2005 B, 0.13% 3/7/12, LOC JPMorgan Chase Bank, VRDN (c) | 6,070 | | 6,070 |
Series 2008 A, 0.12% 3/7/12, LOC JPMorgan Chase Bank, VRDN (c) | 48,200 | | 48,200 |
Series 2009 F, 0.14% 3/7/12, LOC Citibank NA, VRDN (c) | 2,550 | | 2,550 |
Arizona School Facilities Board Ctfs. of Prtn. Bonds Series 2008, 5% 9/1/12 | 24,580 | | 25,110 |
Arizona State Trans. Board Bonds Series 2003 A, 5% 7/1/12 | 2,750 | | 2,795 |
Arizona Trans. Board Excise Tax Rev. Bonds Series 2011, 2% 7/1/12 | 6,625 | | 6,664 |
Arizona Trans. Board Hwy. Rev. Bonds Series 2011 A, 2% 7/1/12 | 8,170 | | 8,218 |
Coconino County Poll. Cont. Corp. Rev. (Tucson Elec. Pwr. Co. Navajo Proj.) Series 2010 A, 0.18% 3/7/12, LOC JPMorgan Chase Bank, VRDN (c)(f) | 14,900 | | 14,900 |
Glendale Indl. Dev. Auth. (Midwestern Univ. Proj.) Series 2008, 0.17% 3/7/12, LOC JPMorgan Chase Bank, VRDN (c) | 11,000 | | 11,000 |
Maricopa County Indl. Dev. Auth. Multi-family Hsg. Rev.: | | | |
(Ranchwood Apts. Proj.) Series 2001 A, 0.17% 3/7/12, LOC Fannie Mae Guaranteed Mtg. pass-thru certificates, VRDN (c)(f) | 2,500 | | 2,500 |
(San Angelin Apts. Proj.) Series 2004, 0.16% 3/7/12, LOC Fannie Mae Guaranteed Mtg. pass-thru certificates, VRDN (c)(f) | 14,900 | | 14,900 |
(San Clemente Apts. Proj.) Series 2004, 0.16% 3/7/12, LOC Fannie Mae Guaranteed Mtg. pass-thru certificates, VRDN (c)(f) | 10,600 | | 10,600 |
Municipal Securities - continued |
| Principal Amount (000s) | | Value (000s) |
Arizona - continued |
Maricopa County Indl. Dev. Auth. Multi-family Hsg. Rev.: - continued | | | |
(San Fernando Apts. Proj.) Series 2004, 0.16% 3/7/12, LOC Fannie Mae Guaranteed Mtg. pass-thru certificates, VRDN (c)(f) | $ 11,800 | | $ 11,800 |
(San Lucas Apts. Proj.) Series 2003, 0.16% 3/7/12, LOC Fannie Mae Guaranteed Mtg. pass-thru certificates, VRDN (c)(f) | 12,000 | | 12,000 |
(San Martin Apts. Proj.): | | | |
Series A1, 0.16% 3/7/12, LOC Fannie Mae Guaranteed Mtg. pass-thru certificates, VRDN (c)(f) | 5,700 | | 5,700 |
Series A2, 0.18% 3/7/12, LOC Fannie Mae Guaranteed Mtg. pass-thru certificates, VRDN (c)(f) | 4,300 | | 4,300 |
(San Miguel Apts. Proj.) Series 2003, 0.16% 3/7/12, LOC Fannie Mae Guaranteed Mtg. pass-thru certificates, VRDN (c)(f) | 14,900 | | 14,900 |
(Sands Apts. Proj.) Series 2001 A, 0.17% 3/7/12, LOC Fannie Mae Guaranteed Mtg. pass-thru certificates, VRDN (c)(f) | 2,800 | | 2,800 |
(Village Square Apts. Proj.) Series 2004, 0.18% 3/7/12, LOC Fannie Mae Guaranteed Mtg. pass-thru certificates, VRDN (c)(f) | 2,500 | | 2,500 |
Maricopa County Indl. Dev. Auth. Rev. (Clayton Homes, Inc. Proj.) Series 1998, 0.2% 3/7/12, LOC U.S. Bank NA, Cincinnati, VRDN (c)(f) | 4,200 | | 4,200 |
Northern Arizona Univ. Revs. Participating VRDN Series Solar 07 14, 0.15% 3/7/12 (Liquidity Facility U.S. Bank NA, Cincinnati) (c)(g) | 16,445 | | 16,445 |
Phoenix Gen. Oblig. Participating VRDN Series BBT 2012, 0.15% 3/7/12 (Liquidity Facility Branch Banking & Trust Co.) (c)(g) | 2,000 | | 2,000 |
Phoenix Indl. Dev. Auth. Multi-family Hsg. Rev. (Paradise Lakes Apt. Proj.): | | | |
Series 2007 A, 0.13% 3/7/12, LOC Wells Fargo Bank NA, VRDN (c) | 13,675 | | 13,675 |
Series 2007 B, 0.15% 3/7/12, LOC Wells Fargo Bank NA, VRDN (c)(f) | 15,000 | | 15,000 |
Pima County Indl. Dev. Auth. Multi-family Hsg. Rev.: | | | |
(Cimarron Place Apts. Proj.) 0.17% 3/7/12, LOC Fannie Mae Guaranteed Mtg. pass-thru certificates, VRDN (c)(f) | 4,500 | | 4,500 |
Series A, 0.17% 3/7/12, LOC Fannie Mae Guaranteed Mtg. pass-thru certificates, VRDN (c)(f) | 2,825 | | 2,825 |
Municipal Securities - continued |
| Principal Amount (000s) | | Value (000s) |
Arizona - continued |
Salt River Proj. Agricultural Impt. & Pwr. District Elec. Sys. Rev.: | | | |
Participating VRDN: | | | |
Series EGL 06 0141, 0.16% 3/7/12 (Liquidity Facility Citibank NA) (c)(g) | $ 16,500 | | $ 16,500 |
Series MT 737, 0.22% 3/7/12 (Liquidity Facility Bank of America NA) (c)(g) | 27,675 | | 27,675 |
Series Putters 3242, 0.16% 3/7/12 (Liquidity Facility JPMorgan Chase Bank) (c)(g) | 960 | | 960 |
Series Putters 3467, 0.16% 3/7/12 (Liquidity Facility JPMorgan Chase Bank) (c)(g) | 4,000 | | 4,000 |
Series Putters 3708Z, 0.16% 3/7/12 (Liquidity Facility JPMorgan Chase Bank) (c)(g) | 15,645 | | 15,645 |
Series RBC O1, 0.14% 3/7/12 (Liquidity Facility Royal Bank of Canada) (c)(g) | 1,800 | | 1,800 |
Series C, 0.2% 8/16/12, CP | 13,000 | | 13,000 |
Show Low Indl. Dev. Auth. Solid Waste Disp. Rev. (Snowflake White Mountain Pwr. LLC Proj.) Series 2006, 0.3% 3/7/12, LOC JPMorgan Chase Bank, VRDN (c)(f) | 24,750 | | 24,750 |
Yavapai County Indl. Dev. Auth. (Northern Arizona Healthcare Sys. Proj.) Series 2008 B, 0.17% 3/7/12, LOC Wells Fargo Bank NA, VRDN (c) | 35,245 | | 35,245 |
Yuma Indl. Dev. Auth. Hosp. Rev. (Yuma Reg'l. Med. Ctr. Proj.) Series 2008, 0.11% 3/7/12, LOC JPMorgan Chase Bank, VRDN (c) | 61,330 | | 61,330 |
| | 489,267 |
Arkansas - 0.6% |
Arkansas Dev. Auth. Indl. Dev. Rev. (Stratton Seed Co. Proj.) Series 1999, 0.63% 3/7/12, LOC Bank of America NA, VRDN (c)(f) | 675 | | 675 |
Arkansas Dev. Fin. Auth. Multi-family Hsg. Rev. (Kiehl Partners LP Proj.) Series 2004 A, 0.22% 3/7/12, LOC Fannie Mae Guaranteed Mtg. pass-thru certificates, VRDN (c) | 7,215 | | 7,215 |
Blytheville Indl. Dev. Rev. (Nucor Corp. Proj.) Series 2002, 0.19% 3/7/12, VRDN (c)(f) | 34,400 | | 34,400 |
Fort Smith Gen. Oblig. (Mitsubishi Pwr. Systems Americas Proj.) Series 2010, 0.17% 3/7/12, LOC Bank of Tokyo-Mitsubishi UFJ Ltd., VRDN (c) | 8,000 | | 8,000 |
Municipal Securities - continued |
| Principal Amount (000s) | | Value (000s) |
Arkansas - continued |
Osceola Solid Waste Disp. Rev. (Plum Point Energy Associates, LLC Proj.) Series 2006, 0.17% 3/7/12, LOC Royal Bank of Scotland PLC, VRDN (c)(f) | $ 95,000 | | $ 95,000 |
Univ. of Arkansas Rev. Participating VRDN Series Putters 3693 Z, 0.18% 3/7/12 (Liquidity Facility JPMorgan Chase Bank) (c)(g) | 5,300 | | 5,300 |
| | 150,590 |
California - 4.6% |
ABAG Fin. Auth. for Nonprofit Corps. Multi-family Hsg. Rev. (Miramar Apts. Proj.) Series 2000 A, 0.13% 3/7/12, LOC Fannie Mae Guaranteed Mtg. pass-thru certificates, VRDN (c)(f) | 6,600 | | 6,600 |
ABAG Fin. Auth. for Nonprofit Corps. Rev. (Sharp HealthCare Proj.) Series 2009 C, 0.16% 3/7/12, LOC Citibank NA, VRDN (c) | 41,800 | | 41,800 |
Anaheim Hsg. Auth. Multi-family Hsg. Rev. (Park Vista Apt. Proj.) Series 2000 D, 0.12% 3/7/12, LOC Freddie Mac, VRDN (c)(f) | 3,600 | | 3,600 |
Bay Area Toll Auth. San Francisco Bay Toll Bridge Rev. Participating VRDN: | | | |
Series EGL 06 83 Class A, 0.16% 3/7/12 (Liquidity Facility Citibank NA) (c)(g) | 35,600 | | 35,600 |
Series II R 11901, 0.16% 3/7/12 (Liquidity Facility Citibank NA) (c)(g) | 2,100 | | 2,100 |
California Edl. Facilities Auth. Rev.: | | | |
Participating VRDN Series ROC II R 11974, 0.16% 3/7/12 (Liquidity Facility Citibank NA) (c)(g) | 4,555 | | 4,555 |
Series 2003, 0.08% 3/16/12, CP | 8,482 | | 8,482 |
California Gen. Oblig.: | | | |
Bonds 2% 3/1/12 | 10,595 | | 10,595 |
Series 2003 C3, 0.15% 3/7/12, LOC Citibank NA, VRDN (c) | 41,000 | | 41,000 |
Series 2003 C4, 0.15% 3/7/12, LOC Citibank NA, VRDN (c) | 10,750 | | 10,750 |
Series 2004 A7, 0.19% 3/7/12, LOC Citibank NA, LOC California Teachers Retirement Sys., VRDN (c) | 4,000 | | 4,000 |
Series 2004 A8, 0.14% 3/7/12, LOC Citibank NA, LOC California Teachers Retirement Sys., VRDN (c) | 14,100 | | 14,100 |
Series 2004 A9, 0.14% 3/7/12, LOC State Street Bank & Trust Co., Boston, LOC California Teachers Retirement Sys., VRDN (c) | 33,500 | | 33,500 |
Series 2004 B5, 0.13% 3/7/12, LOC Citibank NA, VRDN (c) | 10,100 | | 10,100 |
Municipal Securities - continued |
| Principal Amount (000s) | | Value (000s) |
California - continued |
California Gen. Oblig.: - continued | | | |
Series 2005 B1, 0.13% 3/7/12, LOC Bank of America NA, VRDN (c) | $ 26,300 | | $ 26,300 |
Series B6, 0.15% 3/7/12, LOC Citibank NA, VRDN (c) | 23,800 | | 23,800 |
California Health Facilities Fing. Auth. Rev. (St. Joseph Health Sys. Proj.) Series 2011 A, 0.12% 3/7/12, LOC Union Bank of California, VRDN (c) | 14,000 | | 14,000 |
California Hsg. Fin. Agcy. Multifamily Hsg. Rev.: | | | |
Series 2007 B, 0.15% 3/7/12 (Liquidity Facility Fannie Mae Guaranteed Mtg. pass-thru certificates) (Liquidity Facility Freddie Mac), VRDN (c)(f) | 8,205 | | 8,205 |
Series 2007 C: | | | |
0.15% 3/7/12 (Liquidity Facility Fannie Mae Guaranteed Mtg. pass-thru certificates) (Liquidity Facility Freddie Mac), VRDN (c)(f) | 4,740 | | 4,740 |
0.15% 3/7/12 (Liquidity Facility Fannie Mae Guaranteed Mtg. pass-thru certificates) (Liquidity Facility Freddie Mac), VRDN (c)(f) | 5,845 | | 5,845 |
Series 2008 B, 0.12% 3/7/12 (Liquidity Facility Fannie Mae Guaranteed Mtg. pass-thru certificates) (Liquidity Facility Freddie Mac), VRDN (c)(f) | 9,810 | | 9,810 |
Series 2008 C, 0.12% 3/7/12 (Liquidity Facility Fannie Mae Guaranteed Mtg. pass-thru certificates) (Liquidity Facility Freddie Mac), VRDN (c)(f) | 2,105 | | 2,105 |
California Hsg. Fin. Agcy. Rev.: | | | |
(Home Mtg. Prog.): | | | |
Series 2000 X2, 0.1% 3/7/12 (Liquidity Facility Fannie Mae Guaranteed Mtg. pass-thru certificates) (Liquidity Facility Freddie Mac), VRDN (c)(f) | 3,100 | | 3,100 |
Series 2002 J, 0.1% 3/7/12 (Liquidity Facility Fannie Mae Guaranteed Mtg. pass-thru certificates) (Liquidity Facility Freddie Mac), VRDN (c)(f) | 2,030 | | 2,030 |
Series 2003 H, 0.1% 3/7/12 (Liquidity Facility Fannie Mae Guaranteed Mtg. pass-thru certificates) (Liquidity Facility Freddie Mac), VRDN (c)(f) | 20,900 | | 20,900 |
Series 2003 M: | | | |
0.1% 3/7/12 (Liquidity Facility Fannie Mae Guaranteed Mtg. pass-thru certificates) (Liquidity Facility Freddie Mac), VRDN (c)(f) | 28,900 | | 28,900 |
0.1% 3/7/12 (Liquidity Facility Fannie Mae Guaranteed Mtg. pass-thru certificates) (Liquidity Facility Freddie Mac), VRDN (c)(f) | 11,300 | | 11,300 |
Series 2004 E, 0.12% 3/7/12 (Liquidity Facility Fannie Mae Guaranteed Mtg. pass-thru certificates) (Liquidity Facility Freddie Mac), VRDN (c)(f) | 1,245 | | 1,245 |
Municipal Securities - continued |
| Principal Amount (000s) | | Value (000s) |
California - continued |
California Hsg. Fin. Agcy. Rev.: - continued | | | |
(Home Mtg. Prog.): | | | |
Series 2005 B1, 0.12% 3/7/12 (Liquidity Facility Fannie Mae Guaranteed Mtg. pass-thru certificates) (Liquidity Facility Freddie Mac), VRDN (c)(f) | $ 4,735 | | $ 4,735 |
Series 2005 D, 0.1% 3/7/12 (Liquidity Facility Fannie Mae Guaranteed Mtg. pass-thru certificates) (Liquidity Facility Freddie Mac), VRDN (c)(f) | 22,300 | | 22,300 |
Series 2005 F, 0.12% 3/7/12 (Liquidity Facility Fannie Mae Guaranteed Mtg. pass-thru certificates) (Liquidity Facility Freddie Mac), VRDN (c)(f) | 2,950 | | 2,950 |
Series 2007 H, 0.13% 3/7/12 (Liquidity Facility Fannie Mae Guaranteed Mtg. pass-thru certificates) (Liquidity Facility Freddie Mac), VRDN (c)(f) | 2,500 | | 2,500 |
(Multifamily Hsg. Prog.): | | | |
Series 2001 G: | | | |
0.12% 3/7/12 (Liquidity Facility Fannie Mae Guaranteed Mtg. pass-thru certificates) (Liquidity Facility Freddie Mac), VRDN (c)(f) | 3,265 | | 3,265 |
0.12% 3/7/12 (Liquidity Facility Fannie Mae Guaranteed Mtg. pass-thru certificates) (Liquidity Facility Freddie Mac), VRDN (c)(f) | 26,900 | | 26,900 |
Series 2002 C, 0.15% 3/7/12 (Liquidity Facility Fannie Mae Guaranteed Mtg. pass-thru certificates) (Liquidity Facility Freddie Mac), VRDN (c)(f) | 5,610 | | 5,610 |
Series III 2001 E, 0.12% 3/7/12 (Liquidity Facility Fannie Mae Guaranteed Mtg. pass-thru certificates) (Liquidity Facility Freddie Mac), VRDN (c)(f) | 19,000 | | 19,000 |
Series 2000 A, 0.15% 3/7/12 (Liquidity Facility Fannie Mae Guaranteed Mtg. pass-thru certificates) (Liquidity Facility Freddie Mac), VRDN (c)(f) | 31,780 | | 31,780 |
Series 2003 K, 0.12% 3/7/12 (Liquidity Facility Fannie Mae Guaranteed Mtg. pass-thru certificates) (Liquidity Facility Freddie Mac), VRDN (c)(f) | 1,300 | | 1,300 |
California School Cash Reserve Prog. Auth. TRAN Series 2011 C, 2% 3/1/12 | 12,010 | | 12,010 |
California Statewide Cmntys. Dev. Auth. Gas Supply Rev. Series 2010, 0.15% 3/7/12 (Liquidity Facility Royal Bank of Canada), VRDN (c) | 58,900 | | 58,900 |
California Statewide Cmntys. Dev. Auth. Multi-family Hsg. Rev. (Canyon Creek Apts. Proj.) Series 1995 C, 0.12% 3/7/12, LOC Fannie Mae Guaranteed Mtg. pass-thru certificates, VRDN (c)(f) | 38,800 | | 38,800 |
California Statewide Cmntys. Dev. Auth. Rev. (Motion Picture & Television Fund Proj.) Series 2001 A, 0.13% 3/7/12, LOC Northern Trust Co., VRDN (c) | 7,100 | | 7,100 |
Municipal Securities - continued |
| Principal Amount (000s) | | Value (000s) |
California - continued |
Camarillo City Multi-Family Hsg. Rev. (Hacienda de Camarillo Proj.) Series 1996, 0.15% 3/7/12, LOC Fannie Mae Guaranteed Mtg. pass-thru certificates, VRDN (c)(f) | $ 17,065 | | $ 17,065 |
Chula Vista Multi-Family Hsg. Rev. (Teresina Apts. Proj.) Series 2006 A, 0.15% 3/7/12, LOC Fannie Mae Guaranteed Mtg. pass-thru certificates, VRDN (c)(f) | 18,970 | | 18,970 |
Contra Costa County Multi-family Hsg. Rev. (Park Regency Proj.) Series 2003 F, 0.15% 3/7/12, LOC Fannie Mae Guaranteed Mtg. pass-thru certificates, VRDN (c)(f) | 12,800 | | 12,800 |
Dublin Hsg. Auth. Multi-Family Hsg. Rev. (Park Sierra Iron Horse Trail Proj.) Series 1998-A, 0.12% 3/7/12, LOC Freddie Mac, VRDN (c)(f) | 28,700 | | 28,700 |
East Bay Muni. Util. District Wtr. Sys. Rev. Participating VRDN Series RBC O 14, 0.13% 3/7/12 (Liquidity Facility Royal Bank of Canada) (c)(g) | 9,000 | | 9,000 |
Elk Grove Unified School District Spl. Tax Participating VRDN Series Solar 06-80, 0.15% 3/7/12 (Liquidity Facility U.S. Bank NA, Cincinnati) (c)(g) | 9,520 | | 9,520 |
Los Angeles Cmnty. College District Participating VRDN: | | | |
Series MS 3096, 0.26% 3/7/12 (Liquidity Facility Morgan Stanley Bank, West Valley City Utah) (c)(g) | 1,500 | | 1,500 |
Series Putters 2864, 0.16% 3/7/12 (Liquidity Facility JPMorgan Chase Bank) (c)(g) | 4,785 | | 4,785 |
Series ROC II R 11728, 0.16% 3/7/12 (Liquidity Facility Citibank NA) (c)(g) | 7,040 | | 7,040 |
Los Angeles Cmnty. Redev. Agcy. Multi-family Hsg. Rev. (Hollywood & Vine Apts. Proj.) Series A, 0.13% 3/7/12, LOC Fannie Mae Guaranteed Mtg. pass-thru certificates, VRDN (c)(f) | 10,000 | | 10,000 |
Los Angeles County Gen. Oblig. TRAN Series 2012 C, 2.5% 6/29/12 | 42,500 | | 42,791 |
Los Angeles County Schools Pooled Fing. Prog. Ctfs. of Prtn. TRAN Series 2012 B2, 2% 12/31/12 | 10,400 | | 10,543 |
Los Angeles Dept. Arpt. Rev. Participating VRDN Series BC 10 27B, 0.15% 3/7/12 (Liquidity Facility Barclays Bank PLC) (c)(g) | 18,185 | | 18,185 |
Los Angeles Multi-family Hsg. Rev. (Tri-City Hsg. Proj.) Series 1, 0.16% 3/7/12, LOC Citibank NA, VRDN (c)(f) | 1,800 | | 1,800 |
Los Angeles Muni. Impt. Corp. Lease Rev. Series 2004 A2, 0.12% 3/15/12, LOC JPMorgan Chase Bank, CP | 18,112 | | 18,112 |
Los Angeles Wastewtr. Sys. Rev.: | | | |
Participating VRDN Series EGL 7 05 3003, 0.16% 3/7/12 (Liquidity Facility Citibank NA) (c)(g) | 40,000 | | 40,000 |
Series 2008 C, 0.14% 3/7/12, LOC JPMorgan Chase Bank, VRDN (c) | 1,000 | | 1,000 |
Municipal Securities - continued |
| Principal Amount (000s) | | Value (000s) |
California - continued |
Orange County Wtr. District Rev. Ctfs. of Prtn. Series 2003 A, 0.13% 3/7/12, LOC Citibank NA, VRDN (c) | $ 23,675 | | $ 23,675 |
Riverside County Asset Leasing Corp. Leasehold Rev. (Southwest Justice Ctr. Proj.) Series 2008 A, 0.12% 3/7/12, LOC Union Bank of California, VRDN (c) | 38,200 | | 38,200 |
Riverside Ctfs. of Prtn. (Riverside Renaissance Proj.) Series 2008, 0.19% 3/7/12, LOC Bank of America NA, VRDN (c) | 3,000 | | 3,000 |
Riverside Elec. Rev.: | | | |
Series 2008 A, 0.19% 3/7/12, LOC Bank of America NA, VRDN (c) | 38,215 | | 38,215 |
Series 2008 C, 0.19% 3/7/12, LOC Bank of America NA, VRDN (c) | 22,135 | | 22,135 |
San Bernardino County Gen. Oblig. TRAN Series A, 2% 6/29/12 | 34,200 | | 34,392 |
San Francisco City & County Arpts. Commission Int'l. Arpt. Rev. Series 2010 A1, 0.13% 3/7/12, LOC JPMorgan Chase Bank, VRDN (c)(f) | 28,375 | | 28,375 |
San Jose Multi-family Hsg. Rev. (Siena at Renaissance Square Proj.) Series 1996 A, 0.13% 3/7/12, LOC Key Bank NA, VRDN (c)(f) | 8,000 | | 8,000 |
Santa Clara County Fing. Auth. Rev. (El Camino Hosp. Proj.) Series 2009 A, 0.12% 3/7/12, LOC Wells Fargo Bank NA, VRDN (c) | 5,000 | | 5,000 |
Santa Cruz Redev. Agcy. Multi-family Rev. (1010 Pacific Ave. Apts. Proj.) Series B, 0.15% 3/7/12, LOC Fannie Mae Guaranteed Mtg. pass-thru certificates, VRDN (c)(f) | 5,650 | | 5,650 |
Southern California Pub. Pwr. Auth. Rev. (Magnolia Pwr. Proj.) Series 2009-2, 0.11% 3/7/12, LOC Wells Fargo Bank NA, VRDN (c) | 38,945 | | 38,945 |
Stanislaus County Cap. Impts. Fing. Auth. Rev. Series 2004, 0.22% 3/7/12, LOC Bank of America NA, VRDN (c) | 9,545 | | 9,545 |
| | 1,133,155 |
Colorado - 2.2% |
Adams County Hsg. Auth. (Semper Village Apts. Proj.) Series 2004 A, 0.18% 3/7/12, LOC Fannie Mae Guaranteed Mtg. pass-thru certificates, VRDN (c)(f) | 14,000 | | 14,000 |
Aurora Hosp. Rev. (Children's Hosp. Assoc. Proj.) Series 2008 C, 0.14% 3/7/12, LOC Wells Fargo Bank NA, VRDN (c) | 9,295 | | 9,295 |
Aurora Hsg. Auth. Multi-Family Hsg. Rev. (Liberty Creek Proj.) Series 2008, 0.2% 3/7/12, LOC Fannie Mae Guaranteed Mtg. pass-thru certificates, VRDN (c)(f) | 27,580 | | 27,580 |
Aurora Multi-family Hsg. Rev. (Aurora Meadows Apts. Proj.) Series 1996, 0.2% 3/7/12, LOC Fannie Mae Guaranteed Mtg. pass-thru certificates, VRDN (c)(f) | 13,400 | | 13,400 |
Municipal Securities - continued |
| Principal Amount (000s) | | Value (000s) |
Colorado - continued |
Colorado Ed. Ln. Prog. TRAN: | | | |
Series 2011 A, 2% 6/29/12 | $ 16,215 | | $ 16,310 |
Series 2012 A, 2% 6/29/12 | 13,250 | | 13,331 |
Colorado Edl. & Cultural Facilities Auth. Rev. (Clyfford Still Museum Proj.) Series 2008, 0.15% 3/7/12, LOC Wells Fargo Bank NA, VRDN (c) | 2,790 | | 2,790 |
Colorado Health Facilities Auth. Retirement Hsg. Rev. Participating VRDN Series Putters 1390, 0.16% 3/7/12 (Liquidity Facility JPMorgan Chase Bank) (c)(g) | 38,265 | | 38,265 |
Colorado Health Facilities Auth. Rev.: | | | |
(Boulder Cmnty. Hosp. Proj.) Series 2000, 0.16% 3/7/12, LOC JPMorgan Chase Bank, VRDN (c) | 21,060 | | 21,060 |
Participating VRDN Series BA 08 1090, 0.22% 3/7/12 (Liquidity Facility Bank of America NA) (c)(g) | 7,450 | | 7,450 |
Colorado Hsg. & Fin. Auth.: | | | |
Series 2002 B3, 0.13% 3/7/12 (Liquidity Facility Fannie Mae Guaranteed Mtg. pass-thru certificates) (Liquidity Facility Freddie Mac), VRDN (c) | 1,700 | | 1,700 |
Series 2002 C3, 0.14% 3/7/12 (Liquidity Facility Fannie Mae Guaranteed Mtg. pass-thru certificates) (Liquidity Facility Freddie Mac), VRDN (c)(f) | 13,015 | | 13,015 |
Colorado Hsg. & Fin. Auth. Multi-family Hsg. Series 2002 AA, 0.14% 3/7/12 (Liquidity Facility Fannie Mae Guaranteed Mtg. pass-thru certificates) (Liquidity Facility Freddie Mac), VRDN (c) | 6,200 | | 6,200 |
Colorado Hsg. & Fin. Auth. Solid Waste Rev.: | | | |
(Waste Mgmt., Inc. Proj.) 0.18% 3/7/12, LOC Wells Fargo Bank NA, VRDN (c)(f) | 7,000 | | 7,000 |
(Waste Mgmt., Inc. Proj.) 0.2% 3/7/12, LOC JPMorgan Chase Bank, VRDN (c)(f) | 14,160 | | 14,160 |
Colorado Hsg. Fin. Auth. Single Family Mtg. Rev. Series 2008 A3, 0.14% 3/7/12 (Liquidity Facility Fannie Mae Guaranteed Mtg. pass-thru certificates) (Liquidity Facility Freddie Mac), VRDN (c)(f) | 31,750 | | 31,750 |
Colorado Reg'l. Trans. District Sales Tax Rev. Participating VRDN: | | | |
Series EGL 07 0036, 0.16% 3/7/12 (Liquidity Facility Citibank NA) (c)(g) | 29,700 | | 29,700 |
Series EGL 07 0037, 0.16% 3/7/12 (Liquidity Facility Citibank NA) (c)(g) | 16,830 | | 16,830 |
Series EGL 07 0038, 0.16% 3/7/12 (Liquidity Facility Citibank NA) (c)(g) | 36,165 | | 36,165 |
Series EGL 07 0040, 0.16% 3/7/12 (Liquidity Facility Citibank NA) (c)(g) | 30,610 | | 30,610 |
Municipal Securities - continued |
| Principal Amount (000s) | | Value (000s) |
Colorado - continued |
Colorado Reg'l. Trans. District Sales Tax Rev. Participating VRDN: - continued | | | |
Series MT 741, 0.22% 3/7/12 (Liquidity Facility Bank of America NA) (c)(g) | $ 11,500 | | $ 11,500 |
Series ROC II R 12312, 0.16% 3/7/12 (Liquidity Facility Citibank NA) (c)(g) | 3,700 | | 3,700 |
Series WF 10 37C, 0.17% 3/7/12 (Liquidity Facility Wells Fargo Bank NA) (c)(g) | 20,630 | | 20,630 |
Colorado State Bldg. Excellent Schools Today Ctfs. of Prtn. Bonds Series 2011 G, 1% 3/15/12 | 6,435 | | 6,437 |
Denver City & County Indl. Dev. Rev. (Brass Smith/Kevry Proj.) Series 2009, 0.3% 3/7/12, LOC Wells Fargo Bank NA, VRDN (c)(f) | 5,085 | | 5,085 |
Denver Urban Renewal Auth. Tax Increment Rev. Series 2008 A2, 0.17% 3/7/12, LOC U.S. Bank NA, Cincinnati, VRDN (c) | 41,900 | | 41,900 |
Fort Collins Indl. Dev. Rev. (Phelps-Tointon Millwork Proj.) Series 1993, 0.61% 3/7/12, LOC JPMorgan Chase Bank, VRDN (c)(f) | 215 | | 215 |
Lakewood Hsg. Auth. Multi-family Rev.: | | | |
(Ridgemoor Apts. Proj.) Series 2003 A, 0.17% 3/7/12, LOC Fannie Mae Guaranteed Mtg. pass-thru certificates, VRDN (c)(f) | 13,325 | | 13,325 |
(Timberleaf Apts. Proj.) 0.17% 3/7/12, LOC Fannie Mae Guaranteed Mtg. pass-thru certificates, VRDN (c)(f) | 11,165 | | 11,165 |
RBC Muni. Products, Inc. Trust Participating VRDN Series RBC E 25, 0.19% 3/7/12 (Liquidity Facility Royal Bank of Canada) (c)(f)(g) | 22,500 | | 22,500 |
Univ. of Colorado Enterprise Sys. Rev. Bonds Series WF 11 128C, 0.2%, tender 7/25/12 (Liquidity Facility Wells Fargo Bank NA) (c)(g)(h) | 18,425 | | 18,425 |
Univ. of Colorado Hosp. Auth. Rev.: | | | |
Series 2004 A, 0.13% 3/7/12, LOC JPMorgan Chase Bank, VRDN (c) | 28,400 | | 28,400 |
Series 2008 B, 0.12% 3/7/12, LOC JPMorgan Chase Bank, VRDN (c) | 1,300 | | 1,300 |
Westminster County Multi-family Hsg. Rev. (Lakeview Apts. Proj.) Series 1997, 0.2% 3/7/12, LOC Fannie Mae Guaranteed Mtg. pass-thru certificates, VRDN (c)(f) | 7,110 | | 7,110 |
| | 542,303 |
Connecticut - 0.3% |
Connecticut Health & Ed. Rev. Series 2011 B, 0.23% 3/7/12, LOC Bank of America NA, VRDN (c) | 25,910 | | 25,910 |
Municipal Securities - continued |
| Principal Amount (000s) | | Value (000s) |
Connecticut - continued |
Connecticut Health & Edl. Facilities Auth. Rev. (St. Francis Hosp. & Med. Ctr. Proj.) Series F, 0.16% 3/7/12, LOC JPMorgan Chase Bank, VRDN (c) | $ 14,110 | | $ 14,110 |
Hartford County Metropolitan District Gen. Oblig. BAN: | | | |
1% 4/16/12 | 25,000 | | 25,027 |
1.5% 4/16/12 | 17,134 | | 17,162 |
| | 82,209 |
Delaware - 0.3% |
Delaware Econ. Dev. Auth. Rev. (Delmarva Pwr. & Lt. Co. Proj.): | | | |
Series 1987, 0.35% 3/1/12, VRDN (c)(f) | 3,000 | | 3,000 |
Series 1988, 0.35% 3/1/12, VRDN (c)(f) | 13,550 | | 13,550 |
Series 1993 C, 0.43% 3/7/12, VRDN (c) | 4,500 | | 4,500 |
Series 1994, 0.35% 3/1/12, VRDN (c)(f) | 29,900 | | 29,900 |
Series 1999 B, 0.5% 3/7/12, VRDN (c)(f) | 9,900 | | 9,900 |
Delaware Health Facilities Auth. Rev. (Beebe Med. Ctr. Proj.) 0.16% 3/7/12, LOC PNC Bank NA, VRDN (c) | 4,000 | | 4,000 |
Wilmington Adjustable Rate Demand Rev. (Delaware Art Museum, Inc. Proj.) 0.14% 3/7/12, LOC Wells Fargo Bank NA, VRDN (c) | 12,400 | | 12,400 |
| | 77,250 |
District Of Columbia - 1.4% |
District of Columbia Gen. Oblig. Series 2008 C, 0.15% 3/7/12, LOC TD Banknorth, NA, VRDN (c) | 13,800 | | 13,800 |
District of Columbia Hsg. Fin. Agcy. Multi-family Hsg. Rev. (Trenton Park Apts. Proj.) Series 2001, 0.23% 3/7/12, LOC Bank of America NA, VRDN (c)(f) | 2,920 | | 2,920 |
District of Columbia Income Tax Rev.: | | | |
Bonds Series 2011 C, 0.21% 12/1/12 (c) | 3,415 | | 3,415 |
Participating VRDN: | | | |
Series Putters 4020, 0.16% 3/7/12 (Liquidity Facility JPMorgan Chase Bank) (c)(g) | 7,250 | | 7,250 |
Series WF 11 145C, 0.17% 3/7/12 (Liquidity Facility Wells Fargo Bank NA) (c)(g) | 13,610 | | 13,610 |
District of Columbia Rev.: | | | |
(Fort Lincoln New Town/Premium Distributors LLC Proj.) Series 2000, 0.3% 3/7/12, LOC Wells Fargo Bank NA, VRDN (c)(f) | 6,965 | | 6,965 |
(Medlantic/Helix Proj.): | | | |
Series 1998 A Tranche II, 0.14% 3/7/12, LOC Bank of America NA, VRDN (c) | 43,900 | | 43,900 |
Municipal Securities - continued |
| Principal Amount (000s) | | Value (000s) |
District Of Columbia - continued |
District of Columbia Rev.: - continued | | | |
(Medlantic/Helix Proj.): | | | |
Series 1998 A Tranche III, 0.14% 3/7/12, LOC Bank of America NA, VRDN (c) | $ 28,225 | | $ 28,225 |
(The Phillips Collection Issue Proj.) Series 2003, 0.42% 3/7/12, LOC Bank of America NA, VRDN (c) | 1,520 | | 1,520 |
(Washington Drama Society, Inc. Proj.) Series 2008, 0.21% 3/7/12, LOC JPMorgan Chase Bank, VRDN (c) | 12,350 | | 12,350 |
Bonds (American Nat'l. Red Cross Proj.) Series 2000: | | | |
0.12% tender 4/9/12, LOC JPMorgan Chase Bank, CP mode | 41,600 | | 41,600 |
0.19% tender 7/19/12, LOC JPMorgan Chase Bank, CP mode | 29,200 | | 29,200 |
District of Columbia Univ. Rev. (Georgetown Univ. Proj.): | | | |
Series 2007 B1, 0.16% 3/7/12, LOC JPMorgan Chase Bank, VRDN (c) | 8,300 | | 8,300 |
Series 2007 C2, 0.14% 3/7/12, LOC JPMorgan Chase Bank, VRDN (c) | 5,000 | | 5,000 |
Metropolitan Washington DC Arpts. Auth. Sys. Rev.: | | | |
Participating VRDN: | | | |
Series BBT 2040, 0.19% 3/7/12 (Liquidity Facility Branch Banking & Trust Co.) (c)(f)(g) | 9,920 | | 9,920 |
Series BBT 2054, 0.19% 3/7/12 (Liquidity Facility Branch Banking & Trust Co.) (c)(f)(g) | 10,140 | | 10,140 |
Series DB 677, 0.24% 3/7/12 (Liquidity Facility Deutsche Bank AG) (c)(f)(g) | 7,760 | | 7,760 |
Series DB 679, 0.24% 3/7/12 (Liquidity Facility Deutsche Bank AG) (c)(f)(g) | 10,000 | | 10,000 |
Series MS 3140, 0.28% 3/7/12 (Liquidity Facility Morgan Stanley Bank, West Valley City Utah) (c)(f)(g) | 19,540 | | 19,540 |
Series Putters 2855, 0.26% 3/7/12 (Liquidity Facility JPMorgan Chase Bank) (c)(f)(g) | 4,895 | | 4,895 |
Series ROC II R 11798, 0.22% 3/7/12 (Liquidity Facility Citibank NA) (c)(f)(g) | 15,000 | | 15,000 |
Series ROC II R 11815, 0.21% 3/7/12 (Liquidity Facility Citibank NA) (c)(f)(g) | 4,500 | | 4,500 |
Series ROC II R 12329, 0.21% 3/7/12 (Liquidity Facility Citibank NA) (c)(f)(g) | 9,800 | | 9,800 |
Series 2003 D1, 0.2% 3/7/12, LOC Wells Fargo Bank NA, VRDN (c)(f) | 37,170 | | 37,170 |
Series 2009 D1, 0.2% 3/7/12, LOC Bank of America NA, VRDN (c) | 4,850 | | 4,850 |
| | 351,630 |
Municipal Securities - continued |
| Principal Amount (000s) | | Value (000s) |
Florida - 6.5% |
Brevard County Hsg. Fin. Auth. (Manatee Cove Apts. Proj.) 0.19% 3/7/12, LOC Citibank NA, VRDN (c)(f) | $ 10,675 | | $ 10,675 |
Broward County Fin. Auth. Multi-family Hsg. Rev.: | | | |
(Pinnacle Village Apts. Proj.) Series 2004, 0.18% 3/7/12, LOC Citibank NA, VRDN (c)(f) | 6,600 | | 6,600 |
(Sanctuary Apts Proj.) Series A, 0.19% 3/7/12, LOC Fannie Mae Guaranteed Mtg. pass-thru certificates, VRDN (c)(f) | 16,520 | | 16,520 |
Broward County Port Facilities Rev. (Port Everglades Proj.) Series 2008, 0.14% 3/7/12, LOC Bank of Nova Scotia New York Branch, VRDN (c)(f) | 2,795 | | 2,795 |
Charlotte County School District TAN Series 2011, 2% 3/31/12 | 15,000 | | 15,022 |
Clay County Hsg. Fin. Auth. Multi-family Hsg. Rev. (Nassau Club Apts. Proj.) 0.17% 3/7/12, LOC Fannie Mae Guaranteed Mtg. pass-thru certificates, VRDN (c)(f) | 9,605 | | 9,605 |
Coconut Creek Indl. Dev. Rev. (Elite Aluminum Corp. Proj.) Series 2002, 0.53% 3/7/12, LOC Bank of America NA, VRDN (c)(f) | 1,330 | | 1,330 |
Collier County Health Facilities Auth. Health Facilities Rev.: | | | |
(Moorings, Inc. Proj.) 0.14% 3/7/12, LOC JPMorgan Chase Bank, VRDN (c) | 6,800 | | 6,800 |
(Moorings, Inc. Proj.) 0.14% 3/7/12, LOC JPMorgan Chase Bank, VRDN (c) | 8,500 | | 8,500 |
Collier County Hsg. Fin. Auth. Multi-family Rev.: | | | |
(Sawgrass Pines Apts. Proj.) 0.19% 3/7/12, LOC Fannie Mae Guaranteed Mtg. pass-thru certificates, VRDN (c)(f) | 6,800 | | 6,800 |
(Summer Lakes Phase II Apts. Proj.) 0.19% 3/7/12, LOC Citibank NA, VRDN (c)(f) | 18,510 | | 18,510 |
Davie Gen. Oblig. Rev. (United Jewish Cmnty. Proj.) 0.23% 3/7/12, LOC Bank of America NA, VRDN (c) | 8,900 | | 8,900 |
Florida Board of Ed. Lottery Rev. Bonds: | | | |
Series 2002 A, 5.5% 7/1/12 | 2,000 | | 2,035 |
Series 2003 A, 5% 7/1/12 | 2,500 | | 2,539 |
Series 2010 E, 4% 7/1/12 | 5,535 | | 5,604 |
Florida Board of Ed. Pub. Ed. Cap. Outlay: | | | |
Bonds Series 2003 C, 5% 6/1/12 | 3,000 | | 3,036 |
Participating VRDN: | | | |
Series BA 08 1059, 0.22% 3/7/12 (Liquidity Facility Bank of America NA) (c)(g) | 4,165 | | 4,165 |
Series BA 08 1068, 0.22% 3/7/12 (Liquidity Facility Bank of America NA) (c)(g) | 14,385 | | 14,385 |
Series EGL 07 48, 0.15% 3/7/12 (Liquidity Facility Citibank NA) (c)(g) | 21,445 | | 21,445 |
Municipal Securities - continued |
| Principal Amount (000s) | | Value (000s) |
Florida - continued |
Florida Board of Ed. Pub. Ed. Cap. Outlay: - continued | | | |
Participating VRDN: | | | |
Series ROC II R 11884X, 0.16% 3/7/12 (Liquidity Facility Citibank NA) (c)(g) | $ 13,600 | | $ 13,600 |
Florida Dept. of Envir. Protection Rev. Bonds: | | | |
Series 2010 A, 4% 7/1/12 | 1,775 | | 1,796 |
Series 2011 A, 3% 7/1/12 | 29,900 | | 30,173 |
Florida Dept. of Trans. Tpk. Rev.: | | | |
Bonds Series 2010 A, 5% 7/1/12 | 3,860 | | 3,922 |
Participating VRDN Series Solar 07 30, 0.15% 3/7/12 (Liquidity Facility U.S. Bank NA, Cincinnati) (c)(g) | 15,000 | | 15,000 |
Florida Ed. Sys. Hsg. Facility Rev. Participating VRDN Series Solar 06 41, 0.15% 3/7/12 (Liquidity Facility U.S. Bank NA, Cincinnati) (c)(g) | 11,875 | | 11,875 |
Florida Hsg. Fin. Agcy. Rev.: | | | |
(Bainbridge Club Apt. Proj.) Series M, 0.14% 3/7/12, LOC Fannie Mae Guaranteed Mtg. pass-thru certificates, VRDN (c)(f) | 5,470 | | 5,470 |
(Banyan Bay Apts. Proj.) Series 1995 M, 0.14% 3/7/12, LOC Fannie Mae Guaranteed Mtg. pass-thru certificates, VRDN (c)(f) | 8,750 | | 8,750 |
Florida Hsg. Fin. Corp. Multi-family Mtg. Rev.: | | | |
(Avalon Reserve Apts. Proj.) Series 2003 R1, 0.19% 3/7/12, LOC Fannie Mae Guaranteed Mtg. pass-thru certificates, VRDN (c)(f) | 14,900 | | 14,900 |
(Clascona Groves Apts. Proj.) Series A, 0.18% 3/7/12, LOC Citibank NA, VRDN (c)(f) | 8,800 | | 8,800 |
(Collins Cove Sr. Apts. Proj.) Series 2003 W, 0.18% 3/7/12, LOC Citibank NA, VRDN (c)(f) | 5,400 | | 5,400 |
(Grande Court at North Port Apts. Proj.) Series 2004 E, 0.2% 3/7/12, LOC Fannie Mae Guaranteed Mtg. pass-thru certificates, VRDN (c)(f) | 5,700 | | 5,700 |
(Hunters Run Apts. Proj.) Series G, 0.18% 3/7/12, LOC Fannie Mae Guaranteed Mtg. pass-thru certificates, VRDN (c)(f) | 8,100 | | 8,100 |
(Lynn Lake Apts. Proj.) Series B1, 0.19% 3/7/12, LOC Freddie Mac, VRDN (c)(f) | 20,210 | | 20,210 |
(Mill Creek Apts. Proj.) Series 2004 K, 0.19% 3/7/12, LOC Fannie Mae Guaranteed Mtg. pass-thru certificates, VRDN (c)(f) | 14,800 | | 14,800 |
(Pinnacle Grove Apts. Proj.) Series 2003 A, 0.19% 3/7/12, LOC Fannie Mae Guaranteed Mtg. pass-thru certificates, VRDN (c)(f) | 7,650 | | 7,650 |
(Riverwalk I Apts. Proj.) Series 2008 E, 0.18% 3/7/12, LOC Freddie Mac, VRDN (c)(f) | 5,075 | | 5,075 |
Municipal Securities - continued |
| Principal Amount (000s) | | Value (000s) |
Florida - continued |
Florida Hsg. Fin. Corp. Multi-family Mtg. Rev.: - continued | | | |
(Savannah Springs Apts. Proj.) Series G, 0.2% 3/7/12, LOC Citibank NA, VRDN (c)(f) | $ 7,085 | | $ 7,085 |
(Sterling Palms Apts. Proj.) Series F, 0.19% 3/7/12, LOC Fannie Mae Guaranteed Mtg. pass-thru certificates, VRDN (c)(f) | 14,170 | | 14,170 |
(Victoria Park Apts. Proj.) Series 2002 J, 0.17% 3/7/12, LOC Fannie Mae Guaranteed Mtg. pass-thru certificates, VRDN (c) | 8,920 | | 8,920 |
Florida Hsg. Fin. Corp. Rev.: | | | |
(Tuscany Lakes Apts. Proj.) Series 2002 K1, 0.21% 3/7/12, LOC Fannie Mae Guaranteed Mtg. pass-thru certificates, VRDN (c)(f) | 4,000 | | 4,000 |
(Valencia Village Apts. Proj.) Series G, 0.17% 3/7/12, LOC Fannie Mae Guaranteed Mtg. pass-thru certificates, VRDN (c)(f) | 11,755 | | 11,755 |
(Waterford Pointe Apts. Proj.) Series 2000 E1, 0.19% 3/7/12, LOC Fannie Mae Guaranteed Mtg. pass-thru certificates, VRDN (c)(f) | 8,155 | | 8,155 |
Florida Hurricane Catastrophe Fund Fin. Corp. Rev. Bonds Series 2006 A: | | | |
5% 7/1/12 | 7,400 | | 7,517 |
5% 7/1/12 | 5,900 | | 5,986 |
5.25% 7/1/12 | 1,525 | | 1,550 |
Florida Local Govt. Fin. Commission Auth. Rev. Series A, 0.13% 3/6/12, LOC Wells Fargo Bank NA, CP | 1,657 | | 1,657 |
Hillsborough County Cap. Impt. Prog. Rev. Series A: | | | |
0.11% 4/5/12, LOC State Street Bank & Trust Co., Boston, CP | 29,500 | | 29,500 |
0.14% 3/29/12, LOC State Street Bank & Trust Co., Boston, CP | 24,139 | | 24,139 |
Hillsborough County Hsg. Fin. Auth. Multi-family Rev.: | | | |
(Claymore Crossings Apt. Proj.) Series 2005, 0.17% 3/7/12, LOC Citibank NA, VRDN (c)(f) | 11,105 | | 11,105 |
(Grande Oaks Apts. Proj.) Series A, 0.2% 3/7/12, LOC Fannie Mae Guaranteed Mtg. pass-thru certificates, VRDN (c)(f) | 7,200 | | 7,200 |
(Hunters Run Apts. Proj.) Series 2002 A, 0.17% 3/7/12, LOC Fannie Mae Guaranteed Mtg. pass-thru certificates, VRDN (c)(f) | 8,580 | | 8,580 |
(Meridian Pointe Apts. Proj.) Series 2005, 0.19% 3/7/12, LOC Citibank NA, VRDN (c)(f) | 12,100 | | 12,100 |
(Mobley Park Apts. Proj.) Series A, 0.2% 3/7/12, LOC Freddie Mac, VRDN (c)(f) | 7,690 | | 7,690 |
Municipal Securities - continued |
| Principal Amount (000s) | | Value (000s) |
Florida - continued |
Hillsborough County Hsg. Fin. Auth. Multi-family Rev.: - continued | | | |
(Morgan Creek Apts. Proj.) Series 2003, 0.19% 3/7/12, LOC Fannie Mae Guaranteed Mtg. pass-thru certificates, VRDN (c)(f) | $ 12,700 | | $ 12,700 |
(Royal Palm Key Apts. Proj.) Series 2002, 0.17% 3/7/12, LOC Fannie Mae Guaranteed Mtg. pass-thru certificates, VRDN (c)(f) | 8,780 | | 8,780 |
Hillsborough County Indl. Dev. Auth. Indl. Dev. Rev. (Vigo Importing Co. Proj.) Series 1996, 0.51% 3/7/12, LOC Bank of America NA, VRDN (c)(f) | 705 | | 705 |
Indian River County School District TAN Series 2011, 1% 6/30/12 | 16,000 | | 16,039 |
Jacksonville Econ. Dev. Commission Indl. Dev. Rev. (STI Proj.) Series 2002, 0.47% 3/7/12, LOC Bank of America NA, VRDN (c)(f) | 7,350 | | 7,350 |
Jacksonville Elec. Auth. Elec. Sys. Rev.: | | | |
Participating VRDN Series BA 09 1209X, 0.26% 3/7/12 (Liquidity Facility Bank of America NA) (c)(g) | 5,310 | | 5,310 |
Series C1, 0.11% 4/3/12, CP | 42,800 | | 42,800 |
Jacksonville FL Spl. Rev. Participating VRDN Series Putters 3918, 0.16% 3/7/12 (Liquidity Facility JPMorgan Chase Bank) (c)(g) | 3,900 | | 3,900 |
Jacksonville Health Facilities Auth. Hosp. Rev. (Baptist Med. Ctr. Proj.) Series 2007 E, 0.15% 3/7/12, LOC Branch Banking & Trust Co., VRDN (c) | 10,210 | | 10,210 |
Jacksonville Hsg. Fin. Auth. Multi-family Hsg. Rev. (Brookwood Forest Apts. Proj.) 0.17% 3/7/12, LOC Fannie Mae Guaranteed Mtg. pass-thru certificates, VRDN (c)(f) | 9,300 | | 9,300 |
Jacksonville Poll. Cont. Rev. Bonds (Florida Pwr. & Lt. Co. Proj.): | | | |
Series 1992, 0.22% tender 3/20/12, CP mode | 20,300 | | 20,300 |
Series 1994, 0.22% tender 3/20/12, CP mode | 30,855 | | 30,855 |
Jacksonville Port Auth. Rev. (Mitsui O.S.K. Lines Ltd. Proj.) 0.14% 3/7/12, LOC Sumitomo Mitsui Banking Corp., VRDN (c)(f) | 87,390 | | 87,390 |
JEA Saint Johns River Pwr. Park Sys. Rev. Bonds Series 23 Issue 2, 3% 10/1/12 | 16,920 | | 17,195 |
JEA Wtr. & Swr. Sys. Rev. Participating VRDN Series WF 11 4C, 0.17% 3/7/12 (Liquidity Facility Wells Fargo Bank NA) (c)(g) | 5,900 | | 5,900 |
Lee County Hsg. Fin. Auth. Multi-family Hsg. Rev. (Univ. Club Apts. Proj.) Series A, 0.21% 3/7/12, LOC Fannie Mae Guaranteed Mtg. pass-thru certificates, VRDN (c)(f) | 7,500 | | 7,500 |
Municipal Securities - continued |
| Principal Amount (000s) | | Value (000s) |
Florida - continued |
Lee Memorial Health Sys. Hosp. Rev. Series 2009 C, 0.13% 3/7/12, LOC JPMorgan Chase Bank, VRDN (c) | $ 6,545 | | $ 6,545 |
Local Govt. Fin. Cmnty.: | | | |
Series 2011 A1, 0.11% 3/6/12, LOC JPMorgan Chase Bank, CP | 8,414 | | 8,414 |
Series 2011 B1: | | | |
0.13% 3/6/12, LOC JPMorgan Chase Bank, CP (f) | 8,975 | | 8,975 |
0.13% 3/6/12, LOC JPMorgan Chase Bank, CP (f) | 4,000 | | 4,000 |
Marion County School District TAN Series 2011, 1.5% 6/30/12 | 12,500 | | 12,550 |
Miami-Dade County Hsg. Fin. Auth. Multi-family Mtg. Rev. (22nd Avenue Apts., 183rd Street Apts. & 187th Street Apts. Proj.) Series 2003 3, 0.19% 3/7/12, LOC Citibank NA, VRDN (c)(f) | 16,085 | | 16,085 |
Miami-Dade County Indl. Dev. Auth. Rev. (Tarmac America Proj.) Series 2004, 0.29% 3/7/12, LOC Bank of America NA, VRDN (c)(f) | 10,600 | | 10,600 |
Ocean Hwy. & Port Auth. Rev. 0.19% 3/7/12, LOC Wells Fargo Bank NA, VRDN (c)(f) | 6,000 | | 6,000 |
Orange County Health Facilities Auth. Rev.: | | | |
(Orlando Reg'l. Health Care Sys. Proj.) Series 2008 E, 0.13% 3/7/12, LOC Branch Banking & Trust Co., VRDN (c) | 20,000 | | 20,000 |
(The Nemours Foundation Proj.) Series 2009 B, 0.19% 3/7/12, LOC Bank of America NA, VRDN (c) | 40,600 | | 40,600 |
Orange County Hsg. Fin. Auth. Multi-family Rev.: | | | |
(Alta Westgate Apts. Proj.) Series C, 0.19% 3/7/12, LOC Citibank NA, VRDN (c)(f) | 13,085 | | 13,085 |
(Glenn Millenia Proj.) Series 2001 C, 0.12% 3/7/12, LOC Fannie Mae Guaranteed Mtg. pass-thru certificates, VRDN (c)(f) | 3,400 | | 3,400 |
(Osprey Ridge Apts. Proj.) Series 2000 H, 0.19% 3/7/12, LOC Fannie Mae Guaranteed Mtg. pass-thru certificates, VRDN (c)(f) | 7,560 | | 7,560 |
(West Point Villas Apts. Proj.) Series 2000 F, 0.19% 3/7/12, LOC Fannie Mae Guaranteed Mtg. pass-thru certificates, VRDN (c)(f) | 11,500 | | 11,500 |
Orlando & Orange County Expressway Auth. Rev.: | | | |
Series 2003 C1, 0.14% 3/7/12, LOC JPMorgan Chase Bank, VRDN (c) | 43,285 | | 43,285 |
Series 2003 C2, 0.14% 3/7/12, LOC JPMorgan Chase Bank, VRDN (c) | 58,035 | | 58,035 |
Series 2008 B1, 0.16% 3/7/12, LOC Bank of America NA, VRDN (c) | 101,500 | | 101,500 |
Municipal Securities - continued |
| Principal Amount (000s) | | Value (000s) |
Florida - continued |
Orlando Utils. Commission Util. Sys. Rev. Bonds Series 2011 A, 0.27%, tender 9/26/12 (c) | $ 14,500 | | $ 14,500 |
Osceola County Hsg. Fin. Auth. Multi-family Rev. (Regatta Bay Apts. Proj.) Series A, 0.17% 3/7/12, LOC Fannie Mae Guaranteed Mtg. pass-thru certificates, VRDN (c)(f) | 12,920 | | 12,920 |
Palm Beach County Edl. Facilities Auth. (Lynn Univ. Proj.) Series 2001, 0.26% 3/7/12, LOC Bank of America NA, VRDN (c) | 9,370 | | 9,370 |
Palm Beach County Hsg. Fin. Auth. Multi-family Hsg. Rev. (Renaissance Apts. Proj.) 0.17% 3/7/12, LOC Fannie Mae Guaranteed Mtg. pass-thru certificates, VRDN (c)(f) | 17,900 | | 17,900 |
Palm Beach County Rev.: | | | |
(Hanley Ctr. Proj.) Series 2006, 0.36% 3/7/12, LOC Bank of America NA, VRDN (c) | 1,515 | | 1,515 |
(Raymond F. Kravis Ctr. Proj.) Series 2002, 0.15% 3/7/12, LOC Northern Trust Co., VRDN (c) | 3,145 | | 3,145 |
(Saint Andrew's School of Boca Raton, Inc. Proj.) Series 2007, 0.26% 3/7/12, LOC Bank of America NA, VRDN (c) | 10,700 | | 10,700 |
(The Norton Gallery and School of Arts, Inc. Proj.) Series 2000, 0.2% 3/7/12, LOC Bank of America NA, VRDN (c) | 11,400 | | 11,400 |
Palm Beach County Solid Waste Auth. Rev. Participating VRDN Series ROC II R 11986, 0.16% 3/7/12 (Liquidity Facility Citibank NA) (c)(g) | 12,000 | | 12,000 |
Panama City Gen. Oblig. Participating VRDN Series Solar 2006 129, 0.15% 3/7/12 (Liquidity Facility U.S. Bank NA, Cincinnati) (c)(g) | 7,920 | | 7,920 |
Pasco County Indl. Dev. Rev. (Pacific Med., Inc. Proj.) Series 1999, 0.58% 3/7/12, LOC Bank of America NA, VRDN (c)(f) | 970 | | 970 |
Pasco County School Board Ctfs. of Prtn. Series 2008 C, 0.22% 3/7/12, LOC Bank of America NA, VRDN (c) | 33,705 | | 33,705 |
Pinellas County Health Facilities Auth. Rev.: | | | |
(BayCare Health Sys. Proj.): | | | |
Series 2009 A2, 0.15% 3/7/12, LOC Northern Trust Co., VRDN (c) | 15,750 | | 15,750 |
Series 2009 A3, 0.15% 3/7/12, LOC Wells Fargo Bank NA, VRDN (c) | 10,500 | | 10,500 |
(Suncoast Hospice Proj.) Series 2004, 0.15% 3/7/12, LOC Wells Fargo Bank NA, VRDN (c) | 14,335 | | 14,335 |
Pinellas County School District TAN Series 2011, 1% 6/30/12 | 36,000 | | 36,092 |
Polk County Hsg. Fin. Auth. Multi-family Hsg. Rev. (Cambridge Cove Apts. Proj.) Series 2001, 0.17% 3/7/12, LOC Fannie Mae Guaranteed Mtg. pass-thru certificates, VRDN (c)(f) | 8,000 | | 8,000 |
Municipal Securities - continued |
| Principal Amount (000s) | | Value (000s) |
Florida - continued |
Saint Petersburg Health Facilities Auth. Rev. (All Children's Hosp. Proj.): | | | |
Series 2005 A1, 0.15% 3/7/12, LOC Wells Fargo Bank NA, VRDN (c) | $ 2,950 | | $ 2,950 |
Series 2005 A2, 0.15% 3/7/12, LOC Wells Fargo Bank NA, VRDN (c) | 48,575 | | 48,575 |
South Florida Wtr. Mgmt. District Ctfs. of Prtn. Participating VRDN Series MT 765, 0.22% 3/7/12 (Liquidity Facility Bank of America NA) (c)(g) | 8,985 | | 8,985 |
Sunshine State Govt. Fing. Commission Rev.: | | | |
(Miami-Dade County Prog.): | | | |
Series 2010 A, 0.16% 3/7/12, LOC JPMorgan Chase Bank, VRDN (c) | 3,600 | | 3,600 |
Series 2010 B, 0.16% 3/7/12, LOC JPMorgan Chase Bank, VRDN (c) | 35,000 | | 35,000 |
Series 2011 C, 0.16% 3/7/12, LOC JPMorgan Chase Bank, VRDN (c) | 20,500 | | 20,500 |
Bonds Series 2011 A, 5% 9/1/12 | 2,880 | | 2,944 |
USF College of Medicine Health Facilities Series 2006 A1, 0.13% 3/7/12, LOC JPMorgan Chase Bank, VRDN (c) | 21,960 | | 21,960 |
USF Fing. Corp. Ctfs. of Prtn.: | | | |
(College of Medicine Health Facilities Lease Prog.) Series 2006 A2, 0.14% 3/7/12, LOC JPMorgan Chase Bank, VRDN (c) | 17,475 | | 17,475 |
Series 2007, 0.14% 3/7/12, LOC JPMorgan Chase Bank, VRDN (c) | 21,880 | | 21,880 |
| | 1,580,555 |
Georgia - 3.3% |
Atlanta Arpt. Rev.: | | | |
Series 2010 A1: | | | |
0.16% 4/17/12, LOC JPMorgan Chase Bank, CP (f) | 30,000 | | 30,000 |
0.19% 4/18/12, LOC JPMorgan Chase Bank, CP (f) | 111,125 | | 111,125 |
Series 2010 B1: | | | |
0.15% 4/16/12, LOC Wells Fargo Bank NA, CP (f) | 63,257 | | 63,257 |
0.18% 4/17/12, LOC Wells Fargo Bank NA, CP (f) | 35,000 | | 35,000 |
Series 2010 B2, 0.13% 4/16/12, LOC Wells Fargo Bank NA, CP | 18,043 | | 18,043 |
Atlanta Urban Residential Fin. Auth. Multi-family Hsg. Rev.: | | | |
(Capitol Gateway Apts. Proj.) Series 2005, 0.19% 3/7/12, LOC Fannie Mae Guaranteed Mtg. pass-thru certificates, VRDN (c)(f) | 8,475 | | 8,475 |
Municipal Securities - continued |
| Principal Amount (000s) | | Value (000s) |
Georgia - continued |
Atlanta Urban Residential Fin. Auth. Multi-family Hsg. Rev.: - continued | | | |
(Carver Redev. Proj.) Series 2000, 0.42% 3/7/12, LOC Fannie Mae Guaranteed Mtg. pass-thru certificates, VRDN (c)(f) | $ 3,915 | | $ 3,915 |
(Collegetown at Harris Homes Phase I Proj.) Series 2003, 0.19% 3/7/12, LOC Fannie Mae Guaranteed Mtg. pass-thru certificates, VRDN (c)(f) | 7,230 | | 7,230 |
Bartow County Dev. Auth. Poll. Cont. Rev. (Georgia Pwr. Co. Plant Bowen Proj.) Second Series 1998, 0.17% 3/1/12, VRDN (c)(f) | 5,000 | | 5,000 |
Bulloch County Dev. Auth. Indl. Dev. Rev. (Gold Kist, Inc. Proj.) Series 1995, 0.3% 3/7/12, LOC Wells Fargo Bank NA, VRDN (c)(f) | 4,000 | | 4,000 |
Burke County Indl. Dev. Auth. Poll. Cont. Rev.: | | | |
(Oglethorpe Pwr. Corp. Proj.) Series 2010 B, 0.21% 3/7/12, LOC Bank of America NA, VRDN (c) | 30,000 | | 30,000 |
(Oglethorpe Pwr. Corp. Projects) Series 2010 A, 0.21% 3/7/12, LOC Bank of America NA, VRDN (c) | 45,000 | | 45,000 |
Canton Hsg. Auth. Multi-family Hsg. Rev.: | | | |
(Alta Ridgewalk Apts. Proj.) Series 2003, 0.19% 3/7/12, LOC Freddie Mac, VRDN (c)(f) | 20,450 | | 20,450 |
(Canton Mill Lofts Proj.) Series 1999, 0.23% 3/7/12, LOC Branch Banking & Trust Co., VRDN (c)(f) | 13,600 | | 13,600 |
Clarke County Indl. Dev. Auth. Hosp. Facilities Rev. Participating VRDN Series Solar 07 31, 0.15% 3/7/12 (Liquidity Facility U.S. Bank NA, Cincinnati) (c)(g) | 16,385 | | 16,385 |
Covington Hsg. Auth. Multi-family Rev. (Wellington Ridge Apt. Proj.) 0.17% 3/7/12, LOC Freddie Mac, VRDN (c)(f) | 9,265 | | 9,265 |
DeKalb County Hsg. Auth. Multi-family Hsg. Rev. (Eagles Trace Apts. Proj.) Series 1996, 0.17% 3/7/12, LOC Fannie Mae Guaranteed Mtg. pass-thru certificates, VRDN (c)(f) | 7,550 | | 7,550 |
Georgia Gen. Oblig.: | | | |
Bonds: | | | |
Series 2011 E1, 4% 7/1/12 | 16,665 | | 16,872 |
Series WF 08 12C, 0.2%, tender 7/25/12 (Liquidity Facility Wells Fargo & Co.) (c)(g)(h) | 13,990 | | 13,990 |
Participating VRDN Series BC 11 103W, 0.18% 3/7/12 (Liquidity Facility Barclays Bank PLC) (c)(g) | 9,365 | | 9,365 |
Georgia Muni. Gas Auth. Rev. Bonds (Gas Portfolio III Proj.) Series 2011 L, 2% 4/1/12 | 7,050 | | 7,060 |
Georgia State Road & Tollway Auth. Rev. Bonds Series 2001, 5.375% 3/1/12 | 6,000 | | 6,000 |
Municipal Securities - continued |
| Principal Amount (000s) | | Value (000s) |
Georgia - continued |
Gwinnett County Dev. Auth. Indl. Dev. Rev. (Curtis 1000, Inc. Proj.) Series 1996, 0.2% 3/7/12, LOC Wells Fargo Bank NA, VRDN (c)(f) | $ 6,460 | | $ 6,460 |
Gwinnett County Hsg. Auth. Multi-family Hsg. Rev. (Herrington Woods Apt. Proj.) Series 1996 A, 0.17% 3/7/12, LOC Fannie Mae Guaranteed Mtg. pass-thru certificates, VRDN (c)(f) | 11,035 | | 11,035 |
Gwinnett County Wtr. & Swr. Auth. Rev. Participating VRDN Series ROC II R 11910, 0.15% 3/7/12 (Liquidity Facility Citibank NA) (c)(g) | 4,170 | | 4,170 |
Heard County Dev. Auth. Poll. Cont. Rev. (Oglethorpe Pwr. Corp. Scherer Proj.) Series 2009 A, 0.14% 3/7/12, LOC JPMorgan Chase Bank, VRDN (c) | 3,600 | | 3,600 |
Henry County Dev. Auth. Solid Waste Rev. (Atlas Roofing Corp. Proj.) Series 1997, 0.2% 3/7/12, LOC Bank of America NA, VRDN (c)(f) | 2,450 | | 2,450 |
Kennesaw Dev. Auth. Multifamily Hsg. Rev. (Alta Ridenour Apts. Proj.) Series 2008, 0.19% 3/7/12, LOC Freddie Mac, VRDN (c)(f) | 7,350 | | 7,350 |
Loganville Hsg. Auth. Multi-family Hsg. Rev. (Alexander Crossing Apt. Proj.) 0.18% 3/7/12, LOC Freddie Mac, VRDN (c)(f) | 15,555 | | 15,555 |
Main Street Natural Gas, Inc. Georgia Gas Proj. Rev. Series 2010 A, 0.16% 3/7/12 (Liquidity Facility Royal Bank of Canada), VRDN (c) | 69,575 | | 69,575 |
Metropolitan Atlanta Rapid Transit Auth. Sales Tax Rev.: | | | |
Participating VRDN Series Solar 08 0001, 0.14% 3/7/12 (Liquidity Facility U.S. Bank NA, Cincinnati) (c)(g) | 10,230 | | 10,230 |
Series 2000 A, 0.12% 3/7/12, LOC JPMorgan Chase Bank, VRDN (c) | 6,960 | | 6,960 |
Series 2000 B, 0.12% 3/7/12, LOC U.S. Bank NA, Cincinnati, VRDN (c) | 20,000 | | 20,000 |
Monroe County Dev. Auth. Poll. Cont. Rev.: | | | |
(Oglethorpe Pwr. Corp. Scherer Proj.) Series 2009 A, 0.14% 3/7/12, LOC JPMorgan Chase Bank, VRDN (c) | 10,090 | | 10,090 |
Series 2010 A, 0.21% 3/7/12, LOC Bank of America NA, VRDN (c) | 24,145 | | 24,145 |
Muni. Elec. Auth. of Georgia: | | | |
Bonds (Gen. Resolution Projs.) Series 1985 A: | | | |
0.14% tender 3/6/12, LOC Barclays Bank PLC, CP mode | 8,050 | | 8,050 |
0.15% tender 3/1/12, LOC Barclays Bank PLC, CP mode | 7,500 | | 7,500 |
Series 1985 B, 0.14% 3/7/12, LOC Barclays Bank PLC, VRDN (c) | 23,000 | | 23,000 |
Municipal Securities - continued |
| Principal Amount (000s) | | Value (000s) |
Georgia - continued |
Newnan Dev. Auth. Multi-family Hsg. Rev. (The Club at Newnan Crossing Proj.) 0.16% 3/7/12, LOC Fannie Mae Guaranteed Mtg. pass-thru certificates, VRDN (c)(f) | $ 9,225 | | $ 9,225 |
Private Colleges & Univs. Auth. Rev.: | | | |
(Mercer Univ. Proj.) Series 2003, 0.15% 3/7/12, LOC Branch Banking & Trust Co., VRDN (c) | 6,200 | | 6,200 |
Participating VRDN Series WF 11 32C, 0.17% 3/7/12 (Liquidity Facility Wells Fargo Bank NA) (c)(g) | 5,800 | | 5,800 |
Roswell Hsg. Auth. Multi-family Hsg. Rev. (Rosemont Apts. Proj.) 0.15% 3/7/12, LOC Freddie Mac, VRDN (c) | 9,385 | | 9,385 |
Savannah Econ. Dev. Auth. Rev. (Home Depot, Inc. Proj.) Series 1995 A, 0.66% 3/7/12, VRDN (c)(f) | 57,400 | | 57,400 |
Sugar Hill Hsg. Auth. Multi-family Rev. (Level Creek Apts. Proj.) Series 1997, 0.17% 3/7/12, LOC Citibank NA, VRDN (c)(f) | 11,290 | | 11,290 |
Whitfield County Residential Care Facilities Auth. Rev. (Royal Oaks Sr. Living Cmnty. Proj.) 0.21% 3/7/12, LOC Bank of America NA, VRDN (c) | 6,910 | | 6,910 |
| | 817,962 |
Hawaii - 0.1% |
Hawaii Gen. Oblig. Participating VRDN Series MT 4718, 0.22% 3/7/12 (Liquidity Facility Bank of America NA) (c)(g) | 4,000 | | 4,000 |
Hawaii State Hsg. Fin. & Dev. Corp. Rev. (Lokahi Kau Apts. Proj.) Series 2008, 0.13% 3/7/12, LOC Freddie Mac, VRDN (c) | 3,080 | | 3,080 |
Honolulu City and County Wastewtr. Sys. Participating VRDN Series ROC II R 11989, 0.16% 3/7/12 (Liquidity Facility Citibank NA) (c)(g) | 4,005 | | 4,005 |
| | 11,085 |
Idaho - 0.7% |
Idaho Health Facilities Auth. Rev. (St. Luke's Health Sys. Proj.) Series 2009 B, 0.15% 3/7/12, LOC BMO Harris Bank NA, VRDN (c) | 18,000 | | 18,000 |
Idaho Hsg. & Fin. Assoc. Single Family Mtg.: | | | |
(Single Family Mtg. Proj.): | | | |
Series 2001 A, 0.15% 3/7/12 (Liquidity Facility Fannie Mae Guaranteed Mtg. pass-thru certificates) (Liquidity Facility Freddie Mac), VRDN (c)(f) | 7,910 | | 7,910 |
Series 2001 E, 0.15% 3/7/12 (Liquidity Facility Fannie Mae Guaranteed Mtg. pass-thru certificates) (Liquidity Facility Freddie Mac), VRDN (c)(f) | 5,490 | | 5,490 |
Series 2000 F, 0.15% 3/7/12 (Liquidity Facility Fannie Mae Guaranteed Mtg. pass-thru certificates) (Liquidity Facility Freddie Mac), VRDN (c)(f) | 5,045 | | 5,045 |
Municipal Securities - continued |
| Principal Amount (000s) | | Value (000s) |
Idaho - continued |
Idaho Hsg. & Fin. Assoc. Single Family Mtg.: - continued | | | |
Series 2001 B, 0.15% 3/7/12 (Liquidity Facility Fannie Mae Guaranteed Mtg. pass-thru certificates) (Liquidity Facility Freddie Mac), VRDN (c)(f) | $ 3,955 | | $ 3,955 |
Series 2001 C, 0.15% 3/7/12 (Liquidity Facility Fannie Mae Guaranteed Mtg. pass-thru certificates) (Liquidity Facility Freddie Mac), VRDN (c)(f) | 7,705 | | 7,705 |
Series 2001 D1, 0.15% 3/7/12 (Liquidity Facility Fannie Mae Guaranteed Mtg. pass-thru certificates) (Liquidity Facility Freddie Mac), VRDN (c)(f) | 1,400 | | 1,400 |
Series 2002 C, 0.15% 3/7/12 (Liquidity Facility Fannie Mae Guaranteed Mtg. pass-thru certificates) (Liquidity Facility Freddie Mac), VRDN (c)(f) | 7,550 | | 7,550 |
Series 2002, 0.15% 3/7/12 (Liquidity Facility Fannie Mae Guaranteed Mtg. pass-thru certificates) (Liquidity Facility Freddie Mac), VRDN (c)(f) | 10,230 | | 10,230 |
Series 2004 A, 0.15% 3/7/12 (Liquidity Facility Fannie Mae Guaranteed Mtg. pass-thru certificates) (Liquidity Facility Freddie Mac), VRDN (c)(f) | 6,560 | | 6,560 |
Series 2006 G, 0.15% 3/7/12 (Liquidity Facility Fannie Mae Guaranteed Mtg. pass-thru certificates) (Liquidity Facility Freddie Mac), VRDN (c)(f) | 7,140 | | 7,140 |
Series 2007 D, 0.15% 3/7/12 (Liquidity Facility Fannie Mae Guaranteed Mtg. pass-thru certificates) (Liquidity Facility Freddie Mac), VRDN (c)(f) | 4,300 | | 4,300 |
Series 2007 E, 0.15% 3/7/12 (Liquidity Facility Fannie Mae Guaranteed Mtg. pass-thru certificates) (Liquidity Facility Freddie Mac), VRDN (c)(f) | 22,005 | | 22,005 |
Series 2007 J1, 0.15% 3/7/12 (Liquidity Facility Fannie Mae Guaranteed Mtg. pass-thru certificates) (Liquidity Facility Freddie Mac), VRDN (c)(f) | 30,000 | | 30,000 |
Series A, 0.13% 3/7/12 (Liquidity Facility Fannie Mae Guaranteed Mtg. pass-thru certificates) (Liquidity Facility Freddie Mac), VRDN (c) | 2,380 | | 2,380 |
Idaho Hsg. & Fin. Assoc. Unemployment Compensation Bonds Series 2011, 2% 8/15/12 | 26,900 | | 27,110 |
| | 166,780 |
Illinois - 4.9% |
Belvidere Indl. Dev. Rev. (R&D Thiel, Inc. Proj.) Series 1996, 0.25% 3/7/12, LOC Bank of America NA, VRDN (c)(f) | 1,700 | | 1,700 |
Carol Stream Multi-family Rev. (Saint Charles Square Proj.) Series 1997, 0.17% 3/7/12, LOC Fannie Mae Guaranteed Mtg. pass-thru certificates, VRDN (c)(f) | 1,800 | | 1,800 |
Municipal Securities - continued |
| Principal Amount (000s) | | Value (000s) |
Illinois - continued |
Chicago Board of Ed. Series 2000 B, 0.15% 3/7/12, LOC Wells Fargo Bank NA, VRDN (c) | $ 20,700 | | $ 20,700 |
Chicago Gen. Oblig. Participating VRDN Series Solar 06 38, 0.15% 3/7/12 (Liquidity Facility U.S. Bank NA, Cincinnati) (c)(g) | 7,760 | | 7,760 |
Chicago Indl. Dev. Rev. (Chicago Scenic Studios, Inc. Proj.) Series 2000, 0.31% 3/7/12, LOC BMO Harris Bank NA, VRDN (c)(f) | 2,900 | | 2,900 |
Chicago Metropolitan Wtr. Reclamation District Greater Chicago Participating VRDN: | | | |
Series BBT 2007, 0.15% 3/7/12 (Liquidity Facility Branch Banking & Trust Co.) (c)(g) | 22,585 | | 22,585 |
Series Solar 06 75, 0.15% 3/7/12 (Liquidity Facility U.S. Bank NA, Cincinnati) (c)(g) | 19,900 | | 19,900 |
Chicago O'Hare Int'l. Arpt. Rev.: | | | |
Participating VRDN Series Floaters 3236, 0.28% 3/7/12 (Liquidity Facility Morgan Stanley Bank, West Valley City Utah) (c)(f)(g) | 5,050 | | 5,050 |
Series 1994 B, 0.18% 3/7/12, LOC Citibank NA, VRDN (c)(f) | 14,350 | | 14,350 |
Series 1994 C, 0.18% 3/7/12, LOC Citibank NA, VRDN (c) | 17,980 | | 17,980 |
Chicago Park District Gen. Oblig. Participating VRDN: | | | |
Series MT 760, 0.22% 3/7/12 (Liquidity Facility Bank of America NA) (c)(g) | 10,370 | | 10,370 |
Series Putters 3842, 0.16% 3/7/12 (Liquidity Facility JPMorgan Chase Bank) (c)(g) | 4,000 | | 4,000 |
Series ROC II R 11935, 0.16% 3/7/12 (Liquidity Facility Citibank NA) (c)(g) | 9,375 | | 9,375 |
Chicago Wtr. Rev.: | | | |
Series 2004 A1, 0.17% 3/7/12, LOC California Pub. Employees Retirement Sys., VRDN (c) | 90,300 | | 90,300 |
Series 2004 A2, 0.17% 3/7/12, LOC California Pub. Employees Retirement Sys., VRDN (c) | 51,380 | | 51,380 |
Series 2004 A3, 0.15% 3/7/12, LOC State Street Bank & Trust Co., Boston, VRDN (c) | 7,490 | | 7,490 |
City of Rolling Meadows Solid Waste Disp. Rev. (BFI Waste Sys. of North America Proj.) Series 1999, 0.23% 3/7/12, LOC JPMorgan Chase Bank, VRDN (c)(f) | 19,580 | | 19,580 |
DuPage County Gen. Oblig. Bonds Series Merlots 00 A9, 0.2%, tender 7/24/12 (Liquidity Facility Wells Fargo Bank NA) (c)(g)(h) | 9,710 | | 9,710 |
Illinois Dev. Fin. Auth. Indl. Dev. Rev.: | | | |
(Delta-Unibus Corp. Proj.) Series 2001, 0.53% 3/7/12, LOC Bank of America NA, VRDN (c)(f) | 4,000 | | 4,000 |
Municipal Securities - continued |
| Principal Amount (000s) | | Value (000s) |
Illinois - continued |
Illinois Dev. Fin. Auth. Indl. Dev. Rev.: - continued | | | |
(Mapes & Sprowl Steel Ltd. Proj.) Series 1996 A, 0.41% 3/7/12, LOC BMO Harris Bank NA, VRDN (c)(f) | $ 565 | | $ 565 |
(R&R Enterprises 2nd Proj.) Series 1999 A, 0.31% 3/7/12, LOC BMO Harris Bank NA, VRDN (c)(f) | 2,770 | | 2,770 |
Illinois Dev. Fin. Auth. Rev.: | | | |
(Lyric Opera of Chicago Proj.) 0.13% 3/7/12, LOC JPMorgan Chase Bank, LOC BMO Harris Bank NA, VRDN (c) | 22,800 | | 22,800 |
(Rich Prods. Corp. Proj.) Series 1998, 0.26% 3/7/12, LOC HSBC Bank USA, NA, VRDN (c)(f) | 7,825 | | 7,825 |
Illinois Edl. Facilities Auth. Revs.: | | | |
(Elmhurst College Proj.) Series 2003, 0.17% 3/7/12, LOC BMO Harris Bank NA, VRDN (c) | 1,950 | | 1,950 |
(Field Museum of Natural History Proj.) Series 2000, 0.13% 3/7/12, LOC JPMorgan Chase Bank, VRDN (c) | 18,500 | | 18,500 |
Participating VRDN Series ROC II R 12278, 0.15% 3/7/12 (Liquidity Facility Citibank NA) (c)(g) | 12,395 | | 12,395 |
Illinois Fin. Auth. Multi-family Rev. (Hidden Glen Apts. Proj.) Series 2007, 0.18% 3/7/12, LOC U.S. Bank NA, Cincinnati, VRDN (c)(f) | 7,165 | | 7,165 |
Illinois Fin. Auth. Rev.: | | | |
(Chicago Symphony Orchestra Proj.) Series 2008, 0.15% 3/7/12, LOC U.S. Bank NA, Cincinnati, VRDN (c) | 15,765 | | 15,765 |
(Children's Memorial Hosp. Proj.) Series 2008 D, 0.15% 3/7/12, LOC JPMorgan Chase Bank, VRDN (c) | 1,600 | | 1,600 |
(Edward Hosp. Obligated Group Proj.): | | | |
Series 2008 B1, 0.12% 3/7/12, LOC JPMorgan Chase Bank, VRDN (c) | 43,425 | | 43,425 |
Series 2008 B2, 0.12% 3/7/12, LOC JPMorgan Chase Bank, VRDN (c) | 32,800 | | 32,800 |
(Little Co. of Mary Hosp. Proj.) Series 2008 A, 0.12% 3/7/12, LOC JPMorgan Chase Bank, VRDN (c) | 5,345 | | 5,345 |
(Museum of Science & Industry Proj.): | | | |
Series 2009 A, 0.24% 3/7/12, LOC Bank of America NA, VRDN (c) | 1,000 | | 1,000 |
Series 2009 D, 0.16% 3/7/12, LOC Northern Trust Co., VRDN (c) | 16,000 | | 16,000 |
(Northwest Cmnty. Hosp. Proj.) Series 2008 C, 0.16% 3/7/12, LOC JPMorgan Chase Bank, VRDN (c) | 8,390 | | 8,390 |
(OSF Healthcare Sys. Proj.) Series 2009 C, 0.14% 3/7/12, LOC Wells Fargo Bank NA, VRDN (c) | 8,000 | | 8,000 |
Municipal Securities - continued |
| Principal Amount (000s) | | Value (000s) |
Illinois - continued |
Illinois Fin. Auth. Rev.: - continued | | | |
(Provena Health Proj.): | | | |
Series 2009 C, 0.15% 3/7/12, LOC JPMorgan Chase Bank, VRDN (c) | $ 15,000 | | $ 15,000 |
Series 2010 D, 0.14% 3/7/12, LOC Union Bank of California, VRDN (c) | 18,550 | | 18,550 |
(Rehabilitation Institute of Chicago Proj.) Series 2009 B, 0.14% 3/7/12, LOC JPMorgan Chase Bank, VRDN (c) | 16,000 | | 16,000 |
(Rush Univ. Med. Ctr. Proj.) Series 2008 A, 0.15% 3/7/12, LOC Northern Trust Co., VRDN (c) | 4,200 | | 4,200 |
(Saint Xavier Univ. Proj.) Series 2008, 0.23% 3/7/12, LOC Bank of America NA, VRDN (c) | 10,375 | | 10,375 |
(Swedish Covenant Hosp. Proj.) Series 2008 A, 0.24% 3/7/12, LOC Bank of America NA, VRDN (c) | 38,940 | | 38,940 |
Bonds: | | | |
(Advocate Health Care Network Proj.) Series 2011 B, 0.28%, tender 9/26/12 (c) | 11,700 | | 11,700 |
(Advocate Health Care Proj.): | | | |
Series 2008 A1, 0.22%, tender 1/24/13 (c) | 7,500 | | 7,500 |
Series 2008 A2, 1.4%, tender 2/1/13 (c) | 2,375 | | 2,399 |
Series 2008 A3, 3.875%, tender 5/1/12 (c) | 4,900 | | 4,927 |
Participating VRDN: | | | |
Series BA 08 1137, 0.22% 3/7/12 (Liquidity Facility Bank of America NA) (c)(g) | 12,855 | | 12,855 |
Series BBT 08 33, 0.15% 3/7/12 (Liquidity Facility Branch Banking & Trust Co.) (c)(g) | 4,975 | | 4,975 |
Series EGL 06 115, 0.15% 3/7/12 (Liquidity Facility Citibank NA) (c)(g) | 5,445 | | 5,445 |
Series Putters 3174, 0.16% 3/7/12 (Liquidity Facility JPMorgan Chase Bank) (c)(g) | 15,620 | | 15,620 |
Series Putters 3378, 0.16% 3/7/12 (Liquidity Facility JPMorgan Chase Bank) (c)(g) | 11,200 | | 11,200 |
Series Putters 3435, 0.16% 3/7/12 (Liquidity Facility JPMorgan Chase Bank) (c)(g) | 2,105 | | 2,105 |
Series WF 12 2C, 0.17% 3/7/12 (Liquidity Facility Wells Fargo Bank NA) (c)(g) | 8,375 | | 8,375 |
Series 2009 A, 0.14% 3/7/12, LOC JPMorgan Chase Bank, VRDN (c) | 9,000 | | 9,000 |
Illinois Fin. Auth. Solid Waste Rev. (Republic Svcs., Inc. Proj.) Series 2004, 0.21% 3/7/12, LOC JPMorgan Chase Bank, VRDN (c)(f) | 18,000 | | 18,000 |
Municipal Securities - continued |
| Principal Amount (000s) | | Value (000s) |
Illinois - continued |
Illinois Health Facilities Auth. Rev.: | | | |
(Herman M. Finch Univ. of Health Sciences/The Chicago Med. School Proj.) Series 2003, 0.14% 3/7/12, LOC JPMorgan Chase Bank, VRDN (c) | $ 15,000 | | $ 15,000 |
Bonds Series 2003 C, 0.45%, tender 3/28/12 (c) | 9,240 | | 9,240 |
Illinois Hsg. Dev. Auth. Multi-family Hsg. Rev.: | | | |
(Lakeshore Plaza Proj.) Series 2008 B, 0.16% 3/7/12, LOC JPMorgan Chase Bank, VRDN (c) | 14,940 | | 14,940 |
(Prairie Station Apts. Proj.) 0.17% 3/7/12, LOC Fannie Mae Guaranteed Mtg. pass-thru certificates, VRDN (c)(f) | 17,900 | | 17,900 |
(Valley View Apts. Proj.) 0.16% 3/7/12, LOC U.S. Bank NA, Cincinnati, VRDN (c)(f) | 11,115 | | 11,115 |
0.14% 3/7/12, LOC Freddie Mac, VRDN (c) | 29,550 | | 29,550 |
Illinois Toll Hwy. Auth. Toll Hwy. Rev.: | | | |
Participating VRDN: | | | |
Series MT 751, 0.22% 3/7/12 (Liquidity Facility Bank of America NA) (c)(g) | 24,975 | | 24,975 |
Series MT 773, 0.22% 3/7/12 (Liquidity Facility Bank of America NA) (c)(g) | 10,485 | | 10,485 |
Series 2007 A 2D, 0.14% 3/7/12, LOC Wells Fargo Bank NA, VRDN (c) | 38,300 | | 38,300 |
Series 2007 A-2A, 0.15% 3/7/12, LOC Bank of Tokyo-Mitsubishi UFJ Ltd., VRDN (c) | 25,800 | | 25,800 |
0.21% 3/7/12, LOC Citibank NA, VRDN (c) | 69,000 | | 69,000 |
Lake County Solid Waste Disp. Facilities Rev. (Countryside Landfill, Inc. Proj.) Series B, 0.2% 3/7/12, LOC JPMorgan Chase Bank, VRDN (c)(f) | 4,320 | | 4,320 |
Lisle Village Multi-family Hsg. Rev.: | | | |
(Devonshire of Lisle Proj.) Series 1991, 0.15% 3/7/12, LOC Freddie Mac, VRDN (c)(f) | 6,000 | | 6,000 |
(Four Lakes Phase V-Lisle) Series 1996, 0.28% 3/7/12, LOC Bank of America NA, VRDN (c) | 20,000 | | 20,000 |
Metropolitan Pier & Exposition Participating VRDN: | | | |
Series MS 3214, 0.26% 3/7/12 (Liquidity Facility Morgan Stanley Bank, West Valley City Utah) (c)(g) | 20,000 | | 20,000 |
Series MS 3220, 0.26% 3/7/12 (Liquidity Facility Morgan Stanley Bank, West Valley City Utah) (c)(g) | 27,900 | | 27,900 |
Series Putters 3861, 0.16% 3/7/12 (Liquidity Facility JPMorgan Chase Bank) (c)(g) | 18,500 | | 18,500 |
Series ROC II R 11880, 0.16% 3/7/12 (Liquidity Facility Citibank NA) (c)(g) | 7,500 | | 7,500 |
Palos Hills Multi-family Hsg. Rev. (Green Oaks Proj.) Series 1998, 0.18% 3/7/12, LOC Fannie Mae Guaranteed Mtg. pass-thru certificates, VRDN (c)(f) | 14,300 | | 14,300 |
Municipal Securities - continued |
| Principal Amount (000s) | | Value (000s) |
Illinois - continued |
Quincy Hosp. Rev. (Blessing Hosp. Proj.) Series 2004, 0.14% 3/7/12, LOC JPMorgan Chase Bank, VRDN (c) | $ 2,245 | | $ 2,245 |
Univ. of Illinois Rev.: | | | |
(UIC South Campus Dev. Proj.) Series 2008, 0.13% 3/7/12, LOC JPMorgan Chase Bank, VRDN (c) | 22,900 | | 22,900 |
Series 2008, 0.14% 3/7/12, LOC JPMorgan Chase Bank, VRDN (c) | 26,205 | | 26,205 |
Yorkville Svc. Area 2004-106 Tax (MPI Grande Reserve Proj.) Series 2004, 0.48% 3/7/12, LOC Bank of America NA, VRDN (c) | 6,100 | | 6,100 |
| | 1,186,666 |
Indiana - 1.6% |
Crawford County Econ. Dev. Rev. (Jasper Engine Exchange Proj.) Series 1997, 0.2% 3/7/12, LOC PNC Bank NA, VRDN (c)(f) | 800 | | 800 |
Elkhart County Multi-family Hsg. Rev. (Pedcor Investments Proj.) Series 2000, 0.18% 3/7/12, LOC Fed. Home Ln. Bank, Indianapolis, VRDN (c)(f) | 7,456 | | 7,456 |
Hammond Swr. & Solid Waste Disp. Rev. (Cargill, Inc. Proj.) 0.18% 3/7/12, VRDN (c)(f) | 39,000 | | 39,000 |
Indiana Dev. Fin. Auth. Envir. Rev. (Duke Energy Indiana, Inc. Proj.) Series 2009 A3, 0.12% 3/7/12, LOC Mizuho Corporate Bank Ltd., VRDN (c) | 15,425 | | 15,425 |
Indiana Dev. Fin. Auth. Poll. Cont. Rev. (Southern Indiana Gas and Elec. Co. Proj.) Series 1998 A, 0.13% 3/7/12, LOC JPMorgan Chase Bank, VRDN (c) | 16,550 | | 16,550 |
Indiana Dev. Fin. Auth. Rev. (Indianapolis Museum of Art, Inc. Proj.) Series 2001, 0.13% 3/7/12, LOC JPMorgan Chase Bank, VRDN (c) | 12,400 | | 12,400 |
Indiana Dev. Fin. Auth. Solid Waste Disp. Rev. (Waste Mgmt., Inc. Proj.) Series 2002 B, 0.19% 3/7/12, LOC JPMorgan Chase Bank, VRDN (c)(f) | 14,000 | | 14,000 |
Indiana Fin. Auth. Health Sys. Rev. (Sisters of Saint Francis Health Svcs., Inc. Obligated Group Proj.): | | | |
Series 2008 A, 0.13% 3/7/12, LOC JPMorgan Chase Bank, VRDN (c) | 14,500 | | 14,500 |
Series 2008 B, 0.13% 3/7/12, LOC JPMorgan Chase Bank, VRDN (c) | 8,370 | | 8,370 |
Series 2008 H, 0.13% 3/7/12, LOC JPMorgan Chase Bank, VRDN (c) | 1,400 | | 1,400 |
Indiana Fin. Auth. Hosp. Rev.: | | | |
(Cmnty. Health Network Proj.) Series 2009 A, 0.23% 3/7/12, LOC Bank of America NA, VRDN (c) | 34,180 | | 34,180 |
Municipal Securities - continued |
| Principal Amount (000s) | | Value (000s) |
Indiana - continued |
Indiana Fin. Auth. Hosp. Rev.: - continued | | | |
(Parkview Health Sys. Oblig. Group Proj.) Series 2009 C, 0.12% 3/7/12, LOC PNC Bank NA, VRDN (c) | $ 28,575 | | $ 28,575 |
Series 2011 A, 0.14% 3/7/12, LOC JPMorgan Chase Bank, VRDN (c) | 16,420 | | 16,420 |
Indiana Fin. Auth. Rev. (Ascension Health Subordinate Cr. Proj.) Series 2008 E5, 0.12% 3/7/12, VRDN (c) | 36,425 | | 36,425 |
Indiana Health Facility Fing. Auth. Rev. Series 2003 E6, 0.12% 3/7/12, VRDN (c) | 13,000 | | 13,000 |
Indianapolis Econ. Dev. Rev. (Pine Glen Apts. Proj.) 0.18% 3/7/12, LOC Fed. Home Ln. Bank, Cincinnati, VRDN (c)(f) | 6,110 | | 6,110 |
Indianapolis Gas Util. Sys. Rev. Series 2001 A2: | | | |
0.65% 3/6/12, CP | 25,000 | | 25,000 |
0.65% 3/7/12, CP | 25,000 | | 25,000 |
IPS Multi-School Bldg. Corp. Participating VRDN Series Solar 07 26, 0.15% 3/7/12 (Liquidity Facility U.S. Bank NA, Cincinnati) (c)(g) | 13,435 | | 13,435 |
Knox Econ. Dev. Rev. (Toll IN LLC Proj.) 0.29% 3/7/12, LOC Bank of America NA, VRDN (c)(f) | 9,435 | | 9,435 |
Marion Econ. Dev. Rev. (Indiana Wesleyan Univ. Proj.) Series 2006, 0.23% 3/7/12, LOC Bank of America NA, VRDN (c) | 11,600 | | 11,600 |
Saint Joseph County Hosp. Auth. Health Sys. Rev. (Memorial Health Sys. Proj.) Series 2008 B, 0.13% 3/7/12, LOC JPMorgan Chase Bank, VRDN (c) | 37,265 | | 37,265 |
Warrick County Poll. Cont. Rev. (Southern Indiana Gas and Elec. Co. Proj.) Series 1985 A, 0.14% 3/7/12, LOC JPMorgan Chase Bank, VRDN (c) | 9,775 | | 9,775 |
| | 396,121 |
Iowa - 0.1% |
Iowa Fin. Auth. Series 2005 C, 0.19% 3/7/12 (Liquidity Facility State Street Bank & Trust Co., Boston), VRDN (c)(f) | 8,085 | | 8,085 |
Iowa Fin. Auth. Solid Disp. Waste Rev. (MidAmerican Energy Proj.) Series 2008 A, 0.18% 3/7/12, VRDN (c)(f) | 3,100 | | 3,100 |
Iowa Fin. Auth. Wellness Facilities Rev. (Cmnty. Y of Marshalltown Proj.) Series 2001, 0.23% 3/7/12, LOC Bank of America NA, VRDN (c) | 5,800 | | 5,800 |
| | 16,985 |
Kansas - 0.2% |
Chanute Indl. Dev. Rev. (Ash Grove Cement Co. Proj.) Series 2000, 0.28% 3/7/12, LOC Bank of America NA, VRDN (c)(f) | 25,100 | | 25,100 |
Municipal Securities - continued |
| Principal Amount (000s) | | Value (000s) |
Kansas - continued |
City of Lawrence BAN Series 2011 I, 2% 10/1/12 | $ 14,375 | | $ 14,516 |
Lenexa Multi-family Hsg. Rev. (Meadows Apts. Proj.) Series A, 0.19% 3/7/12, LOC Fannie Mae Guaranteed Mtg. pass-thru certificates, VRDN (c)(f) | 15,095 | | 15,095 |
| | 54,711 |
Kentucky - 2.3% |
Boyd County Sewage & Solid Waste Rev. (Air Products and Chemicals, Inc. Proj.) Series 2003, 0.15% 3/7/12, VRDN (c)(f) | 8,500 | | 8,500 |
Carroll County Envir. Facilities Rev. (Kentucky Utils. Co. Proj.): | | | |
Series 2004 A, 0.15% 3/7/12, LOC Sumitomo Mitsui Banking Corp., VRDN (c)(f) | 12,000 | | 12,000 |
Series 2006 B, 0.17% 3/7/12, LOC Sumitomo Mitsui Banking Corp., VRDN (c)(f) | 30,000 | | 30,000 |
Series 2008 A, 0.17% 3/7/12, LOC Sumitomo Mitsui Banking Corp., VRDN (c)(f) | 74,947 | | 74,947 |
Daviess County Exempt Facilities Rev. (Kimberly-Clark Tissue Co. Proj.) Series 1999, 0.16% 3/7/12 (Kimberly-Clark Corp. Guaranteed), VRDN (c)(f) | 4,870 | | 4,870 |
Daviess County Solid Waste Disp. Facilities Rev. (Scott Paper Co. Proj.): | | | |
Series 1993 A, 0.16% 3/7/12 (Kimberly-Clark Corp. Guaranteed), VRDN (c)(f) | 67,250 | | 67,250 |
Series 1993 B, 0.16% 3/7/12 (Kimberly-Clark Corp. Guaranteed), VRDN (c)(f) | 37,700 | | 37,700 |
Elizabethtown Indl. Bldg. Rev. (Altec Industries, Inc. Proj.) Series 1997, 0.07% 3/7/12, LOC Wells Fargo Bank NA, VRDN (c)(f) | 4,000 | | 4,000 |
Henderson County Indl. Dev. Auth. (Pittsburg Tank & Tower Co. Proj.) 0.2% 3/7/12, LOC U.S. Bank NA, Cincinnati, VRDN (c)(f) | 100 | | 100 |
Jefferson County Poll. Cont. Bonds (Louisville Gas & Elec. Co. Proj.) Series A2, 0.4% tender 3/22/12, CP mode (f) | 31,000 | | 31,000 |
Jefferson County Poll. Cont. Rev. Bonds (Louisville Gas & Elec. Co. Proj.) Series 2001 A, 0.31% tender 3/1/12, CP mode | 9,600 | | 9,600 |
Kentucky Econ. Dev. Fin. Auth. Hosp. Rev. (St. Elizabeth Med. Ctr., Inc. Proj.) Series 2009 B, 0.14% 3/7/12, LOC JPMorgan Chase Bank, VRDN (c) | 9,400 | | 9,400 |
Kentucky Higher Ed. Student Ln. Corp. Rev.: | | | |
Series 2008 A1, 0.23% 3/7/12, LOC State Street Bank & Trust Co., Boston, LOC Bank of America NA, VRDN (c)(f) | 129,760 | | 129,760 |
Series 2008 A2, 0.23% 3/7/12, LOC State Street Bank & Trust Co., Boston, LOC Bank of America NA, VRDN (c)(f) | 33,625 | | 33,625 |
Municipal Securities - continued |
| Principal Amount (000s) | | Value (000s) |
Kentucky - continued |
Kentucky Hsg. Corp. Conduit Multi-family Mtg. Rev. (Gleneagles Apts. Proj.) 0.16% 3/7/12, LOC Fannie Mae Guaranteed Mtg. pass-thru certificates, VRDN (c)(f) | $ 9,600 | | $ 9,600 |
Kentucky Hsg. Corp. Multi-family Rev. (Canterbury Southgate Hsg. Proj.) 0.16% 3/7/12, LOC Freddie Mac, VRDN (c)(f) | 12,565 | | 12,565 |
Kentucky Muni. Pwr. Agcy. Pwr. Sys. Rev. Participating VRDN Series Solar 07 107, 0.14% 3/7/12 (Liquidity Facility U.S. Bank NA, Cincinnati) (c)(g) | 20,595 | | 20,595 |
Larue County Indl. Dev. Rev. (CMH Hodgenville, Inc. Proj.) Series 2000, 0.2% 3/7/12, LOC U.S. Bank NA, Cincinnati, VRDN (c)(f) | 6,000 | | 6,000 |
Louisville & Jefferson County Metropolitan Govt. Multi-family Hsg. Rev. (Waterford Place Apts. Proj.) Series 2003, 0.15% 3/7/12, LOC Freddie Mac, VRDN (c) | 9,425 | | 9,425 |
Mercer County Solid Waste Disp. Facility Rev. (Kentucky Utils. Co. Proj.) Series 2000 A, 0.14% 3/7/12, LOC Sumitomo Mitsui Banking Corp., VRDN (c)(f) | 12,900 | | 12,900 |
Minor Lane Heights Solid Waste Disp. Rev. (Waste Mgmt. of Kentucky, LLC Proj. D) Series 2003, 0.17% 3/7/12, LOC PNC Bank NA, VRDN (c)(f) | 11,000 | | 11,000 |
Trimble County Poll. Cont. Rev. Bonds (Louisville Gas & Elec. Co. Proj.): | | | |
Series 2001 A, 0.23% tender 3/19/12, CP mode | 19,800 | | 19,800 |
Series 2001 B, 0.4% tender 3/22/12, CP mode (f) | 8,600 | | 8,600 |
| | 563,237 |
Louisiana - 1.7% |
East Baton Rouge Parish Indl. Dev. Board Rev. (Stupp Bros., Inc. Proj.) Series 2008, 0.31% 3/7/12, LOC Bank of America NA, VRDN (c) | 38,000 | | 38,000 |
Lake Charles Hbr. & Term. District Dock & Wharf Rev. (Conoco, Inc. Proj.) Series 2000, 0.14% 3/7/12, VRDN (c)(f) | 34,100 | | 34,100 |
Louisiana Gas & Fuel Tax Rev. Participating VRDN: | | | |
Series Putters 3806, 0.16% 3/7/12 (Liquidity Facility JPMorgan Chase Bank) (c)(g) | 9,990 | | 9,990 |
Series Solar 06 133, 0.14% 3/7/12 (Liquidity Facility U.S. Bank NA, Cincinnati) (c)(g) | 6,890 | | 6,890 |
Louisiana Hsg. Fin. Auth. Multi-family Hsg. Rev. (The Reserve at Jefferson Proj.) Series 2008, 0.19% 3/7/12, LOC Freddie Mac, VRDN (c) | 4,095 | | 4,095 |
Louisiana Offshore Term. Auth. Deepwater Port Rev. (LOOP LLC Proj.) Series 2003 B, 0.14% 3/7/12, LOC JPMorgan Chase Bank, VRDN (c) | 22,275 | | 22,275 |
Municipal Securities - continued |
| Principal Amount (000s) | | Value (000s) |
Louisiana - continued |
Louisiana Pub. Facilities Auth. Gulf Opportunity Zone Rev. (Celtic Mgmt. Corp. Proj.) Series 2008, 0.21% 3/7/12, LOC JPMorgan Chase Bank, VRDN (c) | $ 14,785 | | $ 14,785 |
Louisiana Pub. Facilities Auth. Hosp. Rev. (Franciscan Missionaries of Our Lady Health Sys. Proj.) Series 2008 A, 0.15% 3/7/12, LOC JPMorgan Chase Bank, VRDN (c) | 23,580 | | 23,580 |
Louisiana Pub. Facilities Auth. Rev.: | | | |
(Air Products & Chemicals, Inc. Proj.): | | | |
Series 2002, 0.15% 3/7/12, VRDN (c)(f) | 1,000 | | 1,000 |
Series 2003, 0.15% 3/7/12, VRDN (c)(f) | 15,650 | | 15,650 |
Series 2004, 0.12% 3/7/12, VRDN (c) | 11,700 | | 11,700 |
Series 2009 A, 0.12% 3/7/12, VRDN (c) | 19,565 | | 19,565 |
(C-Port LLC Proj.) Series 2008, 0.26% 3/7/12, LOC Bank of America NA, VRDN (c) | 9,200 | | 9,200 |
(CommCare Corp. Proj.) Series 2008 A, 0.21% 3/7/12, LOC JPMorgan Chase Bank, VRDN (c) | 3,700 | | 3,700 |
South Louisiana Port Commission Port Facilities Rev. (Holnam, Inc. Proj.) 0.19% 3/7/12, LOC Wells Fargo Bank NA, VRDN (c)(f) | 22,000 | | 22,000 |
St. James Parish Gen. Oblig.: | | | |
(Nucor Steel Louisiana LLC Proj.) Series 2010 B1: | | | |
0.12% 3/7/12, VRDN (c) | 23,000 | | 23,000 |
0.14% 3/7/12, VRDN (c) | 15,000 | | 15,000 |
(NuStar Logistics LP Proj.): | | | |
Series 2010 A, 0.14% 3/7/12, LOC JPMorgan Chase Bank, VRDN (c) | 25,000 | | 25,000 |
Series 2010 B, 0.14% 3/7/12, LOC JPMorgan Chase Bank, VRDN (c) | 25,000 | | 25,000 |
Series 2010, 0.14% 3/7/12, LOC JPMorgan Chase Bank, VRDN (c) | 55,000 | | 55,000 |
Series 2011, 0.14% 3/7/12, LOC Wells Fargo Bank NA, VRDN (c) | 40,000 | | 40,000 |
| | 419,530 |
Maine - 0.2% |
Maine Fin. Auth. Solid Waste Disposable Rev. (Casella Waste Systems, Inc. Proj.) 0.29% 3/7/12, LOC Bank of America NA, VRDN (c)(f) | 3,600 | | 3,600 |
Municipal Securities - continued |
| Principal Amount (000s) | | Value (000s) |
Maine - continued |
Maine Health & Higher Ed. Facilities Auth. Rev. Series 2008 A, 0.16% 3/7/12, LOC JPMorgan Chase Bank, VRDN (c) | $ 27,965 | | $ 27,965 |
Maine Pub. Util. Fin. Pub. Util. Rev. (Maine Pub. Svc. Co. Proj.) Series 1996, 0.55% 3/7/12, LOC Bank of America NA, VRDN (c)(f) | 13,600 | | 13,600 |
| | 45,165 |
Maryland - 2.1% |
Anne Arundel County Gen. Oblig. Bonds Series 2003, 5% 3/1/12 | 5,250 | | 5,250 |
Baltimore County Gen. Oblig. Series 2011: | | | |
0.14% 4/3/12 (Liquidity Facility Mizuho Corporate Bank Ltd.), CP | 25,900 | | 25,900 |
0.15% 4/3/12 (Liquidity Facility Mizuho Corporate Bank Ltd.), CP | 38,800 | | 38,800 |
0.15% 5/21/12 (Liquidity Facility Mizuho Corporate Bank Ltd.), CP | 64,600 | | 64,600 |
Maryland Cmnty. Dev. Administration Dept. of Hsg. & Cmnty. Dev. (Parlane Apts. Proj.) Series 2001 C, 0.13% 3/7/12, LOC Fannie Mae Guaranteed Mtg. pass-thru certificates, VRDN (c)(f) | 3,400 | | 3,400 |
Maryland Econ. Dev. Auth. Rev.: | | | |
(Associated Projs.) Series A, 0.23% 3/7/12, LOC Bank of America NA, VRDN (c) | 14,805 | | 14,805 |
(United States Pharmacopeial Convention, Inc. Proj.) Series 2008 B, 0.25% 3/1/12, LOC Bank of America NA, VRDN (c) | 1,600 | | 1,600 |
Maryland Gen. Oblig. Bonds Second Series 2006, 5% 8/1/12 | 1,000 | | 1,020 |
Maryland Health & Higher Edl. Facilities Auth. Rev.: | | | |
(Adventist Healthcare Proj.) Series 2005 A, 0.14% 3/7/12, LOC Union Bank of California, VRDN (c) | 48,250 | | 48,250 |
(Mercy Med. Ctr. Proj.) Series 2007 D, 0.15% 3/7/12, LOC Wells Fargo Bank NA, VRDN (c) | 28,300 | | 28,300 |
(Univ. of Maryland Med. Sys. Proj.): | | | |
Series 2008 A, 0.26% 3/7/12, LOC Citizens Bank of Pennsylvania, VRDN (c) | 22,300 | | 22,300 |
Series 2008 B, 0.21% 3/7/12, LOC Bank of America NA, VRDN (c) | 56,900 | | 56,900 |
(Villa Julie College, Inc. Proj.) Series 2005, 0.21% 3/7/12, LOC Bank of America NA, VRDN (c) | 57,060 | | 57,060 |
Bonds Series 2011, 2% 8/15/12 | 2,145 | | 2,157 |
Maryland Stadium Auth. Sports Facilities Bonds Series 2011 B: | | | |
1.5% 6/15/12 (f) | 1,295 | | 1,299 |
Municipal Securities - continued |
| Principal Amount (000s) | | Value (000s) |
Maryland - continued |
Maryland Stadium Auth. Sports Facilities Bonds Series 2011 B: - continued | | | |
1.5% 12/15/12 (f) | $ 6,555 | | $ 6,608 |
Maryland Trans. Auth. Trans. Facility Projects Rev. Participating VRDN: | | | |
Series BA 08 1077, 0.26% 3/7/12 (Liquidity Facility Bank of America NA) (c)(g) | 5,055 | | 5,055 |
Series ROC II R 11437, 0.17% 3/7/12 (Liquidity Facility Citibank NA) (c)(g) | 10,000 | | 10,000 |
Montgomery County Econ. Dev. Rev. (Georgetown Preparatory School, Inc. Proj.) Series 2005, 0.23% 3/7/12, LOC Bank of America NA, VRDN (c) | 17,010 | | 17,010 |
Montgomery County Gen. Oblig. Ctfs. of Prtn. Bonds Series 2010, 3% 5/1/12 | 3,060 | | 3,073 |
Montgomery County Hsg. Opportunities Commission Hsg. Rev. (The Grand Proj.) Series 1997 1, 0.12% 3/7/12, LOC Fannie Mae Guaranteed Mtg. pass-thru certificates, VRDN (c)(f) | 33,660 | | 33,660 |
Montgomery County Hsg. Opportunity Commission Single Family Mtg. Rev.: | | | |
Series 2007 F, 0.17% 3/7/12, LOC PNC Bank NA, VRDN (c)(f) | 10,000 | | 10,000 |
Series 2008 C, 0.17% 3/7/12, LOC PNC Bank NA, VRDN (c)(f) | 8,450 | | 8,450 |
Washington Suburban San. District: | | | |
Bonds: | | | |
Series 2004, 5% 6/1/12 | 3,410 | | 3,451 |
Series 2005, 5% 6/1/12 | 3,055 | | 3,092 |
Series 2009 A, 4% 6/1/12 | 2,000 | | 2,019 |
Series 2010 A, 4% 6/1/12 | 4,500 | | 4,543 |
Series 2011, 5% 6/1/12 | 15,000 | | 15,181 |
Participating VRDN Series WF 11 129C, 0.17% 3/7/12 (Liquidity Facility Wells Fargo Bank NA) (c)(g) | 9,155 | | 9,155 |
| | 502,938 |
Massachusetts - 1.4% |
Massachusetts Dev. Fin. Agcy. Electrical Utils. Rev. Bonds (Nantucket Elec. Co. Proj.) Series 2005, 0.45% tender 3/21/12, CP mode (f) | 24,400 | | 24,400 |
Massachusetts Gen. Oblig.: | | | |
Bonds Series 2012 A, 0.13% 9/1/12 (c) | 26,500 | | 26,496 |
Participating VRDN: | | | |
Series Clipper 07 39, 0.19% 3/7/12 (Liquidity Facility State Street Bank & Trust Co., Boston) (c)(g) | 2,675 | | 2,675 |
Municipal Securities - continued |
| Principal Amount (000s) | | Value (000s) |
Massachusetts - continued |
Massachusetts Gen. Oblig.: - continued | | | |
Participating VRDN: | | | |
Series Clipper 07 41, 0.19% 3/7/12 (Liquidity Facility State Street Bank & Trust Co., Boston) (c)(g) | $ 31,500 | | $ 31,500 |
RAN Series 2011 B, 2% 5/31/12 | 87,000 | | 87,398 |
Massachusetts Health & Edl. Facilities Auth. Rev. Participating VRDN Series PT 4633, 0.36% 3/7/12 (Liquidity Facility Deutsche Postbank AG) (c)(g) | 40,490 | | 40,490 |
Massachusetts Indl. Fin. Agcy. Poll. Cont. Rev. Bonds (New England Pwr. Co. Proj.): | | | |
Series 1992, 0.4% tender 3/13/12, CP mode | 8,100 | | 8,100 |
Series 1993 B, 0.55% tender 3/28/12, CP mode | 7,250 | | 7,250 |
Series 1993, 0.4% tender 3/21/12, CP mode | 15,000 | | 15,000 |
Massachusetts School Bldg. Auth. Dedicated Sales Tax Rev. Participating VRDN: | | | |
Series EGL 07 0031, 0.16% 3/7/12 (Liquidity Facility Citibank NA) (c)(g) | 16,500 | | 16,500 |
Series Putters 4029, 0.16% 3/7/12 (Liquidity Facility JPMorgan Chase Bank) (c)(g) | 2,685 | | 2,685 |
Massachusetts State Dev. Fin. Agcy. Elec. Util. Rev. Bonds (Nantucket Elec. Co. Proj.) Series 2007, 0.4% tender 3/8/12, CP mode (f) | 1,100 | | 1,100 |
Massachusetts Wtr. Poll. Abatement Trust Participating VRDN: | | | |
Series Clipper 05 36, 0.16% 3/7/12 (Liquidity Facility State Street Bank & Trust Co., Boston) (c)(g) | 11,835 | | 11,835 |
Series Clipper 06 11, 0.19% 3/7/12 (Liquidity Facility State Street Bank & Trust Co., Boston) (c)(g) | 59,605 | | 59,605 |
| | 335,034 |
Michigan - 3.6% |
Kent Hosp. Fin. Auth. Hosp. Facilities Rev. (Spectrum Health Sys. Proj.) Series 2008 B3, 0.12% 3/7/12 (Liquidity Facility Wells Fargo Bank NA), VRDN (c) | 8,100 | | 8,100 |
Livonia Econ. Dev. Corp. (Madonna Univ. Proj.) Series 2009, 0.15% 3/7/12, LOC Fed. Home Ln. Bank Chicago, VRDN (c) | 13,435 | | 13,435 |
Michigan Bldg. Auth. Rev.: | | | |
Series 2007 I, 0.14% 3/7/12, LOC JPMorgan Chase Bank, VRDN (c) | 3,600 | | 3,600 |
Series 2011 IIB, 0.14% 3/7/12, LOC JPMorgan Chase Bank, VRDN (c) | 39,090 | | 39,090 |
Series 6, 0.15% 3/29/12, LOC State Street Bank & Trust Co., Boston, LOC U.S. Bank NA, Cincinnati, CP | 11,480 | | 11,480 |
Michigan Fin. Auth. Rev.: | | | |
Bonds Series 2011, 2% 10/1/12 | 7,775 | | 7,854 |
Municipal Securities - continued |
| Principal Amount (000s) | | Value (000s) |
Michigan - continued |
Michigan Fin. Auth. Rev.: - continued | | | |
Participating VRDN Series ROC II R 11988, 0.16% 3/7/12 (Liquidity Facility Citibank NA) (c)(g) | $ 2,750 | | $ 2,750 |
RAN Series 2011 C3, 2% 8/20/12, LOC Bank of Nova Scotia New York Branch | 46,300 | | 46,669 |
Series 2011 L, 0.16% 3/7/12, LOC Citibank NA, VRDN (c) | 436,000 | | 436,000 |
Michigan Hosp. Fin. Auth. Rev.: | | | |
(Henry Ford Health Sys. Proj.) Series 2007, 0.13% 3/7/12, LOC JPMorgan Chase Bank, VRDN (c) | 3,400 | | 3,400 |
(McLaren Health Care Corp. Proj.): | | | |
Series 2008 B1, 0.13% 3/7/12, LOC JPMorgan Chase Bank, VRDN (c) | 12,910 | | 12,910 |
Series 2008 B3, 0.13% 3/7/12, LOC JPMorgan Chase Bank, VRDN (c) | 2,500 | | 2,500 |
Bonds: | | | |
(Ascension Health Cr. Group Proj.) Series 1999 B, 3.75%, tender 3/15/12 (c) | 11,300 | | 11,314 |
(Trinity Health Sys. Proj.): | | | |
Series 2008 C, 0.14% tender 7/10/12, CP mode | 92,200 | | 92,200 |
Series B, 0.16% tender 3/6/12, CP mode | 20,000 | | 20,000 |
Michigan Hsg. Dev. Auth. Single Family Mtg. Rev. Series 2007 B, 0.15% 3/7/12 (Liquidity Facility Fannie Mae Guaranteed Mtg. pass-thru certificates) (Liquidity Facility Freddie Mac), VRDN (c)(f) | 26,700 | | 26,700 |
Michigan State Univ. Revs. Participating VRDN Series WF 11 33 C, 0.17% 3/7/12 (Liquidity Facility Wells Fargo Bank NA) (c)(g) | 3,000 | | 3,000 |
Michigan Strategic Fund Ltd. Oblig. Rev. (Evangelical Homes of Michigan Proj.) Series 2008, 0.16% 3/7/12, LOC JPMorgan Chase & Co., VRDN (c) | 7,680 | | 7,680 |
Univ. of Michigan Univ. Rev. Bonds Series 2003, 5% 4/1/12 | 2,080 | | 2,088 |
Wayne County Arpt. Auth. Rev.: | | | |
0.13% 3/7/12, LOC JPMorgan Chase Bank, VRDN (c) | 69,320 | | 69,320 |
0.14% 3/7/12, LOC PNC Bank NA, VRDN (c)(f) | 35,000 | | 35,000 |
0.15% 3/7/12, LOC JPMorgan Chase Bank, VRDN (c)(f) | 16,360 | | 16,360 |
| | 871,450 |
Minnesota - 0.6% |
Dakota County Cmnty. Dev. Agcy. Multi-family Hsg. Rev. (Brentwood Hills Apts. Proj.) Series A, 0.2% 3/1/12, LOC Bank of America NA, VRDN (c)(f) | 22,195 | | 22,195 |
Eagan Multi-family Rev. (Thomas Lake Place Apts. Proj.) Series 2003 A1, 0.2% 3/7/12, LOC Fannie Mae Guaranteed Mtg. pass-thru certificates, VRDN (c)(f) | 6,525 | | 6,525 |
Municipal Securities - continued |
| Principal Amount (000s) | | Value (000s) |
Minnesota - continued |
Hennepin County Gen. Oblig. Bonds Series 2012 A, 3% 12/1/12 | $ 2,375 | | $ 2,425 |
Hennepin County Hsg. & Redev. Auth. Multi-family Rev. (Stone Arch Apts. Proj.) 0.19% 3/7/12, LOC Fannie Mae Guaranteed Mtg. pass-thru certificates, VRDN (c)(f) | 9,800 | | 9,800 |
Metropolitan Council Gen. Oblig. Rev. Bonds Series 2011 C: | | | |
0.25% 3/1/13 | 10,000 | | 10,000 |
1% 3/1/12 | 25,000 | | 25,000 |
Minneapolis & Saint Paul Hsg. & Redev. Auth. Health Care Sys. Rev. (Allina Health Sys. Proj.) Series 2007 C1, 0.15% 3/7/12, LOC Wells Fargo Bank NA, VRDN (c) | 11,075 | | 11,075 |
Minneapolis & Saint Paul Metropolitan Arpts. Commission Arpt. Rev. Participating VRDN Series MT 775, 0.22% 3/7/12 (Liquidity Facility Bank of America NA) (c)(g) | 8,895 | | 8,895 |
Minneapolis Multi-family Rev. (Gateway Real Estate Proj.) 0.22% 3/7/12, LOC Wells Fargo Bank NA, VRDN (c)(f) | 1,910 | | 1,910 |
Minnesota Gen. Oblig. Bonds: | | | |
Series 2009 H, 5% 11/1/12 (Escrowed to Maturity) | 7,150 | | 7,378 |
Series 2010 B, 4% 8/1/12 | 4,065 | | 4,129 |
Minnesota Office of Higher Ed.: | | | |
Series 2008 B, 0.14% 3/7/12, LOC U.S. Bank NA, Cincinnati, VRDN (c)(f) | 9,300 | | 9,300 |
Series 2011 B, 0.15% 3/7/12, LOC State Street Bank & Trust Co., Boston, VRDN (c)(f) | 15,000 | | 15,000 |
Oak Park Heights Multi-Family Rev. 0.14% 3/7/12, LOC Freddie Mac, VRDN (c) | 9,265 | | 9,265 |
Richfield Multi-family Hsg. Rev. (Lynwood Partners, LLC Proj.) Series 2010, 0.16% 3/7/12, LOC Wells Fargo Bank NA, VRDN (c) | 11,150 | | 11,150 |
| | 154,047 |
Mississippi - 0.4% |
Mississippi Bus. Fin. Corp. Indl. Dev. Rev. (Omega Motion LLC Proj.) Series 1996, 0.3% 3/7/12, LOC Wells Fargo Bank NA, VRDN (c)(f) | 500 | | 500 |
Mississippi Bus. Fin. Corp. Solid Waste Disp. Rev. (Waste Mgmt., Inc. Proj.) 0.2% 3/7/12, LOC Bank of America NA, VRDN (c)(f) | 10,000 | | 10,000 |
Mississippi Dev. Bank Spl. Oblig. (Harrison County Proj.) Series 2008 A2, 0.23% 3/7/12, LOC Bank of America NA, VRDN (c) | 14,000 | | 14,000 |
Mississippi Gen. Oblig.: | | | |
Participating VRDN Series WF 11 117C, 0.17% 3/7/12 (Liquidity Facility Wells Fargo Bank NA) (c)(g) | 18,505 | | 18,505 |
Municipal Securities - continued |
| Principal Amount (000s) | | Value (000s) |
Mississippi - continued |
Mississippi Gen. Oblig.: - continued | | | |
0.19% 3/7/12 (Liquidity Facility Bank of America NA), VRDN (c) | $ 14,505 | | $ 14,505 |
Mississippi Home Corp. Multi-family Hsg. Rev. (Bristol Park Apts. Proj.) Series 2001 1, 0.23% 3/7/12, LOC Wells Fargo Bank NA, VRDN (c)(f) | 7,600 | | 7,600 |
Mississippi Hosp. Equip. & Facilities Auth. Bonds (Baptist Memorial Health Care Proj.) Series 2004 B2: | | | |
0.19%, tender 7/11/12 (c)(h) | 9,340 | | 9,340 |
0.19%, tender 7/11/12 (c)(h) | 16,300 | | 16,300 |
| | 90,750 |
Missouri - 1.2% |
Bi-State Dev. Agcy. Missouri Illinois Metropolitan District Rev. (Metrolink Cross County Extension Proj.) Series 2010 A, 0.15% 3/7/12, LOC JPMorgan Chase Bank, VRDN (c) | 9,350 | | 9,350 |
Curators of the Univ. of Missouri Series A: | | | |
0.1% 3/1/12, CP | 4,000 | | 4,000 |
0.15% 3/13/12, CP | 15,625 | | 15,625 |
Curators of the Univ. of Missouri Sys. Facilities Rev. Participating VRDN Series MT 750, 0.22% 3/7/12 (Liquidity Facility Bank of America NA) (c)(g) | 3,990 | | 3,990 |
Grandview Indl. Dev. Auth. Multi-family Hsg. Rev. (Briarwood Apts. Proj.) 0.18% 3/7/12, LOC Fannie Mae Guaranteed Mtg. pass-thru certificates, VRDN (c)(f) | 12,200 | | 12,200 |
Jefferson County Indl. Dev. Auth. Multi-family Hsg. Rev. (Pevely Pointe Apts. Proj.) 0.21% 3/7/12, LOC Freddie Mac, VRDN (c)(f) | 13,900 | | 13,900 |
Kansas City Indl. Dev. Auth. Air Cargo Facility Rev. (Kansas City Air Cargo Svcs. Proj.) 0.18% 3/7/12, LOC JPMorgan Chase Bank, VRDN (c)(f) | 7,300 | | 7,300 |
Missouri Health & Edl. Facilities Auth. Edl. Facilities Rev.: | | | |
(Lutheran High School Assoc. Proj.) Series 2002, 0.16% 3/7/12, LOC U.S. Bank NA, Cincinnati, VRDN (c) | 3,140 | | 3,140 |
Participating VRDN: | | | |
Series PT 4624, 0.36% 3/7/12 (Liquidity Facility Deutsche Postbank AG) (c)(g) | 11,060 | | 11,060 |
Series Putters 3929, 0.16% 3/7/12 (Liquidity Facility JPMorgan Chase Bank) (c)(g) | 2,785 | | 2,785 |
Missouri Health & Edl. Facilities Auth. Health Facilities Rev.: | | | |
(SSM Health Care Sys. Proj.) Series 2005 A1, 0.14% 3/7/12, LOC Bank of America NA, VRDN (c) | 13,070 | | 13,070 |
Municipal Securities - continued |
| Principal Amount (000s) | | Value (000s) |
Missouri - continued |
Missouri Health & Edl. Facilities Auth. Health Facilities Rev.: - continued | | | |
Bonds (CoxHealth Proj.): | | | |
0.13% tender 4/3/12, LOC Bank of Nova Scotia New York Branch, CP mode | $ 20,000 | | $ 20,000 |
0.16% tender 7/10/12, LOC Bank of Nova Scotia New York Branch, CP mode | 22,000 | | 22,000 |
0.21% tender 5/4/12, LOC Bank of Nova Scotia New York Branch, CP mode | 15,000 | | 15,000 |
Missouri Health & Edl. Facilities Auth. Rev. (Lutheran Sr. Svcs. Proj.) Series 2008, 0.14% 3/7/12, LOC PNC Bank NA, VRDN (c) | 14,075 | | 14,075 |
Missouri Highways & Trans. Commission State Road Rev. Participating VRDN: | | | |
Series MT 736, 0.22% 3/7/12 (Liquidity Facility Bank of America NA) (c)(g) | 36,585 | | 36,585 |
Series PT 4625, 0.36% 3/7/12 (Liquidity Facility Deutsche Postbank AG) (c)(g) | 10,220 | | 10,220 |
Saint Louis Indl. Dev. Auth.: | | | |
(Metropolitan Lofts Apts. Proj.) Series 2003 A, 0.14% 3/7/12, LOC Fannie Mae Guaranteed Mtg. pass-thru certificates, VRDN (c)(f) | 28,300 | | 28,300 |
(Saint Luke's Plaza Apts. Proj.) Series 2009, 0.25% 3/7/12, LOC Bank of America NA, VRDN (c) | 5,000 | | 5,000 |
Springfield Pub. Util. Rev. Participating VRDN Series Solar 06 156, 0.15% 3/7/12 (Liquidity Facility U.S. Bank NA, Cincinnati) (c)(g) | 30,210 | | 30,210 |
St. Louis Indl. Dev. Auth. (The St. Louis Art Museum Proj.) Series 2009 B, 0.11% 3/7/12, LOC U.S. Bank NA, Cincinnati, VRDN (c) | 9,165 | | 9,165 |
| | 286,975 |
Montana - 0.1% |
Montana Board of Invt. Bonds Series 1998: | | | |
0.48%, tender 3/1/12 (c) | 11,565 | | 11,565 |
0.48%, tender 3/1/13 (c) | 6,470 | | 6,470 |
| | 18,035 |
Nebraska - 1.4% |
Central Plains Energy Proj. Rev. (Nebraska Gas Proj.) Series 2009, 0.16% 3/7/12 (Liquidity Facility Royal Bank of Canada), VRDN (c) | 53,200 | | 53,200 |
Municipal Securities - continued |
| Principal Amount (000s) | | Value (000s) |
Nebraska - continued |
Douglas County Solid Waste Disp. Rev. (Waste Mgmt., Inc. Proj.) Series A, 0.27% 3/7/12, LOC Bank of America NA, VRDN (c)(f) | $ 9,000 | | $ 9,000 |
Lincoln Elec. Sys. Rev. Bonds Series 2002, 5% 9/1/12 | 5,000 | | 5,119 |
Nebraska Invt. Fin. Auth. Single Family Hsg. Rev.: | | | |
Series 2010 B, 0.13% 3/7/12 (Liquidity Facility Fed. Home Ln. Bank Topeka), VRDN (c) | 48,600 | | 48,600 |
Series 2010 C, 0.13% 3/7/12 (Liquidity Facility Fed. Home Ln. Bank Topeka), VRDN (c)(f) | 127,395 | | 127,395 |
Nebraska Pub. Pwr. Generation Agcy. Rev. Participating VRDN Series Solar 07 20, 0.15% 3/7/12 (Liquidity Facility U.S. Bank NA, Cincinnati) (c)(g) | 19,700 | | 19,700 |
Omaha Pub. Pwr. District Elec. Rev. Series A: | | | |
0.15% 3/5/12, CP | 13,000 | | 13,000 |
0.16% 4/9/12, CP | 15,000 | | 15,000 |
0.16% 4/10/12, CP | 5,000 | | 5,000 |
0.19% 3/6/12, CP | 14,000 | | 14,000 |
0.19% 3/7/12, CP | 14,000 | | 14,000 |
Washington County Indl. Dev. Rev. (Cargill Dow Polymers LLC Proj.) Series 2000, 0.14% 3/7/12 (Cargill, Inc. Guaranteed) (Dow Chemical Co. Guaranteed), LOC Wells Fargo Bank NA, VRDN (c)(f) | 5,400 | | 5,400 |
| | 329,414 |
Nevada - 2.9% |
Clark County Arpt. Rev.: | | | |
Series 2008 C1, 0.15% 3/7/12, LOC JPMorgan Chase Bank, VRDN (c)(f) | 101,750 | | 101,750 |
Series 2008 D 2A, 0.14% 3/7/12, LOC Citibank NA, VRDN (c) | 63,100 | | 63,100 |
Series 2008 D 2B, 0.12% 3/7/12, LOC Royal Bank of Canada, VRDN (c) | 57,800 | | 57,800 |
Series 2008 D1, 0.13% 3/7/12, LOC Citibank NA, VRDN (c) | 31,800 | | 31,800 |
Series 2008 D3, 0.14% 3/7/12, LOC Bank of America NA, VRDN (c) | 53,015 | | 53,015 |
Series 2011 B1, 0.18% 3/7/12, LOC Citibank NA, VRDN (c)(f) | 80,000 | | 80,000 |
Series 2011 B2, 0.14% 3/7/12, LOC Royal Bank of Canada, VRDN (c)(f) | 30,000 | | 30,000 |
Clark County Fuel Tax Participating VRDN: | | | |
Series BA 08 1171, 0.22% 3/7/12 (Liquidity Facility Bank of America NA) (c)(g) | 37,705 | | 37,705 |
Municipal Securities - continued |
| Principal Amount (000s) | | Value (000s) |
Nevada - continued |
Clark County Fuel Tax Participating VRDN: - continued | | | |
Series Putters 3158, 0.16% 3/7/12 (Liquidity Facility JPMorgan Chase Bank) (c)(g) | $ 32,110 | | $ 32,110 |
Clark County Hwy. Impt. Rev. Bonds Series 2011, 4% 7/1/12 | 2,200 | | 2,227 |
Clark County Indl. Dev. Rev. (Southwest Gas Corp. Proj.): | | | |
Series 2003 A, 0.22% 3/7/12, LOC Bank of America NA, VRDN (c)(f) | 45,100 | | 45,100 |
Series 2009 A, 0.13% 3/7/12, LOC JPMorgan Chase Bank, VRDN (c) | 2,000 | | 2,000 |
Clark County McCarran Int'l. Arpt. Passenger Facility Charge Rev. Series 2010 F2, 0.14% 3/7/12, LOC Union Bank of California, VRDN (c) | 48,200 | | 48,200 |
Clark County School District Bonds Series 2003 D, 5.5% 6/15/12 | 8,300 | | 8,425 |
Clark County Wtr. Reclamation District Participating VRDN Series Putters 3355, 0.16% 3/7/12 (Liquidity Facility JPMorgan Chase Bank) (c)(g) | 7,500 | | 7,500 |
Las Vegas Valley Wtr. District Wtr. Impt. Gen. Oblig. Participating VRDN Series Solar 06 93, 0.14% 3/7/12 (Liquidity Facility U.S. Bank NA, Cincinnati) (c)(g) | 14,000 | | 14,000 |
Nevada Dept. of Bus. & Industry: | | | |
(LVE Energy Partners LLC Proj.) 0.17% 3/7/12, LOC Sumitomo Mitsui Banking Corp., VRDN (c)(f) | 37,800 | | 37,800 |
(Republic Svcs., Inc. Proj.) 0.29% 3/7/12, LOC Bank of America NA, VRDN (c)(f) | 2,000 | | 2,000 |
Nevada Hsg. Division (Horizon Apt. Hsg. Proj.) Series 2000 A, 0.16% 3/7/12, LOC Fannie Mae Guaranteed Mtg. pass-thru certificates, VRDN (c)(f) | 7,410 | | 7,410 |
North Las Vegas Gen. Oblig. Participating VRDN Series Solar 06 89, 0.15% 3/7/12 (Liquidity Facility U.S. Bank NA, Cincinnati) (c)(g) | 30,380 | | 30,380 |
Reno Hosp. Rev. (Renown Reg'l. Med. Ctr. Proj.) Series 2008 A, 0.11% 3/7/12, LOC Union Bank of California, VRDN (c) | 20,700 | | 20,700 |
Washoe County School District Gen. Oblig. Bonds Series 2002 B, 5.5% 6/1/12 | 3,595 | | 3,641 |
| | 716,663 |
New Hampshire - 0.6% |
Manchester Arpt. Rev. Series 2008, 0.21% 3/7/12, LOC RBS Citizens NA, VRDN (c)(f) | 16,500 | | 16,500 |
New Hampshire Bus. Fin. Auth. Exempt Facilities Rev. (Waste Mgmt. of New Hampshire, Inc. Proj.) 0.2% 3/7/12, LOC Wells Fargo Bank NA, VRDN (c)(f) | 20,000 | | 20,000 |
Municipal Securities - continued |
| Principal Amount (000s) | | Value (000s) |
New Hampshire - continued |
New Hampshire Bus. Fin. Auth. Ind. Dev. Rev. (Wiggins Airways Proj.) Series 1998, 0.93% 3/7/12, LOC Bank of America NA, VRDN (c)(f) | $ 3,600 | | $ 3,600 |
New Hampshire Bus. Fin. Auth. Poll. Cont. Rev. Bonds (New England Pwr. Co. Proj.): | | | |
Series 1990 A: | | | |
0.45% tender 3/13/12, CP mode (f) | 2,050 | | 2,050 |
0.45% tender 3/13/12, CP mode (f) | 5,900 | | 5,900 |
Series 1990 A1, 0.4% tender 3/22/12, CP mode (f) | 35,500 | | 35,500 |
Series 1990 B, 0.55% tender 3/28/12, CP mode | 19,800 | | 19,800 |
New Hampshire Bus. Fin. Auth. Resource Recovery Rev. (Wheelabrator Concord Co. LP Proj.) Series 1997 A, 0.14% 3/7/12, LOC Wells Fargo Bank NA, VRDN (c) | 13,800 | | 13,800 |
New Hampshire Bus. Fin. Auth. Rev. (Luminescent Sys., Inc. Proj.) Series 1998, 0.4% 3/7/12, LOC HSBC Bank USA, NA, VRDN (c)(f) | 1,650 | | 1,650 |
New Hampshire Gen. Oblig. Bonds: | | | |
Series 2009 B, 4% 3/1/12 | 5,195 | | 5,195 |
Series 2010 B, 5% 6/1/12 | 4,900 | | 4,958 |
New Hampshire Health & Ed. Facilities Auth. Rev. Series 2011 B, 0.18% 3/7/12, LOC Royal Bank of Canada, VRDN (c)(f) | 3,000 | | 3,000 |
New Hampshire Hsg. Fin. Auth. Multi-family Rev. (Pheasant Run Proj.) 0.12% 3/7/12, LOC Fannie Mae Guaranteed Mtg. pass-thru certificates, VRDN (c)(f) | 16,400 | | 16,400 |
| | 148,353 |
New Jersey - 1.0% |
Burlington County Gen. Oblig. BAN Series 2011 A, 1.5% 5/24/12 | 15,654 | | 15,695 |
New Jersey Gen. Oblig. TRAN Series 2012 C, 2% 6/21/12 | 225,700 | | 226,908 |
New Jersey Hsg. & Mtg. Fin. Agcy. Multi-family Rev. Series 2008 F, 0.25% 3/7/12, LOC Bank of America NA, VRDN (c)(f) | 7,600 | | 7,600 |
| | 250,203 |
New Mexico - 0.8% |
New Mexico Edl. Assistance Foundation: | | | |
Series 2003 A2, 0.16% 3/7/12, LOC Royal Bank of Canada, VRDN (c)(f) | 17,600 | | 17,600 |
Series 2004 A1, 0.16% 3/7/12, LOC Royal Bank of Canada, VRDN (c)(f) | 6,435 | | 6,435 |
Series 2004 A2, 0.16% 3/7/12, LOC Royal Bank of Canada, VRDN (c)(f) | 19,910 | | 19,910 |
Municipal Securities - continued |
| Principal Amount (000s) | | Value (000s) |
New Mexico - continued |
New Mexico Edl. Assistance Foundation: - continued | | | |
Series 2004 A3, 0.16% 3/7/12, LOC Royal Bank of Canada, VRDN (c)(f) | $ 19,200 | | $ 19,200 |
New Mexico Muni. Energy Acquisition Auth. Gas Supply Rev. Series 2009, 0.16% 3/7/12 (Liquidity Facility Royal Bank of Canada), VRDN (c) | 138,500 | | 138,500 |
Rio Rancho Wtr. & Wastewtr. Sys. Rev. Participating VRDN Series Solar 2007 19, 0.15% 3/7/12 (Liquidity Facility U.S. Bank NA, Cincinnati) (c)(g) | 4,495 | | 4,495 |
| | 206,140 |
New York - 5.3% |
Amherst Dev. Corp. Student Hsg. Facility Rev. (South Lake Village Proj.) Series 2010 B, 0.12% 3/7/12, LOC HSBC Bank USA, NA, VRDN (c) | 6,000 | | 6,000 |
Barclays Bank PLC Participating VRDN Series BC 11 11B, 0.15% 3/7/12 (Liquidity Facility Barclays Bank PLC) (c)(g) | 6,240 | | 6,240 |
Cold Spring Hbr. Central School District TAN 2% 6/28/12 | 8,200 | | 8,247 |
Commack Union Free School District TAN 1.5% 6/28/12 | 33,000 | | 33,130 |
Huntington Union Free School District TAN 1.5% 6/27/12 | 13,500 | | 13,555 |
New York City Gen. Oblig.: | | | |
Participating VRDN Series Putters 3196, 0.16% 3/7/12 (Liquidity Facility JPMorgan Chase Bank) (c)(g) | 8,425 | | 8,425 |
Series 2004 H6, 0.15% 3/7/12, LOC Bank of America NA, VRDN (c) | 28,505 | | 28,505 |
New York City Hsg. Dev. Corp. Multi-family Hsg. Mtg. Rev.: | | | |
(Beekman Tower Proj.) Series 2008 A, 0.16% 3/7/12, LOC RBS Citizens NA, VRDN (c) | 26,000 | | 26,000 |
(Intervale Gardens Apts.) Series A, 0.18% 3/7/12, LOC Citibank NA, VRDN (c)(f) | 3,115 | | 3,115 |
(Villa Avenue Apts. Proj.) Series 2006 A, 0.1% 3/7/12, LOC Fannie Mae Guaranteed Mtg. pass-thru certificates, VRDN (c)(f) | 5,990 | | 5,990 |
New York City Hsg. Dev. Corp. Multi-family Mtg. Rev.: | | | |
(270 East Burnside Avenue Apts.) Series A, 0.13% 3/7/12, LOC Fannie Mae Guaranteed Mtg. pass-thru certificates, VRDN (c)(f) | 6,400 | | 6,400 |
(Beacon Mews Dev. Proj.) Series 2006 A, 0.18% 3/7/12, LOC Citibank NA, VRDN (c)(f) | 8,000 | | 8,000 |
(Courtland Avenue Apts. Proj.) Series A, 0.13% 3/7/12, LOC Fannie Mae Guaranteed Mtg. pass-thru certificates, VRDN (c)(f) | 4,905 | | 4,905 |
(East 165th Street Proj.) Series A, 0.18% 3/7/12, LOC Citibank NA, VRDN (c)(f) | 7,665 | | 7,665 |
Municipal Securities - continued |
| Principal Amount (000s) | | Value (000s) |
New York - continued |
New York City Hsg. Dev. Corp. Multi-family Mtg. Rev.: - continued | | | |
(Louis Nine Boulevard Apts. Proj.) Series A, 0.13% 3/7/12, LOC Fannie Mae Guaranteed Mtg. pass-thru certificates, VRDN (c)(f) | $ 7,300 | | $ 7,300 |
(Manhattan Court Dev. Proj.) Series A, 0.18% 3/7/12, LOC Citibank NA, VRDN (c)(f) | 16,500 | | 16,500 |
(Morris Ave. Apts. Proj.) Series A, 0.1% 3/7/12, LOC Fannie Mae Guaranteed Mtg. pass-thru certificates, VRDN (c)(f) | 14,700 | | 14,700 |
(State Renaissance Court Proj.) Series A, 0.1% 3/7/12, LOC Freddie Mac, VRDN (c)(f) | 8,700 | | 8,700 |
New York City Hsg. Dev. Corp. Multi-family Rental Hsg. Rev.: | | | |
(155 West 21st Street Dev. Proj.) Series 2007 A, 0.13% 3/7/12, LOC Fannie Mae Guaranteed Mtg. pass-thru certificates, VRDN (c)(f) | 8,400 | | 8,400 |
(One Columbus Place Dev. Proj.) Series A, 0.13% 3/7/12, LOC Fannie Mae Guaranteed Mtg. pass-thru certificates, VRDN (c)(f) | 32,915 | | 32,915 |
(Rivereast Apts. Proj.) Series A, 0.1% 3/7/12, LOC Freddie Mac, VRDN (c)(f) | 4,150 | | 4,150 |
(West 43rd Street Proj.) Series 1999 A, 0.13% 3/7/12, LOC Fannie Mae Guaranteed Mtg. pass-thru certificates, VRDN (c)(f) | 3,300 | | 3,300 |
(West End Towers Proj.) Series 2004 A, 0.13% 3/7/12, LOC Fannie Mae Guaranteed Mtg. pass-thru certificates, VRDN (c)(f) | 16,500 | | 16,500 |
(Westport Dev. Proj.) Series 2004 A, 0.13% 3/7/12, LOC Fannie Mae Guaranteed Mtg. pass-thru certificates, VRDN (c)(f) | 61,000 | | 61,000 |
New York City Hsg. Dev. Corp. Residential Rev. (Montefiore Med. Ctr. Proj.) Series 1993 A, 0.13% 3/7/12, LOC JPMorgan Chase Bank, VRDN (c) | 7,000 | | 7,000 |
New York City Indl. Dev. Agcy. Spl. Facilities Rev. (New York Stock Exchange Proj.) Series 2004 B, 0.22% 3/7/12, LOC Bank of America NA, VRDN (c) | 11,165 | | 11,165 |
New York City Muni. Wtr. Fin. Auth. Wtr. & Swr. Sys. Rev.: | | | |
Participating VRDN: | | | |
Series BBT 08 15, 0.15% 3/7/12 (Liquidity Facility Branch Banking & Trust Co.) (c)(g) | 25,540 | | 25,540 |
Series EGL 06 69 Class A, 0.16% 3/7/12 (Liquidity Facility Citibank NA) (c)(g) | 16,400 | | 16,400 |
Series EGL 07 0157, 0.16% 3/7/12 (Liquidity Facility Citibank NA) (c)(g) | 5,000 | | 5,000 |
Municipal Securities - continued |
| Principal Amount (000s) | | Value (000s) |
New York - continued |
New York City Muni. Wtr. Fin. Auth. Wtr. & Swr. Sys. Rev.: - continued | | | |
Participating VRDN: | | | |
Series EGL 09 46A, 0.16% 3/7/12 (Liquidity Facility Citibank NA) (c)(g) | $ 13,430 | | $ 13,430 |
Series MT 776, 0.22% 3/7/12 (Liquidity Facility Bank of America NA) (c)(g) | 4,895 | | 4,895 |
Series Putters 3496Z, 0.16% 3/7/12 (Liquidity Facility JPMorgan Chase Bank) (c)(g) | 8,000 | | 8,000 |
Series ROC II R 11931, 0.15% 3/7/12 (Liquidity Facility Citibank NA) (c)(g) | 3,750 | | 3,750 |
Series 7, 0.2% 11/26/12, CP | 22,200 | | 22,200 |
Series 8, 0.22% 11/13/12, CP | 26,100 | | 26,100 |
New York City Transitional Fin. Auth. Rev.: | | | |
Bonds: | | | |
Series 2011 A3, 3% 8/1/12 | 2,500 | | 2,529 |
Series E, 4% 11/1/12 | 2,000 | | 2,050 |
Participating VRDN: | | | |
Series EGL 07 0019, 0.16% 3/7/12 (Liquidity Facility Citibank NA) (c)(g) | 8,865 | | 8,865 |
Series ROC II R 11994, 0.16% 3/7/12 (Liquidity Facility Citibank NA) (c)(g) | 2,250 | | 2,250 |
Series 2001 A, 0.13% 3/7/12 (Liquidity Facility JPMorgan Chase Bank), VRDN (c) | 2,000 | | 2,000 |
New York Dorm. Auth. Revs.: | | | |
(City Univ. Proj.) Series 2008 C, 0.2% 3/7/12, LOC Bank of America NA, VRDN (c) | 4,000 | | 4,000 |
(North Shore - Long Island Jewish Obligated Group Proj.): | | | |
Series 2009 C, 0.14% 3/7/12, LOC JPMorgan Chase Bank, VRDN (c) | 9,400 | | 9,400 |
Series 2009 D, 0.15% 3/7/12, LOC Bank of America NA, VRDN (c) | 10,000 | | 10,000 |
Participating VRDN: | | | |
Series EGL 07 0002, 0.16% 3/7/12 (Liquidity Facility Citibank NA) (c)(g) | 18,000 | | 18,000 |
Series EGL 07 0066, 0.16% 3/7/12 (Liquidity Facility Citibank NA) (c)(g) | 31,025 | | 31,025 |
Series ROC II R 11535, 0.16% 3/7/12 (Liquidity Facility Citibank NA) (c)(g) | 3,590 | | 3,590 |
Series ROC II R 11722, 0.16% 3/7/12 (Liquidity Facility Citibank NA) (c)(g) | 2,935 | | 2,935 |
Series ROC II R 11943, 0.16% 3/7/12 (Liquidity Facility Citibank NA) (c)(g) | 3,500 | | 3,500 |
Municipal Securities - continued |
| Principal Amount (000s) | | Value (000s) |
New York - continued |
New York Hsg. Fin. Agcy. Rev.: | | | |
(125 West 31st Street Proj.) Series 2005 A, 0.13% 3/7/12, LOC Fannie Mae Guaranteed Mtg. pass-thru certificates, VRDN (c)(f) | $ 2,000 | | $ 2,000 |
(150 East 44th Street Hsg. Proj.): | | | |
Series 2000 A, 0.13% 3/7/12, LOC Fannie Mae Guaranteed Mtg. pass-thru certificates, VRDN (c)(f) | 28,500 | | 28,500 |
Series 2001 A, 0.13% 3/7/12, LOC Fannie Mae Guaranteed Mtg. pass-thru certificates, VRDN (c)(f) | 2,400 | | 2,400 |
(240 East 39th Street Hsg. Proj.) Series 1997 A, 0.13% 3/7/12, LOC Fannie Mae Guaranteed Mtg. pass-thru certificates, VRDN (c)(f) | 20,000 | | 20,000 |
(250 West 50th Street Hsg. Proj.) Series 1997 A, 0.13% 3/7/12, LOC Fannie Mae Guaranteed Mtg. pass-thru certificates, VRDN (c)(f) | 13,495 | | 13,495 |
(316 Eleventh Ave. Hsg. Proj.) Series 2007 A, 0.13% 3/7/12, LOC Fannie Mae Guaranteed Mtg. pass-thru certificates, VRDN (c)(f) | 8,000 | | 8,000 |
(750 Sixth Avenue Hsg. Proj.) Series 1998 A, 0.13% 3/7/12, LOC Fannie Mae Guaranteed Mtg. pass-thru certificates, VRDN (c)(f) | 5,000 | | 5,000 |
(900 Eighth Avenue Hsg. Proj.) Series 2002 A, 0.12% 3/7/12, LOC Fannie Mae Guaranteed Mtg. pass-thru certificates, VRDN (c)(f) | 59,000 | | 59,000 |
(Avalon Chrystie Place I Hsg. Proj.) Series 2004 B, 0.12% 3/7/12, LOC Freddie Mac, VRDN (c)(f) | 4,100 | | 4,100 |
(Chelsea Apts. Proj.) Series 2003 A, 0.12% 3/7/12, LOC Fannie Mae Guaranteed Mtg. pass-thru certificates, VRDN (c)(f) | 40,500 | | 40,500 |
(Chelsea Arms Hsg. Proj.) Series 1998 A, 0.13% 3/7/12, LOC Fannie Mae Guaranteed Mtg. pass-thru certificates, VRDN (c)(f) | 7,000 | | 7,000 |
(Clinton Green North Hsg. Proj.) Series 2006 A, 0.13% 3/7/12, LOC Freddie Mac, VRDN (c)(f) | 34,000 | | 34,000 |
(Clinton Green South Hsg. Proj.) Series 2006 A, 0.13% 3/7/12, LOC Freddie Mac, VRDN (c)(f) | 16,400 | | 16,400 |
(Helena Hsg. Proj.) Series 2003 A, 0.12% 3/7/12, LOC Fannie Mae Guaranteed Mtg. pass-thru certificates, VRDN (c)(f) | 9,000 | | 9,000 |
(Kew Garden Hills Apts. Hsg. Proj.) Series 2003 A, 0.13% 3/7/12, LOC Fannie Mae Guaranteed Mtg. pass-thru certificates, VRDN (c)(f) | 11,170 | | 11,170 |
(Reverend Polite Ave. Apt. Hsg. Proj.) Series 2005 A, 0.15% 3/7/12, LOC Fannie Mae Guaranteed Mtg. pass-thru certificates, VRDN (c)(f) | 7,435 | | 7,435 |
Municipal Securities - continued |
| Principal Amount (000s) | | Value (000s) |
New York - continued |
New York Hsg. Fin. Agcy. Rev.: - continued | | | |
(Sea Park West Hsg. Proj.) Series 2004 A, 0.15% 3/7/12, LOC Freddie Mac, VRDN (c)(f) | $ 13,200 | | $ 13,200 |
(Tower 31 Hsg. Proj.) Series 2005 A, 0.13% 3/7/12, LOC Freddie Mac, VRDN (c)(f) | 13,400 | | 13,400 |
(Tribeca Park Proj.) Series 1997 A, 0.13% 3/7/12, LOC Fannie Mae Guaranteed Mtg. pass-thru certificates, VRDN (c)(f) | 74,100 | | 74,100 |
(West 20th Street Proj.) Series 2001 A: | | | |
0.12% 3/7/12, LOC Fannie Mae Guaranteed Mtg. pass-thru certificates, VRDN (c)(f) | 24,475 | | 24,475 |
0.12% 3/7/12, LOC Fannie Mae Guaranteed Mtg. pass-thru certificates, VRDN (c)(f) | 48,800 | | 48,800 |
(West 23rd Street Hsg. Proj.): | | | |
Series 2001 A, 0.13% 3/7/12, LOC Fannie Mae Guaranteed Mtg. pass-thru certificates, VRDN (c)(f) | 23,000 | | 23,000 |
Series 2002 A, 0.13% 3/7/12, LOC Fannie Mae Guaranteed Mtg. pass-thru certificates, VRDN (c)(f) | 48,400 | | 48,400 |
(West 33rd Street Hsg. Proj.) Series 2003 A, 0.13% 3/7/12, LOC Fannie Mae Guaranteed Mtg. pass-thru certificates, VRDN (c)(f) | 22,300 | | 22,300 |
(West 38th Street Hsg. Proj.) Series 2002 A, 0.13% 3/7/12, LOC Fannie Mae Guaranteed Mtg. pass-thru certificates, VRDN (c)(f) | 16,000 | | 16,000 |
(Worth Street Hsg. Proj.) Series 2002 A, 0.13% 3/7/12, LOC Fannie Mae Guaranteed Mtg. pass-thru certificates, VRDN (c)(f) | 1,100 | | 1,100 |
Series 2011 A2, 0.12% 3/7/12, LOC Wells Fargo Bank NA, VRDN (c) | 13,400 | | 13,400 |
New York Hsg. Fin. Svc. Contract Rev. Series 2003 L, 0.14% 3/7/12, LOC Bank of America NA, VRDN (c) | 10,000 | | 10,000 |
New York Local Govt. Assistance Corp. Series 2008 BAV, 0.13% 3/7/12 (Liquidity Facility JPMorgan Chase Bank), VRDN (c) | 4,300 | | 4,300 |
New York Metropolitan Trans. Auth. Rev. Series 2C, 0.16% 4/4/12, LOC Royal Bank of Canada, CP | 15,800 | | 15,800 |
New York Pwr. Auth. Series 1, 0.17% 4/13/12, CP | 4,100 | | 4,100 |
New York State Energy Research & Dev. Auth. Facilities Rev. (Consolidated Edison Co. of New York, Inc. Proj.) Series 2004 C1, 0.14% 3/7/12, LOC Mizuho Corporate Bank Ltd., VRDN (c)(f) | 16,800 | | 16,800 |
New York Thruway Auth. Second Gen. Hwy. & Bridge Trust Fund Participating VRDN Series ROC II R 11997, 0.16% 3/7/12 (Liquidity Facility Citibank NA) (c)(g) | 4,800 | | 4,800 |
Municipal Securities - continued |
| Principal Amount (000s) | | Value (000s) |
New York - continued |
South Huntington Union Free School District TAN 1.5% 6/28/12 | $ 12,500 | | $ 12,550 |
Syosset Central School District TAN 1.5% 6/22/12 | 12,500 | | 12,548 |
Triborough Bridge & Tunnel Auth. Revs. Series 2002 F, 0.14% 3/7/12 (Liquidity Facility Royal Bank of Scotland NV), VRDN (c) | 59,725 | | 59,725 |
| | 1,290,064 |
New York & New Jersey - 0.6% |
Port Auth. of New York & New Jersey Participating VRDN Series EGL 06 107 Class A, 0.21% 3/7/12 (Liquidity Facility Citibank NA) (c)(f)(g) | 151,450 | | 151,450 |
Non State Specific - 0.1% |
RBC Muni. Products, Inc. Trust Participating VRDN Series RBC E 23, 0.16% 3/7/12 (Liquidity Facility Royal Bank of Canada) (c)(g) | 20,500 | | 20,500 |
North Carolina - 1.7% |
St Tpk. Auth. Monroe Con Bonds Series 2011, 1.5% 7/1/12 | 22,140 | | 22,235 |
Board of Governors of the Univ. of North Carolina Series D: | | | |
0.09% 4/5/12, CP | 10,000 | | 10,000 |
0.13% 3/6/12, CP | 10,000 | | 10,000 |
0.13% 3/6/12, CP | 11,140 | | 11,140 |
0.13% 3/19/12, CP | 10,000 | | 10,000 |
0.13% 3/26/12, CP | 23,000 | | 23,000 |
Charlotte Ctfs. of Prtn.: | | | |
Bonds Series 2012 A, 3% 12/1/12 | 3,610 | | 3,685 |
Participating VRDN Series Putters 4724, 0.22% 3/7/12 (Liquidity Facility Bank of America NA) (c)(g) | 11,680 | | 11,680 |
Charlotte Int'l. Arpt. Rev.: | | | |
(Charlotte Douglas Int'l. Arpt. Proj.) Series 2008 D, 0.22% 3/7/12, LOC Bank of America NA, VRDN (c) | 29,670 | | 29,670 |
Series 2010 C, 0.14% 3/7/12, LOC Wells Fargo Bank NA, VRDN (c) | 6,765 | | 6,765 |
Gaston County Indl. Facilities & Poll. Cont. Fing. Auth. Rev. (Duke Energy Corp. Proj.) Series 1999, 0.2% 3/1/12, VRDN (c)(f) | 4,000 | | 4,000 |
Greensboro Combined Enterprise Sys. Rev. Series 2009 B, 0.2% 3/7/12 (Liquidity Facility Bank of America NA), VRDN (c) | 10,000 | | 10,000 |
Mecklenburg County Gen. Oblig. Bonds Series 2004 C, 5% 3/1/12 | 1,500 | | 1,500 |
North Carolina Cap. Facilities Fin. Agcy. Edl. Facilities Rev.: | | | |
(Greensboro College Proj.) 0.21% 3/7/12, LOC Bank of America NA, VRDN (c) | 2,500 | | 2,500 |
Municipal Securities - continued |
| Principal Amount (000s) | | Value (000s) |
North Carolina - continued |
North Carolina Cap. Facilities Fin. Agcy. Edl. Facilities Rev.: - continued | | | |
Series 2011, 0.2% 3/7/12, LOC Bank of America NA, VRDN (c) | $ 19,200 | | $ 19,200 |
North Carolina Cap. Facilities Fin. Agcy. Rev.: | | | |
(Elon Univ. Proj.) Series 2006, 0.22% 3/7/12, LOC Bank of America NA, VRDN (c) | 8,480 | | 8,480 |
Participating VRDN: | | | |
Series GS 08 9TP, 0.14% 3/7/12 (Liquidity Facility Wells Fargo & Co.) (c)(g) | 23,175 | | 23,175 |
Series ROC II R 11850, 0.16% 3/7/12 (Liquidity Facility Citibank NA) (c)(g) | 12,600 | | 12,600 |
Series 2011, 0.2% 3/7/12, LOC Bank of America NA, VRDN (c) | 40,340 | | 40,340 |
North Carolina Cap. Impt. Ltd. Participating VRDN Series WF 11 136C, 0.17% 3/7/12 (Liquidity Facility Wells Fargo Bank NA) (c)(g) | 5,515 | | 5,515 |
North Carolina Edl. Facilities Fin. Agcy. Rev. (Queens College Proj.) Series 1999 B, 0.15% 3/7/12, LOC Bank of America NA, VRDN (c) | 2,000 | | 2,000 |
North Carolina Gen. Oblig. Bonds: | | | |
Series 2004, 5% 5/1/12 | 2,200 | | 2,218 |
Series 2005 B, 5% 4/1/12 | 4,500 | | 4,519 |
Series A, 5.5% 3/1/13 | 11,200 | | 11,788 |
North Carolina Infrastructure Fin. Corp. Ctfs. of Prtn. Participating VRDN Series BA 08 1073, 0.26% 3/7/12 (Liquidity Facility Bank of America NA) (c)(g) | 9,760 | | 9,760 |
North Carolina Med. Care Cmnty. Health Participating VRDN Series BA 08 3509, 0.26% 3/7/12 (Liquidity Facility Bank of America NA) (c)(g) | 4,000 | | 4,000 |
North Carolina Med. Care Commission Health Care Facilities Rev.: | | | |
(Wake Forest Univ. Proj.) Series 2008 C, 0.21% 3/7/12, LOC Bank of America NA, VRDN (c) | 9,580 | | 9,580 |
Participating VRDN: | | | |
Series BC 10 31W, 0.18% 3/7/12 (Liquidity Facility Barclays Bank PLC) (c)(g) | 3,625 | | 3,625 |
Series ROC II R 11808, 0.16% 3/7/12 (Liquidity Facility Citibank NA) (c)(g) | 1,365 | | 1,365 |
North Carolina Muni. Pwr. Agcy. #1 Catawba Elec. Rev. Bonds Series 2008 A, 5.25% 1/1/13 | 3,930 | | 4,092 |
North Carolina State Univ. at Raleigh Rev. Participating VRDN Series MT 792, 0.22% 3/7/12 (Liquidity Facility Bank of America NA) (c)(g) | 15,295 | | 15,295 |
Municipal Securities - continued |
| Principal Amount (000s) | | Value (000s) |
North Carolina - continued |
Piedmont Triad Arpt. Auth. Series 2008 B, 0.15% 3/7/12, LOC Branch Banking & Trust Co., VRDN (c)(f) | $ 25,165 | | $ 25,165 |
Raleigh Combined Enterprise Sys. Rev. Participating VRDN: | | | |
Series EGL 07 0010, 0.16% 3/7/12 (Liquidity Facility Citibank NA) (c)(g) | 4,950 | | 4,950 |
Series WF 11-19C, 0.17% 3/7/12 (Liquidity Facility Wells Fargo Bank NA) (c)(g) | 9,000 | | 9,000 |
Sampson County Indl. Facilities & Poll. Cont. Fing. Auth. Envir. Facilities Rev. (Sampson County Disp., Inc. Proj.): | | | |
0.27% 3/7/12, LOC Bank of America NA, VRDN (c)(f) | 10,855 | | 10,855 |
0.27% 3/7/12, LOC Bank of America NA, VRDN (c)(f) | 4,750 | | 4,750 |
Union County Indl. Facilities & Poll. Cont. Fing. Auth. Indl. Dev. Rev. (Greiner Vacuette NA Proj.) 0.3% 3/7/12, LOC Wells Fargo Bank NA, VRDN (c)(f) | 2,300 | | 2,300 |
Univ. of North Carolina at Chapel Hill Rev. Participating VRDN Series EGL 05 3014 Class A, 0.16% 3/7/12 (Liquidity Facility Citibank NA) (c)(g) | 21,000 | | 21,000 |
Wake County Gen. Oblig. Bonds: | | | |
Series 2007, 5% 3/1/12 | 4,775 | | 4,775 |
Series 2009 A, 5% 3/1/12 | 4,500 | | 4,500 |
| | 421,022 |
North Dakota - 0.2% |
Cass County Solid Waste Disp. Rev. (Tharaldson Ethanol Plant I, LLC Proj.) Series 2007, 0.28% 3/7/12, LOC Bank of America NA, VRDN (c)(f) | 55,000 | | 55,000 |
Hebron Indl. Dev. Rev. (Dacco, Inc. Proj.) 0.25% 3/7/12, LOC U.S. Bank NA, Cincinnati, VRDN (c)(f) | 2,255 | | 2,255 |
| | 57,255 |
Ohio - 2.3% |
Akron Bath Copley Hosp. District Rev. (Akron Gen. Health Systems Proj.) Series 2008, 0.11% 3/7/12, LOC JPMorgan Chase Bank, VRDN (c) | 6,500 | | 6,500 |
Allen County Hosp. Facilities Rev. (Catholic Healthcare Partners Proj.) Series 2010 D, 0.13% 3/7/12, LOC JPMorgan Chase Bank, VRDN (c) | 1,300 | | 1,300 |
Cleveland Arpt. Sys. Rev. Series 2009 A, 0.14% 3/7/12, LOC Bank of New York, New York, VRDN (c)(f) | 13,670 | | 13,670 |
Cleveland Wtrwks. Rev. Series 2008 Q, 0.21% 3/7/12, LOC Bank of America NA, VRDN (c) | 29,000 | | 29,000 |
Columbus Gen. Oblig. Participating VRDN Series Clipper 08 2, 0.16% 3/7/12 (Liquidity Facility State Street Bank & Trust Co., Boston) (c)(g) | 7,985 | | 7,985 |
Municipal Securities - continued |
| Principal Amount (000s) | | Value (000s) |
Ohio - continued |
Cuyahoga County Cultural Facilities Rev. (Maltz Museum of Jewish Heritage Proj.) 0.19% 3/7/12, LOC Bank of New York, New York, VRDN (c) | $ 6,300 | | $ 6,300 |
Franklin County Health Care Facilities Rev. (Mother Angeline McCrory Manor, Inc. Proj.) Series 2011, 0.16% 3/7/12, LOC JPMorgan Chase Bank, VRDN (c) | 15,265 | | 15,265 |
Hamilton County Hosp. Facilities Rev. (Children's Hosp. Med. Ctr. Proj.): | | | |
Series 1997 A, 0.17% 3/7/12, LOC PNC Bank NA, VRDN (c) | 16,200 | | 16,200 |
Series 2000, 0.17% 3/7/12, LOC JPMorgan Chase Bank, VRDN (c) | 28,700 | | 28,700 |
Hamilton County Student Hsg. Rev. (Block 3 Proj.) Series 2004, 0.14% 3/7/12, LOC Bank of New York, New York, VRDN (c) | 27,700 | | 27,700 |
Lake County Hosp. Facilities Rev. (Lake Hosp. Sys., Inc. Proj.): | | | |
Series 2008 A, 0.13% 3/7/12, LOC JPMorgan Chase Bank, VRDN (c) | 17,300 | | 17,300 |
Series 2008 B, 0.13% 3/7/12, LOC JPMorgan Chase Bank, VRDN (c) | 33,100 | | 33,100 |
Lancaster Port Auth. Gas Rev. 0.16% 3/7/12 (Liquidity Facility Royal Bank of Canada), VRDN (c) | 71,620 | | 71,620 |
Lucas County Hosp. Rev. Participating VRDN Series BC 11 31B, 0.15% 3/7/12 (Liquidity Facility Barclays Bank PLC) (c)(g) | 8,475 | | 8,475 |
Ohio Air Quality Dev. Auth. Rev.: | | | |
(Dayton Pwr. & Lt. Co. Proj.) Series 2008 A, 0.14% 3/7/12, LOC JPMorgan Chase Bank, VRDN (c)(f) | 7,600 | | 7,600 |
(FirstEnergy Corp. Proj.) Series 2006 B, 0.14% 3/7/12, LOC Wells Fargo Bank NA, VRDN (c) | 3,300 | | 3,300 |
Ohio Higher Edl. Facility Commission Rev.: | | | |
(Case Western Reserve Univ. Proj.) Series 2008 A, 0.12% 3/7/12, LOC PNC Bank NA, VRDN (c) | 5,100 | | 5,100 |
(Ohio Northern Univ. Proj.) Series 2008 A, 0.15% 3/7/12, LOC JPMorgan Chase Bank, VRDN (c) | 17,120 | | 17,120 |
Bonds: | | | |
(The Cleveland Clinic Foundation Proj.): | | | |
Series 2008 B5: | | | |
0.18% tender 3/29/12, CP mode | 7,200 | | 7,200 |
0.27% tender 5/24/12, CP mode | 12,400 | | 12,400 |
0.28% tender 5/4/12, CP mode | 18,650 | | 18,650 |
0.28% tender 6/14/12, CP mode | 10,000 | | 10,000 |
Series 2008 B6, 0.18% tender 3/29/12, CP mode | 8,600 | | 8,600 |
Series 2008 B6, 0.28% tender 6/14/12, CP mode | 8,800 | | 8,800 |
Municipal Securities - continued |
| Principal Amount (000s) | | Value (000s) |
Ohio - continued |
Ohio Hosp. Facilities Rev. Participating VRDN Series Putters 3552, 0.16% 3/7/12 (Liquidity Facility JPMorgan Chase Bank) (c)(g) | $ 3,500 | | $ 3,500 |
Ohio Hsg. Fin. Agcy. Mtg. Rev.: | | | |
(Mtg.-Backed Securities Prog.): | | | |
Series 2005 B2, 0.12% 3/7/12 (Liquidity Facility Fed. Home Ln. Bank, Cincinnati), VRDN (c)(f) | 7,000 | | 7,000 |
Series 2005 F, 0.12% 3/7/12 (Liquidity Facility Fed. Home Ln. Bank, Cincinnati), VRDN (c)(f) | 29,200 | | 29,200 |
Series B, 0.14% 3/7/12 (Liquidity Facility Fed. Home Ln. Bank, Cincinnati), VRDN (c)(f) | 19,990 | | 19,990 |
Participating VRDN Series Putters 1334, 0.24% 3/7/12 (Liquidity Facility JPMorgan Chase & Co.) (c)(f)(g) | 5,400 | | 5,400 |
Ohio Hsg. Fin. Agcy. Residential Mtg. Rev.: | | | |
Series 2006 I, 0.18% 3/7/12 (Liquidity Facility Citibank NA), VRDN (c)(f) | 24,800 | | 24,800 |
Series 2008 B, 0.14% 3/7/12 (Liquidity Facility Fed. Home Ln. Bank, Cincinnati), VRDN (c)(f) | 46,000 | | 46,000 |
Ohio Wtr. Dev. Auth. (Waste Mgmt., Inc. Proj.) Series B, 0.22% 3/7/12, LOC Bank of America NA, VRDN (c)(f) | 8,100 | | 8,100 |
Portage County Hosp. Rev. (Robinson Memorial Hosp. Proj.) Series 2008, 0.17% 3/7/12, LOC JPMorgan Chase Bank, VRDN (c) | 21,200 | | 21,200 |
Westlake Health Facilities Rev. (Lutheran Home Proj.) Series 2005, 0.32% 3/7/12, LOC RBS Citizens NA, VRDN (c) | 7,500 | | 7,500 |
| | 554,575 |
Oklahoma - 0.3% |
Oklahoma City Wtr. Utils. Trust Wtr. and Swr. Rev. Series A, 0.13% 4/5/12, LOC State Street Bank & Trust Co., Boston, CP | 8,205 | | 8,205 |
Oklahoma Dev. Fin. Auth. Rev.: | | | |
(ConocoPhillips Co. Proj.): | | | |
Series 2002 B, 0.15% 3/7/12, VRDN (c)(f) | 5,000 | | 5,000 |
Series 2002, 0.15% 3/7/12, VRDN (c)(f) | 20,000 | | 20,000 |
Series 2003, 0.15% 3/7/12, VRDN (c)(f) | 26,000 | | 26,000 |
(Shawnee Fdg. LP Proj.) Series 1996, 0.2% 3/7/12, LOC Bank of Nova Scotia New York Branch, VRDN (c)(f) | 4,700 | | 4,700 |
Univ. Hospitals Trust Rev. Series 2005 A, 0.23% 3/7/12, LOC Bank of America NA, VRDN (c) | 20,015 | | 20,015 |
| | 83,920 |
Municipal Securities - continued |
| Principal Amount (000s) | | Value (000s) |
Oregon - 1.1% |
Clackamas County Hosp. Facility Auth.: | | | |
(Legacy Health Sys. Proj.): | | | |
Series 2008 A, 0.1% 3/7/12, LOC U.S. Bank NA, Cincinnati, VRDN (c) | $ 5,000 | | $ 5,000 |
Series 2008 B, 0.11% 3/7/12, LOC U.S. Bank NA, Cincinnati, VRDN (c) | 3,000 | | 3,000 |
Series 2008 C, 0.11% 3/7/12, LOC U.S. Bank NA, Cincinnati, VRDN (c) | 3,000 | | 3,000 |
Bonds (Providence Health Sys. Proj.): | | | |
Series 2003 D, 0.16% tender 7/12/12, CP mode | 20,500 | | 20,500 |
Series 2003 E: | | | |
0.1% tender 4/4/12, CP mode | 8,000 | | 8,000 |
0.16% tender 4/16/12, CP mode | 8,000 | | 8,000 |
0.16% tender 7/12/12, CP mode | 6,000 | | 6,000 |
0.17% tender 3/6/12, CP mode | 10,000 | | 10,000 |
Series 2003 G: | | | |
0.16% tender 4/16/12, CP mode | 21,525 | | 21,525 |
0.17% tender 3/6/12, CP mode | 14,400 | | 14,400 |
Series F, 0.16% tender 5/8/12, CP mode | 10,000 | | 10,000 |
Oregon Econ. & Cmnty. Econ. Dev. Rev. (American Bridge Co. Proj.) Series 205, 0.21% 3/7/12, LOC PNC Bank NA, VRDN (c)(f) | 1,520 | | 1,520 |
Oregon Gen. Oblig.: | | | |
Bonds Series 2011 J, 2% 5/1/12 | 3,000 | | 3,009 |
Participating VRDN: | | | |
Series ROC II R 11949, 0.16% 3/7/12 (Liquidity Facility Citibank NA) (c)(g) | 3,615 | | 3,615 |
Series WF11 57 C, 0.17% 3/7/12 (Liquidity Facility Wells Fargo Bank NA) (c)(g) | 10,800 | | 10,800 |
Oregon Health and Science Univ. Spl. Rev.: | | | |
Series 2009 B1, 0.14% 3/7/12, LOC U.S. Bank NA, Cincinnati, VRDN (c) | 5,665 | | 5,665 |
Series 2009 B2, 0.15% 3/7/12, LOC U.S. Bank NA, Cincinnati, VRDN (c) | 4,760 | | 4,760 |
Oregon State Dept. of Administrative Svcs. Lottery Rev. Participating VRDN Series BC 11 5W, 0.18% 3/7/12 (Liquidity Facility Barclays Bank PLC) (c)(g) | 6,555 | | 6,555 |
Port of Portland Arpt. Rev.: | | | |
Series 2009 A1, 0.2% 3/7/12, LOC Bank of America NA, VRDN (c) | 22,500 | | 22,500 |
Series Eighteen B, 0.12% 3/7/12, LOC Wells Fargo Bank NA, VRDN (c)(f) | 33,080 | | 33,080 |
Municipal Securities - continued |
| Principal Amount (000s) | | Value (000s) |
Oregon - continued |
Portland Econ. Dev. Rev. (Columbia Aluminum Recycling Proj.) Series 1991 A, 0.17% 3/7/12, LOC U.S. Bank NA, Cincinnati, VRDN (c)(f) | $ 1,900 | | $ 1,900 |
Portland Hsg. Auth. Rev.: | | | |
(New Columbia - Cecelia Proj.) Series 2004, 0.21% 3/7/12, LOC Bank of America NA, VRDN (c)(f) | 3,685 | | 3,685 |
(New Columbia - Trouton Proj.) Series 2005, 0.21% 3/7/12, LOC Bank of America NA, VRDN (c)(f) | 5,955 | | 5,955 |
Portland Multi-family Hsg. Rev. (The Village at Lovejoy Fountain Proj.) Series 2009, 0.25% 3/7/12, LOC Freddie Mac, VRDN (c)(f) | 15,000 | | 15,000 |
Salem Hosp. Facility Auth. Rev. (Salem Hosp. Proj.): | | | |
Series 2008 B, 0.13% 3/7/12, LOC U.S. Bank NA, Cincinnati, VRDN (c) | 6,000 | | 6,000 |
Series 2008 C, 0.19% 3/7/12, LOC Bank of America NA, VRDN (c) | 25,000 | | 25,000 |
Salem-Keizer School District #24J Bonds Series WF 09 4Z, 0.2%, tender 7/25/12 (Liquidity Facility Wells Fargo & Co.) (c)(g)(h) | 16,145 | | 16,145 |
| | 274,614 |
Pennsylvania - 1.9% |
Allegheny County Hosp. Dev. Auth. Rev. (Children's Institute Pittsburgh Proj.): | | | |
Series 2005 A, 0.16% 3/7/12, LOC PNC Bank NA, VRDN (c) | 9,600 | | 9,600 |
Series 2005 B, 0.16% 3/7/12, LOC PNC Bank NA, VRDN (c) | 7,905 | | 7,905 |
Bucks County Indl. Dev. Auth. Hosp. Rev. (Grand View Hosp. Proj.) Series 2008 A, 0.14% 3/7/12, LOC PNC Bank NA, VRDN (c) | 22,215 | | 22,215 |
Butler Co. Gen. Auth. Rev. (Erie School District Proj.) Series 2011, 0.16% 3/7/12, LOC PNC Bank NA, VRDN (c) | 5,835 | | 5,835 |
Chester County Health & Ed. Auth. Rev. (Jenner's Pond Proj.) Series 2006, 0.15% 3/7/12, LOC Citizens Bank of Pennsylvania, VRDN (c) | 22,725 | | 22,725 |
Chester County Indl. Dev. Auth. Student Hsg. Rev. (West Chester Univ. Proj.): | | | |
Series 2008 A1, 0.16% 3/7/12, LOC Citizens Bank of Pennsylvania, VRDN (c) | 12,700 | | 12,700 |
Series 2008 A2, 0.16% 3/7/12, LOC TD Banknorth, NA, VRDN (c) | 19,170 | | 19,170 |
Erie County Hosp. Auth. Rev. (Saint Vincent Health Ctr. Proj.) Series 2010 B, 0.16% 3/7/12, LOC Manufacturers & Traders Trust Co., VRDN (c) | 11,340 | | 11,340 |
Municipal Securities - continued |
| Principal Amount (000s) | | Value (000s) |
Pennsylvania - continued |
Geisinger Auth. Health Sys. Rev. Participating VRDN: | | | |
Series Putters 3462, 0.16% 3/7/12 (Liquidity Facility JPMorgan Chase Bank) (c)(g) | $ 11,245 | | $ 11,245 |
Series Putters 3490Z, 0.16% 3/7/12 (Liquidity Facility JPMorgan Chase Bank) (c)(g) | 4,995 | | 4,995 |
Lancaster Indl. Dev. Auth. Rev. Series 2009 A, 0.14% 3/7/12, LOC PNC Bank NA, VRDN (c) | 9,675 | | 9,675 |
Lawrence County Gen. Oblig. Indl. Dev. Auth. 0.16% 3/7/12, LOC PNC Bank NA, VRDN (c) | 8,455 | | 8,455 |
Lehigh County Gen. Purp. Auth. (Muhlenberg College Proj.) Series 2008, 0.2% 3/7/12, LOC Bank of America NA, VRDN (c) | 6,900 | | 6,900 |
Lower Merion School District Series 2009 B, 0.16% 3/7/12, LOC U.S. Bank NA, Cincinnati, VRDN (c) | 3,900 | | 3,900 |
Montgomery County Indl. Dev. Auth. Rev. (Foulkeways at Gwynedd Proj.) Series 2006 B, 0.15% 3/7/12, LOC Citizens Bank of Pennsylvania, VRDN (c) | 12,705 | | 12,705 |
Pennsylvania Econ. Dev. Fing. Auth. Indl. Dev. Rev.: | | | |
Series 1996 D5, 0.19% 3/7/12, LOC PNC Bank NA, VRDN (c)(f) | 900 | | 900 |
Series 1997 B4, 0.27% 3/7/12, LOC PNC Bank NA, VRDN (c)(f) | 200 | | 200 |
Pennsylvania Econ. Dev. Fing. Auth. Manufacturing Facility Rev. (Dodge Realty Partners Proj.) Series 2007, 0.19% 3/7/12, LOC Citibank NA, VRDN (c)(f) | 2,500 | | 2,500 |
Pennsylvania Gen. Oblig.: | | | |
Bonds Series 2010 A, 5% 5/1/12 | 3,100 | | 3,125 |
Participating VRDN: | | | |
Series Putters 3350, 0.16% 3/7/12 (Liquidity Facility JPMorgan Chase Bank) (c)(g) | 4,505 | | 4,505 |
Series Putters 3352Z, 0.16% 3/7/12 (Liquidity Facility JPMorgan Chase Bank) (c)(g) | 3,775 | | 3,775 |
Series WF 11 121C, 0.17% 3/7/12 (Liquidity Facility Wells Fargo Bank NA) (c)(g) | 12,930 | | 12,930 |
Pennsylvania Hsg. Fin. Agcy. Single Family Mtg. Rev.: | | | |
Series 2004 85C, 0.12% 3/7/12 (Liquidity Facility Fannie Mae Guaranteed Mtg. pass-thru certificates) (Liquidity Facility Freddie Mac), VRDN (c)(f) | 19,645 | | 19,645 |
Series 2005 90C, 0.12% 3/7/12 (Liquidity Facility Fannie Mae Guaranteed Mtg. pass-thru certificates) (Liquidity Facility Freddie Mac), VRDN (c)(f) | 29,525 | | 29,525 |
Series 2005 97C, 0.13% 3/7/12 (Liquidity Facility Fannie Mae Guaranteed Mtg. pass-thru certificates) (Liquidity Facility Freddie Mac), VRDN (c)(f) | 1,750 | | 1,750 |
Municipal Securities - continued |
| Principal Amount (000s) | | Value (000s) |
Pennsylvania - continued |
Pennsylvania Hsg. Fin. Agcy. Single Family Mtg. Rev.: - continued | | | |
Series 2005-87 C, 0.13% 3/7/12 (Liquidity Facility Fannie Mae Guaranteed Mtg. pass-thru certificates) (Liquidity Facility Freddie Mac), VRDN (c)(f) | $ 18,540 | | $ 18,540 |
Pennsylvania State Pub. School Participating VRDN Series Solar 06 161, 0.14% 3/7/12 (Liquidity Facility U.S. Bank NA, Cincinnati) (c)(g) | 26,430 | | 26,430 |
Pennsylvania Tpk. Commission Tpk. Rev.: | | | |
Bonds Series 2011 B, 0.18% 4/1/12 (c) | 15,475 | | 15,475 |
Series 2008 C, 0.16% 3/7/12, LOC Barclays Bank PLC, VRDN (c) | 13,600 | | 13,600 |
Philadelphia Arpt. Rev.: | | | |
Series 2005 C1, 0.12% 3/7/12, LOC TD Banknorth, NA, VRDN (c)(f) | 11,100 | | 11,100 |
Series 2005 C2, 0.12% 3/7/12, LOC Royal Bank of Canada, VRDN (c)(f) | 20,000 | | 20,000 |
Philadelphia Auth. for Indl. Dev. Rev. (William Penn Charter School Proj.) Series 2008, 0.16% 3/7/12, LOC PNC Bank NA, VRDN (c) | 3,400 | | 3,400 |
Philadelphia Auth. Indl. Dev. Lease Rev. Series 2007 B3, 0.14% 3/7/12, LOC PNC Bank NA, VRDN (c) | 6,650 | | 6,650 |
Philadelphia Gas Works Rev. (1998 Gen. Ordinance Proj.): | | | |
Eighth Series E, 0.14% 3/7/12, LOC PNC Bank NA, VRDN (c) | 10,000 | | 10,000 |
Fifth Series A2, 0.13% 3/7/12, LOC Bank of Nova Scotia New York Branch, LOC JPMorgan Chase Bank, VRDN (c) | 3,200 | | 3,200 |
Philadelphia Wtr. & Wastewtr. Rev. Series 2005 B, 0.18% 3/7/12, LOC Bank of America NA, VRDN (c) | 40,070 | | 40,070 |
Schuylkill County Indl. Dev. Auth. Resource Recovery Rev. (Integrys Energy Group, Inc. Proj.) 0.15% 3/7/12, LOC JPMorgan Chase Bank, VRDN (c) | 2,400 | | 2,400 |
Univ. of Pittsburgh Commonwealth Sys. of Higher Ed. BAN Series 2011, 2% 6/18/12 | 27,400 | | 27,537 |
Washington County Hosp. Auth. Rev.: | | | |
(Monongahela Valley Hosp. Proj.): | | | |
Series 2011 A, 0.14% 3/7/12, LOC PNC Bank NA, VRDN (c) | 2,540 | | 2,540 |
Series 2011 B, 0.14% 3/7/12, LOC PNC Bank NA, VRDN (c) | 6,785 | | 6,785 |
(Washington Hosp. Proj.) Series 2007 B, 0.16% 3/7/12, LOC Wells Fargo Bank NA, VRDN (c) | 4,750 | | 4,750 |
| | 460,697 |
Municipal Securities - continued |
| Principal Amount (000s) | | Value (000s) |
Rhode Island - 0.7% |
Narragansett Bay Commission Wastewtr. Sys. Rev. Series 2008 A, 0.15% 3/7/12, LOC U.S. Bank NA, Cincinnati, VRDN (c) | $ 35,000 | | $ 35,000 |
Rhode Island & Providence Plantations TAN Series 2012, 2% 6/29/12 | 29,000 | | 29,161 |
Rhode Island Health and Edl. Bldg. Corp. Higher Ed. Facility Rev.: | | | |
(Rhode Island School of Design Proj.) Series 2008 A, 0.25% 3/7/12, LOC Bank of America NA, VRDN (c) | 25,925 | | 25,925 |
(Roger Williams Univ. Proj.) Series 2008 B, 0.24% 3/7/12, LOC Bank of America NA, VRDN (c) | 17,700 | | 17,700 |
Rhode Island Indl. Facilities Corp. Indl. Dev. Rev. (NFA Corp. Proj.) Series 1994, 0.93% 3/7/12, LOC Bank of America NA, VRDN (c)(f) | 5,000 | | 5,000 |
Rhode Island Student Ln. Auth. Student Ln. Rev.: | | | |
Series 2008 B1, 0.14% 3/7/12, LOC State Street Bank & Trust Co., Boston, VRDN (c)(f) | 10,000 | | 10,000 |
Series 2008 B2, 0.14% 3/7/12, LOC State Street Bank & Trust Co., Boston, VRDN (c)(f) | 20,000 | | 20,000 |
Series 2008 B3, 0.14% 3/7/12, LOC State Street Bank & Trust Co., Boston, VRDN (c)(f) | 18,000 | | 18,000 |
Series 2008 B4, 0.14% 3/7/12, LOC State Street Bank & Trust Co., Boston, VRDN (c)(f) | 7,000 | | 7,000 |
| | 167,786 |
South Carolina - 1.4% |
Anderson County School District #5 Gen. Oblig. Participating VRDN Series BA 08 1181, 0.22% 3/7/12 (Liquidity Facility Bank of America NA) (c)(g) | 14,650 | | 14,650 |
Darlington County Indl. Dev. Rev. (Nucor Corp. Proj.) Series 2003 A, 0.24% 3/7/12, VRDN (c)(f) | 8,100 | | 8,100 |
Florence City School District BAN Series 2011, 1.5% 7/12/12 | 19,000 | | 19,084 |
Florence County Hosp. Rev. (McLeod Reg'l. Med. Ctr. Proj.) Series 2010 B, 0.15% 3/7/12, LOC Wells Fargo Bank NA, VRDN (c) | 11,465 | | 11,465 |
Greenville County School District Bonds Series 2011, 1.5% 6/1/12 | 50,600 | | 50,761 |
Horry County School District Participating VRDN Series ROC II R 754 PB, 0.39% 3/7/12 (Liquidity Facility Deutsche Postbank AG) (c)(g) | 11,075 | | 11,075 |
Lexington County and Richland County School District #5 Bonds Series 2011, 1% 3/1/12 | 17,500 | | 17,500 |
Lexington County School District #1 Bonds Series 2011 B, 1% 3/1/12 | 6,600 | | 6,600 |
Municipal Securities - continued |
| Principal Amount (000s) | | Value (000s) |
South Carolina - continued |
Oconee County Poll. Cont. Rev. (Duke Energy Corp. Proj.) Series 1999 A, 0.18% 3/1/12, VRDN (c) | $ 16,400 | | $ 16,400 |
Richland County School District #1 Bonds Series 2011 B, 4% 3/1/12 | 5,000 | | 5,000 |
South Carolina Gen. Oblig. Participating VRDN Series ROC II R 692W, 0.15% 3/7/12 (Liquidity Facility Wells Fargo & Co.) (c)(g) | 8,255 | | 8,255 |
South Carolina Jobs-Econ. Dev. Auth. (AnMed Health Proj.) Series 2009 D, 0.13% 3/7/12, LOC Branch Banking & Trust Co., VRDN (c) | 3,355 | | 3,355 |
South Carolina Jobs-Econ. Dev. Auth. Econ. Dev. Rev.: | | | |
(Bon Secours Health Sys. Proj.): | | | |
Series 2008 D, 0.13% 3/7/12, LOC Citibank NA, VRDN (c) | 8,200 | | 8,200 |
0.14% 3/7/12, LOC JPMorgan Chase Bank, VRDN (c) | 34,925 | | 34,925 |
(Carolina Piedmont Foundation Proj.) 0.31% 3/7/12, LOC Bank of America NA, VRDN (c) | 5,175 | | 5,175 |
(Giant Cement Holding, Inc. Proj.) 0.2% 3/7/12, LOC Citibank NA, VRDN (c)(f) | 2,000 | | 2,000 |
(Waste Mgmt. of South Carolina, Inc. Proj.) Series 2003 A, 0.2% 3/7/12, LOC Wells Fargo Bank NA, VRDN (c)(f) | 15,000 | | 15,000 |
South Carolina Jobs-Econ. Dev. Auth. Indl. Rev. (South Carolina Generating Co., Inc. Proj.) Series 2008, 0.2% 3/7/12, LOC Branch Banking & Trust Co., VRDN (c)(f) | 14,000 | | 14,000 |
South Carolina Pub. Svc. Auth. Rev.: | | | |
Series 2010 A: | | | |
0.17% 3/22/12, CP | 6,163 | | 6,163 |
0.18% 3/2/12, CP | 25,000 | | 25,000 |
0.18% 3/9/12, CP | 11,490 | | 11,490 |
Series 2010 B: | | | |
0.14% 3/19/12, CP | 2,483 | | 2,483 |
0.17% 3/22/12, CP | 4,844 | | 4,844 |
0.18% 3/8/12, CP | 18,420 | | 18,420 |
York County Poll. Cont. Rev. Bonds (Duke Energy Corp. Proj.) 0.4% tender 3/1/12, CP mode | 22,350 | | 22,350 |
| | 342,295 |
South Dakota - 0.0% |
South Dakota Hsg. Dev. Auth. (Harmony Heights Proj.) Series 2001, 0.2% 3/7/12, LOC Fannie Mae Guaranteed Mtg. pass-thru certificates, VRDN (c)(f) | 6,500 | | 6,500 |
Municipal Securities - continued |
| Principal Amount (000s) | | Value (000s) |
Tennessee - 1.4% |
Chattanooga Health Ed. & Hsg. Facility Board Rev. (Southern Adventist Univ. Proj.) 0.26% 3/7/12, LOC Bank of America NA, VRDN (c) | $ 1,520 | | $ 1,520 |
Jackson Energy Auth. Wastewtr. Sys. Rev. Series 2009, 0.3% 3/7/12, LOC Bank of America NA, VRDN (c) | 28,425 | | 28,425 |
Johnson City Health & Edl. Hosp. Rev. (Mountain States Health Alliance Proj.): | | | |
Series 2011 A, 0.1% 3/7/12, LOC U.S. Bank NA, Cincinnati, VRDN (c) | 15,090 | | 15,090 |
Series 2011 B, 0.1% 3/7/12, LOC PNC Bank NA, VRDN (c) | 6,670 | | 6,670 |
Knox County Health Edl. & Hsg. Facilities Board Hosp. Facilities Rev. Series 2011 B, 0.14% 3/7/12, LOC Bank of America NA, VRDN (c) | 38,600 | | 38,600 |
Loudon County Indl. Dev. Board Exempt Facilities Rev. (Kimberly-Clark Corp. Proj.) 0.16% 3/7/12, VRDN (c)(f) | 11,600 | | 11,600 |
Loudon Indl. Dev. Board Solid Waste Disp. Rev. (Tate & Lyle Ingredients Americas, Inc. Proj.) Series 2006, 0.36% 3/7/12, LOC Rabobank Nederland, VRDN (c)(f) | 44,100 | | 44,100 |
Memphis Health, Edl. & Hsg. Facilities Board (Ashland Lakes Apts. Proj.) Series A, 0.16% 3/7/12, LOC U.S. Bank NA, Cincinnati, VRDN (c)(f) | 10,000 | | 10,000 |
Metropolitan Govt. Nashville & Davidson County Health & Edl. Facilities Board (Whispering Oaks Apts. Proj.) 0.19% 3/7/12, LOC Fannie Mae Guaranteed Mtg. pass-thru certificates, VRDN (c)(f) | 15,000 | | 15,000 |
Metropolitan Govt. Nashville & Davidson County Indl. Dev. Board Rev. (Nashville Symphony Hall Proj.) Series 2004, 0.23% 3/7/12, LOC Bank of America NA, VRDN (c) | 23,590 | | 23,590 |
Montgomery County Pub. Bldg. Auth. Pooled Fing. Rev. (Tennessee County Ln. Pool Prog.) Series 1999, 0.23% 3/7/12, LOC Bank of America NA, VRDN (c) | 22,300 | | 22,300 |
Nashville and Davidson County Metropolitan Govt. Gen. Oblig.: | | | |
Bonds Series 2010 D, 4% 7/1/12 | 3,140 | | 3,180 |
Participating VRDN Series Putters 2631, 0.16% 3/7/12 (Liquidity Facility JPMorgan Chase Bank) (c)(g) | 67,475 | | 67,475 |
Sevier County Pub. Bldg. Auth. Rev. Series V-A-1, 0.21% 3/7/12, LOC Branch Banking & Trust Co., VRDN (c)(f) | 11,100 | | 11,100 |
Municipal Securities - continued |
| Principal Amount (000s) | | Value (000s) |
Tennessee - continued |
Shelby County Health Edl. & Hsg. Facilities Board Rev. (Trezevant Manor Proj.): | | | |
Series 2007 B, 0.21% 3/1/12, LOC Bank of America NA, VRDN (c) | $ 2,260 | | $ 2,260 |
Series A, 0.21% 3/7/12, LOC Bank of America NA, VRDN (c) | 35,725 | | 35,725 |
| | 336,635 |
Texas - 13.0% |
Austin Arpt. Sys. Rev.: | | | |
Series 2005 1, 0.18% 3/7/12, LOC JPMorgan Chase Bank, VRDN (c)(f) | 41,575 | | 41,575 |
Series 2005 2, 0.18% 3/7/12, LOC JPMorgan Chase Bank, VRDN (c)(f) | 25,025 | | 25,025 |
Series 2005 4, 0.17% 3/7/12, LOC Royal Bank of Canada New York Branch, VRDN (c)(f) | 37,100 | | 37,100 |
Austin Elec. Util. Sys. Rev. Bonds: | | | |
Series 1998, 6.75% 11/15/12 | 1,300 | | 1,359 |
Series 2007, 5% 11/15/12 | 1,280 | | 1,322 |
Austin Gen. Oblig. Bonds: | | | |
Series 2011 A, 2.25% 9/1/12 | 8,400 | | 8,484 |
Series A, 2% 9/1/12 | 15,235 | | 15,368 |
Austin Wtr. & Wastewtr. Sys. Rev.: | | | |
Participating VRDN: | | | |
Series ROC II R 11992, 0.17% 3/7/12 (Liquidity Facility Citibank NA) (c)(g) | 3,900 | | 3,900 |
Series WF 11 139C, 0.17% 3/7/12 (Liquidity Facility Wells Fargo Bank NA) (c)(g) | 21,030 | | 21,030 |
Series 2008, 0.14% 3/7/12, LOC Bank of Tokyo-Mitsubishi UFJ Ltd., LOC Sumitomo Mitsui Banking Corp., VRDN (c) | 38,320 | | 38,320 |
Bexar County Gen. Oblig. Participating VRDN Series ROC II R 11791PB, 0.36% 3/7/12 (Liquidity Facility Deutsche Postbank AG) (c)(g) | 18,830 | | 18,830 |
Birdville Independent School District Participating VRDN Series MT 720, 0.22% 3/7/12 (Liquidity Facility Bank of America NA) (c)(g) | 4,000 | | 4,000 |
Brazos Hbr. Indl. Dev. Corp. Envir. Facilities Rev. (ConocoPhillips Co. Proj.) 0.15% 3/7/12, VRDN (c)(f) | 14,500 | | 14,500 |
Brownsville Indl. Dev. Corp. Rev. (Rich-Seapak Corp. Proj.) Series 1997, 0.26% 3/7/12, LOC HSBC Bank USA, NA, VRDN (c)(f) | 6,250 | | 6,250 |
Brownsville Util. Sys. Rev. Participating VRDN Series Solar 06 68, 0.14% 3/7/12 (Liquidity Facility U.S. Bank NA, Cincinnati) (c)(g) | 20,000 | | 20,000 |
Municipal Securities - continued |
| Principal Amount (000s) | | Value (000s) |
Texas - continued |
Calhoun County Navigation District Poll. Cont. Rev. (Formosa Plastics Corp., Texas Proj.) Series 2002, 0.25% 3/7/12, LOC Bank of America NA, VRDN (c)(f) | $ 10,000 | | $ 10,000 |
Calhoun County Navigation District Port Rev. (Formosa Plastics Corp. Proj.) Series 2000, 0.23% 3/7/12, LOC Bank of America NA, VRDN (c)(f) | 5,500 | | 5,500 |
Calhoun County Solid Waste Disp. Rev. (Formosa Plastics Corp. Proj.): | | | |
Series 2000, 0.25% 3/7/12, LOC Bank of America NA, VRDN (c)(f) | 25,000 | | 25,000 |
Series 2001, 0.25% 3/7/12, LOC Bank of America NA, VRDN (c)(f) | 25,000 | | 25,000 |
Calhoun Port Auth. Envir. Facilities Rev. (Formosa Plastics Corp. Texas Proj.): | | | |
Series 2007 A, 0.18% 3/7/12, LOC PNC Bank NA, VRDN (c)(f) | 47,300 | | 47,300 |
Series 2008, 0.23% 3/7/12, LOC Bank of America NA, VRDN (c)(f) | 30,000 | | 30,000 |
Cap. Area Hsg. Fin. Corp. Multi-family Hsg. Rev. (Marble Falls Vistas Apts. Proj.) 0.19% 3/7/12, LOC Fannie Mae Guaranteed Mtg. pass-thru certificates, VRDN (c)(f) | 5,700 | | 5,700 |
Dallas Area Rapid Transit Sales Tax Rev. Participating VRDN Series WF 09 60C, 0.17% 3/7/12 (Liquidity Facility Wells Fargo & Co.) (c)(g) | 17,235 | | 17,235 |
Dallas Hsg. Fin. Corp. Multi-family Hsg. Rev. (The Masters Apts. Proj.) 0.19% 3/7/12, LOC Fannie Mae Guaranteed Mtg. pass-thru certificates, VRDN (c)(f) | 7,280 | | 7,280 |
Dallas Independent School District Bonds Series 2009, 5% 2/15/13 | 1,000 | | 1,045 |
Dallas Wtr. & Swr. Sys. Rev. Series C, 0.12% 3/16/12, CP | 9,805 | | 9,805 |
Dallas Wtrwks. & Swr. Sys. Rev. Participating VRDN Series ROC II R 12279, 0.16% 3/7/12 (Liquidity Facility Citibank NA) (c)(g) | 23,410 | | 23,410 |
Denton Independent School District Participating VRDN Series Putters 2603, 0.16% 3/7/12 (Liquidity Facility JPMorgan Chase Bank) (c)(g) | 7,370 | | 7,370 |
El Paso County Hosp. District Combination Tax and Rev. Participating VRDN Series Solar 06 32, 0.15% 3/7/12 (Liquidity Facility U.S. Bank NA, Cincinnati) (c)(g) | 19,865 | | 19,865 |
Fort Bend Independent School District Bonds Series 2009, 4% 2/15/13 | 1,000 | | 1,036 |
Frisco Gen. Oblig. Participating VRDN Series ROC II R 11909, 0.16% 3/7/12 (Liquidity Facility Citibank NA) (c)(g) | 4,070 | | 4,070 |
Municipal Securities - continued |
| Principal Amount (000s) | | Value (000s) |
Texas - continued |
Frisco Independent School District Bonds Series WF 11 1C, 0.2%, tender 7/25/12 (Liquidity Facility Wells Fargo Bank NA) (c)(g)(h) | $ 13,600 | | $ 13,600 |
Gilmer Indl. Dev. Corp. (Duoline Technologies LP Proj.) Series 2008 A, 0.2% 3/7/12, LOC Wells Fargo Bank NA, VRDN (c)(f) | 9,565 | | 9,565 |
Granbury Independent School District Bonds Series 1999, 0% 8/1/12 (Permanent School Fund of Texas Guaranteed) | 2,625 | | 2,622 |
Grapevine-Colleyville Independent School District Participating VRDN Series MT 761, 0.22% 3/7/12 (Liquidity Facility Bank of America NA) (c)(g) | 11,990 | | 11,990 |
Greater East Texas Higher Ed. Auth. Student Ln. Rev.: | | | |
Series 1992 B, 0.14% 3/7/12, LOC State Street Bank & Trust Co., Boston, VRDN (c)(f) | 35,200 | | 35,200 |
Series 1993 B: | | | |
0.14% 3/7/12, LOC State Street Bank & Trust Co., Boston, VRDN (c)(f) | 15,000 | | 15,000 |
0.14% 3/7/12, LOC State Street Bank & Trust Co., Boston, VRDN (c)(f) | 17,000 | | 17,000 |
Series 1995 B, 0.14% 3/7/12, LOC State Street Bank & Trust Co., Boston, VRDN (c)(f) | 27,000 | | 27,000 |
Greater Texas Student Ln. Corp. Student Ln. Rev.: | | | |
Series 1998 A, 0.14% 3/7/12, LOC State Street Bank & Trust Co., Boston, VRDN (a)(c)(f) | 24,750 | | 24,750 |
Series 2000 A, 0.14% 3/7/12, LOC State Street Bank & Trust Co., Boston, VRDN (c)(f) | 35,000 | | 35,000 |
Gulf Coast Indl. Dev. Auth. 0.27% 3/7/12, LOC Wells Fargo Bank NA, VRDN (c)(f) | 5,280 | | 5,280 |
Gulf Coast Waste Disp. Auth. Solid Waste Disp. Rev. (Waste Mgmt., Inc. Proj.) Series A, 0.2% 3/7/12, LOC JPMorgan Chase Bank, VRDN (c)(f) | 1,000 | | 1,000 |
Harris County Cultural Ed. Facilities Fin. Corp. Med. Facilities Rev. (Baylor College of Medicine Proj.) Series 2008 E, 0.13% 3/7/12, LOC JPMorgan Chase Bank, VRDN (c) | 1,000 | | 1,000 |
Harris County Cultural Ed. Facilities Fin. Corp. Rev. (Memorial Hermann Healthcare Sys. Proj.): | | | |
Series 2008 C, 0.16% 3/7/12, LOC Wells Fargo Bank NA, VRDN (c) | 46,300 | | 46,300 |
Series 2008 D1, 0.17% 3/7/12, LOC JPMorgan Chase Bank, VRDN (c) | 23,300 | | 23,300 |
Series 2008 D3, 0.18% 3/7/12, LOC Bank of America NA, VRDN (c) | 30,000 | | 30,000 |
Harris County Gen. Oblig.: | | | |
Bonds Series 2011 A, 2%, tender 8/15/12 (c) | 27,400 | | 27,616 |
Municipal Securities - continued |
| Principal Amount (000s) | | Value (000s) |
Texas - continued |
Harris County Gen. Oblig.: - continued | | | |
Participating VRDN: | | | |
Series RBC E 18, 0.16% 3/7/12 (Liquidity Facility Royal Bank of Canada) (c)(g) | $ 11,000 | | $ 11,000 |
Series ROC II R 718 PB, 0.39% 3/7/12 (Liquidity Facility Deutsche Postbank AG) (c)(g) | 8,715 | | 8,715 |
Series A1, 0.09% 3/16/12 (Liquidity Facility State Street Bank & Trust Co., Boston), CP | 5,800 | | 5,800 |
Series C, 0.18% 3/6/12 (Liquidity Facility Bank of America NA), CP | 111,000 | | 111,000 |
Series D: | | | |
0.12% 4/9/12 (Liquidity Facility JPMorgan Chase Bank), CP | 17,860 | | 17,860 |
0.18% 8/10/12 (Liquidity Facility JPMorgan Chase Bank), CP | 2,340 | | 2,340 |
Harris County Health Facilities Dev. Corp. Hosp. Rev. Bonds (Memorial Hosp. Sys. Proj.) Series 1998, 5.5% 6/1/12 | 5,295 | | 5,362 |
Harris County Hosp. District Rev. Series 2010, 0.16% 3/7/12, LOC JPMorgan Chase Bank, VRDN (c) | 14,700 | | 14,700 |
Harris County Hsg. Fin. Corp. Multi-family Hsg. Rev.: | | | |
(Lafayette Village Apts. Proj.) Series 2006, 0.17% 3/7/12, LOC Fannie Mae Guaranteed Mtg. pass-thru certificates, VRDN (c)(f) | 6,615 | | 6,615 |
(Louetta Village Apts. Proj.) Series 2005, 0.17% 3/7/12, LOC Fannie Mae Guaranteed Mtg. pass-thru certificates, VRDN (c)(f) | 6,685 | | 6,685 |
(Primrose Aldine Bender Apt. Proj.) Series 2004, 0.19% 3/7/12, LOC Fannie Mae Guaranteed Mtg. pass-thru certificates, VRDN (c)(f) | 7,710 | | 7,710 |
(Primrose at Bammel Apts. Proj.) Series 2005, 0.19% 3/7/12, LOC Fannie Mae Guaranteed Mtg. pass-thru certificates, VRDN (c)(f) | 8,280 | | 8,280 |
(Quail Chase Apts. Proj.) Series 1999, 0.19% 3/7/12, LOC Gen. Elec. Cap. Corp., VRDN (c)(f) | 11,110 | | 11,110 |
(Wellington Park Apts. Proj.) Series 2004, 0.17% 3/7/12, LOC Fannie Mae Guaranteed Mtg. pass-thru certificates, VRDN (c)(f) | 12,450 | | 12,450 |
Harris County Metropolitan Trans. Auth.: | | | |
Series A1: | | | |
0.15% 5/4/12 (Liquidity Facility JPMorgan Chase Bank), CP | 34,300 | | 34,300 |
0.17% 3/15/12 (Liquidity Facility JPMorgan Chase Bank), CP | 10,000 | | 10,000 |
Municipal Securities - continued |
| Principal Amount (000s) | | Value (000s) |
Texas - continued |
Harris County Metropolitan Trans. Auth.: - continued | | | |
Series A3, 0.17% 3/15/12 (Liquidity Facility State Street Bank & Trust Co., Boston), CP | $ 4,000 | | $ 4,000 |
Harris County Tex Indl. Dev. Corp.: | | | |
(HFOTCO LLC Proj.) Series 2010, 0.25% 3/7/12, LOC Bank of America NA, VRDN (c) | 61,000 | | 61,000 |
Series 2011, 0.25% 3/7/12, LOC Bank of America NA, VRDN (c) | 25,000 | | 25,000 |
Houston Arpt. Sys. Rev. Series 2010, 0.13% 3/7/12, LOC Barclays Bank PLC, VRDN (c) | 30,230 | | 30,230 |
Houston Gen. Oblig.: | | | |
Participating VRDN Series MT 788, 0.22% 3/7/12 (Liquidity Facility Bank of America NA) (c)(g) | 7,760 | | 7,760 |
Series A, 0.2% 3/6/12, LOC Union Bank of California, CP | 23,100 | | 23,100 |
Houston Higher Ed. Fin. Corp. Higher Ed. Rev.: | | | |
Participating VRDN: | | | |
Series ROC II R 11860, 0.16% 3/7/12 (Liquidity Facility Citibank NA) (c)(g) | 6,000 | | 6,000 |
Series WF 11 44C, 0.17% 3/7/12 (Liquidity Facility Wells Fargo Bank NA) (c)(g) | 18,155 | | 18,155 |
Series A: | | | |
0.14% 6/6/12, CP | 10,000 | | 10,000 |
0.17% 5/9/12, CP | 9,725 | | 9,725 |
Houston Hsg. Fin. Corp. Multi-family Hsg. Rev.: | | | |
(Fairlake Cove Apts. Proj.) Series 2005, 0.17% 3/7/12, LOC Citibank NA, VRDN (c)(f) | 9,370 | | 9,370 |
(Little Nell Apts. Proj.) Series 2003, 0.18% 3/7/12, LOC Fannie Mae Guaranteed Mtg. pass-thru certificates, VRDN (c)(f) | 12,700 | | 12,700 |
(Mayfair Park Apts. Proj.) Series 2004, 0.18% 3/7/12, LOC Fannie Mae Guaranteed Mtg. pass-thru certificates, VRDN (c)(f) | 5,700 | | 5,700 |
Houston Independent School District Participating VRDN Series MT 732, 0.22% 3/7/12 (Liquidity Facility Bank of America NA) (c)(g) | 9,805 | | 9,805 |
Houston Util. Sys. Rev.: | | | |
Participating VRDN: | | | |
Series Putters 4719, 0.24% 3/7/12 (Liquidity Facility Bank of America NA) (c)(g) | 9,650 | | 9,650 |
Series ROC II R 11411, 0.16% 3/7/12 (Liquidity Facility Citibank NA) (c)(g) | 9,290 | | 9,290 |
Series ROC II R 12267, 0.16% 3/7/12 (Liquidity Facility Citibank NA) (c)(g) | 16,795 | | 16,795 |
Municipal Securities - continued |
| Principal Amount (000s) | | Value (000s) |
Texas - continued |
Houston Util. Sys. Rev.: - continued | | | |
Participating VRDN: | | | |
Series Solar 06 70, 0.14% 3/7/12 (Liquidity Facility U.S. Bank NA, Cincinnati) (c)(g) | $ 22,120 | | $ 22,120 |
Series 2004 B1, 0.22% 3/7/12, LOC Bank of America NA, VRDN (c) | 38,700 | | 38,700 |
Series 2004 B3, 0.14% 3/7/12, LOC Sumitomo Mitsui Banking Corp., VRDN (c) | 14,000 | | 14,000 |
Series 2004 B4, 0.16% 3/7/12, LOC JPMorgan Chase Bank, VRDN (c) | 19,750 | | 19,750 |
Humble Independent School District Participating VRDN: | | | |
Series MT 733, 0.22% 3/7/12 (Liquidity Facility Bank of America NA) (c)(g) | 8,475 | | 8,475 |
Series Solar 06 20, 0.15% 3/7/12 (Liquidity Facility U.S. Bank NA, Cincinnati) (c)(g) | 13,635 | | 13,635 |
Jewett Econ. Dev. Corp. Indl. Dev. Rev. (Nucor Corp. Proj.) 0.16% 3/7/12, VRDN (c)(f) | 12,600 | | 12,600 |
Judson Independent School District Participating VRDN Series MS 06 1859, 0.15% 3/7/12 (Liquidity Facility Wells Fargo & Co.) (c)(g) | 3,940 | | 3,940 |
Keller Independent School District Participating VRDN Series WF11 55 C, 0.17% 3/7/12 (Liquidity Facility Wells Fargo Bank NA) (c)(g) | 3,000 | | 3,000 |
Kendall County Health Facilities Dev. Corp. Health Care Rev. (Morningside Ministries Proj.) 0.15% 3/7/12, LOC JPMorgan Chase Bank, VRDN (c) | 10,965 | | 10,965 |
Klein Independent School District Participating VRDN Series ROCS II R 11942, 0.16% 3/7/12 (Liquidity Facility Citibank NA) (c)(g) | 5,145 | | 5,145 |
Leander Independent School District Participating VRDN Series BC 10 28W, 0.18% 3/7/12 (Liquidity Facility Barclays Bank PLC) (c)(g) | 2,050 | | 2,050 |
Lovejoy Independent School District Participating VRDN Series DB 514, 0.22% 3/7/12 (Liquidity Facility Deutsche Bank AG) (c)(g) | 3,200 | | 3,200 |
Lower Colorado River Auth. Transmission Contract Rev. Bonds (LCRA Transmission Corp. Proj.) Series 2011A, 1.5% 5/15/12 | 20,300 | | 20,346 |
Lower Neches Valley Auth. Indl. Dev. Corp. Exempt Facilities Rev. (Onyx Envir. Svcs. Proj.) Series 2003, 0.29% 3/7/12, LOC Bank of America NA, VRDN (c)(f) | 11,950 | | 11,950 |
Mansfield Independent School District Participating VRDN Series PT 4627, 0.36% 3/7/12 (Liquidity Facility Deutsche Postbank AG) (c)(g) | 10,815 | | 10,815 |
Municipal Securities - continued |
| Principal Amount (000s) | | Value (000s) |
Texas - continued |
Mesquite Independent School District Series 2003 A, 0.11% 3/7/12 (Permanent School Fund of Texas Guaranteed), VRDN (c) | $ 10,000 | | $ 10,000 |
Midlothian Indl. Dev. Corp. Envir. Facilities Rev. (Holnam Texas LP Proj.) Series 1999, 0.18% 3/7/12, LOC JPMorgan Chase Bank, VRDN (c)(f) | 15,100 | | 15,100 |
Montgomery County Hsg. Fin. Corp. Multi-family Hsg. Rev. (Conroe Lodge at Silverdale Apt. Homes Proj.) 0.17% 3/7/12, LOC Freddie Mac, VRDN (c)(f) | 7,470 | | 7,470 |
North Central Texas Health Facilities Dev. Corp. Bonds Series WF 09 33C, 0.2%, tender 7/25/12 (Liquidity Facility Wells Fargo & Co.) (c)(g)(h) | 7,200 | | 7,200 |
North East Texas Independent School District: | | | |
Bonds Series 2007 A, 0% 8/1/12 (Permanent School Fund of Texas Guaranteed) | 7,500 | | 7,491 |
Participating VRDN Series EGL 07 0123, 0.16% 3/7/12 (Liquidity Facility Citibank NA) (c)(g) | 17,870 | | 17,870 |
North Texas Higher Ed. Auth. Student Ln. Rev.: | | | |
Series 2005 C, 0.31% 3/7/12, LOC Bank of America NA, LOC Lloyds TSB Bank PLC, VRDN (c)(f) | 98,800 | | 98,800 |
Series 2007 A, 0.31% 3/7/12, LOC Bank of America NA, LOC Lloyds TSB Bank PLC, VRDN (c)(f) | 54,780 | | 54,780 |
North Texas Tollway Auth. Rev.: | | | |
Participating VRDN: | | | |
Series Putters 3998, 0.16% 3/7/12 (Liquidity Facility JPMorgan Chase Bank) (c)(g) | 10,000 | | 10,000 |
Series ROC II R 11946, 0.16% 3/7/12 (Liquidity Facility Citibank NA) (c)(g) | 6,750 | | 6,750 |
Series 2009 D, 0.14% 3/7/12, LOC JPMorgan Chase Bank, VRDN (c) | 23,650 | | 23,650 |
Northside Independent School District Participating VRDN Series ROC II R 11965, 0.16% 3/7/12 (Liquidity Facility Citibank NA) (c)(g) | 3,505 | | 3,505 |
Northwest Texas Independent School District Participating VRDN Series ROC II R 11539, 0.39% 3/7/12 (Liquidity Facility Deutsche Postbank AG) (c)(g) | 11,520 | | 11,520 |
Port Arthur Navigation District Envir. Facilities Rev. (Motiva Enterprises LLC Proj.) Series 2004, 0.18% 3/7/12, VRDN (c)(f) | 94,790 | | 94,790 |
Port Arthur Navigation District Indl. Dev. Corp. Exempt Facilities Rev. (Air Products Proj.): | | | |
Series 2000, 0.15% 3/7/12, VRDN (c)(f) | 15,000 | | 15,000 |
Series 2001, 0.15% 3/7/12, VRDN (c)(f) | 15,000 | | 15,000 |
Series 2002, 0.15% 3/7/12, VRDN (c)(f) | 14,500 | | 14,500 |
Municipal Securities - continued |
| Principal Amount (000s) | | Value (000s) |
Texas - continued |
Red River Ed. Fin. Corp. Ed. Rev. (Texas Christian Univ. Proj.) Series 2000, 0.11% 3/7/12, VRDN (c) | $ 1,000 | | $ 1,000 |
Riesel Indl. Dev. Corp. (Sandy Creek Energy Assoc. Proj.): | | | |
0.16% 3/7/12, LOC Cr. Suisse Group, VRDN (c)(f) | 50,000 | | 50,000 |
0.16% 3/7/12, LOC Cr. Suisse Group, VRDN (c)(f) | 50,000 | | 50,000 |
San Antonio Elec. & Gas Sys. Rev.: | | | |
Participating VRDN Series Putters 3560, 0.16% 3/7/12 (Liquidity Facility JPMorgan Chase Bank) (c)(g) | 9,015 | | 9,015 |
Series A, 0.15% 3/2/12, CP | 23,200 | | 23,200 |
San Antonio Independent School District Participating VRDN Series MT 757, 0.22% 3/7/12 (Liquidity Facility Bank of America NA) (c)(g) | 10,360 | | 10,360 |
San Antonio Indl. Dev. Auth. Indl. Dev. Rev.: | | | |
(LGC Bldg. & KLN Steel Proj.) Series 1998, 0.93% 3/7/12, LOC Bank of America NA, VRDN (c)(f) | 5,500 | | 5,500 |
(Tindall Corp. Proj.) Series 2008 A, 0.2% 3/7/12, LOC Wells Fargo Bank NA, VRDN (c)(f) | 2,950 | | 2,950 |
San Antonio Wtr. Sys. Rev.: | | | |
Participating VRDN: | | | |
Series EGL 05 3005 Class A, 0.16% 3/7/12 (Liquidity Facility Citibank NA) (c)(g) | 27,500 | | 27,500 |
Series EGL 06 5, 0.16% 3/7/12 (Liquidity Facility Citibank NA) (c)(g) | 43,500 | | 43,500 |
Series 2001 A: | | | |
0.12% 3/6/12, CP | 71,463 | | 71,463 |
0.16% 3/7/12, CP | 10,000 | | 10,000 |
0.18% 3/1/12, CP | 28,500 | | 28,500 |
Spring Branch Independent School District Participating VRDN Series WF 11 140C, 0.17% 3/7/12 (Liquidity Facility Wells Fargo Bank NA) (c)(g) | 25,590 | | 25,590 |
Tarrant County Cultural Ed. Facilities Fin. Corp. Hosp. Rev.: | | | |
(Baylor Health Care Sys. Proj.): | | | |
Series 2011 C, 0.11% 3/7/12, LOC Northern Trust Co., VRDN (c) | 6,800 | | 6,800 |
Series 2011 E, 0.12% 3/7/12, LOC Wells Fargo Bank NA, VRDN (c) | 1,515 | | 1,515 |
(Methodist Hospitals of Dallas Proj.) Series 2008, 0.15% 3/7/12, LOC JPMorgan Chase Bank, VRDN (c) | 92,350 | | 92,350 |
Bonds (Baylor Health Care Sys. Proj.) Series 2011 B, 0.29%, tender 9/26/12 (c) | 6,300 | | 6,300 |
Tarrant County Cultural Ed. Facilities Fin. Corp. Rev. (Christus Health Proj.) Series 2008 C3, 0.25% 3/7/12, LOC Bank of America NA, VRDN (c) | 33,500 | | 33,500 |
Municipal Securities - continued |
| Principal Amount (000s) | | Value (000s) |
Texas - continued |
Tarrant County Health Facilities Dev. Corp. Hosp. Rev. Participating VRDN Series Putters 3894, 0.16% 3/7/12 (Liquidity Facility JPMorgan Chase Bank) (c)(g) | $ 6,750 | | $ 6,750 |
Texas A&M Univ. Rev.: | | | |
Participating VRDN Series ROC II R 11920, 0.16% 3/7/12 (Liquidity Facility Citibank NA) (c)(g) | 2,795 | | 2,795 |
Series 1993 B: | | | |
0.16% 5/4/12, CP | 18,700 | | 18,700 |
0.18% 6/7/12, CP | 30,600 | | 30,600 |
Texas City Tex Indl. Dev. Corp. (Del Papa Realty Hldgs. LP Proj.) Series 2011, 0.25% 3/7/12, LOC Bank of America NA, VRDN (c) | 10,300 | | 10,300 |
Texas Dept. of Hsg. & Cmnty. Affairs Multi-family Hsg. Rev.: | | | |
(Bristol Apts. Proj.) Series 2004, 0.17% 3/7/12, LOC Fannie Mae Guaranteed Mtg. pass-thru certificates, VRDN (c)(f) | 11,900 | | 11,900 |
(Chisholm Trail Proj.) Series 2004, 0.17% 3/7/12, LOC Fannie Mae Guaranteed Mtg. pass-thru certificates, VRDN (c)(f) | 5,300 | | 5,300 |
(Pinnacle Apts. Proj.) Series 2004, 0.16% 3/7/12, LOC Fannie Mae Guaranteed Mtg. pass-thru certificates, VRDN (c)(f) | 13,865 | | 13,865 |
(Residences at Sunset Pointe Proj.) Series 2006, 0.22% 3/7/12, LOC Fannie Mae Guaranteed Mtg. pass-thru certificates, VRDN (c)(f) | 15,000 | | 15,000 |
(St. Augustine Estate Proj.) Series 2005, 0.17% 3/7/12, LOC Fannie Mae Guaranteed Mtg. pass-thru certificates, VRDN (c)(f) | 6,280 | | 6,280 |
(Windshire Apts. Proj.) Series 2007, 0.17% 3/7/12, LOC Fannie Mae Guaranteed Mtg. pass-thru certificates, VRDN (c)(f) | 13,800 | | 13,800 |
Series 2004, 0.17% 3/7/12, LOC Fannie Mae Guaranteed Mtg. pass-thru certificates, VRDN (c)(f) | 11,800 | | 11,800 |
Series 2006, 0.16% 3/7/12, LOC Fannie Mae Guaranteed Mtg. pass-thru certificates, VRDN (c)(f) | 14,390 | | 14,390 |
Texas Gen. Oblig.: | | | |
(Veterans' Hsg. Assistance Prog.): | | | |
Fund II Series 2005 B, 0.14% 3/7/12 (Liquidity Facility State Street Bank & Trust Co., Boston), VRDN (c)(f) | 37,010 | | 37,010 |
Fund II Series 2007 A, 0.14% 3/7/12 (Liquidity Facility State Street Bank & Trust Co., Boston), VRDN (c)(f) | 40,920 | | 40,920 |
Participating VRDN: | | | |
Series DB 448, 0.24% 3/7/12 (Liquidity Facility Deutsche Bank AG) (c)(f)(g) | 5,695 | | 5,695 |
Municipal Securities - continued |
| Principal Amount (000s) | | Value (000s) |
Texas - continued |
Texas Gen. Oblig.: - continued | | | |
Participating VRDN: | | | |
Series EGL 06 0125, 0.16% 3/7/12 (Liquidity Facility Citibank NA) (c)(g) | $ 27,940 | | $ 27,940 |
Series EGL 07 90, 0.16% 3/7/12 (Liquidity Facility Citibank NA) (c)(g) | 27,000 | | 27,000 |
Series Putters 3478, 0.16% 3/7/12 (Liquidity Facility JPMorgan Chase Bank) (c)(g) | 4,995 | | 4,995 |
Series Putters 3479, 0.16% 3/7/12 (Liquidity Facility JPMorgan Chase Bank) (c)(g) | 11,910 | | 11,910 |
Series Putters 3946, 0.13% 3/1/12 (Liquidity Facility JPMorgan Chase & Co.) (c)(g) | 3,100 | | 3,100 |
Series 2011 B: | | | |
0.18% 8/30/12 (Liquidity Facility Texas Comptroller Pub. Accounts), CP | 25,300 | | 25,300 |
0.18% 8/30/12 (Liquidity Facility Texas Comptroller Pub. Accounts), CP | 15,000 | | 15,000 |
0.18% 8/30/12 (Liquidity Facility Texas Comptroller Pub. Accounts), CP | 23,400 | | 23,400 |
0.18% 8/30/12 (Liquidity Facility Texas Comptroller Pub. Accounts), CP | 42,000 | | 42,000 |
0.21% 3/6/12 (Liquidity Facility Texas Comptroller Pub. Accounts), CP | 33,100 | | 33,100 |
0.21% 3/7/12 (Liquidity Facility Texas Comptroller Pub. Accounts), CP | 16,200 | | 16,200 |
0.21% 3/8/12 (Liquidity Facility Texas Comptroller Pub. Accounts), CP | 15,600 | | 15,600 |
Texas Muni. Pwr. Agcy. Rev. Series 2005, 0.19% 3/6/12, LOC Bank of America NA, LOC JPMorgan Chase Bank, CP | 13,300 | | 13,300 |
Texas State Univ. Sys. Fing. Rev. Participating VRDN Series WF 11 79C, 0.17% 3/7/12 (Liquidity Facility Wells Fargo Bank NA) (c)(g) | 6,385 | | 6,385 |
Texas Tech Univ. Revs. Bonds Fourteenth Series 2012 A, 2% 8/15/12 | 4,040 | | 4,074 |
Travis County Health Facilities Dev. (Longhorn Village Proj.) Series 2008 B, 0.16% 3/7/12, LOC Bank of Scotland PLC, VRDN (c) | 86,470 | | 86,470 |
Travis County Hsg. Fin. Corp. (Rosemont at Old Manor Apts.) Series 2004, 0.19% 3/7/12, LOC Fannie Mae Guaranteed Mtg. pass-thru certificates, VRDN (c)(f) | 4,885 | | 4,885 |
Trinity River Auth. Reg'l. Wastewtr. Sys. Rev. Bonds Series 2008, 5% 8/1/12 | 8,780 | | 8,954 |
Univ. of Texas Board of Regents Sys. Rev.: | | | |
Bonds Series 2004 B, 5.25% 8/15/12 | 1,515 | | 1,550 |
Municipal Securities - continued |
| Principal Amount (000s) | | Value (000s) |
Texas - continued |
Univ. of Texas Board of Regents Sys. Rev.: - continued | | | |
Participating VRDN: | | | |
Series Putters 584, 0.16% 3/7/12 (Liquidity Facility JPMorgan Chase Bank) (c)(g) | $ 18,745 | | $ 18,745 |
Series WF 11 13C, 0.17% 3/7/12 (Liquidity Facility Wells Fargo Bank NA) (c)(g) | 4,000 | | 4,000 |
Series 2002 A: | | | |
0.09% 3/2/12 (Liquidity Facility Univ. of Texas Invt. Mgmt. Co.), CP | 15,000 | | 15,000 |
0.12% 6/5/12 (Liquidity Facility Univ. of Texas Invt. Mgmt. Co.), CP | 14,000 | | 14,000 |
0.16% 3/6/12 (Liquidity Facility Univ. of Texas Invt. Mgmt. Co.), CP | 10,000 | | 10,000 |
0.16% 3/6/12 (Liquidity Facility Univ. of Texas Invt. Mgmt. Co.), CP | 10,000 | | 10,000 |
Univ. of Texas Permanent Univ. Fund Rev. Bonds: | | | |
Series 2004 A, 5% 7/1/12 | 1,000 | | 1,016 |
Series 2005 A, 5% 7/1/12 | 4,860 | | 4,938 |
| | 3,172,236 |
Utah - 1.9% |
Carbon County Poll. Cont. Rev. (PacifiCorp Proj.) Series 1994, 0.12% 3/7/12, LOC Wells Fargo Bank NA, VRDN (c) | 7,565 | | 7,565 |
Davis County School District Bonds TAN Series 2011, 3% 6/29/12 | 6,000 | | 6,055 |
Emery County Poll. Cont. Rev. (PacifiCorp Proj.) Series 1994, 0.14% 3/7/12, LOC Wells Fargo Bank NA, VRDN (c) | 15,000 | | 15,000 |
Granite Gen. Oblig., Bonds Series 2011, 2% 6/1/12 | 8,850 | | 8,889 |
Intermountain Pwr. Agcy. Pwr. Supply Rev.: | | | |
Series 1997 B: | | | |
0.09% 3/16/12 (Liquidity Facility Bank of Nova Scotia), CP | 30,750 | | 30,750 |
0.09% 3/16/12 (Liquidity Facility JPMorgan Chase Bank), CP | 54,300 | | 54,300 |
Series 1997 B2, 0.12% 6/5/12 (Liquidity Facility Bank of Nova Scotia), CP | 17,200 | | 17,200 |
Series 1998 B4, 0.14% 4/5/12 (Liquidity Facility JPMorgan Chase Bank), CP | 87,300 | | 87,300 |
Utah Hsg. Corp. Multi-family Hsg. Rev. (Springwood Apts. Proj.) Series 2005 A, 0.17% 3/7/12, LOC Fannie Mae Guaranteed Mtg. pass-thru certificates, VRDN (c)(f) | 8,485 | | 8,485 |
Municipal Securities - continued |
| Principal Amount (000s) | | Value (000s) |
Utah - continued |
Utah Hsg. Corp. Single Family Mtg. Rev.: | | | |
Series 2002 A, 0.16% 3/7/12 (Liquidity Facility Fannie Mae Guaranteed Mtg. pass-thru certificates) (Liquidity Facility Freddie Mac), VRDN (c)(f) | $ 5,425 | | $ 5,425 |
Series 2002 B, 0.16% 3/7/12 (Liquidity Facility Fannie Mae Guaranteed Mtg. pass-thru certificates) (Liquidity Facility Freddie Mac), VRDN (c)(f) | 9,115 | | 9,115 |
Series 2002 C2, 0.16% 3/7/12 (Liquidity Facility Fannie Mae Guaranteed Mtg. pass-thru certificates) (Liquidity Facility Freddie Mac), VRDN (c)(f) | 2,580 | | 2,580 |
Series 2002 D, 0.16% 3/7/12 (Liquidity Facility Fannie Mae Guaranteed Mtg. pass-thru certificates) (Liquidity Facility Freddie Mac), VRDN (c)(f) | 6,990 | | 6,990 |
Series 2003 B, 0.16% 3/7/12 (Liquidity Facility Fannie Mae Guaranteed Mtg. pass-thru certificates) (Liquidity Facility Freddie Mac), VRDN (c)(f) | 9,600 | | 9,600 |
Series 2003 C, 0.16% 3/7/12 (Liquidity Facility Fannie Mae Guaranteed Mtg. pass-thru certificates) (Liquidity Facility Freddie Mac), VRDN (c)(f) | 8,330 | | 8,330 |
Series 2003 E, 0.16% 3/7/12 (Liquidity Facility Fannie Mae Guaranteed Mtg. pass-thru certificates) (Liquidity Facility Freddie Mac), VRDN (c)(f) | 8,540 | | 8,540 |
Series 2003 F, 0.16% 3/7/12 (Liquidity Facility Fannie Mae Guaranteed Mtg. pass-thru certificates) (Liquidity Facility Freddie Mac), VRDN (c)(f) | 5,585 | | 5,585 |
Series 2003 G, 0.16% 3/7/12 (Liquidity Facility Fannie Mae Guaranteed Mtg. pass-thru certificates) (Liquidity Facility Freddie Mac), VRDN (c)(f) | 5,580 | | 5,580 |
Series 2004 C, 0.17% 3/7/12 (Liquidity Facility Fannie Mae Guaranteed Mtg. pass-thru certificates) (Liquidity Facility Freddie Mac), VRDN (c)(f) | 1,460 | | 1,460 |
Series 2004 E, 0.16% 3/7/12 (Liquidity Facility Fannie Mae Guaranteed Mtg. pass-thru certificates) (Liquidity Facility Freddie Mac), VRDN (c)(f) | 10,475 | | 10,475 |
Series 2004 F, 0.16% 3/7/12 (Liquidity Facility Fannie Mae Guaranteed Mtg. pass-thru certificates) (Liquidity Facility Freddie Mac), VRDN (c)(f) | 10,425 | | 10,425 |
Series 2004 G, 0.16% 3/7/12 (Liquidity Facility Fannie Mae Guaranteed Mtg. pass-thru certificates) (Liquidity Facility Freddie Mac), VRDN (c)(f) | 12,715 | | 12,715 |
Series 2005 A, 0.16% 3/7/12 (Liquidity Facility Fannie Mae Guaranteed Mtg. pass-thru certificates) (Liquidity Facility Freddie Mac), VRDN (c)(f) | 1,300 | | 1,300 |
Series 2005 B, 0.17% 3/7/12 (Liquidity Facility Fannie Mae Guaranteed Mtg. pass-thru certificates) (Liquidity Facility Freddie Mac), VRDN (c)(f) | 11,025 | | 11,025 |
Municipal Securities - continued |
| Principal Amount (000s) | | Value (000s) |
Utah - continued |
Utah Hsg. Corp. Single Family Mtg. Rev.: - continued | | | |
Series 2005 C, 0.16% 3/7/12 (Liquidity Facility Fannie Mae Guaranteed Mtg. pass-thru certificates) (Liquidity Facility Freddie Mac), VRDN (c)(f) | $ 13,805 | | $ 13,805 |
Series 2005 D, 0.16% 3/7/12 (Liquidity Facility Fannie Mae Guaranteed Mtg. pass-thru certificates) (Liquidity Facility Freddie Mac), VRDN (c)(f) | 13,980 | | 13,980 |
Series 2005 E, 0.16% 3/7/12 (Liquidity Facility Fannie Mae Guaranteed Mtg. pass-thru certificates) (Liquidity Facility Freddie Mac), VRDN (c)(f) | 14,685 | | 14,685 |
Series 2005 F, 0.16% 3/7/12 (Liquidity Facility Fannie Mae Guaranteed Mtg. pass-thru certificates) (Liquidity Facility Freddie Mac), VRDN (c)(f) | 5,100 | | 5,100 |
Series 2005 G, 0.16% 3/7/12 (Liquidity Facility Fannie Mae Guaranteed Mtg. pass-thru certificates) (Liquidity Facility Freddie Mac), VRDN (c)(f) | 12,140 | | 12,140 |
Series 2005 H, 0.16% 3/7/12 (Liquidity Facility Fannie Mae Guaranteed Mtg. pass-thru certificates) (Liquidity Facility Freddie Mac), VRDN (c)(f) | 8,500 | | 8,500 |
Series 2006 A, 0.16% 3/7/12 (Liquidity Facility Fannie Mae Guaranteed Mtg. pass-thru certificates) (Liquidity Facility Freddie Mac), VRDN (c)(f) | 5,675 | | 5,675 |
Series 2006 F, 0.16% 3/7/12 (Liquidity Facility Fannie Mae Guaranteed Mtg. pass-thru certificates) (Liquidity Facility Freddie Mac), VRDN (c)(f) | 5,000 | | 5,000 |
Utah Hsg. Fin. Agcy. Series 2001 A2, 0.16% 3/7/12 (Liquidity Facility Fannie Mae Guaranteed Mtg. pass-thru certificates) (Liquidity Facility Freddie Mac), VRDN (c)(f) | 8,305 | | 8,305 |
Utah State Board of Regents Rev. Participating VRDN Series Solar 06 140, 0.15% 3/7/12 (Liquidity Facility U.S. Bank NA, Cincinnati) (c)(g) | 30,925 | | 30,925 |
Utah Transit Auth. Sales Tax Rev. Participating VRDN Series ROC II R 11922, 0.16% 3/7/12 (Liquidity Facility Citibank NA) (c)(g) | 3,225 | | 3,225 |
| | 466,029 |
Vermont - 0.1% |
Vermont Edl. & Health Bldg. Fin. Agcy. Rev. Bonds Series WF 10 27C, 0.25%, tender 5/2/12 (Liquidity Facility Wells Fargo Bank NA) (c)(g)(h) | 25,865 | | 25,865 |
Vermont Indl. Dev. Auth. Indl. Dev. Rev. (Ryegate Proj.) Series 1990, 0.49% 3/7/12, LOC Royal Bank of Scotland NV, VRDN (c)(f) | 3,400 | | 3,400 |
| | 29,265 |
Municipal Securities - continued |
| Principal Amount (000s) | | Value (000s) |
Virginia - 2.0% |
Alexandria Redev. & Hsg. Auth. Multi-family Hsg. Rev. (Fairfield Village Square Proj.) Series A, 0.16% 3/7/12, LOC Fannie Mae Guaranteed Mtg. pass-thru certificates, VRDN (c)(f) | $ 21,720 | | $ 21,720 |
Arlington County Indl. Dev. Auth. Multi-family Hsg. Rev. Series A, 0.2% 3/7/12, LOC Freddie Mac, VRDN (c)(f) | 4,000 | | 4,000 |
Fairfax County Econ. Dev. Auth. Indl. Dev. Rev. (The Lorton Arts Foundation, Inc. Proj.) Series 2010, 0.15% 3/7/12, LOC Wells Fargo Bank NA, VRDN (c) | 13,000 | | 13,000 |
Fairfax County Econ. Dev. Auth. Rev. Bonds (Silver Line Phase I Proj.) Series 2011, 2% 4/1/12 | 6,190 | | 6,199 |
Fairfax County Econ. Dev. Auth. Student Hsg. Rev. (George Mason Univ. Foundation, Inc., Proj.) Series 2003, 0.23% 3/7/12, LOC Bank of America NA, VRDN (c) | 22,345 | | 22,345 |
Fairfax County Gen. Oblig. Participating VRDN Series BC 11 104W, 0.18% 3/7/12 (Liquidity Facility Barclays Bank PLC) (c)(g) | 10,165 | | 10,165 |
Fairfax County Indl. Dev. Auth. Bonds (Inova Health Sys. Proj.) Series 2010 A, 0.28%, tender 9/26/12 (c) | 18,000 | | 18,000 |
Halifax County Indl. Dev. Auth. Poll. Cont. Rev. Bonds (Virginia Elec. & Pwr. Co. Proj.) Series 1992, 1.25% tender 4/5/12, CP mode (f) | 18,200 | | 18,200 |
Hampton Indl. Dev. Auth. Exempt Facilities Rev. (USA Waste of Virginia Landfills, Inc. Proj.) Series 2000, 0.2% 3/7/12, LOC Wells Fargo Bank NA, VRDN (c)(f) | 9,000 | | 9,000 |
Hampton Redev. & Hsg. Auth. Multi-family Hsg. Rev. (Avalon Pointe Proj.) Series 1996, 0.19% 3/7/12, LOC Fannie Mae Guaranteed Mtg. pass-thru certificates, VRDN (c)(f) | 6,387 | | 6,387 |
Hampton Roads Sanitation District Wastewtr. Rev. Series 2011, 0.12% 3/7/12, VRDN (c) | 16,500 | | 16,500 |
Hanover County Econ. Dev. Auth. Rev. (Bon Secours Health Sys. Proj.): | | | |
Series 2008 D1, 0.13% 3/7/12, LOC Citibank NA, VRDN (c) | 4,030 | | 4,030 |
Series 2008 D2, 0.14% 3/7/12, LOC U.S. Bank NA, Cincinnati, VRDN (c) | 7,570 | | 7,570 |
Henrico County Econ. Dev. Auth. Rev. (Bon Secours Health Sys. Proj.) Series 2008 D, 0.14% 3/7/12, LOC JPMorgan Chase Bank, VRDN (c) | 3,100 | | 3,100 |
Norfolk Econ. Dev. Auth. Hosp. Facilities Rev. Bonds (Sentara Healthcare Proj.): | | | |
Series 2009 A, 0.41%, tender 4/26/12 (c) | 12,000 | | 12,000 |
Series 2010 B, 0.28%, tender 9/26/12 (c) | 14,355 | | 14,355 |
Norfolk Econ. Dev. Auth. Rev. Series 1997: | | | |
0.09% 4/5/12, CP | 26,300 | | 26,300 |
Municipal Securities - continued |
| Principal Amount (000s) | | Value (000s) |
Virginia - continued |
Norfolk Econ. Dev. Auth. Rev. Series 1997: - continued | | | |
0.19% 7/19/12, CP | $ 23,180 | | $ 23,180 |
0.2% 8/10/12, CP | 13,800 | | 13,800 |
Prince William County Indl. Dev. Auth. Poll. Cont. Rev. Bonds (Virginia Elec. & Pwr. Co. Proj.) 1.2% tender 4/5/12, CP mode | 11,200 | | 11,200 |
Prince William County Indl. Dev. Auth. Sewage Disp. Facilities Rev. (Dale Svc. Corp. Proj.): | | | |
Series 2000, 0.2% 3/7/12, LOC Wells Fargo Bank NA, VRDN (c)(f) | 4,830 | | 4,830 |
Series 2001, 0.2% 3/7/12, LOC Wells Fargo Bank NA, VRDN (c)(f) | 4,700 | | 4,700 |
Series 2006, 0.2% 3/7/12, LOC Wells Fargo Bank NA, VRDN (c)(f) | 5,300 | | 5,300 |
Smyth County Indl. Dev. Auth. Hosp. Rev. Series 2011 D, 0.1% 3/7/12, LOC Mizuho Corporate Bank Ltd., VRDN (c) | 12,680 | | 12,680 |
Sussex County Indl. Dev. Auth. Solid Waste Disp. Rev. (Atlantic Waste Disp. Proj.) 0.17% 3/7/12, LOC JPMorgan Chase Bank, VRDN (c)(f) | 10,000 | | 10,000 |
Univ. of Virginia Gen. Rev.: | | | |
Bonds Series A: | | | |
0.12% tender 5/8/12, CP mode | 20,000 | | 20,000 |
0.12% tender 6/7/12, CP mode | 20,000 | | 20,000 |
Series 2003 A, 0.14% 7/16/12, CP | 18,100 | | 18,100 |
Virginia Commonwealth Trans. Board Bonds Series 2012 A, 3% 9/15/12 (b) | 6,345 | | 6,442 |
Virginia Commonwealth Trans. Board Rev. Bonds (Trans. Cap. Projects) Series 2010 A1, 5% 5/15/12 | 1,175 | | 1,186 |
Virginia Hsg. Dev. Auth. Participating VRDN Series Merlots 06 C3, 0.19% 3/7/12 (Liquidity Facility Wells Fargo Bank NA) (c)(f)(g) | 4,190 | | 4,190 |
Virginia Hsg. Dev. Auth. Commonwealth Mtg. Rev. Participating VRDN: | | | |
Series BA 1046, 0.29% 3/7/12 (Liquidity Facility Bank of America NA) (c)(f)(g) | 27,260 | | 27,260 |
Series BA 1047, 0.29% 3/7/12 (Liquidity Facility Bank of America NA) (c)(f)(g) | 5,980 | | 5,980 |
Series Merlots 07 C42, 0.19% 3/7/12 (Liquidity Facility Wells Fargo Bank NA) (c)(f)(g) | 6,340 | | 6,340 |
Virginia Pub. Bldg. Auth. Pub. Facilities Rev. Bonds Series 2011 A, 4% 8/1/12 | 8,545 | | 8,679 |
Virginia Pub. School Auth.: | | | |
Bonds Series X, 5% 4/15/12 | 9,885 | | 9,943 |
Municipal Securities - continued |
| Principal Amount (000s) | | Value (000s) |
Virginia - continued |
Virginia Pub. School Auth.: - continued | | | |
Participating VRDN Series CTE 05 38, 0.16% 3/7/12 (Liquidity Facility State Street Bank & Trust Co., Boston) (c)(g) | $ 17,955 | | $ 17,955 |
Virginia Resources Auth. Clean Wtr. Rev. Participating VRDN: | | | |
Series BBT 08 48, 0.15% 3/7/12 (Liquidity Facility Branch Banking & Trust Co.) (c)(g) | 2,930 | | 2,930 |
Series PT 4634, 0.36% 3/7/12 (Liquidity Facility Deutsche Postbank AG) (c)(g) | 11,900 | | 11,900 |
Series ROC II R 11923, 0.15% 3/7/12 (Liquidity Facility Citibank NA) (c)(g) | 3,825 | | 3,825 |
Virginia Small Bus. Fing. (Children's Hosp. of The King's Daughters, Inc. Proj.) Series 2006, 0.23% 3/7/12, LOC Bank of America NA, VRDN (c) | 23,500 | | 23,500 |
| | 486,791 |
Washington - 4.1% |
Central Puget Sound Reg'l. Trans. Auth. Sales & Use Tax Rev. Participating VRDN Series Putters 2866, 0.16% 3/7/12 (Liquidity Facility JPMorgan Chase Bank) (c)(g) | 8,280 | | 8,280 |
Chelan County Pub. Util. District #1 Rev. Participating VRDN Series BC 11 20B, 0.2% 3/7/12 (Liquidity Facility Barclays Bank PLC) (c)(f)(g) | 8,950 | | 8,950 |
Eclipse Fdg. Trust Various States Participating VRDN Series Solar 06 2, 0.14% 3/7/12 (Liquidity Facility U.S. Bank NA, Cincinnati) (c)(g) | 9,660 | | 9,660 |
Everett Indl. Dev. Corp. Exempt Facilities Rev. 0.16% 3/7/12, VRDN (c)(f) | 12,800 | | 12,800 |
King County Gen. Oblig.: | | | |
BAN Series 2011 A, 2.75% 3/1/12 | 12,430 | | 12,430 |
Participating VRDN Series ROC II R 11731, 0.16% 3/7/12 (Liquidity Facility Citibank NA) (c)(g) | 9,810 | | 9,810 |
King County Hsg. Auth. Rev. (Overlake TOD Hsg. Proj.) 0.21% 3/7/12, LOC Bank of America NA, VRDN (c)(f) | 16,840 | | 16,840 |
King County Swr. Rev. Participating VRDN Series Putters 3941, 0.16% 3/7/12 (Liquidity Facility JPMorgan Chase Bank) (c)(g) | 6,950 | | 6,950 |
Pierce County Econ. Dev. Corp. Spl. Rev. (Weyerhaeuser Real Estate Proj.) Series 1997 A, 0.28% 3/7/12, LOC Bank of America NA, VRDN (c) | 19,505 | | 19,505 |
Port of Seattle Rev.: | | | |
Bonds Series 2012 B, 1.5% 8/1/12 (b)(f) | 4,550 | | 4,573 |
Participating VRDN Series Putters 2020, 0.24% 3/7/12 (Liquidity Facility JPMorgan Chase Bank) (c)(f)(g) | 7,440 | | 7,440 |
Municipal Securities - continued |
| Principal Amount (000s) | | Value (000s) |
Washington - continued |
Port of Seattle Rev.: - continued | | | |
Series 1997, 0.19% 3/7/12, LOC Bank of America NA, VRDN (c)(f) | $ 108,830 | | $ 108,830 |
Series 2001 B1, 0.24% 3/6/12, LOC Bank of America NA, CP (f) | 17,655 | | 17,655 |
Port of Vancouver Rev. (United Grain Corp. of Oregon Proj.) Series 2009, 0.23% 3/7/12, LOC Bank of America NA, VRDN (c) | 25,000 | | 25,000 |
Seattle Wtr. Sys. Rev. Participating VRDN Series MS 06 2170, 0.15% 3/7/12 (Liquidity Facility Wells Fargo & Co.) (c)(g) | 2,530 | | 2,530 |
Snohomish County Hsg. Auth. Hsg. Rev. (Ebey Arms Centerhouse Proj.) Series 2003, 0.23% 3/7/12, LOC Bank of America NA, VRDN (c) | 8,170 | | 8,170 |
Univ. of Washington Univ. Revs. Participating VRDN: | | | |
Series Solar 07 75, 0.15% 3/7/12 (Liquidity Facility U.S. Bank NA, Cincinnati) (c)(g) | 38,135 | | 38,135 |
Series Solar 07 94, 0.15% 3/7/12 (Liquidity Facility U.S. Bank NA, Cincinnati) (c)(g) | 2,692 | | 2,692 |
Vancouver Hsg. Auth. Rev. (Anthem Park at Uptown Village Proj.) 0.23% 3/7/12, LOC Bank of America NA, VRDN (c)(f) | 3,450 | | 3,450 |
Washington Econ. Dev. Fin. Auth. Econ. Dev. Rev. (Puget Sound Blood Ctr. Proj.) Series 2008 D, 0.15% 3/7/12, LOC Wells Fargo Bank NA, VRDN (c) | 9,855 | | 9,855 |
Washington Gen. Oblig.: | | | |
Bonds 5% 7/1/12 | 7,000 | | 7,112 |
Participating VRDN: | | | |
Series DB 599, 0.22% 3/7/12 (Liquidity Facility Deutsche Bank AG) (c)(g) | 4,770 | | 4,770 |
Series Floaters 3040, 0.26% 3/7/12 (Liquidity Facility Morgan Stanley Bank, West Valley City Utah) (c)(g) | 12,505 | | 12,505 |
Series GS 06 7T, 0.16% 3/7/12 (Liquidity Facility Wells Fargo & Co.) (c)(g) | 15,435 | | 15,435 |
Series MT 745, 0.22% 3/7/12 (Liquidity Facility Bank of America NA) (c)(g) | 26,465 | | 26,465 |
Series Putters 3501Z, 0.16% 3/7/12 (Liquidity Facility JPMorgan Chase Bank) (c)(g) | 11,660 | | 11,660 |
Series Putters 3539, 0.16% 3/7/12 (Liquidity Facility JPMorgan Chase Bank) (c)(g) | 10,000 | | 10,000 |
Series Putters 3854, 0.16% 3/7/12 (Liquidity Facility JPMorgan Chase Bank) (c)(g) | 3,500 | | 3,500 |
Series putters 4033, 0.16% 3/7/12 (Liquidity Facility JPMorgan Chase Bank) (c)(g) | 5,100 | | 5,100 |
Municipal Securities - continued |
| Principal Amount (000s) | | Value (000s) |
Washington - continued |
Washington Gen. Oblig.: - continued | | | |
Participating VRDN: | | | |
Series ROC II R 759 PB, 0.36% 3/7/12 (Liquidity Facility Deutsche Postbank AG) (c)(g) | $ 15,670 | | $ 15,670 |
Series Solar 06 13, 0.14% 3/7/12 (Liquidity Facility U.S. Bank NA, Cincinnati) (c)(g) | 33,415 | | 33,415 |
Washington Health Care Facilities Auth.: | | | |
(Fred Hutchinson Cancer Ctr. Proj.) Series 2011 B, 0.16% 3/7/12, LOC JPMorgan Chase Bank, VRDN (c) | 17,010 | | 17,010 |
(Swedish Health Svcs. Proj.): | | | |
Series 2011 B, 0.17% 3/7/12, LOC Citibank NA, VRDN (c) | 8,000 | | 8,000 |
Series 2011 C, 0.17% 3/7/12, LOC Citibank NA, VRDN (c) | 35,000 | | 35,000 |
Participating VRDN Series Putters 4038, 0.16% 3/7/12 (Liquidity Facility JPMorgan Chase Bank) (c)(g) | 5,000 | | 5,000 |
Washington Health Care Facilities Auth. Rev.: | | | |
(MultiCare Health Sys. Proj.): | | | |
Series 2009 A, 0.14% 3/7/12, LOC Wells Fargo Bank NA, VRDN (c) | 25,500 | | 25,500 |
Series 2009 B, 0.13% 3/7/12, LOC Wells Fargo Bank NA, VRDN (c) | 1,500 | | 1,500 |
(Southwest Washington Med. Ctr.) Series 2008 A, 0.16% 3/7/12, LOC Union Bank of California, VRDN (c) | 29,600 | | 29,600 |
Participating VRDN Series Solar 07 66, 0.14% 3/7/12 (Liquidity Facility U.S. Bank NA, Cincinnati) (c)(g) | 19,690 | | 19,690 |
Washington Hsg. Fin. Commission Multi-family Hsg. Rev.: | | | |
(Avalon Ridge Apts. Proj.) Series 1999, 0.17% 3/7/12, LOC Fannie Mae Guaranteed Mtg. pass-thru certificates, VRDN (c)(f) | 18,755 | | 18,755 |
(Ballard Landmark Inn Proj.) Series A, 0.17% 3/7/12, LOC Fed. Home Ln. Bank, San Francisco, VRDN (c)(f) | 27,290 | | 27,290 |
(Cedar Ridge Retirement Proj.) Series 2005 A, 0.18% 3/7/12, LOC Fed. Home Ln. Bank, San Francisco, VRDN (c)(f) | 8,050 | | 8,050 |
(Crestview Apts. Proj.) Series 2004, 0.16% 3/7/12, LOC Fannie Mae Guaranteed Mtg. pass-thru certificates, VRDN (c)(f) | 14,000 | | 14,000 |
(Discovery Heights Apt. Proj.) Series 2010, 0.21% 3/7/12, LOC Bank of America NA, VRDN (c) | 17,175 | | 17,175 |
(Echo Lake Sr. Apts. Proj.) Series 2006, 0.16% 3/7/12, LOC Fannie Mae Guaranteed Mtg. pass-thru certificates, VRDN (c)(f) | 17,970 | | 17,970 |
(Fairwinds Redmond Proj.) Series A, 0.17% 3/7/12, LOC Fed. Home Ln. Bank, San Francisco, VRDN (c)(f) | 19,250 | | 19,250 |
Municipal Securities - continued |
| Principal Amount (000s) | | Value (000s) |
Washington - continued |
Washington Hsg. Fin. Commission Multi-family Hsg. Rev.: - continued | | | |
(Gardens Univ. Village Apt. Proj.) Series A, 0.15% 3/7/12, LOC Fannie Mae Guaranteed Mtg. pass-thru certificates, VRDN (c)(f) | $ 48,540 | | $ 48,540 |
(Highland Park Apts. Proj.) Series A, 0.18% 3/7/12, LOC Fannie Mae Guaranteed Mtg. pass-thru certificates, VRDN (c)(f) | 9,040 | | 9,040 |
(Merrill Gardens at Renton Centre Proj.) Series A, 0.16% 3/7/12, LOC Fannie Mae Guaranteed Mtg. pass-thru certificates, VRDN (c)(f) | 20,790 | | 20,790 |
(Pinehurst Apts. Proj.) Series A, 0.17% 3/7/12, LOC Fannie Mae Guaranteed Mtg. pass-thru certificates, VRDN (c)(f) | 12,000 | | 12,000 |
(Seaport Landing Retirement Proj.) Series A, 0.17% 3/7/12, LOC Bank of America NA, VRDN (c)(f) | 11,880 | | 11,880 |
(Silver Creek Apts. Proj.) Series A, 0.17% 3/7/12, LOC Fannie Mae Guaranteed Mtg. pass-thru certificates, VRDN (c)(f) | 12,250 | | 12,250 |
(The Cambridge Apts. Proj.) Series 2009, 0.14% 3/7/12, LOC Fannie Mae Guaranteed Mtg. pass-thru certificates, VRDN (c) | 3,900 | | 3,900 |
(The Vintage at Everett Sr. Living Proj.) Series 2004 A, 0.16% 3/7/12, LOC Fannie Mae Guaranteed Mtg. pass-thru certificates, VRDN (c)(f) | 15,750 | | 15,750 |
(The Vintage at Richland Sr. Living Proj.) Series 2004 A, 0.18% 3/7/12, LOC Fannie Mae Guaranteed Mtg. pass-thru certificates, VRDN (c)(f) | 7,535 | | 7,535 |
(Vintage Mount Vernon Proj.) Series A, 0.18% 3/7/12, LOC Fannie Mae Guaranteed Mtg. pass-thru certificates, VRDN (c)(f) | 7,500 | | 7,500 |
(Washington Terrace Sr. Apts. Proj.) Series 2010, 0.14% 3/7/12, LOC Fannie Mae Guaranteed Mtg. pass-thru certificates, VRDN (c) | 3,750 | | 3,750 |
Washington Hsg. Fin. Commission Nonprofit Hsg. Rev. (Horizon House Proj.) Series 2005, 0.15% 3/7/12, LOC Wells Fargo Bank NA, VRDN (c) | 47,500 | | 47,500 |
Washington Hsg. Fin. Commission Nonprofit Rev. (YMCA of Pierce and Kitsap Countries Proj.): | | | |
Series 2010 A, 0.15% 3/7/12, LOC Wells Fargo Bank NA, VRDN (c) | 5,745 | | 5,745 |
Municipal Securities - continued |
| Principal Amount (000s) | | Value (000s) |
Washington - continued |
Washington Hsg. Fin. Commission Nonprofit Rev. (YMCA of Pierce and Kitsap Countries Proj.): - continued | | | |
Series 2010 B, 0.15% 3/7/12, LOC Wells Fargo Bank NA, VRDN (c) | $ 10,165 | | $ 10,165 |
Washington Pub. Pwr. Supply Sys. Nuclear Proj. #2 Rev. Bonds 5.4% 7/1/12 (Bonneville Pwr. Administration Guaranteed) | 47,150 | | 47,954 |
| | 1,007,276 |
West Virginia - 0.9% |
Grant County Cmnty. Solid Waste Disp. Rev. Bonds (Virginia Elec. & Pwr. Co. Proj.) Series 1996, 0.45% tender 3/21/12, CP mode (f) | 20,000 | | 20,000 |
Grant County Poll. Cont. Rev. Bonds (Virginia Elec. & Pwr. Co. Proj.) Series 1986, 1.25% tender 4/5/12, CP mode (f) | 7,400 | | 7,400 |
Harrison County Commission Solid Waste Disp. Rev. (Waste Mgmt., Inc. Proj.) Series A, 0.27% 3/7/12, LOC Bank of America NA, VRDN (c)(f) | 8,420 | | 8,420 |
Weirton Muni. Hosp. Bldg. Commission Hosp. Rev. (Weirton Med. Ctr., Inc. Proj.) Series 2001 B, 0.16% 3/7/12, LOC PNC Bank NA, VRDN (c) | 4,715 | | 4,715 |
West Virginia Econ. Dev. Auth. Energy (Morgantown Energy Associates Proj.) Series 2011, 0.16% 3/7/12, LOC Union Bank of California, VRDN (c)(f) | 16,200 | | 16,200 |
West Virginia Econ. Dev. Auth. Poll. Cont. Rev. (Ohio Pwr. Co. - Kammer Proj.) Series 2008 B, 0.13% 3/7/12, LOC Bank of Nova Scotia New York Branch, VRDN (c) | 4,200 | | 4,200 |
West Virginia Econ. Dev. Auth. Solid Waste Disp. Facilities Rev.: | | | |
(Appalachian Pwr. Co. - Amos Proj.): | | | |
Series 2008 B, 0.18% 3/7/12, LOC Mizuho Corporate Bank Ltd., VRDN (c)(f) | 20,275 | | 20,275 |
Series 2009 A, 0.15% 3/7/12, LOC Sumitomo Mitsui Banking Corp., VRDN (c) | 11,175 | | 11,175 |
Series 2009 B, 0.13% 3/7/12, LOC Sumitomo Mitsui Banking Corp., VRDN (c) | 10,800 | | 10,800 |
(Appalachian Pwr. Co. - Mountaineer Proj.) Series 2008 A, 0.14% 3/7/12, LOC Mizuho Corporate Bank Ltd., VRDN (c)(f) | 75,000 | | 75,000 |
West Virginia Gen. Oblig. Bonds Series 2005, 5% 6/1/12 | 3,920 | | 3,968 |
Municipal Securities - continued |
| Principal Amount (000s) | | Value (000s) |
West Virginia - continued |
West Virginia Hosp. Fin. Auth. Hosp. Rev. (West Virginia United Health Sys. Proj.) Series 2008 D, 0.28% 3/7/12, LOC Bank of America NA, VRDN (c) | $ 19,975 | | $ 19,975 |
Wood County Commission Solid Waste Disp. Rev. (Waste Mgmt., Inc. Proj.) Series A, 0.27% 3/7/12, LOC Bank of America NA, VRDN (c)(f) | 6,580 | | 6,580 |
| | 208,708 |
Wisconsin - 2.4% |
Appleton Redev. Auth. Rev. (Fox Cities Performing Arts Ctr. Proj.) Series 2001 B, 0.14% 3/7/12, LOC JPMorgan Chase Bank, VRDN (c) | 10,200 | | 10,200 |
Madison Gen. Oblig. Bonds Series 2010 E, 4% 10/1/12 | 2,300 | | 2,349 |
Milwaukee Gen. Oblig.: | | | |
Bonds Series 2011 N3, 4% 5/15/12 | 11,250 | | 11,335 |
Series C2: | | | |
0.12% 5/7/12, LOC State Street Bank & Trust Co., Boston, CP | 6,000 | | 6,000 |
0.15% 3/8/12, LOC State Street Bank & Trust Co., Boston, CP | 4,500 | | 4,500 |
0.15% 5/2/12, LOC State Street Bank & Trust Co., Boston, CP | 5,000 | | 5,000 |
River Falls Indl. Dev. Rev. (Quadion Corp. Proj.) 0.2% 3/7/12, LOC U.S. Bank NA, Cincinnati, VRDN (c)(f) | 1,010 | | 1,010 |
Wisconsin Gen. Oblig.: | | | |
Bonds: | | | |
Series 1, 5% 5/1/12 | 1,700 | | 1,714 |
Series C, 3% 5/1/12 | 11,215 | | 11,265 |
Series 2005 A: | | | |
0.12% 4/9/12 (Liquidity Facility State Street Bank & Trust Co., Boston) (Liquidity Facility California Teachers Retirement Sys.), CP | 16,041 | | 16,041 |
0.14% 4/3/12 (Liquidity Facility State Street Bank & Trust Co., Boston) (Liquidity Facility California Teachers Retirement Sys.), CP | 15,700 | | 15,700 |
Series 2006 A: | | | |
0.1% 4/9/12 (Liquidity Facility State Street Bank & Trust Co., Boston) (Liquidity Facility California Teachers Retirement Sys.), CP | 16,712 | | 16,712 |
0.12% 4/5/12 (Liquidity Facility State Street Bank & Trust Co., Boston) (Liquidity Facility California Teachers Retirement Sys.), CP | 11,300 | | 11,300 |
Municipal Securities - continued |
| Principal Amount (000s) | | Value (000s) |
Wisconsin - continued |
Wisconsin Gen. Oblig.: - continued | | | |
Series 2006 A: | | | |
0.2% 8/10/12 (Liquidity Facility State Street Bank & Trust Co., Boston) (Liquidity Facility California Teachers Retirement Sys.), CP | $ 13,763 | | $ 13,763 |
TAN Series 2011, 2% 6/15/12 | 144,500 | | 145,242 |
Wisconsin Health & Edl. Facilities Auth. Rev.: | | | |
Bonds (Ministry Health Care Proj.) Series 2011 A: | | | |
0.11% tender 4/5/12, LOC U.S. Bank NA, Cincinnati, CP mode | 29,230 | | 29,230 |
0.14% tender 4/3/12, LOC U.S. Bank NA, Cincinnati, CP mode | 15,380 | | 15,380 |
Participating VRDN ROC II R 11837, 0.16% 3/7/12 (Liquidity Facility Citibank NA) (c)(g) | 7,000 | | 7,000 |
Wisconsin Hsg. and Econ. Dev. Auth. Home Ownership Rev.: | | | |
Series 2002 I, 0.18% 3/7/12 (Liquidity Facility Fannie Mae Guaranteed Mtg. pass-thru certificates) (Liquidity Facility Freddie Mac), VRDN (c)(f) | 29,600 | | 29,600 |
Series 2003 B, 0.13% 3/7/12 (Liquidity Facility Fannie Mae Guaranteed Mtg. pass-thru certificates) (Liquidity Facility Freddie Mac), VRDN (c)(f) | 28,090 | | 28,090 |
Series 2008 A, 0.13% 3/7/12 (Liquidity Facility Fannie Mae Guaranteed Mtg. pass-thru certificates) (Liquidity Facility Freddie Mac), VRDN (c)(f) | 83,845 | | 83,845 |
Series D, 0.14% 3/7/12 (Liquidity Facility Fannie Mae Guaranteed Mtg. pass-thru certificates) (Liquidity Facility Freddie Mac), VRDN (c)(f) | 55,085 | | 55,085 |
Wisconsin Hsg. and Econ. Dev. Auth. Multifamily Hsg. Rev.: | | | |
Series 2007 A, 0.19% 3/7/12 (Liquidity Facility Fannie Mae Guaranteed Mtg. pass-thru certificates) (Liquidity Facility Freddie Mac), VRDN (c)(f) | 7,310 | | 7,310 |
Series 2008 A, 0.17% 3/7/12 (Liquidity Facility Fannie Mae Guaranteed Mtg. pass-thru certificates) (Liquidity Facility Freddie Mac), VRDN (c) | 10,740 | | 10,740 |
Wisconsin Trans. Rev.: | | | |
Series 1997 A: | | | |
0.09% 3/16/12 (Liquidity Facility State Street Bank & Trust Co., Boston) (Liquidity Facility California Teachers Retirement Sys.), CP | 10,413 | | 10,413 |
0.18% 3/8/12 (Liquidity Facility State Street Bank & Trust Co., Boston) (Liquidity Facility California Teachers Retirement Sys.), CP | 19,149 | | 19,149 |
Municipal Securities - continued |
| Principal Amount (000s) | | Value (000s) |
Wisconsin - continued |
Wisconsin Trans. Rev.: - continued | | | |
Series 2006 A: | | | |
0.18% 3/7/12 (Liquidity Facility State Street Bank & Trust Co., Boston) (Liquidity Facility California Teachers Retirement Sys.), CP | $ 9,746 | | $ 9,746 |
0.2% 8/10/12 (Liquidity Facility State Street Bank & Trust Co., Boston) (Liquidity Facility California Teachers Retirement Sys.), CP | 7,500 | | 7,500 |
| | 585,219 |
Wyoming - 0.4% |
Laramie County Indl. Dev. Rev. (Cheyenne Lt., Fuel & Pwr. Co. Proj.) Series 2009 A, 0.2% 3/7/12, LOC Wells Fargo Bank NA, VRDN (c)(f) | 5,000 | | 5,000 |
Wyoming Cmnty. Dev. Auth. Hsg. Rev.: | | | |
Series 2005-4, 0.16% 3/7/12 (Liquidity Facility Fannie Mae Guaranteed Mtg. pass-thru certificates) (Liquidity Facility Freddie Mac), VRDN (c)(f) | 4,735 | | 4,735 |
Series 2006-2, 0.16% 3/7/12 (Liquidity Facility Fannie Mae Guaranteed Mtg. pass-thru certificates) (Liquidity Facility Freddie Mac), VRDN (c)(f) | 8,000 | | 8,000 |
Series 2006-5, 0.16% 3/7/12 (Liquidity Facility Fannie Mae Guaranteed Mtg. pass-thru certificates) (Liquidity Facility Freddie Mac), VRDN (c)(f) | 10,000 | | 10,000 |
Series 2006-7, 0.16% 3/7/12 (Liquidity Facility Fannie Mae Guaranteed Mtg. pass-thru certificates) (Liquidity Facility Freddie Mac), VRDN (c)(f) | 10,000 | | 10,000 |
Series 2006-9, 0.16% 3/7/12 (Liquidity Facility Fannie Mae Guaranteed Mtg. pass-thru certificates) (Liquidity Facility Freddie Mac), VRDN (c)(f) | 10,000 | | 10,000 |
Series 2007-11, 0.16% 3/7/12 (Liquidity Facility Fannie Mae Guaranteed Mtg. pass-thru certificates) (Liquidity Facility Freddie Mac), VRDN (c)(f) | 12,000 | | 12,000 |
Series 2007-2, 0.16% 3/7/12 (Liquidity Facility Fannie Mae Guaranteed Mtg. pass-thru certificates) (Liquidity Facility Freddie Mac), VRDN (c)(f) | 6,000 | | 6,000 |
Series 2007-4, 0.16% 3/7/12 (Liquidity Facility Fannie Mae Guaranteed Mtg. pass-thru certificates) (Liquidity Facility Freddie Mac), VRDN (c)(f) | 14,000 | | 14,000 |
Municipal Securities - continued |
| Principal
Amount (000s) | | Value (000s) |
Wyoming - continued |
Wyoming Cmnty. Dev. Auth. Hsg. Rev.: - continued | | | |
Series 2007-8, 0.16% 3/7/12 (Liquidity Facility Fannie Mae Guaranteed Mtg. pass-thru certificates) (Liquidity Facility Freddie Mac), VRDN (c)(f) | $ 12,000 | | $ 12,000 |
Series 2008-2, 0.16% 3/7/12 (Liquidity Facility Fannie Mae Guaranteed Mtg. pass-thru certificates) (Liquidity Facility Freddie Mac), VRDN (c)(f) | 13,000 | | 13,000 |
| | 104,735 |
| Shares | | |
Other - 8.2% |
Fidelity Municipal Cash Central Fund, 0.15% (d)(e) | 2,008,362,134 | | 2,008,362 |
TOTAL INVESTMENT PORTFOLIO - 100.4% (Cost $24,546,352) | | 24,546,352 |
NET OTHER ASSETS (LIABILITIES) - (0.4)% | | (85,685) |
NET ASSETS - 100% | $ 24,460,667 |
Fidelity® Municipal Money Market Fund (the Fund) is a fund of Fidelity Union Street Trust II (the Trust) and is authorized to issue an unlimited number of shares. The Trust is registered under the Investment Company Act of 1940, as amended (the 1940 Act), as an open-end management investment company organized as a Delaware statutory trust.
The Fund invests in Fidelity Central Funds, which are open-end investment companies available only to other investment companies and accounts managed by Fidelity Management & Research Company (FMR) and its affiliates. The Fund's Schedule of Investments lists each of the Fidelity Central Funds held as of period end, if any, as an investment of the Fund, but does not include the underlying holdings of each Fidelity Central Fund. As an Investing Fund, the Fund indirectly bears its proportionate share of the expenses of the underlying Fidelity Central Funds.
The Money Market Central Funds seek preservation of capital and current income and are managed by Fidelity Investments Money Management, Inc. (FIMM), an affiliate of FMR.
A complete unaudited list of holdings for each Fidelity Central Fund is available upon request or at the Securities and Exchange Commission (the SEC) web site at www.sec.gov. In addition, the financial statements of the Fidelity Central Funds are available on the SEC web site or upon request.
The financial statements have been prepared in conformity with accounting principles generally accepted in the United States of America (GAAP), which require management to make certain estimates and assumptions at the date of the financial statements. Actual results could differ from those estimates. Subsequent events, if any, through the date that the financial statements were issued have been evaluated in the preparation of the financial statements. The following summarizes the significant accounting policies of the Fund:
Level 2 - other significant observable inputs (including quoted prices for similar investments, interest rates, prepayment speeds, etc.)
Level 3 - unobservable inputs (including the Fund's own assumptions based on the best information available)
As permitted by compliance with certain conditions under Rule 2a-7 of the 1940 Act, securities are valued at amortized cost, which approximates fair value. The amortized cost of an instrument is determined by valuing it at its original cost and thereafter amortizing any discount or premium from its face value at a constant rate until maturity. Securities held by a money market fund are generally high quality and liquid; however, they are reflected as Level 2 because the inputs used to determine fair value are not quoted prices in an active market.
Dividends are declared and recorded daily and paid monthly from net investment income. Distributions from realized gains, if any, are declared and recorded on the
ex-dividend date. Income and capital gain distributions are determined in accordance with income tax regulations, which may differ from GAAP.
Capital accounts within the financial statements are adjusted for permanent book-tax differences. These adjustments have no impact on net assets or the results of operations. Temporary book-tax differences will reverse in a subsequent period.
Book-tax differences are primarily due to deferred trustees compensation and market discount.
The Fund purchases municipal securities whose interest, in the opinion of the issuer, is free from federal income tax. There is no assurance that the IRS will agree with this opinion. In the event the IRS determines that the issuer does not comply with relevant tax requirements, interest payments from a security could become federally taxable, possibly retroactively to the date the security was issued.
The federal tax cost of investment securities and unrealized appreciation (depreciation) as of period end were as follows:
perform under the contract's terms, or if the issuer does not issue the securities due to political, economic, or other factors.
Citibank also has a sub-arrangement with Fidelity Service Company, Inc. (FSC), an affiliate of FMR, under which FSC maintains the Fund's accounting records. The fee is based on the level of average net assets for the month.
FMR or its affiliates voluntarily agreed to waive certain fees in order to maintain a minimum annualized yield of .01%. Such arrangements may be discontinued by FMR at any time. For the period, the amount of the waiver was $32,536.
Through arrangements with the Fund's custodian, credits realized as a result of uninvested cash balances were used to reduce the Fund's expenses. During the period, these credits reduced the Fund's custody expenses by $8.
The Fund's organizational documents provide former and current trustees and officers with a limited indemnification against liabilities arising in connection with the performance of their duties to the Fund. In the normal course of business, the Fund may also enter into contracts that provide general indemnifications. The Fund's maximum exposure under these arrangements is unknown as this would be dependent on future claims that may be made against the Fund. The risk of material loss from such claims is considered remote.
Each year, the Board of Trustees, including the Independent Trustees (together, the Board), votes on the renewal of the management contract and sub-advisory agreements (together, the Advisory Contracts) for the fund. The Board, assisted by the advice of fund counsel and Independent Trustees' counsel, requests and considers a broad range of information relevant to the renewal of the Advisory Contracts throughout the year.
The Board meets regularly and considers at each of its meetings factors that are relevant to its annual consideration of the renewal of the fund's Advisory Contracts, including the services and support provided to the fund and its shareholders. The Board has established three standing committees, Operations, Audit, and Nominating and Governance, each composed of Independent Trustees with varying backgrounds, to which the Board has assigned specific subject matter responsibilities in order to enhance effective decision-making by the Board. The Operations Committee, of which all of the Independent Trustees are members, meets regularly throughout the year and, among other matters, considers matters specifically related to the annual consideration of the renewal of the fund's Advisory Contracts. The Board, acting directly and through its Committees, requests and receives information concerning the annual consideration of the renewal of the fund's Advisory Contracts. The Board also meets as needed to consider matters specifically related to the Board's annual consideration of the renewal of Advisory Contracts. Members of the Board may also meet with trustees of other Fidelity funds through ad hoc joint committees to discuss certain matters relevant to the Fidelity funds.
At its September 2011 meeting, the Board of Trustees, including the Independent Trustees, unanimously determined to renew the fund's Advisory Contracts. In reaching its determination, the Board considered all factors it believed relevant, including (i) the nature, extent, and quality of the services to be provided to the fund and its shareholders (including the investment performance of the fund); (ii) the competitiveness of the fund's management fee and total expense ratio; (iii) the total costs of the services to be provided by and the profits to be realized by Fidelity from its relationship with the fund; (iv) the extent to which economies of scale would be realized as the fund grows; and (v) whether fee levels reflect these economies of scale, if any, for the benefit of fund shareholders.
In considering whether to renew the Advisory Contracts for the fund, the Board reached a determination, with the assistance of fund counsel and Independent Trustees' counsel and through the exercise of its business judgment, that the renewal of the Advisory Contracts is in the best interests of the fund and its shareholders and that the compensation payable under the Advisory Contracts is fair and reasonable. The Board's decision to renew the Advisory Contracts was not based on any single factor, but rather was based on a comprehensive consideration of all the information provided to the Board at its meetings throughout the year. The Board, in reaching its determination to renew the Advisory Contracts, is aware that shareholders in the fund have a broad range of investment choices available to them, including a wide choice among mutual funds offered by Fidelity's competitors, and that the fund's shareholders, who have the opportunity to review and weigh the disclosure provided by the fund in its prospectus and other public disclosures, have chosen to invest in this fund, managed by Fidelity.
The Board noted that the growth of fund assets over time across the complex allows Fidelity to reinvest in the development of services designed to enhance the value or convenience of the Fidelity funds as investment vehicles. These services include 24-hour access to account information and market information through telephone representatives and over the Internet, investor education materials and asset allocation tools, and the expanded availability of Fidelity Investor Centers, with 35 new branches opening since 2010.
The Board reviewed the fund's relative investment performance against its peer group and noted that the performance of the fund was in the third quartile for the one-year period, the second quartile for the three-year period, and the first quartile for the five-year period. The Board considered that FMR had taken steps to provide shareholders with stability of principal and to enhance safety and liquidity. The Board also reviewed the fund's performance since inception as well as performance in the current year.
Based on its review, the Board concluded that the nature, extent, and quality of services provided to the fund under the Advisory Contracts should benefit the fund's shareholders.
The Board noted that the fund's management fee ranked below the median of its Total Mapped Group and below the median of its ASPG for 2010.
Based on its review, the Board concluded that the fund's management fee is fair and reasonable in light of the services that the fund receives and the other factors considered.
The Board noted that the fund's total expense ratio ranked below its competitive median for 2010. The Board considered that Fidelity has been voluntarily waiving part or all of the transfer agent fees and/or management fees to maintain a minimum yield, and also noted that Fidelity retains the ability to be repaid in certain circumstances.
Based on its review of total expense ratios and fees charged to other Fidelity clients, the Board concluded that the fund's total expense ratio was reasonable in light of the services that the fund and its shareholders receive and the other factors considered, including the findings of the Committee.
PricewaterhouseCoopers LLP (PwC), independent registered public accounting firm and auditor to Fidelity and certain Fidelity funds, has been engaged annually by the Board as part of the Board's assessment of Fidelity's profitability analysis. PwC's engagement includes the review and assessment of Fidelity's methodologies used in determining the revenues and expenses attributable to Fidelity's mutual fund business, and completion of agreed-upon procedures surrounding the mathematical accuracy of fund profitability and its conformity to allocation methodologies. After considering PwC's reports issued under the engagement and information provided by Fidelity, the Board concluded that while other allocation methods may also be reasonable, Fidelity's profitability methodologies are reasonable in all material respects.
The Board also reviewed Fidelity's non-fund businesses and fall-out benefits related to the mutual fund business as well as cases where Fidelity's affiliates may benefit from or be related to the fund's business.
The Board considered the costs of the services provided by and the profits realized by Fidelity in connection with the operation of the fund and was satisfied that the profitability was not excessive in the circumstances.
The Board recognized that the fund's management contract incorporates a "group fee" structure, which provides for lower group fee rates as total fund assets under FMR's management increase, and for higher group fee rates as total fund assets under FMR's management decrease. FMR calculates the group fee rates based on a tiered asset "breakpoint" schedule that varies based on asset class. The Board considered that the group fee is designed to deliver the benefits of economies of scale to fund shareholders when total Fidelity fund assets increase, even if assets of any particular fund are unchanged or have declined, because some portion of Fidelity's costs are attributable to services provided to all Fidelity funds, and all funds benefit if those costs can be allocated among more assets. The Board concluded that, given the group fee structure, fund shareholders will benefit from lower management fees as assets under FMR's management increase at the fund complex level, regardless of whether Fidelity achieves any such economies of scale.
The Board concluded, taking into account the analysis of the Economies of Scale Committee, that any potential economies of scale are being appropriately shared between fund shareholders and Fidelity.
Based on its evaluation of all of the conclusions noted above, and after considering all factors it believed relevant, the Board ultimately concluded that the advisory fee structures are fair and reasonable, and that the fund's Advisory Contracts should be renewed.
Item 2. Code of Ethics
Not applicable.
Item 3. Audit Committee Financial Expert
Not applicable.
Item 4. Principal Accountant Fees and Services
Not applicable.
Item 5. Audit Committee of Listed Registrants
Not applicable.
Item 6. Investments
(a) Not applicable.
Not applicable.
Not applicable.
Item 9. Purchase of Equity Securities by Closed-End Management Investment Company and Affiliated Purchasers
Not applicable.
There were no material changes to the procedures by which shareholders may recommend nominees to the Fidelity Union Street Trust II's Board of Trustees.
(a)(i) The President and Treasurer and the Chief Financial Officer have concluded that the Fidelity Union Street Trust II's (the "Trust") disclosure controls and procedures (as defined in Rule 30a-3(c) under the Investment Company Act) provide reasonable assurances that material information relating to the Trust is made known to them by the appropriate persons, based on their evaluation of these controls and procedures as of a date within 90 days of the filing date of this report.
(a)(ii) There was no change in the Trust's internal control over financial reporting (as defined in Rule 30a-3(d) under the Investment Company Act) that occurred during the second fiscal quarter of the period covered by this report that has materially affected, or is reasonably likely to materially affect, the Trust's internal control over financial reporting.
Pursuant to the requirements of the Securities Exchange Act of 1934 and the Investment Company Act of 1940, the registrant has duly caused this report to be signed on its behalf by the undersigned, thereunto duly authorized.
Pursuant to the requirements of the Securities Exchange Act of 1934 and the Investment Company Act of 1940, this report has been signed below by the following persons on behalf of the registrant and in the capacities and on the dates indicated.


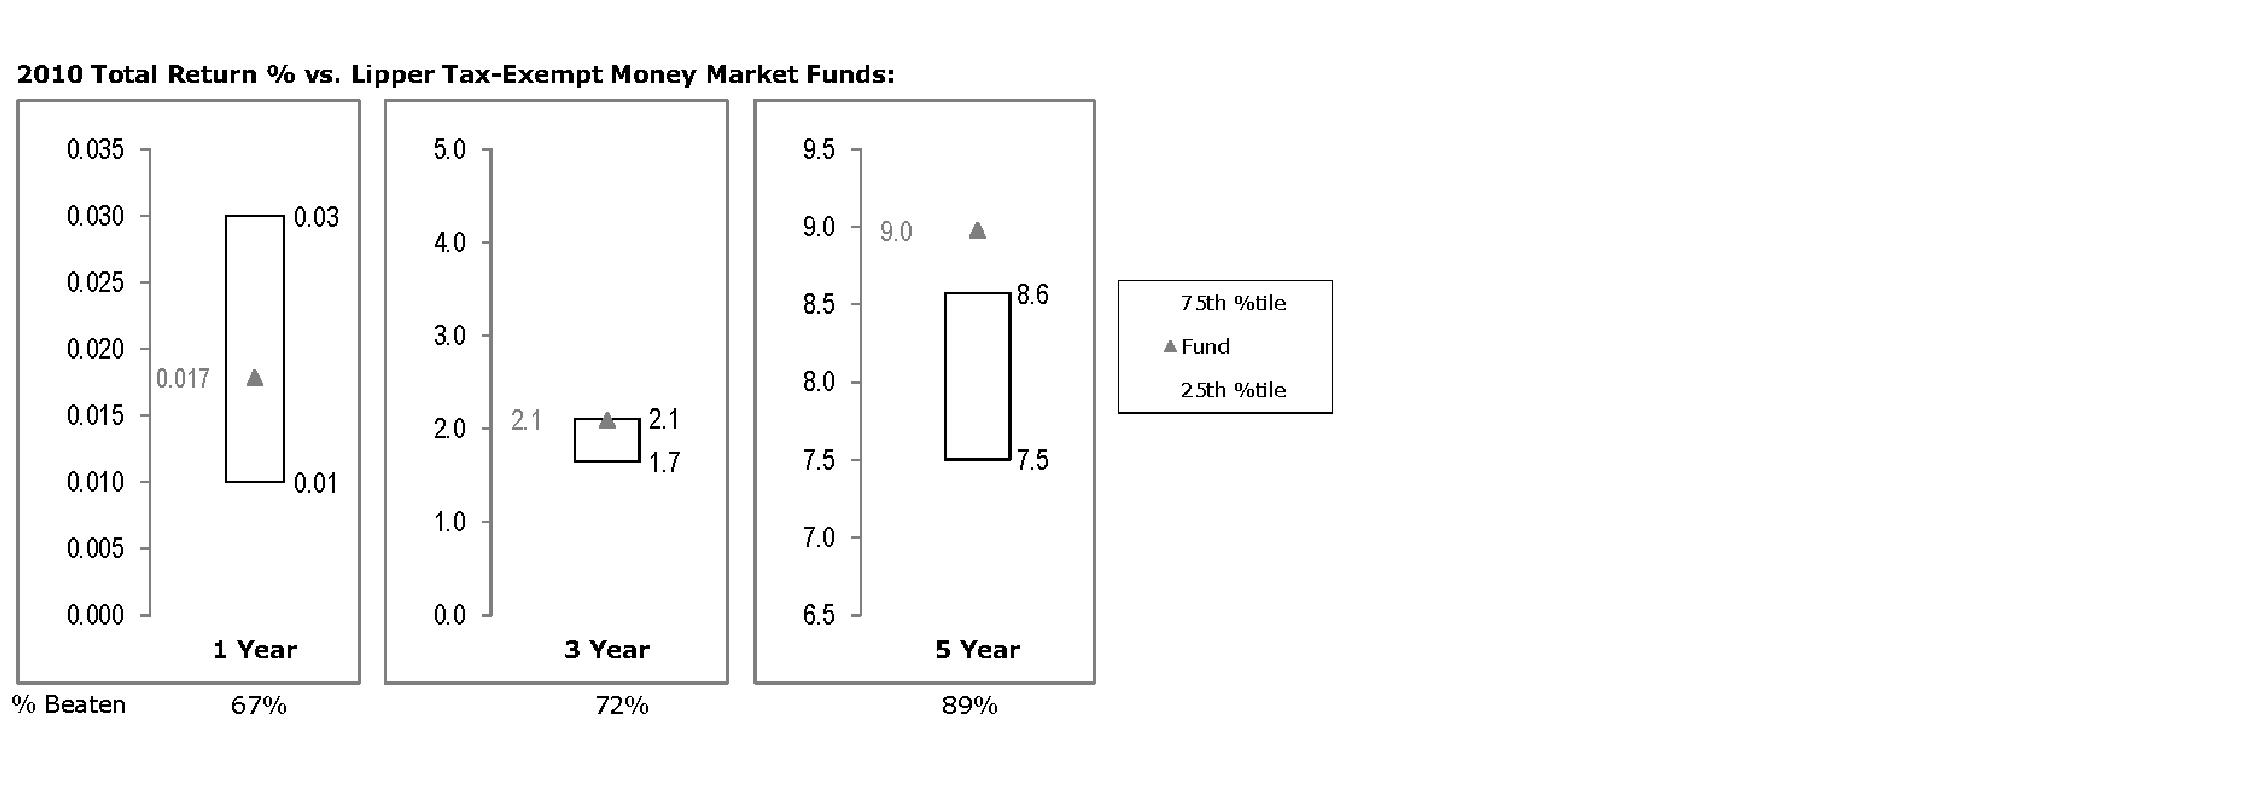
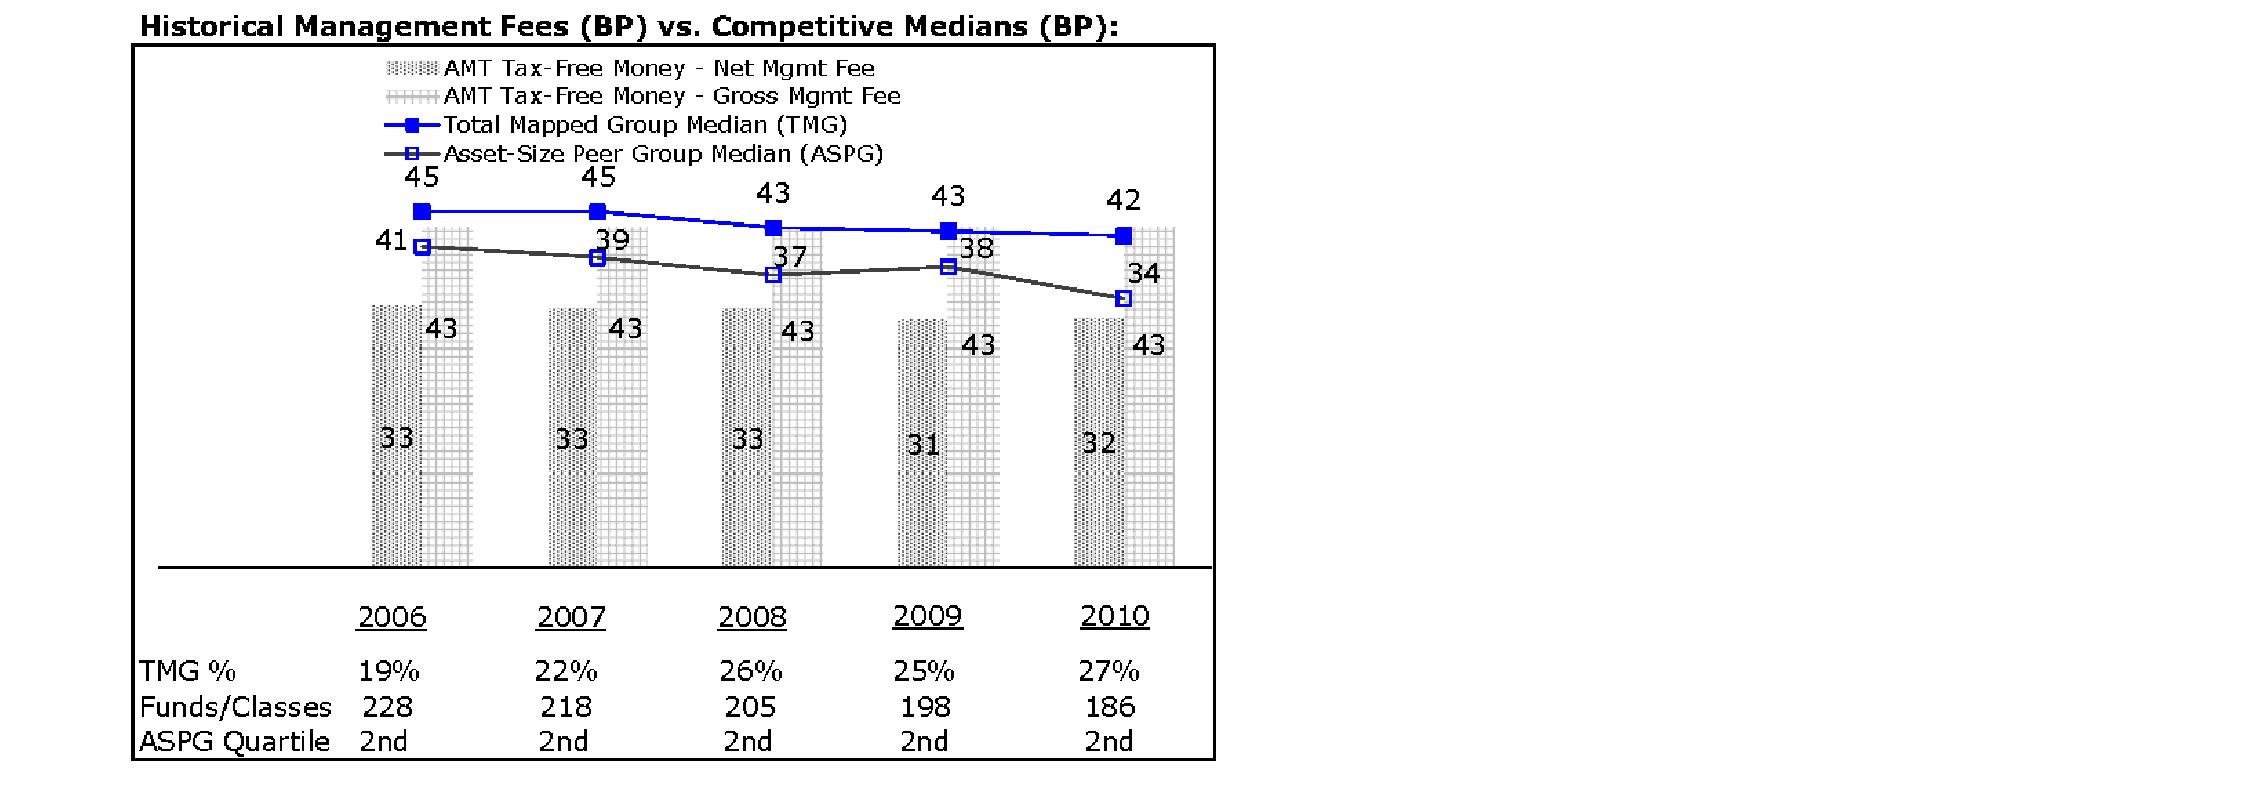
 1-800-544-5555