UNITED STATES
SECURITIES AND EXCHANGE COMMISSION
Washington, D.C. 20549
FORM N-CSR
CERTIFIED SHAREHOLDER REPORT OF REGISTERED
MANAGEMENT INVESTMENT COMPANIES
Investment Company Act file number 811-6452
Fidelity Union Street Trust II
(Exact name of registrant as specified in charter)
82 Devonshire St., Boston, Massachusetts 02109
(Address of principal executive offices) (Zip code)
Scott C. Goebel, Secretary
82 Devonshire St.
Boston, Massachusetts 02109
(Name and address of agent for service)
Registrant's telephone number, including area code: 617-563-7000
Date of fiscal year end: | August 31 |
| |
Date of reporting period: | February 28, 2011 |
Item 1. Reports to Stockholders
Fidelity®
AMT Tax-Free Money
Fund
Semiannual Report
February 28, 2011
(2_fidelity_logos) (Registered_Trademark)
Contents
Chairman's Message | <Click Here> | The Chairman's message to shareholders. |
Shareholder Expense Example | <Click Here> | An example of shareholder expenses. |
Investment Changes | <Click Here> | A summary of major shifts in the fund's investments over the past six months and one year. |
Investments | <Click Here> | A complete list of the fund's investments. |
Financial Statements | <Click Here> | Statements of assets and liabilities, operations, and changes in net assets,
as well as financial highlights. |
Notes | <Click Here> | Notes to the financial statements. |
Board Approval of Investment Advisory Contracts and Management Fees | <Click Here> | |
To view a fund's proxy voting guidelines and proxy voting record for the 12-month period ended June 30, visit http://www.fidelity.com/proxyvotingresults or visit the Securities and Exchange Commission's (SEC) web site at http://www.sec.gov. You may also call 1-800-544-8544 to request a free copy of the proxy voting guidelines.
Standard & Poor's, S&P and S&P 500 are registered service marks of The McGraw-Hill Companies, Inc. and have been licensed for use by Fidelity Distributors Corporation.
Other third party marks appearing herein are the property of their respective owners.
All other marks appearing herein are registered or unregistered trademarks or service marks of FMR LLC or an affiliated company.
This report and the financial statements contained herein are submitted for the general information of the shareholders of the fund. This report is not authorized for distribution to prospective investors in the fund unless preceded or accompanied by an effective prospectus.
A fund files its complete schedule of portfolio holdings with the SEC for the first and third quarters of each fiscal year on Form N-Q. Forms N-Q are available on the SEC's web site at http://www.sec.gov. A fund's Forms N-Q may be reviewed and copied at the SEC's Public Reference Room in Washington, DC. Information regarding the operation of the SEC's Public Reference Room may be obtained by calling 1-800-SEC-0330. For a complete list of a fund's portfolio holdings, view the most recent holdings listing, semiannual report, or annual report on Fidelity's web site at http://www.fidelity.com, http://www.advisor.fidelity.com, or http://www.401k.com, as applicable.
NOT FDIC INSURED • MAY LOSE VALUE • NO BANK GUARANTEE
Neither the fund nor Fidelity Distributors Corporation is a bank.
Semiannual Report
(photo_of_Abigail_P_Johnson)
Dear Shareholder:
Following a year in which the investment environment was volatile but generally supportive of most major asset classes, 2011 has begun on a positive note. U.S. equities gained ground in January and February, reaching their highest point since June 2008, amid indications the U.S. economy had turned a corner. Still, questions remained about the longer-term outlook, most notably persistently high unemployment. Financial markets are always unpredictable, of course, but there also are several time-tested investment principles that can help put the odds in your favor.
One of the basic tenets is to invest for the long term. Over time, riding out the markets' inevitable ups and downs has proven much more effective than selling into panic or chasing the hottest trend. Even missing only a few of the markets' best days can significantly diminish investor returns. Patience also affords the benefits of compounding - of earning interest on additional income or reinvested dividends and capital gains. There can be tax advantages and cost benefits to consider as well. While staying the course doesn't eliminate risk, it can considerably lessen the effect of short-term declines.
You can further manage your investing risk through diversification. And today, more than ever, geographic diversification should be taken into account. Studies indicate that asset allocation is the single most important determinant of a portfolio's long-term success. The right mix of stocks, bonds and cash - aligned to your particular risk tolerance and investment objective - is very important. Age-appropriate rebalancing is also an essential aspect of asset allocation. For younger investors, an emphasis on equities - which historically have been the best-performing asset class over time - is encouraged. As investors near their specific goal, such as retirement or sending a child to college, consideration may be given to replacing volatile assets (e.g. common stocks) with more-stable fixed investments (bonds or savings plans).
A third principle - investing regularly - can help lower the average cost of your purchases. Investing a certain amount of money each month or quarter helps ensure you won't pay for all your shares at market highs. This strategy - known as dollar cost averaging - also reduces "emotion" from investing, helping shareholders avoid selling weak performers just prior to an upswing, or chasing a hot performer just before a correction.
We invite you to contact us via the Internet, through our Investor Centers or by phone. It is our privilege to provide you the information you need to make the investments that are right for you.
Sincerely,
(The chairman's signature appears here.)
Abigail P. Johnson
Semiannual Report
Shareholder Expense Example
As a shareholder of the Fund, you incur two types of costs: (1) transaction costs, and (2) ongoing costs, including management fees and other Fund expenses. This Example is intended to help you understand your ongoing costs (in dollars) of investing in the Fund and to compare these costs with the ongoing costs of investing in other mutual funds.
The Example is based on an investment of $1,000 invested at the beginning of the period and held for the entire period (September 1, 2010 to February 28, 2011).
Actual Expenses
The first line of the accompanying table provides information about actual account values and actual expenses. You may use the information in this line, together with the amount you invested, to estimate the expenses that you paid over the period. Simply divide your account value by $1,000.00 (for example, an $8,600 account value divided by $1,000.00 = 8.6), then multiply the result by the number in the first line under the heading entitled "Expenses Paid During Period" to estimate the expenses you paid on your account during this period. A small balance maintenance fee of $12.00 that is charged once a year may apply for certain accounts with a value of less than $2,000. This fee is not included in the table below. If it was, the estimate of expenses you paid during the period would be higher, and your ending account value lower, by this amount. In addition, the Fund, as a shareholder in the underlying Fidelity Central Funds, will indirectly bear its pro-rata share of the fees and expenses incurred by the underlying Fidelity Central Funds. These fees and expenses are not included in the Fund's annualized expense ratio used to calculate the expense estimate in the table below.
Hypothetical Example for Comparison Purposes
The second line of the accompanying table provides information about hypothetical account values and hypothetical expenses based on the Fund's actual expense ratio and an assumed rate of return of 5% per year before expenses, which is not the Fund's actual return. The hypothetical account values and expenses may not be used to estimate the actual ending account balance or expenses you paid for the period. You may use this information to compare the ongoing costs of investing in the Fund and other funds. To do so, compare this 5% hypothetical example with the 5% hypothetical examples that appear in the shareholder reports of the other funds. A small balance maintenance fee of $12.00 that is charged once a year may apply for certain accounts with a value of less than $2,000. This fee is not included in the table below. If it was, the estimate of expenses you paid during the period would be higher, and your ending account value lower, by this amount. In addition, the Fund, as a shareholder in the underlying Fidelity Central Funds, will indirectly bear its pro-rata share of the fees and expenses incurred by the underlying Fidelity Central Funds. These fees and expenses are not included in the Fund's annualized expense ratio used to calculate the expense estimate in the table below.
Please note that the expenses shown in the table are meant to highlight your ongoing costs only and do not reflect any transaction costs. Therefore, the second line of the table is useful in comparing ongoing costs only, and will not help you determine the relative total costs of owning different funds.
Semiannual Report
Shareholder Expense Example - continued
| Annualized
Expense Ratio | Beginning
Account Value
September 1, 2010 | Ending
Account Value
February 28, 2011 | Expenses Paid
During Period*
September 1, 2010
to February 28, 2011 |
Actual | .32% | $ 1,000.00 | $ 1,000.10 | $ 1.59 |
Hypothetical (5% return per year before expenses) | | $ 1,000.00 | $ 1,023.21 | $ 1.61 |
* Expenses are equal to the Fund's annualized expense ratio, multiplied by the average account value over the period, multiplied by 181/365 (to reflect the one-half year period).
Semiannual Report
Investment Changes (Unaudited)
Weighted Average Maturity Diversification |
Days | % of fund's investments 2/28/11 | % of fund's investments 8/31/10 | % of fund's
investments
2/28/10 |
0 - 30 | 81.8 | 86.1 | 83.9 |
31 - 90 | 7.3 | 5.9 | 5.6 |
91 - 180 | 9.1 | 4.6 | 8.0 |
181 - 397 | 1.8 | 3.4 | 2.5 |
Weighted Average Maturity |
| 2/28/11 | 8/31/10 | 2/28/10 |
Fidelity AMT Tax-Free Money Fund | 24 Days | 24 Days | 24 Days |
All Tax-Free Money Market Funds Average* | 28 Days | 30 Days | 27 Days |
This is a weighted average of all the maturities of the securities held in a fund. Weighted Average Maturity (WAM) can be used as a measure of sensitivity to interest rate changes and markets changes. Generally, the longer the maturity, the greater the sensitivity to such changes. WAM is based on the dollar-weighted average length of time until principal payments must be paid. Depending on the types of securities held in a fund, certain maturity shortening devices (e.g., demand features, interest rate resets, and call options) may be taken into account when calculating the WAM. |
Weighted Average Life |
| 2/28/11 | 8/31/10 | 2/28/10 |
Fidelity AMT Tax-Free Money Fund | 24 Days | 24 Days | n/a** |
Weighted Average Life (WAL) is the weighted average of the life of the securities held in a fund or portfolio and can be used as a measure of sensitivity to changes in liquidity and/or credit risk. Generally, the higher the value, the greater the sensitivity. WAL is based on the dollar-weighted average length of time until principal payments must be paid, taking into account any call options exercised by the issuer and any permissible maturity shortening features other than interest rate resets. The difference between WAM and WAL is that WAM takes into account interest rate resets and WAL does not. WAL for money market funds is not the same as WAL of a mortgage- or asset-backed security. |
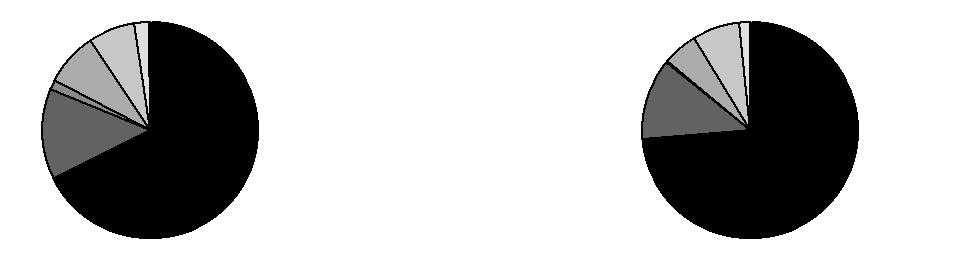
Asset Allocation (% of fund's net assets) |
As of February 28, 2011 | As of August 31, 2010 |
 | Variable Rate
Demand Notes
(VRDNs) 67.7% | | | Variable Rate
Demand Notes
(VRDNs) 74.4% | |
 | Commercial Paper
(including
CP Mode) 13.5% | | | Commercial Paper
(including
CP Mode) 12.1% | |
 | Tender Bonds 1.6% | | | Tender Bonds 0.3% | |
 | Municipal Notes 7.9% | | | Municipal Notes 5.3% | |
 | Fidelity Tax-Free
Cash Central Fund 7.0% | | | Fidelity Tax-Free
Cash Central Fund 7.1% | |
 | Other Investments 2.1% | | | Other Investments 1.7% | |
 | Net Other Assets 0.2% | |  | Net Other Assets† (0.9)% | |
* Source: iMoneyNet, Inc.
** Information not available
† Net Other Assets are not included in the pie chart.
Semiannual Report
Investments February 28, 2011 (Unaudited)
Showing Percentage of Net Assets
Municipal Securities - 99.8% |
| Principal Amount (000s) | | Value (000s) |
Alabama - 1.0% |
Daphne-Villa Mercy Spl. Care Facilities Fing. Auth. Rev. (Mercy Med. Hosp. Proj.) 0.25%, LOC Wells Fargo Bank NA, VRDN (a) | $ 13,100 | | $ 13,100 |
Mobile Indl. Dev. Board Dock & Wharf Rev. (Holnam, Inc. Proj.) Series 1999 A, 0.26%, LOC Bayerische Landesbank Girozentrale, VRDN (a) | 1,990 | | 1,990 |
| | 15,090 |
Alaska - 2.0% |
Alaska Hsg. Fin. Corp. Participating VRDN Series Solar 06 22, 0.25% (Liquidity Facility U.S. Bank NA, Minnesota) (a)(e) | 4,605 | | 4,605 |
Valdez Marine Term. Rev.: | | | |
(ConocoPhillips Proj.) Series 1994 A, 0.26%, VRDN (a) | 21,000 | | 21,000 |
(Phillips Trans. Alaska, Inc. Proj.) Series 1994 B, 0.26% (ConocoPhillips Guaranteed), VRDN (a) | 4,100 | | 4,100 |
| | 29,705 |
Arizona - 1.9% |
Chandler Gen. Oblig. Participating VRDN Series GS 07 49TP, 0.26% (Liquidity Facility Wells Fargo & Co.) (a)(e) | 10,695 | | 10,695 |
Glendale Indl. Dev. Auth. (Midwestern Univ. Proj.) Series 2008, 0.26%, LOC Bank of America NA, VRDN (a) | 1,200 | | 1,200 |
Phoenix Indl. Dev. Auth. Multi-family Hsg. Rev. (Del Mar Terrance Apts. Proj.) Series 1999 A, 0.28%, LOC Freddie Mac, VRDN (a) | 10,500 | | 10,500 |
Salt River Proj. Agricultural Impt. & Pwr. District Elec. Sys. Rev. Participating VRDN: | | | |
Series Putters 3467, 0.26% (Liquidity Facility JPMorgan Chase Bank) (a)(e) | 2,115 | | 2,115 |
Series ROC II R 11712, 0.26% (Liquidity Facility Citibank NA) (a)(e) | 1,000 | | 1,000 |
Tempe Indl. Dev. Auth. Rev. (ASUF Brickyard Proj.) Series 2004 A, 0.32%, LOC Bank of America NA, VRDN (a) | 3,500 | | 3,500 |
| | 29,010 |
California - 2.1% |
California Gen. Oblig.: | | | |
Series 2004 A7, 0.27%, LOC Citibank NA, LOC California Teachers Retirement Sys., VRDN (a) | 1,000 | | 1,000 |
0.3% 3/3/11, LOC Dexia Cr. Local de France, LOC Royal Bank of Canada, CP | 3,800 | | 3,800 |
California Statewide Cmntys. Dev. Auth. Gas Supply Rev. Series 2010, 0.25% (Liquidity Facility Royal Bank of Canada), VRDN (a) | 2,700 | | 2,700 |
Municipal Securities - continued |
| Principal Amount (000s) | | Value (000s) |
California - continued |
Los Angeles Gen. Oblig. TRAN: | | | |
2% 3/31/11 | $ 2,000 | | $ 2,002 |
2% 4/21/11 | 5,400 | | 5,411 |
Los Angeles Unified School District TRAN Series A, 2% 6/30/11 | 4,600 | | 4,620 |
Orange County Sanitation District Ctfs. of Prtn. Participating VRDN Series ROC II R 11304, 0.26% (Liquidity Facility Citibank NA) (a)(e) | 6,970 | | 6,970 |
Orange County Sanitation District Rev. BAN Series 2010 B, 2% 11/23/11 | 4,000 | | 4,048 |
Orange County Spl. Fing. Auth. Teeter Plan Rev. 0.3% 3/1/11, LOC Dexia Cr. Local de France, CP | 1,000 | | 1,000 |
| | 31,551 |
Colorado - 3.1% |
Adams County Rev. (Adams Mental Health Foundation Prog.) Series 1997, 0.78%, LOC JPMorgan Chase Bank, VRDN (a) | 935 | | 935 |
Colorado Ed. Ln. Prog. TRAN Series 2010 D, 2% 6/30/11 | 12,600 | | 12,670 |
Colorado Edl. & Cultural Facilities Auth. Rev. (Clyfford Still Museum Proj.) Series 2008, 0.25%, LOC Wells Fargo Bank NA, VRDN (a) | 1,000 | | 1,000 |
Colorado Health Facilities Auth. Retirement Hsg. Rev. Participating VRDN Series Putters 1390, 0.26% (Liquidity Facility JPMorgan Chase Bank) (a)(e) | 1,685 | | 1,685 |
Colorado Health Facilities Auth. Rev.: | | | |
(Catholic Health Initiatives Proj.) Series 2004 B: | | | |
0.26% (Liquidity Facility Landesbank Hessen-Thuringen), VRDN (a) | 600 | | 600 |
0.28% (Liquidity Facility Landesbank Hessen-Thuringen), VRDN (a) | 2,500 | | 2,500 |
Participating VRDN Series Putters 2999, 0.31% (Liquidity Facility JPMorgan Chase Bank) (a)(e) | 6,245 | | 6,245 |
Colorado Reg'l. Trans. District Sales Tax Rev. Participating VRDN Series EGL 07 0040, 0.26% (Liquidity Facility Citibank NA) (a)(e) | 3,700 | | 3,700 |
Colorado Springs Utils. Rev. Series 2000 A, 0.27%, VRDN (a) | 7,225 | | 7,225 |
Mesa County Econ. Dev. Rev. (Leitner-Poma of America, Inc. Proj.) Series 2009, 0.35%, LOC Wells Fargo Bank NA, VRDN (a) | 8,000 | | 8,000 |
Univ. of Colorado Hosp. Auth. Rev. Series 2008 B, 0.25%, LOC Wells Fargo Bank NA, VRDN (a) | 2,400 | | 2,400 |
| | 46,960 |
Municipal Securities - continued |
| Principal Amount (000s) | | Value (000s) |
Connecticut - 1.9% |
Connecticut Dev. Auth. Poll. Cont. Rev. Bonds (New England Pwr. Co. Proj.) 0.75% tender 3/1/11, CP mode | $ 4,900 | | $ 4,900 |
Connecticut Gen. Oblig.: | | | |
BAN: | | | |
Series 2009 B, 4% 6/1/11 | 5,400 | | 5,449 |
Series 2010 A, 2% 5/19/11 | 6,100 | | 6,120 |
Series 2004 A, 0.33% (Liquidity Facility Landesbank Hessen-Thuringen), VRDN (a) | 4,000 | | 4,000 |
Connecticut Health & Edl. Facilities Auth. Rev.: | | | |
Participating VRDN Series BBT 08 17, 0.25% (Liquidity Facility Branch Banking & Trust Co.) (a)(e) | 3,000 | | 3,000 |
Participating VRDN Series EGL 7 05 3031, 0.26% (Liquidity Facility Citibank NA) (a)(e) | 4,300 | | 4,300 |
| | 27,769 |
Delaware - 0.7% |
Delaware Econ. Dev. Auth. Rev. (Delmarva Pwr. & Lt. Co. Proj.) Series 1999 A, 0.54%, VRDN (a) | 5,400 | | 5,400 |
Wilmington Adjustable Rate Demand Rev. (Delaware Art Museum, Inc. Proj.) 0.28%, LOC Wells Fargo Bank NA, VRDN (a) | 5,000 | | 5,000 |
| | 10,400 |
District Of Columbia - 1.5% |
District of Columbia Income Tax Rev. Participating VRDN Series Putters 3369, 0.26% (Liquidity Facility JPMorgan Chase Bank) (a)(e) | 1,000 | | 1,000 |
District of Columbia Rev.: | | | |
(The AARP Foundation Proj.) Series 2004, 0.3%, LOC Bank of America NA, VRDN (a) | 1,600 | | 1,600 |
(The Phillips Collection Issue Proj.) Series 2003, 0.4%, LOC Bank of America NA, VRDN (a) | 3,835 | | 3,835 |
(The Washington Ctr. for Internships and Academic Seminars Proj.) Series 2009, 0.27%, LOC Branch Banking & Trust Co., VRDN (a) | 4,900 | | 4,900 |
District of Columbia Univ. Rev. (American Univ. Proj.) Series 2003, 0.26%, LOC Bank of America NA, VRDN (a) | 10,900 | | 10,900 |
| | 22,235 |
Florida - 9.5% |
Alachua County Health Facilities Auth. Health Facilities Rev. Bonds (Shands Teaching Hospitals & Clinics, Inc. Proj.) Series 2008 B, 0.32% tender 4/7/11, LOC Bank of America NA, CP mode | 6,200 | | 6,200 |
Municipal Securities - continued |
| Principal Amount (000s) | | Value (000s) |
Florida - continued |
Broward County Fin. Auth. Multi-family Hsg. Rev. (Reflections Apts. Proj.) Series 1999, 0.25%, LOC Freddie Mac, VRDN (a) | $ 2,165 | | $ 2,165 |
Cape Coral Gen. Oblig. 0.33% 4/4/11, LOC Bank of America NA, CP | 6,687 | | 6,687 |
Florida Board of Ed. Pub. Ed. Cap. Outlay Bonds: | | | |
Series 2006 E, 2% 6/1/11 | 1,655 | | 1,662 |
Series 2007 E, 4% 6/1/11 | 1,490 | | 1,503 |
Florida Dept. of Envir. Protection Rev. Bonds: | | | |
Series 2010 A, 2% 7/1/11 | 1,570 | | 1,578 |
Series 2010 C, 4% 7/1/11 | 3,400 | | 3,439 |
Series B, 5% 7/1/11 | 1,250 | | 1,269 |
Florida Gen. Oblig. Participating VRDN Series PZ 130, 0.29% (Liquidity Facility Wells Fargo & Co.) (a)(e) | 3,440 | | 3,440 |
Florida Hsg. Fin. Corp. Multi-family Mtg. Rev. (Victoria Park Apts. Proj.) Series 2002 J, 0.25%, LOC Fannie Mae, VRDN (a) | 1,100 | | 1,100 |
Florida Wtr. Poll. Cont. Fing. Corp. Rev. Bonds Series 2010 A, 4% 7/15/11 | 3,120 | | 3,162 |
Jacksonville Econ. Dev. Commission Rev. (YMCA of Florida's First Coast Proj.) 0.55%, LOC Bank of America NA, VRDN (a) | 8,880 | | 8,880 |
Jacksonville Elec. Auth. Elec. Sys. Rev. Bonds Series F, 0.33% tender 3/7/11 (Liquidity Facility Landesbank Hessen-Thuringen), CP mode | 15,000 | | 15,000 |
Jacksonville Hsg. Fin. Auth. Multi-family Hsg. Rev. (Augustine Apts. Proj.) 0.25%, LOC Fannie Mae, VRDN (a) | 2,650 | | 2,650 |
Jacksonville Poll. Cont. Rev. Bonds (Florida Pwr. & Lt. Co. Proj.): | | | |
Series 1992, 0.32% tender 3/11/11, CP mode | 1,800 | | 1,800 |
Series 1994, 0.32% tender 3/11/11, CP mode | 5,545 | | 5,545 |
Manatee County School District TAN Series 2010, 1.25% 5/1/11 | 2,500 | | 2,504 |
Nassau County Poll. Cont. Rev. (Rayonier Proj.) 0.28%, LOC Bank of America NA, VRDN (a) | 4,400 | | 4,400 |
Palm Beach County Rev.: | | | |
(Benjamin Private School Proj.) 0.33%, LOC Bank of America NA, VRDN (a) | 15,600 | | 15,600 |
(Hanley Ctr. Proj.) Series 2006, 0.33%, LOC Bank of America NA, VRDN (a) | 7,210 | | 7,210 |
(Morse Oblig. Group Proj.) Series 2003, 0.24%, LOC TD Banknorth, NA, VRDN (a) | 6,260 | | 6,260 |
(Saint Andrew's School of Boca Raton, Inc. Proj.) Series 2007, 0.33%, LOC Bank of America NA, VRDN (a) | 2,100 | | 2,100 |
Municipal Securities - continued |
| Principal Amount (000s) | | Value (000s) |
Florida - continued |
Pasco County School Board Ctfs. of Prtn.: | | | |
Series 2008 A, 0.25%, LOC Wells Fargo Bank NA, VRDN (a) | $ 4,900 | | $ 4,900 |
Series 2008 C, 0.3%, LOC Bank of America NA, VRDN (a) | 5,100 | | 5,100 |
Pinellas County Health Facilities Auth. Rev.: | | | |
(BayCare Health Sys. Proj.) Series 2009 A3, 0.25%, LOC Wells Fargo Bank NA, VRDN (a) | 1,000 | | 1,000 |
(Suncoast Hospice Proj.) Series 2004, 0.25%, LOC Wells Fargo Bank NA, VRDN (a) | 1,605 | | 1,605 |
Pinellas County School District TAN Series 2010, 1.5% 6/30/11 | 4,700 | | 4,718 |
Saint Petersburg Health Facilities Auth. Rev. (All Children's Hosp. Proj.) Series 2005 A1, 0.25%, LOC Wells Fargo Bank NA, VRDN (a) | 4,930 | | 4,930 |
Sunshine State Govt. Fing. Commission Rev. Series L, 0.35% 3/2/11, LOC Dexia Cr. Local de France, CP | 4,400 | | 4,400 |
Volusia County Hsg. Fin. Auth. Multi-family Hsg. Rev. (Fisherman's Landing Apts. Proj.) 0.25%, LOC Fannie Mae, VRDN (a) | 1,050 | | 1,050 |
Volusia County School Board Ctfs. of Prtn. Participating VRDN Series Solar 2007-36, 0.25% (Liquidity Facility U.S. Bank NA, Minnesota) (a)(e) | 6,000 | | 6,000 |
Winter Haven Util. Sys. Impt. & Rfdg. Rev. Participating VRDN Series Solar 06 54, 0.25% (Liquidity Facility U.S. Bank NA, Minnesota) (a)(e) | 4,650 | | 4,650 |
| | 142,507 |
Georgia - 2.1% |
Atlanta Tax Allocation (Westside Proj.) Series 2008, 0.25%, LOC Wells Fargo Bank NA, VRDN (a) | 6,100 | | 6,100 |
DeKalb County Hsg. Auth. Multi-family Hsg. Rev. (Timber Trace Apts. Proj.) Series 2003, 0.3%, LOC Freddie Mac, VRDN (a) | 5,225 | | 5,225 |
Fulton County Dev. Auth.: | | | |
(Mount Vernon Presbyterian School Proj.) Series 2005, 0.27%, LOC Branch Banking & Trust Co., VRDN (a) | 2,500 | | 2,500 |
(Pace Academy, Inc. Proj.) Series 2008, 0.33%, LOC Bank of America NA, VRDN (a) | 4,100 | | 4,100 |
Georgia Gen. Oblig. Series H1, 0.35% (Liquidity Facility Dexia Cr. Local de France), VRDN (a) | 1,000 | | 1,000 |
Main Street Natural Gas, Inc. Georgia Gas Proj. Rev. Series 2010 A, 0.26% (Liquidity Facility Royal Bank of Canada), VRDN (a) | 4,300 | | 4,300 |
Municipal Securities - continued |
| Principal Amount (000s) | | Value (000s) |
Georgia - continued |
Muni. Elec. Auth. of Georgia Series 1985 B, 0.33%, LOC Landesbank Hessen-Thuringen, VRDN (a) | $ 5,300 | | $ 5,300 |
Smyrna Hsg. Fin. Auth. Multi-family Hsg. Rev. (The Hills of Post Village Proj.) Series 1995, 0.24%, LOC Fannie Mae, VRDN (a) | 2,200 | | 2,200 |
| | 30,725 |
Hawaii - 0.3% |
Honolulu City & County Gen. Oblig. Participating VRDN Series Putters 3391, 0.26% (Liquidity Facility JPMorgan Chase Bank) (a)(e) | 5,000 | | 5,000 |
Idaho - 0.3% |
Idaho Gen. Oblig. TAN 2% 6/30/11 | 2,900 | | 2,915 |
Idaho Health Facilities Auth. Rev. (St. Luke's Health Sys. Proj.) Series 2009 A, 0.25%, LOC Wells Fargo Bank NA, VRDN (a) | 2,000 | | 2,000 |
| | 4,915 |
Illinois - 4.2% |
Chicago Metropolitan Wtr. Reclamation District Greater Chicago Participating VRDN Series Solar 06 75, 0.25% (Liquidity Facility U.S. Bank NA, Minnesota) (a)(e) | 3,200 | | 3,200 |
Chicago O'Hare Int'l. Arpt. Rev. Series 2005 C, 0.3%, LOC Landesbank Baden-Wuert, VRDN (a) | 1,545 | | 1,545 |
Chicago Wtr. Rev.: | | | |
Series 2004 A2, 0.26%, LOC California Pub. Employees' Retirement Sys., VRDN (a) | 2,470 | | 2,470 |
Series 2004 A3, 0.25%, LOC State Street Bank & Trust Co., Boston, VRDN (a) | 3,175 | | 3,175 |
DuPage County Rev. (Morton Arboretum Proj.) 0.33%, LOC Bank of America NA, VRDN (a) | 10,500 | | 10,500 |
Illinois Fin. Auth. Rev.: | | | |
(Chicago Historical Society Proj.) Series 2006, 0.28%, LOC JPMorgan Chase Bank, VRDN (a) | 18,900 | | 18,900 |
(Northwest Cmnty. Hosp. Proj.) Series 2008 C, 0.25%, LOC Wells Fargo Bank NA, VRDN (a) | 4,000 | | 4,000 |
(Saint Xavier Univ. Proj.) Series 2008, 0.29%, LOC Bank of America NA, VRDN (a) | 3,700 | | 3,700 |
Lake County Multi-family Hsg. Rev. (Whispering Oaks Apts. Proj.) Series 2008, 0.32%, LOC Freddie Mac, VRDN (a) | 3,250 | | 3,250 |
Lisle Village Multi-family Hsg. Rev. (Four Lakes Phase V-Lisle) Series 1996, 0.27%, LOC Bank of America NA, VRDN (a) | 7,180 | | 7,180 |
Municipal Securities - continued |
| Principal Amount (000s) | | Value (000s) |
Illinois - continued |
Univ. of Illinois Rev. (UIC South Campus Dev. Proj.) Series 2008, 0.28%, LOC JPMorgan Chase Bank, VRDN (a) | $ 2,500 | | $ 2,500 |
Yorkville Svc. Area 2004-106 Tax (MPI Grande Reserve Proj.) 0.4%, LOC Bank of America NA, VRDN (a) | 2,500 | | 2,500 |
| | 62,920 |
Indiana - 3.3% |
Indiana Dev. Fin. Auth. Rev. (Indianapolis Museum of Art, Inc. Proj.) Series 2001, 0.28%, LOC JPMorgan Chase Bank, VRDN (a) | 5,800 | | 5,800 |
Indiana Edl. Facilities Auth. Rev. (Earlham College Proj.) Series E, 0.26%, LOC U.S. Bank NA, Minnesota, VRDN (a) | 4,050 | | 4,050 |
Indiana Fin. Auth. Health Sys. Rev. (Sisters of Saint Francis Health Svcs., Inc. Obligated Group Proj.): | | | |
Series 2008 E, 0.27%, LOC Bank of America NA, VRDN (a) | 1,550 | | 1,550 |
Series 2008 F, 0.25%, LOC Bank of New York, New York, VRDN (a) | 6,280 | | 6,280 |
Indiana Fin. Auth. Rev. (DePauw Univ. Proj.) Series 2008 B, 0.26%, LOC Harris NA, VRDN (a) | 16,600 | | 16,600 |
IPS Multi-School Bldg. Corp. Participating VRDN Series Solar 07 26, 0.25% (Liquidity Facility U.S. Bank NA, Minnesota) (a)(e) | 2,000 | | 2,000 |
Lawrenceburg Poll. Cont. Rev. (Indiana Michigan Pwr. Co. Proj.) Series 2008 H, 0.32%, LOC Royal Bank of Scotland PLC, VRDN (a) | 8,400 | | 8,400 |
Whiting Envir. Facilities Rev. Bonds (BP Products North America, Inc. Proj.) 0.3% tender 4/1/11 (BP PLC Guaranteed), CP mode | 4,900 | | 4,900 |
| | 49,580 |
Iowa - 0.5% |
Iowa Fin. Auth. Poll. Cont. Facility Rev. (MidAmerican Energy Proj.) Series 2008 B, 0.34%, VRDN (a) | 7,400 | | 7,400 |
Kansas - 0.2% |
Wyandotte County/Kansas City Unified Govt. Gen. Oblig. BAN Series 2010 I, 0.625% 3/1/11 | 2,845 | | 2,845 |
Louisiana - 0.1% |
Louisiana Gas & Fuel Tax Rev. Participating VRDN Series Putters 2378, 0.31% (Liquidity Facility JPMorgan Chase Bank) (a)(e) | 1,030 | | 1,030 |
Maine - 1.0% |
Maine Health & Higher Ed. Facilities Auth. Rev.: | | | |
Series 2008 A, 0.32%, LOC KBC Bank NV, VRDN (a) | 5,555 | | 5,555 |
Municipal Securities - continued |
| Principal Amount (000s) | | Value (000s) |
Maine - continued |
Maine Health & Higher Ed. Facilities Auth. Rev.: - continued | | | |
Series 2008 B, 0.32%, LOC KBC Bank NV, VRDN (a) | $ 1,700 | | $ 1,700 |
Maine Health Student Finl. Auth. Participating VRDN Series Solar 06 122, 0.25% (Liquidity Facility U.S. Bank NA, Minnesota) (a)(e) | 6,990 | | 6,990 |
| | 14,245 |
Maryland - 2.3% |
Baltimore County Econ. Dev. Rev.: | | | |
(Blue Circle, Inc. Proj.) Series 1992, 0.28%, LOC BNP Paribas SA, VRDN (a) | 6,100 | | 6,100 |
(The Bais Yaakov School for Girls Proj.) Series 2003, 0.52%, LOC Bank of America NA, VRDN (a) | 1,000 | | 1,000 |
Baltimore County Metropolitan District Series 1995, 0.31% 4/8/11 (Liquidity Facility BNP Paribas SA), CP | 2,000 | | 2,000 |
Carroll County Rev. (Fairhaven and Copper Ridge Proj.) Series 2004 A, 0.24%, LOC Branch Banking & Trust Co., VRDN (a) | 4,820 | | 4,820 |
Howard County Gen. Oblig. Series 2006 D, 0.29% 3/18/11 (Liquidity Facility State Street Bank & Trust Co., Boston), CP | 3,000 | | 3,000 |
Maryland Cmnty. Dev. Administration Multi-family Dev. Rev. (Avalon Lea Apt. Proj.) Series 1997, 0.29%, LOC Fannie Mae, VRDN (a) | 1,200 | | 1,200 |
Maryland Econ. Dev. Auth. Rev. (Associated Projs.) Series A, 0.4%, LOC Bank of America NA, VRDN (a) | 1,335 | | 1,335 |
Maryland Health & Higher Edl. Facilities Auth. Rev.: | | | |
(Mercy Med. Ctr. Proj.): | | | |
Series 2007 B, 0.29%, LOC Bank of America NA, VRDN (a) | 2,300 | | 2,300 |
Series 2007 D, 0.25%, LOC Wells Fargo Bank NA, VRDN (a) | 3,100 | | 3,100 |
(Univ. of Maryland Med. Sys. Proj.) Series 2008 A, 0.4%, LOC Citizens Bank of Pennsylvania, VRDN (a) | 6,500 | | 6,500 |
Montgomery County Econ. Dev. Rev. (Georgetown Preparatory School, Inc. Proj.) Series 2005, 0.4%, LOC Bank of America NA, VRDN (a) | 2,630 | | 2,630 |
| | 33,985 |
Massachusetts - 2.4% |
Massachusetts Bay Trans. Auth. Sales Tax Rev.: | | | |
Participating VRDN Series DC 8030, 0.3% (Liquidity Facility Dexia Cr. Local de France) (a)(e) | 1,000 | | 1,000 |
Series 2008 A1, 0.23% (Liquidity Facility JPMorgan Chase Bank), VRDN (a) | 13,500 | | 13,500 |
Municipal Securities - continued |
| Principal Amount (000s) | | Value (000s) |
Massachusetts - continued |
Massachusetts Gen. Oblig.: | | | |
Participating VRDN: | | | |
Series DCL 08 42, 0.3% (Liquidity Facility Dexia Cr. Local de France) (a)(e) | $ 3,000 | | $ 3,000 |
Series SG 126, 0.26% (Liquidity Facility Societe Generale) (a)(e) | 2,000 | | 2,000 |
RAN Series 2010 A, 2% 4/28/11 | 3,300 | | 3,309 |
Massachusetts Indl. Fin. Agcy. Poll. Cont. Rev. Bonds (New England Pwr. Co. Proj.) Series 1993 A, 0.8% tender 3/16/11, CP mode | 900 | | 900 |
Massachusetts School Bldg. Auth. Dedicated Sales Tax Rev.: | | | |
Participating VRDN Series BA 08 1082, 0.33% (Liquidity Facility Bank of America NA) (a)(e) | 6,680 | | 6,680 |
Participating VRDN: | | | |
Series EGL 07 0031, 0.26% (Liquidity Facility Citibank NA) (a)(e) | 1,000 | | 1,000 |
Series Putters 2479Z, 0.26% (Liquidity Facility JPMorgan Chase Bank) (a)(e) | 3,100 | | 3,100 |
Massachusetts Wtr. Resources Auth. Wtr. & Swr. Rev. Series 2008 C, 0.28% (Liquidity Facility Bayerische Landesbank), VRDN (a) | 1,700 | | 1,700 |
| | 36,189 |
Michigan - 1.9% |
Kent Hosp. Fin. Auth. Hosp. Facilities Rev. (Spectrum Health Sys. Proj.) Series 2008 B1, 0.36%, LOC RBS Citizens NA, VRDN (a) | 10,500 | | 10,500 |
Michigan Bldg. Auth. Rev. Series 6, 0.3% 3/10/11, LOC State Street Bank & Trust Co., Boston, LOC U.S. Bank NA, Minnesota, CP | 6,505 | | 6,505 |
Michigan Gen. Oblig. TRAN Series A, 2% 9/30/11 | 4,200 | | 4,238 |
Michigan Hosp. Fin. Auth. Rev. Bonds (Trinity Health Sys. Proj.) Series 2008 C, 0.34% tender 6/6/11, CP mode | 2,000 | | 2,000 |
Michigan Strategic Fund Ltd. Oblig. Rev. (Grand Rapids Art Museum Proj.) Series 2006 A, 0.52%, LOC Bank of America NA, VRDN (a) | 500 | | 500 |
Waterford Econ. Dev. Corp. Ltd. Oblig. Rev. (Canterbury Health Care, Inc. Proj.) Series 2009, 0.27%, LOC Fed. Home Ln. Bank of Boston, VRDN (a) | 4,300 | | 4,300 |
| | 28,043 |
Municipal Securities - continued |
| Principal Amount (000s) | | Value (000s) |
Minnesota - 0.8% |
Oak Park Heights Multi-Fam Rev. 0.27%, LOC Freddie Mac, VRDN (a) | $ 3,180 | | $ 3,180 |
Univ. of Minnesota Series 2001 C, 0.28% (Liquidity Facility JPMorgan Chase Bank), VRDN (a) | 8,050 | | 8,050 |
| | 11,230 |
Mississippi - 0.6% |
Mississippi Bus. Fin. Corp. Indl. Dev. Rev. (New Process Steel, L.P. Proj.) Series 2010, 0.3%, LOC Bank of America NA, VRDN (a) | 8,500 | | 8,500 |
Missouri - 0.9% |
Missouri Health & Edl. Facilities Auth. Edl. Facilities Rev. Participating VRDN Series EGL 07 0001, 0.26% (Liquidity Facility Citibank NA) (a)(e) | 8,000 | | 8,000 |
Missouri Health & Edl. Facilities Auth. Health Facilities Rev. (Cox Health Sys. Proj.) Series 2008 C, 0.29%, LOC Bank of America NA, VRDN (a) | 5,000 | | 5,000 |
| | 13,000 |
Nebraska - 1.4% |
Central Plains Energy Proj. Rev. (Nebraska Gas Proj.) Series 2009, 0.26% (Liquidity Facility Royal Bank of Canada), VRDN (a) | 5,500 | | 5,500 |
Lincoln Elec. Sys. Rev. Series 2005, 0.3% 3/8/11, CP | 1,500 | | 1,500 |
Omaha Pub. Pwr. District Elec. Rev.: | | | |
Participating VRDN Series Putters 3700 Z, 0.26% (Liquidity Facility JPMorgan Chase Bank) (a)(e) | 5,000 | | 5,000 |
Series A: | | | |
0.29% 4/8/11, CP | 7,200 | | 7,200 |
0.33% 3/15/11, CP | 2,000 | | 2,000 |
| | 21,200 |
Nevada - 2.2% |
Clark County Arpt. Rev.: | | | |
Series 2008 D1, 0.3%, LOC Landesbank Baden-Wuert, VRDN (a) | 11,420 | | 11,420 |
Series 2008 D2, 0.3%, LOC Landesbank Baden-Wuert, VRDN (a) | 2,800 | | 2,800 |
Clark County Fuel Tax Participating VRDN Series ROC II R 11507, 0.26% (Liquidity Facility Citibank NA) (a)(e) | 2,800 | | 2,800 |
Clark County School District Bonds Series 2002 C, 5% 6/15/11 | 2,500 | | 2,534 |
Municipal Securities - continued |
| Principal Amount (000s) | | Value (000s) |
Nevada - continued |
Nevada Gen. Oblig. Bonds Series A, 5% 2/1/12 | $ 1,000 | | $ 1,040 |
Reno Hosp. Rev. (Renown Reg'l. Med. Ctr. Proj.) Series 2009 B, 0.25%, LOC Wells Fargo Bank NA, VRDN (a) | 12,050 | | 12,050 |
| | 32,644 |
New Hampshire - 0.1% |
New Hampshire Bus. Fin. Auth. Poll. Cont. Rev. Bonds (New England Pwr. Co. Proj.) Series 1990 B, 0.9% tender 3/3/11, CP mode | 1,700 | | 1,700 |
New Jersey - 2.3% |
Montgomery Township Gen. Oblig. BAN 1.5% 9/22/11 | 16,969 | | 17,060 |
New Jersey Gen. Oblig. Bonds Series Putters 3850, 0.3%, tender 6/23/11 (Liquidity Facility JPMorgan Chase & Co.) (a)(e)(f) | 17,600 | | 17,600 |
| | 34,660 |
New Mexico - 0.7% |
New Mexico Muni. Energy Acquisition Auth. Gas Supply Rev. Series 2009, 0.26% (Liquidity Facility Royal Bank of Canada), VRDN (a) | 10,400 | | 10,400 |
New York - 1.7% |
New York Dorm. Auth. Revs. Participating VRDN: | | | |
Series EGL 06 47 Class A, 0.26% (Liquidity Facility Citibank NA) (a)(e) | 4,500 | | 4,500 |
Series EGL 07 0003, 0.26% (Liquidity Facility Citibank NA) (a)(e) | 15,000 | | 15,000 |
New York Hsg. Fin. Svc. Contract Rev. Series 2003 I, 0.29%, LOC Landesbank Hessen-Thuringen, VRDN (a) | 5,700 | | 5,700 |
| | 25,200 |
North Carolina - 2.6% |
Charlotte Wtr. & Swr. Sys. Rev.: | | | |
Series 2002 B, 0.25% (Liquidity Facility Wells Fargo Bank NA), VRDN (a) | 1,700 | | 1,700 |
Series 2006 B, 0.25% (Liquidity Facility Wells Fargo Bank NA), VRDN (a) | 8,600 | | 8,600 |
Greensboro Combined Enterprise Sys. Rev. Series 2005 B, 0.28% (Liquidity Facility Bank of America NA), VRDN (a) | 3,245 | | 3,245 |
North Carolina Cap. Facilities Fin. Agcy. Edl. Facilities Rev. (Campbell Univ. Proj.) Series 2009, 0.27%, LOC Branch Banking & Trust Co., VRDN (a) | 1,500 | | 1,500 |
North Carolina Cap. Facilities Fin. Agcy. Rev. (Elon Univ. Proj.) Series 2006, 0.25%, LOC Bank of America NA, VRDN (a) | 3,905 | | 3,905 |
Municipal Securities - continued |
| Principal Amount (000s) | | Value (000s) |
North Carolina - continued |
North Carolina Med. Care Commission Health Care Facilities Rev.: | | | |
(Deerfield Episcopal Retirement Cmnty. Proj.) Series 2008 B, 0.27%, LOC Branch Banking & Trust Co., VRDN (a) | $ 1,500 | | $ 1,500 |
(Friends Homes, Inc. Proj.) Series 2003, 0.3%, LOC Bank of America NA, VRDN (a) | 6,170 | | 6,170 |
(WakeMed Proj.) Series 2009 B, 0.25%, LOC Wells Fargo Bank NA, VRDN (a) | 1,200 | | 1,200 |
Raleigh Combined Enterprise Sys. Rev. Participating VRDN Series EGL 07 0010, 0.26% (Liquidity Facility Citibank NA) (a)(e) | 9,900 | | 9,900 |
Wake County Gen. Oblig. Series 2003 C, 0.28% (Liquidity Facility Lloyds TSB Bank PLC), VRDN (a) | 1,685 | | 1,685 |
| | 39,405 |
Ohio - 2.1% |
Columbus Gen. Oblig. Participating VRDN Series Putters 2365, 0.26% (Liquidity Facility JPMorgan Chase Bank) (a)(e) | 4,360 | | 4,360 |
Franklin County Health Care Facilities Rev. (Friendship Village of Dublin, Ohio, Inc. Proj.) Series 2004 B, 0.24%, LOC PNC Bank NA, Pittsburgh, VRDN (a) | 1,760 | | 1,760 |
Hamilton County Hosp. Facilities Rev. (Children's Hosp. Med. Ctr. Proj.) Series 2000, 0.26%, LOC JPMorgan Chase Bank, VRDN (a) | 3,100 | | 3,100 |
Ohio Air Quality Dev. Auth. Rev. (FirstEnergy Corp. Proj.) Series 2006 B, 0.25%, LOC Wells Fargo Bank NA, VRDN (a) | 3,000 | | 3,000 |
Ohio Higher Edl. Facility Commission Rev. Bonds: | | | |
(Cleveland Clinic Foundation Proj.) Series 2008 B6, 0.36% tender 6/15/11, CP mode | 9,200 | | 9,200 |
(Cleveland Clinic Proj.) Series 2008 B6, 0.32% tender 4/7/11, CP mode | 3,000 | | 3,000 |
Ohio Wtr. Dev. Auth. Rev. Participating VRDN Series DCL 08 046, 0.32% (Liquidity Facility Dexia Cr. Local de France) (a)(e) | 2,490 | | 2,490 |
Stow Gen. Oblig. BAN 2% 5/6/11 | 5,025 | | 5,038 |
| | 31,948 |
Oregon - 1.4% |
Clackamas County Hosp. Facility Auth. Bonds (Providence Health Sys. Proj.): | | | |
Series 2003 D, 0.34% tender 4/5/11, CP mode | 4,000 | | 4,000 |
Series F: | | | |
0.32% tender 4/5/11, CP mode | 5,000 | | 5,000 |
Municipal Securities - continued |
| Principal Amount (000s) | | Value (000s) |
Oregon - continued |
Clackamas County Hosp. Facility Auth. Bonds (Providence Health Sys. Proj.): - continued | | | |
Series F: | | | |
0.36% tender 7/13/11, CP mode | $ 10,000 | | $ 10,000 |
Yamhill County Rev. (George Fox Univ. Proj.) Series A, 0.32%, LOC Bank of America NA, VRDN (a) | 1,500 | | 1,500 |
| | 20,500 |
Pennsylvania - 6.3% |
Allegheny County Hosp. Dev. Auth. Rev. (Children's Institute Pittsburgh Proj.) Series 2005 B, 0.25%, LOC PNC Bank NA, Pittsburgh, VRDN (a) | 1,000 | | 1,000 |
Allegheny County Indl. Dev. Auth. Rev. (The Watson Institute Friendship Academy Proj.) Series 2010, 0.25%, LOC PNC Bank NA, Pittsburgh, VRDN (a) | 3,750 | | 3,750 |
Butler Co. Gen. Auth. Rev. (New Castle Area School District Proj.) Series 2009 A, 0.25%, LOC PNC Bank NA, Pittsburgh, VRDN (a) | 3,040 | | 3,040 |
Crawford County Indl. Dev. Auth. College Rev. (Allegheny College Proj.) Series 2009 B, 0.25%, LOC PNC Bank NA, Pittsburgh, VRDN (a) | 2,000 | | 2,000 |
Delaware County Auth. Rev. (White Horse Village Proj.) Series 2006 B, 0.26%, LOC Citizens Bank of Pennsylvania, VRDN (a) | 1,700 | | 1,700 |
Delaware County Indl. Dev. Auth. Rev. (Academy of Notre Dame de Namur Proj.) Series 2007, 0.35%, LOC Citizens Bank of Pennsylvania, VRDN (a) | 200 | | 200 |
Lancaster Indl. Dev. Auth. Rev. (United Zion Retirement Cmnty. Proj.) 0.41%, LOC Citizens Bank of Pennsylvania, VRDN (a) | 4,530 | | 4,530 |
Montgomery County Higher Ed. & Health Auth. Rev. (William Penn Charter School Proj.) Series 2001, 0.25%, LOC PNC Bank NA, Pittsburgh, VRDN (a) | 3,640 | | 3,640 |
Montgomery County Redev. Auth. Multi-family Hsg. Rev. (Forge Gate Apts. Proj.) Series 2001 A, 0.26%, LOC Fannie Mae, VRDN (a) | 4,990 | | 4,990 |
Pennsylvania Econ. Dev. Fing. Auth. Indl. Dev. Rev. Series 2004 E1, 0.25%, LOC PNC Bank NA, Pittsburgh, VRDN (a) | 3,575 | | 3,575 |
Pennsylvania Gen. Oblig. TAN First Series 2010-2011, 2.5% 6/30/11 | 34,800 | | 35,051 |
Pennsylvania Higher Edl. Facilities Auth. Rev.: | | | |
(California Univ. of Pennsylvania Student Hsg. Proj.) Series 2006 A1, 0.31%, LOC Citizens Bank of Pennsylvania, VRDN (a) | 3,270 | | 3,270 |
(Mercyhurst College Proj.) Series 12, 0.25%, LOC PNC Bank NA, Pittsburgh, VRDN (a) | 3,165 | | 3,165 |
Municipal Securities - continued |
| Principal Amount (000s) | | Value (000s) |
Pennsylvania - continued |
Pennsylvania State Univ. Bonds Series 2009 B, 0.4%, tender 6/1/11 (a) | $ 5,200 | | $ 5,200 |
Pennsylvania Tpk. Commission Registration Fee Rev. Bonds Series 2001, 5% 7/15/31 (Pre-Refunded to 7/15/11 @ 101) (d) | 3,400 | | 3,493 |
Pennsylvania Tpk. Commission Tpk. Rev. Series 2008 B3, 0.26%, LOC Bank of America NA, VRDN (a) | 8,000 | | 8,000 |
Scranton-Lackawanna Health & Welfare Auth. Rev. (Cmnty. Med. Ctr. Proj.) Series 2002, 0.25%, LOC PNC Bank NA, Pittsburgh, VRDN (a) | 3,915 | | 3,915 |
Somerset County Gen. Oblig. Series 2009 A, 0.25%, LOC PNC Bank NA, Pittsburgh, VRDN (a) | 3,450 | | 3,450 |
| | 93,969 |
Rhode Island - 0.7% |
Rhode Island Health and Edl. Bldg. Corp. Higher Ed. Facility Rev.: | | | |
(Roger Williams Univ. Proj.) Series 2008 B, 0.33%, LOC Bank of America NA, VRDN (a) | 9,300 | | 9,300 |
Participating VRDN Series Putters 3517, 0.26% (Liquidity Facility JPMorgan Chase Bank) (a)(e) | 995 | | 995 |
| | 10,295 |
South Carolina - 4.3% |
Columbia Wtrwks. & Swr. Rev. Participating VRDN Series BC 10 42W, 0.27% (Liquidity Facility Barclays Bank PLC) (a)(e) | 2,000 | | 2,000 |
Greenville Hosp. Sys. Facilities Rev. Series 2008 E, 0.25%, LOC Wells Fargo Bank NA, VRDN (a) | 8,900 | | 8,900 |
South Carolina Assoc. of Governmental Organizations Ctfs. of Prtn. Bonds Series 2010 C, 2% 3/1/11 | 4,200 | | 4,200 |
South Carolina Edl. Facilities Auth. for Private Nonprofit Institutions of Higher Learning Edl. Facilities Rev. (Claflin Univ. Proj.) 0.33%, LOC Bank of America NA, VRDN (a) | 7,431 | | 7,431 |
South Carolina Jobs-Econ. Dev. Auth. (Palmetto Health Proj.) Series 2008 A, 0.3%, LOC Bank of America NA, VRDN (a) | 4,805 | | 4,805 |
South Carolina Jobs-Econ. Dev. Auth. Econ. Dev. Rev.: | | | |
(Carolina Piedmont Foundation Proj.) 0.33%, LOC Bank of America NA, VRDN (a) | 3,500 | | 3,500 |
(Institute for Bus. and Home Safety Proj.) Series 2009, 0.27%, LOC Branch Banking & Trust Co., VRDN (a) | 4,500 | | 4,500 |
South Carolina Pub. Svc. Auth. Rev.: | | | |
Participating VRDN Series ROC II R 11426, 0.27% (Liquidity Facility Citibank NA) (a)(e) | 3,900 | | 3,900 |
Series 2010 A, 0.31% 3/11/11, CP | 6,790 | | 6,790 |
Municipal Securities - continued |
| Principal Amount (000s) | | Value (000s) |
South Carolina - continued |
Spartanburg County School District #1 Participating VRDN Series Solar 06 152, 0.25% (Liquidity Facility U.S. Bank NA, Minnesota) (a)(e) | $ 10,510 | | $ 10,510 |
York County Poll. Cont. Rev. Bonds (Duke Energy Corp. Proj.) 0.85% tender 3/17/11, CP mode | 7,400 | | 7,400 |
| | 63,936 |
Tennessee - 1.6% |
Blount County Pub. Bldg. Auth. (Local Govt. Pub. Impt. Proj.) Series 2008 E1A, 0.27%, LOC Branch Banking & Trust Co., VRDN (a) | 5,600 | | 5,600 |
Clarksville Pub. Bldg. Auth. Rev. (Tennessee Muni. Bond Fund Proj.) Series 1994, 0.32%, LOC Bank of America NA, VRDN (a) | 6,300 | | 6,300 |
Knox County Health Edl. & Hsg. Facilities Board Hosp. Facilities Rev. (Catholic Healthcare Partners Proj.) Series 2008 A, 0.32%, LOC Landesbank Baden-Wuert, VRDN (a) | 4,300 | | 4,300 |
Montgomery County Pub. Bldg. Auth. Pooled Fing. Rev. (Tennessee County Ln. Pool Prog.) Series 1999, 0.3%, LOC Bank of America NA, VRDN (a) | 6,715 | | 6,715 |
Shelby County Gen. Oblig. Series 2004 B, 0.3% (Liquidity Facility Landesbank Hessen-Thuringen), VRDN (a) | 1,400 | | 1,400 |
| | 24,315 |
Texas - 9.9% |
Austin Independent School District Participating VRDN Series Putters 3554, 0.26% (Liquidity Facility JPMorgan Chase Bank) (a)(e) | 7,040 | | 7,040 |
Austin Util. Sys. Rev. Series A, 0.3% 3/28/11, LOC JPMorgan Chase Bank, LOC State Street Bank & Trust Co., Boston, CP | 4,000 | | 4,000 |
Comal Independent School District Participating VRDN Series Solar 06 36, 0.25% (Liquidity Facility U.S. Bank NA, Minnesota) (a)(e) | 13,105 | | 13,105 |
Dallas North Texas Tollway Auth. Series 2010 A, 0.32% 4/6/11, LOC Bank of America NA, CP | 10,000 | | 10,000 |
Fort Bend Independent School District Participating VRDN Series PZ 124, 0.29% (Liquidity Facility Wells Fargo & Co.) (a)(e) | 10,225 | | 10,225 |
Fort Worth Independent School District Bonds Series 2008, 5% 2/15/12 (Permanent School Fund of Texas Guaranteed) | 1,000 | | 1,044 |
Galena Park Independent School District Participating VRDN Series SG 154, 0.26% (Liquidity Facility Societe Generale) (a)(e) | 9,900 | | 9,900 |
Municipal Securities - continued |
| Principal Amount (000s) | | Value (000s) |
Texas - continued |
Grand Prairie Independent School District Participating VRDN Series ROC II R 11161, 0.27% (Liquidity Facility Citibank NA) (a)(e) | $ 7,935 | | $ 7,935 |
Houston Higher Ed. Fin. Corp. Higher Ed. Rev. (Rice Univ. Proj.) Series 2006 A, 0.23% (Liquidity Facility JPMorgan Chase Bank), VRDN (a) | 7,150 | | 7,150 |
Houston Util. Sys. Rev.: | | | |
Participating VRDN Series Solar 06 70, 0.25% (Liquidity Facility U.S. Bank NA, Minnesota) (a)(e) | 4,000 | | 4,000 |
Series 2004 B1, 0.27%, LOC Bank of America NA, VRDN (a) | 1,400 | | 1,400 |
Judson Independent School District Participating VRDN Series MS 06 1859, 0.25% (Liquidity Facility Wells Fargo & Co.) (a)(e) | 3,940 | | 3,940 |
Lamar Consolidated Independent School District Participating VRDN Series DB 512, 0.26% (Liquidity Facility Deutsche Bank AG) (a)(e) | 3,215 | | 3,215 |
Lovejoy Independent School District Participating VRDN Series DB 514, 0.26% (Liquidity Facility Deutsche Bank AG) (a)(e) | 6,055 | | 6,055 |
Mansfield Independent School District Participating VRDN Series PT 4627, 0.25% (Liquidity Facility Deutsche Postbank AG) (a)(e) | 10,820 | | 10,820 |
North East Texas Independent School District: | | | |
Participating VRDN Series PT 3951, 0.26% (Liquidity Facility Bayerische Hypo-und Vereinsbank AG) (a)(e) | 995 | | 995 |
Participating VRDN Series Putters 2355, 0.26% (Liquidity Facility JPMorgan Chase Bank) (a)(e) | 4,460 | | 4,460 |
Plano Gen. Oblig. Participating VRDN Series MS 06 1862, 0.25% (Liquidity Facility Wells Fargo & Co.) (a)(e) | 2,920 | | 2,920 |
San Antonio Elec. & Gas Sys. Rev. Participating VRDN Series Putters 3344, 0.26% (Liquidity Facility JPMorgan Chase Bank) (a)(e) | 3,215 | | 3,215 |
San Antonio Wtr. Sys. Rev. Series 2010 A, 0.33% 3/15/11, CP | 1,000 | | 1,000 |
Spring Branch Independent School District Participating VRDN Series Putters 3377, 0.26% (Liquidity Facility JPMorgan Chase Bank) (a)(e) | 1,495 | | 1,495 |
Texas A&M Univ. Rev. Participating VRDN Series BC 10 39W, 0.27% (Liquidity Facility Barclays Bank PLC) (a)(e) | 1,500 | | 1,500 |
Texas Pub. Fin. Auth. Series 2002 A: | | | |
0.29% 3/17/11, CP | 10,500 | | 10,500 |
0.3% 4/7/11, CP | 1,400 | | 1,400 |
Texas Pub. Fin. Auth. Rev. Bonds Series 2010 A, 2% 7/1/11 | 3,800 | | 3,822 |
Municipal Securities - continued |
| Principal Amount (000s) | | Value (000s) |
Texas - continued |
Texas Wtr. Dev. Board Rev. Participating VRDN Series SGA 00 104, 0.28% (Liquidity Facility Societe Generale) (a)(e) | $ 10,470 | | $ 10,470 |
Univ. of Texas Permanent Univ. Fund Rev. Participating VRDN Series ROC II R 11266, 0.25% (Liquidity Facility Citibank NA) (a)(e) | 3,660 | | 3,660 |
Upper Trinity Reg'l. Wtr. District Series A, 0.32% 3/8/11, LOC Bank of America NA, CP | 3,000 | | 3,000 |
| | 148,266 |
Utah - 0.9% |
Emery County Poll. Cont. Rev. (PacifiCorp Proj.): | | | |
Series 1991, 0.28%, LOC BNP Paribas SA, VRDN (a) | 2,400 | | 2,400 |
Series 1994, 0.25%, LOC Wells Fargo Bank NA, VRDN (a) | 1,000 | | 1,000 |
Intermountain Pwr. Agcy. Pwr. Supply Rev.: | | | |
Series 1997 B1, 0.28% 3/17/11 (Liquidity Facility Bank of Nova Scotia), CP | 2,735 | | 2,735 |
Series 1997 B2, 0.32% 3/10/11 (Liquidity Facility Bank of Nova Scotia), CP | 2,150 | | 2,150 |
Series 1998 B4, 0.31% 3/15/11 (Liquidity Facility JPMorgan Chase Bank), CP | 450 | | 450 |
Utah State Board of Regents Rev. Participating VRDN Series Solar 06 140, 0.25% (Liquidity Facility U.S. Bank NA, Minnesota) (a)(e) | 1,700 | | 1,700 |
Utah Wtr. Fin. Agcy. Rev. Series B3, 0.31% (Liquidity Facility Landesbank Hessen-Thuringen), VRDN (a) | 3,000 | | 3,000 |
| | 13,435 |
Vermont - 0.1% |
Vermont Gen. Oblig. Bonds Series 2010 E, 1.5% 8/15/11 | 2,055 | | 2,065 |
Virginia - 3.5% |
Albemarle County Indl. Dev. Auth. 0.25%, LOC Wells Fargo Bank NA, VRDN (a) | 3,610 | | 3,610 |
Chesapeake Bay Bridge and Tunnel District Gen. Resolution Rev. Series 2008 A, 0.27%, LOC Branch Banking & Trust Co., VRDN (a) | 1,340 | | 1,340 |
Norfolk BAN Series 2010 C, 1.5% 4/1/11 | 1,700 | | 1,702 |
Norfolk Econ. Dev. Auth. Rev. (Bon Secours Health Sys. Proj.) Series 2008 D1, 0.24%, LOC Citibank NA, VRDN (a) | 11,200 | | 11,200 |
Richmond Pub. Util. Rev. Participating VRDN: | | | |
Series ROC II R 10410, 0.26% (Liquidity Facility Citibank NA) (a)(e) | 3,930 | | 3,930 |
Series ROC II R 11262, 0.26% (Liquidity Facility Citibank NA) (a)(e) | 4,880 | | 4,880 |
Municipal Securities - continued |
| Principal Amount (000s) | | Value (000s) |
Virginia - continued |
Univ. of Virginia Gen. Rev. Participating VRDN Series EGL 06 17 Class A, 0.26% (Liquidity Facility Citibank NA) (a)(e) | $ 17,200 | | $ 17,200 |
Virginia College Bldg. Auth. Edl. Facilities Rev. Participating VRDN Series PZ 161, 0.29% (Liquidity Facility Wells Fargo & Co.) (a)(e) | 3,860 | | 3,860 |
Virginia Resources Auth. Clean Wtr. Rev. Participating VRDN Series MS 06 1860, 0.25% (Liquidity Facility Wells Fargo & Co.) (a)(e) | 4,720 | | 4,720 |
| | 52,442 |
Washington - 2.5% |
Cascade Wtr. Alliance Wtr. Sys. Rev. Participating VRDN Series Solar 06 73 0.25% (Liquidity Facility U.S. Bank NA, Minnesota) (a)(e) | 17,185 | | 17,185 |
Central Puget Sound Reg'l. Trans. Auth. Sales & Use Tax Rev. Participating VRDN Series Putters 2866, 0.26% (Liquidity Facility JPMorgan Chase Bank) (a)(e) | 1,000 | | 1,000 |
Energy Northwest Elec. Rev. Bonds Series D, 5% 7/1/11 | 1,000 | | 1,016 |
Pierce County Econ. Dev. Corp. Spl. Rev. (Weyerhaeuser Real Estate Proj.) Series 1997 A, 0.24%, LOC Bank of America NA, VRDN (a) | 1,100 | | 1,100 |
Port Bellingham Indl. Dev. Corp. Envir. Facilities Indl. Rev. Bonds (BP West Coast Products LLC Proj.) 0.3% tender 3/17/11 (BP PLC Guaranteed), CP mode | 1,500 | | 1,500 |
Seattle Wtr. Sys. Rev. Participating VRDN Series MS 06 2170, 0.25% (Liquidity Facility Wells Fargo & Co.) (a)(e) | 2,510 | | 2,510 |
Vancouver Hsg. Auth. Rev. Series 2008, 0.25%, LOC Freddie Mac, VRDN (a) | 4,345 | | 4,345 |
Washington Gen. Oblig. Participating VRDN Series ROC II R 11889, 0.26% (Liquidity Facility Citibank NA) (a)(e) | 3,250 | | 3,250 |
Washington Health Care Facilities Auth. Rev. (Southwest Washington Med. Ctr.) Series 2008 A, 0.25%, LOC Union Bank of California, VRDN (a) | 2,000 | | 2,000 |
Washington Hsg. Fin. Commission Nonprofit Rev.: | | | |
(United Way King County Proj.) 0.5%, LOC Bank of America NA, VRDN (a) | 1,420 | | 1,420 |
(YMCA of Pierce and Kitsap Countries Proj.) Series 2010 B, 0.25%, LOC Wells Fargo Bank NA, VRDN (a) | 1,700 | | 1,700 |
| | 37,026 |
Municipal Securities - continued |
| Principal Amount (000s) | | Value (000s) |
West Virginia - 0.9% |
West Virginia Hosp. Fin. Auth. Hosp. Rev. (West Virginia United Health Sys. Proj.): | | | |
Series 2008 D, 0.25%, LOC Bank of America NA, VRDN (a) | $ 10,355 | | $ 10,355 |
Series 2009 B, 0.27%, LOC Branch Banking & Trust Co., VRDN (a) | 2,800 | | 2,800 |
| | 13,155 |
Wisconsin - 3.0% |
Wisconsin Ctr. District Tax Rev. Series 2001 A, 0.28%, LOC U.S. Bank NA, Minnesota, VRDN (a) | 7,900 | | 7,900 |
Wisconsin Gen. Oblig.: | | | |
Series 2005 A: | | | |
0.31% 4/8/11 (Liquidity Facility State Street Bank & Trust Co., Boston) (Liquidity Facility California Teachers Retirement Sys.), CP | 4,700 | | 4,700 |
0.32% 3/11/11 (Liquidity Facility State Street Bank & Trust Co., Boston) (Liquidity Facility California Teachers Retirement Sys.), CP | 2,500 | | 2,500 |
0.3% 4/8/11 (Liquidity Facility State Street Bank & Trust Co., Boston) (Liquidity Facility California Teachers Retirement Sys.), CP | 4,939 | | 4,939 |
Wisconsin Health & Edl. Facilities Auth. Rev. Bonds (Alexian Brothers Health Sys. Proj.) 0.35% tender 3/1/11, LOC JPMorgan Chase Bank, CP mode | 2,900 | | 2,900 |
Wisconsin Trans. Rev.: | | | |
Series 1997 A, 0.31% 4/8/11 (Liquidity Facility State Street Bank & Trust Co., Boston) (Liquidity Facility California Teachers Retirement Sys.), CP | 10,884 | | 10,884 |
Series 2006 A, 0.31% 4/7/11 (Liquidity Facility State Street Bank & Trust Co., Boston) (Liquidity Facility California Teachers Retirement Sys.), CP | 7,500 | | 7,500 |
0.3% 4/8/11 (Liquidity Facility State Street Bank & Trust Co., Boston) (Liquidity Facility California Teachers Retirement Sys.), CP | 3,000 | | 3,000 |
0.3% 4/8/11 (Liquidity Facility State Street Bank & Trust Co., Boston) (Liquidity Facility California Teachers Retirement Sys.), CP | 1,051 | | 1,051 |
| | 45,374 |
Municipal Securities - continued |
| Shares | | Value (000s) |
Other - 7.0% |
Fidelity Tax-Free Cash Central Fund, 0.23% (b)(c) | 105,327,900 | | $ 105,327 |
TOTAL INVESTMENT PORTFOLIO - 99.8% (Cost $1,492,096) | | 1,492,096 |
NET OTHER ASSETS (LIABILITIES) - 0.2% | | 3,509 |
NET ASSETS - 100% | $ 1,495,605 |
Security Type Abbreviations |
BAN - BOND ANTICIPATION NOTE |
CP - COMMERCIAL PAPER |
RAN - REVENUE ANTICIPATION NOTE |
TAN - TAX ANTICIPATION NOTE |
TRAN - TAX AND REVENUE
ANTICIPATION NOTE |
VRDN - VARIABLE RATE DEMAND NOTE
(A debt instrument that is
payable upon demand, either
daily, weekly or monthly) |
Legend |
(a) Coupon rates for floating and adjustable rate securities reflect the rates in effect at period end. |
(b) Information in this report regarding holdings by state and security types does not reflect the holdings of the Fidelity Tax-Free Cash Central Fund. |
(c) Affiliated fund that is available only to investment companies and other accounts managed by Fidelity Investments. The rate quoted is the annualized seven-day yield of the fund at period end. A complete unaudited listing of the fund's holdings as of its most recent quarter end is available upon request. In addition, each Fidelity Central Fund's financial statements are available on the SEC's website or upon request. |
(d) Security collateralized by an amount sufficient to pay interest and principal. |
(e) Provides evidence of ownership in one or more underlying municipal bonds. |
(f) Restricted securities - Investment in securities not registered under the Securities Act of 1933 (excluding 144A issues). At the end of the period, the value of restricted securities (excluding 144A issues) amounted to $17,600,000 or 1.2% of net assets. |
Additional information on each restricted holding is as follows: |
Security | Acquisition Date | Cost (000s) |
New Jersey Gen. Oblig. Bonds Series Putters 3850, 0.3%, tender 6/23/11 (Liquidity Facility JPMorgan Chase & Co.) | 12/6/10 | $ 17,600 |
Affiliated Central Funds |
Information regarding fiscal year to date income earned by the Fund from investments in Fidelity Central Funds is as follows: |
Fund | Income earned
(Amounts in thousands) |
Fidelity Tax-Free Cash Central Fund | $ 112 |
Other Information |
The date shown for securities represents the date when principal payments must be paid, taking into account any call options exercised by the issuer and permissible maturity shortening features other than interest rate resets. |
All investments are categorized as Level 2 under the Fair Value Hierarchy. The inputs or methodology used for valuing securities may not be an indication of the risk associated with investing in those securities. For more information on valuation inputs, please refer to the Security Valuation section in the accompanying Notes to Financial Statements. |
See accompanying notes which are an integral part of the financial statements.
Semiannual Report
Statement of Assets and Liabilities
Amounts in thousands (except per-share amount) | February 28, 2011 (Unaudited) |
| | |
Assets | | |
Investment in securities, at value - See accompanying schedule: Unaffiliated issuers (cost $1,386,769) | $ 1,386,769 | |
Fidelity Central Funds (cost $105,327) | 105,327 | |
Total Investments (cost $1,492,096) | | $ 1,492,096 |
Cash | | 458 |
Receivable for investments sold | | 4,100 |
Receivable for fund shares sold | | 2,964 |
Interest receivable | | 1,737 |
Distributions receivable from Fidelity Central Funds | | 20 |
Receivable from investment adviser for expense reductions | | 159 |
Other receivables | | 9 |
Total assets | | 1,501,543 |
| | |
Liabilities | | |
Payable for investments purchased | $ 1,840 | |
Payable for fund shares redeemed | 3,591 | |
Distributions payable | 1 | |
Accrued management fee | 505 | |
Other affiliated payables | 1 | |
Total liabilities | | 5,938 |
| | |
Net Assets | | $ 1,495,605 |
Net Assets consist of: | | |
Paid in capital | | $ 1,495,527 |
Accumulated undistributed net realized gain (loss) on investments | | 78 |
Net Assets, for 1,493,927 shares outstanding | | $ 1,495,605 |
Net Asset Value, offering price and redemption price per share ($1,495,605 ÷ 1,493,927 shares) | | $ 1.00 |
See accompanying notes which are an integral part of the financial statements.
Semiannual Report
Financial Statements - continued
Statement of Operations
Amounts in thousands | Six months ended February 28, 2011 (Unaudited) |
| | |
Investment Income | | |
Interest | | $ 2,535 |
Income from Fidelity Central Funds | | 112 |
Total income | | 2,647 |
| | |
Expenses | | |
Management fee | $ 3,480 | |
Independent trustees' compensation | 3 | |
Total expenses before reductions | 3,483 | |
Expense reductions | (946) | 2,537 |
Net investment income (loss) | | 110 |
Realized and Unrealized Gain (Loss) Net realized gain (loss) on: | | |
Investment securities: | | |
Unaffiliated issuers | | 16 |
Net increase in net assets resulting from operations | | $ 126 |
See accompanying notes which are an integral part of the financial statements.
Semiannual Report
Statement of Changes in Net Assets
Amounts in thousands | Six months ended February 28, 2011 (Unaudited) | Year ended
August 31,
2010 |
Increase (Decrease) in Net Assets | | |
Operations | | |
Net investment income (loss) | $ 110 | $ 306 |
Net realized gain (loss) | 16 | 196 |
Net increase in net assets resulting
from operations | 126 | 502 |
Distributions to shareholders from net investment income | (110) | (306) |
Distributions to shareholders from net realized gain | (97) | (139) |
Total distributions | (207) | (445) |
Share transactions at net asset value of $1.00 per share
Proceeds from sales of shares | 187,012 | 613,977 |
Reinvestment of distributions | 189 | 384 |
Cost of shares redeemed | (438,750) | (1,374,041) |
Net increase (decrease) in net assets and shares resulting from share transactions | (251,549) | (759,680) |
Total increase (decrease) in net assets | (251,630) | (759,623) |
| | |
Net Assets | | |
Beginning of period | 1,747,235 | 2,506,858 |
End of period | $ 1,495,605 | $ 1,747,235 |
See accompanying notes which are an integral part of the financial statements.
Semiannual Report
Financial Highlights
| Six months ended
February 28, 2011 | Years ended August 31, |
| (Unaudited) | 2010 | 2009 | 2008 | 2007 | 2006 |
Selected Per-Share Data | | | | | |
Net asset value, beginning of period | $ 1.00 | $ 1.00 | $ 1.00 | $ 1.00 | $ 1.00 | $ 1.00 |
Income from Investment Operations | | | | | | |
Net investment income (loss) | - F | - F | .007 | .024 | .034 | .029 |
Net realized and unrealized gain (loss) F | - | - | - | - | - | - |
Total from investment operations | - F | - F | .007 | .024 | .034 | .029 |
Distributions from net investment income | - F | - F | (.007) | (.024) | (.034) | (.029) |
Distributions from net realized gain | - F | - F | - F | - F | - | - |
Total distributions | - F | - F | (.007) | (.024) | (.034) | (.029) |
Net asset value, end of period | $ 1.00 | $ 1.00 | $ 1.00 | $ 1.00 | $ 1.00 | $ 1.00 |
Total Return B,C | .01% | .02% | .75% | 2.44% | 3.41% | 2.94% |
Ratios to Average Net Assets D,E | | | | | |
Expenses before reductions | .43% A | .43% | .48% | .43% | .43% | .43% |
Expenses net of fee waivers, if any | .32%A | .29% | .38% | .33% | .33% | .33% |
Expenses net of all reductions | .32%A | .29% | .36% | .26% | .24% | .24% |
Net investment income (loss) | .01%A | .01% | .79% | 2.39% | 3.36% | 2.88% |
Supplemental Data | | | | | | |
Net assets, end of period (in millions) | $ 1,496 | $ 1,747 | $ 2,507 | $ 3,540 | $ 3,474 | $ 3,333 |
A Annualized
B Total returns for periods of less than one year are not annualized.
C Total returns would have been lower had certain expenses not been reduced during the periods shown.
D Fees and expenses of the underlying Fidelity Central Funds are not included in the Fund's expense ratio. The Fund indirectly bears its proportionate share of the expenses of any underlying Fidelity Central Funds.
E Expense ratios reflect operating expenses of the Fund. Expenses before reductions do not reflect amounts reimbursed or waived or reductions from expense offset arrangements and do not represent the amount paid by the Fund during periods when reimbursements, waivers or reductions occur. Expenses net of fee waivers reflect expenses after reimbursement and waivers but prior to reductions from expense offset arrangements. Expenses net of all reductions represent the net expenses paid by the Fund.
F Amount represents less than $.001 per share.
See accompanying notes which are an integral part of the financial statements.
Semiannual Report
Notes to Financial Statements
For the period ended February 28, 2011 (Unaudited)
(Amounts in thousands except ratios)
1. Organization.
Fidelity AMT Tax-Free Money Fund (the Fund) is a fund of Fidelity Union Street Trust II (the Trust) and is authorized to issue an unlimited number of shares. The Trust is registered under the Investment Company Act of 1940, as amended (the 1940 Act), as an open-end management investment company organized as a Delaware statutory trust.
2. Investments in Fidelity Central Funds.
The Fund may invest in Fidelity Central Funds, which are open-end investment companies available only to other investment companies and accounts managed by Fidelity Management & Research Company (FMR) and its affiliates. The Fund's Schedule of Investments lists each of the Fidelity Central Funds held as of period end, if any, as an investment of the Fund, but does not include the underlying holdings of each Fidelity Central Fund. As an Investing Fund, the Fund indirectly bears its proportionate share of the expenses of the underlying Fidelity Central Funds.
The Money Market Central Funds seek preservation of capital and current income and are managed by Fidelity Investments Money Management, Inc. (FIMM), an affiliate of FMR.
A complete unaudited list of holdings for each Fidelity Central Fund is available upon request or at the Securities and Exchange Commission (the SEC) web site at www.sec.gov. In addition, the financial statements of the Fidelity Central Funds, are available on the SEC web site or upon request.
3. Significant Accounting Policies.
The financial statements have been prepared in conformity with accounting principles generally accepted in the United States of America (GAAP), which require management to make certain estimates and assumptions at the date of the financial statements. Actual results could differ from those estimates. Subsequent events, if any, through the date that the financial statements were issued have been evaluated in the preparation of the financial statements. The following summarizes the significant accounting policies of the Fund:
Security Valuation. The Fund categorizes the inputs to valuation techniques used to value its investments into a disclosure hierarchy consisting of three levels as shown below.
Level 1 - quoted prices in active markets for identical investments
Level 2 - other significant observable inputs (including quoted prices for similar investments, interest rates, prepayment speeds, etc.)
Level 3 - unobservable inputs (including the Fund's own assumptions based on the best information available)
Semiannual Report
3. Significant Accounting Policies - continued
Security Valuation - continued
As permitted by compliance with certain conditions under Rule 2a-7 of the 1940 Act, securities are valued at amortized cost, which approximates fair value, and are categorized as Level 2 in the hierarchy.
Investment Transactions and Income. The net asset value per share for processing shareholder transactions is calculated as of the close of business of the New York Stock Exchange (NYSE), normally 4:00 p.m. Eastern time. Security transactions, including the Fund's investment activity in the Fidelity Central Funds, are accounted for as of trade date. Gains and losses on securities sold are determined on the basis of identified cost. Interest income and distributions from the Fidelity Central Funds are accrued as earned. Interest income includes coupon interest and amortization of premium and accretion of discount on debt securities.
Expenses. Expenses directly attributable to a fund are charged to that fund. Expenses attributable to more than one fund are allocated among the respective funds on the basis of relative net assets or other appropriate methods. Expense estimates are accrued in the period to which they relate and adjustments are made when actual amounts are known.
Income Tax Information and Distributions to Shareholders. Each year the Fund intends to qualify as a regulated investment company, including distributing substantially all of its taxable income and realized gains under Subchapter M of the Internal Revenue Code and filing its U.S. federal tax return. As a result, no provision for income taxes is required. A fund's federal tax return is subject to examination by the Internal Revenue Service (IRS) for a period of three years.
Dividends are declared and recorded daily and paid monthly from net investment income. Distributions from realized gains, if any, are declared and recorded on the ex-dividend date. Income and capital gain distributions are determined in accordance with income tax regulations, which may differ from GAAP.
Capital accounts within the financial statements are adjusted for permanent book-tax differences. These adjustments have no impact on net assets or the results of operations. Temporary book-tax differences will reverse in a subsequent period.
Book-tax differences are primarily due to deferred trustees compensation.
Semiannual Report
Notes to Financial Statements (Unaudited) - continued
(Amounts in thousands except ratios)
3. Significant Accounting Policies - continued
Income Tax Information and Distributions to Shareholders - continued
The Fund purchases municipal securities whose interest, in the opinion of the issuer, is free from federal income tax. There is no assurance that the IRS will agree with this opinion. In the event the IRS determines that the issuer does not comply with relevant tax requirements, interest payments from a security could become federally taxable, possibly retroactively to the date the security was issued.
The federal tax cost of investment securities and unrealized appreciation (depreciation) as of period end were as follows:
Gross unrealized appreciation | $ - |
Gross unrealized depreciation | - |
Net unrealized appreciation (depreciation) on securities and other investments | $ - |
Tax cost | $ 1,492,096 |
4. Operating Policies.
Restricted Securities. The Fund may invest in securities that are subject to legal or contractual restrictions on resale. These securities generally may be resold in transactions exempt from registration or to the public if the securities are registered. Disposal of these securities may involve time-consuming negotiations and expense, and prompt sale at an acceptable price may be difficult. Information regarding restricted securities is included at the end of the Fund's Schedule of Investments.
5. Fees and Other Transactions with Affiliates.
Management Fee. FMR and its affiliates provide the Fund with investment management related services for which the Fund pays a monthly management fee that is based on an annual rate of .43% of the Fund's average net assets. FMR pays all other expenses, except the compensation of the independent Trustees and certain exceptions such as interest expense. The management fee paid to FMR by the Fund is reduced by an amount equal to the fees and expenses paid by the Fund to the independent Trustees.
6. Expense Reductions.
FMR voluntarily agreed to reimburse the Fund to the extent annual operating expenses exceeded .33% of average net assets. Some expenses, for example interest expense, are excluded from this reimbursement. During the period this reimbursement reduced the Fund's expenses by $830.
Semiannual Report
6. Expense Reductions - continued
Additionally, FMR or its affiliates voluntarily agreed to waive certain fees in order to maintain a minimum annualized yield of .01%. Such arrangements may be discontinued by FMR at any time. For the period, the amount of the waiver was $115.
In addition, through arrangements with the Fund's custodian, credits realized as a result of uninvested cash balances were used to reduce the Fund's management fee. During the period, these credits reduced the Fund's management fee by $1.
7. Other.
The Fund's organizational documents provide former and current trustees and officers with a limited indemnification against liabilities arising in connection with the performance of their duties to the Fund. In the normal course of business, the Fund may also enter into contracts that provide general indemnifications. The Fund's maximum exposure under these arrangements is unknown as this would be dependent on future claims that may be made against the Fund. The risk of material loss from such claims is considered remote.
Semiannual Report
Board Approval of Investment Advisory Contracts and Management Fees
Fidelity AMT Tax-Free Money Fund
Each year, the Board of Trustees, including the Independent Trustees (together, the Board), votes on the renewal of the management contract and sub-advisory agreements (together, the Advisory Contracts) for the fund. The Board, assisted by the advice of fund counsel and Independent Trustees' counsel, requests and considers a broad range of information relevant to the renewal of the Advisory Contracts throughout the year.
The Board meets regularly and considers at each of its meetings factors that are relevant to its annual consideration of the renewal of the fund's Advisory Contracts, including the services and support provided to the fund and its shareholders. The Board has established three standing committees, each composed of Independent Trustees with varying backgrounds, to which the Board has assigned specific subject matter responsibilities in order to enhance effective decision-making by the Board. The Operations Committee, of which all of the Independent Trustees are members, meets regularly throughout the year and, among other matters, considers matters specifically related to the annual consideration of the renewal of the fund's Advisory Contracts. The Board, acting directly and through its Committees, requests and receives information concerning the annual consideration of the renewal of the fund's Advisory Contracts. The Board also meets as needed to consider matters specifically related to the Board's annual consideration of the renewal of Advisory Contracts. Members of the Board may also meet with trustees of other Fidelity funds through ad hoc joint committees to discuss certain matters relevant to the Fidelity funds.
At its September 2010 meeting, the Board of Trustees, including the Independent Trustees, unanimously determined to renew the fund's Advisory Contracts. In reaching its determination, the Board considered all factors it believed relevant, including (i) the nature, extent, and quality of the services to be provided to the fund and its shareholders (including the investment performance of the fund); (ii) the competitiveness of the fund's management fee and total expenses; (iii) the total costs of the services to be provided by and the profits to be realized by Fidelity from its relationship with the fund; (iv) the extent to which economies of scale would be realized as the fund grows; and (v) whether fee levels reflect these economies of scale, if any, for the benefit of fund shareholders.
In considering whether to renew the Advisory Contracts for the fund, the Board reached a determination, with the assistance of fund counsel and Independent Trustees' counsel and through the exercise of its business judgment, that the renewal of the Advisory Contracts is in the best interests of the fund and its shareholders and that the compensation to be received by Fidelity under the management contract is fair and reasonable. The Board's decision to renew the Advisory Contracts was not based on any single factor, but rather was based on a comprehensive consideration of all the information provided to the Board at its meetings throughout the year. The Board, in reaching its determination to renew the Advisory Contracts, is aware that shareholders in the fund have a broad range of investment choices available to them, including a wide choice among mutual funds offered by Fidelity's competitors, and that the fund's shareholders, with the opportunity to review and weigh the disclosure provided by the fund in its prospectus and other public disclosures, have chosen to invest in this fund, managed by Fidelity.
Semiannual Report
Board Approval of Investment Advisory Contracts and
Management Fees - continued
Nature, Extent, and Quality of Services Provided. The Board considered the staffing within the investment adviser, FMR, and the sub-advisers (together, the Investment Advisers), including the backgrounds of the fund's investment personnel and the fund's investment objective and discipline. The Independent Trustees also had discussions with senior management of Fidelity's investment operations and investment groups. The Board considered the structure of the portfolio manager compensation program and whether this structure provides appropriate incentives to act in the best interest of the fund.
Resources Dedicated to Investment Management and Support Services. The Board reviewed the size, education, and experience of the Investment Advisers' investment staff, their use of technology, and the Investment Advisers' approach to recruiting, training, and retaining portfolio managers and other research, advisory, and management personnel. The Board noted that Fidelity's analysts have access to a variety of technological tools and market and securities data that enable them to perform both fundamental and quantitative analysis and to specialize in various disciplines. The Board considered Fidelity's extensive global research capabilities that enable the Investment Advisers to aggregate data from various sources in an effort to produce positive investment results. The Board also considered that Fidelity's portfolio managers and analysts have access to daily portfolio attribution that allows for monitoring of a fund's portfolio, as well as an electronic communication system that provides immediate real-time access to research concerning issuers and credit enhancers. In addition, the Board considered the trading resources that are an integral part of the fixed-income portfolio management investment process.
Shareholder and Administrative Services. The Board considered (i) the nature, extent, quality, and cost of advisory, administrative, and shareholder services performed by the Investment Advisers and their affiliates under the Advisory Contracts and under separate agreements covering transfer agency and pricing and bookkeeping services for the fund; (ii) the nature and extent of the investment adviser's supervision of third party service providers, principally custodians and subcustodians; and (iii) the resources devoted to, and the record of compliance with, the fund's compliance policies and procedures.
The Board noted that the growth of fund assets over time across the complex allows Fidelity to reinvest in the development of services designed to enhance the value or convenience of the Fidelity funds as investment vehicles. These services include 24-hour access to account information and market information through telephone representatives and over the Internet, and investor education materials and asset allocation tools.
Semiannual Report
Investment in a Large Fund Family. The Board considered the benefits to shareholders of investing in a Fidelity fund, including the benefits of investing in a fund that is part of a large family of funds offering a variety of investment disciplines and providing a large variety of mutual fund investor services. The Board noted that Fidelity had taken, or had made recommendations that resulted in the Fidelity funds taking, a number of actions over the previous year that benefited particular funds, including (i) dedicating additional resources to investment research and restructuring and broadening the focus of the investment research teams; (ii) bolstering the senior management team that oversees asset management; (iii) launching Class F of certain funds as a lower-fee class available to Freedom K and Freedom Index Funds; (iv) lowering the initial investment minimums and ongoing balance requirements for Real Estate High Income Fund; (v) eliminating subsequent purchase minimums for all funds and adding a waiver of the investment minimum requirement for new accounts opened with the proceeds of a systematic withdrawal plan; (vi) eliminating the withdrawal minimum and maximum limits for systematic withdrawals from Advisor funds; (vii) expanding sales load waivers on Class A shares for Destiny Planholders and expanding Institutional Class eligibility for Class O Destiny Planholders; and (viii) changing certain Class A and Class T sales charge structures to further align them with industry practices.
Investment Performance. The Board considered whether the fund has operated in accordance with its investment objective, as well as its record of compliance with its investment restrictions. It also reviewed the fund's absolute investment performance, as well as the fund's relative investment performance measured over multiple periods against a peer group of mutual funds deemed appropriate by Fidelity and reviewed by the Board. The following charts considered by the Board show, over the one-, three-, and five-year periods ended December 31, 2009, the fund's cumulative total returns and a range of cumulative total returns of a peer group of mutual funds identified by Lipper Inc. as having an investment objective similar to that of the fund. The box within each chart shows the 25th percentile return (bottom of box) and the 75th percentile return (top of box) of the peer group. Returns shown above the box are in the first quartile and returns shown below the box are in the fourth quartile. The percentage beaten number noted below each chart corresponds to the percentile box and represents the percentage of funds in the peer group whose performance was equal to or lower than that of the fund.
Semiannual Report
Board Approval of Investment Advisory Contracts and
Management Fees - continued
Fidelity AMT Tax-Free Money Fund
The Board reviewed the fund's relative investment performance against its peer group and noted that the performance of the fund was in the second quartile for the one-year period and the first quartile for the three- and five-year periods. The Board considered that FMR had taken steps to provide shareholders with stability of principal and to enhance safety and liquidity, which contributed to the fund's weakened performance relative to its peer group. The Board also reviewed the fund's performance since inception as well as performance in the current year.
Based on its review, and giving particular weight to the nature and quality of the resources dedicated by the Investment Advisers to maintain and improve relative performance and factoring in the unprecedented market events in recent years, the Board concluded that the nature, extent, and quality of investment management and support services and of shareholder and administrative services provided to the fund will benefit the fund's shareholders, particularly in light of the Board's view that the fund's shareholders benefit from investing in a fund that is part of a large family of funds offering a variety of investment disciplines and services.
Competitiveness of Management Fee and Total Fund Expenses. The Board considered the fund's management fee and total expenses compared to "mapped groups" of competitive funds and classes. Fidelity creates "mapped groups" by combining similar Lipper investment objective categories that have comparable management fee characteristics. Combining Lipper investment objective categories aids the Board's management fee and total expense comparisons by broadening the competitive group used for comparison and by reducing the number of universes to which various Fidelity funds are compared.
Semiannual Report
Management Fee. The Board considered two proprietary management fee comparisons for the 12-month periods shown in the chart below. The group of Lipper funds used by the Board for management fee comparisons is referred to below as the "Total Mapped Group" and, for the reasons explained above, is broader than the Lipper peer group used by the Board for performance comparisons. The Total Mapped Group comparison focuses on a fund's standing relative to the total universe of comparable funds available to investors, in terms of gross management fees before expense reimbursements or caps. "TMG %" represents the percentage of funds in the Total Mapped Group that had management fees that were lower than the fund's. For example, a TMG % of 25% means that 75% of the funds in the Total Mapped Group had higher management fees than the fund. The "Asset-Size Peer Group" (ASPG) comparison focuses on a fund's standing relative to non-Fidelity funds similar in size to the fund within the Total Mapped Group. The ASPG represents at least 15% of the funds in the Total Mapped Group with comparable asset size and management fee characteristics, subject to a minimum of 50 funds (or all funds in the Total Mapped Group if fewer than 50). Additional information, such as the ASPG quartile in which the fund's management fee ranked, is also included in the chart and considered by the Board. For a more meaningful comparison of management fees, the fund is compared on the basis of a hypothetical "net management fee," which is derived by subtracting payments made by FMR for non-management expenses (including transfer agent fees, pricing and bookkeeping fees, and fees paid to non-affiliated custodians) from the fund's all-inclusive fee. In this regard, the Board realizes that net management fees can vary from year to year because of differences in non-management expenses.
Semiannual Report
Board Approval of Investment Advisory Contracts and
Management Fees - continued
Fidelity AMT Tax-Free Money Fund
The Board noted that the fund's hypothetical net management fee ranked below the median of its Total Mapped Group and below the median of its ASPG for 2009.
Based on its review, the Board concluded that the fund's management fee is fair and reasonable in light of the services that the fund receives and the other factors considered.
Total Expenses. In its review of the fund's total expenses, the Board considered the fund's hypothetical net management fee as well as the fund's all-inclusive fee. The Board also considered other expenses, such as transfer agent fees, pricing and bookkeeping fees, and custodial, legal, and audit fees, paid by FMR under the all-inclusive arrangement. The Board also noted the effects of any waivers and reimbursements on fees and expenses. As part of its review, the Board also considered current and historical total expenses of the fund compared to competitive fund median expenses. The fund is compared to those funds and classes in the Total Mapped Group (used by the Board for management fee comparisons) that have a similar sales load structure.
The Board noted that the fund's total expenses ranked below its competitive median for 2009. The Board considered that Fidelity has been voluntarily waiving part or all of the management fees to maintain a minimum yield for the fund.
Fees Charged to Other Fidelity Clients. The Board also considered Fidelity fee structures and other information with respect to clients of FMR and its affiliates, such as other mutual funds advised or subadvised by FMR or its affiliates, pension plan clients, and other institutional clients. In March 2010, the Board created an ad hoc joint committee with the board of other Fidelity funds (the Committee) to review and compare Fidelity's institutional investment advisory business with its business of providing services to the Fidelity funds, including the differences in services provided, fees charged, and costs incurred, as well as competition in their respective marketplaces.
Semiannual Report
Based on its review of total expenses and fees charged to other Fidelity clients, the Board concluded that the fund's total expenses were reasonable in light of the services that the fund and its shareholders receive and the other factors considered, including the findings of the Committee.
Costs of the Services and Profitability. The Board considered the revenues earned and the expenses incurred by Fidelity in conducting the business of developing, marketing, distributing, managing, administering and servicing the fund and its shareholders. The Board also considered the level of Fidelity's profits in respect of all the Fidelity funds.
On an annual basis, FMR presents to the Board Fidelity's profitability for the fund. Fidelity calculates the profitability for each fund, as well as aggregate profitability for groups of Fidelity funds and all Fidelity funds, using a series of detailed revenue and cost allocation methodologies which originate with the audited books and records of Fidelity. The Audit Committee of the Board reviews any significant changes from the prior year's methodologies.
PricewaterhouseCoopers LLP (PwC), independent registered public accounting firm and auditor to Fidelity and certain Fidelity funds, has been engaged annually by the Board as part of the Board's assessment of Fidelity's profitability analysis. PwC's engagement includes the review and assessment of Fidelity's methodologies used in determining the revenues and expenses attributable to Fidelity's mutual fund business, and completion of agreed-upon procedures surrounding the mathematical accuracy of fund profitability and its conformity to allocation methodologies. After considering PwC's reports issued under the engagement and information provided by Fidelity, the Board believes that while other allocation methods may also be reasonable, Fidelity's profitability methodologies are reasonable in all material respects.
The Board has also reviewed Fidelity's non-fund businesses and fall-out benefits related to the mutual fund business as well as cases where Fidelity's affiliates may benefit from or be related to the fund's business.
The Board considered the costs of the services provided by and the profits realized by Fidelity in connection with the operation of the fund and were satisfied that the profitability was not excessive in the circumstances.
Economies of Scale. The Board considered whether there have been economies of scale in respect of the management of the Fidelity funds, whether the Fidelity funds (including the fund) have appropriately benefited from any such economies of scale, and whether there is potential for realization of any further economies of scale. The Board considered the extent to which the fund will benefit from economies of scale through increased services to the fund, through waivers or reimbursements, or through fee or expense reductions.
Semiannual Report
Board Approval of Investment Advisory Contracts and
Management Fees - continued
In February 2009, the Board and the board of other Fidelity funds created an ad hoc committee (the Economies of Scale Committee) to analyze whether FMR attains economies of scale in respect of the management and servicing of the Fidelity funds, whether the Fidelity funds have appropriately benefited from such economies of scale, and whether there is potential for realization of any further economies of scale.
The Board concluded, considering the findings of the Economies of Scale Committee, that any potential economies of scale are being appropriately shared between fund shareholders and Fidelity.
Additional Information Requested by the Board. In order to develop fully the factual basis for consideration of the Fidelity funds' Advisory Contracts, the Board requested and received additional information on certain topics, including (i) fund performance trends, actions to be taken by FMR to improve certain funds' overall performance, and Fidelity's long-term strategies for certain funds; (ii) Fidelity's fund profitability methodology and profitability trends for certain funds; (iii) portfolio manager changes that have occurred during the past year and the amount of the investment that each portfolio manager has made in the Fidelity fund(s) that he or she manages; (iv) Fidelity's compensation structure for portfolio managers, research analysts, and other key personnel, including its effects on fund profitability, the rationale for the compensation structure, and the extent to which current market conditions have affected retention and recruitment; (v) the compensation paid by FMR to fund sub-advisers on behalf of the Fidelity funds; (vi) Fidelity's fee structures and rationale for recommending different fees among different categories of funds and classes, as well as Fidelity's voluntary waiver of fees to maintain minimum yields for certain funds and classes; (vii) the rationale for any differences between fund fee structures and fee structures in place for other Fidelity clients; and (viii) explanations regarding the relative total expenses borne by certain funds and classes, total expense competitive trends, and actions that might be taken by FMR to reduce total expenses for certain funds and classes or to achieve further economies of scale.
Based on its evaluation of all of the conclusions noted above, and after considering all factors it believed relevant, the Board ultimately concluded that the advisory fee structures are fair and reasonable, and that the fund's Advisory Contracts should be renewed.
Semiannual Report
Managing Your Investments
Fidelity offers several ways to conveniently manage your personal investments via your telephone or PC. You can access your account information, conduct trades and research your investments 24 hours a day.
By Phone
Fidelity Automated Service Telephone provides a single toll-free number to access account balances, positions, quotes and trading. It's easy to navigate the service, and on your first call, the system will help you create a personal identification number (PIN) for security.
(phone_graphic)
Fidelity Automated
Service Telephone (FAST®)
1-800-544-5555
Press
 For mutual fund and brokerage trading.
 For quotes.*
 For account balances and holdings.
 To review orders and mutual
fund activity.
 To change your PIN.

 To speak to a Fidelity representative.
By PC
Fidelity's web site on the Internet provides a wide range of information, including daily financial news, fund performance, interactive planning tools and news about Fidelity products and services.
(computer_graphic)
Fidelity's Web Site
www.fidelity.com
* When you call the quotes line, please remember that a fund's yield and return will vary and, except for money market funds, share price will also vary. This means that you may have a gain or loss when you sell your shares. There is no assurance that money market funds will be able to maintain a stable $1 share price; an investment in a money market fund is not insured or guaranteed by the U.S. government. Total returns are historical and include changes in share price, reinvestment of dividends and capital gains distributions, and the effects of any sales charges.
Semiannual Report
To Write Fidelity
We'll give your correspondence immediate attention and send you written confirmation upon completion of your request.
(letter_graphic)
Making Changes
To Your Account
(such as changing name, address, bank, etc.)
Fidelity Investments
P.O. Box 770001
Cincinnati, OH 45277-0002
(letter_graphic)
For Non-Retirement
Accounts
Buying shares
Fidelity Investments
P.O. Box 770001
Cincinnati, OH 45277-0003
Overnight Express
Fidelity Investments
Attn: Distribution Services
100 Crosby Parkway - KC1H
Covington, KY 41015
Selling shares
Fidelity Investments
P.O. Box 770001
Cincinnati, OH 45277-0035
Overnight Express
Fidelity Investments
Attn: Distribution Services
100 Crosby Parkway - KC1H
Covington, KY 41015
General Correspondence
Fidelity Investments
P.O. Box 500
Merrimack, NH 03054-0500
(letter_graphic)
For Retirement
Accounts
Buying shares
Fidelity Investments
P.O. Box 770001
Cincinnati, OH 45277-0003
Selling shares
Fidelity Investments
P.O. Box 770001
Cincinnati, OH 45277-0035
Overnight Express
Fidelity Investments
Attn: Distribution Services
100 Crosby Parkway - KC1H
Covington, KY 41015
General Correspondence
Fidelity Investments
P.O. Box 500
Merrimack, NH 03054-0500
Semiannual Report
To Visit Fidelity
For directions and hours,
please call 1-800-544-9797.
Arizona
7001 West Ray Road
Chandler, AZ
15445 N. Scottsdale Road
Scottsdale, AZ
17550 North 75th Avenue
Glendale, AZ
5330 E. Broadway Blvd
Tucson, AZ
California
815 East Birch Street
Brea, CA
1411 Chapin Avenue
Burlingame, CA
851 East Hamilton Avenue
Campbell, CA
601 Larkspur Landing Circle
Larkspur, CA
2000 Avenue of the Stars
Los Angeles, CA
27101 Puerta Real
Mission Viejo, CA
73575 El Paseo
Palm Desert, CA
251 University Avenue
Palo Alto, CA
123 South Lake Avenue
Pasadena, CA
16656 Bernardo Ctr. Drive
Rancho Bernardo, CA
1220 Roseville Parkway
Roseville, CA
1740 Arden Way
Sacramento, CA
7676 Hazard Center Drive
San Diego, CA
11943 El Camino Real
San Diego, CA
8 Montgomery Street
San Francisco, CA
3793 State Street
Santa Barbara, CA
1200 Wilshire Boulevard
Santa Monica, CA
398 West El Camino Real
Sunnyvale, CA
111 South Westlake Blvd
Thousand Oaks, CA
21701 Hawthorne Boulevard
Torrance, CA
2001 North Main Street
Walnut Creek, CA
6326 Canoga Avenue
Woodland Hills, CA
2211 Michelson Drive
Irvine, CA
Colorado
281 East Flatiron Circle
Broomfield, CO
1625 Broadway
Denver, CO
9185 Westview Road
Lone Tree, CO
Connecticut
48 West Putnam Avenue
Greenwich, CT
265 Church Street
New Haven, CT
300 Atlantic Street
Stamford, CT
29 South Main Street
West Hartford, CT
1261 Post Road
Fairfield, CT
Delaware
400 Delaware Avenue
Wilmington, DE
Florida
175 East Altamonte Drive
Altamonte Springs, FL
1400 Glades Road
Boca Raton, FL
121 Alhambra Plaza
Coral Gables, FL
2948 N. Federal Highway
Ft. Lauderdale, FL
4671 Town Center Parkway
Jacksonville, FL
8880 Tamiami Trail, North
Naples, FL
230 Royal Palm Way
Palm Beach, FL
3501 PGA Boulevard
Palm Beach Gardens, FL
3550 Tamiami Trail, South
Sarasota, FL
1502 N. Westshore Blvd.
Tampa, FL
2465 State Road 7
Wellington, FL
Georgia
3242 Peachtree Road
Atlanta, GA
1000 Abernathy Road
Atlanta, GA
Illinois
One North LaSalle Street
Chicago, IL
401 North Michigan Avenue
Chicago, IL
One Skokie Valley Road
Highland Park, IL
1415 West 22nd Street
Oak Brook, IL
15105 S LaGrange Road
Orland Park, IL
1572 East Golf Road
Schaumburg, IL
1823 Freedom Drive
Naperville, IL
Indiana
8480 Keystone Crossing
Indianapolis, IN
Kansas
5400 College Boulevard
Overland Park, KS
Maine
Three Canal Plaza
Portland, ME
Maryland
7315 Wisconsin Avenue
Bethesda, MD
610 York Road
Towson, MD
Massachusetts
801 Boylston Street
Boston, MA
155 Congress Street
Boston, MA
300 Granite Street
Braintree, MA
44 Mall Road
Burlington, MA
238 Main Street
Cambridge, MA
200 Endicott Street
Danvers, MA
Semiannual Report
405 Cochituate Road
Framingham, MA
551 Boston Turnpike
Shrewsbury, MA
Michigan
500 E. Eisenhower Pkwy.
Ann Arbor, MI
280 N. Old Woodward Ave.
Birmingham, MI
30200 Northwestern Hwy.
Farmington Hills, MI
43420 Grand River Avenue
Novi, MI
3480 28th Street
Grand Rapids, MI
2425 S. Linden Road STE E
Flint, MI
Minnesota
7740 France Avenue South
Edina, MN
8342 3rd Street North
Oakdale, MN
Missouri
1524 South Lindbergh Blvd.
St. Louis, MO
Nevada
2225 Village Walk Drive
Henderson, NV
New Jersey
501 Route 73 South
Marlton, NJ
150 Essex Street
Millburn, NJ
35 Morris Street
Morristown, NJ
396 Route 17, North
Paramus, NJ
3518 Route 1 North
Princeton, NJ
530 Broad Street
Shrewsbury, NJ
New Mexico
2261 Q Street NE
Albuquerque, NM
New York
1130 Franklin Avenue
Garden City, NY
37 West Jericho Turnpike
Huntington Station, NY
1271 Avenue of the Americas
New York, NY
980 Madison Avenue
New York, NY
61 Broadway
New York, NY
350 Park Avenue
New York, NY
200 Fifth Avenue
New York, NY
733 Third Avenue
New York, NY
2070 Broadway
New York, NY
1075 Northern Blvd.
Roslyn, NY
799 Central Park Avenue
Scarsdale, NY
3349 Monroe Avenue
Rochester, NY
North Carolina
4611 Sharon Road
Charlotte, NC
7011 Fayetteville Road
Durham, NC
Ohio
3805 Edwards Road
Cincinnati, OH
1324 Polaris Parkway
Columbus, OH
1800 Crocker Road
Westlake, OH
28699 Chagrin Boulevard
Woodmere Village, OH
Oregon
7493 SW Bridgeport Road
Tigard, OR
Pennsylvania
600 West DeKalb Pike
King of Prussia, PA
1735 Market Street
Philadelphia, PA
12001 Perry Highway
Wexford, PA
Rhode Island
10 Memorial Boulevard
Providence, RI
Tennessee
3018 Peoples Street
Johnson City, TN
7628 West Farmington Blvd.
Germantown, TN
2035 Mallory Lane
Franklin, TN
Texas
10000 Research Boulevard
Austin, TX
4001 Northwest Parkway
Dallas, TX
12532 Memorial Drive
Houston, TX
2701 Drexel Drive
Houston, TX
6560 Fannin Street
Houston, TX
1701 Lake Robbins Drive
The Woodlands, TX
6500 N. MacArthur Blvd.
Irving, TX
6005 West Park Boulevard
Plano, TX
1576 East Southlake Blvd.
Southlake, TX
15600 Southwest Freeway
Sugar Land, TX
139 N. Loop 1604 East
San Antonio, TX
Utah
279 West South Temple
Salt Lake City, UT
Virginia
1861 International Drive
McLean, VA
11957 Democracy Drive
Reston, VA
Washington
10500 NE 8th Street
Bellevue, WA
1518 6th Avenue
Seattle, WA
304 Strander Blvd
Tukwila, WA
Washington, DC
1900 K Street, N.W.
Washington, DC
Wisconsin
16020 West Bluemound Road
Brookfield, WI
Fidelity Brokerage Services, Inc., 100 Summer St., Boston, MA 02110 Member NYSE/SIPC
Semiannual Report
Investment Adviser
Fidelity Management & Research Company
Boston, MA
Investment Sub-Advisers
Fidelity Investments
Money Management, Inc.
Fidelity Management & Research
(Japan) Inc.
Fidelity Management & Research
(U.K.) Inc.
Fidelity Management & Research
(Hong Kong) Limited
General Distributor
Fidelity Distributors Corporation
Boston, MA
Transfer and Service Agents
Citibank, N.A.
New York, NY
Fidelity Investments Institutional Operations Company, Inc.
Boston, MA
Fidelity Service Company, Inc.
Boston, MA
Custodian
Citibank, N.A.
New York, NY
The Fidelity Telephone Connection
Mutual Fund 24-Hour Service
Exchanges/Redemptions
and Account Assistance 1-800-544-6666
Product Information 1-800-544-6666
Retirement Accounts 1-800-544-4774 (8 a.m. - 9 p.m.)
TDD Service 1-800-544-0118
for the deaf and hearing impaired
(9 a.m. - 9 p.m. Eastern time)
Fidelity Automated Service
Telephone (FAST®)
1-800-544-5555
Automated line for quickest service
SMM-USAN-0411
1.790945.107

Fidelity®
Arizona Municipal
Income Fund
and
Fidelity
Arizona Municipal
Money Market Fund
Semiannual Report
February 28, 2011
(2_fidelity_logos) (Registered_Trademark)
Contents
Chairman's Message | <Click Here> | The Chairman's message to shareholders. |
Shareholder Expense Example | <Click Here> | An example of shareholder expenses. |
Fidelity® Arizona Municipal Income Fund |
Investment Changes | <Click Here> | A summary of major shifts in the fund's investments over the past six months. |
Investments | <Click Here> | A complete list of the fund's investments with their market values. |
Financial Statements | <Click Here> | Statements of assets and liabilities, operations, and changes in net assets,
as well as financial highlights. |
Fidelity Arizona Municipal Money Market Fund |
Investment Changes | <Click Here> | A summary of major shifts in the fund's investments over the past six months, and one year. |
Investments | <Click Here> | A complete list of the fund's investments with their market values. |
Financial Statements | <Click Here> | Statements of assets and liabilities, operations, and changes in net assets,
as well as financial highlights. |
Notes | <Click Here> | Notes to the financial statements. |
Board Approval of Investment Advisory Contracts and Management Fees | <Click Here> | |
To view a fund's proxy voting guidelines and proxy voting record for the 12-month period ended June 30, visit http://www.fidelity.com/proxyvotingresults or visit the Securities and Exchange Commission's (SEC) web site at http://www.sec.gov. You may also call 1-800-544-8544 to request a free copy of the proxy voting guidelines.
Standard & Poor's, S&P and S&P 500 are registered service marks of The McGraw-Hill Companies, Inc. and have been licensed for use by Fidelity Distributors Corporation.
Other third party marks appearing herein are the property of their respective owners.
All other marks appearing herein are registered or unregistered trademarks or service marks of FMR LLC or an affiliated company.
Semiannual Report
This report and the financial statements contained herein are submitted for the general information of the shareholders of the funds. This report is not authorized for distribution to prospective investors in the funds unless preceded or accompanied by an effective prospectus.
A fund files its complete schedule of portfolio holdings with the SEC for the first and third quarters of each fiscal year on Form N-Q. Forms N-Q are available on the SEC's web site at http://www.sec.gov. A fund's Forms N-Q may be reviewed and copied at the SEC's Public Reference Room in Washington, DC. Information regarding the operation of the SEC's Public Reference Room may be obtained by calling 1-800-SEC-0330. For a complete list of a fund's portfolio holdings, view the most recent holdings listing, semiannual report, or annual report on Fidelity's web site at http://www.fidelity.com, http://www.advisor.fidelity.com, or http://www.401k.com, as applicable.
NOT FDIC INSURED • MAY LOSE VALUE • NO BANK GUARANTEE
Neither the funds nor Fidelity Distributors Corporation is a bank.
Semiannual Report
Dear Shareholder:
Following a year in which the investment environment was volatile but generally supportive of most major asset classes, 2011 has begun on a positive note. U.S. equities gained ground in January and February, reaching their highest point since June 2008, amid indications the U.S. economy had turned a corner. Still, questions remained about the longer-term outlook, most notably persistently high unemployment. Financial markets are always unpredictable, of course, but there also are several time-tested investment principles that can help put the odds in your favor.
One of the basic tenets is to invest for the long term. Over time, riding out the markets' inevitable ups and downs has proven much more effective than selling into panic or chasing the hottest trend. Even missing only a few of the markets' best days can significantly diminish investor returns. Patience also affords the benefits of compounding - of earning interest on additional income or reinvested dividends and capital gains. There can be tax advantages and cost benefits to consider as well. While staying the course doesn't eliminate risk, it can considerably lessen the effect of short-term declines.
You can further manage your investing risk through diversification. And today, more than ever, geographic diversification should be taken into account. Studies indicate that asset allocation is the single most important determinant of a portfolio's long-term success. The right mix of stocks, bonds and cash - aligned to your particular risk tolerance and investment objective - is very important. Age-appropriate rebalancing is also an essential aspect of asset allocation. For younger investors, an emphasis on equities - which historically have been the best-performing asset class over time - is encouraged. As investors near their specific goal, such as retirement or sending a child to college, consideration may be given to replacing volatile assets (e.g. common stocks) with more-stable fixed investments (bonds or savings plans).
A third principle - investing regularly - can help lower the average cost of your purchases. Investing a certain amount of money each month or quarter helps ensure you won't pay for all your shares at market highs. This strategy - known as dollar cost averaging - also reduces "emotion" from investing, helping shareholders avoid selling weak performers just prior to an upswing, or chasing a hot performer just before a correction.
We invite you to contact us via the Internet, through our Investor Centers or by phone. It is our privilege to provide you the information you need to make the investments that are right for you.
Sincerely,
(The chairman's signature appears here.)
Abigail P. Johnson
Semiannual Report
Shareholder Expense Example
As a shareholder of a Fund, you incur two types of costs: (1) transaction costs, including redemption fees, and (2) ongoing costs, including management fees and other Fund expenses. This Example is intended to help you understand your ongoing costs (in dollars) of investing in the Funds and to compare these costs with the ongoing costs of investing in other mutual funds.
The Example is based on an investment of $1,000 invested at the beginning of the period and held for the entire period (September 1, 2010 to February 28, 2011).
Actual Expenses
The first line of the accompanying table for each fund provides information about actual account values and actual expenses. You may use the information in this line, together with the amount you invested, to estimate the expenses that you paid over the period. Simply divide your account value by $1,000.00 (for example, an $8,600 account value divided by $1,000.00 = 8.6), then multiply the result by the number in the first line for a fund under the heading entitled "Expenses Paid During Period" to estimate the expenses you paid on your account during this period. A small balance maintenance fee of $12.00 that is charged once a year may apply for certain accounts with a value of less than $2,000. This fee is not included in the table below. If it was, the estimate of expenses you paid during the period would be higher, and your ending account value lower, by this amount. In addition, each Fund, as a shareholder in the underlying Fidelity Central Funds, will indirectly bear its pro-rata share of the fees and expenses incurred by the underlying Fidelity Central Funds. These fees and expenses are not included in the Fund's annualized expense ratio used to calculate the expense estimate in the table below.
Hypothetical Example for Comparison Purposes
The second line of the accompanying table for each fund provides information about hypothetical account values and hypothetical expenses based on a fund's actual expense ratio and an assumed rate of return of 5% per year before expenses, which is not the Fund's actual return. The hypothetical account values and expenses may not be used to estimate the actual ending account balance or expenses you paid for the period. You may use this information to compare the ongoing costs of investing in the Fund and other funds. To do so, compare this 5% hypothetical example with the 5% hypothetical examples that appear in the shareholder reports of the other funds. A small balance maintenance fee of $12.00 that is charged once a year may apply for certain accounts with a value of less than $2,000. This fee is not included in the table below. If it was, the estimate of expenses you paid during the period would be higher, and your ending account value lower, by this amount. In addition, each Fund, as a shareholder in the underlying Fidelity Central Funds, will indirectly bear its pro-rata share of the fees and expenses incurred by the underlying Fidelity Central Funds. These fees and expenses are not included in the Fund's annualized expense ratio used to calculate the expense estimate in the table below.
Please note that the expenses shown in the table are meant to highlight your ongoing costs only and do not reflect any transaction costs. Therefore, the second line of the table is useful in comparing ongoing costs only, and will not help you determine the relative total costs of owning different funds. In addition, if these transactional costs were included, your costs would have been higher.
Semiannual Report
| Annualized Expense Ratio | Beginning
Account Value
September 1,
2010 | Ending
Account Value
February 28,
2011 | Expenses Paid
During Period*
September 1, 2010
to February 28, 2011 |
Fidelity Arizona Municipal Income Fund | .55% | | | |
Actual | | $ 1,000.00 | $ 965.70 | $ 2.68 |
HypotheticalA | | $ 1,000.00 | $ 1,022.07 | $ 2.76 |
Fidelity Arizona Municipal Money Market Fund | .30% | | | |
Actual | | $ 1,000.00 | $ 1,000.00 | $ 1.49 ** |
HypotheticalA | | $ 1,000.00 | $ 1,023.31 | $ 1.51 ** |
A 5% return per year before expenses
* Expenses are equal to each Fund's annualized expense ratio, multiplied by the average account value over the period, multiplied by 181/365 (to reflect the one-half year period).
** If certain fees were not voluntarily waived by FMR or its affiliates during the period, the annualized expense ratio for the Arizona Municipal Money Market Fund would have been .50% and the expenses paid in the actual and hypothetical examples above would have been $2.48 and $2.51, respectively.
Semiannual Report
Fidelity Arizona Municipal Income Fund
Investment Changes (Unaudited)
Top Five Sectors as of February 28, 2011 |
| % of fund's
net assets | % of fund's net assets
6 months ago |
General Obligations | 21.6 | 24.5 |
Special Tax | 16.9 | 17.0 |
Electric Utilities | 14.8 | 15.0 |
Water & Sewer | 14.6 | 16.4 |
Health Care | 11.0 | 9.2 |
Weighted Average Maturity as of February 28, 2011 |
| | 6 months ago |
Years | 9.2 | 7.0 |
This is a weighted average of all the maturities of the securities held in a fund. Weighted Average Maturity (WAM) can be used as a measure of sensitivity to interest rate changes and markets changes. Generally, the longer the maturity, the greater the sensitivity to such changes. WAM is based on the dollar-weighted average length of time until principal payments must be paid. Depending on the types of securities held in a fund, certain maturity shortening devices (e.g., demand features, interest rate resets, and call options) may be taken into account when calculating the WAM. |
Duration as of February 28, 2011 |
| | 6 months ago |
Years | 8.3 | 8.1 |
Duration estimates how much a bond fund's price will change with a change in comparable interest rates. If rates rise 1%, for example, a fund with a 5-year duration is likely to lose about 5% of its value. Other factors also can influence a bond fund's performance and share price. Accordingly, a bond fund's actual performance may differ from this example. Duration takes into account any call or put option embedded in the bonds. |
Quality Diversification (% of fund's net assets) |
As of February 28, 2011 | As of August 31, 2010 |
| AAA 3.4% | | | AAA 6.3% | |
| AA,A 78.6% | | | AA,A 79.4% | |
 | BBB 12.8% | | | BBB 11.8% | |
 | BB and Below 1.0% | |  | BB and Below 0.0% | |
| Short-Term
Investments and
Net Other Assets 4.2% | | | Short-Term
Investments and
Net Other Assets 2.5% | |

We have used ratings from Moody's Investors Service, Inc. Where Moody's ® ratings are not available, we have used S&P ® ratings. All ratings are as of the report date and do not reflect subsequent changes. |
Semiannual Report
Fidelity Arizona Municipal Income Fund
Investments February 28, 2011 (Unaudited)
Showing Percentage of Net Assets
Municipal Bonds - 95.8% |
| Principal Amount | | Value |
Arizona - 90.9% |
Arizona Board of Regents Arizona State Univ. Rev. (Polytechnic Campus Proj.) Series 2008 C: | | | | |
5.75% 7/1/22 | | $ 1,500,000 | | $ 1,649,220 |
5.75% 7/1/23 | | 250,000 | | 272,398 |
Arizona Board of Regents Ctfs. of Prtn.: | | | | |
(Arizona Biomedical Research Collaborative Bldg. Proj.) Series 2006, 5% 6/1/19 (AMBAC Insured) | | 1,140,000 | | 1,228,019 |
(Univ. of Arizona Projs.) Series 2006 A, 5% 6/1/18 (AMBAC Insured) | | 1,000,000 | | 1,089,250 |
Arizona Ctfs. of Prtn.: | | | | |
Series 2008 A, 5% 9/1/20 (FSA Insured) | | 1,640,000 | | 1,712,734 |
Series 2010 A, 5% 10/1/29 (FSA Insured) | | 5,000,000 | | 4,934,300 |
Arizona Game and Fish Dept. and Commission (AGF Administration Bldg. Proj.) Series 2006: | | | | |
5% 7/1/21 | | 1,280,000 | | 1,326,502 |
5% 7/1/32 | | 470,000 | | 438,980 |
Arizona Health Facilities Auth. Rev. (Banner Health Sys. Proj.): | | | | |
Series 2007 A, 5% 1/1/21 | | 1,000,000 | | 1,027,380 |
Series 2007 B, 1.013% 1/1/37 (b) | | 1,000,000 | | 635,070 |
Series 2008 A, 5.25% 1/1/31 | | 1,000,000 | | 959,480 |
Series 2008 D, 6% 1/1/27 | | 1,000,000 | | 1,050,670 |
Arizona School Facilities Board Ctfs. of Prtn.: | | | | |
Series 2005 A2, 5% 9/1/16 (Nat'l. Pub. Fin. Guarantee Corp. Insured) | | 1,665,000 | | 1,766,615 |
Series 2008, 5.75% 9/1/22 | | 1,000,000 | | 1,065,030 |
Series A2, 5% 9/1/18 (Nat'l. Pub. Fin. Guarantee Corp. Insured) | | 1,000,000 | | 1,043,270 |
Arizona State Lottery Rev. Series 2010 A, 5% 7/1/21 | | 1,000,000 | | 1,067,570 |
Arizona State Univ. Ctfs. of Prtn. (Research Infrastructure Proj.) Series 2004, 5.25% 9/1/24 | | 1,230,000 | | 1,246,421 |
Arizona State Univ. Revs. Series 2005, 5% 7/1/26 (AMBAC Insured) | | 1,000,000 | | 1,014,300 |
Arizona Trans. Board Hwy. Rev.: | | | | |
Series 2006, 5% 7/1/22 | | 400,000 | | 428,712 |
Series 2008 A, 5% 7/1/33 | | 1,000,000 | | 1,014,020 |
Arizona Wtr. Infrastructure Fin. Auth. Rev.: | | | | |
(Wtr. Quality Proj.) Series 2006 A, 5% 10/1/23 | | 500,000 | | 535,075 |
Series 2009 A, 5% 10/1/29 | | 1,000,000 | | 1,041,720 |
Series 2010 A, 5% 10/1/30 | | 2,000,000 | | 2,078,620 |
Avondale Muni. Dev. Corp. Excise Tax Rev. 5% 7/1/28 | | 500,000 | | 506,700 |
Municipal Bonds - continued |
| Principal Amount | | Value |
Arizona - continued |
Cottonwood Wtr. Sys. Rev.: | | | | |
5% 7/1/26 (XL Cap. Assurance, Inc. Insured) | | $ 1,405,000 | | $ 1,390,079 |
5% 7/1/30 (XL Cap. Assurance, Inc. Insured) | | 1,125,000 | | 1,058,006 |
5% 7/1/35 (XL Cap. Assurance, Inc. Insured) | | 1,300,000 | | 1,137,578 |
Downtown Phoenix Hotel Corp. Rev. Series A, 5.25% 7/1/23 (FGIC Insured) | | 1,750,000 | | 1,552,635 |
Glendale Indl. Dev. Auth. (Midwestern Univ. Proj.) Series 2007, 5.25% 5/15/19 | | 1,000,000 | | 1,084,410 |
Glendale Indl. Dev. Auth. Hosp. Rev. (John C. Lincoln Health Network Proj.): | | | | |
Series 2005 B, 5.25% 12/1/19 | | 1,040,000 | | 1,010,807 |
Series 2005, 5% 12/1/35 | | 1,000,000 | | 810,240 |
Series 2007: | | | | |
5% 12/1/27 | | 1,000,000 | | 862,870 |
5% 12/1/32 | | 1,000,000 | | 826,560 |
Glendale Western Loop 101 Pub. Facilities Corp. Series 2008 A: | | | | |
6.25% 7/1/38 | | 3,000,000 | | 3,087,150 |
7% 7/1/33 | | 1,000,000 | | 1,054,190 |
Goodyear McDowell Road Commercial Corridor Impt. District 5.25% 1/1/17 (AMBAC Insured) | | 1,580,000 | | 1,721,947 |
Goodyear Pub. Impt. Corp. Facilities Rev. Series 2008, 6% 7/1/31 | | 1,000,000 | | 1,050,010 |
Marana Muni. Property Corp. Facilities Rev. Series A, 5.25% 7/1/22 | | 1,620,000 | | 1,746,360 |
Maricopa County Indl. Dev. Auth. Health Facilities Rev.: | | | | |
(Catholic Healthcare West Proj.): | | | | |
Series 1998 A, 5% 7/1/16 | | 480,000 | | 480,605 |
Series 2007 A, 5% 7/1/16 | | 1,000,000 | | 1,081,880 |
Series 2009 A, 6% 7/1/39 | | 1,000,000 | | 997,200 |
Series A, 5.25% 7/1/32 | | 1,000,000 | | 930,630 |
(Mayo Clinic Proj.) 5% 11/15/36 | | 1,000,000 | | 943,360 |
Maricopa County Poll. Cont. Rev. (Southern California Edison Co. Proj.) Series 2000 A, 5% 6/1/35 | | 3,000,000 | | 2,881,680 |
Maricopa County Unified School District #60 Higley (School Impt. Proj.) Series B, 5% 7/1/19 (FGIC Insured) | | 1,000,000 | | 1,077,960 |
McAllister Academic Village LLC Rev. (Arizona State Univ. Hassayampa Academic Village Proj.) Series 2008, 5% 7/1/38 | | 1,000,000 | | 919,080 |
Mesa Util. Sys. Rev. 5% 7/1/24 (FGIC Insured) | | 1,000,000 | | 1,068,300 |
Municipal Bonds - continued |
| Principal Amount | | Value |
Arizona - continued |
Navajo County Poll. Cont. Corp. Rev. Bonds (Arizona Pub. Svc. Co. Cholla Proj.) Series 2009 A, 5%, tender 6/1/12 (b) | | $ 2,000,000 | | $ 2,060,820 |
North Campus Facilities LLC (Northern Arizona Univ. Sys. Rev. Proj.) 5% 6/1/31 (AMBAC Insured) | | 1,225,000 | | 1,184,036 |
Northern Arizona Univ. Revs. 5% 6/1/21 (AMBAC Insured) | | 1,085,000 | | 1,140,693 |
Phoenix Civic Impt. Board Arpt. Rev.: | | | | |
Series A, 5% 7/1/33 | | 1,000,000 | | 971,120 |
Series B, 5.25% 7/1/27 (Nat'l. Pub. Fin. Guarantee Corp. Insured) (c) | | 1,100,000 | | 1,100,748 |
Phoenix Civic Impt. Corp. District Rev. (Plaza Expansion Proj.) Series 2005 B, 0% 7/1/38 (a) | | 2,000,000 | | 1,684,520 |
Phoenix Civic Impt. Corp. Excise Tax Rev.: | | | | |
(Civic Plaza Expansion Proj.) Series 2005 A: | | | | |
5% 7/1/18 (FGIC Insured) | | 550,000 | | 584,205 |
5% 7/1/30 (Nat'l. Pub. Fin. Guarantee Corp. Insured) | | 1,000,000 | | 1,000,320 |
Series 2007 A, 5% 7/1/22 (Nat'l. Pub. Fin. Guarantee Corp. Insured) | | 1,250,000 | | 1,297,250 |
Phoenix Civic Impt. Corp. Wastewtr. Sys. Rev.: | | | | |
Series 2004: | | | | |
5% 7/1/24 | | 1,750,000 | | 1,799,525 |
5% 7/1/29 (Nat'l. Pub. Fin. Guarantee Corp. Insured) | | 770,000 | | 779,117 |
Series 2007, 5% 7/1/20 (Nat'l. Pub. Fin. Guarantee Corp. Insured) | | 1,000,000 | | 1,077,960 |
Phoenix Civic Impt. Corp. Wtr. Sys. Rev.: | | | | |
Series 2001, 5.5% 7/1/24 (Nat'l. Pub. Fin. Guarantee Corp. Insured) | | 1,000,000 | | 1,138,180 |
Series 2002, 5.5% 7/1/20 (Nat'l. Pub. Fin. Guarantee Corp. Insured) | | 1,500,000 | | 1,569,210 |
Series 2005: | | | | |
5% 7/1/20 | | 5,000,000 | | 5,443,100 |
5% 7/1/29 | | 1,750,000 | | 1,783,268 |
Phoenix Gen. Oblig. Series 2002 B, 5.375% 7/1/20 | | 1,060,000 | | 1,116,371 |
Phoenix Street & Hwy. User Rev. Series 1992, 6.25% 7/1/11 (Nat'l. Pub. Fin. Guarantee Corp. Insured) | | 10,000 | | 10,040 |
Pima County Ctfs. of Prtn. (Justice Bldg. Proj.): | | | | |
Series 2007 A, 5% 7/1/19 (AMBAC Insured) | | 735,000 | | 780,761 |
Series A, 5% 7/1/21 (AMBAC Insured) | | 935,000 | | 975,074 |
Municipal Bonds - continued |
| Principal Amount | | Value |
Arizona - continued |
Pima County Unified School District #1 Tucson (Proj. of 2004): | | | | |
Series 2007 C, 5% 7/1/23 (FGIC Insured) | | $ 1,000,000 | | $ 1,055,940 |
Series 2008 D, 5% 7/1/25 (FSA Insured) | | 1,000,000 | | 1,036,540 |
Pinal County Indl. Dev. Auth. Correctional Facilities Contract Rev. (Florence West Prison Proj.): | | | | |
Series 2006 A, 5.25% 10/1/12 (ACA Finl. Guaranty Corp. Insured) | | 1,000,000 | | 1,014,310 |
Series 2007 A, 5.25% 10/1/13 (ACA Finl. Guaranty Corp. Insured) | | 1,335,000 | | 1,357,762 |
Pinal County Unified School District #1 Florence (2006 School Impt. Proj.) Series 2007 A: | | | | |
5% 7/1/19 (FGIC Insured) | | 1,000,000 | | 1,077,960 |
5% 7/1/20 (FGIC Insured) | | 1,000,000 | | 1,066,880 |
Pinal County Unified School District #44 J.O. Combs (2006 School Impt. Proj.) Series B, 5% 7/1/21 (Nat'l. Pub. Fin. Guarantee Corp. Insured) | | 860,000 | | 910,568 |
Queen Creek Excise Tax & State Shared Rev. 5% 8/1/22 (Nat'l. Pub. Fin. Guarantee Corp. Insured) | | 1,125,000 | | 1,159,144 |
Salt River Proj. Agricultural Impt. & Pwr. District Elec. Sys. Rev.: | | | | |
Series 2002 B, 5% 1/1/31 | | 1,995,000 | | 2,009,763 |
Series 2005 A, 5% 1/1/35 | | 3,000,000 | | 3,007,440 |
Series 2006 A, 5% 1/1/37 | | 5,690,000 | | 5,694,435 |
Series 2008 A: | | | | |
5% 1/1/24 | | 1,075,000 | | 1,143,241 |
5% 1/1/38 | | 3,400,000 | | 3,379,872 |
Series 2010 B, 5% 12/1/26 | | 2,000,000 | | 2,135,000 |
Salt Verde Finl. Corp. Sr. Gas Rev. Series 2007, 5.5% 12/1/29 | | 3,000,000 | | 2,822,370 |
Scottsdale Indl. Dev. Auth. Hosp. Rev. (Scottsdale Healthcare Proj.): | | | | |
Series 2006 C, 5% 9/1/35 (Assured Guaranty Corp. Insured) | | 1,000,000 | | 920,940 |
Series 2008 A: | | | | |
5% 9/1/16 | | 1,000,000 | | 1,074,390 |
5% 9/1/23 | | 355,000 | | 350,137 |
Scottsdale Muni. Property Corp. Excise Tax Rev. (Wtr. and Swr. Impt. Proj.) Series 2008 A, 5% 7/1/28 | | 1,050,000 | | 1,100,432 |
Sedona Excise Tax Rev.: | | | | |
Series 2004, 5% 7/1/15 (Nat'l. Pub. Fin. Guarantee Corp. Insured) | | 2,120,000 | | 2,261,998 |
Municipal Bonds - continued |
| Principal Amount | | Value |
Arizona - continued |
Sedona Excise Tax Rev.: - continued | | | | |
Series 2005, 5% 7/1/19 (Nat'l. Pub. Fin. Guarantee Corp. Insured) | | $ 1,000,000 | | $ 1,032,100 |
Tempe Gen. Oblig. Series 2006, 5% 7/1/20 | | 3,200,000 | | 3,531,072 |
Tempe Transit Excise Tax Rev. Series 2008, 4.75% 7/1/38 | | 85,000 | | 82,092 |
Tucson Ctfs. of Prtn.: | | | | |
Series 2006 A, 5% 7/1/18 (Nat'l. Pub. Fin. Guarantee Corp. Insured) | | 3,050,000 | | 3,268,929 |
Series 2007, 5% 7/1/18 (Nat'l. Pub. Fin. Guarantee Corp. Insured) | | 1,000,000 | | 1,077,960 |
Univ. Med. Ctr. Corp. Hosp. Rev.: | | | | |
Series 2004: | | | | |
5.25% 7/1/11 | | 210,000 | | 211,709 |
5.25% 7/1/15 | | 1,000,000 | | 1,034,430 |
Series 2005, 5% 7/1/16 | | 1,515,000 | | 1,556,693 |
Univ. of Arizona Univ. Revs.: | | | | |
(Univ. of Arizona Projs.): | | | | |
Series 2003 B, 5% 6/1/31 (AMBAC Insured) | | 300,000 | | 299,220 |
Series 2005 A, 5% 6/1/24 (AMBAC Insured) | | 1,040,000 | | 1,067,092 |
Series 2005 C, 5% 6/1/14 (AMBAC Insured) | | 360,000 | | 392,566 |
Series 2008 A, 5% 6/1/22 | | 1,315,000 | | 1,404,591 |
Series 2009 A, 5% 6/1/39 | | 1,000,000 | | 935,430 |
Yavapai County Indl. Dev. Auth. Solid Waste Disp. Rev. Bonds (Waste Mgmt., Inc. Proj.) Series 2002, 3.5%, tender 6/3/13 (b)(c) | | 1,000,000 | | 996,970 |
| | 136,871,887 |
Guam - 0.3% |
Guam Ed. Fing. Foundation Ctfs. of Prtn. Series A, 5% 10/1/12 | | 500,000 | | 516,225 |
Puerto Rico - 4.1% |
Puerto Rico Commonwealth Hwy. & Trans. Auth. Trans. Rev.: | | | | |
Series 1998, 5.75% 7/1/22 (CIFG North America Insured) | | 700,000 | | 703,108 |
Series 2003, 5.75% 7/1/19 (FGIC Insured) | | 700,000 | | 712,271 |
Puerto Rico Commonwealth Pub. Impt. Gen. Oblig.: | | | | |
Series 2002 A, 5.5% 7/1/18 | | 700,000 | | 736,988 |
Series 2003 A, 5.25% 7/1/14 | | 275,000 | | 287,158 |
Puerto Rico Govt. Dev. Bank: | | | | |
Series 2006 B, 5% 12/1/12 | | 1,000,000 | | 1,047,980 |
Series 2006 C, 5.25% 1/1/15 (c) | | 500,000 | | 502,370 |
Municipal Bonds - continued |
| Principal Amount | | Value |
Puerto Rico - continued |
Puerto Rico Pub. Bldg. Auth. Rev.: | | | | |
Bonds Series M2, 5.75%, tender 7/1/17 (b) | | $ 200,000 | | $ 209,582 |
Series G, 5.25% 7/1/13 | | 315,000 | | 326,274 |
Puerto Rico Sales Tax Fing. Corp. Sales Tax Rev.: | | | | |
Series 2007 A, 0% 8/1/41 (FGIC Insured) | | 3,200,000 | | 409,024 |
Series 2009 A, 6% 8/1/42 | | 1,300,000 | | 1,301,612 |
| | 6,236,367 |
Virgin Islands - 0.5% |
Virgin Islands Pub. Fin. Auth. Series 2009 B, 5% 10/1/25 | | 300,000 | | 295,413 |
Virgin Islands Pub. Fin. Auth. Refinery Facilities Rev. Series 2007, 4.7% 7/1/22 (c) | | 500,000 | | 411,025 |
| | 706,438 |
TOTAL INVESTMENT PORTFOLIO - 95.8% (Cost $146,262,426) | | 144,330,917 |
NET OTHER ASSETS (LIABILITIES) - 4.2% | | 6,294,419 |
NET ASSETS - 100% | $ 150,625,336 |
Legend |
(a) Security initially issued in zero coupon form which converts to coupon form at a specified rate and date. The rate shown is the rate at period end. |
(b) Coupon rates for floating and adjustable rate securities reflect the rates in effect at period end. |
(c) Private activity obligations whose interest is subject to the federal alternative minimum tax for individuals. |
Other Information |
All investments are categorized as Level 2 under the Fair Value Hierarchy. The inputs or methodology used for valuing securities may not be an indication of the risk associated with investing in those securities. For more information on valuation inputs, please refer to the Security Valuation section in the accompanying Notes to Financial Statements. |
The distribution of municipal securities by revenue source, as a percentage of total net assets, is as follows (Unaudited): |
General Obligations | 21.6% |
Special Tax | 16.9% |
Electric Utilities | 14.8% |
Water & Sewer | 14.6% |
Health Care | 11.0% |
Education | 9.9% |
Others* (Individually Less Than 5%) | 11.2% |
| 100.0% |
*Includes net other assets |
Income Tax Information |
At August 31, 2010, the Fund had a capital loss carryforward of approximately $276,075 all of which will expire in fiscal 2017. Capital loss carryforwards are only available to offset future capital gains of the Fund to the extent provided by regulations and may be limited. |
See accompanying notes which are an integral part of the financial statements.
Semiannual Report
Fidelity Arizona Municipal Income Fund
Statement of Assets and Liabilities
| February 28, 2011 (Unaudited) |
| | |
Assets | | |
Investment in securities, at value -
See accompanying schedule: Unaffiliated issuers (cost $146,262,426) | | $ 144,330,917 |
Cash | | 4,642,745 |
Receivable for fund shares sold | | 485,743 |
Interest receivable | | 1,567,928 |
Other receivables | | 249 |
Total assets | | 151,027,582 |
| | |
Liabilities | | |
Payable for fund shares redeemed | $ 154,618 | |
Distributions payable | 180,518 | |
Accrued management fee | 67,110 | |
Total liabilities | | 402,246 |
| | |
Net Assets | | $ 150,625,336 |
Net Assets consist of: | | |
Paid in capital | | $ 152,921,195 |
Undistributed net investment income | | 34,118 |
Accumulated undistributed net realized gain (loss) on investments | | (398,468) |
Net unrealized appreciation (depreciation) on investments | | (1,931,509) |
Net Assets, for 13,514,811 shares outstanding | | $ 150,625,336 |
Net Asset Value, offering price and redemption price per share ($150,625,336 ÷ 13,514,811 shares) | | $ 11.15 |
See accompanying notes which are an integral part of the financial statements.
Semiannual Report
Fidelity Arizona Municipal Income Fund
Financial Statements - continued
Statement of Operations
Six months ended February 28, 2011 (Unaudited) |
| | |
Investment Income | | |
Interest | | $ 3,587,810 |
| | |
Expenses | | |
Management fee | $ 466,817 | |
Independent trustees' compensation | 344 | |
Miscellaneous | 328 | |
Total expenses before reductions | 467,489 | |
Expense reductions | (1,737) | 465,752 |
Net investment income (loss) | | 3,122,058 |
Realized and Unrealized Gain (Loss) Net realized gain (loss) on: | | |
Investment securities: | | |
Unaffiliated issuers | | (122,393) |
Change in net unrealized appreciation (depreciation) on investment securities | | (9,737,122) |
Net gain (loss) | | (9,859,515) |
Net increase (decrease) in net assets resulting from operations | | $ (6,737,457) |
See accompanying notes which are an integral part of the financial statements.
Semiannual Report
Statement of Changes in Net Assets
| Six months ended February 28, 2011 (Unaudited) | Year ended
August 31,
2010 |
Increase (Decrease) in Net Assets | | |
Operations | | |
Net investment income (loss) | $ 3,122,058 | $ 6,231,043 |
Net realized gain (loss) | (122,393) | 261,192 |
Change in net unrealized appreciation (depreciation) | (9,737,122) | 9,261,589 |
Net increase (decrease) in net assets resulting
from operations | (6,737,457) | 15,753,824 |
Distributions to shareholders from net investment income | (3,119,436) | (6,226,317) |
Share transactions
Proceeds from sales of shares | 28,294,623 | 63,302,201 |
Reinvestment of distributions | 1,791,072 | 3,632,180 |
Cost of shares redeemed | (53,806,018) | (47,321,565) |
Net increase (decrease) in net assets resulting from share transactions | (23,720,323) | 19,612,816 |
Redemption fees | 1,983 | 7,644 |
Total increase (decrease) in net assets | (33,575,233) | 29,147,967 |
| | |
Net Assets | | |
Beginning of period | 184,200,569 | 155,052,602 |
End of period (including undistributed net investment income of $34,118 and undistributed net investment income of $31,496, respectively) | $ 150,625,336 | $ 184,200,569 |
Other Information Shares | | |
Sold | 2,499,537 | 5,576,691 |
Issued in reinvestment of distributions | 157,992 | 318,847 |
Redeemed | (4,811,322) | (4,168,259) |
Net increase (decrease) | (2,153,793) | 1,727,279 |
See accompanying notes which are an integral part of the financial statements.
Semiannual Report
Financial Highlights
| Six months ended February 28, 2011 | Years ended August 31, |
| (Unaudited) | 2010 | 2009 | 2008 | 2007 | 2006 |
Selected Per-Share Data | | | | | |
Net asset value, beginning of period | $ 11.76 | $ 11.12 | $ 11.04 | $ 11.13 | $ 11.39 | $ 11.59 |
Income from Investment
Operations | | | | | |
Net investment income (loss) D | .209 | .416 | .425 | .419 | .418 | .417 |
Net realized and unrealized gain (loss) | (.610) | .639 | .112 | (.054) | (.205) | (.149) |
Total from investment operations | (.401) | 1.055 | .537 | .365 | .213 | .268 |
Distributions from net investment income | (.209) | (.416) | (.425) | (.418) | (.418) | (.417) |
Distributions from net realized gain | - | - | (.033) | (.037) | (.055) | (.051) |
Total distributions | (.209) | (.416) | (.458) | (.455) | (.473) | (.468) |
Redemption fees added to paid in capital D | - F | .001 | .001 | - F | - F | - F |
Net asset value, end of period | $ 11.15 | $ 11.76 | $ 11.12 | $ 11.04 | $ 11.13 | $ 11.39 |
Total Return B, C | (3.43)% | 9.69% | 5.15% | 3.33% | 1.87% | 2.41% |
Ratios to Average Net Assets E | | | | | |
Expenses before reductions | .55% A | .55% | .55% | .55% | .55% | .55% |
Expenses net of fee waivers, if any | .55% A | .55% | .55% | .55% | .55% | .55% |
Expenses net of all reductions | .55% A | .55% | .55% | .52% | .48% | .50% |
Net investment income (loss) | 3.70% A | 3.66% | 3.97% | 3.76% | 3.70% | 3.69% |
Supplemental Data | | | | | | |
Net assets, end of period (000 omitted) | $ 150,625 | $ 184,201 | $ 155,053 | $ 143,432 | $ 129,125 | $ 107,024 |
Portfolio turnover rate | 5% A | 10% | 19% | 22% | 15% | 22% |
A Annualized
B Total returns for periods of less than one year are not annualized.
C Total returns would have been lower had certain expenses not been reduced during the periods shown.
D Calculated based on average shares outstanding during the period.
E Expense ratios reflect operating expenses of the Fund. Expenses before reductions do not reflect amounts reimbursed by the investment adviser or reductions from expense offset arrangements and do not represent the amount paid by the Fund during periods when reimbursements or reductions occur. Expenses net of fee waivers reflect expenses after reimbursement by the investment adviser but prior to reductions from expense offset arrangements. Expenses net of all reductions represent the net expenses paid by the Fund.
F Amount represents less than $.001 per share.
See accompanying notes which are an integral part of the financial statements.
Semiannual Report
Fidelity Arizona Municipal Money Market Fund
Investment Changes (Unaudited)
Weighted Average Maturity Diversification |
Days | % of fund's investments 2/28/11 | % of fund's investments 8/31/10 | % of fund's investments 2/28/10 |
0 - 30 | 83.3 | 93.9 | 90.5 |
31 - 90 | 3.0 | 1.0 | 0.0 |
91 - 180 | 10.8 | 0.9 | 8.9 |
181 - 397 | 2.9 | 4.2 | 0.6 |
Weighted Average Maturity |
| 2/28/11 | 8/31/10 | 2/28/10 |
Fidelity Arizona Municipal Money Market Fund | 29 Days | 20 Days | 18 Days |
All Tax Free Money Market Funds Average* | 28 Days | 30 Days | 27 Days |
This is a weighted average of all the maturities of the securities held in a fund. Weighted Average Maturity (WAM) can be used as a measure of sensitivity to interest rate changes and markets changes. Generally, the longer the maturity, the greater the sensitivity to such changes. WAM is based on the dollar-weighted average length of time until principal payments must be paid. Depending on the types of securities held in a fund, certain maturity shortening devices (e.g., demand features, interest rate resets, and call options) may be taken into account when calculating the WAM. |
Weighted Average Life |
| 2/28/11 | 8/31/10 | 2/28/10 |
Fidelity Arizona Municipal Money Market Fund | 29 Days | 20 Days | n/a** |
Weighted Average Life (WAL) is the weighted average of the life of the securities held in a fund or portfolio and can be used as a measure of sensitivity to changes in liquidity and/or credit risk. Generally, the higher the value, the greater the sensitivity. WAL is based on the dollar-weighted average length of time until principal payments must be paid, taking into account any call options exercised by the issuer and any permissible maturity shortening features other than interest rate resets. The difference between WAM and WAL is that WAM takes into account interest rate resets and WAL does not. WAL for money market funds is not the same as WAL of a mortgage- or asset-backed security. |
Asset Allocation (% of fund's net assets) |
As of February 28, 2011 | As of August 31, 2010 |
| Variable Rate
Demand Notes
(VRDNs) 75.6% | | | Variable Rate
Demand Notes
(VRDNs) 82.4% | |
| Commercial Paper (including CP Mode) 5.3% | | | Commercial Paper (including CP Mode) 4.5% | |
| Fidelity Municipal
Cash Central Fund 2.8% | | | Fidelity Municipal
Cash Central Fund 7.9% | |
| Other Investments 14.5% | | | Other Investments 5.2% | |
| Net Other Assets 1.8% | | | Net Other Assets† 0.0% | |

* Source: iMoneyNet, Inc.
** Information not available.
† Net Other Assets is not included in the pie chart.
Semiannual Report
Fidelity Arizona Municipal Money Market Fund
Investments February 28, 2011 (Unaudited)
Showing Percentage of Net Assets
Municipal Securities - 98.2% |
| Principal Amount | | Value |
Arizona - 91.2% |
Arizona Health Facilities Auth. Rev.: | | | |
Bonds (Banner Health Proj.) Series 2008 D, 5% 1/1/12 | $ 2,250,000 | | $ 2,323,375 |
(Banner Health Sys. Proj.): | | | |
Series 2008 B, 0.21%, LOC Bank of Nova Scotia New York Branch, VRDN (a) | 7,700,000 | | 7,700,000 |
Series 2008 C, 0.23%, LOC Bank of Nova Scotia New York Branch, VRDN (a) | 4,540,000 | | 4,540,000 |
Series 2008 E, 0.23%, LOC Bank of America NA, VRDN (a) | 1,600,000 | | 1,600,000 |
Series 2008 F, 0.28%, LOC JPMorgan Chase Bank, VRDN (a) | 1,485,000 | | 1,485,000 |
(Catholic Healthcare West Proj.): | | | |
Series 2008 B, 0.27%, LOC Bank of America NA, VRDN (a) | 13,950,000 | | 13,950,000 |
Series 2009 F, 0.24%, LOC Citibank NA, VRDN (a) | 21,750,000 | | 21,750,000 |
(Southwest Behavioral Health Svcs., Inc. Proj.) Series 2004, 0.28%, LOC JPMorgan Chase Bank, VRDN (a) | 1,770,000 | | 1,770,000 |
Arizona Hsg. Fin. Auth. Multi-family Hsg. Rev. (Santa Carolina Apts. Proj.) Series 2005, 0.31%, LOC Fannie Mae, VRDN (a)(d) | 3,645,000 | | 3,645,000 |
Arizona Trans. Board Excise Tax Rev. Bonds (Maricopa County Reg'l. Area Road Fund Proj.): | | | |
Series 2007, 5% 7/1/11 | 3,000,000 | | 3,046,134 |
Series 2010, 1.5% 7/1/11 | 3,400,000 | | 3,413,114 |
Arizona Trans. Board Hwy. Rev.: | | | |
Bonds Series 2004 A, 5% 7/1/11 | 4,000,000 | | 4,061,426 |
Participating VRDN Series PT 4605, 0.25% (Liquidity Facility Deutsche Postbank AG) (a)(f) | 4,000,000 | | 4,000,000 |
Casa Grande Indl. Dev. Auth. Indl. Dev. Rev. (Price Companies, Inc. Proj.) Series A, 0.49%, LOC Bank of America NA, VRDN (a)(d) | 1,630,000 | | 1,630,000 |
Chandler Gen. Oblig. Participating VRDN Series GS 07 49TP, 0.26% (Liquidity Facility Wells Fargo & Co.) (a)(f) | 4,700,000 | | 4,700,000 |
Coconino County Poll. Cont. Corp. Rev.: | | | |
(Arizona Pub. Svc. Co. Navajo Proj.) Series 2009 B, 0.23%, LOC JPMorgan Chase Bank, VRDN (a)(d) | 11,700,000 | | 11,700,000 |
(Tucson Elec. Pwr. Co. Navajo Proj.) Series 2010 A, 0.32%, LOC JPMorgan Chase Bank, VRDN (a)(d) | 3,500,000 | | 3,500,000 |
Maricopa County Indl. Dev. Auth. Multi-family Hsg. Rev.: | | | |
(Glenn Oaks Apts. Proj.) Series 2001, 0.31%, LOC Fannie Mae, VRDN (a)(d) | 3,299,675 | | 3,299,675 |
(Ranchwood Apts. Proj.) Series 2001 A, 0.29%, LOC Fannie Mae, VRDN (a)(d) | 5,000,000 | | 5,000,000 |
Municipal Securities - continued |
| Principal Amount | | Value |
Arizona - continued |
Maricopa County Indl. Dev. Auth. Multi-family Hsg. Rev.: - continued | | | |
(San Angelin Apts. Proj.) Series 2004, 0.27%, LOC Fannie Mae, VRDN (a)(d) | $ 3,100,000 | | $ 3,100,000 |
(San Lucas Apts. Proj.) Series 2003, 0.27%, LOC Fannie Mae, VRDN (a)(d) | 1,700,000 | | 1,700,000 |
(San Martin Apts. Proj.) Series A1, 0.27%, LOC Fannie Mae, VRDN (a)(d) | 7,000,000 | | 7,000,000 |
(San Miguel Apts. Proj.) Series 2003, 0.27%, LOC Fannie Mae, VRDN (a)(d) | 1,300,000 | | 1,300,000 |
(San Remo Apts. Proj.) Series 2002, 0.27%, LOC Fannie Mae, VRDN (a)(d) | 10,800,000 | | 10,800,000 |
(Village at Sun Valley Apts. Proj.) Series 2008, 0.31%, LOC Freddie Mac, VRDN (a)(d) | 3,500,000 | | 3,500,000 |
(Village Square Apts. Proj.) Series 2004, 0.31%, LOC Fannie Mae, VRDN (a)(d) | 1,000,000 | | 1,000,000 |
Maricopa County Indl. Dev. Auth. Rev. (Clayton Homes, Inc. Proj.) Series 1998, 0.31%, LOC U.S. Bank NA, Minnesota, VRDN (a)(d) | 1,000,000 | | 1,000,000 |
Maricopa County Unified School District #48 Scottsdale Bonds Series 2010, 2.5% 7/1/11 | 3,600,000 | | 3,623,960 |
Mohave County Beneficial Interest Ctfs. Bonds (Mohave Jail Facility Proj.) Series 2008, 3.125% 4/1/11 | 3,110,000 | | 3,116,791 |
Northern Arizona Univ. Revs. Participating VRDN Series Solar 07 14, 0.25% (Liquidity Facility U.S. Bank NA, Minnesota) (a)(f) | 3,600,000 | | 3,600,000 |
Peoria Gen. Oblig. Bonds (Projects of 2000, 2005, & 2008) Series 2010, 3% 7/1/11 | 4,040,000 | | 4,072,541 |
Phoenix Civic Impt. Corp. Series 2009, 0.32% 4/7/11, LOC Bank of America NA, CP | 3,800,000 | | 3,800,000 |
Phoenix Civic Impt. Corp. Wastewtr. Sys. Rev. Bonds Series 2004, 5% 7/1/11 | 5,780,000 | | 5,869,541 |
Phoenix Civic Impt. Corp. Wtr. Sys. Rev.: | | | |
Bonds Series 2005, 5% 7/1/11 | 3,400,000 | | 3,452,617 |
Participating VRDN: | | | |
Series Putters 3458, 0.26% (Liquidity Facility JPMorgan Chase Bank) (a)(f) | 6,000,000 | | 6,000,000 |
Series ROC II R 12311, 0.26% (Liquidity Facility Citibank NA) (a)(f) | 3,500,000 | | 3,500,000 |
Phoenix Gen. Oblig. Participating VRDN Series BBT 2012, 0.25% (Liquidity Facility Branch Banking & Trust Co.) (a)(f) | 7,765,000 | | 7,765,000 |
Phoenix Indl. Dev. Auth. Cultural Facilities Rev. (Phoenix Art Museum Proj.) Series 2006, 0.35%, LOC Wells Fargo Bank NA, VRDN (a) | 200,000 | | 200,000 |
Municipal Securities - continued |
| Principal Amount | | Value |
Arizona - continued |
Phoenix Indl. Dev. Auth. Multi-family Hsg. Rev.: | | | |
(Del Mar Terrance Apts. Proj.) Series 1999 A, 0.28%, LOC Freddie Mac, VRDN (a) | $ 700,000 | | $ 700,000 |
(Paradise Lakes Apt. Proj.): | | | |
Series 2007 A, 0.24%, LOC Wells Fargo Bank NA, VRDN (a) | 3,150,000 | | 3,150,000 |
Series 2007 B, 0.25%, LOC Wells Fargo Bank NA, VRDN (a)(d) | 20,800,000 | | 20,800,000 |
(Westward Ho Apts. Proj.) Series 2003 A, 0.3%, LOC Bank of America NA, VRDN (a)(d) | 1,300,000 | | 1,300,000 |
Phoenix Indl. Dev. Auth. Rev.: | | | |
(Desert Botanical Garden Proj.) Series 2000, 0.28%, LOC JPMorgan Chase Bank, VRDN (a) | 600,000 | | 600,000 |
(Independent Newspaper, Inc. Proj.) Series 2000, 0.47%, LOC Wells Fargo Bank NA, VRDN (a)(d) | 805,000 | | 805,000 |
(Phoenix Expansion Proj.) Series 2002, 0.68%, LOC JPMorgan Chase Bank, VRDN (a)(d) | 2,035,000 | | 2,035,000 |
(Swift Aviation Svcs., Inc. Proj.) Series 2002, 0.26%, LOC U.S. Bank NA, Minnesota, VRDN (a)(d) | 6,125,000 | | 6,125,000 |
Pima County Indl. Dev. Auth. Indl. Rev. (Tucson Elec. Pwr. Co. Proj.) Series 1982 A, 0.28%, LOC Wells Fargo Bank NA, VRDN (a) | 100,000 | | 100,000 |
Pima County Indl. Dev. Auth. Multi-family Hsg. Rev.: | | | |
(River Point Proj.) Series 2001, 0.29%, LOC Fannie Mae, VRDN (a)(d) | 6,000,000 | | 6,000,000 |
Series A, 0.29%, LOC Fannie Mae, VRDN (a)(d) | 3,500,000 | | 3,500,000 |
Pima County Indl. Dev. Auth. Rev. (Broadway Proper Congregate Proj.) Series 2000 A, 0.26%, LOC State Street Bank & Trust Co., Boston, VRDN (a) | 2,000,000 | | 2,000,000 |
Salt River Proj. Agricultural Impt. & Pwr. District Elec. Sys. Rev.: | | | |
Bonds 5.125% 1/1/27 (Pre-Refunded to 1/1/12 @ 101) (e) | 7,500,000 | | 7,871,072 |
Participating VRDN: | | | |
Series EGL 06 14 Class A, 0.26% (Liquidity Facility Citibank NA) (a)(f) | 2,400,000 | | 2,400,000 |
Series Putters 3708Z, 0.26% (Liquidity Facility JPMorgan Chase Bank) (a)(f) | 4,605,000 | | 4,605,000 |
Series ROC II R 11712, 0.26% (Liquidity Facility Citibank NA) (a)(f) | 3,635,000 | | 3,635,000 |
Series WF 09 40C, 0.26% (Liquidity Facility Wells Fargo & Co.) (a)(f) | 3,300,000 | | 3,300,000 |
Series C: | | | |
0.3% 3/8/11, CP | 3,500,000 | | 3,500,000 |
Municipal Securities - continued |
| Principal Amount | | Value |
Arizona - continued |
Salt River Proj. Agricultural Impt. & Pwr. District Elec. Sys. Rev.: - continued | | | |
Series C: | | | |
0.32% 3/16/11, CP | $ 5,000,000 | | $ 5,000,000 |
0.32% 4/21/11, CP | 3,500,000 | | 3,500,000 |
Scottsdale Gen. Oblig. Participating VRDN Series BBT 08 20, 0.25% (Liquidity Facility Branch Banking & Trust Co.) (a)(f) | 11,150,000 | | 11,150,000 |
Show Low Indl. Dev. Auth. Solid Waste Disp. Rev. (Snowflake White Mountain Pwr. LLC Proj.) Series 2006, 0.38%, LOC JPMorgan Chase Bank, VRDN (a)(d) | 4,000,000 | | 4,000,000 |
Tempe Gen. Oblig. Bonds Series 2010 C, 1.25% 7/1/11 | 3,400,000 | | 3,410,486 |
Tempe Indl. Dev. Auth. Rev. (ASUF Brickyard Proj.) Series 2004 A, 0.32%, LOC Bank of America NA, VRDN (a) | 7,250,000 | | 7,250,000 |
Tempe Transit Excise Tax Rev. Series 2006, 0.25% (Liquidity Facility Royal Bank of Canada), VRDN (a) | 25,060,000 | | 25,060,001 |
Tolleson Muni. Fin. Corp. Rev. Bonds (American Wtr. Corp. Proj.) 0.92% tender 3/2/11, CP mode | 1,600,000 | | 1,600,000 |
Tucson Street & Hwy. User Rev. Bonds Series 1994 B, 7.5% 7/1/11 | 515,000 | | 526,789 |
Tucson Wtr. Rev. Bonds Series 2001 A, 5% 7/1/11 | 1,095,000 | | 1,111,799 |
Univ. of Arizona Univ. Revs. Bonds: | | | |
Series 1992 A, 6% 6/1/11 | 1,255,000 | | 1,272,295 |
Series 2004 A, 5.25% 6/1/11 | 3,225,000 | | 3,262,616 |
Yuma Indl. Dev. Auth. Hosp. Rev. (Yuma Reg'l. Med. Ctr. Proj.) Series 2008, 0.29%, LOC JPMorgan Chase Bank, VRDN (a) | 3,500,000 | | 3,500,000 |
| | 320,584,232 |
Kentucky - 0.1% |
Trimble County Poll. Cont. Rev. Bonds 0.85% tender 3/30/11, CP mode (d) | 500,000 | | 500,000 |
Massachusetts - 0.3% |
Massachusetts Indl. Fin. Agcy. Poll. Cont. Rev. Bonds (New England Pwr. Co. Proj.) Series 1992, 0.8% tender 3/18/11, CP mode | 1,100,000 | | 1,100,000 |
North Carolina - 1.4% |
New Hanover County Hosp. Rev. (New Hanover Reg'l. Med. Ctr. Proj.) Series 2008 A, 0.28%, LOC RBC Centura Bank, Rocky Mount, VRDN (a) | 4,800,000 | | 4,800,000 |
Ohio - 0.3% |
Ohio Higher Edl. Facility Commission Rev. (Univ. Hosp. Health Sys. Proj.) Series 2008 B, 0.36%, LOC RBS Citizens NA, VRDN (a) | 1,000,000 | | 1,000,000 |
Municipal Securities - continued |
| Principal Amount | | Value |
Pennsylvania - 0.4% |
Chester County Health & Ed. Auth. Rev. (Jenner's Pond Proj.) Series 2006, 0.35%, LOC Citizens Bank of Pennsylvania, VRDN (a) | $ 1,455,000 | | $ 1,455,000 |
Puerto Rico - 1.4% |
Puerto Rico Commonwealth Hwy. & Trans. Auth. Trans. Rev. Series 1998 A, 0.23%, LOC Bank of Nova Scotia New York Branch, VRDN (a) | 4,800,000 | | 4,800,000 |
Texas - 0.3% |
Greater East Texas Higher Ed. Auth. Student Ln. Rev. Series 1995 B, 0.26%, LOC State Street Bank & Trust Co., Boston, VRDN (a)(d) | 1,000,000 | | 1,000,000 |
| Shares | | |
Other - 2.8% |
Fidelity Municipal Cash Central Fund, 0.25% (b)(c) | 9,685,000 | | 9,685,000 |
TOTAL INVESTMENT PORTFOLIO - 98.2% (Cost $344,924,232) | 344,924,232 |
NET OTHER ASSETS (LIABILITIES) - 1.8% | | 6,386,596 |
NET ASSETS - 100% | $ 351,310,828 |
Security Type Abbreviations |
CP - COMMERCIAL PAPER |
VRDN - VARIABLE RATE DEMAND NOTE
(A debt instrument that is
payable upon demand, either
daily, weekly or monthly) |
Legend |
(a) Coupon rates for floating and adjustable rate securities reflect the rates in effect at period end. |
(b) Information in this report regarding holdings by state and security types does not reflect the holdings of the Fidelity Municipal Cash Central Fund. |
(c) Affiliated fund that is available only to investment companies and other accounts managed by Fidelity Investments. The rate quoted is the annualized seven-day yield of the fund at period end. A complete unaudited listing of the fund's holdings as of its most recent quarter end is available upon request. In addition, each Fidelity Central Fund's financial statements are available on the SEC's website or upon request. |
(d) Private activity obligations whose interest is subject to the federal alternative minimum tax for individuals. |
(e) Security collateralized by an amount sufficient to pay interest and principal. |
(f) Provides evidence of ownership in one or more underlying municipal bonds. |
Affiliated Central Funds |
Information regarding fiscal year to date income earned by the Fund from investments in Fidelity Central Funds is as follows: |
Fund | Income earned |
Fidelity Municipal Cash Central Fund | $ 34,549 |
Other Information |
The date shown for securities represents the date when principal payments must be paid, taking into account any call options exercised by the issuer and any permissible maturity shortening features other than interest rate resets. |
All investments are categorized as Level 2 under the Fair Value Hierarchy. The inputs or methodology used for valuing securities may not be an indication of the risk associated with investing in those securities. For more information on valuation inputs, please refer to the Security Valuation section in the accompanying Notes to Financial Statements. |
Income Tax Information |
At August 31, 2010, the Fund had a capital loss carryforward of approximately $5 all of which will expire in fiscal 2018. Capital loss carryforwards are only available to offset future capital gains of the Fund to the extent provided by regulations and may be limited. |
See accompanying notes which are an integral part of the financial statements.
Semiannual Report
Fidelity Arizona Municipal Money Market Fund
Statement of Assets and Liabilities
| February 28, 2011 (Unaudited) |
| | |
Assets | | |
Investment in securities, at value -
See accompanying schedule: Unaffiliated issuers (cost $335,239,232) | $ 335,239,232 | |
Fidelity Central Funds (cost $9,685,000) | 9,685,000 | |
Total Investments (cost $344,924,232) | | $ 344,924,232 |
Cash | | 304,331 |
Receivable for investments sold | | 3,501,579 |
Receivable for fund shares sold | | 6,315,534 |
Interest receivable | | 456,511 |
Distributions receivable from Fidelity Central Funds | | 3,338 |
Other receivables | | 552 |
Total assets | | 355,506,077 |
| | |
Liabilities | | |
Payable for fund shares redeemed | $ 4,113,337 | |
Distributions payable | 37 | |
Accrued management fee | 81,875 | |
Total liabilities | | 4,195,249 |
| | |
Net Assets | | $ 351,310,828 |
Net Assets consist of: | | |
Paid in capital | | $ 351,310,048 |
Distributions in excess of net investment income | | (28) |
Accumulated undistributed net realized gain (loss) on investments | | 808 |
Net Assets, for 351,118,826 shares outstanding | | $ 351,310,828 |
Net Asset Value, offering price and redemption price per share ($351,310,828 ÷ 351,118,826 shares) | | $ 1.00 |
See accompanying notes which are an integral part of the financial statements.
Semiannual Report
Statement of Operations
Six months ended February 28, 2011 (Unaudited) |
| | |
Investment Income | | |
Interest | | $ 510,237 |
Income from Fidelity Central Funds | | 34,549 |
Total income | | 544,786 |
| | |
Expenses | | |
Management fee | $ 873,095 | |
Independent trustees' compensation | 680 | |
Total expenses before reductions | 873,775 | |
Expense reductions | (346,277) | 527,498 |
Net investment income (loss) | | 17,288 |
Realized and Unrealized Gain (Loss) Net realized gain (loss) on: | | |
Investment securities: | | |
Unaffiliated issuers | | (19) |
Net increase in net assets resulting from operations | | $ 17,269 |
See accompanying notes which are an integral part of the financial statements.
Semiannual Report
Fidelity Arizona Municipal Money Market Fund
Financial Statements - continued
Statement of Changes in Net Assets
| Six months ended February 28, 2011 (Unaudited) | Year ended
August 31,
2010 |
Increase (Decrease) in Net Assets | | |
Operations | | |
Net investment income (loss) | $ 17,288 | $ 36,196 |
Net realized gain (loss) | (19) | (65) |
Net increase in net assets resulting
from operations | 17,269 | 36,131 |
Distributions to shareholders from net investment income | (17,316) | (36,176) |
Share transactions at net asset value of $1.00 per share
Proceeds from sales of shares | 577,069,011 | 1,139,546,855 |
Reinvestment of distributions | 17,147 | 35,756 |
Cost of shares redeemed | (571,137,080) | (1,167,427,147) |
Net increase (decrease) in net assets and shares resulting from share transactions | 5,949,078 | (27,844,536) |
Total increase (decrease) in net assets | 5,949,031 | (27,844,581) |
| | |
Net Assets | | |
Beginning of period | 345,361,797 | 373,206,378 |
End of period (including distributions in excess of net investment income of $28 and net investment income of $0, respectively) | $ 351,310,828 | $ 345,361,797 |
See accompanying notes which are an integral part of the financial statements.
Semiannual Report
Financial Highlights
| Six months ended February 28, 2011 | Years ended August 31, |
| (Unaudited) | 2010 | 2009 | 2008 | 2007 | 2006 |
Selected Per-Share Data | | | | | |
Net asset value, beginning of period | $ 1.00 | $ 1.00 | $ 1.00 | $ 1.00 | $ 1.00 | $ 1.00 |
Income from Investment
Operations | | | | | |
Net investment income (loss) | - G | - G | .006 | .022 | .032 | .027 |
Distributions from net investment income | (-) G | (-) G | (.006) | (.022) | (.032) | (.027) |
Net asset value, end of period | $ 1.00 | $ 1.00 | $ 1.00 | $ 1.00 | $ 1.00 | $ 1.00 |
Total Return B, C | .00% E | .01% | .64% | 2.25% | 3.26% | 2.78% |
Ratios to Average Net Assets D, F | | | | | |
Expenses before reductions | .50% A | .50% | .54% | .50% | .50% | .50% |
Expenses net of fee waivers, if any | .30% A | .33% | .53% | .50% | .50% | .50% |
Expenses net of all reductions | .30% A | .33% | .52% | .41% | .38% | .37% |
Net investment income (loss) | .01% A | .01% | .64% | 2.20% | 3.22% | 2.77% |
Supplemental Data | | | | | | |
Net assets, end of period (000 omitted) | $ 351,311 | $ 345,362 | $ 373,206 | $ 393,043 | $ 340,848 | $ 267,738 |
A Annualized
B Total returns for periods of less than one year are not annualized.
C Total returns would have been lower had certain expenses not been reduced during the periods shown.
D Fees and expenses of the underlying Fidelity Central Funds are not included in the Fund's expense ratio. The Fund indirectly bears its proportionate share of the expenses of any underlying Fidelity Central Funds.
E Amount represents less than .01%.
F Expense ratios reflect operating expenses of the Fund. Expenses before reductions do not reflect amounts reimbursed or waived or reductions from expense offset arrangements and do not represent the amount paid by the Fund during periods when reimbursements, waivers or reductions occur. Expenses net of fee waivers reflect expenses after reimbursement and waivers but prior to reductions from expense offset arrangements. Expenses net of all reductions represent the net expenses paid by the Fund.
G Amount represents less than $.001 per share.
See accompanying notes which are an integral part of the financial statements.
Semiannual Report
Notes to Financial Statements
For the period ended February 28, 2011 (Unaudited)
1. Organization.
Fidelity Arizona Municipal Income Fund (the Income Fund) is a fund of Fidelity Union Street Trust. Fidelity Arizona Municipal Money Market Fund (the Money Market Fund) is a fund of Fidelity Union Street Trust II. Each Trust is registered under the Investment Company Act of 1940, as amended (the 1940 Act), as an open-end management investment company. Fidelity Union Street Trust and Fidelity Union Street Trust II (the Trusts) are organized as a Massachusetts business trust and a Delaware statutory trust, respectively. The Income Fund is a non-diversified fund. Each Fund is authorized to issue an unlimited number of shares. Each Fund may be affected by economic and political developments in the state of Arizona.
2. Investments in Fidelity Central Funds.
The Funds may in Fidelity Central Funds, which are open-end investment companies available only to other investment companies and accounts managed by Fidelity Management & Research Company (FMR) and its affiliates. The Funds' Schedules of Investments list each of the Fidelity Central Funds held as of period end, if any, as an investment of each Fund, but does not include the underlying holdings of each Fidelity Central Fund. As an Investing Fund, the Funds indirectly bear their proportionate share of the expenses of the underlying Fidelity Central Funds.
The Money Market Central Funds seek preservation of capital and current income and are managed by Fidelity Investments Money Management, Inc. (FIMM), an affiliate of FMR.
A complete unaudited list of holdings for each Fidelity Central Fund is available upon request or at the Securities and Exchange Commission (the SEC) web site at www.sec.gov. In addition, the financial statements of the Fidelity Central Funds, are available on the SEC web site or upon request.
3. Significant Accounting Policies.
The financial statements have been prepared in conformity with accounting principles generally accepted in the United States of America (GAAP), which require management to make certain estimates and assumptions at the date of the financial statements. Actual results could differ from those estimates. Subsequent events, if any, through the date that the financial statements were issued have been evaluated in the preparation of the financial statements. The following summarizes the significant accounting policies of the Funds:
Semiannual Report
Notes to Financial Statements (Unaudited) - continued
3. Significant Accounting Policies - continued
Security Valuation. Investments are valued as of 4:00 p.m. Eastern time on the last calendar day of the period. The Income Fund uses independent pricing services approved by the Board of Trustees to value their investments. When current market prices or quotations are not readily available or reliable, valuations may be determined in good faith in accordance with procedures adopted by the Board of Trustees. Factors used in determining value may include market or security specific events, changes in interest rates and credit quality. The frequency with which these procedures are used cannot be predicted and they may be utilized to a significant extent. The value used for net asset value (NAV) calculation under these procedures may differ from published prices for the same securities.
Each Fund categorizes the inputs to valuation techniques used to value their investments into a disclosure hierarchy consisting of three levels as shown below.
Level 1 - quoted prices in active markets for identical investments
Level 2 - other significant observable inputs (including quoted prices for similar investments, interest rates, prepayment speeds, etc.)
Level 3 - unobservable inputs (including the Fund's own assumptions based on the best information available)
For the Income Fund, changes in valuation techniques may result in transfers in or out of an assigned level within the disclosure hierarchy. Valuation techniques used to value each Fund's investments by major category are as follows.
For the Income Fund, debt securities, including restricted securities, are valued based on evaluated prices received from independent pricing services or from dealers who make markets in such securities. For municipal securities, pricing services utilize matrix pricing which considers yield or price of bonds of comparable quality, coupon, maturity and type as well as dealer supplied prices and are generally categorized as Level 2 in the hierarchy.
When independent prices are unavailable or unreliable, debt securities may be valued utilizing pricing matrices which consider similar factors that would be used by independent pricing services. These are generally categorized as Level 2 in the hierarchy but may be Level 3 depending on the circumstances.
For the Money Market Fund, as permitted by compliance with certain conditions under Rule 2a-7 of the 1940 Act, securities are valued at amortized cost, which approximates fair value, and are categorized as Level 2 in the hierarchy.
Semiannual Report
3. Significant Accounting Policies - continued
Investment Transactions and Income. For financial reporting purposes, the Funds' investment holdings and NAV include trades executed through the end of the last business day of the period. The NAV per share for processing shareholder transactions is calculated as of the close of business of the New York Stock Exchange (NYSE), normally 4:00 p.m. Eastern time and includes trades executed through the end of the prior business day for the Income Fund and trades executed through the end of the current business day for the Money Market Fund. Gains and losses on securities sold are determined on the basis of identified cost. Interest income and distributions from the Fidelity Central Funds are accrued as earned. Interest income includes coupon interest and amortization of premium and accretion of discount on debt securities.
Expenses. Expenses directly attributable to a fund are charged to that fund. Expenses attributable to more than one fund are allocated among the respective funds on the basis of relative net assets or other appropriate methods. Expense estimates are accrued in the period to which they relate and adjustments are made when actual amounts are known.
Income Tax Information and Distributions to Shareholders. Each year each Fund intends to qualify as a regulated investment company, including distributing substantially all of its taxable income and realized gains under Subchapter M of the Internal Revenue Code and filing its U.S. federal tax return. As a result, no provision for income taxes is required. A fund's federal tax return is subject to examination by the Internal Revenue Service (IRS) for a period of three years.
Dividends are declared and recorded daily and paid monthly from net investment income. Distributions from realized gains, if any, are declared and recorded on the ex-dividend date. Income and capital gain distributions are determined in accordance with income tax regulations, which may differ from GAAP.
Capital accounts within the financial statements are adjusted for permanent book-tax differences. These adjustments have no impact on net assets or the results of operations. Temporary book-tax differences will reverse in a subsequent period.
Book-tax differences are primarily due to market discount, capital loss carryforwards and losses deferred due to excise tax regulations.
The Funds purchase municipal securities whose interest, in the opinion of the issuer, is free from federal income tax. There is no assurance that the IRS will agree with this opinion. In the event the IRS determines that the issuer does not comply with relevant tax requirements, interest payments from a security could become federally taxable, possibly retroactively to the date the security was issued.
Semiannual Report
Notes to Financial Statements (Unaudited) - continued
3. Significant Accounting Policies - continued
Income Tax Information and Distributions to Shareholders - continued
The federal tax cost of investment securities and unrealized appreciation (depreciation) as of period end were as follows for each Fund:
| Tax cost | Gross unrealized appreciation | Gross unrealized depreciation | Net unrealized appreciation
(depreciation) on securities and
other investments |
Fidelity Arizona Municipal Income Fund | $ 146,230,652 | $ 1,908,152 | $ (3,807,887) | $ (1,899,735) |
Fidelity Arizona Municipal Money Market Fund | 344,924,232 | - | - | - |
Short-Term Trading (Redemption) Fees. Shares held by investors in the Income Fund less than 30 days are subject to a redemption fee equal to ..50% of the net asset value of shares redeemed. All redemption fees, which reduce the proceeds of the shareholder redemption, are retained by the Fund and accounted for as an addition to paid in capital.
4. Purchases and Sales of Investments.
Purchases and sales of securities, other than short-term securities, for the Income Fund aggregated $4,371,680 and $29,353,213, respectively.
5. Fees and Other Transactions with Affiliates.
Management Fee. FMR and its affiliates provides the Funds with investment management related services for which the Funds pay a monthly management fee. FMR pays all other expenses, except the compensation of the independent Trustees and certain exceptions such as interest expense, including commitment fees. The management fee paid to FMR by the Funds is reduced by an amount equal to the fees and expenses paid by the Funds to the independent Trustees. Each Fund's management fee is equal to the following annual rate of average net assets:
Fidelity Arizona Municipal Income Fund | .55% |
Fidelity Arizona Municipal Money Market Fund | .50% |
6. Committed Line of Credit.
The Income Fund participates with other funds managed by FMR or an affiliate in a $3.75 billion credit facility (the "line of credit") to be utilized for temporary or emergency purposes to fund shareholder redemptions or for other short-term liquidity purposes. The participating funds have agreed to pay commitment fees on their pro-rata portion of
Semiannual Report
6. Committed Line of Credit - continued
the line of credit, which are reflected in Miscellaneous expenses on the Statement of Operations, and are as follows:
Fidelity Arizona Municipal Income Fund | $ 328 |
During the period, there were no borrowings on this line of credit.
7. Expense Reductions.
FMR or its affiliates voluntarily agreed to waive certain fees for the Money Market Fund in order to maintain a minimum annualized yield of .01%. Such arrangements may be discontinued by FMR at any time. For the period, the amount of the waiver was $345,479.
In addition, through arrangements with each applicable Fund's custodian, credits realized as a result of uninvested cash balances were used to reduce each applicable Fund's management fee. During the period, these credits reduced management fee by the following amounts:
Fidelity Arizona Municipal Income Fund | $ 1,737 |
Fidelity Arizona Municipal Money Market Fund | 798 |
8. Other.
The Funds' organizational documents provide former and current trustees and officers with a limited indemnification against liabilities arising in connection with the performance of their duties to the Funds. In the normal course of business, the Funds may also enter into contracts that provide general indemnifications. The Funds' maximum exposure under these arrangements is unknown as this would be dependent on future claims that may be made against the Funds. The risk of material loss from such claims is considered remote.
Semiannual Report
Board Approval of Investment Advisory Contracts and Management Fees
Fidelity Arizona Municipal Income Fund / Fidelity Arizona Municipal Money Market Fund
Each year, the Board of Trustees, including the Independent Trustees (together, the Board), votes on the renewal of the management contract and sub-advisory agreements (together, the Advisory Contracts) for each fund. The Board, assisted by the advice of fund counsel and Independent Trustees' counsel, requests and considers a broad range of information relevant to the renewal of the Advisory Contracts throughout the year.
The Board meets regularly and considers at each of its meetings factors that are relevant to its annual consideration of the renewal of each fund's Advisory Contracts, including the services and support provided to each fund and its shareholders. The Board has established three standing committees, each composed of Independent Trustees with varying backgrounds, to which the Board has assigned specific subject matter responsibilities in order to enhance effective decision-making by the Board. The Operations Committee, of which all of the Independent Trustees are members, meets regularly throughout the year and, among other matters, considers matters specifically related to the annual consideration of the renewal of each fund's Advisory Contracts. The Board, acting directly and through its Committees, requests and receives information concerning the annual consideration of the renewal of each fund's Advisory Contracts. The Board also meets as needed to consider matters specifically related to the Board's annual consideration of the renewal of Advisory Contracts. Members of the Board may also meet with trustees of other Fidelity funds through ad hoc joint committees to discuss certain matters relevant to the Fidelity funds.
At its September 2010 meeting, the Board of Trustees, including the Independent Trustees, unanimously determined to renew each fund's Advisory Contracts. In reaching its determination, the Board considered all factors it believed relevant, including (i) the nature, extent, and quality of the services to be provided to each fund and its shareholders (including the investment performance of each fund); (ii) the competitiveness of each fund's management fee and total expenses; (iii) the total costs of the services to be provided by and the profits to be realized by Fidelity from its relationship with each fund; (iv) the extent to which economies of scale would be realized as each fund grows; and (v) whether fee levels reflect these economies of scale, if any, for the benefit of fund shareholders.
In considering whether to renew the Advisory Contracts for each fund, the Board reached a determination, with the assistance of fund counsel and Independent Trustees' counsel and through the exercise of its business judgment, that the renewal of the Advisory Contracts is in the best interests of each fund and its shareholders and that the compensation to be received by Fidelity under the management contracts is fair and reasonable. The Board's decision to renew the Advisory Contracts was not based on any single factor, but rather was based on a comprehensive consideration of all the information provided to the Board at its meetings throughout the year. The Board, in reaching its determination to renew the Advisory Contracts, is aware that shareholders in each fund have a broad range of investment choices available to them, including a wide choice among mutual funds offered by Fidelity's competitors, and that each fund's shareholders, with the opportunity to review and weigh the disclosure provided by the fund in its prospectus and other public disclosures, have chosen to invest in that fund, managed by Fidelity.
Semiannual Report
Board Approval of Investment Advisory Contracts and
Management Fees - continued
Nature, Extent, and Quality of Services Provided. The Board considered the staffing within the investment adviser, FMR, and the sub-advisers (together, the Investment Advisers), including the backgrounds of the funds' investment personnel and the funds' investment objectives and disciplines. The Independent Trustees also had discussions with senior management of Fidelity's investment operations and investment groups. The Board considered the structure of the portfolio manager compensation program and whether this structure provides appropriate incentives to act in the best interest of each fund.
Resources Dedicated to Investment Management and Support Services. The Board reviewed the size, education, and experience of the Investment Advisers' investment staff, their use of technology, and the Investment Advisers' approach to recruiting, training, and retaining portfolio managers and other research, advisory, and management personnel. The Board noted that Fidelity's analysts have access to a variety of technological tools and market and securities data that enable them to perform both fundamental and quantitative analysis and to specialize in various disciplines. The Board considered Fidelity's extensive global research capabilities that enable the Investment Advisers to aggregate data from various sources in an effort to produce positive investment results. The Board also considered that Fidelity's portfolio managers and analysts have access to daily portfolio attribution that allows for monitoring of a fund's portfolio, as well as an electronic communication system that provides immediate real-time access to research concerning issuers and credit enhancers. In addition, the Board considered the trading resources that are an integral part of the fixed-income portfolio management investment process.
Shareholder and Administrative Services. The Board considered (i) the nature, extent, quality, and cost of advisory, administrative, and shareholder services performed by the Investment Advisers and their affiliates under the Advisory Contracts and under separate agreements covering transfer agency and pricing and bookkeeping services for each fund; (ii) the nature and extent of the investment adviser's supervision of third party service providers, principally custodians and subcustodians; and (iii) the resources devoted to, and the record of compliance with, each fund's compliance policies and procedures.
Semiannual Report
The Board noted that the growth of fund assets over time across the complex allows Fidelity to reinvest in the development of services designed to enhance the value or convenience of the Fidelity funds as investment vehicles. These services include 24-hour access to account information and market information through telephone representatives and over the Internet, and investor education materials and asset allocation tools.
Investment in a Large Fund Family. The Board considered the benefits to shareholders of investing in a Fidelity fund, including the benefits of investing in a fund that is part of a large family of funds offering a variety of investment disciplines and providing a large variety of mutual fund investor services. The Board noted that Fidelity had taken, or had made recommendations that resulted in the Fidelity funds taking, a number of actions over the previous year that benefited particular funds, including (i) dedicating additional resources to investment research and restructuring and broadening the focus of the investment research teams; (ii) bolstering the senior management team that oversees asset management; (iii) launching Class F of certain funds as a lower-fee class available to Freedom K and Freedom Index Funds; (iv) lowering the initial investment minimums and ongoing balance requirements for Real Estate High Income Fund; (v) eliminating subsequent purchase minimums for all funds and adding a waiver of the investment minimum requirement for new accounts opened with the proceeds of a systematic withdrawal plan; (vi) eliminating the withdrawal minimum and maximum limits for systematic withdrawals from Advisor funds; (vii) expanding sales load waivers on Class A shares for Destiny Planholders and expanding Institutional Class eligibility for Class O Destiny Planholders; and (viii) changing certain Class A and Class T sales charge structures to further align them with industry practices.
Investment Performance. The Board considered whether each fund has operated in accordance with its investment objective, as well as its record of compliance with its investment restrictions. It also reviewed each fund's absolute investment performance, as well as each fund's relative investment performance measured over multiple periods against (i) a broad-based securities market index (bond fund only, as money market funds are typically not compared against a market index), and (ii) a peer group of mutual funds. For each fund, the following charts considered by the Board show, over the one-, three-, and five-year periods ended December 31, 2009, the fund's cumulative total returns, the cumulative total returns of a broad-based securities market index ("benchmark") (bond fund only), and a range of cumulative total returns of a peer group of mutual funds identified by Lipper Inc. as having an investment objective similar to that of the fund. The box within each chart shows the 25th percentile return (bottom of box) and the 75th percentile return (top of box) of the peer group. Returns shown above the box are in the first quartile and returns shown below the box are in the fourth quartile. The percentage beaten number noted below each chart corresponds to the percentile box and represents the percentage of funds in the peer group whose performance was equal to or lower than that of the fund.
Semiannual Report
Board Approval of Investment Advisory Contracts and
Management Fees - continued
Fidelity Arizona Municipal Income Fund
The Board reviewed the fund's relative investment performance against its peer group and noted that the performance of the fund was in the third quartile for the one-year period and the first quartile for the three- and five-year periods. The Board also noted that the investment performance of the fund was lower than its benchmark for all the periods shown. The Board discussed with FMR actions that have been taken by FMR to improve the fund's below-benchmark performance. The Board also reviewed the fund's performance since inception as well as performance in the current year.
Semiannual Report
Fidelity Arizona Municipal Money Market Fund
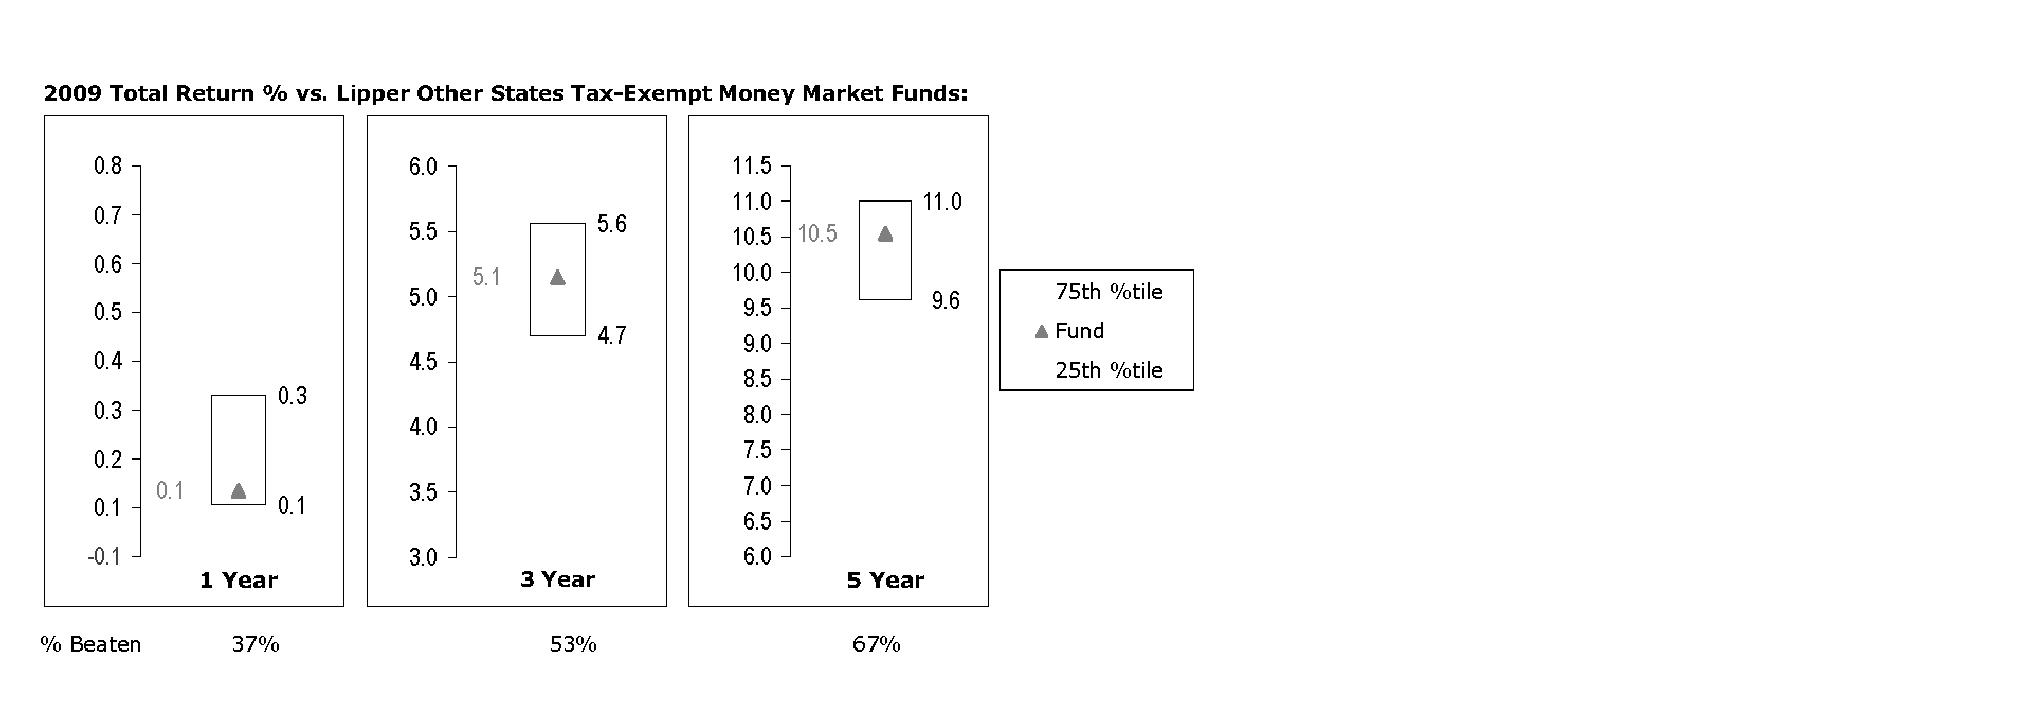
The Board reviewed the fund's relative investment performance against its peer group and noted that the performance of the fund was in the third quartile for the one-year period and the second quartile for the three- and five-year periods. The Board considered that FMR had taken steps to provide shareholders with stability of principal and to enhance safety and liquidity, which contributed to the fund's weakened performance relative to its peer group. The Board noted that FMR does not consider that Lipper peer group to be a particularly meaningful comparison for the fund, however, because the peer group combines tax-exempt money market funds from several different states. The Board also reviewed the fund's performance since inception as well as performance in the current year.
Based on its review, and giving particular weight to the nature and quality of the resources dedicated by the Investment Advisers to maintain and improve relative performance and factoring in the unprecedented market events in recent years, the Board concluded that the nature, extent, and quality of investment management and support services and of shareholder and administrative services provided to each fund will benefit each fund's shareholders, particularly in light of the Board's view that each fund's shareholders benefit from investing in a fund that is part of a large family of funds offering a variety of investment disciplines and services.
Competitiveness of Management Fee and Total Fund Expenses. The Board considered each fund's management fee and total expenses compared to "mapped groups" of competitive funds and classes. Fidelity creates "mapped groups" by combining similar Lipper investment objective categories that have comparable management fee characteristics. Combining Lipper investment objective categories aids the Board's management fee and total expense comparisons by broadening the competitive group used for comparison and by reducing the number of universes to which various Fidelity funds are compared.
Semiannual Report
Board Approval of Investment Advisory Contracts and
Management Fees - continued
Management Fee. The Board considered two proprietary management fee comparisons for the 12-month periods shown in the charts below. The group of Lipper funds used by the Board for management fee comparisons is referred to below as the "Total Mapped Group" and, for the reasons explained above, is broader than the Lipper peer group used by the Board for performance comparisons. The Total Mapped Group comparison focuses on a fund's standing relative to the total universe of comparable funds available to investors, in terms of gross management fees before expense reimbursements or caps. "TMG %" represents the percentage of funds in the Total Mapped Group that had management fees that were lower than a fund's. For example, a TMG % of 26% would mean that 74% of the funds in the Total Mapped Group had higher management fees than a fund. The "Asset-Size Peer Group" (ASPG) comparison focuses on a fund's standing relative to non-Fidelity funds similar in size to the fund within the Total Mapped Group. The ASPG represents at least 15% of the funds in the Total Mapped Group with comparable asset size and management fee characteristics, subject to a minimum of 50 funds (or all funds in the Total Mapped Group if fewer than 50). Additional information, such as the ASPG quartile in which a fund's management fee ranked, is also included in the charts and considered by the Board. For a more meaningful comparison of management fees, each fund is compared on the basis of a hypothetical "net management fee," which is derived by subtracting payments made by FMR for non-management expenses (including transfer agent fees, pricing and bookkeeping fees, and fees paid to non-affiliated custodians) from the fund's all-inclusive fee. In this regard, the Board realizes that net management fees can vary from year to year because of differences in non-management expenses.
Semiannual Report
Fidelity Arizona Municipal Income Fund
Fidelity Arizona Municipal Money Market Fund
The Board noted that each fund's hypothetical net management fee ranked below the median of its Total Mapped Group and below the median of its ASPG for 2009.
Based on its review, the Board concluded that each fund's management fee is fair and reasonable in light of the services that the fund receives and the other factors considered.
Semiannual Report
Board Approval of Investment Advisory Contracts and
Management Fees - continued
Total Expenses. In its review of each fund's total expenses, the Board considered the fund's hypothetical net management fee as well as the fund's all-inclusive fee. The Board also considered other expenses, such as transfer agent fees, pricing and bookkeeping fees, and custodial, legal, and audit fees, paid by FMR under the all-inclusive arrangement. The Board also noted the effects of any waivers and reimbursements on fees and expenses. As part of its review, the Board also considered current and historical total expenses of each fund compared to competitive fund median expenses. Each fund is compared to those funds and classes in the Total Mapped Group (used by the Board for management fee comparisons) that have a similar sales load structure.
The Board noted that Arizona Municipal Income Fund's total expenses ranked equal to its competitive median for 2009.
The Board noted that Arizona Municipal Money Market Fund's total expenses ranked below its competitive median for 2009. The Board considered that Fidelity has been voluntarily waiving part or all of the management fees to maintain a minimum yield for Fidelity Arizona Municipal Money Market Fund.
Fees Charged to Other Fidelity Clients. The Board also considered Fidelity fee structures and other information with respect to clients of FMR and its affiliates, such as other mutual funds advised or subadvised by FMR or its affiliates, pension plan clients, and other institutional clients. In March 2010, the Board created an ad hoc joint committee with the board of other Fidelity funds (the Committee) to review and compare Fidelity's institutional investment advisory business with its business of providing services to the Fidelity funds, including the differences in services provided, fees charged, and costs incurred, as well as competition in their respective marketplaces.
Based on its review of total expenses and fees charged to other Fidelity clients, the Board concluded that each fund's total expenses were reasonable in light of the services that the fund and its shareholders receive and the other factors considered, including the findings of the Committee.
Costs of the Services and Profitability. The Board considered the revenues earned and the expenses incurred by Fidelity in conducting the business of developing, marketing, distributing, managing, administering and servicing each fund and its shareholders. The Board also considered the level of Fidelity's profits in respect of all the Fidelity funds.
On an annual basis, FMR presents to the Board Fidelity's profitability for each fund. Fidelity calculates the profitability for each fund, as well as aggregate profitability for groups of Fidelity funds and all Fidelity funds, using a series of detailed revenue and cost allocation methodologies which originate with the audited books and records of Fidelity. The Audit Committee of the Board reviews any significant changes from the prior year's methodologies.
Semiannual Report
PricewaterhouseCoopers LLP (PwC), independent registered public accounting firm and auditor to Fidelity and certain Fidelity funds, has been engaged annually by the Board as part of the Board's assessment of Fidelity's profitability analysis. PwC's engagement includes the review and assessment of Fidelity's methodologies used in determining the revenues and expenses attributable to Fidelity's mutual fund business, and completion of agreed-upon procedures surrounding the mathematical accuracy of fund profitability and its conformity to allocation methodologies. After considering PwC's reports issued under the engagement and information provided by Fidelity, the Board believes that while other allocation methods may also be reasonable, Fidelity's profitability methodologies are reasonable in all material respects.
The Board has also reviewed Fidelity's non-fund businesses and fall-out benefits related to the mutual fund business as well as cases where Fidelity's affiliates may benefit from or be related to the funds' business.
The Board considered the costs of the services provided by and the profits realized by Fidelity in connection with the operation of each fund and were satisfied that the profitability was not excessive in the circumstances.
Economies of Scale. The Board considered whether there have been economies of scale in respect of the management of the Fidelity funds, whether the Fidelity funds (including each fund) have appropriately benefited from any such economies of scale, and whether there is potential for realization of any further economies of scale. The Board considered the extent to which each fund will benefit from economies of scale through increased services to the fund, through waivers or reimbursements, or through fee or expense reductions.
In February 2009, the Board and the board of other Fidelity funds created an ad hoc committee (the Economies of Scale Committee) to analyze whether FMR attains economies of scale in respect of the management and servicing of the Fidelity funds, whether the Fidelity funds have appropriately benefited from such economies of scale, and whether there is potential for realization of any further economies of scale.
The Board concluded, considering the findings of the Economies of Scale Committee, that any potential economies of scale are being appropriately shared between fund shareholders and Fidelity.
Additional Information Requested by the Board. In order to develop fully the factual basis for consideration of the Fidelity funds' Advisory Contracts, the Board requested and received additional information on certain topics, including (i) fund performance trends, actions to be taken by FMR to improve certain funds' overall performance, and Fidelity's long-term strategies for certain funds; (ii) Fidelity's fund profitability methodology and profitability trends for certain funds; (iii) portfolio manager changes that have occurred during the past year and the amount of the investment that each portfolio manager has made in the Fidelity fund(s) that he or she manages; (iv) Fidelity's compensation structure for portfolio managers, research analysts, and other key personnel, including its effects on fund profitability, the rationale for the compensation structure, and the extent to which current market conditions have affected retention and recruitment; (v) the compensation paid by FMR to fund sub-advisers on behalf of the Fidelity funds; (vi) Fidelity's fee structures and rationale for recommending different fees among different categories of funds and classes, as well as Fidelity's voluntary waiver of fees to maintain minimum yields for certain funds and classes; (vii) the rationale for any differences between fund fee structures and fee structures in place for other Fidelity clients; and (viii) explanations regarding the relative total expenses borne by certain funds and classes, total expense competitive trends, and actions that might be taken by FMR to reduce total expenses for certain funds and classes or to achieve further economies of scale.
Semiannual Report
Board Approval of Investment Advisory Contracts and
Management Fees - continued
Based on its evaluation of all of the conclusions noted above, and after considering all factors it believed relevant, the Board ultimately concluded that the advisory fee structures are fair and reasonable, and that each fund's Advisory Contracts should be renewed.
Semiannual Report
Managing Your Investments
Fidelity offers several ways to conveniently manage your personal investments via your telephone or PC. You can access your account information, conduct trades and research your investments 24 hours a day.
By Phone
Fidelity Automated Service Telephone provides a single toll-free number to access account balances, positions, quotes and trading. It's easy to navigate the service, and on your first call, the system will help you create a personal identification number (PIN) for security.
(phone_graphic)
Fidelity Automated
Service Telephone (FAST®)
1-800-544-5555
Press
For mutual fund and brokerage trading.
For quotes.*
For account balances and holdings.
To review orders and mutual
fund activity.
To change your PIN.
To speak to a Fidelity representative.
By PC
Fidelity's web site on the Internet provides a wide range of information, including daily financial news, fund performance, interactive planning tools and news about Fidelity products and services.
(computer_graphic)
Fidelity's Web Site
www.fidelity.com
* When you call the quotes line, please remember that a fund's yield and return will vary and, except for money market funds, share price will also vary. This means that you may have a gain or loss when you sell your shares. There is no assurance that money market funds will be able to maintain a stable $1 share price; an investment in a money market fund is not insured or guaranteed by the U.S. government. Total returns are historical and include changes in share price, reinvestment of dividends and capital gains distributions, and the effects of any sales charges.
Semiannual Report
To Visit Fidelity
For directions and hours,
please call 1-800-544-9797.
Arizona
7001 West Ray Road
Chandler, AZ
15445 N. Scottsdale Road
Scottsdale, AZ
17550 North 75th Avenue
Glendale, AZ
5330 E. Broadway Blvd
Tucson, AZ
California
815 East Birch Street
Brea, CA
1411 Chapin Avenue
Burlingame, CA
851 East Hamilton Avenue
Campbell, CA
601 Larkspur Landing Circle
Larkspur, CA
2000 Avenue of the Stars
Los Angeles, CA
27101 Puerta Real
Mission Viejo, CA
73575 El Paseo
Palm Desert, CA
251 University Avenue
Palo Alto, CA
123 South Lake Avenue
Pasadena, CA
16656 Bernardo Ctr. Drive
Rancho Bernardo, CA
1220 Roseville Parkway
Roseville, CA
1740 Arden Way
Sacramento, CA
7676 Hazard Center Drive
San Diego, CA
11943 El Camino Real
San Diego, CA
8 Montgomery Street
San Francisco, CA
3793 State Street
Santa Barbara, CA
1200 Wilshire Boulevard
Santa Monica, CA
398 West El Camino Real
Sunnyvale, CA
111 South Westlake Blvd
Thousand Oaks, CA
21701 Hawthorne Boulevard
Torrance, CA
2001 North Main Street
Walnut Creek, CA
6326 Canoga Avenue
Woodland Hills, CA
2211 Michelson Drive
Irvine, CA
Colorado
281 East Flatiron Circle
Broomfield, CO
1625 Broadway
Denver, CO
9185 Westview Road
Lone Tree, CO
Connecticut
48 West Putnam Avenue
Greenwich, CT
265 Church Street
New Haven, CT
300 Atlantic Street
Stamford, CT
29 South Main Street
West Hartford, CT
1261 Post Road
Fairfield, CT
Delaware
400 Delaware Avenue
Wilmington, DE
Florida
175 East Altamonte Drive
Altamonte Springs, FL
1400 Glades Road
Boca Raton, FL
121 Alhambra Plaza
Coral Gables, FL
2948 N. Federal Highway
Ft. Lauderdale, FL
4671 Town Center Parkway
Jacksonville, FL
8880 Tamiami Trail, North
Naples, FL
230 Royal Palm Way
Palm Beach, FL
3501 PGA Boulevard
Palm Beach Gardens, FL
3550 Tamiami Trail, South
Sarasota, FL
1502 N. Westshore Blvd.
Tampa, FL
2465 State Road 7
Wellington, FL
Georgia
3242 Peachtree Road
Atlanta, GA
1000 Abernathy Road
Atlanta, GA
Illinois
One North LaSalle Street
Chicago, IL
401 North Michigan Avenue
Chicago, IL
One Skokie Valley Road
Highland Park, IL
1415 West 22nd Street
Oak Brook, IL
15105 S LaGrange Road
Orland Park, IL
1572 East Golf Road
Schaumburg, IL
1823 Freedom Drive
Naperville, IL
Indiana
8480 Keystone Crossing
Indianapolis, IN
Kansas
5400 College Boulevard
Overland Park, KS
Maine
Three Canal Plaza
Portland, ME
Maryland
7315 Wisconsin Avenue
Bethesda, MD
610 York Road
Towson, MD
Massachusetts
801 Boylston Street
Boston, MA
155 Congress Street
Boston, MA
300 Granite Street
Braintree, MA
44 Mall Road
Burlington, MA
238 Main Street
Cambridge, MA
200 Endicott Street
Danvers, MA
Fidelity Brokerage Services, Inc., 100 Summer St., Boston, MA 02110 Member NYSE/SIPC
Semiannual Report
405 Cochituate Road
Framingham, MA
551 Boston Turnpike
Shrewsbury, MA
Michigan
500 E. Eisenhower Pkwy.
Ann Arbor, MI
280 N. Old Woodward Ave.
Birmingham, MI
30200 Northwestern Hwy.
Farmington Hills, MI
43420 Grand River Avenue
Novi, MI
3480 28th Street
Grand Rapids, MI
2425 S. Linden Road STE E
Flint, MI
Minnesota
7740 France Avenue South
Edina, MN
8342 3rd Street North
Oakdale, MN
Missouri
1524 South Lindbergh Blvd.
St. Louis, MO
Nevada
2225 Village Walk Drive
Henderson, NV
New Jersey
501 Route 73 South
Marlton, NJ
150 Essex Street
Millburn, NJ
35 Morris Street
Morristown, NJ
396 Route 17, North
Paramus, NJ
3518 Route 1 North
Princeton, NJ
530 Broad Street
Shrewsbury, NJ
New Mexico
2261 Q Street NE
Albuquerque, NM
New York
1130 Franklin Avenue
Garden City, NY
37 West Jericho Turnpike
Huntington Station, NY
1271 Avenue of the Americas
New York, NY
980 Madison Avenue
New York, NY
61 Broadway
New York, NY
350 Park Avenue
New York, NY
200 Fifth Avenue
New York, NY
733 Third Avenue
New York, NY
2070 Broadway
New York, NY
1075 Northern Blvd.
Roslyn, NY
799 Central Park Avenue
Scarsdale, NY
3349 Monroe Avenue
Rochester, NY
North Carolina
4611 Sharon Road
Charlotte, NC
7011 Fayetteville Road
Durham, NC
Ohio
3805 Edwards Road
Cincinnati, OH
1324 Polaris Parkway
Columbus, OH
1800 Crocker Road
Westlake, OH
28699 Chagrin Boulevard
Woodmere Village, OH
Oregon
7493 SW Bridgeport Road
Tigard, OR
Pennsylvania
600 West DeKalb Pike
King of Prussia, PA
1735 Market Street
Philadelphia, PA
12001 Perry Highway
Wexford, PA
Rhode Island
10 Memorial Boulevard
Providence, RI
Tennessee
3018 Peoples Street
Johnson City, TN
7628 West Farmington Blvd.
Germantown, TN
2035 Mallory Lane
Franklin, TN
Texas
10000 Research Boulevard
Austin, TX
4001 Northwest Parkway
Dallas, TX
12532 Memorial Drive
Houston, TX
2701 Drexel Drive
Houston, TX
6560 Fannin Street
Houston, TX
1701 Lake Robbins Drive
The Woodlands, TX
6500 N. MacArthur Blvd.
Irving, TX
6005 West Park Boulevard
Plano, TX
1576 East Southlake Blvd.
Southlake, TX
15600 Southwest Freeway
Sugar Land, TX
139 N. Loop 1604 East
San Antonio, TX
Utah
279 West South Temple
Salt Lake City, UT
Virginia
1861 International Drive
McLean, VA
11957 Democracy Drive
Reston, VA
Washington
10500 NE 8th Street
Bellevue, WA
1518 6th Avenue
Seattle, WA
304 Strander Blvd
Tukwila, WA
Washington, DC
1900 K Street, N.W.
Washington, DC
Wisconsin
16020 West Bluemound Road
Brookfield, WI
Semiannual Report
Investment Adviser
Fidelity Management & Research Company
Boston, MA
Sub-Advisers
Fidelity Investments
Money Management, Inc.
Fidelity Management & Research
(U.K.) Inc.
Fidelity Management & Research
(Hong Kong) Limited
Fidelity Management & Research
(Japan) Inc.
General Distributor
Fidelity Distributors Corporation
Boston, MA
Transfer and Service Agents
Citibank, N.A.
New York, NY
Fidelity Investments Institutional Operations Company, Inc.
Boston, MA
Fidelity Service Company, Inc.
Boston, MA
Custodian
Citibank, N.A.
New York, NY
The Fidelity Telephone Connection
Mutual Fund 24-Hour Service
Exchanges/Redemptions
and Account Assistance 1-800-544-6666
Product Information 1-800-544-6666
Retirement Accounts 1-800-544-4774 (8 a.m. - 9 p.m.)
TDD Service 1-800-544-0118
for the deaf and hearing impaired
(9 a.m. - 9 p.m. Eastern time)
Fidelity Automated Service
Telephone (FAST®)
1-800-544-5555
Automated line for quickest service
AZI/SPZ-USAN-0411
1.790941.107
Fidelity®
Municipal Money Market
Fund
Semiannual Report
February 28, 2011
(2_fidelity_logos) (Registered_Trademark)
Contents
Chairman's Message | <Click Here> | The Chairman's message to shareholders. |
Shareholder Expense Example | <Click Here> | An example of shareholder expenses. |
Investment Changes | <Click Here> | A summary of major shifts in the fund's investments over the past six months. |
Investments | <Click Here> | A complete list of the fund's investments. |
Financial Statements | <Click Here> | Statements of assets and liabilities, operations, and changes in net assets,
as well as financial highlights. |
Notes | <Click Here> | Notes to the financial statements. |
Board Approval of Investment Advisory Contracts and Management Fees | <Click Here> | |
To view a fund's proxy voting guidelines and proxy voting record for the 12-month period ended June 30, visit http://www.fidelity.com/proxyvotingresults or visit the Securities and Exchange Commission's (SEC) web site at http://www.sec.gov. You may also call 1-800-544-8544 to request a free copy of the proxy voting guidelines.
Standard & Poor's, S&P and S&P 500 are registered service marks of The McGraw-Hill Companies, Inc. and have been licensed for use by Fidelity Distributors Corporation.
Other third party marks appearing herein are the property of their respective owners.
All other marks appearing herein are registered or unregistered trademarks or service marks of FMR LLC or an affiliated company.
This report and the financial statements contained herein are submitted for the general information of the shareholders of the fund. This report is not authorized for distribution to prospective investors in the fund unless preceded or accompanied by an effective prospectus.
A fund files its complete schedule of portfolio holdings with the SEC for the first and third quarters of each fiscal year on Form N-Q. Forms N-Q are available on the SEC's web site at http://www.sec.gov. A fund's Forms N-Q may be reviewed and copied at the SEC's Public Reference Room in Washington, DC. Information regarding the operation of the SEC's Public Reference Room may be obtained by calling 1-800-SEC-0330. For a complete list of a fund's portfolio holdings, view the most recent holdings listing, semiannual report, or annual report on Fidelity's web site at http://www.fidelity.com, http://www.advisor.fidelity.com, or http://www.401k.com, as applicable.
NOT FDIC INSURED • MAY LOSE VALUE • NO BANK GUARANTEE
Neither the fund nor Fidelity Distributors Corporation is a bank.
Semiannual Report
Dear Shareholder:
Following a year in which the investment environment was volatile but generally supportive of most major asset classes, 2011 has begun on a positive note. U.S. equities gained ground in January and February, reaching their highest point since June 2008, amid indications the U.S. economy had turned a corner. Still, questions remained about the longer-term outlook, most notably persistently high unemployment. Financial markets are always unpredictable, of course, but there also are several time-tested investment principles that can help put the odds in your favor.
One of the basic tenets is to invest for the long term. Over time, riding out the markets' inevitable ups and downs has proven much more effective than selling into panic or chasing the hottest trend. Even missing only a few of the markets' best days can significantly diminish investor returns. Patience also affords the benefits of compounding - of earning interest on additional income or reinvested dividends and capital gains. There can be tax advantages and cost benefits to consider as well. While staying the course doesn't eliminate risk, it can considerably lessen the effect of short-term declines.
You can further manage your investing risk through diversification. And today, more than ever, geographic diversification should be taken into account. Studies indicate that asset allocation is the single most important determinant of a portfolio's long-term success. The right mix of stocks, bonds and cash - aligned to your particular risk tolerance and investment objective - is very important. Age-appropriate rebalancing is also an essential aspect of asset allocation. For younger investors, an emphasis on equities - which historically have been the best-performing asset class over time - is encouraged. As investors near their specific goal, such as retirement or sending a child to college, consideration may be given to replacing volatile assets (e.g. common stocks) with more-stable fixed investments (bonds or savings plans).
A third principle - investing regularly - can help lower the average cost of your purchases. Investing a certain amount of money each month or quarter helps ensure you won't pay for all your shares at market highs. This strategy - known as dollar cost averaging - also reduces "emotion" from investing, helping shareholders avoid selling weak performers just prior to an upswing, or chasing a hot performer just before a correction.
We invite you to contact us via the Internet, through our Investor Centers or by phone. It is our privilege to provide you the information you need to make the investments that are right for you.
Sincerely,
(The chairman's signature appears here.)
Abigail P. Johnson
Semiannual Report
Shareholder Expense Example
As a shareholder of the Fund, you incur two types of costs: (1) transaction costs, and (2) ongoing costs, including management fees and other Fund expenses. This Example is intended to help you understand your ongoing costs (in dollars) of investing in the Fund and to compare these costs with the ongoing costs of investing in other mutual funds.
The Example is based on an investment of $1,000 invested at the beginning of the period and held for the entire period (September 1, 2010 to February 28, 2011).
Actual Expenses
The first line of the accompanying table provides information about actual account values and actual expenses. You may use the information in this line, together with the amount you invested, to estimate the expenses that you paid over the period. Simply divide your account value by $1,000.00 (for example, an $8,600 account value divided by $1,000.00 = 8.6), then multiply the result by the number in the first line under the heading entitled "Expenses Paid During Period" to estimate the expenses you paid on your account during this period. A small balance maintenance fee of $12.00 that is charged once a year may apply for certain accounts with a value of less than $2,000. This fee is not included in the table below. If it was, the estimate of expenses you paid during the period would be higher, and your ending account value lower, by this amount. In addition, the Fund, as a shareholder in the underlying Fidelity Central Funds, will indirectly bear its pro-rata share of the fees and expenses incurred by the underlying Fidelity Central Funds. These fees and expenses are not included in the Fund's annualized expense ratio used to calculate the expense estimate in the table below.
Hypothetical Example for Comparison Purposes
The second line of the accompanying table provides information about hypothetical account values and hypothetical expenses based on the Fund's actual expense ratio and an assumed rate of return of 5% per year before expenses, which is not the Fund's actual return. The hypothetical account values and expenses may not be used to estimate the actual ending account balance or expenses you paid for the period. You may use this information to compare the ongoing costs of investing in the Fund and other funds. To do so, compare this 5% hypothetical example with the 5% hypothetical examples that appear in the shareholder reports of the other funds. A small balance maintenance fee of $12.00 that is charged once a year may apply for certain accounts with a value of less than $2,000. This fee is not included in the table below. If it was, the estimate of expenses you paid during the period would be higher, and your ending account value lower, by this amount. In addition, the Fund, as a shareholder in the underlying Fidelity Central Funds, will indirectly bear its pro-rata share of the fees and expenses incurred by the underlying Fidelity Central Funds. These fees and expenses are not included in the Fund's annualized expense ratio used to calculate the expense estimate in the table below.
Please note that the expenses shown in the table are meant to highlight your ongoing costs only and do not reflect any transaction costs. Therefore, the second line of the table is useful in comparing ongoing costs only, and will not help you determine the relative total costs of owning different funds.
Semiannual Report
Shareholder Expense Example - continued
| Annualized
Expense
Ratio | Beginning
Account Value
September 1, 2010 | Ending
Account Value
February 28, 2011 | Expenses Paid
During Period*
September 1, 2010 to
February 28, 2011 |
Actual | .31% | $ 1,000.00 | $ 1,000.00 | $ 1.54** |
Hypothetical (5% return per year before expenses) | | $ 1,000.00 | $ 1,023.26 | $ 1.56** |
* Expenses are equal to the Fund's annualized expense ratio, multiplied by the average account value over the period, multiplied by 181/365 (to reflect the one-half year period).
** If certain fees were not voluntarily waived by FMR or its affiliates during the period, the annualized expense ratio would have been ..43% and the expenses paid in the actual and hypothetical examples above would have been $2.13 and $2.16, respectively.
Semiannual Report
Investment Changes (Unaudited)
Weighted Average Maturity Diversification |
Days | % of fund's
investments
2/28/11 | % of fund's
investments
8/31/10 | % of fund's
investments
2/28/10 |
0 - 30 | 89.5 | 90.6 | 90.5 |
31 - 90 | 4.4 | 4.5 | 4.2 |
91 - 180 | 4.4 | 1.5 | 4.4 |
181 - 397 | 1.7 | 3.4 | 0.9 |
Weighted Average Maturity |
| 2/28/11 | 8/31/10 | 2/28/10 |
Fidelity Municipal Money Market Fund | 18 Days | 19 Days | 16 Days |
All Tax-Free Money Market Funds Average* | 28 Days | 30 Days | 27 Days |
This is a weighted average of all the maturities of the securities held in a fund. Weighted Average Maturity (WAM) can be used as a measure of sensitivity to interest rate changes and markets changes. Generally, the longer the maturity, the greater the sensitivity to such changes. WAM is based on the dollar-weighted average length of time until principal payments must be paid. Depending on the types of securities held in a fund, certain maturity shortening devices (e.g., demand features, interest rate resets, and call options) may be taken into account when calculating the WAM. |
Weighted Average Life |
| 2/28/11 | 8/31/10 | 2/28/10 |
Fidelity Municipal Money Market Fund | 18 Days | 20 Days | n/a** |
Weighted Average Life (WAL) is the weighted average of the life of the securities held in a fund or portfolio and can be used as a measure of sensitivity to changes in liquidity and/or credit risk. Generally, the higher the value, the greater the sensitivity. WAL is based on the dollar-weighted average length of time until principal payments must be paid, taking into account any call options exercised by the issuer and any permissible maturity shortening features other than interest rate resets. The difference between WAM and WAL is that WAM takes into account interest rate resets and WAL does not. WAL for money market funds is not the same as WAL of a mortgage- or asset-backed security. |
Asset Allocation (% of fund's net assets) |
As of February 28, 2011 | As of August 31, 2010 |
| Variable Rate
Demand Notes
(VRDNs) 66.8% | | | Variable Rate
Demand Notes
(VRDNs) 75.5% | |
| Commercial
Paper (including
CP Mode) 11.0% | | | Commercial
Paper (including
CP Mode) 11.6% | |
| Tender Bonds 1.1% | | | Tender Bonds 0.8% | |
| Municipal Notes 4.4% | | | Municipal Notes 2.5% | |
| Fidelity Municipal
Cash Central
Fund 14.7% | | | Fidelity Municipal
Cash Central
Fund 8.9% | |
| Other Investments 1.8% | | | Other Investments 0.9% | |
 | Net Other Assets 0.2% | |  | Net Other Assets† (0.2)% | |

* Source: iMoneyNet, Inc.
** Information not available
† Net Other Assets are not included in the pie chart
Semiannual Report
Investments February 28, 2011 (Unaudited)
Showing Percentage of Net Assets
Municipal Securities - 99.8% |
| Principal Amount (000s) | | Value (000s) |
Alabama - 0.4% |
Alabama Hsg. Fin. Auth. Single Family Mtg. Rev. Bonds Series Merlots 01 A38, 0.43%, tender 8/17/11 (Liquidity Facility Wells Fargo Bank NA) (c)(f)(g)(h) | $ 3,465 | | $ 3,465 |
Auburn Indl. Dev. Board Indl. Dev. Rev. (Donaldson Co., Inc. Proj.) Series 1999, 0.46%, LOC Bank of America NA, VRDN (c)(f) | 4,875 | | 4,875 |
Auburn Univ. Gen. Fee Rev. Bonds Series WF 08 55C, 0.38%, tender 8/18/11 (Liquidity Facility Wells Fargo & Co.) (c)(g)(h) | 23,570 | | 23,570 |
Birmingham Spl. Care Facilities Auth. Rev. (Methodist Home for the Aging Proj.) Series 2010, 0.27%, LOC Branch Banking & Trust Co., VRDN (c) | 5,725 | | 5,725 |
Courtland Indl. Dev. Board Rev. (Specialty Minerals, Inc. Proj.) 0.57%, LOC Wells Fargo Bank NA, VRDN (c)(f) | 8,000 | | 8,000 |
Decatur Indl. Dev. Board Exempt Facilities Rev. (Nucor Steel Decatur LLC Proj.) Series 2003 A, 0.34%, VRDN (c)(f) | 23,800 | | 23,800 |
Univ. of Alabama at Birmingham Hosp. Rev. Series 2008 B, 0.29%, LOC Bank of America NA, VRDN (c) | 24,930 | | 24,930 |
| | 94,365 |
Alaska - 0.8% |
Alaska Int'l. Arpts. Revs. Series 2009 A, 0.25%, LOC State Street Bank & Trust Co., Boston, VRDN (c) | 31,500 | | 31,500 |
Alaska Student Ln. Corp. Ed. Ln. Rev. Bonds Series 2005 A, 5% 6/1/11 (f) | 4,500 | | 4,549 |
Anchorage Gen. Oblig. Series 2008 A: | | | |
0.32% 3/11/11, LOC U.S. Bank NA, Minnesota, CP (f) | 20,000 | | 20,000 |
0.32% 3/17/11, LOC U.S. Bank NA, Minnesota, CP (f) | 20,000 | | 20,000 |
North Slope Borough Gen. Oblig. Bonds Series 2000 B, 0% 6/30/11 | 6,780 | | 6,769 |
Valdez Marine Term. Rev.: | | | |
(ConocoPhillips Proj.) Series 1994 A, 0.26%, VRDN (c) | 66,000 | | 66,000 |
(Phillips Trans. Alaska, Inc. Proj.): | | | |
Series 1994 B, 0.26% (ConocoPhillips Guaranteed), VRDN (c) | 26,000 | | 26,000 |
Series 1994 C, 0.43% (ConocoPhillips Guaranteed), VRDN (c) | 3,000 | | 3,000 |
| | 177,818 |
Arizona - 1.6% |
Arizona Health Facilities Auth. Rev. (Banner Health Sys. Proj.) Series 2008 E, 0.23%, LOC Bank of America NA, VRDN (c) | 41,305 | | 41,305 |
Arizona Trans. Board Excise Tax Rev. Bonds (Maricopa County Reg'l. Area Road Fund Proj.) Series 2010, 1.5% 7/1/11 | 7,570 | | 7,599 |
Municipal Securities - continued |
| Principal Amount (000s) | | Value (000s) |
Arizona - continued |
Arizona Trans. Board Hwy. Rev. Participating VRDN Series PT 4605, 0.25% (Liquidity Facility Deutsche Postbank AG) (c)(g) | $ 16,430 | | $ 16,430 |
Coconino County Poll. Cont. Corp. Rev. (Tucson Elec. Pwr. Co. Navajo Proj.) Series 2010 A, 0.32%, LOC JPMorgan Chase Bank, VRDN (c)(f) | 14,900 | | 14,900 |
Glendale Indl. Dev. Auth. (Midwestern Univ. Proj.) Series 2008, 0.26%, LOC Bank of America NA, VRDN (c) | 11,000 | | 11,000 |
Maricopa County Indl. Dev. Auth. Multi-family Hsg. Rev.: | | | |
(Ranchwood Apts. Proj.) Series 2001 A, 0.29%, LOC Fannie Mae, VRDN (c)(f) | 9,000 | | 9,000 |
(San Angelin Apts. Proj.) Series 2004, 0.27%, LOC Fannie Mae, VRDN (c)(f) | 14,900 | | 14,900 |
(San Clemente Apts. Proj.) 0.27%, LOC Fannie Mae, VRDN (c)(f) | 10,600 | | 10,600 |
(San Fernando Apts. Proj.) Series 2004, 0.27%, LOC Fannie Mae, VRDN (c)(f) | 6,750 | | 6,750 |
(San Lucas Apts. Proj.) Series 2003, 0.27%, LOC Fannie Mae, VRDN (c)(f) | 12,000 | | 12,000 |
(San Martin Apts. Proj.): | | | |
Series A1, 0.27%, LOC Fannie Mae, VRDN (c)(f) | 5,000 | | 5,000 |
Series A2, 0.31%, LOC Fannie Mae, VRDN (c)(f) | 4,300 | | 4,300 |
(San Miguel Apts. Proj.) Series 2003, 0.27%, LOC Fannie Mae, VRDN (c)(f) | 14,900 | | 14,900 |
(Sands Apts. Proj.) Series 2001 A, 0.29%, LOC Fannie Mae, VRDN (c)(f) | 7,000 | | 7,000 |
(Village Square Apts. Proj.) Series 2004, 0.31%, LOC Fannie Mae, VRDN (c)(f) | 2,500 | | 2,500 |
Maricopa County Indl. Dev. Auth. Rev. (Clayton Homes, Inc. Proj.) Series 1998, 0.31%, LOC U.S. Bank NA, Minnesota, VRDN (c)(f) | 4,200 | | 4,200 |
Maricopa County Unified School District #48 Scottsdale Bonds Series 2010, 2.5% 7/1/11 | 5,550 | | 5,587 |
Northern Arizona Univ. Revs. Participating VRDN Series Solar 07 14, 0.25% (Liquidity Facility U.S. Bank NA, Minnesota) (c)(g) | 17,455 | | 17,455 |
Phoenix Civic Impt. Corp. Series 2009, 0.32% 4/7/11, LOC Bank of America NA, CP | 20,000 | | 20,000 |
Phoenix Gen. Oblig. Participating VRDN Series BBT 2012, 0.25% (Liquidity Facility Branch Banking & Trust Co.) (c)(g) | 2,000 | | 2,000 |
Pima County Indl. Dev. Auth. Multi-family Hsg. Rev.: | | | |
(Cimarron Place Apts. Proj.) 0.29%, LOC Fannie Mae, VRDN (c)(f) | 4,500 | | 4,500 |
Series A, 0.29%, LOC Fannie Mae, VRDN (c)(f) | 2,925 | | 2,925 |
Municipal Securities - continued |
| Principal Amount (000s) | | Value (000s) |
Arizona - continued |
Salt River Proj. Agricultural Impt. & Pwr. District Elec. Sys. Rev.: | | | |
Participating VRDN: | | | |
Series Putters 3242, 0.26% (Liquidity Facility JPMorgan Chase Bank) (c)(g) | $ 4,300 | | $ 4,300 |
Series Putters 3467, 0.26% (Liquidity Facility JPMorgan Chase Bank) (c)(g) | 4,000 | | 4,000 |
Series C, 0.3% 3/8/11, CP | 27,500 | | 27,500 |
Show Low Indl. Dev. Auth. Solid Waste Disp. Rev. (Snowflake White Mountain Pwr. LLC Proj.) Series 2006, 0.38%, LOC JPMorgan Chase Bank, VRDN (c)(f) | 24,750 | | 24,750 |
Tolleson Muni. Fin. Corp. Rev. Bonds (American Wtr. Corp. Proj.) 0.92% tender 3/2/11, CP mode | 6,960 | | 6,960 |
Yuma Indl. Dev. Auth. Hosp. Rev. (Yuma Reg'l. Med. Ctr. Proj.) Series 2008, 0.29%, LOC JPMorgan Chase Bank, VRDN (c) | 61,935 | | 61,935 |
| | 364,296 |
Arkansas - 0.6% |
Arkansas Dev. Auth. Indl. Dev. Rev. (Stratton Seed Co. Proj.) Series 1999, 0.46%, LOC Bank of America NA, VRDN (c)(f) | 1,000 | | 1,000 |
Arkansas Dev. Fin. Auth. Multi-family Hsg. Rev. (Kiehl Partners LP Proj.) Series 2004 A, 0.34%, LOC Fannie Mae, VRDN (c) | 7,415 | | 7,415 |
Arkansas Dev. Fin. Auth. Single Family Mtg. Rev. Participating VRDN Series ROC II R 121, 0.32% (Liquidity Facility Citibank NA) (c)(f)(g) | 915 | | 915 |
Blytheville Indl. Dev. Rev. (Nucor Corp. Proj.) Series 2002, 0.38%, VRDN (c)(f) | 34,400 | | 34,400 |
Fort Smith Gen. Oblig. (Mitsubishi Pwr. Systems Americas Proj.) Series 2010, 0.3%, LOC Bank of Tokyo-Mitsubishi, VRDN (c) | 8,000 | | 8,000 |
Osceola Solid Waste Disp. Rev. (Plum Point Energy Associates, LLC Proj.) 0.26%, LOC Royal Bank of Scotland PLC, VRDN (c)(f) | 95,000 | | 95,000 |
Univ. of Arkansas Rev. Participating VRDN Series Putters 3693 Z, 0.31% (Liquidity Facility JPMorgan Chase Bank) (c)(g) | 5,300 | | 5,300 |
| | 152,030 |
California - 3.5% |
ABAG Fin. Auth. for Nonprofit Corps. Multi-family Hsg. Rev. (Miramar Apts. Proj.) Series 2000 A, 0.25%, LOC Fannie Mae, VRDN (c)(f) | 6,600 | | 6,600 |
Anaheim Pub. Fing. Auth. Rev. Participating VRDN Series ROC II R 861, 0.27% (Liquidity Facility Citibank NA) (c)(g) | 15,825 | | 15,825 |
Municipal Securities - continued |
| Principal Amount (000s) | | Value (000s) |
California - continued |
California Gen. Oblig.: | | | |
Series 2003 B2, 0.21%, LOC JPMorgan Chase Bank, LOC California Pub. Employees Retirement Sys., VRDN (c) | $ 75,000 | | $ 75,000 |
Series 2003 C3, 0.26%, LOC Citibank NA, VRDN (c) | 11,000 | | 11,000 |
Series 2003 C4, 0.25%, LOC Citibank NA, VRDN (c) | 10,750 | | 10,750 |
Series 2005 B5, 0.23%, LOC Barclays Bank PLC, VRDN (c) | 14,000 | | 14,000 |
0.3% 3/3/11, LOC Dexia Cr. Local de France, LOC Royal Bank of Canada, CP | 40,965 | | 40,965 |
California Health Facilities Fing. Auth. Rev. (Catholic Healthcare West Proj.) Series 2004 K, 0.28%, LOC Bank of America NA, VRDN (c) | 24,900 | | 24,900 |
California Hsg. Fin. Agcy. Multifamily Hsg. Rev.: | | | |
Series 2007 B, 0.24% (Liquidity Facility Fannie Mae) (Liquidity Facility Freddie Mac), VRDN (c)(f) | 8,530 | | 8,530 |
Series 2007 C: | | | |
0.24% (Liquidity Facility Fannie Mae) (Liquidity Facility Freddie Mac), VRDN (c)(f) | 13,930 | | 13,930 |
0.24% (Liquidity Facility Fannie Mae) (Liquidity Facility Freddie Mac), VRDN (c)(f) | 6,830 | | 6,830 |
Series 2008 C, 0.24% (Liquidity Facility Fannie Mae) (Liquidity Facility Freddie Mac), VRDN (c)(f) | 4,375 | | 4,375 |
California Hsg. Fin. Agcy. Rev.: | | | |
(Home Mtg. Prog.): | | | |
Series 2000 X2, 0.26% (Liquidity Facility Fannie Mae) (Liquidity Facility Freddie Mac), VRDN (c)(f) | 5,520 | | 5,520 |
Series 2002 J, 0.26% (Liquidity Facility Fannie Mae) (Liquidity Facility Freddie Mac), VRDN (c)(f) | 2,430 | | 2,430 |
Series 2003 M: | | | |
0.26% (Liquidity Facility Fannie Mae) (Liquidity Facility Freddie Mac), VRDN (c)(f) | 14,000 | | 14,000 |
0.28% (Liquidity Facility Fannie Mae) (Liquidity Facility Freddie Mac), VRDN (c)(f) | 32,200 | | 32,200 |
Series 2006 F1, 0.26% (Liquidity Facility Fannie Mae) (Liquidity Facility Freddie Mac), VRDN (c)(f) | 20,470 | | 20,470 |
Series 2007 K, 0.26% (Liquidity Facility Fannie Mae) (Liquidity Facility Freddie Mac), VRDN (c)(f) | 25,000 | | 25,000 |
Series 2008 C, 0.26% (Liquidity Facility Fannie Mae) (Liquidity Facility Freddie Mac), VRDN (c)(f) | 60,965 | | 60,965 |
Series 2008 E, 0.26% (Liquidity Facility Fannie Mae) (Liquidity Facility Freddie Mac), VRDN (c)(f) | 10,025 | | 10,025 |
(Multifamily Hsg. Prog.): | | | |
Series 2000 C, 0.24% (Liquidity Facility Fannie Mae) (Liquidity Facility Freddie Mac), VRDN (c)(f) | 13,500 | | 13,500 |
Municipal Securities - continued |
| Principal Amount (000s) | | Value (000s) |
California - continued |
California Hsg. Fin. Agcy. Rev.: - continued | | | |
(Multifamily Hsg. Prog.): | | | |
Series 2001 G, 0.24% (Liquidity Facility Fannie Mae) (Liquidity Facility Freddie Mac), VRDN (c)(f) | $ 3,320 | | $ 3,320 |
Series 2002 C: | | | |
0.24% (Liquidity Facility Fannie Mae) (Liquidity Facility Freddie Mac), VRDN (c)(f) | 6,135 | | 6,135 |
0.24% (Liquidity Facility Fannie Mae) (Liquidity Facility Freddie Mac), VRDN (c)(f) | 15,470 | | 15,470 |
Series 2005 D, 0.24% (Liquidity Facility Fannie Mae) (Liquidity Facility Freddie Mac), VRDN (c)(f) | 17,125 | | 17,125 |
Series 2003 H, 0.26% (Liquidity Facility Fannie Mae) (Liquidity Facility Freddie Mac), VRDN (c)(f) | 23,600 | | 23,600 |
California Infrastructure & Econ. Dev. Bank Rev. (Nelson Name Plate Co. Proj.) Series 1999, 0.55%, LOC Bank of America NA, VRDN (c)(f) | 900 | | 900 |
California Statewide Cmntys. Dev. Auth. Gas Supply Rev. Series 2010, 0.25% (Liquidity Facility Royal Bank of Canada), VRDN (c) | 36,300 | | 36,300 |
Dublin Hsg. Auth. Multi-Family Hsg. Rev. (Park Sierra Iron Horse Trail Proj.) Series 1998-A, 0.25%, LOC Freddie Mac, VRDN (c)(f) | 28,700 | | 28,700 |
Irvine Ranch Wtr. District Rev. (District #105 Impt. Proj.) Series 2008 B, 0.27%, LOC Landesbank Baden-Wuert, VRDN (c) | 9,000 | | 9,000 |
Los Angeles Cmnty. College District Participating VRDN Series Putters 2864, 0.26% (Liquidity Facility JPMorgan Chase Bank) (c)(g) | 4,785 | | 4,785 |
Los Angeles Cmnty. Redev. Agcy. Multi-family Hsg. Rev. (Hollywood & Vine Apts. Proj.) Series A, 0.25%, LOC Fannie Mae, VRDN (c)(f) | 10,000 | | 10,000 |
Los Angeles Gen. Oblig. TRAN: | | | |
2% 3/31/11 | 22,900 | | 22,927 |
2% 4/21/11 | 24,100 | | 24,147 |
Los Angeles Multi-family Hsg. Rev. (Tri-City Hsg. Proj.) Series 1, 0.26%, LOC Citibank NA, VRDN (c)(f) | 1,800 | | 1,800 |
Los Angeles Unified School District TRAN Series A, 2% 6/30/11 | 52,500 | | 52,730 |
Los Angeles Wastewtr. Sys. Rev.: | | | |
Participating VRDN Series EGL 7 05 3003, 0.26% (Liquidity Facility Citibank NA) (c)(g) | 40,000 | | 40,000 |
Series 2008 G, 0.26%, LOC Bank of America NA, VRDN (c) | 3,000 | | 3,000 |
Orange County Sanitation District Rev. BAN Series 2010 B, 2% 11/23/11 | 55,465 | | 56,128 |
Municipal Securities - continued |
| Principal Amount (000s) | | Value (000s) |
California - continued |
Riverside County Asset Leasing Corp. Leasehold Rev. (Southwest Justice Ctr. Proj.) Series 2008 A, 0.25%, LOC Union Bank of California, VRDN (c) | $ 10,200 | | $ 10,200 |
Riverside Elec. Rev.: | | | |
Series 2008 A, 0.23%, LOC Bank of America NA, VRDN (c) | 5,300 | | 5,300 |
Series 2008 C, 0.23%, LOC Bank of America NA, VRDN (c) | 5,000 | | 5,000 |
San Jose Multi-family Hsg. Rev. (Siena at Renaissance Square Proj.) Series 1996 A, 0.25%, LOC Key Bank NA, VRDN (c)(f) | 8,000 | | 8,000 |
Santa Clara County Fing. Auth. Lease Rev. (Multiple Facilities Proj.) Series 2008 M, 0.23%, LOC Bank of America NA, VRDN (c) | 3,500 | | 3,500 |
Santa Cruz Redev. Agcy. Multi-family Rev. (1010 Pacific Ave. Apts. Proj.) Series B, 0.27%, LOC Fannie Mae, VRDN (c)(f) | 5,650 | | 5,650 |
Stockton Pub. Fing. Auth. Wtr. Rev. (Delta Wtr. Supply Proj.) Series 2010 A, 0.25%, LOC Union Bank of California, VRDN (c) | 14,000 | | 14,000 |
| | 824,532 |
Colorado - 3.4% |
Adams County Hsg. Auth. (Semper Village Apts. Proj.) Series 2004 A, 0.29%, LOC Fannie Mae, VRDN (c)(f) | 14,000 | | 14,000 |
Aurora Hsg. Auth. Multi-Family Hsg. Rev. (Liberty Creek Proj.) 0.3%, LOC Fannie Mae, VRDN (c)(f) | 27,580 | | 27,580 |
Aurora Multi-family Hsg. Rev. (Aurora Meadows Apts. Proj.) Series 1996, 0.3%, LOC Fannie Mae, VRDN (c)(f) | 13,400 | | 13,400 |
Colorado Ed. Ln. Prog. TRAN Series 2010 D, 2% 6/30/11 | 176,800 | | 177,781 |
Colorado Edl. & Cultural Facilities Auth. Rev.: | | | |
(Clyfford Still Museum Proj.) Series 2008, 0.25%, LOC Wells Fargo Bank NA, VRDN (c) | 3,400 | | 3,400 |
(YMCA of the Rockies Proj.) 0.26%, LOC Bank of America NA, VRDN (c) | 8,000 | | 8,000 |
Colorado Health Facilities Auth. Retirement Hsg. Rev. Participating VRDN Series Putters 1390, 0.26% (Liquidity Facility JPMorgan Chase Bank) (c)(g) | 32,940 | | 32,940 |
Colorado Health Facilities Auth. Rev.: | | | |
Participating VRDN: | | | |
Series BA 08 1088, 0.33% (Liquidity Facility Bank of America NA) (c)(g) | 153 | | 153 |
Series BA 08 1090, 0.33% (Liquidity Facility Bank of America NA) (c)(g) | 14,900 | | 14,900 |
(Adventist Health Sys./Sunbelt Obligated Group Proj.) Series 2004 B, 0.25%, LOC JPMorgan Chase Bank, VRDN (c) | 14,145 | | 14,145 |
Municipal Securities - continued |
| Principal Amount (000s) | | Value (000s) |
Colorado - continued |
Colorado Health Facilities Auth. Rev.: - continued | | | |
(Boulder Cmnty. Hosp. Proj.) Series 2000, 0.28%, LOC JPMorgan Chase Bank, VRDN (c) | $ 14,495 | | $ 14,495 |
(Catholic Health Initiatives Proj.): | | | |
Series 2004 B, 0.28% (Liquidity Facility Landesbank Hessen-Thuringen), VRDN (c) | 6,500 | | 6,500 |
Series 2004 B2, 0.3% (Liquidity Facility Bayerische Landesbank Girozentrale), VRDN (c) | 19,125 | | 19,125 |
Participating VRDN Series Putters 3702, 0.26% (Liquidity Facility JPMorgan Chase Bank) (c)(g) | 3,550 | | 3,550 |
Colorado Hsg. & Fin. Auth. Series 2002 C3, 0.26% (Liquidity Facility Fannie Mae) (Liquidity Facility Freddie Mac), VRDN (c)(f) | 10,750 | | 10,750 |
Colorado Hsg. & Fin. Auth. Solid Waste Rev.: | | | |
(Waste Mgmt., Inc. Proj.) 0.36%, LOC Wells Fargo Bank NA, VRDN (c)(f) | 7,000 | | 7,000 |
(Waste Mgmt., Inc. Proj.) 0.36%, LOC JPMorgan Chase Bank, VRDN (c)(f) | 14,160 | | 14,160 |
Colorado Hsg. Fin. Auth. Single Family Mtg. Rev.: | | | |
Series 2003 B3, 0.26% (Liquidity Facility Fed. Home Ln. Bank Topeka), VRDN (c)(f) | 30,000 | | 30,000 |
Series 2008 A3, 0.26% (Liquidity Facility Fannie Mae) (Liquidity Facility Freddie Mac), VRDN (c)(f) | 20,250 | | 20,250 |
Colorado Reg'l. Trans. District Sales Tax Rev. Participating VRDN: | | | |
Series EGL 07 0036, 0.26% (Liquidity Facility Citibank NA) (c)(g) | 29,700 | | 29,700 |
Series EGL 07 0037, 0.26% (Liquidity Facility Citibank NA) (c)(g) | 16,830 | | 16,830 |
Series EGL 07 0038, 0.26% (Liquidity Facility Citibank NA) (c)(g) | 18,080 | | 18,080 |
Series EGL 07 0040, 0.26% (Liquidity Facility Citibank NA) (c)(g) | 30,610 | | 30,610 |
Series WF 10 37C, 0.26% (Liquidity Facility Wells Fargo Bank NA) (c)(g) | 20,660 | | 20,660 |
Colorado Springs Utils. Rev. Series 2000 A, 0.27%, VRDN (c) | 27,600 | | 27,600 |
Denver City & County Arpt. Rev.: | | | |
Series 2008 C1, 0.29%, LOC KBC Bank NV, VRDN (c)(f) | 38,800 | | 38,800 |
Series 2008 C2, 0.31%, LOC Landesbank Baden-Wuert, VRDN (c)(f) | 40,000 | | 40,000 |
Series 2008 C3, 0.31%, LOC Landesbank Baden-Wuert, VRDN (c)(f) | 75,800 | | 75,800 |
Municipal Securities - continued |
| Principal Amount (000s) | | Value (000s) |
Colorado - continued |
Denver City & County Indl. Dev. Rev. (Brass Smith/Kevry Proj.) Series 2009, 0.42%, LOC Wells Fargo Bank NA, VRDN (c)(f) | $ 5,215 | | $ 5,215 |
Denver Urban Renewal Auth. Tax Increment Rev. Series 2008 A2, 0.26%, LOC U.S. Bank NA, Minnesota, VRDN (c) | 24,100 | | 24,100 |
Fort Collins Indl. Dev. Rev. (Phelps-Tointon Millwork Proj.) Series 1993, 0.88%, LOC JPMorgan Chase Bank, VRDN (c)(f) | 315 | | 315 |
Lakewood Hsg. Auth. Multi-family Rev.: | | | |
(Ridgemoor Apts. Proj.) Series 2003 A, 0.28%, LOC Fannie Mae, VRDN (c)(f) | 13,325 | | 13,325 |
(Timberleaf Apts. Proj.) 0.28%, LOC Fannie Mae, VRDN (c)(f) | 11,165 | | 11,165 |
Westminster County Multi-family Hsg. Rev. (Lakeview Apts. Proj.) Series 1997, 0.3%, LOC Fannie Mae, VRDN (c)(f) | 7,110 | | 7,110 |
| | 791,439 |
Connecticut - 0.8% |
Connecticut Gen. Oblig.: | | | |
Bonds Series 2010 B, 1.5% 6/1/11 | 19,050 | | 19,103 |
BAN: | | | |
Series 2009 B, 4% 6/1/11 | 25,830 | | 26,060 |
Series 2010 A, 2% 5/19/11 | 68,600 | | 68,830 |
Series 2004 A, 0.33% (Liquidity Facility Landesbank Hessen-Thuringen), VRDN (c) | 6,050 | | 6,050 |
Series 2005 A1, 0.31% (Liquidity Facility Dexia Cr. Local de France), VRDN (c) | 5,000 | | 5,000 |
Connecticut Health & Edl. Facilities Auth. Rev. (St. Francis Hosp. & Med. Ctr. Proj.) Series F, 0.27%, LOC JPMorgan Chase Bank, VRDN (c) | 12,110 | | 12,110 |
Connecticut Hsg. Fin. Auth.: | | | |
(Hsg. Mtg. Fin. Prog.): | | | |
Series 1989 D, 0.31% (Liquidity Facility Fed. Home Ln. Bank of Boston), VRDN (c)(f) | 6,154 | | 6,154 |
Series 2002 B3, 0.27% (Liquidity Facility Fed. Home Ln. Bank of Boston), VRDN (c)(f) | 7,900 | | 7,900 |
Series 2004 B4, 0.3% (Liquidity Facility Fed. Home Ln. Bank of Boston), VRDN (c) | 12,280 | | 12,280 |
Series 2005 D5, 0.31% (Liquidity Facility Fed. Home Ln. Bank of Boston), VRDN (c)(f) | 5,065 | | 5,065 |
Municipal Securities - continued |
| Principal Amount (000s) | | Value (000s) |
Connecticut - continued |
Connecticut Hsg. Fin. Auth.: - continued | | | |
(Hsg. Mtg. Fin. Prog.): | | | |
Series 2005 D6, 0.3% (Liquidity Facility Fed. Home Ln. Bank of Boston), VRDN (c) | $ 8,380 | | $ 8,380 |
Series 2008 E, 0.26% (Liquidity Facility Bank of America NA), VRDN (c)(f) | 4,500 | | 4,500 |
| | 181,432 |
Delaware - 0.4% |
Delaware Econ. Dev. Auth. Rev. (Delmarva Pwr. & Lt. Co. Proj.): | | | |
Series 1987, 1%, VRDN (c)(f) | 3,000 | | 3,000 |
Series 1988, 1%, VRDN (c)(f) | 13,550 | | 13,550 |
Series 1993 C, 0.79%, VRDN (c) | 4,500 | | 4,500 |
Series 1994, 1%, VRDN (c)(f) | 29,900 | | 29,900 |
Series 1999 B, 0.59%, VRDN (c)(f) | 9,900 | | 9,900 |
Delaware Gen. Oblig. Bonds 5% 3/1/11 | 10,000 | | 10,000 |
Delaware Hsg. Auth. Rev. Participating VRDN: | | | |
Series BC 2010 11W, 0.3% (Liquidity Facility Barclays Bank PLC) (c)(f)(g) | 3,005 | | 3,005 |
Series Merlots 07 C103, 0.33% (Liquidity Facility Wells Fargo Bank NA) (c)(f)(g) | 4,175 | | 4,175 |
Series Merlots 07 C66, 0.33% (Liquidity Facility Wells Fargo Bank NA) (c)(f)(g) | 5,730 | | 5,730 |
Series ROC II R 11651, 0.32% (Liquidity Facility Citibank NA) (c)(f)(g) | 7,395 | | 7,395 |
Wilmington Adjustable Rate Demand Rev. (Delaware Art Museum, Inc. Proj.) 0.28%, LOC Wells Fargo Bank NA, VRDN (c) | 14,800 | | 14,800 |
| | 105,955 |
District Of Columbia - 1.7% |
District of Columbia Gen. Oblig. Series 2008 C, 0.25%, LOC TD Banknorth, NA, VRDN (c) | 8,000 | | 8,000 |
District of Columbia Hsg. Fin. Agcy. Multi-family Hsg. Rev. (Trenton Park Apts. Proj.) Series 2001, 0.46%, LOC Bank of America NA, VRDN (c)(f) | 2,965 | | 2,965 |
District of Columbia Income Tax Rev. Bonds Series 2009 B, 4% 12/1/11 | 7,645 | | 7,852 |
District of Columbia Rev.: | | | |
(Fort Lincoln New Town/Premium Distributors LLC Proj.) Series 2000, 0.42%, LOC Wells Fargo Bank NA, VRDN (c)(f) | 7,250 | | 7,250 |
Municipal Securities - continued |
| Principal Amount (000s) | | Value (000s) |
District Of Columbia - continued |
District of Columbia Rev.: - continued | | | |
(George Washington Univ. Proj.): | | | |
Series 1999 B, 0.29%, LOC Bank of America NA, VRDN (c) | $ 30,000 | | $ 30,000 |
Series 1999 C, 0.29%, LOC Bank of America NA, VRDN (c) | 16,380 | | 16,380 |
(Medlantic/Helix Proj.): | | | |
Series 1998 A Tranche II, 0.26%, LOC Bank of America NA, VRDN (c) | 29,900 | | 29,900 |
Series 1998 A Tranche III, 0.26%, LOC Bank of America NA, VRDN (c) | 18,675 | | 18,675 |
(The AARP Foundation Proj.) Series 2004, 0.3%, LOC Bank of America NA, VRDN (c) | 9,950 | | 9,950 |
(The Phillips Collection Issue Proj.) Series 2003, 0.4%, LOC Bank of America NA, VRDN (c) | 1,535 | | 1,535 |
(Washington Drama Society, Inc. Proj.) Series 2008, 0.25%, LOC JPMorgan Chase Bank, VRDN (c) | 12,350 | | 12,350 |
Bonds: | | | |
(American Nat'l. Red Cross Proj.) Series 2000 L, 0.3% tender 3/7/11, LOC JPMorgan Chase Bank, CP mode | 29,200 | | 29,200 |
(Nat'l. Academy of Sciences Proj.): | | | |
Series A, 0.32% tender 4/7/11, LOC Bank of America NA, CP mode | 30,000 | | 30,000 |
0.32% tender 3/8/11, LOC Bank of America NA, CP mode | 14,125 | | 14,125 |
District of Columbia Univ. Rev. (American Univ. Proj.): | | | |
Series 2003, 0.26%, LOC Bank of America NA, VRDN (b)(c) | 18,700 | | 18,700 |
Series 2006 A, 0.26%, LOC Bank of America NA, VRDN (c) | 33,000 | | 33,000 |
Metropolitan Washington DC Arpts. Auth. Sys. Rev.: | | | |
Participating VRDN: | | | |
Series BBT 2040, 0.28% (Liquidity Facility Branch Banking & Trust Co.) (c)(f)(g) | 9,920 | | 9,920 |
Series BBT 2054, 0.28% (Liquidity Facility Branch Banking & Trust Co.) (c)(f)(g) | 10,165 | | 10,165 |
Series DB 505, 0.28% (Liquidity Facility Deutsche Bank AG) (c)(f)(g) | 7,535 | | 7,535 |
ROC II R 11815, 0.32% (Liquidity Facility Citibank NA) (c)(f)(g) | 6,000 | | 6,000 |
Series DB 677, 0.28% (Liquidity Facility Deutsche Bank AG) (c)(f)(g) | 7,780 | | 7,780 |
Series DB 679, 0.28% (Liquidity Facility Deutsche Bank AG) (c)(f)(g) | 10,000 | | 10,000 |
Municipal Securities - continued |
| Principal Amount (000s) | | Value (000s) |
District Of Columbia - continued |
Metropolitan Washington DC Arpts. Auth. Sys. Rev.: - continued | | | |
Participating VRDN: | | | |
Series Putters 1691, 0.36% (Liquidity Facility JPMorgan Chase Bank) (c)(f)(g) | $ 11,970 | | $ 11,970 |
Series Putters 2855, 0.38% (Liquidity Facility JPMorgan Chase Bank) (c)(f)(g) | 4,895 | | 4,895 |
Series ROC II R 11798, 0.32% (Liquidity Facility Citibank NA) (c)(f)(g) | 15,000 | | 15,000 |
Series 2003 D1, 0.32%, LOC Wells Fargo Bank NA, VRDN (c)(f) | 37,985 | | 37,985 |
| | 391,132 |
Florida - 7.1% |
Alachua County Health Facilities Auth. Health Facilities Rev. Bonds (Shands Teaching Hospitals & Clinics, Inc. Proj.): | | | |
Series 2008 A, 0.32% tender 4/7/11, LOC Bank of America NA, CP mode | 25,000 | | 25,000 |
Series 2008 B, 0.32% tender 4/7/11, LOC Bank of America NA, CP mode | 8,000 | | 8,000 |
Brevard County Hsg. Fin. Auth. (Manatee Cove Apts. Proj.) 0.29%, LOC Citibank NA, VRDN (c)(f) | 10,885 | | 10,885 |
Broward County Fin. Auth. Multi-family Hsg. Rev.: | | | |
(Pinnacle Village Apts. Proj.) 0.31%, LOC Citibank NA, VRDN (c)(f) | 6,700 | | 6,700 |
(Sanctuary Apts Proj.) Series A, 0.29%, LOC Fannie Mae, VRDN (c)(f) | 15,895 | | 15,895 |
Cape Coral Gen. Oblig.: | | | |
0.31% 3/9/11, LOC Bank of America NA, CP | 8,015 | | 8,015 |
0.32% 3/7/11, LOC Bank of America NA, CP | 81,000 | | 81,000 |
0.33% 4/4/11, LOC Bank of America NA, CP | 54,330 | | 54,330 |
Clay County Hsg. Fin. Auth. Multi-family Hsg. Rev. (Nassau Club Apts. Proj.) 0.29%, LOC Fannie Mae, VRDN (c)(f) | 9,805 | | 9,805 |
Coconut Creek Indl. Dev. Rev. (Elite Aluminum Corp. Proj.) Series 2002, 0.49%, LOC Bank of America NA, VRDN (c)(f) | 1,435 | | 1,435 |
Collier County Hsg. Fin. Auth. Multi-family Rev.: | | | |
(Sawgrass Pines Apts. Proj.) 0.29%, LOC Fannie Mae, VRDN (c)(f) | 6,800 | | 6,800 |
(Summer Lakes Phase II Apts. Proj.) 0.29%, LOC Citibank NA, VRDN (c)(f) | 18,810 | | 18,810 |
Florida Board of Ed. Pub. Ed. Cap. Outlay: | | | |
Bonds Series 2009 C, 5% 6/1/11 | 8,220 | | 8,317 |
Municipal Securities - continued |
| Principal Amount (000s) | | Value (000s) |
Florida - continued |
Florida Board of Ed. Pub. Ed. Cap. Outlay: - continued | | | |
Participating VRDN: | | | |
Series BA 08 1059, 0.33% (Liquidity Facility Bank of America NA) (c)(g) | $ 4,165 | | $ 4,165 |
Series BA 08 1068, 0.33% (Liquidity Facility Bank of America NA) (c)(g) | 14,385 | | 14,385 |
Series ROC II R 11884X, 0.26% (Liquidity Facility Citibank NA) (c)(g) | 8,800 | | 8,800 |
Florida Dept. of Envir. Protection Rev. Bonds: | | | |
Series 2010 C, 4% 7/1/11 | 7,500 | | 7,591 |
Series 2010 D, 4% 7/1/11 | 40,690 | | 41,166 |
Florida Dept. of Trans. Tpk. Rev.: | | | |
Bonds Series 2003 B, 5% 7/1/11 | 1,000 | | 1,015 |
Participating VRDN Series Solar 07 30, 0.25% (Liquidity Facility U.S. Bank NA, Minnesota) (c)(g) | 15,000 | | 15,000 |
Florida Ed. Sys. Hsg. Facility Rev. Participating VRDN Series Solar 06 41, 0.25% (Liquidity Facility U.S. Bank NA, Minnesota) (c)(g) | 11,930 | | 11,930 |
Florida Hsg. Fin. Agcy. Rev.: | | | |
(Bainbridge Club Apt. Proj.) Series M, 0.28%, LOC Fannie Mae, VRDN (c)(f) | 5,670 | | 5,670 |
(Banyan Bay Apts. Proj.) 0.28%, LOC Fannie Mae, VRDN (c)(f) | 8,950 | | 8,950 |
Florida Hsg. Fin. Corp. Participating VRDN Series Clipper 05 40, 0.38% (Liquidity Facility State Street Bank & Trust Co., Boston) (c)(f)(g) | 25,100 | | 25,100 |
Florida Hsg. Fin. Corp. Multi-family Mtg. Rev.: | | | |
(Avalon Reserve Apts. Proj.) Series 2003 R1, 0.29%, LOC Fannie Mae, VRDN (c)(f) | 14,900 | | 14,900 |
(Clascona Groves Apts. Proj.) Series A, 0.28%, LOC Citibank NA, VRDN (c)(f) | 9,000 | | 9,000 |
(Collins Cove Sr. Apts. Proj.) Series 2003 W, 0.28%, LOC Citibank NA, VRDN (c)(f) | 5,500 | | 5,500 |
(Grande Court at North Port Apts. Proj.) Series 2004 E, 0.29%, LOC Fannie Mae, VRDN (c)(f) | 5,800 | | 5,800 |
(Hunters Run Apts. Proj.) Series G, 0.28%, LOC Fannie Mae, VRDN (c)(f) | 8,300 | | 8,300 |
(Lynn Lake Apts. Proj.) Series B1, 0.29%, LOC Freddie Mac, VRDN (c)(f) | 20,210 | | 20,210 |
(Mill Creek Apts. Proj.) 0.29%, LOC Fannie Mae, VRDN (c)(f) | 15,000 | | 15,000 |
(Pinnacle Grove Apts. Proj.) Series 2003 A, 0.29%, LOC Fannie Mae, VRDN (c)(f) | 7,750 | | 7,750 |
Municipal Securities - continued |
| Principal Amount (000s) | | Value (000s) |
Florida - continued |
Florida Hsg. Fin. Corp. Multi-family Mtg. Rev.: - continued | | | |
(Riverwalk I Apts. Proj.) Series 2008 E, 0.29%, LOC Freddie Mac, VRDN (c)(f) | $ 5,075 | | $ 5,075 |
(Savannah Springs Apts. Proj.) Series G, 0.3%, LOC Citibank NA, VRDN (c)(f) | 7,095 | | 7,095 |
(Sterling Palms Apts. Proj.) Series F, 0.29%, LOC Fannie Mae, VRDN (c)(f) | 14,170 | | 14,170 |
Florida Hsg. Fin. Corp. Rev.: | | | |
Participating VRDN Series BA 07 1034, 0.4% (Liquidity Facility Bank of America NA) (c)(f)(g) | 5,939 | | 5,939 |
(Tuscany Lakes Apts. Proj.) Series 2002 K1, 0.32%, LOC Fannie Mae, VRDN (c)(f) | 4,000 | | 4,000 |
(Valencia Village Apts. Proj.) Series G, 0.29%, LOC Fannie Mae, VRDN (c)(f) | 11,755 | | 11,755 |
(Waterford Pointe Apts. Proj.) Series 2000 E1, 0.29%, LOC Fannie Mae, VRDN (c)(f) | 8,155 | | 8,155 |
Participating VRDN: | | | |
Series BA 08 1191, 0.4% (Liquidity Facility Bank of America NA) (c)(f)(g) | 5,280 | | 5,280 |
Series Merlots 06 B17, 0.33% (Liquidity Facility Wells Fargo Bank NA) (c)(f)(g) | 3,110 | | 3,110 |
Series Merlots 07 C64, 0.33% (Liquidity Facility Wells Fargo Bank NA) (c)(f)(g) | 9,585 | | 9,585 |
Series Putters 1336 B, 0.39% (Liquidity Facility JPMorgan Chase & Co.) (c)(f)(g) | 2,020 | | 2,020 |
Florida Local Govt. Fin. Commission Auth. Rev. Series A, 0.32% 4/4/11, LOC Wells Fargo Bank NA, CP | 3,839 | | 3,839 |
Fort Myers Util. Sys. Rev. Series 2009, 0.27%, LOC Bank of America NA, VRDN (c) | 38,470 | | 38,470 |
Gainesville Utils. Sys. Rev. 0.52% 3/24/11, CP | 31,000 | | 31,000 |
Hillsborough County Hsg. Fin. Auth. Multi-family Rev.: | | | |
(Claymore Crossings Apt. Proj.) 0.28%, LOC Citibank NA, VRDN (c)(f) | 11,305 | | 11,305 |
(Grande Oaks Apts. Proj.) Series A, 0.29%, LOC Fannie Mae, VRDN (c)(f) | 7,200 | | 7,200 |
(Hunters Run Apts. Proj.) Series 2002 A, 0.29%, LOC Fannie Mae, VRDN (c)(f) | 8,780 | | 8,780 |
(Meridian Pointe Apts. Proj.) 0.29%, LOC Citibank NA, VRDN (c)(f) | 12,400 | | 12,400 |
(Mobley Park Apts. Proj.) Series A, 0.29%, LOC Freddie Mac, VRDN (c)(f) | 7,890 | | 7,890 |
(Morgan Creek Apts. Proj.) 0.29%, LOC Fannie Mae, VRDN (c)(f) | 12,700 | | 12,700 |
Municipal Securities - continued |
| Principal Amount (000s) | | Value (000s) |
Florida - continued |
Hillsborough County Hsg. Fin. Auth. Multi-family Rev.: - continued | | | |
(Royal Palm Key Apts. Proj.) 0.29%, LOC Fannie Mae, VRDN (c)(f) | $ 8,780 | | $ 8,780 |
Hillsborough County Indl. Dev. Auth. Indl. Dev. Rev. (Vigo Importing Co. Proj.) 0.66%, LOC Bank of America NA, VRDN (c)(f) | 500 | | 500 |
Jacksonville Econ. Dev. Commission Indl. Dev. Rev. (STI Proj.) Series 2002, 0.46%, LOC Bank of America NA, VRDN (c)(f) | 7,350 | | 7,350 |
Jacksonville Elec. Auth. Elec. Sys. Rev.: | | | |
Bonds Series F, 0.33% tender 3/7/11 (Liquidity Facility Landesbank Hessen-Thuringen), CP mode | 13,600 | | 13,600 |
Participating VRDN Series BA 09 1209X, 0.33% (Liquidity Facility Bank of America NA) (c)(g) | 5,310 | | 5,310 |
Series Three 2008 B4, 0.25%, LOC Wells Fargo Bank NA, VRDN (c) | 7,400 | | 7,400 |
Jacksonville Health Facilities Auth. Hosp. Rev. (Baptist Med. Ctr. Proj.) Series 2007 E, 0.26%, LOC Branch Banking & Trust Co., VRDN (c) | 10,790 | | 10,790 |
Jacksonville Hsg. Fin. Auth. Multi-family Hsg. Rev. (Brookwood Forest Apts. Proj.) 0.29%, LOC Fannie Mae, VRDN (c)(f) | 9,500 | | 9,500 |
Jacksonville Poll. Cont. Rev. Bonds (Florida Pwr. & Lt. Co. Proj.): | | | |
Series 1992, 0.32% tender 3/11/11, CP mode | 20,300 | | 20,300 |
Series 1994, 0.32% tender 3/11/11, CP mode | 30,855 | | 30,855 |
Jacksonville Port Auth. Rev. (Mitsui O.S.K. Lines Ltd. Proj.) 0.25%, LOC Sumitomo Mitsui Banking Corp., VRDN (c)(f) | 89,890 | | 89,890 |
Lakeland Elec. & Wtr. Rev. Bonds Series 1999 A, 0% 10/1/11 | 8,420 | | 8,394 |
Lee County Hsg. Fin. Auth. Multi-family Hsg. Rev. (Univ. Club Apts. Proj.) Series A, 0.33%, LOC Fannie Mae, VRDN (c)(f) | 7,500 | | 7,500 |
Manatee County School District TAN Series 2010, 1.25% 5/1/11 | 32,300 | | 32,349 |
Miami-Dade County Hsg. Fin. Auth. Multi-family Mtg. Rev. (22nd Avenue Apts., 183rd Street Apts. & 187th Street Apts. Proj.) Series 2003 3, 0.29%, LOC Citibank NA, VRDN (c)(f) | 16,420 | | 16,420 |
Miami-Dade County Indl. Dev. Auth. Rev. (Tarmac America Proj.) Series 2004, 0.36%, LOC Bank of America NA, VRDN (c)(f) | 10,600 | | 10,600 |
Ocean Hwy. & Port Auth. Rev. 0.38%, LOC Wells Fargo Bank NA, VRDN (c)(f) | 7,500 | | 7,500 |
Orange County Health Facilities Auth. Rev.: | | | |
(Orlando Reg'l. Health Care Sys. Proj.) Series 2008 E, 0.26%, LOC Branch Banking & Trust Co., VRDN (c) | 9,000 | | 9,000 |
Municipal Securities - continued |
| Principal Amount (000s) | | Value (000s) |
Florida - continued |
Orange County Health Facilities Auth. Rev.: - continued | | | |
(The Nemours Foundation Proj.) Series 2009 B, 0.25%, LOC Bank of America NA, VRDN (c) | $ 20,600 | | $ 20,600 |
Orange County Hsg. Fin. Auth. Multi-family Rev.: | | | |
(Alta Westgate Apts. Proj.) Series C, 0.29%, LOC Citibank NA, VRDN (c)(f) | 13,300 | | 13,300 |
(Glenn Millenia Proj.) Series 2001 C, 0.28%, LOC Fannie Mae, VRDN (c)(f) | 3,200 | | 3,200 |
(Osprey Ridge Apts. Proj.) Series 2000 H, 0.29%, LOC Fannie Mae, VRDN (c)(f) | 7,660 | | 7,660 |
(West Point Villas Apts. Proj.) Series 2000 F, 0.29%, LOC Fannie Mae, VRDN (c)(f) | 11,500 | | 11,500 |
Orlando & Orange County Expressway Auth. Rev. Series 2008 B1, 0.27%, LOC Bank of America NA, VRDN (c) | 64,165 | | 64,165 |
Orlando Utils. Commission Util. Sys. Rev. Bonds Series 2010 D, 2.5% 5/1/11 | 14,665 | | 14,715 |
Osceola County Hsg. Fin. Auth. Multi-family Rev. (Regatta Bay Apts. Proj.) Series A, 0.29%, LOC Fannie Mae, VRDN (c)(f) | 12,920 | | 12,920 |
Palm Beach County Edl. Facilities Auth. (Lynn Univ. Proj.) Series 2001, 0.33%, LOC Bank of America NA, VRDN (c) | 10,270 | | 10,270 |
Palm Beach County Hsg. Fin. Auth. Multi-family Hsg. Rev. (Renaissance Apts. Proj.) 0.29%, LOC Fannie Mae, VRDN (c)(f) | 18,200 | | 18,200 |
Palm Beach County Rev.: | | | |
(Hanley Ctr. Proj.) Series 2006, 0.33%, LOC Bank of America NA, VRDN (c) | 1,550 | | 1,550 |
(Raymond F. Kravis Ctr. Proj.) Series 2002, 0.25%, LOC Northern Trust Co., VRDN (c) | 3,145 | | 3,145 |
(Saint Andrew's School of Boca Raton, Inc. Proj.) Series 2007, 0.33%, LOC Bank of America NA, VRDN (c) | 11,100 | | 11,100 |
Panama City Beach Participating VRDN Series Solar 2006 129, 0.25% (Liquidity Facility U.S. Bank NA, Minnesota) (c)(g) | 7,955 | | 7,955 |
Pasco County Indl. Dev. Rev. (Pacific Med., Inc. Proj.) Series 1999, 0.49%, LOC Bank of America NA, VRDN (c)(f) | 1,260 | | 1,260 |
Pasco County School Board Ctfs. of Prtn.: | | | |
Series 2008 A, 0.25%, LOC Wells Fargo Bank NA, VRDN (c) | 50,900 | | 50,900 |
Series 2008 C, 0.3%, LOC Bank of America NA, VRDN (c) | 33,810 | | 33,810 |
Pinellas County Health Facilities Auth. Rev.: | | | |
(BayCare Health Sys. Proj.) Series 2009 A2, 0.25%, LOC Northern Trust Co., VRDN (c) | 6,000 | | 6,000 |
(Suncoast Hospice Proj.) Series 2004, 0.25%, LOC Wells Fargo Bank NA, VRDN (c) | 15,170 | | 15,170 |
Municipal Securities - continued |
| Principal Amount (000s) | | Value (000s) |
Florida - continued |
Pinellas County School District TAN Series 2010, 1.5% 6/30/11 | $ 61,300 | | $ 61,529 |
Polk County Hsg. Fin. Auth. Multi-family Hsg. Rev. (Cambridge Cove Apts. Proj.) Series 2001, 0.29%, LOC Fannie Mae, VRDN (c)(f) | 8,200 | | 8,200 |
Saint Petersburg Health Facilities Auth. Rev. (All Children's Hosp. Proj.): | | | |
Series 2005 A1, 0.25%, LOC Wells Fargo Bank NA, VRDN (c) | 3,000 | | 3,000 |
Series 2005 A2, 0.25%, LOC Wells Fargo Bank NA, VRDN (c) | 49,620 | | 49,620 |
Sarasota County Pub. Hosp. District Hosp. Rev. (Sarasota Memorial Hosp. Proj.) Series 2009 B, 0.27%, LOC Bank of America NA, VRDN (c) | 43,385 | | 43,385 |
Seminole County School District TAN Series 2010, 2% 9/28/11 | 15,000 | | 15,140 |
South Florida Wtr. Mgmt. District Ctfs. of Prtn. Participating VRDN Series ROC II R 12313, 0.26% (Liquidity Facility Citibank NA) (c)(g) | 13,100 | | 13,100 |
South Miami Health Facilities Auth. Hosp. Rev.: | | | |
Participating VRDN Series BA 07 1030, 0.33% (Liquidity Facility Bank of America NA) (c)(g) | 6,970 | | 6,970 |
Participating VRDN: | | | |
Series Putters 2407, 0.26% (Liquidity Facility JPMorgan Chase Bank) (c)(g) | 41,995 | | 41,995 |
Series ROC II R 11060, 0.27% (Liquidity Facility Citibank NA) (c)(g) | 20,260 | | 20,260 |
Sunshine State Govt. Fing. Commission Rev.: | | | |
(Miami-Dade County Prog.) Series 2010 B, 0.25%, LOC JPMorgan Chase Bank, VRDN (c) | 35,000 | | 35,000 |
Series L: | | | |
0.3% 3/1/11, LOC Dexia Cr. Local de France, CP | 14,800 | | 14,800 |
0.35% 3/2/11, LOC Dexia Cr. Local de France, CP | 65,815 | | 65,815 |
| | 1,677,264 |
Georgia - 2.4% |
Atlanta Arpt. Rev. Series 2010 B1: | | | |
0.32% 3/15/11, LOC Wells Fargo Bank NA, CP | 9,100 | | 9,100 |
0.32% 3/15/11, LOC Wells Fargo Bank NA, CP | 9,157 | | 9,157 |
0.33% 3/15/11, LOC Wells Fargo Bank NA, CP | 10,000 | | 10,000 |
Atlanta Tax Allocation (Westside Proj.): | | | |
Series 2008, 0.25%, LOC Wells Fargo Bank NA, VRDN (c) | 26,300 | | 26,300 |
Series A, 0.25%, LOC Wells Fargo Bank NA, VRDN (c) | 26,890 | | 26,890 |
Municipal Securities - continued |
| Principal Amount (000s) | | Value (000s) |
Georgia - continued |
Atlanta Urban Residential Fin. Auth. Multi-family Hsg. Rev.: | | | |
(Capitol Gateway Apts. Proj.) 0.29%, LOC Fannie Mae, VRDN (c)(f) | $ 8,475 | | $ 8,475 |
(Carver Redev. Proj.) Series 2000, 0.85%, LOC Fannie Mae, VRDN (c)(f) | 3,915 | | 3,915 |
(Collegetown at Harris Homes Phase I Proj.) 0.29%, LOC Fannie Mae, VRDN (c)(f) | 7,230 | | 7,230 |
Bulloch County Dev. Auth. Indl. Dev. Rev. (Gold Kist, Inc. Proj.) Series 1995, 0.42%, LOC Wells Fargo Bank NA, VRDN (c)(f) | 4,000 | | 4,000 |
Burke County Indl. Dev. Auth. Poll. Cont. Rev.: | | | |
(Oglethorpe Pwr. Corp. Proj.) Series 2010 B, 0.24%, LOC Bank of America NA, VRDN (c) | 30,000 | | 30,000 |
(Oglethorpe Pwr. Corp. Projects) Series 2010 A, 0.24%, LOC Bank of America NA, VRDN (c) | 40,000 | | 40,000 |
Canton Hsg. Auth. Multi-family Hsg. Rev.: | | | |
(Alta Ridgewalk Apts. Proj.) Series 2003, 0.29%, LOC Freddie Mac, VRDN (c)(f) | 20,450 | | 20,450 |
(Canton Mill Lofts Proj.) Series 1999, 0.35%, LOC Branch Banking & Trust Co., VRDN (c)(f) | 13,850 | | 13,850 |
Clarke County Hosp. Auth. Rev. Participating VRDN Series Solar 07 31, 0.25% (Liquidity Facility U.S. Bank NA, Minnesota) (c)(g) | 16,555 | | 16,555 |
Cobb County Hsg. Auth. Multi-family Hsg. Rev. 0.25%, LOC Bank of America NA, VRDN (c) | 10,700 | | 10,700 |
Cobb County Kennestone Hosp. Auth. Rev. (WellStar Health Sys. Proj.) Series 2005 A, 0.28%, LOC Bank of America NA, VRDN (c) | 32,500 | | 32,500 |
Covington Hsg. Auth. Multi-family Rev. (Wellington Ridge Apt. Proj.) 0.29%, LOC Freddie Mac, VRDN (c)(f) | 9,455 | | 9,455 |
DeKalb County Hsg. Auth. Multi-family Hsg. Rev. (Eagles Trace Apts. Proj.) Series 1996, 0.29%, LOC Fannie Mae, VRDN (c)(f) | 7,750 | | 7,750 |
Fulton County Dev. Auth. Bonds (Georgia Tech Athletic Assoc. Proj.) Series 2008 A, 0.3%, tender 3/1/11, LOC Northern Trust Co. (c) | 7,000 | | 7,000 |
Fulton County Wtr. & Swr. Rev. Participating VRDN Series Solar 06 51, 0.25% (Liquidity Facility U.S. Bank NA, Minnesota) (c)(g) | 12,880 | | 12,880 |
Georgia Gen. Oblig.: | | | |
Bonds Series 1994 B, 5.35% 3/1/11 | 3,730 | | 3,730 |
Participating VRDN Series WF 08 12C, 0.26% (Liquidity Facility Wells Fargo & Co.) (c)(g) | 13,695 | | 13,695 |
Municipal Securities - continued |
| Principal Amount (000s) | | Value (000s) |
Georgia - continued |
Gwinnett County Dev. Auth. Indl. Dev. Rev. (Curtis 1000, Inc. Proj.) Series 1996, 0.29%, LOC Wells Fargo Bank NA, VRDN (c)(f) | $ 6,460 | | $ 6,460 |
Gwinnett County Hsg. Auth. Multi-family Hsg. Rev. (Herrington Woods Apt. Proj.) Series 1996 A, 0.29%, LOC Fannie Mae, VRDN (c)(f) | 11,435 | | 11,435 |
Henry County Dev. Auth. Solid Waste Rev. (Atlas Roofing Corp. Proj.) Series 1997, 0.3%, LOC Bank of America NA, VRDN (c)(f) | 4,900 | | 4,900 |
Kennesaw Dev. Auth. Multifamily Hsg. Rev. (Alta Ridenour Apts. Proj.) Series 2008, 0.29%, LOC Freddie Mac, VRDN (c)(f) | 7,350 | | 7,350 |
Loganville Hsg. Auth. Multi-family Hsg. Rev. (Alexander Crossing Apt. Proj.) 0.3%, LOC Freddie Mac, VRDN (c)(f) | 15,555 | | 15,555 |
Main Street Natural Gas, Inc. Georgia Gas Proj. Rev. Series 2010 A, 0.26% (Liquidity Facility Royal Bank of Canada), VRDN (c) | 69,700 | | 69,700 |
Muni. Elec. Auth. of Georgia (Proj. One) Series 2008 B, 0.31%, LOC Dexia Cr. Local de France, VRDN (c) | 14,050 | | 14,050 |
Newnan Dev. Auth. Multi-family Hsg. Rev. (The Club at Newnan Crossing Proj.) 0.3%, LOC Fannie Mae, VRDN (c)(f) | 9,325 | | 9,325 |
Roswell Hsg. Auth. Multi-family Hsg. Rev. (Walton Centennial Proj.) Series A, 0.32%, LOC Wells Fargo Bank NA, VRDN (c)(f) | 19,200 | | 19,200 |
Savannah Econ. Dev. Auth. Rev. (Home Depot, Inc. Proj.) Series 1995 A, 1%, VRDN (c)(f) | 57,400 | | 57,400 |
Sugar Hill Hsg. Auth. Multi-family Rev. (Level Creek Apts. Proj.) Series 1997, 0.28%, LOC Citibank NA, VRDN (c)(f) | 11,290 | | 11,290 |
| | 550,297 |
Hawaii - 0.1% |
Hawaii Arpts. Sys. Rev. Bonds Series 2000 B, 8% 7/1/11 (f) | 10,550 | | 10,797 |
Hawaii Dept. of Budget & Fin. Spl. Purp. Rev. (Queen's Health Sys. Proj.) Series 2009 B, 0.27%, LOC Bank of America NA, VRDN (c) | 10,900 | | 10,900 |
Hawaii Gen. Oblig. Bonds Series CY, 5.5% 2/1/12 | 8,750 | | 9,158 |
| | 30,855 |
Idaho - 0.4% |
Idaho Gen. Oblig. TAN 2% 6/30/11 | 32,200 | | 32,369 |
Idaho Hsg. & Fin. Assoc. Single Family Mtg.: | | | |
Series 2000 F, 0.28% (Liquidity Facility Fannie Mae) (Liquidity Facility Freddie Mac), VRDN (c)(f) | 5,905 | | 5,905 |
Series 2001 B, 0.28% (Liquidity Facility Fannie Mae) (Liquidity Facility Freddie Mac), VRDN (c)(f) | 4,025 | | 4,025 |
Municipal Securities - continued |
| Principal Amount (000s) | | Value (000s) |
Idaho - continued |
Idaho Hsg. & Fin. Assoc. Single Family Mtg.: - continued | | | |
Series 2001 C, 0.28% (Liquidity Facility Fannie Mae) (Liquidity Facility Freddie Mac), VRDN (c)(f) | $ 8,125 | | $ 8,125 |
Series 2002 C, 0.28% (Liquidity Facility Fannie Mae) (Liquidity Facility Freddie Mac), VRDN (c)(f) | 8,200 | | 8,200 |
Series 2004 A, 0.28% (Liquidity Facility Fannie Mae) (Liquidity Facility Freddie Mac), VRDN (c)(f) | 7,885 | | 7,885 |
Series 2006 G, 0.28% (Liquidity Facility Fannie Mae) (Liquidity Facility Freddie Mac), VRDN (c)(f) | 7,640 | | 7,640 |
Series 2007 D, 0.28% (Liquidity Facility Fannie Mae) (Liquidity Facility Freddie Mac), VRDN (c)(f) | 4,300 | | 4,300 |
Series 2007 E, 0.28% (Liquidity Facility Fannie Mae) (Liquidity Facility Freddie Mac), VRDN (c)(f) | 24,000 | | 24,000 |
Series A, 0.26% (Liquidity Facility Fannie Mae) (Liquidity Facility Freddie Mac), VRDN (c) | 2,550 | | 2,550 |
| | 104,999 |
Illinois - 3.5% |
Aurora Single Family Mtg. Rev. Participating VRDN Series DB 616, 0.28% (Liquidity Facility Deutsche Bank AG) (c)(f)(g) | 6,015 | | 6,015 |
Belvidere Indl. Dev. Rev. (R&D Thiel, Inc. Proj.) Series 1996, 0.31%, LOC Bank of America NA, VRDN (c)(f) | 1,940 | | 1,940 |
Carol Stream Multi-family Rev. (Saint Charles Square Proj.) Series 1997, 0.31%, LOC Fannie Mae, VRDN (c)(f) | 1,900 | | 1,900 |
Chicago Board of Ed.: | | | |
Series 2009 A1, 0.27%, LOC Harris NA, VRDN (c) | 9,900 | | 9,900 |
Series 2009 A2, 0.26%, LOC Northern Trust Co., VRDN (c) | 7,220 | | 7,220 |
Chicago Indl. Dev. Rev. (Chicago Scenic Studios, Inc. Proj.) Series 2000, 0.44%, LOC Harris NA, VRDN (c)(f) | 2,900 | | 2,900 |
Chicago Metropolitan Wtr. Reclamation District Greater Chicago: | | | |
Participating VRDN Series Solar 06 75, 0.25% (Liquidity Facility U.S. Bank NA, Minnesota) (c)(g) | 20,000 | | 20,000 |
Participating VRDN Series BBT 2007, 0.25% (Liquidity Facility Branch Banking & Trust Co.) (c)(g) | 3,800 | | 3,800 |
Chicago O'Hare Int'l. Arpt. Rev.: | | | |
Participating VRDN Series Floaters 3236, 0.3% (Liquidity Facility Morgan Stanley Bank, West Valley City Utah) (c)(f)(g) | 5,050 | | 5,050 |
Series 2005 C, 0.3%, LOC Landesbank Baden-Wuert, VRDN (c) | 130,910 | | 130,910 |
Chicago Park District Gen. Oblig. Participating VRDN Series Putters 3842, 0.26% (Liquidity Facility JPMorgan Chase Bank) (c)(g) | 4,000 | | 4,000 |
Municipal Securities - continued |
| Principal Amount (000s) | | Value (000s) |
Illinois - continued |
Chicago Wtr. Rev.: | | | |
Series 2004 A1, 0.26%, LOC California Pub. Employees Retirement Sys., VRDN (c) | $ 73,955 | | $ 73,955 |
Series 2004 A2, 0.26%, LOC California Pub. Employees Retirement Sys., VRDN (c) | 51,770 | | 51,770 |
Series 2004 A3, 0.25%, LOC State Street Bank & Trust Co., Boston, VRDN (c) | 4,165 | | 4,165 |
City of Rolling Meadows Solid Waste Disp. Rev. (BFI Waste Sys. of North America Proj.) Series 1999, 0.34%, LOC JPMorgan Chase Bank, VRDN (c)(f) | 19,580 | | 19,580 |
DuPage County Gen. Oblig. Bonds Series Merlots 00 A9, 0.38%, tender 8/17/11 (Liquidity Facility Wells Fargo Bank NA) (c)(g)(h) | 9,720 | | 9,720 |
Illinois Dev. Fin. Auth. Indl. Dev. Rev.: | | | |
(Camcraft Proj.) Series 1993, 2.01%, LOC JPMorgan Chase Bank, VRDN (c)(f) | 100 | | 100 |
(Delta-Unibus Corp. Proj.) Series 2001, 0.49%, LOC Bank of America NA, VRDN (c)(f) | 4,400 | | 4,400 |
(Mapes & Sprowl Steel Ltd. Proj.) Series 1996 A, 0.46%, LOC Harris NA, VRDN (c)(f) | 678 | | 678 |
(R&R Enterprises 2nd Proj.) Series 1999 A, 0.44%, LOC Harris NA, VRDN (c)(f) | 3,085 | | 3,085 |
Illinois Dev. Fin. Auth. Rev. (Rich Prods. Corp. Proj.) Series 1998, 0.4%, LOC HSBC Bank USA, NA, VRDN (c)(f) | 7,825 | | 7,825 |
Illinois Edl. Facilities Auth. Revs.: | | | |
(Elmhurst College Proj.) Series 2003, 0.28%, LOC JPMorgan Chase Bank, VRDN (c) | 1,875 | | 1,875 |
Participating VRDN Series ROC II R 12278, 0.26% (Liquidity Facility Citibank NA) (c)(g) | 10,395 | | 10,395 |
Illinois Fin. Auth. Indl. Dev. Rev. (Bohler Uddeholm Corp. Proj.) 0.32%, LOC Bayerische Hypo-und Vereinsbank AG, VRDN (c)(f) | 10,000 | | 10,000 |
Illinois Fin. Auth. Poll. Cont. Rev. (Commonwealth Edison Co. Proj.): | | | |
Series 2008 D, 0.25%, LOC JPMorgan Chase Bank, VRDN (c) | 7,800 | | 7,800 |
Series 2008 E, 0.24%, LOC JPMorgan Chase Bank, VRDN (c) | 16,610 | | 16,610 |
Illinois Fin. Auth. Rev.: | | | |
Bonds (Advocate Health Care Proj.) Series 2008 D, 4% 11/1/11 | 2,000 | | 2,041 |
Participating VRDN: | | | |
Series BA 08 1137, 0.33% (Liquidity Facility Bank of America NA) (c)(g) | 12,855 | | 12,855 |
Municipal Securities - continued |
| Principal Amount (000s) | | Value (000s) |
Illinois - continued |
Illinois Fin. Auth. Rev.: - continued | | | |
Participating VRDN: | | | |
Series BBT 08 33, 0.25% (Liquidity Facility Branch Banking & Trust Co.) (c)(g) | $ 5,050 | | $ 5,050 |
Series DB 601, 0.26% (Liquidity Facility Deutsche Bank AG) (c)(g) | 15,135 | | 15,135 |
(Alexian Brothers Health Sys. Proj.) Series 2004, 0.27%, LOC JPMorgan Chase Bank, VRDN (c) | 1,000 | | 1,000 |
(Edward Hosp. Obligated Group Proj.) Series 2008 B2, 0.21%, LOC JPMorgan Chase Bank, VRDN (c) | 53,575 | | 53,575 |
(Little Co. of Mary Hosp. Proj.) Series 2008 A, 0.26%, LOC JPMorgan Chase Bank, VRDN (c) | 5,535 | | 5,535 |
(Museum of Science & Industry Proj.): | | | |
Series 2009 C, 0.28%, LOC Harris NA, VRDN (c) | 5,500 | | 5,500 |
Series 2009 D, 0.26%, LOC Northern Trust Co., VRDN (c) | 16,000 | | 16,000 |
(Provena Health Proj.) Series 2009 C, 0.28%, LOC JPMorgan Chase Bank, VRDN (c) | 15,000 | | 15,000 |
(Saint Xavier Univ. Proj.) Series 2008, 0.29%, LOC Bank of America NA, VRDN (c) | 3,620 | | 3,620 |
Bonds (Advocate Health Care Proj.) Series 2008 A1, 0.48%, tender 2/1/12 (c) | 11,640 | | 11,640 |
Participating VRDN: | | | |
Series Putters 3174, 0.26% (Liquidity Facility JPMorgan Chase Bank) (c)(g) | 15,620 | | 15,620 |
Series Putters 3378, 0.26% (Liquidity Facility JPMorgan Chase Bank) (c)(g) | 11,200 | | 11,200 |
Series Putters 3435, 0.26% (Liquidity Facility JPMorgan Chase Bank) (c)(g) | 2,105 | | 2,105 |
Illinois Fin. Auth. Solid Waste Rev.: | | | |
(Air Products & Chemicals, Inc. Proj.) Series 2005, 0.3%, VRDN (c)(f) | 3,600 | | 3,600 |
(Republic Svcs., Inc. Proj.) Series 2004, 0.38%, LOC JPMorgan Chase Bank, VRDN (c)(f) | 18,000 | | 18,000 |
Illinois Hsg. Dev. Auth. Multi-family Hsg. Rev.: | | | |
(Lakeshore Plaza Proj.) Series 2008 B, 0.28%, LOC JPMorgan Chase Bank, VRDN (c) | 12,780 | | 12,780 |
(Prairie Station Apts. Proj.) 0.28%, LOC Fannie Mae, VRDN (c)(f) | 17,900 | | 17,900 |
(Valley View Apts. Proj.) 0.27%, LOC U.S. Bank NA, Minnesota, VRDN (c)(f) | 11,160 | | 11,160 |
Lake County Solid Waste Disp. Facilities Rev. (Countryside Landfill, Inc. Proj.) Series B, 0.46%, LOC JPMorgan Chase Bank, VRDN (c)(f) | 4,320 | | 4,320 |
Municipal Securities - continued |
| Principal Amount (000s) | | Value (000s) |
Illinois - continued |
Lisle Village Multi-family Hsg. Rev.: | | | |
(Devonshire of Lisle Proj.) Series 1991, 0.29%, LOC Freddie Mac, VRDN (c)(f) | $ 6,000 | | $ 6,000 |
(Four Lakes Phase V-Lisle) Series 1996, 0.27%, LOC Bank of America NA, VRDN (c) | 20,000 | | 20,000 |
Metropolitan Pier & Exposition Participating VRDN: | | | |
Series MS 3214, 0.26% (Liquidity Facility Morgan Stanley Bank, West Valley City Utah) (c)(g) | 20,000 | | 20,000 |
Series Putters 3861, 0.26% (Liquidity Facility JPMorgan Chase Bank) (c)(g) | 18,500 | | 18,500 |
Series ROC II R 11880, 0.27% (Liquidity Facility Citibank NA) (c)(g) | 7,500 | | 7,500 |
Series ROC II R 11887, 0.27% (Liquidity Facility Citibank NA) (c)(g) | 9,375 | | 9,375 |
Palos Hills Multi-family Hsg. Rev. (Green Oaks Proj.) Series 1998, 0.32%, LOC Fannie Mae, VRDN (c)(f) | 14,300 | | 14,300 |
Quincy Hosp. Rev. (Blessing Hosp. Proj.) Series 2004, 0.28%, LOC JPMorgan Chase Bank, VRDN (c) | 2,300 | | 2,300 |
Univ. of Illinois Rev.: | | | |
(UIC South Campus Dev. Proj.) Series 2008, 0.28%, LOC JPMorgan Chase Bank, VRDN (c) | 23,100 | | 23,100 |
Series 2008, 0.26%, LOC JPMorgan Chase Bank, VRDN (c) | 27,000 | | 27,000 |
Yorkville Svc. Area 2004-106 Tax (MPI Grande Reserve Proj.) 0.4%, LOC Bank of America NA, VRDN (c) | 6,100 | | 6,100 |
| | 813,404 |
Indiana - 1.8% |
Anderson Econ. Dev. Auth. Rev. (AppleCreek Commons Proj.) 0.31%, LOC Fed. Home Ln. Bank, Indianapolis, VRDN (c)(f) | 5,090 | | 5,090 |
Crawford County Econ. Dev. Rev. (Jasper Engine Exchange Proj.) Series 1997, 0.34%, LOC PNC Bank NA, Pittsburgh, VRDN (c)(f) | 1,200 | | 1,200 |
Elkhart County Hosp. Auth. Rev. (Elkhart Gen. Hosp. Proj.) Series 2008, 0.24%, LOC JPMorgan Chase Bank, VRDN (c) | 2,000 | | 2,000 |
Elkhart County Multi-family Hsg. Rev. (Pedcor Investments Proj.) Series 2000, 0.3%, LOC Fed. Home Ln. Bank, Indianapolis, VRDN (c)(f) | 7,568 | | 7,568 |
Hammond Swr. & Solid Waste Disp. Rev. (Cargill, Inc. Proj.) 0.37%, VRDN (c)(f) | 39,000 | | 39,000 |
Indiana Dev. Fin. Auth. Envir. Rev. (Duke Energy Indiana, Inc. Proj.): | | | |
Series 2009 A1, 0.3%, LOC Bank of America NA, VRDN (c)(f) | 6,000 | | 6,000 |
Municipal Securities - continued |
| Principal Amount (000s) | | Value (000s) |
Indiana - continued |
Indiana Dev. Fin. Auth. Envir. Rev. (Duke Energy Indiana, Inc. Proj.): - continued | | | |
Series 2009 A2, 0.29%, LOC Bank of America NA, VRDN (c)(f) | $ 19,700 | | $ 19,700 |
Indiana Dev. Fin. Auth. Poll. Cont. Rev. (Southern Indiana Gas and Elec. Co. Proj.) Series 1998 A, 0.28%, LOC JPMorgan Chase Bank, VRDN (c) | 11,550 | | 11,550 |
Indiana Dev. Fin. Auth. Rev. (Indianapolis Museum of Art, Inc. Proj.) Series 2001, 0.28%, LOC JPMorgan Chase Bank, VRDN (c) | 20,000 | | 20,000 |
Indiana Dev. Fin. Auth. Solid Waste Disp. Rev. (Waste Mgmt., Inc. Proj.) Series 2002 B, 0.29%, LOC JPMorgan Chase Bank, VRDN (c)(f) | 14,000 | | 14,000 |
Indiana Fin. Auth. Health Sys. Rev. (Sisters of Saint Francis Health Svcs., Inc. Obligated Group Proj.): | | | |
Series 2008 A, 0.25%, LOC JPMorgan Chase Bank, VRDN (c) | 36,415 | | 36,415 |
Series 2008 D, 0.26%, LOC Bank of America NA, VRDN (c) | 2,500 | | 2,500 |
Series 2008 E, 0.27%, LOC Bank of America NA, VRDN (c) | 11,000 | | 11,000 |
Indiana Fin. Auth. Hosp. Rev.: | | | |
(Clarian Health Partners, Inc. Obligated Group Proj.) Series 2008 A, 0.27%, LOC Branch Banking & Trust Co., VRDN (c) | 7,500 | | 7,500 |
(Cmnty. Health Network Proj.) Series 2009 A, 0.29%, LOC Bank of America NA, VRDN (c) | 25,000 | | 25,000 |
Indiana Hsg. & Cmnty. Dev. Auth. Single Family Mtg. Rev. Participating VRDN Series Merlots 07 C52, 0.33% (Liquidity Facility Wells Fargo Bank NA) (c)(f)(g) | 4,175 | | 4,175 |
Indianapolis Econ. Dev. Rev. (Pine Glen Apts. Proj.) 0.32%, LOC Fed. Home Ln. Bank, Cincinnati, VRDN (c)(f) | 6,160 | | 6,160 |
Indianapolis Gas Util. Sys. Rev.: | | | |
0.82% 4/8/11, CP | 25,000 | | 25,000 |
0.85% 4/18/11, CP | 25,000 | | 25,000 |
IPS Multi-School Bldg. Corp. Participating VRDN Series Solar 07 26, 0.25% (Liquidity Facility U.S. Bank NA, Minnesota) (c)(g) | 13,435 | | 13,435 |
Knox Econ. Dev. Rev. (Toll IN LLC Proj.) 0.46%, LOC Bank of America NA, VRDN (c)(f) | 9,435 | | 9,435 |
Marion Econ. Dev. Rev. (Indiana Wesleyan Univ. Proj.) Series 2006, 0.32%, LOC Bank of America NA, VRDN (c) | 5,300 | | 5,300 |
Purdue Univ. Rev. Participating VRDN Series DCL 08 60, 0.3% (Liquidity Facility Dexia Cr. Local de France) (c)(g) | 7,100 | | 7,100 |
Municipal Securities - continued |
| Principal Amount (000s) | | Value (000s) |
Indiana - continued |
Warrick County Poll. Cont. Rev. (Southern Indiana Gas and Elec. Co. Proj.) Series 1985 A, 0.28%, LOC JPMorgan Chase Bank, VRDN (c) | $ 9,775 | | $ 9,775 |
Whiting Envir. Facilities Rev. Bonds: | | | |
(BP Products North America, Inc. Proj.): | | | |
0.3% tender 3/31/11 (BP PLC Guaranteed), CP mode | 15,000 | | 15,000 |
0.3% tender 4/1/11 (BP PLC Guaranteed), CP mode | 81,200 | | 81,200 |
0.33% tender 3/8/11 (BP PLC Guaranteed), CP mode | 7,600 | | 7,600 |
| | 417,703 |
Iowa - 0.2% |
Iowa Fin. Auth.: | | | |
Series 2003 F, 0.27% (Liquidity Facility Wells Fargo Bank NA), VRDN (c)(f) | 9,140 | | 9,140 |
Series 2005 C, 0.27% (Liquidity Facility State Street Bank & Trust Co., Boston), VRDN (c)(f) | 10,665 | | 10,665 |
Iowa Fin. Auth. Single Family Rev. (Mtg. Backed Securities Prog.) Series 2004 G, 0.27% (Liquidity Facility State Street Bank & Trust Co., Boston), VRDN (c)(f) | 12,105 | | 12,105 |
Iowa Fin. Auth. Solid Disp. Waste Rev. (MidAmerican Energy Proj.) Series 2008 A, 0.38%, VRDN (c)(f) | 3,100 | | 3,100 |
Iowa Fin. Auth. Wellness Facilities Rev. (Cmnty. Y of Marshalltown Proj.) Series 2001, 0.4%, LOC Bank of America NA, VRDN (c) | 6,000 | | 6,000 |
| | 41,010 |
Kansas - 0.3% |
Chanute Indl. Dev. Rev. (Ash Grove Cement Co. Proj.) Series 2000, 0.37%, LOC Bank of America NA, VRDN (c)(f) | 25,100 | | 25,100 |
Lenexa Multi-family Hsg. Rev. (Meadows Apts. Proj.) Series A, 0.31%, LOC Fannie Mae, VRDN (c)(f) | 16,400 | | 16,400 |
Wyandotte County/Kansas City Unified Govt. Gen. Oblig. BAN Series 2010 I, 0.625% 3/1/11 | 30,220 | | 30,220 |
| | 71,720 |
Kentucky - 1.9% |
Carroll County Envir. Facilities Rev. (Kentucky Utils. Co. Proj.): | | | |
Series 2006 B, 0.35%, LOC Wells Fargo Bank NA, VRDN (c)(f) | 14,750 | | 14,750 |
Series 2008 A, 0.3%, LOC Wells Fargo Bank NA, VRDN (c)(f) | 27,447 | | 27,447 |
Daviess County Exempt Facilities Rev. (Kimberly-Clark Tissue Co. Proj.) Series 1999, 0.33% (Kimberly-Clark Corp. Guaranteed), VRDN (c)(f) | 4,870 | | 4,870 |
Municipal Securities - continued |
| Principal Amount (000s) | | Value (000s) |
Kentucky - continued |
Daviess County Solid Waste Disp. Facilities Rev. (Scott Paper Co. Proj.): | | | |
Series 1993 A, 0.33% (Kimberly-Clark Corp. Guaranteed), VRDN (c)(f) | $ 67,250 | | $ 67,250 |
Series 1993 B, 0.33% (Kimberly-Clark Corp. Guaranteed), VRDN (c)(f) | 37,700 | | 37,700 |
Elizabethtown Indl. Bldg. Rev. (Altec Industries, Inc. Proj.) Series 1997, 0.35%, LOC Wells Fargo Bank NA, VRDN (c)(f) | 4,000 | | 4,000 |
Henderson County Indl. Dev. Auth. (Pittsburg Tank & Tower Co. Proj.) 0.33%, LOC U.S. Bank NA, Minnesota, VRDN (c)(f) | 100 | | 100 |
Jefferson County Indl. Bldg. Rev. (Wynn Starr Foods Proj.) Series 1996, 0.88%, LOC JPMorgan Chase Bank, VRDN (c)(f) | 100 | | 100 |
Jefferson County Poll. Cont. Bonds 0.85% tender 3/30/11, CP mode (f) | 31,000 | | 31,000 |
Kentucky Econ. Dev. Fin. Auth. Hosp. Rev.: | | | |
(Baptist Healthcare Sys. Proj.) Series 2009 B4, 0.26%, LOC Branch Banking & Trust Co., VRDN (c) | 8,000 | | 8,000 |
(St. Elizabeth Med. Ctr., Inc. Proj.) Series 2009 B, 0.26%, LOC JPMorgan Chase Bank, VRDN (c) | 2,200 | | 2,200 |
Kentucky Higher Ed. Student Ln. Corp. Rev.: | | | |
Series 2008 A1, 0.29%, LOC State Street Bank & Trust Co., Boston, LOC Bank of America NA, VRDN (c)(f) | 146,900 | | 146,900 |
Series 2008 A2, 0.33%, LOC State Street Bank & Trust Co., Boston, LOC Bank of America NA, VRDN (c)(f) | 37,375 | | 37,375 |
Kentucky Hsg. Corp. Conduit Multi-family Mtg. Rev. (Gleneagles Apts. Proj.) 0.46%, LOC Fannie Mae, VRDN (c)(f) | 9,700 | | 9,700 |
Kentucky Hsg. Corp. Hsg. Rev.: | | | |
Participating VRDN Series Clipper 05 35, 0.38% (Liquidity Facility State Street Bank & Trust Co., Boston) (c)(f)(g) | 7,000 | | 7,000 |
Participating VRDN Series Putters 3780 Z, 0.36% (Liquidity Facility JPMorgan Chase Bank) (c)(f)(g) | 2,410 | | 2,410 |
Kentucky Hsg. Corp. Multi-family Rev. (Canterbury Southgate Hsg. Proj.) 0.29%, LOC Freddie Mac, VRDN (c)(f) | 13,880 | | 13,880 |
Larue County Indl. Dev. Rev. (CMH Hodgenville, Inc. Proj.) Series 2000, 0.31%, LOC U.S. Bank NA, Minnesota, VRDN (c)(f) | 6,000 | | 6,000 |
Mercer County Solid Waste Disp. Facility Rev. (Kentucky Utils. Co. Proj.) Series 2000 A, 0.25%, LOC Wells Fargo Bank NA, VRDN (c)(f) | 12,900 | | 12,900 |
Municipal Securities - continued |
| Principal Amount (000s) | | Value (000s) |
Kentucky - continued |
Minor Lane Heights Solid Waste Disp. Rev. (Waste Mgmt. of Kentucky, LLC Proj. D) Series 2003, 0.28%, LOC PNC Bank NA, Pittsburgh, VRDN (c)(f) | $ 11,000 | | $ 11,000 |
Trimble County Poll. Cont. Rev. Bonds 0.85% tender 3/30/11, CP mode (f) | 4,600 | | 4,600 |
| | 449,182 |
Louisiana - 1.3% |
East Baton Rouge Parish Indl. Dev. Board Rev. (Stupp Bros., Inc. Proj.) Series 2008, 0.33%, LOC Bank of America NA, VRDN (c) | 39,400 | | 39,400 |
Lake Charles Hbr. & Term. District Dock & Wharf Rev. (Conoco, Inc. Proj.) Series 2000, 0.35%, VRDN (c)(f) | 34,100 | | 34,100 |
Louisiana Gas & Fuel Tax Rev. Participating VRDN: | | | |
Series Putters 2378, 0.31% (Liquidity Facility JPMorgan Chase Bank) (c)(g) | 14,385 | | 14,385 |
Series Putters 3806, 0.26% (Liquidity Facility JPMorgan Chase Bank) (c)(g) | 9,990 | | 9,990 |
Series Solar 06 133, 0.25% (Liquidity Facility U.S. Bank NA, Minnesota) (c)(g) | 6,900 | | 6,900 |
Louisiana Gen. Oblig. Bonds Series 2009 B, 3% 4/15/11 | 5,000 | | 5,017 |
Louisiana Hsg. Fin. Agcy. Mtg. Rev. Participating VRDN Series Clipper 05 11, 0.38% (Liquidity Facility State Street Bank & Trust Co., Boston) (c)(f)(g) | 5,395 | | 5,395 |
Louisiana Hsg. Fin. Auth. Multi-family Hsg. Rev. (The Reserve at Jefferson Proj.) Series 2008, 0.28%, LOC Freddie Mac, VRDN (c) | 4,095 | | 4,095 |
Louisiana Offshore Term. Auth. Deepwater Port Rev. (LOOP LLC Proj.) Series 2003 B, 0.28%, LOC JPMorgan Chase Bank, VRDN (c) | 20,775 | | 20,775 |
Louisiana Pub. Facilities Auth. Hosp. Rev. (Franciscan Missionaries of Our Lady Health Sys. Proj.) Series 2008 A, 0.27%, LOC JPMorgan Chase Bank, VRDN (c) | 23,750 | | 23,750 |
Louisiana Pub. Facilities Auth. Rev.: | | | |
(Air Products & Chemicals, Inc. Proj.): | | | |
Series 2007 A, 0.25%, VRDN (c) | 1,900 | | 1,900 |
Series A, 0.25%, VRDN (c) | 3,750 | | 3,750 |
(Air Products and Chemicals Proj.) Series 2010, 0.3%, VRDN (c) | 24,000 | | 24,000 |
(CommCare Corp. Proj.) Series 2008 A, 0.25%, LOC JPMorgan Chase Bank, VRDN (c) | 4,895 | | 4,895 |
South Louisiana Port Commission Port Facilities Rev. (Holnam, Inc. Proj.) 0.32%, LOC Wells Fargo Bank NA, VRDN (c)(f) | 22,000 | | 22,000 |
Municipal Securities - continued |
| Principal Amount (000s) | | Value (000s) |
Louisiana - continued |
St. James Parish Gen. Oblig.: | | | |
(Nucor Steel Louisiana LLC Proj.) Series 2010 B1, 0.29%, VRDN (c) | $ 15,000 | | $ 15,000 |
(NuStar Logistics LP Proj.): | | | |
Series 2010 B, 0.26%, LOC JPMorgan Chase Bank, VRDN (c) | 25,000 | | 25,000 |
Series 2010, 0.26%, LOC JPMorgan Chase Bank, VRDN (c) | 40,000 | | 40,000 |
| | 300,352 |
Maine - 0.3% |
Maine Fin. Auth. Solid Waste Disposable Rev. (Casella Waste Systems, Inc. Proj.) 0.4%, LOC Bank of America NA, VRDN (c)(f) | 25,000 | | 25,000 |
Maine Gen. Oblig. BAN 2% 6/15/11 | 2,675 | | 2,688 |
Maine Health & Higher Ed. Facilities Auth. Rev. Series 2008 A, 0.32%, LOC KBC Bank NV, VRDN (c) | 14,700 | | 14,700 |
Maine Hsg. Auth. Multi-family Dev. Rev. (Park Village Apts. Proj.) 0.26%, LOC Fannie Mae, VRDN (c)(f) | 23,100 | | 23,100 |
Maine Pub. Util. Fin. Pub. Util. Rev. (Maine Pub. Svc. Co. Proj.) Series 1996, 0.3%, LOC Bank of America NA, VRDN (c)(f) | 13,600 | | 13,600 |
| | 79,088 |
Maryland - 1.5% |
Baltimore County Gen. Oblig.: | | | |
0.31% 3/15/11 (Liquidity Facility BNP Paribas SA), CP | 16,300 | | 16,300 |
0.31% 3/15/11 (Liquidity Facility BNP Paribas SA), CP | 16,600 | | 16,600 |
Howard County Gen. Oblig. Series 2006 D: | | | |
0.28% 3/17/11 (Liquidity Facility State Street Bank & Trust Co., Boston), CP | 13,500 | | 13,500 |
0.29% 3/18/11 (Liquidity Facility State Street Bank & Trust Co., Boston), CP | 25,000 | | 25,000 |
Maryland Econ. Dev. Auth. Rev. (Associated Projs.) Series A, 0.4%, LOC Bank of America NA, VRDN (c) | 15,305 | | 15,305 |
Maryland Health & Higher Edl. Facilities Auth. Rev.: | | | |
(Adventist Healthcare Proj.) Series 2005 A, 0.24%, LOC Union Bank of California, VRDN (c) | 25,250 | | 25,250 |
(Mercy Med. Ctr. Proj.): | | | |
Series 2007 B, 0.29%, LOC Bank of America NA, VRDN (c) | 13,345 | | 13,345 |
Series 2007 C, 0.3%, LOC Bank of America NA, VRDN (c) | 4,340 | | 4,340 |
Series 2007 D, 0.25%, LOC Wells Fargo Bank NA, VRDN (c) | 28,300 | | 28,300 |
Municipal Securities - continued |
| Principal Amount (000s) | | Value (000s) |
Maryland - continued |
Maryland Health & Higher Edl. Facilities Auth. Rev.: - continued | | | |
(Univ. of Maryland Med. Sys. Proj.): | | | |
Series 2008 A, 0.4%, LOC Citizens Bank of Pennsylvania, VRDN (c) | $ 22,300 | | $ 22,300 |
Series 2008 B, 0.23%, LOC Bank of America NA, VRDN (c) | 18,900 | | 18,900 |
(Upper Chesapeake Hosp. Proj.) Series 2008 B, 0.26%, LOC Branch Banking & Trust Co., VRDN (c) | 11,085 | | 11,085 |
(Villa Julie College, Inc. Proj.) Series 2005, 0.27%, LOC Bank of America NA, VRDN (c) | 55,130 | | 55,130 |
Series E, 0.3% 3/4/11, LOC Bank of America NA, CP | 25,000 | | 25,000 |
Maryland Trans. Auth. Trans. Facility Projects Rev.: | | | |
Participating VRDN Series BA 08 1077, 0.33% (Liquidity Facility Bank of America NA) (c)(g) | 5,055 | | 5,055 |
Participating VRDN Series ROC II R 11437, 0.27% (Liquidity Facility Citibank NA) (c)(g) | 10,000 | | 10,000 |
Montgomery County Econ. Dev. Rev. (Georgetown Preparatory School, Inc. Proj.) Series 2005, 0.4%, LOC Bank of America NA, VRDN (c) | 17,110 | | 17,110 |
Montgomery County Hsg. Opportunities Commission Hsg. Rev. (The Grand Proj.) Series 1997 1, 0.27%, LOC Fannie Mae, VRDN (c)(f) | 2,460 | | 2,460 |
Montgomery County Hsg. Opportunities Commission Multifamily Hsg. Rev. (Oak Mill II Apts. Proj.) Series 2010 B, 0.28%, LOC Bank of America NA, VRDN (c) | 9,600 | | 9,600 |
Montgomery County Hsg. Opportunity Commission Single Family Mtg. Rev. Series 2008 C, 0.28% (Liquidity Facility Fannie Mae) (Liquidity Facility Freddie Mac), VRDN (c)(f) | 8,450 | | 8,450 |
| | 343,030 |
Massachusetts - 1.3% |
Massachusetts Bay Trans. Auth. Sales Tax Rev.: | | | |
Participating VRDN: | | | |
Series PT 4140, 0.29% (Liquidity Facility Bayerische Hypo-und Vereinsbank AG) (c)(g) | 11,860 | | 11,860 |
Series PT 4368, 0.26% (Liquidity Facility Wells Fargo & Co.) (c)(g) | 5,000 | | 5,000 |
Series 2008 A1, 0.23% (Liquidity Facility JPMorgan Chase Bank), VRDN (c) | 52,210 | | 52,210 |
Series 2008 A2, 0.23% (Liquidity Facility JPMorgan Chase Bank), VRDN (c) | 14,900 | | 14,900 |
Municipal Securities - continued |
| Principal Amount (000s) | | Value (000s) |
Massachusetts - continued |
Massachusetts Dev. Fin. Agcy. Electrical Utils. Rev. Bonds (Nantucket Elec. Co. Proj.) Series 2005, 0.85% tender 3/16/11, CP mode (f) | $ 24,400 | | $ 24,400 |
Massachusetts Gen. Oblig.: | | | |
Participating VRDN Series Clipper 07 39, 0.29% (Liquidity Facility State Street Bank & Trust Co., Boston) (c)(g) | 11,000 | | 11,000 |
RAN Series 2010 A, 2% 4/28/11 | 41,500 | | 41,612 |
Series 1998 A, 0.28% (Liquidity Facility JPMorgan Chase Bank), VRDN (c) | 7,500 | | 7,500 |
Massachusetts Indl. Fin. Agcy. Poll. Cont. Rev. Bonds (New England Pwr. Co. Proj.): | | | |
Series 1992, 0.8% tender 3/18/11, CP mode | 8,000 | | 8,000 |
Series 1993 A, 0.8% tender 3/16/11, CP mode | 15,000 | | 15,000 |
Series 1993 B: | | | |
0.9% tender 3/3/11, CP mode | 1,350 | | 1,350 |
0.9% tender 3/10/11, CP mode | 5,900 | | 5,900 |
Massachusetts School Bldg. Auth. Dedicated Sales Tax Rev. Participating VRDN Series EGL 07 0031, 0.26% (Liquidity Facility Citibank NA) (c)(g) | 31,500 | | 31,500 |
Massachusetts State Dev. Fin. Agcy. Elec. Util. Rev. Bonds (Nantucket Elec. Co. Proj.) Series 2007, 0.75% tender 3/1/11, CP mode (f) | 1,000 | | 1,000 |
Massachusetts Wtr. Poll. Abatement Trust Participating VRDN: | | | |
Series Clipper 05 36, 0.26% (Liquidity Facility State Street Bank & Trust Co., Boston) (c)(g) | 11,835 | | 11,835 |
Series Clipper 06 11, 0.29% (Liquidity Facility State Street Bank & Trust Co., Boston) (c)(g) | 59,605 | | 59,605 |
Massachusetts Wtr. Resources Auth. Wtr. & Swr. Rev.: | | | |
Series 2008 C, 0.28% (Liquidity Facility Bayerische Landesbank), VRDN (c) | 10,250 | | 10,250 |
Series 2008 D, 0.28% (Liquidity Facility Bayerische Landesbank), VRDN (c) | 800 | | 800 |
| | 313,722 |
Michigan - 1.7% |
Kent County Bldg. Auth. Participating VRDN Series PT 3242, 0.4% (Liquidity Facility Dexia Cr. Local de France) (c)(g) | 10,700 | | 10,700 |
Kent Hosp. Fin. Auth. Hosp. Facilities Rev. (Spectrum Health Sys. Proj.) Series 2008 B1, 0.36%, LOC RBS Citizens NA, VRDN (c) | 42,800 | | 42,800 |
Michigan Bldg. Auth. Rev.: | | | |
Series 2007 I, 0.26%, LOC JPMorgan Chase Bank, VRDN (c) | 5,500 | | 5,500 |
Municipal Securities - continued |
| Principal Amount (000s) | | Value (000s) |
Michigan - continued |
Michigan Bldg. Auth. Rev.: - continued | | | |
Series 6: | | | |
0.3% 3/10/11, LOC State Street Bank & Trust Co., Boston, LOC U.S. Bank NA, Minnesota, CP | $ 3,220 | | $ 3,220 |
0.3% 3/10/11, LOC State Street Bank & Trust Co., Boston, LOC U.S. Bank NA, Minnesota, CP | 3,590 | | 3,590 |
0.3% 3/10/11, LOC State Street Bank & Trust Co., Boston, LOC U.S. Bank NA, Minnesota, CP | 16,100 | | 16,100 |
Michigan Fin. Auth. Rev. RAN: | | | |
Series 2010 D2, 2% 8/22/11, LOC JPMorgan Chase Bank | 21,100 | | 21,260 |
Series 2010 D3, 2% 8/22/11, LOC Bank of Nova Scotia New York Branch | 16,100 | | 16,222 |
Michigan Gen. Oblig. TRAN Series A, 2% 9/30/11 | 57,500 | | 58,026 |
Michigan Hosp. Fin. Auth. Rev. Bonds (Trinity Health Sys. Proj.): | | | |
Series 2008 C: | | | |
0.29% tender 3/7/11, CP mode | 19,500 | | 19,500 |
0.31% tender 4/7/11, CP mode | 27,500 | | 27,500 |
0.32% tender 3/3/11, CP mode | 34,000 | | 34,000 |
0.34% tender 6/3/11, CP mode | 10,000 | | 10,000 |
0.34% tender 6/6/11, CP mode | 13,300 | | 13,300 |
Series B, 0.29% tender 3/7/11, CP mode | 20,000 | | 20,000 |
Michigan Hsg. Dev. Auth. Multi-family Hsg. Rev. Bonds Series 1988 A, 0.4% tender 5/4/11, LOC Landesbank Hessen-Thuringen, CP mode (f) | 1,900 | | 1,900 |
Michigan Hsg. Dev. Auth. Single Family Mtg. Rev. Series 2007 B, 0.3% (Liquidity Facility Fannie Mae) (Liquidity Facility Freddie Mac), VRDN (c)(f) | 17,200 | | 17,200 |
Michigan Strategic Fund Ltd. Oblig. Rev. (Orchestra Place Renewal Proj.) Series 2000, 0.6%, LOC Bank of America NA, VRDN (c) | 2,800 | | 2,800 |
Wayne County Arpt. Auth. Rev.: | | | |
0.25%, LOC JPMorgan Chase Bank, VRDN (c) | 40,000 | | 40,000 |
0.26%, LOC PNC Bank NA, Pittsburgh, VRDN (c)(f) | 19,000 | | 19,000 |
0.27%, LOC JPMorgan Chase Bank, VRDN (c)(f) | 16,360 | | 16,360 |
| | 398,978 |
Minnesota - 0.4% |
Eagan Multi-family Rev. (Thomas Lake Place Apts. Proj.) Series 2003 A1, 0.3%, LOC Fannie Mae, VRDN (c)(f) | 6,525 | | 6,525 |
Hennepin County Hsg. & Redev. Auth. Multi-family Rev. (Stone Arch Apts. Proj.) 0.31%, LOC Fannie Mae, VRDN (c)(f) | 9,800 | | 9,800 |
Municipal Securities - continued |
| Principal Amount (000s) | | Value (000s) |
Minnesota - continued |
Minneapolis Health Care Sys. Rev. Participating VRDN Series RBC E-19, 0.26% (Liquidity Facility Royal Bank of Canada) (c)(g) | $ 15,000 | | $ 15,000 |
Minneapolis Multi-family Rev. (Gateway Real Estate Proj.) 0.33%, LOC Wells Fargo Bank NA, VRDN (c)(f) | 2,000 | | 2,000 |
Minnesota Gen. Oblig. Bonds: | | | |
Series 2010 D, 2% 8/1/11 | 2,000 | | 2,014 |
5% 10/1/11 | 13,850 | | 14,230 |
Minnesota Hsg. Fin. Agcy. Participating VRDN Series Putters 1207, 0.39% (Liquidity Facility JPMorgan Chase & Co.) (c)(f)(g) | 1,060 | | 1,060 |
Minnesota Office of Higher Ed. Series 2008 B, 0.28%, LOC U.S. Bank NA, Minnesota, VRDN (c)(f) | 9,300 | | 9,300 |
Richfield Multifamily Hsg. Rev. (Lynwood Partners, LLC Proj.) Series 2010, 0.26%, LOC Wells Fargo Bank NA, VRDN (c) | 11,310 | | 11,310 |
Saint Paul Hsg. & Redev. Auth. Rev. (River Pointe Lofts Proj.) Series 2007 A, 0.33%, LOC Bank of America NA, VRDN (c)(f) | 16,885 | | 16,885 |
St. Paul Port Auth. District Cooling Rev. Series 2009 12EE, 0.29%, LOC Deutsche Bank AG, VRDN (c)(f) | 1,100 | | 1,100 |
Univ. of Minnesota Series 2001 C, 0.28% (Liquidity Facility JPMorgan Chase Bank), VRDN (c) | 3,680 | | 3,680 |
| | 92,904 |
Mississippi - 0.3% |
Mississippi Bus. Fin. Corp. Solid Waste Disp. Rev. (Waste Mgmt., Inc. Proj.) 0.3%, LOC Bank of America NA, VRDN (c)(f) | 5,000 | | 5,000 |
Mississippi Gen. Oblig.: | | | |
Series 2007, 0.24% (Liquidity Facility Bank of America NA), VRDN (c) | 22,500 | | 22,500 |
0.26% (Liquidity Facility Bank of America NA), VRDN (c) | 9,955 | | 9,955 |
Mississippi Home Corp. Multi-family Hsg. Rev. (Bristol Park Apts. Proj.) Series 2001 1, 0.38%, LOC Wells Fargo Bank NA, VRDN (c)(f) | 7,600 | | 7,600 |
Mississippi Hosp. Equip. & Facilities Auth. Bonds (Baptist Memorial Health Care Proj.) Series 2004 B2: | | | |
0.35%, tender 7/6/11 (c)(h) | 11,810 | | 11,810 |
0.35%, tender 7/6/11 (c)(h) | 15,000 | | 15,000 |
| | 71,865 |
Municipal Securities - continued |
| Principal Amount (000s) | | Value (000s) |
Missouri - 1.8% |
Bi-State Dev. Agcy. Missouri Illinois Metropolitan District Rev. (Metrolink Cross County Extension Proj.) Series 2010 A, 0.27%, LOC JPMorgan Chase Bank, VRDN (c) | $ 9,350 | | $ 9,350 |
Grandview Indl. Dev. Auth. Multi-family Hsg. Rev. (Briarwood Apts. Proj.) 0.29%, LOC Fannie Mae, VRDN (c)(f) | 12,400 | | 12,400 |
Jefferson County Indl. Dev. Auth. Multi-family Hsg. Rev. (Pevely Pointe Apts. Proj.) 0.32%, LOC Freddie Mac, VRDN (c)(f) | 13,900 | | 13,900 |
Kansas City Indl. Dev. Auth. Air Cargo Facility Rev. (Kansas City Air Cargo Svcs. Proj.) 0.3%, LOC JPMorgan Chase Bank, VRDN (c)(f) | 7,300 | | 7,300 |
Kansas City Indl. Dev. Auth. Student Hsg. Facilities Rev. (Oak Street West Proj.) Series 2006, 0.25%, LOC Bank of America NA, VRDN (c) | 8,600 | | 8,600 |
Missouri Health & Edl. Facilities Auth. Edl. Facilities Rev. (Lutheran High School Assoc. Proj.) Series 2002, 0.25%, LOC U.S. Bank NA, Minnesota, VRDN (c) | 3,140 | | 3,140 |
Missouri Health & Edl. Facilities Auth. Health Facilities Rev.: | | | |
(Cox Health Sys. Proj.) Series 2008 C, 0.29%, LOC Bank of America NA, VRDN (c) | 28,000 | | 28,000 |
(SSM Health Care Sys. Proj.): | | | |
Series 2005 A1, 0.26%, LOC Bank of America NA, VRDN (c) | 16,670 | | 16,670 |
Series 2005 C2, 0.25%, LOC Bank of America NA, VRDN (c) | 8,000 | | 8,000 |
Bonds (Cox Health Proj.) Series B: | | | |
0.29% tender 3/8/11, LOC Bank of Nova Scotia New York Branch, CP mode | 15,000 | | 15,000 |
0.3% tender 4/5/11, LOC Bank of Nova Scotia New York Branch, CP mode | 15,000 | | 15,000 |
0.3% tender 4/7/11, LOC Bank of Nova Scotia New York Branch, CP mode | 13,000 | | 13,000 |
Participating VRDN Series Putters 2587, 0.26% (Liquidity Facility JPMorgan Chase Bank) (c)(g) | 7,955 | | 7,955 |
Missouri Health & Edl. Facilities Auth. Rev. Bonds (Ascension Health Proj.) Series 2003 C2, 0.37%, tender 3/2/11 (c) | 25,000 | | 25,000 |
Missouri Higher Ed. Ln. Auth. Student Ln. Rev.: | | | |
Series 2008 A1, 0.3%, LOC Bank of America NA, VRDN (c)(f) | 37,500 | | 37,500 |
Series 2008 A2, 0.3%, LOC Bank of America NA, VRDN (c)(f) | 136,300 | | 136,300 |
Missouri Hsg. Dev. Commission Single Family Mtg. Rev. Participating VRDN Series Putters 1514, 0.41% (Liquidity Facility JPMorgan Chase & Co.) (c)(f)(g) | 240 | | 240 |
Municipal Securities - continued |
| Principal Amount (000s) | | Value (000s) |
Missouri - continued |
Saint Louis Indl. Dev. Auth. (Metropolitan Lofts Apts. Proj.) Series 2003 A, 0.27%, LOC Fannie Mae, VRDN (c)(f) | $ 28,300 | | $ 28,300 |
Springfield Pub. Util. Rev. Participating VRDN Series Solar 06 156, 0.25% (Liquidity Facility U.S. Bank NA, Minnesota) (c)(g) | 30,290 | | 30,290 |
| | 415,945 |
Montana - 0.1% |
Montana Board of Hsg. Participating VRDN Series Clipper 2006 2, 0.38% (Liquidity Facility State Street Bank & Trust Co., Boston) (c)(f)(g) | 8,000 | | 8,000 |
Montana Board of Invt. Bonds Series 1998, 0.5%, tender 3/1/11 (c) | 11,565 | | 11,565 |
| | 19,565 |
Nebraska - 1.1% |
Central Plains Energy Proj. Rev. (Nebraska Gas Proj.) Series 2009, 0.26% (Liquidity Facility Royal Bank of Canada), VRDN (c) | 53,300 | | 53,300 |
Douglas County Solid Waste Disp. Rev. (Waste Mgmt., Inc. Proj.) Series A, 0.37%, LOC Bank of America NA, VRDN (c)(f) | 9,000 | | 9,000 |
Lincoln Elec. Sys. Rev. Series 2005: | | | |
0.3% 3/8/11, CP | 3,150 | | 3,150 |
0.3% 4/8/11, CP | 2,850 | | 2,850 |
Nebraska Invt. Fin. Auth. Single Family Hsg. Rev.: | | | |
Participating VRDN Series Putters 1352, 0.36% (Liquidity Facility JPMorgan Chase & Co.) (c)(f)(g) | 3,735 | | 3,735 |
Series 2010 C, 0.28% (Liquidity Facility Fed. Home Ln. Bank Topeka), VRDN (c)(f) | 70,000 | | 70,000 |
Nebraska Pub. Pwr. District Rev. Series A: | | | |
0.3% 4/21/11, CP | 20,550 | | 20,550 |
0.32% 3/16/11, CP | 15,000 | | 15,000 |
Nebraska Pub. Pwr. Generation Agcy. Rev. Participating VRDN Series Solar 07 20, 0.25% (Liquidity Facility U.S. Bank NA, Minnesota) (c)(g) | 19,700 | | 19,700 |
Omaha Pub. Pwr. District Elec. Rev. Series A: | | | |
0.29% 3/7/11, CP | 15,000 | | 15,000 |
0.29% 3/17/11, CP | 15,000 | | 15,000 |
0.32% 3/2/11, CP | 14,000 | | 14,000 |
0.32% 3/11/11, CP | 14,000 | | 14,000 |
0.33% 3/15/11, CP | 5,000 | | 5,000 |
| | 260,285 |
Municipal Securities - continued |
| Principal Amount (000s) | | Value (000s) |
Nevada - 2.6% |
Clark County Arpt. Rev.: | | | |
Series 2008 C1, 0.3%, LOC Bayerische Landesbank, VRDN (c)(f) | $ 101,750 | | $ 101,750 |
Series 2008 C2, 0.3%, LOC Landesbank Baden-Wuert, VRDN (c)(f) | 71,550 | | 71,550 |
Series 2008 C3, 0.3%, LOC Landesbank Baden-Wuert, VRDN (c)(f) | 64,750 | | 64,750 |
Series 2008 D1, 0.3%, LOC Landesbank Baden-Wuert, VRDN (c) | 15,800 | | 15,800 |
Series 2008 D2, 0.3%, LOC Landesbank Baden-Wuert, VRDN (c) | 90,405 | | 90,405 |
Series 2008 D3, 0.3%, LOC Bayerische Landesbank, VRDN (c) | 15,000 | | 15,000 |
Clark County Fuel Tax Participating VRDN Series Putters 3158, 0.26% (Liquidity Facility JPMorgan Chase Bank) (c)(g) | 32,110 | | 32,110 |
Clark County Indl. Dev. Rev. (Southwest Gas Corp. Proj.): | | | |
Series 2003 A, 0.38%, LOC Bank of America NA, VRDN (c)(f) | 45,100 | | 45,100 |
Series 2009 A, 0.23%, LOC JPMorgan Chase Bank, VRDN (c) | 2,000 | | 2,000 |
Clark County School District Participating VRDN Series BA 08 1153, 0.33% (Liquidity Facility Bank of America NA) (c)(g) | 32,600 | | 32,600 |
Clark County Wtr. Reclamation District Participating VRDN Series Putters 3355, 0.26% (Liquidity Facility JPMorgan Chase Bank) (c)(g) | 7,500 | | 7,500 |
Las Vegas Valley Wtr. District Wtr. Impt. Gen. Oblig. Participating VRDN Series Solar 06 93, 0.25% (Liquidity Facility U.S. Bank NA, Minnesota) (c)(g) | 14,000 | | 14,000 |
Nevada Dept. of Bus. & Industry: | | | |
(LVE Energy Partners LLC Proj.) 0.35%, LOC Sumitomo Mitsui Banking Corp., VRDN (c)(f) | 29,700 | | 29,700 |
(Republic Svcs., Inc. Proj.) 0.37%, LOC Bank of America NA, VRDN (c)(f) | 2,000 | | 2,000 |
Nevada Hsg. Division (Horizon Apt. Hsg. Proj.) Series 2000 A, 0.27%, LOC Fannie Mae, VRDN (c)(f) | 7,410 | | 7,410 |
North Las Vegas Gen. Oblig. Participating VRDN Series Solar 06 89, 0.25% (Liquidity Facility U.S. Bank NA, Minnesota) (c)(g) | 30,455 | | 30,455 |
Reno Cap. Impt. Rev. Series 2005 A, 0.26%, LOC Bank of America NA, VRDN (c) | 13,400 | | 13,400 |
Truckee Meadows Wtr. Auth. Wtr. Rev. Series 2006 B, 0.28% 3/17/11, LOC Lloyds TSB Bank PLC, CP | 27,000 | | 27,000 |
| | 602,530 |
Municipal Securities - continued |
| Principal Amount (000s) | | Value (000s) |
New Hampshire - 0.9% |
Manchester Arpt. Rev. Series 2008, 0.35%, LOC RBS Citizens NA, VRDN (c)(f) | $ 14,915 | | $ 14,915 |
New Hampshire Bus. Fin. Auth. Exempt Facilities Rev. (Waste Mgmt. of New Hampshire, Inc. Proj.) 0.32%, LOC Wells Fargo Bank NA, VRDN (c)(f) | 20,000 | | 20,000 |
New Hampshire Bus. Fin. Auth. Ind. Dev. Rev. (Wiggins Airways Proj.) Series 1998, 0.49%, LOC Bank of America NA, VRDN (c)(f) | 3,900 | | 3,900 |
New Hampshire Bus. Fin. Auth. Poll. Cont. Rev. Bonds (New England Pwr. Co. Proj.): | | | |
Series 1990 A, 0.85% tender 3/17/11, CP mode (f) | 26,500 | | 26,500 |
Series 1990 B, 0.9% tender 3/3/11, CP mode | 20,100 | | 20,100 |
Series A1: | | | |
0.75% tender 3/1/11, CP mode (f) | 20,000 | | 20,000 |
0.8% tender 3/7/11, CP mode (f) | 11,500 | | 11,500 |
New Hampshire Bus. Fin. Auth. Resource Recovery Rev. (Wheelabrator Concord Co. LP Proj.) Series 1997 A, 0.28%, LOC Wells Fargo Bank NA, VRDN (c) | 13,800 | | 13,800 |
New Hampshire Bus. Fin. Auth. Rev. (Luminescent Sys., Inc. Proj.) Series 1998, 0.45%, LOC HSBC Bank USA, NA, VRDN (c)(f) | 1,850 | | 1,850 |
New Hampshire Bus. Fin. Auth. Solid Waste Disp. Rev. (Lonza Biologics, Inc. Proj.): | | | |
Series 1998, 0.38%, LOC Landesbank Hessen-Thuringen, VRDN (c)(f) | 20,000 | | 20,000 |
Series 2005, 0.38%, LOC Landesbank Hessen-Thuringen, VRDN (c)(f) | 19,500 | | 19,500 |
New Hampshire Health & Ed. Facilities Auth. Rev. (Frisbie Memorial Hosp. Proj.) Series 2006, 0.25%, LOC TD Banknorth, NA, VRDN (c) | 11,500 | | 11,500 |
New Hampshire Hsg. Fin. Auth. Multi-family Rev. (Pheasant Run Proj.) 0.28%, LOC Fannie Mae, VRDN (c)(f) | 16,400 | | 16,400 |
| | 199,965 |
New Jersey - 0.4% |
Burlington County Gen. Oblig. BAN 1.5% 9/8/11 | 21,972 | | 22,099 |
New Jersey Econ. Dev. Auth. School Facilities Construction Rev.: | | | |
Series 2008 V4, 0.28%, LOC Bank of America NA, VRDN (c) | 900 | | 900 |
Series 2008 X, 0.23%, LOC Bank of America NA, VRDN (c) | 6,900 | | 6,900 |
New Jersey Hsg. & Mtg. Fin. Agcy. Multi-family Hsg. Rev. Series 2008-3, 0.34%, LOC Dexia Cr. Local de France, VRDN (c)(f) | 40,900 | | 40,900 |
Municipal Securities - continued |
| Principal Amount (000s) | | Value (000s) |
New Jersey - continued |
New Jersey Hsg. & Mtg. Fin. Agcy. Multi-family Rev.: | | | |
Series 2008 B, 0.26%, LOC Bank of America NA, VRDN (c) | $ 5,700 | | $ 5,700 |
Series 2008 F, 0.28%, LOC Bank of America NA, VRDN (c)(f) | 7,600 | | 7,600 |
South Jersey Trans. Auth. Trans. Sys. Rev. Series 2009 A3, 0.26%, LOC Bank of America NA, VRDN (c) | 4,400 | | 4,400 |
| | 88,499 |
New Jersey/Pennsylvania - 0.0% |
Delaware River Port Auth. Pennsylvania & New Jersey Rev. Series 2008 A, 0.26%, LOC Bank of America NA, VRDN (c) | 8,340 | | 8,340 |
New Mexico - 0.7% |
New Mexico Edl. Assistance Foundation: | | | |
Series 2003 A2, 0.29%, LOC Royal Bank of Canada, VRDN (c)(f) | 1,700 | | 1,700 |
Series 2004 A1, 0.29%, LOC Royal Bank of Canada, VRDN (c)(f) | 1,450 | | 1,450 |
Series 2004 A2, 0.29%, LOC Royal Bank of Canada, VRDN (c)(f) | 10,000 | | 10,000 |
Series 2004 A3, 0.29%, LOC Royal Bank of Canada, VRDN (c)(f) | 26,500 | | 26,500 |
Series 2009 A, 0.29%, LOC Royal Bank of Canada, VRDN (c)(f) | 3,500 | | 3,500 |
New Mexico Muni. Energy Acquisition Auth. Gas Supply Rev. Series 2009, 0.26% (Liquidity Facility Royal Bank of Canada), VRDN (c) | 111,200 | | 111,200 |
Rio Rancho Wtr. & Wastewtr. Sys. Rev. Participating VRDN Series Solar 2007 19, 0.25% (Liquidity Facility U.S. Bank NA, Minnesota) (c)(g) | 4,495 | | 4,495 |
Univ. of New Mexico Univ. Revs. Participating VRDN Series Putters 2533, 0.31% (Liquidity Facility JPMorgan Chase Bank) (c)(g) | 9,990 | | 9,990 |
| | 168,835 |
New York - 3.6% |
Great Neck Union Free School District TAN 1.25% 6/23/11 | 9,900 | | 9,928 |
New York City Gen. Oblig.: | | | |
Participating VRDN Series Putters 3196, 0.26% (Liquidity Facility JPMorgan Chase Bank) (c)(g) | 8,425 | | 8,425 |
Series 2004 A2, 0.28%, LOC Bank of America NA, VRDN (c) | 29,000 | | 29,000 |
Series 2008 J11, 0.25% (Liquidity Facility KBC Bank NV), VRDN (c) | 45,700 | | 45,700 |
Municipal Securities - continued |
| Principal Amount (000s) | | Value (000s) |
New York - continued |
New York City Gen. Oblig.: - continued | | | |
Series 2008 J7, 0.3%, LOC Landesbank Baden-Wuert, VRDN (c) | $ 19,550 | | $ 19,550 |
New York City Hsg. Dev. Corp. Multi-family Hsg. Mtg. Rev. (Villa Avenue Apts. Proj.) Series 2006 A, 0.26%, LOC Fannie Mae, VRDN (c)(f) | 5,990 | | 5,990 |
New York City Hsg. Dev. Corp. Multi-family Mtg. Rev.: | | | |
(Courtland Avenue Apts. Proj.) Series A, 0.26%, LOC Fannie Mae, VRDN (c)(f) | 4,905 | | 4,905 |
(East 165th Street Proj.) Series A, 0.27%, LOC Citibank NA, VRDN (c)(f) | 7,665 | | 7,665 |
(Morris Ave. Apts. Proj.) Series A, 0.26%, LOC Fannie Mae, VRDN (c)(f) | 14,700 | | 14,700 |
(Related-Upper East Proj.) Series A, 0.34%, LOC Landesbank Baden-Wuert, VRDN (c)(f) | 10,000 | | 10,000 |
(State Renaissance Court Proj.) Series A, 0.26%, LOC Freddie Mac, VRDN (c)(f) | 8,700 | | 8,700 |
New York City Hsg. Dev. Corp. Multi-family Rental Hsg. Rev.: | | | |
(One Columbus Place Dev. Proj.) Series A, 0.25%, LOC Fannie Mae, VRDN (c)(f) | 32,915 | | 32,915 |
(Rivereast Apts. Proj.) Series A, 0.26%, LOC Freddie Mac, VRDN (c)(f) | 4,150 | | 4,150 |
(West End Towers Proj.) Series 2004 A, 0.25%, LOC Fannie Mae, VRDN (c)(f) | 11,000 | | 11,000 |
New York City Hsg. Dev. Corp. Residential Rev. (Montefiore Med. Ctr. Proj.) Series 1993 A, 0.26%, LOC JPMorgan Chase Bank, VRDN (c) | 7,200 | | 7,200 |
New York City Indl. Dev. Agcy. Spl. Facilities Rev. (New York Stock Exchange Proj.) Series 2004 B, 0.26%, LOC Bank of America NA, VRDN (c) | 11,165 | | 11,165 |
New York City Muni. Wtr. Fin. Auth. Wtr. & Swr. Sys. Rev.: | | | |
Participating VRDN: | | | |
EGL 09 46A, 0.26% (Liquidity Facility Citibank NA) (c)(g) | 13,430 | | 13,430 |
Series ROC II R 10381, 0.26% (Liquidity Facility Citibank NA) (c)(g) | 4,070 | | 4,070 |
Series ROC II R 11249, 0.26% (Liquidity Facility Citibank NA) (c)(g) | 10,110 | | 10,110 |
Series ROC II R 11264, 0.26% (Liquidity Facility Citibank NA) (c)(g) | 11,980 | | 11,980 |
Series ROC II R 12262, 0.26% (Liquidity Facility Citibank NA) (c)(g) | 24,000 | | 24,000 |
Series 1, 0.3% 5/2/11, CP | 10,000 | | 10,000 |
Series 2008 BB2, 0.25% (Liquidity Facility Bank of America NA), VRDN (c) | 7,100 | | 7,100 |
Municipal Securities - continued |
| Principal Amount (000s) | | Value (000s) |
New York - continued |
New York City Muni. Wtr. Fin. Auth. Wtr. & Swr. Sys. Rev.: - continued | | | |
Series 7, 0.34% 10/11/11, CP | $ 6,000 | | $ 6,000 |
New York City Transitional Fin. Auth. Rev.: | | | |
Series 2003 1E, 0.23% (Liquidity Facility Bayerische Landesbank Girozentrale), VRDN (c) | 7,125 | | 7,125 |
Series 2003 2B, 0.31% (Liquidity Facility Dexia Cr. Local de France), VRDN (c) | 3,165 | | 3,165 |
New York Dorm. Auth. Revs.: | | | |
(City Univ. Proj.) Series 2008 C, 0.26%, LOC Bank of America NA, VRDN (c) | 4,000 | | 4,000 |
Participating VRDN: | | | |
Series EGL 07 0066, 0.26% (Liquidity Facility Citibank NA) (c)(g) | 31,025 | | 31,025 |
Series ROC II R 11535, 0.26% (Liquidity Facility Citibank NA) (c)(g) | 2,950 | | 2,950 |
New York Hsg. Fin. Agcy. Rev.: | | | |
(125 West 31st Street Proj.) Series 2005 A, 0.26%, LOC Fannie Mae, VRDN (c)(f) | 2,000 | | 2,000 |
(150 East 44th Street Hsg. Proj.) Series 2001 A, 0.26%, LOC Fannie Mae, VRDN (c)(f) | 2,400 | | 2,400 |
(1500 Lexington Avenue Proj.) Series A, 0.25%, LOC Fannie Mae, VRDN (c)(f) | 18,125 | | 18,125 |
(240 East 39th Street Hsg. Proj.) Series 1997 A, 0.25%, LOC Fannie Mae, VRDN (c)(f) | 20,000 | | 20,000 |
(250 West 50th Street Hsg. Proj.) Series 1997 A, 0.25%, LOC Fannie Mae, VRDN (c)(f) | 13,495 | | 13,495 |
(350 West 43rd Street Hsg. Proj.): | | | |
Series 2001 A, 0.32%, LOC Landesbank Hessen-Thuringen, VRDN (c)(f) | 4,000 | | 4,000 |
Series 2002 A, 0.32%, LOC Landesbank Hessen-Thuringen, VRDN (c)(f) | 14,700 | | 14,700 |
(42nd & 10 Hsg. Proj.) Series 2010 A, 0.25%, LOC Landesbank Baden-Wuert, VRDN (c) | 24,400 | | 24,400 |
(455 West 37th Street Hsg. Proj.) Series A, 0.32%, LOC Landesbank Hessen-Thuringen, VRDN (c)(f) | 45,000 | | 45,000 |
(505 West 37th Street Proj.) Series 2008 A, 0.34%, LOC Landesbank Hessen-Thuringen, VRDN (c)(f) | 10,700 | | 10,700 |
(750 Sixth Avenue Hsg. Proj.) Series 1998 A, 0.26%, LOC Fannie Mae, VRDN (c)(f) | 5,000 | | 5,000 |
(900 Eighth Avenue Hsg. Proj.) Series 2002 A, 0.25%, LOC Fannie Mae, VRDN (c)(f) | 18,900 | | 18,900 |
Municipal Securities - continued |
| Principal Amount (000s) | | Value (000s) |
New York - continued |
New York Hsg. Fin. Agcy. Rev.: - continued | | | |
(Avalon Chrystie Place I Hsg. Proj.) Series 2004 B, 0.25%, LOC Freddie Mac, VRDN (c)(f) | $ 4,100 | | $ 4,100 |
(Chelsea Apts. Proj.) Series A, 0.25%, LOC Fannie Mae, VRDN (c)(f) | 29,330 | | 29,330 |
(Hegeman Residence Apts. Proj.) Series 2010 A, 0.24%, LOC JPMorgan Chase Bank, VRDN (c) | 10,000 | | 10,000 |
(Kew Garden Hills Apts. Hsg. Proj.) Series 2003 A, 0.28%, LOC Fannie Mae, VRDN (c)(f) | 11,000 | | 11,000 |
(Related-42nd & 10th Street Proj.) Series 2007 A, 0.33%, LOC Landesbank Baden-Wuert, VRDN (c)(f) | 5,300 | | 5,300 |
(Reverend Polite Ave. Apt. Hsg. Proj.) Series 2005 A, 0.26%, LOC Fannie Mae, VRDN (c)(f) | 7,435 | | 7,435 |
(Sea Park West Hsg. Proj.) Series 2004 A, 0.26%, LOC Freddie Mac, VRDN (c)(f) | 13,600 | | 13,600 |
(South Cove Plaza Proj.) Series A, 0.25%, LOC Freddie Mac, VRDN (c)(f) | 12,700 | | 12,700 |
(West 20th Street Proj.) Series A: | | | |
0.25%, LOC Fannie Mae, VRDN (c)(f) | 24,475 | | 24,475 |
0.25%, LOC Fannie Mae, VRDN (c)(f) | 41,500 | | 41,500 |
(West 23rd Street Hsg. Proj.) Series 2001 A, 0.25%, LOC Fannie Mae, VRDN (c)(f) | 22,800 | | 22,800 |
(West 38th Street Hsg. Proj.) Series A, 0.24%, LOC Fannie Mae, VRDN (c)(f) | 16,000 | | 16,000 |
New York Local Govt. Assistance Corp. Series 2008 BV2, 0.34% (Liquidity Facility Dexia Cr. Local de France), VRDN (c) | 14,490 | | 14,490 |
New York Pwr. Auth.: | | | |
Bonds 0.29%, tender 9/1/11 (b)(c) | 22,600 | | 22,600 |
Series 1, 0.29% 3/10/11, CP | 6,000 | | 6,000 |
Riverhead Central School District TAN 1.5% 6/30/11 | 20,000 | | 20,072 |
Triborough Bridge & Tunnel Auth. Revs.: | | | |
Series 2003 B, 0.29% (Liquidity Facility Dexia Cr. Local de France), VRDN (c) | 25,850 | | 25,850 |
Series 2005 A, 0.27% (Liquidity Facility Dexia Cr. Local de France), VRDN (c) | 8,170 | | 8,170 |
Series 2005 B2, 0.33% (Liquidity Facility Dexia Cr. Local de France), VRDN (c) | 5,265 | | 5,265 |
Yonkers Indl. Dev. Agcy. Civic Facility Rev. (Consumers Union of United States, Inc. Proj.) Series 2005, 0.25%, LOC JPMorgan Chase Bank, VRDN (c) | 5,850 | | 5,850 |
| | 851,205 |
Municipal Securities - continued |
| Principal Amount (000s) | | Value (000s) |
New York & New Jersey - 0.6% |
Port Auth. of New York & New Jersey Participating VRDN Series EGL 06 107 Class A, 0.31% (Liquidity Facility Citibank NA) (c)(f)(g) | $ 151,450 | | $ 151,450 |
Non State Specific - 0.1% |
Missouri, Indiana and Texas Hsg. Authorities Participating VRDN Series Clipper 05 14, 0.41% (Liquidity Facility State Street Bank & Trust Co., Boston) (c)(f)(g) | 10,681 | | 10,681 |
North Carolina - 2.1% |
Charlotte Int'l. Arpt. Rev. (Charlotte Douglas Int'l. Arpt. Proj.) Series 2008 D, 0.24%, LOC Bank of America NA, VRDN (c) | 18,300 | | 18,300 |
Charlotte-Mecklenburg Hosp. Auth. Health Care Sys. Rev. Series 2007 G, 0.26%, LOC Bank of America NA, VRDN (c) | 47,000 | | 47,000 |
Gaston County Indl. Facilities & Poll. Cont. Fing. Auth. Rev. (Duke Energy Corp. Proj.) Series 1999, 0.31%, VRDN (c)(f) | 4,000 | | 4,000 |
Greensboro Combined Enterprise Sys. Rev. Series 2009 B, 0.28% (Liquidity Facility Bank of America NA), VRDN (c) | 10,000 | | 10,000 |
Lower Cape Fear Wtr. & Swr. Auth. Rev. (Bladen Bluffs Proj.) Series 2010, 0.26%, LOC JPMorgan Chase Bank, VRDN (c) | 1,150 | | 1,150 |
North Carolina Cap. Facilities Fin. Agcy. Edl. Facilities Rev. (Campbell Univ. Proj.) Series 2009, 0.27%, LOC Branch Banking & Trust Co., VRDN (c) | 4,330 | | 4,330 |
North Carolina Cap. Facilities Fin. Agcy. Rev.: | | | |
(Elon Univ. Proj.): | | | |
Series 2006, 0.25%, LOC Bank of America NA, VRDN (c) | 4,725 | | 4,725 |
Series 2010, 0.25%, LOC Bank of America NA, VRDN (c) | 19,935 | | 19,935 |
Participating VRDN: | | | |
Series GS 08 9TP, 0.26% (Liquidity Facility Wells Fargo & Co.) (c)(g) | 14,620 | | 14,620 |
Series ROC II R 11850, 0.26% (Liquidity Facility Citibank NA) (c)(g) | 12,600 | | 12,600 |
North Carolina Gen. Oblig. Bonds Series 2004 A, 5% 3/1/11 | 4,000 | | 4,000 |
North Carolina Hsg. Fin. Agcy. Home Ownership Rev.: | | | |
Participating VRDN Series Clipper 05 8, 0.38% (Liquidity Facility State Street Bank & Trust Co., Boston) (c)(f)(g) | 9,270 | | 9,270 |
Participating VRDN Series Merlots 06 B12, 0.33% (Liquidity Facility Wells Fargo Bank NA) (c)(f)(g) | 29,925 | | 29,925 |
Series 15 C, 0.27% (Liquidity Facility Fannie Mae) (Liquidity Facility Freddie Mac), VRDN (c)(f) | 3,885 | | 3,885 |
Series 16C, 0.27% (Liquidity Facility Fannie Mae) (Liquidity Facility Freddie Mac), VRDN (c)(f) | 15,615 | | 15,615 |
Series 17 C, 0.27% (Liquidity Facility Fannie Mae) (Liquidity Facility Freddie Mac), VRDN (c)(f) | 19,410 | | 19,410 |
Municipal Securities - continued |
| Principal Amount (000s) | | Value (000s) |
North Carolina - continued |
North Carolina Hsg. Fin. Agcy. Home Ownership Rev.: - continued | | | |
Series 18 C, 0.27% (Liquidity Facility Fannie Mae) (Liquidity Facility Freddie Mac), VRDN (c)(f) | $ 18,795 | | $ 18,795 |
North Carolina Infrastructure Fin. Corp. Ctfs. of Prtn. Participating VRDN Series BA 08 1073, 0.33% (Liquidity Facility Bank of America NA) (c)(g) | 9,760 | | 9,760 |
North Carolina Med. Care Cmnty. Health Participating VRDN Series BA 08 3509, 0.33% (Liquidity Facility Bank of America NA) (c)(g) | 4,000 | | 4,000 |
North Carolina Med. Care Commission Health Care Facilities Rev.: | | | |
(Friends Homes, Inc. Proj.) Series 2003, 0.3%, LOC Bank of America NA, VRDN (c) | 12,500 | | 12,500 |
(Univ. Health Systems of Eastern Carolina Proj.) Series 2008 A2, 0.24%, LOC Bank of America NA, VRDN (c) | 17,200 | | 17,200 |
(Wake Forest Univ. Proj.) Series 2008 C, 0.28%, LOC Bank of America NA, VRDN (c) | 9,760 | | 9,760 |
Participating VRDN Series ROC II R 11808, 0.26% (Liquidity Facility Citibank NA) (c)(g) | 1,365 | | 1,365 |
North Carolina Med. Care Commission Hosp. Rev. (CaroMont Health Proj.) Series 2003 A, 0.28%, LOC Bank of America NA, VRDN (c) | 9,400 | | 9,400 |
North Carolina State Ed. Assistance Auth. Student Ln. Rev.: | | | |
Series 2008 2A1, 0.28%, LOC Royal Bank of Canada, VRDN (c)(f) | 33,200 | | 33,200 |
Series 2008 3A2, 0.37%, LOC Bank of America NA, VRDN (c)(f) | 45,200 | | 45,200 |
Series 2008 A2, 0.28%, LOC Royal Bank of Canada, VRDN (c)(f) | 17,475 | | 17,475 |
Series 2008-5, 0.32%, LOC Branch Banking & Trust Co., VRDN (c)(f) | 15,400 | | 15,400 |
Person County Indl. Facilities and Poll. Cont. Fing. Auth. (CertainTeed Gypsum NC, Inc. Proj.) Series 2010, 0.28%, LOC Cr. Industriel et Commercial, VRDN (c) | 16,625 | | 16,625 |
Piedmont Triad Arpt. Auth.: | | | |
Series 2008 A, 0.32%, LOC Branch Banking & Trust Co., VRDN (c) | 3,500 | | 3,500 |
Series 2008 B, 0.34%, LOC Branch Banking & Trust Co., VRDN (c)(f) | 5,500 | | 5,500 |
Raleigh Combined Enterprise Sys. Rev. Participating VRDN Series WF 11-19C, 0.26% (Liquidity Facility Wells Fargo Bank NA) (c)(g) | 9,000 | | 9,000 |
Municipal Securities - continued |
| Principal Amount (000s) | | Value (000s) |
North Carolina - continued |
Sampson County Indl. Facilities & Poll. Cont. Fing. Auth. Envir. Facilities Rev. (Sampson County Disp., Inc. Proj.) 0.32%, LOC Wells Fargo Bank NA, VRDN (c)(f) | $ 30,855 | | $ 30,855 |
Union County Indl. Facilities & Poll. Cont. Fing. Auth. Indl. Dev. Rev. (Greiner Vacuette NA Proj.) 0.42%, LOC Wells Fargo Bank NA, VRDN (c)(f) | 3,100 | | 3,100 |
Univ. of North Carolina at Chapel Hill Rev. Participating VRDN Series EGL 05 3014 Class A, 0.26% (Liquidity Facility Citibank NA) (c)(g) | 21,000 | | 21,000 |
| | 502,400 |
North Dakota - 0.4% |
Cass County Solid Waste Disp. Rev. (Tharaldson Ethanol Plant I, LLC Proj.) Series 2007, 0.33%, LOC Bank of America NA, VRDN (c)(f) | 58,000 | | 58,000 |
Hebron Indl. Dev. Rev. (Dacco, Inc. Proj.) 0.35%, LOC U.S. Bank NA, Minnesota, VRDN (c)(f) | 2,745 | | 2,745 |
North Dakota Hsg. Fin. Agcy. Rev. (Home Mtg. Fin. Prog.): | | | |
Series 2004 C, 0.28% (Liquidity Facility Fed. Home Ln. Bank-Des Moines), VRDN (c)(f) | 15,630 | | 15,630 |
Series 2005 A, 0.28% (Liquidity Facility Lloyds TSB Bank PLC), VRDN (c)(f) | 15,030 | | 15,030 |
Series 2008 A, 0.28% (Liquidity Facility Lloyds TSB Bank PLC), VRDN (c)(f) | 13,700 | | 13,700 |
| | 105,105 |
Ohio - 2.3% |
Cuyahoga County Cultural Facilities Rev. (Maltz Museum of Jewish Heritage Proj.) 0.28%, LOC Bank of New York, New York, VRDN (c) | 6,300 | | 6,300 |
Hamilton County Hosp. Facilities Rev.: | | | |
(Children's Hosp. Med. Ctr. Proj.) Series 2000, 0.26%, LOC JPMorgan Chase Bank, VRDN (c) | 23,500 | | 23,500 |
(Childrens Hosp. Med. Ctr. Proj.) Series 1997 A, 0.26%, LOC PNC Bank NA, Pittsburgh, VRDN (c) | 5,815 | | 5,815 |
Hamilton County Student Hsg. Rev. (Block 3 Proj.) Series 2004, 0.26%, LOC Bank of New York, New York, VRDN (c) | 28,000 | | 28,000 |
Independence Gen. Oblig. BAN Series 2010, 1.875% 4/26/11 | 4,200 | | 4,200 |
Lake County Hosp. Facilities Rev. (Lake Hosp. Sys., Inc. Proj.) Series 2008 B, 0.27%, LOC JPMorgan Chase Bank, VRDN (c) | 33,100 | | 33,100 |
Lancaster Port Auth. Gas Rev. 0.26% (Liquidity Facility Royal Bank of Canada), VRDN (c) | 72,320 | | 72,320 |
Municipal Securities - continued |
| Principal Amount (000s) | | Value (000s) |
Ohio - continued |
Ohio Higher Edl. Facility Commission Rev. Bonds: | | | |
(Cleveland Clinic Foundation Proj.): | | | |
Series 2008 B5, 0.36% tender 6/15/11, CP mode | $ 7,200 | | $ 7,200 |
Series 2008 B6, 0.36% tender 6/15/11, CP mode | 8,600 | | 8,600 |
(Cleveland Clinic Proj.): | | | |
Series 2008 B5: | | | |
0.34% tender 3/29/11, CP mode | 10,000 | | 10,000 |
0.42% tender 3/1/11, CP mode | 18,650 | | 18,650 |
Series 2008 B6, 0.34% tender 3/29/11, CP mode | 8,800 | | 8,800 |
Ohio Hosp. Facilities Rev. Participating VRDN Series Putters 3558, 0.26% (Liquidity Facility JPMorgan Chase Bank) (c)(g) | 12,800 | | 12,800 |
Ohio Hsg. Fin. Agcy. Mtg. Rev.: | | | |
(Mtg.-Backed Securities Prog.) Series 2005 B1, 0.26% (Liquidity Facility Fed. Home Ln. Bank, Cincinnati), VRDN (c)(f) | 26,500 | | 26,500 |
Participating VRDN Series Putters 1334, 0.41% (Liquidity Facility JPMorgan Chase & Co.) (c)(f)(g) | 1,630 | | 1,630 |
Series 2007 E, 0.28% (Liquidity Facility KBC Bank NV), VRDN (c)(f) | 90,600 | | 90,600 |
Series H, 0.28% (Liquidity Facility KBC Bank NV), VRDN (c)(f) | 26,630 | | 26,630 |
Ohio Hsg. Fin. Agcy. Multi-family Hsg. Rev. (Club at Spring Valley Apts. Proj.) Series 1996 A, 0.6%, LOC RBS Citizens NA, VRDN (c)(f) | 3,400 | | 3,400 |
Ohio Hsg. Fin. Agcy. Residential Mtg. Rev.: | | | |
(Mtg.-Backed Securities Prog.) Series 2008 D, 0.26% (Liquidity Facility Fed. Home Ln. Bank, Cincinnati), VRDN (c)(f) | 9,400 | | 9,400 |
Series 2006 J, 0.25% (Liquidity Facility State Street Bank & Trust Co., Boston), VRDN (c)(f) | 58,800 | | 58,800 |
Series 2006 N, 0.26% (Liquidity Facility State Street Bank & Trust Co., Boston), VRDN (c)(f) | 1,000 | | 1,000 |
Ohio Major New State Infrastructure Rev. Bonds: | | | |
Series 2010-1, 2% 6/15/11 | 9,650 | | 9,694 |
Series 2010-3, 2.5% 12/15/11 | 23,000 | | 23,383 |
Ohio Wtr. Dev. Auth. (Waste Mgmt., Inc. Proj.) Series B, 0.36%, LOC Bank of America NA, VRDN (c)(f) | 8,100 | | 8,100 |
Portage County Hosp. Rev. (Robinson Memorial Hosp. Proj.) Series 2008, 0.27%, LOC JPMorgan Chase Bank, VRDN (c) | 21,700 | | 21,700 |
Westlake Health Facilities Rev. (Lutheran Home Proj.) Series 2005, 0.43%, LOC RBS Citizens NA, VRDN (c) | 7,700 | | 7,700 |
| | 527,822 |
Municipal Securities - continued |
| Principal Amount (000s) | | Value (000s) |
Oklahoma - 0.7% |
Oklahoma Dev. Fin. Auth. Rev.: | | | |
(ConocoPhillips Co. Proj.): | | | |
Series 2002 B, 0.28%, VRDN (c)(f) | $ 2,500 | | $ 2,500 |
Series 2002, 0.28%, VRDN (c)(f) | 20,000 | | 20,000 |
0.28%, VRDN (c)(f) | 6,000 | | 6,000 |
(Shawnee Fdg. LP Proj.) Series 1996, 0.3%, LOC Bank of Nova Scotia New York Branch, VRDN (c)(f) | 4,700 | | 4,700 |
Oklahoma Hsg. Fin. Agcy. Single Family Mtg. Rev. Participating VRDN Series Clipper 04 3, 0.38% (Liquidity Facility State Street Bank & Trust Co., Boston) (c)(f)(g) | 19,302 | | 19,302 |
Oklahoma Student Ln. Auth. Rev. Series 2008 A1, 0.29%, LOC Bank of America NA, VRDN (c)(f) | 102,905 | | 102,905 |
Tulsa Arpts. Impt. Trust Spl. Facility Rev. 0.26%, LOC Landesbank Hessen-Thuringen, VRDN (c)(f) | 3,120 | | 3,120 |
Univ. Hospitals Trust Rev. Series 2005 A, 0.29%, LOC Bank of America NA, VRDN (c) | 5,250 | | 5,250 |
| | 163,777 |
Oregon - 0.5% |
Clackamas County Hosp. Facility Auth. Bonds (Providence Health Sys. Proj.): | | | |
Series 2003 D: | | | |
0.29% tender 3/3/11, CP mode | 12,500 | | 12,500 |
0.32% tender 4/6/11, CP mode | 8,000 | | 8,000 |
Series 2003 E: | | | |
0.32% tender 4/5/11, CP mode | 8,000 | | 8,000 |
0.35% tender 6/10/11, CP mode | 6,000 | | 6,000 |
Series F, 0.36% tender 7/13/11, CP mode | 10,000 | | 10,000 |
Oregon Econ. & Cmnty. Econ. Dev. Rev. (American Bridge Co. Proj.) Series 205, 0.35%, LOC PNC Bank NA, Pittsburgh, VRDN (c)(f) | 2,040 | | 2,040 |
Oregon State Dept. of Administrative Svcs. Lottery Rev. Participating VRDN Series BC 11 5W, 0.27% (Liquidity Facility Barclays Bank PLC) (c)(g) | 6,555 | | 6,555 |
Portland Econ. Dev. Rev. (Columbia Aluminum Recycling Proj.) 0.3%, LOC U.S. Bank NA, Minnesota, VRDN (c)(f) | 1,900 | | 1,900 |
Portland Hsg. Auth. Rev.: | | | |
(New Columbia - Cecelia Proj.) Series 2004, 0.49%, LOC Bank of America NA, VRDN (c)(f) | 1,500 | | 1,500 |
(New Columbia - Trouton Proj.) 0.37%, LOC Bank of America NA, VRDN (c)(f) | 6,065 | | 6,065 |
Portland Multi-family Hsg. Rev. (The Village at Lovejoy Fountain Proj.) Series 2009, 0.32%, LOC Freddie Mac, VRDN (c)(f) | 15,000 | | 15,000 |
Municipal Securities - continued |
| Principal Amount (000s) | | Value (000s) |
Oregon - continued |
Salem Hosp. Facility Auth. Rev. (Salem Hosp. Proj.): | | | |
Series 2008 B, 0.25%, LOC U.S. Bank NA, Minnesota, VRDN (c) | $ 6,000 | | $ 6,000 |
Series 2008 C, 0.3%, LOC Bank of America NA, VRDN (c) | 12,500 | | 12,500 |
Salem-Keizer School District #24J Bonds Series WF 09 4Z, 0.38%, tender 8/18/11 (Liquidity Facility Wells Fargo & Co.) (c)(g)(h) | 15,285 | | 15,285 |
| | 111,345 |
Pennsylvania - 3.7% |
Allegheny County Hosp. Dev. Auth. Rev. (Children's Institute Pittsburgh Proj.): | | | |
Series 2005 A, 0.25%, LOC PNC Bank NA, Pittsburgh, VRDN (c) | 9,730 | | 9,730 |
Series 2005 B, 0.25%, LOC PNC Bank NA, Pittsburgh, VRDN (c) | 8,170 | | 8,170 |
Allegheny County Indl. Dev. Auth. Health & Hsg. Facilities Rev. (Longwood at Oakmont, Inc. Proj.) Series 2008 B, 0.27%, LOC Citizens Bank of Pennsylvania, VRDN (c) | 10,155 | | 10,155 |
Cambria County Ind. Dev. Auth. (Cambria Cogen Co. Proj.): | | | |
Series 1998 A1, 0.28%, LOC Bayerische Hypo-und Vereinsbank AG, VRDN (c)(f) | 90,550 | | 90,550 |
Series 1998 A2, 0.4%, LOC Bayerische Hypo-und Vereinsbank AG, VRDN (c)(f) | 22,105 | | 22,105 |
Chester County Health & Ed. Auth. Rev. (Jenner's Pond Proj.) Series 2006, 0.35%, LOC Citizens Bank of Pennsylvania, VRDN (c) | 23,225 | | 23,225 |
Clarion County Indl. Dev. Auth. Energy Dev. Rev. (Piney Creek Proj.) Series 1990, 0.27%, LOC Landesbank Hessen-Thuringen, VRDN (c)(f) | 5,700 | | 5,700 |
Cumberland County Muni. Auth. Rev. (Presbyterian Homes Proj.) Series 2008 B, 0.25%, LOC Bank of America NA, VRDN (c) | 16,600 | | 16,600 |
Delaware County Auth. Rev. (White Horse Village Proj.) Series 2006 B, 0.26%, LOC Citizens Bank of Pennsylvania, VRDN (c) | 20,800 | | 20,800 |
Geisinger Auth. Health Sys. Rev. Participating VRDN: | | | |
Series Putters 3462, 0.26% (Liquidity Facility JPMorgan Chase Bank) (c)(g) | 11,245 | | 11,245 |
Series Putters 3490Z, 0.26% (Liquidity Facility JPMorgan Chase Bank) (c)(g) | 4,995 | | 4,995 |
Montgomery County Indl. Dev. Auth. Rev. (Foulkeways at Gwynedd Proj.) Series 2006 B, 0.35%, LOC Citizens Bank of Pennsylvania, VRDN (c) | 12,855 | | 12,855 |
Municipal Securities - continued |
| Principal Amount (000s) | | Value (000s) |
Pennsylvania - continued |
Pennsylvania Econ. Dev. Fing. Auth. Exempt Facilities Rev. (Amtrak Proj.) Series 2001 B, 0.3%, LOC JPMorgan Chase Bank, VRDN (c)(f) | $ 5,000 | | $ 5,000 |
Pennsylvania Econ. Dev. Fing. Auth. Indl. Dev. Rev.: | | | |
Series 1996 D5, 0.31%, LOC PNC Bank NA, Pittsburgh, VRDN (c)(f) | 1,100 | | 1,100 |
Series 1997 B1, 0.4%, LOC PNC Bank NA, Pittsburgh, VRDN (c)(f) | 500 | | 500 |
Series 1997 B4, 0.4%, LOC PNC Bank NA, Pittsburgh, VRDN (c)(f) | 400 | | 400 |
Series 1997 B9, 0.4%, LOC PNC Bank NA, Pittsburgh, VRDN (c)(f) | 100 | | 100 |
Pennsylvania Econ. Dev. Fing. Auth. Manufacturing Facility Rev. (Dodge Realty Partners Proj.) 0.28%, LOC PNC Bank NA, Pittsburgh, VRDN (c)(f) | 2,700 | | 2,700 |
Pennsylvania Econ. Dev. Fing. Auth. Wastewtr. Treatment Rev. (Sunoco, Inc. (R&M) Proj.) Series 2009 A, 0.25% (Sunoco, Inc. Guaranteed), LOC JPMorgan Chase Bank, VRDN (c) | 17,900 | | 17,900 |
Pennsylvania Gen. Oblig.: | | | |
Participating VRDN: | | | |
Series Putters 3350, 0.26% (Liquidity Facility JPMorgan Chase Bank) (c)(g) | 4,505 | | 4,505 |
Series Putters 3352Z, 0.26% (Liquidity Facility JPMorgan Chase Bank) (c)(g) | 3,775 | | 3,775 |
TAN First Series 2010-2011, 2.5% 6/30/11 | 120,000 | | 120,867 |
Pennsylvania Higher Edl. Facilities Auth. Rev.: | | | |
(California Univ. of Pennsylvania Student Hsg. Proj.) Series 2006 A1, 0.31%, LOC Citizens Bank of Pennsylvania, VRDN (c) | 24,095 | | 24,095 |
(Univ. of Pennsylvania Health Sys. Proj.) Series 2008 A, 0.26%, LOC Bank of America NA, VRDN (c) | 14,300 | | 14,300 |
Pennsylvania Hsg. Fin. Agcy. Single Family Mtg. Rev.: | | | |
Participating VRDN Series Merlots 07 C50, 0.33% (Liquidity Facility Wells Fargo Bank NA) (c)(f)(g) | 3,345 | | 3,345 |
Series 2002 74A, 0.35% (Liquidity Facility Lloyds TSB Bank PLC), VRDN (c)(f) | 21,900 | | 21,900 |
Series 2002 75A, 0.35% (Liquidity Facility Lloyds TSB Bank PLC), VRDN (c)(f) | 21,900 | | 21,900 |
Series 2003 77B, 0.33% (Liquidity Facility BNP Paribas SA), VRDN (c)(f) | 18,975 | | 18,975 |
Series 2003 77C, 0.33% (Liquidity Facility BNP Paribas SA), VRDN (c)(f) | 4,105 | | 4,105 |
Series 2003 79B, 0.35% (Liquidity Facility BNP Paribas SA), VRDN (c)(f) | 20,900 | | 20,900 |
Municipal Securities - continued |
| Principal Amount (000s) | | Value (000s) |
Pennsylvania - continued |
Pennsylvania Hsg. Fin. Agcy. Single Family Mtg. Rev.: - continued | | | |
Series 2004 81B, 0.33% (Liquidity Facility Lloyds TSB Bank PLC), VRDN (c)(f) | $ 8,975 | | $ 8,975 |
Series 2004 81C, 0.33% (Liquidity Facility Lloyds TSB Bank PLC), VRDN (c)(f) | 54,600 | | 54,600 |
Series 2004 85C, 0.26% (Liquidity Facility Fannie Mae) (Liquidity Facility Freddie Mac), VRDN (c)(f) | 13,145 | | 13,145 |
Series 2006 92B, 0.33% (Liquidity Facility Landesbank Hessen-Thuringen), VRDN (c)(f) | 19,500 | | 19,500 |
Series 2006 93B, 0.33% (Liquidity Facility Dexia Cr. Local de France), VRDN (c)(f) | 31,725 | | 31,725 |
Series 2006 94B, 0.32% (Liquidity Facility Dexia Cr. Local de France), VRDN (c)(f) | 13,850 | | 13,850 |
Pennsylvania Pub. School Bldg. Auth. School Rev. (Harrisburg School District Proj.) Series 2009 D, 0.25%, LOC Wells Fargo Bank NA, VRDN (c) | 42,400 | | 42,400 |
Pennsylvania Tpk. Commission Tpk. Rev.: | | | |
Series 2008 B2, 0.26%, LOC Bank of America NA, VRDN (c) | 1,000 | | 1,000 |
Series 2008 B3, 0.26%, LOC Bank of America NA, VRDN (c) | 1,600 | | 1,600 |
Series 2008 B5, 0.26%, LOC Bank of America NA, VRDN (c) | 13,600 | | 13,600 |
Philadelphia Auth. for Indl. Dev. Rev. (William Penn Charter School Proj.) Series 2008, 0.25%, LOC PNC Bank NA, Pittsburgh, VRDN (c) | 3,400 | | 3,400 |
Philadelphia Gas Works Rev. (1998 Gen. Ordinance Proj.) Eighth Series D, 0.26%, LOC Bank of America NA, VRDN (c) | 7,500 | | 7,500 |
Philadelphia State Pub. School Participating VRDN Series Solar 06 161, 0.25% (Liquidity Facility U.S. Bank NA, Minnesota) (c)(g) | 26,530 | | 26,530 |
Philadelphia Wtr. & Wastewtr. Rev.: | | | |
Series 1997 B, 0.26%, LOC Bank of America NA, VRDN (c) | 12,360 | | 12,360 |
Series 2005 B, 0.23%, LOC Bank of America NA, VRDN (c) | 63,140 | | 63,140 |
Univ. of Pittsburgh Commonwealth Sys. of Higher Ed. BAN Series 2010, 2% 5/31/11 | 18,300 | | 18,370 |
Washington County Hosp. Auth. Rev. (Washington Hosp. Proj.) Series 2007 B, 0.25%, LOC Wells Fargo Bank NA, VRDN (c) | 4,785 | | 4,785 |
| | 858,977 |
Municipal Securities - continued |
| Principal Amount (000s) | | Value (000s) |
Rhode Island - 0.3% |
East Greenwich Gen. Oblig. BAN 1.5% 2/15/12 | $ 11,000 | | $ 11,105 |
Narragansett Bay Commission Wastewtr. Sys. Rev. Series 2008 A, 0.25%, LOC U.S. Bank NA, Minnesota, VRDN (c) | 13,000 | | 13,000 |
Rhode Island Indl. Facilities Corp. Indl. Dev. Rev. (NFA Corp. Proj.) 0.46%, LOC Bank of America NA, VRDN (c)(f) | 5,000 | | 5,000 |
Rhode Island Student Ln. Auth. Student Ln. Rev.: | | | |
Series 2008 B2, 0.25%, LOC State Street Bank & Trust Co., Boston, VRDN (c)(f) | 20,000 | | 20,000 |
Series 2008 B3, 0.25%, LOC State Street Bank & Trust Co., Boston, VRDN (c)(f) | 18,000 | | 18,000 |
Series 2008 B4, 0.25%, LOC State Street Bank & Trust Co., Boston, VRDN (c)(f) | 7,000 | | 7,000 |
| | 74,105 |
South Carolina - 2.1% |
Anderson County School District #5 Participating VRDN Series BA 08 1181, 0.33% (Liquidity Facility Bank of America NA) (c)(g) | 14,650 | | 14,650 |
Charleston Wtrwks. & Swr. Rev. Series A, 0.27% (Liquidity Facility Bank of America NA), VRDN (c) | 20,745 | | 20,745 |
Darlington County Indl. Dev. Rev. (Nucor Corp. Proj.) Series 2003 A, 0.41%, VRDN (c)(f) | 8,100 | | 8,100 |
Florence County Hosp. Rev. (McLeod Reg'l. Med. Ctr. Proj.) Series 2010 B, 0.25%, LOC Wells Fargo Bank NA, VRDN (c) | 9,470 | | 9,470 |
Greenville County School District Bonds: | | | |
Series 2010 C, 1% 6/1/11 | 12,000 | | 12,020 |
Series 2010 D, 1% 6/1/11 | 34,655 | | 34,713 |
Greenville Hosp. Sys. Facilities Rev. Series 2008 E, 0.25%, LOC Wells Fargo Bank NA, VRDN (c) | 46,155 | | 46,155 |
Greenwood School District #50 Gen. Oblig. Bonds Series 2010 B, 1% 4/1/11 | 6,435 | | 6,439 |
Lexington County School District #1 Bonds Series 2010 B, 1% 3/1/11 | 9,145 | | 9,145 |
Richland County School District #2 Gen. Oblig. Bonds Series 2010 B, 3% 5/1/11 | 4,000 | | 4,017 |
South Carolina Assoc. of Governmental Organizations Ctfs. of Prtn. Bonds: | | | |
Series 2010 C, 2% 3/1/11 | 53,800 | | 53,800 |
Series 2010 D, 2% 3/1/11 | 6,270 | | 6,270 |
South Carolina Gen. Oblig. Participating VRDN Series ROC II R 692W, 0.25% (Liquidity Facility Wells Fargo & Co.) (c)(g) | 2,170 | | 2,170 |
Municipal Securities - continued |
| Principal Amount (000s) | | Value (000s) |
South Carolina - continued |
South Carolina Jobs-Econ. Dev. Auth.: | | | |
(AnMed Health Proj.) Series 2009 D, 0.26%, LOC Branch Banking & Trust Co., VRDN (c) | $ 3,355 | | $ 3,355 |
(Palmetto Health Proj.): | | | |
Series 2008 A, 0.3%, LOC Bank of America NA, VRDN (c) | 13,000 | | 13,000 |
Series 2008 B, 0.3%, LOC Bank of America NA, VRDN (c) | 32,210 | | 32,210 |
South Carolina Jobs-Econ. Dev. Auth. Econ. Dev. Rev.: | | | |
(Alfmeier Corp. Proj.) 0.42%, LOC Bayerische Landesbank Girozentrale, VRDN (c)(f) | 800 | | 800 |
(Bon Secours Health Sys. Proj.) Series 2008 D, 0.24%, LOC Citibank NA, VRDN (c) | 4,300 | | 4,300 |
(Carolina Piedmont Foundation Proj.) 0.33%, LOC Bank of America NA, VRDN (c) | 5,410 | | 5,410 |
(Giant Cement Holding, Inc. Proj.) 0.32%, LOC Citibank NA, VRDN (c)(f) | 2,000 | | 2,000 |
(Waste Mgmt. of South Carolina, Inc. Proj.) Series 2003 A, 0.33%, LOC Wells Fargo Bank NA, VRDN (c)(f) | 15,000 | | 15,000 |
South Carolina Jobs-Econ. Dev. Auth. Indl. Rev. (South Carolina Generating Co., Inc. Proj.) Series 2008, 0.32%, LOC Branch Banking & Trust Co., VRDN (c)(f) | 15,400 | | 15,400 |
South Carolina Pub. Svc. Auth. Rev.: | | | |
Participating VRDN: | | | |
Series ROC II R 11426, 0.27% (Liquidity Facility Citibank NA) (c)(g) | 33,000 | | 33,000 |
Series ROC II R 11528, 0.27% (Liquidity Facility Citibank NA) (c)(g) | 17,820 | | 17,820 |
Series 2010 A: | | | |
0.31% 3/9/11, CP | 25,000 | | 25,000 |
0.31% 3/10/11, CP | 12,730 | | 12,730 |
Series 2010 B: | | | |
0.31% 3/8/11, CP | 18,000 | | 18,000 |
0.32% 3/16/11, CP | 2,447 | | 2,447 |
0.32% 3/16/11, CP | 489 | | 489 |
South Carolina Trans. Infrastructure Bank Rev. Series 2003 B1, 0.23%, LOC Bank of America NA, VRDN (c) | 27,490 | | 27,490 |
Spartanburg County School District #5 Bonds Series 2009, 5% 5/1/11 | 6,220 | | 6,269 |
Sumter County School District #2 Bonds Series A, 3% 4/1/11 | 3,025 | | 3,032 |
York County Poll. Cont. Rev. Bonds (Duke Energy Corp. Proj.) 0.85% tender 3/17/11, CP mode | 22,400 | | 22,400 |
| | 487,846 |
Municipal Securities - continued |
| Principal Amount (000s) | | Value (000s) |
South Dakota - 0.4% |
South Dakota Conservancy District Rev. BAN Series 2010, 1.75% 9/30/11 | $ 54,330 | | $ 54,773 |
South Dakota Hsg. Dev. Auth.: | | | |
(Harmony Heights Proj.) Series 2001, 0.3%, LOC Fannie Mae, VRDN (c)(f) | 6,500 | | 6,500 |
(Homeownership Mtg. Proj.): | | | |
Series 2003 F, 0.31% (Liquidity Facility Landesbank Hessen-Thuringen), VRDN (c)(f) | 10,000 | | 10,000 |
Series 2008 F, 0.25% (Liquidity Facility Fed. Home Ln. Bank Chicago), VRDN (c)(f) | 9,000 | | 9,000 |
Series 2007 I, 0.25% (Liquidity Facility Fed. Home Ln. Bank-Des Moines), VRDN (c)(f) | 20,800 | | 20,800 |
| | 101,073 |
Tennessee - 1.3% |
Blount County Pub. Bldg. Auth. (Local Govt. Pub. Impt. Proj.) Series 2008 E1A, 0.27%, LOC Branch Banking & Trust Co., VRDN (c) | 4,200 | | 4,200 |
Chattanooga Health Ed. & Hsg. Facility Board Rev. (Southern Adventist Univ. Proj.) 0.4%, LOC Bank of America NA, VRDN (c) | 1,620 | | 1,620 |
Chattanooga Indl. Dev. Board Indl. Rev. (Burner Systems Int'l., Inc. Proj.) 0.49%, LOC JPMorgan Chase Bank, VRDN (c)(f) | 4,500 | | 4,500 |
Jackson Energy Auth. Wastewtr. Sys. Rev. Series 2009, 0.3%, LOC Bank of America NA, VRDN (c) | 10,425 | | 10,425 |
Knox County Health Edl. & Hsg. Facilities Board Hosp. Facilities Rev. (Catholic Healthcare Partners Proj.): | | | |
Series 2008 A, 0.32%, LOC Landesbank Baden-Wuert, VRDN (c) | 4,300 | | 4,300 |
Series 2008 B, 0.31%, LOC Landesbank Baden-Wuert, VRDN (c) | 10,000 | | 10,000 |
Loudon County Indl. Dev. Board Exempt Facilities Rev. (Kimberly-Clark Corp. Proj.) 0.33%, VRDN (c)(f) | 11,600 | | 11,600 |
Loudon Indl. Dev. Board Solid Waste Disp. Rev. (Tate & Lyle Ingredients Americas, Inc. Proj.) Series 2006, 0.31%, LOC Rabobank Nederland, VRDN (c)(f) | 42,100 | | 42,100 |
Memphis Health, Edl. & Hsg. Facilities Board (Ashland Lakes Apts. Proj.) Series A, 0.27%, LOC U.S. Bank NA, Minnesota, VRDN (c)(f) | 10,000 | | 10,000 |
Metropolitan Govt. Nashville & Davidson County Health & Edl. Facilities Board (Whispering Oaks Apts. Proj.) 0.29%, LOC Fannie Mae, VRDN (c)(f) | 15,000 | | 15,000 |
Montgomery County Pub. Bldg. Auth. Pooled Fing. Rev. (Tennessee County Ln. Pool Prog.) Series 1999, 0.3%, LOC Bank of America NA, VRDN (c) | 24,825 | | 24,825 |
Municipal Securities - continued |
| Principal Amount (000s) | | Value (000s) |
Tennessee - continued |
Nashville and Davidson County Metropolitan Govt. Gen. Oblig. Participating VRDN Series Putters 2631, 0.26% (Liquidity Facility JPMorgan Chase Bank) (c)(g) | $ 67,475 | | $ 67,475 |
Sevier County Pub. Bldg. Auth. Rev. Series V-A-1, 0.36%, LOC Branch Banking & Trust Co., VRDN (c)(f) | 13,100 | | 13,100 |
Shelby County Gen. Oblig. Series 2006 C, 0.28% (Liquidity Facility Dexia Cr. Local de France), VRDN (c) | 2,025 | | 2,025 |
Shelby County Health Edl. & Hsg. Facilities Board Rev.: | | | |
Bonds (Baptist Memorial Health Care Proj.) Series 2004 A, 2.5% 9/1/11 | 7,830 | | 7,909 |
(Trezevant Manor Proj.): | | | |
Series 2007 B, 0.28%, LOC Bank of America NA, VRDN (c) | 8,200 | | 8,200 |
Series A, 0.28%, LOC Bank of America NA, VRDN (c) | 36,125 | | 36,125 |
Tennessee Hsg. Participating VRDN Series Clipper 05 10, 0.38% (Liquidity Facility State Street Bank & Trust Co., Boston) (c)(f)(g) | 14,815 | | 14,815 |
White County Indl. Dev. Board Indl. Dev. Rev. (Genlyte Thomas Group LLC Proj.) Series 2001, 0.3%, LOC Bank of America NA, VRDN (c)(f) | 5,000 | | 5,000 |
| | 293,219 |
Texas - 10.7% |
Austin Hotel Occupancy Tax Rev. Series 2008 B, 0.32%, LOC Dexia Cr. Local de France, VRDN (c) | 14,060 | | 14,060 |
Austin Util. Sys. Rev. Series A: | | | |
0.29% 3/18/11, LOC JPMorgan Chase Bank, LOC State Street Bank & Trust Co., Boston, CP | 14,205 | | 14,205 |
0.3% 3/28/11, LOC JPMorgan Chase Bank, LOC State Street Bank & Trust Co., Boston, CP | 78,576 | | 78,576 |
Bexar County Gen. Oblig. Participating VRDN Series ROC II R 11791PB, 0.29% (Liquidity Facility Deutsche Postbank AG) (c)(g) | 18,920 | | 18,920 |
Brownsville Indl. Dev. Corp. Rev. (Rich-Seapak Corp. Proj.) Series 1997, 0.4%, LOC HSBC Bank USA, NA, VRDN (c)(f) | 6,250 | | 6,250 |
Brownsville Util. Sys. Rev. Participating VRDN Series Solar 06 68, 0.25% (Liquidity Facility U.S. Bank NA, Minnesota) (c)(g) | 20,000 | | 20,000 |
Calhoun County Navigation District Poll. Cont. Rev. (Formosa Plastics Corp., Texas Proj.) 0.35%, LOC Bank of America NA, VRDN (c)(f) | 10,000 | | 10,000 |
Calhoun County Navigation District Port Rev. (Formosa Plastics Corp. Proj.) Series 2000, 0.42%, LOC Bank of America NA, VRDN (c)(f) | 5,500 | | 5,500 |
Municipal Securities - continued |
| Principal Amount (000s) | | Value (000s) |
Texas - continued |
Calhoun County Navigation Indl. Dev. Auth. Port Rev. (Formosa Plastics Corp. Proj.) Series 1994, 0.26%, LOC Bank of America NA, VRDN (c)(f) | $ 34,300 | | $ 34,300 |
Calhoun County Solid Waste Disp. Rev. (Formosa Plastics Corp. Proj.): | | | |
Series 2000, 0.35%, LOC Bank of America NA, VRDN (c)(f) | 25,000 | | 25,000 |
0.35%, LOC Bank of America NA, VRDN (c)(f) | 25,000 | | 25,000 |
Calhoun Port Auth. Envir. Facilities Rev. (Formosa Plastics Corp. Texas Proj.): | | | |
Series 2007 A, 0.36%, LOC PNC Bank NA, Pittsburgh, VRDN (c)(f) | 47,300 | | 47,300 |
Series 2008, 0.36%, LOC Bank of America NA, VRDN (c)(f) | 20,000 | | 20,000 |
Cap. Area Hsg. Fin. Corp. Multi-family Hsg. Rev. (Marble Falls Vistas Apts. Proj.) 0.3%, LOC Fannie Mae, VRDN (c)(f) | 5,800 | | 5,800 |
Cypress-Fairbanks Independent School District Participating VRDN Series DB 597, 0.26% (Liquidity Facility Deutsche Bank AG) (c)(g) | 7,395 | | 7,395 |
Dallas Area Rapid Transit Sales Tax Rev. Participating VRDN Series WF 09 60C, 0.26% (Liquidity Facility Wells Fargo & Co.) (c)(g) | 17,280 | | 17,280 |
Dallas Hsg. Fin. Corp. Multi-family Hsg. Rev. (The Masters Apts. Proj.) 0.3%, LOC Fannie Mae, VRDN (c)(f) | 7,380 | | 7,380 |
Dallas North Texas Tollway Auth. Series 2010 A, 0.32% 4/6/11, LOC Bank of America NA, CP | 13,700 | | 13,700 |
Dallas Wtr. & Swr. Sys. Rev. Series C: | | | |
0.32% 3/3/11, CP | 14,000 | | 14,000 |
0.33% 6/23/11, CP | 15,500 | | 15,500 |
0.34% 5/4/11, CP | 8,300 | | 8,300 |
0.34% 5/5/11, CP | 23,000 | | 23,000 |
0.36% 7/21/11, CP | 10,000 | | 10,000 |
0.37% 7/14/11, CP | 12,000 | | 12,000 |
0.37% 7/21/11, CP | 22,000 | | 22,000 |
Denton Independent School District Participating VRDN Series Putters 2603, 0.26% (Liquidity Facility JPMorgan Chase Bank) (c)(g) | 7,380 | | 7,380 |
Eagle Mountain & Saginaw Independent School District Participating VRDN Series SGA 03 141, 0.27% (Liquidity Facility Societe Generale) (c)(g) | 16,000 | | 16,000 |
El Paso County Hosp. District Combination Tax and Rev. Participating VRDN Series Solar 06 32, 0.25% (Liquidity Facility U.S. Bank NA, Minnesota) (c)(g) | 19,940 | | 19,940 |
Frisco Gen. Oblig. Participating VRDN Series ROC II R 11909, 0.26% (Liquidity Facility Citibank NA) (c)(g) | 4,095 | | 4,095 |
Municipal Securities - continued |
| Principal Amount (000s) | | Value (000s) |
Texas - continued |
Frisco Independent School District Participating VRDN Series WF 11 1C, 0.26% (Liquidity Facility Wells Fargo Bank NA) (c)(g) | $ 6,800 | | $ 6,800 |
Gilmer Indl. Dev. Corp. (Duoline Technologies LP Proj.) Series 2008 A, 0.32%, LOC Wells Fargo Bank NA, VRDN (c)(f) | 10,000 | | 10,000 |
Greater East Texas Higher Ed. Auth. Student Ln. Rev.: | | | |
Series 1992 B, 0.26%, LOC State Street Bank & Trust Co., Boston, VRDN (c)(f) | 35,200 | | 35,200 |
Series 1993 B: | | | |
0.26%, LOC State Street Bank & Trust Co., Boston, VRDN (c)(f) | 15,000 | | 15,000 |
0.26%, LOC State Street Bank & Trust Co., Boston, VRDN (c)(f) | 17,000 | | 17,000 |
Series 1995 A, 0.26%, LOC State Street Bank & Trust Co., Boston, VRDN (a)(c)(f) | 46,700 | | 46,700 |
Series 1995 B, 0.26%, LOC State Street Bank & Trust Co., Boston, VRDN (c)(f) | 26,000 | | 26,000 |
Greater Texas Student Ln. Corp. Student Ln. Rev.: | | | |
Series 1998 A, 0.26%, LOC State Street Bank & Trust Co., Boston, VRDN (a)(c)(f) | 24,750 | | 24,750 |
Series 2000 A, 0.26%, LOC State Street Bank & Trust Co., Boston, VRDN (c)(f) | 35,000 | | 35,000 |
Gulf Coast Indl. Dev. Auth. 0.37%, LOC Wells Fargo Bank NA, VRDN (c)(f) | 5,280 | | 5,280 |
Gulf Coast Waste Disp. Auth. Solid Waste Disp. Rev. (Waste Mgmt., Inc. Proj.) Series A, 0.34%, LOC JPMorgan Chase Bank, VRDN (c)(f) | 1,000 | | 1,000 |
Harris County Cultural Ed. Facilities Fin. Corp. Med. Facilities Rev. (Baylor College of Medicine Proj.) Series 2008 E, 0.24%, LOC JPMorgan Chase Bank, VRDN (c) | 1,000 | | 1,000 |
Harris County Gen. Oblig.: | | | |
Participating VRDN: | | | |
Series RBC E 18, 0.26% (Liquidity Facility Royal Bank of Canada) (c)(g) | 11,000 | | 11,000 |
Series ROC II R 10360, 0.26% (Liquidity Facility Citibank NA) (c)(g) | 14,345 | | 14,345 |
Series ROC II R 718 PB, 0.3% (Liquidity Facility Deutsche Postbank AG) (c)(g) | 8,780 | | 8,780 |
Series A1, 0.31% 3/18/11 (Liquidity Facility State Street Bank & Trust Co., Boston), CP | 5,000 | | 5,000 |
Series C, 0.31% 3/18/11 (Liquidity Facility Bank of America NA), CP | 10,000 | | 10,000 |
Municipal Securities - continued |
| Principal Amount (000s) | | Value (000s) |
Texas - continued |
Harris County Gen. Oblig.: - continued | | | |
Series D: | | | |
0.31% 3/18/11 (Liquidity Facility JPMorgan Chase Bank), CP | $ 11,085 | | $ 11,085 |
0.32% 3/18/11 (Liquidity Facility JPMorgan Chase Bank), CP | 3,100 | | 3,100 |
Harris County Hosp. District Rev. Series 2010, 0.26%, LOC JPMorgan Chase Bank, VRDN (c) | 14,900 | | 14,900 |
Harris County Hsg. Fin. Corp. Multi-family Hsg. Rev.: | | | |
(Lafayette Village Apts. Proj.) Series 2006, 0.28%, LOC Fannie Mae, VRDN (c)(f) | 6,615 | | 6,615 |
(Louetta Village Apts. Proj.) 0.28%, LOC Fannie Mae, VRDN (c)(f) | 6,895 | | 6,895 |
(Primrose Aldine Bender Apt. Proj.) 0.29%, LOC Fannie Mae, VRDN (c)(f) | 7,710 | | 7,710 |
(Primrose at Bammel Apts. Proj.) 0.29%, LOC Fannie Mae, VRDN (c)(f) | 8,380 | | 8,380 |
(Quail Chase Apts. Proj.) Series 1999, 0.34%, LOC Gen. Elec. Cap. Corp., VRDN (c)(f) | 11,110 | | 11,110 |
(Wellington Park Apts. Proj.) 0.28%, LOC Fannie Mae, VRDN (c)(f) | 12,650 | | 12,650 |
Harris County Metropolitan Trans. Auth. Series A1: | | | |
0.3% 3/8/11 (Liquidity Facility JPMorgan Chase Bank), CP | 11,800 | | 11,800 |
0.32% 4/7/11 (Liquidity Facility JPMorgan Chase Bank), CP | 22,500 | | 22,500 |
0.32% 4/7/11 (Liquidity Facility JPMorgan Chase Bank), CP | 10,000 | | 10,000 |
Harris County Tex Indl. Dev. Corp. (HFOTCO LLC Proj.) Series 2010, 0.27%, LOC Bank of America NA, VRDN (c) | 35,000 | | 35,000 |
Houston Gen. Oblig. Bonds Series 2004 A, 5% 3/1/11 | 13,955 | | 13,955 |
Houston Higher Ed. Fin. Corp. Higher Ed. Rev.: | | | |
(Rice Univ. Proj.) Series 2006 A, 0.23% (Liquidity Facility JPMorgan Chase Bank), VRDN (c) | 12,055 | | 12,055 |
Participating VRDN: | | | |
Series Putters 3709, 0.26% (Liquidity Facility JPMorgan Chase Bank) (c)(g) | 6,665 | | 6,665 |
Series ROC II R 11860, 0.26% (Liquidity Facility Citibank NA) (c)(g) | 6,000 | | 6,000 |
Houston Hsg. Fin. Corp. Multi-family Hsg. Rev.: | | | |
(Fairlake Cove Apts. Proj.) 0.28%, LOC Citibank NA, VRDN (c)(f) | 9,595 | | 9,595 |
(Little Nell Apts. Proj.) 0.29%, LOC Fannie Mae, VRDN (c)(f) | 12,900 | | 12,900 |
(Mayfair Park Apts. Proj.) 0.29%, LOC Fannie Mae, VRDN (c)(f) | 5,800 | | 5,800 |
Municipal Securities - continued |
| Principal Amount (000s) | | Value (000s) |
Texas - continued |
Houston Independent School District 0.25% (Permanent School Fund of Texas Guaranteed), VRDN (c) | $ 2,735 | | $ 2,735 |
Houston Util. Sys. Rev.: | | | |
Participating VRDN Series Solar 06 70, 0.25% (Liquidity Facility U.S. Bank NA, Minnesota) (c)(g) | 22,220 | | 22,220 |
Participating VRDN: | | | |
Series ROC II R 11133, 0.26% (Liquidity Facility Citibank NA) (c)(g) | 15,155 | | 15,155 |
Series ROC II R 11411, 0.26% (Liquidity Facility Citibank NA) (c)(g) | 9,290 | | 9,290 |
Series ROC II R 12267, 0.26% (Liquidity Facility Citibank NA) (c)(g) | 16,795 | | 16,795 |
Series 2004 B1, 0.27%, LOC Bank of America NA, VRDN (c) | 8,600 | | 8,600 |
Series 2004 B4, 0.25%, LOC JPMorgan Chase Bank, VRDN (c) | 19,750 | | 19,750 |
Series B1: | | | |
0.28% 3/7/11, LOC JPMorgan Chase Bank, CP | 12,250 | | 12,250 |
0.3% 3/7/11, LOC JPMorgan Chase Bank, CP | 38,100 | | 38,100 |
Series B2: | | | |
0.3% 3/17/11, LOC Wells Fargo Bank NA, San Francisco, CP | 9,900 | | 9,900 |
0.32% 3/17/11, LOC Wells Fargo Bank NA, San Francisco, CP | 17,000 | | 17,000 |
Series B3: | | | |
0.28% 3/17/11, LOC Bank of Nova Scotia New York Branch, CP | 7,000 | | 7,000 |
0.29% 3/17/11, LOC Bank of Nova Scotia New York Branch, CP | 5,000 | | 5,000 |
Series B4, 0.3% 3/17/11, LOC Barclays Bank PLC, CP | 4,000 | | 4,000 |
Humble Independent School District Participating VRDN Series Solar 06 20, 0.25% (Liquidity Facility U.S. Bank NA, Minnesota) (c)(g) | 13,700 | | 13,700 |
Jewett Econ. Dev. Corp. Indl. Dev. Rev. (Nucor Corp. Proj.) 0.34%, VRDN (c)(f) | 12,600 | | 12,600 |
Judson Independent School District Participating VRDN Series MS 06 1859, 0.25% (Liquidity Facility Wells Fargo & Co.) (c)(g) | 3,940 | | 3,940 |
Katy Independent School District Series 2004 C, 0.27% (Permanent School Fund of Texas Guaranteed), VRDN (c) | 5,100 | | 5,100 |
Kendall County Health Facilities Dev. Corp. Health Care Rev. (Morningside Ministries Proj.) 0.26%, LOC JPMorgan Chase Bank, VRDN (c) | 11,240 | | 11,240 |
Municipal Securities - continued |
| Principal Amount (000s) | | Value (000s) |
Texas - continued |
Lamar Consolidated Independent School District Participating VRDN Series DB 512, 0.26% (Liquidity Facility Deutsche Bank AG) (c)(g) | $ 3,160 | | $ 3,160 |
Leander Independent School District Participating VRDN Series BC 10 28W, 0.27% (Liquidity Facility Barclays Bank PLC) (c)(g) | 9,250 | | 9,250 |
Lower Colorado River Auth. Rev. Series B, 0.3% 3/8/11, LOC Bank of America NA, CP | 10,100 | | 10,100 |
Lower Neches Valley Auth. Indl. Dev. Corp. Exempt Facilities Rev. (Onyx Envir. Svcs. Proj.) Series 2003, 0.37%, LOC Bank of America NA, VRDN (c)(f) | 11,950 | | 11,950 |
Midlothian Indl. Dev. Corp. Envir. Facilities Rev. (Holnam Texas LP Proj.) Series 1999, 0.29%, LOC JPMorgan Chase Bank, VRDN (c)(f) | 15,100 | | 15,100 |
Mineral Wells Ind. Dev. Corp. Rev. (Ameron Int'l. Corp. Proj.) 0.48%, LOC Bank of America NA, VRDN (c)(f) | 7,200 | | 7,200 |
Montgomery County Hsg. Fin. Corp. Multi-family Hsg. Rev. (Conroe Lodge at Silverdale Apt. Homes Proj.) 0.28%, LOC Freddie Mac, VRDN (c)(f) | 7,470 | | 7,470 |
North East Texas Independent School District Participating VRDN Series DCL 08 002, 0.3% (Liquidity Facility Dexia Cr. Local de France) (c)(g) | 11,325 | | 11,325 |
North Texas Higher Ed. Auth. Student Ln. Rev.: | | | |
Series 2005 C, 0.28%, LOC Bank of America NA, LOC Lloyds TSB Bank PLC, VRDN (c)(f) | 98,800 | | 98,800 |
Series 2007 A, 0.28%, LOC Bank of America NA, LOC Lloyds TSB Bank PLC, VRDN (c)(f) | 54,780 | | 54,780 |
North Texas Muni. Wtr. District Wtr. Sys. Rev. Bonds Series 2009 C, 4% 9/1/11 | 1,170 | | 1,191 |
Port Arthur Navigation District Envir. Facilities Rev. (Motiva Enterprises LLC Proj.) Series 2004, 0.32%, VRDN (c)(f) | 94,790 | | 94,790 |
Riesel Indl. Dev. Corp. (Sandy Creek Energy Assoc. Proj.): | | | |
0.31%, LOC Cr. Suisse Group, VRDN (c)(f) | 46,500 | | 46,500 |
0.31%, LOC Cr. Suisse Group, VRDN (c)(f) | 50,000 | | 50,000 |
Round Rock Independent School District Participating VRDN Series SGA 133, 0.28% (Liquidity Facility Societe Generale) (c)(g) | 12,615 | | 12,615 |
San Antonio Elec. & Gas Participating VRDN Series DB 602, 0.26% (Liquidity Facility Deutsche Bank AG) (c)(g) | 8,055 | | 8,055 |
San Antonio Elec. & Gas Sys. Rev.: | | | |
Participating VRDN Series Putters 3560, 0.26% (Liquidity Facility JPMorgan Chase Bank) (c)(g) | 9,015 | | 9,015 |
Series 2003, 0.27% (Liquidity Facility Bank of America NA), VRDN (c) | 23,175 | | 23,175 |
Municipal Securities - continued |
| Principal Amount (000s) | | Value (000s) |
Texas - continued |
San Antonio Indl. Dev. Auth. Indl. Dev. Rev.: | | | |
(LGC Bldg. & KLN Steel Proj.) Series 1998, 0.46%, LOC Bank of America NA, VRDN (c)(f) | $ 5,500 | | $ 5,500 |
(Tindall Corp. Proj.) Series 2008 A, 0.32%, LOC Wells Fargo Bank NA, VRDN (c)(f) | 3,150 | | 3,150 |
San Antonio Wtr. Sys. Rev.: | | | |
Participating VRDN: | | | |
Series EGL 06 5, 0.26% (Liquidity Facility Citibank NA) (c)(g) | 43,500 | | 43,500 |
Series SG 02 159, 0.26% (Liquidity Facility Societe Generale) (c)(g) | 22,500 | | 22,500 |
Series 2001 A: | | | |
0.28% 3/18/11, CP | 22,900 | | 22,900 |
0.32% 3/8/11, CP | 35,733 | | 35,733 |
0.32% 3/8/11, CP | 30,000 | | 30,000 |
Spring Independent School District Participating VRDN Series DB 603, 0.26% (Liquidity Facility Deutsche Bank AG) (c)(g) | 3,775 | | 3,775 |
Tarrant County Cultural Ed. Facilities Fin. Corp. Hosp. Rev.: | | | |
(Methodist Hospitals of Dallas Proj.) Series 2008, 0.27%, LOC JPMorgan Chase Bank, VRDN (c) | 94,300 | | 94,300 |
(Scott and White Memorial Hosp. and Scott, Sherwood and Brindley Foundation Proj.) Series 2008 1, 0.25%, LOC Bank of America NA, VRDN (c) | 13,400 | | 13,400 |
Tarrant County Cultural Ed. Facilities Fin. Corp. Rev. (Christus Health Proj.): | | | |
Series 2008 C3, 0.25%, LOC Bank of America NA, VRDN (c) | 11,500 | | 11,500 |
Series 2008 C4, 0.25%, LOC Bank of America NA, VRDN (c) | 26,900 | | 26,900 |
Texas Dept. of Hsg. & Cmnty. Affairs Multi-family Hsg. Rev.: | | | |
(Bristol Apts. Proj.) 0.28%, LOC Fannie Mae, VRDN (c)(f) | 3,800 | | 3,800 |
(Chisholm Trail Proj.) 0.28%, LOC Fannie Mae, VRDN (c)(f) | 5,500 | | 5,500 |
(Pinnacle Apts. Proj.) 0.27%, LOC Fannie Mae, VRDN (c)(f) | 7,065 | | 7,065 |
(Residences at Sunset Pointe Proj.) 0.36%, LOC Fannie Mae, VRDN (c)(f) | 15,000 | | 15,000 |
(St. Augustine Estate Proj.) Series 2005, 0.29%, LOC Fannie Mae, VRDN (c)(f) | 6,380 | | 6,380 |
(Windshire Apts. Proj.) 0.28%, LOC Fannie Mae, VRDN (c)(f) | 13,900 | | 13,900 |
Texas Dept. of Hsg. & Cmnty. Affairs Single Family Hsg. Rev. Participating VRDN Series BA 1048, 0.4% (Liquidity Facility Bank of America NA) (c)(f)(g) | 2,498 | | 2,498 |
Municipal Securities - continued |
| Principal Amount (000s) | | Value (000s) |
Texas - continued |
Texas Dept. of Hsg. & Cmnty. Affairs Single Family Mtg. Rev. Participating VRDN Series ROC II R 11215 WF, 0.31% (Liquidity Facility Wells Fargo & Co.) (c)(f)(g) | $ 12,120 | | $ 12,120 |
Texas Gen. Oblig.: | | | |
Participating VRDN Series DB 448, 0.28% (Liquidity Facility Deutsche Bank AG) (c)(f)(g) | 5,730 | | 5,730 |
(Veterans' Hsg. Assistance Prog.): | | | |
Fund II Series 2002 A2: | | | |
0.28%, VRDN (c)(f) | 6,700 | | 6,700 |
0.28%, VRDN (c)(f) | 8,650 | | 8,650 |
Fund II Series 2005 B, 0.26% (Liquidity Facility State Street Bank & Trust Co., Boston), VRDN (c)(f) | 39,305 | | 39,305 |
Fund II Series 2007 A, 0.26% (Liquidity Facility State Street Bank & Trust Co., Boston), VRDN (c)(f) | 43,250 | | 43,250 |
Participating VRDN: | | | |
Series EGL 06 0125, 0.26% (Liquidity Facility Citibank NA) (c)(g) | 27,940 | | 27,940 |
Series EGL 07 90, 0.26% (Liquidity Facility Citibank NA) (c)(g) | 15,000 | | 15,000 |
Series Putters 3478, 0.26% (Liquidity Facility JPMorgan Chase Bank) (c)(g) | 4,995 | | 4,995 |
Series Putters 3479, 0.26% (Liquidity Facility JPMorgan Chase Bank) (c)(g) | 11,910 | | 11,910 |
Series ROC II R 11087, 0.31% (Liquidity Facility Citibank NA) (c)(f)(g) | 15,680 | | 15,680 |
Texas Pub. Fin. Auth.: | | | |
Series 2002 A, 0.3% 4/7/11, CP | 5,200 | | 5,200 |
Series 2002 B, 0.3% 4/7/11, CP | 12,000 | | 12,000 |
Texas Pub. Fin. Auth. Rev.: | | | |
Bonds Series 2010 A, 2% 7/1/11 | 52,000 | | 52,296 |
Series 2008, 0.29% 3/7/11, CP | 12,850 | | 12,850 |
0.3% 4/21/11, CP | 10,000 | | 10,000 |
Texas Trans. Commission State Hwy. Fund Rev. Bonds Series 2006 A, 5% 4/1/11 | 10,000 | | 10,040 |
Travis County Health Facilities Dev. (Longhorn Village Proj.) Series 2008 B, 0.26%, LOC Bank of Scotland PLC, VRDN (c) | 41,400 | | 41,400 |
Travis County Hsg. Fin. Corp. (Rosemont at Old Manor Apts.) 0.29%, LOC Fannie Mae, VRDN (c)(f) | 4,885 | | 4,885 |
Municipal Securities - continued |
| Principal Amount (000s) | | Value (000s) |
Texas - continued |
Univ. of Texas Board of Regents Sys. Rev. Series 2002 A, 0.3% 4/7/11 (Liquidity Facility Univ. of Texas Invt. Mgmt. Co.), CP | $ 30,000 | | $ 30,000 |
Waco Health Facilities Dev. Corp. Participating VRDN Series Solar 07 40X, 0.25% (Liquidity Facility U.S. Bank NA, Minnesota) (c)(g) | 21,285 | | 21,285 |
| | 2,491,839 |
Utah - 2.3% |
Carbon County Poll. Cont. Rev. (PacifiCorp Proj.) Series 1994, 0.25%, LOC Wells Fargo Bank NA, VRDN (c) | 1,900 | | 1,900 |
Davis County School District Bonds TAN 2% 6/30/11 | 15,000 | | 15,079 |
Emery County Poll. Cont. Rev. (PacifiCorp Proj.) Series 1994, 0.25%, LOC Wells Fargo Bank NA, VRDN (c) | 22,000 | | 22,000 |
Intermountain Pwr. Agcy. Pwr. Supply Rev.: | | | |
Series 1997 B1: | | | |
0.28% 3/17/11 (Liquidity Facility Bank of Nova Scotia), CP | 30,850 | | 30,850 |
0.3% 4/8/11 (Liquidity Facility Bank of Nova Scotia), CP | 6,750 | | 6,750 |
Series 1997 B2, 0.32% 3/10/11 (Liquidity Facility Bank of Nova Scotia), CP | 17,200 | | 17,200 |
Series 1997 B3, 0.31% 4/8/11 (Liquidity Facility JPMorgan Chase Bank), CP | 33,700 | | 33,700 |
Series 1998 B4: | | | |
0.31% 3/15/11 (Liquidity Facility JPMorgan Chase Bank), CP | 10,200 | | 10,200 |
0.31% 3/15/11 (Liquidity Facility JPMorgan Chase Bank), CP | 9,000 | | 9,000 |
0.32% 4/7/11 (Liquidity Facility JPMorgan Chase Bank), CP | 44,300 | | 44,300 |
0.32% 4/7/11 (Liquidity Facility JPMorgan Chase Bank), CP | 23,500 | | 23,500 |
Riverton Hosp. Rev. Participating VRDN Series Putters 1762, 0.26% (Liquidity Facility JPMorgan Chase & Co.) (c)(g) | 63,015 | | 63,015 |
Salt Lake City Sales Tax Rev. 0.27% (Liquidity Facility State Street Bank & Trust Co., Boston), VRDN (c) | 7,485 | | 7,485 |
Utah Gen. Oblig. Bonds 5% 7/1/11 | 4,885 | | 4,962 |
Utah Hsg. Corp. Multi-family Hsg. Rev. (Springwood Apts. Proj.) 0.27%, LOC Fannie Mae, VRDN (c)(f) | 8,485 | | 8,485 |
Utah Hsg. Corp. Single Family Mtg. Rev.: | | | |
Series 2002 A, 0.28% (Liquidity Facility Fannie Mae) (Liquidity Facility Freddie Mac), VRDN (c)(f) | 6,840 | | 6,840 |
Series 2002 B, 0.28% (Liquidity Facility Fannie Mae) (Liquidity Facility Freddie Mac), VRDN (c)(f) | 9,530 | | 9,530 |
Municipal Securities - continued |
| Principal Amount (000s) | | Value (000s) |
Utah - continued |
Utah Hsg. Corp. Single Family Mtg. Rev.: - continued | | | |
Series 2002 D, 0.28% (Liquidity Facility Fannie Mae) (Liquidity Facility Freddie Mac), VRDN (c)(f) | $ 6,740 | | $ 6,740 |
Series 2003 B, 0.28% (Liquidity Facility Fannie Mae) (Liquidity Facility Freddie Mac), VRDN (c)(f) | 10,145 | | 10,145 |
Series 2003 C, 0.28% (Liquidity Facility Fannie Mae) (Liquidity Facility Freddie Mac), VRDN (c)(f) | 8,610 | | 8,610 |
Series 2003 E, 0.28% (Liquidity Facility Fannie Mae) (Liquidity Facility Freddie Mac), VRDN (c)(f) | 8,625 | | 8,625 |
Series 2003 F, 0.28% (Liquidity Facility Fannie Mae) (Liquidity Facility Freddie Mac), VRDN (c)(f) | 6,060 | | 6,060 |
Series 2003 G, 0.28% (Liquidity Facility Fannie Mae) (Liquidity Facility Freddie Mac), VRDN (c)(f) | 6,060 | | 6,060 |
Series 2004 G, 0.28% (Liquidity Facility Fannie Mae) (Liquidity Facility Freddie Mac), VRDN (c)(f) | 13,870 | | 13,870 |
Series 2005 B, 0.27% (Liquidity Facility Fannie Mae) (Liquidity Facility Freddie Mac), VRDN (c)(f) | 10,990 | | 10,990 |
Series 2005 D, 0.28% (Liquidity Facility Fannie Mae) (Liquidity Facility Freddie Mac), VRDN (c)(f) | 15,290 | | 15,290 |
Series 2005 E, 0.28% (Liquidity Facility Fannie Mae) (Liquidity Facility Freddie Mac), VRDN (c)(f) | 16,160 | | 16,160 |
Series 2005 F, 0.28% (Liquidity Facility Fannie Mae) (Liquidity Facility Freddie Mac), VRDN (c)(f) | 5,300 | | 5,300 |
Series 2005 G, 0.28% (Liquidity Facility Fannie Mae) (Liquidity Facility Freddie Mac), VRDN (c)(f) | 12,675 | | 12,675 |
Series 2005 H, 0.28% (Liquidity Facility Fannie Mae) (Liquidity Facility Freddie Mac), VRDN (c)(f) | 8,800 | | 8,800 |
Series 2006 A, 0.28% (Liquidity Facility Fannie Mae) (Liquidity Facility Freddie Mac), VRDN (c)(f) | 6,165 | | 6,165 |
Series 2006 F, 0.28% (Liquidity Facility Fannie Mae) (Liquidity Facility Freddie Mac), VRDN (c)(f) | 5,000 | | 5,000 |
Utah State Board of Regents Rev. Participating VRDN Series Solar 06 140, 0.25% (Liquidity Facility U.S. Bank NA, Minnesota) (c)(g) | 26,265 | | 26,265 |
Utah Transit Auth. Sales Tax Rev. Participating VRDN: | | | |
Series DCL 021, 0.3% (Liquidity Facility Dexia Cr. Local de France) (c)(g) | 8,860 | | 8,860 |
Series ROC II R 11922, 0.26% (Liquidity Facility Citibank NA) (c)(g) | 3,225 | | 3,225 |
Municipal Securities - continued |
| Principal Amount (000s) | | Value (000s) |
Utah - continued |
Utah Wtr. Fin. Agcy. Rev. Series B3: | | | |
0.31% (Liquidity Facility Landesbank Hessen-Thuringen), VRDN (c) | $ 33,400 | | $ 33,400 |
0.31% (Liquidity Facility Landesbank Hessen-Thuringen), VRDN (c) | 18,000 | | 18,000 |
| | 545,036 |
Vermont - 0.1% |
Vermont Edl. & Health Bldg. Fin. Agcy. Rev. Bonds Series WF 10 27C, 0.37%, tender 5/4/11 (Liquidity Facility Wells Fargo Bank NA) (c)(g)(h) | 25,955 | | 25,955 |
Vermont Indl. Dev. Auth. Indl. Dev. Rev. (Ryegate Proj.) Series 1990, 0.45%, LOC ABN-AMRO Bank NV, VRDN (c)(f) | 6,600 | | 6,600 |
| | 32,555 |
Virginia - 2.0% |
Albemarle County Econ. Dev. Auth. Hosp. Rev. (Martha Jefferson Hosp. Proj.) Series 2008 B, 0.25%, LOC Branch Banking & Trust Co., VRDN (c) | 19,585 | | 19,585 |
Alexandria Redev. & Hsg. Auth. Multi-family Hsg. Rev. (Fairfield Village Square Proj.) Series A, 0.27%, LOC Fannie Mae, VRDN (c)(f) | 21,720 | | 21,720 |
Arlington County Indl. Dev. Auth. Multi-family Hsg. Rev.: | | | |
(Gates of Ballston Apts.) 0.41%, LOC RBC Centura Bank, Rocky Mount, VRDN (c)(f) | 14,200 | | 14,200 |
Series A, 0.31%, LOC Freddie Mac, VRDN (c)(f) | 4,000 | | 4,000 |
Chesapeake Bay Bridge and Tunnel District Gen. Resolution Rev. Series 2008 A, 0.27%, LOC Branch Banking & Trust Co., VRDN (c) | 13,080 | | 13,080 |
Fairfax County Econ. Dev. Auth. Indl. Dev. Rev. (The Lorton Arts Foundation, Inc. Proj.) Series 2010, 0.25%, LOC Wells Fargo Bank NA, VRDN (c) | 13,000 | | 13,000 |
Fairfax County Econ. Dev. Auth. Student Hsg. Rev. (George Mason Univ. Foundation, Inc., Proj.) 0.29%, LOC Bank of America NA, VRDN (c) | 13,900 | | 13,900 |
Fairfax County Indl. Dev. Auth.: | | | |
Bonds (Inova Health Sys. Proj.) 0.38%, tender 9/26/11 (c) | 18,000 | | 18,000 |
Participating VRDN Series Putters 3590, 0.26% (Liquidity Facility JPMorgan Chase Bank) (c)(g) | 9,495 | | 9,495 |
Halifax County Indl. Dev. Auth. Poll. Cont. Rev. Bonds (Virginia Elec. & Pwr. Co. Proj.) Series 1992: | | | |
1.35% tender 3/4/11, CP mode (f) | 5,000 | | 5,000 |
1.4% tender 3/4/11, CP mode (f) | 13,200 | | 13,200 |
Municipal Securities - continued |
| Principal Amount (000s) | | Value (000s) |
Virginia - continued |
Hampton Indl. Dev. Auth. Exempt Facilities Rev. (USA Waste of Virginia Landfills, Inc. Proj.) Series 2000, 0.32%, LOC Wells Fargo Bank NA, VRDN (c)(f) | $ 9,000 | | $ 9,000 |
Hampton Redev. & Hsg. Auth. Multi-family Hsg. Rev. (Avalon Pointe Proj.) Series 1996, 0.32%, LOC Fannie Mae, VRDN (c)(f) | 6,387 | | 6,387 |
Norfolk BAN Series 2010 C, 1.5% 4/1/11 | 30,690 | | 30,722 |
Norfolk Econ. Dev. Auth. Hosp. Facilities Rev. Bonds (Sentara Healthcare Proj.) Series 2010 B, 0.38%, tender 9/26/11 (c) | 14,355 | | 14,355 |
Norfolk Econ. Dev. Auth. Rev.: | | | |
(Bon Secours Health Sys. Proj.) Series 2008 D1, 0.24%, LOC Citibank NA, VRDN (c) | 10,210 | | 10,210 |
Series 1997, 0.32% 3/17/11, CP | 13,800 | | 13,800 |
Prince William County Indl. Dev. Auth. Poll. Cont. Rev. Bonds (Virginia Elec. & Pwr. Co. Proj.) 1.35% tender 3/4/11, CP mode | 11,200 | | 11,200 |
Prince William County Indl. Dev. Auth. Sewage Disp. Facilities Rev. (Dale Svc. Corp. Proj.): | | | |
Series 2000, 0.32%, LOC Wells Fargo Bank NA, VRDN (c)(f) | 5,360 | | 5,360 |
Series 2001, 0.32%, LOC Wells Fargo Bank NA, VRDN (c)(f) | 5,350 | | 5,350 |
Series 2006, 0.32%, LOC Wells Fargo Bank NA, VRDN (c)(f) | 5,850 | | 5,850 |
Richmond Gen. Oblig. Bonds Series 2010 C, 1.5% 7/15/11 | 8,315 | | 8,352 |
Richmond Pub. Util. Rev. Participating VRDN Series ROC II R 11262, 0.26% (Liquidity Facility Citibank NA) (c)(g) | 4,875 | | 4,875 |
Sussex County Indl. Dev. Auth. Solid Waste Disp. Rev. (Atlantic Waste Disp. Proj.) 0.28%, LOC JPMorgan Chase Bank, VRDN (c)(f) | 10,000 | | 10,000 |
Virginia College Bldg. Auth. Edl. Facilities Rev. Bonds Series 2010 A, 2% 9/1/11 | 4,460 | | 4,496 |
Virginia Hsg. Dev. Auth. Participating VRDN: | | | |
Series Merlots 06 B16, 0.33% (Liquidity Facility Wells Fargo Bank NA) (c)(f)(g) | 11,385 | | 11,385 |
Series Merlots 06 C3, 0.33% (Liquidity Facility Wells Fargo Bank NA) (c)(f)(g) | 4,190 | | 4,190 |
Virginia Hsg. Dev. Auth. Commonwealth Mtg. Rev.: | | | |
Participating VRDN: | | | |
Series BA 1046, 0.4% (Liquidity Facility Bank of America NA) (c)(f)(g) | 36,960 | | 36,960 |
Series BA 1047, 0.4% (Liquidity Facility Bank of America NA) (c)(f)(g) | 22,080 | | 22,080 |
Municipal Securities - continued |
| Principal Amount (000s) | | Value (000s) |
Virginia - continued |
Virginia Hsg. Dev. Auth. Commonwealth Mtg. Rev.: - continued | | | |
Bonds Series Merlots B20, 0.43%, tender 8/17/11 (Liquidity Facility Wells Fargo Bank NA) (c)(f)(g)(h) | $ 6,285 | | $ 6,285 |
Participating VRDN: | | | |
Series Merlots 06 07, 0.33% (Liquidity Facility Wells Fargo Bank NA) (c)(f)(g) | 3,785 | | 3,785 |
Series Merlots 06 B18, 0.33% (Liquidity Facility Wells Fargo Bank NA) (c)(f)(g) | 19,995 | | 19,995 |
Series Merlots 06 B21, 0.33% (Liquidity Facility Wells Fargo Bank NA) (c)(f)(g) | 8,285 | | 8,285 |
Series Merlots 07 C42, 0.33% (Liquidity Facility Wells Fargo Bank NA) (c)(f)(g) | 6,340 | | 6,340 |
Virginia Pub. Bldg. Auth. Pub. Facilities Rev. Bonds Series 2010 B1, 2% 8/1/11 | 7,565 | | 7,618 |
Virginia Pub. School Auth. Participating VRDN Series CTE 05 38, 0.26% (Liquidity Facility State Street Bank & Trust Co., Boston) (c)(g) | 17,955 | | 17,955 |
Virginia Resources Auth. Clean Wtr. Rev. Participating VRDN: | | | |
Series BBT 08 48, 0.25% (Liquidity Facility Branch Banking & Trust Co.) (c)(g) | 2,955 | | 2,955 |
Series PT 4634, 0.25% (Liquidity Facility Deutsche Postbank AG) (c)(g) | 11,935 | | 11,935 |
Series ROC II R 11923, 0.26% (Liquidity Facility Citibank NA) (c)(g) | 3,850 | | 3,850 |
Virginia Small Bus. Fing. (Children's Hosp. of The King's Daughters, Inc. Proj.) Series 2006, 0.28%, LOC Bank of America NA, VRDN (c) | 24,000 | | 24,000 |
| | 472,755 |
Washington - 4.4% |
Central Puget Sound Reg'l. Trans. Auth. Sales & Use Tax Rev. Participating VRDN Series Putters 2866, 0.26% (Liquidity Facility JPMorgan Chase Bank) (c)(g) | 8,280 | | 8,280 |
Chelan County Pub. Util. District #1 Rev. Participating VRDN Series Merlots 01 B1, 0.33% (Liquidity Facility Wells Fargo Bank NA) (c)(f)(g) | 26,990 | | 26,990 |
Energy Northwest Elec. Rev. Bonds (#3 Proj.) Series 2003 A, 5.5% 7/1/11 | 8,300 | | 8,443 |
Everett Indl. Dev. Corp. Exempt Facilities Rev. 0.33%, VRDN (c)(f) | 12,800 | | 12,800 |
King County Gen. Oblig.: | | | |
Bonds Series 2010 A, 2% 12/1/11 | 6,660 | | 6,741 |
Municipal Securities - continued |
| Principal Amount (000s) | | Value (000s) |
Washington - continued |
King County Gen. Oblig.: - continued | | | |
Participating VRDN Series DB 598, 0.26% (Liquidity Facility Deutsche Bank AG) (c)(g) | $ 3,505 | | $ 3,505 |
Participating VRDN Series ROC II R 11731, 0.26% (Liquidity Facility Citibank NA) (c)(g) | 9,810 | | 9,810 |
King County Hsg. Auth. Rev. (Overlake TOD Hsg. Proj.) 0.37%, LOC Bank of America NA, VRDN (c)(f) | 11,245 | | 11,245 |
Pierce County Econ. Dev. Corp. Spl. Rev. (Weyerhaeuser Real Estate Proj.) Series 1997 A, 0.24%, LOC Bank of America NA, VRDN (c) | 19,505 | | 19,505 |
Port Bellingham Indl. Dev. Corp. Envir. Facilities Indl. Rev. Bonds (BP West Coast Products LLC Proj.) 0.3% tender 3/17/11 (BP PLC Guaranteed), CP mode | 4,750 | | 4,750 |
Port of Seattle Gen. Oblig. Series 2002 B2, 0.33% 3/1/11, LOC Bayerische Landesbank Girozentrale, CP (f) | 10,455 | | 10,455 |
Port of Seattle Rev.: | | | |
Participating VRDN: | | | |
Series Putters 2020, 0.41% (Liquidity Facility JPMorgan Chase Bank) (c)(f)(g) | 7,455 | | 7,455 |
Series Putters 2553Z, 0.41% (Liquidity Facility JPMorgan Chase Bank) (c)(f)(g) | 5,135 | | 5,135 |
Series 1997, 0.26%, LOC Bank of America NA, VRDN (c)(f) | 24,000 | | 24,000 |
Series 2001 B1, 0.35% 4/8/11, LOC Bank of America NA, CP (f) | 12,200 | | 12,200 |
Series 2008, 0.28%, LOC Landesbank Hessen-Thuringen, VRDN (c)(f) | 190,715 | | 190,715 |
Port of Vancouver Rev. (United Grain Corp. of Oregon Proj.) Series 2009, 0.29%, LOC Bank of America NA, VRDN (c) | 6,000 | | 6,000 |
Seattle Muni. Lt. & Pwr. Rev. Bonds Series 2011 A: | | | |
1% 8/1/11 | 2,965 | | 2,970 |
1% 2/1/12 | 10,770 | | 10,827 |
Seattle Wtr. Sys. Rev. Participating VRDN: | | | |
Series MS 06 2170, 0.25% (Liquidity Facility Wells Fargo & Co.) (c)(g) | 2,530 | | 2,530 |
Series ROC II R 11144, 0.26% (Liquidity Facility Citibank NA) (c)(g) | 11,705 | | 11,705 |
Spokane County School District #81 Bonds Series 2010 A, 2% 12/1/11 (Washington Gen. Oblig. Guaranteed) | 10,500 | | 10,629 |
Vancouver Hsg. Auth. Rev. (Anthem Park at Uptown Village Proj.) 0.49%, LOC Bank of America NA, VRDN (c)(f) | 2,300 | | 2,300 |
Washington Econ. Dev. Fin. Auth. Econ. Dev. Rev.: | | | |
(Mount Ainstar Resort Proj.) Series 2003 C, 0.26%, LOC U.S. Bank NA, Minnesota, VRDN (c)(f) | 17,895 | | 17,895 |
Municipal Securities - continued |
| Principal Amount (000s) | | Value (000s) |
Washington - continued |
Washington Econ. Dev. Fin. Auth. Econ. Dev. Rev.: - continued | | | |
(Puget Sound Blood Ctr. Proj.) Series 2008 D, 0.25%, LOC Wells Fargo Bank NA, VRDN (c) | $ 7,200 | | $ 7,200 |
Washington Gen. Oblig.: | | | |
Participating VRDN: | | | |
Series DB 599, 0.26% (Liquidity Facility Deutsche Bank AG) (c)(g) | 4,835 | | 4,835 |
Series DB 606, 0.26% (Liquidity Facility Deutsche Bank AG) (c)(g) | 6,040 | | 6,040 |
Series Solar 06 13, 0.25% (Liquidity Facility U.S. Bank NA, Minnesota) (c)(g) | 33,645 | | 33,645 |
Series Putters 3501Z, 0.26% (Liquidity Facility JPMorgan Chase Bank) (c)(g) | 11,660 | | 11,660 |
Series Putters 3539, 0.26% (Liquidity Facility JPMorgan Chase Bank) (c)(g) | 10,000 | | 10,000 |
Series Putters 3854, 0.26% (Liquidity Facility JPMorgan Chase Bank) (c)(g) | 3,500 | | 3,500 |
Series 1996 A, 0.21% (Liquidity Facility Landesbank Hessen-Thuringen), VRDN (c) | 15,000 | | 15,000 |
Washington Health Care Facilities Auth. Rev.: | | | |
Bonds (Providence Health Systems Proj.) Series A, 5.5% 10/1/11 | 3,000 | | 3,086 |
(Children's Hosp. Reg'l. Med. Ctr. Proj.): | | | |
Series 2008 A, 0.3%, LOC Bank of America NA, VRDN (c) | 10,500 | | 10,500 |
Series 2008 B, 0.27%, LOC Bank of America NA, VRDN (c) | 54,100 | | 54,100 |
(Southwest Washington Med. Ctr.) Series 2008 A, 0.25%, LOC Union Bank of California, VRDN (c) | 30,100 | | 30,100 |
(Swedish Health Svcs. Proj.) Series 2009 C, 0.26%, LOC Bank of America NA, VRDN (c) | 55,000 | | 55,000 |
Participating VRDN Series Solar 07 66, 0.25% (Liquidity Facility U.S. Bank NA, Minnesota) (c)(g) | 19,735 | | 19,735 |
Washington Hsg. Fin. Commission Participating VRDN Series BC 10 10W, 0.3% (Liquidity Facility Barclays Bank PLC) (c)(f)(g) | 7,340 | | 7,340 |
Washington Hsg. Fin. Commission Multi-family Hsg. Rev.: | | | |
(Avalon Ridge Apts. Proj.) 0.29%, LOC Fannie Mae, VRDN (c)(f) | 18,755 | | 18,755 |
(Ballard Landmark Inn Proj.) Series A, 0.26%, LOC Fannie Mae, VRDN (c)(f) | 31,590 | | 31,590 |
Municipal Securities - continued |
| Principal Amount (000s) | | Value (000s) |
Washington - continued |
Washington Hsg. Fin. Commission Multi-family Hsg. Rev.: - continued | | | |
(Cedar Ridge Retirement Proj.) Series 2005 A, 0.27%, LOC Wells Fargo Bank NA, VRDN (c)(f) | $ 4,550 | | $ 4,550 |
(Crestview Apts. Proj.) 0.27%, LOC Fannie Mae, VRDN (c)(f) | 14,000 | | 14,000 |
(Echo Lake Sr. Apts. Proj.) 0.27%, LOC Fannie Mae, VRDN (c)(f) | 17,970 | | 17,970 |
(Fairwinds Redmond Proj.) Series A, 0.27%, LOC Bank of America NA, VRDN (c)(f) | 11,750 | | 11,750 |
(Gardens Univ. Village Apt. Proj.) Series A, 0.26%, LOC Bank of America NA, VRDN (c)(f) | 53,900 | | 53,900 |
(Highland Park Apts. Proj.) Series A, 0.29%, LOC Fannie Mae, VRDN (c)(f) | 9,040 | | 9,040 |
(Merrill Gardens at Renton Centre Proj.) Series A, 0.27%, LOC Fannie Mae, VRDN (c)(f) | 20,790 | | 20,790 |
(Pinehurst Apts. Proj.) Series A, 0.29%, LOC Fannie Mae, VRDN (c)(f) | 12,000 | | 12,000 |
(Seaport Landing Retirement Proj.) Series A, 0.3%, LOC Bank of America NA, VRDN (c)(f) | 11,880 | | 11,880 |
(Silver Creek Apts. Proj.) Series A, 0.28%, LOC Fannie Mae, VRDN (c)(f) | 8,150 | | 8,150 |
(The Cambridge Apts. Proj.) Series 2009, 0.25%, LOC Fannie Mae, VRDN (c) | 3,900 | | 3,900 |
(The Vintage at Everett Sr. Living Proj.) Series 2004 A, 0.27%, LOC Fannie Mae, VRDN (c)(f) | 15,750 | | 15,750 |
(The Vintage at Richland Sr. Living Proj.) Series 2004 A, 0.29%, LOC Fannie Mae, VRDN (c)(f) | 7,535 | | 7,535 |
(Vintage Mount Vernon Proj.) Series A, 0.29%, LOC Fannie Mae, VRDN (c)(f) | 7,500 | | 7,500 |
(Washington Terrace Sr. Apts. Proj.) Series 2010, 0.25%, LOC Fannie Mae, VRDN (c) | 3,750 | | 3,750 |
0.3%, LOC Bank of America NA, VRDN (c) | 17,175 | | 17,175 |
Washington Hsg. Fin. Commission Nonprofit Hsg. Rev. (Horizon House Proj.) Series 2005, 0.25%, LOC Wells Fargo Bank NA, VRDN (c) | 48,475 | | 48,475 |
Washington Hsg. Fin. Commission Nonprofit Rev. (YMCA of Pierce and Kitsap Countries Proj.) Series 2010 A, 0.25%, LOC Wells Fargo Bank NA, VRDN (c) | 6,470 | | 6,470 |
Washington Univ. Revs. Participating VRDN Series Solar 07 94, 0.25% (Liquidity Facility U.S. Bank NA, Minnesota) (c)(g) | 2,692 | | 2,692 |
| | 1,026,248 |
Municipal Securities - continued |
| Principal Amount (000s) | | Value (000s) |
West Virginia - 1.1% |
Grant County Cmnty. Solid Waste Disp. Rev. Bonds (Virginia Elec. & Pwr. Co. Proj.) Series 1996, 0.85% tender 3/16/11, CP mode (f) | $ 20,000 | | $ 20,000 |
Grant County Poll. Cont. Rev. Bonds (Virginia Elec. & Pwr. Co. Proj.) Series 1986, 1.4% tender 3/4/11, CP mode (f) | 7,400 | | 7,400 |
Harrison County Commission Solid Waste Disp. Rev. (Waste Mgmt., Inc. Proj.) Series A, 0.37%, LOC Bank of America NA, VRDN (c)(f) | 8,420 | | 8,420 |
Marion County Solid Waste Disp. Rev. (Grant Town Cogeneration Proj.): | | | |
Series 1990 A, 0.26%, LOC Deutsche Bank AG, VRDN (c)(f) | 7,530 | | 7,530 |
Series 1990 B, 0.26%, LOC Deutsche Bank AG, VRDN (c)(f) | 16,285 | | 16,285 |
Series 1990 C, 0.26%, LOC Deutsche Bank AG, VRDN (c)(f) | 700 | | 700 |
Series 1990 D, 0.26%, LOC Deutsche Bank AG, VRDN (c)(f) | 8,500 | | 8,500 |
West Virginia Econ. Dev. Auth. Solid Waste Disp. Facilities Rev.: | | | |
(Appalachian Pwr. Co. - Amos Proj.) Series 2009 A, 0.25%, LOC Royal Bank of Scotland PLC, VRDN (c) | 6,050 | | 6,050 |
(Appalachian Pwr. Co. - Mountaineer Proj.) Series 2008 A, 0.27%, LOC Royal Bank of Scotland PLC, VRDN (c)(f) | 75,000 | | 75,000 |
(Ohio Pwr. Co. - Mitchell Proj.) Series 2008 A, 0.25%, LOC Royal Bank of Scotland PLC, VRDN (c)(f) | 65,000 | | 65,000 |
(Ohio Pwr. Co. - Sporn Proj.) Series 2008 C, 0.25%, LOC JPMorgan Chase Bank, VRDN (c) | 35,000 | | 35,000 |
| | 249,885 |
Wisconsin - 0.9% |
Milwaukee Gen. Oblig.: | | | |
Series C2: | | | |
0.29% 3/15/11, LOC State Street Bank & Trust Co., Boston, CP | 14,000 | | 14,000 |
0.29% 5/3/11, LOC State Street Bank & Trust Co., Boston, CP | 18,000 | | 18,000 |
0.28% 4/15/11, LOC State Street Bank & Trust Co., Boston, CP | 8,000 | | 8,000 |
River Falls Indl. Dev. Rev. (Quadion Corp. Proj.) 0.31%, LOC U.S. Bank NA, Minnesota, VRDN (c)(f) | 1,315 | | 1,315 |
Wisconsin Gen. Oblig. Series 2006 A, 0.31% 4/8/11 (Liquidity Facility State Street Bank & Trust Co., Boston) (Liquidity Facility California Teachers Retirement Sys.), CP | 20,000 | | 20,000 |
Wisconsin Health & Edl. Facilities Auth. Rev.: | | | |
(Gundersen Lutheran Proj.): | | | |
Series 2009 A, 0.27%, LOC JPMorgan Chase Bank, VRDN (c) | 17,000 | | 17,000 |
Municipal Securities - continued |
| Principal Amount (000s) | | Value (000s) |
Wisconsin - continued |
Wisconsin Health & Edl. Facilities Auth. Rev.: - continued | | | |
(Gundersen Lutheran Proj.): | | | |
Series 2009 B, 0.27%, LOC JPMorgan Chase Bank, VRDN (c) | $ 13,000 | | $ 13,000 |
Participating VRDN ROC II R 11837, 0.26% (Liquidity Facility Citibank NA) (c)(g) | 7,000 | | 7,000 |
Wisconsin Hsg. & Econ. Dev. Auth. Home Ownership Rev.: | | | |
Series 2002 I, 0.27% (Liquidity Facility Fannie Mae) (Liquidity Facility Freddie Mac), VRDN (c)(f) | 29,600 | | 29,600 |
Series 2003 B, 0.28% (Liquidity Facility Fannie Mae) (Liquidity Facility Freddie Mac), VRDN (c)(f) | 1,810 | | 1,810 |
Wisconsin Hsg. and Econ. Dev. Auth. Multifamily Hsg. Rev.: | | | |
Series 2007 A, 0.29% (Liquidity Facility Fannie Mae) (Liquidity Facility Freddie Mac), VRDN (c)(f) | 7,400 | | 7,400 |
Series 2008 A, 0.26% (Liquidity Facility Fannie Mae) (Liquidity Facility Freddie Mac), VRDN (c) | 10,785 | | 10,785 |
Wisconsin Trans. Rev.: | | | |
Series 1997 A: | | | |
0.31% 4/7/11 (Liquidity Facility State Street Bank & Trust Co., Boston) (Liquidity Facility California Teachers Retirement Sys.), CP | 19,149 | | 19,149 |
0.32% 3/11/11 (Liquidity Facility State Street Bank & Trust Co., Boston) (Liquidity Facility California Teachers Retirement Sys.), CP | 14,499 | | 14,499 |
Series 2006 A: | | | |
0.3% 3/8/11 (Liquidity Facility State Street Bank & Trust Co., Boston) (Liquidity Facility California Teachers Retirement Sys.), CP | 13,465 | | 13,465 |
0.31% 4/8/11 (Liquidity Facility State Street Bank & Trust Co., Boston) (Liquidity Facility California Teachers Retirement Sys.), CP | 7,500 | | 7,500 |
| | 202,523 |
Wyoming - 0.2% |
Laramie County Indl. Dev. Rev. (Cheyenne Lt., Fuel & Pwr. Co. Proj.) Series 2009 A, 0.32%, LOC Wells Fargo Bank NA, San Francisco, VRDN (c)(f) | 5,000 | | 5,000 |
Sweetwater County Poll. Cont. Rev. (PacifiCorp Proj.) Series 1994, 0.25%, LOC Wells Fargo Bank NA, VRDN (c) | 3,750 | | 3,750 |
Wyoming Cmnty. Dev. Auth. Hsg. Rev.: | | | |
Series 2003-4, 0.3% (Liquidity Facility Fannie Mae) (Liquidity Facility Freddie Mac), VRDN (c)(f) | 5,000 | | 5,000 |
Series 2004-3, 0.3% (Liquidity Facility Fannie Mae) (Liquidity Facility Freddie Mac), VRDN (c)(f) | 5,000 | | 5,000 |
Municipal Securities - continued |
| Principal Amount (000s) | | Value (000s) |
Wyoming - continued |
Wyoming Cmnty. Dev. Auth. Hsg. Rev.: - continued | | | |
Series 2005-4, 0.3% (Liquidity Facility Fannie Mae) (Liquidity Facility Freddie Mac), VRDN (c)(f) | $ 8,000 | | $ 8,000 |
Series 2006-2, 0.3% (Liquidity Facility Fannie Mae) (Liquidity Facility Freddie Mac), VRDN (c)(f) | 8,000 | | 8,000 |
Series 2008-2, 0.3% (Liquidity Facility Fannie Mae) (Liquidity Facility Freddie Mac), VRDN (c)(f) | 13,000 | | 13,000 |
| | 47,750 |
| Shares | | |
Other - 14.7% |
Fidelity Municipal Cash Central Fund, 0.25% (d)(e) | 3,436,917,134 | | 3,436,917 |
TOTAL INVESTMENT PORTFOLIO - 99.8%
(Cost $23,347,849) | | 23,347,849 |
NET OTHER ASSETS (LIABILITIES) - 0.2% | | 35,440 |
NET ASSETS - 100% | $ 23,383,289 |
Security Type Abbreviations |
BAN | - | BOND ANTICIPATION NOTE |
CP | - | COMMERCIAL PAPER |
RAN | - | REVENUE ANTICIPATION NOTE |
TAN | - | TAX ANTICIPATION NOTE |
TRAN | - | TAX AND REVENUE ANTICIPATION NOTE |
VRDN | - | VARIABLE RATE DEMAND NOTE (A debt instrument that is payable upon demand, either daily, weekly, or monthly) |
Legend |
(a) Security exempt from registration under Rule 144A of the Securities Act of 1933. These securities may be resold in transactions exempt from registration, normally to qualified institutional buyers. At the end of the period, the value of these securities amounted to $71,450,000 or 0.3% of net assets. |
(b) Security or a portion of the security purchased on a delayed delivery or when-issued basis. |
(c) Coupon rates for floating and adjustable rate securities reflect the rates in effect at period end. |
(d) Information in this report regarding holdings by state and security types does not reflect the holdings of the Fidelity Municipal Cash Central Fund. |
(e) Affiliated fund that is available only to investment companies and other accounts managed by Fidelity Investments. The rate quoted is the annualized seven-day yield of the fund at period end. A complete unaudited listing of the fund's holdings as of its most recent quarter end is available upon request. In addition, each Fidelity Central Fund's financial statements are available on the SEC's website or upon request. |
(f) Private activity obligations whose interest is subject to the federal alternative minimum tax for individuals. |
(g) Provides evidence of ownership in one or more underlying municipal bonds. |
(h) Restricted securities - Investment in securities not registered under the Securities Act of 1933 (excluding 144A issues). At the end of the period, the value of restricted securities (excluding 144A issues) amounted to $111,090,000 or 0.5% of net assets. |
Additional information on each restricted holding is as follows: |
Security | Acquisition
Date | Acquisition
Cost (000s) |
Alabama Hsg. Fin. Auth. Single Family Mtg. Rev. Bonds Series Merlots 01 A38, 0.43%, tender 8/17/11 (Liquidity Facility Wells Fargo Bank NA) | 4/19/01 | $ 3,465 |
Security | Acquisition
Date | Acquisition
Cost (000s) |
Auburn Univ. Gen. Fee Rev. Bonds Series WF 08 55C, 0.38%, tender 8/18/11 (Liquidity Facility Wells Fargo & Co.) | 10/2/08 | $ 23,570 |
DuPage County Gen. Oblig. Bonds Series Merlots 00 A9, 0.38%, tender 8/17/11 (Liquidity Facility Wells Fargo Bank NA) | 7/13/09 | $ 9,720 |
Mississippi Hosp. Equip. & Facilities Auth. Bonds (Baptist Memorial Health Care Proj.) Series 2004 B2, 0.35%, tender 7/6/11 | 1/5/11 | $ 26,810 |
Salem-Keizer School District #24J Bonds Series WF 09 4Z, 0.38%, tender 8/18/11 (Liquidity Facility Wells Fargo & Co.) | 3/19/09 -
1/7/11 | $ 15,285 |
Vermont Edl. & Health Bldg. Fin. Agcy. Rev. Bonds Series WF 10 27C, 0.37%, tender 5/4/11 (Liquidity Facility Wells Fargo Bank NA) | 11/4/10 -
12/15/10 | $ 25,955 |
Virginia Hsg. Dev. Auth. Commonwealth Mtg. Rev. Bonds Series Merlots B20, 0.43%, tender 8/17/11 (Liquidity Facility Wells Fargo Bank NA) | 1/20/09 | $ 6,285 |
Affiliated Central Funds |
Information regarding fiscal year to date income earned by the Fund from investments in Fidelity Central Funds is as follows: |
Fund | Income earned
(Amounts in thousands) |
Fidelity Municipal Cash Central Fund | $ 3,797 |
Other Information |
The date shown for securities represents the date when principal payments must be paid, taking into account any call options exercised by the issuer and any permissible maturity shortening features other than interest rate resets. |
All investments are categorized as Level 2 under the Fair Value Hierarchy. The inputs or methodology used for valuing securities may not be an indication of the risk associated with investing in those securities. For more information on valuation inputs, please refer to the Security Valuation section in the accompanying Notes to Financial Statements. |
See accompanying notes which are an integral part of the financial statements.
Semiannual Report
Statement of Assets and Liabilities
Amounts in thousands (except per-share amount) | February 28, 2011 (Unaudited) |
| | |
Assets | | |
Investment in securities, at value - See accompanying schedule: Unaffiliated issuers (cost $19,910,932) | $ 19,910,932 | |
Fidelity Central Funds (cost $3,436,917) | 3,436,917 | |
Total Investments (cost $23,347,849) | | $ 23,347,849 |
Cash | | 936 |
Receivable for fund shares sold | | 456,743 |
Interest receivable | | 20,506 |
Distributions receivable from Fidelity Central Funds | | 640 |
Prepaid expenses | | 43 |
Other receivables | | 200 |
Total assets | | 23,826,917 |
| | |
Liabilities | | |
Payable for investments purchased
Regular delivery | $ 19,471 | |
Delayed delivery | 23,100 | |
Payable for fund shares redeemed | 392,607 | |
Distributions payable | 2 | |
Accrued management fee | 5,143 | |
Other affiliated payables | 3,134 | |
Other payables and accrued expenses | 171 | |
Total liabilities | | 443,628 |
| | |
Net Assets | | $ 23,383,289 |
Net Assets consist of: | | |
Paid in capital | | $ 23,382,750 |
Undistributed net investment income | | 23 |
Accumulated undistributed net realized gain (loss) on investments | | 516 |
Net Assets, for 23,377,423 shares outstanding | | $ 23,383,289 |
Net Asset Value, offering price and redemption price per share ($23,383,289 ÷ 23,377,423 shares) | | $ 1.00 |
See accompanying notes which are an integral part of the financial statements.
Semiannual Report
Financial Statements - continued
Statement of Operations
Amounts in thousands | Six months ended February 28, 2011 (Unaudited) |
| | |
Investment Income | | |
Interest | | $ 32,807 |
Income from Fidelity Central Funds | | 3,797 |
Total income | | 36,604 |
| | |
Expenses | | |
Management fee | $ 30,313 | |
Transfer agent fees | 17,162 | |
Accounting fees and expenses | 672 | |
Custodian fees and expenses | 157 | |
Independent trustees' compensation | 45 | |
Registration fees | 216 | |
Audit | 31 | |
Legal | 54 | |
Miscellaneous | 66 | |
Total expenses before reductions | 48,716 | |
Expense reductions | (13,266) | 35,450 |
Net investment income (loss) | | 1,154 |
Realized and Unrealized Gain (Loss) Net realized gain (loss) on: | | |
Investment securities: | | |
Unaffiliated issuers | | 247 |
Net increase in net assets resulting from operations | | $ 1,401 |
See accompanying notes which are an integral part of the financial statements.
Semiannual Report
Statement of Changes in Net Assets
Amounts in thousands | Six months ended
February 28, 2011
(Unaudited) | Year ended
August 31,
2010 |
Increase (Decrease) in Net Assets | | |
Operations | | |
Net investment income (loss) | $ 1,154 | $ 2,920 |
Net realized gain (loss) | 247 | 830 |
Net increase in net assets resulting
from operations | 1,401 | 3,750 |
Distributions to shareholders from net investment income | (1,131) | (2,776) |
Distributions to shareholders from net realized gain | - | (237) |
Total distributions | (1,131) | (3,013) |
Share transactions at net asset value of $1.00 per share
Proceeds from sales of shares | 41,444,848 | 78,309,889 |
Reinvestment of distributions | 1,118 | 2,980 |
Cost of shares redeemed | (40,432,546) | (80,473,972) |
Net increase (decrease) in net assets and shares resulting from share transactions | 1,013,420 | (2,161,103) |
Total increase (decrease) in net assets | 1,013,690 | (2,160,366) |
| | |
Net Assets | | |
Beginning of period | 22,369,599 | 24,529,965 |
End of period (including undistributed net investment income of $23 and $0, respectively) | $ 23,383,289 | $ 22,369,599 |
See accompanying notes which are an integral part of the financial statements.
Semiannual Report
Financial Highlights
| Six months ended
February 28, 2011 | Years ended August 31, |
| (Unaudited) | 2010 | 2009 | 2008 | 2007 | 2006 |
Selected Per-Share Data | | | | | |
Net asset value, beginning of period | $ 1.00 | $ 1.00 | $ 1.00 | $ 1.00 | $ 1.00 | $ 1.00 |
Income from Investment Operations | | | | | | |
Net investment income (loss) | - G | - G | .008 | .024 | .033 | .028 |
Net realized and unrealized gain (loss) G | - | - | - | - | - | - |
Total from investment operations | - G | - G | .008 | .024 | .033 | .028 |
Distributions from net investment income | - G | -G | (.008) | (.024) | (.033) | (.028) |
Distribution from net realized gain | - | - G | - G | - G | - | - |
Total distributions | - G | -G | (.008) | (.024) | (.033) | (.028) |
Net asset value, end of period | $ 1.00 | $ 1.00 | $ 1.00 | $ 1.00 | $ 1.00 | $ 1.00 |
Total Return B,C | .00% E | .01% | .77% | 2.39% | 3.33% | 2.85% |
Ratios to Average Net Assets D,F | | | | | |
Expenses before reductions | .43% A | .43% | .47% | .43% | .43% | .44% |
Expenses net of fee waivers, if any | .31% A | .34% | .47% | .43% | .43% | .44% |
Expenses net of all reductions | .31% A | .34% | .46% | .34% | .31% | .33% |
Net investment income (loss) | .01% A | .01% | .76% | 2.32% | 3.29% | 2.81% |
Supplemental Data | | | | | | |
Net assets, end of period (in millions) | $ 23,383 | $ 22,370 | $ 24,530 | $ 23,700 | $ 18,677 | $ 17,022 |
A Annualized
B Total returns for periods of less than one year are not annualized.
C Total returns would have been lower had certain expenses not been reduced during the periods shown.
D Fees and expenses of the underlying Fidelity Central Funds are not included in the Fund's expense ratio. The Fund indirectly bears its proportionate share of the expenses of any underlying Fidelity Central Funds.
E Amount represents less than .01%.
F Expense ratios reflect operating expenses of the Fund. Expenses before reductions do not reflect amounts reimbursed or waived or reductions from expense offset arrangements and do not represent the amount paid by the Fund during periods when reimbursements, waivers or reductions occur. Expenses net of fee waivers reflect expenses after reimbursement and waivers but prior to reductions from expense offset arrangements. Expenses net of all reductions represent the net expenses paid by the Fund.
G Amount represents less than $.001 per share.
See accompanying notes which are an integral part of the financial statements.
Semiannual Report
Notes to Financial Statements
For the period ended February 28, 2011 (Unaudited)
(Amounts in thousands except ratios)
1. Organization.
Fidelity Municipal Money Market Fund (the Fund) is a fund of Fidelity Union Street Trust II (the Trust) and is authorized to issue an unlimited number of shares. The Trust is registered under the Investment Company Act of 1940, as amended (the 1940 Act), as an open-end management investment company organized as a Delaware statutory trust.
2. Investments in Fidelity Central Funds.
The Fund may invest in Fidelity Central Funds, which are open-end investment companies available only to other investment companies and accounts managed by Fidelity Management & Research Company (FMR) and its affiliates. The Fund's Schedule of Investments lists each of the Fidelity Central Funds held as of period end, if any, as an investment of the Fund, but does not include the underlying holdings of each Fidelity Central Fund. As an Investing Fund, the Fund indirectly bears its proportionate share of the expenses of the underlying Fidelity Central Funds.
The Money Market Central Funds seek preservation of capital and current income and are managed by Fidelity Investments Money Management, Inc. (FIMM), an affiliate of FMR.
A complete unaudited list of holdings for each Fidelity Central Fund is available upon request or at the Securities and Exchange Commission (the SEC) web site at www.sec.gov. In addition, the financial statements of the Fidelity Central Funds, are available on the SEC web site or upon request.
3. Significant Accounting Policies.
The financial statements have been prepared in conformity with accounting principles generally accepted in the United States of America (GAAP), which require management to make certain estimates and assumptions at the date of the financial statements. Actual results could differ from those estimates. Subsequent events, if any, through the date that the financial statements were issued have been evaluated in the preparation of the financial statements. The following summarizes the significant accounting policies of the Fund:
Security Valuation. The Fund categorizes the inputs to valuation techniques used to value its investments into a disclosure hierarchy consisting of three levels as shown below.
Level 1 - quoted prices in active markets for identical investments
Level 2 - other significant observable inputs (including quoted prices for similar investments, interest rates, prepayment speeds, etc.)
Level 3 - unobservable inputs (including the Fund's own assumptions based on the best information available)
Semiannual Report
Notes to Financial Statements (Unaudited) - continued
(Amounts in thousands except ratios)
3. Significant Accounting Policies - continued
Security Valuation - continued
As permitted by compliance with certain conditions under Rule 2a-7 of the 1940 Act, securities are valued at amortized cost, which approximates fair value, and are categorized as Level 2 in the hierarchy.
Investment Transactions and Income. The net asset value per share for processing shareholder transactions is calculated as of the close of business of the New York Stock Exchange (NYSE), normally 4:00 p.m. Eastern time. Security transactions, including the Fund's investment activity in the Fidelity Central Funds, are accounted for as of trade date. Gains and losses on securities sold are determined on the basis of identified cost. Interest income and distributions from the Fidelity Central Funds are accrued as earned. Interest income includes coupon interest and amortization of premium and accretion of discount on debt securities.
Expenses. Expenses directly attributable to a fund are charged to that fund. Expenses attributable to more than one fund are allocated among the respective funds on the basis of relative net assets or other appropriate methods. Expense estimates are accrued in the period to which they relate and adjustments are made when actual amounts are known.
Deferred Trustee Compensation. Under a Deferred Compensation Plan (the Plan), independent Trustees may elect to defer receipt of a portion of their annual compensation. Deferred amounts are invested in a cross-section of Fidelity funds, are marked-to-market and remain in the Fund until distributed in accordance with the Plan. The investment of deferred amounts and the offsetting payable to the Trustees are included in the accompanying Statement of Assets and Liabilities.
Income Tax Information and Distributions to Shareholders. Each year the Fund intends to qualify as a regulated investment company, including distributing substantially all of its taxable income and realized gains under Subchapter M of the Internal Revenue Code and filing its U.S. federal tax return. As a result, no provision for income taxes is required. A fund's federal tax return is subject to examination by the Internal Revenue Service (IRS) for a period of three years.
Dividends are declared and recorded daily and paid monthly from net investment income. Distributions from realized gains, if any, are declared and recorded on the ex-dividend date. Income and capital gain distributions are determined in accordance with income tax regulations, which may differ from GAAP.
Semiannual Report
3. Significant Accounting Policies - continued
Income Tax Information and Distributions to Shareholders - continued
Capital accounts within the financial statements are adjusted for permanent book-tax differences. These adjustments have no impact on net assets or the results of operations. Temporary book-tax differences will reverse in a subsequent period.
Book-tax differences are primarily due to deferred trustees compensation.
The Fund purchases municipal securities whose interest, in the opinion of the issuer, is free from federal income tax. There is no assurance that the IRS will agree with this opinion. In the event the IRS determines that the issuer does not comply with relevant tax requirements, interest payments from a security could become federally taxable, possibly retroactively to the date the security was issued.
The federal tax cost of investment securities and unrealized appreciation (depreciation) as of period end were as follows:
Gross unrealized appreciation | $ - |
Gross unrealized depreciation | - |
Net unrealized appreciation (depreciation) | $ - |
| |
Tax cost | $ 23,347,849 |
4. Operating Policies.
Delayed Delivery Transactions and When-Issued Securities. The Fund may purchase or sell securities on a delayed delivery or when-issued basis. Payment and delivery may take place after the customary settlement period for that security. The price of the underlying securities and the date when the securities will be delivered and paid for are fixed at the time the transaction is negotiated. During the time a delayed delivery sell is outstanding, equivalent deliverable securities are held for the transaction. The securities purchased on a delayed delivery or when-issued basis are identified as such in the Fund's Schedule of Investments. The Fund may receive compensation for interest forgone in the purchase of a delayed delivery or when-issued security. With respect to purchase commitments, the Fund identifies securities as segregated in its records with a value at least equal to the amount of the commitment. Losses may arise due to changes in the value of the underlying securities or if the counterparty does not perform under the contract's terms, or if the issuer does not issue the securities due to political, economic, or other factors.
Semiannual Report
Notes to Financial Statements (Unaudited) - continued
(Amounts in thousands except ratios)
4. Operating Policies - continued
Restricted Securities. The Fund may invest in securities that are subject to legal or contractual restrictions on resale. These securities generally may be resold in transactions exempt from registration or to the public if the securities are registered. Disposal of these securities may involve time-consuming negotiations and expense, and prompt sale at an acceptable price may be difficult. Information regarding restricted securities is included at the end of the Fund's Schedule of Investments.
5. Fees and Other Transactions with Affiliates.
Management Fee. FMR and its affiliates provide the Fund with investment management related services for which the Fund pays a monthly management fee. The management fee is the sum of an individual fund fee rate that is based on an annual rate of .15% of the Fund's average net assets and a group fee rate that averaged .12% during the period. The group fee rate is based upon the average net assets of all the mutual funds advised by FMR. The group fee rate decreases as assets under management increase and increases as assets under management decrease. For the period, the total annualized management fee rate was .27% of the Fund's average net assets.
Transfer Agent and Accounting Fees. Citibank, N.A. (Citibank) is the custodian, transfer agent and servicing agent for the Fund. Citibank has entered into a sub-arrangement with Fidelity Investments Institutional Operations Company, Inc. (FIIOC), an affiliate of FMR, under which FIIOC performs the activities associated with the Fund's transfer agency, dividend disbursing and shareholder servicing functions. The Fund pays account fees and asset-based fees that vary according to account size and type of account. FIIOC pays for typesetting, printing and mailing of shareholder reports, except proxy statements. For the period, transfer agent fees were equivalent to an annualized rate of .15% of average net assets.
Citibank also has a sub-arrangement with Fidelity Service Company, Inc. (FSC), an affiliate of FMR, under which FSC maintains the Fund's accounting records. The fee is based on the level of average net assets for the month.
6. Expense Reductions.
FMR or its affiliates voluntarily agreed to waive certain fees in order to maintain a minimum annualized yield of .01%. Such arrangements may be discontinued by FMR at any time. For the period, the amount of the waiver was $13,260.
In addition, through arrangements with the Fund's custodian, credits realized as a result of uninvested cash balances were used to reduce the Fund's expenses. During the period, these credits reduced the Fund's custody expenses by $6.
Semiannual Report
7. Other.
The Fund's organizational documents provide former and current trustees and officers with a limited indemnification against liabilities arising in connection with the performance of their duties to the Fund. In the normal course of business, the Fund may also enter into contracts that provide general indemnifications. The Fund's maximum exposure under these arrangements is unknown as this would be dependent on future claims that may be made against the Fund. The risk of material loss from such claims is considered remote.
Semiannual Report
Board Approval of Investment Advisory Contracts and Management Fees
Fidelity Municipal Money Market Fund
Each year, the Board of Trustees, including the Independent Trustees (together, the Board), votes on the renewal of the management contract and sub-advisory agreements (together, the Advisory Contracts) for the fund. The Board, assisted by the advice of fund counsel and Independent Trustees' counsel, requests and considers a broad range of information relevant to the renewal of the Advisory Contracts throughout the year.
The Board meets regularly and considers at each of its meetings factors that are relevant to its annual consideration of the renewal of the fund's Advisory Contracts, including the services and support provided to the fund and its shareholders. The Board has established three standing committees, each composed of Independent Trustees with varying backgrounds, to which the Board has assigned specific subject matter responsibilities in order to enhance effective decision-making by the Board. The Operations Committee, of which all of the Independent Trustees are members, meets regularly throughout the year and, among other matters, considers matters specifically related to the annual consideration of the renewal of the fund's Advisory Contracts. The Board, acting directly and through its Committees, requests and receives information concerning the annual consideration of the renewal of the fund's Advisory Contracts. The Board also meets as needed to consider matters specifically related to the Board's annual consideration of the renewal of Advisory Contracts. Members of the Board may also meet with trustees of other Fidelity funds through ad hoc joint committees to discuss certain matters relevant to the Fidelity funds.
At its September 2010 meeting, the Board of Trustees, including the Independent Trustees, unanimously determined to renew the fund's Advisory Contracts. In reaching its determination, the Board considered all factors it believed relevant, including (i) the nature, extent, and quality of the services to be provided to the fund and its shareholders (including the investment performance of the fund); (ii) the competitiveness of the fund's management fee and total expenses; (iii) the total costs of the services to be provided by and the profits to be realized by Fidelity from its relationship with the fund; (iv) the extent to which economies of scale would be realized as the fund grows; and (v) whether fee levels reflect these economies of scale, if any, for the benefit of fund shareholders.
In considering whether to renew the Advisory Contracts for the fund, the Board reached a determination, with the assistance of fund counsel and Independent Trustees' counsel and through the exercise of its business judgment, that the renewal of the Advisory Contracts is in the best interests of the fund and its shareholders and that the compensation to be received by Fidelity under the management contract is fair and reasonable. The Board's decision to renew the Advisory Contracts was not based on any single factor, but rather was based on a comprehensive consideration of all the information provided to the Board at its meetings throughout the year. The Board, in reaching its determination to renew the Advisory Contracts, is aware that shareholders in the fund have a broad range of investment choices available to them, including a wide choice among mutual funds offered by Fidelity's competitors, and that the fund's shareholders, with the opportunity to review and weigh the disclosure provided by the fund in its prospectus and other public disclosures, have chosen to invest in this fund, managed by Fidelity.
Semiannual Report
Board Approval of Investment Advisory Contracts and
Management Fees - continued
Nature, Extent, and Quality of Services Provided. The Board considered the staffing within the investment adviser, FMR, and the sub-advisers (together, the Investment Advisers), including the backgrounds of the fund's investment personnel and the fund's investment objective and discipline. The Independent Trustees also had discussions with senior management of Fidelity's investment operations and investment groups. The Board considered the structure of the portfolio manager compensation program and whether this structure provides appropriate incentives to act in the best interest of the fund.
Resources Dedicated to Investment Management and Support Services. The Board reviewed the size, education, and experience of the Investment Advisers' investment staff, their use of technology, and the Investment Advisers' approach to recruiting, training, and retaining portfolio managers and other research, advisory, and management personnel. The Board noted that Fidelity's analysts have access to a variety of technological tools and market and securities data that enable them to perform both fundamental and quantitative analysis and to specialize in various disciplines. The Board considered Fidelity's extensive global research capabilities that enable the Investment Advisers to aggregate data from various sources in an effort to produce positive investment results. The Board also considered that Fidelity's portfolio managers and analysts have access to daily portfolio attribution that allows for monitoring of a fund's portfolio, as well as an electronic communication system that provides immediate real-time access to research concerning issuers and credit enhancers. In addition, the Board considered the trading resources that are an integral part of the fixed-income portfolio management investment process.
Shareholder and Administrative Services. The Board considered (i) the nature, extent, quality, and cost of advisory, administrative, and shareholder services performed by the Investment Advisers and their affiliates under the Advisory Contracts and under separate agreements covering transfer agency and pricing and bookkeeping services for the fund; (ii) the nature and extent of the investment adviser's supervision of third party service providers, principally custodians and subcustodians; and (iii) the resources devoted to, and the record of compliance with, the fund's compliance policies and procedures.
The Board noted that the growth of fund assets over time across the complex allows Fidelity to reinvest in the development of services designed to enhance the value or convenience of the Fidelity funds as investment vehicles. These services include 24-hour access to account information and market information through telephone representatives and over the Internet, and investor education materials and asset allocation tools.
Semiannual Report
Investment in a Large Fund Family. The Board considered the benefits to shareholders of investing in a Fidelity fund, including the benefits of investing in a fund that is part of a large family of funds offering a variety of investment disciplines and providing a large variety of mutual fund investor services. The Board noted that Fidelity had taken, or had made recommendations that resulted in the Fidelity funds taking, a number of actions over the previous year that benefited particular funds, including (i) dedicating additional resources to investment research and restructuring and broadening the focus of the investment research teams; (ii) bolstering the senior management team that oversees asset management; (iii) launching Class F of certain funds as a lower-fee class available to Freedom K and Freedom Index Funds; (iv) lowering the initial investment minimums and ongoing balance requirements for Real Estate High Income Fund; (v) eliminating subsequent purchase minimums for all funds and adding a waiver of the investment minimum requirement for new accounts opened with the proceeds of a systematic withdrawal plan; (vi) eliminating the withdrawal minimum and maximum limits for systematic withdrawals from Advisor funds; (vii) expanding sales load waivers on Class A shares for Destiny Planholders and expanding Institutional Class eligibility for Class O Destiny Planholders; and (viii) changing certain Class A and Class T sales charge structures to further align them with industry practices.
Investment Performance. The Board considered whether the fund has operated in accordance with its investment objective, as well as its record of compliance with its investment restrictions. It also reviewed the fund's absolute investment performance, as well as the fund's relative investment performance measured over multiple periods against a peer group of mutual funds deemed appropriate by Fidelity and reviewed by the Board. The following charts considered by the Board show, over the one-, three-, and five-year periods ended December 31, 2009, the fund's cumulative total returns and a range of cumulative total returns of a peer group of mutual funds identified by Lipper Inc. as having an investment objective similar to that of the fund. The box within each chart shows the 25th percentile return (bottom of box) and the 75th percentile return (top of box) of the peer group. Returns shown above the box are in the first quartile and returns shown below the box are in the fourth quartile. The percentage beaten number noted below each chart corresponds to the percentile box and represents the percentage of funds in the peer group whose performance was equal to or lower than that of the fund.
Semiannual Report
Board Approval of Investment Advisory Contracts and
Management Fees - continued
Fidelity Municipal Money Market Fund
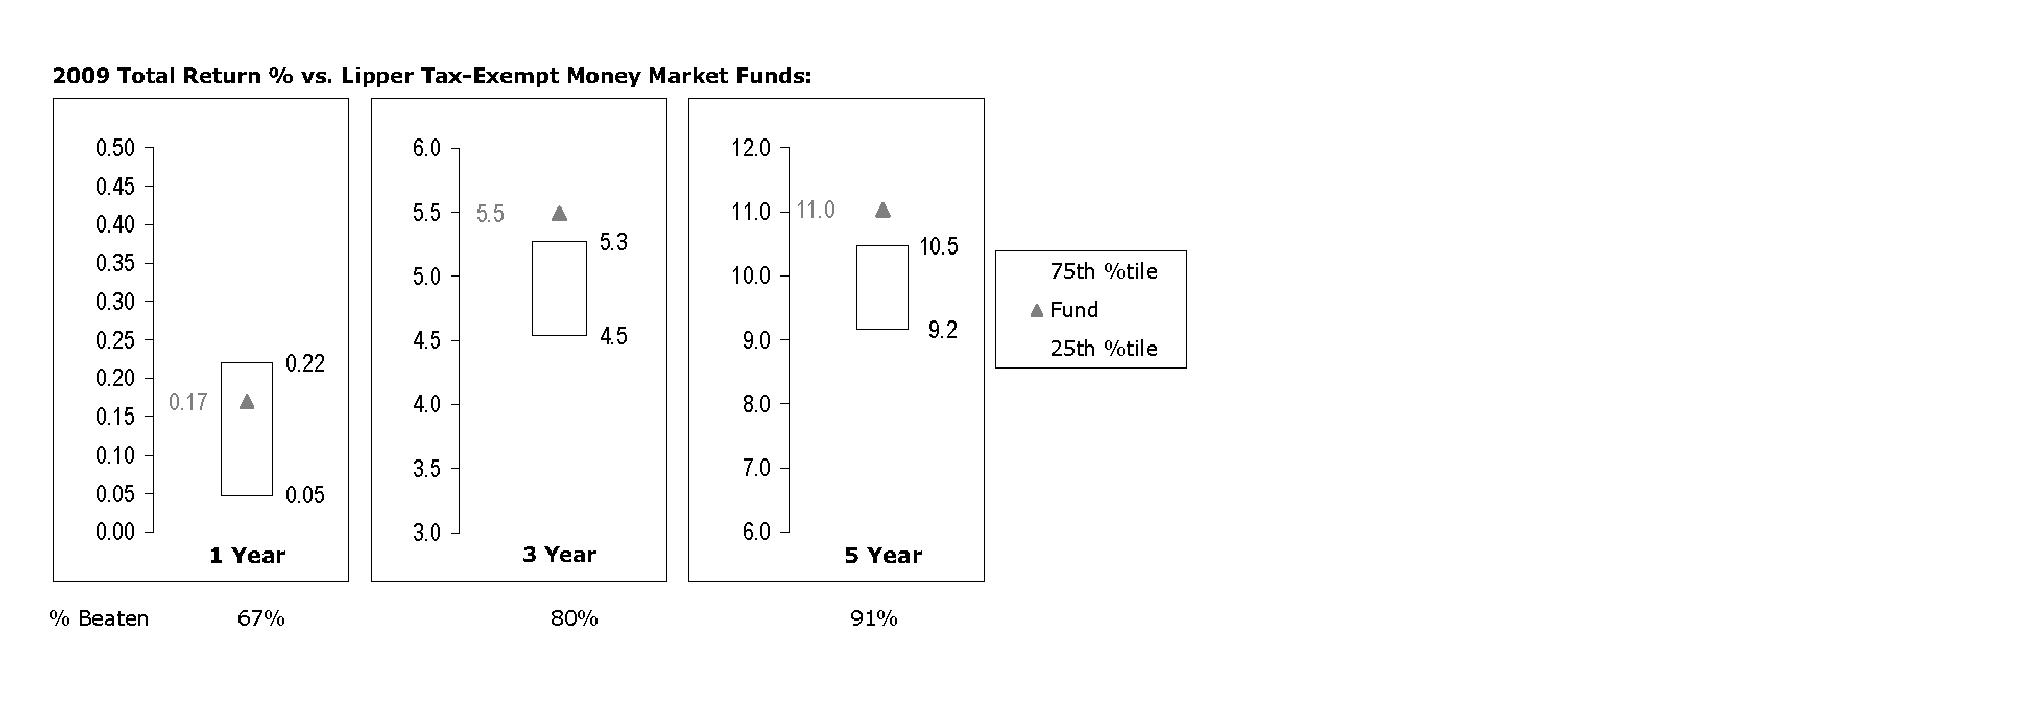
The Board reviewed the fund's relative investment performance against its peer group and noted that the performance of the fund was in the second quartile for the one-year period and the first quartile for the three- and five- year periods. The Board considered that FMR had taken steps to provide shareholders with stability of principal and to enhance safety and liquidity, which contributed to the fund's weakened performance relative to its peer group. The Board also reviewed the fund's performance since inception as well as performance in the current year.
Based on its review, and giving particular weight to the nature and quality of the resources dedicated by the Investment Advisers to maintain and improve relative performance and factoring in the unprecedented market events in recent years, the Board concluded that the nature, extent, and quality of investment management and support services and of shareholder and administrative services provided to the fund will benefit the fund's shareholders, particularly in light of the Board's view that the fund's shareholders benefit from investing in a fund that is part of a large family of funds offering a variety of investment disciplines and services.
Competitiveness of Management Fee and Total Fund Expenses. The Board considered the fund's management fee and total expenses compared to "mapped groups" of competitive funds and classes. Fidelity creates "mapped groups" by combining similar Lipper investment objective categories that have comparable management fee characteristics. Combining Lipper investment objective categories aids the Board's management fee and total expense comparisons by broadening the competitive group used for comparison and by reducing the number of universes to which various Fidelity funds are compared.
Semiannual Report
Management Fee. The Board considered two proprietary management fee comparisons for the 12-month periods shown in the chart below. The group of Lipper funds used by the Board for management fee comparisons is referred to below as the "Total Mapped Group" and, for the reasons explained above, is broader than the Lipper peer group used by the Board for performance comparisons. The Total Mapped Group comparison focuses on a fund's standing relative to the total universe of comparable funds available to investors, in terms of gross management fees before expense reimbursements or caps. "TMG %" represents the percentage of funds in the Total Mapped Group that had management fees that were lower than the fund's. For example, a TMG % of 23% means that 77% of the funds in the Total Mapped Group had higher management fees than the fund. The "Asset-Size Peer Group" (ASPG) comparison focuses on a fund's standing relative to non-Fidelity funds similar in size to the fund within the Total Mapped Group. The ASPG represents at least 15% of the funds in the Total Mapped Group with comparable asset size and management fee characteristics, subject to a minimum of 50 funds (or all funds in the Total Mapped Group if fewer than 50). Additional information, such as the ASPG quartile in which the fund's management fee ranked, is also included in the chart and considered by the Board.
Fidelity Municipal Money Market Fund
The Board noted that the fund's management fee ranked below the median of its Total Mapped Group and below the median of its ASPG for 2009.
Semiannual Report
Board Approval of Investment Advisory Contracts and
Management Fees - continued
Based on its review, the Board concluded that the fund's management fee is fair and reasonable in light of the services that the fund receives and the other factors considered.
Total Expenses. In its review of the fund's total expenses, the Board considered the fund's management fee as well as other fund expenses, such as transfer agent fees, pricing and bookkeeping fees, and custodial, legal, and audit fees. The Board also noted the effects of any waivers and reimbursements on fees and expenses. As part of its review, the Board also considered current and historical total expenses of the fund compared to competitive fund median expenses. The fund is compared to those funds and classes in the Total Mapped Group (used by the Board for management fee comparisons) that have a similar sales load structure.
The Board noted that the fund's total expenses ranked below its competitive median for 2009. The Board considered that Fidelity has been voluntarily waiving part or all of the transfer agent fees and/or management fees to maintain a minimum yield for the fund.
Fees Charged to Other Fidelity Clients. The Board also considered Fidelity fee structures and other information with respect to clients of FMR and its affiliates, such as other mutual funds advised or subadvised by FMR or its affiliates, pension plan clients, and other institutional clients. In March 2010, the Board created an ad hoc joint committee with the board of other Fidelity funds (the Committee) to review and compare Fidelity's institutional investment advisory business with its business of providing services to the Fidelity funds, including the differences in services provided, fees charged, and costs incurred, as well as competition in their respective marketplaces.
Based on its review of total expenses and fees charged to other Fidelity clients, the Board concluded that the fund's total expenses were reasonable in light of the services that the fund and its shareholders receive and the other factors considered, including the findings of the Committee.
Costs of the Services and Profitability. The Board considered the revenues earned and the expenses incurred by Fidelity in conducting the business of developing, marketing, distributing, managing, administering and servicing the fund and its shareholders. The Board also considered the level of Fidelity's profits in respect of all the Fidelity funds.
On an annual basis, FMR presents to the Board Fidelity's profitability for the fund. Fidelity calculates the profitability for each fund, as well as aggregate profitability for groups of Fidelity funds and all Fidelity funds, using a series of detailed revenue and cost allocation methodologies which originate with the audited books and records of Fidelity. The Audit Committee of the Board reviews any significant changes from the prior year's methodologies.
Semiannual Report
PricewaterhouseCoopers LLP (PwC), independent registered public accounting firm and auditor to Fidelity and certain Fidelity funds, has been engaged annually by the Board as part of the Board's assessment of Fidelity's profitability analysis. PwC's engagement includes the review and assessment of Fidelity's methodologies used in determining the revenues and expenses attributable to Fidelity's mutual fund business, and completion of agreed-upon procedures surrounding the mathematical accuracy of fund profitability and its conformity to allocation methodologies. After considering PwC's reports issued under the engagement and information provided by Fidelity, the Board believes that while other allocation methods may also be reasonable, Fidelity's profitability methodologies are reasonable in all material respects.
The Board has also reviewed Fidelity's non-fund businesses and fall-out benefits related to the mutual fund business as well as cases where Fidelity's affiliates may benefit from or be related to the fund's business.
The Board considered the costs of the services provided by and the profits realized by Fidelity in connection with the operation of the fund and were satisfied that the profitability was not excessive in the circumstances.
Economies of Scale. The Board considered whether there have been economies of scale in respect of the management of the Fidelity funds, whether the Fidelity funds (including the fund) have appropriately benefited from any such economies of scale, and whether there is potential for realization of any further economies of scale. The Board considered the extent to which the fund will benefit from economies of scale through increased services to the fund, through waivers or reimbursements, or through fee or expense reductions.
In February 2009, the Board and the board of other Fidelity funds created an ad hoc committee (the Economies of Scale Committee) to analyze whether FMR attains economies of scale in respect of the management and servicing of the Fidelity funds, whether the Fidelity funds have appropriately benefited from such economies of scale, and whether there is potential for realization of any further economies of scale.
The Board recognized that the fund's management contract incorporates a "group fee" structure, which provides for lower group fee rates as total fund assets under FMR's management increase, and for higher group fee rates as total fund assets under FMR's management decrease. FMR calculates the group fee rates based on a tiered asset "breakpoint" schedule that varies based on asset class. The Board considered that the group fee is designed to deliver the benefits of economies of scale to fund shareholders when total Fidelity fund assets increase, even if assets of any particular fund are unchanged or have declined, because some portion of Fidelity's costs are attributable to services provided to all Fidelity funds, and all funds benefit if those costs can be allocated among more assets. The Board concluded that, given the group fee structure, fund shareholders will benefit from lower management fees as assets under FMR's management increase at the fund complex level, regardless of whether Fidelity achieves any such economies of scale.
Semiannual Report
Board Approval of Investment Advisory Contracts and
Management Fees - continued
The Board concluded, considering the findings of the Economies of Scale Committee, that any potential economies of scale are being appropriately shared between fund shareholders and Fidelity.
Additional Information Requested by the Board. In order to develop fully the factual basis for consideration of the Fidelity funds' Advisory Contracts, the Board requested and received additional information on certain topics, including (i) fund performance trends, actions to be taken by FMR to improve certain funds' overall performance, and Fidelity's long-term strategies for certain funds; (ii) Fidelity's fund profitability methodology and profitability trends for certain funds; (iii) portfolio manager changes that have occurred during the past year and the amount of the investment that each portfolio manager has made in the Fidelity fund(s) that he or she manages; (iv) Fidelity's compensation structure for portfolio managers, research analysts, and other key personnel, including its effects on fund profitability, the rationale for the compensation structure, and the extent to which current market conditions have affected retention and recruitment; (v) the compensation paid by FMR to fund sub-advisers on behalf of the Fidelity funds; (vi) Fidelity's fee structures and rationale for recommending different fees among different categories of funds and classes, as well as Fidelity's voluntary waiver of fees to maintain minimum yields for certain funds and classes; (vii) the rationale for any differences between fund fee structures and fee structures in place for other Fidelity clients; and (viii) explanations regarding the relative total expenses borne by certain funds and classes, total expense competitive trends, and actions that might be taken by FMR to reduce total expenses for certain funds and classes or to achieve further economies of scale.
Based on its evaluation of all of the conclusions noted above, and after considering all factors it believed relevant, the Board ultimately concluded that the advisory fee structures are fair and reasonable, and that the fund's Advisory Contracts should be renewed.
Semiannual Report
Investment Adviser
Fidelity Management & Research
Company
Boston, MA
Investment Sub-Advisers
Fidelity Investments
Money Management, Inc.
Fidelity Management & Research
(Japan) Inc.
Fidelity Management & Research
(U.K.) Inc.
Fidelity Management & Research
(Hong Kong) Limited
General Distributor
Fidelity Distributors Corporation
Boston, MA
Transfer and Service Agents
Citibank, N.A.
New York, NY
Fidelity Investments Institutional
Operations Company, Inc.
Boston, MA
Fidelity Service Company, Inc.
Boston, MA
Custodian
Citibank, N.A.
New York, NY
The Fidelity Telephone Connection
Mutual Fund 24-Hour Service
Exchanges/Redemptions
and Account Assistance 1-800-544-6666
Product Information 1-800-544-6666
Retirement Accounts 1-800-544-4774
(8 a.m. - 9 p.m.)
TDD Service 1-800-544-0118
for the deaf and hearing impaired
(9 a.m. - 9 p.m. Eastern time)
Fidelity Automated Service
Telephone (FAST®)
1-800-544-5555
Automated line for quickest service
MMM-USAN-0411
1.790940.107
Item 2. Code of Ethics
Not applicable.
Item 3. Audit Committee Financial Expert
Not applicable.
Item 4. Principal Accountant Fees and Services
Not applicable.
Item 5. Audit Committee of Listed Registrants
Not applicable.
Item 6. Investments
(a) Not applicable.
(b) Not applicable
Item 7. Disclosure of Proxy Voting Policies and Procedures for Closed-End Management Investment Companies
Not applicable.
Item 8. Portfolio Managers of Closed-End Management Investment Companies
Not applicable.
Item 9. Purchase of Equity Securities by Closed-End Management Investment Company and Affiliated Purchasers
Not applicable.
Item 10. Submission of Matters to a Vote of Security Holders
There were no material changes to the procedures by which shareholders may recommend nominees to the Fidelity Union Street Trust II's Board of Trustees.
Item 11. Controls and Procedures
(a)(i) The President and Treasurer and the Chief Financial Officer have concluded that the Fidelity Union Street Trust II's (the "Trust") disclosure controls and procedures (as defined in Rule 30a-3(c) under the Investment Company Act) provide reasonable assurances that material information relating to the Trust is made known to them by the appropriate persons, based on their evaluation of these controls and procedures as of a date within 90 days of the filing date of this report.
(a)(ii) There was no change in the Trust's internal control over financial reporting (as defined in Rule 30a-3(d) under the Investment Company Act) that occurred during the second fiscal quarter of the period covered by this report that has materially affected, or is reasonably likely to materially affect, the Trust's internal control over financial reporting.
Item 12. Exhibits
(a) | (1) | Not applicable. |
(a) | (2) | Certification pursuant to Rule 30a-2(a) under the Investment Company Act of 1940 (17 CFR 270.30a-2(a)) is filed and attached hereto as Exhibit 99.CERT. |
(a) | (3) | Not applicable. |
(b) | | Certification pursuant to Rule 30a-2(b) under the Investment Company Act of 1940 (17 CFR 270.30a-2(b)) is furnished and attached hereto as Exhibit 99.906CERT. |
SIGNATURES
Pursuant to the requirements of the Securities Exchange Act of 1934 and the Investment Company Act of 1940, the registrant has duly caused this report to be signed on its behalf by the undersigned, thereunto duly authorized.
Fidelity Union Street Trust II
By: | /s/John R. Hebble |
| John R. Hebble |
| President and Treasurer |
| |
Date: | April 25, 2011 |
Pursuant to the requirements of the Securities Exchange Act of 1934 and the Investment Company Act of 1940, this report has been signed below by the following persons on behalf of the registrant and in the capacities and on the dates indicated.
By: | /s/John R. Hebble |
| John R. Hebble |
| President and Treasurer |
| |
Date: | April 25, 2011 |
By: | /s/Christine Reynolds |
| Christine Reynolds |
| Chief Financial Officer |
| |
Date: | April 25, 2011 |