Scott C. Goebel, Secretary
245 Summer St.
Item 1. Reports to Stockholders
As a shareholder of a Fund, you incur two types of costs: (1) transaction costs, including redemption fees and (2) ongoing costs, including management fees and other Fund expenses. This Example is intended to help you understand your ongoing costs (in dollars) of investing in the Funds and to compare these costs with the ongoing costs of investing in other mutual funds.
The Example is based on an investment of $1,000 invested at the beginning of the period and held for the entire period (September 1, 2012 to February 28, 2013).
The first line of the accompanying table for each fund provides information about actual account values and actual expenses. You may use the information in this line, together with the amount you invested, to estimate the expenses that you paid over the period. Simply divide your account value by $1,000.00 (for example, an $8,600 account value divided by $1,000.00 = 8.6), then multiply the result by the number in the first line for a fund under the heading entitled "Expenses Paid During Period" to estimate the expenses you paid on your account during this period. A small balance maintenance fee of $12.00 that is charged once a year may apply for certain accounts with a value of less than $2,000. This fee is not included in the table below. If it was, the estimate of expenses you paid during the period would be higher, and your ending account value lower, by this amount. In addition, each Fund, as a shareholder in the underlying Fidelity Central Funds, will indirectly bear its pro-rata share of the fees and expenses incurred by the underlying Fidelity Central Funds. These fees and expenses are not included in the Fund's annualized expense ratio used to calculate the expense estimate in the table below.
The second line of the accompanying table for each fund provides information about hypothetical account values and hypothetical expenses based on a fund's actual expense ratio and an assumed rate of return of 5% per year before expenses, which is not the Fund's actual return. The hypothetical account values and expenses may not be used to estimate the actual ending account balance or expenses you paid for the period. You may use this information to compare the ongoing costs of investing in the Fund and other funds. To do so, compare this 5% hypothetical example with the 5% hypothetical examples that appear in the shareholder reports of the other funds. A small balance maintenance fee of $12.00 that is charged once a year may apply for certain accounts with a value of less than $2,000. This fee is not included in the table below. If it was, the estimate of expenses you paid during the period would be higher, and your ending account value lower, by this amount. In addition, each Fund, as a shareholder in the underlying Fidelity Central Funds, will indirectly bear its pro-rata share of the fees and expenses incurred by the underlying Fidelity Central Funds. These fees and expenses are not included in the Fund's annualized expense ratio used to calculate the expense estimate in the table below.
Please note that the expenses shown in the table are meant to highlight your ongoing costs only and do not reflect any transaction costs. Therefore, the second line of the table is useful in comparing ongoing costs only, and will not help you determine the relative total costs of owning different funds. In addition, if these transactional costs were included, your costs would have been higher.
Yield refers to the income paid by the fund over a given period. Yields for money market funds are usually for seven-day periods, as they are here, though they are expressed as annual percentage rates. Past performance is no guarantee of future results. Yield will vary and it's possible to lose money investing in the Fund. A portion of the Fund's expenses was reimbursed and/or waived. Absent such reimbursements and/or waivers the yield for the period ending February 28, 2013, the most recent period shown in the table, would have been -0.38%.
Fidelity® Arizona Municipal Income Fund (the Income Fund) is a fund of Fidelity Union Street Trust. Fidelity Arizona Municipal Money Market Fund (the Money Market Fund) is a fund of Fidelity Union Street Trust II. Each Trust is registered under the Investment Company Act of 1940, as amended (the 1940 Act), as an open-end management investment company. Fidelity Union Street Trust and Fidelity Union Street Trust II (the Trusts) are organized as a Massachusetts business trust and a Delaware statutory trust, respectively. The Income Fund is a non-diversified fund. Each Fund is authorized to issue an unlimited number of shares. Each Fund may be affected by economic and political developments in the state of Arizona.
The Funds may invest in Fidelity Central Funds, which are open-end investment companies available only to other investment companies and accounts managed by Fidelity Management & Research Company (FMR) and its affiliates. The Funds' Schedules of Investments list each of the Fidelity Central Funds held as of period end, if any, as an investment of each Fund, but do not include the underlying holdings of each Fidelity Central Fund. As an Investing Fund, each Fund indirectly bears its proportionate share of the expenses of the underlying Fidelity Central Funds.
The Money Market Central Funds seek preservation of capital and current income and are managed by Fidelity Investments Money Management, Inc. (FIMM), an affiliate of FMR.
A complete unaudited list of holdings for each Fidelity Central Fund is available upon request or at the Securities and Exchange Commission (the SEC) website at www.sec.gov. In addition, the financial statements of the Fidelity Central Funds are available on the SEC website or upon request.
The financial statements have been prepared in conformity with accounting principles generally accepted in the United States of America (GAAP), which require management to make certain estimates and assumptions at the date of the financial statements. Actual results could differ from those estimates. Subsequent events, if any, through the date that the financial statements were issued have been evaluated in the preparation of the financial statements. The following summarizes the significant accounting policies of the Funds:
from one or more third party pricing vendors or brokers to value its investments. When current market prices, quotations or currency exchange rates are not readily available or reliable, investments will be fair valued in good faith by the FMR Fair Value Committee (the Committee), in accordance with procedures adopted by the Board. Factors used in determining fair value vary by investment type and may include market or investment specific events, changes in interest rates and credit quality. The frequency with which these procedures are used cannot be predicted and they may be utilized to a significant extent. The Committee oversees the Income Fund's valuation policies and procedures and is responsible for approving and reporting to the Board all fair value determinations.
Each Fund categorizes the inputs to valuation techniques used to value their investments into a disclosure hierarchy consisting of three levels as shown below:
Level 2 - other significant observable inputs (including quoted prices for similar investments, interest rates, prepayment speeds, etc.)
Level 3 - unobservable inputs (including the Fund's own assumptions based on the best information available)
Valuation techniques used to value each Fund's investments by major category are as follows:
For the Income Fund, debt securities, including restricted securities, are valued based on evaluated prices received from third party pricing vendors or from brokers who make markets in such securities. For municipal securities, pricing vendors utilize matrix pricing which considers yield or price of bonds of comparable quality, coupon, maturity and type as well as broker-supplied prices. When independent prices are unavailable or unreliable, debt securities may be valued utilizing pricing methodologies which consider similar factors that would be used by third party pricing vendors. Debt securities are generally categorized as Level 2 in the hierarchy but may be Level 3 depending on the circumstances.
For the Money Market Fund, as permitted by compliance with certain conditions under Rule 2a-7 of the 1940 Act, securities are valued at amortized cost, which approximates fair value. The amortized cost of an instrument is determined by valuing it at its original cost and thereafter amortizing any discount or premium from its face value at a constant rate until maturity. Securities held by a money market fund are generally high quality and liquid; however, they are reflected as Level 2 because the inputs used to determine fair value are not quoted prices in an active market.
For the Income Fund, changes in valuation techniques may result in transfers in or out of an assigned level within the disclosure hierarchy.
Dividends are declared and recorded daily and paid monthly from net investment income. Distributions from realized gains, if any, are declared and recorded on the ex-dividend date. Income and capital gain distributions are determined in accordance with income tax regulations, which may differ from GAAP.
Capital accounts within the financial statements are adjusted for permanent book-tax differences. These adjustments have no impact on net assets or the results of operations. Temporary book-tax differences will reverse in a subsequent period.
Book-tax differences are primarily due to market discount, deferred trustees compensation, capital loss carryforwards and losses deferred due to excise tax regulations.
The Funds purchase municipal securities whose interest, in the opinion of the issuer, is free from federal income tax. There is no assurance that the IRS will agree with this opinion. In the event the IRS determines that the issuer does not comply with relevant tax requirements, interest payments from a security could become federally taxable, possibly retroactively to the date the security was issued.
The federal tax cost of investment securities and unrealized appreciation (depreciation) as of period end were as follows for each Fund:
these securities may involve time-consuming negotiations and expense, and prompt sale at an acceptable price may be difficult. Information regarding restricted securities is included at the end of each applicable Fund's Schedule of Investments.
Purchases and sales of securities, other than short-term securities, for the Income Fund aggregated $21,542,268 and $9,723,099, respectively.
The Income Fund participates with other funds managed by FMR or an affiliate in a $4.25 billion credit facility (the "line of credit") to be utilized for temporary or emergency purposes to fund shareholder redemptions or for other short-term liquidity purposes. The participating funds have agreed to pay commitment fees on their pro-rata portion of the line of credit, which are reflected in Miscellaneous expenses on the Statement of Operations, and are as follows:
During the period, there were no borrowings on this line of credit.
FMR or its affiliates voluntarily agreed to waive certain fees for the Money Market Fund in order to maintain a minimum annualized yield of .01%. Such arrangements may be discontinued by FMR at any time. For the period, the amount of the waiver was $656,083.
In addition, through arrangements with each applicable Fund's custodian, credits realized as a result of uninvested cash balances were used to reduce each applicable Fund's management fee. During the period, these credits reduced management fee by the following amounts:
The Funds' organizational documents provide former and current trustees and officers with a limited indemnification against liabilities arising in connection with the performance of their duties to the Funds. In the normal course of business, the Funds may also enter into contracts that provide general indemnifications. The Funds' maximum exposure under these arrangements is unknown as this would be dependent on future claims that may be made against the Funds. The risk of material loss from such claims is considered remote.
Each year, the Board of Trustees, including the Independent Trustees (together, the Board), votes on the renewal of the management contract and sub-advisory agreements (together, the Advisory Contracts) for each fund. The Board, assisted by the advice of fund counsel and Independent Trustees' counsel, requests and considers a broad range of information relevant to the renewal of the Advisory Contracts throughout the year.
The Board meets regularly and, at each of its meetings, covers an extensive agenda of topics and materials and considers factors that are relevant to its annual consideration of the renewal of each fund's Advisory Contracts, including the services and support provided to each fund and its shareholders. The Board has established three standing committees, Operations, Audit, and Governance and Nominating, each composed of and chaired by Independent Trustees with varying backgrounds, to which the Board has assigned specific subject matter responsibilities in order to enhance effective decision-making by the Board. The Operations Committee, of which all of the Independent Trustees are members, meets regularly throughout the year and, among other matters, considers matters specifically related to the annual consideration of the renewal of each fund's Advisory Contracts. The Board, acting directly and through its Committees, requests and receives information concerning the annual consideration of the renewal of each fund's Advisory Contracts. The Board also meets as needed to consider matters specifically related to the Board's annual consideration of the renewal of Advisory Contracts. Members of the Board may also meet with trustees of other Fidelity funds through ad hoc joint committees to discuss certain matters relevant to the Fidelity funds.
At its September 2012 meeting, the Board of Trustees, including the Independent Trustees, unanimously determined to renew each fund's Advisory Contracts. In reaching its determination, the Board considered all factors it believed relevant, including (i) the nature, extent, and quality of the services to be provided to each fund and its shareholders (including the investment performance of each fund); (ii) the competitiveness of each fund's management fee and total expense ratio relative to peer funds; (iii) the total costs of the services to be provided by and the profits to be realized by Fidelity from its relationship with each fund; (iv) the extent to which economies of scale exist and would be realized as each fund grows; and (v) whether fee levels reflect these economies of scale, if any, for the benefit of fund shareholders.
In considering whether to renew the Advisory Contracts for each fund, the Board reached a determination, with the assistance of fund counsel and Independent Trustees' counsel and through the exercise of its business judgment, that the renewal of the Advisory Contracts is in the best interests of each fund and its shareholders and that the compensation payable under the Advisory Contracts is fair and reasonable. The Board's decision to renew the Advisory Contracts was not based on any single factor, but rather was based on a comprehensive consideration of all the information provided to the Board at its meetings throughout the year. The Board, in reaching its determination to renew the Advisory Contracts, was aware that shareholders in each fund have a broad range of investment choices available to them, including a wide choice among mutual funds offered by Fidelity's competitors, and that each fund's shareholders, who have the opportunity to review and weigh the disclosure provided by the fund in its prospectus and other public disclosures, have chosen to invest in that fund, managed by Fidelity.
The Board noted that the growth of fund assets over time across the complex allows Fidelity to reinvest in the development of services designed to enhance the value or convenience of the Fidelity funds as investment vehicles. These services include 24-hour access to account information and market information through telephone representatives and over the Internet, investor education materials and asset allocation tools, and the expanded availability of Fidelity Investor Centers.
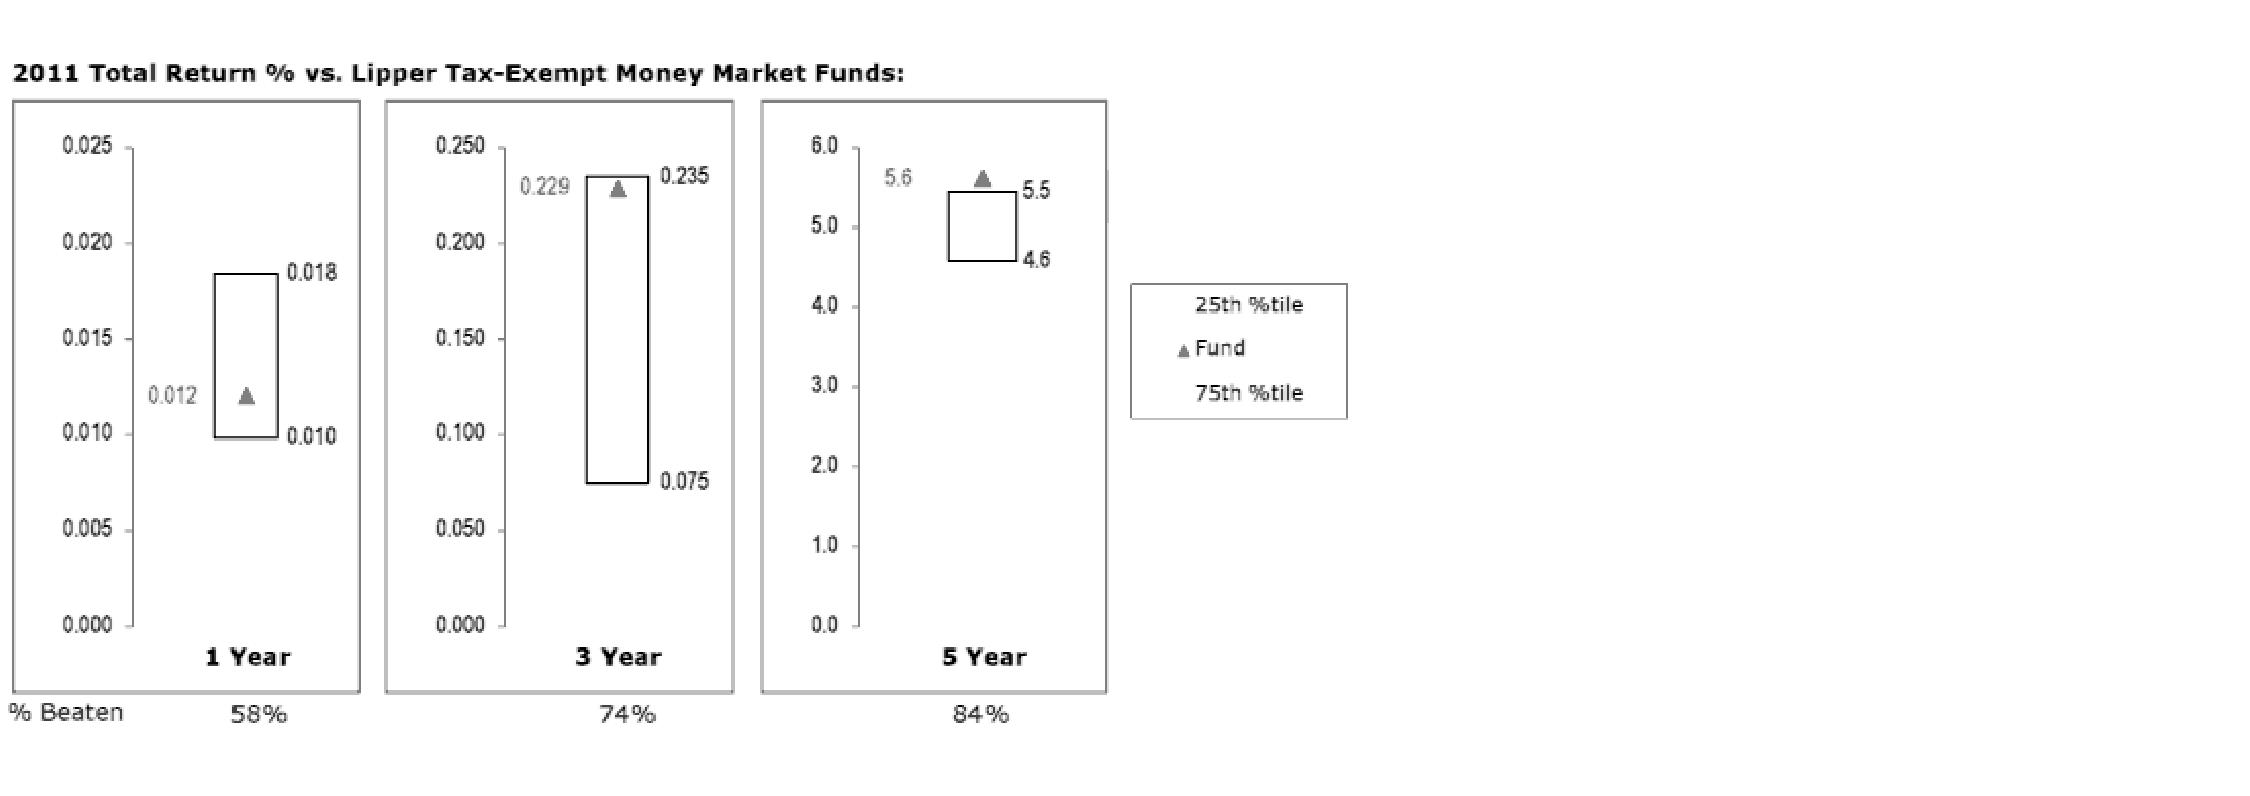
The Board reviewed the fund's relative investment performance against its peer group and noted that the performance of the fund was in the second quartile for the one-year period, the third quartile for the three-year period, and the first quartile for the five-year period. The Board also noted that the investment performance of the fund was lower than its benchmark for all the periods shown. The Board discussed with FMR actions to improve the fund's below-benchmark performance. The Board also reviewed the fund's performance since inception as well as performance in the current year. The Board will continue to closely monitor the performance of the fund in the coming year and discuss with FMR if other actions to address performance are appropriate.
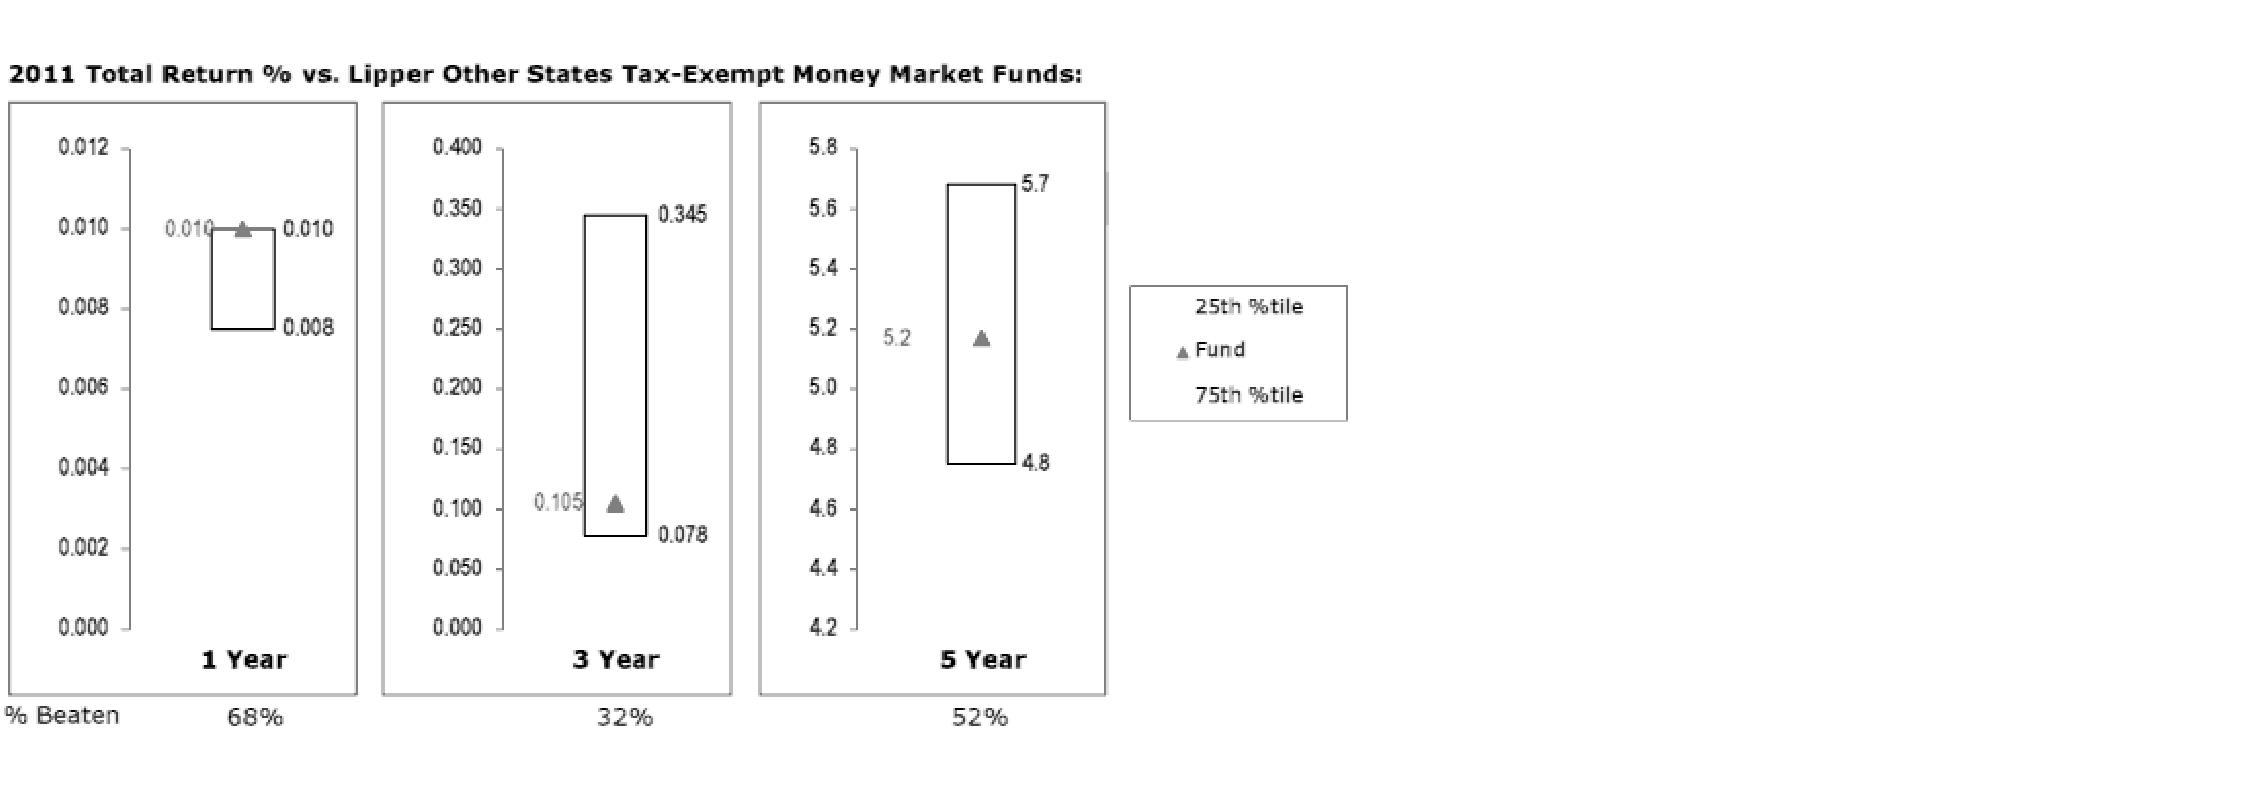
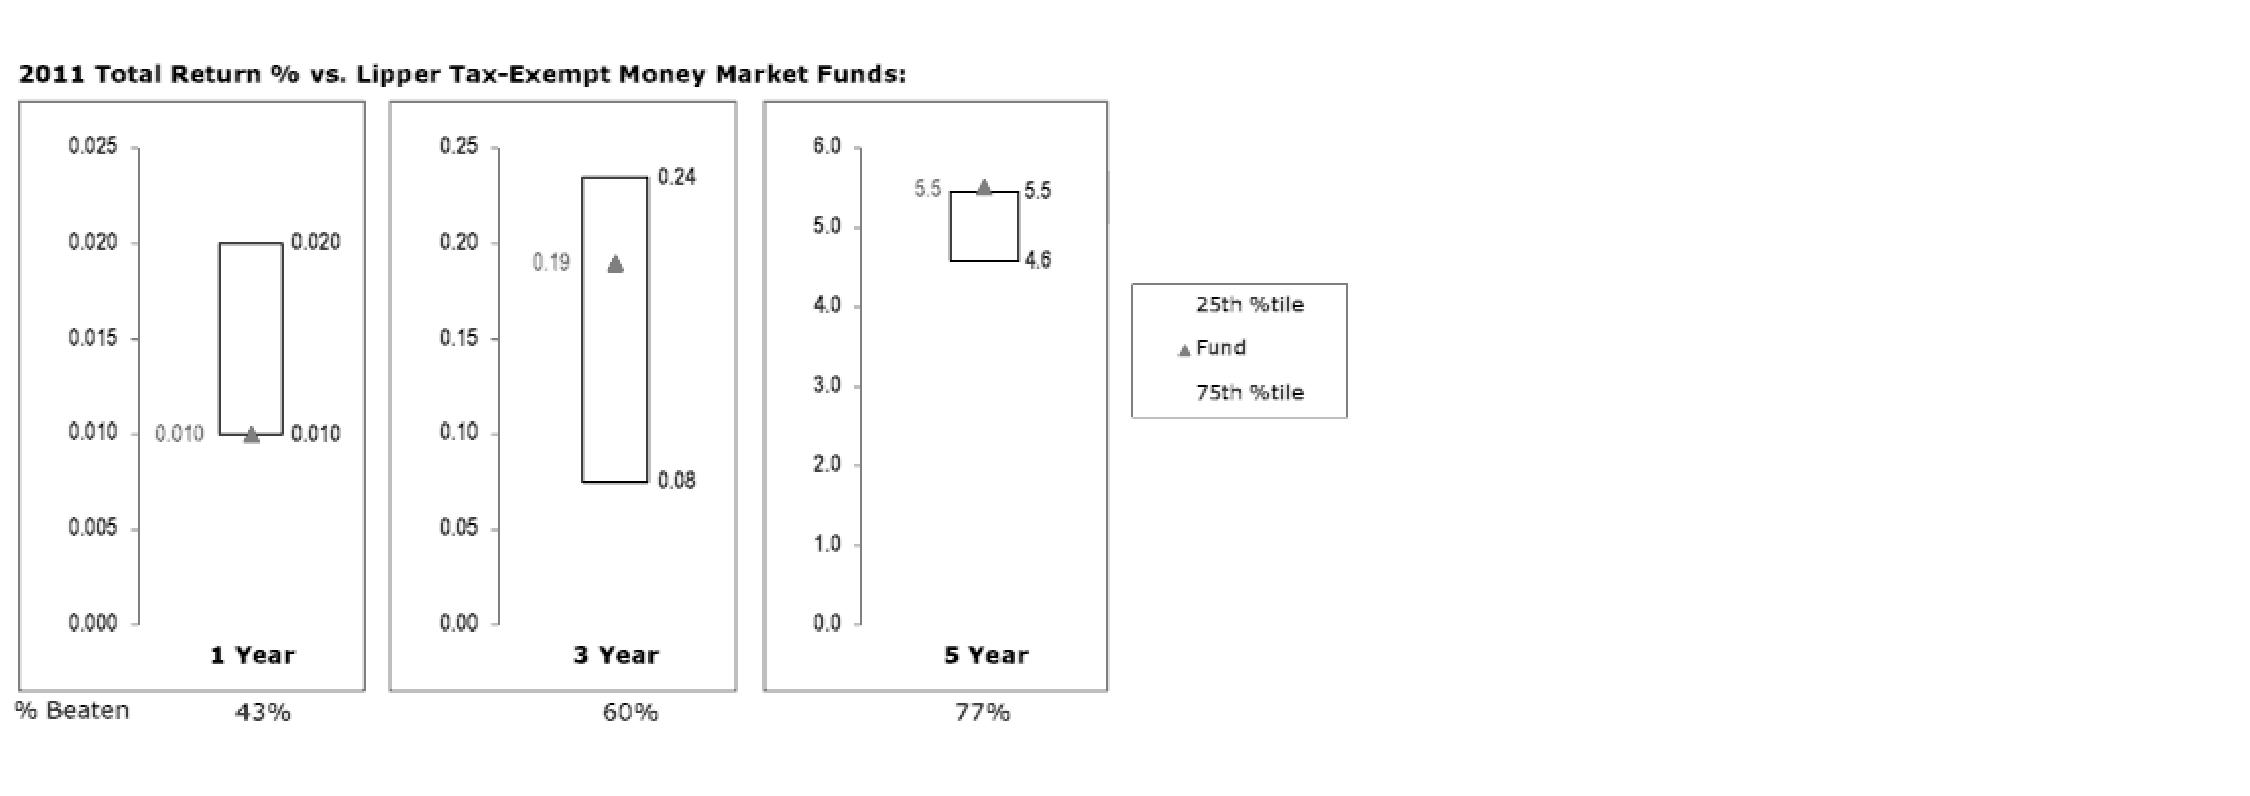
The Board reviewed the fund's relative investment performance against its peer group and noted that the performance of the fund was in the second quartile for the one- and five-year periods and the third quartile for the three-year period. The Board considered that FMR had taken steps to provide shareholders with stability of principal and to enhance safety and liquidity. The Board also reviewed the fund's performance since inception as well as performance in the current year.
The Board noted as a general matter that the percentage beaten numbers for money market funds in recent years were less meaningful than in earlier years, as many competitors have been waiving fees to maintain a one basis point yield and performance differences among funds may not be apparent due to rounding.
Based on its review, the Board concluded that the nature, extent, and quality of services provided to each fund under the Advisory Contracts should benefit each fund's shareholders.
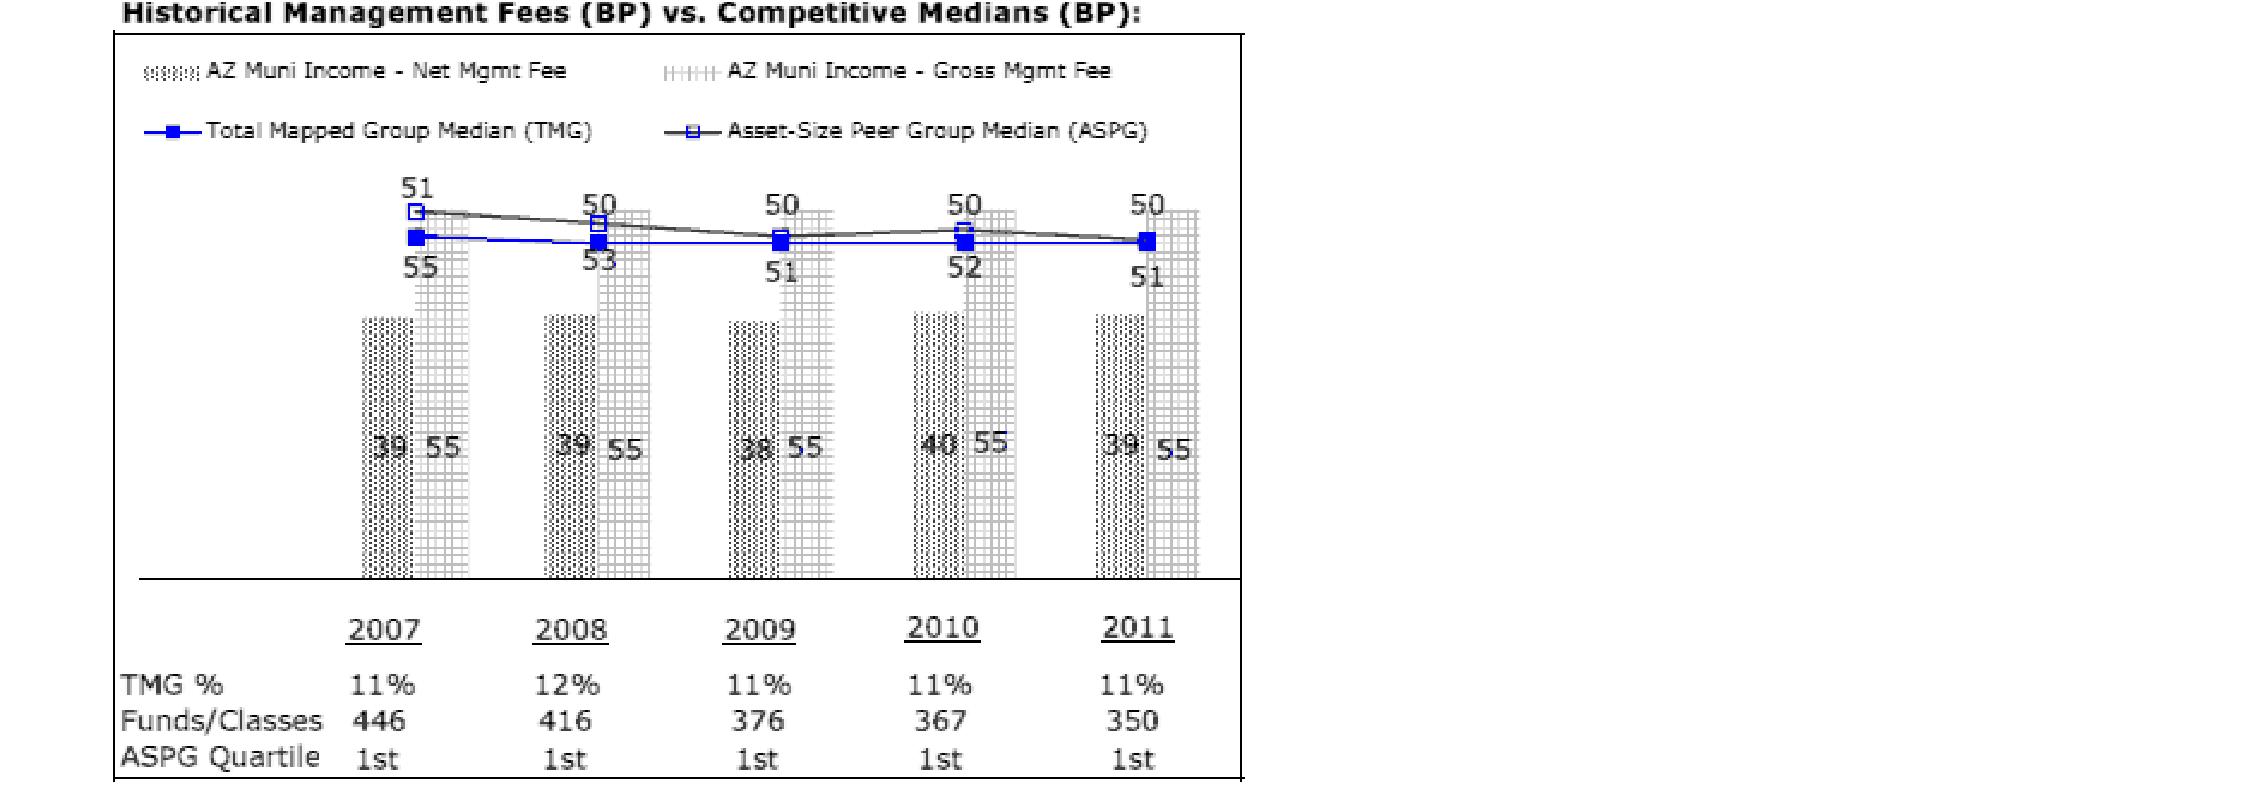
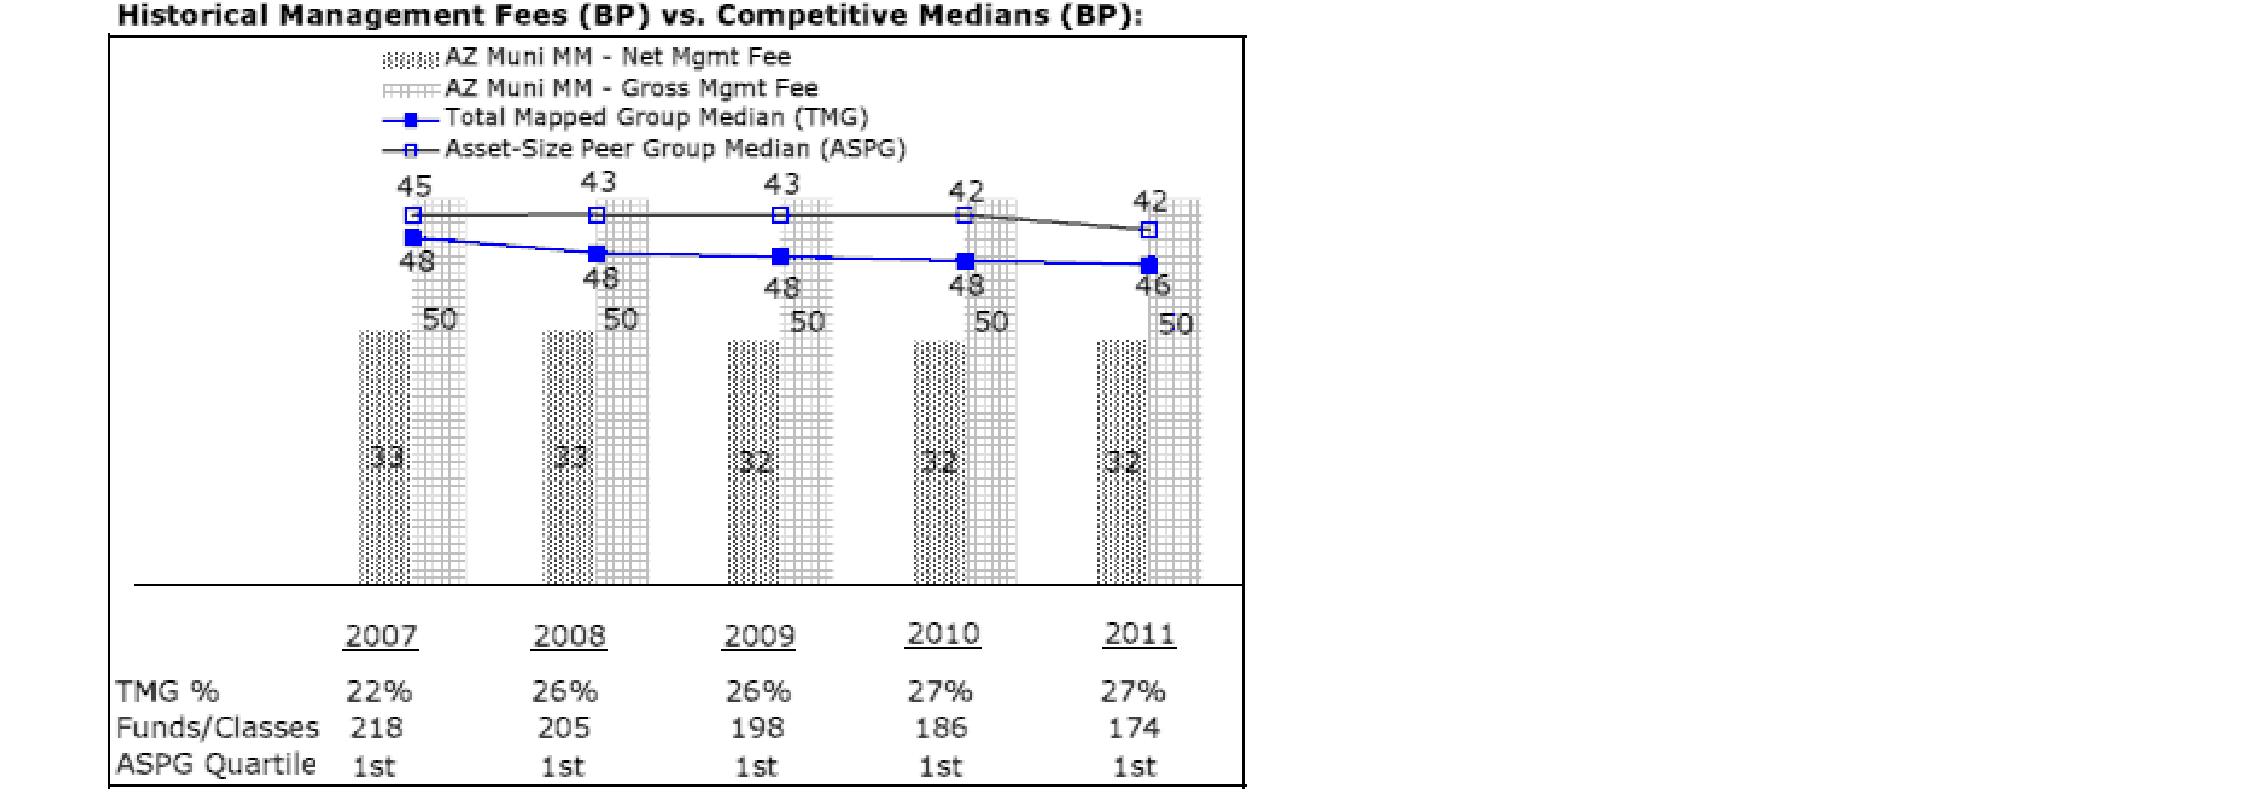
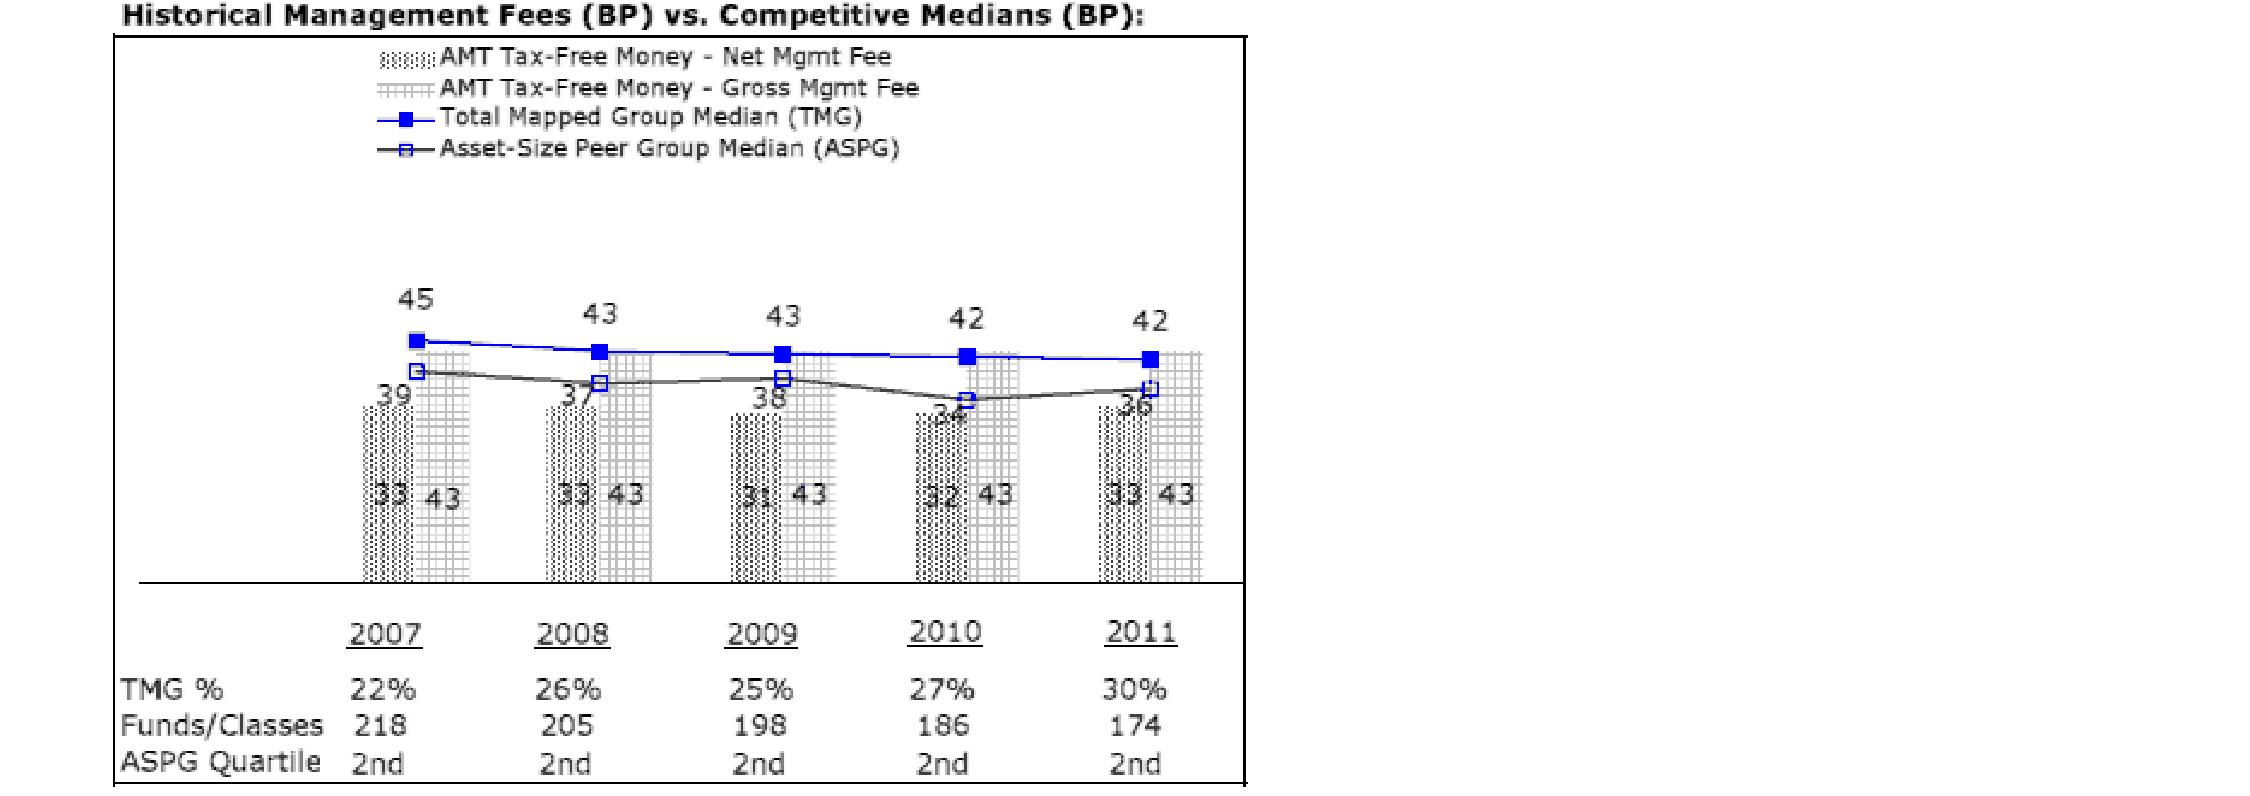
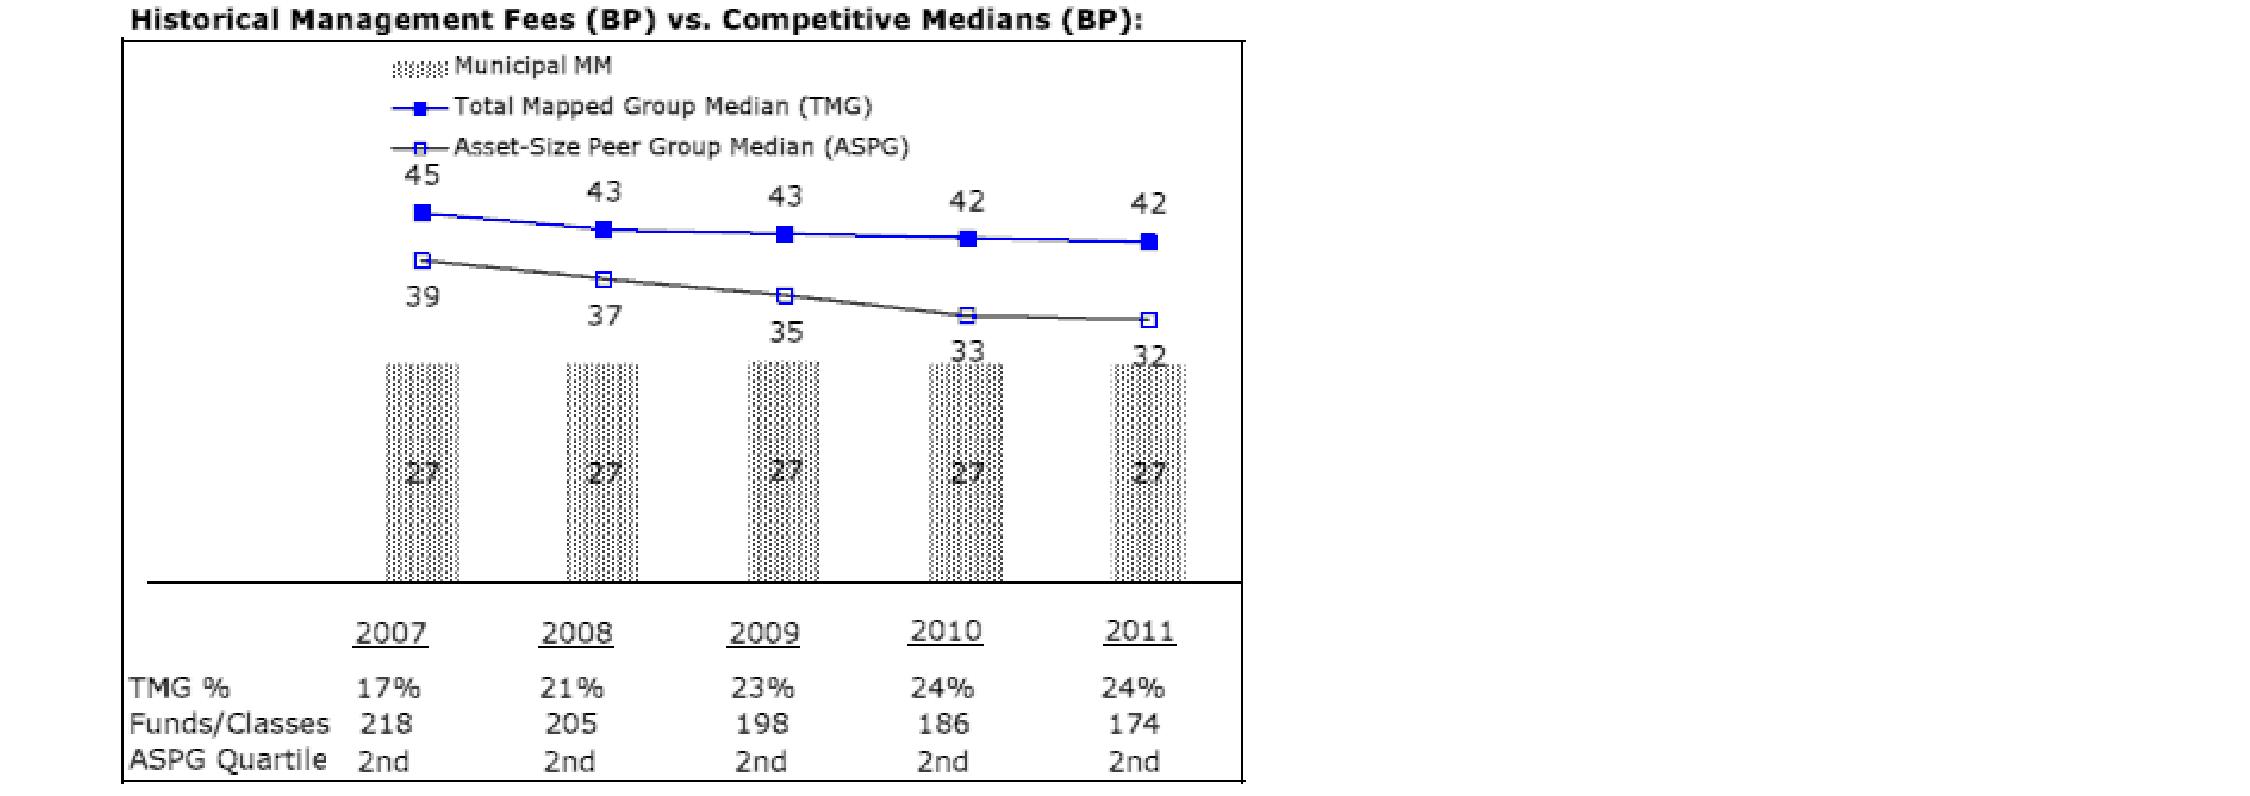
The Board noted that each fund's hypothetical net management fee ranked below the median of its Total Mapped Group and below the median of its ASPG for 2011.
Based on its review, the Board concluded that each fund's management fee is fair and reasonable in light of the services that the fund receives and the other factors considered.
The Board noted that each fund's total expense ratio ranked below its competitive median for 2011. The Board considered that Fidelity has been voluntarily waiving part or all of the management fees to maintain a minimum yield for Fidelity Arizona Municipal Money Market Fund, and also noted that Fidelity retains the ability to be repaid in certain circumstances.
Based on its review of total expense ratios and fees charged to other Fidelity clients, the Board concluded that each fund's total expense ratio was reasonable in light of the services that the fund and its shareholders receive and the other factors considered.
On an annual basis, FMR presents to the Board Fidelity's profitability for each fund. Fidelity calculates the profitability for each fund, as well as aggregate profitability for groups of Fidelity funds and all Fidelity funds, using a series of detailed revenue and cost allocation methodologies which originate with the books and records of Fidelity on which Fidelity's audited financial statements are based. The Audit Committee of the Board reviews any significant changes from the prior year's methodologies.
PricewaterhouseCoopers LLP (PwC), independent registered public accounting firm and auditor to Fidelity and certain Fidelity funds, has been engaged annually by the Board as part of the Board's assessment of Fidelity's profitability analysis. PwC's engagement includes the review and assessment of Fidelity's methodologies used in determining the revenues and expenses attributable to Fidelity's mutual fund business, and completion of agreed-upon procedures surrounding the mathematical accuracy of fund profitability and its conformity to allocation methodologies. After considering PwC's reports issued under the engagement and information provided by Fidelity, the Board concluded that while other allocation methods may also be reasonable, Fidelity's profitability methodologies are reasonable in all material respects.
The Board also reviewed Fidelity's non-fund businesses and fall-out benefits related to the mutual fund business as well as cases where Fidelity's affiliates may benefit from or be related to the funds' business.
The Board considered the costs of the services provided by and the profits realized by Fidelity in connection with the operation of each fund and was satisfied that the profitability was not excessive in the circumstances.
The Board concluded, taking into account the analysis of the Economies of Scale Committee, that economies of scale, if any, are being appropriately shared between fund shareholders and Fidelity.
Based on its evaluation of all of the conclusions noted above, and after considering all factors it believed relevant, the Board ultimately concluded that the advisory fee structures are fair and reasonable, and that each fund's Advisory Contracts should be renewed.
Citibank, N.A.
Fidelity Investments Institutional Operations Company, Inc.
Fidelity Service Company, Inc.
Citibank, N.A.
As a shareholder of the Fund, you incur two types of costs: (1) transaction costs and (2) ongoing costs, including management fees and other Fund expenses. This Example is intended to help you understand your ongoing costs (in dollars) of investing in the Fund and to compare these costs with the ongoing costs of investing in other mutual funds.
The Example is based on an investment of $1,000 invested at the beginning of the period and held for the entire period (September 1, 2012 to February 28, 2013).
The first line of the accompanying table provides information about actual account values and actual expenses. You may use the information in this line, together with the amount you invested, to estimate the expenses that you paid over the period. Simply divide your account value by $1,000.00 (for example, an $8,600 account value divided by $1,000.00 = 8.6), then multiply the result by the number in the first line under the heading entitled "Expenses Paid During Period" to estimate the expenses you paid on your account during this period. A small balance maintenance fee of $12.00 that is charged once a year may apply for certain accounts with a value of less than $2,000. This fee is not included in the table below. If it was, the estimate of expenses you paid during the period would be higher, and your ending account value lower, by this amount. In addition, the Fund, as a shareholder in the underlying Fidelity Central Funds, will indirectly bear its pro-rata share of the fees and expenses incurred by the underlying Fidelity Central Funds. These fees and expenses are not included in the Fund's annualized expense ratio used to calculate the expense estimate in the table below.
The second line of the accompanying table provides information about hypothetical account values and hypothetical expenses based on the Fund's actual expense ratio and an assumed rate of return of 5% per year before expenses, which is not the Fund's actual return. The hypothetical account values and expenses may not be used to estimate the actual ending account balance or expenses you paid for the period. You may use this information to compare the ongoing costs of investing in the Fund and other funds. To do so, compare this 5% hypothetical example with the 5% hypothetical examples that appear in the shareholder reports of the other funds. A small balance maintenance fee of $12.00 that is charged once a year may apply for certain accounts with a value of less than $2,000. This fee is not included in the table below. If it was, the estimate of expenses you paid during the period would be higher, and your ending account value lower, by this amount. In addition, the Fund, as a shareholder in the underlying Fidelity Central Funds, will indirectly bear its pro-rata share of the fees and expenses incurred by the underlying Fidelity Central Funds. These fees and expenses are not included in the Fund's annualized expense ratio used to calculate the expense estimate in the table below.
Please note that the expenses shown in the table are meant to highlight your ongoing costs only and do not reflect any transaction costs. Therefore, the second line of the table is useful in comparing ongoing costs only, and will not help you determine the relative total costs of owning different funds.
Yield refers to the income paid by the fund over a given period. Yields for money market funds are usually for seven-day periods, as they are here, though they are expressed as annual percentage rates. Past performance is no guarantee of future results. Yield will vary and it's possible to lose money investing in the Fund. A portion of the Fund's expenses was reimbursed and/or waived. Absent such reimbursements and/or waivers the yield for the period ending February 28, 2013, the most recent period shown in the table, would have been -0.31%.
Variable Rate Demand Note - 53.8% |
| Principal Amount (000s) | | Value (000s) |
Alabama - 0.2% |
Univ. of Alabama Gen. Rev. Participating VRDN Series WF 12 83C, 0.1% 3/7/13 (Liquidity Facility Wells Fargo Bank NA) (c)(f) | $ 1,800 | | $ 1,800 |
Alaska - 1.1% |
Anchorage Wastewtr. Rev. Participating VRDN Series Solar 07 97, 0.11% 3/7/13 (Liquidity Facility U.S. Bank NA, Cincinnati) (c)(f) | 2,850 | | 2,850 |
Valdez Marine Term. Rev.: | | | |
(ConocoPhillips Proj.) Series 1994 A, 0.1% 3/7/13 (ConocoPhillips Guaranteed), VRDN (c) | 2,400 | | 2,400 |
(Phillips Trans. Alaska, Inc. Proj.) Series 1994 B, 0.13% 3/7/13 (ConocoPhillips Guaranteed), VRDN (c) | 6,600 | | 6,600 |
| | 11,850 |
Arizona - 2.8% |
Arizona Health Facilities Auth. Rev.: | | | |
(Banner Health Sys. Proj.) Series 2008 F, 0.13% 3/7/13, LOC JPMorgan Chase Bank, VRDN (c) | 2,840 | | 2,840 |
(Catholic Healthcare West Proj.): | | | |
Series 2005 B, 0.12% 3/7/13, LOC JPMorgan Chase Bank, VRDN (c) | 600 | | 600 |
Series 2008 A, 0.11% 3/7/13, LOC JPMorgan Chase Bank, VRDN (c) | 1,500 | | 1,500 |
Glendale Indl. Dev. Auth. (Midwestern Univ. Proj.) Series 2008, 0.11% 3/7/13, LOC JPMorgan Chase Bank, VRDN (c) | 1,200 | | 1,200 |
Maricopa County Indl. Dev. Auth. Rev. (Valley of the Sun YMCA Proj.) Series 2008, 0.14% 3/7/13, LOC U.S. Bank NA, Cincinnati, VRDN (c) | 1,300 | | 1,300 |
Phoenix Indl. Dev. Auth. Multi-family Hsg. Rev. (Del Mar Terrace Apts. Proj.) Series 1999 A, 0.12% 3/7/13, LOC Freddie Mac, VRDN (c) | 10,500 | | 10,500 |
Salt River Proj. Agricultural Impt. & Pwr. District Elec. Sys. Rev. Participating VRDN: | | | |
Series Putters 3467, 0.12% 3/7/13 (Liquidity Facility JPMorgan Chase Bank) (c)(f) | 2,115 | | 2,115 |
Series Putters 3708Z, 0.12% 3/7/13 (Liquidity Facility JPMorgan Chase Bank) (c)(f) | 5,875 | | 5,875 |
Tempe Indl. Dev. Auth. Rev. (ASUF Brickyard Proj.) Series 2004 A, 0.14% 3/7/13, LOC Bank of America NA, VRDN (c) | 3,500 | | 3,500 |
| | 29,430 |
Variable Rate Demand Note - continued |
| Principal Amount (000s) | | Value (000s) |
California - 1.9% |
Bay Area Toll Auth. San Francisco Bay Toll Bridge Rev. Participating VRDN Series ROC II R 11453, 0.12% 3/7/13 (Liquidity Facility Citibank NA) (c)(f) | $ 1,800 | | $ 1,800 |
California Gen. Oblig.: | | | |
Participating VRDN Series Putters 4265, 0.12% 3/1/13 (Liquidity Facility JPMorgan Chase & Co.) (c)(f) | 6,100 | | 6,100 |
Series 2005 B1, 0.11% 3/7/13, LOC Bank of America NA, VRDN (c) | 4,600 | | 4,600 |
El Dorado Irrigation District Rev. Ctfs. of Prtn. Series 2008 A, 0.11% 3/7/13, LOC Citibank NA, VRDN (c) | 2,550 | | 2,550 |
Riverside Ctfs. of Prtn. (Riverside Renaissance Proj.) Series 2008, 0.13% 3/7/13, LOC Bank of America NA, VRDN (c) | 2,800 | | 2,800 |
San Francisco City and County Fin. Corp. Lease Rev. (Moscone Ctr. Expansion Proj.) Series 2008-1, 0.13% 3/7/13, LOC Bank of America NA, VRDN (c) | 900 | | 900 |
Santa Clara County Fing. Auth. Lease Rev. (Multiple Facilities Proj.) Series 2008 M, 0.12% 3/7/13, LOC Bank of America NA, VRDN (c) | 1,595 | | 1,595 |
| | 20,345 |
Colorado - 1.9% |
Colorado Health Facilities Auth. Retirement Hsg. Rev. Participating VRDN Series Putters 1390, 0.12% 3/7/13 (Liquidity Facility JPMorgan Chase Bank) (c)(f) | 1,020 | | 1,020 |
Colorado Reg'l. Trans. District Sales Tax Rev. Participating VRDN: | | | |
Series EGL 07 0040, 0.11% 3/7/13 (Liquidity Facility Citibank NA) (c)(f) | 3,700 | | 3,700 |
Series ROC II R 12312, 0.12% 3/7/13 (Liquidity Facility Citibank NA) (c)(f) | 3,000 | | 3,000 |
Denver Urban Renewal Auth. Tax Increment Rev. Series 2008 A1, 0.11% 3/7/13, LOC U.S. Bank NA, Cincinnati, VRDN (c) | 3,500 | | 3,500 |
Mesa County Econ. Dev. Rev. (Leitner-Poma of America, Inc. Proj.) Series 2009, 0.21% 3/7/13, LOC Wells Fargo Bank NA, VRDN (c) | 7,405 | | 7,405 |
Moffat County Poll. Cont. Rev.: | | | |
(PacifiCorp Proj.) Series 1994, 0.12% 3/7/13, LOC Wells Fargo Bank NA, VRDN (c) | 500 | | 500 |
(Tri-State Generation and Transmission Assoc., Inc. Proj.) Series 2009, 0.13% 3/7/13, LOC Bank of America NA, VRDN (c) | 1,000 | | 1,000 |
| | 20,125 |
Variable Rate Demand Note - continued |
| Principal Amount (000s) | | Value (000s) |
Connecticut - 0.4% |
Connecticut Health & Edl. Facilities Auth. Rev.: | | | |
(Yale-New Haven Hosp. Proj.) Series L2, 0.15% 3/7/13, LOC Bank of America NA, VRDN (c) | $ 400 | | $ 400 |
Participating VRDN Series EGL 7 05 3031, 0.11% 3/7/13 (Liquidity Facility Citibank NA) (c)(f) | 4,300 | | 4,300 |
| | 4,700 |
Delaware - 0.9% |
Delaware Econ. Dev. Auth. Rev. (Delmarva Pwr. & Lt. Co. Proj.) Series 1999 A, 0.3% 3/7/13, VRDN (c) | 5,500 | | 5,500 |
Wilmington Adjustable Rate Demand Rev. (Delaware Art Museum, Inc. Proj.) 0.11% 3/7/13, LOC Wells Fargo Bank NA, VRDN (c) | 4,200 | | 4,200 |
| | 9,700 |
District Of Columbia - 1.0% |
District of Columbia Rev.: | | | |
(American Psychological Assoc. Proj.) Series 2003, 0.17% 3/7/13, LOC Bank of America NA, VRDN (c) | 1,060 | | 1,060 |
(Medlantic/Helix Proj.): | | | |
Series 1998 A Tranche I, 0.11% 3/1/13, LOC Wells Fargo Bank NA, VRDN (c) | 1,000 | | 1,000 |
Series 1998 A Tranche II, 0.12% 3/7/13, LOC JPMorgan Chase Bank, VRDN (c) | 900 | | 900 |
(The AARP Foundation Proj.) Series 2004, 0.14% 3/7/13, LOC Bank of America NA, VRDN (c) | 1,500 | | 1,500 |
(The Washington Ctr. for Internships and Academic Seminars Proj.) Series 2009, 0.12% 3/7/13, LOC Branch Banking & Trust Co., VRDN (c) | 4,800 | | 4,800 |
District of Columbia Univ. Rev. (American Univ. Proj.) Series 2006 B, 0.11% 3/7/13, LOC JPMorgan Chase Bank, VRDN (c) | 1,000 | | 1,000 |
| | 10,260 |
Florida - 3.3% |
Broward County Fin. Auth. Multi-family Hsg. Rev. (Reflections Apts. Proj.) Series 1999, 0.11% 3/7/13, LOC Freddie Mac, VRDN (c) | 3,165 | | 3,165 |
Florida Hsg. Fin. Corp. Multi-family Mtg. Rev.: | | | |
(Mariner's Cay Apts. Proj.) Series 2008 M, 0.11% 3/7/13, LOC Fannie Mae, VRDN (c) | 1,360 | | 1,360 |
(Victoria Park Apts. Proj.) Series 2002 J, 0.11% 3/7/13, LOC Fannie Mae, VRDN (c) | 1,100 | | 1,100 |
Variable Rate Demand Note - continued |
| Principal Amount (000s) | | Value (000s) |
Florida - continued |
Jacksonville Hsg. Fin. Auth. Multi-family Hsg. Rev. (Augustine Apts. Proj.) 0.11% 3/7/13, LOC Fannie Mae, VRDN (c) | $ 2,650 | | $ 2,650 |
Orange County Indl. Dev. Auth. Indl. Dev. Rev. (Central Florida YMCA Proj.) Series 2002 A, 0.15% 3/7/13, LOC Bank of America NA, VRDN (c) | 1,300 | | 1,300 |
Palm Beach County Rev. (Saint Andrew's School of Boca Raton, Inc. Proj.) Series 2007, 0.15% 3/7/13, LOC Bank of America NA, VRDN (c) | 2,000 | | 2,000 |
Palm Beach County Wtr. & Swr. Rev. Participating VRDN Series Putters 2622, 0.12% 3/7/13 (Liquidity Facility JPMorgan Chase Bank) (c)(f) | 2,765 | | 2,765 |
Pasco County School Board Ctfs. of Prtn. Series 2008 C, 0.15% 3/7/13, LOC Bank of America NA, VRDN (c) | 5,100 | | 5,100 |
Pinellas County Hsg. Fin. Auth. (Booker Creek Apts. Proj.) Series 2009, 0.11% 3/7/13, LOC Freddie Mac, VRDN (c) | 5,000 | | 5,000 |
Sunshine State Govt. Fing. Commission Rev. (Miami-Dade County Prog.) Series 2010 A, 0.11% 3/7/13, LOC JPMorgan Chase Bank, VRDN (c) | 600 | | 600 |
Tallahassee Energy Sys. Rev. Participating VRDN Series Putters 4204, 0.11% 3/1/13 (Liquidity Facility JPMorgan Chase Bank) (c)(f) | 995 | | 995 |
USF College of Medicine Health Facilities Series 2006 A1, 0.11% 3/7/13, LOC JPMorgan Chase Bank, VRDN (c) | 2,500 | | 2,500 |
USF Fing. Corp. Ctfs. of Prtn. Series 2007, 0.11% 3/7/13, LOC JPMorgan Chase Bank, VRDN (c) | 600 | | 600 |
Volusia County Hsg. Fin. Auth. Multi-family Hsg. Rev. (Fisherman's Landing Apts. Proj.) 0.11% 3/7/13, LOC Fannie Mae, VRDN (c) | 1,050 | | 1,050 |
Winter Haven Util. Sys. Impt. & Rfdg. Rev. Participating VRDN Series Solar 06 54, 0.11% 3/7/13 (Liquidity Facility U.S. Bank NA, Cincinnati) (c)(f) | 4,600 | | 4,600 |
| | 34,785 |
Georgia - 1.1% |
Burke County Indl. Dev. Auth. Poll. Cont. Rev. (Oglethorpe Pwr. Corp. Proj.) Series 2010 A, 0.13% 3/7/13, LOC Bank of America NA, VRDN (c) | 1,600 | | 1,600 |
Cobb County Kennestone Hosp. Auth. Rev. (WellStar Health Sys. Proj.) Series 2005 A, 0.14% 3/7/13, LOC Bank of America NA, VRDN (c) | 1,500 | | 1,500 |
Fulton County Dev. Auth. (Mount Vernon Presbyterian School Proj.) Series 2005, 0.12% 3/7/13, LOC Branch Banking & Trust Co., VRDN (c) | 2,500 | | 2,500 |
Georgia Muni. Elec. Auth. Pwr. Rev. Series 1985 B, 0.1% 3/7/13, LOC Barclays Bank PLC, VRDN (c) | 1,500 | | 1,500 |
Variable Rate Demand Note - continued |
| Principal Amount (000s) | | Value (000s) |
Georgia - continued |
Main Street Natural Gas, Inc. Georgia Gas Proj. Rev. Series 2010 A, 0.11% 3/7/13 (Liquidity Facility Royal Bank of Canada), VRDN (c) | $ 4,300 | | $ 4,300 |
Metropolitan Atlanta Rapid Transit Auth. Sales Tax Rev. Series 2000 B, 0.12% 3/7/13, LOC PNC Bank NA, VRDN (c) | 500 | | 500 |
| | 11,900 |
Hawaii - 1.6% |
Eclipse Fdg. Trust Custody Rpt. Various States Participating VRDN Series Solar 12 14, 0.11% 3/7/13 (Liquidity Facility U.S. Bank NA, Cincinnati) (c)(f) | 600 | | 600 |
Hawaii Gen. Oblig. Participating VRDN: | | | |
Series Putters 4007, 0.12% 3/7/13 (Liquidity Facility JPMorgan Chase Bank) (c)(f) | 4,665 | | 4,665 |
Series ROC II R 11910, 0.11% 3/7/13 (Liquidity Facility Citibank NA) (c)(f) | 3,880 | | 3,880 |
Hawaii State Hsg. Fin. & Dev. Corp. Rev. (Lokahi Kau Apts. Proj.) Series 2008, 0.11% 3/7/13, LOC Freddie Mac, VRDN (c) | 2,300 | | 2,300 |
Honolulu City & County Gen. Oblig. Participating VRDN Series Putters 3391, 0.12% 3/7/13 (Liquidity Facility JPMorgan Chase Bank) (c)(f) | 5,000 | | 5,000 |
| | 16,445 |
Illinois - 5.4% |
Chicago Metropolitan Wtr. Reclamation District Greater Chicago Participating VRDN Series Solar 06 75, 0.11% 3/7/13 (Liquidity Facility U.S. Bank NA, Cincinnati) (c)(f) | 3,200 | | 3,200 |
Chicago O'Hare Int'l. Arpt. Rev. Series 2005 D, 0.12% 3/7/13, LOC Barclays Bank PLC, VRDN (c) | 700 | | 700 |
Chicago Wtr. Rev.: | | | |
Series 2004 A2, 0.13% 3/7/13, LOC California Pub. Employees Retirement Sys., VRDN (c) | 3,915 | | 3,915 |
Series 2004 A3, 0.12% 3/7/13, LOC State Street Bank & Trust Co., Boston, VRDN (c) | 1,550 | | 1,550 |
Illinois Fin. Auth. Rev.: | | | |
(Chicago Historical Society Proj.) Series 2006, 0.11% 3/7/13, LOC JPMorgan Chase Bank, VRDN (c) | 18,900 | | 18,900 |
(Edward Hosp. Obligated Group Proj.) Series 2009 A, 0.12% 3/7/13, LOC Bank of America NA, VRDN (c) | 1,200 | | 1,200 |
(Little Co. of Mary Hosp. Proj.) Series 2008 A, 0.11% 3/7/13, LOC JPMorgan Chase Bank, VRDN (c) | 4,000 | | 4,000 |
(Museum of Science & Industry Proj.) Series 2009 C, 0.12% 3/7/13, LOC PNC Bank NA, VRDN (c) | 1,000 | | 1,000 |
Variable Rate Demand Note - continued |
| Principal Amount (000s) | | Value (000s) |
Illinois - continued |
Illinois Fin. Auth. Rev.: - continued | | | |
(Rush Univ. Med. Ctr. Proj.) Series 2008 A, 0.12% 3/7/13, LOC Northern Trust Co., VRDN (c) | $ 3,100 | | $ 3,100 |
(Spertus Institute of Jewish Studies Proj.) 0.11% 3/7/13, LOC Northern Trust Co., VRDN (c) | 3,400 | | 3,400 |
Illinois Health Facilities Auth. Rev. (Herman M. Finch Univ. of Health Sciences/The Chicago Med. School Proj.) Series 2003, 0.11% 3/7/13, LOC JPMorgan Chase Bank, VRDN (c) | 400 | | 400 |
Illinois Hsg. Dev. Auth. Multi-family Hsg. Rev. 0.12% 3/7/13, LOC Freddie Mac, VRDN (c) | 500 | | 500 |
Illinois Toll Hwy. Auth. Toll Hwy. Rev. Series 2007 A1, 0.13% 3/7/13, LOC Citibank NA, VRDN (c) | 5,900 | | 5,900 |
Lake County Multi-family Hsg. Rev. (Whispering Oaks Apts. Proj.) Series 2008, 0.12% 3/7/13, LOC Freddie Mac, VRDN (c) | 1,500 | | 1,500 |
Metropolitan Pier & Exposition Participating VRDN Series MS 3214, 0.12% 3/7/13 (Liquidity Facility Cr. Suisse) (c)(f) | 800 | | 800 |
Univ. of Illinois Rev. (UIC South Campus Dev. Proj.) Series 2008, 0.11% 3/7/13, LOC JPMorgan Chase Bank, VRDN (c) | 6,900 | | 6,900 |
| | 56,965 |
Indiana - 0.9% |
Indiana Dev. Fin. Auth. Econ. (Archer-Daniels Midland Co. Proj.) Series 2012, 0.17% 3/7/13 (Archer Daniels Midland Co. Guaranteed), VRDN (c) | 200 | | 200 |
Indiana Dev. Fin. Auth. Envir. Rev. (Duke Energy Indiana, Inc. Proj.) Series 2009 A3, 0.12% 3/7/13, LOC Mizuho Corporate Bank Ltd., VRDN (c) | 700 | | 700 |
Indiana Edl. Facilities Auth. Rev.: | | | |
(Earlham College Proj.) Series E, 0.11% 3/1/13, LOC U.S. Bank NA, Cincinnati, VRDN (c) | 3,005 | | 3,005 |
(Wabash College Proj.) Series 2001, 0.13% 3/7/13, LOC JPMorgan Chase Bank, VRDN (c) | 600 | | 600 |
Indiana Fin. Auth. Health Sys. Rev. (Sisters of Saint Francis Health Svcs., Inc. Obligated Group Proj.): | | | |
Series 2008 B, 0.13% 3/7/13, LOC JPMorgan Chase Bank, VRDN (c) | 800 | | 800 |
Variable Rate Demand Note - continued |
| Principal Amount (000s) | | Value (000s) |
Indiana - continued |
Indiana Fin. Auth. Health Sys. Rev. (Sisters of Saint Francis Health Svcs., Inc. Obligated Group Proj.): - continued | | | |
Series 2008 E, 0.12% 3/7/13, LOC Bank of America NA, VRDN (c) | $ 2,000 | | $ 2,000 |
Lawrenceburg Poll. Cont. Rev. (Indiana Michigan Pwr. Co. Proj.) Series 2008 H, 0.1% 3/7/13, LOC Bank of Nova Scotia New York Branch, VRDN (c) | 2,000 | | 2,000 |
| | 9,305 |
Iowa - 0.6% |
Iowa Fin. Auth. Midwestern (Archer-Daniels Midland Co. Proj.) Series 2012, 0.17% 3/7/13 (Archer Daniels Midland Co. Guaranteed), VRDN (c) | 700 | | 700 |
Iowa Fin. Auth. Poll. Cont. Facility Rev. (MidAmerican Energy Proj.) Series 2008 B, 0.13% 3/7/13, VRDN (c) | 5,900 | | 5,900 |
| | 6,600 |
Louisiana - 0.7% |
East Baton Rouge Parish Pub. Impt. Sales Tax Rev. Series 2008 A, 0.12% 3/7/13, LOC JPMorgan Chase Bank, VRDN (c) | 1,200 | | 1,200 |
Louisiana Pub. Facilities Auth. Rev. (Air Products & Chemicals, Inc. Proj.): | | | |
Series 2004, 0.1% 3/7/13, VRDN (c) | 1,500 | | 1,500 |
Series 2009 A, 0.1% 3/7/13, VRDN (c) | 1,515 | | 1,515 |
Saint James Parish Gen. Oblig.: | | | |
(Nucor Steel Louisiana LLC Proj.) Series 2010 B1: | | | |
0.29% 3/7/13, VRDN (c) | 1,250 | | 1,250 |
0.29% 3/7/13, VRDN (c) | 200 | | 200 |
(NuStar Logistics, L.P. Proj.) Series 2010 B, 0.12% 3/7/13, LOC JPMorgan Chase Bank, VRDN (c) | 2,000 | | 2,000 |
| | 7,665 |
Maryland - 0.3% |
Maryland Cmnty. Dev. Administration Multi-family Dev. Rev. (Avalon Lea Apt. Proj.) Series 1997, 0.12% 3/7/13, LOC Fannie Mae, VRDN (c) | 1,200 | | 1,200 |
Maryland Health & Higher Edl. Facilities Auth. Rev.: | | | |
(Anne Arundel Health Sys. Proj.) Series 2009 B, 0.14% 3/7/13, LOC Bank of America NA, VRDN (c) | 1,000 | | 1,000 |
Participating VRDN Series RBC O 29, 0.11% 3/7/13 (Liquidity Facility Royal Bank of Canada) (c)(f) | 1,085 | | 1,085 |
| | 3,285 |
Variable Rate Demand Note - continued |
| Principal Amount (000s) | | Value (000s) |
Massachusetts - 0.6% |
Massachusetts Gen. Oblig. Participating VRDN Series Clipper 07 41, 0.14% 3/7/13 (Liquidity Facility State Street Bank & Trust Co., Boston) (c)(f) | $ 2,500 | | $ 2,500 |
Massachusetts School Bldg. Auth. Dedicated Sales Tax Rev. Participating VRDN: | | | |
Series EGL 07 0031, 0.11% 3/7/13 (Liquidity Facility Citibank NA) (c)(f) | 1,000 | | 1,000 |
Series Putters 2479Z, 0.12% 3/7/13 (Liquidity Facility JPMorgan Chase Bank) (c)(f) | 3,100 | | 3,100 |
| | 6,600 |
Michigan - 1.0% |
Michigan Fin. Auth. Rev. Participating VRDN: | | | |
Series ROC II R 11988, 0.12% 3/7/13 (Liquidity Facility Citibank NA) (c)(f) | 3,000 | | 3,000 |
Series WF 11 111C, 0.1% 3/7/13 (Liquidity Facility Wells Fargo Bank NA) (c)(f) | 2,500 | | 2,500 |
Michigan Hosp. Fin. Auth. Rev. Participating VRDN Series ROC II R 11676, 0.12% 3/7/13 (Liquidity Facility Citibank NA) (c)(f) | 1,300 | | 1,300 |
Waterford Econ. Dev. Corp. Ltd. Oblig. Rev. (Canterbury Health Care, Inc. Proj.) Series 2009, 0.11% 3/7/13, LOC Fed. Home Ln. Bank of Boston, VRDN (c) | 4,200 | | 4,200 |
| | 11,000 |
Minnesota - 0.7% |
Minnesota Gen. Oblig. Participating VRDN Series Putters 3844 Q, 0.12% 3/7/13 (Liquidity Facility JPMorgan Chase Bank) (c)(f) | 6,860 | | 6,860 |
Oak Park Heights Multi-family Rev. 0.1% 3/7/13, LOC Freddie Mac, VRDN (c) | 100 | | 100 |
| | 6,960 |
Mississippi - 0.8% |
Mississippi Bus. Fin. Corp. Indl. Dev. Rev. (New Process Steel, L.P. Proj.) Series 2010, 0.16% 3/7/13, LOC Bank of America NA, VRDN (c) | 8,500 | | 8,500 |
Variable Rate Demand Note - continued |
| Principal Amount (000s) | | Value (000s) |
Missouri - 1.0% |
Missouri Health & Edl. Facilities Auth. Edl. Facilities Rev. Participating VRDN Series EGL 07 0001, 0.11% 3/7/13 (Liquidity Facility Citibank NA) (c)(f) | $ 8,000 | | $ 8,000 |
Saint Louis Indl. Dev. Auth. (Saint Luke's Plaza Apts. Proj.) Series 2009, 0.11% 3/7/13 (Liquidity Facility Freddie Mac), VRDN (c) | 2,100 | | 2,100 |
| | 10,100 |
Nebraska - 1.0% |
Central Plains Energy Proj. Rev. (Nebraska Gas Proj.) Series 2009, 0.11% 3/7/13 (Liquidity Facility Royal Bank of Canada), VRDN (c) | 5,485 | | 5,485 |
Omaha Pub. Pwr. District Elec. Rev. Participating VRDN Series Putters 3700 Z, 0.12% 3/7/13 (Liquidity Facility JPMorgan Chase Bank) (c)(f) | 5,000 | | 5,000 |
| | 10,485 |
Nevada - 0.6% |
Clark County Arpt. Rev.: | | | |
Series 2008 D 2A, 0.12% 3/7/13, LOC Citibank NA, VRDN (c) | 800 | | 800 |
Series 2008 D 2B, 0.1% 3/7/13, LOC Royal Bank of Canada, VRDN (c) | 1,200 | | 1,200 |
Clark County Fuel Tax Participating VRDN Series ROC II R 11507, 0.11% 3/7/13 (Liquidity Facility Citibank NA) (c)(f) | 2,800 | | 2,800 |
Clark County McCarran Int'l. Arpt. Passenger Facility Charge Rev. Series 2010 F2, 0.11% 3/7/13, LOC Union Bank of California, VRDN (c) | 1,500 | | 1,500 |
| | 6,300 |
New Jersey - 0.0% |
Salem County Poll. Cont. Fin. Auth. Rev. (Pub. Svc. Elec. and Gas Co. Proj.) Series 2003 B1, 0.3% 3/7/13, VRDN (c) | 200 | | 200 |
New Mexico - 1.1% |
New Mexico Muni. Energy Acquisition Auth. Gas Supply Rev. Series 2009, 0.11% 3/7/13 (Liquidity Facility Royal Bank of Canada), VRDN (c) | 11,775 | | 11,775 |
New York - 3.1% |
Dutchess County Indl. Dev. Agcy. Civic Facility Rev. (Lutheran Ctr. at Poughkeepsie, Inc. Proj.) 0.2% 3/7/13, LOC KeyBank NA, VRDN (c) | 100 | | 100 |
New York City Muni. Wtr. Fin. Auth. Wtr. & Swr. Sys. Rev. Participating VRDN Series Putters 2559, 0.12% 3/7/13 (Liquidity Facility JPMorgan Chase Bank) (c)(f) | 1,775 | | 1,775 |
Variable Rate Demand Note - continued |
| Principal Amount (000s) | | Value (000s) |
New York - continued |
New York City Transitional Fin. Auth. Rev. Participating VRDN Series Putters 3857, 0.12% 3/7/13 (Liquidity Facility JPMorgan Chase Bank) (c)(f) | $ 2,500 | | $ 2,500 |
New York Dorm. Auth. Revs.: | | | |
(City Univ. Proj.) Series 2008 C, 0.12% 3/7/13, LOC Bank of America NA, VRDN (c) | 2,600 | | 2,600 |
(Univ. of Rochester Proj.) Series 2008 A1, 0.1% 3/7/13, LOC Wells Fargo Bank NA, VRDN (c) | 3,600 | | 3,600 |
Participating VRDN: | | | |
Series EGL 06 47 Class A, 0.12% 3/7/13 (Liquidity Facility Citibank NA) (c)(f) | 4,500 | | 4,500 |
Series EGL 07 0003, 0.11% 3/7/13 (Liquidity Facility Citibank NA) (c)(f) | 15,000 | | 15,000 |
New York Hsg. Fin. Agcy. Rev. (330 West 39th Street Hsg. Proj.) Series 2010 A, 0.11% 3/7/13, LOC Bank of America NA, VRDN (c) | 1,100 | | 1,100 |
New York Metropolitan Trans. Auth. Rev. Series 2005 A, 0.11% 3/7/13, LOC JPMorgan Chase Bank, VRDN (c) | 1,500 | | 1,500 |
| | 32,675 |
New York & New Jersey - 0.3% |
Port Auth. of New York & New Jersey Participating VRDN Series ROC II R 14020, 0.12% 3/7/13 (Liquidity Facility Citibank NA) (c)(f) | 3,000 | | 3,000 |
North Carolina - 2.1% |
Charlotte Int'l. Arpt. Rev. (Charlotte Douglas Int'l. Arpt. Proj.) Series 2008 D, 0.12% 3/7/13, LOC Bank of America NA, VRDN (c) | 3,000 | | 3,000 |
Greensboro Combined Enterprise Sys. Rev. Series 2005 B, 0.13% 3/7/13 (Liquidity Facility Bank of America NA), VRDN (c) | 2,195 | | 2,195 |
North Carolina Cap. Facilities Fin. Agcy. Rev. Participating VRDN: | | | |
Series EGL 06 0139, 0.11% 3/7/13 (Liquidity Facility Citibank NA) (c)(f) | 1,000 | | 1,000 |
Series Putters 3649, 0.12% 3/7/13 (Liquidity Facility JPMorgan Chase Bank) (c)(f) | 3,000 | | 3,000 |
North Carolina Med. Care Commission Health Care Facilities Rev.: | | | |
(Univ. Health Systems of Eastern Carolina Proj.) Series 2008 A2, 0.12% 3/7/13, LOC Bank of America NA, VRDN (c) | 1,200 | | 1,200 |
Variable Rate Demand Note - continued |
| Principal Amount (000s) | | Value (000s) |
North Carolina - continued |
North Carolina Med. Care Commission Health Care Facilities Rev.: - continued | | | |
(Univ. Health Systems of Eastern Carolina Proj.) Series 2008 A1, 0.14% 3/7/13, LOC Bank of America NA, VRDN (c) | $ 1,825 | | $ 1,825 |
Raleigh Combined Enterprise Sys. Rev. Participating VRDN Series EGL 07 0010, 0.11% 3/7/13 (Liquidity Facility Citibank NA) (c)(f) | 9,900 | | 9,900 |
| | 22,120 |
Ohio - 1.4% |
Columbus Gen. Oblig. Participating VRDN Series Putters 2365, 0.12% 3/7/13 (Liquidity Facility JPMorgan Chase Bank) (c)(f) | 4,360 | | 4,360 |
Hamilton County Hosp. Facilities Rev. (Children's Hosp. Med. Ctr. Proj.) Series 2000, 0.1% 3/7/13, LOC JPMorgan Chase Bank, VRDN (c) | 5,100 | | 5,100 |
Ohio Higher Edl. Facility Commission Rev. (Univ. Hosp. Health Sys. Proj.) Series 2008 D, 0.12% 3/7/13, LOC JPMorgan Chase Bank, VRDN (c) | 700 | | 700 |
Ohio Hosp. Facilities Rev. Participating VRDN Series Putters 3558, 0.12% 3/7/13 (Liquidity Facility JPMorgan Chase Bank) (c)(f) | 4,330 | | 4,330 |
| | 14,490 |
Oklahoma - 0.1% |
RBC Muni. Products, Inc. Trust Participating VRDN Series RBC E 40, 0.11% 3/7/13 (Liquidity Facility Royal Bank of Canada) (a)(c)(f) | 700 | | 700 |
Pennsylvania - 2.9% |
Allegheny County Hosp. Dev. Auth. Rev. (Children's Institute Pittsburgh Proj.) Series 2005 B, 0.12% 3/7/13, LOC PNC Bank NA, VRDN (c) | 1,000 | | 1,000 |
Allegheny County Indl. Dev. Auth. Rev. (The Watson Institute Friendship Academy Proj.) Series 2010, 0.12% 3/7/13, LOC PNC Bank NA, VRDN (c) | 3,750 | | 3,750 |
Butler County Gen. Auth. Rev. (Erie School District Proj.) Series 2011, 0.12% 3/7/13, LOC PNC Bank NA, VRDN (c) | 1,200 | | 1,200 |
Chester County Indl. Dev. Auth. Student Hsg. Rev. (West Chester Univ. Proj.) Series 2008 A2, 0.11% 3/7/13, LOC TD Banknorth, NA, VRDN (c) | 1,000 | | 1,000 |
Crawford County Indl. Dev. Auth. College Rev. (Allegheny College Proj.) Series 2009 B, 0.13% 3/7/13, LOC PNC Bank NA, VRDN (c) | 2,000 | | 2,000 |
Variable Rate Demand Note - continued |
| Principal Amount (000s) | | Value (000s) |
Pennsylvania - continued |
Lancaster Indl. Dev. Auth. Rev. (United Zion Retirement Cmnty. Proj.) 0.22% 3/7/13, LOC Citizens Bank of Pennsylvania, VRDN (c) | $ 3,975 | | $ 3,975 |
Montgomery County Higher Ed. & Health Auth. Rev. (William Penn Charter School Proj.) Series 2001, 0.12% 3/7/13, LOC PNC Bank NA, VRDN (c) | 3,275 | | 3,275 |
Montgomery County Redev. Auth. Multi-family Hsg. Rev. (Forge Gate Apts. Proj.) Series 2001 A, 0.11% 3/7/13, LOC Fannie Mae, VRDN (c) | 4,990 | | 4,990 |
Pennsylvania Gen. Oblig. Participating VRDN Series Putters 4014, 0.12% 3/7/13 (Liquidity Facility JPMorgan Chase Bank) (c)(f) | 3,500 | | 3,500 |
Philadelphia Auth. for Indl. Dev. Rev. (The Franklin Institute Proj.) Series 2006, 0.14% 3/7/13, LOC Bank of America NA, VRDN (c) | 2,895 | | 2,895 |
Somerset County Gen. Oblig. Series 2009 A, 0.12% 3/7/13, LOC PNC Bank NA, VRDN (c) | 3,445 | | 3,445 |
| | 31,030 |
Rhode Island - 0.8% |
Rhode Island Health and Edl. Bldg. Corp. Higher Ed. Facility Rev. (Roger Williams Univ. Proj.) Series 2008 B, 0.1% 3/7/13, LOC U.S. Bank NA, Cincinnati, VRDN (c) | 8,800 | | 8,800 |
South Carolina - 1.4% |
Columbia Wtrwks. & Swr. Rev. Participating VRDN Series BC 10 42W, 0.14% 3/7/13 (Liquidity Facility Barclays Bank PLC) (c)(f) | 2,000 | | 2,000 |
South Carolina Edl. Facilities Auth. for Private Nonprofit Institutions of Higher Learning Edl. Facilities Rev. (Claflin Univ. Proj.) 0.15% 3/7/13, LOC Bank of America NA, VRDN (c) | 6,831 | | 6,831 |
South Carolina Jobs-Econ. Dev. Auth. Econ. Dev. Rev.: | | | |
(Carolina Piedmont Foundation Proj.) 0.17% 3/7/13, LOC Bank of America NA, VRDN (c) | 3,500 | | 3,500 |
(Institute for Bus. and Home Safety Proj.) Series 2009, 0.12% 3/7/13, LOC Branch Banking & Trust Co., VRDN (c) | 2,400 | | 2,400 |
| | 14,731 |
Tennessee - 2.7% |
Blount County Pub. Bldg. Auth. (Local Govt. Pub. Impt. Proj.) Series 2008 E1A, 0.12% 3/7/13, LOC Branch Banking & Trust Co., VRDN (c) | 5,600 | | 5,600 |
Variable Rate Demand Note - continued |
| Principal Amount (000s) | | Value (000s) |
Tennessee - continued |
Clarksville Pub. Bldg. Auth. Rev. (Tennessee Muni. Bond Fund Proj.): | | | |
Series 1994, 0.17% 3/7/13, LOC Bank of America NA, VRDN (c) | $ 3,645 | | $ 3,645 |
Series 2003, 0.17% 3/1/13, LOC Bank of America NA, VRDN (c) | 900 | | 900 |
Series 2004, 0.17% 3/1/13, LOC Bank of America NA, VRDN (c) | 1,445 | | 1,445 |
Series 2005, 0.17% 3/1/13, LOC Bank of America NA, VRDN (c) | 3,735 | | 3,735 |
Knox County Health Edl. & Hsg. Facilities Board Hosp. Facilities Rev. Series 2011 A, 0.11% 3/7/13, LOC Bank of America NA, VRDN (c) | 500 | | 500 |
Metropolitan Govt. Nashville & Davidson County Indl. Dev. Board Rev. (Nashville Symphony Hall Proj.) Series 2004, 0.15% 3/7/13, LOC Bank of America NA, VRDN (c) | 3,500 | | 3,500 |
Montgomery County Pub. Bldg. Auth. Pooled Fing. Rev. (Tennessee County Ln. Pool Prog.): | | | |
Series 1999, 0.16% 3/7/13, LOC Bank of America NA, VRDN (c) | 5,500 | | 5,500 |
Series 2006, 0.17% 3/1/13, LOC Bank of America NA, VRDN (c) | 600 | | 600 |
Nashville and Davidson County Metropolitan Govt. Gen. Oblig. Participating VRDN Series Clipper 06 4, 0.11% 3/7/13 (Liquidity Facility State Street Bank & Trust Co., Boston) (c)(f) | 1,500 | | 1,500 |
Shelby County Health Edl. & Hsg. Facilities Board Rev. (Trezevant Manor Proj.) Series A, 0.14% 3/7/13, LOC Bank of America NA, VRDN (c) | 1,400 | | 1,400 |
| | 28,325 |
Texas - 3.0% |
Harris County Cultural Ed. Facilities Fin. Corp. Med. Facilities Rev. Series 2012 C, 0.11% 3/7/13, LOC Barclays Bank PLC, VRDN (c) | 1,400 | | 1,400 |
Harris County Indl. Dev. Corp. (HFOTCO LLC Proj.) Series 2012, 0.13% 3/7/13, LOC Bank of America NA, VRDN (c) | 2,000 | | 2,000 |
North East Texas Independent School District Participating VRDN Series Putters 2355, 0.12% 3/7/13 (Liquidity Facility JPMorgan Chase Bank) (c)(f) | 4,460 | | 4,460 |
San Antonio Elec. & Gas Sys. Rev. Participating VRDN Series Putters 3344, 0.12% 3/7/13 (Liquidity Facility JPMorgan Chase Bank) (c)(f) | 3,215 | | 3,215 |
Variable Rate Demand Note - continued |
| Principal Amount (000s) | | Value (000s) |
Texas - continued |
San Antonio Pub. Facilities Corp. and Rfdg. Lease Participating VRDN Series CTE 12 3AX, 0.11% 3/7/13 (Liquidity Facility State Street Bank & Trust Co., Boston) (c)(f) | $ 400 | | $ 400 |
Spring Branch Independent School District Participating VRDN Series Putters 3377, 0.12% 3/7/13 (Liquidity Facility JPMorgan Chase Bank) (c)(f) | 1,495 | | 1,495 |
Texas A&M Univ. Rev. Participating VRDN Series BC 10 39W, 0.14% 3/7/13 (Liquidity Facility Barclays Bank PLC) (c)(f) | 1,500 | | 1,500 |
Texas City Indl. Dev. Corp. (NRG Energy, Inc. Proj.) Series 2012, 0.16% 3/7/13, LOC Bank of America NA, VRDN (c) | 200 | | 200 |
Texas Dept. of Hsg. & Cmnty. Affairs Multi-family Hsg. Rev. Series 2003, 0.11% 3/7/13, LOC Freddie Mac, VRDN (c) | 1,300 | | 1,300 |
Texas Gen. Oblig. Participating VRDN: | | | |
Series Putters 4262, 0.12% 3/1/13 (Liquidity Facility JPMorgan Chase Bank) (c)(f) | 1,400 | | 1,400 |
Series Solar 06 57, 0.11% 3/7/13 (Liquidity Facility U.S. Bank NA, Cincinnati) (c)(f) | 1,000 | | 1,000 |
Univ. of Texas Board of Regents Sys. Rev. Participating VRDN Series WF 11 13C, 0.1% 3/7/13 (Liquidity Facility Wells Fargo Bank NA) (c)(f) | 12,900 | | 12,900 |
| | 31,270 |
Virginia - 2.7% |
Fairfax County Indl. Dev. Auth. Participating VRDN Series Putters 4254, 0.12% 3/7/13 (Liquidity Facility JPMorgan Chase Bank) (c)(f) | 3,495 | | 3,495 |
Richmond Pub. Util. Rev. Participating VRDN Series ROC II R 10410, 0.13% 3/7/13 (Liquidity Facility Citibank NA) (c)(f) | 4,130 | | 4,130 |
Univ. of Virginia Gen. Rev. Participating VRDN Series EGL 06 17 Class A, 0.11% 3/7/13 (Liquidity Facility Citibank NA) (c)(f) | 17,200 | | 17,200 |
Virginia College Bldg. Auth. Edl. Facilities Rev. Participating VRDN Series PZ 161, 0.13% 3/7/13 (Liquidity Facility Wells Fargo & Co.) (c)(f) | 3,860 | | 3,860 |
| | 28,685 |
Washington - 1.3% |
Central Puget Sound Reg'l. Trans. Auth. Sales & Use Tax Rev. Participating VRDN Series Putters 2866, 0.12% 3/7/13 (Liquidity Facility JPMorgan Chase Bank) (c)(f) | 1,000 | | 1,000 |
King County Gen. Oblig. Participating VRDN Series MT 789, 0.14% 3/7/13 (Liquidity Facility Bank of America NA) (c)(f) | 3,210 | | 3,210 |
King County Swr. Rev. Participating VRDN Series ROC II R 11962, 0.11% 3/7/13 (Liquidity Facility Citibank NA) (c)(f) | 1,600 | | 1,600 |
Variable Rate Demand Note - continued |
| Principal Amount (000s) | | Value (000s) |
Washington - continued |
Washington Gen. Oblig. Participating VRDN Series ROC II R 11889, 0.11% 3/7/13 (Liquidity Facility Citibank NA) (c)(f) | $ 3,250 | | $ 3,250 |
Washington Health Care Facilities Auth. Rev. Participating VRDN Series Putters 4728, 0.11% 3/7/13 (Liquidity Facility Bank of America NA) (c)(f) | 1,200 | | 1,200 |
Washington Hsg. Fin. Commission Multi-family Hsg. Rev. (Discovery Heights Apt. Proj.) Series 2010, 0.12% 3/7/13, LOC Freddie Mac, VRDN (c) | 1,000 | | 1,000 |
Washington Hsg. Fin. Commission Nonprofit Hsg. Rev. (Horizon House Proj.) Series 2005, 0.11% 3/7/13, LOC Wells Fargo Bank NA, VRDN (c) | 2,300 | | 2,300 |
| | 13,560 |
Wisconsin - 0.8% |
Wisconsin Ctr. District Tax Rev. Series 2001 A, 0.11% 3/7/13, LOC U.S. Bank NA, Cincinnati, VRDN (c) | 7,900 | | 7,900 |
Wyoming - 0.3% |
Converse County Poll. Cont. Rev. (PacifiCorp Proj.) Series 1994, 0.12% 3/7/13, LOC Wells Fargo Bank NA, VRDN (c) | 2,600 | | 2,600 |
TOTAL VARIABLE RATE DEMAND NOTE | 566,966 |
Other Municipal Debt - 40.5% |
| | | |
Alabama - 0.0% |
Alabama Pub. School & College Auth. Rev. Bonds Series WF 11 37C, 0.2%, tender 8/15/13 (Liquidity Facility Wells Fargo Bank NA) (c)(f)(g) | 200 | | 200 |
Alaska - 0.1% |
Anchorage Gen. Oblig. Series A1, 0.23% 6/5/13, LOC Wells Fargo Bank NA, CP | 200 | | 200 |
North Slope Borough Gen. Oblig. Bonds Series 2012 A, 1% 6/30/13 | 500 | | 501 |
| | 701 |
Arizona - 1.6% |
Chandler Gen. Oblig. Bonds Series GS 07 49TP, 0.27%, tender 6/13/13 (Liquidity Facility Wells Fargo & Co.) (c)(f)(g) | 11,195 | | 11,195 |
Phoenix Civic Impt. Series 2011 B: | | | |
0.15% 4/4/13, LOC Barclays Bank PLC, CP | 800 | | 800 |
0.15% 4/5/13, LOC Barclays Bank PLC, CP | 800 | | 800 |
Other Municipal Debt - continued |
| Principal Amount (000s) | | Value (000s) |
Arizona - continued |
Phoenix Civic Impt. Corp. Wastewtr. Sys. Rev.: | | | |
Series 2012 A, 0.18% 3/14/13, LOC Royal Bank of Canada, CP | $ 2,000 | | $ 2,000 |
Series 2012 B, 0.15% 3/7/13, LOC Wells Fargo Bank NA, CP | 2,400 | | 2,400 |
| | 17,195 |
California - 4.2% |
California Edl. Facilities Auth. Rev. Bonds (Stanford Univ. Proj.) Series S3, 0.21% tender 3/28/13, CP mode | 1,600 | | 1,600 |
California Gen. Oblig. RAN: | | | |
Series A1, 2.5% 5/30/13 | 5,000 | | 5,027 |
Series A2, 2.5% 6/20/13 | 1,500 | | 1,509 |
Fresno County Gen. Oblig. TRAN 2% 6/28/13 | 1,000 | | 1,006 |
Orange County Sanitation District Ctfs. of Prtn. BAN Series 2012 C, 2% 10/30/13 | 700 | | 708 |
Riverside County Gen. Oblig. TRAN: | | | |
Series 2012 A, 2% 3/29/13 | 2,500 | | 2,503 |
Series 2012 B, 2% 6/28/13 | 1,100 | | 1,106 |
San Bernardino County Gen. Oblig. TRAN 2% 6/28/13 | 1,000 | | 1,006 |
San Diego County Wtr. Auth. Wtr. Rev. Bonds Series WF 08 29C, 0.2%, tender 8/15/13 (Liquidity Facility Wells Fargo & Co.) (c)(f)(g) | 1,095 | | 1,095 |
San Diego Gen. Oblig. TRAN 2.5% 6/28/13 | 25,000 | | 25,193 |
San Francisco County Trans. Auth. Series 2004 A, 0.2% 3/14/13, LOC Wells Fargo Bank NA, CP | 4,000 | | 4,000 |
| | 44,753 |
Colorado - 0.4% |
Colorado Ed. Ln. Prog. TRAN Series 2012 C, 1.5% 6/27/13 | 1,300 | | 1,306 |
Colorado Gen. Fdg. Rev. TRAN Series 2012 A, 2.5% 6/27/13 | 2,100 | | 2,116 |
Colorado Reg'l. Trans. District Sales Tax Rev. Bonds Series WF 12 110C, 0.27%, tender 6/13/13 (Liquidity Facility Wells Fargo Bank NA) (c)(f)(g) | 700 | | 700 |
Jefferson County School District #R1 TAN Series 2012, 1.5% 6/28/13 | 500 | | 502 |
| | 4,624 |
Connecticut - 0.4% |
Connecticut Dev. Auth. Poll. Cont. Rev. Bonds (New England Pwr. Co. Proj.) Series 1999, 0.4% tender 4/3/13, CP mode | 1,700 | | 1,700 |
Connecticut Gen. Oblig. Bonds: | | | |
Series 2007 E, 5% 3/15/13 | 2,000 | | 2,004 |
Other Municipal Debt - continued |
| Principal Amount (000s) | | Value (000s) |
Connecticut - continued |
Connecticut Gen. Oblig. Bonds: - continued | | | |
Series 2012 F, 1% 9/15/13 | $ 600 | | $ 602 |
Connecticut Spl. Tax Oblig. Trans. Infrastructure Rev. Bonds Series 2012 A, 2% 1/1/14 | 200 | | 203 |
| | 4,509 |
District Of Columbia - 0.4% |
District of Columbia Rev. Bonds (American Nat'l. Red Cross Proj.) Series 2000, 0.15% tender 3/19/13, LOC JPMorgan Chase Bank, CP mode | 1,300 | | 1,300 |
Metropolitan Washington Arpts. Auth. Dulles Toll Road Rev. Series 1, 0.15% 4/9/13, LOC JPMorgan Chase Bank, CP | 2,600 | | 2,600 |
| | 3,900 |
Florida - 1.0% |
Alachua County Health Facilities Auth. Health Facilities Rev. Bonds (Shands Teaching Hosp. and Clinics, Inc. Proj.) Series 2008 A, 0.15% tender 4/2/13, LOC Bank of America NA, CP mode | 1,600 | | 1,600 |
Florida Dept. of Envir. Protection Rev. Bonds Series 2010 D, 5% 7/1/13 | 1,625 | | 1,651 |
Florida Division of Bond Fin. Dept. Gen. Svcs. Revs. Bonds: | | | |
Series 1997 B, 6% 7/1/13 | 955 | | 973 |
Series 1998 A, 6% 7/1/13 | 300 | | 306 |
Florida Gen. Oblig. Bonds Series PZ 130, 0.27%, tender 5/30/13 (Liquidity Facility Wells Fargo & Co.) (c)(f)(g) | 3,440 | | 3,440 |
Florida Wtr. Poll. Cont. Fing. Corp. Rev. Bonds Series 2010 A, 5% 7/15/13 | 500 | | 509 |
Indian River County School District TAN Series 2012, 1.25% 6/30/13 | 500 | | 502 |
Orlando & Orange County Expressway Auth. Rev. Bonds Series 2003 A, 5% 7/1/13 (Escrowed to Maturity) | 500 | | 508 |
Tampa Health Sys. Rev. Bonds: | | | |
Series 2012 B, 0.21%, tender 9/26/13 (c) | 1,000 | | 1,000 |
Series WF 12 21 C, 0.24%, tender 3/7/13 (Liquidity Facility Wells Fargo Bank NA) (c)(f)(g) | 300 | | 300 |
| | 10,789 |
Georgia - 0.3% |
Georgia Gen. Oblig. Bonds Series 2011 F, 5% 12/1/13 | 2,250 | | 2,332 |
Georgia Muni. Gas Auth. Rev. Bonds (Gas Portfolio III Proj.) Series R, 2% 10/1/13 | 500 | | 505 |
Other Municipal Debt - continued |
| Principal Amount (000s) | | Value (000s) |
Georgia - continued |
Metropolitan Atlanta Rapid Transit Series 2012 D1: | | | |
0.16% 5/3/13, LOC Bank of Tokyo-Mitsubishi UFJ Ltd., CP | $ 400 | | $ 400 |
0.16% 5/3/13, LOC Bank of Tokyo-Mitsubishi UFJ Ltd., CP | 300 | | 300 |
| | 3,537 |
Idaho - 0.7% |
Idaho Gen. Oblig. TAN Series 2012, 2% 6/28/13 | 7,400 | | 7,443 |
Illinois - 0.3% |
Illinois Fin. Auth. Ed. Rev. 0.14% 4/3/13, LOC PNC Bank NA, CP | 600 | | 600 |
Illinois Fin. Auth. Rev. Bonds: | | | |
(Hosp. Sisters Svcs., Inc. Proj.) Series 2012 H, 0.17% tender 6/3/13, CP mode | 600 | | 600 |
Series 2012 H, 0.2% tender 3/6/13, CP mode | 1,885 | | 1,885 |
| | 3,085 |
Indiana - 0.7% |
Indiana Fin. Auth. Indl. Rev. Bonds (Midwest Fertilizer Corp. Proj.) Series 2012, 0.2%, tender 7/1/13 (c) | 5,000 | | 5,000 |
Indiana Fin. Auth. Rev. Bonds (Trinity Health Sys. Proj.) Series D2: | | | |
0.13% tender 3/12/13, CP mode | 600 | | 600 |
0.13% tender 3/20/13, CP mode | 1,000 | | 1,000 |
Indianapolis Gas Util. Sys. Rev. Series 2001 A2, 0.22% 3/7/13, LOC JPMorgan Chase Bank, CP | 900 | | 900 |
| | 7,500 |
Iowa - 0.7% |
Iowa Fin. Auth. Midwestern Bonds (Fertilizer Co. Proj.) Series 2012, 0.18%, tender 4/12/13 (c) | 6,900 | | 6,900 |
Kansas - 1.3% |
Kansas Dept. of Trans. Hwy. Rev. Bonds Series 2012 A1, 0.14% 9/1/13 (c) | 500 | | 500 |
Wichita Gen. Oblig. BAN Series 254, 0.25% 2/11/14 | 1,600 | | 1,600 |
Wyandotte County/Kansas City Unified Govt. Gen. Oblig. BAN 0.24% 3/1/14 | 12,000 | | 12,002 |
| | 14,102 |
Other Municipal Debt - continued |
| Principal Amount (000s) | | Value (000s) |
Kentucky - 0.2% |
Jefferson County Poll. Cont. Rev. Bonds (Louisville Gas & Elec. Co. Proj.) Series 2001 A, 0.25% tender 3/11/13, CP mode | $ 600 | | $ 600 |
Trimble County Poll. Cont. Rev. Bonds (Louisville Gas & Elec. Co. Proj.) Series 2001 A, 0.25% tender 3/6/13, CP mode | 1,200 | | 1,200 |
| | 1,800 |
Maryland - 2.3% |
Baltimore County Gen. Oblig. Series 2011: | | | |
0.13% 3/5/13 (Liquidity Facility Mizuho Corporate Bank Ltd.), CP | 1,563 | | 1,563 |
0.13% 3/5/13 (Liquidity Facility Mizuho Corporate Bank Ltd.), CP | 1,400 | | 1,400 |
0.14% 4/2/13 (Liquidity Facility Mizuho Corporate Bank Ltd.), CP | 2,000 | | 2,000 |
0.17% 6/3/13 (Liquidity Facility Mizuho Corporate Bank Ltd.), CP | 1,898 | | 1,898 |
0.18% 7/9/13 (Liquidity Facility Mizuho Corporate Bank Ltd.), CP | 3,000 | | 3,000 |
Maryland Dept. of Trans. Consolidated Trans. Rev. Bonds Series 2007, 5% 3/1/13 | 4,950 | | 4,950 |
Maryland Gen. Oblig. Bonds First Series C, 5% 3/1/13 | 1,000 | | 1,000 |
Maryland Trans. Auth. Grant Rev. Bonds Series 2008, 5% 3/1/13 | 4,975 | | 4,975 |
Montgomery County Gen. Oblig. Bonds Series 2010 A, 5% 8/1/13 | 1,000 | | 1,020 |
Prince Georges County Ctfs. of Prtn. Bonds (Equip. Aquisition Prog.) Series 2012, 2% 10/15/13 | 1,035 | | 1,047 |
Univ. of Maryland Sys. Auxiliary Facility & Tuition Rev. Bonds Series 2009 A, 5% 4/1/13 | 1,570 | | 1,576 |
| | 24,429 |
Massachusetts - 0.3% |
Massachusetts Gen. Oblig. RAN Series 2012 A, 2% 4/25/13 | 500 | | 501 |
Massachusetts Indl. Fin. Agcy. Poll. Cont. Rev. Bonds (New England Pwr. Co. Proj.): | | | |
Series 1992, 0.4% tender 4/1/13, CP mode | 1,600 | | 1,600 |
Series 1993 A, 0.4% tender 3/6/13, CP mode | 800 | | 800 |
| | 2,901 |
Michigan - 0.2% |
Michigan Bldg. Auth. Rev. Series 6, 0.14% 3/21/13, LOC State Street Bank & Trust Co., Boston, LOC U.S. Bank NA, Cincinnati, CP | 2,300 | | 2,300 |
Other Municipal Debt - continued |
| Principal Amount (000s) | | Value (000s) |
Minnesota - 0.2% |
Minnesota Pub. Facilities Auth. Wtr. Poll. Cont. Rev. Bonds Series 2004 D, 5% 3/1/13 | $ 1,825 | | $ 1,825 |
Univ. of Minnesota Univ. Revs. Series 2005 A, 0.14% 4/3/13, CP | 600 | | 600 |
| | 2,425 |
Missouri - 0.2% |
Curators of the Univ. of Missouri Series 2012 A, 0.19% 3/8/13, CP | 700 | | 700 |
Missouri Board of Pub. Buildings Spl. Oblig. Bonds Series 2003 A, 5% 10/15/13 (Pre-Refunded to 10/15/13 @ 100) | 400 | | 412 |
Saint Louis Gen. Fund Rev. TRAN Series 2012, 2% 5/30/13 | 1,000 | | 1,004 |
| | 2,116 |
New Hampshire - 0.1% |
New Hampshire Bus. Fin. Auth. Poll. Cont. Rev. Bonds (New England Pwr. Co. Proj.) Series 1990 B, 0.45% tender 4/4/13, CP mode | 1,200 | | 1,200 |
New Jersey - 0.1% |
Passaic County Gen. Oblig. BAN Series 2012 A, 1.25% 12/27/13 | 500 | | 504 |
New Mexico - 0.3% |
New Mexico Severance Tax Rev. Bonds Series 2010 D, 4% 7/1/13 | 2,600 | | 2,633 |
New York - 3.5% |
Brewster Central School District BAN Series 2013, 1.5% 1/31/14 | 28,330 | | 28,671 |
New York City Muni. Wtr. Fin. Auth. Wtr. & Swr. Sys. Rev. Series 8, 0.15% 10/28/13, CP | 1,400 | | 1,400 |
New York Metropolitan Trans. Auth. Rev. Series 2, 0.17% 3/12/13, LOC Royal Bank of Canada, CP | 3,900 | | 3,900 |
New York Thruway Auth. Svc. Contract Rev. Bonds Series 2012 A, 2% 4/1/13 | 3,100 | | 3,105 |
| | 37,076 |
North Carolina - 1.0% |
Charlotte Gen. Oblig. Series 2009, 0.15% 3/14/13 (Liquidity Facility Wells Fargo Bank NA), CP | 2,570 | | 2,570 |
Mecklenburg County Gen. Oblig. Bonds Series 2004 C, 5% 3/1/13 | 1,000 | | 1,000 |
North Carolina Gen. Oblig. Bonds: | | | |
Series 2003 A, 5.25% 3/1/13 | 1,735 | | 1,735 |
Other Municipal Debt - continued |
| Principal Amount (000s) | | Value (000s) |
North Carolina - continued |
North Carolina Gen. Oblig. Bonds: - continued | | | |
Series 2009 A, 5% 3/1/13 | $ 3,500 | | $ 3,500 |
North Carolina Muni. Pwr. Agcy. #1 Catawba Elec. Rev. Bonds Series 2012 A, 2% 1/1/14 | 1,900 | | 1,928 |
| | 10,733 |
Ohio - 1.8% |
Ohio Higher Edl. Facility Commission Rev. Bonds: | | | |
(The Cleveland Clinic Foundation Proj.) Series 2008 B6, 0.15% tender 6/13/13, CP mode | 9,200 | | 9,200 |
Series 2008 B6, 0.19% tender 6/6/13, CP mode | 8,000 | | 8,000 |
Univ. of Cincinnati Gen. Receipts BAN Series 2012 B, 2% 5/9/13 | 1,360 | | 1,364 |
| | 18,564 |
Oklahoma - 0.8% |
Oklahoma City Wtr. Utils. Trust Wtr. and Swr. Rev.
Series 2013 A: | | | |
0.14% 3/6/13, LOC State Street Bank & Trust Co., Boston, CP | 6,665 | | 6,665 |
0.15% 3/12/13, LOC State Street Bank & Trust Co., Boston, CP | 2,000 | | 2,000 |
| | 8,665 |
Oregon - 0.5% |
Clackamas County Hosp. Facility Auth. Bonds (Providence Health Sys. Proj.) Series D, 0.17% tender 6/11/13, CP mode | 4,000 | | 4,000 |
Oregon Gen. Oblig. Bonds Series WF11 57 C, 0.27%, tender 6/13/13 (Liquidity Facility Wells Fargo Bank NA) (c)(f)(g) | 1,030 | | 1,030 |
| | 5,030 |
Pennsylvania - 0.1% |
Philadelphia Gen. Oblig. TRAN Series 2012 A, 2% 6/28/13 | 1,500 | | 1,509 |
South Carolina - 1.5% |
Charleston County School District TAN Series 2012, 1% 4/1/13 | 2,400 | | 2,402 |
South Carolina Assoc. of Governmental Organizations Ctfs. of Prtn. Bonds Series 2012 A, 2% 3/1/13 (South Carolina Gen. Oblig. Guaranteed) | 2,810 | | 2,810 |
South Carolina Gen. Oblig. Bonds: | | | |
Series 2011 A, 5% 3/1/13 | 1,000 | | 1,000 |
Other Municipal Debt - continued |
| Principal Amount (000s) | | Value (000s) |
South Carolina - continued |
South Carolina Gen. Oblig. Bonds: - continued | | | |
Series ROC II R 692W, 0.27%, tender 5/30/13 (Liquidity Facility Wells Fargo & Co.) (c)(f)(g) | $ 4,165 | | $ 4,165 |
York County Poll. Cont. Rev. Bonds (Duke Energy Corp. Proj.) 0.4% tender 3/1/13, CP mode | 5,300 | | 5,300 |
| | 15,677 |
Tennessee - 0.6% |
Knoxville Gen. Oblig. Bonds Series 2012, 1% 5/1/13 | 5,865 | | 5,873 |
Texas - 8.5% |
Fort Bend Independent School District Bonds Series PZ 124, 0.27%, tender 5/30/13 (Liquidity Facility Wells Fargo & Co.) (c)(f)(g) | 10,345 | | 10,345 |
Harris County Gen. Oblig. Series 2013 D, 0.15% 4/9/13 (Liquidity Facility JPMorgan Chase Bank), CP | 1,985 | | 1,985 |
Harris County Metropolitan Trans. Auth.: | | | |
Series 2012 A3, 0.17% 3/7/13 (Liquidity Facility State Street Bank & Trust Co., Boston), CP | 3,600 | | 3,600 |
Series 2013 A1, 0.17% 5/8/13 (Liquidity Facility JPMorgan Chase Bank), CP | 16,500 | | 16,500 |
Houston Gen. Oblig. Series 2013 A, 0.15% 4/9/13, LOC Union Bank of California, CP | 1,400 | | 1,400 |
Houston Util. Sys. Rev. Series 2013 B2, 0.15% 4/4/13, LOC Wells Fargo Bank NA, CP | 500 | | 500 |
Irving Independent School District Bonds Series PT 3954, 0.27%, tender 5/30/13 (Liquidity Facility Wells Fargo & Co.) (c)(f)(g) | 500 | | 500 |
Lower Colorado River Auth. Rev.: | | | |
Bonds Series 2012, 5% 5/15/13 | 1,740 | | 1,758 |
Series 2013 B: | | | |
0.14% 3/6/13, LOC Bank of America NA, CP | 1,400 | | 1,400 |
0.15% 3/21/13, LOC Bank of America NA, CP | 500 | | 500 |
0.14% 3/21/13, LOC JPMorgan Chase Bank, LOC State Street Bank & Trust Co., Boston, CP | 3,100 | | 3,100 |
Pasadena Independent School District Bonds Series 2013: | | | |
1% 8/15/13 (Permanent School Fund of Texas Guaranteed) (b) | 400 | | 401 |
2% 2/15/14 (Permanent School Fund of Texas Guaranteed) (b) | 2,550 | | 2,594 |
Round Rock Independent School District Bonds Series 2005, 5% 8/1/13 (Permanent School Fund of Texas Guaranteed) | 875 | | 892 |
Texas A&M Univ. Rev. Series 1993 B, 0.15% 3/7/13, CP | 2,500 | | 2,500 |
Texas Gen. Oblig. TRAN 2.5% 8/30/13 | 38,600 | | 39,038 |
Other Municipal Debt - continued |
| Principal Amount (000s) | | Value (000s) |
Texas - continued |
Texas Muni. Pwr. Agy. Rev. Series 2005, 0.15% 4/1/13, LOC Bank of America NA, LOC JPMorgan Chase Bank, CP | $ 800 | | $ 800 |
Texas State Univ. Sys. Fing. Rev. Bonds Series 2013, 2% 3/15/13 | 920 | | 921 |
Univ. of Texas Board of Regents Sys. Rev. Series 2002 A, 0.16% 3/13/13 (Liquidity Facility Univ. of Texas Invt. Mgmt. Co.), CP | 700 | | 700 |
| | 89,434 |
Utah - 0.1% |
Intermountain Pwr. Agcy. Pwr. Supply Rev. Series 1997 B1, 0.14% 3/19/13 (Liquidity Facility Bank of Nova Scotia), CP | 1,300 | | 1,300 |
Virginia - 0.8% |
Fairfax County Indl. Dev. Auth. Bonds (Inova Health Sys. Proj.) Series 2012 C, 0.19%, tender 9/26/13 (c) | 1,100 | | 1,100 |
Virginia Commonwealth Trans. Board Bonds Series 2012 A, 3% 3/15/13 | 6,960 | | 6,967 |
| | 8,067 |
Washington - 0.6% |
Energy Northwest Elec. Rev. Bonds: | | | |
(#1 Proj.): | | | |
Series 2003 A, 5.5% 7/1/13 | 1,630 | | 1,659 |
Series 2005 A, 5% 7/1/13 | 500 | | 508 |
Series 2007 A, 5% 7/1/13 | 1,000 | | 1,016 |
King County Kent School District #145 Gen. Oblig. Bonds (Cr. Enhancement Prog.) Series 2012 A, 2% 12/1/13 (Washington Gen. Oblig. Guaranteed) | 1,265 | | 1,282 |
Seattle Muni. Lt. & Pwr. Rev. Bonds Series 2008, 5% 4/1/13 | 1,000 | | 1,004 |
Washington State Ctfs. Prtn. Bonds Series 2012 B, 3% 7/1/13 | 1,250 | | 1,260 |
| | 6,729 |
Wisconsin - 4.7% |
Madison Gen. Oblig. Bonds Series 2012 C, 2% 10/1/13 | 765 | | 773 |
Milwaukee Gen. Oblig. Bonds Series 2012 N2, 3% 5/1/13 | 22,925 | | 23,033 |
Wisconsin Gen. Oblig.: | | | |
Bonds: | | | |
Series 1, 5.5% 5/1/13 | 1,000 | | 1,009 |
Series 2010 C, 5% 5/1/13 | 1,830 | | 1,845 |
Series WF 12 111C, 0.27%, tender 6/13/13 (Liquidity Facility Wells Fargo Bank NA) (c)(f)(g) | 600 | | 600 |
Other Municipal Debt - continued |
| Principal Amount (000s) | | Value (000s) |
Wisconsin - continued |
Wisconsin Gen. Oblig.: - continued | | | |
Series 2005 A: | | | |
0.14% 3/8/13 (Liquidity Facility State Street Bank & Trust Co., Boston) (Liquidity Facility California Teachers Retirement Sys.), CP | $ 2,500 | | $ 2,500 |
0.19% 3/7/13 (Liquidity Facility State Street Bank & Trust Co., Boston) (Liquidity Facility California Teachers Retirement Sys.), CP | 5,200 | | 5,200 |
Wisconsin Health & Edl. Facilities Auth. Rev. Bonds: | | | |
(Agnesian HealthCare, Inc. Proj.) Series 2013 B, 0.14% tender 3/5/13, LOC Bank of America NA, CP mode | 1,500 | | 1,500 |
(Ministry Health Care Proj.) Series 2009 A, 0.15% tender 4/3/13, LOC U.S. Bank NA, Cincinnati, CP mode | 650 | | 650 |
Series 2012 B, 2% 8/15/13 | 500 | | 504 |
Series 2012 J, 0.15% tender 4/3/13, CP mode | 400 | | 400 |
Wisconsin Trans. Rev.: | | | |
Series 1997, 0.19% 3/7/13 (Liquidity Facility State Street Bank & Trust Co., Boston) (Liquidity Facility California Teachers Retirement Sys.), CP | 3,125 | | 3,125 |
Series 2006 A: | | | |
0.18% 4/4/13 (Liquidity Facility State Street Bank & Trust Co., Boston) (Liquidity Facility California Teachers Retirement Sys.), CP | 5,260 | | 5,260 |
0.19% 3/7/13 (Liquidity Facility State Street Bank & Trust Co., Boston) (Liquidity Facility California Teachers Retirement Sys.), CP | 3,000 | | 3,000 |
| | 49,399 |
TOTAL OTHER MUNICIPAL DEBT | 427,602 |
Investment Company - 4.8% |
| Shares | | |
Fidelity Tax-Free Cash Central Fund, 0.11% (d)(e) | 50,470 | | 50,470 |
TOTAL INVESTMENT PORTFOLIO - 99.1% (Cost $1,045,038) | | 1,045,038 |
NET OTHER ASSETS (LIABILITIES) - 0.9% | | 9,729 |
NET ASSETS - 100% | $ 1,054,767 |
Fidelity® AMT Tax-Free Money Fund (the Fund) is a fund of Fidelity Union Street Trust II (the Trust) and is authorized to issue an unlimited number of shares. The Trust is registered under the Investment Company Act of 1940, as amended (the 1940 Act), as an open-end management investment company organized as a Delaware statutory trust.
The Fund invests in Fidelity Central Funds, which are open-end investment companies available only to other investment companies and accounts managed by Fidelity Management & Research Company (FMR) and its affiliates. The Fund's Schedule of Investments lists each of the Fidelity Central Funds held as of period end, as an investment of the Fund, but does not include the underlying holdings of each Fidelity Central Fund. As an Investing Fund, the Fund indirectly bears its proportionate share of the expenses of the underlying Fidelity Central Funds.
The Money Market Central Funds seek preservation of capital and current income and are managed by Fidelity Investments Money Management, Inc. (FIMM), an affiliate of FMR.
A complete unaudited list of holdings for each Fidelity Central Fund is available upon request or at the Securities and Exchange Commission (the SEC) website at www.sec.gov. In addition, the financial statements of the Fidelity Central Funds are available on the SEC website or upon request.
The financial statements have been prepared in conformity with accounting principles generally accepted in the United States of America (GAAP), which require management to make certain estimates and assumptions at the date of the financial statements. Actual results could differ from those estimates. Subsequent events, if any, through the date that the financial statements were issued have been evaluated in the preparation of the financial statements. The following summarizes the significant accounting policies of the Fund:
Level 2 - other significant observable inputs (including quoted prices for similar investments, interest rates, prepayment speeds, etc.)
Level 3 - unobservable inputs (including the Fund's own assumptions based on the best information available)
As permitted by compliance with certain conditions under Rule 2a-7 of the 1940 Act, securities are valued at amortized cost, which approximates fair value. The amortized cost of an instrument is determined by valuing it at its original cost and thereafter amortizing any discount or premium from its face value at a constant rate until maturity. Securities held by a money market fund are generally high quality and liquid; however, they are reflected as Level 2 because the inputs used to determine fair value are not quoted prices in an active market.
Dividends are declared and recorded daily and paid monthly from net investment income. Distributions from realized gains, if any, are declared and recorded on the ex-dividend date. Income and capital gain distributions are determined in accordance with income tax regulations, which may differ from GAAP.
Capital accounts within the financial statements are adjusted for permanent book-tax differences. These adjustments have no impact on net assets or the results of operations. Temporary book-tax differences will reverse in a subsequent period.
The Fund purchases municipal securities whose interest, in the opinion of the issuer, is free from federal income tax. There is no assurance that the IRS will agree with this opinion. In the event the IRS determines that the issuer does not comply with relevant tax requirements, interest payments from a security could become federally taxable, possibly retroactively to the date the security was issued.
The federal tax cost of investment securities and unrealized appreciation (depreciation) as of period end were as follows:
FMR voluntarily agreed to reimburse the Fund to the extent annual operating expenses exceeded .33% of average net assets. During the period this reimbursement reduced the Fund's expenses by $561.
Additionally, FMR or its affiliates voluntarily agreed to waive certain fees in order to maintain a minimum annualized yield of .01%. Such arrangements may be discontinued by FMR at any time. For the period, the amount of the waiver was $876.
In addition, through arrangements with the Fund's custodian, credits realized as a result of uninvested cash balances were used to reduce the Fund's management fee. During the period, these credits reduced the Fund's management fee by $3.
The Fund's organizational documents provide former and current trustees and officers with a limited indemnification against liabilities arising in connection with the performance of their duties to the Fund. In the normal course of business, the Fund may also enter into contracts that provide general indemnifications. The Fund's maximum exposure under these arrangements is unknown as this would be dependent on future claims that may be made against the Fund. The risk of material loss from such claims is considered remote.
Each year, the Board of Trustees, including the Independent Trustees (together, the Board), votes on the renewal of the management contract and sub-advisory agreements (together, the Advisory Contracts) for the fund. The Board, assisted by the advice of fund counsel and Independent Trustees' counsel, requests and considers a broad range of information relevant to the renewal of the Advisory Contracts throughout the year.
The Board meets regularly and, at each of its meetings, covers an extensive agenda of topics and materials and considers factors that are relevant to its annual consideration of the renewal of the fund's Advisory Contracts, including the services and support provided to the fund and its shareholders. The Board has established three standing committees, Operations, Audit, and Governance and Nominating, each composed of and chaired by Independent Trustees with varying backgrounds, to which the Board has assigned specific subject matter responsibilities in order to enhance effective decision-making by the Board. The Operations Committee, of which all of the Independent Trustees are members, meets regularly throughout the year and, among other matters, considers matters specifically related to the annual consideration of the renewal of the fund's Advisory Contracts. The Board, acting directly and through its Committees, requests and receives information concerning the annual consideration of the renewal of the fund's Advisory Contracts. The Board also meets as needed to consider matters specifically related to the Board's annual consideration of the renewal of Advisory Contracts. Members of the Board may also meet with trustees of other Fidelity funds through ad hoc joint committees to discuss certain matters relevant to the Fidelity funds.
At its September 2012 meeting, the Board of Trustees, including the Independent Trustees, unanimously determined to renew the fund's Advisory Contracts. In reaching its determination, the Board considered all factors it believed relevant, including (i) the nature, extent, and quality of the services to be provided to the fund and its shareholders (including the investment performance of the fund); (ii) the competitiveness of the fund's management fee and total expense ratio relative to peer funds; (iii) the total costs of the services to be provided by and the profits to be realized by Fidelity from its relationship with the fund; (iv) the extent to which economies of scale exist and would be realized as the fund grows; and (v) whether fee levels reflect these economies of scale, if any, for the benefit of fund shareholders.
In considering whether to renew the Advisory Contracts for the fund, the Board reached a determination, with the assistance of fund counsel and Independent Trustees' counsel and through the exercise of its business judgment, that the renewal of the Advisory Contracts is in the best interests of the fund and its shareholders and that the compensation payable under the Advisory Contracts is fair and reasonable. The Board's decision to renew the Advisory Contracts was not based on any single factor, but rather was based on a comprehensive consideration of all the information provided to the Board at its meetings throughout the year. The Board, in reaching its determination to renew the Advisory Contracts, was aware that shareholders in the fund have a broad range of investment choices available to them, including a wide choice among mutual funds offered by Fidelity's competitors, and that the fund's shareholders, who have the opportunity to review and weigh the disclosure provided by the fund in its prospectus and other public disclosures, have chosen to invest in this fund, managed by Fidelity.
The Board noted that the growth of fund assets over time across the complex allows Fidelity to reinvest in the development of services designed to enhance the value or convenience of the Fidelity funds as investment vehicles. These services include 24-hour access to account information and market information through telephone representatives and over the Internet, investor education materials and asset allocation tools, and the expanded availability of Fidelity Investor Centers.
The Board reviewed the fund's relative investment performance against its peer group and noted that the performance of the fund was in the second quartile for the one- and three-year periods and the first quartile for the five-year period. The Board considered that FMR had taken steps to provide shareholders with stability of principal and to enhance safety and liquidity. The Board also reviewed the fund's performance since inception as well as performance in the current year.
The Board noted that the fund's hypothetical net management fee ranked below the median of its Total Mapped Group and below the median of its ASPG for 2011.
Based on its review, the Board concluded that the fund's management fee is fair and reasonable in light of the services that the fund receives and the other factors considered.
The Board noted that the fund's total expense ratio ranked below its competitive median for 2011. The Board considered that Fidelity has been voluntarily waiving part or all of the management fees to maintain a minimum yield, and also noted that Fidelity retains the ability to be repaid in certain circumstances.
Based on its review of total expense ratios and fees charged to other Fidelity clients, the Board concluded that the fund's total expense ratio was reasonable in light of the services that the fund and its shareholders receive and the other factors considered.
PricewaterhouseCoopers LLP (PwC), independent registered public accounting firm and auditor to Fidelity and certain Fidelity funds, has been engaged annually by the Board as part of the Board's assessment of Fidelity's profitability analysis. PwC's engagement includes the review and assessment of Fidelity's methodologies used in determining the revenues and expenses attributable to Fidelity's mutual fund business, and completion of agreed-upon procedures surrounding the mathematical accuracy of fund profitability and its conformity to allocation methodologies. After considering PwC's reports issued under the engagement and information provided by Fidelity, the Board concluded that while other allocation methods may also be reasonable, Fidelity's profitability methodologies are reasonable in all material respects.
The Board also reviewed Fidelity's non-fund businesses and fall-out benefits related to the mutual fund business as well as cases where Fidelity's affiliates may benefit from or be related to the fund's business.
The Board considered the costs of the services provided by and the profits realized by Fidelity in connection with the operation of the fund and was satisfied that the profitability was not excessive in the circumstances.
Based on its evaluation of all of the conclusions noted above, and after considering all factors it believed relevant, the Board ultimately concluded that the advisory fee structures are fair and reasonable, and that the fund's Advisory Contracts should be renewed.
Citibank, N.A.
New York, NY
Fidelity Investments Institutional Operations Company, Inc.
Fidelity Service Company, Inc.
Citibank, N.A.
As a shareholder of the Fund, you incur two types of costs: (1) transaction costs, and (2) ongoing costs, including management fees and other Fund expenses. This Example is intended to help you understand your ongoing costs (in dollars) of investing in the Fund and to compare these costs with the ongoing costs of investing in other mutual funds.
The Example is based on an investment of $1,000 invested at the beginning of the period and held for the entire period (September 1, 2012 to February 28, 2013).
The first line of the accompanying table provides information about actual account values and actual expenses. You may use the information in this line, together with the amount you invested, to estimate the expenses that you paid over the period. Simply divide your account value by $1,000.00 (for example, an $8,600 account value divided by $1,000.00 = 8.6), then multiply the result by the number in the first line under the heading entitled "Expenses Paid During Period" to estimate the expenses you paid on your account during this period. A small balance maintenance fee of $12.00 that is charged once a year may apply for certain accounts with a value of less than $2,000. This fee is not included in the table below. If it was, the estimate of expenses you paid during the period would be higher, and your ending account value lower, by this amount. In addition, the Fund, as a shareholder in the underlying Fidelity Central Funds, will indirectly bear its pro-rata share of the fees and expenses incurred by the underlying Fidelity Central Funds. These fees and expenses are not included in the Fund's annualized expense ratio used to calculate the expense estimate in the table below.
The second line of the accompanying table provides information about hypothetical account values and hypothetical expenses based on the Fund's actual expense ratio and an assumed rate of return of 5% per year before expenses, which is not the Fund's actual return. The hypothetical account values and expenses may not be used to estimate the actual ending account balance or expenses you paid for the period. You may use this information to compare the ongoing costs of investing in the Fund and other funds. To do so, compare this 5% hypothetical example with the 5% hypothetical examples that appear in the shareholder reports of the other funds. A small balance maintenance fee of $12.00 that is charged once a year may apply for certain accounts with a value of less than $2,000. This fee is not included in the table below. If it was, the estimate of expenses you paid during the period would be higher, and your ending account value lower, by this amount. In addition, the Fund, as a shareholder in the underlying Fidelity Central Funds, will indirectly bear its pro-rata share of the fees and expenses incurred by the underlying Fidelity Central Funds. These fees and expenses are not included in the Fund's annualized expense ratio used to calculate the expense estimate in the table below.
Please note that the expenses shown in the table are meant to highlight your ongoing costs only and do not reflect any transaction costs. Therefore, the second line of the table is useful in comparing ongoing costs only, and will not help you determine the relative total costs of owning different funds.
Yield refers to the income paid by the fund over a given period. Yields for money market funds are usually for seven-day periods, as they are here, though they are expressed as annual percentage rates. Past performance is no guarantee of future results. Yield will vary and it's possible to lose money investing in the Fund. A portion of the Fund's expenses was reimbursed and/or waived. Absent such reimbursements and/or waivers the yield for the period ending February 28, 2013, the most recent period shown in the table, would have been -0.29%.
Variable Rate Demand Note - 63.5% |
| Principal
Amount (000s) | | Value (000s) |
Alabama - 0.7% |
Alabama Pub. School & College Auth. Rev. Participating VRDN Series MT 719, 0.1% 3/7/13 (Liquidity Facility Bank of America NA) (c)(g) | $ 5,810 | | $ 5,810 |
Decatur Indl. Dev. Board Exempt Facilities Rev. (Nucor Steel Decatur LLC Proj.) Series 2003 A, 0.35% 3/7/13, VRDN (c)(f) | 39,215 | | 39,215 |
Mobile Indl. Dev. Board Dock & Wharf Rev. (Holnam, Inc. Proj.) Series 1999 A, 0.15% 3/7/13, LOC Bayerische Landesbank Girozentrale, VRDN (c) | 21,000 | | 21,000 |
Mobile Indl. Dev. Board Exempt Facilities Rev. Series 1997, 0.13% 3/7/13 (Kimberly-Clark Corp. Guaranteed), VRDN (c) | 14,800 | | 14,800 |
Mobile Indl. Dev. Board Rev. (Alabama Pwr. Theodore Plant Proj.) Series A, 0.13% 3/1/13, VRDN (c)(f) | 4,000 | | 4,000 |
Mobile Indl. Dev. Board Solid Waste Disp. Rev. (Alabama Pwr. Co. Barry Plant Proj.) Second Series 2009, 0.13% 3/4/13, VRDN (c) | 20,800 | | 20,800 |
Univ. of Alabama Gen. Rev. Participating VRDN Series WF 12 83C, 0.1% 3/7/13 (Liquidity Facility Wells Fargo Bank NA) (c)(g) | 39,725 | | 39,725 |
Washington County Indl. Dev. Auth. Rev. (Sempra Energy Proj.) Series 2007, 0.11% 3/7/13, LOC UBS AG, VRDN (c) | 33,895 | | 33,895 |
West Jefferson Indl. Dev. Board Solid Waste Disp. Rev. (Alabama Pwr. Co. Miller Plant Proj.) Series 2008, 0.13% 3/1/13, VRDN (c)(f) | 15,000 | | 15,000 |
| | 194,245 |
Alaska - 0.3% |
Alaska Indl. Dev. & Export Auth. Rev.: | | | |
(Greater Fairbanks Cmnty. Hosp. Foundation Proj.) Series 2009 A, 0.13% 3/7/13, LOC Union Bank of California, VRDN (c) | 16,400 | | 16,400 |
Participating VRDN Series Putters 4722, 0.11% 3/7/13 (Liquidity Facility Bank of America NA) (c)(g) | 16,665 | | 16,665 |
Valdez Marine Term. Rev.: | | | |
(ConocoPhillips Proj.) Series 1994 A, 0.1% 3/7/13 (ConocoPhillips Guaranteed), VRDN (c) | 12,400 | | 12,400 |
(Phillips Trans. Alaska, Inc. Proj.): | | | |
Series 1994 B, 0.13% 3/7/13 (ConocoPhillips Guaranteed), VRDN (c) | 26,000 | | 26,000 |
Series 1994 C, 0.16% 3/7/13 (ConocoPhillips Guaranteed), VRDN (c) | 3,000 | | 3,000 |
Series 2002, 0.1% 3/7/13, VRDN (c) | 11,000 | | 11,000 |
| | 85,465 |
Variable Rate Demand Note - continued |
| Principal
Amount (000s) | | Value (000s) |
Arizona - 1.7% |
Arizona Board of Regents Arizona State Univ. Rev.: | | | |
Participating VRDN Series Putters 4147, 0.12% 3/7/13 (Liquidity Facility JPMorgan Chase Bank) (c)(g) | $ 10,160 | | $ 10,160 |
Series 2008 B, 0.11% 3/7/13, LOC JPMorgan Chase Bank, VRDN (c) | 10,020 | | 10,020 |
Arizona Health Facilities Auth. Rev.: | | | |
(Banner Health Sys. Proj.) Series 2008 F, 0.13% 3/7/13, LOC JPMorgan Chase Bank, VRDN (c) | 21,640 | | 21,640 |
(Catholic Healthcare West Proj.): | | | |
Series 2005 B, 0.12% 3/7/13, LOC JPMorgan Chase Bank, VRDN (c) | 13,930 | | 13,930 |
Series 2008 A, 0.11% 3/7/13, LOC JPMorgan Chase Bank, VRDN (c) | 16,900 | | 16,900 |
Series 2009 F, 0.11% 3/7/13, LOC Mizuho Corporate Bank Ltd., VRDN (c) | 37,750 | | 37,750 |
(Royal Oaks Life Care Cmnty. Proj.) Series 2002, 0.12% 3/7/13, LOC Bank of America NA, VRDN (c) | 11,715 | | 11,715 |
(Southwest Behavioral Health Svcs., Inc. Proj.) Series 2004, 0.11% 3/7/13, LOC JPMorgan Chase Bank, VRDN (c) | 3,395 | | 3,395 |
Coconino County Poll. Cont. Corp. Rev. (Tucson Elec. Pwr. Co. Navajo Proj.) Series 2010 A, 0.16% 3/7/13, LOC JPMorgan Chase Bank, VRDN (c)(f) | 14,900 | | 14,900 |
Glendale Indl. Dev. Auth. (Midwestern Univ. Proj.) Series 2008, 0.11% 3/7/13, LOC JPMorgan Chase Bank, VRDN (c) | 10,900 | | 10,900 |
Maricopa County Indl. Dev. Auth. Multi-family Hsg. Rev.: | | | |
(Ranchwood Apts. Proj.) Series 2001 A, 0.16% 3/7/13, LOC Fannie Mae, VRDN (c)(f) | 2,400 | | 2,400 |
(San Angelin Apts. Proj.) Series 2004, 0.12% 3/7/13, LOC Fannie Mae, VRDN (c)(f) | 14,900 | | 14,900 |
(San Clemente Apts. Proj.) Series 2004, 0.12% 3/7/13, LOC Fannie Mae, VRDN (c)(f) | 10,600 | | 10,600 |
(San Fernando Apts. Proj.) Series 2004, 0.12% 3/7/13, LOC Fannie Mae, VRDN (c)(f) | 14,500 | | 14,500 |
(San Lucas Apts. Proj.) Series 2003, 0.12% 3/7/13, LOC Fannie Mae, VRDN (c)(f) | 13,700 | | 13,700 |
(San Martin Apts. Proj.): | | | |
Series A1, 0.12% 3/7/13, LOC Fannie Mae, VRDN (c)(f) | 5,700 | | 5,700 |
Series A2, 0.14% 3/7/13, LOC Fannie Mae, VRDN (c)(f) | 4,300 | | 4,300 |
(San Miguel Apts. Proj.) Series 2003, 0.12% 3/7/13, LOC Fannie Mae, VRDN (c)(f) | 14,900 | | 14,900 |
(San Remo Apts. Proj.) Series 2002, 0.12% 3/7/13, LOC Fannie Mae, VRDN (c)(f) | 4,100 | | 4,100 |
Variable Rate Demand Note - continued |
| Principal
Amount (000s) | | Value (000s) |
Arizona - continued |
Maricopa County Indl. Dev. Auth. Multi-family Hsg. Rev.: - continued | | | |
(Sands Apts. Proj.) Series 2001 A, 0.16% 3/7/13, LOC Fannie Mae, VRDN (c)(f) | $ 2,800 | | $ 2,800 |
(Village Square Apts. Proj.) Series 2004, 0.14% 3/7/13, LOC Fannie Mae, VRDN (c)(f) | 2,500 | | 2,500 |
Maricopa County Indl. Dev. Auth. Rev. (Clayton Homes, Inc. Proj.) Series 1998, 0.15% 3/7/13, LOC U.S. Bank NA, Cincinnati, VRDN (c)(f) | 4,200 | | 4,200 |
Northern Arizona Univ. Revs. Participating VRDN Series Solar 07 14, 0.11% 3/7/13 (Liquidity Facility U.S. Bank NA, Cincinnati) (c)(g) | 16,435 | | 16,435 |
Pima County Indl. Dev. Auth. Indl. Rev. (Tucson Elec. Pwr. Co. Proj.) Series 1982 A, 0.11% 3/7/13, LOC Wells Fargo Bank NA, VRDN (c) | 4,000 | | 4,000 |
Pima County Indl. Dev. Auth. Multi-family Hsg. Rev.: | | | |
(Cimarron Place Apts. Proj.) 0.16% 3/7/13, LOC Fannie Mae, VRDN (c)(f) | 4,500 | | 4,500 |
Series A, 0.16% 3/7/13, LOC Fannie Mae, VRDN (c)(f) | 2,725 | | 2,725 |
Salt River Proj. Agricultural Impt. & Pwr. District Elec. Sys. Rev. Participating VRDN: | | | |
Series BC 10 21W, 0.14% 3/7/13 (Liquidity Facility Barclays Bank PLC) (c)(g) | 5,200 | | 5,200 |
Series EGL 06 0141, 0.11% 3/7/13 (Liquidity Facility Citibank NA) (c)(g) | 16,500 | | 16,500 |
Series EGL 07 0012, 0.11% 3/7/13 (Liquidity Facility Citibank NA) (c)(g) | 13,850 | | 13,850 |
Series MT 737, 0.1% 3/7/13 (Liquidity Facility Bank of America NA) (c)(g) | 27,675 | | 27,675 |
Series Putters 3307, 0.12% 3/7/13 (Liquidity Facility JPMorgan Chase Bank) (c)(g) | 6,395 | | 6,395 |
Series Putters 3467, 0.12% 3/7/13 (Liquidity Facility JPMorgan Chase Bank) (c)(g) | 4,000 | | 4,000 |
Series Putters 3708Z, 0.12% 3/7/13 (Liquidity Facility JPMorgan Chase Bank) (c)(g) | 23,895 | | 23,895 |
Tempe Indl. Dev. Auth. Rev. (ASUF Brickyard Proj.) Series 2004 A, 0.14% 3/7/13, LOC Bank of America NA, VRDN (c) | 1,000 | | 1,000 |
Yavapai County Indl. Dev. Auth. (Northern Arizona Healthcare Sys. Proj.) Series 2008 B, 0.11% 3/7/13, LOC Wells Fargo Bank NA, VRDN (c) | 34,340 | | 34,340 |
Yuma Indl. Dev. Auth. Hosp. Rev. (Yuma Reg'l. Med. Ctr. Proj.) Series 2008, 0.12% 3/7/13, LOC JPMorgan Chase Bank, VRDN (c) | 74,780 | | 74,780 |
| | 481,205 |
Variable Rate Demand Note - continued |
| Principal
Amount (000s) | | Value (000s) |
Arkansas - 0.5% |
Arkansas Dev. Auth. Indl. Dev. Rev. (Stratton Seed Co. Proj.) Series 1999, 0.31% 3/7/13, LOC Bank of America NA, VRDN (c)(f) | $ 450 | | $ 450 |
Arkansas Dev. Fin. Auth. Multi-family Hsg. Rev. (Kiehl Partners LP Proj.) Series 2004 A, 0.16% 3/7/13, LOC Fannie Mae, VRDN (c) | 7,115 | | 7,115 |
Blytheville Indl. Dev. Rev. (Nucor Corp. Proj.) Series 2002, 0.4% 3/7/13, VRDN (c)(f) | 34,400 | | 34,400 |
Fort Smith Gen. Oblig. (Mitsubishi Pwr. Systems Americas Proj.) Series 2010, 0.12% 3/7/13, LOC Bank of Tokyo-Mitsubishi UFJ Ltd., VRDN (c) | 8,000 | | 8,000 |
Osceola Solid Waste Disp. Rev. (Plum Point Energy Associates, LLC Proj.) Series 2006, 0.13% 3/7/13, LOC Royal Bank of Scotland PLC, VRDN (c)(f) | 100,000 | | 100,000 |
| | 149,965 |
California - 3.0% |
ABAG Fin. Auth. for Nonprofit Corps. Rev. (Sharp HealthCare Proj.) Series 2009 C, 0.13% 3/7/13, LOC Citibank NA, VRDN (c) | 41,800 | | 41,800 |
Anaheim Hsg. Auth. Multi-family Hsg. Rev. (Park Vista Apt. Proj.) Series 2000 D, 0.12% 3/7/13, LOC Freddie Mac, VRDN (c)(f) | 3,600 | | 3,600 |
Bay Area Toll Auth. San Francisco Bay Toll Bridge Rev. Participating VRDN: | | | |
Series EGL 06 83 Class A, 0.12% 3/7/13 (Liquidity Facility Citibank NA) (c)(g) | 35,600 | | 35,600 |
Series II R 11901, 0.12% 3/7/13 (Liquidity Facility Citibank NA) (c)(g) | 2,100 | | 2,100 |
California Edl. Facilities Auth. Rev. Participating VRDN: | | | |
Series BA 08 1207, 0.14% 3/7/13 (Liquidity Facility Deutsche Bank AG New York Branch) (c)(g) | 11,110 | | 11,110 |
Series ROC II R 11974, 0.11% 3/7/13 (Liquidity Facility Citibank NA) (c)(g) | 4,555 | | 4,555 |
California Gen. Oblig.: | | | |
Participating VRDN Series Putters 4265, 0.12% 3/1/13 (Liquidity Facility JPMorgan Chase & Co.) (c)(g) | 55,200 | | 55,200 |
Series 2003 C1, 0.11% 3/7/13, LOC Bank of America NA, VRDN (c) | 6,200 | | 6,200 |
Series 2003 C3, 0.11% 3/7/13, LOC Citibank NA, VRDN (c) | 41,000 | | 41,000 |
Variable Rate Demand Note - continued |
| Principal
Amount (000s) | | Value (000s) |
California - continued |
California Health Facilities Fing. Auth. Rev. Participating VRDN: | | | |
Series DB 3294, 0.12% 3/7/13 (Liquidity Facility Deutsche Bank AG) (c)(g) | $ 15,615 | | $ 15,615 |
Series MS 3248, 0.12% 3/7/13 (Liquidity Facility Deutsche Bank AG New York Branch) (c)(g) | 15,700 | | 15,700 |
Series WF 12 7C, 0.1% 3/7/13 (Liquidity Facility Wells Fargo Bank NA) (c)(g) | 26,360 | | 26,360 |
California Hsg. Fin. Agcy. Multi-family Hsg. Rev. Series 2007 B, 0.11% 3/7/13 (Liquidity Facility Fannie Mae) (Liquidity Facility Freddie Mac), VRDN (c)(f) | 2,260 | | 2,260 |
California Hsg. Fin. Agcy. Rev. (Home Mtg. Prog.): | | | |
Series 2000 N, 0.12% 3/7/13 (Liquidity Facility Fannie Mae) (Liquidity Facility Freddie Mac), VRDN (c)(f) | 18,775 | | 18,775 |
Series 2000 X2, 0.12% 3/7/13 (Liquidity Facility Fannie Mae) (Liquidity Facility Freddie Mac), VRDN (c)(f) | 1,500 | | 1,500 |
Series 2002 J, 0.12% 3/7/13 (Liquidity Facility Fannie Mae) (Liquidity Facility Freddie Mac), VRDN (c)(f) | 1,530 | | 1,530 |
Series 2003 H, 0.12% 3/7/13 (Liquidity Facility Fannie Mae) (Liquidity Facility Freddie Mac), VRDN (c)(f) | 23,690 | | 23,690 |
Series 2003 M: | | | |
0.12% 3/7/13 (Liquidity Facility Fannie Mae) (Liquidity Facility Freddie Mac), VRDN (c)(f) | 22,800 | | 22,800 |
0.12% 3/7/13 (Liquidity Facility Fannie Mae) (Liquidity Facility Freddie Mac), VRDN (c)(f) | 27,500 | | 27,500 |
Series 2006 C, 0.11% 3/7/13 (Liquidity Facility Fannie Mae) (Liquidity Facility Freddie Mac), VRDN (c)(f) | 50,000 | | 50,000 |
California Statewide Cmntys. Dev. Auth. Multi-family Hsg. Rev. (Maple Square Apt. Proj.) Series AA, 0.12% 3/7/13, LOC Citibank NA, VRDN (c)(f) | 5,755 | | 5,755 |
Chula Vista Multi-family Hsg. Rev. (Teresina Apts. Proj.) Series 2006 A, 0.1% 3/7/13, LOC Fannie Mae, VRDN (c)(f) | 18,970 | | 18,970 |
Contra Costa County Multi-family Hsg. Rev. (Park Regency Proj.) Series 2003 F, 0.1% 3/7/13, LOC Fannie Mae, VRDN (c)(f) | 12,800 | | 12,800 |
El Dorado Irrigation District Rev. Ctfs. of Prtn. Series 2008 A, 0.11% 3/7/13, LOC Citibank NA, VRDN (c) | 59,195 | | 59,195 |
Grossmont Healthcare District Participating VRDN Series WF 11 30C, 0.1% 3/7/13 (Liquidity Facility Wells Fargo Bank NA) (c)(g) | 10,145 | | 10,145 |
Loma Linda Hosp. Rev. (Loma Linda Univ. Med. Ctr. Proj.) Series 2008 B, 0.13% 3/7/13, LOC Bank of America NA, VRDN (c) | 23,300 | | 23,300 |
Variable Rate Demand Note - continued |
| Principal
Amount (000s) | | Value (000s) |
California - continued |
Los Angeles Cmnty. College District Participating VRDN: | | | |
Series MS 3096, 0.12% 3/7/13 (Liquidity Facility Deutsche Bank AG) (c)(g) | $ 1,500 | | $ 1,500 |
Series Putters 2864, 0.12% 3/7/13 (Liquidity Facility JPMorgan Chase Bank) (c)(g) | 4,785 | | 4,785 |
Series ROC II R 11728, 0.11% 3/7/13 (Liquidity Facility Citibank NA) (c)(g) | 7,040 | | 7,040 |
Los Angeles Dept. of Wtr. & Pwr. Rev. Participating VRDN: | | | |
Series MT 782, 0.1% 3/7/13 (Liquidity Facility Bank of America NA) (c)(g) | 3,505 | | 3,505 |
Series Putters 3902 Z, 0.12% 3/7/13 (Liquidity Facility JPMorgan Chase Bank) (c)(g) | 3,380 | | 3,380 |
Los Angeles Multi-family Hsg. Rev. (Tri-City Hsg. Proj.) Series 1, 0.13% 3/7/13, LOC Citibank NA, VRDN (c)(f) | 1,800 | | 1,800 |
Milpitas Multi-family Rev. (Crossing at Montague Proj.) Series A, 0.12% 3/7/13, LOC Fannie Mae, VRDN (c)(f) | 29,000 | | 29,000 |
Modesto Pub. Fing. Auth. Lease Rev. Series 2008 B, 0.16% 3/7/13, LOC Bank of America NA, VRDN (c) | 16,750 | | 16,750 |
Newport Beach Rev. (Hoag Memorial Hosp. Presbyterian Proj.) Series 2008 F, 0.13% 3/7/13, LOC Bank of America NA, VRDN (c) | 7,705 | | 7,705 |
Newport Mesa Unified School District Participating VRDN Series WF 11 70Z, 0.1% 3/7/13 (Liquidity Facility Wells Fargo Bank NA) (c)(g) | 13,530 | | 13,530 |
Northern California Pwr. Agcy. Rev. (Hydroelectric #1 Proj.) Series 2008 A, 0.11% 3/7/13, LOC Citibank NA, VRDN (c) | 62,060 | | 62,060 |
Riverside Ctfs. of Prtn. (Riverside Renaissance Proj.) Series 2008, 0.13% 3/7/13, LOC Bank of America NA, VRDN (c) | 67,450 | | 67,450 |
San Francisco City & County Arpts. Commission Int'l. Arpt. Rev.: | | | |
Series 2010 A2, 0.11% 3/7/13, LOC JPMorgan Chase Bank, VRDN (c)(f) | 14,500 | | 14,500 |
Series 2010 A3, 0.1% 3/7/13, LOC JPMorgan Chase Bank, VRDN (c)(f) | 14,000 | | 14,000 |
San Francisco City and County Fin. Corp. Lease Rev. (Moscone Ctr. Expansion Proj.) Series 2008-1, 0.13% 3/7/13, LOC Bank of America NA, VRDN (c) | 23,050 | | 23,050 |
San Jose Multi-family Hsg. Rev. (Las Ventanas Apts. Proj.) Series 2008 B, 0.12% 3/7/13, LOC Freddie Mac, VRDN (c) | 5,000 | | 5,000 |
Variable Rate Demand Note - continued |
| Principal
Amount (000s) | | Value (000s) |
California - continued |
San Juan Capistrano Gen. Oblig. Participating VRDN Series Putters 3646, 0.12% 3/7/13 (Liquidity Facility JPMorgan Chase Bank) (c)(g) | $ 10,050 | | $ 10,050 |
Stanislaus County Cap. Impts. Fing. Auth. Rev. Series 2004, 0.14% 3/7/13, LOC Bank of America NA, VRDN (c) | 9,270 | | 9,270 |
| | 831,435 |
Colorado - 2.1% |
Adams County Hsg. Auth. (Semper Village Apts. Proj.) Series 2004 A, 0.13% 3/7/13, LOC Fannie Mae, VRDN (c)(f) | 14,000 | | 14,000 |
Aurora Hosp. Rev. (Children's Hosp. Assoc. Proj.) Series 2008 C, 0.1% 3/7/13, LOC Wells Fargo Bank NA, VRDN (c) | 10,000 | | 10,000 |
Aurora Hsg. Auth. Multi-family Hsg. Rev. (Liberty Creek Proj.) Series 2008, 0.14% 3/7/13, LOC Fannie Mae, VRDN (c)(f) | 27,580 | | 27,580 |
Aurora Multi-family Hsg. Rev. (Aurora Meadows Apts. Proj.) Series 1996, 0.14% 3/7/13, LOC Fannie Mae, VRDN (c)(f) | 13,400 | | 13,400 |
Colorado Edl. & Cultural Facilities Auth. Rev. (Clyfford Still Museum Proj.) Series 2008, 0.11% 3/7/13, LOC Wells Fargo Bank NA, VRDN (c) | 2,260 | | 2,260 |
Colorado Health Facilities Auth. Retirement Hsg. Rev. Participating VRDN Series Putters 1390, 0.12% 3/7/13 (Liquidity Facility JPMorgan Chase Bank) (c)(g) | 38,265 | | 38,265 |
Colorado Health Facilities Auth. Rev. (Boulder Cmnty. Hosp. Proj.) Series 2000, 0.12% 3/7/13, LOC JPMorgan Chase Bank, VRDN (c) | 40,045 | | 40,045 |
Colorado Hsg. & Fin. Auth. Solid Waste Rev.: | | | |
(Waste Mgmt., Inc. Proj.) 0.15% 3/7/13, LOC Wells Fargo Bank NA, VRDN (c)(f) | 7,000 | | 7,000 |
(Waste Mgmt., Inc. Proj.) 0.16% 3/7/13, LOC JPMorgan Chase Bank, VRDN (c)(f) | 14,160 | | 14,160 |
Colorado Reg'l. Trans. District Sales Tax Rev. Participating VRDN: | | | |
Series EGL 07 0036, 0.11% 3/7/13 (Liquidity Facility Citibank NA) (c)(g) | 29,700 | | 29,700 |
Series EGL 07 0037, 0.11% 3/7/13 (Liquidity Facility Citibank NA) (c)(g) | 16,830 | | 16,830 |
Series EGL 07 0038, 0.11% 3/7/13 (Liquidity Facility Citibank NA) (c)(g) | 36,165 | | 36,165 |
Series EGL 07 0040, 0.11% 3/7/13 (Liquidity Facility Citibank NA) (c)(g) | 30,610 | | 30,610 |
Series MT 741, 0.1% 3/7/13 (Liquidity Facility Bank of America NA) (c)(g) | 10,520 | | 10,520 |
Series ROC II R 12312, 0.12% 3/7/13 (Liquidity Facility Citibank NA) (c)(g) | 3,700 | | 3,700 |
Variable Rate Demand Note - continued |
| Principal
Amount (000s) | | Value (000s) |
Colorado - continued |
Colorado Reg'l. Trans. District Sales Tax Rev. Participating VRDN: - continued | | | |
Series WF 10 37C, 0.1% 3/7/13 (Liquidity Facility Wells Fargo Bank NA) (c)(g) | $ 20,595 | | $ 20,595 |
Colorado Univ. Co. Hosp. Auth. Rev.: | | | |
Series 2004 A, 0.11% 3/7/13, LOC JPMorgan Chase Bank, VRDN (c) | 29,300 | | 29,300 |
Series 2008 B, 0.11% 3/7/13, LOC JPMorgan Chase Bank, VRDN (c) | 51,970 | | 51,970 |
Denver City & County Indl. Dev. Rev. (Brass Smith/Kevry Proj.) Series 2009, 0.26% 3/7/13, LOC Wells Fargo Bank NA, VRDN (c)(f) | 4,945 | | 4,945 |
Denver Urban Renewal Auth. Tax Increment Rev. Series 2008 A2, 0.11% 3/7/13, LOC U.S. Bank NA, Cincinnati, VRDN (c) | 40,300 | | 40,300 |
Eclipse Fdg. Trust Custody Rpt. Various States Participating VRDN Series Solar 12 11, 0.12% 3/7/13 (Liquidity Facility U.S. Bank NA, Cincinnati) (c)(g) | 14,970 | | 14,970 |
Fort Collins Indl. Dev. Rev. (Phelps-Tointon Millwork Proj.) Series 1993, 0.56% 3/7/13, LOC JPMorgan Chase Bank, VRDN (c)(f) | 110 | | 110 |
Lakewood Hsg. Auth. Multi-family Rev.: | | | |
(Ridgemoor Apts. Proj.) Series 2003 A, 0.13% 3/7/13, LOC Fannie Mae, VRDN (c)(f) | 13,325 | | 13,325 |
(Timberleaf Apts. Proj.) 0.13% 3/7/13, LOC Fannie Mae, VRDN (c)(f) | 11,165 | | 11,165 |
Moffat County Poll. Cont. Rev.: | | | |
(PacifiCorp Proj.) Series 1994, 0.12% 3/7/13, LOC Wells Fargo Bank NA, VRDN (c) | 20,155 | | 20,155 |
(Tri-State Generation and Transmission Assoc., Inc. Proj.) Series 2009, 0.13% 3/7/13, LOC Bank of America NA, VRDN (c) | 26,900 | | 26,900 |
RBC Muni. Products, Inc. Trust Participating VRDN Series RBC E 25, 0.14% 3/7/13 (Liquidity Facility Royal Bank of Canada) (c)(f)(g) | 45,490 | | 45,490 |
Univ. of Colorado Enterprise Sys. Rev. Participating VRDN Series ROC II R 14039, 0.13% 3/7/13 (Liquidity Facility Deutsche Postbank AG) (c)(g) | 5,910 | | 5,910 |
Westminster County Multi-family Hsg. Rev. (Lakeview Apts. Proj.) Series 1997, 0.14% 3/7/13, LOC Fannie Mae, VRDN (c)(f) | 7,110 | | 7,110 |
| | 586,480 |
Variable Rate Demand Note - continued |
| Principal
Amount (000s) | | Value (000s) |
Connecticut - 0.2% |
Connecticut Health & Edl. Facilities Auth. Rev.: | | | |
(St. Francis Hosp. & Med. Ctr. Proj.) Series F, 0.11% 3/7/13, LOC JPMorgan Chase Bank, VRDN (c) | $ 10,540 | | $ 10,540 |
(Yale-New Haven Hosp. Proj.): | | | |
Series K1, 0.12% 3/7/13, LOC JPMorgan Chase Bank, VRDN (c) | 12,955 | | 12,955 |
Series L1, 0.15% 3/7/13, LOC Bank of America NA, VRDN (c) | 6,130 | | 6,130 |
Series L2, 0.15% 3/7/13, LOC Bank of America NA, VRDN (c) | 8,800 | | 8,800 |
Series 2011 B, 0.13% 3/7/13, LOC Bank of America NA, VRDN (c) | 13,785 | | 13,785 |
| | 52,210 |
Delaware - 0.3% |
Delaware Econ. Dev. Auth. Rev. (Delmarva Pwr. & Lt. Co. Proj.): | | | |
Series 1987, 0.23% 3/1/13, VRDN (c)(f) | 3,000 | | 3,000 |
Series 1988, 0.23% 3/1/13, VRDN (c)(f) | 13,550 | | 13,550 |
Series 1993 C, 0.27% 3/7/13, VRDN (c) | 4,500 | | 4,500 |
Series 1994, 0.23% 3/1/13, VRDN (c)(f) | 30,000 | | 30,000 |
Series 1999 B, 0.35% 3/7/13, VRDN (c)(f) | 9,900 | | 9,900 |
Delaware Health Facilities Auth. Rev. (Beebe Med. Ctr. Proj.) 0.12% 3/7/13, LOC PNC Bank NA, VRDN (c) | 3,920 | | 3,920 |
Wilmington Adjustable Rate Demand Rev. (Delaware Art Museum, Inc. Proj.) 0.11% 3/7/13, LOC Wells Fargo Bank NA, VRDN (c) | 12,400 | | 12,400 |
| | 77,270 |
District Of Columbia - 0.6% |
District of Columbia Hsg. Fin. Agcy. Multi-family Hsg. Rev. (Trenton Park Apts. Proj.) Series 2001, 0.15% 3/7/13, LOC Bank of America NA, VRDN (c)(f) | 5,720 | | 5,720 |
District of Columbia Income Tax Rev. Participating VRDN: | | | |
Series Putters 3369, 0.12% 3/7/13 (Liquidity Facility JPMorgan Chase Bank) (c)(g) | 1,000 | | 1,000 |
Series Putters 4020, 0.12% 3/7/13 (Liquidity Facility JPMorgan Chase Bank) (c)(g) | 7,250 | | 7,250 |
District of Columbia Rev.: | | | |
(Fort Lincoln New Town/Premium Distributors LLC Proj.) Series 2000, 0.26% 3/7/13, LOC Wells Fargo Bank NA, VRDN (c)(f) | 6,665 | | 6,665 |
(Friends Legal Svcs. Corp. Proj.) 0.17% 3/7/13, LOC Bank of America NA, VRDN (c) | 9,675 | | 9,675 |
Variable Rate Demand Note - continued |
| Principal
Amount (000s) | | Value (000s) |
District Of Columbia - continued |
District of Columbia Rev.: - continued | | | |
(Medlantic/Helix Proj.) Series 1998 A Tranche II, 0.12% 3/7/13, LOC JPMorgan Chase Bank, VRDN (c) | $ 19,400 | | $ 19,400 |
(The AARP Foundation Proj.) Series 2004, 0.14% 3/7/13, LOC Bank of America NA, VRDN (c) | 10,900 | | 10,900 |
(Washington Drama Society, Inc. Proj.) Series 2008, 0.11% 3/7/13, LOC JPMorgan Chase Bank, VRDN (c) | 35,170 | | 35,170 |
(World Wildlife Fund Proj.) Series 2010, 0.11% 3/7/13, LOC JPMorgan Chase Bank, VRDN (c) | 10,185 | | 10,185 |
District of Columbia Univ. Rev.: | | | |
(American Univ. Proj.) Series 2006 B, 0.11% 3/7/13, LOC JPMorgan Chase Bank, VRDN (c) | 31,100 | | 31,100 |
(Georgetown Univ. Proj.): | | | |
Series 2007 B1, 0.1% 3/7/13, LOC JPMorgan Chase Bank, VRDN (c) | 12,850 | | 12,850 |
Series 2007 B2, 0.1% 3/7/13, LOC JPMorgan Chase Bank, VRDN (c) | 5,000 | | 5,000 |
| | 154,915 |
Florida - 3.5% |
Brevard County Hsg. Fin. Auth. (Manatee Cove Apts. Proj.) 0.15% 3/7/13, LOC Citibank NA, VRDN (c)(f) | 10,565 | | 10,565 |
Broward County Fin. Auth. Multi-family Hsg. Rev.: | | | |
(Pinnacle Village Apts. Proj.) Series 2004, 0.15% 3/7/13, LOC Citibank NA, VRDN (c)(f) | 6,400 | | 6,400 |
(Sanctuary Apts Proj.) Series A, 0.12% 3/7/13, LOC Fannie Mae, VRDN (c)(f) | 16,320 | | 16,320 |
Broward County Port Facilities Rev. (Port Everglades Proj.) Series 2008, 0.16% 3/7/13, LOC Bank of Nova Scotia New York Branch, VRDN (c)(f) | 8,630 | | 8,630 |
Coconut Creek Indl. Dev. Rev. (Elite Aluminum Corp. Proj.) Series 2002, 0.26% 3/7/13, LOC Bank of America NA, VRDN (c)(f) | 1,225 | | 1,225 |
Collier County Hsg. Fin. Auth. Multi-family Rev.: | | | |
(Sawgrass Pines Apts. Proj.) 0.12% 3/7/13, LOC Fannie Mae, VRDN (c)(f) | 6,800 | | 6,800 |
(Summer Lakes Phase II Apts. Proj.) 0.15% 3/7/13, LOC Citibank NA, VRDN (c)(f) | 18,190 | | 18,190 |
Davie Gen. Oblig. Rev. (United Jewish Cmnty. Proj.) 0.15% 3/7/13, LOC Bank of America NA, VRDN (c) | 8,400 | | 8,400 |
Florida Board of Ed. Pub. Ed. Cap. Outlay Participating VRDN: | | | |
Series BA 08 1059, 0.11% 3/7/13 (Liquidity Facility Bank of America NA) (c)(g) | 4,165 | | 4,165 |
Variable Rate Demand Note - continued |
| Principal
Amount (000s) | | Value (000s) |
Florida - continued |
Florida Board of Ed. Pub. Ed. Cap. Outlay Participating VRDN: - continued | | | |
Series EGL 07 48, 0.11% 3/7/13 (Liquidity Facility Citibank NA) (c)(g) | $ 21,445 | | $ 21,445 |
Series ROC II R 11884X, 0.11% 3/7/13 (Liquidity Facility Citibank NA) (c)(g) | 13,600 | | 13,600 |
Florida Dept. of Trans. Tpk. Rev. Participating VRDN: | | | |
Series BC 13 4WX, 0.13% 3/7/13 (Liquidity Facility Barclays Bank PLC) (c)(g) | 6,000 | | 6,000 |
Series Solar 07 30, 0.11% 3/7/13 (Liquidity Facility U.S. Bank NA, Cincinnati) (c)(g) | 15,000 | | 15,000 |
Florida Hsg. Fin. Agcy. Rev.: | | | |
(Bainbridge Club Apt. Proj.) Series M, 0.13% 3/7/13, LOC Fannie Mae, VRDN (c)(f) | 5,370 | | 5,370 |
(Banyan Bay Apts. Proj.) Series 1995 M, 0.13% 3/7/13, LOC Fannie Mae, VRDN (c)(f) | 8,450 | | 8,450 |
Florida Hsg. Fin. Corp. Multi-family Mtg. Rev.: | | | |
(Avalon Reserve Apts. Proj.) Series 2003 R1, 0.12% 3/7/13, LOC Fannie Mae, VRDN (c)(f) | 14,670 | | 14,670 |
(Clarcona Groves Apts. Proj.) Series A, 0.14% 3/7/13, LOC Citibank NA, VRDN (c)(f) | 8,700 | | 8,700 |
(Collins Cove Sr. Apts. Proj.) Series 2003 W, 0.14% 3/7/13, LOC Citibank NA, VRDN (c)(f) | 5,300 | | 5,300 |
(Grande Court at North Port Apts. Proj.) Series 2004 E, 0.13% 3/7/13, LOC Fannie Mae, VRDN (c)(f) | 5,600 | | 5,600 |
(Hunters Run Apts. Proj.) Series G, 0.15% 3/7/13, LOC Fannie Mae, VRDN (c)(f) | 8,000 | | 8,000 |
(Lynn Lake Apts. Proj.) Series B1, 0.13% 3/7/13, LOC Freddie Mac, VRDN (c)(f) | 20,210 | | 20,210 |
(Mill Creek Apts. Proj.) Series 2004 K, 0.12% 3/7/13, LOC Fannie Mae, VRDN (c)(f) | 14,600 | | 14,600 |
(Pinnacle Grove Apts. Proj.) Series 2003 A, 0.12% 3/7/13, LOC Fannie Mae, VRDN (c)(f) | 7,550 | | 7,550 |
(Riverwalk I Apts. Proj.) Series 2008 E, 0.13% 3/7/13, LOC Freddie Mac, VRDN (c)(f) | 5,075 | | 5,075 |
(Savannah Springs Apts. Proj.) Series G, 0.16% 3/7/13, LOC Citibank NA, VRDN (c)(f) | 6,980 | | 6,980 |
(Sterling Palms Apts. Proj.) Series F, 0.12% 3/7/13, LOC Fannie Mae, VRDN (c)(f) | 14,170 | | 14,170 |
Florida Hsg. Fin. Corp. Rev.: | | | |
(Tuscany Lakes Apts. Proj.) Series 2002 K1, 0.16% 3/7/13, LOC Fannie Mae, VRDN (c)(f) | 4,000 | | 4,000 |
Variable Rate Demand Note - continued |
| Principal
Amount (000s) | | Value (000s) |
Florida - continued |
Florida Hsg. Fin. Corp. Rev.: - continued | | | |
(Valencia Village Apts. Proj.) Series G, 0.13% 3/7/13, LOC Fannie Mae, VRDN (c)(f) | $ 11,650 | | $ 11,650 |
(Waterford Pointe Apts. Proj.) Series 2000 E1, 0.12% 3/7/13, LOC Fannie Mae, VRDN (c)(f) | 8,155 | | 8,155 |
Fort Myers Util. Sys. Rev. Participating VRDN Series Solar 06 53, 0.11% 3/7/13 (Liquidity Facility U.S. Bank NA, Cincinnati) (c)(g) | 12,565 | | 12,565 |
Highlands County Health Facilities Auth. Rev. Participating VRDN Series ROCS II R 11830, 0.13% 3/7/13 (Liquidity Facility Citibank NA) (c)(g) | 5,000 | | 5,000 |
Hillsborough County Hsg. Fin. Auth. Multi-family Rev.: | | | |
(Claymore Crossings Apt. Proj.) Series 2005, 0.15% 3/7/13, LOC Citibank NA, VRDN (c)(f) | 10,875 | | 10,875 |
(Grande Oaks Apts. Proj.) Series A, 0.13% 3/7/13, LOC Fannie Mae, VRDN (c)(f) | 7,200 | | 7,200 |
(Hunters Run Apts. Proj.) Series 2002 A, 0.13% 3/7/13, LOC Fannie Mae, VRDN (c)(f) | 8,380 | | 8,380 |
(Meridian Pointe Apts. Proj.) Series 2005, 0.15% 3/7/13, LOC Citibank NA, VRDN (c)(f) | 11,800 | | 11,800 |
(Mobley Park Apts. Proj.) Series A, 0.13% 3/7/13, LOC Freddie Mac, VRDN (c)(f) | 7,490 | | 7,490 |
(Morgan Creek Apts. Proj.) Series 2003, 0.12% 3/7/13, LOC Fannie Mae, VRDN (c)(f) | 12,700 | | 12,700 |
(Royal Palm Key Apts. Proj.) Series 2002, 0.13% 3/7/13, LOC Fannie Mae, VRDN (c)(f) | 8,780 | | 8,780 |
Hillsborough County Indl. Dev. Auth. Indl. Dev. Rev. (Vigo Importing Co. Proj.) Series 1996, 0.46% 3/7/13, LOC Bank of America NA, VRDN (c)(f) | 505 | | 505 |
Jacksonville Econ. Dev. Commission Indl. Dev. Rev. (STI Proj.) Series 2002, 0.26% 3/7/13, LOC Bank of America NA, VRDN (c)(f) | 7,350 | | 7,350 |
Jacksonville Elec. Auth. Elec. Sys. Rev. Participating VRDN Series BA 09 1209X, 0.15% 3/7/13 (Liquidity Facility Bank of America NA) (c)(g) | 5,310 | | 5,310 |
Jacksonville Hsg. Fin. Auth. Multi-family Hsg. Rev. (Brookwood Forest Apts. Proj.) 0.13% 3/7/13, LOC Fannie Mae, VRDN (c)(f) | 9,100 | | 9,100 |
Jacksonville Port Auth. Rev. (Mitsui O.S.K. Lines Ltd. Proj.) 0.13% 3/7/13, LOC Sumitomo Mitsui Banking Corp., VRDN (c)(f) | 80,470 | | 80,470 |
JEA Wtr. & Swr. Sys. Rev. Participating VRDN Series WF 11 4C, 0.1% 3/7/13 (Liquidity Facility Wells Fargo Bank NA) (c)(g) | 11,800 | | 11,800 |
Variable Rate Demand Note - continued |
| Principal
Amount (000s) | | Value (000s) |
Florida - continued |
Lee County Hsg. Fin. Auth. Multi-family Hsg. Rev. (Univ. Club Apts. Proj.) Series A, 0.16% 3/7/13, LOC Fannie Mae, VRDN (c)(f) | $ 7,500 | | $ 7,500 |
Lee Memorial Health Sys. Hosp. Rev. Series 2009 C, 0.12% 3/7/13, LOC JPMorgan Chase Bank, VRDN (c) | 6,540 | | 6,540 |
Liberty County Indl. Dev. Rev. (Georgia-Pacific Corp. Proj.) 0.14% 3/7/13, LOC Bank of Nova Scotia New York Branch, VRDN (c)(f) | 5,000 | | 5,000 |
Miami-Dade County Hsg. Fin. Auth. Multi-family Mtg. Rev. (22nd Avenue Apts., 183rd Street Apts. & 187th Street Apts. Proj.) Series 2003 3, 0.15% 3/7/13, LOC Citibank NA, VRDN (c)(f) | 15,620 | | 15,620 |
Miami-Dade County Indl. Dev. Auth. Rev. (Tarmac America Proj.) Series 2004, 0.17% 3/7/13, LOC Bank of America NA, VRDN (c)(f) | 10,600 | | 10,600 |
Ocean Hwy. & Port Auth. Rev. 0.16% 3/7/13, LOC Wells Fargo Bank NA, VRDN (c)(f) | 4,500 | | 4,500 |
Orange County Health Facilities Auth. Rev. (The Nemours Foundation Proj.) Series 2009 B, 0.13% 3/7/13, LOC Bank of America NA, VRDN (c) | 26,010 | | 26,010 |
Orange County Hsg. Fin. Auth. Multi-family Rev.: | | | |
(Alta Westgate Apts. Proj.) Series C, 0.15% 3/7/13, LOC Citibank NA, VRDN (c)(f) | 12,860 | | 12,860 |
(Glenn Millenia Proj.) Series 2001 C, 0.13% 3/7/13, LOC Fannie Mae, VRDN (c)(f) | 3,400 | | 3,400 |
(Osprey Ridge Apts. Proj.) Series 2000 H, 0.12% 3/7/13, LOC Fannie Mae, VRDN (c)(f) | 7,360 | | 7,360 |
Orange County School Board Ctfs. of Prtn. Participating VRDN Series Putters 4107, 0.15% 3/7/13 (Liquidity Facility JPMorgan Chase Bank) (c)(g) | 5,210 | | 5,210 |
Orlando Utils. Commission Util. Sys. Rev. Participating VRDN Series Putters 4148, 0.12% 3/7/13 (Liquidity Facility JPMorgan Chase Bank) (c)(g) | 27,545 | | 27,545 |
Osceola County Hsg. Fin. Auth. Multi-family Rev. (Regatta Bay Apts. Proj.) Series A, 0.13% 3/7/13, LOC Fannie Mae, VRDN (c)(f) | 12,920 | | 12,920 |
Palm Beach County Edl. Facilities Auth. (Lynn Univ. Proj.) Series 2001, 0.15% 3/7/13, LOC Bank of America NA, VRDN (c) | 8,470 | | 8,470 |
Palm Beach County Hsg. Fin. Auth. Multi-family Hsg. Rev. (Renaissance Apts. Proj.) 0.13% 3/7/13, LOC Fannie Mae, VRDN (c)(f) | 20,900 | | 20,900 |
Palm Beach County Rev.: | | | |
(Benjamin Private School Proj.) 0.11% 3/7/13, LOC Northern Trust Co., VRDN (c) | 5,925 | | 5,925 |
Variable Rate Demand Note - continued |
| Principal
Amount (000s) | | Value (000s) |
Florida - continued |
Palm Beach County Rev.: - continued | | | |
(Hospice of Palm Beach Proj.) Series 2001, 0.11% 3/7/13, LOC Northern Trust Co., VRDN (c) | $ 3,000 | | $ 3,000 |
(Raymond F. Kravis Ctr. Proj.) Series 2002, 0.11% 3/7/13, LOC Northern Trust Co., VRDN (c) | 3,145 | | 3,145 |
(Saint Andrew's School of Boca Raton, Inc. Proj.) Series 2007, 0.15% 3/7/13, LOC Bank of America NA, VRDN (c) | 10,300 | | 10,300 |
(The Norton Gallery and School of Arts, Inc. Proj.) Series 2000, 0.21% 3/7/13, LOC Bank of America NA, VRDN (c) | 11,400 | | 11,400 |
Palm Beach County Wtr. & Swr. Rev. Participating VRDN Series Putters 2622, 0.12% 3/7/13 (Liquidity Facility JPMorgan Chase Bank) (c)(g) | 1,000 | | 1,000 |
Pasco County School Board Ctfs. of Prtn. Series 2008 C, 0.15% 3/7/13, LOC Bank of America NA, VRDN (c) | 68,135 | | 68,135 |
Pinellas County Health Facilities Auth. Rev.: | | | |
(BayCare Health Sys. Proj.) Series 2009 A3, 0.11% 3/7/13, LOC Wells Fargo Bank NA, VRDN (c) | 20,375 | | 20,375 |
(Suncoast Hospice Proj.) Series 2004, 0.11% 3/7/13, LOC Wells Fargo Bank NA, VRDN (c) | 13,565 | | 13,565 |
Polk County Hsg. Fin. Auth. Multi-family Hsg. Rev. (Cambridge Cove Apts. Proj.) Series 2001, 0.13% 3/7/13, LOC Fannie Mae, VRDN (c)(f) | 7,800 | | 7,800 |
Sunshine State Govt. Fing. Commission Rev. (Miami-Dade County Prog.): | | | |
Series 2010 A, 0.11% 3/7/13, LOC JPMorgan Chase Bank, VRDN (c) | 37,000 | | 37,000 |
Series 2010 B, 0.13% 3/7/13, LOC JPMorgan Chase Bank, VRDN (c) | 59,550 | | 59,550 |
Series 2011 C, 0.11% 3/7/13, LOC JPMorgan Chase Bank, VRDN (c) | 20,500 | | 20,500 |
Tallahassee Energy Sys. Rev. Participating VRDN Series Putters 4204, 0.11% 3/1/13 (Liquidity Facility JPMorgan Chase Bank) (c)(g) | 2,590 | | 2,590 |
USF College of Medicine Health Facilities Series 2006 A1, 0.11% 3/7/13, LOC JPMorgan Chase Bank, VRDN (c) | 14,100 | | 14,100 |
USF Fing. Corp. Ctfs. of Prtn.: | | | |
(College of Medicine Health Facilities Lease Prog.) Series 2006 A2, 0.11% 3/7/13, LOC JPMorgan Chase Bank, VRDN (c) | 21,415 | | 21,415 |
Series 2007, 0.11% 3/7/13, LOC JPMorgan Chase Bank, VRDN (c) | 15,475 | | 15,475 |
| | 974,255 |
Variable Rate Demand Note - continued |
| Principal
Amount (000s) | | Value (000s) |
Georgia - 1.6% |
Atlanta Urban Residential Fin. Auth. Multi-family Hsg. Rev.: | | | |
(Capitol Gateway Apts. Proj.) Series 2005, 0.13% 3/7/13, LOC Fannie Mae, VRDN (c)(f) | $ 8,475 | | $ 8,475 |
(Carver Redev. Proj.) Series 2000, 0.22% 3/7/13, LOC Fannie Mae, VRDN (c)(f) | 3,815 | | 3,815 |
(Collegetown at Harris Homes Phase I Proj.) Series 2003, 0.13% 3/7/13, LOC Fannie Mae, VRDN (c)(f) | 7,230 | | 7,230 |
Bartow County Dev. Auth. Poll. Cont. Rev. (Georgia Pwr. Co. Plant Bowen Proj.) Second Series 1998, 0.14% 3/1/13, VRDN (c)(f) | 11,400 | | 11,400 |
Bulloch County Dev. Auth. Indl. Dev. Rev. (Gold Kist, Inc. Proj.) Series 1995, 0.26% 3/7/13, LOC Wells Fargo Bank NA, VRDN (c)(f) | 4,000 | | 4,000 |
Burke County Indl. Dev. Auth. Poll. Cont. Rev.: | | | |
(Georgia Pwr. Co. Plant Vogtle Proj.) Second Series 1995, 0.13% 3/1/13, VRDN (c) | 16,000 | | 16,000 |
(Oglethorpe Pwr. Corp. Proj.) Series 2010 A, 0.13% 3/7/13, LOC Bank of America NA, VRDN (c) | 35,200 | | 35,200 |
Canton Hsg. Auth. Multi-family Hsg. Rev. (Alta Ridgewalk Apts. Proj.) Series 2003, 0.13% 3/7/13, LOC Freddie Mac, VRDN (c)(f) | 20,450 | | 20,450 |
Clarke County Indl. Dev. Auth. Hosp. Facilities Rev. Participating VRDN Series Solar 07 31, 0.11% 3/7/13 (Liquidity Facility U.S. Bank NA, Cincinnati) (c)(g) | 16,200 | | 16,200 |
Cobb County Kennestone Hosp. Auth. Rev. (WellStar Health Sys. Proj.) Series 2005 A, 0.14% 3/7/13, LOC Bank of America NA, VRDN (c) | 41,400 | | 41,400 |
Covington Hsg. Auth. Multi-family Rev. (Wellington Ridge Apt. Proj.) 0.13% 3/7/13, LOC Freddie Mac, VRDN (c)(f) | 9,060 | | 9,060 |
DeKalb County Hsg. Auth. Multi-family Hsg. Rev. (Eagles Trace Apts. Proj.) Series 1996, 0.13% 3/7/13, LOC Fannie Mae, VRDN (c)(f) | 7,350 | | 7,350 |
Georgia Gen. Oblig. Participating VRDN Series Putters 4170, 0.12% 3/7/13 (Liquidity Facility JPMorgan Chase Bank) (c)(g) | 6,770 | | 6,770 |
Gwinnett County Dev. Auth. Indl. Dev. Rev. (Curtis 1000, Inc. Proj.) Series 1996, 0.14% 3/7/13, LOC Wells Fargo Bank NA, VRDN (c)(f) | 6,460 | | 6,460 |
Gwinnett County Hsg. Auth. Multi-family Hsg. Rev. (Herrington Woods Apt. Proj.) Series 1996 A, 0.13% 3/7/13, LOC Fannie Mae, VRDN (c)(f) | 10,535 | | 10,535 |
Gwinnett County Wtr. & Swr. Auth. Rev. Participating VRDN Series ROC II R 11910, 0.12% 3/7/13 (Liquidity Facility Citibank NA) (c)(g) | 4,130 | | 4,130 |
Variable Rate Demand Note - continued |
| Principal
Amount (000s) | | Value (000s) |
Georgia - continued |
Heard County Dev. Auth. Poll. Cont. Rev. (Oglethorpe Pwr. Corp. Scherer Proj.) Series 2009 A, 0.11% 3/7/13, LOC JPMorgan Chase Bank, VRDN (c) | $ 3,600 | | $ 3,600 |
Kennesaw Dev. Auth. Multi-family Hsg. Rev. (Alta Ridenour Apts. Proj.) Series 2008, 0.13% 3/7/13, LOC Freddie Mac, VRDN (c)(f) | 7,350 | | 7,350 |
Loganville Hsg. Auth. Multi-family Hsg. Rev. (Alexander Crossing Apt. Proj.) 0.14% 3/7/13, LOC Freddie Mac, VRDN (c)(f) | 15,555 | | 15,555 |
Main Street Natural Gas, Inc. Georgia Gas Proj. Rev. Series 2010 A, 0.11% 3/7/13 (Liquidity Facility Royal Bank of Canada), VRDN (c) | 70,475 | | 70,475 |
Metropolitan Atlanta Rapid Transit Auth. Sales Tax Rev. Series 2000 B, 0.12% 3/7/13, LOC PNC Bank NA, VRDN (c) | 44,100 | | 44,100 |
Monroe County Dev. Auth. Poll. Cont. Rev. (Oglethorpe Pwr. Corp. Scherer Proj.) Series 2009 A, 0.11% 3/7/13, LOC JPMorgan Chase Bank, VRDN (c) | 10,090 | | 10,090 |
Newnan Dev. Auth. Multi-family Hsg. Rev. (The Club at Newnan Crossing Proj.) 0.14% 3/7/13, LOC Fannie Mae, VRDN (c)(f) | 9,700 | | 9,700 |
Private Colleges & Univs. Auth. Rev. Participating VRDN Series WF 11 32C, 0.1% 3/7/13 (Liquidity Facility Wells Fargo Bank NA) (c)(g) | 5,800 | | 5,800 |
Roswell Hsg. Auth. Multi-family Hsg. Rev.: | | | |
(Azalea Park Apts. Proj.) Series 1996, 0.11% 3/7/13, LOC Fannie Mae, VRDN (c) | 1,400 | | 1,400 |
(Rosemont Apts. Proj.) 0.13% 3/7/13, LOC Freddie Mac, VRDN (c) | 9,385 | | 9,385 |
Savannah Econ. Dev. Auth. Rev. (Home Depot, Inc. Proj.) Series 1995 A, 0.33% 3/7/13, VRDN (c)(f) | 57,400 | | 57,400 |
Sugar Hill Hsg. Auth. Multi-family Rev. (Level Creek Apts. Proj.) Series 1997, 0.13% 3/7/13, LOC Citibank NA, VRDN (c)(f) | 11,290 | | 11,290 |
| | 454,620 |
Hawaii - 0.1% |
Eclipse Fdg. Trust Custody Rpt. Various States Participating VRDN Series Solar 12 14, 0.11% 3/7/13 (Liquidity Facility U.S. Bank NA, Cincinnati) (c)(g) | 14,355 | | 14,355 |
Hawaii Dept. of Budget & Fin. Spl. Purp. Rev. (Queen's Health Sys. Proj.) Series 2009 A, 0.13% 3/7/13, LOC Bank of America NA, VRDN (c) | 16,640 | | 16,640 |
Hawaii Gen. Oblig. Participating VRDN Series MT 4718, 0.15% 3/7/13 (Liquidity Facility Bank of America NA) (c)(g) | 1,340 | | 1,340 |
Variable Rate Demand Note - continued |
| Principal
Amount (000s) | | Value (000s) |
Hawaii - continued |
Hawaii State Hsg. Fin. & Dev. Corp. Rev. (Lokahi Kau Apts. Proj.) Series 2008, 0.11% 3/7/13, LOC Freddie Mac, VRDN (c) | $ 6,160 | | $ 6,160 |
Honolulu City and County Wastewtr. Sys. Participating VRDN Series ROC II R 11989, 0.11% 3/7/13 (Liquidity Facility Citibank NA) (c)(g) | 4,005 | | 4,005 |
| | 42,500 |
Idaho - 0.2% |
Idaho Hsg. & Fin. Assoc. Single Family Mtg.: | | | |
(Single Family Mtg. Proj.): | | | |
Series 2001 A, 0.13% 3/7/13 (Liquidity Facility Fannie Mae) (Liquidity Facility Freddie Mac), VRDN (c)(f) | 6,450 | | 6,450 |
Series 2001 E, 0.13% 3/7/13 (Liquidity Facility Fannie Mae) (Liquidity Facility Freddie Mac), VRDN (c)(f) | 5,400 | | 5,400 |
Series 2000 F, 0.13% 3/7/13 (Liquidity Facility Fannie Mae) (Liquidity Facility Freddie Mac), VRDN (c)(f) | 4,115 | | 4,115 |
Series 2001 B, 0.13% 3/7/13 (Liquidity Facility Fannie Mae) (Liquidity Facility Freddie Mac), VRDN (c)(f) | 3,820 | | 3,820 |
Series 2001 C, 0.13% 3/7/13 (Liquidity Facility Fannie Mae) (Liquidity Facility Freddie Mac), VRDN (c)(f) | 6,225 | | 6,225 |
Series 2001 D1, 0.13% 3/7/13 (Liquidity Facility Fannie Mae) (Liquidity Facility Freddie Mac), VRDN (c)(f) | 1,100 | | 1,100 |
Series 2002 C, 0.13% 3/7/13 (Liquidity Facility Fannie Mae) (Liquidity Facility Freddie Mac), VRDN (c)(f) | 6,715 | | 6,715 |
Series 2002, 0.13% 3/7/13 (Liquidity Facility Fannie Mae) (Liquidity Facility Freddie Mac), VRDN (c)(f) | 9,250 | | 9,250 |
Series 2004 A, 0.13% 3/7/13 (Liquidity Facility Fannie Mae) (Liquidity Facility Freddie Mac), VRDN (c)(f) | 5,920 | | 5,920 |
Series 2006 G, 0.13% 3/7/13 (Liquidity Facility Fannie Mae) (Liquidity Facility Freddie Mac), VRDN (c)(f) | 6,760 | | 6,760 |
| | 55,755 |
Illinois - 3.7% |
Belvidere Indl. Dev. Rev. (R&D Thiel, Inc. Proj.) Series 1996, 0.2% 3/7/13, LOC Bank of America NA, VRDN (c)(f) | 1,460 | | 1,460 |
Carol Stream Multi-family Rev. (Saint Charles Square Proj.) Series 1997, 0.11% 3/7/13, LOC Fannie Mae, VRDN (c)(f) | 1,800 | | 1,800 |
Chicago Board of Ed. Series 2000 B, 0.1% 3/7/13, LOC Wells Fargo Bank NA, VRDN (c) | 14,400 | | 14,400 |
Chicago Gen. Oblig. Participating VRDN Series Solar 06 38, 0.11% 3/7/13 (Liquidity Facility U.S. Bank NA, Cincinnati) (c)(g) | 7,650 | | 7,650 |
Variable Rate Demand Note - continued |
| Principal
Amount (000s) | | Value (000s) |
Illinois - continued |
Chicago Indl. Dev. Rev. (Chicago Scenic Studios, Inc. Proj.) Series 2000, 0.22% 3/7/13, LOC BMO Harris Bank NA, VRDN (c)(f) | $ 2,595 | | $ 2,595 |
Chicago Metropolitan Wtr. Reclamation District Greater Chicago Participating VRDN Series Solar 06 75, 0.11% 3/7/13 (Liquidity Facility U.S. Bank NA, Cincinnati) (c)(g) | 19,795 | | 19,795 |
Chicago O'Hare Int'l. Arpt. Rev. Series 2005 D, 0.12% 3/7/13, LOC Barclays Bank PLC, VRDN (c) | 44,700 | | 44,700 |
Chicago Park District Gen. Oblig. Participating VRDN: | | | |
Series MT 760, 0.1% 3/7/13 (Liquidity Facility Bank of America NA) (c)(g) | 6,510 | | 6,510 |
Series Putters 3842, 0.12% 3/7/13 (Liquidity Facility JPMorgan Chase Bank) (c)(g) | 4,000 | | 4,000 |
Series ROC II R 11935, 0.11% 3/7/13 (Liquidity Facility Citibank NA) (c)(g) | 9,375 | | 9,375 |
Chicago Wtr. Rev.: | | | |
Series 2004 A1, 0.13% 3/7/13, LOC California Pub. Employees Retirement Sys., VRDN (c) | 87,915 | | 87,915 |
Series 2004 A2, 0.13% 3/7/13, LOC California Pub. Employees Retirement Sys., VRDN (c) | 50,025 | | 50,025 |
Series 2004 A3, 0.12% 3/7/13, LOC State Street Bank & Trust Co., Boston, VRDN (c) | 17,745 | | 17,745 |
Illinois Dev. Fin. Auth. Indl. Dev. Rev.: | | | |
(Delta-Unibus Corp. Proj.) Series 2001, 0.26% 3/7/13, LOC Bank of America NA, VRDN (c)(f) | 3,600 | | 3,600 |
(Mapes & Sprowl Steel Ltd. Proj.) Series 1996 A, 0.35% 3/7/13, LOC BMO Harris Bank NA, VRDN (c)(f) | 452 | | 452 |
(R&R Enterprises 2nd Proj.) Series 1999 A, 0.22% 3/7/13, LOC BMO Harris Bank NA, VRDN (c)(f) | 2,455 | | 2,455 |
Illinois Dev. Fin. Auth. Rev. (Rich Prods. Corp. Proj.) Series 1998, 0.17% 3/7/13, LOC HSBC Bank USA, NA, VRDN (c)(f) | 7,825 | | 7,825 |
Illinois Fin. Auth. Multi-family Rev. (Hidden Glen Apts. Proj.) Series 2007, 0.11% 3/7/13, LOC U.S. Bank NA, Cincinnati, VRDN (c)(f) | 7,070 | | 7,070 |
Illinois Fin. Auth. Rev.: | | | |
(Chicago Symphony Orchestra Proj.) Series 2008, 0.12% 3/7/13, LOC U.S. Bank NA, Cincinnati, VRDN (c) | 19,540 | | 19,540 |
(Children's Memorial Hosp. Proj.): | | | |
Series 2008 C, 0.12% 3/7/13, LOC JPMorgan Chase Bank, VRDN (c) | 10,000 | | 10,000 |
Series 2008 D, 0.11% 3/7/13, LOC JPMorgan Chase Bank, VRDN (c) | 13,250 | | 13,250 |
Variable Rate Demand Note - continued |
| Principal
Amount (000s) | | Value (000s) |
Illinois - continued |
Illinois Fin. Auth. Rev.: - continued | | | |
(Edward Hosp. Obligated Group Proj.): | | | |
Series 2008 B1, 0.11% 3/7/13, LOC JPMorgan Chase Bank, VRDN (c) | $ 24,300 | | $ 24,300 |
Series 2008 B2, 0.12% 3/7/13, LOC JPMorgan Chase Bank, VRDN (c) | 38,400 | | 38,400 |
Series 2009 A, 0.12% 3/7/13, LOC Bank of America NA, VRDN (c) | 24,500 | | 24,500 |
(Little Co. of Mary Hosp. Proj.) Series 2008 A, 0.11% 3/7/13, LOC JPMorgan Chase Bank, VRDN (c) | 32,045 | | 32,045 |
(Museum of Science & Industry Proj.): | | | |
Series 2009 A, 0.13% 3/7/13, LOC Bank of America NA, VRDN (c) | 15,500 | | 15,500 |
Series 2009 C, 0.12% 3/7/13, LOC PNC Bank NA, VRDN (c) | 12,870 | | 12,870 |
Series 2009 D, 0.12% 3/7/13, LOC Northern Trust Co., VRDN (c) | 15,500 | | 15,500 |
(OSF Healthcare Sys. Proj.) Series 2009 C, 0.12% 3/7/13, LOC Wells Fargo Bank NA, VRDN (c) | 16,000 | | 16,000 |
(Provena Health Proj.): | | | |
Series 2009 C, 0.11% 3/7/13, LOC JPMorgan Chase Bank, VRDN (c) | 21,000 | | 21,000 |
Series 2010 D, 0.1% 3/7/13, LOC Union Bank of California, VRDN (c) | 24,985 | | 24,985 |
(Rehabilitation Institute of Chicago Proj.) Series 2009 B, 0.11% 3/7/13, LOC JPMorgan Chase Bank, VRDN (c) | 16,000 | | 16,000 |
(Rockford Mem. Hosp. Proj.) 0.11% 3/7/13, LOC JPMorgan Chase Bank, VRDN (c) | 50,400 | | 50,400 |
(Rush Univ. Med. Ctr. Proj.) Series 2008 A, 0.12% 3/7/13, LOC Northern Trust Co., VRDN (c) | 7,700 | | 7,700 |
(Saint Xavier Univ. Proj.) Series 2008, 0.16% 3/7/13, LOC Bank of America NA, VRDN (c) | 9,775 | | 9,775 |
Participating VRDN: | | | |
Series BA 08 1137, 0.11% 3/7/13 (Liquidity Facility Bank of America NA) (c)(g) | 12,855 | | 12,855 |
Series EGL 06 115, 0.11% 3/7/13 (Liquidity Facility Citibank NA) (c)(g) | 5,445 | | 5,445 |
Series Putters 3378, 0.12% 3/7/13 (Liquidity Facility JPMorgan Chase Bank) (c)(g) | 11,200 | | 11,200 |
Series Putters 3435, 0.12% 3/7/13 (Liquidity Facility JPMorgan Chase Bank) (c)(g) | 2,105 | | 2,105 |
Series WF 12 2C, 0.1% 3/7/13 (Liquidity Facility Wells Fargo Bank NA) (c)(g) | 20,645 | | 20,645 |
Variable Rate Demand Note - continued |
| Principal
Amount (000s) | | Value (000s) |
Illinois - continued |
Illinois Fin. Auth. Rev.: - continued | | | |
Series 2009 A, 0.11% 3/7/13, LOC JPMorgan Chase Bank, VRDN (c) | $ 9,000 | | $ 9,000 |
Illinois Health Facilities Auth. Rev. (Herman M. Finch Univ. of Health Sciences/The Chicago Med. School Proj.) Series 2003, 0.11% 3/7/13, LOC JPMorgan Chase Bank, VRDN (c) | 25,000 | | 25,000 |
Illinois Hsg. Dev. Auth. Multi-family Hsg. Rev.: | | | |
(Lakeshore Plaza Proj.) Series 2008 B, 0.11% 3/7/13, LOC JPMorgan Chase Bank, VRDN (c) | 31,985 | | 31,985 |
(Prairie Station Apts. Proj.) 0.12% 3/7/13, LOC Fannie Mae, VRDN (c)(f) | 17,900 | | 17,900 |
(Valley View Apts. Proj.) 0.12% 3/7/13, LOC U.S. Bank NA, Cincinnati, VRDN (c)(f) | 11,065 | | 11,065 |
0.12% 3/7/13, LOC Freddie Mac, VRDN (c) | 11,700 | | 11,700 |
Illinois Toll Hwy. Auth. Toll Hwy. Rev. Series 2007 A1, 0.13% 3/7/13, LOC Citibank NA, VRDN (c) | 69,000 | | 69,000 |
Lake County Multi-family Hsg. Rev. (Whispering Oaks Apts. Proj.) Series 2008, 0.12% 3/7/13, LOC Freddie Mac, VRDN (c) | 16,650 | | 16,650 |
Lake County Solid Waste Disp. Facilities Rev. (Countryside Landfill, Inc. Proj.) Series B, 0.16% 3/7/13, LOC JPMorgan Chase Bank, VRDN (c)(f) | 4,320 | | 4,320 |
Lisle Village Multi-family Hsg. Rev. (Devonshire of Lisle Proj.) Series 1991, 0.16% 3/7/13, LOC Freddie Mac, VRDN (c)(f) | 6,000 | | 6,000 |
Metropolitan Pier & Exposition Participating VRDN: | | | |
Series MS 3214, 0.12% 3/7/13 (Liquidity Facility Cr. Suisse) (c)(g) | 18,400 | | 18,400 |
Series MS 3220, 0.11% 3/7/13 (Liquidity Facility Cr. Suisse) (c)(g) | 27,900 | | 27,900 |
Series MS 3297, 0.11% 3/7/13 (Liquidity Facility Cr. Suisse) (c)(g) | 5,000 | | 5,000 |
Series MS 3305X, 0.11% 3/7/13 (Liquidity Facility Cr. Suisse) (c)(g) | 11,500 | | 11,500 |
Series Putters 3861, 0.14% 3/7/13 (Liquidity Facility JPMorgan Chase Bank) (c)(g) | 20,375 | | 20,375 |
Series RBC O 42, 0.11% 3/7/13 (Liquidity Facility Royal Bank of Canada) (c)(g) | 4,320 | | 4,320 |
Palos Hills Multi-family Hsg. Rev. (Green Oaks Proj.) Series 1998, 0.16% 3/7/13, LOC Fannie Mae, VRDN (c)(f) | 14,300 | | 14,300 |
Univ. of Illinois Rev. Series 2008, 0.1% 3/7/13, LOC JPMorgan Chase Bank, VRDN (c) | 24,890 | | 24,890 |
| | 1,022,692 |
Variable Rate Demand Note - continued |
| Principal
Amount (000s) | | Value (000s) |
Indiana - 1.5% |
Crawford County Econ. Dev. Rev. (Jasper Engine Exchange Proj.) Series 1997, 0.23% 3/7/13, LOC PNC Bank NA, VRDN (c)(f) | $ 400 | | $ 400 |
Eclipse Fdg. Trust Custody Rpt. Various States Participating VRDN Series Solar 07 26, 0.11% 3/7/13 (Liquidity Facility U.S. Bank NA, Cincinnati) (c)(g) | 13,435 | | 13,435 |
Elkhart County Hosp. Auth. Rev. (Elkhart Gen. Hosp. Proj.) Series 2008, 0.12% 3/7/13, LOC JPMorgan Chase Bank, VRDN (c) | 21,825 | | 21,825 |
Elkhart County Multi-family Hsg. Rev. (Pedcor Investments Proj.) Series 2000, 0.16% 3/7/13, LOC Fed. Home Ln. Bank, Indianapolis, VRDN (c)(f) | 7,333 | | 7,333 |
Hammond Swr. & Solid Waste Disp. Rev. (Cargill, Inc. Proj.) 0.13% 3/7/13, VRDN (c)(f) | 39,000 | | 39,000 |
Indiana Dev. Fin. Auth. Econ. (Archer-Daniels Midland Co. Proj.) Series 2012, 0.17% 3/7/13 (Archer Daniels Midland Co. Guaranteed), VRDN (c) | 5,500 | | 5,500 |
Indiana Dev. Fin. Auth. Envir. Rev. (Duke Energy Indiana, Inc. Proj.) Series 2009 A3, 0.12% 3/7/13, LOC Mizuho Corporate Bank Ltd., VRDN (c) | 32,450 | | 32,450 |
Indiana Dev. Fin. Auth. Poll. Cont. Rev. (Southern Indiana Gas and Elec. Co. Proj.) Series 1998 A, 0.11% 3/7/13, LOC JPMorgan Chase Bank, VRDN (c) | 16,000 | | 16,000 |
Indiana Dev. Fin. Auth. Solid Waste Disp. Rev. (Waste Mgmt., Inc. Proj.) Series 2002 B, 0.14% 3/7/13, LOC JPMorgan Chase Bank, VRDN (c)(f) | 14,000 | | 14,000 |
Indiana Edl. Facilities Auth. Rev. (Wabash College Proj.) Series 2001, 0.13% 3/7/13, LOC JPMorgan Chase Bank, VRDN (c) | 15,600 | | 15,600 |
Indiana Fin. Auth. Health Sys. Rev.: | | | |
(Sisters of Saint Francis Health Svcs., Inc. Obligated Group Proj.): | | | |
Series 2008 A, 0.12% 3/7/13, LOC JPMorgan Chase Bank, VRDN (c) | 29,200 | | 29,200 |
Series 2008 B, 0.13% 3/7/13, LOC JPMorgan Chase Bank, VRDN (c) | 21,200 | | 21,200 |
Series 2008 E, 0.12% 3/7/13, LOC Bank of America NA, VRDN (c) | 32,700 | | 32,700 |
Series 2008 I, 0.11% 3/7/13, LOC Wells Fargo Bank NA, VRDN (c) | 8,000 | | 8,000 |
Participating VRDN Series 3654 Z, 0.12% 3/7/13 (Liquidity Facility JPMorgan Chase Bank) (c)(g) | 15,730 | | 15,730 |
Indiana Fin. Auth. Hosp. Rev. Series 2011 A, 0.11% 3/7/13, LOC JPMorgan Chase Bank, VRDN (c) | 16,070 | | 16,070 |
Variable Rate Demand Note - continued |
| Principal
Amount (000s) | | Value (000s) |
Indiana - continued |
Indiana Health & Edl. Facilities Fing. Auth. Rev. Participating VRDN Series Solar 07 63, 0.11% 3/7/13 (Liquidity Facility U.S. Bank NA, Cincinnati) (c)(g) | $ 15,030 | | $ 15,030 |
Indianapolis Econ. Dev. Rev. (Pine Glen Apts. Proj.) 0.15% 3/7/13, LOC Fed. Home Ln. Bank, Cincinnati, VRDN (c)(f) | 6,090 | | 6,090 |
Knox Econ. Dev. Rev. (Toll IN LLC Proj.) 0.17% 3/7/13, LOC Bank of America NA, VRDN (c)(f) | 9,435 | | 9,435 |
Lawrenceburg Poll. Cont. Rev. (Indiana Michigan Pwr. Co. Proj.) Series 2008 H, 0.1% 3/7/13, LOC Bank of Nova Scotia New York Branch, VRDN (c) | 4,000 | | 4,000 |
Marion Econ. Dev. Rev. (Indiana Wesleyan Univ. Proj.) Series 2006, 0.16% 3/7/13, LOC Bank of America NA, VRDN (c) | 15,000 | | 15,000 |
RBC Muni. Products, Inc. Trust Participating VRDN Series RBC E 23, 0.11% 3/7/13 (Liquidity Facility Royal Bank of Canada) (c)(g) | 20,500 | | 20,500 |
Saint Joseph County Hosp. Auth. Health Sys. Rev. (Memorial Health Sys. Proj.) Series 2008 A, 0.12% 3/7/13, LOC JPMorgan Chase Bank, VRDN (c) | 31,930 | | 31,930 |
Warrick County Poll. Cont. Rev. (Southern Indiana Gas and Elec. Co. Proj.) Series 1985 A, 0.11% 3/7/13, LOC JPMorgan Chase Bank, VRDN (c) | 9,775 | | 9,775 |
| | 400,203 |
Iowa - 0.2% |
Iowa Fin. Auth. Series 2005 C, 0.12% 3/7/13 (Liquidity Facility State Street Bank & Trust Co., Boston), VRDN (c)(f) | 5,095 | | 5,095 |
Iowa Fin. Auth. Midwestern (Archer-Daniels Midland Co. Proj.) Series 2012, 0.17% 3/7/13 (Archer Daniels Midland Co. Guaranteed), VRDN (c) | 17,400 | | 17,400 |
Iowa Fin. Auth. Poll. Cont. Facility Rev. (MidAmerican Energy Proj.) Series 2008 B, 0.13% 3/7/13, VRDN (c) | 14,000 | | 14,000 |
Iowa Fin. Auth. Solid Disp. Waste Rev. (MidAmerican Energy Proj.) Series 2008 A, 0.16% 3/7/13, VRDN (c)(f) | 3,100 | | 3,100 |
Iowa Fin. Auth. Wellness Facilities Rev. (Cmnty. Y of Marshalltown Proj.) Series 2001, 0.11% 3/7/13, LOC Northern Trust Co., VRDN (c) | 5,600 | | 5,600 |
| | 45,195 |
Variable Rate Demand Note - continued |
| Principal
Amount (000s) | | Value (000s) |
Kansas - 0.1% |
Chanute Indl. Dev. Rev. (Ash Grove Cement Co. Proj.) Series 2000, 0.17% 3/7/13, LOC Bank of America NA, VRDN (c)(f) | $ 25,100 | | $ 25,100 |
Lenexa Multi-family Hsg. Rev. (Meadows Apts. Proj.) Series A, 0.13% 3/7/13, LOC Fannie Mae, VRDN (c)(f) | 14,855 | | 14,855 |
| | 39,955 |
Kentucky - 1.5% |
Boyd County Sewage & Solid Waste Rev. (Air Products and Chemicals, Inc. Proj.) Series 2003, 0.11% 3/7/13, VRDN (c)(f) | 8,500 | | 8,500 |
Carroll County Envir. Facilities Rev. (Kentucky Utils. Co. Proj.): | | | |
Series 2004 A, 0.12% 3/7/13, LOC Sumitomo Mitsui Banking Corp., VRDN (c)(f) | 38,000 | | 38,000 |
Series 2006 B, 0.1% 3/7/13, LOC Sumitomo Mitsui Banking Corp., VRDN (c)(f) | 32,000 | | 32,000 |
Series 2008 A, 0.12% 3/7/13, LOC Sumitomo Mitsui Banking Corp., VRDN (c)(f) | 74,947 | | 74,947 |
Carroll County Solid Waste Disp. Rev. (North American Stainless LP Proj.) Series 2000, 0.14% 3/1/13, LOC PNC Bank NA, VRDN (c)(f) | 7,000 | | 7,000 |
Daviess County Exempt Facilities Rev. (Kimberly-Clark Tissue Co. Proj.) Series 1999, 0.14% 3/7/13 (Kimberly-Clark Corp. Guaranteed), VRDN (c)(f) | 4,870 | | 4,870 |
Daviess County Solid Waste Disp. Facilities Rev. (Scott Paper Co. Proj.): | | | |
Series 1993 A, 0.14% 3/7/13 (Kimberly-Clark Corp. Guaranteed), VRDN (c)(f) | 67,250 | | 67,250 |
Series 1993 B, 0.14% 3/7/13 (Kimberly-Clark Corp. Guaranteed), VRDN (c)(f) | 37,700 | | 37,700 |
Elizabethtown Indl. Bldg. Rev. (Altec Industries, Inc. Proj.) Series 1997, 0.18% 3/7/13, LOC Wells Fargo Bank NA, VRDN (c)(f) | 5,000 | | 5,000 |
Henderson County Indl. Dev. Auth. (Pittsburg Tank & Tower Co. Proj.) 0.14% 3/7/13, LOC U.S. Bank NA, Cincinnati, VRDN (c)(f) | 100 | | 100 |
Kentucky Econ. Dev. Fin. Auth. Hosp. Rev. (St. Elizabeth Med. Ctr., Inc. Proj.) Series 2009 B, 0.11% 3/7/13, LOC JPMorgan Chase Bank, VRDN (c) | 19,075 | | 19,075 |
Kentucky Hsg. Corp. Conduit Multi-family Mtg. Rev. (Gleneagles Apts. Proj.) 0.14% 3/7/13, LOC Fannie Mae, VRDN (c)(f) | 9,500 | | 9,500 |
Kentucky Hsg. Corp. Multi-family Rev. (Canterbury Southgate Hsg. Proj.) 0.12% 3/7/13, LOC Freddie Mac, VRDN (c)(f) | 12,565 | | 12,565 |
Variable Rate Demand Note - continued |
| Principal
Amount (000s) | | Value (000s) |
Kentucky - continued |
Kentucky Muni. Pwr. Agcy. Pwr. Sys. Rev. Participating VRDN Series Solar 07 107, 0.11% 3/7/13 (Liquidity Facility U.S. Bank NA, Cincinnati) (c)(g) | $ 20,505 | | $ 20,505 |
Larue County Indl. Dev. Rev. (CMH Hodgenville, Inc. Proj.) Series 2000, 0.15% 3/7/13, LOC U.S. Bank NA, Cincinnati, VRDN (c)(f) | 6,000 | | 6,000 |
Louisville & Jefferson County Series 2011 A, 0.13% 3/7/13, LOC JPMorgan Chase Bank, VRDN (c) | 26,000 | | 26,000 |
Louisville & Jefferson County Metropolitan Govt. Multi-family Hsg. Rev. (Waterford Place Apts. Proj.) Series 2003, 0.13% 3/7/13, LOC Freddie Mac, VRDN (c) | 12,075 | | 12,075 |
Mercer County Solid Waste Disp. Facility Rev. (Kentucky Utils. Co. Proj.) Series 2000 A, 0.13% 3/7/13, LOC Sumitomo Mitsui Banking Corp., VRDN (c)(f) | 12,900 | | 12,900 |
Minor Lane Heights Solid Waste Disp. Rev. (Waste Mgmt. of Kentucky, LLC Proj. D) Series 2003, 0.14% 3/7/13, LOC PNC Bank NA, VRDN (c)(f) | 11,000 | | 11,000 |
| | 404,987 |
Louisiana - 1.7% |
East Baton Rouge Parish Pub. Impt. Sales Tax Rev. Series 2008 A, 0.12% 3/7/13, LOC JPMorgan Chase Bank, VRDN (c) | 63,640 | | 63,640 |
Louisiana Gas & Fuel Tax Rev. Participating VRDN: | | | |
Series Putters 3806, 0.12% 3/7/13 (Liquidity Facility JPMorgan Chase Bank) (c)(g) | 9,990 | | 9,990 |
Series Solar 06 133, 0.11% 3/7/13 (Liquidity Facility U.S. Bank NA, Cincinnati) (c)(g) | 6,840 | | 6,840 |
Series WF 12 32C, 0.1% 3/7/13 (Liquidity Facility Wells Fargo Bank NA) (c)(g) | 12,240 | | 12,240 |
Louisiana Gen. Oblig. Participating VRDN: | | | |
Series Putters 4119, 0.12% 3/7/13 (Liquidity Facility JPMorgan Chase Bank) (c)(g) | 18,480 | | 18,480 |
Series Putters 4120, 0.12% 3/7/13 (Liquidity Facility JPMorgan Chase Bank) (c)(g) | 18,585 | | 18,585 |
Series Putters 4121, 0.12% 3/7/13 (Liquidity Facility JPMorgan Chase Bank) (c)(g) | 17,400 | | 17,400 |
Series Putters 4122, 0.12% 3/7/13 (Liquidity Facility JPMorgan Chase Bank) (c)(g) | 17,955 | | 17,955 |
Louisiana Hsg. Fin. Auth. Multi-family Hsg. Rev. (The Reserve at Jefferson Proj.) Series 2008, 0.14% 3/7/13, LOC Freddie Mac, VRDN (c) | 4,095 | | 4,095 |
Louisiana Offshore Term. Auth. Deepwater Port Rev. (LOOP LLC Proj.) Series 2003 B, 0.11% 3/7/13, LOC JPMorgan Chase Bank, VRDN (c) | 37,550 | | 37,550 |
Variable Rate Demand Note - continued |
| Principal
Amount (000s) | | Value (000s) |
Louisiana - continued |
Louisiana Pub. Facilities Auth. Gulf Opportunity Zone Rev. (Celtic Mgmt. Corp. Proj.) Series 2008, 0.11% 3/7/13, LOC JPMorgan Chase Bank, VRDN (c) | $ 14,250 | | $ 14,250 |
Louisiana Pub. Facilities Auth. Hosp. Rev. (Franciscan Missionaries of Our Lady Health Sys. Proj.): | | | |
Series 2005 B, 0.11% 3/7/13, LOC JPMorgan Chase Bank, VRDN (c) | 18,600 | | 18,600 |
Series 2008 A, 0.13% 3/7/13, LOC JPMorgan Chase Bank, VRDN (c) | 23,510 | | 23,510 |
Louisiana Pub. Facilities Auth. Rev.: | | | |
(Air Products & Chemicals, Inc. Proj.): | | | |
Series 2002, 0.11% 3/7/13, VRDN (c)(f) | 1,000 | | 1,000 |
Series 2003, 0.11% 3/7/13, VRDN (c)(f) | 15,650 | | 15,650 |
Series 2004, 0.1% 3/7/13, VRDN (c) | 5,900 | | 5,900 |
Series 2009 A, 0.1% 3/7/13, VRDN (c) | 28,900 | | 28,900 |
(C-Port LLC Proj.) Series 2008, 0.16% 3/7/13, LOC Bank of America NA, VRDN (c) | 8,100 | | 8,100 |
Saint James Parish Gen. Oblig.: | | | |
(Nucor Steel Louisiana LLC Proj.) Series 2010 B1, 0.29% 3/7/13, VRDN (c) | 30,600 | | 30,600 |
(NuStar Logistics, L.P. Proj.): | | | |
Series 2010 A, 0.12% 3/7/13, LOC JPMorgan Chase Bank, VRDN (c) | 50,000 | | 50,000 |
Series 2010 B, 0.12% 3/7/13, LOC JPMorgan Chase Bank, VRDN (c) | 43,800 | | 43,800 |
Series 2011, 0.12% 3/7/13, LOC Wells Fargo Bank NA, VRDN (c) | 40,000 | | 40,000 |
| | 487,085 |
Maine - 0.3% |
Maine Fin. Auth. Solid Waste Disposable Rev. (Casella Waste Systems, Inc. Proj.) 0.17% 3/7/13, LOC Bank of America NA, VRDN (c)(f) | 3,600 | | 3,600 |
Maine Health & Higher Ed. Facilities Auth. Rev.: | | | |
Series 2008 A, 0.12% 3/7/13, LOC JPMorgan Chase Bank, VRDN (c) | 29,830 | | 29,830 |
Series 2008 B, 0.11% 3/7/13, LOC JPMorgan Chase Bank, VRDN (c) | 9,300 | | 9,300 |
Maine Hsg. Auth. Multi-family Dev. Rev. (Park Village Apts. Proj.) 0.14% 3/7/13, LOC Fannie Mae, VRDN (c)(f) | 23,100 | | 23,100 |
Variable Rate Demand Note - continued |
| Principal
Amount (000s) | | Value (000s) |
Maine - continued |
Maine Pub. Util. Fin. Pub. Util. Rev. (Maine Pub. Svc. Co. Proj.) Series 1996, 0.26% 3/7/13, LOC Bank of America NA, VRDN (c)(f) | $ 13,600 | | $ 13,600 |
Old Town ME Solid Waste Disp. (Georgia-Pacific Corp. Proj.) 0.13% 3/7/13, LOC Bank of Nova Scotia New York Branch, VRDN (c)(f) | 8,000 | | 8,000 |
| | 87,430 |
Maryland - 0.7% |
Anne Arundel County Gen. Oblig. Participating VRDN Series BBT 08 10, 0.1% 3/7/13 (Liquidity Facility Branch Banking & Trust Co.) (c)(g) | 13,650 | | 13,650 |
Maryland Cmnty. Dev. Administration Dept. of Hsg. & Cmnty. Dev.: | | | |
(Barrington Apts. Proj.) Series A, 0.11% 3/7/13, LOC Fannie Mae, VRDN (c)(f) | 12,190 | | 12,190 |
(Parlane Apts. Proj.) Series 2001 C, 0.11% 3/7/13, LOC Fannie Mae, VRDN (c)(f) | 3,400 | | 3,400 |
Maryland Cmnty. Dev. Administration Multi-family Dev. Rev. (Avalon Lea Apt. Proj.) Series 1997, 0.12% 3/7/13, LOC Fannie Mae, VRDN (c) | 2,000 | | 2,000 |
Maryland Health & Higher Edl. Facilities Auth. Rev.: | | | |
(Anne Arundel Health Sys. Proj.) Series 2009 B, 0.14% 3/7/13, LOC Bank of America NA, VRDN (c) | 2,500 | | 2,500 |
(Villa Julie College, Inc. Proj.) Series 2005, 0.14% 3/7/13, LOC Bank of America NA, VRDN (c) | 69,120 | | 69,120 |
Maryland Trans. Auth. Passenger Facility Charge Rev. Series 2012 C, 0.13% 3/7/13, LOC Wells Fargo Bank NA, VRDN (c)(f) | 20,500 | | 20,500 |
Maryland Trans. Auth. Trans. Facility Projects Rev. Participating VRDN: | | | |
Series BA 08 1077, 0.15% 3/7/13 (Liquidity Facility Bank of America NA) (c)(g) | 5,055 | | 5,055 |
Series ROC II R 11437, 0.12% 3/7/13 (Liquidity Facility Citibank NA) (c)(g) | 10,000 | | 10,000 |
Montgomery County Hsg. Opportunities Commission Hsg. Rev. (Falklands Apts. Proj.) Series 1985 B, 0.12% 3/7/13, LOC Fannie Mae, VRDN (c) | 11,400 | | 11,400 |
Montgomery County Hsg. Opportunity Commission Single Family Mtg. Rev.: | | | |
Series 2002 C, 0.11% 3/7/13, LOC PNC Bank NA, VRDN (c) | 12,200 | | 12,200 |
Series 2007 F, 0.12% 3/7/13, LOC PNC Bank NA, VRDN (c)(f) | 10,000 | | 10,000 |
Variable Rate Demand Note - continued |
| Principal
Amount (000s) | | Value (000s) |
Maryland - continued |
Montgomery County Hsg. Opportunity Commission Single Family Mtg. Rev.: - continued | | | |
Series 2008 C, 0.12% 3/7/13, LOC PNC Bank NA, VRDN (c)(f) | $ 8,450 | | $ 8,450 |
Washington Suburban San. District Participating VRDN Series WF 11 129C, 0.1% 3/7/13 (Liquidity Facility Wells Fargo Bank NA) (c)(g) | 18,295 | | 18,295 |
| | 198,760 |
Massachusetts - 0.8% |
Massachusetts Gen. Oblig. Participating VRDN: | | | |
Series Clipper 07 39, 0.11% 3/7/13 (Liquidity Facility State Street Bank & Trust Co., Boston) (c)(g) | 2,675 | | 2,675 |
Series Clipper 07 41, 0.14% 3/7/13 (Liquidity Facility State Street Bank & Trust Co., Boston) (c)(g) | 39,000 | | 39,000 |
Massachusetts Health & Edl. Facilities Auth. Rev. Participating VRDN: | | | |
Series PT 4633, 0.16% 3/7/13 (Liquidity Facility Deutsche Postbank AG) (c)(g) | 40,415 | | 40,415 |
Series Putters 4244, 0.12% 3/7/13 (Liquidity Facility Deutsche Bank AG New York Branch) (c)(g) | 11,625 | | 11,625 |
Massachusetts School Bldg. Auth. Dedicated Sales Tax Rev. Participating VRDN: | | | |
ROC II R 12193, 0.13% 3/7/13 (Liquidity Facility Citibank NA) (c)(g) | 4,000 | | 4,000 |
Series EGL 07 0031, 0.11% 3/7/13 (Liquidity Facility Citibank NA) (c)(g) | 16,500 | | 16,500 |
Series Putters 3990, 0.12% 3/7/13 (Liquidity Facility JPMorgan Chase Bank) (c)(g) | 2,000 | | 2,000 |
Series Putters 4029, 0.12% 3/7/13 (Liquidity Facility JPMorgan Chase Bank) (c)(g) | 2,685 | | 2,685 |
Series ROC II R 14021, 0.11% 3/7/13 (Liquidity Facility Citibank NA) (c)(g) | 4,500 | | 4,500 |
Massachusetts Wtr. Poll. Abatement Trust Participating VRDN: | | | |
Series Clipper 05 36, 0.11% 3/7/13 (Liquidity Facility State Street Bank & Trust Co., Boston) (c)(g) | 11,835 | | 11,835 |
Series Clipper 06 11, 0.14% 3/7/13 (Liquidity Facility State Street Bank & Trust Co., Boston) (c)(g) | 59,605 | | 59,605 |
Series PT 4644, 0.16% 3/7/13 (Liquidity Facility Deutsche Postbank AG) (c)(g) | 9,955 | | 9,955 |
Series ROC II R 11537, 0.13% 3/7/13 (Liquidity Facility Deutsche Postbank AG) (c)(g) | 5,070 | | 5,070 |
| | 209,865 |
Variable Rate Demand Note - continued |
| Principal
Amount (000s) | | Value (000s) |
Michigan - 1.1% |
Detroit City School District Participating VRDN Series Solar 06 01, 0.11% 3/7/13 (Liquidity Facility U.S. Bank NA, Cincinnati) (c)(g) | $ 3,400 | | $ 3,400 |
Livonia Econ. Dev. Corp. (Madonna Univ. Proj.) Series 2009, 0.12% 3/7/13, LOC Fed. Home Ln. Bank Chicago, VRDN (c) | 13,405 | | 13,405 |
Michigan Bldg. Auth. Rev. Series 2011 IIB, 0.13% 3/7/13, LOC JPMorgan Chase Bank, VRDN (c) | 34,790 | | 34,790 |
Michigan Fin. Auth. Rev.: | | | |
Participating VRDN: | | | |
Series ROC II R 11988, 0.12% 3/7/13 (Liquidity Facility Citibank NA) (c)(g) | 2,750 | | 2,750 |
Series ROC II R 14014, 0.12% 3/7/13 (Liquidity Facility Citibank NA) (c)(g) | 2,145 | | 2,145 |
Series 2012 C, 0.11% 3/7/13, LOC Citibank NA, VRDN (c) | 23,600 | | 23,600 |
Michigan Hosp. Fin. Auth. Rev.: | | | |
(Henry Ford Health Sys. Proj.) Series 2007, 0.11% 3/7/13, LOC JPMorgan Chase Bank, VRDN (c) | 61,865 | | 61,865 |
(McLaren Health Care Corp. Proj.): | | | |
Series 2008 B2, 0.12% 3/7/13, LOC JPMorgan Chase Bank, VRDN (c) | 18,050 | | 18,050 |
Series 2008 B3, 0.12% 3/7/13, LOC JPMorgan Chase Bank, VRDN (c) | 12,000 | | 12,000 |
Michigan Hsg. Dev. Auth. Single Family Mtg. Rev. Series 2007 B, 0.13% 3/7/13 (Liquidity Facility Fannie Mae) (Liquidity Facility Freddie Mac), VRDN (c)(f) | 25,500 | | 25,500 |
Michigan Strategic Fund Ltd. Oblig. Rev.: | | | |
(Consumers Energy Co. Proj.): | | | |
0.12% 3/7/13, LOC JPMorgan Chase Bank, VRDN (c)(f) | 30,500 | | 30,500 |
0.13% 3/7/13, LOC JPMorgan Chase Bank, VRDN (c) | 17,000 | | 17,000 |
(Van Andel Research Institute Proj.) Series 2008, 0.12% 3/7/13, LOC Bank of America NA, VRDN (c) | 5,600 | | 5,600 |
Wayne County Arpt. Auth. Rev.: | | | |
0.11% 3/7/13, LOC PNC Bank NA, VRDN (c)(f) | 34,900 | | 34,900 |
0.12% 3/7/13, LOC JPMorgan Chase Bank, VRDN (c)(f) | 16,300 | | 16,300 |
| | 301,805 |
Minnesota - 0.2% |
Eagan Multi-family Rev. (Thomas Lake Place Apts. Proj.) Series 2003 A1, 0.14% 3/7/13, LOC Fannie Mae, VRDN (c)(f) | 6,525 | | 6,525 |
Hennepin County Hsg. & Redev. Auth. Multi-family Rev. (Stone Arch Apts. Proj.) 0.13% 3/7/13, LOC Fannie Mae, VRDN (c)(f) | 9,800 | | 9,800 |
Variable Rate Demand Note - continued |
| Principal
Amount (000s) | | Value (000s) |
Minnesota - continued |
Minneapolis & Saint Paul Metropolitan Arpts. Commission Arpt. Rev. Participating VRDN Series MT 775, 0.1% 3/7/13 (Liquidity Facility Bank of America NA) (c)(g) | $ 8,895 | | $ 8,895 |
Minneapolis Multi-family Rev. (Gateway Real Estate Proj.) 0.17% 3/7/13, LOC Wells Fargo Bank NA, VRDN (c)(f) | 1,805 | | 1,805 |
Minnesota Gen. Oblig. Participating VRDN Series ROC II R 11538, 0.13% 3/7/13 (Liquidity Facility Deutsche Postbank AG) (c)(g) | 10,280 | | 10,280 |
Oak Park Heights Multi-family Rev. 0.1% 3/7/13, LOC Freddie Mac, VRDN (c) | 100 | | 100 |
Richfield Multi-family Hsg. Rev. (Lynwood Partners, LLC Proj.) Series 2010, 0.11% 3/7/13, LOC Wells Fargo Bank NA, VRDN (c) | 11,015 | | 11,015 |
St. Paul City Port Auth. District Heating Rev. Series 2009 5O, 0.13% 3/7/13, LOC Deutsche Bank AG, VRDN (c) | 2,600 | | 2,600 |
St. Paul Port Auth. District Cooling Rev. Series 2009 12EE, 0.15% 3/7/13, LOC Deutsche Bank AG, VRDN (c)(f) | 4,700 | | 4,700 |
| | 55,720 |
Mississippi - 0.2% |
Mississippi Bus. Fin. Corp. Rev. (Jackson Med. Mall Foundation Prog.) Series 2008 A, 0.12% 3/7/13, LOC JPMorgan Chase Bank, VRDN (c) | 7,700 | | 7,700 |
Mississippi Bus. Fin. Corp. Solid Waste Disp. Rev. (Waste Mgmt., Inc. Proj.) 0.15% 3/7/13, LOC Bank of America NA, VRDN (c)(f) | 10,000 | | 10,000 |
Mississippi Dev. Bank Spl. Oblig. (Harrison County Proj.) Series 2008 A2, 0.15% 3/7/13, LOC Bank of America NA, VRDN (c) | 14,000 | | 14,000 |
Mississippi Gen. Oblig. Participating VRDN Series WF 11 117C, 0.1% 3/7/13 (Liquidity Facility Wells Fargo Bank NA) (c)(g) | 18,475 | | 18,475 |
Mississippi Home Corp. Multi-family Hsg. Rev. (Bristol Park Apts. Proj.) Series 2001 1, 0.16% 3/7/13, LOC Wells Fargo Bank NA, VRDN (c)(f) | 7,600 | | 7,600 |
| | 57,775 |
Missouri - 0.8% |
Bi-State Dev. Agcy. Missouri Illinois Metropolitan District Rev. (Metrolink Cross County Extension Proj.) Series 2010 A, 0.12% 3/7/13, LOC JPMorgan Chase Bank, VRDN (c) | 33,650 | | 33,650 |
Curators of the Univ. of Missouri Sys. Facilities Rev. Participating VRDN Series Putters 4166, 0.12% 3/7/13 (Liquidity Facility JPMorgan Chase Bank) (c)(g) | 8,865 | | 8,865 |
Variable Rate Demand Note - continued |
| Principal
Amount (000s) | | Value (000s) |
Missouri - continued |
Grandview Indl. Dev. Auth. Multi-family Hsg. Rev. (Briarwood Apts. Proj.) 0.13% 3/7/13, LOC Fannie Mae, VRDN (c)(f) | $ 12,000 | | $ 12,000 |
Kansas City Indl. Dev. Auth. Air Cargo Facility Rev. (Kansas City Air Cargo Svcs. Proj.) 0.15% 3/7/13, LOC JPMorgan Chase Bank, VRDN (c)(f) | 2,310 | | 2,310 |
Missouri Health & Edl. Facilities Auth. Edl. Facilities Rev.: | | | |
(Lutheran High School Assoc. Proj.) Series 2002, 0.21% 3/7/13, LOC U.S. Bank NA, Cincinnati, VRDN (c) | 3,140 | | 3,140 |
(Saint Louis Univ. Proj.) Series 2008 B1, 0.13% 3/1/13, LOC Bank of America NA, VRDN (c) | 13,800 | | 13,800 |
Participating VRDN: | | | |
Series EGL 07 0001, 0.11% 3/7/13 (Liquidity Facility Citibank NA) (c)(g) | 6,000 | | 6,000 |
Series PT 4624, 0.16% 3/7/13 (Liquidity Facility Deutsche Postbank AG) (c)(g) | 11,050 | | 11,050 |
Series Putters 3546, 0.12% 3/7/13 (Liquidity Facility JPMorgan Chase Bank) (c)(g) | 11,300 | | 11,300 |
Series Putters 3929, 0.12% 3/7/13 (Liquidity Facility JPMorgan Chase Bank) (c)(g) | 2,785 | | 2,785 |
Missouri Health & Edl. Facilities Auth. Rev.: | | | |
(Ascension Health Cr. Group Proj.) Series 2003 C2, 0.11% 3/7/13, VRDN (c) | 14,800 | | 14,800 |
(Ascension Health Proj.): | | | |
Series 2003 C3, 0.11% 3/7/13, VRDN (c) | 18,600 | | 18,600 |
Series 2008 C4, 0.11% 3/7/13, VRDN (c) | 1,100 | | 1,100 |
Missouri Highways & Trans. Commission State Road Rev. Participating VRDN Series PT 4625, 0.16% 3/7/13 (Liquidity Facility Deutsche Postbank AG) (c)(g) | 10,170 | | 10,170 |
Saint Louis Indl. Dev. Auth.: | | | |
(Metropolitan Lofts Apts. Proj.) Series 2003 A, 0.16% 3/7/13, LOC Fannie Mae, VRDN (c)(f) | 27,600 | | 27,600 |
(Saint Luke's Plaza Apts. Proj.) Series 2009, 0.11% 3/7/13 (Liquidity Facility Freddie Mac), VRDN (c) | 1,900 | | 1,900 |
Springfield Pub. Util. Rev. Participating VRDN Series Solar 06 156, 0.11% 3/7/13 (Liquidity Facility U.S. Bank NA, Cincinnati) (c)(g) | 30,125 | | 30,125 |
| | 209,195 |
Montana - 0.1% |
Montana Board Invt. Resource Recovery Rev. (Colstrip Proj.) Series 1989, 0.13% 3/7/13, LOC Union Bank of California, VRDN (c)(f) | 23,800 | | 23,800 |
Variable Rate Demand Note - continued |
| Principal
Amount (000s) | | Value (000s) |
Nebraska - 0.9% |
Central Plains Energy Proj. Rev. (Nebraska Gas Proj.) Series 2009, 0.11% 3/7/13 (Liquidity Facility Royal Bank of Canada), VRDN (c) | $ 52,845 | | $ 52,845 |
Douglas County Solid Waste Disp. Rev. (Waste Mgmt., Inc. Proj.) Series A, 0.16% 3/7/13, LOC Bank of America NA, VRDN (c)(f) | 9,000 | | 9,000 |
Nebraska Invt. Fin. Auth. Single Family Hsg. Rev. Series 2010 C, 0.11% 3/7/13 (Liquidity Facility Fed. Home Ln. Bank Topeka), VRDN (c)(f) | 119,825 | | 119,825 |
Nebraska Pub. Pwr. Generation Agcy. Rev. Participating VRDN Series Solar 07 20, 0.11% 3/7/13 (Liquidity Facility U.S. Bank NA, Cincinnati) (c)(g) | 44,260 | | 44,260 |
Omaha Pub. Pwr. District Elec. Rev. Participating VRDN Series WF 12 79C, 0.1% 3/7/13 (Liquidity Facility Wells Fargo Bank NA) (c)(g) | 10,000 | | 10,000 |
Washington County Indl. Dev. Rev. (Cargill Dow Polymers LLC Proj.) Series 2000, 0.11% 3/7/13 (Cargill, Inc. Guaranteed) (The Dow Chemical Co. Guaranteed), LOC Wells Fargo Bank NA, VRDN (c)(f) | 5,400 | | 5,400 |
| | 241,330 |
Nevada - 2.9% |
Clark County Arpt. Rev.: | | | |
Series 2008 A2, 0.16% 3/7/13, LOC State Street Bank & Trust Co., Boston, VRDN (c)(f) | 6,000 | | 6,000 |
Series 2008 C1, 0.12% 3/7/13, LOC JPMorgan Chase Bank, VRDN (c)(f) | 122,900 | | 122,900 |
Series 2008 C2, 0.4% 3/7/13, LOC Landesbank Baden-Wuert, VRDN (c)(f) | 44,450 | | 44,450 |
Series 2008 C3, 0.4% 3/7/13, LOC Landesbank Baden-Wuert, VRDN (c)(f) | 20,000 | | 20,000 |
Series 2008 D 2A, 0.12% 3/7/13, LOC Citibank NA, VRDN (c) | 77,600 | | 77,600 |
Series 2008 D 2B, 0.1% 3/7/13, LOC Royal Bank of Canada, VRDN (c) | 26,500 | | 26,500 |
Series 2008 D1, 0.12% 3/7/13, LOC Citibank NA, VRDN (c) | 38,400 | | 38,400 |
Series 2008 D3, 0.12% 3/7/13, LOC Bank of America NA, VRDN (c) | 39,415 | | 39,415 |
Series 2011 B1, 0.13% 3/7/13, LOC Citibank NA, VRDN (c)(f) | 88,700 | | 88,700 |
Series 2011 B2, 0.12% 3/7/13, LOC Royal Bank of Canada, VRDN (c)(f) | 36,800 | | 36,800 |
Variable Rate Demand Note - continued |
| Principal
Amount (000s) | | Value (000s) |
Nevada - continued |
Clark County Fuel Tax Participating VRDN: | | | |
Series BA 08 1171, 0.11% 3/7/13 (Liquidity Facility Bank of America NA) (c)(g) | $ 47,475 | | $ 47,475 |
Series Putters 3158, 0.12% 3/7/13 (Liquidity Facility JPMorgan Chase Bank) (c)(g) | 32,110 | | 32,110 |
Series ROC II R 11507, 0.11% 3/7/13 (Liquidity Facility Citibank NA) (c)(g) | 2,740 | | 2,740 |
Clark County Indl. Dev. Rev. (Southwest Gas Corp. Proj.): | | | |
Series 2003 A, 0.16% 3/7/13, LOC JPMorgan Chase Bank, VRDN (c)(f) | 17,200 | | 17,200 |
Series 2009 A, 0.13% 3/7/13, LOC JPMorgan Chase Bank, VRDN (c) | 16,000 | | 16,000 |
Clark County McCarran Int'l. Arpt. Passenger Facility Charge Rev. Series 2010 F2, 0.11% 3/7/13, LOC Union Bank of California, VRDN (c) | 65,050 | | 65,050 |
Clark County Wtr. Reclamation District Participating VRDN Series Putters 3355, 0.12% 3/7/13 (Liquidity Facility JPMorgan Chase Bank) (c)(g) | 7,500 | | 7,500 |
Eclipse Fdg. Trust Custody Rpt. Various States Participating VRDN Series Solar NV D7, 0.12% 3/7/13 (Liquidity Facility U.S. Bank NA, Cincinnati) (c)(g) | 12,380 | | 12,380 |
Las Vegas Valley Wtr. District Wtr. Impt. Gen. Oblig. Participating VRDN Series Solar 06 93, 0.11% 3/7/13 (Liquidity Facility U.S. Bank NA, Cincinnati) (c)(g) | 14,000 | | 14,000 |
Nevada Dept. of Bus. & Industry (LVE Energy Partners LLC Proj.) 0.11% 3/7/13, LOC Sumitomo Mitsui Banking Corp., VRDN (c)(f) | 37,800 | | 37,800 |
Nevada Hsg. Division (Horizon Apt. Hsg. Proj.) Series 2000 A, 0.11% 3/7/13, LOC Fannie Mae, VRDN (c)(f) | 7,410 | | 7,410 |
Reno Hosp. Rev. (Renown Reg'l. Med. Ctr. Proj.): | | | |
Series 2008 A, 0.12% 3/7/13, LOC Union Bank of California, VRDN (c) | 31,400 | | 31,400 |
Series 2009 A, 0.12% 3/7/13, LOC Wells Fargo Bank NA, VRDN (c) | 7,000 | | 7,000 |
Series 2009 B, 0.1% 3/7/13, LOC Wells Fargo Bank NA, VRDN (c) | 7,000 | | 7,000 |
| | 805,830 |
New Hampshire - 0.2% |
New Hampshire Bus. Fin. Auth. Ind. Dev. Rev. (Wiggins Airways Proj.) Series 1998, 0.41% 3/7/13, LOC Bank of America NA, VRDN (c)(f) | 3,300 | | 3,300 |
New Hampshire Bus. Fin. Auth. Resource Recovery Rev. (Wheelabrator Concord Co. LP Proj.) Series 1997 A, 0.11% 3/7/13, LOC Wells Fargo Bank NA, VRDN (c) | 13,800 | | 13,800 |
Variable Rate Demand Note - continued |
| Principal
Amount (000s) | | Value (000s) |
New Hampshire - continued |
New Hampshire Bus. Fin. Auth. Rev. (Luminescent Sys., Inc. Proj.) Series 1998, 0.4% 3/7/13, LOC HSBC Bank USA, NA, VRDN (c)(f) | $ 1,450 | | $ 1,450 |
New Hampshire Health & Ed. Facilities Auth. Rev.: | | | |
(Exeter Hosp. Obligated Group Proj.) Series 2001 B, 0.12% 3/7/13, LOC Bank of America NA, VRDN (c) | 7,385 | | 7,385 |
Series 2011 B, 0.12% 3/7/13, LOC Royal Bank of Canada, VRDN (c)(f) | 2,800 | | 2,800 |
New Hampshire Hsg. Fin. Auth. Multi-family Rev. (Pheasant Run Proj.) 0.13% 3/7/13, LOC Fannie Mae, VRDN (c)(f) | 16,400 | | 16,400 |
| | 45,135 |
New Jersey - 0.1% |
New Jersey Econ. Dev. Auth. Gas Facilities Rev. (NUI Corp. Proj.) Series 1996 A, 0.13% 3/1/13 (AGL Resources, Inc. Guaranteed), LOC JPMorgan Chase Bank, VRDN (c)(f) | 8,700 | | 8,700 |
New Jersey Hsg. & Mtg. Fin. Agcy. Multi-family Rev. Series 2008 F, 0.15% 3/7/13, LOC Bank of America NA, VRDN (c)(f) | 7,600 | | 7,600 |
Salem County Poll. Cont. Fin. Auth. Rev. (Pub. Svc. Elec. and Gas Co. Proj.): | | | |
Series 2003 B1, 0.3% 3/7/13, VRDN (c) | 4,000 | | 4,000 |
Series 2012 A, 0.32% 3/7/13, VRDN (c)(f) | 15,000 | | 15,000 |
| | 35,300 |
New Mexico - 0.1% |
New Mexico Muni. Energy Acquisition Auth. Gas Supply Rev. Series 2009, 0.11% 3/7/13 (Liquidity Facility Royal Bank of Canada), VRDN (c) | 15,060 | | 15,060 |
Rio Rancho Wtr. & Wastewtr. Sys. Rev. Participating VRDN Series Solar 2007 19, 0.11% 3/7/13 (Liquidity Facility U.S. Bank NA, Cincinnati) (c)(g) | 4,490 | | 4,490 |
Univ. of New Mexico Univ. Revs. Participating VRDN Series ROC II R 11961, 0.11% 3/7/13 (Liquidity Facility Citibank NA) (c)(g) | 2,000 | | 2,000 |
| | 21,550 |
New York - 8.8% |
Dutchess County Indl. Dev. Agcy. Civic Facility Rev. (Lutheran Ctr. at Poughkeepsie, Inc. Proj.) 0.2% 3/7/13, LOC KeyBank NA, VRDN (c) | 2,400 | | 2,400 |
Long Island Pwr. Auth. Elec. Sys. Rev. Subseries 2001 2B, 0.13% 3/1/13, LOC Bayerische Landesbank Girozentrale, VRDN (c) | 3,000 | | 3,000 |
Variable Rate Demand Note - continued |
| Principal
Amount (000s) | | Value (000s) |
New York - continued |
Nassau County Indl. Dev. Agcy. (Amsterdam at Harborside Proj.) Series 2007 C, 0.13% 3/7/13, LOC Bank of America NA, VRDN (c) | $ 11,600 | | $ 11,600 |
New York City Gen. Oblig.: | | | |
Participating VRDN Series Putters 3196, 0.12% 3/7/13 (Liquidity Facility JPMorgan Chase Bank) (c)(g) | 8,425 | | 8,425 |
Series 2004 H6, 0.11% 3/7/13, LOC Bank of America NA, VRDN (c) | 34,005 | | 34,005 |
Series 2004 H8, 0.12% 3/7/13 (Liquidity Facility Bank of America NA), VRDN (c) | 5,035 | | 5,035 |
Series 2008 J8, 0.13% 3/1/13, LOC Landesbank Baden-Wuert, VRDN (c) | 31,800 | | 31,800 |
Series 2012 G3, 0.11% 3/7/13 (Liquidity Facility Citibank NA), VRDN (c) | 80,450 | | 80,450 |
New York City Hsg. Dev. Corp. Multi-family Mtg. Rev.: | | | |
(89 Murray St. Proj.) Series A, 0.1% 3/7/13, LOC Fannie Mae, VRDN (c)(f) | 4,000 | | 4,000 |
(941 Hoe Avenue Apts. Proj.) Series A, 0.12% 3/7/13, LOC Fannie Mae, VRDN (c)(f) | 6,660 | | 6,660 |
(Beacon Mews Dev. Proj.) Series 2006 A, 0.14% 3/7/13, LOC Citibank NA, VRDN (c)(f) | 8,000 | | 8,000 |
(Beekman Tower Proj.) Series 2008 A, 0.11% 3/7/13, LOC RBS Citizens NA, VRDN (c) | 26,000 | | 26,000 |
(Courtland Avenue Apts. Proj.) Series A, 0.11% 3/7/13, LOC Fannie Mae, VRDN (c)(f) | 7,905 | | 7,905 |
(East 165th Street Proj.) Series A, 0.15% 3/7/13, LOC Citibank NA, VRDN (c)(f) | 7,665 | | 7,665 |
(Intervale Gardens Apts.) Series A, 0.15% 3/7/13, LOC Citibank NA, VRDN (c)(f) | 3,115 | | 3,115 |
(Louis Nine Boulevard Apts. Proj.) Series A, 0.11% 3/7/13, LOC Fannie Mae, VRDN (c)(f) | 7,300 | | 7,300 |
(Manhattan Court Dev. Proj.) Series A, 0.15% 3/7/13, LOC Citibank NA, VRDN (c)(f) | 16,500 | | 16,500 |
(Morris Ave. Apts. Proj.) Series A, 0.12% 3/7/13, LOC Fannie Mae, VRDN (c)(f) | 14,700 | | 14,700 |
(Peter Cintron Apts. Proj.) Series C, 0.12% 3/7/13, LOC Fannie Mae, VRDN (c)(f) | 4,140 | | 4,140 |
(State Renaissance Court Proj.) Series A, 0.12% 3/7/13, LOC Freddie Mac, VRDN (c)(f) | 28,700 | | 28,700 |
(Villa Avenue Apts. Proj.) Series 2006 A, 0.12% 3/7/13, LOC Fannie Mae, VRDN (c)(f) | 5,990 | | 5,990 |
(West 48th Street Dev. Proj.) Series 2001 A, 0.1% 3/7/13, LOC Fannie Mae, VRDN (c)(f) | 2,000 | | 2,000 |
Variable Rate Demand Note - continued |
| Principal
Amount (000s) | | Value (000s) |
New York - continued |
New York City Hsg. Dev. Corp. Multi-family Rental Hsg. Rev.: | | | |
(155 West 21st Street Dev. Proj.) Series 2007 A, 0.11% 3/7/13, LOC Fannie Mae, VRDN (c)(f) | $ 8,400 | | $ 8,400 |
(255 West 9th Street Proj.) Series 2001 A, 0.1% 3/7/13, LOC Fannie Mae, VRDN (c)(f) | 66,935 | | 66,935 |
(Brittany Dev. Proj.) Series A, 0.1% 3/7/13, LOC Fannie Mae, VRDN (c)(f) | 46,000 | | 46,000 |
(Linden Plaza Proj.) Series 2008 A, 0.12% 3/7/13, LOC Freddie Mac, VRDN (c)(f) | 68,240 | | 68,240 |
(Morris Avenue Apts. Proj.) Series A, 0.11% 3/7/13, LOC Fannie Mae, VRDN (c)(f) | 26,000 | | 26,000 |
(One Columbus Place Dev. Proj.) Series A, 0.1% 3/7/13, LOC Fannie Mae, VRDN (c)(f) | 32,915 | | 32,915 |
(Related-Tribeca Tower Proj.) Series 1997 A, 0.12% 3/7/13, LOC Fannie Mae, VRDN (c)(f) | 15,000 | | 15,000 |
(Rivereast Apts. Proj.) Series A, 0.12% 3/7/13, LOC Freddie Mac, VRDN (c)(f) | 4,150 | | 4,150 |
(West 43rd Street Proj.) Series 1999 A, 0.1% 3/7/13, LOC Fannie Mae, VRDN (c)(f) | 3,300 | | 3,300 |
(West End Towers Proj.) Series 2004 A, 0.1% 3/7/13, LOC Fannie Mae, VRDN (c)(f) | 16,500 | | 16,500 |
(Westport Dev. Proj.) Series 2004 A, 0.1% 3/7/13, LOC Fannie Mae, VRDN (c)(f) | 61,000 | | 61,000 |
Series 2002 A, 0.1% 3/7/13, LOC Fannie Mae, VRDN (c)(f) | 30,400 | | 30,400 |
New York City Indl. Dev. Agcy. Civic Facility Rev. (Casa Proj.) Series 2000, 0.11% 3/7/13, LOC JPMorgan Chase Bank, VRDN (c) | 12,645 | | 12,645 |
New York City Muni. Wtr. Fin. Auth. Wtr. & Swr. Sys. Rev. Participating VRDN: | | | |
Series EGL 06 69 Class A, 0.11% 3/7/13 (Liquidity Facility Citibank NA) (c)(g) | 16,400 | | 16,400 |
Series EGL 06 74 Class A, 0.12% 3/7/13 (Liquidity Facility Citibank NA) (c)(g) | 7,045 | | 7,045 |
Series EGL 07 0157, 0.11% 3/7/13 (Liquidity Facility Citibank NA) (c)(g) | 19,800 | | 19,800 |
Series EGL 09 46A, 0.11% 3/7/13 (Liquidity Facility Citibank NA) (c)(g) | 13,430 | | 13,430 |
Series Putters 3384, 0.12% 3/7/13 (Liquidity Facility JPMorgan Chase Bank) (c)(g) | 3,750 | | 3,750 |
Series Putters 3496Z, 0.12% 3/7/13 (Liquidity Facility JPMorgan Chase Bank) (c)(g) | 7,945 | | 7,945 |
Series ROC II R 11904, 0.11% 3/7/13 (Liquidity Facility Citibank NA) (c)(g) | 3,000 | | 3,000 |
Variable Rate Demand Note - continued |
| Principal
Amount (000s) | | Value (000s) |
New York - continued |
New York City Muni. Wtr. Fin. Auth. Wtr. & Swr. Sys. Rev. Participating VRDN: - continued | | | |
Series ROC II R 11931, 0.11% 3/7/13 (Liquidity Facility Citibank NA) (c)(g) | $ 3,750 | | $ 3,750 |
New York City Transitional Fin. Auth. Rev.: | | | |
Participating VRDN: | | | |
Series EGL 07 0019, 0.11% 3/7/13 (Liquidity Facility Citibank NA) (c)(g) | 8,865 | | 8,865 |
Series Putters 4084Z, 0.12% 3/7/13 (Liquidity Facility JPMorgan Chase Bank) (c)(g) | 3,850 | | 3,850 |
Series ROC II R 11971, 0.11% 3/7/13 (Liquidity Facility Citibank NA) (c)(g) | 2,000 | | 2,000 |
Series ROC II R 11972, 0.11% 3/7/13 (Liquidity Facility Citibank NA) (c)(g) | 2,900 | | 2,900 |
Series ROC II R 11994, 0.11% 3/7/13 (Liquidity Facility Citibank NA) (c)(g) | 4,500 | | 4,500 |
Series 2001 B, 0.16% 3/1/13 (Liquidity Facility Landesbank Baden-Wuert), VRDN (c) | 13,400 | | 13,400 |
Series 2003 1E, 0.13% 3/7/13 (Liquidity Facility Bayerische Landesbank Girozentrale), VRDN (c) | 14,195 | | 14,195 |
New York Dorm. Auth. Personal Income Tax Rev. Participating VRDN: | | | |
Series Putters 3518, 0.12% 3/7/13 (Liquidity Facility JPMorgan Chase Bank) (c)(g) | 2,640 | | 2,640 |
Series Putters 3698 Z, 0.12% 3/7/13 (Liquidity Facility JPMorgan Chase Bank) (c)(g) | 15,800 | | 15,800 |
Series ROC II R 14005, 0.11% 3/7/13 (Liquidity Facility Citibank NA) (c)(g) | 14,030 | | 14,030 |
New York Dorm. Auth. Revs.: | | | |
(City Univ. Proj.) Series 2008 C, 0.12% 3/7/13, LOC Bank of America NA, VRDN (c) | 147,950 | | 147,950 |
(New York City Court Facilities Lease Proj.) Series 2005 B, 0.12% 3/7/13, LOC Bayerische Landesbank Girozentrale, VRDN (c) | 1,000 | | 1,000 |
Participating VRDN: | | | |
ROC II R 11944, 0.11% 3/7/13 (Liquidity Facility Citibank NA) (c)(g) | 5,150 | | 5,150 |
Series EGL 06 47 Class A, 0.12% 3/7/13 (Liquidity Facility Citibank NA) (c)(g) | 15,500 | | 15,500 |
Series EGL 07 0002, 0.11% 3/7/13 (Liquidity Facility Citibank NA) (c)(g) | 18,000 | | 18,000 |
Series EGL 07 0066, 0.11% 3/7/13 (Liquidity Facility Citibank NA) (c)(g) | 31,025 | | 31,025 |
Variable Rate Demand Note - continued |
| Principal
Amount (000s) | | Value (000s) |
New York - continued |
New York Dorm. Auth. Revs.: - continued | | | |
Series ROC II R 11535, 0.11% 3/7/13 (Liquidity Facility Citibank NA) (c)(g) | $ 3,590 | | $ 3,590 |
Series ROC II R 11722, 0.11% 3/7/13 (Liquidity Facility Citibank NA) (c)(g) | 2,935 | | 2,935 |
Series ROC II R 11943, 0.11% 3/7/13 (Liquidity Facility Citibank NA) (c)(g) | 5,580 | | 5,580 |
New York Hsg. Fin. Agcy. Rev.: | | | |
(101 West End Hsg. Proj.): | | | |
Series 1998 A, 0.11% 3/7/13, LOC Fannie Mae, VRDN (c)(f) | 30,800 | | 30,800 |
Series 1999 A, 0.11% 3/7/13, LOC Fannie Mae, VRDN (c)(f) | 52,850 | | 52,850 |
(125 West 31st Street Proj.) Series 2005 A, 0.11% 3/7/13, LOC Fannie Mae, VRDN (c)(f) | 12,500 | | 12,500 |
(150 East 44th Street Hsg. Proj.): | | | |
Series 2000 A, 0.11% 3/7/13, LOC Fannie Mae, VRDN (c)(f) | 28,500 | | 28,500 |
Series 2001 A, 0.11% 3/7/13, LOC Fannie Mae, VRDN (c)(f) | 2,400 | | 2,400 |
(1500 Lexington Avenue Proj.) Series A, 0.12% 3/7/13, LOC Fannie Mae, VRDN (c)(f) | 4,400 | | 4,400 |
(240 East 39th Street Hsg. Proj.) Series 1997 A, 0.1% 3/7/13, LOC Fannie Mae, VRDN (c)(f) | 111,800 | | 111,800 |
(250 West 50th Street Hsg. Proj.) Series 1997 A, 0.1% 3/7/13, LOC Fannie Mae, VRDN (c)(f) | 13,495 | | 13,495 |
(316 Eleventh Ave. Hsg. Proj.) Series 2007 A, 0.11% 3/7/13, LOC Fannie Mae, VRDN (c)(f) | 8,000 | | 8,000 |
(330 West 39th Street Hsg. Proj.) Series 2010 A, 0.11% 3/7/13, LOC Bank of America NA, VRDN (c) | 23,400 | | 23,400 |
(360 West 43rd Street Hsg. Proj.) Series A, 0.11% 3/7/13, LOC Fannie Mae, VRDN (c)(f) | 9,900 | | 9,900 |
(55 West 25th Street Hsg. Proj.) Series 2005 A, 0.1% 3/7/13, LOC Fannie Mae, VRDN (c)(f) | 105,400 | | 105,400 |
(66 West 38th Street Hsg. Proj.) Series A: | | | |
0.11% 3/7/13, LOC Fannie Mae, VRDN (c)(f) | 4,000 | | 4,000 |
0.11% 3/7/13, LOC Fannie Mae, VRDN (c)(f) | 44,300 | | 44,300 |
(70 Battery Place Hsg. Proj.) Series 1999 A, 0.1% 3/7/13, LOC Fannie Mae, VRDN (c)(f) | 10,000 | | 10,000 |
(900 Eighth Avenue Hsg. Proj.) Series 2002 A, 0.12% 3/7/13, LOC Fannie Mae, VRDN (c)(f) | 59,000 | | 59,000 |
(Avalon Chrystie Place I Hsg. Proj.) Series 2004 B, 0.12% 3/7/13, LOC Freddie Mac, VRDN (c)(f) | 51,500 | | 51,500 |
Variable Rate Demand Note - continued |
| Principal
Amount (000s) | | Value (000s) |
New York - continued |
New York Hsg. Fin. Agcy. Rev.: - continued | | | |
(Chelsea Apts. Proj.) Series 2003 A, 0.12% 3/7/13, LOC Fannie Mae, VRDN (c)(f) | $ 40,500 | | $ 40,500 |
(Chelsea Arms Hsg. Proj.) Series 1998 A, 0.11% 3/7/13, LOC Fannie Mae, VRDN (c)(f) | 7,000 | | 7,000 |
(Clinton Green North Hsg. Proj.) Series 2005 A, 0.11% 3/7/13, LOC Freddie Mac, VRDN (c)(f) | 35,000 | | 35,000 |
(Clinton Green South Hsg. Proj.) Series 2005 A, 0.11% 3/7/13, LOC Freddie Mac, VRDN (c)(f) | 23,000 | | 23,000 |
(Clinton Park Phase II Hsg. Proj.) Series 2011 A2, 0.13% 3/7/13, LOC Wells Fargo Bank NA, VRDN (c) | 34,400 | | 34,400 |
(East 39th Street Hsg. Proj.) Series 1999 A, 0.11% 3/7/13, LOC Fannie Mae, VRDN (c)(f) | 33,700 | | 33,700 |
(Helena Hsg. Proj.) Series 2003 A, 0.12% 3/7/13, LOC Fannie Mae, VRDN (c)(f) | 9,000 | | 9,000 |
(Kew Garden Hills Apts. Hsg. Proj.) Series 2003 A, 0.1% 3/7/13, LOC Fannie Mae, VRDN (c)(f) | 11,170 | | 11,170 |
(Reverend Polite Ave. Apt. Hsg. Proj.) Series 2005 A, 0.15% 3/7/13, LOC Fannie Mae, VRDN (c)(f) | 7,435 | | 7,435 |
(Sea Park West Hsg. Proj.) Series 2004 A, 0.15% 3/7/13, LOC Freddie Mac, VRDN (c)(f) | 12,500 | | 12,500 |
(South Cove Plaza Proj.) Series A, 0.12% 3/7/13, LOC Freddie Mac, VRDN (c)(f) | 28,000 | | 28,000 |
(Talleyrand Crescent Hsg. Proj.) Series A, 0.11% 3/7/13, LOC Fannie Mae, VRDN (c)(f) | 20,500 | | 20,500 |
(Theatre Row Tower Hsg. Proj.) Series 2001 A, 0.11% 3/7/13, LOC Freddie Mac, VRDN (c)(f) | 10,000 | | 10,000 |
(Tribeca Park Proj.) Series 1997 A, 0.11% 3/7/13, LOC Fannie Mae, VRDN (c)(f) | 11,800 | | 11,800 |
(West 20th Street Proj.) Series 2001 A: | | | |
0.12% 3/7/13, LOC Fannie Mae, VRDN (c)(f) | 28,875 | | 28,875 |
0.12% 3/7/13, LOC Fannie Mae, VRDN (c)(f) | 51,000 | | 51,000 |
(West 23rd Street Hsg. Proj.): | | | |
Series 2001 A, 0.11% 3/7/13, LOC Fannie Mae, VRDN (c)(f) | 23,000 | | 23,000 |
Series 2002 A, 0.11% 3/7/13, LOC Fannie Mae, VRDN (c)(f) | 62,600 | | 62,600 |
(West 33rd Street Hsg. Proj.) Series 2003 A, 0.1% 3/7/13, LOC Fannie Mae, VRDN (c)(f) | 26,700 | | 26,700 |
(West 38th Street Hsg. Proj.) Series 2002 A, 0.11% 3/7/13, LOC Fannie Mae, VRDN (c)(f) | 16,000 | | 16,000 |
Series 2007 A: | | | |
0.12% 3/7/13, LOC Fannie Mae, VRDN (c)(f) | 62,100 | | 62,100 |
Variable Rate Demand Note - continued |
| Principal
Amount (000s) | | Value (000s) |
New York - continued |
New York Hsg. Fin. Agcy. Rev.: - continued | | | |
0.12% 3/7/13, LOC Freddie Mac, VRDN (c)(f) | $ 50,000 | | $ 50,000 |
Series 2008 A, 0.13% 3/7/13, LOC Freddie Mac, VRDN (c) | 26,900 | | 26,900 |
Series 2009 A, 0.1% 3/7/13, LOC Fannie Mae, VRDN (c) | 14,575 | | 14,575 |
Series 2010 A, 0.13% 3/7/13, LOC Freddie Mac, VRDN (c) | 21,700 | | 21,700 |
New York Hsg. Fin. Svc. Contract Rev.: | | | |
Series 2003 L, 0.13% 3/7/13, LOC Bank of America NA, VRDN (c) | 27,200 | | 27,200 |
Series 2003 M1, 0.13% 3/7/13, LOC Bank of America NA, VRDN (c) | 16,000 | | 16,000 |
New York Liberty Dev. Corp. Lib Participating VRDN Series Putters 4083, 0.12% 3/7/13 (Liquidity Facility JPMorgan Chase Bank) (c)(g) | 5,910 | | 5,910 |
New York Metropolitan Trans. Auth. Rev. Series 2005 A, 0.11% 3/7/13, LOC JPMorgan Chase Bank, VRDN (c) | 34,000 | | 34,000 |
New York State Energy Research & Dev. Auth. Facilities Rev. (Consolidated Edison Co. of New York, Inc. Proj.) Series 2004 C1, 0.12% 3/7/13, LOC Mizuho Corporate Bank Ltd., VRDN (c)(f) | 17,800 | | 17,800 |
New York Thruway Auth. Second Gen. Hwy. & Bridge Trust Fund Participating VRDN Series ROC II R 11997, 0.12% 3/7/13 (Liquidity Facility Citibank NA) (c)(g) | 4,800 | | 4,800 |
Yonkers Indl. Dev. Agcy. Civic Facility Rev. (Consumers Union of United States, Inc. Proj.) Series 2005, 0.13% 3/7/13, LOC JPMorgan Chase Bank, VRDN (c) | 17,225 | | 17,225 |
| | 2,461,540 |
New York & New Jersey - 0.5% |
Port Auth. of New York & New Jersey Participating VRDN Series EGL 06 107 Class A, 0.16% 3/7/13 (Liquidity Facility Citibank NA) (c)(f)(g) | 151,450 | | 151,450 |
Non State Specific - 0.1% |
Illinois Fin. Auth. Rev. Participating VRDN Series Putters 3174, 0.12% 3/7/13 (Liquidity Facility JPMorgan Chase Bank) (c)(g) | 15,620 | | 15,620 |
North Carolina - 1.8% |
BB&T Muni. Trust Participating VRDN Series BBT 08 11, 0.1% 3/7/13 (Liquidity Facility Branch Banking & Trust Co.) (c)(g) | 21,335 | | 21,335 |
Charlotte Ctfs. of Prtn. Participating VRDN Series Putters 4724, 0.11% 3/7/13 (Liquidity Facility Bank of America NA) (c)(g) | 11,680 | | 11,680 |
Variable Rate Demand Note - continued |
| Principal
Amount (000s) | | Value (000s) |
North Carolina - continued |
Charlotte Int'l. Arpt. Rev.: | | | |
(Charlotte Douglas Int'l. Arpt. Proj.) Series 2008 D, 0.12% 3/7/13, LOC Bank of America NA, VRDN (c) | $ 36,155 | | $ 36,155 |
Series 2010 C, 0.12% 3/7/13, LOC Wells Fargo Bank NA, VRDN (c) | 6,625 | | 6,625 |
Charlotte Wtr. & Swr. Sys. Rev.: | | | |
Participating VRDN Series BC 09 43W, 0.14% 3/7/13 (Liquidity Facility Barclays Bank PLC) (c)(g) | 5,000 | | 5,000 |
Series 2002 B, 0.09% 3/7/13 (Liquidity Facility Wells Fargo Bank NA), VRDN (c) | 24,050 | | 24,050 |
Series 2002 C, 0.13% 3/7/13 (Liquidity Facility Bank of America NA), VRDN (c) | 1,445 | | 1,445 |
Series 2006 B, 0.09% 3/7/13 (Liquidity Facility Wells Fargo Bank NA), VRDN (c) | 10,600 | | 10,600 |
Charlotte-Mecklenburg Hosp. Auth. Health Care Sys. Rev. Series 2007 G, 0.13% 3/7/13, LOC Bank of America NA, VRDN (c) | 44,700 | | 44,700 |
Greensboro Combined Enterprise Sys. Rev. Series 2009 B, 0.13% 3/7/13 (Liquidity Facility Bank of America NA), VRDN (c) | 10,000 | | 10,000 |
North Carolina Cap. Facilities Fin. Agcy. Edl. Facilities Rev.: | | | |
(Greensboro College Proj.) 0.14% 3/7/13, LOC Bank of America NA, VRDN (c) | 2,400 | | 2,400 |
Series 2011, 0.13% 3/7/13, LOC Bank of America NA, VRDN (c) | 19,200 | | 19,200 |
North Carolina Cap. Facilities Fin. Agcy. Rev. Participating VRDN: | | | |
Series EGL 7050060, 0.11% 3/7/13 (Liquidity Facility Citibank NA) (c)(g) | 23,150 | | 23,150 |
Series GS 08 9TP, 0.12% 3/7/13 (Liquidity Facility Wells Fargo & Co.) (c)(g) | 23,160 | | 23,160 |
Series ROC II R 11850, 0.11% 3/7/13 (Liquidity Facility Citibank NA) (c)(g) | 12,600 | | 12,600 |
North Carolina Gen. Oblig. Series 2002 E, 0.11% 3/7/13 (Liquidity Facility Landesbank Hessen-Thuringen), VRDN (c) | 9,900 | | 9,900 |
North Carolina Med. Care Cmnty. Health Participating VRDN Series BA 08 3509, 0.15% 3/7/13 (Liquidity Facility Bank of America NA) (c)(g) | 4,000 | | 4,000 |
North Carolina Med. Care Commission Health Care Facilities Rev.: | | | |
(Univ. Health Systems of Eastern Carolina Proj.) Series 2008 A2, 0.12% 3/7/13, LOC Bank of America NA, VRDN (c) | 38,580 | | 38,580 |
(WakeMed Proj.) Series 2009 C, 0.11% 3/7/13, LOC Wells Fargo Bank NA, VRDN (c) | 15,775 | | 15,775 |
Variable Rate Demand Note - continued |
| Principal
Amount (000s) | | Value (000s) |
North Carolina - continued |
North Carolina Med. Care Commission Health Care Facilities Rev.: - continued | | | |
Participating VRDN: | | | |
Series BC 10 31W, 0.14% 3/7/13 (Liquidity Facility Barclays Bank PLC) (c)(g) | $ 3,625 | | $ 3,625 |
Series ROC II R 11808, 0.11% 3/7/13 (Liquidity Facility Citibank NA) (c)(g) | 1,365 | | 1,365 |
North Carolina Med. Care Commission Hosp. Rev. (CaroMont Health Proj.) Series 2003 A, 0.11% 3/7/13, LOC Wells Fargo Bank NA, VRDN (c) | 36,390 | | 36,390 |
North Carolina State Univ. at Raleigh Rev. Participating VRDN Series MT 792, 0.14% 3/7/13 (Liquidity Facility Bank of America NA) (c)(g) | 6,460 | | 6,460 |
Parson County Indl. Facilities and Poll. Cont. Fing. Auth. (CertainTeed Gypsum NC, Inc. Proj.) Series 2010, 0.16% 3/7/13, LOC Cr. Industriel et Commercial, VRDN (c) | 32,515 | | 32,515 |
Piedmont Triad Arpt. Auth. Series 2008 B, 0.14% 3/7/13, LOC Branch Banking & Trust Co., VRDN (c)(f) | 24,090 | | 24,090 |
Raleigh Combined Enterprise Sys. Rev. Participating VRDN Series EGL 07 0010, 0.11% 3/7/13 (Liquidity Facility Citibank NA) (c)(g) | 4,950 | | 4,950 |
Reset Optional Ctfs. Trust II-R Participating VRDN Series ROC II R 645, 0.12% 3/7/13 (Liquidity Facility Citibank NA) (c)(g) | 9,625 | | 9,625 |
Sampson County Indl. Facilities & Poll. Cont. Fing. Auth. Envir. Facilities Rev. (Sampson County Disp., Inc. Proj.): | | | |
0.16% 3/7/13, LOC Bank of America NA, VRDN (c)(f) | 15,855 | | 15,855 |
0.16% 3/7/13, LOC Bank of America NA, VRDN (c)(f) | 4,750 | | 4,750 |
Union County Indl. Facilities & Poll. Cont. Fing. Auth. Indl. Dev. Rev. (Greiner Vacuette NA Proj.) 0.26% 3/7/13, LOC Wells Fargo Bank NA, VRDN (c)(f) | 1,500 | | 1,500 |
Univ. of North Carolina at Chapel Hill Rev. Participating VRDN Series EGL 05 3014 Class A, 0.12% 3/7/13 (Liquidity Facility Citibank NA) (c)(g) | 28,900 | | 28,900 |
| | 490,380 |
North Dakota - 0.2% |
Cass County Solid Waste Disp. Rev. (Tharaldson Ethanol Plant I, LLC Proj.) Series 2007, 0.41% 3/7/13, LOC Bank of America NA, VRDN (c)(f) | 49,000 | | 49,000 |
Hebron Indl. Dev. Rev. (Dacco, Inc. Proj.) 0.2% 3/7/13, LOC U.S. Bank NA, Cincinnati, VRDN (c)(f) | 1,740 | | 1,740 |
| | 50,740 |
Variable Rate Demand Note - continued |
| Principal
Amount (000s) | | Value (000s) |
Ohio - 1.6% |
Akron Bath Copley Hosp. District Rev.: | | | |
(Akron Gen. Health Systems Proj.) Series 2008, 0.15% 3/7/13, LOC JPMorgan Chase Bank, VRDN (c) | $ 6,500 | | $ 6,500 |
Series B, 0.12% 3/7/13, LOC JPMorgan Chase Bank, VRDN (c) | 11,665 | | 11,665 |
Allen County Hosp. Facilities Rev. (Catholic Healthcare Partners Proj.) Series 2010 D, 0.11% 3/7/13, LOC JPMorgan Chase Bank, VRDN (c) | 9,700 | | 9,700 |
Columbus Gen. Oblig. Participating VRDN Series Clipper 08 2, 0.11% 3/7/13 (Liquidity Facility State Street Bank & Trust Co., Boston) (c)(g) | 7,985 | | 7,985 |
Cuyahoga County Cultural Facilities Rev. (Maltz Museum of Jewish Heritage Proj.) 0.14% 3/7/13, LOC Bank of New York, New York, VRDN (c) | 6,300 | | 6,300 |
Franklin County Health Care Facilities Rev. (Mother Angeline McCrory Manor, Inc. Proj.) Series 2011, 0.13% 3/7/13, LOC JPMorgan Chase Bank, VRDN (c) | 14,915 | | 14,915 |
Hamilton County Hosp. Facilities Rev. (Children's Hosp. Med. Ctr. Proj.): | | | |
Series 1997 A, 0.1% 3/7/13, LOC PNC Bank NA, VRDN (c) | 15,500 | | 15,500 |
Series 2000, 0.1% 3/7/13, LOC JPMorgan Chase Bank, VRDN (c) | 28,400 | | 28,400 |
Hamilton County Student Hsg. Rev. (Block 3 Proj.) Series 2004, 0.24% 3/7/13, LOC Bank of New York, New York, LOC Citizens Bank of Pennsylvania, VRDN (c) | 27,100 | | 27,100 |
Lancaster Port Auth. Gas Rev. 0.11% 3/7/13 (Liquidity Facility Royal Bank of Canada), VRDN (c) | 70,920 | | 70,920 |
Middletown Hosp. Facilities Rev. (Atrium Med. Ctr. Obligated Group Proj.) Series 2008 A, 0.15% 3/7/13, LOC JPMorgan Chase Bank, VRDN (c) | 8,305 | | 8,305 |
Ohio Air Quality Dev. Auth. Rev.: | | | |
(Cincinnati Gas & Elec. Co. Proj.): | | | |
Series A, 0.31% 3/7/13, VRDN (c) | 5,400 | | 5,400 |
Series B, 0.2% 3/7/13, VRDN (c) | 2,100 | | 2,100 |
(Dayton Pwr. & Lt. Co. Proj.): | | | |
Series 2008 A, 0.14% 3/7/13, LOC JPMorgan Chase Bank, VRDN (c)(f) | 16,700 | | 16,700 |
Series 2008 B, 0.11% 3/7/13, LOC JPMorgan Chase Bank, VRDN (c)(f) | 8,300 | | 8,300 |
Ohio Higher Edl. Facility Commission Rev.: | | | |
(Case Western Reserve Univ. Proj.) Series 2008 A, 0.12% 3/7/13, LOC PNC Bank NA, VRDN (c) | 5,100 | | 5,100 |
Variable Rate Demand Note - continued |
| Principal
Amount (000s) | | Value (000s) |
Ohio - continued |
Ohio Higher Edl. Facility Commission Rev.: - continued | | | |
(Marietta College Proj.) 0.12% 3/7/13, LOC JPMorgan Chase Bank, VRDN (c) | $ 4,895 | | $ 4,895 |
(Univ. Hosp. Health Sys. Proj.) Series 2008 D, 0.12% 3/7/13, LOC JPMorgan Chase Bank, VRDN (c) | 18,575 | | 18,575 |
Ohio Hosp. Facilities Rev. Participating VRDN: | | | |
Series Putters 3552, 0.12% 3/7/13 (Liquidity Facility JPMorgan Chase Bank) (c)(g) | 3,500 | | 3,500 |
Series Putters 3558, 0.12% 3/7/13 (Liquidity Facility JPMorgan Chase Bank) (c)(g) | 2,300 | | 2,300 |
Ohio Hsg. Fin. Agcy. Mtg. Rev.: | | | |
(Mtg.-Backed Securities Prog.): | | | |
Series 2005 B1, 0.1% 3/7/13 (Liquidity Facility Fed. Home Ln. Bank, Cincinnati), VRDN (c)(f) | 11,900 | | 11,900 |
Series 2005 B2, 0.12% 3/7/13 (Liquidity Facility Fed. Home Ln. Bank, Cincinnati), VRDN (c)(f) | 12,500 | | 12,500 |
Series 2005 F, 0.12% 3/7/13 (Liquidity Facility Fed. Home Ln. Bank, Cincinnati), VRDN (c)(f) | 29,200 | | 29,200 |
Series B, 0.13% 3/7/13 (Liquidity Facility Fed. Home Ln. Bank, Cincinnati), VRDN (c)(f) | 18,830 | | 18,830 |
Series 2004 D, 0.12% 3/7/13 (Liquidity Facility Fed. Home Ln. Bank, Cincinnati), VRDN (c)(f) | 2,000 | | 2,000 |
Ohio Hsg. Fin. Agcy. Residential Mtg. Rev. Series 2008 B, 0.13% 3/7/13 (Liquidity Facility Fed. Home Ln. Bank, Cincinnati), VRDN (c)(f) | 12,750 | | 12,750 |
Ohio Wtr. Dev. Auth. (Waste Mgmt., Inc. Proj.) Series B, 0.15% 3/7/13, LOC Bank of America NA, VRDN (c)(f) | 2,900 | | 2,900 |
Ohio Wtr. Dev. Auth. Poll. Cont. Facilities Rev. (FirstEnergy Nuclear Generation Corp. Proj.) Series 2006 B, 0.11% 3/7/13, LOC Wells Fargo Bank NA, VRDN (c) | 65,350 | | 65,350 |
| | 429,590 |
Oklahoma - 0.1% |
RBC Muni. Products, Inc. Trust Participating VRDN Series RBC E 40, 0.11% 3/7/13 (Liquidity Facility Royal Bank of Canada) (a)(c)(g) | 19,500 | | 19,500 |
Oregon - 0.5% |
Clackamas County Hosp. Facility Auth. (Legacy Health Sys. Proj.): | | | |
Series 2008 B, 0.11% 3/7/13, LOC U.S. Bank NA, Cincinnati, VRDN (c) | 10,050 | | 10,050 |
Series 2008 C, 0.11% 3/7/13, LOC U.S. Bank NA, Cincinnati, VRDN (c) | 7,700 | | 7,700 |
Variable Rate Demand Note - continued |
| Principal
Amount (000s) | | Value (000s) |
Oregon - continued |
Oregon Econ. & Cmnty. Econ. Dev. Rev. (American Bridge Co. Proj.) Series 205, 0.2% 3/7/13, LOC PNC Bank NA, VRDN (c)(f) | $ 985 | | $ 985 |
Oregon Gen. Oblig. Participating VRDN Series ROC II R 11949, 0.12% 3/7/13 (Liquidity Facility Citibank NA) (c)(g) | 3,615 | | 3,615 |
Oregon State Dept. of Administrative Svcs. Lottery Rev. Participating VRDN Series BC 11 5W, 0.14% 3/7/13 (Liquidity Facility Barclays Bank PLC) (c)(g) | 6,555 | | 6,555 |
Port of Portland Arpt. Rev.: | | | |
Series Eighteen A, 0.13% 3/7/13, LOC U.S. Bank NA, Cincinnati, VRDN (c)(f) | 7,340 | | 7,340 |
Series Eighteen B, 0.13% 3/7/13, LOC Wells Fargo Bank NA, VRDN (c)(f) | 58,230 | | 58,230 |
Portland Hsg. Auth. Rev.: | | | |
(New Columbia - Cecelia Proj.) Series 2004, 0.15% 3/7/13, LOC Bank of America NA, VRDN (c)(f) | 3,610 | | 3,610 |
(New Columbia - Trouton Proj.) Series 2005, 0.15% 3/7/13, LOC Bank of America NA, VRDN (c)(f) | 5,840 | | 5,840 |
Portland Multi-family Hsg. Rev. (The Village at Lovejoy Fountain Proj.) Series 2009, 0.16% 3/7/13, LOC Freddie Mac, VRDN (c)(f) | 15,000 | | 15,000 |
Salem Hosp. Facility Auth. Rev. (Salem Hosp. Proj.): | | | |
Series 2008 B, 0.1% 3/7/13, LOC U.S. Bank NA, Cincinnati, VRDN (c) | 6,000 | | 6,000 |
Series 2008 C, 0.12% 3/7/13, LOC Bank of America NA, VRDN (c) | 25,000 | | 25,000 |
| | 149,925 |
Pennsylvania - 1.1% |
Allegheny County Hosp. Dev. Auth. Rev. (Children's Institute Pittsburgh Proj.): | | | |
Series 2005 A, 0.12% 3/7/13, LOC PNC Bank NA, VRDN (c) | 9,300 | | 9,300 |
Series 2005 B, 0.12% 3/7/13, LOC PNC Bank NA, VRDN (c) | 7,630 | | 7,630 |
Beaver County Indl. Dev. Auth. Poll. Cont. Rev. (FirstEnergy Nuclear Generation Corp. Proj.) Series 2006 B, 0.12% 3/1/13, LOC Citibank NA, VRDN (c) | 29,000 | | 29,000 |
Butler County Gen. Auth. Rev. (Erie School District Proj.) Series 2011, 0.12% 3/7/13, LOC PNC Bank NA, VRDN (c) | 5,800 | | 5,800 |
Chester County Health & Ed. Auth. Rev. (Jenner's Pond Proj.) Series 2006, 0.11% 3/7/13, LOC Citizens Bank of Pennsylvania, VRDN (c) | 22,110 | | 22,110 |
Variable Rate Demand Note - continued |
| Principal
Amount (000s) | | Value (000s) |
Pennsylvania - continued |
Chester County Indl. Dev. Auth. Student Hsg. Rev. (West Chester Univ. Proj.) Series 2008 A1, 0.12% 3/7/13, LOC Citizens Bank of Pennsylvania, VRDN (c) | $ 12,615 | | $ 12,615 |
Chester County Intermediate Unit Rev. Series 2003, 0.11% 3/7/13, LOC PNC Bank NA, VRDN (c) | 2,255 | | 2,255 |
Delaware County Auth. Rev. (White Horse Village Proj.): | | | |
Series 2006 B, 0.15% 3/1/13, LOC Citizens Bank of Pennsylvania, VRDN (c) | 1,600 | | 1,600 |
Series 2008, 0.15% 3/1/13, LOC Citizens Bank of Pennsylvania, VRDN (c) | 2,810 | | 2,810 |
Erie County Hosp. Auth. Rev. (Saint Vincent Health Ctr. Proj.) Series 2010 B, 0.13% 3/7/13, LOC Manufacturers & Traders Trust Co., VRDN (c) | 11,340 | | 11,340 |
Geisinger Auth. Health Sys. Rev. Participating VRDN: | | | |
Series Putters 3462, 0.12% 3/7/13 (Liquidity Facility JPMorgan Chase Bank) (c)(g) | 11,245 | | 11,245 |
Series Putters 3490Z, 0.12% 3/7/13 (Liquidity Facility JPMorgan Chase Bank) (c)(g) | 4,995 | | 4,995 |
Lawrence County Gen. Oblig. Indl. Dev. Auth. 0.12% 3/7/13, LOC PNC Bank NA, VRDN (c) | 8,160 | | 8,160 |
Luzerne County Convention Ctr. Series 2012, 0.12% 3/7/13, LOC PNC Bank NA, VRDN (c) | 6,330 | | 6,330 |
Montgomery County Indl. Dev. Auth. Rev. (Foulkeways at Gwynedd Proj.) Series 2006 B, 0.11% 3/7/13, LOC Citizens Bank of Pennsylvania, VRDN (c) | 12,555 | | 12,555 |
Pennsylvania Econ. Dev. Fing. Auth. Indl. Dev. Rev. Series 1996 D5, 0.17% 3/7/13, LOC PNC Bank NA, VRDN (c)(f) | 800 | | 800 |
Pennsylvania Econ. Dev. Fing. Auth. Manufacturing Facility Rev. (Dodge Realty Partners Proj.) Series 2007, 0.2% 3/7/13, LOC Citibank NA, VRDN (c)(f) | 2,400 | | 2,400 |
Pennsylvania Gen. Oblig. Participating VRDN: | | | |
Series Putters 3350, 0.12% 3/7/13 (Liquidity Facility JPMorgan Chase Bank) (c)(g) | 4,505 | | 4,505 |
Series Putters 3352Z, 0.12% 3/7/13 (Liquidity Facility JPMorgan Chase Bank) (c)(g) | 3,775 | | 3,775 |
Pennsylvania Higher Edl. Facilities Auth. Rev.: | | | |
(Holy Family Univ. Proj.) Series 2008, 0.11% 3/7/13, LOC TD Banknorth, NA, VRDN (c) | 6,985 | | 6,985 |
Participating VRDN Series ROC II R 14041, 0.13% 3/7/13 (Liquidity Facility Deutsche Postbank AG) (c)(g) | 11,420 | | 11,420 |
Pennsylvania Hsg. Fin. Agcy. Single Family Mtg. Rev. Participating VRDN Series Putters 4109, 0.11% 3/1/13 (Liquidity Facility JPMorgan Chase Bank) (c)(f)(g) | 8,180 | | 8,180 |
Variable Rate Demand Note - continued |
| Principal
Amount (000s) | | Value (000s) |
Pennsylvania - continued |
Pennsylvania State Pub. School Participating VRDN Series Solar 06 161, 0.11% 3/7/13 (Liquidity Facility U.S. Bank NA, Cincinnati) (c)(g) | $ 26,400 | | $ 26,400 |
Philadelphia Arpt. Rev. Series 2005 C1, 0.11% 3/7/13, LOC TD Banknorth, NA, VRDN (c)(f) | 6,045 | | 6,045 |
Philadelphia Auth. for Indl. Dev. Rev.: | | | |
(Spl. People in Northeast, Inc. Proj.) Series 2006, 0.16% 3/7/13, LOC Citizens Bank of Pennsylvania, VRDN (c) | 1,200 | | 1,200 |
(William Penn Charter School Proj.) Series 2008, 0.12% 3/7/13, LOC PNC Bank NA, VRDN (c) | 8,000 | | 8,000 |
Philadelphia Auth. Indl. Dev. Lease Rev. Series 2007 B1, 0.11% 3/7/13, LOC JPMorgan Chase Bank, VRDN (c) | 9,000 | | 9,000 |
Philadelphia Wtr. & Wastewtr. Rev. Series 2005 B, 0.12% 3/7/13, LOC Bank of America NA, VRDN (c) | 35,030 | | 35,030 |
RBC Muni. Products, Inc. Trust Participating VRDN Series RBC E 22, 0.11% 3/7/13 (Liquidity Facility Royal Bank of Canada) (c)(g) | 17,610 | | 17,610 |
Washington County Hosp. Auth. Rev. (Monongahela Valley Hosp. Proj.): | | | |
Series 2011 A, 0.12% 3/7/13, LOC PNC Bank NA, VRDN (c) | 2,540 | | 2,540 |
Series 2011 B, 0.12% 3/7/13, LOC PNC Bank NA, VRDN (c) | 10,175 | | 10,175 |
| | 301,810 |
Rhode Island - 0.1% |
Rhode Island Health and Edl. Bldg. Corp. Higher Ed. Facility Rev.: | | | |
(New England Institute of Technology Proj.) Series 2008, 0.11% 3/7/13, LOC TD Banknorth, NA, VRDN (c) | 140 | | 140 |
(Rhode Island School of Design Proj.): | | | |
Series 2008 A, 0.11% 3/7/13, LOC JPMorgan Chase Bank, VRDN (c) | 5,280 | | 5,280 |
Series 2008 B, 0.1% 3/7/13, LOC TD Banknorth, NA, VRDN (c) | 19,200 | | 19,200 |
Rhode Island Indl. Facilities Corp. Indl. Dev. Rev. (NFA Corp. Proj.) Series 1994, 0.41% 3/7/13, LOC Bank of America NA, VRDN (c)(f) | 5,000 | | 5,000 |
| | 29,620 |
Variable Rate Demand Note - continued |
| Principal
Amount (000s) | | Value (000s) |
South Carolina - 0.8% |
Anderson County School District #5 Gen. Oblig. Participating VRDN: | | | |
Series BA 08 1181, 0.11% 3/7/13 (Liquidity Facility Bank of America NA) (c)(g) | $ 14,650 | | $ 14,650 |
Series Putters 4218, 0.12% 3/7/13 (Liquidity Facility JPMorgan Chase Bank) (c)(g) | 8,915 | | 8,915 |
Darlington County Indl. Dev. Rev. (Nucor Corp. Proj.) Series 2003 A, 0.38% 3/7/13, VRDN (c)(f) | 8,100 | | 8,100 |
Florence County Hosp. Rev. (McLeod Reg'l. Med. Ctr. Proj.) Series 2010 B, 0.11% 3/7/13, LOC Wells Fargo Bank NA, VRDN (c) | 11,465 | | 11,465 |
Greenville Hosp. Sys. Facilities Rev. Series 2008 B, 0.1% 3/7/13, LOC U.S. Bank NA, Cincinnati, VRDN (c) | 28,695 | | 28,695 |
Horry County School District Participating VRDN Series ROC II R 754 PB, 0.13% 3/7/13 (Liquidity Facility Deutsche Postbank AG) (c)(g) | 11,000 | | 11,000 |
Oconee County Poll. Cont. Rev. (Duke Energy Corp. Proj.): | | | |
Series 1999 A, 0.18% 3/1/13, VRDN (c) | 16,400 | | 16,400 |
Series 1999 B, 0.2% 3/1/13, VRDN (c)(f) | 2,500 | | 2,500 |
South Carolina Jobs-Econ. Dev. Auth. Econ. Dev. Rev.: | | | |
(Bon Secours Health Sys. Proj.) 0.13% 3/7/13, LOC JPMorgan Chase Bank, VRDN (c) | 69,925 | | 69,925 |
(Carolina Piedmont Foundation Proj.) 0.17% 3/7/13, LOC Bank of America NA, VRDN (c) | 5,020 | | 5,020 |
(Chambers Richland Co. Landfill Proj.) Series 1997, 0.16% 3/7/13, LOC Bank of America NA, VRDN (c)(f) | 10,000 | | 10,000 |
(Waste Mgmt. of South Carolina, Inc. Proj.) Series 2003 A, 0.13% 3/7/13, LOC Wells Fargo Bank NA, VRDN (c)(f) | 15,000 | | 15,000 |
South Carolina Jobs-Econ. Dev. Auth. Indl. Rev. (South Carolina Generating Co., Inc. Proj.) Series 2008, 0.16% 3/7/13, LOC Branch Banking & Trust Co., VRDN (c)(f) | 18,600 | | 18,600 |
South Carolina Pub. Svc. Auth. (Santee Cooper) Rev. Oblig. Participating VRDN: | | | |
Series putters 4227, 0.11% 3/1/13 (Liquidity Facility JPMorgan Chase Bank) (c)(g) | 7,865 | | 7,865 |
Series RBC O 57, 0.14% 3/7/13 (Liquidity Facility Royal Bank of Canada) (c)(g) | 3,750 | | 3,750 |
| | 231,885 |
South Dakota - 0.0% |
South Dakota Hsg. Dev. Auth. (Harmony Heights Proj.) Series 2001, 0.14% 3/7/13, LOC Fannie Mae, VRDN (c)(f) | 6,500 | | 6,500 |
Variable Rate Demand Note - continued |
| Principal
Amount (000s) | | Value (000s) |
Tennessee - 1.8% |
Clarksville Pub. Bldg. Auth. Rev. (Tennessee Muni. Bond Fund Proj.): | | | |
Series 2001, 0.17% 3/1/13, LOC Bank of America NA, VRDN (c) | $ 13,500 | | $ 13,500 |
Series 2003, 0.17% 3/1/13, LOC Bank of America NA, VRDN (c) | 13,500 | | 13,500 |
Series 2004, 0.17% 3/1/13, LOC Bank of America NA, VRDN (c) | 15,545 | | 15,545 |
Series 2005, 0.17% 3/1/13, LOC Bank of America NA, VRDN (c) | 26,855 | | 26,855 |
Series 2008, 0.17% 3/1/13, LOC Bank of America NA, VRDN (c) | 59,155 | | 59,155 |
Johnson City Health & Edl. Hosp. Rev. (Mountain States Health Alliance Proj.) Series 2011 B, 0.11% 3/7/13, LOC PNC Bank NA, VRDN (c) | 13,900 | | 13,900 |
Knox County Health Edl. & Hsg. Facilities Board Hosp. Facilities Rev.: | | | |
Series 2011 A, 0.11% 3/7/13, LOC Bank of America NA, VRDN (c) | 13,000 | | 13,000 |
Series 2011 B, 0.11% 3/7/13, LOC Bank of America NA, VRDN (c) | 28,400 | | 28,400 |
Loudon County Indl. Dev. Board Exempt Facilities Rev. (Kimberly-Clark Corp. Proj.) 0.14% 3/7/13, VRDN (c)(f) | 11,600 | | 11,600 |
Loudon Indl. Dev. Board Solid Waste Disp. Rev. (Tate & Lyle Ingredients Americas, Inc. Proj.) Series 2006, 0.2% 3/7/13, LOC Rabobank Nederland, VRDN (c)(f) | 44,100 | | 44,100 |
Memphis Health, Edl. & Hsg. Facilities Board: | | | |
(Ashland Lakes Apts. Proj.) Series A, 0.12% 3/7/13, LOC U.S. Bank NA, Cincinnati, VRDN (c)(f) | 10,000 | | 10,000 |
(Watergrove Apts. Proj.) Series 2004, 0.11% 3/7/13, LOC Freddie Mac, VRDN (c) | 18,170 | | 18,170 |
Metropolitan Govt. Nashville & Davidson County Health & Edl. Facilities Board (Whispering Oaks Apts. Proj.) 0.13% 3/7/13, LOC Fannie Mae, VRDN (c)(f) | 15,000 | | 15,000 |
Metropolitan Govt. Nashville & Davidson County Indl. Dev. Board Rev. (Nashville Symphony Hall Proj.) Series 2004, 0.15% 3/7/13, LOC Bank of America NA, VRDN (c) | 22,775 | | 22,775 |
Montgomery County Pub. Bldg. Auth. Pooled Fing. Rev. (Tennessee County Ln. Pool Prog.): | | | |
Series 1999, 0.16% 3/7/13, LOC Bank of America NA, VRDN (c) | 24,200 | | 24,200 |
Series 2002, 0.17% 3/1/13, LOC Bank of America NA, VRDN (c) | 6,120 | | 6,120 |
Variable Rate Demand Note - continued |
| Principal
Amount (000s) | | Value (000s) |
Tennessee - continued |
Montgomery County Pub. Bldg. Auth. Pooled Fing. Rev. (Tennessee County Ln. Pool Prog.): - continued | | | |
Series 2004, 0.17% 3/1/13, LOC Bank of America NA, VRDN (c) | $ 11,750 | | $ 11,750 |
Series 2006, 0.17% 3/1/13, LOC Bank of America NA, VRDN (c) | 42,660 | | 42,660 |
Nashville and Davidson County Metropolitan Govt. Gen. Oblig. Participating VRDN Series Putters 2631, 0.12% 3/7/13 (Liquidity Facility JPMorgan Chase Bank) (c)(g) | 67,475 | | 67,475 |
Sevier County Pub. Bldg. Auth. Rev. Series V-A-1, 0.17% 3/7/13, LOC Branch Banking & Trust Co., VRDN (c)(f) | 11,100 | | 11,100 |
Shelby County Health Edl. & Hsg. Facilities Board Rev. (Trezevant Manor Proj.) Series A, 0.14% 3/7/13, LOC Bank of America NA, VRDN (c) | 31,700 | | 31,700 |
| | 500,505 |
Texas - 7.8% |
Austin Arpt. Sys. Rev.: | | | |
Series 2005 1, 0.14% 3/7/13, LOC JPMorgan Chase Bank, VRDN (c)(f) | 52,950 | | 52,950 |
Series 2005 2, 0.14% 3/7/13, LOC JPMorgan Chase Bank, VRDN (c)(f) | 57,500 | | 57,500 |
Series 2005 4, 0.13% 3/7/13, LOC Royal Bank of Canada New York Branch, VRDN (c)(f) | 36,100 | | 36,100 |
Austin Independent School District Participating VRDN Series Putters 3554, 0.12% 3/7/13 (Liquidity Facility JPMorgan Chase Bank) (c)(g) | 3,510 | | 3,510 |
Austin Wtr. & Wastewtr. Sys. Rev. Participating VRDN: | | | |
Series ROC II R 11992, 0.12% 3/7/13 (Liquidity Facility Citibank NA) (c)(g) | 3,875 | | 3,875 |
Series ROC II R 14042, 0.13% 3/7/13 (Liquidity Facility Deutsche Postbank AG) (c)(g) | 7,260 | | 7,260 |
Bexar County Gen. Oblig. Participating VRDN Series ROC II R 11791PB, 0.13% 3/7/13 (Liquidity Facility Deutsche Postbank AG) (c)(g) | 18,730 | | 18,730 |
Birdville Independent School District Participating VRDN Series MT 720, 0.1% 3/7/13 (Liquidity Facility Bank of America NA) (c)(g) | 13,895 | | 13,895 |
Brazos River Auth. Poll. Cont. Rev. (Texas Utils. Elec. Co. Proj.) Series 2001 D2, 0.13% 3/1/13, LOC Citibank NA, VRDN (c)(f) | 15,410 | | 15,410 |
Variable Rate Demand Note - continued |
| Principal
Amount (000s) | | Value (000s) |
Texas - continued |
Brazos River Hbr. Navigation District of Brazoria County Envir. Facilities Rev. (Merey Sweeny LP Proj.): | | | |
Series 2000 A, 0.13% 3/1/13, LOC JPMorgan Chase Bank, VRDN (c)(f) | $ 8,700 | | $ 8,700 |
Series 2002 A, 0.15% 3/1/13, LOC Bank of America NA, VRDN (c)(f) | 9,600 | | 9,600 |
Brownsville Indl. Dev. Corp. Rev. (Rich-Seapak Corp. Proj.) Series 1997, 0.17% 3/7/13, LOC HSBC Bank USA, NA, VRDN (c)(f) | 6,250 | | 6,250 |
Brownsville Util. Sys. Rev. Participating VRDN Series Solar 06 68, 0.11% 3/7/13 (Liquidity Facility U.S. Bank NA, Cincinnati) (c)(g) | 20,000 | | 20,000 |
Calhoun County Navigation District Envir. Facilities Rev. (Formosa Plastics Corp. Proj.) 0.13% 3/7/13, LOC Citibank NA, VRDN (c)(f) | 13,775 | | 13,775 |
Calhoun County Navigation District Poll. Cont. Rev. (Formosa Plastics Corp., Texas Proj.) Series 2002, 0.13% 3/7/13, LOC Citibank NA, VRDN (c)(f) | 10,000 | | 10,000 |
Calhoun County Navigation District Port Rev. (Formosa Plastics Corp. Proj.) Series 2000, 0.13% 3/7/13, LOC Bank of America NA, VRDN (c)(f) | 5,500 | | 5,500 |
Calhoun County Solid Waste Disp. Rev. (Formosa Plastics Corp. Proj.): | | | |
Series 2000, 0.14% 3/7/13, LOC JPMorgan Chase Bank, VRDN (c)(f) | 12,500 | | 12,500 |
Series 2001, 0.14% 3/7/13, LOC JPMorgan Chase Bank, VRDN (c)(f) | 12,500 | | 12,500 |
Calhoun Port Auth. Envir. Facilities Rev. (Formosa Plastics Corp. Texas Proj.): | | | |
Series 2007 A, 0.13% 3/7/13, LOC PNC Bank NA, VRDN (c)(f) | 47,300 | | 47,300 |
Series 2008, 0.13% 3/7/13, LOC Bank of America NA, VRDN (c)(f) | 30,000 | | 30,000 |
Cap. Area Hsg. Fin. Corp. Multi-family Hsg. Rev. (Marble Falls Vistas Apts. Proj.) 0.15% 3/7/13, LOC Fannie Mae, VRDN (c)(f) | 5,600 | | 5,600 |
Dallas Area Rapid Transit Sales Tax Rev. Participating VRDN Series WF 09 60C, 0.1% 3/7/13 (Liquidity Facility Wells Fargo & Co.) (c)(g) | 20,625 | | 20,625 |
Dallas Hsg. Fin. Corp. Multi-family Hsg. Rev. (The Masters Apts. Proj.) 0.14% 3/7/13, LOC Fannie Mae, VRDN (c)(f) | 7,180 | | 7,180 |
Dallas Wtrwks. & Swr. Sys. Rev. Participating VRDN Series ROC II R 12279, 0.11% 3/7/13 (Liquidity Facility Citibank NA) (c)(g) | 23,410 | | 23,410 |
Variable Rate Demand Note - continued |
| Principal
Amount (000s) | | Value (000s) |
Texas - continued |
Denton Independent School District Participating VRDN Series Putters 2603, 0.12% 3/7/13 (Liquidity Facility JPMorgan Chase Bank) (c)(g) | $ 7,360 | | $ 7,360 |
El Paso County Hosp. District Combination Tax and Rev. Participating VRDN Series Solar 06 32, 0.11% 3/7/13 (Liquidity Facility U.S. Bank NA, Cincinnati) (c)(g) | 19,865 | | 19,865 |
Frisco Independent School District Participating VRDN Series ROC II R 11960, 0.11% 3/7/13 (Liquidity Facility Citibank NA) (c)(g) | 6,310 | | 6,310 |
Gilmer Indl. Dev. Corp. (Duoline Technologies LP Proj.) Series 2008 A, 0.16% 3/7/13, LOC Wells Fargo Bank NA, VRDN (c)(f) | 9,130 | | 9,130 |
Gulf Coast Indl. Dev. Auth. 0.2% 3/7/13, LOC Wells Fargo Bank NA, VRDN (c)(f) | 5,280 | | 5,280 |
Gulf Coast Waste Disp. Auth. Solid Waste Disp. Rev. (Waste Mgmt., Inc. Proj.) Series A, 0.16% 3/7/13, LOC JPMorgan Chase Bank, VRDN (c)(f) | 13,700 | | 13,700 |
Harris County Cultural Ed. Facilities Fin. Corp. Med. Facilities Rev. Series 2012 C, 0.11% 3/7/13, LOC Barclays Bank PLC, VRDN (c) | 33,400 | | 33,400 |
Harris County Gen. Oblig. Participating VRDN: | | | |
Series RBC E 18, 0.11% 3/7/13 (Liquidity Facility Royal Bank of Canada) (c)(g) | 11,000 | | 11,000 |
Series ROC II R 718 PB, 0.13% 3/7/13 (Liquidity Facility Deutsche Postbank AG) (c)(g) | 18,205 | | 18,205 |
Harris County Health Facilities Dev. Corp. Rev. (Saint Dominic Village Proj.) Series 2000, 0.11% 3/7/13, LOC JPMorgan Chase Bank, VRDN (c) | 2,800 | | 2,800 |
Harris County Hosp. District Rev. Series 2010, 0.12% 3/7/13, LOC JPMorgan Chase Bank, VRDN (c) | 11,500 | | 11,500 |
Harris County Hsg. Fin. Corp. Multi-family Hsg. Rev.: | | | |
(Lafayette Village Apts. Proj.) Series 2006, 0.13% 3/7/13, LOC Fannie Mae, VRDN (c)(f) | 6,515 | | 6,515 |
(Louetta Village Apts. Proj.) Series 2005, 0.13% 3/7/13, LOC Fannie Mae, VRDN (c)(f) | 6,580 | | 6,580 |
(Primrose Aldine Bender Apt. Proj.) Series 2004, 0.13% 3/7/13, LOC Fannie Mae, VRDN (c)(f) | 7,610 | | 7,610 |
(Primrose at Bammel Apts. Proj.) Series 2005, 0.13% 3/7/13, LOC Fannie Mae, VRDN (c)(f) | 8,180 | | 8,180 |
(Quail Chase Apts. Proj.) Series 1999, 0.14% 3/7/13, LOC Gen. Elec. Cap. Corp., VRDN (c)(f) | 11,110 | | 11,110 |
(Wellington Park Apts. Proj.) Series 2004, 0.13% 3/7/13, LOC Fannie Mae, VRDN (c)(f) | 12,250 | | 12,250 |
Variable Rate Demand Note - continued |
| Principal
Amount (000s) | | Value (000s) |
Texas - continued |
Harris County Indl. Dev. Corp. (HFOTCO LLC Proj.): | | | |
Series 2010, 0.13% 3/7/13, LOC Bank of America NA, VRDN (c) | $ 75,000 | | $ 75,000 |
Series 2011, 0.13% 3/7/13, LOC Bank of America NA, VRDN (c) | 50,000 | | 50,000 |
Series 2012, 0.13% 3/7/13, LOC Bank of America NA, VRDN (c) | 51,800 | | 51,800 |
Houston Arpt. Sys. Rev. Series 2010, 0.11% 3/7/13, LOC Barclays Bank PLC, VRDN (c) | 44,155 | | 44,155 |
Houston Gen. Oblig. Participating VRDN Series MT 788, 0.1% 3/7/13 (Liquidity Facility Bank of America NA) (c)(g) | 7,760 | | 7,760 |
Houston Higher Ed. Fin. Corp. Higher Ed. Rev. Participating VRDN: | | | |
Series ROC II R 11860, 0.11% 3/7/13 (Liquidity Facility Citibank NA) (c)(g) | 6,000 | | 6,000 |
Series WF 11 44C, 0.1% 3/7/13 (Liquidity Facility Wells Fargo Bank NA) (c)(g) | 18,155 | | 18,155 |
Houston Hsg. Fin. Corp. Multi-family Hsg. Rev.: | | | |
(Fairlake Cove Apts. Proj.) Series 2005, 0.13% 3/7/13, LOC Citibank NA, VRDN (c)(f) | 9,160 | | 9,160 |
(Little Nell Apts. Proj.) Series 2003, 0.13% 3/7/13, LOC Fannie Mae, VRDN (c)(f) | 12,500 | | 12,500 |
(Mayfair Park Apts. Proj.) Series 2004, 0.13% 3/7/13, LOC Fannie Mae, VRDN (c)(f) | 5,600 | | 5,600 |
Houston Independent School District Participating VRDN Series MT 732, 0.1% 3/7/13 (Liquidity Facility Bank of America NA) (c)(g) | 9,805 | | 9,805 |
Houston Util. Sys. Rev.: | | | |
Participating VRDN: | | | |
Series Putters 4719, 0.11% 3/7/13 (Liquidity Facility Bank of America NA) (c)(g) | 19,305 | | 19,305 |
Series ROC II R 11411, 0.11% 3/7/13 (Liquidity Facility Citibank NA) (c)(g) | 9,290 | | 9,290 |
Series ROC II R 12267, 0.11% 3/7/13 (Liquidity Facility Citibank NA) (c)(g) | 16,795 | | 16,795 |
Series 2004 B4, 0.11% 3/7/13, LOC JPMorgan Chase Bank, VRDN (c) | 19,750 | | 19,750 |
Humble Independent School District Participating VRDN: | | | |
Series MT 733, 0.1% 3/7/13 (Liquidity Facility Bank of America NA) (c)(g) | 8,475 | | 8,475 |
Series Solar 06 20, 0.11% 3/7/13 (Liquidity Facility U.S. Bank NA, Cincinnati) (c)(g) | 28,160 | | 28,160 |
Jewett Econ. Dev. Corp. Indl. Dev. Rev. (Nucor Corp. Proj.) 0.35% 3/7/13, VRDN (c)(f) | 12,600 | | 12,600 |
Variable Rate Demand Note - continued |
| Principal
Amount (000s) | | Value (000s) |
Texas - continued |
Keller Independent School District Participating VRDN Series WF11 55 C, 0.1% 3/7/13 (Liquidity Facility Wells Fargo Bank NA) (c)(g) | $ 5,640 | | $ 5,640 |
Klein Independent School District Participating VRDN Series ROCS II R 11942, 0.11% 3/7/13 (Liquidity Facility Citibank NA) (c)(g) | 5,145 | | 5,145 |
Lamar Consolidated Independent School District Participating VRDN Series Putters 4193, 0.12% 3/7/13 (Liquidity Facility JPMorgan Chase Bank) (c)(g) | 11,380 | | 11,380 |
Leander Independent School District Participating VRDN Series BC 10 28W, 0.14% 3/7/13 (Liquidity Facility Barclays Bank PLC) (c)(g) | 2,050 | | 2,050 |
Lovejoy Independent School District Participating VRDN Series DB 514, 0.12% 3/7/13 (Liquidity Facility Deutsche Bank AG) (c)(g) | 10,520 | | 10,520 |
Lower Neches Valley Auth. Indl. Dev. Corp. Exempt Facilities Rev. (Onyx Envir. Svcs. Proj.) Series 2003, 0.17% 3/7/13, LOC Bank of America NA, VRDN (c)(f) | 11,950 | | 11,950 |
Mansfield Independent School District Participating VRDN Series PT 4627, 0.16% 3/7/13 (Liquidity Facility Deutsche Postbank AG) (c)(g) | 10,810 | | 10,810 |
Montgomery County Hsg. Fin. Corp. Multi-family Hsg. Rev. (Conroe Lodge at Silverdale Apt. Homes Proj.) 0.13% 3/7/13, LOC Freddie Mac, VRDN (c)(f) | 7,470 | | 7,470 |
North Central Texas Health Facilities Dev. Corp. Participating VRDN: | | | |
Series WF 09 33C, 0.1% 3/7/13 (Liquidity Facility Wells Fargo & Co.) (c)(g) | 7,200 | | 7,200 |
Series WF 1249C, 0.1% 3/7/13 (Liquidity Facility Wells Fargo Bank NA) (c)(g) | 5,000 | | 5,000 |
North East Texas Independent School District Participating VRDN Series EGL 07 0123, 0.11% 3/7/13 (Liquidity Facility Citibank NA) (c)(g) | 17,870 | | 17,870 |
North Texas Muni. Wtr. District Wtr. Sys. Rev. Participating VRDN: | | | |
Series BA 08 1174, 0.11% 3/7/13 (Liquidity Facility Bank of America NA) (c)(g) | 9,105 | | 9,105 |
Series ROC II R 593 PB, 0.13% 3/7/13 (Liquidity Facility Deutsche Postbank AG) (c)(g) | 19,890 | | 19,890 |
North Texas Tollway Auth. Rev.: | | | |
Participating VRDN Series ROC II R 11946, 0.12% 3/7/13 (Liquidity Facility Citibank NA) (c)(g) | 6,750 | | 6,750 |
Series 2011 A, 0.12% 3/7/13, LOC Morgan Stanley Bank, West Valley City Utah, VRDN (c) | 63,760 | | 63,760 |
Variable Rate Demand Note - continued |
| Principal
Amount (000s) | | Value (000s) |
Texas - continued |
Northside Independent School District Participating VRDN Series ROC II R 11965, 0.11% 3/7/13 (Liquidity Facility Citibank NA) (c)(g) | $ 3,505 | | $ 3,505 |
Northwest Texas Independent School District Participating VRDN Series ROC II R 11539, 0.13% 3/7/13 (Liquidity Facility Deutsche Postbank AG) (c)(g) | 11,500 | | 11,500 |
Pflugerville Independent School District Participating VRDN Series Putters 4183, 0.12% 3/7/13 (Liquidity Facility JPMorgan Chase Bank) (c)(g) | 7,530 | | 7,530 |
Port Arthur Navigation District Envir. Facilities Rev. (Motiva Enterprises LLC Proj.) Series 2004, 0.14% 3/7/13, VRDN (c)(f) | 109,425 | | 109,425 |
Port Arthur Navigation District Indl. Dev. Corp. Exempt Facilities Rev.: | | | |
(Air Products Proj.): | | | |
Series 2000, 0.11% 3/7/13, VRDN (c)(f) | 24,000 | | 24,000 |
Series 2001, 0.11% 3/7/13, VRDN (c)(f) | 25,000 | | 25,000 |
Series 2002, 0.11% 3/7/13, VRDN (c)(f) | 14,500 | | 14,500 |
Series 2010 A, 0.13% 3/7/13 (Total SA Guaranteed), VRDN (c) | 1,000 | | 1,000 |
(Total Petrochemicals and Refining USA, Inc. Proj.) Series 2012 A, 0.13% 3/7/13 (Total SA Guaranteed), VRDN (c) | 34,200 | | 34,200 |
Richardson Independent School District Participating VRDN Series Putters 4238, 0.12% 3/7/13 (Liquidity Facility Deutsche Bank AG) (c)(g) | 6,600 | | 6,600 |
Riesel Indl. Dev. Corp. (Sandy Creek Energy Assoc. Proj.): | | | |
0.15% 3/7/13, LOC Cr. Suisse Group, VRDN (c)(f) | 50,000 | | 50,000 |
0.15% 3/7/13, LOC Cr. Suisse Group, VRDN (c)(f) | 50,000 | | 50,000 |
San Antonio Elec. & Gas Sys. Rev. Participating VRDN: | | | |
Series Putters 3344, 0.12% 3/7/13 (Liquidity Facility JPMorgan Chase Bank) (c)(g) | 1,700 | | 1,700 |
Series Putters 3560, 0.12% 3/7/13 (Liquidity Facility JPMorgan Chase Bank) (c)(g) | 9,015 | | 9,015 |
Series Putters 3688Z, 0.12% 3/7/13 (Liquidity Facility JPMorgan Chase Bank) (c)(g) | 4,605 | | 4,605 |
San Antonio Indl. Dev. Auth. Indl. Dev. Rev.: | | | |
(LGC Bldg. & KLN Steel Proj.) Series 1998, 0.41% 3/7/13, LOC Bank of America NA, VRDN (c)(f) | 5,500 | | 5,500 |
(Tindall Corp. Proj.) Series 2008 A, 0.16% 3/7/13, LOC Wells Fargo Bank NA, VRDN (c)(f) | 2,850 | | 2,850 |
San Antonio Pub. Facilities Corp. and Rfdg. Lease Participating VRDN Series CTE 12 3AX, 0.11% 3/7/13 (Liquidity Facility State Street Bank & Trust Co., Boston) (c)(g) | 10,100 | | 10,100 |
Variable Rate Demand Note - continued |
| Principal
Amount (000s) | | Value (000s) |
Texas - continued |
San Antonio Wtr. Sys. Rev. Participating VRDN Series EGL 05 3005 Class A, 0.11% 3/7/13 (Liquidity Facility Citibank NA) (c)(g) | $ 27,500 | | $ 27,500 |
Tarrant County Cultural Ed. Facilities Fin. Corp. Hosp. Rev. (Methodist Hospitals of Dallas Proj.) Series 2008, 0.12% 3/7/13, LOC JPMorgan Chase Bank, VRDN (c) | 90,400 | | 90,400 |
Tarrant County Health Facilities Dev. Corp. Hosp. Rev. Participating VRDN Series Putters 3894, 0.12% 3/7/13 (Liquidity Facility JPMorgan Chase Bank) (c)(g) | 6,750 | | 6,750 |
Tarrant County Health Facilities Dev. Corp. Rev. (Carter Blood Care Proj.) Series 1998, 0.11% 3/7/13, LOC JPMorgan Chase Bank, VRDN (c) | 2,910 | | 2,910 |
Tarrant Reg'l. Wtr. District Wtr. R Participating VRDN Series WF 12 6C, 0.1% 3/7/13 (Liquidity Facility Wells Fargo Bank NA) (c)(g) | 12,375 | | 12,375 |
Texas A&M Univ. Rev. Participating VRDN Series ROC II R 11920, 0.12% 3/7/13 (Liquidity Facility Citibank NA) (c)(g) | 5,870 | | 5,870 |
Texas City Indl. Dev. Corp.: | | | |
(Del Papa Realty Hldgs. LP Proj.) Series 2011, 0.15% 3/7/13, LOC Bank of America NA, VRDN (c) | 9,450 | | 9,450 |
(NRG Energy, Inc. Proj.) Series 2012, 0.16% 3/7/13, LOC Bank of America NA, VRDN (c) | 6,400 | | 6,400 |
Texas Dept. of Hsg. & Cmnty. Affairs Multi-family Hsg. Rev.: | | | |
(Bristol Apts. Proj.) Series 2004, 0.13% 3/7/13, LOC Fannie Mae, VRDN (c)(f) | 11,800 | | 11,800 |
(Chisholm Trail Proj.) Series 2004, 0.13% 3/7/13, LOC Fannie Mae, VRDN (c)(f) | 5,200 | | 5,200 |
(Pinnacle Apts. Proj.) Series 2004, 0.12% 3/7/13, LOC Fannie Mae, VRDN (c)(f) | 13,665 | | 13,665 |
(Residences at Sunset Pointe Proj.) Series 2006, 0.16% 3/7/13, LOC Fannie Mae, VRDN (c)(f) | 15,000 | | 15,000 |
(St. Augustine Estate Proj.) Series 2005, 0.13% 3/7/13, LOC Fannie Mae, VRDN (c)(f) | 6,180 | | 6,180 |
(Windshire Apts. Proj.) Series 2007, 0.13% 3/7/13, LOC Fannie Mae, VRDN (c)(f) | 13,700 | | 13,700 |
Series 2004, 0.13% 3/7/13, LOC Fannie Mae, VRDN (c)(f) | 11,600 | | 11,600 |
Series 2006, 0.14% 3/7/13, LOC Fannie Mae, VRDN (c)(f) | 14,190 | | 14,190 |
Texas Gen. Oblig.: | | | |
(Veterans Land Proj.) Series A, 0.11% 3/7/13, VRDN (c)(f) | 18,580 | | 18,580 |
(Veterans' Hsg. Assistance Prog.): | | | |
Fund II Series 2005 B, 0.1% 3/7/13 (Liquidity Facility State Street Bank & Trust Co., Boston), VRDN (c)(f) | 23,100 | | 23,100 |
Fund II Series 2007 A, 0.1% 3/7/13 (Liquidity Facility State Street Bank & Trust Co., Boston), VRDN (c)(f) | 38,760 | | 38,760 |
Variable Rate Demand Note - continued |
| Principal
Amount (000s) | | Value (000s) |
Texas - continued |
Texas Gen. Oblig.: - continued | | | |
Participating VRDN: | | | |
Series DB 448, 0.14% 3/7/13 (Liquidity Facility Deutsche Bank AG) (c)(f)(g) | $ 5,660 | | $ 5,660 |
Series EGL 06 0125, 0.11% 3/7/13 (Liquidity Facility Citibank NA) (c)(g) | 27,940 | | 27,940 |
Series EGL 07 90, 0.11% 3/7/13 (Liquidity Facility Citibank NA) (c)(g) | 27,000 | | 27,000 |
Series Putters 3478, 0.12% 3/7/13 (Liquidity Facility JPMorgan Chase Bank) (c)(g) | 4,995 | | 4,995 |
Series Putters 3479, 0.12% 3/7/13 (Liquidity Facility JPMorgan Chase Bank) (c)(g) | 11,910 | | 11,910 |
Series Putters 3480, 0.12% 3/7/13 (Liquidity Facility JPMorgan Chase Bank) (c)(g) | 5,000 | | 5,000 |
Series Putters 4262, 0.12% 3/1/13 (Liquidity Facility JPMorgan Chase Bank) (c)(g) | 120,700 | | 120,700 |
Series WF 12 15C, 0.1% 3/7/13 (Liquidity Facility Wells Fargo Bank NA) (c)(g) | 9,915 | | 9,915 |
Texas State Univ. Sys. Fing. Rev. Participating VRDN Series WF 11 79C, 0.1% 3/7/13 (Liquidity Facility Wells Fargo Bank NA) (c)(g) | 6,365 | | 6,365 |
Travis County Hsg. Fin. Corp. (Rosemont at Old Manor Apts.) Series 2004, 0.13% 3/7/13, LOC Fannie Mae, VRDN (c)(f) | 9,485 | | 9,485 |
Univ. of Texas Board of Regents Sys. Rev. Participating VRDN: | | | |
Series Putters 1646, 0.12% 3/7/13 (Liquidity Facility JPMorgan Chase Bank) (c)(g) | 13,055 | | 13,055 |
Series WF 11 13C, 0.1% 3/7/13 (Liquidity Facility Wells Fargo Bank NA) (c)(g) | 4,000 | | 4,000 |
| | 2,182,300 |
Utah - 0.9% |
Carbon County Poll. Cont. Rev. (PacifiCorp Proj.) Series 1994, 0.12% 3/7/13, LOC Wells Fargo Bank NA, VRDN (c) | 7,565 | | 7,565 |
Emery County Poll. Cont. Rev. (PacifiCorp Proj.) Series 1994, 0.12% 3/7/13, LOC Wells Fargo Bank NA, VRDN (c) | 18,500 | | 18,500 |
Salt Lake City Sales Tax Rev. 0.11% 3/7/13 (Liquidity Facility State Street Bank & Trust Co., Boston), VRDN (c) | 4,480 | | 4,480 |
Utah County Hosp. Rev. Participating VRDN Series Putters 274 Z, 0.12% 3/7/13 (Liquidity Facility JPMorgan Chase Bank) (c)(g) | 7,500 | | 7,500 |
Utah Hsg. Corp. Multi-family Hsg. Rev. (Springwood Apts. Proj.) Series 2005 A, 0.12% 3/7/13, LOC Fannie Mae, VRDN (c)(f) | 8,485 | | 8,485 |
Variable Rate Demand Note - continued |
| Principal
Amount (000s) | | Value (000s) |
Utah - continued |
Utah Hsg. Corp. Single Family Mtg. Rev.: | | | |
Series 2002 A, 0.13% 3/7/13 (Liquidity Facility Fannie Mae) (Liquidity Facility Freddie Mac), VRDN (c)(f) | $ 4,330 | | $ 4,330 |
Series 2002 B, 0.13% 3/7/13 (Liquidity Facility Fannie Mae) (Liquidity Facility Freddie Mac), VRDN (c)(f) | 6,035 | | 6,035 |
Series 2002 C2, 0.13% 3/7/13 (Liquidity Facility Fannie Mae) (Liquidity Facility Freddie Mac), VRDN (c)(f) | 2,300 | | 2,300 |
Series 2002 D, 0.13% 3/7/13 (Liquidity Facility Fannie Mae) (Liquidity Facility Freddie Mac), VRDN (c)(f) | 6,855 | | 6,855 |
Series 2002 F1, 0.13% 3/7/13 (Liquidity Facility Fannie Mae) (Liquidity Facility Freddie Mac), VRDN (c)(f) | 6,745 | | 6,745 |
Series 2002 G Class I, 0.13% 3/7/13 (Liquidity Facility Fannie Mae) (Liquidity Facility Freddie Mac), VRDN (c)(f) | 9,140 | | 9,140 |
Series 2003 A, 0.13% 3/7/13 (Liquidity Facility Fannie Mae) (Liquidity Facility Freddie Mac), VRDN (c)(f) | 6,720 | | 6,720 |
Series 2003 B, 0.13% 3/7/13 (Liquidity Facility Fannie Mae) (Liquidity Facility Freddie Mac), VRDN (c)(f) | 7,655 | | 7,655 |
Series 2003 C, 0.13% 3/7/13 (Liquidity Facility Fannie Mae) (Liquidity Facility Freddie Mac), VRDN (c)(f) | 6,665 | | 6,665 |
Series 2003 E, 0.13% 3/7/13 (Liquidity Facility Fannie Mae) (Liquidity Facility Freddie Mac), VRDN (c)(f) | 8,375 | | 8,375 |
Series 2003 F, 0.13% 3/7/13 (Liquidity Facility Fannie Mae) (Liquidity Facility Freddie Mac), VRDN (c)(f) | 5,240 | | 5,240 |
Series 2005 A, 0.13% 3/7/13 (Liquidity Facility Fannie Mae) (Liquidity Facility Freddie Mac), VRDN (c)(f) | 1,300 | | 1,300 |
Series 2005 B, 0.12% 3/7/13 (Liquidity Facility Fannie Mae) (Liquidity Facility Freddie Mac), VRDN (c)(f) | 10,585 | | 10,585 |
Series 2005 C, 0.13% 3/7/13 (Liquidity Facility Fannie Mae) (Liquidity Facility Freddie Mac), VRDN (c)(f) | 13,165 | | 13,165 |
Series 2005 D, 0.13% 3/7/13 (Liquidity Facility Fannie Mae) (Liquidity Facility Freddie Mac), VRDN (c)(f) | 13,300 | | 13,300 |
Series 2005 E, 0.13% 3/7/13 (Liquidity Facility Fannie Mae) (Liquidity Facility Freddie Mac), VRDN (c)(f) | 14,295 | | 14,295 |
Series 2005 F, 0.13% 3/7/13 (Liquidity Facility Fannie Mae) (Liquidity Facility Freddie Mac), VRDN (c)(f) | 4,800 | | 4,800 |
Series 2005 G, 0.13% 3/7/13 (Liquidity Facility Fannie Mae) (Liquidity Facility Freddie Mac), VRDN (c)(f) | 11,590 | | 11,590 |
Series 2005 H, 0.13% 3/7/13 (Liquidity Facility Fannie Mae) (Liquidity Facility Freddie Mac), VRDN (c)(f) | 8,000 | | 8,000 |
Utah Hsg. Fin. Agcy. Series 2001 A2, 0.13% 3/7/13 (Liquidity Facility Fannie Mae) (Liquidity Facility Freddie Mac), VRDN (c)(f) | 6,010 | | 6,010 |
Variable Rate Demand Note - continued |
| Principal
Amount (000s) | | Value (000s) |
Utah - continued |
Utah State Board of Regents Rev. Participating VRDN Series Solar 06 140, 0.11% 3/7/13 (Liquidity Facility U.S. Bank NA, Cincinnati) (c)(g) | $ 30,755 | | $ 30,755 |
Utah Transit Auth. Sales Tax Rev. Participating VRDN Series PT 4606, 0.16% 3/7/13 (Liquidity Facility Deutsche Postbank AG) (c)(g) | 13,260 | | 13,260 |
| | 243,650 |
Virginia - 0.9% |
Albemarle County Indl. Dev. Auth. 0.11% 3/7/13, LOC Wells Fargo Bank NA, VRDN (c) | 3,165 | | 3,165 |
Albemarle Econ. Dev. Auth. Health Svcs. Rev. (The Univ. of Virginia Health Svcs. Foundation Proj.) Series 2009, 0.13% 3/1/13, LOC Bank of America NA, VRDN (c) | 13,600 | | 13,600 |
Alexandria Redev. & Hsg. Auth. Multi-family Hsg. Rev. (Fairfield Village Square Proj.) Series A, 0.12% 3/7/13, LOC Fannie Mae, VRDN (c)(f) | 21,720 | | 21,720 |
Arlington County Indl. Dev. Auth. Multi-family Hsg. Rev. Series A, 0.13% 3/7/13, LOC Freddie Mac, VRDN (c)(f) | 4,000 | | 4,000 |
Fairfax County Econ. Dev. Auth. Indl. Dev. Rev. (The Lorton Arts Foundation, Inc. Proj.) Series 2010, 0.11% 3/7/13, LOC Wells Fargo Bank NA, VRDN (c) | 13,000 | | 13,000 |
Fairfax County Econ. Dev. Auth. Student Hsg. Rev. (George Mason Univ. Foundation, Inc., Proj.) Series 2003, 0.13% 3/7/13, LOC Bank of America NA, VRDN (c) | 21,320 | | 21,320 |
Fairfax County Indl. Dev. Auth. Participating VRDN Series MS 3309, 0.11% 3/7/13 (Liquidity Facility Cr. Suisse) (c)(g) | 2,600 | | 2,600 |
Hampton Indl. Dev. Auth. Exempt Facilities Rev. (USA Waste of Virginia Landfills, Inc. Proj.) Series 2000, 0.16% 3/7/13, LOC Wells Fargo Bank NA, VRDN (c)(f) | 10,000 | | 10,000 |
Hampton Redev. & Hsg. Auth. Multi-family Hsg. Rev. (Avalon Pointe Proj.) Series 1996, 0.13% 3/7/13, LOC Fannie Mae, VRDN (c)(f) | 6,387 | | 6,387 |
Hanover County Econ. Dev. Auth. Rev. (Bon Secours Health Sys. Proj.) Series 2008 D2, 0.11% 3/7/13, LOC U.S. Bank NA, Cincinnati, VRDN (c) | 15,445 | | 15,445 |
Henrico County Econ. Dev. Auth. Rev. (Bon Secours Health Sys. Proj.) Series 2008 D, 0.11% 3/7/13, LOC JPMorgan Chase Bank, VRDN (c) | 18,275 | | 18,275 |
Newport News Indl. Dev. Auth. (CNU Warwick LLC Student Apts. Proj.) 0.19% 3/7/13, LOC Bank of America NA, VRDN (c) | 3,730 | | 3,730 |
Variable Rate Demand Note - continued |
| Principal
Amount (000s) | | Value (000s) |
Virginia - continued |
Prince William County Indl. Dev. Auth. Sewage Disp. Facilities Rev. (Dale Svc. Corp. Proj.): | | | |
Series 2000, 0.16% 3/7/13, LOC Wells Fargo Bank NA, VRDN (c)(f) | $ 4,300 | | $ 4,300 |
Series 2001, 0.16% 3/7/13, LOC Wells Fargo Bank NA, VRDN (c)(f) | 4,050 | | 4,050 |
Series 2006, 0.16% 3/7/13, LOC Wells Fargo Bank NA, VRDN (c)(f) | 5,450 | | 5,450 |
Richmond Pub. Util. Rev. Participating VRDN Series ROC II R 10410, 0.13% 3/7/13 (Liquidity Facility Citibank NA) (c)(g) | 8,200 | | 8,200 |
Sussex County Indl. Dev. Auth. Solid Waste Disp. Rev. (Atlantic Waste Disp. Proj.) 0.14% 3/7/13, LOC JPMorgan Chase Bank, VRDN (c)(f) | 10,000 | | 10,000 |
Virginia Commonwealth Trans. Board Rev. Participating VRDN Series WF 12 44C, 0.1% 3/7/13 (Liquidity Facility Wells Fargo Bank NA) (c)(g) | 4,030 | | 4,030 |
Virginia Hsg. Dev. Auth. Participating VRDN Series Merlots 06 C3, 0.15% 3/7/13 (Liquidity Facility Wells Fargo Bank NA) (c)(f)(g) | 4,190 | | 4,190 |
Virginia Hsg. Dev. Auth. Commonwealth Mtg. Rev. Participating VRDN: | | | |
Series BA 1046, 0.16% 3/7/13 (Liquidity Facility Bank of America NA) (c)(f)(g) | 27,260 | | 27,260 |
Series BA 1047, 0.16% 3/7/13 (Liquidity Facility Bank of America NA) (c)(f)(g) | 9,180 | | 9,180 |
Series Merlots 07 C42, 0.15% 3/7/13 (Liquidity Facility Wells Fargo Bank NA) (c)(f)(g) | 6,340 | | 6,340 |
Series Putters 4115, 0.11% 3/1/13 (Liquidity Facility JPMorgan Chase Bank) (c)(f)(g) | 12,210 | | 12,210 |
Virginia Pub. School Auth. Participating VRDN Series CTE 05 38, 0.11% 3/7/13 (Liquidity Facility State Street Bank & Trust Co., Boston) (c)(g) | 17,955 | | 17,955 |
Virginia Resources Auth. Clean Wtr. Rev. Participating VRDN: | | | |
Series PT 4634, 0.16% 3/7/13 (Liquidity Facility Deutsche Postbank AG) (c)(g) | 11,860 | | 11,860 |
Series ROC II R 11923, 0.11% 3/7/13 (Liquidity Facility Citibank NA) (c)(g) | 3,785 | | 3,785 |
| | 262,052 |
Washington - 3.3% |
Central Puget Sound Reg'l. Trans. Auth. Sales & Use Tax Rev. Participating VRDN Series Putters 2866, 0.12% 3/7/13 (Liquidity Facility JPMorgan Chase Bank) (c)(g) | 8,280 | | 8,280 |
Variable Rate Demand Note - continued |
| Principal
Amount (000s) | | Value (000s) |
Washington - continued |
Chelan County Pub. Util. District #1 Rev. Participating VRDN Series BC 11 20B, 0.16% 3/7/13 (Liquidity Facility Barclays Bank PLC) (c)(f)(g) | $ 8,950 | | $ 8,950 |
Eclipse Fdg. Trust Various States Participating VRDN Series Solar 06 2, 0.11% 3/7/13 (Liquidity Facility U.S. Bank NA, Cincinnati) (c)(g) | 9,600 | | 9,600 |
King County Gen. Oblig. Participating VRDN Series ROC II R 11731, 0.11% 3/7/13 (Liquidity Facility Citibank NA) (c)(g) | 9,810 | | 9,810 |
King County Hsg. Auth. Rev. (Overlake TOD Hsg. Proj.) 0.15% 3/7/13, LOC Bank of America NA, VRDN (c)(f) | 16,745 | | 16,745 |
King County Swr. Rev. Participating VRDN: | | | |
Series Putters 3941, 0.12% 3/7/13 (Liquidity Facility JPMorgan Chase Bank) (c)(g) | 6,950 | | 6,950 |
Series ROC II R 11962, 0.11% 3/7/13 (Liquidity Facility Citibank NA) (c)(g) | 2,200 | | 2,200 |
Pierce County Econ. Dev. Corp. Spl. Rev. (Weyerhaeuser Real Estate Proj.) Series 1997 A, 0.15% 3/7/13, LOC Bank of America NA, VRDN (c) | 19,505 | | 19,505 |
Port of Seattle Rev.: | | | |
Participating VRDN Series Putters 2020, 0.16% 3/7/13 (Liquidity Facility JPMorgan Chase Bank) (c)(f)(g) | 7,420 | | 7,420 |
Series 1997, 0.14% 3/7/13, LOC Bank of America NA, VRDN (c)(f) | 108,830 | | 108,830 |
Series 2008, 0.15% 3/7/13, LOC Landesbank Hessen-Thuringen, VRDN (c)(f) | 55,890 | | 55,890 |
Port of Vancouver Rev. (United Grain Corp. of Oregon Proj.) Series 2009, 0.15% 3/7/13, LOC Bank of America NA, VRDN (c) | 25,000 | | 25,000 |
Seattle Wtr. Sys. Rev. Participating VRDN Series MS 06 2170, 0.11% 3/7/13 (Liquidity Facility Wells Fargo & Co.) (c)(g) | 2,530 | | 2,530 |
Snohomish County Hsg. Auth. Hsg. Rev. (Ebey Arms Centerhouse Proj.) Series 2003, 0.15% 3/7/13, LOC Bank of America NA, VRDN (c) | 7,965 | | 7,965 |
Univ. of Washington Univ. Revs. Participating VRDN: | | | |
Series Putters 4086, 0.12% 3/7/13 (Liquidity Facility JPMorgan Chase Bank) (c)(g) | 7,425 | | 7,425 |
Series Solar 07 75, 0.11% 3/7/13 (Liquidity Facility U.S. Bank NA, Cincinnati) (c)(g) | 38,000 | | 38,000 |
Series Solar 07 94, 0.11% 3/7/13 (Liquidity Facility U.S. Bank NA, Cincinnati) (c)(g) | 2,687 | | 2,687 |
Vancouver Hsg. Auth. Rev. (Anthem Park at Uptown Village Proj.) 0.15% 3/7/13, LOC Bank of America NA, VRDN (c)(f) | 3,395 | | 3,395 |
Variable Rate Demand Note - continued |
| Principal
Amount (000s) | | Value (000s) |
Washington - continued |
Washington Econ. Dev. Fin. Auth. Econ. Dev. Rev. (Puget Sound Blood Ctr. Proj.) Series 2008 D, 0.11% 3/7/13, LOC Wells Fargo Bank NA, VRDN (c) | $ 9,535 | | $ 9,535 |
Washington Gen. Oblig. Participating VRDN: | | | |
Series Clipper 05 39, 0.11% 3/7/13 (Liquidity Facility State Street Bank & Trust Co., Boston) (c)(g) | 4,000 | | 4,000 |
Series DB 599, 0.12% 3/7/13 (Liquidity Facility Deutsche Bank AG) (c)(g) | 4,675 | | 4,675 |
Series Floaters 3040, 0.14% 3/7/13 (Liquidity Facility Morgan Stanley Bank, West Valley City Utah) (c)(g) | 12,505 | | 12,505 |
Series MT 745, 0.1% 3/7/13 (Liquidity Facility Bank of America NA) (c)(g) | 26,465 | | 26,465 |
Series Putters 3054, 0.12% 3/7/13 (Liquidity Facility JPMorgan Chase Bank) (c)(g) | 3,035 | | 3,035 |
Series Putters 3501Z, 0.12% 3/7/13 (Liquidity Facility JPMorgan Chase Bank) (c)(g) | 11,660 | | 11,660 |
Series Putters 3539, 0.12% 3/7/13 (Liquidity Facility JPMorgan Chase Bank) (c)(g) | 10,000 | | 10,000 |
Series Putters 3854, 0.12% 3/7/13 (Liquidity Facility JPMorgan Chase Bank) (c)(g) | 3,500 | | 3,500 |
Series putters 4033, 0.12% 3/7/13 (Liquidity Facility JPMorgan Chase Bank) (c)(g) | 5,100 | | 5,100 |
Series ROC II R 14046, 0.12% 3/7/13 (Liquidity Facility Citibank NA) (c)(g) | 4,000 | | 4,000 |
Series ROC II R 759 PB, 0.13% 3/7/13 (Liquidity Facility Deutsche Postbank AG) (c)(g) | 15,570 | | 15,570 |
Series Solar 06 13, 0.11% 3/7/13 (Liquidity Facility U.S. Bank NA, Cincinnati) (c)(g) | 33,185 | | 33,185 |
Washington Health Care Facilities Auth. Rev. Participating VRDN: | | | |
Series Putters 4728, 0.11% 3/7/13 (Liquidity Facility Bank of America NA) (c)(g) | 26,600 | | 26,600 |
Series Solar 07 66, 0.11% 3/7/13 (Liquidity Facility U.S. Bank NA, Cincinnati) (c)(g) | 19,645 | | 19,645 |
Washington Higher Ed. Facilities Auth. Rev. (Seattle Pacific Univ. Proj.) Series 2008, 0.12% 3/7/13, LOC U.S. Bank NA, Cincinnati, VRDN (c) | 19,325 | | 19,325 |
Washington Hsg. Fin. Commission Multi-family Hsg. Rev.: | | | |
(Affinity at Olympia Apts. Proj.) Series 2012 A, 0.13% 3/7/13, LOC Fed. Home Ln. Bank, San Francisco, VRDN (c) | 3,200 | | 3,200 |
(Avalon Ridge Apts. Proj.) Series 1999, 0.16% 3/7/13, LOC Fannie Mae, VRDN (c)(f) | 18,755 | | 18,755 |
Variable Rate Demand Note - continued |
| Principal
Amount (000s) | | Value (000s) |
Washington - continued |
Washington Hsg. Fin. Commission Multi-family Hsg. Rev.: - continued | | | |
(Ballard Landmark Inn Proj.) Series A, 0.13% 3/7/13, LOC Fed. Home Ln. Bank, San Francisco, VRDN (c)(f) | $ 27,290 | | $ 27,290 |
(Cedar Ridge Retirement Proj.) Series 2005 A, 0.14% 3/7/13, LOC Fed. Home Ln. Bank, San Francisco, VRDN (c)(f) | 8,050 | | 8,050 |
(Crestview Apts. Proj.) Series 2004, 0.12% 3/7/13, LOC Fannie Mae, VRDN (c)(f) | 14,000 | | 14,000 |
(Discovery Heights Apt. Proj.) Series 2010, 0.12% 3/7/13, LOC Freddie Mac, VRDN (c) | 22,000 | | 22,000 |
(Echo Lake Sr. Apts. Proj.) Series 2006, 0.12% 3/7/13, LOC Fannie Mae, VRDN (c)(f) | 17,970 | | 17,970 |
(Fairwinds Redmond Proj.) Series A, 0.13% 3/7/13, LOC Fed. Home Ln. Bank, San Francisco, VRDN (c)(f) | 19,250 | | 19,250 |
(Gardens Univ. Village Apt. Proj.) Series A, 0.11% 3/7/13, LOC Fannie Mae, VRDN (c)(f) | 48,540 | | 48,540 |
(Highland Park Apts. Proj.) Series A, 0.14% 3/7/13, LOC Fannie Mae, VRDN (c)(f) | 9,040 | | 9,040 |
(Merrill Gardens at Renton Centre Proj.) Series A, 0.12% 3/7/13, LOC Fannie Mae, VRDN (c)(f) | 20,790 | | 20,790 |
(Pinehurst Apts. Proj.) Series A, 0.13% 3/7/13, LOC Fannie Mae, VRDN (c)(f) | 12,000 | | 12,000 |
(Silver Creek Apts. Proj.) Series A, 0.13% 3/7/13, LOC Fannie Mae, VRDN (c)(f) | 12,250 | | 12,250 |
(The Cambridge Apts. Proj.) Series 2009, 0.11% 3/7/13, LOC Fannie Mae, VRDN (c) | 10,500 | | 10,500 |
(The Lodge at Eagle Ridge Proj.) Series A, 0.14% 3/7/13, LOC Fed. Home Ln. Bank, San Francisco, VRDN (c)(f) | 9,485 | | 9,485 |
(The Vintage at Everett Sr. Living Proj.) Series 2004 A, 0.12% 3/7/13, LOC Fannie Mae, VRDN (c)(f) | 15,750 | | 15,750 |
(The Vintage at Richland Sr. Living Proj.) Series 2004 A, 0.14% 3/7/13, LOC Fannie Mae, VRDN (c)(f) | 7,535 | | 7,535 |
(Urban Ctr. Apts. Proj.) Series 2012, 0.12% 3/7/13, LOC JPMorgan Chase Bank, VRDN (c) | 19,900 | | 19,900 |
(Vintage Mount Vernon Proj.) Series A, 0.14% 3/7/13, LOC Fannie Mae, VRDN (c)(f) | 7,500 | | 7,500 |
(Washington Terrace Sr. Apts. Proj.) Series 2010, 0.11% 3/7/13, LOC Fannie Mae, VRDN (c) | 3,750 | | 3,750 |
(Willow Tree Grove Apts. Proj.) Series 2011, 0.12% 3/7/13, LOC Freddie Mac, VRDN (c) | 5,070 | | 5,070 |
Washington Hsg. Fin. Commission Nonprofit Hsg. Rev. (Horizon House Proj.) Series 2005, 0.11% 3/7/13, LOC Wells Fargo Bank NA, VRDN (c) | 40,200 | | 40,200 |
Variable Rate Demand Note - continued |
| Principal
Amount (000s) | | Value (000s) |
Washington - continued |
Washington Hsg. Fin. Commission Nonprofit Rev. (YMCA of Pierce and Kitsap Countries Proj.): | | | |
Series 2010 A, 0.11% 3/7/13, LOC Wells Fargo Bank NA, VRDN (c) | $ 4,995 | | $ 4,995 |
Series 2010 B, 0.11% 3/7/13, LOC Wells Fargo Bank NA, VRDN (c) | 9,870 | | 9,870 |
Washington State Ctfs. Prtn. Participating VRDN Series putters 4280Z, 0.12% 3/7/13 (Liquidity Facility JPMorgan Chase Bank) (c)(g) | 6,600 | | 6,600 |
| | 924,272 |
West Virginia - 0.6% |
Harrison County Commission Solid Waste Disp. Rev. (Waste Mgmt., Inc. Proj.) Series A, 0.16% 3/7/13, LOC Bank of America NA, VRDN (c)(f) | 8,420 | | 8,420 |
Marion County Solid Waste Disp. Rev. (Grant Town Cogeneration Proj.): | | | |
Series 1990 A, 0.11% 3/7/13, LOC Deutsche Bank AG, VRDN (c)(f) | 15,200 | | 15,200 |
Series 1990 B, 0.11% 3/7/13, LOC Deutsche Bank AG, VRDN (c)(f) | 15,300 | | 15,300 |
Series 1990 C, 0.11% 3/7/13, LOC Deutsche Bank AG, VRDN (c)(f) | 7,700 | | 7,700 |
Series 1990 D, 0.11% 3/7/13, LOC Deutsche Bank AG, VRDN (c)(f) | 7,700 | | 7,700 |
West Virginia Econ. Dev. Auth. Energy (Morgantown Energy Associates Proj.) Series 2011, 0.14% 3/7/13, LOC Union Bank of California, VRDN (c)(f) | 23,200 | | 23,200 |
West Virginia Econ. Dev. Auth. Solid Waste Disp. Facilities Rev.: | | | |
(Appalachian Pwr. Co. - Amos Proj.): | | | |
Series 2008 B, 0.12% 3/7/13, LOC Mizuho Corporate Bank Ltd., VRDN (c)(f) | 30,275 | | 30,275 |
Series 2009 A, 0.11% 3/7/13, LOC Sumitomo Mitsui Banking Corp., VRDN (c) | 11,175 | | 11,175 |
Series 2009 B, 0.11% 3/7/13, LOC Sumitomo Mitsui Banking Corp., VRDN (c) | 3,000 | | 3,000 |
(Appalachian Pwr. Co. - Mountaineer Proj.) Series 2008 A, 0.11% 3/7/13, LOC Mizuho Corporate Bank Ltd., VRDN (c)(f) | 29,600 | | 29,600 |
Wood County Commission Solid Waste Disp. Rev. (Waste Mgmt., Inc. Proj.) Series A, 0.16% 3/7/13, LOC Bank of America NA, VRDN (c)(f) | 6,580 | | 6,580 |
| | 158,150 |
Variable Rate Demand Note - continued |
| Principal
Amount (000s) | | Value (000s) |
Wisconsin - 0.8% |
Appleton Redev. Auth. Rev. (Fox Cities Performing Arts Ctr. Proj.) Series 2001 B, 0.13% 3/7/13, LOC JPMorgan Chase Bank, VRDN (c) | $ 18,200 | | $ 18,200 |
Wisconsin Gen. Oblig. Participating VRDN Series Putters 4212, 0.12% 3/7/13 (Liquidity Facility JPMorgan Chase Bank) (c)(g) | 8,995 | | 8,995 |
Wisconsin Health & Edl. Facilities Auth. Rev. Participating VRDN ROC II R 11837, 0.11% 3/7/13 (Liquidity Facility Citibank NA) (c)(g) | 2,025 | | 2,025 |
Wisconsin Hsg. and Econ. Dev. Auth. Home Ownership Rev.: | | | |
Series 2002 I, 0.12% 3/1/13 (Liquidity Facility Fannie Mae) (Liquidity Facility Freddie Mac), VRDN (c)(f) | 25,730 | | 25,730 |
Series 2003 B, 0.11% 3/7/13 (Liquidity Facility Fannie Mae) (Liquidity Facility Freddie Mac), VRDN (c)(f) | 23,730 | | 23,730 |
Series 2008 A, 0.11% 3/7/13 (Liquidity Facility Fannie Mae) (Liquidity Facility Freddie Mac), VRDN (c)(f) | 75,810 | | 75,810 |
Series D, 0.13% 3/7/13 (Liquidity Facility Fannie Mae) (Liquidity Facility Freddie Mac), VRDN (c)(f) | 41,875 | | 41,875 |
Wisconsin Hsg. and Econ. Dev. Auth. Multi-family Hsg. Rev.: | | | |
Series 2007 A, 0.13% 3/7/13 (Liquidity Facility Fannie Mae) (Liquidity Facility Freddie Mac), VRDN (c)(f) | 7,205 | | 7,205 |
Series 2008 A, 0.11% 3/7/13 (Liquidity Facility Fannie Mae) (Liquidity Facility Freddie Mac), VRDN (c) | 10,635 | | 10,635 |
| | 214,205 |
Wyoming - 0.0% |
Laramie County Indl. Dev. Rev. (Cheyenne Lt., Fuel & Pwr. Co. Proj.) Series 2009 A, 0.16% 3/7/13, LOC Wells Fargo Bank NA, VRDN (c)(f) | 5,000 | | 5,000 |
TOTAL VARIABLE RATE DEMAND NOTE | 17,662,626 |
Other Municipal Debt - 28.7% |
| | | |
Alabama - 0.2% |
Alabama Pub. School & College Auth. Rev. Bonds: | | | |
Series 2010 B, 5% 5/1/13 | 5,255 | | 5,297 |
Series 2012 A, 5% 3/1/13 | 6,080 | | 6,080 |
Series WF 11 37C, 0.2%, tender 8/15/13 (Liquidity Facility Wells Fargo Bank NA) (c)(g)(h) | 4,930 | | 4,930 |
Other Municipal Debt - continued |
| Principal
Amount (000s) | | Value (000s) |
Alabama - continued |
Auburn Univ. Gen. Fee Rev. Bonds: | | | |
Series WF 08 55C, 0.2%, tender 8/15/13 (Liquidity Facility Wells Fargo & Co.) (c)(g)(h) | $ 23,510 | | $ 23,510 |
Series WF 11 53 C, 0.2%, tender 8/15/13 (Liquidity Facility Wells Fargo Bank NA) (c)(g)(h) | 7,010 | | 7,010 |
| | 46,827 |
Alaska - 0.2% |
Anchorage Gen. Oblig.: | | | |
Series 2008 A: | | | |
0.15% 3/28/13, LOC U.S. Bank NA, Cincinnati, CP (f) | 20,000 | | 20,000 |
0.23% 3/19/13, LOC U.S. Bank NA, Cincinnati, CP (f) | 20,000 | | 20,000 |
Series A1, 0.23% 6/5/13, LOC Wells Fargo Bank NA, CP | 5,600 | | 5,600 |
North Slope Borough Gen. Oblig. Bonds Series 2012 A, 1% 6/30/13 | 4,600 | | 4,612 |
| | 50,212 |
Arizona - 0.6% |
Arizona Ctfs. of Partnership Bonds Series 2013 A, 2% 4/1/13 | 1,980 | | 1,983 |
Phoenix Civic Impt. Series 2011 B: | | | |
0.14% 4/5/13, LOC Barclays Bank PLC, CP | 14,700 | | 14,700 |
0.15% 4/4/13, LOC Barclays Bank PLC, CP | 20,900 | | 20,900 |
0.15% 4/5/13, LOC Barclays Bank PLC, CP | 21,000 | | 21,000 |
Phoenix Civic Impt. Corp. Wastewtr. Sys. Rev.: | | | |
Series 2012 A, 0.18% 3/14/13, LOC Royal Bank of Canada, CP | 40,300 | | 40,300 |
Series 2012 B, 0.15% 3/7/13, LOC Wells Fargo Bank NA, CP | 46,900 | | 46,900 |
Salt River Proj. Agricultural Impt. & Pwr. District Elec. Sys. Rev. Series 2012 C, 0.17% 4/4/13, CP | 13,200 | | 13,200 |
| | 158,983 |
California - 5.2% |
Berkeley Gen. Oblig. TRAN 1% 7/11/13 | 18,700 | | 18,754 |
California Dept. of Wtr. Resources Pwr. Supply Rev. Bonds: | | | |
Series 2010 M, 5% 5/1/13 | 11,200 | | 11,287 |
Series 2011 N, 5% 5/1/13 | 3,300 | | 3,326 |
California Econ. Recovery Bonds Series 2004 A, 5.25% 7/1/13 | 7,020 | | 7,138 |
California Edl. Facilities Auth. Rev. Bonds (Stanford Univ. Proj.) Series S3, 0.21% tender 3/28/13, CP mode | 33,100 | | 33,100 |
California Gen. Oblig.: | | | |
Bonds 5% 2/1/14 (Pre-Refunded to 2/1/14 @ 100) | 5,475 | | 5,718 |
Other Municipal Debt - continued |
| Principal
Amount (000s) | | Value (000s) |
California - continued |
California Gen. Oblig.: - continued | | | |
RAN: | | | |
Series A1, 2.5% 5/30/13 | $ 300,000 | | $ 301,601 |
Series A2, 2.5% 6/20/13 | 80,585 | | 81,126 |
California School Cash Reserve Prog. Auth. TRAN: | | | |
Series 2012 E, 2% 3/1/13 | 46,200 | | 46,200 |
Series 2012 G, 2% 3/1/13 | 54,400 | | 54,400 |
Series 2012 L, 2% 6/3/13 | 8,130 | | 8,167 |
California State Univ. Rev. Series 2001 A, 0.17% 3/5/13, LOC JPMorgan Chase Bank, LOC State Street Bank & Trust Co., Boston, CP | 1,927 | | 1,927 |
Fresno County Gen. Oblig. TRAN 2% 6/28/13 | 10,800 | | 10,863 |
Los Angeles County Gen. Oblig.: | | | |
Series 2010 A, 0.17% 3/4/13, LOC JPMorgan Chase Bank, CP | 69,980 | | 69,980 |
Series 2010 C: | | | |
0.15% 3/8/13, LOC Wells Fargo Bank NA, CP | 7,000 | | 7,000 |
0.18% 3/1/13, LOC Wells Fargo Bank NA, CP | 10,400 | | 10,400 |
TRAN Series 2012 B, 2% 3/29/13 | 118,500 | | 118,665 |
Los Angeles County Schools Pooled Fing. Prog. Ctfs. of Prtn. TRAN Series 2013 C1: | | | |
2% 9/30/13 | 4,000 | | 4,042 |
2% 1/31/14 | 5,000 | | 5,082 |
Los Angeles Dept. of Wtr. & Pwr. Rev. 0.15% 5/7/13 (Liquidity Facility Wells Fargo Bank NA), CP | 62,000 | | 62,000 |
Los Angeles Gen. Oblig. TRAN Series 2012 B, 2% 3/28/13 | 62,100 | | 62,183 |
Los Angeles Muni. Impt. Corp. Lease Rev. Series 2004 A1: | | | |
0.14% 4/3/13, LOC Wells Fargo Bank NA, CP | 13,503 | | 13,503 |
0.14% 4/3/13, LOC Wells Fargo Bank NA, CP | 22,000 | | 22,000 |
0.14% 4/3/13, LOC Wells Fargo Bank NA, CP | 5,000 | | 5,000 |
Los Angeles Unified School District Bonds Series 2005 C, 5% 7/1/13 | 2,545 | | 2,586 |
Metropolitan Wtr. District of Southern California Wtr. Rev. Bonds Series 2011 B, 4% 7/1/13 | 2,645 | | 2,679 |
Orange County Local Trans. Auth. Sales Tax Rev. Series 2012 A, 0.16% 3/14/13, LOC JPMorgan Chase Bank, CP | 25,000 | | 25,000 |
Orange County Sanitation District Ctfs. of Prtn. BAN Series 2012 C, 2% 10/30/13 | 16,600 | | 16,797 |
Riverside County Gen. Oblig. TRAN: | | | |
Series 2012 A, 2% 3/29/13 | 51,200 | | 51,272 |
Series 2012 B, 2% 6/28/13 | 23,000 | | 23,135 |
Sacramento Muni. Util. District Elec. Rev. Series 2012 K1, 0.16% 3/5/13, LOC JPMorgan Chase Bank, CP | 3,600 | | 3,600 |
Other Municipal Debt - continued |
| Principal
Amount (000s) | | Value (000s) |
California - continued |
San Bernardino County Gen. Oblig. TRAN 2% 6/28/13 | $ 19,600 | | $ 19,714 |
San Diego County Wtr. Auth. Wtr. Rev. Bonds Series WF 08 29C, 0.2%, tender 8/15/13 (Liquidity Facility Wells Fargo & Co.) (c)(g)(h) | 21,985 | | 21,985 |
San Francisco City & County Unified School District TRAN Series 2012 A, 2% 6/28/13 | 85,000 | | 85,495 |
San Francisco County Trans. Auth.: | | | |
Series 2004 A, 0.2% 3/14/13, LOC Wells Fargo Bank NA, CP | 27,215 | | 27,215 |
Series 2004 B, 0.2% 3/7/13, LOC Wells Fargo Bank NA, CP | 56,250 | | 56,250 |
San Jose Int'l. Arpt. Rev. Series 2012 A3, 0.16% 3/12/13, LOC Wells Fargo Bank NA, CP | 7,683 | | 7,683 |
Santa Clara Valley Wtr. District Wtr. Util. Rev. Series 2010 A2: | | | |
0.13% 3/5/13, LOC JPMorgan Chase Bank, CP | 19,980 | | 19,980 |
0.16% 3/14/13, LOC JPMorgan Chase Bank, CP | 27,320 | | 27,320 |
Univ. of California Revs. Bonds Series Floaters 09 7C, 0.2%, tender 8/15/13 (Liquidity Facility Wells Fargo & Co.) (c)(g)(h) | 8,600 | | 8,600 |
Ventura County Gen. Oblig. TRAN 2.5% 7/1/13 | 89,270 | | 89,956 |
| | 1,452,729 |
Colorado - 0.8% |
Colorado Ed. Ln. Prog. TRAN: | | | |
Series 2012 B, 2% 6/27/13 | 93,400 | | 93,942 |
Series 2012 C, 1.5% 6/27/13 | 33,900 | | 34,048 |
Colorado Gen. Fdg. Rev. TRAN Series 2012 A, 2.5% 6/27/13 | 51,600 | | 51,989 |
Colorado Reg'l. Trans. District Sales Tax Rev. Bonds Series WF 12 110C, 0.27%, tender 6/13/13 (Liquidity Facility Wells Fargo Bank NA) (c)(g)(h) | 16,700 | | 16,700 |
Denver City & County School District # 1 Bonds Series 2012 B, 2% 12/1/13 | 9,515 | | 9,642 |
Jefferson County School District #R1 TAN Series 2012, 1.5% 6/28/13 | 9,400 | | 9,439 |
Univ. of Colorado Enterprise Sys. Rev. Bonds Series WF 11 128C, 0.22%, tender 7/25/13 (Liquidity Facility Wells Fargo Bank NA) (c)(g)(h) | 18,310 | | 18,310 |
| | 234,070 |
Other Municipal Debt - continued |
| Principal
Amount (000s) | | Value (000s) |
Connecticut - 0.1% |
Connecticut Gen. Oblig. Bonds Series 2012 F, 1% 9/15/13 | $ 14,200 | | $ 14,259 |
Connecticut Spl. Tax Oblig. Trans. Infrastructure Rev. Bonds Series 2012 A, 2% 1/1/14 | 4,500 | | 4,568 |
| | 18,827 |
Delaware - 0.0% |
Delaware Gen. Oblig. Bonds: | | | |
Series 2008 A, 5% 3/1/14 | 2,350 | | 2,463 |
Series 2010 B, 5% 7/1/13 | 4,310 | | 4,380 |
| | 6,843 |
District Of Columbia - 0.5% |
District of Columbia Income Tax Rev. Bonds Series WF 11 145C, 0.2%, tender 8/15/13 (Liquidity Facility Wells Fargo Bank NA) (c)(g)(h) | 13,440 | | 13,440 |
District of Columbia Rev. Bonds (American Nat'l. Red Cross Proj.) Series 2000, 0.15% tender 3/19/13, LOC JPMorgan Chase Bank, CP mode | 71,600 | | 71,600 |
District of Columbia Wtr. & Swr. Auth. Pub. Util. Rev. Bonds Series 2012 A, 2% 10/1/13 | 1,250 | | 1,263 |
Metropolitan Washington Arpts. Auth. Dulles Toll Road Rev. Series 1: | | | |
0.15% 4/9/13, LOC JPMorgan Chase Bank, CP | 57,700 | | 57,700 |
0.17% 3/7/13, LOC JPMorgan Chase Bank, CP | 5,660 | | 5,660 |
| | 149,663 |
Florida - 1.1% |
Alachua County Health Facilities Auth. Health Facilities Rev. Bonds (Shands Teaching Hosp. and Clinics, Inc. Proj.) Series 2008 A, 0.15% tender 4/2/13, LOC Bank of America NA, CP mode | 36,000 | | 36,000 |
Florida Board of Ed. Bonds Series 2005 B, 5% 1/1/14 | 13,395 | | 13,935 |
Florida Board of Ed. Lottery Rev. Bonds: | | | |
Series 2006 A, 5% 7/1/13 | 3,450 | | 3,505 |
Series 2006 B, 5% 7/1/13 | 3,300 | | 3,353 |
Series 2008 B, 4% 7/1/13 | 4,230 | | 4,282 |
Series 2009 A, 5% 7/1/13 | 6,500 | | 6,604 |
Series 2010 A, 5% 7/1/13 | 2,000 | | 2,032 |
Florida Board of Ed. Pub. Ed. Cap. Outlay Bonds: | | | |
Series 2008 D, 5% 6/1/13 | 500 | | 506 |
Series 2009 C, 5% 6/1/13 | 2,475 | | 2,505 |
Series 2010 A, 5% 6/1/13 | 2,900 | | 2,935 |
Series 2012 B, 5% 6/1/13 | 23,750 | | 24,037 |
Other Municipal Debt - continued |
| Principal
Amount (000s) | | Value (000s) |
Florida - continued |
Florida Dept. of Envir. Protection Rev. Bonds: | | | |
Series 2003 B, 5% 7/1/13 | $ 6,760 | | $ 6,866 |
Series 2004 A, 5% 7/1/13 | 4,200 | | 4,267 |
Series 2007 B, 5% 7/1/13 | 1,250 | | 1,270 |
Series 2010 D, 5% 7/1/13 | 1,090 | | 1,107 |
Series 2011 A, 4% 7/1/13 | 4,700 | | 4,758 |
Series 2011 B, 4% 7/1/13 | 2,940 | | 2,977 |
Florida Division of Bond Fin. Dept. Gen. Svcs. Revs. Bonds: | | | |
Series 1997 B, 6% 7/1/13 | 8,670 | | 8,837 |
Series 1998 A, 6% 7/1/13 | 6,700 | | 6,829 |
Florida Gen. Oblig. Bonds Series WF 12 87C, 0.27%, tender 6/13/13 (Liquidity Facility Wells Fargo Bank NA) (c)(g)(h) | 6,155 | | 6,155 |
Florida Hurricane Catastrophe Fund Fin. Corp. Rev. Bonds Series 2008 A: | | | |
4.125% 7/1/13 | 2,000 | | 2,025 |
5% 7/1/13 | 10,425 | | 10,585 |
Florida Local Govt. Fin. Cmnty. Series 2011 A1: | | | |
0.15% 4/1/13, LOC JPMorgan Chase Bank, CP | 8,414 | | 8,414 |
0.17% 5/6/13, LOC JPMorgan Chase Bank, CP | 9,532 | | 9,532 |
0.18% 3/5/13, LOC JPMorgan Chase Bank, CP | 13,431 | | 13,431 |
Florida Wtr. Poll. Cont. Fing. Corp. Rev. Bonds: | | | |
Series 2009 A, 3% 1/15/14 | 1,000 | | 1,025 |
Series 2010 A, 5% 7/15/13 | 1,200 | | 1,222 |
Hillsborough County Cap. Impt. Prog. Rev. Series 2013 A, 0.18% 7/11/13, LOC State Street Bank & Trust Co., Boston, CP | 5,000 | | 5,000 |
Indian River County School District TAN Series 2012, 1.25% 6/30/13 | 8,500 | | 8,529 |
Jacksonville Elec. Auth. Elec. Sys. Rev.: | | | |
Bonds Series 2013 A, 2% 10/1/13 | 6,485 | | 6,554 |
Series 2013 C1, 0.14% 3/4/13, CP | 41,300 | | 41,300 |
Jacksonville Gen. Oblig. Series 2004 A, 0.2% 3/6/13, LOC Landesbank Baden-Wuert, CP | 8,095 | | 8,095 |
JEA Saint Johns River Pwr. Park Sys. Rev. Bonds Series 2012 B, 3% 10/1/13 | 1,000 | | 1,016 |
JEA Wtr. & Swr. Sys. Rev. Bonds 2% 10/1/13 | 1,235 | | 1,248 |
Orlando & Orange County Expressway Auth. Rev. Bonds Series 2003 A, 5% 7/1/13 (Escrowed to Maturity) | 4,710 | | 4,781 |
Orlando Utils. Commission Util. Sys. Rev. Bonds: | | | |
Series 2007, 5% 10/1/13 | 2,900 | | 2,982 |
Series 2011 A, 0.22%, tender 9/26/13 (c) | 14,500 | | 14,500 |
Series 2013 A, 1.5% 10/1/13 | 4,500 | | 4,534 |
Other Municipal Debt - continued |
| Principal
Amount (000s) | | Value (000s) |
Florida - continued |
Tampa Health Sys. Rev. Bonds: | | | |
Series 2012 B, 0.21%, tender 9/26/13 (c) | $ 14,515 | | $ 14,515 |
Series WF 12 21 C, 0.24%, tender 3/7/13 (Liquidity Facility Wells Fargo Bank NA) (c)(g)(h) | 24,425 | | 24,425 |
| | 326,473 |
Georgia - 0.2% |
Georgia Gen. Oblig. Bonds: | | | |
Series 2009 E, 4% 7/1/13 | 5,000 | | 5,064 |
Series WF 08 12C, 0.22%, tender 7/25/13 (Liquidity Facility Wells Fargo & Co.) (c)(g)(h) | 14,300 | | 14,300 |
Georgia Muni. Elec. Auth. Pwr. Rev. Bonds (Gen. Resolution Projs.) Series 1985 A, 0.15% tender 4/9/13, LOC Barclays Bank PLC, CP mode | 15,550 | | 15,550 |
Georgia Muni. Gas Auth. Rev. Bonds (Gas Portfolio III Proj.) Series R, 2% 10/1/13 | 6,900 | | 6,969 |
Georgia Road & Thruway Auth. Rev. Bonds: | | | |
Series 2006, 5% 6/1/13 | 4,250 | | 4,301 |
Series 2011 A, 4% 3/1/13 | 4,400 | | 4,400 |
Metropolitan Atlanta Rapid Transit Series 2012 D1: | | | |
0.16% 5/3/13, LOC Bank of Tokyo-Mitsubishi UFJ Ltd., CP | 8,300 | | 8,300 |
0.16% 5/3/13, LOC Bank of Tokyo-Mitsubishi UFJ Ltd., CP | 8,500 | | 8,500 |
| | 67,384 |
Hawaii - 0.0% |
Hawaii Gen. Oblig. Bonds Series 2003 DB, 5.25% 9/1/13 | 1,000 | | 1,025 |
Idaho - 0.5% |
Idaho Gen. Oblig. TAN Series 2012, 2% 6/28/13 | 150,000 | | 150,878 |
Illinois - 0.5% |
DuPage County Gen. Oblig. Bonds Series Merlots 00 A9, 0.22%, tender 7/24/13 (Liquidity Facility Wells Fargo Bank NA) (c)(g)(h) | 9,705 | | 9,705 |
Illinois Fin. Auth. Ed. Rev. 0.14% 4/3/13, LOC PNC Bank NA, CP | 14,000 | | 14,000 |
Illinois Fin. Auth. Rev. Bonds: | | | |
(Advocate Health Care Network Proj.) Series 2011 B, 0.23%, tender 9/26/13 (c) | 11,700 | | 11,700 |
(Hosp. Sisters Svcs., Inc. Proj.): | | | |
Series 2012 H, 0.17% tender 6/3/13, CP mode | 16,900 | | 16,900 |
Series 2012 I, 0.17% tender 6/3/13, CP mode | 39,460 | | 39,460 |
Series 2012 C, 2% 8/15/13 | 6,495 | | 6,543 |
Illinois Health Facilities Auth. Rev. Bonds Series 2003 C, 0.25%, tender 4/19/13 (c) | 8,245 | | 8,245 |
Other Municipal Debt - continued |
| Principal
Amount (000s) | | Value (000s) |
Illinois - continued |
Illinois Sales Tax Rev. Bonds Series WF 11 125C, 0.27%, tender 6/13/13 (Liquidity Facility Wells Fargo Bank NA) (c)(g)(h) | $ 13,700 | | $ 13,700 |
Illinois Unemployment Ins. Fund Bldg. Receipts Bonds: | | | |
Series 2012 A, 2% 6/15/13 | 8,500 | | 8,542 |
Series 2012, 5% 12/15/13 | 3,100 | | 3,217 |
| | 132,012 |
Indiana - 1.0% |
Indiana Fin. Auth. Indl. Rev. Bonds (Midwest Fertilizer Corp. Proj.) Series 2012, 0.2%, tender 7/1/13 (c) | 120,700 | | 120,700 |
Indiana Fin. Auth. Rev. Bonds: | | | |
(Trinity Health Cr. Group Proj.) Series 2009 A, 5% 12/1/13 | 2,045 | | 2,118 |
(Trinity Health Sys. Proj.): | | | |
Series 2008 D2: | | | |
0.13% tender 3/21/13, CP mode | 50,000 | | 50,000 |
0.15% tender 5/15/13, CP mode | 10,000 | | 10,000 |
Series D2: | | | |
0.13% tender 3/12/13, CP mode | 17,360 | | 17,360 |
0.13% tender 3/20/13, CP mode | 28,960 | | 28,960 |
Indianapolis Gas Util. Sys. Rev. Series 2001 A2, 0.22% 3/7/13, LOC JPMorgan Chase Bank, CP | 43,000 | | 43,000 |
| | 272,138 |
Iowa - 0.6% |
Iowa Fin. Auth. Midwestern Bonds (Fertilizer Co. Proj.) Series 2012, 0.18%, tender 4/12/13 (c) | 167,200 | | 167,200 |
Kansas - 0.2% |
Kansas Dept. of Trans. Hwy. Rev. Bonds Series 2012 A1, 0.14% 9/1/13 (c) | 7,400 | | 7,400 |
Wichita Gen. Oblig. BAN: | | | |
Series 254, 0.25% 2/11/14 | 42,830 | | 42,843 |
Series 256, 0.25% 2/11/14 (f) | 15,065 | | 15,067 |
| | 65,310 |
Kentucky - 0.2% |
Jefferson County Poll. Cont. Bonds (Louisville Gas & Elec. Co. Proj.) Series 2002 A2, 0.4% tender 4/3/13, CP mode (f) | 30,000 | | 30,000 |
Jefferson County Poll. Cont. Rev. Bonds (Louisville Gas & Elec. Co. Proj.) Series 2001 A, 0.25% tender 3/11/13, CP mode | 9,600 | | 9,600 |
Other Municipal Debt - continued |
| Principal
Amount (000s) | | Value (000s) |
Kentucky - continued |
Trimble County Poll. Cont. Rev. Bonds (Louisville Gas & Elec. Co. Proj.): | | | |
Series 2001 A, 0.25% tender 3/6/13, CP mode | $ 19,800 | | $ 19,800 |
Series 2001 B, 0.4% tender 4/3/13, CP mode (f) | 8,600 | | 8,600 |
| | 68,000 |
Louisiana - 0.0% |
Louisiana Gas & Fuel Tax Rev. Bonds Series 2012 A1, 2.5% 5/1/13 | 7,290 | | 7,318 |
Maryland - 0.5% |
Baltimore County Gen. Oblig.: | | | |
Bonds: | | | |
Series 2004, 5% 8/1/13 | 2,250 | | 2,295 |
Series 2012, 5% 8/1/13 | 1,000 | | 1,020 |
4% 8/1/13 | 2,855 | | 2,901 |
Series 2011: | | | |
0.13% 3/5/13 (Liquidity Facility Mizuho Corporate Bank Ltd.), CP | 33,125 | | 33,125 |
0.13% 3/5/13 (Liquidity Facility Mizuho Corporate Bank Ltd.), CP | 33,400 | | 33,400 |
0.17% 6/3/13 (Liquidity Facility Mizuho Corporate Bank Ltd.), CP | 32,815 | | 32,815 |
Baltimore Gen. Oblig. Bonds Series 2013 A, 1% 10/15/13 | 12,720 | | 12,785 |
Maryland Dept. of Trans. Consolidated Trans. Rev. Bonds Series 2008, 4% 2/15/14 | 2,500 | | 2,591 |
Maryland Gen. Oblig. Bonds: | | | |
First Series 2001, 5.5% 3/1/13 | 7,285 | | 7,285 |
First Series 2007, 5% 3/15/13 | 5,950 | | 5,961 |
Second Series 2010 B, 5% 8/1/13 | 5,500 | | 5,611 |
Montgomery County Gen. Oblig. Bonds Series 2010 A, 5% 8/1/13 | 1,500 | | 1,530 |
Univ. of Maryland Sys. Auxiliary Facility & Tuition Rev. Bonds: | | | |
Series 2010 A, 2.5% 4/1/13 | 4,300 | | 4,308 |
Series 2011 A, 3% 4/1/13 | 2,000 | | 2,005 |
Washington Suburban San. District Bonds Series 2010 A, 5% 6/1/13 | 4,500 | | 4,555 |
| | 152,187 |
Massachusetts - 0.3% |
Massachusetts Dev. Fin. Agcy. Electrical Utils. Rev. Bonds (Nantucket Elec. Co. Proj.) Series 2005, 0.45% tender 3/6/13, CP mode (f) | 24,400 | | 24,400 |
Massachusetts Gen. Oblig. RAN Series 2012 A, 2% 4/25/13 | 12,900 | | 12,936 |
Other Municipal Debt - continued |
| Principal
Amount (000s) | | Value (000s) |
Massachusetts - continued |
Massachusetts Indl. Fin. Agcy. Poll. Cont. Rev. Bonds (New England Pwr. Co. Proj.): | | | |
Series 1992, 0.4% tender 4/1/13, CP mode | $ 8,100 | | $ 8,100 |
Series 1993 A, 0.4% tender 3/6/13, CP mode | 15,000 | | 15,000 |
Series 1993 B: | | | |
0.4% tender 3/6/13, CP mode | 950 | | 950 |
0.45% tender 4/4/13, CP mode | 7,150 | | 7,150 |
Massachusetts State Dev. Fin. Agcy. Elec. Util. Rev. Bonds (Nantucket Elec. Co. Proj.) Series 2007, 0.4% tender 4/3/13, CP mode (f) | 1,100 | | 1,100 |
| | 69,636 |
Michigan - 0.4% |
Michigan Bldg. Auth. Rev. Series 6, 0.14% 3/21/13, LOC State Street Bank & Trust Co., Boston, LOC U.S. Bank NA, Cincinnati, CP | 32,240 | | 32,240 |
Michigan Hosp. Fin. Auth. Rev. Bonds: | | | |
(Trinity Health Sys. Proj.) Series 2008 C: | | | |
0.13% tender 3/5/13, CP mode | 5,100 | | 5,100 |
0.14% tender 4/1/13, CP mode | 26,025 | | 26,025 |
0.15% tender 5/3/13, CP mode | 15,125 | | 15,125 |
0.15% tender 5/3/13, CP mode | 22,865 | | 22,865 |
Series 2008 C, 0.13% tender 3/5/13, CP mode | 6,900 | | 6,900 |
Michigan State Univ. Revs. Bonds Series WF 11 33 C, 0.27%, tender 6/13/13 (Liquidity Facility Wells Fargo Bank NA) (c)(g)(h) | 3,000 | | 3,000 |
| | 111,255 |
Minnesota - 0.3% |
Hennepin County Gen. Oblig. Bonds Series 2013 A, 3% 12/1/13 | 4,365 | | 4,458 |
Metropolitan Council Gen. Oblig. Rev. Bonds: | | | |
Series 2011 C, 0.25% 3/1/13 | 10,000 | | 10,000 |
Series 2012 C, 3% 3/1/13 | 12,390 | | 12,390 |
Minnesota Gen. Oblig. Bonds: | | | |
Series 2012 B, 5% 8/1/13 | 5,850 | | 5,967 |
Series WF 11 110C, 0.27%, tender 6/13/13 (Liquidity Facility Wells Fargo Bank NA) (c)(g)(h) | 23,535 | | 23,535 |
Southern Minnesota Muni. Pwr. Agcy. Pwr. Supply Sys. Rev. Bonds Series 2002 A, 5.25% 1/1/14 | 2,000 | | 2,082 |
Univ. of Minnesota Gen. Oblig.: | | | |
Bonds Series 2011 A, 5% 12/1/13 | 2,500 | | 2,589 |
Other Municipal Debt - continued |
| Principal
Amount (000s) | | Value (000s) |
Minnesota - continued |
Univ. of Minnesota Gen. Oblig.: - continued | | | |
Series 2009 D: | | | |
0.14% 4/3/13, CP | $ 9,000 | | $ 9,000 |
0.16% 6/6/13, CP | 8,350 | | 8,350 |
| | 78,371 |
Mississippi - 0.1% |
Mississippi Gen. Oblig. Bonds Series 2007 B, 5% 12/1/13 | 1,000 | | 1,036 |
Mississippi Hosp. Equip. & Facilities Auth. Bonds (Baptist Memorial Health Care Proj.) Series 2004 B2: | | | |
0.18%, tender 7/10/13 (c)(h) | 3,455 | | 3,455 |
0.18%, tender 7/10/13 (c)(h) | 14,250 | | 14,250 |
| | 18,741 |
Missouri - 0.2% |
Curators of the Univ. of Missouri Series 2012 A, 0.19% 3/8/13, CP | 16,000 | | 16,000 |
Missouri Board of Pub. Buildings Spl. Oblig. Bonds Series 2003 A: | | | |
5% 10/15/13 (Pre-Refunded to 10/15/13 @ 100) | 9,045 | | 9,315 |
5% 10/15/13 (Pre-Refunded to 10/15/13 @ 100) | 2,240 | | 2,305 |
Missouri Highways & Trans. Commission State Road Rev. Bonds Series 2005, 5% 5/1/13 | 1,000 | | 1,008 |
Saint Louis Gen. Fund Rev. TRAN Series 2012, 2% 5/30/13 | 16,300 | | 16,371 |
| | 44,999 |
Montana - 0.0% |
Montana Board of Invt. Bonds Series 1998, 0.22%, tender 3/1/13 (c) | 6,470 | | 6,470 |
Nebraska - 0.1% |
Omaha Pub. Pwr. District Elec. Rev. Series 2013 A: | | | |
0.13% 3/5/13, CP | 15,000 | | 15,000 |
0.15% 3/14/13, CP | 5,200 | | 5,200 |
0.15% 3/21/13, CP | 13,500 | | 13,500 |
| | 33,700 |
Nevada - 0.2% |
Clark County Fuel Tax Bonds Series 2010 D, 5% 7/1/13 | 3,735 | | 3,794 |
Nevada Gen. Oblig. Bonds Series 2005 A, 5% 2/1/14 | 1,000 | | 1,044 |
Other Municipal Debt - continued |
| Principal
Amount (000s) | | Value (000s) |
Nevada - continued |
Truckee Meadows Wtr. Auth. Wtr. Rev.: | | | |
Series 2006 A, 0.18% 4/4/13, LOC JPMorgan Chase Bank, CP | $ 23,000 | | $ 23,000 |
Series 2006 B1, 0.17% 4/4/13, LOC Wells Fargo Bank NA, CP | 25,000 | | 25,000 |
| | 52,838 |
New Hampshire - 0.3% |
New Hampshire Bus. Fin. Auth. Poll. Cont. Rev. Bonds (New England Pwr. Co. Proj.): | | | |
Series 1990 A: | | | |
0.4% tender 4/3/13, CP mode (f) | 35,500 | | 35,500 |
0.45% tender 4/1/13, CP mode (f) | 8,350 | | 8,350 |
Series 1990 B, 0.45% tender 4/4/13, CP mode | 19,900 | | 19,900 |
New Hampshire Gen. Oblig. Bonds: | | | |
Series 2009 B, 5% 3/1/13 | 5,450 | | 5,450 |
Series 2010 B, 3% 6/1/13 | 4,055 | | 4,083 |
| | 73,283 |
New Jersey - 0.0% |
Passaic County Gen. Oblig. BAN Series 2012 A, 1.25% 12/27/13 | 11,481 | | 11,573 |
New Mexico - 0.0% |
New Mexico Fin. Auth. Trans. Rev. Bonds: | | | |
Series 2009 A, 5% 6/15/13 | 4,940 | | 5,010 |
Series 2012, 2% 6/15/13 | 2,945 | | 2,960 |
New Mexico Gen. Oblig. Bonds Series 2008 A, 5% 3/1/13 | 4,560 | | 4,560 |
| | 12,530 |
New York - 0.9% |
New York City Muni. Wtr. Fin. Auth. Wtr. & Swr. Sys. Rev.: | | | |
Series 1, 0.12% 3/1/13, CP | 25,200 | | 25,200 |
Series 8, 0.15% 10/28/13, CP | 36,100 | | 36,100 |
New York Local Govt. Assistance Corp. Bonds Series 2007 A, 5% 4/1/13 | 8,520 | | 8,555 |
New York Metropolitan Trans. Auth. Rev.: | | | |
Series 2, 0.17% 3/12/13, LOC Royal Bank of Canada, CP | 88,300 | | 88,300 |
Series 2013 D, 0.13% 3/13/13, LOC Citibank NA, CP | 30,000 | | 30,000 |
New York Thruway Auth. Hwy. & Bridge Trust Fund Bonds Series 2005 B, 5% 4/1/13 | 3,225 | | 3,238 |
Other Municipal Debt - continued |
| Principal
Amount (000s) | | Value (000s) |
New York - continued |
New York Thruway Auth. Personal Income Tax Rev. Bonds Series 2011 A, 3% 3/15/13 | $ 5,000 | | $ 5,005 |
New York Thruway Auth. Svc. Contract Rev. Bonds Series 2012 A, 2% 4/1/13 | 60,685 | | 60,778 |
| | 257,176 |
New York & New Jersey - 0.0% |
Port Auth. of New York & New Jersey Series 2012 B, 0.2% 3/1/13, CP | 12,080 | | 12,080 |
North Carolina - 0.5% |
Board of Governors of the Univ. of North Carolina: | | | |
Series 2012 D, 0.19% 3/6/13, CP | 5,000 | | 5,000 |
Series 2013 D: | | | |
0.12% 3/1/13, CP | 2,500 | | 2,500 |
0.13% 3/13/13, CP | 17,700 | | 17,700 |
0.14% 3/19/13, CP | 10,300 | | 10,300 |
0.16% 6/5/13, CP | 3,000 | | 3,000 |
Charlotte Gen. Oblig. Bonds Series 2008, 5% 8/1/13 | 1,000 | | 1,020 |
Charlotte Wtr. & Swr. Sys. Rev. Bonds Series 2011, 3% 12/1/13 | 1,500 | | 1,532 |
Durham County Gen. Oblig. Bonds Series 2012, 3% 4/1/13 | 6,990 | | 7,007 |
Mecklenburg County Gen. Oblig. Bonds Series 2009 A, 5% 8/1/13 | 1,250 | | 1,275 |
North Carolina Cap. Impt. Ltd. Bonds Series WF 11 136C, 0.27%, tender 6/13/13 (Liquidity Facility Wells Fargo Bank NA) (c)(g)(h) | 8,030 | | 8,030 |
North Carolina Gen. Oblig. Bonds: | | | |
Series 2003 A, 5.25% 3/1/13 | 4,650 | | 4,650 |
Series 2005 B, 5% 4/1/13 | 2,350 | | 2,360 |
Series 2013 B, 3% 6/1/13 | 3,975 | | 4,004 |
Series A, 5.5% 3/1/13 | 13,750 | | 13,750 |
North Carolina Muni. Pwr. Agcy. #1 Catawba Elec. Rev. Bonds Series 2012 A, 2% 1/1/14 | 44,645 | | 45,293 |
Raleigh Combined Enterprise Sys. Rev. Bonds Series WF 11-19C, 0.27%, tender 6/13/13 (Liquidity Facility Wells Fargo Bank NA) (c)(g)(h) | 9,000 | | 9,000 |
Wake County Gen. Oblig. Bonds: | | | |
Series 2004, 4.5% 3/1/13 | 5,250 | | 5,250 |
Series 2007, 5% 3/1/13 | 1,400 | | 1,400 |
| | 143,071 |
Other Municipal Debt - continued |
| Principal
Amount (000s) | | Value (000s) |
Ohio - 0.3% |
Franklin County Hosp. Rev. Bonds (U.S. Health Corp. of Columbus Proj.) Series 2011 B, 0.25%, tender 7/9/13 (c) | $ 4,200 | | $ 4,200 |
Ohio Higher Edl. Facility Commission Rev. Bonds (The Cleveland Clinic Foundation Proj.): | | | |
Series 2008 B5: | | | |
0.15% tender 6/13/13, CP mode | 7,200 | | 7,200 |
0.2% tender 4/4/13, CP mode | 18,650 | | 18,650 |
0.21% tender 3/6/13, CP mode | 12,400 | | 12,400 |
0.22% tender 5/8/13, CP mode | 10,000 | | 10,000 |
Series 2008 B6: | | | |
0.15% tender 6/13/13, CP mode | 8,600 | | 8,600 |
0.22% tender 5/8/13, CP mode | 8,800 | | 8,800 |
| | 69,850 |
Oklahoma - 0.1% |
Oklahoma City Wtr. Utils. Trust Wtr. and Swr. Rev. Series 2013 A: | | | |
0.14% 3/6/13, LOC State Street Bank & Trust Co., Boston, CP | 4,500 | | 4,500 |
0.14% 3/6/13, LOC State Street Bank & Trust Co., Boston, CP | 10,705 | | 10,705 |
| | 15,205 |
Oregon - 1.2% |
Clackamas County Hosp. Facility Auth.: | | | |
(Providence Health Sys. Proj.) Bonds Series 2003 G, 0.13% tender 3/6/13, CP mode | 21,525 | | 21,525 |
Bonds (Providence Health Sys. Proj.): | | | |
Series 2003 D, 0.16% tender 5/21/13, CP mode | 10,600 | | 10,600 |
Series 2003 E: | | | |
0.13% tender 3/6/13, CP mode | 8,000 | | 8,000 |
0.13% tender 3/12/13, CP mode | 9,900 | | 9,900 |
0.16% tender 6/5/13, CP mode | 10,000 | | 10,000 |
0.17% tender 6/17/13, CP mode | 8,000 | | 8,000 |
0.17% tender 6/17/13, CP mode | 6,000 | | 6,000 |
Series 2003 F: | | | |
0.13% tender 3/6/13, CP mode | 5,000 | | 5,000 |
0.14% tender 4/4/13, CP mode | 10,000 | | 10,000 |
0.16% tender 6/5/13, CP mode | 25,000 | | 25,000 |
Series 2003 G, 0.14% tender 4/4/13, CP mode | 14,400 | | 14,400 |
Oregon Gen. Oblig.: | | | |
Bonds Series WF11 57 C, 0.27%, tender 6/13/13 (Liquidity Facility Wells Fargo Bank NA) (c)(g)(h) | 10,800 | | 10,800 |
Other Municipal Debt - continued |
| Principal
Amount (000s) | | Value (000s) |
Oregon - continued |
Oregon Gen. Oblig.: - continued | | | |
TAN Series 2012 A, 2% 6/28/13 | $ 141,200 | | $ 142,028 |
Portland Gen. Oblig. TAN Series 2012, 2% 6/27/13 | 21,030 | | 21,152 |
Portland Swr. Sys. Rev. Bonds Series 2008 A, 5% 6/15/13 | 1,000 | | 1,014 |
Salem-Keizer School District #24J Bonds Series WF 09 4Z, 0.22%, tender 7/25/13 (Liquidity Facility Wells Fargo & Co.) (c)(g)(h) | 17,060 | | 17,060 |
| | 320,479 |
Pennsylvania - 0.3% |
Pennsylvania Gen. Oblig. Bonds Series WF 11 121C, 0.22%, tender 8/1/13 (Liquidity Facility Wells Fargo Bank NA) (c)(g)(h) | 12,915 | | 12,915 |
Pennsylvania Infrastructure Invt. Auth. Rev. Series 2010 A, 0.15% 3/4/13, LOC Bank of America NA, CP | 18,643 | | 18,643 |
Philadelphia Gen. Oblig. TRAN Series 2012 A, 2% 6/28/13 | 35,300 | | 35,502 |
Univ. of Pittsburgh Commonwealth Sys. of Higher Ed. BAN Series 2012, 2% 7/2/13 | 13,300 | | 13,380 |
| | 80,440 |
Rhode Island - 0.0% |
Rhode Island & Providence Plantations Bonds Series 2012 B, 2% 10/15/13 | 2,370 | | 2,395 |
South Carolina - 0.9% |
Aiken County Consolodated School District Bonds Series 2012, 2% 4/1/13 | 5,750 | | 5,759 |
Charleston County School District: | | | |
Bonds Series 2012 B, 5% 3/1/13 | 16,880 | | 16,880 |
TAN Series 2012, 1% 4/1/13 | 51,500 | | 51,535 |
Cherokee County School District No. 1 Bonds Series 2013 A, 3% 3/1/14 (South Carolina Gen. Oblig. Guaranteed) | 4,310 | | 4,431 |
Darlington County School District Bonds Series 2012, 1.25% 5/1/13 (South Carolina Gen. Oblig. Guaranteed) | 5,000 | | 5,008 |
Florence City School District #1 Bonds Series 2012, 3% 3/1/13 | 11,980 | | 11,980 |
Lancaster County School District Bonds 2% 3/1/13 (South Carolina Gen. Oblig. Guaranteed) | 9,060 | | 9,060 |
Oconee County School District Bonds Series 2012, 2% 3/1/13 (South Carolina Gen. Oblig. Guaranteed) | 5,515 | | 5,515 |
South Carolina Assoc. of Governmental Organizations Ctfs. of Prtn. Bonds: | | | |
Series 2012 A, 2% 3/1/13 (South Carolina Gen. Oblig. Guaranteed) | 56,600 | | 56,600 |
Other Municipal Debt - continued |
| Principal
Amount (000s) | | Value (000s) |
South Carolina - continued |
South Carolina Assoc. of Governmental Organizations Ctfs. of Prtn. Bonds: - continued | | | |
Series 2012 D, 1.75% 3/1/13 (South Carolina Gen. Oblig. Guaranteed) | $ 22,300 | | $ 22,300 |
Series 2012 E, 4% 3/1/13 (South Carolina Gen. Oblig. Guaranteed) | 3,765 | | 3,765 |
South Carolina Gen. Oblig. Bonds: | | | |
Series 2011 A: | | | |
5% 3/1/13 | 5,000 | | 5,000 |
5% 3/1/13 | 5,000 | | 5,000 |
Series 2012 A, 4% 4/1/13 | 5,880 | | 5,899 |
Series ROC II R 692W, 0.27%, tender 5/30/13 (Liquidity Facility Wells Fargo & Co.) (c)(g)(h) | 8,295 | | 8,295 |
South Carolina Pub. Svc. Auth. (Santee Cooper) Rev. Oblig. Bonds Series 2012 C, 5% 12/1/13 | 5,000 | | 5,178 |
York County Poll. Cont. Rev. Bonds (Duke Energy Corp. Proj.) 0.4% tender 3/1/13, CP mode | 22,400 | | 22,400 |
York County School District #4 Bonds Series 2012 B, 4% 3/1/13 (South Carolina Gen. Oblig. Guaranteed) | 8,400 | | 8,400 |
| | 253,005 |
Tennessee - 0.1% |
Memphis Elec. Sys. Rev. Bonds Series 2003 A, 5% 12/1/13 | 2,500 | | 2,590 |
Nashville and Davidson County Metropolitan Govt. Gen. Oblig. Bonds Series 2010 A, 5% 7/1/13 | 4,500 | | 4,572 |
Shelby County Gen. Oblig. Bonds Series 2009 A, 5% 4/1/13 | 5,125 | | 5,147 |
Tennessee Gen. Oblig. Bonds: | | | |
Series 1999 A, 5% 5/1/13 | 1,845 | | 1,860 |
Series 2008 A, 5% 9/1/13 | 3,835 | | 3,928 |
Series 2010 A, 4% 5/1/13 | 2,300 | | 2,315 |
Series 2011, 5% 10/1/13 | 1,920 | | 1,974 |
| | 22,386 |
Texas - 6.6% |
Austin Elec. Util. Sys. Rev. Series 2013 A, 0.12% 3/19/13, LOC JPMorgan Chase Bank, LOC State Street Bank & Trust Co., Boston, CP | 50,000 | | 50,000 |
Austin Wtr. & Wastewtr. Sys. Rev. Bonds Series WF 11 139C, 0.2%, tender 8/15/13 (Liquidity Facility Wells Fargo Bank NA) (c)(g)(h) | 20,950 | | 20,950 |
Corpus Christi Util. Sys. Rev. Bonds: | | | |
2% 7/15/13 | 2,155 | | 2,169 |
2% 7/15/13 | 5,855 | | 5,893 |
Other Municipal Debt - continued |
| Principal
Amount (000s) | | Value (000s) |
Texas - continued |
Cypress-Fairbanks Independent School District Bonds Series 86TP, 0.27%, tender 6/13/13 (Liquidity Facility Wells Fargo & Co.) (c)(g)(h) | $ 6,620 | | $ 6,620 |
Dallas Independent School District Bonds Series 2010 B, 5% 2/15/14 (Permanent School Fund of Texas Guaranteed) | 2,100 | | 2,197 |
Eanes Independent School District Bonds Series 2011, 3% 8/1/13 (Permanent School Fund of Texas Guaranteed) | 1,000 | | 1,011 |
Frisco Independent School District Bonds Series WF 11 1C, 0.22%, tender 7/25/13 (Liquidity Facility Wells Fargo Bank NA) (c)(g)(h) | 13,600 | | 13,600 |
Harris County Gen. Oblig.: | | | |
Bonds: | | | |
Series 2012 A, 2% 10/1/13 | 4,085 | | 4,127 |
Series 2012 C, 2% 8/15/13 | 10,000 | | 10,082 |
Series 2012 D, 0.17% 4/4/13 (Liquidity Facility JPMorgan Chase Bank), CP | 17,860 | | 17,860 |
Series 2013 A1, 0.14% 3/19/13 (Liquidity Facility State Street Bank & Trust Co., Boston), CP | 7,550 | | 7,550 |
Series D, 0.23% 3/7/13 (Liquidity Facility JPMorgan Chase Bank), CP | 3,190 | | 3,190 |
Harris County Metropolitan Trans. Auth.: | | | |
Series 2012 A1, 0.17% 3/14/13 (Liquidity Facility JPMorgan Chase Bank), CP | 34,300 | | 34,300 |
Series 2013 A1, 0.17% 5/8/13 (Liquidity Facility JPMorgan Chase Bank), CP | 10,000 | | 10,000 |
Series 2013 A3, 0.16% 5/8/13 (Liquidity Facility State Street Bank & Trust Co., Boston), CP | 4,000 | | 4,000 |
Houston Gen. Oblig. Series 2013 A, 0.15% 4/9/13, LOC Union Bank of California, CP | 23,100 | | 23,100 |
Houston Higher Ed. Fin. Corp. Higher Ed. Rev. Series 2013 A, 0.16% 6/11/13, CP | 5,550 | | 5,550 |
Houston Util. Sys. Rev.: | | | |
Bonds Series 2010 C, 5% 11/15/13 | 1,000 | | 1,034 |
Series 2013 B2: | | | |
0.15% 4/3/13, LOC Wells Fargo Bank NA, CP | 6,300 | | 6,300 |
0.15% 4/4/13, LOC Wells Fargo Bank NA, CP | 13,600 | | 13,600 |
Irving Independent School District Bonds Series PT 3954, 0.27%, tender 5/30/13 (Liquidity Facility Wells Fargo & Co.) (c)(g)(h) | 20,835 | | 20,835 |
Judson Independent School District Bonds Series MS 06 1859, 0.27%, tender 5/23/13 (Liquidity Facility Wells Fargo & Co.) (c)(g)(h) | 7,890 | | 7,890 |
Klein Independent School District Bonds Series 2012 B, 2% 2/1/14 (Permanent School Fund of Texas Guaranteed) | 2,000 | | 2,033 |
Other Municipal Debt - continued |
| Principal
Amount (000s) | | Value (000s) |
Texas - continued |
Lower Colorado River Auth. Rev.: | | | |
Bonds Series 2012, 5% 5/15/13 | $ 4,890 | | $ 4,939 |
Series 2013 B: | | | |
0.14% 3/6/13, LOC Bank of America NA, CP | 52,500 | | 52,500 |
0.15% 3/21/13, LOC Bank of America NA, CP | 14,200 | | 14,200 |
0.13% 3/5/13, LOC JPMorgan Chase Bank, LOC State Street Bank & Trust Co., Boston, CP | 12,900 | | 12,900 |
0.13% 3/12/13, LOC JPMorgan Chase Bank, LOC State Street Bank & Trust Co., Boston, CP | 26,100 | | 26,100 |
0.14% 3/21/13, LOC JPMorgan Chase Bank, LOC State Street Bank & Trust Co., Boston, CP | 57,150 | | 57,150 |
North East Texas Independent School District Bonds Series 2012, 2% 8/1/13 (Permanent School Fund of Texas Guaranteed) | 2,155 | | 2,171 |
North Texas Muni. Wtr. District Upper East Fork Wastewtr. Interceptor Sys. Bonds Series 2012, 2% 6/1/13 | 2,145 | | 2,155 |
North Texas Tollway Auth. Rev. Bonds Series 2009 D: | | | |
0.15% tender 4/10/13, LOC JPMorgan Chase Bank, CP mode | 11,000 | | 11,000 |
0.16% tender 4/9/13, LOC JPMorgan Chase Bank, CP mode | 10,000 | | 10,000 |
Pasadena Independent School District Bonds Series 2013, 1% 8/15/13 (Permanent School Fund of Texas Guaranteed) (b) | 10,100 | | 10,137 |
Plano Gen. Oblig. Bonds Series MS 06 1862, 0.27%, tender 5/23/13 (Liquidity Facility Wells Fargo & Co.) (c)(g)(h) | 11,665 | | 11,665 |
San Antonio Elec. & Gas Sys. Rev. Bonds Series 2002, 5.375% 2/1/14 | 6,400 | | 6,705 |
San Antonio Wtr. Sys. Rev. Bonds Series WF 12 76C, 0.22%, tender 8/1/13 (Liquidity Facility Wells Fargo Bank NA) (c)(g)(h) | 5,125 | | 5,125 |
Spring Branch Independent School District Bonds Series WF 11 140C, 0.2%, tender 8/15/13 (Liquidity Facility Wells Fargo Bank NA) (c)(g)(h) | 25,430 | | 25,430 |
Tarrant County Cultural Ed. Facilities Fin. Corp. Hosp. Rev. Bonds (Baylor Health Care Sys. Proj.) Series 2011 B, 0.24%, tender 9/26/13 (c) | 6,300 | | 6,300 |
Texas A&M Univ. Rev. Series 1993 B: | | | |
0.13% 3/4/13, CP | 30,600 | | 30,600 |
0.15% 3/14/13, CP | 52,800 | | 52,800 |
Texas Gen. Oblig.: | | | |
Bonds: | | | |
Series 2010 B. 5% 4/1/13 | 3,600 | | 3,615 |
Series 2013, 1% 8/1/13 | 1,000 | | 1,004 |
TRAN 2.5% 8/30/13 | 1,085,650 | | 1,097,977 |
Other Municipal Debt - continued |
| Principal
Amount (000s) | | Value (000s) |
Texas - continued |
Texas Muni. Pwr. Agy. Rev. Series 2005, 0.15% 4/1/13, LOC Bank of America NA, LOC JPMorgan Chase Bank, CP | $ 21,500 | | $ 21,500 |
Texas Pub. Fin. Auth. Rev. Bonds Series 2010 A: | | | |
4% 7/1/13 | 8,370 | | 8,475 |
5% 7/1/13 | 2,000 | | 2,032 |
Texas State Univ. Sys. Fing. Rev. Bonds 5% 3/15/13 | 2,000 | | 2,004 |
Texas Trans. Commission State Hwy. Fund Rev. Bonds: | | | |
Series 2006 A, 5% 4/1/13 | 2,970 | | 2,982 |
Series 2007, 5% 4/1/13 | 5,600 | | 5,624 |
Univ. of Texas Board of Regents Sys. Rev.: | | | |
Bonds Series 2004 B, 5.25% 8/15/13 | 8,985 | | 9,192 |
Series 2002 A: | | | |
0.14% 4/9/13 (Liquidity Facility Univ. of Texas Invt. Mgmt. Co.), CP | 20,683 | | 20,683 |
0.15% 3/6/13 (Liquidity Facility Univ. of Texas Invt. Mgmt. Co.), CP | 11,000 | | 11,000 |
0.16% 3/13/13 (Liquidity Facility Univ. of Texas Invt. Mgmt. Co.), CP | 16,439 | | 16,439 |
Upper Trinity Reg'l. Wtr. District Series 2013 A, 0.14% 3/5/13, LOC Bank of America NA, CP | 15,000 | | 15,000 |
| | 1,833,295 |
Utah - 0.6% |
Intermountain Pwr. Agcy. Pwr. Supply Rev.: | | | |
Series 1997 B1, 0.14% 3/19/13 (Liquidity Facility Bank of Nova Scotia), CP | 23,300 | | 23,300 |
Series 1997 B3, 0.15% 4/9/13 (Liquidity Facility JPMorgan Chase Bank), CP | 55,200 | | 55,200 |
Series 1998 B4, 0.15% 4/2/13 (Liquidity Facility JPMorgan Chase Bank), CP | 87,300 | | 87,300 |
| | 165,800 |
Vermont - 0.1% |
Vermont Edl. & Health Bldg. Fin. Agcy. Rev. Bonds Series WF 10 27C, 0.22%, tender 7/25/13 (Liquidity Facility Wells Fargo Bank NA) (c)(g)(h) | 25,775 | | 25,775 |
Virginia - 0.8% |
Fairfax County Gen. Oblig. Bonds: | | | |
Series 2012 A, 3% 4/1/13 | 10,880 | | 10,906 |
Series 2013 A, 1.5% 10/1/13 | 5,170 | | 5,210 |
Fairfax County Indl. Dev. Auth. Bonds (Inova Health Sys. Proj.) Series 2012 C, 0.19%, tender 9/26/13 (c) | 23,200 | | 23,200 |
Other Municipal Debt - continued |
| Principal
Amount (000s) | | Value (000s) |
Virginia - continued |
Halifax County Indl. Dev. Auth. Poll. Cont. Rev. Bonds (Virginia Elec. & Pwr. Co. Proj.) Series 1992, 0.7% tender 3/14/13, CP mode (f) | $ 21,500 | | $ 21,500 |
Hampton Roads Sanitation District Wastewtr. Rev. Bonds Series 2012 A, 2% 1/1/14 | 2,205 | | 2,238 |
Norfolk Econ. Dev. Auth. Hosp. Facilities Rev. Bonds (Sentara Healthcare Proj.): | | | |
Series 2010 B, 0.23%, tender 9/26/13 (c) | 14,255 | | 14,255 |
Series 2012 A, 0.19%, tender 9/26/13 (c) | 13,200 | | 13,200 |
Norfolk Econ. Dev. Auth. Rev. Series 1997: | | | |
0.17% 4/4/13, CP | 13,800 | | 13,800 |
0.2% 3/19/13, CP | 20,500 | | 20,500 |
Prince William County Indl. Dev. Auth. Poll. Cont. Rev. Bonds (Virginia Elec. & Pwr. Co. Proj.) Series 1986, 0.65% tender 3/14/13, CP mode | 11,200 | | 11,200 |
Virginia Beach Gen. Oblig. Bonds Series 2012 A, 5% 4/1/13 | 3,250 | | 3,263 |
Virginia College Bldg. Auth. Edl. Facilities Rev. Bonds: | | | |
(Pub. Higher Ed. Fing. Prog.) Series 2009 B, 5% 9/1/13 | 7,530 | | 7,710 |
Series 2001 A, 5% 9/1/13 | 6,010 | | 6,154 |
Virginia Commonwealth Trans. Board Rev. Bonds: | | | |
(Route 28 Proj.) Series 2012, 2% 4/1/13 | 5,640 | | 5,649 |
(Trans. Cap. Proj.) 3% 5/15/13 | 14,365 | | 14,448 |
(Transprotation District Prog.) Series 2012 A, 2.5% 5/15/13 | 8,040 | | 8,078 |
Series 2013 A, 5% 5/15/13 | 10,000 | | 10,102 |
Virginia Gen. Oblig. Bonds Series 2004 B, 5% 6/1/13 | 4,285 | | 4,337 |
Virginia Pub. Bldg. Auth. Pub. Facilities Rev. Bonds Series 2004 A, 5% 8/1/13 | 1,000 | | 1,020 |
Virginia Pub. School Auth. Bonds: | | | |
Series 1997 C, 5% 8/1/13 | 1,070 | | 1,091 |
Series XII, 3% 4/15/13 | 10,385 | | 10,421 |
Virginia Resources Auth. Clean Wtr. Rev. Bonds Series 2005 A, 5.25% 10/1/13 | 3,035 | | 3,125 |
| | 211,407 |
Washington - 0.4% |
Energy Northwest Elec. Rev. Bonds (#1 Proj.): | | | |
Series 2004 A, 5.25% 7/1/13 | 9,745 | | 9,909 |
Series 2005 A, 5% 7/1/13 | 7,720 | | 7,845 |
Series 2006 A, 5% 7/1/13 | 6,825 | | 6,934 |
Series 2008 C, 5% 7/1/13 | 1,950 | | 1,981 |
Port of Seattle Rev. Series 2001 B1, 0.24% 4/9/13, LOC Bank of America NA, CP (f) | 17,655 | | 17,655 |
Seattle Gen. Oblig. Bonds Series 2009, 5% 5/1/13 | 6,540 | | 6,592 |
Other Municipal Debt - continued |
| Principal
Amount (000s) | | Value (000s) |
Washington - continued |
Seattle Muni. Lt. & Pwr. Rev. Bonds: | | | |
Series 2008, 5% 4/1/13 | $ 2,870 | | $ 2,882 |
Series 2010 B, 5% 2/1/14 | 2,550 | | 2,662 |
Spokane County School District #81 Bonds Series 2012, 4% 12/1/13 (Washington Gen. Oblig. Guaranteed) | 8,525 | | 8,767 |
Univ. of Washington Univ. Revs. Bonds Series 2012 C, 2% 7/1/13 | 3,050 | | 3,068 |
Washington Gen. Oblig. Bonds: | | | |
Series 2011 A, 5% 1/1/14 | 1,750 | | 1,820 |
Series 2013 A, 4% 7/1/13 | 5,500 | | 5,569 |
Series 2013 B, 3% 7/1/13 | 4,015 | | 4,052 |
Series 2013 D, 2% 7/1/13 | 9,580 | | 9,639 |
Series GS 06 7T, 0.27%, tender 6/13/13 (Liquidity Facility Wells Fargo & Co.) (c)(g)(h) | 15,435 | | 15,435 |
Series WF 11-16C, 0.27%, tender 5/9/13 (Liquidity Facility Wells Fargo Bank NA) (c)(g)(h) | 6,200 | | 6,200 |
| | 111,010 |
West Virginia - 0.1% |
Grant County Cmnty. Solid Waste Disp. Rev. Bonds (Virginia Elec. & Pwr. Co. Proj.) Series 1996, 0.45% tender 3/6/13, CP mode (f) | 20,000 | | 20,000 |
Grant County Poll. Cont. Rev. Bonds (Virginia Elec. & Pwr. Co. Proj.) Series 1986, 0.7% tender 3/14/13, CP mode (f) | 7,400 | | 7,400 |
| | 27,400 |
Wisconsin - 1.4% |
Madison Gen. Oblig. Bonds Series 2012 A, 2% 10/1/13 | 3,970 | | 4,011 |
Milwaukee Gen. Oblig. Bonds Series 2011 N3, 5% 5/15/13 | 4,300 | | 4,342 |
Milwaukee School District RAN Series 2012 M11, 1.5% 6/26/13 | 75,740 | | 76,053 |
Oshkosh Area School District TRAN 1.5% 6/28/13 | 8,000 | | 8,032 |
Wisconsin Gen. Oblig.: | | | |
Bonds: | | | |
Series 1: | | | |
5% 5/1/13 | 1,500 | | 1,512 |
5% 5/1/13 | 2,405 | | 2,424 |
5.5% 5/1/13 | 2,000 | | 2,018 |
Series 2008 C, 4% 5/1/13 | 5,000 | | 5,032 |
Series 2009 C, 3% 5/1/13 | 1,000 | | 1,005 |
Series WF 12 111C, 0.27%, tender 6/13/13 (Liquidity Facility Wells Fargo Bank NA) (c)(g)(h) | 15,515 | | 15,515 |
Other Municipal Debt - continued |
| Principal
Amount (000s) | | Value (000s) |
Wisconsin - continued |
Wisconsin Gen. Oblig.: - continued | | | |
Series 2005 A: | | | |
0.14% 3/12/13 (Liquidity Facility State Street Bank & Trust Co., Boston) (Liquidity Facility California Teachers Retirement Sys.), CP | $ 15,700 | | $ 15,700 |
0.16% 3/5/13 (Liquidity Facility State Street Bank & Trust Co., Boston) (Liquidity Facility California Teachers Retirement Sys.), CP | 16,041 | | 16,041 |
Series 2006 A: | | | |
0.13% 3/5/13 (Liquidity Facility State Street Bank & Trust Co., Boston) (Liquidity Facility California Teachers Retirement Sys.), CP | 28,553 | | 28,553 |
0.14% 3/12/13 (Liquidity Facility State Street Bank & Trust Co., Boston) (Liquidity Facility California Teachers Retirement Sys.), CP | 11,300 | | 11,300 |
0.16% 3/5/13 (Liquidity Facility State Street Bank & Trust Co., Boston) (Liquidity Facility California Teachers Retirement Sys.), CP | 16,712 | | 16,712 |
0.19% 3/7/13 (Liquidity Facility State Street Bank & Trust Co., Boston) (Liquidity Facility California Teachers Retirement Sys.), CP | 13,763 | | 13,763 |
Wisconsin Health & Edl. Facilities Auth. Rev. Bonds: | | | |
(Agnesian HealthCare, Inc. Proj.) Series 2013 B, 0.14% tender 3/5/13, LOC Bank of America NA, CP mode | 38,700 | | 38,700 |
(Ministry Health Care Proj.) Series 2009 A, 0.15% tender 4/3/13, LOC U.S. Bank NA, Cincinnati, CP mode | 58,360 | | 58,360 |
Series 2012 B, 2% 8/15/13 | 2,425 | | 2,443 |
Series 2012 J, 0.15% tender 4/3/13, CP mode | 9,600 | | 9,600 |
Wisconsin Petroleum Inspection Fee Rev. Bonds Series 1, 5% 7/1/13 | 3,500 | | 3,557 |
Wisconsin Trans. Rev.: | | | |
Bonds Series 2009 A, 3.5% 7/1/13 | 1,000 | | 1,011 |
Series 1997 A, 0.18% 4/4/13 (Liquidity Facility State Street Bank & Trust Co., Boston) (Liquidity Facility California Teachers Retirement Sys.), CP | 19,149 | | 19,149 |
Series 1997, 0.14% 3/19/13 (Liquidity Facility State Street Bank & Trust Co., Boston) (Liquidity Facility California Teachers Retirement Sys.), CP | 10,413 | | 10,413 |
Other Municipal Debt - continued |
| Principal
Amount (000s) | | Value (000s) |
Wisconsin - continued |
Wisconsin Trans. Rev.: - continued | | | |
Series 2006 A: | | | |
0.18% 4/4/13 (Liquidity Facility State Street Bank & Trust Co., Boston) (Liquidity Facility California Teachers Retirement Sys.), CP | $ 6,836 | | $ 6,836 |
0.19% 3/7/13 (Liquidity Facility State Street Bank & Trust Co., Boston) (Liquidity Facility California Teachers Retirement Sys.), CP | 7,500 | | 7,500 |
| | 379,582 |
TOTAL OTHER MUNICIPAL DEBT | 7,971,831 |
Investment Company - 6.8% |
| Shares | | |
Fidelity Municipal Cash Central Fund, 0.13% (d)(e) | 1,884,244 | | 1,884,244 |
TOTAL INVESTMENT PORTFOLIO - 99.0% (Cost $27,518,701) | | 27,518,701 |
NET OTHER ASSETS (LIABILITIES) - 1.0% | | 290,794 |
NET ASSETS - 100% | $ 27,809,495 |
Fidelity® Municipal Money Market Fund (the Fund) is a fund of Fidelity Union Street Trust II (the Trust) and is authorized to issue an unlimited number of shares. The Trust is registered under the Investment Company Act of 1940, as amended (the 1940 Act), as an open-end management investment company organized as a Delaware statutory trust.
The Fund invests in Fidelity Central Funds, which are open-end investment companies available only to other investment companies and accounts managed by Fidelity Management & Research Company (FMR) and its affiliates. The Fund's Schedule of Investments lists each of the Fidelity Central Funds held as of period end, if any, as an investment of the Fund, but does not include the underlying holdings of each Fidelity Central Fund. As an Investing Fund, the Fund indirectly bears its proportionate share of the expenses of the underlying Fidelity Central Funds.
The Money Market Central Funds seek preservation of capital and current income and are managed by Fidelity Investments Money Management, Inc. (FIMM), an affiliate of FMR.
A complete unaudited list of holdings for each Fidelity Central Fund is available upon request or at the Securities and Exchange Commission (the SEC) website at www.sec.gov. In addition, the financial statements of the Fidelity Central Funds are available on the SEC website or upon request.
The financial statements have been prepared in conformity with accounting principles generally accepted in the United States of America (GAAP), which require management to make certain estimates and assumptions at the date of the financial statements. Actual results could differ from those estimates. Subsequent events, if any, through the date that the financial statements were issued have been evaluated in the preparation of the financial statements. The following summarizes the significant accounting policies of the Fund:
Level 2 - other significant observable inputs (including quoted prices for similar investments, interest rates, prepayment speeds, etc.)
Level 3 - unobservable inputs (including the Fund's own assumptions based on the best information available)
As permitted by compliance with certain conditions under Rule 2a-7 of the 1940 Act, securities are valued at amortized cost, which approximates fair value. The amortized cost of an instrument is determined by valuing it at its original cost and thereafter amortizing any discount or premium from its face value at a constant rate until maturity. Securities held by a money market fund are generally high quality and liquid; however, they are reflected as Level 2 because the inputs used to determine fair value are not quoted prices in an active market.
Dividends are declared and recorded daily and paid monthly from net investment income. Distributions from realized gains, if any, are declared and recorded on the ex-dividend date. Income and capital gain distributions are determined in accordance with income tax regulations, which may differ from GAAP.
Capital accounts within the financial statements are adjusted for permanent book-tax differences. These adjustments have no impact on net assets or the results of operations. Temporary book-tax differences will reverse in a subsequent period.
Book-tax differences are primarily due to deferred trustees compensation.
The Fund purchases municipal securities whose interest, in the opinion of the issuer, is free from federal income tax. There is no assurance that the IRS will agree with this opinion. In the event the IRS determines that the issuer does not comply with relevant tax requirements, interest payments from a security could become federally taxable, possibly retroactively to the date the security was issued.
The federal tax cost of investment securities and unrealized appreciation (depreciation) as of period end were as follows:
transactions exempt from registration or to the public if the securities are registered. Disposal of these securities may involve time-consuming negotiations and expense, and prompt sale at an acceptable price may be difficult. Information regarding restricted securities is included at the end of the Fund's Schedule of Investments.
Citibank also has a sub-arrangement with Fidelity Service Company, Inc. (FSC), an affiliate of FMR, under which FSC maintains the Fund's accounting records. The fee is paid to Citibank and is based on the level of average net assets for each month.
FMR or its affiliates voluntarily agreed to waive certain fees in order to maintain a minimum annualized yield of .01%. Such arrangements may be discontinued by FMR at any time. For the period, the amount of the waiver was $32,572.
In addition, through arrangements with the Fund's custodian, credits realized as a result of uninvested cash balances were used to reduce the Fund's expenses. During the period, these credits reduced the Fund's expenses by $65.
The Fund's organizational documents provide former and current trustees and officers with a limited indemnification against liabilities arising in connection with the performance of their duties to the Fund. In the normal course of business, the Fund may also enter into contracts that provide general indemnifications. The Fund's maximum exposure under these arrangements is unknown as this would be dependent on future claims that may be made against the Fund. The risk of material loss from such claims is considered remote.
Each year, the Board of Trustees, including the Independent Trustees (together, the Board), votes on the renewal of the management contract and sub-advisory agreements (together, the Advisory Contracts) for the fund. The Board, assisted by the advice of fund counsel and Independent Trustees' counsel, requests and considers a broad range of information relevant to the renewal of the Advisory Contracts throughout the year.
At its September 2012 meeting, the Board of Trustees, including the Independent Trustees, unanimously determined to renew the fund's Advisory Contracts. In reaching its determination, the Board considered all factors it believed relevant, including (i) the nature, extent, and quality of the services to be provided to the fund and its shareholders (including the investment performance of the fund); (ii) the competitiveness of the fund's management fee and total expense ratio relative to peer funds; (iii) the total costs of the services to be provided by and the profits to be realized by Fidelity from its relationship with the fund; (iv) the extent to which economies of scale exist and would be realized as the fund grows; and (v) whether fee levels reflect these economies of scale, if any, for the benefit of fund shareholders.
In considering whether to renew the Advisory Contracts for the fund, the Board reached a determination, with the assistance of fund counsel and Independent Trustees' counsel and through the exercise of its business judgment, that the renewal of the Advisory Contracts is in the best interests of the fund and its shareholders and that the compensation payable under the Advisory Contracts is fair and reasonable. The Board's decision to renew the Advisory Contracts was not based on any single factor, but rather was based on a comprehensive consideration of all the information provided to the Board at its meetings throughout the year. The Board, in reaching its determination to renew the Advisory Contracts, was aware that shareholders in the fund have a broad range of investment choices available to them, including a wide choice among mutual funds offered by Fidelity's competitors, and that the fund's shareholders, who have the opportunity to review and weigh the disclosure provided by the fund in its prospectus and other public disclosures, have chosen to invest in this fund, managed by Fidelity.
The Board noted that the growth of fund assets over time across the complex allows Fidelity to reinvest in the development of services designed to enhance the value or convenience of the Fidelity funds as investment vehicles. These services include 24-hour access to account information and market information through telephone representatives and over the Internet, investor education materials and asset allocation tools, and the expanded availability of Fidelity Investor Centers.
The Board reviewed the fund's relative investment performance against its peer group and noted that the performance of the fund was in the third quartile for the one-year period, the second quartile for the three-year period, and the first quartile for the five-year period. The Board considered that FMR had taken steps to provide shareholders with stability of principal and to enhance safety and liquidity. The Board also reviewed the fund's performance since inception as well as performance in the current year.
The Board noted as a general matter that the percentage beaten numbers for money market funds in recent years were less meaningful than in earlier years, as many competitors have been waiving fees to maintain a one basis point yield and performance differences among funds may not be apparent due to rounding.
Based on its review, the Board concluded that the nature, extent, and quality of services provided to the fund under the Advisory Contracts should benefit the fund's shareholders.
The Board noted that the fund's management fee ranked below the median of its Total Mapped Group and below the median of its ASPG for 2011.
Based on its review, the Board concluded that the fund's management fee is fair and reasonable in light of the services that the fund receives and the other factors considered.
The Board noted that the fund's total expense ratio ranked below its competitive median for 2011. The Board considered that Fidelity has been voluntarily waiving part or all of the transfer agent fees and/or management fees to maintain a minimum yield, and also noted that Fidelity retains the ability to be repaid in certain circumstances.
Based on its review of total expense ratios and fees charged to other Fidelity clients, the Board concluded that the fund's total expense ratio was reasonable in light of the services that the fund and its shareholders receive and the other factors considered.
PricewaterhouseCoopers LLP (PwC), independent registered public accounting firm and auditor to Fidelity and certain Fidelity funds, has been engaged annually by the Board as part of the Board's assessment of Fidelity's profitability analysis. PwC's engagement includes the review and assessment of Fidelity's methodologies used in determining the revenues and expenses attributable to Fidelity's mutual fund business, and completion of agreed-upon procedures surrounding the mathematical accuracy of fund profitability and its conformity to allocation methodologies. After considering PwC's reports issued under the engagement and information provided by Fidelity, the Board concluded that while other allocation methods may also be reasonable, Fidelity's profitability methodologies are reasonable in all material respects.
The Board also reviewed Fidelity's non-fund businesses and fall-out benefits related to the mutual fund business as well as cases where Fidelity's affiliates may benefit from or be related to the fund's business.
The Board considered the costs of the services provided by and the profits realized by Fidelity in connection with the operation of the fund and was satisfied that the profitability was not excessive in the circumstances.
The Board recognized that the fund's management contract incorporates a "group fee" structure, which provides for lower group fee rates as total fund assets under FMR's management increase, and for higher group fee rates as total fund assets under FMR's management decrease. FMR calculates the group fee rates based on a tiered asset "breakpoint" schedule that varies based on asset class. The Board considered that the group fee is designed to deliver the benefits of economies of scale to fund shareholders when total Fidelity fund assets increase, even if assets of any particular fund are unchanged or have declined, because some portion of Fidelity's costs are attributable to services provided to all Fidelity funds, and all funds benefit if those costs can be allocated among more assets. The Board concluded that, given the group fee structure, fund shareholders will benefit from lower management fees as assets under FMR's management increase at the fund complex level, regardless of whether Fidelity achieves any such economies of scale.
The Board concluded, taking into account the analysis of the Economies of Scale Committee, that economies of scale, if any, are being appropriately shared between fund shareholders and Fidelity.
Based on its evaluation of all of the conclusions noted above, and after considering all factors it believed relevant, the Board ultimately concluded that the advisory fee structures are fair and reasonable, and that the fund's Advisory Contracts should be renewed.
Item 2. Code of Ethics
Not applicable.
Item 3. Audit Committee Financial Expert
Not applicable.
Item 4. Principal Accountant Fees and Services
Not applicable.
Item 5. Audit Committee of Listed Registrants
Not applicable.
Item 6. Investments
(a) Not applicable.
Not applicable.
Not applicable.
Item 9. Purchase of Equity Securities by Closed-End Management Investment Company and Affiliated Purchasers
Not applicable.
There were no material changes to the procedures by which shareholders may recommend nominees to the Fidelity Union Street Trust II's Board of Trustees.
(a)(i) The President and Treasurer and the Chief Financial Officer have concluded that the Fidelity Union Street Trust II's (the "Trust") disclosure controls and procedures (as defined in Rule 30a-3(c) under the Investment Company Act) provide reasonable assurances that material information relating to the Trust is made known to them by the appropriate persons, based on their evaluation of these controls and procedures as of a date within 90 days of the filing date of this report.
(a)(ii) There was no change in the Trust's internal control over financial reporting (as defined in Rule 30a-3(d) under the Investment Company Act) that occurred during the second fiscal quarter of the period covered by this report that has materially affected, or is reasonably likely to materially affect, the Trust's internal control over financial reporting.
Pursuant to the requirements of the Securities Exchange Act of 1934 and the Investment Company Act of 1940, the registrant has duly caused this report to be signed on its behalf by the undersigned, thereunto duly authorized.
Pursuant to the requirements of the Securities Exchange Act of 1934 and the Investment Company Act of 1940, this report has been signed below by the following persons on behalf of the registrant and in the capacities and on the dates indicated.