UNITED STATES
SECURITIES AND EXCHANGE COMMISSION
Washington, D.C. 20549
FORM N-CSR
CERTIFIED SHAREHOLDER REPORT OF REGISTERED
MANAGEMENT INVESTMENT COMPANIES
| | |
Investment Company Act file number | | 811-01136 |
SECURITY EQUITY FUND
|
| (Exact name of registrant as specified in charter) |
| | |
| ONE SECURITY BENEFIT PLACE, TOPEKA, KANSAS | | 66636-0001 |
| (Address of principal executive offices) | | (Zip code) |
MICHAEL G. ODLUM, PRESIDENT
SECURITY EQUITY FUND
ONE SECURITY BENEFIT PLACE
TOPEKA, KANSAS 66636-0001
|
| (Name and address of agent for service) |
Registrant’s telephone number, including area code: (785) 438-3000
Date of fiscal year end: September 30
Date of reporting period: March 31, 2007
Form N-CSR is to be used by management investment companies to file reports with the Commission not later than 10 days after the transmission to stockholders of any report that is required to be transmitted to stockholders under Rule 30e-1 under the Investment Company Act of 1940 (17 CFR 270.30e-1). The Commission may use the information provided on Form N-CSR in its regulatory, disclosure review, inspection, and policymaking roles.
A registrant is required to disclose the information specified by Form N-CSR, and the Commission will make this information public. A registrant is not required to respond to the collection of information contained in Form N-CSR unless the Form displays a currently valid Office of Management and Budget (“OMB”) control number. Please direct comments concerning the accuracy of the information collection burden estimate and any suggestions for reducing the burden to Secretary, Securities and Exchange Commission, 450 Fifth Street, NW, Washington, DC 20549-0609. The OMB has reviewed this collection of information under the clearance requirements of 44 U.S.C. §3507.
| Item 1. | Reports to Stockholders. |

Security Equity Fund
Security Large Cap Value Fund
Security Mid Cap Growth Fund
March 31, 2007
Semi-Annual Report
(unaudited)
Table of Contents
1
Chairman’s Letter
May 16, 2007

Mike Odlum
Chairman of the Board
To Our Shareholders:
The performance of selected major indexes in each quarter and for the six-month period is shown in the table below.
| | | | | | |
| | | Return % |
Index | | 4th Qtr
2006 | | 1st Qtr
2007 | | Six Months
9/30/06-
3/31/07 |
S&P 500 | | 6.70 | | .64 | | 7.38 |
Russell 1000 | | 6.95 | | 1.21 | | 8.24 |
Russell 2500 | | 8.70 | | 3.55 | | 12.56 |
Russell 2000 | | 8.90 | | 1.95 | | 11.02 |
MSCI EAFE ($US) | | 10.35 | | 4.08 | | 14.85 |
Lehman Aggregate Bond | | 1.24 | | 1.50 | | 2.75 |
Lehman High Yield | | 4.20 | | 2.64 | | 6.95 |
While the markets provided positive returns on average in each quarter, most of that was concentrated in the 4th quarter of 2006. This was a period when investors were generally positive about the state of the economy, and corporate earnings along with consumer spending were showing continued strength. In addition, merger and acquisition activity was generating headlines, which helped to keep investors thinking positively about the markets. In the 1st quarter of 2007 events were quite different as the market weathered news about the housing market as well as increased volatility triggered by events in the Asian markets. The fact that the stock market rebounded to end the quarter with positive returns is remarkable and an indication that fundamentals such as corporate earnings growth and benign inflation continued to be strong drivers.
Overall during the period, the highest returns came from international equities. On the domestic side, mid and small cap stocks outperformed their large cap brethren representing a mini resurgence of a trend that had persisted for much of the first half of this decade.
Interest rates on U.S. Treasury securities with both short-term and long-term maturities during the period are summarized below.
| | | | | | |
| | | % Rates |
U.S. Treasury Maturity | | 9/30/06 | | 12/31/05 | | 3/31/07 |
3 Month | | 4.89 | | 5.02 | | 5.04 |
5 Year | | 4.59 | | 4.70 | | 4.54 |
10 Year | | 4.64 | | 4.71 | | 4.65 |
20 Year | | 4.84 | | 4.91 | | 4.92 |
Interest rates overall were fairly steady in both the 4th quarter of 2006 and the 1st quarter of 2007. The Federal Reserve was in a watch and wait mode with the key factors being the growth in the economy and inflationary trends. As economic growth moderates over the next few quarters, and absent any spike in inflation, the market would expect the next Federal Reserve move to be one of easing, or lowering short term rates. Short term rates more traditionally tend to be lower than long term rates; so the current flat yield curve is not the norm. Over the past several quarters, with low inflation and an economy growing faster than the level of short term rates, this has not been an issue. However, if economic growth begins to dip below the short term rates, the rate level becomes more of a burden, and the Fed may be more likely to lower them later in 2007.
Regardless of what the future may bring, investors always need to be cognizant of the need to maintain a diversified portfolio strategy that is designed to meet their objectives over the long run. One of the key purposes of the Security Funds is to provide professionally managed investment portfolios that give shareholders the benefits of diversification as well as to seek investment returns that help meet their goals over the long run. We appreciate your continued investment in the Funds and as always welcome any comments or questions you may have.
With this my first written shareholder communication for the Security Funds since recently assuming the role of Chairman, I would like to acknowledge the enormous contribution made by the outgoing Chairman, John Cleland. John has played a pivotal role in close to 40 years of service to the Security and SBL Funds in various roles including Portfolio Manager, long-time Director and in recent years the Chairman of the Board of the Security Funds. The entire Board I think put it best,
“…we have been privileged in our friendship and association with John Cleland and have benefited from his guidance, experience, sense of history and investing savvy, all of which have favorably affected the Security Funds… the Directors of the Security Funds, and his many friends throughout Security Management, wish him the best in the years ahead.”
Sincerely,
Michael G. Odlum
Chairman, The Security Funds
2
Security Equity Fund
Alpha Opportunity Series

Adviser,
Security Management Company, LLC
and

Subadviser,
Mainstream Investment Advisers
3
| | |
| | Security Equity Fund |
| Performance Summary | | Alpha Opportunity Series |
| March 31, 2007 | | (unaudited) |
PERFORMANCE
Security Alpha Opportunity Series vs. S&P 500 Index
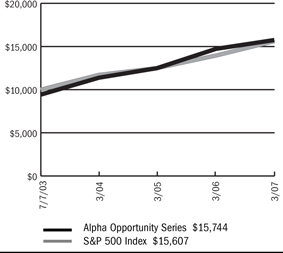
$10,000 Since Inception
This chart assumes a $10,000 investment in Class A shares of Alpha Opportunity Series on July 7, 2003 (date of inception), reflects deduction of the 5.75% sales load and assumes all dividends reinvested. The chart does not reflect the deduction of taxes that a shareholder would pay on distributions or the redemption of fund shares. The S&P 500 Index is a capitalization weighted index composed of 500 selected common stocks that represent the broad domestic economy and is a widely recognized unmanaged index of market performance.
Average Annual Returns
| | | | | |
Periods Ended 3-31-07 | | 1 Year | | | Since Inception |
A Shares | | 6.90 | % | | 14.73% (7-07-03) |
A Shares with sales charge | | 0.74 | % | | 12.92% (7-07-03) |
B Shares | | 6.07 | % | | 13.87% (7-07-03) |
B Shares with CDSC | | 1.30 | % | | 13.30% (7-07-03) |
C Shares | | 6.07 | % | | 13.87% (7-07-03) |
C Shares with CDSC | | 5.12 | % | | 13.87% (7-07-03) |
The performance data above represents past performance that is not predictive of future results. The investment return and principal value of an investment in the Series will fluctuate so that an investor’s shares, when redeemed, may be worth more or less than their original cost. The figures above do not reflect deduction of the maximum front-end sales charge of 5.75% for Class A shares or the contingent deferred sales charge of 5% for Class B shares and 1% for Class C shares, as applicable, except where noted. The figures do not reflect the deduction of taxes that a shareholder would pay on distributions or redemption of shares. Such figures would be lower if the maximum sales charge and any applicable taxes were deducted. Fee waivers and/or reimbursements reduced expenses of the Series and in the absence of such waiver, the performance quoted would be reduced.
Portfolio Composition by Sector as of 3-31-07*
| | | |
Consumer Discretionary | | (0.57 | )% |
Consumer Staples | | 0.39 | |
Energy | | 2.22 | |
Financials | | 0.14 | |
Health Care | | (0.24 | ) |
Industrials | | 14.04 | |
Information Technology | | 2.18 | |
Materials | | 15.89 | |
Telecommunication Services | | 0.90 | |
Exchange Traded Funds | | 4.31 | |
U.S. Government Sponsored Agencies | | 40.25 | |
Cash & other assets, less liabilities | | 20.49 | |
Total net assets | | 100.00 | % |
| | | |
| * | Securities sold short are netted with long positions in common stocks in the appropriate sectors. |
The accompanying notes are an integral part of the financial statements.
| | |
| | Security Equity Fund |
| Performance Summary | | Alpha Opportunity Series |
| March 31, 2007 | | (unaudited) |
PERFORMANCE
Information About Your Series Expenses
Calculating your ongoing Series expenses
Example
As a shareholder of the Series, you incur two types of costs: (1) transaction costs, which may include sales charges (loads) on purchase payments; contingent deferred sales charges on redemptions; and redemption fees, if any; and (2) ongoing costs, including management fees; distribution and/or service fees (12b-1); and other Series expenses. This example is intended to help you understand your ongoing costs (in dollars) of investing in the Series and to compare these costs with ongoing costs of investing in other mutual funds. The example is based on an investment of $1,000 invested at the beginning of the period and held for the entire period, October 1, 2006 – March 31, 2007.
Actual Expenses
The first line for each class of shares in the table provides information about actual account values and actual expenses. You may use the information in this table, together with the amount you invested, to estimate the expenses that you paid over the period. Simply divide your account value by $1,000 (for example, an $8,600 account value divided by $1,000 = 8.6), then multiply the result by the number in the table under the heading entitled “Expenses Paid During Period” to estimate the expenses you paid on your account during this period.
Hypothetical Example for Comparison Purposes
The second line for each class of shares in the table provides information about hypothetical account values and hypothetical expenses based on the Series actual expense ratio and an assumed rate of return of 5% per year before expenses, which is not the Series actual return. The hypothetical account values and expenses may not be used to estimate the actual ending account balance or expenses you paid for the period. You may use this information to compare the ongoing costs of investing in the Series and other funds. To do so, compare this 5% hypothetical example with the 5% hypothetical examples that appear in the shareholder reports of the other mutual funds.
Please note that the expenses shown in the table are meant to highlight your ongoing costs only and do not reflect any transactional costs, such as sales charges (loads) on purchase payments, contingent deferred sales charges on redemptions, and redemption fees, if any. Therefore, the second line for each class of shares is useful in comparing ongoing costs only, and will not help you determine the relative total costs of owning different funds. In addition, if these transactional costs were included, your costs would have been higher.
Series Expenses
| | | | | | | | | |
| | | Beginning
Account Value
10-01-06 | | Ending
Account Value
03-31-071 | | Expenses
During
Period2 |
Alpha Opportunity | | | | | | | | | |
Series - Class A | | | | | | | | | |
Actual | | $ | 1,000.00 | | $ | 1,115.30 | | $ | 13.55 |
Hypothetical | | | 1,000.00 | | | 1,012.12 | | | 12.89 |
| | | |
Alpha Opportunity | | | | | | | | | |
Series - Class B | | | | | | | | | |
Actual | | | 1,000.00 | | | 1,111.60 | | | 17.48 |
Hypothetical | | | 1,000.00 | | | 1,008.38 | | | 16.62 |
| | | |
Alpha Opportunity | | | | | | | | | |
Series - Class C | | | | | | | | | |
Actual | | | 1,000.00 | | | 1,111.60 | | | 17.48 |
Hypothetical | | | 1,000.00 | | | 1,008.38 | | | 16.62 |
1 | The actual ending account value is based on the actual total return of the Series for the period from October 1, 2006 to March 31, 2007, after actual expenses and will differ from the hypothetical ending account value, which is based on the Series expense ratio and a hypothetical annual return of 5% before expenses. The actual cumulative return at net asset value for the period from October 1, 2006 to March 31, 2007 was 11.53%, 11.16% and 11.16%, for Class A, B and C shares, respectively. |
2 | Expenses are equal to the Series annualized expense ratio (2.57%, 3.32% and 3.32% for Class A, B and C shares, respectively), net of any applicable fee waivers or custodian earnings credits, multiplied by the average account value over the period, multiplied by 182/365 (to reflect the one-half year period). |
5
| | |
| | |
| Schedule of Investments | | Security Equity Fund - Alpha Opportunity Series |
| March 31, 2007 (Unaudited) | | |
| | | | | |
| | | Shares | | Value |
COMMON STOCK—41.4% | | | | | |
Aerospace & Defense—0.4% | | | | | |
Hexcel Corporation * | | 6,800 | | $ | 134,980 |
| | | | | |
Agricultural Products—0.0% | | | | | |
Cresud S.A. ADR | | 600 | | | 12,318 |
| | | | | |
Airlines—0.1% | | | | | |
Alaska Air Group, Inc. * | | 900 | | | 34,290 |
| | | | | |
Alternative Carriers—0.9% | | | | | |
Level 3 Communications, Inc. * | | 49,800 | | | 303,780 |
| | | | | |
Aluminum—1.4% | | | | | |
Alcoa, Inc. | | 1,600 | | | 54,240 |
Aluminum Corporation of China, Ltd. ADR | | 8,500 | | | 220,915 |
Century Aluminum Company * | | 3,900 | | | 182,832 |
| | | | | |
| | | | | 457,987 |
| | | | | |
Commodity Chemicals—1.2% | | | | | |
Lyondell Chemical Company (1) | | 13,200 | | | 395,604 |
| | | | | |
Construction & Engineering—4.5% | | | | | |
Chicago Bridge & Iron Company N.V. | | 11,400 | | | 350,550 |
EMCOR Group, Inc. * | | 3,800 | | | 224,124 |
Fluor Corporation | | 1,100 | | | 98,692 |
Foster Wheeler, Ltd. * | | 6,200 | | | 362,018 |
Granite Construction, Inc. | | 2,400 | | | 132,624 |
KBR, Inc. * | | 8,700 | | | 177,045 |
Perini Corporation * | | 3,100 | | | 114,266 |
Quanta Services, Inc. * | | 2,700 | | | 68,094 |
| | | | | |
| | | | | 1,527,413 |
| | | | | |
Construction & Farm Machinery & Heavy Trucks—2.7% | | | | | |
AGCO Corporation * | | 4,600 | | | 170,062 |
ASV, Inc. * | | 1,000 | | | 15,260 |
Bucyrus International, Inc. (1) | | 9,200 | | | 473,800 |
CNH Global N.V. | | 2,200 | | | 82,038 |
Lindsay Corporation | | 3,500 | | | 111,265 |
Wabash National Corporation | | 3,300 | | | 50,886 |
| | | | | |
| | | | | 903,311 |
| | | | | |
Data Processing & Outsourced Services—1.2% | | | | | |
Electronic Data Systems Corporation (1) | | 14,300 | | | 395,824 |
| | | | | |
Diversified Commercial & Professional Services—0.8% | | | | | |
Pike Electric Corporation * | | 5,200 | | | 94,016 |
Ritchie Bros Auctioneers, Inc. | | 3,100 | | | 181,412 |
| | | | | |
| | | | | 275,428 |
| | | | | |
Diversified Metals & Mining—1.4% | | | | | |
AMCOL International Corporation | | 2,200 | | | 65,230 |
Anglo American plc ADR | | 1,900 | | | 50,198 |
Mechel ADR | | 3,600 | | | 119,700 |
Peru Copper, Inc. * | | 15,300 | | | 63,036 |
Titanium Metals Corporation * | | 5,000 | | | 179,400 |
| | | | | |
| | | | | 477,564 |
| | | | | |
Electrical Components & Equipment—0.9% | | | | | |
American Superconductor Corporation * | | 600 | | | 8,082 |
General Cable Corporation * | | 2,700 | | | 144,261 |
GrafTech International, Ltd. * | | 200 | | | 1,816 |
Lamson & Sessions Company * | | 5,300 | | | 147,287 |
| | | | | |
| | | | | 301,446 |
| | | | | |
Electronic Equipment Manufacturers—0.1% | | | | | |
OYO Geospace Corporation * | | 300 | | | 21,276 |
| | | | | |
Exchange Traded Funds—4.3% | | | | | |
CurrencyShares Japanese Yen Trust * | | 1,600 | | | 135,776 |
iShares Lehman 20+ Year Treasury Bond Fund | | 2,100 | | | 185,535 |
iShares Silver Trust * | | 2,600 | | | 347,100 |
Streettracks Gold Trust * (1) | | 11,900 | | | 782,544 |
| | | | | |
| | | | | 1,450,955 |
| | | | | |
Fertilizers & Agricultural Chemicals—4.4% | | | | | |
Agrium, Inc. | | 2,200 | | | 84,326 |
CF Industries Holdings, Inc. | | 1,600 | | | 61,680 |
Monsanto Company | | 3,000 | | | 164,880 |
Mosaic Company * | | 2,200 | | | 58,652 |
Potash Corporation of Saskatchewan, Inc. (1) | | 5,800 | | | 927,594 |
Sociedad Quimica y Minera de Chile S.A. ADR | | 1,300 | | | 189,800 |
| | | | | |
| | | | | 1,486,932 |
| | | | | |
Gold—0.4% | | | | | |
Randgold Resources, Ltd. ADR | | 6,100 | | | 145,851 |
| | | | | |
Industrial Conglomerates—0.5% | | | | | |
McDermott International, Inc. * | | 3,500 | | | 171,430 |
| | | | | |
Industrial Machinery—3.1% | | | | | |
SPX Corporation (1) | | 7,100 | | | 498,420 |
Valmont Industries, Inc. (1) | | 9,500 | | | 549,385 |
| | | | | |
| | | | | 1,047,805 |
| | | | | |
Oil & Gas Equipment & Services—0.5% | | | | | |
Input/Output, Inc. * | | 2,100 | | | 28,938 |
Lone Star Technologies, Inc. * | | 500 | | | 33,015 |
Willbros Group, Inc. * | | 5,300 | | | 119,462 |
| | | | | |
| | | | | 181,415 |
| | | | | |
Oil & Gas Exploration & Production—1.7% | | | | | |
Apache Corporation | | 3,900 | | | 275,730 |
The accompanying notes are an integral part of the financial statements.
6
| | |
| | |
| Schedule of Investments | | Security Equity Fund - Alpha Opportunity Series |
| March 31, 2007 (Unaudited) - continued | | |
| | | | | |
| | | Shares | | Value |
COMMON STOCK (continued) | | | | | |
Oil & Gas Exploration & Production (continued) | | | | | |
Norsk Hydro ASA ADR | | 6,400 | | $ | 210,048 |
Quicksilver Resources, Inc. * | | 2,000 | | | 79,540 |
| | | | | |
| | | | | 565,318 |
| | | | | |
Packaged Foods & Meats—0.4% | | | | | |
Perdigao S.A. ADR | | 1,100 | | | 29,205 |
Pilgrim’s Pride Corporation | | 1,100 | | | 36,509 |
Smithfield Foods, Inc. * | | 1,100 | | | 32,945 |
Tyson Foods, Inc. | | 1,100 | | | 21,351 |
| | | | | |
| | | | | 120,010 |
| | | | | |
Paper Products—0.9% | | | | | |
Abitibi-Consolidated, Inc. | | 33,300 | | | 93,906 |
Bowater, Inc. | | 8,000 | | | 190,560 |
| | | | | |
| | | | | 284,466 |
| | | | | |
Personal Products—0.2% | | | | | |
Estee Lauder Companies, Inc. | | 1,100 | | | 53,735 |
| | | | | |
Real Estate Management & Development—1.1% | | | | | |
Brookfield Asset Management, Inc. (1) | | 7,100 | | | 371,046 |
| | | | | |
Semiconductor Equipment—0.4% | | | | | |
Asyst Technologies, Inc. * | | 2,500 | | | 17,575 |
Formfactor, Inc. * | | 2,500 | | | 111,875 |
| | | | | |
| | | | | 129,450 |
| | | | | |
Semiconductors—0.6% | | | | | |
Analog Devices, Inc. | | 1,500 | | | 51,735 |
Intersil Corporation | | 4,400 | | | 116,556 |
ON Semiconductor Corporation * | | 2,000 | | | 17,840 |
| | | | | |
| | | | | 186,131 |
| | | | | |
Steel—6.3% | | | | | |
AK Steel Holding Corporation * | | 10,600 | | | 247,934 |
Allegheny Technologies, Inc. | | 1,400 | | | 149,366 |
Cia Vale do Rio Doce ADR | | 9,600 | | | 355,104 |
Friedman Industries, Inc. | | 1,000 | | | 9,240 |
Gibraltar Industries, Inc. | | 7,300 | | | 165,126 |
Olympic Steel, Inc. | | 5,800 | | | 179,742 |
Quanex Corporation | | 3,800 | | | 160,930 |
Schnitzer Steel Industries, Inc. | | 7,600 | | | 305,292 |
Steel Technologies, Inc. | | 7,900 | | | 233,682 |
Worthington Industries, Inc. | | 15,800 | | | 325,164 |
| | | | | |
| | | | | 2,131,580 |
| | | | | |
Trading Companies & Distributors—0.8% | | | | | |
UAP Holding Corporation | | 9,500 | | | 245,575 |
United Rentals, Inc. * | | 1,300 | | | 35,750 |
| | | | | |
| | | | | 281,325 |
| | | | | |
Trucking—0.2% | | | | | |
J.B. Hunt Transport Services, Inc. | | 3,100 | | | 81,344 |
| | | | | |
TOTAL COMMON STOCK (Cost $13,781,707) | | | | $ | 13,930,014 |
| | | | | |
| | | | | | |
| | | Principal
Amount | | Value |
U.S. GOVERNMENT SPONSORED AGENCY BONDS & NOTES—40.3% | | | | | | |
Federal Farm Credit Discount Note | | | | | | |
5.03% - 2007 (1) | | $ | 600,000 | | $ | 592,211 |
5.103% - 2007 (1) | | | 1,175,000 | | | 1,170,312 |
| | |
Federal Home Loan Bank | | | | | | |
5.107% - 2007 (1) | | | 700,000 | | | 692,150 |
5.12% - 2007 (1) | | | 425,000 | | | 422,764 |
5.135% - 2007 (1) | | | 450,000 | | | 447,112 |
5.15% - 2007 (1) | | | 450,000 | | | 446,736 |
5.17% - 2007 (1) | | | 250,000 | | | 249,180 |
5.17% - 2007 (1) | | | 1,100,000 | | | 1,097,492 |
| | |
Federal Home Loan Mortgage Corporation | | | | | | |
5.11% - 2007 (1) | | | 383,000 | | | 379,738 |
5.124% - 2007 (1) | | | 1,150,000 | | | 1,147,706 |
5.12% - 2007 (1) | | | 275,000 | | | 272,770 |
5.135% - 2007 (2) | | | 750,000 | | | 750,000 |
5.135% - 2007 (1) | | | 725,000 | | | 724,277 |
| | |
Federal National Mortgage Association | | | | | | |
5.09% - 2007 (1) | | | 200,000 | | | 196,782 |
5.13% - 2007 (1) | | | 1,500,000 | | | 1,498,077 |
5.125% - 2007 (2) | | | 1,050,000 | | | 1,045,520 |
5.135% - 2007 (2) | | | 750,000 | | | 749,786 |
5.137% - 2007 (1) | | | 300,000 | | | 299,017 |
5.14% - 2007 (2) | | | 1,100,000 | | | 1,093,116 |
5.135% - 2007 (1) | | | 270,000 | | | 267,509 |
| | | | | | |
TOTAL U.S. GOVERNMENT SPONSORED AGENCY BONDS & NOTES | | | | | $ | 13,542,255 |
(Cost $13,540,394) | | | | | | |
| | | | | | |
Total Investments (Security Equity Fund—Alpha Opportunity Series) | | | | | $ | 27,472,269 |
(Cost $27,322,101)—81.7% | | | | | | |
Other Assets in Excess of Liabilities—18.3% | | | | | | 6,171,191 |
| | | | | | |
TOTAL NET ASSETS—100.0% | | | | | $ | 33,643,460 |
| | | | | | |
Schedule of Securities Sold Short
March 31, 2007
Security Equity Fund - Alpha Opportunity Series
| | | | | | | |
| | | Shares | | | Value | |
COMMON STOCK—(2.1)% | | | | | | | |
| | |
Apparel Retail—(0.1)% | | | | | | | |
HOT Topic, Inc. * | | (3,900 | ) | | $ | (43,290 | ) |
| | | | | | | |
Biotechnology—(0.2)% | | | | | | | |
Genentech, Inc. * | | (1,000 | ) | | | (82,120 | ) |
| | | | | | | |
Diversified Chemicals—(0.1)% | | | | | | | |
Ashland, Inc. | | (500 | ) | | | (32,800 | ) |
| | | | | | | |
General Merchandise Stores—(0.2)% | | | | | | | |
Family Dollar Stores, Inc. | | (2,900 | ) | | | (85,898 | ) |
| | | | | | | |
The accompanying notes are an integral part of the financial statements.
7
| | |
| | |
| Schedule of Investments | | Security Equity Fund - Alpha Opportunity Series |
| March 31, 2007 (Unaudited) - continued | | |
| | | | | | | |
| | | Shares | | | Value | |
COMMON STOCK (continued) | | | | | | | |
| | |
Human Resource & Employment Services—(0.1)% | | | | | | | |
Administaff, Inc. | | (1,000 | ) | | $ | (35,200 | ) |
| | | | | | | |
Hypermarkets & Super Centers—(0.1)% | | | | | | | |
Wal-Mart Stores, Inc. | | (500 | ) | | | (23,475 | ) |
| | | | | | | |
Other Diversified Financial Services—(0.6)% | | | | | | | |
Bank of America Corporation | | (3,900 | ) | | | (198,978 | ) |
| | | | | | | |
Regional Banks—(0.3)% | | | | | | | |
BB&T Corporation | | (500 | ) | | | (20,510 | ) |
PNC Financial Services Group, Inc. | | (1,000 | ) | | | (71,970 | ) |
| | | | | | | |
| | | | | | (92,480 | ) |
| | | | | | | |
Reinsurance—(0.1)% | | | | | | | |
Montpelier Re Holdings, Ltd. | | (1,900 | ) | | | (32,946 | ) |
| | | | | | | |
Restaurants—(0.2)% | | | | | | | |
Brinker International, Inc. | | (1,900 | ) | | | (62,130 | ) |
| | | | | | | |
Tobacco—(0.1)% | | | | | | | |
Reynolds American, Inc. | | (500 | ) | | | (31,205 | ) |
| | | | | | | |
TOTAL COMMON STOCK | | | | | $ | (720,522 | ) |
(Proceeds $719,069) | | | | | | | |
| | | | | | | |
Total Securities Sold Short (Security Equity Fund—Alpha Opportunity Series) (Proceeds $719,069) | | | | | $ | (720,522 | ) |
| | | | | | | |
Footnotes
Percentages are stated as a percent of net assets. For federal income tax purposes the identified cost of investments owned at 3/31/2007 was $27,487,503.
| * | - Non-income producing security |
| 1 | - Security is segregated as collateral for open futures contracts. |
| 2 | - Security is segregated as collateral for snort positions. |
Glossary:
| ADR | - American Depositary Receipt |
| plc | - Public Limited Company |
See notes to financial statements.
The accompanying notes are an integral part of the financial statements.
8
| | |
| | Security Equity Fund |
| | Alpha Opportunity Series |
| | (unaudited) |
Statement of Assets and Liabilities
March 31, 2007
| | | | |
Assets: | | | | |
Investments, at value1 | | $ | 27,472,269 | |
Cash | | | 5,282,703 | |
Receivables: | | | | |
Fund shares sold | | | 57,986 | |
Securities sold | | | 3,646,384 | |
Dividends | | | 10,304 | |
Prepaid expenses | | | 29,073 | |
| | | | |
Total assets | | | 36,498,719 | |
| | | | |
Liabilities: | | | | |
Common stock sold short, at value2 | | | 720,522 | |
Payable for: | | | | |
Securities purchased | | | 2,035,741 | |
Fund shares redeemed | | | 4,043 | |
Variation margin | | | 2,925 | |
Dividends on short sales | | | 143 | |
Management fees | | | 55,274 | |
Custodian fees | | | 2,289 | |
Transfer agent/maintenance fees | | | 2,083 | |
Administration fees | | | 5,196 | |
Professional fees | | | 9,580 | |
12b-1 distribution plan fees | | | 13,957 | |
Directors’ fees | | | 48 | |
Other | | | 3,458 | |
| | | | |
Total liabilities | | | 2,855,259 | |
| | | | |
Net Assets | | $ | 33,643,460 | |
| | | | |
Net assets consist of: | | | | |
Paid in capital | | $ | 31,650,046 | |
Accumulated net investment loss | | | (14,477 | ) |
Undistributed net realized gain on sale of investments, securities sold short and futures | | | 1,547,853 | |
Net unrealized appreciation in value of investments, securities sold short and futures | | | 460,038 | |
| | | | |
Net assets | | $ | 33,643,460 | |
| | | | |
Class A: | | | | |
Capital shares outstanding (unlimited number of shares authorized) | | | 1,801,276 | |
Net assets | | $ | 22,204,940 | |
Net asset value and redemption price per share | | $ | 12.33 | |
| | | | |
Maximum offering price per share (net asset value divided by 94.25%) | | $ | 13.08 | |
| | | | |
Class B: | | | | |
Capital shares outstanding (unlimited number of shares authorized) | | | 469,929 | |
Net assets | | $ | 5,601,674 | |
Net asset value, offering and redemption price per share (excluding any applicable contingent deferred sales charge) | | $ | 11.92 | |
| | | | |
Class C: | | | | |
Capital shares outstanding (unlimited number of shares authorized) | | | 489,612 | |
Net assets | | $ | 5,836,846 | |
Net asset value, offering and redemption price per share (excluding any applicable contingent deferred sales charge) | | $ | 11.92 | |
| | | | |
1 Investments, at cost | | $ | 27,322,101 | |
2 Common stock sold short, at proceeds | | | 719,069 | |
Statement of Operations
For the Six Months Ended March 31, 2007
| | | | |
Investment Income: | | | | |
Dividends (net of foreign witholding tax $ 166) | | $ | 72,526 | |
Interest | | | 375,550 | |
| | | | |
Total investment income | | | 448,076 | |
| | | | |
Expenses: | | | | |
Management fees | | | 303,916 | |
Custodian fees | | | 31,631 | |
Transfer agent/maintenance fees | | | 16,386 | |
Administration fees | | | 26,749 | |
Directors’ fees | | | 693 | |
Professional fees | | | 3,688 | |
Reports to shareholders | | | 2,317 | |
Registration fees | | | 15,337 | |
Other expenses | | | 1,474 | |
Dividends on short sales | | | 8,052 | |
12b-1 distribution plan fees—Class A | | | 27,016 | |
12b-1 distribution plan fees—Class B | | | 26,060 | |
12b-1 distribution plan fees—Class C | | | 29,534 | |
| | | | |
Total expenses | | | 492,853 | |
Less: Earnings credits | | | (30,403 | ) |
| | | | |
Net expenses | | | 462,450 | |
| | | | |
Net investment loss | | | (14,374 | ) |
| | | | |
Net Realized and Unrealized Gain (Loss): | | | | |
Net realized gain (loss) during the period on: | | | | |
Investments | | | 2,739,868 | |
Securities sold short | | | (388,635 | ) |
Futures | | | 485,608 | |
| | | | |
Net realized gain | | | 2,836,841 | |
| | | | |
Net unrealized appreciation during the period on: | | | | |
Investments | | | 486,380 | |
Securities sold short | | | 92,556 | |
Futures | | | 127,718 | |
| | | | |
Net unrealized appreciation | | | 706,654 | |
| | | | |
Net realized and unrealized gain | | | 3,543,495 | |
| | | | |
Net increase in net assets resulting from operations | | $ | 3,529,121 | |
| | | | |
The accompanying notes are an integral part of the financial statements.
| | |
| | Security Equity Fund |
Statement of Changes in Net Assets | | Alpha Opportunity Series |
| | | | | | | | |
| | | Six Months Ended
March 31, 2007
(unaudited) | | | Year Ended
September 30, 2006 | |
Increase (decrease) in net assets from operations: | | | | | | | | |
Net investment loss | | $ | (14,374 | ) | | $ | (212,445 | ) |
Net realized gain during the period on investments, securities sold short and futures | | | 2,836,841 | | | | 2,290,275 | |
Net unrealized appreciation during the period on investments, securities sold short and futures | | | 706,654 | | | | (514,291 | ) |
| | | | | | | | |
Net increase in net assets resulting from operations | | | 3,529,121 | | | | 1,563,539 | |
| | | | | | | | |
Distributions to shareholders from: | | | | | | | | |
Net realized gain | | | | | | | | |
Class A | | | (2,136,563 | ) | | | (1,193,077 | ) |
Class B | | | (523,992 | ) | | | (346,675 | ) |
Class C | | | (617,311 | ) | | | (438,798 | ) |
| | | | | | | | |
Total distributions to shareholders | | | (3,277,866 | ) | | | (1,978,550 | ) |
| | | | | | | | |
Capital share transactions: | | | | | | | | |
Proceeds from sale of shares | | | | | | | | |
Class A | | | 3,811,977 | | | | 7,974,133 | |
Class B | | | 813,745 | | | | 988,390 | |
Class C | | | 485,780 | | | | 1,340,669 | |
Distributions reinvested | | | | | | | | |
Class A | | | 2,077,296 | | | | 1,170,685 | |
Class B | | | 522,694 | | | | 343,297 | |
Class C | | | 556,963 | | | | 380,745 | |
Cost of shares redeemed | | | | | | | | |
Class A | | | (4,506,403 | ) | | | (2,922,942 | ) |
Class B | | | (605,371 | ) | | | (512,280 | ) |
Class C | | | (781,290 | ) | | | (3,871,410 | ) |
| | | | | | | | |
Net increase from capital share transactions | | | 2,375,391 | | | | 4,891,287 | |
| | | | | | | | |
Net increase in net assets | | | 2,626,646 | | | | 4,476,276 | |
| | | | | | | | |
Net assets: | | | | | | | | |
Beginning of period | | | 31,016,814 | | | | 26,540,538 | |
| | | | | | | | |
End of period | | $ | 33,643,460 | | | $ | 31,016,814 | |
| | | | | | | | |
Accumulated net investment loss at end of period | | $ | (14,477 | ) | | $ | (103 | ) |
| | | | | | | | |
Capital Share Activity: | | | | | | | | |
Shares sold | | | | | | | | |
Class A | | | 311,700 | | | | 641,932 | |
Class B | | | 68,346 | | | | 81,728 | |
Class C | | | 40,000 | | | | 110,434 | |
Shares reinvested | | | | | | | | |
Class A | | | 174,124 | | | | 99,888 | |
Class B | | | 45,216 | | | | 29,904 | |
Class C | | | 48,180 | | | | 33,166 | |
Shares redeemed | | | | | | | | |
Class A | | | (369,173 | ) | | | (239,609 | ) |
Class B | | | (50,851 | ) | | | (42,378 | ) |
Class C | | | (67,049 | ) | | | (318,091 | ) |
The accompanying notes are an integral part of the financial statements.
| | |
| Financial Highlights | | Security Equity Fund |
| Selected data for each share of capital stock outstanding throughout each period | | Alpha Opportunity Series |
| | | | | | | | | | | | | | | | | | | | |
Class A | | Six Months Ended
March 31, 2007g | | | 2006 | | | 2005 | | | 2004 | | | Year Ended,
September 30, 2003e | |
Per Share Data | | | | | | | | | | | | | | | | | | | | |
Net asset value, beginning of period | | $ | 12.23 | | | $ | 12.37 | | | $ | 11.79 | | | $ | 10.21 | | | $ | 10.00 | |
| | | | | | | | | | | | | | | | | | | | |
Income (loss) from investment operations: | | | | | | | | | | | | | | | | | | | | |
Net investment income (loss)c | | | 0.01 | | | | (0.06 | ) | | | (0.10 | ) | | | (0.16 | ) | | | (0.03 | ) |
Net gain on securities (realized and unrealized) | | | 1.36 | | | | 0.93 | | | | 1.50 | | | | 2.33 | | | | 0.24 | |
| | | | | | | | | | | | | | | | | | | | |
Total from investment operations | | | 1.37 | | | | 0.87 | | | | 1.40 | | | | 2.17 | | | | 0.21 | |
| | | | | | | | | | | | | | | | | | | | |
Less distributions: | | | | | | | | | | | | | | | | | | | | |
Distributions from realized gains | | | (1.27 | ) | | | (1.01 | ) | | | (0.82 | ) | | | (0.59 | ) | | | — | |
| | | | | | | | | | | | | | | | | | | | |
Total distributions | | | (1.27 | ) | | | (1.01 | ) | | | (0.82 | ) | | | (0.59 | ) | | | — | |
| | | | | | | | | | | | | | | | | | | | |
Net asset value, end of period | | $ | 12.33 | | | $ | 12.23 | | | $ | 12.37 | | | $ | 11.79 | | | $ | 10.21 | |
| | | | | | | | | | | | | | | | | | | | |
Total Returna | | | 11.53 | % | | | 7.39 | % | | | 12.26 | % | | | 21.68 | % | | | 2.10 | % |
| | | | | | | | | | | | | | | | | | | | |
Ratios/Supplemental Data | | | | | | | | | | | | | | | | | | | | |
| | | | | |
Net assets, end of period (in thousands) | | $ | 22,205 | | | $ | 20,595 | | | $ | 14,622 | | | $ | 6,556 | | | $ | 2,935 | |
| | | | | | | | | | | | | | | | | | | | |
Ratios to average net assets: | | | | | | | | | | | | | | | | | | | | |
Net investment income (loss) | | | 0.17 | % | | | (0.50 | )% | | | (0.83 | )% | | | (1.48 | )% | | | (1.35 | )% |
Total expensesb | | | 2.76 | % | | | 3.20 | % | | | 2.94 | % | | | 3.57 | % | | | 3.25 | % |
Net expensesd | | | 2.57 | % | | | 3.01 | % | | | 2.86 | % | | | 2.78 | % | | | 2.75 | % |
Expenses prior to custodian earnings credits and net of expense waivers | | | 2.76 | % | | | 3.10 | % | | | 2.86 | % | | | 2.79 | % | | | 2.75 | % |
Net expenses prior to performance fee adjustmentf | | | 2.71 | % | | | 2.82 | % | | | 2.78 | % | | | 2.78 | % | | | 2.75 | % |
| | | | | | | | | | | | | | | | | | | | |
Portfolio turnover rate | | | 1,599 | % | | | 1,302 | % | | | 1,502 | % | | | 1,175 | % | | | 867 | % |
| | | | | | | | | | | | | | | | | | | | |
Class B | | Six Months Ended
March 31, 2007g | | | 2006 | | | 2005 | | | 2004 | | | Year Ended, September 30, 2003e | |
Per Share Data | | | | | | | | | | | | | | | | | | | | |
Net asset value, beginning of period | | $ | 11.90 | | | $ | 12.15 | | | $ | 11.68 | | | $ | 10.20 | | | $ | 10.00 | |
| | | | | | | | | | | | | | | | | | | | |
Income (loss) from investment operations: | | | | | | | | | | | | | | | | | | | | |
Net investment lossc | | | (0.03 | ) | | | (0.15 | ) | | | (0.18 | ) | | | (0.25 | ) | | | (0.05 | ) |
Net gain on securities (realized and unrealized) | | | 1.32 | | | | 0.91 | | | | 1.47 | | | | 2.32 | | | | 0.25 | |
| | | | | | | | | | | | | | | | | | | | |
Total from investment operations | | | 1.29 | | | | 0.76 | | | | 1.29 | | | | 2.07 | | | | 0.20 | |
| | | | | | | | | | | | | | | | | | | | |
Less distributions: | | | | | | | | | | | | | | | | | | | | |
Distributions from realized gains | | | (1.27 | ) | | | (1.01 | ) | | | (0.82 | ) | | | (0.59 | ) | | | — | |
| | | | | | | | | | | | | | | | | | | | |
Total distributions | | | (1.27 | ) | | | (1.01 | ) | | | (0.82 | ) | | | (0.59 | ) | | | — | |
| | | | | | | | | | | | | | | | | | | | |
Net asset value, end of period | | $ | 11.92 | | | $ | 11.90 | | | $ | 12.15 | | | $ | 11.68 | | | $ | 10.20 | |
| | | | | | | | | | | | | | | | | | | | |
Total Returna | | | 11.16 | % | | | 6.56 | % | | | 11.39 | % | | | 20.68 | % | | | 2.00 | % |
| | | | | | | | | | | | | | | | | | | | |
Ratios/Supplemental Data | | | | | | | | | | | | | | | | | | | | |
| | | | | |
Net assets, end of period (in thousands) | | $ | 5,602 | | | $ | 4,846 | | | $ | 4,106 | | | $ | 2,324 | | | $ | 1,731 | |
| | | | | | | | | | | | | | | | | | | | |
Ratios to average net assets: | | | | | | | | | | | | | | | | | | | | |
Net investment loss | | | (0.58 | )% | | | (1.24 | )% | | | (1.60 | )% | | | (2.25 | )% | | | (2.11 | )% |
Total expensesb | | | 3.50 | % | | | 3.95 | % | | | 3.69 | % | | | 4.29 | % | | | 4.01 | % |
Net expensesd | | | 3.32 | % | | | 3.76 | % | | | 3.61 | % | | | 3.53 | % | | | 3.50 | % |
Expenses prior to custodian earnings credits and net of expense waivers | | | 3.50 | % | | | 3.85 | % | | | 3.61 | % | | | 3.53 | % | | | 3.50 | % |
Net expenses prior to performance fee adjustmentf | | | 3.46 | % | | | 3.57 | % | | | 3.53 | % | | | 3.53 | % | | | 3.50 | % |
| | | | | | | | | | | | | | | | | | | | |
Portfolio turnover rate | | | 1,599 | % | | | 1,302 | % | | | 1,502 | % | | | 1,175 | % | | | 867 | % |
The accompanying notes are an integral part of the financial statements.
| | |
| Financial Highlights | | Security Equity Fund |
Selected data for each share of capital stock outstanding throughout each period | | Alpha Opportunity Series |
| | | | | | | | | | | | | | | | | | | | |
Class C | | Six Months Ended
March 31, 2007g | | | 2006 | | | 2005 | | | 2004 | | | Year Ended,
September 30, 2003e | |
Per Share Data | | | | | | | | | | | | | | | | | | | | |
Net asset value, beginning of period | | $ | 11.90 | | | $ | 12.15 | | | $ | 11.68 | | | $ | 10.20 | | | $ | 10.00 | |
| | | | | | | | | | | | | | | | | | | | |
Income (loss) from investment operations: | | | | | | | | | | | | | | | | | | | | |
Net investment lossc | | | (0.03 | ) | | | (0.15 | ) | | | (0.18 | ) | | | (0.25 | ) | | | (0.05 | ) |
Net gain on securities (realized and unrealized) | | | 1.32 | | | | 0.91 | | | | 1.47 | | | | 2.32 | | | | 0.25 | |
| | | | | | | | | | | | | | | | | | | | |
Total from investment operations | | | 1.29 | | | | 0.76 | | | | 1.29 | | | | 2.07 | | | | 0.20 | |
| | | | | | | | | | | | | | | | | | | | |
Less distributions: | | | | | | | | | | | | | | | | | | | | |
Distributions from realized gains | | | (1.27 | ) | | | (1.01 | ) | | | (0.82 | ) | | | (0.59 | ) | | | — | |
| | | | | | | | | | | | | | | | | | | | |
Total distributions | | | (1.27 | ) | | | (1.01 | ) | | | (0.82 | ) | | | (0.59 | ) | | | — | |
| | | | | | | | | | | | | | | | | | | | |
Net asset value, end of period | | $ | 11.92 | | | $ | 11.90 | | | $ | 12.15 | | | $ | 11.68 | | | $ | 10.20 | |
| | | | | | | | | | | | | | | | | | | | |
Total Returna | | | 11.16 | % | | | 6.56 | % | | | 11.39 | % | | | 20.68 | % | | | 2.00 | % |
| | | | | | | | | | | | | | | | | | | | |
Ratios/Supplemental Data | | | | | | | | | | | | | | | | | | | | |
Net assets, end of period (in thousands) | | $ | 5,837 | | | $ | 5,576 | | | $ | 7,813 | | | $ | 3,143 | | | $ | 1,723 | |
| | | | | | | | | | | | | | | | | | | | |
Ratios to average net assets: | | | | | | | | | | | | | | | | | | | | |
Net investment loss | | | (0.58 | )% | | | (1.18 | )% | | | (1.58 | %) | | | (2.24 | )% | | | (2.11 | )% |
Total expensesb | | | 3.51 | % | | | 3.95 | % | | | 3.68 | % | | | 4.30 | % | | | 4.01 | % |
Net expensesd | | | 3.32 | % | | | 3.75 | % | | | 3.61 | % | | | 3.53 | % | | | 3.50 | % |
Expenses prior to custodian earnings credits and net of expense waivers | | | 3.51 | % | | | 3.83 | % | | | 3.61 | % | | | 3.53 | % | | | 3.50 | % |
Net expenses prior to performance fee adjustmentf | | | 3.46 | % | | | 3.57 | % | | | 3.53 | % | | | 3.53 | % | | | 3.50 | % |
| | | | | | | | | | | | | | | | | | | | |
Portfolio turnover rate | | | 1,599 | % | | | 1,302 | % | | | 1,502 | % | | | 1,175 | % | | | 867 | % |
a | Total return information does not reflect deduction of any sales charges imposed at the time of purchase for Class A shares or upon redemption for Class B and C shares. |
b | Total expense information reflects expense ratios absent fund expense reductions by the Investment Manager and custodian earnings credits, as applicable. |
c | Net investment income (loss) was computed using average shares outstanding throughout the period. |
d | Net expense information reflects the expense ratios after voluntary expense waivers, reimbursements and custodian earnings credits, as applicable. |
e | Security Alpha Opportunity Series was initially capitalized on July 7, 2003 with a net asset value of $10 per share. Percentage amounts for the period, except total return, have been annualized. |
f | Net expenses prior to performance fee adjustment reflect ratios after voluntary expense waivers, reimbursements, custodian earnings credits, and before performance fee adjustments, as applicable. |
g | Unaudited figures for the six months ended March 31, 2007. Percentage amounts, except total return, have been annualized. |
The accompanying notes are an integral part of the financial statements.
Security Equity Fund
Equity Series

Adviser,
Security Management Company, LLC
13
| | |
| | Security Equity Fund |
| Performance Summary | | Equity Series |
| March 31, 2007 | | (unaudited) |
PERFORMANCE
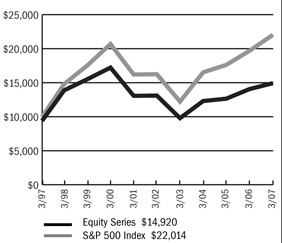
$10,000 Over Ten Years
This chart assumes a $10,000 investment in Class A shares of Equity Series on March 31, 1997, reflects deduction of the 5.75% sales load and assumes all dividends reinvested. The chart does not reflect the deduction of taxes that a shareholder would pay on distributions or the redemption of fund shares. The S&P 500 Index is a capitalization weighted index composed of 500 selected common stocks that represent the broad domestic economy and is a widely recognized unmanaged index of market performance.
Average Annual Returns
| | | | | | | | | |
Periods Ended 3-31-07 | | 1 Year | | | 5 Years | | | 10 Years or
Since Inception | |
A Shares | | 6.11 | % | | 2.63 | % | | 4.70 | % |
A Shares with sales charge | | 0.07 | % | | 1.42 | % | | 4.08 | % |
B Shares | | 5.40 | % | | 1.85 | % | | 3.90 | % |
B Shares with CDSC | | 0.70 | % | | 1.52 | % | | 3.90 | % |
C Shares | | 5.41 | % | | 1.84 | % | | (1.42 | )% |
| | | | | | | | (1-29-99 | ) |
C Shares with CDSC | | 4.47 | % | | 1.84 | % | | (1.42 | )% |
| | | | | | | | (1-29-99 | ) |
The performance data above represents past performance that is not predictive of future results. The investment return and principal value of an investment in the Series will fluctuate so that an investor’s shares, when redeemed, may be worth more or less than their original cost. The figures above do not reflect deduction of the maximum front-end sales charge of 5.75% for Class A shares or the contingent deferred sales charge of 5% for Class B shares and 1% for Class C shares, as applicable, except where noted. The figures do not reflect the deduction of taxes that a shareholder would pay on distributions or redemption of shares. Such figures would be lower if the maximum sales charge and any applicable taxes were deducted.
Portfolio Composition by Sector as of 3-31-07
| | | |
Consumer Discretionary | | 9.69 | % |
Consumer Staples | | 8.56 | |
Energy | | 11.65 | |
Financials | | 21.71 | |
Health Care | | 15.58 | |
Industrials | | 16.28 | |
Information Technology | | 11.76 | |
Materials | | 1.27 | |
Telecommunication Services | | 2.31 | |
Asset Backed Commerical Paper | | 0.94 | |
Commercial Paper | | 0.25 | |
Repurchase Agreement | | 0.07 | |
Liabilities in excess of other assets | | (0.07 | ) |
Total net assets | | 100.00 | % |
| | | |
The accompanying notes are an integral part of the financial statements.
| | |
| | Security Equity Fund |
| Performance Summary | | Equity Series |
| March 31, 2007 | | (unaudited) |
PERFORMANCE
Information About Your Series Expenses
Calculating your ongoing Series expenses
Example
As a shareholder of the Series, you incur two types of costs: (1) transaction costs, which may include sales charges (loads) on purchase payments; contingent deferred sales charges on redemptions; and redemption fees, if any; and (2) ongoing costs, including management fees; distribution and/or service fees (12b-1); and other Series expenses. This example is intended to help you understand your ongoing costs (in dollars) of investing in the Series and to compare these costs with ongoing costs of investing in other mutual funds. The example is based on an investment of $1,000 invested at the beginning of the period and held for the entire period, October 1, 2006 – March 31, 2007.
Actual Expenses
The first line for each class of shares in the table provides information about actual account values and actual expenses. You may use the information in this table, together with the amount you invested, to estimate the expenses that you paid over the period. Simply divide your account value by $1,000 (for example, an $8,600 account value divided by $1,000 = 8.6), then multiply the result by the number in the table under the heading entitled “Expenses Paid During Period” to estimate the expenses you paid on your account during this period.
Hypothetical Example for Comparison Purposes
The second line for each class of shares in the table provides information about hypothetical account values and hypothetical expenses based on the Series actual expense ratio and an assumed rate of return of 5% per year before expenses, which is not the Series actual return. The hypothetical account values and expenses may not be used to estimate the actual ending account balance or expenses you paid for the period. You may use this information to compare the ongoing costs of investing in the Series and other funds. To do so, compare this 5% hypothetical example with the 5% hypothetical examples that appear in the shareholder reports of the other mutual funds.
Please note that the expenses shown in the table are meant to highlight your ongoing costs only and do not reflect any transactional costs, such as sales charges (loads) on purchase payments, contingent deferred sales charges on redemptions, and redemption fees, if any. Therefore, the second line for each class of shares is useful in comparing ongoing costs only, and will not help you determine the relative total costs of owning different funds. In addition, if these transactional costs were included, your costs would have been higher.
Series Expenses
| | | | | | | | | |
| | | Beginning
Account Value
10-01-06 | | Ending
Account Value
03-31-071 | | Expenses Paid
During
Period2 |
Equity Series—Class A | | | | | | | | | |
Actual | | $ | 1,000.00 | | $ | 1,053.30 | | $ | 6.81 |
Hypothetical | | | 1,000.00 | | | 1,018.30 | | | 6.69 |
Equity Series—Class B | | | | | | | | | |
Actual | | | 1,000.00 | | | 1,048.80 | | | 10.62 |
Hypothetical | | | 1,000.00 | | | 1,014.56 | | | 10.45 |
Equity Series—Class C | | | | | | | | | |
Actual | | | 1,000.00 | | | 1,049.20 | | | 10.63 |
Hypothetical | | | 1,000.00 | | | 1,014.56 | | | 10.45 |
1 | The actual ending account value is based on the actual total return of the Series for the period from October 1, 2006 to March 31, 2007, after actual expenses and will differ from the hypothetical ending account value, which is based on the Series expense ratio and a hypothetical annual return of 5% before expenses. The actual cumulative return at net asset value for the period from October 1, 2006 to March 31, 2007 was 5.33%, 4.88% and 4.92%, for Class A, B and C shares, respectively. |
2 | Expenses are equal to the Series annualized expense ratio (1.33%, 2.08% and 2.08% for Class A, B and C shares, respectively) multiplied by the average account value over the period, multiplied by 182/365 (to reflect the one-half year period). |
15
| | |
| Schedule of Investments | | Security Equity Fund - Equity Series |
| March 31, 2007 (Unaudited) | | |
| | | | | |
| | | Shares | | Value |
COMMON STOCK—98.8% | | | | | |
Aerospace & Defense—4.3% | | | | | |
General Dynamics Corporation | | 173,800 | | $ | 13,278,320 |
L-3 Communications Holdings, Inc. | | 42,000 | | | 3,673,740 |
| | | | | |
| | | | | 16,952,060 |
| | | | | |
Air Freight & Logistics—2.9% | | | | | |
FedEx Corporation | | 107,700 | | | 11,570,211 |
| | | | | |
Biotechnology—1.8% | | | | | |
Amgen, Inc. * | | 127,700 | | | 7,135,876 |
| | | | | |
Broadcasting & Cable TV—1.2% | | | | | |
CBS Corporation (CI.B) | | 158,100 | | | 4,836,279 |
| | | | | |
Coal & Consumable Fuels—1.6% | | | | | |
Evergreen Energy, Inc. * | | 979,800 | | | 6,437,286 |
| | | | | |
Communications Equipment—1.9% | | | | | |
ADC Telecommunications, Inc. * | | 447,757 | | | 7,495,452 |
| | | | | |
Construction & Engineering—1.5% | | | | | |
Shaw Group, Inc. * | | 184,800 | | | 5,778,696 |
| | | | | |
Consumer Finance—8.1% | | | | | |
American Express Company | | 193,850 | | | 10,933,140 |
Capital One Financial Corporation | | 112,500 | | | 8,489,250 |
First Marblehead Corporation | | 278,850 | | | 12,517,576 |
| | | | | |
| | | | | 31,939,966 |
| | | | | |
Data Processing & Outsourced Services—4.0% | | | | | |
First Data Corporation | | 208,100 | | | 5,597,890 |
Western Union Company | | 456,400 | | | 10,017,980 |
| | | | | |
| | | | | 15,615,870 |
| | | | | |
Drug Retail—2.3% | | | | | |
CVS Corporation | | 264,200 | | | 9,019,788 |
| | | | | |
Health Care Equipment—1.8% | | | | | |
Hospira, Inc. * | | 175,700 | | | 7,186,130 |
| | | | | |
Health Care Services—3.7% | | | | | |
Medco Health Solutions, Inc. * | | 198,550 | | | 14,400,832 |
| | | | | |
Home Improvement Retail—3.9% | | | | | |
Home Depot, Inc. | | 421,700 | | | 15,493,258 |
| | | | | |
Hotels, Resorts & Cruise Lines—1.9% | | | | | |
Carnival Corporation | | 158,800 | | | 7,441,368 |
| | | | | |
Hypermarkets & Super Centers—6.3% | | | | | |
Costco Wholesale Corporation | | 226,300 | | | 12,183,992 |
Wal-Mart Stores, Inc. | | 267,000 | | | 12,535,650 |
| | | | | |
| | | | | 24,719,642 |
| | | | | |
Industrial Conglomerates—7.6% | | | | | |
General Electric Company | | 491,400 | | | 17,375,904 |
Tyco International, Ltd. | | 394,300 | | | 12,440,165 |
| | | | | |
| | | | | 29,816,069 |
| | | | | |
Industrial Gases—1.3% | | | | | |
Praxair, Inc. | | 79,500 | | | 5,005,320 |
| | | | | |
Integrated Oil & Gas—7.1% | | | | | |
Chevron Corporation | | 128,500 | | | 9,503,860 |
ConocoPhillips | | 8,500 | | | 580,975 |
Exxon Mobil Corporation | | 229,700 | | | 17,330,865 |
Sasol, Ltd. ADR | | 15,600 | | | 515,580 |
| | | | | |
| | | | | 27,931,280 |
| | | | | |
IT Consulting & Other Services—2.3% | | | | | |
Unisys Corporation * | | 1,088,000 | | | 9,171,840 |
| | | | | |
Managed Health Care—5.4% | | | | | |
UnitedHealth Group, Inc. | | 162,000 | | | 8,581,140 |
WellPoint, Inc. * | | 156,700 | | | 12,708,370 |
| | | | | |
| | | | | 21,289,510 |
| | | | | |
Movies & Entertainment—2.6% | | | | | |
Time Warner, Inc. | | 528,000 | | | 10,412,160 |
| | | | | |
Multi-Line Insurance—4.8% | | | | | |
American International Group, Inc. | | 282,500 | | | 18,989,650 |
| | | | | |
Oil & Gas Drilling—0.7% | | | | | |
Transocean, Inc. * | | 36,200 | | | 2,957,540 |
| | | | | |
Oil & Gas Equipment & Services—2.2% | | | | | |
Baker Hughes, Inc. | | 61,000 | | | 4,033,930 |
BJ Services Company | | 53,900 | | | 1,503,810 |
Halliburton Company | | 95,600 | | | 3,034,344 |
| | | | | |
| | | | | 8,572,084 |
| | | | | |
Other Diversified Financial Services—5.0% | | | | | |
Citigroup, Inc. | | 244,600 | | | 12,557,764 |
JPMorgan Chase & Company | | 150,600 | | | 7,286,028 |
| | | | | |
| | | | | 19,843,792 |
| | | | | |
Pharmaceuticals—2.9% | | | | | |
Johnson & Johnson | | 189,000 | | | 11,389,140 |
| | | | | |
Properly & Casualty Insurance—3.8% | | | | | |
Berkshire Hathaway, Inc. * | | 136 | | | 14,822,640 |
| | | | | |
Systems Software—3.6% | | | | | |
Microsoft Corporation | | 505,300 | | | 14,082,711 |
| | | | | |
Wireless Telecommunication Services —2.3% | | | | | |
Sprint Nextel Corporation | | 480,600 | | | 9,112,176 |
| | | | | |
TOTAL COMMON STOCK (Cost $313,723 ,587) | | | | $ | 389,418,626 |
| | | | | |
| | | | |
| | | Principal
Amount | | Value |
ASSET BACKED COMMERCIAL PAPER— 0.9% | | | | |
Financial Companies—Trade Receivables—0.9% | | | | |
Old Line Funding LLC | | | | |
5.28%, 4/2/2007 | | 1,000,000 | | 999,853 |
The accompanying notes are an integral part of the financial statements.
16
| | |
| Schedule of Investments | | Security Equity Fund - Equity Series |
| March 31, 2007 (Unaudited) - continued | | |
| | | | | | | |
| | | Principal Amount | | Value | |
ASSET BACKED COMMERCIAL PAPER (continued) | | | | | | | |
Financial Companies—Trade Receivables (continued) | | | | | | | |
Sheffield Receivables Corporation | | | | | | | |
5.35%, 4/2/2007 | | | 1,300,000 | | $ | 1,299,807 | |
5.29%, 4/4/2007 | | | 1,400,000 | | | 1,399,383 | |
| | | | | | | |
| | | | | | 3,699,043 | |
| | | | | | | |
TOTAL ASSET BACKED COMMERCIAL PAPER (Cost $3,699,043) | | | | | $ | 3,699,043 | |
| | | | | | | |
COMMERCIAL PAPER—0.3% | | | | | | | |
Financial—Other—0.3% | | | | | | | |
Countrywide Financial Corporation | | | | | | | |
5.37%, 4/5/2007 | | | 1,000,000 | | | 999,403 | |
| | | | | | | |
TOTAL COMMERCIAL PAPER (Cost $999,403) | | | | | $ | 999,403 | |
| | | | | | | |
REPURCHASE AGREEMENT—0.1% | | | | | | | |
United Missouri Bank, 4.89%, dated 3/30/07, matures 4/02/07; repurchase amount of $266,108 (Collateralized by GNMA, 3.50%, 5/20/26 with a value of $271,320) | | $ | 266,000 | | $ | 266,000 | |
| | | | | | | |
TOTAL REPURCHASE AGREEMENT (Cost $266,000) | | | | | $ | 266,000 | |
| | | | | | | |
Total Investments (Security Equity Fund—Equity Series) | | | | | $ | 394,383,072 | |
(Cost $318,688,033)—100.1% | | | | | | | |
Liabilities in Excess of Other Assets—(0.1)% | | | | | | (257,916 | ) |
| | | | | | | |
TOTAL NET ASSETS—100.0% | | | | | $ | 394,125,156 | |
| | | | | | | |
Footnotes
Percentages are stated as a percent of net assets.
For federal income tax purposes the identified cost of investments owned at 3/31/2007 was $318,688,033.
| * | -Non-income producing security |
Glossary:
| ADR | -American Depositary Receipt |
See notes to financial statements.
The accompanying notes are an integral part of the financial statements.
17
| | |
| | Security Equity Fund |
| | Equity Series (unaudited) |
Statement of Assets and Liabilities
March 31, 2007
| | | | |
Assets: | | | | |
Investments, at value1 | | $ | 394,383,072 | |
Cash | | | 452 | |
Receivables: | | | | |
Fund shares sold | | | 45,663 | |
Dividends | | | 289,275 | |
Prepaid expenses | | | 41,741 | |
| | | | |
Total assets | | | 394,760,203 | |
| | | | |
| |
Liabilities: | | | | |
Payable for: | | | | |
Fund shares redeemed | | | 143,410 | |
Management fees | | | 251,267 | |
Custodian fees | | | 2,250 | |
Transfer agent/maintenance fees | | | 38,024 | |
Administration fees | | | 31,977 | |
Professional fees | | | 30,841 | |
12b-l distribution plan fees | | | 102,494 | |
Directors’ fees | | | 258 | |
Other | | | 34,526 | |
| | | | |
Total liabilities | | | 635,047 | |
| | | | |
Net Assets | | $ | 394,125,156 | |
| | | | |
| |
Net assets consist of: | | | | |
Paid in capital | | $ | 306,030,527 | |
Accumulated net investment loss | | | (187,517 | ) |
Undistributed net realized gain on sale of investments and options written | | | 12,587,107 | |
Net unrealized appreciation in value of investments and options written | | | 75,695,039 | |
| | | | |
Net assets | | $ | 394,125,156 | |
| | | | |
| |
Class A: | | | | |
Capital shares outstanding (unlimited number of shares authorized) | | | 55,864,867 | |
Net assets | | $ | 365,070,791 | |
Net asset value and redemption price per share | | $ | 6.53 | |
| | | | |
Maximum offering price per share (net asset value divided by 94.25%) | | $ | 6.93 | |
| | | | |
| |
Class B: | | | | |
Capital shares outstanding (unlimited number of shares authorized) | | | 4,135,046 | |
Net assets | | $ | 23,377,962 | |
Net asset value, offering and redemption price per share (excluding any applicable contingent deferred sales charge) | | $ | 5.65 | |
| | | | |
| |
Class C: | | | | |
Capital shares outstanding (unlimited number of shares authorized) | | | 942,620 | |
Net assets | | $ | 5,676,403 | |
Net asset value, offering and redemption price per share (excluding any applicable contingent deferred sales charge) | | $ | 6.02 | |
| | | | |
1 Investments, at cost | | $ | 318,688,033 | |
Statement of Operations
For the Six Months Ended March 31, 2007
| | | | |
Investment Income: | | | | |
Dividends | | $ | 2,369,661 | |
Interest | | | 283,296 | |
| | | | |
Total investment income | | | 2,652,957 | |
| | | | |
| |
Expenses: | | | | |
Management fees | | | 1,534,900 | |
Custodian fees | | | 21,879 | |
Transfer agent/maintenance fees | | | 379,085 | |
Administration fees | | | 194,776 | |
Directors’ fees | | | 7,312 | |
Professional fees | | | 14,776 | |
Reports to shareholders | | | 20,935 | |
Registration fees | | | 21,003 | |
Other expenses | | | 14,146 | |
12b-l distribution plan fees—Class A | | | 471,622 | |
12b-l distribution plan fees—Class B | | | 130,470 | |
12b-l distribution plan fees—Class C | | | 29,575 | |
| | | | |
Total expenses | | | 2,840,479 | |
Less: Earnings credits | | | (5 | ) |
| | | | |
Net expenses | | | 2,840,474 | |
| | | | |
Net investment loss | | | (187,517 | ) |
| | | | |
| |
Net Realized and Unrealized Gain: | | | | |
Net realized gain during the period on: | | | | |
Investments | | | 19,184,552 | |
Options written | | | 693,377 | |
| | | | |
Net realized gain | | | 19,877,929 | |
| | | | |
| |
Net unrealized appreciation during the period on: | | | | |
Investments | | | 1,900,027 | |
Options written | | | 164,800 | |
| | | | |
Net unrealized appreciation | | | 2,064,827 | |
| | | | |
Net realized and unrealized gain | | | 21,942,756 | |
| | | | |
Net increase in net assets resulting from operations | | $ | 21,755,239 | |
| | | | |
The accompanying notes are an integral part of the financial statements.
| | |
| | Security Equity Fund |
| Statement of Changes in Net Assets | | Equity Series |
| | | | | | | | |
| | | Six Months Ended
March 31, 2007
(unaudited) | | | Year Ended
September 30, 2006 | |
Increase (decrease) in net assets from operations: | | | | | | | | |
Net investment loss | | $ | (187,517 | ) | | $ | (625,371 | ) |
Net realized gain during the period on investments and options written | | | 19,877,929 | | | | 41,580,103 | |
Net unrealized appreciation (depreciation) during the period on investments and options written | | | 2,064,827 | | | | (9,213,626 | ) |
| | | | | | | | |
Net increase in net assets resulting from operations | | | 21,755,239 | | | | 31,741,106 | |
| | | | | | | | |
Distributions to shareholders from: | | | | | | | | |
Net investment income | | | | | | | | |
Class A | | | — | | | | (2,147,421 | ) |
Net realized gain | | | | | | | | |
Class A | | | (36,813,622 | ) | | | (11,068,277 | ) |
Class B | | | (2,833,129 | ) | | | (1,320,160 | ) |
Class C | | | (617,995 | ) | | | (182,232 | ) |
| | | | | | | | |
Total distributions to shareholders | | | (40,264,746 | ) | | | (14,718,090 | ) |
| | | | | | | | |
Capital share transactions: | | | | | | | | |
Proceeds from sale of shares | | | | | | | | |
Class A | | | 13,181,817 | | | | 52,710,115 | |
Class B | | | 2,187,220 | | | | 7,159,305 | |
Class C | | | 376,674 | | | | 1,001,095 | |
Distributions reinvested | | | | | | | | |
Class A | | | 33,789,434 | | | | 12,004,929 | |
Class B | | | 2,766,531 | | | | 1,296,700 | |
Class C | | | 607,148 | | | | 180,424 | |
Cost of shares redeemed | | | | | | | | |
Class A | | | (36,172,453 | ) | | | (84,851,352 | ) |
Class B | | | (7,964,537 | ) | | | (21,542,434 | ) |
Class C | | | (779,023 | ) | | | (1,287,944 | ) |
| | | | | | | | |
Net increase (decrease) from capital share transactions | | | 7,992,811 | | | | (33,329,162 | ) |
| | | | | | | | |
Net decrease in net assets | | | (10,516,696 | ) | | | (16,306,146 | ) |
| | | | | | | | |
Net assets: | | | | | | | | |
Beginning of period | | | 404,641,852 | | | | 420,947,998 | |
| | | | | | | | |
End of period | | $ | 394,125,156 | | | $ | 404,641,852 | |
| | | | | | | | |
Accumulated net investment loss at end of period | | $ | (187,517 | ) | | $ | — | |
| | | | | | | | |
Capital Share Activity: | | | | | | | | |
Shares sold | | | | | | | | |
Class A | | | 1,926,515 | | | | 8,042,578 | |
Class B | | | 365,674 | | | | 1,205,513 | |
Class C | | | 59,641 | | | | 160,281 | |
Shares reinvested | | | | | | | | |
Class A | | | 5,073,489 | | | | 1,816,177 | |
Class B | | | 479,468 | | | | 221,280 | |
Class C | | | 98,723 | | | | 29,101 | |
Shares redeemed | | | | | | | | |
Class A | | | (5,271,307 | ) | | | (12,720,895 | ) |
Class B | | | (1,320,807 | ) | | | (3,666,875 | ) |
Class C | | | (122,674 | ) | | | (208,581 | ) |
The accompanying notes are an integral part of the financial statements.
| | |
| Financial Highlights | | Security Equity Fund |
| Selected data for each share of capital stock outstanding throughout each period | | Equity Series |
| | | | | | | | | | | | | | | | | | | | | | | | |
Class A | | Six Months Ended
March 31, 2007i | | | 2006 | | | 2005 | | | 2004 | | | 2003 | | | Year Ended,
September 30,
2002c,e | |
Per Share Data | | | | | | | | | | | | | | | | | | | | | | | | |
Net asset value, beginning of period | | $ | 6.85 | | | $ | 6.58 | | | $ | 6.50 | | | $ | 5.98 | | | $ | 5.09 | | | $ | 6.36 | |
| | | | | | | | | | | | | | | | | | | | | | | | |
Income (loss) from investment operations: | | | | | | | | | | | | | | | | | | | | | | | | |
Net investment income (loss)b | | | — | h | | | (0.01 | ) | | | 0.04 | | | | 0.01 | | | | 0.01 | | | | 0.01 | |
Net gain (loss) on securities (realized and unrealized) | | | 0.38 | | | | 0.52 | | | | 0.49 | | | | 0.52 | | | | 0.88 | | | | (1.28 | ) |
| | | | | | | | | | | | | | | | | | | | | | | | |
Total from investment operations | | | 0.38 | | | | 0.51 | | | | 0.53 | | | | 0.53 | | | | 0.89 | | | | (1.27 | ) |
| | | | | | | | | | | | | | | | | | | | | | | | |
Less distributions: | | | | | | | | | | | | | | | | | | | | | | | | |
Dividends from net investment income | | | — | | | | (0.04 | ) | | | — | | | | (0.01 | ) | | | — | | | | — | |
Distributions from realized gains | | | (0.70 | ) | | | (0.20 | ) | | | (0.45 | ) | | | — | | | | — | | | | — | |
| | | | | | | | | | | | | | | | | | | | | | | | |
Total distributions | | | (0.70 | ) | | | (0.24 | ) | | | (0.45 | ) | | | (0.01 | ) | | | ��� | | | | — | |
| | | | | | | | | | | | | | | | | | | | | | | | |
Net asset value, end of period | | $ | 6.53 | | | $ | 6.85 | | | $ | 6.58 | | | $ | 6.50 | | | $ | 5.98 | | | $ | 5.09 | |
| | | | | | | | | | | | | | | | | | | | | | | | |
Total Returna | | | 5.33 | % | | | 7.88 | % | | | 8.20 | % | | | 8.87 | % | | | 17.49 | % | | | (19.97 | )% |
| | | | | | | | | | | | | | | | | | | | | | | | |
Ratios/Supplemental Data | | | | | | | | | | | | | | | | | | | | | | | | |
Net assets, end of period (in thousands) | | $ | 365,071 | | | $ | 371,006 | | | $ | 375,280 | | | $ | 391,384 | | | $ | 430,161 | | | $ | 412,791 | |
| | | | | | | | | | | | | | | | | | | | | | | | |
Ratios to average net assets: | | | | | | | | | | | | | | | | | | | | | | | | |
Net investment income (loss) | | | (0.03 | )% | | | (0.08 | )% | | | 0.57 | % | | | 0.08 | % | | | 0.23 | % | | | 0.13 | % |
Total expensesf | | | 1.33 | % | | | 1.34 | % | | | 1.30 | % | | | 1.28 | % | | | 1.25 | % | | | 1.11 | % |
Net expensesg | | | 1.33 | % | | | 1.34 | % | | | 1.30 | % | | | 1.28 | % | | | 1.25 | % | | | 1.11 | % |
| | | | | | | | | | | | | | | | | | | | | | | | |
Portfolio turnover rate | | | 26 | % | | | 34 | % | | | 32 | % | | | 28 | % | | | 54 | % | | | 30 | % |
Class B | | Six Months Ended
March 31, 2007i | | | 2006 | | | 2005 | | | 2004 | | | 2003 | | | Year Ended,
September 30,
2002c,e | |
Per Share Data | | | | | | | | | | | | | | | | | | | | | | | | |
Net asset value, beginning of period | | $ | 6.04 | | | $ | 5.83 | | | $ | 5.85 | | | $ | 5.41 | | | $ | 4.64 | | | $ | 5.86 | |
| | | | | | | | | | | | | | | | | | | | | | | | |
Income (loss) from investment operations: | | | | | | | | | | | | | | | | | | | | | | | | |
Net investment lossb | | | (0.02 | ) | | | (0.05 | ) | | | (0.01 | ) | | | (0.04 | ) | | | (0.03 | ) | | | (0.05 | ) |
Net gain (loss) on securities (realized and unrealized) | | | 0.33 | | | | 0.46 | | | | 0.44 | | | | 0.48 | | | | 0.80 | | | | (1.17 | ) |
| | | | | | | | | | | | | | | | | | | | | | | | |
Total from investment operations | | | 0.31 | | | | 0.41 | | | | 0.43 | | | | 0.44 | | | | 0.77 | | | | (1.22 | ) |
| | | | | | | | | | | | | | | | | | | | | | | | |
Less distributions: | | | | | | | | | | | | | | | | | | | | | | | | |
Distributions from realized gains | | | (0.70 | ) | | | (0.20 | ) | | | (0.45 | ) | | | — | | | | — | | | | — | |
| | | | | | | | | | | | | | | | | | | | | | | | |
Total distributions | | | (0.70 | ) | | | (0.20 | ) | | | (0.45 | ) | | | — | | | | — | | | | — | |
| | | | | | | | | | | | | | | | | | | | | | | | |
Net asset value, end of period | | $ | 5.65 | | | $ | 6.04 | | | $ | 5.83 | | | $ | 5.85 | | | $ | 5.41 | | | $ | 4.64 | |
| | | | | | | | | | | | | | | | | | | | | | | | |
Total Returna | | | 4.88 | % | | | 7.16 | % | | | 7.35 | % | | | 8.13 | % | | | 16.59 | % | | | (20.82 | )% |
| | | | | | | | | | | | | | | | | | | | | | | | |
Ratios/Supplemental Data | | | | | | | | | | | | | | | | | | | | | | | | |
Net assets, end of period (in thousands) | | $ | 23,378 | | | $ | 27,842 | | | $ | 39,962 | | | $ | 49,600 | | | $ | 61,733 | | | $ | 66,267 | |
| | | | | | | | | | | | | | | | | | | | | | | | |
Ratios to average net assets: | | | | | | | | | | | | | | | | | | | | | | | | |
Net investment loss | | | (0.78 | )% | | | (0.83 | )% | | | (0.16 | )% | | | (0.67 | )% | | | (0.52 | )% | | | (0.78 | )% |
Total expensesf | | | 2.08 | % | | | 2.09 | % | | | 2.05 | % | | | 2.03 | % | | | 2.00 | % | | | 2.02 | % |
Net expensesg | | | 2.08 | % | | | 2.09 | % | | | 2.05 | % | | | 2.03 | % | | | 2.00 | % | | | 2.02 | % |
| | | | | | | | | | | | | | | | | | | | | | | | |
Portfolio turnover rate | | | 26 | % | | | 34 | % | | | 32 | % | | | 28 | % | | | 54 | % | | | 30 | % |
The accompanying notes are an integral part of the financial statements.
| | |
| Financial Highlights | | Security Equity Fund |
Selected data for each share of capital stock outstanding throughout each period | | Equity Series |
| | | | | | | | | | | | | | | | | | | | | | | | |
Class C | | Six Months Ended
March 31, 2007i | | | 2006 | | | 2005 | | | 2004 | | | 2003 | | | Year Ended,
September 30,
2002c,d,e | |
Per Share Data | | | | | | | | | | | | | | | | | | | | | | | | |
Net asset value, beginning of period | | $ | 6.39 | | | $ | 6.16 | | | $ | 6.16 | | | $ | 5.69 | | | $ | 4.88 | | | $ | 6.16 | |
| | | | | | | | | | | | | | | | | | | | | | | | |
Income (loss) from investment operations: | | | | | | | | | | | | | | | | | | | | | | | | |
Net investment lossb | | | (0.02 | ) | | | (0.05 | ) | | | (0.01 | ) | | | (0.04 | ) | | | (0.03 | ) | | | (0.05 | ) |
Net gain (loss) on securities (realized and unrealized) | | | 0.35 | | | | 0.48 | | | | 0.46 | | | | 0.51 | | | | 0.84 | | | | (1.23 | ) |
| | | | | | | | | | | | | | | | | | | | | | | | |
Total from investment operations | | | 0.33 | | | | 0.43 | | | | 0.45 | | | | 0.47 | | | | 0.81 | | | | (1.28 | ) |
| | | | | | | | | | | | | | | | | | | | | | | | |
Less distributions: | | | | | | | | | | | | | | | | | | | | | | | | |
Distributions from realized gains | | | (0.70 | ) | | | (0.20 | ) | | | (0.45 | ) | | | — | | | | — | | | | — | |
| | | | | | | | | | | | | | | | | | | | | | | | |
Total distributions | | | (0.70 | ) | | | (0.20 | ) | | | (0.45 | ) | | | — | | | | — | | | | — | |
| | | | | | | | | | | | | | | | | | | | | | | | |
Net asset value, end of period | | $ | 6.02 | | | $ | 6.39 | | | $ | 6.16 | | | $ | 6.16 | | | $ | 5.69 | | | $ | 4.88 | |
| | | | | | | | | | | | | | | | | | | | | | | | |
Total Returna | | | 4.92 | % | | | 7.10 | % | | | 7.32 | % | | | 8.26 | % | | | 16.60 | % | | | (20.78 | )% |
| | | | | | | | | | | | | | | | | | | | | | | | |
Ratios/Supplemental Data | | | | | | | | | | | | | | | | | | | | | | | | |
Net assets, end of period (in thousands) | | $ | 5,676 | | | $ | 5,794 | | | $ | 5,706 | | | $ | 6,329 | | | $ | 6,651 | | | $ | 4,979 | |
| | | | | | | | | | | | | | | | | | | | | | | | |
Ratios to average net assets: | | | | | | | | | | | | | | | | | | | | | | | | |
Net investment loss | | | (0.78 | )% | | | (0.83 | )% | | | (0.18 | )% | | | (0.67 | )% | | | (0.52 | )% | | | (0.76 | )% |
Total expensesf | | | 2.08 | % | | | 2.09 | % | | | 2.05 | % | | | 2.03 | % | | | 2.00 | % | | | 2.02 | % |
Net expensesg | | | 2.08 | % | | | 2.09 | % | | | 2.05 | % | | | 2.03 | % | | | 2.00 | % | | | 2.02 | % |
| | | | | | | | | | | | | | | | | | | | | | | | |
Portfolio turnover rate | | | 26 | % | | | 34 | % | | | 32 | % | | | 28 | % | | | 54 | % | | | 30 | % |
a | Total return information does not reflect deduction of any sales charges imposed at the time of purchase for Class A shares or upon redemption for Class B and C shares. |
b | Net investment income (loss) was computed using average shares outstanding throughout the period. |
c | The financial highlights for the Equity Series exclude the historical financial highlights of the Total Return Series Class A, B and C shares. The assets of the Total Return Series were acquired by the Equity Series on August 27, 2002. |
d | The financial highlights for Class C shares exclude the historical financial highlights of Class S shares. Class S shares were exchanged for Class C shares on June 3, 2002. |
e | Effective May 1, 2002 the fee structure for Equity Series changed. Per share information reflects this change. |
f | Total expense information reflects expense ratios absent fund expense reductions by the Investment Manager and custodian earnings credits, as applicable. |
g | Net expense information reflects the expense ratios after voluntary expense waivers, reimbursements and custodian earnings credits, as applicable. |
h | Net investment income is less than $0.01 per share. |
i | Unaudited figures for the six months ended March 31, 2007. Percentage amounts, except total return, have been annualized. |
The accompanying notes are an integral part of the financial statements.
This page left blank intentionally.
22
Security Equity Fund
Global Series

Subadviser,
OppenheimerFunds, Inc.
23
| | |
| | Security Equity Fund |
| Performance Summary | | Global Series |
| March 31, 2007 | | (unaudited) |
PERFORMANCE
Security Global Series vs. Morgan Stanley Capital International World Index
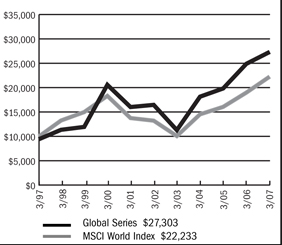
$10,000 Over Ten Years
This chart assumes a $10,000 investment in Class A shares of Global Series on March 31, 1997, reflects deduction of the 5.75% sales load and assumes all dividends reinvested. The chart does not reflect the deduction of taxes that a shareholder would pay on distributions or the redemption of fund shares. The MSCI World Index is an unmanaged capitalization-weighted index that is designed to measure global developed market equity performance.
Portfolio Composition by Sector as of 3-31-07
| | | |
Consumer Discretionary | | 18.91 | % |
Consumer Staples | | 8.34 | |
Energy | | 5.68 | |
Financials | | 14.50 | |
Health Care | | 9.53 | |
Industrials | | 14.31 | |
Information Technology | | 21.30 | |
Materials | | 0.24 | |
Telecommunication Services | | 3.90 | |
Utilities | | 0.62 | |
Repurchase Agreement | | 2.31 | |
Cash & other assets, less liabilities | | 0.36 | |
Total net assets | | 100.00 | % |
| | | |
Average Annual Returns
| | | | | | | | | |
Periods Ended 3-31-07 | | 1 Year | | | 5 Years | | | 10 Years or
Since Inception | |
A Shares | | 9.72 | % | | 10.65 | % | | 11.23 | % |
A Shares with sales charge | | 3.42 | % | | 9.35 | % | | 10.57 | % |
B Shares | | 10.04 | % | | 10.45 | % | | 10.68 | % |
B Shares with CDSC | | 5.27 | % | | 10.18 | % | | 10.68 | % |
C Shares | | 8.91 | % | | 9.84 | % | | 9.75 | % |
| | | | | | | | (1-29-99 | ) |
C Shares with CDSC | | 7.97 | % | | 9.84 | % | | 9.75 | % |
| | | | | | | | (1-29-99 | ) |
The performance data above represents past performance that is not predictive of future results. The investment return and principal value of an investment in the Series will fluctuate so that an investor’s shares, when redeemed, may be worth more or less than their original cost. The figures above do not reflect deduction of the maximum front-end sales charge of 5.75% for Class A shares or the contingent deferred sales charge of 5% for Class B shares and 1% for Class C shares, as applicable, except where noted. The figures do not reflect the deduction of taxes that a shareholder would pay on distributions or redemption of shares. Such figures would be lower if the maximum sales charge and any applicable taxes were deducted. Fee waivers and/or reimbursements reduced expenses of the Series and in the absence of such waiver, the performance quoted would be reduced.
The accompanying notes are an integral part of the financial statements.
| | |
| | Security Equity Fund |
| Performance Summary | | Global Series |
| March 31, 2007 | | (unaudited) |
PERFORMANCE
Information About Your Series Expenses
Calculating your ongoing Series expenses
Example
As a shareholder of the Series, you incur two types of costs: (1) transaction costs, which may include sales charges (loads) on purchase payments; contingent deferred sales charges on redemptions; and redemption fees, if any; and (2) ongoing costs, including management fees; distribution and/or service fees (12b-1); and other Series expenses. This example is intended to help you understand your ongoing costs (in dollars) of investing in the Series and to compare these costs with ongoing costs of investing in other mutual funds. The example is based on an investment of $1,000 invested at the beginning of the period and held for the entire period, October 1, 2006 – March 31, 2007.
Actual Expenses
The first line for each class of shares in the table provides information about actual account values and actual expenses. You may use the information in this table, together with the amount you invested, to estimate the expenses that you paid over the period. Simply divide your account value by $1,000 (for example, an $8,600 account value divided by $1,000 = 8.6), then multiply the result by the number in the table under the heading entitled “Expenses Paid During Period” to estimate the expenses you paid on your account during this period.
Hypothetical Example for Comparison Purposes
The second line for each class of shares in the table provides information about hypothetical account values and hypothetical expenses based on the Series actual expense ratio and an assumed rate of return of 5% per year before expenses, which is not the Series actual return. The hypothetical account values and expenses may not be used to estimate the actual ending account balance or expenses you paid for the period. You may use this information to compare the ongoing costs of investing in the Series and other funds. To do so, compare this 5% hypothetical example with the 5% hypothetical examples that appear in the shareholder reports of the other mutual funds.
Please note that the expenses shown in the table are meant to highlight your ongoing costs only and do not reflect any transactional costs, such as sales charges (loads) on purchase payments, contingent deferred sales charges on redemptions, and redemption fees, if any. Therefore, the second line for each class of shares is useful in comparing ongoing costs only, and will not help you determine the relative total costs of owning different funds. In addition, if these transactional costs were included, your costs would have been higher.
Series Expenses
| | | | | | | | | |
| | | Beginning
Account Value
10-01-06 | | Ending
Account Value
03-31-071 | | Expenses Paid
During
Period2 |
Global Series—Class A | | | | | | | | | |
Actual | | $ | 1,000.00 | | $ | 1,091.60 | | $ | 8.86 |
Hypothetical | | | 1,000.00 | | | 1,016.45 | | | 8.55 |
Global Series—Class B | | | | | | | | | |
Actual | | | 1,000.00 | | | 1,093.80 | | | 7.57 |
Hypothetical | | | 1,000.00 | | | 1,017.70 | | | 7.29 |
Global Series—Class C | | | | | | | | | |
Actual | | | 1,000.00 | | | 1,088.00 | | | 12.75 |
Hypothetical | | | 1,000.00 | | | 1,012.72 | | | 12.29 |
1 | The actual ending account value is based on the actual total return of the Series for the period from October 1, 2006 to March 31, 2007, after actual expenses and will differ from the hypothetical ending account value, which is based on the Series expense ratio and a hypothetical annual return of 5% before expenses. The actual cumulative return at net asset value for the period from October 1, 2006 to March 31, 2007 was 9.16%, 9.38% and 8.80%, for Class A, B and C shares, respectively. |
2 | Expenses are equal to the Series annualized expense ratio (1.70%, 1.45% and 2.45% for Class A, B and C shares, respectively), net of earnings credits, multiplied by the average account value over the period, multiplied by 182/365 (to reflect the one-half year period). |
| | |
| Schedule of Investments | | Security Equity Fund - Global Series |
| March 31, 2007 (Unaudited) | | |
| | | | | |
| | | Shares | | Value |
COMMON STOCK—96.5% | | | | | |
Bermuda—0.3% | | | | | |
Everest Re Group, Ltd. | | 5,200 | | $ | 500,084 |
| | | | | |
Brazil—1.7% | | | | | |
Companhia de Bebidas das Americas ADR | | 22,757 | | | 1,250,725 |
Empresa Brasileira de Aeronautica S.A. ADR | | 39,768 | | | 1,823,760 |
| | | | | |
| | | | | 3,074,485 |
| | | | | |
Canada—1.6% | | | | | |
Husky Energy, Inc. | | 30,080 | | | 2,101,379 |
Manulife Financial Corporation | | 27,146 | | | 933,394 |
| | | | | |
| | | | | 3,034,773 |
| | | | | |
Cayman Islands—2.4% | | | | | |
3SBio, Inc. ADR * | | 3,500 | | | 38,570 |
ACE, Ltd. | | 18,740 | | | 1,069,304 |
GlobalSantaFe Corporation | | 8,100 | | | 499,608 |
Transocean, Inc. * | | 25,100 | | | 2,050,670 |
XL Capital, Ltd. | | 12,400 | | | 867,504 |
| | | | | |
| | | | | 4,525,656 |
| | | | | |
Denmark—0.3% | | | | | |
Novo-Nordisk A/S (CI.B) | | 6,900 | | | 629,657 |
| | | | | |
Finland—0.7% | | | | | |
Fortum Oyj | | 39,100 | | | 1,140,275 |
Neste Oil Oyj | | 5,225 | | | 180,088 |
| | | | | |
France—5.5% | | | | | 1,320,363 |
| | | | | |
LVMH Moet Hennessy Louis Vuitton S.A | | 22,789 | | | 2,528,390 |
NicOxSA * | | 9,284 | | | 244,952 |
Sanofi-Aventis | | 30,465 | | | 2,649,484 |
Societe Generale | | 9,674 | | | 1,671,933 |
Technip S.A. | | 28,860 | | | 2,117,415 |
Total S.A. | | 13,800 | | | 966,950 |
| | | | | |
| | | | | 10,179,124 |
| | | | | |
Germany—5.0% | | | | | |
Allianz AG | | 11,298 | | | 2,319,973 |
Bayerische Motoren Werke (BMW) AG * | | 30,297 | | | 1,787,748 |
SAP AG | | 43,596 | | | 1,943,489 |
Siemens AG | | 29,716 | | | 3,176,640 |
| | | | | |
| | | | | 9,227,850 |
| | | | | |
Hong Kong—0.4% | | | | | |
Hutchison Whampoa, Ltd. | | 68,082 | | | 654,811 |
| | | | | |
India—2.7% | | | | | |
Hindustan Lever, Ltd. | | 194,400 | | | 923,988 |
ICICI Bank, Ltd. ADR | | 11,250 | | | 413,438 |
Infosys Technologies, Ltd. | | 43,247 | | | 2,022,133 |
Wire and Wireless India, Ltd. * | | 93,600 | | | 192,848 |
Zee Entertainment Enterprises, Ltd. | | 202,800 | | | 1,402,607 |
Zee News, Ltd. * | | 84,633 | | $ | 76,061 |
| | | | | |
| | | | | 5,031,075 |
| | | | | |
Italy—0.5% | | | | | |
Bulgari SpA | | 62,400 | | | 901,134 |
| | | | | |
Japan—11.1% | | | | | |
Canon, Inc. | | 12,800 | | | 687,606 |
Chugai Pharmaceutical Company, Ltd. | | 31,600 | | | 799,151 |
Credit Saison Company, Ltd. | | 32,700 | | | 1,076,726 |
Fanuc, Ltd. | | 5,200 | | | 484,101 |
Hoya Corporation | | 40,900 | | | 1,357,144 |
KDDI Corporation | | 261 | | | 2,084,279 |
Keyence Corporation | | 4,000 | | | 902,618 |
Kyocera Corporation | | 9,700 | | | 914,559 |
Murata Manufacturing Company, Ltd. | | 24,700 | | | 1,802,690 |
Nidec Corporation | | 6,900 | | | 445,029 |
Nintendo Company, Ltd. | | 3,400 | | | 988,246 |
Resona Holdings, Inc. | | 254 | | | 683,311 |
Secom Company, Ltd. | | 18,000 | | | 835,575 |
Sega Sammy Holdings, Inc. | | 24,800 | | | 578,775 |
Seven & I Holdings Company, Ltd. | | 20,778 | | | 633,029 |
Shionogi & Company, Ltd. | | 47,000 | | | 845,589 |
Sony Corporation | | 49,300 | | | 2,506,106 |
Square Enix Company, Ltd. | | 26,700 | | | 688,828 |
Sumitomo Mitsui Financial Group, Inc. | | 56 | | | 508,508 |
Toyota Motor Corporation | | 27,700 | | | 1,774,812 |
| | | | | |
| | | | | 20,596,682 |
| | | | | |
Mexico—2.3% | | | | | |
Fomento Economico Mexicano, S.A.B. de C.V. * | | 119,000 | | | 1,312,855 |
Grupo Modelo, S.A. de C.V. (CI.C) | | 160,700 | | | 823,270 |
Grupo Televisa S.A. ADR | | 74,456 | | | 2,218,789 |
| | | | | |
| | | | | 4,354,914 |
| | | | | |
Netherlands—2.2% | | | | | |
European Aeronautic Defence and Space Company N.V. | | 59,490 | | | 1,845,378 |
Koninklijke (Royal) Philips Electronics N.V. | | 56,900 | | | 2,173,230 |
| | | | | |
| | | | | 4,018,608 |
| | | | | |
Norway—0.6% | | | | | |
Tandberg ASA | | 51,700 | | | 1,080,220 |
| | | | | |
Panama—1.2% | | | | | |
Carnival Corporation | | 47,600 | | | 2,230,536 |
| | | | | |
Republic of Korea—1.9% | | | | | |
Hyundai Heavy Industries Company, Ltd. | | 4,413 | | | 881,775 |
The accompanying notes are an integral part of the financial statements.
26
| | |
| Schedule of Investments | | Security Equity Fund - Global Series |
| March 31, 2007 (Unaudited) - continued | | |
| | | | | |
| | | Shares | | Value |
COMMON STOCK (continued) | | | | | |
Republic of Korea (continued) | | | | | |
Samsung Electronics Company, Ltd.* | | 1,819 | | $ | 1,088,446 |
SK Telecom Company, Ltd. ADR | | 65,160 | | | 1,526,047 |
| | | | | |
| | | | | 3,496,268 |
| | | | | |
Singapore—0.2% | | | | | |
Singapore Press Holdings, Ltd. | | 148,848 | | | 431,671 |
| | | | | |
Spain—1.1% | | | | | |
Industria de Diseno Textil S.A. | | 31,779 | | | 1,975,388 |
| | | | | |
Sweden—6.3% | | | | | |
Hennes & Mauritz AB (CI.B) | | 66,400 | | | 3,822,595 |
Investor AB (CI.B) (1) | | 45,155 | | | 1,073,441 |
Telefonaktiebolaget LM Ericsson (CI.B) | | 1,859,400 | | | 6,843,372 |
| | | | | |
| | | | | 11,739,408 |
| | | | | |
Switzerland—3.4% | | | | | |
Credit Suisse Group | | 37,330 | | | 2,678,716 |
Novartis AG | | 16,284 | | | 933,998 |
Roche Holding AG | | 12,858 | | | 2,274,910 |
Syngenta AG | | 2,327 | | | 445,217 |
| | | | | |
| | | | | 6,332,841 |
| | | | | |
Taiwan—1.5% | | | | | |
Benq Corporation | | 528,000 | | | 210,594 |
MediaTek, Inc. | | 123,700 | | | 1,420,335 |
Taiwan Semiconductor Manufacturing Company, Ltd. ADR | | 99,636 | | | 1,071,087 |
| | | | | |
| | | | | 2,702,016 |
| | | | | |
United Kingdom—12.6% | | | | | |
BP plc ADR | | 21,167 | | | 1,370,563 |
Burberry Group plc | | 62,891 | | | 808,183 |
Cadbury Schweppes plc | | 178,624 | | | 2,293,657 |
Diageo plc | | 51,362 | | | 1,040,582 |
Experian Group, Ltd. | | 29,675 | | | 341,337 |
HSBC Holdings plc | | 98,745 | | | 1,716,205 |
Pearson plc | | 50,790 | | | 872,071 |
Prudential plc | | 118,809 | | | 1,677,565 |
Reckitt Benckiser plc | | 58,364 | | | 3,040,234 |
Royal Bank of Scotland Group plc | | 76,824 | | | 2,997,973 |
Smith & Nephew plc | | 90,312 | | | 1,148,117 |
Tesco plc | | 189,179 | | | 1,654,828 |
Vodafone Group plc | | 1,278,313 | | | 3,408,667 |
WPP Group plc | | 66,130 | | | 1,002,068 |
| | | | | |
| | | | | 23,372,050 |
| | | | | |
United States—31.0% | | | | | |
3M Company | | 22,300 | | | 1,704,389 |
Adobe Systems, Inc. * | | 56,700 | | | 2,364,390 |
Advanced Micro Devices, Inc. * | | 114,600 | | | 1,496,676 |
Affymetrix, Inc. * | | 16,000 | | | 481,120 |
Altera Corporation | | 56,100 | | | 1,121,439 |
Amgen, Inc. * | | 12,200 | | | 681,736 |
Atherogenics, Inc. * | | 35,400 | | | 99,474 |
Automatic Data Processing, Inc. | | 43,000 | | | 2,081,200 |
Avon Products, Inc. | | 5,100 | | | 190,026 |
Berkshire Hathaway, Inc. (CI.B) * | | 300 | | | 1,092,000 |
Boeing Company | | 13,800 | | | 1,226,958 |
Boston Scientific Corporation * | | 69,179 | | | 1,005,863 |
Chevron Corporation | | 16,766 | | | 1,240,013 |
Cisco Systems, Inc. * | | 29,800 | | | 760,794 |
Coach, Inc. * | | 17,900 | | | 895,895 |
Colgate-Palmolive Company | | 18,200 | | | 1,215,578 |
Corning, Inc. * | | 84,100 | | | 1,912,434 |
Cree, Inc. * | | 39,500 | | | 650,170 |
eBay, Inc. * | | 88,100 | | | 2,920,515 |
Emerson Electric Company | | 41,300 | | | 1,779,617 |
Genentech, Inc. * | | 9,000 | | | 739,080 |
Getty Images, Inc. * | | 11,200 | | | 544,656 |
Gilead Sciences, Inc. * | | 21,000 | | | 1,606,500 |
InterMune, Inc. * | | 13,100 | | | 323,046 |
International Game Technology | | 25,400 | | | 1,025,652 |
International Rectifier Corporation * | | 17,100 | | | 653,391 |
Intuit, Inc. * | | 59,400 | | | 1,625,184 |
Johnson & Johnson | | 6,800 | | | 409,768 |
JPMorgan Chase & Company | | 18,369 | | | 888,692 |
Juniper Networks, Inc. * | | 104,400 | | | 2,054,592 |
Linear Technology Corporation | | 23,700 | | | 748,683 |
Lockheed Martin Corporation | | 10,800 | | | 1 047 816 |
Maxim Integrated Products, Inc. | | 46,300 | | | 1,361,220 |
McDonald’s Corporation | | 26,100 | | | 1,175,805 |
Medtronic, Inc. | | 12,400 | | | 608,344 |
Microsoft Corporation | | 110,600 | | | 3,082,422 |
Morgan Stanley | | 24,600 | | | 1,937,496 |
Nektar Therapeutics * | | 13,108 | | | 171,191 |
Northern Trust Corporation | | 28,800 | | | 1,732,032 |
Northrop Grumman Corporation | | 12,100 | | | 898,062 |
Nuvelo, Inc. * | | 8,800 | | | 32,384 |
Raytheon Company | | 19,900 | | | 1,043,954 |
Regeneron Pharmaceuticals, Inc. * | | 7,900 | | | 170,798 |
Scientific Games Corporation * | | 5,900 | | | 193,697 |
Sirius Satellite Radio, Inc. * | | 452,900 | | | 1,449,280 |
Theravance, Inc. * | | 13,400 | | | 395,300 |
Tiffany & Company | | 37,300 | | | 1,696,404 |
Wal-Mart Stores, Inc. | | 35,900 | | | 1,685,505 |
Walt Disney Company | | 51,800 | | | 1,783,474 |
Xilinx, Inc. | | 37,500 | | | 964,875 |
Yahoo!, Inc. * | | 11,400 | | | 356,706 |
| | | | | |
| | | | | 57,326,296 |
| | | | | |
TOTAL COMMON STOCK (Cost $132 ,376,945) | | | | $ | 178,735,910 |
| | | | | |
The accompanying notes are an integral part of the financial statements.
27
| | |
| Schedule of Investments | | Security Equity Fund - Global Series |
| March 31, 2007 (Unaudited) - continued | | |
| | | | | | |
| | | Shares | | Value |
PREFERRED STOCK—0.8% | | | | | | |
Germany—0.8% | | | | | | |
Porsche AG | | | 928 | | $ | 1,417,916 |
| | | | | | |
TOTAL PREFERRED STOCK (Cost $456,518) | | | | | $ | 1,417,916 |
| | | | | | |
| | |
| | | Principal
Amount | | Value |
REPURCHASE AGREEMENT—2.3% | | | | | | |
State Street, 2.75%, dated 3/30/07, matures 4/02/07; repurchase amount $4,278,474 (Collateralized by FHLB, 6/08/07 with a value of $4,364,574) | | $ | 4,277,494 | | $ | 4,277,494 |
| | | | | | |
TOTAL REPURCHASE AGREEMENT (Cost $4,277,494) | | | | | $ | 4,277,494 |
| | | | | | |
Total Investments (Security Equity Fund Series) —Global | | | | | $ | 184,431,320 |
(Cost $137,110,957)—99.6% | | | | | | |
Other Assets in Excess of Liabilities—0.4 % | | | | | | 670.737 |
| | | | | | |
TOTAL NET ASSETS—100.0% | | | | | $ | 185,102,057 |
| | | | | | |
INVESTMENT CONCENTRATION
At March 31, 2007, the investment diversification of the fund was as follows:
| | | | | | |
| | |
Industry | | % of Net Assets | | | Value |
Communications Equipment | | 6.8 | % | | $ | 12,651,412 |
Semiconductors | | 5.7 | | | | 10,576,322 |
Pharmaceuticals | | 4.5 | | | | 8,642,031 |
Aerospace & Defense | | 4.4 | | | | 7,885,928 |
Diversified Banks | | 4.0 | | | | 7,308,057 |
Wireless Telecommunication Services | | 3.7 | | | | 7,018,993 |
Application Software | | 3.2 | | | | 5,933,063 |
Apparel Retail | | 3.1 | | | | 5,797,983 |
Integrated Oil & Gas | | 3.0 | | | | 5,678,906 |
Industrial Conglomerates | | 2.9 | | | | 5,535,840 |
Electronic Equipment Manufacturers | | 2.9 | | | | 5,422,039 |
Broadcasting & Cable TV | | 2.9 | | | | 5,339,585 |
Household Products | | 2.8 | | | | 5,179,800 |
Apparel, Accessories & Luxury Goods | | 2.8 | | | | 5,133,602 |
Automobile Manufacturers | | 2.8 | | | | 4,980,476 |
Consumer Electronics | | 2.5 | | | | 4,679,336 |
Repurchase Agreements | | 2.3 | | | | 4,277,494 |
Biotechnology | | 2.3 | | | | 4,232,366 |
Internet Software & Services | | 1.8 | | | | 3,277,221 |
Systems Software | | 1.7 | | | | 3,082,422 |
Property & Casualty Insurance | | 1.6 | | | | 3,028,808 |
Other Diversified Financial Services | | 1.6 | | | | 2,826,188 |
Health Care Equipment | | 1.4 | | | | 2,762,324 |
Diversified Capital Markets | | 1.5 | | | | 2,678,716 |
Life & Health Insurance | | 1.4 | | | | 2,610,959 |
Oil & Gas Drilling | | 1.4 | | | | 2,550,278 |
Multi-Line Insurance | | 1.3 | | | | 2,319,973 |
Packaged Foods & Meats | | 1.2 | | | | 2,293,657 |
Food Retail | | 1.3 | | | | 2,287,857 |
Hotels, Resorts & Cruise Lines | | 1.2 | | | | 2,230,536 |
Oil & Gas Equipment & Services | | 1.2 | | | | 2,117,415 |
Data Processing & Outsourced Services | | 1.1 | | | | 2,081,200 |
Brewers | | 1.2 | | | | 2,073,995 |
IT Consulting & Other Services | | 1.1 | | | | 2,022,134 |
Publishing | | 1.0 | | | | 1,848,398 |
Movies & Entertainment | | 1.0 | | | | 1,783,474 |
Electrical Components & Equipment | | 0.9 | | | | 1,779,617 |
Asset Management & Custody Banks | | 0.9 | | | | 1,732,032 |
Specialty Stores | | 0.9 | | | | 1,696,404 |
Hypermarkets & Super Centers | | 0.9 | | | | 1,685,505 |
Home Entertainment Software | | 0.9 | | | | 1,677,074 |
Soft Drinks | | 0.7 | | | | 1,312,855 |
Casinos & Gaming | | 0.6 | | | | 1,219,349 |
Diversified Commercial & Professional Services | | 0.6 | | | | 1,176,912 |
Restaurants | | 0.6 | | | | 1,175,805 |
Electric Utilities | | 0.6 | | | | 1,140,275 |
Consumer Finance | | 0.6 | | | | 1,076,726 |
Multi-Sector Holdings | | 0.6 | | | | 1,073,441 |
Distillers & Vintners | | 0.6 | | | | 1,040,582 |
Advertising | | 0.6 | | | | 1,002,068 |
Construction & Farm Machinery & Heavy Trucks | | 0.5 | | | | 881,774 |
Office Electronics | | 0.4 | | | | 687,606 |
Regional Banks | | 0.3 | | | | 683,311 |
Life Sciences Tools & Services | | 0.4 | | | | 652,310 |
Leisure Products | | 0.3 | | | | 578,776 |
Reinsurance | | 0.3 | | | | 500,084 |
Industrial Machinery | | 0.3 | | | | 484,101 |
Fertilizers & Agricultural Chemicals | | 0.2 | | | | 445,217 |
Computer Storage & Peripherals | | 0.1 | | | | 210,594 |
Personal Products | | 0.1 | | | | 190,026 |
Oil & Gas Refining & Marketing | | 0.1 | | | | 180,088 |
| | | | | | |
Total Investments | | 99.6 | | | | 184,431,320 |
Other Assets and Liabilities, Net | | 0.4 | | | | 670,737 |
| | | | | | |
Net Assets | | 100 | % | | $ | 185,102,057 |
| | | | | | |
Footnotes
Percentages are stated as a percent of net assets. For federal income tax purposes the identified cost of investments owned at 3/31/2007 was $138,544,478.
| * | —Non-income producing security |
| 1 | —Security is a PFIC (Passive Foreign Investment Company) |
The accompanying notes are an integral part of the financial statements.
28
| | |
| Schedule of Investments | | Security Equity Fund - Global Series |
| March 31, 2007 (Unaudited) - continued | | |
| | |
| Glossary: | | |
| ADR | | - American Depositary Receipt |
| plc | | - Public Limited Company |
See notes to financial statements.
The accompanying notes are an integral part of the financial statements.
29
| | |
| | Security Equity Fund |
| | Global Series |
| | (unaudited) |
Statement of Assets and Liabilities
March 31, 2007
| | | | |
Assets: | | | | |
Investments, at value1 | | $ | 184,431,320 | |
Cash denominated in a foreign currency, at value2 | | | 161,555 | |
Receivables: | | | | |
Securities sold | | | 428,405 | |
Fund shares sold | | | 117,731 | |
Dividends | | | 453,869 | |
Interest | | | 9,791 | |
Foreign taxes recoverable | | | 26,282 | |
Prepaid expenses | | | 30,803 | |
| | | | |
Total assets | | | 185,659,756 | |
| | | | |
Liabilities: | | | | |
Cash overdraft | | | 36,150 | |
Payable for: | | | | |
Securities purchased | | | 49,185 | |
Fund shares redeemed | | | 191,290 | |
Management fees | | | 154,294 | |
Custodian fees | | | 19,301 | |
Transfer agent/maintenance fees | | | 15,783 | |
Administration fees | | | 26,744 | |
Professional fees | | | 13,324 | |
12b-l distribution plan fees | | | 39,949 | |
Directors’ fees | | | 132 | |
Other | | | 11,547 | |
| | | | |
Total liabilities | | | 557,699 | |
| | | | |
Net Assets | | $ | 185,102,057 | |
| | | | |
Net assets consist of: | | | | |
Paid in capital | | $ | 140,497,338 | |
Accumulated net investment loss | | | (5,328,073 | ) |
Undistributed net realized gain on sale of investments and foreign currency transactions | | | 2,610,978 | |
Net unrealized appreciation in value of investments and translation of assets and liabilities in foreign currencies | | | 47,321,814 | |
| | | | |
Net assets | | $ | 185,102,057 | |
| | | | |
Class A: | | | | |
Capital shares outstanding (unlimited number of shares authorized) | | | 7,649,756 | |
Net assets | | $ | 143,921,114 | |
Net asset value and redemption price per share | | $ | 18.81 | |
| | | | |
Maximum offering price per share (net asset value divided by 94.25%) | | $ | 19.96 | |
| | | | |
Class B: | | | | |
Capital shares outstanding (unlimited number of shares authorized) | | | 1,699,289 | |
Net assets | | $ | 29,271,789 | |
Net asset value, offering and redemption price per share (excluding any applicable continge deferred sales charge) | | $ | 17.23 | |
| | | | |
Class C: | | | | |
Capital shares outstanding (unlimited number of shares authorized) | | | 686,371 | |
Net assets | | $ | 11,909,154 | |
Net asset value, offering and redemption price per share (excluding any applicable continge deferred sales charge) | | $ | 17.35 | |
| | | | |
1 Investments, at cost | | $ | 137,110,957 | |
2 Cash denominated in a foreign currency, at cost | | | 163,565 | |
Statement of Operations
For the Six Months Ended March 31, 2007
| | | | |
Investment Income: | | | | |
Dividends (net of foreign witholding tax $63,702) | | $ | 1,098,437 | |
Interest | | | 40,692 | |
| | | | |
Total investment income | | | 1,139,129 | |
| | | | |
Expenses: | | | | |
Management fees | | | 869,918 | |
Custodian fees | | | 50,743 | |
Transfer agent/maintenance fees | | | 155,521 | |
Administration fees | | | 136,870 | |
Directors’ fees | | | 3,727 | |
Professional fees | | | 11,982 | |
Reports to shareholders | | | 9,914 | |
Registration fees | | | 21,529 | |
Other expenses | | | 5,858 | |
12b-l distribution plan fees—Class A | | | 167,240 | |
12b-l distribution plan fees—Class B | | | 144,149 | |
12b-l distribution plan fees—Class C | | | 56,859 | |
| | | | |
Total expenses | | | 1,634,310 | |
Less: Earnings credits | | | (2,203 | ) |
Expenses waived | | | (144,149 | ) |
Net expenses | | | 1,487,958 | |
| | | | |
Net investment loss | | | (348,829 | ) |
| | | | |
Net Realized and Unrealized Gain (Loss): | | | | |
Net realized gain (loss) during the period on: | | | | |
Investments | | | 5,013,970 | |
Foreign currency transactions | | | (48,246 | ) |
| | | | |
Net realized gain | | | 4,965,724 | |
| | | | |
Net unrealized appreciation during the period on: | | | | |
Investments | | | 9,823,856 | |
Translation of assets and liabilities in foreign currencies | | | 2,507 | |
| | | | |
Net unrealized appreciation | | | 9,826,363 | |
| | | | |
Net realized and unrealized gain | | | 14,792,087 | |
| | | | |
Net increase in net assets resulting from operations | | $ | 14,443,258 | |
| | | | |
The accompanying notes are an integral part of the financial statements.
| | |
| | Security Equity Fund |
| Statement of Changes in Net Assets | | Global Series |
| | | | | | | | |
| | | Six Months Ended
March 31, 2007 | | | Year Ended
September 30, 2006 | |
| | | (unaudited) | | | | |
Increase (decrease) in net assets from operations: | | | | | | | | |
Net investment loss | | $ | (348,829 | ) | | $ | (254,402 | ) |
Net realized gain during the period on investments and foreign currency transactions | | | 4,965,724 | | | | 21,748,719 | |
Net unrealized appreciation (depreciation) during the period on investments and translation of assets and liabilities in foreign currencies | | | 9,826,363 | | | | (2,331,105 | ) |
| | | | | | | | |
Net increase in net assets resulting from operations | | | 14,443,258 | | | | 19,163,212 | |
| | | | | | | | |
| | |
Distributions to shareholders from: | | | | | | | | |
Net realized gain | | | | | | | | |
Class A | | | (17,339,157 | ) | | | — | |
Class B | | | (3,994,735 | ) | | | — | |
Class C | | | (1,528,583 | ) | | | — | |
| | | | | | | | |
Total distributions to shareholders | | | (22,862,475 | ) | | | — | |
| | | | | | | | |
| | |
Capital share transactions: | | | | | | | | |
Proceeds from sale of shares | | | | | | | | |
Class A | | | 31,021,294 | | | | 38,473,976 | |
Class B | | | 3,474,410 | | | | 4,863,534 | |
Class C | | | 1,600,044 | | | | 2,579,360 | |
Distributions reinvested | | | | | | | | |
Class A | | | 17,194,918 | | | | — | |
Class B | | | 3,949,908 | | | | — | |
Class C | | | 1,493,247 | | | | — | |
Cost of shares redeemed | | | | | | | | |
Class A | | | (17,149,489 | ) | | | (62,028,224 | ) |
Class B | | | (4,160,117 | ) | | | (9,756,709 | ) |
Class C | | | (934,468 | ) | | | (2,073,631 | ) |
| | | | | | | | |
Net increase (decrease) from capital share transactions | | | 36,489,747 | | | | (27,941,694 | ) |
| | | | | | | | |
Net increase (decrease) in net assets | | | 28,070,530 | | | | (8,778,482 | ) |
| | | | | | | | |
| | |
Net assets: | | | | | | | | |
Beginning of period | | | 157,031,527 | | | | 165,810,009 | |
| | | | | | | | |
End of period | | $ | 185,102,057 | | | $ | 157,031,527 | |
| | | | | | | | |
| | | | | | | | |
Accumulated net investment loss at end of period | | $ | (5,328,073 | ) | | $ | (4,979,244 | ) |
| | | | | | | | |
| | | | | | | | |
| | |
Capital Share Activity: | | | | | | | | |
Shares sold | | | | | | | | |
Class A | | | 1,544,852 | | | | 2,071,616 | |
Class B | | | 190,202 | | | | 283,447 | |
Class C | | | 88,235 | | | | 146,502 | |
Shares reinvested | | | | | | | | |
Class A | | | 922,474 | | | | — | |
Class B | | | 231,666 | | | | — | |
Class C | | | 86,716 | | | | — | |
Shares redeemed | | | | | | | | |
Class A | | | (882,569 | ) | | | (3,331,473 | ) |
Class B | | | (235,433 | ) | | | (569,781 | ) |
Class C | | | (52,479 | ) | | | (119,789 | ) |
The accompanying notes are an integral part of the financial statements.
| | |
| Financial Highlights | | Security Equity Fund |
| Selected data for each share of capital stock outstanding throughout each period | | Global Series |
| | | | | | | | | | | | | | | | | | | | | | | | |
Class A | | Six Months Ended March 31, 2007j | | | 2006 | | | 2005 | | | 2004h | | | 2003 | | | Year Ended September 30,
2002e,g | |
Per Share Data | | | | | | | | | | | | | | | | | | | | | | | | |
Net asset value, beginning of period | | $ | 19.65 | | | $ | 17.47 | | | $ | 13.93 | | | $ | 11.68 | | | $ | 9.49 | | | $ | 11.04 | |
| | | | | | | | | | | | | | | | | | | | | | | | |
Income (loss) from investment operations: | | | | | | | | | | | | | | | | | | | | | | | | |
Net investment lossc | | | (0.04 | ) | | | (0.03 | ) | | | (0.02 | ) | | | (0.03 | ) | | | (0.03 | ) | | | (0.05 | ) |
Net gain (loss) on securities (realized and unrealized) | | | 1.82 | | | | 2.21 | | | | 3.56 | | | | 2.28 | | | | 2.22 | | | | (1.50 | ) |
| | | | | | | | | | | | | | | | | | | | | | | | |
Total from investment operations | | | 1.78 | | | | 2.18 | | | | 3.54 | | | | 2.25 | | | | 2.19 | | | | (1.55 | ) |
| | | | | | | | | | | | | | | | | | | | | | | | |
Less distributions: | | | | | | | | | | | | | | | | | | | | | | | | |
Distributions from realized gains | | | (2.62 | ) | | | — | | | | — | | | | — | | | | — | | | | — | |
| | | | | | | | | | | | | | | | | | | | | | | | |
Total distributions | | | (2.62 | ) | | | — | | | | — | | | | — | | | | — | | | | — | |
| | | | | | | | | | | | | | | | | | | | | | | | |
Net asset value, end of period | | $ | 18.81 | | | $ | 19.65 | | | $ | 17.47 | | | $ | 13.93 | | | $ | 11.68 | | | $ | 9.49 | |
| | | | | | | | | | | | | | | | | | | | | | | | |
Total Returna | | | 9.16 | % | | | 12.48 | % | | | 25.41 | % | | | 19.26 | % | | | 23.08 | % | | | (14.04 | )% |
| | | | | | | | | | | | | | | | | | | | | | | | |
Ratios/Supplemental Data | | | | | | | | | | | | | | | | | | | | | | | | |
Net assets, end of period (in thousands) | | $ | 143,921 | | | $ | 119,176 | | | $ | 127,970 | | | $ | 98,450 | | | $ | 42,711 | | | $ | 50,893 | |
| | | | | | | | | | | | | | | | | | | | | | | | |
Ratios to average net assets: | | | | | | | | | | | | | | | | | | | | | | | | |
Net investment loss | | | (0.39 | )% | | | (0.17 | )% | | | (0.14 | )% | | | (0.20 | )% | | | (0.26 | )% | | | (0.46 | )% |
Total expensesb | | | 1.70 | % | | | 1.75 | % | | | 1.73 | % | | | 1.79 | % | | | 2.00 | % | | | 1.85 | % |
Net expensesd | | | 1.70 | % | | | 1.75 | % | | | 1.73 | % | | | 1.79 | % | | | 2.00 | % | | | 1.85 | % |
| | | | | | | | | | | | | | | | | | | | | | | | |
Portfolio turnover rate | | | 20 | % | | | 28 | % | | | 31 | % | | | 25 | % | | | 62 | % | | | 36 | % |
| | | | | | | | | | | | | | | | | | | | | | | | |
Class B | | Six Months Ended
March 31, 2007i,j | | | 2006i | | | 2005i | | | 2004h | | | 2003 | | | Year Ended,
September 30,
2002e,g | |
Per Share Data | | | | | | | | | | | | | | | | | | | | | | | | |
Net asset value, beginning of period | | $ | 18.17 | | | $ | 16.12 | | | $ | 12.93 | | | $ | 10.93 | | | $ | 8.89 | | | $ | 10.38 | |
| | | | | | | | | | | | | | | | | | | | | | | | |
Income (loss) from investment operations: | | | | | | | | | | | | | | | | | | | | | | | | |
Net investment income (loss)c | | | (0.01 | ) | | | 0.02 | | | | (0.12 | ) | | | (0.13 | ) | | | (0.04 | ) | | | (0.10 | ) |
Net gain (loss) on securities (realized and unrealized) | | | 1.69 | | | | 2.03 | | | | 3.31 | | | | 2.13 | | | | 2.08 | | | | (1.39 | ) |
| | | | | | | | | | | | | | | | | | | | | | | | |
Total from investment operations | | | 1.68 | | | | 2.05 | | | | 3.19 | | | | 2.00 | | | | 2.04 | | | | (1.49 | ) |
| | | | | | | | | | | | | | | | | | | | | | | | |
Less distributions: | | | | | | | | | | | | | | | | | | | | | | | | |
Distributions from realized gains | | | (2.62 | ) | | | — | | | | — | | | | — | | | | — | | | | — | |
| | | | | | | | | | | | | | | | | | | | | | | | |
Total distributions | | | (2.62 | ) | | | — | | | | — | | | | — | | | | — | | | | — | |
| | | | | | | | | | | | | | | | | | | | | | | | |
Net asset value, end of period | | $ | 17.23 | | | $ | 18.17 | | | $ | 16.12 | | | $ | 12.93 | | | $ | 10.93 | | | $ | 8.89 | |
| | | | | | | | | | | | | | | | | | | | | | | | |
Total Returna | | | 9.38 | % | | | 12.72 | % | | | 24.67 | % | | | 18.30 | % | | | 22.95 | % | | | (14.35 | )% |
| | | | | | | | | | | | | | | | | | | | | | | | |
Ratios/Supplemental Data | | | | | | | | | | | | | | | | | | | | | | | | |
Net assets, end of period (in thousands) | | $ | 29,272 | | | $ | 27,494 | | | $ | 28,999 | | | $ | 28,360 | | | $ | 16,461 | | | $ | 19,021 | |
| | | | | | | | | | | | | | | | | | | | | | | | |
Ratios to average net assets: | | | | | | | | | | | | | | | | | | | | | | | | |
Net investment income (loss) | | | (0.16 | )% | | | 0.11 | % | | | (0.80 | )% | | | (1.00 | )% | | | (0.42 | )% | | | (0.89 | )% |
Total expensesb | | | 1.45 | % | | | 1.50 | % | | | 2.38 | % | | | 2.54 | % | | | 2.18 | % | | | 2.28 | % |
Net expensesd | | | 2.45 | % | | | 1.50 | % | | | 2.38 | % | | | 2.54 | % | | | 2.18 | % | | | 2.28 | % |
| | | | | | | | | | | | | | | | | | | | | | | | |
Portfolio turnover rate | | | 20 | % | | | 28 | % | | | 31 | % | | | 25 | % | | | 62 | % | | | 36 | % |
| | | | | | | | | | | | | | | | | | | | | | | | |
The accompanying notes are an integral part of the financial statements.
| | |
| Financial Highlights | | Security Equity Fund |
| Selected data for each share of capital stock outstanding throughout each period | | Global Series |
| | | | | | | | | | | | | | | | | | | | | | | | |
Class C | | Six Months Ended
March 31, 2007j | | | 2006 | | | 2005 | | | 2004h | | | 2003 | | | Year Ended,
September 30,
2002e,f,g | |
Per Share Data | | | | | | | | | | | | | | | | | | | | | | | | |
| | | | | | |
Net asset value, beginning of period | | $ | 18.37 | | | $ | 16.46 | | | $ | 13.22 | | | $ | 11.17 | | | $ | 9.14 | | | $ | 10.72 | |
| | | | | | | | | | | | | | | | | | | | | | | | |
Income (loss) from investment operations: | | | | | | | | | | | | | | | | | | | | | | | | |
Net investment lossc | | | (0.10 | ) | | | (0.15 | ) | | | (0.13 | ) | | | (0.13 | ) | | | (0.09 | ) | | | (0.15 | ) |
Net gain (loss) on securities (realized and unrealized) | | | 1.70 | | | | 2.06 | | | | 3.37 | | | | 2.18 | | | | 2.12 | | | | (1.43 | ) |
| | | | | | | | | | | | | | | | | | | | | | | | |
Total from investment operations | | | 1.60 | | | | 1.91 | | | | 3.24 | | | | 2.05 | | | | 2.03 | | | | (1.58 | ) |
| | | | | | | | | | | | | | | | | | | | | | | | |
Less distributions: | | | | | | | | | | | | | | | | | | | | | | | | |
Distributions from realized gains | | | (2.62 | ) | | | — | | | | — | | | | — | | | | — | | | | — | |
| | | | | | | | | | | | | | | | | | | | | | | | |
Total distributions | | | (2.62 | ) | | | — | | | | — | | | | — | | | | — | | | | — | |
| | | | | | | | | | | | | | | | | | | | | | | | |
Net asset value, end of period | | $ | 17.35 | | | $ | 18.37 | | | $ | 16.46 | | | $ | 13.22 | | | $ | 11.17 | | | $ | 9.14 | |
| | | | | | | | | | | | | | | | | | | | | | | | |
| | | | | | |
Total Returna | | | 8.80 | % | | | 11.60 | % | | | 24.51 | % | | | 18.35 | % | | | 22.21 | % | | | (14.74 | )% |
| | | | | | | | | | | | | | | | | | | | | | | | |
Ratios/Supplemental Data | | | | | | | | | | | | | | | | | | | | | | | | |
| | | | | | |
Net assets, end of period (in thousands) | | $ | 11,909 | | | $ | 10,361 | | | $ | 8,841 | | | $ | 7,557 | | | $ | 5,326 | | | $ | 4,076 | |
| | | | | | | | | | | | | | | | | | | | | | | | |
Ratios to average net assets: | | | | | | | | | | | | | | | | | | | | | | | | |
Net investment loss | | | (1.15 | )% | | | (0.87 | )% | | | (0.90 | )% | | | (1.02 | )% | | | (0.96 | )% | | | (1.33 | )% |
Total expensesb | | | 2.45 | % | | | 2.51 | % | | | 2.48 | % | | | 2.54 | % | | | 2.77 | % | | | 2.74 | % |
Net expensesd | | | 2.45 | % | | | 2.50 | % | | | 2.48 | % | | | 2.54 | % | | | 2.77 | % | | | 2.74 | % |
| | | | | | | | | | | | | | | | | | | | | | | | |
Portfolio turnover rate | | | 20 | % | | | 28 | % | | | 31 | % | | | 25 | % | | | 62 | % | | | 36 | % |
a | Total return information does not reflect deduction of any sales charges imposed at the time of purchase for Class A shares or upon redemption for Class B and C shares. |
b | Total expense information reflects expense ratios absent fund expense reductions by the Investment Manager and custodian earnings credits, as applicable. |
c | Net investment income (loss) was computed using average shares outstanding throughout the period. |
d | Net expense information reflects the expense ratios after voluntary expense waivers, reimbursements and custodian earnings credits, as applicable. |
e | As required, effective October 1, 2001, the Funds adopted the provisions of the AICPA Audit and Accounting Guide for Investment Companies and began amortizing premiums on fixed income securities. The effect of this change for the period ended September 30, 2002, was to increase net investment income per share by less than 1/2 of a cent, decrease net realized and unrealized gains and losses per share by less than 1/2 of a cent and increase the ratio of net investment income to average net assets from 0.06% to 0.07%. Per share, ratios and supplemental data for periods prior to October 1, 2001 have not been restated to reflect this change in presentation. |
f | The financial highlights for Class C shares exclude the historical financial highlights of Class S shares. Class S shares were exchanged for Class C shares on June 3, 2002. |
g | Effective May 1, 2002 the fee structure for Global Series changed. Per share information reflects this change. |
h | The financial highlights for the Global Series exclude the historical financial highlights of the International Series Class A, B and C shares. The net assets of the International Series were acquired by the Global Series on October 3, 2003. |
i | Effective August 25, 2005, Class B shares ceased charging 12b-1 fees in accordance with the NASD sales cap regulations. Per share information reflects this change. This fee may be reinstated at any time. |
j | Unaudited figures for the six months ended March 31, 2007. Percentage amounts, except total return, have been annualized. |
The accompanying notes are an integral part of the financial statements.
This page left blank intentionally.
34
Security Equity Fund
Mid Cap Value Series

Adviser,
Security Management Company, LLC
35
| | |
| | Security Equity Fund |
| Performance Summary | | Mid Cap Value Series |
| March 31, 2007 | | (unaudited) |
PERFORMANCE
Security Mid Cap Value Series vs. Russell 2500 Value Index
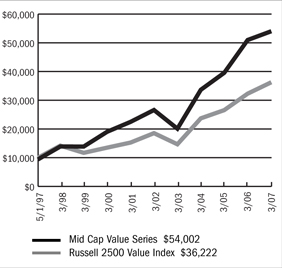
$10,000 Since Inception
This chart assumes a $10,000 investment in Class A shares of Mid Cap Value Series on May 1, 1997 (date of inception), reflects deduction of the 5.75% sales load and assumes all dividends reinvested. The chart does not reflect the deduction of taxes that a shareholder would pay on distributions or the redemption of fund shares. The Russell 2500 Value Index is an unmanaged index that measures the performance of securities of small-to-mid cap U.S. companies with greater-than-average value orientation.
Average Annual Returns
| | | | | | |
Periods Ended 3-31-07 | | 1 Year | | 5 Years | | Since Inception |
A Shares | | 5.93% | | 15.22% | | 19.25% (5-1-97) |
A Shares with sales charge | | (0.16)% | | 13.86% | | 18.54% (5-1-97) |
B Shares | | 5.13% | | 14.34% | | 18.37% (5-1-97) |
B Shares with CDSC | | 0.16% | | 14.11% | | 18.37% (5-1-97) |
C Shares | | 5.14% | | 14.35% | | 16.94% (1-29-99) |
C Shares with CDSC | | 4.14% | | 14.35% | | 16.94% (1-29-99) |
The performance data above represents past performance that is not predictive of future results. The investment return and principal value of an investment in the Series will fluctuate so that an investor’s shares, when redeemed, may be worth more or less than their original cost. The figures above do not reflect deduction of the maximum front-end sales charge of 5.75% for Class A shares or the contingent deferred sales charge of 5% for Class B shares and 1% for Class C shares, as applicable, except where noted. The figures do not reflect the deduction of taxes that a shareholder would pay on distributions or redemption of shares. Such figures would be lower if the maximum sales charge and any applicable taxes were deducted.
Portfolio Composition by Sector as of 3-31-07
| | | |
Consumer Discretionary | | 4.47 | % |
Consumer Staples | | 8.71 | |
Energy | | 18.20 | |
Financials | | 10.95 | |
Health Care | | 2.60 | |
Industrials | | 18.26 | |
Information Technology | | 15.40 | |
Materials | | 3.88 | |
Utilities | | 6.69 | |
Exchange Traded Funds | | 3.25 | |
Commercial Paper | | 3.00 | |
Asset Backed Commercial Paper | | 4.91 | |
Warrants | | 0.15 | |
Repurchase Agreement | | 0.09 | |
Liabilities in excess of other assets | | (0.56 | ) |
Total net assets | | 100.00 | % |
| | | |
The accompanying notes are an integral part of the financial statements.
| | |
| | Security Equity Fund |
| Performance Summary | | Mid Cap Value Series |
| March 31, 2007 | | (unaudited) |
PERFORMANCE
Information About Your Series Expenses
Calculating your ongoing Series expenses
Example
As a shareholder of the Series, you incur two types of costs: (1) transaction costs, which may include sales charges (loads) on purchase payments; contingent deferred sales charges on redemptions; and redemption fees, if any; and (2) ongoing costs, including management fees; distribution and/or service fees (12b-1); and other Series expenses. This example is intended to help you understand your ongoing costs (in dollars) of investing in the Series and to compare these costs with ongoing costs of investing in other mutual funds. The example is based on an investment of $1,000 invested at the beginning of the period and held for the entire period, October 1, 2006 – March 31, 2007.
Actual Expenses
The first line for each class of shares in the table provides information about actual account values and actual expenses. You may use the information in this table, together with the amount you invested, to estimate the expenses that you paid over the period. Simply divide your account value by $1,000 (for example, an $8,600 account value divided by $1,000 = 8.6), then multiply the result by the number in the table under the heading entitled “Expenses Paid During Period” to estimate the expenses you paid on your account during this period.
Hypothetical Example for Comparison Purposes
The second line for each class of shares in the table provides information about hypothetical account values and hypothetical expenses based on the Series actual expense ratio and an assumed rate of return of 5% per year before expenses, which is not the Series actual return. The hypothetical account values and expenses may not be used to estimate the actual ending account balance or expenses you paid for the period. You may use this information to compare the ongoing costs of investing in the Series and other funds. To do so, compare this 5% hypothetical example with the 5% hypothetical examples that appear in the shareholder reports of the other mutual funds.
Please note that the expenses shown in the table are meant to highlight your ongoing costs only and do not reflect any transactional costs, such as sales charges (loads) on purchase payments, contingent deferred sales charges on redemptions, and redemption fees, if any. Therefore, the second line for each class of shares is useful in comparing ongoing costs only, and will not help you determine the relative total costs of owning different funds. In addition, if these transactional costs were included, your costs would have been higher.
Series Expenses
| | | | | | | | | |
| | | Beginning
Account Value
10-01-06 | | Ending
Account Value
03-31-071 | | Expenses Paid
During
Period2 |
Mid Cap Value | | | | | | | | | |
Series—Class A | | | | | | | | | |
Actual | | $ | 1,000.00 | | $ | 1,098.90 | | $ | 6.96 |
Hypothetical | | | 1,000.00 | | | 1,018.30 | | | 6.69 |
| | | |
Mid Cap Value | | | | | | | | | |
Series—Class B | | | | | | | | | |
Actual | | | 1,000.00 | | | 1,094.80 | | | 10.86 |
Hypothetical | | | 1,000.00 | | | 1,014.56 | | | 10.45 |
| | | |
Mid Cap Value | | | | | | | | | |
Series—Class C | | | | | | | | | |
Actual | | | 1,000.00 | | | 1,095.00 | | | 10.86 |
Hypothetical | | | 1,000.00 | | | 1,014.56 | | | 10.45 |
1 | The actual ending account value is based on the actual total return of the Series for the period from October 1, 2006 to March 31, 2007, after actual expenses and will differ from the hypothetical ending account value, which is based on the Series expense ratio and a hypothetical annual return of 5% before expenses. The actual cumulative return at net asset value for the period from October 1, 2006 to March 31, 2007 was 9.89%, 9.48% and 9.50%, for Class A, B and C shares, respectively. |
2 | Expenses are equal to the Series annualized expense ratio (1.33%, 2.08% and 2.08% for Class A, B and C shares, respectively) multiplied by the average account value over the period, multiplied by 182/365 (to reflect the one-half year period). |
| | |
| Schedule of Investments | | Security Equity Fund - Mid Cap Value Series |
| March 31, 2007 (Unaudited) | | |
| | | | | |
| | | Shares | | Value |
COMMON STOCK—91.8% | | | | | |
Aerospace & Defense—1.5% | | | | | |
Orbital Sciences Corporation * | | 762,000 | | $ | 14,279,880 |
| | | | | |
Agricultural Products—0.9% | | | | | |
Corn Products International, Inc. | | 247,700 | | | 8,815,643 |
| | | | | |
Application Software—2.0% | | | | | |
EPIQ Systems, Inc. * | | 784,300 | | | 15,984,034 |
PLATO Learning, Inc. * (1) | | 895,000 | | | 3,759,000 |
| | | | | |
| | | | | 19,743,034 |
| | | | | |
Auto Parts & Equipment—0.4% | | | | | |
HydroGen Corporation LLC * (1)(2) | | 835,000 | | | 3,924,500 |
| | | | | |
Coal & Consumable Fuels—6.7% | | | | | |
Arch Coal, Inc. | | 620,000 | | | 19,027,800 |
Consol Energy, Inc. | | 298,700 | | | 11,688,131 |
Evergreen Energy, Inc. * | | 2,641,000 | | | 17,351,370 |
USEC, Inc. * (3) | | 1,084,000 | | | 17,615,000 |
| | | | | |
| | | | | 65,682,301 |
| | | | | |
Communications Equipment—2.7% | | | | | |
Dycom Industries, Inc. * | | 235,000 | | | 6,124,100 |
EFJ, Inc. * | | 535,300 | | | 2,858,502 |
Mastec, Inc. * | | 1,100,000 | | | 12,111,000 |
MRV Communications, Inc. * | | 1,500,000 | | | 5,325,000 |
| | | | | |
| | | | | 26,418,602 |
| | | | | |
Construction & Engineering—6.8% | | | | | |
Insituform Technologies, Inc. * | | 420,000 | | | 8,731,800 |
Quanta Services, Inc. * | | 1,225,000 | | | 30,894,500 |
Shaw Group, Inc. * | | 867,600 | | | 27,129,852 |
| | | | | |
| | | | | 66,756,152 |
| | | | | |
Consumer Finance—1.2% | | | | | |
First Marblehead Corporation | | 213,150 | | | 9,568,304 |
Nelnet, Inc. | | 83,700 | | | 2,006,289 |
| | | | | |
| | | | | 11,574,593 |
| | | | | |
Data Processing & Outsourced Services -5.6% | | | | | |
Affiliated Computer Services, Inc.* | | 465,300 | | | 27,396,864 |
Computer Sciences Corporation * | | 516,300 | | | 26,914,719 |
| | | | | |
| | | | | 54,311,583 |
| | | | | |
Diversified Commercial & Professional Services -3.5% | | | | | |
FTI Consulting, Inc. * | | 466,000 | | | 15,652,940 |
Navigant Consulting, Inc. * | | 328,000 | | | 6,481,280 |
PHH Corporation * | | 380,000 | | | 11,612,800 |
| | | | | |
| | | | | 33,747,020 |
| | | | | |
Drug Retail—1.3% | | | | | |
Longs Drug Stores Corporation | | 255,000 | | | 13,168,200 |
| | | | | |
Electric Utilities—6.2% | | | | | |
Allete, Inc. | | 70,500 | | | 3,286,710 |
Empire District Electric Company | | 96,600 | | | 2,395,680 |
Great Plains Energy, Inc. | | 1,415,650 | | | 45,937,842 |
Northeast Utilities | | 250,500 | | | 8,208,885 |
Westar Energy, Inc. | | 25,900 | | | 712,768 |
| | | | | |
| | | | | 60,541,885 |
| | | | | |
Electrical Components & Equipment—1.6% | | | | | |
Lime Energy Company * (1) | | 101,200 | | | 91,080 |
Powell Industries, Inc. * | | 11,600 | | | 371,200 |
Power-One, Inc. * | | 2,648,800 | | | 15,151,136 |
| | | | | |
| | | | | 15,613,416 |
| | | | | |
Electronic Manufacturing Services—2.1% | | | | | |
Maxwell Technologies, Inc. * | | 695,000 | | | 8,701,400 |
Merix Corporation * (1)(2) | | 1,476,000 | | | 12,132,720 |
| | | | | |
| | | | | 20,834,120 |
| | | | | |
Exchange Traded Funds—3.3% | | | | | |
iShares Russell 2000 Value Index Fund | | 202,000 | | | 16,351,900 |
iShares S&P MidCap 400 | | 185,000 | | | 15,440,100 |
| | | | | |
| | | | | 31,792,000 |
| | | | | |
Gas Utilities—0.5% | | | | | |
Southern Union Company | | 160,000 | | | 4,862,400 |
| | | | | |
General Merchandise Stores—0.5% | | | | | |
Dollar General Corporation | | 210,800 | | | 4,458,420 |
| | | | | |
Health Care Equipment—0.3% | | | | | |
HealthTronics, Inc. * | | 510,000 | | | 2,748,900 |
| | | | | |
Health Care Facilities—2.3% | | | | | |
Community Health Systems, Inc. * | | 185,000 | | | 6,521,250 |
Triad Hospitals, Inc. * | | 310,000 | | | 16,197,500 |
| | | | | |
| | | | | 22,718,750 |
| | | | | |
Highways & Railtracks—0.8% | | | | | |
Quixote Corporation (1) | | 370,450 | | | 7,409,000 |
| | | | | |
Home Furnishings—0.6% | | | | | |
Leggett & Platt, Inc. | | 268,700 | | | 6,091,429 |
| | | | | |
Independent Power Producers & Energy Traders—0.0% | | | | | |
Dynegy, Inc. * | | 7,754 | | | 71,802 |
| | | | | |
Industrial Conglomerates—3.0% | | | | | |
McDermott International, Inc. * | | 603,800 | | | 29,574,124 |
| | | | | |
Insurance Brokers—0.4% | | | | | |
Hub International, Ltd. | | 96,000 | | | 4,001,280 |
| | | | | |
Integrated Oil & Gas—1.5% | | | | | |
Murphy Oil Corporation | | 279,000 | | | 14,898,600 |
| | | | | |
Life & Health Insurance—0.4% | | | | | |
KMG America Corporation * | | 905,400 | | | 4,192,002 |
| | | | | |
The accompanying notes are an integral part of the financial statements.
38
| | |
| Schedule of Investments | | Security Equity Fund - Mid Cap Value Series |
| March 31, 2007 (Unaudited) - continued | | |
| | | | | |
| | | Shares | | Value |
COMMON STOCK (continued) | | | | | |
Mortgage REIPs—2.5% | | | | | |
HomeBanc Corporation | | 650,000 | | $ | 2,268,500 |
Luminent Mortgage Capital, Inc. | | 750,000 | | | 6,705,000 |
MFA Mortgage Investments, Inc. | | 1,200,000 | | | 9,240,000 |
Opteum, Inc. (1)(2) | | 1,474,400 | | | 6,634,800 |
| | | | | |
| | | | | 24,848,300 |
| | | | | |
Multi-Line Insurance—1.3% | | | | | |
American Financial Group, Inc. | | 382,500 | | | 13,020,300 |
| | | | | |
Oil & Gas Drilling—2.3% | | | | | |
Helmerich & Payne, Inc. | | 740,000 | | | 22,451,600 |
| | | | | |
Oil & Gas Equipment & Services—1.3% | | | | | |
Key Energy Services, Inc. * | | 780,000 | | | 12,753,000 |
| | | | | |
Oil & Gas Exploration & Production—1.5% | | | | | |
Gulfport Energy Corporation * | | 260,000 | | | 3,473,600 |
Newfield Exploration Company * | | 260,000 | | | 10,844,600 |
| | | | | |
| | | | | 14,318,200 |
| | | | | |
Oil & Gas Refining & Marketing—0.4% | | | | | |
Nova Biosource Fuels, Inc. * (1) | | 1,354,900 | | | 3,725,975 |
| | | | | |
Oil & Gas Storage & Transportation—4.1% | | | | | |
Double Hull Tankers, Inc. | | 340,500 | | | 5,032,590 |
Williams Companies, Inc. | | 1,234,000 | | | 35,119,640 |
| | | | | |
| | | | | 40,152,230 |
| | | | | |
Packaged Foods & Meats—3.6% | | | | | |
Hormel Foods Corporation | | 500,000 | | | 18,595,000 |
JM Smucker Company | | 305,000 | | | 16,262,600 |
| | | | | |
| | | | | 34,857,600 |
| | | | | |
Paper Packaging—2.8% | | | | | |
Bemis Company, Inc. | | 440,000 | | | 14,691,600 |
Sonoco Products Company | | 345,600 | | | 12,987,648 |
| | | | | |
| | | | | 27,679,248 |
| | | | | |
Personal Products—2.0% | | | | | |
Alberto-Culver Company | | 180,000 | | | 4,118,400 |
Playtex Products, Inc. * | | 1,150,000 | | | 15,605,500 |
| | | | | |
| | | | | 19,723,900 |
| | | | | |
Property & Casualty Insurance—4.1% | | | | | |
Allegheny Corporation * | | 28,196 | | | 10,533,973 |
Hanover Insurance Group, Inc. | | 212,000 | | | 9,777,440 |
North Pointe Holdings Corporation * (1)(2) | | 525,000 | | | 6,347,250 |
United America Indemnity, Ltd. * | | 154,500 | | | 3,584,400 |
W.R. Berkley Corporation | | 282,500 | | | 9,356,400 |
| | | | | |
| | | | | 39,599,463 |
| | | | | |
Regional Banks—1.0% | | | | | |
South Financial Group, Inc. | | 3,400 | | | 84,048 |
Wilmington Trust Corporation | | 232,000 | | | 9,783,440 |
| | | | | |
| | | | | 9,867,488 |
| | | | | |
Semiconductor Equipment—0.8% | | | | | |
Ultratech, Inc. * | | 603,800 | | | 8,217,718 |
| | | | | |
Semiconductors—2.1% | | | | | |
Applied Micro Circuits Corporation * | | 850,000 | | | 3,102,500 |
IXYS Corporation * | | 926,000 | | | 9,472,980 |
STATS ChipPAC, Ltd. ADR * | | 700,000 | | | 8,414,000 |
| | | | | |
| | | | | 20,989,480 |
| | | | | |
Soft Drinks—0.9% | | | | | |
Cott Corporation * | | 633,600 | | | 8,477,568 |
| | | | | |
Specialized Consumer Services—1.3% | | | | | |
Regis Corporation | | 309,200 | | | 12,482,404 |
| | | | | |
Specialty Chemicals—0.9% | | | | | |
Material Sciences Corporation * | | 85,700 | | | 855,286 |
Minerals Technologies, Inc. | | 134,100 | | | 8,335,656 |
| | | | | |
| | | | | 9,190,942 |
| | | | | |
Specialty Stores—0.2% | | | | | |
Sally Beauty Holdings, Inc. * | | 180,000 | | | 1,654,200 |
| | | | | |
Tires & Rubber—1.5% | | | | | |
Bandag, Inc. | | 296,000 | | | 15,004,240 |
| | | | | |
Trading Companies & Distributors—1.1% | | | | | |
United Rentals, Inc. * (3) | | 383,000 | | | 10,532,500 |
| | | | | |
TOTAL COMMON STOCK (Cost $706,260,784) | | | | $ | 897,775,992 |
| | | | | |
PREFERRED STOCK—0.2% | | | | | |
Diversified Metals & Mining—0.1% | | | | | |
Arch Coal, Inc. | | 4,600 | | | 686,550 |
| | | | | |
Environmental & Facilities Services—0.1% | | | | | |
ThermoEnergy Corporation PIPE * (1)(2)(4)(5) | | 1,745,000 | | | 523,500 |
| | | | | |
Metal & Glass Containers—0.0% | | | | | |
Owens-Illinois, Inc. | | 11,000 | | | 421,300 |
| | | | | |
TOTAL PREFERRED STOCK (Cost $2,281,297) | | | | $ | 1,631,350 |
| | | | | |
WARRANTS—0.2% | | | | | |
Warrants—0.2% | | | | | |
Lime Energy Company $ 1.00, 3/19/2009 (1) | | 29,517 | | | 12,494 |
Nova Biosource Fuels, Inc. $ 2.40, 7/5/2011 (1) | | 677,450 | | | 1,286,330 |
ThermoEnergy Corporation $ 0.75, 7/14/2008 (1)(2)(4) | | 1,745,000 | | | 145,010 |
| | | | | |
| | | | | 1,443,834 |
| | | | | |
TOTAL WARRANTS (Cost $1,561,837) | | | | | 1,443,834 |
| | | | | |
The accompanying notes are an integral part of the financial statements.
39
| | |
| Schedule of Investments | | Security Equity Fund - Mid Cap Value Series |
| March 31, 2007 (Unaudited) - continued | | |
| | | | | | | |
| | | Principal Amount | | Value | |
CONVERTIBLE BOND—0.4% | | | | | | | |
Natural Gas—0.4% | | | | | | | |
Hanover Compressor Company | | | | | | | |
4.75%, 2008 | | $ | 4,000,000 | | $ | 3,880,000 | |
| | | | | | | |
TOTAL CONVERTIBLE BOND (Cost $3,955,478) | | | | | $ | 3,880,000 | |
| | | | | | | |
ASSET BACKED COMMERCIAL PAPER—4.9% | | | | | | | |
Financial Companies - Diversified—1.3% | | | | | | | |
Amstel Funding Corporation | | | | | | | |
5.27%, 4/16/2007 | | | 2,500,000 | | | 2,494,510 | |
Amsterdam Funding Corporation | | | | | | | |
5.25%, 4/9/2007 | | | 4,100,000 | | | 4,095,217 | |
5.25%, 4/11/2007 | | | 3,500,000 | | | 3,494,896 | |
5.25%, 4/23/2007 | | | 3,000,000 | | | 2,990,375 | |
| | | | | | | |
| | | | | | 13,074,998 | |
| | | | | | | |
Financial Companies - Miscellaneous | | | | | | | |
Receivables—2.0% | | | | | | | |
Fairway Finance Corporation | | | | | | | |
5.255%, 4/4/2007 | | | 2,000,000 | | | 1,999,124 | |
5.27%, 4/23/2007 | | | 1,000,000 | | | 996,779 | |
Falcon Asset Securitization Corporation | | | | | | | |
5.262%, 4/17/2007 | | | 4,000,000 | | | 3,990,645 | |
5.27%, 4/20/2007 | | | 1,220,000 | | | 1,216,607 | |
5.27%, 4/26/2007 | | | 4,000,000 | | | 3,985,361 | |
Jupiter Securitization Corporation | | | | | | | |
5.26%, 4/4/2007 | | | 2,500,000 | | | 2,498,904 | |
5.26%, 4/12/2007 | | | 1,800,000 | | | 1,797,107 | |
5.27%, 4/16/2007 | | | 2,700,000 | | | 2,694,071 | |
| | | | | | | |
| | | | | | 19,178,598 | |
| | | | | | | |
Financial Companies - Trade & Term | | | | | | | |
Receivables—0.9% | | | | | | | |
CAFCO LLC | | | | | | | |
5.25%, 4/13/2007 | | | 3,500,000 | | | 3,493,875 | |
5.26%, 4/18/2007 | | | 1,200,000 | | | 1,197,019 | |
Eureka Securitization | | | | | | | |
5.26%, 4/3/2007 | | | 4,000,000 | | | 3,998,831 | |
| | | | | | | |
| | | | | | 8,689,725 | |
| | | | | | | |
Financial Companies - Trade | | | | | | | |
Receivables—0.7% | | | | | | | |
Old Line Funding LLC | | | | | | | |
5.255%, 4/2/2007 | | | 3,449,000 | | | 3,448,497 | |
5.26%, 4/5/2007 | | | 3,600,000 | | | 3,597,896 | |
| | | | | | | |
| | | | | | 7,046,393 | |
| | | | | | | |
TOTAL ASSET BACKED COMMERCIAL PAPER | | | | | $ | 47,989,714 | |
| | | | | | | |
(Cost $47,989,714) | | | | | | | |
COMMERCIAL PAPER 3.0% | | | | | | | |
Automotive—0.2% | | | | | | | |
American Honda Finance | | | | | | | |
5.21%, 4/12/2007 | | | 2,100,000 | | | 2,096,657 | |
| | | | | | | |
Banking—0.7% | | | | | | | |
UBS Finance (DE) LLC | | | | | | | |
5.245%, 4/20/2007 | | | 3,000,000 | | | 2,991,695 | |
5.245%, 4/30/2007 | | | 3,500,000 | | | 3,485,212 | |
| | | | | | | |
| | | | | | 6,476,907 | |
| | | | | | | |
Brokerage—0.4% | | | | | | | |
Merrill Lynch & Company, Inc. | | | | | | | |
5.25%, 4/19/2007 | | | 3,800,000 | | | 3,790,025 | |
| | | | | | | |
Electric—0.4% | | | | | | | |
Southern Company | | | | | | | |
5.27%, 4/24/2007 | | | 4,500,000 | | | 4,484,849 | |
| | | | | | | |
Non U.S. Banking—0.6% | | | | | | | |
Bank of Ireland | | | | | | | |
5.30%, 4/5/2007 | | | 1,600,000 | | | 1,599,058 | |
5.25%, 4/10/2007 | | | 1,000,000 | | | 998,687 | |
Danske Corporation | | | | | | | |
5.25%, 4/27/2007 | | | 3,000,000 | | | 2,988,625 | |
| | | | | | | |
| | | | | | 5,586,370 | |
| | | | | | | |
Pharmaceuticals—0.7% | | | | | | | |
Abbott Laboratories | | | | | | | |
5.23%, 4/10/2007 | | | 3,000,000 | | | 2,996,077 | |
5.23%, 4/18/2007 | | | 3,000,000 | | | 2,992,591 | |
5.23%, 4/27/2007 | | | 1,000,000 | | | 996,223 | |
| | | | | | | |
| | | | | | 6,984,891 | |
| | | | | | | |
TOTAL COMMERCIAL PAPER (Cost $29,419,699) | | | | | $ | 29,419,699 | |
| | | | | | | |
REPURCHASE AGREEMENT—0.1% | | | | | | | |
United Missouri Bank, 4.89%, dated 3/30/07, matures 4/02/07; repurchase amount $893,364 (Collateralized by GNMA, 4.50%, 12/20/27 & U.S. Treasury Note, 4.875%, 4/3/11 with values of $480,697 and $430,618 respectively) | | $ | 893,000 | | $ | 893,000 | |
| | | | | | | |
TOTAL REPURCHASE AGREEMENT (Cost $893,000) | | | | | $ | 893,000 | |
| | | | | | | |
Total Investments (Security Equity Fund - Mid Cap Value Series) | | | | | $ | 983,033,589 | |
(Cost $792,361,809)—100.6% | | | | | | | |
Liabilities in Excess of Other Assets—(0.6)% | | | | | | (5.468.707 | ) |
| | | | | | | |
TOTAL NET ASSETS—100.0% | | | | | $ | 977,564,882 | |
| | | | | | | |
Footnotes
Percentages are stated as a percent of net assets.
For federal income tax purposes the identified cost of investments owned at 3/31/2007 was $792,361,809.
| * | —Non-income producing security |
| 1 | —Security is deemed illiquid. See Note 9 in notes to financial statements. |
| 2 | —Investment in an affiliated issuer. See Note 11 in notes to financial statements. |
The accompanying notes are an integral part of the financial statements.
40
| | |
| Schedule of Investments | | Security Equity Fund - Mid Cap Value Series |
| March 31, 2007 (Unaudited) - continued | | |
| 3 | —Security is segregated as collateral for open written option contracts. |
| 4 | —Security is restricted from resale. See Note 7 in notes to financial statements. |
| 5 | —PIPE (Private Investment in Public Equity)—Stock issued by a company in the secondary market as a means of raising capital more quickly and less expensively than through registration of a secondary public offering. |
Glossary:
| ADR | —American Depositary Receipt |
See notes to financial statements.
The accompanying notes are an integral part of the financial statements.
41
| | |
| | Security Equity Fund |
| | Mid Cap Value Series (unaudited) |
Statement of Assets and Liabilities
March 31, 2007
| | | | |
Assets: | | | | |
Investments in unaffiliated issues, at value1 | | $ | 953,325,809 | |
Investments in affiliated issues, at value2 | | | 29,707,780 | |
| | | | |
Total investments | | | 983,033,589 | |
Cash | | | 6,879 | |
Receivables: | | | | |
Securities sold | | | 271,241 | |
Fund shares sold | | | 2,400,506 | |
Interest | | | 8,777 | |
Dividends | | | 292,857 | |
Prepaid expenses | | | 90,238 | |
| | | | |
Total assets | | | 986,104,087 | |
| | | | |
Liabilities: | | | | |
Payable for: | | | | |
Securities purchased | | | 5,085,818 | |
Fund shares redeemed | | | 1,402,595 | |
Written options, at value (premiums received $610,913) | | | 781,770 | |
Management fees | | | 657,842 | |
Custodian fees | | | 4,204 | |
Transfer agent/maintenance fees | | | 71,316 | |
Administration fees | | | 79,072 | |
Professional fees | | | 32,432 | |
12b-l distribution plan fees | | | 388,340 | |
Other | | | 35,816 | |
| | | | |
Total liabilities | | | 8,539,205 | |
| | | | |
Net Assets | | $ | 977,564,882 | |
| | | | |
Net assets consist of: | | | | |
Paid in capital | | $ | 742,741,498 | |
Undistributed net investment income | | | 341,884 | |
Undistributed net realized gain on sale of investments and options written | | | 43,980,578 | |
Net unrealized appreciation in value of investments and options written | | | 190,500,922 | |
| | | | |
Net assets | | $ | 977,564,882 | |
| | | | |
Class A: | | | | |
Capital shares outstanding (unlimited number of shares authorized) | | | 17,324,873 | |
Net assets | | $ | 687,498,149 | |
Net asset value and redemption price per share | | $ | 39.68 | |
| | | | |
Maximum offering price per share (net asset value divided by 94.25%) | | $ | 42.10 | |
| | | | |
Class B: | | | | |
Capital shares outstanding (unlimited number of shares authorized) | | | 3,159,695 | |
Net assets | | $ | 113,489,427 | |
Net asset value, offering and redemption price per share (excluding any applicable contingent deferred sales charge) | | $ | 35.92 | |
| | | | |
Class C: | | | | |
Capital shares outstanding (unlimited number of shares authorized) | | | 4,816,580 | |
Net assets | | $ | 176,577,306 | |
Net asset value, offering and redemption price per share (excluding any applicable contingent deferred sales charge) | | $ | 36.66 | |
| | | | |
| |
1 Investments in unaffiliated issues, at cost | | $ | 747,930,667 | |
2 Investments in affiliated issues, at cost | | | 44,431,142 | |
| | | | |
Total cost | | | 792,361,809 | |
| |
Statement of Operations | | | | |
For the Six Months Ended March 31, 2007 | | | | |
| |
Investment Income: | | | | |
Dividends from securities of unaffiliated issuers | | $ | 9,007,057 | |
Dividends from securities of affiliated issuers | | | 147,440 | |
Interest | | | 1,986,885 | |
| | | | |
Total investment income | | | 11,141,382 | |
| | | | |
Expenses: | | | | |
Management fees | | | 3,719,270 | |
Custodian fees | | | 25,278 | |
Transfer agent/maintenance fees | | | 648,913 | |
Administration fees | | | 441,858 | |
Directors’ fees | | | 11,918 | |
Professional fees | | | 44,867 | |
Reports to shareholders | | | 33,368 | |
Registration fees | | | 45,090 | |
Other expenses | | | 24,436 | |
12b-l distribution plan fees-Class A | | | 805,301 | |
12b-l distribution plan fees-Class B | | | 565,164 | |
12b-l distribution plan fees-Class C | | | 840,239 | |
| | | | |
Total expenses | | | 7,205,702 | |
Less: Earnings credits | | | (103 | ) |
| | | | |
Net expenses | | | 7,205,599 | |
| | | | |
Net investment income | | | 3,935,783 | |
| | | | |
Net Realized and Unrealized Gain: | | | | |
Net realized gain during the period on: | | | | |
Investments | | | 46,493,993 | |
Options written | | | 804,747 | |
| | | | |
Net realized gain | | | 47,298,740 | |
| | | | |
Net unrealized appreciation during the period on: | | | | |
Investments | | | 33,108,932 | |
Options written | | | 582,198 | |
| | | | |
Net unrealized appreciation | | | 33,691,130 | |
| | | | |
Net realized and unrealized gain | | | 80,989,870 | |
| | | | |
Net increase in net assets resulting from operations | | $ | 84,925,653 | |
| | | | |
The accompanying notes are an integral part of the financial statements.
42
| | |
| | Security Equity Fund |
| Statement of Changes in Net Assets | | Mid Cap Value Series |
| | | | | | | | |
| | | Six Months Ended
March 31, 2007
(unaudited) | | | Year Ended
September 30, 2006 | |
Increase (decrease) in net assets from operations: | | | | | | | | |
Net investment income (loss) | | $ | 3,935,783 | | | $ | (1,056,502 | ) |
Net realized gain during the period on investments and options written | | | 47,298,740 | | | | 53,841,896 | |
Net unrealized appreciation during the period on investments and options written | | | 33,691,130 | | | | 8,972,790 | |
| | | | | | | | |
Net increase in net assets resulting from operations | | | 84,925,653 | | | | 61,758,184 | |
| | | | | | | | |
Distributions to shareholders from: | | | | | | | | |
Net investment income | | | | | | | | |
Class A | | | (3,593,899 | ) | | | — | |
Net realized gain | | | | | | | | |
Class A | | | (32,959,838 | ) | | | (21,770,226 | ) |
Class B | | | (6,506,051 | ) | | | (5,997,235 | ) |
Class C | | | (9,330,424 | ) | | | (6,154,241 | ) |
| | | | | | | | |
Total distributions to shareholders | | | (52,390,212 | ) | | | (33,921,702 | ) |
| | | | | | | | |
Capital share transactions: | | | | | | | | |
Proceeds from sale of shares | | | | | | | | |
Class A | | | 145,501,178 | | | | 336,551,934 | |
Class B | | | 8,854,397 | | | | 24,068,613 | |
Class C | | | 24,254,304 | | | | 66,012,687 | |
Distributions reinvested | | | | | | | | |
Class A | | | 32,587,928 | | | | 20,081,172 | |
Class B | | | 6,199,076 | | | | 5,715,437 | |
Class C | | | 8,812,099 | | | | 5,766,876 | |
Cost of shares redeemed | | | | | | | | |
Class A | | | (109,931,094 | ) | | | (153,088,973 | ) |
Class B | | | (13,992,131 | ) | | | (22,952,102 | ) |
Class C | | | (14,693,462 | ) | | | (17,136,873 | ) |
| | | | | | | | |
Net increase from capital share transactions | | | 87,592,295 | | | | 265,018,771 | |
| | | | | | | | |
Net increase in net assets | | | 120,127,736 | | | | 292,855,253 | |
| | | | | | | | |
Net assets: | | | | | | | | |
Beginning of period | | | 857,437,146 | | | | 564,581,893 | |
| | | | | | | | |
End of period | | $ | 977,564,882 | | | $ | 857,437,146 | |
| | | | | | | | |
Undistributed net investment income at end of period | | $ | 341,884 | | | $ | — | |
| | | | | | | | |
Capital Share Activity: | | | | | | | | |
Shares sold | | | | | | | | |
Class A | | | 3,706,867 | | | | 8,840,332 | |
Class B | | | 246,104 | | | | 695,272 | |
Class C | | | 668,302 | | | | 1,858,360 | |
Shares reinvested | | | | | | | | |
Class A | | | 840,394 | | | | 565,349 | |
Class B | | | 176,260 | | | | 176,130 | |
Class C | | | 245,462 | | | | 174,331 | |
Shares redeemed | | | | | | | | |
Class A | | | (2,798,733 | ) | | | (4,094,527 | ) |
Class B | | | (392,692 | ) | | | (663,202 | ) |
Class C | | | (403,355 | ) | | | (485,231 | ) |
The accompanying notes are an integral part of the financial statements.
| | |
| Financial Highlights | | Security Equity Fund |
| Selected data for each share of capital stock outstanding throughout each period | | Mid Cap Value Series |
| | | | | | | | | | | | | | | | | | | | | | | | |
Class A | | Six Months Ended
March 31, 2007f | | | 2006 | | | 2005 | | | 2004 | | | 2003 | | | Year Ended,
September 30,
2002 | |
Per Share Data | | | | | | | | | | | | | | | | | | | | | | | | |
Net asset value, beginning of period | | $ | 38.27 | | | $ | 36.34 | | | $ | 30.45 | | | $ | 24.48 | | | $ | 16.90 | | | $ | 18.04 | |
| | | | | | | | | | | | | | | | | | | | | | | | |
Income (loss) from investment operations: | | | | | | | | | | | | | | | | | | | | | | | | |
Net investment income (loss)b | | | 0.21 | | | | 0.04 | | | | 0.01 | | | | (0.09 | ) | | | (0.07 | ) | | | (0.04 | ) |
Net gain (loss) on securities (realized and unrealized) | | | 3.52 | | | | 3.96 | | | | 8.16 | | | | 6.32 | | | | 7.65 | | | | (0.78 | ) |
| | | | | | | | | | | | | | | | | | | | | | | | |
Total from investment operations | | | 3.73 | | | | 4.00 | | | | 8.17 | | | | 6.23 | | | | 7.58 | | | | (0.82 | ) |
| | | | | | | | | | | | | | | | | | | | | | | | |
Less distributions: | | | | | | | | | | | | | | | | | | | | | | | | |
Dividends from net investment income | | | (0.23 | ) | | | — | | | | | | | | — | | | | — | | | | — | |
Distributions from realized gains | | | (2.09 | ) | | | (2.07 | ) | | | (2.28 | ) | | | (0.26 | ) | | | — | | | | (0.21 | ) |
Return of capital | | | — | | | | — | | | | — | | | | — | | | | — | | | | (0.11 | ) |
| | | | | | | | | | | | | | | | | | | | | | | | |
Total distributions | | | (2.32 | ) | | | (2.07 | ) | | | (2.28 | ) | | | (0.26 | ) | | | — | | | | (0.32 | ) |
| | | | | | | | | | | | | | | | | | | | | | | | |
Net asset value, end of period | | $ | 39.68 | | | $ | 38.27 | | | $ | 36.34 | | | $ | 30.45 | | | $ | 24.48 | | | $ | 16.90 | |
| | | | | | | | | | | | | | | | | | | | | | | | |
Total Returna | | | 9.89 | % | | | 11.44 | % | | | 27.77 | % | | | 25.59 | % | | | 44.85 | % | | | (4.89 | )% |
| | | | | | | | | | | | | | | | | | | | | | | | |
Ratios/Supplemental Data | | | | | | | | | | | | | | | | | | | | | | | | |
Net assets, end of period (in thousands) | | $ | 687,498 | | | $ | 596,074 | | | $ | 373,031 | | | $ | 215,659 | | | $ | 113,822 | | | $ | 68,544 | |
| | | | | | | | | | | | | | | | | | | | | | | | |
Ratios to average net assets: | | | | | | | | | | | | | | | | | | | | | | | | |
Net investment income (loss) | | | 1.07 | % | | | 0.10 | % | | | 0.04 | % | | | (0.31 | )% | | | (0.33 | )% | | | (0.20 | )% |
Total expensesd | | | 1.33 | % | | | 1.36 | % | | | 1.41 | % | | | 1.48 | % | | | 1.65 | % | | | 1.45 | % |
Net expensese | | | 1.33 | % | | | 1.36 | % | | | 1.41 | % | | | 1.48 | % | | | 1.65 | % | | | 1.45 | % |
| | | | | | | | | | | | | | | | | | | | | | | | |
Portfolio turnover rate | | | 35 | % | | | 33 | % | | | 19 | % | | | 45 | % | | | 52 | % | | | 51 | % |
| | | | | | |
Class B | | Six Months Ended
March 31, 2007f | | | 2006 | | | 2005 | | | 2004 | | | 2003 | | | Year Ended,
September 30,
2002 | |
Per Share Data | | | | | | | | | | | | | | | | | | | | | | | | |
Net asset value, beginning of period | | $ | 34.76 | | | $ | 33.43 | | | $ | 28.37 | | | $ | 22.99 | | | $ | 15.99 | | | $ | 17.26 | |
| | | | | | | | | | | | | | | | | | | | | | | | |
Income (loss) from investment operations: | | | | | | | | | | | | | | | | | | | | | | | | |
Net investment income (loss)b | | | 0.06 | | | | (0.23 | ) | | | (0.22 | ) | | | (0.28 | ) | | | (0.20 | ) | | | (0.21 | ) |
Net gain (loss) on securities (realized and unrealized) | | | 3.19 | | | | 3.63 | | | | 7.56 | | | | 5.92 | | | | 7.20 | | | | (0.74 | ) |
| | | | | | | | | | | | | | | | | | | | | | | | |
Total from investment operations | | | 3.25 | | | | 3.40 | | | | 7.34 | | | | 5.64 | | | | 7.00 | | | | (0.95 | ) |
| | | | | | | | | | | | | | | | | | | | | | | | |
Less distributions: | | | | | | | | | | | | | | | | | | | | | | | | |
Distributions from realized gains | | | (2.09 | ) | | | (2.07 | ) | | | (2.28 | ) | | | (0.26 | ) | | | — | | | | (0.21 | ) |
Return of capital | | | — | | | | — | | | | — | | | | — | | | | — | | | | (0.11 | ) |
| | | | | | | | | | | | | | | | | | | | | | | | |
Total distributions | | | (2.09 | ) | | | (2.07 | ) | | | (2.28 | ) | | | (0.26 | ) | | | — | | | | (0.32 | ) |
| | | | | | | | | | | | | | | | | | | | | | | | |
Net asset value, end of period | | $ | 35.92 | | | $ | 34.76 | | | $ | 33.43 | | | $ | 28.37 | | | $ | 22.99 | | | $ | 15.99 | |
| | | | | | | | | | | �� | | | | | | | | | | | | | |
Total Returna | | | 9.48 | % | | | 10.60 | % | | | 26.83 | % | | | 24.67 | % | | | 43.78 | % | | | (5.88 | )% |
| | | | | | | | | | | | | | | | | | | | | | | | |
Ratios/Supplemental Data | | | | | | | | | | | | | | | | | | | | | | | | |
Net assets, end of period (in thousands) | | $ | 113,489 | | | $ | 108,784 | | | $ | 97,664 | | | $ | 74,650 | | | $ | 53,947 | | | $ | 37,136 | |
| | | | | | | | | | | | | | | | | | | | | | | | |
Ratios to average net assets: | | | | | | | | | | | | | | | | | | | | | | | | |
Net investment income (loss) | | | 0.35 | % | | | (0.68 | )% | | | (0.72 | )% | | | (1.07 | )% | | | (1.08 | )% | | | (1.09 | )% |
Total expensesd | | | 2.08 | % | | | 2.11 | % | | | 2.16 | % | | | 2.23 | % | | | 2.40 | % | | | 2.34 | % |
Net expensese | | | 2.08 | % | | | 2.11 | % | | | 2.16 | % | | | 2.23 | % | | | 2.40 | % | | | 2.34 | % |
| | | | | | | | | | | | | | | | | | | | | | | | |
Portfolio turnover rate | | | 35 | % | | | 33 | % | | | 19 | % | | | 45 | % | | | 52 | % | | | 51 | % |
The accompanying notes are an integral part of the financial statements.
44
| | |
| Financial Highlights | | Security Equity Fund |
| Selected data for each share of capital stock outstanding throughout each period | | Mid Cap Value Series |
| | | | | | | | | | | | | | | | | | | | | | | | |
Class C | | Six Months Ended
March 31, 2007f | | | 2006 | | | 2005 | | | 2004 | | | 2003 | | | Year Ended,
September 30,
2002e | |
Per Share Data | | | | | | | | | | | | | | | | | | | | | | | | |
Net asset value, beginning of period | | $ | 35.43 | | | $ | 34.03 | | | $ | 28.85 | | | $ | 23.37 | | | $ | 16.26 | | | $ | 17.53 | |
| | | | | | | | | | | | | | | | | | | | | | | | |
Income (loss) from investment operations: | | | | | | | | | | | | | | | | | | | | | | | | |
Net investment income (loss)b | | | 0.06 | | | | (0.22 | ) | | | (0.21 | ) | | | (0.29 | ) | | | (0.21 | ) | | | (0.21 | ) |
Net gain (loss) on securities (realized and unrealized) | | | 3.26 | | | | 3.69 | | | | 7.67 | | | | 6.03 | | | | 7.32 | | | | (0.74 | ) |
| | | | | | | | | | | | | | | | | | | | | | | | |
Total from investment operations | | | 3.32 | | | | 3.47 | | | | 7.46 | | | | 5.74 | | | | 7.11 | | | | (0.95 | ) |
| | | | | | | | | | | | | | | | | | | | | | | | |
Less distributions: | | | | | | | | | | | | | | | | | | | | | | | | |
Distributions from realized gains | | | (2.09 | ) | | | (2.07 | ) | | | (2.28 | ) | | | (0.26 | ) | | | — | | | | (0.21 | ) |
Return of capital | | | — | | | | — | | | | — | | | | — | | | | — | | | | (0.11 | ) |
| | | | | | | | | | | | | | | | | | | | | | | | |
Total distributions | | | (2.09 | ) | | | (2.07 | ) | | | (2.28 | ) | | | (0.26 | ) | | | — | | | | (0.32 | ) |
| | | | | | | | | | | | | | | | | | | | | | | | |
Net asset value, end of period | | $ | 36.66 | | | $ | 35.43 | | | $ | 34.03 | | | $ | 28.85 | | | $ | 23.37 | | | $ | 16.26 | |
| | | | | | | | | | | | | | | | | | | | | | | | |
Total Returna | | | 9.50 | % | | | 10.62 | % | | | 26.80 | % | | | 24.70 | % | | | 43.73 | % | | | (5.79 | )% |
| | | | | | | | | | | | | | | | | | | | | | | | |
Ratios/Supplemental Data | | | | | | | | | | | | | | | | | | | | | | | | |
Net assets, end of period (in thousands) | | $ | 176,577 | | | $ | 152,579 | | | $ | 93,887 | | | $ | 54,133 | | | $ | 32,999 | | | $ | 18,785 | |
| | | | | | | | | | | | | | | | | | | | | | | | |
Ratios to average net assets: | | | | | | | | | | | | | | | | | | | | | | | | |
Net investment income (loss) | | | 0.34 | % | | | (0.65 | )% | | | (0.71 | )% | | | (1.06 | )% | | | (1.08 | )% | | | (1.06 | )% |
Total expensesd | | | 2.08 | % | | | 2.11 | % | | | 2.16 | % | | | 2.23 | % | | | 2.40 | % | | | 2.35 | % |
Net expensese | | | 2.08 | % | | | 2.11 | % | | | 2.16 | % | | | 2.23 | % | | | 2.40 | % | | | 2.35 | % |
| | | | | | | | | | | | | | | | | | | | | | | | |
Portfolio turnover rate | | | 35 | % | | | 33 | % | | | 19 | % | | | 45 | % | | | 52 | % | | | 51 | % |
a | Total return information does not reflect deduction of any sales charges imposed at the time of purchase for Class A shares or upon redemption for Class B and C shares. |
b | Net investment income (loss) was computed using average shares outstanding throughout the period. |
c | The financial highlights for Class C shares exclude the historical financial highlights of Class S shares. Class S shares were exchanged for Class C shares on June 3, 2002. |
d | Total expense information reflects expense ratios absent fund expense reductions by the Investment Manager and custodian earnings credits, as applicable. |
e | Net expense information reflects expense ratios after voluntary expense waivers, reimbursements and custodian earnings credits, as applicable. |
f | Unaudited figures for the six months ended March 31, 2007. Percentage amounts, except total return, have been annualized. |
The accompanying notes are an integral part of the financial statements.
This page left blank intentionally.
46
Security Equity Fund
Select 25 Series

Adviser,
Security Management Company, LLC
47
| | |
| | Security Equity Fund |
| Performance Summary | | Select 25 Series |
| March 31, 2007 | | (unaudited) |
PERFORMANCE
Security Select 25 Series vs. Russell 1000 Growth Index
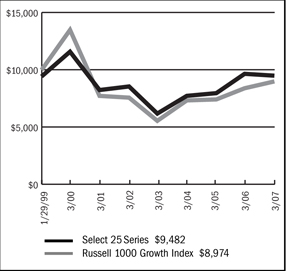
$10,000 Since Inception
This chart assumes a $10,000 investment in Class A shares of Select 25 Series on January 29, 1999 (date of inception), reflects deduction of the 5.75% sales load and assumes all dividends are reinvested. The chart does not reflect the deduction of taxes that a shareholder would pay on distributions or the redemption of fund shares. The Russell 1000 Growth Index is an unmanaged capitalization-weighted index which includes stocks incorporated in the United States and its territories and measures the performance of the Russell 1000 companies with higher price-to-book ratios and higher forecasted growth values.
Average Annual Returns
| | | | | | | | |
Periods Ended 3-31-07 | | 1 Year | | | 5 Years | | | Since Inception |
A Shares | | (1.66 | )% | | 2.12 | % | | 0.07% (1-29-99) |
A Shares with sales charge | | (7.28 | )% | | 0.92 | % | | (0.65)% (1-29-99) |
B Shares | | (2.47 | )% | | 1.34 | % | | (0.63)% (1-29-99) |
B Shares with CDSC | | (7.35 | )% | | 0.96 | % | | (0.63)% (1-29-99) |
C Shares | | (2.46 | )% | | 1.33 | % | | (0.61)% (1-29-99) |
C Shares with CDSC | | (3.44 | )% | | 1.33 | % | | (0.61)% (1-29-99) |
The performance data above represents past performance that is not predictive of future results. The investment return and principal value of an investment in the Series will fluctuate so that an investor’s shares, when redeemed, may be worth more or less than their original cost. The figures above do not reflect deduction of the maximum front-end sales charge of 5.75% for Class A shares or the contingent deferred sales charge of 5% for Class B shares and 1% for Class C shares, as applicable, except where noted. The figures do not reflect the deduction of taxes that a shareholder would pay on distributions or redemption of shares. Such figures would be lower if the maximum sales charge and any applicable taxes were deducted.
Portfolio Composition by Sector as of 3-31-07
| | | |
Consumer Discretionary | | 10.52 | % |
Consumer Staples | | 6.42 | |
Energy | | 12.27 | |
Financials | | 16.97 | |
Health Care | | 12.84 | |
Industrials | | 15.76 | |
Information Technology | | 13.84 | |
Materials | | 1.07 | |
Exchange Traded Funds | | 7.06 | |
Repurchase Agreement | | 3.41 | |
Liabilities in excess of other assets | | (0.16 | ) |
Total net assets | | 100.00 | % |
| | | |
The accompanying notes are an integral part of the financial statements.
| | |
| | Security Equity Fund |
| Performance Summary | | Select 25 Series |
| March 31, 2007 | | (unaudited) |
PERFORMANCE
Information About Your Series Expenses
Calculating your ongoing Series expenses
Example
As a shareholder of the Series, you incur two types of costs: (1) transaction costs, which may include sales charges (loads) on purchase payments; contingent deferred sales charges on redemptions; and redemption fees, if any; and (2) ongoing costs, including management fees; distribution and/or service fees (12b-1); and other Series expenses. This example is intended to help you understand your ongoing costs (in dollars) of investing in the Series and to compare these costs with ongoing costs of investing in other mutual funds. The example is based on an investment of $1,000 invested at the beginning of the period and held for the entire period, October 1, 2006 – March 31, 2007.
Actual Expenses
The first line for each class of shares in the table provides information about actual account values and actual expenses. You may use the information in this table, together with the amount you invested, to estimate the expenses that you paid over the period. Simply divide your account value by $1,000 (for example, an $8,600 account value divided by $1,000 = 8.6), then multiply the result by the number in the table under the heading entitled “Expenses Paid During Period” to estimate the expenses you paid on your account during this period.
Hypothetical Example for Comparison Purposes
The second line for each class of shares in the table provides information about hypothetical account values and hypothetical expenses based on the Series actual expense ratio and an assumed rate of return of 5% per year before expenses, which is not the Series actual return. The hypothetical account values and expenses may not be used to estimate the actual ending account balance or expenses you paid for the period. You may use this information to compare the ongoing costs of investing in the Series and other funds. To do so, compare this 5% hypothetical example with the 5% hypothetical examples that appear in the shareholder reports of the other mutual funds.
Please note that the expenses shown in the table are meant to highlight your ongoing costs only and do not reflect any transactional costs, such as sales charges (loads) on purchase payments, contingent deferred sales charges on redemptions, and redemption fees, if any. Therefore, the second line for each class of shares is useful in comparing ongoing costs only, and will not help you determine the relative total costs of owning different funds. In addition, if these transactional costs were included, your costs would have been higher.
Series Expenses
| | | | | | | | | |
| | | Beginning
Account Value
10-01-06 | | Ending
Account Value
03-31-071 | | Expenses Paid
During
Period2 |
Select 25 | | | | | | | | | |
Series—Class A | | | | | | | | | |
Actual | | $ | 1,000.00 | | $ | 1,020.30 | | $ | 7.71 |
Hypothetical | | | 1,000.00 | | | 1,017.30 | | | 7.70 |
Select 25 | | | | | | | | | |
Series—Class B | | | | | | | | | |
Actual | | | 1,000.00 | | | 1,016.10 | | | 11.51 |
Hypothetical | | | 1,000.00 | | | 1,013.51 | | | 11.50 |
Select 25 | | | | | | | | | |
Series—Class C | | | | | | | | | |
Actual | | | 1,000.00 | | | 1,016.00 | | | 11.51 |
Hypothetical | | | 1,000.00 | | | 1,013.51 | | | 11.50 |
1 | The actual ending account value is based on the actual total return of the Series for the period from October 1, 2006 to March 31, 2007, after actual expenses and will differ from the hypothetical ending account value, which is based on the Series expense ratio and a hypothetical annual return of 5% before expenses. The actual cumulative return at net asset value for the period from October 1, 2006 to March 31, 2007 was 2.03%, 1.61% and 1.60%, for Class A, B and C shares, respectively. |
2 | Expenses are equal to the Series annualized expense ratio (1.53%, 2.29% and 2.29% for Class A, B and C shares, respectively) multiplied by the average account value over the period, multiplied by 182/365 (to reflect the one-half year period). |
49
| | |
| Schedule of Investments | | Security Equity Fund - Select 25 Series |
| March 31, 2007 (Unaudited) | | |
| | | | | | | |
| | | Shares | | Value | |
COMMON STOCK—96.8% | | | | | | | |
Aerospace & Defense—3.1% | | | | | | | |
L-3 Communications Holdings, Inc. | | | 18,813 | | $ | 1,645,573 | |
| | | | | | | |
Air Freight & Logistics—5.0% | | | | | | | |
FedEx Corporation | | | 24,943 | | | 2,679,627 | |
| | | | | | | |
Biotechnology—3.2% | | | | | | | |
Amgen, Inc. * | | | 31,242 | | | 1,745,803 | |
| | | | | | | |
Broadcasting & Cable TV—1.5% | | | | | | | |
CBS Corporation (CI.B) | | | 25,626 | | | 783,899 | |
| | | | | | | |
Coal & Consumable Fuels—2.1% | | | | | | | |
Evergreen Energy, Inc. * | | | 172,100 | | | 1,130,697 | |
| | | | | | | |
Communications Equipment—6.3% | | | | | | | |
ADC Telecommunications, Inc. * | | | 110,374 | | | 1,847,661 | |
Cisco Systems, Inc. * | | | 61,000 | | | 1,557,330 | |
| | | | | | | |
| | | | | | 3,404,991 | |
| | | | | | | |
Construction & Engineering—2.2% | | | | | | | |
Shaw Group, Inc. * | | | 37,154 | | | 1,161,806 | |
| | | | | | | |
Consumer Finance—7.3% | | | | | | | |
Capital One Financial Corporation | | | 22,500 | | | 1,697,850 | |
First Marblehead Corporation | | | 49,213 | | | 2,209,172 | |
| | | | | | | |
| | | | | | 3,907,022 | |
| | | | | | | |
Data Processing & Outsourced Services—5.3% | | | | | | | |
First Data Corporation | | | 40,346 | | | 1,085,307 | |
Western Union Company | | | 80,800 | | | 1,773,560 | |
| | | | | | | |
| | | | | | 2,858,867 | |
| | | | | | | |
Electric Utilities—0.0% | | | | | | | |
Progress Energy, Inc.—Contingent Value Obligation * (1) | | | 400 | | | 124 | |
| | | | | | | |
Exchange Traded Funds—7.0% | | | | | | | |
iShares Russell 1000 Growth Index Fund | | | 33,886 | | | 1,884,739 | |
iShares S&P 500 Growth Index Fund | | | 29,500 | | | 1,906,585 | |
| | | | | | | |
| | | | | | 3,791,324 | |
| | | | | | | |
Home Improvement Retail—5.3% | | | | | | | |
Home Depot, Inc. | | | 78,272 | | | 2,875,713 | |
| | | | | | | |
Hotels, Resorts & Cruise Lines—2.6% | | | | | | | |
Carnival Corporation | | | 30,333 | | | 1,421,404 | |
| | | | | | | |
Hypermarkets & Super Centers—4.3% | | | | | | | |
Wal-Mart Stores, Inc. | | | 49,796 | | | 2,337,922 | |
| | | | | | | |
Industrial Gases—1.1% | | | | | | | |
Praxair, Inc. | | | 9,101 | | | 572,999 | |
| | | | | | | |
Life Sciences Tools & Services—4.8% | | | | | | | |
Covance, Inc. * | | | 43,592 | | | 2,586,749 | |
| | | | | | | |
Movies & Entertainment—1.1% | | | | | | | |
Viacom, Inc. (CI.B) * | | | 13,953 | | | 573,608 | |
| | | | | | | |
Multi-Line Insurance—6.3% | | | | | | | |
American International Group, Inc. | | | 50,634 | | | 3,403,618 | |
| | | | | | | |
Oil & Gas Equipment & Services—4.7% | | | | | | | |
Baker Hughes, Inc. | | | 8,500 | | | 562,105 | |
BJ Services Company | | | 70,477 | | | 1,966,308 | |
| | | | | | | |
| | | | | | 2,528,413 | |
| | | | | | | |
Oil & Gas Storage & Transportation—5.5% | | | | | | | |
Williams Companies, Inc. (2) | | | 103,259 | | | 2,938,751 | |
| | | | | | | |
Other Diversified Financial Services—3.4% | | | | | | | |
Citigroup, Inc. | | | 35,323 | | | 1,813,483 | |
| | | | | | | |
Pharmaceuticals—4.8% | | | | | | | |
Johnson & Johnson | | | 42,617 | | | 2,568,101 | |
| | | | | | | |
Soft Drinks—2.1% | | | | | | | |
PepsiCo, Inc. | | | 17,495 | | | 1,111,982 | |
| | | | | | | |
Systems Software—2.2% | | | | | | | |
Microsoft Corporation | | | 42,100 | | | 1,173,327 | |
| | | | | | | |
Trading Companies & Distributors—5.6% | | | | | | | |
W.W. Grainger, Inc. | | | 38,653 | | | 2,985,558 | |
| | | | | | | |
TOTAL COMMON STOCK (Cost $48,262,527) | | | | | $ | 52,001,361 | |
| | | | | | | |
| | |
| | | Principal
Amount | | Value | |
REPURCHASE AGREEMENT—3.4% | | | | | | | |
United Missouri Bank, 4.89%, dated 3/30/07, matures 4/2/07; repurchase amount $1,830,746 (Collateralized by U.S. Treasury Note, 4.375%, 5/15/07 with a value of $1,866,853) | | $ | 1,830,000 | | $ | 1,830,000 | |
| | | | | | | |
TOTAL REPURCHASE AGREEMENT (Cost $1,830,000) | | | | | $ | 1,830,000 | |
| | | | | | | |
Total Investments (Security Equity Fund—Select 25 Series) | | | | | $ | 53,831,361 | |
(Cost $50,092,527)—100.2% | | | | | | | |
Liabilities in Excess of Other Assets—(0.2)% | | | | | | (85,590 | ) |
| | | | | | | |
TOTAL NET ASSETS—100.0% | | | | | $ | 53,745,771 | |
| | | | | | | |
Footnotes
Percentages are stated as a percent of net assets.
For federal income tax purposes the identified cost of investments owned at 3/31/2007 was $50,191,979.
| * | -Non-income producing security |
| 1 | -Security is deemed illiquid. See Note 9 in notes to financial statements. |
The accompanying notes are an integral part of the financial statements
50
| | |
| Schedule of Investments | | Security Equity Fund - Select 25 Series |
| March 31, 2007 (Unaudited) - continued | | |
2 | - Security is segregated as collateral for open written option contracts. |
See notes to financial statements
The accompanying notes are an integral part of the financial statements.
51
| | |
| | Security Equity Fund |
| | Select 25 Series |
| | (unaudited) |
Statement of Assets and Liabilities
March 31, 2007
| | | | |
Assets: | | | | |
Investments, at value1 | | $ | 53,831,361 | |
Cash | | | 354 | |
Receivables: | | | | |
Fund shares sold | | | 29,493 | |
Dividends | | | 23,572 | |
Prepaid expenses | | | 27,942 | |
| | | | |
Total assets | | | 53,912,722 | |
| | | | |
Liabilities: | | | | |
Payable for | | | | |
Fund shares redeemed | | | 35,328 | |
Written options, at value (premiums received, $27,218) | | | 24,960 | |
Management fees | | | 34,704 | |
Custodian fees | | | 2,961 | |
Transfer agent/maintenance fees | | | 12,203 | |
Administration fees | | | 4,501 | |
Professional fees | | | 18,264 | |
12b-l distribution plan fees | | | 28,052 | |
Other | | | 5,978 | |
| | | | |
Total liabilities | | | 166,951 | |
| | | | |
Net Assets | | $ | 53,745,771 | |
| | | | |
Net assets consist of: | | | | |
Paid in capital | | $ | 61,830,371 | |
Accumulated net investment loss | | | (211,806 | ) |
Accumulated net realized loss on sale of investments and options written | | | (11,613,886 | ) |
Net unrealized appreciation in value of investments and options written | | | 3,741,092 | |
| | | | |
Net assets | | $ | 53,745,771 | |
| | | | |
Class A: | | | | |
Capital shares outstanding (unlimited number of shares authorized) | | | 2,833,624 | |
Net assets | | $ | 28,504,140 | |
Net asset value and redemption price per share | | $ | 10.06 | |
| | | | |
Maximum offering price per share (net asset value divided by 94.25%) | | $ | 10.67 | |
| | | | |
Class B: | | | | |
Capital shares outstanding (unlimited number of shares authorized) | | | 1,417,390 | |
Net assets | | $ | 13,439,700 | |
| | | | |
Net asset value, offering and redemption price per share (excluding any applicable contingent deferred sales charge) | | $ | 9.48 | |
| | | | |
Class C: | | | | |
Capital shares outstanding (unlimited number of shares authorized) | | | 1,240,698 | |
Net assets | | $ | 11,801,931 | |
Net asset value, offering and redemption price per share (excluding any applicable contingent deferred sales charge) | | $ | 9.51 | |
| | | | |
1Investments, at cost | | $ | 50,092,527 | |
Statement of Operations
For the Six Months Ended March 31, 2007
| | | | |
Investment Income: | | | | |
Dividends | | $ | 295,167 | |
Interest | | | 54,108 | |
| | | | |
Total investment income | | | 349,275 | |
| | | | |
Expenses: | | | | |
Management fees | | | 222,052 | |
Custodian fees | | | 4,854 | |
Transfer agent/maintenance fees | | | 97,964 | |
Administration fees | | | 28,303 | |
Directors’ fees | | | 1,010 | |
Professional fees | | | 8,308 | |
Registration fees | | | 16,872 | |
Other expenses | | | 1,361 | |
12b-l distribution plan fees—Class A | | | 38,570 | |
12b-l distribution plan fees—Class B | | | 78,020 | |
12b-l distribution plan fees—Class C | | | 63,769 | |
| | | | |
Total expenses | | | 561,083 | |
Less: Earnings credits | | | (2 | ) |
| | | | |
Net expenses | | | 561,081 | |
| | | | |
Net investment loss | | | (211,806 | ) |
| | | | |
Net Realized and Unrealized Gain (Loss): | | | | |
Net realized gain during the period on: | | | | |
Investments | | | 5,710,442 | |
Options written | | | 77,650 | |
| | | | |
Net realized gain | | | 5,788,092 | |
| | | | |
Net unrealized appreciation (depreciation) during the period on: | | | | |
Investments | | | (4,338,468 | ) |
Options written | | | 30,885 | |
| | | | |
Net unrealized depreciation | | | (4,307,583 | ) |
| | | | |
Net realized and unrealized gain | | | 1,480,509 | |
| | | | |
Net increase in net assets resulting from operations | | $ | 1,268,703 | |
| | | | |
The accompanying notes are an integral part of the financial statements.
| | |
| | Security Equity Fund |
| Statement of Changes in Net Assets | | Select 25 Series |
| | | | | | | | |
| | | Six Months Ended
March 31, 2007 (unaudited) | | | Year Ended
September 30, 2006 | |
Increase (decrease) in net assets from operations: | | | | | | | | |
Net investment loss | | $ | (211,806 | ) | | $ | (376,395 | ) |
Net realized gain during the period on investments and options written | | | 5,788,092 | | | | 1,021,606 | |
Net unrealized appreciation (depreciation) during the period on investments and options written | | | (4,307,583 | ) | | | 3,322,165 | |
| | | | | | | | |
Net increase in net assets resulting from operations | | | 1,268,703 | | | | 3,967,376 | |
| | | | | | | | |
Capital share transactions: | | | | | | | | |
Proceeds from sale of shares | | | | | | | | |
Class A | | | 4,778,248 | | | | 7,864,377 | |
Class B | | | 656,142 | | | | 4,340,849 | |
Class C | | | 798,019 | | | | 2,041,112 | |
Issuance of shares in connection with Enhanced Index Series, Large Cap Growth Series & Social Awareness Series (Note 12) | | | | | | | | |
Class A | | | — | | | | 15,062,441 | |
Class B | | | — | | | | 9,166,885 | |
Class C | | | — | | | | 8,374,157 | |
Cost of shares redeemed | | | | | | | | |
Class A | | | (7,063,364 | ) | | | (6,429,656 | ) |
Class B | | | (3,608,282 | ) | | | (4,179,088 | ) |
Class C | | | (2,012,188 | ) | | | (2,220,890 | ) |
| | | | | | | | |
Net increase (decrease) from capital share transactions | | | (6,451,425 | ) | | | 34,020,187 | |
| | | | | | | | |
Net increase (decrease) in net assets | | | (5,182,722 | ) | | | 37,987,563 | |
| | | | | | | | |
Net assets: | | | | | | | | |
Beginning of period | | | 58,928,493 | | | | 20,940,930 | |
| | | | | | | | |
End of period | | $ | 53,745,771 | | | $ | 58,928,493 | |
| | | | | | | | |
Accumulated net investment loss at end of period | | $ | (211,806 | ) | | $ | — | |
| | | | | | | | |
Capital Share Activity: | | | | | | | | |
Shares sold | | | | | | | | |
Class A | | | 468,076 | | | | 803,448 | |
Class B | | | 67,658 | | | | 468,049 | |
Class C | | | 81,993 | | | | 220,684 | |
Issuance of shares in connection with Enhanced Index Series, Large Cap Growth Series & Social Awareness Series (Note 12) | | | | | | | | |
Class A | | | — | | | | 1,968,338 | |
Class B | | | — | | | | 929,480 | |
Class C | | | — | | | | 826,684 | |
Shares redeemed | | | | | | | | |
Class A | | | (685,058 | ) | | | (676,660 | ) |
Class B | | | (373,210 | ) | | | (459,639 | ) |
Class C | | | (206,568 | ) | | | (244,326 | ) |
The accompanying notes are an integral part of the financial statements.
| | |
| Financial Highlights | | Security Equity Fund |
| Selected data for each share of capital stock outstanding throughout each period | | Select 25 Series |
| | | | | | | | | | | | | | | | | | | | | | | | |
Class A | | Six Months Ended
March 31, 2007g | | | 2006d | | | 2005 | | | 2004 | | | 2003 | | | Year Ended
September 30,
2002 | |
Per Share Data | | | | | | | | | | | | | | | | | | | | | | | | |
Net asset value, beginning of period | | $ | 9.86 | | | $ | 9.36 | | | $ | 7.81 | | | $ | 7.27 | | | $ | 6.52 | | | $ | 7.58 | |
| | | | | | | | | | | | | | | | | | | | | | | | |
Income (loss) from investment operations: | | | | | | | | | | | | | | | | | | | | | | | | |
Net investment lossb | | | (0.02 | ) | | | (0.06 | ) | | | (0.07 | ) | | | (0.06 | ) | | | (0.05 | ) | | | (0.07 | ) |
Net gain (loss) on securities (realized and unrealized) | | | 0.22 | | | | 0.56 | | | | 1.62 | | | | 0.60 | | | | 0.80 | | | | (0.99 | ) |
| | | | | | | | | | | | | | | | | | | | | | | | |
Total from investment operations | | | 0.20 | | | | 0.50 | | | | 1.55 | | | | 0.54 | | | | 0.75 | | | | (1.06 | ) |
| | | | | | | | | | | | | | | | | | | | | | | | |
Net asset value, end of period | | $ | 10.06 | | | $ | 9.86 | | | $ | 9.36 | | | $ | 7.81 | | | $ | 7.27 | | | $ | 6.52 | |
| | | | | | | | | | | | | | | | | | | | | | | | |
Total Returna | | | 2.03 | % | | | 5.34 | % | | | 19.85 | % | | | 7.43 | % | | | 11.50 | % | | | (13.98 | )% |
| | | | | | | | | | | | | | | | | | | | | | | | |
Ratios/Supplemental Data | | | | | | | | | | | | | | | | | | | | | | | | |
Net assets, end of period (in thousands) | | $ | 28,504 | | | $ | 30,078 | | | $ | 8,912 | | | $ | 9,228 | | | $ | 10,396 | | | $ | 11,933 | |
| | | | | | | | | | | | | | | | | | | | | | | | |
Ratios to average net assets: | | | | | | | | | | | | | | | | | | | | | | | | |
Net investment loss | | | (0.35 | )% | | | (0.68 | )% | | | (0.79 | )% | | | (0.75 | )% | | | (0.70 | )% | | | (0.81 | )% |
Total expensese | | | 1.53 | % | | | 1.76 | % | | | 1.67 | % | | | 1.56 | % | | | 1.63 | % | | | 1.46 | % |
Net expenses | | | 1.53 | % | | | 1.76 | % | | | 1.67 | % | | | 1.56 | % | | | 1.63 | % | | | 1.46 | % |
| | | | | | | | | | | | | | | | | | | | | | | | |
Portfolio turnover rate | | | 30 | % | | | 39 | % | | | 13 | % | | | 44 | % | | | 54 | % | | | 33 | % |
| | | | | | | | | | | | | | | | | | | | | | | | |
Class B | | Six Months Ended
March 31, 2007g | | | 2006d | | | 2005 | | | 2004 | | | 2003 | | | Year Ended
September 30,
2002 | |
Per Share Data | | | | | | | | | | | | | | | | | | | | | | | | |
Net asset value, beginning of period | | $ | 9.33 | | | $ | 8.92 | | | $ | 7.50 | | | $ | 7.04 | | | $ | 6.36 | | | $ | 7.44 | |
| | | | | | | | | | | | | | | | | | | | | | | | |
Income (loss) from investment operations: | | | | | | | | | | | | | | | | | | | | | | | | |
Net investment lossb | | | (0.05 | ) | | | (0.13 | ) | | | (0.13 | ) | | | (0.11 | ) | | | (0.10 | ) | | | (0.13 | ) |
Net gain (loss) on securities (realized and unrealized) | | | 0.20 | | | | 0.54 | | | | 1.55 | | | | 0.57 | | | | 0.78 | | | | (0.95 | ) |
| | | | | | | | | | | | | | | | | | | | | | | | |
Total from investment operations | | | 0.15 | | | | 0.41 | | | | 1.42 | | | | 0.46 | | | | 0.68 | | | | (1.08 | ) |
| | | | | | | | | | | | | | | | | | | | | | | | |
Net asset value, end of period | | $ | 9.48 | | | $ | 9.33 | | | $ | 8.92 | | | $ | 7.50 | | | $ | 7.04 | | | $ | 6.36 | |
| | | | | | | | | | | | | | | | | | | | | | | | |
Total Returna | | | 1.61 | % | | | 4.60 | % | | | 18.93 | % | | | 6.53 | % | | | 10.69 | % | | | (14.52 | )% |
| | | | | | | | | | | | | | | | | | | | | | | | |
Ratios/Supplemental Data | | | | | | | | | | | | | | | | | | | | | | | | |
Net assets, end of period (in thousands) | | $ | 13,440 | | | $ | 16,073 | | | $ | 7,000 | | | $ | 7,333 | | | $ | 8,203 | | | $ | 8,566 | |
| | | | | | | | | | | | | | | | | | | | | | | | |
Ratios to average net assets: | | | | | | | | | | | | | | | | | | | | | | | | |
Net investment loss | | | (1.11 | )% | | | (1.46 | )% | | | (1.54 | )% | | | (1.50 | )% | | | (1.45 | )% | | | (1.56 | )% |
Total expensese | | | 2.29 | % | | | 2.53 | % | | | 2.42 | % | | | 2.31 | % | | | 2.38 | % | | | 2.21 | % |
Net expensesf | | | 2.29 | % | | | 2.53 | % | | | 2.42 | % | | | 2.31 | % | | | 2.38 | % | | | 2.21 | % |
| | | | | | | | | | | | | | | | | | | | | | | | |
Portfolio turnover rate | | | 30 | % | | | 39 | % | | | 13 | % | | | 44 | % | | | 54 | % | | | 33 | % |
The accompanying notes are an integral part of the financial statements.
| | |
| Financial Highlights | | Security Equity Fund |
| Selected data for each share of capital stock outstanding throughout each period | | Select 25 Series |
| | | | | | | | | | | | | | | | | | | | | | | | |
Class C | | Six Months Ended
March 31, 2007g | | | 2006d | | | 2005 | | | 2004 | | | 2003 | | | Year Ended September 30,
2002e | |
Per Share Data | | | | | | | | | | | | | | | | | | | | | | | | |
Net asset value, beginning of period | | $ | 9.36 | | | $ | 8.94 | | | $ | 7.52 | | | $ | 7.06 | | | $ | 6.38 | | | $ | 7.47 | |
| | | | | | | | | | | | | | | | | | | | | | | | |
Income (loss) from investment operations: | | | | | | | | | | | | | | | | | | | | | | | | |
Net investment lossb | | | (0.05 | ) | | | (0.13 | ) | | | (0.13 | ) | | | (0.11 | ) | | | (0.10 | ) | | | (0.13 | ) |
Net gain (loss) on securities (realized and unrealized) | | | 0.20 | | | | 0.55 | | | | 1.55 | | | | 0.57 | | | | 0.78 | | | | (0.96 | ) |
| | | | | | | | | | | | | | | | | | | | | | | | |
Total from investment operations | | | 0.15 | | | | 0.42 | | | | 1.42 | | | | 0.46 | | | | 0.68 | | | | (1.09 | ) |
| | | | | | | | | | | | | | | | | | | | | | | | |
Net asset value, end of period | | $ | 9.51 | | | $ | 9.36 | | | $ | 8.94 | | | $ | 7.52 | | | $ | 7.06 | | | $ | 6.38 | |
| | | | | | | | | | | | | | | | | | | | | | | | |
Total Returna | | | 1.60 | % | | | 4.70 | % | | | 18.88 | % | | | 6.52 | % | | | 10.66 | % | | | (14.59 | )% |
| | | | | | | | | | | | | | | | | | | | | | | | |
Ratios/Supplemental Data | | | | | | | | | | | | | | | | | | | | | | | | |
Net assets, end of period (in thousands) | | $ | 11,802 | | | $ | 12,777 | | | $ | 5,029 | | | $ | 5,866 | | | $ | 6,225 | | | $ | 3,954 | |
| | | | | | | | | | | | | | | | | | | | | | | | |
Ratios to average net assets: | | | | | | | | | | | | | | | | | | | | | | | | |
Net investment loss | | | (1.11 | )% | | | (1.44 | )% | | | (1.54 | )% | | | (1.50 | )% | | | (1.44 | )% | | | (1.56 | )% |
Total expensese | | | 2.29 | % | | | 2.52 | % | | | 2.42 | % | | | 2.31 | % | | | 2.37 | % | | | 2.21 | % |
Net expensesf | | | 2.29 | % | | | 2.52 | % | | | 2.42 | % | | | 2.31 | % | | | 2.37 | % | | | 2.21 | % |
| | | | | | | | | | | | | | | | | | | | | | | | |
Portfolio turnover rate | | | 30 | % | | | 39 | % | | | 13 | % | | | 44 | % | | | 54 | % | | | 33 | % |
a | Total return information does not reflect deduction of any sales charges imposed at the time of purchase for Class A shares or upon redemption for Class B and C shares. |
b | Net investment loss was computed using average shares outstanding throughout the period. |
c | The financial highlights for Class C shares exclude the historical financial highlights of Class S shares. Class S shares were exchanged for Class C shares on June 3, 2002. |
d | The financial highlights for the Select 25 Series exclude the historical financial highlights of the Enhanced Index Series, Class A, B and C shares, the Large Cap Growth Series, Class A, B and C shares and the Social Awareness Series Class A, B and C shares. A total of $29,412,366 was excluded from purchases in the portfolio turnover calculation. This was the cost of the securities Select 25 received as a result of the merger. The assets of the Enhanced Index, Large Cap Growth and Social Awareness Series’ were acquired by the Select 25 Series on June 16, 2006. |
e | Total expense information reflects expense ratios absent fund expense reductions by the Investment Manager and custodian earnings credits, as applicable. |
f | Net expense information reflects the expense ratios after voluntary expense waivers, reimbursements and custodian earnings credits, as applicable. |
g | Unaudited figures for the six months ended March 31, 2007. Percentage amounts, except total return, have been annualized. |
The accompanying notes are an integral part of the financial statements.
55
This page left blank intentionally.
56
Security Equity Fund
Small Cap Growth Series

Subadviser,
RS Investments
57
| | |
| | Security Equity Fund |
| Performance Summary | | Small Cap Growth Series |
| March 31, 2007 | | (unaudited) |
PERFORMANCE
Security Small Cap Growth Series vs. Russell 2000 Growth Index
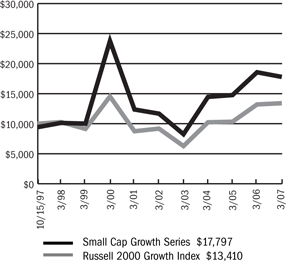
$10,000 Since Inception
This chart assumes a $10,000 investment in Class A shares of Small Cap Growth Series on October 15, 1997 (date of inception), reflects deduction of the 5.75% sales load and assumes all dividends reinvested. The chart does not reflect the deduction of taxes that a shareholder would pay on distributions or the redemption of fund shares. The Russell 2000 Growth Index measures the performance of those Russell 2000 companies with higher price-to-book ratios and higher forecasted growth values.
Portfolio Composition by Sector as of 3-31-07
| | | |
Consumer Discretionary | | 14.57 | % |
Consumer Staples | | 1.16 | |
Energy | | 5.32 | |
Financials | | 14.28 | |
Health Care | | 21.56 | |
Industrials | | 14.21 | |
Information Technology | | 20.82 | |
Telecommunication Services | | 2.44 | |
Repurchase Agreement | | 3.50 | |
Cash & other assets, less liabilities | | 2.14 | |
Total net assets | | 100.00 | % |
| | | |
Average Annual Returns
| | | | | | | | |
Periods Ended 3-31-07 | | 1 Year | | | 5 Years | | | Since Inception |
A Shares | | (4.12 | )% | | 8.80 | % | | 6.95% (10-15-97) |
A Shares with sales charge | | (9.64 | )% | | 7.52 | % | | 6.28% (10-15-97) |
B Shares | | (4.77 | )% | | 8.00 | % | | 6.12% (10-15-97) |
B Shares with CDSC | | (9.53 | )% | | 7.70 | % | | 6.12% (10-15-97) |
C Shares | | (4.80 | )% | | 8.01 | % | | 5.78% (1-29-99) |
C Shares with CDSC | | (5.76 | )% | | 8.01 | % | | 5.78% (1-29-99) |
The performance data above represents past performance that is not predictive of future results. The investment return and principal value of an investment in the Series will fluctuate so that an investor’s shares, when redeemed, may be worth more or less than their original cost. The figures above do not reflect deduction of the maximum front-end sales charge of 5.75% for Class A shares or the contingent deferred sales charge of 5% for Class B shares and 1% for Class C shares, as applicable, except where noted. The figures do not reflect the deduction of taxes that a shareholder would pay on distributions or redemption of shares. Such figures would be lower if the maximum sales charge and any applicable taxes were deducted. Fee waivers reduced expenses of the Series and in the absence of such waiver, the performance quoted would be reduced.
The accompanying notes are an integral part of the financial statements.
| | |
| | Security Equity Fund |
| Performance Summary | | Small Cap Growth Series |
| March 31, 2007 | | (unaudited) |
PERFORMANCE
Information About Your Series Expenses
Calculating your ongoing Series expenses
Example
As a shareholder of the Series, you incur two types of costs: (1) transaction costs, which may include sales charges (loads) on purchase payments; contingent deferred sales charges on redemptions; and redemption fees, if any; and (2) ongoing costs, including management fees; distribution and/or service fees (12b-1); and other Series expenses. This example is intended to help you understand your ongoing costs (in dollars) of investing in the Series and to compare these costs with ongoing costs of investing in other mutual funds. The example is based on an investment of $1,000 invested at the beginning of the period and held for the entire period, October 1, 2006 – March 31, 2007.
Actual Expenses
The first line for each class of shares in the table provides information about actual account values and actual expenses. You may use the information in this table, together with the amount you invested, to estimate the expenses that you paid over the period. Simply divide your account value by $1,000 (for example, an $8,600 account value divided by $1,000 = 8.6), then multiply the result by the number in the table under the heading entitled “Expenses Paid During Period” to estimate the expenses you paid on your account during this period.
Hypothetical Example for Comparison Purposes
The second line for each class of shares in the table provides information about hypothetical account values and hypothetical expenses based on the Series actual expense ratio and an assumed rate of return of 5% per year before expenses, which is not the Series actual return. The hypothetical account values and expenses may not be used to estimate the actual ending account balance or expenses you paid for the period. You may use this information to compare the ongoing costs of investing in the Series and other funds. To do so, compare this 5% hypothetical example with the 5% hypothetical examples that appear in the shareholder reports of the other mutual funds.
Please note that the expenses shown in the table are meant to highlight your ongoing costs only and do not reflect any transactional costs, such as sales charges (loads) on purchase payments, contingent deferred sales charges on redemptions, and redemption fees, if any. Therefore, the second line for each class of shares is useful in comparing ongoing costs only, and will not help you determine the relative total costs of owning different funds. In addition, if these transactional costs were included, your costs would have been higher.
Series Expenses
| | | | | | | | | |
| | | Beginning
Account Value
10-01-06 | | Ending
Account Value
03-31-071 | | Expenses Paid
During
Period2 |
Small Cap Growth | | | | | | | | | |
Series—Class A | | | | | | | | | |
Actual | | $ | 1,000.00 | | $ | 1,085.70 | | $ | 9.31 |
Hypothetical | | | 1,000.00 | | | 1,016.01 | | | 9.00 |
Small Cap Growth | | | | | | | | | |
Series—Class B | | | | | | | | | |
Actual | | | 1,000.00 | | | 1,082.10 | | | 13.24 |
Hypothetical | | | 1,000.00 | | | 1,012.22 | | | 12.79 |
Small Cap Growth | | | | | | | | | |
Series—Class C | | | | | | | | | |
Actual | | | 1,000.00 | | | 1,082.70 | | | 13.24 |
Hypothetical | | | 1,000.00 | | | 1,012.22 | | | 12.79 |
1 | The actual ending account value is based on the actual total return of the Series for the period from October 1, 2006 to March 31, 2007, after actual expenses and will differ from the hypothetical ending account value, which is based on the Series expense ratio and a hypothetical annual return of 5% before expenses. The actual cumulative return at net asset value for the period from October 1, 2006 to March 31, 2007 was 8.57%, 8.21% and 8.27%, for Class A, B and C shares, respectively. |
2 | Expenses are equal to the Series annualized expense ratio (1.79%, 2.55% and 2.55% for Class A, B and C shares, respectively), net of any applicable fee waivers and/or custodian earnings credits, multiplied by the average account value over the period, multiplied by 182/365 (to reflect the one-half year period). |
59
| | |
| Schedule of Investments | | Security Equity Fund - Small Cap Growth Series |
| March 31, 2007 (Unaudited) | | |
| | | | | |
| | | Shares | | Value |
COMMON STOCK—94.4% | | | | | |
Aerospace & Defense—5.8% | | | | | |
BE Aerospace, Inc. * | | 30,350 | | $ | 962,095 |
Ceradyne, Inc. * | | 11,880 | | | 650,311 |
Heico Corporation | | 21,920 | | | 799,861 |
Ladish Company, Inc. * | | 15,190 | | | 571,752 |
| | | | | |
| | | | | 2,984,019 |
| | | | | |
Airlines—0.7% | | | | | |
Allegiant Travel Company * | | 12,140 | | | 382,410 |
| | | | | |
Alternative Carriers—1.1% | | | | | |
Time Warner Telecom, Inc. * | | 28,070 | | | 583,014 |
| | | | | |
Apparel Retail—2.4% | | | | | |
Cache, Inc. * | | 25,770 | | | 457,418 |
Jos A. Bank Clothiers, Inc. * | | 22,826 | | | 806,899 |
| | | | | |
| | | | | 1,264,317 |
| | | | | |
Application Software—2.8% | | | | | |
Advent Software, Inc. * | | 24,420 | | | 851,525 |
Concur Technologies, Inc. * | | 33,750 | | | 589,275 |
| | | | | |
| | | | | 1,440,800 |
| | | | | |
Asset Management & Custody Banks—0.8% | | | | | |
Penson Worldwide, Inc. * | | 13,390 | | | 404,244 |
| | | | | |
Broadcasting & Cable TV—0.7% | | | | | |
DG FastChannel, Inc. * | | 22,300 | | | 370,849 |
| | | | | |
Casinos & Gaming—3.5% | | | | | |
Century Casinos, Inc. * | | 77,540 | | | 639,705 |
Scientific Games Corporation * | | 35,690 | | | 1,171,703 |
| | | | | |
| | | | | 1,811,408 |
| | | | | |
Computer Hardware—0.8% | | | | | |
Cray, Inc. * | | 31,370 | | | 432,592 |
| | | | | |
Education Services—1.1% | | | | | |
DeVry, Inc. | | 19,800 | | | 581,130 |
| | | | | |
Electronic Equipment Manufacturers—0.6% | | | | | |
DTS, Inc. * | | 12,020 | | | 291,245 |
| | | | | |
Environmental & Facilities Services—2.3% | | | | | |
Rollins, Inc. | | 31,390 | | | 722,284 |
Team, Inc. * | | 12,730 | | | 485,649 |
| | | | | |
| | | | | 1,207,933 |
| | | | | |
Footwear—2.0% | | | | | |
CROCS, Inc. * | | 8,490 | | | 401,153 |
Iconix Brand Group, Inc. * | | 30,780 | | | 627,912 |
| | | | | |
| | | | | 1,029,065 |
| | | | | |
Health Care Equipment—11.8% | | | | | |
American Medical Systems Holdings, Inc. * | | 44,560 | | | 943,335 |
Angiodynamics, Inc. * | | 39,020 | | | 659,048 |
Cutera, Inc. * | | 12,580 | | | 455,270 |
Kyphon, Inc. * | | 7,560 | | | 341,258 |
LeMaitre Vascular, Inc. * | | 84,190 | | | 543,026 |
Micrus Endovascular Corporation * | | 23,980 | | | 571,683 |
NuVasive, Inc. * | | 27,740 | | | 658,825 |
Orthovita, Inc. * | | 114,880 | | | 335,450 |
Resmed, Inc. * | | 15,760 | | | 793,831 |
Spectranetics Corporation * | | 76,620 | | | 819,834 |
| | | | | |
| | | | | 6,121,560 |
| | | | | |
Health Care Facilities—2.6% | | | | | |
Five Star Quality Care, Inc. * | | 85,730 | | | 881,305 |
NovaMed, Inc. * | | 73,640 | | | 477,187 |
| | | | | |
| | | | | 1,358,492 |
| | | | | |
Health Care Services—1.0% | | | | | |
HMS Holdings Corporation * | | 23,330 | | | 510,927 |
| | | | | |
Health Care Supplies—1.6% | | | | | |
PolyMedica Corporation | | 19,962 | | | 844,991 |
| | | | | |
Health Care Technology—2.5% | | | | | |
Systems Xcellence, Inc. * | | 25,200 | | | 474,768 |
Trizetto Group * | | 25,430 | | | 508,854 |
Vital Images, Inc. * | | 9,340 | | | 310,649 |
| | | | | |
| | | | | 1,294,271 |
| | | | | |
Home Entertainment Software—2.7% | | | | | |
The9, Ltd. ADR * | | 20,230 | | | 682,560 |
THQ, Inc. * | | 20,390 | | | 697,134 |
| | | | | |
| | | | | 1,379,694 |
| | | | | |
Human Resource & Employment Services—1.5% | | | | | |
Barrett Business Services | | 34,010 | | | 783,931 |
| | | | | |
Industrial Machinery—1.3% | | | | | |
Flow International Corporation * | | 63,820 | | | 685,427 |
| | | | | |
Integrated Telecommunication Services—1.3% | | | | | |
Cbeyond, Inc. * | | 23,110 | | | 677,816 |
| | | | | |
Internet Retail—1.8% | | | | | |
NutriSystem, Inc. * | | 17,940 | | | 940,235 |
| | | | | |
Internet Software & Services—12.2% | | | | | |
Cybersource Corporation * | | 52,490 | | | 656,650 |
DealerTrack Holdings, Inc. * | | 16,130 | | | 495,514 |
Equinix, Inc. * | | 5,245 | | | 449,129 |
j2 Global Communications, Inc. * | | 33,090 | | | 917,255 |
Marchex, Inc. (CI.B) | | 50,970 | | | 780,860 |
Navisite, Inc. * | | 98,750 | | | 593,487 |
Online Resources Corporation * | | 49,390 | | | 566,503 |
Perficient, Inc. * | | 30,660 | | | 606,455 |
RADVision, Ltd. * | | 24,250 | | | 572,300 |
The accompanying notes are an integral part of the financial statements.
60
| | |
| Schedule of Investments | | Security Equity Fund - Small Cap Growth Series |
| March 31, 2007 (Unaudited) - continued | | |
| | | | | | |
| | | Shares | | Value |
COMMON STOCK (continued) | | | | | | |
Internet Software & Services (continued) | | | | | | |
WebEx Communications, Inc. * | | | 11,530 | | $ | 655,596 |
| | | | | | |
| | | | | | 6,293,749 |
| | | | | | |
Investment Banking & Brokerage—3.0% | | | | | | |
Investment Technology Group, Inc. * | | | 22,810 | | | 894,152 |
Optionable, Inc. * | | | 32,300 | | | 191,539 |
optionsXpress Holdings, Inc. | | | 19,560 | | | 460,442 |
| | | | | | |
| | | | | | 1,546,133 |
| | | | | | |
Leisure Facilities—1.2% | | | | | | |
Life Time Fitness, Inc. * | | | 12,010 | | | 617,434 |
| | | | | | |
Marine Ports & Services—1.2% | | | | | | |
Aegean Marine Petroleum Network, Inc. | | | 37,030 | | | 623,585 |
| | | | | | |
Mortgage REITs—1.7% | | | | | | |
KKR Financial Corporation | | | 32,030 | | | 878,583 |
| | | | | | |
Oil & Gas Equipment & Services—5.3% | | | | | | |
Core Laboratories N.V. * | | | 7,610 | | | 637,946 |
Dril-Quip, Inc. * | | | 14,210 | | | 615,009 |
Oil States International, Inc. * | | | 23,300 | | | 747,697 |
Superior Energy Services, Inc. * | | | 21,860 | | | 753,514 |
| | | | | | |
| | | | | | 2,754,166 |
| | | | | | |
Packaged Foods & Meats—1.2% | | | | | | |
SunOpta, Inc. * | | | 50,690 | | | 603,211 |
| | | | | | |
Pharmaceuticals—2.0% | | | | | | |
KV Pharmaceutical Company * | | | 27,060 | | | 669,194 |
Medicis Pharmaceutical Corporation | | | 11,700 | | | 360,594 |
| | | | | | |
| | | | | | 1,029,788 |
| | | | | | |
Property & Casualty Insurance—4.5% | | | | | | |
Amerisafe, Inc. * | | | 26,900 | | | 507,065 |
Amtrust Financial Services, Inc. | | | 56,700 | | | 598,752 |
First Mercury Financial Corporation * | | | 24,000 | | | 493,200 |
Security Capital Assurance, Ltd. | | | 25,760 | | | 727,205 |
| | | | | | |
| | | | | | 2,326,222 |
| | | | | | |
Real Estate Management & Development—1.5% | | | | | | |
FirstService Corporation * | | | 27,180 | | | 749,624 |
| | | | | | |
Semiconductor Equipment—1.0% | | | | | | |
Varian Semiconductor Equipment Associates, Inc. * | | | 9,830 | | | 524,725 |
| | | | | | |
Semiconductors—0.8% | | | | | | |
Atheros Communications, Inc. * | | | 17,290 | | | 413,750 |
| | | | | | |
Specialized Consumer Services—1.8% | | | | | | |
Steiner Leisure, Ltd. * | | | 20,580 | | | 925,688 |
| | | | | | |
Specialized Finance—2.9% | | | | | | |
International Securities Exchange Holdings, Inc. | | | 13,290 | | | 648,552 |
Portfolio Recovery Associates, Inc. * | | | 18,730 | | | 836,295 |
| | | | | | |
| | | | | | 1,484,847 |
| | | | | | |
Trading Companies & Distributors—0.7% | | | | | | |
Houston Wire & Cable Company * | | | 11,890 | | | 333,158 |
| | | | | | |
Trucking—0.7% | | | | | | |
Old Dominion Freight Line, Inc. * | | | 12,650 | | | 364,447 |
| | | | | | |
TOTAL COMMON STOCK (Cost $41,658,337) | | | | | $ | 48,849,480 |
| | | | | | |
| | |
| | | Principal
Amount | | Value |
REPURCHASE AGREEMENT—3.5% | | | | | | |
United Missouri Bank, 4.89%, dated 3/30/07, matures 4/02/07; repurchase amount $1,815,740 (Collateralized by U.S. Treasury Note, 4.375%, 5/15/07 & U.S. Treasury Note, 6.50%, 2/15/10 with values of $1,596,677 & $255,412 respectively) | | $ | 1,815,00 | | $ | 1,815,000 |
| | | | | | |
TOTAL REPURCHASE AGREEMENT (Cost $1,815,000) | | | | | $ | 1,815,000 |
| | | | | | |
Total Investments (Security Equity Fund - Small Cap Growth Series) | | | | | $ | 50,664,480 |
(Cost $43,473,337)—97.9% | | | | | | |
Other Assets in Excess of Liabilities—2.1% | | | | | | 1,105,827 |
| | | | | | |
TOTAL NET ASSETS—100.0% | | | | | $ | 51,770,307 |
| | | | | | |
Footnotes
Percentages are stated as a percent of net assets.
For federal income tax purposes the identified cost of investments owned at 3/31/2007 was $43,704,684.
| * | — Non-income producing security |
Glossary:
| ADR | — American Depositary Receipt |
See notes to financial statements.
The accompanying notes are an integral part of the financial statements.
61
| | |
| | Security Equity Fund |
| | Small Cap Growth Series |
| | (unaudited) |
Statement of Assets and Liabilities
March 31, 2007
| | | | |
Assets: | | | | |
Investments, at value1 | | $ | 50,664,480 | |
Cash | | | 583 | |
Receivables: | | | | |
Fund shares sold | | | 26,926 | |
Securities sold | | | 1,774,821 | |
Dividends | | | 2,059 | |
Prepaid expenses | | | 23,845 | |
| | | | |
Total assets | | | 52,492,714 | |
| | | | |
Liabilities: | | | | |
Payable for: | | | | |
Securities purchased | | | 582,865 | |
Fund shares redeemed | | | 54,604 | |
Management fees | | | 43,568 | |
Custodian fees | | | 2,298 | |
Transfer agent/maintenance fees | | | 8,492 | |
Administration fees | | | 4,679 | |
Professional fees | | | 8,348 | |
12b-1 distribution plan fees | | | 16,877 | |
Directors’ fees | | | 187 | |
Other | | | 489 | |
| | | | |
Total liabilities | | | 722,407 | |
| | | | |
Net Assets | | $ | 51,770,307 | |
| | | | |
Net assets consist of: | | | | |
Paid in capital | | $ | 43,827,120 | |
Accumulated net investment loss | | | (386,171 | ) |
Undistributed net realized gain on sale of investments | | | 1,138,215 | |
Net unrealized appreciation in value of investments | | | 7,191,143 | |
| | | | |
Net assets | | $ | 51,770,307 | |
| | | | |
Class A: | | | | |
Capital shares outstanding (unlimited number of shares authorized) | | | 2,497,688 | |
Net assets | | $ | 42,396,451 | |
Net asset value and redemption price per share | | $ | 16.97 | |
| | | | |
Maximum offering price per share (net asset value divided by 94.25%) | | $ | 18.01 | |
| | | | |
Class B: | | | | |
Capital shares outstanding (unlimited number of shares authorized) | | | 350,639 | |
Net assets | | $ | 5,455,375 | |
Net asset value, offering and redemption price per share (excluding any applicable contingent deferred sales charge) | | $ | 15.56 | |
| | | | |
Class C: | | | | |
Capital shares outstanding (unlimited number of shares authorized) | | | 247,283 | |
Net assets | | $ | 3,918,481 | |
Net asset value, offering and redemption price per share (excluding any applicable contingent deferred sales charge) | | $ | 15.85 | |
| | | | |
1 Investments, at cost | | $ | 43,473,337 | |
| |
Statement of Operations For the Six Months Ended March 31, 2007 | | | | |
| |
Investment Income: | | | | |
Dividends | | $ | 64,139 | |
Interest | | | 91,547 | |
| | | | |
Total investment income | | | 155,686 | |
| | | | |
Expenses: | | | | |
Management fees | | | 281,341 | |
Custodian fees | | | 13,271 | |
Transfer agent/maintenance fees | | | 77,791 | |
Administration fees | | | 27,712 | |
Directors’ fees | | | 1,302 | |
Professional fees | | | 12,522 | |
Reports to shareholders | | | 1,732 | |
Registration fees | | | 17,715 | |
Other expenses | | | 1,838 | |
12b-1 distribution plan fees—Class A | | | 57,921 | |
12b-1 distribution plan fees—Class B | | | 28,646 | |
12b-1 distribution plan fees—Class C | | | 21,009 | |
| | | | |
Total expenses | | | 542,800 | |
Less: Earnings credits | | | (943 | ) |
| | | | |
Net expenses | | | 541,857 | |
| | | | |
Net investment loss | | | (386,171 | ) |
| | | | |
Net Realized and Unrealized Gain: | | | | |
Net realized gain during the period on: | | | | |
Investments | | | 3,429,937 | |
| | | | |
Net realized gain | | | 3,429,937 | |
| | | | |
Net unrealized appreciation during the period on: | | | | |
Investments | | | 1,666,100 | |
| | | | |
Net realized and unrealized gain | | | 5,096,037 | |
| | | | |
Net increase in net assets resulting from operations | | $ | 4,709,866 | |
| | | | |
The accompanying notes are an integral part of the financial statements.
| | |
| | Security Equity Fund |
| Statement of Changes in Nets Assets | | Small Cap Growth Series |
| | | | | | | | |
| | | Six Months Ended
March 31, 2007
(unaudited) | | | Year Ended
September 30, 2006 | |
Increase (decrease) in net assets from operations: | | | | | | | | |
Net investment loss | | $ | (386,171 | ) | | $ | (722,692 | ) |
Net realized gain during the period on investments | | | 3,429,937 | | | | 1,764,643 | |
Net unrealized appreciation (depreciation) during the period on investments | | | 1,666,100 | | | | (1,130,941 | ) |
| | | | | | | | |
Net increase (decrease) in net assets resulting from operations | | | 4,709,866 | | | | (88,990 | ) |
| | | | | | | | |
Capital share transactions: | | | | | | | | |
Proceeds from sale of shares | | | | | | | | |
Class A | | | 8,030,559 | | | | 34,591,629 | |
Class B | | | 375,210 | | | | 2,145,297 | |
Class C | | | 442,327 | | | | 1,341,687 | |
Cost of shares redeemed | | | | | | | | |
Class A | | | (14,994,614 | ) | | | (11,879,893 | ) |
Class B | | | (1,298,578 | ) | | | (4,367,496 | ) |
Class C | | | (1,168,999 | ) | | | (1,407,378 | ) |
| | | | | | | | |
Net increase (decrease) from capital share transactions | | | (8,614,095 | ) | | | 20,423,846 | |
| | | | | | | | |
Net increase (decrease) in net assets | | | (3,904,229 | ) | | | 20,334,856 | |
| | | | | | | | |
Net assets: | | | | | | | | |
Beginning of period | | | 55,674,536 | | | | 35,339,680 | |
| | | | | | | | |
End of period | | $ | 51,770,307 | | | $ | 55,674,536 | |
| | | | | | | | |
Accumulated net investment loss at end of period | | $ | (386,171 | ) | | $ | — | |
| | | | | | | | |
Capital Share Activity: | | | | | | | | |
Shares sold | | | | | | | | |
Class A | | | 486,272 | | | | 2,223,136 | |
Class B | | | 24,521 | | | | 141,177 | |
Class C | | | 28,509 | | | | 87,821 | |
Shares redeemed | | | | | | | | |
Class A | | | (896,807 | ) | | | (751,218 | ) |
Class B | | | (85,560 | ) | | | (296,698 | ) |
Class C | | | (75,160 | ) | | | (90,959 | ) |
The accompanying notes are an integral part of the financial statements.
63
| | |
| Financial Highlights | | Security Equity Fund |
| Selected data for each share of capital stock outstanding throughout each period | | Small Cap Growth Series |
| | | | | | | | | | | | | | | | | | | | | | | | |
Class A | | Six Months Ended
March 31, 2007g | | | 2006 | | | 2005 | | | 2004 | | | 2003 | | | Year Ended
September 30,
2002f | |
Per Share Data | | | | | | | | | | | | | | | | | | | | | | | | |
Net asset value, beginning of period | | $ | 15.63 | | | $ | 15.76 | | | $ | 13.11 | | | $ | 11.63 | | | $ | 7.88 | | | $ | 9.80 | |
Income (loss) from investment operations: | | | | | | | | | | | | | | | | | | | | | | | | |
Net investment lossc | | | (0.10 | ) | | | (0.23 | ) | | | (0.24 | ) | | | (0.25 | ) | | | (0.18 | ) | | | (0.20 | ) |
Net gain (loss) on securities (realized and unrealized) | | | 1.44 | | | | 0.10 | | | | 2.89 | | | | 1.73 | | | | 3.93 | | | | (1.72 | ) |
| | | | | | | | | | | | | | | | | | | | | | | | |
Total from investment operations | | | 1.34 | | | | (0.13 | ) | | | 2.65 | | | | 1.48 | | | | 3.75 | | | | (1.92 | ) |
Net asset value, end of period | | $ | 16.97 | | | $ | 15.63 | | | $ | 15.76 | | | $ | 13.11 | | | $ | 11.63 | | | $ | 7.88 | |
| | | | | | | | | | | | | | | | | | | | | | | | |
Total Returna | | | 8.57 | % | | | (0.82 | )% | | | 20.21 | % | | | 12.73 | % | | | 47.59 | % | | | (19.59 | )% |
Ratios/Supplemental Data | | | | | | | | | | | | | | | | | | | | | | | | |
Net assets, end of period (in thousands) | | $ | 42,396 | | | $ | 45,451 | | | $ | 22,637 | | | $ | 21,443 | | | $ | 14,406 | | | $ | 8,350 | |
Ratios to average net assets: | | | | | | | | | | | | | | | | | | | | | | | | |
Net investment loss | | | (1.24 | )% | | | (1.46 | )% | | | (1.67 | )% | | | (1.95 | )% | | | (2.01 | )% | | | (1.93 | )% |
Total expensesb | | | 1.80 | % | | | 2.01 | % | | | 2.10 | % | | | 2.09 | % | | | 2.51 | % | | | 2.14 | % |
Net expensesd | | | 1.79 | % | | | 2.01 | % | | | 2.10 | % | | | 2.09 | % | | | 2.25 | % | | | 2.14 | % |
Portfolio turnover rate | | | 171 | % | | | 136 | % | | | 134 | % | | | 157 | % | | | 206 | % | | | 302 | % |
| | | | | | |
Class B | | Six Months Ended
March 31, 2007g | | | 2006 | | | 2005 | | | 2004 | | | 2003 | | | Year Ended
September 30,
2002f | |
Per Share Data | | | | | | | | | | | | | | | | | | | | | | | | |
Net asset value, beginning of period | | $ | 14.38 | | | $ | 14.60 | | | $ | 12.24 | | | $ | 10.94 | | | $ | 7.47 | | | $ | 9.37 | |
Income (loss) from investment operations: | | | | | | | | | | | | | | | | | | | | | | | | |
Net investment lossc | | | (0.15 | ) | | | (0.36 | ) | | | (0.33 | ) | | | (0.33 | ) | | | (0.24 | ) | | | (0.26 | ) |
Net gain (loss) on securities (realized and unrealized) | | | 1.33 | | | | 0.14 | | | | 2.69 | | | | 1.63 | | | | 3.71 | | | | (1.64 | ) |
| | | | | | | | | | | | | | | | | | | | | | | | |
Total from investment operations | | | 1.18 | | | | (0.22 | ) | | | 2.36 | | | | 1.30 | | | | 3.47 | | | | (1.90 | ) |
Net asset value, end of period | | $ | 15.56 | | | $ | 14.38 | | | $ | 14.60 | | | $ | 12.24 | | | $ | 10.94 | | | $ | 7.47 | |
| | | | | | | | | | | | | | | | | | | | | | | | |
Total Returna | | | 8.21 | % | | | (1.51 | )% | | | 19.28 | % | | | 11.88 | % | | | 46.45 | % | | | (20.28 | )% |
Ratios/Supplemental Data | | | | | | | | | | | | | | | | | | | | | | | | |
Net assets, end of period (in thousands) | | $ | 5,455 | | | $ | 5,919 | | | $ | 8,283 | | | $ | 9,218 | | | $ | 6,838 | | | $ | 4,292 | |
Ratios to average net assets: | | | | | | | | | | | | | | | | | | | | | | | | |
Net investment loss | | | (1.99 | )% | | | (2.31 | )% | | | (2.41 | )% | | | (2.69 | )% | | | (2.76 | )% | | | (2.69 | )% |
Total expensesb | | | 2.55 | % | | | 2.79 | % | | | 2.85 | % | | | 2.84 | % | | | 3.23 | % | | | 2.90 | % |
Net expensesd | | | 2.55 | % | | | 2.79 | % | | | 2.85 | % | | | 2.83 | % | | | 3.00 | % | | | 2.90 | % |
Portfolio turnover rate | | | 171 | % | | | 136 | % | | | 134 | % | | | 157 | % | | | 206 | % | | | 302 | % |
The accompanying notes are an integral part of the financial statements.
| | |
| Financial Highlights | | Security Equity Fund |
| Selected data for each share of capital stock outstanding through each period | | Small Cap Growth Series |
| | | | | | | | | | | | | | | | | | | | | | | | |
Class C | | Six Months Ended
March 31, 2007g | | | 2006 | | | 2005 | | | 2004 | | | 2003 | | | Year Ended
September 30,
2002e,f | |
Per Share Data | | | | | | | | | | | | | | | | | | | | | | | | |
Net asset value, beginning of period | | $ | 14.64 | | | $ | 14.88 | | | $ | 12.47 | | | $ | 11.15 | | | $ | 7.61 | | | $ | 9.53 | |
| | | | | | | | | | | | | | | | | | | | | | | | |
Income (loss) from investment operations: | | | | | | | | | | | | | | | | | | | | | | | | |
Net investment lossc | | | (0.16 | ) | | | (0.35 | ) | | | (0.33 | ) | | | (0.33 | ) | | | (0.24 | ) | | | (0.26 | ) |
Net gain (loss) on securities (realized and unrealized) | | | 1.37 | | | | 0.11 | | | | 2.74 | | | | 1.65 | | | | 3.78 | | | | (1.66 | ) |
| | | | | | | | | | | | | | | | | | | | | | | | |
Total from investment operations | | | 1.21 | | | | (0.24 | ) | | | 2.41 | | | | 1.32 | | | | 3.54 | | | | (1.92 | ) |
| | | | | | | | | | | | | | | | | | | | | | | | |
Net asset value, end of period | | $ | 15.85 | | | $ | 14.64 | | | $ | 14.88 | | | $ | 12.47 | | | $ | 11.15 | | | $ | 7.61 | |
| | | | | | | | | | | | | | | | | | | | | | | | |
Total Returna | | | 8.27 | % | | | (1.61 | )% | | | 19.33 | % | | | 11.84 | % | | | 46.52 | % | | | (20.15 | )% |
| | | | | | | | | | | | | | | | | | | | | | | | |
Ratios/Supplemental Data | | | | | | | | | | | | | | | | | | | | | | | | |
Net assets, end of period (in thousands) | | $ | 3,918 | | | $ | 4,304 | | | $ | 4,420 | | | $ | 4,160 | | | $ | 3,533 | | | $ | 2,164 | |
| | | | | | | | | | | | | | | | | | | | | | | | |
Ratios to average net assets: | | | | | | | | | | | | | | | | | | | | | | | | |
Net investment loss | | | (1.99 | )% | | | (2.29 | )% | | | (2.42 | )% | | | (2.69 | )% | | | (2.76 | )% | | | (2.69 | )% |
Total expensesb | | | 2.55 | % | | | 2.79 | % | | | 2.85 | % | | | 2.83 | % | | | 3.23 | % | | | 2.91 | % |
Net expensesd | | | 2.55 | % | | | 2.79 | % | | | 2.85 | % | | | 2.82 | % | | | 3.00 | % | | | 2.91 | % |
| | | | | | | | | | | | | | | | | | | | | | | | |
Portfolio turnover rate | | | 171 | % | | | 136 | % | | | 134 | % | | | 157 | % | | | 206 | % | | | 302 | % |
a | Total return information does not reflect deduction of any sales charges imposed at the time of purchase for Class A shares or upon redemption for Class B and C shares. |
b | Total expense information reflects expense ratios absent fund expense reductions by the Investment Manager and custodian earnings credits, as applicable. |
c | Net investment income (loss) was computed using average shares outstanding throughout the period. |
d | Net expense information reflects expense ratios after voluntary expense waivers and custodian earnings credits, as applicable. |
e | The financial highlights for Class C shares exclude the historical financial highlights of Class S shares. Class S shares were exchanged for Class C shares on June 3, 2002. |
f | RS Investments, Inc. became the sub–adviser of Small Cap Growth Series effective September 3, 2002. Prior to September 3, 2002, Security Management Company, LLC paid Strong Capital Management, Inc. for sub–advisory services. |
g | Unaudited figures for the six months ended March 31, 2007. Percentage amounts, except total return, have been annualized. |
The accompanying notes are an integral part of the financial statements.
This page left blank intentionally.
66
Security Large Cap
Value Fund

Adviser,
Security Management Company, LLC
67
| | |
| | Security |
| Performance Summary | | Large Cap Value Fund |
| March 31, 2007 | | (unaudited) |
PERFORMANCE
Security Large Cap Value Fund vs. Russell 1000 Value Index

$10,000 Over Ten Years
This chart assumes a $10,000 investment in Class A shares of Large Cap Value Fund on March 31, 1997, reflects deduction of the 5.75% sales load and assumes all dividends reinvested. The chart does not reflect the deduction of taxes that a shareholder would pay on distributions or the redemption of fund shares. The Russell 1000 Value Index is an unmanaged index representing the performance of those Russell 1000 Index companies with lower price-to-book ratios and lower forecasted growth values.
| | | | | | | | | |
Average Annual Returns | | | | | | | | | |
| | | |
Periods Ended 3-31-07 | | 1 Year | | | 5 Years | | | 10 Years or
Since Inception | |
A Shares | | 14.62 | % | | 7.55 | % | | 5.26 | % |
A Shares with sales charge | | 8.00 | % | | 6.29 | % | | 4.64 | % |
B Shares | | 13.73 | % | | 6.74 | % | | 4.47 | % |
B Shares with CDSC | | 8.73 | % | | 6.43 | % | | 4.47 | % |
C Shares | | 13.62 | % | | 6.71 | % | | 2.31 | % |
| | | | | | | | (1-29-99 | ) |
C Shares with CDSC | | 12.62 | % | | 6.71 | % | | 2.31 | % |
| | | | | | | | (1-29-99 | ) |
The performance data above represents past performance that is not predictive of future results. The investment return and principal value of an investment in the Fund will fluctuate so that an investor’s shares, when redeemed, may be worth more or less than their original cost. The figures above do not reflect deduction of the maximum front-end sales charge of 5.75% for Class A shares or the contingent deferred sales charge of 5% for Class B shares and 1% for Class C shares, as applicable, except where noted. The figures do not reflect the deduction of taxes that a shareholder would pay on distributions or redemption of Fund shares. Such figures would be lower if the maximum sales charge and any applicable taxes were deducted.
| | | |
Portfolio Composition by Sector as of 3-31-07 | | | |
| |
Consumer Discretionary | | 10.10 | % |
Consumer Staples | | 10.04 | |
Energy | | 13.44 | |
Financials | | 18.77 | |
Health Care | | 8.50 | |
Industrials | | 17.04 | |
Information Technology | | 2.68 | |
Materials | | 5.09 | |
Telecommunication Services | | 4.01 | |
Utilities | | 1.59 | |
Exchange Traded Funds | | 5.81 | |
Asset Backed Commercial Paper | | 1.10 | |
Commercial Paper | | 1.54 | |
Repurchase Agreement | | 0.28 | |
Cash & other assets, less liabilities | | 0.01 | |
Total net assets | | 100.00 | % |
| | | |
The accompanying notes are an integral part of the financial statements.
| | |
| | Security |
| Performance Summary | | Large Cap Value Fund |
| March 31, 2007 | | (unaudited) |
PERFORMANCE
Information About Your Fund’s Expenses
Calculating your ongoing Fund expenses
Example
As a shareholder of the Fund, you incur two types of costs: (1) transaction costs, which may include sales charges (loads) on purchase payments; contingent deferred sales charges on redemptions; and redemption fees, if any; and (2) ongoing costs, including management fees; distribution and/or service fees (12b-1); and other Fund expenses. This example is intended to help you understand your ongoing costs (in dollars) of investing in the Fund and to compare these costs with ongoing costs of investing in other mutual funds. The example is based on an investment of $1,000 invested at the beginning of the period and held for the entire period, October 1, 2006 – March 31, 2007.
Actual Expenses
The first line for each class of shares in the table provides information about actual account values and actual expenses. You may use the information in this table, together with the amount you invested, to estimate the expenses that you paid over the period. Simply divide your account value by $1,000 (for example, an $8,600 account value divided by $1,000 = 8.6), then multiply the result by the number in the table under the heading entitled “Expenses Paid During Period” to estimate the expenses you paid on your account during this period.
Hypothetical Example for Comparison Purposes
The second line for each class of shares in the table provides information about hypothetical account values and hypothetical expenses based on the Fund’s actual expense ratio and an assumed rate of return of 5% per year before expenses, which is not the Fund’s actual return. The hypothetical account values and expenses may not be used to estimate the actual ending account balance or expenses you paid for the period. You may use this information to compare the ongoing costs of investing in the Fund and other funds. To do so, compare this 5% hypothetical example with the 5% hypothetical examples that appear in the shareholder reports of the other mutual funds.
Please note that the expenses shown in the table are meant to highlight your ongoing costs only and do not reflect any transactional costs, such as sales charges (loads) on purchase payments, contingent deferred sales charges on redemptions, and redemption fees, if any. Therefore, the second line for each class of shares is useful in comparing ongoing costs only, and will not help you determine the relative total costs of owning different funds. In addition, if these transactional costs were included, your costs would have been higher.
| | | | | | | | | |
Fund Expenses | | | | | | | | | |
| | | Beginning
Account Value
10-01-06 | | Ending
Account Value
03-31-071 | | Expenses Paid
During
Period2 |
Large Cap Value Fund | | | | | | | | | |
- Class A | | | | | | | | | |
Actual | | $ | 1,000.00 | | $ | 1,099.70 | | $ | 7.22 |
Hypothetical | | | 1,000.00 | | | 1,018.05 | | | 6.94 |
Large Cap Value Fund | | | | | | | | | |
- Class B | | | | | | | | | |
Actual | | | 1,000.00 | | | 1,096.10 | | | 11.08 |
Hypothetical | | | 1,000.00 | | | 1,014.36 | | | 10.65 |
Large Cap Value Fund | | | | | | | | | |
- Class C | | | | | | | | | |
Actual | | | 1,000.00 | | | 1,095.80 | | | 11.13 |
Hypothetical | | | 1,000.00 | | | 1,014.31 | | | 10.70 |
1 | The actual ending account value is based on the actual total return of the Fund for the period from October 1, 2006 to March 31, 2007, after actual expenses and will differ from the hypothetical ending account value, which is based on the Fund expense ratio and a hypothetical annual return of 5% before expenses. The actual cumulative return at net asset value for the period from October 1, 2006 to March 31, 2007 was 9.97%, 9.61% and 9.58%, for Class A, B and C shares, respectively. |
2 | Expenses are equal to the Fund’s annualized expense ratio (1.38%, 2.12% and 2.13% for Class A, B and C shares, respectively) multiplied by the average account value over the period, multiplied by 182/365 (to reflect the one-half year period). |
69
| | |
| Schedule of Investments | | Security Large Cap Value Fund |
| March 31, 2007 (Unaudited) | | |
| | | | | |
| | | Shares | | Value |
COMMON STOCK—97.1% | | | | | |
Aerospace & Defense—3.0% | | | | | |
United Technologies Corporation | | 42,400 | | $ | 2,756,000 |
| | | | | |
Agricultural Products—2.1% | | | | | |
Archer-Daniels-Midland Company | | 51,500 | | | 1,890,050 |
| | | | | |
Aluminum—0.8% | | | | | |
Alcoa, Inc. | | 20,100 | | | 681,390 |
| | | | | |
Broadcasting & Cable TV—3.0% | | | | | |
CBS Corporation (CI.B) | | 88,200 | | | 2,698,038 |
| | | | | |
Building Products—0.9% | | | | | |
USG Corporation * | | 16,500 | | | 770,220 |
| | | | | |
Computer Hardware—2.1% | | | | | |
Hewlett-Packard Company | | 46,500 | | | 1,866,510 |
| | | | | |
Construction & Engineering—1.4% | | | | | |
Shaw Group, Inc. * | | 40,950 | | | 1,280,507 |
| | | | | |
Consumer Finance—5.2% | | | | | |
Capital One Financial Corporation | | 25,000 | | | 1,886,500 |
First Marblehead Corporation | | 62,750 | | | 2,816,848 |
| | | | | |
| | | | | 4,703,348 |
| | | | | |
Diversified Chemicals—2.7% | | | | | |
Dow Chemical Company | | 30,100 | | | 1,380,386 |
E.I. Du Pont de Nemours & Company | | 22,100 | | | 1,092,403 |
| | | | | |
| | | | | 2,472,789 |
| | | | | |
Drug Retail—2.0% | | | | | |
CVS Corporation | | 54,100 | | | 1,846,974 |
| | | | | |
Electric Utilities—1.6% | | | | | |
Edison International | | 29,300 | | | 1,439,509 |
| | | | | |
Exchange Traded Funds—5.8% | | | | | |
iShares Russell 1000 Value Index Fund | | 31,600 | | | 2,627,224 |
iShares S&P 500 Value Index Fund | | 34,100 | | | 2,637,976 |
| | | | | |
| | | | | 5,265,200 |
| | | | | |
Health Care Equipment—1.7% | | | | | |
Hospira, Inc. * | | 36,500 | | | 1,492,850 |
| | | | | |
Health Care Services—3.7% | | | | | |
Medco Health Solutions, Inc. * | | 46,500 | | | 3,372,645 |
| | | | | |
Home Improvement Retail—1.8% | | | | | |
Home Depot, Inc. | | 44,000 | | | 1,616,560 |
| | | | | |
Hypermarkets & Super Centers—2.9% | | | | | |
Costco Wholesale Corporation | | 48,900 | | | 2,632,776 |
| | | | | |
Industrial Conglomerates—8.9% | | | | | |
General Electric Company | | 77,400 | | | 2,736,864 |
McDermott International, Inc. * (1) | | 61,750 | | | 3,024,515 |
Tyco International, Ltd. | | 72,600 | | $ | 2,290,530 |
| | | | | |
| | | | | 8,051,909 |
| | | | | |
Integrated Oil & Gas—8.5% | | | | | |
Chevron Corporation | | 22,400 | | | 1,656,704 |
ConocoPhillips | | 20,300 | | | 1,387,505 |
Exxon Mobil Corporation | | 35,100 | | | 2,648,295 |
Sasol, Ltd. ADR | | 59,800 | | | 1,976,390 |
| | | | | |
| | | | | 7,668,894 |
| | | | | |
Integrated Telecommunication Services—1.0% | | | | | |
Windstream Corporation | | 61,476 | | | 903,082 |
| | | | | |
IT Consulting & Other Services—0.6% | | | | | |
Unisys Corporation * | | 66,400 | | | 559,752 |
| | | | | |
Managed Health Care—3.1% | | | | | |
WellPoint, Inc. * | | 34,900 | | | 2,830,390 |
| | | | | |
Movies & Entertainment—5.3% | | | | | |
News Corporation | | 95,500 | | | 2,207,960 |
Time Warner, Inc. | | 112,500 | | | 2,218,500 |
Viacom, Inc. (CI.B) * | | 10,000 | | | 411,100 |
| | | | | |
| | | | | 4,837,560 |
| | | | | |
Multi-Line Insurance—4.3% | | | | | |
American International Group, Inc. | | 58,300 | | | 3,918,926 |
| | | | | |
Oil & Gas Drilling—0.5% | | | | | |
Transocean, Inc. * | | 5,500 | | | 449,350 |
| | | | | |
Oil & Gas Equipment & Services—1.5% | | | | | |
Halliburton Company | | 43,100 | | | 1,367,994 |
| | | | | |
Oil & Gas Storage & Transportation—3.0% | | | | | |
Williams Companies, Inc. | | 94,500 | | | 2,689,470 |
Other Diversified Financial Services—5.3% | | | | | |
Citigroup, Inc. | | 58,000 | | | 2,977,720 |
JPMorgan Chase & Company | | 37,600 | | | 1,819,088 |
| | | | | |
| | | | | 4,796,808 |
| | | | | |
Properly & Casualty Insurance—4.0% | | | | | |
Berkshire Hathaway, Inc. * | | 33 | | | 3,596,670 |
| | | | | |
Railroads—2.8% | | | | | |
Union Pacific Corporation | | 25,400 | | | 2,579,370 |
| | | | | |
Specially Chemicals—1.6% | | | | | |
Rohm & Haas Company | | 28,100 | | | 1,453,332 |
| | | | | |
Tobacco—3.0% | | | | | |
Altria Group, Inc. | | 31,100 | | | 2,730,891 |
| | | | | |
Wireless Telecommunication Services—3.0% | | | | | |
Alltel Corporation | | 11,100 | | | 688,200 |
The accompanying notes are an integral part of the financial statements.
70
| | |
| Schedule of Investments | | Security Large Cap Value Fund |
| March 31, 2007 (Unaudited) - continued | | |
| | | | | | |
| | | Shares | | Value |
COMMON STOCK (continued) | | | | | | |
Wireless Telecommunication Services (continued) | | | | | | |
Sprint Nextel Corporation | | | 107,700 | | $ | 2,041,992 |
| | | | | | |
| | | | | | 2,730,192 |
| | | | | | |
TOTAL COMMON STOCK (Cost $72,347, 296) | | | | | $ | 87,949,956 |
| | | | | | |
| | |
| | | Principal
Amount | | Value |
CORPORATE BOND—0.0% | | | | | | |
Services—0.0% | | | | | | |
American ECO Corporation 9.625%, 2008 (2)(3)(4)(5) | | $ | 125,000 | | | — |
| | | | | | |
TOTAL CORPORATE BOND (Cost $125,000) | | | | | $ | — |
| | | | | | |
ASSET BACKED COMMERCIAL PAPER—1.1% | | | | | | |
Financial Companies - Trade | | | | | | |
Receivables—1.1% | | | | | | |
Sheffield Receivables Corporation 5.35%, 4/2/2007 | | | 1,000,000 | | | 999,851 |
| | | | | | |
TOTAL ASSET BACKED COMMERCIAL PAPER (Cost $999,851) | | | | | $ | 999,851 |
| | | | | | |
COMMERCIAL PAPER—1.5% | | | | | | |
Brokerage—1.5% | | | | | | |
Goldman Sachs Group, Inc. 5.30%, 4/3/2007 | | | 1,400,000 | | | 1,399,588 |
| | | | | | |
TOTAL COMMERCIAL PAPER (Cost $1,399,588) | | | | | $ | 1,399,588 |
| | | | | | |
REPURCHASE AGREEMENT—0.3% | | | | | | |
United Missouri Bank, 4.89%, dated 3/30/07, matures 4/02/07; repurchase amount $252,103 (Collateralized by GNMA, 4.50%, 10/16/28 with a value of $257,040) | | $ | 252,000 | | $ | 252,000 |
| | | | | | |
TOTAL REPURCHASE AGREEMENT (Cost $252,000) | | | | | $ | 252,000 |
| | | | | | |
Total Investments (Security Large Cap Value Fund) (Cost $75,123,735)—100.0% | | | | | $ | 90,601,395 |
Other Assets in Excess of Liabilities—0.0% | | | | | | 11,424 |
| | | | | | |
TOTAL NET ASSETS—100.0% | | | | | $ | 90,612,819 |
| | | | | | |
Footnotes
Percentages are stated as a percent of net assets.
For federal income tax purposes the identified cost of investments owned at 3/31/2007 was $75,236,341.
| * | -Non-income producing security |
| 1 | -Security is segregated as collateral for open written option contracts. |
| 2 | -Security is deemed illiquid. See Note 9 in notes to financial statements. |
| 3 | -Security is in default of interest and/or principal obligations. |
| 4 | -Security was acquired through a private placement. |
| 5 | -Security is fair valued by the Board of Directors. See Note 8 in notes to financial statements. |
The accompanying notes are an integral part of the financial statements.
71
| | |
| | Security |
| | Large Cap Value Fund |
| | (unaudited) |
Statement of Assets and Liabilities
March 31, 2007
| | | | |
Assets: | | | | |
Investments, at value1 | | $ | 90,601,395 | |
Cash | | | 884 | |
Receivables: | | | | |
Fund shares sold | | | 56,397 | |
Dividends | | | 128,843 | |
Prepaid expenses | | | 42,657 | |
| | | | |
Total assets | | | 90,830,176 | |
| | | | |
Liabilities: | | | | |
Payable for: | | | | |
Fund shares redeemed | | | 91,813 | |
Written options, at value (premiums received $7,648) | | | 720 | |
Management fees | | | 49,553 | |
Custodian fees | | | 759 | |
Transfer agent/maintenance fees | | | 11,185 | |
Administration fees | | | 7,392 | |
Professional fees | | | 7,363 | |
12b-l distribution plan fees | | | 30,942 | |
Directors’ fees | | | 14,632 | |
Other | | | 2,998 | |
| | | | |
Total liabilities | | | 217,357 | |
| | | | |
Net Assets | | $ | 90,612,819 | |
| | | | |
Net assets consist of: | | | | |
Paid in capital | | $ | 78,335,270 | |
Undistributed net investment income | | | 116,327 | |
Accumulated net realized loss on sale of investments and options written | | | (3,323,366 | ) |
Net unrealized appreciation in value of investments and options written | | | 15,484,588 | |
| | | | |
Net assets | | $ | 90,612,819 | |
| | | | |
Class A: | | | | |
Capital shares outstanding (unlimited number of shares authorized) | | | 8,539,064 | |
Net assets | | $ | 71,773,900 | |
Net asset value and redemption price per share | | $ | 8.41 | |
| | | | |
Maximum offering price per share (net asset value divided by 94.25%) | | $ | 8.92 | |
| | | | |
Class B: | | | | |
Capital shares outstanding (unlimited number of shares authorized) | | | 1,723,831 | |
Net assets | | $ | 13,559,321 | |
Net asset value, offering and redemption price per share (excluding any applicable contingent deferred sales charge) | | $ | 7.87 | |
| | | | |
Class C: | | | | |
Capital shares outstanding (unlimited number of shares authorized) | | | 659,026 | |
Net assets | | $ | 5,279,598 | |
Net asset value, offering and redemption price per share (excluding any applicable contingent deferred sales charge) | | $ | 8.01 | |
| | | | |
1Investments, at cost | | $ | 75,123,735 | |
Statements of Operations
For the Six Months Ended March 31, 2007
| | | | |
Investment Income: | | | | |
Dividends | | $ | 658,819 | |
Interest | | | 124,152 | |
| | | | |
Total investment income | | | 782,971 | |
| | | | |
Expenses: | | | | |
Management fees | | | 281,348 | |
Custodian fees | | | 3,146 | |
Transfer agent/maintenance fees | | | 105,926 | |
Administration fees | | | 41,458 | |
Directors’ fees | | | 10,728 | |
Professional fees | | | 3,394 | |
Reports to shareholders | | | 3,489 | |
Registration fees | | | 23,501 | |
Other expenses | | | 14,797 | |
12b-l distribution plan fees—Class A | | | 85,963 | |
12b-l distribution plan fees—Class B | | | 65,873 | |
12b-l distribution plan fees—Class C | | | 23,118 | |
| | | | |
Total expenses | | | 662,741 | |
Less: Earnings credits | | | (11 | ) |
| | | | |
Net expenses | | | 662,730 | |
| | | | |
Net investment income | | | 120,241 | |
| | | | |
Net Realized and Unrealized Gain (Loss): | | | | |
Net realized gain during the period on: | | | | |
Investments | | | 2,043,620 | |
Options written | | | 118,384 | |
Net realized gain | | | 2,162,004 | |
Net unrealized appreciation (depreciation) during the period on: | | | | |
Investments | | | 5,639,415 | |
Options written | | | (498 | ) |
| | | | |
Net unrealized appreciation | | | 5,638,917 | |
| | | | |
Net realized and unrealized gain | | | 7,800,921 | |
| | | | |
Net increase in net assets resulting from operations | | $ | 7,921,162 | |
| | | | |
The accompanying notes are an integral part of the financial statements.
| | |
| | Security |
| Statement of Changes in Net Assets | | Large Cap Value Fund |
| | | | | | | | |
| | | Six Months Ended
March 31, 2007
(unaudited) | | | Year Ended September 30, 2006 | |
Increase (decrease) in net assets from operations: | | | | | | | | |
Net investment income | | $ | 120,241 | | | $ | 26,815 | |
Net realized gain during the period on investments and options written | | | 2,162,004 | | | | 2,351,724 | |
Net unrealized appreciation during the period on investments and options written | | | 5,638,917 | | | | 4,881,917 | |
| | | | | | | | |
Net increase in net assets resulting from operations | | | 7,921,162 | | | | 7,260,456 | |
| | | | | | | | |
Distributions to shareholders from: | | | | | | | | |
Net investment income | | | | | | | | |
Class A | | | (25,135 | ) | | | (232,389 | ) |
| | | | | | | | |
Total distributions to shareholders | | | (25,135 | ) | | | (232,389 | ) |
| | | | | | | | |
Capital share transactions: | | | | | | | | |
Proceeds from sale of shares | | | | | | | | |
Class A | | | 13,579,133 | | | | 52,794,309 | |
Class B | | | 2,789,398 | | | | 8,335,522 | |
Class C | | | 1,817,373 | | | | 2,030,893 | |
Distributions reinvested | | | | | | | | |
Class A | | | 23,953 | | | | 214,200 | |
Cost of shares redeemed | | | | | | | | |
Class A | | | (12,929,609 | ) | | | (39,239,195 | ) |
Class B | | | (3,196,776 | ) | | | (5,067,244 | ) |
Class C | | | (449,574 | ) | | | (1,707,635 | ) |
| | | | | | | | |
Net increase from capital share transactions | | | 1,633,898 | | | | 17,360,850 | |
| | | | | | | | |
Net increase in net assets | | | 9,529,925 | | | | 24,388,917 | |
| | | | | | | | |
Net assets: | | | | | | | | |
Beginning of period | | | 81,082,894 | | | | 56,693,977 | |
| | | | | | | | |
End of period | | $ | 90,612,819 | | | $ | 81,082,894 | |
| | | | | | | | |
Undistributed net investment income at end of period | | $ | 116,327 | | | $ | 21,221 | |
| | | | | | | | |
Capital Share Activity: | | | | | | | | |
Shares sold | | | | | | | | |
Class A | | | 1,654,881 | | | | 7,129,132 | |
Class B | | | 361,172 | | | | 1,198,221 | |
Class C | | | 232,979 | | | | 287,449 | |
Shares reinvested | | | | | | | | |
Class A | | | 2,882 | | | | 30,999 | |
Shares redeemed | | | | | | | | |
Class A | | | (1,590,987 | ) | | | (5,369,253 | ) |
Class B | | | (414,457 | ) | | | (753,462 | ) |
Class C | | | (57,435 | ) | | | (250,401 | ) |
The accompanying notes are an integral part of the financial statements.
73
| | |
| Financial Highlights | | Security Equity Fund |
| Selected data for each share of capital stock outstanding throughout each period | | Mid Cap Value Series |
| | | | | | | | | | | | | | | | | | | | | | | | |
Class A | | Six Months Ended
March 31, 2007i | | | 2006 | | | 2005f | | | 2004 | | | 2003 | | | Year Ended,
September 30,
2002c,e | |
Per Share Data | | | | | | | | | | | | | | | | | | | | | | | | |
Net asset value, beginning of period | | $ | 7.65 | | | $ | 6.78 | | | $ | 5.71 | | | $ | 5.11 | | | $ | 4.25 | | | $ | 5.37 | |
| | | | | | | | | | | | | | | | | | | | | | | | |
Income (loss) from investment operations: | | | | | | | | | | | | | | | | | | | | | | | | |
Net investment incomeb | | | 0.02 | | | | 0.01 | | | | 0.03 | | | | 0.01 | | | | 0.02 | | | | 0.01 | |
Net gain (loss) on securities (realized and unrealized) | | | 0.74 | | | | 0.90 | | | | 1.04 | | | | 0.60 | | | | 0.84 | | | | (1.10 | ) |
| | | | | | | | | | | | | | | | | | | | | | | | |
Total from investment operations | | | 0.76 | | | | 0.91 | | | | 1.07 | | | | 0.61 | | | | 0.86 | | | | (1.09 | ) |
| | | | | | | | | | | | | | | | | | | | | | | | |
Less distributions: | | | | | | | | | | | | | | | | | | | | | | | | |
Dividends from net investment income | | | — | | | | (0.04 | ) | | | — | | | | (0.01 | ) | | | — | | | | (0.03 | ) |
| | | | | | | | | | | | | | | | | | | | | | | | |
Total distributions | | | — | | | | (0.04 | ) | | | — | | | | (0.01 | ) | | | — | | | | (0.03 | ) |
| | | | | | | | | | | | | | | | | | | | | | | | |
Net asset value, end of period | | $ | 8.41 | | | $ | 7.65 | | | $ | 6.78 | | | $ | 5.71 | | | $ | 5.11 | | | $ | 4.25 | |
| | | | | | | | | | | | | | | | | | | | | | | | |
Total Returna | | | 9.97 | % | | | 13.45 | % | | | 18.74 | % | | | 11.98 | % | | | 20.24 | % | | | (20.51 | )% |
| | | | | | | | | | | | | | | | | | | | | | | | |
Ratios/Supplemental Data | | | | | | | | | | | | | | | | | | | | | | | | |
Net assets, end of period (in thousands) | | $ | 71,774 | | | $ | 64,786 | | | $ | 45,295 | | | $ | 43,071 | | | $ | 45,858 | | | $ | 32,997 | |
| | | | | | | | | | | | | | | | | | | | | | | | |
Ratios to average net assets: | | | | | | | | | | | | | | | | | | | | | | | | |
Net investment income | | | 0.43 | % | | | 0.17 | % | | | 0.56 | % | | | 0.19 | % | | | 0.41 | % | | | 0.20 | % |
Total expensesg | | | 1.38 | % | | | 1.49 | % | | | 1.61 | % | | | 1.52 | % | | | 1.45 | % | | | 1.37 | % |
Net expensesh | | | 1.38 | % | | | 1.49 | % | | | 1.61 | % | | | 1.52 | % | | | 1.45 | % | | | 1.37 | % |
| | | | | | | | | | | | | | | | | | | | | | | | |
Portfolio turnover rate | | | 18 | % | | | 54 | % | | | 110 | % | | | 75 | % | | | 76 | % | | | 68 | % |
| | | | | | | | | | | | | | | | | | | | | | | | |
Class B | | Six Months Ended
March 31, 2007i | | | 2006 | | | 2005f | | | 2004 | | | 2003 | | | Year Ended,
September 30,
2002c,e | |
Per Share Data | | | | | | | | | | | | | | | | | | | | | | | | |
Net asset value, beginning of period | | $ | 7.18 | | | $ | 6.38 | | | $ | 5.42 | | | $ | 4.87 | | | $ | 4.08 | | | $ | 5.18 | |
| | | | | | | | | | | | | | | | | | | | | | | | |
Income (loss) from investment operations: | | | | | | | | | | | | | | | | | | | | | | | | |
Net investment lossb | | | (0.01 | ) | | | (0.04 | ) | | | (0.01 | ) | | | (0.03 | ) | | | (0.02 | ) | | | (0.04 | ) |
Net gain (loss) on securities (realized and unrealized) | | | 0.70 | | | | 0.84 | | | | 0.97 | | | | 0.58 | | | | 0.81 | | | | (1.06 | ) |
| | | | | | | | | | | | | | | | | | | | | | | | |
Total from investment operations | | | 0.69 | | | | 0.80 | | | | 0.96 | | | | 0.55 | | | | 0.79 | | | | (1.10 | ) |
| | | | | | | | | | | | | | | | | | | | | | | | |
Net asset value, end of period | | $ | 7.87 | | | $ | 7.18 | | | $ | 6.38 | | | $ | 5.42 | | | $ | 4.87 | | | $ | 4.08 | |
| | | | | | | | | | | | | | | | | | | | | | | | |
Total Returna | | | 9.61 | % | | | 12.54 | % | | | 17.71 | % | | | 11.29 | % | | | 19.36 | % | | | (21.24 | )% |
| | | | | | | | | | | | | | | | | | | | | | | | |
Ratios/Supplemental Data | | | | | | | | | | | | | | | | | | | | | | | | |
Net assets, end of period (in thousands) | | $ | 13,559 | | | $ | 12,761 | | | $ | 8,500 | | | $ | 10,164 | | | $ | 11,687 | | | $ | 4,905 | |
| | | | | | | | | | | | | | | | | | | | | | | | |
Ratios to average net assets: | | | | | | | | | | | | | | | | | | | | | | | | |
Net investment loss | | | (0.32 | )% | | | (0.58 | )% | | | (0.16 | )% | | | (0.57 | )% | | | (0.42 | )% | | | (0.71 | )% |
Total expensesg | | | 2.12 | % | | | 2.26 | % | | | 2.36 | % | | | 2.27 | % | | | 2.20 | % | | | 2.27 | % |
Net expensesh | | | 2.12 | % | | | 2.26 | % | | | 2.36 | % | | | 2.27 | % | | | 2.20 | % | | | 2.27 | % |
| | | | | | | | | | | | | | | | | | | | | | | | |
Portfolio turnover rate | | | 18 | % | | | 54 | % | | | 110 | % | | | 75 | % | | | 76 | % | | | 68 | % |
The accompanying notes are an integral part of the financial statements.
74
| | |
| Financial Highlights | | Security |
| Selected data for each share of capital stock outstanding throughout each period | | Large Cap Value Fund |
| | | | | | | | | | | | | | | | | | | | | | | | |
Class C | | Six Months Ended
March 31, 2007i | | | 2006 | | | 2005f | | | 2004 | | | 2003 | | | Year Ended,
September 30,
2002c,d,e | |
Per Share Data | | | | | | | | | | | | | | | | | | | | | | | | |
Net asset value, beginning of period | | $ | 7.31 | | | $ | 6.49 | | | $ | 5.52 | | | $ | 4.96 | | | $ | 4.16 | | | $ | 5.28 | |
| | | | | | | | | | | | | | | | | | | | | | | | |
Income (loss) from investment operations: | | | | | | | | | | | | | | | | | | | | | | | | |
Net investment lossb | | | (0.01 | ) | | | (0.04 | ) | | | (0.01 | ) | | | (0.03 | ) | | | (0.02 | ) | | | (0.04 | ) |
Net gain (loss) on securities (realized and unrealized) | | | 0.71 | | | | 0.86 | | | | 0.98 | | | | 0.59 | | | | 0.82 | | | | (1.08 | ) |
| | | | | | | | | | | | | | | | | | | | | | | | |
Total from investment operations | | | 0.70 | | | | 0.82 | | | | 0.97 | | | | 0.56 | | | | 0.80 | | | | (1.12 | ) |
| | | | | | | | | | | | | | | | | | | | | | | | |
Net asset value, end of period | | $ | 8.01 | | | $ | 7.31 | | | $ | 6.49 | | | $ | 5.52 | | | $ | 4.96 | | | $ | 4.16 | |
| | | | | | | | | | | | | | | | | | | | | | | | |
Total Returna | | | 9.58 | % | | | 12.63 | % | | | 17.57 | % | | | 11.29 | % | | | 19.23 | % | | | (21.21 | )% |
| | | | | | | | | | | | | | | | | | | | | | | | |
Ratios/Supplemental Data | | | | | | | | | | | | | | | | | | | | | | | | |
Net assets, end of period (in thousands) | | $ | 5,280 | | | $ | 3,536 | | | $ | 2,899 | | | $ | 2,561 | | | $ | 2,130 | | | $ | 1,510 | |
| | | | | | | | | | | | | | | | | | | | | | | | |
Ratios to average net assets: | | | | | | | | | | | | | | | | | | | | | | | | |
Net investment loss | | | (0.30 | )% | | | (0.60 | )% | | | (0.18 | )% | | | (0.57 | )% | | | (0.33 | )% | | | (0.72 | )% |
Total expensesg | | | 2.13 | % | | | 2.25 | % | | | 2.36 | % | | | 2.28 | % | | | 2.20 | % | | | 2.25 | % |
Net expensesh | | | 2.13 | % | | | 2.25 | % | | | 2.36 | % | | | 2.28 | % | | | 2.20 | % | | | 2.25 | % |
| | | | | | | | | | | | | | | | | | | | | | | | |
Portfolio turnover rate | | | 18 | % | | | 54 | % | | | 110 | % | | | 75 | % | | | 76 | % | | | 68 | % |
a | Total return information does not reflect deduction of any sales charges imposed at the time of purchase for Class A shares or upon redemption for Class B and C shares. |
b | Net investment income (loss) was computed using average shares outstanding throughout the period. |
c | As required, effective October 1, 2001, the Funds adopted the provisions of the AICPA Audit and Accounting Guide for Investment Companies and began amortizing premiums on fixed income securities. The effect of this change for the period ended September 30, 2002, was to increase net investment income per share by less than 1/2 of a cent, decrease net realized and unrealized gains and losses per share by less than 1/2 of a cent and increase the ratio of net investment income to average net assets from 0.06% to 0.07%. Per share, ratios and supplemental data for periods prior to October 1, 2001 have not been restated to reflect this change in presentation. |
d | The financial highlights for Class C shares exclude the historical financial highlights of Class S shares. Class S shares were exchanged for Class C shares on June 3, 2002. |
e | Effective May 1, 2002 the fee structure for Security Large Cap Value Fund changed. Per share information reflects this change. |
f | Security Management Company, LLC (SMC) became the advisor of Security Large Cap Value Fund effective June 30, 2005. Prior to June 30, 2005, SMC paid Dreyfus Corporation for sub–advisory services. |
g | Total expense information reflects expense ratios absent fund expense reductions by the Investment Manager and custodian earnings credits, as applicable. |
h | Net expense information reflects the expense ratios after voluntary expense waivers, reimbursements, and custodian earnings credits, as applicable. |
i | Unaudited figures for the six months ended March 31, 2007. Percentage amounts, except total return, have been annualized. |
The accompanying notes are an integral part of the financial statements.
This page left blank intentionally.
76
Security Mid Cap
Growth Fund

Adviser,
Security Management Company, LLC
77
| | |
| | Security |
| Performance Summary | | Mid Cap Growth Fund |
| March 31, 2007 | | (unaudited) |
PERFORMANCE
Security Mid Cap Growth Fund vs. Russell 2500 Growth Index
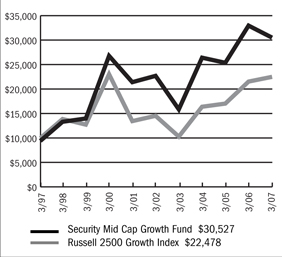
$10,000 Over Ten Years
This chart assumes a $10,000 investment in Class A shares of Security Mid Cap Growth Fund on March 31, 1997, reflects deduction of the 5.75% sales load and assumes all dividends reinvested. The chart does not reflect the deduction of taxes that a shareholder would pay on distributions of the redemption of fund shares. The Russell 2500 Growth Index is an unmanaged index that measures the performance of securities of small-to-mid U.S. companies with greater-than-average growth orientation.
Average Annual Returns
| | | | | | | | | |
Periods Ended 3-31-07 | | 1 Year | | | 5 Years | | | 10 Years or
Since Inception | |
A Shares | | (7.38) | % | | 6.11 | % | | 12.47 | % |
A Shares with sales charge | | (12.69) | % | | 4.87 | % | | 11.81 | % |
B Shares | | (8.16) | % | | 5.33 | % | | 11.66 | % |
B Shares with CDSC | | (12.23) | % | | 5.02 | % | | 11.66 | % |
C Shares | | (8.06) | % | | 5.37 | % | | 8.64
(1-29-99) | %
|
C Shares with CDSC | | (8.88) | % | | 5.37 | % | | 8.64
(1-29-99) | %
|
The performance data above represents past performance that is not predictive of future results. The investment return and principal value of an investment in the Fund will fluctuate so that an investor’s shares, when redeemed, may be worth more or less than their original cost. The figures above do not reflect deduction of the maximum front-end sales charge of 5.75% for Class A shares or the contingent deferred sales charge of 5% for Class B shares and 1% for Class C shares, as applicable, except where noted. The figures do not reflect the deduction of taxes that a shareholder would pay on distributions or redemption of shares. Such figures would be lower if the maximum sales charge and any applicable taxes were deducted.
Portfolio Composition by Sector as of 3-31-07
| | | |
Consumer Discretionary | | 3.83 | % |
Consumer Staples | | 2.02 | |
Energy | | 16.59 | |
Financials | | 7.15 | |
Health Care | | 10.27 | |
Industrials | | 19.99 | |
Information Technology | | 27.12 | |
Materials | | 4.95 | |
Exchange Traded Funds | | 1.70 | |
Warrants | | 0.21 | |
Commercial Paper | | 3.71 | |
Asset Backed Commerical Paper | | 2.02 | |
Repurchase Agreement | | 0.12 | |
Cash & other assets, less liabilities | | 0.32 | |
Total net assets | | 100.00 | % |
| | | |
The accompanying notes are an integral part of the financial statements.
78
| | |
| | Security |
| Performance Summary | | Mid Cap Growth Fund |
| March 31, 2007 | | (unaudited) |
PERFORMANCE
Information About Your Fund’s Expenses
Calculating your ongoing Fund expenses
Example
As a shareholder of the Fund, you incur two types of costs: (1) transaction costs, which may include sales charges (loads) on purchase payments; contingent deferred sales charges on redemptions; and redemption fees, if any; and (2) ongoing costs, including management fees; distribution and/or service fees (12b-1); and other Fund expenses. This example is intended to help you understand your ongoing costs (in dollars) of investing in the Fund and to compare these costs with ongoing costs of investing in other mutual funds. The example is based on an investment of $1,000 invested at the beginning of the period and held for the entire period, October 1, 2006 – March 31, 2007.
Actual Expenses
The first line for each class of shares in the table provides information about actual account values and actual expenses. You may use the information in this table, together with the amount you invested, to estimate the expenses that you paid over the period. Simply divide your account value by $1,000 (for example, an $8,600 account value divided by $1,000 = 8.6), then multiply the result by the number in the table under the heading entitled “Expenses Paid During Period” to estimate the expenses you paid on your account during this period.
Hypothetical Example for Comparison Purposes
The second line for each class of shares in the table provides information about hypothetical account values and hypothetical expenses based on the Fund’s actual expense ratio and an assumed rate of return of 5% per year before expenses, which is not the Fund’s actual return. The hypothetical account values and expenses may not be used to estimate the actual ending account balance or expenses you paid for the period. You may use this information to compare the ongoing costs of investing in the Fund and other funds. To do so, compare this 5% hypothetical example with the 5% hypothetical examples that appear in the shareholder reports of the other mutual funds.
Please note that the expenses shown in the table are meant to highlight your ongoing costs only and do not reflect any transactional costs, such as sales charges (loads) on purchase payments, contingent deferred sales charges on redemptions, and redemption fees, if any. Therefore, the second line for each class of shares is useful in comparing ongoing costs only, and will not help you determine the relative total costs of owning different funds. In addition, if these transactional costs were included, your costs would have been higher.
Fund Expenses
| | | | | | | | | |
| | | Beginning
Account Value
10-01-06 | | Ending
Account Value
03-31-071 | | Expenses Paid
During
Period2 |
Mid Cap Growth Fund | | | | | | | | | |
- Class A | | | | | | | | | |
Actual | | $ | 1,000.00 | | $ | 1,039.40 | | $ | 7.12 |
Hypothetical | | | 1,000.00 | | | 1,017.95 | | | 7.04 |
| | | |
Mid Cap Growth Fund | | | | | | | | | |
- Class B | | | | | | | | | |
Actual | | | 1,000.00 | | | 1,034.60 | | | 10.91 |
Hypothetical | | | 1,000.00 | | | 1,014.21 | | | 10.80 |
| | | |
Mid Cap Growth Fund | | | | | | | | | |
- Class C | | | | | | | | | |
Actual | | | 1,000.00 | | | 1,035.10 | | | 10.91 |
Hypothetical | | | 1,000.00 | | | 1,014.21 | | | 10.80 |
1 | The actual ending account value is based on the actual total return of the Fund for the period from October 1, 2006 to March 31, 2007, after actual expenses and will differ from the hypothetical ending account value, which is based on the Fund’s expense ratio and a hypothetical annual return of 5% before expenses. The actual cumulative return at net asset value for the period from October 1, 2006 to March 31, 2007 was 3.94%, 3.46% and 3.51%, for Class A, B and C shares, respectively. |
2 | Expenses are equal to the Fund’s annualized expense ratio (1.40%, 2.15% and 2.15% for Class A, B and C shares, respectively) multiplied by the average account value over the period, multiplied by 182/365 (to reflect the one-half year period). |
79
| | |
| Schedule of Investments | | Security Mid Cap Growth Fund |
March 31, 2007 (Unaudited) | | |
| | | | | |
| | | Shares | | Value |
COMMON STOCK -93.5% | | | | | |
Aerospace & Defense—1.3% | | | | | |
Argon ST, Inc. * | | 111,400 | | $ | 2,947,644 |
| | | | | |
Apparel, Accessories & Luxury Goods -0.9% | | | | | |
Maidenform Brands, Inc. * | | 87,500 | | | 2,018,625 |
| | | | | |
Application Software—1.1% | | | | | |
TIBCO Software, Inc. * | | 307,000 | | | 2,615,640 |
| | | | | |
Asset Management & Custody Banks—2.5% | | | | | |
Northern Trust Corporation | | 97,000 | | | 5,833,580 |
| | | | | |
Auto Parts & Equipment—0.5% | | | | | |
HydroGen Corporation LLC * (1) | | 253,722 | | | 1,192,493 |
| | | | | |
Biotechnology—4.1% | | | | | |
Cell Genesys, Inc. * | | 229,000 | | | 961,800 |
Combinatorx, Inc. * | | 152,000 | | | 1,062,480 |
Human Genome Sciences, Inc. * | | 179,800 | | | 1,909,476 |
Incyte Corporation * | | 355,000 | | | 2,339,450 |
Iomai Corporation * | | 244,000 | | | 1,195,600 |
Isis Pharmaceuticals, Inc. * | | 100,000 | | | 927,000 |
Zymogenetics, Inc. * | | 63,000 | | | 980,280 |
| | | | | |
| | | | | 9,376,086 |
| | | | | |
Broadcasting & Cable TV—1.5% | | | | | |
Salem Communications Corporation | | 195,000 | | | 2,437,500 |
WorldSpace, Inc. * | | 290,000 | | | 1,038,200 |
| | | | | |
| | | | | 3,475,700 |
| | | | | |
Coal & Consumable Fuels—3.4% | | | | | |
Evergreen Energy, Inc. * | | 1,206,000 | | | 7,923,420 |
| | | | | |
Communications Equipment—8.2% | | | | | |
ADC Telecommunications, Inc. * | | 233,000 | | | 3,900,420 |
Finisar Corporation * | �� | 2,145,000 | | | 7,507,500 |
PC-Tel, Inc. * | | 349,400 | | | 3,553,398 |
Symmetricom, Inc. * | | 475,000 | | | 3,942,500 |
| | | | | |
| | | | | 18,903,818 |
| | | | | |
Computer Storage & Peripherals—1.1% | | | | | |
Novatel Wireless, Inc. * | | 157,300 | | | 2,523,092 |
| | | | | |
Construction & Engineering—4.6% | | | | | |
Insituform Technologies, Inc. * | | 192,000 | | | 3,991,680 |
Shaw Group, Inc. * | | 213,400 | | | 6,673,018 |
| | | | | |
| | | | | 10,664,698 |
| | | | | |
Consumer Finance—1.6% | | | | | |
First Marblehead Corporation | | 84,000 | | | 3,770,760 |
| | | | | |
Data Processing & Outsourced Services—1.1% | | | | | |
Euronet Worldwide, Inc. * | | 94,700 | | | 2,543,642 |
| | | | | |
Diversified Commercial & Professional Services—1.5% | | | | | |
Navigant Consulting, Inc. * | | 180,000 | | | 3,556,800 |
| | | | | |
Electrical Components & Equipment—7.0% | | | | | |
Millennium Cell, Inc. * | | 141,500 | | | 137,255 |
Power-One, Inc. * | | 1,379,800 | | | 7,892,456 |
Roper Industries, Inc. | | 108,700 | | | 5,965,456 |
UQM Technologies, Inc. * | | 525,216 | | | 2,179,647 |
| | | | | |
| | | | | 16,174,814 |
| | | | | |
Electronic Equipment Manufacturers—3.1% | | | | | |
Aeroflex, Inc. * | | 240,000 | | | 3,156,000 |
Cogent, Inc. * | | 185,750 | | | 2,498,338 |
Flir Systems, Inc. * (2) | | 40,000 | | | 1,426,800 |
| | | | | |
| | | | | 7,081,138 |
| | | | | |
Electronic Manufacturing Services -2.1% | | | | | |
Maxwell Technologies, Inc. * | | 396,000 | | | 4,957,920 |
| | | | | |
Exchange Traded Funds—1.7% | | | | | |
iShares Russell 2000 Growth Index Fund | | 25,000 | | | 2,014,000 |
iShares S&P MidCap 400 Growth Index Fund | | 23,000 | | | 1,934,990 |
| | | | | |
| | | | | 3,948,990 |
| | | | | |
Health Care Equipment—0.9% | | | | | |
Orthovita, Inc. * | | 375,000 | | | 1,095,000 |
Strategic Diagnostics, Inc. * | | 206,300 | | | 1,056,256 |
| | | | | |
| | | | | 2,151,256 |
| | | | | |
Health Care Facilities—2.4% | | | | | |
United Surgical Partners International, Inc. * | | 138,000 | | | 4,251,780 |
US Physical Therapy, Inc. * | | 97,000 | | | 1,350,240 |
| | | | | |
| | | | | 5,602,020 |
| | | | | |
Health Care Services—2.2% | | | | | |
Hythiam, Inc. * | | 126,800 | | | 862,240 |
Providence Service Corporation * | | 180,000 | | | 4,269,600 |
| | | | | |
| | | | | 5,131,840 |
| | | | | |
Health Care Supplies—0.6% | | | | | |
Regeneration Technologies, Inc. * | | 180,000 | | | 1,305,000 |
| | | | | |
Heavy Electrical Equipment—0.7% | | | | | |
Plug Power, Inc. * | | 504,000 | | | 1,592,640 |
| | | | | |
Homefurnishing Retail—0.3% | | | | | |
Kirkland’s, Inc. * (1) | | 116,725 | | | 580,123 |
| | | | | |
Industrial Machinery—1.2% | | | | | |
Basin Water, Inc. * | | 260,500 | | | 1,789,635 |
Tennant Company | | 34,200 | | | 1,076,958 |
| | | | | |
| | | | | 2,866,593 |
| | | | | |
The accompanying notes are an integral part of the financial statements.
80
| | |
| Schedule of Investments | | Security Mid Cap Growth Fund |
| March 31, 2007 (Unaudited) - continued | | |
| | | | | |
| | | Shares | | Value |
COMMON STOCK (continued) | | | | | |
IT Consulting & Other Services—0.6% | | | | | |
Keane, Inc. * | | 98,700 | | $ | 1,340,346 |
| | | | | |
Marine Ports & Services—0.0% | | | | | |
Aegean Marine Petroleum Network, Inc. | | 3,700 | | | 62,308 |
| | | | | |
Metal & Glass Containers—5.0% | | | | | |
Pactiv Corporation * | | 340,000 | | | 11,471,600 |
| | | | | |
Oil & Gas Drilling—5.6% | | | | | |
Diamond Offshore Drilling, Inc. | | 34,500 | | | 2,792,775 |
ENSCO International, Inc. | | 82,300 | | | 4,477,120 |
Helmerich & Payne, Inc. | | 187,000 | | | 5,673,580 |
| | | | | |
| | | | | 12,943,475 |
| | | | | |
Oil & Gas Equipment & Services—1.2% | | | | | |
BJ Services Company | | 80,000 | | | 2,232,000 |
Superior Energy Services, Inc. * | | 15,700 | | | 541,179 |
| | | | | |
| | | | | 2,773,179 |
| | | | | |
Oil & Gas Refining & Marketing—4.0% | | | | | |
Nova Biosource Fuels, Inc. * | | 416,100 | | | 1,144,275 |
Rentech, Inc. * | | 2,300,000 | | | 7,222,000 |
Syntroleum Corporation * | | 320,000 | | | 998,400 |
| | | | | |
| | | | | 9,364,675 |
| | | | | |
Oil & Gas Storage & Transportation—2.3% | | | | | |
Williams Companies, Inc. | | 190,000 | | | 5,407,400 |
| | | | | |
Packaged Foods & Meats—2.0% | | | | | |
Hormel Foods Corporation | | 126,000 | | | 4,685,940 |
| | | | | |
Pharmaceuticals—0.1% | | | | | |
Artes Medical, Inc. * | | 26,700 | | | 213,066 |
| | | | | |
Publishing—0.7% | | | | | |
Dow Jones & Company, Inc. | | 46,000 | | | 1,585,620 |
| | | | | |
Railroads—2.2% | | | | | |
Kansas City Southern * | | 141,000 | | | 5,016,780 |
| | | | | |
Regional Banks—1.0% | | | | | |
Boston Private Financial Holdings, Inc. | | 80,000 | | | 2,233,600 |
| | | | | |
Semiconductor Equipment—0.0% | | | | | |
Semitool, Inc. * | | 5,450 | | | 70,850 |
| | | | | |
Semiconductors—7.6% | | | | | |
Applied Micro Circuits Corporation * | | 1,100,000 | | | 4,015,000 |
IXYS Corporation * | | 790,000 | | | 8,081,700 |
Mindspeed Technologies, Inc. * | | 1,516,700 | | | 3,291,239 |
Netlogic Microsystems, Inc. * | | 40,000 | | | 1,064,800 |
QuickLogic Corporation * | | 401,900 | | | 1,129,339 |
| | | | | |
| | | | | 17,582,078 |
| | | | | |
Systems Software—2.2% | | | | | |
Progress Software Corporation * | | 90,000 | | | 2,808,000 |
Sybase, Inc. * | | 91,950 | | | 2,324,496 |
| | | | | |
| | | | | 5,132,496 |
| | | | | |
Thrifts & Mortgage Finance—2.0% | | | | | |
Clayton Holdings, Inc. * | | 307,500 | | | 4,717,050 |
| | | | | |
Trading Companies & Distributors—1.4% | | | | | |
MSC Industrial Direct Company, Inc. | | 67,300 | | | 3,141,564 |
| | | | | |
TOTAL COMMON STOCK (Cost $180,867,165) | | | | $ | 216,480,359 |
| | | | | |
PREFERRED STOCK—0.1% | | | | | |
Environmental & Facilities Services—0.1% | | | | | |
ThermoEnergy Corporation PIPE * (1)(3)(4) | | 745,000 | | | 223,500 |
| | | | | |
TOTAL PREFERRED STOCK (Cost $702,947) | | | | $ | 223,500 |
| | | | | |
Warrants—0.2% | | | | | |
Hollis-Eden Pharmaceuticals, Inc. $ 15.45, 6/19/2007 | | 8,143 | | | |
Lime Energy Company $ 1.00, 3/19/2009 | | 20,767 | | | 8,790 |
Nova Biosource Fuels, Inc. $ 2.40, 7/5/2011 | | 208,050 | | | 395,042 |
Orthovita, Inc. $ 4.00, 6/26/2008 | | 75,000 | | | 12,391 |
Syntroleum Corporation $ 7.60, 5/26/2008 | | 14,100 | | | 9,306 |
ThermoEnergy Corporation $ 0.75, 7/14/2008 (1)(3) | | 745,000 | | | 61,909 |
| | | | | |
| | | | | 487,438 |
| | | | | |
TOTAL WARRANTS (Cost $849,026) | | | | $ | 487,438 |
| | | | | |
| | | | | |
| | | Principal
Amount | | Value |
ASSET BACKED COMMERCIAL PAPER—2.1% | | | | | |
Financial Companies—Diversified—0.6% | | | | | |
Amsterdam Funding Corporation 5.28%, 4/10/2007 | | 1,300,000 | | | 1,298,284 |
| | | | | |
Financial Companies—Miscellaneous Receivables—0.7% | | | | | |
Fairway Finance Corporation 5.30%, 4/13/2007 | | 1,600,000 | | | 1,597,173 |
| | | | | |
Financial Companies—Trade Receivables—0.8% | | | | | |
Sheffield Receivables Corporation 5.29%, 4/12/2007 | | 1,800,000 | | | 1,797,091 |
| | | | | |
TOTAL ASSET BACKED COMMERCIAL PAPER (Cost $4,692,548) | | | | $ | 4,692,548 |
| | | | | |
The accompanying notes are an integral part of the financial statements.
81
| | |
| Schedule of Investments | | Security Mid Cap Growth Fund |
| March 31, 2007 (Unaudited) - continued | | |
| | | | | | |
| | | Principal
Amount | | Value |
COMMERCIAL PAPER—3.7% | | | | | | |
Banking—1.0% | | | | | | |
UBS Finance (DE) LLC | | | | | | |
5.25%, 4/5/2007 | | | 1,300,000 | | $ | 1,299,241 |
5.25%, 4/16/2007 | | | 1,100,000 | | | 1,097,594 |
| | | | | | |
| | | | | | 2,396,835 |
| | | | | | |
Brokerage—1.6% | | | | | | |
Goldman Sachs Group, Inc. | | | | | | |
5.27%, 4/3/2007 | | | 1,600,000 | | | 1,599,532 |
5.26%, 4/9/2007 | | | 1,000,000 | | | 998,831 |
Merrill Lynch & Company, Inc. | | | | | | |
5.25%, 4/2/2007 | | | 1,000,000 | | | 999,854 |
| | | | | | |
| | | | | | 3,598,217 |
| | | | | | |
Captive—0.6% | | | | | | |
HSBC Finance Corporation | | | | | | |
5.30%, 4/11/2007 | | | 1,400,000 | | | 1,397,939 |
| | | | | | |
Pharmaceuticals—0.5% | | | | | | |
Abbott Laboratories | | | | | | |
5.24%, 4/4/2007 | | | 1,200,000 | | | 1,199,476 |
| | | | | | |
TOTAL COMMERCIAL PAPER (Cost $8,592, 467) | | | | | $ | 8,592,467 |
| | | | | | |
REPURCHASE AGREEMENT—0.1% | | | | | | |
United Missouri Bank, 4.89%, dated 3/30/07, matures 4/02/07; repurchase amount $273,111 (Collateralized by GNMA, 3.50%, 5/20/26 with a value of $278,460) | | $ | 273,000 | | $ | 273,000 |
| | | | | | |
TOTAL REPURCHASE AGREEMENT (Cost $273,000) | | | | | $ | 273,000 |
| | | | | | |
Total Investments (Security Mid Cap Growth Fund) (Cost $195,977,153) -99.7% | | | | | $ | 230,749,312 |
Other Assets in Excess of Liabilities—0.3% | | | | | | 753.547 |
| | | | | | |
TOTAL NET ASSETS—100.0% | | | | | $ | 231,502,859 |
| | | | | | |
Footnotes
Percentages are stated as a percent of net assets. For federal income tax purposes the identified cost of investments owned at 3/31/2007 was $196,555,943.
| * | -Non-income producing security |
| 1 | -Security is deemed illiquid. See Note 9 in notes to financial statements. |
| 2 | -Security is segregated as collateral for open written option contracts. |
| 3 | -Security is restricted from resale. See Note 7 in notes to financial statements. |
| 4 | -PIPE (Private Investment in Public Equity)—Stock issued by a company in the secondary market as a means of raising capital more quickly and less expensively than through registration of a secondary public offering. |
See notes to financial statements.
The accompanying notes are an integral part of the financial statements.
82
| | |
| | Security |
| Performance Summary | | Mid Cap Growth Fund |
| March 31, 2007 | | (unaudited) |
Statement of Assets and Liabilities
March 31, 2007
| | | | |
Assets: | | | | |
Investments, at value1 | | $ | 230,749,312 | |
Cash | | | 322 | |
Receivables: | | | | |
Fund shares sold | | | 198,943 | |
Securities sold | | | 1,012,275 | |
Dividends | | | 28,250 | |
Prepaid expenses | | | 60,480 | |
| | | | |
Total assets | | | 232,049,582 | |
| | | | |
Liabilities: | | | | |
Payable for: | | | | |
Fund shares redeemed | | | 194,396 | |
Written options, at value (premiums received, $ 75,450) | | | 50,000 | |
Management fees | | | 145,582 | |
Custodian fees | | | 2,737 | |
Transfer agent/maintenance fees | | | 25,776 | |
Administration fees | | | 19,040 | |
Professional fees | | | 15,981 | |
12b-1 distribution plan fees | | | 70,132 | |
Directors’ fees | | | 7,774 | |
Other | | | 15,305 | |
| | | | |
Total liabilities | | | 546,723 | |
| | | | |
Net Assets | | $ | 231,502,859 | |
| | | | |
Net assets consist of: | | | | |
Paid in capital | | $ | 193,197,269 | |
Accumulated net investment loss | | | (1,068,240 | ) |
Undistributed net realized gain on sale of investments and options written | | | 4,576,222 | |
Net unrealized appreciation in value of investments and options written | | | 34,797,608 | |
| | | | |
Net assets | | $ | 231,502,859 | |
| | | | |
Class A: | | | | |
Capital shares outstanding (unlimited number of shares authorized) | | | 17,493,800 | |
Net assets | | $ | 197,824,159 | |
Net asset value and redemption price per share | | $ | 11.31 | |
| | | | |
Maximum offering price per share (net asset value divided by 94.25%) | | $ | 12.00 | |
| | | | |
Class B: | | | | |
Capital shares outstanding (unlimited number of shares authorized) | | | 2,102,346 | |
Net assets | | $ | 19,511,711 | |
Net asset value, offering and redemption price per share (excluding any applicable contingent deferred sales charge) | | $ | 9.28 | |
| | | | |
Class C: | | | | |
Capital shares outstanding (unlimited number of shares authorized) | | | 1,372,009 | |
Net assets | | $ | 14,166,989 | |
Net asset value, offering and redemption price per share (excluding any applicable contingent deferred sales charge) | | $ | 10.33 | |
| | | | |
1Investments, at cost | | $ | 195,977,153 | |
Statement of Operations
For the Six Months Ended March 31, 2007
| | | | |
Investment Income: | | | | |
Dividends | | $ | 429,872 | |
Interest | | | 297,518 | |
| | | | |
Total investment income | | | 727,390 | |
| | | | |
Expenses: | | | | |
Management fees | | | 887,083 | |
Custodian fees | | | 10,153 | |
Transfer agent/maintenance fees | | | 270,025 | |
Administration fees | | | 113,549 | |
Directors’ fees | | | 7,427 | |
Professional fees | | | 13,794 | |
Reports to shareholders | | | 13,922 | |
Registration fees | | | 28,225 | |
Other expenses | | | 17,991 | |
12b-1 distribution plan fees—Class A | | | 249,741 | |
12b-1 distribution plan fees—Class B | | | 107,174 | |
12b-1 distribution plan fees—Class C | | | 76,640 | |
| | | | |
Total expenses | | | 1,795,724 | |
Less: Earnings credits | | | (94 | ) |
| | | | |
Net expenses | | | 1,795,630 | |
| | | | |
Net investment loss | | | (1,068,240 | ) |
| | | | |
Net Realized and Unrealized Gain: | | | | |
Net realized gain during the period on: | | | | |
Investments | | | 7,392,163 | |
Options written | | | 51,158 | |
| | | | |
Net realized gain | | | 7,443,321 | |
| | | | |
Net unrealized appreciation during the period on: | | | | |
Investments | | | 2,230,111 | |
Options written | | | 229,785 | |
| | | | |
Net unrealized appreciation | | | 2,459,896 | |
| | | | |
Net realized and unrealized gain | | | 9,903,217 | |
| | | | |
Net increase in net assets resulting from operations | | $ | 8,834,977 | |
| | | | |
The accompanying notes are an integral part of the financial statements.
83
| | |
| | Security |
| Statement of Changes in Net Assets | | Mid Cap Growth Fund |
| | | | | | | | |
| | | Six Months Ended
March 31, 2007
(unaudited) | | | Year Ended
September 30,
2006 | |
Increase (decrease) in net assets from operations: | | | | | | | | |
Net investment loss | | $ | (1,068,240 | ) | | $ | (2,484,452 | ) |
Net realized gain during the period on investments and options written | | | 7,443,321 | | | | 31,881,628 | |
Net unrealized appreciation (depreciation) during the period on investments and options written | | | 2,459,896 | | | | (24,964,195 | ) |
| | | | | | | | |
Net increase in net assets resulting from operations | | | 8,834,977 | | | | 4,432,981 | |
| | | | | | | | |
Distributions to shareholders from: | | | | | | | | |
Net realized gain | | | | | | | | |
Class A | | | (19,775,292 | ) | | | (13,404,927 | ) |
Class B | | | (2,496,080 | ) | | | (2,137,907 | ) |
Class C | | | (1,608,868 | ) | | | (1,288,551 | ) |
| | | | | | | | |
Total distributions to shareholders | | | (23,880,240 | ) | | | (16,831,385 | ) |
| | | | | | | | |
Capital share transactions: | | | | | | | | |
Proceeds from sale of shares | | | | | | | | |
Class A | | | 35,438,031 | | | | 64,440,077 | |
Class B | | | 686,128 | | | | 3,192,315 | |
Class C | | | 1,081,752 | | | | 3,755,889 | |
Distributions reinvested | | | | | | | | |
Class A | | | 19,132,877 | | | | 12,899,625 | |
Class B | | | 2,453,633 | | | | 2,106,540 | |
Class C | | | 1,496,764 | | | | 1,195,749 | |
Cost of shares redeemed | | | | | | | | |
Class A | | | (36,664,459 | ) | | | (58,969,056 | ) |
Class B | | | (3,905,344 | ) | | | (8,845,377 | ) |
Class C | | | (2,845,495 | ) | | | (4,824,246 | ) |
| | | | | | | | |
Net increase from capital share transactions | | | 16,873,887 | | | | 14,951,516 | |
| | | | | | | | |
Net increase in net assets | | | 1,828,624 | | | | 2,553,112 | |
| | | | | | | | |
Net assets: | | | | | | | | |
Beginning of period | | | 229,674,235 | | | | 227,121,123 | |
| | | | | | | | |
End of period | | $ | 231,502,859 | | | $ | 229,674,235 | |
| | | | | | | | |
Accumulated net investment loss at end of period | | $ | (1,068,240 | ) | | $ | — | |
| | | | | | | | |
Capital Share Activity: | | | | | | | | |
Shares sold | | | | | | | | |
Class A | | | 2,941,068 | | | | 5,111,243 | |
Class B | | | 70,000 | | | | 297,700 | |
Class C | | | 100,272 | | | | 323,232 | |
Shares reinvested | | | | | | | | |
Class A | | | 1,702,213 | | | | 1,075,865 | |
Class B | | | 265,258 | | | | 207,746 | |
Class C | | | 145,458 | | | | 107,242 | |
Shares redeemed | | | | | | | | |
Class A | | | (3,117,879 | ) | | | (4,738,606 | ) |
Class B | | | (408,475 | ) | | | (827,165 | ) |
Class C | | | (267,288 | ) | | | (415,740 | ) |
The accompanying notes are an integral part of the financial statements.
84
| | |
| Financial Highlights | | Security |
| Selected data for each share of capital stock outstanding throughout each period | | Mid Cap Growth Fund |
| | | | | | | | | | | | | | | | | | | | | | | | |
Class A | | Six Months Ended
March 31, 2007h | | | 2006 | | | 2005 | | | 2004e | | | 2003 | | | Year Ended,
September 30,
2002d | |
| Per Share Data | | | | | | | | | | | | | | | | | | | | | | | | |
Net asset value, beginning of period | | $ | 12.03 | | | $ | 12.65 | | | $ | 11.02 | | | $ | 10.84 | | | $ | 7.03 | | | $ | 8.48 | |
| | | | | | | | | | | | | | | | | | | | | | | | |
Income (loss) from investment operations: | | | | | | | | | | | | | | | | | | | | | | | | |
Net investment lossb | | | (0.05 | ) | | | (0.12 | ) | | | (0.10 | ) | | | (0.13 | ) | | | (0.10 | ) | | | (0.09 | ) |
Net gain (loss) on securities (realized and unrealized) | | | 0.52 | | | | 0.47 | | | | 2.46 | | | | 0.71 | | | | 3.91 | | | | (1.30 | ) |
| | | | | | | | | | | | | | | | | | | | | | | | |
Total from investment operations | | | 0.47 | | | | 0.35 | | | | 2.36 | | | | 0.58 | | | | 3.81 | | | | (1.39 | ) |
| | | | | | | | | | | | | | | | | | | | | | | | |
Less distributions: | | | | | | | | | | | | | | | | | | | | | | | | |
Distributions from realized gains | | | (1.19 | ) | | | (0.97 | ) | | | (0.73 | ) | | | (0.40 | ) | | | – | | | | (0.06 | ) |
| | | | | | | | | | | | | | | | | | | | | | | | |
Total distributions | | | (1.19 | ) | | | (0.97 | ) | | | (0.73 | ) | | | (0.40 | ) | | | – | | | | (0.06 | ) |
| | | | | | | | | | | | | | | | | | | | | | | | |
Net asset value, end of period | | $ | 11.31 | | | $ | 12.03 | | | $ | 12.65 | | | $ | 11.02 | | | $ | 10.84 | | | $ | 7.03 | |
| | | | | | | | | | | | | | | | | | | | | | | | |
Total Returna | | | 3.94 | % | | | 2.81 | % | | | 21.76 | % | | | 5.23 | % | | | 54.20 | % | | | (16.64 | %) |
| Ratios/Supplemental Data | | | | | | | | | | | | | | | | | | | | | | | | |
Net assets, end of period (in thousands) | | $ | 197,824 | | | $ | 192,159 | | | $ | 183,676 | | | $ | 149,715 | | | $ | 134,208 | | | $ | 90,948 | |
| | | | | | | | | | | | | | | | | | | | | | | | |
Ratios to average net assets: | | | | | | | | | | | | | | | | | | | | | | | | |
Net investment loss | | | (0.79 | %) | | | (0.93 | %) | | | (0.85 | %) | | | (1.11 | %) | | | (1.14 | %) | | | (0.92 | %) |
Total expensesf | | | 1.40 | % | | | 1.40 | % | | | 1.42 | % | | | 1.41 | % | | | 1.41 | % | | | 1.20 | % |
Net expensesg | | | 1.40 | % | | | 1.40 | % | | | 1.42 | % | | | 1.41 | % | | | 1.41 | % | | | 1.20 | % |
| | | | | | | | | | | | | | | | | | | | | | | | |
Portfolio turnover rate | | | 21 | % | | | 41 | % | | | 31 | % | | | 50 | % | | | 57 | % | | | 47 | % |
| | | | | | |
Class B | | Six Months Ended
March 31, 2007h | | | 2006 | | | 2005 | | | 2004e | | | 2003 | | | Year Ended,
September 30,
2002d | |
| Per Share Data | | | | | | | | | | | | | | | | | | | | | | | | |
Net asset value, beginning of period | | $ | 10.12 | | | $ | 10.86 | | | $ | 9.61 | | | $ | 9.57 | | | $ | 6.26 | | | $ | 7.62 | |
| | | | | | | | | | | | | | | | | | | | | | | | |
Income (loss) from investment operations: | | | | | | | | | | | | | | | | | | | | | | | | |
Net investment lossb | | | (0.08 | ) | | | (0.18 | ) | | | (0.16 | ) | | | (0.19 | ) | | | (0.15 | ) | | | (0.16 | ) |
Net gain (loss) on securities (realized and unrealized) | | | 0.43 | | | | 0.41 | | | | 2.14 | | | | 0.63 | | | | 3.46 | | | | (1.14 | ) |
| | | | | | | | | | | | | | | | | | | | | | | | |
Total from investment operations | | | 0.35 | | | | 0.23 | | | | 1.98 | | | | 0.44 | | | | 3.31 | | | | (1.30 | ) |
| | | | | | | | | | | | | | | | | | | | | | | | |
Less distributions: | | | | | | | | | | | | | | | | | | | | | | | | |
Distributions from realized gains | | | (1.19 | ) | | | (0.97 | ) | | | (0.73 | ) | | | (0.40 | ) | | | – | | | | (0.06 | ) |
| | | | | | | | | | | | | | | | | | | | | | | | |
Total distributions | | | (1.19 | ) | | | (0.97 | ) | | | (0.73 | ) | | | (0.40 | ) | | | – | | | | (0.06 | ) |
| | | | | | | | | | | | | | | | | | | | | | | | |
Net asset value, end of period | | $ | 9.28 | | | $ | 10.12 | | | $ | 10.86 | | | $ | 9.61 | | | $ | 9.57 | | | $ | 6.26 | |
| | | | | | | | | | | | | | | | | | | | | | | | |
Total Returna | | | 3.46 | % | | | 2.12 | % | | | 20.95 | % | | | 4.44 | % | | | 52.88 | % | | | (17.35 | %) |
| Ratios/Supplemental Data | | | | | | | | | | | | | | | | | | | | | | | | |
Net assets, end of period (in thousands) | | $ | 19,512 | | | $ | 22,010 | | | $ | 27,115 | | | $ | 26,578 | | | $ | 26,459 | | | $ | 17,502 | |
| | | | | | | | | | | | | | | | | | | | | | | | |
Ratios to average net assets: | | | | | | | | | | | | | | | | | | | | | | | | |
Net investment loss | | | (1.54 | %) | | | (1.68 | %) | | | (1.61 | %) | | | (1.86 | %) | | | (1.89 | %) | | | (1.84 | %) |
Total expensesf | | | 2.15 | % | | | 2.15 | % | | | 2.17 | % | | | 2.16 | % | | | 2.16 | % | | | 2.11 | % |
Net expensesg | | | 2.15 | % | | | 2.15 | % | | | 2.17 | % | | | 2.16 | % | | | 2.16 | % | | | 2.11 | % |
| | | | | | | | | | | | | | | | | | | | | | | | |
Portfolio turnover rate | | | 21 | % | | | 41 | % | | | 31 | % | | | 50 | % | | | 57 | % | | | 47 | % |
The accompanying notes are an integral part of the financial statements.
85
| | |
| Financial Highlights | | Security |
| Selected data for each share of capital stock outstanding throughout each period | | Mid Cap Growth Fund |
| | | | | | | | | | | | | | | | | | | | | | | | |
Class C | | Six Months Ended
March 31, 2007h | | | 2006 | | | 2005 | | | 2004e | | | 2003 | | | Year Ended,
September 30,
2002c,d | |
| Per Share Data | | | | | | | | | | | | | | | | | | | | | | | | |
Net asset value, beginning of period | | $ | 11.13 | | | $ | 11.84 | | | $ | 10.43 | | | $ | 10.34 | | | $ | 6.76 | | | $ | 8.22 | |
| | | | | | | | | | | | | | | | | | | | | | | | |
Income (loss) from investment operations: | | | | | | | | | | | | | | | | | | | | | | | | |
Net investment lossb | | | (0.08 | ) | | | (0.19 | ) | | | (0.18 | ) | | | (0.21 | ) | | | (0.16 | ) | | | (0.16 | ) |
Net gain (loss) on securities (realized and unrealized) | | | 0.47 | | | | 0.45 | | | | 2.32 | | | | 0.70 | | | | 3.74 | | | | (1.24 | ) |
| | | | | | | | | | | | | | | | | | | | | | | | |
Total from investment operations | | | 0.39 | | | | 0.26 | | | | 2.14 | | | | 0.49 | | | | 3.58 | | | | (1.40 | ) |
| | | | | | | | | | | | | | | | | | | | | | | | |
Less distributions: | | | | | | | | | | | | | | | | | | | | | | | | |
Distributions from realized gains | | | (1.19 | ) | | | (0.97 | ) | | | (0.73 | ) | | | (0.40 | ) | | | – | | | | (0.06 | ) |
| | | | | | | | | | | | | | | | | | | | | | | | |
Total distributions | | | (1.19 | ) | | | (0.97 | ) | | | (0.73 | ) | | | (0.40 | ) | | | – | | | | (0.06 | ) |
| | | | | | | | | | | | | | | | | | | | | | | | �� |
Net asset value, end of period | | $ | 10.33 | | | $ | 11.13 | | | $ | 11.84 | | | $ | 10.43 | | | $ | 10.34 | | | $ | 6.76 | |
| | | | | | | | | | | | | | | | | | | | | | | | |
Total Returna | | | 3.51 | % | | | 2.20 | % | | | 20.83 | % | | | 4.59 | % | | | 52.96 | % | | | (17.30 | %) |
| Ratios/Supplemental Data | | | | | | | | | | | | | | | | | | | | | | | | |
Net assets, end of period (in thousands) | | $ | 14,167 | | | $ | 15,505 | | | $ | 16,330 | | | $ | 14,759 | | | $ | 11,279 | | | $ | 5,883 | |
| | | | | | | | | | | | | | | | | | | | | | | | |
Ratios to average net assets: | | | | | | | | | | | | | | | | | | | | | | | | |
Net investment loss | | | (1.54 | %) | | | (1.68 | %) | | | (1.60 | %) | | | (1.86 | %) | | | (1.89 | %) | | | (1.85 | %) |
Total expensesf | | | 2.15 | % | | | 2.15 | % | | | 2.17 | % | | | 2.16 | % | | | 2.16 | % | | | 2.12 | % |
Net expensesg | | | 2.15 | % | | | 2.15 | % | | | 2.17 | % | | | 2.16 | % | | | 2.16 | % | | | 2.12 | % |
| | | | | | | | | | | | | | | | | | | | | | | | |
Portfolio turnover rate | | | 21 | % | | | 41 | % | | | 31 | % | | | 50 | % | | | 57 | % | | | 47 | % |
a | Total return information does not reflect deduction of any sales charges imposed at the time of purchase for Class A shares or upon redemption for Class B and C shares. |
b | Net investment loss was computed using average shares outstanding throughout the period. |
c | The financial highlights for Class C shares exclude the historical financial highlights of Class S shares. Class S shares were exchanged for Class C shares on June 3, 2002. |
d | Effective May 1, 2002 the fee structure for Security Mid Cap Growth Fund changed. Per share information reflects this change. |
e | The financial highlights for the Mid Cap Growth Fund exclude the historical financial highlights of the Technology Series Class A, B and C shares. The assets of the Technology Series were acquired by the Mid Cap Growth Fund on October 3, 2003. |
f | Total expense information reflects expense ratios absent fund expense reductions by the Investment Manager and custodian earnings credits, as applicable. |
g | Net expense information reflects the expense ratios after voluntary expense waivers, reimbursements and custodian earnings credits, as applicable. |
h | Unaudited figures for the six months ended March 31, 2007. Percentage amounts, except total return, have been annualized. |
The accompanying notes are an integral part of the financial statements.
86
Notes to Financial Statements
March 31, 2007
(unaudited)
1. Significant Accounting Policies
Security Large Cap Value, Equity and Mid Cap Growth Funds (the Funds) are registered under the Investment Company Act of 1940, as amended, as open-end management investment companies. The shares of Security Equity Fund are currently issued in multiple series, with each series, in effect, representing a separate fund. The Security Funds offer different classes and, therefore, are required to account for each class separately and to allocate general expenses to each class based on the net asset value of each class. Class “A” shares are generally sold with a sales charge at the time of purchase. Class “A” shares are not subject to a sales charge when they are redeemed, except that purchases of Class “A” shares of $1 million or more sold without a front-end sales charge are subject to a contingent deferred sales charge if redeemed within one year of purchase. Class “B” shares may be subject to a contingent deferred sales charge for six years and automatically convert to Class “A” shares after eight years. Redemptions of Class “B” shares within five years of acquisition incur a contingent deferred sales charge. Class “C” shares are offered without a front-end sales charge but incur additional class-specific expenses. Redemptions of Class “C” shares within one year of acquisition incur a contingent deferred sales charge. The following is a summary of the significant accounting policies followed by the Funds in the preparation of their financial statements.
A. Security Valuation – Valuations of the Funds’ or Series’ securities are supplied by pricing services approved by the Board of Directors. The Funds’ officers, under the general super vision of the Board of Directors, regularly review procedures used by, and valuations provided by, the pricing services. Each security owned by the Funds or Series that is listed on a securities exchange is valued at its last sale price on that exchange on the date as of which assets are valued. Where the security is listed on more than one exchange, the Funds or Series will use the price of that exchange that it generally considers to be the principal exchange on which the stock is traded. Securities listed on the Nasdaq Stock Market, Inc. (“Nasdaq”) will be valued at the Nasdaq Official Closing Price, which may not necessarily represent the last sale price. If there has been no sale on such exchange or NASDAQ on such day, the security is valued at the closing bid price on such day. Securities for which market quotations are not readily available are valued by a pricing service considering securities with similar yields, quality, type of issue, coupon, duration and rating. If there is no bid price or if the bid price is deemed to be unsatisfactory by the Board of Directors or by the Funds’ or Series’ investment manager, then the securities are valued in good faith by such method as the Board of Directors determines will reflect the fair value. If events occur that will affect the value of a Fund’s or Series’ portfolio securities before the NAV has been calculated (a “significant event”), the security will generally be priced using a fair value procedure. If the Valuation Committee determines a significant event has occurred, it will evaluate the impact of that event on an affected security or securities, to determine whether a fair value adjustment would materially affect the Fund or Series NAV per share. Some of the factors which may be considered by the Board of Directors in determining fair value are fundamental analytical data relating to the investment; the nature and duration of any restrictions on disposition; trading in similar securities of the same issuer or comparable companies; information from broker-dealers; and an evaluation of the forces that influence the market in which the securities are purchased and sold. The Funds or Series generally will value short-term debt securities at prices based on market quotations for such securities or securities of similar type, yield, quality and duration, except those securities purchased with 60 days or less to maturity are valued on the basis of amortized cost which approximates market value.
Generally, trading in foreign securities markets is substantially completed each day at various times prior to the close of the New York Stock Exchange. The values of foreign securities are determined as of the close of such foreign markets or the close of the New York Stock Exchange, if earlier. All investments quoted in foreign currency are valued in U.S. dollars on the basis of the foreign currency exchange rates prevailing at the close of business. Investments in foreign securities may involve risks not present in domestic investments. The Valuation Committee will determine the current value of such foreign securities by taking into consideration certain factors which may include those discussed above, as well as the following factors, among others: the value of the securities traded on other foreign markets, ADR trading, closed-end fund trading, foreign currency exchange activity, and the trading prices of financial products that are tied to foreign securities such as WEBS®. In addition, the Board of Directors has authorized the Valuation Committee and Administrator to use prices and other information supplied by Interactive Data Corporation’s Fair Value Information Service in valuing such securities. Since foreign securities may be denominated in a foreign currency and involve settlement and pay interest or dividends in foreign currencies, changes in the relationship of these foreign currencies to the U.S. dollar can significantly affect the value of the investments and earnings of the Funds or Series. Foreign investments may also subject the Series/Fund to foreign government exchange restrictions, expropriation, taxation or other political, social or economic developments, all of which could affect the market and/or credit risk of the investments.
B. Repurchase Agreements – In connection with transactions in repurchase agreements, it is the Funds’ or Series’ policy that their custodian take possession of the underlying collateral and that the fair value of the collateral exceed the principal amount of the repurchase transaction, including accrued interest, at all times. If the seller defaults, and the fair value of the collateral declines, realization of the collateral by the Funds may be delayed or limited.
C. Foreign Currency Transactions – The accounting records of the Funds or Series are maintained in U.S. dollars. All assets and liabilities initially expressed in foreign currencies are converted into U.S. dollars at prevailing exchange rates. Purchases and sales of investment securities, dividend and interest income, and certain expenses are translated at the rates of exchange prevailing on the respective dates of such transactions.
87
Notes to Financial Statements
March 31, 2007
(unaudited)
The Funds or Series do not isolate that portion of the results of operations resulting from changes in the foreign exchange rates on investments from the fluctuations arising from changes in the market prices of securities held. Such fluctuations are included with the net realized and unrealized gain or loss on investments.
Net realized foreign exchange gains and losses arise from sales of portfolio securities, sales of foreign currencies, and the difference between asset and liability amounts initially stated in foreign currencies and the U.S. dollar value of the amounts actually received or paid. Net unrealized foreign exchange gains or losses arise from changes in the value of portfolio securities and other assets and liabilities at the end of the reporting period, resulting from changes in the exchange rates.
D. Forward Foreign Currency Exchange Contracts – Global Series of the Security Equity Fund may enter into forward foreign exchange contracts in order to manage foreign currency risk from purchase or sale of securities denominated in foreign currency. The Series may also enter into such contracts to manage the effect of changes in foreign currency exchange rates on portfolio positions. These contracts are marked to market daily, by recognizing the difference between the contract exchange rate and the current market rate as unrealized gains or losses. Realized gains or losses are recognized when contracts are settled and are reflected in the Statement of Operations. These contracts involve market risk in excess of the amount reflected in the Statement of Assets and Liabilities. The face or contract amount in U.S. dollars reflects the total exposure these funds have in that particular currency contract. Losses may arise due to changes in the value of the foreign currency or if the counterparty does not perform under the contract.
E. Futures – The Funds or Series may utilize futures contracts to a limited extent, with the objectives of maintaining full exposure to the underlying stock market, enhancing returns, maintaining liquidity, minimizing transaction costs and hedging possible variations in foreign exchange rates. The Funds or Series, as applicable, may purchase or sell financial and foreign currency futures contracts to immediately position incoming cash in the market, thereby simulating a fully invested position in the underlying index while maintaining a cash balance for liquidity. In the event of redemptions, the Funds or Series, as applicable, may pay from its cash balances and reduce its futures positions accordingly. Returns may be enhanced by purchasing futures contracts instead of the underlying securities when futures are believed to be priced more attractively than the underlying securities. The primary risks associated with the use of futures contracts are imperfect correlation between changes in market values of stocks contained in the indexes and the prices of futures contracts, and the possibility of an illiquid market. Futures contracts are valued based upon their quoted daily settlement prices. Upon entering into a futures contract, the Funds or Series are required to deposit and maintain as collateral either cash or securities, representing the initial margin, equal to a certain percentage of the contract value. Cash deposits are shown as restricted cash on the Statement of Assets and Liabilities; securities held as collateral are noted in the Schedule of Investments. Subsequent changes in the value of the contract are recorded as unrealized gains or losses. The variation margin is paid or received in cash daily by the Funds or Series. The Funds or Series realize a gain or loss when the contract is closed or expires.
F. Options Purchased and Wrtten – The Funds or Series may purchase put and call options and write such options on a covered basis on securities that are traded on recognized securities exchanges and over-the-counter markets. Call and put options on securities give the holder the right to purchase or sell (and the writer the obligation to sell or purchase), respectively, a security at a specified price, until a certain date. Options may be used to hedge the Funds’ or Series’ portfolio, to increase returns or to maintain exposure to the equity markets. The primary risks associated with the use of options are an imperfect correlation between the change in market value of the securities held by the Fund or Series and the price of the option, the possibility of an illiquid market, and the inability of the counterparty to meet the terms of the contract.
The premium received for a written option is recorded as an asset with an equal liability which is marked to market based on the option’s quoted daily settlement price. Fluctuations in the value of such instruments are recorded as unrealized appreciation (depreciation) until terminated, at which time realized gains and losses are recognized.
G. Security Transactions and Investment Income – Security transactions are accounted for on the date the securities are purchased or sold (trade date). Realized gains and losses are reported on an identified cost basis. Dividend income is accrued as of ex-dividend date, except that certain dividends for foreign securities where the ex-dividend date may have passed are recorded as soon as the Fund or Series is informed of the dividend in the exercise of reasonable diligence. Interest income is recognized on the accrual basis including the amortization of premiums and accretion of discounts on debt securities. Each class of shares participates in investment income fund-level expenses and unrealized gains and losses based on the total net asset value of its shares in proportion to the total net assets of the Fund or Series.
H. Expenses – Expenses that are directly related to one of the Funds or Series are charged directly to that Fund or Series. Other operating expenses are allocated to the Funds or Series on the basis of relative net assets. Class specific expenses, such as 12b-1 fees, are borne by that class. Income, other expenses and realized and unrealized gains and losses of a Fund or Series are allocated to each respective class in proportion to the relative net assets of each class.
I. Distributions to Shareholders – Distributions to shareholders are recorded on the ex-dividend date. The character of distributions made during the year from net investment income or net realized gains may differ from their ultimate characterization for federal income tax purposes.
J. Taxes – The Fund or Series intend to comply with the requirements of the Internal Revenue Code applicable to regulated investment companies and distributed all of their taxable net income and net realized gains sufficient to relieve them from all, or substantially all, federal income, excise and state income taxes. Therefore, no provision for federal or state income tax is required.
88
Notes to Financial Statements
March 31, 2007
(unaudited)
K. Earnings Credits – Under the fee schedule with the custodian, the Funds or Series earn credits based on overnight custody cash balances. These credits can be utilized to reduce related custodial expenses. The custodian fees disclosed in the Statement of Operations are before the reduction in expense from the related earnings credits.
L. Use of Estimates – The preparation of financial statements in conformity with U.S. generally accepted accounting principles requires management to make estimates and assumptions that affect the reported amounts of assets and liabilities at the date of the financial statements and the reported amounts of increases and decreases in net assets from operations during the reporting period. Actual results could differ from those estimates.
M. Securities Sold Short – Certain Funds or Series may make short sales “against the box,” in which the Fund or Series enters into a short sale of a security it owns. At no time will more than 15% of the value of the Funds’ or Series’ net assets be in deposits on short sales against the box. If a Fund or Series makes a short sale, the Fund or Series does not immediately deliver from its own account the securities sold and does not receive the proceeds from the sale. To complete the sale, the Fund or Series must borrow the security (generally from the broker through which the short sale is made) in order to make delivery to the buyer. The Fund or Series must replace the security borrowed by purchasing it at the market price at the time of replacement or delivering the security from its own portfolio. The Fund or Series is said to have a “short position” in securities sold until it delivers them to the broker, at which time it receives the proceeds of the sale. Certain Funds or Series may make short sales that are not “against the box,” which create opportunities to increase the Fund’s or Series’ return but, at the same time, involve specific risk considerations and may be considered a speculative technique. Such short sales theoretically involve unlimited loss potential, as the market price of securities sold short may continually increase, although a Fund or Series may mitigate such losses by replacing the securities sold short before the market price has increased significantly. For financial statement purposes, an amount equal to the settlement amount is included in the Statement of Assets and Liabilities as an asset and an equivalent liability. The amount of the liability is subsequently marked-to-market to reflect the current value of the short position. Subsequent fluctuations in the market prices of securities sold, but not yet purchased, may require purchasing the securities at prices which differ from the market value reflected on the Statement of Assets and Liabilities. The Fund or Series are liable for any dividends or interest payable on securities while those securities are in a short position. As collateral for its short positions, the Fund or Series are required under the Investment Company Act of 1940 to maintain segregated assets consisting of cash, cash equivalents or liquid securities. These segregated assets are valued consistent with Note 1a above. These segregated assets are required to be adjusted daily to reflect changes in the market value of the securities sold short.
N. Indemnifications – Under the Funds’ or Series’ organizational documents, its Officers and Directors are indemnified against certain liabilities arising out of the performance of their duties to the Funds or Series. In addition, in the normal course of business, the Funds or Series enter into contracts that provide general indemnification to other parties. The Funds’ or Series’ maximum exposure under these arrangements is unknown as this would involve future claims that may be made against the Funds or Series that have not yet occurred, and may not occur. However, the Funds have not had prior claims or losses pursuant to these contracts and expect the risk of loss to be remote.
O. Recent Accounting Pronouncements – On July 13, 2006, the Financial Accounting Standards Board (“FASB”) released FASB interpretation No. 48, “Accounting for Uncertainty in Income Taxes” (“FIN 48”). FIN 48 provides guidance for how uncertain tax positions should be recognized, measured, presented and disclosed in the financial statements. FIN 48 requires the evaluation of tax positions taken or expected to be taken in the course of preparing the Company’s tax returns to determine whether the tax positions are “more-likely-than-not” of being sustained by the applicable tax authority. Tax positions not deemed to meet the more-likely-than-not threshold would be recorded as a tax benefit or expense in the current year. Adoption of FIN 48 is required for fiscal years beginning after December 15, 2006 but not before its last NAV calculation in the first required financial statement reporting period for its fiscal year beginning after December 15, 2006 and is to be applied to all open tax years as of the effective date. At this time, management is evaluating the implication of FIN 48 and its impact in the financial statements has not yet been determined.
In September 2006, the FASB issued Statement of Financial Accounting Standards No. 157, “Fair Value Measurements” (FAS 157). This standard clarifies the definition of fair value for financial reporting, establishes a framework for measuring fair value and requires additional disclosure about the use of fair value requirements. FAS 157 is effective for financial statements issued for fiscal years beginning after November 15, 2007 and interim periods within those fiscal years. As of March 31, 2007, the Funds are currently evaluating the impact of FAS 157.
2. Management Fees and Other Transactions with Affiliates
Management fees are paid monthly to Security Management Company, LLC (SMC) based on the following annual rates as of March 31, 2007:
| | | |
| | | Management
Fees (as a %
of net assets) | |
Security Equity Fund: | | | |
Alpha Opportunity Series* | | 1.86 | %1 |
Equity Series | | 0.75 | % |
Global Series | | 1.00 | % |
Mid Cap Value Series | | 0.80 | %2 |
Select 25 Series | | 0.75 | % |
Small Cap Growth Series | | 1.00 | % |
Security Large Cap Value Fund | | 0.65 | % |
Security Mid Cap Growth Fund | | 0.75 | % |
| * | Alpha Opportunity Series’ management fee will range from 1.25% to 2.75% of average daily net assets as discussed below. |
89
Notes to Financial Statements
March 31, 2007
(unaudited)
1SMC receives a management fee from the Alpha Opportunity Series that consists of two components. The first component is an annual base fee equal to 2.00% of Alpha Opportunity Series average daily net assets. The second component is a base fee adjustment that either increases or decreases the base fee, depending on how Alpha Opportunity Series (calculated by reference to its Class A shares) performed relative to the S&P 500 Index over the prior 12-month period (the “Measuring Period”). SMC will receive the base fee of 2.00% without adjustment if the performance of Alpha Opportunity Series (calculated by reference to its Class A shares) matches the performance of the S&P 500 Index. The maximum base fee adjustment at each calculation period is 0.75% up or down in the event that Alpha Opportunity Series outperforms or underperforms the S&P 500 Index by 15% or more. SMC calculates the base fee adjustment each month based upon Alpha Opportunity Series’ performance relative to the S&P 500 Index during the Measuring Period ending on the last day of the month. If Alpha Opportunity Series outperforms the S&P 500 Index over the Measuring Period, the base fee is adjusted upward. The upward adjustment is equal to the amount by which Alpha Opportunity Series’ performance exceeds that of the S&P 500 Index divided by 15 and multiplied by the average daily net assets of Alpha Opportunity Series during the Measuring Period to determine the base fee adjustment for the month. If Alpha Opportunity Series underperforms the Index, the base fee is adjusted downward on the same basis. SMC will determine the dollar amount of any performance adjustment each month by multiplying the adjustment percentage by the average daily net assets of the Alpha Opportunity Series during the Measuring Period and dividing that number by the number of days in the Measuring Period and then multiplying that amount by the number of days in the current month.
2Management fees are payable at an annual rate of 1.00% of the average daily net assets of $200 million or less, and 0.75% of the average daily net assets of the Mid Cap Value Series in excess of $200 million.
SMC also acts as the administrative agent and transfer agent for the Funds, and as such performs administrative functions, transfer agency and dividend disbursing services, and the bookkeeping, accounting and pricing functions for each Fund or Series. For these services, the Investment Manager receives the following:
| | |
| | | Administrative Fees
(as a % of net assets) |
Security Equity Fund: | | |
Alpha Opportunity Series | | 0.15% |
Equity Series | | 0.095% |
Global Series | | 0.05% + greater of 0.10% or $ 60,000 |
Mid Cap Value Series | | 0.095% |
Select 25 Series | | 0.095% |
Small Cap Growth Series | | 0.095% |
Security Large Cap Value Fund | | 0.095% |
Security Mid Cap Growth Fund | | 0.095% |
Minimum charge per Series or Fund | | $25,000 |
Certain out-of-pocket charges | | Varies |
| |
SMC is paid the following for providing transfer agent services to the Funds: | | |
| |
Annual per account charge | | $5.00 - $8.00 |
Transaction fee | | $0.60 -$1.10 |
Annual minimum charge (per Series or Fund) | | $25,000 |
Certain out-of-pocket charges | | Varies |
Effective January 1, 2007, the investment advisory contract for Security Large Cap Value Fund provides that the total expenses be limited to 1.25% of average net assets for Class A shares and 2.00% of average net assets for both Class B and Class C shares, exclusive of interest, taxes, extraordinary expenses and brokerage fees and commissions. Effective January 1, 2007, the investment advisory contract for the Select 25 Series provides that the total expenses be limited to 1.35% of average net assets for Class A shares and 2.10% of average net assets for both Class B and C shares, exclusive of interest, taxes, extraordinary expenses and brokerage fees and commissions. Effective January 1, 2007, the investment advisory contract for the Alpha Opportunity Series provides that the total other expenses be limited to 0.50% of average net assets for each class of shares, exclusive of interest, taxes, extraordinary expenses, brokerage fees and commissions, 12b-1 fees and dividends on short sales. These contracts are in effect through December 31, 2008. SMC has agreed to limit the total expenses for each class of the Mid Cap Value Series and the Small Cap Growth Series to 2.00% of average net assets, exclusive of interest, taxes, extraordinary expenses, brokerage fees and commissions and 12-1 fees for the aforementioned Series. The expense limits are voluntary and may be terminated at any time without notice to shareholders.
The Funds have adopted Distribution Plans related to the offering of Class A, Class B and Class C shares pursuant to Rules 12b-1 under the Investment Company Act of 1940. The plans provide for payments at an annual rate of 1.00% of the average daily net assets of each Fund’s or Series’ Class B and Class C shares, and 0.25% of the average daily net assets of each Fund’s or Series’ Class A shares. The distribution plan fees are paid to Security Distributors, Inc. (SDI), a wholly-owned subsidiary of Security Benefit Corporation and the national distributor of the Funds or Series. Effective August 25, 2005, Global Series ceased charging 12b-1 fees on Class B shares in accordance with the NASD sales cap regulations. This fee may be reinstated at any time.
SDI retained net under writing commissions on sales of shares after allowances to brokers and dealers as follows:
| | | |
| | | SDI Underwriting
Commissions |
Security Equity Fund: | | | |
Alpha Opportunity Series | | $ | 8,173 |
Equity Series | | | 1,671 |
Global Series | | | 77,562 |
Mid Cap Value Series | | | 197,859 |
Select 25 Series | | | 6,541 |
Security Large Cap Value Fund | | | 16,339 |
Security Mid Cap Growth Fund | | | 20,167 |
90
Notes to Financial Statements
March 31, 2007
(unaudited)
Certain officers and directors of the Funds are also officers and/or directors of Security Benefit Life Insurance Company, a subsidiary of Security Benefit Corporation and its affiliates, which include SMC and SDI.
At March 31, 2007, Security Benefit Corporation and its subsidiaries owned over five percent of the outstanding shares of the Funds or Series, as follows:
| | | |
Fund or Series | | Percent of
outstanding
shares owned | |
Security Equity Fund: | | | |
Alpha Opportunity Series | | 42.23 | % |
Equity Series | | 14.17 | % |
Global Series | | 8.35 | % |
Select 25 Series | | 17.82 | % |
Small Cap Growth Series | | 15.27 | % |
Security Large Cap Value Fund | | 19.90 | % |
Security Mid Cap Growth Fund | | 5.95 | % |
3. Unrealized Appreciation/Depreciation
For federal income tax purposes, the amounts of unrealized appreciation (depreciation) on investments at March 31, 2007, were as follows:
| | | | | | | | | | | |
| | | Gross
unrealized
appreciation | | Gross
unrealized
(depreciation) | | | Net unrealized
appreciation
(depreciation) | |
Security Equity Fund: | | | | | | | | | | | |
Alpha Opportunity Series | | $ | 125,791 | | $ | (141,025 | ) | | $ | (15,234 | ) |
Equity Series | | | 92,684,605 | | | (16,989,566 | ) | | | 75,695,039 | |
Global Series | | | 48,168,626 | | | (2,281,784 | ) | | | 45,886,842 | |
Mid Cap Value Series | | | 224,015,524 | | | (33,343,744 | ) | | | 190,671,780 | |
Select 25 Series | | | 5,688,445 | | | (2,049,063 | ) | | | 3,639,382 | |
Small Cap Growth Series | | | 7,949,731 | | | (989,935 | ) | | | 6,959,796 | |
Security Large Cap | | | | | | | | | | | |
Value Fund | | | 15,825,829 | | | (460,775 | ) | | | 15,365,054 | |
Security Mid Cap | | | | | | | | | | | |
Growth Fund | | | 48,033,980 | | | (13,840,611 | ) | | | 34,193,369 | |
4. Investment Transactions
Investment transactions for the six months ended March 31, 2007, (excluding overnight investments and short-term commercial paper) were as follows:
| | | | | | |
| | | Purchases | | Proceeds from
Sales |
Security Equity Fund: | | | | | | |
Alpha Opportunity Series | | $ | 115,521,611 | | $ | 119,243,832 |
Equity Series | | | 51,786,472 | | | 80,755,641 |
Global Series | | | 25,998,129 | | | 16,800,526 |
Mid Cap Value Series | | | 159,315,088 | | | 148,395,213 |
Select 25 Series | | | 8,363,029 | | | 14,301,071 |
Small Cap Growth Series | | | 43,911,659 | | | 50,869,266 |
Security Large Cap Value Fund | | | 10,603,156 | | | 7,451,391 |
Security Mid Cap Growth Fund | | | 23,840,995 | | | 35,538,245 |
5. Open Futures Contracts
Open futures contracts for Alpha Opportunity Series as of March 31, 2007, were as follows:
| | |
| | | Alpha Opportunity Series
S&P 500 Index Futures |
Position | | Long |
Number of Contracts | | 39 |
Expiration Date | | 6-15-2007 |
Contract Amount | | $13,642,878 |
Market Value | | $13,954,200 |
Unrealized Gain | | $311,322 |
6. Options Written
Information as to options written by the Fund or Series during the six months ended March 31, 2007 and options outstanding at March 31, 2007 is provided below:
Equity Series Call Options Written
| | | | | | | |
| | | Number of
Contracts | | | Premium
Amount | |
Balance at September 30, 2006 | | 1,968 | | | $ | 320,690 | |
Opened | | 4,315 | | | | 429,562 | |
Expired | | (1,086 | ) | | | (176,253 | ) |
Exercised | | (5,197 | ) | | | (573,999 | ) |
| | | | | | | |
Balance at March 31, 2007 | | — | | | $ | — | |
| | | | | | | |
Equity Series Put Options Written
| | | | | | | |
| | | Number of
Contracts | | | Premium
Amount | |
Balance at September 30, 2006 | | 980 | | | $ | 142,320 | |
Opened | | 1,428 | | | | 374,805 | |
Expired | | (2,408 | ) | | | (517,125 | ) |
| | | | | | | |
Balance at March 31, 2007 | | — | | | $ | — | |
| | | | | | | |
Mid Cap Value Series Call Options Written Outstanding
| | | | | | | | | | |
Common Stock | | Expiration
Date | | Exercise
Price | | Number of
Contracts | | Market
Value |
USEC, Inc. | | 04-20-07 | | $ | 15.00 | | 428 | | $ | 57,780 |
| | 07-20-07 | | | 15.00 | | 3,340 | | | 718,100 |
United Rentals, Inc. | | 04-20-07 | | | 30.00 | | 589 | | | 5,890 |
| | | | | | | | | | |
Total call options outstanding (premiums received, $ 610,913) | | | | | | | 4,357 | | $ | 781,770 |
| | | | | | | | | | |
Mid Cap Value Series Call Options Written
| | | | | | | |
| | | Number of
Contracts | | | Premium
Amount | |
Balance at September 30, 2006 | | 6,254 | | | $ | 1,118,959 | |
Opened | | 8,869 | | | | 1,494,691 | |
Bought Back | | (260 | ) | | | (18,979 | ) |
Expired | | (2,289 | ) | | | (537,638 | ) |
Exercised | | (8,217 | ) | | | (1,446,120 | ) |
| | | | | | | |
Balance at March 31, 2007 | | 4,357 | | | $ | 610,913 | |
| | | | | | | |
91
Notes to Financial Statements
March 31, 2007
(unaudited)
Mid Cap Value Series Put Options Written
| | | | | | | |
| | | Number of
Contracts | | | Premium
Amount | |
Balance at September 30, 2006 | | 1,200 | | | $ | 129,596 | |
Opened | | 1,125 | | | | 165,854 | |
Expired | | (2,325 | ) | | | (295,450 | ) |
| | | | | | | |
Balance at March 31, 2007 | | — | | | $ | — | |
| | | | | | | |
Select 25 Series Call Options Written Outstanding
| | | | | | | | | | |
Common Stock | | Expiration
Date | | Exercise
Price | | Number of
Contracts | | Market
Value |
Williams Companies, Inc. | | 04-20-07 | | $ | 27.50 | | 208 | | $ | 24,960 |
| | | | | | | | | | |
Total call options outstanding (premiums received, $ 27,218) | | | | | | | 208 | | $ | 24,960 |
| | | | | | | | | | |
Select 25 Series Call Options Written
| | | | | | | |
| | | Number of
Contracts | | | Premium
Amount | |
Balance at September 30, 2006 | | 237 | | | $ | 41,934 | |
Opened | | 575 | | | | 67,077 | |
Expired | | (162 | ) | | | (30,497 | ) |
Exercised | | (442 | ) | | | (51,296 | ) |
| | | | | | | |
Balance at March 31, 2007 | | 208 | | | $ | 27,218 | |
| | | | | | | |
Select 25 Series Put Options Written
| | | | | | | |
| | | Number of
Contracts | | | Premium
Amount | |
Balance at September 30, 2006 | | — | | | $ | — | |
Opened | | 144 | | | | 47,154 | |
Expired | | (144 | ) | | | (47,154 | ) |
| | | | | | | |
Balance at March 31, 2007 | | — | | | $ | — | |
| | | | | | | |
Security Large Cap Value Fund Put Options Written Outstanding
| | | | | | | | | | |
Common Stock | | Expiration
Date | | Exercise
Price | | Number of
Contracts | | Market
Value |
McDermott International, Inc. | | 04-20-07 | | $ | 45.00 | | 48 | | $ | 720 |
| | | | | | | | | | |
Total put options outstanding (premiums received, $ 7,648) | | | | | | | 48 | | $ | 720 |
| | | | | | | | | | |
Security Large Cap Value Fund Call Options Written
| | | | | | | |
| | | Number of
Contracts | | | Premium
Amount | |
Balance at September 30, 2006 | | 518 | | | $ | 67,841 | |
Opened | | 789 | | | | 85,964 | |
Expired | | (369 | ) | | | (43,708 | ) |
Exercised | | (938 | ) | | | (110,097 | ) |
| | | | | | | |
Balance at March 31, 2007 | | — | | | $ | — | |
| | | | | | | |
Security Large Cap Value Fund Put Options Written
| | | | | | | |
| | | Number of
Contracts | | | Premium
Amount | |
Balance at September 30, 2006 | | — | | | $ | — | |
Opened | | 332 | | | | 82,324 | |
Expired | | (284 | ) | | | (74,676 | ) |
| | | | | | | |
Balance at March 31, 2007 | | 48 | | | $ | 7,648 | |
| | | | | | | |
Security Mid Cap Growth Fund Call Options Written Outstanding
| | | | | | | | | | |
Common Stock | | Expiration
Date | | Exercise
Price | | Number of
Contracts | | Market
Value |
Flir Systems, Inc. | | 04-20-07 | | $ | 35.00 | | 400 | | $ | 50,000 |
| | | | | | | | | | |
Total call options outstanding (premiums received, $75,450) | | | | | | | 400 | | $ | 50,000 |
| | | | | | | | | | |
Security Mid Cap Growth Fund Call Options Written
| | | | | | | |
| | | Number of
Contracts | | | Premium
Amount | |
Balance at September 30, 2006 | | 1,313 | | | $ | 258,245 | |
Opened | | 1,661 | | | | 216,136 | |
Bought Back | | (589 | ) | | | (42,996 | ) |
Expired | | (672 | ) | | | (97,690 | ) |
Exercised | | (1,313 | ) | | | (258,245 | ) |
| | | | | | | |
Balance at March 31, 2007 | | 400 | | | $ | 75,450 | |
| | | | | | | |
92
Notes to Financial Statements
March 31, 2007
(unaudited)
7. Restricted Securities
As of March 31, 2007, the following Funds or Series contained restricted securities. Market value, cost, percentage of total net assets and acquisition dates are as follows:
| | | | | | | | | | | | | | | | |
| | | Number of
Shares | | Price Per
Share | | Market
Value | | Cost | | % of
Net Assets | | | Acquisition
Dates |
Security Equity Fund: | | | | | | | | | | | | | | | | |
Mid Cap Value Series | | | | | | | | | | | | | | | | |
ThermoEnergy Corporation PIPE | | 1,745,000 | | $ | 0.30 | | $ | 523,500 | | $ | 1,646,500 | | 0.1 | % | | 7-14-05 |
ThermoEnergy Corporation Warrant | | 1,745,000 | | | 0,0831 | | | 145,010 | | | 447,500 | | 0.0 | % | | 7-14-05 |
| | | | | | |
Security Mid Cap Growth Fund: | | | | | | | | | | | | | | | | |
ThermoEnergy Corporation PIPE | | 745,000 | | | 0.30 | | | 223,500 | | | 702,947 | | 0.1 | % | | 7-14-05 |
ThermoEnergy Corporation Warrant | | 745,000 | | | 0.0831 | | | 61,910 | | | 191,03 | | 0.0 | % | | 7-14-05 |
These securities have been valued after considering certain pertinent factors, including the results of operations since the date of purchase, and the recent sales price of its common stock. No quoted market price exists for these shares. It is possible that the estimated value may differ significantly from the amount that might ultimately be realized in the near term, and difference could be material.
8. Fair Valued Securities
As of March 31, 2007, the following Fund contained securities that were fair valued by the Board of Directors. Market value, cost and percentage of total net assets are as follows:
| | | | | | | | | |
| | | Market
Value | | Cost | | Market Value
% of
Net Assets | |
Security Large Cap Value Fund | | $ | — | | $ | 125,000 | | 0.0 | % |
9. Illiquid Securities
As of March 31, 2007, the following Funds or Series contained securities that were considered illiquid. Market value, cost and percentage of total net assets are as follows:
| | | | | | | | | |
| | | Market Value | | Cost | | Market Value
% of
Net Assets | |
Security Equity Fund: | | | | | | | | | |
Mid Cap Value Series | | $ | 45,991,659 | | $ | 60,617,574 | | 4.7 | % |
Select 25 Series | | | 124 | | | 190 | | 0.0 | % |
Security Large Cap Value Fund | | | — | | | 125,000 | | 0.0 | % |
Security Mid Cap Growth Fund | | | 2,058,025 | | | 3,127,450 | | 0.9 | % |
10. Federal tax matters
The tax character of distributions paid during the fiscal year ended September 30, 2006, was the same as that reported in the Statement of Changes in Net Assets, except as follows:
| | | | | | | | | |
2006 | | Ordinary
Income | | Capital
Gain | | Total |
Security Equity Fund: | | | | | | | | | |
Alpha Opportunity Series | | $ | 1,674,911 | | $ | 303,639 | | $ | 1,978,550 |
Note: For federal income tax purposes, short term capital gain distributions are treated as ordinary income distributions.
93
Notes to Financial Statements
March 31, 2007
(unaudited)
As of September 30, 2006 the components of distributable earnings on a tax basis were:
| | | | | | | | | | | | | | | | | | |
| | | Undistributed
Ordinary
Income | | Undistributed
Long-Term
Gain | | Accumulated
Capital and
Other Losses* | | | Unrealized
Appreciation
(Depreciation)** | | | Total
Accumulated
Earnings/(Deficit) | |
Security Equity Fund: | | | | | | | | | | | | | | | | | | |
Alpha Opportunity Series | | $ | 1,969,025 | | $ | 368,755 | | $ | — | | | $ | (595,621 | ) | | $ | 1,742,159 | |
Equity Series | | | 5,800,679 | | | 27,173,244 | | | — | | | | 73,630,213 | | | | 106,604,136 | |
Global Series | | | 68,515 | | | 22,807,551 | | | (5,914,060 | ) | | | 36,061,930 | | | | 53,023,936 | |
Mid Cap Value Series | | | 11,335,111 | | | 34,143,040 | | | — | | | | 156,809,792 | | | | 202,287,943 | |
Select 25 Series | | | — | | | — | | | (17,302,526 | ) | | | 7,949,223 | | | | (9,353,303 | ) |
Small Cap Growth Series | | | — | | | — | | | (2,060,375 | ) | | | 5,293,696 | | | | 3,233,321 | |
Security Large Cap Value Fund | | | 21,221 | | | — | | | (5,372,764 | ) | | | 9,733,065 | | | | 4,381,522 | |
Security Mid Cap Growth Fund | | | 1,579,334 | | | 22,297,681 | | | (2,285,084 | ) | | | 31,758,922 | | | | 53,350,853 | |
| * | Certain Funds had net capital loss carryovers and deferred post October losses as identified elsewhere in the Notes. |
| ** | The differences between book-basis and tax-basis unrealized appreciation (depreciation) are attributable primarily to the tax deferral of wash sale losses, the differences between book and tax basis passive foreign investment companies and bond discount accretion. |
As of September 30, 2006, the accumulated net realized loss on sales of investments for federal income tax purposes which are available to offset future taxable gains and post-October losses that are deferred to the first day of the next fiscal year are as follows:
| | | | | | | | | | | |
| | | Capital Loss
Carryovers
Utilized
in 2006 | | Capital Loss
Carryovers | | Expires In | | Deferred
Post-
October
Losses |
Security Equity Fund: | | | | | | | | | | | |
Global Series | | $ | — | | $ | 651,525 | | 2009 | | $ | 4,353,895 |
| | | 442,978 | | | 908,640 | | 2010 | | | |
| | | 96,592 | | | — | | 2011 | | | |
| | | 2,397,360 | | | — | | 2012 | | | |
| | | | | | | | | | | |
| | $ | 2,936,930 | | $ | 1,560,165 | | | | | |
| | | | | | | | | | | |
Select 25 Series* | | $ | 263,458 | | $ | 1,867,435 | | 2008 | | $ | — |
| | | — | | | 3,495,954 | | 2009 | | | |
| | | — | | | 6,080,559 | | 2010 | | | |
| | | — | | | 5,819,939 | | 2011 | | | |
| | | — | | | 38,639 | | 2012 | | | |
| | | | | | | | | | | |
| | $ | 263,458 | | $ | 17,302,526 | | | | $ | — |
| | | | | | | | | | | |
Small Cap Growth Series | | $ | 1,865,093 | | $ | 2,060,375 | | 2010 | | $ | — |
| | | | | | | | | | | |
Security Large Cap Value Fund | | $ | 2,409,607 | | $ | 5,372,764 | | 2011 | | $ | — |
| | | | | | | | | | | |
Security Mid Cap Growth Fund | | $ | 567,035 | | $ | 1,701,105 | | 2009 | | $ | — |
| | | — | | | 567,035 | | 2010 | | | |
| | | — | | | 16,944 | | 2011 | | | |
| | | | | | | | | | | |
| | $ | 567,035 | | $ | 2,285,084 | | | | $ | — |
| | | | | | | | | | | |
| * | The Security Equity Fund - Select 25 Series obtained approximately $1,236,753, $3,140,789 and $1,728,838 of capital losses (included above) from its merger with Security Equity Fund - - Social Awareness Series, Enhanced Index Series and Large Cap Growth Series, respectively, on June 16, 2006 (see Note 12), which may be applied against realized net taxable capital gains in future years or until September 30, 2012, subject to certain limitations imposed by Section 382 of the Internal Revenue Code. |
94
Notes to Financial Statements
March 31, 2007
(unaudited)
Net investment income and net realized gains (losses) may differ for financial statement and tax purposes because of temporary or permanent book/tax differences. These differences are primarily due to post-October losses, losses deferred due to wash sales, foreign currency gains and losses, and the “mark-to-market” of certain passive foreign investment companies (PFICs) for tax purposes. To the extent these differences are permanent, reclassifications are made to the appropriate equity accounts in the period that the differences arise.
11. Affiliated Transactions*
Investments representing 5% or more of the outstanding voting securities of a portfolio company of a fund result in that portfolio company being considered an affiliated company of such fund, as defined in the 1940 Act. The aggregate market value of all securities of affiliated companies held in the Mid Cap Value Series of the Security Equity Fund as of March 31, 2007 amounted to $29,707,780 which represents 3.04% of net assets. There were no affiliated companies held in any other Fund or Series. Transactions in the Mid Cap Value Series during the period ended March 31, 2007 in which the portfolio company is an “affiliated person” are as follows:
| | | | | | | | | | | | | | | | | | |
| | | Hydrogen
Corporation,
LLC | | Merix
Corporation | | North Pointe
Holdings
Corporation | | Opteum, Inc. | | ThermoEnergy
Corporation
PIPES | | ThermoEnergy
Corporation
Warrants |
September 30, 2006 | | | | | | | | | | | | | | | | | | |
Balance | | | | | | | | | | | | | | | | | | |
Shares | | | 732,850 | | | 1,476,000 | | | 470,000 | | | 1,474,400 | | | 1,745,000 | | | 1,745,000 |
Cost | | $ | 3,536,282 | | $ | 15,588,034 | | $ | 5,861,235 | | $ | 16,310,457 | | $ | 1,646,500 | | $ | 447,500 |
Gross Additions | | | | | | | | | | | | | | | | | | |
Shares | | | 102,150 | | | — | | | 55,000 | | | — | | | — | | | — |
Cost | | $ | 493,384 | | $ | — | | $ | 547,750 | | $ | — | | $ | — | | $ | — |
Gross Reductions | | | | | | | | | | | | | | | | | | |
Shares | | | — | | | — | | | — | | | — | | | — | | | — |
Cost | | $ | — | | $ | — | | $ | — | | $ | — | | $ | — | | $ | — |
March 31, 2007 | | | | | | | | | | | | | | | | | | |
Balance | | | | | | | | | | | | | | | | | | |
Shares | | | 835,000 | | | 1,476,000 | | | 525,000 | | | 1,474,400 | | | 1,745,000 | | | 1,745,000 |
Cost | | $ | 4,029,666 | | $ | 15,588,034 | | $ | 6,408,985 | | $ | 16,310,457 | | $ | 1,646,500 | | $ | 447,500 |
Realized Gain/(Loss) | | $ | — | | $ | — | | $ | — | | $ | — | | $ | — | | $ | — |
Investment Income | | $ | — | | $ | — | | $ | — | | $ | 147,440 | | $ | — | | $ | — |
| * | As a result of the Security Mid Cap Values Series’ beneficial ownership of the common stock of these portfolio companies, applicable regulations require that the Series state that it may be deemed an affiliate of the respective portfolio company. The Series disclaims that the “affiliated persons” are affiliates of the Distributor, Advisor, Series or any other client of the Advisor. |
12. Acquisition of the Enhanced Index Series, Large Cap Growth Series and Social Awareness Series of Security Equity Fund
Pursuant to a plan of reorganization approved by the shareholders of the Enhanced Index Series, Large Cap Growth Series and Social Awareness Series of Security Equity Fund, Select 25 Series of Security Equity Fund acquired all of the net assets of Enhanced Index Series, Large Cap Growth Series and Social Awareness Series on June 16, 2006 which totaled $10,521,264, $9,349,430 and $15,026,332, respectively. A total of 1,113,825 shares of Enhanced Index Series, 1,516,468 shares of Large Cap Growth Series and 734,975 shares of Social Awareness Series were exchanged for 1,136,596 shares, 995,315 shares and 1,592,592 shares, respectively of Select 25 Series immediately after the closing date. This exchange qualified as a tax-free reorganization under Section 368(a)(1)(c) of the Internal Revenue Code. Enhanced Index Series’ net assets included $134,643 of unrealized appreciation and $3,166,376 of accumulated realized loss on investments. Large Cap Growth Series’ net assets included $950,756 of unrealized appreciation and $1,763,332 of accumulated realized loss on investments. Social Awareness Series’ net assets included $1,208,145 of unrealized appreciation and $2,034,274 of accumulated realized loss. The aggregate net assets of Select 25 Series immediately before the acquisition totaled $28,909,382 and following the acquisition, the combined net assets of Select 25 Series totaled $63,806,408.
95
Notes to Financial Statements
March 31, 2007
(unaudited)
13. Subsequent Event
At a meeting held on May 11, 2007, the Board of Directors of Security Equity Fund Global Series (“the Fund”) approved a proposed change of sub-advisers for the Fund. Under the proposed change, effective approximately August 1, 2007, the sub-adviser of the Fund will change from OppenheimerFunds, Inc. to Security Global Investors, LLC, a wholly-owned subsidiary of Security Benefit Life Insurance Company. The proposed change is contingent upon the approval of shareholders of record in the Fund as of June 1, 2007.
14. Subsequent Event
Effective May 1, 2007, Security Management Company, LLC changed its name to 6th Avenue Investment Management Company, LLC.
96
Director’s Disclosure
Director Approval of Investment Advisory Agreement
At an in-person meeting of the Funds’ Boards of Directors held on November 16-17, 2006, called for the purpose of, among other things, voting on the renewal of the investment advisory and sub-advisory agreements applicable to the Funds, each Fund’s Board of Directors, including the Independent Directors, unanimously approved the continuation for a one year period of the investment advisory agreement between the Fund and Security Management Company, LLC (“SMC”), as well as each investment sub-advisory agreement applicable to the Fund. In reaching this conclusion, the Directors requested and obtained from SMC and each investment sub-adviser such information as the Directors deemed reasonably necessary to evaluate the proposed renewal of the agreements. Each Fund’s Board of Directors carefully evaluated this information, and was advised by legal counsel with respect to its deliberations.
In considering the proposed continuation of the investment advisory and sub-advisory agreements, the Independent Directors evaluated a number of considerations, including, among others, (1) the nature, extent, and quality of the advisory services to be provided by SMC and the investment sub-advisers; (2) the investment performance of the Funds, SMC and the various investment sub-advisers; (3) the costs of the services to be provided and profits to be realized by SMC and its affiliates from the relationship with the Funds; (4) the extent to which economies of scale would be realized as the Funds grow; and (5) whether advisory and sub-advisory fee levels reflect these economies of scale for the benefit of Fund investors. Each Board of Directors also took into account other considerations that it believed, in light of the legal advice furnished to the Independent Directors by their independent legal counsel and the Directors’ own business judgment, to be relevant. Following its review, each Fund’s Board of Directors determined that the investment advisory agreement and each investment sub-advisory agreement applicable to the Fund (if any) will enable Fund shareholders to obtain high quality services at a cost that is appropriate, reasonable, and in the best interests of shareholders. Accordingly, the Directors, including the Independent Directors, unanimously approved the renewal of the investment advisory and investment subadvisory agreements based upon the following considerations, among others:
| | • | | The nature, extent and quality of the advisory services to be provided. Each Board of Directors concluded that SMC and the investment sub-advisers retained to provide portfolio management services with respect to certain of the Funds are capable of providing high quality services to each Fund, as indicated by the nature and quality of services provided in the past, SMC’s management capabilities demonstrated with respect to the Funds and other mutual funds managed by SMC, the professional qualifications and experience of SMC’s and the various sub-advisers’ portfolio managers, and SMC’s investment and management oversight processes. The Directors also determined that SMC and the sub-advisers proposed to provide investment and related services that were of the same quality and quantity as services provided to the Funds in the past, and that these services are appropriate in scope and extent in light of the Funds’ operations, the competitive landscape of the investment company business and investor needs. |
| | • | | The investment performance of the Funds. With respect to each Fund, the Directors concluded on the basis of information supplied by Lipper and Morningstar that SMC and the investment sub-advisers had achieved investment performance that was acceptable, and competitive or superior relative to comparable funds over trailing periods. On the basis of the Directors’ assessment of the nature, extent and quality of advisory services to be provided or procured by SMC, the Directors concluded that SMC is capable of generating a level of long-term investment performance that is appropriate in light of the Funds’ investment objectives, policies and strategies and competitive with many other investment companies. |
| | • | | The cost of advisory services provided and the level of profitability. On the basis of each Board’s review of the fees to be charged by SMC for investment advisory and related services, SMC’s financial statements, SMC’s estimated net management income resulting from its management of the funds, and the estimated profitability of SMC’s relationships with the funds, the directors concluded that the level of profitability to SMC as to each fund was not unreasonable. As to each sub-adviser, each Board took into consideration that the sub-advisory fee was negotiated on an arms-length basis by SMC with an unaffiliated party and that SMC compensates the subadviser from its own fees and, therefore, did not review estimated profitability of the subadvisers. With respect to benefits to SMC, its affiliates and the sub-advisers from their relationship with the funds, each Board considered fees charged by SMC for related services, benefits such as soft dollar usage by SMC or the sub-advisers and any intangible benefits, and concluded that the advisory fees and sub-advisory fees appropriately reflected any such benefits. |
| | • | | Whether the advisory fees reflect economies of scale. The Directors concluded that the Funds’ investment advisory fees appropriately reflect the current economic environment for SMC and the competitive nature of the mutual fund market. The Directors further determined that the Funds have yet to achieve meaningful 118 Director’s Disclosure economies of scale, which, therefore, cannot be reflected in the investment advisory fees. |
| | • | | The extent to which economies of scale will be realized as the Funds grow. While the Funds’ investment advisory fees do not reduce should Fund assets grow meaningfully, the Directors determined that the investment advisory fees payable by the Funds other than Security Equity Fund Alpha Opportunity Series (whose |
97
Director’s Disclosure
| | investment advisory fee varies depending on that Fund’s performance relative to its benchmark index) already reflect potential future economies of scale to some extent by virtue of their competitive levels (determined with reference to industry standards as reported by Lipper and SMC’s estimated profitability at current or foreseeable asset levels). The Directors also considered that they will have the opportunity to periodically reexamine whether a Fund has achieved economies of scale, and the appropriateness of investment advisory fees payable to SMC and fees payable by SMC to the investment sub-advisers, in the future. |
| | • | | Benefits (such as soft dollars) to SMC from its relationship with the Funds (and any corresponding benefits to the Funds). The Directors concluded that other benefits described by SMC and the investment sub-advisers from their relationships with the Funds, including “soft dollar” benefits in connection with Fund brokerage transactions, are reasonable and fair, and consistent with industry practice and the best interests of the Funds and their shareholders. In addition, the Directors determined that the administration, transfer agency and fund accounting fees paid by the Funds to SMC are reasonable, fair and in the best interests of Fund shareholders in light of the nature and quality of the services provided, the associated costs, and the necessity of the services for the Funds’ operations. |
| | • | | Other Considerations: In approving the investment advisory and sub-advisory agreements, the Directors determined that SMC has made a substantial commitment to the recruitment and retention of high quality personnel, and maintains the financial, compliance and operational resources reasonably necessary to manage the Funds in a professional manner that is consistent with the best interests of the Funds and their shareholders. In this regard, the Directors favorably considered the compliance track record of the Funds and SMC. The Directors also concluded that SMC has made a significant entrepreneurial commitment to the management and success of the Funds, which entails a substantial financial and professional commitment, including investment advisory fee waivers and expense limitation arrangements with respect to several of the Funds to the benefit of Fund shareholders. |
98
Directors and Officers (unaudited)
The business address of each director and officer is One Security Benefit Place, Topeka, KS 66636-0001.
Directors
| | |
Name (Date of Birth) Year Elected*** | | Principal Occupation(s) During Past 5 Years |
| Donald A. Chubb, Jr.** | | Business broker, Griffith & Blair Realtors |
| (12-14-46) | | Director - Jayhawk Area Boy Scouts Council |
| 1994 | | |
| |
| Harry W. Craig, Jr.** | | Chairman, CEO, Secretary & Director, The Martin Tractor Company, Inc.; |
| (05-11-39) | | Director - Stormont-Vail Corporation |
| 2004 | | Director - Concerned Citizens for Topeka |
| | Director - Oscar S. Stauffer Executive in Residence |
| |
| Jerry B. Farley** | | President, Washburn University |
| (09-20-46) | | President, J&J Bonanza |
| 2005 | | |
| |
| Penny A. Lumpkin** | | Partner, Vivians’ Gift Shop (Corporate Retail) |
| (08-20-39) | | Vice President, Palmer Companies, Inc. (Small Business and Shopping Center Development) |
| 1993 | | Vice President, PLB (Real Estate Equipment Leasing) |
| | Vice President, Town Crier (Retail) |
| | Prior to 1999: |
| | Vice President & Treasurer, Palmer News, Inc. |
| | Vice President, M/S News, Inc. |
| | Secretary, Kansas City Periodicals |
| | Prior to 2002: |
| | Vice President, Bellaire Shopping Center (Managing and Leasing) |
| | Partner, Goodwin Enterprises (Retail) |
| |
| Maynard F. Oliverius** | | President & Chief Executive Officer, Stormont-Vail HealthCare |
| (12-18-43) | | Director - VHA Mid-America |
| 1998 | | Director - Go Topeka |
| |
| Michael G. Odlum* | | President & Managing Member Representative, Security Management Company, LLC |
| (01-12-52) | | Senior Vice President and Chief Investment Officer, Security Benefit Corporation and |
| 2006 (Acting Chairman | | Security Benefit Life Insurance Company |
| of the Board) | | Director, Security Distributors, Inc. |
| 2004 (President) | | Director, Vice President and Chief Investment Officer, First Security Benefit Life Insurance and |
| 2004 (Director) | | Annuity Company of New York |
| * | | This director is deemed to be an “interested person” of the Funds under the Investment Company Act of 1940, as amended, by reason of his position with the Funds’ Investment Manager and/or the parent of the Investment Manager. |
| ** | | These directors serve on the Fund’s joint audit committee, the purpose of which is to meet with the independent registered public accounting firm, to review the work of the independent registered public accounting firm, and to oversee the handling by Security Management Company, LLC of the accounting function for the Funds. |
| *** | | Each director oversees 28 Security Fund portfolios and serves until the next annual meeting, or until a successor has been duly elected and qualified. |
99
Directors and Officers (unaudited) (continued)
Officers
| | |
Name
(Date of Birth)
Title - Year Elected* | | Principal Occupation(s) During Past 5 Years |
| Steven M. Bowser | | Vice President & Senior Portfolio Manager, Security Management Company, LLC; |
| (02-11-60) | | Vice President & Senior Portfolio Manager, Security Benefit Life Insurance Company |
| Vice President - 2003 | | |
| |
| Christina Fletcher | | Vice President & Portfolio Manager, Security Management Company, LLC |
| (07-25-72) | | Credit Analyst/Portfolio Manager, Horizon Cash Management |
| Vice President - 2005 | | Senior Money Market Trader, Scudder Investments |
| |
| Brenda M. Harwood | | Assistant Vice President, Chief Compliance Officer & Treasurer, Security Management Company, LLC; |
| (11-03-63) | | Assistant Vice President, Security Benefit Life Insurance Company |
| Chief Compliance Officer - 2004 | | Vice President, Assistant Treasurer & Director, Security Distributors, Inc. |
| Treasurer - 1988 | | |
| |
| Richard J. King | | Vice President & Head of Fixed Income Asset Management, Security Management Company, LLC; |
| (03-59) | | Vice President & Head of Fixed Income Asset Management, Security Benefit Life Insurance Company |
| Vice President - 2005 | | Partner, Head of Portfolio Management, INVESCO |
| |
| Mark Lamb | | Vice President, Security Management Company, LLC, |
| (02-03-60) | | Vice President, Security Benefit Life Insurance Company |
| Vice President - 2003 | | |
| |
| Amy J. Lee | | Secretary, Security Management Company, LLC; |
| (06-05-61) | | Secretary, Security Distributors, Inc. |
| Secretary - 1987 | | Vice President, Associate General Counsel & Assistant Secretary, Security Benefit Corporation & |
| | Security Benefit Life Insurance Company; Director, Brecek & Young Advisors, Inc. |
| |
| Mark Mitchell | | Vice President & Portfolio Manager, Security Management Company, LLC |
| (08-24-64) | | Vice President & Portfolio Manager, Security Benefit Life Insurance Company |
| Vice President - 2003 | | |
| |
| Christopher Phalen | | Vice President & Portfolio Manager, Security Management |
| (11-9-70) | | Company, LLC; |
| Vice President - 2002 | | Assistant Vice President & Portfolio Manager, Security Benefit Life Insurance Company |
| |
| James P. Schier | | Vice President & Senior Portfolio Manager, Security Management Company, LLC; |
| (12-28-57) | | Vice President & Senior Portfolio Manager, Security Benefit Life Insurance Company |
Vice President - 1998 | | |
| |
Cindy L. Shields | | Vice President & Head of Equity Asset Management, Security Management Company, LLC, |
(06-05-67) | | Vice President & Head of Equity Asset Management, Security Benefit Life Insurance Company |
Vice President - 1988 | | |
| |
Christopher D. Swickard | | Assistant Secretary, Security Management Company, LLC; |
(10-09-65) | | Second Vice President & Assistant General Counsel, Security Benefit Corporation & |
Assistant Secretary -1996 | | Security Benefit Life Insurance Company; Assistant Secretary, Security Distributors, Inc. |
| |
David G. Toussaint | | Vice President & Portfolio Manager, Security Management |
(10-10-66) | | Company, LLC; |
Vice President - 2001 | | Assistant Vice President & Portfolio Manager, Security Benefit Life Insurance Company |
| |
Eric Welt | | Vice President, Director of Portfolio Risk Analysis & Consultant Relations, |
(10-31-67) | | Portfolio Risk Manager, Security Management Company, LLC; |
Vice President - 2006 | | Associate Director - Senior Due Diligence Analyst, Bear Stearns & Company |
| * | Officers serve until the next annual meeting or until a successor has been duly elected and qualified. |
100
Other Information
Each of the Security Funds files a complete schedule of portfolio holdings with the U.S. Securities and Exchange Commission for the first and third quarters of each fiscal year on Form N-Q. The Forms N-Q of each such Fund are available on the Commission’s website at www.sec.gov. The Forms N-Q may be reviewed and copied at the Commission’s Public Reference Room in Washington, DC. Information on the operation of the Public Reference Room may be obtained by calling 1-800-SEC-0330. The portfolio holdings of each of the Security Funds are available on their website, www.securitybenefit.com or by calling 1-800-888-2461.
A description of the policies and procedures that the Security Funds use to determine how to vote proxies relating to portfolio securities is available upon request, free of charge by calling 1-800-888-2461, or accessing the U.S. Securities and Exchange Commission website at www.sec.gov. Information regarding how the Security Funds voted proxies relating to portfolio securities during the 12 month period ended June 30, 2006 is available upon request, free of charge by calling 1-800-888-2461, or accessing the U.S. Securities and Exchange Commission website at www.sec.gov.
The statement of additional information (“SAI”) includes additional information about the Funds’ Directors and is available upon request without charge by calling 1-800-888-2461.
101
The Security Group of Mutual Funds
Security Equity Fund
| | • | | Alpha Opportunity Series |
| | • | | Small Cap Growth Series |
Security Large Cap Value Fund
Security Mid Cap Growth Fund
Security Income Fund
| | • | | Capital Preservation Series |
| | • | | Diversified Income Series |
| | • | | Income Opportunity Series |
Security Cash Fund
Security Funds Officers and Directors
Directors
Donald A. Chubb, Jr.
Harry W. Craig, Jr.
Jerry B. Farley
Penny A. Lumpkin
Michael G. Odlum
Maynard F. Oliverius
Officers
Michael G. Odlum, President
Steve M. Bowser, Vice President
Christina Fletcher, Vice President
Richard J. King, Vice President
Mark Lamb, Vice President
Mark Mitchell, Vice President
Christopher Phalen, Vice President
James P. Schier, Vice President
Cindy L. Shields, Vice President
David G. Toussaint, Vice President
Eric Welt, Vice President
Amy J. Lee, Secretary
Christopher D. Swickard, Assistant Secretary
Brenda M. Harwood, Chief Compliance Officer & Treasurer
This report is submitted for the general information of the shareholders of the Funds. The report is not authorized for distribution to prospective investors in the Funds unless preceded or accompanied by an effective prospectus which contains details concerning the sales charges and other pertinent information.

One Security Benefit Place · Topeka, Kansas 66636-0001 · securitybenefit.com
Not required at this time.
| Item 3. | Audit Committee Financial Expert. |
Not required at this time.
| Item 4. | Principal Accountant Fees and Services. |
Not required at this time.
| Item 5. | Audit Committee of Listed Registrants. |
Not applicable.
| Item 6. | Schedule of Investments. |
The Schedule of Investments is included under Item 1 of this form.
| Item 7. | Disclosure of Proxy Voting Policies and Procedures for Closed-End Management Investment Companies. |
Not applicable.
| Item 8. | Purchases of Equity Securities by Closed-End Management Investment Company and Affiliated Purchasers. |
Not applicable.
| Item 9. | Submission of Matters to a Vote of Security Holders. |
The registrant does not currently have in place procedures by which shareholders may recommend nominees to the registrant’s board.
There have been no changes to the procedures by which shareholders may recommend nominees to the registrant’s board.
| Item 10. | Controls and Procedures. |
| | (a) | The registrant’s President and Treasurer have concluded that the registrant’s disclosure controls and procedures (as defined in rule 30a-3(c) under the Investment Company Act of 1940) are effective based on their evaluation of these disclosure controls and procedures within 90 days of the filing date of this report on Form N-CSR. |
| | (b) | There were no significant changes in the registrant’s internal controls, or in other factors that could significantly affect these controls subsequent to the date of their evaluation, including any corrective actions with regard to significant deficiencies and material weaknesses. |
| | | | |
| (a) | | (1) | | Not required at this time. |
| | (2) | Certifications pursuant to Section 302 of the Sarbanes-Oxley Act of 2002 and required by Rule 30a-2(a) under the Investment Company Act of 1940, are attached hereto. |
| | (b) | Certifications pursuant to Section 906 of the Sarbanes-Oxley Act of 2002 and required by Rule 30a-2(a) under the Investment Company Act of 1940, are attached hereto. |
SIGNATURES
Pursuant to the requirements of the Securities Exchange Act of 1934 and the Investment Company Act of 1940, the registrant has duly caused this report to be signed on its behalf by the undersigned, thereunto duly authorized.
| | |
| SECURITY EQUITY FUND |
| |
| By: | | /s/ MICHAEL G. ODLUM |
| | Michael G. Odlum, President |
| |
| Date: | | May 30, 2007 |
Pursuant to the requirements of the Securities Exchange Act of 1934 and the Investment Company Act of 1940, this report has been signed below by the following persons on behalf of the registrant and in the capacities and on the dates indicated.
| | |
| By: | | /s/ MICHAEL G. ODLUM |
| | Michael G. Odlum, President |
| |
| Date: | | May 30, 2007 |
| |
| By: | | /s/ BRENDA M. HARWOOD |
| | Brenda M. Harwood, Treasurer |
| |
| Date: | | May 30, 2007 |