UNITED STATES
SECURITIES AND EXCHANGE COMMISSION
Washington, D.C. 20549
FORM N-CSR
CERTIFIED SHAREHOLDER REPORT OF REGISTERED
MANAGEMENT INVESTMENT COMPANIES
| | |
Investment Company Act file number | | 811-01136 |
SECURITY EQUITY FUND
|
| (Exact name of registrant as specified in charter) |
|
| ONE SECURITY BENEFIT PLACE, TOPEKA, KANSAS 66636-0001 |
| (Address of principal executive offices) (Zip code) |
THOMAS A. SWANK, PRESIDENT
SECURITY EQUITY FUND
ONE SECURITY BENEFIT PLACE
TOPEKA, KANSAS 66636-0001
|
| (Name and address of agent for service) |
Registrant’s telephone number, including area code: (785) 438-3000
Date of fiscal year end: September 30
Date of reporting period: March 31, 2008
Form N-CSR is to be used by management investment companies to file reports with the Commission not later than 10 days after the transmission to stockholders of any report that is required to be transmitted to stockholders under Rule 30e-1 under the Investment Company Act of 1940 (17 CFR 270.30e-1). The Commission may use the information provided on Form N-CSR in its regulatory, disclosure review, inspection, and policymaking roles.
A registrant is required to disclose the information specified by Form N-CSR, and the Commission will make this information public. A registrant is not required to respond to the collection of information contained in Form N-CSR unless the Form displays a currently valid Office of Management and Budget (“OMB”) control number. Please direct comments concerning the accuracy of the information collection burden estimate and any suggestions for reducing the burden to Secretary, Securities and Exchange Commission, 450 Fifth Street, NW, Washington, DC 20549-0609. The OMB has reviewed this collection of information under the clearance requirements of 44 U.S.C. §3507.
| Item 1. | Reports to Stockholders. |

Security Equity Fund
Security Large Cap Value Fund
Security Mid Cap Growth Fund
March 31, 2008
Semi-Annual Report
(unaudited)
Table of Contents
Security Global Investors refers to the asset management arm of Security Benefit Corporation (“Security Benefit”) that consists of Security Investors, LLC, and for global investing, Security Global Investors, LLC. Security Distributors, Inc., Security Investors, LLC and Security Global Investors, LLC are subsidiaries of Security Benefit.
1
Chairman’s Letter
May 16, 2008

Thomas A. Swank
President & CEO
To Our Shareholders:
Over the past six months, the financial markets were characterized by concern for a slowing economy due to the continued sub-prime mortgage crisis and related liquidity squeeze, the rising cost of oil, and the decline of the U.S. dollar. Global economic headlines focused on the U.S. Federal Reserve Board’s efforts to add liquidity to the financial system due to increased concerns regarding the impact of sub-prime mortgage loans.
The underlying negative trends in the markets became apparent in the third quarter 2007. These trends included peak profit margins, slowing earnings growth, full valuations, energy and agricultural driven inflation, and a potential consumer-led economic slowdown. The volatility in the markets was a reaction to the uncertainty within the credit markets, as the losses related to sub-prime mortgages and collateralized debt obligations worsened, and the slowdown in earnings growth. Additionally, the financial markets saw the constant and steady rise of oil and decline of the dollar.
In mid-October of last year, markets turned downward and spiraled through November recovering slightly in December. The sub-prime mortgage contagion permeated through the financial system triggering liquidity and availability of credit concerns, adding to the continued uncertainty about the depth and breadth of the sub-prime fallout and its impact on the overall economy. These concerns motivated a huge flight to quality, driving interest rates on Treasury securities downward.
Liquidity in the financial system and concern of economic recession were the dominant macro factors as 2008 began to unfold. The tremendous flight to quality and away from equity assets, both domestic and international, was reflected in indexes that were down between 7% and 10% in the first quarter.
Write-downs within the credit markets continued and were of a greater magnitude than originally expected. In an unprecedented move, the Federal Reserve cut rates 200 basis points during the quarter, 125 bps in January alone, injecting massive liquidity into the financial system. Additionally, the Federal Reserve found alternative methods to provide much needed liquidity to banks and brokerage firms. The most significant event was the Fed-orchestrated buyout of Bear Stearns by JP Morgan. The Fed had to guarantee $29 billion of mortgage related paper to entice JP Morgan to acquire Bear Stearns.
As time goes by, the sub-prime mortgage situation continues to unfold and becomes clearer. In addition to the injection of liquidity by the Federal Reserve, fiscal stimulus in the form of a tax rebate will take place from May through August, infusing the financial system and economy with more cash. Possibly due to these actions, the markets seem to have found a range of stability as this semi-annual period ends.
Investors should always be cognizant of the need to maintain a diversified portfolio strategy designed to meet their objectives. Two of the key objectives of the Security Funds are to provide professionally-managed investment portfolios that give shareholders the benefits of diversification, and to seek investment returns that help meet their goals over the long run. We appreciate your continued investment in the Funds.
|
| Sincerely, |
|
| Tom Swank |
| Chairman, The Security Funds |
2
Security Equity Fund
Alpha Opportunity Series

Adviser,
Security Global Investors
and

Subadviser,
Mainstream Investment Advisers
3
| | |
| Performance Summary | | Security Equity Fund Alpha Opportunity Series |
March 31, 2008 | | (unaudited) |
PERFORMANCE
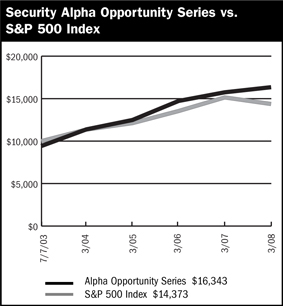
$10,000 Since Inception
This chart assumes a $10,000 investment in Class A shares of Alpha Opportunity Series on July 7, 2003 (date of inception), reflects deduction of the 5.75% sales load and assumes all dividends reinvested. The chart does not reflect the deduction of taxes that a shareholder would pay on distributions or the redemption of fund shares. The S&P 500 Index is a capitalization weighted index composed of 500 selected common stocks that represent the broad domestic economy and is a widely recognized unmanaged index of market performance.
Average Annual Returns
| | | | | | |
Periods Ended 3-31-08 | | 1 Year | | | Since Inception | |
| A Shares | | 3.81 | % | | 12.33% (7-07-03 | ) |
| | |
| A Shares with sales charge | | (2.15 | )% | | 10.93% (7-07-03 | ) |
| | |
| B Shares | | 3.05 | % | | 11.49% (7-07-03 | ) |
| | |
| B Shares with CDSC | | (1.02 | )% | | 11.22% (7-07-03 | ) |
| | |
| C Shares | | 3.16 | % | | 11.52% (7-07-03 | ) |
| | |
| C Shares with CDSC | | 2.34 | % | | 11.52% (7-07-03 | ) |
The performance data above represents past performance that is not predictive of future results. The investment return and principal value of an investment in the Series will fluctuate so that an investor’s shares, when redeemed, may be worth more or less than their original cost. The figures above do not reflect deduction of the maximum front-end sales charge of 5.75% for Class A shares or the contingent deferred sales charge of 5% for Class B shares and 1% for Class C shares, as applicable, except where noted. The figures do not reflect the deduction of taxes that a shareholder would pay on distributions or redemption of shares. Such figures would be lower if the maximum sales charge and any applicable taxes were deducted. Fee waivers and/or reimbursements reduced expenses of the Series and in the absence of such waiver, the performance quoted would be reduced.
Portfolio Composition by Sector as of 3-31-08*
| | | |
| Consumer Discretionary | | 4.35 | % |
| Consumer Staples | | 0.49 | |
| Energy | | 14.72 | |
| Financials | | 3.96 | |
| Health Care | | (0.01 | ) |
| Industrials | | 11.26 | |
| Information Technology | | 6.06 | |
| Materials | | 11.94 | |
| Telecommunication Services | | 0.38 | |
| Utilities | | (0.64 | ) |
| Exchange Traded Funds | | 2.16 | |
| U.S. Government Sponsored Agencies | | 39.05 | |
| Other Assets in Excess of Liabilities | | 6.28 | |
| Total Net Assets | | 100.00 | % |
| | | |
| * | Securities sold short are netted with long positions in common stocks in the appropriate sectors. |
| | | | |
| | 4 | | The accompanying notes are an integral part of the financial statements. |
| | |
| Performance Summary | | Security Equity Fund Alpha Opportunity Series |
March 31, 2008 | | (unaudited) |
Information About Your Series Expenses
Calculating your ongoing Series expenses
Example
As a shareholder of the Series, you incur two types of costs: (1) transaction costs, which may include sales charges (loads) on purchase payments; contingent deferred sales charges on redemptions; and redemption fees, if any; and (2) ongoing costs, including management fees; distribution and/or service fees (12b-1); and other Series expenses. This example is intended to help you understand your ongoing costs (in dollars) of investing in the Series and to compare these costs with ongoing costs of investing in other mutual funds. The example is based on an investment of $1,000 invested at the beginning of the period and held for the entire period October 1, 2007 through March 31, 2008.
Actual Expenses
The first line for each class of shares in the table provides information about actual account values and actual expenses. You may use the information in this table, together with the amount you invested, to estimate the expenses that you paid over the period. Simply divide your account value by $1,000 (for example, an $8,600 account value divided by $1,000 = 8.6), then multiply the result by the number in the table under the heading entitled “Expenses Paid During the Period” to estimate the expenses you paid on your account during this period.
Hypothetical Example for Comparison Purposes
The second line for each class of shares in the table provides information about hypothetical account values and hypothetical expenses based on the Series actual expense ratio and an assumed rate of return of 5% per year before expenses, which is not the Series actual return. The hypothetical account values and expenses may not be used to estimate the actual ending account balance or expenses you paid for the period. You may use this information to compare the ongoing costs of investing in the Series and other funds. To do so, compare this 5% hypothetical example with the 5% hypothetical examples that appear in the shareholder reports of the other mutual funds.
Please note that the expenses shown in the table are meant to highlight your ongoing costs only and do not reflect any transactional costs, such as sales charges (loads) on purchase payments, contingent deferred sales charges on redemptions, and redemption fees, if any. Therefore, the second line for each class of shares is useful in comparing ongoing costs only, and will not help you determine the relative total costs of owning different funds. In addition, if these transactional costs were included, your costs would have been higher.
Series Expenses
| | | | | | | | | |
| | | Beginning
Account
Value
10/1/2007 | | Ending
Account
Value
3/31/20081 | | Expenses
Paid
During
Period2 |
Alpha Opportunity Series - Class A | | | | | | | | | |
Actual | | $ | 1,000.00 | | $ | 918.17 | | $ | 15.73 |
Hypothetical | | | 1,000.00 | | | 1,008.60 | | | 16.47 |
| | | |
Alpha Opportunity Series - Class B | | | | | | | | | |
Actual | | | 1,000.00 | | | 915.34 | | | 19.30 |
Hypothetical | | | 1,000.00 | | | 1,004.85 | | | 20.20 |
| | | |
Alpha Opportunity Series - Class C | | | | | | | | | |
Actual | | | 1,000.00 | | | 915.60 | | | 19.30 |
Hypothetical | | | 1,000.00 | | | 1,004.85 | | | 20.20 |
1 | The actual ending account value is based on the actual total return of the Series for the period October 1, 2007 to March 31, 2008 after actual expenses and will differ from the hypothetical ending account value which is based on the Series expense ratio and a hypothetical annual return of 5% before expenses. The actual cumulative return at net asset value for the period October 1, 2007 to March 31, 2008 was (8.18%), (8.47%) and (8.44%), for Class A, B, and C respectively. |
2 | Expenses are equal to the Series annualized expense ratio (3.28%, 4.03% and 4.03% for Class A, B, and C shares, respectively) net of any applicable fee waivers or earnings credits, multiplied by the average account value over the period, multiplied by 183/366 (to reflect the one-half year period). |
5
| | |
| Schedule of Investments | | Security Equity Fund - Alpha Opportunity Series |
| March 31, 2008 (Unaudited) | | |
| | | | | |
| | | Shares | | Value |
COMMON STOCK - 58.4% | | | | | |
Agricultural Products - 0.2% | | | | | |
Fresh Del Monte Produce, Inc. * | | 1,951 | | $ | 71,016 |
| | | | | |
Airlines - 0.7% | | | | | |
Delta Air Lines, Inc. * | | 15,428 | | | 132,681 |
Northwest Airlines Corporation * | | 12,446 | | | 111,889 |
| | | | | |
| | | | | 244,570 |
| | | | | |
Aluminum - 0.2% | | | | | |
Century Aluminum Company * | | 1,061 | | | 70,281 |
| | | | | |
Apparel Retail - 1.5% | | | | | |
Buckle, Inc. | | 1,596 | | | 71,389 |
Ross Stores, Inc. | | 4,246 | | | 127,210 |
Urban Outfitters, Inc. * | | 11,160 | | | 349,866 |
| | | | | |
| | | | | 548,465 |
| | | | | |
Application Software - 0.3% | | | | | |
Salesforce.com, Inc. * | | 1,593 | | | 92,187 |
| | | | | |
Coal & Consumable Fuels - 2.6% | | | | | |
Alpha Natural Resources, Inc. * | | 3,183 | | | 138,269 |
Foundation Coal Holdings, Inc. | | 2,835 | | | 142,686 |
International Coal Group, Inc. * | | 29,056 | | | 184,506 |
Peabody Energy Corporation | | 9,020 | | | 460,020 |
| | | | | |
| | | | | 925,481 |
| | | | | |
Communications Equipment - 0.9% | | | | | |
Research In Motion, Ltd. * | | 2,805 | | | 314,805 |
| | | | | |
Computer Storage & Peripherals - 0.2% | | | | | |
Western Digital Corporation * | | 2,653 | | | 71,737 |
| | | | | |
Construction & Engineering - 0.7% | | | | | |
Shaw Group, Inc. * | | 5,192 | | | 244,751 |
| | | | | |
Construction & Farm Machinery & Heavy Trucks - 2.7% | | | | | |
AGCO Corporation * | | 940 | | | 56,287 |
Joy Global, Inc. (1) | | 14,113 | | | 919,603 |
| | | | | |
| | | | | 975,890 |
| | | | | |
Consumer Electronics - 0.1% | | | | | |
Matsushita Electric Industrial Company, Ltd. ADR | | 2,412 | | | 52,365 |
| | | | | |
Diversified Banks - 2.1% | | | | | |
CrediCorp, Ltd. | | 558 | | | 40,031 |
U.S. Bancorp | | 22,365 | | | 723,731 |
| | | | | |
| | | | | 763,762 |
| | | | | |
Diversified Metals & Mining - 1.7% | | | | | |
Cia Vale do Rio Doce ADR | | 3,790 | | | 131,285 |
Fording Canadian Coal Trust | | 4,928 | | | 257,242 |
Freeport-McMoRan Copper & Gold, Inc. (CI.B) | | 1,592 | | | 153,182 |
Teck Cominco, Ltd. (CI.B) | | 1,900 | | | 77,824 |
| | | | | |
| | | | | 619,533 |
| | | | | |
Electrical Components & Equipment - 2.9% | | | | | |
American Superconductor Corporation * | | 3,335 | | | 77,339 |
Ametek, Inc. | | 1,592 | | | 69,905 |
First Solar, Inc. * | | 2,812 | | | 649,966 |
Powell Industries, Inc. * | | 6,147 | | | 242,007 |
| | | | | |
| | | | | 1,039,217 |
| | | | | |
Electronic Equipment Manufacturers - 1.1% | | | | | |
Itron, Inc. * | | 4,246 | | | 383,117 |
| | | | | |
Electronic Manufacturing Services - 0.1% | | | | | |
Celestica, Inc. * | | 2,729 | | | 18,339 |
| | | | | |
Exchange Traded Funds - 2.4% | | | | | |
iShares Silver Trust * | | 379 | | | 64,745 |
Market Vectors-Coal ETF * | | 9,576 | | | 363,792 |
PowerShares DB Agriculture Fund | | 6,898 | | | 250,397 |
SPDR S&P Metals & Mining ETF | | 1,062 | | | 73,395 |
Streettracks Gold Trust * | | 1,061 | | | 95,893 |
| | | | | |
| | | | | 848,222 |
| | | | | |
Fertilizers & Agricultural Chemicals - 2.2% | | | | | |
Agrium, Inc. | | 2,501 | | | 155,337 |
CF Industries Holdings, Inc. | | 3,714 | | | 384,845 |
Monsanto Company | | 1,061 | | | 118,301 |
Mosaic Company * | | 1,063 | | | 109,064 |
| | | | | |
| | | | | 767,547 |
| | | | | |
Gold - 2.3% | | | | | |
Agnico-Eagle Mines, Ltd. | | 2,654 | | | 179,702 |
Barrick Gold Corporation | | 606 | | | 26,331 |
Newmont Mining Corporation | | 13,264 | | | 600,859 |
| | | | | |
| | | | | 806,892 |
| | | | | |
Heavy Electrical Equipment - 0.6% | | | | | |
ABB, Ltd. ADR | | 7,584 | | | 204,161 |
| | | | | |
Home Entertainment Software - 0.4% | | | | | |
Activision, Inc. * | | 4,882 | | | 133,327 |
| | | | | |
Homebuilding - 3.0% | | | | | |
Desarrolladora Homex SAB de CV ADR * | | 2,654 | | | 154,065 |
DR Horton, Inc. | | 7,415 | | | 116,786 |
NVR, Inc. * | | 1,361 | | | 813,198 |
| | | | | |
| | | | | 1,084,049 |
| | | | | |
Hotels, Resorts & Cruise Lines - 0.2% | | | | | |
Ctrip.com International, Ltd. ADR | | 1,520 | | | 80,590 |
| | | | | |
Hypermarkets & Super Centers - 0.1% | | | | | |
BJ’s Wholesale Club, Inc. * | | 532 | | | 18,987 |
Costco Wholesale Corporation | | 532 | | | 34,564 |
| | | | | |
| | | | | 53,551 |
| | | | | |
| | | | |
| | 6 | | The accompanying notes are an integral part of the financial statements |
| | |
| Schedule of Investments | | Security Equity Fund - Alpha Opportunity Series |
| March 31, 2008 (Unaudited) - continued | | |
| | | | | |
| | | Shares | | Value |
COMMON STOCK (continued) | | | | | |
Industrial Conglomerates - 0.8% | | | | | |
McDermott International, Inc. * | | 5,306 | | $ | 290,875 |
| | | | | |
Industrial Gases - 0.6% | | | | | |
Praxair, Inc. | | 2,654 | | | 223,546 |
| | | | | |
Industrial Machinery - 0.8% | | | | | |
Clarcor, Inc. | | 1,516 | | | 53,894 |
Donaldson Company, Inc. | | 2,123 | | | 85,515 |
Flowserve Corporation | | 1,061 | | | 110,747 |
Nordson Corporation | | 531 | | | 28,594 |
| | | | | |
| | | | | 278,750 |
| | | | | |
Integrated Oil & Gas - 2.9% | | | | | |
Hess Corporation | | 8,472 | | | 747,061 |
Sasol, Ltd. ADR | | 2,431 | | | 117,636 |
Suncor Energy, Inc. | | 1,895 | | | 182,583 |
| | | | | |
| | | | | 1,047,280 |
| | | | | |
Integrated Telecommunication Services - 0.1% | | | | | |
TELUS Corporation | | 484 | | | 20,255 |
| | | | | |
Internet Software & Services - 2.1% | | | | | |
AsiaInfo Holdings, Inc. * | | 532 | | | 5,777 |
Google, Inc. * | | 994 | | | 437,827 |
Open Text Corporation * | | 5,990 | | | 187,547 |
Sohu.com, Inc. * | | 1,289 | | | 58,173 |
Yahoo!, Inc. * | | 2,275 | | | 65,816 |
| | | | | |
| | | | | 755,140 |
| | | | | |
Investment Banking & Brokerage - 0.4% | | | | | |
Nomura Holdings, Inc. ADR | | 2,432 | | | 36,553 |
Oppenheimer Holdings, Inc. | | 2,309 | | | 100,095 |
| | | | | |
| | | | | 136,648 |
| | | | | |
IT Consulting & Other Services - 0.0% | | | | | |
Yucheng Technologies, Ltd. * | | 532 | | | 8,805 |
| | | | | |
Marine - 0.0% | | | | | |
Quintana Maritime, Ltd. | | 723 | | | 17,121 |
| | | | | |
Oil & Gas Drilling - 0.5% | | | | | |
ENSCO International, Inc. | | 1,062 | | | 66,502 |
Nabors Industries, Ltd. * | | 3,714 | | | 125,422 |
| | | | | |
| | | | | 191,924 |
| | | | | |
Oil & Gas Equipment & Services - 4.3% | | | | | |
Halliburton Company | | 6,368 | | | 250,454 |
Weatherford International, Ltd. * | | 4,775 | | | 346,044 |
W-H Energy Services, Inc. * | | 1,592 | | | 109,609 |
Willbros Group, Inc. * | | 27,060 | | | 828,036 |
| | | | | |
| | | | | 1,534,143 |
| | | | | |
Oil & Gas Exploration & Production - 4.2% | | | | | |
Anadarko Petroleum Corporation | | 531 | | | 33,469 |
Arena Resources, Inc. * | | 1,592 | | | 61,626 |
Chesapeake Energy Corporation | | 14,058 | | | 648,777 |
Denbury Resources, Inc. * | | 2,127 | | | 60,726 |
Harvest Natural Resources, Inc. * | | 34,659 | | | 417,988 |
Quicksilver Resources, Inc. * | | 3,714 | | | 135,672 |
Range Resources Corporation | | 2,123 | | | 134,704 |
| | | | | |
| | | | | 1,492,962 |
| | | | | |
Oil & Gas Storage & Transportation - 0.1% | | | | | |
Frontline, Ltd. | | 1,061 | | | 48,827 |
| | | | | |
Packaged Foods & Meats - 0.7% | | | | | |
Cosan, Ltd. * | | 98 | | | 1,207 |
Perdigao S.A. ADR | | 4,169 | | | 189,815 |
Sadia S.A. ADR ADR | | 2,162 | | | 38,462 |
Zhongpin, Inc. * | | 2,157 | | | 20,988 |
| | | | | |
| | | | | 250,472 |
| | | | | |
Pharmaceuticals - 0.3% | | | | | |
Novo Nordisk A ADR | | 1,546 | | | 107,045 |
| | | | | |
Precious Metals & Minerals - 0.1% | | | | | |
Coeur d’Alene Mines Corporation * | | 1,569 | | | 6,339 |
Stillwater Mining Company * | | 1,061 | | | 16,413 |
| | | | | |
| | | | | 22,752 |
| | | | | |
Railroads - 1.1% | | | | | |
Norfolk Southern Corporation | | 6,905 | | | 375,080 |
| | | | | |
Real Estate Management & Development - 0.1% | | | | | |
St. Joe Company | | 532 | | | 22,839 |
| | | | | |
Regional Banks - 0.1% | | | | | |
Republic Bancorp, Inc. | | 1,170 | | | 22,090 |
| | | | | |
Semiconductor Equipment - 0.7% | | | | | |
MEMC Electronic Materials, Inc. * | | 3,714 | | | 263,323 |
| | | | | |
Semiconductors - 0.3% | | | | | |
Taiwan Semiconductor Manufacturing Company, Ltd. ADR | | 10,169 | | | 104,436 |
| | | | | |
Specialized REIT’s - 2.0% | | | | | |
Plum Creek Timber Company, Inc. | | 14,733 | | | 599,633 |
Potlatch Corporation | | 1,592 | | | 65,702 |
Rayonier, Inc. | | 1,062 | | | 46,133 |
| | | | | |
| | | | | 711,468 |
| | | | | |
Steel - 5.0% | | | | | |
Cleveland-Cliffs, Inc. | | 1,061 | | | 127,129 |
Commercial Metals Company | | 3,185 | | | 95,454 |
Gerdau Ameristeel Corporation | | 1,064 | | | 15,013 |
Mechel ADR | | 1,896 | | | 215,746 |
Reliance Steel & Aluminum Company | | 1,061 | | | 63,512 |
Ternium S.A. ADR | | 2,032 | | | 72,908 |
| | | | |
| | 7 | | The accompanying notes are an integral part of the financial statements |
| | |
| Schedule of Investments | | Security Equity Fund - Alpha Opportunity Series |
| March 31, 2008 (Unaudited) - continued | | |
| | | | | | | | |
| | | Shares | | | Value | |
COMMON STOCK (continued) | | | | | | | | |
Steel (continued) | | | | | | | | |
United States Steel Corporation (1) | | | 9,360 | | | $ | 1,187,503 | |
| | | | | | | | |
| | | | | | | 1,777,265 | |
| | | | | | | | |
Systems Software - 0.2% | | | | | | | | |
Check Point Software Technologies * | | | 2,474 | | | | 55,418 | |
| | | | | | | | |
Trading Companies & Distributors - 0.8% | | | | | | | | |
UAP Holding Corporation | | | 6,997 | | | | 268,265 | |
| | | | | | | | |
Trucking - 0.6% | | | | | | | | |
Arkansas Best Corporation | | | 1,064 | | | | 33,899 | |
Con-way, Inc. | | | 532 | | | | 26,323 | |
J.B. Hunt Transport Services, Inc. | | | 4,711 | | | | 148,067 | |
| | | | | | | | |
| | | | | | | 208,289 | |
| | | | | | | | |
Wireless Telecommunication Services - 0.4% | | | | | | | | |
America Movil S.A. de CV ADR | | | 1,064 | | | | 67,766 | |
Cellcom Israel, Ltd. | | | 1,024 | | | | 32,184 | |
Vivo Participacoes S.A. ADR * | | | 5,685 | | | | 33,883 | |
| | | | | | | | |
| | | | | | | 133,833 | |
| | | | | | | | |
TOTAL COMMON STOCK (Cost $21,505,083) | | | | | | $ | 20,782,706 | |
| | | | | | | | |
FOREIGN STOCK - 0.1% | | | | | | | | |
Wireless Telecommunication Services - 0.1% | | | | | | | | |
Partner Communications ADR | | | 1,064 | | | | 23,887 | |
| | | | | | | | |
TOTAL FOREIGN STOCK (Cost $23,755) | | | | | | $ | 23,887 | |
| | | | | | | | |
| | |
| | | Principal
Amount | | | | |
U.S. GOVERNMENT SPONSORED AGENCY BONDS & NOTES 39.0% | | | | | | | | |
Federal Home Loan Bank | | | | | | | | |
1.80% - 2008 (1) | | $ | 410,000 | | | | 409,119 | |
2.225% - 2008 (2) | | | 500,000 | | | | 498,750 | |
2.88% - 2008 (1) | | | 1,000,000 | | | | 998,800 | |
Federal Home Loan Mortgage Corporation | | | | | | | | |
1.90% - 2008 (1) | | | 450,000 | | | | 448,157 | |
2.07% - 2008 (1) | | | 1,000,000 | | | | 996,128 | |
2.215% - 2008 (2) | | | 450,000 | | | | 448,434 | |
2.23% - 2008 (2) | | | 500,000 | | | | 498,800 | |
2.70% - 2008 (1) | | | 450,000 | | | | 449,347 | |
4.01% - 2008 (1) | | | 675,000 | | | | 674,797 | |
Federal National Mortgage Association | | | | | | | | |
1.72% - 2008 (1) | | | 300,000 | | | | 299,220 | |
1.80% - 2008 (1) | | | 300,000 | | | | 299,385 | |
1.87% - 2008 (1) | | | 1,400,000 | | | | 1,393,872 | |
1.99% - 2008 (1) | | | 750,000 | | | | 747,788 | |
2.62% - 2008 (1) | | | 750,000 | | | | 749,250 | |
2.64% - 2008 (1) | | | 950,000 | | | | 948,528 | |
2.68% - 2008 (1) | | | 1,225,000 | | | | 1,222,795 | |
2.72% - 2008 (1) | | | 1,000,000 | | | | 999,250 | |
4.13% - 2008 (1) | | | 500,000 | | | | 499,975 | |
4.19% - 2008 (1) | | $ | 325,000 | | | | 324,837 | |
4.21% - 2008 (1) | | | 1,000,000 | | | | 999,700 | |
| | | | | | | | |
TOTAL U.S. GOVERNMENT SPONSORED AGENCY BONDS & NOTES
(Cost $13,902,035) | | | $ | 13,906,932 | |
| | | | | | | | |
Total Investments (Security Equity Fund - Alpha Opportunity Series)
(Cost $35,430,873) - 97.5% | | | $ | 34,713,525 | |
Other Assets in Excess of Liabilities - 2.5% | | | | 898.144 | |
| | | | | | | | |
TOTAL NET ASSETS - 100.0% | | | $ | 35,611,669 | |
| | | | | | | | |
Schedule of Securities Sold Short March 31, 2008 Security Equity Fund – Alpha Opportunity Series | |
| | |
| | | Shares | | | Value | |
COMMON STOCK - (3.8)% | | | | | | | | |
Air Freight & Logistics - (0.2)% | | | | | | | | |
Expediters International | | | (1,300 | ) | | $ | (58,734 | ) |
| | | | | | | | |
Apparel Retail - (0.1)% | | | | | | | | |
Cache, Inc. * | | | (796 | ) | | | (8,987 | ) |
Pacific Sunwear of California * | | | (1,239 | ) | | | (15,624 | ) |
| | | | | | | | |
| | | | | | | (24,611 | ) |
| | | | | | | | |
Biotechnology - (0.1)% | | | | | | | | |
Amylin Pharmaceuticals, Inc. * | | | (924 | ) | | | (26,990 | ) |
| | | | | | | | |
Broadcasting & Cable TV - (0.1)% | | | | | | | | |
Comcast Corporation | | | (1,239 | ) | | | (23,962 | ) |
| | | | | | | | |
Computer & Electronics Retail - (0.1)% | | | | | | | | |
Best Buy Company, Inc. | | | (433 | ) | | | (17,952 | ) |
| | | | | | | | |
Consumer Electronics - (0.1)% | | | | | | | | |
Garmin, Ltd. | | | (433 | ) | | | (23,386 | ) |
| | | | | | | | |
Data Processing & Outsourced Services - (0.1)% | | | | | | | | |
Paychex, Inc. | | | (866 | ) | | | (29,669 | ) |
| | | | | | | | |
Diversified Banks - (0.2)% | | | | | | | | |
Barclays plc ADR | | | (1,547 | ) | | | (56,001 | ) |
Comerica, Inc. | | | (433 | ) | | | (15,190 | ) |
| | | | | | | | |
| | | | | | | (71,191 | ) |
| | | | | | | | |
Diversified Chemicals - (0.1)% | | | | | | | | |
E.I. Du Pont de Nemours & | | | (796 | ) | | | (37,221 | ) |
| | | | | | | | |
Diversified Commercial & Professional Services - (0.1)% | | | | | | | | |
China Security & Surveillance | | | (867 | ) | | | (44,113 | ) |
| | | | | | | | |
| | | | |
| | 8 | | The accompanying notes are an integral part of the financial statements |
| | |
| Schedule of Investments | | Security Equity Fund - Alpha Opportunity Series |
| March 31, 2008 (Unaudited) | | |
| | | | | | | |
| | | Shares | | | Value | |
COMMON STOCK (continued) | | | | | | | |
Drug Retail - (0.1)% | | | | | | | |
Walgreen Company | | (867 | ) | | $ | (33,024 | ) |
| | | | | | | |
Electric Utilities - (0.4)% | | | | | | | |
Duke Energy Corporation | | (619 | ) | | | (11,049 | ) |
Southern Company | | (3,899 | ) | | | (138,844 | ) |
| | | | | | | |
| | | | | | (149,893 | ) |
| | | | | | | |
Exchange Traded Funds - (0.2)% | | | | | | | |
Consumer Discretionary Select | | (866 | ) | | | (26,777 | ) |
Financial Select Sector SPDR Fund | | (866 | ) | | | (21,494 | ) |
iShares Russell 2000 Growth Index | | (433 | ) | | | (31,540 | ) |
| | | | | | | |
| | | | | | (79,811 | ) |
| | | | | | | |
Footwear - 0.0% | | | | | | | |
K-Swiss, Inc. | | (619 | ) | | | (9,793 | ) |
| | | | | | | |
Health Care Equipment - (0.2)% | | | | | | | |
Medtronic, Inc. | | (1,735 | ) | | | (83,922 | ) |
| | | | | | | |
Industrial Conglomerates - (0.1)% | | | | | | | |
3M Company | | (433 | ) | | | (34,272 | ) |
| | | | | | | |
Integrated Telecommunication Services - (0.1)% | | | | | | | |
AT&T, Inc. | | (866 | ) | | | (33,168 | ) |
| | | | | | | |
Internet Software & Services - 0.0% | | | | | | | |
Knot, Inc. * | | (619 | ) | | | (7,274 | ) |
SonicWALL, Inc. * | | (619 | ) | | | (5,057 | ) |
| | | | | | (12,331 | ) |
| | | | | | | |
Leisure Products - (0.1)% | | | | | | | |
Brunswick Corporation | | (1,487 | ) | | | (23,747 | ) |
| | | | | | | |
Multi-Line Insurance - (0.1)% | | | | | | | |
AXA S.A. ADR | | (434 | ) | | | (15,672 | ) |
| | | | | | | |
Multi-Utilities - (0.2)% | | | | | | | |
Avista Corporation | | (3,218 | ) | | | (62,944 | ) |
TECO Energy, Inc. | | (662 | ) | | | (10,559 | ) |
Vectren Corporation | | (173 | ) | | | (4,642 | ) |
| | | | | | | |
| | | | | | (78,145 | ) |
| | | | | | | |
Packaged Foods & Meats - (0.5)% | | | | | | | |
Hershey Company | | (4,403 | ) | | | (165,861 | ) |
| | | | | | | |
Photographic Products - 0.0% | | | | | | | |
Eastman Kodak Company | | (619 | ) | | | (10,938 | ) |
| | | | | | | |
Real Estate Management & Development - (0.2)% | | | | | | | |
Consolidated-Tomoka Land | | (1,027 | ) | | | (57,563 | ) |
| | | | | | | |
Regional Banks - 0.0% | | | | | | | |
Huntington Bancshares, Inc. | | (619 | ) | | | (6,654 | ) |
| | | | | | | |
Restaurants - 0.0% | | | | | | | |
Cheesecake Factory * | | (434 | ) | | | (9,457 | ) |
Steak N Shake Company * | | (136 | ) | | | (1,070 | ) |
| | | | | | | |
| | | | | | (10,527 | ) |
| | | | | | | |
Retail REIT’s - (0.2)% | | | | | | | |
General Growth Properties, Inc. | | (2,152 | ) | | | (82,142 | ) |
| | | | | | | |
Specialized Consumer Services - (0.2)% | | | | | | | |
Regis Corporation | | (1,735 | ) | | | (47,695 | ) |
Weight Watchers International Inc | | (513 | ) | | | (23 767 | ) |
| | | | | | | |
| | | | | | (71,462 | ) |
| | | | | | | |
Specialized Finance - 0.0% | | | | | | | |
Moody’s Corporation | | (433 | ) | | | (15,081 | ) |
| | | | | | | |
Wireless Telecommunication Services - 0.0% | | | | | | | |
American Tower Corporation * | | (140 | ) | | | (5,489 | ) |
TOTAL COMMON STOCK
(Proceeds $1,320,297) | | | | | $ | (1,337,324 | ) |
| | | | | | | |
Total Securities Sold Short (Security Equity Fund-Alpha Opportunity Series) (Proceeds $1,320,297) | | | | | $ | (1,337,324 | ) |
| | | | | | | |
Footnotes
Percentages are stated as a percent of net assets.
For federal income tax purposes the identified cost of investments owned at 3/31/2008 was $35,526,411.
| * | - Non-income producing security |
| 1 | - Security is segregated as collateral for open futures contracts. |
| 2 | - Security is segregated as collateral for short positions. |
Glossary:
ADR - American Depositary Receipt
See notes to financial statements.
| | | | |
| | 9 | | The accompanying notes are an integral part of the financial statements |
Security Equity Fund
Alpha Opportunity Series
(unaudited)
Statement of Assets and Liabilities
March 31, 2008
| | | | |
Assets: | | | | |
Investments, at value* | | $ | 34,713,525 | |
Cash | | | 2,843,838 | |
| |
Receivables: | | | | |
Fund shares sold | | | 75,453 | |
Securities sold | | | 1,032,801 | |
Dividends | | | 15,501 | |
Variation margin | | | 54,825 | |
Prepaid expenses | | | 16,719 | |
| | | | |
Total assets | | | 38,752,662 | |
| | | | |
Liabilities: | | | | |
Common stock sold short, at value** | | | 1,337,324 | |
Payable for: | | | | |
Securities purchased | | | 1,614,590 | |
Fund shares redeemed | | | 75,244 | |
Dividends on short sales | | | 301 | |
Management fees | | | 76,095 | |
Custodian fees | | | 2,999 | |
Transfer agent/maintenance fees | | | 2,978 | |
Administration fees | | | 5,587 | |
Professional fees | | | 7,831 | |
12b-1 distribution plan fees | | | 13,275 | |
Directors’ fees | | | 103 | |
Other | | | 4,666 | |
| | | | |
Total liabilities | | | 3,140,993 | |
| | | | |
Net assets | | $ | 35,611,669 | |
| | | | |
Net assets consist of: | | | | |
Paid in capital | | $ | 39,592,796 | |
Accumulated net investment loss | | | (221,712 | ) |
Accumulated net realized loss on sale of investments | | | (2,898,673 | ) |
Net unrealized depreciation in value of investments | | | (860,742 | ) |
| | | | |
Net assets | | $ | 35,611,669 | |
| | | | |
Class A: | | | | |
Capital shares outstanding (unlimited number of shares authorized) | | | 2,586,701 | |
Net assets | | $ | 26,472,929 | |
Net asset value and redemption price per share . | | $ | 10.23 | |
| | | | |
Maximum offering price per share (net asset value divided by 94.25%) | | $ | 10.85 | |
| | | | |
Class B: | | | | |
Capital shares outstanding (unlimited number of shares authorized) | | | 382,936 | |
Net assets | | $ | 3,723,513 | |
Net asset value, offering and redemption price per share (excluding any applicable contingent deferred sales charge) | | $ | 9.72 | |
| | | | |
Class C: | | | | |
Capital shares outstanding (unlimited number of shares authorized) | | | 556,825 | |
Net assets | | $ | 5,415,227 | |
Net asset value, offering and redemption price per share (excluding any applicable contingent deferred sales charge) | | $ | 9.73 | |
| | | | |
* Investments, at cost | | $ | 35,430,873 | |
** Common stock sold short, at proceeds | | | 1,320,297 | |
Statement of Operations
For the Six Months Ended March 31, 2008
| | | | |
Investment Income: | | | | |
Dividends | | $ | 87,714 | |
Interest | | | 289,952 | |
| | | | |
Total investment income | | | 377,666 | |
| | | | |
Expenses: | | | | |
Management fees | | | 430,614 | |
Transfer agent/maintenance fees | | | 22,676 | |
Administration fees | | | 28,004 | |
Custodian fees | | | 29,506 | |
Directors’ fees | | | 427 | |
Professional fees | | | 5,854 | |
Reports to shareholders | | | 2,020 | |
Registration fees | | | 15,712 | |
Other expenses | | | 1,623 | |
Dividends on short sales | | | 11,570 | |
12b-1 distribution fees - Class A | | | 32,333 | |
12b-1 distribution fees - Class B | | | 18,401 | |
12b-1 distribution fees - Class C | | | 24,840 | |
| | | | |
Total expenses | | | 623,580 | |
Less: | | | | |
Earnings credits applied | | | (24,202 | ) |
| | | | |
Net expenses | | | 599,378 | |
| | | | |
Net investment loss | | | (221,712 | ) |
| | | | |
Net Realized and Unrealized Gain (Loss): | | | | |
Net realized gain (loss) during the period on: | | | | |
Investments | | | (69,763 | ) |
Securities sold short | | | 378,762 | |
Futures | | | (1,684,846 | ) |
| | | | |
Net realized loss | | | (1,375,847 | ) |
| | | | |
Net unrealized appreciation (depreciation) during the period on: | | | | |
Investments | | | (827,067 | ) |
Securities sold short | | | (19,412 | ) |
Futures | | | (665,708 | ) |
| | | | |
Net unrealized depreciation | | | (1,512,187 | ) |
| | | | |
Net loss | | | (2,888,034 | ) |
| | | | |
Net decrease in net assets resulting from operations | | $ | (3,109,746 | ) |
| | | | |
| | | | |
| | 10 | | The accompanying notes are an integral part of the financial statements |
| | |
| Statement of Changes in Net Assets | | Security Equity Fund Alpha Opportunity Series |
| | | | | | | | |
| | |
| | | Six Months Ended
March 31, 2008 | | | Year Ended
September 30, 2007 | |
| | | (unaudited) | | | | |
Increase (decrease) in net assets from operations: | | | | | | | | |
Net investment loss | | $ | (221,712 | ) | | $ | (98,282 | ) |
Net realized gain (loss) during the period on investments | | | (1,375,847 | ) | | | 6,873,561 | |
Net unrealized appreciation (depreciation) during the period on investments | | | (1,512,187 | ) | | | 898,061 | |
| | | | | | | | |
Net increase (decrease) in net assets resulting from operations | | | (3,109,746 | ) | | | 7,673,340 | |
| | | | | | | | |
Distributions to shareholders from: | | | | | | | | |
Net realized gain | | | | | | | | |
Class A | | | (5,132,996 | ) | | | (2,136,563 | ) |
Class B | | | (811,284 | ) | | | (523,991 | ) |
Class C | | | (1,064,735 | ) | | | (617,311 | ) |
| | | | | | | | |
Total distributions to shareholders | | | (7,009,015 | ) | | | (3,277,865 | ) |
| | | | | | | | |
Capital share transactions: | | | | | | | | |
Proceeds from sale of shares | | | | | | | | |
Class A | | | 8,768,399 | | | | 10,352,391 | |
Class B | | | 1,818,379 | | | | 1,279,776 | |
Class C | | | 2,582,315 | | | | 1,430,285 | |
Distributions reinvested | | | | | | | | |
Class A | | | 5,033,793 | | | | 2,077,296 | |
Class B | | | 802,594 | | | | 522,694 | |
Class C | | | 960,779 | | | | 556,963 | |
Cost of shares redeemed | | | | | | | | |
Class A | | | (4,980,273 | ) | | | (11,078,834 | ) |
Class B | | | (890,964 | ) | | | (4,098,624 | ) |
Class C | | | (806,205 | ) | | | (4,012,623 | ) |
| | | | | | | | |
Net increase (decrease) from capital share transactions | | | 13,288,817 | | | | (2,970,676 | ) |
| | | | | | | | |
Net increase in net assets | | | 3,170,056 | | | | 1,424,799 | |
| | | | | | | | |
Net assets: | | | | | | | | |
Beginning of period | | | 32,441,613 | | | | 31,016,814 | |
| | | | | | | | |
End of period | | $ | 35,611,669 | | | $ | 32,441,613 | |
| | | | | | | | |
Accumulated net investment loss at end of period | | $ | (221,712 | ) | | | — | |
| | | | | | | | |
Capital share activity: | | | | | | | | |
Shares sold | | | | | | | | |
Class A | | | 774,869 | | | | 802,495 | |
Class B | | | 159,091 | | | | 104,269 | |
Class C | | | 226,994 | | | | 114,901 | |
Shares reinvested | | | | | | | | |
Class A | | | 463,091 | | | | 174,124 | |
Class B | | | 77,545 | | | | 45,216 | |
Class C | | | 92,829 | | | | 48,180 | |
Shares redeemed | | | | | | | | |
Class A | | | (449,991 | ) | | | (862,512 | ) |
Class B | | | (88,702 | ) | | | (321,701 | ) |
Class C | | | (77,025 | ) | | | (317,535 | ) |
| | | | |
| | 11 | | The accompanying notes are an integral part of the financial statements |
| | |
| Financial Highlights | | Security Equity Fund |
| Selected data for each share of capital stock outstanding throughout each year | | Alpha Opportunity Series |
| | | | | | | | | | | | | | | | | | | | | | | | |
| | | | | | |
Class A | | Six Months Ended
March 31,
2008a | | | 2007 | | | 2006 | | | 2005 | | | 2004 | | | Year Ended
September 30,
2003b | |
Per Share Data | | | | | | | | | | | | | | | | | | | | | | | | |
Net asset value, beginning of period | | $ | 13.94 | | | $ | 12.23 | | | $ | 12.37 | | | $ | 11.79 | | | $ | 10.21 | | | $ | 10.00 | |
| | | | | | | | | | | | | | | | | | | | | | | | |
Income (loss) from investment operations: | | | | | | | | | | | | | | | | | | | | | | | | |
Net investment lossc | | | (0.07 | ) | | | (0.01 | ) | | | (0.06 | ) | | | (0.10 | ) | | | (0.16 | ) | | | (0.03 | ) |
Net gain (loss) on securities (realized and unrealized) | | | (0.91 | ) | | | 2.99 | | | | 0.93 | | | | 1.50 | | | | 2.33 | | | | 0.24 | |
| | | | | | | | | | | | | | | | | | | | | | | | |
Total from investment operations | | | (0.98 | ) | | | 2.98 | | | | 0.87 | | | | 1.40 | | | | 2.17 | | | | 0.21 | |
| | | | | | | | | | | | | | | | | | | | | | | | |
Less distributions: | | | | | | | | | | | | | | | | | | | | | | | | |
Distributions from realized gains | | | (2.73 | ) | | | (1.27 | ) | | | (1.01 | ) | | | (0.82 | ) | | | (0.59 | ) | | | — | |
| | | | | | | | | | | | | | | | | | | | | | | | |
Total distributions | | | (2.73 | ) | | | (1.27 | ) | | | (1.01 | ) | | | (0.82 | ) | | | (0.59 | ) | | | — | |
| | | | | | | | | | | | | | | | | | | | | | | | |
Net asset value, end of period | | $ | 10.23 | | | $ | 13.94 | | | $ | 12.23 | | | $ | 12.37 | | | $ | 11.79 | | | $ | 10.21 | |
| | | | | | | | | | | | | | | | | | | | | | | | |
Total Returnd | | | (8.18 | )% | | | 26.10 | % | | | 7.39 | % | | | 12.26 | % | | | 21.68 | % | | | 2.10 | % |
| | | | | | | | | | | | | | | | | | | | | | | | |
Ratios/Supplemental Data | | | | | | | | | | | | | | | | | | | | | | | | |
Net assets, end of period (in thousands) | | $ | 26,473 | | | $ | 25,072 | | | $ | 20,595 | | | $ | 14,622 | | | $ | 6,556 | | | $ | 2,935 | |
| | | | | | | | | | | | | | | | | | | | | | | | |
Ratios to average net assets: | | | | | | | | | | | | | | | | | | | | | | | | |
Net investment loss | | | (1.15 | )% | | | (0.08 | )% | | | (0.50 | )% | | | (0.83 | )% | | | (1.48 | )% | | | (1.35 | )% |
Total expensese | | | 3.42 | % | | | 2.88 | % | | | 3.20 | % | | | 2.94 | % | | | 3.57 | % | | | 3.25 | % |
Net expensesf | | | 3.28 | % | | | 2.68 | % | | | 3.01 | % | | | 2.86 | % | | | 2.78 | % | | | 2.75 | % |
Net expenses prior to custodian earning credits and net of expense waivers | | | 3.42 | % | | | 2.88 | % | | | 3.10 | % | | | 2.86 | % | | | 2.79 | % | | | 2.75 | % |
Net expenses prior to performance fee adjustmentg | | | 2.78 | % | | | 2.77 | % | | | 2.82 | % | | | 2.78 | % | | | 2.78 | % | | | 2.75 | % |
| | | | | | | | | | | | | | | | | | | | | | | | |
Portfolio turnover rate | | | 1,287 | % | | | 1,697 | % | | | 1,302 | % | | | 1,502 | % | | | 1,175 | % | | | 867 | % |
| | | | | | |
Class B | | Six Months Ended
March 31,
2008a | | | 2007 | | | 2006 | | | 2005 | | | 2004 | | | Year Ended
September 30,
2003b | |
Per Share Data | | | | | | | | | | | | | | | | | | | | | | | | |
Net asset value, beginning of period | | $ | 13.42 | | | $ | 11.90 | | | $ | 12.15 | | | $ | 11.68 | | | $ | 10.20 | | | $ | 10.00 | |
| | | | | | | | | | | | | | | | | | | | | | | | |
Income (loss) from investment operations: | | | | | | | | | | | | | | | | | | | | | | | | |
Net investment lossc | | | (0.11 | ) | | | (0.09 | ) | | | (0.15 | ) | | | (0.18 | ) | | | (0.25 | ) | | | (0.05 | ) |
Net gain (loss) on securities (realized and unrealized) | | | (0.86 | ) | | | 2.88 | | | | 0.91 | | | | 1.47 | | | | 2.32 | | | | 0.25 | |
| | | | | | | | | | | | | | | | | | | | | | | | |
Total from investment operations | | | (0.97 | ) | | | 2.79 | | | | 0.76 | | | | 1.29 | | | | 2.07 | | | | 0.20 | |
| | | | | | | | | | | | | | | | | | | | | | | | |
Less distributions: | | | | | | | | | | | | | | | | | | | | | | | | |
Distributions from realized gains | | | (2.73 | ) | | | (1.27 | ) | | | (1.01 | ) | | | (0.82 | ) | | | (0.59 | ) | | | — | |
| | | | | | | | | | | | | | | | | | | | | | | | |
Total distributions | | | (2.73 | ) | | | (1.27 | ) | | | (1.01 | ) | | | (0.82 | ) | | | (0.59 | ) | | | — | |
| | | | | | | | | | | | | | | | | | | | | | | | |
Net asset value, end of period | | $ | 9.72 | | | $ | 13.42 | | | $ | 11.90 | | | $ | 12.15 | | | $ | 11.68 | | | $ | 10.20 | |
| | | | | | | | | | | | | | | | | | | | | | | | |
Total Returnd | | | (8.47 | )% | | | 25.14 | % | | | 6.56 | % | | | 11.39 | % | | | 20.68 | % | | | 2.00 | % |
| | | | | | | | | | | | | | | | | | | | | | | | |
Ratios/Supplemental Data | | | | | | | | | | | | | | | | | | | | | | | | |
Net assets, end of period (in thousands) | | $ | 3,724 | | | $ | 3,154 | | | $ | 4,846 | | | $ | 4,106 | | | $ | 2,324 | | | $ | 1,731 | |
| | | | | | | | | | | | | | | | | | | | | | | | |
Ratios to average net assets: | | | | | | | | | | | | | | | | | | | | | | | | |
Net investment loss | | | (1.91 | )% | | | (0.77 | )% | | | (1.24 | )% | | | (1.60 | )% | | | (2.25 | )% | | | (2.11 | )% |
Total expensese | | | 4.17 | % | | | 3.59 | % | | | 3.95 | % | | | 3.69 | % | | | 4.29 | % | | | 4.01 | % |
Net expensesf | | | 4.03 | % | | | 3.39 | % | | | 3.76 | % | | | 3.61 | % | | | 3.53 | % | | | 3.50 | % |
Net expenses prior to custodian earning credits and net of expense waivers | | | 4.17 | % | | | 3.59 | % | | | 3.85 | % | | | 3.61 | % | | | 3.53 | % | | | 3.50 | % |
Net expenses prior to performance fee adjustmentg | | | 3.53 | % | | | 3.51 | % | | | 3.57 | % | | | 3.53 | % | | | 3.53 | % | | | 3.50 | % |
| | | | | | | | | | | | | | | | | | | | | | | | |
Portfolio turnover rate | | | 1,287 | % | | | 1,697 | % | | | 1,302 | % | | | 1,502 | % | | | 1,175 | % | | | 867 | % |
| | | | |
| | 12 | | The accompanying notes are an integral part of the financial statements |
| | |
| Financial Highlights | | Security Equity Fund |
| Selected data for each share of capital stock outstanding throughout each year | | Alpha Opportunity Series |
| | | | | | | | | | | | | | | | | | | | | | | | |
| | | | | | |
Class C | | Six Months Ended
March 31,
2008a | | | 2007 | | | 2006 | | | 2005 | | | 2004 | | | Year Ended
September 30,
2003b | |
Per Share Data | | | | | | | | | | | | | | | | | | | | | | | | |
Net asset value, beginning of period | | $ | 13.43 | | | $ | 11.90 | | | $ | 12.15 | | | $ | 11.68 | | | $ | 10.20 | | | $ | 10.00 | |
| | | | | | | | | | | | | | | | | | | | | | | | |
Income (loss) from investment operations: | | | | | | | | | | | | | | | | | | | | | | | | |
Net investment lossc | | | (0.11 | ) | | | (0.10 | ) | | | (0.15 | ) | | | (0.18 | ) | | | (0.25 | ) | | | (0.05 | ) |
Net gain (loss) on securities (realized and unrealized) | | | (0.86 | ) | | | 2.90 | | | | 0.91 | | | | 1.47 | | | | 2.32 | | | | 0.25 | |
| | | | | | | | | | | | | | | | | | | | | | | | |
Total from investment operations | | | (0.97 | ) | | | 2.80 | | | | 0.76 | | | | 1.29 | | | | 2.07 | | | | 0.20 | |
| | | | | | | | | | | | | | | | | | | | | | | | |
Less distributions: | | | | | | | | | | | | | | | | | | | | | | | | |
Distributions from realized gains | | | (2.73 | ) | | | (1.27 | ) | | | (1.01 | ) | | | (0.82 | ) | | | (0.59 | ) | | | — | |
| | | | | | | | | | | | | | | | | | | | | | | | |
Total distributions | | | (2.73 | ) | | | (1.27 | ) | | | (1.01 | ) | | | (0.82 | ) | | | (0.59 | ) | | | — | |
| | | | | | | | | | | | | | | | | | | | | | | | |
Net asset value, end of period | | $ | 9.73 | | | $ | 13.43 | | | $ | 11.90 | | | $ | 12.15 | | | $ | 11.68 | | | $ | 10.20 | |
| | | | | | | | | | | | | | | | | | | | | | | | |
Total Returnd | | | (8.44 | )% | | | 25.24 | % | | | 6.56 | % | | | 11.39 | % | | | 20.68 | % | | | 2.00 | % |
| | | | | | | | | | | | | | | | | | | | | | | | |
Ratios/Supplemental Data | | | | | | | | | | | | | | | | | | | | | | | | |
Net assets, end of period (in thousands) | | $ | 5,415 | | | $ | 4,216 | | | $ | 5,576 | | | $ | 7,813 | | | $ | 3,143 | | | $ | 1,723 | |
| | | | | | | | | | | | | | | | | | | | | | | | |
Ratios to average net assets: | | | | | | | | | | | | | | | | | | | | | | | | |
Net investment loss | | | (1.91 | )% | | | (0.77 | )% | | | (1.18 | )% | | | (1.58 | )% | | | (2.24 | )% | | | (2.11 | )% |
Total expensese | | | 4.17 | % | | | 3.60 | % | | | 3.95 | % | | | 3.68 | % | | | 4.30 | % | | | 4.01 | % |
Net expensesf | | | 4.03 | % | | | 3.40 | % | | | 3.75 | % | | | 3.61 | % | | | 3.53 | % | | | 3.50 | % |
Net expenses prior to custodian earning credits and net of expense waivers | | | 4.17 | % | | | 3.60 | % | | | 3.83 | % | | | 3.61 | % | | | 3.53 | % | | | 3.50 | % |
Net expenses prior to performance fee adjustmentg | | | 3.53 | % | | | 3.51 | % | | | 3.57 | % | | | 3.53 | % | | | 3.53 | % | | | 3.50 | % |
| | | | | | | | | | | | | | | | | | | | | | | | |
Portfolio turnover rate | | | 1,287 | % | | | 1,697 | % | | | 1,302 | % | | | 1,502 | % | | | 1,175 | % | | | 867 | % |
a | Unaudited figures for the six months ended March 31, 2008. Percentage amounts for the period, except total return, have been annualized. |
b | Security Alpha Opportunity Series was initially capitalized on July 7, 2003 with a net asset value of $10 per share. Percentage amounts for the period, except total return have been annualized. |
c | Net investment income (loss) was computed using average shares outstanding throughout the period. |
d | Total return information does not reflect deduction of any sales charges imposed at the time of purchase for Class A shares or upon redemption for Class B and C shares. |
e | Total expense information reflects expense ratios absent expense reductions by the Investment Manager and custodian earnings credits, as applicable. |
f | Net expense information reflects the expense ratios after voluntary expense waivers, reimbursements and custodian earnings credits, as applicable. |
g | Net expenses prior to performance fee adjustment reflect ratios after voluntary expense waivers, reimbursements, custodian earnings credits, and before performance fees adjustments, as applicable. |
| | | | |
| | 13 | | The accompanying notes are an integral part of the financial statements |
This page left blank intentionally.
14
Security Equity Fund
Equity Series

Adviser,
Security Global Investors
15
| | |
| Performance Summary | | Security Equity Fund Equity Series |
| March 31, 2008 | | (unaudited) |
PERFORMANCE
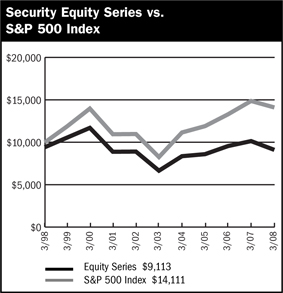
$10,000 Over Ten Years
This chart assumes a $10,000 investment in Class A shares of Equity Series on March 31, 1998, reflects deduction of the 5.75% sales load and assumes all dividends reinvested. The chart does not reflect the deduction of taxes that a shareholder would pay on distributions or the redemption of fund shares. The S&P 500 Index is a capitalization weighted index composed of 500 selected common stocks that represent the broad domestic economy and is a widely recognized unmanaged index of market performance.
Average Annual Returns
| | | | | | | | | | | | |
Periods Ended 3-31-08 | | 1 Year | | | 5 Years | | | 10 Years | | | Since
Inception | |
| A Shares | | (10.07 | )% | | 6.52 | % | | (0.34 | )% | | — | |
| | | | |
| A Shares with sales charge | | (15.26 | )% | | 5.26 | % | | (0.92 | )% | | — | |
| | | | |
| B Shares | | (10.80 | )% | | 5.71 | % | | (1.05 | )% | | — | |
| | | | |
| B Shares with CDSC | | (14.45 | )% | | 5.43 | % | | (1.05 | )% | | — | |
| | | | |
| C Shares | | (10.80 | )% | | 5.75 | % | | — | | | (2.49)% (1-29-99 | ) |
| | | | |
| C Shares with CDSC | | (11.54 | )% | | 5.75 | % | | — | | | (2.49)% (1-29-99 | ) |
The performance data above represents past performance that is not predictive of future results. The investment return and principal value of an investment in the Series will fluctuate so that an investor’s shares, when redeemed, may be worth more or less than their original cost. The figures above do not reflect deduction of the maximum front-end sales charge of 5.75% for Class A shares or the contingent deferred sales charge of 5% for Class B shares and 1% for Class C shares, as applicable, except where noted. The figures do not reflect the deduction of taxes that a shareholder would pay on distributions or redemption of shares. Such figures would be lower if the maximum sales charge and any applicable taxes were deducted.
Portfolio Composition by Sector as of 3-31-08
| | | |
Consumer Discretionary | | 9.78 | % |
Consumer Staples | | 9.28 | |
Energy | | 8.86 | |
Financials | | 14.51 | |
Health Care | | 10.51 | |
Industrials | | 17.71 | |
Information Technology | | 15.02 | |
Materials | | 7.02 | |
Telecommunication Services | | 1.31 | |
Exchange Traded Funds | | 2.89 | |
Utilities | | 0.88 | |
Commercial Paper | | 0.54 | |
Repurchase Agreement | | 2.09 | |
Liabilities in Excess of Other Assets | | (0.40 | ) |
Total Net Assets | | 100.00 | % |
| | | |
| | | | |
| | 16 | | The accompanying notes are an integral part of the financial statements |
| | |
| Performance Summary | | Security Equity Fund Equity Series |
| March 31, 2008 | | (unaudited) |
Information About Your Series Expenses
Calculating your ongoing Series expenses
Example
As a shareholder of the Series, you incur two types of costs: (1) transaction costs, which may include sales charges (loads) on purchase payments; contingent deferred sales charges on redemptions; and redemption fees, if any; and (2) ongoing costs, including management fees; distribution and/or service fees (12b-1); and other Series expenses. This example is intended to help you understand your ongoing costs (in dollars) of investing in the Series and to compare these costs with ongoing costs of investing in other mutual funds. The example is based on an investment of $1,000 invested at the beginning of the period and held for the entire period October 1, 2007 through March 31, 2008.
Actual Expenses
The first line for each class of shares in the table provides information about actual account values and actual expenses. You may use the information in this table, together with the amount you invested, to estimate the expenses that you paid over the period. Simply divide your account value by $1,000 (for example, an $8,600 account value divided by $1,000 = 8.6), then multiply the result by the number in the table under the heading entitled “Expenses Paid During the Period” to estimate the expenses you paid on your account during this period.
Hypothetical Example for Comparison Purposes
The second line for each class of shares in the table provides information about hypothetical account values and hypothetical expenses based on the Series actual expense ratio and an assumed rate of return of 5% per year before expenses, which is not the Series actual return. The hypothetical account values and expenses may not be used to estimate the actual ending account balance or expenses you paid for the period. You may use this information to compare the ongoing costs of investing in the Series and other funds. To do so, compare this 5% hypothetical example with the 5% hypothetical examples that appear in the shareholder reports of the other mutual funds.
Please note that the expenses shown in the table are meant to highlight your ongoing costs only and do not reflect any transactional costs, such as sales charges (loads) on purchase payments, contingent deferred sales charges on redemptions, and redemption fees, if any. Therefore, the second line for each class of shares is useful in comparing ongoing costs only, and will not help you determine the relative total costs of owning different funds. In addition, if these transactional costs were included, your costs would have been higher.
Series Expenses
| | | | | | | | | |
| | | Beginning
Account
Value
10/1/2007 | | Ending
Account
Value
3/31/20081 | | Expenses
Paid
During
Period2 |
Equity Series - Class A | | | | | | | | | |
Actual | | $ | 1,000.00 | | $ | 858.52 | | $ | 6.37 |
Hypothetical | | | 1,000.00 | | | 1,018.15 | | | 6.91 |
| | | |
Equity Series - Class B | | | | | | | | | |
Actual | | | 1,000.00 | | | 855.64 | | | 9.83 |
Hypothetical | | | 1,000.00 | | | 1,014.40 | | | 10.68 |
| | | |
Equity Series - Class C | | | | | | | | | |
Actual | | | 1,000.00 | | | 855.10 | | | 9.79 |
Hypothetical | | | 1,000.00 | | | 1,014.45 | | | 10.63 |
1 | The actual ending account value is based on the actual total return of the Series for the period October 1, 2007 to March 31, 2008 after actual expenses and will differ from the hypothetical ending account value which is based on the Series expense ratio and a hypothetical annual return of 5% before expenses. The actual cumulative return at net asset value for the period October 1, 2007 to March 31, 2008 was (14.15%), (14.44%) and (14.49%), for Class A, B, and C respectively. |
2 | Expenses are equal to the Series annualized expense ratio (1.37%, 2.12% and 2.11% for Class A, B, and C shares, respectively) net of any applicable fee waivers or earnings credits, multiplied by the average account value over the period, multiplied by 183/366 (to reflect the one-half year period). |
17
| | |
| Schedule of Investments | | Security Equity Fund - Equity Series |
| March 31, 2008 (Unaudited) | | |
| | | | | |
| | | Shares | | Value |
COMMON STOCK - 97.8% | | | | | |
Aerospace & Defense - 3.8% | | | | | |
Honeywell International, Inc. | | 52,355 | | $ | 2,953,869 |
Precision Castparts Corporation | | 27,685 | | | 2,826,085 |
United Technologies Corporation | | 68,900 | | | 4,741,698 |
| | | | | |
| | | | | 10,521,652 |
| | | | | |
Air Freight & Logistics - 1.6% | | | | | |
FedEx Corporation | | 48,400 | | | 4,485,228 |
| | | | | |
Asset Management & Custody | | | | | |
Banks - 1.2% | | | | | |
Bank of New York Mellon Corporation | | 78,300 | | | 3,267,459 |
| | | | | |
Biotechnology - 4.9% | | | | | |
Celgene Corporation * | | 101,440 | | | 6,217,258 |
Gilead Sciences, Inc. * | | 140,900 | | | 7,260,577 |
| | | | | |
| | | | | 13,477,835 |
| | | | | |
Broadcasting & Cable TV - 0.4% | | | | | |
CBS Corporation | | 47,000 | | | 1,038,700 |
| | | | | |
Building Products - 2.0% | | | | | |
| | | | | |
USG Corporation * | | 151,800 | | | 5,589,276 |
| | | | | |
Casinos & Gaming - 1.4% | | | | | |
Las Vegas Sands Corporation * | | 53,790 | | | 3,961,095 |
| | | | | |
Communications Equipment - 4.1% | | | | | |
Cisco Systems, Inc. * | | 227,400 | | | 5,478,066 |
Corning, Inc. | | 240,205 | | | 5,774,528 |
| | | | | |
| | | | | 11,252,594 |
| | | | | |
Computer Hardware - 4.9% | | | | | |
Apple, Inc. * | | 35,355 | | | 5,073,443 |
Hewlett-Packard Company | | 183,605 | | | 8,383,404 |
| | | | | |
| | | | | 13,456,847 |
| | | | | |
Construction & Farm Machinery & Heavy Trucks - 2.0% | | | | | |
Deere & Company | | 69,440 | | | 5,585,754 |
| | | | | |
Consumer Finance - 2.8% | | | | | |
Capital One Financial Corporation | | 97,200 | | | 4,784,184 |
Discover Financial Services | | 32,500 | | | 532,025 |
First Marblehead Corporation | | 334,900 | | | 2,498,354 |
| | | | | |
| | | | | 7,814,563 |
| | | | | |
Data Processing & Outsourced Services - 1.2% | | | | | |
Western Union Company | | 154,400 | | | 3,284,088 |
| | | | | |
Department Stores - 1.7% | | | | | |
JC Penney Company, Inc. | | 123,070 | | | 4,640,970 |
| | | | | |
Diversified Banks - 1.8% | | | | | |
Wells Fargo & Company | | 168,650 | | | 4,907,715 |
| | | | | |
Diversified Chemicals - 0.7% | | | | | |
Dow Chemical Company | | 49,600 | | | 1,827,760 |
| | | | | |
Diversified Commercial & Professional Services - 0.5% | | | | | |
Equifax, Inc. | | 39,000 | | | 1,344,720 |
| | | | | |
Drug Retail - 3.5% | | | | | |
CVS Caremark Corporation | | 236,700 | | | 9,588,717 |
| | | | | |
Electric Utilities - 0.9% | | | | | |
Edison International | | 49,800 | | | 2,441,196 |
| | | | | |
Electrical Components & Equipment - 1.6% | | | | | |
Emerson Electric Company | | 85,055 | | | 4,376,930 |
| | | | | |
Electronic Manufacturing Services - 0.4% | | | | | |
Tyco Electronics, Ltd. | | 32,800 | | | 1,125,696 |
| | | | | |
Exchange Traded Funds - 2.9% | | | | | |
iShares Russell 1000 Value Index Fund | | 54,700 | | | 4,000,758 |
iShares S&P 500 Value Index Fund | | 57,600 | | | 3,989,376 |
| | | | | |
| | | | | 7,990,134 |
| | | | | |
Fertilizers & Agricultural Chemicals - 3.9% | | | | | |
Monsanto Company | | 45,200 | | | 5,039,800 |
Mosaic Company * | | 56,045 | | | 5,750,217 |
| | | | | |
| | | | | 10,790,017 |
| | | | | |
Health Care Equipment - 3.0% | | | | | |
Covidien, Ltd. | | 33,800 | | | 1,495,650 |
Hospira, Inc. * | | 52,700 | | | 2,253,979 |
St. Jude Medical, Inc. * | | 102,800 | | | 4,439,932 |
| | | | | |
| | | | | 8,189,561 |
| | | | | |
Health Care Services - 0.7% | | | | | |
Medco Health Solutions, Inc. * | | 44,800 | | | 1,961,792 |
| | | | | |
Home Improvement Retail - 1.8% | | | | | |
Home Depot, Inc. | | 181,100 | | | 5,065,367 |
| | | | | |
Hypermarkets & Super Centers - 2.9% | | | | | |
Costco Wholesale Corporation | | 42,500 | | | 2,761,225 |
Wal-Mart Stores, Inc. | | 102,200 | | | 5,383,896 |
| | | | | |
| | | | | 8,145,121 |
| | | | | |
Industrial Conglomerates - 4.3% | | | | | |
General Electric Company | | 237,675 | | | 8,796,352 |
McDermott International, Inc. * | | 32,400 | | | 1,776,168 |
Tyco International, Ltd. | | 29,100 | | | 1,281,855 |
| | | | | |
| | | | | 11,854,375 |
| | | | | |
Industrial Gases - 1.6% | | | | | |
Air Products & Chemicals, Inc. | | 48,200 | | | 4,434,400 |
| | | | | |
Integrated Oil & Gas - 3.5% | | | | | |
Chevron Corporation | | 29,900 | | | 2,552,264 |
ConocoPhillips | | 14,400 | | | 1,097,424 |
| | | | |
| | 18 | | The accompanying notes are an integral part of the financial statements |
| | |
| Schedule of Investments | | Security Equity Fund - Equity Series |
| March 31, 2008 (Unaudited) - continued | | |
| | | | | | | |
| | | Shares | | Value | |
COMMON STOCK (continued) | | | | | | | |
Integrated Oil & Gas (continued) | | | | | | | |
Exxon Mobil Corporation | | | 45,700 | | $ | 3,865,306 | |
Sasol, Ltd. ADR | | | 46,300 | | | 2,240,457 | |
| | | | | | | |
| | | | | | 9,755,451 | |
| | | | | | | |
Integrated Telecommunication Services - 0.8% | | | | | | | |
Windstream Corporation | | | 192,200 | | | 2,296,790 | |
| | | | | | | |
Internet Software & Services - 1.3% | | | | | | | |
Google, Inc. * | | | 8,440 | | | 3,717,567 | |
| | | | | | | |
Movies & Entertainment - 2.3% | | | | | | | |
Time Warner, Inc. | | | 185,100 | | | 2,595,102 | |
Walt Disney Company | | | 122,100 | | | 3,831,498 | |
| | | | | | | |
| | | | | | 6,426,600 | |
| | | | | | | |
Multi-Line Insurance - 2.2% | | | | | | | |
American International Group, Inc. | | | 141,900 | | | 6,137,175 | |
| | | | | | | |
Oil & Gas Drilling - 1.6% | | | | | | | |
Transocean, Inc. | | | 33,500 | | | 4,529,200 | |
| | | | | | | |
Oil & Gas Equipment & Services - 0.9% | | | | | | | |
Halliburton Company | | | 66,200 | | | 2,603,646 | |
| | | | | | | |
Oil & Gas Exploration & Production - 1.6% | | | | | | | |
Apache Corporation | | | 37,290 | | | 4,505,378 | |
| | | | | | | |
Oil & Gas Storage & Transportation - 1.1% | | | | | | | |
Williams Companies, Inc. | | | 93,900 | | | 3,096,822 | |
| | | | | | | |
Other Diversified Financial Services - 1.9% | | | | | | | |
JPMorgan Chase & Company | | | 119,100 | | | 5,115,345 | |
| | | | | | | |
Pharmaceuticals - 2.0% | | | | | | | |
Merck & Company, Inc. | | | 100,800 | | | 3,825,360 | |
Schering-Plough Corporation | | | 111,100 | | | 1,600,951 | |
| | | | | | | |
| | | | | | 5,426,311 | |
| | | | | | | |
Property & Casualty Insurance - 2.4% | | | | | | | |
Berkshire Hathaway, Inc. * | | | 49 | | | 6,536,600 | |
| | | | | | | |
Railroads - 1.9% | | | | | | | |
Union Pacific Corporation | | | 41,300 | | | 5,178,194 | |
| | | | | | | |
Restaurants - 2.1% | | | | | | | |
McDonald’s Corporation | | | 105,800 | | | 5,900,466 | |
| | | | | | | |
Semiconductor Equipment - 1.4% | | | | | | | |
MEMC Electronic Materials, Inc. * | | | 55,285 | | | 3,919,706 | |
| | | | | | | |
Soft Drinks - 1.6% | | | | | | | |
PepsiCo, Inc. | | | 61,400 | | | 4,433,080 | |
| | | | | | | |
Specialized Finance - 1.1% | | | | | | | |
CME Group, Inc. | | | 6,700 | | | 3,142,970 | |
| | | | | | | |
Specialty Chemicals - 0.9% | | | | | | | |
Rohm & Haas Company | | | 43,600 | | | 2,357,888 | |
| | | | | | | |
Systems Software - 1.7% | | | | | | | |
Oracle Corporation * | | | 243,420 | | | 4,761,295 | |
| | | | | | | |
Thrifts & Mortgage Finance - 1.2% | | | | | | | |
Federal Home Loan Mortgage Corporation | | | 84,500 | | | 2,139,540 | |
Federal National Mortgage Association | | | 39,200 | | | 1,031,744 | |
| | | | | | | |
| | | | | | 3,171,284 | |
| | | | | | | |
Tobacco - 1.3% | | | | | | | |
Altria Group, Inc. | | | 47,700 | | | 1,058,940 | |
Philip Morris International, Inc. * | | | 47,700 | | | 2,412,666 | |
| | | | | | | |
| | | | | | 3,471,606 | |
| | | | | | | |
Wireless Telecommunication Services - 0.5% | | | | | | | |
Sprint Nextel Corporation | | | 196,300 | | | 1,313,247 | |
| | | | | | | |
TOTAL COMMON STOCK (Cost $277,009,476) | | | | | $ | 270,216,183 | |
| | | | | | | |
| | |
| | | Principal
Amount | | | |
COMMERCIAL PAPER - 0.5% | | | | | | | |
Brokerage - 0.5% | | | | | | | |
JP Morgan Chase & Company | | | | | | | |
2.50%, 4/1/2008 | | | 1,500,000 | | | 1,500,000 | |
| | | | | | | |
TOTAL COMMERCIAL PAPER (Cost $1,500,000) | | | | | $ | 1,500,000 | |
| | | | | | | |
REPURCHASE AGREEMENT - 2.1% | | | | | | | |
United Missouri Bank, 1.99%, dated 3/31/08, matures 4/01/08; repurchase amount $4,856,268 (Collateralized by FNMA, 4/09/08 with a value of $4,953,380) | | $ | 4,856,000 | | $ | 4,856,000 | |
United Missouri Bank, 1.99%, dated 3/31/08, matures 4/01/08; repurchase amount $929,051 (Collateralized by FNSM, 6.50%, 10/01/37 with a value of $948,371) | | | 929,000 | | | 929,000 | |
| | | | | | | |
TOTAL REPURCHASE AGREEMENT (Cost $5,785,00) | | | | | $ | 5,785,000 | |
| | | | | | | |
Total Investments (Security Equity Fund - Equity Series)
(Cost $284,294,476) - 100.4% | | | | | $ | 277,501,183 | |
Liabilities in Excess of Other Assets - (0.4)% | | | | | | (1,109.436 | ) |
| | | | | | | |
TOTAL NET ASSETS - 100.0% | | | | | $ | 276,391,747 | |
| | | | | | | |
Footnotes
Percentages are stated as a percent of net assets.
For federal income tax purposes the identified cost of investments owned at 3/31/2008 was $284,294,476.
| * | - Non-income producing security |
Glossary:
| ADR | - American Depositary Receipt |
See notes to financial statements.
| | | | |
| | 19 | | The accompanying notes are an integral part of the financial statements |
Security Equity Fund
Equity Series
(unaudited)
Statement of Assets & Liabilities
March 31, 2008
| | | | |
Assets: | | | | |
Investments, at value* | | $ | 277,501,183 | |
Cash | | | 1,176 | |
| |
Receivables: | | | | |
Fund shares sold | | | 567,606 | |
Securities sold | | | 2,833,582 | |
Dividends | | | 366,932 | |
Prepaid expenses | | | 32,202 | |
| | | | |
Total assets | | | 281,302,681 | |
| | | | |
Liabilities: | | | | |
Payable for: | | | | |
Securities purchased | | | 3,860,196 | |
Fund shares redeemed | | | 671,774 | |
Management fees | | | 175,672 | |
Custodian fees | | | 4,900 | |
Transfer agent/maintenance fees | | | 42,167 | |
Administration fees | | | 22,401 | |
Professional fees | | | 21,901 | |
12b-1 distribution plan fees | | | 70,814 | |
Directors’ fees | | | 2,249 | |
Other | | | 38,860 | |
| | | | |
Total liabilities | | | 4,910,934 | |
| | | | |
Net assets | | $ | 276,391,747 | |
| | | | |
Net assets consist of: | | | | |
Paid in capital | | $ | 266,887,349 | |
Undistributed net investment income | | | 219,539 | |
Undistributed net realized gain on sale of investments | | | 16,078,152 | |
Net unrealized depreciation in value of investments | | | (6,793,293 | ) |
| | | | |
Net assets | | $ | 276,391,747 | |
| | | | |
Class A: | | | | |
Capital shares outstanding (unlimited number of shares authorized) | | | 51,997,450 | |
Net assets | | $ | 257,202,839 | |
Net asset value and redemption price per share | | $ | 4.95 | |
| | | | |
Maximum offering price per share (net asset value divided by 94.25%) | | $ | 5.25 | |
| | | | |
Class B: | | | | |
Capital shares outstanding (unlimited number of shares authorized) | | | 3,702,540 | |
Net assets | | $ | 15,253,678 | |
Net asset value, offering and redemption price per share (excluding any applicable contingent deferred sales charge) | | $ | 4.12 | |
| | | | |
Class C: | | | | |
Capital shares outstanding (unlimited number of shares authorized) | | | 884,766 | |
Net assets | | $ | 3,935,230 | |
Net asset value, offering and redemption price per share (excluding any applicable contingent deferred sales charge) | | $ | 4.45 | |
| | | | |
* Investments, at cost | | $ | 284,294,476 | |
Statement of Operations
For the Six Months Ended March 31, 2008
| | | | |
Investment Income: | | | | |
Dividends | | $ | 2,199,575 | |
Interest | | | 205,513 | |
| | | | |
Total investment income | | | 2,405,088 | |
| | | | |
Expenses: | | | | |
Management fees | | | 1,153,696 | |
Transfer agent/maintenance fees | | | 342,169 | |
Administration fees | | | 146,402 | |
Custodian fees | | | 7,452 | |
Directors’ fees | | | 6,989 | |
Professional fees | | | 13,397 | |
Reports to shareholders | | | 15,229 | |
Registration fees | | | 20,363 | |
Other expenses | | | 13,711 | |
12b-1 distribution fees - Class A | | | 357,369 | |
12b-1 distribution fees - Class B | | | 86,724 | |
12b-1 distribution fees - Class C | | | 22,062 | |
| | | | |
Total expenses | | | 2,185,563 | |
Less: | | | | |
Earnings credits applied | | | (14 | ) |
| | | | |
Net expenses | | | 2,185,549 | |
| | | | |
Net investment income | | | 219,539 | |
| | | | |
Net Realized and Unrealized Gain (Loss): | | | | |
Net realized gain (loss) during the period on: | | | | |
Investments | | | 20,832,034 | |
Options written | | | 40,765 | |
| | | | |
Net realized gain | | | 20,872,799 | |
| | | | |
Net unrealized appreciation (depreciation) during the period on: | | | | |
Investments | | | (68,899,722 | ) |
| | | | |
Net unrealized depreciation | | | (68,899,722 | ) |
| | | | |
Net loss | | | (48,026,923 | ) |
| | | | |
Net decrease in net assets resulting from operations | | $ | (47,807,384 | ) |
| | | | |
| | | | |
| | 20 | | The accompanying notes are an integral part of the financial statements |
| | |
| Statement of Changes in Net Assets | | Security Equity Fund Equity Series |
| | | | | | | | |
| | | Six Months Ended
March 31, 2008 | | | Year Ended
September 30, 2007 | |
| | | (unaudited) | | | | |
Increase (decrease) in net assets from operations: | | | | | | | | |
Net investment income (loss) | | $ | 219,539 | | | $ | (156,727 | ) |
Net realized gain during the period on investments | | | 20,872,799 | | | | 51,607,692 | |
Net unrealized depreciation during the period on investments | | | (68,899,722 | ) | | | (11,523,783 | ) |
| | | | | | | | |
Net increase (decrease) in net assets resulting from operations | | | (47,807,384 | ) | | | 39,927,182 | |
| | | | | | | | |
Distributions to shareholders from: | | | | | | | | |
Net realized gain | | | | | | | | |
Class A | | | (45,050,358 | ) | | | (36,813,817 | ) |
Class B | | | (3,149,316 | ) | | | (2,833,129 | ) |
Class C | | | (754,921 | ) | | | (617,995 | ) |
| | | | | | | | |
Total distributions to shareholders | | | (48,954,595 | ) | | | (40,264,941 | ) |
| | | | | | | | |
Capital share transactions: | | | | | | | | |
Proceeds from sale of shares | | | | | | | | |
Class A | | | 6,145,699 | | | | 22,425,266 | |
Class B | | | 1,872,522 | | | | 4,149,590 | |
Class C | | | 238,650 | | | | 664,065 | |
Distributions reinvested | | | | | | | | |
Class A | | | 41,061,233 | | | | 33,789,629 | |
Class B | | | 3,104,059 | | | | 2,766,531 | |
Class C | | | 741,250 | | | | 607,148 | |
Cost of shares redeemed | | | | | | | | |
Class A | | | (23,451,566 | ) | | | (104,634,399 | ) |
Class B | | | (3,743,413 | ) | | | (14,318,878 | ) |
Class C | | | (640,456 | ) | | | (1,927,297 | ) |
| | | | | | | | |
Net increase (decrease) from capital share transactions | | | 25,327,978 | | | | (56,478,345 | ) |
| | | | | | | | |
Net decrease in net assets | | | (71,434,001 | ) | | | (56,816,104 | ) |
| | | | | | | | |
Net assets: | | | | | | | | |
Beginning of period | | | 347,825,748 | | | | 404,641,852 | |
| | | | | | | | |
End of period | | $ | 276,391,747 | | | $ | 347,825,748 | |
| | | | | | | | |
Accumulated net investment income at end of period | | $ | 219,539 | | | $ | — | |
| | | | | | | | |
Capital share activity: | | | | | | | | |
Shares sold | | | | | | | | |
Class A | | | 1,084,667 | | | | 3,287,276 | |
Class B | | | 398,326 | | | | 699,825 | |
Class C | | | 46,660 | | | | 105,654 | |
Shares reinvested | | | | | | | | |
Class A | | | 7,806,380 | | | | 5,073,518 | |
Class B | | | 707,075 | | | | 479,468 | |
Class C | | | 156,382 | | | | 98,723 | |
Shares redeemed | | | | | | | | |
Class A | | | (4,115,649 | ) | | | (15,274,912 | ) |
Class B | | | (784,484 | ) | | | (2,408,381 | ) |
Class C | | | (122,567 | ) | | | (307,016 | ) |
| | | | |
| | 21 | | The accompanying notes are an integral part of the financial statements |
| | |
| Financial Highlights | | Security Equity Fund |
| Selected data for each share of capital stock outstanding throughout each year | | Equity Series |
| | | | | | | | | | | | | | | | | | | | | | | | |
Class A | | Six Months Ended
March 31,
2008a | | | 2007 | | | 2006 | | | 2005 | | | 2004 | | | Year Ended
September 30,
2003 | |
Per Share Data | | | | | | | | | | | | | | | | | | | | | | | | |
Net asset value, beginning of period | | $ | 6.84 | | | $ | 6.85 | | | $ | 6.58 | | | $ | 6.50 | | | $ | 5.98 | | | $ | 5.09 | |
| | | | | | | | | | | | | | | | | | | | | | | | |
Income (loss) from investment operations: | | | | | | | | | | | | | | | | | | | | | | | | |
Net investment income (loss)b | | | (0.01 | ) | | | — | | | | (0.01 | ) | | | 0.04 | | | | 0.01 | | | | 0.01 | |
Net gain (loss) on securities (realized and unrealized) | | | (0.90 | ) | | | 0.69 | | | | 0.52 | | | | 0.49 | | | | 0.52 | | | | 0.88 | |
| | | | | | | | | | | | | | | | | | | | | | | | |
Total from investment operations | | | (0.91 | ) | | | 0.69 | | | | 0.51 | | | | 0.53 | | | | 0.53 | | | | 0.89 | |
| | | | | | | | | | | | | | | | | | | | | | | | |
Less distributions: | | | | | | | | | | | | | | | | | | | | | | | | |
Dividends from net investment income | | | — | | | | — | | | | (0.04 | ) | | | — | | | | (0.01 | ) | | | — | |
Distributions from realized gains | | | (0.98 | ) | | | (0.70 | ) | | | (0.20 | ) | | | (0.45 | ) | | | — | | | | — | |
| | | | | | | | | | | | | | | | | | | | | | | | |
Total distributions | | | (0.98 | ) | | | (0.70 | ) | | | (0.24 | ) | | | (0.45 | ) | | | (0.01 | ) | | | — | |
| | | | | | | | | | | | | | | | | | | | | | | | |
Net asset value, end of period | | $ | 4.95 | | | $ | 6.84 | | | $ | 6.85 | | | $ | 6.58 | | | $ | 6.50 | | | $ | 5.98 | |
| | | | | | | | | | | | | | | | | | | | | | | | |
Total Returnc | | | (14.15 | )% | | | 10.33 | % | | | 7.88 | % | | | 8.20 | % | | | 8.87 | % | | | 17.49 | % |
| | | | | | | | | | | | | | | | | | | | | | | | |
Ratios/Supplemental Data | | | | | | | | | | | | | | | | | | | | | | | | |
Net assets, end of period (in thousands) | | $ | 257,203 | | | $ | 322,850 | | | $ | 371,006 | | | $ | 375,280 | | | $ | 391,384 | | | $ | 430,161 | |
| | | | | | | | | | | | | | | | | | | | | | | | |
Ratios to average net assets: | | | | | | | | | | | | | | | | | | | | | | | | |
Net investment income (loss) | | | (0.20 | )% | | | 0.02 | % | | | (0.08 | )% | | | 0.57 | % | | | 0.08 | % | | | 0.23 | % |
Total expensesd | | | 1.37 | % | | | 1.34 | % | | | 1.34 | % | | | 1.30 | % | | | 1.28 | % | | | 1.25 | % |
Net expensese | | | 1.37 | % | | | 1.34 | % | | | 1.34 | % | | | 1.30 | % | | | 1.28 | % | | | 1.25 | % |
Net expenses prior to custodian earning credits and net of expense waivers | | | 1.37 | % | | | 1.34 | % | | | 1.34 | % | | | 1.30 | % | | | 1.28 | % | | | 1.25 | % |
| | | | | | | | | | | | | | | | | | | | | | | | |
Portfolio turnover rate | | | 142 | % | | | 20 | % | | | 34 | % | | | 32 | % | | | 28 | % | | | 54 | % |
| | | | | | |
Class B | | Six Months Ended
March 31,
2008a | | | 2007 | | | 2006 | | | 2005 | | | 2004 | | | Year Ended
September 30,
2003 | |
Per Share Data | | | | | | | | | | | | | | | | | | | | | | | | |
Net asset value, beginning of period | | $ | 5.89 | | | $ | 6.04 | | | $ | 5.83 | | | $ | 5.85 | | | $ | 5.41 | | | $ | 4.64 | |
| | | | | | | | | | | | | | | | | | | | | | | | |
Income (loss) from investment operations: | | | | | | | | | | | | | | | | | | | | | | | | |
Net investment income (loss)b | | | 0.01 | | | | (0.04 | ) | | | (0.05 | ) | | | (0.01 | ) | | | (0.04 | ) | | | (0.03 | ) |
Net gain (loss) on securities (realized and unrealized) | | | (0.80 | ) | | | 0.59 | | | | 0.46 | | | | 0.44 | | | | 0.48 | | | | 0.80 | |
| | | | | | | | | | | | | | | | | | | | | | | | |
Total from investment operations | | | (0.79 | ) | | | 0.55 | | | | 0.41 | | | | 0.43 | | | | 0.44 | | | | 0.77 | |
| | | | | | | | | | | | | | | | | | | | | | | | |
Less distributions: | | | | | | | | | | | | | | | | | | | | | | | | |
Distributions from realized gains | | | (0.98 | ) | | | (0.70 | ) | | | (0.20 | ) | | | (0.45 | ) | | | — | | | | — | |
| | | | | | | | | | | | | | | | | | | | | | | | |
Total distributions | | | (0.98 | ) | | | (0.70 | ) | | | (0.20 | ) | | | (0.45 | ) | | | — | | | | — | |
| | | | | | | | | | | | | | | | | | | | | | | | |
Net asset value, end of period | | $ | 4.12 | | | $ | 5.89 | | | $ | 6.04 | | | $ | 5.83 | | | $ | 5.85 | | | $ | 5.41 | |
| | | | | | | | | | | | | | | | | | | | | | | | |
Total Returnc | | | (14.44 | )% | | | 9.33 | % | | | 7.16 | % | | | 7.35 | % | | | 8.13 | % | | | 16.59 | % |
Ratios/Supplemental Data | | | | | | | | | | | | | | | | | | | | | | | | |
Net assets, end of period (in thousands) | | $ | 15,254 | | | $ | 19,928 | | | $ | 27,842 | | | $ | 39,962 | | | $ | 49,600 | | | $ | 61,733 | |
| | | | | | | | | | | | | | | | | | | | | | | | |
Ratios to average net assets: | | | | | | | | | | | | | | | | | | | | | | | | |
Net investment income (loss) | | | 0.56 | % | | | (0.74 | )% | | | (0.83 | )% | | | (0.16 | )% | | | (0.67 | )% | | | (0.52 | )% |
Total expensesd | | | 2.12 | % | | | 2.09 | % | | | 2.09 | % | | | 2.05 | % | | | 2.03 | % | | | 2.00 | % |
Net expensese | | | 2.12 | % | | | 2.09 | % | | | 2.09 | % | | | 2.05 | % | | | 2.03 | % | | | 2.00 | % |
Net expenses prior to custodian earning credits and net of expense waivers | | | 2.12 | % | | | 2.09 | % | | | 2.09 | % | | | 2.05 | % | | | 2.03 | % | | | 2.00 | % |
| | | | | | | | | | | | | | | | | | | | | | | | |
Portfolio turnover rate | | | 142 | % | | | 20 | % | | | 34 | % | | | 32 | % | | | 28 | % | | | 54 | % |
| | | | |
| | 22 | | The accompanying notes are an integral part of the financial statements |
| | |
| Financial Highlights | | Security Equity Fund |
| Selected data for each share of capital stock outstanding throughout each year | | Equity Series |
| | | | | | | | | | | | | | | | | | | | | | | | |
Class C | | Six Months Ended
March 31,
2008a | | | 2007 | | | 2006 | | | 2005 | | | 2004 | | | Year Ended
September 30,
2003 | |
Per Share Data | | | | | | | | | | | | | | | | | | | | | | | | |
Net asset value, beginning of period | | $ | 6.28 | | | $ | 6.39 | | | $ | 6.16 | | | $ | 6.16 | | | $ | 5.69 | | | $ | 4.88 | |
| | | | | | | | | | | | | | | | | | | | | | | | |
Income (loss) from investment operations: | | | | | | | | | | | | | | | | | | | | | | | | |
Net investment income (loss)b | | | 0.01 | | | | (0.05 | ) | | | (0.05 | ) | | | (0.01 | ) | | | (0.04 | ) | | | (0.03 | ) |
Net gain (loss) on securities (realized and unrealized) | | | (0.86 | ) | | | 0.64 | | | | 0.48 | | | | 0.46 | | | | 0.51 | | | | 0.84 | |
| | | | | | | | | | | | | | | | | | | | | | | | |
Total from investment operations | | | (0.85 | ) | | | 0.59 | | | | 0.43 | | | | 0.45 | | | | 0.47 | | | | 0.81 | |
| | | | | | | | | | | | | | | | | | | | | | | | |
Less distributions: | | | | | | | | | | | | | | | | | | | | | | | | |
Distributions from realized gains | | | (0.98 | ) | | | (0.70 | ) | | | (0.20 | ) | | | (0.45 | ) | | | — | | | | — | |
| | | | | | | | | | | | | | | | | | | | | | | | |
Total distributions | | | (0.98 | ) | | | (0.70 | ) | | | (0.20 | ) | | | (0.45 | ) | | | — | | | | — | |
| | | | | | | | | | | | | | | | | | | | | | | | |
Net asset value, end of period | | $ | 4.45 | | | $ | 6.28 | | | $ | 6.39 | | | $ | 6.16 | | | $ | 6.16 | | | $ | 5.69 | |
| | | | | | | | | | | | | | | | | | | | | | | | |
Total Returnc | | | (14.49 | )% | | | 9.45 | % | | | 7.10 | % | | | 7.32 | % | | | 8.26 | % | | | 16.60 | % |
| | | | | | | | | | | | | | | | | | | | | | | | |
Ratios/Supplemental Data | | | | | | | | | | | | | | | | | | | | | | | | |
Net assets, end of period (in thousands) | | $ | 3,935 | | | $ | 5,048 | | | $ | 5,794 | | | $ | 5,706 | | | $ | 6,329 | | | $ | 6,651 | |
| | | | | | | | | | | | | | | | | | | | | | | | |
Ratios to average net assets: | | | | | | | | | | | | | | | | | | | | | | | | |
Net investment income (loss) | | | 0.56 | % | | | (0.73 | )% | | | (0.83 | )% | | | (0.18 | )% | | | (0.67 | )% | | | (0.52 | )% |
Total expensesd | | | 2.11 | % | | | 2.09 | % | | | 2.09 | % | | | 2.05 | % | | | 2.03 | % | | | 2.00 | % |
Net expensese | | | 2.11 | % | | | 2.09 | % | | | 2.09 | % | | | 2.05 | % | | | 2.03 | % | | | 2.00 | % |
Net expenses prior to custodian earning credits and net of expense waivers | | | 2.11 | % | | | 2.09 | % | | | 2.09 | % | | | 2.05 | % | | | 2.03 | % | | | 2.00 | % |
| | | | | | | | | | | | | | | | | | | | | | | | |
Portfolio turnover rate | | | 142 | % | | | 20 | % | | | 34 | % | | | 32 | % | | | 28 | % | | | 54 | % |
| a | Unaudited figures for the six months ended March 31, 2008. Percentage amounts for the period, except total return, have been annualized. |
| b | Net investment income (loss) was computed using average shares outstanding throughout the period. |
| c | Total return information does not reflect deduction of any sales charges imposed at the time of purchase for Class A shares or upon redemption for Class B and C shares. |
| d | Total expense information reflects expense ratios absent expense reductions by the Investment Manager and custodian earnings credits, as applicable. |
| e | Net expense information reflects the expense ratios after voluntary expense waivers, reimbursements and custodian earnings credits, as applicable. |
| | | | |
| | 23 | | The accompanying notes are an integral part of the financial statements |
Security Equity Fund
Global Series

Adviser,
Security Global Investors
24
| | |
| Performance Summary | | Security Equity Fund Global Series |
| March 31, 2008 | | (unaudited) |
PERFORMANCE
$10,000 Over Ten Years
This chart assumes a $10,000 investment in Class A shares of Global Series on March 31, 1998, reflects deduction of the 5.75% sales load and assumes all dividends reinvested. The chart does not reflect the deduction of taxes that a shareholder would pay on distributions or the redemption of fund shares. The MSCI World Index is an unmanaged capitalization-weighted index that is designed to measure global developed market equity performance.
Portfolio Composition by Sector as of 3-31-08
| | | |
Consumer Discretionary | | 15.05 | % |
Consumer Staples | | 9.75 | |
Energy | | 8.19 | |
Financials | | 14.71 | |
Health Care | | 13.07 | |
Industrials | | 15.73 | |
Information Technology | | 7.02 | |
Materials | | 4.63 | |
Telecommunication Services | | 9.00 | |
Utilities | | 1.52 | |
Short Term Investments | | 2.56 | |
Liabilities in Excess of Other Assets | | (1.23 | ) |
Total Net Assets | | 100.00 | % |
| | | |
Average Annual Returns
| | | | | | | | |
Periods Ended 3-31-08 | | 1 Year | | 5 Years | | 10 Years | | Since
Inception |
A Shares | | (1.13)% | | 19.07% | | 9.06% | | — |
A Shares with sales charge | | (6.83)% | | 17.67% | | 8.42% | | — |
B Shares | | (0.94)% | | 18.83% | | 8.63% | | — |
B Shares with CDSC | | (4.09)% | | 18.63% | | 8.63% | | — |
C Shares | | (1.87)% | | 18.20% | | — | | 8.42% (1-29-99) |
C Shares with CDSC | | (2.50)% | | 18.20% | | — | | 8.42% (1-29-99) |
The performance data above represents past performance that is not predictive of future results. The investment return and principal value of an investment in the Series will fluctuate so that an investor’s shares, when redeemed, may be worth more or less than their original cost. The figures above do not reflect deduction of the maximum front-end sales charge of 5.75% for Class A shares or the contingent deferred sales charge of 5% for Class B shares and 1% for Class C shares, as applicable, except where noted. The figures do not reflect the deduction of taxes that a shareholder would pay on distributions or redemption of shares. Such figures would be lower if the maximum sales charge and any applicable taxes were deducted. Fee waivers and/or reimbursements reduced expenses of the Series and in the absence of such waiver, the performance quoted would be reduced.
| | | | |
| | 25 | | The accompanying notes are an integral part of the financial statements |
| | |
| Performance Summary | | Security Equity Fund Global Series |
| March 31, 2008 | | (unaudited) |
Information About Your Series Expenses
Calculating your ongoing Series expenses
Example
As a shareholder of the Series, you incur two types of costs: (1) transaction costs, which may include sales charges (loads) on purchase payments; contingent deferred sales charges on redemptions; and redemption fees, if any; and (2) ongoing costs, including management fees; distribution and/or service fees (12b-1); and other Series expenses. This example is intended to help you understand your ongoing costs (in dollars) of investing in the Series and to compare these costs with ongoing costs of investing in other mutual funds. The example is based on an investment of $1,000 invested at the beginning of the period and held for the entire period October 1, 2007 through March 31, 2008.
Actual Expenses
The first line for each class of shares in the table provides information about actual account values and actual expenses. You may use the information in this table, together with the amount you invested, to estimate the expenses that you paid over the period. Simply divide your account value by $1,000 (for example, an $8,600 account value divided by $1,000 = 8.6), then multiply the result by the number in the table under the heading entitled “Expenses Paid During the Period” to estimate the expenses you paid on your account during this period.
Hypothetical Example for Comparison Purposes
The second line for each class of shares in the table provides information about hypothetical account values and hypothetical expenses based on the Series actual expense ratio and an assumed rate of return of 5% per year before expenses, which is not the Series actual return. The hypothetical account values and expenses may not be used to estimate the actual ending account balance or expenses you paid for the period. You may use this information to compare the ongoing costs of investing in the Series and other funds. To do so, compare this 5% hypothetical example with the 5% hypothetical examples that appear in the shareholder reports of the other mutual funds.
Please note that the expenses shown in the table are meant to highlight your ongoing costs only and do not reflect any transactional costs, such as sales charges (loads) on purchase payments, contingent deferred sales charges on redemptions, and redemption fees, if any. Therefore, the second line for each class of shares is useful in comparing ongoing costs only, and will not help you determine the relative total costs of owning different funds. In addition, if these transactional costs were included, your costs would have been higher.
Series Expenses
| | | | | | | | | |
| | | Beginning
Account
Value
10/1/2007 | | Ending
Account
Value
3/31/20081 | | Expenses
Paid
During
Period2 |
Global Series - Class A | | | | | | | | | |
Actual | | $ | 1,000.00 | | $ | 898.82 | | $ | 8.16 |
Hypothetical | | | 1,000.00 | | | 1,016.40 | | | 8.67 |
| | | |
Global Series - Class B | | | | | | | | | |
Actual | | | 1,000.00 | | | 900.21 | | | 6.98 |
Hypothetical | | | 1,000.00 | | | 1,017.65 | | | 7.41 |
| | | |
Global Series - Class C | | | | | | | | | |
Actual | | | 1,000.00 | | | 896.04 | | | 11.71 |
Hypothetical | | | 1,000.00 | | | 1,012.65 | | | 12.43 |
1 | The actual ending account value is based on the actual total return of the Series for the period October 1, 2007 to March 31, 2008 after actual expenses and will differ from the hypothetical ending account value which is based on the Series expense ratio and a hypothetical annual return of 5% before expenses. The actual cumulative return at net asset value for the period October 1, 2007 to March 31, 2008 was (10.12%), (9.98%) and (10.40%), for Class A, B, and C respectively. |
2 | Expenses are equal to the Series annualized expense ratio (1.72%, 1.47% and 2.47% for Class A, B, and C shares, respectively) net of any applicable fee waivers or earnings credits, multiplied by the average account value over the period, multiplied by 183/366 (to reflect the one-half year period). |
26
| | |
| Schedule of Investments | | Security Equity Fund - Global Series |
March 31, 2008 (Unaudited) | | |
| | | | | |
| | | Shares | | Value |
COMMON STOCK - 98.7% | | | | | |
Australia - 0.7% | | | | | |
Bendigo and Adelaide Bank, Ltd. | | 105,013 | | $ | 1,142,072 |
| | | | | |
Cayman Islands - 4.1% | | | | | |
Herbalife, Ltd. | | 28,068 | | | 1,333,230 |
Shanda Interactive Entertainment, Ltd. ADR * | | 82,701 | | | 2,406,599 |
Suntech Power Holdings Company, Ltd. ADR * | | 76,630 | | | 3,108,113 |
| | | | | |
| | | | | 6,847,942 |
| | | | | |
China - 3.1% | | | | | |
China BlueChemical, Ltd. | | 5,903,930 | | | 3,125,378 |
China Petroleum & Chemical Corporation | | 2,288,000 | | | 1,957,917 |
| | | | | |
| | | | | 5,083,295 |
| | | | | |
France - 4.6% | | | | | |
France Telecom S.A. | | 123,577 | | | 4,155,980 |
UBISOFT Entertainment * | | 40,749 | | | 3,510,970 |
| | | | | |
| | | | | 7,666,950 |
| | | | | |
Germany - 2.3% | | | | | |
Fresenius Medical Care AG & Company KGaA | | 24,119 | | | 1,212,900 |
Kloeckner & Company AG | | 51,210 | | | 2,620,535 |
SAP AG | | 630 | | | 31,314 |
| | | | | |
| | | | | 3,864,749 |
| | | | | |
Hong Kong - 4.8% | | | | | |
Link REIT(1) | | 2,116,700 | | | 4,694,229 |
Sun Hung Kai Properties, Ltd. | | 72,485 | | | 1,130,657 |
Wharf Holdings, Ltd. | | 457,836 | | | 2,155,996 |
| | | | | |
| | | | | 7,980,882 |
| | | | | |
India - 1.9% | | | | | |
Infosys Technologies, Ltd. ADR | | 89,005 | | | 3,183,709 |
| | | | | |
Indonesia - 1.9% | | | | | |
Bumi Resources Tbk PT | | 4,788,500 | | | 3,224,929 |
| | | | | |
Ireland - 2.8% | | | | | |
Anglo Irish Bank Corporation plc | | 343,763 | | | 4,586,402 |
| | | | | |
Italy - 3.0% | | | | | |
Unione di Banche Italiane SCPA | | 196,515 | | | 5,035,823 |
| | | | | |
Japan - 11.9% | | | | | |
Astellas Pharma, Inc. | | 28,280 | | | 1,095,112 |
Chiba Bank, Ltd. | | 517,461 | | | 3,514,457 |
Fuji Heavy Industries, Ltd. | | 225,700 | | | 944,190 |
JGC Corporation | | 318,570 | | | 4,864,201 |
Nintendo Company, Ltd. | | 6,612 | | | 3,409,478 |
Nippon Paper Group, Inc. | | 314 | | | 743,419 |
NTT DoCoMo, Inc. | | 847 | | | 1,283,076 |
Shimachu Company, Ltd. | | 50,860 | | | 1,528,147 |
Takeda Pharmaceutical Company, Ltd. | | 22,290 | | | 1,115,842 |
Toyo Suisan Kaisha, Ltd. | | 79,655 | | | 1,198,661 |
| | | | | |
| | | | | 19,696,583 |
| | | | | |
Singapore - 5.0% | | | | | |
Singapore Airlines, Ltd. | | 78,290 | | | 887,332 |
Singapore Press Holdings, Ltd. | | 2,205,948 | | | 7,372,393 |
| | | | | |
| | | | | 8,259,725 |
| | | | | |
South Africa - 1.0% | | | | | |
Aveng, Ltd. | | 236,713 | | | 1,692,850 |
| | | | | |
Spain - 1.9% | | | | | |
Telefonica S.A. | | 107,262 | | | 3,082,290 |
| | | | | |
Switzerland - 0.6% | | | | | |
Actelion Ltd. * | | 18,739 | | | 1,021,561 |
| | | | | |
United Kingdom - 2.7% | | | | | |
Cadbury Schweppes plc | | 298,440 | | | 3,277,185 |
Thomas Cook Group plc | | 206,808 | | | 1,189,849 |
| | | | | |
| | | | | 4,467,034 |
| | | | | |
United States - 46.4% | | | | | |
Altria Group, Inc. | | 126,000 | | | 2,797,200 |
AMERIGROUP Corporation * | | 33,904 | | | 926,596 |
Amgen, Inc. * | | 18,941 | | | 791,355 |
Anadarko Petroleum Corporation | | 65,705 | | | 4,141,386 |
AT&T, Inc. | | 102,730 | | | 3,934,559 |
Baxter International, Inc. | | 21,453 | | | 1,240,412 |
CA, Inc. | | 112,241 | | | 2,525,423 |
Charles River Laboratories International, Inc. * | | 20,694 | | | 1,219,704 |
Citizens Communications Company | | 151,100 | | | 1,585,039 |
Clorox Company | | 21,831 | | | 1,236,508 |
ConocoPhillips | | 16,107 | | | 1,227,515 |
DRS Technologies, Inc. | | 16,100 | | | 938,308 |
Eli Lilly & Company | | 22,871 | | | 1,179,915 |
Embarq Corporation | | 22,399 | | | 898,200 |
Gap, Inc. | | 61,435 | | | 1,209,041 |
Gilead Sciences, Inc. * | | 21,640 | | | 1,115,109 |
Humana, Inc. * | | 18,035 | | | 809,050 |
IMS Health, Inc. | | 37,510 | | | 788,085 |
Integrys Energy Group, Inc. | | 16,200 | | | 755,568 |
Invitrogen Corporation * | | 15,820 | | | 1,352,135 |
Johnson & Johnson | | 77,533 | | | 5,029,566 |
Joy Global Inc. | | 36,970 | | | 2,408,965 |
Kinetic Concepts, Inc. * | | 35,474 | | | 1,639,963 |
Laboratory Corporation of America Holdings * | | 15,972 | | | 1,176,817 |
Lockheed Martin Corporation | | 41,114 | | | 4,082,620 |
Longs Drug Stores Corporation | | 15,877 | | | 674,137 |
Marvel Entertainment, Inc. * | | 216,980 | | | 5,812,894 |
Pepco Holdings, Inc. | | 44,600 | | | 1,102,512 |
Philip Morris International, Inc. * | | 126,000 | | | 6,373,080 |
| | | | |
| | 27 | | The accompanying notes are an integral part of the financial statements |
| | |
Schedule of Investments | | Security Equity Fund - Global Series |
March 31, 2008 (Unaudited) – continued | | |
| | | | | | | | |
| | | Shares | | | Value | |
COMMON STOCK (continued) | | | | | | | | |
United States (continued) | | | | | | | | |
RadioShack Corporation | | | 73,290 | | | $ | 1,190,963 | |
Safeco Corporation | | | 28,115 | | | | 1,233,686 | |
Safeway, Inc. | | | 40,740 | | | | 1,195,719 | |
Schnitzer Steel Industries, Inc. | | | 53,875 | | | | 3,826,203 | |
Tesoro Corporation | | | 34,220 | | | | 1,026,600 | |
Trinity Industries, Inc. | | | 72,770 | | | | 1,939,321 | |
Unisource Energy Corporation | | | 29,587 | | | | 658,607 | |
Valero Energy Corporation | | | 41,204 | | | | 2,023,528 | |
Wabtec Corporation | | | 95,195 | | | | 3,585,044 | |
Wal-Mart Stores, Inc. | | | 26,110 | | | | 1,375,475 | |
| | | | | | | | |
| | | | | | | 77,026,808 | |
| | | | | | | | |
TOTAL COMMON STOCK (Cost $169,100,685) | | | | | | $ | 163,863,604 | |
| | | | | | | | |
| | |
| | | Principal
Amount | | | | |
SHORT TERM INVESTMENTS - 2.5% | | | | | | | | |
State Street GA Prime Money Market Fund | | $ | 4,255,667 | | | $ | 4,255,667 | |
| | | | | | | | |
TOTAL SHORT TERM INVESTMENTS (Cost $4,255,667) | | | | | | $ | 4,255,667 | |
| | | | | | | | |
Total Investments (Security Equity Fund - Global Series) | | | | | | $ | 168,119,271 | |
(Cost $173,356,352) – 101.2% | | | | | | | | |
Liabilities in Excess of Other Assets - (1.2 )% | | | | | | | (2.044.809 | ) |
| | | | | | | | |
TOTAL NET ASSETS - 100.0% | | | | | | $ | 166,074,462 | |
| | | | | | | | |
| | |
INVESTMENT CONCENTRATION | | | | | | | | |
At March 31, 2008, the investment diversification of the fund was as follows: | | | | | | | | |
Industry | | % of Net
Asset | | | | |
Integrated Telecommunication Services | | | 8.2 | % | | $ | 13,656,068 | |
Diversified Banks | | | 5.8 | | | | 9,622,225 | |
Home Entertainment Software | | | 5.6 | | | | 9,327,047 | |
Tobacco | | | 5.5 | | | | 9,170,280 | |
Pharmaceuticals | | | 5.0 | | | | 8,420,435 | |
Construction & Farm Machinery & Heavy Trucks | | | 4.8 | | | | 7,933,330 | |
Publishing | | | 4.5 | | | | 7,372,393 | |
Construction & Engineering | | | 3.9 | | | | 6,557,051 | |
Movies & Entertainment | | | 3.5 | | | | 5,812,894 | |
Aerospace & Defense | | | 3.0 | | | | 5,020,928 | |
Retail REIT’s | | | 2.8 | | | | 4,694,229 | |
Regional Banks | | | 2.8 | | | | 4,656,529 | |
Packaged Foods & Meats | | | 2.7 | | | | 4,475,846 | |
Money Markets | | | 2.6 | | | | 4,255,667 | |
Oil & Gas Exploration & Production | | | 2.5 | | | | 4,141,386 | |
Steel | | | 2.3 | | | | 3,826,202 | |
Real Estate Management & Development | | | 2.0 | | | | 3,286,653 | |
Coal & Consumable Fuels | | | 1.9 | | | | 3,224,929 | |
Integrated Oil & Gas | | | 2.0 | | | | 3,185,432 | |
IT Consulting & Other Services | | | 1.9 | | | | 3,183,709 | |
Fertilizers & Agricultural Chemicals | | | 1.9 | | | | 3,125,378 | |
Electrical Components & Equipment | | | 1.9 | | | | 3,108,113 | |
Oil & Gas Refining & Marketing | | | 1.8 | | | | 3,050,128 | |
Biotechnology | | | 1.8 | | | | 2,928,025 | |
Health Care Equipment | | | 1.7 | | | | 2,880,376 | |
Trading Companies & Distributors | | | 1.6 | | | | 2,620,535 | |
Life Sciences Tools & Services | | | 1.5 | | | | 2,571,839 | |
Systems Software | | | 1.5 | | | | 2,525,423 | |
Health Care Services | | | 1.4 | | | | 2,389,717 | |
Electric Utilities | | | 1.1 | | | | 1,761,119 | |
Managed Health Care | | | 1.1 | | | | 1,735,646 | |
Home Improvement Retail | | | 0.9 | | | | 1,528,147 | |
Hypermarkets & Super Centers | | | 0.8 | | | | 1,375,475 | |
Personal Products | | | 0.8 | | | | 1,333,230 | |
Wireless Telecommunication Services | | | 0.8 | | | | 1,283,076 | |
Household Products | | | 0.8 | | | | 1,236,508 | |
Property & Casualty Insurance | | | 0.7 | | | | 1,233,686 | |
Apparel Retail | | | 0.8 | | | | 1,209,041 | |
Food Retail | | | 0.7 | | | | 1,195,719 | |
Computer & Electronics Retail | | | 0.7 | | | | 1,190,962 | |
Hotels, Resorts & Cruise Lines | | | 0.7 | | | | 1,189,849 | |
Automobile Manufacturers | | | 0.6 | | | | 944,191 | |
Airlines | | | 0.5 | | | | 887,332 | |
Health Care Technology | | | 0.5 | | | | 788,085 | |
Multi-Utilities | | | 0.4 | | | | 755,568 | |
Paper Products | | | 0.5 | | | | 743,419 | |
Drug Retail | | | 0.4 | | | | 674,137 | |
Application Software | | | 0.0 | | | | 31,314 | |
| | | | | | | | |
Total Investments | | | 101.2 | | | | 168,119,271 | |
Other Assets and Liabilities, Net | | | -1.2 | | | | (2,044,809 | ) |
| | | | | | | | |
Net Assets | | | 100 | % | | $ | 166,074,462 | |
| | | | | | | | |
Footnotes
Percentages are stated as a percent of net assets.
For federal income tax purposes the identified cost of investments owned at 3/31/2008 was $173,526,193.
| * | - Non-income producing security |
| 1 | - Security is a PFIC (Passive Foreign Investment Company) |
Glossary:
| ADR | - American Depositary Receipt |
| plc | - Public Limited Company |
| REIT | - Real Estate Investment Trust |
See notes to financial statements.
| | | | |
| | 28 | | The accompanying notes are an integral part of the financial statements |
Security Equity Fund
Global Series
(unaudited)
Statement of Assets and Liabilities
March 31, 2008
| | | | |
Assets: | | | | |
Investments, at value* | | $ | 168,119,271 | |
Cash | | | 4,362 | |
Cash denominated in a foreign currency, at value** | | | 214,316 | |
Receivables: | | | | |
Fund shares sold | | | 154,752 | |
Interest | | | 18,824 | |
Dividends | | | 378,177 | |
Foreign taxes recoverable | | | 40,049 | |
Prepaid expenses | | | 29,021 | |
| | | | |
Total assets | | | 168,958,772 | |
| | | | |
Liabilities: | | | | |
Payable for: | | | | |
Securities purchased | | | 2,377,065 | |
Fund shares redeemed | | | 252,337 | |
Management fees | | | 139,897 | |
Custodian fees | | | 14,627 | |
Transfer agent/maintenance fees | | | 16,001 | |
Administration fees | | | 24,285 | |
Professional fees | | | 15,589 | |
12b-l distribution plan fees | | | 36,753 | |
Directors’ fees | | | 1,636 | |
Other | | | 6,120 | |
| | | | |
Total liabilities | | | 2,884,310 | |
| | | | |
Net assets | | $ | 166,074,462 | |
| | | | |
Net assets consist of: | | | | |
Paid in capital | | $ | 183,823,527 | |
Accumulated net investment loss | | | (609,797 | ) |
Accumulated net realized loss on sale of investments and foreign currency transactions | | | (11,922,646 | ) |
Net unrealized depreciation in value of investments and translation of assets and liabilities in foreign currencies | | | (5,216,622 | ) |
| | | | |
Net assets | | $ | 166,074,462 | |
| | | | |
Class A: | | | | |
Capital shares outstanding (unlimited number of shares authorized) | | | 10,544,086 | |
Net assets | | $ | 131,094,149 | |
Net asset value and redemption price per share | | $ | 12.43 | |
| | | | |
Maximum offering price per share (net asset value divided by 94.25%) | | $ | 13.19 | |
| | | | |
Class B: | | | | |
Capital shares outstanding (unlimited number of shares authorized) | | | 2,222,557 | |
Net assets | | $ | 24,123,991 | |
Net asset value, offering and redemption price per share (excluding any applicable contingent deferred sales charge) | | $ | 10.85 | |
| | | | |
Class C: | | | | |
Capital shares outstanding (unlimited number of shares authorized) | | | 996,026 | |
Net assets | | $ | 10,856,322 | |
Net asset value, offering and redemption price per share (excluding any applicable contingent deferred sales charge) | | $ | 10.90 | |
| | | | |
* Investments, at cost | | $ | 173,356,352 | |
** Cash denominated in a foreign currency, at cost | | | 200,045 | |
Statement of Operations
For the Six Months Ended March 31, 2008
| | | | |
Investment Income: | | | | |
Dividends (net of foreign withholding tax of $38,449) | | $ | 1,551,259 | |
Interest | | | 86,671 | |
| | | | |
Total investment income | | | 1,637,930 | |
| | | | |
Expenses: | | | | |
Management fees | | | 907,227 | |
Transfer agent/maintenance fees | | | 167,846 | |
Administration fees | | | 140,061 | |
Custodian fees | | | 69,301 | |
Directors’ fees | | | 4,922 | |
Professional fees | | | 21,834 | |
Reports to shareholders | | | 13,652 | |
Registration fees | | | 21,082 | |
Other expenses | | | 6,725 | |
12b-l distribution fees - Class A | | | 176,798 | |
12b-l distribution fees - Class C | | | 60,345 | |
| | | | |
Total expenses | | | 1,589,793 | |
Less: | | | | |
Earnings credits applied | | | (19,452 | ) |
| | | | |
Net expenses | | | 1,570,341 | |
| | | | |
Net investment income | | | 67,589 | |
| | | | |
Net Realized and Unrealized Gain (Loss): | | | | |
Net realized gain (loss) during the period on: | | | | |
Investments | | | (4,698,936 | ) |
Foreign currency transactions | | | (306,563 | ) |
| | | | |
Net realized loss | | | (5,005,499 | ) |
| | | | |
Net unrealized appreciation (depreciation) during the period on: | | | | |
Investments | | | (14,102,562 | ) |
Translation of assets and liabilities in foreign currencies | | | 13,526 | |
| | | | |
Net unrealized depreciation | | | (14,089,036 | ) |
| | | | |
Net loss | | | (19,094,535 | ) |
| | | | |
Net decrease in net assets resulting from operations | | $ | (19,026,946 | ) |
| | | | |
| | | | |
| | 29 | | The accompanying notes are an integral part of the financial statements |
| | |
Statement of Changes in Net Assets | | Security Equity Fund Global Series |
| | | | | | | | |
| | | Six Months Ended
March 31, 2008
(unaudited) | | | Year Ended
September 30, 2007 | |
Increase (decrease) in net assets from operations: | | | | | | | | |
Net investment income | | $ | 67,589 | | | $ | 494,177 | |
Net realized gain (loss) during the period on investments and foreign currency transactions | | | (5,005,499 | ) | | | 60,286,278 | |
Net unrealized depreciation during the period on investments and translation of assets and liabilities in foreign currencies | | | (14,089,036 | ) | | | (28,623,037 | ) |
| | | | | | | | |
Net increase (decrease) in net assets resulting from operations | | | (19,026,946 | ) | | | 32,157,418 | |
| | | | | | | | |
Distributions to shareholders from: | | | | | | | | |
Net investment income | | | | | | | | |
Class A | | | (256,486 | ) | | | — | |
Class B | | | (137,988 | ) | | | — | |
Net realized gain | | | | | | | | |
Class A | | | (47,920,010 | ) | | | (17,339,157 | ) |
Class B | | | (10,546,655 | ) | | | (3,994,738 | ) |
Class C | | | (4,424,426 | ) | | | (1,528,583 | ) |
| | | | | | | | |
Total distributions to shareholders | | | (63,285,565 | ) | | | (22,862,478 | ) |
| | | | | | | | |
Capital share transactions: | | | | | | | | |
Proceeds from sale of shares | | | | | | | | |
Class A | | | 17,593,081 | | | | 48,735,358 | |
Class B | | | 3,413,408 | | | | 5,700,956 | |
Class C | | | 2,158,550 | | | | 2,621,539 | |
Distributions reinvested | | | | | | | | |
Class A | | | 47,766,696 | | | | 17,194,918 | |
Class B | | | 10,521,767 | | | | 3,949,911 | |
Class C | | | 4,347,344 | | | | 1,493,247 | |
Cost of shares redeemed | | | | | | | | |
Class A | | | (16,441,170 | ) | | | (47,413,380 | ) |
Class B | | | (5,898,602 | ) | | | (8,829,233 | ) |
Class C | | | (2,340,459 | ) | | | (2,513,425 | ) |
| | | | | | | | |
Net increase from capital share transactions | | | 61,120,615 | | | | 20,939,891 | |
| | | | | | | | |
Net increase (decrease) in net assets | | | (21,191,896 | ) | | | 30,234,831 | |
| | | | | | | | |
Net assets: | | | | | | | | |
Beginning of period | | | 187,266,358 | | | | 157,031,527 | |
| | | | | | | | |
End of period | | $ | 166,074,462 | | | $ | 187,266,358 | |
| | | | | | | | |
Accumulated net investment loss at end of period | | $ | (609,797 | ) | | $ | (282,912 | ) |
| | | | | | | | |
Capital share activity: | | | | | | | | |
Shares sold | | | | | | | | |
Class A | | | 1,127,009 | | | | 2,436,280 | |
Class B | | | 229,135 | | | | 311,989 | |
Class C | | | 160,337 | | | | 144,145 | |
Shares reinvested | | | | | | | | |
Class A | | | 3,504,526 | | | | 922,474 | |
Class B | | | 884,926 | | | | 231,666 | |
Class C | | | 363,187 | | | | 86,716 | |
Shares redeemed | | | | | | | | |
Class A | | | (1,104,748 | ) | | | (2,406,454 | ) |
Class B | | | (455,440 | ) | | | (492,573 | ) |
Class C | | | (182,602 | ) | | | (139,656 | ) |
| | | | |
| | 30 | | The accompanying notes are an integral part of the financial statements |
| | |
Financial Highlights | | Security Equity Fund |
Selected data for each share of capital stock outstanding throughout each year | | Global Series |
| | | | | | | | | | | | | | | | | | | | | | | | |
Class A | | Six Months Ended
March 31,
2008a | | | 2007b | | | 2006 | | | 2005 | | | 2004c | | | Year Ended ,
September 30,
2003 | |
Per Share Data | | | | | | | | | | | | | | | | | | | | | | | | |
Net asset value, beginning of period | | $ | 20.69 | | | $ | 19.65 | | | $ | 17.47 | | | $ | 13.93 | | | $ | 11.68 | | | $ | 9.49 | |
| | | | | | | | | | | | | | | | | | | | | | | | |
Income (loss) from investment operations: | | | | | | | | | | | | | | | | | | | | | | | | |
Net investment income (loss)d | | | 0.01 | | | | 0.06 | | | | (0.03 | ) | | | (0.02 | ) | | | (0.03 | ) | | | (0.03 | ) |
Net gain (loss) on securities (realized and unrealized) | | | (1.51 | ) | | | 3.60 | | | | 2.21 | | | | 3.56 | | | | 2.28 | | | | 2.22 | |
| | | | | | | | | | | | | | | | | | | | | | | | |
Total from investment operations | | | (1.50 | ) | | | 3.66 | | | | 2.18 | | | | 3.54 | | | | 2.25 | | | | 2.19 | |
| | | | | | | | | | | | | | | | | | | | | | | | |
Less distributions: | | | | | | | | | | | | | | | | | | | | | | | | |
Dividends from net investment income | | | (0.03 | ) | | | — | | | | — | | | | — | | | | — | | | | — | |
Distributions from realized gains | | | (6.73 | ) | | | (2.62 | ) | | | — | | | | — | | | | — | | | | — | |
| | | | | | | | | | | | | | | | | | | | | | | | |
Total distributions | | | (6.76 | ) | | | (2.62 | ) | | | — | | | | — | | | | — | | | | — | |
| | | | | | | | | | | | | | | | | | | | | | | | |
Net asset value, end of period | | $ | 12.43 | | | $ | 20.69 | | | $ | 19.65 | | | $ | 17.47 | | | $ | 13.93 | | | $ | 11.68 | |
| | | | | | | | | | | | | | | | | | | | | | | | |
Total Returne | | | (10.12 | )% | | | 20.07 | % | | | 12.48 | % | | | 25.41 | % | | | 19.26 | % | | | 23.08 | % |
| | | | | | | | | | | | | | | | | | | | | | | | |
Ratios/Supplemental Data | | | | | | | | | | | | | | | | | | | | | | | | |
Net assets, end of period (in thousands) | | $ | 131,094 | | | $ | 145,158 | | | $ | 119,176 | | | | 127,970 | | | $ | 98,450 | | | $ | 42,711 | |
| | | | | | | | | | | | | | | | | | | | | | | | |
Ratios to average net assets: | | | | | | | | | | | | | | | | | | | | | | | | |
Net investment income (loss) | | | 0.09 | % | | | 0.29 | % | | | (0.17 | )% | | | (0.14 | )% | | | (0.20 | )% | | | (0.26 | )% |
Total expensesf | | | 1.74 | % | | | 1.69 | % | | | 1.75 | % | | | 1.73 | % | | | 1.79 | % | | | 2.00 | % |
Net expensesg | | | 1.72 | % | | | 1.69 | % | | | 1.75 | % | | | 1.73 | % | | | 1.79 | % | | | 2.00 | % |
Net expenses prior to custodian earning credits and net of expense waivers | | | 1.74 | % | | | 1.69 | % | | | 1.75 | % | | | 1.73 | % | | | 1.79 | % | | | 2.00 | % |
Portfolio turnover rate | | | 257 | % | | | 162 | % | | | 28 | % | | | 31 | % | | | 25 | % | | | 62 | % |
| | | | | | |
Class B | | Six Months Ended
March 31,
2008a,h | | | 2007b,h | | | 2006h | | | 2005h | | | 2004c | | | Year Ended ,
September 30,
2003 | |
Per Share Data | | | | | | | | | | | | | | | | | | | | | | | | |
Net asset value, beginning of period | | $ | 18.96 | | | $ | 18.17 | | | $ | 16.12 | | | $ | 12.93 | | | $ | 10.93 | | | $ | 8.89 | |
| | | | | | | | | | | | | | | | | | | | | | | | |
Income (loss) from investment operations: | | | | | | | | | | | | | | | | | | | | | | | | |
Net investment income (loss)d | | | 0.02 | | | | 0.09 | | | | 0.02 | | | | (0.12 | ) | | | (0.13 | ) | | | (0.04 | ) |
Net gain (loss) on securities (realized and unrealized) | �� | | (1.32 | ) | | | 3.32 | | | | 2.03 | | | | 3.31 | | | | 2.13 | | | | 2.08 | |
| | | | | | | | | | | | | | | | | | | | | | | | |
Total from investment operations | | | (1.30 | ) | | | 3.41 | | | | 2.05 | | | | 3.19 | | | | 2.00 | | | | 2.04 | |
| | | | | | | | | | | | | | | | | | | | | | | | |
Less distributions: | | | | | | | | | | | | | | | | | | | | | | | | |
Dividends from net investment income | | | (0.08 | ) | | | — | | | | — | | | | — | | | | — | | | | — | |
Distributions from realized gains | | | (6.73 | ) | | | (2.62 | ) | | | — | | | | — | | | | — | | | | — | |
| | | | | | | | | | | | | | | | | | | | | | | | |
Total distributions | | | (6.81 | ) | | | (2.62 | ) | | | — | | | | — | | | | — | | | | — | |
| | | | | | | | | | | | | | | | | | | | | | | | |
Net asset value, end of period | | $ | 10.85 | | | $ | 18.96 | | | $ | 18.17 | | | $ | 16.12 | | | $ | 12.93 | | | $ | 10.93 | |
| | | | | | | | | | | | | | | | | | | | | | | | |
Total Returne | | | (9.98 | )% | | | 20.36 | % | | | 12.72 | % | | | 24.67 | % | | | 18.30 | % | | | 22.95 | % |
| | | | | | | | | | | | | | | | | | | | | | | | |
Ratios/Supplemental Data | | | | | | | | | | | | | | | | | | | | | | | | |
Net assets, end of period (in thousands) | | $ | 24,124 | | | $ | 29,659 | | | $ | 27,494 | | | $ | 28,999 | | | $ | 28,360 | | | $ | 16,461 | |
| | | | | | | | | | | | | | | | | | | | | | | | |
Ratios to average net assets: | | | | | | | | | | | | | | | | | | | | | | | | |
Net investment income (loss) | | | 0.32 | % | | | 0.50 | % | | | 0.11 | % | | | (0.80 | )% | | | (1.00 | )% | | | (0.42 | )% |
Total expensesf | | | 1.49 | % | | | 1.44 | % | | | 1.50 | % | | | 2.38 | % | | | 2.54 | % | | | 2.18 | % |
Net expensesg | | | 1.47 | % | | | 1.44 | % | | | 1.50 | % | | | 2.38 | % | | | 2.54 | % | | | 2.18 | % |
Net expenses prior to custodian earning credits and net of expense waivers | | | 1.49 | % | | | 1.44 | % | | | 1.50 | % | | | 2.38 | % | | | 2.54 | % | | | 2.18 | % |
| | | | | | | | | | | | | | | | | | | | | | | | |
Portfolio turnover rate | | | 257 | % | | | 162 | % | | | 28 | % | | | 31 | % | | | 25 | % | | | 62 | % |
| | | | |
| | 31 | | The accompanying notes are an integral part of the financial statements |
| | |
Financial Highlights | | Security Equity Fund |
Selected data for each share of capital stock outstanding throughout each year | | Global Series |
| | | | | | | | | | | | | | | | | | | | | | | | |
Class C | | Six Months Ended
March 31,
2008a | | | 2007b | | | 2006 | | | 2005 | | | 2004c | | | Year Ended ,
September 30,
2003 | |
Per Share Data | | | | | | | | | | | | | | | | | | | | | | | | |
Net asset value, beginning of period | | $ | 19.00 | | | $ | 18.37 | | | $ | 16.46 | | | $ | 13.22 | | | $ | 11.17 | | | $ | 9.14 | |
| | | | | | | | | | | | | | | | | | | | | | | | |
Income (loss) from investment operations: | | | | | | | | | | | | | | | | | | | | | | | | |
Net investment lossd | | | (0.05 | ) | | | (0.09 | ) | | | (0.15 | ) | | | (0.13 | ) | | | (0.13 | ) | | | (0.09 | ) |
Net gain (loss) on securities (realized and unrealized) | | | (1.32 | ) | | | 3.34 | | | | 2.06 | | | | 3.37 | | | | 2.18 | | | | 2.12 | |
| | | | | | | | | | | | | | | | | | | | | | | | |
Total from investment operations | | | (1.37 | ) | | | 3.25 | | | | 1.91 | | | | 3.24 | | | | 2.05 | | | | 2.03 | |
| | | | | | | | | | | | | | | | | | | | | | | | |
Less distributions: | | | | | | | | | | | | | | | | | | | | | | | | |
Distributions from realized gains | | | (6.73 | ) | | | (2.62 | ) | | | — | | | | — | | | | — | | | | — | |
| | | | | | | | | | | | | | | | | | | | | | | | |
Total distributions | | | (6.73 | ) | | | (2.62 | ) | | | — | | | | — | | | | — | | | | — | |
| | | | | | | | | | | | | | | | | | | | | | | | |
Net asset value, end of period | | $ | 10.90 | | | $ | 19.00 | | | $ | 18.37 | | | $ | 16.46 | | | $ | 13.22 | | | $ | 11.17 | |
| | | | | | | | | | | | | | | | | | | | | | | | |
Total Returne | | | (10.40 | )% | | | 19.14 | % | | | 11.60 | % | | | 24.51 | % | | | 18.35 | % | | | 22.21 | % |
| | | | | | | | | | | | | | | | | | | | | | | | |
Ratios/Supplemental Data | | | | | | | | | | | | | | | | | | | | | | | | |
Net assets, end of period (in thousands) | | $ | 10,856 | | | $ | 12,449 | | | $ | 10,361 | | | $ | 8,841 | | | $ | 7,557 | | | $ | 5,326 | |
| | | | | | | | | | | | | | | | | | | | | | | | |
Ratios to average net assets: | | | | | | | | | | | | | | | | | | | | | | | | |
Net investment loss | | | (0.68 | )% | | | (0.48 | )% | | | (0.87 | )% | | | (0.90 | )% | | | (1.02 | )% | | | (0.96 | )% |
Total expensesf | | | 2.49 | % | | | 2.44 | % | | | 2.51 | % | | | 2.48 | % | | | 2.54 | % | | | 2.77 | % |
Net expensesg | | | 2.47 | % | | | 2.44 | % | | | 2.50 | % | | | 2.48 | % | | | 2.54 | % | | | 2.77 | % |
Net expenses prior to custodian earning credits and net of expense waivers | | | 2.49 | % | | | 2.44 | % | | | 2.51 | % | | | 2.48 | % | | | 2.54 | % | | | 2.77 | % |
| | | | | | | | | | | | | | | | | | | | | | | | |
Portfolio turnover rate | | | 257 | % | | | 162 | % | | | 28 | % | | | 31 | % | | | 25 | % | | | 62 | % |
a | Unaudited figures for the six months ended March 31, 2008. Percentage amounts for the period, except total return, have been annualized. |
b | Security Global Investors, LLC (SGI) became the sub-advisor of the Global Series effective August 1, 2007. Prior to August 1, 2007, Security Investors (SI) paid Oppenheimer Funds for sub-advisory services. |
c | The financial highlights for the Global Series exclude the historical financial highlights of the International Series Class A, B and C shares. The assets of the International Series were acquired by the Global Series on October 3, 2003. |
d | Net investment income (loss) was computed using average shares outstanding throughout the period. |
e | Total return information does not reflect deduction of any sales charges imposed at the time of purchase for Class A shares or upon redemption for Class B and C shares. |
f | Total expense information reflects expense ratios absent expense reductions by the Investment Manager and custodian earnings credits, as applicable. |
g | Net expense information reflects the expense ratios after voluntary expense waivers, reimbursements and custodian earnings credits, as applicable. |
h | Effective August 25, 2005, Class B shares ceased charging 12b-l fees in accordance with FINRA (formerly NASD) sales cap regulations. Per share information reflects this change. This fee will be reinstated when sales reach above the sales cap limit. |
| | | | |
| | 32 | | The accompanying notes are an integral part of the financial statements |
This page left blank intentionally.
33
Security Equity Fund
Mid Cap Value Series

Adviser,
Security Global Investors
34
PERFORMANCE
$10,000 Over 10 Years
This chart assumes a $10,000 investment in Class A shares of Mid Cap Value Series on March 31, 1998, reflects deduction of the 5.75% sales load and assumes all dividends reinvested. The chart does not reflect the deduction of taxes that a shareholder would pay on distributions or the redemption of fund shares. The Russell 2500 Value Index is an unmanaged index that measures the performance of securities of small-to-mid cap U.S. companies with greater-than-average value orientation.
Average Annual Returns
| | | | | | | | |
Periods Ended 3-31-08 | | 1 Year | | 5 Years | | 10 Years | | Since Inception |
A Shares | | (10.67)% | | 19.14% | | 13.26% | | — |
| | | | |
A Shares with sales charge | | (15.80)% | | 17.74% | | 12.59% | | — |
| | | | |
B Shares | | (11.32)% | | 18.25% | | 12.44% | | — |
| | | | |
B Shares with CDSC | | (14.76)% | | 18.05% | | 12.44% | | — |
| | | | |
C Shares | | (11.34)% | | 18.25% | | — | | 13.46% (1-29-99) |
| | | | |
C Shares with CDSC | | (12.04)% | | 18.25% | | — | | 13.46% (1-29-99) |
The performance data above represents past performance that is not predictive of future results. The investment return and principal value of an investment in the Series will fluctuate so that an investor’s shares, when redeemed, may be worth more or less than their original cost. The figures above do not reflect deduction of the maximum front-end sales charge of 5.75% for Class A shares or the contingent deferred sales charge of 5% for Class B shares and 1% for Class C shares, as applicable, except where noted. The figures do not reflect the deduction of taxes that a shareholder would pay on distributions or redemption of shares. Such figures would be lower if the maximum sales charge and any applicable taxes were deducted.
Portfolio Composition by Sector as of 3-31-08
| | | |
Consumer Discretionary | | 10.32 | % |
Consumer Staples | | 7.23 | |
Energy | | 9.81 | |
Financials | | 18.29 | |
Health Care | | 2.21 | |
Industrials | | 13.59 | |
Information Technology | | 15.27 | |
Materials | | 5.18 | |
Utilities | | 10.52 | |
Convertible Bonds | | 0.59 | |
Commercial Paper | | 6.72 | |
Warrants | | 0.10 | |
U.S. Government Sponsored Agencies | | 1.03 | |
Liabilities in Excess of Other Assets | | (0.86 | ) |
Total Net Assets | | 100.00 | % |
| | | |
| | | | |
| | 35 | | The accompanying notes are an integral part of the financial statements |
| | |
| | Security Equity Fund |
Performance Summary | | Mid Cap Value Series |
| March 31, 2008 | | (unaudited) |
Information About Your Series Expenses
Calculating your ongoing Series expenses
Example
As a shareholder of the Series, you incur two types of costs: (1) transaction costs, which may include sales charges (loads) on purchase payments; contingent deferred sales charges on redemptions; and redemption fees, if any; and (2) ongoing costs, including management fees; distribution and/or service fees (12b-1); and other Series expenses. This example is intended to help you understand your ongoing costs (in dollars) of investing in the Series and to compare these costs with ongoing costs of investing in other mutual funds. The example is based on an investment of $1,000 invested at the beginning of the period and held for the entire period October 1, 2007 through March 31, 2008.
Actual Expenses
The first line for each class of shares in the table provides information about actual account values and actual expenses. You may use the information in this table, together with the amount you invested, to estimate the expenses that you paid over the period. Simply divide your account value by $1,000 (for example, an $8,600 account value divided by $1,000 = 8.6), then multiply the result by the number in the table under the heading entitled “Expenses Paid During the Period” to estimate the expenses you paid on your account during this period.
Hypothetical Example for Comparison Purposes
The second line for each class of shares in the table provides information about hypothetical account values and hypothetical expenses based on the Series actual expense ratio and an assumed rate of return of 5% per year before expenses, which is not the Series actual return. The hypothetical account values and expenses may not be used to estimate the actual ending account balance or expenses you paid for the period. You may use this information to compare the ongoing costs of investing in the Series and other funds. To do so, compare this 5% hypothetical example with the 5% hypothetical examples that appear in the shareholder reports of the other mutual funds.
Please note that the expenses shown in the table are meant to highlight your ongoing costs only and do not reflect any transactional costs, such as sales charges (loads) on purchase payments, contingent deferred sales charges on redemptions, and redemption fees, if any. Therefore, the second line for each class of shares is useful in comparing ongoing costs only, and will not help you determine the relative total costs of owning different funds. In addition, if these transactional costs were included, your costs would have been higher.
Series Expenses
| | | | | | | | | |
| | | |
| | | Beginning
Account
Value
10/1/2007 | | Ending
Account
Value
3/31/20081 | | Expenses
Paid
During
Period2 |
Mid Cap Value Series - Class A | | | | | | | | | |
Actual | | $ | 1,000.00 | | $ | 869.00 | | $ | 6.35 |
Hypothetical | | | 1,000.00 | | | 1,018.20 | | | 6.86 |
| | | |
Mid Cap Value Series - Class B | | | | | | | | | |
Actual | | | 1,000.00 | | | 866.10 | | | 9.84 |
Hypothetical | | | 1,000.00 | | | 1,014.45 | | | 10.63 |
| | | |
Mid Cap Value Series - Class C | | | | | | | | | |
Actual | | | 1,000.00 | | | 865.80 | | | 9.84 |
Hypothetical | | | 1,000.00 | | | 1,014.45 | | | 10.63 |
1 | The actual ending account value is based on the actual total return of the Series for the period October 1, 2007 to March 31, 2008 after actual expenses and will differ from the hypothetical ending account value which is based on the Series expense ratio and a hypothetical annual return of 5% before expenses. The actual cumulative return at net asset value for the period October 1, 2007 to March 31, 2008 was (13.10%), (13.39%) and (13.42%), for Class A, B, and C respectively. |
2 | Expenses are equal to the Series annualized expense ratio (1.36%, 2.11% and 2.11% for Class A, B, and C shares, respectively) net of any applicable fee waivers or earnings credits, multiplied by the average account value over the period, multiplied by 183/366 (to reflect the one-half year period). |
| | |
| Schedule of Investments | | Security Equity Fund - Mid Cap Value Series |
| March 31, 2008 (Unaudited) | | |
| | | | | |
| | | Shares | | Value |
COMMON STOCK - 92.3% | | | | | |
Aerospace & Defense - 2.5% | | | | | |
Argon ST, Inc. * | | 147,900 | | $ | 2,515,779 |
Orbital Sciences Corporation * | | 668,050 | | | 16,100,005 |
| | | | | |
| | | | | 18,615,784 |
| | | | | |
Apparel Retail - 2.9% | | | | | |
Brown Shoe Company, Inc. | | 542,900 | | | 8,181,503 |
Collective Brands, Inc. * | | 567,300 | | | 6,875,676 |
Talbots, Inc. | | 619,300 | | | 6,676,054 |
| | | | | |
| | | | | 21,733,233 |
| | | | | |
Apparel, Accessories & Luxury Goods - 1.7% | | | | | |
Maidenform Brands, Inc. * | | 468,000 | | | 7,614,360 |
Oxford Industries, Inc. | | 215,000 | | | 4,843,950 |
| | | | | |
| | | | | 12,458,310 |
| | | | | |
Application Software - 1.5% | | | | | |
EPIQ Systems, Inc. * | | 579,250 | | | 8,989,960 |
PLATO Learning, Inc. * (1) | | 887,550 | | | 2,600,522 |
| | | | | |
| | | | | 11,590,482 |
| | | | | |
Auto Parts & Equipment - 0.3% | | | | | |
HydroGen Corporation * (1)(2) | | 1,260,000 | | | 2,394,000 |
| | | | | |
Biotechnology - 0.2% | | | | | |
Combinatorx, Inc. * | | 337,400 | | | 1,160,656 |
| | | | | |
Building Products - 0.3% | | | | | |
Trex Company, Inc. * | | 250,000 | | | 1,970,000 |
| | | | | |
Coal & Consumable Fuels - 3.9% | | | | | |
Arch Coal, Inc. (3) | | 82,000 | | | 3,567,000 |
Consol Energy, Inc. (3) | | 194,800 | | | 13,478,212 |
Evergreen Energy, Inc. * | | 3,660,000 | | | 5,636,400 |
USEC, Inc. * | | 1,667,100 | | | 6,168,270 |
| | | | | |
| | | | | 28,849,882 |
| | | | | |
Communications Equipment - 2.1% | | | | | |
EFJ, Inc. * | | 870,000 | | | 1,044,000 |
MasTec, Inc. * | | 1,100,000 | | | 9,031,000 |
Symmetricom, Inc. * | | 1,711,700 | | | 5,973,833 |
| | | | | |
| | | | | 16,048,833 |
| | | | | |
Computer Storage & Peripherals - 0.3% | | | | | |
STEC, Inc. * | | 307,300 | | | 1,902,187 |
| | | | | |
Construction & Engineering - 4.0% | | | | | |
Insituform Technologies, Inc. * | | 423,600 | | | 5,858,388 |
Quanta Services, Inc. * | | 899,000 | | | 20,829,830 |
URS Corporation * | | 102,000 | | | 3,334,380 |
| | | | | |
| | | | | 30,022,598 |
| | | | | |
Consumer Finance - 1.3% | | | | | |
First Marblehead Corporation | | 1,324,500 | | | 9,880,770 |
| | | | | |
Data Processing & Outsourced Services - 6.6% | | | | | |
Affiliated Computer Services, Inc.* | | 495,000 | | | 24,804,450 |
Computer Sciences Corporation * | | 516,300 | | | 21,059,877 |
Gevity HR, Inc. | | 396,600 | | | 3,434,556 |
| | | | | |
| | | | | 49,298,883 |
| | | | | |
Diversified Commercial & Professional Services -2.6% | | | | | |
Navigant Consulting, Inc. * | | 1,020,000 | | | 19,359,600 |
| | | | | |
Drug Retail - 1.5% | | | | | |
Longs Drug Stores Corporation | | 258,400 | | | 10,971,664 |
| | | | | |
Electric Utilities - 5.6% | | | | | |
Allete, Inc. | | 323,800 | | | 12,505,156 |
Empire District Electric Company | | 185,000 | | | 3,746,250 |
Great Plains Energy, Inc. | | 608,200 | | | 14,992,130 |
Northeast Utilities (3) | | 250,500 | | | 6,147,270 |
Westar Energy, Inc. | | 200,000 | | | 4,554,000 |
| | | | | |
| | | | | 41,944,806 |
| | | | | |
Electrical Components & Equipment - 2.0% | | | | | |
Power-One, Inc. * (1) | | 4,350,700 | | | 13,965,747 |
UQM Technologies, Inc. * | | 517,722 | | | 874,950 |
| | | | | |
| | | | | 14,840,697 |
| | | | | |
Electronic Manufacturing Services - 2.0% | | | | | |
Maxwell Technologies, Inc. * (2) | | 1,325,300 | | | 13,504,807 |
Merix Corporation * | | 813,450 | | | 1,659,438 |
| | | | | |
| | | | | 15,164,245 |
| | | | | |
Forest Products - 0.7% | | | | | |
Louisiana-Pacific Corporation | | 590,000 | | | 5,416,200 |
| | | | | |
Gas Utilities - 1.1% | | | | | |
Atmos Energy Corporation | | 335,000 | | | 8,542,500 |
| | | | | |
Health Care Equipment - 0.3% | | | | | |
Aspect Medical Systems, Inc. * | | 338,400 | | | 2,064,240 |
| | | | | |
Health Care Facilities - 1.4% | | | | | |
Community Health Systems, Inc. * | | 309,900 | | | 10,403,343 |
| | | | | |
Health Care Services - 0.4% | | | | | |
RehabCare Group, Inc. * | | 195,200 | | | 2,928,000 |
| | | | | |
Highways & Railtracks - 0.5% | | | | | |
Quixote Corporation (1)(2) | | 479,100 | | | 4,000,485 |
| | | | | |
Home Furnishings - 1.7% | | | | | |
Leggett & Platt, Inc. | | 827,400 | | | 12,617,850 |
| | | | | |
Household Appliances - 1.9% | | | | | |
Whirlpool Corporation (3) | | 164,300 | | | 14,257,954 |
| | | | | |
Industrial Machinery - 1.4% | | | | | |
Briggs & Stratton Corporation | | 568,700 | | | 10,179,730 |
| | | | | |
| | | | |
| | 37 | | The accompanying notes are an integral part of the financial statements |
| | |
| Schedule of Investments | | Security Equity Fund - Mid Cap Value Series |
| March 31, 2008 (Unaudited) - continued | | |
| | | | | | |
| | | Shares | | Value |
COMMON STOCK (continued) | | | | | | |
Metal & Glass Containers - 0.1% | | | | | | |
Owens-Illinois, Inc. * | | | 10,440 | | $ | 589,129 |
| | | | | | |
Mortgage REIT’s - 0.0% | | | | | | |
Bimini Capital Management, Inc. * (1)(2) | | | 1,474,400 | | | 398,088 |
| | | | | | |
Multi-Line Insurance - 1.5% | | | | | | |
American Financial Group, Inc. (3) | | | 443,700 | | | 11,340,972 |
| | | | | | |
Multi-Utilities - 3.8% | | | | | | |
NorthWestern Corporation | | | 359,700 | | | 8,765,889 |
SCANA Corporation | | | 400,000 | | | 14,632,000 |
TECO Energy, Inc. | | | 300,000 | | | 4,785,000 |
| | | | | | |
| | | | | | 28,182,889 |
| | | | | | |
Oil & Gas Drilling - 3.1% | | | | | | |
Helmerich & Payne, Inc. | | | 491,500 | | | 23,036,605 |
| | | | | | |
Oil & Gas Exploration & Production - 2.4% | | | | | | |
Edge Petroleum Corporation * | | | 89,700 | | | 361,491 |
Gulfport Energy Corporation * | | | 395,900 | | | 4,196,540 |
Newfield Exploration Company * | | | 260,000 | | | 13,741,000 |
| | | | | | |
| | | | | | 18,299,031 |
| | | | | | |
Oil & Gas Refining & Marketing - 0.4% | | | | | | |
Nova Biosource Fuels, Inc. * | | | 2,071,100 | | | 3,127,361 |
| | | | | | |
Packaged Foods & Meats - 5.8% | | | | | | |
Hormel Foods Corporation (3) | | | 399,500 | | | 16,643,170 |
JM Smucker Company | | | 305,000 | | | 15,436,050 |
Smithfield Foods, Inc. * | | | 425,900 | | | 10,971,184 |
| | | | | | |
| | | | | | 43,050,404 |
| | | | | | |
Paper Packaging - 3.7% | | | | | | |
Bemis Company, Inc. | | | 620,000 | | | 15,766,600 |
Sonoco Products Company | | | 410,000 | | | 11,738,300 |
| | | | | | |
| | | | | | 27,504,900 |
| | | | | | |
Paper Products - 0.3% | | | | | | |
Schweitzer-Mauduit International, Inc. | | | 91,400 | | | 2,114,996 |
| | | | | | |
Property & Casualty Insurance - 5.3% | | | | | | |
Alleghany Corporation * | | | 28,760 | | | 9,821,464 |
Employers Holdings, Inc. | | | 271,100 | | | 5,026,194 |
Hanover Insurance Group, Inc. | | | 212,000 | | | 8,721,680 |
MBIA, Inc. | | | 429,800 | | | 5,252,156 |
United America Indemnity, Ltd. * | | | 154,500 | | | 2,975,670 |
W.R. Berkley Corporation | | | 282,500 | | | 7,822,425 |
| | | | | | |
| | | | | | 39,619,589 |
| | | | | | |
Railroads - 0.2% | | | | | | |
Kansas City Southern * | | | 42,300 | | | 1,696,653 |
| | | | | | |
Regional Banks - 7.8% | | | | | | |
Commerce Bancshares, Inc. | | | 357,000 | | | 15,004,710 |
Hancock Holding Company | | | 241,800 | | | 10,160,436 |
Old National Bancorp | | | 316,000 | | | 5,688,000 |
Whitney Holding Corporation (3) | | | 527,700 | | | 13,081,683 |
Wilmington Trust Corporation | | | 462,000 | | | 14,368,200 |
| | | | | | |
| | | | | | 58,303,029 |
| | | | | | |
Restaurants - 0.7% | | | | | | |
Red Robin Gourmet Burgers, Inc. * | | | 137,100 | | | 5,150,847 |
| | | | | | |
Semiconductor Equipment - 0.6% | | | | | | |
Ultratech, Inc. * | | | 476,200 | | | 4,576,282 |
| | | | | | |
Semiconductors - 2.1% | | | | | | |
IXYS Corporation * (1)(2) | | | 2,279,300 | | | 15,567,619 |
| | | | | | |
Specialized Consumer Services - 1.1% | | | | | | |
Regis Corporation (3) | | | 309,200 | | | 8,499,908 |
| | | | | | |
Specially Chemicals - 0 .4% | | | | | | |
Minerals Technologies, Inc. | | | 49,300 | | | 3,096,040 |
| | | | | | |
Thrifts & Mortgage Finance - 2.3% | | | | | | |
Clayton Holdings, Inc. * (1)(2) | | | 1,490,200 | | | 6,914,528 |
MGIC Investment Corporation | | | 975,000 | | | 10,266,750 |
| | | | | | |
| | | | | | 17,181,278 |
| | | | | | |
TOTAL COMMON STOCK (Cost $783,038,932) | | | | | $ | 689,952,552 |
| | | | | | |
PREFERRED STOCK - 0.1% | | | | | | |
Environmental & Facilities Services - 0.1% | | | | | | |
ThermoEnergy Corporation | | | | | | |
PIPE * (1)(2)(4)(5) | | | 1,745,000 | | | 889,950 |
| | | | | | |
TOTAL PREFERRED STOCK (Cost $1,646,500) | | | | | $ | 889,950 |
| | | | | | |
WARRANTS - 0.1% | | | | | | |
Warrants - 0.1% | | | | | | |
Lime Energy Company | | | | | | |
$ 1.00, 3/19/2009 | | | 4,217 | | | 28,957 |
Nova Biosource Fuels, Inc. | | | | | | |
$ 2.40, 7/5/2011 | | | 677,450 | | | 587,176 |
ThermoEnergy Corporation | | | | | | |
$ 0.75, 7/14/2008 (1)(2)(4) | | | 1,745,000 | | | 146,023 |
| | | | | | |
| | | | | | 762,156 |
| | | | | | |
TOTAL WARRANTS (Cost $1,561,837) | | | | | $ | 762,156 |
| | | | | | |
| | |
| | | Principal
Amount | | |
CONVERTIBLE BOND - 0.6% | | | | | | |
Petroleum - 0.6% | | | | | | |
USEC, Inc. | | | | | | |
3.00%, 2014 | | $ | 7,600,000 | | $ | 4,417,500 |
| | | | | | |
TOTAL CONVERTIBLE BOND (Cost $7,600,000) | | | | | $ | 4,417,500 |
| | | | | | |
U.S. GOVERNMENT SPONSORED AGENCY BONDS & NOTES - 1.1% | | | | | | |
Federal Home Loan Bank | | | | | | |
1.95% - 2008 | | | 3,700,000 | | | 3,696,506 |
| | | | |
| | 38 | | The accompanying notes are an integral part of the financial statements |
| | |
| Schedule of Investments | | Security Equity Fund - Mid Cap Value Series |
| March 31, 2008 (Unaudited) - continued | | |
| | | | | | | |
| | | Principal
Amount | | Value | |
U.S. GOVERNMENT SPONSORED AGENCY BONDS & NOTES (continued) | | | | | | | |
Federal Home Loan Bank (continued) | | | | | | | |
2.00% - 2008 | | $ | 4,000,000 | | $ | 3,996,444 | |
| | | | | | | |
TOTAL U.S. GOVERNMENT SPONSORED AGENCY BONDS & NOTES
(Cost $7,692,950) | | | | | $ | 7,692,950 | |
| | | | | | | |
COMMERCIAL PAPER - 6.7% | | | | | | | |
Banking - 1.1% | | | | | | | |
UBS Finance (DE) LLC | | | | | | | |
2.40%, 4/10/2008 | | | 3,100,000 | | | 3,098,140 | |
2.60%, 4/23/2008 | | | 1,200,000 | | | 1,198,093 | |
Wells Fargo & Company, Inc. | | | | | | | |
2.39%, 4/2/2008 | | | 4,000,000 | | | 3,999,735 | |
| | | | | | | |
| | | | | | 8,295,968 | |
| | | | | | | |
Brokerage - 1.6% | | | | | | | |
Goldman Sachs Group, Inc. | | | | | | | |
2.40%, 4/3/2008 | | | 4,000,000 | | | 3,999,467 | |
JP Morgan Chase & Company | | | | | | | |
2.14%, 4/7/2008 | | | 1,600,000 | | | 1,599,429 | |
2.14%, 4/8/2008 | | | 4,000,000 | | | 3,998,336 | |
2.30%, 4/30/2008 | | | 2,500,000 | | | 2,495,368 | |
| | | | | | | |
| | | | | | 12,092,600 | |
| | | | | | | |
Consumer Products - 0.5% | | | | | | | |
Procter & Gamble International Funding | | | | | | | |
2.20%, 4/25/2008 | | | 3,700,000 | | | 3,694,573 | |
| | | | | | | |
Electric - 0.5% | | | | | | | |
Southern Company | | | | | | | |
2.25%, 4/16/2008 | | | 4,000,000 | | | 3,996,250 | |
| | | | | | | |
Financial Companies - Captive - 1.4% | | | | | | | |
Caterpillar Financial Services Corporation | | | | | | | |
2.21%, 4/15/2008 | | | 2,600,000 | | | 2,597,765 | |
General Electric Capital Corporation | | | | | | | |
2.25%, 4/14/2008 | | | 4,000,000 | | | 3,996,750 | |
International Lease Finance Company | | | | | | | |
2.55%, 4/1/2008 | | | 4,200,000 | | | 4,200,000 | |
| | | | | | | |
| | | | | | 10,794,515 | |
| | | | | | | |
Non U.S. Banking - 1.1% | | | | | | | |
Bank of Ireland | | | | | | | |
3.00%, 4/4/2008 | | | 4,000,000 | | | 3,999,000 | |
Royal Bank of Canada | | | | | | | |
2.61%, 4/28/2008 | | | 4,000,000 | | | 3,992,170 | |
| | | | | | | |
| | | | | | 7,991,170 | |
| | | | | | | |
Pharmaceuticals - 0.5% | | | | | | | |
Abbott Laboratories | | | | | | | |
2.15%, 4/9/2008 | | | 3,400,000 | | $ | 3,398,376 | |
| | | | | | | |
TOTAL COMMERCIAL PAPER (Cost $50,263,452) | | | | | $ | 50,263,452 | |
| | | | | | | |
Total Investments (Security Equity Fund - Mid Cap Value Series)
(Cost $851,803,671) - 100.9% | | | | | $ | 753,978,560 | |
Liabilities in Excess of Other Assets - (0.9)% | | | | | | (6,500,353 | ) |
| | | | | | | |
TOTAL NET ASSETS - 100.0% | | | | | $ | 747,478,207 | |
| | | | | | | |
Footnotes
Percentages are stated as a percent of net assets.
For federal income tax purposes the identified cost of investments owned at 3/31/2008 was $851,803,671.
| * | - Non-income producing security |
| 1 | - Security is deemed illiquid. The total market value of illiquid securities is $46,876,962 (cost $92,167,147), or 6.3% of total net assets. |
| 2 | - Investment in an affiliated issuer. See Note 8 in notes to financial statements. |
| 3 | - Security is segregated as collateral for open written option contracts. |
| 4 | - Security is restricted from resale. See Note 6 in notes to financial statements. |
| 5 | - PIPE (Private Investment in Public Equity) - Stock issued by a company in the secondary market as a means of raising capital more quickly and less expensively than through registration of a secondary public offering. |
See notes to financial statements.
| | | | |
| | 39 | | The accompanying notes are an integral part of the financial statements |
Security Equity Fund
Mid Cap Value Series
(unaudited)
Statement of Assets and Liabilities
March 31, 2008
| | | | |
Assets: | | | | |
Investments in unaffiliated issues, at value* | | $ | 710,163,060 | |
Investments in affiliated issues, at value** | | | 43,815,500 | |
| | | | |
Total investments | | | 753,978,560 | |
Cash | | | 163,030 | |
Receivables: | | | | |
Fund shares sold | | | 2,134,249 | |
Securities sold | | | 994,744 | |
Interest | | | 115,900 | |
Dividends | | | 783,786 | |
Prepaid expenses | | | 66,141 | |
| | | | |
Total assets | | | 758,236,410 | |
| | | | |
Liabilities: | | | | |
Payable for: | | | | |
Securities purchased | | | 6,082,200 | |
Fund shares redeemed | | | 1,695,678 | |
Written options, at value (premiums received, $1,908,851) | | | 1,959,550 | |
Management fees | | | 517,791 | |
Custodian fees | | | 18,900 | |
Transfer agent/maintenance fees | | | 74,058 | |
Administration fees | | | 60,822 | |
Professional fees | | | 30,920 | |
12b-1 distribution plan fees | | | 285,203 | |
Directors’ fees | | | 5,627 | |
Other | | | 27,454 | |
| | | | |
Total liabilities | | | 10,758,203 | |
| | | | |
Net assets | | $ | 747,478,207 | |
| | | | |
Net assets consist of: | | | | |
Paid in capital | | $ | 784,772,924 | |
Undistributed net investment income | | | 269,473 | |
Undistributed net realized gain on sale of investments | | | 60,311,621 | |
Net unrealized depreciation in value of investments | | | (97,875,811 | ) |
| | | | |
Net assets | | $ | 747,478,207 | |
| | | | |
Class A: | | | | |
Capital shares outstanding (unlimited number of shares authorized) | | | 19,500,829 | |
Net assets | | $ | 550,171,804 | |
Net asset value and redemption price per share | | $ | 28.21 | |
| | | | |
Maximum offering price per share (net asset value divided by 94.25%) | | $ | 29.93 | |
| | | | |
Class B: | | | | |
Capital shares outstanding (unlimited number of shares authorized) | | | 2,972,837 | |
Net assets | | $ | 73,592,457 | |
Net asset value, offering and redemption price per share (excluding any applicable contingent deferred sales charge) . | | $ | 24.75 | |
| | | | |
Class C: | | | | |
Capital shares outstanding (unlimited number of shares authorized) | | | 4,868,305 | |
Net assets | | $ | 123,713,946 | |
Net asset value, offering and redemption price per share (excluding any applicable contingent deferred sales charge) | | $ | 25.41 | |
| | | | |
* Investments in unaffiliated issues, at cost | | $ | 774,934,747 | |
** Investments in affiliated issues, at cost | | | 76,868,924 | |
| | | | |
Total cost | | $ | 851,803,671 | |
Statement of Operations
For the Six Months Ended March 31, 2008
| | | | |
Investment Income: | | | | |
Dividends from securities of unaffiliated issuers | | $ | 8,013,689 | |
Dividends from securities of affiliated issuers | | | 95,820 | |
Interest | | | 742,998 | |
| | | | |
Total investment income | | | 8,852,507 | |
| | | | |
Expenses: | | | | |
Management fees | | | 3,404,421 | |
Transfer agent/maintenance fees | | | 677,237 | |
Administration fees | | | 400,449 | |
Custodian fees | | | 31,274 | |
Directors’ fees | | | 18,458 | |
Professional fees | | | 31,315 | |
Reports to shareholders | | | 26,461 | |
Registration fees | | | 39,697 | |
Other expenses | | | 32,383 | |
12b-1 distribution fees - Class A | | | 751,865 | |
12b-1 distribution fees - Class B | | | 445,785 | |
12b-1 distribution fees - Class C | | | 752,191 | |
| | | | |
Total expenses | | | 6,611,536 | |
| | | | |
Net investment income | | | 2,240,971 | |
| | | | |
Net Realized and Unrealized Gain (Loss): | | | | |
Net realized gain (loss) during the period on: | | | | |
Investments | | | 83,203,400 | |
Options written | | | 2,236,246 | |
| | | | |
Net realized gain | | | 85,439,646 | |
| | | | |
Net unrealized appreciation (depreciation) during the period on: | | | | |
Investments | | | (211,925,611 | ) |
Options written | | | 4,799,948 | |
| | | | |
Net unrealized depreciation | | | (207,125,663 | ) |
| | | | |
Net loss | | | (121,686,017 | ) |
| | | | |
Net decrease in net assets resulting from operations | | $ | (119,445,046 | ) |
| | | | |
| | | | |
| | 40 | | The accompanying notes are an integral part of the financial statements |
| | |
| | Security Equity Fund |
| Statement of Changes in Net Assets | | Mid Cap Value Series |
| | | | | | | | |
| | | Six Months Ended
March 31, 2008
(unaudited) | | | Year Ended
September 30,
2007 | |
Increase (decrease) in net assets from operations: | | | | | | | | |
Net investment income | | $ | 2,240,971 | | | $ | 3,825,424 | |
Net realized gain during the period on investments | | | 85,439,646 | | | | 154,819,641 | |
Net unrealized depreciation during the period on investments | | | (207,125,663 | ) | | | (47,559,940 | ) |
| | | | | | | | |
Net increase (decrease) in net assets resulting from operations | | | (119,445,046 | ) | | | 111,085,125 | |
| | | | | | | | |
Distributions to shareholders from: | | | | | | | | |
Net investment income | | | | | | | | |
Class A | | | (2,202,930 | ) | | | (3,593,992 | ) |
Net realized gain | | | | | | | | |
Class A | | | (121,470,192 | ) | | | (32,960,688 | ) |
Class B | | | (20,681,860 | ) | | | (6,506,572 | ) |
Class C | | | (34,476,081 | ) | | | (9,330,424 | ) |
| | | | | | | | |
Total distributions to shareholders | | | (178,831,063 | ) | | | (52,391,676 | ) |
| | | | | | | | |
Capital share transactions: | | | | | | | | |
Proceeds from sale of shares | | | | | | | | |
Class A | | | 132,702,158 | | | | 245,384,311 | |
Class B | | | 3,053,321 | | | | 14,976,325 | |
Class C | | | 8,382,781 | | | | 39,616,310 | |
Distributions reinvested | | | | | | | | |
Class A | | | 112,053,976 | | | | 32,588,871 | |
Class B | | | 19,668,020 | | | | 6,199,597 | |
Class C | | | 32,802,694 | | | | 8,812,100 | |
Cost of shares redeemed | | | | | | | | |
Class A | | | (173,886,732 | ) | | | (228,752,745 | ) |
Class B | | | (21,641,068 | ) | | | (30,375,678 | ) |
Class C | | | (37,789,684 | ) | | | (34,170,836 | ) |
| | | | | | | | |
Net increase from capital share transactions | | | 75,345,466 | | | | 54,278,255 | |
| | | | | | | | |
Net increase (decrease) in net assets | | | (222,930,643 | ) | | | 112,971,704 | |
| | | | | | | | |
Net assets: | | | | | | | | |
Beginning of period | | | 970,408,850 | | | | 857,437,146 | |
| | | | | | | | |
End of period | | $ | 747,478,207 | | | $ | 970,408,850 | |
| | | | | | | | |
Accumulated net investment income at end of period | | $ | 269,473 | | | $ | 231,432 | |
| | | | | | | | |
Capital share activity: | | | | | | | | |
Shares sold | | | | | | | | |
Class A | | | 4,219,402 | | | | 6,118,943 | |
Class B | | | 100,776 | | | | 409,793 | |
Class C | | | 268,258 | | | | 1,071,179 | |
Shares reinvested | | | | | | | | |
Class A | | | 3,657,112 | | | | 840,418 | |
Class B | | | 730,070 | | | | 176,275 | |
Class C | | | 1,185,925 | | | | 245,462 | |
Shares redeemed | | | | | | | | |
Class A | | | (5,231,731 | ) | | | (5,679,660 | ) |
Class B | | | (745,120 | ) | | | (828,980 | ) |
Class C | | | (1,294,346 | ) | | | (914,344 | ) |
| | | | |
| | 41 | | The accompanying notes are an integral part of the financial statements |
| | |
| Financial Highlights | | Security Equity Fund |
Selected data for each share of capital stock outstanding throughout each year | | Mid Cap Value Series |
| | | | | | | | | | | | | | | | | | | | | | | | |
Class A | | Six Months Ended
March 31, 2008a | | | 2007 | | | 2006 | | | 2005 | | | 2004 | | | Year Ended
September 30,
2003 | |
Per Share Data | | | | | | | | | | | | | | | | | | | | | | | | |
Net asset value, beginning of period | | $ | 40.79 | | | $ | 38.27 | | | $ | 36.34 | | | $ | 30.45 | | | $ | 24.48 | | | $ | 16.90 | |
Income (loss) from investment operations: | | | | | | | | | | | | | | | | | | | | | | | | |
Net investment income (loss)b | | | 0.13 | | | | 0.25 | | | | 0.04 | | | | 0.01 | | | | (0.09 | ) | | | (0.07 | ) |
Net gain (loss) on securities (realized and unrealized) | | | (4.85 | ) | | | 4.59 | | | | 3.96 | | | | 8.16 | | | | 6.32 | | | | 7.65 | |
| | | | | | | | | | | | | | | | | | | | | | | | |
Total from investment operations | | | (4.72 | ) | | | 4.84 | | | | 4.00 | | | | 8.17 | | | | 6.23 | | | | 7.58 | |
| | | | | | | | | | | | | | | | | | | | | | | | |
Less distributions: | | | | | | | | | | | | | | | | | | | | | | | | |
Dividends from net investment income | | | (0.14 | ) | | | (0.23 | ) | | | — | | | | — | | | | — | | | | — | |
Distributions from realized gains | | | (7.72 | ) | | | (2.09 | ) | | | (2.07 | ) | | | (2.28 | ) | | | (0.26 | ) | | | — | |
| | | | | | | | | | | | | | | | | | | | | | | | |
Total distributions | | | (7.86 | ) | | | (2.32 | ) | | | (2.07 | ) | | | (2.28 | ) | | | (0.26 | ) | | | — | |
| | | | | | | | | | | | | | | | | | | | | | | | |
Net asset value, end of period | | $ | 28.21 | | | $ | 40.79 | | | $ | 38.27 | | | $ | 36.34 | | | $ | 30.45 | | | $ | 24.48 | |
| | | | | | | | | | | | | | | | | | | | | | | | |
Total Returnc | | | (13.10 | )% | | | 12.96 | % | | | 11.44 | % | | | 27.77 | % | | | 25.59 | % | | | 44.85 | % |
| | | | | | | | | | | | | | | | | | | | | | | | |
Ratios/Supplemental Data | | | | | | | | | | | | | | | | | | | | | | | | |
Net assets, end of period (in thousands) | | $ | 550,172 | | | $ | 687,484 | | | $ | 596,074 | | | $ | 373,031 | | | $ | 215,659 | | | $ | 113,822 | |
| | | | | | | | | | | | | | | | | | | | | | | | |
Ratios to average net assets: | | | | | | | | | | | | | | | | | | | | | | | | |
Net investment income (loss) | | | 0.75 | % | | | 0.61 | % | | | 0.10 | % | | | 0.04 | % | | | (0.31 | )% | | | (0.33 | )% |
Total expensesd | | | 1.36 | % | | | 1.32 | % | | | 1.36 | % | | | 1.41 | % | | | 1.48 | % | | | 1.65 | % |
Net expensese | | | 1.36 | % | | | 1.32 | % | | | 1.36 | % | | | 1.41 | % | | | 1.48 | % | | | 1.65 | % |
Net expenses prior to custodian earning credits and net of expense waivers | | | 1.36 | % | | | 1.32 | % | | | 1.36 | % | | | 1.41 | % | | | 1.48 | % | | | 1.65 | % |
| | | | | | | | | | | | | | | | | | | | | | | | |
Portfolio turnover rate | | | 49 | % | | | 44 | % | | | 33 | % | | | 19 | % | | | 45 | % | | | 52 | % |
| | | | | | |
Class B | | Six Months Ended
March 31, 2008a | | | 2007 | | | 2006 | | | 2005 | | | 2004 | | | Year Ended
September 30,
2003 | |
Per Share Data | | | | | | | | | | | | | | | | | | | | | | | | |
Net asset value, beginning of period | | $ | 36.78 | | | $ | 34.76 | | | $ | 33.43 | | | $ | 28.37 | | | $ | 22.99 | | | $ | 15.99 | |
| | | | | | | | | | | | | | | | | | | | | | | | |
Income (loss) from investment operations: | | | | | | | | | | | | | | | | | | | | | | | | |
Net investment lossb | | | — | | | | (0.04 | ) | | | (0.23 | ) | | | (0.22 | ) | | | (0.28 | ) | | | (0.20 | ) |
Net gain (loss) on securities (realized and unrealized) | | | (4.31 | ) | | | 4.15 | | | | 3.63 | | | | 7.56 | | | | 5.92 | | | | 7.20 | |
| | | | | | | | | | | | | | | | | | | | | | | | |
Total from investment operations | | | (4.31 | ) | | | 4.11 | | | | 3.40 | | | | 7.34 | | | | 5.64 | | | | 7.00 | |
| | | | | | | | | | | | | | | | | | | | | | | | |
Less distributions: | | | | | | | | | | | | | | | | | | | | | | | | |
Distributions from realized gains | | | (7.72 | ) | | | (2.09 | ) | | | (2.07 | ) | | | (2.28 | ) | | | (0.26 | ) | | | — | |
| | | | | | | | | | | | | | | | | | | | | | | | |
Total distributions | | | (7.72 | ) | | | (2.09 | ) | | | (2.07 | ) | | | (2.28 | ) | | | (0.26 | ) | | | — | |
| | | | | | | | | | | | | | | | | | | | | | | | |
Net asset value, end of period | | $ | 24.75 | | | $ | 36.78 | | | $ | 34.76 | | | $ | 33.43 | | | $ | 28.37 | | | $ | 22.99 | |
| | | | | | | | | | | | | | | | | | | | | | | | |
Total Returnc | | | (13.39 | )% | | | 12.10 | % | | | 10.60 | % | | | 26.83 | % | | | 24.67 | % | | | 43.78 | % |
| | | | | | | | | | | | | | | | | | | | | | | | |
Ratios/Supplemental Data | | | | | | | | | | | | | | | | | | | | | | | | |
Net assets, end of period (in thousands) | | $ | 73,592 | | | $ | 106,179 | | | $ | 108,784 | | | $ | 97,664 | | | $ | 74,650 | | | $ | 53,947 | |
| | | | | | | | | | | | | | | | | | | | | | | | |
Ratios to average net assets: | | | | | | | | | | | | | | | | | | | | | | | | |
Net investment loss | | | (0.01 | )% | | | (0.10 | )% | | | (0.68 | )% | | | (0.72 | )% | | | (1.07 | )% | | | (1.08 | )% |
Total expensesd | | | 2.11 | % | | | 2.07 | % | | | 2.11 | % | | | 2.16 | % | | | 2.23 | % | | | 2.40 | % |
Net expensese | | | 2.11 | % | | | 2.07 | % | | | 2.11 | % | | | 2.16 | % | | | 2.23 | % | | | 2.40 | % |
Net expenses prior to custodian earning credits and net of expense waivers | | | 2.11 | % | | | 2.07 | % | | | 2.11 | % | | | 2.16 | % | | | 2.23 | % | | | 2.40 | % |
| | | | | | | | | | | | | | | | | | | | | | | | |
Portfolio turnover rate | | | 49 | % | | | 44 | % | | | 33 | % | | | 19 | % | | | 45 | % | | | 52 | % |
| | | | |
| | 42 | | The accompanying notes are an integral part of the financial statements |
| | |
| Financial Highlights | | Security Equity Fund |
Selected data for each share of capital stock outstanding throughout each year | | Mid Cap Value Series |
| | | | | | | | | | | | | | | | | | | | | | | | |
Class C | | Six Months Ended
March 31, 2008a | | | 2007 | | | 2006 | | | 2005 | | | 2004 | | | Year Ended
September 30,
2003 | |
Per Share Data | | | | | | | | | | | | | | | | | | | | | | | | |
Net asset value, beginning of period | | $ | 37.54 | | | $ | 35.43 | | | $ | 34.03 | | | $ | 28.85 | | | $ | 23.37 | | | $ | 16.26 | |
| | | | | | | | | | | | | | | | | | | | | | | | |
Income (loss) from investment operations: | | | | | | | | | | | | | | | | | | | | | | | | |
Net investment lossb | | | — | | | | (0.05 | ) | | | (0.22 | ) | | | (0.21 | ) | | | (0.29 | ) | | | (0.21 | ) |
Net gain (loss) on securities (realized and unrealized) | | | (4.41 | ) | | | 4.25 | | | | 3.69 | | | | 7.67 | | | | 6.03 | | | | 7.32 | |
| | | | | | | | | | | | | | | | | | | | | | | | |
Total from investment operations | | | (4.41 | ) | | | 4.20 | | | | 3.47 | | | | 7.46 | | | | 5.74 | | | | 7.11 | |
| | | | | | | | | | | | | | | | | | | | | | | | |
Less distributions: | | | | | | | | | | | | | | | | | | | | | | | | |
Distributions from realized gains | | | (7.72 | ) | | | (2.09 | ) | | | (2.07 | ) | | | (2.28 | ) | | | (0.26 | ) | | | — | |
| | | | | | | | | | | | | | | | | | | | | | | | |
Total distributions | | | (7.72 | ) | | | (2.09 | ) | | | (2.07 | ) | | | (2.28 | ) | | | (0.26 | ) | | | — | |
| | | | | | | | | | | | | | | | | | | | | | | | |
Net asset value, end of period | | $ | 25.41 | | | $ | 37.54 | | | $ | 35.43 | | | $ | 34.03 | | | $ | 28.85 | | | $ | 23.37 | |
| | | | | | | | | | | | | | | | | | | | | | | | |
Total Returnc | | | (13.42 | )% | | | 12.13 | % | | | 10.62 | % | | | 26.80 | % | | | 24.70 | % | | | 43.73 | % |
| | | | | | | | | | | | | | | | | | | | | | | | |
Ratios/Supplemental Data | | | | | | | | | | | | | | | | | | | | | | | | |
Net assets, end of period (in thousands) | | $ | 123,714 | | | $ | 176,746 | | | $ | 152,579 | | | $ | 93,887 | | | $ | 54,133 | | | $ | 32,999 | |
| | | | | | | | | | | | | | | | | | | | | | | | |
Ratios to average net assets: | | | | | | | | | | | | | | | | | | | | | | | | |
Net investment loss | | | (0.01 | )% | | | (0.12 | )% | | | (0.65 | )% | | | (0.71 | )% | | | (1.06 | )% | | | (1.08 | )% |
Total expensesd | | | 2.11 | % | | | 2.07 | % | | | 2.11 | % | | | 2.16 | % | | | 2.23 | % | | | 2.40 | % |
Net expensese | | | 2.11 | % | | | 2.07 | % | | | 2.11 | % | | | 2.16 | % | | | 2.23 | % | | | 2.40 | % |
Net expenses prior to custodian earning credits and net of expense waivers | | | 2.11 | % | | | 2.07 | % | | | 2.11 | % | | | 2.16 | % | | | 2.23 | % | | | 2.40 | % |
| | | | | | | | | | | | | | | | | | | | | | | | |
Portfolio turnover rate | | | 49 | % | | | 44 | % | | | 33 | % | | | 19 | % | | | 45 | % | | | 52 | % |
a | Unaudited figures for the six months ended March 31, 2008. Percentage amounts for the period, except total return, have been annualized. |
b | Net investment income (loss) was computed using average shares outstanding throughout the period. |
c | Total return information does not reflect deduction of any sales charges imposed at the time of purchase for Class A shares or upon redemption for Class B and C shares. |
d | Total expense information reflects expense ratios absent expense reductions by the Investment Manager and custodian earnings credits, as applicable. |
e | Net expense information reflects the expense ratios after voluntary expense waivers, reimbursements and custodian earnings credits, as applicable. |
| | | | |
| | 43 | | The accompanying notes are an integral part of the financial statements |
Security Equity Fund
Select 25 Series

Adviser,
Security Global Investors
44
| | |
| | Security Equity Fund |
Performance Summary | | Select 25 Series |
| March 31, 2008 | | (unaudited) |
PERFORMANCE
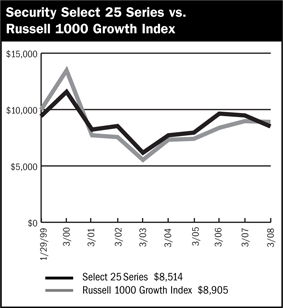
$10,000 Since Inception
This chart assumes a $10,000 investment in Class A shares of Select 25 Series on January 29, 1999 (date of inception), reflects deduction of the 5.75% sales load and assumes all dividends are reinvested. The chart does not reflect the deduction of taxes that a shareholder would pay on distributions or the redemption of fund shares. The Russell 1000 Growth Index is an unmanaged capitalization-weighted index which includes stocks incorporated in the United States and its territories and measures the performance of the Russell 1000 companies with higher price-to-book ratios and higher forecasted growth values.
| | | | | | | | | |
Average Annual Returns | |
Periods Ended 3-31-08 | | 1 Year | | | 5 Years | | | Since Inception | |
A Shares | | (10.20) | % | | 6.64 | % | | (1.10) | % (1-29-99) |
| | | |
A Shares with sales charge | | (15.34) | % | | 5.38 | % | | (1.74) | % (1-29-99) |
| | | |
B Shares | | (10.84) | % | | 5.85 | % | | (1.73) | % (1-29-99) |
| | | |
B Shares with CDSC | | (14.88) | % | | 5.53 | % | | (1.73) | % (1-29-99) |
| | | |
C Shares | | (10.80) | % | | 5.86 | % | | (1.78) | % (1-29-99) |
| | | |
C Shares with CDSC | | (11.61) | % | | 5.86 | % | | (1.78) | % (1-29-99) |
The performance data above represents past performance that is not predictive of future results. The investment return and principal value of an investment in the Series will fluctuate so that an investor’s shares, when redeemed, may be worth more or less than their original cost. The figures above do not reflect deduction of the maximum front-end sales charge of 5.75% for Class A shares or the contingent deferred sales charge of 5% for Class B shares and 1% for Class C shares, as applicable, except where noted. The figures do not reflect the deduction of taxes that a shareholder would pay on distributions or redemption of shares. Such figures would be lower if the maximum sales charge and any applicable taxes were deducted.
| | | |
Portfolio Composition by Sector as of 3-31-08 | |
Consumer Discretionary | | 11.92 | % |
Consumer Staples | | 7.89 | |
Energy | | 6.49 | |
Financials | | 6.43 | |
Health Care | | 14.49 | |
Industrials | | 14.24 | |
Information Technology | | 23.98 | |
Materials | | 10.56 | |
Repurchase Agreement | | 2.36 | |
Other Assets in Excess of Liabilities | | 1.64 | |
Total Net Assets | | 100.00 | % |
| | | |
| | | | |
| | 45 | | The accompanying notes are an integral part of the financial statements |
| | |
| Performance Summary | | Security Equity Fund Select 25 Series |
| March 31, 2008 | | (unaudited) |
Information About Your Series Expenses
Calculating your ongoing Series expenses
Example
As a shareholder of the Series, you incur two types of costs: (1) transaction costs, which may include sales charges (loads) on purchase payments; contingent deferred sales charges on redemptions; and redemption fees, if any; and (2) ongoing costs, including management fees; distribution and/or service fees (12b-1); and other Series expenses. This example is intended to help you understand your ongoing costs (in dollars) of investing in the Series and to compare these costs with ongoing costs of investing in other mutual funds. The example is based on an investment of $1,000 invested at the beginning of the period and held for the entire period October 1, 2007 through March 31, 2008.
Actual Expenses
The first line for each class of shares in the table provides information about actual account values and actual expenses. You may use the information in this table, together with the amount you invested, to estimate the expenses that you paid over the period. Simply divide your account value by $1,000 (for example, an $8,600 account value divided by $1,000 = 8.6), then multiply the result by the number in the table under the heading entitled “Expenses Paid During the Period” to estimate the expenses you paid on your account during this period.
Hypothetical Example for Comparison Purposes
The second line for each class of shares in the table provides information about hypothetical account values and hypothetical expenses based on the Series actual expense ratio and an assumed rate of return of 5% per year before expenses, which is not the Series actual return. The hypothetical account values and expenses may not be used to estimate the actual ending account balance or expenses you paid for the period. You may use this information to compare the ongoing costs of investing in the Series and other funds. To do so, compare this 5% hypothetical example with the 5% hypothetical examples that appear in the shareholder reports of the other mutual funds.
Please note that the expenses shown in the table are meant to highlight your ongoing costs only and do not reflect any transactional costs, such as sales charges (loads) on purchase payments, contingent deferred sales charges on redemptions, and redemption fees, if any. Therefore, the second line for each class of shares is useful in comparing ongoing costs only, and will not help you determine the relative total costs of owning different funds. In addition, if these transactional costs were included, your costs would have been higher.
Series Expenses
| | | | | | | | | |
| | | Beginning
Account
Value
10/1/2007 | | Ending
Account
Value
3/31/20081 | | Expenses
Paid
During
Period2 |
Select 25 Series - Class A | | | | | | | | | |
Actual | | $ | 1,000.00 | | $ | 847.41 | | $ | 6.24 |
Hypothetical | | | 1,000.00 | | | 1,018.25 | | | 6.81 |
| | | |
Select 25 Series - Class B | | | | | | | | | |
Actual | | | 1,000.00 | | | 844.38 | | | 9.68 |
Hypothetical | | | 1,000.00 | | | 1,014.50 | | | 10.58 |
| | | |
Select 25 Series - Class C | | | | | | | | | |
Actual | | | 1,000.00 | | | 844.87 | | | 9.69 |
Hypothetical | | | 1,000.00 | | | 1,014.50 | | | 10.58 |
1 | The actual ending account value is based on the actual total return of the Series for the period October 1, 2007 to March 31, 2008 after actual expenses and will differ from the hypothetical ending account value which is based on the Series expense ratio and a hypothetical annual return of 5% before expenses. The actual cumulative return at net asset value for the period October 1, 2007 to March 31, 2008 was (15.26%), (15.56%) and (15.51%), for Class A, B, and C respectively. |
2 | Expenses are equal to the Series annualized expense ratio (1.35%, 2.10% and 2.10% for Class A, B, and C shares, respectively) net of any applicable fee waivers or earnings credits, multiplied by the average account value over the period, multiplied by 183/366 (to reflect the one-half year period). |
46
| | |
| Schedule of Investments | | Security Equity Fund - Select 25 Series |
| March 31, 2008 (Unaudited) | | |
| | | | | | |
| | | Shares | | Value |
COMMON STOCK - 96.0% | | | | | | |
Aerospace & Defense - 4.1% | | | | | | |
Honeywell International, Inc. | | | 18,290 | | $ | 1,031,922 |
Precision Castparts Corporation | | | 9,725 | | | 992,728 |
| | | | | | |
| | | | | | 2,024,650 |
| | | | | | |
Asset Management & Custody Banks - 2.4% | | | | | | |
Bank of New York Mellon Corporation | | | 28,200 | | | 1,176,786 |
| | | | | | |
Biotechnology - 8.7% | | | | | | |
Celgene Corporation * | | | 32,045 | | | 1,964,038 |
Gilead Sciences, Inc. * | | | 45,070 | | | 2,322,457 |
| | | | | | |
| | | | | | 4,286,495 |
| | | | | | |
Casinos & Gaming - 2.8% | | | | | | |
Las Vegas Sands Corporation * | | | 18,895 | | | 1,391,428 |
| | | | | | |
Communications Equipment - 8.1% | | | | | | |
Cisco Systems, Inc. * | | | 81,800 | | | 1,970,562 |
Corning, Inc. | | | 84,490 | | | 2,031,140 |
| | | | | | |
| | | | | | 4,001,702 |
| | | | | | |
Computer Hardware - 7.0% | | | | | | |
Apple, Inc. * | | | 10,710 | | | 1,536,885 |
Hewlett-Packard Company | | | 42,210 | | | 1,927,308 |
| | | | | | |
| | | | | | 3,464,193 |
| | | | | | |
Construction & Farm Machinery & Heavy Trucks - 4.0% | | | | | | |
Deere & Company | | | 24,395 | | | 1,962,334 |
| | | | | | |
Department Stores - 2.2% | | | | | | |
JC Penney Company, Inc. | | | 29,195 | | | 1,100,943 |
| | | | | | |
Diversified Banks - 2.1% | | | | | | |
Wells Fargo & Company | | | 35,590 | | | 1,035,669 |
| | | | | | |
Drug Retail - 4.7% | | | | | | |
CVS Caremark Corporation | | | 56,800 | | | 2,300,968 |
| | | | | | |
Electrical Components & Equipment - 3.2% | | | | | | |
Emerson Electric Company | | | 30,350 | | | 1,561,811 |
| | | | | | |
Fertilizers & Agricultural Chemicals - 7.6% | | | | | | |
Monsanto Company | | | 16,300 | | | 1,817,450 |
Mosaic Company * | | | 18,895 | | | 1,938,627 |
| | | | | | |
| | | | | | 3,756,077 |
| | | | | | |
Health Care Equipment - 3.0% | | | | | | |
St. Jude Medical, Inc. * | | | 34,455 | | | 1,488,111 |
| | | | | | |
Industrial Conglomerates - 3.0% | | | | | | |
General Electric Company | | | 39,890 | | | 1,476,329 |
| | | | | | |
Industrial Gases - 2.9% | | | | | | |
Air Products & Chemicals, Inc. | | | 15,795 | | | 1,453,140 |
| | | | | | |
Internet Software & Services - 2.7% | | | | | | |
Google, Inc. * | | | 3,010 | | | 1,325,815 |
| | | | | | |
Movies & Entertainment - 2.8% | | | | | | |
Walt Disney Company | | | 43,900 | | | 1,377,582 |
| | | | | | |
Oil & Gas Drilling - 3.3% | | | | | | |
Transocean, Inc. | | | 12,000 | | | 1,622,400 |
| | | | | | |
Oil & Gas Exploration & Production - 3.2% | | | | | | |
Apache Corporation | | | 13,085 | | | 1,580,930 |
| | | | | | |
Pharmaceuticals - 2.8% | | | | | | |
Merck & Company, Inc. | | | 36,300 | | | 1,377,585 |
| | | | | | |
Restaurants - 4.1% | | | | | | |
McDonald’s Corporation | | | 36,060 | | | 2,011,066 |
| | | | | | |
Semiconductor Equipment - 2.8% | | | | | | |
MEMC Electronic Materials, Inc. * | | | 19,400 | | | 1,375,460 |
| | | | | | |
Soft Drinks - 3.2% | | | | | | |
PepsiCo, Inc. | | | 22,100 | | | 1,595,620 |
| | | | | | |
Specialized Finance - 1.9% | | | | | | |
CME Group, Inc. | | | 2,045 | | | 959,309 |
| | | | | | |
Systems Software - 3.4% | | | | | | |
Oracle Corporation * | | | 85,110 | | | 1,664,752 |
| | | | | | |
TOTAL COMMON STOCK (Cost $46,565,265) | | | | | $ | 47,371,155 |
| | | | | | |
| | |
| | | Principal
Amount | | |
REPURCHASE AGREEMENT - 2.4% | | | | | | |
United Missouri Bank, 1.99%, dated 3/31/08, matures 4/01/08; repurchase amount $1,167,065 (Collateralized by FNSM, 6.50%, 10/01/37 with a value of $1,191,138) | | $ | 1,167,000 | | $ | 1,167,000 |
| | | | | | |
TOTAL REPURCHASE AGREEMENT (Cost $1,167,000) | | | | | $ | 1,167,000 |
| | | | | | |
Total Investments (Security Equity Fund - Select 25 Series)
(Cost $47,732,265) - 98.4% | | | | | $ | 48,538,155 |
Other Assets in Excess of Liabilities - 1.6% | | | | | | 809,031 |
| | | | | | |
TOTAL NET ASSETS - 100.0% | | | | | $ | 49,347,186 |
| | | | | | |
Footnotes
Percentages are stated as a percent of net assets.
For federal income tax purposes the identified cost of investments owned at 3/31/2008 was $47,826,790.
| * | - Non-income producing security |
See notes to financial statements.
| | | | |
| | 47 | | The accompanying notes are an integral part of the financial statements |
Security Equity Fund
Select 25 Series
(unaudited)
Statement of Assets and Liabilities
March 31, 2008
| | | | |
Assets: | | | | |
Investments, at value* | | $ | 48,538,155 | |
Cash | | | 806 | |
| |
Receivables: | | | | |
Fund shares sold | | | 46,538 | |
Securities sold | | | 1,880,600 | |
Dividends | | | 46,596 | |
Security Investors | | | 10,196 | |
Prepaid expenses | | | 21,935 | |
| | | | |
Total assets | | | 50,544,826 | |
| | | | |
Liabilities: | | | | |
Payable for: | | | | |
Securities purchased | | | 1,011,560 | |
Fund shares redeemed | | | 105,136 | |
Management fees | | | 31,747 | |
Custodian fees | | | 1,200 | |
Transfer agent/maintenance fees | | | 12,396 | |
Administration fees | | | 4,321 | |
Professional fees | | | 5,885 | |
12b-1 distribution plan fees | | | 22,046 | |
Directors’ fees | | | 441 | |
Other | | | 2,908 | |
| | | | |
Total liabilities | | | 1,197,640 | |
| | | | |
Net assets | | $ | 49,347,186 | |
| | | | |
Net assets consist of: | | | | |
Paid in capital | | $ | 61,787,393 | |
Accumulated net investment loss | | | (91,376 | ) |
Accumulated net realized loss on sale of investments | | | (13,154,721 | ) |
Net unrealized appreciation in value of investments | | | 805,890 | |
| | | | |
Net assets | | $ | 49,347,186 | |
| | | | |
Class A: | | | | |
Capital shares outstanding (unlimited number of shares authorized) | | | 3,844,964 | |
Net assets | | $ | 31,649,827 | |
Net asset value and redemption price per share | | $ | 8.23 | |
| | | | |
Maximum offering price per share (net asset value divided by 94.25%) | | $ | 8.73 | |
| | | | |
Class B: | | | | |
Capital shares outstanding (unlimited number of shares authorized) | | | 1,336,241 | |
Net assets | | $ | 10,224,607 | |
Net asset value, offering and redemption price per share (excluding any applicable contingent deferred sales charge) | | $ | 7.65 | |
| | | | |
Class C: | | | | |
Capital shares outstanding (unlimited number of shares authorized) | | | 973,143 | |
Net assets | | $ | 7,472,752 | |
Net asset value, offering and redemption price per share (excluding any applicable contingent deferred sales charge) | | $ | 7.68 | |
| | | | |
* Investments, at cost | | $ | 47,732,265 | |
Statement of Operations
For the Six Months Ended March 31, 2008
| | | | |
Investment Income: | | | | |
Dividends | | $ | 271,186 | |
Interest | | | 53,423 | |
| | | | |
Total investment income | | | 324,609 | |
| | | | |
Expenses: | | | | |
Management fees | | | 189,949 | |
Transfer agent/maintenance fees | | | 127,381 | |
Administration fees | | | 24,512 | |
Custodian fees | | | 1,204 | |
Directors’ fees | | | 904 | |
Professional fees | | | 3,555 | |
Reports to shareholders | | | 1,684 | |
Registration fees | | | 17,423 | |
Other expenses | | | 2,608 | |
12b-1 distribution fees - Class A | | | 38,436 | |
12b-1 distribution fees - Class B | | | 52,104 | |
12b-1 distribution fees - Class C | | | 47,419 | |
| | | | |
Total expenses | | | 507,179 | |
Less: | | | | |
Reimbursement of expenses - Class A | | | (56,160 | ) |
Reimbursement of expenses - Class B | | | (18,929 | ) |
Reimbursement of expenses - Class C | | | (16,105 | ) |
| | | | |
Net expenses | | | 415,985 | |
| | | | |
Net investment loss | | | (91,376 | ) |
| | | | |
Net Realized and Unrealized Gain (Loss): | | | | |
Net realized gain (loss) during the period on: | | | | |
Investments | | | (4,483,292 | ) |
| | | | |
Net realized loss | | | (4,483,292 | ) |
| | | | |
Net unrealized appreciation (depreciation) during the period on: | | | | |
Investments | | | (3,998,546 | ) |
| | | | |
Net unrealized depreciation | | | (3,998,546 | ) |
| | | | |
Net loss | | | (8,481,838 | ) |
| | | | |
Net decrease in net assets resulting from operations | | $ | (8,573,214 | ) |
| | | | |
| | | | |
| | 48 | | The accompanying notes are an integral part of the financial statements |
| | |
| | Security Equity Fund |
| Statement of Changes in Net Assets | | Select 25 Series |
| | | | | | | | |
| | | Six Months Ended
March 31, 2008 | | | Year Ended
September 30, 2007 | |
| | | (unaudited) | | | | |
Increase (decrease) in net assets from operations: | | | | | | | | |
Net investment loss | | $ | (91,376 | ) | | $ | (257,870 | ) |
Net realized gain (loss) during the period on investments | | | (4,483,292 | ) | | | 7,853,362 | |
Net unrealized depreciation during the period on investments | | | (3,998,546 | ) | | | (3,244,239 | ) |
| | | | | | | | |
Net increase (decrease) in net assets resulting from operations | | | (8,573,214 | ) | | | 4,351,253 | |
| | | | | | | | |
Distributions to shareholders from: | | | | | | | | |
Net realized gain | | | | | | | | |
Class A | | | (2,418,632 | ) | | | — | |
Class B | | | (850,835 | ) | | | — | |
Class C | | | (907,367 | ) | | | — | |
| | | | | | | | |
Total distributions to shareholders | | | (4,176,834 | ) | | | — | |
| | | | | | | | |
Capital share transactions: | | | | | | | | |
Proceeds from sale of shares | | | | | | | | |
Class A | | | 11,409,910 | | | | 10,493,477 | |
Class B | | | 4,003,560 | | | | 1,517,578 | |
Class C | | | 649,398 | | | | 1,462,460 | |
Distributions reinvested | | | | | | | | |
Class A | | | 2,377,172 | | | | — | |
Class B | | | 845,322 | | | | — | |
Class C | | | 902,367 | | | | — | |
Cost of shares redeemed | | | | | | | | |
Class A | | | (4,978,730 | ) | | | (12,657,596 | ) |
Class B | | | (2,855,438 | ) | | | (7,738,929 | ) |
Class C | | | (2,743,481 | ) | | | (3,869,582 | ) |
| | | | | | | | |
Net increase (decrease) from capital share transactions | | | 9,610,080 | | | | (10,792,592 | ) |
| | | | | | | | |
Net decrease in net assets | | | (3,139,968 | ) | | | (6,441,339 | ) |
| | | | | | | | |
Net assets: | | | | | | | | |
Beginning of period | | | 52,487,154 | | | | 58,928,493 | |
| | | | | | | | |
End of period | | $ | 49,347,186 | | | $ | 52,487,154 | |
| | | | | | | | |
Accumulated net investment loss at end of period | | $ | (91,376 | ) | | $ | — | |
| | | | | | | | |
Capital share activity: | | | | | | | | |
Shares sold | | | | | | | | |
Class A | | | 1,284,670 | | | | 1,014,621 | |
Class B | | | 485,501 | | | | 155,252 | |
Class C | | | 75,305 | | | | 148,937 | |
Shares reinvested | | | | | | | | |
Class A | | | 269,521 | | | | — | |
Class B | | | 102,962 | | | | — | |
Class C | | | 109,511 | | | | — | |
Shares redeemed | | | | | | | | |
Class A | | | (558,448 | ) | | | (1,216,006 | ) |
Class B | | | (337,658 | ) | | | (792,758 | ) |
Class C | | | (331,200 | ) | | | (394,683 | ) |
| | | | |
| | 49 | | The accompanying notes are an integral part of the financial statements |
| | |
| Financial Highlights | | Security Equity Fund |
| Selected data for each share of capital stock outstanding throughout each year | | Select 25 Series |
| | | | | | | | | | | | | | | | | | | | | | | | |
Class A | | Six Months Ended
March 31,
2008a | | | 2007 | | | 2006b | | | 2005 | | | 2004 | | | Year Ended
September 30,
2003 | |
Per Share Data | | | | | | | | | | | | | | | | | | | | | | | | |
Net asset value, beginning of period | | $ | 10.66 | | | $ | 9.86 | | | $ | 9.36 | | | $ | 7.81 | | | $ | 7.27 | | | $ | 6.52 | |
| | | | | | | | | | | | | | | | | | | | | | | | |
Income (loss) from investment operations: | | | | | | | | | | | | | | | | | | | | | | | | |
Net investment lossc | | | — | | | | (0.01 | ) | | | (0.06 | ) | | | (0.07 | ) | | | (0.06 | ) | | | (0.05 | ) |
Net gain (loss) on securities (realized and unrealized) | | | (1.57 | ) | | | 0.81 | | | | 0.56 | | | | 1.62 | | | | 0.60 | | | | 0.80 | |
| | | | | | | | | | | | | | | | | | | | | | | | |
Total from investment operations | | | (1.57 | ) | | | 0.80 | | | | 0.50 | | | | 1.55 | | | | 0.54 | | | | 0.75 | |
| | | | | | | | | | | | | | | | | | | | | | | | |
Less distributions: | | | | | | | | | | | | | | | | | | | | | | | | |
Distributions from realized gains | | | (0.86 | ) | | | — | | | | — | | | | — | | | | — | | | | — | |
| | | | | | | | | | | | | | | | | | | | | | | | |
Total distributions | | | (0.86 | ) | | | — | | | | — | | | | — | | | | — | | | | — | |
| | | | | | | | | | | | | | | | | | | | | | | | |
Net asset value, end of period | | $ | 8.23 | | | $ | 10.66 | | | $ | 9.86 | | | $ | 9.36 | | | $ | 7.81 | | | $ | 7.27 | |
| | | | | | | | | | | | | | | | | | | | | | | | |
Total Returnd | | | (15.26 | )% | | | 8.11 | % | | | 5.34 | % | | | 19.85 | % | | | 7.43 | % | | | 11.50 | % |
| | | | | | | | | | | | | | | | | | | | | | | | |
Ratios/Supplemental Data | | | | | | | | | | | | | | | | | | | | | | | | |
Net assets, end of period (in thousands) | | $ | 31,650 | | | $ | 30,375 | | | $ | 30,078 | | | $ | 8,912 | | | $ | 9,228 | | | $ | 10,396 | |
| | | | | | | | | | | | | | | | | | | | | | | | |
Ratios to average net assets: | | | | | | | | | | | | | | | | | | | | | | | | |
Net investment loss | | | (0.07 | )% | | | (0.10 | )% | | | (0.68 | )% | | | (0.79 | )% | | | (0.75 | )% | | | (0.70 | )% |
Total expensese | | | 1.71 | % | | | 1.57 | % | | | 1.76 | % | | | 1.67 | % | | | 1.56 | % | | | 1.63 | % |
Net expensesf | | | 1.35 | % | | | 1.40 | % | | | 1.76 | % | | | 1.67 | % | | | 1.56 | % | | | 1.63 | % |
Net expenses prior to custodian earning credits and net of expense waivers | | | 1.35 | % | | | 1.40 | % | | | 1.76 | % | | | 1.67 | % | | | 1.56 | % | | | 1.63 | % |
| | | | | | | | | | | | | | | | | | | | | | | | |
Portfolio turnover rate | | | 238 | % | | | 21 | % | | | 39 | % | | | 13 | % | | | 44 | % | | | 54 | % |
| | | | | | |
Class B | | Six Months Ended
March 31,
2008a | | | 2007 | | | 2006b | | | 2005 | | | 2004 | | | Year Ended
September 30,
2003 | |
Per Share Data | | | | | | | | | | | | | | | | | | | | | | | | |
Net asset value, beginning of period | | $ | 10.01 | | | $ | 9.33 | | | $ | 8.92 | | | $ | 7.50 | | | $ | 7.04 | | | $ | 6.36 | |
| | | | | | | | | | | | | | | | | | | | | | | | |
Income (loss) from investment operations: | | | | | | | | | | | | | | | | | | | | | | | | |
Net investment lossc | | | (0.03 | ) | | | (0.09 | ) | | | (0.13 | ) | | | (0.13 | ) | | | (0.11 | ) | | | (0.10 | ) |
Net gain (loss) on securities (realized and unrealized) | | | (1.47 | ) | | | 0.77 | | | | 0.54 | | | | 1.55 | | | | 0.57 | | | | 0.78 | |
| | | | | | | | | | | | | | | | | | | | | | | | |
Total from investment operations | | | (1.50 | ) | | | 0.68 | | | | 0.41 | | | | 1.42 | | | | 0.46 | | | | 0.68 | |
| | | | | | | | | | | | | | | | | | | | | | | | |
Less distributions: | | | | | | | | | | | | | | | | | | | | | | | | |
Distributions from realized gains | | | (0.86 | ) | | | — | | | | — | | | | — | | | | — | | | | — | |
| | | | | | | | | | | | | | | | | | | | | | | | |
Total distributions | | | (0.86 | ) | | | — | | | | — | | | | — | | | | — | | | | — | |
| | | | | | | | | | | | | | | | | | | | | | | | |
Net asset value, end of period | | $ | 7.65 | | | $ | 10.01 | | | $ | 9.33 | | | $ | 8.92 | | | $ | 7.50 | | | $ | 7.04 | |
| | | | | | | | | | | | | | | | | | | | | | | | |
Total Returnd | | | (15.56 | )% | | | 7.29 | % | | | 4.60 | % | | | 18.93 | % | | | 6.53 | % | | | 10.69 | % |
| | | | | | | | | | | | | | | | | | | | | | | | |
Ratios/Supplemental Data | | | | | | | | | | | | | | | | | | | | | | | | |
Net assets, end of period (in thousands) | | $ | 10,225 | | | $ | 10,868 | | | $ | 16,073 | | | $ | 7,000 | | | $ | 7,333 | | | $ | 8,203 | |
| | | | | | | | | | | | | | | | | | | | | | | | |
Ratios to average net assets: | | | | | | | | | | | | | | | | | | | | | | | | |
Net investment loss | | | (0.82 | )% | | | (0.88 | )% | | | (1.46 | )% | | | (1.54 | )% | | | (1.50 | )% | | | (1.45 | )% |
Total expensese | | | 2.46 | % | | | 2.32 | % | | | 2.53 | % | | | 2.42 | % | | | 2.31 | % | | | 2.38 | % |
Net expensesf | | | 2.10 | % | | | 2.15 | % | | | 2.53 | % | | | 2.42 | % | | | 2.31 | % | | | 2.38 | % |
Net expenses prior to custodian earning credits and net of expense waivers | | | 2.10 | % | | | 2.15 | % | | | 2.53 | % | | | 2.42 | % | | | 2.31 | % | | | 2.38 | % |
| | | | | | | | | | | | | | | | | | | | | | | | |
Portfolio turnover rate | | | 238 | % | | | 21 | % | | | 39 | % | | | 13 | % | | | 44 | % | | | 54 | % |
| | | | |
| | 50 | | The accompanying notes are an integral part of the financial statements |
| | | | |
| Financial Highlights | | | | Security Equity Fund |
Selected data for each share of capital stock outstanding throughout each year | | Select 25 Series |
| | | | | | | | | | | | | | | | | | | | | | | | |
Class C | | Six Months
Ended March 31,
2008a | | | 2007 | | | 2006b | | | 2005 | | | 2004 | | | Year Ended
September 30,
2003 | |
Per Share Data | | | | | | | | | | | | | | | | | | | | | | | | |
Net asset value, beginning of period | | $ | 10.04 | | | $ | 9.36 | | | $ | 8.94 | | | $ | 7.52 | | | $ | 7.06 | | | $ | 6.38 | |
| | | | | | | | | | | | | | | | | | | | | | | | |
Income (loss) from investment operations: | | | | | | | | | | | | | | | | | | | | | | | | |
Net investment lossc | | | (0.03 | ) | | | (0.08 | ) | | | (0.13 | ) | | | (0.13 | ) | | | (0.11 | ) | | | (0.10 | ) |
Net gain (loss) on securities (realized and unrealized) | | | (1.47 | ) | | | 0.76 | | | | 0.55 | | | | 1.55 | | | | 0.57 | | | | 0.78 | |
| | | | | | | | | | | | | | | | | | | | | | | | |
Total from investment operations | | | (1.50 | ) | | | 0.68 | | | | 0.42 | | | | 1.42 | | | | 0.46 | | | | 0.68 | |
| | | | | | | | | | | | | | | | | | | | | | | | |
Less distributions: | | | | | | | | | | | | | | | | | | | | | | | | |
Distributions from realized gains | | | (0.86 | ) | | | — | | | | — | | | | — | | | | — | | | | — | |
| | | | | | | | | | | | | | | | | | | | | | | | |
Total distributions | | | (0.86 | ) | | | — | | | | — | | | | — | | | | — | | | | — | |
| | | | | | | | | | | | | | | | | | | | | | | | |
Net asset value, end of period | | $ | 7.68 | | | $ | 10.04 | | | $ | 9.36 | | | $ | 8.94 | | | $ | 7.52 | | | $ | 7.06 | |
| | | | | | | | | | | | | | | | | | | | | | | | |
Total Returnd | | | (15.51 | )% | | | 7.26 | % | | | 4.70 | % | | | 18.88 | % | | | 6.52 | % | | | 10.66 | % |
| | | | | | | | | | | | | | | | | | | | | | | | |
Ratios/Supplemental Data | | | | | | | | | | | | | | | | | | | | | | | | |
Net assets, end of period (in thousands) | | $ | 7,473 | | | $ | 11,245 | | | $ | 12,777 | | | $ | 5,029 | | | $ | 5,866 | | | $ | 6,225 | |
| | | | | | | | | | | | | | | | | | | | | | | | |
Ratios to average net assets: | | | | | | | | | | | | | | | | | | | | | | | | |
Net investment loss | | | (0.79 | )% | | | (0.86 | )% | | | (1.44 | )% | | | (1.54 | )% | | | (1.50 | )% | | | (1.44 | )% |
Total expensese | | | 2.44 | % | | | 2.32 | % | | | 2.52 | % | | | 2.42 | % | | | 2.31 | % | | | 2.37 | % |
Net expensesf | | | 2.10 | % | | | 2.15 | % | | | 2.52 | % | | | 2.42 | % | | | 2.31 | % | | | 2.37 | % |
Net expenses prior to custodian earning credits and net of expense waivers | | | 2.10 | % | | | 2.15 | % | | | 2.52 | % | | | 2.42 | % | | | 2.31 | % | | | 2.37 | % |
| | | | | | | | | | | | | | | | | | | | | | | | |
Portfolio turnover rate | | | 238 | % | | | 21 | % | | | 39 | % | | | 13 | % | | | 44 | % | | | 54 | % |
a | Unaudited figures for the six months ended March 31, 2008. Percentage amounts for the period, except total return, have been annualized. |
b | The financial highlights for the Select 25 Series exclude the historical financial highlights of the Enhanced Index Series, Class A, B and C shares, the Large Cap Growth Series, Class A, B and C shares and the Social Awareness Series, Class A, B and C shares. A total of $29,412,366 was excluded from purchases in the portfolio turnover calculation. This was the cost of the securities Select 25 received as a result of the merger. The assets of the Enhanced Index, Large Cap Growth and Social Awareness Series’ were acquired by the Select 25 Series on June 16, 2006. |
c | Net investment income (loss) was computed using average shares outstanding throughout the period. |
d | Total return information does not reflect deduction of any sales charges imposed at the time of purchase for Class A shares or upon redemption for Class B and C shares. |
e | Total expense information reflects expense ratios absent expense reductions by the Investment Manager and custodian earnings credits, as applicable. |
f | Net expense information reflects the expense ratios after voluntary expense waivers, reimbursements and custodian earnings credits, as applicable. |
| | | | |
| | 51 | | The accompanying notes are an integral part of the financial statements |
Security Equity Fund
Small Cap Growth Series

Subadviser,
RS Investments
| | |
| | Security Equity Fund |
| Performance Summary | | Small Cap Growth Series |
| March 31, 2008 | | (unaudited) |
PERFORMANCE
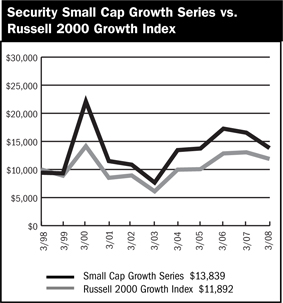
$10,000 Over 10 Years
This chart assumes a $10,000 investment in Class A shares of Small Cap Growth Series on March 31, 1998, reflects deduction of the 5.75% sales load and assumes all dividends reinvested. The chart does not reflect the deduction of taxes that a shareholder would pay on distributions or the redemption of fund shares. The Russell 2000 Growth Index measures the performance of those Russell 2000 companies with higher price-to-book ratios and higher forecasted growth values.
Average Annual Returns
| | | | | | | | | | | | |
Periods Ended 3-31-08 | | 1 Year | | | 5 Years | | | 10 Years | | | Since
Inception | |
A Shares | | (16.40 | )% | | 12.51 | % | | 3.92 | % | | — | |
A Shares with sales charge | | (21.22 | )% | | 11.18 | % | | 3.30 | % | | — | |
B Shares | | (17.06 | )% | | 11.67 | % | | 3.16 | % | | — | |
B Shares with CDSC | | (20.87 | )% | | 11.42 | % | | 3.16 | % | | — | |
C Shares | | (17.07 | )% | | 11.67 | % | | — | | | 3.01% (1-29-99 | ) |
C Shares with CDSC | | (17.83 | )% | | 11.67 | % | | — | | | 3.01% (1-29-99 | ) |
The performance data above represents past performance that is not predictive of future results. The investment return and principal value of an investment in the Series will fluctuate so that an investor’s shares, when redeemed, may be worth more or less than their original cost. The figures above do not reflect deduction of the maximum front-end sales charge of 5.75% for Class A shares or the contingent deferred sales charge of 5% for Class B shares and 1% for Class C shares, as applicable, except where noted. The figures do not reflect the deduction of taxes that a shareholder would pay on distributions or redemption of shares. Such figures would be lower if the maximum sales charge and any applicable taxes were deducted. Fee waivers reduced expenses of the Series and in the absence of such waiver, the performance quoted would be reduced.
Portfolio Composition by Sector as of 3-31-08
| | | |
Consumer Discretionary | | 13.19 | % |
Consumer Staples | | 1.85 | |
Energy | | 6.46 | |
Financials | | 7.12 | |
Health Care | | 25.02 | |
Industrials | | 14.99 | |
Information Technology | | 16.89 | |
Telecommunication Services | | 2.77 | |
Repurchase Agreement | | 12.81 | |
Liabilities in Excess of Other Assets | | (1.10 | ) |
Total Net Assets | | 100.00 | % |
| | | |
| | | | |
| | 53 | | The accompanying notes are an integral part of the financial statements |
| | | | |
| | Security Equity Fund |
| Performance Summary | | Small Cap Growth Series |
| March 31, 2008 | | | | (unaudited) |
Information About Your Series Expenses
Calculating your ongoing Series expenses
Example
As a shareholder of the Series, you incur two types of costs: (1) transaction costs, which may include sales charges (loads) on purchase payments; contingent deferred sales charges on redemptions; and redemption fees, if any; and (2) ongoing costs, including management fees; distribution and/or service fees (12b-1); and other Series expenses. This example is intended to help you understand your ongoing costs (in dollars) of investing in the Series and to compare these costs with ongoing costs of investing in other mutual funds. The example is based on an investment of $1,000 invested at the beginning of the period and held for the entire period October 1, 2007 through March 31, 2008.
Actual Expenses
The first line for each class of shares in the table provides information about actual account values and actual expenses. You may use the information in this table, together with the amount you invested, to estimate the expenses that you paid over the period. Simply divide your account value by $1,000 (for example, an $8,600 account value divided by $1,000 = 8.6), then multiply the result by the number in the table under the heading entitled “Expenses Paid During the Period” to estimate the expenses you paid on your account during this period.
Hypothetical Example for Comparison Purposes
The second line for each class of shares in the table provides information about hypothetical account values and hypothetical expenses based on the Series actual expense ratio and an assumed rate of return of 5% per year before expenses, which is not the Series actual return. The hypothetical account values and expenses may not be used to estimate the actual ending account balance or expenses you paid for the period. You may use this information to compare the ongoing costs of investing in the Series and other funds. To do so, compare this 5% hypothetical example with the 5% hypothetical examples that appear in the shareholder reports of the other mutual funds.
Please note that the expenses shown in the table are meant to highlight your ongoing costs only and do not reflect any transactional costs, such as sales charges (loads) on purchase payments, contingent deferred sales charges on redemptions, and redemption fees, if any. Therefore, the second line for each class of shares is useful in comparing ongoing costs only, and will not help you determine the relative total costs of owning different funds. In addition, if these transactional costs were included, your costs would have been higher.
Series Expenses
| | | | | | | | | |
| | | Beginning
Account
Value
10/1/2007 | | Ending
Account
Value
3/31/20081 | | Expenses
Paid
During
Period2 |
Small Cap Growth | | | | | | | | | |
Series - Class A | | | | | | | | | |
Actual | | $ | 1,000.00 | | $ | 765.65 | | $ | 8.39 |
Hypothetical | | | 1,000.00 | | | 1,015.50 | | | 9.57 |
| | | |
Small Cap Growth | | | | | | | | | |
Series - Class B | | | | | | | | | |
Actual | | | 1,000.00 | | | 762.69 | | | 12.12 |
Hypothetical | | | 1,000.00 | | | 1,011.25 | | | 13.83 |
| | | |
Small Cap Growth | | | | | | | | | |
Series - Class C | | | | | | | | | |
Actual | | | 1,000.00 | | | 762.91 | | | 12.21 |
Hypothetical | | | 1,000.00 | | | 1,011.15 | | | 13.93 |
1 | The actual ending account value is based on the actual total return of the Series for the period October 1, 2007 to March 31, 2008 after actual expenses and will differ from the hypothetical ending account value which is based on the Series expense ratio and a hypothetical annual return of 5% before expenses. The actual cumulative return at net asset value for the period October 1, 2007 to March 31, 2008 was (23.43%), (23.73%) and (23.71%), for Class A, B, and C respectively. |
2 | Expenses are equal to the Series annualized expense ratio (1.90%, 2.75% and 2.77% for Class A, B, and C shares, respectively) net of any applicable fee waivers or earnings credits, multiplied by the average account value over the period, multiplied by 183/366 (to reflect the one-half year period). |
| | | | |
| Schedule of Investments | | Security Equity Fund - Small Cap Growth Series |
March 31, 2008 (Unaudited) | | | | |
| | | | | |
| | | Shares | | Value |
COMMON STOCK - 88.3% | | | | | |
Aerospace & Defense - 5.2% | | | | | |
BE Aerospace, Inc. * | | 9,720 | | $ | 339,714 |
Heico Corporation | | 7,580 | | | 369,525 |
Ladish Company, Inc. * | | 5,550 | | | 199,800 |
Orbital Sciences Corporation * | | 10,580 | | | 254,978 |
| | | | | |
| | | | | 1,164,017 |
| | | | | |
Agricultural Products - 0.7% | | | | | |
Darling International, Inc. * | | 12,790 | | | 165,631 |
| | | | | |
Airlines - 1.3% | | | | | |
Allegiant Travel Company * | | 11,240 | | | 296,961 |
| | | | | |
Alternative Carriers - 1.0% | | | | | |
Premiere Global Services, Inc. * | | 15,090 | | | 216,391 |
| | | | | |
Apparel Retail - 2.1% | | | | | |
Aeropostale, Inc. * | | 7,890 | | | 213,898 |
Jos A. Bank Clothiers, Inc. * | | 11,956 | | | 245,098 |
| | | | | |
| | | | | 458,996 |
| | | | | |
Apparel, Accessories & Luxury Goods - 1.6% | | | | | |
FGX International Holdings, Ltd. * | | 29,950 | | | 358,202 |
| | | | | |
Application Software - 4.1% | | | | | |
Advent Software, Inc. * | | 5,690 | | | 242,508 |
Concur Technologies, Inc. * | | 3,400 | | | 105,570 |
Nuance Communications, Inc. * | | 18,020 | | | 313,728 |
PROS Holdings, Inc. * | | 20,650 | | | 259,157 |
| | | | | |
| | | | | 920,963 |
| | | | | |
Asset Management & Custody Banks - 1.0% | | | | | |
Affiliated Managers Group, Inc. * | | 2,390 | | | 216,869 |
| | | | | |
Auto Parts & Equipment - 0.5% | | | | | |
Amerigon, Inc. * | | 7,380 | | | 109,224 |
| | | | | |
Biotechnology - 2.0% | | | | | |
Lifecell Corporation * | | 6,140 | | | 258,064 |
Myriad Genetics, Inc. * | | 4,530 | | | 182,514 |
| | | | | |
| | | | | 440,578 |
| | | | | |
Broadcasting & Cable TV - 1.3% | | | | | |
DG FastChannel, Inc. * | | 14,850 | | | 284,823 |
| | | | | |
Casinos & Gaming - 1.9% | | | | | |
Scientific Games Corporation * | | 19,700 | | | 415,867 |
| | | | | |
Commercial Printing - 1.3% | | | | | |
Innerworkings, Inc. * | | 21,210 | | | 297,576 |
| | | | | |
Consumer Finance - 1.1% | | | | | |
Cardtronics, Inc. * | | 35,582 | | | 248,007 |
| | | | | |
Data Processing & Outsourced Services - 1.5% | | | | | |
Cybersource Corporation * | | 22,930 | | | 335,007 |
| | | | | |
Diversified Commercial & Professional Services - 2.0% | | | | | |
GeoEye, Inc. * | | 4,230 | | | 109,938 |
TeleTech Holdings, Inc. * | | 15,090 | | | 338,921 |
| | | | | |
| | | | | 448,859 |
| | | | | |
Education Services - 2.4% | | | | | |
American Public Education, Inc. * | | 7,088 | | | 215,263 |
DeVry, Inc. | | 7,680 | | | 321,331 |
| | | | | |
| | | | | 536,594 |
| | | | | |
Environmental & Facilities Services - 2.7% | | | | | |
Rollins, Inc. | | 20,105 | | | 355,657 |
Team, Inc. * | | 8,620 | | | 235,326 |
| | | | | |
| | | | | 590,983 |
| | | | | |
Footwear - 0.8% | | | | | |
Iconix Brand Group, Inc. * | | 10,110 | | | 175,408 |
| | | | | |
Health Care Equipment - 7.3% | | | | | |
LeMaitre Vascular, Inc. * | | 70,050 | | | 227,662 |
Micrus Endovascular Corporation * | | 9,060 | | | 111,982 |
Natus Medical, Inc. * | | 11,730 | | | 212,900 |
NuVasive, Inc. * | | 8,540 | | | 294,715 |
Spectranetics Corporation * | | 47,260 | | | 395,094 |
Vnus Medical Technologies, Inc. * | | 6,290 | | | 114,415 |
Zoll Medical Corporation * | | 9,800 | | | 260,582 |
| | | | | |
| | | | | 1,617,350 |
| | | | | |
Health Care Facilities - 3.5% | | | | | |
NovaMed, Inc. * | | 40,560 | | | 153,722 |
Psychiatric Solutions, Inc. * | | 11,570 | | | 392,454 |
RadNet, Inc. * | | 33,090 | | | 232,954 |
| | | | | |
| | | | | 779,130 |
| | | | | |
Health Care Services - 5.4% | | | | | |
Amedisys, Inc. * | | 6,550 | | | 257,677 |
Healthways, Inc. * | | 6,070 | | | 214,514 |
HMS Holdings Corporation * | | 5,580 | | | 159,309 |
IPC The Hospitalist Company, Inc.* | | 12,257 | | | 242,443 |
Pediatrix Medical Group, Inc. * | | 5,010 | | | 337,674 |
| | | | | |
| | | | | 1,211,617 |
| | | | | |
Health Care Technology - 2.3% | | | | | |
Phase Forward, Inc. * | | 10,660 | | | 182,073 |
Trizetto Group * | | 19,120 | | | 319,113 |
| | | | | |
| | | | | 501,186 |
| | | | | |
Industrial Machinery - 2.4% | | | | | |
Dynamic Materials Corporation | | 6,390 | | | 276,048 |
Valmont Industries, Inc. | | 3,010 | | | 264,549 |
| | | | | |
| | | | | 540,597 |
| | | | | |
Insurance Brokers - 1.2% | | | | | |
eHealth, Inc. * | | 11,960 | | | 263,957 |
| | | | | |
| | | | |
| | 55 | | The accompanying notes are an integral part of the financial statements |
| | | | |
| Schedule of Investments | | Security Equity Fund - Small Cap Growth Series |
| March 31, 2008 (Unaudited) - continued | | | | |
| | | | | | | |
| | | Shares | | Value | |
COMMON STOCK (continued) | | | | | | | |
Integrated Telecommunication Services - 0.6% | | | | | | | |
Cbeyond, Inc. * | | | 6,930 | | $ | 130,215 | |
| | | | | | | |
Internet Retail - 0.6% | | | | | | | |
Shutterfly, Inc. * | | | 8,840 | | | 131,451 | |
| | | | | | | |
Internet Software & Services - 9.9% | | | | | | | |
Digital River, Inc. * | | | 7,250 | | | 224,533 | |
Equinix, Inc. * | | | 2,535 | | | 168,552 | |
Internet Brands, Inc. * | | | 39,460 | | | 290,820 | |
j2 Global Communications, Inc. * | | | 18,610 | | | 415,375 | |
NaviSite, Inc. * | | | 58,640 | | | 129,594 | |
NIC, Inc. | | | 40,940 | | | 291,084 | |
TheStreet.com, Inc. | | | 31,260 | | | 252,581 | |
Valueclick, Inc. * | | | 16,040 | | | 276,690 | |
Website Pros, Inc. * | | | 16,310 | | | 160,327 | |
| | | | | | | |
| | | | | | 2,209,556 | |
| | | | | | | |
Investment Banking & Brokerage - 1.6% | | | | | | | |
Investment Technology Group, Inc.* | | | 7,790 | | | 359,742 | |
| | | | | | | |
Leisure Facilities - 1.0% | | | | | | | |
Life Time Fitness, Inc. * | | | 6,820 | | | 212,852 | |
| | | | | | | |
Oil & Gas Equipment & Services - 5.1% | | | | | | | |
Core Laboratories N.V. * | | | 2,460 | | | 293,478 | |
Dril-Quip, Inc. * | | | 6,030 | | | 280,214 | |
Oil States International, Inc. * | | | 6,400 | | | 286,784 | |
Superior Energy Services, Inc. * | | | 7,050 | | | 279,321 | |
| | | | | | | |
| | | | | | 1,139,797 | |
| | | | | | | |
Oil & Gas Exploration & Production - 1.3% | | | | | | | |
Arena Resources, Inc. * | | | 7,720 | | | 298,841 | |
| | | | | | | |
Personal Products - 1.1% | | | | | | | |
Bare Escentuals, Inc. * | | | 10,500 | | | 245,910 | |
| | | | | | | |
Pharmaceuticals - 4.6% | | | | | | | |
KV Pharmaceutical Company * | | | 20,830 | | | 519,917 | |
Medicines Company * | | | 9,630 | | | 194,526 | |
Sciele Pharma, Inc. * | | | 15,900 | | | 310,050 | |
| | | | | | | |
| | | | | | 1,024,493 | |
| | | | | | | |
Property & Casualty Insurance - 2.2% | | | | | | | |
Amtrust Financial Services, Inc. | | | 30,650 | | | 496,836 | |
| | | | | | | |
Publishing - 1.1% | | | | | | | |
Dolan Media Company * | | | 12,700 | | | 255,397 | |
| | | | | | | |
Semiconductors - 0.7% | | | | | | | |
02Micro International, Ltd. ADR * | | | 19,320 | | | 149,344 | |
| | | | | | | |
Systems Software - 0.7% | | | | | | | |
Aladdin Knowledge Systems, Ltd.* | | | 7,840 | | | 149,195 | |
| | | | | | | |
Wireless Telecommunication Services - 1.2% | | | | | | | |
Syniverse Holdings, Inc. * | | | 16,310 | | | 271,725 | |
| | | | | | | |
TOTAL COMMON STOCK (Cost $18,919,662) | | | | | $ | 19,670,147 | |
| | | | | | | |
| | |
| | | Principal
Amount | | | |
REPURCHASE AGREEMENT - 12.8% | | | | | | | |
United Missouri Bank, 1.99%, dated 3/31/08, matures 4/01/08; repurchase amount $2,854,158 (Collateralized by FHLB, 9/24/08 with a value of $2,911,113) | | $ | 2,854,000 | | $ | 2,854,000 | |
| | | | | | | |
TOTAL REPURCHASE AGREEMENT (Cost $2,854,000) | | | | | $ | 2,854,000 | |
| | | | | | | |
Total Investments (Security Equity Fund - Small Cap Growth Series)
(Cost $21,773,662) - 101.1% | | | | | $ | 22,524,147 | |
Liabilities in Excess of Other Assets - (1.1%) | | | | | | (245,776 | ) |
| | | | | | | |
TOTAL NET ASSETS - 100.0% | | | | | $ | 22,278,371 | |
| | | | | | | |
Footnotes
Percentages are stated as a percent of net assets.
For federal income tax purposes the identified cost of investments owned at 3/31/2008 was $22,012,988.
| * | -Non-income producing security |
Glossary:
| ADR | - American Depositary Receipt |
See notes to financial statements.
| | | | |
| | 56 | | The accompanying notes are an integral part of the financial statements |
Security Equity Fund
Small Cap Growth Series
(unaudited)
Statement of Assets and Liabilities
March 31, 2008
| | | | |
Assets: | | | | |
Investments, at value* | | $ | 19,670,147 | |
Repurchase agreement, at value** | | | 2,854,000 | |
| |
Receivables: | | | | |
Fund shares sold | | | 23,069 | |
Securities sold | | | 152,610 | |
Dividends | | | 1,542 | |
Prepaid expenses | | | 19,425 | |
| | | | |
Total assets | | | 22,720,793 | |
| | | | |
Liabilities: | | | | |
Cash overdraft | | | 1,789 | |
Payable for: | | | | |
Securities purchased | | | 286,256 | |
Fund shares redeemed | | | 98,250 | |
Management fees | | | 18,534 | |
Custodian fees | | | 6,641 | |
Transfer agent/maintenance fees | | | 7,956 | |
Administration fees | | | 2,301 | |
Professional fees | | | 7,988 | |
12b-1 distribution plan fees | | | 9,045 | |
Directors’ fees | | | 897 | |
Other | | | 2,765 | |
| | | | |
Total liabilities | | | 442,422 | |
| | | | |
Net assets | | $ | 22,278,371 | |
| | | | |
Net assets consist of: | | | | |
Paid in capital | | $ | 24,344,802 | |
Accumulated net investment loss | | | (341,430 | ) |
Accumulated net realized loss on sale of investments | | | (2,475,486 | ) |
Net unrealized appreciation in value of investments | | | 750,485 | |
| | | | |
Net assets | | $ | 22,278,371 | |
| | | | |
Class A: | | | | |
Capital shares outstanding (unlimited number of shares authorized) | | | 1,177,306 | |
Net assets | | $ | 15,432,266 | |
Net asset value and redemption price per share | | $ | 13.11 | |
| | | | |
Maximum offering price per share (net asset value divided by 94.25%) | | $ | 13.91 | |
| | | | |
Class B: | | | | |
Capital shares outstanding (unlimited number of shares authorized) | | | 315,292 | |
Net assets | | $ | 3,730,154 | |
Net asset value, offering and redemption price per share (excluding any applicable contingent deferred sales charge) | | $ | 11.83 | |
| | | | |
Class C: | | | | |
Capital shares outstanding (unlimited number of shares authorized) | | | 258,178 | |
Net assets | | $ | 3,115,951 | |
Net asset value, offering and redemption price per share (excluding any applicable contingent deferred sales charge) | | $ | 12.07 | |
| | | | |
| | | |
* Investments, at cost | | $ | 18,919,662 |
** Repurchase agreement, at cost | | | 2,854,000 |
Statement of Operations
For the Six Months Ended March 31, 2008
| | | | |
Investment Income: | | | | |
Dividends | | $ | 22,632 | |
Interest | | | 64,792 | |
| | | | |
Total investment income | | | 87,424 | |
| | | | |
Expenses: | | | | |
Management fees | | | 207,179 | |
Transfer agent/maintenance fees | | | 77,407 | |
Administration fees | | | 20,698 | |
Custodian fees | | | 9,380 | |
Directors’ fees | | | 1,371 | |
Professional fees | | | 5,824 | |
Reports to shareholders | | | 2,160 | |
Registration fees | | | 17,805 | |
Other expenses | | | 3,509 | |
12b-1 distribution fees - Class A | | | 41,131 | |
12b-1 distribution fees - Class B | | | 24,210 | |
12b-1 distribution fees - Class C | | | 18,443 | |
| | | | |
Total expenses | | | 429,117 | |
Less: | | | | |
Earnings credits applied | | | (263 | ) |
| | | | |
Net expenses | | | 428,854 | |
| | | | |
Net investment loss | | | (341,430 | ) |
| | | | |
Net Realized and Unrealized Gain (Loss): | | | | |
Net realized gain (loss) during the period on: | | | | |
Investments | | | (1,960,044 | ) |
| | | | |
Net realized loss | | | (1,960,044 | ) |
| | | | |
Net unrealized appreciation (depreciation) during the period on: | | | | |
Investments | | | (8,455,055 | ) |
| | | | |
Net unrealized depreciation | | | (8,455,055 | ) |
| | | | |
Net loss | | | (10,415,099 | ) |
| | | | |
Net decrease in net assets resulting from operations | | $ | (10,756,529 | ) |
| | | | |
| | | | |
| | 57 | | The accompanying notes are an integral part of the financial statements |
| | |
| | Security Equity Fund |
| Statement of Changes in Net Assets | | Small Cap Growth Series |
| | | | | | | | |
| | | Six Months Ended
March 31, 2008
(unaudited) | | | Year Ended
September 30, 2007 | |
Increase (decrease) in net assets from operations: | | | | | | | | |
Net investment loss | | $ | (341,430 | ) | | $ | (801,855 | ) |
Net realized gain (loss) during the period on investments | | | (1,960,044 | ) | | | 6,497,308 | |
Net unrealized appreciation (depreciation) during the period on investments | | | (8,455,055 | ) | | | 3,680,497 | |
| | | | | | | | |
Net increase (decrease) in net assets resulting from operations | | | (10,756,529 | ) | | | 9,375,950 | |
| | | | | | | | |
Distributions to shareholders from: | | | | | | | | |
Net realized gain | | | | | | | | |
Class A | | | (3,191,745 | ) | | | — | |
Class B | | | (420,821 | ) | | | — | |
Class C | | | (306,607 | ) | | | — | |
| | | | | | | | |
Total distributions to shareholders | | | (3,919,173 | ) | | | — | |
| | | | | | | | |
Capital share transactions: | | | | | | | | |
Proceeds from sale of shares | | | | | | | | |
Class A | | | 3,781,070 | | | | 12,762,020 | |
Class B | | | 273,434 | | | | 823,764 | |
Class C | | | 708,287 | | | | 685,312 | |
Distributions reinvested | | | | | | | | |
Class A | | | 3,177,232 | | | | — | |
Class B | | | 416,649 | | | | — | |
Class C | | | 305,485 | | | | — | |
Cost of shares redeemed | | | | | | | | |
Class A | | | (25,239,622 | ) | | | (20,550,155 | ) |
Class B | | | (1,094,109 | ) | | | (1,886,074 | ) |
Class C | | | (560,226 | ) | | | (1,699,480 | ) |
| | | | | | | | |
Net decrease from capital share transactions | | | (18,231,800 | ) | | | (9,864,613 | ) |
| | | | | | | | |
Net decrease in net assets | | | (32,907,502 | ) | | | (488,663 | ) |
| | | | | | | | |
Net assets: | | | | | | | | |
Beginning of period | | | 55,185,873 | | | | 55,674,536 | |
| | | | | | | | |
End of period | | $ | 22,278,371 | | | $ | 55,185,873 | |
| | | | | | | | |
Accumulated net investment loss at end of period | | $ | (341,430 | ) | | $ | — | |
| | | | | | | | |
Capital share activity: | | | | | | | | |
Shares sold | | | | | | | | |
Class A | | | 2,423,838 | | | | 750,895 | |
Class B | | | 18,169 | | | | 52,173 | |
Class C | | | 45,769 | | | | 43,122 | |
Shares reinvested | | | | | | | | |
Class A | | | 199,200 | | | | — | |
Class B | | | 28,874 | | | | — | |
Class C | | | 20,753 | | | | — | |
Shares redeemed | | | | | | | | |
Class A | | | (3,897,508 | ) | | | (1,207,342 | ) |
Class B | | | (74,086 | ) | | | (121,516 | ) |
Class C | | | (38,377 | ) | | | (107,023 | ) |
| | | | |
| | 58 | | The accompanying notes are an integral part of the financial statements |
| | | | |
| Financial Highlights | | | | Security Equity Fund |
| Selected data for each share of capital stock outstanding throughout each year | | Small Cap Growth Series |
| | | | | | | | | | | | | | | | | | | | | | | | |
Class A | | Six Months
Ended March 31,
2008a | | | 2007 | | | 2006 | | | 2005 | | | 2004 | | | Year Ended
September 30,
2003 | |
Per Share Data | | | | | | | | | | | | | | | | | | | | | | | | |
Net asset value, beginning of period | | $ | 18.53 | | | $ | 15.63 | | | $ | 15.76 | | | $ | 13.11 | | | $ | 11.63 | | | $ | 7.88 | |
| | | | | | | | | | | | | | | | | | | | | | | | |
Income (loss) from investment operations: | | | | | | | | | | | | | | | | | | | | | | | | |
Net investment lossb | | | (0.12 | ) | | | (0.23 | ) | | | (0.23 | ) | | | (0.24 | ) | | | (0.25 | ) | | | (0.18 | ) |
Net gain (loss) on securities (realized and unrealized) | | | (3.99 | ) | | | 3.13 | | | | 0.10 | | | | 2.89 | | | | 1.73 | | | | 3.93 | |
| | | | | | | | | | | | | | | | | | | | | | | | |
Total from investment operations | | | (4.11 | ) | | | 2.90 | | | | (0.13 | ) | | | 2.65 | | | | 1.48 | | | | 3.75 | |
| | | | | | | | | | | | | | | | | | | | | | | | |
Less distributions: | | | | | | | | | | | | | | | | | | | | | | | | |
Distributions from realized gains | | | (1.31 | ) | | | — | | | | — | | | | — | | | | — | | | | — | |
| | | | | | | | | | | | | | | | | | | | | | | | |
Total distributions | | | (1.31 | ) | | | — | | | | — | | | | — | | | | — | | | | — | |
| | | | | | | | | | | | | | | | | | | | | | | | |
Net asset value, end of period | | $ | 13.11 | | | $ | 18.53 | | | $ | 15.63 | | | $ | 15.76 | | | $ | 13.11 | | | $ | 11.63 | |
| | | | | | | | | | | | | | | | | | | | | | | | |
Total Returnc | | | (23.43 | )% | | | 18.55 | % | | | (0.82 | )% | | | 20.21 | % | | | 12.73 | % | | | 47.59 | % |
| | | | | | | | | | | | | | | | | | | | | | | | |
Ratios/Supplemental Data | | | | | | | | | | | | | | | | | | | | | | | | |
Net assets, end of period (in thousands) | | $ | 15,432 | | | $ | 45,430 | | | $ | 45,451 | | | $ | 22,637 | | | $ | 21,443 | | | $ | 14,406 | |
| | | | | | | | | | | | | | | | | | | | | | | | |
Ratios to average net assets: | | | | | | | | | | | | | | | | | | | | | | | | |
Net investment loss | | | (1.48 | )% | | | (1.32 | )% | | | (1.46 | )% | | | (1.67 | )% | | | (1.95 | )% | | | (2.01 | )% |
Total expensesd | | | 1.90 | % | | | 1.80 | % | | | 2.01 | % | | | 2.10 | % | | | 2.09 | % | | | 2.51 | % |
Net expensese | | | 1.90 | % | | | 1.80 | % | | | 2.01 | % | | | 2.10 | % | | | 2.09 | % | | | 2.25 | % |
Net expenses prior to custodian earning credits and net of expense waivers | | | 1.90 | % | | | 1.80 | % | | | 2.01 | % | | | 2.10 | % | | | 2.09 | % | | | 2.25 | % |
| | | | | | | | | | | | | | | | | | | | | | | | |
Portfolio turnover rate | | | 173 | % | | | 145 | % | | | 136 | % | | | 134 | % | | | 157 | % | | | 206 | % |
| | | | | | |
Class B | | Six Months
Ended March 31,
2008a | | | 2007 | | | 2006 | | | 2005 | | | 2004 | | | Year Ended
September 30,
2003 | |
Per Share Data | | | | | | | | | | | | | | | | | | | | | | | | |
Net asset value, beginning of period | | $ | 16.92 | | | $ | 14.38 | | | $ | 14.60 | | | $ | 12.24 | | | $ | 10.94 | | | $ | 7.47 | |
| | | | | | | | | | | | | | | | | | | | | | | | |
Income (loss) from investment operations: | | | | | | | | | | | | | | | | | | | | | | | | |
Net investment lossb | | | (0.17 | ) | | | (0.33 | ) | | | (0.36 | ) | | | (0.33 | ) | | | (0.33 | ) | | | (0.24 | ) |
Net gain (loss) on securities (realized and unrealized) | | | (3.61 | ) | | | 2.87 | | | | 0.14 | | | | 2.69 | | | | 1.63 | | | | 3.71 | |
| | | | | | | | | | | | | | | | | | | | | | | | |
Total from investment operations | | | (3.78 | ) | | | 2.54 | | | | (0.22 | ) | | | 2.36 | | | | 1.30 | | | | 3.47 | |
| | | | | | | | | | | | | | | | | | | | | | | | |
Less distributions: | | | | | | | | | | | | | | | | | | | | | | | | |
Distributions from realized gains | | | (1.31 | ) | | | — | | | | — | | | | — | | | | — | | | | — | |
| | | | | | | | | | | | | | | | | | | | | | | | |
Total distributions | | | (1.31 | ) | | | — | | | | — | | | | — | | | | — | | | | — | |
| | | | | | | | | | | | | | | | | | | | | | | | |
Net asset value, end of period | | $ | 11.83 | | | $ | 16.92 | | | $ | 14.38 | | | $ | 14.60 | | | $ | 12.24 | | | $ | 10.94 | |
| | | | | | | | | | | | | | | | | | | | | | | | |
Total Returnc | | | (23.73 | )% | | | 17.66 | % | | | (1.51 | )% | | | 19.28 | % | | | 11.88 | % | | | 46.45 | % |
| | | | | | | | | | | | | | | | | | | | | | | | |
Ratios/Supplemental Data | | | | | | | | | | | | | | | | | | | | | | | | |
Net assets, end of period (in thousands) | | $ | 3,730 | | | $ | 5,792 | | | $ | 5,919 | | | $ | 8,283 | | | $ | 9,218 | | | $ | 6,838 | |
| | | | | | | | | | | | | | | | | | | | | | | | |
Ratios to average net assets: | | | | | | | | | | | | | | | | | | | | | | | | |
Net investment loss | | | (2.31 | )% | | | (2.07 | )% | | | (2.31 | )% | | | (2.41 | )% | | | (2.69 | )% | | | (2.76 | )% |
Total expensesd | | | 2.75 | % | | | 2.56 | % | | | 2.79 | % | | | 2.85 | % | | | 2.84 | % | | | 3.23 | % |
Net expensese | | | 2.75 | % | | | 2.55 | % | | | 2.79 | % | | | 2.85 | % | | | 2.83 | % | | | 3.00 | % |
Net expenses prior to custodian earning credits and net of expense waivers | | | 2.75 | % | | | 2.56 | % | | | 2.79 | % | | | 2.85 | % | | | 2.84 | % | | | 3.00 | % |
| | | | | | | | | | | | | | | | | | | | | | | | |
Portfolio turnover rate | | | 173 | % | | | 145 | % | | | 136 | % | | | 134 | % | | | 157 | % | | | 206 | % |
| | | | |
| | 59 | | The accompanying notes are an integral part of the financial statements |
| | | | |
| Financial Highlights | | | | Security Equity Fund |
| Selected data for each share of capital stock outstanding throughout each year | | Small Cap Growth Series |
| | | | | | | | | | | | | | | | | | | | | | | | |
Class C | | Six Months
Ended March 31,
2008a | | | 2007 | | | 2006 | | | 2005 | | | 2004 | | | Year Ended
September 30,
2003 | |
Per Share Data | | | | | | | | | | | | | | | | | | | | | | | | |
Net asset value, beginning of period | | $ | 17.23 | | | $ | 14.64 | | | $ | 14.88 | | | $ | 12.47 | | | $ | 11.15 | | | $ | 7.61 | |
| | | | | | | | | | | | | | | | | | | | | | | | |
Income (loss) from investment operations: | | | | | | | | | | | | | | | | | | | | | | | | |
Net investment lossb | | | (0.17 | ) | | | (0.33 | ) | | | (0.35 | ) | | | (0.33 | ) | | | (0.33 | ) | | | (0.24 | ) |
Net gain (loss) on securities (realized and unrealized) | | | (3.68 | ) | | | 2.92 | | | | 0.11 | | | | 2.74 | | | | 1.65 | | | | 3.78 | |
| | | | | | | | | | | | | | | | | | | | | | | | |
Total from investment operations | | | (3.85 | ) | | | 2.59 | | | | (0.24 | ) | | | 2.41 | | | | 1.32 | | | | 3.54 | |
| | | | | | | | | | | | | | | | | | | | | | | | |
Less distributions: | | | | | | | | | | | | | | | | | | | | | | | | |
Distributions from realized gains | | | (1.31 | ) | | | — | | | | — | | | | — | | | | — | | | | — | |
| | | | | | | | | | | | | | | | | | | | | | | | |
Total distributions | | | (1.31 | ) | | | — | | | | — | | | | — | | | | — | | | | — | |
| | | | | | | | | | | | | | | | | | | | | | | | |
Net asset value, end of period | | $ | 12.07 | | | $ | 17.23 | | | $ | 14.64 | | | $ | 14.88 | | | $ | 12.47 | | | $ | 11.15 | |
| | | | | | | | | | | | | | | | | | | | | | | | |
Total Returnc | | | (23.71 | )% | | | 17.69 | % | | | (1.61 | )% | | | 19.33 | % | | | 11.84 | % | | | 46.52 | % |
| | | | | | | | | | | | | | | | | | | | | | | | |
Ratios/Supplemental Data | | | | | | | | | | | | | | | | | | | | | | | | |
Net assets, end of period (in thousands) | | $ | 3,116 | | | $ | 3,964 | | | $ | 4,304 | | | $ | 4,420 | | | $ | 4,160 | | | $ | 3,533 | |
| | | | | | | | | | | | | | | | | | | | | | | | |
Ratios to average net assets: | | | | | | | | | | | | | | | | | | | | | | | | |
Net investment loss | | | (2.33 | )% | | | (2.07 | )% | | | (2.29 | )% | | | (2.42 | )% | | | (2.69 | )% | | | (2.76 | )% |
Total expensesd | | | 2.77 | % | | | 2.56 | % | | | 2.79 | % | | | 2.85 | % | | | 2.83 | % | | | 3.23 | % |
Net expensese | | | 2.77 | % | | | 2.55 | % | | | 2.79 | % | | | 2.85 | % | | | 2.82 | % | | | 3.00 | % |
Net expenses prior to custodian earning credits and net of expense waivers | | | 2.77 | % | | | 2.56 | % | | | 2.79 | % | | | 2.85 | % | | | 2.83 | % | | | 3.00 | % |
| | | | | | | | | | | | | | | | | | | | | | | | |
Portfolio turnover rate | | | 173 | % | | | 145 | % | | | 136 | % | | | 134 | % | | | 157 | % | | | 206 | % |
a | Unaudited figures for the six months ended March 31, 2008. Percentage amounts for the period, except total return, have been annualized. |
b | Net investment income (loss) was computed using average shares outstanding throughout the period. |
c | Total return information does not reflect deduction of any sales charges imposed at the time of purchase for Class A shares or upon redemption for Class B and C shares. |
d | Total expense information reflects expense ratios absent expense reductions by the Investment Manager and custodian earnings credits, as applicable. |
e | Net expense information reflects the expense ratios after voluntary expense waivers, reimbursements and custodian earnings credits, as applicable. |
| | | | |
| | 60 | | The accompanying notes are an integral part of the financial statements |
This page left blank intentionally.
61
Security Large Cap
Value Fund

Adviser,
Security Global Investors
62
| | |
| | Security |
| Performance Summary | | Large Cap Value Fund |
| March 31, 2008 | | (unaudited) |
PERFORMANCE
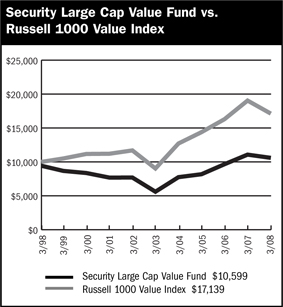
$10,000 Over Ten Years
This chart assumes a $10,000 investment in Class A shares of Large Cap Value Fund on March 31, 1998, reflects deduction of the 5.75% sales load and assumes all dividends reinvested. The chart does not reflect the deduction of taxes that a shareholder would pay on distributions or the redemption of fund shares. The Russell 1000 Value Index is an unmanaged index representing the performance of those Russell 1000 Index companies with lower price-to-book ratios and lower forecasted growth values.
Average Annual Returns
| | | | | | | | | | | | |
Periods Ended 3-31-08 | | 1 Year | | | 5 Years | | | 10 Years | | | Since
Inception | |
A Shares | | (4.25 | )% | | 13.60 | % | | 1.18 | % | | — | |
A Shares with sales charge | | (9.73 | )% | | 12.27 | % | | 0.58 | % | | — | |
B Shares | | (4.39 | )% | | 12.86 | % | | 0.46 | % | | — | |
B Shares with CDSC | | (8.97 | )% | | 12.61 | % | | 0.46 | % | | — | |
C Shares | | (4.99 | )% | | 12.73 | % | | — | | | 1.49 | % |
| | | | | | | | | | | (1-29-99 | ) |
C Shares with CDSC | | (5.90 | )% | | 12.73 | % | | — | | | 1.49 | % |
| | | | | | | | | | | (1-29-99 | ) |
The performance data above represents past performance that is not predictive of future results. The investment return and principal value of an investment in the Fund will fluctuate so that an investor’s shares, when redeemed, may be worth more or less than their original cost. The figures above do not reflect deduction of the maximum front-end sales charge of 5.75% for Class A shares or the contingent deferred sales charge of 5% for Class B shares and 1% for Class C shares, as applicable, except where noted. The figures do not reflect the deduction of taxes that a shareholder would pay on distributions or redemption of Fund shares. Such figures would be lower if the maximum sales charge and any applicable taxes were deducted.
Portfolio Composition by Sector as of 3-31-08
| | | |
Consumer Discretionary | | 8.35 | % |
Consumer Staples | | 11.53 | |
Energy | | 11.12 | |
Financials | | 21.78 | |
Health Care | | 5.16 | |
Industrials | | 19.54 | |
Information Technology | | 5.20 | |
Materials | | 2.90 | |
Telecommunication Services | | 1.61 | |
Utilities | | 2.02 | |
Exchange Traded Funds | | 5.82 | |
Commercial Paper | | 2.47 | |
Repurchase Agreement | | 0.81 | |
Other Assets in Excess of Liabilities | | 1.69 | |
Total Net Assets | | 100.00 | % |
| | | |
| | | | |
| | 63 | | The accompanying notes are an integral part of the financial statements |
| | |
| | Security |
| Performance Summary | | Large Cap Value Fund |
March 31, 2008 | | (unaudited) |
Information About Your Fund’s Expenses
Calculating your ongoing Fund expenses
Example
As a shareholder of the Fund, you incur two types of costs: (1) transaction costs, which may include sales charges (loads) on purchase payments; contingent deferred sales charges on redemptions; and redemption fees, if any; and (2) ongoing costs, including management fees; distribution and/or service fees (12b-1); and other Fund expenses. This example is intended to help you understand your ongoing costs (in dollars) of investing in the Series and to compare these costs with ongoing costs of investing in other mutual funds. The example is based on an investment of $1,000 invested at the beginning of the period and held for the entire period October 1, 2007 through March 31, 2008.
Actual Expenses
The first line for each class of shares in the table provides information about actual account values and actual expenses. You may use the information in this table, together with the amount you invested, to estimate the expenses that you paid over the period. Simply divide your account value by $1,000 (for example, an $8,600 account value divided by $1,000 = 8.6), then multiply the result by the number in the table under the heading entitled “Expenses Paid During the Period” to estimate the expenses you paid on your account during this period.
Hypothetical Example for Comparison Purposes
The second line for each class of shares in the table provides information about hypothetical account values and hypothetical expenses based on the Fund’s actual expense ratio and an assumed rate of return of 5% per year before expenses, which is not the Fund’s actual return. The hypothetical account values and expenses may not be used to estimate the actual ending account balance or expenses you paid for the period. You may use this information to compare the ongoing costs of investing in the Fund and other funds. To do so, compare this 5% hypothetical example with the 5% hypothetical examples that appear in the shareholder reports of the other mutual funds.
Please note that the expenses shown in the table are meant to highlight your ongoing costs only and do not reflect any transactional costs, such as sales charges (loads) on purchase payments, contingent deferred sales charges on redemptions, and redemption fees, if any. Therefore, the second line for each class of shares is useful in comparing ongoing costs only, and will not help you determine the relative total costs of owning different funds. In addition, if these transactional costs were included, your costs would have been higher.
Fund Expenses
| | | | | | | | | |
| | | Beginning
Account
Value
10/1/2007 | | Ending
Account
Value
3/31/20081 | | Expenses
Paid
During
Period2 |
Large Cap Value | | | | | | | | | |
Fund - Class A | | | | | | | | | |
Actual | | $ | 1,000.00 | | $ | 877.18 | | $ | 5.87 |
Hypothetical | | | 1,000.00 | | | 1,018.75 | | | 6.31 |
| | | |
Large Cap Value | | | | | | | | | |
Fund - Class B | | | | | | | | | |
Actual | | | 1,000.00 | | | 876.94 | | | 4.69 |
Hypothetical | | | 1,000.00 | | | 1,020.00 | | | 5.05 |
| | | |
Large Cap Value | | | | | | | | | |
Fund - Class C | | | | | | | | | |
Actual | | | 1,000.00 | | | 872.71 | | | 9.36 |
Hypothetical | | | 1,000.00 | | | 1,015.00 | | | 10.08 |
1 | The actual ending account value is based on the actual total return of the Fund for the period October 1, 2007 to March 31, 2008 after actual expenses and will differ from the hypothetical ending account value which is based on the Fund expense ratio and a hypothetical annual return of 5% before expenses. The actual cumulative return at net asset value for the period October 1, 2007 to March 31, 2008 was (12.28%), (12.31%) and (12.73%), for Class A, B, and C respectively. |
2 | Expenses are equal to the Fund annualized expense ratio (1.25%, 1.00% and 2.00% for Class A, B, and C shares, respectively) net of any applicable fee waivers or earnings credits, multiplied by the average account value over the period, multiplied by 183/366 (to reflect the one-half year period). |
64
| | |
| Schedule of Investments | | Security Large Cap Value Fund |
| March 31, 2008 (Unaudited) | | |
| | | | | |
| | | Shares | | Value |
COMMON STOCK - 95.0% | | | | | |
Aerospace & Defense - 3.2% | | | | | |
United Technologies Corporation | | 47,400 | | $ | 3,262,068 |
| | | | | |
Agricultural Products - 0.9% | | | | | |
Archer-Daniels-Midland Company | | 21,100 | | | 868,476 |
| | | | | |
Air Freight & Logistics - 3.0% | | | | | |
FedEx Corporation | | 32,900 | | | 3,048,843 |
| | | | | |
Broadcasting & Cable TV - 1.7% | | | | | |
CBS Corporation (CI.B) | | 77,100 | | | 1,702,368 |
| | | | | |
Building Products - 3.4% | | | | | |
USG Corporation * | | 94,200 | | | 3,468,444 |
| | | | | |
Computer Hardware - 2.3% | | | | | |
Hewlett-Packard Company | | 51,900 | | | 2,369,754 |
| | | | | |
Consumer Finance - 5.3% | | | | | |
Capital One Financial Corporation | | 61,700 | | | 3,036,874 |
Discover Financial Services | | 24,400 | | | 399,428 |
First Marblehead Corporation | | 254,950 | | | 1,901,927 |
| | | | | |
| | | | | 5,338,229 |
| | | | | |
Data Processing & Outsourced Services - 2.2% | | | | | |
Western Union Company | | 103,000 | | | 2,190,810 |
| | | | | |
Department Stores - 1.2% | | | | | |
JC Penney Company, Inc. | | 31,200 | | | 1,176,552 |
| | | | | |
Diversified Banks - 1.3% | | | | | |
Wells Fargo & Company | | 43,800 | | | 1,274,580 |
| | | | | |
Diversified Chemicals - 1.2% | | | | | |
Dow Chemical Company | | 33,600 | | | 1,238,160 |
| | | | | |
Diversified Commercial & Professional Services - 1.0% | | | | | |
Equifax, Inc. | | 29,400 | | | 1,013,712 |
| | | | | |
Drug Retail - 2.4% | | | | | |
CVS Caremark Corporation | | 60,400 | | | 2,446,804 |
| | | | | |
Electric Utilities - 2.0% | | | | | |
Edison International | | 41,700 | | | 2,044,134 |
| | | | | |
Electronic Manufacturing Services - 0.7% | | | | | |
Tyco Electronics, Ltd. | | 20,450 | | | 701,844 |
| | | | | |
Exchange Traded Funds - 5.8% | | | | | |
iShares Russell 1000 Value Index Fund | | 40,300 | | | 2,947,542 |
iShares S&P 500 Value Index Fund | | 42,600 | | | 2,950,476 |
| | | | | |
| | | | | 5,898,018 |
| | | | | |
Health Care Equipment - 2.6% | | | | | |
Covidien, Ltd. | | 20,350 | | | 900,488 |
Hospira, Inc. * | | 40,800 | | | 1,745,016 |
| | | | | |
| | | | | 2,645,504 |
| | | | | |
Health Care Services - 1.4% | | | | | |
Medco Health Solutions, Inc. * | | 31,400 | | | 1,375,006 |
| | | | | |
Home Improvement Retail - 3.3% | | | | | |
Home Depot, Inc. | | 118,100 | | | 3,303,257 |
| | | | | |
Hypermarkets & Super Centers - 5.7% | | | | | |
Costco Wholesale Corporation | | 33,200 | | | 2,157,004 |
Wal-Mart Stores, Inc. | | 69,700 | | | 3,671,796 |
| | | | | |
| | | | | 5,828,800 |
| | | | | |
Industrial Conglomerates - 5.4% | | | | | |
General Electric Company | | 86,400 | | | 3,197,664 |
McDermott International, Inc. * | | 24,300 | | | 1,332,126 |
Tyco International, Ltd. | | 20,450 | | | 900,822 |
| | | | | |
| | | | | 5,430,612 |
| | | | | |
Integrated Oil & Gas - 7.1% | | | | | |
Chevron Corporation | | 21,000 | | | 1,792,560 |
ConocoPhillips | | 8,900 | | | 678,269 |
Exxon Mobil Corporation | | 33,000 | | | 2,791,140 |
Sasol, Ltd. ADR | | 40,300 | | | 1,950,117 |
| | | | | |
| | | | | 7,212,086 |
| | | | | |
Integrated Telecommunication Services - 0.8% | | | | | |
Windstream Corporation | | 69,176 | | | 826,653 |
| | | | | |
Movies & Entertainment - 2.2% | | | | | |
News Corporation | | 27,500 | | | 515,625 |
Time Warner, Inc. | | 125,600 | | | 1,760,912 |
| | | | | |
| | | | | 2,276,537 |
| | | | | |
Multi-Line Insurance - 4.5% | | | | | |
American International Group, Inc. | | 105,100 | | | 4,545,575 |
| | | | | |
Oil & Gas Equipment & Services - 1.9% | | | | | |
Halliburton Company | | 48,100 | | | 1,891,773 |
| | | | | |
Oil & Gas Storage & Transportation - 2.1% | | | | | |
Williams Companies, Inc. | | 65,500 | | | 2,160,190 |
| | | | | |
Other Diversified Financial Services - 3.5% | | | | | |
JPMorgan Chase & Company | | 83,300 | | | 3,577,735 |
| | | | | |
Pharmaceuticals - 1.2% | | | | | |
Schering-Plough Corporation | | 83,600 | | | 1,204,676 |
| | | | | |
Property & Casualty Insurance - 4.9% | | | | | |
Berkshire Hathaway, Inc. * | | 37 | | | 4,935,800 |
| | | | | |
Railroads - 3.5% | | | | | |
Union Pacific Corporation | | 28,400 | | | 3,560,792 |
| | | | | |
| | | | |
| | 65 | | The accompanying notes are an integral part of the financial statements |
| | |
| Schedule of Investments | | Security Large Cap Value Fund |
| March 31, 2008 (Unaudited) - continued | | |
| | | | | | |
| | | Shares | | Value |
COMMON STOCK (continued) | | | | | | |
Specialty Chemicals - 1.7% | | | | | | |
Rohm & Haas Company | | | 31,400 | | $ | 1,698,112 |
| | | | | | |
Thrifts & Mortgage Finance - 2.3% | | | | | | |
Federal Home Loan Mortgage Corporation | | | 63,600 | | | 1,610,352 |
Federal National Mortgage Association | | | 29,300 | | | 771,176 |
| | | | | | |
| | | | | | 2,381,528 |
| | | | | | |
Tobacco - 2.5% | | | | | | |
Altria Group, Inc. | | | 34,800 | | | 772,560 |
Philip Morris International, Inc. * | | | 34,800 | | | 1,760,184 |
| | | | | | |
| | | | | | 2,532,744 |
| | | | | | |
Wireless Telecommunication Services - 0.8% | | | | | | |
Sprint Nextel Corporation | | | 120,300 | | | 804,807 |
| | | | | | |
TOTAL COMMON STOCK (Cost $93,195,700) | | | | | $ | 96,234,983 |
| | | | | | |
| | |
| | | Principal
Amount | | |
COMMERCIAL PAPER - 2.5% | | | | | | |
Banking - 1.0% | | | | | | |
Wells Fargo & Company, Inc.
2.39%, 4/1/2008 | | | 1,000,000 | | | 1,000,000 |
| | | | | | |
Brokerage - 1.5% | | | | | | |
Merrill Lynch & Company, Inc.
2.95%, 4/2/2008 | | | 1,500,000 | | | 1,499,877 |
| | | | | | |
TOTAL COMMERCIAL PAPER (Cost $2,499,877) | | | | | $ | 2,499,877 |
| | | | | | |
REPURCHASE AGREEMENT - 0.8% | | | | | | |
United Missouri Bank, 1.99%, dated 3/31/08, matures 4/01/08; repurchase amount $825,046 (Collateralized by FNSM, 6.50%, 10/01/37 with a value of $841,790) | | $ | 825,000 | | $ | 825,000 |
| | | | | | |
TOTAL REPURCHASE AGREEMENT (Cost $825,000) | | | | | $ | 825,000 |
| | | | | | |
Total Investments (Security Large Cap Value Fund)
(Cost $96,520,577) - 98.3% | | | | | $ | 99,559,860 |
Other Assets in Excess of Liabilities - 1.7% | | | | | | 1,712,233 |
| | | | | | |
TOTAL NET ASSETS - 100.0% | | | | | $ | 101,272,093 |
| | | | | | |
Footnotes
Percentages are stated as a percent of net assets.
For federal income tax purposes the identified cost of investments owned at 3/31/2008 was $96,589,997.
| * | - Non-income producing security |
Glossary:
| ADR | - American Depositary Receipt |
See notes to financial statements.
| | | | |
| | 66 | | The accompanying notes are an integral part of the financial statements |
Security
Large Cap Value Fund
(unaudited)
Statement of Assets and Liabilities
March 31, 2008
| | | |
Assets: | | | |
Investments, at value* | | $ | 99,559,860 |
Cash | | | 940 |
| |
Receivables: | | | |
Fund shares sold | | | 117,043 |
Securities sold | | | 2,775,438 |
Dividends | | | 160,779 |
Security Investors | | | 827 |
Prepaid expenses | | | 40,639 |
| | | |
Total assets | | | 102,655,526 |
| | | |
Liabilities: | | | |
Payable for: | | | |
Securities purchased | | | 1,172,936 |
Fund shares redeemed | | | 104,386 |
Management fees | | | 55,587 |
Custodian fees | | | 2,800 |
Transfer agent/maintenance fees | | | 10,479 |
Administration fees | | | 8,244 |
Professional fees | | | 3,568 |
12b-1 distribution plan fees | | | 22,716 |
Directors’ fees | | | 1,302 |
Other | | | 1,415 |
| | | |
Total liabilities | | | 1,383,433 |
| | | |
Net assets | | $ | 101,272,093 |
| | | |
Net assets consist of: | | | |
Paid in capital | | $ | 96,394,485 |
Undistributed net investment income | | | 294,186 |
Undistributed net realized gain on sale of investments | | | 1,544,139 |
Net unrealized appreciation in value of investments | | | 3,039,283 |
| | | |
Net assets | | $ | 101,272,093 |
| | | |
Class A: | | | |
Capital shares outstanding (unlimited number of shares authorized) | | | 11,248,698 |
Net assets | | $ | 86,568,416 |
Net asset value and redemption price per share | | $ | 7.70 |
| | | |
Maximum offering price per share (net asset value divided by 94.25%) | | $ | 8.17 |
| | | |
Class B: | | | |
Capital shares outstanding (unlimited number of shares authorized) | | | 1,299,739 |
Net assets | | $ | 9,359,546 |
Net asset value, offering and redemption price per share (excluding any applicable contingent deferred sales charge) | | $ | 7.20 |
| | | |
Class C: | | | |
Capital shares outstanding (unlimited number of shares authorized) | | | 731,951 |
Net assets | | $ | 5,344,131 |
Net asset value, offering and redemption price per share (excluding any applicable contingent deferred sales charge) | | $ | 7.30 |
| | | |
| | | |
* Investments, at cost | | $ | 96,520,577 |
Statement of Operations
For the Six Months Ended March 31, 2008
| | | | |
Investment Income: | | | | |
Dividends | | $ | 865,775 | |
Interest | | | 103,983 | |
| | | | |
Total investment income | | | 969,758 | |
| | | | |
Expenses: | | | | |
Management fees | | | 319,229 | |
Transfer agent/maintenance fees | | | 122,212 | |
Administration fees | | | 46,912 | |
Custodian fees | | | 4,473 | |
Directors’ fees | | | 1,178 | |
Professional fees | | | 4,278 | |
Reports to shareholders | | | 2,614 | |
Registration fees | | | 23,484 | |
Other expenses | | | 11,740 | |
12b-1 distribution fees - Class A | | | 101,183 | |
12b-1 distribution fees - Class C | | | 27,733 | |
| | | | |
Total expenses | | | 665,036 | |
Less: | | | | |
Reimbursement of expenses - Class A | | | (38,054 | ) |
Reimbursement of expenses - Class B | | | (5,201 | ) |
Reimbursement of expenses - Class C | | | (2,586 | ) |
| | | | |
Net expenses | | | 619,195 | |
| | | | |
Net investment income | | | 350,563 | |
| | | | |
Net Realized and Unrealized Gain (Loss): | | | | |
Net realized gain (loss) during the period on: | | | | |
Investments | | | 4,107,006 | |
Options written | | | 50,175 | |
| | | | |
Net realized gain | | | 4,157,181 | |
| | | | |
Net unrealized appreciation (depreciation) during the period on: | | | | |
Investments | | | (16,240,302 | ) |
Options written | | | (15,980 | ) |
| | | | |
Net unrealized depreciation | | | (16,256,282 | ) |
| | | | |
Net loss | | | (12,099,101 | ) |
| | | | |
Net decrease in net assets resulting from operations | | $ | (11,748,538 | ) |
| | | | |
| | | | |
| | 67 | | The accompanying notes are an integral part of the financial statements |
| | |
| | Security |
| Statement of Changes in Net Assets | | Large Cap Value Fund |
| | | | | | | | |
| | | Six Months Ended
March 31, 2008
(unaudited) | | | Year Ended
September 30, 2007 | |
Increase (decrease) in net assets from operations: | | | | | | | | |
Net investment income | | $ | 350,563 | | | $ | 347,813 | |
Net realized gain during the period on investments | | | 4,157,181 | | | | 6,463,825 | |
Net unrealized appreciation (depreciation) during the period on investments | | | (16,256,282 | ) | | | 9,449,894 | |
| | | | | | | | |
Net increase (decrease) in net assets resulting from operations | | | (11,748,538 | ) | | | 16,261,532 | |
| | | | | | | | |
Distributions to shareholders from: | | | | | | | | |
Net investment income | | | | | | | | |
Class A | | | (378,053 | ) | | | (25,136 | ) |
Class B | | | (22,222 | ) | | | — | |
Net realized gain | | | | | | | | |
Class A | | | (2,835,403 | ) | | | — | |
Class B | | | (523,802 | ) | | | — | |
Class C | | | (232,292 | ) | | | — | |
| | | | | | | | |
Total distributions to shareholders | | | (3,991,772 | ) | | | (25,136 | ) |
| | | | | | | | |
Capital share transactions: | | | | | | | | |
Proceeds from sale of shares | | | | | | | | |
Class A | | | 32,112,926 | | | | 30,239,174 | |
Class B | | | 1,384,361 | | | | 5,176,235 | |
Class C | | | 1,654,974 | | | | 2,465,830 | |
Distributions reinvested | | | | | | | | |
Class A | | | 3,086,622 | | | | 23,953 | |
Class B | | | 540,480 | | | | — | |
Class C | | | 228,559 | | | | — | |
Cost of shares redeemed | | | | | | | | |
Class A | | | (15,980,303 | ) | | | (28,048,187 | ) |
Class B | | | (4,258,134 | ) | | | (6,549,458 | ) |
Class C | | | (1,255,865 | ) | | | (1,128,054 | ) |
| | | | | | | | |
Net increase from capital share transactions | | | 17,513,620 | | | | 2,179,493 | |
| | | | | | | | |
Net increase in net assets | | | 1,773,310 | | | | 18,415,889 | |
| | | | | | | | |
Net assets: | | | | | | | | |
Beginning of period | | | 99,498,783 | | | | 81,082,894 | |
| | | | | | | | |
End of period | | $ | 101,272,093 | | | $ | 99,498,783 | |
| | | | | | | | |
Accumulated net investment income at end of period | | $ | 294,186 | | | $ | 343,898 | |
| | | | | | | | |
Capital share activity: | | | | | | | | |
Shares sold | | | | | | | | |
Class A | | | 4,075,308 | | | | 3,513,517 | |
Class B | | | 172,923 | | | | 644,129 | |
Class C | | | 211,740 | | | | 309,682 | |
Shares reinvested | | | | | | | | |
Class A | | | 377,800 | | | | 2,882 | |
Class B | | | 70,743 | | | | — | |
Class C | | | 29,416 | | | | — | |
Shares redeemed | | | | | | | | |
Class A | | | (1,914,387 | ) | | | (3,278,710 | ) |
Class B | | | (551,147 | ) | | | (814,025 | ) |
Class C | | | (164,818 | ) | | | (137,551 | ) |
| | | | |
| | 68 | | The accompanying notes are an integral part of the financial statements |
| | | | |
| Financial Highlights | | | | Security |
Selected data for each share of capital stock outstanding throughout each year | | Large Cap Value Fund |
| | | | | | | | | | | | | | | | | | | | | | | | |
Class A | | Six Months
Ended March 31,
2008a | | | 2007 | | | 2006 | | | 2005b | | | 2004 | | | Year Ended
September 30,
2003 | |
Per Share Data | | | | | | | | | | | | | | | | | | | | | | | | |
Net asset value, beginning of period | | $ | 9.18 | | | $ | 7.65 | | | $ | 6.78 | | | $ | 5.71 | | | $ | 5.11 | | | $ | 4.25 | |
| | | | | | | | | | | | | | | | | | | | | | | | |
Income (loss) from investment operations: | | | | | | | | | | | | | | | | | | | | | | | | |
Net investment incomec | | | 0.03 | | | | 0.04 | | | | 0.01 | | | | 0.03 | | | | 0.01 | | | | 0.02 | |
Net gain (loss) on securities (realized and unrealized) | | | (1.14 | ) | | | 1.49 | | | | 0.90 | | | | 1.04 | | | | 0.60 | | | | 0.84 | |
| | | | | | | | | | | | | | | | | | | | | | | | |
Total from investment operations | | | (1.11 | ) | | | 1.53 | | | | 0.91 | | | | 1.07 | | | | 0.61 | | | | 0.86 | |
| | | | | | | | | | | | | | | | | | | | | | | | |
Less distributions: | | | | | | | | | | | | | | | | | | | | | | | | |
Dividends from net investment income | | | (0.04 | ) | | | — | | | | (0.04 | ) | | | — | | | | (0.01 | ) | | | — | |
Distributions from realized gains | | | (0.33 | ) | | | — | | | | — | | | | — | | | | — | | | | — | |
| | | | | | | | | | | | | | | | | | | | | | | | |
Total distributions | | | (0.37 | ) | | | — | | | | (0.04 | ) | | | — | | | | (0.01 | ) | | | — | |
| | | | | | | | | | | | | | | | | | | | | | | | |
Net asset value, end of period | | $ | 7.70 | | | $ | 9.18 | | | $ | 7.65 | | | $ | 6.78 | | | $ | 5.71 | | | $ | 5.11 | |
| | | | | | | | | | | | | | | | | | | | | | | | |
Total Returnd | | | (12.28 | )% | | | 20.04 | % | | | 13.45 | % | | | 18.74 | % | | | 11.98 | % | | | 20.24 | % |
| | | | | | | | | | | | | | | | | | | | | | | | |
Ratios/Supplemental Data | | | | | | | | | | | | | | | | | | | | | | | | |
Net assets, end of period (in thousands) | | $ | 86,568 | | | $ | 79,998 | | | $ | 64,786 | | | $ | 45,295 | | | $ | 43,071 | | | $ | 45,858 | |
| | | | | | | | | | | | | | | | | | | | | | | | |
Ratios to average net assets: | | | | | | | | | | | | | | | | | | | | | | | | |
Net investment income | | | 0.73 | % | | | 0.51 | % | | | 0.17 | % | | | 0.56 | % | | | 0.19 | % | | | 0.41 | % |
Total expensese | | | 1.34 | % | | | 1.35 | % | | | 1.49 | % | | | 1.61 | % | | | 1.52 | % | | | 1.45 | % |
Net expensesf | | | 1.25 | % | | | 1.27 | % | | | 1.49 | % | | | 1.61 | % | | | 1.52 | % | | | 1.45 | % |
Net expenses prior to custodian earning credits and net of expense waivers | | | 1.25 | % | | | 1.27 | % | | | 1.49 | % | | | 1.61 | % | | | 1.52 | % | | | 1.45 | % |
| | | | | | | | | | | | | | | | | | | | | | | | |
Portfolio turnover rate | | | 49 | % | | | 25 | % | | | 54 | % | | | 110 | % | | | 75 | % | | | 76 | % |
| | | | | | |
Class B | | Six Months
Ended March 31,
2008a,g | | | 2007g | | | 2006 | | | 2005b | | | 2004 | | | Year Ended
September 30,
2003 | |
Per Share Data | | | | | | | | | | | | | | | | | | | | | | | | |
Net asset value, beginning of period | | $ | 8.58 | | | $ | 7.18 | | | $ | 6.38 | | | $ | 5.42 | | | $ | 4.87 | | | $ | 4.08 | |
| | | | | | | | | | | | | | | | | | | | | | | | |
Income (loss) from investment operations: | | | | | | | | | | | | | | | | | | | | | | | | |
Net investment income (loss)c | | | 0.04 | | | | (0.01 | ) | | | (0.04 | ) | | | (0.01 | ) | | | (0.03 | ) | | | (0.02 | ) |
Net gain (loss) on securities (realized and unrealized) | | | (1.08 | ) | | | 1.41 | | | | 0.84 | | | | 0.97 | | | | 0.58 | | | | 0.81 | |
| | | | | | | | | | | | | | | | | | | | | | | | |
Total from investment operations | | | (1.04 | ) | | | 1.40 | | | | 0.80 | | | | 0.96 | | | | 0.55 | | | | 0.79 | |
| | | | | | | | | | | | | | | | | | | | | | | | |
Less distributions: | | | | | | | | | | | | | | | | | | | | | | | | |
Dividends from net investment income | | | (0.01 | ) | | | — | | | | — | | | | — | | | | — | | | | — | |
Distributions from realized gains | | | (0.33 | ) | | | — | | | | — | | | | — | | | | — | | | | — | |
| | | | | | | | | | | | | | | | | | | | | | | | |
Total distributions | | | (0.34 | ) | | | — | | | | — | | | | — | | | | — | | | | — | |
| | | | | | | | | | | | | | | | | | | | | | | | |
Net asset value, end of period | | $ | 7.20 | | | $ | 8.58 | | | $ | 7.18 | | | $ | 6.38 | | | $ | 5.42 | | | $ | 4.87 | |
| | | | | | | | | | | | | | | | | | | | | | | | |
Total Returnd | | | (12.31 | )% | | | 19.50 | % | | | 12.54 | % | | | 17.71 | % | | | 11.29 | % | | | 19.36 | % |
| | | | | | | | | | | | | | | | | | | | | | | | |
Ratios/Supplemental Data | | | | | | | | | | | | | | | | | | | | | | | | |
Net assets, end of period (in thousands) | | $ | 9,360 | | | $ | 13,784 | | | $ | 12,761 | | | $ | 8,500 | | | $ | 10,164 | | | $ | 11,687 | |
| | | | | | | | | | | | | | | | | | | | | | | | |
Ratios to average net assets: | | | | | | | | | | | | | | | | | | | | | | | | |
Net investment income (loss) | | | 0.94 | % | | | (0.08 | )% | | | (0.58 | )% | | | (0.16 | )% | | | (0.57 | )% | | | (0.42 | )% |
Total expensese | | | 1.09 | % | | | 1.92 | % | | | 2.26 | % | | | 2.36 | % | | | 2.27 | % | | | 2.20 | % |
Net expensesf | | | 1.00 | % | | | 1.85 | % | | | 2.26 | % | | | 2.36 | % | | | 2.27 | % | | | 2.20 | % |
Net expenses prior to custodian earning credits and net of expense waivers | | | 1.00 | % | | | 1.85 | % | | | 2.26 | % | | | 2.36 | % | | | 2.27 | % | | | 2.20 | % |
| | | | | | | | | | | | | | | | | | | | | | | | |
Portfolio turnover rate | | | 49 | % | | | 25 | % | | | 54 | % | | | 110 | % | | | 75 | % | | | 76 | % |
| | | | |
| | 69 | | The accompanying notes are an integral part of the financial statements |
| | | | |
| Financial Highlights | | | | Security |
| Selected data for each share of capital stock outstanding throughout each year | | Large Cap Value Fund |
| | | | | | | | | | | | | | | | | | | | | | | | |
Class C | | Six Months
Ended March 31,
2008a | | | 2007 | | | 2006 | | | 2005b | | | 2004 | | | Year Ended
September 30,
2003 | |
Per Share Data | | | | | | | | | | | | | | | | | | | | | | | | |
Net asset value, beginning of period | | $ | 8.72 | | | $ | 7.31 | | | $ | 6.49 | | | $ | 5.52 | | | $ | 4.96 | | | $ | 4.16 | |
| | | | | | | | | | | | | | | | | | | | | | | | |
Income (loss) from investment operations: | | | | | | | | | | | | | | | | | | | | | | | | |
Net investment lossc | | | — | | | | (0.02 | ) | | | (0.04 | ) | | | (0.01 | ) | | | (0.03 | ) | | | (0.02 | ) |
Net gain (loss) on securities (realized and unrealized) | | | (1.09 | ) | | | 1.43 | | | | 0.86 | | | | 0.98 | | | | 0.59 | | | | 0.82 | |
| | | | | | | | | | | | | | | | | | | | | | | | |
Total from investment operations | | | (1.09 | ) | | | 1.41 | | | | 0.82 | | | | 0.97 | | | | 0.56 | | | | 0.80 | |
| | | | | | | | | | | | | | | | | | | | | | | | |
Less distributions: | | | | | | | | | | | | | | | | | | | | | | | | |
Distributions from realized gains | | | (0.33 | ) | | | — | | | | — | | | | — | | | | — | | | | — | |
| | | | | | | | | | | | | | | | | | | | | | | | |
Total distributions | | | (0.33 | ) | | | — | | | | — | | | | — | | | | — | | | | — | |
| | | | | | | | | | | | | | | | | | | | | | | | |
Net asset value, end of period | | $ | 7.30 | | | $ | 8.72 | | | $ | 7.31 | | | $ | 6.49 | | | $ | 5.52 | | | $ | 4.96 | |
| | | | | | | | | | | | | | | | | | | | | | | | |
Total Returnd | | | (12.73 | )% | | | 19.29 | % | | | 12.63 | % | | | 17.57 | % | | | 11.29 | % | | | 19.23 | % |
| | | | | | | | | | | | | | | | | | | | | | | | |
Ratios/Supplemental Data | | | | | | | | | | | | | | | | | | | | | | | | |
Net assets, end of period (in thousands) | | $ | 5,344 | | | $ | 5,717 | | | $ | 3,536 | | | $ | 2,899 | | | $ | 2,561 | | | $ | 2,130 | |
| | | | | | | | | | | | | | | | | | | | | | | | |
Ratios to average net assets: | | | | | | | | | | | | | | | | | | | | | | | | |
Net investment loss | | | (0.03 | )% | | | (0.23 | )% | | | (0.60 | )% | | | (0.18 | )% | | | (0.57 | )% | | | (0.33 | )% |
Total expensese | | | 2.09 | % | | | 2.10 | % | | | 2.25 | % | | | 2.36 | % | | | 2.28 | % | | | 2.20 | % |
Net expensesf | | | 2.00 | % | | | 2.02 | % | | | 2.25 | % | | | 2.36 | % | | | 2.28 | % | | | 2.20 | % |
Net expenses prior to custodian earning credits and net of expense waivers | | | 2.00 | % | | | 2.02 | % | | | 2.25 | % | | | 2.36 | % | | | 2.28 | % | | | 2.20 | % |
| | | | | | | | | | | | | | | | | | | | | | | | |
Portfolio turnover rate | | | 49 | % | | | 25 | % | | | 54 | % | | | 110 | % | | | 75 | % | | | 76 | % |
a | Unaudited figures for the six months ended March 31, 2008. Percentage amounts for the period, except total return, have been annualized. |
b | Security Investors (SI) became the advisor of Security Large Cap Value Fund effective June 30, 2005. Prior to June 30, 2005, SI paid Dreyfus Corporation for sub-advisory services. |
c | Net investment income (loss) was computed using average shares outstanding throughout the period. |
d | Total return information does not reflect deduction of any sales charges imposed at the time of purchase for Class A shares or upon redemption for Class B and C shares. |
e | Total expense information reflects expense ratios absent expense reductions by the Investment Manager and custodian earnings credits, as applicable. |
f | Net expense information reflects the expense ratios after voluntary expense waivers, reimbursements and custodian earnings credits, as applicable. |
g | Effective August 1, 2007, Class B shares ceased charging 12b-1 fees in accordance with FINRA (formerly NASD) sales cap regulations. Per share information reflects this change. This fee will be reinstated when sales reach above the sales cap limit. |
| | | | |
| | 70 | | The accompanying notes are an integral part of the financial statements |
This page left blank intentionally.
71
Security Mid Cap
Growth Fund

Adviser,
Security Global Investors
72
| | |
| | Security |
| Performance Summary | | Mid Cap Growth Fund |
| March 31, 2008 | | (unaudited) |
PERFORMANCE
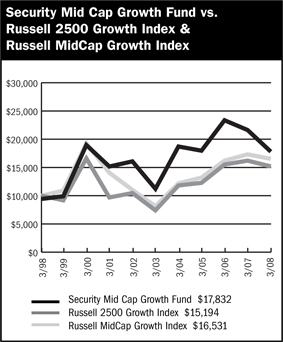
$10,000 Over Ten Years
This chart assumes a $10,000 investment in Class A shares of Security Mid Cap Growth Fund on March 31, 1998, reflects deduction of the 5.75% sales load and assumes all dividends reinvested. The chart does not reflect the deduction of taxes that a shareholder would pay on distributions of the redemption of fund shares. The Russell 2500 Growth Index is an unmanaged index that measures the performance of securities of small-to-mid U.S. companies with greater-than-average growth orientation. The Russell MidCap Growth Index is an unmanaged capitalization-weighted index that is designed to measure the performance of the 800 smallest companies in the Russell 1000 Index with higher price-to-book ratios and higher forecasted growth values. The Russell MidCap Growth Index replaced the Russell 2500 Growth Index as the Fund’s primary benchmark effective February 1, 2008, to provide a more meaningful comparison of the Fund’s performance in light of the investment strategies that it employs.
Average Annual Returns
| | | | | | | | | | | | |
Periods Ended 3-31-08 | | 1 Year | | | 5 Years | | | 10 Years | | | Since
Inception | |
A Shares | | (17.56 | )% | | 9.70 | % | | 6.58 | % | | — | |
A Shares with sales charge | | (22.30 | )% | | 8.41 | % | | 5.95 | % | | — | |
B Shares | | (18.23 | )% | | 8.89 | % | | 5.84 | % | | — | |
B Shares with CDSC | | (21.26 | )% | | 8.66 | % | | 5.84 | % | | — | |
C Shares | | (18.20 | )% | | 8.94 | % | | — | | | 5.33 | % |
| | | | | | | | | | | (1-29-99 | ) |
C Shares with CDSC | | (18.83 | )% | | 8.94 | % | | — | | | 5.33 | % |
| | | | | | | | | | | (1-29-99 | ) |
The performance data above represents past performance that is not predictive of future results. The investment return and principal value of an investment in the Fund will fluctuate so that an investor’s shares, when redeemed, may be worth more or less than their original cost. The figures above do not reflect deduction of the maximum front-end sales charge of 5.75% for Class A shares or the contingent deferred sales charge of 5% for Class B shares and 1% for Class C shares, as applicable, except where noted. The figures do not reflect the deduction of taxes that a shareholder would pay on distributions or redemption of shares. Such figures would be lower if the maximum sales charge and any applicable taxes were deducted.
Portfolio Composition by Sector as of 3-31-08
| | | |
Consumer Discretionary | | 13.28 | % |
Energy | | 9.98 | |
Financials | | 6.58 | |
Health Care | | 15.56 | |
Industrials | | 12.27 | |
Information Technology | | 23.66 | |
Materials | | 11.62 | |
Warrants | | 0.20 | |
Repurchase Agreement | | 6.96 | |
Liabilities in Excess of Other Assets | | (0.11 | ) |
Total Net Assets | | 100.00 | % |
| | | |
| | | | |
| | 73 | | The accompanying notes are an integral part of the financial statements |
| | |
| | Security |
| Performance Summary | | Mid Cap Growth Fund |
| March 31, 2008 | | (unaudited) |
Information About Your Fund’s Expenses
Calculating your ongoing Fund expenses
Example
As a shareholder of the Fund, you incur two types of costs: (1) transaction costs, which may include sales charges (loads) on purchase payments; contingent deferred sales charges on redemptions; and redemption fees, if any; and (2) ongoing costs, including management fees; distribution and/or service fees (12b-1); and other Fund expenses. This example is intended to help you understand your ongoing costs (in dollars) of investing in the Series and to compare these costs with ongoing costs of investing in other mutual funds. The example is based on an investment of $1,000 invested at the beginning of the period and held for the entire period October 1, 2007 through March 31, 2008.
Actual Expenses
The first line for each class of shares in the table provides information about actual account values and actual expenses. You may use the information in this table, together with the amount you invested, to estimate the expenses that you paid over the period. Simply divide your account value by $1,000 (for example, an $8,600 account value divided by $1,000 = 8.6), then multiply the result by the number in the table under the heading entitled “Expenses Paid During the Period” to estimate the expenses you paid on your account during this period.
Hypothetical Example for Comparison Purposes
The second line for each class of shares in the table provides information about hypothetical account values and hypothetical expenses based on the Fund’s actual expense ratio and an assumed rate of return of 5% per year before expenses, which is not the Fund’s actual return. The hypothetical account values and expenses may not be used to estimate the actual ending account balance or expenses you paid for the period. You may use this information to compare the ongoing costs of investing in the Fund and other funds. To do so, compare this 5% hypothetical example with the 5% hypothetical examples that appear in the shareholder reports of the other mutual funds.
Please note that the expenses shown in the table are meant to highlight your ongoing costs only and do not reflect any transactional costs, such as sales charges (loads) on purchase payments, contingent deferred sales charges on redemptions, and redemption fees, if any. Therefore, the second line for each class of shares is useful in comparing ongoing costs only, and will not help you determine the relative total costs of owning different funds. In addition, if these transactional costs were included, your costs would have been higher.
Fund Expenses
| | | | | | | | | |
| | | Beginning
Account
Value
10/1/2007 | | Ending
Account
Value
3/31/20081 | | Expenses
Paid
During
Period2 |
Mid Cap Growth | | | | | | | | | |
Fund - Class A | | | | | | | | | |
Actual | | $ | 1,000.00 | | $ | 839.23 | | $ | 6.76 |
Hypothetical | | | 1,000.00 | | | 1,017.65 | | | 7.41 |
| | | |
Mid Cap Growth | | | | | | | | | |
Fund - Class B | | | | | | | | | |
Actual | | | 1,000.00 | | | 834.75 | | | 10.18 |
Hypothetical | | | 1,000.00 | | | 1,013.90 | | | 11.18 |
| | | |
Mid Cap Growth | | | | | | | | | |
Fund - Class C | | | | | | | | | |
Actual | | | 1,000.00 | | | 835.78 | | | 10.19 |
Hypothetical | | | 1,000.00 | | | 1,013.90 | | | 11.18 |
1 | The actual ending account value is based on the actual total return of the Fund for the period October 1, 2007 to March 31, 2008 after actual expenses and will differ from the hypothetical ending account value which is based on the Fund expense ratio and a hypothetical annual return of 5% before expenses. The actual cumulative return at net asset value for the period October 1, 2007 to March 31, 2008 was (16.08%), (16.52%) and (16.42%), for Class A, B, and C respectively. |
2 | Expenses are equal to the Fund annualized expense ratio (1.47%, 2.22% and 2.22% for Class A, B, and C shares, respectively) net of any applicable fee waivers or earnings credits, multiplied by the average account value over the period, multiplied by 183/366 (to reflect the one-half year period). |
74
| | |
| Schedule of Investments | | Security Mid Cap Growth Fund |
| March 31, 2008 (Unaudited) | | |
| | | | | |
| | | Shares | | Value |
COMMON STOCK - 92.7% | | | | | |
Aerospace & Defense - 7.7% | | | | | |
Goodrich Corporation | | 74,080 | | $ | 4,260,341 |
Precision Castparts Corporation | | 28,635 | | | 2,923,061 |
Rockwell Collins, Inc. | | 57,800 | | | 3,303,270 |
| | | | | |
| | | | | 10,486,672 |
| | | | | |
Apparel Retail - 3.1% | | | | | |
TJX Companies, Inc. | | 127,000 | | | 4,199,890 |
| | | | | |
Apparel, Accessories & Luxury Goods - 2.8% | | | | | |
Phillips-Van Heusen Corporation | | 101,000 | | | 3,829,920 |
| | | | | |
Asset Management & Custody Banks - 1.6% | | | | | |
T. Rowe Price Group, Inc. | | 43,920 | | | 2,196,000 |
| | | | | |
Biotechnology - 8.0% | | | | | |
Genzyme Corporation * | | 70,500 | | | 5,255,070 |
Gilead Sciences, Inc. * | | 109,400 | | | 5,637,382 |
| | | | | |
| | | | | 10,892,452 |
| | | | | |
Coal & Consumable Fuels - 1.3% | | | | | |
Peabody Energy Corporation | | 34,900 | | | 1,779,900 |
| | | | | |
Communications Equipment - 7.0% | | | | | |
Ciena Corporation * | | 117,700 | | | 3,628,691 |
F5 Networks, Inc. * | | 78,300 | | | 1,422,711 |
Foundry Networks, Inc. * | | 381,190 | | | 4,414,180 |
| | | | | |
| | | | | 9,465,582 |
| | | | | |
Data Processing & Outsourced Services - 1.5% | | | | | |
Alliance Data Systems Corporation * | | 42,295 | | | 2,009,435 |
| | | | | |
Electrical Components & Equipment - 4.3% | | | | | |
Ametek, Inc. | | 132,400 | | | 5,813,684 |
| | | | | |
Electronic Equipment Manufacturers - 2.0% | | | | | |
Amphenol Corporation | | 73,170 | | | 2,725,583 |
| | | | | |
Fertilizers & Agricultural Chemicals - 5.9% | | | | | |
Agrium, Inc. | | 47,600 | | | 2,956,436 |
Mosaic Company * | | 49,800 | | | 5,109,480 |
| | | | | |
| | | | | 8,065,916 |
| | | | | |
Home Entertainment Software - 4.3% | | | | | |
Activision, Inc. * | | 213,075 | | | 5,819,078 |
| | | | | |
Hotels, Resorts & Cruise Lines - 1.7% | | | | | |
Royal Caribbean Cruises, Ltd. | | 72,000 | | | 2,368,800 |
| | | | | |
Industrial Gases - 4.4% | | | | | |
AirGas, Inc. | | 64,785 | | | 2,945,774 |
Praxair, Inc. | | 35,800 | | | 3,015,434 |
| | | | | |
| | | | | 5,961,208 |
| | | | | |
IT Consulting & Other Services - 3.7% | | | | | |
Cognizant Technology Solutions Corporation * | | 172,980 | | | 4,987,013 |
| | | | | |
Leisure Facilities - 1.6% | | | | | |
Life Time Fitness, Inc. * | | 68,285 | | | 2,131,175 |
| | | | | |
Life Sciences Tools & Services - 3.3% | | | | | |
Thermo Fisher Scientific, Inc. * | | 80,100 | | | 4,552,884 |
| | | | | |
Managed Health Care - 0.7% | | | | | |
Humana, Inc. * | | 21,550 | | | 966,733 |
| | | | | |
Multi-Line Insurance - 5.0% | | | | | |
Assurant, Inc. | | 78,600 | | | 4,783,596 |
HCC Insurance Holdings, Inc. | | 86,650 | | | 1,966,089 |
| | | | | |
| | | | | 6,749,685 |
| | | | | |
Oil & Gas Equipment & Services - 6.2% | | | | | |
Grant Prideco, Inc. * | | 75,700 | | | 3,725,954 |
Weatherford International, Ltd. * | | 65,700 | | | 4,761,279 |
| | | | | |
| | | | | 8,487,233 |
| | | | | |
Oil & Gas Storage & Transportation - 2.4% | | | | | |
Williams Companies, Inc. | | 99,800 | | | 3,291,404 |
| | | | | |
Pharmaceuticals - 3.5% | | | | | |
Teva Pharmaceutical Industries, Ltd. ADR ADR | | 102,555 | | | 4,737,015 |
| | | | | |
Restaurants - 4.1% | | | | | |
Darden Restaurants, Inc. | | 169,630 | | | 5,521,457 |
| | | | | |
Semiconductor Equipment - 2.4% | | | | | |
MEMC Electronic Materials, Inc. * | | 45,460 | | | 3,223,114 |
| | | | | |
Semiconductors - 2.9% | | | | | |
Fairchild Semiconductor International, Inc. * | | 146,700 | | | 1,748,664 |
ON Semiconductor Corporation * | | 383,190 | | | 2,176,519 |
| | | | | |
| | | | | 3,925,183 |
| | | | | |
Steel - 1.3% | | | | | |
Carpenter Technology Corporation | | 31,515 | | | 1,763,895 |
| | | | | |
TOTAL COMMON STOCK (Cost $123,950,882) | | | | $ | 125,950,911 |
| | | | | |
PREFERRED STOCK - 0.3% | | | | | |
Environmental & Facilities Services - 0.3% | | | | | |
ThermoEnergy Corporation PIPE * (1)(2)(3) | | 745,000 | | | 379,950 |
| | | | | |
TOTAL PREFERRED STOCK (Cost $702,947) | | | | $ | 379,950 |
| | | | | |
WARRANTS - 0.2% | | | | | |
Warrants - 0.2% | | | | | |
Lime Energy Company
$ 1.00, 3/19/2009 | | 2,967 | | | 20,373 |
Nova Biosource Fuels, Inc.
$ 2.40, 7/5/2011 | | 208,050 | | | 180,326 |
| | | | |
| | 75 | | The accompanying notes are an integral part of the financial statements |
| | |
| Schedule of Investments | | Security Mid Cap Growth Fund |
| March 31, 2008 (Unaudited) - continued | | |
| | | | | | | |
| | | Shares | | Value | |
WARRANTS (continued) | | | | | | | |
Warrants (continued) | | | | | | | |
Orthovita, Inc.
$ 4.00, 6/26/2008 | | | 75,000 | | $ | 2,133 | |
ThermoEnergy Corporation
$ 0.75, 7/14/2008 (1)(2) | | | 745,000 | | | 62,342 | |
| | | | | | | |
| | | | | | 265,174 | |
| | | | | | | |
TOTAL WARRANTS (Cost $802,849) | | | | | $ | 265,174 | |
| | | | | | | |
| | |
| | | Principal
Amount | | | |
REPURCHASE AGREEMENT - 6.9% | | | | | | | |
United Missouri Bank, 1.99%, dated 3/31/08, matures 4/01/08; repurchase amount $9,463,523 (Collateralized by FNSM, 5.50%, 11/01/33 with a value of $9,652,472) | | $ | 9,463,000 | | $ | 9,463,000 | |
| | | | | | | |
TOTAL REPURCHASE AGREEMENT (Cost $9,463,000) | | | | | $ | 9,463,000 | |
| | | | | | | |
Total Investments (Security Mid Cap Growth Fund)
(Cost $134,919,678) - 100.1% | | | | | $ | 136,059,035 | |
Liabilities in Excess of Other Assets - (0.1)% | | | | | | (144,881 | ) |
| | | | | | | |
TOTAL NET ASSETS - 100.0% | | | | | $ | 135,914,154 | |
| | | | | | | |
Footnotes
Percentages are stated as a percent of net assets.
For federal income tax purposes the identified cost of investments owned at 3/31/2008 was $134,919,678.
| * | - Non-income producing security |
| 1 | - Security is restricted from resale. See Note 6 in notes to financial statements. |
| 2 | - Security is deemed illiquid. The total market value of illiquid securities is $442,292 (cost $894,000), or 0.3% of total net assets. |
| 3 | - PIPE (Private Investment in Public Equity) - Stock issued by a company in the secondary market as a means of raising capital more quickly and less expensively than through registration of a secondary public offering. |
Glossary:
| ADR | - American Depositary Receipt |
See notes to financial statements.
| | | | |
| | 76 | | The accompanying notes are an integral part of the financial statements |
Security
Mid Cap Growth Fund
(unaudited)
Statement of Assets and Liabilities
March 31, 2008
| | | | |
Assets: | | | | |
Investments, at value* | | $ | 136,059,035 | |
| |
Receivables: | | | | |
Fund shares sold | | | 83,411 | |
Dividends | | | 38,097 | |
Prepaid expenses | | | 47,514 | |
| | | | |
Total assets | | | 136,228,057 | |
| | | | |
Liabilities: | | | | |
Cash overdraft | | | 1,610 | |
Payable for: | | | | |
Fund shares redeemed | | | 109,885 | |
Management fees | | | 86,254 | |
Custodian fees | | | 7,080 | |
Transfer agent/maintenance fees | | | 18,909 | |
Administration fees | | | 11,525 | |
Professional fees | | | 16,235 | |
12b-1 distribution plan fees | | | 40,605 | |
Directors’ fees | | | 2,559 | |
Other | | | 19,241 | |
| | | | |
Total liabilities | | | 313,903 | |
| | | | |
Net assets | | $ | 135,914,154 | |
| | | | |
Net assets consist of: | | | | |
Paid in capital | | $ | 162,247,655 | |
Accumulated net investment loss | | | (474,631 | ) |
Accumulated net realized loss on sale of investments | | | (26,998,227 | ) |
Net unrealized appreciation in value of investments | | | 1,139,357 | |
| | | | |
Net assets | | $ | 135,914,154 | |
| | | | |
Class A: | | | | |
Capital shares outstanding (unlimited number of shares authorized) | | | 15,972,876 | |
Net assets | | $ | 117,387,115 | |
Net asset value and redemption price per share | | $ | 7.35 | |
| | | | |
Maximum offering price per share (net asset value divided by 94.25%) | | $ | 7.80 | |
| | | | |
Class B: | | | | |
Capital shares outstanding (unlimited number of shares authorized) | | | 1,911,543 | |
Net assets | | $ | 10,750,565 | |
Net asset value, offering and redemption price per share (excluding any applicable contingent deferred sales charge) | | $ | 5.62 | |
| | | | |
Class C: | | | | |
Capital shares outstanding (unlimited number of shares authorized) | | | 1,200,218 | |
Net assets | | $ | 7,776,474 | |
Net asset value, offering and redemption price per share (excluding any applicable contingent deferred sales charge) | | $ | 6.48 | |
| | | | |
| | | |
* Investments, at cost | | $ | 134,919,678 |
Statement of Operations
For the Six Months Ended March 31, 2008
| | | | |
Investment Income: | | | | |
Dividends | | $ | 396,229 | |
Interest | | | 358,533 | |
| | | | |
Total investment income | | | 754,762 | |
| | | | |
Expenses: | | | | |
Management fees | | | 584,778 | |
Transfer agent/maintenance fees | | | 207,770 | |
Administration fees | | | 75,212 | |
Custodian fees | | | 8,520 | |
Directors’ fees | | | 4,448 | |
Professional fees | | | 17,342 | |
Reports to shareholders | | | 12,704 | |
Registration fees | | | 29,685 | |
Other expenses | | | 12,245 | |
12b-1 distribution fees - Class A | | | 167,671 | |
12b-1 distribution fees - Class B | | | 63,849 | |
12b-1 distribution fees - Class C | | | 45,169 | |
| | | | |
Total expenses | | | 1,229,393 | |
| | | | |
Net investment loss | | | (474,631 | ) |
| | | | |
Net Realized and Unrealized Gain (Loss): | | | | |
Net realized gain (loss) during the period on: | | | | |
Investments | | | (25,266,165 | ) |
| | | | |
Net realized loss | | | (25,266,165 | ) |
| | | | |
Net unrealized appreciation (depreciation) during the period on: | | | | |
Investments | | | (1,677,343 | ) |
| | | | |
Net unrealized depreciation | | | (1,677,343 | ) |
| | | | |
Net loss | | | (26,943,508 | ) |
| | | | |
Net decrease in net assets resulting from operations | | $ | (27,418,139 | ) |
| | | | |
| | | | |
| | 77 | | The accompanying notes are an integral part of the financial statements |
| | |
| | Security |
| Statement of Changes in Net Assets | | Mid Cap Growth Fund |
| | | | | | | | |
| | | Six Months Ended
March 31, 2008
(unaudited) | | | Year Ended
September 30, 2007 | |
Increase (decrease) in net assets from operations: | | | | | | | | |
Net investment loss | | $ | (474,631 | ) | | $ | (1,710,600 | ) |
Net realized gain (loss) during the period on investments | | | (25,266,165 | ) | | | 36,643,823 | |
Net unrealized depreciation during the period on investments | | | (1,677,343 | ) | | | (29,521,012 | ) |
| | | | | | | | |
Net increase (decrease) in net assets resulting from operations | | | (27,418,139 | ) | | | 5,412,211 | |
| | | | | | | | |
Distributions to shareholders from: | | | | | | | | |
Net realized gain | | | | | | | | |
Class A | | | (28,305,723 | ) | | | (19,776,158 | ) |
Class B | | | (3,379,810 | ) | | | (2,496,080 | ) |
Class C | | | (2,111,786 | ) | | | (1,608,868 | ) |
| | | | | | | | |
Total distributions to shareholders | | | (33,797,319 | ) | | | (23,881,106 | ) |
| | | | | | | | |
Capital share transactions: | | | | | | | | |
Proceeds from sale of shares | | | | | | | | |
Class A | | | 9,651,396 | | | | 48,235,738 | |
Class B | | | 655,663 | | | | 1,357,847 | |
Class C | | | 826,159 | | | | 1,704,430 | |
Distributions reinvested | | | | | | | | |
Class A | | | 27,267,565 | | | | 19,133,742 | |
Class B | | | 3,319,686 | | | | 2,453,633 | |
Class C | | | 1,945,652 | | | | 1,496,764 | |
Cost of shares redeemed | | | | | | | | |
Class A | | | (28,306,982 | ) | | | (83,873,354 | ) |
Class B | | | (2,390,937 | ) | | | (8,893,103 | ) |
Class C | | | (1,976,417 | ) | | | (6,683,210 | ) |
| | | | | | | | |
Net increase (decrease) from capital share transactions | | | 10,991,785 | | | | (25,067,513 | ) |
| | | | | | | | |
Net decrease in net assets | | | (50,223,673 | ) | | | (43,536,408 | ) |
| | | | | | | | |
Net assets: | | | | | | | | |
Beginning of period | | | 186,137,827 | | | | 229,674,235 | |
| | | | | | | | |
End of period | | $ | 135,914,154 | | | $ | 186,137,827 | |
| | | | | | | | |
Accumulated net investment loss at end of period | | $ | (474,631 | ) | | $ | — | |
| | | | | | | | |
Capital share activity: | | | | | | | | |
Shares sold | | | | | | | | |
Class A | | | 1,129,867 | | | | 4,072,151 | |
Class B | | | 89,431 | | | | 142,975 | |
Class C | | | 111,416 | | | | 160,950 | |
Shares reinvested | | | | | | | | |
Class A | | | 3,416,988 | | | | 1,702,290 | |
Class B | | | 542,432 | | | | 265,258 | |
Class C | | | 275,979 | | | | 145,458 | |
Shares redeemed | | | | | | | | |
Class A | | | (3,022,388 | ) | | | (7,294,430 | ) |
Class B | | | (357,777 | ) | | | (946,339 | ) |
Class C | | | (247,381 | ) | | | (639,771 | ) |
| | | | |
| | 78 | | The accompanying notes are an integral part of the financial statements |
| | | | |
| Financial Highlights | | | | Security |
| Selected data for each share of capital stock outstanding throughout each year | | Mid Cap Growth Fund |
| | | | | | | | | | | | | | | | | | | | | | | | |
Class A | | Six Months
Ended March 31,
2008a | | | 2007 | | | 2006 | | | 2005 | | | 2004b | | | Year Ended
September 30,
2003 | |
Per Share Data | | | | | | | | | | | | | | | | | | | | | | | | |
Net asset value, beginning of period | | $ | 11.11 | | | $ | 12.03 | | | $ | 12.65 | | | $ | 11.02 | | | $ | 10.84 | | | $ | 7.03 | |
| | | | | | | | | | | | | | | | | | | | | | | | |
Income (loss) from investment operations: | | | | | | | | | | | | | | | | | | | | | | | | |
Net investment lossc | | | (0.02 | ) | | | (0.08 | ) | | | (0.12 | ) | | | (0.10 | ) | | | (0.13 | ) | | | (0.10 | ) |
Net gain (loss) on securities (realized and unrealized) | | | (1.60 | ) | | | 0.35 | | | | 0.47 | | | | 2.46 | | | | 0.71 | | | | 3.91 | |
| | | | | | | | | | | | | | | | | | | | | | | | |
Total from investment operations | | | (1.62 | ) | | | 0.27 | | | | 0.35 | | | | 2.36 | | | | 0.58 | | | | 3.81 | |
| | | | | | | | | | | | | | | | | | | | | | | | |
Less distributions: | | | | | | | | | | | | | | | | | | | | | | | | |
Distributions from realized gains | | | (2.14 | ) | | | (1.19 | ) | | | (0.97 | ) | | | (0.73 | ) | | | (0.40 | ) | | | — | |
| | | | | | | | | | | | | | | | | | | | | | | | |
Total distributions | | | (2.14 | ) | | | (1.19 | ) | | | (0.97 | ) | | | (0.73 | ) | | | (0.40 | ) | | | — | |
| | | | | | | | | | | | | | | | | | | | | | | | |
Net asset value, end of period | | $ | 7.35 | | | $ | 11.11 | | | $ | 12.03 | | | $ | 12.65 | | | $ | 11.02 | | | $ | 10.84 | |
| | | | | | | | | | | | | | | | | | | | | | | | |
Total Return d | | | (16.08 | )% | | | 2.10 | % | | | 2.81 | % | | | 21.76 | % | | | 5.23 | % | | | 54.20 | % |
| | | | | | | | | | | | | | | | | | | | | | | | |
Ratios/Supplemental Data | | | | | | | | | | | | | | | | | | | | | | | | |
Net assets, end of period (in thousands) | | $ | 117,387 | | | $ | 160,544 | | | $ | 192,159 | | | $ | 183,676 | | | $ | 149,715 | | | $ | 134,208 | |
| | | | | | | | | | | | | | | | | | | | | | | | |
Ratios to average net assets: | | | | | | | | | | | | | | | | | | | | | | | | |
Net investment loss | | | (0.50 | )% | | | (0.67 | )% | | | (0.93 | )% | | | (0.85 | )% | | | (1.11 | )% | | | (1.14 | )% |
Total expensese | | | 1.47 | % | | | 1.41 | % | | | 1.40 | % | | | 1.42 | % | | | 1.41 | % | | | 1.41 | % |
Net expensesf | | | 1.47 | % | | | 1.41 | % | | | 1.40 | % | | | 1.42 | % | | | 1.41 | % | | | 1.41 | % |
Net expenses prior to custodian earning credits and net of expense waivers | | | 1.47 | % | | | 1.41 | % | | | 1.40 | % | | | 1.42 | % | | | 1.41 | % | | | 1.41 | % |
| | | | | | | | | | | | | | | | | | | | | | | | |
Portfolio turnover rate | | | 231 | % | | | 34 | % | | | 41 | % | | | 31 | % | | | 50 | % | | | 57 | % |
| | | | | | |
Class B | | Six Months
Ended March 31,
2008a | | | 2007 | | | 2006 | | | 2005 | | | 2004b | | | Year Ended
September 30,
2003 | |
Per Share Data | | | | | | | | | | | | | | | | | | | | | | | | |
Net asset value, beginning of period | | $ | 9.09 | | | $ | 10.12 | | | $ | 10.86 | | | $ | 9.61 | | | $ | 9.57 | | | $ | 6.26 | |
| | | | | | | | | | | | | | | | | | | | | | | | |
Income (loss) from investment operations: | | | | | | | | | | | | | | | | | | | | | | | | |
Net investment lossc | | | (0.04 | ) | | | (0.14 | ) | | | (0.18 | ) | | | (0.16 | ) | | | (0.19 | ) | | | (0.15 | ) |
Net gain (loss) on securities (realized and unrealized) | | | (1.29 | ) | | | 0.30 | | | | 0.41 | | | | 2.14 | | | | 0.63 | | | | 3.46 | |
| | | | | | | | | | | | | | | | | | | | | | | | |
Total from investment operations | | | (1.33 | ) | | | 0.16 | | | | 0.23 | | | | 1.98 | | | | 0.44 | | | | 3.31 | |
| | | | | | | | | | | | | | | | | | | | | | | | |
Less distributions: | | | | | | | | | | | | | | | | | | | | | | | | |
Distributions from realized gains | | | (2.14 | ) | | | (1.19 | ) | | | (0.97 | ) | | | (0.73 | ) | | | (0.40 | ) | | | — | |
| | | | | | | | | | | | | | | | | | | | | | | | |
Total distributions | | | (2.14 | ) | | | (1.19 | ) | | | (0.97 | ) | | | (0.73 | ) | | | (0.40 | ) | | | — | |
| | | | | | | | | | | | | | | | | | | | | | | | |
Net asset value, end of period | | $ | 5.62 | | | $ | 9.09 | | | $ | 10.12 | | | $ | 10.86 | | | $ | 9.61 | | | $ | 9.57 | |
| | | | | | | | | | | | | | | | | | | | | | | | |
Total Returnd | | | (16.52 | )% | | | 1.34 | % | | | 2.12 | % | | | 20.95 | % | | | 4.44 | % | | | 52.88 | % |
| | | | | | | | | | | | | | | | | | | | | | | | |
Ratios/Supplemental Data | | | | | | | | | | | | | | | | | | | | | | | | |
Net assets, end of period (in thousands) | | $ | 10,751 | | | $ | 14,877 | | | $ | 22,010 | | | $ | 27,115 | | | $ | 26,578 | | | $ | 26,459 | |
| | | | | | | | | | | | | | | | | | | | | | | | |
Ratios to average net assets: | | | | | | | | | | | | | | | | | | | | | | | | |
Net investment loss | | | (1.25 | )% | | | (1.43 | )% | | | (1.68 | )% | | | (1.61 | )% | | | (1.86 | )% | | | (1.89 | )% |
Total expensese | | | 2.22 | % | | | 2.16 | % | | | 2.15 | % | | | 2.17 | % | | | 2.16 | % | | | 2.16 | % |
Net expensesf | | | 2.22 | % | | | 2.16 | % | | | 2.15 | % | | | 2.17 | % | | | 2.16 | % | | | 2.16 | % |
Net expenses prior to custodian earning credits and net of expense waivers | | | 2.22 | % | | | 2.16 | % | | | 2.15 | % | | | 2.17 | % | | | 2.16 | % | | | 2.16 | % |
| | | | | | | | | | | | | | | | | | | | | | | | |
Portfolio turnover rate | | | 231 | % | | | 34 | % | | | 41 | % | | | 31 | % | | | 50 | % | | | 57 | % |
| | | | |
| | 79 | | The accompanying notes are an integral part of the financial statements |
| | | | |
| Financial Highlights | | Security Mid Cap Growth Fund |
| Selected data for each share of capital stock outstanding throughout each year | |
| | | | | | | | | | | | | | | | | | | | | | | | |
Class C | | Six Months
Ended March 31,
2008a | | | 2007 | | | 2006 | | | 2005 | | | 2004b | | | Year Ended
September 30,
2003 | |
Per Share Data | | | | | | | | | | | | | | | | | | | | | | | | |
Net asset value, beginning of period | | $ | 10.11 | | | $ | 11.13 | | | $ | 11.84 | | | $ | 10.43 | | | $ | 10.34 | | | $ | 6.76 | |
| | | | | | | | | | | | | | | | | | | | | | | | |
Income (loss) from investment operations: | | | | | | | | | | | | | | | | | | | | | | | | |
Net investment lossc | | | (0.05 | ) | | | (0.15 | ) | | | (0.19 | ) | | | (0.18 | ) | | | (0.21 | ) | | | (0.16 | ) |
Net gain (loss) on securities (realized and unrealized) | | | (1.44 | ) | | | 0.32 | | | | 0.45 | | | | 2.32 | | | | 0.70 | | | | 3.74 | |
| | | | | | | | | | | | | | | | | | | | | | | | |
Total from investment operations | | | (1.49 | ) | | | 0.17 | | | | 0.26 | | | | 2.14 | | | | 0.49 | | | | 3.58 | |
| | | | | | | | | | | | | | | | | | | | | | | | |
Less distributions: | | | | | | | | | | | | | | | | | | | | | | | | |
Distributions from realized gains | | | (2.14 | ) | | | (1.19 | ) | | | (0.97 | ) | | | (0.73 | ) | | | (0.40 | ) | | | — | |
| | | | | | | | | | | | | | | | | | | | | | | | |
Total distributions | | | (2.14 | ) | | | (1.19 | ) | | | (0.97 | ) | | | (0.73 | ) | | | (0.40 | ) | | | — | |
| | | | | | | | | | | | | | | | | | | | | | | | |
Net asset value, end of period | | $ | 6.48 | | | $ | 10.11 | | | $ | 11.13 | | | $ | 11.84 | | | $ | 10.43 | | | $ | 10.34 | |
| | | | | | | | | | | | | | | | | | | | | | | | |
Total Returnd | | | (16.42 | )% | | | 1.31 | % | | | 2.20 | % | | | 20.83 | % | | | 4.59 | % | | | 52.96 | % |
| | | | | | | | | | | | | | | | | | | | | | | | |
Ratios/Supplemental Data | | | | | | | | | | | | | | | | | | | | | | | | |
Net assets, end of period (in thousands) | | $ | 7,776 | | | $ | 10,717 | | | $ | 15,505 | | | $ | 16,330 | | | $ | 14,759 | | | $ | 11,279 | |
| | | | | | | | | | | | | | | | | | | | | | | | |
Ratios to average net assets: | | | | | | | | | | | | | | | | | | | | | | | | |
Net investment loss | | | (1.26 | )% | | | (1.43 | )% | | | (1.68 | )% | | | (1.60 | )% | | | (1.86 | )% | | | (1.89 | )% |
Total expensese | | | 2.22 | % | | | 2.16 | % | | | 2.15 | % | | | 2.17 | % | | | 2.16 | % | | | 2.16 | % |
Net expensesf | | | 2.22 | % | | | 2.16 | % | | | 2.15 | % | | | 2.17 | % | | | 2.16 | % | | | 2.16 | % |
Net expenses prior to custodian earning credits and net of expense waivers | | | 2.22 | % | | | 2.16 | % | | | 2.15 | % | | | 2.17 | % | | | 2.16 | % | | | 2.16 | % |
| | | | | | | | | | | | | | | | | | | | | | | | |
Portfolio turnover rate | | | 231 | % | | | 34 | % | | | 41 | % | | | 31 | % | | | 50 | % | | | 57 | % |
a | Unaudited figures for the six months ended March 31, 2008. Percentage amounts for the period, except total return, have been annualized. |
b | The financial highlights for the Security Mid Cap Growth Fund exclude the historical financial highlights of the Technology Series Class, A, B and C shares. The assets of the Technology Series were acquired by the Security Mid Cap Growth Fund on October 3, 2003. |
c | Net investment income (loss) was computed using average shares outstanding throughout the period. |
d | Total return information does not reflect deduction of any sales charges imposed at the time of purchase for Class A shares or upon redemption for Class B and C shares. |
e | Total expense information reflects expense ratios absent expense reductions by the Investment Manager and custodian earnings credits, as applicable. |
f | Net expense information reflects the expense ratios after voluntary expense waivers, reimbursements and custodian earnings credits, as applicable. |
| | | | |
| | 80 | | The accompanying notes are an integral part of the financial statements |
Notes to Financial Statements
March 31, 2008 (unaudited)
1. Significant Accounting Policies
Security Large Cap Value, Equity and Mid Cap Growth Funds (the Funds) are registered under the Investment Company Act of 1940, as amended, as open-end management investment companies. The shares of Security Equity Fund are currently issued in multiple series, with each series, in effect, representing a separate fund. The Equity Fund accounts for the assets of each series separately. Additionally, within each Series or Fund are multiple classes of shares. Class “A” shares are generally sold with a sales charge at the time of purchase. Class “A” shares are not subject to a sales charge when they are redeemed, except for purchases of $1 million or more sold without a front-end sales charge are subject to a contingent deferred sales charge if redeemed within one year of purchase. Class “B” shares may be subject to a contingent deferred sales charge for six years and automatically convert to Class A shares after eight years. Redemptions of Class “B” shares within five years of acquisition incur a contingent deferred sales charge. Redemptions of Class “C” shares within one year of acquisition incur a contingent deferred sales charge. The following is a summary of the significant accounting policies followed by the Funds in the preparation of their financial statements.
A. Security Valuation – Valuations of the Funds’ or Series’ securities are supplied by pricing services approved by the Board of Directors. The Funds’ officers, under the general supervision of the Board of Directors, regularly review procedures used by, and valuations provided by, the pricing services. Each security owned by the Funds or Series that is listed on a securities exchange is valued at its last sale price on that exchange on the date as of which assets are valued. Where the security is listed on more than one exchange, the Fund or Series will use the price of that exchange that it generally considers to be the principal exchange on which the stock is traded. Securities listed on the Nasdaq Stock Market, Inc. (“Nasdaq”) will be valued at the Nasdaq Official Closing Price, which may not necessarily represent the last sale price. If there has been no sale on such exchange or NASDAQ on such day, the security is valued at the closing bid price on such day. Securities for which market quotations are not readily available are valued by a pricing service considering securities with similar yields, quality, type of issue, coupon, duration and rating. If there is no bid price or if the bid price is deemed to be unsatisfactory by the Board of Directors or by the Funds’ or Series’ investment manager, then the securities are valued in good faith by such method as the Board of Directors determines will reflect the fair value. If events occur after the close of a foreign exchange that will affect the value of a Fund or Series portfolio securities before the time as of which the NAV is calculated (a “significant event”), the security will generally be priced using a fair value procedure. If the Valuation Committee determines a significant event has occurred, it will evaluate the impact of that event on an affected security or securities, to determine whether a fair value adjustment would materially affect the Fund or Series net asset value per share. Some of the factors which may be considered by the Board of Directors in determining fair value are fundamental analytical data relating to the investment; the nature and duration of any restrictions on disposition; trading in similar securities of the same issuer or comparable companies; information from broker-dealers; and an evaluation of the forces that influence the market in which the securities are purchased and sold. The Funds or Series generally will value short-term debt securities at prices based on market quotations for such securities or securities of similar type, yield, quality and duration, except those securities purchased with 60 days or less to maturity are valued on the basis of amortized cost which approximates market value.
Generally, trading in foreign securities markets is substantially completed each day at various times prior to the close of the New York Stock Exchange. The values of foreign securities are determined as of the close of such foreign markets or the close of the New York Stock Exchange, if earlier. All investments quoted in foreign currency are valued in U.S. dollars on the basis of the foreign currency exchange rates prevailing at the close of business. Investments in foreign securities may involve risks not present in domestic investments. The Valuation Committee will determine the current value of such foreign securities by taking into consideration certain factors which may include those discussed above, as well as the following factors, among others: the value of the securities traded on other foreign markets, ADR trading, closed-end fund trading, foreign currency exchange activity, and the trading prices of financial products that are tied to foreign securities such as WEBS®. In addition, the Board of Directors has authorized the Valuation Committee and Administrator to use prices and other information supplied by a third party pricing vendor in valuing foreign securities.
B. Repurchase Agreements – In connection with transactions in repurchase agreements, it is the Funds’ or Series’ policy that their custodian take possession of the underlying collateral securities, the fair value of which exceeds the principal amount of the repurchase transaction, including accrued interest, at all times. If the seller defaults, and the fair value of the collateral declines, realization of the collateral by the Fund or Series may be delayed or limited.
C. Foreign Currency Transactions – The accounting records of the Funds or Series are maintained in U.S. dollars. All assets and liabilities initially expressed in foreign currencies are converted into U.S. dollars at prevailing exchange rates. Purchases and sales of investment securities, dividend and interest income, and certain expenses are translated at the rates of exchange prevailing on the respective dates of such transactions. Changes in the relationship of these foreign currencies to the U.S. dollar can significantly affect the value of the investments and earnings of the Funds or Series. Foreign investments may also subject the Fund or Series to foreign government exchange restrictions, expropriation, taxation or other political, social or economic developments, all of which could affect the market and/or credit risk of the investments.
The Funds or Series do not isolate that portion of the results of operations resulting from changes in the foreign exchange rates on investments from the fluctuations arising from changes in the market prices of securities held. Such fluctuations are included with the net realized and unrealized gain or loss on investments.
Net realized foreign exchange gains or losses arise from sales of portfolio securities, sales of foreign currencies, and the difference between asset and liability amounts initially stated in
81
Notes to Financial Statements
March 31, 2008 (unaudited)
foreign currencies and the U.S. dollar value of the amounts actually received or paid. Net unrealized foreign exchange gains or losses arise from changes in the value of portfolio securities and other assets and liabilities at the end of the reporting period, resulting from changes in the exchange rates.
D. Forward Foreign Currency Exchange Contracts – Global Series of the Security Equity Fund may enter into forward foreign exchange contracts in order to manage foreign currency risk from purchase or sale of securities denominated in foreign currency. The Series may also enter into such contracts to manage the effect of changes in foreign currency exchange rates on portfolio positions. These contracts are marked to market daily, by recognizing the difference between the contract exchange rate and the current market rate as unrealized gains or losses. Realized gains or losses are recognized when contracts are settled and are reflected in the Statement of Operations. These contracts involve market risk in excess of the amount reflected in the Statement of Assets and Liabilities. The face or contract amount in U.S. dollars reflects the total exposure the Global Series has in that particular currency contract. Losses may arise due to changes in the value of the foreign currency or if the counterparty does not perform under the contract.
E. Futures – The Funds or Series may utilize futures contracts to a limited extent, with the objectives of maintaining full exposure to the underlying stock market, enhancing returns, maintaining liquidity minimizing transaction costs and hedging possible variations in foreign exchange values. The Funds or Series, as applicable, may purchase or sell financial and foreign currency futures contracts to immediately position incoming cash in the market, thereby simulating a fully invested position in the underlying index while maintaining a cash balance for liquidity. In the event of redemptions, the Fund or Series, as applicable, may pay from its cash balances and reduce its future positions accordingly. Returns may be enhanced by purchasing futures contracts instead of the underlying securities when futures are believed to be priced more attractively than the underlying securities. The primary risks associated with the use of futures contracts are imperfect correlation between changes in market values of stocks contained in the indexes and the prices of futures contracts, and the possibility of an illiquid market. Futures contracts are valued based upon their quoted daily settlement prices. Upon entering into a futures contract, the Funds or Series are required to deposit and maintain as collateral either cash or securities, representing the initial margin, equal to a certain percentage of the contract value. Cash deposits are shown as restricted cash on the Statement of Assets and Liabilities; securities held as collateral are noted in the Schedule of Investments. Subsequent changes in the value of the contract are recorded as unrealized gains or losses. The variation margin is paid or received in cash daily by the Funds or Series. The Funds or Series realize a gain or loss when the contract is closed or expires.
F. Options Purchased and Written – The Funds or Series may purchase put and call options and write such options on a covered basis on securities that are traded on recognized securities exchanges and over-the-counter markets. Call and put options on securities give the holder the right to purchase or sell (and the writer the obligation to sell or purchase), respectively, a security at a specified price, until a certain date. Options may be used to economically hedge the Funds’ or Series’ portfolio, to increase returns or to maintain exposure to the equity markets. The primary risks associated with the use of options are an imperfect correlation between the change in market value of the securities held by the Fund or Series and the price of the option, the possibility of an illiquid market, and the inability of the counterparty to meet the terms of the contract.
The premium received for a written option is recorded as an asset with an equal liability which is marked to market based on the option’s quoted daily settlement price. Fluctuations in the value of such instruments are recorded as unrealized appreciation (depreciation) until terminated, at which time realized gains and losses are recognized.
G. Securities Sold Short – Certain Funds or Series may make short sales “against the box,” in which the Fund or Series enters into a short sale of a security it owns. At no time will more than 15% of the value of the Funds’ or Series’ net assets be in deposits on short sales against the box. If a Fund or Series makes a short sale, the Fund or Series does not immediately deliver from its own account the securities sold and does not receive the proceeds from the sale. To complete the sale, the Fund or Series must borrow the security (generally from the broker through which the short sale is made) in order to make delivery to the buyer. The Fund or Series must replace the security borrowed by purchasing it at the market price at the time of replacement or delivering the security from its own portfolio. The Fund or Series is said to have a “short position” in securities sold until it delivers them to the broker, at which time it receives the proceeds of the sale. Certain Funds or Series may make short sales that are not “against the box,” which create opportunities to increase the Fund’s or Series’ return but, at the same time, involve specific risk considerations and may be considered a speculative technique. Such short sales theoretically involve unlimited loss potential, as the market price of securities sold short may continually increase, although a Fund or Series may mitigate such losses by replacing the securities sold short before the market price has increased significantly. For financial statement purposes, an amount equal to the settlement amount is included in the Statement of Assets and Liabilities as an asset and an equivalent liability. The amount of the liability is subsequently marked-to-market to reflect the current value of the short position. Subsequent fluctuations in the market prices of securities sold, but not yet purchased, may require purchasing the securities at prices which differ from the market value reflected on the Statement of Assets and Liabilities. The Fund or Series are liable for any dividends or interest payable on securities while those securities are in a short position. As collateral for its short positions, the Fund or Series are required under the Investment Company Act of 1940 to maintain segregated assets consisting of cash, cash equivalents or liquid securities. These segregated assets are valued consistent with Note 1a above. These segregated assets are required to be adjusted daily to reflect changes in the market value of the securities sold short.
H. Security Transactions and Investment Income – Security transactions are accounted for on the date the securities are purchased or sold (trade date). Realized gains and losses are
82
Notes to Financial Statements
March 31, 2008 (unaudited)
reported on an identified cost basis. Dividend income is accrued as of ex-dividend date, except that certain dividends for foreign securities where the ex-dividend date may have passed are recorded as soon as the Fund or Series is informed of the dividend in the exercise of reasonable diligence. Interest income is recognized on the accrual basis including the amortization of premiums and accretion of discounts on debt securities.
I. Expenses – Expenses that are directly related to one of the Funds or Series are charged directly to that Fund or Series. Other operating expenses are allocated to the Funds or Series on the basis of relative net assets. Class specific expenses, such as 12b-1 fees, are borne by that class. Income, other expenses and realized and unrealized gains and losses of a Fund or Series are allocated to each respective class in proportion to the relative net assets of each class.
J. Distributions to Shareholders – Distributions to shareholders are recorded on the ex-dividend date. The character of distributions made during the year from net investment income or net realized gains may differ from their ultimate characterization for federal income tax purposes.
K. Taxes – The Funds or Series intend to comply with the requirements of the Internal Revenue Code applicable to regulated investment companies and distribute all of their taxable net income and net realized gains sufficient to relieve them from all, or substantially all, federal income, excise and state income taxes. Therefore, no provision for federal or state income tax is required.
On July 13, 2006, the Financial Accounting Standards Board (FASB) released FASB Interpretation No. 48 “Accounting for Uncertainty in Income Taxes” (“FIN 48”). FIN 48 provides guidance for how uncertain tax positions should be recognized, measured, presented and disclosed in the financial statements. FIN 48 requires the evaluation of tax positions taken or expected to be taken in the course of preparing the Funds’ tax returns to determine whether the tax positions are “more-likely-than-not” of being sustained by the applicable tax authority. Tax positions not deemed to meet the more-likely-than-not threshold would be recorded as a tax benefit or expense in the current year. If applicable, the Fund would recognize interest and penalties accrued related to unrecognized tax benefits in “Other expenses” on the Statement of Operations. Adoption of FIN 48 is required as of the date of the last Net Asset Value (“NAV”) calculation in the first required financial statement reporting period for fiscal years beginning after December 15, 2006 and is to be applied to all open tax years (September 30, 2005 - September 30, 2007) as of the effective date. The Funds have adopted FIN 48 and as of March 31, 2008, management has determined the Funds did not have any tax positions that did not meet the “more-likely-than-not threshold” of being sustained by the applicable tax authority.
L. Earnings Credits – Under the fee agreement with the custodian, the Funds or Series may earn credits based on overnight custody cash balances. These credits are utilized to reduce related custodial expenses. The custodian fees disclosed in the Statement of Operations are before the reduction in expense from the related earnings credits.
M. Use of Estimates – The preparation of financial statements in conformity with U.S. generally accepted accounting principles requires management to make estimates and assumptions that affect the reported amounts of assets and liabilities and disclosure of contingent assets and liabilities at the date of the financial statements and the reported amounts of increases and decreases in net assets from operations during the reporting period. Actual results could differ from those estimates.
N. Indemnifications – Under the Funds’ or Series’ organizational documents, its Officers and Directors are indemnified against certain liabilities arising out of the performance of their duties to the Funds or Series. In addition, in the normal course of business, the Funds or Series enter into contracts that provide general indemnification to other parties. The Funds’ or Series’ maximum exposure under these arrangements is unknown as this would involve future claims that may be made against the Funds or Series that have not yet occurred, and may not occur. However, the Funds have not had prior claims or losses pursuant to these contracts and expect the risk of loss to be remote.
O. Recent Accounting Pronouncements – In September 2006, FASB issued Statement on Financial Accounting Standards No. 157, “Fair Value Measurements” (FAS 157). This standard clarifies the definition of fair value for financial reporting, establishes a framework for measuring fair value and requires additional disclosure about the use of fair value requirements. FAS 157 is effective for financial statements issued for fiscal years beginning after November 15, 2007 and interim periods within those fiscal years. As of March 31, 2008, the Funds do not believe the adoption of FAS 157 will impact the amounts reported in the financial statements, however, additional disclosures will be required about the inputs used to develop the measurements of fair value and the effect of certain of the measurements reported in the Statement of Operations for a fiscal period.
In March 2008, the FASB issued Statement on Financial Accounting Standards No. 161 (SFAS “161”), “Disclosures about Derivative Instruments and Hedging Activities — an amendment of FASB Statement No. 133,” which requires enhanced disclosures about an entity’s derivative and hedging activities. Entities are required to provide enhanced disclosures about (a) how and why an entity uses derivative instruments, (b) how derivative instruments and related hedged items are accounted for under Statement 133 and its related interpretations, and (c) how derivative instruments and related hedged items affect an entity’s financial position, financial performance, and cash flows. SFAS 161 is effective for financial statements issued for fiscal years and interim periods beginning after November 15, 2008. The Funds do not expect SFAS 161 to have a material impact on their financial statements.
83
Notes to Financial Statements
March 31, 2008 (unaudited)
2. Management Fees and Other Transactions with Affiliates
Management fees are paid monthly to Security Investors (SI), (formerly known as Security Management Company) based on the following annual rates for the six months ended March 31, 2008:
| | | |
| | | Management
Fees (as a %
of net assets) | |
Security Equity Fund: | | | |
Alpha Opportunity Series* | | 2.50 | %1 |
Equity Series | | 0.75 | % |
Global Series | | 1.00 | % |
Mid Cap Value Series | | 0.81 | %2 |
Select 25 Series | | 0.75 | % |
Small Cap Growth Series | | 1.00 | % |
Security Large Cap Value Fund | | 0.65 | % |
Security Mid Cap Growth Fund | | 0.75 | % |
| * | Alpha Opportunity Series’ management fee will range from 1.25% to 2.75% of average daily net assets as discussed below. |
1 | SI receives a management fee from the Alpha Opportunity Series that consists of two components. The first component is an annual base fee equal to 2.00% of Alpha Opportunity Series average daily net assets. The second component is a base fee adjustment that either increases or decreases the base fee, depending on how Alpha Opportunity Series (calculated by reference to its Class A shares) performed relative to the S&P 500 Index over the prior 12-month period (the “Measuring Period”). SI will receive the base fee of 2.00% without adjustment if the performance of Alpha Opportunity Series (calculated by reference to its Class A shares) matches the performance of the S&P 500 Index. The maximum base fee adjustment at each calculation period is 0.75% up or down in the event that Alpha Opportunity Series outperforms or underperforms the S&P 500 Index by 15% or more. SI calculates the base fee adjustment each month based upon Alpha Opportunity Series’ performance relative to the S&P 500 Index during the Measuring Period ending on the last day of the month. If Alpha Opportunity Series outperforms the S&P 500 Index over the Measuring Period, the base fee is adjusted upward. The upward adjustment is equal to the amount by which Alpha Opportunity Series’ performance exceeds that of the S&P 500 Index divided by 15 and multiplied by the average daily net assets of Alpha Opportunity Series during the Measuring Period to determine the base fee adjustment for the month. If Alpha Opportunity Series underperforms the Index, the base fee is adjusted downward on the same basis. SI will determine the dollar amount of any performance adjustment each month by multiplying the adjustment percentage by the average daily net assets of the Alpha Opportunity Series during the Measuring Period and dividing that number by the number of days in the Measuring Period and then multiplying that amount by the number of days in the current month. |
2 | Management fees are payable at an annual rate of 1.00% of the average daily net assets of $200 million or less, and 0.75% of the average daily net assets of the Mid Cap Value Series in excess of $200 million. |
SI also acts as the administrative agent and transfer agent for the Funds, and as such performs administrative functions, transfer agency and dividend disbursing services, and the bookkeeping, accounting and pricing functions for each Fund or Series. For these services, the Investment Manager receives the following:
| | |
| | | Administrative Fees
(as a % of net assets) |
Security Equity Fund: | | |
Alpha Opportunity Series | | 0.15% |
Equity Series | | 0.095% |
Global Series | | 0.05% + greater of 0.10% or $60,000 |
Mid Cap Value Series | | 0.095% |
Select 25 Series | | 0.095% |
Small Cap Growth Series | | 0.095% |
Security Large Cap Value Fund | | 0.095% |
Security Mid Cap Growth Fund | | 0.095% |
Minimum charge per Series or Fund | | $25,000 |
Certain out-of-pocket charges | | Varies |
SI is paid the following for providing transfer agent services to the Funds:
| | |
Annual per account charge | | $5.00 - $8.00 |
Transaction fee | | $0.60 - $1.10 |
Annual minimum charge (per Series or Fund) | | $25,000 |
Certain out-of-pocket charges | | Varies |
Effective January 1, 2007, the investment advisory contract for Security Large Cap Value Fund provides that the total expenses be limited to 1.25% of average net assets for Class A shares and 2.00% of average net assets for both Class B and Class C shares, exclusive of interest, taxes, extraordinary expenses and brokerage fees and commissions. Effective January 1, 2007, the investment advisory contract for the Select 25 Series provides that the total expenses be limited to 1.35% of average net assets for Class A shares and 2.10% of average net assets for both Class B and C shares, exclusive of interest, taxes, extraordinary expenses and brokerage fees and commissions. Effective January 1, 2007, the investment advisory contract for the Alpha Opportunity Series provides that the total other expenses be limited to 0.50% of average net assets for each class of shares, exclusive of interest, taxes, extraordinary expenses, brokerage fees and commissions, 12b-1 fees and dividends on short sales. These contracts are in effect through December 31, 2008. The Investment Manager is entitled to reimbursement by the Security Large Cap Value Fund, the Select 25 Series and the Alpha Opportunity Series of fees waived or expenses reimbursed during any of the previous 36 months, beginning on the date of the expense limitation agreement, if on any day the estimated operating expenses are less than the indicated percentages. As of March 31, 2008, the amount of fees waived or expenses reimbursed in the Security Large Cap Value Fund, the Select 25 Series and the Alpha Opportunity Series were $45,841, $91,194 and $0, respectively. As of March 31, 2008, no amounts were recouped by the Investment Manager. SI has agreed to limit the total expenses for each class of the Mid Cap Value Series and the Small Cap Growth Series to 2.00% of average net assets, exclusive of interest, taxes, extraordinary expenses, brokerage fees and commissions and 12b-1 fees for the aforementioned Series. The expense limits are voluntary and may be terminated at any time without notice to shareholders.
84
Notes to Financial Statements
March 31, 2008 (unaudited)
The Funds have adopted Distribution Plans related to the offering of Class A, Class B and Class C shares pursuant to Rule 12b-1 under the Investment Company Act of 1940. The plans provide for payments at an annual rate of 1.00% of the average daily net assets of each Fund’s or Series’ Class B and Class C shares, and 0.25% of the average daily net assets of each Fund’s or Series’ Class A shares. The distribution plan fees are paid to Security Distributors, Inc., (SDI) a wholly owned subsidiary of Security Benefit Corporation and the national distributor of the Funds. Effective August 25, 2005, Global Series ceased charging 12b-1 fees on Class B shares in accordance with the FINRA sales cap regulations. Effective August 1, 2007, the Security Large Cap Value Fund ceased charging 12b-1 fees on Class B shares in accordance with the FINRA sales cap regulations.
SDI retained under writing commissions during the six months ended March 31, 2008, on sales of shares after allowances to brokers and dealers in the following amounts:
| | | |
| | | SDI
Underwriting
Commissions |
Security Equity Fund: | | | |
Alpha Opportunity Series | | $ | 9,729 |
Equity Series | | | 11,905 |
Global Series | | | 67,981 |
Mid Cap Value Series | | | 172,480 |
Select 25 Series | | | 7,817 |
Small Cap Growth Series | | | 5,860 |
Security Large Cap Value Fund | | | 15,753 |
Security Mid Cap Growth Fund | | | 18,725 |
Certain officers and directors of the Funds are also officers and/or directors of Security Benefit Life Insurance Company, a subsidiary of Security Benefit Corporation, and its affiliates, which include Security Global Investors (SGI) and SDI.
At March 31, 2008, Security Benefit Corporation and its subsidiaries owned over five percent of the outstanding shares of the Funds or Series, as follows:
| | | |
Fund or Series | | Percent of outstanding shares owned | |
Security Equity Fund: | | | |
Alpha Opportunity Series | | 17.84 | % |
Equity Series | | 15.61 | % |
Global Series | | 9.14 | % |
Select 25 Series | | 15.48 | % |
Small Cap Growth Series | | 28.13 | % |
Security Large Cap Value Fund | | 15.90 | % |
Security Mid Cap Growth Fund | | 6.68 | % |
3. Investment Transactions
Investment transactions for the year ended March 31, 2008, (excluding overnight investments and short-term commercial paper) were as follows:
| | | | | | |
| | | Purchases | | Proceeds
from Sales |
Security Equity Fund: | | | | | | |
Alpha Opportunity Series | | $ | 118,819,920 | | $ | 115,656,977 |
Equity Series | | | 212,990,389 | | | 235,441,696 |
Global Series | | | 232,502,290 | | | 226,915,165 |
Mid Cap Value Series | | | 202,498,400 | | | 315,493,588 |
Select 25 Series | | | 64,550,898 | | | 58,745,077 |
Small Cap Growth Series | | | 32,714,002 | | | 53,638,289 |
Security Large Cap Value Fund | | | 36,095,994 | | | 23,111,821 |
Security Mid Cap Growth Fund | | | 164,504,736 | | | 180,555,656 |
4. Open Futures Contracts
Open futures contracts for Alpha Opportunity Series as of March 31, 2008, were as follows:
| | | | |
| | | Alpha Opportunity Series
S&P 500 Index Futures | |
| Position | | | Long | |
| Number of Contracts | | | 43 | |
| Expiration Date | | | 6-20-08 | |
| Contract Amount | | $ | 14,359,367 | |
| Market Value | | $ | 14,233,000 | |
| Unrealized Gain | | $ | (126,367 | ) |
5. Options Written
Information as to options written by the Fund or Series during the six months ended March 31, 2008, and options outstanding at period end is provided below:
Equity Series Call Options Written
| | | | | | | |
| | | Number of
Contracts | | | Premium
Amount | |
Balance at September 30, 2007 | | — | | | $ | — | |
Opened | | 242 | | | | 40,765 | |
Expired | | (242 | ) | | | (40,765 | ) |
| | | | | | | |
Balance at March 31, 2008 | | — | | | $ | — | |
| | | | | | | |
Equity Series Put Options Written
| | | | | | | |
| | | Number of
Contracts | | | Premium
Amount | |
Balance at September 30, 2007 | | — | | | $ | — | |
Opened | | 439 | | | | 44,326 | |
Exercised | | (439 | ) | | | (44,326 | ) |
| | | | | | | |
Balance at March 31, 2008 | | — | | | $ | — | |
| | | | | | | |
Mid Cap Value Series Call Options Written Outstanding
| | | | | | | | | | |
Common Stock | | Expiration
Date | | Exercise
Price | | Number of
Contracts | | Market
Value |
Arch Coal, Inc. | | 04-18-08 | | $ | 50.00 | | 820 | | $ | 32,800 |
Consol Energy, Inc. | | 04-18-08 | | | 90.00 | | 487 | | | 2,435 |
Northeast Utilities | | 04-18-08 | | | 35.00 | | 167 | | | 835 |
Regis Corporation | | 06-20-08 | | | 25.00 | | 1,552 | | | 527,680 |
Whirlpool Corporation | | 06-20-08 | | | 95.00 | | 410 | | | 143,500 |
Whitney Holding Corporation | | 06-20-08 | | | 25.00 | | 1,500 | | | 262,500 |
| | | | | | | | | | |
Total call options outstanding (premiums received, $1,346,685) | | | | | | | 4,936 | | $ | 969,750 |
| | | | | | | | | | |
85
Notes to Financial Statements
March 31, 2008 (unaudited)
Mid Cap Value Series Put Options Written Outstanding
| | | | | | | | | | | |
Common Stock | | Expiration
Date | | Exercise
Price | | Number of
Contracts | | | Market Value | |
Dover Corporation | | 06-20-08 | | 40.00 | | 1,050 | | | $ | 183,750 | |
Louisiana-Pacific Corporation | | 05-16-08 | | 12.50 | | 2,303 | | | | 806,050 | |
| | | | | | | | | | | |
Total put options outstanding (premiums received, $562,165) | | | | | | 3,353 | | | $ | 989,800 | |
| | | | | | | | | | | |
Mid Cap Value Series Call Options Written | | | | | | | | | | | |
| | | | | | | Number of
Contracts | | | Premium
Amount | |
Balance at September 30, 2007 | | | | | | 13,062 | | | $ | 2,685,538 | |
Opened | | | | | | 10,815 | | | | 2,603,986 | |
Bought Back | | | | | | (1,430 | ) | | | (268,836 | ) |
Expired | | | | | | (11,708 | ) | | | (2,256,270 | ) |
Exercised | | | | | | (5,803 | ) | | | (1,417,733 | ) |
| | | | | | | | | | | |
Balance at March 31, 2008 | | | | | | 4,936 | | | $ | 1,346,685 | |
| | | | | | | | | | | |
Mid Cap Value Series Put Options Written
| | | | | | | |
| | | Number of
Contracts | | | Premium
Amount | |
Balance at September 30, 2007 | | — | | | $ | — | |
Opened | | 6,173 | | | | 987,992 | |
Exercised | | (2,820 | ) | | | (425,826 | ) |
| | | | | | | |
Balance at March 31, 2008 | | 3,353 | | | $ | 562,166 | |
| | | | | | | |
Security Mid Cap Growth Fund Put Options Written
| | | | | | | |
| | | Number of
Contracts | | | Premium
Amount | |
Balance at September 30, 2007 | | — | | | $ | — | |
Opened | | 327 | | | | 13,006 | |
Exercised | | (327 | ) | | | (13,006 | ) |
| | | | | | | |
Balance at March 31, 2008 | | — | | | $ | — | |
| | | | | | | |
Security Large Cap Value Fund Call Options Written
| | | | | | | |
| | | Number of
Contracts | | | Premium
Amount | |
Balance at September 30, 2007 | | — | | | $ | — | |
Opened | | 182 | | | | 30,670 | |
Expired | | (182 | ) | | | (30,670 | ) |
| | | | | | | |
Balance at March 31, 2008 | | — | | | $ | — | |
| | | | | | | |
Security Large Cap Value Fund Put Options Written
| | | | | | | |
| | | Number of
Contracts | | | Premium
Amount | |
Balance at September 30, 2007 | | 235 | | | $ | 19,505 | |
Opened | | 329 | | | | 33,218 | |
Expired | | (329 | ) | | | (33,218 | ) |
Exercised | | (235 | ) | | | (19,505 | ) |
| | | | | | | |
Balance at March 31, 2008 | | — | | | $ | — | |
| | | | | | | |
86
Notes to Financial Statements
March 31, 2008 (unaudited)
6. Restricted Securities
As of March 31, 2008, the following Funds or Series contained restricted securities. Market value, cost, percentage of total net assets and acquisition dates are as follows:
| | | | | | | | | | | | | | | | |
| | | Number of
Shares | | Price Per
Share | | Market
Value | | Cost | | % of
Net Assets | | | Acquisition
Dates |
| Security Equity Fund: | | | | | | | | | | | | | | | | |
Mid Cap Value Series | | | | | | | | | | | | | | | | |
ThermoEnergy Corporation PIPE | | 1,745,000 | | $ | 0.51 | | $ | 889,950 | | $ | 1,646,500 | | 0.1 | % | | 07-14-05 |
ThermoEnery Corporation Warrant | | 1,745,000 | | | 0.0837 | | | 146,023 | | | 447,500 | | 0.0 | % | | 07-14-05 |
| | | | | | |
| Security Mid Cap Growth Fund | | | | | | | | | | | | | | | | |
ThermoEnergy Corporation PIPE | | 745,000 | | | 0.51 | | | 379,950 | | | 702,947 | | 0.3 | % | | 07-14-05 |
ThermoEnergy Corporation Warrant | | 745,000 | | | 0.0837 | | | 62,342 | | | 191,053 | | 0.0 | % | | 07-14-05 |
These securities have been valued after considering certain pertinent factors including the results of operations since the date of purchase, and the recent sales price of its common stock. No quoted market price exists for these shares. It is possible that the estimated fair value may differ significantly from the amount that might ultimately be realized in the near term.
7. Federal Tax Matters
For federal income tax purposes, the amounts of unrealized appreciation (depreciation) on investments at March 31, 2008, were as follows:
| | | | | | | | | | | |
| | | Gross
unrealized
appreciation | | Gross
unrealized
(depreciation) | | | Net unrealized
appreciation
(depreciation) | |
Security Equity Fund: | | | | | | | | | | | |
Alpha Opportunity Series | | $ | 535,537 | | $ | (1,348,423 | ) | | $ | (812,886 | ) |
Equity Series | | | 22,642,654 | | | (29,435,947 | ) | | | (6,793,293 | ) |
Global Series | | | 7,844,191 | | | (13,251,113 | ) | | | (5,406,922 | ) |
Mid Cap Value Series | | | 72,580,152 | | | (170,405,263 | ) | | | (97,825,111 | ) |
Select 25 Series | | | 2,743,973 | | | (2,032,608 | ) | | | 711,365 | |
Small Cap Growth Series | | | 2,448,745 | | | (1,937,586 | ) | | | 511,159 | |
Security Large Cap Value Fund | | | 14,025,720 | | | (11,055,857 | ) | | | 2,969,863 | |
Security Mid Cap Growth Fund | | | 6,350,404 | | | (5,211,047 | ) | | | 1,139,357 | |
The tax character of distributions paid during the fiscal year ended September 30, 2007 was as follows:
| | | | | | | | | |
2007 | | Ordinary
Income | | Capital
Gain | | Total |
Security Equity Fund: | | | | | | | | | |
Alpha Opportunity Series | | $ | 2,569,557 | | $ | 708,308 | | $ | 3,277,865 |
Equity Series | | | 9,735,014 | | | 30,529,927 | | | 40,264,941 |
Global Series | | | 68,515 | | | 22,793,963 | | | 22,862,478 |
Mid Cap Value Series | | | 15,495,867 | | | 36,895,809 | | | 52,391,676 |
Security Large Cap Value Fund | | | 25,136 | | | — | | | 25,136 |
Security Mid Cap Growth Fund | | | 1,583,425 | | | 22,297,681 | | | 23,881,106 |
Note: For federal income tax purposes, short term capital gain distributions are treated as ordinary income distributions.
87
Notes to Financial Statements
March 31, 2008 (unaudited)
As of September 30, 2007, the components of distributable earnings on a tax basis were:
| | | | | | | | | | | | | | | | |
| | | Undistributed
Ordinary
Income | | Undistributed
Long-Term
Gain | | Accumulated
Capital and
Other Losses* | | | Unrealized
Appreciation
(Depreciation)** | | Total
Accumulated
Earnings/(Deficit) |
Security Equity Fund: | | | | | | | | | | | | | | | | |
Alpha Opportunity Series | | $ | 5,671,129 | | $ | 449,941 | | $ | — | | | $ | 16,564 | | $ | 6,137,634 |
Equity Series | | | 4,553,171 | | | 39,606,777 | | | — | | | | 62,106,429 | | | 106,266,377 |
Global Series | | | — | | | 57,260,972 | | | (1,400,099 | ) | | | 8,702,573 | | | 64,563,446 |
Mid Cap Value Series | | | 7,481,260 | | | 144,250,280 | | | — | | | | 109,249,852 | | | 260,981,392 |
Select 25 Series | | | — | | | 4,184,456 | | | (8,584,526 | ) | | | 4,709,911 | | | 309,841 |
Small Cap Growth Series | | | 841,392 | | | 2,801,665 | | | — | | | | 8,966,214 | | | 12,609,271 |
Security Large Cap Value Fund | | | 343,898 | | | 1,047,876 | | | — | | | | 19,226,145 | | | 20,617,919 |
Security Mid Cap Growth Fund | | | 6,035,045 | | | 27,748,261 | | | (1,718,049 | ) | | | 2,816,700 | | | 34,881,957 |
| * | Certain Funds had net capital loss carryovers and deferred post October losses as identified elsewhere in the Notes. |
| ** | The differences between book-basis and tax-basis unrealized appreciation (depreciation) are attributable primarily to the tax deferral of wash sale losses, the differences between book and tax basis passive foreign investment companies and bond discount accretion. |
As of September 30, 2007, the capital loss carryovers utilized and expired in 2007 and the accumulated net realized loss on sales of investments for federal income tax purposes which are available to offset future taxable gains and post-October losses that are deferred to the first day of the next fiscal year are as follows:
| | | | | | | | | | | | | | |
| | | Capital Loss
Carryovers
Utilized
in 2007 | | Capital Loss
Carryovers
Expired
In 2007 | | Capital Loss
Carryovers
at 9/30/07 | | Expires In | | Deferred
Post-
October
Losses |
Security Equity Fund: | | | | | | | | | | | | | | |
Global Series | | $ | 442,978 | | $ | — | | $ | 208,547 | | 2009 | | $ | 282,912 |
| | | — | | | — | | | 908,640 | | 2010 | | | |
| | | | | | | | | | | | | | |
| | $ | 442,978 | | $ | — | | $ | 1,117,187 | | | | | |
| | | | | | | | | | | | | | |
Select 25 Series* | | $ | 1,707,436 | | $ | — | | $ | 159,999 | | 2008 | | $ | — |
| | | 132,011 | | | 951,007 | | | 2,412,936 | | 2009 | | | |
| | | 1,824,532 | | | 1,673,951 | | | 2,582,076 | | 2010 | | | |
| | | — | | | 2,429,063 | | | 3,390,876 | | 2011 | | | |
| | | — | | | — | | | 38,639 | | 2012 | | | |
| | | | | | | | | | | | | | |
| | $ | 3,663,979 | | $ | 5,054,021 | | $ | 8,584,526 | | | | | |
| | | | | | | | | | | | | | |
Small Cap Growth Series | | $ | 2,060,375 | | $ | — | | $ | — | | | | $ | — |
| | | | | | | | | | | | | | |
Security Large Cap Value Fund | | $ | 5,372,763 | | $ | — | | $ | — | | | | $ | — |
| | | | | | | | | | | | | | |
Security Mid Cap Growth Fund | | $ | 567,035 | | $ | — | | $ | 1,134,070 | | 2009 | | $ | — |
| | | — | | | — | | | 567,035 | | 2010 | | | |
| | | — | | | — | | | 16,944 | | 2011 | | | |
| | | | | | | | | | | | | | |
| | $ | 567,035 | | $ | — | | $ | 1,718,049 | | | | | |
| | | | | | | | | | | | | | |
| * | The Security Equity Fund - Select 25 Series obtained approximately $1,236,753, $3,140,789 and $1,728,838 of capital losses (included above) from its merger with Security Equity Fund - - Social Awareness Series, Enhanced Index Series and Large Cap Growth Series, respectively, on June 16, 2006. Certain of these capital losses expired (as shown above) due to limitations imposed by Section 382 of the Internal Revenue Code. The remaining capital losses may be applied against future realized capital gains subject to annual limitations. |
88
Notes to Financial Statements
March 31, 2008 (unaudited)
Net investment income and net realized gains (losses) may differ for financial statement and tax purposes because of temporary or permanent book/tax differences. These differences are primarily due to post-October losses, losses deferred due to wash sales, foreign currency gains and losses, and the “mark-to-market” of certain passive foreign investment companies (PFICs) for tax purposes. To the extent these differences are permanent, reclassifications are made to the appropriate equity accounts in the period that the differences arise.
8. Affiliated Transactions*
Investments representing 5% or more of the outstanding voting securities of a portfolio company of a fund result in that portfolio company being considered an affiliated company of such fund, as defined in the 1940 Act. The aggregate market value of all securities of affiliated companies held in the Mid Cap Value Series of the Security Equity Fund as of March 31, 2008 amounted to $43,815,500 which represents 5.9% of net assets. There were no affiliated companies held in any other Fund or Series. Transactions in the Mid Cap Value Series during the six months ended March 31, 2008, in which the portfolio company is an “affiliated person” are as follows:
| | | | | | | | | | | | | | | | | | |
| | | Balance
9-30-07 | | Gross
Additions | | Gross
Reductions | | Balance
3-31-08 | | Realized
Gain/(Loss) | | Investment
Income |
Bimini Capital Management, Inc. (Shares) | | | 1,474,400 | | | — | | | — | | | 1,474,400 | | | — | | | — |
Bimini Capital Management, Inc. (Cost) | | $ | 16,310,457 | | $ | — | | $ | — | | $ | 16,310,457 | | $ | — | | $ | — |
| | | | | | |
Clayton Holdings, Inc. (Shares) | | | 569,100 | | | 921,100 | | | — | | | 1,490,200 | | | — | | | — |
Clayton Holdings, Inc. (Cost) | | $ | 5,267,192 | | $ | 4,809,921 | | $ | — | | $ | 10,077,113 | | $ | — | | $ | — |
| | | | | | |
Hydrogen Corporation (Shares) | | | 840,300 | | | 419,700 | | | — | | | 1,260,000 | | | — | | | — |
Hydrogen Corporation (Cost) | | $ | 4,054,365 | | $ | 1,170,963 | | $ | — | | $ | 5,225,328 | | $ | — | | $ | — |
| | | | | | |
IXYS Corporation (Shares) | | | 1,335,400 | | | 943,900 | | | — | | | 2,279,300 | | | — | | | — |
IXYS Corporation (Cost) | | $ | 11,770,248 | | $ | 7,466,249 | | $ | — | | $ | 19,236,497 | | $ | — | | $ | — |
| | | | | | |
Maxwell Technologies, Inc. (Shares) | | | 789,400 | | | 535,900 | | | — | | | 1,325,300 | | | — | | | — |
Maxwell Technologies, Inc. (Cost) | | $ | 10,502,509 | | $ | 4,104,994 | | $ | — | | $ | 14,607,503 | | $ | — | | $ | — |
| | | | | | |
Quixote Corporation (Shares) | | | 479,100 | | | — | | | — | | | 479,100 | | | — | | | — |
Quixote Corporation (Cost) | | $ | 9,318,028 | | $ | — | | $ | — | | $ | 9,318,028 | | $ | — | | $ | 95,820 |
| | | | | | |
ThermoEnergy Corporation PIPE (Shares) | | | 1,745,000 | | | — | | | — | | | 1,745,000 | | | — | | | — |
ThermoEnergy Corporation PIPE (cost) | | $ | 1,646,500 | | $ | — | | $ | — | | $ | 1,646,500 | | $ | — | | $ | — |
| | | | | | |
ThermoEnergy Corporation Warrant (Shares) | | | 1,745,000 | | | — | | | — | | | 1,745,000 | | | — | | | — |
ThermoEnergy Corporation Warrant (Cost) | | $ | 447,500 | | $ | — | | $ | — | | $ | 447,500 | | $ | — | | $ | — |
| * | As a result of the Security Mid Cap Values Series’ beneficial ownership of the common stock of these portfolio companies, applicable regulations require that the Series state that it may be deemed an affiliate of the respective portfolio company. The Series disclaims that the “affiliated persons” are affiliates of the Distributor, Advisor, Series or any other client of the Advisor. |
89
Directors’ Disclosure
(unaudited)
Director Approval of Investment Advisory Agreement
At an in-person meeting of the Fund’s Boards of Directors held on November 8-9, 2007, called for the purpose of, among other things, voting on the renewal of the investment advisory and sub-advisory agreements applicable to the Fund, the Fund’s Board of Directors, including the Independent Directors, unanimously approved the continuation for a one year period of the investment advisory agreement between the Fund and Security Investors, LLC (“SI”), as well as each investment sub-advisory agreement applicable to the Fund. In reaching this conclusion, the Directors requested and obtained from SI and each investment sub-adviser such information as the Directors deemed reasonably necessary to evaluate the proposed renewal of the agreements. The Fund’s Board of Directors carefully evaluated this information, and was advised by legal counsel with respect to its deliberations.
In considering the proposed continuation of the investment advisory and sub-advisory agreements, the Independent Directors evaluated a number of considerations, including, among others, (1) the nature, extent, and quality of the advisory services to be provided by SI and the investment sub-advisers; (2) the investment performance of the Fund, SI and the various investment sub-advisers; (3) a comparison of each Funds’ expense ratios and those of similarly situated funds; (4) any fall out benefits or indirect profits to the sub-advisors from their relationship to the funds (such as “soft dollars”); and (5) other factors of the Board deemed to be relevant. Each Board of Directors also took into account other considerations that it believed, in light of the legal advice furnished to the Independent Directors by their independent legal counsel and the Directors’ own business judgment, to be relevant. Following its review, the Fund’s Board of Directors determined that the investment advisory agreement and each investment sub-advisory agreement applicable to the Fund (if any) will enable Fund shareholders to obtain high quality services at a cost that is appropriate, reasonable, and in the best interests of shareholders. Accordingly, the Directors, including the Independent Directors, unanimously approved the renewal of the investment advisory and investment subadvisory agreements based upon the following considerations, among others:
| | • | | The nature, extent and quality of the advisory services to be provided. The Board of Directors concluded that SI and the investment sub-advisers retained to provide portfolio management services with respect to the Fund are capable of providing high quality services to the Fund, as indicated by the nature and quality of services provided in the past, SI’s management capabilities demonstrated with respect to the Fund and other mutual funds managed by SI, the professional qualifications and experience of SI’s and the various sub-advisers’ portfolio managers, and SI’s investment and management oversight processes. The Directors also determined that SI and the subadvisers proposed to provide investment and related services that were of the same quality and quantity as services provided to the Fund in the past, and that these services are appropriate in scope and extent in light of the Fund’s operations, the competitive landscape of the investment company business and investor needs. |
| | • | | The investment performance of the Fund. With respect to the Fund, the Directors concluded on the basis of information supplied by Lipper and Morningstar that SI and the investment sub-advisers had achieved investment performance that was acceptable, and competitive or superior relative to comparable funds over trailing periods. On the basis of the Directors’ assessment of the nature, extent and quality of advisory services to be provided or procured by SI, the Directors concluded that SI is capable of generating a level of long-term investment performance that is appropriate in light of the Fund’s investment objectives, policies and strategies and competitive with many other investment companies. |
| | • | | The cost of advisory services provided and the level of profitability. On the basis of each Board’s review of the fees to be charged by SI for investment advisory and other services, and the estimated profitability of SI’s relationship with the Fund, each Board concluded that the level of investment advisory fees and SI’s profitability are appropriate in light of the management fees and overall expense ratios of comparable investment companies and the anticipated profitability of the relationship between the Fund and SI and its affiliates. On the basis of comparative information supplied by Lipper the Directors determined that the advisory fees and estimated overall expense ratio of the Fund are consistent with, and often below, industry medians, particularly with respect to mutual funds of comparable size. |
| | • | | Whether the advisory fees reflect economies of scale. The Directors concluded that the Fund’s investment advisory fees appropriately reflect the current economic environment for SI and the competitive nature of the mutual fund market. The Directors further determined that the Fund has yet to achieve meaningful economies of scale, which, therefore, cannot be reflected in the investment advisory fees. |
| | • | | The extent to which economies of scale will be realized as the Fund grows. While the Fund’s investment advisory fees do not reduce should Fund assets grow meaningfully, the Directors determined that the investment advisory fees payable by the Funds other than Security Equity Fund Alpha Opportunity Series (whose investment advisory fee varies depending on that Fund’s performance relative to its benchmark index) already reflect potential future economies of scale to some extent by virtue of their competitive levels (determined with reference to industry standards as |
Directors’ Disclosure
(unaudited)
| | reported by Lipper and SI’s estimated profitability at current or foreseeable asset levels. The Directors also considered that they will have the opportunity to periodically reexamine whether a Fund has achieved economies of scale, and the appropriateness of investment advisory fees payable to SI and fees payable by SI to the investment sub-advisers, in the future. |
| | • | | Benefits (such as soft dollars) to SI from its relationship with the Fund (and any corresponding benefits to the Fund). The Directors concluded that other benefits described by SI and the investment sub-advisers from their relationships with the Fund, including “soft dollar” benefits in connection with Fund brokerage transactions, are reasonable and fair, and consistent with industry practice and the best interests of the Fund and their shareholders. In addition, the Directors determined that the administration, transfer agency and fund accounting fees paid by the Fund to SI are reasonable, fair and in the best interests of Fund shareholders in light of the nature and quality of the services provided, the associated costs, and the necessity of the services for the Fund’s operations. |
| | • | | Other Considerations: In approving the investment advisory and sub-advisory agreements, the Directors determined that SI has made a substantial commitment to the recruitment and retention of high quality personnel, and maintains the financial, compliance and operational resources reasonably necessary to manage the Fund in a professional manner that is consistent with the best interests of the Fund and their shareholders. In this regard, the Directors favorably considered the compliance track record of the Fund and SI. The Directors also concluded that SI has made a significant entrepreneurial commitment to the management and success of the Fund, which entails a substantial financial and professional commitment, including investment advisory fee waivers and expense limitation arrangements with respect to the Fund to the benefit of Fund shareholders. |
91
Directors (unaudited)
The business address of each director is One Security Benefit Place, Topeka, KS 66636-0001
| | |
Name (Date of Birth) Year Elected*** | | Principal Occupation(s) During Past 5 Years |
| Donald A. Chubb, Jr.** | | Business Broker - Griffith & Blair Realtors |
| (12-14-46) | | Director - Jayhawk Area Boy Scouts Council |
| 1994 | | |
| |
| Harry W. Craig, Jr.** | | Chairman, CEO, Secretary & Director - The Martin Tractor Company, Inc. |
| (05-11-39) | | Director - Stormont-Vail Corporation |
| 2004 | | Director - Concerned Citizens for Topeka |
| | Director - Oscar S. Stauffer Executive in Residence |
| |
| Jerry B. Farley** | | President - Washburn University |
| (09-20-46) | | President - J&J Bonanza |
| 2005 | | |
| |
| Penny A. Lumpkin** | | Partner - Vivian’s Gift Shop (Corporate Retail) |
| (08-20-39) | | Vice President - Palmer Companies, Inc.(Small Business and Shopping Center Development) |
| 1993 | | Vice President - PLB (Real Estate Equipment Leasing) |
| | Vice President - Town Crier (Retail) |
| | Prior to 2002: |
| | Vice President - Bellaire Shopping Center (Managing and Leasing) |
| | Partner - Goodwin Enterprises (Retail) |
| |
| Maynard F. Oliverius** | | President & Chief Executive Officer - Stormont-Vail HealthCare |
| (12-18-43) | | Director - VHA Mid-America |
| 1998 | | Director - Go Topeka |
| |
Thomas A. Swank* (01-10-60) 2007 (President, Director & Chairman of the Board) | | President & Chief Executive Officer - Security Benefit Corporation and Security Benefit Life Insurance Company Chief Operating Officer - Security Benefit Life Insurance Company President - First Security Benefit Life Insurance & Annuity Company of New York Chief Financial Officer & Treasurer - Security Benefit Corporation, Security Benefit Life Insurance Company and First Security Benefit Life Insurance & Annuity Company of New York |
| |
| |
| |
| * | This director is deemed to be an “interested person” of the Funds under the Investment Company Act of 1940, as amended, by reason of his position with the Funds’ Investment Manager and/or the parent of the Investment Manager. |
| ** | These directors serve on the Fund’s joint audit committee, the purpose of which is to meet with the independent registered public accounting firm, to review the work of the independent registered public accounting firm, and to oversee the handling by Security Investors of the accounting function for the Funds. |
| *** | Each director oversees 28 Security Funds portfolios and serves until the next annual meeting, or until a successor has been duly elected and qualified. |
92
Officers (unaudited)
The business address of each officer is One Security Benefit Place, Topeka, KS 66636-0001
| | |
Name (Date of Birth) Title - Year Elected | | Principal Occupation(s) During Past 5 Years |
| Steven M. Bowser | | Vice President & Senior Portfolio Manager - Security Investors, LLC; |
| (02-11-60) | | Vice President & Senior Portfolio Manager - Security Benefit Life Insurance Company |
| Vice President - 2003 | | |
| |
| Christina Fletcher | | Vice President & Portfolio Manager - Security Investors, LLC |
| (07-25-72) | | Credit Analyst/Portfolio Manager - Horizon Cash Management |
| Vice President - 2005 | | Senior Money Market Trader - Scudder Investments |
| |
| Brenda M. Harwood | | Vice President, Chief Compliance Officer & Treasurer - Security Global Investors, LLC |
| (11-03-63) | | Assistant Vice President - Security Benefit Life Insurance Company |
| Chief Compliance Officer -2004 | | Vice President, Assistant Treasurer & Director - Security Distributors, Inc. |
| Treasurer - 1988 | | |
| |
| Mark Lamb | | Vice President - Security Investors, LLC, |
| (02-03-60) | | Vice President - Security Benefit Life Insurance Company |
| Vice President - 2003 | | |
| |
| Amy J. Lee | | Secretary - Security Investors, LLC |
| (06-05-61) | | Secretary & Chief Compliance Officer - Security Distributors, Inc. |
| Secretary - 1987 | | Vice President, Associate General Counsel & Assistant Secretary -Security Benefit Corporation & Security Benefit Life Insurance Company |
| | Director - Brecek & Young Advisors, Inc. |
| |
| Mark Mitchell | | Vice President & Portfolio Manager - Security Investors, LLC |
| (08-24-64) | | Vice President & Portfolio Manager - Security Benefit Life Insurance Company |
| Vice President - 2003 | | |
| |
| Christopher Phalen | | Vice President & Head of Fixed Income - Security Global Investors, LLC; |
| (11-9-70) | | Assistant Vice President & Head of Fixed Income - Security Benefit Life Insurance Company |
| Vice President - 2002 | | Vice President & Portfolio Manager - Security Investors, LLC |
| | Vice President & Portfolio Manager - Security Benefit Life Insurance Company |
| |
| James P. Schier | | Vice President & Senior Portfolio Manager - Security Investors, LLC; |
| (12-28-57) | | Vice President & Senior Portfolio Manager - Security Benefit Life Insurance Company |
| Vice President - 1998 | | |
| |
| Cindy L. Shields | | Vice President & Head of Operations - Security Global Investors |
| (06-05-67) | | Vice President & Head of Equity Asset Management - Security Investors, LLC |
| Vice President - 1988 | | Vice President & Head of Equity Asset Management - Security Benefit Life Insurance Company |
| |
Christopher D. Swickard (10-09-65) Assistant Secretary - 1996 | | Assistant Secretary - Security Investors, LLC Second Vice President & Assistant General Counsel - Security Benefit Corporation and Security Benefit Life Insurance Company Assistant Secretary - Security Distributors, Inc. |
| |
| |
| |
| David G. Toussaint | | Vice President & Portfolio Manager - Security Investors, LLC |
| (10-10-66) | | Assistant Vice President & Portfolio Manager - Security Benefit Life Insurance Company |
| Vice President - 2001 | | |
| * | Officers serve until the next annual meeting or until a successor has been duly elected and qualified. |
93
This page left blank intentionally.
94
This page left blank intentionally.
95
Other Information
Each of the Security Funds files a complete schedule of portfolio holdings with the U.S. Securities and Exchange Commission for the first and third quarters of each fiscal year on Form N-Q. The Forms N-Q of each such Fund are available on the Commission’s website at www.sec.gov. The Forms N-Q may be reviewed and copied at the Commission’s Public Reference Room in Washington, DC. Information on the operation of the Public Reference Room may be obtained by calling 1-800-SEC-0330. The portfolio holdings of each of the Security Funds are available on their website, www.securitybenefit.com or by calling 1-800-888-2461.
A description of the policies and procedures that the Security Funds use to determine how to vote proxies relating to portfolio securities is available upon request, free of charge by calling 1-800-888-2461, or accessing the U.S. Securities and Exchange Commission website at www.sec.gov. Information regarding how the Security Funds voted proxies relating to portfolio securities during the 12 month period ended June 30, 2007 is available upon request, free of charge by calling 1-800-888-2461, or accessing the U.S. Securities and Exchange Commission website at www.sec.gov.
The statement of additional information (“SAI”) includes additional information about the Funds’ Directors and is available upon request without charge by calling 1-800-888-2461.
96
The Security Group of Mutual Funds
Security Equity Fund
| | • | | Alpha Opportunity Series |
| | • | | Small Cap Growth Series |
Security Large Cap Value Fund
Security Mid Cap Growth Fund
Security Income Fund
| | • | | Capital Preservation Series |
| | • | | Diversified Income Series |
| | • | | Income Opportunity Series |
Security Cash Fund
Security Funds Officers and Directors
Directors
Donald A. Chubb, Jr.
Harry W. Craig, Jr.
Jerry B. Farley
Penny A. Lumpkin
Maynard F. Oliverius
Thomas A. Swank
Officers
Thomas A. Swank, President
Steve M. Bowser, Vice President
Christina Fletcher, Vice President
Mark Lamb, Vice President
Mark Mitchell, Vice President
Christopher Phalen, Vice President
James P. Schier, Vice President
Cindy L. Shields, Vice President
David G. Toussaint, Vice President
Amy J. Lee, Secretary
Christopher D. Swickard, Assistant Secretary
Brenda M. Harwood, Chief Compliance Officer & Treasurer
This report is submitted for the general information of the shareholders of the Funds. The report is not authorized for distribution to prospective investors in the Funds unless preceded or accompanied by an effective prospectus which contains details concerning the sales charges and other pertinent information.

Not required at this time.
| Item 3. | Audit Committee Financial Expert. |
Not required at this time.
| Item 4. | Principal Accountant Fees and Services. |
Not required at this time.
| Item 5. | Audit Committee of Listed Registrants. |
Not applicable.
| Item 6. | Schedule of Investments. |
The Schedule of Investments is included under Item 1 of this form.
| Item 7. | Disclosure of Proxy Voting Policies and Procedures for Closed-End Management Investment Companies. |
Not applicable.
| Item 8. | Purchases of Equity Securities by Closed-End Management Investment Company and Affiliated Purchasers. |
Not applicable.
| Item 9. | Submission of Matters to a Vote of Security Holders. |
The registrant does not currently have in place procedures by which shareholders may recommend nominees to the registrant’s board.
There have been no changes to the procedures by which shareholders may recommend nominees to the registrant’s board.
| Item 10. | Controls and Procedures. |
| | (a) | The registrant’s President and Treasurer have concluded that the registrant’s disclosure controls and procedures (as defined in rule 30a-3(c) under the Investment Company Act of 1940) are effective based on their evaluation of these disclosure controls and procedures within 90 days of the filing date of this report on Form N-CSR. |
| | (b) | There were no significant changes in the registrant’s internal controls, or in other factors that could significantly affect these controls subsequent to the date of their evaluation, including any corrective actions with regard to significant deficiencies and material weaknesses. |
| | | | |
| | (a) | | (1) Not required at this time. |
| | |
| | | | (2) Certifications pursuant to Section 302 of the Sarbanes-Oxley Act of 2002 and required by Rule 30a-2(a) under the Investment Company Act of 1940, are attached hereto. |
| | |
| | (b) | | Certifications pursuant to Section 906 of the Sarbanes-Oxley Act of 2002 and required by Rule 30a-2(a) under the Investment Company Act of 1940, are attached hereto. |
SIGNATURES
Pursuant to the requirements of the Securities Exchange Act of 1934 and the Investment Company Act of 1940, the registrant has duly caused this report to be signed on its behalf by the undersigned, thereunto duly authorized.
| | |
| SECURITY EQUITY FUND |
| |
| By: | | /s/ THOMAS A. SWANK |
| | Thomas A. Swank, President |
| |
| Date: | | May 29, 2008 |
Pursuant to the requirements of the Securities Exchange Act of 1934 and the Investment Company Act of 1940, this report has been signed below by the following persons on behalf of the registrant and in the capacities and on the dates indicated.
| | |
| By: | | /s/ THOMAS A. SWANK |
| | Thomas A. Swank, President |
| |
| Date: | | May 29, 2008 |
| |
| By: | | /s/ BRENDA M. HARWOOD |
| | Brenda M. Harwood, Treasurer |
| |
| Date: | | May 29, 2008 |