UNITED STATES
SECURITIES AND EXCHANGE COMMISSION
Washington, D.C. 20549
FORM N-CSR
CERTIFIED SHAREHOLDER REPORT OF REGISTERED
MANAGEMENT INVESTMENT COMPANIES
Investment Company Act file number 811-01136
SECURITY EQUITY FUND
(Exact name of registrant as specified in charter)
ONE SECURITY BENEFIT PLACE, TOPEKA, KANSAS 66636-0001
(Address of principal executive offices) (Zip code)
RICHARD M. GOLDMAN, PRESIDENT
SECURITY EQUITY FUND
ONE SECURITY BENEFIT PLACE
TOPEKA, KANSAS 66636-0001
(Name and address of agent for service)
Registrant’s telephone number, including area code: (785) 438-3000
Date of fiscal year end: September 30
Date of reporting period: March 31, 2010
Form N-CSR is to be used by management investment companies to file reports with the Commission not later than 10 days after the transmission to stockholders of any report that is required to be transmitted to stockholders under Rule 30e-1 under the Investment Company Act of 1940 (17 CFR 270.30e-1). The Commission may use the information provided on Form N-CSR in its regulatory, disclosure review, inspection, and policymaking roles.
A registrant is required to disclose the information specified by Form N-CSR, and the Commission will make this information public. A registrant is not required to respond to the collection of information contained in Form N-CSR unless the Form displays a currently valid Office of Management and Budget (“OMB”) control number. Please direct comments concerning the accuracy of the information collection burden estimate and any suggestions for reducing the burden to Secretary, Securities and Exchange Commission, 450 Fifth Street, NW, Washington, DC 20549-0609. The OMB has reviewed this collection of information under the clearance requirements of 44 U.S.C. §3507.
| Item 1. | Reports to Stockholders. |
Rydex | SGI Equity Fund
Rydex | SGI Large Cap Value Fund
Rydex | SGI Mid Cap Growth Fund
March 31, 2010
Semi-Annual Report
Table of Contents
1
Chairman’s Letter
May 17, 2010
To Our Shareholders:
The six-month period ended March 31, 2010 has been marked by strong equity market performance brought on by an increased appetite for risk. In anticipation of an improving economic environment, many portfolio managers added higher “beta” and more cyclical names to their portfolios. Better than expected earnings also fueled equity returns during the last six months.
Actions taken by the U.S. Treasury and Federal Reserve to unlock what were once frozen credit markets played a large role in bolstering corporate profits. At the height of the credit freeze, investors were nervous that impending corporate debt maturities would go unpaid for fear of companies’ inability to roll over debt. Through a variety of programs and security purchases, the U.S. Treasury, FDIC and Federal Reserve enabled corporations to once again issue debt and meet near term obligations. As a result of a reduction in implied default rates, corporations were able to tender for other debt and amend covenants and reduced near-term maturities.
A brightening U.S. employment picture also led to investor optimism over the last six months. Compared to the latter part of 2008 and early 2009 when job losses measured by the change in non-farm payrolls averaged -500,000 to -780,000 per month, consensus expectations as of March 31, 2010 showed a job gain of approximately 185,000 per month. Although job gains will need to exceed 200,000 per month over an extended period of time to substantially lower the nation’s unemployment rate, the March report proved a positive sign for the U.S. economy.
Despite strong equity market performance and increased investor optimism, challenges remain. Demand continues to be soft which will make it difficult for companies to continue to increase earnings. Consequently, earnings expectations for 2010 may be too high as it is not yet evident that consumers have changed their restrictive behavior and companies continue to be reluctant to hire. Additionally, an already historically steep Treasury yield curve steepened further during the first quarter of 2010. Against the backdrop of an improving U.S. economy and the federal government’s need to continue issuing debt as a means of funding various social and monetary programs, we can eventually expect to see interest rates climb. Higher interest rates will ultimately result in limited P/E expansion in the equity markets.
Amid a changing economic landscape, our portfolio managers remain resolute in pursuing their investment objectives. Our commitment to providing competitive risk-adjusted returns entails a rigorous fundamental investment process to identify strong companies, a focus on risk management, as well as flexibility to employ an opportunistic approach.
At Rydex | SGI we seek to offer investors a greater potential to successfully navigate diverse market conditions through a broad lineup of quality mutual funds. We appreciate the trust you have placed in us, and will endeavor to continue to provide high quality investment management solutions.
Sincerely,
Richard M. Goldman
President and Chairman, Rydex | SGI Funds
Securities offered through Rydex Distributors, Inc. (RDI) Security Global lnvestorsSM (SGI) is the investment advisory arm of Security Benefit Corporation (Security Benefit). Security Global Investors consists of Security Global Investors, LLC, Security Investors, LLC and Rydex Investments. Rydex Investments is the primary business name for PADCO Advisors, Inc. and PADCO Advisors II, Inc. SGI and RDI are all subsidiaries of Security Benefit.
2
Information About Your Fund Expenses
March 31, 2010 (unaudited)
Calculating your ongoing Fund expenses
As a shareholder of the Fund, you incur two types of costs: (1) transaction costs, which may include sales charges (loads) on purchase payments; contingent deferred sales charges on redemptions; and redemption fees, if any; and (2) ongoing costs, including management fees; distribution and/or service fees (12b-l); and other Fund expenses. This example is intended to help you understand your ongoing costs (in dollars) of investing in the Fund and to compare these costs with ongoing costs of investing in other mutual funds. The example is based on an investment of $1,000 invested at the beginning of the period and held for the entire period September 30, 2009 through March 31, 2010.
Actual Expenses
The first table provides information about actual account values and actual expenses. You may use the information in this table, together with the amount you invested, to estimate the expenses that you paid over the period. Simply divide your account value by $1,000 (for example, an $8,600 account value divided by $1,000 = 8.6), then multiply the result by the number in the table under the heading entitled “Expenses Paid During the Period” to estimate the expenses you paid on your account during this period.
Hypothetical Example for Comparison Purposes
The second table provides information about hypothetical account values and hypothetical expenses based on the Fund actual expense ratio and an assumed rate of return of 5% per year before expenses, which is not the Fund actual return. The hypothetical account values and expenses may not be used to estimate the actual ending account balance or expenses you paid for the period. You may use this information to compare the ongoing costs of investing in the Fund and other funds. To do so, compare this 5% hypothetical example with the 5% hypothetical examples that appear in the shareholder reports of the other mutual funds.
Please note that the expenses shown in the table are meant to highlight your ongoing costs only and do not reflect any transactional costs, such as sales charges (loads) on purchase payments, contingent deferred sales charges on redemptions, and redemption fees, if any. Therefore, the second line for each class of shares is useful in comparing ongoing costs only, and will not help you determine the relative total costs of owning different funds. In addition, if these transactional costs were included, your costs would have been higher.
3
Information About Your Fund Expenses (continued)
March 31, 2010 (unaudited)
| | | | | | | | | | | | | | | |
| | | Expense
Ratio2 | | | Fund Return | | | Beginning
Account Value
9/30/2009 | | Ending
Account Value
3/31/2010 | | Expenses Paid
During the Period3 |
Table 1. Based on actual Fund return1 | | | | | | | | | | | | | | | |
| | | | | |
All Cap Value Fund | | | | | | | | | | | | | | | |
A Class | | 1.31 | % | | 11.23 | % | | $ | 1,000.00 | | $ | 1,112.26 | | $ | 7.11 |
C Class | | 2.06 | % | | 10.86 | % | | | 1,000.00 | | | 1,108.59 | | | 11.04 |
Institutional Class | | 2.03 | % | | 11.29 | % | | | 1,000.00 | | | 1,112.87 | | | 5.79 |
Alpha Opportunity Fund | | | | | | | | | | | | | | | |
A Class | | 2.01 | % | | 12.03 | % | | | 1,000.00 | | | 1,120.33 | | | 10.31 |
B Class | | 2.67 | % | | 11.44 | % | | | 1,000.00 | | | 1,114.43 | | | 14.23 |
C Class | | 2.67 | % | | 11.72 | % | | | 1,000.00 | | | 1,117.21 | | | 14.25 |
Institutional Class | | 1.65 | % | | 12.28 | % | | | 1,000.00 | | | 1,122.76 | | | 9.00 |
Global Fund | | | | | | | | | | | | | | | |
A Class | | 1.84 | % | | 6.22 | % | | | 1,000.00 | | | 1,062.19 | | | 9.46 |
B Class | | 1.59 | % | | 6.21 | % | | | 1,000.00 | | | 1,062.14 | | | 8.17 |
C Class | | 2.59 | % | | 5.66 | % | | | 1,000.00 | | | 1,056.58 | | | 13.28 |
| | | | | |
Global Institutional Fund | | 0.97 | % | | 6.37 | % | | | 1,000.00 | | | 1,063.75 | | | 5.92 |
| | | | | |
Large Cap Concentrated Growth Fund | | | | | | | | | | | | | | | |
A Class | �� | 1.35 | % | | 12.95 | % | | | 1,000.00 | | | 1,129.50 | | | 7.17 |
B Class | | 2.10 | % | | 12.52 | % | | | 1,000.00 | | | 1,125.20 | | | 11.13 |
C Class | | 2.10 | % | | 12.64 | % | | | 1,000.00 | | | 1,126.36 | | | 11.13 |
Large Cap Core Fund | | | | | | | | | | | | | | | |
A Class | | 1.41 | % | | 12.35 | % | | | 1,000.00 | | | 1,123.46 | | | 7.68 |
B Class | | 2.16 | % | | 11.98 | % | | | 1,000.00 | | | 1,119.76 | | | 11.63 |
C Class | | 2.16 | % | | 11.88 | % | | | 1,000.00 | | | 1,118.78 | | | 11.62 |
Large Cap Value Fund | | | | | | | | | | | | | | | |
A Class | | 1.22 | % | | 10.96 | % | | | 1,000.00 | | | 1,109.59 | | | 6.57 |
B Class | | 0.97 | % | | 11.20 | % | | | 1,000.00 | | | 1,112.05 | | | 5.27 |
C Class | | 1.97 | % | | 10.56 | % | | | 1,000.00 | | | 1,105.62 | | | 10.50 |
| | | | | |
Large Cap Value Institutional Fund | | 0.97 | % | | 11.19 | % | | | 1,000.00 | | | 1,111.93 | | | 5.16 |
| | | | | |
Mid Cap Growth Fund | | | | | | | | | | | | | | | |
A Class | | 1.62 | % | | 11.47 | % | | | 1,000.00 | | | 1,114.68 | | | 9.07 |
B Class | | 2.37 | % | | 11.16 | % | | | 1,000.00 | | | 1,111.56 | | | 12.95 |
C Class | | 2.37 | % | | 10.90 | % | | | 1,000.00 | | | 1,108.96 | | | 12.99 |
Mid Cap Value Fund | | | | | | | | | | | | | | | |
A Class | | 1.39 | % | | 9.63 | % | | | 1,000.00 | | | 1,096.29 | | | 7.53 |
B Class | | 2.14 | % | | 9.17 | % | | | 1,000.00 | | | 1,091.75 | | | 11.42 |
C Class | | 2.14 | % | | 9.20 | % | | | 1,000.00 | | | 1,092.03 | | | 11.42 |
| | | | | |
Mid Cap Value Institutional Fund | | 0.90 | % | | 9.99 | % | | | 1,000.00 | | | 1,099.87 | | | 4.71 |
| | | | | |
Small Cap Growth Fund | | | | | | | | | | | | | | | |
A Class | | 2.27 | % | | 13.35 | % | | | 1,000.00 | | | 1,133.52 | | | 14.26 |
B Class | | 3.03 | % | | 12.94 | % | | | 1,000.00 | | | 1,129.37 | | | 18.10 |
C Class | | 3.03 | % | | 12.90 | % | | | 1,000.00 | | | 1,129.03 | | | 17.99 |
Small Cap Value Fund | | | | | | | | | | | | | | | |
A Class | | 1.30 | % | | 9.89 | % | | | 1,000.00 | | | 1,098.95 | | | 8.11 |
C Class | | 2.05 | % | | 9.76 | % | | | 1,000.00 | | | 1,097.64 | | | 12.03 |
Institutional Class | | 1.04 | % | | 10.02 | % | | | 1,000.00 | | | 1,100.16 | | | 6.81 |
4
Information About Your Fund Expenses (concluded)
March 31, 2010 (unaudited)
| | | | | | | | | | | | | | | |
| | | Expense
Ratio2 | | | Fund Return | | | Beginning
Account Value
9/30/2009 | | Ending
Account Value
3/31/2010 | | Expenses Paid
During the Period3 |
Table 2. Based on hypothetical 5% return (before expenses) | | | | | | | | | | |
| | | | | |
All Cap Value Fund | | | | | | | | | | | | | | | |
A Class | | 1.31 | % | | 5.00 | % | | $ | 1,000.00 | | $ | 1,018.20 | | $ | 6.79 |
C Class | | 2.06 | % | | 5.00 | % | | | 1,000.00 | | | 1,014.46 | | | 10.55 |
Institutional Class | | 2.03 | % | | 5.00 | % | | | 1,000.00 | | | 1,019.45 | | | 5.54 |
Alpha Opportunity Fund | | | | | | | | | | | | | | | |
A Class | | 2.01 | % | | 5.00 | % | | | 1,000.00 | | | 1,015.21 | | | 9.80 |
B Class | | 2.67 | % | | 5.00 | % | | | 1,000.00 | | | 1,011.47 | | | 13.54 |
C Class | | 2.67 | % | | 5.00 | % | | | 1,000.00 | | | 1,011.47 | | | 13.54 |
Institutional Class | | 1.65 | % | | 5.00 | % | | | 1,000.00 | | | 1,016.45 | | | 8.55 |
Global Fund | | | | | | | | | | | | | | | |
A Class | | 1.84 | % | | 5.00 | % | | | 1,000.00 | | | 1,015.76 | | | 9.25 |
B Class | | 1.59 | % | | 5.00 | % | | | 1,000.00 | | | 1,017.00 | | | 8.00 |
C Class | | 2.59 | % | | 5.00 | % | | | 1,000.00 | | | 1,012.02 | | | 12.99 |
| | | | | |
Global Institutional Fund | | 0.97 | % | | 5.00 | % | | | 1,000.00 | | | 1,019.20 | | | 5.79 |
| | | | | |
Large Cap Concentrated Growth Fund | | | | | | | | | | | | | | | |
A Class | | 1.35 | % | | 5.00 | % | | | 1,000.00 | | | 1,018.20 | | | 6.79 |
B Class | | 2.10 | % | | 5.00 | % | | | 1,000.00 | | | 1,014.46 | | | 10.55 |
C Class | | 2.10 | % | | 5.00 | % | | | 1,000.00 | | | 1,014.46 | | | 10.55 |
Large Cap Core Fund | | | | | | | | | | | | | | | |
A Class | | 1.41 | % | | 5.00 | % | | | 1,000.00 | | | 1,017.70 | | | 7.29 |
B Class | | 2.16 | % | | 5.00 | % | | | 1,000.00 | | | 1,013.96 | | | 11.05 |
C Class | | 2.16 | % | | 5.00 | % | | | 1,000.00 | | | 1,013.96 | | | 11.05 |
Large Cap Value Fund | | | | | | | | | | | | | | | |
A Class | | 1.22 | % | | 5.00 | % | | | 1,000.00 | | | 1,018.70 | | | 6.29 |
B Class | | 0.97 | % | | 5.00 | % | | | 1,000.00 | | | 1,019.95 | | | 5.04 |
C Class | | 1.97 | % | | 5.00 | % | | | 1,000.00 | | | 1,014.96 | | | 10.05 |
| | | | | |
Large Cap Value Institutional Fund | | 0.97 | % | | 5.00 | % | | | 1,000.00 | | | 1,020.04 | | | 4.94 |
| | | | | |
Mid Cap Growth Fund | | | | | | | | | | | | | | | |
A Class | | 1.62 | % | | 5.00 | % | | | 1,000.00 | | | 1,016.36 | | | 8.65 |
B Class | | 2.37 | % | | 5.00 | % | | | 1,000.00 | | | 1,012.67 | | | 12.34 |
C Class | | 2.37 | % | | 5.00 | % | | | 1,000.00 | | | 1,012.62 | | | 12.39 |
Mid Cap Value Fund | | | | | | | | | | | | | | | |
A Class | | 1.39 | % | | 5.00 | % | | | 1,000.00 | | | 1,017.75 | | | 7.24 |
B Class | | 2.14 | % | | 5.00 | % | | | 1,000.00 | | | 1,014.01 | | | 11.00 |
C Class | | 2.14 | % | | 5.00 | % | | | 1,000.00 | | | 1,014.01 | | | 11.00 |
| | | | | |
Mid Cap Value Institutional Fund | | 0.90 | % | | 5.00 | % | | | 1,000.00 | | | 1,020.44 | | | 4.53 |
| | | | | |
Small Cap Growth Fund | | | | | | | | | | | | | | | |
A Class | | 2.27 | % | | 5.00 | % | | | 1,000.00 | | | 1,011.57 | | | 13.44 |
B Class | | 3.03 | % | | 5.00 | % | | | 1,000.00 | | | 1,007.93 | | | 17.07 |
C Class | | 3.03 | % | | 5.00 | % | | | 1,000.00 | | | 1,008.03 | | | 16.97 |
Small Cap Value Fund | | | | | | | | | | | | | | | |
A Class | | 1.30 | % | | 5.00 | % | | | 1,000.00 | | | 1,017.20 | | | 7.80 |
C Class | | 2.05 | % | | 5.00 | % | | | 1,000.00 | | | 1,013.46 | | | 11.55 |
Institutional Class | | 1.04 | % | | 5.00 | % | | | 1,000.00 | | | 1,018.45 | | | 6.54 |
| 1 | Actual cumulative return at net asset value for the period September 30, 2009 to March 31, 2010. |
| 3 | Expenses are equal to the Fund’s annualized expense net of any applicable fee waivers or earnings credits, multiplied by the average account value over the period, multiplied by 182/365 (to reflect the one-half year period). |
5
| | |
| | Rydex | SGI Equity Fund |
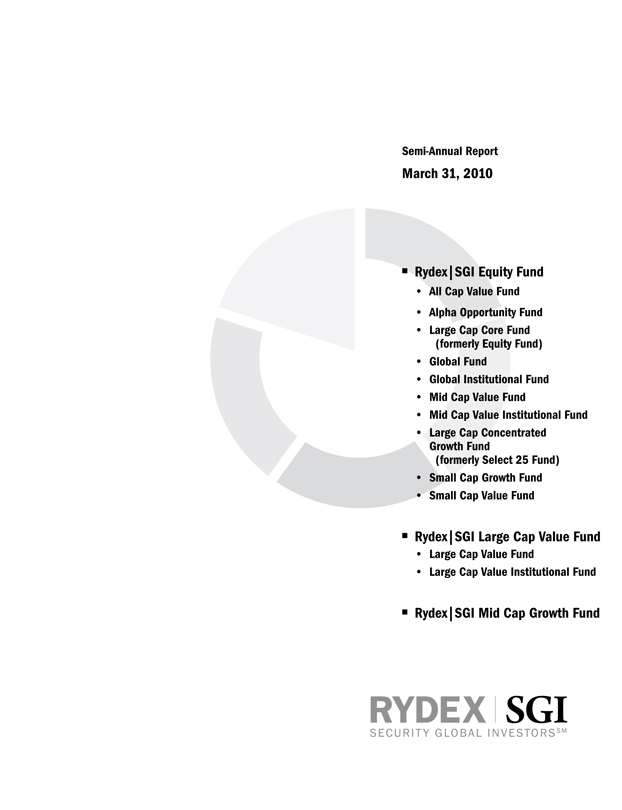
| Performance Summary | | All Cap Value Fund |
| March 31, 2010 | | (unaudited) |
PERFORMANCE
$10,000 Since Inception
This chart assumes a $10,000 investment in Class A shares of All Cap Value Fund on October 3, 2008 (date of inception), reflects deduction of the 5.75% sales load and assumes all dividends reinvested. The chart does not reflect the deduction of taxes that a shareholder would pay on distributions or the redemption of fund shares. The Russell 3000 Value Index is an unmanaged index that measures the performance of the broad value segment of the U.S. equity universe. It includes those Russell 3000 companies with lower price-to-book ratios and lower forecasted growth values.
Average Annual Returns
| | | | | | |
Periods Ended 3-31-10 | | 1 Year | | | Since Inception
(10-03-08) | |
A Shares | | 54.72 | % | | 8.91 | % |
A Shares with sales charge | | 45.78 | % | | 4.67 | % |
C Shares | | 53.42 | % | | 8.09 | % |
C Shares with CDSC | | 52.42 | % | | 8.09 | % |
Institutional Class | | 55.05 | % | | 9.16 | % |
The performance data above represents past performance that is not predictive of future results. The investment return and principal value of an investment in the Fund will fluctuate so that an investor’s shares, when redeemed, may be worth more or less than their original cost. The figures above do not reflect deduction of the maximum front-end sales charge of 5.75% for Class A shares or the contingent deferred sales charge of 1% for Class C shares, as applicable, except where noted. The figures do not reflect the deduction of taxes that a shareholder would pay on distributions or redemption of shares. Such figures would be lower if the maximum sales charge and any applicable taxes were deducted. Fee waivers and/or reimbursements reduced expenses of the Fund and in the absence of such waiver, the performance quoted would be reduced.
Portfolio Composition by Sector as of 3-31-10
| | | |
Consumer Discretionary | | 10.38 | % |
Consumer Staples | | 7.86 | |
Energy | | 10.64 | |
Financials | | 15.13 | |
Health Care | | 5.34 | |
Industrials | | 20.39 | |
Information Technology | | 11.87 | |
Materials | | 2.48 | |
Telecommunication Services | | 0.90 | |
Utilities | | 5.12 | |
Exchange Traded Funds | | 5.82 | |
Cash & Other Assets, Less Liabilities | | 4.07 | |
| | | |
Total Net Assets | | 100.00 | % |
| | | |
| | | | |
| | 6 | | The accompanying notes are an integral part of the financial statements |
| | |
| Schedule of Investments | | Rydex | SGI Equity Fund |
| March 31, 2010 (unaudited) | | All Cap Value Fund |
| | | | | |
| | | Shares | | Value |
COMMON STOCKS - 95.9% | | | | | |
Aerospace & Defense - 2.9% | | | | | |
GeoEye, Inc. * | | 600 | | $ | 17,700 |
Orbital Sciences Corporation * | | 645 | | | 12,261 |
United Technologies Corporation | | 620 | | | 45,639 |
| | | | | |
| | | | | 75,600 |
| | | | | |
Air Freight & Logistics - 2.2% | | | | | |
FedEx Corporation | | 617 | | | 57,628 |
| | | | | |
Apparel Retail - 1.2% | | | | | |
Brown Shoe Company, Inc. | | 721 | | | 11,161 |
Chico’s FAS, Inc. | | 1,200 | | | 17,304 |
Talbots, Inc. * | | 223 | | | 2,890 |
| | | | | |
| | | | | 31,355 |
| | | | | |
Apparel, Accessories & Luxury
Goods - 0.4% | | | | | |
Columbia Sportswear Company | | 7 | | | 368 |
Maidenform Brands, Inc. * | | 517 | | | 11,296 |
| | | | | |
| | | | | 11,664 |
| | | | | |
Application Software - 1.0% | | | | | |
Synopsys, Inc. * | | 1,200 | | | 26,844 |
| | | | | |
Asset Management & Custody
Banks - 1.7% | | | | | |
Bank of New York Mellon Corporation | | 1,107 | | | 34,184 |
Fifth Street Finance Corporation | | 1,000 | | | 11,610 |
| | | | | |
| | | | | 45,794 |
| | | | | |
Building Products - 2.3% | | | | | |
Trex Company, Inc. * | | 289 | | | 6,153 |
USG Corporation * | | 3,204 | | | 54,980 |
| | | | | |
| | | | | 61,133 |
| | | | | |
Casinos & Gaming - 0.4% | | | | | |
Penn National Gaming, Inc. * | | 400 | | | 11,120 |
| | | | | |
Coal & Consumable Fuels - 0.2% | | | | | |
USEC, Inc. * | | 835 | | | 4,818 |
| | | | | |
Communications Equipment - 0.4% | | | | | |
Symmetricom, Inc. *2 | | 1,745 | | | 10,173 |
| | | | | |
Computer & Electronics Retail - 0.1% | | | | | |
Conn’s, Inc. * | | 289 | | | 2,263 |
| | | | | |
Computer Hardware - 1.5% | | | | | |
Hewlett-Packard Company | | 733 | | | 38,959 |
| | | | | |
Construction & Engineering - 1.8% | | | | | |
Insituform Technologies, Inc. * | | 649 | | | 17,270 |
Quanta Services, Inc. * | | 1,150 | | | 22,034 |
URS Corporation * | | 183 | | | 9,079 |
| | | | | |
| | | | | 48,383 |
| | | | | |
Construction & Farm Machinery &
Heavy Trucks - 0.3% | | | | | |
Force Protection, Inc. * | | 1,511 | | | 9,096 |
| | | | | |
Construction Materials - 0.2% | | | | | |
Eagle Materials, Inc. | | 188 | | | 4,990 |
| | | | | |
Consumer Finance - 0.2% | | | | | |
First Marblehead Corporation * | | 1,699 | | | 4,825 |
| | | | | |
| | | | | |
| | | Shares | | Value |
COMMON STOCKS - 95.9% (continued) |
Data Processing & Outsourced
Services - 5.1% | | | | | |
Computer Sciences Corporation * | | 1,023 | | $ | 55,743 |
Western Union Company | | 4,500 | | | 76,321 |
| | | | | |
| | | | | 132,064 |
| | | | | |
Department Stores - 1.7% | | | | | |
JC Penney Company, Inc. | | 1,421 | | | 45,714 |
| | | | | |
Diversified Banks - 1.3% | | | | | |
U.S. Bancorp | | 477 | | | 12,345 |
Wells Fargo & Company | | 726 | | | 22,593 |
| | | | | |
| | | | | 34,938 |
| | | | | |
Diversified Chemicals - 0.6% | | | | | |
Dow Chemical Company | | 546 | | | 16,145 |
| | | | | |
Diversified REITs - 0.3% | | | | | |
Investors Real Estate Trust | | 900 | | | 8,118 |
| | | | | |
Drug Retail - 1.5% | | | | | |
CVS Caremark Corporation | | 1,088 | | | 39,777 |
| | | | | |
Electric Utilities - 3.1% | | | | | |
Allete, Inc. | | 263 | | | 8,805 |
Edison International | | 1,560 | | | 53,305 |
Great Plains Energy, Inc. | | 507 | | | 9,415 |
Northeast Utilities | | 212 | | | 5,860 |
Westar Energy, Inc. | | 190 | | | 4,237 |
| | | | | |
| | | | | 81,622 |
| | | | | |
Electrical Components &
Equipment - 0.4% | | | | | |
General Cable Corporation * | | 400 | | | 10,800 |
| | | | | |
Electronic Components - 0.5% | | | | | |
Power-One, Inc. * | | 3,300 | | | 13,926 |
| | | | | |
Electronic Manufacturing
Services - 2.4% | | | | | |
Maxwell Technologies, Inc. * | | 839 | | | 10,395 |
Tyco Electronics, Ltd. | | 1,922 | | | 52,817 |
| | | | | |
| | | | | 63,212 |
| | | | | |
Environmental & Facilities
Services - 0.5% | | | | | |
Covanta Holding Corporation * | | 750 | | | 12,495 |
| | | | | |
Exchange Traded Funds - 5.8% | | | | | |
iShares Russell 1000 Value Index Fund | | 1,260 | | | 76,948 |
iShares S&P 500 Value Index Fund | | 1,350 | | | 76,221 |
| | | | | |
| | | | | 153,169 |
| | | | | |
Forest Products - 0.5% | | | | | |
Louisiana-Pacific Corporation * | | 1,560 | | | 14,118 |
| | | | | |
Gas Utilities - 0.2% | | | | | |
Atmos Energy Corporation | | 216 | | | 6,171 |
| | | | | |
Health Care Equipment - 2.3% | | | | | |
Covidien plc | | 328 | | | 16,492 |
Hologic, Inc. * | | 409 | | | 7,583 |
Hospira, Inc. * | | 609 | | | 34,499 |
| | | | | |
| | | | | 58,574 |
| | | | | |
| | | | |
| | 7 | | The accompanying notes are an integral part of the financial statements |
| | |
| Schedule of Investments | | Rydex | SGI Equity Fund |
| March 31, 2010 (unaudited) | | All Cap Value Fund |
| | | | | |
| | | Shares | | Value |
COMMON STOCKS - 95.9% (continued) |
Health Care Services - 1.0% | | | | | |
Amedisys, Inc. * | | 15 | | $ | 828 |
Medco Health Solutions, Inc. * | | 244 | | | 15,754 |
Mednax, Inc. * | | 149 | | | 8,670 |
RehabCare Group, Inc. * | | 72 | | | 1,963 |
| | | | | |
| | | | | 27,215 |
| | | | | |
Home Furnishings - 0.5% | | | | | |
Leggett & Platt, Inc. | | 567 | | | 12,270 |
| | | | | |
Home Improvement Retail - 2.8% | | | | | |
Lowe’s Companies, Inc. | | 2,919 | | | 70,756 |
| | | | | |
Human Resources & Employment
Services - 0.4% | | | | | |
Administaff, Inc. | | 460 | | | 9,816 |
| | | | | |
Hypermarkets & Super
Centers - 2.1% | | | | | |
Wal-Mart Stores, Inc. | | 980 | | | 54,488 |
| | | | | |
Independent Power Producers &
Energy Traders - 0.7% | | | | | |
NRG Energy, Inc. * | | 880 | | | 18,392 |
| | | | | |
Industrial Conglomerates - 2.1% | | | | | |
McDermott International, Inc. * | | 2,038 | | | 54,863 |
| | | | | |
Industrial Machinery - 2.1% | | | | | |
Dover Corporation | | 357 | | | 16,690 |
Harsco Corporation | | 349 | | | 11,147 |
Parker Hannifin Corporation | | 442 | | | 28,615 |
| | | | | |
| | | | | 56,452 |
| | | | | |
Insurance Brokers - 1.5% | | | | | |
AON Corporation | | 834 | | | 35,620 |
Arthur J Gallagher & Company | | 107 | | | 2,627 |
| | | | | |
| | | | | 38,247 |
| | | | | |
Integrated Oil & Gas - 4.6% | | | | | |
Chevron Corporation | | 650 | | | 49,289 |
ConocoPhillips | | 940 | | | 48,100 |
Exxon Mobil Corporation | | 390 | | | 26,122 |
| | | | | |
| | | | | 123,511 |
| | | | | |
Integrated Telecommunication
Services - 0.9% | | | | | |
Windstream Corporation | | 2,172 | | | 23,653 |
| | | | | |
IT Consulting & Other
Services - 0.2% | | | | | |
Satyam Computer Services, Ltd. ADR | | 894 | | | 4,667 |
| | | | | |
Managed Health Care - 1.6% | | | | | |
Aetna, Inc. | | 1,229 | | | 43,150 |
| | | | | |
Movies & Entertainment - 2.0% | | | | | |
Time Warner, Inc. | | 1,667 | | | 52,127 |
| | | | | |
Multi-Line Insurance - 0.7% | | | | | |
American Financial Group, Inc. | | 610 | | | 17,355 |
| | | | | |
Multi-Utilities - 1.1% | | | | | |
Alliant Energy Corporation | | 389 | | | 12,939 |
Black Hills Corporation | | 300 | | | 9,105 |
| | | | | |
| | | Shares | | Value |
COMMON STOCKS - 95.9% (continued) |
Multi-Utilities - 1.1% (continued) | | | | | |
SCANA Corporation | | 172 | | $ | 6,465 |
| | | | | |
| | | | | 28,509 |
| | | | | |
Office Services & Supplies - 0.1% | | | | | |
United Stationers, Inc. * | | 47 | | | 2,766 |
| | | | | |
Oil & Gas Equipment &
Services - 2.3% | | | | | |
Complete Production Services, Inc. * | | 300 | | | 3,465 |
Global Industries, Ltd. * | | 2,584 | | | 16,589 |
Halliburton Company | | 1,349 | | | 40,646 |
| | | | | |
| | | | | 60,700 |
| | | | | |
Oil & Gas Exploration &
Production - 1.3% | | | | | |
Chesapeake Energy Corporation | | 569 | | | 13,451 |
Goodrich Petroleum Corporation * | | 183 | | | 2,862 |
Gulfport Energy Corporation * | | 240 | | | 2,698 |
Petrohawk Energy Corporation * | | 750 | | | 15,210 |
| | | | | |
| | | | | 34,221 |
| | | | | |
Oil & Gas Storage &
Transportation - 2.2% | | | | | |
Southern Union Company | | 483 | | | 12,254 |
Williams Companies, Inc. | | 1,930 | | | 44,583 |
| | | | | |
| | | | | 56,837 |
| | | | | |
Other Diversified Financial
Services - 1.0% | | | | | |
JPMorgan Chase & Company | | 610 | | | 27,298 |
| | | | | |
Packaged Foods & Meats - 2.6% | | | | | |
Del Monte Foods Company | | 900 | | | 13,140 |
Hormel Foods Corporation | | 629 | | | 26,425 |
JM Smucker Company | | 381 | | | 22,959 |
Ralcorp Holdings, Inc. * | | 100 | | | 6,778 |
| | | | | |
| | | | | 69,302 |
| | | | | |
Paper Packaging - 0.9% | | | | | |
Bemis Company, Inc. | | 574 | | | 16,485 |
Sonoco Products Company | | 221 | | | 6,805 |
| | | | | |
| | | | | 23,290 |
| | | | | |
Personal Products - 0.6% | | | | | |
Elizabeth Arden, Inc. * | | 859 | | | 15,462 |
| | | | | |
Pharmaceuticals - 0.4% | | | | | |
Merck & Company, Inc. | | 310 | | | 11,579 |
| | | | | |
Property & Casualty
Insurance - 4.9% | | | | | |
Alleghany Corporation * | | 34 | | | 9,853 |
Berkshire Hathaway, Inc. * | | 850 | | | 69,079 |
Employers Holdings, Inc. | | 439 | | | 6,519 |
Hanover Insurance Group, Inc. | | 544 | | | 23,724 |
W.R. Berkley Corporation | | 816 | | | 21,289 |
| | | | | |
| | | | | 130,464 |
| | | | | |
Railroads - 1.4% | | | | | |
Union Pacific Corporation | | 510 | | | 37,383 |
| | | | | |
Regional Banks - 3.5% | | | | | |
Associated Banc-Corporation | | 814 | | | 11,233 |
BB&T Corporation | | 800 | | | 25,912 |
Fifth Third Bancorp | | 500 | | | 6,795 |
First Horizon National Corporation * | | 370 | | | 5,203 |
| | | | |
| | 8 | | The accompanying notes are an integral part of the financial statements |
| | |
| Schedule of Investments | | Rydex | SGI Equity Fund |
| March 31, 2010 (unaudited) | | All Cap Value Fund |
| | | | | |
| | | Shares | | Value |
COMMON STOCKS - 95.9% (continued) |
Regional Banks - 3.5% (continued) | | | | | |
Old National Bancorp | | 713 | | $ | 8,520 |
Regions Financial Corporation | | 4,250 | | | 33,363 |
| | | | | |
| | | | | 91,026 |
| | | | | |
Research & Consulting
Services - 3.7% | | | | | |
Equifax, Inc. | | 2,335 | | | 83,592 |
ICF International, Inc. * | | 149 | | | 3,701 |
Navigant Consulting, Inc. * | | 715 | | | 8,673 |
| | | | | |
| | | | | 95,966 |
| | | | | |
Restaurants - 0.6% | | | | | |
Burger King Holdings, Inc. | | 578 | | | 12,288 |
Jack in the Box, Inc. * | | 200 | | | 4,710 |
| | | | | |
| | | | | 16,998 |
| | | | | |
Semiconductor Equipment - 0.0% | | | | | |
FEI Company * | | 54 | | | 1,237 |
| | | | | |
Semiconductors - 0.8% | | | | | |
IXYS Corporation *2 | | 2,484 | | | 21,213 |
| | | | | |
Specialty Chemicals - 0.3% | | | | | |
HB Fuller Company | | 200 | | | 4,642 |
Zoltek Companies, Inc. * | | 214 | | | 2,063 |
| | | | | |
| | | | | 6,705 |
| | | | | |
Specialty Stores - 0.7% | | | | | |
Cabela’s, Inc. * | | 1,079 | | | 18,872 |
| | | | | |
Tobacco - 1.1% | | | | | |
Philip Morris International, Inc. | | 532 | | | 27,749 |
| | | | | |
Trucking - 0.2% | | | | | |
Saia, Inc. * | | 302 | | | 4,192 |
| | | | | |
TOTAL COMMON STOCKS (cost $2,161,084) | | | | $ | 2,524,219 |
| | | | | |
Total Investments - 95.9% 1 (cost $2,161,084) | | | | $ | 2,524,219 |
Cash & Other Assets, Less Liabilities - 4.1% | | | 107,015 |
| | | | | |
Total Net Assets - 100.0% | | | | $ | 2,631,234 |
| | | | | |
For federal income tax purposes the identified cost of investments owned at March 31, 2010 was $2,162,111.
| ADR | American Depositary Receipt |
| plc | Public Limited Company |
| * | Non-income producing security |
| 1 | Unless otherwise indicated, the values of the securities of the Portfolio are determined based on Level 1 inputs. |
| 2 | Security is deemed illiquid. The total market value of illiquid securities is $31,386 (cost $30,396), or 1.2% of total net assets. |
| | | | |
| | 9 | | The accompanying notes are an integral part of the financial statements |
| | |
| | Rydex | SGI Equity Fund |
| | All Cap Value Fund (unaudited) |
Statement of Assets and Liabilities
March 31, 2010
| | | |
Assets: | | | |
Investments, at value * | | $ | 2,524,219 |
Cash | | | 194,809 |
Receivables: | | | |
Fund shares sold | | | 6,600 |
Dividends | | | 2,885 |
Security Investors | | | 4,263 |
Prepaid expenses | | | 13,620 |
| | | |
Total assets | | | 2,746,396 |
| | | |
Liabilities: | | | |
Payable for: | | | |
Securities purchased | | | 99,342 |
Fund shares redeemed | | | 2 |
Management fees | | | 1,511 |
Custodian fees | | | 1,235 |
Transfer agent/maintenance fees | | | 1,062 |
Administration fees | | | 505 |
Professional fees | | | 6,274 |
12b-l distribution plan fees | | | 815 |
Directors’ fees | | | 71 |
Other | | | 4,345 |
| | | |
Total liabilities | | | 115,162 |
| | | |
Net assets | | $ | 2,631,234 |
| | | |
Net assets consist of: | | | |
Paid in capital | | $ | 2,257,159 |
Undistributed net investment income | | | 1,427 |
Undistributed net realized gain on sale of investments | | | 9,513 |
Net unrealized appreciation in value of investments | | | 363,135 |
| | | |
Net assets | | $ | 2,631,234 |
| | | |
Class A: | | | |
Capital shares outstanding
(unlimited number of shares authorized) | | | 155,264 |
Net assets | | $ | 1,760,031 |
Net asset value and redemption price per share | | $ | 11.34 |
| | | |
Maximum offering price per share (net asset value divided by 94.25%) | | $ | 12.03 |
| | | |
Class C: | | | |
Capital shares outstanding
(unlimited number of shares authorized) | | | 48,692 |
Net assets | | $ | 546,749 |
Net asset value, offering and redemption price per share (excluding any applicable contingent deferred sales charge) | | $ | 11.23 |
| | | |
Institutional Class: | | | |
Capital shares outstanding
(unlimited number of shares authorized) | | | 28,629 |
Net assets | | $ | 324,454 |
Net asset value, offering and redemption price per share | | $ | 11.33 |
| | | |
*Investments, at cost | | $ | 2.161.084 |
Statement of Operations
For the Six Months Ended March 31, 2010
| | | | |
Investment Income: | | | | |
Dividends | | $ | 17,761 | |
Interest | | | 27 | |
| | | | |
Total investment income | | | 17,788 | |
| | | | |
Expenses: | | | | |
Management fees | | | 7,857 | |
Transfer agent/maintenance fees | | | 2,586 | |
Administration fees | | | 1,448 | |
Custodian fees | | | 5,310 | |
Directors’ fees | | | 103 | |
Professional fees | | | 4,415 | |
Reports to shareholders | | | 2,016 | |
Registration fees | | | 14,023 | |
Other expenses | | | 577 | |
12b-l distribution fees - Class A | | | 1,792 | |
12b-l distribution fees - Class C | | | 2,556 | |
| | | | |
Total expenses | | | 42,683 | |
Less: | | | | |
Reimbursement of expenses - Class A | | | (16,847 | ) |
Reimbursement of expenses - Class C | | | (5,993 | ) |
Reimbursement of expenses -
Institutional Class | | | (3,616 | ) |
| | | | |
Net expenses | | | 16,227 | |
| | | | |
Net investment income | | | 1,561 | |
| | | | |
Net Realized and Unrealized Gain (Loss): | | | | |
Net realized gain (loss) during the period on: | | | | |
Investments | | | 31,218 | |
Options written | | | 2,078 | |
| | | | |
Net realized gain | | | 33,296 | |
| | | | |
Net unrealized appreciation (depreciation) during the period on: | | | | |
Investments | | | 215,047 | |
Options written | | | (623 | ) |
| | | | |
Net unrealized appreciation | | | 214,424 | |
| | | | |
Net realized and unrealized gain | | | 247,720 | |
| | | | |
Net increase in net assets resulting from operations | | $ | 249,281 | |
| | | | |
| | | | |
| | 10 | | The accompanying notes are an integral part of the financial statements |
| | |
| | Rydex | SGI Equity Fund |
| Statement of Changes in Net Assets | | All Cap Value Fund |
| | | | | | | | |
| | | Six Months Ended
March 31, 2010
(unaudited) | | | Period Ended
September 30,
2009* | |
Increase (decrease) in net assets from operations: | | | | | | | | |
Net investment income | | $ | 1,561 | | | $ | 3,576 | |
Net realized gain (loss) during the period on investments | | | 33,296 | | | | (23,783 | ) |
Net unrealized appreciation during the period on investments | | | 214,424 | | | | 148,711 | |
| | | | | | | | |
Net increase in net assets resulting from operations | | | 249,281 | | | | 128,504 | |
| | | | | | | | |
Distributions to shareholders from: | | | | | | | | |
Net investment income | | | | | | | | |
Class A | | | (1,974 | ) | | | — | |
Institutional Class | | | (1,736 | ) | | | — | |
| | | | | | | | |
Total distributions to shareholders | | | (3,710 | ) | | | — | |
| | | | | | | | |
Capital share transactions: | | | | | | | | |
Proceeds from sale of shares | | | | | | | | |
Class A | | | 376,674 | | | | 1,271,992 | |
Class C | | | 129,100 | | | | 418,597 | |
Institutional Class | | | — | | | | 284,637 | |
Distributions reinvested | | | | | | | | |
Class A | | | 1,960 | | | | — | |
Institutional Class | | | 1,736 | | | | — | |
Cost of shares redeemed | | | | | | | | |
Class A | | | (97,619 | ) | | | (56,559 | ) |
Class C | | | (72,404 | ) | | | (955 | ) |
| | | | | | | | |
Net increase from capital share transactions | | | 339,447 | | | | 1,917,712 | |
| | | | | | | | |
Net increase in net assets | | | 585,018 | | | | 2,046,216 | |
| | | | | | | | |
Net assets: | | | | | | | | |
Beginning of period | | | 2,046,216 | | | | — | |
| | | | | | | | |
End of period | | $ | 2,631,234 | | | $ | 2,046,216 | |
| | | | | | | | |
Undistributed net investment income at end of period | | $ | 1,427 | | | $ | 3,576 | |
| | | | | | | | |
Capital share activity: | | | | | | | | |
Shares sold | | | | | | | | |
Class A | | | 35,245 | | | | 134,995 | |
Class C | | | 12,414 | | | | 43,096 | |
Institutional Class | | | — | | | | 28,464 | |
Shares reinvested | | | | | | | | |
Class A | | | 186 | | | | — | |
Institutional Class | | | 165 | | | | — | |
Shares redeemed | | | | | | | | |
Class A | | | (9,423 | ) | | | (5,739 | ) |
Class C | | | (6,704 | ) | | | (114 | ) |
| * | For the period October 3, 2008 (commencement of operations) to September 30, 2009. |
| | | | |
| | 11 | | The accompanying notes are an integral part of the financial statements |
| | |
| Financial Highlights | | Rydex | SGI Equity Fund |
| Selected data for each share of capital stock outstanding throughout each period | | All Cap Value Fund |
| | | | | | | | |
Class A | | Six Months
Ended March 31,
2010a | | | Year Ended
September 30,
2009b | |
Per Share Data | | | | | | | | |
Net asset value, beginning of period | | $ | 10.21 | | | $ | 10.00 | |
| | | | | | | | |
Income (loss) from investment operations: | | | | | | | | |
Net investment income c | | | 0.01 | | | | 0.04 | |
Net gain on securities (realized and unrealized) | | | 1.14 | | | | 0.17 | |
| | | | | | | | |
Total from investment operations | | | 1.15 | | | | 0.21 | |
| | | | | | | | |
Less distributions: | | | | | | | | |
Dividends from net investment income | | | (0.02 | ) | | | — | |
| | | | | | | | |
Total distributions | | | (0.02 | ) | | | — | |
| | | | | | | | |
Net asset value, end of period | | $ | 11.34 | | | $ | 10.21 | |
| | | | | | | | |
Total Return d | | | 11.23 | % | | | 2.10 | % |
| | | | | | | | |
Ratios/Supplemental Data | | | | | | | | |
Net assets, end of period (in thousands) | | $ | 1,760 | | | $ | 1,319 | |
| | | | | | | | |
Ratios to average net assets: | | | | | | | | |
Net investment income | | | 0.28 | % | | | 0.51 | % |
Total expenses e | | | 3.66 | % | | | 6.65 | % |
Net expenses f | | | 1.31 | % | | | 1.33 | % |
Net expenses prior to custodian earning credits and net of expense waivers | | | 1.31 | % | | | 1.33 | % |
| | | | | | | | |
Portfolio turnover rate | | | 18 | % | | | 17 | % |
| | |
Class C | | Six Months
Ended March 31,
2010a | | | Year Ended
September 30,
2009b | |
Per Share Data | | | | | | | | |
Net asset value, beginning of period | | $ | 10.13 | | | $ | 10.00 | |
| | | | | | | | |
Income (loss) from investment operations: | | | | | | | | |
Net investment loss c | | | (0.03 | ) | | | (0.02 | ) |
Net gain on securities (realized and unrealized) | | | 1.13 | | | | 0.15 | |
| | | | | | | | |
Total from investment operations | | | 1.10 | | | | 0.13 | |
| | | | | | | | |
Net asset value, end of period | | $ | 11.23 | | | $ | 10.13 | |
| | | | | | | | |
Total Return d | | | 10.86 | % | | | 1.30 | % |
| | | | | | | | |
Ratios/Supplemental Data | | | | | | | | |
Net assets, end of period (in thousands) | | $ | 547 | | | $ | 436 | |
| | | | | | | | |
Ratios to average net assets: | | | | | | | | |
Net investment loss | | | (0.48 | )% | | | (0.18 | )% |
Total expenses e | | | 4.40 | % | | | 8.77 | % |
Net expenses f | | | 2.06 | % | | | 2.07 | % |
Net expenses prior to custodian earning credits and net of expense waivers | | | 2.06 | % | | | 2.07 | % |
| | | | | | | | |
Portfolio turnover rate | | | 18 | % | | | 17 | % |
| | | | |
| | 12 | | The accompanying notes are an integral part of the financial statements |
| | |
| Financial Highlights | | Rydex | SGI Equity Fund |
| Selected data for each share of capital stock outstanding throughout each period | | All Cap Value Fund |
| | | | | | | | |
Institutional Class | | Six Months
Ended March 31,
2010a | | | Year Ended
September 30,
2009b | |
Per Share Date | | | | | | | | |
Net asset value, beginning of period | | $ | 10.24 | | | $ | 10.00 | |
| | | | | | | | |
Income (loss) from investment operations: | | | | | | | | |
Net investment income c | | | 0.03 | | | | 0.07 | |
Net gain on securities (realized and unrealized) | | | 1.12 | | | | 0.17 | |
| | | | | | | | |
Total from investment operations | | | 1.15 | | | | 0.24 | |
| | | | | | | | |
Less distributions: | | | | | | | | |
Dividends from net investment income | | | (0.06 | ) | | | — | |
| | | | | | | | |
Total distributions | | | (0.06 | ) | | | — | |
| | | | | | | | |
Net asset value, end of period | | $ | 11.33 | | | $ | 10.24 | |
| | | | | | | | |
Total Return d | | | 11.29 | % | | | 2.40 | % |
| | | | | | | | |
Ratios/Supplemental Data | | | | | | | | |
Net assets, end of period (in thousands) | | $ | 324 | | | $ | 291 | |
| | | | | | | | |
Ratios to average net assets: | | | | | | | | |
Net investment income | | | 0.54 | % | | | 0.81 | % |
Total expenses e | | | 3.44 | % | | | 8.08 | % |
Net expenses f | | | 1.03 | % | | | 1.09 | % |
Net expenses prior to custodian earning credits and net of expense waivers | | | 1.03 | % | | | 1.09 | % |
| | | | | | | | |
Portfolio turnover rate | | | 18 | % | | | 17 | % |
| a | Unaudited figures for the six months ended March 31, 2010. Percentage amounts for the period, except total return, have been annualized. |
| b | Security All Cap Value Fund was initially capitalized on October 3, 2008 with a net asset value of $10 per share. Percentage amounts for the period, except total return, have been annualized. |
| c | Net investment income (loss) was computed using average shares outstanding throughout the period. |
| d | Total return information does not reflect deduction of any sales charges imposed at the time of purchase for Class A shares or upon redemption for Class C shares. |
| e | Total expense information reflects expense ratios absent expense reductions by the Investment Manager and custodian earnings credits, as applicable. |
| f | Net expense information reflects the expense ratios after voluntary expense waivers, reimbursements and custodian earnings credits, as applicable. |
| | | | |
| | 13 | | The accompanying notes are an integral part of the financial statements |
| | |
| | Rydex | SGI Equity Fund |
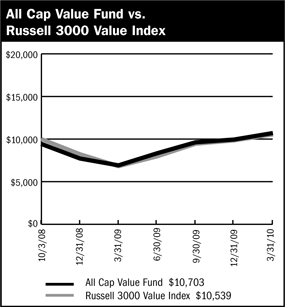
| Performance Summary | | Alpha Opportunity Fund |
| March 31, 2010 | | (unaudited) |
PERFORMANCE
$10,000 Since Inception
This chart assumes a $10,000 investment in Class A shares of Alpha Opportunity Fund on July 7, 2003 (date of inception), reflects deduction of the 5.75% sales load and assumes all dividends reinvested. The chart does not reflect the deduction of taxes that a shareholder would pay on distributions or the redemption of fund shares. The S&P 500 Index is a capitalization weighted index composed of 500 selected common stocks that represent the broad domestic economy and is a widely recognized unmanaged index of market performance.
Average Annual Returns
| | | | | | | | |
Periods Ended 3-31-10 | | 1 Year | | | 5 Years | | | Since Inception |
A Shares | | 48.91 | % | | 4.18 | % | | 7.48%
(7-07-03) |
A Shares with sales charge | | 40.41 | % | | 2.95 | % | | 6.54%
(7-07-03) |
B Shares | | 47.61 | % | | 3.36 | % | | 6.65%
(7-07-03) |
B Shares with CDSC | | 42.61 | % | | 3.09 | % | | 6.65%
(7-07-03) |
C Shares | | 47.85 | % | | 3.36 | % | | 6.65%
(7-07-03) |
C Shares with CDSC | | 46.85 | % | | 3.36 | % | | 6.65%
(7-07-03) |
Institutional Shares | | 49.32 | % | | — | | | 21.83%
(11-07-08) |
The performance data above represents past performance that is not predictive of future results. The investment return and principal value of an investment in the Fund will fluctuate so that an investor’s shares, when redeemed, may be worth more or less than their original cost. The figures above do not reflect deduction of the maximum front-end sales charge of 5.75% for Class A shares or the contingent deferred sales charge of 5% for Class B shares and 1% for Class C shares, as applicable, except where noted. The figures do not reflect the deduction of taxes that a shareholder would pay on distributions or redemption of shares. Such figures would be lower if the maximum sales charge and any applicable taxes were deducted. Fee waivers and/or reimbursements reduced expenses of the Fund and in the absence of such waiver, the performance quoted would be reduced.
Portfolio Composition by Sector as of 3-31-10*
| | | |
Consumer Discretionary | | (2.95 | )% |
Consumer Staples | | 8.88 | |
Energy | | 2.06 | |
Financials | | (1.95 | ) |
Health Care | | 2.08 | |
Industrials | | 7.29 | |
Information Technology | | 13.35 | |
Materials | | 4.98 | |
Telecommunication Services | | 0.20 | |
Utilities | | (0.53 | ) |
Exchange Traded Funds | | 3.54 | |
U.S. Government Sponsored Agencies | | 9.65 | |
Repurchase Agreement | | 10.79 | |
Short Term Investments | | 15.83 | |
Cash & Other Assets, Less Liabilities | | 26.78 | |
| | | |
Total Net Assets | | 100.00 | % |
| | | |
| * | Securities sold short are netted with long positions in common stocks in the appropriate sectors. |
| | | | |
| | 14 | | The accompanying notes are an integral part of the financial statements |
| | |
| Schedule of Investments | | Rydex | SGI Equity Fund |
March 31, 2010 (unaudited) | | Alpha Opportunity Fund |
| | | | | |
| | | Shares | | Value |
COMMON STOCKS - 86.4% |
Aerospace & Defense - 3.3% | | | | | |
Goodrich Corporation 8 | | 820 | | $ | 57,826 |
ITT Corporation | | 656 | | | 35,168 |
Lockheed Martin Corporation 1,7 | | 3,753 | | | 312,325 |
Northrop Grumman Corporation 1,7 | | 1,100 | | | 72,127 |
| | | | | |
| | | | | 477,446 |
| | | | | |
Airlines - 0.0% | | | | | |
US Airways Group, Inc. * | | 656 | | | 4,822 |
| | | | | |
Aluminum - 0.8% | | | | | |
Alcoa, Inc. 8 | | 4,258 | | | 60,634 |
Century Aluminum Company * | | 3,605 | | | 49,605 |
| | | | | |
| | | | | 110,239 |
| | | | | |
Apparel Retail - 4.7% | | | | | |
Gap, Inc. 1,7 | | 6,000 | | | 138,660 |
Gymboree Corporation 1,7* | | 3,000 | | | 154,890 |
Ltd. Brands, Inc. 1,7 | | 5,100 | | | 125,562 |
Ross Stores, Inc. 1,7 | | 2,100 | | | 112,287 |
TJX Companies, Inc. 1,7 | | 3,600 | | | 153,072 |
| | | | | |
| | | | | 684,471 |
| | | | | |
Apparel, Accessories & Luxury Goods - 0.3% | | | | | |
Phillips-Van Heusen Corporation 1,7 | | 800 | | | 45,888 |
| | | | | |
Application Software - 0.4% | | | | | |
Bottomline Technologies, Inc. * | | 655 | | | 11,024 |
JDA Software Group, Inc. * | | 1,650 | | | 45,903 |
| | | | | |
| | | | | 56,927 |
| | | | | |
Auto Parts & Equipment - 0.3% | | | | | |
BorgWarner, Inc. * | | 820 | | | 31,307 |
Gentex Corporation | | 328 | | | 6,370 |
| | | | | |
| | | | | 37,677 |
| | | | | |
Automotive Retail - 0.0% | | | | | |
Advance Auto Parts, Inc. | | 164 | | | 6,875 |
| | | | | |
Biotechnology - 1.4% | | | | | |
Amgen, Inc. 1,7* | | 1,800 | | | 107,568 |
Celgene Corporation * | | 164 | | | 10,161 |
Gilead Sciences, Inc. 8* | | 1,475 | | | 67,083 |
United Therapeutics Corporation * | | 233 | | | 12,892 |
| | | | | |
| | | | | 197,704 |
| | | | | |
Building Products - 0.1% | | | | | |
Lennox International, Inc. | | 328 | | | 14,537 |
| | | | | |
Coal & Consumable Fuels - 0.1% | | | | | |
International Coal Group, Inc. * | | 772 | | | 3,528 |
Massey Energy Company | | 117 | | | 6,118 |
| | | | | |
| | | | | 9,646 |
| | | | | |
Communications Equipment - 0.6% | | | | | |
DG FastChannel, Inc. * | | 618 | | | 19,745 |
Harmonic, Inc. 1,7* | | 11,000 | | | 69,410 |
Motorola, Inc. * | | 327 | | | 2,296 |
| | | | | |
| | | | | 91,451 |
| | | | | |
Computer & Electronics
Retail - 0.8% | | | | | |
RadioShack Corporation 1,7 | | 5,100 | | | 115,413 |
| | | | | |
Computer Hardware - 1.3% | | | | | |
International Business Machines Corporation 8 | | 1,463 | | | 187,630 |
| | | | | |
| | | | | |
| | | Shares | | Value |
COMMON STOCKS - 86.4% (continued) |
Computer Storage &
Peripherals - 0.6% | | | | | |
EMC Corporation * | | 328 | | $ | 5,917 |
Hypercom Corporation * | | 1,966 | | | 7,589 |
Seagate Technology | | 2,293 | | | 41,870 |
Western Digital Corporation * | | 669 | | | 26,084 |
| | | | | |
| | | | | 81,460 |
| | | | | |
Construction & Engineering - 0.2% | | | | | |
Michael Baker Corporation * | | 803 | | | 27,687 |
| | | | | |
Construction & Farm Machinery & Heavy Trucks - 5.5% | | | | | |
Joy Global, Inc. 1,7 | | 9,080 | | | 513,928 |
Kubota Corporation ADR * | | 781 | | | 35,606 |
Terex Corporation * | | 1,311 | | | 29,773 |
Titan International, Inc. | | 1,802 | | | 15,731 |
Trinity Industries, Inc. 1,7 | | 10,200 | | | 203,592 |
| | | | | |
| | | | | 798,630 |
| | | | | |
Data Processing & Outsourced Services - 1.2% | | | | | |
Visa, Inc. 8 | | 1,967 | | | 179,056 |
| | | | | |
Diversified Chemicals - 0.3% | | | | | |
Dow Chemical Company | | 1,475 | | | 43,616 |
| | | | | |
Diversified Metals & Mining - 0.8% | | | | | |
Brush Engineered Materials, Inc. * | | 328 | | | 7,403 |
Freeport-McMoRan Copper & Gold, Inc. (CI.B) 8 | | 819 | | | 68,418 |
General Moly, Inc. * | | 2,458 | | | 8,161 |
Southern Copper Corporation | | 656 | | | 20,776 |
Thompson Creek Metals Company, Inc. * | | 1,170 | | | 15,830 |
| | | | | |
| | | | | 120,588 |
| | | | | |
Electrical Components & Equipment - 2.1% | | | | | |
AO Smith Corporation 1,7 | | 2,800 | | | 147,196 |
Cooper Industries plc 8 | | 1,476 | | | 70,759 |
Rockwell Automation, Inc. 8 | | 1,474 | | | 83,075 |
| | | | | |
| | | | | 301,030 |
| | | | | |
Electronic Components - 0.1% | | | | | |
Vishay Intertechnology, Inc. * | | 1,039 | | | 10,629 |
| | | | | |
Environmental & Facilities Services - 0.1% | | | | | |
Metalico, Inc. * | | 2,458 | | | 14,723 |
| | | | | |
Exchange Traded Funds - 2.8% | | | | | |
Health Care Select Sector SPDR Fund | | 489 | | | 15,687 |
iPath Dow Jones-UBS Coffee Subindex Total Return ETN * | | 194 | | | 7,403 |
iPATH S&P 500 VIX Mid-Term Futures ETN * | | 713 | | | 48,149 |
iPATH S&P 500 VIX Short-Term Futures ETN * | | 664 | | | 13,951 |
iShares MSCI Taiwan Index Fund | | 2,925 | | | 36,709 |
Market Vectors - Agribusiness ETF 8 | | 4,347 | | | 196,441 |
Market Vectors - Coal ETF | | 1,147 | | | 43,253 |
PowerShares DB Agriculture Fund * | | 1,146 | | | 27,779 |
| | | | |
| | 15 | | The accompanying notes are an integral part of the financial statements |
| | |
| Schedule of Investments | | Rydex | SGI Equity Fund |
| March 31, 2010 (unaudited) | | Alpha Opportunity Fund |
| | | | | |
| | | Shares | | Value |
COMMON STOCKS - 86.4% (continued) |
Exchange Traded Funds - 2.8% (continued) | | | | | |
United States Natural Gas Fund, LP * | | 2,888 | | $ | 19,956 |
| | | | | |
| | | | | 409,328 |
| | | | | |
Food Distributors - 0.5% | | | | | |
Sysco Corporation | | 1,474 | | | 43,483 |
United Natural Foods, Inc. * | | 984 | | | 27,680 |
| | | | | |
| | | | | 71,163 |
| | | | | |
Food Retail - 0.7% | | | | | |
Safeway, Inc. 1,7 | | 3,900 | | | 96,954 |
| | | | | |
Forest Products - 0.6% | | | | | |
Louisiana-Pacific Corporation * | | 2,948 | | | 26,679 |
Weyerhaeuser Company 8 | | 1,311 | | | 59,349 |
| | | | | |
| | | | | 86,028 |
| | | | | |
General Merchandise Stores - 0.9% | | | | | |
Family Dollar Stores, Inc. 1,7 | | 3,700 | | | 135,457 |
| | | | | |
Gold - 1.3% | | | | | |
IAMGOLD Corporation 8 | | 6,128 | | | 81,013 |
New Gold, Inc. * | | 5,265 | | | 22,955 |
Newmont Mining Corporation 8 | | 1,638 | | | 83,423 |
| | | | | |
| | | | | 187,391 |
| | | | | |
Health Care Distributors - 1.1% | | | | | |
AmerisourceBergen Corporation | | 1,107 | | | 32,014 |
Owens & Minor, Inc. 1,7 | | 2,700 | | | 125,253 |
| | | | | |
| | | | | 157,267 |
| | | | | |
Health Care Equipment - 2.9% | | | | | |
Baxter International, Inc. 1,7 | | 5,242 | | | 305,084 |
Covidien plc | | 1,147 | | | 57,671 |
Medtronic, Inc. | | 1,231 | | | 55,432 |
| | | | | |
| | | | | 418,187 |
| | | | | |
Health Care Facilities - 0.8% | | | | | |
Community Health Systems, Inc. * | | 1,147 | | | 42,359 |
Kindred Healthcare, Inc. 1,7* | | 3,900 | | | 70,395 |
Tenet Healthcare Corporation * | | 1,147 | | | 6,561 |
| | | | | |
| | | | | 119,315 |
| | | | | |
Health Care Services - 1.5% | | | | | |
DaVita, Inc. * | | 819 | | | 51,925 |
Lincare Holdings, Inc. 1,7* | | 3,800 | | | 170,544 |
| | | | | |
| | | | | 222,469 |
| | | | | |
Home Entertainment Software - 4.5% | | | | | |
Shanda Interactive Entertainment, Ltd. ADR 1,7* | | 15,100 | | | 658,209 |
| | | | | |
Homebuilding - 0.2% | | | | | |
Pulte Group, Inc. * | | 2,153 | | | 24,221 |
| | | | | |
Human Resources & Employment Services - 0.7% | | | | | |
Towers Watson & Company 1,7 | | 2,200 | | | 104,500 |
| | | | | |
Hypermarkets & Super
Centers - 0.8% | | | | | |
Wal-Mart Stores, Inc. 1,7 | | 2,200 | | | 122,320 |
| | | | | |
| | | | | |
| | | Shares | | Value |
COMMON STOCKS - 86.4% (continued) |
Independent Power Producers & Energy Traders - 1.2% | | | | | |
Constellation Energy Group, Inc. 1,7 | | 5,100 | | $ | 179,061 |
| | | | | |
Industrial Conglomerates - 1.8% | | | | | |
3M Company 8 | | 1,473 | | | 123,099 |
General Electric Company 1,7 | | 4,200 | | | 76,440 |
Tyco International, Ltd. | | 1,474 | | | 56,381 |
| | | | | |
| | | | | 255,920 |
| | | | | |
Industrial Machinery - 2.0% | | | | | |
Dover Corporation | | 1,148 | | | 53,669 |
Illinois Tool Works, Inc. | | 984 | | | 46,602 |
Ingersoll-Rand plc | | 1,148 | | | 40,031 |
Snap-On, Inc. 8 | | 1,417 | | | 61,413 |
Watts Water Technologies, Inc. 1,7 | | 2,800 | | | 86,968 |
| | | | | |
| | | | | 288,683 |
| | | | | |
Integrated Oil & Gas - 2.9% | | | | | |
ConocoPhillips 1,7 | | 1,500 | | | 76,755 |
Hess Corporation | | 819 | | | 51,228 |
Occidental Petroleum Corporation 8 | | 3,391 | | | 286,676 |
| | | | | |
| | | | | 414,659 |
| | | | | |
Integrated Telecommunication Services - 1.9% | | | | | |
AT&T, Inc. 1,7 | | 10,600 | | | 273,904 |
| | | | | |
Internet Software & Services - 0.1% | | | | | |
LivePerson, Inc. * | | 1,368 | | | 10,493 |
| | | | | |
Life Sciences Tools & Services - 2.9% | | | | | |
Charles River Laboratories International, Inc. 1,7* | | 2,000 | | | 78,620 |
Life Technologies Corporation 1,7* | | 2,800 | | | 146,356 |
Millipore Corporation 1,7* | | 1,800 | | | 190,080 |
PerkinElmer, Inc. | | 328 | | | 7,839 |
| | | | | |
| | | | | 422,895 |
| | | | | |
Managed Health Care - 0.8% | | | | | |
CIGNA Corporation | | 1,310 | | | 47,920 |
WellCare Health Plans, Inc. 1,7* | | 2,300 | | | 68,494 |
| | | | | |
| | | | | 116,414 |
| | | | | |
Metal & Glass Containers - 0.2% | | | | | |
Greif, Inc. | | 656 | | | 36,028 |
| | | | | |
Movies & Entertainment - 1.0% | | | | | |
LodgeNet Interactive Corporation * | | 1,147 | | | 7,995 |
Walt Disney Company 8 | | 4,024 | | | 140,477 |
| | | | | |
| | | | | 148,472 |
| | | | | |
Multi-Line Insurance - 0.5% | | | | | |
Genworth Financial, Inc. 1,7* | | 4,000 | | | 73,360 |
| | | | | |
Oil & Gas Equipment &
Services - 0.5% | | | | | |
Basic Energy Services, Inc. * | | 808 | | | 6,230 |
Dresser-Rand Group, Inc. * | | 656 | | | 20,612 |
RPC, Inc. | | 2,176 | | | 24,218 |
Willbros Group, Inc. * | | 1,198 | | | 14,388 |
| | | | | |
| | | | | 65,448 |
| | | | | |
Oil & Gas Exploration & Production - 1.8% | | | | | |
Anadarko Petroleum Corporation 1,7 | | 2,755 | | | 200,646 |
| | | | |
| | 16 | | The accompanying notes are an integral part of the financial statements |
| | |
| Schedule of Investments | | Rydex | SGI Equity Fund |
March 31, 2010 (unaudited) | | Alpha Opportunity Fund |
| | | | | |
| | | Shares | | Value |
COMMON STOCKS - 86.4% (continued) |
Oil & Gas Exploration & Production - 1.8% (continued) | | | | | |
Berry Petroleum Company | | 2,130 | | $ | 59,981 |
| | | | | |
| | | | | 260,627 |
| | | | | |
Packaged Foods & Meats - 0.1% | | | | | |
Kraft Foods, Inc. | | 655 | | | 19,807 |
| | | | | |
Paper Packaging - 0.2% | | | | | |
Rock-Tenn Company | | 656 | | | 29,894 |
| | | | | |
Paper Products - 0.4% | | | | | |
International Paper Company | | 2,131 | | | 52,444 |
| | | | | |
Personal Products - 0.8% | | | | | |
Herbalife, Ltd. 1,7 | | 2,500 | | | 115,300 |
| | | | | |
Pharmaceuticals - 5.0% | | | | | |
Abbott Laboratories 8 | | 1,639 | | | 86,343 |
Forest Laboratories, Inc. 1,7* | | 4,711 | | | 147,737 |
Johnson & Johnson 1, 7 | | 5,000 | | | 325,999 |
Merck & Company, Inc. | | 819 | | | 30,590 |
Viropharma, Inc. 1,7* | | 9,900 | | | 134,937 |
| | | | | |
| | | | | 725,606 |
| | | | | |
Property & Casualty
Insurance - 0.6% | | | | | |
Amtrust Financial Services, Inc. 1, 7 | | 6,000 | | | 83,700 |
| | | | | |
Real Estate Development - 0.0% | | | | | |
Forestar Group, Inc. * | | 328 | | | 6,193 |
| | | | | |
Reinsurance - 0.8% | | | | | |
Endurance Specialty Holdings, Ltd. 1,7 | | 3,000 | | | 111,450 |
| | | | | |
Restaurants - 0.7% | | | | | |
Jack in the Box, Inc. 1, 7* | | 4,000 | | | 94,200 |
| | | | | |
Semiconductor Equipment - 0.8% | | | | | |
Amkor Technology, Inc. 1,7* | | 9,200 | | | 65,044 |
Brooks Automation, Inc. * | | 1,212 | | | 10,690 |
KLA-Tencor Corporation | | 873 | | | 26,993 |
Lam Research Corporation * | | 385 | | | 14,368 |
Entegris, Inc. * | | 960 | | | 4,838 |
| | | | | |
| | | | | 121,933 |
| | | | | |
Semiconductors - 2.2% | | | | | |
Analog Devices, Inc. | | 1,564 | | | 45,074 |
Entropic Communications, Inc. * | | 178 | | | 904 |
Fairchild Semiconductor International, Inc. * | | 3,523 | | | 37,520 |
National Semiconductor Corporation | | 1,311 | | | 18,944 |
ON Semiconductor Corporation * | | 4,470 | | | 35,760 |
RF Micro Devices, Inc. * | | 795 | | | 3,959 |
Skyworks Solutions, Inc. * | | 2,300 | | | 35,880 |
Texas Instruments, Inc. 8 | | 4,235 | | | 103,631 |
TriQuint Semiconductor, Inc. * | | 4,402 | | | 30,814 |
| | | | | |
| | | | | 312,486 |
| | | | | |
Soft Drinks - 0.2% | | | | | |
Coca-Cola Company | | 655 | | | 36,025 |
| | | | | |
| | | | | | |
| | | Shares | | Value |
COMMON STOCKS - 86.4% (continued) | | | |
Specialized REIT’s - 0.2% | | | | | | |
Plum Creek Timber Company, Inc. | | | 656 | | $ | 25,525 |
| | | | | | |
Specialty Chemicals - 0.2% | | | | | | |
OM Group, Inc. * | | | 819 | | | 27,748 |
| | | | | | |
Steel - 0.7% | | | | | | |
Schnitzer Steel Industries, Inc. 8 | | | 1,958 | | | 102,854 |
| | | | | | |
Systems Software - 4.1% | | | | | | |
CA, Inc. 1,7 | | | 20,018 | | | 469,822 |
Oracle Corporation | | | 656 | | | 16,853 |
Symantec Corporation 1, 7* | | | 5,900 | | | 99,828 |
| | | | | | |
| | | | | | 586,503 |
| | | | | | |
Technology Distributors - 1.2% | | | |
Arrow Electronics, Inc. 1, 7* | | | 2,600 | | | 78,338 |
Avnet, Inc. 1,7* | | | 3,100 | | | 93,000 |
| | | | | | |
| | | | | | 171,338 |
| | | | | | |
Tobacco - 5.9% | | | | | | |
Altria Group, Inc. 1,7 | | | 16,700 | | | 342,684 |
Philip Morris International, Inc. 1, 7 | | | 9,800 | | | 511,169 |
| | | | | | |
| | | | | | 853,853 |
| | | | | | |
Trucking - 0.4% | | | | | | |
Con-Way, Inc. 1,7 | | | 1,700 | | | 59,704 |
| | | | | | |
TOTAL COMMON STOCKS (cost $12,837,503) | | | | | $ | 12,513,481 |
| | | | | | |
| | | Principal
Amount | | Value |
U.S. GOVERNMENT SPONSORED AGENCY BONDS & NOTES - 15.9% |
Federal Home Loan Mortgage Corporation
0.90%, 4/1/2010 1,2 | | $ | 900,000 | | $ | 900,000 |
Federal National Mortgage Association
0.15%, 5/3/2010 2,8 | | | 1,400,000 | | | 1,399,813 |
| | | | | | |
TOTAL U.S. GOVERNMENT SPONSORED AGENCY BONDS & NOTES (cost $2,299,813) | | $ | 2,299,813 |
| | | | | | |
| | | Principal
Amount | | Value |
SHORT TERM INVESTMENTS - 5.7% |
State Street General Account U.S. Government Fund 2 | | $ | 827,114 | | $ | 827,114 |
| | | | | | |
TOTAL SHORT TERM INVESTMENTS (cost $827,114) | | $ | 827,114 |
| | | | | | |
| | | Principal
Amount | | Value |
REPURCHASE AGREEMENT - 13.2% | | | |
State Street, 0.01%, dated 3/31/10, matures 4/01/10; repurchase amount $1,910,272 (Collateralized by FHLB, 9/17/10 with a value of $1,954,258) 2 | | $ | 1,910,272 | | $ | 1,910,272 |
| | | | | | |
TOTAL REPURCHASE AGREEMENT (cost $1,910,272) | | $ | 1,910,272 |
| | | | | | |
| | | | |
| | 17 | | The accompanying notes are an integral part of the financial statements |
| | |
| Schedule of Investments | | Rydex | SGI Equity Fund |
March 31, 2010 (unaudited) | | Alpha Opportunity Fund |
| | | | | | |
| | | | | Value | |
Total Investments - 145.4% 3 (cost $17,874,702) | | | | $ | 17,550,680 | |
Liabilities, Less Cash & Other
Assets - (45.4)% | | | (3,078,652 | ) |
| | | | | | |
Total Net Assets - 100.0% | | | | $ | 14,472,028 | |
| | | | | | |
Schedule of Securities Sold Short
| | | | | | | |
| | | Shares | | | Value | |
COMMON STOCKS - (29.5)% | | | | | | | |
Advertising - (0.4)% | | | | | | | |
Focus Media Holding, Ltd. ADR 4,6* | | (2,130 | ) | | $ | (63,900 | ) |
| | | | | | | |
Air Freight & Logistics - 0.0% | | | | | | | |
CH Robinson Worldwide, Inc. | | (128 | ) | | | (7,149 | ) |
| | | | | | | |
Airlines - 0.0% | | | | | | | |
Continental Airlines, Inc. * | | (127 | ) | | | (2,790 | ) |
UAL Corporation * | | (30 | ) | | | (587 | ) |
| | | | | | | |
| | | | | | (3,377 | ) |
| | | | | | | |
Alternative Carriers - (0.2)% | | | | | | | |
Global Crossing, Ltd. 4,6* | | (1,800 | ) | | | (28,746 | ) |
| | | | | | | |
Apparel Retail - (0.1)% | | | | | | | |
Abercrombie & Fitch Company | | (362 | ) | | | (16,522 | ) |
Rue21, Inc. * | | (35 | ) | | | (1,213 | ) |
| | | | | | | |
| | | | | | (17,735 | ) |
| | | | | | | |
Biotechnology - (4.4)% | | | | | | | |
Acorda Therapeutics, Inc. 4,6* | | (2,800 | ) | | | (74,900 | ) |
Alnylam Pharmaceuticals, Inc. 4,6* | | (2,900 | ) | | | (85,288 | ) |
AMAG Pharmaceuticals, Inc. 4,6* | | (1,900 | ) | | | (82,954 | ) |
Cepheid, Inc. 4,6* | | (5,300 | ) | | | (81,620 | ) |
Exelixis, Inc. 4,6* | | (4,500 | ) | | | (28,845 | ) |
Regeneron Pharmaceuticals, Inc. 4,6* | | (3,180 | ) | | | (69,038 | ) |
Rigel Pharmaceuticals, Inc. 4,6* | | (3,050 | ) | | | (78,324 | ) |
Savient Pharmaceuticals, Inc. 4,6* | | (2,420 | ) | | | (48,013 | ) |
Vertex Pharmaceuticals, Inc. 4,6* | | (2,600 | ) | | | (71,942 | ) |
| | | | | | | |
| | | | | | (620,924 | ) |
| | | | | | | |
Building Products - (1.0)% | | | | | | | |
USG Corporation 4,6* | | (4,940 | ) | | | (141,877 | ) |
| | | | | | | |
Casinos & Gaming - 0.0% | | | | | | | |
Churchill Downs, Inc. | | (51 | ) | | | (1,913 | ) |
| | | | | | | |
Communications
Equipment - (0.3)% | | | | | | | |
Riverbed Technology, Inc. 4,6* | | (3,280 | ) | | | (43,624 | ) |
| | | | | | | |
Computer Storage &
Peripherals - (0.5)% | | | | | | | |
Intermec, Inc. 4,6* | | (2,740 | ) | | | (54,307 | ) |
| | | | | | | |
Consumer Electronics - (0.2)% | | | | | | | |
Garmin, Ltd. | | (566 | ) | | | (21,780 | ) |
| | | | | | | |
Consumer Finance - 0.0% | | | | | | | |
Ezcorp, Inc. * | | (259 | ) | | | (5,335 | ) |
| | | | | | | |
| | | | | | | |
| | | Shares | | | Value | |
COMMON STOCKS - (29.5)% (continued) | |
Department Stores - (0.3)% | | | | | | | |
Sears Holdings Corporation * | | (419 | ) | | $ | (45,432 | ) |
| | | | | | | |
Diversified Banks - (3.8)% | | | | | | | |
Wells Fargo & Company 4,6 | | (12,384 | ) | | | (539,689 | ) |
| | | | | | | |
Diversified Metals &
Mining - (0.3)% | | | | | | | |
Ivanhoe Mines, Ltd. 4,6* | | (4,440 | ) | | | (37,030 | ) |
| | | | | | | |
Electric Utilities - (1.7)% | | | | | | | |
Korea Electric Power Corporation ADR 4,6 | | (18,310 | ) | | | (247,734 | ) |
| | | | | | | |
Electronic Equipment & Instruments - (0.1)% | | | | | | | |
Agilent Technologies, Inc. * | | (255 | ) | | | (8,769 | ) |
| | | | | | | |
Electronic Manufacturing Services - 0.0% | | | | | | | |
Benchmark Electronics, Inc. * | | (151 | ) | | | (3,132 | ) |
| | | | | | | |
Exchange Traded
Funds - (0.9)% | | | | | | | |
Consumer Discretionary Select Sector SPDR Fund * | | (777 | ) | | | (25,517 | ) |
iShares Barclays 20+ Year Treasury Bond Fund | | (1,030 | ) | | | (92,144 | ) |
iShares Russell 2000 Index Fund | | (130 | ) | | | (8,815 | ) |
SPDR S&P Retail ETF * | | (259 | ) | | | (10,702 | ) |
| | | | | | | |
| | | | | | (137,178 | ) |
| | | | | | | |
Food Retail - 0.0% | | | | | | | |
Whole Foods Market, Inc. * | | (128 | ) | | | (4,627 | ) |
| | | | | | | |
Footwear - (0.1)% | | | | | | | |
K-Swiss, Inc. * | | (760 | ) | | | (7,950 | ) |
| | | | | | | |
Health Care Equipment - (0.5)% | | | | | | | |
Intuitive Surgical, Inc. 4,6* | | (200 | ) | | | (56,100 | ) |
| | | | | | | |
Health Care Facilities - 0.0% | | | | | | | |
Kindred Healthcare, Inc. * | | (128 | ) | | | (2,310 | ) |
| | | | | | | |
Health Care Supplies - (0.5)% | | | | | | | |
Align Technology, Inc. 4,6* | | (6,100 | ) | | | (74,420 | ) |
| | | | | | | |
Health Care
Technology - (0.6)% | | | | | | | |
athenahealth, Inc. 4,6* | | (2,500 | ) | | | (89,625 | ) |
| | | | | | | |
Home Entertainment
Software - (0.3)% | | | | | | | |
Electronic Arts, Inc. 4,6* | | (900 | ) | | | (36,720 | ) |
| | | | | | | |
Home Furnishings - 0.0% | | | | | | | |
Mohawk Industries, Inc. * | | (128 | ) | | | (6,961 | ) |
| | | | | | | |
Integrated Telecommunication Services - 0.0% | | | | | | | |
Qwest Communications International, Inc. | | (518 | ) | | | (2,704 | ) |
| | | | | | | |
| | | | |
| | 18 | | The accompanying notes are an integral part of the financial statements |
| | |
| Schedule of Investments | | Rydex | SGI Equity Fund |
| March 31, 2010 (unaudited) | | Alpha Opportunity Fund |
| | | | | | | |
| | | Shares | | | Value | |
COMMON STOCKS - (29.5)% (continued) | |
Internet Retail - 0.0% | | | | | | | |
PetMed Express, Inc. | | (235 | ) | | $ | (5,210 | ) |
| | | | | | | |
Internet Software &
Services - (2.4)% | | | | | | | |
Baidu, Inc. ADR 4,6* | | (200 | ) | | | (53,725 | ) |
Digital River, Inc. * | | (510 | ) | | | (15,453 | ) |
Equinix, Inc. 4,6* | | (1,000 | ) | | | (79,940 | ) |
SAVVIS, Inc. 4,6* | | (5,700 | ) | | | (84,018 | ) |
VeriSign, Inc. 4,6* | | (1,200 | ) | | | (30,756 | ) |
WebMD Health Corporation * | | (130 | ) | | | (6,029 | ) |
| | | | | | | |
| | | | | | (269,921 | ) |
| | | | | | | |
IT Consulting & Other Services - 0.0% | | | | | | | |
RightNow Technologies, Inc. * | | (227 | ) | | | (4,054 | ) |
| | | | | | | |
Leisure Products - (2.1)% | | | | | | | |
Brunswick Corporation | | (128 | ) | | | (2,044 | ) |
Pool Corporation 4,6 | | (11,639 | ) | | | (288,065 | ) |
| | | | | | | |
| | | | | | (290,109 | ) |
| | | | | | | |
Life Sciences Tools & Services - (1.0)% | | | | | |
Luminex Corporation 4,6* | | (2,500 | ) | | | (63,725 | ) |
Sequenom, Inc. 4,6* | | (3,810 | ) | | | (78,524 | ) |
| | | | | | | |
| | | | | | (142,249 | ) |
| | | | | | | |
Oil & Gas Exploration & Production - (0.7)% | | | | | | | |
BPZ Resources, Inc. 4,6* | | (5,700 | ) | | | (107,160 | ) |
| | | | | | | |
Oil & Gas Refining &
Marketing - (0.1)% | | | | | |
Valero Energy Corporation | | (566 | ) | | | (11,150 | ) |
| | | | | | | |
Pharmaceuticals - (1.0)% | | | | | | | |
Auxilium Pharmaceuticals,
Inc. 4,6* | | (1,540 | ) | | | (56,703 | ) |
Perrigo Company | | (104 | ) | | | (6,107 | ) |
Sepracor, Inc. 4,6* | | (1,400 | ) | | | (24,500 | ) |
XenoPort, Inc. 4,6* | | (1,376 | ) | | | (63,062 | ) |
| | | | | | | |
| | | | | | (150,372 | ) |
| | | | | | | |
Photographic Products - 0.0% | | | | | |
Eastman Kodak Company | | (451 | ) | | | (2,611 | ) |
| | | | | | | |
Regional Banks - (0.7)% | | | | | | | |
PrivateBancorp, Inc. 4,6 | | (2,390 | ) | | | (102,770 | ) |
| | | | | | | |
Residential REIT’s - 0.0% | | | | | |
Mid-America Apartment Communities, Inc. | | (122 | ) | | | (6,318 | ) |
| | | | | | | |
Restaurants - (0.3)% | | | | | |
Cheesecake Factory, Inc. * | | (666 | ) | | | (18,022 | ) |
PF Chang’s China Bistro, Inc. * | | (284 | ) | | | (12,533 | ) |
Ruby Tuesday, Inc. * | | (259 | ) | | | (2,738 | ) |
Sonic Corporation * | | (259 | ) | | | (2,862 | ) |
Texas Roadhouse, Inc. * | | (388 | ) | | | (5,389 | ) |
| | | | | | | |
| | | | | | (41,544 | ) |
| | | | | | | |
Security & Alarm Services - (0.2)% | | | | | |
Brink’s Company | | (777 | ) | | | (21,935 | ) |
| | | | | | | |
| | | | | | | |
| | | Shares | | | Value | |
COMMON STOCKS - (29.5)% (continued) | |
Semiconductor
Equipment - (0.2)% | | | | | |
Varian Semiconductor Equipment Associates,
Inc. 4,6* | | (1,260 | ) | | $ | (33,037 | ) |
| | | | | | | |
Semiconductors - (1.1)% | | | | | | | |
Cree, Inc. 4,6* | | (4,000 | ) | | | (109,840 | ) |
Rambus, Inc. 4,6* | | (3,600 | ) | | | (55,224 | ) |
| | | | | | | |
| | | | | | (165,064 | ) |
| | | | | | | |
Sort Drinks - (0.7)% | | | | | | | |
Dr Pepper Snapple Group, Inc. | | (255 | ) | | | (8,968 | ) |
Hansen Natural Corporation 4,6* | | (3,250 | ) | | | (96,233 | ) |
| | | | | | | |
| | | | | | (105,201 | ) |
| | | | | | | |
Specialized Finance - (0.2)% | | | | | | | |
Moody’s Corporation | | (763 | ) | | | (22,699 | ) |
NASDAQ OMX Group, Inc. * | | (259 | ) | | | (5,470 | ) |
| | | | | | | |
| | | | | | (28,169 | ) |
| | | | | | | |
Specialized REIT’s - (0.1)% | | | | | | | |
Healthcare Realty Trust, Inc. | | (399 | ) | | | (9,293 | ) |
| | | | | | | |
Specialty Chemicals - (0.3)% | | | | | | | |
Zoltek Companies, Inc. 4,6* | | (2,700 | ) | | | (49,221 | ) |
| | | | | | | |
Specialty Stores - 0.0% | | | | | | | |
Books-A-Million, Inc. | | (770 | ) | | | (5,575 | ) |
| | | | | | | |
Steel - (0.1)% | | | | | | | |
Allegheny Technologies, Inc. | | (283 | ) | | | (15,279 | ) |
| | | | | | | |
Systems Software - (0.8)% | | | | | | | |
Red Hat, Inc. 4,6* | | (2,610 | ) | | | (46,589 | ) |
VMware, Inc. 4,6* | | (2,400 | ) | | | (68,592 | ) |
| | | | | | | |
| | | | | | (115,181 | ) |
| | | | | | | |
Trading Companies & Distributors - 0.0% | | | | | | | |
Beacon Roofing Supply, Inc. * | | (140 | ) | | | (2,678 | ) |
Watsco, Inc. | | (26 | ) | | | (1,479 | ) |
| | | | | | | |
| | | | | | (4,157 | ) |
| | | | | | | |
Wireless Telecommunication Services - (1.3)% | | | | | | | |
Clearwire Corporation 4,6* | | (2,530 | ) | | | (28,665 | ) |
Leap Wireless International, Inc. 4,6* | | (1,500 | ) | | | (65,100 | ) |
SBA Communications Corporation 4,6* | | (2,400 | ) | | | (69,095 | ) |
Telephone & Data Systems, Inc. | | (130 | ) | | | (4,401 | ) |
| | | | | | | |
| | | | | | (167,261 | ) |
| | | | | | | |
TOTAL COMMON STOCKS SOLD SHORT (proceeds $4,086,626) | | | $ | (4,163,889 | ) |
| | | | | | | |
| | | Shares | | | Value | |
FOREIGN STOCKS - (25.1)% | | | | | |
Airlines - (0.2)% | | | | | | | |
Ryanair Holdings plc 4,6* | | (9,600 | ) | | $ | (35,971 | ) |
| | | | | | | |
Airport Services - (1.3)% | | | | | | | |
Beijing Capital International Airport Company, Ltd. 4,6 | | (218,000 | ) | | | (188,550 | ) |
| | | | | | | |
Apparel, Accessories & Luxury Goods - (0.1)% | | | | | | | |
C C Land Holdings, Ltd. 4,6 | | (50,000 | ) | | | (13,945 | ) |
| | | | | | | |
| | | | |
| | 19 | | The accompanying notes are an integral part of the financial statements |
| | |
| Schedule of Investments | | Rydex | SGI Equity Fund |
| March 31, 2010 (unaudited) | | Alpha Opportunity Fund |
| | | | | | | |
| | | Shares | | | Value | |
FOREIGN STOCKS - (25.1)% (continued) | |
Automobile Manufacturers - (3.7)% | | | | | |
Volkswagen AG 4,6 | | (1,300 | ) | | $ | (538,567 | ) |
| | | | | | | |
Biotechnology - (1.5)% | | | | | | | |
Basilea Pharmaceutica 4,6* | | (500 | ) | | | (83,364 | ) |
Intercell AG 4,6* | | (1,900 | ) | | | (74,840 | ) |
Zeltia S.A. 4,6 | | (8,000 | ) | | | (54,559 | ) |
| | | | | | | |
| | | | | | (212,763 | ) |
| | | | | | | |
Broadcasting - (0.2)% | | | | | | | |
Tokyo Broadcasting System Holdings, Inc. 4,6 | | (1,300 | ) | | | (21,836 | ) |
| | | | | | | |
Cable & Satellite - (0.5)% | | | | | | | |
Sky Deutschland AG 4,6* | | (4,000 | ) | | | (65,668 | ) |
| | | | | | | |
Casinos & Gaming - (1.4)% | | | | | | | |
bwin Interactive Entertainment
AG 4,6* | | (1,600 | ) | | | (45,582 | ) |
Genting Singapore plc 4,6* | | (124,900 | ) | | | (41,123 | ) |
PartyGaming plc 4,6 | | (15,200 | ) | | | (57,210 | ) |
| | | | | | | |
| | | | | | (143,915 | ) |
| | | | | | | |
Coal & Consumable
Fuels - (0.5)% | | | | | | | |
Aquila Resources, Ltd. 4,6* | | (2,750 | ) | | | (21,907 | ) |
Riversdale Mining, Ltd. 4,6* | | (6,700 | ) | | | (50,985 | ) |
| | | | | | | |
| | | | | | (72,892 | ) |
| | | | | | | |
Construction &
Engineering - (0.3)% | | | | | | | |
Ausenco, Ltd. 4,6 | | (2,100 | ) | | | (22,659 | ) |
China Communications Construction Company, Ltd. 4,6 | | (15,000 | ) | | | (15,536 | ) |
| | | | | | | |
| | | | | | (38,195 | ) |
| | | | | | | |
Construction & Farm Machinery &
Heavy Trucks - (0.1)% | | | | | | | |
China National Materials Company, Ltd. 4,6 | | (34,400 | ) | | | (17,537 | ) |
| | | | | | | |
Construction Materials - (0.3)% | | | | | | | |
Anhui Conch Cement Company,
Ltd. 4,6 | | (4,500 | ) | | | (20,259 | ) |
China National Building Material Company, Ltd. 4,6 | | (14,700 | ) | | | (19,910 | ) |
| | | | | | | |
| | | | | | (40,169 | ) |
| | | | | | | |
Department Stores - (1.4)% | | | | | | | |
Marui Group Company, Ltd. 4,6 | | (29,100 | ) | | | (219,528 | ) |
| | | | | | | |
Diversified Banks - (2.7)% | | | | | | | |
Aozora Bank, Ltd. 4,6* | | (16,300 | ) | | | (26,250 | ) |
Erste Group Bank AG 4,6 | | (5,200 | ) | | | (319,536 | ) |
Mizuho Financial Group, Inc. 4,6* | | (11,000 | ) | | | (45,462 | ) |
Mizuho Trust & Banking Company, Ltd. 4,6* | | (17,700 | ) | | | (24,682 | ) |
| | | | | | | |
| | | | | | (415,930 | ) |
| | | | | | | |
Diversified Metals &
Mining - (0.4)% | | | | | | | |
Fushan International Energy Group, Ltd. 4,6 | | (66,000 | ) | | | (23,727 | ) |
Western Areas NL 4,6 | | (6,200 | ) | | | (44,456 | ) |
| | | | | | | |
| | | | | | (68,183 | ) |
| | | | | | | |
| | | | | | | |
| | | Shares | | | Value | |
FOREIGN STOCKS - (25.1)% (continued) | |
Diversified Real Estate Activities - (0.2)% | | | | | | | |
Franshion Properties China,
Ltd. 4,6 | | (79,400 | ) | | $ | (22,104 | ) |
| | | | | | | |
Electrical Components & Equipment - (0.6)% | | | | | | | |
Toyo Tanso Company, Ltd. 4,6 | | (500 | ) | | | (27,007 | ) |
| | | | | | | |
Electronic Manufacturing Services - (0.5)% | | | | | | | |
IEC Electronics Corporation 4,6* | | (3,900 | ) | | | (77,681 | ) |
| | | | | | | |
Gold - (0.8)% | |
Agnico-Eagle Mines, Ltd. 4,5,6* | | (1,800 | ) | | | (119,001 | ) |
Sino Gold Mining, Ltd. 4,6* | | (8,600 | ) | | | (35,368 | ) |
| | | | | | | |
| | | | | | (154,369 | ) |
| | | | | | | |
Highways &
Railtracks - (3.2)% | | | | | | | |
Brisa Auto-Estradas de Portugal S.A. 4,6 | | (44,400 | ) | | | (461,804 | ) |
| | | | | | | |
Household Appliances - (2.7)% | | | | | | | |
Electrolux AB 4,6 | | (30,100 | ) | | | (395,761 | ) |
| | | | | | | |
Industrial Machinery - (0.1)% | | | | | | | |
Japan Steel Works, Ltd. 4,6 | | (1,500 | ) | | | (20,809 | ) |
Meyer Burger Technology
AG 4,6* | | (200 | ) | | | (49,879 | ) |
| | | | | | | |
| | | | | | (70,688 | ) |
| | | | | | | |
Internet Software &
Services - (0.2)% | | | | | |
Access Company, Ltd. 4,6 | | (17 | ) | | | (32,755 | ) |
| | | | | | | |
Investment Banking & Brokerage - (0.2)% | | | | | | | |
Monex Group, Inc. 4,6 | | (78 | ) | | | (27,384 | ) |
| | | | | | | |
Marine Ports &
Services - (0.1)% | | | | | |
China Merchants Holdings International Company,
Ltd. 4,6 | | (3,100 | ) | | | (11,047 | ) |
| | | | | | | |
Oil & Gas Equipment & Services - (0.6)% | | | | | | | |
Modec, Inc. 4,6 | | (900 | ) | | | (23,195 | ) |
Sevan Marine ASA 4,6* | | (5,900 | ) | | | (30,951 | ) |
Trican Well Service, Ltd. 4,6 | | (2,000 | ) | | | (34,043 | ) |
| | | | | | | |
| | | | | | (88,189 | ) |
| | | | | | | |
Oil & Gas Exploration & Production - (0.6)% | | | | | | | |
Arrow Energy, Ltd. 4,6 * | | (8,900 | ) | | | (22,965 | ) |
Queensland Gas Company,
Ltd. 4,6* | | (12,800 | ) | | | (49,787 | ) |
| | | | | | | |
| | | | | | (72,752 | ) |
| | | | | | | |
Precious Metals &
Minerals - (0.7)% | | | | | |
Silver Wheaton Corporation 4,6* | | (6,100 | ) | | | (64,046 | ) |
| | | | | | | |
Real Estate Operating Companies - (0.4)% | | | | | | | |
Aeon Mall Company, Ltd. 4,6 | | (1,700 | ) | | | (52,093 | ) |
| | | | | | | |
TOTAL FOREIGN STOCKS SOLD SHORT (proceeds $3,493,322) | | | | | $ | (3,651,329 | ) |
| | | | | | | |
| | | | |
| | 20 | | The accompanying notes are an integral part of the financial statements |
| | |
| Schedule of Investments | | Rydex | SGI Equity Fund |
| March 31, 2010 (unaudited) | | Alpha Opportunity Fund |
| | | | | | | |
| | | Shares | | | Value | |
RIGHTS - (0.0)% | | | | | | | |
Automobile
Manufacturers - (0.0)% | | | | | |
Volkswagen AG
Expires 04/13/10 | | (1,300 | ) | | $ | (808 | ) |
| | | | | | | |
TOTAL RIGHTS (proceeds $2,258) | | | | | $ | (808 | ) |
| | | | | | | |
TOTAL SECURITIES SOLD SHORT - (55.0%) (proceeds $7,582,206) | | | | | $ | (7,816,026 | ) |
| | | | | | | |
INVESTMENT CONCENTRATION
At March 31, 2010, the investment diversification of the Fund was as follows:
| | | | | | | |
Country | | % of Net
Assets | | | Value | |
United States | | 110.3 | % | | $ | 15,961,902 | |
Cayman Islands | | 4.2 | | | | 610,299 | |
Ireland | | 1.0 | | | | 132,490 | |
Bermuda | | 0.5 | | | | 68,759 | |
US | | 0.2 | | | | 35,168 | |
Switzerland | | (0.2 | ) | | | (26,983 | ) |
Norway | | (0.2 | ) | | | (30,951 | ) |
Singapore | | (0.3 | ) | | | (41,123 | ) |
Spain | | (0.4 | ) | | | (54,559 | ) |
Hong Kong | | (0.4 | ) | | | (56,878 | ) |
Gibraltar | | (0.4 | ) | | | (57,210 | ) |
United Kingdom | | (0.5 | ) | | | (77,681 | ) |
Canada | | (1.0 | ) | | | (139,450 | ) |
Australia | | (1.4 | ) | | | (198,340 | ) |
Republic of Korea | | (1.7 | ) | | | (247,734 | ) |
China | | (1.8 | ) | | | (261,792 | ) |
Sweden | | (2.7 | ) | | | (395,761 | ) |
Portugal | | (3.2 | ) | | | (461,804 | ) |
Austria | | (3.4 | ) | | | (488,494 | ) |
Japan | | (3.6 | ) | | | (518,057 | ) |
Germany | | (4.2 | ) | | | (605,851 | ) |
| | | | | | | |
Total Investments | | 90.8 | | | $ | 13,145,950 | |
| | | | | | | |
For federal income tax purposes the identified cost of investments owned at March 31, 2010 was $17,926,965.
| | | | |
| ADR | | | | American Depositary Receipt |
| plc | | | | Public Limited Company |
| * | Non-income producing security |
| 1 | Security is segregated as collateral for open short positions. |
| 2 | Value determined based on Level 2 inputs. |
| 3 | Unless otherwise indicated, the values of the securities of the Portfolio are determined based on Level 1 inputs. |
| 4 | Value determined based on Level 3 inputs. |
| 5 | Security was acquired through a private placement. |
| 6 | Security is fair valued by the Valuation Committee at March 31, 2010. The total market value of fair valued securities amounts to $(7,341,377) (cost $(7,166,693)), or (50.7%) of total net assets. |
| 7 | All or a portion of the security is deemed illiquid. The total market value of illiquid securities is $7,602,323 (cost $7,961,773), or 52.5% of total net assets. The security was deemed liquid at the time of purchase. The security is deemed illiquid due to the Fund’s exposure to Lehman Brothers International Europe (“LBIE”) prime brokerage services. See Note 9 in Notes to Financial Statements for additional information. |
| 8 | Security is segregated as collateral for open futures contracts. |
| | | | |
| | 21 | | The accompanying notes are an integral part of the financial statements |
| | |
| | Rydex | SGI Equity Fund |
| | Alpha Opportunity Fund (unaudited) |
Statement of Assets and Liabilities
March 31, 2010
| | | | |
Assets: | | | | |
Investments. at value * | | $ | 15,640,408 | |
Repurchase agreement, at value * | | | 1,910,272 | |
Cash | | | 620,241 | |
Restricted cash | | | 708,516 | |
Restricted cash denominated in a foreign currency, at value *** | | | 3,431,132 | |
Receivables: | | | | |
Fund shares sold | | | 521 | |
Securities sold | | | 947,147 | |
Dividends | | | 23,969 | |
Foreign taxes recoverable | | | 537 | |
Prepaid expenses | | | 48,890 | |
| | | | |
Total assets | | | 23,331,633 | |
| | | | |
Liabilities: | | | | |
Securities sold short, at value ** | | | 7,816,026 | |
Foreign Cash Overdraft | | | 709 | |
Payable for: | | | | |
Securities purchased | | | 945,035 | |
Fund shares redeemed | | | 651 | |
Variation margin | | | 12,600 | |
Dividends on short sales | | | 4,180 | |
Management fees | | | 15,158 | |
Custodian fees | | | 24,000 | |
Transfer agent/maintenance fees | | | 3,182 | |
Administration fees | | | 6,619 | |
Professional fees | | | 20,365 | |
12b-l distribution plan fees | | | 4,573 | |
Directors’ fees | | | 609 | |
Other | | | 5,898 | |
| | | | |
Total liabilities | | | 8,859,605 | |
| | | | |
Net assets | | $ | 14,472,028 | |
| | | | |
Net assets consist of: | | | | |
Paid in capital | | $ | 27,596,976 | |
Accumulated net investment loss | | | (97,831 | ) |
Accumulated net realized loss on sale of investments and foreign currency transactions | | | (12,571,635 | ) |
Net unrealized depreciation in value of investments and translation of assets and liabilities in foreign currencies | | | (455,482 | ) |
| | | | |
Net assets | | $ | 14,472,028 | |
| | | | |
Class A: | | | | |
Capital shares outstanding
(unlimited number of shares authorized) | | | 1,013,086 | |
Net assets | | $ | 9,720,774 | |
Net asset value and redemption price per share | | $ | 9.59 | |
| | | | |
Maximum offering price per share (net asset value divided by 94.25%) | | $ | 10.18 | |
| | | | |
Class B: | | | | |
Capital shares outstanding
(unlimited number of shares authorized) | | | 157,589 | |
Net assets | | $ | 1,411,813 | |
Net asset value, offering and redemption price per share (excluding any applicable contingent deferred sales charge) | | $ | 8.96 | |
| | | | |
Class C: | | | | |
Capital shares outstanding
(unlimited number of shares authorized) | | | 180,097 | |
Net assets | | $ | 1,613,052 | |
Net asset value, offering and redemption price per share (excluding any applicable contingent deferred sales charge) | | $ | 8.96 | |
| | | | |
Class Institutional: | | | | |
Capital shares outstanding
(unlimited number of shares authorized) | | | 131,095 | |
Net assets | | $ | 1,726,389 | |
Net asset value, offering and redemption price per share | | $ | 13.17 | |
| | | | |
*Investments, at cost | | $ | 17,874,702 | |
**Securities sold short, proceeds | | | 7,582,206 | |
***Restricted cash denominated in a foreign currency, at cost | | | 3,383,563 | |
Statement of Operations
For the Six Months Ended March 31, 2010
| | | | |
Investment Income: | | | | |
Dividends (net of foreign withholding tax of $159) | | $ | 92,972 | |
Interest | | | 752 | |
| | | | |
Total investment income | | | 93,724 | |
| | | | |
Expenses: | | | | |
Management fees | | | 90,638 | |
Transfer agent/maintenance fees | | | 23,432 | |
Administration fees | | | 19,040 | |
Custodian fees | | | 41,722 | |
Directors’ fees | | | 463 | |
Professional fees | | | 30,304 | |
Reports to shareholders | | | 1,934 | |
Registration fees | | | 23,335 | |
Other expenses | | | 2,156 | |
Dividends on short sales | | | 8,657 | |
12b-l distribution fees - Class A | | | 11,805 | |
12b-l distribution fees - Class B | | | 7,477 | |
12b-l distribution fees - Class C | | | 8,927 | |
| | | | |
Total expenses | | | 269,890 | |
Less: | | | | |
Reimbursement of expenses - Class A | | | (68,469 | ) |
Reimbursement of expenses - Class B | | | (11,519 | ) |
Reimbursement of expenses - Class C | | | (13,874 | ) |
Reimbursement of expenses - Institutional Class | | | (13,900 | ) |
| | | | |
Net expenses | | | 162,128 | |
| | | | |
Net investment loss | | | (68,404 | ) |
| | | | |
Net Realized and Unrealized Gain (Loss): | | | | |
Net realized gain (loss) during the period on: | | | | |
Investments | | | 679,953 | |
Securities sold short | | | (8,069 | ) |
Foreign currency transactions | | | 301 | |
Futures | | | 442,780 | |
| | | | |
Net realized gain | | | 1,114,965 | |
| | | | |
Net unrealized appreciation (depreciation) during the period on: | | | | |
Investments | | | 751,251 | |
Securities sold short | | | (35,641 | ) |
Futures | | | 20,273 | |
Translation of assets and liabilities in foreign currencies | | | (137,954 | ) |
| | | | |
Net unrealized appreciation | | | 597,929 | |
| | | | |
Net realized and unrealized gain | | | 1,712,894 | |
| | | | |
Net increase in net assets resulting from operations | | $ | 1,644,490 | |
| | | | |
| | | | |
| | 22 | | The accompanying notes are an integral part of the financial statements |
| | |
| | Rydex | SGI Equity Fund |
| Statement of Changes in Net Assets | | Alpha Opportunity Fund |
| | | | | | | | |
| | | Six Months Ended
March 31, 2010
(unaudited) | | | Year Ended
September 30, 2009 | |
Increase (decrease) in net assets from operations: | | | | | | | | |
Net investment loss | | $ | (68,404 | ) | | $ | (123,718 | ) |
Net realized gain (loss) during the period on investments and foreign currency transactions | | | 1,114,965 | | | | (10,496,580 | ) |
Net unrealized appreciation during the period on investments and translation of assets and liabilities in foreign currencies | | | 597,929 | | | | 3,498,389 | |
| | | | | | | | |
Net increase (decrease) in net assets resulting from operations | | | 1,644,490 | | | | (7,121,909 | ) |
| | | | | | | | |
Capital share transactions: | | | | | | | | |
Proceeds from sale of shares | | | | | | | | |
Class A | | | 167,029 | | | | 1,524,278 | |
Class B | | | 129 | | | | 4,268 | |
Class C | | | 832 | | | | 7,933 | |
Institutional Class | | | 515 | | | | 4,980,476 | |
Cost of shares redeemed | | | | | | | | |
Class A | | | (1,284,145 | ) | | | (16,913,028 | ) |
Class B | | | (383,693 | ) | | | (2,762,142 | ) |
Class C | | | (575,045 | ) | | | (2,096,985 | ) |
Institutional Class | | | (635,582 | ) | | | (3,025,562 | ) |
| | | | | | | | |
Net decrease from capital share transactions | | | (2,709,960 | ) | | | (18,280,762 | ) |
| | | | | | | | |
Net decrease in net assets | | | (1,065,470 | ) | | | (25,402,671 | ) |
| | | | | | | | |
Net assets: | | | | | | | | |
Beginning of period | | | 15,537,498 | | | | 40,940,169 | |
| | | | | | | | |
End of period | | $ | 14,472,028 | | | $ | 15,537,498 | |
| | | | | | | | |
Accumulated net investment loss at end of period | | $ | (97,831 | ) | | $ | (29,427 | ) |
| | | | | | | | |
Capital share activity: | | | | | | | | |
Shares sold | | | | | | | | |
Class A | | | 18,435 | | | | 208,127 | |
Class B | | | — | | | | 292 | |
Class C | | | 92 | | | | 796 | |
Institutional Class | | | 41 | | | | 502,702 | |
Shares redeemed | | | | | | | | |
Class A | | | (145,068 | ) | | | (2,335,782 | ) |
Class B | | | (45,851 | ) | | | (404,666 | ) |
Class C | | | (68,917 | ) | | | (308,317 | ) |
Institutional Class | | | (52,690 | ) | | | (318,958 | ) |
| | | | |
| | 23 | | The accompanying notes are an integral part of the financial statements |
| | |
| Financial Highlights | | Rydex | SGI Equity Fund |
| Selected data for each share of capital stock outstanding throughout each period | | Alpha Opportunity Fund |
| | | | | | | | | | | | | | | | | | | | | | | | |
Class A | | Six Months
Ended March 31,
2010a | | | 2009 | | | 2008b | | | 2007 | | | 2006 | | | Year Ended
September 30,
2005 | |
Per Share Data | | | | | | | | | | | | | | | | | | | | | | | | |
Net asset value, beginning of period | | $ | 8.56 | | | $ | 9.37 | | | $ | 13.94 | | | $ | 12.23 | | | $ | 12.37 | | | $ | 11.79 | |
| | | | | | | | | | | | | | | | | | | | | | | | |
Income (loss) from investment operations: | | | | | | | | | | | | | | | | | | | | | | | | |
Net investment income (loss) c | | | (0.03 | ) | | | (0.04 | ) | | | (0.16 | ) | | | (0.01 | ) | | | (0.06 | ) | | | (0.10 | ) |
Net gain (loss) on securities (realized and unrealized) | | | 1.06 | | | | (0.77 | ) | | | (1.68 | ) | | | 2.99 | | | | 0.93 | | | | 1.50 | |
| | | | | | | | | | | | | | | | | | | | | | | | |
Total from investment operations | | | 1.03 | | | | (0.81 | ) | | | (1.84 | ) | | | 2.98 | | | | 0.87 | | | | 1.40 | |
| | | | | | | | | | | | | | | | | | | | | | | | |
Less distributions: | | | | | | | | | | | | | | | | | | | | | | | | |
Distributions from realized gains | | | — | | | | — | | | | (2.57 | ) | | | (1.27 | ) | | | (1.01 | ) | | | (0.82 | ) |
Return of capital | | | — | | | | — | | | | (0.16 | ) | | | — | | | | — | | | | — | |
| | | | | | | | | | | | | | | | | | | | | | | | |
Total distributions | | | — | | | | — | | | | (2.73 | ) | | | (1.27 | ) | | | (1.01 | ) | | | (0.82 | ) |
| | | | | | | | | | | | | | | | | | | | | | | | |
Net asset value, end of period | | $ | 9.59 | | | $ | 8.56 | | | $ | 9.37 | | | $ | 13.94 | | | $ | 12.23 | | | $ | 12.37 | |
| | | | | | | | | | | | | | | | | | | | | | | | |
Total Return d | | | 12.03 | % | | | (8.55 | )% | | | (15.99 | )% | | | 26.10 | % | | | 7.39 | % | | | 12.26 | % |
| | | | | | | | | | | | | | | | | | | | | | | | |
Ratios/Supplemental Data | | | | | | | | | | | | | | | | | | | | | | | | |
Net assets, end of period (in thousands) | | $ | 9,721 | | | $ | 9,752 | | | $ | 30,615 | | | $ | 25,072 | | | $ | 20,595 | | | $ | 14,622 | |
| | | | | | | | | | | | | | | | | | | | | | | | |
Ratios to average net assets: | | | | | | | | | | | | | | | | | | | | | | | | |
Net investment income (loss) | | | (0.71 | )% | | | (0.52 | )% | | | (1.44 | )% | | | (0.08 | )% | | | (0.50 | )% | | | (0.83 | )% |
Total expenses e | | | 3.58 | % | | | 3.84 | % | | | 3.41 | %f | | | 2.88 | % | | | 3.20 | % | | | 2.94 | % |
Net expenses g | | | 2.01 | % | | | 1.98 | % | | | 3.16 | %h | | | 2.68 | % | | | 3.01 | % | | | 2.86 | % |
Net expenses prior to custodian earning credits and net of expense waivers | | | 2.01 | % | | | 2.01 | % | | | 3.32 | %i | | | 2.88 | % | | | 3.10 | % | | | 2.86 | % |
Net expenses prior to performance fee adjustment | | | 2.01 | % | | | 1.98 | % | | | 2.75 | %j | | | 2.77 | % | | | 2.82 | % | | | 2.78 | % |
| | | | | | | | | | | | | | | | | | | | | | | | |
Portfolio turnover rate | | | 507 | % | | | 422 | % | | | 1,248 | % | | | 1,697 | % | | | 1,302 | % | | | 1,502 | % |
| | | | | | |
Class B | | Six Months
Ended March 31,
2010a | | | 2009 | | | 2008b | | | 2007 | | | 2006 | | | Year Ended
September 30,
2005 | |
Per Share Data | | | | | | | | | | | | | | | | | | | | | | | | |
Net asset value, beginning of period | | $ | 8.04 | | | $ | 8.87 | | | $ | 13.42 | | | $ | 11.90 | | | $ | 12.15 | | | $ | 11.68 | |
| | | | | | | | | | | | | | | | | | | | | | | | |
Income (loss) from investment operations: | | | | | | | | | | | | | | | | | | | | | | | | |
Net investment income (loss) c | | | (0.06 | ) | | | (0.09 | ) | | | (0.23 | ) | | | (0.09 | ) | | | (0.15 | ) | | | (0.18 | ) |
Net gain (loss) on securities (realized and unrealized) | | | 0.98 | | | | (0.74 | ) | | | (1.59 | ) | | | 2.88 | | | | 0.91 | | | | 1.47 | |
| | | | | | | | | | | | | | | | | | | | | | | | |
Total from investment operations | | | 0.92 | | | | (0.83 | ) | | | (1.82 | ) | | | 2.79 | | | | 0.76 | | | | 1.29 | |
| | | | | | | | | | | | | | | | | | | | | | | | |
Less distributions: | | | | | | | | | | | | | | | | | | | | | | | | |
Distributions from realized gains | | | — | | | | — | | | | (2.57 | ) | | | (1.27 | ) | | | (1.01 | ) | | | (0.82 | ) |
Return of capital | | | — | | | | — | | | | (0.16 | ) | | | — | | | | — | | | | — | |
| | | | | | | | | | | | | | | | | | | | | | | | |
Total distributions | | | — | | | | — | | | | (2.73 | ) | | | (1.27 | ) | | | (1.01 | ) | | | (0.82 | ) |
| | | | | | | | | | | | | | | | | | | | | | | | |
Net asset value, end of period | | $ | 8.96 | | | $ | 8.04 | | | $ | 8.87 | | | $ | 13.42 | | | $ | 11.90 | | | $ | 12.15 | |
| | | | | | | | | | | | | | | | | | | | | | | | |
Total Return d | | | 11.44 | % | | | (9.15 | )% | | | (16.66 | )% | | | 25.14 | % | | | 6.56 | % | | | 11.39 | % |
| | | | | | | | | | | | | | | | | | | | | | | | |
Ratios/Supplemental Data | | | | | | | | | | | | | | | | | | | | | | | | |
Net assets, end of period (in thousands) | | $ | 1,412 | | | $ | 1,635 | | | $ | 5,391 | | | $ | 3,154 | | | $ | 4,846 | | | $ | 4,106 | |
Ratios to average net assets: | | | | | | | | | | | | | | | | | | | | | | | | |
Net investment income (loss) | | | (1.39 | )% | | | (1.27 | )% | | | (2.18 | )% | | | (0.77 | )% | | | (1.24 | )% | | | (1.60 | )% |
Total expenses e | | | 4.33 | % | | | 4.59 | % | | | 4.16 | %f | | | 3.59 | % | | | 3.95 | % | | | 3.69 | % |
Net expenses g | | | 2.67 | % | | | 2.73 | % | | | 3.89 | %h | | | 3.39 | % | | | 3.76 | % | | | 3.61 | % |
Net expenses prior to custodian earning credits and net of expense waivers | | | 2.67 | % | | | 2.76 | % | | | 4.04 | %i | | | 3.59 | % | | | 3.85 | % | | | 3.61 | % |
Net expenses prior to performance fee adjustment | | | 2.67 | % | | | 2.73 | % | | | 3.49 | %j | | | 3.51 | % | | | 3.57 | % | | | 3.53 | % |
| | | | | | | | | | | | | | | | | | | | | | | | |
Portfolio turnover rate | | | 507 | % | | | 422 | % | | | 1,248 | % | | | 1,697 | % | | | 1,302 | % | | | 1,502 | % |
| | | | |
| | 24 | | The accompanying notes are an integral part of the financial statements |
| | |
| Financial Highlights | | Rydex | SGI Equity Fund |
| Selected data for each share of capital stock outstanding throughout each period | | Alpha Opportunity Fund |
| | | | | | | | | | | | | | | | | | | | | | | | |
Class C | | Six Months
Ended March 31,
2010a | | | 2009 | | | 2008b | | | 2007 | | | 2006 | | | Year Ended
September 30,
2005 | |
Per Share Data | | | | | | | | | | | | | | | | | | | | | | | | |
Net asset value, beginning of period | | $ | 8.02 | | | $ | 8.87 | | | $ | 13.43 | | | $ | 11.90 | | | $ | 12.15 | | | $ | 11.68 | |
| | | | | | | | | | | | | | | | | | | | | | | | |
Income (loss) from investment operations: | | | | | | | | | | | | | | | | | | | | | | | | |
Net investment income (loss) c | | | (0.06 | ) | | | (0.09 | ) | | | (0.23 | ) | | | (0.10 | ) | | | (0.15 | ) | | | (0.18 | ) |
Net gain (loss) on securities (realized and unrealized) | | | 1.00 | | | | (0.76 | ) | | | (1.60 | ) | | | 2.90 | | | | 0.91 | | | | 1.47 | |
| | | | | | | | | | | | | | | | | | | | | | | | |
Total from investment operations | | | 0.94 | | | | (0.85 | ) | | | (1.83 | ) | | | 2.80 | | | | 0.76 | | | | 1.29 | |
| | | | | | | | | | | | | | | | | | | | | | | | |
Less distributions: | | | | | | | | | | | | | | | | | | | | | | | | |
Distributions from realized gains | | | — | | | | — | | | | (2.57 | ) | | | (1.27 | ) | | | (1.01 | ) | | | (0.82 | ) |
Return of capital | | | — | | | | — | | | | (0.16 | ) | | | — | | | | — | | | | — | |
| | | | | | | | | | | | | | | | | | | | | | | | |
Total distributions | | | — | | | | — | | | | (2.73 | ) | | | (1.27 | ) | | | (1.01 | ) | | | (0.82 | ) |
| | | | | | | | | | | | | | | | | | | | | | | | |
Net asset value, end of period | | $ | 8.96 | | | $ | 8.02 | | | $ | 8.87 | | | $ | 13.43 | | | $ | 11.90 | | | $ | 12.15 | |
| | | | | | | | | | | | | | | | | | | | | | | | |
Total Return d | | | 11.72 | % | | | (9.48 | )% | | | (16.63 | )% | | | 25.24 | % | | | 6.56 | % | | | 11.39 | % |
| | | | | | | | | | | | | | | | | | | | | | | | |
Ratios/Supplemental Data | | | | | | | | | | | | | | | | | | | | | | | | |
Net assets, end of period (in thousands) | | $ | 1,613 | | | $ | 1,996 | | | $ | 4,935 | | | $ | 4,216 | | | $ | 5,576 | | | $ | 7,813 | |
| | | | | | | | | | | | | | | | | | | | | | | | |
Ratios to average net assets: | | | | | | | | | | | | | | | | | | | | | | | | |
Net investment income (loss) | | | (1.39 | )% | | | (1.26 | )% | | | (2.21 | )% | | | (0.77 | )% | | | (1.18 | )% | | | (1.58 | )% |
Total expenses e | | | 4.34 | % | | | 4.69 | % | | | 4.16 | %f | | | 3.60 | % | | | 3.95 | % | | | 3.68 | % |
Net expenses g | | | 2.67 | % | | | 2.72 | % | | | 3.93 | %h | | | 3.40 | % | | | 3.75 | % | | | 3.61 | % |
Net expenses prior to custodian earning credits and net of expense waivers | | | 2.67 | % | | | 2.76 | % | | | 4.09 | %i | | | 3.60 | % | | | 3.83 | % | | | 3.61 | % |
Net expenses prior to performance fee adjustment | | | 2.67 | % | | | 2.72 | % | | | 3.51 | %j | | | 3.51 | % | | | 3.57 | % | | | 3.53 | % |
| | | | | | | | | | | | | | | | | | | | | | | | |
Portfolio turnover rate | | | 507 | % | | | 422 | % | | | 1,248 | % | | | 1,697 | % | | | 1,302 | % | | | 1,502 | % |
| | | | | | | | |
Institutional Class | | Six Months
Ended March 31,
2010a | | | Year Ended
September 30,
2009k | |
Per Share Data | | | | | | | | |
Net asset value, beginning of period | | $ | 11.73 | | | $ | 10.00 | |
| | | | | | | | |
Income (loss) from investment operations: | | | | | | | | |
Net investment income (loss) c | | | (0.02 | ) | | | (0.01 | ) |
Net loss on securities (realized and unrealized) | | | 1.46 | | | | 1.74 | |
| | | | | | | | |
Total from investment operations | | | 1.44 | | | | 1.73 | |
| | | | | | | | |
Net asset value, end of period | | $ | 13.17 | | | $ | 11.73 | |
| | | | | | | | |
Total Return | | | 12.28 | % | | | 17.30 | % |
| | | | | | | | |
Ratios/Supplemental Data | | | | | | | | |
Net assets, end of period (in thousands) | | $ | 1,726 | | | $ | 2,155 | |
| | | | | | | | |
Ratios to average net assets: | | | | | | | | |
Net investment income (loss) | | | (0.37 | )% | | | (0.07 | )% |
Total expenses e | | | 3.33 | % | | | 3.94 | % |
Net expenses g | | | 1.65 | % | | | 1.70 | % |
Net expenses prior to custodian earning credits and net of expense waivers | | | 1.65 | % | | | 1.73 | % |
Net expenses prior to performance fee adjustment | | | 1.65 | % | | | N/A | |
| | | | | | | | |
Portfolio turnover rate | | | 507 | % | | | 422 | % |
| | | | |
| | 25 | | The accompanying notes are an integral part of the financial statements |
| | |
| Financial Highlights | | Rydex | SGI Equity Fund |
| Selected data for each share of capital stock outstanding throughout each period | | Alpha Opportunity Fund |
| a | Unaudited figures for the six months ended March 31, 2010. Percentage amounts for the period, except total return, have been annualized. |
| b | Security Global Investors, LLC (SGI) became the sub-adviser of 37.5% of the assets of the Alpha Opportunity Fund effective August 18, 2008. Also effective August 18, 2008, Mainstream Investment Advisers, LLC (Mainstream) sub-advises 37.5% of the assets and Security Investors, LLC (SI) manages 25% of the assets. Prior to August 18, 2008, SI paid Mainstream sub-advisory fees for 60% of the assets. SI managed the remaining 40% of the assets. |
| c | Net investment income (loss) was computed using average shares outstanding throughout the period. |
| d | Total return information does not reflect deduction of any sales charges imposed at the time of purchase for Class A shares or upon redemption for Class B and C shares. |
| e | Total expense information reflects expense ratios absent expense reductions by the Investment Manager and custodian earnings credits, as applicable. |
| f | The Fund has restated its financial highlights in order to properly present the Fund’ total expense ratios. The effect of this restatement was to increase the ratios of total expenses to average net assets by 0.45% for Class A, 1.03% for Class B and 0.14% for Class C. |
| g | Net expense information reflects the expense ratios after voluntary expense waivers, reimbursements and custodian earnings credits, as applicable. |
| h | The Fund has restated this ratio in order to properly present the Fund’ net expense ratios. The effect of this restatement was to increase the ratios of net expenses to average net assets by 0.41% for Class A, 0.96% for Class B and 0.13% for Class C. |
| i | The Fund has restated this ratio in order to properly present the Fund’ net expense ratios prior to custodian earning credits and net of expense waivers. The effect of this restatement was to increase the ratios of net expenses prior to custodian earning credits and net of expense waivers to average net assets by 0.44% for Class A, 1.00% for Class B and 0.14% for Class C. |
| j | The Fund has restated this ratio in order to properly present the Fund’ net expense ratios prior to performance fee adjustment. The effect of this restatement was to increase the ratios of net expenses prior to performance fee adjustment to average net assets by 0.36% for Class A, 0.87% for Class B and 0.11% for Class C. |
| k | The Institutional Class of Alpha Opportunity Fund was initially capitalized on November 7, 2008 with a net asset value of $10 per share. Percentage amounts for the period, except total return, have been annualized. |
| | | | |
| | 26 | | The accompanying notes are an integral part of the financial statements |
| | |
| | Rydex | SGI Equity Fund |
| Performance Summary | | Large cap core Fund |
| March 31, 2010 | | (unaudited) |
PERFORMANCE
$10,000 Over Ten Years
This chart assumes a $10,000 investment in Class A shares of Large Cap Core Fund on March 31, 2000, reflects deduction of the 5.75% sales load and assumes all dividends reinvested. The chart does not reflect the deduction of taxes that a shareholder would pay on distributions or the redemption of fund shares. The S&P 500 Index is a capitalization weighted index composed of 500 selected common stocks that represent the broad domestic economy and is a widely recognized unmanaged index on market performance.
Average Annual Returns
| | | | | | | | | |
Periods Ended 3-31-10 | | l Year | | | 5 Years | | | 10 Years | |
A Shares | | 51.16 | % | | (0.38 | )% | | (3.22 | )% |
A Shares with sales charge | | 42.63 | % | | (1.56 | )% | | (3.79 | )% |
B Shares | | 50.20 | % | | (1.09 | )% | | (3.86 | )% |
B Shares with CDSC | | 45.20 | % | | (1.37 | )% | | (3.86 | )% |
C Shares | | 50.56 | % | | (1.06 | )% | | (3.99 | )% |
C Shares with CDSC | | 49.56 | % | | (1.06 | )% | | (3.99 | )% |
The performance data above represents past performance that is not predictive of future results. The investment return and principal value of an investment in the Fund will fluctuate so that an investor’s shares, when redeemed, may be worth more or less than their original cost. The figures above do not reflect deduction of the maximum front-end sales charge of 5.75% for Class A shares or the contingent deferred sales charge of 5% for Class B shares and 1% for Class C shares, as applicable, except where noted. The figures do not reflect the deduction of taxes that a shareholder would pay on distributions or redemption of shares. Such figures would be lower if the maximum sales charge and any applicable taxes were deducted.
Portfolio Composition by Sector as of 3-31-10
| | | |
Consumer Discretionary | | 13.10 | % |
Consumer Staples | | 9.95 | |
Energy | | 9.99 | |
Financials | | 9.44 | |
Health Care | | 10.94 | |
Industrials | | 16.47 | |
Information Technology | | 20.80 | |
Materials | | 2.65 | |
Telecommunication Services | | 0.53 | |
Utilities | | 1.88 | |
Exchange Traded Funds | | 1.70 | |
Cash & Other Assets, Less Liabilities | | 2.55 | |
| | | |
Total Net Assets | | 100.00 | % |
| | | |
| | | | |
| | 27 | | The accompanying notes are an integral part of the financial statements |
| | |
| Schedule of Investments | | Rydex | SGI Equity Fund |
| March 31, 2010 (unaudited) | | Large Cap Core Fund |
| | | | | |
| | | Shares | | Value |
COMMON STOCKS - 97.5% | | | | | |
Aerospace & Defense - 3.0% | | | | | |
Precision Castparts Corporation | | 28,390 | | $ | 3,597,297 |
United Technologies Corporation | | 33,600 | | | 2,473,296 |
| | | | | |
| | | | | 6,070,593 |
| | | | | |
Air Freight & Logistics - 1.5% | | | | | |
FedEx Corporation | | 33,600 | | | 3,138,240 |
| | | | | |
Apparel Retail - 1.6% | | | | | |
TJX Companies, Inc. | | 78,780 | | | 3,349,726 |
| | | | | |
Application Software - 0.5% | | | | | |
Synopsys, Inc. * | | 44,500 | | | 995,465 |
| | | | | |
Asset Management & Custody Banks - 0.8% | | | | | |
Bank of New York Mellon Corporation | | 50,000 | | | 1,544,000 |
| | | | | |
Auto Parts & Equipment - 1.7% | | | | | |
Johnson Controls, Inc. | | 103,100 | | | 3,401,269 |
| | | | | |
Biotechnology - 1.6% | | | | | |
Amgen, Inc. * | | 55,250 | | | 3,301,740 |
| | | | | |
Building Products - 1.4% | | | | | |
USG Corporation * | | 167,100 | | | 2,867,436 |
| | | | | |
Coal & Consumable Fuels - 1.1% | | | | | |
Peabody Energy Corporation | | 49,980 | | | 2,284,086 |
| | | | | |
Communications
Equipment - 3.4% | | | | | |
Cisco Systems, Inc. * | | 162,960 | | | 4,241,849 |
Motorola, Inc. * | | 366,215 | | | 2,570,829 |
| | | | | |
| | | | | 6,812,678 |
| | | | | |
Computer Hardware - 5.5% | | | | | |
Apple, Inc. * | | 19,255 | | | 4,523,578 |
Hewlett-Packard Company | | 122,500 | | | 6,510,875 |
| | | | | |
| | | | | 11,034,453 |
| | | | | |
Computer Storage & Peripherals - 2.1% | | | | | |
EMC Corporation * | | 239,570 | | | 4,321,843 |
| | | | | |
Consumer Finance - 0.1% | | | | | |
First Marblehead Corporation * | | 97,760 | | | 277,638 |
| | | | | |
Data Processing & Outsourced Services - 4.0% | | | | | |
Computer Sciences Corporation * | | 13,500 | | | 735,615 |
Visa, Inc. | | 38,200 | | | 3,477,346 |
Western Union Company | | 232,200 | | | 3,938,112 |
| | | | | |
| | | | | 8,151,073 |
| | | | | |
Department Stores - 2.6% | | | | | |
JC Penney Company, Inc. | | 62,900 | | | 2,023,493 |
Kohl’s Corporation * | | 57,740 | | | 3,162,997 |
| | | | | |
| | | | | 5,186,490 |
| | | | | |
Diversified Banks - 2.1% | | | | | |
U.S. Bancorp | | 87,775 | | | 2,271,617 |
Wells Fargo & Company | | 66,764 | | | 2,077,696 |
| | | | | |
| | | | | 4,349,313 |
| | | | | |
Diversified Chemicals - 2.4% | | | | | |
Dow Chemical Company | | 159,130 | | | 4,705,474 |
| | | | | |
| | | | | |
| | | Shares | | Value |
COMMON STOCKS - 97.5% (continued) | | | |
Drug Retail - 1.0% | | | | | |
CVS Caremark Corporation | | 57,600 | | $ | 2,105,856 |
| | | | | |
Electric Utilities - 1.5% | | | | | |
Edison International | | 86,500 | | | 2,955,705 |
| | | | | |
Electrical Components & Equipment - 3.3% | | | | | |
Cooper Industries plc | | 69,280 | | | 3,321,283 |
Emerson Electric Company | | 66,190 | | | 3,332,004 |
| | | | | |
| | | | | 6,653,287 |
| | | | | |
Electronic Manufacturing
Services - 1.2% | | | | | |
Tyco Electronics, Ltd. | | 85,600 | | | 2,352,288 |
| | | | | |
Exchange Traded Funds - 1.7% | | | | | |
iShares Russell 1000 Value Index Fund | | 23,600 | | | 1,441,252 |
iShares S&P 500 Value Index Fund | | 35,800 | | | 2,021,268 |
| | | | | |
| | | | | 3,462,520 |
| | | | | |
Food Distributors - 1.6% | | | | | |
Sysco Corporation | | 109,500 | | | 3,230,250 |
| | | | | |
Health Care Equipment - 3.8% | | | | | |
Covidien plc | | 100,760 | | | 5,066,213 |
Hospira, Inc. * | | 49,500 | | | 2,804,175 |
| | | | | |
| | | | | 7,870,388 |
| | | | | |
Health Care Services - 0.6% | | | | | |
Medco Health Solutions, Inc. * | | 18,200 | | | 1,174,992 |
| | | | | |
Home Improvement Retail - 3.0% | | | | | |
Home Depot, Inc. | | 100,675 | | | 3,256,836 |
Lowe’s Companies, Inc. | | 118,200 | | | 2,865,168 |
| | | | | |
| | | | | 6,122,004 |
| | | | | |
Hotels, Resorts & Cruise
Lines - 1.6% | | | | | |
Carnival Corporation | | 85,550 | | | 3,326,184 |
| | | | | |
Hypermarkets & Super
Centers - 2.4% | | | | | |
Costco Wholesale Corporation | | 42,500 | | | 2,537,675 |
Wal-Mart Stores, Inc. | | 43,600 | | | 2,424,160 |
| | | | | |
| | | | | 4,961,835 |
| | | | | |
Independent Power Producers & Energy Traders - 0.4% | | | | | |
NRG Energy, Inc. * | | 41,500 | | | 867,350 |
| | | | | |
Industrial Conglomerates - 3.2% | | | | | |
3M Company | | 40,810 | | | 3,410,492 |
McDermott International, Inc. * | | 117,100 | | | 3,152,332 |
| | | | | |
| | | | | 6,562,824 |
| | | | | |
Industrial Machinery - 1.0% | | | | | |
Parker Hannifin Corporation | | 31,400 | | | 2,032,836 |
| | | | | |
Insurance Brokers - 1.1% | | | | | |
AON Corporation | | 54,400 | | | 2,323,424 |
| | | | | |
Integrated Oil & Gas - 4.7% | | | | | |
Chevron Corporation | | 29,900 | | | 2,267,317 |
ConocoPhillips | | 14,400 | | | 736,848 |
Exxon Mobil Corporation | | 45,700 | | | 3,060,986 |
| | | | |
| | 28 | | The accompanying notes are an integral part of the financial statements |
| | |
| Schedule of Investments | | Rydex | SGI Equity Fund |
March 31, 2010 (unaudited) | | Large Cap Core Fund |
| | | | | |
| | | Shares | | Value |
COMMON STOCKS - 97.5% (continued) |
Integrated Oil & Gas - 4.7% (continued) | | | | | |
Occidental Petroleum Corporation | | 38,940 | | $ | 3,291,988 |
| | | | | |
| | | | | 9,357,139 |
| | | | | |
Integrated Telecommunication Services - 0.5% | | | | | |
Windstream Corporation | | 98,400 | | | 1,071,576 |
| | | | | |
Managed Health Care - 1.2% | | | | | |
Aetna, Inc. | | 68,300 | | | 2,398,013 |
| | | | | |
Movies & Entertainment - 2.6% | | | | | |
Time Warner, Inc. | | 61,700 | | | 1,929,359 |
Walt Disney Company | | 94,100 | | | 3,285,031 |
| | | | | |
| | | | | 5,214,390 |
| | | | | |
Oil & Gas Equipment &
Services - 2.4% | | | | | |
Halliburton Company | | 74,300 | | | 2,238,659 |
Schlumberger, Ltd. | | 42,800 | | | 2,716,088 |
| | | | | |
| | | | | 4,954,747 |
| | | | | |
Oil & Gas Exploration & Production - 0.7% | | | | | |
Chesapeake Energy Corporation | | 64,400 | | | 1,522,416 |
| | | | | |
Oil & Gas Storage & Transportation - 1.1% | | | | | |
Williams Companies, Inc. | | 93,900 | | | 2,169,090 |
| | | | | |
Other Diversified Financial Services - 2.5% | | | | | |
JPMorgan Chase & Company | | 110,635 | | | 4,950,916 |
| | | | | |
Packaged Foods & Meats - 1.6% | | | | | |
Kraft Foods, Inc. | | 105,250 | | | 3,182,760 |
| | | | | |
Paper Packaging - 0.3% | | | | | |
Bemis Company, Inc. | | 24,000 | | | 689,280 |
| | | | | |
Pharmaceuticals - 3.7% | | | | | |
Merck & Company, Inc. | | 17,762 | | | 663,411 |
Pfizer, Inc. | | 175,590 | | | 3,011,369 |
Teva Pharmaceutical Industries, Ltd. ADR | | 60,165 | | | 3,795,207 |
| | | | | |
| | | | | 7,469,987 |
| | | | | |
Property & Casualty
Insurance - 1.4% | | | | | |
Berkshire Hathaway, Inc.* | | 23 | | | 2,801,400 |
| | | | | |
Railroads - 1.4% |
Union Pacific Corporation | | 38,000 | | | 2,785,400 |
| | | | | |
Regional Banks - 1.4% |
BB&T Corporation | | 34,600 | | | 1,120,694 |
Fifth Third Bancorp | | 41,000 | | | 557,190 |
Regions Financial Corporation | | 159,600 | | | 1,252,860 |
| | | | | |
| | | | | 2,930,744 |
| | | | | |
Research & Consulting
Services - 1.7% | | | | | |
Equifax, Inc. | | 93,700 | | | 3,354,460 |
| | | | | |
| | | | | |
| | | Shares | | Value |
COMMON STOCKS - 97.5% (continued) |
Semiconductors - 2.1% |
Intel Corporation | | 192,190 | | $ | 4,278,149 |
| | | | | |
Soft Drinks - 2.2% |
PepsiCo, Inc. | | 66,870 | | | 4,424,119 |
| | | | | |
Systems Software - 2.1% |
Oracle Corporation | | 167,400 | | | 4,300,506 |
| | | | | |
Tobacco - 1.1% |
Altria Group, Inc. | | 34,500 | | | 707,940 |
Philip Morris International, Inc. | | 30,600 | | | 1,596,096 |
| | | | | |
| | | | | 2,304,036 |
| | | | | |
TOTAL COMMON STOCKS | | | | | |
(cost $179,035,600) | | | | $ | 197,952,388 |
| | | | | |
Total Investments - 97.5% 1 | | | | | |
(cost $179,035,600) | | | | $ | 197,952,388 |
Cash & Other Assets, Less
Liabilities - 2.5% | | | 5,178,392 |
| | | | | |
Total Net Assets - 100.0% | | | | $ | 203,130,780 |
| | | | | |
For federal income tax purposes the identified cost of investments owned at March 31, 2010 was $179,860,746.
ADR American Depositary Receipt
plc Public Limited Company
| * | Non-income producing security |
| 1 | Unless otherwise indicated, the values of the securities of the Portfolio are determined based on Level 1 inputs. |
| | | | |
| | 29 | | The accompanying notes are an integral part of the financial statements |
| | |
| | Rydex | SGI Equity Fund |
| | Large Cap Core Fund (unaudited) |
Statement of Assets & Liabilities
March 31, 2010
| | | | |
Assets: | | | | |
Investments, at value * | | $ | 197,952,388 | |
Cash | | | 3,814,655 | |
Receivables: | | | | |
Fund shares sold | | | 240 | |
Securities sold | | | 1,513,476 | |
Dividends | | | 250,329 | |
Prepaid expenses | | | 26,456 | |
| | | | |
Total assets | | | 203,557,544 | |
| | | | |
Liabilities: | | | | |
Payable for: | | | | |
Fund shares redeemed | | | 100,743 | |
Management fees | | | 129,189 | |
Custodian fees | | | 818 | |
Transfer agent/maintenance fees | | | 24,673 | |
Administration fees | | | 16,524 | |
Professional fees | | | 23,614 | |
12b-l distribution plan fees | | | 50,383 | |
Directors’ fees | | | 1,971 | |
Other | | | 78,849 | |
| | | | |
Total liabilities | | | 426,764 | |
| | | | |
Net assets | | $ | 203,130,780 | |
| | | | |
Net assets consist of: | | | | |
Paid in capital | | $ | 220,527,334 | |
Accumulated net investment loss | | | (23,469 | ) |
Accumulated net realized loss on sale of investments | | | (36,289,873 | ) |
Net unrealized appreciation in value of investments | | | 18,916,788 | |
| | | | |
Net assets | | $ | 203,130,780 | |
| | | | |
Class A: | | | | |
Capital shares outstanding
(unlimited number of shares authorized) | | | 42,152,575 | |
Net assets | | $ | 191,839,619 | |
Net asset value and redemption price per share | | $ | 4.55 | |
| | | | |
Maximum offering price per share (net asset value divided by 94.25%) | | $ | 4.83 | |
| | | | |
Class B: | | | | |
Capital shares outstanding
(unlimited number of shares authorized) | | | 2,391,527 | |
Net assets | | $ | 8,946,584 | |
Net asset value, offering and redemption price per share (excluding any applicable contingent deferred sales charge) | | $ | 3.74 | |
| | | | |
Class C: | | | | |
Capital shares outstanding
(unlimited number of shares authorized) | | | 579,319 | |
Net assets | | $ | 2,344,577 | |
Net asset value, offering and redemption price per share (excluding any applicable contingent deferred sales charge) | | $ | 4.05 | |
| | | | |
* Investments, at cost | | $ | 179,035,600 | |
Statement of Operations
For the Six Months Ended March 31, 2010
| | | | |
Investment Income: | | | | |
Dividends (net of foreign withholding tax of $426) | | $ | 1,384, 474 | |
Interest | | | 974 | |
| | | | |
Total investment income | | | 1,385,448 | |
| | | | |
Expenses: | | | | |
Management fees | | | 726,025 | |
Transfer agent/maintenance fees | | | 227,882 | |
Administration fees | | | 92 186 | |
Custodian fees | | | 3,807 | |
Directors’ fees | | | 9,363 | |
Professional fees | | | 19,559 | |
Reports to shareholders | | | 22,175 | |
Registration fees | | | 18,815 | |
Other expenses | | | 5,915 | |
12b-l distribution fees - Class A | | | 228,281 | |
12b-l distribution fees - Class B | | | 43,505 | |
12b-l distribution fees - Class C | | | 11,404 | |
| | | | |
Total expenses | | | 1,408,917 | |
| | | | |
Net investment loss | | | (23,469 | ) |
| | | | |
Net Realized and Unrealized Gain (Loss): | | | | |
Net realized gain (loss) during the period on: | | | | |
Investments | | | 5,054,437 | |
| | | | |
Net realized gain | | | 5,054,437 | |
| | | | |
Net unrealized appreciation (depreciation) during the period on: | | | | |
Investments | | | 17,686,678 | |
| | | | |
Net unrealized appreciation | | | 17,686,678 | |
| | | | |
Net realized and unrealized gain | | | 22,741,115 | |
| | | | |
Net increase in net assets resulting from operations | | $ | 22,717,646 | |
| | | | |
| | | | |
| | 30 | | The accompanying notes are an integral part of the financial statements |
| | |
| | Rydex | SGI Equity Fund |
| Statement of Changes in Net Assets | | Large Cap Core Fund |
| | | | | | | | |
| | | Six Months Ended
March 31, 2010
(unaudited) | | | Year Ended
September 30, 2009 | |
Increase (decrease) in net assets from operations: | | | | | | | | |
Net investment income (loss) | | $ | (23,469 | ) | | $ | 392,434 | |
Net realized gain (loss) during the period on investments | | | 5 054 437 | | | | (39,927,753 | ) |
Net unrealized appreciation during the period on investments | | | 17,686,678 | | | | 25,674,075 | |
| | | | | | | | |
Net increase (decrease) in net assets resulting from operations | | | 22,717,646 | | | | (13,861,244 | ) |
| | | | | | | | |
Distributions to shareholders from: | | | | | | | | |
Net investment income | | | | | | | | |
Class A | | | — | | | | (423,903 | ) |
Return of capital | | | | | | | | |
Class A | | | — | | | | (565,163 | ) |
Class B | | | — | | | | (33,423 | ) |
Class C | | | — | | | | (9,223 | ) |
| | | | | | | | |
Total distributions to shareholders | | | — | | | | (1,031,712 | ) |
| | | | | | | | |
Capital share transactions: | | | | | | | | |
Proceeds from sale of shares | | | | | | | | |
Class A | | | 9,174,592 | | | | 5,175,096 | |
Class B | | | 2,263,146 | | | | 913,069 | |
Class C | | | 152,388 | | | | 584,733 | |
Distributions reinvested | | | | | | | | |
Class A | | | — | | | | 906,902 | |
Class B | | | — | | | | 32,949 | |
Class C | | | — | | | | 9,093 | |
Cost of shares redeemed | | | | | | | | |
Class A | | | (14,196,509 | ) | | | (22,903,493 | ) |
Class B | | | (2,100,853 | ) | | | (2,826,140 | ) |
Class C | | | (311,715 | ) | | | (1,012,475 | ) |
| | | | | | | | |
Net decrease from capital share transactions | | | (5,018,951 | ) | | | (19,120,266 | ) |
| | | | | | | | |
Net increase (decrease) in net assets | | | 17,698,695 | | | | (34,013,222 | ) |
| | | | | | | | |
Net assets: | | | | | | | | |
Beginning of period | | | 185,432,085 | | | | 219,445,307 | |
| | | | | | | | |
End of period | | $ | 203,130,780 | | | $ | 185,432,085 | |
| | | | | | | | |
Accumulated net investment loss at end of period | | $ | (23,469 | ) | | $ | — | |
| | | | | | | | |
Capital share activity: | | | | | | | | |
Shares sold | | | | | | | | |
Class A | | | 2,166,785 | | | | 1,556,038 | |
Class B | | | 652,161 | | | | 331,911 | |
Class C | | | 40,514 | | | | 194,316 | |
Shares reinvested | | | | | | | | |
Class A | | | — | | | | 279,047 | |
Class B | | | — | | | | 12,204 | |
Class C | | | — | | | | 3,114 | |
Shares redeemed | | | | | | | | |
Class A | | | (3,302,238 | ) | | | (6,925,030 | ) |
Class B | | | (588,842 | ) | | | (1,023,385 | ) |
Class C | | | (81,637 | ) | | | (341,567 | ) |
| | | | |
| | 31 | | The accompanying notes are an integral part of the financial statements |
| | |
| Financial Highlights | | Rydex | SGI Equity Fund |
| Selected data for each share of capital stock outstanding throughout each period | | Large Cap Core Fund |
| | | | | | | | | | | | | | | | | | | | | | | | |
Class A | | Six Months
Ended March 31,
2010a,g | | | 2009 | | | 2008 | | | 2007 | | | 2006 | | | Year Ended
September 30,
2005 | |
Per Share Data | | | | | | | | | | | | | | | | | | | | | | | | |
Net asset value, beginning of period | | $ | 4.05 | | | $ | 4.26 | | | $ | 6.84 | | | $ | 6.85 | | | $ | 6.58 | | | $ | 6.50 | |
| | | | | | | | | | | | | | | | | | | | | | | | |
Income (loss) from investment operations: | | | | | | | | | | | | | | | | | | | | | | | | |
Net investment income (loss) b | | | — | | | | 0.01 | | | | 0.01 | | | | — | | | | (0.01 | ) | | | 0.04 | |
Net gain (loss) on securities (realized and unrealized) | | | 0.50 | | | | (0.20 | ) | | | (1.61 | ) | | | 0.69 | | | | 0.52 | | | | 0.49 | |
| | | | | | | | | | | | | | | | | | | | | | | | |
Total from investment operations | | | 0.50 | | | | (0.19 | ) | | | (1.60 | ) | | | 0.69 | | | | 0.51 | | | | 0.53 | |
| | | | | | | | | | | | | | | | | | | | | | | | |
Less distributions: | | | | | | | | | | | | | | | | | | | | | | | | |
Dividends from net investment income | | | — | | | | (0.01 | ) | | | — | | | | — | | | | (0.04 | ) | | | — | |
Distributions from realized gains | | | — | | | | (0.01 | ) | | | (0.97 | ) | | | (0.70 | ) | | | (0.20 | ) | | | (0.45 | ) |
Return of capital | | | — | | | | — | | | | (0.01 | ) | | | — | | | | — | | | | — | |
| | | | | | | | | | | | | | | | | | | | | | | | |
Total distributions | | | — | | | | (0.02 | ) | | | (0.98 | ) | | | (0.70 | ) | | | (0.24 | ) | | | (0.45 | ) |
| | | | | | | | | | | | | | | | | | | | | | | | |
Net asset value, end of period | | $ | 4.55 | | | $ | 4.05 | | | $ | 4.26 | | | $ | 6.84 | | | $ | 6.85 | | | $ | 6.58 | |
| | | | | | | | | | | | | | | | | | | | | | | | |
Total Return c | | | 12.35 | % | | | (4.32 | )% | | | (26.12 | )% | | | 10.33 | % | | | 7.88 | % | | | 8.20 | % |
| | | | | | | | | | | | | | | | | | | | | | | | |
Ratios/Supplemental Data | | | | | | | | | | | | | | | | | | | | | | | | |
Net assets, end of period (in thousands) | | $ | 191,840 | | | $ | 175,404 | | | $ | 205,908 | | | $ | 322,850 | | | $ | 371,006 | | | $ | 375,280 | |
| | | | | | | | | | | | | | | | | | | | | | | | |
Ratios to average net assets: | | | | | | | | | | | | | | | | | | | | | | | | |
Net investment income (loss) | | | 0.02 | % | | | 0.28 | % | | | 0.15 | % | | | 0.02 | % | | | (0.08 | )% | | | 0.57 | % |
Total expenses d | | | 1.41 | % | | | 1.49 | % | | | 1.36 | % | | | 1.34 | % | | | 1.34 | % | | | 1.30 | % |
Net expenses e | | | 1.41 | % | | | 1.49 | % | | | 1.36 | % | | | 1.34 | % | | | 1.34 | % | | | 1.30 | % |
Net expenses prior to custodian earning credits and net of expense waivers | | | 1.41 | % | | | 1.49 | % | | | 1.36 | % | | | 1.34 | % | | | 1.34 | % | | | 1.30 | % |
| | | | | | | | | | | | | | | | | | | | | | | | |
Portfolio turnover rate | | | 103 | % | | | 69 | % | | | 111 | %f | | | 20 | % | | | 34 | % | | | 32 | % |
| | | | | | | | | | | | | | | | | | | | | | | | |
Class B | | Six Months
Ended March 31,
2010a,g | | | 2009 | | | 2008 | | | 2007 | | | 2006 | | | Year Ended
September 30,
2005 | |
Per Share Data | | | | | | | | | | | | | | | | | | | | | | | | |
Net asset value, beginning of period | | $ | 3.34 | | | $ | 3.53 | | | $ | 5.89 | | | $ | 6.04 | | | $ | 5.83 | | | $ | 5.85 | |
| | | | | | | | | | | | | | | | | | | | | | | | |
Income (loss) from investment operations: | | | | | | | | | | | | | | | | | | | | | | | | |
Net investment loss b | | | (0.01 | ) | | | (0.01 | ) | | | (0.03 | ) | | | (0.04 | ) | | | (0.05 | ) | | | (0.01 | ) |
Net gain (loss) on securities (realized and unrealized) | | | 0.41 | | | | (0.17 | ) | | | (1.35 | ) | | | 0.59 | | | | 0.46 | | | | 0.44 | |
| | | | | | | | | | | | | | | | | | | | | | | | |
Total from investment operations | | | 0.40 | | | | (0.18 | ) | | | (1.38 | ) | | | 0.55 | | | | 0.41 | | | | 0.43 | |
| | | | | | | | | | | | | | | | | | | | | | | | |
Less distributions: | | | | | | | | | | | | | | | | | | | | | | | | |
Distributions from realized gains | | | — | | | | (0.01 | ) | | | (0.97 | ) | | | (0.70 | ) | | | (0.20 | ) | | | (0.45 | ) |
Return of capital | | | — | | | | — | | | | (0.01 | ) | | | — | | | | — | | | | — | |
| | | | | | | | | | | | | | | | | | | | | | | | |
Total distributions | | | — | | | | (0.01 | ) | | | (0.98 | ) | | | (0.70 | ) | | | (0.20 | ) | | | (0.45 | ) |
| | | | | | | | | | | | | | | | | | | | | | | | |
Net asset value, end of period | | $ | 3.74 | | | $ | 3.34 | | | $ | 3.53 | | | $ | 5.89 | | | $ | 6.04 | | | $ | 5.83 | |
| | | | | | | | | | | | | | | | | | | | | | | | |
Total Return c | | | 11.98 | % | | | (4.96 | )% | | | (26.69 | )% | | | 9.33 | % | | | 7.16 | % | | | 7.35 | % |
| | | | | | | | | | | | | | | | | | | | | | | | |
Ratios/Supplemental Data | | | | | | | | | | | | | | | | | | | | | | | | |
Net assets, end of period (in thousands) | | $ | 8,947 | | | $ | 7,784 | | | $ | 10,621 | | | $ | 19,928 | | | $ | 27,842 | | | $ | 39,962 | |
| | | | | | | | | | | | | | | | | | | | | | | | |
Ratios to average net assets: | | | | | | | | | | | | | | | | | | | | | | | | |
Net investment loss | | | (0.73 | )% | | | (0.46 | )% | | | (0.61 | )% | | | (0.74 | )% | | | (0.83 | )% | | | (0.16 | )% |
Total expenses d | | | 2.16 | % | | | 2.24 | % | | | 2.11 | % | | | 2.09 | % | | | 2.09 | % | | | 2.05 | % |
Net expenses e | | | 2.16 | % | | | 2.24 | % | | | 2.11 | % | | | 2.09 | % | | | 2.09 | % | | | 2.05 | % |
Net expenses prior to custodian earning credits and net of expense waivers | | | 2.16 | % | | | 2.24 | % | | | 2.11 | % | | | 2.09 | % | | | 2.09 | % | | | 2.05 | % |
| | | | | | | | | | | | | | | | | | | | | | | | |
Portfolio turnover rate | | | 103 | % | | | 69 | % | | | 111 | %f | | | 20 | % | | | 34 | % | | | 32 | % |
| | | | |
| | 32 | | The accompanying notes are an integral part of the financial statements |
| | |
| Financial Highlights | | Rydex | SGI Equity Fund |
| Selected data for each share of capital stock outstanding throughout each period | | Large Cap Core Fund |
| | | | | | | | | | | | | | | | | | | | | | | | |
Class C | | Six Months
Ended March 31,
2010a,g | | | 2009 | | | 2008 | | | 2007 | | | 2006 | | | Year Ended
September 30,
2005 | |
Per Share Data | | | | | | | | | | | | | | | | | | | | | | | | |
Net asset value, beginning of period | | $ | 3.62 | | | $ | 3.81 | | | $ | 6.28 | | | $ | 6.39 | | | $ | 6.16 | | | $ | 6.16 | |
| | | | | | | | | | | | | | | | | | | | | | | | |
Income (loss) from investment operations: | | | | | | | | | | | | | | | | | | | | | | | | |
Net investment loss b | | | (0.01 | ) | | | (0.01 | ) | | | (0.03 | ) | | | (0.05 | ) | | | (0.05 | ) | | | (0.01 | ) |
Net gain (loss) on securities (realized and unrealized) | | | 0.44 | | | | (0.17 | ) | | | (1.46 | ) | | | 0.64 | | | | 0.48 | | | | 0.46 | |
| | | | | | | | | | | | | | | | | | | | | | | | |
Total from investment operations | | | 0.43 | | | | (0.18 | ) | | | (1.49 | ) | | | 0.59 | | | | 0.43 | | | | 0.45 | |
| | | | | | | | | | | | | | | | | | | | | | | | |
Less distributions: | | | | | | | | | | | | | | | | | | | | | | | | |
Distributions from realized gains | | | — | | | | (0.01 | ) | | | (0.97 | ) | | | (0.70 | ) | | | (0.20 | ) | | | (0.45 | ) |
Return of capital | | | — | | | | — | | | | (0.01 | ) | | | — | | | | — | | | | — | |
| | | | | | | | | | | | | | | | | | | | | | | | |
Total distributions | | | — | | | | (0.01 | ) | | | (0.98 | ) | | | (0.70 | ) | | | (0.20 | ) | | | (0.45 | ) |
| | | | | | | | | | | | | | | | | | | | | | | | |
Net asset value, end of period | | $ | 4.05 | | | $ | 3.62 | | | $ | 3.81 | | | $ | 6.28 | | | $ | 6.39 | | | $ | 6.16 | |
| | | | | | | | | | | | | | | | | | | | | | | | |
Total Return c | | | 11.88 | % | | | (4.60 | )% | | | (26.79 | )% | | | 9.45 | % | | | 7.10 | % | | | 7.32 | % |
| | | | | | | | | | | | | | | | | | | | | | | | |
Ratios/Supplemental Data | | | | | | | | | | | | | | | | | | | | | | | | |
Net assets, end of period (in thousands) | | $ | 2,345 | | | $ | 2,244 | | | $ | 2,915 | | | $ | 5,048 | | | $ | 5,794 | | | $ | 5,706 | |
| | | | | | | | | | | | | | | | | | | | | | | | |
Ratios to average net assets: | | | | | | | | | | | | | | | | | | | | | | | | |
Net investment loss | | | (0.73 | )% | | | (0.47 | )% | | | (0.60 | )% | | | (0.73 | )% | | | (0.83 | )% | | | (0.18 | )% |
Total expenses d | | | 2.16 | % | | | 2.24 | % | | | 2.11 | % | | | 2.09 | % | | | 2.09 | % | | | 2.05 | % |
Net expenses e | | | 2.16 | % | | | 2.24 | % | | | 2.11 | % | | | 2.09 | % | | | 2.09 | % | | | 2.05 | % |
Net expenses prior to custodian earning credits and net of expense waivers | | | 2.16 | % | | | 2.24 | % | | | 2.11 | % | | | 2.09 | % | | | 2.09 | % | | | 2.05 | % |
| | | | | | | | | | | | | | | | | | | | | | | | |
Portfolio turnover rate | | | 103 | % | | | 69 | % | | | 111 | %f | | | 20 | % | | | 34 | % | | | 32 | % |
| a | Unaudited figures for the six months ended March 31, 2010. Percentage amounts for the period, except total return, have been annualized. |
| b | Net investment income (loss) was computed using average shares outstanding throughout the period. |
| c | Total return information does not reflect deduction of any sales charges imposed at the time of purchase for Class A shares or upon redemption for Class B and C shares. |
| d | Total expense information reflects expense ratios absent expense reductions by the Investment Manager and custodian earnings credits, as applicable. |
| e | Net expense information reflects the expense ratios after voluntary expense waivers, reimbursements and custodian earnings credits, as applicable. |
| f | Significant variation in the portfolio turnover rate is due to the Investment Manager’s appointment of new portfolio managers for the Fund. |
| g | Effective February 1, 2010, the Fund’s name became Large Cap Core Fund. Prior to February 1, 2010, the Fund was known as the Equity Fund. |
| | | | |
| | 33 | | The accompanying notes are an integral part of the financial statements |
| | |
| | Rydex | SGI Equity Fund |
| Performance Summary | | Global Fund |
| March 31, 2010 | | (unaudited) |
PERFORMANCE
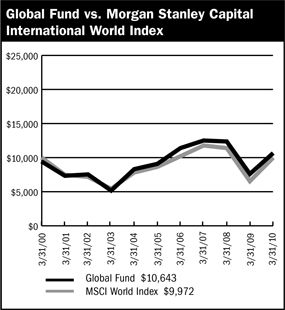
$10,000 Over Ten Years
This chart assumes a $10,000 investment in Class A shares of Global Fund on March 31, 2000, reflects deduction of the 5.75% sales load and assumes all dividends reinvested. The chart does not reflect the deduction of taxes that a shareholder would pay on distributions or the redemption of fund shares. The MSCI World Index is an unmanaged capitalization-weighted index that is designed to measure global developed market equity performance.
Average Annual Returns
| | | | | | | | | |
Periods Ended 3-31-10 | | 1 Year | | | 5 Years | | | 10 Years | |
A Shares | | 39.89 | % | | 3.21 | % | | 1.22 | % |
A Shares with sales charge | | 31.88 | % | | 2.00 | % | | 0.63 | % |
B Shares | | 40.06 | % | | 3.38 | % | | 1.06 | % |
B Shares with CDSC | | 35.06 | % | | 3.15 | % | | 1.06 | % |
C Shares | | 38.64 | % | | 2.42 | % | | 0.44 | % |
C Shares with CDSC | | 37.64 | % | | 2.42 | % | | 0.44 | % |
The performance data above represents past performance that is not predictive of future results. The investment return and principal value of an investment in the Fund will fluctuate so that an investor’s shares, when redeemed, may be worth more or less than their original cost. The figures above do not reflect deduction of the maximum front-end sales charge of 5.75% for Class A shares or the contingent deferred sales charge of 5% for Class B shares and 1% for Class C shares, as applicable, except where noted. The figures do not reflect the deduction of taxes that a shareholder would pay on distributions or redemption of shares. Such figures would be lower if the maximum sales charge and any applicable taxes were deducted. Fee waivers and/or reimbursements reduced expenses of the Fund and in the absence of such waiver, the performance quoted would be reduced.
Portfolio Composition by Sector as of 3-31-10
| | | |
Consumer Discretionary | | 9.38 | % |
Consumer Staples | | 9.42 | |
Energy | | 10.44 | |
Financials | | 18.29 | |
Health Care | | 13.32 | |
Industrials | | 10.62 | |
Information Technology | | 14.53 | |
Materials | | 4.94 | |
Utilities | | 7.88 | |
Cash & Other Assets, Less Liabilities | | 1.18 | |
| | | |
Total Net Assets | | 100.00 | % |
| | | |
| | | | |
| | 34 | | The accompanying notes are an integral part of the financial statements |
| | |
| Schedule of Investments | | Rydex | SGI Equity Fund |
March 31, 2010 (unaudited) | | Global Fund |
| | | | | |
| | | Shares | | Value |
COMMON STOCKS - 48.1% | | | | | |
Airlines - 0.8% | | | | | |
Alaska Air Group, Inc. * | | 18,500 | | $ | 762,755 |
| | | | | |
Cable & Satellite - 2.1% | | | | | |
Time Warner Cable, Inc. | | 37,729 | | | 2,011,333 |
| | | | | |
Computer Hardware - 2.1% | | | | | |
Apple, Inc. * | | 8,888 | | | 2,088,058 |
| | | | | |
Construction & Farm Machinery & Heavy
Trucks - 0.8% | | | | | |
Oshkosh Corporation | | 18,900 | | | 762,426 |
| | | | | |
Education Services - 1.6% | | | | | |
Corinthian Colleges, Inc. * | | 33,400 | | | 587,506 |
ITT Educational Services, Inc. * | | 8,730 | | | 981,950 |
| | | | | |
| | | | | 1 569,456 |
| | | | | |
Electric Utilities - 1.4% | | | | | |
FPL Group, Inc. | | 15,800 | | | 763,614 |
Northeast Utilities | | 21,875 | | | 604,625 |
| | | | | |
| | | | | 1,368,239 |
| | | | | |
Gas Utilities - 2.5% | | | | | |
UGI Corporation | | 91,600 | | | 2,431,064 |
| | | | | |
Health Care Facilities - 0.8% | | | | | |
Healthsouth Corporation * | | 42,100 | | | 787,270 |
| | | | | |
Health Care Services - 4.3% | | | | | |
Express Scripts, Inc. * | | 23,016 | | | 2,342,107 |
Medco Health Solutions, Inc. * | | 29,420 | | | 1,899,355 |
| | | | | |
| | | | | 4,241,462 |
| | | | | |
Home Improvement Retail - 0.7% | | | | | |
Home Depot, Inc. | | 20,600 | | | 666,410 |
| | | | | |
Independent Power Producers & Energy Traders - 0.5% | | | | | |
Constellation Energy Group, Inc. | | 13,500 | | | 473,985 |
| | | | | |
Integrated Oil & Gas - 3.5% | | | | | |
Occidental Petroleum Corporation | | 22,625 | | | 1,912,718 |
Petroleo Brasileiro S.A. ADR | | 33,100 | | | 1,472,619 |
| | | | | |
| | | | | 3,385,337 |
| | | | | |
Life & Health Insurance - 0.7% | | | | | |
Protective Life Corporation | | 29,500 | | | 648,705 |
| | | | | |
Life Sciences Tools &
Services - 2.3% | | | | | |
Life Technologies Corporation * | | 42,682 | | | 2,230,988 |
| | | | | |
Managed Health Care - 0.7% | | | | | |
Humana, Inc. * | | 15,400 | | | 720,258 |
| | | | | |
Multi-Line Insurance - 0.6% | | | | | |
Hartford Financial Services Group, Inc. | | 21,100 | | | 599,662 |
| | | | | |
Multi-Utilities - 0.7% | | | | | |
Xcel Energy, Inc. | | 32,600 | | | 691,120 |
| | | | | |
| | | | | |
| | | Shares | | Value |
COMMON STOCKS - 48.1% (continued) | | | |
Office Electronics - 2.3% | | | | | |
Xerox Corporation | | 228,700 | | $ | 2,229,825 |
| | | | | |
Office Services & Supplies - 0.5% | | | | | |
Pitney Bowes, Inc. | | 21,400 | | | 523,230 |
| | | | | |
Oil & Gas Equipment &
Services - 0.2% | | | | | |
Helix Energy Solutions Group, Inc. * | | 13,200 | | | 171,996 |
| | | | | |
Oil & Gas Exploration &
Production - 1.6% | | | | | |
Forest Oil Corporation * | | 59,283 | | | 1,530,687 |
| | | | | |
Oil & Gas Refining &
Marketing - 0.6% | | | | | |
World Fuel Services Corporation | | 21,300 | | | 567,432 |
| | | | | |
Other Diversified Financial Services - 2.4% | | | | | |
JPMorgan Chase & Company | | 52,557 | | | 2,351,926 |
| | | | | |
Packaged Foods & Meats - 0.8% | | | | | |
Smithfield Foods, Inc. * | | 39,100 | | | 810,934 |
| | | | | |
Paper Packaging - 0.7% | | | | | |
Rock-Tenn Company | | 14,500 | | | 660,765 |
| | | | | |
Personal Products - 0.8% | | | | | |
Herbalife, Ltd. | | 17,400 | | | 802,488 |
| | | | | |
Pharmaceuticals - 1.6% | | | | | |
Eli Lilly & Company | | 21,000 | | | 760,620 |
Endo Pharmaceuticals Holdings, Inc. * | | 32,500 | | | 769,925 |
| | | | | |
| | | | | 1,530,545 |
| | | | | |
Property & Casualty
Insurance - 3.1% | | | | | |
ACE, Ltd. | | 42,220 | | | 2,208,106 |
W.R. Berkley Corporation | | 30,400 | | | 793,136 |
| | | | | |
| | | | | 3,001,242 |
| | | | | |
Security & Alarm Services - 0.6% | | | | | |
Brink’s Company | | 19,000 | | | 536,370 |
| | | | | |
Specialty Stores - 0.7% | | | | | |
Tractor Supply Company | | 11,300 | | | 655,965 |
| | | | | |
Systems Software - 2.4% | | | | | |
Check Point Software Technologies * | | 67,960 | | | 2,382,678 |
| | | | | |
Thrifts & Mortgage Finance - 2.0% | | | | | |
Washington Federal, Inc. | | 95,100 | | | 1,932,432 |
| | | | | |
| | | | |
| | 35 | | The accompanying notes are an integral part of the financial statements |
| | |
| Schedule of Investments | | Rydex | SGI Equity Fund |
March 31, 2010 (unaudited) | | Global Fund |
| | | | | |
| | | Shares | | Value |
COMMON STOCKS - 48.1% (continued) |
Tobacco - 1.7% |
Altria Group, Inc. | | 80,680 | | $ | 1,655,554 |
| | | | | |
TOTAL COMMON STOCKS (cost $40,400,109) | | | | $ | 46,782,597 |
| | | | | |
| | | Shares | | Value |
FOREIGN STOCKS - 50.7% | | | | | |
Airlines - 0.8% | | | | | |
British Airways plc | | 214,323 | | $ | 790,561 |
| | | | | |
Asset Management & Custody Banks - 2.8% | | | | | |
Julius Baer Group, Ltd. | | 73,326 | | | 2,660,015 |
| | | | | |
Automobile Manufacturers - 4.3% | | | | | |
Honda Motor Company, Ltd. | | 49,200 | | | 1,736,563 |
Renault S.A. | | 42,546 | | | 1,994,119 |
Volkswagen AG | | 5,138 | | | 496,207 |
| | | | | |
| | | | | 4,226,889 |
| | | | | |
Construction & Farm
Machinery & Heavy
Trucks - 0.7% | | | | | |
SembCorp Marine, Ltd. | | 234,000 | | | 700,854 |
| | | | | |
Diversified Banks - 3.1% | | | | | |
DBS Group Holdings, Ltd. | | 200,000 | | | 2,044,391 |
Standard Chartered plc | | 37,416 | | | 1,020,772 |
| | | | | |
| | | | | 3,065,163 |
| | | | | |
Electrical Components & Equipment - 4.1% | | | | | |
Nexans S.A. | | 19,399 | | | 1,653,638 |
Prysmian SpA | | 117,882 | | | 2,316,719 |
| | | | | |
| | | | | 3,970,357 |
| | | | | |
Electronic Equipment & Instruments - 1.5% | | | | | |
Hitachi, Ltd. | | 386,000 | | | 1,440,869 |
| | | | | |
Fertilizers & Agricultural Chemicals - 1 7% | | | | | |
Syngenta AG | | 6,017 | | | 1,670,882 |
| | | | | |
Food Retail - 1.2% |
Empire Company, Ltd. | | 11,098 | | | 575,606 |
Metro, Inc. | | 13,739 | | | 569,606 |
| | | | | |
| | | | | 1,145,212 |
| | | | | |
Health Care Services - 1.6% |
Fresenius Medical Care AG & Company KGaA | | 27,910 | | | 1,574,850 |
| | | | | |
Integrated Oil & Gas - 1.7% |
BG Group plc | | 94,031 | | | 1,627,226 |
| | | | | |
Internet Software & Services - 2.3% | | | | | |
Gree, Inc. | | 36,210 | | | 2,211,446 |
| | | | | |
Life & Health Insurance - 2.3% |
Sony Financial Holdings, Inc. | | 686 | | | 2,252,548 |
| | | | | |
Multi-Utilities - 2.8% |
Veolia Environnement | | 77,952 | | | 2,703,867 |
| | | | | |
| | | | | |
| | | Shares | | Value |
FOREIGN STOCKS - 50.7% (continued) |
Oil & Gas Exploration & Production - 3.0% | | | | | |
CNOOC, Ltd. | | 1,335,087 | | $ | 2,197,575 |
EnCana Corporation | | 21,700 | | | 675,121 |
| | | | | |
| | | | | 2,872,696 |
| | | | | |
Packaged Foods & Meats - 2.8% | | | | | |
Marine Harvest ASA * | | 1,541,641 | | | 1,369,679 |
Toyo Suisan Kaisha, Ltd. | | 51,188 | | | 1,323,842 |
| | | | | |
| | | | | 2,693,521 |
| | | | | |
Pharmaceuticals - 1.9% | | | | | |
Novartis AG 1 | | 34,637 | | | 1,870,805 |
| | | | | |
Property & Casualty
Insurance - 1.3% | | | | | |
Lancashire Holdings, Ltd. | | 175,275 | | | 1,280,288 |
| | | | | |
Semiconductor Equipment - 1.8% | | | | | |
Tokyo Electron, Ltd. | | 25,900 | | | 1,717,525 |
| | | | | |
Semiconductors - 2.1% | | | | | |
Samsung Electronics Company, Ltd. | | 2,850 | | | 2,062,002 |
| | | | | |
Specialty Chemicals - 0.7% | | | | | |
Johnson Matthey plc | | 25,374 | �� | | 672,610 |
| | | | | |
Steel - 1.9% | | | | | |
Voestalpine AG | | 44,581 | | | 1,803,473 |
| | | | | |
Tobacco - 2.1% | | | | | |
Imperial Tobacco Group plc | | 67,417 | | | 2,056,114 |
| | | | | |
Trading Companies & Distributors - 2.2% | | | | | |
Mitsui & Company, Ltd. | | 135,900 | | | 2,283,532 |
| | | | | |
TOTAL FOREIGN STOCKS (cost $46,274,312) | | | | $ | 49,353,305 |
| | | | | |
| | | Shares | | Value |
RIGHT - 0.0% | | | | | |
Germany - 0.00% | | | | | |
Volkswagen AG
Expires 04/13/10 | | 5,138 | | $ | 3,192 |
| | | | | |
TOTAL RIGHT (cost $2,957) | | | | $ | 3,192 |
| | | | | |
Total Investments - 98.8% 1 (cost $86,677,378) | | | | $ | 96,139,094 |
Cash & Other Assets, Less Liabilities - 1.2% | | | 1,153,597 |
| | | | | |
Total Net Assets - 100.0% | | | | $ | 97,292,691 |
| | | | | |
INVESTMENT CONCENTRATION
At March 31, 2010, the investment diversification of the Fund was as follows:
| | | | | | |
Country | | % of Net
Assets | | | Value |
United States | | 41.1 | % | | $ | 39,916,706 |
Japan | | 13.3 | | | | 12,966,325 |
Switzerland | | 8.7 | | | | 8,409,808 |
France | | 6.5 | | | | 6,351,624 |
United Kingdom | | 6.3 | | | | 6,167,283 |
| | | | |
| | 36 | | The accompanying notes are an integral part of the financial statements |
| | |
| Schedule of Investments | | Rydex | SGI Equity Fund |
March 31, 2010 (unaudited) | | Global Fund |
INVESTMENT CONCENTRATION (continued)
| | | | | |
Country | | % of Net
Assets | | | Value |
Singapore | | 2.8 | % | | $2,745,245 |
Israel | | 2.4 | | | 2,382,678 |
Italy | | 2.4 | | | 2,316,719 |
Hong Kong | | 2.3 | | | 2,197,575 |
Germany | | 2.1 | | | 2,074,249 |
Republic of Korea | | 2.1 | | | 2,062,002 |
Canada | | 1.9 | | | 1,820,333 |
Austria | | 1.9 | | | 1,803,473 |
Brazil | | 1.5 | | | 1,472,619 |
Norway | | 1.4 | | | 1,369,679 |
Bermuda | | 1.3 | | | 1,280,288 |
Cayman Islands | | 0.8 | | | 802,488 |
| | | | | |
Total Investments | | 98.8 | | | $96,139,094 |
| | | | | |
For federal income tax purposes the identified cost of investments owned at March 31, 2010 was $87,010,230.
| ADR | American Depositary Receipt |
| plc | Public Limited Company |
| * | Non-income producing security |
| 1 | Unless otherwise indicated, the values of the securities of the Portfolio are determined based on Level 1 inputs. |
| | | | |
| | 37 | | The accompanying notes are an integral part of the financial statements |
| | |
| | Rydex | SGI Equity Fund |
| | Global Fund (unaudited) |
Statement of Assets and Liabilities
March 31, 2010
| | | | |
Assets: | | | | |
Investments at value * | | $ | 96,139,094 | |
Cash | | | 673,390 | |
Cash denominated in a foreign currency, at value *** | | | 2 | |
Receivables: | | | | |
Fund shares sold | | | 24,857 | |
Securities sold | | | 6,333,345 | |
Dividends | | | 163,429 | |
Foreign taxes recoverable | | | 48,451 | |
Prepaid expenses | | | 35,028 | |
| | | | |
Total assets | | | 103,417,596 | |
| | | | |
Liabilities: | | | | |
Payable for: | | | | |
Securities purchased | | | 5,815,995 | |
Fund shares redeemed | | | 125,929 | |
Management fees | | | 83,824 | |
Custodian fees | | | 15,000 | |
Transfer agent/maintenance fees | | | 13,811 | |
Administration fees | | | 14,674 | |
Professional fees | | | 9,894 | |
12b-l distribution plan fees | | | 21,997 | |
Directors’ fees | | | 899 | |
Other | | | 22,882 | |
| | | | |
Total liabilities | | | 6,124,905 | |
| | | | |
Net assets | | $ | 97,292,691 | |
| | | | |
Net assets consist of: | | | | |
Paid in capital | | $ | 132,786,799 | |
Accumulated net investment loss | | | (324,012 | ) |
Accumulated net realized loss on sale of investments and foreign currency transactions | | | (44,667,169 | ) |
Net unrealized appreciation in value of investments and translation of assets and liabilities in foreign currencies | | | 9,497,073 | |
| | | | |
Net assets | | $ | 97,292,691 | |
| | | | |
Class A: | | | | |
Capital shares outstanding
(unlimited number of shares authorized) | | | 7,891,478 | |
Net assets | | $ | 83,543,590 | |
Net asset value and redemption price per share | | $ | 10.59 | |
| | | | |
Maximum offering price per share (net asset value divided by 94.25%) | | $ | 11.24 | |
| | | | |
Class B: | | | | |
Capital shares outstanding
(unlimited number of shares authorized) | | | 970,340 | |
Net assets | | $ | 8,960,138 | |
Net asset value, offering and redemption price per share (excluding any applicable contingent deferred sales charge) | | $ | 9.23 | |
| | | | |
Class C: | | | | |
Capital shares outstanding (unlimited number of shares authorized) | | | 523,183 | |
Net assets | | $ | 4,788,963 | |
Net asset value, offering and redemption price per share (excluding any applicable contingent deferred sales charge) | | $ | 9.15 | |
| | | | |
*Investments, at cost | | $ | 86,677,378 | |
***Cash denominated in a foreign currency, at cost | | | 2 | |
Statement of Operations
For the Six Months Ended March 31, 2010
| | | | |
Investment Income: | | | | |
Dividends (net of foreign withholding tax of $35,132) | | $ | 963,648 | |
| | | | |
Total investment income | | | 963,648 | |
| | | | |
Expenses: | | | | |
Management fees | | | 529,375 | |
Transfer agent/maintenance fees | | | 133,669 | |
Administration fees | | | 82,939 | |
Custodian fees | | | 30,533 | |
Directors’ fees | | | 4,642 | |
Professional fees | | | 19,882 | |
Reports to shareholders | | | 11,771 | |
Registration fees | | | 20,516 | |
Other expenses | | | 8,113 | |
12b-l distribution fees - Class A | | | 113,874 | |
12b-l distribution fees - Class C | | | 23,579 | |
| | | | |
Total expenses | | | 978,893 | |
| | | | |
Net investment loss | | | (15,245 | ) |
| | | | |
Net Realized and Unrealized Gain (Loss): | |
Net realized gain (loss) during the period on: | |
Investments | | | 11,172,119 | |
Foreign currency transactions | | | (162,716 | ) |
| | | | |
Net realized gain | | | 11,009,403 | |
| | | | |
Net unrealized appreciation (depreciation) during the period on: | | | | |
Investments | | | (4,761,406 | ) |
Translation of assets and liabilities in foreign currencies | | | 26,434 | |
| | | | |
Net unrealized depreciation | | | (4,734,972 | ) |
| | | | |
Net realized and unrealized gain | | | 6,274,431 | |
| | | | |
Net increase in net assets resulting from operations | | $ | 6,259,186 | |
| | | | |
| | | | |
| | 38 | | The accompanying notes are an integral part of the financial statements |
| | |
| | Rydex | SGI Equity Fund |
| Statement of Changes in Net Assets | | Global Fund |
| | | | | | | | |
| | | Six Months Ended
March 31, 2010
(unaudited) | | | Year Ended
September 30,
2009 | |
Increase (decrease) in net assets from operations: | | | | | | | | |
Net investment income (loss) | | $ | (15,245 | ) | | $ | 588,726 | |
Net realized gain (loss) during the period on investments and foreign currency transactions | | | 11,009,403 | | | | (32,306,831 | ) |
Net unrealized appreciation (depreciation) during the period on investments and translation of assets and liabilities | | | (4,734,972 | ) | | | 30,228,428 | |
| | | | | | | | |
Net increase (decrease) in net assets resulting from operations | | | 6,259,186 | | | | (1,489,677 | ) |
| | | | | | | | |
Distributions to shareholders from: | | | | | | | | |
Net investment income | | | | | | | | |
Class A | | | — | | | | (163,957 | ) |
Class B | | | — | | | | (75,171 | ) |
Return of capital | | | | | | | | |
Class A | | | — | | | | (535,384 | ) |
Class B | | | — | | | | (101,453 | ) |
Class C | | | — | | | | (46,236 | ) |
| | | | | | | | |
Total distributions to shareholders | | | — | | | | (922,201 | ) |
| | | | | | | | |
Capital share transactions: | | | | | | | | |
Proceeds from sale of shares | | | | | | | | |
Class A | | | 10,081,224 | | | | 34,945,358 | |
Class B | | | 697,823 | | | | 2,542,896 | |
Class C | | | 223,820 | | | | 988,149 | |
Distributions reinvested | | | | | | | | |
Class A | | | — | | | | 692,086 | |
Class B | | | — | | | | 175,483 | |
Class C | | | — | | | | 45,624 | |
Cost of shares redeemed | | | | | | | | |
Class A | | | (29,161,586 | ) | | | (26,643,873 | ) |
Class B | | | (3,469,125 | ) | | | (5,753,043 | ) |
Class C | | | (536,650 | ) | | | (3,334,066 | ) |
| | | | | | | | |
Net increase (decrease) from capital share transactions | | | (22,164,494 | ) | | | 3,658,614 | |
| | | | | | | | |
Net increase (decrease) in net assets | | | (15,905,308 | ) | | | 1,246,736 | |
| | | | | | | | |
Net assets: | | | | | | | | |
Beginning of period | | | 113,197,999 | | | | 111,951,263 | |
| | | | | | | | |
End of period | | $ | 97,292,691 | | | $ | 113,197,999 | |
| | | | | | | | |
Accumulated net investment loss at end of period | | $ | (324,012 | ) | | $ | (286,682 | ) |
| | | | | | | | |
Capital share activity: | | | | | | | | |
Shares sold | | | | | | | | |
Class A | | | 997,051 | | | | 4,245,498 | |
Class B | | | 79,543 | | | | 355,824 | |
Class C | | | 25,521 | | | | 136,231 | |
Shares reinvested | | | | | | | | |
Class A | | | — | | | | 84,093 | |
Class B | | | — | | | | 24,543 | |
Class C | | | — | | | | 6,354 | |
Shares redeemed | | | | | | | | |
Class A | | | (2,851,168 | ) | | | (3,160,197 | ) |
Class B | | | (393,063 | ) | | | (787,666 | ) |
Class C | | | (61,288 | ) | | | (453,603 | ) |
| | | | |
| | 39 | | The accompanying notes are an integral part of the financial statements |
| | |
| Financial Highlights | | Rydex | SGI Equity Fund |
| Selected data for each share of capital stock outstanding throughout each period | | Global Fund |
| | | | | | | | | | | | | | | | | | | | | | | | |
Class A | | Six Months
Ended March 31,
2010a | | | 2009 | | | 2008 | | | 2007b | | | 2006 | | | Year Ended
September 30,
2005 | |
Per Share Data | | | | | | | | | | | | | | | | | | | | | | | | |
Net asset value, beginning of period | | $ | 9.97 | | | $ | 10.35 | | | $ | 20.69 | | | $ | 19.65 | | | $ | 17.47 | | | $ | 13.93 | |
| | | | | | | | | | | | | | | | | | | | | | | | |
Income (loss) from investment operations: | | | | | | | | | | | | | | | | | | | | | | | | |
Net investment income (loss) c | | | — | | | | 0.05 | | | | 0.05 | | | | 0.06 | | | | (0.03 | ) | | | (0.02 | ) |
Net gain (loss) on securities (realized and unrealized) | | | 0.62 | | | | (0.35 | ) | | | (3.63 | ) | | | 3.60 | | | | 2.21 | | | | 3.56 | |
| | | | | | | | | | | | | | | | | | | | | | | | |
Total from investment operations | | | 0.62 | | | | (0.30 | ) | | | (3.58 | ) | | | 3.66 | | | | 2.18 | | | | 3.54 | |
| | | | | | | | | | | | | | | | | | | | | | | | |
Less distributions: | | | | | | | | | | | | | | | | | | | | | | | | |
Dividends from net investment income | | | — | | | | (0.02 | ) | | | (0.04 | ) | | | — | | | | — | | | | — | |
Distributions from realized gains | | | — | | | | (0.06 | ) | | | (6.72 | ) | | | (2.62 | ) | | | — | | | | — | |
| | | | | | | | | | | | | | | | | | | | | | | | |
Total distributions | | | — | | | | (0.08 | ) | | | (6.76 | ) | | | (2.62 | ) | | | — | | | | — | |
| | | | | | | | | | | | | | | | | | | | | | | | |
Net asset value, end of period | | $ | 10.59 | | | $ | 9.97 | | | $ | 10.35 | | | $ | 20.69 | | | $ | 19.65 | | | $ | 17.47 | |
| | | | | | | | | | | | | | | | | | | | | | | | |
Total Return d | | | 6.22 | % | | | (2.71 | )% | | | (25.16 | )% | | | 20.07 | % | | | 12.48 | % | | | 25.41 | % |
| | | | | | | | | | | | | | | | | | | | | | | | |
Ratios/Supplemental Data | | | | | | | | | | | | | | | | | | | | | | | | |
Net assets, end of period (in thousands) | | $ | 83,544 | | | $ | 97,205 | | | $ | 88,782 | | | $ | 145,158 | | | $ | 119,176 | | | $ | 127,970 | |
| | | | | | | | | | | | | | | | | | | | | | | | |
Ratios to average net assets: | | | | | | | | | | | | | | | | | | | | | | | | |
Net investment income (loss) | | | (0.02 | )% | | | 0.63 | % | | | 0.33 | % | | | 0.29 | % | | | (0.17 | )% | | | (0.14 | )% |
Total expenses e | | | 1.84 | % | | | 1.89 | % | | | 1.73 | % | | | 1.69 | % | | | 1.75 | % | | | 1.73 | % |
Net expenses f | | | 1.84 | % | | | 1.89 | % | | | 1.72 | % | | | 1.69 | % | | | 1.75 | % | | | 1.73 | % |
Net expenses prior to custodian earning credits and net of expense waivers | | | 1.84 | % | | | 1.89 | % | | | 1.73 | % | | | 1.69 | % | | | 1.75 | % | | | 1.73 | % |
| | | | | | | | | | | | | | | | | | | | | | | | |
Portfolio turnover rate | | | 252 | % | | | 368 | % | | | 280 | %g | | | 162 | %g | | | 28 | % | | | 31 | % |
| | | | | | |
Class B | | Six Months
Ended March 31,
2010a,h | | | 2009h | | | 2008h | | | 2007b,h | | | 2006h | | | Year Ended
September 30,
2005h | |
Per Share Data | | | | | | | | | | | | | | | | | | | | | | | | |
Net asset value, beginning of period | | $ | 8.69 | | | $ | 9.05 | | | $ | 18.96 | | | $ | 18.17 | | | $ | 16.12 | | | $ | 12.93 | |
| | | | | | | | | | | | | | | | | | | | | | | | |
Income (loss) from investment operations: | | | | | | | | | | | | | | | | | | | | | | | | |
Net investment income (loss) c | | | 0.01 | | | | 0.07 | | | | 0.07 | | | | 0.09 | | | | 0.02 | | | | (0.12 | ) |
Net gain (loss) on securities (realized and unrealized) | | | 0.53 | | | | (0.32 | ) | | | (3.17 | ) | | | 3.32 | | | | 2.03 | | | | 3.31 | |
| | | | | | | | | | | | | | | | | | | | | | | | |
Total from investment operations | | | 0.54 | | | | (0.25 | ) | | | (3.10 | ) | | | 3.41 | | | | 2.05 | | | | 3.19 | |
| | | | | | | | | | | | | | | | | | | | | | | | |
Less distributions: | | | | | | | | | | | | | | | | | | | | | | | | |
Dividends from net investment income | | | — | | | | (0.05 | ) | | | (0.09 | ) | | | — | | | | — | | | | — | |
Distributions from realized gains | | | — | | | | (0.06 | ) | | | (6.72 | ) | | | (2.62 | ) | | | — | | | | — | |
| | | | | | | | | | | | | | | | | | | | | | | | |
Total distributions | | | — | | | | (0.11 | ) | | | (6.81 | ) | | | (2.62 | ) | | | — | | | | — | |
| | | | | | | | | | | | | | | | | | | | | | | | |
Net asset value, end of period | | $ | 9.23 | | | $ | 8.69 | | | $ | 9.05 | | | $ | 18.96 | | | $ | 18.17 | | | $ | 16.12 | |
| | | | | | | | | | | | | | | | | | | | | | | | |
Total Return d | | | 6.21 | % | | | (2.45 | )% | | | (24.91 | )% | | | 20.36 | % | | | 12.72 | % | | | 24.67 | % |
| | | | | | | | | | | | | | | | | | | | | | | | |
| | | | | | | | | | | | | | | | | | | | | | | | |
Ratios/Supplemental Data | | | | | | | | | | | | | | | | | | | | | | | | |
Net assets, end of period (in thousands) | | $ | 8,960 | | | $ | 11,155 | | | $ | 15,303 | | | $ | 29,659 | | | $ | 27,494 | | | $ | 28,999 | |
| | | | | | | | | | | | | | | | | | | | | | | | |
Ratios to average net assets: | | | | | | | | | | | | | | | | | | | | | | | | |
Net investment income (loss) | | | 0.23 | % | | | 0.90 | % | | | 0.55 | % | | | 0.50 | % | | | 0.11 | % | | | (0.80 | )% |
Total expenses e | | | 1.59 | % | | | 1.65 | % | | | 1.48 | % | | | 1.44 | % | | | 1.50 | % | | | 2.38 | % |
Net expenses f | | | 1.59 | % | | | 1.65 | % | | | 1.47 | % | | | 1.44 | % | | | 1.50 | % | | | 2.38 | % |
Net expenses prior to custodian earning credits and net of expense waivers | | | 1.59 | % | | | 1.65 | % | | | 1.48 | % | | | 1.44 | % | | | 1.50 | % | | | 2.38 | % |
| | | | | | | | | | | | | | | | | | | | | | | | |
Portfolio turnover rate | | | 252 | % | | | 368 | % | | | 280 | %g | | | 162 | %g | | | 28 | % | | | 31 | % |
| | | | |
| | 40 | | The accompanying notes are an integral part of the financial statements |
| | |
| Financial Highlights | | Rydex | SGI Equity Fund |
| Selected data for each share of capital stock outstanding throughout each period | | Global Fund |
| | | | | | | | | | | | | | | | | | | | | | | | |
Class C | | Six Months
Ended March 31,
2010a | | | 2009 | | | 2008 | | | 2007b | | | 2006 | | | Year Ended
September 30,
2005 | |
Per Share Data | | | | | | | | | | | | | | | | | | | | | | | | |
Net asset value, beginning of period | | $ | 8.66 | | | $ | 9.04 | | | $ | 19.00 | | | $ | 18.37 | | | $ | 16.46 | | | $ | 13.22 | |
| | | | | | | | | | | | | | | | | | | | | | | | |
Income (loss) from investment operations: | | | | | | | | | | | | | | | | | | | | | | | | |
Net investment loss c | | | (0.03 | ) | | | (0.01 | ) | | | (0.05 | ) | | | (0.09 | ) | | | (0.15 | ) | | | (0.13 | ) |
Net gain (loss) on securities (realized and unrealized) | | | 0.52 | | | | (0.31 | ) | | | (3.18 | ) | | | 3.34 | | | | 2.06 | | | | 3.37 | |
| | | | | | | | | | | | | | | | | | | | | | | | |
Total from investment operations | | | 0.49 | | | | (0.32 | ) | | | (3.23 | ) | | | 3.25 | | | | 1.91 | | | | 3.24 | |
| | | | | | | | | | | | | | | | | | | | | | | | |
Less distributions: | | | | | | | | | | | | | | | | | | | | | | | | |
Distributions from realized gains | | | — | | | | (0.06 | ) | | | (6.73 | ) | | | (2.62 | ) | | | — | | | | — | |
| | | | | | | | | | | | | | | | | | | | | | | | |
Total distributions | | | — | | | | (0.06 | ) | | | (6.73 | ) | | | (2.62 | ) | | | — | | | | — | |
| | | | | | | | | | | | | | | | | | | | | | | | |
Net asset value, end of period | | $ | 9.15 | | | $ | 8.66 | | | $ | 9.04 | | | $ | 19.00 | | | $ | 18.37 | | | $ | 16.46 | |
| | | | | | | | | | | | | | | | | | | | | | | | |
Total Return d | | | 5.66 | % | | | (3.39 | )% | | | (25.69 | )% | | | 19.14 | % | | | 11.60 | % | | | 24.51 | % |
| | | | | | | | | | | | | | | | | | | | | | | | |
Ratios/Supplemental Data | | | | | | | | | | | | | | | | | | | | | | | | |
Net assets, end of period (in thousands) | | $ | 4,789 | | | $ | 4,838 | | | $ | 7,866 | | | $ | 12,449 | | | $ | 10,361 | | | $ | 8,841 | |
| | | | | | | | | | | | | | | | | | | | | | | | |
Ratios to average net assets: | | | | | | | | | | | | | | | | | | | | | | | | |
Net investment loss | | | (0.79 | )% | | | (0.11 | )% | | | (0.44 | )% | | | (0.48 | )% | | | (0.87 | )% | | | (0.90 | )% |
Total expenses e | | | 2.59 | % | | | 2.65 | % | | | 2.49 | % | | | 2.44 | % | | | 2.51 | % | | | 2.48 | % |
Net expenses f | | | 2.59 | % | | | 2.65 | % | | | 2.47 | % | | | 2.44 | % | | | 2.50 | % | | | 2.48 | % |
Net expenses prior to custodian earning credits and net of expense waivers | | | 2.59 | % | | | 2.65 | % | | | 2.49 | % | | | 2.44 | % | | | 2.51 | % | | | 2.48 | % |
| | | | | | | | | | | | | | | | | | | | | | | | |
Portfolio turnover rate | | | 252 | % | | | 368 | % | | | 280 | %g | | | 162 | %g | | | 28 | % | | | 31 | % |
| a | Unaudited figures for the six months ended March 31, 2010. Percentage amounts for the period, except total return, have been annualized. |
| b | Security Global Investors, LLC (SGI) became the sub-advisor of the Global Fund effective August 1, 2007. Prior to August 1, 2007, Security Investors (SI) paid Oppenheimer Funds for sub-advisory services. |
| c | Net investment income (loss) was computed using average shares outstanding throughout the period. |
| d | Total return information does not reflect deduction of any sales charges imposed at the time of purchase for Class A shares or upon redemption for Class B and C shares. |
| e | Total expense information reflects expense ratios absent expense reductions by the Investment Manager and custodian earnings credits, as applicable. |
| f | Net expense information reflects the expense ratios after voluntary expense waivers, reimbursements and custodian earnings credits, as applicable. |
| g | Significant variation in the portfolio turnover rate is due to the re-alignment of the Fund1 portfolio following the appointment of SGI as sub-advisor. |
| h | Effective August 25, 2005, Class B shares ceased charging 12b-l fees in accordance with FINRA sales cap regulations. Per share information reflects this change. This fee will be reinstated when sales exceed the sales cap limit. |
| | | | |
| | 41 | | The accompanying notes are an integral part of the financial statements |
| | |
| | Rydex | SGI Equity Fund |
| Performance Summary | | Global Institutional Fund |
| March 31, 2010 | | (unaudited) |
PERFORMANCE
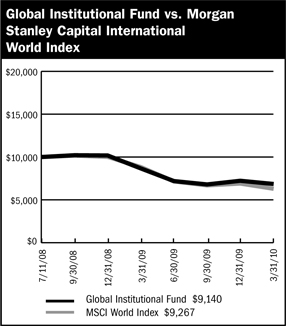
$10,000 Since Inception
This chart assumes a $10,000 investment in shares of Global Institutional Fund on July 11, 2008 (date of inception), and reflects the fees and expenses of the Fund and assumes all dividends reinvested. The chart does not reflect the deduction of taxes that a shareholder would pay on distributions or the redemption of fund shares. The MSCI World Index is an unmanaged capitalization-weighted index that is designed to measure global developed market equity performance.
Average Annual Returns
| | | | | | |
Periods Ended 3-31-10 | | l Year | | | Since Inception
(7-11-08) | |
Global Institutional Fund | | 41.61 | % | | (5.09 | )% |
The performance data above represents past performance that is not predictive of future results. The investment return and principal value of an investment in the Fund will fluctuate so that an investor’s shares, when redeemed, may be worth more or less than their original cost. The figures do not reflect the deduction of taxes that a shareholder would pay on distributions or redemption of shares. Such figures would be lower any applicable taxes were deducted. Fee waivers and/or reimbursements reduced expenses of the Fund and in the absence of such waiver, the performance quoted would be reduced.
Portfolio Composition by Sector as of 3-31-10
| | | |
Consumer Discretionary | | 9.41 | % |
Consumer Staples | | 9.19 | |
Energy | | 10.72 | |
Financials | | 18.26 | |
Health Care | | 13.30 | |
Industrials | | 10.63 | |
Information Technology | | 14.56 | |
Materials | | 4.95 | |
Utilities | | 7.76 | |
Cash & Other Assets, Less Liabilities | | 1.22 | |
| | | |
Total Net Assets | | 100.00 | % |
| | | |
| | | | |
| | 42 | | The accompanying notes are an integral part of the financial statements |
| | |
| Schedule of Investments | | Rydex | SGI Equity Fund |
March 31, 2010 (unaudited) | | Global Institutional Fund |
| | | | | |
| | | Shares | | Value |
COMMON STOCKS - 48.1% | | | | | |
Airlines - 0 8% | | | | | |
Alaska Air Group, Inc. * | | 800 | | $ | 32,984 |
| | | | | |
Cable & Satellite - 2.1% | | | | | |
Time Warner Cable, Inc. | | 1,648 | | | 87,855 |
| | | | | |
Computer Hardware - 2.2% | | | | | |
Apple, Inc. * | | 403 | | | 94,677 |
| | | | | |
Construction & Farm Machinery & Heavy Trucks - 0.8% | | | | | |
Oshkosh Corporation | | 800 | | | 32,272 |
| | | | | |
Education Services - 1.6% | | | | | |
Corinthian Colleges, Inc. * | | 1,500 | | | 26,385 |
ITT Educational Services, Inc. * | | 385 | | | 43,305 |
| | | | | |
| | | | | 69,690 |
| | | | | |
Electric Utilities - 1.4% | | | | | |
FPL Group, Inc. | | 700 | | | 33,831 |
Northeast Utilities | | 997 | | | 27,557 |
| | | | | |
| | | | | 61,388 |
| | | | | |
Gas Utilities - 2.4% | | | | | |
UGI Corporation | | 4,000 | | | 106,160 |
| | | | | |
Health Care Facilities - 0.8% | | | | | |
Healthsouth Corporation * | | 1,900 | | | 35,530 |
| | | | | |
Health Care Services - 4.3% | | | | | |
Express Scripts, Inc. * | | 1,031 | | | 104,914 |
Medco Health Solutions, Inc. * | | 1,279 | | | 82,572 |
| | | | | |
| | | | | 187,486 |
| | | | | |
Home Improvement Retail - 0.7% | | | | | |
Home Depot, Inc. | | 895 | | | 28,953 |
| | | | | |
Independent Power Producers & Energy Traders - 0.5% | | | | | |
Constellation Energy Group, Inc. | | 600 | | | 21,066 |
| | | | | |
Integrated Oil & Gas - 3.6% | | | | | |
Occidental Petroleum Corporation | | 1,024 | | | 86,569 |
Petroleo Brasileiro S.A. ADR | | 1,500 | | | 66,735 |
| | | | | |
| | | | | 153,304 |
| | | | | |
Life & Health Insurance - 0.7% | | | | | |
Protective Life Corporation | | 1,300 | | | 28,587 |
| | | | | |
Life Sciences Tools & Services - 2.3% | | | | | |
Life Technologies Corporation * | | 1,894 | | | 98,999 |
| | | | | |
Managed Health Care - 0.8% | | | | | |
Humana, Inc. * | | 700 | | | 32,739 |
| | | | | |
Multi-Line Insurance - 0.6% | | | | | |
Hartford Financial Services Group, Inc. | | 920 | | | 26,146 |
| | | | | |
Multi-Utilities - 0.7% | | | | | |
Xcel Energy, Inc. | | 1,400 | | | 29,680 |
| | | | | |
| | | | | |
| | | Shares | | Value |
COMMON STOCKS - 48.1% (continued) | | | |
Office Electronics - 2.3% | | | |
Xerox Corporation | | 10,100 | | $ | 98,475 |
| | | | | |
Office Services & Supplies - 0.6% | | | |
Pitney Bowes, Inc. | | 1,000 | | | 24,450 |
| | | | | |
Oil & Gas Equipment &
Services - 0.2% | | | | | |
Helix Energy Solutions Group, Inc. * | | 600 | | | 7,818 |
| | | | | |
Oil & Gas Exploration & Production - 1.6% | | | | | |
Forest Oil Corporation * | | 2,596 | | | 67,029 |
| | | | | |
Oil & Gas Refining & Marketing - 0.6% | | | |
World Fuel Services Corporation | | 990 | | | 26,374 |
| | | | | |
Other Diversified Financial Services - 2.4% | | | | | |
JPMorgan Chase & Company | | 2,314 | | | 103,552 |
| | | | | |
Packaged Foods & Meats - 0.8% | | | | | |
Smithfield Foods, Inc. * | | 1,700 | | | 35,258 |
| | | | | |
Paper Packaging - 0.6% | | | | | |
Rock-Tenn Company | | 600 | | | 27,342 |
| | | | | |
Personal Products - 0.8% | | | | | |
Herbalife, Ltd. | | 700 | | | 32,284 |
| | | | | |
Pharmaceuticals - 1.5% | | | | | |
Eli Lilly & Company | | 900 | | | 32,598 |
Endo Pharmaceuticals Holdings, Inc. * | | 1,400 | | | 33,166 |
| | | | | |
| | | | | 65,764 |
| | | | | |
Property & Casualty
Insurance - 3.1% | | | | | |
ACE, Ltd. | | 1,846 | | | 96,546 |
W.R. Berkley Corporation | | 1,300 | | | 33,917 |
| | | | | |
| | | | | 130,463 |
| | | | | |
Security & Alarm Services - 0.5% | | | | | |
Brink’s Company | | 800 | | | 22,584 |
| | | | | |
Specialty Stores - 0.7% | | | | | |
Tractor Supply Company | | 500 | | | 29,025 |
| | | | | |
Systems Software - 2.4% | | | | | |
Check Point Software Technologies * | | 2,976 | | | 104,339 |
| | | | | |
Thrifts & Mortgage Finance - 2.0% | | | | | |
Washington Federal, Inc. | | 4,200 | | | 85,344 |
| | | | | |
| | | | |
| | 43 | | The accompanying notes are an integral part of the financial statements |
| | |
| Schedule of Investments | | Rydex | SGI Equity Fund |
March 31, 2010 (unaudited) | | Global Institutional Fund |
| | | | | |
| | | Shares | | Value |
COMMON STOCKS - 48.1% (continued) | | | |
Tobacco - 1.7% | | | | | |
Altria Group, Inc. | | 3,520 | | $ | 72,230 |
| | | | | |
TOTAL COMMON STOCKS
(cost $1,777, 747) | | | | $ | 2,059,847 |
| | | | | |
| | | Shares | | Value |
FOREIGN STOCKS - 50.7% | | | | | |
Airlines - 0.8% | | | | | |
British Airways plc | | 9,552 | | $ | 35,234 |
| | | | | |
Asset Management & Custody Banks - 2.8% | | | | | |
Julius Baer Group, Ltd. | | 3,268 | | | 118,552 |
| | | | | |
Automobile Manufacturers - 4.4% | | | | | |
Honda Motor Company, Ltd. | | 2,200 | | | 77,651 |
Renault S.A. | | 1,876 | | | 87,928 |
Volkswagen AG | | 229 | | | 22,116 |
| | | | | |
| | | | | 187,695 |
| | | | | |
Construction & Farm Machinery & Heavy Trucks - 0.7% | | | | | |
SembCorp Marine, Ltd. | | 10,000 | | | 29,951 |
| | | | | |
Diversified Banks - 3.2% | | | | | |
DBS Group Holdings, Ltd. | | 8,600 | | | 87,909 |
Standard Chartered plc | | 1,694 | | | 46,215 |
| | | | | |
| | | | | 134,124 |
| | | | | |
Electrical Components & Equipment - 4.1% | | | | | |
Nexans S.A. | | 865 | | | 73,736 |
Prysmian SpA | | 5,254 | | | 103,256 |
| | | | | |
| | | | | 176,992 |
| | | | | |
Electronic Equipment & Instruments - 1.5% | | | | | |
Hitachi, Ltd. | | 17,000 | | | 63,458 |
| | | | | |
Fertilizers & Agricultural Chemicals - 1.7% | | | | | |
Syngenta AG | | 268 | | | 74,422 |
| | | | | |
Food Retail - 1.2% | | | | | |
Empire Company, Ltd. | | 520 | | | 26,970 |
Metro, Inc. | | 606 | | | 25,124 |
| | | | | |
| | | | | 52,094 |
| | | | | |
Health Care Services - 1.7% | | | | | |
Fresenius Medical Care AG & Company KGaA | | 1,244 | | | 70,194 |
| | | | | |
Integrated Oil & Gas - 1.7% | | | | | |
BG Group plc | | 4,191 | | | 72,526 |
| | | | | |
Internet Software & Services - 2.3% | | | | | |
Gree, Inc. | | 1,593 | | | 97,289 |
| | | | | |
Life & Health Insurance - 2.3% | | | | | |
Sony Financial Holdings, Inc. | | 30 | | | 98,508 |
| | | | | |
Multi-Utilities - 2.6% | | | | | |
Veolia Environnement | | 3,294 | | | 114,256 |
| | | | | |
| | | | | |
| | | Shares | | Value |
FOREIGN STOCKS - 50.7% (continued) | | | |
Oil & Gas Exploration & Production - 3.1% | | | | | |
CNOOC, Ltd. | | 61,501 | | $ | 101,232 |
EnCana Corporation | | 1,000 | | | 31,112 |
| | | | | |
| | | | | 132,344 |
| | | | | |
Packaged Foods & Meats - 2.6% | | | | | |
Marine Harvest ASA * | | 62,648 | | | 55,660 |
Toyo Suisan Kaisha, Ltd. | | 2,101 | | | 54,337 |
| | | | | |
| | | | | 109,997 |
| | | | | |
Pharmaceuticals - 1.8% | | | | | |
NovartisAG l | | 1,460 | | | 78,857 |
| | | | | |
Property & Casualty
Insurance - 1.3% | | | | | |
Lancashire Holdings, Ltd. | | 7,811 | | | 57,055 |
| | | | | |
Semiconductor Equipment - 1.7% | | | | | |
Tokyo Electron, Ltd. | | 1,100 | | | 72,945 |
| | | | | |
Semiconductors - 2.2% | | | | | |
Samsung Electronics Company, Ltd. | | 128 | | | 92,609 |
| | | | | |
Specialty Chemicals - 0.7% | | | | | |
Johnson Matthey plc | | 1,131 | | | 29,980 |
| | | | | |
Steel - 1.9% | | | | | |
Voestalpine AG | | 1,987 | | | 80,382 |
| | | | | |
Tobacco - 2.1% | | | | | |
Imperial Tobacco Group plc | | 3,005 | | | 91,648 |
| | | | | |
Trading Companies & Distributors - 2.3% | | | | | |
Mitsui & Company, Ltd. | | 6,000 | | | 100,818 |
| | | | | |
TOTAL FOREIGN STOCKS
(cost $2,041,795) | | | | $ | 2,171,930 |
| | | | | |
| | | Shares | | Value |
RIGHT - 0.0% | | | | | |
Germany - 0.00% | | | | | |
Volkswagen AG
Expires 04/13/10 | | 229 | | $ | 142 |
| | | | | |
TOTAL RIGHT
(cost $132) | | | | $ | 142 |
| | | | | |
Total Investments - 98.8% 1
(cost $3,819,674) | | | | $ | 4,231,919 |
Cash & Other Assets, Less Liabilities - 1.2% | | | 52,437 |
| | | | | |
Total Net Assets- 100.0% | | | | $ | 4,284,356 |
| | | | | |
INVESTMENT CONCENTRATION
At March 31, 2010, the investment diversification of the Fund was as follows:
| | | | | | |
Country | | % of Net
Assets | | | Value |
United States | | 41.0 | % | | $ | 1,759,943 |
Japan | | 13.2 | | | | 565,006 |
Switzerland | | 8.6 | | | | 368,377 |
France | | 6.4 | | | | 275,920 |
United Kingdom | | 6.4 | | | | 275,603 |
| | | | |
| | 44 | | The accompanying notes are an integral part of the financial statements |
| | |
| Schedule of Investments | | Rydex | SGI Equity Fund |
March 31, 2010 (unaudited) | | Global Institutional Fund |
INVESTMENT CONCENTRATION (continued)
| | | | | | |
Country | | % of Net
Assets | | | Value |
Singapore | | 2.8 | % | | $ | 117,860 |
Israel | | 2.4 | | | | 104,339 |
Italy | | 2.4 | | | | 103,256 |
Hong Kong | | 2.4 | | | | 101,232 |
Republic of Korea | | 2.2 | | | | 92,609 |
Germany | | 2.2 | | | | 92,452 |
Canada | | 1.9 | | | | 83,206 |
Austria | | 1.9 | | | | 80,382 |
Brazil | | 1.6 | | | | 66,735 |
Bermuda | | 1.3 | | | | 57,055 |
Norway | | 1.3 | | | | 55,660 |
Cayman Islands | | 0.8 | | | | 32,284 |
| | | | | | |
Total Investments | | 98.8 | | | $ | 4,231,919 |
| | | | | | |
For federal income tax purposes the identified cost of investments owned at March 31, 2010 was $3,848,222.
| ADR | American Depositary Receipt |
| plc | Public Limited Company |
| * | Non-income producing security |
| 1 | Unless otherwise indicated, the values of the portfolio are determined based on Level 1 inputs. |
| | | | |
| | 45 | | The accompanying notes are an integral part of the financial statements |
| | |
| | Rydex | SGI Equity Fund |
| | Global Institutional Fund (unaudited) |
Statement of Assets and Liabilities
March 31, 2010
| | | | |
Assets: | | | | |
Investments, at value * | | $ | 4,231,919 | |
Cash denominated in a foreign currency, at value ** | | | 40 | |
Receivables: | | | | |
Securities sold | | | 318,603 | |
Dividends | | | 7,620 | |
Security investors | | | 10,629 | |
Foreign taxes recoverable | | | 1,881 | |
Prepaid expenses | | | 6,115 | |
| | | | |
Total assets | | | 4,576,807 | |
| | | | |
Liabilities: | | | | |
Cash overdraft | | | 8,484 | |
Payable for: | | | | |
Fund shares redeemed | | | 1,569 | |
Securities purchased | | | 256,866 | |
Management fees | | | 3,741 | |
Administration fees | | | 2,161 | |
Transfer agent/maintenance fees | | | 2,083 | |
Custodian fees | | | 6,500 | |
Directors’ fees | | | 131 | |
Professional fees | | | 5,910 | |
Other fees | | | 5,006 | |
| | | | |
Total liabilities | | | 292,451 | |
| | | | |
Net assets | | $ | 4,284,356 | |
| | | | |
Net assets consist of: | | | | |
Paid in capital | | $ | 5,756,753 | |
Accumulated net investment loss | | | (35,736 | ) |
Accumulated net realized loss on sale of investments and foreign currency transactions | | | (1,850,440 | ) |
Net unrealized appreciation in value of investments and translation of assets and liabilities in foreign currencies | | | 413,779 | |
| | | | |
Net assets | | $ | 4,284,356 | |
| | | | |
| |
Capital shares authorized | | | unlimited | |
Capital shares outstanding | | | 480,920 | |
Net asset value per share (net assets divided by shares outstanding) | | $ | 8.91 | |
| | | | |
| |
* Investments, at cost | | $ | 3,819,674 | |
**Cash denominated in a foreign currency, at cost | | | 39 | |
Statement of Operations
For the Six Months Ended March 31, 2010
| | | | |
Investment Income: | | | | |
Dividends (net of foreign withholding tax $1,662) | | $ | 42,019 | |
| | | | |
Total investment income | | | 42,019 | |
| | | | |
Expenses: | | | | |
Management fees | | | 22,808 | |
Administration fees | | | 9,635 | |
Transfer agent/maintenance fees | | | 4,418 | |
Custodian fees | | | 11,374 | |
Directors’ fees | | | 224 | |
Professional fees | | | 4,342 | |
Reports to shareholders | | | 2,252 | |
Registration fees | | | 7,073 | |
Other | | | 435 | |
| | | | |
Total expenses | | | 62,561 | |
Reimbursement of expenses | | | (40,357 | ) |
| | | | |
Net expenses | | | 22,204 | |
| | | | |
Net investment income | | | 19,815 | |
| | | | |
Net Realized and Unrealized Gain (Loss): | | | | |
Net realized gain (loss) during the period on: | | | | |
Investments | | | 458,018 | |
Foreign currency transactions | | | (8,164 | ) |
| | | | |
Net realized gain | | | 449,854 | |
| | | | |
Net unrealized appreciation (depreciation) during the period on: | | | | |
Investments | | | (190,592 | ) |
Translation of assets and liabilities in foreign currencies | | | 1,431 | |
| | | | |
Net unrealized depreciation | | | (189,161 | ) |
| | | | |
Net realized and unrealized gain | | | 260,693 | |
| | | | |
Net increase in net assets resulting from operations | | $ | 280,508 | |
| | | | |
| | | | |
| | 46 | | The accompanying notes are an integral part of the financial statements |
| | |
| | Rydex | SGI Equity Fund |
| Statement of Changes in Net Assets | | Global Institutional Fund |
| | | | | | | | |
| | | Six Months Ended
March 31, 2010
(unaudited) | | | Year Ended
September 30,
2009 | |
Increase (decrease) in net assets from operations: | | | | | | | | |
Net investment income | | $ | 19,815 | | | $ | 77,330 | |
Net realized gain (loss) during the period on investments and foreign currency transactions | | | 449,854 | | | | (1,936,023 | ) |
Net unrealized appreciation (depreciation) during the period on investments and translation of assets and liabilities in foreign currencies | | | (189,161 | ) | | | 1,376,356 | |
| | | | | | | | |
Net increase (decrease) in net assets resulting from operations | | | 280,508 | | | | (482,337 | ) |
| | | | | | | | |
Distributions to shareholders from: | | | | | | | | |
Net investment income | | | (97,135 | ) | | | (21,309 | ) |
| | | | | | | | |
Total distributions to shareholders | | | (97,135 | ) | | | (21,309 | ) |
| | | | | | | | |
Capital share transactions: | | | | | | | | |
Proceeds from sale of shares | | | 374,600 | | | | 1,489,252 | |
Dividends reinvested | | | 97,135 | | | | 20,899 | |
Cost of shares redeemed | | | (1,281,114 | ) | | | (3,478,142 | ) |
| | | | | | | | |
Net decrease from capital share transactions | | | (809,379 | ) | | | (1,967,991 | ) |
| | | | | | | | |
Net decrease in net assets | | | (626,006 | ) | | | (2,471,637 | ) |
| | | | | | | | |
Net assets: | | | | | | | | |
Beginning of period | | | 4,910,362 | | | | 7,381,999 | |
| | | | | | | | |
End of period | | $ | 4,284,356 | | | $ | 4,910,362 | |
| | | | | | | | |
Undistributed net investment income at end of period | | $ | (35,736 | ) | | $ | 41,584 | |
| | | | | | | | |
Capital share activity: | | | | | | | | |
Shares sold | | | 43,753 | | | | 214,539 | |
Shares reinvested | | | 11,468 | | | | 2,998 | |
Shares redeemed | | | (148,206 | ) | | | (495,421 | ) |
| | | | | | | | |
Total capital share activity | | | (92,985 | ) | | | (277,884 | ) |
| | | | | | | | |
| | | | |
| | 47 | | The accompanying notes are an integral part of the financial statements |
| | |
| Financial Highlights | | Rydex | SGI Equity Fund |
| Selected data for each share of capital stock outstanding throughout each period | | Global Institutional Fund |
| | | | | | | | | | | | |
| | | Six Months
Ended March 31,
2010a | | | 2009 | | | Year Ended
September 30,
2008b | |
Per Share Data | | | | | | | | | | | | |
Net asset value, beginning of period | | $ | 8.56 | | | $ | 8.67 | | | $ | 10.00 | |
| | | | | | | | | | | | |
Income (loss) from investment operations: | | | | | | | | | | | | |
Net investment income c | | | 0.04 | | | | 0.17 | | | | 0.02 | |
Net gain (loss) on securities (realized and unrealized) | | | 0.50 | | | | (0.25 | ) | | | (1.35 | ) |
| | | | | | | | | | | | |
Total from investment operations | | | 0.54 | | | | (0.08 | ) | | | (1.33 | ) |
| | | | | | | | | | | | |
Less distributions: | | | | | | | | | | | | |
Dividends from net investment income | | | (0.19 | ) | | | (0.03 | ) | | | — | |
| | | | | | | | | | | | |
Total distributions | | | (0.19 | ) | | | (0.03 | ) | | | — | |
| | | | | | | | | | | | |
Net asset value, end of period | | $ | 8.91 | | | $ | 8.56 | | | $ | 8.67 | |
| | | | | | | | | | | | |
Total Return | | | 6.37 | % | | | (0.90 | )% | | | (13.30 | )% |
| | | | | | | | | | | | |
Ratios/Supplemental Data | | | | | | | | | | | | |
Net assets, end of period (in thousands) | | $ | 4,284 | | | $ | 4,910 | | | $ | 7,382 | |
| | | | | | | | | | | | |
Ratios to average net assets: | | | | | | | | | | | | |
Net investment income | | | 0.87 | % | | | 2.34 | % | | | 0.87 | % |
Total expenses d | | | 2.74 | % | | | 2.76 | % | | | 1.97 | % |
Net expenses e | | | 0.97 | % | | | 1.15 | % | | | 1.15 | % |
Net expenses prior to custodian earnings credits and net of expense waivers | | | 0.97 | % | | | 1.15 | % | | | 1.15 | % |
| | | | | | | | | | | | |
Portfolio turnover rate | | | 265 | % | | | 379 | % | | | 325 | % |
| a | Unaudited figures for the six months ended March 31, 2010. Percentage amounts, except total return, have been annualized. |
| b | Security Global Institutional Fund was initially capitalized on July 11, 2008 with a net asset value of $10 per share. Percentage amounts for the period, except total return, have been annualized. |
| c | Net investment income (loss) was computed using average shares outstanding throughout the period. |
| d | Total expense information reflects the expense ratios absent expense reductions by the Investment Manager and custodian earnings credits, as applicable. |
| e | Net expense information reflects the expense ratios after voluntary expense waivers, reimbursements and custodian earnings credits, as applicable. |
| | | | |
| | 48 | | The accompanying notes are an integral part of the financial statements |
| | |
| | Rydex | SGI Equity Fund |
| Performance Summary | | Mid Cap Value Fund |
| March 31, 2010 | | (unaudited) |
PERFORMANCE
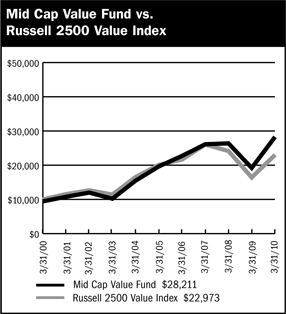
$10,000 Over 10 Years
This chart assumes a $10,000 investment in Class A shares of Mid Cap Value Fund on March 31, 2000, reflects deduction of the 5.75% sales load and assumes all dividends reinvested. The chart does not reflect the deduction of taxes that a shareholder would pay on distributions or the redemption of fund shares. The Russell 2500 Value Index is an unmanaged index that measures the performance of securities of small-to-mid cap U.S. companies with greater-than-average value orientation.
Average Annual Returns
| | | | | | | | | |
Periods Ended 3-31-10 | | 1 Year | | | 5 Years | | | 10 Years | |
A Shares | | 60.02 | % | | 7.55 | % | | 11.59 | % |
A Shares with sales charge | | 50.82 | % | | 6.29 | % | | 10.93 | % |
B Shares | | 58.81 | % | | 6.75 | % | | 10.86 | % |
B Shares with CDSC | | 53.81 | % | | 6.50 | % | | 10.86 | % |
C Shares | | 58.90 | % | | 6.75 | % | | 10.69 | % |
C Shares with CDSC | | 57.90 | % | | 6.75 | % | | 10.69 | % |
The performance data above represents past performance that is not predictive of future results. The investment return and principal value of an investment in the Fund will fluctuate so that an investor’s shares, when redeemed, may be worth more or less than their original cost. The figures above do not reflect deduction of the maximum front-end sales charge of 5.75% for Class A shares or the contingent deferred sales charge of 5% for Class B shares and 1% for Class C shares, as applicable, except where noted. The figures do not reflect the deduction of taxes that a shareholder would pay on distributions or redemption of shares. Such figures would be lower if the maximum sales charge and any applicable taxes were deducted.
Portfolio Composition by Sector as of 3-31-10
| | | |
Consumer Discretionary | | 12.21 | % |
Consumer Staples | | 4.88 | |
Energy | | 7.04 | |
Financials | | 14.13 | |
Health Care | | 3.56 | |
Industrials | | 20.58 | |
Information Technology | | 10.79 | |
Materials | | 6.91 | |
Utilities | | 12.77 | |
Exchange Traded Funds | | 1.32 | |
Convertible Bonds | | 0.52 | |
Commercial Paper | | 4.87 | |
Cash & Other Assets, Less Liabilities | | 0.42 | |
| | | |
Total Net Assets | | 100.00 | % |
| | | |
| | | | |
| | 49 | | The accompanying notes are an integral part of the financial statements |
| | |
| Schedule of Investments | | Rydex | SGI Equity Fund |
| March 31, 2010 (unaudited) | | Mid Cap Value Fund |
| | | | | |
| | | Shares | | Value |
COMMON STOCKS - 94.2% | | | | | |
Aerospace & Defense - 3.7% | | | | | |
GeoEye, Inc. * | | 844,500 | | $ | 24,912,749 |
Orbital Sciences Corporation * | | 961,080 | | | 18,270,131 |
| | | | | |
| | | | | 43,182,880 |
| | | | | |
Apparel Retail - 4.2% | | | | | |
Brown Shoe Company, Inc. | | 1,069,950 | | | 16,562,826 |
Chico’s FAS, Inc. | | 1,790,100 | | | 25,813,242 |
Talbots, Inc. * | | 446,395 | | | 5,785,279 |
| | | | | |
| | | | | 48,161,347 |
| | | | | |
Apparel, Accessories & Luxury Goods - 1.2% | | | | | |
Columbia Sportswear Company | | 6,728 | | | 353,422 |
Maidenform Brands, Inc. * | | 655,900 | | | 14,331,415 |
| | | | | |
| | | | | 14,684,837 |
| | | | | |
Asset Management & Custody Banks - 1.0% | | | | | |
Fifth Street Finance Corporation | | 1,011,932 | | | 11,748,531 |
| | | | | |
Auto Parts & Equipment - 0.0% | | | | | |
HydroGen Corporation *4,6 | | 1,265,700 | | | 30,377 |
| | | | | |
Building Products - 0.7% | | | | | |
Trex Company, Inc. * | | 359,900 | | | 7,662,271 |
| | | | | |
Casinos & Gaming - 1.1% | | | | | |
Penn National Gaming, Inc. * | | 480,000 | | | 13,344,000 |
| | | | | |
Coal & Consumable Fuels - 0.6% |
USEC, Inc. * | | 1,214,730 | | | 7,008,992 |
| | | | | |
Communications Equipment -1.0% |
EF Johnson Technologies, Inc. *6 | | 870,000 | | | 811,101 |
Symmetricom, Inc. *6 | | 1,910,270 | | | 11,136,874 |
| | | | | |
| | | | | 11,947,975 |
| | | | | |
Construction & Engineering - 5.3% |
Insituform Technologies, Inc. * | | 984,300 | | | 26,192,222 |
Quanta Services, Inc. * | | 1,032,600 | | | 19,784,616 |
URS Corporation * | | 338,300 | | | 16,783,063 |
| | | | | |
| | | | | 62,759,901 |
| | | | | |
Construction & Farm Machinery & Heavy Trucks - 1.0% | | | | | |
Force Protection, Inc. * | | 2,043,525 | | | 12,302,021 |
| | | | | |
Construction Materials - 0.3% | | | | | |
Eagle Materials, Inc. | | 117,115 | | | 3,108,232 |
| | | | | |
Consumer Finance - 0.3% | | | | | |
First Marblehead Corporation * | | 1,117,473 | | | 3,173,623 |
| | | | | |
Data Processing & Outsourced Services - 3.5% | | | | | |
Computer Sciences Corporation * | | 761,000 | | | 41,466,889 |
| | | | | |
Diversified REIT’s - 0.8% | | | | | |
Investors Real Estate Trust | | 1,025,492 | | | 9,249,938 |
| | | | | |
Electric Utilities - 6.1% | | | | | |
Allete, Inc. | | 424,757 | | | 14,220,864 |
Great Plains Energy, Inc. | | 953,117 | | | 17,699,383 |
Northeast Utilities | | 562,060 | | | 15,535,338 |
Pepco Holdings, Inc. | | 408,400 | | | 7,004,060 |
| | | | | |
| | | Shares | | Value |
COMMON STOCKS - 94.2% (continued) |
Electric Utilities - 6.1% (continued) |
Westar Energy, Inc. | | 739,800 | | $ | 16,497,540 |
| | | | | |
| | | | | 70,957,185 |
| | | | | |
Electrical Components & Equipment - 1.5% | | | | | |
General Cable Corporation * | | 565,900 | | | 15,279,300 |
UQM Technologies, Inc. * | | 517,722 | | | 2,179,610 |
| | | | | |
| | | | | 17,458,910 |
| | | | | |
Electronic Components - 1.8% | | | | | |
Power-One, Inc. *4 | | 5,122,200 | | | 21,615,684 |
| | | | | |
Electronic Manufacturing Services - 1.6% | | | | | |
Maxwell Technologies, Inc. *4 | | 1,477,200 | | | 18,302,508 |
| | | | | |
Environmental & Facilities Services - 1.4% | | | | | |
Covanta Holding Corporation * | | 973,000 | | | 16,210,180 |
| | | | | |
Exchange Traded Funds - 1.3% | | | | | |
iShares Russell Midcap Value Index Fund | | 300,000 | | | 12,099,000 |
iShares S&P Mid Cap 400 | | 48,395 | | | 3,452,015 |
| | | | | |
| | | | | 15,551,015 |
| | | | | |
Forest Products - 1.6% | | | | | |
Louisiana-Pacific Corporation * | | 2,079,300 | | | 18,817,665 |
| | | | | |
Gas Utilities - 2.1% | | | | | |
Atmos Energy Corporation | | 508,000 | | | 14,513,560 |
UGI Corporation | | 386,242 | | | 10,250,863 |
| | | | | |
| | | | | 24,764,423 |
| | | | | |
Health Care Equipment - 1.2% | | | | | |
Hologic, Inc. * | | 737,801 | | | 13,678,831 |
| | | | | |
Health Care Services - 2.4% | | | | | |
Mednax, Inc. * | | 345,500 | | | 20,104,645 |
RehabCare Group, Inc. * | | 293,530 | | | 8,004,563 |
| | | | | |
| | | | | 28,109,208 |
| | | | | |
Home Furnishings - 1.2% | | | | | |
Leggett & Platt, Inc. | | 668,800 | | | 14,472,832 |
| | | | | |
Human Resources & Employment Services - 1.1% | | | | | |
Administaff, Inc. | | 595,000 | | | 12,697,300 |
| | | | | |
Industrial Conglomerates - 2.1% | | | | | |
McDermott International, Inc. * | | 921,300 | | | 24,801,396 |
| | | | | |
Industrial Machinery - 0.9% | | | | | |
Harsco Corporation | | 315,300 | | | 10,070,682 |
Thermoenergy Corporation *4,6 | | 2,701,839 | | | 756,515 |
| | | | | |
| | | | | 10,827,197 |
| | | | | |
Insurance Brokers - 0.4% | | | | | |
Arthur J Gallagher & Company | | 189,000 | | | 4,639,950 |
| | | | | |
IT Consulting & Other Services - 0.7% |
Satyam Computer Services, Ltd. ADR | | 1,482,112 | | | 7,736,625 |
| | | | | |
Mortgage REIT’s - 0.4% | | | | | |
Bimini Capital Management, Inc. *6 | | 473,362 | | | 468,155 |
| | | | |
| | 50 | | The accompanying notes are an integral part of the financial statements |
| | |
| Schedule of Investments | | Rydex | SGI Equity Fund |
| March 31, 2010 (unaudited) | | Mid Cap Value Fund |
| | | | | |
| | | Shares | | Value |
COMMON STOCKS - 94.2% (continued) |
Mortgage REIT’s - 0.4% (continued) |
Redwood Trust, Inc. | | 285,027 | | $ | 4,395,116 |
| | | | | |
| | | | | 4,863,271 |
| | | | | |
Multi-Line Insurance - 1.5% | | | | | |
American Financial Group, Inc. 5 | | 629,400 | | | 17,906,430 |
| | | | | |
Multi-Utilities - 4.6% | | | | | |
Alliant Energy Corporation | | 547,300 | | | 18,203,198 |
Black Hills Corporation | | 397,000 | | | 12,048,950 |
Northwestern Corporation | | 603,100 | | | 16,169,111 |
SCANA Corporation | | 210,000 | | | 7,893,900 |
| | | | | |
| | | | | 54,315,159 |
| | | | | |
Office REIT’s - 0.5% | | | | | |
Lexington Realty Trust | | 968,000 | | | 6,301,680 |
| | | | | |
Office Services & Supplies - 0.4% |
United Stationers, Inc. * | | 77,729 | | | 4,574,352 |
| | | | | |
Oil & Gas Drilling - 0.5% | | | | | |
Helmerich & Payne, Inc. | | 148,600 | | | 5,658,688 |
| | | | | |
Oil & Gas Equipment & Services - 2.3% | | | | | |
Complete Production Services, Inc. * | | 261,400 | | | 3,019,170 |
Global Industries, Ltd. * | | 3,973,500 | | | 25,509,870 |
| | | | | |
| | | | | 28,529,040 |
| | | | | |
Oil & Gas Exploration & Production - 1.7% | | | | | |
Goodrich Petroleum Corporation * | | 159,569 | | | 2,495,659 |
Gulfport Energy Corporation * | | 664,000 | | | 7,463,360 |
Petrohawk Energy Corporation * | | 473,300 | | | 9,598,524 |
| | | | | |
| | | | | 19,557,543 |
| | | | | |
Oil & Gas Storage & Transportation - 1.9% | | | | | |
Southern Union Company | | 866,360 | | | 21,979,553 |
| | | | | |
Packaged Foods & Meats - 4.9% |
Del Monte Foods Company | | 688,300 | | | 10,049,180 |
Hormel Foods Corporation 5 | | 376,600 | | | 15,820,966 |
JM Smucker Company | | 395,300 | | | 23,820,778 |
Ralcorp Holdings, Inc. * | | 113,200 | | | 7,672,696 |
| | | | | |
| | | | | 57,363,620 |
| | | | | |
Paper Packaging - 3.6% | | | | | |
Bemis Company, Inc. | | 940,800 | | | 27,019,776 |
Sonoco Products Company | | 517,200 | | | 15,924,588 |
| | | | | |
| | | | | 42,944,364 |
| | | | | |
Property & Casualty Insurance - 6.0% |
Allegheny Corporation * | | 60,021 | | | 17,568,712 |
Employers Holdings, Inc. | | 382,300 | | | 5,677,155 |
Hanover Insurance Group, Inc. | | 607,000 | | | 26,471,270 |
W.R. Berkley Corporation | | 776,100 | | | 20,248,449 |
| | | | | |
| | | | | 69,965,586 |
| | | | | |
Regional Banks - 3.2% | | | | | |
Associated Banc-Corporation | | 1,067,807 | | | 14,735,737 |
Commerce Bancshares, Inc. | | 207,532 | | | 8,537,866 |
First Horizon National Corporation * | | 192,624 | | | 2,706,366 |
Old National Bancorp | | 1,015,822 | | | 12,139,073 |
| | | | | |
| | | | | 38,119,042 |
| | | | | |
| | | | | | |
| | | Shares | | Value |
COMMON STOCKS - 94.2% (continued) |
Research & Consulting Services - 1.8% |
ICF International, Inc. * | | | 355,700 | | $ | 8,835,588 |
Navigant Consulting, Inc. * | | | 1,057,500 | | | 12,827,475 |
| | | | | | |
| | | | | | 21,663,063 |
| | | | | | |
Restaurants - 2.3% | | | | | | |
Burger King Holdings, Inc. | | | 838,651 | | | 17,829,720 |
Jack in the Box, Inc. * | | | 375,000 | | | 8,831,250 |
| | | | | | |
| | | | | | 26,660,970 |
| | | | | | |
Semiconductor Equipment - 0.5% |
FEI Company * | | | 59,927 | | | 1,372,928 |
Ultratech, Inc. * | | | 316,200 | | | 4,300,320 |
| | | | | | |
| | | | | | 5,673,248 |
| | | | | | |
Semiconductors - 1.7% | | | | | | |
IXYS Corporation *4,6 | | | 2,340,000 | | | 19,983,600 |
| | | | | | |
Specialty Chemicals - 1.4% | | | | | | |
HB Fuller Company | | | 250,000 | | | 5,802,500 |
Landec Corporation *6 | | | 861,716 | | | 5,713,177 |
Zoltek Companies, Inc. * | | | 501,000 | | | 4,829,640 |
| | | | | | |
| | | | | | 16,345,317 |
| | | | | | |
Specialty Stores - 2.2% | | | | | | |
Cabela’s, Inc. * | | | 1,489,693 | | | 26,054,731 |
| | | | | | |
Trucking - 0.7% | | | | | | |
Saia, Inc. * | | | 551,770 | | | 7,658,568 |
| | | | | | |
TOTAL COMMON STOCKS (cost $974,499,030) | | $ | 1,106,590,548 |
| | | | | | |
| | |
| | | Shares | | Value |
WARRANTS - 0.0% | | | | | | |
Nova Biosource Fuels, Inc. $2.40, 7/5/2011 1 | | | 677,450 | | $ | 1,571 |
| | | | | | |
TOTAL WARRANTS (cost $699,774) | | | | | $ | 1,571 |
| | | | | | |
| | |
| | | Principal
Amount | | Value |
CONVERTIBLE BONDS - 0.5% |
Metals & Minerals - 0.5% | | | | | | |
USEC, Inc.
3.00%, 2014 1 | | $ | 7,600,000 | | $ | 6,137,000 |
| | | | | | |
TOTAL CONVERTIBLE BONDS (cost $7,600,000) | | | | | $ | 6,137,000 |
| | | | | | |
| | |
| | | Principal
Amount | | Value |
COMMERCIAL PAPER - 4.9% |
Diversified Manufacturing - 0.8% |
General Electric Company
0.11%, 04/15/2010 1 | | $ | 9,000,000 | | $ | 8,999,615 |
| | | | | | |
Food & Beverage - 2.4% | | | | | | |
Nestle Capital Corporation
0.11%, 04/01/2010 1,2 | | | 6,000,000 | | | 6,000,000 |
0.12%, 04/06/2010 1,2 | | | 7,780,000 | | | 7,779,870 |
0.14%, 04/07/2010 1,2 | | | 6,000,000 | | | 5,999,860 |
PepsiCo, Inc.
0.11%, 04/05/2010 1 | | | 8,000,000 | | | 7,999,903 |
| | | | | | |
| | | | | | 27,779,633 |
| | | | | | |
Non U.S. Banking - 1.7% | | | | | | |
Barclays Funding LLC
0.13%, 04/08/2010 1 | | | 8,000,000 | | | 7,999,798 |
| | | | |
| | 51 | | The accompanying notes are an integral part of the financial statements |
| | |
| Schedule of Investments | | Rydex | SGI Equity Fund |
| March 31, 2010 (unaudited) | | Mid Cap Value Fund |
| | | | | | |
| | | Principal
Amount | | Value |
COMMERCIAL PAPER - 4.9% (continued) |
Non U.S. Banking - 1.7% (continued) |
BNP Paribas Finance, Inc, 0.13%, 04/07/2010 1 | | $ | 9,000,000 | | $ | 8,999,804 |
Societe Generale
0.15%, 04/07/2010 1 | | | 3,500,000 | | | 3,499,913 |
| | | | | | |
| | | | | | 20,499,515 |
| | | | | | |
TOTAL COMMERCIAL PAPER (cost $57,278,763) | | | | | $ | 57,278,763 |
| | | | | | |
Total Investments - 99.6% 3 (cost $1,040,077,567) | | $ | 1,170,007,882 |
Cash & Other Assets, Less Liabilities - 0.4% | | | | | | 4,967,665 |
| | | | | | |
Total Net Assets - 100.0% | | | | | $ | 1,174,975,547 |
| | | | | | |
For federal income tax purposes the identified cost of investments owned at March 31, 2010 was $1,050,298,359.
| | | | |
ADR | | | | American Depositary Receipt |
| * | Non-income producing security |
| 1 | Value determined based on Level 2 inputs. |
| 2 | Security is a 144A or Section 4(2) security. The total market value of 144A or Section 4(2) securities is $19,779,730 (cost $19,779,730), or 1.7% of total net assets. |
| 3 | Unless otherwise indicated, the values of the securities of the Portfolio are determined based on Level 1 inputs. |
| 4 | Investment in an affiliated issuer. See Note 8 in the Notes to Financial Statements. |
| 5 | Security is segregated as collateral for open written option contracts. |
| 6 | Security is deemed illiquid. The total market value of illiquid securities is $38,899,799 (cost $61,110,833), or 3.3% or total net assets. |
| | | | |
| | 52 | | The accompanying notes are an integral part of the financial statements |
| | |
| | Rydex | SGI Equity Fund |
| | Mid Cap Value Fund (unaudited) |
Statement of Assets and Liabilities
March 31, 2010
| | | | |
Assets: | | | | |
Investments in unaffiliated issues, at value * | | $ | 1,109,319,198 | |
Investments in affiliated issues, at value ** | | | 60,688,684 | |
| | | | |
Total investments | | | 1,170,007,882 | |
Cash | | | 2,924,943 | |
Receivables: | | | | |
Fund shares sold | | | 4,733,561 | |
Securities sold | | | 181,902 | |
Interest | | | 114,000 | |
Dividends | | | 1,247,761 | |
Prepaid expenses | | | 97,716 | |
| | | | |
Total assets | | | 1,179,307,765 | |
| | | | |
Liabilities: | | | | |
Payable for: | | | | |
Securities purchased | | | 801,408 | |
Fund shares redeemed | | | 1,511,787 | |
Written options, at value
(premiums received, $305,623) | | | 21,120 | |
Management fees | | | 774,975 | |
Transfer agent/maintenance fees | | | 109,195 | |
Administration fees | | | 93,183 | |
Professional fees | | | 54,250 | |
12b-l distribution plan fees | | | 386,944 | |
Other | | | 579,356 | |
| | | | |
Total liabilities | | | 4,332,218 | |
| | | | |
Net assets | | $ | 1,174,975,547 | |
| | | | |
Net assets consist of: | | | | |
Paid in capital | | $ | 1,132,716,580 | |
Undistributed net investment income | | | 1,453,901 | |
Accumulated net realized loss on sale of investments | | | (89,409,753 | ) |
Net unrealized appreciation in value of investments | | | 130,214,819 | |
| | | | |
Net assets | | $ | 1,174,975,547 | |
| | | | |
Class A: | | | | |
Capital shares outstanding
(unlimited number of shares authorized) | | | 32,522,973 | |
Net assets | | $ | 946,300,731 | |
Net asset value and redemption price per share | | $ | 29.10 | |
| | | | |
Maximum offering price per share (net asset value divided by 94.25%) | | $ | 30.88 | |
| | | | |
Class B: | | | | |
Capital shares outstanding
(unlimited number of shares authorized) | | | 2,135,382 | |
Net assets | | $ | 53,113,794 | |
Net asset value, offering and redemption price per share (excluding any applicable contingent deferred sales charge) | | $ | 24.87 | |
| | | | |
Class C: | | | | |
Capital shares outstanding
(unlimited number of shares authorized) | | | 6,850,361 | |
Net assets | | $ | 175,561,022 | |
Net asset value, offering and redemption price per share (excluding any applicable contingent deferred sales charge) | | $ | 25.63 | |
| | | | |
*Investments in unaffiliated issues, at cost | | $ | 974,132,665 | |
**lnvestments in affiliated issues, at cost | | | 65,944,902 | |
| | | | |
Total cost | | $ | 1,040,077,567 | |
Statement of Operations
For the Six Months Ended March 31, 2010
| | | | |
Investment Income: | | | | |
Dividends from securities of unaffiliated issuers | | $ | 9,596,258 | |
Interest | | | 134,494 | |
| | | | |
Total investment income | | | 9,730,752 | |
| | | | |
Expenses: | | | | |
Management fees | | | 4,252,854 | |
Transfer agent/maintenance fees | | | 1,008,707 | |
Administration fees | | | 507,899 | |
Custodian fees | | | 20,633 | |
Directors’ fees | | | 51,366 | |
Professional fees | | | 78,615 | |
Reports to shareholders | | | 91,149 | |
Registration fees | | | 50,910 | |
Other expenses | | | 26,400 | |
12b-l distribution fees - Class A | | | 1,074,343 | |
12b-l distribution fees - Class B | | | 273,427 | |
12b-l distribution fees - Class C | | | 767,253 | |
| | | | |
Total expenses | | | 8,203,556 | |
| | | | |
Net investment income | | | 1,527,196 | |
| | | | |
Net Realized and Unrealized Gain (Loss): | | | | |
Net realized gain (loss) during the period on: | | | | |
Investments | | | 3,362,207 | |
Investment transactions of affiliated issuers | | | (9,930,929 | ) |
Options written | | | 2,579,834 | |
| | | | |
Net realized loss | | | (3,988,888 | ) |
| | | | |
Net unrealized appreciation (depreciation) during the period on: | | | | |
Investments | | | 103,573,076 | |
Options written | | | (282,461 | ) |
| | | | |
Net unrealized appreciation | | | 103,290,615 | |
| | | | |
Net realized and unrealized gain | | | 99,301,727 | |
| | | | |
Net increase in net assets resulting from operations | | $ | 100,828,923 | |
| | | | |
| | | | |
| | 53 | | The accompanying notes are an integral part of the financial statements |
| | |
| | Rydex | SGI Equity Fund |
| Statement of Changes in Net Assets | | Mid Cap Value Fund |
| | | | | | | | |
| | | Six Months Ended
March 31, 2010
(unaudited) | | | Year Ended
September 30,
2009 | |
Increase (decrease) in net assets from operations: | | | | | | | | |
Net investment income | | $ | 1,527,196 | | | $ | 1,892,720 | |
Net realized loss during the period on investments | | | (3,988,888 | ) | | | (84,154,831 | ) |
Net unrealized appreciation during the period on investments | | | 103,290,615 | | | | 155,944,161 | |
| | | | | | | | |
Net increase in net assets resulting from operations | | | 100,828,923 | | | | 73,682,050 | |
| | | | | | | | |
Distributions to shareholders from: | | | | | | | | |
Net investment income | | | | | | | | |
Class A | | | (1,178,918 | ) | | | (3,569,957 | ) |
Net realized gain | | | | | | | | |
Class A | | | — | | | | (68,549,175 | ) |
Class B | | | — | | | | (6,651,443 | ) |
Class C | | | — | | | | (11,126,589 | ) |
| | | | | | | | |
Total distributions to shareholders | | | (1,178,918 | ) | | | (89,897,164 | ) |
| | | | | | | | |
Capital share transactions: | | | | | | | | |
Proceeds from sale of shares | | | | | | | | |
Class A | | | 249,496,229 | | | | 388,375,263 | |
Class B | | | 1,888,664 | | | | 7,862,714 | |
Class C | | | 32,729,637 | | | | 46,299,086 | |
Distributions reinvested | | | | | | | | |
Class A | | | 1,064,400 | | | | 67,810,290 | |
Class B | | | — | | | | 6,316,674 | |
Class C | | | — | | | | 10,539,574 | |
Cost of shares redeemed | | | | | | | | |
Class A | | | (166,857,444 | ) | | | (325,079,843 | ) |
Class B | | | (11,729,101 | ) | | | (16,824,893 | ) |
Class C | | | (10,491,968 | ) | | | (25,735,329 | ) |
| | | | | | | | |
Net increase from capital share transactions | | | 96,100,417 | | | | 159,563,536 | |
| | | | | | | | |
Net increase in net assets | | | 195,750,422 | | | | 143,348,422 | |
| | | | | | | | |
Net assets: | | | | | | | | |
Beginning of period | | | 979,225,125 | | | | 835,876,703 | |
| | | | | | | | |
End of period | | $ | 1,174,975,547 | | | $ | 979,225,125 | |
| | | | | | | | |
Undistributed net investment income at end of period | | $ | 1,453,901 | | | $ | 1,105,623 | |
| | | | | | | | |
Capital share activity: | | | | | | | | |
Shares sold | | | | | | | | |
Class A | | | 9,172,033 | | | | 18,036,421 | |
Class B | | | 81,213 | | | | 420,635 | |
Class C | | | 1,360,119 | | | | 2,271,053 | |
Shares reinvested | | | | | | | | |
Class A | | | 38,861 | | | | 3,546,564 | |
Class B | | | — | | | | 383,293 | |
Class C | | | — | | | | 620,705 | |
Shares redeemed | | | | | | | | |
Class A | | | (6,099,099 | ) | | | (15,264,008 | ) |
Class B | | | (501,833 | ) | | | (931,362 | ) |
Class C | | | (437,650 | ) | | | (1,403,785 | ) |
| | | | |
| | 54 | | The accompanying notes are an integral part of the financial statements |
| | |
| Financial Highlights | | Rydex | SGI Equity Fund |
| Selected data for each share of capital stock outstanding throughout each period | | Mid Cap Value Fund |
| | | | | | | | | | | | | | | | | | | | | | | | |
Class A | | Six Months
Ended March 31,
2010a | | | 2009 | | | 2008 | | | 2007 | | | 2006 | | | Year Ended
September 30,
2005 | |
Per Share Data | | | | | | | | | | | | | | | | | | | | | | | | |
Net asset value, beginning of period | | $ | 26.58 | | | $ | 28.41 | | | $ | 40.79 | | | $ | 38.27 | | | $ | 36.34 | | | $ | 30.45 | |
| | | | | | | | | | | | | | | | | | | | | | | | |
Income (loss) from investment operations: | | | | | | | | | | | | | | | | | | | | | | | | |
Net investment income b | | | 0.06 | | | | 0.08 | | | | 0.25 | | | | 0.25 | | | | 0.04 | | | | 0.01 | |
Net gain (loss) on securities (realized and unrealized) | | | 2.50 | | | | 0.82 | | | | (4.77 | ) | | | 4.59 | | | | 3.96 | | | | 8.16 | |
| | | | | | | | | | | | | | | | | | | | | | | | |
Total from investment operations | | | 2.56 | | | | 0.90 | | | | (4.52 | ) | | | 4.84 | | | | 4.00 | | | | 8.17 | |
| | | | | | | | | | | | | | | | | | | | | | | | |
Less distributions: | | | | | | | | | | | | | | | | | | | | | | | | |
Dividends from net investment income | | | (0.04 | ) | | | (0.14 | ) | | | (0.14 | ) | | | (0.23 | ) | | | — | | | | — | |
Distributions from realized gains | | | — | | | | (2.59 | ) | | | (7.72 | ) | | | (2.09 | ) | | | (2.07 | ) | | | (2.28 | ) |
| | | | | | | | | | | | | | | | | | | | | | | | |
Total distributions | | | (0.04 | ) | | | (2.73 | ) | | | (7.86 | ) | | | (2.32 | ) | | | (2.07 | ) | | | (2.28 | ) |
| | | | | | | | | | | | | | | | | | | | | | | | |
Net asset value, end of period | | $ | 29.10 | | | $ | 26.58 | | | $ | 28.41 | | | $ | 40.79 | | | $ | 38.27 | | | $ | 36.34 | |
| | | | | | | | | | | | | | | | | | | | | | | | |
Total Return c | | | 9.63 | % | | | 6.90 | % | | | (12.48 | )% | | | 12.96 | % | | | 11.44 | % | | | 27.77 | % |
| | | | | | | | | | | | | | | | | | | | | | | | |
Ratios/Supplemental Data | | | | | | | | | | | | | | | | | | | | | | | | |
Net assets, end of period (in thousands) | | $ | 946,301 | | | $ | 781,883 | | | $ | 656,044 | | | $ | 687,484 | | | $ | 596,074 | | | $ | 373,031 | |
| | | | | | | | | | | | | | | | | | | | | | | | |
Ratios to average net assets: | | | | | | | | | | | | | | | | | | | | | | | | |
Net investment income | | | 0.43 | % | | | 0.39 | % | | | 0.79 | % | | | 0.61 | % | | | 0.10 | % | | | 0.04 | % |
Total expenses d | | | 1.39 | % | | | 1.48 | % | | | 1.37 | % | | | 1.32 | % | | | 1.36 | % | | | 1.41 | % |
Net expenses e | | | 1.39 | % | | | 1.48 | % | | | 1.37 | % | | | 1.32 | % | | | 1.36 | % | | | 1.41 | % |
Net expenses prior to custodian earning credits and net of expense waivers | | | 1.39 | % | | | 1.48 | % | | | 1.37 | % | | | 1.32 | % | | | 1.36 | % | | | 1.41 | % |
| | | | | | | | | | | | | | | | | | | | | | | | |
Portfolio turnover rate | | | 28 | % | | | 31 | % | | | 68 | % | | | 44 | % | | | 33 | % | | | 19 | % |
| | | | | | |
Class B | | Six Months
Ended March 31,
2010a | | | 2009 | | | 2008 | | | 2007 | | | 2006 | | | Year Ended
September 30,
2005 | |
Per Share Data | | | | | | | | | | | | | | | | | | | | | | | | |
Net asset value, beginning of period | | $ | 22.78 | | | $ | 24.83 | | | $ | 36.78 | | | $ | 34.76 | | | $ | 33.43 | | | $ | 28.37 | |
| | | | | | | | | | | | | | | | | | | | | | | | |
Income (loss) from investment operations: | | | | | | | | | | | | | | | | | | | | | | | | |
Net investment loss b | | | (0.04 | ) | | | (0.06 | ) | | | — | | | | (0.04 | ) | | | (0.23 | ) | | | (0.22 | ) |
Net gain (loss) on securities (realized and unrealized) | | | 2.13 | | | | 0.60 | | | | (4.23 | ) | | | 4.15 | | | | 3.63 | | | | 7.56 | |
| | | | | | | | | | | | | | | | | | | | | | | | |
Total from investment operations | | | 2.09 | | | | 0.54 | | | | (4.23 | ) | | | 4.11 | | | | 3.40 | | | | 7.34 | |
| | | | | | | | | | | | | | | | | | | | | | | | |
Less distributions: | | | | | | | | | | | | | | | | | | | | | | | | |
Distributions from realized gains | | | — | | | | (2.59 | ) | | | (7.72 | ) | | | (2.09 | ) | | | (2.07 | ) | | | (2.28 | ) |
| | | | | | | | | | | | | | | | | | | | | | | | |
Total distributions | | | — | | | | (2.59 | ) | | | (7.72 | ) | | | (2.09 | ) | | | (2.07 | ) | | | (2.28 | ) |
| | | | | | | | | | | | | | | | | | | | | | | | |
Net asset value, end of period | | $ | 24.87 | | | $ | 22.78 | | | $ | 24.83 | | | $ | 36.78 | | | $ | 34.76 | | | $ | 33.43 | |
| | | | | | | | | | | | | | | | | | | | | | | | |
Total Return c | | | 9.17 | % | | | 6.17 | % | | | (13.14 | )% | | | 12.10 | % | | | 10.60 | % | | | 26.83 | % |
| | | | | | | | | | | | | | | | | | | | | | | | |
Ratios/Supplemental Data | | | | | | | | | | | | | | | | | | | | | | | | |
Net assets, end of period (in thousands) | | $ | 53,114 | | | $ | 58,221 | | | $ | 66,641 | | | $ | 106,179 | | | $ | 108,784 | | | $ | 97,664 | |
| | | | | | | | | | | | | | | | | | | | | | | | |
Ratios to average net assets: | | | | | | | | | | | | | | | | | | | | | | | | |
Net investment loss | | | (0.35 | )% | | | (0.34 | )% | | | (0.01 | )% | | | (0.10 | )% | | | (0.68 | )% | | | (0.72 | )% |
Total expenses d | | | 2.14 | % | | | 2.23 | % | | | 2.12 | % | | | 2.07 | % | | | 2.11 | % | | | 2.16 | % |
Net expenses e | | | 2.14 | % | | | 2.23 | % | | | 2.12 | % | | | 2.07 | % | | | 2.11 | % | | | 2.16 | % |
Net expenses prior to custodian earning credits and net of expense waivers | | | 2.14 | % | | | 2.23 | % | | | 2.12 | % | | | 2.07 | % | | | 2.11 | % | | | 2.16 | % |
| | | | | | | | | | | | | | | | | | | | | | | | |
Portfolio turnover rate | | | 28 | % | | | 31 | % | | | 68 | % | | | 44 | % | | | 33 | % | | | 19 | % |
| | | | |
| | 55 | | The accompanying notes are an integral part of the financial statements |
| | |
| Financial Highlights | | Rydex | SGI Equity Fund |
| Selected data for each share of capital stock outstanding throughout each period | | Mid Cap Value Fund |
| | | | | | | | | | | | | | | | | | | | | | | | |
Class C | | Six Months
Ended March 31,
2010a | | | 2009 | | | 2008 | | | 2007 | | | 2006 | | | Year Ended
September 30,
2005 | |
Per Share Data | | | | | | | | | | | | | | | | | | | | | | | | |
Net asset value, beginning of period | | $ | 23.47 | | | $ | 25.49 | | | $ | 37.54 | | | $ | 35.43 | | | $ | 34.03 | | | $ | 28.85 | |
| | | | | | | | | | | | | | | | | | | | | | | | |
Income (loss) from investment operations: | | | | | | | | | | | | | | | | | | | | | | | | |
Net investment loss b | | | (0.04 | ) | | | (0.07 | ) | | | — | | | | (0.05 | ) | | | (0.22 | ) | | | (0.21 | ) |
Net gain (loss) on securities (realized and unrealized) | | | 2.20 | | | | 0.64 | | | | (4.33 | ) | | | 4.25 | | | | 3.69 | | | | 7.67 | |
| | | | | | | | | | | | | | | | | | | | | | | | |
Total from investment operations | | | 2.16 | | | | 0.57 | | | | (4.33 | ) | | | 4.20 | | | | 3.47 | | | | 7.46 | |
| | | | | | | | | | | | | | | | | | | | | | | | |
Less distributions: | | | | | | | | | | | | | | | | | | | | | | | | |
Distributions from realized gains | | | — | | | | (2.59 | ) | | | (7.72 | ) | | | (2.09 | ) | | | (2.07 | ) | | | (2.28 | ) |
| | | | | | | | | | | | | | | | | | | | | | | | |
Total distributions | | | — | | | | (2.59 | ) | | | (7.72 | ) | | | (2.09 | ) | | | (2.07 | ) | | | (2.28 | ) |
| | | | | | | | | | | | | | | | | | | | | | | | |
Net asset value, end of period | | $ | 25.63 | | | $ | 23.47 | | | $ | 25.49 | | | $ | 37.54 | | | $ | 35.43 | | | $ | 34.03 | |
| | | | | | | | | | | | | | | | | | | | | | | | |
Total Return c | | | 9.20 | % | | | 6.13 | % | | | (13.15 | )% | | | 12.13 | % | | | 10.62 | % | | | 26.80 | % |
| | | | | | | | | | | | | | | | | | | | | | | | |
Ratios/Supplemental Data | | | | | | | | | | | | | | | | | | | | | | | | |
Net assets, end of period (in thousands) | | $ | 175,561 | | | $ | 139,121 | | | $ | 113,192 | | | $ | 176,746 | | | $ | 152,579 | | | $ | 93,887 | |
| | | | | | | | | | | | | | | | | | | | | | | | |
Ratios to average net assets: | | | | | | | | | | | | | | | | | | | | | | | | |
Net investment loss | | | (0.31 | )% | | | (0.35 | )% | | | (0.01 | )% | | | (0.12 | )% | | | (0.65 | )% | | | (0.71 | )% |
Total expenses d | | | 2.14 | % | | | 2.22 | % | | | 2.12 | % | | | 2.07 | % | | | 2.11 | % | | | 2.16 | % |
Net expenses e | | | 2.14 | % | | | 2.22 | % | | | 2.12 | % | | | 2.07 | % | | | 2.11 | % | | | 2.16 | % |
Net expenses prior to custodian earning credits and net of expense waivers | | | 2.14 | % | | | 2.22 | % | | | 2.12 | % | | | 2.07 | % | | | 2.11 | % | | | 2.16 | % |
| | | | | | | | | | | | | | | | | | | | | | | | |
Portfolio turnover rate | | | 28 | % | | | 31 | % | | | 68 | % | | | 44 | % | | | 33 | % | | | 19 | % |
| a | Unaudited figures for the six months ended March 31, 2010. Percentage amounts for the period, except total return, have been annualized. |
| b | Net investment income (loss) was computed using average shares outstanding throughout the period. |
| c | Total return information does not reflect deduction of any sales charges imposed at the time of purchase for Class A shares or upon redemption for Class B and C shares. |
| d | Total expense information reflects expense ratios absent expense reductions by the Investment Manager and custodian earnings credits, as applicable. |
| e | Net expense information reflects the expense ratios after voluntary expense waivers, reimbursements and custodian earnings credits, as applicable. |
| | | | |
| | 56 | | The accompanying notes are an integral part of the financial statements |
| | |
| | Rydex | SGI Equity Fund |
| Performance Summary | | Mid Cap Value Institutional Fund |
| March 31, 2010 | | (unaudited) |
PERFORMANCE
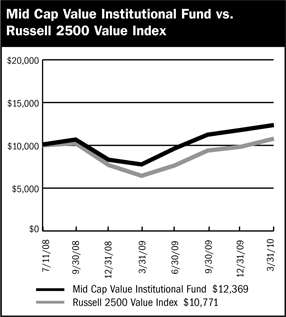
$10,000 Since Inception
This chart assumes a $10,000 investment in shares of Mid Cap Value Institutional Fund on July 11, 2008 (date of Inception) and assumes all dividends reinvested. The chart does not reflect the deduction of taxes that a shareholder would pay on distributions or the redemption of fund shares. The Russell 2500 Value Index is an unmanaged index that measures the performance of securities of small-to-mid cap U.S. companies with greater-than-average value orientation.
Average Annual Returns
| | | | | | |
Periods Ended 3-31-10 | | 1 Year | | | Since Inception
(7-11-08) | |
Mid Cap Value Institutional Fund | | 59.14 | % | | 13.15 | % |
The performance data above represents past performance that is not predictive of future results. The investment return and principal value of an investment in the Fund will fluctuate so that an investor’s shares, when redeemed, may be worth more or less than their original cost. The figures do not reflect the deduction of taxes that a shareholder would pay on distributions or redemption of shares. Such figures would be lower any applicable taxes were deducted. Fee waivers and/or reimbursements reduced expenses of the Fund and in the absence of such waiver, the performance quoted would be reduced.
Portfolio Composition by Sector as of 3-31-10
| | | |
Consumer Discretionary | | 11.40 | % |
Consumer Staples | | 4.76 | |
Energy | | 6.94 | |
Financials | | 14.25 | |
Health Care | | 3.48 | |
Industrials | | 20.14 | |
Information Technology | | 10.07 | |
Materials | | 6.93 | |
Utilities | | 12.49 | |
Exchange Traded Funds | | 4.77 | |
Commercial Paper | | 5.78 | |
Liabilities, Less Cash & Other Assets | | (1.01 | ) |
| | | |
Total Net Assets | | 100.00 | % |
| | | |
| | | | |
| | 57 | | The accompanying notes are an integral part of the financial statements |
| | |
| Schedule of Investments | | Rydex | SGI Equity Fund |
| March 31, 2010 (unaudited) | | Mid Cap Value Institutional Fund |
| | | | | |
| | | Shares | | Value |
COMMON STOCKS - 95.2% | | | | | |
Aerospace & Defense - 3.5% | | | | | |
GeoEye, Inc. * | | 271,600 | | $ | 8,012,200 |
Orbital Sciences Corporation * | | 311,558 | | | 5,922,718 |
| | | | | |
| | | | | 13,934,918 |
| | | | | |
Apparel Retail - 3.6% | | | | | |
Brown Shoe Company, Inc. | | 341,300 | | | 5,283,324 |
Chico’s FAS, Inc. | | 579,400 | | | 8,354,948 |
Talbots, Inc. * | | 55,987 | | | 725,592 |
| | | | | |
| | | | | 14,363,864 |
| | | | | |
Apparel, Accessories & Luxury Goods - 1.2% | | | | | |
Columbia Sportswear Company | | 2,140 | | | 112,414 |
Maidenform Brands, Inc. * | | 209,900 | | | 4,586,315 |
| | | | | |
| | | | | 4,698,729 |
| | | | | |
Asset Management & Custody Banks - 0.9% | | | | | |
Fifth Street Finance Corporation | | 321,227 | | | 3,729,445 |
| | | | | |
Building Products - 0.7% | | | | | |
Trex Company, Inc. * | | 129,200 | | | 2,750,668 |
| | | | | |
Casinos & Gaming - 1.1% | | | | | |
Penn National Gaming, Inc. * | | 159,000 | | | 4,420,200 |
| | | | | |
Coal & Consumable Fuels - 0.6% | | | | | |
USEC, Inc. * | | 435,800 | | | 2,514,566 |
| | | | | |
Communications Equipment - 0.7% | | | |
EF Johnson Technologies, Inc. *5 | | 120,000 | | | 111,876 |
Symmetricom, Inc. *5 | | 467,900 | | | 2,727,857 |
| | | | | |
| | | | | 2,839,733 |
| | | | | |
Construction & Engineering - 5.1% | | | |
Insituform Technologies, Inc. * | | 309,100 | | | 8,225,151 |
Quanta Services, Inc. * | | 346,900 | | | 6,646,604 |
URS Corporation * | | 113,600 | | | 5,635,696 |
| | | | | |
| | | | | 20,507,451 |
| | | | | |
Construction & Farm Machinery &
Heavy Trucks - 1.0% | | | |
Force Protection, Inc. * | | 669,103 | | | 4,028,000 |
| | | | | |
Construction Materials - 0.3% | | | | | |
Eagle Materials, Inc. | | 38,554 | | | 1,023,223 |
| | | | | |
Consumer Finance - 0.2% | | | | | |
First Marblehead Corporation * | | 254,984 | | | 724,155 |
| | | | | |
Data Processing & Outsourced Services - 3.5% | | | | | |
Computer Sciences Corporation * | | 255,700 | | | 13,933,092 |
| | | | | |
Diversified REIT’s - 0.8% | | | | | |
Investors Real Estate Trust | | 370,112 | | | 3,338,410 |
| | | | | |
Electric Utilities - 6.0% | | | | | |
Allete, Inc. | | 147,854 | | | 4,950,152 |
Great Plains Energy, Inc. | | 326,735 | | | 6,067,469 |
Northeast Utilities | | 179,100 | | | 4,950,324 |
Pepco Holdings, Inc. | | 135,500 | | | 2,323,825 |
Westar Energy, Inc. | | 246,100 | | | 5,488,030 |
| | | | | |
| | | | | 23,779,800 |
| | | | | |
| | | | | |
| | | Shares | | Value |
COMMON STOCKS - 95.2% (contiued) | | | |
Electrical Components & Equipment - 1.4% | | | | | |
General Cable Corporation * | | 180,400 | | $ | 4,870,800 |
UQM Technologies, Inc. * | | 153,200 | | | 644,972 |
| | | | | |
| | | | | 5,515,772 |
| | | | | |
Electronic Components - 1.8% | | | | | |
Power-One, Inc. * | | 1,675,400 | | | 7,070,188 |
| | | | | |
Electronic Manufacturing Services - 1.3% | | | | | |
Maxwell Technologies, Inc. * | | 411,381 | | | 5,097,011 |
| | | | | |
Environmental & Facilities Services - 1.3% | | | | | |
Covanta Holding Corporation * | | 318,800 | | | 5,311,208 |
| | | | | |
Exchange Traded Funds - 4.8% | | | | | |
iShares Russell Midcap Value Index Fund | | 325,570 | | | 13,130,238 |
iShares S&P MidCap 400 | | 82,000 | | | 5,849,060 |
| | | | | |
| | | | | 18,979,298 |
| | | | | |
Forest Products - 1.6% | | | | | |
Louisiana-Pacific Corporation * | | 694,200 | | | 6,282,510 |
| | | | | |
Gas Utilities - 2.0% | | | | | |
Atmos Energy Corporation | | 161,800 | | | 4,622,626 |
UGI Corporation | | 123,357 | | | 3,273,895 |
| | | | | |
| | | | | 7,896,521 |
| | | | | |
Health Care Equipment - 1.1% | | | | | |
Hologic, Inc. * | | 235,282 | | | 4,362,128 |
| | | | | |
Health Care Services - 2.4% | | | | | |
Mednax, Inc. * | | 110,500 | | | 6,429,995 |
RehabCare Group, Inc. * | | 113,100 | | | 3,084,237 |
| | | | | |
| | | | | 9,514,232 |
| | | | | |
Home Furnishings - 1.2% | | | | | |
Leggett & Platt, Inc. | | 216,200 | | | 4,678,568 |
| | | | | |
Human Resources & Employment Services - 1.0% | | | | | |
Administaff, Inc. | | 195,000 | | | 4,161,300 |
| | | | | |
Industrial Conglomerates - 2.0% | | | |
McDermott International, Inc. * | | 294,200 | | | 7,919,864 |
| | | | | |
Industrial Machinery - 0.8% | | | | | |
Harsco Corporation | | 102,000 | | | 3,257,880 |
| | | | | |
Insurance Brokers - 0.4% | | | | | |
Arthur J Gallagher & Company | | 62,400 | | | 1,531,920 |
| | | | | |
IT Consulting & Other Services - 0.6% | | | |
Satyam Computer Services, Ltd. ADR | | 489,680 | | | 2,556,130 |
| | | | | |
Mortgage REIT’s - 0.4% | | | | | |
Redwood Trust, Inc. | | 93,900 | | | 1,447,938 |
| | | | | |
Multi-Line Insurance - 1.6% | | | | | |
American Financial Group, Inc. 4 | | 223,000 | | | 6,344,350 |
| | | | | |
| | | | |
| | 58 | | The accompanying notes are an integral part of the financial statements |
| | |
| Schedule of Investments | | Rydex | SGI Equity Fund |
| March 31, 2010 (unaudited) | | Mid Cap Value Institutional Fund |
| | | | | |
| | | Shares | | Value |
COMMON STOCKS - 95.2% (continued) |
Multi-Utilities - 4.5% |
Alliant Energy Corporation | | 182,500 | | $ | 6,069,950 |
Black Hills Corporation | | 128,800 | | | 3,909,080 |
Northwestern Corporation | | 203,200 | | | 5,447,792 |
SCANA Corporation | | 69,700 | | | 2,620,023 |
| | | | | |
| | | | | 18,046,845 |
| | | | | |
Office REIT’s - 0.5% | | | | | |
Lexington Realty Trust | | 304,000 | | | 1,979,040 |
| | | | | |
Office Services & Supplies - 0.5% |
United Stationers, Inc. * | | 33,678 | | | 1,981,950 |
| | | | | |
Oil & Gas Drilling - 0.5% | | | | | |
Helmerich & Payne, Inc. | | 50,400 | | | 1,919,232 |
| | | | | |
Oil & Gas Equipment & Services - 2.4% | | | | | |
Complete Production Services, Inc. * | | 84,600 | | | 977,130 |
Global Industries, Ltd. * | | 1,366,359 | | | 8,772,025 |
| | | | | |
| | | | | 9,749,155 |
| | | | | |
Oil & Gas Exploration & Production - 1.6% | | | | | |
Goodrich Petroleum Corporation * | | 53,100 | | | 830,484 |
Gulfport Energy Corporation * | | 237,688 | | | 2,671,613 |
Petrohawk Energy Corporation * | | 144,900 | | | 2,938,572 |
| | | | | |
| | | | | 6,440,669 |
| | | | | |
Oil & Gas Storage & Transportation - 1.8% | | | | | |
Southern Union Company | | 276,900 | | | 7,024,953 |
| | | | | |
Packaged Foods & Meats - 4.8% | | | |
Del Monte Foods Company | | 226,100 | | | 3,301,060 |
Hormel Foods Corporation 4 | | 120,100 | | | 5,045,401 |
JM Smucker Company | | 134,500 | | | 8,104,970 |
Ralcorp Holdings, Inc. * | | 37,200 | | | 2,521,416 |
| | | | | |
| | | | | 18,972,847 |
| | | | | |
Paper Packaging - 3.6% | | | | | |
Bemis Company, Inc. | | 331,900 | | | 9,532,168 |
Sonoco Products Company | | 174,100 | | | 5,360,539 |
| | | | | |
| | | | | 14,892,707 |
| | | | | |
Property & Casualty Insurance - 5.9% |
Allegheny Corporation * | | 19,376 | | | 5,671,526 |
Employers Holdings, Inc. | | 125,700 | | | 1,866,645 |
Hanover Insurance Group, Inc. | | 204,000 | | | 8,896,440 |
W.R. Berkley Corporation | | 258,200 | | | 6,736,438 |
| | | | | |
| | | | | 23,171,049 |
| | | | | |
Regional Banks - 3.6% | | | | | |
Associated Banc-Corporation | | 344,905 | | | 4,759,689 |
Commerce Bancshares, Inc. | | 96,746 | | | 3,980,130 |
First Horizon National Corporation * | | 130,341 | | | 1,831,297 |
Old National Bancorp | | 328,645 | | | 3,927,308 |
| | | | | |
| | | | | 14,498,424 |
| | | | | |
Research & Consulting Services - 2.2% | | | |
ICF International, Inc. * | | 123,494 | | | 3,067,591 |
Navigant Consulting, Inc. * | | 476,600 | | | 5,781,158 |
| | | | | |
| | | | | 8,848,749 |
| | | | | |
Restaurants - 2.2% | | | | | |
Burger King Holdings, Inc. | | 276,900 | | | 5,886,894 |
| | | | | | | |
| | | Shares | | Value | |
COMMON STOCKS - 95.2% (continued) | |
Restaurants - 2.2% (continued) | |
Jack in the Box, Inc. * | | | 125,700 | | $ | 2,960,235 | |
| | | | | | | |
| | | | | | 8,847,129 | |
| | | | | | | |
Semiconductor Equipment - 0.5% | |
FEI Company * | | | 19,575 | | | 448,463 | |
Ultratech, Inc. * | | | 104,900 | | | 1,426,640 | |
| | | | | | | |
| | | | | | 1,875,103 | |
| | | | | | | |
Semiconductors - 1.7% | | | | | | | |
IXYS Corporation *5 | | | 787,900 | | | 6,728,666 | |
| | | | | | | |
Specialty Chemicals - 1.4% | |
HB Fuller Company | | | 77,700 | | | 1,803,417 | |
Landec Corporation *5 | | | 304,600 | | | 2,019,498 | |
Zoltek Companies, Inc. * | | | 164,200 | | | 1,582,888 | |
| | | | | | | |
| | | | | | 5,405,803 | |
| | | | | | | |
Specialty Stores - 2.1% | | | | | | | |
Cabela’s, Inc. * | | | 481,001 | | | 8,412,707 | |
| | | | | | | |
Trucking - 0.5% | | | | | | | |
Saia, Inc. * | | | 142,500 | | | 1,977,900 | |
| | | | | | | |
TOTAL COMMON STOCKS (cost $319,579,376) | | | | | $ | 379,286,000 | |
| | | | | | | |
| | |
| | | Principal
Amount | | Value | |
COMMERCIAL PAPER - 5.8% | |
Diversified Manufacturing - 1.0% | |
General Electric Company
0.11%, 04/15/2010 1 | | $ | 4,000,000 | | $ | 3,999,829 | |
| | | | | | | |
Food & Beverage - 2.0% | | | | | | | |
Nestle Capital Corporation
0.11%, 04/01/2010 1,2 | | | 4,000,000 | | | 4,000,000 | |
PepsiCo, Inc.
0.11%, 04/05/2010 1 | | | 4,000,000 | | | 3,999,951 | |
| | | | | | | |
| | | | | | 7,999,951 | |
| | | | | | | |
Non U.S. Banking -2.8% | | | | | | | |
Barclay’s Funding LLC
0.13%, 04/08/2010 1 | | | 4,000,000 | | | 3,999,899 | |
BNP Paribas Finance, Inc.
0.13%, 04/07/2010 1 | | | 4,000,000 | | | 3,999,913 | |
Societe Generale
0.15%, 04/07/2010 1 | | | 3,000,000 | | | 2,999,925 | |
| | | | | | | |
| | | | | | 10,999,737 | |
| | | | | | | |
TOTAL COMMERCIAL PAPER (cost $22,999,517) | | | | | $ | 22,999,517 | |
| | | | | | | |
Total Investments - 101.0% 3 | | | | |
(cost $342,578,893) | | | | | $ | 402,285,517 | |
| | | | | | | |
Liabilities, Less Cash & Other Assets - (1.0)% | | | | | | (4,031,670 | ) |
| | | | | | | |
Total Net Assets - 100.0% | | | | | $ | 398,253,847 | |
| | | | | | | |
For federal income tax purposes the identified cost of investments owned at March 31, 2010 was $342,829,128.
| | | | |
ADR | | | | American Depositary Receipt |
| * | Non-income producing security |
| 1 | Value determined based on Level 2 inputs. |
| 2 | Security is a 144A or Section 4(2) security. The total market value of 144A or Section 4(2) securities is $4,000,000 (cost $4,000,000), or 1.0% of total net assets. |
| | | | |
| | 59 | | The accompanying notes are an integral part of the financial statements |
| | |
| Schedule of Investments | | Rydex | SGI Equity Fund |
| March 31, 2010 (unaudited) | | Mid Cap Value Institutional Fund |
| 3 | Unless otherwise indicated, the values of the securities of the Portfolio are determined based on Level 1 inputs. |
| 4 | Security is segregated as collateral for open written option contracts. |
| 5 | Security is deemed illiquid. The total market value of illiquid securities is $11,587,897 (cost $11,919,044), or 2.9% of total net assets. |
| | | | |
| | 60 | | The accompanying notes are an integral part of the financial statements |
| | |
| | Rydex | SGI Equity Fund |
| | Mid Cap Value Institutional Fund (unaudited) |
Statement of Assets and Liabilities
March 31, 2010
| | | |
Assets: | | | |
Investments, at value * | | $ | 402,285,517 |
Cash | | | 936,183 |
Receivables: | | | |
Fund shares sold | | | 3,555,151 |
Dividends | | | 405,204 |
Security Investors | | | 27,329 |
Prepaid expenses | | | 29,866 |
| | | |
Total assets | | | 407,239,250 |
| | | |
Liabilities: | | | |
Payable for: | | | |
Fund shares redeemed | | | 232,802 |
Securities purchased | | | 8,435,888 |
Written options, at value (premiums received $98,402) | | | 6,800 |
Management fees | | | 244,414 |
Administration fees | | | 31,259 |
Transfer agent/maintenance fees | | | 4,207 |
Custodian fees | | | 3,018 |
Professional fees | | | 6,960 |
Other fees | | | 20,055 |
| | | |
Total liabilities | | | 8,985,403 |
| | | |
Net assets | | $ | 398,253,847 |
| | | |
Net assets consist of: | | | |
Paid in capital | | $ | 329,598,308 |
Undistributed net investment income | | | 1,684,745 |
Undistributed net realized gain on sale of investments | | | 7,172,568 |
Net unrealized appreciation in value of investments | | | 59,798,226 |
| | | |
Net assets | | $ | 398,253,847 |
| | | |
Capital shares authorized | | | unlimited |
Capital shares outstanding | | | 35,670,708 |
Net asset value per share (net assets divided by shares outstanding) | | $ | 11.16 |
| | | |
* Investments, at cost | | $ | 342,578,893 |
Statement of Operations
For the Six Months Ended March 31, 2010
| | | | |
Investment Income: | | | | |
Dividends | | $ | 2,899,360 | |
Interest | | | 6,071 | |
| | | | |
Total investment income | | | 2,905,431 | |
| | | | |
Expenses: | | | | |
Management fees | | | 1,303,183 | |
Administration fees | | | 165,473 | |
Transfer agent/maintenance fees | | | 188,009 | |
Custodian fees | | | 14,217 | |
Directors’ fees | | | 12,705 | |
Professional fees | | | 11,331 | |
Reports to shareholders | | | 4,533 | |
Registration fees | | | 13,149 | |
Other | | | 4,856 | |
| | | | |
Total expenses | | | 1,717,456 | |
Reimbursement of expenses | | | (147,699 | ) |
| | | | |
Net expenses | | | 1,569,757 | |
| | | | |
Net investment income | | | 1,335,674 | |
| | | | |
Net Realized and Unrealized Gain (Loss): | | | | |
Net realized gain (loss) during the period on: | | | | |
Investments | | | 9,998,380 | |
Options written | | | 642,212 | |
| | | | |
Net realized gain | | | 10,640,592 | |
| | | | |
Net unrealized appreciation (depreciation) during the period on: | | | | |
Investments | | | 22,551,698 | |
Options written | | | 72,855 | |
| | | | |
Net unrealized appreciation | | | 22,624,553 | |
| | | | |
Net realized and unrealized gain | | | 33,265,145 | |
| | | | |
Net increase in net assets resulting from operations | | $ | 34,600,819 | |
| | | | |
| | | | |
| | 61 | | The accompanying notes are an integral part of the financial statements |
| | |
| | Rydex | SGI Equity Fund |
| Statement of Changes in Net Assets | | Mid Cap Value Institutional Fund |
| | | | | | | | |
| | | Six Months Ended
March 31, 2010 | | | Year Ended
September 30, 2009 | |
| | | (unaudited) | | | | |
Increase (decrease) in net assets from operations: | | | | | | | | |
Net investment income | | $ | 1,335,674 | | | $ | 721,069 | |
Net realized gain during the period on investments | | | 10,640,592 | | | | 7,639,819 | |
Net unrealized appreciation during the period on investments | | | 22,624,553 | | | | 37,041,254 | |
| | | | | | | | |
Net increase in net assets resulting from operations | | | 34,600,819 | | | | 45,402,142 | |
| | | | | | | | |
Distributions to shareholders from: | | | | | | | | |
Net investment income | | | (326,335 | ) | | | (116,483 | ) |
Net realized gain | | | (11,082,828 | ) | | | (966,008 | ) |
| | | | | | | | |
Total distributions to shareholders | | | (11,409,163 | ) | | | (1,082,491 | ) |
| | | | | | | | |
Capital share transactions: | | | | | | | | |
Proceeds from sale of shares | | | 93,319,417 | | | | 285,643,830 | |
Dividends reinvested | | | 5,348,897 | | | | 946,155 | |
Cost of shares redeemed | | | (41,061,439 | ) | | | (30,890,230 | ) |
| | | | | | | | |
Net increase from capital share transactions | | | 57,606,875 | | | | 255,699,755 | |
| | | | | | | | |
Net increase in net assets | | | 80,798,531 | | | | 300,019,406 | |
| | | | | | | | |
Net assets: | | | | | | | | |
Beginning of period | | | 317,455,316 | | | | 17,435,910 | |
| | | | | | | | |
End of period | | $ | 398,253,847 | | | $ | 317,455,316 | |
| | | | | | | | |
Undistributed net investment income at end of period | | $ | 1,684,745 | | | $ | 675,406 | |
| | | | | | | | |
Capital share activity: | | | | | | | | |
Shares sold | | | 8,785,115 | | | | 31,844,224 | |
Shares reinvested | | | 509,904 | | | | 126,492 | |
Shares redeemed | | | (3,882,617 | ) | | | (3,344,963 | ) |
| | | | | | | | |
Total capital share activity | | | 5,412,402 | | | | 28,625,753 | |
| | | | | | | | |
| | | | |
| | 62 | | The accompanying notes are an integral part of the financial statements |
| | |
| Financial Highlights | | Rydex | SGI Equity Fund |
Selected data for each share of capital stock outstanding throughout each period | | Mid Cap Value Institutional Fund |
| | | | | | | | | | | | |
| | | Six Months
Ended March 31,
2010 a | | | 2009 | | | Year Ended
September 30,
2008 b | |
Per Share Data | | | | | | | | | | | | |
Net asset value, beginning of period | | $ | 10.49 | | | $ | 10.68 | | | $ | 10.00 | |
| | | | | | | | | | | | |
Income (loss) from investment operations: | | | | | | | | | | | | |
Net investment income c | | | 0.04 | | | | 0.08 | | | | 0.04 | |
Net gain on securities (realized and unrealized) | | | 0.99 | | | | 0.27 | | | | 0.64 | |
| | | | | | | | | | | | |
Total from investment operations | | | 1.03 | | | | 0.35 | | | | 0.68 | |
| | | | | | | | | | | | |
Less distributions: | | | | | | | | | | | | |
Dividends from net investment income | | | (0.01 | ) | | | (0.06 | ) | | | — | |
Distributions from realized gains | | | (0.35 | ) | | | (0.48 | ) | | | — | |
| | | | | | | | | | | | |
Total distributions | | | (0.36 | ) | | | (0.54 | ) | | | — | |
| | | | | | | | | | | | |
Net asset value, end of period | | $ | 11.16 | | | $ | 10.49 | | | $ | 10.68 | |
| | | | | | | | | | | | |
Total Return | | | 9.99 | % | | | 5.30 | % | | | 6.80 | % |
| | | | | | | | | | | | |
Ratios/Supplemental Data | | | | | | | | | | | | |
Net assets, end of period (in thousands) | | $ | 398,254 | | | $ | 317,455 | | | $ | 17,436 | |
| | | | | | | | | | | | |
Ratios to average net assets: | | | | | | | | | | | | |
Net investment income | | | 0.77 | % | | | 0.81 | % | | | 1.81 | % |
Total expenses d | | | 0.99 | % | | | 0.97 | % | | | 1.19 | % |
Net expenses e | | | 0.90 | % | | | 0.90 | % | | | 1.10 | % |
Net expenses prior to custodian earnings credits and net of expense waivers | | | 0.90 | % | | | 0.90 | % | | | 1.10 | % |
| | | | | | | | | | | | |
Portfolio turnover rate | | | 27 | % | | | 76 | % | | | 63 | % |
| a | Unaudited figures for the six months ended March 31, 2010. Percentage amounts, except total return, have been annualized. |
| b | Security Mid Cap Value Institutional Fund was initially capitalized on July 11, 2008 with a net asset value of $10 per share. Percentage amounts for the period, except total return, have been annualized. |
| c | Net investment income (loss) was computed using average shares outstanding throughout the period. |
| d | Total expense information reflects the expense ratios absent expense reductions by the Investment Manager and custodian earnings credits, as applicable. |
| e | Net expense information reflects the expense ratios after voluntary expense waivers, reimbursements and custodian earnings credits, as applicable. |
| | | | |
| | 63 | | The accompanying notes are an integral part of the financial statements |
| | |
| | Rydex | SGI Equity Fund |
| Performance Summary | | Large Cap Concentrated Growth Fund |
| March 31, 2010 | | (unaudited) |
PERFORMANCE
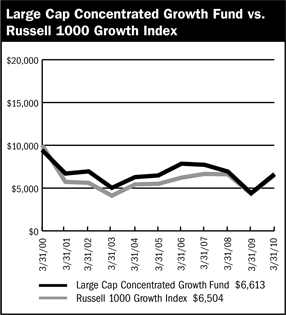
$10,000 Over 10 Years
This chart assumes a $10,000 investment in Class A shares of Large Cap Concentrated Growth Fund on March 31, 2000 reflects deduction of the 5.75% sales load and assumes all dividends are reinvested. The chart does not reflect the deduction of taxes that a shareholder would pay on distributions or the redemption of fund shares. The Russell 1000 Growth Index is an unmanaged capitalization index which includes stocks incorporated in the United States and its territories and measures the performance of the Russell 1000 companies with higher price-to-book ratios and higher forecasted growth values.
Average Annual Returns
| | | | | | | | | |
Periods Ended 3-31-10 | | 1 Year | | | 5 Years | | | 10 Years | |
A Shares | | 50.10 | % | | 0.41 | % | | (3.48 | )% |
A Shares with sales charge | | 41.44 | % | | (0.76 | )% | | (4.05 | )% |
B Shares | | 49.17 | % | | (0.34 | )% | | (4.06 | )% |
B Shares with CDSC | | 44.17 | % | | (0.70 | )% | | (4.06 | )% |
C Shares | | 49.17 | % | | (0.31 | )% | | (4.19 | )% |
C Shares with CDSC | | 48.17 | % | | (0.31 | )% | | (4.19 | )% |
The performance data above represents past performance that is not predictive of future results. The investment return and principal value of an investment in the Fund will fluctuate so that an investor’s shares, when redeemed, may be worth more or less than their original cost. The above do not reflect the maximum front-end sales charge of 5.75% for Class A shares or the contingent deferred sales charge of 5% for Class B shares and 1% for Class C shares, as applicable, except where noted. The figures do that a shareholder would pay on distributions or redemption of shares. Such figures would be lower if the maximum sales charge and any applicable taxes were deducted. Fee waivers and/or reimbursements reduced expenses of the Fund and in the absence of such waiver, the performance quoted would be reduced.
Portfolio Composition by Sector as of 3-31-10
| | | |
Consumer Discretionary | | 18.35 | % |
Consumer Staples | | 10.08 | |
Energy | | 7.72 | |
Financials | | 3.09 | |
Health Care | | 12.70 | |
Industrials | | 12.72 | |
Information Technology | | 29.82 | |
Materials | | 3.01 | |
Cash & Other Assets, Less Liabilities | | 2.51 | |
| | | |
Total Net Assets | | 100.00 | % |
| | | |
| | | | |
| | 64 | | The accompanying notes are an integral part of the financial statements |
| | |
| Schedule of Investments | | Rydex | SGI Equity Fund |
March 31, 2010 (unaudited) | | Large Cap Concentrated Growth Fund |
| | | | | |
| | | Shares | | Value |
COMMON STOCKS - 97.5% |
Aerospace & Defense - 3.4% | | | | | |
Precision Castparts Corporation | | 11,410 | | $ | 1,445,761 |
| | | | | |
Apparel Retail - 3.1% | | | | | |
TJX Companies, Inc. | | 31,540 | | | 1,341,081 |
| | | | | |
Auto Parts & Equipment - 3.2% | | | | | |
Johnson Controls, Inc. | | 41,100 | | | 1,355,888 |
| | | | | |
Biotechnology - 3.1% | | | | | |
Amgen, Inc. * | | 22,120 | | | 1,321,891 |
| | | | | |
Coal & Consumable Fuels - 2.1% | | | | | |
Peabody Energy Corporation | | 20,070 | | | 917,199 |
| | | | | |
Communications Equipment - 6.3% | | | | | |
Cisco Systems, Inc. * | | 65,120 | | | 1,695,073 |
Motorola, Inc. * | | 146,895 | | | 1,031,203 |
| | | | | |
| | | | | 2,726,276 |
| | | | | |
Computer Hardware - 8.3% | | | | | |
Apple, Inc. * | | 7,690 | | | 1,806,611 |
Hewlett-Packard Company | | 32,800 | | | 1,743,320 |
| | | | | |
| | | | | 3,549,931 |
| | | | | |
Computer Storage &
Peripherals - 4.0% | | | | | |
EMC Corporation * | | 96,590 | | | 1,742,484 |
| | | | | |
Data Processing & Outsourced Services - 3.3% | | | | | |
Visa, Inc. | | 15,400 | | | 1,401,862 |
| | | | | |
Department Stores - 2.9% | | | | | |
Kohl’s Corporation * | | 23,110 | | | 1,265,966 |
| | | | | |
Diversified Chemicals - 3.0% | | | | | |
Dow Chemical Company | | 43,845 | | | 1,296,497 |
| | | | | |
Electrical Components & Equipment - 6.1% | | | | | |
Cooper Industries plc | | 27,780 | | | 1,331,773 |
Emerson Electric Company | | 26,570 | | | 1,337,534 |
| | | | | |
| | | | | 2,669,307 |
| | | | | |
Food Distributors - 3.0% | | | | | |
Sysco Corporation | | 44,100 | | | 1,300,950 |
| | | | | |
Health Care Equipment - 3.3% | | | | | |
Covidien plc | | 28,440 | | | 1,429,963 |
| | | | | |
Home Improvement Retail - 3.0% | | | | | |
Home Depot, Inc. | | 40,250 | | | 1,302,088 |
| | | | | |
Hotels, Resorts & Cruise
Lines - 3.1% | | | | | |
Carnival Corporation | | 34,250 | | | 1,331,640 |
| | | | | |
Industrial Conglomerates - 3.2% | | | | | |
3M Company | | 16,340 | | | 1,365,534 |
| | | | | |
Integrated Oil & Gas - 3.1% | | | | | |
Occidental Petroleum Corporation | | 15,590 | | | 1,317,979 |
| | | | | |
| | | | | |
| | | Shares | | Value |
COMMON STOCKS - 97.5% (continued) |
Movies & Entertainment - 3.0% | | | | | |
Walt Disney Company | | 37,550 | | $ | 1,310,871 |
| | | | | |
Oil & Gas Equipment &
Services - 2.5% | | | | | |
Schlumberger, Ltd. | | 17,200 | | | 1,091,512 |
| | | | | |
Other Diversified Financial
Services - 3.1% | | | | | |
JPMorgan Chase & Company | | 29,725 | | | 1,330,194 |
| | | | | |
Packaged Foods & Meats - 3.0% | | | | | |
Kraft Foods, Inc. | | 42,100 | | | 1,273,104 |
| | | | | |
Pharmaceuticals - 6.3% | | | | | |
Pfizer, Inc. | | 70,290 | | | 1,205,474 |
Teva Pharmaceutical Industries, Ltd. ADR | | 24,035 | | | 1,516,128 |
| | | | | |
| | | | | 2,721,602 |
| | | | | |
Semiconductors - 4.0% | | | | | |
Intel Corporation | | 76,840 | | | 1,710,458 |
| | | | | |
Soft Drinks - 4.1% | | | | | |
PepsiCo, Inc. | | 26,770 | | | 1,771,103 |
| | | | | |
Systems Software - 4.0% | | | | | |
Oracle Corporation | | 66,900 | | | 1,718,661 |
| | | | | |
TOTAL COMMON STOCKS (cost $36,725,268) | | | | $ | 42,009,802 |
| | | | | |
Total Investments - 97.5% 1 (cost $36,725,268) | | | | $ | 42,009,802 |
Cash & Other Assets, Less Liabilities - 2.5% | | | | | 1,083,823 |
| | | | | |
Total Net Assets - 100.0% | | | | $ | 43,093,625 |
| | | | | |
For federal income tax purposes the identified cost of investments owned at March 31, 2010 was $37,428,343.
| | |
| ADR | | American Depositary Receipt |
| plc | | Public Limited Company |
| * | Non-income producing security |
| 1 | Unless otherwise indicated, the values of the securities of the Portfolio are determined based on Level 1 inputs. |
| | | | |
| | 65 | | The accompanying notes are an integral part of the financial statements |
| | |
| | Rydex | SGI Equity Fund |
| | Large Cap Concentrated Growth Fund (unaudited) |
Statement of Assets and Liabilities
March 31, 2010
| | | | |
Assets: | | | | |
Investments, at value* | | $ | 42,009,802 | |
Cash | | | 1,079,900 | |
| |
Receivables: | | | | |
Fund shares sold | | | 22,998 | |
Dividends | | | 45,080 | |
Security Investors | | | 7,576 | |
Prepaid expenses | | | 25,965 | |
| | | | |
Total assets | | | 43,191,321 | |
| | | | |
Liabilities: | | | | |
Payable for: | | | | |
Fund shares redeemed | | | 20,641 | |
Management fees | | | 27,330 | |
Custodian fees | | | 525 | |
Transfer agent/maintenance fees | | | 9,842 | |
Administration fees | | | 3,522 | |
Professional fees | | | 11,066 | |
12b-1 distribution plan fees | | | 15,557 | |
Directors’ fees | | | 23 | |
Other | | | 9,190 | |
| | | | |
Total liabilities | | | 97,696 | |
| | | | |
Net assets | | $ | 43,093,625 | |
| | | | |
Net assets consist of: | | | | |
Paid in capital | | $ | 54,763,740 | |
Accumulated net investment loss | | | (45,799 | ) |
Accumulated net realized loss on sale of investments | | | (16,908,850 | ) |
Net unrealized appreciation in value of investments | | | 5,284,534 | |
| | | | |
Net assets | | $ | 43,093,625 | |
| | | | |
Class A: | | | | |
Capital shares outstanding (unlimited number of shares authorized) | | | 4,220,022 | |
Net assets | | $ | 33,129,662 | |
Net asset value and redemption price per share | | $ | 7.85 | |
| | | | |
Maximum offering price per share (net asset value divided by 94.25%) | | $ | 8.33 | |
| | | | |
Class B: | | | | |
Capital shares outstanding (unlimited number of shares authorized) | | | 887,681 | |
Net assets | | $ | 6,382,000 | |
Net asset value, offering and redemption price per share (excluding any applicable contingent deferred sales charge) | | $ | 7.19 | |
| | | | |
Class C: | | | | |
Capital shares outstanding (unlimited number of shares authorized) | | | 496,299 | |
Net assets | | $ | 3,581,963 | |
Net asset value, offering and redemption price per share (excluding any applicable contingent deferred sales charge) | | $ | 7.22 | |
| | | | |
*Investments, at cost | | $ | 36,725,268 | |
Statement of Operations
For the Six Months Ended March 31, 2010
| | | | |
Investment Income: | | | | |
Dividends (net of foreign withholding tax of $172) | | $ | 261,498 | |
Interest | | | 203 | |
| | | | |
Total investment income | | | 261,701 | |
| | | | |
Expenses: | | | | |
Management fees | | | 150,177 | |
Transfer agent/maintenance fees | | | 100,195 | |
Administration fees | | | 19,116 | |
Custodian fees | | | 1,037 | |
Directors’ fees | | | 1,902 | |
Professional fees | | | 2,719 | |
Reports to shareholders | | | 1,154 | |
Registration fees | | | 16,290 | |
Other expenses | | | 1,888 | |
12b-1 distribution fees - Class A | | | 37,661 | |
12b-1 distribution fees - Class B | | | 31,413 | |
12b-1 distribution fees - Class C | | | 18,181 | |
| | | | |
Total expenses | | | 381,733 | |
Less: | | | | |
Reimbursement of expenses - Class A | | | (56,065 | ) |
Reimbursement of expenses - Class B | | | (11,488 | ) |
Reimbursement of expenses - Class C | | | (6,680 | ) |
| | | | |
Net expenses | | | 307,500 | |
| | | | |
Net investment loss | | | (45,799 | ) |
| | | | |
Net Realized and Unrealized Gain (Loss): | | | | |
Net realized gain (loss) during the period on: | | | | |
Investments | | | 3,790,791 | |
| | | | |
Net realized gain | | | 3,790,791 | |
| | | | |
Net unrealized appreciation (depreciation) during the period on: | | | | |
Investments | | | 1,287,571 | |
| | | | |
Net unrealized appreciation | | | 1,287,571 | |
| | | | |
Net realized and unrealized gain | | | 5,078,362 | |
| | | | |
Net increase in net assets resulting from operations | | $ | 5,032,563 | |
| | | | |
| | | | |
| | 66 | | The accompanying notes are an integral part of the financial statements |
| | |
| | Rydex | SGI Equity Fund |
| Statement of Changes in Net Assets | | Large Cap Concentrated Growth Fund |
| | | | | | | | |
| | | Six Months Ended
March 31, 2010 | | | Year Ended
September 30, 2009 | |
| | | (unaudited) | | | | |
Increase (decrease) in net assets from operations: | | | | | | | | |
Net investment loss | | $ | (45,799 | ) | | $ | (44,288 | ) |
Net realized gain (loss) during the period on investments | | | 3,790,791 | | | | (9,322,393 | ) |
Net unrealized appreciation during the period on investments | | | 1,287,571 | | | | 9,260,235 | |
| | | | | | | | |
Net increase (decrease) in net assets resulting from operations | | | 5,032,563 | | | | (106,446 | ) |
| | | | | | | | |
Capital share transactions: | | | | | | | | |
Proceeds from sale of shares | | | | | | | | |
Class A | | | 10,764,888 | | | | 8,421,946 | |
Class B | | | 1,127,622 | | | | 2,137,575 | |
Class C | | | 153,228 | | | | 463,278 | |
Cost of shares redeemed | | | | | | | | |
Class A | | | (3,901,760 | ) | | | (10,110,314 | ) |
Class B | | | (1,239,289 | ) | | | (3,656,353 | ) |
Class C | | | (751,056 | ) | | | (1,859,843 | ) |
| | | | | | | | |
Net increase (decrease) from capital share transactions | | | 6,153,633 | | | | (4,603,711 | ) |
| | | | | | | | |
Net increase (decrease) in net assets | | | 11,186,196 | | | | (4,710,157 | ) |
| | | | | | | | |
Net assets: | | | | | | | | |
Beginning of period | | | 31,907,429 | | | | 36,617,586 | |
| | | | | | | | |
End of period | | $ | 43,093,625 | | | $ | 31,907,429 | |
| | | | | | | | |
Accumulated net investment loss at end of period | | $ | (45,799 | ) | | $ | — | |
| | | | | | | | |
Capital share activity: | | | | | | | | |
Shares sold | | | | | | | | |
Class A | | | 1,517,559 | | | | 1,538,705 | |
Class B | | | 168,639 | | | | 427,040 | |
Class C | | | 22,577 | | | | 88,295 | |
Shares redeemed | | | | | | | | |
Class A | | | (525,433 | ) | | | (1,744,788 | ) |
Class B | | | (179,861 | ) | | | (683,944 | ) |
Class C | | | (109,923 | ) | | | (361,341 | ) |
| | | | |
| | 67 | | The accompanying notes are an integral part of the financial statements |
| | |
| Financial Highlights | | Rydex | SGI Equity Fund |
Selected data for each share of capital stock outstanding throughout each period | | Large Cap Concentrated Growth Fund |
| | | | | | | | | | | | | | | | | | | | | | | | |
Class A | | Six Months
Ended March 31,
2010 a,h | | | 2009 | | | 2008 | | | 2007 | | | 2006 b | | | Year Ended
September 30,
2005 | |
Per Share Data Net asset value, beginning of period | | $ | 6.95 | | | $ | 6.91 | | | $ | 10.66 | | | $ | 9.86 | | | $ | 9.36 | | | $ | 7.81 | |
| | | | | | | | | | | | | | | | | | | | | | | | |
Income (loss) from investment operations: Net investment income (loss) c | | | (— | )* | | | 0.01 | | | | (0.02 | ) | | | (0.01 | ) | | | (0.06 | ) | | | (0.07 | ) |
Net gain (loss) on securities (realized and unrealized) | | | 0.90 | | | | 0.03 | | | | (2.87 | ) | | | 0.81 | | | | 0.56 | | | | 1.62 | |
| | | | | | | | | | | | | | | | | | | | | | | | |
Total from investment operations | | | 0.90 | | | | 0.04 | | | | (2.89 | ) | | | 0.80 | | | | 0.50 | | | | 1.55 | |
Less distributions: | | | | | | | | | | | | | | | | | | | | | | | | |
Distributions from realized gains | | | — | | | | — | | | | (0.86 | ) | | | — | | | | — | | | | — | |
| | | | | | | | | | | | | | | | | | | | | | | | |
Total distributions | | | — | | | | — | | | | (0.86 | ) | | | — | | | | — | | | | — | |
| | | | | | | | | | | | | | | | | | | | | | | | |
Net asset value, end of period | | $ | 7.85 | | | $ | 6.95 | | | $ | 6.91 | | | $ | 10.66 | | | $ | 9.86 | | | $ | 9.36 | |
| | | | | | | | | | | | | | | | | | | | | | | | |
Total Return d | | | 12.95 | % | | | 0.58 | % | | | (28.85 | )% | | | 8.11 | % | | | 5.34 | % | | | 19.85 | % |
Ratios/Supplemental Data | | | | | | | | | | | | | | | | | | | | | | | | |
Net assets, end of period (in thousands) | | $ | 33,130 | | | $ | 22,425 | | | $ | 23,723 | | | $ | 30,375 | | | $ | 30,078 | | | $ | 8,912 | |
Ratios to average net assets: | | | | | | | | | | | | | | | | | | | | | | | | |
Net investment income (loss) | | | (0.04 | )% | | | 0.09 | % | | | (0.20 | )% | | | (0.10 | )% | | | (0.68 | )% | | | (0.79 | )% |
Total expenses e | | | 1.72 | % | | | 2.04 | % | | | 1.72 | % | | | 1.57 | % | | | 1.76 | % | | | 1.67 | % |
Net expenses f | | | 1.35 | % | | | 1.35 | % | | | 1.35 | % | | | 1.40 | % | | | 1.76 | % | | | 1.67 | % |
Net expenses prior to custodian earning credits and net of expense waivers | | | 1.35 | % | | | 1.35 | % | | | 1.35 | % | | | 1.40 | % | | | 1.76 | % | | | 1.67 | % |
| | | | | | | | | | | | | | | | | | | | | | | | |
Portfolio turnover rate | | | 185 | % | | | 134 | % | | | 198 | % g | | | 21 | % | | | 39 | % | | | 13 | % |
| | | | | | |
Class B | | Six Months
Ended March 31,
2010a,h | | | 2009 | | | 2008 | | | 2007 | | | 2006b | | | Year Ended
September 30,
2005 | |
Per Share Data | | | | | | | | | | | | | | | | | | | | | | | | |
Net asset value, beginning of period | | $ | 6.39 | | | $ | 6.40 | | | $ | 10.01 | | | $ | 9.33 | | | $ | 8.92 | | | $ | 7.50 | |
| | | | | | | | | | | | | | | | | | | | | | | | |
Income (loss) from investment operations: | | | | | | | | | | | | | | | | | | | | | | | | |
Net investment loss c | | | (0.03 | ) | | | (0.03 | ) | | | (0.08 | ) | | | (0.09 | ) | | | (0.13 | ) | | | (0.13 | ) |
Net gain (loss) on securities (realized and unrealized) | | | 0.83 | | | | 0.02 | | | | (2.67 | ) | | | 0.77 | | | | 0.54 | | | | 1.55 | |
| | | | | | | | | | | | | | | | | | | | | | | | |
Total from investment operations | | | 0.80 | | | | (0.01 | ) | | | (2.75 | ) | | | 0.68 | | | | 0.41 | | | | 1.42 | |
| | | | | | | | | | | | | | | | | | | | | | | | |
Less distributions: | | | | | | | | | | | | | | | | | | | | | | | | |
Distributions from realized gains | | | — | | | | — | | | | (0.86 | ) | | | — | | | | — | | | | — | |
| | | | | | | | | | | | | | | | | | | | | | | | |
Total distributions | | | — | | | | — | | | | (0.86 | ) | | | — | | | | — | | | | — | |
| | | | | | | | | | | | | | | | | | | | | | | | |
Net asset value, end of period | | $ | 7.19 | | | $ | 6.39 | | | $ | 6.40 | | | $ | 10.01 | | | $ | 9.33 | | | $ | 8.92 | |
| | | | | | | | | | | | | | | | | | | | | | | | |
Total Return d | | | 12.52 | % | | | (0.16 | %) | | | (29.36 | %) | | | 7.29 | % | | | 4.60 | % | | | 18.93 | % |
| | | | | | | | | | | | | | | | | | | | | | | | |
Ratios/Supplemental Data Net assets, end of period (in thousands) | | $ | 6,382 | | | $ | 5,740 | | | $ | 7,394 | | | $ | 10,868 | | | $ | 16,073 | | | $ | 7,000 | |
| | | | | | | | | | | | | | | | | | | | | | | | |
Ratios to average net assets: | | | | | | | | | | | | | | | | | | | | | | | | |
Net investment loss | | | (0.81 | )% | | | (0.66 | )% | | | (0.95 | )% | | | (0.88 | )% | | | (1.46 | )% | | | (1.54 | )% |
Total expenses e | | | 2.47 | % | | | 2.79 | % | | | 2.47 | % | | | 2.32 | % | | | 2.53 | % | | | 2.42 | % |
Net expenses f | | | 2.10 | % | | | 2.10 | % | | | 2.10 | % | | | 2.15 | % | | | 2.53 | % | | | 2.42 | % |
Net expenses prior to custodian earning credits and net of expense waivers | | | 2.10 | % | | | 2.10 | % | | | 2.10 | % | | | 2.15 | % | | | 2.53 | % | | | 2.42 | % |
| | | | | | | | | | | | | | | | | | | | | | | | |
Portfolio turnover rate | | | 185 | % | | | 134 | % | | | 198 | % g | | | 21 | % | | | 39 | % | | | 13 | % |
| | | | |
| | 68 | | The accompanying notes are an integral part of the financial statements |
| | |
| Financial Highlights | | Rydex | SGI Equity Fund |
Selected data for each share of capital stock outstanding throughout each period | | Large Cap Concentrated Growth Fund |
| | | | | | | | | | | | | | | | | | | | | | | | |
Class C | | Six Months
Ended March 31,
2010 a,h | | | 2009 | | | 2008 | | | 2007 | | | 2006 b | | | Year Ended
September 30,
2005 | |
Per Share Data | | | | | | | | | | | | | | | | | | | | | | | | |
Net asset value, beginning of period | | $ | 6.41 | | | $ | 6.42 | | | $ | 10.04 | | | $ | 9.36 | | | $ | 8.94 | | | $ | 7.52 | |
| | | | | | | | | | | | | | | | | | | | | | | | |
Income (loss) from investment operations: | | | | | | | | | | | | | | | | | | | | | | | | |
Net investment loss c | | | (0.03 | ) | | | (0.03 | ) | | | (0.08 | ) | | | (0.08 | ) | | | (0.13 | ) | | | (0.13 | ) |
Net gain (loss) on securities (realized and unrealized) | | | 0.84 | | | | 0.02 | | | | (2.68 | ) | | | 0.76 | | | | 0.55 | | | | 1.55 | |
| | | | | | | | | | | | | | | | | | | | | | | | |
Total from investment operations | | | 0.81 | | | | (0.01 | ) | | | (2.76 | ) | | | 0.68 | | | | 0.42 | | | | 1.42 | |
| | | | | | | | | | | | | | | | | | | | | | | | |
Less distributions: | | | | | | | | | | | | | | | | | | | | | | | | |
Distributions from realized gains | | | — | | | | — | | | | (0.86 | ) | | | — | | | | — | | | | — | |
| | | | | | | | | | | | | | | | | | | | | | | | |
Total distributions | | | — | | | | — | | | | (0.86 | ) | | | — | | | | — | | | | — | |
| | | | | | | | | | | | | | | | | | | | | | | | |
Net asset value, end of period | | $ | 7.22 | | | $ | 6.41 | | | $ | 6.42 | | | $ | 10.04 | | | $ | 9.36 | | | $ | 8.94 | |
| | | | | | | | | | | | | | | | | | | | | | | | |
Total Return d | | | 12.64 | % | | | (0.16 | %) | | | (29.37 | %) | | | 7.26 | % | | | 4.70 | % | | | 18.88 | % |
| | | | | | | | | | | | | | | | | | | | | | | | |
Ratios/Supplemental Data | | | | | | | | | | | | | | | | | | | | | | | | |
Net assets, end of period (in thousands) | | $ | 3,582 | | | $ | 3,742 | | | $ | 5,501 | | | $ | 11,245 | | | $ | 12,777 | | | $ | 5,029 | |
| | | | | | | | | | | | | | | | | | | | | | | | |
Ratios to average net assets: | | | | | | | | | | | | | | | | | | | | | | | | |
Net investment loss | | | (0.80 | )% | | | (0.66 | )% | | | (0.92 | )% | | | (0.86 | )% | | | (1.44 | )% | | | (1.54 | )% |
Total expenses e | | | 2.47 | % | | | 2.78 | % | | | 2.46 | % | | | 2.32 | % | | | 2.52 | % | | | 2.42 | % |
Net expenses f | | | 2.10 | % | | | 2.10 | % | | | 2.10 | % | | | 2.15 | % | | | 2.52 | % | | | 2.42 | % |
Net expenses prior to custodian earning credits and net of expense waivers | | | 2.10 | % | | | 2.10 | % | | | 2.10 | % | | | 2.15 | % | | | 2.52 | % | | | 2.42 | % |
| | | | | | | | | | | | | | | | | | | | | | | | |
Portfolio turnover rate | | | 185 | % | | | 134 | % | | | 198 | %g | | | 21 | % | | | 39 | % | | | 13 | % |
| a | Unaudited figures for the six months ended March 31, 2010. Percentage amounts for the period, except total return, have been annualized. |
| b | The financial highlights for the Large Cap Concentrated Growth Fund exclude the historical financial highlights of the Enhanced Index Fund, Class A, B and C shares, the Large Cap Growth Fund, Class A, B and C shares and the Social Awareness Fund, Class A, B and C shares. A total of $29,412,366 was excluded from purchases in the portfolio turnover calculation. This was the cost of the securities Large Cap Concentrated Growth received as a result of the merger. The assets of the Enhanced Index, Large Cap Growth and Social Awareness Fund’ were acquired by the Large Cap Concentrated Growth Fund on June 16, 2006. |
| c | Net investment income (loss) was computed using average shares outstanding throughout the period. |
| d | Total return information does not reflect deduction of any sales charges imposed at the time of purchase for Class A shares or upon redemption for Class B and C shares. |
| e | Total expense information reflects expense ratios absent expense reductions by the Investment Manager and custodian earnings credits, as applicable. |
| f | Net expense information reflects the expense ratios after voluntary expense waivers, reimbursements and custodian earnings credits, as applicable. |
| g | Significant variation in the portfolio turnover rate is due to the Investment Manager’s appointment of new portfolio managers for the Fund. |
| h | Effective February 1, 2010, the Fund’s name became Large Cap Concentrated Growth Fund. Prior to February 1, 2010, the Fund was known as the Select 25 Fund. |
| * | Less than $0.01 per share. |
| | | | |
| | 69 | | The accompanying notes are an integral part of the financial statements
|
| | |
| | Rydex | SGI Equity Fund |
| Performance Summary | | Small Cap Growth Fund |
| March 31, 2010 | | (unaudited) |
PERFORMANCE
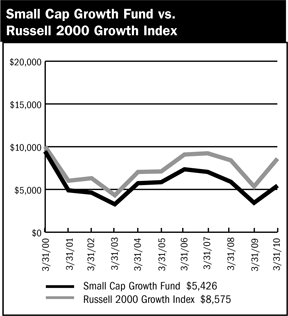
$10,000 Over 10 Years
This chart assumes a $10,000 investment in Class A shares of Small Cap Growth Fund on March 31, 2000, reflects deduction of the 5.75% sales load and assumes all dividends reinvested. The chart does not reflect the deduction of taxes that a shareholder would pay on distributions or the redemption of fund shares. The Russell 2000 Growth Index measures the performance of those Russell 2000 companies with higher price-to-book ratios and higher forecasted growth values.
| | | | | | | | | |
Average Annual Returns | | | | | | | | | |
Periods Ended 3-31-10 | | 1 Year | | | 5 Years | | | 10 Years | |
A Shares | | 57.71 | % | | (1.50 | )% | | (5.37 | )% |
A Shares with sales charge | | 48.70 | % | | (2.66 | )% | | (5.93 | )% |
B Shares | | 56.85 | % | | (2.20 | )% | | (5.97 | )% |
B Shares with CDSC | | 51.85 | % | | (2.56 | )% | | (5.97 | )% |
C Shares | | 56.57 | % | | (2.23 | )% | | (6.11 | )% |
C Shares with CDSC | | 55.57 | % | | (2.23 | )% | | (6.11 | )% |
The performance data above represents past performance that is not predictive of future results. The investment return and principal value of an investment in the Fund will fluctuate so that an investor’s shares, when redeemed, may be worth more or less than their original cost. The figures above do not reflect deduction of the maximum front-end sales charge of 5.75% for Class A shares or the contingent deferred sales charge of 5% for Class B shares and 1% for Class C shares, as applicable, except where noted. The figures do not reflect the deduction of taxes that a shareholder would pay on distributions or redemption of shares. Such figures would be lower if the maximum sales charge and any applicable taxes were deducted. Fee waivers reduced expenses of the Fund and in the absence of such waiver, the performance quoted would be reduced.
Portfolio Composition by Sector as of 3-31-10
| | | |
Consumer Discretionary | | 15.22 | % |
Consumer Staples | | 4.53 | |
Energy | | 5.33 | |
Financials | | 5.13 | |
Health Care | | 15.46 | |
Industrials | | 17.04 | |
Information Technology | | 24.21 | |
Materials | | 5.29 | |
Utilities | | 1.97 | |
Exchange Traded Funds | | 3.52 | |
Cash & Other Assets, Less Liabilities | | 2.30 | |
| | | |
Total Net Assets | | 100.00 | % |
| | | |
| | | | |
| | 70 | | The accompanying notes are an integral part of the financial statements |
| | |
| Schedule of Investments | | Rydex | SGI Equity Fund |
March 31, 2010 (unaudited) | | Small Cap Growth Fund |
| | | | | |
| | | Shares | | Value |
COMMON STOCKS - 97.7% | | | | | |
Aerospace & Defense - 2.4% | | | | | |
BE Aerospace, Inc.* | | 9,740 | | $ | 296,583 |
DigitalGlobe, Inc.* | | 3,120 | | | 87,017 |
| | | | | |
| | | | | 383,600 |
| | | | | |
Aluminum - 0.5% | | | | | |
Kaiser Aluminum Corporation | | 2,250 | | | 86,783 |
| | | | | |
Apparel, Accessories & Luxury | | | | | |
Goods - 3.1% | | | | | |
Hanesbrands, Inc.* | | 8,500 | | | 236,469 |
Lululemon Athletica, Inc.* | | 4,200 | | | 174,300 |
Oxford Industries, Inc. | | 5,100 | | | 103,683 |
| | | | | |
| | | | | 514,452 |
| | | | | |
Application Software - 9.9% | | | | | |
Cadence Design Systems, Inc.* | | 19,600 | | | 130,536 |
Informatica Corporation* | | 7,600 | | | 204,136 |
JDA Software Group, Inc.* | | 7,574 | | | 210,709 |
Longtop Financial Technologies, Ltd. ADR* | | 4,450 | | | 143,335 |
Nuance Communications, Inc.* | | 12,965 | | | 215,738 |
Smith Micro Software, Inc.* | | 15,250 | | | 134,810 |
Solera Holdings, Inc. | | 9,800 | | | 378,769 |
Vancelnfo Technologies, Inc. ADR* | | 7,750 | | | 172,748 |
| | | | | |
| | | | | 1,590,781 |
| | | | | |
Auto Parts & Equipment - 0.6% | | | | | |
Gentex Corporation | | 4,780 | | | 92,828 |
| | | | | |
Automotive Retail - 0.6% | | | | | |
Monro Muffler Brake, Inc. | | 2,850 | | | 101,916 |
| | | | | |
Biotechnology -2.4% | | | | | |
Halozyme Therapeutics, Inc.* | | 12,890 | | | 102,991 |
Martek Biosciences Corporation* | | 12,600 | | | 283,626 |
| | | | | |
| | | | | 386,617 |
| | | | | |
Casinos & Gaming - 2.3% | | | | | |
Penn National Gaming, Inc.* | | 7,555 | | | 210,029 |
WMS Industries, Inc.* | | 3,955 | | | 165,873 |
| | | | | |
| | | | | 375,902 |
| | | | | |
Coal & Consumable Fuels - 1.6% | | | | | |
Massey Energy Company | | 4,820 | | | 252,038 |
| | | | | |
Communications
Equipment - 2.4% | | | | | |
Ciena Corporation* | | 10,840 | | | 165,202 |
InterDigital, Inc.* | | 7,820 | | | 217,865 |
| | | | | |
| | | | | 383,067 |
| | | | | |
Computer Storage &
Peripherals - 1.9% | | | | | |
QLogic Corporation* | | 15,520 | | | 315,056 |
| | | | | |
Construction &
Engineering - 2.0% | | | | | |
Aecom Technology Corporation* | | 11,400 | | | 323,418 |
| | | | | |
Construction & Farm Machinery & | | | | | |
Heavy Trucks - 2.4% | | | | | |
Bucyrus International, Inc. | | 3,500 | | | 230,965 |
Wabtec Corporation | | 3,800 | | | 160,056 |
| | | | | |
| | | | | 391,021 |
| | | | | |
Consumer Finance - 0.0% | | | | | |
Cardtronics, Inc.* | | 300 | | | 3,771 |
| | | | | |
| | | | | |
| | | Shares | | Value |
COMMON STOCKS - 97.7% (continued) |
Data Processing & Outsourced | | | | | |
Services - 1.7% | | | | | |
Alliance Data Systems Corporation* | | 4,435 | | $ | 283,796 |
| | | | | |
Diversified Metals & Mining - 0.8% | | | | | |
Thompson Creek Metals Company, Inc.* | | 10,040 | | | 135,841 |
| | | | | |
Education Services - 1.1% | | | | | |
DeVry, Inc. | | 2,650 | | | 172,780 |
| | | | | |
Electric Utilities -1.0% | | | | | |
ITC Holdings Corporation | | 2,870 | | | 157,850 |
| | | | | |
Electrical Components &
Equipment - 2.8% | | | | | |
Regal-Beloit Corporation | | 3,570 | | | 212,094 |
Roper Industries, Inc. | | 4,250 | | | 245,820 |
| | | | | |
| | | | | 457,914 |
| | | | | |
Electronic Equipment &
Instruments - 1.7% | | | | | |
FLIR Systems, Inc.* | | 5,700 | | | 160,740 |
Rofin-Sinar Technologies, Inc.* | | 4,870 | | | 110,159 |
| | | | | |
| | | | | 270,899 |
| | | | | |
Exchange Traded Funds - 3.5% | | | | | |
iShares Russell 2000 Growth Index Fund | | 7,805 | | | 571,638 |
| | | | | |
Fertilizers & Agricultural
Chemicals - 0.9% | | | | | |
CF Industries Holdings, Inc. | | 1,650 | | | 150,447 |
| | | | | |
Health Care Equipment - 4.1% | | | | | |
ev3, Inc.* | | 8,400 | | | 133,224 |
| | | | | |
Integra LifeSciences Holdings Corporation* | | 4,570 | | | 200,303 |
Natus Medical, Inc.* | | 11,120 | | | 176,919 |
Wright Medical Group, Inc.* | | 9,000 | | | 159,930 |
| | | | | |
| | | | | 670,376 |
| | | | | |
Health Care Services - 3.5% | | | | | |
CardioNet, Inc.* | | 14,210 | | | 108,707 |
Clarient, Inc.* | | 26,850 | | | 70,347 |
LHC Group, Inc.* | | 5,580 | | | 187,097 |
Mednax, Inc.* | | 3,330 | | | 193,773 |
| | | | | |
| | | | | 559,924 |
| | | | | |
Health Care Supplies - 1.4% | | | | | |
Haemonetics Corporation* | | 3,995 | | | 228,314 |
| | | | | |
Homebuilding - 1.3% | | | | | |
Lennar Corporation | | 12,530 | | | 215,641 |
| | | | | |
Home Furnishing Retail - 1.3% | | | | | |
Select Comfort Corporation* | | 25,800 | | | 205,626 |
| | | | | |
Household Products - 1.5% | | | | | |
Church & Dwight Company, Inc. | | 3,700 | | | 247,715 |
| | | | | |
Housewares & Specialties - 1.5% | | | | | |
Jarden Corporation | | 7,075 | | | 235,527 |
| | | | | |
| | | | |
| | 71 | | The accompanying notes are an integral part of the financial statements |
| | |
| Schedule of Investments | | Rydex | SGI Equity Fund |
March 31, 2010 (unaudited) | | Small Cap Growth Fund |
| | | | | |
| | | Shares | | Value |
COMMON STOCKS - 97.7% (continued) |
Human Resources & Employment Services - 0.8% | | | | | |
Towers Watson & Company | | 2,900 | | $ | 137,750 |
| | | | | |
Hypermarkets & Super
Centers - 1.1% | | | | | |
BJ’s Wholesale Club, Inc.* | | 4,930 | | | 182,361 |
| | | | | |
Industrial Machinery - 4.1% | | | | | |
IDEX Corporation | | 7,890 | | | 261,159 |
Pall Corporation | | 3,660 | | | 148,193 |
Pentair, Inc. | | 7,260 | | | 258,601 |
| | | | | |
| | | | | 667,953 |
| | | | | |
Investment Banking &
Brokerage - 2.5% | | | | | |
Knight Capital Group, Inc.* | | 12,150 | | | 185,288 |
Stifel Financial Corporation* | | 4,100 | | | 220,374 |
| | | | | |
| | | | | 405,662 |
| | | | | |
Leisure Facilities - 2.6% | | | | | |
Life Time Fitness, Inc.* | | 7,950 | | | 223,395 |
Vail Resorts, Inc.* | | 4,915 | | | 197,042 |
| | | | | |
| | | | | 420,437 |
| | | | | |
Life Sciences Tools & Services - 0.9% | | | | | |
Charles River Laboratories International, Inc.* | | 3,700 | | | 145,447 |
| | | | | |
Metal & Glass Containers - 1.5% | | | | | |
Silgan Holdings, Inc. | | 3,950 | | | 237,909 |
| | | | | |
Multi-Line Insurance - 1.7% | | | | | |
HCC Insurance Holdings, Inc. | | 9,850 | | | 271,860 |
| | | | | |
Multi-Utilities - 1.0% | | | | | |
NorthWestern Corporation | | 6,030 | | | 161,664 |
| | | | | |
Office Services & Supplies - 0.7% | | | | | |
Interface, Inc. | | 9,800 | | | 113,484 |
| | | | | |
Oil & Gas Equipment &
Services - 2.3% | | | | | |
Oil States International, Inc.* | | 5,150 | | | 233,501 |
Superior Energy Services, Inc.* | | 7,510 | | | 157,860 |
| | | | | |
| | | | | 391,361 |
| | | | | |
Oil & Gas Exploration &
Production-1.4% | | | | | |
Bill Barrett Corporation* | | 4,800 | | | 147,408 |
Comstock Resources, Inc.* | | 2,320 | | | 73,776 |
| | | | | |
| | | | | 221,184 |
| | | | | |
Packaged Foods & Meats - 1.9% | | | | | |
Flowers Foods, Inc. | | 8,270 | | | 204,600 |
J&J Snack Foods Corporation | | 2,300 | | | 99,981 |
| | | | | |
| | | | | 304,581 |
| | | | | |
Pharmaceuticals - 3.2% | | | | | |
Endo Pharmaceuticals Holdings, Inc.* | | 7,300 | | | 172,937 |
Obagi Medical Products, Inc.* | | 7,200 | | | 87,696 |
Perrigo Company | | 4,350 | | | 255,432 |
| | | | | |
| | | | | 516,065 |
| | | | | |
Railroads - 1.0% | | | | | |
Kansas City Southern* | | 4,395 | | | 158,967 |
| | | | | |
| | | | | |
| | | Shares | | Value |
COMMON STOCKS - 97.7% (continued) |
Regional Banks - 0.9% | | | | | |
TCF Financial Corporation | | 9,420 | | $ | 150,155 |
| | | | | |
Research & Consulting Services - 0.8% | | | | | |
ICF International, Inc.* | | 5,200 | | | 129,168 |
| | | | | |
Restaurants - 0.8% | | | | | |
Einstein Noah Restaurant Group, Inc.* | | 5,900 | | | 71,685 |
McCormick & Schmick’s Seafood Restaurants, Inc.* | | 6,150 | | | 61,931 |
| | | | | |
| | | | | 133,616 |
| | | | | |
Semiconductor Equipment - 0.8% | | | | | |
Nanometrics, Inc.* | | 14,400 | | | 136,512 |
| | | | | |
Semiconductors - 3.1% | | | | | |
ON Semiconductor Corporation* | | 27,865 | | | 222,920 |
Skyworks Solutions, Inc.* | | 16,840 | | | 262,704 |
| | | | | |
| | | | | 485,624 |
| | | | | |
Steel - 1.6% | | | | | |
AK Steel Holding Corporation | | 10,835 | | | 247,687 |
| | | | | |
Systems Software - 1.4% | | | | | |
Rovi Corporation* | | 6,100 | | | 226,493 |
| | | | | |
Technology Distributors - 1.4% | | | | | |
SYNNEX Corporation* | | 7,950 | | | 235,002 |
| | | | | |
TOTAL COMMON STOCKS
(cost $12,247,191) | | | | $ | 15,846,480 |
| | | | | |
Total Investments - 97.7% 1
(cost $12,247,191) | | | | $ | 15,846,480 |
| Cash & Other Assets, Less Liabilities-2.3% | | | | | 372,936 |
| | | | | |
Total Net Assets-100.0% | | | | $ | 16,219,416 |
| | | | | |
For federal income tax purposes the identified cost of investments owned at March 31, 2010 was $12,525,725.
ADR American Depositary Receipt
| * | Non-income producing security |
| 1 | Unless otherwise indicated, the values of the securities of the Portfolio are determined based on Level 1 inputs. |
| | | | |
| | 72 | | The accompanying notes are an integral part of the financial statements |
| | |
| | Rydex | SGI Equity Fund |
| | Small Cap Growth Fund (unaudited) |
Statement of Assets and Liabilities
March 31, 2010
| | | | |
Assets: | | | | |
Investments, at value * | | $ | 15,846,480 | |
Cash | | | 277,705 | |
Receivables: | | | | |
Fund shares sold | | | 3,785 | |
Securities sold | | | 314,235 | |
Dividends | | | 2,949 | |
Prepaid expenses | | | 21,223 | |
| | | | |
Total assets | | | 16,466,377 | |
| | | | |
Liabilities: | | | | |
Payable for: | | | | |
Securities purchased | | | 209,150 | |
Fund shares redeemed | | | 1,651 | |
Management fees | | | 11,606 | |
Custodian fees | | | 625 | |
Transfer agent/maintenance fees | | | 5,588 | |
Administration fees | | | 1,697 | |
Professional fees | | | 7,669 | |
12b-l distribution plan fees | | | 5,481 | |
Directors’ fees | | | 64 | |
Other | | | 3,430 | |
| | | | |
Total liabilities | | | 246,961 | |
| | | | |
Net assets | | $ | 16,219,416 | |
| | | | |
Net assets consist of: | | | | |
Paid in capital | | $ | 20,595,230 | |
Accumulated net investment loss | | | (104,311 | ) |
Accumulated net realized loss on sale of investments | | | (7,870,792 | ) |
Net unrealized appreciation in value of investments | | | 3,599,289 | |
| | | | |
Net assets | | $ | 16,219,416 | |
| | | | |
Class A: | | | | |
Capital shares outstanding (unlimited number of shares authorized) | | | 1,083,674 | |
Net assets | | $ | 12,970,308 | |
Net asset value and redemption price per share | | $ | 11.97 | |
| | | | |
Maximum offering price per share (net asset value divided by 94.25%) | | $ | 12.70 | |
| | | | |
Class B: | | | | |
Capital shares outstanding (unlimited number of shares authorized) | | | 157,937 | |
Net assets | | $ | 1,681,298 | |
Net asset value, offering and redemption price per share (excluding any applicable contingent deferred sales charge) | | $ | 10.65 | |
| | | | |
Class C: | | | | |
Capital shares outstanding (unlimited number of shares authorized) | | | 144,497 | |
Net assets | | $ | 1,567,810 | |
Net asset value, offering and redemption price per share (excluding any applicable contingent deferred sales charge) | | $ | 10.85 | |
| | | | |
*Investments, at cost | | $ | 12,247,191 | |
Statement of Operations
For the Six Months Ended March 31, 2010
| | | | |
Investment Income: | | | | |
Dividends | | $ | 69,450 | |
Interest | | | 84 | |
| | | | |
Total investment income | | | 69,534 | |
| | | | |
Expenses: | | | | |
Management fees | | | 60,587 | |
Transfer agent/maintenance fees | | | 45,389 | |
Administration fees | | | 13,407 | |
Directors’ fees | | | 563 | |
Professional fees | | | 4,978 | |
Reports to shareholders | | | 1,551 | |
Registration fees | | | 16,421 | |
Other expenses | | | 1,181 | |
12b-1 distribution fees—Class A | | | 13,836 | |
12b-1 distribution fees—Class B | | | 8,367 | |
12b-1 distribution fees—Class C | | | 7,565 | |
| | | | |
Total expenses | | | 173,845 | |
| | | | |
Net investment loss | | | (104,311 | ) |
| | | | |
Net Realized and Unrealized Gain (Loss): | | | | |
Net realized gain (loss) during the period on: | | | | |
Investments | | | 1,288,559 | |
| | | | |
Net realized gain | | | 1,288,559 | |
| | | | |
Net unrealized appreciation (depreciation) during the period on: | | | | |
Investments | | | 684,004 | |
| | | | |
Net unrealized appreciation | | | 684,004 | |
| | | | |
Net realized and unrealized gain | | | 1,972,563 | |
| | | | |
Net increase in net assets resulting from operations | | $ | 1,868,252 | |
| | | | |
| | | | |
| | 73 | | The accompanying notes are an integral part of the financial statements |
| | |
| | Rydex | SGI Equity Fund |
| Statement of Changes in Net Assets | | Small Cap Growth Fund |
| | | | | | | | |
| | | Six Months Ended
March 31, 2010 | | | Year Ended
September 30, 2009 | |
| | | (unaudited) | | | | |
Increase (decrease) in net assets from operations: | | | | | | | | |
Net investment loss | | $ | (104,311 | ) | | $ | (267,291 | ) |
Net realized gain (loss) during the period on investments | | | 1,288,559 | | | | (5,298,229 | ) |
Net unrealized appreciation during the period on investments | | | 684 ,004 | | | | 3,555,194 | |
| | | | | | | | |
Net increase (decrease) in net assets resulting from operations | | | 1,868,252 | | | | (2,010,326 | ) |
| | | | | | | | |
Distributions to shareholders from: | | | | | | | | |
Net realized gain | | | | | | | | |
Class A | | | — | | | | (68,412 | ) |
Class B | | | — | | | | (15,241 | ) |
Class C | | | — | | | | (14,153 | ) |
| | | | | | | | |
Total distributions to shareholders | | | — | | | | (97,806 | ) |
| | | | | | | | |
Capital share transactions: | | | | | | | | |
Proceeds from sale of shares | | | | | | | | |
Class A | | | 5,166,398 | | | | 2,029,895 | |
Class B | | | 75,726 | | | | 248,049 | |
Class C | | | 111,321 | | | | 317,482 | |
Distributions reinvested | | | | | | | | |
Class A | | | — | | | | 67,918 | |
Class B | | | — | | | | 15,032 | |
Class C | | | — | | | | 14,129 | |
Cost of shares redeemed | | | | | | | | |
Class A | | | (3,638,616 | ) | | | (3,116,009 | ) |
Class B | | | (364,505 | ) | | | (805,709 | ) |
Class C | | | (248,475 | ) | | | (820,807 | ) |
| | | | | | | | |
Net increase (decrease) from capital share transactions | | | 1,101,849 | | | | (2,050,020 | ) |
| | | | | | | | |
Net increase (decrease) in net assets | | | 2,970,101 | | | | (4,158,152 | ) |
| | | | | | | | |
Net assets: | | | | | | | | |
Beginning of period | | | 13,249,315 | | | | 17,407,467 | |
| | | | | | | | |
End of period | | $ | 16,219,416 | | | $ | 13,249,315 | |
| | | | | | | | |
Accumulated net investment loss at end of period | | $ | (104,311 | ) | | $ | — | |
| | | | | | | | |
Capital share activity: | | | | | | | | |
Shares sold | | | | | | | | |
Class A | | | 470,062 | | | | 233,845 | |
Class B | | | 7,878 | | | | 32,329 | |
Class C | | | 11,069 | | | | 41,277 | |
Shares reinvested | | | | | | | | |
Class A | | | — | | | | 8,334 | |
Class B | | | — | | | | 2,056 | |
Class C | | | — | | | | 1,894 | |
Shares redeemed | | | | | | | | |
Class A | | | (329,773 | ) | | | (384,736 | ) |
Class B | | | (37,291 | ) | | | (107,295 | ) |
Class C | | | (24,474 | ) | | | (106,372 | ) |
| | | | |
| | 74 | | The accompanying notes are an integral part of the financial statements |
| | |
| Financial Highlights | | Rydex | SGI Equity Fund |
Selected data for each share of capital stock outstanding throughout each period | | Small Cap Growth Fund |
| | | | | | | | | | | | | | | | | | | | | | | | |
Class A | | Six Months
Ended
March 31,
2010 a | | | 2009 | | | 2008 | | | 2007 | | | 2006 | | | Year Ended
September 30,
2005 | |
Per Share Data | | | | | | | | | | | | | | | | | | | | | | | | |
Net asset value, beginning of period | | $ | 10.56 | | | $ | 11.43 | | | $ | 18.53 | | | $ | 15.63 | | | $ | 15.76 | | | $ | 13.11 | |
| | | | | | | | | | | | | | | | | | | | | | | | |
Income (loss) from investment operations: | | | | | | | | | | | | | | | | | | | | | | | | |
Net investment loss b | | | (0.07 | ) | | | (0.18 | ) | | | (0.24 | ) | | | (0.23 | ) | | | (0.23 | ) | | | (0.24 | ) |
Net gain (loss) on securities (realized and unrealized) | | | 1.48 | | | | (0.63 | ) | | | (5.55 | ) | | | 3.13 | | | | 0.10 | | | | 2.89 | |
| | | | | | | | | | | | | | | | | | | | | | | | |
Total from investment operations | | | 1.41 | | | | (0.81 | ) | | | (5.79 | ) | | | 2.90 | | | | (0.13 | ) | | | 2.65 | |
| | | | | | | | | | | | | | | | | | | | | | | | |
Less distributions: | | | | | | | | | | | | | | | | | | | | | | | | |
Distributions from realized gains | | | — | | | | (0.06 | ) | | | (1.31 | ) | | | — | | | | — | | | | — | |
| | | | | | | | | | | | | | | | | | | | | | | | |
Total distributions | | | — | | | | (0.06 | ) | | | (1.31 | ) | | | — | | | | — | | | | — | |
| | | | | | | | | | | | | | | | | | | | | | | | |
Net asset value, end of period | | $ | 11.97 | | | $ | 10.56 | | | $ | 11.43 | | | $ | 18.53 | | | $ | 15.63 | | | $ | 15.76 | |
| | | | | | | | | | | | | | | | | | | | | | | | |
Total Return c | | | 13.35 | % | | | (6.89 | )% | | | (33.25 | )% | | | 18.55 | % | | | (0.82 | )% | | | 20.21 | % |
| | | | | | | | | | | | | | | | | | | | | | | | |
Ratios/Supplemental Data | | | | | | | | | | | | | | | | | | | | | | | | |
Net assets, end of period (in thousands) | | $ | 12,970 | | | $ | 9,966 | | | $ | 12,414 | | | $ | 45,430 | | | $ | 45,451 | | | $ | 22,637 | |
| | | | | | | | | | | | | | | | | | | | | | | | |
Ratios to average net assets: | | | | | | | | | | | | | | | | | | | | | | | | |
Net investment loss | | | (1.29 | )% | | | (2.04 | )% | | | (1.59 | )% | | | (1.32 | )% | | | (1.46 | )% | | | (1.67 | )% |
Total expenses d | | | 2.27 | % | | | 2.67 | % | | | 1.98 | % | | | 1.80 | % | | | 2.01 | % | | | 2.10 | % |
Net expenses e | | | 2.27 | % | | | 2.60 | % | | | 1.98 | % | | | 1.80 | % | | | 2.01 | % | | | 2.10 | % |
Net expenses prior to custodian earning credits and net of expense waivers | | | 2.27 | % | | | 2.60 | % | | | 1.98 | % | | | 1.80 | % | | | 2.01 | % | | | 2.10 | % |
| | | | | | | | | | | | | | | | | | | | | | | | |
Portfolio turnover rate | | | 109 | % | | | 200 | % | | | 169 | % | | | 145 | % | | | 136 | % | | | 134 | % |
| | | | | | |
Class B | | Six Months
Ended
March 31,
2010 a | | | 2009 | | | 2008 | | | 2007 | | | 2006 | | | Year Ended
September 30,
2005 | |
Per Share Data | | | | | | | | | | | | | | | | | | | | | | | | |
Net asset value, beginning of period | | $ | 9.43 | | | $ | 10.28 | | | $ | 16.92 | | | $ | 14.38 | | | $ | 14.60 | | | $ | 12.24 | |
| | | | | | | | | | | | | | | | | | | | | | | | |
Income (loss) from investment operations: | | | | | | | | | | | | | | | | | | | | | | | | |
Net investment loss b | | | (0.10 | ) | | | (0.21 | ) | | | (0.32 | ) | | | (0.33 | ) | | | (0.36 | ) | | | (0.33 | ) |
Net gain (loss) on securities (realized and unrealized) | | | 1.32 | | | | (0.58 | ) | | | (5.01 | ) | | | 2.87 | | | | 0.14 | | | | 2.69 | |
| | | | | | | | | | | | | | | | | | | | | | | | |
Total from investment operations | | | 1.22 | | | | (0.79 | ) | | | (5.33 | ) | | | 2.54 | | | | (0.22 | ) | | | 2.36 | |
| | | | | | | | | | | | | | | | | | | | | | | | |
Less distributions: | | | | | | | | | | | | | | | | | | | | | | | | |
Distributions from realized gains | | | — | | | | (0.06 | ) | | | (1.31 | ) | | | — | | | | — | | | | — | |
| | | | | | | | | | | | | | | | | | | | | | | | |
Total distributions | | | — | | | | (0.06 | ) | | | (1.31 | ) | | | — | | | | — | | | | — | |
| | | | | | | | | | | | | | | | | | | | | | | | |
Net asset value, end of period | | $ | 10.65 | | | $ | 9.43 | | | $ | 10.28 | | | $ | 16.92 | | | $ | 14.38 | | | $ | 14.60 | |
| | | | | | | | | | | | | | | | | | | | | | | | |
Total Return c | | | 12.94 | % | | | (7.47 | )% | | | (33.72 | )% | | | 17.66 | % | | | (1.51 | )% | | | 19.28 | % |
| | | | | | | | | | | | | | | | | | | | | | | | |
Ratios/Supplemental Data | | | | | | | | | | | | | | | | | | | | | | | | |
Net assets, end of period (in thousands) | | $ | 1,681 | | | $ | 1,766 | | | $ | 2,675 | | | $ | 5,792 | | | $ | 5,919 | | | $ | 8,283 | |
| | | | | | | | | | | | | | | | | | | | | | | | |
Ratios to average net assets: | | | | | | | | | | | | | | | | | | | | | | | | |
Net investment loss | | | (2.05 | )% | | | (2.78 | )% | | | (2.42 | )% | | | (2.07 | )% | | | (2.31 | )% | | | (2.41 | )% |
Total expenses d | | | 3.03 | % | | | 3.41 | % | | | 2.82 | % | | | 2.56 | % | | | 2.79 | % | | | 2.85 | % |
Net expenses e | | | 3.03 | % | | | 3.34 | % | | | 2.82 | % | | | 2.55 | % | | | 2.79 | % | | | 2.85 | % |
Net expenses prior to custodian earning credits and net of expense waivers | | | 3.03 | % | | | 3.34 | % | | | 2.82 | % | | | 2.56 | % | | | 2.79 | % | | | 2.85 | % |
| | | | | | | | | | | | | | | | | | | | | | | | |
Portfolio turnover rate | | | 109 | % | | | 200 | % | | | 169 | % | | | 145 | % | | | 136 | % | | | 134 | % |
| | | | |
| | 75 | | The accompanying notes are an integral part of the financial statements |
| | |
| Financial Highlights | | Rydex | SGI Equity Fund |
Selected data for each share of capital stock outstanding throughout each period | | Small Cap Growth Fund |
| | | | | | | | | | | | | | | | | | | | | | | | |
Class C | | Six Months
Ended March 31,
2010 a | | | 2009 | | | 2008 | | | 2007 | | | 2006 | | | Year Ended
September 30,
2005 | |
Per Share Data | | | | | | | | | | | | | | | | | | | | | | | | |
Net asset value, beginning of period | | $ | 9.61 | | | $ | 10.48 | | | $ | 17.23 | | | $ | 14.64 | | | $ | 14.88 | | | $ | 12.47 | |
| | | | | | | | | | | | | | | | | | | | | | | | |
Income (loss) from investment operations: | | | | | | | | | | | | | | | | | | | | | | | | |
Net investment loss b | | | (0.10 | ) | | | (0.22 | ) | | | (0.33 | ) | | | (0.33 | ) | | | (0.35 | ) | | | (0.33 | ) |
Net gain (loss) on securities (realized and unrealized) | | | 1.34 | | | | (0.59 | ) | | | (5.11 | ) | | | 2.92 | | | | 0.11 | | | | 2.74 | |
| | | | | | | | | | | | | | | | | | | | | | | | |
Total from investment operations | | | 1.24 | | | | (0.81 | ) | | | (5.44 | ) | | | 2.59 | | | | (0.24 | ) | | | 2.41 | |
| | | | | | | | | | | | | | | | | | | | | | | | |
Less distributions: | | | | | | | | | | | | | | | | | | | | | | | | |
Distributions from realized gains | | | — | | | | (0.06 | ) | | | (1.31 | ) | | | — | | | | — | | | | — | |
| | | | | | | | | | | | | | | | | | | | | | | | |
Total distributions | | | — | | | | (0.06 | ) | | | (1.31 | ) | | | — | | | | — | | | | — | |
| | | | | | | | | | | | | | | | | | | | | | | | |
Net asset value, end of period | | $ | 10.85 | | | $ | 9.61 | | | $ | 10.48 | | | $ | 17.23 | | | $ | 14.64 | | | $ | 14.88 | |
| | | | | | | | | | | | | | | | | | | | | | | | |
Total Return c | | | 12.90 | % | | | (7.51 | )% | | | (33.76 | )% | | | 17.69 | % | | | (1.61 | )% | | | 19.33 | % |
| | | | | | | | | | | | | | | | | | | | | | | | |
Ratios/Supplemental Data | | | | | | | | | | | | | | | | | | | | | | | | |
Net assets, end of period (in thousands) | | $ | 1,568 | | | $ | 1,518 | | | $ | 2,318 | | | $ | 3,964 | | | $ | 4,304 | | | $ | 4,420 | |
| | | | | | | | | | | | | | | | | | | | | | | | |
Ratios to average net assets: | | | | | | | | | | | | | | | | | | | | | | | | |
Net investment loss | | | (2.07 | )% | | | (2.77 | )% | | | (2.43 | )% | | | (2.07 | )% | | | (2.29 | )% | | | (2.42 | )% |
Total expenses d | | | 3.03 | % | | | 3.40 | % | | | 2.83 | % | | | 2.56 | % | | | 2.79 | % | | | 2.85 | % |
Net expenses e | | | 3.03 | % | | | 3.33 | % | | | 2.83 | % | | | 2.55 | % | | | 2.79 | % | | | 2.85 | % |
Net expenses prior to custodian earning credits and net of expense waivers | | | 3.03 | % | | | 3.33 | % | | | 2.83 | % | | | 2.56 | % | | | 2.79 | % | | | 2.85 | % |
| | | | | | | | | | | | | | | | | | | | | | | | |
Portfolio turnover rate | | | 109 | % | | | 200 | % | | | 169 | % | | | 145 | % | | | 136 | % | | | 134 | % |
| a | Unaudited figures for the six months ended March 31, 2010. Percentage amounts for the period, except total return, have been annualized. |
| b | Net investment income (loss) was computed using average shares outstanding throughout the period. |
| c | Total return information does not reflect deduction of any sales charges imposed at the time of purchase for Class A shares or upon redemption for Class B and C shares. |
| d | Total expense information reflects expense ratios absent expense reductions by the Investment Manager and custodian earnings credits, as applicable. |
| e | Net expense information reflects the expense ratios after voluntary expense waivers, reimbursements and custodian earnings credits, as applicable. |
| | | | |
| | 76 | | The accompanying notes are an integral part of the financial statements |
| | |
| | Rydex | SGI Equity Fund |
| Performance Summary | | Small Cap Value Fund |
| March 31, 2010 | | (unaudited) |
PERFORMANCE
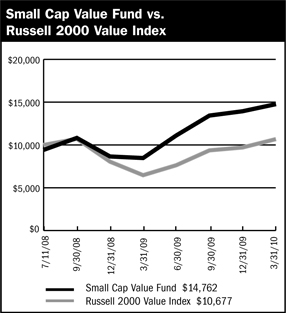
$10,000 Since Inception
This chart assumes a $10,000 investment in Class A shares of Small Cap Value Fund on July 11, 2008 (date of inception), reflects deduction of the 5.75% sales load and assumes all dividends reinvested. The chart does not reflect the deduction of taxes that a shareholder would pay on distributions or the redemption of fund shares. The Russell 2000 Value Index is an unmanaged index that measures the performance of securities of small to mid cap U.S. companies with lower price-to-book ratios and lower forecasted growth values.
Average Annual Returns
| | | | |
Periods Ended 3-31-10 | | 1 Year | | Since Inception
(7-11-08) |
| | | | | | |
A Shares | | 74.25 | % | | 29.79 | % |
A Shares with Sales Charge | | 64.22 | % | | 25.40 | % |
C Shares | | 73.37 | % | | 26.97 | % |
C Shares with CDSC | | 72.37 | % | | 28.97 | % |
Institutional Class | | 74.76 | % | | 30.10 | % |
The performance data above represents past performance that is not predictive of future results. The investment return and principal value of an investment in the Fund will fluctuate so that an investor’s shares, when redeemed, may be worth more or less than their original cost. The figures above do not reflect deduction of the maximum front-end sales charge of 5.75% for Class A shares or the contingent deferred sales charge of 1% for Class C shares, as applicable, except where noted. The figures do not reflect the deduction of taxes that a shareholder would pay on distributions or redemption of shares. Such figures would be lower if the maximum sales charge and any applicable taxes were deducted. Fee waivers and/or reimbursements reduced expenses of the Fund and in the absence of such waiver, the performance quoted would be reduced.
| | | |
Portfolio Composition by Sector as of 3-31-10 | | | |
Consumer Discretionary | | 14.46 | % |
Consumer Staples | | 6.13 | |
Energy | | 10.15 | |
Financials | | 13.27 | |
Health Care | | 2.11 | |
Industrials | | 19.57 | |
Information Technology | | 13.58 | |
Materials | | 10.11 | |
Utilities | | 4.98 | |
Cash & Other Assets, Less Liabilities | | 5.64 | |
| | | |
Total Net Assets | | 100.00 | % |
| | | |
| | | | |
| | 77 | | The accompanying notes are an integral part of the financial statements |
| | |
| Schedule of Investments | | Rydex | SGI Equity Fund |
March 31, 2010 (unaudited) | | Small Cap Value Fund |
| | | | | |
| | | Shares | | Value |
COMMON STOCKS - 94.4% | | | | | |
Aerospace & Defense - 5.5% | | | | | |
Ceradyne, Inc. * | | 1,520 | | $ | 34,489 |
DynCorp International, Inc. * | | 10,200 | | | 117,300 |
GeoEye, Inc. * | | 5,850 | | | 172,574 |
Orbital Sciences Corporation * | | 6,576 | | | 125,010 |
| | | | | |
| | | | | 449,373 |
| | | | | |
Apparel Retail - 4.2% | | | | | |
Brown Shoe Company, Inc. | | 8,520 | | | 131,890 |
Chico’s FAS, Inc. | | 12,320 | | | 177,654 |
Talbots, Inc. * | | 1,873 | | | 24,274 |
| | | | | |
| | | | | 333,818 |
| | | | | |
Apparel, Accessories & Luxury | | | | | |
Goods - 2.3% | | | | | |
Columbia Sportswear Company | | 44 | | | 2,311 |
Maidenform Brands, Inc. * | | 8,270 | | | 180,700 |
| | | | | |
| | | | | 183,011 |
| | | | | |
Asset Management & Custody | | | | | |
Banks - 1.2% | | | | | |
Fifth Street Finance Corporation | | 8,520 | | | 98,917 |
| | | | | |
Building Products - 1.2% | | | | | |
Griffon Corporation * | | 1,499 | | | 18,678 |
Trex Company, Inc. * | | 3,680 | | | 78,347 |
| | | | | |
| | | | | 97,025 |
| | | | | |
Casinos & Gaming - 1.2% | | | | | |
Penn National Gaming, Inc. * | | 3,450 | | | 95,910 |
| | | | | |
Coal & Consumable Fuels - 0.6% | | | | | |
USEC, Inc. * | | 8,140 | | | 46,968 |
| | | | | |
Communications Equipment - 1.7% | | | | | |
Harmonic, Inc. * | | 11,800 | | | 74,458 |
Symmetricom, Inc. *3 | | 11,060 | | | 64,480 |
| | | | | |
| | | | | 138,938 |
| | | | | |
Computer & Electronics
Retail - 0.5% | | | | | |
Conn’s, Inc. * | | 5,590 | | | 43,770 |
| | | | | |
Computer Hardware - 1.2% | | | | | |
Silicon Graphics International Corporation * | | 9,235 | | | 98,722 |
| | | | | |
Computer Storage &
Peripherals - 1.2% | | | | | |
Adaptec, Inc. * | | 29,630 | | | 96,890 |
| | | | | |
Construction & Engineering - 2.9% | | | | | |
Insituform Technologies, Inc. * | | 8,260 | | | 219,798 |
Quanta Services, Inc. * | | 600 | | | 11,496 |
| | | | | |
| | | | | 231,294 |
| | | | | |
Construction & Farm Machinery & Heavy Trucks - 1.3% | | | | | |
Force Protection, Inc. * | | 17,670 | | | 106,373 |
| | | | | |
Construction Materials - 0.1% | | | | | |
Eagle Materials, Inc. | | 331 | | | 8,785 |
| | | | | |
Consumer Finance - 0.2% | | | | | |
First Marblehead Corporation * | | 6,601 | | | 18,747 |
| | | | | |
| | | | | |
| | | Shares | | Value |
COMMON STOCKS - 94.4% (continued) | | | | | |
Diversified Chemicals - 0.7% | | | | | |
LSB Industries, Inc. * | | 3,900 | | $ | 59,436 |
| | | | | |
Diversified REIT’s - 1.3% | | | | | |
Investors Real Estate Trust | | 11,844 | | | 106,833 |
| | | | | |
Electric Utilities - 2.2% | | | | | |
Allete, Inc. | | 2,924 | | | 97,895 |
Westar Energy, Inc. | | 3,430 | | | 76,489 |
| | | | | |
| | | | | 174,384 |
| | | | | |
Electrical Components &
Equipment - 2.4% | | | | | |
General Cable Corporation * | | 3,600 | | | 97,200 |
La Barge, Inc. * | | 6,230 | | | 68,842 |
UQM Technologies, Inc. * | | 5,500 | | | 23,155 |
| | | | | |
| | | | | 189,197 |
| | | | | |
Electronic Components - 1.7% | | | | | |
Power-One, Inc. * | | 31,690 | | | 133,732 |
| | | | | |
Electronic Manufacturing
Services - 2.1% | | | | | |
Maxwell Technologies, Inc. * | | 8,390 | | | 103,952 |
Methode Electronics, Inc. | | 6,574 | | | 65,083 |
| | | | | |
| | | | | 169,035 |
| | | | | |
Food Retail - 1.4% | | | | | |
Winn-Dixie Stores, Inc. * | | 8,900 | | | 111,161 |
| | | | | |
Forest Products - 3.3% | | | | | |
Louisiana-Pacific Corporation * | | 28,610 | | | 258,921 |
| | | | | |
Gas Utilities - 1.3% | | | | | |
Atmos Energy Corporation 2 | | 3,560 | | | 101,709 |
| | | | | |
Health Care Services - 2.1% | | | | | |
Amedisys, Inc. * | | 80 | | | 4,418 |
Mednax, Inc. * | | 1,460 | | | 84,957 |
RehabCare Group, Inc. * | | 2,920 | | | 79,628 |
| | | | | |
| | | | | 169,003 |
| | | | | |
Human Resources & Employment Services - 1.1% | | | | | |
Administaff, Inc. | | 4,200 | | | 89,628 |
| | | | | |
Industrial Machinery - 1.0% | | | | | |
Flow International Corporation * | | 26,482 | | | 79,711 |
| | | | | |
Industrial REIT’s - 0.5% | | | | | |
First Potomac Realty Trust | | 2,800 | | | 42,084 |
| | | | | |
IT Consulting & Other
Services - 2.4% | | | | | |
CACI International, Inc. * | | 2,940 | | | 143,619 |
Satyam Computer Services, Ltd. ADR | | 9,508 | | | 49,632 |
| | | | | |
| | | | | 193,251 |
| | | | | |
Leisure Products - 1.5% | | | | | |
Smith & Wesson Holding
Corporation * | | 30,900 | | | 116,802 |
| | | | | |
Metal & Glass Containers - 1.5% | | | | | |
Myers Industries, Inc. | | 11,700 | | | 122,616 |
| | | | | |
| | | | |
| | 78 | | The accompanying notes are an integral part of the financial statements |
| | |
| Schedule of Investments | | Rydex | SGI Equity Fund |
March 31, 2010 (unaudited) | | Small Cap Value Fund |
| | | | | |
| | | Shares | | Value |
COMMON STOCKS - 94.4% (continued) |
Mortgage REIT’s - 0.4% | | | | | |
Redwood Trust, Inc. | | 2,030 | | $ | 31,303 |
| | | | | |
Multi-Line Insurance -1.4% | | | | | |
Horace Mann Educators Corporation | | 7,630 | | | 114,908 |
| | | | | |
Multi-Utilities - 1.5% | | | | | |
Northwestern Corporation | | 4,570 | | | 122,522 |
| | | | | |
Office REIT’s - 0.5% | | | | | |
Lexington Realty Trust | | 6,100 | | | 39,711 |
| | | | | |
Office Services & Supplies - 0.3% | | | | | |
United Stationers, Inc. * | | 421 | | | 24,776 |
| | | | | |
Oil & Gas Drilling -1.0% | | | | | |
Vantage Drilling Company * | | 51,421 | | | 76,103 |
| | | | | |
Oil & Gas Equipment &
Services - 3.8% | | | | | |
Global Industries, Ltd. * | | 19,772 | | | 126,936 |
Superior Well Services, Inc. * | | 3,600 | | | 48,168 |
Tesco Corporation * | | 11,060 | | | 129,070 |
| | | | | |
| | | | | 304,174 |
| | | | | |
Oil & Gas Exploration &
Production - 2.2% | | | | | |
GMX Resources, Inc. * | | 4,960 | | | 40,771 |
Goodrich Petroleum Corporation * | | 3,754 | | | 58,712 |
Gulfport Energy Corporation * | | 3,940 | | | 44,286 |
Petrohawk Energy Corporation * | | 1,520 | | | 30,826 |
| | | | | |
| | | | | 174,595 |
| | | | | |
Oil & Gas Storage &
Transportation - 2.6% | | | | | |
Southern Union Company | | 8 ,330 | | | 211,332 |
| | | | | |
Packaged Foods & Meats - 2.7% | | | | | |
Del Monte Foods Company | | 9,380 | | | 136,948 |
Smart Balance, Inc. * | | 12,600 | | | 81,648 |
| | | | | |
| | | | | 218,596 |
| | | | | |
Paper Packaging - 1.0% | | | | | |
Bemis Company, Inc. | | 2,920 | | | 83,862 |
| | | | | |
Paper Products - 0.5% | | | | | |
Clearwater Paper Corporation * | | 740 | | | 36,445 |
| | | | | |
Personal Products - 2.0% | | | | | |
Elizabeth Arden, Inc. * | | 8,950 | | | 161,100 |
| | | | | |
Property & Casualty
Insurance - 3.0% | | | | | |
Employers Holdings, Inc. | | 4,190 | | | 62,222 |
Hanover Insurance Group, Inc. | | 3,940 | | | 171,823 |
| | | | | |
| | | | | 234,045 |
| | | | | |
Regional Banks - 4.8% | | | | | |
1st Source Corporation | | 4,700 | | | 82,485 |
Associated Banc-Corporation | | 6,624 | | | 91,411 |
Bancfirst Corporation | | 890 | | | 37,300 |
Commerce Bancshares, Inc. | | 1,281 | | | 52,700 |
Heritage Financial Corporation | | 1,800 | | | 27,162 |
Old National Bancorp | | 7,099 | | | 84,833 |
| | | | | |
| | | | | 375,891 |
| | | | | |
| | | | | |
| | | Shares | | Value |
COMMON STOCKS - 94.4% (continued) |
Research & Consulting
Services - 2.7% | | | | | |
ICF International, Inc. * | | 3,680 | | $ | 91,412 |
Navigant Consulting, Inc. * | | 7,370 | | | 89,398 |
School Specialty, Inc. * | | 1,520 | | | 34,519 |
| | | | | |
| | | | | 215,329 |
| | | | | |
Restaurants - 2.5% | | | | | |
Burger King Holdings, Inc. | | 6,380 | | | 135,639 |
Jack in the Box, Inc. * | | 2,700 | | | 63,585 |
| | | | | |
| | | | | 199,224 |
| | | | | |
Semiconductor Equipment - 0.1% | | | | | |
FEI Company * | | 407 | | | 9,324 |
| | | | | |
Semiconductors - 3.2% | | | | | |
IXYS Corporation*3 | | 13,730 | | | 117,254 |
Standard Microsystems Corporation * | | 5,593 | | | 130,205 |
| | | | | |
| | | | | 247,459 |
| | | | | |
Specialty Chemicals - 3.0% | | | | | |
HB Fuller Company | | 1,650 | | | 38,297 |
Landec Corporation *3 | | 16,280 | | | 107,936 |
Zoltek Companies, Inc. * | | 9,660 | | | 93,122 |
| | | | | |
| | | | | 239,355 |
| | | | | |
Specialty Stores - 2.3% | | | | | |
Cabela’s, Inc. * | | 10,629 | | | 185,901 |
| | | | | |
Trucking - 1.1% | | | | | |
Saia, Inc. * | | 6,100 | | | 84,668 |
| | | | | |
TOTAL COMMON STOCKS (cost $6,489,857) | | | | $ | 7,556,667 |
| | | | | |
Total Investments - 94.4% 1 | | | | | |
(cost $6,489,857) | | | | $ | 7,556,667 |
Cash & Other Assets, Less Liabilities - 5.6% | | | | | 451,393 |
| | | | | |
Total Net Assets - 100.0% | | | | $ | 8,008,060 |
| | | | | |
For federal income tax purposes the identified cost of investments owned at March 31, 2010 was $6,492,595.
| ADR American | Depositary Receipt |
| * | Non-income producing security |
| 1 | Unless otherwise indicated, the values of the securities of the Portfolio are determined based on Level 1 inputs. |
| 2 | Security is marked as collateral for open written option contracts. |
| 3 | Security is deemed illiquid. The total market value of illiquid securities is $289,670 (cost $274,954), or 3.6% of total net assets. |
| | | | |
| | 79 | | The accompanying notes are an integral part of the financial statements |
| | |
| | Rydex | SGI Equity Fund |
| | Small Cap Value Fund (unaudited) |
Statement of Assets and Liabilities
March 31, 2010
| | | | |
Assets: | | | | |
Investments, at value* | | $ | 7,556,667 | |
Cash | | | 478,416 | |
Receivables: | | | | |
Fund shares sold | | | 14,190 | |
Dividends | | | 7,056 | |
Security Investors | | | 10,363 | |
Prepaid expenses | | | 14,495 | |
| | | | |
Total assets | | | 8,081,187 | |
| | | | |
Liabilities: | | | | |
Payable for: | | | | |
Securities purchased | | | 51,037 | |
Fund shares redeemed | | | 22 | |
Written options, at value (premiums received, $2,172) | | | 150 | |
Management fees | | | 6,768 | |
Custodian fees | | | 1,575 | |
Transfer agent/maintenance fees | | | 2,083 | |
Administration fees | | | 1,043 | |
Professional fees | | | 5,731 | |
12b-1 distribution plan fees | | | 2,147 | |
Other | | | 2,571 | |
| | | | |
Total liabilities | | | 73,127 | |
| | | | |
Net assets | | $ | 8,008,060 | |
| | | | |
Net assets consist of: | | | | |
Paid in capital | | $ | 6,620,414 | |
Accumulated net investment loss | | | (4,454 | ) |
Undistributed net realized gain on sale of investments | | | 323,268 | |
Net unrealized appreciation in value of investments | | | 1,068,832 | |
| | | | |
Net assets | | $ | 8,008,060 | |
| | | | |
Class A: | | | | |
Capital shares outstanding (unlimited number of shares authorized) | | | 433,396 | |
Net assets | | $ | 6,130,166 | |
Net asset value and redemption price per share . | | $ | 14.14 | |
| | | | |
Maximum offering price per share (net asset value divided by 94.25%) | | $ | 15.00 | |
| | | | |
Class C: | | | | |
Capital shares outstanding (unlimited number of shares authorized) | | | 75,620 | |
Net assets | | $ | 1,056,804 | |
Net asset value, offering and redemption price per share (excluding any applicable contingent deferred sales charge) | | $ | 13.98 | |
| | | | |
Institutional Class: | | | | |
Capital shares outstanding (unlimited number of shares authorized) | | | 57,823 | |
Net assets | | $ | 821,090 | |
Net asset value, offering and redemption price per share | | $ | 14.20 | |
| | | | |
*Investments, at cost | | $ | 6,489,857 | |
Statement of Operations
For the Six Months Ended March 31, 2010
| | | | |
Investment Income: | | | | |
Dividends | | $ | 43,140 | |
Interest | | | 70 | |
| | | | |
Total investment income | | | 43,210 | |
| | | | |
Expenses: | | | | |
Management fees | | | 35,054 | |
Transfer agent/maintenance fees | | | 7,323 | |
Administration fees | | | 6,851 | |
Custodian fees | | | 6,386 | |
Directors’ fees | | | 272 | |
Professional fees | | | 3,938 | |
Reports to shareholders | | | 1,208 | |
Registration fees | | | 15,524 | |
Other expenses | | | 692 | |
12b-l distribution fees - Class A | | | 6,752 | |
12b-l distribution fees - Class C | | | 4,295 | |
| | | | |
Total expenses | | | 88,295 | |
Less: | | | | |
Reimbursement of expenses - Class A. | | | (31,329 | ) |
Reimbursement of expenses - Class C. | | | (4,957 | ) |
Reimbursement of expenses - Institutional Class | | | (4,345 | ) |
| | | | |
Net expenses | | | 47,664 | |
| | | | |
Net investment loss | | | (4,454 | ) |
| | | | |
Net Realized and Unrealized Gain (Loss): | | | | |
Net realized gain (loss) during the period on: | | | | |
Investments | | | 361,654 | |
Options written | | | 21,005 | |
| | | | |
Net realized gain | | | 382,659 | |
| | | | |
Net unrealized appreciation (depreciation) during the period on: | | | | |
Investments | | | 349,540 | |
Options written | | | (1,670 | ) |
| | | | |
Net unrealized appreciation | | | 347,870 | |
| | | | |
Net realized and unrealized gain | | | 730,529 | |
| | | | |
Net increase in net assets resulting from operations | | $ | 726,075 | |
| | | | |
| | | | |
| | 80 | | The accompanying notes are an integral part of the financial statements |
| | |
| | Rydex | SGI Equity Fund |
| Statement of Changes in Net Assets | | Small Cap Value Fund |
| | | | | | | | |
| | | Six Months Ended
March 31, 2010
(unaudited) | | | Year Ended
September 30, 2009 | |
Increase (decrease) in net assets from operations: | | | | | | | | |
Net investment loss | | $ | (4,454 | ) | | $ | (10,392 | ) |
Net realized gain during the period on investments | | | 382,659 | | | | 151,123 | |
Net unrealized appreciation during the period on investments | | | 347,870 | | | | 654,339 | |
| | | | | | | | |
Net increase in net assets resulting from operations | | | 726,075 | | | | 795,070 | |
| | | | | | | | |
Distributions to shareholders from: | | | | | | | | |
Net realized gain | | | | | | | | |
Class A | | | (152,192 | ) | | | (37,409 | ) |
Class C | | | (21,874 | ) | | | (26,547 | ) |
Institutional Class | | | (21,435 | ) | | | (20,967 | ) |
| | | | | | | | |
Total distributions to shareholders | | | (195,501 | ) | | | (84,923 | ) |
| | | | | | | | |
Capital share transactions: | | | | | | | | |
Proceeds from sale of shares | | | | | | | | |
Class A | | | 3,972,805 | | | | 2,415,545 | |
Class C | | | 386,979 | | | | 242,210 | |
Institutional Class | | | 154,006 | | | | 144,125 | |
Distributions reinvested | | | | | | | | |
Class A | | | 150,268 | | | | 37,409 | |
Class C | | | 21,874 | | | | 26,547 | |
Institutional Class | | | 13,598 | | | | 20,967 | |
Cost of shares redeemed | | | | | | | | |
Class A | | | (1,657,674 | ) | | | (126,867 | ) |
Class C | | | (116,130 | ) | | | (59,944 | ) |
Institutional Class | | | (31,928 | ) | | | (340 | ) |
| | | | | | | | |
Net increase from capital share transactions | | | 2,893,798 | | | | 2,699,652 | |
| | | | | | | | |
Net increase in net assets | | | 3,424,372 | | | | 3,409,799 | |
| | | | | | | | |
Net assets: | | | | | | | | |
Beginning of period | | | 4,583,688 | | | | 1,173,889 | |
| | | | | | | | |
End of period | | $ | 8,008,060 | | | $ | 4,583,688 | |
| | | | | | | | |
Accumulated net investment loss at end of period | | $ | (4,454 | ) | | $ | — | |
| | | | | | | | |
Capital share activity: | | | | | | | | |
Shares sold | | | | | | | | |
Class A | | | 298,815 | | | | 216,245 | |
Class C | | | 29,050 | | | | 23,833 | |
Institutional Class | | | 11,677 | | | | 11,584 | |
Shares reinvested | | | | | | | | |
Class A | | | 11,497 | | | | 4,545 | |
Class C | | | 1,693 | | | | 3,234 | |
Institutional Class | | | 1,036 | | | | 2,545 | |
Shares redeemed | | | | | | | | |
Class A | | | (122,097 | ) | | | (10,413 | ) |
Class C | | | (9,206 | ) | | | (7,117 | ) |
Institutional Class | | | (2,321 | ) | | | (31 | ) |
| | | | |
| | 81 | | The accompanying notes are an integral part of the financial statements |
| | |
| Financial Highlights | | Rydex | SGI Equity Fund |
Selected data for each share of capital stock outstanding throughout each period | | Small Cap Value Fund |
| | | | | | | | | | | | |
Class A | | Six Months
Ended March 31,
2010a | | | 2009 | | | Year Ended
September 30,
2008b | |
Per Share Data | | | | | | | | | | | | |
Net asset value, beginning of period | | $ | 13.24 | | | $ | 11.48 | | | $ | 10.00 | |
| | | | | | | | | | | | |
Income (loss) from investment operations: | | | | | | | | | | | | |
Net investment loss c | | | (— | )* | | | (0.05 | ) | | | — | |
Net gain on securities (realized and unrealized) | | | 1.28 | | | | 2.44 | | | | 1.48 | |
| | | | | | | | | | | | |
Total from investment operations | | | 1.28 | | | | 2.39 | | | | 1.48 | |
| | | | | | | | | | | | |
Less distributions: | | | | | | | | | | | | |
Distributions from realized gains | | | (0.38 | ) | | | (0.63 | ) | | | — | |
| | | | | | | | | | | | |
Total distributions | | | (0.38 | ) | | | (0.63 | ) | | | — | |
| | | | | | | | | | | | |
Net asset value, end of period | | $ | 14.14 | | | $ | 13.24 | | | $ | 11.48 | |
| | | | | | | | | | | | |
Total Return d | | | 9.89 | % | | | 24.15 | % | | | 14.80 | % |
| | | | | | | | | | | | |
Ratios/Supplemental Data | | | | | | | | | | | | |
Net assets, end of period (in thousands) | | $ | 6,130 | | | $ | 3,245 | | | $ | 400 | |
| | | | | | | | | | | | |
Ratios to average net assets: | | | | | | | | | | | | |
Net investment loss | | | (0.06 | )% | | | (0.46 | )% | | | (0.19 | )% |
Total expenses e | | | 2.45 | % | | | 4.88 | % | | | 6.10 | % |
Net expenses f | | | 1.30 | % | | | 1.54 | % | | | 1.55 | % |
Net expenses prior to custodian earning credits and net of expense waivers | | | 1.30 | % | | | 1.54 | % | | | 1.55 | % |
| | | | | | | | | | | | |
Portfolio turnover rate | | | 85 | % | | | 58 | % | | | 86 | % |
| | | | | | | | | | | | |
Class C | | Six Months
Ended March 31,
2010a | | | 2009 | | | Year Ended
September 30,
2008b | |
Per Share Data | | | | | | | | | | | | |
Net asset value, beginning of period | | $ | 13.11 | | | $ | 11.46 | | | $ | 10.00 | |
| | | | | | | | | | | | |
Income (loss) from investment operations: | | | | | | | | | | | | |
Net investment loss c | | | (0.05 | ) | | | (0.11 | ) | | | (0.02 | ) |
Net gain on securities (realized and unrealized) | | | 1.30 | | | | 2.39 | | | | 1.48 | |
| | | | | | | | | | | | |
Total from investment operations | | | 1.25 | | | | 2.28 | | | | 1.46 | |
| | | | | | | | | | | | |
Less distributions: | | | | | | | | | | | | |
Distributions from realized gains | | | (0.38 | ) | | | (0.63 | ) | | | | |
| | | | | | | | | | | | |
Total distributions | | | (0.38 | ) | | | (0.63 | ) | | | — | |
| | | | | | | | | | | | |
Net asset value, end of period | | $ | 13.98 | | | $ | 13.11 | | | $ | 11.46 | |
| | | | | | | | | | | | |
Total Return d | | | 9.76 | % | | | 23.16 | % | | | 14.60 | % |
| | | | | | | | | | | | |
Ratios/Supplemental Data | | | | | | | | | | | | |
Net assets, end of period (in thousands) | | $ | 1,057 | | | $ | 709 | | | $ | 391 | |
| | | | | | | | | | | | |
Ratios to average net assets: | | | | | | | | | | | | |
Net investment loss | | | (0.83 | )% | | | (1.15 | )% | | | (0.94 | )% |
Total expenses e | | | 3.20 | % | | | 6.38 | % | | | 6.88 | % |
Net expenses f | | | 2.05 | % | | | 2.29 | % | | | 2.30 | % |
Net expenses prior to custodian earning credits and net of expense waivers | | | 2.05 | % | | | 2.29 | % | | | 2.30 | % |
| | | | | | | | | | | | |
Portfolio turnover rate | | | 85 | % | | | 58 | % | | | 86 | % |
| | | | |
| | 82 | | The accompanying notes are an integral part of the financial statements |
| | |
| Financial Highlights | | Rydex | SGI Equity Fund |
Selected data for each share of capital stock outstanding throughout each period | | Small Cap Value Fund |
| | | | | | | | | | | | |
Institutional Class | | Six Months
Ended March 31,
2010a | | | 2009 | | | Year Ended
September 30,
2008b | |
Per Share Data | | | | | | | | | | | | |
Net asset value, beginning of period | | $ | 13.28 | | | $ | 11.49 | | | $ | 10.00 | |
| | | | | | | | | | | | |
Income (loss) from investment operations: | | | | | | | | | | | | |
Net investment income (loss) c | | | 0.01 | | | | (0.01 | ) | | | — | |
Net gain on securities (realized and unrealized) | | | 1.29 | | | | 2.43 | | | | 1.49 | |
| | | | | | | | | | | | |
Total from investment operations | | | 1.30 | | | | 2.42 | | | | 1.49 | |
| | | | | | | | | | | | |
Less distributions: | | | | | | | | | | | | |
Distributions from realized gains | | | (0.38 | ) | | | (0.63 | ) | | | — | |
| | | | | | | | | | | | |
Total distributions | | | (0.38 | ) | | | (0.63 | ) | | | — | |
| | | | | | | | | | | | |
Net asset value, end of period | | $ | 14.20 | | | $ | 13.28 | | | $ | 11.49 | |
| | | | | | | | | | | | |
Total Return d | | | 10.02 | % | | | 24.40 | % | | | 14.90 | % |
| | | | | | | | | | | | |
Ratios/Supplemental Data | | | | | | | | | | | | |
Net assets, end of period (in thousands) | | $ | 821 | | | $ | 630 | | | $ | 383 | |
| | | | | | | | | | | | |
Ratios to average net assets: | | | | | | | | | | | | |
Net investment income (loss) | | | 0.17 | % | | | (0.14 | %) | | | 0.06 | % |
Total expenses e | | | 2.19 | % | | | 5.43 | % | | | 5.90 | % |
Net expenses f | | | 1.04 | % | | | 1.30 | % | | | 1.30 | % |
Net expenses prior to custodian earning credits and net of expense waivers | | | 1.04 | % | | | 1.30 | % | | | 1.30 | % |
| | | | | | | | | | | | |
Portfolio turnover rate | | | 85 | % | | | 58 | % | | | 86 | % |
| a | Unaudited figures for the six months ended March 31, 2010. Percentage amounts for the period, except total return, have been annualized. |
| b | Security Small Cap Value Fund was initially capitalized on July 11, 2008 with a net asset value of $10 per share. Percentage amounts for the period, except total return have been annualized |
| c | Net investment income (loss) was computed using average shares outstanding throughout the period. |
| d | Total return information does not reflect deduction of any sales charges imposed at the time of purchase for Class A shares or upon redemption for Class C shares. |
| e | Total expense information reflects expense ratios absent expense reductions by the Investment Manager and custodian earnings credits, as applicable. |
| f | Net expense information reflects the expense ratios after voluntary expense waivers, reimbursements and custodian earnings credits, as applicable |
| * | Less than $0.01 per share |
| | | | |
| | 83 | | The accompanying notes are an integral part of the financial statements |
| | |
| | Rydex | SGI |
| Performance Summary | | Large Cap Value Fund |
| March 31, 2010 | | (unaudited) |
PERFORMANCE
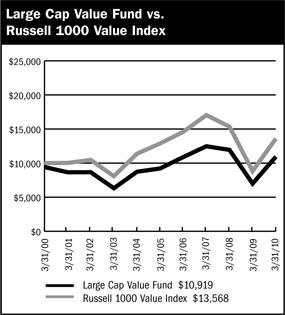
$10,000 Over Ten Years
This chart assumes a $10,000 investment in Class A shares of Large Cap Value Fund on March 31, 2000, reflects deduction of the 5.75% sales load and assumes all dividends reinvested. The chart does not reflect the deduction of taxes that a shareholder would pay on distributions or the redemption of fund shares. The Russell 1000 Value Index is an unmanaged index representing the performance of those Russell 1000 Index companies with lower price-to-book ratios and lower forecasted growth values.
| | | | | | | | | |
Average Annual Returns | | | | | | | | | |
Perioda Ended 3-31-10 | | | | | | | | | |
| | | 1 Year | | | 5 Years | | | 10 Years | |
A Shares | | 56.04 | % | | 3.45 | % | | 1.49 | % |
A Shares with sales charge | | 47.08 | % | | 2.23 | % | | 0.88 | % |
B Shares | | 56.39 | % | | 3.12 | % | | 0.88 | % |
B Shares with CDSC | | 51.39 | % | | 2.76 | % | | 0.88 | % |
C Shares | | 54.89 | % | | 2.57 | % | | 0.64 | % |
C Shares with CDSC | | 53.89 | % | | 2.57 | % | | 0.64 | % |
The performance data above represents past performance that is not predictive of future results. The investment return and principal value of an investment in the Fund will fluctuate so that an investor’s shares, when redeemed, may be worth more or less than their original cost. The figures above do not reflect deduction of the maximum front-end sales charge of 5.75% for Class A shares or the contingent deferred sales charge of 5% for Class B shares and 1% for Class C shares, as applicable, except where noted. The figures do not reflect the deduction of taxes that a shareholder would pay on distributions or redemption of Fund shares. Such figures would be lower if the maximum sales charge and any applicable taxes were deducted. Fee waivers and/or reimbursements reduced expenses of the Fund and in the absence of such waiver, the performance quoted would be reduced.
| | | |
Portfolio Composition by Sector as of 3-31-10 | |
Consumer Discretionary | | 7.07 | % |
Consumer Staples | | 9.76 | |
Energy | | 13.70 | |
Financials | | 16.55 | |
Health Care | | 9.18 | |
Industrials | | 21.41 | |
Information Technology | | 11.54 | |
Materials | | 2.43 | |
Telecommunication Services | | 1.01 | |
Utilities | | 4.42 | |
Cash & Other Assets, Less Liabilities | | 2.93 | |
| | | |
Total Net Assets | | 100.00 | % |
| | | |
| | | | |
| | 84 | | The accompanying notes are an integral part of the financial statements |
| | |
| Schedule of Investments | | Rydex | SGI |
| March 31, 2010 (unaudited) | | Large Cap Value Fund |
| | | | | |
| | | Shares | | Value |
COMMON STOCKS - 97.1% | | | | | |
Aerospace & Defense - 2.8% | | | | | |
United Technologies Corporation | | 20,900 | | $ | 1,538,449 |
| | | | | |
Air Freight & Logistics - 3.3% | | | | | |
FedEx Corporation | | 19,300 | | | 1,802,620 |
| | | | | |
Application Software - 1.0% | | | | | |
Synopsys, Inc. * | | 25,400 | | | 568,198 |
| | | | | |
Asset Management & Custody Banks - 1.6% | | | | | |
Bank of New York Mellon Corporation | | 28,800 | | | 889,344 |
| | | | | |
Building Products - 3.2% | | | | | |
USG Corporation * | | 100,800 | | | 1,729,728 |
| | | | | |
Computer Hardware - 2.4% | | | | | |
Hewlett-Packard Company | | 24,300 | | | 1,291,545 |
| | | | | |
Consumer Finance - 0.4% | | | | | |
First Marblehead Corporation * | | 74,421 | | | 211,356 |
| | | | | |
Data Processing & Outsourced Services - 5.5% | | | | | |
Computer Sciences Corporation * | | 10,500 | | | 572,145 |
Western Union Company | | 145,100 | | | 2,460,896 |
| | | | | |
| | | | | 3,033,041 |
| | | | | |
Department Stores - 2.1% | | | | | |
JC Penney Company, Inc. | | 36,000 | | | 1,158,120 |
| | | | | |
Diversified Banks - 4.6% | | | | | |
U.S. Bancorp | | 52,127 | | | 1,349,047 |
Wells Fargo & Company | | 34,716 | | | 1,080,362 |
| | | | | |
| | | | | 2,429,409 |
| | | | | |
Diversified Chemicals—1.4% | | | | | |
Dow Chemical Company | | 26,200 | | | 774,734 |
| | | | | |
Drug Retail - 2.5% | | | | | |
CVS Caremark Corporation | | 36,600 | | | 1,338,096 |
| | | | | |
Electric Utilities - 3.4% | | | | | |
Edison International | | 54,300 | | | 1,855,431 |
| | | | | |
Electronic Manufacturing Services - 2.6% | | | | | |
Tyco Electronics, Ltd. | | 50,650 | | | 1,391,862 |
| | | | | |
Health Care Equipment - 4.8% | | | | | |
Covidien plc | | 21,950 | | | 1,103,646 |
Hospira, Inc. * | | 26,400 | | | 1,495,560 |
| | | | | |
| | | | | 2,599,206 |
| | | | | |
Health Care Services - 1.2% | | | | | |
Medco Health Solutions, Inc. * | | 10,300 | | | 664,968 |
| | | | | |
Home Improvement Retail - 2.3% | | | | | |
Lowe’s Companies, Inc. | | 52,700 | | | 1,277,448 |
| | | | | |
Hypermarkets & Super Centers - 4.8% | | | | | |
Costco Wholesale Corporation | | 21,100 | | | 1,259,881 |
| | | | | |
| | | Shares | | Value |
COMMON STOCKS - 97.1% (continued) | | | |
Hypermarkets & Super Centers -4.8% (continued) | | | | | |
Wal-Mart Stores, Inc. | | 24,400 | | $ | 1,356,640 |
| | | | | |
| | | | | 2,616,521 |
| | | | | |
Independent Power Producers & Energy Traders - 1.0% | | | | | |
NRG Energy, Inc. * | | 26,500 | | | 553,850 |
| | | | | |
Industrial Conglomerates - 3.3% | | | | | |
McDermott International, Inc. * | | 67,500 | | | 1,817,100 |
| | | | | |
Industrial Machinery - 2.1% | | | | | |
Parker Hannifin Corporation | | 17,900 | | | 1,158,846 |
| | | | | |
Insurance Brokers - 2.4% | | | | | |
AON Corporation | | 30,800 | | | 1,315,468 |
| | | | | |
Integrated Oil & Gas - 7.3% | | | | | |
Chevron Corporation | | 20,100 | | | 1,524,183 |
ConocoPhillips | | 9,600 | | | 491,232 |
Exxon Mobil Corporation | | 28,900 | | | 1,935,722 |
| | | | | |
| | | | | 3,951,137 |
| | | | | |
Integrated Telecommunication Services - 1.0% | | | | | |
Windstream Corporation | | 50,576 | | | 550,773 |
| | | | | |
Managed Health Care - 2.5% | | | | | |
Aetna, Inc. | | 38,900 | | | 1,365,779 |
| | | | | |
Movies & Entertainment - 2.7% | | | | | |
Time Warner, Inc. | | 45,166 | | | 1,412,341 |
| | | | | |
Oil & Gas Equipment & Services - 2.5% | | | | | |
Halliburton Company | | 45,300 | | | 1,364,889 |
| | | | | |
Oil & Gas Exploration & Production - 1.4% | | | | | |
Chesapeake Energy Corporation | | 32,000 | | | 756,480 |
| | | | | |
Oil & Gas Storage & Transportation - 2.5% | | | | | |
Williams Companies, Inc. | | 60,000 | | | 1,386,000 |
| | | | | |
Other Diversified Financial Services - 1.6% | | | | | |
JPMorgan Chase & Company | | 19,763 | | | 884,394 |
| | | | | |
Paper Packaging - 1.0% | | | | | |
Bemis Company, Inc. | | 19,000 | | | 545,680 |
| | | | | |
Pharmaceuticals - 0.7% | | | | | |
Merck & Company, Inc. | | 9,919 | | | 370,475 |
| | | | | |
Property & Casualty Insurance - 2.9% | | | | | |
Berkshire Hathaway, Inc. * | | 13 | | | 1,583,400 |
| | | | | |
Railroads - 3.0% | | | | | |
Union Pacific Corporation | | 22,000 | | | 1,612,600 |
| | | | | |
Regional Banks - 3.1% | | | | | |
BB&T Corporation | | 19,700 | | | 638,083 |
| | | | |
| | 85 | | The accompanying notes are an integral part of the financial statements |
| | |
| Schedule of Investments | | Rydex | SGI |
| March 31, 2010 (unaudited) | | Large Cap Value Fund |
| | | | | |
| | | Shares | | Value |
COMMON STOCKS - 97.1% (continued) | | | |
Regional Banks - 3.1% (continued) | | | | | |
Fifth Third Bancorp | | 23,800 | | $ | 323,442 |
Regions Financial Corporation | | 94,100 | | | 738,685 |
| | | | | |
| | | | | 1,700,210 |
| | | | | |
Research & Consulting
Services - 3.7% | | | | | |
Equifax, Inc. | | 55,900 | | | 2,001,219 |
| | | | | |
Tobacco - 2.5% | | | | | |
Altria Group, Inc. | | 20,100 | | | 412,452 |
Philip Morris International, Inc. | | 18,200 | | | 949,312 |
| | | | | |
| | | | | 1,361,764 |
| | | | | |
TOTAL COMMON STOCKS | | | | | |
(cost $49,326,511) | | | | $ | 52,862,481 |
| | | | | |
Total Investments - 97.1% 1 | | | | | |
(cost $49,326,511) | | | | $ | 52,862,481 |
Cash & Other Assets, Less Liabilities - 2.9% | | | 1,593,774 |
| | | | | |
Total Net Assets - 100.0% | | | | $ | 54,456,255 |
| | | | | |
For federal income tax purposes the identified cost of investments owned at March 31, 2010 was $49,336,878.
plc Public Limited Company
| * | Non-income producing security |
| 1 | Unless otherwise indicated, the values of the securities of the Portfolio are determined based on Level 1 inputs. |
| | | | |
| | 86 | | The accompanying notes are an integral part of the financial statements |
| | |
| | Rydex | SGI |
| | Large Cap Value Fund (unaudited) |
| | | | |
Statement of Assets and Liabilities March 31, 2010 | |
Assets: | |
Investments, at value * | | $ | 52,862,481 | |
Cash | | | 1,518,739 | |
Receivables: | | | | |
Fund shares sold | | | 13,036 | |
Dividends | | | 78,612 | |
Security Investors | | | 18,942 | |
Prepaid expenses | | | 41,909 | |
| | | | |
Total assets | | | 54,533,719 | |
| | | | |
Liabilities: | | | | |
Payable for: | | | | |
Fund shares redeemed | | | 5,293 | |
Management fees | | | 30,863 | |
Custodian fees | | | 427 | |
Transfer agent/maintenance fees | | | 9,544 | |
Administration fees | | | 4,591 | |
Professional fees | | | 5,258 | |
12b-1 distribution plan fees | | | 12,789 | |
Directors’ fees | | | 1,184 | |
Other | | | 7,515 | |
| | | | |
Total liabilities | | | 77,464 | |
| | | | |
Net assets | | $ | 54,456,255 | |
| | | | |
Net assets consist of: | | | | |
Paid in capital | | $ | 67,810,954 | |
Undistributed net investment income | | | 83,559 | |
Accumulated net realized loss on sale of investments | | | (16,974,228 | ) |
Net unrealized appreciation in value of investments | | | 3,535,970 | |
| | | | |
Net assets | | $ | 54,456,255 | |
| | | | |
Class A: | | | | |
Capital shares outstanding (unlimited number of shares authorized) . | | | 6,943,677 | |
Net assets | | $ | 47,631,415 | |
Net asset value and redemption price per share | | $ | 6.86 | |
| | | | |
Maximum offering price per share (net asset value divided by 94.25%) | | $ | 7.28 | |
| | | | |
Class B: | | | | |
Capital shares outstanding (unlimited number of shares authorized) | | | 629,821 | |
Net assets | | $ | 3,996,544 | |
Net asset value, offering and redemption price per share (excluding any applicable contingent deferred sales charge) | | $ | 6.35 | |
| | | | |
Class C: | | | | |
Capital shares outstanding (unlimited number of shares authorized) | | | 435,847 | |
Net assets | | $ | 2,828,296 | |
Net asset value, offering and redemption price per share (excluding any applicable contingent deferred sales charge) | | $ | 6.49 | |
| | | | |
* Investments, at cost | | $ | 49,326,511 | |
| | | | |
Statement of Operations For the Six Months Ended March 31, 2010 | |
Investment Income: | | | | |
Dividends | | $ | 416,260 | |
Interest | | | 501 | |
| | | | |
Total investment income | | | 416,761 | |
| | | | |
Expenses: | | | | |
Management fees | | | 170,072 | |
Transfer agent/maintenance fees | | | 98,193 | |
Administration fees | | | 24,963 | |
Custodian fees | | | 1,127 | |
Directors’ fees | | | 1,914 | |
Professional fees | | | 8,171 | |
Reports to shareholders | | | 4,235 | |
Registration fees | | | 22,998 | |
Other expenses | | | 12,652 | |
12b-1 distribution fees - Class A | | | 56,653 | |
12b-1 distribution fees - Class C | | | 13,700 | |
| | | | |
Total expenses | | | 414,678 | |
Less: | | | | |
Reimbursement of expenses - ClassA | | | (78,843 | ) |
Reimbursement of expenses - Class B | | | (7,347 | ) |
Reimbursement of expenses - Class C | | | (4,660 | ) |
| | | | |
Net expenses | | | 323,828 | |
| | | | |
Net investment income | | | 92,933 | |
| | | | |
Net Realized and Unrealized Gain (Loss): | | | | |
Net realized gain (loss) during the period on: | | | | |
Investments | | | (226,927 | ) |
| | | | |
Net realized loss | | | (226,927 | ) |
| | | | |
Net unrealized appreciation (depreciation) during the period on: | | | | |
Investments | | | 5,925,928 | |
| | | | |
Net unrealized appreciation | | | 5,925,928 | |
| | | | |
Net realized and unrealized gain | | | 5,699,001 | |
| | | | |
Net increase in net assets resulting from operations | | $ | 5,791,934 | |
| | | | |
| | | | |
| | 87 | | The accompanying notes are an integral part of the financial statements |
| | |
| | Rydex | SGI |
| Statement of Changes in Net Assets | | Large Cap Value Fund |
| | | | | | | | |
| | | Six Months Ended
March 31, 2010
(unaudited) | | | Year Ended
September 30, 2009 | |
Increase (decrease) in net assets from operations: | | | | | | | | |
Net investment income | | $ | 92,933 | | | $ | 414,061 | |
Net realized loss during the period on investments | | | (226,927 | ) | | | (9,147,170 | ) |
Net unrealized appreciation (depreciation) during the period on investments | | | 5,925,928 | | | | (2,052,233 | ) |
| | | | | | | | |
Net increase (decrease) in net assets resulting from operations | | | 5,791,934 | | | | (10,785,342 | ) |
| | | | | | | | |
Distributions to shareholders from: | | | | | | | | |
Net investment income | | | | | | | | |
Class A | | | (355,260 | ) | | | (503,278 | ) |
Class B | | | (50,199 | ) | | | (90,508 | ) |
Net realized gain | | | | | | | | |
Class A | | | — | | | | (377,459 | ) |
Class B | | | — | | | | (49,025 | ) |
Class C | | | — | | | | (28,173 | ) |
| | | | | | | | |
Total distributions to shareholders | | | (405,459 | ) | | | (1,048,443 | ) |
| | | | | | | | |
Capital share transactions: | | | | | | | | |
Proceeds from sale of shares | | | | | | | | |
Class A | | | 14,554,431 | | | | 9,579,824 | |
Class B | | | 320,218 | | | | 2,086,370 | |
Class C | | | 146,382 | | | | 1,077,179 | |
Distributions reinvested | | | | | | | | |
Class A | | | 337,051 | | | | 846,030 | |
Class B | | | 49,907 | | | | 138,477 | |
Class C | | | — | | | | 28,048 | |
Cost of shares redeemed | | | | | | | | |
Class A | | | (9,979,818 | ) | | | (29,267,639 | ) |
Class B | | | (1,573,278 | ) | | | (4,280,914 | ) |
Class C | | | (723,498 | ) | | | (1,844,593 | ) |
| | | | | | | | |
Net increase (decrease) from capital share transactions | | | 3,131,395 | | | | (21,637,218 | ) |
| | | | | | | | |
Net increase (decrease) in net assets | | | 8,517,870 | | | | (33,471,003 | ) |
| | | | | | | | |
Net assets: | | | | | | | | |
Beginning of period | | | 45,938,385 | | | | 79,409,388 | |
| | | | | | | | |
End of period | | $ | 54,456,255 | | | $ | 45,938,385 | |
| | | | | | | | |
Undistributed net investment income at end of period | | $ | 83,559 | | | $ | 396,085 | |
| | | | | | | | |
Capital share activity: | | | | | | | | |
Shares sold | | | | | | | | |
Class A | | | 2,310,309 | | | | 1,952,259 | |
Class B | | | 54,142 | | | | 449,727 | |
Class C | | | 23,748 | | | | 222,048 | |
Shares reinvested | | | | | | | | |
Class A | | | 52,912 | | | | 170,227 | |
Class B | | | 8,473 | | | | 29,908 | |
Class C | | | — | | | | 5,930 | |
Shares redeemed | | | | | | | | |
Class A | | | (1,523,941 | ) | | | (5,975,380 | ) |
Class B | | | (263,853 | ) | | | (934,814 | ) |
Class C | | | (121,036 | ) | | | (389,302 | ) |
| | | | |
| | 88 | | The accompanying notes are an integral part of the financial statements |
| | |
| Financial Highlights | | Rydex | SGI |
| Selected data for each share of capital stock outstanding throughout each period | | Large Cap Value Fund |
| | | | | | | | | | | | | | | | | | | | | | | | |
Class A | | Six Months
Ended March 31,
2010a | | | 2009 | | | 2008 | | | 2007 | | | 2006 | | | Year Ended
September 30,
2005b | |
Per Share Data | | | | | | | | | | | | | | | | | | | | | | | | |
Net asset value, beginning of period | | $ | 6.23 | | | $ | 6.72 | | | $ | 9.18 | | | $ | 7.65 | | | $ | 6.78 | | | $ | 5.71 | |
| | | | | | | | | | | | | | | | | | | | | | | | |
Income (loss) from investment operations: | | | | | | | | | | | | | | | | | | | | | | | | |
Net investment incomec | | | 0.01 | | | | 0.05 | | | | 0.05 | | | | 0.04 | | | | 0.01 | | | | 0.03 | |
Net gain (loss) on securities (realized and unrealized) | | | 0.67 | | | | (0.45 | ) | | | (2.14 | ) | | | 1.49 | | | | 0.90 | | | | 1.04 | |
| | | | | | | | | | | | | | | | | | | | | | | | |
Total from investment operations | | | 0.68 | | | | (0.40 | ) | | | (2.09 | ) | | | 1.53 | | | | 0.91 | | | | 1.07 | |
| | | | | | | | | | | | | | | | | | | | | | | | |
Less distributions: | | | | | | | | | | | | | | | | | | | | | | | | |
Dividends from net investment income | | | (0.05 | ) | | | (0.05 | ) | | | (0.04 | ) | | | — | | | | (0.04 | ) | | | — | |
Distributions from realized gains | | | — | | | | (0.04 | ) | | | (0.33 | ) | | | — | | | | — | | | | — | |
| | | | | | | | | | | | | | | | | | | | | | | | |
Total distributions | | | (0.05 | ) | | | (0.09 | ) | | | (0.37 | ) | | | — | | | | (0.04 | ) | | | — | |
| | | | | | | | | | | | | | | | | | | | | | | | |
Net asset value, end of period | | $ | 6.86 | | | $ | 6.23 | | | $ | 6.72 | | | $ | 9.18 | | | $ | 7.65 | | | $ | 6.78 | |
| | | | | | | | | | | | | | | | | | | | | | | | |
Total Return d | | | 10.96 | % | | | (5.59 | )% | | | (23.45 | )% | | | 20.04 | % | | | 13.45 | % | | | 18.74 | % |
| | | | | | | | | | | | | | | | | | | | | | | | |
Ratios/Supplemental Data | | | | | | | | | | | | | | | | | | | | | | | | |
Net assets, end of period (in thousands) | | $ | 47,631 | | | $ | 38,008 | | | $ | 66,902 | | | $ | 79,998 | | | $ | 64,786 | | | $ | 45,295 | |
| | | | | | | | | | | | | | | | | | | | | | | | |
Ratios to average net assets: | | | | | | | | | | | | | | | | | | | | | | | | |
Net investment income | | | 0.38 | % | | | 0.88 | % | | | 0.68 | % | | | 0.51 | % | | | 0.17 | % | | | 0.56 | % |
Total expenses e | | | 1.56 | % | | | 1.70 | % | | | 1.36 | % | | | 1.35 | % | | | 1.49 | % | | | 1.61 | % |
Net expenses f | | | 1.22 | % | | | 1.25 | % | | | 1.25 | % | | | 1.27 | % | | | 1.49 | % | | | 1.61 | % |
Net expenses prior to custodian earning credits and net of expense waivers | | | 1.22 | % | | | 1.25 | % | | | 1.25 | % | | | 1.27 | % | | | 1.49 | % | | | 1.61 | % |
| | | | | | | | | | | | | | | | | | | | | | | | |
Portfolio turnover rate | | | 31 | % | | | 25 | % | | | 48 | % | | | 25 | % | | | 54 | % | | | 110 | % |
| | | | | | |
Class B | | Six Months
Ended March 31,
2010a,g | | | 2009g | | | 2008g | | | 2007g | | | 2006 | | | Year Ended
September 30,
2005b | |
Per Share Data | | | | | | | | | | | | | | | | | | | | | | | | |
Net asset value, beginning of period | | $ | 5.78 | | | $ | 6.29 | | | $ | 8.58 | | | $ | 7.18 | | | $ | 6.38 | | | $ | 5.42 | |
| | | | | | | | | | | | | | | | | | | | | | | | |
Income (loss) from investment operations: | | | | | | | | | | | | | | | | | | | | | | | | |
Net investment income (loss) c | | | 0.02 | | | | 0.06 | | | | 0.07 | | | | (0.01 | ) | | | (0.04 | ) | | | (0.01 | ) |
Net gain (loss) on securities (realized and unrealized) | | | 0.62 | | | | (0.46 | ) | | | (2.02 | ) | | | 1.41 | | | | 0.84 | | | | 0.97 | |
| | | | | | | | | | | | | | | | | | | | | | | | |
Total from investment operations | | | 0.64 | | | | (0.40 | ) | | | (1.95 | ) | | | 1.40 | | | | 0.80 | | | | 0.96 | |
| | | | | | | | | | | | | | | | | | | | | | | | |
Less distributions: | | | | | | | | | | | | | | | | | | | | | | | | |
Dividends from net investment income | | | (0.07 | ) | | | (0.07 | ) | | | (0.01 | ) | | | — | | | | — | | | | — | |
Distributions from realized gains | | | — | | | | (0.04 | ) | | | (0.33 | ) | | | — | | | | — | | | | — | |
| | | | | | | | | | | | | | | | | | | | | | | | |
Total distributions | | | (0.07 | ) | | | (0.11 | ) | | | (0.34 | ) | | | — | | | | — | | | | — | |
| | | | | | | | | | | | | | | | | | | | | | | | |
Net asset value, end of period | | $ | 6.35 | | | $ | 5.78 | | | $ | 6.29 | | | $ | 8.58 | | | $ | 7.18 | | | $ | 6.38 | |
| | | | | | | | | | | | | | | | | | | | | | | | |
Total Return d | | | 11.20 | % | | | (5.91 | %) | | | (23.39 | %) | | | 19.50 | % | | | 12.54 | % | | | 17.71 | % |
| | | | | | | | | | | | | | | | | | | | | | | | |
Ratios/Supplemental Data | | | | | | | | | | | | | | | | | | | | | | | | |
Net assets, end of period (in thousands) | | $ | 3,997 | | | $ | 4,802 | | | $ | 8,097 | | | $ | 13,784 | | | $ | 12,761 | | | $ | 8,500 | |
| | | | | | | | | | | | | | | | | | | | | | | | |
Ratios to average net assets: | | | | | | | | | | | | | | | | | | | | | | | | |
Net investment income (loss) | | | 0.59 | % | | | 1.17 | % | | | 0.93 | % | | | (0.08 | )% | | | (0.58 | )% | | | (0.16 | )% |
Total expenses e | | | 1.31 | % | | | 1.47 | % | | | 1.11 | % | | | 1.92 | % | | | 2.26 | % | | | 2.36 | % |
Net expenses f | | | 0.97 | % | | | 1.00 | % | | | 1.00 | % | | | 1.85 | % | | | 2.26 | % | | | 2.36 | % |
Net expenses prior to custodian earning credits and net of expense waivers | | | 0.97 | % | | | 1.00 | % | | | 1.00 | % | | | 1.85 | % | | | 2.26 | % | | | 2.36 | % |
| | | | | | | | | | | | | | | | | | | | | | | | |
Portfolio turnover rate | | | 31 | % | | | 25 | % | | | 48 | % | | | 25 | % | | | 54 | % | | | 110 | % |
| | | | |
| | 89 | | The accompanying notes are an integral part of the financial statements |
| | |
| Financial Highlights | | Rydex | SGI |
| Selected data for each share of capital stock outstanding throughout each period | | Large Cap Value Fund |
| | | | | | | | | | | | | | | | | | | | | | | | |
Class C | | Six Months
Ended March 31,
2010a | | | 2009 | | | 2008 | | | 2007 | | | 2006 | | | Year Ended
September 30,
2005b | |
Per Share Data | | | | | | | | | | | | | | | | | | | | | | | | |
Net asset value, beginning of period | | $ | 5.87 | | | $ | 6.35 | | | $ | 8.72 | | | $ | 7.31 | | | $ | 6.49 | | | $ | 5.52 | |
| | | | | | | | | | | | | | | | | | | | | | | | |
Income (loss) from investment operations: | | | | | | | | | | | | | | | | | | | | | | | | |
Net investment income (loss) c | | | (0.01 | ) | | | 0.01 | | | | — | | | | (0.02 | ) | | | (0.04 | ) | | | (0.01 | ) |
Net gain (loss) on securities (realized and unrealized) | | | 0.63 | | | | (0.45 | ) | | | (2.04 | ) | | | 1.43 | | | | 0.86 | | | | 0.98 | |
| | | | | | | | | | | | | | | | | | | | | | | | |
Total from investment operations | | | 0.62 | | | | (0.44 | ) | | | (2.04 | ) | | | 1.41 | | | | 0.82 | | | | 0.97 | |
| | | | | | | | | | | | | | | | | | | | | | | | |
Less distributions: | | | | | | | | | | | | | | | | | | | | | | | | |
Distributions from realized gains | | | — | | | | (0.04 | ) | | | (0.33 | ) | | | — | | | | — | | | | — | |
| | | | | | | | | | | | | | | | | | | | | | | | |
Total distributions | | | — | | | | (0.04 | ) | | | (0.33 | ) | | | — | | | | — | | | | — | |
| | | | | | | | | | | | | | | | | | | | | | | | |
Net asset value, end of period | | $ | 6.49 | | | $ | 5.87 | | | $ | 6.35 | | | $ | 8.72 | | | $ | 7.31 | | | $ | 6.49 | |
| | | | | | | | | | | | | | | | | | | | | | | | |
Total Return d | | | 10.56 | % | | | (6.80 | )% | | | (24.09 | )% | | | 19.29 | % | | | 12.63 | % | | | 17.57 | % |
| | | | | | | | | | | | | | | | | | | | | | | | |
Ratios/Supplemental Data | | | | | | | | | | | | | | | | | | | | | | | | |
Net assets, end of period (in thousands) | | $ | 2,828 | | | $ | 3,128 | | | $ | 4,410 | | | $ | 5,717 | | | $ | 3,536 | | | $ | 2,899 | |
| | | | | | | | | | | | | | | | | | | | | | | | |
Ratios to average net assets: | | | | | | | | | | | | | | | | | | | | | | | | |
Net investment income (loss) | | | (0.40 | )% | | | 0.14 | % | | | (0.07 | )% | | | (0.23 | )% | | | (0.60 | )% | | | (0.18 | )% |
Total expenses e | | | 2.31 | % | | | 2.47 | % | | | 2.11 | % | | | 2.10 | % | | | 2.25 | % | | | 2.36 | % |
Net expenses f | | | 1.97 | % | | | 1.99 | % | | | 2.00 | % | | | 2.02 | % | | | 2.25 | % | | | 2.36 | % |
Net expenses prior to custodian earning credits and net of expense waivers | | | 1.97 | % | | | 1.99 | % | | | 2.00 | % | | | 2.02 | % | | | 2.25 | % | | | 2.36 | % |
| | | | | | | | | | | | | | | | | | | | | | | | |
Portfolio turnover rate | | | 31 | % | | | 25 | % | | | 48 | % | | | 25 | % | | | 54 | % | | | 110 | % |
| a | Unaudited figures for the six months ended March 31, 2010. Percentage amounts for the period, except total return, have been annualized. |
| b | Security Investors (SI) became the advisor of Security Large Cap Value Fund effective June 30, 2005. Prior to June 30, 2005, SI paid Dreyfus Corporation for sub-advisory services, |
| c | Net investment income (loss) was computed using average shares outstanding throughout the period. |
| d | Total return information does not reflect deduction of any sales charges imposed at the time of purchase for Class A shares or upon redemption for Class B and C shares, |
| e | Total expense information reflects expense ratios absent expense reductions by the Investment Manager and custodian earnings credits, as applicable. |
| f | Net expense information reflects the expense ratios after voluntary expense waivers, reimbursements and custodian earnings credits, as applicable. |
| g | Effective August 1, 2007, Class B shares ceased charging 12b-l fees in accordance with FINRA (formerly NASD) sales cap regulations. Per share information reflects this change. This fee will be reinstated when sales exceed the sales cap limit. |
| | | | |
| | 90 | | The accompanying notes are an integral part of the financial statements |
| | |
| | Rydex | SGI Large Cap Value Fund |
| Performance Summary | | Large Cap Value Institutional Fund |
| March 31, 2010 | | (unaudited) |
PERFORMANCE
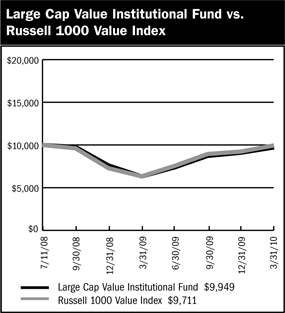
$10,000 Since Inception
This chart assumes a $10,000 investment in shares of Large Cap Value Institutional Fund on July 11, 2008 (date of inception), and assumes all dividends reinvested. The chart does not reflect the deduction of taxes that a shareholder would pay on distributions or the redemption of fund shares. The Russell 1000 Value Index is an unmanaged index representing the performance of those Russell 1000 Index companies with lower price-to-book ratios and lower forecasted growth values.
| | | | |
| Average Annual Returns |
Periods Ended 3-31-10 |
| | | 1 Year | | Since Inception
(7-11-08) |
| Large Cap Value Institutional Fund | | 57.16% | | (0.30)% |
The performance data above represents past performance that is not predictive of future results. The investment return and principal value of an investment in the Fund will fluctuate so that an investor’s shares, when redeemed, may be worth more or less than their original cost. The figures do not reflect the deduction of taxes that a shareholder would pay on distributions or redemption of shares. Such figures would be lower if the maximum sales charge and any applicable taxes were deducted. Fee waivers and/or reimbursements reduced expenses of the Fund and in the absence of such waiver, the performance quoted would be reduced.
| | | |
Portfolio Composition by Sector as of 3-31-10 | |
Consumer Discretionary | | 6.63 | % |
Consumer Staples | | 9.90 | |
Energy | | 14.74 | |
Financials | | 17.92 | |
Health Care | | 8.93 | |
Industrials | | 20.30 | |
Information Technology | | 11.36 | |
Materials | | 2.44 | |
Telecommunication Services | | 1.16 | |
Utilities | | 4.42 | |
Cash & Other Assets, Less Liabilities | | 2.20 | |
| | | |
Total Net Assets | | 100.00 | % |
| | | |
| | | | |
| | 91 | | The accompanying notes are an integral part of the financial statements |
| | |
| Schedule of Investments | | Rydex | SGI Large Cap Value Fund |
March 31, 2010 (unaudited) | | Large Cap Value Institutional Fund |
| | | | | |
| | | Shares | | Value |
COMMON STOCKS - 97.8% | | | | | |
Aerospace & Defense - 2.6% | | | | | |
United Technologies Corporation | | 1,030 | | $ | 75,818 |
| | | | | |
Air Freight & Logistics - 3.2% | | | | | |
FedEx Corporation | | 1,000 | | | 93,400 |
| | | | | |
Application Software - 1.0% | | | | | |
Synopsys, Inc. * | | 1,300 | | | 29,081 |
| | | | | |
Asset Management & Custody Banks - 1.6% | | | | | |
Bank of New York Mellon Corporation | | 1,500 | | | 46,320 |
| | | | | |
Building Products - 2.8% | | | | | |
USG Corporation * | | 4,890 | | | 83,912 |
| | | | | |
Computer Hardware - 2.3% | | | | | |
Hewlett-Packard Company | | 1,250 | | | 66,438 |
| | | | | |
Consumer Finance - 0.3% | | | | | |
First Marblehead Corporation * | | 3,412 | | | 9,690 |
| | | | | |
Data Processing & Outsourced Services - 5.5% | | | | | |
Computer Sciences Corporation * | | 500 | | | 27,245 |
Western Union Company | | 7,940 | | | 134,662 |
| | | | | |
| | | | | 161,907 |
| | | | | |
Department Stores - 2.0% | | | | | |
JC Penney Company, Inc. | | 1,870 | | | 60,158 |
| | | | | |
Diversified Banks - 4.8% | | | | | |
U.S. Bancorp | | 3,041 | | | 78,701 |
Wells Fargo & Company | | 1,917 | | | 59,657 |
| | | | | |
| | | | | 138,358 |
| | | | | |
Diversified Chemicals - 1.6% | | | | | |
Dow Chemical Company | | 1,650 | | | 48,791 |
| | | | | |
Drug Retail - 2.4% | | | | | |
CVS Caremark Corporation | | 1,960 | | | 71,658 |
| | | | | |
Electric Utilities - 3.3% | | | | | |
Edison International | | 2,830 | | | 96,701 |
| | | | | |
Electronic Manufacturing Services - 2.6% | | | | | |
Tyco Electronics, Ltd. | | 2,810 | | | 77,219 |
| | | | | |
Health Care Equipment - 4.7% | | | | | |
Covidien plc | | 1,150 | | | 57,822 |
Hospira, Inc. * | | 1,460 | | | 82,709 |
| | | | | |
| | | | | 140,531 |
| | | | | |
Health Care Services - 1.3% | | | | | |
Medco Health Solutions, Inc. * | | 580 | | | 37,445 |
| | | | | |
Home Improvement Retail - 2.2% | | | | | |
Lowe’s Companies, Inc. | | 2,680 | | | 64,963 |
| | | | | |
Hypermarkets & Super Centers - 4.9% | | | | | |
Costco Wholesale Corporation | | 1,140 | | | 68,069 |
| | | | | |
| | | Shares | | Value |
COMMON STOCKS - 97.8% (continued) | | | | | |
Hypermarkets & Super Centers - 4.9% (continued) | | | | | |
Wal-Mart Stores, Inc. | | 1,360 | | $ | 75,616 |
| | | | | |
| | | | | 143,685 |
| | | | | |
Independent Power Producers & Energy Traders - 1.1% | | | | | |
NRG Energy, Inc. * | | 1,600 | | | 33,440 |
| | | | | |
Industrial Conglomerates - 3.3% | | | | | |
McDermott International, Inc. * | | 3,570 | | | 96,104 |
| | | | | |
Industrial Machinery - 2.1% | | | | | |
Parker Hannifin Corporation | | 940 | | | 60,856 |
| | | | | |
Insurance Brokers - 2.4% | | | | | |
AON Corporation | | 1,670 | | | 71,326 |
| | | | | |
Integrated Oil & Gas - 7.9% | | | | | |
Chevron Corporation | | 1,190 | | | 90,238 |
ConocoPhillips | | 660 | | | 33,772 |
Exxon Mobil Corporation | | 1,620 | | | 108,507 |
| | | | | |
| | | | | 232,517 |
| | | | | |
Integrated Telecommunication Services - 1.2% | | | | | |
Windstream Corporation | | 3,130 | | | 34,086 |
| | | | | |
Managed Health Care - 2.9% | | | | | |
Aetna, Inc. | | 2,420 | | | 84,966 |
| | | | | |
Movies & Entertainment - 2.4% | | | | | |
Time Warner, Inc. | | 2,240 | | | 70,045 |
| | | | | |
Oil & Gas Equipment & Services - 3.1% | | | | | |
Halliburton Company | | 3,060 | | | 92,198 |
| | | | | |
Oil & Gas Exploration & Production - 1.3% | | | | | |
Chesapeake Energy Corporation | | 1,600 | | | 37,824 |
| | | | | |
Oil & Gas Storage & Transportation -2.4% | | | | | |
Williams Companies, Inc. 3,090 | | | | | 71,379 |
| | | | | |
Other Diversified Financial Services - 1.6% | | | | | |
JPMorgan Chase & Company | | 1,076 | | | 48,151 |
| | | | | |
Paper Packaging - 0.8% | | | | | |
Bern is Company, Inc. | | 800 | | | 22,976 |
| | | | | |
Property & Casualty Insurance - 4.1% | | | | | |
Berkshire Hathaway, Inc. * | | 1 | | | 121,800 |
| | | | | |
Railroads - 2.6% | | | | | |
Union Pacific Corporation | | 1,060 | | | 77,698 |
| | | | | |
Regional Banks - 3.1% | | | | | |
BB&T Corporation | | 1,000 | | | 32,390 |
Fifth Third Bancorp | | 1,500 | | | 20,385 |
| | | | |
| | 92 | | The accompanying notes are an integral part of the financial statements |
| | |
| Schedule of Investments | | Rydex | SGI Large Cap Value Fund |
| March 31, 2010 (unaudited) | | Large Cap Value Institutional Fund |
| | | | | |
| | | Shares | | Value |
COMMON STOCKS - 97.8% (continued) | | | | | |
Regional Banks - 3.1% (continued) | | | | $ | 39,250 |
| | | | | |
Regions Financial Corporation | | 5,000 | | | 92,025 |
| | | | | |
Research & Consulting Services - 3.8% | | | | | |
Equifax, Inc. | | 3,070 | | | 109,906 |
| | | | | |
Tobacco - 2.6% | | | | | |
Altria Group, Inc. | | 1,100 | | | 22,572 |
Philip Morris International, Inc. | | 1,030 | | | 53,725 |
| | | | | |
| | | | | 76,297 |
| | | | | |
TOTAL COMMON STOCKS | | | | | |
(cost $2,629,515) | | | | $ | 2,879,669 |
| | | | | |
Total Investments - 97.8% 1 | | | | | |
(cost $2,629,515) | | | | $ | 2,879,669 |
Cash & Other Assets, Less Liabilities - 2.2% | | | | | 64,907 |
| | | | | |
Total Net Assets - 100.0% | | | | $ | 2,944,576 |
| | | | | |
For federal income tax purposes the identified cost of investments owned at March 31, 2010 was $2,634,817.
plc Public Limited Company
| * | Non-income producing security |
| 1 | Unless otherwise indicated, the values of the securities of the Portfolio are determined based on Level 1 inputs. |
| | | | |
| | 93 | | The accompanying notes are an integral part of the financial statements |
| | |
| | Rydex | SGI Large Cap Value Fund |
| | Large Cap Value Institutional Fund (unaudited) |
| | | | |
Statement of Assets and Liabilities | | | |
| March 31, 2010 | | | |
Assets: | | | | |
Investments, at value * | | $ | 2,879,669 | |
Cash | | | 63,410 | |
Receivables: | | | | |
Dividends | | | 4,148 | |
Security Investors | | | 6,688 | |
Prepaid expenses | | | 7,252 | |
| | | | |
Total assets | | | 2,961,167 | |
| | | | |
Liabilities: | | | | |
Payable for: | | | | |
Fund shares redeemed | | | 1,381 | |
Management fees | | | 1,651 | |
Administration fees | | | 361 | |
Transfer agent/maintenance fees | | | 2,083 | |
Custodian fees | | | 420 | |
Directors’ fees | | | 12 | |
Professional fees | | | 5,808 | |
Other fees | | | 4,875 | |
| | | | |
Total liabilities | | | 16,591 | |
| | | | |
Net assets | | $ | 2,944,576 | |
| | | | |
Net assets consist of: | | | | |
Paid in capital | | $ | 3,007,401 | |
Undistributed net investment income | | | 6,138 | |
Accumulated net realized loss on sale of investments | | | (319,117 | ) |
Net unrealized appreciation in value of investments | | | 250,154 | |
| | | | |
Net assets | | $ | 2,944,576 | |
| | | | |
Capital shares authorized | | | unlimited | |
Capital shares outstanding | | | 300,431 | |
Net asset value per share (net assets divided by shares outstanding) | | $ | 9.80 | |
| | | | |
* Investments, at cost | | $ | 2,629,515 | |
| | | | |
| Statement of Operations | | | |
For the Six Months Ended March 31, 2010 | | | |
Investment Income: | | | | |
Dividends | | $ | 21,879 | |
Interest | | | 30 | |
| | | | |
Total investment income | | | 21,909 | |
| | | | |
Expenses: | | | | |
Management fees | | | 9,074 | |
Administration fees | | | 5,166 | |
Transfer agent/maintenance fees | | | 4,272 | |
Custodian fees | | | 675 | |
Directors’ fees | | | 115 | |
Professional fees | | | 4,267 | |
Reports to shareholders | | | 2,265 | |
Registration fees | | | 7,839 | |
Other | | | 915 | |
| | | | |
Total expenses | | | 34,588 | |
Reimbursement of expenses | | | (21,047 | ) |
| | | | |
Net expenses | | | 13,541 | |
| | | | |
Net investment income | | | 8,368 | |
| | | | |
Net Realized and Unrealized Gain (Loss): | | | | |
Net realized gain (loss) during the period on: | | | | |
Investments | | | 4,126 | |
| | | | |
Net realized gain | | | 4,126 | |
| | | | |
Net unrealized appreciation (depreciation) during the period on: | | | | |
Investments | | | 289,535 | |
| | | | |
Net unrealized appreciation | | | 289,535 | |
| | | | |
Net realized and unrealized gain | | | 293,661 | |
| | | | |
Net increase in net assets resulting from operations | | $ | 302,029 | |
| | | | |
| | | | |
| | 94 | | The accompanying notes are an integral part of the financial statements |
| | |
| | |
| | Rydex | SGI Large Cap Value Fund |
| Statement of Changes in Net Assets | | Large Cap Value Institutional Fund |
| | | | | | | | |
| | | Six Months Ended
March 31, 2010
(unaudited) | | | Year Ended
September 30, 2009 | |
Increase (decrease) in net assets from operations: | | | | | | | | |
Net investment income | | $ | 8,368 | | | $ | 33,258 | |
Net realized gain (loss) during the period on investments | | | 4,126 | | | | (280,294 | ) |
Net unrealized appreciation during the period on investments | | | 289,535 | | | | 42,891 | |
| | | | | | | | |
Net increase (decrease) in net assets resulting from operations | | | 302,029 | | | | (204,145 | ) |
| | | | | | | | |
Distributions to shareholders from: | | | | | | | | |
Net investment income | | | (23,939 | ) | | | (19,621 | ) |
| | | | | | | | |
Total distributions to shareholders | | | (23,939 | ) | | | (19,621 | ) |
| | | | | | | | |
Capital share transactions: | | | | | | | | |
Proceeds from sale of shares | | | 556,727 | | | | 2,460,110 | |
Dividends reinvested | | | 23,939 | | | | 19,622 | |
Cost of shares redeemed | | | (631,823 | ) | | | (2,416,519 | ) |
| | | | | | | | |
Net increase (decrease) from capital share transactions | | | (51,157 | ) | | | 63,213 | |
| | | | | | | | |
Net increase (decrease) in net assets | | | 226,933 | | | | (160,553 | ) |
| | | | | | | | |
Net assets: | | | | | | | | |
Beginning of period | | | 2,717,643 | | | | 2,878,196 | |
| | | | | | | | |
End of period | | $ | 2,944,576 | | | $ | 2,717,643 | |
| | | | | | | | |
Undistributed net investment income at end of period | | $ | 6,138 | | | $ | 21,709 | |
| | | | | | | | |
Capital share activity: | | | | | | | | |
Shares sold | | | 59,980 | | | | 343,781 | |
Shares reinvested | | | 2,631 | | | | 2,763 | |
Shares redeemed | | | (67,721 | ) | | | (340,533 | ) |
| | | | | | | | |
Total capital share activity | | | (5,110 | ) | | | 6,011 | |
| | | | | | | | |
| | | | |
| | 95 | | The accompanying notes are an integral part of the financial statements |
| | |
| Financial Highlights | | Rydex | SGI Large Cap Value Fund |
| Selected data for each share of capital stock outstanding throughout each period | | Large Cap Value Institutional Fund |
| | | | | | | | | | | | |
| | | Six Months
Ended March 31,
2010a | | | 2009 | | | Year Ended
September 30,
2008b | |
Per Share Data | | | | | | | | | | | | |
Net asset value, beginning of period | | $ | 8.89 | | | $ | 9.61 | | | $ | 10.00 | |
| | | | | | | | | | | | |
Income (loss) from investment operations: | | | | | | | | | | | | |
Net investment income c | | | 0.03 | | | | 0.09 | | | | 0.03 | |
| | | | | | | | | | | | |
Net gain (loss) on securities (realized and unrealized) | | | 0.96 | | | | (0.76 | ) | | | (0.42 | ) |
| | | | | | | | | | | | |
Total from investment operations | | | 0.99 | | | | (0.67 | ) | | | (0.39 | ) |
| | | | | | | | | | | | |
Less distributions: | | | | | | | | | | | | |
Dividends from net investment income | | | (0.08 | ) | | | (0.05 | ) | | | — | |
| | | | | | | | | | | | |
Total distributions | | | (0.08 | ) | | | (0.05 | ) | | | — | |
| | | | | | | | | | | | |
Net asset value, end of period | | $ | 9.80 | | | $ | 8.89 | | | $ | 9.61 | |
| | | | | | | | | | | | |
Total Return | | | 11.19 | % | | | (6.89 | )% | | | (3.90 | )% |
| | | | | | | | | | | | |
Ratios/Supplemental Data | | | | | | | | | | | | |
Net assets, end of period (in thousands) | | $ | 2,945 | | | $ | 2,718 | | | $ | 2,878 | |
| | | | | | | | | | | | |
Ratios to average net assets: | | | | | | | | | | | | |
Net investment income | | | 0.60 | % | | | 1.22 | % | | | 1.17 | % |
Total expenses d | | | 2.48 | % | | | 2.37 | % | | | 2.33 | % |
Net expenses e | | | 0.97 | % | | | 0.98 | % | | | 0.98 | % |
Net expenses prior to custodian earnings credits and net of expense waivers | | | 0.97 | % | | | 0.98 | % | | | 0.98 | % |
| | | | | | | | | | | | |
Portfolio turnover rate | | | 23 | % | | | 45 | % | | | 35 | % |
| a | Unaudited figures for the six months ended March 31, 2010. Percentage amounts, except total return, have been annualized. |
| b | Security Large Cap Value Institutional Fund was initially capitalized on July 11, 2008 with a net asset value of $10 per share. Percentage amounts for the period, except total return, have been annualized. |
| c | Net investment income (loss) was computed using average shares outstanding throughout the period. |
| d | Total expense information reflects the expense ratios absent expense reductions by the Investment Manager and custodian earnings credits, as applicable. |
| e | Net expense information reflects the expense ratios after voluntary expense waivers, reimbursements and custodian earnings credits, as applicable. |
| | | | |
| | 96 | | The accompanying notes are an integral part of the financial statements |
| | |
| | Rydex | SGI |
| Performance Summary | | Mid Cap Growth Fund |
| March 31, 2010 | | (unaudited) |
PERFORMANCE
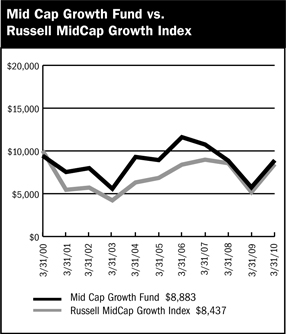
$10,000 Over Ten Years
This chart assumes a $10,000 investment in Class A shares of Mid Cap Growth Fund on March 31, 2000, reflects deduction of the 5.75% sales load and assumes all dividends reinvested. The chart does not reflect the deduction of taxes that a shareholder would pay on distributions of the redemption of fund shares. The Russell MidCap Growth Index is an unmanaged capitalization-weighted index that is designed to measure the performance of the 800 smallest companies in the Russell 1000 Index with higher price-to-book ratios and higher forecasted growth values.
| | | | | | | | | |
Average Annual Returns | |
Periods Ended 3-31-10 | |
| | | 1 Year | | | 5 Years | | | 10 Years | |
A Shares | | 54.78 | % | | (0.11 | )% | | (0.59 | )% |
A Shares with sales charge | | 45.80 | % | | (1.29 | )% | | (1.18 | )% |
B Shares | | 53.50 | % | | (0.85 | )% | | (1.25 | )% |
B Shares with CDSC | | 48.50 | % | | (1.08 | )% | | (1.25 | )% |
C Shares | | 53.53 | % | | (0.87 | )% | | (1.34 | )% |
C Shares with CDSC | | 52.53 | % | | (0.87 | )% | | (1.34 | )% |
The performance data above represents past performance that is not predictive of future results. The investment return and principal value of an investment in the Fund will fluctuate so that an investor’s shares, when redeemed, may be worth more or less than their original cost. The figures above do not reflect deduction of the maximum front-end sales charge of 5.75% for Class A shares or the contingent deferred sales charge of 5% for Class B shares and 1% for Class C shares, as applicable, except where noted. The figures do not reflect the deduction of taxes that a shareholder would pay on distributions or redemption of shares. Such figures would be lower if the maximum sales charge and any applicable taxes were deducted.
| | | |
Portfolio Composition by Sector as of 3-31-10 | |
Consumer Discretionary | | 20.51 | % |
Consmer Staples | | 1.94 | |
Energy | | 6.92 | |
Financials | | 5.22 | |
Health Care | | 10.71 | |
Industrials | | 16.45 | |
Information Technology | | 25.24 | |
Materials | | 6.38 | |
Exchange Traded Funds | | 3.81 | |
Cash & Other Assets, Less Liabilities | | 2.82 | |
| | | |
Total Net Assets | | 100.00 | % |
| | | |
| | | | |
| | 97 | | The accompanying notes are an integral part of the financial statements |
| | |
| Schedule of Investments | | Rydex | SGI |
| March 31, 2010 (unaudited) | | Mid Cap Growth Fund |
| | | | | |
| | | Shares | | Value |
COMMON STOCKS - 97.2% | | | | | |
Aerospace & Defense - 3.9% | | | | | |
Goodrich Corporation | | 29,350 | | $ | 2,069,762 |
Precision Castparts Corporation | | 9,565 | | | 1,211,981 |
| | | | | |
| | | | | 3,281,743 |
| | | | | |
Apparel Retail - 3.8% | | | | | |
Gap, Inc. | | 68,730 | | | 1,588,350 |
TJX Companies, Inc. | | 37,630 | | | 1,600,028 |
| | | | | |
| | | | | 3,188,378 |
| | | | | |
Apparel, Accessories & Luxury Goods - 2.4% | | | | | |
Phillips-Van Heusen Corporation | | 36,200 | | | 2,076,432 |
| | | | | |
Application Software - 2.9% | | | | | |
Cadence Design Systems, Inc. * | | 102,700 | | | 683,982 |
Nuance Communications, Inc. * | | 105,635 | | | 1,757,766 |
| | | | | |
| | | | | 2,441,748 |
| | | | | |
Asset Management & Custody Banks - 3.6% | | | |
BlackRock, Inc. | | 6,110 | | | 1,330,514 |
T. Rowe Price Group, Inc. | | 31,800 | | | 1,746,774 |
| | | | | |
| | | | | 3,077,288 |
| | | | | |
Casinos & Gaming - 1.9% | | | | | |
Penn National Gaming, Inc. * | | 25,870 | | | 719,186 |
WMS Industries, Inc. * | | 20,755 | | | 870,465 |
| | | | | |
| | | | | 1,589,651 |
| | | | | |
Coal & Consumable Fuels - 2.3% | | | | | |
Peabody Energy Corporation | | 41,380 | | | 1,891,066 |
| | | | | |
Communications Equipment - 2.1% | | | |
Ciena Corporation * | | 56,950 | | | 867,918 |
Juniper Networks, Inc. * | | 30,800 | | | 944,944 |
| | | | | |
| | | | | 1,812,862 |
| | | | | |
Computer Storage & Peripherals - 2.0% | | | |
QLogic Corporation * | | 85,555 | | | 1,736,767 |
| | | | | |
Construction & Engineering - 1.8% | | | |
Aecom Technology Corporation * | | 55,200 | | | 1,566,024 |
| | | | | |
Data Processing & Outsourced Services - 1.4% | | | | | |
Alliance Data Systems Corporation * | | 19,170 | | | 1,226,688 |
| | | | | |
Electrical Components & Equipment - 5.2% | | | |
Cooper Industries pic | | 51,300 | | | 2,459,321 |
Roper Industries, Inc. | | 33,570 | | | 1,941,689 |
| | | | | |
| | | | | 4,401,010 |
| | | | | |
Electronic Equipment & Instruments - 1.8% | | | |
Agilent Technologies, Inc. * | | 44,300 | | | 1,523,477 |
| | | | | |
Exchange Traded Funds - 3.8% | | | | | |
iShares Russell Midcap Growth Index Fund | | 66,585 | | | 3,230,704 |
| | | | | |
Fertilizers & Agricultural Chemicals - 1.1% | | | |
Agrium, Inc. | | 13,000 | | | 918,190 |
| | | | | |
| | | | | |
| | | Shares | | Value |
COMMON STOCKS - 97.2% (continued) | | | |
Health Care Equipment - 5.0% | | | | | |
Beckman Coulter, Inc. | | 36,870 | | $ | 2,315,436 |
Zimmer Holdings, Inc. * | | 32,130 | | | 1,902,096 |
| | | | | |
| | | | | 4,217,532 |
| | | | | |
Homebuilding - 1.4% | | | | | |
Lennar Corporation | | 68,300 | | | 1,175,443 |
| | | | | |
Home Furnishing Retail - 2.2% | | | | | |
Bed Bath & Beyond, Inc. * | | 41,670 | | | 1,823,479 |
| | | | | |
Hotels, Resorts & Cruise Lines - 1.7% | | | |
Royal Caribbean Cruises, Ltd. * | | 42,700 | | | 1,408,673 |
| | | | | |
Household Products - 1.9% | | | | | |
Clorox Company | | 25,700 | | | 1,648,398 |
| | | | | |
Housewares & Specialties - 4.6% | | | | | |
Fortune Brands, Inc. | | 31,050 | | | 1,506,236 |
Jarden Corporation | | 70,480 | | | 2,346,279 |
| | | | | |
| | | | | 3,852,515 |
| | | | | |
Industrial Gases - 1.7% | | | | | |
Praxair, Inc. | | 17,575 | | | 1,458,725 |
| | | | | |
Industrial Machinery - 3.4% | | | | | |
Dover Corporation | | 61,850 | | | 2,891,488 |
| | | | | |
IT Consulting & Other Services - 3.9% | | | |
Amdocs, Ltd. * | | 57,000 | | | 1,716,270 |
Cognizant Technology Solutions Corporation * | | 29,885 | | | 1,523,537 |
| | | | | |
| | | | | 3,239,807 |
| | | | | |
Leisure Facilities - 0.9% | | | | | |
Life Time Fitness, Inc. * | | 28,500 | | | 800,850 |
| | | | | |
Life Sciences Tools & Services - 2.7% | | | |
Thermo Fisher Scientific, Inc. * | | 44,815 | | | 2,305,284 |
| �� | | | | |
Metal & Glass Containers - 2.1% | | | | | |
Ball Corporation | | 32,522 | | | 1,736,024 |
| | | | | |
Multi-Line Insurance - 1.6% | | | | | |
HCC Insurance Holdings, Inc. | | 48,850 | | | 1,348,260 |
| | | | | |
Oil & Gas Drilling - 1.6% | | | | | |
Ensco International plc ADR | | 31,000 | | | 1,388,180 |
| | | | | |
Oil & Gas Equipment & Services -1.4% | | | |
Cameron International Corporation * | | 28,350 | | | 1,215,081 |
| | | | | |
Oil & Gas Storage & Transportation - 1.6% | | | |
Williams Companies, Inc. | | 59,305 | | | 1,369,946 |
| | | | | |
Pharmaceuticals - 3.0% | | | | | |
Teva Pharmaceutical Industries, Ltd. ADR | | 40,565 | | | 2,558,840 |
| | | | | |
| | | | |
| | 98 | | The accompanying notes are an integral part of the financial statements |
| | |
| Schedule of Investments | | Rydex | SGI |
| March 31, 2010 (unaudited) | | Mid Cap Growth Fund |
| | | | | |
| | | Shares | | Value |
COMMON STOCKS -97.2% (continued) | | | | | |
Railroads - 2.1% | | | | | |
Union Pacific Corporation | | 24,620 | | $ | 1,804,646 |
| | | | | |
Restaurants - 1.7% | | | | | |
Darden Restaurants, Inc. | | 33,050 | | | 1,472,047 |
| | | | | |
Semiconductor Equipment - 1.8% | | | | | |
Lam Research Corporation * | | 40,075 | | | 1,495,599 |
| | | | | |
Semiconductors - 3.0% | | | | | |
ON Semiconductor Corporation * | | 143,965 | | | 1,151,720 |
Skyworks Solutions, Inc. * | | 90,825 | | | 1,416,870 |
| | | | | |
| | | | | 2,568,590 |
| | | | | |
Specialty Chemicals - 1.5% | | | | | |
International Flavors & Fragrances, Inc. | | 27,150 | | | 1,294,241 |
| | | | | |
Systems Software - 6.4% | | | | | |
Check Point Software Technologies * | | 49,895 | | | 1,749,318 |
McAfee, Inc. * | | 37,600 | | | 1,508,888 |
Rovi Corporation * | | 33,300 | | | 1,236,429 |
Sybase, Inc. * | | 18,280 | | | 852,214 |
| | | | | |
| | | | | 5,346,849 |
| | | | | |
TOTAL COMMON STOCKS | | | | | |
(cost $68,061,145) | | | | $ | 82,382,525 |
| | | | | |
| | |
| | | Shares | | Value |
WARRANTS – 0.0% | | | | | |
Nova Biosource Fuels, Inc.
$2.40, 7/5/2011 1 | | 208,050 | | $ | 482 |
| | | | | |
TOTAL WARRANTS (cost $214,905) | | | | $ | 482 |
| | | | | |
Total Investments - 97.2% 2 | | | | | |
(cost $68,276,050) | | | | $ | 82,383,007 |
Cash & Other Assets, Less
Liabilities - 2.8% | | | | | 2,390,114 |
| | | | | |
Total Net Assets - 100.0% | | | | $ | 84,773,121 |
| | | | | |
For federal income tax purposes the identified cost of
investments owned at March 31, 2010 was $68,964,092.
| ADR | American Depositary Receipt |
| plc | Public Limited Company |
| * | Non-income producing security |
| 1 | Value determined based on Level 2 inputs. |
| 2 | Unless otherwise indicated, the values of the securities of the Portfolio are determined based on Level 1 inputs. |
| | | | |
| | 99 | | The accompanying notes are an integral part of the financial statements |
| | |
| | Rydex | SGI |
| | Mid Cap Growth Fund (unaudited) |
Statement of Assets and Liabilities
March 31, 2010
| | | | |
Assets: | |
Investments, at value * | | $ | 82,383,007 | |
Cash | | | 2,516,315 | |
Receivables: | | | | |
Fund shares sold | | | 9,290 | |
Securities sold | | | 311,291 | |
Dividends | | | 47,620 | |
Prepaid expenses | | | 44,250 | |
| | | | |
Total assets | | | 85,311,773 | |
| | | | |
Liabilities: | | | | |
Payable for: | | | | |
Securities purchased | | | 349,162 | |
Fund shares redeemed | | | 55,242 | |
Management fees | | | 53,611 | |
Custodian fees | | | 520 | |
Transfer agent/maintenance fees | | | 15,258 | |
Administration fees | | | 6,991 | |
Professional fees | | | 9,984 | |
12b-1distribution plan fees | | | 24,999 | |
Directors’ fees | | | 426 | |
Other | | | 22,459 | |
| | | | |
Total liabilities | | | 538,652 | |
| | | | |
Net assets | | $ | 84,773,121 | |
| | | | |
Net assets consist of: | | | | |
Paid in capital | | $ | 109,599,989 | |
Accumulated net investment loss | | | (378,990 | ) |
Accumulated net realized loss on sale of investments | | | (38,554,835 | ) |
Net unrealized appreciation in value of investments | | | 14,106,957 | |
| | | | |
Net assets | | $ | 84,773,121 | |
| | | | |
Class A: | | | | |
Capital shares outstanding
(unlimited number of shares authorized) | | | 10,087,393 | |
Net assets | | $ | 73,524,619 | |
Net asset value and redemption price per share | | $ | 7.29 | |
| | | | |
Maximum offering price per share (net asset value divided by 94.25%) | | $ | 7.73 | |
| | | | |
Class B: | | | | |
Capital shares outstanding
(unlimited number of shares authorized) | | | 997,528 | |
Net assets | | $ | 5,462,126 | |
Net asset value, offering and redemption price per share (excluding any applicable contingent deferred sales charge) | | $ | 5.48 | |
| | | | |
Class C: | | | | |
Capital shares outstanding
(unlimited number of shares authorized) . | | | 916,650 | |
Net assets | | $ | 5,786,376 | |
Net asset value, offering and redemption price per share (excluding any applicable contingent deferred sales charge) | | $ | 6.31 | |
| | | | |
* investments, at cost | | $ | 68,276,050 | |
Statement of Operations
For the Six Months Ended March 31, 2010
| | | | |
Investment Income: | |
Dividends | | $ | 335,774 | |
Interest | | | 593 | |
| | | | |
Total investment income | | | 336,367 | |
| | | | |
Expenses: | | | | |
Management fees | | | 310,758 | |
Transfer agent/maintenance fees | | | 152,768 | |
Administration fees | | | 39,496 | |
Custodian fees | | | 3,192 | |
Directors’ fees | | | 3,482 | |
Professional fees | | | 11,345 | |
Reports to shareholders | | | 12,144 | |
Registration fees | | | 22,681 | |
Other expenses | | | 12,337 | |
12b-1distribution fees - Class A | | | 89,063 | |
12b-1distribution fees - Class B | | | 30,792 | |
12b-1distribution fees - Class C | | | 27,299 | |
| | | | |
Total expenses | | | 715,357 | |
| | | | |
Net investment loss | | | (378,990 | ) |
| | | | |
Net Realized and Unrealized Gain (Loss): | | | | |
Net realized gain (loss) during the period on: | | | | |
Investments | | | 7,141,043 | |
| | | | |
Net realized gain | | | 7,141,043 | |
| | | | |
Net unrealized appreciation (depreciation) during the period on: | | | | |
Investments | | | 2,168,495 | |
| | | | |
Net unrealized appreciation | | | 2,168,495 | |
| | | | |
Net realized and unrealized gain | | | 9,309,538 | |
| | | | |
Net increase in net assets resulting from operations | | $ | 8,930,548 | |
| | | | |
| | | | |
| | 100 | | The accompanying notes are an integral part of the financial statements |
| | |
| | Rydex | SGI |
| Statement of Changes in Net Assets | | Mid Cap Growth Fund |
| | | | | | | | |
| | | Six Months Ended
March 31, 2010
(unaudited) | | | Year Ended
September 30, 2009 | |
Increase (decrease) in net assets from operations: | | | | | | | | |
Net investment loss | | $ | (378,990 | ) | | $ | (750,158 | ) |
Net realized gain (loss) during the period on investments | | | 7,141,043 | | | | (21,443,279 | ) |
Net unrealized appreciation during the period on investments | | | 2,168,495 | | | | 22,788,661 | |
| | | | | | | | |
Net increase in net assets resulting from operations | | | 8,930,548 | | | | 595,224 | |
| | | | | | | | |
Distributions to shareholders from: | | | | | | | | |
Net realized gain | | | | | | | | |
Class A | | | — | | | | (535,743 | ) |
Class B | | | — | | | | (73,574 | ) |
Class C | | | — | | | | (53,571 | ) |
| | | | | | | | |
Total distributions to shareholders | | | — | | | | (662,888 | ) |
| | | | | | | | |
Capital share transactions: | | | | | | | | |
Proceeds from sale of shares | | | | | | | | |
Class A | | | 4,958,645 | | | | 12,472,300 | |
Class B | | | 146,269 | | | | 2,327,638 | |
Class C | | | 385,903 | | | | 1,992,612 | |
Distributions reinvested | | | | | | | | |
Class A | | | — | | | | 513,214 | |
Class B | | | — | | | | 72,606 | |
Class C | | | — | | | | 50,288 | |
Cost of shares redeemed | | | | | | | | |
Class A | | | (11,172,398 | ) | | | (12,908,354 | ) |
Class B | | | (2,734,827 | ) | | | (2,576,449 | ) |
Class C | | | (800,951 | ) | | | (2,633,411 | ) |
| | | | | | | | |
Net decrease from capital share transactions | | | (9,217,359 | ) | | | (689,556 | ) |
| | | | | | | | |
Net decrease in net assets | | | (286,811 | ) | | | (757,220 | ) |
| | | | | | | | |
Net assets: | | | | | | | | |
Beginning of period | | | 85,059,932 | | | | 85,817,152 | |
| | | | | | | | |
End of period | | $ | 84,773,121 | | | $ | 85,059,932 | |
| | | | | | | | |
Accumulated net investment loss at end of period | | $ | (378,990 | ) | | $ | — | |
| | | | | | | | |
Capital share activity: | | | | | | | | |
Shares sold | | | | | | | | |
Class A | | | 747,650 | | | | 2,324,333 | |
Class B | | | 29,062 | | | | 571,695 | |
Class C | | | 66,002 | | | | 344,666 | |
Shares reinvested | | | | | | | | |
Class A | | | — | | | | 111,569 | |
Class B | | | — | | | | 20,804 | |
Class C | | | — | | | | 12,509 | |
Shares redeemed | | | | | | | | |
Class A | | | (1,667,211 | ) | | | (2,528,289 | ) |
Class B | | | (542,631 | ) | | | (647,831 | ) |
Class C | | | (138,079 | ) | | | (506,175 | ) |
| | | | |
| | 101 | | The accompanying notes are an integral part of the financial statements |
| | |
| Financial Highlights | | Rydex | SGI |
| Selected data for each share of capital stock outstanding throughout each period | | Mid Cap Growth Fund |
| | | | | | | | | | | | | | | | | | | | | | | | |
Class A | | Six Months
Ended March 31,
2010a | | | 2009 | | | 2008 | | | 2007 | | | 2006 | | | Year Ended
September 30,
2005 | |
Per Share Data | | | | | | | | | | | | | | | | | | | | | | | | |
Net asset value, beginning of period | | $ | 6.54 | | | $ | 6.46 | | | $ | 11.11 | | | $ | 12.03 | | | $ | 12.65 | | | $ | 11.02 | |
| | | | | | | | | | | | | | | | | | | | | | | | |
Income (loss) from investment operations: | | | | | | | | | | | | | | | | | | | | | | | | |
Net investment loss b | | | (0.03 | ) | | | (0.05 | ) | | | (0.05 | ) | | | (0.08 | ) | | | (0.12 | ) | | | (0.10 | ) |
Net gain (loss) on securities (realized and unrealized) | | | 0.78 | | | | 0.18 | | | | (2.46 | ) | | | 0.35 | | | | 0.47 | | | | 2.46 | |
| | | | | | | | | | | | | | | | | | | | | | | | |
Total from investment operations | | | 0.75 | | | | 0.13 | | | | (2.51 | ) | | | 0.27 | | | | 0.35 | | | | 2.36 | |
| | | | | | | | | | | | | | | | | | | | | | | | |
Less distributions: | | | | | | | | | | | | | | | | | | | | | | | | |
Distributions from realized gains | | | — | | | | (0.05 | ) | | | (2.14 | ) | | | (1.19 | ) | | | (0.97 | ) | | | (0.73 | ) |
| | | | | | | | | | | | | | | | | | | | | | | | |
Total distributions | | | — | | | | (0.05 | ) | | | (2.14 | ) | | | (1.19 | ) | | | (0.97 | ) | | | (0.73 | ) |
| | | | | | | | | | | | | | | | | | | | | | | | |
Net asset value, end of period | | $ | 7.29 | | | $ | 6.54 | | | $ | 6.46 | | | $ | 11.11 | | | $ | 12.03 | | | $ | 12.65 | |
| | | | | | | | | | | | | | | | | | | | | | | | |
Total Return c | | | 11.47 | % | | | 2.32 | % | | | (26.24 | )% | | | 2.10 | % | | | 2.81 | % | | | 21.76 | % |
| | | | | | | | | | | | | | | | | | | | | | | | |
Ratios/Supplemental Data | | | | | | | | | | | | | | | | | | | | | | | | |
Net assets, end of period (in thousands) | | $ | 73,525 | | | $ | 71,985 | | | $ | 71,655 | | | $ | 160,544 | | | $ | 192,159 | | | $ | 183,676 | |
| | | | | | | | | | | | | | | | | | | | | | | | |
Ratios to average net assets: | | | | | | | | | | | | | | | | | | | | | | | | |
Net investment loss | | | (0.81 | )% | | | (0.99 | )% | | | (0.63 | )% | | | (0.67 | )% | | | (0.93 | )% | | | (0.85 | )% |
Total expenses d | | | 1.62 | % | | | 1.78 | % | | | 1.50 | % | | | 1.41 | % | | | 1.40 | % | | | 1.42 | % |
Net expenses e | | | 1.62 | % | | | 1.78 | % | | | 1.50 | % | | | 1.41 | % | | | 1.40 | % | | | 1.42 | % |
Net expenses prior to custodian earning credits and net of expense waivers | | | 1.62 | % | | | 1.78 | % | | | 1.50 | % | | | 1.41 | % | | | 1.40 | % | | | 1.42 | % |
| | | | | | | | | | | | | | | | | | | | | | | | |
Portfolio turnover rate | | | 131 | % | | | 138 | % | | | 191 | %f | | | 34 | % | | | 41 | % | | | 31 | % |
| | | | | | |
Class B | | Six Months
Ended March 31,
2010a | | | 2009 | | | 2008 | | | 2007 | | | 2006 | | | Year Ended
September 30,
2005 | |
Per Share Data | | | | | | | | | | | | | | | | | | | | | | | | |
Net asset value, beginning of period | | $ | 4.93 | | | $ | 4.92 | | | $ | 9.09 | | | $ | 10.12 | | | $ | 10.86 | | | $ | 9.61 | |
| | | | | | | | | | | | | | | | | | | | | | | | |
Income (loss) from investment operations: | | | | | | | | | | | | | | | | | | | | | | | | |
Net investment lossb | | | (0.04 | ) | | | (0.07 | ) | | | (0.09 | ) | | | (0.14 | ) | | | (0.18 | ) | | | (0.16 | ) |
Net gain (loss) on securities (realized and unrealized) | | | 0.59 | | | | 0.13 | | | | (1.94 | ) | | | 0.30 | | | | 0.41 | | | | 2.14 | |
| | | | | | | | | | | | | | | | | | | | | | | | |
Total from investment operations | | | 0.55 | | | | 0.06 | | | | (2.03 | ) | | | 0.16 | | | | 0.23 | | | | 1.98 | |
| | | | | | | | | | | | | | | | | | | | | | | | |
Less distributions: | | | | | | | | | | | | | | | | | | | | | | | | |
Distributions from realized gains | | | — | | | | (0.05 | ) | | | (2.14 | ) | | | (1.19 | ) | | | (0.97 | ) | | | (0.73 | ) |
| | | | | | | | | | | | | | | | | | | | | | | | |
Total distributions | | | — | | | | (0.05 | ) | | | (2.14 | ) | | | (1.19 | ) | | | (0.97 | ) | | | (0.73 | ) |
| | | | | | | | | | | | | | | | | | | | | | | | |
Net asset value, end of period | | $ | 5.48 | | | $ | 4.93 | | | $ | 4.92 | | | $ | 9.09 | | | $ | 10.12 | | | $ | 10.86 | |
| | | | | | | | | | | | | | | | | | | | | | | | |
Total Return c | | | 11.16 | % | | | 1.61 | % | | | (26.92 | )% | | | 1.34 | % | | | 2.12 | % | | | 20.95 | % |
| | | | | | | | | | | | | | | | | | | | | | | | |
Ratios/Supplemental Data | | | | | | | | | | | | | | | | | | | | | | | | |
Net assets, end of period (in thousands) | | $ | 5,462 | | | $ | 7,454 | | | $ | 7,711 | | | $ | 14,877 | | | $ | 22,010 | | | $ | 27,115 | |
| | | | | | | | | | | | | | | | | | | | | | | | |
Ratios to average net assets: | | | | | | | | | | | | | | | | | | | | | | | | |
Net investment loss | | | (1.57 | )% | | | (1.73 | )% | | | (1.40 | )% | | | (1.43 | )% | | | (1.68 | )% | | | (1.61 | )% |
Total expenses d | | | 2.37 | % | | | 2.53 | % | | | 2.26 | % | | | 2.16 | % | | | 2.15 | % | | | 2.17 | % |
Net expenses e | | | 2.37 | % | | | 2.53 | % | | | 2.26 | % | | | 2.16 | % | | | 2.15 | % | | | 2.17 | % |
Net expenses prior to custodian earning credits and net of expense waivers | | | 2.37 | % | | | 2.53 | % | | | 2.26 | % | | | 2.16 | % | | | 2.15 | % | | | 2.17 | % |
| | | | | | | | | | | | | | | | | | | | | | | | |
Portfolio turnover rate | | | 131 | % | | | 138 | % | | | 191 | %f | | | 34 | % | | | 41 | % | | | 31 | % |
| | | | |
| | 102 | | The accompanying notes are an integral part of the financial statements |
| | |
| Financial Highlights | | Rydex | SGI |
| Selected data for each share of capital stock outstanding throughout each period | | Mid Cap Growth Fund |
| | | | | | | | | | | | | | | | | | | | | | | | |
Class C | | Six Months
Ended March 31,
2010a | | | 2009 | | | 2008 | | | 2007 | | | 2006 | | | Year Ended
September 30,
2005 | |
Per Share Data | | | | | | | | | | | | | | | | | | | | | | | | |
Net asset value, beginning of period | | $ | 5.69 | | | $ | 5.67 | | | $ | 10.11 | | | $ | 11.13 | | | $ | 11.84 | | | $ | 10.43 | |
| | | | | | | | | | | | | | | | | | | | | | | | |
Income (loss) from investment operations: | | | | | | | | | | | | | | | | | | | | | | | | |
Net investment loss b | | | (0.05 | ) | | | (0.08 | ) | | | (0.10 | ) | | | (0.15 | ) | | | (0.19 | ) | | | (0.18 | ) |
Net gain (loss) on securities (realized and unrealized) | | | 0.67 | | | | 0.15 | | | | (2.20 | ) | | | 0.32 | | | | 0.45 | | | | 2.32 | |
| | | | | | | | | | | | | | | | | | | | | | | | |
Total from investment operations | | | 0.62 | | | | 0.07 | | | | (2.30 | ) | | | 0.17 | | | | 0.26 | | | | 2.14 | |
| | | | | | | | | | | | | | | | | | | | | | | | |
Less distributions: | | | | | | | | | | | | | | | | | | | | | | | | |
Distributions from realized gains | | | — | | | | (0.05 | ) | | | (2.14 | ) | | | (1.19 | ) | | | (0.97 | ) | | | (0.73 | ) |
| | | | | | | | | | | | | | | | | | | | | | | | |
Total distributions | | | — | | | | (0.05 | ) | | | (2.14 | ) | | | (1.19 | ) | | | (0.97 | ) | | | (0.73 | ) |
| | | | | | | | | | | | | | | | | | | | | | | | |
Net asset value, end of period | | $ | 6.31 | | | $ | 5.69 | | | $ | 5.67 | | | $ | 10.11 | | | $ | 11.13 | | | $ | 11.84 | |
| | | | | | | | | | | | | | | | | | | | | | | | |
Total Return c | | | 10.90 | % | | | 1.58 | % | | | (26.87 | )% | | | 1.31 | % | | | 2.20 | % | | | 20.83 | % |
| | | | | | | | | | | | | | | | | | | | | | | | |
Ratios/Supplemental Data | | | | | | | | | | | | | | | | | | | | | | | | |
Net assets, end of period (in thousands) | | $ | 5,786 | | | $ | 5,622 | | | $ | 6,452 | | | $ | 10,717 | | | $ | 15,505 | | | $ | 16,330 | |
| | | | | | | | | | | | | | | | | | | | | | | | |
Ratios to average net assets: | | | | | | | | | | | | | | | | | | | | | | | | |
Net investment loss | | | (1.55 | )% | | | (1.74 | )% | | | (1.40 | )% | | | (1.43 | )% | | | (1.68 | )% | | | (1.60 | )% |
Total expenses d | | | 2.37 | % | | | 2.54 | % | | | 2.26 | % | | | 2.16 | % | | | 2.15 | % | | | 2.17 | % |
Net expenses e | | | 2.37 | % | | | 2.54 | % | | | 2.26 | % | | | 2.16 | % | | | 2.15 | % | | | 2.17 | % |
Net expenses prior to custodian earning credits and net of expense waivers | | | 2.37 | % | | | 2.54 | % | | | 2.26 | % | | | 2.16 | % | | | 2.15 | % | | | 2.17 | % |
| | | | | | | | | | | | | | | | | | | | | | | | |
Portfolio turnover rate | | | 131 | % | | | 138 | % | | | 191 | %f | | | 34 | % | | | 41 | % | | | 31 | % |
| a | Unaudited figures for the six months ended March 31, 2010. Percentage amounts for the period, except total return, have been annualized. |
| b | Net investment income (loss) was computed using average shares outstanding throughout the period. |
| c | Total return information does not reflect deduction of any sales charges imposed at the time of purchase for Class A shares or upon redemption for ClassB and C shares. |
| d | Total expense information reflects expense ratios absent expense reductions by the Investment Manager and custodian earnings credits, as applicable. |
| e | Net expense information reflects the expense ratios after voluntary expense waivers, reimbursements and custodian earnings credits, as applicable. |
| f | Significant variation in the portfolio turnover rate is due to the Investment Manager’s appointment of new portfolio managers for the Fund. |
| | | | |
| | 103 | | The accompanying notes are an integral part of the financial statements |
| | |
| Notes to Financial Statements | | |
| March 31, 2010 (unaudited) | | |
1. Significant Accounting Policies
Rydex | SGI Large Cap Value, Equity and Mid Cap Growth Funds (formerly Security Large Cap Value Fund, Security Equity Fund and Security Mid Cap Growth Fund, respectively), (collectively referred to herein as the Funds) are registered under the Investment Company Act of 1940 (the “1940 Act”), as amended, as open-end management investment companies. The shares of Rydex I SGI Equity Fund and Large Cap Value Fund are currently issued in multiple series, with each series, in effect, representing a separate fund. The Rydex | SGI Equity Fund and Large Cap Value Fund account for the assets of each series separately. Class “A” shares are generally sold with a sales charge at the time of purchase. Class “A” shares are not subject to a sales charge when they are redeemed, except for purchases of $1 million or more sold without a front-end sales charge are subject to a contingent deferred sales charge if redeemed within one year of purchase. Class “B” shares may be subject to a contingent deferred sales charge for six years and automatically convert to Class A shares after eight years. Redemptions of Class “B” shares within five years of acquisition incur a contingent deferred sales charge. Class “C” shares are offered without a front-end sales charge but incur additional class-specific expenses. Redemptions of Class “C” shares within one year of acquisition incur a contingent deferred sales charge. “Institutional” Class shares are offered primarily for direct investment by institutions, such as pension and profit sharing plans, endowments, foundations and corporations. Institutional class shares have a minimum initial investment of $2 million and a minimum account balance of $1 million. Institutional Class shares are offered without a front-end sales charge or a contingent deferred sales charge. The following is a summary of the significant accounting policies followed by the Funds in the preparation of their financial statements.
A. Security Valuation - Valuations of the Funds’ securities are supplied by pricing services approved by the Board of Directors. The Funds’ officers, under the general supervision of the Board of Directors, regularly review procedures used by, and valuations provided by, the pricing services. Each security owned by the Funds that is listed on a securities exchange is valued at its last sale price on that exchange on the date as of which assets are valued. Where the security is listed on more than one exchange, the Fund will use the price of that exchange that it generally considers to be the principal exchange on which the stock is traded. Securities listed on the NASDAQ Stock Market, Inc. (“NASDAQ”) will be valued at the NASDAQ Official Closing Price, which may not necessarily represent the last sale price. If there has been no sale on such exchange or NASDAQ on such day, the security is valued at the closing bid price on such day. Securities for which market quotations are not readily available are valued taking into consideration securities with similar yields, quality, type of issue, coupon, duration and rating. If there is no bid price or if the bid price is deemed to be unsatisfactory by the Board of Directors or by the Funds’ investment manager, then the securities are valued in good faith by such method as the Board of Directors determines will reflect the fair value. If events occur after the close of a foreign exchange that will affect the value of a Funds portfolio securities before the time as of which the NAV is calculated (a “significant event”), the security will generally be
priced using a fair value procedure. If the Valuation Committee determines a significant event has occurred, it will evaluate the impact of that event on an affected security or securities, to determine whether a fair value adjustment would materially affect the Funds net asset value per share. Some of the factors which may be considered by the Board of Directors in determining fair value are fundamental analytical data relating to the investment, the nature and duration of any restrictions on disposition, trading in similar securities of the same issuer or comparable companies, information from broker-dealers, and an evaluation of the forces that influence the market in which the securities are purchased and sold. The Funds generally will value short-term debt securities at prices based on market quotations for such securities or securities of similar type, yield, quality and duration, except those securities purchased with 60 days or less to maturity are valued on the basis of amortized cost, which approximates market value.
Generally, trading in foreign securities markets is substantially completed each day at various times prior to the close of the New York Stock Exchange. The values of foreign securities are determined as of the close of such foreign markets or the close of the New York Stock Exchange, if earlier. All investments quoted in foreign currency are valued in U.S. dollars on the basis of the foreign currency exchange rates prevailing at the close of business. Investments in foreign securities may involve risks not present in domestic investments. The Valuation Committee will determine the current value of such foreign securities by taking into consideration certain factors which may include those discussed above, as well as the following factors, among others: the value of the securities traded on other foreign markets, ADR trading, closed-end fund trading, foreign currency exchange activity, and the trading prices of financial products that are tied to foreign securities such as WEBS®. In addition, the Board of Directors has authorized the Valuation Committee and Administrator to use prices and other information supplied by a third party pricing vendor in valuing foreign securities.
B. Repurchase Agreements - In connection with transactions in repurchase agreements, it is the Funds’ policy that their custodian take possession of the underlying collateral and that the fair value of the collateral exceed the principal amount of the repurchase transaction, including accrued interest, at all times. If the seller defaults, and the fair value of the collateral declines, realization of the collateral by the Fund may be delayed or limited.
C. Foreign Currency Transactions - The accounting records of the Funds are maintained in U.S. dollars. All assets and liabilities initially expressed in foreign currencies are converted into U.S. dollars at prevailing exchange rates. Purchases and sales of investment securities, dividend and interest income, and certain expenses are translated at the rates of exchange prevailing on the respective dates of such transactions. Changes in the relationship of these foreign currencies to the U.S. dollar can significantly affect the value of the investments and earnings of the Funds. Foreign investments may also subject the Fund to foreign government exchange restrictions, expropriation, taxation or other political, social or economic developments, all of which could affect the market and/or credit risk of the investments.
Notes to Financial Statements
March 31, 2010 (unaudited)
The Funds do not isolate that portion of the results of operations resulting from changes in the foreign exchange rates on investments from the fluctuations arising from changes in the market prices of securities held. Such fluctuations are included with the net realized and unrealized gain or loss on investments.
Net realized foreign exchange gains or losses arise from sales of portfolio securities, sales of foreign currencies, and the difference between asset and liability amounts initially stated in foreign currencies and the U.S. dollar value of the amounts actually received or paid. Net unrealized foreign exchange gains or losses arise from changes in the value of portfolio securities and other assets and liabilities at the end of the reporting period, resulting from changes in the exchange rates.
D. Forward Foreign Currency Exchange Contracts - Certain Funds may enter into forward foreign exchange contracts in order to manage foreign currency risk from purchase or sale of securities denominated in foreign currency. The Funds may also enter into such contracts to manage the effect of changes in foreign currency exchange rates on portfolio positions. These contracts are marked to market daily, by recognizing the difference between the contract exchange rate and the current market rate as unrealized gains or losses. Realized gains or losses are recognized when contracts are settled and are reflected in the Statement of Operations. These contracts involve market risk in excess of the amount reflected in the Statement of Assets and Liabilities. The face or contract amount in U.S. dollars reflects the total exposure these Funds have in that particular currency contract. Losses may arise due to changes in the value of the foreign currency or if the counterparty does not perform under the contract.
E. Futures - The Funds may utilize futures contracts to a limited extent, with the objectives of maintaining full exposure to the underlying stock market, enhancing returns, maintaining liquidity, minimizing transaction costs and hedging possible variations in foreign exchange values. The Funds, as applicable, may purchase or sell financial and foreign currency futures contracts to immediately position incoming cash in the market, thereby simulating a fully invested position in the underlying index while maintaining a cash balance for liquidity. In the event of redemptions, the Fund, as applicable, may pay from its cash balances and reduce its future positions accordingly. Returns may be enhanced by purchasing futures contracts instead of the underlying securities when futures are believed to be priced more attractively than the underlying securities. The primary risks associated with the use of futures contracts are imperfect correlation between changes in market values of stocks contained in the indexes and the prices of futures contracts, and the possibility of an illiquid market. Futures contracts are valued based upon their quoted daily settlement prices. Upon entering into a futures contract, the Funds are required to deposit and maintain as collateral either cash or securities, representing the initial margin, equal to a certain percentage of the contract value. Cash deposits are shown as restricted cash on the Statement of Assets and Liabilities; securities held as collateral are noted in the Schedule of Investments. Subsequent changes in the value of the contract are recorded as unrealized gains or losses. The variation margin is paid or received in cash daily by the Funds. The Funds realize a gain or loss when the contract is closed or expires.
F. Options Purchased and Written - The Funds may purchase put and call options and write such options on a covered basis on securities that are traded on recognized securities exchanges and over-the-counter markets. Call and put options on securities give the holder the right to purchase or sell (and the writer the obligation to sell or purchase), respectively, a security at a specified price, until a certain date. Options may be used to hedge the Funds’ or portfolio, to increase returns or to maintain exposure to the equity markets. The primary risks associated with the use of options are an imperfect correlation between the change in market value of the securities held by the Fund and the price of the option, the possibility of an illiquid market, and the inability of the counterparty to meet the terms of the contract.
The premium received for a written option is recorded as an asset with an equal liability which is marked to market based on the option’s quoted daily settlement price. Fluctuations in the value of such instruments are recorded as unrealized appreciation (depreciation) until terminated, at which time realized gains and losses are recognized.
G. Securities Sold Short - Certain Funds may make short sales “against the box,” in which the Fund enters into a short sale of a security it owns. At no time will more than 15% of the value of the Funds’ net assets be in deposits on short sales against the box. If a Fund makes a short sale, the Fund does not immediately deliver from its own account the securities sold and does not receive the proceeds from the sale. To complete the sale, the Fund must borrow the security (generally from the broker through which the short sale is made) in order to make delivery to the buyer. The Fund must replace the security borrowed by purchasing it at the market price at the time of replacement or delivering the security from its own portfolio. The Fund is said to have a “short position” in securities sold until it delivers them to the broker, at which time it receives the proceeds of the sale. Certain Funds may make short sales that are not “against the box,” which create opportunities to increase the Fund’s return but, at the same time, involve specific risk considerations and may be considered a speculative technique. Such short sales theoretically involve unlimited loss potential, as the market price of securities sold short may continually increase, although a Fund may mitigate such losses by replacing the securities sold short before the market price has increased significantly. For financial statement purposes, an amount equal to the settlement amount is included in the Statement of Assets and Liabilities as an asset and an equivalent liability. The amount of the liability is subsequently marked-to-market to reflect the current value of the short position. Subsequent fluctuations in the market prices of securities sold, but not yet purchased, may require purchasing the securities at prices which differ from the market value reflected on the Statement of Assets and Liabilities. The Funds are liable for any dividends or interest payable on securities while those securities are in a short position and are recorded as dividend expense in the statement of operations. As collateral for its short positions, the Funds are required under the 1940 Act to maintain segregated assets consisting
105
Notes to Financial Statements
March 31, 2010 (unaudited)
of cash, cash equivalents or liquid securities. These segregated assets are valued consistent with Note 1A above. These segregated assets are required to be adjusted daily to reflect changes in the market value of the securities sold short.
H. Security Transactions and Investment Income - Security transactions are accounted for on the date the securities are purchased or sold (trade date). Realized gains and losses are reported on an identified cost basis. Dividend income is accrued as of the ex-dividend date, except that certain dividends for foreign securities where the ex-dividend date may have passed are recorded as soon as the Fund is informed of the dividend in the exercise of reasonable diligence. Interest income is recognized on the accrual basis, including the amortization of premiums and accretion of discounts on debt securities.
I. Expenses - Expenses that are directly related to one of the Funds are charged directly to that Fund. Other operating expenses are allocated to the Funds on the basis of relative net assets. Class specific expenses, such as 12b-1fees, are borne by that class. Income, other expenses and realized and unrealized gains and losses of a Fund are allocated to each respective class in proportion to the relative net assets of each class.
J. Distributions to Shareholders - Distributions to shareholders are recorded on the ex-dividend date. The character of distributions made during the year from net investment income or net realized gains may differ from their ultimate characterization for federal income tax purposes.
K. Taxes - The Funds intend to comply with the requirements of the Internal Revenue Code applicable to regulated investment companies and distribute all of their taxable net income and net realized gains sufficient to relieve them from all, or substantially all, federal income, excise and state income taxes. Therefore, no provision for federal or state income tax is required.
The evaluation of tax positions taken or expected to be taken in the course of preparing the Fund’s tax returns is required to determine whether the tax positions are “more-likely-than-not” of being sustained by the applicable tax authority. For all open tax years (September 30, 2006 - September 30, 2009) and all major taxing jurisdictions through the end of the reporting period, the Fund’s management has completed a review and evaluation and has determined that no tax liability is required and no additional disclosures are needed as of September 30, 2009.
L. Earning’s Credits - Under the fee agreement with the custodian, the Funds may earn credits based on overnight custody cash balances. These credits are utilized to reduce related custodial expenses. The custodian fees disclosed in the Statement of Operations are before the reduction in expense from the related earnings credits.
M. Use of Estimates - The preparation of financial statements in conformity with U.S. generally accepted accounting principles requires management to make estimates and assumptions that affect the reported amounts of assets and liabilities and disclosure of contingent assets and liabilities at the date of the financial statements and the reported amounts of increases and decreases in net assets from operations during the reporting period. Actual results could differ from those estimates.
N. Indemnifications - Under the Funds’ organizational documents, its Officers and Directors are indemnified against certain liabilities arising out of the performance of their duties to the Funds. In addition, in the normal course of business, the Funds enter into contracts that provide general indemnification to other parties. The Funds’ maximum exposure under these arrangements is unknown as this would involve future claims that may be made against the Funds that have not yet occurred, and may not occur. However, the Funds have not had prior claims or losses pursuant to these contracts and expect the risk of loss to be remote.
106
Notes to Financial Statements
March 31, 2010 (unaudited)
2. Management Fees and Other Transactions with Affiliates
Management fees are paid monthly to Security Investors (SI), based on the following annual rates for the six months ended March 31, 2010:
| | | |
| | | Management
Fees (as a %
of net assets) | |
Rydex | SGI Equity Fund: | | | |
All Cap Value Fund | | 0.70 | % |
Alpha Opportunity Fund | | 1.25 | % |
Large Cap Core Fund | | 0.75 | % |
Global Fund | | 1.00 | % |
Global Institutional Fund | | 1.00 | % |
Mid Cap Value Fund | | 0.80 | % 1 |
Mid Cap Value Institutional Fund | | 0.75 | % |
Large Cap Concentrated Growth Fund | | 0.75 | % |
Small Cap Growth Fund | | 0.85 | % |
Small Cap Value Fund | | 1.00 | % |
Rydex | SGI large Cap Value Fund | | | |
Large Cap Value Fund | | 0.65 | % |
Large Cap Value Institutional Fund | | 0.65 | % |
Rydex | SGI Mid Cap Growth Fund | | 0.75 | % |
| 1 | Management fees are payable at an annual rate of 1.00% of the average daily net assets of $200 million or less, and 0.75% of the average daily net assets of the Mid Cap Value Fund in excess of $200 million. |
SI also acts as the administrative agent and transfer agent for the Funds, and as such performs administrative functions, transfer agency and dividend disbursing services, and the bookkeeping, accounting and pricing functions for each Fund. For these services, the Investment Manager receives the following:
| | |
| | | Administrative Fees
(as a % of net assets) |
Rydex | SGI Equity Fund: | | |
All Cap Value Fund | | 0.095% |
Alpha Opportunity Fund | | 0.15% |
Large Cap Core Fund | | 0.095% |
Global Fund | | 0.05% + greater of 0.10% or $60,000 |
Global Institutional Fund | | 0.15% |
Mid Cap Value Fund | | 0.095% |
Mid Cap Value Institutional Fund | | 0.095% |
Large Cap Concentrated Growth Fund | | 0.095% |
Small Cap Growth Fund | | 0.095% |
Small Cap Value Fund | | 0.095% |
Rydex | SGI Large Cap Value Fund: | | |
Large Cap Value Fund | | 0.095% |
Large Cap Value Institutional Fund | | 0.095% |
Rydex | SGI Mid Cap Growth Fund | | 0.095% |
Minimum charge per Fund | | $25,000 1 |
Certain out-of-pocket charges | | Varies |
| 1 | SI has agreed not to charge the $25,000 minimum fee on the All Cap Value Fund indefinitely. |
SI is paid the following for providing transfer agent services to the Funds:
| | |
Annual per account charge | | $5.00 - $8.00 |
Transaction fee | | $0.60 -$1.10 |
Annual minimum charge
(per Fund) | | $25,000 1 |
Certain out-of-pocket charges | | Varies |
| 1 | SI has agreed not to charge the $25,000 minimum fee on the All Cap Value Fund indefinitely. |
107
Notes to Financial Statements
March 31, 2010 (unaudited)
The investment advisory contracts for the following Funds provides that the total expenses be limited to a percentage of average net assets for each class of shares, exclusive of brokerage costs, dividends on securities sold short, expenses of other investment companies in which a Fund invests, interest, taxes, litigation, indemnification and extraordinary expenses (as determined under generally accepted accounting principles) The limits are listed below:
| | | | | | | | |
| | | Limit | | | Effective
Date | | | Contract
End Date |
Rydex | SGI Equity Fund: | | | | | | | | |
All Cap Value Fund - Class A | | 1.27 | % | | 2/1/2010 | 2 | | 1/31/2011 |
All Cap Value Fund - Class C | | 2.02 | % | | 2/1/2010 | 2 | | 1/31/2011 |
All Cap Value Fund - Institutional Class | | 1.02 | % | | 2/1/2010 | 2 | | 1/31/2011 |
Alpha Opportunity Fund - Class A | | 2.11 | % | | 2/1/2010 | 1 | | 1/31/2011 |
Alpha Opportunity Fund - Class B | | 2.86 | % | | 2/1/2010 | 1 | | 1/31/2011 |
Alpha Opportunity Fund - Class C | | 2.86 | % | | 2/1/2010 | 1 | | 1/31/2011 |
Alpha Opportunity Fund - Institutional Class | | 1.86 | % | | 2/1/2010 | 1 | | 1/31/2011 |
Global Institutional Fund | | 1.00 | % | | 7/11/2008 | | | 1/31/2011 |
Mid Cap Value Institutional Fund | | 0.90 | % | | 4/13/2009 | | | 3/31/2011 |
Large Cap Concentrated Growth Fund - Class A | | 1.35 | % | | 1/11/2007 | | | 1/31/2011 |
Large Cap Concentrated Growth Fund - Class B | | 2.10 | % | | 1/11/2007 | | | 1/31/2011 |
Large Cap Concentrated Growth Fund - Class C | | 2.10 | % | | 1/11/2007 | | | 1/31/2011 |
Small Cap Value Fund - Class A | | 1.30 | % | | 7/11/2008 | | | 1/31/2011 |
Small Cap Value Fund - Class C | | 2.05 | % | | 7/11/2008 | | | 1/31/2011 |
Small Cap Value Fund - Institutional Class | | 1.05 | % | | 7/11/2008 | | | 1/31/2011 |
Rydex | SGI Large Cap Value Fund: | | | | | | | | |
Large Cap Value Fund - Class A | | 1.15 | % | | 2/1/2010 | 3 | | 1/31/2011 |
Large Cap Value Fund - Class B | | 1.90 | % | | 2/1/2010 | 3 | | 1/31/2011 |
Large Cap Value Fund - Class C | | 1.90 | % | | 2/1/2010 | 3 | | 1/31/2011 |
Large Cap Value Institutional Fund | | 0.96 | % | | 2/1/2010 | 4 | | 1/31/2011 |
| 1 | Prior to February 1, 2010 the expense limit was 1.95% for Class A shares, 2.70% for Class B & Class C shares and 1.70% for the Institutional Class of shares. |
| 2 | Prior to February 1, 2010 the expense limit was 1.35% for Class A shares, 2.10% for Class C shares and 1.10% for the Institutional Class of shares. |
| 3 | Prior to February 1, 2010 the expense limit was 1.25% for Class A shares, 2.00% for Class B & Class C shares. |
| 4 | Prior to February 1, 2010 the expense ratio was 0.98%. |
The Investment Manager is entitled to reimbursement by the All Cap Value Fund, Alpha Opportunity Fund, Global Institutional Fund, Mid Cap Value Institutional Fund, Large Cap Concentrated Growth Fund, Small Cap Value Fund, Large Cap Value Fund and the Large Cap Value Institutional Fund of fees waived or expenses reimbursed during any of the previous 36 months, beginning on the date of the expense limitation agreement, if on any day the estimated operating expenses are less than the indicated percentages. As of March 31, 2010, the amount of fees waived or expenses reimbursed in the All Cap Value Fund, Alpha Opportunity Fund, Global Institutional Fund, Mid Cap Value Institutional Fund, Select 25 Fund, Small Cap Value Fund, Large Cap Value Fund and the Large Cap Value Institutional Fund were $26,456, $107,762, $40,357, $147,699, $74,232, $40,631,$90,850 and $21,047, respectively. As of March 31, 2010, no amounts were recouped by the Investment Manager.
The Funds have adopted Distribution Plans related to the offering of Class A, Class B and Class C shares pursuant to Rule 12b-1under the Investment Company Act of 1940. The plans provide for payments at an annual rate of 1.00% of the average daily net assets of each Fund’s Class B and Class C shares, and 0.25% of the average daily net assets of each Fund’s Class A shares. Effective August 25, 2005, the Global Fund ceased charging 12b-1fees on Class B shares in accordance with the FINRA sales cap regulations. Effective August 1, 2007, the Rydex I SGI Large Cap Value Fund ceased charging 12b-1fees on Class B shares in accordance with the FINRA sales cap regulations. These fees may be reinstated at any time.
108
Notes to Financial Statements
March 31, 2010 (unaudited)
SDI retained underwriting commissions during the period ended October 16, 2009, on sales of shares after allowances to broker dealers in the following amounts:
| | | |
| | | SDI
Underwriting
Commissions |
Rydex | SGI Equity Fund: | | | |
All Cap Value Fund | | $ | 32 |
Large Cap Core Fund | | | 4,744 |
Global Fund | | | 20,101 |
Mid Cap Value Fund | | | 53,880 |
Large Cap Concentrated Growth Fund | | | 856 |
Small Cap Growth Fund | | | 991 |
Small Cap Value Fund | | | 961 |
Rydex | SGI Large Cap Value Fund | | | 5,586 |
Rydex I SGI Mid Cap Growth Fund | | | 5,553 |
Rydex Distributors retained underwriting commissions during the period ended October 16, 2009 to March 31, 2010, on sales of shares after allowances to brokers and dealers in the following amounts:
| | | |
| | | Rydex Distributors
Underwriting
Commissions |
Rydex | SGI Equity Fund: | | | |
All Cap Value Fund | | $ | 444 |
Large Cap Core Fund | | | 2,341 |
Global Fund | | | 2,274 |
Small Cap Growth Fund | | | 583 |
Small Cap Value Fund | | | 1,238 |
Rydex | SGI Large Cap Value Fund | | | 5,108 |
Rydex | SGI Mid Cap Growth Fund | | | 1,746 |
Certain officers and directors of the Funds are also officers and/or directors of Security Benefit Life Insurance Company, a subsidiary of Security Benefit Corporation, and its affiliates, which include Security Investors, Security Global Investors (SGI), SDI, and Rydex Distributors.
At March 31, 2010, Security Benefit Corporation and its subsidiaries owned over five percent of the outstanding shares of the Funds, as follows:
| | | |
Fund | | Percent of outstanding
shares owned | |
Rydex | SGI Equity Fund: | | | |
All Cap Value Fund | | 36.81 | % |
Alpha Opportunity Fund | | 12.6 | % |
Large Cap Core Fund | | 14.58 | % |
Global Institutional Fund | | 100 | % |
Large Cap Concentrated Growth Fund | | 6.13 | % |
Small Cap Growth Fund | | 18.19 | % |
Small Cap Value Fund | | 19.54 | % |
Rydex | SGI Large Cap Value Fund: | | | |
Large Cap Value Fund | | 16.18 | % |
Large Cap Value Institutional Fund | | 100 | % |
Rydex | SGI Mid Cap Growth Fund | | 7.13 | % |
3. Investment Transactions
Investment transactions for the six months ended March 31, 2010, (excluding overnight investments and short-term commercial paper) were as follows:
| | | | | | |
| | | Purchases | | Proceeds
from Sales |
Rydex | SGI Equity Fund: | | | | | | |
All Cap Value Fund | | $ | 496,726 | | $ | 166,709 |
Alpha Opportunity Fund | | | 31,802,022 | | | 34,337,547 |
Large Cap Core Fund | | | 95,863,163 | | | 100,350,932 |
Global Fund | | | 130,090,937 | | | 151,370,724 |
Global Institutional Fund | | | 5,924,935 | | | 6,755,334 |
Mid Cap Value Fund | | | 208,875,617 | | | 142,562,895 |
Mid Cap Value Institutional Fund | | | 72,929,915 | | | 39,765,744 |
Large Cap Concentrated Growth Fund | | | 40,827,629 | | | 35,056,993 |
Small Cap Growth Fund | | | 8,505,573 | | | 7,386,834 |
Small Cap Value Fund | | | 5,139,421 | | | 2,759,500 |
Rydex | SGI Large Cap Value Fund: | | | | | | |
Large Cap Value Fund | | | 10,051,381 | | | 7,502,251 |
Large Cap Value Institutional Fund | | | 268,417 | | | 444,534 |
Rydex | SGI Mid Cap Growth Fund | | | 51,772,233 | | | 59,438,026 |
4. Open Futures Contracts
Open futures contracts for Alpha Opportunity Fund as of March 31, 2010, were as follows:
| | |
| | | Alpha Opportunity Fund
S&P 500 Index Futures |
Position | | Long |
Number of Contracts | | 12 |
Expiration Date | | 6-18-2010 |
Contract Amount | | $3,440,158 |
Market Value | | $3,495,600 |
Unrealized Gain | | $55,442 |
5. Options Written
Information as to options written by the Funds during the six months ended March 31, 2010, and options outstanding at March 31, 2010 is provided below:
All Cap Value Fund Written Call Options
| | | | | | | |
All Cap Value Fund Written Call Options | | Number of
Contracts | | | Premium
Amount | |
Balance at September 30, 2009 | | 28 | | | $ | 1,701 | |
Opened | | 1 | | | | 308 | |
Exercised | | (2 | ) | | | (462 | ) |
Expired | | (27 | ) | | | (1,547 | ) |
| | | | | | | |
Balance at March 31,2010 | | — | | | $ | — | |
| | | | | | | |
All Cap Value Fund Written Call Options
| | | | | | | |
| | | Number of
Contracts | | | Premium
Amount | |
Balance at September 30, 2009 | | 5 | | | $ | 532 | |
Opened | | 2 | | | | 236 | |
Exercised | | (2 | ) | | | (236 | ) |
Expired | | (5 | ) | | | (532 | ) |
| | | | | | | |
Balance at March 31, 2010 | | — | | | $ | — | |
| | | | | | | |
109
Notes to Financial Statements
March 31, 2010 (unaudited)
Mid Cap Value Fund Written Put Options Outstanding
| | | | | | | | | |
Common Stock | | Expiration
Date | | Exercise
Price | | Number of
Contracts | | Market
Value |
Group 1 Automotive, Inc. | | 04-16-10 | | 25.00 | | 2,112 | | $ | 21,120 |
| | | | | | | | | |
Total call options outstanding
(premiums received, $305, 623) | | | | | | 2,112 | | $ | 21,120 |
| | | | | | | | | |
Mid Cap Value Fund Written Call Options
| | | | | | | |
Common Stock | | Number of
Contracts | | | Premium
Amount | |
Balance at September 30, 2009 | | 25,125 | | | $ | 2,200,451 | |
Opened | | 6,576 | | | | 1,391,352 | |
Bought Back | | (408 | ) | | | (74,662 | ) |
Exercised | | (7,661 | ) | | | (1,769,135 | ) |
Expired | | (23,632 | ) | | | (1,748,006 | ) |
| | | | | | | |
Balance at March 31, 2010 | | — | | | $ | — | |
| | | | | | | |
Mid Cap Value Fund Written Put Options
| | | | | | | |
Common Stock | | Number of
Contracts | | | Premium
Amount | |
Balance at September 30, 2009 | | 6,939 | | | $ | 790,339 | |
Opened | | 4,839 | | | | 718,929 | |
Exercised | | (2,727 | ) | | | (413,306 | ) |
Expired | | (6,939 | ) | | | (790,339 | ) |
| | | | | | | |
Balance at March 31, 2010 | | 2,112 | | | $ | 305,623 | |
| | | | | | | |
Mid Cap Value Institutional Fund standing
Written Put Options Outstanding
| | | | | | | | | | |
Common Stock | | Expiration
Date | | Exercise
Price | | Number of
Contracts | | Market
Value |
Group 1 Automotive, Inc. | | 04-16-10 | | $ | 25.00 | | 680 | | $ | 6,800 |
| | | | | | | | | | |
Total call options outstanding
(premiums received, $98,402) | | | | | | | 680 | | $ | 6,800 |
| | | | | | | | | | |
Mid Cap Value Institutional Fund Written Call Options
| | | | | | | |
Common Stock | | Number of
Contracts | | | Premium
Amount | |
Balance at September 30, 2009 | | 6,637 | | | $ | 519,263 | |
Opened | | 2,057 | | | | 440,612 | |
Bought Back | | (24 | ) | | | (4,392 | ) |
Exercised | | (1,645 | ) | | | (397,011 | ) |
Expired | | (7,025 | ) | | | (558,472 | ) |
| | | | | | | |
Balance at March 31, 2010 | | — | | | $ | — | |
| | | | | | | |
Mid Cap Value Institutional Fund Written Put Options
| | | | | | | |
| | |
| | | Number of
Contracts | | | Premium
Amount | |
Balance at September 30, 2009 | | 683 | | | $ | 81,300 | |
Opened | | 1,588 | | | | 236,052 | |
Exercised | | (908 | ) | | | (137,650 | ) |
Expired | | (683 | ) | | | (81,300 | ) |
| | | | | | | |
Balance at March 31, 2010 | | 680 | | | $ | 98,402 | |
| | | | | | | |
Small Cap Value Fund Written Put Options Outstanding
| | | | | | | | | | |
| | | Expiration
Date | | Exercise
Price | | Number of
Contracts | | Market
Value |
Common Stock Group 1 Automotive, Inc. | | 04-16-10 | | $ | 25.00 | | 15 | | $ | 150 |
| | | | | | | | | | |
Total call options outstanding
(premiums received, $2,172) | | | | | | | 15 | | $ | 150 |
| | | | | | | | | | |
Small Cap Value Fund Written Call Options
| | | | | | | |
| | | Number of
Contracts | | | Premium
Amount | |
Balance at September 30, 2009 | | 134 | | | $ | 12,682 | |
Opened | | 41 | | | | 9,012 | |
Bought Back | | (1 | ) | | | (183 | ) |
Exercised | | (41 | ) | | | (11,320 | ) |
Expired | | (133 | ) | | | (10,191 | ) |
| | | | | | | |
Balance at March 31, 2010 | | — | | | $ | — | |
| | | | | | | |
Small Cap Value Fund Written Put Options
| | | | | | | |
| | | Number of
Contracts | | | Premium
Amount | |
Balance at September 30, 2009 | | 75 | | | $ | 7,544 | |
Opened | | 3 | | | | 6,318 | |
Exercised | | (6 | ) | | | (978 | ) |
Expired | | (91 | ) | | | (10,172 | ) |
| | | | | | | |
Balance at March 31, 2010 | | 15 | | | $ | 2,172 | |
| | | | | | | |
110
Notes to Financial Statements
March 31, 2010 (unaudited)
6. Derivative Investment Holdings Categorized by Risk Exposure
U.S. generally accepted accounting principles requires enhanced disclosures to enable investors to better understand how and why the Funds use derivative instruments, how these derivative instruments are accounted for and their effects on the Funds’ financial position and results of operations. None of the derivatives currently held by the Funds are being used as hedging instruments.
The following is a summary of the location of derivative investments on the Funds’ Statements of Assets and Liabilities as of March 31, 2010:
Location on the Statements of Assets and Liabilities
| | | | |
Derivative Investments Type | | Asset Derivatives | | Liability Derivatives |
Futures - equity contracts Options - equity contracts | | Receivable: Variation margin Investments, at value | | Payable: Variation margin Outstanding options written, at value |
The following table sets forth the fair value of the Funds’ derivative contracts by primary risk exposure as of March 31, 2010:
Asset Derivative Investments Value
| | | | | | | | | |
Fund | | Futures
Equity
Contracts* | | Options
Equity
Contracts | | Total Value at
March 31, 2010 |
Rydex | SGI Equity Fund: | | | | | | | | | |
Alpha Opportunity Fund | | $ | 55,442 | | $ | — | | $ | 55,442 |
Liability Derivative Investments Value
| | | | | | | | | |
Fund | | Futures
Equity
Contracts* | | Options
Equity
Contracts | | Total Value at
March 31, 2010 |
Rydex | SGI Equity Fund: | | | | | | | | | |
Mid Cap Value Fund | | $ | — | | $ | 21,120 | | $ | 21,120 |
Mid Cap Value Institutional Fund | | | — | | | 6,800 | | | 6,800 |
Small Cap Value Fund | | | — | | | 150 | | | 150 |
| * | Includes cumulative appreciation (depreciation) of futures contracts as reported in the Notes to Financial Statements. Only current day’s variation margin is reported within the Statement of Assets and Liabilities. |
111
Notes to Financial Statements
March 31, 2010 (unaudited)
The following is a summary of the location of derivative investments on the Funds’ Statements of Operations as of March 31, 2010:
| | |
Derivative Investment Type | | Location of Gain (Loss) on Derivatives |
| Futures - equity contracts | | Net realized gain (loss) on futures contracts and change in net unrealized appreciation (depreciation) on futures contracts |
| |
| Options - equity contracts | | Net realized gain (loss) on options written and change in net unrealized appreciation (depreciation) on options written |
The following is a summary of the Fund’s realized gain (loss) and change in unrealized appreciation (depreciation) on derivative investments recognized in the Statements of Operations categorized by primary risk exposure as of March 31, 2010:
Realized Gain (Loss) on Derivative Investments Recognized in the Statement of Operations
| | | | | | | | | |
Fund | | Futures
Equity
Contracts | | Options
Equity
Contracts | | Total Value at
March 31, 2010 |
Rydex | SGI Equity Fund: | | | | | | | | | |
All Cap Value Fund | | $ | — | | $ | 2,078 | | $ | 2,078 |
Alpha Opportunity Fund | | | 442,780 | | | — | | | 442,780 |
Mid Cap Value Fund | | | — | | | 2,579,834 | | | 2,579,834 |
Mid Cap Value Institutional Fund | | | — | | | 642,212 | | | 642,212 |
Small Cap Value Fund | | | — | | | 21,005 | | | 21,005 |
Change in Unrealized Appreciation (Depreciation) on Derivative Investments Recognized in the Statement of Operations
| | | | | | | | | | | |
Fund | | Futures
Equity
Contracts | | Options
Equity
Contracts | | | Total Value at
March 31, 2010 | |
Rydex | SGI Equity Fund: | | | | | | | | | | | |
All Cap Value Fund | | $ | — | | $ | (623 | ) | | $ | (623 | ) |
Alpha Opportunity Fund | | | 20,273 | | | — | | | | 20,273 | |
Mid Cap Value Fund | | | — | | | (282,461 | ) | | | (282,461 | ) |
Mid Cap Value Institutional Fund | | | — | | | 72,855 | | | | 72,855 | |
Small Cap Value Fund | | | — | | | (1,670 | ) | | | (1,670 | ) |
112
Notes to Financial Statements
March 31, 2010 (unaudited)
7. Federal Tax Matters
For federal income tax purposes, the amounts of unrealized appreciation (depreciation) on investments at March 31, 2010, were as follows:
| | | | | | | | | | | |
| | | Gross
unrealized
appreciation | | Gross
unrealized
(depreciation) | | | Net unrealized
appreciation
(depreciation) | |
Rydex | SGI Equity Fund: | | | | | | | | | | | |
All Cap Value Fund | | $ | 385,474 | | $ | (23,366 | ) | | $ | 362,108 | |
Alpha Opportunity Fund | | | 752,171 | | | (1,128,456 | ) | | | (376,285 | ) |
Large Cap Core Fund | | | 28,474,923 | | | (10,383,281 | ) | | | 18,091,642 | |
Global Fund | | | 9,510,850 | | | (381,986 | ) | | | 9,128,864 | |
Global Institutional Fund | | | 400,808 | | | (17,111 | ) | | | 383,697 | |
Mid Cap Value Fund | | | 177,822,860 | | | (58,113,337 | ) | | | 119,709,523 | |
Mid Cap Value Institutional Fund | | | 63,860,850 | | | (4,404,461 | ) | | | 59,456,389 | |
Large Cap Concentrated Growth Fund | | | 4,653,932 | | | (72,473 | ) | | | 4,581,459 | |
Small Cap Growth Fund | | | 3,583,794 | | | (263,039 | ) | | | 3,320,755 | |
Small Cap Value Fund | | | 1,268,497 | | | (204,425 | ) | | | 1,064,072 | |
Rydex | SGI Large Cap Value Fund | | | | | | | | | | | |
Large Cap Value Fund | | | 7,719,770 | | | (4,194,167 | ) | | | 3,525,603 | |
Large Cap Value Institutional Fund | | | 392,625 | | | (147,773 | ) | | | 244,852 | |
Rydex | SGI Mid Cap Growth Fund | | | 13,812,261 | | | (393,346 | ) | | | 13,418,915 | |
The tax character of distributions paid during the fiscal year ended September 30, 2009 is as follows:
| | | | | | | | | | | | |
2009 | | Ordinary
Income | | Capital
Gain | | Return of
Capital | | Total |
Rydex | SGI Equity Fund: | | | | | | | | | | | | |
Large Cap Core Fund | | $ | 392,434 | | $ | — | | $ | 639,278 | | $ | 1,031,712 |
Global Fund | | | 239,128 | | | — | | | 683,073 | | | 922,201 |
Global Institutional Fund | | | 21,309 | | | — | | | — | | | 21,309 |
Mid Cap Value Fund | | | 3,483,597 | | | 86,413,567 | | | — | | | 89,897,164 |
Mid Cap Value Institutional Fund | | | 1,082,491 | | | — | | | — | | | 1,082,491 |
Small Cap Growth Fund | | | — | | | 97,806 | | | — | | | 97,806 |
Small Cap Value Fund | | | 84,923 | | | — | | | — | | | 84,923 |
Rydex | SGI Large Cap Value Fund: | | | | | | | | | | | | |
Large Cap Value Fund | | | 620,709 | | | 427,734 | | | — | | | 1,048,443 |
Large Cap Value Institutional Fund | | | 19,621 | | | — | | | — | | | 19,621 |
Rydex | SGI Mid Cap Growth Fund | | | — | | | 651,342 | | | 11,546 | | | 662,888 |
Note: For federal income tax purposes, short term capital gain distributions are treated as ordinary income distributions.
113
Notes to Financial Statements
March 31, 2010 (unaudited)
As of September 30, 2009, the components of distributable earnings on a tax basis were:
| | | | | | | | | | | | | | | | | | |
| | | Undistributed
Ordinary
Income | | Undistributed
Long-Term
Capital Gain | | Accumulated
Capital and
Other Losses* | | | Unrealized
Appreciation
(Depreciation)** | | | Total
Accumulated
Earnings/(Deficit) | |
Rydex | SGI Equity Fund: | | | | | | | | | | | | | | | | | | |
All Cap Value Fund | | $ | 3,576 | | $ | — | | $ | (22,756 | ) | | $ | 147,684 | | | $ | 128,504 | |
Alpha Opportunity Fund | | | — | | | — | | | (13,628,594 | ) | | | (1,140,844 | ) | | | (14,769,438 | ) |
Large Cap Core Fund | | | — | | | — | | | (40,519,164 | ) | | | 404,964 | | | | (40,114,200 | ) |
Global Fund | | | — | | | — | | | (55,652,487 | ) | | | 13,899,193 | | | | (41,753,294 | ) |
Global Institutional Fund | | | 61,382 | | | — | | | (2,291,544 | ) | | | 574,392 | | | | (1,655,770 | ) |
Mid Cap Value Fund | | | 1,105,623 | | | — | | | (75,200,073 | ) | | | 16,703,412 | | | | (57,391,038 | ) |
Mid Cap Value Institutional Fund | �� | | 8,586,009 | | | — | | | (45,564 | ) | | | 36,923,438 | | | | 45,463,883 | |
Large Cap Concentrated Growth Fund | | | — | | | — | | | (19,996,566 | ) | | | 3,293,888 | | | | (16,702,678 | ) |
Small Cap Growth Fund | | | — | | | — | | | (8,880,816 | ) | | | 2,636,750 | | | | (6,244,066 | ) |
Small Cap Value Fund | | | 133,540 | | | 5,308 | | | — | | | | 718,224 | | | | 857,072 | |
Rydex | SGI Large Cap Value Fund: | | | | | | | | | | | | | | | | | | |
Large Cap Value Fund | | | 396,085 | | | — | | | (16,736,934 | ) | | | (2,400,325 | ) | | | (18,741,174 | ) |
Large Cap Value Institutional Fund | | | 21,709 | | | — | | | (317,941 | ) | | | (44,683 | ) | | | (340,915 | ) |
Rydex | SGI Mid Cap Growth Fund | | | — | | | — | | | (45,007,835 | ) | | | 11,250,419 | | | | (33,757,416 | ) |
| * | Certain Funds had net capital loss carryovers and deferred post October losses as identified elsewhere in the Notes to the Financial Statements. |
| ** | The differences between book-basis and tax-basis unrealized appreciation (depreciation) are attributable primarily to the tax deferral of wash sale losses, the differences between book and tax basis passive foreign investment companies and bond discount accretion. |
114
Notes to Financial Statements
March 31, 2010 (unaudited)
For the year ended September 30, 2009, the capital loss carryovers utilized or expired and the accumulated net realized loss on sales of investments for federal income tax purposes which are available to offset future taxable gains are shown in the table below. The post-October losses that are deferred to the first day of the next fiscal year are as follows:
| | | | | | | | | | | | | | |
| | | Capital Loss
Carryovers
Utilized | | Capital Loss
Carryovers
Expired | | Remaining
Capital Loss
Carryovers | | Expires In | | Deferred
Post-
October
Losses |
Rydex | SGI Equity Fund:
All Cap Value Fund | | $ | — | | $ | — | | $ | 4,080 | | 2017 | | $ | 18,676 |
| | | | | | | | | | | | | | |
Alpha Opportunity Fund | | $ | — | | $ | — | | $ | 8,215,458 | | 2017 | | $ | 5,413,137 |
| | | | | | | | | | | | | | |
Large Cap Core Fund | | $ | — | | $ | — | | $ | 10,341,572 | | 2017 | | $ | 30,177,593 |
| | | | | | | | | | | | | | |
Global Fund | | $ | — | | $ | — | | $ | 674,209 | | 2010 | | $ | 17,677,910 |
| | | | | | | | | 37,300,368 | | 2017 | | | 37,300,368 |
| | | | | | | | | | | | | | |
| | $ | — | | $ | — | | $ | 37,974,577 | | | | | |
| | | | | | | | | | | | | | |
Global Institutional Fund | | $ | — | | $ | — | | $ | 1,263,838 | | 2017 | | $ | 1,027,707 |
| | | | | | | | | | | | | | |
Mid Cap Value Fund | | $ | — | | $ | — | | $ | 3,357,672 | | 2017 | | $ | 71,842,401 |
| | | | | | | | | | | | | | |
Mid Cap Value Institutional Fund | | $ | — | | $ | — | | $ | — | | | | $ | 45,464 |
| | | | | | | | | | | | | | |
Large Cap Concentrated Growth Fund* | | $ | — | | $ | 2,412,936 | | $ | — | | 2009 | | $ | 6,543,280 |
| | | — | | | — | | | 2,582,076 | | 2010 | | | |
| | | — | | | — | | | 3,390,876 | | 2011 | | | |
| | | — | | | — | | | 38,639 | | 2012 | | | |
| | | — | | | — | | | 7,441,695 | | 2017 | | | |
| | | | | | | | | | | | | | |
| | $ | — | | $ | 2,412,936 | | $ | 13,453,286 | | | | | |
| | | | | | | | | | | | | | |
Small Cap Growth Fund | | $ | — | | $ | — | | $ | 4,589,755 | | 2017 | | $ | 4,291,061 |
| | | | | | | | | | | | | | |
Rydex | SGI Large Cap Value Fund: | | | | | | | | | | | | | | |
Large Cap Value Fund | | $ | — | | $ | — | | $ | 7,053,807 | | 2017 | | $ | 9,683,127 |
| | | | | | | | | | | | | | |
Large Cap Value Institutional Fund | | $ | — | | $ | — | | $ | 70,714 | | 2017 | | $ | 247,227 |
| | | | | | | | | | | | | | |
Rydex | SGI Mid Cap Growth Fund | | $ | — | | $ | 567,035 | | $ | — | | 2009 | | $ | 17,668,750 |
| | | | | | | | | 567,035 | | 2010 | | | |
| | | | | | | | | 16,944 | | 2011 | | | |
| | | | | | | | | 26,755,106 | | 2017 | | | |
| | | | | | | | | | | | | | |
| | $ | — | | $ | 567,035 | | $ | 27,339,085 | | | | | |
| | | | | | | | | | | | | | |
| * | Subject to limitations pursuant to Section 382 of the Internal Revenue Code. |
115
Notes to Financial Statements
March 31, 2010 (unaudited)
Net investment income and net realized gains (losses) may differ for financial statement and tax purposes because of temporary or permanent book/tax differences. These differences are primarily due to post-October losses, losses deferred due to wash sales, foreign currency gains and losses, and the “mark-to-market” of certain passive foreign investment companies (PFICs) for tax purposes. To the extent these differences are permanent, reclassifications are made to the appropriate equity accounts in the period that the differences arise.
8. Affiliated Transactions*
Investments representing 5% or more of the outstanding voting securities of a portfolio company of a Fund results in that portfolio company being considered an affiliated company of such Fund, as defined in the 1940 Act. The aggregate market value of all securities of affiliated companies held in the Mid Cap Value Fund of the Rydex I SGI Equity Fund as of March 31, 2010 amounted to $60,688,684, which represents 5.2% of net assets. There were no affiliated companies held in any other Fund. Transactions in the Mid Cap Value Fund during the six months ended March 31, 2010, in which the portfolio company is an “affiliated person” are as follows:
| | | | | | | | | | | | | | | | | | | | |
| | | Balance
9-30-09 | | Gross
Additions | | Gross
Reductions | | | Balance
3-31-10 | | Realized
Gain/(Loss) | | | Investment
Income |
Hydrogen Corporation (Shares) | | | 1,265,700 | | | — | | | — | | | | 1,285700 | | | — | | | | — |
Hydrogen Corporation (Cost) | | $ | 5,225,373 | | $ | — | | $ | — | | | $ | 5,225,373 | | $ | — | | | $ | — |
| | | | | | |
IXYS Corporation (Shares) | | | 2,361,300 | | | — | | | (21,300 | ) | | | 2,340,300 | | | — | | | | — |
IXYS Corporation (Cost) | | $ | 20,328,503 | | $ | — | | $ | (146,971 | ) | | $ | 20,181,532 | | $ | 34,931 | | | $ | 242,704 |
| | | | | | |
Maxwell Technologies, Inc. (Shares) | | | 1,446,000 | | | 31,200 | | | — | | | | 1,477,200 | | | — | | | | — |
Maxwell Technologies, Inc. (Cost) | | $ | 15,721,564 | | $ | 508,560 | | $ | — | | | $ | 16,230,124 | | $ | — | | | $ | — |
| | | | | | |
Power-One, Inc. (Shares) | | | 5,626,300 | | | 91,000 | | | (595,100 | ) | | | 5,122,200 | | | — | | | | — |
Power-One, Inc. (Cost) | | $ | 26,663,702 | | $ | 395,850 | | $ | (4,694,814 | ) | | $ | 22,364,738 | | $ | (3,349,888 | ) | | $ | — |
| | | | | | |
Quixote Corporation (Shares) | | | 469,100 | | | — | | | (469,100 | ) | | | — | | | — | | | | — |
Quixote Corporation (Cost) | | $ | 9,097,228 | | $ | — | | $ | (9,097,228 | ) | | $ | — | | $ | (6,104,369 | ) | | $ | — |
| | | | | | |
Thermoenergy Corporation (Shares) | | | 3,582,432 | | | — | | | (880,593 | ) | | | 2,701,839 | | | . | | | | . |
Thermoenergy Corporation (Cost) | | $ | 2,774,021 | | $ | — | | $ | (830,886 | ) | | $ | 1,943,135 | | $ | (511,604 | ) | | $ | — |
| * | As a result of the Rydex I SGI Mid Cap Values Funds’ beneficial ownership of the common stock of these portfolio companies, applicable regulations require that the Fund states that it may be deemed an affiliate of the respective portfolio company. The Fund disclaims that the “affiliated persons” are affiliates of the Distributor, Advisor, Fund or any other client of the Advisor. |
9. Alpha Opportunity Fund
Alpha Opportunity Fund contracted with Lehman Brothers International Europe (“LBIE”) to provide prime brokerage services related to the Fund’s short selling. On September 15, 2008, LBIE was placed into administration and a third party administrator has been named (the “Administrator”). The Fund’s exposure to LBIE consists of short sale proceeds held by LBIE, and restricted long positions held at the Fund’s custodian, as collateral for said short sales. The Fund has delivered a Notice of Termination of Loans to LBIE and the Administrator. The Fund is working to resolve these issues with LBIE and the Administrator. As of March 31, 2010, included in the statement of net assets are the value of restricted long positions of $7,602,331, restricted cash representing the value of short sale proceeds of $4,139,648 and liabilities for short sales of $7,341,377 representing the value of securities sold short at the date of termination. Until such time as the liability for short sales is settled and all restrictions are removed, the Fund cannot sell such restricted long positions and/or utilize the restricted cash balances to achieve the Fund’s investment objectives and/or meet Fund redemption or other Fund obligations. As of the close of business on October 3, 2008, and until further notice, the Fund is not accepting subscriptions for shares from either new or existing shareholders.
116
Notes to Financial Statements
March 31, 2010 (unaudited)
10. Fair Value of Financial Instruments
In accordance with FASB ASC 820, Fair Value Measurements and Disclosure (ASC 820) (formerly known as FASB 157) , fair value is defined as the price that the Fund would receive to sell an investment or pay to transfer a liability in an orderly transaction with an independent buyer in the principal market, or in the absence of a principal market the most advantageous market for the investment or liability. ASC 820 establishes a three-tier hierarchy to distinguish between (1) inputs that reflect the assumptions market participants would use in pricing an asset or liability developed based on market data obtained from sources independent of the reporting entity (observable inputs) and (2) inputs that reflect the reporting entity’s own assumptions about the assumptions market participants would use in pricing an asset or liability developed based on the best information available in the circumstances (unobservable inputs) and to establish classification of fair value measurements for disclosure purposes. Various inputs are used in determining the value of the Funds’ investments. The inputs are summarized in the three broad levels listed below:
| | |
| Level 1 - | | quoted prices in active markets for identical securities. The types of assets and liabilities carried at Level 1 fair value generally are government and agency securities, equities listed in active markets, certain futures and certain options. |
| Level 2 - | | other significant observable inputs (including quoted prices for similar securities, interest rates, prepayment speeds, credit risk, etc.). The types of assets and liabilities carried at Level 2 fair value generally are municipal bonds, certain mortgage and asset-backed securities, certain corporate debt, commercial paper and repurchase agreements. |
| Level 3 - | | significant unobservable inputs (including the Fund’s own assumptions in determining the fair value of investments). The types of assets and liabilities carried at Level 3 fair value generally are certain mortgage and asset-backed securities, certain corporate debt and certain derivatives. |
Observable inputs are those based on market data obtained from sources independent of the Fund, and unobservable inputs reflect the Fund’s own assumptions based on the best information available.
The inputs or methodology used for valuing securities are not necessarily an indication of the risk association with investing in those securities.
117
Notes to Financial Statements
March 31, 2010 (unaudited)
The following table provides the fair value measurement of applicable Fund assets by level within the fair value hierarchy as of March 31, 2010. These assets are measured on a recurring basis.
| | | | | | | | | | | | |
| | | | | LEVEL 1 | | LEVEL 2 | | LEVEL 3 |
Description | | Total | | Quoted prices in
active markets for
identical assets | | Significant
other
observable
inputs | | Significant
unobservable
inputs |
Rydex 1 SGI Equity Fund: | | | | | | | | | | | | |
All Cap Value Fund | | | | | | | | | | | | |
Common Stocks | | $ | 2,524,219 | | $ | 2,524,219 | | $ | — | | $ | — |
| | | | |
Alpha Opportunity Fund | | | | | | | | | | | | |
ASSETS: | | | | | | | | | | | | |
Common Stocks | | | 12,513,481 | | | 12,513,481 | | | — | | | — |
U.S. Government Sponsored Agency Bonds & Notes | | | 2,299,813 | | | — | | | 2,299,813 | | | — |
Short Term Investments | | | 827,114 | | | _ | | | 827,114 | | | _ |
Repurchase Agreement | | | 1,910,272 | | | — | | | 1,910,272 | | | — |
Futures Contracts | | | 55,442 | | | 55,442 | | | — | | | — |
| | | | | | | | | | | | |
Total | | | 17,606,122 | | | 12,568,923 | | | 5,037,199 | | | — |
| | | | | | | | | | | | |
LIABILITIES: | | | | | | | | | | | | |
Common Stocks (sold short) | | | 4,163,889 | | | 474,649 | | | — | | | 3,689,240 |
Foreign Stocks (sold short) | | | 3,651,329 | | | — | | | — | | | 3,651,329 |
Foreign Rights (sold short) | | | 808 | | | — | | | — | | | 808 |
| | | | | | | | | | | | |
Total | | | 7,816,026 | | | 474,649 | | | — | | | 7,341,377 |
| | | | | | | | | | | | |
Large Cap Core Fund | | | | | | | | | | | | |
Common Stocks | | | 197,952,388 | | | 197,952,388 | | | — | | | — |
| | | | |
Global Fund | | | | | | | | | | | | |
Common Stocks | | | 46,782,597 | | | 46,782,597 | | | — | | | — |
Foreign Stocks | | | 49,353,305 | | | 49,353,305 | | | — | | | — |
Short Term Investments | | | 3,192 | | | 3,192 | | | — | | | — |
| | | | | | | | | | | | |
Total | | | 96,139,094 | | | 96,139,094 | | | — | | | — |
| | | | | | | | | | | | |
Global Institutional Fund | | | | | | | | | | | | |
Common Stocks | | | 2,059,847 | | | 2,059,847 | | | — | | | — |
Foreign Stocks | | | 2,171,930 | | | 2,171,930 | | | — | | | — |
Rights | | | 142 | | | 142 | | | — | | | — |
| | | | | | | | | | | | |
Total | | | 4,231,919 | | | 4,231,919 | | | — | | | — |
| | | | | | | | | | | | |
Mid Cap Value Fund | | | | | | | | | | | | |
ASSETS: | | | | | | | | | | | | |
Common Stocks | | | 1,106,590,548 | | | 1,106,590,548 | | | — | | | — |
Warrants | | | 1,571 | | | — | | | 1,571 | | | — |
Convertible Bonds | | | 6,137,000 | | | — | | | 6,137,000 | | | — |
Commercial Paper | | | 57,278,763 | | | — | | | 57,278,763 | | | — |
| | | | | | | | | | | | |
Total | | | 1,170,007,882 | | | 1,106,590,548 | | | 63,417,334 | | | — |
| | | | | | | | | | | | |
(continued)
118
Notes to Financial Statements
March 31, 2010 (unaudited)
| | | | | | | | | | | | |
| (continued) | | | | LEVEL 1 | | LEVEL 2 | | LEVEL 3 |
Description | | Total | | Quoted prices in
active markets for
identical assets | | Significant
other
observable
inputs | | Significant
unobservable
inputs |
LIABILITIES: | | | | | | | | | | | | |
Options (net of premiums received) | | $ | 284,503 | | $ | 284,503 | | $ | — | | $ | — |
| | | | |
Mid Cap Value Institutional Fund | | | | | | | | | | | | |
ASSETS: | | | | | | | | | | | | |
Common Stocks | | | 379,286,000 | | | 379,286,000 | | | — | | | — |
Repurchase Agreement | | | 22,999,517 | | | — | | | 22,999,517 | | | — |
| | | | | | | | | | | | |
Total | | | 402,285,517 | | | 379,286,000 | | | 22,999,517 | | | — |
| | | | | | | | | | | | |
LIABILITIES: | | | | | | | | | | | | |
Options (net of premiums received) | | | 91,602 | | | 98,602 | | | — | | | — |
| | | | |
Large Cap Concentrated Growth Fund | | | | | | | | | | | | |
Common Stocks | | | 42,009,802 | | | 42,009,802 | | | — | | | — |
| | | | |
Small Cap Growth Fund | | | | | | | | | | | | |
Common Stocks | | | 15,846,480 | | | 15,846,480 | | | — | | | — |
| | | | |
Small Cap Value Fund | | | | | | | | | | | | |
ASSETS: | | | | | | | | | | | | |
Common Stocks | | | 7,556,667 | | | 7,556,667 | | | — | | | — |
| | | | |
LIABILITIES: | | | | | | | | | | | | |
Options (net of premiums received) | | | 2,022 | | | 2,022 | | | — | | | — |
| | | | |
Rydex 1 SGI Large Cap Value Fund: | | | | | | | | | | | | |
Large Cap Value Fund | | | | | | | | | | | | |
Common Stocks | | | 52,862,481 | | | 52,862,481 | | | — | | | — |
| | | | |
Large Cap Value Institutional Fund | | | | | | | | | | | | |
Common Stocks | | | 2,879,669 | | | 2,879,669 | | | — | | | — |
| | | | |
Rydex 1 SGI Mid Cap Growth Fund | | | | | | | | | | | | |
Common Stocks | | | 82,382,525 | | | 82,382,525 | | | — | | | — |
Warrants | | | 482 | | | — | | | 482 | | | — |
| | | | | | | | | | | | |
Total | | | 82,383,007 | | | 82,382,525 | | | 482 | | | — |
| | | | | | | | | | | | |
119
Notes to Financial Statements
March 31, 2010 (unaudited)
Following is a reconciliation of Level 3 assets for which significant unobservable inputs were used to determine fair value for the six months ended March 31, 2010:
| | | | | | | | | |
| | | LEVEL 3 - Fair value measurement using significant
unobservable inputs |
| | | Securities | | Derivatives | | Total |
Alpha Opportunity Fund | | | | | | | | | |
LIABILITIES: | | | | | | | | | |
Beginning Balance | | $ | 7,341,377 | | $ | — | | $ | 7,341,377 |
| | | |
Total realized gains or losses included in earnings | | | | | | | | | |
| | | |
Total unrealized gains or losses included in earnings | | | — | | | — | | | — |
| | | |
Purchases, sales, issuances, and settlements (net) | | | — | | | — | | | — |
| | | |
Transfers in and/or out of Level 3 Ending Balance | | | — | | | — | | | — |
| | | | | | | | | |
| | $ | 7,341,377 | | $ | — | | $ | 7,341,377 |
| | | | | | | | | |
11. Other Liabilities
Rydex I SGI Equity Fund-Mid Cap Value Fund, Rydex I SGI Equity Fund-Mid Cap Value Institutional Fund and Rydex I SGI Equity Fund-Large Cap Core Fund each wrote put option contracts through Lehman Brothers Inc., (“Lehman”) that were exercised prior to the option contracts’ expiration and prior to the bankruptcy filing by Lehman, during September, 2008. However, these transactions have not settled and the securities have not been delivered to the Funds as of March 31, 2010.
Although the ultimate resolution of these transactions is uncertain, the Funds have recorded a liability on their respective books equal to the difference between the strike price on the put options and the market price of the underlying security on the exercise date. The amount of the liability recorded by the Funds as of March 31, 2010 was $473,594 for Rydex I SGI Equity Fund-Mid Cap Value Fund, $15,940 for Rydex I SGI Equity Fund-Mid Cap Value Institutional Fund, and $18,615 for Rydex I SGI Equity Fund-Large Cap Core Fund.
12. New Accounting Pronouncements
In January 2010, the Financial Accounting Standards Board issued an Accounting Standards Update, Improving Disclosures about Fair Value Measurements, which introduces new disclosure requirements and clarifies certain existing disclosure requirements around fair value measurements currently presented in Note 10. The new disclosures and clarifications of existing disclosures are generally effective for the Funds’ year ending September 30, 2010 and interim periods therein. Management is evaluating the impact of this update on its current disclosures.
13. Subsequent Events
Management has evaluated events or transactions that may have occurred since March 31, 2010, that would merit recognition of disclosure in the financial statements.
120
Directors’ Disclosure
(unaudited)
Director Approval of Investment Advisory Agreement
At an in-person meeting of the Fund’s Boards of Directors held on November 9-10, 2009, called for the purpose of, among other things, voting on the renewal of the investment advisory and sub-advisory agreements applicable to the Funds, the Fund’s Board of Directors, including the Independent Directors, unanimously approved the continuation for a one year period of the investment advisory agreement between the Funds and Security Investors, LLC (“SI”). In reaching this conclusion, the Directors requested and obtained from SI and each investment sub-adviser such information as the Directors deemed reasonably necessary to evaluate the proposed renewal of the agreements. Each Fund’s Board of Directors carefully evaluated this information and was advised by legal counsel with respect to its deliberations.
In considering the proposed continuation of the investment advisory agreements, the Independent Directors evaluated a number of considerations, including, among others, (1) the nature, extent, and quality of the advisory services to be provided by SI; (2) the investment performance of the Funds and SI; (3) the costs of services provided by SI and the profits derived by SI from its relationship with the Funds; (4) a comparison of each Funds’ expense ratios and those of similarly situated funds; (5) benefits (such as soft dollars) to SI and its affiliates from their relationship with the Funds (and any corresponding benefits to the Funds); (6) the expense limitation/fee waiver agreements between SI and certain of the Funds; and (7) other factors of the Board deemed to be relevant. Each Board of Directors also took into account other considerations that it believed, in light of the legal advice furnished to the Independent Directors by their independent legal counsel and the Directors’ own business judgment, to be relevant. Following its review, each Fund’s Board of Directors determined that the investment advisory agreement will enable Fund shareholders to obtain high quality services at a cost that is appropriate, reasonable and in the best interests of shareholders. Accordingly, the Directors, including the Independent Directors, unanimously approved the renewal of the investment advisory agreements based upon the following considerations, among others:
| | • | | The nature, extent and quality of the advisory services to be provided. Each Board of Directors concluded that SI is capable of providing high quality services to the Funds, as indicated by the nature and quality of services provided in the past, SI’s management capabilities demonstrated with respect to the Funds and other mutual funds managed by SI, the professional qualifications and experience of SI’s and SI’s investment and management oversight processes. The Directors also determined that SI proposed to provide investment and related services |
| | | that were of the same quality and quantity as services provided to the Funds in the past, and that these services are appropriate in scope and extent in light of the Fund’s operations, the competitive landscape of the investment company business and investor needs. |
| | • | | The investment performance of the Fund. With respect to the Funds, the Directors concluded on the basis of information compiled by Morningstar that SI and the investment sub-advisers had achieved investment performance that was acceptable, and competitive or superior relative to comparable funds over trailing periods. |
| | • | | The cost of advisory services provided and the level of profitability. On the basis of each Board’s review of the fees to be charged by SI for investment advisory and other services, and the estimated profitability of SI’s relationship with each Fund, each Board concluded that the level of investment advisory fees and SI’s profitability are appropriate in light of the management fees and overall expense ratios of comparable investment companies and the anticipated profitability of the relationship between each Fund and SI and its affiliates. On the basis of comparative information compiled by Morningstar, the Directors determined that the advisory fees and estimated overall expense ratio of each Fund are consistent with, and often below, industry medians, particularly with respect to mutual funds of comparable size. |
| | • | | Whether the advisory fees reflect economies of scale. The directors concluded that the Funds’ investment advisory fees appropriately reflect the current economic environment for SI and the competitive nature of the mutual fund market. |
| | • | | The extent to which economies of scale will be realized as the Fund grows. While the Funds’ investment advisory fees do not reduce should Fund assets grow meaningfully, the Directors determined that the investment advisory fees payable by the Funds already reflect potential future economies of scale to some extent by virtue of their competitive levels (determined with reference to industry standards as reported by Lipper and SI’s estimated profitability at current or foreseeable asset levels. The Directors also considered that they will have the opportunity to periodically re-examine whether each Fund has achieved economies of scale, and the appropriateness of investment advisory fees payable to SI in the future. |
121
Directors’ Disclosure
(unaudited)
| | • | | Benefits (such as soft dollars) to SI from its relationship with the Funds (and any corresponding benefits to the Funds). The Directors concluded that other benefits described by SI and the investment sub-advisers from their relationships with the Funds, including “soft dollar” benefits in connection with the Funds’ brokerage transactions, are reasonable and fair, and consistent with industry practice and the best interests of the Funds and their shareholders. In addition, the Directors determined that the administration, transfer agency and fund accounting fees paid by the Funds to SI are reasonable, fair and in the best interests of Funds’ shareholders in light of the nature and quality of the services provided, the associated costs, and the necessity of the services for the Funds’ operations. |
| | • | | Other considerations: In approving the investment advisory and sub-advisory agreements the Directors determined that SI has made a substantial commitment to the recruitment and retention of high quality personnel, and maintains the financial, compliance and operational resources reasonably necessary to manage the Funds in a professional manner that is consistent with the best interests of the Funds and their shareholders. In this regard, the Directors favorably considered the compliance track record of the Funds and SI. The Directors also concluded that SI has made a significant entrepreneurial commitment to the management and success of the Funds, which entails a substantial financial and professional commitment, including investment advisory fee waivers and expense limitation arrangements with respect to the Funds to the benefit of Funds’ shareholders. |
122
Directors (unaudited)
The business address of each director is One Security Benefit Place, Topeka, KS 66636-0001
| | |
Name (Date of Birth) Year Elected*** | | Principal Occupation(s) During Past 5 Years |
Donald A. Chubb, Jr. ** (12-14-46) 1994 | | Business Broker- Griffith & Blair Realtors |
| |
Harry W. Craig, Jr. ** (05-11-39) 2004 | | Chairman, CEO, Secretary & Director - The Martin Tractor Company, Inc. |
| |
Jerry B. Farley ** (09-20-46) 2005 | | President - Washburn University |
| |
Penny A. Lumpkin ** (08-20-39) 1993 | | Partner - Vivian’s Gift Shop (Corporate Retail) Vice President - Palmer Companies, lnc.(Small Business and Shopping Center Development) Vice President - PLB (Real Estate Equipment Leasing) |
| |
Maynard F. Oliverius ** (12-18-43) 1998 | | President & Chief Executive Officer - Stormont-Vail Healthcare |
| |
Richard M. Goldman * (03-04-61) 2008 (President, Director & Chairman of the Board) | | Senior Vice President - Security Benefit Corporation Director, First Security Benefit Life Insurance and Annuity Company of New York President, Security Investors, LLC President & Director, Security Global Investors, LLC CEO, President, & Director, Rydex Distributors, Inc. President & CEO, Rydex Holdings, LLC CEO & Director, Padco Advisors, Inc. CEO & Director, Padco Advisors II, Inc. Director, Rydex Fund Services, Inc. Director, Security Distributors, Inc. (2007- 2009) Managing Member, RM Goldman Partners, LLC (2006-2007) President and CEO, ForstmannLeff (2003-2005) |
| * | This director is deemed to be an “interested person” of the Funds under the Investment Company Act of 1940, as amended, by reason of his position with the Funds’ Investment Manager and/or the parent of the Investment Manager. This director is also an officer of the funds. |
| ** | These directors serve on the Fund’s joint audit committee, the purpose of which is to meet with the independent registered public accounting firm, to review the work of the independent registered public accounting firm, and to oversee the handling by Security Investors of the accounting and financial reporting functions for the Funds. |
| *** | Each director oversees 30 Security Funds portfolios and serves until the next annual meeting, or until a successor has been duly elected and qualified. |
123
Officers (unaudited)
The business address of each officer is One Security Benefit Place, Topeka, KS 66636-0001
| | |
Name (Date of Birth) Title - Year Elected | | Principal Occupation(s) During Past 5 Years |
Mark P. Bronzo (11-01-60) Vice President—2008 | | Portfolio Manager, Security Investors, LLC Managing Director & Chief Compliance Officer, Nationwide Separate Accounts LLC (2003 - 2008) |
| |
Brenda M. Harwood (11-03-63) Chief Compliance Officer - 2004 Treasurer - 1988 | | Vice President and Chief Compliance Officer, Security Investors, LLC Chief Compliance Officer, Security Global Investors, LLC Assistant Vice President, Security Benefit Life Insurance Company (2004-2009) Vice President & Assistant Treasurer (2006-2009) & Director, Security Distributors, Inc.
(2004-2009) |
| |
Amy J. Lee (06-05-61) Secretary - 1987 Vice President - 2007 | | Secretary - Security Investors, LLC Secretary & Chief Compliance Officer - Security Distributors, Inc. Vice President, Associate General Counsel & Assistant Secretary - Security Benefit Life Insurance Company & Security Benefit Corporation Secretary, Security Global Investors, LLC Associate General Counsel, First Security Benefit Life Insurance and Annuity of New York Secretary, Security Financial Resources, Inc. Vice President & Assistant Secretary, Rydex Series Funds, Rydex ETF Trust, Rydex Dynamic Funds, and Rydex Variable Trust Secretary, Rydex Holdings, LLC Vice President and Secretary, Rydex Advisory Services, LLC President and Secretary, Advisor Research Center, Inc. Director, Brecek & Young Advisors, Inc. (2004-2008) |
| |
Mark Mitchell (08-24-64) Vice President - 2003 | | Vice President & Portfolio Manager - Security Investors, LLC Vice President & Portfolio Manager - Security Benefit Life Insurance Company |
| |
Joseph C. O’Connor (07-15-60) Vice President - 2008 | | Portfolio Manager, Security Investors, LLC Managing Director, Nationwide Separate Accounts LLC (2003 - 2008) |
| |
Christopher Phalen (11-9-70) Vice President - 2002 | | Vice President, Security Investors, LLC Vice President, Security Benefit Corporation Vice President, Security Benefit Life Insurance Company Vice President, Security Global Investors, LLC Chief Investment Officer-Fixed Income, First Security Benefit Life Insurance and Annuity Company of New York Vice President, PADCO Advisors II, Inc. Vice President, Rydex Advisory Services, LLC Vice President, Rydex Specialized Products, LLC Vice President, Rydex Fund Services, Inc. |
| |
Daniel W. Portanova (10-02-60) Vice President - 2008 | | Portfolio Manager, Security Investors, LLC Managing Director, Nationwide Separate Accounts LLC (2003 - 2008) |
| |
James P. Schier (12-28-57) Vice President - 1998 | | Senior Portfolio Manager - Security Investors, LLC; Vice President & Senior Portfolio Manager - Security Benefit Life Insurance Company |
| |
Christopher D. Swickard (10-09-65) Assistant Secretary - 1996 | | Assistant Secretary - Security Investors, LLC and Security Distributors, Inc. Second Vice President & Assistant General Counsel - Security Benefit Corporation and Security Benefit Life Insurance Company Assistant General Counsel, First Security Benefit Life Insurance and Annuity Company of New York |
| |
David G. Toussaint (10-10-66) Vice President - 2001 | | Vice President & Portfolio Manager - Security Investors, LLC Assistant Vice President & Portfolio Manager - Security Benefit Life Insurance Company (2005 - 2009) |
| * | Officers serve until the next annual meeting or until a successor has been duly elected and qualified. |
124
This page left blank intentionally.
125
Rydex | SGI Privacy Policies
Rydex Funds, Rydex I SGI Funds, Rydex Investments, Rydex Distributors, Inc., Security Investors, LLC, Security Global Investors, LLC, Security Distributors, Inc. and Rydex Advisory Services (Collectively “Rydex”)
Our Commitment to You
When you become a Rydex I SGI investor, you entrust us with not only your hard-earned money but also with personal and financial information about you. We recognize that your relationship with us is based on trust and that you expect us to act responsibly and in your best interests. Because we have access to this private information about you, we hold ourselves to the highest standards in its safekeeping and use. This means, most importantly, that we do not sell client information to anyone—whether it is your personal information or if you are a current or former Rydex I SGI client.
The Information We Collect About You
In the course of doing business with shareholders and investors, we collect nonpublic personal information about you. You typically provide personal information when you complete a Rydex I SGI account application or when you request a transaction that involves Rydex and Rydex I SGI funds or one of the Rydex I SGI affiliated companies. “Nonpublic personal information” is personally identifiable private information about you. For example, it includes information regarding your name and address, Social Security or taxpayer identification number, assets, income, account balance, bank account information and investment activity (e.g., purchase and redemption history).
How We Handle Your Personal Information
As emphasized above, we do not sell information about current or former clients or their accounts to third parties. Nor do we share such information, except when necessary to complete transactions at your request or to make you aware of related investment products and services that we offer. Additional details about how we handle your personal information are provided below. To complete certain transactions or account changes that you direct, it may be necessary to provide identifying information to companies, individuals or groups that are not affiliated with Rydex I SGI. For example, if you ask to transfer assets from another financial institution to Rydex I SGI, we will need to provide certain information about you to that company to complete the transaction. To alert you to other Rydex I SGI investment products and services, we may share your information within the Rydex I SGI family of affiliated companies. This would include, for example, sharing your information within Rydex I SGI so we can make you aware of new Rydex and Rydex I SGI funds or the services offered through another Rydex I SGI affiliated company. In certain instances, we may contract with nonaffiliated companies to perform services for us. Where necessary, we will disclose information we have about you to these third parties. In all such cases, we provide the third party with only the information necessary to carry out its assigned responsibilities and only for that purpose. And we require these third parties to treat your private information with the same high degree of confidentiality that we do. In certain instances, we may share information with other financial institutions regarding individuals and entities in response to the U.S.A. Patriot Act. Finally, we will release information about you if you direct us to do so, if we are compelled by law to do so or in other circumstances permitted by law.
Opt Out Provisions
We do not sell your personal information to anyone. The law allows you to “opt out” of only certain kinds of information sharing with third parties. The firm does not share personal information about you with any third parties that triggers this opt-out right. This means YOU ARE ALREADY OPTED OUT.
How We Protect Privacy Online
Our concern for the privacy of our shareholders also extends to those who use our web site, www.rydex-sgi.com. Our web site uses some of the most secure forms of online communication available, including encryption technology, Secure Socket Layer (SSL) protocol, firewalls and user names and passwords. These technologies provide a high level of security and privacy when you access your account information or initiate online transactions. The Rydex I SGI web site offers customized features that require our use of “http cookies”—tiny pieces of information that we ask your browser to store. However, we make very limited use of these cookies. We only use cookies for session management and security features on the Rydex I SGI web site. We do not use them to pull data from your hard drive, to learn your email address, or to view data in cookies created by other web sites. We will not share the information in our cookies or give others access to it. See the legal information area on our web site for more details about web site security and privacy features.
126
Rydex I SGI Privacy Policies (continued)
How We Safeguard Your Personal Information
We restrict access to nonpublic personal information about shareholders to our employees and in some cases to third parties (for example, the service providers described above) as permitted by law. We maintain strict physical, electronic and procedural safeguards that comply with federal standards to guard your nonpublic personal information.
We’ll Keep You Informed
As required by federal law, we will notify shareholders of our privacy policy annually. We reserve the right to modify this policy at any time, but rest assured that if we do change it, we will tell you promptly. You will also be able to access our privacy policy from our web site at www.rydex-sgi.com. Should you have any questions regarding our privacy policy, contact us at 800.820.0888 or 301.296.5100.
127
Other Information
Pending Acquisition Transaction
On February 16, 2010, Security Benefit Corporation (“SBC”), the parent company of PADCO Advisors, Inc., PADCO Advisors II, Inc. and Security Investors, LLC, the Funds’ investment advisers, as applicable (the “Investment Advisers”), and certain of SBC’s affiliates entered into agreements with an investor group (the “Investors”) led by Guggenheim Partners, LLC (“Guggenheim”). Under the agreements, a special purpose vehicle owned by the Investors and managed by an affiliate of Guggenheim would receive a 100% ownership stake in SBC and consequently acquire control of the Investment Advisers and affiliates (the “Purchase Transaction”). Guggenheim is a global, independent, privately held, diversified financial services firm with more than $100 billion in assets under supervision. The Purchase Transaction should not result in material changes to the day-to-day management and operations of the Funds or any increase in fees. While the parties expect the Purchase Transaction’s closing to take place on or about May 31, 2010, it is subject to various conditions, and may be delayed or even terminated due to unforeseen circumstances.
Each of the Security Funds files a complete schedule of portfolio holdings with the U.S. Securities and Exchange Commission for the first and third quarters of each fiscal year on Form N-Q. The Forms N-Q of each such Fund are available on the Commission’s website at www.sec.gov. The Forms N-Q may be reviewed and copied at the Commission’s Public Reference Room in Washington, DC. Information on the operation of the Public Reference Room may be obtained by calling 1-800-SEC-0330. The portfolio holdings of each of the Security Funds are available on their website, www.securitvbenefit.com or by calling 1-800-888-2461.
A description of the policies and procedures that the Security Funds use to determine how to vote proxies relating to portfolio securities is available upon request, free of charge by calling 1-800-888-2461, or accessing the U.S. Securities and Exchange Commission website at www.sec.gov. Information regarding how the Security Funds voted proxies relating to portfolio securities during the 12 month period ended June 30, 2008 is available upon request, free of charge by calling 1-800-888-2461, or accessing the U.S. Securities and Exchange Commission website at www.sec.gov.
The statement of additional information (“SAI”) includes additional information about the Funds’ Directors and is available upon request without charge by calling 1-800-888-2461.
This page left blank intentionally.
129
| | |

One Security Benefit Place — Topeka, Kansas 66636-0001 — securitybenefit.com Rydex Distributors, Inc. | | PRSRT STD U.S. POSTAGE PAID LANCASTER, PA PERMIT NO. 732 |
| | |
| SDI 604 | | 46-06043-00 2010/03/31 |
Not required at this time.
| Item 3. | Audit Committee Financial Expert. |
Not required at this time.
| Item 4. | Principal Accountant Fees and Services. |
Not required at this time.
| Item 5. | Audit Committee of Listed Registrants. |
Not applicable.
| Item 6. | Schedule of Investments. |
The Schedule of Investments is included under Item 1 of this form.
| Item 7. | Disclosure of Proxy Voting Policies and Procedures for Closed-End Management Investment Companies. |
Not applicable.
| Item 8. | Portfolio Managers of Closed-end Management Investment Companies |
Not applicable
| Item 9. | Purchases of Equity Securities by Closed-End Management Investment Company and Affiliated Purchasers. |
Not applicable.
| Item 10. | Submission of Matters to a Vote of Security Holders. |
The registrant does not currently have in place procedures by which shareholders may recommend nominees to the registrant’s board.
There have been no changes to the procedures by which shareholders may recommend nominees to the registrant’s board.
| Item 11. | Controls and Procedures. |
| | (a) | The registrant’s President and Treasurer have concluded that the registrant’s disclosure controls and procedures (as defined in rule 30a-3(c) under the |
| | Investment Company Act of 1940) are effective based on their evaluation of these disclosure controls and procedures within 90 days of the filing date of this report on Form N-CSR. |
| | | There was no fraud, whether or not material, involving officers or employees of the Registrant who have a significant role in the Registrant’s internal controls, including disclosure controls and procedures (as defined in Rule 30a-3(c) under the Investment Company Act of 1940) that has come to the attention of the Registrant, including its President and Treasurer. |
| | (b) | There were no significant changes in the registrant’s internal controls, or in other factors that could significantly affect these controls subsequent to the date of their evaluation, including any corrective actions with regard to significant deficiencies and material weaknesses. |
| | (a) (2) | Separate certifications by the President (principal executive officer) and Treasurer (principal financial officer) of the registrant as required by Rule 30a-2(a) under the Act (17 CFR 270.30a-2(a)) are attached. |
| | (b) | A certification by the registrant’s President (principal executive officer) and Treasurer (principal financial officer) as required by Rule 30a-2(b) under the Act (17 CFR 270.30a-2(b)) is attached. |
SIGNATURES
Pursuant to the requirements of the Securities Exchange Act of 1934 and the Investment Company Act of 1940, the registrant has duly caused this report to be signed on its behalf by the undersigned, thereunto duly authorized.
| | |
|
| (Registrant) SECURITY EQUITY FUND |
| |
| By (Signature and Title)* | | /s/ RICHARD M. GOLDMAN |
| | Richard M. Goldman, President |
| |
| Date June 9, 2010 | | |
Pursuant to the requirements of the Securities Exchange Act of 1934 and the Investment Company Act of 1940, this report has been signed below by the following persons on behalf of the registrant and in the capacities and on the dates indicated.
| | |
| By (Signature and Title)* | | /s/ RICHARD M. GOLDMAN |
| | Richard M. Goldman, President |
| |
| Date June 9, 2010 | | |
| |
| By (Signature and Title)* | | /s/ BRENDA M. HARWOOD |
| | Brenda M. Harwood, Treasurer |
| |
| Date June 9, 2010 | | |
| * | Print the name and title of each signing officer under his or her signature. |