UNITED STATES
SECURITIES AND EXCHANGE COMMISSION
Washington, D.C. 20549
FORM N-CSR
CERTIFIED SHAREHOLDER REPORT OF REGISTERED
MANAGEMENT INVESTMENT COMPANIES
Investment Company Act file number 811-01136
SECURITY EQUITY FUND
(Exact name of registrant as specified in charter)
ONE SECURITY BENEFIT PLACE, TOPEKA, KANSAS 66636-0001
(Address of principal executive offices) (Zip code)
RICHARD M. GOLDMAN, PRESIDENT
SECURITY EQUITY FUND
ONE SECURITY BENEFIT PLACE
TOPEKA, KANSAS 66636-0001
(Name and address of agent for service)
Registrant’s telephone number, including area code: (785) 438-3000
Date of fiscal year end: September 30
Date of reporting period: March 31, 2009
Form N-CSR is to be used by management investment companies to file reports with the Commission not later than 10 days after the transmission to stockholders of any report that is required to be transmitted to stockholders under Rule 30e-1 under the Investment Company Act of 1940 (17 CFR 270.30e-1). The Commission may use the information provided on Form N-CSR in its regulatory, disclosure review, inspection, and policymaking roles.
A registrant is required to disclose the information specified by Form N-CSR, and the Commission will make this information public. A registrant is not required to respond to the collection of information contained in Form N-CSR unless the Form displays a currently valid Office of Management and Budget (“OMB”) control number. Please direct comments concerning the accuracy of the information collection burden estimate and any suggestions for reducing the burden to Secretary, Securities and Exchange Commission, 450 Fifth Street, NW, Washington, DC 20549-0609. The OMB has reviewed this collection of information under the clearance requirements of 44 U.S.C. §3507.
| Item 1. | Reports to Stockholders. |
Security Equity Fund
Security Large Cap Value Fund
Security Mid Cap Growth Fund
March 31, 2009
Semi-Annual Report
(unaudited)
Table of Contents
Chairman’s Letter
May 16, 2009
| | |

| | To Our Shareholders: I am pleased to announce our new brand name, Rydex | SGI Funds, which reflects the array of quantitative alternative mutual funds offered through Rydex Investments and the traditional investment offerings which you have known as the Security Funds. With the integration of Rydex Investments and the Security Funds, we look forward to providing you with an expanded choice of funds managed by investment professionals committed to your best interests and future. |
The six-month period ended March 31, 2009 began with one of the most precipitous and unnerving market drops in the past 20 years. Only during the final month of the period did the markets and economy begin to show signs of stability, preventing further collapse.
The end of the six-month period marked the one-year anniversary of the Federal Reserve Bank’s supported buyout of Bear Stearns by JPMorgan, the first major event in the current crisis. Historically, the average financial crisis has resulted in a 55% decline in stock prices, almost exactly the peak to trough drop for the S&P 500 during this crisis, only with more intensity. To add perspective, the 50% decline in stock prices in the wake of the dotcom bubble occurred over a three-year period. The wealth destruction in the recent market environment took a mere 11 months.
While uncertainty lessened in the first quarter, there were still many unknowns regarding the effects of the enormous budget proposal by the Obama administration and Treasury Secretary Geithner’s plan for troubled banks and toxic assets. Since the market lows of early March, the Federal Reserve and the Treasury Department unveiled and articulated plans to inject massive liquidity into the financial markets and remove toxic assets from bank balance sheets. However, investors continue to worry about these actions on individual businesses and consumers.
The outlook for economic growth throughout 2009 remains dismal and may continue into 2010 as unemployment continues to rise, but there is hope that the worst of the economic and market turmoil is behind us. Toward the end of the period, the rate of deceleration in the U.S. economy began to slow and there were indications of stabilization returning to the
housing market and interest rates, which remained at historic lows. While the housing market, and mortgage foreclosures, remains a key to the economy, a deceleration in the rate of decline does not foretell a recovery, but may indicate the beginning-of-the-end to the recession.
In March, markets bounced off lows due to a viewpoint that securities may have been oversold. Consumers continued to pay down debt and save at levels not seen in 15 years. As with all major downturns, it appears that a deep analysis of necessary business rationalization is in the early stages, fundamentally changing how organizations will operate, which should eventually support economic recovery.
It is in times as these when our core philosophy and the disciplined process of our investment strategies become paramount. Our managers continue to use a rigorous fundamental process to identify strong companies, focus on risk management, and remain opportunistic in our approach.
The economic and market conditions of the past six months reinforces how vital it is for investors to develop a strategy to meet their individual circumstances and to maintain a diversified portfolio. One of the key objectives of the Security Funds is to provide professional risk-managed investment portfolios that give shareholders the benefits of diversification and performance returns to help meet their goals over the long-term.
Thank you for your continued investments in the Rydex | SGI Funds.
Sincerely,
Richard M. Goldman
President and Chairman, Rydex | SGI Funds
The funds are distributed by Security Distributors, Inc. (SDI) and/or Rydex Distributors, Inc. (RDI). Security Global InvestorsSM is the investment advisory arm of Security Benefit Corporation (Security Benefit). Security Global Investors consists of Security Global Investors, LLC, Security Investors, LLC and Rydex Investments. Rydex Investments is the primary business name for PADCO Advisors, Inc. and PADCO Advisors II, Inc. SGI, SDI, Rydex Investments and RDI are affiliates and are all subsidiaries of Security Benefit.
This page left blank intentionally.
| | |
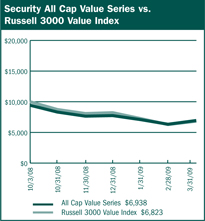
Performance Summary March 31, 2009 | | Security Equity Fund All Cap Value Series (unaudited) |
| |
| |
$10,000 Since Inception
This chart assumes a $10,000 investment in Class A shares of All Cap Value Series on October 3, 2008 (date of inception), reflects deduction of the 5.75% sales load and assumes all dividends reinvested. The chart does not reflect the deduction of taxes that a shareholder would pay on distributions or the redemption of fund shares. The Russell 3000 Value Index is an unmanaged index that measures the performance of the broad value segment of the U.S. equity universe. It includes those Russell 3000 companies with lower price-to-book ratios and lower forecasted growth values.
| | |
| Average Annual Returns |
Period Ended 3-31-09 | | Since
Inception
(10-03-08) |
A Shares | | (26.60%) |
A Shares with sales charge | | (30.82%) |
C Shares | | (26.80%) |
C Shares with CDSC | | (27.53%) |
Institutional Class | | (26.50%) |
| | |
Period Ended 3-31-09 | | Since
Inception
(10-03-08) |
The performance data above represents past performance that is not predictive of future results. The investment return and principal value of an investment in the Series will fluctuate so that an investor’s shares, when redeemed, may be worth more or less than their original cost. The figures above do not reflect deduction of the maximum front-end sales charge of 5.75% for Class A shares or the contingent deferred sales charge of 1% for Class C shares, as applicable, except where noted. The figures do not reflect the deduction of taxes that a shareholder would pay on distributions or redemption of shares. Such figures would be lower if the maximum sales charge and any applicable taxes were deducted. Fee waivers and/or reimbursements reduced expenses of the Series and in the absence of such waiver, the performance quoted would be reduced. |
| | | | | | | | |
| | | Portfolio Composition by Sector as of 3-31-09 | | |
| | | Consumer Discretionary | | 10.00% | | | | |
| | | Consumer Staples | | 8.92 | | | | |
| | | Energy | | 11.69 | | | | |
| | | Financials | | 9.96 | | | | |
| | | Health Care | | 8.30 | | | | |
| | | Industrials | | 18.49 | | | | |
| | | Information Technology | | 9.60 | | | | |
| | | Materials | | 4.64 | | | | |
| | | Telecommunication Services | | 0.93 | | | | |
| | | Utilities | | 6.03 | | | | |
| | | Exchange Traded Funds | | 2.85 | | | | |
| | | Cash & Other Assets, Less Liabilities | | 8.59 | | | | |
| | | Total Net Assets | | 100.00% | | | | |
| | | | | | | | | |
| | | | | | | | | |
| | | | |
| | | 4 | | The accompanying notes are an integral part of the financial statements |
| | |
Performance Summary March 31, 2009 | | Security Equity Fund All Cap Value Series (unaudited) |
| |
| |
Information About Your Series Expenses
Calculating your ongoing Series expenses
Example
As a shareholder of the Series, you incur two types of costs: (1) transaction costs, which may include sales charges (loads) on purchase payments; contingent deferred sales charges on redemptions; and redemption fees, if any; and (2) ongoing costs, including management fees; distribution and/or service fees (12b-1); and other Series expenses. This example is intended to help you understand your ongoing costs (in dollars) of investing in the Series and to compare these costs with ongoing costs of investing in other mutual funds. The example is based on an investment of $1,000 invested at the beginning of the period and held for the entire period October 3, 2008 (commencement of operations) through March 31, 2009.
Actual Expenses
The first line for each class of shares in the table provides information about actual account values and actual expenses. You may use the information in this table, together with the amount you invested, to estimate the expenses that you paid over the period. Simply divide your account value by $1,000 (for example, an $8,600 account value divided by $1,000 = 8.6), then multiply the result by the number in the table under the heading entitled “Expenses Paid During the Period” to estimate the expenses you paid on your account during this period.
Hypothetical Example for Comparison Purposes
The second line for each class of shares in the table provides information about hypothetical account values and hypothetical expenses based on the Series actual expense ratio and an assumed rate of return of 5% per year before expenses, which is not the Series actual return. The hypothetical account values and expenses may not be used to estimate the actual ending account balance or expenses you paid for the period. You may use this information to compare the ongoing costs of investing in the Series and other funds. To do so, compare this 5% hypothetical example with the 5% hypothetical examples that appear in the shareholder reports of the other mutual funds.
Please note that the expenses shown in the table are meant to highlight your ongoing costs only and do not reflect any transactional costs, such as sales charges (loads) on purchase payments, contingent deferred sales charges on redemptions, and redemption fees, if any. Therefore, the second line for each class of shares is useful in comparing ongoing costs only, and will not help you determine the relative total costs of owning different funds. In addition, if these transactional costs were included, your costs would have been higher.
| | | | | | |
| Series Expenses |
| | | Beginning
Account
Value
10/3/2008* | | Ending
Account
Value
3/31/2009 1 | | Expenses
Paid
During
Period 2 |
All Cap Value | | | | | | |
Series - Class A | | | | | | |
Actual | | $1,000.00 | | $734.00 | | $5.77 |
Hypothetical | | 1,000.00 | | 1,018.00 | | 6.72 |
All Cap Value | | | | | | |
Series - Class C | | | | | | |
Actual | | 1,000.00 | | 732.00 | | 8.97 |
Hypothetical | �� | 1,000.00 | | 1,014.62 | | 10.43 |
All Cap Value | | | | | | |
Series- Institutional Class | | | | | | |
Actual | | 1,000.00 | | 735.00 | | 4.71 |
Hypothetical | | 1,000.00 | | 1,019.66 | | 5.48 |
* Commencement of operations
1 The actual ending account value is based on the actual total return of the Series for the period October 3, 2008 (commencement of operations) to March 31, 2009 after actual expenses and will differ from the hypothetical ending account value which is based on the Series expense ratio and a hypothetical annual return of 5% before expenses. The actual cumulative return at net asset value for the period October 3, 2008 to March 31, 2009 was (26.60%), (26.80%) and (26.50%) for Class A, C and Institutional shares, respectively.
2 Expenses are equal to the Series annualized expense ratio (1.42%, 2.17% and 1.17% for Class A, C, and Institutional shares, respectively), net of any applicable fee waivers, multiplied by the average account value over the period, multiplied by 176/365 (to reflect the period since commencement of operations).
| | |
Schedule of Investments March 31, 2009 (unaudited) | | Security Equity Fund All Cap Value Series |
| |
| | | | | |
| | | Shares | | Value |
COMMON STOCKS - 91.4% | | | | | |
Aerospace & Defense - 1.9% | | | | | |
United Technologies Corporation | | 302 | | $ | 12,980 |
| | | | | |
| | |
Air Freight & Logistics - 2.3% | | | | | |
FedEx Corporation | | 349 | | | 15,527 |
| | | | | |
| | |
Apparel Retail - 0.6% | | | | | |
Brown Shoe Company, Inc. | | 401 | | | 1,504 |
Chico's FAS, Inc. * | | 160 | | | 859 |
Talbots, Inc. | | 460 | | | 1,615 |
| | | | | |
| | | | | 3,978 |
| | | | | |
Apparel, Accessories & Luxury | | | | | |
Goods - 0.6% | | | | | |
Fossil, Inc. * | | 100 | | | 1,570 |
Maidenform Brands, Inc. * | | 183 | | | 1,676 |
Oxford Industries, Inc. | | 115 | | | 710 |
| | | | | |
| | | | | 3,956 |
| | | | | |
| | |
Biotechnology - 0.0% | | | | | |
Combinatorx, Inc. * | | 440 | | | 273 |
| | | | | |
| | |
Building Products - 1.0% | | | | | |
Trex Company, Inc. * | | 200 | | | 1,526 |
USG Corporation * | | 650 | | | 4,947 |
| | | | | |
| | | | | 6,473 |
| | | | | |
| | |
Cable & Satellite - 0.5% | | | | | |
Time Warner Cable, Inc. | | 127 | | | 3,156 |
| | | | | |
| | |
Coal & Consumable Fuels - 0.9% | | | | | |
Evergreen Energy, Inc. * | | 1,500 | | | 2,088 |
USEC, Inc. * | | 874 | | | 4,195 |
| | | | | |
| | | | | 6,283 |
| | | | | |
Communications Equipment - 0.6% | | | | | |
Symmetricom, Inc. 1,* | | 1,220 | | | 4,270 |
| | | | | |
| | |
Computer Hardware - 1.7% | | | | | |
Hewlett-Packard Company | | 364 | | | 11,670 |
| | | | | |
| | |
Computer Storage & | | | | | |
Peripherals - 0.5% | | | | | |
STEC, Inc. * | | 441 | | | 3,250 |
| | | | | |
| | |
Construction & Engineering - 1.4% | | | | | |
Insituform Technologies, Inc. * | | 304 | | | 4,755 |
URS Corporation * | | 126 | | | 5,091 |
| | | | | |
| | | | | 9,846 |
| | | | | |
Construction Materials - 1.3% | | | | | |
Eagle Materials, Inc. | | 400 | | | 9,700 |
| | | | | |
Consumer Finance - 0.6% | | | | | |
First Marblehead Corporation * | | 3,021 | | | 3,897 |
| | | | | |
Data Processing & Outsourced | | | | | |
Services - 4.3% | | | | | |
Affiliated Computer Services, Inc. * | | 77 | | | 3,688 |
Computer Sciences Corporation * | | 218 | | | 8,031 |
Western Union Company | | 1,370 | | | 17,221 |
| | | | | |
| | | | | 28,940 |
| | | | | |
| | |
Department Stores-3.2% | | | | | |
JC Penney Company, Inc. | | 1,101 | | | 22,097 |
| | | | | |
| | | Shares | | Value |
COMMON STOCKS - 91.4% (continued) | | | | | |
Diversified Banks - 1.0% | | | | | |
Wells Fargo & Company | | 486 | | $ | 6,921 |
| | | | | |
| | |
Diversified Chemicals - 0.5% | | | | | |
Dow Chemical Company | | 382 | | | 3,220 |
| | | | | |
| | |
Drug Retail - 1.4% | | | | | |
CVS Caremark Corporation | | 336 | | | 9,237 |
| | | | | |
| | |
Electric Utilities - 4.2% | | | | | |
Allete, Inc. | | 80 | | | 2,135 |
Edison International | | 612 | | | 17,633 |
Empire District Electric Company | | 60 | | | 866 |
Great Plains Energy, Inc. | | 242 | | | 3,260 |
Northeast Utilities | | 116 | | | 2,504 |
Westar Energy, Inc. | | 131 | | | 2,296 |
| | | | | |
| | | | | 28,694 |
| | | | | |
| | |
Electrical Components & | | | | | |
Equipment - 0.3% | | | | | |
Power-One, Inc. 1,* | | 2,307 | | | 2,030 |
| | | | | |
| | |
Electronic Manufacturing | | | | | |
Services - 1.5% | | | | | |
Maxwell Technologies, Inc. 1,* | | 646 | | | 4,490 |
Tyco Electronics, Ltd. | | 510 | | | 5,630 |
| | | | | |
| | | | | 10,120 |
| | | | | |
| | |
Exchange Traded Funds - 2.8% | | | | | |
iShares Russell 1000 Value Index Fund | | 239 | | | 9,701 |
iShares S&P 500 Value Index Fund | | 260 | | | 9,672 |
| | | | | |
| | | | | 19,373 |
| | | | | |
| | |
Forest Products - 0.2% | | | | | |
Louisiana-Pacific Corporation | | 693 | | | 1,545 |
| | | | | |
| | |
Gas Utilities - 0.5% | | | | | |
Atmos Energy Corporation | | 151 | | | 3,491 |
| | | | | |
| | |
Health Care Equipment - 3.2% | | | | | |
Aspect Medical Systems, Inc. * | | 263 | | | 1,102 |
Covidien, Ltd. | | 230 | | | 7,645 |
Hospira, Inc. * | | 423 | | | 13,054 |
| | | | | |
| | | | | 21,801 |
| | | | | |
| | |
Health Care Facilities - 0.3% | | | | | |
Community Health Systems, Inc. * | | 125 | | | 1,918 |
| | | | | |
| | |
Health Care Services - 1.7% | | | | | |
Medco Health Solutions, Inc. * | | 173 | | | 7,152 |
Mednax, Inc. * | | 100 | | | 2,947 |
Providence Service Corporation * | | 100 | | | 688 |
RehabCare Group, Inc. * | | 48 | | | 837 |
| | | | | |
| | | | | 11,624 |
| | | | | |
| | |
Highways & Railtracks - 0.1% | | | | | |
Quixote Corporation 1 | | 142 | | | 493 |
| | | | | |
| | |
Home Furnishings - 0.8% | | | | | |
Leggett & Platt, Inc. | | 398 | | | 5,170 |
| | | | | |
| | |
Home Improvement Retail - 2.9% | | | | | |
Lowe's Companies, Inc. | | 1,092 | | | 19,929 |
| | | | | |
| | | | |
| | | 6 | | The accompanying notes are an integral part of the financial statements |
| | |
Schedule of Investments March 31, 2009 | | Security Equity Fund All Cap Value Series |
| |
| | | | | |
| | | Shares | | Value |
COMMON STOCKS - 91.4% (continued) | | | | | |
Human Resources & Employment | | | | | |
Services - 0.4% | | | | | |
Administaff, Inc. | | 125 | | $ | 2,641 |
| | | | | |
| | |
Hypermarkets & Super | | | | | |
Centers - 2.5% | | | | | |
Wal-Mart Stores, Inc. | | 324 | | | 16,880 |
| | | | | |
| | |
Independent Power Producers & | | | | | |
Energy Traders - 0.8% | | | | | |
NRG Energy, Inc. * | | 300 | | | 5,280 |
| | | | | |
| | |
Industrial Conglomerates - 3.0% | | | | | |
General Electric Company | | 806 | | | 8,149 |
McDermott International, Inc. * | | 915 | | | 12,252 |
| | | | | |
| | | | | 20,401 |
| | | | | |
| | |
Industrial Machinery - 1.7% | | | | | |
Dover Corporation | | 106 | | | 2,796 |
Harsco Corporation | | 100 | | | 2,217 |
Parker Hannifin Corporation | | 200 | | | 6,796 |
| | | | | |
| | | | | 11,809 |
| | | | | |
| | |
Insurance Brokers - 0.2% | | | | | |
Arthur J Gallagher & Company | | 75 | | | 1,275 |
| | | | | |
| | |
Integrated Oil & Gas - 5.6% | | | | | |
Chevron Corporation | | 214 | | | 14,390 |
ConocoPhillips | | 238 | | | 9,320 |
Exxon Mobil Corporation | | 206 | | | 14,029 |
| | | | | |
| | | | | 37,739 |
| | | | | |
| | |
Integrated Telecommunication | | | | | |
Services - 0.9% | | | | | |
Windstream Corporation | | 787 | | | 6,343 |
| | | | | |
| | |
Managed Health Care - 1.1% | | | | | |
Aetna, Inc. | | 300 | | | 7,299 |
| | | | | |
| | |
Movies & Entertainment - 1.4% | | | | | |
Time Warner, Inc. | | 507 | | | 9,787 |
| | | | | |
| | |
Multi-Line Insurance - 0.7% | | | | | |
American Financial Group, Inc. | | 292 | | | 4,687 |
| | | | | |
| | |
Multi-Utilities - 0.5% | | | | | |
SCANA Corporation | | 117 | | | 3,614 |
| | | | | |
| | |
Oil & Gas Drilling - 0.4% | | | | | |
Helmerich & Payne, Inc. | | 116 | | | 2,641 |
| | | | | |
| | |
Oil & Gas Equipment & | | | | | |
Services - 1.7% | | | | | |
Global Industries, Ltd. * | | 1,304 | | | 5,007 |
Halliburton Company | | 438 | | | 6,776 |
| | | | | |
| | | | | 11,783 |
| | | | | |
| | |
Oil & Gas Exploration & | | | | | |
Production - 2.0% | | | | | |
Chesapeake Energy Corporation | | 400 | | | 6,824 |
Goodrich Petroleum Corporation * | | 100 | | | 1,936 |
Gulfport Energy Corporation * | | 162 | | | 376 |
Newfield Exploration Company * | | 19 | | | 431 |
PetroHawk Energy Corporation * | | 200 | | | 3,846 |
| | | | | |
| | | | | 13,413 |
| | | | | |
| | | | | |
| | | Shares | | Value |
COMMON STOCKS - 91.4% (continued) | | | | | |
Oil & Gas Storage & | | | | | |
Transportation - 1.1% | | | | | |
Southern Union Company | | 191 | | $ | 2,907 |
Williams Companies, Inc. | | 424 | | | 4,825 |
| | | | | |
| | | | | 7,732 |
| | | | | |
| | |
Other Diversified Financial | | | | | |
Services - 1.1% | | | | | |
JPMorgan Chase & Company | | 276 | | | 7,336 |
| | | | | |
| | |
Packaged Foods & Meats - 3.1% | | | | | |
Hormel Foods Corporation | | 261 | | | 8,277 |
JM Smucker Company | | 124 | | | 4,621 |
Smithfield Foods, Inc. * | | 281 | | | 2,658 |
TreeHouse Foods, Inc. * | | 203 | | | 5,845 |
| | | | | |
| | | | | 21,401 |
| | | | | |
| | |
Paper Packaging - 1.2% | | | | | |
Bemis Company, Inc. | | 234 | | | 4,907 |
Sonoco Products Company | | 155 | | | 3,252 |
| | | | | |
| | | | | 8,159 |
| | | | | |
| | |
Paper Products - 0.5% | | | | | |
Schweitzer-Mauduit International, Inc. | | 166 | | | 3,064 |
| | | | | |
| | |
Pharmaceuticals - 2.0% | | | | | |
Schering-Plough Corporation | | 577 | | | 13,588 |
| | | | | |
| | |
Property & Casualty | | | | | |
Insurance - 6.0% | | | | | |
Alleghany Corporation * | | 18 | | | 4,972 |
Assured Guaranty, Ltd. | | 100 | | | 677 |
Berkshire Hathaway, Inc. (Cl.B) * | | 8 | | | 22,560 |
Employers Holdings, Inc. | | 169 | | | 1,612 |
Hanover Insurance Group, Inc. | | 142 | | | 4,092 |
United America Indemnity, Ltd. * | | 71 | | | 285 |
W.R. Berkley Corporation | | 290 | | | 6,540 |
| | | | | |
| | | | | 40,738 |
| | | | | |
| | |
Railroads - 2.4% | | | | | |
Kansas City Southern * | | 127 | | | 1,614 |
Union Pacific Corporation | | 354 | | | 14,553 |
| | | | | |
| | | | | 16,167 |
| | | | | |
| | |
Regional Banks - 0.4% | | | | | |
Wilmington Trust Corporation | | 300 | | | 2,907 |
| | | | | |
| | |
Research & Consulting | | | | | |
Services - 3.1% | | | | | |
Equifax, Inc. | | 637 | | | 15,574 |
ICF International, Inc. * | | 100 | | | 2,297 |
Navigant Consulting, Inc. * | | 245 | | | 3,202 |
| | | | | |
| | | | | 21,073 |
| | | | | |
| | |
Security & Alarm Services - 0.6% | | | | | |
GeoEye, Inc. * | | 200 | | | 3,950 |
| | | | | |
| | |
Semiconductors - 1.0% | | | | | |
IXYS Corporation 1 | | 884 | | | 7,125 |
| | | | | |
| | |
Specialty Chemicals-0.9% | | | | | |
Rohm & Haas Company | | 62 | | | 4,888 |
Zoltek Companies, Inc. * | | 150 | | | 1,022 |
| | | | | |
| | | | | 5,910 |
| | | | | |
| | | | |
| | | 7 | | The accompanying notes are an integral part of the financial statements |
| | |
Schedule of Investments March 31, 2009 (unaudited) | | Security Equity Fund All Cap Value Series |
| |
| | | | |
| | | Shares | | Value |
COMMON STOCKS - 91.4% (continued) |
Tobacco - 1.9% | | | | |
Philip Morris International, Inc. | | 371 | | $13,200 |
| | | | |
Trucking - 0.4% | | | | |
Saia, Inc. * | | 210 | | 2,510 |
| | | | |
| | | | |
TOTAL COMMON STOCKS | | | | |
(cost $822,758) | | | | $622,314 |
Total Investments - 91.4% | | | | |
(cost $822,758) | | | | $622,314 |
Cash & Other Assets, Less Liabilities - 8.6% | | | | 58,492 |
| | | | |
Total Net Assets - 100.0% | | | | $680,806 |
| | | | |
For federal income tax purposes the identified cost of investments owned at March 31, 2009 was $822,758.
* Non-income producing security
1 Security is deemed illiquid. The total market value of illiquid securities is $18,408 (cost $24,790), or 2.7% of total net assets.
| | | | |
| | | 8 | | The accompanying notes are an integral part of the financial statements |
Security Equity Fund
All Cap Value Series
(unaudited)
| | |
Statement of Assets and Liabilities March 31, 2009 |
| | | |
Assets: | | | |
Investments, at value* | | $ | 622,314 |
Cash | | | 35,480 |
Receivables: | | | |
Securities sold | | | 152 |
Dividends | | | 1,480 |
Security Investors | | | 4,654 |
Prepaid expenses | | | 25,906 |
| | | |
Total assets | | | 689,986 |
| | | |
Liabilities: | | | |
Payable for: | | | |
Management fees | | | 372 |
Custodian fees | | | 499 |
Transfer agent/maintenance fees | | | 18 |
Administration fees | | | 275 |
Professional fees | | | 5,133 |
12b-1 distribution plan fees | | | 222 |
Directors’ fees | | | 277 |
Other | | | 2,384 |
| | | |
Total liabilities | | | 9,180 |
| | | |
Net assets | | $ | 680,806 |
| | | |
Net assets consist of: | | | |
Paid in capital | | $ | 903,002 |
Undistributed net investment income | | | 2,460 |
Accumulated net realized loss on sale of investments | | | (24,212) |
Net unrealized depreciation in value of investments | | | (200,444) |
| | | |
Net assets | | $ | 680,806 |
| | | |
Class A: | | | |
Capital shares outstanding (unlimited number of shares authorized) | | | 34,393 |
Net assets | | $ | 252,541 |
Net asset value and redemption price per share . | | $ | 7.34 |
| | | |
Maximum offering price per share (net asset value divided by 94.25%) | | $ | 7.79 |
| | | |
Class C: | | | |
Capital shares outstanding (unlimited number of shares authorized) | | | 29,932 |
Net assets | | $ | 219,003 |
Net asset value, offering and redemption price per share (excluding any applicable contingent deferred sales charge) | | $ | 7.32 |
| | | |
Institutional Class: | | | |
Capital shares outstanding (unlimited number of shares authorized) | | | 28,464 |
Net assets | | $ | 209,262 |
Net asset value, offering and redemption price per share (excluding any applicable contingent deferred sales charge) | | $ | 7.35 |
| | | |
*Investments, at cost | | $ | 822,758 |
| | |
Statement of Operations For the Period Ended March 31, 2009* |
| | | |
Investment Income: | | | |
Dividends | | $ | 7,482 |
Interest | | | 114 |
| | | |
Total investment income | | | 7,596 |
| | | |
| |
Expenses: | | | |
Management fees | | | 2,162 |
Transfer agent/maintenance fees | | | 54 |
Administration fees | | | 692 |
Custodian fees | | | 2,203 |
Directors’ fees | | | 294 |
Professional fees | | | 6,076 |
Reports to shareholders | | | 2,384 |
Registration fees | | | 17,378 |
Other expenses | | | 1,741 |
12b-1 distribution fees - Class A | | | 272 |
12b-1 distribution fees - Class C | | | 1,079 |
| | | |
Total expenses | | | 34,335 |
Less: | | | |
Reimbursement of expenses - Class A | | | (9,838) |
Reimbursement of expenses - Class C | | | (9,760) |
Reimbursement of expenses - Institutional Class | | | (9,601) |
| | | |
Net expenses | | | 5,136 |
| | | |
Net investment income | | | 2,460 |
| | | |
| |
Net Realized and Unrealized Gain (Loss): | | | |
Net realized gain (loss) during the period on: | | | |
Investments | | | (24,212) |
| | | |
Net realized loss | | | (24,212) |
| | | |
| |
Net unrealized appreciation (depreciation) during the period on: | | | |
Investments | | | (200,444) |
| | | |
Net unrealized depreciation | | | (200,444) |
| | | |
Net loss | | | (224,656) |
| | | |
Net decrease in net assets resulting from operations | | $ | (222,196) |
| | | |
*For the period from October 3, 2008 (commencement of operations) to March 31, 2009.
| | | | |
| | | 9 | | The accompanying notes are an integral part of the financial statements |
| | |
| Statement of Changes in Net Assets | | Security Equity Fund All Cap Value Series |
| |
| | | | |
| | | Period Ended
March 31, 2009* | |
| | | | |
| |
Increase (decrease) in net assets from operations: | | | | |
Net investment income | | $ | 2,460 | |
Net realized loss during the period on investments | | | (24,212 | ) |
Net unrealized depreciation during the period on investments | | | (200,444 | ) |
| | | | |
Net decrease in net assets resulting from operations | | | (222,196 | ) |
| | | | |
| |
Capital share transactions: | | | | |
Proceeds from sale of shares | | | | |
Class A | | | 322,321 | |
Class C | | | 296,051 | |
Institutional Class | | | 284,637 | |
Cost of shares redeemed | | | | |
Class A | | | (7 | ) |
| | | | |
Net increase from capital share transactions | | | 903,002 | |
| | | | |
Net increase in net assets | | | 680,806 | |
| | | | |
| |
Net assets: | | | | |
Beginning of period | | | – | |
| | | | |
End of period | | $ | 680,806 | |
| | | | |
| |
Undistributed net investment income at end of period | | $ | 2,460 | |
| | | | |
| |
Capital share activity: | | | | |
Shares sold | | | | |
Class A | | | 34,394 | |
Class C | | | 29,932 | |
Institutional Class | | | 28,464 | |
Shares redeemed | | | | |
Class A | | | (1 | ) |
* For the period October 3, 2008 (commencement of operations) to March 31, 2009.
| | | | |
| | | 10 | | The accompanying notes are an integral part of the financial statements |
| | |
Financial Highlights Selected data for each share of capital stock outstanding throughout each period | | Security Equity Fund All Cap Value Series |
| | |
| Class A | | Period Ended
March 31, 2009a |
Per Share Data | | |
Net asset value, beginning of period | | $10.00 |
Income (loss) from investment operations: | | |
Net investment incomeb | | 0.03 |
Net loss on securities (realized and unrealized) | | (2.69) |
| | |
Total from investment operations | | (2.66) |
Net asset value, end of period | | $7.34 |
| | |
| | |
Total Return c | | (26.60%) |
Ratios/Supplemental Data | | |
Net assets, end of period (in thousands) | | $253 |
Ratios to average net assets: | | |
Net investment income | | 0.92% |
Total expensesd | | 10.10% |
Net expensese | | 1.42% |
Net expenses prior to custodian earning credits and net of expense waivers | | 1.42% |
Portfolio turnover rate | | 30% |
| |
| Class C | | Period Ended
March 31, 2009a |
Per Share Data | | |
Net asset value, beginning of period | | $10.00 |
Income (loss) from investment operations: | | |
Net investment incomeb | | 0.01 |
Net loss on securities (realized and unrealized) | | (2.69) |
| | |
Total from investment operations | | (2.68) |
Net asset value, end of period | | $7.32 |
| | |
| | |
Total Return c | | (26.80%) |
Ratios/Supplemental Data | | |
Net assets, end of period (in thousands) | | $219 |
Ratios to average net assets: | | |
Net investment income | | 0.18% |
Total expensesd | | 10.83% |
Net expensese | | 2.17% |
Net expenses prior to custodian earning credits and net of expense waivers | | 2.17% |
Portfolio turnover rate | | 30% |
| | | | |
| | 11 | | The accompanying notes are an integral part of the financial statements |
| | |
Financial Highlights Selected data for each share of capital stock outstanding throughout each period | | Security Equity Fund
All Cap Value Series |
| |
| | |
| Institutional Class | | Period Ended
March 31,
2009a |
Per Share Data | | |
Net asset value, beginning of period | | $10.00 |
Income (loss) from investment operations: | | |
Net investment incomeb | | 0.04 |
Net loss on securities (realized and unrealized) | | (2.69) |
| | |
Total from investment operations | | (2.65) |
Net asset value, end of period | | $7.35 |
| | |
| | |
Total Return | | (26.50%) |
Ratios/Supplemental Data | | |
Net assets, end of period (in thousands) | | $209 |
Ratios to average net assets: | | |
Net investment income | | 1.14% |
Total expensesd | | 9.87% |
Net expensese | | 1.17% |
Net expenses prior to custodian earning credits and net of expense waivers | | 1.17% |
Portfolio turnover rate | | 30% |
a Security All Cap Value Series was initially capitalized on October 3, 2008 with a net asset value of $10 per share. Percentage amounts for the period, except total return, have been annualized.
b Net investment income (loss) was computed using average shares outstanding throughout the period.
c Total return information does not reflect deduction of any sales charges imposed at the time of purchase for Class A shares or upon redemption for Class C shares.
d Total expense information reflects expense ratios absent expense reductions by the Investment Manager and custodian earnings credits, as applicable.
e Net expense information reflects the expense ratios after voluntary expense waivers, reimbursements and custodian earnings credits, as applicable.
| | | | |
| | | 12 | | The accompanying notes are an integral part of the financial statements |
This page left blank intentionally.
| | |
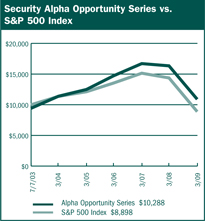
Performance Summary March 31, 2009 | | Security Equity Fund Alpha Opportunity Series (unaudited) |
| |
| |
$10,000 Since Inception
This chart assumes a $10,000 investment in Class A shares of Alpha Opportunity Series on July 7, 2003 (date of inception), reflects deduction of the 5.75% sales load and assumes all dividends reinvested. The chart does not reflect the deduction of taxes that a shareholder would pay on distributions or the redemption of fund shares. The S&P 500 Index is a capitalization weighted index composed of 500 selected common stocks that represent the broad domestic economy and is a widely recognized unmanaged index of market performance.
| | | | | | |
Average Annual Returns |
Periods Ended 3-31-09 | | 1 Year | | 5 Years | | Since
Inception |
A Shares | | (37.05%) | | (2.00%) | | 1.54% (7-07-03) |
A Shares with sales charge | | (40.65%) | | (3.15%) | | 0.50% (7-07-03) |
B Shares | | (37.55%) | | (2.75%) | | 0.77% (7-07-03) |
B Shares with CDSC | | (40.67%) | | (2.99%) | | 0.77% (7-07-03) |
C Shares | | (37.72%) | | (2.78%) | | 0.75% (7-07-03) |
C Shares with CDSC | | (38.34%) | | (2.78%) | | 0.75% (7-07-03) |
Institutional Class | | – | | – | | (11.80%) (11-07-08) |
The performance data above represents past performance that is not predictive of future results. The investment return and principal value of an investment in the Series will fluctuate so that an investor’s shares, when redeemed, may be worth more or less than their original cost. The figures above do not reflect deduction of the maximum front-end sales charge of 5.75% for Class A shares or the contingent deferred sales charge of 5% for Class B shares and 1% for Class C shares, as applicable, except where noted. The figures do not reflect the deduction of taxes that a shareholder would pay on distributions or redemption of shares. Such figures would be lower if the maximum sales charge and any applicable taxes were deducted. Fee waivers and/or reimbursements reduced expenses of the Series and in the absence of such waiver, the performance quoted would be reduced. |
| | | | | | | | |
| | | Portfolio Composition by Sector as of 3-31-09* | | |
| | | Consumer Discretionary | | 5.98% | | | | |
| | | Consumer Staples | | 8.40 | | | | |
| | | Energy | | 0.63 | | | | |
| | | Financials | | (1.21) | | | | |
| | | Health Care | | 0.55 | | | | |
| | | Industrials | | 5.09 | | | | |
| | | Information Technology | | 8.43 | | | | |
| | | Materials | | 0.02 | | | | |
| | | Telecommunication Services | | 0.82 | | | | |
| | | Utilities | | (0.91) | | | | |
| | | Exchange Traded Funds | | 1.24 | | | | |
| | | U.S. Government Sponsored Agencies | | 14.63 | | | | |
| | | Repurchase Agreement | | 9.70 | | | | |
| | | Short Term Investments | | 21.44 | | | | |
| | | Cash & Other Assets, Less Liabilities | | 25.19 | | | | |
| | | Total Net Assets | | 100.00% | | | | |
| | | | | | | | | |
| | | | | | | | | |
*Securities sold short are netted with long positions in common stocks in the appropriate sectors.
| | | | |
| | | 14 | | The accompanying notes are an integral part of the financial statements |
| | |
Performance Summary March 31, 2009 | | Security Equity Fund Alpha Opportunity Series (unaudited) |
| |
| |
Information About Your Series Expenses
Calculating your ongoing Series expenses
Example
As a shareholder of the Series, you incur two types of costs: (1) transaction costs, which may include sales charges (loads) on purchase payments; contingent deferred sales charges on redemptions; and redemption fees, if any; and (2) ongoing costs, including management fees; distribution and/or service fees (12b-1); and other Series expenses. This example is intended to help you understand your ongoing costs (in dollars) of investing in the Series and to compare these costs with ongoing costs of investing in other mutual funds. The example is based on an investment of $1,000 invested at the beginning of the period and held for the entire period October 1, 2008 or November 7, 2008 (commencement of operations) through March 31, 2009.
Actual Expenses
The first line for each class of shares in the table provides information about actual account values and actual expenses. You may use the information in this table, together with the amount you invested, to estimate the expenses that you paid over the period. Simply divide your account value by $1,000 (for example, an $8,600 account value divided by $1,000 = 8.6), then multiply the result by the number in the table under the heading entitled “Expenses Paid During the Period” to estimate the expenses you paid on your account during this period.
Hypothetical Example for Comparison Purposes
The second line for each class of shares in the table provides information about hypothetical account values and hypothetical expenses based on the Series actual expense ratio and an assumed rate of return of 5% per year before expenses, which is not the Series actual return. The hypothetical account values and expenses may not be used to estimate the actual ending account balance or expenses you paid for the period. You may use this information to compare the ongoing costs of investing in the Series and other funds. To do so, compare this 5% hypothetical example with the 5% hypothetical examples that appear in the shareholder reports of the other mutual funds.
Please note that the expenses shown in the table are meant to highlight your ongoing costs only and do not reflect any transactional costs, such as sales charges (loads) on purchase payments, contingent deferred sales charges on redemptions, and redemption fees, if any. Therefore, the second line for each class of shares is useful in comparing ongoing costs only, and will not help you determine the relative total costs of owning different funds. In addition, if these transactional costs were included, your costs would have been higher
| | | | | | |
Series Expenses | | | | |
| | | Beginning
Account
Value
10/1/2008 | | Ending
Account
Value
3/31/2009 1 | | Expenses
Paid
During
Period 2 |
Alpha Opportunity | | | | |
Series - Class A | | | | | | |
Actual | | $1,000.00 | | $688.03 | | $8.25 |
Hypothetical | | 1,000.00 | | 1,015.16 | | 9.85 |
Alpha Opportunity | | | | | | |
Series - Class B | | | | | | |
Actual | | 1,000.00 | | 685.88 | | 11.43 |
Hypothetical | | 1,000.00 | | 1,011.37 | | 13.64 |
Alpha Opportunity | | | | |
Series - Class C | | | | | | |
Actual | | 1,000.00 | | 683.97 | | 11.38 |
Hypothetical | | 1,000.00 | | 1,011.42 | | 13.59 |
Alpha Opportunity | | | | |
Series - Institutional Class * | | | | | | |
Actual | | 1,000.00 | | 882.00 | | 5.12 |
Hypothetical | | 1,000.00 | | 1,018.05 | | 6.94 |
* November 7, 2008 (commencement of operations)
1 The actual ending account value is based on the actual total return of the Series for the period October 1, 2008 or November 7, 2008 (commencement of operations), as applicable, to March 31, 2009 after actual expenses and will differ from the hypothetical ending account value which is based on the Series expense ratio and a hypothetical annual return of 5% before expenses. The actual cumulative return at net asset value for the period October 1, 2008 or November 7, 2008 (commencement of operations), as applicable, to March 31, 2009 was (31.20%), (31.41%), (31.60%) and (11.80%) for Class A, B, C and Institutional Class shares, respectively.
2 Expenses are equal to the Series annualized expense ratio (1.99%, 2.80%, 2.80% and 1.80% for Class A, B, C and Institutional Class shares, respectively), net of any applicable fee waivers, multiplied by the average account value over the period, multiplied by 180/365 (to reflect the one-half year period) for Class A, B and C shares, and multiplied by 141/365 (to reflect the period since commencement of operations) for Institutional Class shares.
| | |
| Schedule of Investments | | Security Equity Fund |
| | Alpha Opportunity Series |
March 31, 2009 | | (unaudited) |
| | | | |
| | | Shares | | Value |
COMMON STOCKS - 70.5% | | | | |
Aerospace & Defense - 2.0% | | | | |
Lockheed Martin Corporation 1,2 | | 3,753 | | $259,070 |
Northrop Grumman
Corporation 1,2 | | 1,100 | | 48,004 |
| | | | |
| | | | 307,074 |
| | | | |
| | |
Agricultural Products - 2.1% | | | | |
Archer-Daniels-Midland
Company 3 | | 11,897 | | 330,499 |
| | | | |
| | |
Airlines - 0.5% | | | | |
Airtran Holdings, Inc. * | | 18,224 | | 82,919 |
| | | | |
| | |
Apparel Retail - 3.9% | | | | |
Aeropostale, Inc. * | | 4,439 | | 117,900 |
Chico’s FAS, Inc. * | | 24,298 | | 130,479 |
Gap, Inc. 1,2 | | 6,000 | | 77,940 |
Gymboree Corporation 1,2,* | | 3,000 | | 64,050 |
Jos A. Bank Clothiers, Inc. * | | 934 | | 25,975 |
Ltd. Brands, Inc. 1,2 | | 5,100 | | 44,370 |
Ross Stores, Inc. 1,2 | | 2,100 | | 75,348 |
TJX Companies, Inc. 1,2 | | 3,600 | | 92,304 |
| | | | |
| | | | 628,366 |
| | | | |
|
Apparel, Accessories & Luxury |
Goods - 1.6% | | | | |
Carter’s, Inc. * | | 11,999 | | 225,701 |
Phillips-Van Heusen
Corporation 1,2 | | 800 | | 18,144 |
| | | | |
| | | | 243,845 |
| | | | |
|
Automobile Manufacturers - 0.1% |
Honda Motor Company,
Ltd. ADR | | 835 | | 19,790 |
| | | | |
|
Automotive Retail - 0.8% |
Carmax, Inc. * | | 2,804 | | 34,882 |
O'Reilly Automotive, Inc. * | | 2,618 | | 91,656 |
| | | | |
| | | | 126,538 |
| | | | |
|
Biotechnology - 1.0% |
Amgen, Inc. 1,2,* | | 1,800 | | 89,136 |
Cephalon, Inc. * | | 890 | | 60,609 |
| | | | |
| | | | 149,745 |
| | | | |
|
Casinos & Gaming - 0.1% |
Ameristar Casinos, Inc. | | 1,401 | | 17,625 |
| | | | |
|
Communications Equipment - 0.5% |
Harmonic, Inc. 1,2,* | | 11,000 | | 71,500 |
| | | | |
|
Computer & Electronics |
Retail - 0.3% | | | | |
RadioShack Corporation 1,2 | | 5,100 | | 43,707 |
| | | | |
|
Computer Storage & |
Peripherals - 0.2% | | | | |
China Digital TV Holding Company, |
Ltd. ADR | | 434 | | 2,921 |
STEC, Inc. * | | 2,804 | | 20,665 |
| | | | |
| | | | 23,586 |
| | | | |
|
Construction & Engineering - 3.6% |
Aecom Technology Corporation * | | 3,739 | | 97,513 |
Foster Wheeler AG * | | 2,137 | | 37,333 |
Granite Construction, Inc. | | 3,972 | | 148,872 |
| | | | |
| | | Shares | | Value |
COMMON STOCKS - 70.5% (continued) |
Construction & Engineering - 3.6% |
(continued) | | | | |
MasTec, Inc. * | | 3,037 | | $36,717 |
MYR Group, Inc. * | | 4,921 | | 75,045 |
Quanta Services, Inc. * | | 5,140 | | 110,253 |
URS Corporation * | | 1,168 | | 47,199 |
| | | | |
| | | | 552,932 |
| | | | |
|
Construction & Farm Machinery & |
Heavy Trucks - 1.8% | | | | |
Joy Global, Inc. 1,2 | | 9,080 | | 193,404 |
Trinity Industries, Inc. 1,2 | | 10,200 | | 93,228 |
| | | | |
| | | | 286,632 |
| | | | |
|
Diversified Banks - 0.6% |
Wells Fargo & Company | | 7,009 | | 99,808 |
| | | | |
|
Electrical Components & |
Equipment - 0.4% | | | | |
AO Smith Corporation 1,2 | | 2,800 | | 70,504 |
| | | | |
|
Electronic Components - 0.1% |
AU Optronics Corporation ADR | | 1,669 | | 14,003 |
| | | | |
|
Environmental & Facilities |
Services - 0.8% | | | | |
Tetra Tech, Inc. * | | 6,542 | | 133,326 |
| | | | |
|
Exchange Traded Funds - 2.4% |
Claymore | | 6,022 | | 56,245 |
iShares Silver Trust * | | 5,140 | | 65,792 |
SPDR Gold Trust * | | 2,804 | | 253,146 |
| | | | |
| | | | 375,183 |
| | | | |
| | |
Food Retail - 0.5% | | | | |
Safeway, Inc. 1,2 | | 3,900 | | 78,741 |
| | | | |
|
General Merchandise |
Stores - 0.8% | | | | |
Family Dollar Stores, Inc. 1,2 | | 3,700 | | 123,469 |
| | | | |
| | |
Gold - 0.4% | | | | |
Harmony Gold Mining Company, |
Ltd. ADR * | | 2,804 | | 30,676 |
Iamgold Corporation | | 2,504 | | 21,409 |
Yamana Gold, Inc. | | 835 | | 7,724 |
| | | | |
| | | | 59,809 |
| | | | |
|
Health Care Distributors - 0.6% |
Owens & Minor, Inc. 1,2 | | 2,700 | | 89,451 |
| | | | |
|
Health Care Equipment - 0.6% |
Baxter International, Inc. 1,2 | | 1,800 | | 92,196 |
China Medical Technologies, Inc. |
ADR | | 280 | | 3,856 |
| | | | |
| | | | 96,052 |
| | | | |
|
Health Care Facilities - 0.4% |
Kindred Healthcare, Inc. 1,2,* | | 3,900 | | 58,305 |
| | | | |
|
Health Care Services - 0.5% |
Lincare Holdings, Inc. 1,2,* | | 3,800 | | 82,840 |
| | | | |
| | | | |
| | | 16 | | The accompanying notes are an integral part of the financial statements |
| | |
Schedule of Investments March 31, 2009 | | Security Equity Fund Alpha Opportunity Series (unaudited) |
| |
| |
| | | | |
| | | Shares | | Value |
COMMON STOCKS - 70.5% (continued) |
| Home Entertainment Software - 3.7% | | | | |
Shanda Interactive Entertainment, Ltd. ADR 1,2,* | | 15,100 | | $596,902 |
| | | | |
| | |
| Homebuilding - 0.6% | | | | |
DR Horton, Inc. | | 1,402 | | 13,599 |
Pulte Homes, Inc. | | 7,242 | | 79,155 |
| | | | |
| | | | 92,754 |
| | | | |
| | |
Homefurnishing Retail - 0.3% | | | | |
Rent-A-Center, Inc. * | | 2,103 | | 40,735 |
| | | | |
| | |
| Hotels, Resorts & Cruise Lines - 1.7% | | | | |
Choice Hotels International, Inc. 3 | | 10,247 | | 264,578 |
| | | | |
| | |
| Human Resources & Employment Services - 0.9% | | | | |
Watson Wyatt Worldwide, Inc. 1,2 | | 2,901 | | 143,222 |
| | | | |
| | |
| Hypermarkets & Super Centers - 0.7% | | | | |
Wal-Mart Stores, Inc. 1,2 | | 2,200 | | 114,620 |
| | | | |
| | |
| Independent Power Producers & Energy Traders - 0.7% | | | | |
Constellation Energy Group, Inc. 1,2 | | 5,100 | | 105,366 |
| | | | |
| | |
| Industrial Conglomerates - 0.3% | | | | |
General Electric Company 1,2 | | 4,200 | | 42,462 |
| | | | |
| | |
| Industrial Machinery - 0.3% | | | | |
Watts Water Technologies, Inc. 1,2 | | 2,800 | | 54,768 |
| | | | |
| | |
| Integrated Oil & Gas - 0.5% | | | | |
ConocoPhillips 1,2 | | 1,500 | | 58,740 |
StatoilHydro ASA ADR | | 835 | | 14,562 |
| | | | |
| | | | 73,302 |
| | | | |
| | |
| Integrated Telecommunication Services - 1.7% | | | | |
AT&T, Inc. 1,2 | | 10,600 | | 267,120 |
| | | | |
| | |
| Internet Retail - 2.1% | | | | |
Amazon.com, Inc. 3,* | | 4,439 | | 326,000 |
| | | | |
| | |
| Internet Software & Services - 0.3% | | | | |
Akamai Technologies, Inc. * | | 2,569 | | 49,839 |
| | | | |
| | |
| Investment Banking & Brokerage - 2.0% | | | | |
Greenhill & Company, Inc. | | 2,987 | | 220,590 |
Knight Capital Group, Inc. * | | 2,570 | | 37,882 |
MF Global, Ltd. * | | 5,607 | | 23,718 |
Morgan Stanley | | 934 | | 21,267 |
| | | | |
| | | | 303,457 |
| | | | |
| | |
| IT Consulting & Other Services - 0.5% | | | | |
Accenture, Ltd. | | 2,153 | | 59,186 |
| | | | |
| | | Shares | | Value |
COMMON STOCKS - 70.5% (continued) |
| IT Consulting & Other Services - 0.5% (continued) | | | | |
MAXIMUS, Inc. | | 531 | | $21,166 |
| | | | |
| | | | 80,352 |
| | | | |
| | |
| Life Sciences Tools & Services - 2.9% | | | | |
Charles River Laboratories International, Inc. 1,2,* | | 2,000 | | 54,420 |
Illumina, Inc. * | | 6,075 | | 226,232 |
Life Technologies Corporation 1,2,* | | 2,800 | | 90,944 |
Millipore Corporation 1,2,* | | 1,800 | | 103,338 |
| | | | |
| | | | 474,934 |
| | | | |
| | |
| Managed Health Care - 0.2% | | | | |
WellCare Health Plans, Inc. 1,2,* | | 2,300 | | 25,875 |
| | | | |
| | |
| Mortgage REIT’s - 0.2% | | | | |
Annaly Capital Management, Inc. | | 1,968 | | 27,296 |
| | | | |
| | |
| Movies & Entertainment - 0.9% | | | | |
Marvel Entertainment, Inc. 1,2,* | | 5,400 | | 143,370 |
| | | | |
| | |
| Multi-Line Insurance - 0.7% | | | | |
Genworth Financial, Inc. 1,2 | | 4,000 | | 7,600 |
HCC Insurance Holdings, Inc. | | 4,306 | | 108,468 |
| | | | |
| | | | 116,068 |
| | | | |
| | |
| Oil & Gas Exploration & Production -1.3% | | | | |
Anadarko Petroleum | | | | |
Corporation 1,2 | | 2,755 | | 107,142 |
Concho Resources, Inc. * | | 467 | | 11,951 |
EnCana Corporation | | 334 | | 13,564 |
Southwestern Energy Company * | | 2,431 | | 72,176 |
| | | | |
| | | | 204,833 |
| | | | |
| | |
| Oil & Gas Refining & Marketing - 1.0% | | | | |
NuStar Energy, LP | | 1,169 | | 53,903 |
Sunoco, Inc. | | 934 | | 24,732 |
Western Refining, Inc. | | 7,009 | | 83,687 |
| | | | |
| | | | 162,322 |
| | | | |
| | |
| Packaged Foods & Meats - 0.5% | | | | |
Cosan, Ltd. * | | 2,449 | | 6,000 |
Dean Foods Company * | | 4,382 | | 79,227 |
| | | | |
| | | | 85,227 |
| | | | |
| | |
| Personal Products - 0.2% | | | | |
Herbalife, Ltd. 1,2 | | 2,500 | | 37,450 |
| | | | |
| | |
| Pharmaceuticals - 2.9% | | | | |
Biovail Corporation | | 1,135 | | 12,428 |
Forest Laboratories, Inc. 1,2,* | | 3,400 | | 74,664 |
Johnson & Johnson 1,2 | | 5,000 | | 263,001 |
Teva Pharmaceutical Industries, Ltd. ADR | | 1,069 | | 48,158 |
Viropharma, Inc. 1,2,* | | 9,900 | | 51,975 |
| | | | |
| | | | 450,226 |
| | | | |
| | |
| Property & Casualty Insurance - 0.6% | | | | |
ACE, Ltd. | | 961 | | 38,824 |
| | | | |
| | | 17 | | The accompanying notes are an integral part of the financial statements |
| | |
Schedule of Investments March 31, 2009 | | Security Equity Fund Alpha Opportunity Series (unaudited) |
| |
| | | | |
| | | Shares | | Value |
COMMON STOCKS - 70.5% (continued) |
Property & Casualty Insurance - 0.6% (continued) | | | | |
Amtrust Financial Services, Inc. 1,2 | | 6,000 | | $57,300 |
| | | | |
| | | | 96,124 |
| | | | |
Regional Banks - 1.2% | | | | |
Commerce Bancshares, Inc. | | 0 | | 2 |
First Horizon National Corporation | | 17,897 | | 192,214 |
| | | | |
| | | | 192,216 |
| | | | |
Reinsurance - 1.3% | | | | |
Endurance Specialty Holdings, Ltd. 1,2 | | 3,000 | | 74,820 |
RenaissanceRe Holdings, Ltd. | | 934 | | 46,177 |
Validus Holdings, Ltd. | | 3,423 | | 81,057 |
| | | | |
| | | | 202,054 |
| | | | |
Restaurants - 1.4% | | | | |
BJ’s Restaurants, Inc. * | | 802 | | 11,156 |
Jack in the Box, Inc. 1,2,* | | 5,869 | | 136,689 |
Papa John’s International, Inc. * | | 3,271 | | 74,808 |
| | | | |
| | | | 222,653 |
| | | | |
Semiconductor Equipment - 0.2% | | | | |
Amkor Technology, Inc. 1,2,* | | 9,200 | | 24,656 |
| | | | |
Semiconductors - 3.4% | | | | |
Atmel Corporation * | | 65,543 | | 237,922 |
Broadcom Corporation * | | 1,402 | | 28,012 |
Cree, Inc. * | | 4,138 | | 97,367 |
Cypress Semiconductor Corporation * | | 16,622 | | 112,531 |
Nvidia Corporation * | | 1,168 | | 11,516 |
PMC - Sierra, Inc. * | | 7,944 | | 50,683 |
Taiwan Semiconductor Manufacturing Company, Ltd. ADR | | 835 | | 7,473 |
| | | | |
| | | | 545,504 |
| | | | |
Soft Drinks - 0.4% | | | | |
Hansen Natural Corporation * | | 1,636 | | 58,896 |
| | | | |
Systems Software - 3.4% | | | | |
CA, Inc. 1,2 | | 19,362 | | 340,964 |
Check Point Software Technologies * | | 3,196 | | 70,984 |
McAfee, Inc. * | | 934 | | 31,289 |
Symantec Corporation 1,2,* | | 5,900 | | 88,146 |
| | | | |
| | | | 531,383 |
| | | | |
Technology Distributors - 0.7% | | | | |
Arrow Electronics, Inc. 1,2,* | | 2,600 | | 49,556 |
Avnet, Inc. 1,2,* | | 3,100 | | 54,281 |
| | | | |
| | | | 103,837 |
| | | | |
Tobacco - 4.0% | | | | |
Altria Group, Inc. 1,2 | | 16,700 | | 267,534 |
Philip Morris International, Inc. 1,2 | | 9,800 | | 348,683 |
| | | | |
| | | | 616,217 |
| | | | |
| | | | |
| | | Shares | | Value |
COMMON STOCKS - 70.5% (continued) |
Trucking - 0.2% | | | | |
Con-way, Inc. 1,2 | | 1,700 | | $30,481 |
| | | | |
| | | | |
TOTAL COMMON STOCKS (cost $14,283,791) | | $11,073,348 |
| | | Shares | | Value |
FOREIGN STOCKS - 7.3% |
Canada - 2.3% | | | | |
Agnico-Eagle Mines, Ltd. | | 6,195 | | $356,057 |
| | | | |
France - 0.3% | | | | |
UBISOFT Entertainment * | | 2,446 | | 44,712 |
| | | | |
Germany - 2.5% | | | | |
Volkswagen AG 3 | | 1,300 | | 399,455 |
| | | | |
Japan - 0.6% | | | | |
JGC Corporation | | 4,288 | | 48,347 |
NTT DoCoMo, Inc. | | 39 | | 52,680 |
| | | | |
| | | | 101,027 |
| | | | |
Portugal - 0.7% | | | | |
BRISA | | 15,796 | | 109,119 |
| | | | |
South Africa - 0.2% | | | | |
Aveng, Ltd. | | 9,842 | | 27,061 |
| | | | |
United Kingdom - 0.7% | | | | |
Cadbury plc | | 5,903 | | 44,636 |
Imperial Tobacco Group plc | | 2,724 | | 61,284 |
| | | | |
| | | | 105,920 |
TOTAL FOREIGN STOCKS (cost $1,219,858) | | $1,143,351 |
| | | Principal
Amount | | Value |
U.S. GOVERNMENT SPONSORED AGENCY BONDS & NOTES - 14.6% |
Federal Home Loan Mortgage Corporation | | | | |
0.36%, 4/27/20091 | | $1,000,000 | | $999,964 |
0.30%, 5/4/20093 | | 800,000 | | 799,875 |
Federal National Mortgage Association | | | | |
0.70%, 4/20/20093 | | 500,000 | | 499,987 |
TOTAL U.S. GOVERNMENT SPONSORED AGENCY BONDS & NOTES (cost $2,299,422) | | $2,299,826 |
| | | Principal
Amount | | Value |
SHORT TERM INVESTMENTS - 21.4% |
State Street General Account U.S. Government Fund | | $3,370,252 | | $3,370,252 |
TOTAL SHORT TERM INVESTMENTS (cost $3,370,252) | | | | $3,370,252 |
| | | | |
| | | 18 | | The accompanying notes are an integral part of the financial statements |
| | |
Schedule of Investments March 31, 2009 (unaudited) | | Security Equity Fund Alpha Opportunity Series |
| |
| | | | | |
| | | Principal
Amount | | Value | |
REPURCHASE AGREEMENT - 9.7% | | | |
State Street, 0.01%, dated 3/31/09, matures 4/01/09; repurchase amount $1,525,478 (Collateralized by U.S. Treasury Note, 07/02/09 with a value of $1,559,220) | | $1,525,478 | | $1,525,478 | |
TOTAL REPURCHASE AGREEMENT | | | | | |
(cost $1,525,478) | | | | $1,525,478 | |
Total Investments - 123.5% | | | |
(cost $22,698,801) | | | | $19,412,255 | |
Liabilities, Less Cash & Other Assets - (23.5)% | | | | (3,689,398 | ) |
| | | | | |
Total Net Assets - 100.0% | | $15,722,857 | |
| | | | | |
Schedule of Securities Sold Short
| | | | | | |
| | | Shares | | | Value | |
COMMON STOCKS - (25.5)% | | | | | | |
Advertising - (0.4)% | | | | | | |
Focus Media Holding, Ltd. ADR 4 ,* | | (2,130 | ) | | $(63,900 | ) |
| | | | | | |
Air Freight & Logistics - (0.1)% | | | | | | |
United Parcel Service, Inc. (Cl.B) | | (387 | ) | | (19,048 | ) |
| | | | | | |
Alternative Carriers - (0.2)% | | | | | | |
Global Crossing, Ltd. 4,* | | (1,800 | ) | | (28,746 | ) |
| | | | | | |
Application Software - (0.1)% | | | | | | |
Autodesk, Inc. * | | (773 | ) | | (12,994 | ) |
| | | | | | |
Biotechnology - (3.3)% | | | | | | |
Acorda Therapeutics, Inc. 4,* | | (2,800 | ) | | (74,900 | ) |
Alnylam Pharmaceuticals, Inc. 4,* | | (2,900 | ) | | (85,289 | ) |
Cepheid, Inc. 4,* | | (5,300 | ) | | (81,620 | ) |
Regeneron Pharmaceuticals,
Inc. 4,* | | (3,180 | ) | | (69,038 | ) |
Rigel Pharmaceuticals, Inc. 4,* | | (3,050 | ) | | (78,324 | ) |
Savient Pharmaceuticals, Inc. 4,* | | (2,420 | ) | | (48,013 | ) |
Vertex Pharmaceuticals, Inc. 4,* | | (2,600 | ) | | (71,942 | ) |
| | | | | | |
| | | | | (509,126 | ) |
| | | | | | |
Building Products - (0.9)% | | | | | | |
USG Corporation 4,* | | (4,940 | ) | | (141,877 | ) |
| | | | | | |
Communications | | | | | | |
Equipment - (0.3)% | | | | | | |
Riverbed Technology, Inc. 4,* | | (3,280 | ) | | (43,624 | ) |
| | | | | | |
Computer Hardware - (0.1)% | | | | | | |
Hewlett-Packard Company | | (580 | ) | | (18,595 | ) |
| | | | | | |
Computer Storage & | | | | | | |
Peripherals - (0.3)% | | | | | | |
Intermec, Inc. 4,* | | (2,740 | ) | | (54,307 | ) |
| | | | | | |
Diversified Banks - (3.4)% | | | | | | |
Wells Fargo & Company 4 | | (12,384 | ) | | (539,689 | ) |
| | | | | | |
| | | | | | |
| | | Shares | | | Value | |
COMMON STOCKS - (25.5)% (continued) | |
Diversified Metals & | | | | | | |
Mining - (0.2)% | | | | | | |
Ivanhoe Mines, Ltd. 4,* | | (4,440 | ) | | $(37,030 | ) |
| | | | | | |
Electric Utilities - (1.6)% | | | | | | |
Korea Electric Power Corporation
ADR 4 | | (18,310 | ) | | (247,734 | ) |
| | | | | | |
Exchange Traded Funds - (1.1)% | | | | | | |
Currency Shares Euro Trust | | (387 | ) | | (51,421 | ) |
iShares Barclays 20+ Year | | | | | | |
Treasury Bond Fund | | (966 | ) | | (102,115 | ) |
iShares MSCI Germany Index | | | | | | |
Fund | | (552 | ) | | (8,258 | ) |
iShares MSCI South Korea Index | | | | | | |
Fund | | (359 | ) | | (10,221 | ) |
SPDR KBW Regional Banking ETF | | (387 | ) | | (7,438 | ) |
| | | | | | |
| | | | | (179,453 | ) |
| | | | | | |
Food Retail - (0.1)% | | | | | | |
Whole Foods Market, Inc. | | (607 | ) | | (10,198 | ) |
| | | | | | |
Health Care Equipment - (0.4)% | | | | | | |
Intuitive Surgical, Inc. 4,* | | (200 | ) | | (56,100 | ) |
| | | | | | |
Health Care Supplies - (0.5)% | | | | | | |
Align Technology, Inc. 4,* | | (6,100 | ) | | (74,420 | ) |
| | | | | | |
Health Care Technology - (0.6)% | | | | | | |
athenahealth, Inc. 4,* | | (2,500 | ) | | (89,625 | ) |
| | | | | | |
Home Entertainment | | | | | | |
Software - (0.2)% | | | | | | |
Electronic Arts, Inc. 4,* | | (900 | ) | | (36,720 | ) |
| | | | | | |
Internet Software & | | | | | | |
Services - (1.7)% | | | | | | |
Baidu, Inc. ADR 4,* | | (200 | ) | | (53,726 | ) |
Equinix, Inc. 4,* | | (1,000 | ) | | (79,940 | ) |
SAVVIS, Inc. 4,* | | (5,700 | ) | | (84,017 | ) |
VeriSign, Inc. 4,* | | (1,200 | ) | | (30,756 | ) |
| | | | | | |
| | | | | (248,439 | ) |
| | | | | | |
Leisure Products - (1.8)% | | | | | | |
Pool Corporation 4 | | (11,639 | ) | | (288,065 | ) |
| | | | | | |
Life Sciences Tools & | | | | | | |
Services - (1.6)% | | | | | | |
AMAG Pharmaceuticals, Inc. 4,* | | (1,900 | ) | | (82,954 | ) |
Exelixis, Inc. 4,* | | (4,500 | ) | | (28,845 | ) |
Luminex Corporation 4,* | | (2,500 | ) | | (63,725 | ) |
Sequenom, Inc. 4,* | | (3,810 | ) | | (78,524 | ) |
| | | | | | |
| | | | | (254,048 | ) |
| | | | | | |
Oil & Gas Exploration & | | | | | | |
Production - (0.7)% | | | | | | |
BPZ Resources, Inc. 4,* | | (5,700 | ) | | (107,160 | ) |
| | | | | | |
Pharmaceuticals - (0.9)% | | | | | | |
Auxilium Pharmaceuticals, Inc. 4,* | | (1,540 | ) | | (56,703 | ) |
Sepracor, Inc. 4,* | | (1,400 | ) | | (24,500 | ) |
XenoPort, Inc. 4,* | | (1,376 | ) | | (63,062 | ) |
| | | | | | |
| | | | | (144,265 | ) |
| | | | | | |
| | | | |
| | | 19 | | The accompanying notes are an integral part of the financial statements |
| | |
Schedule of Investments March 31, 2009 (unaudited) | | Security Equity Fund Alpha Opportunity Series |
| |
| | | | |
| | | Shares | | Value |
COMMON STOCKS - (25.5)% (continued) |
Regional Banks - (0.7)% |
PrivateBancorp, Inc. 4 | | (2,390) | | $(102,770) |
| | | | |
Semiconductor Equipment - (0.2)% |
Varian Semiconductor Equipment Associates, Inc. 4,* | | (1,260) | | (33,037) |
| | | | |
Semiconductors - (1.1)% |
Cree, Inc. 4,* | | (4,000) | | (109,840) |
Rambus, Inc. 4,* | | (3,600) | | (55,224) |
| | | | |
| | | | (165,064) |
| | | | |
Soft Drinks - (0.6)% |
Hansen Natural Corporation 4,* | | (3,250) | | (96,232) |
| | | | |
Specialized Finance - (0.4)% |
CME Group, Inc. | | (276) | | (68,004) |
| | | | |
Specialty Chemicals - (0.3)% |
Zoltek Companies, Inc. 4,* | | (2,700) | | (49,221) |
| | | | |
Systems Software - (0.7)% |
Red Hat, Inc. 4,* | | (2,610) | | (46,589) |
VMware, Inc. 4,* | | (2,400) | | (68,592) |
| | | | |
| | | | (115,181) |
| | | | |
| Wireless Telecommunication Services - (1.0)% | | | | |
Clearwire Corporation 4,* | | (2,530) | | (28,665) |
Leap Wireless International, Inc. 4,* | | (1,500) | | (65,100) |
SBA Communications Corporation 4,* | | (2,400) | | (69,096) |
| | | | |
| | | | | (162,861) |
TOTAL COMMON STOCKS SOLD SHORT |
(proceeds $3,973,206) | | | | $(3,997,533) |
| | | Shares | | Value |
FOREIGN STOCKS - (23.2)% |
Australia - (1.4)% | | | | |
Aquila Resources, Ltd. 4,* | | (2,500) | | $(21,907) |
Arrow Energy, Ltd. 4,* | | (8,900) | | (22,965) |
Ausenco, Ltd. 4 | | (2,100) | | (22,658) |
Queensland Gas Company, Ltd. 4,* | | (12,800) | | (49,787) |
Riversdale Mining, Ltd. 4,* | | (6,700) | | (50,985) |
Sino Gold Mining, Ltd. 4,5,* | | (8,600) | | (35,368) |
Western Areas NL 4,* | | (6,200) | | (44,457) |
| | | | |
| | | | (248,127) |
| | | | |
Austria - (2.8)% | | | | |
bwin Interactive Entertainment AG 4,* | | (1,600) | | (45,582) |
Erste Group Bank AG 4 | | (5,200) | | (319,536) |
Intercell AG 4,* | | (1,900) | | (74,840) |
| | | | |
| | | | (439,958) |
| | | | |
Bermuda - (0.1)% | | | | |
C C Land Holdings, Ltd. 4 | | (50,000) | | (13,945) |
| | | | |
Canada - (1.5)% | | | | |
Agnico-Eagle Mines, Ltd. 4 | | (1,800) | | (119,002) |
Silver Wheaton Corporation 4,* | | (6,100) | | (64,046) |
Trican Well Service, Ltd. 4 | | (2,000) | | (34,043) |
| | | | |
| | | | (217,091) |
| | | | |
| | | | |
| | | Shares | | Value |
FOREIGN STOCKS - (23.2)% (continued) |
China - (1.7)% | | | | |
Anhui Conch Cement Company, Ltd. 4 | | (4,500) | | $(20,259) |
Beijing Capital International Airport Company, Ltd. 4 | | (218,000) | | (188,550) |
China Communications Construction Company, Ltd. 4 | | (15,000) | | (15,536) |
China National Building Material Company, Ltd. 4 | | (14,700) | | (19,910) |
China National Materials Company, Ltd. 4,* | | (34,400) | | (17,537) |
| | | | |
| | | | (261,792) |
| | | | |
Germany - (3.8)% | | | | |
Premiere AG 4,* | | (4,000) | | (65,668) |
Volkswagen AG 4 | | (1,300) | | (539,375) |
| | | | |
| | | | (605,043) |
| | | | |
Gibraltar - (0.3)% | | | | |
PartyGaming plc 4 | | (15,200) | | (57,210) |
| | | | |
Hong Kong - (0.4)% | | | | |
China Merchants Holdings International Company, Ltd. 4 | | (3,100) | | (11,047) |
Franshion Properties China, Ltd. 4 | | (79,400) | | (22,104) |
Fushan International Energy Group, Ltd. 4,* | | (66,000) | | (23,727) |
| | | | |
| | | | (56,878) |
| | | | |
Ireland - (0.2)% | | | | |
Ryanair Holdings plc 4,* | | (9,600) | | (35,971) |
| | | | |
Isle Of Man - (0.3)% |
Genting International plc 4,* | | (124,900) | | (41,123) |
| | | | |
Japan - (3.3)% | | | | |
Access Company, Ltd. 4,* | | (17) | | (32,755) |
Aeon Mall Company, Ltd. 4 | | (1,700) | | (52,093) |
Aozora Bank, Ltd. 4 | | (16,300) | | (26,250) |
Japan Steel Works, Ltd. 4 | | (1,500) | | (20,809) |
Marui Group Company, Ltd. 4 | | (29,100) | | (219,527) |
Mizuho Financial Group, Inc. 4 | | (11,000) | | (45,461) |
Mizuho Trust & Banking Company, Ltd. 4 | | (17,700) | | (24,682) |
Modec, Inc. 4 | | (900) | | (23,195) |
Monex Group, Inc. 4 | | (78) | | (27,384) |
Tokyo Broadcasting System, Inc. 4 | | (1,300) | | (21,836) |
Toyo Tanso Company, Ltd. 4 | | (500) | | (27,007) |
| | | | |
| | | | (520,999) |
| | | | |
Norway - (0.2)% | | | | |
Sevan Marine ASA 4,* | | (5,900) | | (30,951) |
| | | | |
Portugal - (3.0)% | | | | |
BRISA 4 | | (44,400) | | (461,804) |
| | | | |
Spain - (0.3)% | | | | |
Zeltia S.A. 4 | | (8,000) | | (54,559) |
| | | | |
Sweden - (2.5)% | | | | |
Electrolux AB 4 | | (30,100) | | (395,762) |
| | | | |
Switzerland - (0.9)% | | | | |
Basilea Pharmaceutica 4,* | | (500) | | (83,364) |
Meyer Burger Technology AG 4,* | | (200) | | (49,878) |
| | | | |
| | | | (133,242) |
| | | | |
| | | | |
| | | 20 | | The accompanying notes are an integral part of the financial statements |
| | |
Schedule of Investments March 31, 2009 (unadited) | | Security Equity Fund Alpha Opportunity Series |
| |
| | | | |
| | | Shares | | Value |
FOREIGN STOCKS - (23.2)% (continued) | | | | |
United Kingdom - (0.5)% | | | | |
Imperial Energy Corporation plc 4,* | | (3,900) | | $(77,681) |
| | | | |
| | | | |
TOTAL FOREIGN STOCKS SOLD SHORT | | | | |
(proceeds $3,495,580) | | | | $(3,652,136) |
TOTAL SECURITIES SOLD SHORT - (48.7%) | | | | |
(proceeds $7,468,786) | | | | $(7,649,669) |
| | | | |
For federal income tax purposes the identified cost of investments owned at March 31, 2009 was $23,017,253.
| ADR | American Depositary Receipt |
| plc | Public Limited Company |
* Non-income producing security
1 Security is segregated as collateral for open short positions.
2 Security is deemed illiquid. The total market value of illiquid securities is $5,581,800 (cost $8,577,438), or 35.5% of total net assets. The securities were liquid at time of purchase. This security is deemed illiquid due to the Series exposure to Lehman Brothers International Europe ("LBIE") prime brokerage services.
3 Security is segregated as collateral for open futures contracts.
4 Security is fair valued by the Valuation Committee at March 31, 2009. The total market value of fair valued securities amounts to $(7,341,377) (cost $(7,166,694)), or (46.7%) of total net assets.
5 Security is a PFIC (Passive Foreign Investment Company).
| | | | |
| | 21 | | The accompanying notes are an integral part of the financial statements |
| | |
| | Security Equity Fund Alpha Opportunity Series (unaudited) |
| |
| |
| | |
Statement of Assets and Liabilities March 31, 2009 |
Assets: | | |
Investments, at value* | | $19,412,255 |
Cash | | 93,863 |
Cash denominated in a foreign currency, at value*** | | 544,332 |
Restricted cash | | 708,516 |
Restricted cash denominated in a foreign currency, at value**** | | 2,668,108 |
Receivables: | | |
Fund shares sold | | 6 |
Securities sold | | 822,985 |
Interest | | 549 |
Dividends | | 24,458 |
Variation margin | | 31,500 |
Security Investors | | 6,665 |
Prepaid expenses | | 34,757 |
| | |
Total assets | | 24,347,994 |
| | |
Liabilities: | | |
Securities sold short, at value** | | 7,649,669 |
Payable for: | | |
Securities purchased | | 705,752 |
Fund shares redeemed | | 195,085 |
Dividends on short sales | | 7,126 |
Management fees | | 16,433 |
Transfer agent/maintenance fees | | 3,531 |
Administration fees | | 5,572 |
Professional fees | | 35,710 |
12b-1 distribution plan fees | | 4,973 |
Directors’ fees | | 1,286 |
| | |
Total liabilities | | 8,625,137 |
| | |
Net assets | | $15,722,857 |
| | |
Net assets consist of: | | |
Paid in capital | | $35,266,071 |
Accumulated net investment loss | | (93,055) |
Accumulated net realized loss on sale of investments and foreign currency transactions | | (16,026,684) |
Net unrealized depreciation in value of investments and translation of assets and liabilities in foreign currencies | | (3,423,475) |
| | |
Net assets | | $15,722,857 |
| | |
Class A: | | |
Capital shares outstanding (unlimited number of shares authorized) | | 1,564,269 |
Net assets | | $10,072,699 |
Net asset value and redemption price per share | | $6.44 |
| | |
Maximum offering price per share (net asset value divided by 94.25%) | | $6.83 |
| | |
Class B: | | |
Capital shares outstanding (unlimited number of shares authorized) | | 246,301 |
Net assets | | $1,495,198 |
Net asset value, offering and redemption price per share (excluding any applicable contingent deferred sales charge) | | $6.07 |
| | |
Class C: | | |
Capital shares outstanding (unlimited number of shares authorized) | | 334,772 |
Net assets | | $2,027,733 |
Net asset value, offering and redemption price per share (excluding any applicable contingent deferred sales charge) | | $6.06 |
| | |
Class Institutional: | | |
Capital shares outstanding (unlimited number of shares authorized) | | 241,294 |
Net assets | | $2,127,227 |
Net asset value, offering and redemption price per share (excluding any applicable contingent deferred sales charge) | | $8.82 |
| | |
| |
*Investments, at cost | | $22,698,801 |
**Securities sold short, proceeds | | 7,468,786 |
***Cash denominated in a foreign currency, at cost | | 571,928 |
****Restricted cash denominated in a foreign currency, at cost | | 2,803,373 |
| | |
Statement of Operations For the Six Months Ended March 31, 2009 |
Investment Income: | | |
Dividends (net of foreign withholding tax of $1,176) | | $151,844 |
Interest | | 33,077 |
| | |
Total investment income | | 184,921 |
| | |
| |
Expenses: | | |
Management fees | | 140,140 |
Transfer agent/maintenance fees | | 78,577 |
Administration fees | | 25,889 |
Custodian fees | | 16,009 |
Directors' fees | | 1,097 |
Professional fees | | 94,951 |
Reports to shareholders | | 6,342 |
Registration fees | | 19,806 |
Other expenses | | 2,913 |
Dividends on short sales | | 6,897 |
12b-1 distribution fees - Class A | | 18,552 |
12b-1 distribution fees - Class B | | 12,263 |
12b-1 distribution fees - Class C | | 14,354 |
| | |
Total expenses | | 437,790 |
Less: | | |
Reimbursement of expenses - Class A | | (120,157) |
Reimbursement of expenses - Class B | | (19,401) |
Reimbursement of expenses - Class C | | (25,233) |
Reimbursement of expenses - Institutional Class | | (24,871) |
Earnings credits applied | | (5,723) |
| | |
Net expenses | | 242,405 |
| | |
Net investment loss | | (57,484) |
| | |
Net Realized and Unrealized Gain (Loss): |
Net realized gain (loss) during the period on: | | |
Investments | | (8,880,819) |
Securities sold short | | 205,505 |
Foreign currency transactions | | (146,295) |
Futures | | (3,881,478) |
| | |
Net realized loss | | (12,703,087) |
| | |
Net unrealized appreciation (depreciation) during the period on: | | |
Investments | | 344,825 |
Securities sold short | | (255,763) |
Futures | | 1,114,290 |
Translation of assets and liabilities in foreign currencies | | (75,027) |
| | |
Net unrealized appreciation | | 1,128,325 |
| | |
Net loss | | (11,574,762) |
| | |
Net decrease in net assets resulting from operations | | $(11,632,246) |
| | |
| | | | |
| | | 22 | | The accompanying notes are an integral part of the financial statements |
| | |
| | Security Equity Fund Alpha Opportunity Series |
Statement of Changes in Net Assets | |
| | | | | | | | |
| | | Six Months Ended March 31, 2009 (unaudited) | | | Year Ended September 30, 2008 | |
| | |
Increase (decrease) in net assets from operations: | | | | | | | | |
Net investment loss | | $ | (57,484 | ) | | $ | (630,670 | ) |
Net realized loss during the period on investments and foreign currency transactions | | | (12,703,087 | ) | | | (1,900,322 | ) |
Net unrealized appreciation (depreciation) during the period on investments and translation of assets and liabilities in foreign currencies | | | 1,128,325 | | | | (5,203,245 | ) |
| | | | | | | | |
Net (decrease) in net assets resulting from operations | | | (11,632,246 | ) | | | (7,734,237 | ) |
| | | | | | | | |
| | |
Distributions to shareholders from: | | | | | | | | |
Net realized gain | | | | | | | | |
Class A | | | – | | | | (4,624,275 | ) |
Class B | | | – | | | | (730,879 | ) |
Class C | | | – | | | | (959,211 | ) |
Return of capital | | | | | | | | |
Class A | | | – | | | | (508,721 | ) |
Class B | | | – | | | | (80,405 | ) |
Class C | | | – | | | | (105,524 | ) |
| | | | | | | | |
Total distributions to shareholders | | | – | | | | (7,009,015 | ) |
| | | | | | | | |
| | |
Capital share transactions: | | | | | | | | |
Proceeds from sale of shares | | | | | | | | |
Class A | | | 1,465,581 | | | | 20,613,127 | |
Class B | | | 3,368 | | | | 5,409,786 | |
Class C | | | 7,885 | | | | 3,698,851 | |
Institutional Class | | | 4,976,825 | | | | – | |
Distributions reinvested | | | | | | | | |
Class A | | | – | | | | 5,033,793 | |
Class B | | | – | | | | 802,594 | |
Class C | | | – | | | | 960,779 | |
Cost of shares redeemed | | | | | | | | |
Class A | | | (13,689,380 | ) | | | (9,305,440 | ) |
Class B | | | (2,453,883 | ) | | | (2,099,606 | ) |
Class C | | | (1,492,902 | ) | | | (1,872,076 | ) |
Institutional Class | | | (2,402,560 | ) | | | – | |
| | | | | | | | |
Net increase (decrease) from capital share transactions | | | (13,585,066 | ) | | | 23,241,808 | |
| | | | | | | | |
Net increase (decrease) in net assets | | | (25,217,312 | ) | | | 8,498,556 | |
| | | | | | | | |
| | |
Net assets: | | | | | | | | |
Beginning of period | | | 40,940,169 | | | | 32,441,613 | |
| | | | | | | | |
End of period | | $ | 15,722,857 | | | $ | 40,940,169 | |
| | | | | | | | |
| | |
Accumulated net investment loss at end of period | | $ | (93,055 | ) | | $ | (35,571 | ) |
| | | | | | | | |
| | |
Capital share activity: | | | | | | | | |
Shares sold | | | | | | | | |
Class A | | | 200,512 | | | | 1,869,043 | |
Class B | | | 152 | | | | 505,963 | |
Class C | | | 789 | | | | 335,936 | |
Institutional Class | | | 502,377 | | | | – | |
Shares reinvested | | | | | | | | |
Class A | | | – | | | | 463,090 | |
Class B | | | – | | | | 77,545 | |
Class C | | | – | | | | 92,829 | |
Shares redeemed | | | | | | | | |
Class A | | | (1,903,617 | ) | | | (863,491 | ) |
Class B | | | (361,665 | ) | | | (210,696 | ) |
Class C | | | (222,460 | ) | | | (186,349 | ) |
Institutional Class | | | (261,083 | ) | | | – | |
| | | | |
| | 23 | | The accompanying notes are an integral part of the financial statements |
| | |
| Financial Highlights | | Security Equity Fund |
Selected data for each share of capital stock outstanding throughout each period | | Alpha Opportunity Series |
| | | | | | | | | | | | | | |
Class A | | Six Months Ended
March 31, 2009 |
a | | 2008 | b | | 2007 | | 2006 | | 2005 | | Year Ended
September 30, 2004 |
Per Share Data | | | | | | | | | | | | | | |
Net asset value, beginning of period | | $9.37 | | | $13.94 | | | $12.23 | | $12.37 | | $11.79 | | $10.21 |
Income (loss) from investment operations: | | | | | | | | | | | | | | |
Net investment lossc | | (0.01) | | | (0.16) | | | (0.01) | | (0.06) | | (0.10) | | (0.16) |
Net gain (loss) on securities (realized and unrealized) | | (2.92) | | | (1.68) | | | 2.99 | | 0.93 | | 1.50 | | 2.33 |
Total from investment operations | | (2.93) | | | (1.84) | | | 2.98 | | 0.87 | | 1.40 | | 2.17 |
Less distributions: | | | | | | | | | | | | | | |
Distributions from realized gains | | – | | | (2.57) | | | (1.27) | | (1.01) | | (0.82) | | (0.59) |
Return of capital | | – | | | (0.16) | | | – | | – | | – | | – |
Total distributions | | – | | | (2.73) | | | (1.27) | | (1.01) | | (0.82) | | (0.59) |
Net asset value, end of period | | $6.44 | | | $9.37 | | | $13.94 | | $12.23 | | $12.37 | | $11.79 |
| | |
| | | | | | | | | | | | | | |
Total Return d | | (31.20%) | | | (15.99%) | | | 26.10% | | 7.39% | | 12.26% | | 21.68% |
Ratios/Supplemental Data | | | | | | | | | | | | | | |
Net assets, end of period (in thousands) | | $10,073 | | | $30,615 | | | $25,072 | | $20,595 | | $14,622 | | $6,556 |
Ratios to average net assets: | | | | | | | | | | | | | | |
Net investment loss | | (0.36%) | | | (1.44%) | | | (0.08%) | | (0.50%) | | (0.83%) | | (1.48%) |
Total expensese | | 3.68% | | | 3.41% f | | | 2.88% | | 3.20% | | 2.94% | | 3.57% |
Net expensesg | | 1.95% | | | 3.16% h | | | 2.68% | | 3.01% | | 2.86% | | 2.78% |
Net expenses prior to custodian earning credits and net of expense waivers | | 1.99% | | | 3.32% i | | | 2.88% | | 3.10% | | 2.86% | | 2.79% |
Net expenses prior to performance fee adjustmentj | | N/A | | | 2.75% k | | | 2.77% | | 2.82% | | 2.78% | | 2.78% |
Portfolio turnover rate | | 269% | | | 1,248% | | | 1,697% | | 1,302% | | 1,502% | | 1,175% |
| | | | | | |
Class B | | Six Months Ended
March 31, 2009 |
a | | 2008 | b | | 2007 | | 2006 | | 2005 | | Year Ended
September 30, 2004 |
Per Share Data | | | | | | | | | | | | | | |
Net asset value, beginning of period | | $8.87 | | | $13.42 | | | $11.90 | | $12.15 | | $11.68 | | $10.20 |
Income (loss) from investment operations: | | | | | | | | | | | | | | |
Net investment lossc | | (0.04) | | | (0.23) | | | (0.09) | | (0.15) | | (0.18) | | (0.25) |
Net gain (loss) on securities (realized and unrealized) | | (2.76) | | | (1.59) | | | 2.88 | | 0.91 | | 1.47 | | 2.32 |
Total from investment operations | | (2.80) | | | (1.82) | | | 2.79 | | 0.76 | | 1.29 | | 2.07 |
Less distributions: | | | | | | | | | | | | | | |
Distributions from realized gains | | – | | | (2.57) | | | (1.27) | | (1.01) | | (0.82) | | (0.59) |
Return of capital | | – | | | (0.16) | | | – | | – | | – | | – |
Total distributions | | – | | | (2.73) | | | (1.27) | | (1.01) | | (0.82) | | (0.59) |
Net asset value, end of period | | $6.07 | | | $8.87 | | | $13.42 | | $11.90 | | $12.15 | | $11.68 |
| | |
| | | | | | | | | | | | | | |
Total Return d | | (31.41%) | | | (16.66%) | | | 25.14% | | 6.56% | | 11.39% | | 20.68% |
Ratios/Supplemental Data | | | | | | | | | | | | | | |
Net assets, end of period (in thousands) | | $1,495 | | | $5,391 | | | $3,154 | | $4,846 | | $4,106 | | $2,324 |
Ratios to average net assets: | | | | | | | | | | | | | | |
Net investment loss | | (1.12%) | | | (2.18%) | | | (0.77%) | | (1.24%) | | (1.60%) | | (2.25%) |
Total expensese | | 4.38% | | | 4.16% f | | | 3.59% | | 3.95% | | 3.69% | | 4.29% |
Net expensesg | | 2.70% | | | 3.89% h | | | 3.39% | | 3.76% | | 3.61% | | 3.53% |
Net expenses prior to custodian earning credits and net of expense waivers | | 2.80% | | | 4.04% i | | | 3.59% | | 3.85% | | 3.61% | | 3.53% |
Net expenses prior to performance fee adjustmentj | | N/A | | | 3.49% k | | | 3.51% | | 3.57% | | 3.53% | | 3.53% |
Portfolio turnover rate | | 269% | | | 1,248% | | | 1,697% | | 1,302% | | 1,502% | | 1,175% |
| | | | |
| | 24 | | The accompanying notes are an integral part of the financial statements |
| | |
| Financial Highlights | | Security Equity Fund |
Selected data for each share of capital stock outstanding throughout each period | | Alpha Opportunity Series |
| | | | | | | | | | | | | | |
Class C | | Six Months Ended
March 31, 2009 |
a | | 2008 | b | | 2007 | | 2006 | | 2005 | | Year Ended
September 30, 2004 |
Per Share Data | | | | | | | | | | | | | | |
Net asset value, beginning of period | | $8.87 | | | $13.43 | | | $11.90 | | $12.15 | | $11.68 | | $10.20 |
Income (loss) from investment operations: | | | | | | | | | | | | | | |
Net investment lossc | | (0.04) | | | (0.23) | | | (0.10) | | (0.15) | | (0.18) | | (0.25) |
Net gain (loss) on securities (realized and unrealized) | | (2.77) | | | (1.60) | | | 2.90 | | 0.91 | | 1.47 | | 2.32 |
Total from investment operations | | (2.81) | | | (1.83) | | | 2.80 | | 0.76 | | 1.29 | | 2.07 |
Less distributions: | | | | | | | | | | | | | | |
Distributions from realized gains | | – | | | (2.57) | | | (1.27) | | (1.01) | | (0.82) | | (0.59) |
Return of capital | | – | | | (0.16) | | | – | | – | | – | | – |
Total distributions | | – | | | (2.73) | | | (1.27) | | (1.01) | | (0.82) | | (0.59) |
Net asset value, end of period | | $6.06 | | | $8.87 | | | $13.43 | | $11.90 | | $12.15 | | $11.68 |
| | |
| | | | | | | | | | | | | | |
Total Return d | | (31.60%) | | | (16.63%) | | | 25.24% | | 6.56% | | 11.39% | | 20.68% |
Ratios/Supplemental Data | | | | | | | | | | | | | | |
Net assets, end of period (in thousands) | | $2,028 | | | $4,935 | | | $4,216 | | $5,576 | | $7,813 | | $3,143 |
Ratios to average net assets: | | | | | | | | | | | | | | |
Net investment loss | | (1.09%) | | | (2.21%) | | | (0.77%) | | (1.18%) | | (1.58%) | | (2.24%) |
Total expensese | | 4.56% | | | 4.16% f | | | 3.60% | | 3.95% | | 3.68% | | 4.30% |
Net expensesg | | 2.70% | | | 3.93% h | | | 3.40% | | 3.75% | | 3.61% | | 3.53% |
Net expenses prior to custodian earning credits and net of expense waivers | | 2.80% | | | 4.09% i | | | 3.60% | | 3.83% | | 3.61% | | 3.53% |
Net expenses prior to performance fee adjustmentj | | N/A | | | 3.51% k | | | 3.51% | | 3.57% | | 3.53% | | 3.53% |
Portfolio turnover rate | | 269% | | | 1,248% | | | 1,697% | | 1,302% | | 1,502% | | 1,175% |
| | |
| Institutional Class | | Year Ended March 31, 2009l |
| Per Share Data | | |
Net asset value, beginning of period | | $10.00 |
Income (loss) from investment operations: | | |
Net investment incomec | | 0.02 |
Net gain on securities (realized and unrealized) | | (1.20) |
| | |
Total from investment operations | | (1.18) |
Net asset value, end of period | | $8.82 |
| | |
| | |
Total Return | | (11.80%) |
Ratios/Supplemental Data | | |
Net assets, end of period (in thousands) | | $2,127 |
Ratios to average net assets: | | |
Net investment income | | 0.49% |
Total expensese | | 4.00% |
Net expensesg | | 1.70% |
Net expenses prior to custodian earning credits and net of expense waivers | | 1.80% |
Net expenses prior to performance fee adjustmentj | | N/A |
Portfolio turnover rate | | 269% |
| | | | |
| | 25 | | The accompanying notes are an integral part of the financial statements |
| | |
Financial Highlights Selected data for each share of capital stock outstanding throughout each period | | Security Equity Fund Alpha Opportunity Series |
| |
a Unaudited figures for the six months ended March 31, 2009. Percentage amounts for the period, except total return, have been annualized.
b Security Global Investors, LLC (SGI) became the sub-adviser of 37.5% of the assets of the Alpha Opportunity Series effective August 18, 2008. Also effective August 18, 2008, Mainstream Investment Advisers, LLC (Mainstream) sub-advises 37.5% of the assets and Security Investors, LLC (SI) manages 25% of the assets. Prior to August 18, 2008, SI paid Mainstream sub-advisory fees for 60% of the assets. SI managed the remaining 40% of the assets.
c Net investment income (loss) was computed using average shares outstanding throughout the period.
d Total return information does not reflect deduction of any sales charges imposed at the time of purchase for Class A shares or upon redemption for Class B and C shares.
e Total expense information reflects expense ratios absent expense reductions by the Investment Manager and custodian earnings credits, as applicable.
f The Series has restated its financial highlights in order to properly present the Series' total expense ratios. The effect of this restatement was to increase the ratios of total expenses to average net assets by 0.45% for Class A, 1.03% for Class B and 0.14% for Class C.
g Net expense information reflects the expense ratios after voluntary expense waivers, reimbursements and custodian earnings credits, as applicable.
h The Series has restated this ratio in order to properly present the Series' net expense ratios. The effect of this restatement was to increase the ratios of net expenses to average net assets by 0.41% for Class A, 0.96% for Class B and 0.13% for Class C.
i The Series has restated this ratio in order to properly present the Series' net expense ratios prior to custodian earning credits and net of expense waivers. The effect of this restatement was to increase the ratios of net expenses prior to custodian earning credits and net of expense waivers to average net assets by 0.44% for Class A, 1.00% for Class B and 0.14% for Class C.
j Net expenses prior to performance fee adjustment reflect ratios after voluntary expense waivers, reimbursements, custodian earnings credits, and before performance fees adjustments, as applicable.
k The Series has restated this ratio in order to properly present the Series' net expense ratios prior to performance fee adjustment. The effect of this restatement was to increase the ratios of net expenses prior to performance fee adjustment to average net assets by 0.36% for Class A, 0.87% for Class B and 0.11% for Class C.
l The Institutional Class of Alpha Opportunity Series was initially capitalized on November 7, 2008 with a net asset value of $10 per share. Percentage amounts for the period, except total return, have been annualized.
| | | | |
| | | 26 | | The accompanying notes are an integral part of the financial statements |
This page left blank intentionally.
| | |
Performance Summary March 31, 2009 | | Security Equity Fund Equity Series (unaudited) |
| |
| |
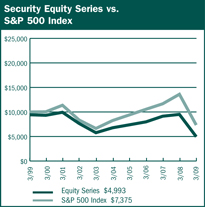
$10,000 Over Ten Years
This chart assumes a $10,000 investment in Class A shares of Equity Series on March 31, 1999, reflects deduction of the 5.75% sales load and assumes all dividends reinvested. The chart does not reflect the deduction of taxes that a shareholder would pay on distributions or the redemption of fund shares. The S&P 500 Index is a capitalization capitalization weighted index composed of 500 selected common stocks that represent the broad domestic economy and is a widely recognized unmanaged index on market performance.
| | | | | | |
Average Annual Returns |
| | | | |
Periods Ended 3-31-09 | | 1 Year | | 5 Years | | 10 Years |
| | | |
A Shares | | (38.80%) | | (7.77%) | | (6.16%) |
A Shares with sales charge | | (42.30%) | | (8.85%) | | (6.71%) |
B Shares | | (39.29%) | | (8.47%) | | (6.79%) |
B Shares with CDSC | | (42.32%) | | (8.71%) | | (6.79%) |
C Shares | | (39.30%) | | (8.47%) | | (6.98%) |
C Shares with CDSC | | (39.91%) | | (8.47%) | | (6.98%) |
The performance data above represents past performance that is not predictive of future results. The investment return and principal value of an investment in the Series will fluctuate so that an investor’s shares, when redeemed, may be worth more or less than their original cost. The figures above do not reflect deduction of the maximum front-end sales charge of 5.75% for Class A shares or the contingent deferred sales charge of 5% for Class B shares and 1% for Class C shares, as applicable, except where noted. The figures do not reflect the deduction of taxes that a shareholder would pay on distributions or redemption of shares. Such figures would be lower if the maximum sales charge and any applicable taxes were deducted. |
| | | | | | |
| | | Portfolio Composition by Sector as of 3-31-09 |
| | | Consumer Discretionary | | 10.33% | | |
| | | Consumer Staples | | 10.89 | | |
| | | Energy | | 9.80 | | |
| | | Financials | | 8.86 | | |
| | | Health Care | | 12.17 | | |
| | | Industrials | | 16.15 | | |
| | | Information Technology | | 18.26 | | |
| | | Materials | | 6.34 | | |
| | | Telecommunication Services | | 0.55 | | |
| | | Utilities | | 2.22 | | |
| | | Exchange Traded Funds | | 0.95 | | |
| | | Cash & Other Assets, Less Liabilities | | 3.48 | | |
| | | Total Net Assets | | 100.00% | | |
| | | | | | | |
| | | | | | | |
| | | | |
| | | 28 | | The accompanying notes are an integral part of the financial statements |
| | |
Performance Summary March 31, 2009 | | Security Equity Fund Equity Series (unaudited) |
Information About Your Series Expenses
Calculating your ongoing Series expenses
Example
As a shareholder of the Series, you incur two types of costs: (1) transaction costs, which may include sales charges (loads) on purchase payments; contingent deferred sales charges on redemptions; and redemption fees, if any; and (2) ongoing costs, including management fees; distribution and/or service fees (12b-1); and other Series expenses. This example is intended to help you understand your ongoing costs (in dollars) of investing in the Series and to compare these costs with ongoing costs of investing in other mutual funds. The example is based on an investment of $1,000 invested at the beginning of the period and held for the entire period October 1, 2008 through March 31, 2009.
Actual Expenses
The first line for each class of shares in the table provides information about actual account values and actual expenses. You may use the information in this table, together with the amount you invested, to estimate the expenses that you paid over the period. Simply divide your account value by $1,000 (for example, an $8,600 account value divided by $1,000 = 8.6), then multiply the result by the number in the table under the heading entitled “Expenses Paid During the Period” to estimate the expenses you paid on your account during this period.
Hypothetical Example for Comparison Purposes
The second line for each class of shares in the table provides information about hypothetical account values and hypothetical expenses based on the Series actual expense ratio and an assumed rate of return of 5% per year before expenses, which is not the Series actual return. The hypothetical account values and expenses may not be used to estimate the actual ending account balance or expenses you paid for the period. You may use this information to compare the ongoing costs of investing in the Series and other funds. To do so, compare this 5% hypothetical example with the 5% hypothetical examples that appear in the shareholder reports of the other mutual funds.
Please note that the expenses shown in the table are meant to highlight your ongoing costs only and do not reflect any transactional costs, such as sales charges (loads) on purchase payments, contingent deferred sales charges on redemptions, and redemption fees, if any. Therefore, the second line for each class of shares is useful in comparing ongoing costs only, and will not help you determine the relative total costs of owning different funds. In addition, if these transactional costs were included, your costs would have been higher.
| | | | | | |
Series Expenses |
| | | Beginning
Account
Value
10/1/2008 | | Ending
Account
Value
3/31/2009 1 | | Expenses
Paid
During
Period 2 |
Equity Series - Class A | | | | | | |
Actual | | $1,000.00 | | $711.14 | | $6.53 |
Hypothetical | | 1,000.00 | | 1,017.30 | | 7.70 |
Equity Series - Class B | | | | | | |
Actual | | 1,000.00 | | 708.52 | | 9.71 |
Hypothetical | | 1,000.00 | | 1,013.56 | | 11.45 |
Equity Series - Class C | | | | | | |
Actual | | 1,000.00 | | 708.94 | | 9.71 |
Hypothetical | | 1,000.00 | | 1,013.56 | | 11.45 |
1 The actual ending account value is based on the actual total return of the Series for the period October 1, 2008 to March 31, 2009 after actual expenses and will differ from the hypothetical ending account value which is based on the Series expense ratio and a hypothetical annual return of 5% before expenses. The actual cumulative return at net asset value for the period October 1, 2008 to March 31, 2009 was (28.89%), (29.15%) and (29.11%), for Class A, B and C shares, respectively.
2 Expenses are equal to the Series annualized expense ratio (1.53%, 2.28% and 2.29% for Class A, B, and C shares, respectively), net of any applicable fee waivers, multiplied by the average account value over the period, multiplied by 182/365 (to reflect the one-half year period).
| | |
Schedule of Investments March 31, 2009 (unaudited) | | Security Equity Fund Equity Series |
| |
| | | | |
| | | Shares | | Value |
COMMON STOCKS - 96.5% | | | | |
Advertising - 1.3% | | | | |
Omnicom Group, Inc. | | 80,200 | | $1,876,680 |
| | | | |
| Aerospace & Defense - 2.8% | | | | |
Honeywell International, Inc. | | 77,770 | | 2,166,672 |
United Technologies Corporation | | 42,700 | | 1,835,246 |
| | | | |
| | | | 4,001,918 |
| | | | |
Air Freight & Logistics - 1.5% | | | | |
FedEx Corporation | | 49,200 | | 2,188,908 |
| | | | |
| Asset Management & Custody Banks - 1.6% | | | | |
Bank of New York Mellon Corporation | | 83,245 | | 2,351,671 |
| | | | |
Biotechnology - 1.8% | | | | |
Gilead Sciences, Inc. * | | 55,385 | | 2,565,433 |
| | | | |
| | |
Broadcasting - 0.1% | | | | |
CBS Corporation | | 47,000 | | 184,240 |
| | | | |
| | |
Building Products - 0.8% | | | | |
USG Corporation * | | 151,800 | | 1,155,198 |
| | | | |
| | |
Cable & Satellite - 0.3% | | | | |
Time Warner Cable, Inc. | | 15,487 | | 384,085 |
| | | | |
Communications Equipment - 2.4% | | | | |
Qualcomm, Inc. | | 89,895 | | 3,497,814 |
| | | | |
| Computer Hardware - 5.9% | | | | |
Apple, Inc. * | | 25,640 | | 2,695,277 |
Dell, Inc. * | | 168,350 | | 1,595,958 |
Hewlett-Packard Company | | 127,735 | | 4,095,184 |
| | | | |
| | | | 8,386,419 |
| | | | |
| Construction Materials - 0.6% | | | | |
Vulcan Materials Company | | 19,400 | | 859,226 |
| | | | |
| Consumer Finance - 0.2% | | | | |
First Marblehead Corporation * | | 173,842 | | 224,256 |
| | | | |
| | |
| Data Processing & Outsourced Services - 2.0% | | | | |
Western Union Company | | 232,200 | | 2,918,754 |
| | | | |
| Department Stores - 2.7% | | | | |
JC Penney Company, Inc. | | 84,300 | | 1,691,901 |
Kohl's Corporation * | | 54,850 | | 2,321,252 |
| | | | |
| | | | 4,013,153 |
| | | | |
| Diversified Banks - 1.2% | | | | |
U.S. Bancorp | | 57,521 | | 840,382 |
Wells Fargo & Company | | 59,900 | | 852,976 |
| | | | |
| | | | 1,693,358 |
| | | | |
| Diversified Chemicals - 0.3% | | | | |
Dow Chemical Company | | 49,600 | | 418,128 |
| | | | |
Drug Retail - 3.3% | | | | |
CVS Caremark Corporation | | 173,635 | | 4,773,226 |
| | | | |
| | | | |
| | | Shares | | Value |
COMMON STOCKS - 96.5% (continued) |
| Electric Utilities - 1.7% | | | | |
Edison International | | 86,500 | | $2,492,065 |
| | | | |
| Electrical Components & Equipment - 1.6% | | | | |
Emerson Electric Company | | 82,430 | | 2,355,849 |
| | | | |
| Electronic Manufacturing Services - 0.7% | | | | |
Tyco Electronics, Ltd. | | 85,600 | | 945,024 |
| | | | |
| Exchange Traded Funds - 0.9% | | | | |
iShares Russell 1000 Value Index Fund | | 17,100 | | 694,089 |
iShares S&P 500 Value Index Fund | | 18,300 | | 680,760 |
| | | | |
| | | | 1,374,849 |
| | | | |
| Fertilizers & Agricultural Chemicals - 3.2% | | | | |
Monsanto Company | | 28,860 | | 2,398,266 |
Mosaic Company | | 53,945 | | 2,264,611 |
| | | | |
| | | | 4,662,877 |
| | | | |
| General Merchandise Stores - 1.4% | | | | |
Target Corporation | | 60,350 | | 2,075,437 |
| | | | |
| Health Care Equipment - 1.9% | | | | |
Covidien, Ltd. | | 33,800 | | 1,123,512 |
Hospira, Inc. * | | 52,700 | | 1,626,322 |
| | | | |
| | | | 2,749,834 |
| | | | |
| Health Care Services - 1.1% | | | | |
Medco Health Solutions, Inc. * | | 39,400 | | 1,628,796 |
| | | | |
| Home Entertainment Software - 2.0% | | | | |
Activision Blizzard, Inc. * | | 276,585 | | 2,893,079 |
| | | | |
| Home Improvement Retail - 1.8% | | | | |
Lowe's Companies, Inc. | | 139,800 | | 2,551,350 |
| | | | |
| Hypermarkets & Super Centers - 5.2% | | | | |
Costco Wholesale Corporation | | 42,500 | | 1,968,600 |
Wal-Mart Stores, Inc. | | 106,830 | | 5,565,843 |
| | | | |
| | | | 7,534,443 |
| | | | |
| Independent Power Producers & Energy Traders - 0.5% | | | | |
NRG Energy, Inc. * | | 41,500 | | 730,400 |
| | | | |
Industrial Conglomerates - 2.0% | | | | |
General Electric Company | | 134,800 | | 1,362,828 |
McDermott International, Inc. * | | 117,100 | | 1,567,969 |
| | | | |
| | | | 2,930,797 |
| | | | |
Industrial Gases - 1.7% | | | | |
Air Products & Chemicals, Inc. | | 44,480 | | 2,502,000 |
| | | | |
Industrial Machinery - 2.1% | | | | |
Parker Hannifin Corporation | | 91,250 | | 3,100,675 |
| | | | |
| | | | |
| | | 30 | | The accompanying notes are an integral part of the financial statements |
| | |
Schedule of Investments March 31, 2009 (unaudited) | | Security Equity Fund Equity Series |
| |
| | | | |
| | | Shares | | Value |
COMMON STOCKS - 96.5% (continued) |
Insurance Brokers - 0.9% | | | | |
AON Corporation | | 32,900 | | $1,342,978 |
| | | | |
| Integrated Oil & Gas - 3.9% | | | | |
Chevron Corporation | | 29,900 | | 2,010,476 |
ConocoPhillips | | 14,400 | | 563,904 |
Exxon Mobil Corporation | | 45,700 | | 3,112,170 |
| | | | |
| | | | 5,686,550 |
| | | | |
| Integrated Telecommunication Services - 0.5% | | | | |
Windstream Corporation | | 98,400 | | 793,104 |
| | | | |
| Internet Software & Services - 2.5% | | | | |
Google, Inc. * | | 10,200 | | 3,550,212 |
| | | | |
| Life Sciences Tools & Services - 1.7% | | | | |
Thermo Fisher Scientific, Inc. * | | 70,170 | | 2,502,964 |
| | | | |
| Managed Health Care - 0.8% | | | | |
Aetna, Inc. | | 49,600 | | 1,206,768 |
| | | | |
| Movies & Entertainment - 0.8% | | | | |
Time Warner, Inc. | | 61,700 | | 1,190,810 |
| | | | |
| Oil & Gas Drilling - 2.0% | | | | |
Transocean, Ltd. * | | 49,010 | | 2,883,748 |
| | | | |
| Oil & Gas Equipment & Services - 0.8% | | | | |
Halliburton Company | | 74,300 | | 1,149,421 |
| | | | |
| Oil & Gas Exploration & Production - 2.4% | | | | |
Chesapeake Energy Corporation | | 64,400 | | 1,098,664 |
XTO Energy, Inc. | | 76,000 | | 2,327,120 |
| | | | |
| | | | 3,425,784 |
| | | | |
| Oil & Gas Storage & Transportation - 0.7% | | | | |
Williams Companies, Inc. | | 93,900 | | 1,068,582 |
| | | | |
| Other Diversified Financial Services - 2.5% | | | | |
JPMorgan Chase & Company 1 | | 135,105 | | 3,591,091 |
| | | | |
| Packaged Foods & Meats - 1.1% | | | | |
General Mills, Inc. | | 32,860 | | 1,639,057 |
| | | | |
| Pharmaceuticals - 4.9% | | | | |
Pfizer, Inc. | | 137,720 | | 1,875,746 |
Schering-Plough Corporation | | 85,200 | | 2,006,460 |
Teva Pharmaceutical Industries, Ltd. ADR | | 69,190 | | 3,117,010 |
| | | | |
| | | | 6,999,216 |
| | | | |
| Property & Casualty Insurance - 2.5% | | | | |
Berkshire Hathaway, Inc. * | | 42 | | 3,641,400 |
| | | | |
| | | | |
| | | Shares | | Value |
COMMON STOCKS - 96.5% (continued) |
Railroads - 4.2% | | | | |
Burlington Northern Santa Fe Corporation | | 57,600 | | $3,464,641 |
Union Pacific Corporation | | 62,500 | | 2,569,375 |
| | | | |
| | | | 6,034,016 |
| | | | |
| Research & Consulting Services - 1.1% | | | | |
Equifax, Inc. | | 67,400 | | 1,647,930 |
| | | | |
| Restaurants - 1.9% | | | | |
McDonald's Corporation | | 49,410 | | 2,696,304 |
| | | | |
| Semiconductors - 1.3% | | | | |
Intel Corporation | | 129,000 | | 1,941,450 |
| | | | |
| Specialty Chemicals - 0.5% | | | | |
Rohm & Haas Company | | 9,600 | | 756,864 |
| | | | |
| Systems Software - 1.6% | | | | |
Oracle Corporation | | 129,830 | | 2,346,028 |
| | | | |
| Tobacco - 1.3% | | | | |
Altria Group, Inc. | | 47,700 | | 764,154 |
Philip Morris International, Inc. | | 30,600 | | 1,088,748 |
| | | | |
| | | | 1,852,902 |
| TOTAL COMMON STOCKS | | | | |
(cost $196,013,240) | | | | $139,967,121 |
Total Investments - 96.5% (cost $196,013,240) | | | | $139,967,121 |
| Cash & Other Assets, Less Liabilities - 3.5% | | 5,040,494 |
| | | | |
Total Net Assets - 100.0% | | | | $145,007,615 |
| | | | |
For federal income tax purposes the identified cost of investments owned at March 31, 2009 was $197,429,798.
ADR American Depositary Receipt
* Non-income producing security
1 Security is segregated as collateral for open written option contracts.
| | | | |
| | | 31 | | The accompanying notes are an integral part of the financial statements |
Security Equity Fund
Equity Series
(unaudited)
| | |
Statement of Assets & Liabilities March 31, 2009 | | Statement of Operations For the Six Months Ended March 31, 2009 |
| | | |
Assets: | | | |
Investments, at value* | | $139,967,121 | |
Cash | | 5,137,358 | |
Receivables: | | | |
Fund shares sold | | 8,880 | |
Securities sold | | 464,964 | |
Dividends | | 274,098 | |
Prepaid expenses | | 22,884 | |
| | | |
Total assets | | 145,875,305 | |
| | | |
Liabilities: | | | |
Payable for: | | | |
Securities purchased | | 191,754 | |
Fund shares redeemed | | 414,743 | |
Written options, at value (premiums received, $12,355) | | 4,551 | |
Management fees | | 87,844 | |
Custodian fees | | 927 | |
Transfer agent/maintenance fees | | 24,546 | |
Administration fees | | 11,247 | |
Professional fees | | 28,735 | |
12b-1 distribution plan fees | | 34,378 | |
Directors’ fees | | 9,935 | |
Other | | 59,030 | |
| | | |
Total liabilities | | 867,690 | |
| | | |
Net assets | | $145,007,615 | |
| | | |
Net assets consist of: | | | |
Paid in capital | | $234,674,289 | |
Undistributed net investment income | | 231,206 | |
Accumulated net realized loss on sale of investments | | (33,859,565 | ) |
Net unrealized depreciation in value of investments | | (56,038,315 | ) |
| | | |
Net assets | | $145,007,615 | |
| | | |
Class A: | | | |
Capital shares outstanding (unlimited number of shares authorized) | | 45,414,386 | |
Net assets | | $136,579,071 | |
Net asset value and redemption price per share | | $3.01 | |
| | | |
Maximum offering price per share (net asset value divided by 94.25%) | | $3.19 | |
| | | |
Class B: | | | |
Capital shares outstanding (unlimited number of shares authorized) | | 2,601,702 | |
Net assets | | $6,480,823 | |
Net asset value, offering and redemption price per share (excluding any applicable contingent deferred sales charge) | | $2.49 | |
| | | |
Class C: | | | |
Capital shares outstanding (unlimited number of shares authorized) | | 722,838 | |
Net assets | | $1,947,721 | |
Net asset value, offering and redemption price per share (excluding any applicable contingent deferred sales charge) | | $2.69 | |
| | | |
| |
*Investments, at cost | | $196,013,240 | |
| | | |
Investment Income: | | | |
Dividends | | $1,616,936 | |
Interest | | 9,939 | |
| | | |
Total investment income | | 1,626,875 | |
| | | |
| |
Expenses: | | | |
Management fees | | 598,411 | |
Transfer agent/maintenance fees | | 257,066 | |
Administration fees | �� | 76,004 | |
Custodian fees | | 4,646 | |
Directors’ fees | | 8,345 | |
Professional fees | | 21,826 | |
Reports to shareholders | | 23,393 | |
Registration fees | | 18,285 | |
Other expenses | | 11,006 | |
12b-1 distribution fees - Class A | | 187,485 | |
12b-1 distribution fees - Class B | | 37,016 | |
12b-1 distribution fees - Class C | | 10,925 | |
| | | |
Total expenses | | 1,254,408 | |
| | | |
Net investment income | | 372,467 | |
| | | |
| |
Net Realized and Unrealized Gain (Loss): | | | |
Net realized gain (loss) during the period on: | | | |
Investments | | (31,960,294 | ) |
Options written | | 125,094 | |
| | | |
Net realized loss | | (31,835,200 | ) |
| | | |
| |
Net unrealized appreciation (depreciation) during the period on: | | | |
Investments | | (31,602,154 | ) |
Options written | | 7,804 | |
| | | |
Net unrealized depreciation | | (31,594,350 | ) |
| | | |
Net loss | | (63,429,550 | ) |
| | | |
Net decrease in net assets resulting from operations | | $(63,057,083 | ) |
| | | |
| | | | |
| | | 32 | | The accompanying notes are an integral part of the financial statements |
| | |
Statement of Changes in Net Assets | | Security Equity Fund Equity Series |
| |
| | | | | | | | |
| | | Six Months Ended
March 31, 2009
(unaudited) | | | Year Ended
September 30, 2008 | |
| | |
Increase (decrease) in net assets from operations: | | | | | | | | |
Net investment income | | $ | 372,467 | | | $ | 282,642 | |
Net realized gain (loss) during the period on investments | | | (31,835,200 | ) | | | 2,814,005 | |
Net unrealized depreciation during the period on investments | | | (31,594,350 | ) | | | (86,550,394 | ) |
| | | | | | | | |
Net (decrease) in net assets resulting from operations | | | (63,057,083 | ) | | | (83,453,747 | ) |
| | | | | | | | |
| | |
Distributions to shareholders from: | | | | | | | | |
Net investment income | | | | | | | | |
Class A | | | (423,903 | ) | | | – | |
Net realized gain | | | | | | | | |
Class A | | | (565,163 | ) | | | (44,531,074 | ) |
Class B | | | (33,423 | ) | | | (3,113,215 | ) |
Class C | | | (9,222 | ) | | | (746,220 | ) |
Return of capital | | | | | | | | |
Class A | | | – | | | | (519,229 | ) |
Class B | | | – | | | | (36,300 | ) |
Class C | | | – | | | | (8,701 | ) |
| | | | | | | | |
Total distributions to shareholders | | | (1,031,711 | ) | | | (48,954,739 | ) |
| | | | | | | | |
| | |
Capital share transactions: | | | | | | | | |
Proceeds from sale of shares | | | | | | | | |
Class A | | | 3,137,855 | | | | 9,417,273 | |
Class B | | | 577,575 | | | | 3,123,443 | |
Class C | | | 456,325 | | | | 474,151 | |
Distributions reinvested | | | | | | | | |
Class A | | | 906,901 | | | | 41,061,179 | |
Class B | | | 32,949 | | | | 3,104,258 | |
Class C | | | 9,093 | | | | 741,250 | |
Cost of shares redeemed | | | | | | | | |
Class A | | | (13,214,449 | ) | | | (44,578,317 | ) |
Class B | | | (1,695,906 | ) | | | (7,922,053 | ) |
Class C | | | (559,241 | ) | | | (1,393,139 | ) |
| | | | | | | | |
Net increase (decrease) from capital share transactions | | | (10,348,898 | ) | | | 4,028,045 | |
| | | | | | | | |
Net decrease in net assets | | | (74,437,692 | ) | | | (128,380,441 | ) |
| | | | | | | | |
| | |
Net assets: | | | | | | | | |
Beginning of period | | | 219,445,307 | | | | 347,825,748 | |
| | | | | | | | |
End of period | | $ | 145,007,615 | | | $ | 219,445,307 | |
| | | | | | | | |
| | |
Undistributed net investment income at end of period | | $ | 231,206 | | | $ | 282,642 | |
| | | | | | | | |
| | |
Capital share activity: | | | | | | | | |
Shares sold | | | | | | | | |
Class A | | | 985,482 | | | | 1,742,458 | |
Class B | | | 218,351 | | | | 703,548 | |
Class C | | | 155,340 | | | | 99,582 | |
Shares reinvested | | | | | | | | |
Class A | | | 279,046 | | | | 7,806,369 | |
Class B | | | 12,203 | | | | 707,120 | |
Class C | | | 3,114 | | | | 156,382 | |
Shares redeemed | | | | | | | | |
Class A | | | (4,228,115 | ) | | | (8,392,906 | ) |
Class B | | | (636,330 | ) | | | (1,784,812 | ) |
Class C | | | (200,195 | ) | | | (295,676 | ) |
| | | | |
| | 33 | | The accompanying notes are an integral part of the financial statements |
| | |
Financial Highlights Selected data for each share of capital stock outstanding throughout each period | | Security Equity Fund Equity Series |
| |
| |
| | | | | | | | | | | | | |
Class A | | Six Months
Ended March 31,
2009 |
a | | 2008 | | 2007 | | 2006 | | 2005 | | Year Ended
September 30,
2004 |
Per Share Data | | | | | | | | | | | | | |
Net asset value, beginning of period | | $4.26 | | | $6.84 | | $6.85 | | $6.58 | | $6.50 | | $5.98 |
Income (loss) from investment operations: | | | | | | | | | | | | | |
Net investment income (loss)b | | 0.01 | | | 0.01 | | – | | (0.01) | | 0.04 | | 0.01 |
Net gain (loss) on securities (realized and unrealized) | | (1.24) | | | (1.61) | | 0.69 | | 0.52 | | 0.49 | | 0.52 |
| | |
Total from investment operations | | (1.23) | | | (1.60) | | 0.69 | | 0.51 | | 0.53 | | 0.53 |
Less distributions: | | | | | | | | | | | | | |
Dividends from net investment income | | (0.01) | | | – | | – | | (0.04) | | – | | (0.01) |
Distributions from realized gains | | (0.01) | | | (0.97) | | (0.70) | | (0.20) | | (0.45) | | – |
Return of capital | | – | | | (0.01) | | – | | – | | – | | – |
| | |
Total distributions | | (0.02) | | | (0.98) | | (0.70) | | (0.24) | | (0.45) | | (0.01) |
Net asset value, end of period | | $3.01 | | | $4.26 | | $6.84 | | $6.85 | | $6.58 | | $6.50 |
| | |
| | | | | | | | | | | | | |
| | | | | | | | | | | | | | |
Total Return c | | (28.89%) | | | (26.12%) | | 10.33% | | 7.88% | | 8.20% | | 8.87% |
Ratios/Supplemental Data | | | | | | | | | | | | | |
Net assets, end of period (in thousands) | | $136,579 | | | $205,908 | | $322,850 | | $371,006 | | $375,280 | | $391,384 |
Ratios to average net assets: | | | | | | | | | | | | | |
Net investment income (loss) | | 0.51% | | | 0.15% | | 0.02% | | (0.08%) | | 0.57% | | 0.08% |
Total expensesd | | 1.53% | | | 1.36% | | 1.34% | | 1.34% | | 1.30% | | 1.28% |
Net expensese | | 1.53% | | | 1.36% | | 1.34% | | 1.34% | | 1.30% | | 1.28% |
Net expenses prior to custodian earning credits and net of expense waivers | | 1.53% | | | 1.36% | | 1.34% | | 1.34% | | 1.30% | | 1.28% |
Portfolio turnover rate | | 70% | | | 111% f | | 20% | | 34% | | 32% | | 28% |
| | | | | | | | | | | | | |
Class B | | Six Months
Ended March 31,
2009 |
a | | 2008 | | 2007 | | 2006 | | 2005 | | Year Ended
September 30,
2004 |
Per Share Data | | | | | | | | | | | | | |
Net asset value, beginning of period | | $3.53 | | | $5.89 | | $6.04 | | $5.83 | | $5.85 | | $5.41 |
Income (loss) from investment operations: | | | | | | | | | | | | | |
Net investment lossb | | – | | | (0.03) | | (0.04) | | (0.05) | | (0.01) | | (0.04) |
Net gain (loss) on securities (realized and unrealized) | | (1.03) | | | (1.35) | | 0.59 | | 0.46 | | 0.44 | | 0.48 |
| | |
Total from investment operations | | (1.03) | | | (1.38) | | 0.55 | | 0.41 | | 0.43 | | 0.44 |
Less distributions: | | | | | | | | | | | | | |
Distributions from realized gains | | (0.01) | | | (0.97) | | (0.70) | | (0.20) | | (0.45) | | – |
Return of capital | | – | | | (0.01) | | – | | – | | – | | – |
| | |
Total distributions | | (0.01) | | | (0.98) | | (0.70) | | (0.20) | | (0.45) | | – |
Net asset value, end of period | | $2.49 | | | $3.53 | | $5.89 | | $6.04 | | $5.83 | | $5.85 |
| | |
| | | | | | | | | | | | | |
Total Return c | | (29.15%) | | | (26.69%) | | 9.33% | | 7.16% | | 7.35% | | 8.13% |
Ratios/Supplemental Data | | | | | | | | | | | | | |
Net assets, end of period (in thousands) | | $6,481 | | | $10,621 | | $19,928 | | $27,842 | | $39,962 | | $49,600 |
Ratios to average net assets: | | | | | | | | | | | | | |
Net investment loss | | (0.25%) | | | (0.61%) | | (0.74%) | | (0.83%) | | (0.16%) | | (0.67%) |
Total expensesd | | 2.28% | | | 2.11% | | 2.09% | | 2.09% | | 2.05% | | 2.03% |
Net expensese | | 2.28% | | | 2.11% | | 2.09% | | 2.09% | | 2.05% | | 2.03% |
Net expenses prior to custodian earning credits and net of expense waivers | | 2.28% | | | 2.11% | | 2.09% | | 2.09% | | 2.05% | | 2.03% |
Portfolio turnover rate | | 70% | | | 111% f | | 20% | | 34% | | 32% | | 28% |
| | | | |
| | 34 | | The accompanying notes are an integral part of the financial statements |
| | |
Financial Highlights Selected data for each share of capital stock outstanding throughout each period | | Security Equity Fund Equity Series |
| |
| | | | | | | | | | | | |
| Class C | | Six Months Ended March 31, 2009a | | 2008 | | 2007 | | 2006 | | 2005 | | Year Ended
September 30,
2004 |
Per Share Data | | | | | | | | | | | | |
Net asset value, beginning of period | | $3.81 | | $6.28 | | $6.39 | | $6.16 | | $6.16 | | $5.69 |
Income (loss) from investment operations: | | | | | | | | | | | | |
Net investment lossb | | – | | (0.03) | | (0.05) | | (0.05) | | (0.01) | | (0.04) |
Net gain (loss) on securities (realized and unrealized) | | (1.11) | | (1.46) | | 0.64 | | 0.48 | | 0.46 | | 0.51 |
| | |
Total from investment operations | | (1.11) | | (1.49) | | 0.59 | | 0.43 | | 0.45 | | 0.47 |
Less distributions: | | | | | | | | | | | | |
Distributions from realized gains | | (0.01) | | (0.97) | | (0.70) | | (0.20) | | (0.45) | | – |
Return of capital | | – | | (0.01) | | – | | – | | – | | – |
| | |
Total distributions | | (0.01) | | (0.98) | | (0.70) | | (0.20) | | (0.45) | | – |
Net asset value, end of period | | $2.69 | | $3.81 | | $6.28 | | $6.39 | | $6.16 | | $6.16 |
| | |
| | | | | | | | | | | | |
Total Return c | | (29.11%) | | (26.79%) | | 9.45% | | 7.10% | | 7.32% | | 8.26% |
Ratios/Supplemental Data | | | | | | | | | | | | |
Net assets, end of period (in thousands) | | $1,948 | | $2,915 | | $5,048 | | $5,794 | | $5,706 | | $6,329 |
Ratios to average net assets: | | | | | | | | | | | | |
Net investment loss | | (0.25%) | | (0.60%) | | (0.73%) | | (0.83%) | | (0.18%) | | (0.67%) |
Total expensesd | | 2.29% | | 2.11% | | 2.09% | | 2.09% | | 2.05% | | 2.03% |
Net expensese | | 2.29% | | 2.11% | | 2.09% | | 2.09% | | 2.05% | | 2.03% |
Net expenses prior to custodian earning credits and net of expense waivers | | 2.29% | | 2.11% | | 2.09% | | 2.09% | | 2.05% | | 2.03% |
Portfolio turnover rate | | 70% | | 111%f | | 20% | | 34% | | 32% | | 28% |
a Unaudited figures for the six months ended March 31, 2009. Percentage amounts for the period, except total return, have been annualized.
b Net investment income (loss) was computed using average shares outstanding throughout the period.
c Total return information does not reflect deduction of any sales charges imposed at the time of purchase for Class A shares or upon redemption for Class B and C shares.
d Total expense information reflects expense ratios absent expense reductions by the Investment Manager and custodian earnings credits, as applicable.
e Net expense information reflects the expense ratios after voluntary expense waivers, reimbursements and custodian earnings credits, as applicable.
f Significant variation in the portfolio turnover rate is due to the Investment Manager's appointment of new portfolio managers for the series.
| | | | |
| | | 35 | | The accompanying notes are an integral part of the financial statements |
| | |
Performance Summary March 31, 2009 | | Security Equity Fund Global Series (unaudited) |
| |
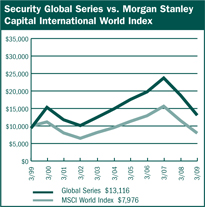
$10,000 Over Ten Years
This chart assumes a $10,000 investment in Class A shares of Global Series on March 31, 1999, reflects deduction of the 5.75% sales load and assumes all dividends reinvested. The chart does not reflect the deduction of taxes that a shareholder would pay on distributions or the redemption of fund shares. The MSCI World Index is an unmanaged capitalization-weighted index that is designed to measure global developed market equity performance.
| | | | | | |
| | | Portfolio Composition by Sector as of 3-31-09 |
| | | Consumer Discretionary | | 5.52% | | |
| | | Consumer Staples | | 15.79 | | |
| | | Energy | | 9.94 | | |
| | | Financials | | 10.58 | | |
| | | Health Care | | 12.27 | | |
| | | Industrials | | 6.64 | | |
| | | Information Technology | | 11.92 | | |
| | | Materials | | 6.67 | | |
| | | Telecommunication Services | | 4.42 | | |
| | | Utilities | | 3.15 | | |
| | | Cash & Other Assets, Less Liabilities | | 13.10 | | |
| | | Total Net Assets | | 100.00% | | |
| | | | | | | |
| | | | |
| | | | | | | |
| | | | | | |
Average Annual Returns |
Periods Ended 3-31-09 | | 1 Year | | 5 Years | | 10 Years |
A Shares | | (38.49%) | | (1.75%) | | 3.36% |
A Shares with sales charge | | (42.04%) | | (2.91%) | | 2.75% |
B Shares | | (38.29%) | | (1.78%) | | 3.07% |
B Shares with CDSC | | (41.33%) | | (2.00%) | | 3.07% |
C Shares | | (38.94%) | | (2.48%) | | 2.54% |
C Shares with CDSC | | (39.54%) | | (2.48%) | | 2.54% |
The performance data above represents past performance that is not predictive of future results. The investment return and principal value of an investment in the Series will fluctuate so that an investor's shares, when redeemed, may be worth more or less than their original cost. The figures above do not reflect deduction of the maximum front-end sales charge of 5.75% for Class A shares or the contingent deferred sales charge of 5% for Class B shares and 1% for Class C shares, as applicable, except where noted. The figures do not reflect the deduction of taxes that a shareholder would pay on distributions or redemption of shares. Such figures would be lower if the maximum sales charge and any applicable taxes were deducted. Fee waivers and/or reimbursements reduced expenses of the Series and in the absence of such waiver, the performance quoted would be reduced. |
| | | | |
| | 36 | | The accompanying notes are an integral part of the financial statements |
| | |
Performance Summary March 31, 2009 | | Security Equity Fund Global Series (unaudited) |
| |
| |
Information About Your Series Expenses
Calculating your ongoing Series expenses
Example
As a shareholder of the Series, you incur two types of costs: (1) transaction costs, which may include sales charges (loads) on purchase payments; contingent deferred sales charges on redemptions; and redemption fees, if any; and (2) ongoing costs, including management fees; distribution and/or service fees (12b-1); and other Series expenses. This example is intended to help you understand your ongoing costs (in dollars) of investing in the Series and to compare these costs with ongoing costs of investing in other mutual funds. The example is based on an investment of $1,000 invested at the beginning of the period and held for the entire period October 1, 2008 through March 31, 2009.
Actual Expenses
The first line for each class of shares in the table provides information about actual account values and actual expenses. You may use the information in this table, together with the amount you invested, to estimate the expenses that you paid over the period. Simply divide your account value by $1,000 (for example, an $8,600 account value divided by $1,000 = 8.6), then multiply the result by the number in the table under the heading entitled “Expenses Paid During the Period” to estimate the expenses you paid on your account during this period.
Hypothetical Example for Comparison Purposes
The second line for each class of shares in the table provides information about hypothetical account values and hypothetical expenses based on the Series actual expense ratio and an assumed rate of return of 5% per year before expenses, which is not the Series actual return. The hypothetical account values and expenses may not be used to estimate the actual ending account balance or expenses you paid for the period. You may use this information to compare the ongoing costs of investing in the Series and other funds. To do so, compare this 5% hypothetical example with the 5% hypothetical examples that appear in the shareholder reports of the other mutual funds.
Please note that the expenses shown in the table are meant to highlight your ongoing costs only and do not reflect any transactional costs, such as sales charges (loads) on purchase payments, contingent deferred sales charges on redemptions, and redemption fees, if any. Therefore, the second line for each class of shares is useful in comparing ongoing costs only, and will not help you determine the relative total costs of owning different funds. In addition, if these transactional costs were included, your costs would have been higher.
| | | | | | |
| Series Expenses |
| | | Beginning
Account
Value
10/1/2008 | | Ending
Account
Value
3/31/20091 | | Expenses
Paid
During
Period2 |
Global Series - | | | | | | |
Class A | | | | | | |
Actual | | $1,000.00 | | $738.69 | | $8.50 |
Hypothetical | | 1,000.00 | | 1,015.16 | | 9.85 |
Global Series - | | | | | | |
Class B | | | | | | |
Actual | | 1,000.00 | | 739.79 | | 7.42 |
Hypothetical | | 1,000.00 | | 1,016.40 | | 8.60 |
Global Series - | | | | | | |
Class C | | | | | | |
Actual | | 1,000.00 | | 736.29 | | 11.73 |
Hypothetical | | 1,000.00 | | 1,011.42 | | 13.59 |
1 The actual ending account value is based on the actual total return of the Series for the period October 1, 2008 to March 31, 2009 after actual expenses and will differ from the hypothetical ending account value which is based on the Series expense ratio and a hypothetical annual return of 5% before expenses. The actual cumulative return at net asset value for the period October 1, 2008 to March 31, 2009 was (26.13%), (26.02%) and (26.37%), for Class A, B and C shares, respectively.
2 Expenses are equal to the Series annualized expense ratio (1.96%, 1.71% and 2.71% for Class A, B, and C shares, respectively), net of any applicable fee waivers, multiplied by the average account value over the period, multiplied by 182/365 (to reflect the one-half year period).
| | |
Schedule of Investments March 31, 2009 (unaudited) | | Security Equity Fund Global Series |
| |
| | | | |
| | | Shares | | Value |
RIGHT - 0.0% | | | | |
Spain - 0.00% | | | | |
Mapfre S.A. | | $154,392 | | $2,051 |
TOTAL RIGHT | | | | |
(Cost $1,865) | | | | $2,051 |
| | | Shares | | Value |
COMMON STOCKS - 86.9% | | | | |
Australia - 0.8% | | | | |
Caltex Australia, Ltd. | | 33,400 | | $206,914 |
Macquarie Group, Ltd. 1 | | 24,004 | | 451,457 |
| | | | |
| | | | 658,371 |
| | | | |
Belgium - 0.5% | | | | |
UCB S.A. | | 13,003 | | 383,310 |
| | | | |
Bermuda - 4.0% | | | | |
Arch Capital Group, Ltd. * | | 8,500 | | 457,810 |
Aspen Insurance Holdings, Ltd. | | 15,500 | | 348,130 |
Axis Capital Holdings, Ltd. | | 16,900 | | 380,926 |
Endurance Specialty Holdings, Ltd. | | 16,600 | | 414,004 |
Validus Holdings, Ltd. | | 67,053 | | 1,587,815 |
| | | | |
| | | | 3,188,685 |
| | | | |
Canada - 2.3% | | | | |
Agnico-Eagle Mines, Ltd. | | 8,860 | | 509,227 |
Canadian Imperial Bank of Commerce | | 15,400 | | 560,355 |
CGI Group, Inc. * | | 33,448 | | 270,046 |
Empire Company, Ltd. | | 11,798 | | 495,911 |
| | | | |
| | | | 1,835,539 |
| | | | |
Czech Republic - 0.4% | | | | |
Telefonica O2 Czech Republic AS | | 15,272 | | 302,741 |
| | | | |
Finland - 1.3% | | | | |
Neste Oil Oyj | | 46,000 | | 612,315 |
Wartsila Oyj | | 19,834 | | 418,681 |
| | | | |
| | | | 1,030,996 |
| | | | |
France - 3.4% | | | | |
Nexans S.A. * | | 8,700 | | 330,317 |
Pernod-Ricard S.A. | | 4,251 | | 237,045 |
Sanofi-Aventis S.A. | | 10,600 | | 596,782 |
UBISOFT Entertainment * | | 69,305 | | 1,266,871 |
Wendel * | | 10,548 | | 278,851 |
| | | | |
| | | | 2,709,866 |
| | | | |
Germany - 0.6% | | | | |
ThyssenKrupp AG | | 28,837 | | 504,528 |
| | | | |
Hong Kong - 1.1% | | | | |
CNOOC, Ltd. | | 883,000 | | 874,945 |
| | | | |
Israel - 0.8% | | | | |
Check Point Software Technologies * | | 30,422 | | 675,673 |
| | | | |
Italy - 1.4% | | | | |
Enel SpA | | 124,561 | | 597,777 |
Prysmian SpA | | 50,500 | | 503,155 |
| | | | |
| | | | 1,100,932 |
| | | | |
Japan - 7.6% | | | | |
JGC Corporation | | 34,000 | | 383,350 |
Kubota Corporation | | 38,000 | | 205,395 |
Kurita Water Industries, Ltd. | | 26,700 | | 510,640 |
Nintendo Company, Ltd. | | 4,305 | | 1,237,394 |
Nippon Mining Holdings, Inc. | | 103,000 | | 405,840 |
| | | | |
| | | Shares | | Value |
COMMON STOCKS - 86.9% (continued) | | |
Japan - 7.6% (continued) | | | | |
NISSIN FOODS HOLDINGS CO, Ltd. | | 14,700 | | $430,693 |
NTT DoCoMo, Inc. | | 1,549 | | 2,092,354 |
Takeda Pharmaceutical Company, Ltd. | | 12,900 | | 443,120 |
Yamato Holdings Company, Ltd. | | 42,000 | | 393,352 |
| | | | |
| | | | 6,102,138 |
| | | | |
Jersey - 1.4% | | | | |
Randgold Resources, Ltd. ADR | | 21,211 | | 1,152,818 |
| | | | |
Norway - 0.4% | | | | |
Tandberg ASA | | 22,800 | | 336,242 |
| | | | |
Papua New Guinea - 1.8% | | | | |
Oil Search, Ltd. | | 393,037 | | 1,437,424 |
| | | | |
Philippines - 1.0% | | | | |
Philippine Long Distance Telephone Company ADR | | 18,695 | | 825,010 |
| | | | |
Poland - 0.4% | | | | |
Polski Koncern Naftowy Orlen | | 50,300 | | 344,164 |
| | | | |
Spain - 0.9% | | | | |
Mapfre S.A. | | 154,392 | | 338,422 |
Repsol YPF S.A. | | 24,405 | | 422,447 |
| | | | |
| | | | 760,869 |
| | | | |
Switzerland - 4.2% | | | | |
ACE, Ltd. | | 8,400 | | 339,360 |
Syngenta AG | | 9,579 | | 1,930,442 |
Transocean, Ltd. * | | 18,825 | | 1,107,663 |
| | | | |
| | | | 3,377,465 |
| | | | |
United Kingdom - 9.4% | | | | |
AstraZeneca plc | | 16,369 | | 575,657 |
Balfour Beatty plc | | 54,912 | | 257,837 |
BG Group plc | | 63,338 | | 958,772 |
Cadbury plc | | 270,300 | | 2,043,879 |
Diageo plc | | 36,506 | | 411,966 |
GKN plc | | 255,397 | | 251,018 |
GlaxoSmithKline plc | | 36,459 | | 568,895 |
Imperial Tobacco Group plc | | 70,241 | | 1,580,284 |
Ladbrokes plc | | 118,752 | | 311,810 |
Meggitt plc | | 142,800 | | 263,287 |
Prudential plc | | 68,913 | | 333,219 |
| | | | |
| | | | 7,556,624 |
| | | | |
United States - 43.2% | | | | |
Abbott Laboratories | | 18,145 | | 865,517 |
Activision Blizzard, Inc. * | | 103,400 | | 1,081,564 |
AllianceBernstein Holding, LP | | 58,100 | | 855,232 |
Allstate Corporation | | 12,000 | | 229,800 |
Altria Group, Inc. | | 136,752 | | 2,190,767 |
American Electric Power Company, Inc. | | 22,400 | | 565,824 |
Apple, Inc. * | | 5,185 | | 545,047 |
Bank of New York Mellon Corporation | | 18,444 | | 521,043 |
Bristow Group, Inc. * | | 12,500 | | 267,875 |
Carpenter Technology Corporation | | 15,100 | | 213,212 |
Cephalon, Inc. * | | 12,096 | | 823,738 |
CVS Caremark Corporation | | 15,700 | | 431,593 |
Darden Restaurants, Inc. | | 9,500 | | 325,470 |
DTE Energy Company | | 13,900 | | 385,030 |
| | | | |
| | | 38 | | The accompanying notes are an integral part of the financial statements |
| | |
Schedule of Investments March 31, 2009 (unaudited) | | Security Equity Fund Global Series |
| |
| | | | |
| | | Shares | | Value |
COMMON STOCKS - 86.9% (continued) |
United States - 43.2% (continued) | | |
Eaton Corporation | | 12,100 | | $446,006 |
Express Scripts, Inc. * | | 33,762 | | 1,558,792 |
Family Dollar Stores, Inc. | | 15,470 | | 516,234 |
Frontier Communications Corporation | | 46,200 | | 331,716 |
General Electric Company | | 36,700 | | 371,037 |
Gilead Sciences, Inc. * | | 35,657 | | 1,651,632 |
Google, Inc. * | | 5,844 | | 2,034,063 |
H&R Block, Inc. | | 10,100 | | 183,719 |
Interactive Brokers Group, Inc. * | | 55,556 | | 896,118 |
International Business Machines Corporation | | 6,480 | | 627,847 |
Kennametal, Inc. | | 29,000 | | 470,090 |
Kimberly-Clark Corporation | | 42,080 | | 1,940,309 |
Kroger Company | | 18,000 | | 381,960 |
Life Technologies Corporation * | | 12,800 | | 415,744 |
Manitowoc Company, Inc. | | 88,900 | | 290,703 |
Marvel Entertainment, Inc. * | | 60,760 | | 1,613,178 |
Mylan, Inc. * | | 92,425 | | 1,239,419 |
NiSource, Inc. | | 55,400 | | 542,920 |
Northern Trust Corporation | | 6,900 | | 412,758 |
Occidental Petroleum Corporation | | 14,100 | | 784,665 |
Olin Corporation | | 19,100 | | 272,557 |
Oneok, Inc. | | 19,500 | | 441,285 |
Oshkosh Truck Corporation | | 31,900 | | 215,006 |
Overseas Shipholding Group, Inc. | | 8,200 | | 185,894 |
Owens-Illinois, Inc. * | | 19,200 | | 277,248 |
People’s United Financial, Inc. | | 21,000 | | 377,370 |
Philip Morris International, Inc. | | 58,552 | | 2,083,280 |
Qualcomm, Inc. | | 28,310 | | 1,101,542 |
Schnitzer Steel Industries, Inc. | | 6,500 | | 204,035 |
Sohu.com, Inc. * | | 39,788 | | 1,643,642 |
Universal Health Services, Inc. | | 8,200 | | 314,388 |
Valero Energy Corporation | | 21,000 | | 375,900 |
Walgreen Company | | 17,800 | | 462,088 |
Watson Pharmaceuticals, Inc. * | | 13,600 | | 423,096 |
Worthington Industries, Inc. | | 33,900 | | 295,269 |
| | | | |
| | | | 34,683,222 |
| |
TOTAL COMMON STOCKS | | |
(Cost $69,132,587) | | | | $69,841,562 |
| | | Principal
Amount | | Value |
SHORT TERM INVESTMENTS - 5.9% |
State Street General Account U.S. | | | | |
Government Fund | | $4,739,698 | | $4,739,698 |
| |
TOTAL SHORT TERM INVESTMENTS | | |
(Cost $4,739,698) | | | | $4,739,698 |
| |
Total Investments - 92.8% | | $74,583,311 |
(cost $73,874,150) | | | | |
Cash & Other Assets, Less Liabilities - 7.2% | | 5,787,442 |
| | | | |
Total Net Assets - 100.0% | | $80,370,753 |
| | | | |
| | | | | |
INVESTMENT CONCENTRATION |
| At March 31, 2009, the investment diversification of the Series was as follows: |
| Industry | | % of Net
Assets | | | Value |
Tobacco | | 7.4 | % | | $5,854,331 |
Pharmaceuticals | | 6.4 | | | 5,095,796 |
Money Markets | | 5.9 | | | 4,739,698 |
| | | | | |
| | | | | |
INVESTMENT CONCENTRATION (continued) |
| Industry | | % of Net
Assets | | | Value |
Internet Software & Services | | 4.7 | % | | $3,677,705 |
Home Entertainment Software | | 4.5 | | | 3,585,829 |
Wireless Telecommunication Services | | 3.6 | | | 2,917,364 |
Biotechnology | | 3.1 | | | 2,475,370 |
Packaged Foods & Meats | | 3.1 | | | 2,474,572 |
Reinsurance | | 3.1 | | | 2,459,629 |
Oil & Gas Exploration & Production | | 2.9 | | | 2,312,369 |
Integrated Oil & Gas | | 2.7 | | | 2,165,884 |
Oil & Gas Refining & Marketing | | 2.5 | | | 1,945,133 |
Household Products | | 2.4 | | | 1,940,309 |
Fertilizers & Agricultural Chemicals | | 2.4 | | | 1,930,442 |
Industrial Machinery | | 2.2 | | | 1,845,417 |
Asset Management & Custody Banks | | 2.2 | | | 1,789,033 |
Gold | | 2.0 | | | 1,662,045 |
Movies & Entertainment | | 2.0 | | | 1,613,178 |
Health Care Services | | 1.9 | | | 1,558,792 |
Communications Equipment | | 1.8 | | | 1,437,784 |
Property & Casualty Insurance | | 1.6 | | | 1,298,216 |
Steel | | 1.5 | | | 1,217,044 |
Computer Hardware | | 1.5 | | | 1,172,894 |
Electric Utilities | | 1.5 | | | 1,163,601 |
Oil & Gas Drilling | | 1.4 | | | 1,107,663 |
Multi-Utilities | | 1.2 | | | 927,950 |
Specialized Finance | | 1.1 | | | 896,118 |
Drug Retail | | 1.1 | | | 893,681 |
Food Retail | | 1.1 | | | 877,871 |
Electrical Components & Equipment | | 1.0 | | | 833,472 |
Construction & Farm Machinery & Heavy Trucks | | 0.9 | | | 711,104 |
Systems Software | | 0.8 | | | 675,673 |
Industrial Conglomerates | | 0.8 | | | 649,888 |
Distillers & Vintners | | 0.8 | | | 649,011 |
Construction & Engineering | | 0.8 | | | 641,187 |
Integrated Telecommunication Services | | 0.8 | | | 634,457 |
Diversified Banks | | 0.8 | | | 560,355 |
General Merchandise Stores | | 0.6 | | | 516,234 |
Investment Banking & Brokerage | | 0.5 | | | 451,457 |
Gas Utilities | | 0.5 | | | 441,285 |
Life Sciences Tools & Services | | 0.5 | | | 415,744 |
Air Freight & Logistics | | 0.5 | | | 393,352 |
Thrifts & Mortgage Finance | | 0.5 | | | 377,370 |
Multi-line Insurance | | 0.4 | | | 338,422 |
Life & Health Insurance | | 0.4 | | | 333,219 |
Restaurants | | 0.4 | | | 325,470 |
Health Care Facilities | | 0.4 | | | 314,388 |
Casinos & Gaming | | 0.4 | | | 311,810 |
Metal & Glass Containers | | 0.3 | | | 277,248 |
Diversified Chemicals | | 0.3 | | | 272,557 |
IT Consulting & Other Services | | 0.3 | | | 270,046 |
Oil & Gas Equipment & Services | | 0.3 | | | 267,875 |
Aerospace & Defense | | 0.3 | | | 263,287 |
Auto Parts & Equipment | | 0.3 | | | 251,018 |
Oil & Gas Storage & Transportation | | 0.2 | | | 185,894 |
Specialized Consumer Services | | 0.2 | | | 183,719 |
Rights | | 0.0 | | | 2,051 |
| | | | | |
Total Investments | | 92.8 | | | $74,583,311 |
| | | | | |
| | | | |
| | | 39 | | The accompanying notes are an integral part of the financial statements |
| | |
Schedule of Investments March 31, 2009 (unaudited) | | Security Equity Fund Global Series |
| |
For federal income tax purposes the identified cost of investments owned at March 31, 2009 was $76,492,269.
| | |
| ADR | | American Depositary Receipt |
| plc | | Public Limited Company |
* Non-income producing security
1 Security is a PFIC (Passive Foreign Investment Company).
| | | | |
| | | 40 | | The accompanying notes are an integral part of the financial statements |
Security Equity Fund
Global Series
(unaudited)
| | | |
Statement of Assets and Liabilities March 31, 2009 | |
Assets: | | | |
Investments, at value* | | $74,583,311 | |
Cash denominated in a foreign currency, at value** | | 157,713 | |
| |
Receivables: | | | |
Fund shares sold | | 32,590 | |
Securities sold | | 7,202,163 | |
Interest | | 691 | |
Dividends | | 338,316 | |
Foreign taxes recoverable | | 11,052 | |
Prepaid expenses | | 33,741 | |
| | | |
Total assets | | 82,359,577 | |
| | | |
Liabilities: | | | |
Cash overdraft | | 4,333 | |
Payable for: | | | |
Securities purchased | | 1,719,466 | |
Fund shares redeemed | | 111,866 | |
Management fees | | 66,524 | |
Custodian fees | | 8,530 | |
Transfer agent/maintenance fees | | 13,926 | |
Administration fees | | 11,179 | |
Professional fees | | 13,865 | |
12b-1 distribution plan fees | | 17,299 | |
Directors’ fees | | 4,347 | |
Other | | 17,489 | |
| | | |
Total liabilities | | 1,988,824 | |
| | | |
Net assets | | $80,370,753 | |
| | | |
| |
Net assets consist of: | | | |
Paid in capital | | $150,293,032 | |
Accumulated net investment loss | | (324,707 | ) |
Accumulated net realized loss on sale of investments and foreign currency transactions | | (70,302,377 | ) |
Net unrealized appreciation in value of investments and translation of assets and liabilities in foreign currencies | | 704,805 | |
| | | |
Net assets | | $80,370,753 | |
| | | |
| |
Class A: | | | |
Capital shares outstanding (unlimited number of shares authorized) | | 8,662,730 | |
Net assets | | $65,601,881 | |
Net asset value and redemption price per share | | $7.57 | |
| | | |
Maximum offering price per share (net asset value divided by 94.25%) | | $8.03 | |
| | | |
| |
Class B: | | | |
Capital shares outstanding (unlimited number of shares authorized) | | 1,558,371 | |
Net assets | | $10,268,116 | |
Net asset value, offering and redemption price per share (excluding any applicable contingent deferred sales charge) | | $6.59 | |
| | | |
| |
Class C: | | | |
Capital shares outstanding (unlimited number of shares authorized) | | 681,994 | |
Net assets | | $4,500,756 | |
Net asset value, offering and redemption price per share (excluding any applicable contingent deferred sales charge) | | $6.60 | |
| | | |
*Investments, at cost | | $73,874,150 | |
**Cash denominated in a foreign currency, at cost | | 161,082 | |
| | | |
Statement of Operations For the Six Months Ended March 31, 2009 | |
Investment Income: | | | |
Dividends (net of foreign withholding tax of $27,772) | | $1,121,279 | |
Interest | | 2,042 | |
| | | |
Total investment income | | 1,123,321 | |
| | | |
| |
Expenses: | | | |
Management fees | | 430,533 | |
Transfer agent/maintenance fees | | 149,628 | |
Administration fees | | 65,548 | |
Custodian fees | | 30,878 | |
Directors’ fees | | 4,579 | |
Professional fees | | 17,198 | |
Reports to shareholders | | 12,499 | |
Registration fees | | 18,982 | |
Other expenses | | 5,926 | |
12b-1 distribution fees - Class A | | 86,894 | |
12b-1 distribution fees - Class C | | 26,659 | |
| | | |
Total expenses | | 849,324 | |
Less: | | | |
Earnings credits applied | | (442 | ) |
| | | |
Net expenses | | 848,882 | |
| | | |
Net investment income | | 274,439 | |
| | | |
| |
Net Realized and Unrealized Gain (Loss): | | | |
Net realized gain (loss) during the period on: | | | |
Investments | | (46,030,922 | ) |
Foreign currency transactions | | (145,764 | ) |
| | | |
Net realized loss | | (46,176,686 | ) |
| | | |
Net unrealized appreciation (depreciation) during the period on: | | | |
Investments | | 16,758,730 | |
Translation of assets and liabilities in foreign currencies | | (57,542 | ) |
| | | |
Net unrealized appreciation | | 16,701,188 | |
| | | |
Net loss | | (29,475,498 | ) |
| | | |
Net decrease in net assets resulting from operations | | $(29,201,059 | ) |
| | | |
| | | | |
| |
| | |
| | 41 | | The accompanying notes are an integral part of the financial statements |
| | |
| Statement of Changes in Net Assets | | Security Equity Fund Global Series |
| | | | | | | | |
| | | Six Months Ended
March 31, 2009
(unaudited) | | | Year Ended
September 30, 2008 | |
| | |
Increase (decrease) in net assets from operations: | | | | | | | | |
Net investment income | | $ | 274,439 | | | $ | 520,278 | |
Net realized loss during the period on investments and foreign currency transactions | | | (46,176,686 | ) | | | (17,073,963 | ) |
Net unrealized appreciation (depreciation) during the period on investments and translation of assets and liabilities in foreign currencies | | | 16,701,188 | | | | (24,868,797 | ) |
| | | | | | | | |
Net decrease in net assets resulting from operations | | | (29,201,059 | ) | | | (41,422,482 | ) |
| | | | | | | | |
| | |
Distributions to shareholders from: | | | | | | | | |
Net investment income | | | | | | | | |
Class A | | | (179,099 | ) | | | (256,485 | ) |
Class B | | | (82,114 | ) | | | (137,990 | ) |
Net realized gain | | | | | | | | |
Class A | | | (520,241 | ) | | | (47,919,890 | ) |
Class B | | | (94,510 | ) | | | (10,546,794 | ) |
Class C | | | (46,236 | ) | | | (4,424,426 | ) |
| | | | | | | | |
Total distributions to shareholders | | | (922,200 | ) | | | (63,285,585 | ) |
| | | | | | | | |
| | |
Capital share transactions: | | | | | | | | |
Proceeds from sale of shares | | | | | | | | |
Class A | | | 12,782,263 | | | | 29,605,642 | |
Class B | | | 1,741,304 | | | | 4,778,339 | |
Class C | | | 703,068 | | | | 2,736,093 | |
Distributions reinvested | | | | | | | | |
Class A | | | 692,086 | | | | 47,766,576 | |
Class B | | | 175,482 | | | | 10,521,908 | |
Class C | | | 45,624 | | | | 4,347,344 | |
Cost of shares redeemed | | | | | | | | |
Class A | | | (12,633,592 | ) | | | (52,959,002 | ) |
Class B | | | (2,840,220 | ) | | | (13,096,148 | ) |
Class C | | | (2,123,266 | ) | | | (4,307,780 | ) |
| | | | | | | | |
Net increase (decrease) from capital share transactions | | | (1,457,251 | ) | | | 29,392,972 | |
| | | | | | | | |
Net decrease in net assets | | | (31,580,510 | ) | | | (75,315,095 | ) |
| | | | | | | | |
| | |
Net assets: | | | | | | | | |
Beginning of period | | | 111,951,263 | | | | 187,266,358 | |
| | | | | | | | |
End of period | | $ | 80,370,753 | | | $ | 111,951,263 | |
| | | | | | | | |
| | |
Accumulated net investment loss at end of period | | $ | (324,707 | ) | | $ | (337,933 | ) |
| | | | | | | | |
| | |
Capital share activity: | | | | | | | | |
Shares sold | | | | | | | | |
Class A | | | 1,566,085 | | | | 2,084,793 | |
Class B | | | 248,924 | | | | 352,156 | |
Class C | | | 99,457 | | | | 213,727 | |
Shares reinvested | | | | | | | | |
Class A | | | 84,093 | | | | 3,504,518 | |
Class B | | | 24,543 | | | | 884,938 | |
Class C | | | 6,354 | | | | 363,187 | |
Shares redeemed | | | | | | | | |
Class A | | | (1,563,649 | ) | | | (4,030,409 | ) |
Class B | | | (406,255 | ) | | | (1,109,871 | ) |
Class C | | | (293,785 | ) | | | (362,050 | ) |
| | | | |
| | 42 | | The accompanying notes are an integral part of the financial statements |
| | |
Financial Highlights Selected data for each share of capital stock outstanding throughout each period | | Security Equity Fund
Global Series |
| |
| | | | | | | | | | | | |
| Class A | | Six Months
Ended March 31,
2009 a | | 2008 | | 2007b | | 2006 | | 2005 | | Year Ended
September 30,
2004 c |
Per Share Data | | | | | | | | | | | | |
Net asset value, beginning of period | | $10.35 | | $20.69 | | $19.65 | | $17.47 | | $13.93 | | $11.68 |
| |
Income (loss) from investment operations: | | | | | | | | | | | | |
Net investment income (loss)d | | 0.03 | | 0.05 | | 0.06 | | (0.03) | | (0.02) | | (0.03) |
Net gain (loss) on securities (realized and unrealized) | | (2.73) | | (3.63) | | 3.60 | | 2.21 | | 3.56 | | 2.28 |
| | |
Total from investment operations | | (2.70) | | (3.58) | | 3.66 | | 2.18 | | 3.54 | | 2.25 |
| |
Less distributions: | | | | | | | | | | | | |
Dividends from net investment income | | (0.02) | | (0.04) | | – | | – | | – | | – |
Distributions from realized gains | | (0.06) | | (6.72) | | (2.62) | | – | | – | | – |
| | |
Total distributions | | (0.08) | | (6.76) | | (2.62) | | – | | – | | – |
| |
Net asset value, end of period | | $7.57 | | $10.35 | | $20.69 | | $19.65 | | $17.47 | | $13.93 |
| | |
| | | | | | | | | | | | |
Total Return e | | (26.13%) | | (25.16%) | | 20.07% | | 12.48% | | 25.41% | | 19.26% |
Ratios/Supplemental Data | | | | | | | | | | | | |
Net assets, end of period (in thousands) | | $65,602 | | $88,782 | | $145,158 | | $119,176 | | $127,970 | | $98,450 |
Ratios to average net assets: | | | | | | | | | | | | |
Net investment income (loss) | | 0.66% | | 0.33% | | 0.29% | | (0.17%) | | (0.14%) | | (0.20%) |
Total expensesf | | 1.96% | | 1.73% | | 1.69% | | 1.75% | | 1.73% | | 1.79% |
Net expensesg | | 1.96% | | 1.72% | | 1.69% | | 1.75% | | 1.73% | | 1.79% |
Net expenses prior to custodian earning credits and net of expense waivers | | 1.96% | | 1.73% | | 1.69% | | 1.75% | | 1.73% | | 1.79% |
Portfolio turnover rate | | 419% | | 280% h | | 162% h | | 28% | | 31% | | 25% |
| | | | | | |
| Class B | | Six Months
Ended March 31,
2009a,i | | 2008i | | 2007b,i | | 2006i | | 2005i | | Year Ended
September 30,
2004c |
Per Share Data | | | | | | | | | | | | |
Net asset value, beginning of period | | $9.05 | | $18.96 | | $18.17 | | $16.12 | | $12.93 | | $10.93 |
Income (loss) from investment operations: | | | | | | | | | | | | |
Net investment income (loss)d | | 0.03 | | 0.07 | | 0.09 | | 0.02 | | (0.12) | | (0.13) |
Net gain (loss) on securities (realized and unrealized) | | (2.38) | | (3.17) | | 3.32 | | 2.03 | | 3.31 | | 2.13 |
| | |
Total from investment operations | | (2.35) | | (3.10) | | 3.41 | | 2.05 | | 3.19 | | 2.00 |
Less distributions: | | | | | | | | | | | | |
Dividends from net investment income | | (0.05) | | (0.09) | | – | | – | | – | | – |
Distributions from realized gains | | (0.06) | | (6.72) | | (2.62) | | – | | – | | – |
| | |
Total distributions | | (0.11) | | (6.81) | | (2.62) | | – | | – | | – |
Net asset value, end of period | | $6.59 | | $9.05 | | $18.96 | | $18.17 | | $16.12 | | $12.93 |
| | |
| | | | | | | | | | | | |
Total Return e | | (26.02%) | | (24.91%) | | 20.36% | | 12.72% | | 24.67% | | 18.30% |
Ratios/Supplemental Data | | | | | | | | | | | | |
Net assets, end of period (in thousands) | | $10,268 | | $15,303 | | $29,659 | | $27,494 | | $28,999 | | $28,360 |
| |
Ratios to average net assets: | | | | | | | | | | | | |
Net investment income (loss) | | 0.89% | | 0.55% | | 0.50% | | 0.11% | | (0.80%) | | (1.00%) |
Total expensesf | | 1.71% | | 1.48% | | 1.44% | | 1.50% | | 2.38% | | 2.54% |
Net expensesg | | 1.71% | | 1.47% | | 1.44% | | 1.50% | | 2.38% | | 2.54% |
Net expenses prior to custodian earning credits and net of expense waivers | | 1.71% | | 1.48% | | 1.44% | | 1.50% | | 2.38% | | 2.54% |
| |
Portfolio turnover rate | | 419% | | 280% h | | 162% h | | 28% | | 31% | | 25% |
| | | | |
|
| | |
| | 43 | | The accompanying notes are an integral part of the financial statements |
| | |
Financial Highlights Selected data for each share of capital stock outstanding throughout each period | | Security Equity Fund
Global Series |
| |
| | | | | | | | | | | | | |
| Class C | | Six Months Ended March 31, 2009a | | 2008 | | 2007b | | 2006 | | 2005 | | Year Ended
September 30,
2004c | |
Per Share Data | | | | | | | | | | | | | |
Net asset value, beginning of period | | $9.04 | | $19.00 | | $18.37 | | $16.46 | | $13.22 | | $11.17 | |
| | |
Income (loss) from investment operations: | | | | | | | | | | | | | |
Net investment lossd | | – | | (0.05) | | (0.09) | | (0.15) | | (0.13) | | (0.13) | |
Net gain (loss) on securities (realized and unrealized) | | (2.38) | | (3.18) | | 3.34 | | 2.06 | | 3.37 | | 2.18 | |
| | | |
Total from investment operations | | (2.38) | | (3.23) | | 3.25 | | 1.91 | | 3.24 | | 2.05 | |
| | |
Less distributions: | | | | | | | | | | | | | |
Distributions from realized gains | | (0.06) | | (6.73) | | (2.62) | | – | | – | | – | |
| | | |
Total distributions | | (0.06) | | (6.73) | | (2.62) | | – | | – | | – | |
| | |
Net asset value, end of period | | $6.60 | | $9.04 | | $19.00 | | $18.37 | | $16.46 | | $13.22 | |
| | | |
| | | | | | | | | | | | | |
Total Return e | | (26.37%) | | (25.69%) | | 19.14% | | 11.60% | | 24.51% | | 18.35% | |
Ratios/Supplemental Data | | | | | | | | | | | | | |
Net assets, end of period (in thousands) | | $4,501 | | $7,866 | | $12,449 | | $10,361 | | $8,841 | | $7,557 | |
| | |
Ratios to average net assets: | | | | | | | | | | | | | |
Net investment loss | | (0.13%) | | (0.44%) | | (0.48%) | | (0.87%) | | (0.90%) | | (1.02%) | |
Total expensesf | | 2.71% | | 2.49% | | 2.44% | | 2.51% | | 2.48% | | 2.54% | |
Net expensesg | | 2.71% | | 2.47% | | 2.44% | | 2.50% | | 2.48% | | 2.54% | |
Net expenses prior to custodian earning credits and net of expense waivers | | 2.71% | | 2.49% | | 2.44% | | 2.51% | | 2.48% | | 2.54% | |
| | |
Portfolio turnover rate | | 419% | | 280% h | | 162% h | | 28% | | 31% | | 25% | |
a Unaudited figures for the six months ended March 31, 2009. Percentage amounts for the period, except total return, have been annualized.
b Security Global Investors, LLC (SGI) became the sub-advisor of the Global Series effective August 1, 2007. Prior to August 1, 2007, Security Investors (SI) paid Oppenheimer Funds for sub-advisory services.
c The financial highlights for the Global Series exclude the historical financial highlights of the International Series Class A, B and C shares. The assets of the International Series were acquired by the Global Series on October 3, 2003.
d Net investment income (loss) was computed using average shares outstanding throughout the period.
e Total return information does not reflect deduction of any sales charges imposed at the time of purchase for Class A shares or upon redemption for Class B and C shares.
f Total expense information reflects expense ratios absent expense reductions by the Investment Manager and custodian earnings credits, as applicable.
g Net expense information reflects the expense ratios after voluntary expense waivers, reimbursements and custodian earnings credits, as applicable.
h Significant variation in the portfolio turnover rate is due to the re-alignment of the Series' portfolio following the appointment of SGI as sub-advisor.
i Effective August 25, 2005, Class B shares ceased charging 12b-1 fees in accordance with FINRA sales cap regulations. Per share information reflects this change. This fee will be reinstated when sales exceed the sales cap limit.
| | | | |
|
| | |
| | 44 | | The accompanying notes are an integral part of the financial statements |
This page left blank intentionally.
| | |
Performance Summary March 31, 2009 | | Security Equity Fund Global Institutional Series (unaudited) |
| |
| |
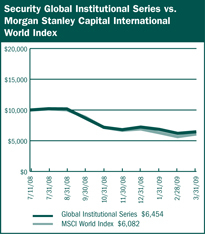
$10,000 Since Inception
This chart assumes a $10,000 investment in shares of Global Institutional Series on July 11, 2008 (date of inception), and reflects the fees and expenses of the Series and assumes all dividends reinvested. The chart does not reflect the deduction of taxes that a shareholder would pay on distributions or the redemption of fund shares. The MSCI World Index is an unmanaged capitalization-weighted index that is designed to measure global developed market equity performance.
| | |
Average Annual Returns |
Periods Ended 3-31-09 | | Since
Inception
(7-11-08) |
Global Institutional Series | | (35.46%) |
The performance data above represents past performance that is not predictive of future results. The investment return and principal value of an investment in the Series will fluctuate so that an investor’s shares, when redeemed, may be worth more or less than their original cost. The figures do not reflect the deduction of taxes that a shareholder would pay on distributions or redemption of shares. Such figures would be lower any applicable taxes were deducted. Fee waivers and/or reimbursements reduced expenses of the Series and in the absence of such waiver, the performance quoted would be reduced. |
| | | | | | |
| | | Portfolio Composition by Sector as of 3-31-09 |
| | | Consumer Discretionary | | 6.96% | | |
| | | Consumer Staples | | 19.64 | | |
| | | Energy | | 12.40 | | |
| | | Financials | | 13.28 | | |
| | | Health Care | | 15.32 | | |
| | | Industrials | | 8.22 | | |
| | | Information Technology | | 14.89 | | |
| | | Materials | | 8.17 | | |
| | | Telecommunication Services | | 5.49 | | |
| | | Utilities | | 3.89 | | |
| | | Short Term Investments | | 9.31 | | |
| | | Liabilities, Less Cash & Other Assets | | (17.57) | | |
| | | Total Net Assets | | 100.00% | | |
| | | | | | | |
| | | | | | | |
| | | | |
| | | 46 | | The accompanying notes are an integral part of the financial statements |
| | |
Performance Summary March 31, 2009 | | Security Equity Fund Global Institutional Series (unaudited) |
| |
| |
Information About Your Series Expenses
Calculating your ongoing Series expenses
Example
As a shareholder of the Series, you incur ongoing costs, including management fees and other Series expenses. This example is intended to help you understand your ongoing costs (in dollars) of investing in the Series and to compare these costs with ongoing costs of investing in other mutual funds. The example is based on an investment of $1,000 invested at the beginning of the period and held for the entire period October 1, 2008 through March 31, 2009.
Actual Expenses
The first line for each class of shares in the table provides information about actual account values and actual expenses. You may use the information in this table, together with the amount you invested, to estimate the expenses that you paid over the period. Simply divide your account value by $1,000 (for example, an $8,600 account value divided by $1,000 = 8.6), then multiply the result by the number in the table under the heading entitled “Expenses Paid During the Period” to estimate the expenses you paid on your account during this period.
Hypothetical Example for Comparison Purposes
The second line for each class of shares in the table provides information about hypothetical account values and hypothetical expenses based on the Series actual expense ratio and an assumed rate of return of 5% per year before expenses, which is not the Series actual return. The hypothetical account values and expenses may not be used to estimate the actual ending account balance or expenses you paid for the period. You may use this information to compare the ongoing costs of investing in the Series and other funds. To do so, compare this 5% hypothetical example with the 5% hypothetical examples that appear in the shareholder reports of the other mutual funds.
Please note that the expenses shown in the table are meant to highlight your ongoing costs. Therefore, the second line for each class of shares is useful in comparing ongoing costs only, and will not help you determine the relative total costs of owning different funds.
| | | | | | |
Series Expenses |
| | | Beginning
Account
Value
10/1/2008 | | Ending
Account
Value
3/31/20091 | | Expenses
Paid
During
Period2 |
Global Institutional Series | | | | |
Actual | | $1,000.00 | | $744.40 | | $5.00 |
Hypothetical | | 1,000.00 | | 1,019.20 | | 5.79 |
1 The actual ending account value is based on the actual total return of the Series for the period October 1, 2008 to March 31, 2009 after actual expenses and will differ from the hypothetical ending account value which is based on the Series expense ratio and a hypothetical annual return of 5% before expenses. The actual cumulative return at net asset value for the period October 1, 2008 to March 31, 2009 was (25.56%).
2 Expenses are equal to the Series annualized expense ratio of 1.15%, net of any applicable fee waivers, multiplied by the average account value over the period, multiplied by 182/365 (to reflect the one-half year period).
| | |
Schedule of Investments March 31, 2009 (unaudited) | | Security Equity Fund Global Institutional Series |
| |
| | | | | |
| | | Shares | | Value |
RIGHT - 0.0% | | | | | |
Spain - 0.00% | | | | | |
Mapfre S.A. | | $ | 10,592 | | $141 |
TOTAL RIGHT (Cost $128) | | | | | $141 |
| | | Shares | | Value |
COMMON STOCKS - 108.3% |
Australia - 1.0% | | | | | |
Caltex Australia, Ltd. | | | 2,300 | | $14,249 |
Macquarie Group, Ltd. 1 | | | 1,647 | | 30,976 |
| | | | | |
| | | | | 45,225 |
| | | | | |
Belgium - 0.6% | | | | | |
UCB S.A. | | | 892 | | 26,295 |
| | | | | |
Bermuda - 5.0% | | | | | |
Arch Capital Group, Ltd. * | | | 600 | | 32,316 |
Aspen Insurance Holdings, Ltd. | | | 1,100 | | 24,706 |
Axis Capital Holdings, Ltd. | | | 1,200 | | 27,048 |
Endurance Specialty Holdings, Ltd. | | | 1,100 | | 27,434 |
Validus Holdings, Ltd. | | | 4,654 | | 110,207 |
| | | | | |
| | | | | 221,711 |
| | | | | |
Canada - 2.8% | | | | | |
Agnico-Eagle Mines, Ltd. | | | 580 | | 33,335 |
Canadian Imperial Bank of Commerce | | | 1,100 | | 40,026 |
CGI Group, Inc. * | | | 2,296 | | 18,537 |
Empire Company, Ltd. | | | 820 | | 34,467 |
| | | | | |
| | | | | 126,365 |
| | | | | |
Czech Republic - 0.5% | | | | | |
Telefonica O2 Czech Republic AS | | | 1,059 | | 20,993 |
| | | | | |
Finland - 1.6% | | | | | |
Neste Oil Oyj | | | 3,200 | | 42,596 |
Wartsila Oyj | | | 1,361 | | 28,730 |
| | | | | |
| | | | | 71,326 |
| | | | | |
France - 4.1% | | | | | |
Nexans S.A. * | | | 600 | | 22,780 |
Pernod-Ricard S.A. | | | 292 | | 16,283 |
Sanofi-Aventis S.A. | | | 700 | | 39,410 |
UBISOFT Entertainment * | | | 4,738 | | 86,609 |
Wendel * | | | 724 | | 19,140 |
| | | | | |
| | | | | 184,222 |
| | | | | |
Germany - 0.8% | | | | | |
ThyssenKrupp AG | | | 1,978 | | 34,607 |
| | | | | |
Hong Kong - 1.4% | | | | | |
CNOOC, Ltd. | | | 61,000 | | 60,444 |
| | | | | |
Israel - 1.0% | | | | | |
Check Point Software Technologies * | | | 2,093 | | 46,486 |
| | | | | |
Italy - 1.7% | | | | | |
Enel SpA | | | 8,545 | | 41,008 |
Prysmian SpA | | | 3,500 | | 34,872 |
| | | | | |
| | | | | 75,880 |
| | | | | |
Japan - 9.4% | | | | | |
JGC Corporation | | | 2,000 | | 22,550 |
Kubota Corporation | | | 3,000 | | 16,215 |
Kurita Water Industries, Ltd. | | | 1,800 | | 34,425 |
Nintendo Company, Ltd. | | | 297 | | 85,367 |
Nippon Mining Holdings, Inc. | | | 7,000 | | 27,581 |
| | | | |
| | | Shares | | Value |
COMMON STOCKS - 108.3% (continued) |
Japan - 9.4% (continued) | | | | |
NISSIN FOODS HOLDINGS CO, Ltd. | | 1,000 | | $29,299 |
NTT DoCoMo, Inc. | | 106 | | 143,182 |
Takeda Pharmaceutical Company, Ltd. | | 900 | | 30,915 |
Yamato Holdings Company, Ltd. | | 3,000 | | 28,097 |
| | | | |
| | | | 417,631 |
| | | | |
Jersey - 1.8% | | | | |
Randgold Resources, Ltd. ADR | | 1,475 | | 80,166 |
| | | | |
Norway - 0.5% | | | | |
Tandberg ASA | | 1,600 | | 23,596 |
| | | | |
Papua New Guinea - 2.2% | | | | |
Oil Search, Ltd. | | 26,931 | | 98,493 |
| | | | |
Philippines - 1.3% | | | | |
Philippine Long Distance Telephone Company ADR | | 1,298 | | 57,281 |
| | | | |
Poland - 0.5% | | | | |
Polski Koncern Naftowy Orlen | | 3,400 | | 23,264 |
| | | | |
Spain - 1.2% | | | | |
Mapfre S.A. | | 10,592 | | 23,217 |
Repsol YPF S.A. | | 1,694 | | 29,323 |
| | | | |
| | | | 52,540 |
| | | | |
Switzerland - 5.3% | | | | |
ACE, Ltd. | | 600 | | 24,240 |
Syngenta AG | | 655 | | 132,001 |
Transocean, Ltd. * | | 1,313 | | 77,257 |
| | | | |
| | | | 233,498 |
| | | | |
United Kingdom - 11.7% | | | | |
AstraZeneca plc | | 1,163 | | 40,900 |
Balfour Beatty plc | | 3,831 | | 17,988 |
BG Group plc | | 4,345 | | 65,772 |
Cadbury plc | | 18,544 | | 140,222 |
Diageo plc | | 2,547 | | 28,743 |
GKN plc | | 17,819 | | 17,513 |
GlaxoSmithKline plc | | 2,439 | | 38,057 |
Imperial Tobacco Group plc | | 4,819 | | 108,418 |
Ladbrokes plc | | 8,244 | | 21,646 |
Meggitt plc | | 10,000 | | 18,437 |
Prudential plc | | 4,808 | | 23,248 |
| | | | |
| | | | 520,944 |
| | | | |
United States - 53.9% | | | | |
Abbott Laboratories | | 1,262 | | 60,197 |
Activision Blizzard, Inc. * | | 7,200 | | 75,312 |
AllianceBernstein Holding, LP | | 4,000 | | 58,880 |
Allstate Corporation | | 800 | | 15,320 |
Altria Group, Inc. | | 9,379 | | 150,251 |
American Electric Power Company, Inc. | | 1,500 | | 37,890 |
Apple, Inc. * | | 360 | | 37,843 |
Bank of New York Mellon Corporation | | 1,269 | | 35,849 |
Bristow Group, Inc. * | | 900 | | 19,287 |
Carpenter Technology Corporation | | 1,000 | | 14,120 |
Cephalon, Inc. * | | 842 | | 57,340 |
CVS Caremark Corporation | | 1,100 | | 30,239 |
Darden Restaurants, Inc. | | 700 | | 23,982 |
DTE Energy Company | | 1,000 | | 27,700 |
| | | | |
| | | 48 | | The accompanying notes are an integral part of the financial statements |
| | |
Schedule of Investments March 31, 2009 (unaudited) | | Security Equity Fund Global Institutional Series |
| |
| | | | | |
| | | Shares | | Value | |
COMMON STOCKS - 108.3% (continued) | |
United States - 53.9% (continued) | | | |
Eaton Corporation | | 800 | | $29,488 | |
Express Scripts, Inc. * | | 2,345 | | 108,269 | |
Family Dollar Stores, Inc. | | 1,078 | | 35,973 | |
Frontier Communications Corporation | | 3,200 | | 22,976 | |
General Electric Company | | 2,600 | | 26,286 | |
Gilead Sciences, Inc. * | | 2,478 | | 114,781 | |
Google, Inc. * | | 406 | | 141,313 | |
H&R Block, Inc. | | 700 | | 12,733 | |
Interactive Brokers Group, Inc. * | | 3,919 | | 63,213 | |
International Business Machines Corporation | | 449 | | 43,504 | |
Kennametal, Inc. | | 2,000 | | 32,420 | |
Kimberly-Clark Corporation | | 2,920 | | 134,641 | |
Kroger Company | | 1,257 | | 26,674 | |
Life Technologies Corporation * | | 900 | | 29,232 | |
Manitowoc Company, Inc. | | 6,100 | | 19,947 | |
Marvel Entertainment, Inc. * | | 4,255 | | 112,970 | |
Mylan, Inc. * | | 6,415 | | 86,026 | |
NiSource, Inc. | | 3,800 | | 37,240 | |
Northern Trust Corporation | | 500 | | 29,910 | |
Occidental Petroleum Corporation | | 1,000 | | 55,650 | |
Olin Corporation | | 1,300 | | 18,551 | |
Oneok, Inc. | | 1,300 | | 29,419 | |
Oshkosh Truck Corporation | | 2,200 | | 14,828 | |
Overseas Shipholding Group, Inc. | | 600 | | 13,602 | |
Owens-Illinois, Inc. * | | 1,300 | | 18,772 | |
People’s United Financial, Inc. | | 1,400 | | 25,158 | |
Philip Morris International, Inc. | | 4,060 | | 144,455 | |
Qualcomm, Inc. | | 1,965 | | 76,458 | |
Schnitzer Steel Industries, Inc. | | 400 | | 12,556 | |
Sohu.com, Inc. * | | 2,753 | | 113,726 | |
Universal Health Services, Inc. | | 600 | | 23,004 | |
Valero Energy Corporation | | 1,400 | | 25,060 | |
Walgreen Company | | 1,200 | | 31,152 | |
Watson Pharmaceuticals, Inc. * | | 900 | | 27,999 | |
Worthington Industries, Inc. | | 2,300 | | 20,033 | |
| | | | | |
| | | | | 2,402,229 | |
TOTAL COMMON STOCKS (Cost $4,786,552) | | | | $4,823,196 | |
| | | Principal
Amount | | Value | |
SHORT TERM INVESTMENTS - 9.3% | |
State Street General Account U.S. Government Fund | | $414,673 | | $414,673 | |
TOTAL SHORT TERM INVESTMENTS (Cost $414,673) | | $414,673 | |
Total Investments - 117.6% (cost $5,201,353) | | | | $5,238,010 | |
Liabilities, Less Cash & Other Assets - (17.6%) | | (782,807 | ) |
| | | | | |
Total Net Assets - 100.0% | | | | $4,455,203 | |
| | | | | |
| | | | | | |
INVESTMENT CONCENTRATION |
At March 31, 2009, the investment diversification of the Series was as follows: |
| Industry | | % of Net
Assets | | | Value |
Money Markets | | 9.3 | % | | $ | 414,673 |
Tobacco | | 9.1 | | | | 403,124 |
Pharmaceuticals | | 7.9 | | | | 349,799 |
| | | | | |
INVESTMENT CONCENTRATION (continued) |
| Industry | | % of Net
Assets | | | Value |
Internet Software & Services | | 5.7 | % | | $255,039 |
Home Entertainment Software | | 5.5 | | | 247,288 |
Wireless Telecommunication Services | | 4.5 | | | 200,463 |
Biotechnology | | 3.9 | | | 172,121 |
Reinsurance | | 3.8 | | | 169,957 |
Packaged Foods & Meats | | 3.9 | | | 169,521 |
Oil & Gas Exploration & Production | | 3.6 | | | 158,937 |
Integrated Oil & Gas | | 3.4 | | | 150,745 |
Household Products | | 3.0 | | | 134,641 |
Oil & Gas Refining & Marketing | | 3.0 | | | 132,750 |
Fertilizers & Agricultural Chemicals | | 3.0 | | | 132,001 |
Industrial Machinery | | 2.8 | | | 125,063 |
Asset Management & Custody Banks | | 2.8 | | | 124,639 |
Gold | | 2.5 | | | 113,501 |
Movies & Entertainment | | 2.5 | | | 112,970 |
Health Care Services | | 2.4 | | | 108,269 |
Communications Equipment | | 2.2 | | | 100,054 |
Property & Casualty Insurance | | 2.0 | | | 91,314 |
Computer Hardware | | 1.8 | | | 81,347 |
Steel | | 1.8 | | | 81,316 |
Electric Utilities | | 1.8 | | | 78,898 |
Oil & Gas Drilling | | 1.8 | | | 77,257 |
Multi-Utilities | | 1.5 | | | 64,940 |
Specialized Finance | | 1.4 | | | 63,213 |
Drug Retail | | 1.4 | | | 61,391 |
Food Retail | | 1.4 | | | 61,141 |
Electrical Components & Equipment | | 1.3 | | | 57,652 |
Construction & Farm Machinery & Heavy Trucks | | 1.2 | | | 50,990 |
Systems Software | | 1.0 | | | 46,486 |
Industrial Conglomerates | | 1.0 | | | 45,426 |
Distillers & Vintners | | 1.0 | | | 45,026 |
Integrated Telecommunication Services | | 1.0 | | | 43,969 |
Construction & Engineering | | 0.9 | | | 40,538 |
Diversified Banks | | 0.9 | | | 40,026 |
General Merchandise Stores | | 0.8 | | | 35,973 |
Investment Banking & Brokerage | | 0.7 | | | 30,976 |
Gas Utilities | | 0.7 | | | 29,419 |
Life Sciences Tools & Services | | 0.7 | | | 29,232 |
Air Freight & Logistics | | 0.6 | | | 28,097 |
Thrifts & Mortgage Finance | | 0.6 | | | 25,158 |
Restaurants | | 0.5 | | | 23,982 |
Life & Health Insurance | | 0.5 | | | 23,248 |
Multi-line Insurance | | 0.5 | | | 23,217 |
Health Care Facilities | | 0.5 | | | 23,004 |
Casinos & Gaming | | 0.5 | | | 21,646 |
Oil & Gas Equipment & Services | | 0.4 | | | 19,287 |
Metal & Glass Containers | | 0.4 | | | 18,772 |
Diversified Chemicals | | 0.4 | | | 18,551 |
IT Consulting & Other Services | | 0.4 | | | 18,537 |
Aerospace & Defense | | 0.4 | | | 18,437 |
Auto Parts & Equipment | | 0.4 | | | 17,513 |
Oil & Gas Storage & Transportation | | 0.3 | | | 13,602 |
Specialized Consumer Services | | 0.3 | | | 12,733 |
Rights | | 0.0 | | | 141 |
| | | | | |
Total Investments | | 117.6 | | | $5,238,010 |
| | | | | |
| | | | |
| | | 49 | | The accompanying notes are an integral part of the financial statements |
| | |
Schedule of Investments March 31, 2009 (unaudited) | | Security Equity Fund Global Institutional Series |
| |
| |
For federal income tax purposes the identified cost of investments owned at March 31, 2009 was $5,326,801.
| | |
ADR | | American Depositary Receipt |
plc | | Public Limited Company |
* Non-income producing security
1 Security is a PFIC (Passive Foreign Investment Company).
| | | | |
| | | 50 | | The accompanying notes are an integral part of the financial statements |
Security Equity Fund
Global Institutional Series
(unaudited)
Statement of Assets and
Liabilities
March 31, 2009
| | |
Assets: | | |
Investments, at value* | | $5,238,010 |
Cash denominated in a foreign currency, at value** | | 5,989 |
Receivables: | | |
Fund shares sold | | 4,298 |
Securities sold | | 499,478 |
Interest | | 41 |
Dividends | | 23,258 |
Security Investors | | 12,053 |
Foreign taxes recoverable | | 111 |
Prepaid expenses | | 11,657 |
| | |
Total assets | | 5,794,895 |
| | |
| |
Liabilities: | | |
Cash overdraft | | 4,723 |
Payable for: | | |
Fund shares redeemed | | 1,197,193 |
Securities purchased | | 119,679 |
Management fees | | 4,632 |
Administration fees | | 1,595 |
Transfer agent/maintenance fees | | 22 |
Custodian fees | | 4,661 |
Directors’ fees | | 286 |
Professional fees | | 4,090 |
Other fees | | 2,811 |
| | |
Total liabilities | | 1,339,692 |
| | |
Net assets | | $4,455,203 |
| | |
| |
Net assets consist of: | | |
Paid in capital | | $7,548,863 |
Undistributed net investment income | | 30,385 |
Accumulated net realized loss on sale of investments | | (3,160,567) |
Net unrealized appreciation in value of investments | | 36,522 |
| | |
Net assets | | $4,455,203 |
| | |
| | |
Capital shares authorized | | unlimited |
Capital shares outstanding | | 693,468 |
Net asset value per share (net assets divided by shares outstanding) | | $6.42 |
| | |
| |
*Investments, at cost | | $5,201,353 |
**Cash denominated in a foreign currency, at cost | | 6,064 |
Statement of Operations
For the Six Months Ended March 31, 2009
| | |
Investment Income: | | |
Dividends (net of foreign withholding tax $1,912) | | $78,570 |
Interest | | (300) |
| | |
Total investment income | | 78,270 |
| | |
| |
Expenses: | | |
Management fees | | 29,162 |
Administration fees | | 5,707 |
Transfer agent/maintenance fees | | 191 |
Custodian fees | | 18,779 |
Directors’ fees | | 308 |
Professional fees | | 6,625 |
Reports to shareholders | | 2,358 |
Registration fees | | 10,701 |
Other | | 1,503 |
| | |
Total expenses | | 75,334 |
Less: | | |
Reimbursement of expenses | | (41,801) |
| | |
Net expenses | | 33,533 |
| | |
Net investment income | | 44,737 |
| | |
| |
Net Realized and Unrealized Gain (Loss): | | |
Net realized gain (loss) during the period on: | | |
Investments | | (2,762,940) |
Foreign currency transactions | | (11,962) |
| | |
Net realized loss | | (2,774,902) |
| | |
| |
Net unrealized appreciation (depreciation) during the period on: | | |
Investments | | 813,247 |
Translation of assets and liabilities in foreign currencies | | (3,309) |
| | |
Net unrealized appreciation | | 809,938 |
| | |
Net realized and unrealized loss | | (1,964,964) |
| | |
Net decrease in net assets resulting from operations | | $(1,920,227) |
| | |
| | | | |
| | 51 | | The accompanying notes are an integral part of the financial statements |
| | |
| | | Security Equity Fund |
| Statement of Changes in Net Assets | | Global Institutional Series |
| | | | | | | | |
| | | Six Months Ended
March 31, 2009
(unaudited) | | | Period Ended
September 30,
2008* | |
| | |
Increase (decrease) in net assets from operations: | | | | | | | | |
Net investment income | | $ | 44,737 | | | $ | 14,698 | |
Net realized loss during the period on investments | | | (2,774,902 | ) | | | (393,406 | ) |
Net unrealized appreciation (depreciation) during the period on investments | | | 809,938 | | | | (773,416 | ) |
| | | | | | | | |
Net decrease in net assets resulting from operations | | | (1,920,227 | ) | | | (1,152,124 | ) |
| | | | | | | | |
| | |
Distributions to shareholders from: | | | | | | | | |
Net investment income | | | (21,309 | ) | | | – | |
| | | | | | | | |
Total distributions to shareholders | | | (21,309 | ) | | | – | |
| | | | | | | | |
| | |
Capital share transactions: | | | | | | | | |
Proceeds from sale of shares | | | 1,203,800 | | | | 8,934,232 | |
Dividends reinvested | | | 20,899 | | | | – | |
Cost of shares redeemed | | | (2,209,959 | ) | | | (400,109 | ) |
| | | | | | | | |
Net increase (decrease) from capital share transactions | | | (985,260 | ) | | | 8,534,123 | |
| | | | | | | | |
Net increase (decrease) in net assets | | | (2,926,796 | ) | | | 7,381,999 | |
| | | | | | | | |
| | |
Net assets: | | | | | | | | |
Beginning of period | | | 7,381,999 | | | | – | |
| | | | | | | | |
End of period | | $ | 4,455,203 | | | $ | 7,381,999 | |
| | | | | | | | |
| | |
Undistributed net investment income at end of period | | $ | 30,385 | | | $ | 6,957 | |
| | | | | | | | |
| | |
Capital share activity: | | | | | | | | |
Shares sold | | | 177,113 | | | | 893,198 | |
Shares reinvested | | | 2,999 | | | | – | |
Shares redeemed | | | (338,433 | ) | | | (41,409 | ) |
| | | | | | | | |
Total capital share activity | | | (158,321 | ) | | | 851,789 | |
| | | | | | | | |
* For the period July 11, 2008 (commencement of operations) to September 30, 2008.
| | | | |
| | 52 | | The accompanying notes are an integral part of the financial statements |
| | |
Financial Highlights Selected data for each share of capital stock outstanding throughout each period | | Security Equity Fund
Global Institutional Series |
| |
| | | | |
| | | Six Months Ended
March 31, 2009a | | Period Ended
September 30,
2008b |
| Per Share Data |
Net asset value, beginning of period | | $8.67 | | $10.00 |
| | |
Income (loss) from investment operations: | | | | |
Net investment incomec | | 0.05 | | 0.02 |
Net loss on securities (realized and unrealized) | | (2.27) | | (1.35) |
| | | | |
Total from investment operations | | (2.22) | | (1.33) |
| | |
Less distributions: | | | | |
Dividends from net investment income | | (0.03) | | – |
| | | | |
Total distributions | | (0.03) | | – |
Net asset value, end of period | | $6.42 | | $8.67 |
| | | | |
| | | | |
| | | | |
Total Return | | (25.56%) | | (13.30%) |
| Ratios/Supplemental Data | | | | |
Net assets, end of period (in thousands) | | $4,455 | | $7,382 |
| | |
Ratios to average net assets: | | | | |
Net investment income | | 1.53% | | 0.87% |
Total expensesd | | 2.58% | | 1.97% |
Net expensese | | 1.15% | | 1.15% |
Net expenses prior to custodian earnings credits and net of expense waivers | | 1.15% | | 1.15% |
Portfolio turnover rate | | 430% | | 325% |
a Unaudited figures for the six months ended March 31, 2009. Percentage amounts, except total return, have been annualized.
b Security Global Institutional Series was initially capitalized on July 11, 2008 with a net asset value of $10 per share. Percentage amounts for the period, except total return, have been annualized.
c Net investment income (loss) was computed using average shares outstanding throughout the period.
d Total expense information reflects the expense ratios absent expense reductions by the Investment Manager and earnings credits, as applicable.
e Net expense information reflects the expense ratios after voluntary expense waivers, reimbursements and custodian earnings credits, as applicable.
| | | | |
| | | 53 | | The accompanying notes are an integral part of the financial statements |
| | |
Performance Summary March 31, 2009 | | Security Equity Fund Mid Cap Value Series (unaudited) |
| |
| |
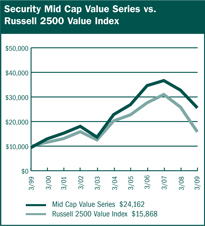
$10,000 Over 10 Years
This chart assumes a $10,000 investment in Class A shares of Mid Cap Value Series on March 31, 1999, reflects deduction of the 5.75% sales load and assumes all dividends reinvested. The chart does not reflect the deduction of taxes that a shareholder would pay on distributions or the redemption of fund shares. The Russell 2500 Value Index is an unmanaged index that measures the performance of securities of small-to-mid cap U.S. companies with greater-than-average value orientation.
| | | | | | |
Average Annual Returns |
Periods Ended 3-31-09 | | 1 Year | | 5 Years | | 10 Years |
A Shares | | (26.24%) | | 1.13% | | 9.87% |
A Shares with sales charge | | (30.48%) | | (0.06%) | | 9.22% |
B Shares | | (26.81%) | | 0.37% | | 9.12% |
B Shares with CDSC | | (29.97%) | | 0.15% | | 9.12% |
C Shares | | (26.83%) | | 0.37% | | 8.95% |
C Shares with CDSC | | (27.47%) | | 0.37% | | 8.95% |
The performance data above represents past performance that is not predictive of future results. The investment return and principal value of an investment in the Series will fluctuate so that an investor’s shares, when redeemed, may be worth more or less than their original cost. The figures above do not reflect deduction of the maximum front-end sales charge of 5.75% for Class A shares or the contingent deferred sales charge of 5% for Class B shares and 1% for Class C shares, as applicable, except where noted. The figures do not reflect the deduction of taxes that a shareholder would pay on distributions or redemption of shares. Such figures would be lower if the maximum sales charge and any applicable taxes were deducted. |
| | | | | | |
| | | Portfolio Composition by Sector as of 3-31-09 |
| | | Consumer Discretionary | | 5.83% | | |
| | | Consumer Staples | | 6.08 | | |
| | | Energy | | 10.03 | | |
| | | Financials | | 15.04 | | |
| | | Health Care | | 4.20 | | |
| | | Industrials | | 17.08 | | |
| | | Information Technology | | 13.66 | | |
| | | Materials | | 9.08 | | |
| | | Utilities | | 12.13 | | |
| | | Exchange Traded Funds | | 2.05 | | |
| | | Convertible Bonds | | 1.19 | | |
| | | Commercial Paper | | 0.79 | | |
| | | Repurchase Agreement | | 2.83 | | |
| | | Cash & Other Assets, Less Liabilities | | 0.01 | | |
| | | Total Net Assets | | 100.00% | | |
| | | | | | | |
| | | | | | | |
| | | | |
| | | 54 | | The accompanying notes are an integral part of the financial statements |
| | |
Performance Summary March 31, 2009 | | Security Equity Fund Mid Cap Value Series (unaudited) |
| |
| |
Information About Your Series Expenses
Calculating your ongoing Series expenses
Example
As a shareholder of the Series, you incur two types of costs: (1) transaction costs, which may include sales charges (loads) on purchase payments; contingent deferred sales charges on redemptions; and redemption fees, if any; and (2) ongoing costs, including management fees; distribution and/or service fees (12b-1); and other Series expenses. This example is intended to help you understand your ongoing costs (in dollars) of investing in the Series and to compare these costs with ongoing costs of investing in other mutual funds. The example is based on an investment of $1,000 invested at the beginning of the period and held for the entire period October 1, 2008 through March 31, 2009.
Actual Expenses
The first line for each class of shares in the table provides information about actual account values and actual expenses. You may use the information in this table, together with the amount you invested, to estimate the expenses that you paid over the period. Simply divide your account value by $1,000 (for example, an $8,600 account value divided by $1,000 = 8.6), then multiply the result by the number in the table under the heading entitled “Expenses Paid During the Period” to estimate the expenses you paid on your account during this period.
Hypothetical Example for Comparison Purposes
The second line for each class of shares in the table provides information about hypothetical account values and hypothetical expenses based on the Series actual expense ratio and an assumed rate of return of 5% per year before expenses, which is not the Series actual return. The hypothetical account values and expenses may not be used to estimate the actual ending account balance or expenses you paid for the period. You may use this information to compare the ongoing costs of investing in the Series and other funds. To do so, compare this 5% hypothetical example with the 5% hypothetical examples that appear in the shareholder reports of the other mutual funds.
Please note that the expenses shown in the table are meant to highlight your ongoing costs only and do not reflect any transactional costs, such as sales charges (loads) on purchase payments, contingent deferred sales charges on redemptions, and redemption fees, if any. Therefore, the second line for each class of shares is useful in comparing ongoing costs only, and will not help you determine the relative total costs of owning different funds. In addition, if these transactional costs were included, your costs would have been higher.
| | | | | | |
| Series Expenses |
| | | Beginning
Account
Value
10/1/2008 | | Ending
Account
Value
3/31/2009 1 | | Expenses
Paid
During
Period 2 |
Mid Cap Value | | | | | | |
Series - Class A | | | | | | |
Actual | | $1,000.00 | | $732.39 | | $6.57 |
Hypothetical | | 1,000.00 | | 1,017.35 | | 7.64 |
Mid Cap Value | | | | | | |
Series - Class B | | | | | | |
Actual | | 1,000.00 | | 729.88 | | 9.79 |
Hypothetical | | 1,000.00 | | 1,013.61 | | 11.40 |
Mid Cap Value | | | | | | |
Series - Class C | | | | | | |
Actual | | 1,000.00 | | 729.39 | | 9.79 |
Hypothetical | | 1,000.00 | | 1,013.61 | | 11.40 |
1 The actual ending account value is based on the actual total return of the Series for the period October 1, 2008 to March 31, 2009 after actual expenses and will differ from the hypothetical ending account value which is based on the Series expense ratio and a hypothetical annual return of 5% before expenses. The actual cumulative return at net asset value for the period October 1, 2008 to March 31, 2009 was (26.76%), (27.01%) and (27.06%), for Class A, B and C shares, respectively.
2 Expenses are equal to the Series annualized expense ratio (1.52%, 2.27% and 2.27% for Class A, B, and C shares, respectively), net of any applicable fee waivers, multiplied by the average account value over the period, multiplied by 182/365 (to reflect the one-half year period).
| | |
Schedule of Investments March 31, 2009 (unaudited) | | Security Equity Fund Mid Cap Value Series |
| |
| | | | |
| | | Shares | | Value |
COMMON STOCKS - 95.2% | | | | |
Apparel Retail - 2.6% | | | | |
Brown Shoe Company, Inc. | | 879,500 | | $3,298,125 |
Chico’s FAS, Inc. * | | 1,790,100 | | 9,612,837 |
Talbots, Inc. | | 1,029,000 | | 3,611,790 |
| | | | |
| | | | 16,522,752 |
| | | | |
| Apparel, Accessories & Luxury | | | | |
| Goods - 1.8% | | | | |
Fossil, Inc. * | | 236,700 | | 3,716,190 |
Maidenform Brands, Inc. * | | 635,900 | | 5,824,844 |
Oxford Industries, Inc. | | 318,300 | | 1,963,911 |
| | | | |
| | | | 11,504,945 |
| | | | |
| Application Software - 0.2% | | | | |
PLATO Learning, Inc. 1,* | | 845,700 | | 1,505,346 |
| | | | |
| Auto Parts & Equipment - 0.0% | | | | |
HydroGen Corporation 1,2,* | | 1,265,700 | | 25,314 |
| | | | |
| Biotechnology - 0.1% | | | | |
Combinatorx, Inc. * | | 866,300 | | 537,106 |
| | | | |
| Building Products - 0.4% | | | | |
Trex Company, Inc. * | | 359,900 | | 2,746,037 |
| | | | |
| Coal & Consumable Fuels - 2.3% | | | | |
Evergreen Energy, Inc. * | | 3,905,700 | | 5,436,734 |
USEC, Inc. * | | 1,822,100 | | 8,746,080 |
| | | | |
| | | | 14,182,814 |
| | | | |
| Communications Equipment - 1.2% | | | | |
EF Johnson Technologies, Inc. 1,* | | 870,000 | | 652,500 |
Symmetricom, Inc. 1,* | | 1,910,270 | | 6,685,945 |
| | | | |
| | | | 7,338,445 |
| | | | |
| Computer Storage & Peripherals - 0.4% | | | | |
STEC, Inc. * | | 307,300 | | 2,264,801 |
| | | | |
| Construction & Engineering - 5.3% | | | | |
Insituform Technologies, Inc. * | | 824,300 | | 12,892,052 |
Quanta Services, Inc. * | | 437,100 | | 9,375,795 |
URS Corporation * | | 269,190 | | 10,877,968 |
| | | | |
| | | | 33,145,815 |
| | | | |
| Construction Materials - 1.5% | | | | |
Eagle Materials, Inc. | | 400,100 | | 9,702,425 |
| | | | |
| Consumer Finance - 0.3% | | | | |
First Marblehead Corporation * | | 1,443,431 | | 1,862,026 |
| | | | |
| Data Processing & Outsourced | | | | |
| Services - 5.8% | | | | |
Affiliated Computer Services, Inc. * | | 250,300 | | 11,986,867 |
Computer Sciences Corporation * | | 670,500 | | 24,701,220 |
| | | | |
| | | | 36,688,087 |
| | | | |
| Electric Utilities - 7.3% | | | | |
Allete, Inc. | | 194,557 | | 5,192,726 |
Empire District Electric Company | | 189,566 | | 2,737,333 |
Great Plains Energy, Inc. | | 875,400 | | 11,791,638 |
Northeast Utilities | | 378,900 | | 8,180,451 |
Pepco Holdings, Inc. | | 408,400 | | 5,096,832 |
Westar Energy, Inc. | | 739,800 | | 12,968,694 |
| | | | |
| | | | 45,967,674 |
| | | | |
| | | | |
| | | Shares | | Value |
COMMON STOCKS - 95.2% (continued) |
Electrical Components & | | | | |
Equipment - 0.9% | | | | |
Power-One, Inc. 1,2,* | | 5,626,300 | | $4,951,144 |
UQM Technologies, Inc. 1,* | | 517,722 | | 849,064 |
| | | | |
| | | | 5,800,208 |
| | | | |
| | |
| Electronic Manufacturing Services - 1.6% | | | | |
Maxwell Technologies, Inc. 1,2,* | | 1,446,000 | | 10,049,700 |
| | | | |
| Exchange Traded Funds - 2.0% | | | | |
iShares Russell 2000 Value Index Fund | | 97,600 | | 3,851,296 |
iShares S&P MidCap 400 | | 204,700 | | 9,045,693 |
| | | | |
| | | | 12,896,989 |
| | | | |
| | |
| Forest Products - 0.7% | | | | |
Louisiana-Pacific Corporation | | 2,014,300 | | 4,491,889 |
| | | | |
| | |
| Gas Utilities - 1.8% | | | | |
Atmos Energy Corporation | | 493,000 | | 11,398,160 |
| | | | |
| | |
| Health Care Equipment - 0.4% | | | | |
Aspect Medical Systems, Inc. * | | 606,700 | | 2,542,073 |
| | | | |
| | |
| Health Care Facilities - 1.5% | | | | |
Community Health Systems, Inc. * | | 610,100 | | 9,358,934 |
| | | | |
| | |
| Health Care Services - 2.2% | | | | |
Mednax, Inc. * | | 318,500 | | 9,386,195 |
Providence Service Corporation * | | 90,000 | | 619,200 |
RehabCare Group, Inc. * | | 228,530 | | 3,985,563 |
| | | | |
| | | | 13,990,958 |
| | | | |
| | |
| Highways & Railtracks - 0.3% | | | | |
Quixote Corporation 1,2 | | 479,100 | | 1,662,477 |
| | | | |
| | |
| Home Furnishings - 1.4% | | | | |
Leggett & Platt, Inc. | | 668,800 | | 8,687,712 |
| | | | |
| | |
| Human Resources & Employment Services - 0.8% | | | | |
Administaff, Inc. | | 232,000 | | 4,902,160 |
| | | | |
| | |
| Industrial Conglomerates - 2.0% | | | | |
McDermott International, Inc. * | | 921,300 | | 12,336,207 |
| | | | |
| | |
| Industrial Machinery - 1.1% | | | | |
Harsco Corporation | | 230,800 | | 5,116,836 |
Thermoenergy Corporation 1,2,* | | 3,792,870 | | 1,782,649 |
| | | | |
| | | | 6,899,485 |
| | | | |
| | |
| Insurance Brokers - 0.5% | | | | |
Arthur J Gallagher & Company | | 189,000 | | 3,213,000 |
| | | | |
| | |
| Mortgage REIT’s - 0.7% | | | | |
Bimini Capital Management, Inc. 1,2,* | | 1,474,400 | | 66,348 |
Redwood Trust, Inc. | | 285,027 | | 4,375,164 |
| | | | |
| | | | 4,441,512 |
| | | | |
| | |
| Multi-Line Insurance - 1.5% | | | | |
American Financial Group, Inc. | | 602,050 | | 9,662,903 |
| | | | |
| | | | |
| | | 56 | | The accompanying notes are an integral part of the financial statements |
| | |
Schedule of Investments March 31, 2009 (unaudited) | | Security Equity Fund Mid Cap Value Series |
| |
| | | | |
| | | Shares | | Value |
COMMON STOCKS - 95.2% (continued) |
Multi-Utilities - 3.0% | | | | |
NorthWestern Corporation | | 586,100 | | $12,589,428 |
SCANA Corporation | | 210,000 | | 6,486,900 |
| | | | |
| | | | 19,076,328 |
| | | | |
Oil & Gas Drilling - 1.4% | | | | |
Helmerich & Payne, Inc. 3 | | 397,300 | | 9,046,521 |
| | | | |
| Oil & Gas Equipment & | | | | |
Services - 2.1% | | | | |
Global Industries, Ltd. * | | 3,365,070 | | 12,921,869 |
| | | | |
| Oil & Gas Exploration & | | | | |
| Production - 2.4% | | | | |
Goodrich Petroleum Corporation * | | 89,100 | | 1,724,976 |
Gulfport Energy Corporation * | | 664,000 | | 1,540,480 |
Newfield Exploration Company * | | 53,007 | | 1,203,259 |
PetroHawk Energy Corporation * | | 582,500 | | 11,201,475 |
| | | | |
| | | | 15,670,190 |
| | | | |
Oil & Gas Storage & | | | | |
Transportation - 1.8% | | | | |
Southern Union Company | | 746,660 | | 11,364,165 |
| | | | |
| Packaged Foods & Meats - 6.1% | | | | |
Del Monte Foods Company | | 570,000 | | 4,155,300 |
Hormel Foods Corporation | | 360,700 | | 11,437,797 |
JM Smucker Company | | 381,300 | | 14,211,051 |
Smithfield Foods, Inc. * | | 898,500 | | 8,499,810 |
| | | | |
| | | | 38,303,958 |
| | | | |
| Paper Packaging - 4.4% | | | | |
Bemis Company, Inc. | | 802,800 | | 16,834,716 |
Sonoco Products Company | | 503,200 | | 10,557,136 |
| | | | |
| | | | 27,391,852 |
| | | | |
| Paper Products - 1.3% | | | | |
Schweitzer-Mauduit International, Inc. | | 438,700 | | 8,098,402 |
| | | | |
| Property & Casualty | | | | |
| Insurance - 7.5% | | | | |
Alleghany Corporation * | | 43,845 | | 11,874,460 |
Assured Guaranty, Ltd. | | 241,900 | | 1,637,663 |
Employers Holdings, Inc. | | 382,300 | | 3,647,142 |
Hanover Insurance Group, Inc. | | 447,000 | | 12,882,540 |
United America Indemnity, Ltd. * | | 54,325 | | 218,387 |
W.R. Berkley Corporation | | 759,800 | | 17,133,490 |
| | | | |
| | | | 47,393,682 |
| | | | |
Railroads - 0.8% | | | | |
Kansas City Southern 3,* | | 400,733 | | 5,093,316 |
| | | | |
| Regional Banks - 4.5% | | | | |
Commerce Bancshares, Inc. 3 | | 311,745 | | 11,316,343 |
First Horizon National Corporation 3 | | 430,897 | | 4,627,832 |
Old National Bancorp | | 158,630 | | 1,771,897 |
Wilmington Trust Corporation | | 1,077,400 | | 10,440,006 |
| | | | |
| | | | 28,156,078 |
| | | | |
| Research & Consulting | | | | |
| Services - 2.9% | | | | |
ICF International, Inc. * | | 355,700 | | 8,170,429 |
Navigant Consulting, Inc. 3,* | | 763,500 | | 9,978,945 |
| | | | |
| | | | 18,149,374 |
| | | | |
| | | | |
| | | Shares | | Value |
COMMON STOCKS - 95.2% (continued) |
| Security & Alarm Services - 1.7% | | | | |
GeoEye, Inc. * | | 526,710 | | $10,402,523 |
| | | | |
| Semiconductor Equipment - 0.6% | | | | |
Ultratech, Inc. * | | 316,200 | | 3,949,338 |
| | | | |
| Semiconductors - 3.9% | | | | |
IXYS Corporation 1,2 | | 2,742,900 | | 22,107,774 |
RF Micro Devices, Inc. * | | 1,614,700 | | 2,147,551 |
| | | | |
| | | | 24,255,325 |
| | | | |
| Specialty Chemicals - 1.2% | | | | |
Landec Corporation * | | 741,716 | | 4,131,358 |
Zoltek Companies, Inc. * | | 501,000 | | 3,411,810 |
| | | | |
| | | | 7,543,168 |
| | | | |
| Trucking - 1.0% | | | | |
Old Dominion Freight Line, Inc. * | | 61,790 | | 1,451,447 |
Saia, Inc. * | | 417,270 | | 4,986,377 |
| | | | |
| | | | | 6,437,824 |
TOTAL COMMON STOCKS | | |
(cost $905,405,257) | | | | $599,581,867 |
| | | Shares | | Value |
| WARRANTS - 0.0% | | |
Nova Biosource Fuels, Inc.
$2.40, 7/5/2011 | | 677,450 | | $37,438 |
TOTAL WARRANTS | | |
(cost $699,773) | | | | $37,438 |
| | | Principal
Amount | | Value |
CONVERTIBLE BONDS - 1.2% |
| Electric Utilities - 0.5% | | | | |
Power-One, Inc.
8.00%, 2013 4,5 | | $4,000,000 | | $3,305,800 |
| | | | |
| Metals & Minerals - 0.7% | | | | |
USEC, Inc.
3.00%, 2014 | | 7,600,000 | | 4,189,500 |
| TOTAL CONVERTIBLE BONDS |
(cost $11,600,000) | | | | $7,495,300 |
| | | Principal
Amount | | Value |
| COMMERCIAL PAPER - 0.8% | | |
| Oil Field Services - 0.8% | | | | |
ConocoPhillips | | | | |
0.23%, 04/01/20095 | | $5,000,000 | | $5,000,000 |
TOTAL COMMERCIAL PAPER (cost $5,000,000) | | $5,000,000 |
| | | Principal
Amount | | Value |
REPURCHASE AGREEMENT - 2.8% |
UMB Financial Corp, 0.06%, dated 3/31/09, matures 4/01/09; repurchase amount $17,837,030 (Collateralized by FNMA, 5.625%, 05/19/11 with a value of $18,194,208) | | $17,837,000 | | $17,837,000 |
TOTAL REPURCHASE AGREEMENT |
(cost $17,837,000) | | | | $17,837,000 |
| | | | |
| | | 57 | | The accompanying notes are an integral part of the financial statements |
| | |
Schedule of Investments March 31, 2009 (unaudited) | | Security Equity Fund Mid Cap Value Series |
| |
| | |
| | | Value |
Total Investments - 100.0% (cost $940,542,030) | | $629,951,605 |
Cash & Other Assets, Less Liabilities - 0.0% | | 35,211 |
| | |
Total Net Assets - 100.0% | | $629,986,816 |
| | |
For federal income tax purposes the identified cost of investments owned at March 31, 2009 was $941,808,064.
* Non-income producing security
1 Security is deemed illiquid. The total market value of illiquid securities is $50,338,261 (cost $120,097,226), or 8.0% of total net assets.
2 Investment in an affiliated issuer. See Note 8 in notes to financial statements.
3 Security is segregated as collateral for open written option contracts.
4 Security was acquired through a private placement.
5 Security is a 144A or Section 4(2) security. The total market value of 144A or Section 4(2) securities is $8,305,800 (cost $9,000,000), or 1.3% of total net assets.
| | | | |
| | 58 | | The accompanying notes are an integral part of the financial statements |
Security Equity Fund
Mid Cap Value Series
(unaudited)
Statement of Assets and Liabilities
March 31, 2009
| | |
Assets: | | |
Investments in unaffiliated issues, at value* | | $589,306,199 |
Investments in affiliated issues, at value** | | 40,645,406 |
| | |
Total investments | | 629,951,605 |
Cash | | 422 |
| |
Receivables: | | |
Fund shares sold | | 1,842,806 |
Securities sold | | 336,432 |
Interest | | 115,739 |
Dividends | | 879,639 |
Prepaid expenses | | 61,857 |
| | |
Total assets | | 633,188,500 |
| | |
Liabilities: | | |
Payable for: | | |
Fund shares redeemed | | 879,349 |
Written options, at value (premiums received, $1,928,858) | | 921,195 |
Management fees | | 418,772 |
Custodian fees | | 6,000 |
Transfer agent/maintenance fees | | 124,151 |
Administration fees | | 47,890 |
Professional fees | | 48,937 |
12b-1 distribution plan fees | | 195,627 |
Directors’ fees | | 31,826 |
Other | | 527,937 |
| | |
Total liabilities | | 3,201,684 |
| | |
Net assets | | $629,986,816 |
| | |
Net assets consist of: | | |
Paid in capital | | $986,856,058 |
Undistributed net investment income | | 1,153,812 |
Accumulated net realized loss on sale of investments | | (48,440,291) |
Net unrealized depreciation in value of investments | | (309,582,763) |
| | |
Net assets | | $629,986,816 |
| | |
Class A: | | |
Capital shares outstanding (unlimited number of shares authorized) | | 28,149,178 |
Net assets | | $512,512,789 |
Net asset value and redemption price per share | | $18.21 |
| | |
Maximum offering price per share (net asset value divided by 94.25%) | | $19.32 |
| | |
Class B: | | |
Capital shares outstanding (unlimited number of shares authorized) | | 2,720,026 |
Net assets | | $42,586,242 |
| | |
Net asset value, offering and redemption price per share (excluding any applicable contingent deferred sales charge) | | $15.66 |
| | |
Class C: | | |
Capital shares outstanding (unlimited number of shares authorized) | | 4,642,192 |
Net assets | | $74,887,785 |
Net asset value, offering and redemption price per share (excluding any applicable contingent deferred sales charge) | | $16.13 |
| | |
*Investments in unaffiliated issues, at cost | | $841,228,542 |
**Investments in affiliated issues, at cost | | 99,313,488 |
| | |
Total cost | | $940,542,030 |
Statement of Operations
For the Six Months Ended March 31, 2009
| | |
Investment Income: | | |
Dividends from securities of unaffiliated issuers | | $6,974,823 |
Dividends from securities of affiliated issuers | | 242,704 |
Interest | | 325,888 |
| | |
Total investment income | | 7,543,415 |
| | |
Expenses: | | |
Management fees | | 2,730,649 |
Transfer agent/maintenance fees | | 942,582 |
Administration fees | | 314,637 |
Custodian fees | | 14,183 |
Directors’ fees | | 29,492 |
Professional fees | | 57,768 |
Reports to shareholders | | 47,405 |
Registration fees | | 40,585 |
Other expenses | | 30,748 |
12b-1 distribution fees - Class A | | 666,933 |
12b-1 distribution fees - Class B | | 235,039 |
12b-1 distribution fees - Class C | | 406,133 |
| | |
Total expenses | | 5,516,154 |
Less: | | |
Earnings credits applied | | (7) |
| | |
Net expenses | | 5,516,147 |
| | |
Net investment income | | 2,027,268 |
| | |
Net Realized and Unrealized Gain (Loss): |
Net realized gain (loss) during the period on: |
Investments | | (52,741,030) |
Investment transactions of affiliated issuers | | 9,311 |
Options written | | 5,471,103 |
| | |
Net realized loss | | (47,260,616) |
| | |
Net unrealized appreciation (depreciation) during the period on: |
Investments | | (182,260,929) |
Options written | | 1,698,123 |
| | |
Net unrealized depreciation | | (180,562,806) |
| | |
Net loss | | (227,823,422) |
| | |
Net decrease in net assets resulting from operations | | $(225,796,154) |
| | |
| | | | |
| | | 59 | | The accompanying notes are an integral part of the financial statements |
| | |
Statement of Changes in Net Assets | | Security Equity Fund
Mid Cap Value Series |
| |
| | | | | | | | |
| | | Six Months Ended
March 31, 2009
(unaudited) | | | Year Ended
September 30, 2008 | |
| | |
Increase (decrease) in net assets from operations: | | | | | | | | |
Net investment income | | $ | 2,027,268 | | | $ | 4,667,997 | |
Net realized gain (loss) during the period on investments | | | (47,260,616 | ) | | | 110,275,572 | |
Net unrealized depreciation during the period on investments | | | (180,562,806 | ) | | | (238,269,809 | ) |
| | | | | | | | |
Net decrease in net assets resulting from operations | | | (225,796,154 | ) | | | (123,326,240 | ) |
| | | | | | | | |
| | |
Distributions to shareholders from: | | | | | | | | |
Net investment income | | | | | | | | |
Class A | | | (3,569,957 | ) | | | (2,202,928 | ) |
Net realized gain | | | | | | | | |
Class A | | | (68,549,175 | ) | | | (121,470,120 | ) |
Class B | | | (6,651,444 | ) | | | (20,681,946 | ) |
Class C | | | (11,126,589 | ) | | | (34,476,081 | ) |
| | | | | | | | |
Total distributions to shareholders | | | (89,897,165 | ) | | | (178,831,075 | ) |
| | | | | | | | |
| | |
Capital share transactions: | | | | | | | | |
Proceeds from sale of shares | | | | | | | | |
Class A | | | 222,469,265 | | | | 371,736,030 | |
Class B | | | 3,386,447 | | | | 5,200,948 | |
Class C | | | 9,968,512 | | | | 15,042,995 | |
Distributions reinvested | | | | | | | | |
Class A | | | 67,810,290 | | | | 112,053,902 | |
Class B | | | 6,316,674 | | | | 19,668,106 | |
Class C | | | 10,539,574 | | | | 32,802,694 | |
Cost of shares redeemed | | | | | | | | |
Class A | | | (184,809,874 | ) | | | (301,963,588 | ) |
Class B | | | (9,053,125 | ) | | | (31,210,126 | ) |
Class C | | | (16,824,331 | ) | | | (55,705,793 | ) |
| | | | | | | | |
Net increase from capital share transactions | | | 109,803,432 | | | | 167,625,168 | |
| | | | | | | | |
Net decrease in net assets | | | (205,889,887 | ) | | | (134,532,147 | ) |
| | | | | | | | |
| | |
Net assets: | | | | | | | | |
Beginning of period | | | 835,876,703 | | | | 970,408,850 | |
| | | | | | | | |
End of period | | $ | 629,986,816 | | | $ | 835,876,703 | |
| | | | | | | | |
| | |
Undistributed net investment income at end of period | | $ | 1,153,812 | | | $ | 2,696,501 | |
| | | | | | | | |
| | |
Capital share activity: | | | | | | | | |
Shares sold | | | | | | | | |
Class A | | | 10,889,242 | | | | 12,267,686 | |
Class B | | | 193,492 | | | | 184,126 | |
Class C | | | 568,451 | | | | 518,567 | |
Shares reinvested | | | | | | | | |
Class A | | | 3,546,563 | | | | 3,657,110 | |
Class B | | | 383,293 | | | | 730,073 | |
Class C | | | 620,706 | | | | 1,185,925 | |
Shares redeemed | | | | | | | | |
Class A | | | (9,378,828 | ) | | | (9,688,641 | ) |
Class B | | | (540,195 | ) | | | (1,117,874 | ) |
Class C | | | (986,884 | ) | | | (1,973,041 | ) |
| | | | |
| | 60 | | The accompanying notes are an integral part of the financial statements |
| | |
Financial Highlights Selected data for each share of capital stock outstanding throughout each period | | Security Equity Fund
Mid Cap Value Series |
| |
| | | | | | | | | | | | |
| Class A | | Six Months
Ended March 31,
2009a | | 2008 | | 2007 | | 2006 | | 2005 | | Year Ended
September 30,
2004 |
Per Share Data | | | | | | | | | | | | |
Net asset value, beginning of period | | $28.41 | | $40.79 | | $38.27 | | $36.34 | | $30.45 | | $24.48 |
| |
Income (loss) from investment operations: | | | | | | | | | | | | |
Net investment income (loss)b | | 0.07 | | 0.25 | | 0.25 | | 0.04 | | 0.01 | | (0.09) |
Net gain (loss) on securities (realized and unrealized) | | (7.54) | | (4.77) | | 4.59 | | 3.96 | | 8.16 | | 6.32 |
| | |
Total from investment operations | | (7.47) | | (4.52) | | 4.84 | | 4.00 | | 8.17 | | 6.23 |
| |
Less distributions: | | | | | | | | | | | | |
Dividends from net investment income | | (0.14) | | (0.14) | | (0.23) | | – | | – | | – |
Distributions from realized gains | | (2.59) | | (7.72) | | (2.09) | | (2.07) | | (2.28) | | (0.26) |
| | |
Total distributions | | (2.73) | | (7.86) | | (2.32) | | (2.07) | | (2.28) | | (0.26) |
| |
Net asset value, end of period | | $18.21 | | $28.41 | | $40.79 | | $38.27 | | $36.34 | | $30.45 |
| | |
| | | | | | | | | | | | |
Total Return c | | (26.76%) | | (12.48%) | | 12.96% | | 11.44% | | 27.77% | | 25.59% |
Ratios/Supplemental Data | | | | | | | | | | | | |
Net assets, end of period (in thousands) | | $512,513 | | $656,044 | | $687,484 | | $596,074 | | $373,031 | | $215,659 |
| |
Ratios to average net assets: | | | | | | | | | | | | |
Net investment income (loss) | | 0.76% | | 0.79% | | 0.61% | | 0.10% | | 0.04% | | (0.31%) |
Total expensesd | | 1.52% | | 1.37% | | 1.32% | | 1.36% | | 1.41% | | 1.48% |
Net expensese | | 1.52% | | 1.37% | | 1.32% | | 1.36% | | 1.41% | | 1.48% |
Net expenses prior to custodian earning credits and net of expense waivers | | 1.52% | | 1.37% | | 1.32% | | 1.36% | | 1.41% | | 1.48% |
| |
Portfolio turnover rate | | 32% | | 68% | | 44% | | 33% | | 19% | | 45% |
| | | | | | |
| Class B | | Six Months
Ended March 31,
2009a | | 2008 | | 2007 | | 2006 | | 2005 | | Year Ended
September 30,
2004 |
Per Share Data | | | | | | | | | | | | |
Net asset value, beginning of period | | $24.83 | | $36.78 | | $34.76 | | $33.43 | | $28.37 | | $22.99 |
| |
Income (loss) from investment operations: | | | | | | | | | | | | |
Net investment lossb | | – | | – | | (0.04) | | (0.23) | | (0.22) | | (0.28) |
Net gain (loss) on securities (realized and unrealized) | | (6.58) | | (4.23) | | 4.15 | | 3.63 | | 7.56 | | 5.92 |
| | |
Total from investment operations | | (6.58) | | (4.23) | | 4.11 | | 3.40 | | 7.34 | | 5.64 |
| |
Less distributions: | | | | | | | | | | | | |
Distributions from realized gains | | (2.59) | | (7.72) | | (2.09) | | (2.07) | | (2.28) | | (0.26) |
| | |
Total distributions | | (2.59) | | (7.72) | | (2.09) | | (2.07) | | (2.28) | | (0.26) |
| |
Net asset value, end of period | | $15.66 | | $24.83 | | $36.78 | | $34.76 | | $33.43 | | $28.37 |
| | |
| | | | | | | | | | | | |
Total Return c | | (27.01%) | | (13.14%) | | 12.10% | | 10.60% | | 26.83% | | 24.67% |
Ratios/Supplemental Data | | | | | | | | | | | | |
Net assets, end of period (in thousands) | | $42,586 | | $66,641 | | $106,179 | | $108,784 | | $97,664 | | $74,650 |
| |
Ratios to average net assets: | | | | | | | | | | | | |
Net investment income (loss) | | 0.01% | | (0.01%) | | (0.10%) | | (0.68%) | | (0.72%) | | (1.07%) |
Total expensesd | | 2.27% | | 2.12% | | 2.07% | | 2.11% | | 2.16% | | 2.23% |
Net expensese | | 2.27% | | 2.12% | | 2.07% | | 2.11% | | 2.16% | | 2.23% |
Net expenses prior to custodian earning credits and net of expense waivers | | 2.27% | | 2.12% | | 2.07% | | 2.11% | | 2.16% | | 2.23% |
| |
Portfolio turnover rate | | 32% | | 68% | | 44% | | 33% | | 19% | | 45% |
| | | | |
| | | 61 | | The accompanying notes are an integral part of the financial statements |
| | |
Financial Highlights Selected data for each share of capital stock outstanding throughout each period | | Security Equity Fund
Mid Cap Value Series |
| |
| | | | | | | | | | | | |
| Class C | | Six Months
Ended March 31,
2009a | | 2008 | | 2007 | | 2006 | | 2005 | | Year Ended
September 30,
2004 |
Per Share Data | | | | | | | | | | | | |
Net asset value, beginning of period | | $25.49 | | $37.54 | | $35.43 | | $34.03 | | $28.85 | | $23.37 |
| |
Income (loss) from investment operations: | | | | | | | | | | | | |
Net investment lossb | | – | | – | | (0.05) | | (0.22) | | (0.21) | | (0.29) |
Net gain (loss) on securities (realized and unrealized) | | (6.77) | | (4.33) | | 4.25 | | 3.69 | | 7.67 | | 6.03 |
| | |
Total from investment operations | | (6.77) | | (4.33) | | 4.20 | | 3.47 | | 7.46 | | 5.74 |
| |
Less distributions: | | | | | | | | | | | | |
Distributions from realized gains | | (2.59) | | (7.72) | | (2.09) | | (2.07) | | (2.28) | | (0.26) |
| | |
Total distributions | | (2.59) | | (7.72) | | (2.09) | | (2.07) | | (2.28) | | (0.26) |
| |
Net asset value, end of period | | $16.13 | | $25.49 | | $37.54 | | $35.43 | | $34.03 | | $28.85 |
| | |
| | | | | | | | | | | | |
Total Return c | | (27.06%) | | (13.15%) | | 12.13% | | 10.62% | | 26.80% | | 24.70% |
Ratios/Supplemental Data | | | | | | | | | | | | |
Net assets, end of period (in thousands) | | $74,888 | | $113,192 | | $176,746 | | $152,579 | | $93,887 | | $54,133 |
| |
Ratios to average net assets: | | | | | | | | | | | | |
Net investment income (loss) | | 0.01% | | (0.01%) | | (0.12%) | | (0.65%) | | (0.71%) | | (1.06%) |
Total expensesd | | 2.27% | | 2.12% | | 2.07% | | 2.11% | | 2.16% | | 2.23% |
Net expensese | | 2.27% | | 2.12% | | 2.07% | | 2.11% | | 2.16% | | 2.23% |
Net expenses prior to custodian earning credits and net of expense waivers | | 2.27% | | 2.12% | | 2.07% | | 2.11% | | 2.16% | | 2.23% |
| |
Portfolio turnover rate | | 32% | | 68% | | 44% | | 33% | | 19% | | 45% |
a Unaudited figures for the six months ended March 31, 2009. Percentage amounts for the period, except total return, have been annualized.
b Net investment income (loss) was computed using average shares outstanding throughout the period.
c Total return information does not reflect deduction of any sales charges imposed at the time of purchase for Class A shares or upon redemption for Class B and C shares.
d Total expense information reflects expense ratios absent expense reductions by the Investment Manager and custodian earnings credits, as applicable.
e Net expense information reflects the expense ratios after voluntary expense waivers, reimbursements and custodian earnings credits, as applicable.
| | | | |
| | | 62 | | The accompanying notes are an integral part of the financial statements |
This page left blank intentionally.
| | |
Performance Summary March 31, 2009 | | Security Equity Fund Mid Cap Value Institutional Series (unaudited) |
| |
| |
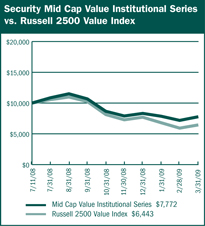
$10,000 Since Inception
This chart assumes a $10,000 investment in shares of Mid Cap Value Institutional Series on July 11, 2008 (date of Inception) and assumes all dividends reinvested. The chart does not reflect the deduction of taxes that a shareholder would pay on distributions or the redemption of fund shares. The Russell 2500 Value Index is an unmanaged index that measures the performance of securities of small-to-mid cap U.S. companies with greater-than-average value orientation.
| | |
Average Annual Returns | | |
Periods Ended 3-31-09 | | Since Inception (7-11-08) |
Mid Cap Value Institutional Series | | (22.28%) |
The performance data above represents past performance that is not predictive of future results. The investment return and principal value of an investment in the Series will fluctuate so that an investor’s shares, when redeemed, may be worth more or less than their original cost. The figures do not reflect the deduction of taxes that a shareholder would pay on distributions or redemption of shares. Such figures would be lower any applicable taxes were deducted. Fee waivers and/or reimbursements reduced expenses of the Series and in the absence of such waiver, the performance quoted would be reduced. |
| | | | | | |
| | | Portfolio Composition by Sector as of 3-31-09 |
| | | Consumer Discretionary | | 5.57% | | |
| | | Consumer Staples | | 6.92 | | |
| | | Energy | | 10.33 | | |
| | | Financials | | 14.22 | | |
| | | Health Care | | 3.89 | | |
| | | Industrials | | 16.07 | | |
| | | Information Technology | | 11.39 | | |
| | | Materials | | 7.80 | | |
| | | Utilities | | 10.27 | | |
| | | Exchange Traded Funds | | 14.02 | | |
| | | Liabilities, Less Cash & Other Assets | | (0.48) | | |
| | | Total Net Assets | | 100.00% | | |
| | | | | | | |
| | | | |
| | | 64 | | The accompanying notes are an integral part of the financial statements |
| | |
Performance Summary March 31, 2009 | | Security Equity Fund Mid Cap Value Institutional Series (unaudited) |
| |
| |
Information About Your Series Expenses
Calculating your ongoing Series expenses
Example
As a shareholder of the Series, you incur ongoing costs, including management fees and other Series expenses. This example is intended to help you understand your ongoing costs (in dollars) of investing in the Series and to compare these costs with ongoing costs of investing in other mutual funds. The example is based on an investment of $1,000 invested at the beginning of the period and held for the entire period October 1, 2008 through March 31, 2009.
Actual Expenses
The first line for each class of shares in the table provides information about actual account values and actual expenses. You may use the information in this table, together with the amount you invested, to estimate the expenses that you paid over the period. Simply divide your account value by $1,000 (for example, an $8,600 account value divided by $1,000 = 8.6), then multiply the result by the number in the table under the heading entitled “Expenses Paid During the Period” to estimate the expenses you paid on your account during this period.
Hypothetical Example for Comparison Purposes
The second line for each class of shares in the table provides information about hypothetical account values and hypothetical expenses based on the Series actual expense ratio and an assumed rate of return of 5% per year before expenses, which is not the Series actual return. The hypothetical account values and expenses may not be used to estimate the actual ending account balance or expenses you paid for the period. You may use this information to compare the ongoing costs of investing in the Series and other funds. To do so, compare this 5% hypothetical example with the 5% hypothetical examples that appear in the shareholder reports of the other mutual funds.
Please note that the expenses shown in the table are meant to highlight your ongoing costs. Therefore, the second line for each class of shares is useful in comparing ongoing costs only, and will not help you determine the relative total costs of owning different funds.
| | | | | | | | | |
Series Expenses |
| | | Beginning
Account
Value
10/1/2008 | | Ending
Account
Value
3/31/2009 1 | | Expenses
Paid
During
Period 2 |
Mid Cap Value Institutional Series |
Actual | | $ | 1,000.00 | | $ | 727.76 | | $ | 4.22 |
Hypothetical | | | 1,000.00 | | | 1,020.04 | | | 4.94 |
1 The actual ending account value is based on the actual total return of the Series for the period October 1, 2008 to March 31, 2009 after actual expenses and will differ from the hypothetical ending account value which is based on the Series expense ratio and a hypothetical annual return of 5% before expenses. The actual cumulative return at net asset value for the period October 1, 2008 to March 31, 2009 was (27.22%).
2 Expenses are equal to the Series annualized expense ratio of 0.98%, net of any applicable fee waivers, multiplied by the average account value over the period, multiplied by 182/365 (to reflect the one-half year period).
| | |
Schedule of Investments March 31, 2009 (unaudited) | | Security Equity Fund Mid Cap Value Institutional Series |
| |
| | | | |
| | | Shares | | Value |
COMMON STOCKS - 100.5% | | | | |
Apparel Retail - 2.0% | | | | |
Brown Shoe Company, Inc. | | 44,600 | | $167,250 |
Chico’s FAS, Inc. * | | 63,900 | | 343,143 |
Talbots, Inc. | | 42,000 | | 147,420 |
| | | | |
| | | | 657,813 |
| | | | |
Apparel, Accessories & Luxury Goods - 2.2% | | | | |
Fossil, Inc. * | | 15,455 | | 242,644 |
Maidenform Brands, Inc. * | | 42,455 | | 388,887 |
Oxford Industries, Inc. | | 19,800 | | 122,166 |
| | | | |
| | | | 753,697 |
| | | | |
Application Software - 0.2% | | | | |
PLATO Learning, Inc. 1,* | | 45,000 | | 80,100 |
| | | | |
| | |
Biotechnology - 0.0% | | | | |
Combinatorx, Inc. * | | 22,200 | | 13,764 |
| | | | |
| | |
Building Products - 0.2% | | | | |
Trex Company, Inc. * | | 9,900 | | 75,537 |
| | | | |
| | |
Coal & Consumable Fuels - 2.9% | | | | |
Evergreen Energy, Inc. * | | 358,855 | | 499,527 |
USEC, Inc. * | | 103,600 | | 497,280 |
| | | | |
| | | | 996,807 |
| | | | |
Communications Equipment - 1.0% | | | | |
Symmetricom, Inc. 1,* | | 96,000 | | 336,000 |
| | | | |
| | |
Computer Storage & Peripherals - 0.3% | | | | |
STEC, Inc. * | | 12,300 | | 90,651 |
| | | | |
| | |
Construction & Engineering - 4.9% | | | | |
Insituform Technologies, Inc. * | | 37,700 | | 589,628 |
Quanta Services, Inc. * | | 21,300 | | 456,885 |
URS Corporation * | | 14,755 | | 596,251 |
| | | | |
| | | | 1,642,764 |
| | | | |
Construction Materials - 0.9% | | | | |
Eagle Materials, Inc. | | 12,755 | | 309,309 |
| | | | |
| | |
Consumer Finance - 0.2% | | | | |
First Marblehead Corporation * | | 42,876 | | 55,310 |
| | | | |
| | |
Data Processing & Outsourced Services - 4.8% | | | | |
Affiliated Computer Services, Inc. * | | 13,400 | | 641,726 |
Computer Sciences Corporation * | | 26,455 | | 974,603 |
| | | | |
| | | | 1,616,329 |
| | | | |
Electric Utilities - 6.2% | | | | |
Allete, Inc. | | 6,254 | | 166,919 |
Empire District Electric Company | | 6,600 | | 95,304 |
Great Plains Energy, Inc. | | 48,055 | | 647,302 |
Northeast Utilities | | 21,855 | | 471,849 |
Pepco Holdings, Inc. | | 16,955 | | 211,598 |
Westar Energy, Inc. | | 27,455 | | 481,286 |
| | | | |
| | | | 2,074,258 |
| | | | |
Electrical Components & Equipment - 0.9% | | | | |
Power-One, Inc. 1,* | | 265,800 | | 233,904 |
UQM Technologies, Inc. 1,* | | 45,000 | | 73,800 |
| | | | |
| | | | 307,704 |
| | | | |
| | | | |
| | | Shares | | Value |
COMMON STOCKS - 100.5% (continued) |
Electronic Manufacturing Services - 1.6% | | | | |
Maxwell Technologies, Inc. 1,* | | 79,255 | | $550,822 |
| | | | |
| | |
Exchange Traded Funds - 14.0% | | | | |
iShares Russell 2000 Value Index Fund | | 59,000 | | 2,328,140 |
iShares S&P MidCap 400 | | 54,000 | | 2,386,260 |
| | | | |
| | | | 4,714,400 |
| | | | |
Forest Products - 0.8% | | | | |
Louisiana-Pacific Corporation | | 125,200 | | 279,196 |
| | | | |
| | |
Gas Utilities - 1.2% | | | | |
Atmos Energy Corporation | | 16,800 | | 388,416 |
| | | | |
| | |
Health Care Equipment - 0.3% | | | | |
Aspect Medical Systems, Inc. * | | 27,500 | | 115,225 |
| | | | |
| | |
Health Care Facilities - 1.2% | | | | |
Community Health Systems, Inc. * | | 26,855 | | 411,956 |
| | | | |
| | |
Health Care Services - 2.4% | | | | |
Mednax, Inc. * | | 15,775 | | 464,889 |
Providence Service Corporation * | | 3,455 | | 23,770 |
RehabCare Group, Inc. * | | 15,895 | | 277,209 |
| | | | |
| | | | 765,868 |
| | | | |
Highways & Railtracks - 0.2% | | | | |
Quixote Corporation 1 | | 15,600 | | 54,132 |
| | | | |
| | |
Home Furnishings - 1.4% | | | | |
Leggett & Platt, Inc. | | 35,700 | | 463,743 |
| | | | |
| | |
Human Resources & Employment Services - 0.9% | | | | |
Administaff, Inc. | | 14,100 | | 297,933 |
| | | | |
| | |
Industrial Conglomerates - 2.0% | | | | |
McDermott International, Inc. * | | 49,355 | | 660,863 |
| | | | |
| | |
Industrial Machinery - 1.6% | | | | |
Harsco Corporation | | 23,655 | | 524,431 |
| | | | |
| | |
Insurance Brokers - 0.5% | | | | |
Arthur J Gallagher & Company | | 9,950 | | 169,150 |
| | | | |
| | |
Mortgage REIT’s - 0.6% | | | | |
Redwood Trust, Inc. | | 12,482 | | 191,599 |
| | | | |
| | |
Multi-Line Insurance - 1.4% | | | | |
American Financial Group, Inc. | | 29,680 | | 476,364 |
| | | | |
| | |
Multi-Utilities - 2.9% | | | | |
NorthWestern Corporation | | 31,200 | | 670,176 |
SCANA Corporation | | 10,355 | | 319,866 |
| | | | |
| | | | 990,042 |
| | | | |
Oil & Gas Drilling - 1.3% | | | | |
Helmerich & Payne, Inc. 2 | | 18,655 | | 424,774 |
| | | | |
| | | | |
| | | 66 | | The accompanying notes are an integral part of the financial statements |
| | |
Schedule of Investments March 31, 2009 (unaudited) | | Security Equity Fund Mid Cap Value Institutional Series |
| |
| | | | |
| | | Shares | | Value |
COMMON STOCKS - 100.5% (continued) |
Oil & Gas Equipment & Services - 2.0% | | | | |
Global Industries, Ltd. * | | 176,687 | | $678,478 |
| | | | |
| | |
Oil & Gas Exploration & Production - 2.1% | | | | |
Goodrich Petroleum Corporation * | | 10,155 | | 196,601 |
Gulfport Energy Corporation * | | 13,955 | | 32,376 |
Newfield Exploration Company * | | 4,422 | | 100,379 |
PetroHawk Energy Corporation * | | 20,255 | | 389,503 |
| | | | |
| | | | 718,859 |
| | | | |
Oil & Gas Storage & Transportation - 2.0% | | | | |
Southern Union Company | | 43,088 | | 655,799 |
| | | | |
| | |
Packaged Foods & Meats - 6.9% | | | | |
Del Monte Foods Company | | 15,000 | | 109,350 |
Hormel Foods Corporation | | 23,855 | | 756,442 |
JM Smucker Company | | 19,700 | | 734,219 |
Smithfield Foods, Inc. * | | 54,100 | | 511,786 |
TreeHouse Foods, Inc. * | | 7,500 | | 215,925 |
| | | | |
| | | | 2,327,722 |
| | | | |
Paper Packaging - 3.4% | | | | |
Bemis Company, Inc. | | 29,555 | | 619,768 |
Sonoco Products Company | | 24,755 | | 519,360 |
| | | | |
| | | | 1,139,128 |
| | | | |
Paper Products - 1.6% | | | | |
Schweitzer-Mauduit International, Inc. | | 28,555 | | 527,125 |
| | | | |
| | |
Property & Casualty Insurance - 7.5% | | | | |
Alleghany Corporation * | | 2,346 | | 635,367 |
Assured Guaranty, Ltd. | | 10,500 | | 71,085 |
Employers Holdings, Inc. | | 16,900 | | 161,226 |
Hanover Insurance Group, Inc. | | 22,555 | | 650,035 |
United America Indemnity, Ltd. * | | 2,097 | | 8,430 |
W.R. Berkley Corporation | | 45,500 | | 1,026,025 |
| | | | |
| | | | 2,552,168 |
| | | | |
Railroads - 0.6% | | | | |
Kansas City Southern 2,* | | 16,953 | | 215,473 |
| | | | |
| | |
Regional Banks - 4.0% | | | | |
Commerce Bancshares, Inc. 2 | | 14,200 | | 515,460 |
First Horizon National Corporation 2 | | 16,156 | | 173,515 |
Old National Bancorp | | 3,600 | | 40,212 |
Wilmington Trust Corporation | | 62,613 | | 606,720 |
| | | | |
| | | | 1,335,907 |
| | | | |
Research & Consulting Services - 2.3% | | | | |
ICF International, Inc. * | | 18,600 | | 427,242 |
Navigant Consulting, Inc. 2,* | | 26,700 | | 348,969 |
| | | | |
| | | | 776,211 |
| | | | |
Security & Alarm Services - 1.4% | | | | |
GeoEye, Inc. * | | 24,660 | | 487,035 |
| | | | |
| | |
Semiconductor Equipment - 0.3% | | | | |
Ultratech, Inc. * | | 7,600 | | 94,924 |
| | | | |
| | | | |
| | | Shares | | Value |
COMMON STOCKS - 100.5% (continued) |
Semiconductors - 3.2% | | | | |
IXYS Corporation 1 | | 122,400 | | $986,544 |
RF Micro Devices, Inc. * | | 57,155 | | 76,016 |
| | | | |
| | | | 1,062,560 |
| | | | |
Specialty Chemicals - 1.1% | | | | |
Landec Corporation * | | 38,665 | | 215,364 |
Zoltek Companies, Inc. * | | 22,300 | | 151,863 |
| | | | |
| | | | 367,227 |
| | | | |
Trucking - 1.1% | | | | |
Old Dominion Freight Line, Inc. * | | 1,608 | | 37,772 |
Saia, Inc. * | | 27,000 | | 322,650 |
| | | | |
| | | | 360,422 |
TOTAL COMMON STOCKS (cost $38,333,145) | | | | $33,787,995 |
Total Investments - 100.5% (cost $38,333,145) | | | | $33,787,995 |
Liabilities, Less Cash & Other Assets - (0.5)% | | | | (162,645) |
| | | | |
Total Net Assets - 100.0% | | | | $33,625,350 |
| | | | |
For federal income tax purposes the identified cost of investments owned at March 31, 2009 was $38,333,145.
* Non-income producing security
1 Security is deemed illiquid. The total market value of illiquid securities is $2,315,302 (cost $2,727,995), or 6.9% of total net assets.
2 Security is segregated as collateral for open written option contracts.
| | | | |
| | | 67 | | The accompanying notes are an integral part of the financial statements |
| | |
| | Security Equity Fund Mid Cap Value Institutional Series (unaudited) |
| |
| |
Statement of Assets and Liabilities
March 31, 2009
| | |
Assets: | | |
Investments, at value* | | $33,787,995 |
Cash | | 2,362,160 |
| |
Receivables: | | |
Fund shares sold | | 68,424 |
Securities sold | | 27,344 |
Dividends | | 41,024 |
Security Investors | | 2,170 |
Prepaid expenses | | 14,377 |
| | |
Total assets | | 36,303,494 |
| | |
Liabilities: | | |
Payable for: | | |
Fund shares redeemed | | 2,580,845 |
Written options, at value (premiums received $84,115) | | 49,485 |
Management fees | | 20,998 |
Administration fees | | 2,959 |
Transfer agent/maintenance fees | | 244 |
Custodian fees | | 644 |
Directors' fees | | 572 |
Professional fees | | 3,946 |
Other fees | | 18,451 |
| | |
Total liabilities | | 2,678,144 |
| | |
Net assets | | $33,625,350 |
| | |
Net assets consist of: | | |
Paid in capital | | $38,351,985 |
Undistributed net investment income | | 90,460 |
Accumulated net realized loss on sale of investments | | (306,574) |
Net unrealized depreciation in value of investments | | (4,510,521) |
| | |
Net assets | | $33,625,350 |
| | |
Capital shares authorized | | unlimited |
Capital shares outstanding | | 4,637,467 |
Net asset value per share (net assets divided by shares outstanding) | | $7.25 |
| | |
| |
*Investments, at cost | | $38,333,145 |
Statement of Operations
For the Six Months Ended March 31, 2009
| | |
Investment Income: | | |
Dividends | | $239,023 |
Interest | | 1,558 |
| | |
Total investment income | | 240,581 |
| | |
Expenses: | | |
Management fees | | 79,870 |
Administration fees | | 10,392 |
Transfer agent/maintenance fees | | 1,407 |
Directors' fees | | 616 |
Professional fees | | 6,717 |
Reports to shareholders | | 2,653 |
Registration fees | | 11,126 |
Other | | 595 |
| | |
Total expenses | | 113,376 |
Less: | | |
Reimbursement of expenses | | (8,918) |
| | |
Net expenses | | 104,458 |
| | |
Net investment income | | 136,123 |
| | |
Net Realized and Unrealized Gain (Loss): | | |
Net realized gain (loss) during the period on: | | |
Investments | | (398,991) |
Options written | | 117,432 |
| | |
Net realized loss | | (281,559) |
| | |
Net unrealized appreciation (depreciation) during the period on: | | |
Investments | | (4,694,446) |
Options written | | 51,506 |
| | |
Net unrealized depreciation | | (4,642,940) |
| | |
Net realized and unrealized loss | | (4,924,499) |
| | |
Net decrease in net assets resulting from operations | | $(4,788,376) |
| | |
| | | | |
| | | 68 | | The accompanying notes are an integral part of the financial statements |
| | |
| Statement of Changes in Net Assets | | Security Equity Fund Mid Cap Value Institutional Series |
| |
| | | | | | | | |
| | | Six Months Ended
March 31, 2009 (unaudited) | | | Period Ended
September 30,
2008* | |
| | |
Increase (decrease) in net assets from operations: | | | | | | | | |
Net investment income | | $ | 136,123 | | | $ | 70,820 | |
Net realized gain (loss) during the period on investments | | | (281,559 | ) | | | 940,993 | |
Net unrealized appreciation (depreciation) during the period on investments | | | (4,642,940 | ) | | | 132,419 | |
| | | | | | | | |
Net increase (decrease) in net assets resulting from operations | | | (4,788,376 | ) | | | 1,144,232 | |
| | | | | | | | |
| | |
Distributions to shareholders from: | | | | | | | | |
Net investment income | | | (116,483 | ) | | | – | |
Net realized gain | | | (966,008 | ) | | | – | |
| | | | | | | | |
Total distributions to shareholders | | | (1,082,491 | ) | | | – | |
| | | | | | | | |
| | |
Capital share transactions: | | | | | | | | |
Proceeds from sale of shares | | | 28,652,715 | | | | 17,301,324 | |
Dividends reinvested | | | 946,155 | | | | – | |
Cost of shares redeemed | | | (7,538,563 | ) | | | (1,009,646 | ) |
| | | | | | | | |
Net increase from capital share transactions | | | 22,060,307 | | | | 16,291,678 | |
| | | | | | | | |
Net increase in net assets | | | 16,189,440 | | | | 17,435,910 | |
| | | | | | | | |
| | |
Net assets: | | | | | | | | |
Beginning of period | | | 17,435,910 | | | | – | |
| | | | | | | | |
End of period | | $ | 33,625,350 | | | $ | 17,435,910 | |
| | | | | | | | |
Undistributed net investment income at end of period | | $ | 90,460 | | | $ | 70,820 | |
| | | | | | | | |
| | |
Capital share activity: | | | | | | | | |
Shares sold | | | 3,877,626 | | | | 1,725,544 | |
Shares reinvested | | | 126,492 | | | | – | |
Shares redeemed | | | (999,204 | ) | | | (92,991 | ) |
| | | | | | | | |
Total capital share activity | | | 3,004,914 | | | | 1,632,553 | |
| | | | | | | | |
* For the period July 11, 2008 (commencement of operations) to September 30, 2008.
| | | | |
| | 69 | | The accompanying notes are an integral part of the financial statements |
| | |
Financial Highlights Selected data for each share of capital stock outstanding throughout each period | | Security Equity Fund Mid Cap Value Institutional Series |
| |
| | | | | |
| | | Six Months
Ended March 31,
2009a | | Period Ended
September 30,
2008b | |
Per Share Data | | | | | |
Net asset value, beginning of period | | $10.68 | | $10.00 | |
| | |
Income (loss) from investment operations: | | | | | |
Net investment incomec | | 0.05 | | 0.04 | |
Net gain (loss) on securities (realized and unrealized) | | (2.94) | | 0.64 | |
| | | |
Total from investment operations | | (2.89) | | 0.68 | |
| | |
Less distributions: | | | | | |
Dividends from net investment income | | (0.06) | | – | |
Distributions from realized gains | | (0.48) | | – | |
| | | |
Total distributions | | (0.54) | | – | |
| | |
Net asset value, end of period | | $7.25 | | $10.68 | |
| | | |
| | |
| | | | | | |
Total Return | | (27.22%) | | 6.80% | |
| Ratios/Supplemental Data | | | | | |
Net assets, end of period (in thousands) | | $33,625 | | $17,436 | |
| | |
Ratios to average net assets: | | | | | |
Net investment income | | 1.27% | | 1.81% | |
Total expensesd | | 1.06% | | 1.19% | |
Net expensese | | 0.98% | | 1.10% | |
Net expenses prior to custodian earnings credits and net of expense waivers | | 0.98% | | 1.10% | |
| | |
Portfolio turnover rate | | 44% | | 63% | |
a Unaudited figures for the six months ended March 31, 2009. Percentage amounts, except total return, have been annualized.
b Security Mid Cap Value Institutional Series was initially capitalized on July 11, 2008 with a net asset value of $10 per share. Percentage amounts for the period, except total return, have been annualized.
c Net investment income (loss) was computed using average shares outstanding throughout the period.
d Total expense information reflects the expense ratios absent expense reductions by the Investment Manager and earnings credits, as applicable.
e Net expense information reflects the expense ratios after voluntary expense waivers, reimbursements and custodian earnings credits, as applicable.
| | | | |
| | 70 | | The accompanying notes are an integral part of the financial statements |
This page left blank intentionally.
| | |
Performance Summary March 31, 2009 | | Security Equity Fund Select 25 Series (unaudited) |
| |
| |
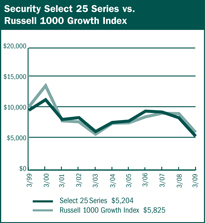
$10,000 Over 10 Years
This chart assumes a $10,000 investment in Class A shares of Select 25 Series on March 31, 1999 reflects deduction of the 5.75% sales load and assumes all dividends are reinvested. The chart does not reflect the deduction of taxes that a shareholder would pay on distributions or the redemption of fund shares. The Russell 1000 Growth Index is an unmanaged capitalization index which includes stocks incorporated in the United States and its territories and measures the performance of the Russell 1000 companies with higher price-to-book ratios and higher forecasted growth values.
| | | | | | |
Average Annual Returns |
Periods Ended 3-31-09 | | 1 Year | | 5 Years | | 10 Years |
A Shares | | (36.45%) | | (6.86%) | | (5.77%) |
A Shares with sales charge | | (40.09%) | | (7.96%) | | �� (6.32%) |
B Shares | | (36.99%) | | (7.58%) | | (6.31%) |
Shares with CDSC | | (40.14%) | | (7.92%) | | (6.31%) |
C Shares | | (36.98%) | | (7.56%) | | (6.44%) |
C Shares with CDSC | | (37.61%) | | (7.56%) | | (6.44%) |
The performance data above represents past performance that is not predictive of future results. The investment return and principal value of an investment in the Series will fluctuate so that an investor’s shares, when redeemed, may be worth more or less than their original cost. The above do not reflect the maximum front-end sales charge of 5.75% for Class A shares or the contingent deferred sales charge of 5% for Class B shares and 1% for Class C shares, as applicable, except where noted. The figures do that a shareholder would pay on distributions or redemption of shares. Such figures would be lower if the maximum sales charge and any applicable taxes were deducted. Fee waivers and/or reimbursements reduced expenses of the Series and in the absence of such waiver, the performance quoted would be reduced. |
| | | | | | | | |
| | | | | Portfolio Composition by Sector as of 3-31-09 | | |
| | | | | Consumer Discretionary | | 11.58% | | |
| | | | | Consumer Staples | | 10.12 | | |
| | | | | Energy | | 6.85 | | |
| | | | | Financials | | 6.35 | | |
| | | | | Health Care | | 12.92 | | |
| | | | | Industrials | | 13.10 | | |
| | | | | Information Technology | | 26.86 | | |
| | | | | Materials | | 8.74 | | |
| | | | | Cash & Other Assets, Less Liabilities | | 3.48 | | |
| | | | | Total Net Assets | | 100.00% | | |
| | | | | | | | | |
| | | | | | | | | |
| | | | |
| | | 72 | | The accompanying notes are an integral part of the financial statements |
| | |
Performance Summary March 31, 2009 | | Security Equity Fund Select 25 Series (unaudited) |
| |
| |
Information About Your Series Expenses
Calculating your ongoing Series expenses
Example
As a shareholder of the Series, you incur two types of costs: (1) transaction costs, which may include sales charges (loads) on purchase payments; contingent deferred sales charges on redemptions; and redemption fees, if any; and (2) ongoing costs, including management fees; distribution and/or service fees (12b-1); and other Series expenses. This example is intended to help you understand your ongoing costs (in dollars) of investing in the Series and to compare these costs with ongoing costs of investing in other mutual funds. The example is based on an investment of $1,000 invested at the beginning of the period and held for the entire period October 1, 2008 through March 31, 2009.
Actual Expenses
The first line for each class of shares in the table provides information about actual account values and actual expenses. You may use the information in this table, together with the amount you invested, to estimate the expenses that you paid over the period. Simply divide your account value by $1,000 (for example, an $8,600 account value divided by $1,000 = 8.6), then multiply the result by the number in the table under the heading entitled “Expenses Paid During the Period” to estimate the expenses you paid on your account during this period.
Hypothetical Example for Comparison Purposes
The second line for each class of shares in the table provides information about hypothetical account values and hypothetical expenses based on the Series actual expense ratio and an assumed rate of return of 5% per year before expenses, which is not the Series actual return. The hypothetical account values and expenses may not be used to estimate the actual ending account balance or expenses you paid for the period. You may use this information to compare the ongoing costs of investing in the Series and other funds. To do so, compare this 5% hypothetical example with the 5% hypothetical examples that appear in the shareholder reports of the other mutual funds.
Please note that the expenses shown in the table are meant to highlight your ongoing costs only and do not reflect any transactional costs, such as sales charges (loads) on purchase payments, contingent deferred sales charges on redemptions, and redemption fees, if any. Therefore, the second line for each class of shares is useful in comparing ongoing costs only, and will not help you determine the relative total costs of owning different funds. In addition, if these transactional costs were included, your costs would have been higher.
| | | | | | |
| Series Expenses |
| | | Beginning
Account
Value
10/1/2008 | | Ending
Account
Value
3/31/2009 1 | | Expenses
Paid
During
Period 2 |
Select 25 Series - Class A |
Actual | | $1,000.00 | | $756.87 | | $5.91 |
Hypothetical | | 1,000.00 | | 1,018.20 | | 6.79 |
Select 25 Series - Class B |
Actual | | 1,000.00 | | 753.13 | | 9.18 |
Hypothetical | | 1,000.00 | | 1,014.46 | | 10.55 |
Select 25 Series - Class C |
Actual | | 1,000.00 | | 753.89 | | 9.23 |
Hypothetical | | 1,000.00 | | 1,014.41 | | 10.60 |
1 The actual ending account value is based on the actual total return of the Series for the period October 1, 2008 to March 31, 2009 after actual expenses and will differ from the hypothetical ending account value which is based on the Series expense ratio and a hypothetical annual return of 5% before expenses. The actual cumulative return at net asset value for the period October 1, 2008 to March 31, 2009 was (24.31%), (24.69%) and (24.61%), for Class A, B and C shares, respectively.
2 Expenses are equal to the Series annualized expense ratio (1.35%, 2.10% and 2.10% for Class A, B, and C shares, respectively), net of any applicable fee waivers, multiplied by the average account value over the period, multiplied by 182/365 (to reflect the one-half year period).
| | |
Schedule of Investments March 31, 2009 (unaudited) | | Security Equity Fund Select 25 Series |
| |
| | | | |
| | | Shares | | Value |
COMMON STOCKS - 96.5% |
Advertising - 2.4% | | | | |
Omnicom Group, Inc. | | 32,030 | | $749,502 |
| | | | |
| | |
Aerospace & Defense - 2.9% | | | | |
Honeywell International, Inc. | | 32,580 | | 907,679 |
| | | | |
| | |
Asset Management & Custody | | | | |
Banks - 3.1% | | | | |
Bank of New York Mellon Corporation | | 34,055 | | 962,054 |
| | | | |
| | |
Biotechnology - 3.5% | | | | |
Gilead Sciences, Inc. * | | 23,495 | | 1,088,288 |
| | | | |
| | |
| Communications Equipment - 4.6% | | | | |
Qualcomm, Inc. | | 36,750 | | 1,429,943 |
| | | | |
| | |
Computer Hardware - 8.5% | | | | |
Apple, Inc. * | | 10,330 | | 1,085,889 |
Dell, Inc. * | | 61,830 | | 586,148 |
Hewlett-Packard Company | | 30,420 | | 975,265 |
| | | | |
| | | | 2,647,302 |
| | | | |
Department Stores - 3.1% | | | | |
Kohl’s Corporation * | | 22,930 | | 970,398 |
| | | | |
| | |
Drug Retail - 4.0% | | | | |
CVS Caremark Corporation | | 46,040 | | 1,265,640 |
| | | | |
| | |
Electrical Components & | | | | |
Equipment - 3.0% | | | | |
Emerson Electric Company | | 33,155 | | 947,570 |
| | | | |
| | |
Fertilizers & Agricultural | | | | |
Chemicals - 5.8% | | | | |
Monsanto Company | | 11,355 | | 943,601 |
Mosaic Company | | 20,745 | | 870,875 |
| | | | |
| | | | 1,814,476 |
| | | | |
General Merchandise | | | | |
Stores - 2.6% | | | | |
Target Corporation | | 23,650 | | 813,324 |
| | | | |
| | |
Home Entertainment | | | | |
Software - 3.7% | | | | |
Activision Blizzard, Inc. * | | 111,255 | | 1,163,727 |
| | | | |
| | |
Hypermarkets & Super | | | | |
Centers - 4.1% | | | | |
Wal-Mart Stores, Inc. | | 24,340 | | 1,268,113 |
| | | | |
| | |
Industrial Gases - 2.9% | | | | |
Air Products & Chemicals, Inc. | | 16,365 | | 920,531 |
| | | | |
| | |
Industrial Machinery - 2.5% | | | | |
Parker Hannifin Corporation | | 23,010 | | 781,880 |
| | | | |
| | |
Internet Software & | | | | |
Services - 4.6% | | | | |
Google, Inc. * | | 4,110 | | 1,430,527 |
| | | | |
| | | | |
| | | Shares | | Value |
COMMON STOCKS - 96.5% (continued) |
Life Sciences Tools & | | | | |
Services - 3.1% | | | | |
Thermo Fisher Scientific, Inc. * | | 26,885 | | $958,988 |
| | | | |
| | |
Oil & Gas Drilling - 3.7% | | | | |
Transocean, Ltd. * | | 19,480 | | 1,146,204 |
| | | | |
| | |
Oil & Gas Exploration & | | | | |
Production - 3.2% | | | | |
XTO Energy, Inc. | | 32,620 | | 998,824 |
| | | | |
| | |
Other Diversified Financial | | | | |
Services - 3.2% | | | | |
JPMorgan Chase & Company | | 38,535 | | 1,024,260 |
| | | | |
| | |
Packaged Foods & Meats - 2.0% | | | | |
General Mills, Inc. | | 12,685 | | 632,728 |
| | | | |
| | |
Pharmaceuticals - 6.3% | | | | |
Pfizer, Inc. | | 55,120 | | 750,734 |
Teva Pharmaceutical Industries, Ltd. ADR | | 27,600 | | 1,243,381 |
| | | | |
| | | | 1,994,115 |
| | | | |
Railroads - 4.7% | | | | |
Burlington Northern Santa Fe Corporation | | 24,290 | | 1,461,043 |
| | | | |
| | |
Restaurants - 3.5% | | | | |
McDonald’s Corporation | | 20,000 | | 1,091,399 |
| | | | |
| | |
Semiconductors - 2.5% | | | | |
Intel Corporation | | 52,610 | | 791,781 |
| | | | |
| | |
Systems Software - 3.0% | | | | |
Oracle Corporation | | 52,145 | | 942,260 |
| | | | |
| | |
| | | | | |
TOTAL COMMON STOCKS (cost $37,493,922) | | | | $30,202,556 |
Total Investments - 96.5% | | | | |
(cost $37,493,922) | | | | $30,202,556 |
| Cash & Other Assets, Less Liabilities - 3.5% | | | | 1,088,669 |
| | | | |
Total Net Assets - 100.0% | | | | $31,291,225 |
| | | | |
For federal income tax purposes the identified cost of investments owned at March 31, 2009 was $37,586,940.
ADR American Depositary Receipt
* Non-income producing security
| | | | |
| | | 74 | | The accompanying notes are an integral part of the financial statements |
| | |
| | Security Equity Fund Select 25 Series (unaudited) |
| |
| |
| | |
| Statement of Assets and Liabilities |
March 31, 2009 | | |
Assets: | | |
Investments, at value* | | $30,202,556 |
Cash | | 1,345,744 |
| |
Receivables: | | |
Fund shares sold | | 58,264 |
Dividends | | 32,144 |
Security Investors | | 13,629 |
Prepaid expenses | | 22,777 |
| | |
Total assets | | 31,675,114 |
| | |
Liabilities: | | |
Payable for: | | |
Securities purchased | | 218,570 |
Fund shares redeemed | | 104,775 |
Management fees | | 17,341 |
Transfer agent/maintenance fees | | 10,647 |
Administration fees | | 2,242 |
Professional fees | | 9,722 |
12b-1 distribution plan fees | | 11,247 |
Directors’ fees | | 1,680 |
Other | | 7,665 |
| | |
Total liabilities | | 383,889 |
| | |
Net assets | | $31,291,225 |
| | |
Net assets consist of: | | |
Paid in capital | | $59,481,633 |
Accumulated net investment loss | | (8,069) |
Accumulated net realized loss on sale of investments | | (20,890,973) |
Net unrealized depreciation in value of investments | | (7,291,366) |
| | |
Net assets | | $31,291,225 |
| | |
Class A: | | |
Capital shares outstanding | | |
(unlimited number of shares authorized) | | 4,117,311 |
Net assets | | $21,535,076 |
Net asset value and redemption price per share | | $5.23 |
| | |
Maximum offering price per share (net asset value divided by 94.25%) | | $5.55 |
| | |
Class B: | | |
Capital shares outstanding (unlimited number of shares authorized) | | 1,334,812 |
Net assets | | $6,439,282 |
Net asset value, offering and redemption price per share (excluding any applicable contingent deferred sales charge) | | $4.82 |
| | |
Class C: | | |
Capital shares outstanding (unlimited number of shares authorized) | | 684,726 |
Net assets | | $3,316,867 |
Net asset value, offering and redemption price per share (excluding any applicable contingent deferred sales charge) | | $4.84 |
| | |
| |
*Investments, at cost | | $37,493,922 |
| | |
Statement of Operations |
For the Six Months Ended March 31, 2009 |
Investment Income: | | |
Dividends | | $220,246 |
Interest | | 1,802 |
| | |
Total investment income | | 222,048 |
| | |
| |
Expenses: | | |
Management fees | | 107,453 |
Transfer agent/maintenance fees | | 105,165 |
Administration fees | | 13,709 |
Custodian fees | | 1,400 |
Directors’ fees | | 1,498 |
Professional fees | | 7,672 |
Reports to shareholders | | 6,866 |
Registration fees | | 15,359 |
Other expenses | | 2,417 |
12b-1 distribution fees - Class A | | 23,692 |
12b-1 distribution fees - Class B | | 28,219 |
12b-1 distribution fees - Class C | | 20,285 |
| | |
Total expenses | | 333,735 |
Less: | | |
Reimbursement of expenses - Class A | | (68,989) |
Reimbursement of expenses - Class B | | (20,323) |
Reimbursement of expenses - Class C | | (14,306) |
| | |
Net expenses | | 230,117 |
| | |
Net investment loss | | (8,069) |
| | |
| |
Net Realized and Unrealized Gain (Loss): | | |
Net realized gain (loss) during the period on: | | |
Investments | | (7,108,413) |
| | |
Net realized loss | | (7,108,413) |
| | |
| |
Net unrealized appreciation (depreciation) during the period on: | | |
Investments | | (2,028,094) |
| | |
Net unrealized depreciation | | (2,028,094) |
| | |
Net loss | | (9,136,507) |
| | |
Net decrease in net assets resulting from operations | | $(9,144,576) |
| | |
| | | | |
| | | 75 | | The accompanying notes are an integral part of the financial statements |
| | |
Statement of Changes in Net Assets | | Security Equity Fund
Select 25 Series |
| |
| | | | | | |
| | | Six Months Ended
March 31, 2009
(unaudited) | | Year Ended
September 30, 2008 |
| | |
Increase (decrease) in net assets from operations: | | | | | | |
Net investment loss | | $ | (8,069) | | $ | (231,859) |
Net realized (loss) during the period on investments | | | (7,108,413) | | | (5,269,391) |
Net unrealized depreciation during the period on investments | | | (2,028,094) | | | (10,067,708) |
| | | | | | |
Net (decrease) in net assets resulting from operations | | | (9,144,576) | | | (15,568,958) |
| | | | | | |
| | |
Distributions to shareholders from: | | | | | | |
Net realized gain | | | | | | |
Class A | | | – | | | (2,418,632) |
Class B | | | – | | | (850,835) |
Class C | | | – | | | (907,367) |
| | | | | | |
Total distributions to shareholders | | | – | | | (4,176,834) |
| | | | | | |
| | |
Capital share transactions: | | | | | | |
Proceeds from sale of shares | | | | | | |
Class A | | | 6,935,276 | | | 14,423,069 |
Class B | | | 1,918,814 | | | 4,664,269 |
Class C | | | 316,568 | | | 1,014,911 |
Distributions reinvested | | | | | | |
Class A | | | – | | | 2,377,173 |
Class B | | | – | | | 845,322 |
Class C | | | – | | | 902,367 |
Cost of shares redeemed | | | | | | |
Class A | | | (3,179,959) | | | (11,428,342) |
Class B | | | (1,026,622) | | | (4,903,980) |
Class C | | | (1,145,862) | | | (4,018,565) |
| | | | | | |
Net increase from capital share transactions | | | 3,818,215 | | | 3,876,224 |
| | | | | | |
Net decrease in net assets | | | (5,326,361) | | | (15,869,568) |
| | | | | | |
| | |
Net assets: | | | | | | |
Beginning of period | | | 36,617,586 | | | 52,487,154 |
| | | | | | |
End of period | | $ | 31,291,225 | | $ | 36,617,586 |
| | | | | | |
| | |
Accumulated net investment loss at end of period | | $ | (8,069) | | $ | – |
| | | | | | |
| | |
Capital share activity: | | | | | | |
Shares sold | | | | | | |
Class A | | | 1,293,167 | | | 1,645,603 |
Class B | | | 387,744 | | | 569,560 |
Class C | | | 62,606 | | | 122,944 |
Shares reinvested | | | | | | |
Class A | | | – | | | 269,520 |
Class B | | | – | | | 102,963 |
Class C | | | – | | | 109,511 |
Shares redeemed | | | | | | |
Class A | | | (609,835) | | | (1,330,365) |
Class B | | | (208,739) | | | (602,152) |
Class C | | | (234,571) | | | (495,291) |
| | | | |
| | 76 | | The accompanying notes are an integral part of the financial statements |
| | |
Financial Highlights Selected data for each share of capital stock outstanding throughout each period | | Security Equity Fund Select 25 Series |
| |
| | | | | | | | | | | | |
Class A | | Six Months
Ended March 31, 2009a | | 2008 | | 2007 | | 2006b | | 2005 | | Year Ended
September 30, 2004 |
Per Share Data | | | | | | | | | | | | |
Net asset value, beginning of period | | $6.91 | | $10.66 | | $9.86 | | $9.36 | | $7.81 | | $7.27 |
Income (loss) from investment operations: | | | | | | | | | | | | |
Net investment income (loss)c | | 0.01 | | (0.02) | | (0.01) | | (0.06) | | (0.07) | | (0.06) |
Net gain (loss) on securities (realized and unrealized) | | (1.69) | | (2.87) | | 0.81 | | 0.56 | | 1.62 | | 0.60 |
| | |
Total from investment operations | | (1.68) | | (2.89) | | 0.80 | | 0.50 | | 1.55 | | 0.54 |
Less distributions: | | | | | | | | | | | | |
Distributions from realized gains | | – | | (0.86) | | – | | – | | – | | – |
| | |
Total distributions | | – | | (0.86) | | – | | – | | – | | – |
Net asset value, end of period | | $5.23 | | $6.91 | | $10.66 | | $9.86 | | $9.36 | | $7.81 |
| | |
| | | | | | | | | | | | |
Total Return d | | (24.31%) | | (28.85%) | | 8.11% | | 5.34% | | 19.85% | | 7.43% |
Ratios/Supplemental Data | | | | | | | | | | | | |
Net assets, end of period (in thousands) | | $21,535 | | $23,723 | | $30,375 | | $30,078 | | $8,912 | | $9,228 |
Ratios to average net assets: | | | | | | | | | | | | |
Net investment income (loss) | | 0.20% | | (0.20%) | | (0.10%) | | (0.68%) | | (0.79%) | | (0.75%) |
Total expensese | | 2.08% | | 1.72% | | 1.57% | | 1.76% | | 1.67% | | 1.56% |
Net expensesf | | 1.35% | | 1.35% | | 1.40% | | 1.76% | | 1.67% | | 1.56% |
Net expenses prior to custodian earning credits and net of expense waivers | | 1.35% | | 1.35% | | 1.40% | | 1.76% | | 1.67% | | 1.56% |
Portfolio turnover rate | | 113% | | 198% g | | 21% | | 39% | | 13% | | 44% |
| | | | | | |
Class B | | Six Months
Ended March 31, 2009a | | 2008 | | 2007 | | 2006b | | 2005 | | Year Ended
September 30, 2004 |
Per Share Data | | | | | | | | | | | | |
Net asset value, beginning of period | | $6.40 | | $10.01 | | $9.33 | | $8.92 | | $7.50 | | $7.04 |
Income (loss) from investment operations: | | | | | | | | | | | | |
Net investment lossc | | (0.01) | | (0.08) | | (0.09) | | (0.13) | | (0.13) | | (0.11) |
Net gain (loss) on securities (realized and unrealized) | | (1.57) | | (2.67) | | 0.77 | | 0.54 | | 1.55 | | 0.57 |
| | |
Total from investment operations | | (1.58) | | (2.75) | | 0.68 | | 0.41 | | 1.42 | | 0.46 |
Less distributions: | | | | | | | | | | | | |
Distributions from realized gains | | – | | (0.86) | | – | | – | | – | | – |
| | |
Total distributions | | – | | (0.86) | | – | | – | | – | | – |
Net asset value, end of period | | $4.82 | | $6.40 | | $10.01 | | $9.33 | | $8.92 | | $7.50 |
| | |
| | | | | | | | | | | | |
Total Return d | | (24.69%) | | (29.36%) | | 7.29% | | 4.60% | | 18.93% | | 6.53% |
Ratios/Supplemental Data | | | | | | | | | | | | |
Net assets, end of period (in thousands) | | $6,439 | | $7,394 | | $10,868 | | $16,073 | | $7,000 | | $7,333 |
Ratios to average net assets: | | | | | | | | | | | | |
Net investment loss | | (0.55%) | | (0.95%) | | (0.88%) | | (1.46%) | | (1.54%) | | (1.50%) |
Total expensese | | 2.82% | | 2.47% | | 2.32% | | 2.53% | | 2.42% | | 2.31% |
Net expensesf | | 2.10% | | 2.10% | | 2.15% | | 2.53% | | 2.42% | | 2.31% |
Net expenses prior to custodian earning credits and net of expense waivers | | 2.10% | | 2.10% | | 2.15% | | 2.53% | | 2.42% | | 2.31% |
Portfolio turnover rate | | 113% | | 198% g | | 21% | | 39% | | 13% | | 44% |
| | | | |
| | | 77 | | The accompanying notes are an integral part of the financial statements |
| | |
Financial Highlights Selected data for each share of capital stock outstanding throughout each period | | Security Equity Fund Select 25 Series |
| |
| | | | | | | | | | | | |
Class C | | Six Months
Ended March 31, 2009a | | 2008 | | 2007 | | 2006b | | 2005 | | Year Ended
September 30, 2004 |
Per Share Data | | | | | | | | | | | | |
Net asset value, beginning of period | | $6.42 | | $10.04 | | $9.36 | | $8.94 | | $7.52 | | $7.06 |
Income (loss) from investment operations: | | | | | | | | | | | | |
Net investment lossc | | (0.01) | | (0.08) | | (0.08) | | (0.13) | | (0.13) | | (0.11) |
Net gain (loss) on securities (realized and unrealized) | | (1.57) | | (2.68) | | 0.76 | | 0.55 | | 1.55 | | 0.57 |
| | |
Total from investment operations | | (1.58) | | (2.76) | | 0.68 | | 0.42 | | 1.42 | | 0.46 |
Less distributions: | | | | | | | | | | | | |
Distributions from realized gains | | – | | (0.86) | | – | | – | | – | | – |
| | |
Total distributions | | – | | (0.86) | | – | | – | | – | | – |
Net asset value, end of period | | $4.84 | | $6.42 | | $10.04 | | $9.36 | | $8.94 | | $7.52 |
| | |
| | | | | | | | | | | | |
Total Return d | | (24.61%) | | (29.37%) | | 7.26% | | 4.70% | | 18.88% | | 6.52% |
Ratios/Supplemental Data | | | | | | | | | | | | |
Net assets, end of period (in thousands) | | $3,317 | | $5,501 | | $11,245 | | $12,777 | | $5,029 | | $5,866 |
Ratios to average net assets: | | | | | | | | | | | | |
Net investment loss | | (0.58%) | | (0.92%) | | (0.86%) | | (1.44%) | | (1.54%) | | (1.50%) |
Total expensese | | 2.80% | | 2.46% | | 2.32% | | 2.52% | | 2.42% | | 2.31% |
Net expensesf | | 2.10% | | 2.10% | | 2.15% | | 2.52% | | 2.42% | | 2.31% |
Net expenses prior to custodian earning credits and net of expense waivers | | 2.10% | | 2.10% | | 2.15% | | 2.52% | | 2.42% | | 2.31% |
Portfolio turnover rate | | 113% | | 198% g | | 21% | | 39% | | 13% | | 44% |
a Unaudited figures for the six months ended March 31, 2009. Percentage amounts for the period, except total return, have been annualized.
b The financial highlights for the Select 25 Series exclude the historical financial highlights of the Enhanced Index Series, Class A, B and C shares, the Large Cap Growth Series, Class A, B and C shares and the Social Awareness Series, Class A, B and C shares. A total of $29,412,366 was excluded from purchases in the portfolio turnover calculation. This was the cost of the securities Select 25 received as a result of the merger. The assets of the Enhanced Index, Large Cap Growth and Social Awareness Series’ were acquired by the Select 25 Series on June 16, 2006.
c Net investment income (loss) was computed using average shares outstanding throughout the period.
d Total return information does not reflect deduction of any sales charges imposed at the time of purchase for Class A shares or upon redemption for Class B and C shares.
e Total expense information reflects expense ratios absent expense reductions by the Investment Manager and custodian earnings credits, as applicable.
f Net expense information reflects the expense ratios after voluntary expense waivers, reimbursements and custodian earnings credits, as applicable.
g Significant variation in the portfolio turnover rate is due to the Investment Manager’s appointment of new portfolio managers for the series.
| | | | |
| | | 78 | | The accompanying notes are an integral part of the financial statements |
This page left blank intentionally.
| | |
Performance Summary March 31, 2009 | | Security Equity Fund Small Cap Growth Series (unaudited) |
| |
| |
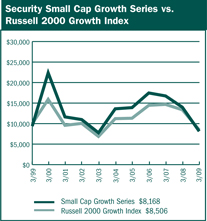
$10,000 Over 10 Years
This chart assumes a $10,000 investment in Class A shares of Small Cap Growth Series on March 31, 1999, reflects deduction of the 5.75% sales load and assumes all dividends reinvested. The chart does not reflect the deduction of taxes that a shareholder would pay on distributions or the redemption of fund shares. The Russell 2000 Growth Index measures the performance of those Russell 2000 companies with higher price-to-book ratios and higher forecasted growth values.
| | | | | | |
Average Annual Returns |
Periods Ended 3-31-09 | | 1 Year | | 5 Years | | 10 Years |
A Shares | | (41.65%) | | (9.70%) | | (1.42%) |
A Shares with
sales charge | | (45.01%) | | (10.76%) | | (2.00%) |
B Shares | | (42.10%) | | (10.39%) | | (2.08%) |
B Shares with
CDSC | | (44.97%) | | (10.72%) | | (2.08%) |
C Shares | | (42.09%) | | (10.38%) | | (2.22%) |
C Shares with
CDSC | | (42.67%) | | (10.38%) | | (2.22%) |
The performance data above represents past performance that is not predictive of future results. The investment return and principal value of an investment in the Series will fluctuate so that an investor’s shares, when redeemed, may be worth more or less than their original cost. The figures above do not reflect deduction of the maximum front-end sales charge of 5.75% for Class A shares or the contingent deferred sales charge of 5% for Class B shares and 1% for Class C shares, as applicable, except where noted. The figures do not reflect the deduction of taxes that a shareholder would pay on distributions or redemption of shares. Such figures would be lower if the maximum sales charge and any applicable taxes were deducted. Fee waivers reduced expenses of the Series and in the absence of such waiver, the performance quoted would be reduced. |
| | | | | | |
| | | Portfolio Composition by Sector as of 3-31-09 |
| | | Consumer Discretionary | | 17.37% | | |
| | | Consumer Staples | | 2.26 | | |
| | | Energy | | 6.28 | | |
| | | Financials | | 9.27 | | |
| | | Health Care | | 13.77 | | |
| | | Industrials | | 10.54 | | |
| | | Materials | | 6.50 | | |
| | | Information Technology | | 22.87 | | |
| | | Telecommunication Services | | 1.55 | | |
| | | Utilities | | 1.24 | | |
| | | Exchange Traded Funds | | 5.12 | | |
| | | Cash & Other Assets, Less Liabilities | | 3.23 | | |
| | | Total Net Assets | | 100.00% | | |
| | | | | | | |
| | | | | | | |
| | | | |
| | | 80 | | The accompanying notes are an integral part of the financial statements |
| | |
Performance Summary March 31, 2009 | | Security Equity Fund Small Cap Growth Series (unaudited) |
| |
| |
Information About Your Series Expenses
Calculating your ongoing Series expenses
Example
As a shareholder of the Series, you incur two types of costs: (1) transaction costs, which may include sales charges (loads) on purchase payments; contingent deferred sales charges on redemptions; and redemption fees, if any; and (2) ongoing costs, including management fees; distribution and/or service fees (12b-1); and other Series expenses. This example is intended to help you understand your ongoing costs (in dollars) of investing in the Series and to compare these costs with ongoing costs of investing in other mutual funds. The example is based on an investment of $1,000 invested at the beginning of the period and held for the entire period October 1, 2008 through March 31, 2009.
Actual Expenses
The first line for each class of shares in the table provides information about actual account values and actual expenses. You may use the information in this table, together with the amount you invested, to estimate the expenses that you paid over the period. Simply divide your account value by $1,000 (for example, an $8,600 account value divided by $1,000 = 8.6), then multiply the result by the number in the table under the heading entitled “Expenses Paid During the Period” to estimate the expenses you paid on your account during this period.
Hypothetical Example for Comparison Purposes
The second line for each class of shares in the table provides information about hypothetical account values and hypothetical expenses based on the Series actual expense ratio and an assumed rate of return of 5% per year before expenses, which is not the Series actual return. The hypothetical account values and expenses may not be used to estimate the actual ending account balance or expenses you paid for the period. You may use this information to compare the ongoing costs of investing in the Series and other funds. To do so, compare this 5% hypothetical example with the 5% hypothetical examples that appear in the shareholder reports of the other mutual funds.
Please note that the expenses shown in the table are meant to highlight your ongoing costs only and do not reflect any transactional costs, such as sales charges (loads) on purchase payments, contingent deferred sales charges on redemptions, and redemption fees, if any. Therefore, the second line for each class of shares is useful in comparing ongoing costs only, and will not help you determine the relative total costs of owning different funds. In addition, if these transactional costs were included, your costs would have been higher.
| | | | | | |
Series Expenses |
| | | Beginning Account Value 10/1/2008 | | Ending Account Value 3/31/20091 | | Expenses Paid During Period2 |
Small Cap Growth | | | | |
Series-Class A | | | | |
Actual | | $1,000.00 | | $669.26 | | $10.49 |
Hypothetical | | 1,000.00 | | 1,012.37 | | 12.64 |
Small Cap Growth | | | | |
Series-Class B | | | | |
Actual | | 1,000.00 | | 666.29 | | 13.54 |
Hypothetical | | 1,000.00 | | 1,008.68 | | 16.33 |
Small Cap Growth | | | | |
Series-Class C | | | | |
Actual | | 1,000.00 | | 666.93 | | 13.55 |
Hypothetical | | 1,000.00 | | 1,008.68 | | 16.33 |
1 The actual ending account value is based on the actual total return of the Series for the period October 1, 2008 to March 31, 2009 after actual expenses and will differ from the hypothetical ending account value which is based on the Series expense ratio and a hypothetical annual return of 5% before expenses. The actual cumulative return at net asset value for the period October 1, 2008 to March 31, 2009 was (33.07%), (33.37%) and (33.31%), for Class A, B and C shares, respectively.
2 Expenses are equal to the Series annualized expense ratio (2.51%, 3.25% and 3.26% for Class A, B, and C shares, respectively), net of any applicable fee waivers, multiplied by the average account value over the period, multiplied by 182/365 (to reflect the one-half year period).
| | |
Schedule of Investments March 31, 2009 (unaudited) | | Security Equity Fund Small Cap Growth Series |
| |
| | | | |
| | | Shares | | Value |
COMMON STOCKS - 96.8% | | | | |
Aluminum - 1.2% | | | | |
Kaiser Aluminum Corporation | | 5,100 | | $117,912 |
| | | | |
| | |
Apparel, Accessories & Luxury - Goods 2.5% | | | | |
FGX International Holdings, Ltd. * | | 15,100 | | 175,462 |
Hanesbrands, Inc. * | | 7,700 | | 73,689 |
| | | | |
| | | | 249,151 |
| | | | |
| | |
Application Software - 6.2% | | | | |
Informatica Corporation * | | 13,600 | | 180,336 |
Nuance Communications, Inc. * | | 23,410 | | 254,232 |
Solera Holdings, Inc. * | | 7,800 | | 193,284 |
| | | | |
| | | | 627,852 |
| | | | |
| | |
Asset Management & Custody Banks - 1.4% | | | | |
Westwood Holdings Group, Inc. | | 3,700 | | 144,633 |
| | | | |
| | |
Biotechnology - 1.1% | | | | |
Martek Biosciences Corporation | | 6,200 | | 113,150 |
| | | | |
| | |
Casinos & Gaming - 3.7% | | | | |
Penn National Gaming, Inc. * | | 8,200 | | 198,030 |
WMS Industries, Inc. * | | 7,800 | | 163,098 |
| | | | |
| | | | 361,128 |
| | | | |
Communications Equipment - 1.0% | | | | |
InterDigital, Inc. * | | 3,800 | | 98,116 |
| | | | |
| | |
Computer Storage & Peripherals - 3.7% | | | | |
QLogic Corporation * | | 15,550 | | 172,916 |
Synaptics, Inc. * | | 7,550 | | 202,037 |
| | | | |
| | | | 374,953 |
| | | | |
| | |
Construction & Farm Machinery & Heavy Trucks - 1.4% | | | | |
Wabtec Corporation | | 5,300 | | 139,814 |
| | | | |
| | |
Data Processing & Outsourced Services - 2.2% | | | | |
Alliance Data Systems Corporation * | | 6,040 | | 223,178 |
| | | | |
| | |
Diversified Chemicals - 1.3% | | | | |
Olin Corporation | | 9,300 | | 132,711 |
| | | | |
| | |
Diversified Support Services - 1.5% | | | | |
Ritchie Bros Auctioneers, Inc. | | 8,400 | | 156,156 |
| | | | |
| | |
Education Services - 1.1% | | | | |
DeVry, Inc. | | 2,400 | | 115,632 |
| | | | |
| | |
Electric Utilities - 1.2% | | | | |
ITC Holdings Corporation | | 2,870 | | 125,189 |
| | | | |
| | |
Electrical Components & Equipment - 0.5% | | | | |
| | |
Regal-Beloit Corporation | | 1,750 | | 53,620 |
| | | | |
Electronic Equipment & Instruments - 0.8% | | | | |
Rofin-Sinar Technologies, Inc. * | | 4,870 | | 78,504 |
| | | | |
| | | | |
| | | Shares | | Value |
COMMON STOCKS - 96.8% (continued) | | |
Environmental & Facilities Services - 1.6% | | | | |
Clean Harbors, Inc. * | | 3,400 | | $163,200 |
| | | | |
| | |
Exchange Traded Funds - 5.1% | | | | |
iShares Russell 2000 Growth Index Fund | | 11,240 | | 516,815 |
| | | | |
| | |
Fertilizers & Agricultural Chemicals - 2.1% | | | | |
Agrium, Inc. | | 2,080 | | 74,443 |
Terra Industries, Inc. | | 5,055 | | 141,995 |
| | | | |
| | | | 216,438 |
| | | | |
| | |
Health Care Equipment - 3.5% | | | | |
NuVasive, Inc. * | | 5,110 | | 160,352 |
Wright Medical Group, Inc. * | | 14,600 | | 190,237 |
| | | | |
| | | | 350,589 |
| | | | |
| | |
Health Care Facilities - 1.5% | | | | |
Psychiatric Solutions, Inc. * | | 9,450 | | 148,649 |
| | | | |
| | |
Health Care Services - 3.4% | | | | |
CardioNet, Inc. * | | 8,560 | | 240,194 |
LHC Group, Inc. * | | 4,600 | | 102,488 |
| | | | |
| | | | 342,682 |
| | | | |
| | |
Homebuilding - 2.1% | | | | |
KB Home | | 15,800 | | 208,244 |
| | | | |
| | |
Hotels, Resorts & Cruise Lines - 1.1% | | | | |
Starwood Hotels & Resorts Worldwide, Inc. | | 9,130 | | 115,951 |
| | | | |
| | |
Household Products - 1.5% | | | | |
Church & Dwight Company, Inc. | | 2,750 | | 143,632 |
| | | | |
| | |
Housewares & Specialties - 1.7% | | | | |
Jarden Corporation * | | 13,570 | | 171,932 |
| | | | |
| | |
Human Resources & Employment Services - 2.6% | | | | |
Watson Wyatt Worldwide, Inc. | | 5,100 | | 251,787 |
| | | | |
| | |
Hypermarkets & Super Centers - 0.8% | | | | |
BJ’s Wholesale Club, Inc. * | | 2,630 | | 84,134 |
| | | | |
Industrial Machinery - 1.2% | | | | |
CIRCOR International, Inc. | | 5,600 | | 126,112 |
| | | | |
| | |
Internet Software & Services - 1.0% | | | | |
Constant Contact, Inc. * | | 7,050 | | 98,630 |
| | | | |
| | |
Investment Banking & Brokerage - 3.2% | | | | |
Knight Capital Group, Inc. * | | 8,100 | | 119,394 |
Stifel Financial Corporation * | | 4,600 | | 199,226 |
| | | | |
| | | | 318,620 |
| | | | |
| | | | |
| | | 82 | | The accompanying notes are an integral part of the financial statements |
| | |
Schedule of Investments March 31, 2009 (unaudited) | | Security Equity Fund Small Cap Growth Series |
| |
| | | | |
| | | Shares | | Value |
COMMON STOCKS - 96.8% (continued) | | |
IT Consulting & Other Services - 1.2% | | | | |
Cognizant Technology Solutions Corporation * | | 6,000 | | $124,740 |
| | | | |
| | |
Leisure Facilities - 1.5% | | | | |
Life Time Fitness, Inc. * | | 12,200 | | 153,232 |
| | | | |
| | |
Life Sciences Tools & Services - 2.1% | | | | |
PerkinElmer, Inc. | | 9,000 | | 114,930 |
Techne Corporation | | 1,700 | | 93,007 |
| | | | |
| | | | 207,937 |
| | | | |
Metal & Glass Containers - 1.9% | | | | |
Silgan Holdings, Inc. | | 3,600 | | 189,144 |
| | | | |
| | |
Movies & Entertainment - 0.5% | | | | |
Imax Corporation * | | 12,525 | | 53,983 |
| | | | |
| | |
Multi-Line Insurance - 2.8% | | | | |
Assurant, Inc. | | 4,200 | | 91,476 |
HCC Insurance Holdings, Inc. | | 7,500 | | 188,925 |
| | | | |
| | | | 280,401 |
| | | | |
Oil & Gas Equipment & Services - 2.0% | | | | |
Oil States International, Inc. * | | 4,700 | | 63,074 |
Superior Energy Services, Inc. * | | 11,140 | | 143,595 |
| | | | |
| | | | 206,669 |
| | | | |
Oil & Gas Exploration & Production - 4.3% | | | | |
Bill Barrett Corporation * | | 6,800 | | 151,232 |
Comstock Resources, Inc. * | | 4,700 | | 140,060 |
Goodrich Petroleum Corporation * | | 4,800 | | 92,928 |
Petroquest Energy, Inc. * | | 18,000 | | 43,200 |
| | | | |
| | | | 427,420 |
| | | | |
Pharmaceuticals - 2.2% | | | | |
Perrigo Company | | 9,120 | | 226,450 |
| | | | |
| | |
Railroads - 1.7% | | | | |
Kansas City Southern * | | 13,615 | | 173,047 |
| | | | |
| | |
Regional Banks - 1.9% | | | | |
TCF Financial Corporation | | 16,350 | | 192,276 |
| | | | |
| | |
Restaurants - 3.2% | | | | |
Burger King Holdings, Inc. | | 8,000 | | 183,600 |
Panera Bread Company * | | 2,500 | | 139,750 |
| | | | |
| | | | 323,350 |
| | | | |
Semiconductor Equipment - 0.9% | | | | |
Tessera Technologies, Inc. * | | 6,500 | | 86,905 |
| | | | |
Semiconductors - 3.4% | | | | |
Silicon Laboratories, Inc. * | | 5,400 | | 142,560 |
Skyworks Solutions, Inc. * | | 25,180 | | 202,951 |
| | | | |
| | | | 345,511 |
| | | | |
Systems Software - 1.5% | | | | |
Sybase, Inc. * | | 4,940 | | 149,633 |
| | | | |
| | | | | |
| | | Shares | | Value |
COMMON STOCKS - 96.8% (continued) |
Technology Distributors - 1.0% | | | | | |
Avnet, Inc. * | | 5,720 | | | $100,157 |
| | | | | |
| | |
Wireless Telecommunication Services - 1.5% | | | | | |
NII Holdings, Inc. * | | 10,400 | | | 156,000 |
| | | | | |
| | | | | |
TOTAL COMMON STOCKS | | | | | |
(cost $9,861,190) | | | | | $9,765,969 |
Total Investments - 96.8% | | | | | |
(cost $9,861,190) | | | | | $9,765,969 |
Cash & Other Assets, Less Liabilities - 3.2% | | | | | 325,863 |
| | | | | |
Total Net Assets - 100.0% | | | | $ | 10,091,832 |
| | | | | |
For federal income tax purposes the identified cost of investments owned at March 31, 2009 was $10,246,497.
* Non-income producing security
| | | | |
| | | 83 | | The accompanying notes are an integral part of the financial statements |
| | |
| | Security Equity Fund Small Cap Growth Series (unaudited) |
| |
| |
| | |
| Statement of Assets and Liabilities |
March 31, 2009 |
Assets: | | |
Investments, at value* | | $9,765,969 |
Cash | | 398,190 |
Receivables: | | |
Fund shares sold | | 6,523 |
Dividends | | 3,758 |
Prepaid expenses | | 25,151 |
| | |
Total assets | | 10,199,591 |
| | |
Liabilities: | | |
Payable for: | | |
Fund shares redeemed | | 77,197 |
Management fees | | 6,874 |
Custodian fees | | 1,785 |
Transfer agent/maintenance fees | | 5,629 |
Administration fees | | 1,308 |
Professional fees | | 7,984 |
12b-1 distribution plan fees | | 3,759 |
Directors’ fees | | 760 |
Other | | 2,463 |
| | |
Total liabilities | | 107,759 |
| | |
Net assets | | $10,091,832 |
| | |
Net assets consist of: | | |
Paid in capital | | $20,460,573 |
Accumulated net investment loss | | (121,113) |
Accumulated net realized loss on sale of investments | | (10,152,407) |
Net unrealized depreciation in value of investments | | (95,221) |
| | |
Net assets | | $10,091,832 |
| | |
Class A: | | |
Capital shares outstanding
(unlimited number of shares authorized) | | 944,290 |
Net assets | | $7,164,920 |
Net asset value and redemption price per share | | $7.59 |
| | |
Maximum offering price per share (net asset value divided by 94.25%) | | $8.05 |
| | |
Class B: | | |
Capital shares outstanding
(unlimited number of shares authorized) | | 217,054 |
Net assets | | $1,474,682 |
Net asset value, offering and redemption price per share (excluding any applicable contingent deferred sales charge) | | $6.79 |
| | |
Class C: | | |
Capital shares outstanding | | |
(unlimited number of shares authorized) | | 209,606 |
Net assets | | $1,452,230 |
Net asset value, offering and redemption price per share (excluding any applicable contingent deferred sales charge) | | $6.93 |
| | |
*Investments, at cost | | $9,861,190 |
| | | |
Statement of Operations |
For the Six Months Ended March 31, 2009 |
Investment Income: | | | |
Dividends | | $ | 34,895 |
Interest | | | 2,089 |
| | | |
Total investment income | | | 36,984 |
| | | |
| |
Expenses: | | | |
Management fees | | | 53,354 |
Transfer agent/maintenance fees | | | 49,523 |
Administration fees | | | 6,364 |
Custodian fees | | | 5,175 |
Directors’ fees | | | 740 |
Professional fees | | | 6,826 |
Reports to shareholders | | | 2,044 |
Registration fees | | | 16,185 |
Other expenses | | | 1,433 |
12b-1 distribution fees - Class A | | | 10,563 |
12b-1 distribution fees - Class B | | | 8,612 |
12b-1 distribution fees - Class C | | | 8,040 |
| | | |
Total expenses | | | 168,859 |
Less: | | | |
Reimbursement of expenses - Class A | | | (6,028) |
Reimbursement of expenses - Class B | | | (1,247) |
Reimbursement of expenses - Class C | | | (1,148) |
Earnings credits applied | | | (152) |
| | | |
Net expenses | | | 160,284 |
| | | |
Net investment loss | | | (123,300) |
| | | |
| |
Net Realized and Unrealized Gain (Loss): | | | |
Net realized gain (loss) during the period on: | | | |
Investments | | | (6,289,967) |
| | | |
Net realized loss | | | (6,289,967) |
| | | |
| |
Net unrealized appreciation
(depreciation) during the period on: | | | |
Investments | | | 544,689 |
| | | |
Net unrealized appreciation | | | 544,689 |
| | | |
Net loss | | | (5,745,278) |
| | | |
Net decrease in net assets resulting from operations | | $ | (5,868,578) |
| | | |
| | | | |
| | | 84 | | The accompanying notes are an integral part of the financial statements |
| | |
| Statement of Changes in Net Assets | | Security Equity Fund Small Cap Growth Series |
| |
| | | | | | | | |
| | | Six Months Ended
March 31, 2009
(unaudited) | | | Year Ended
September 30, 2008 | |
| | |
Increase (decrease) in net assets from operations: | | | | | | | | |
Net investment loss | | $ | (121,113 | ) | | $ | (561,834 | ) |
Net realized (loss) during the period on investments | | | (6,289,967 | ) | | | (3,033,923 | ) |
Net unrealized appreciation (depreciation) during the period on investments | | | 544,688 | | | | (9,845,449 | ) |
| | | | | | | | |
Net (decrease) in net assets resulting from operations | | | (5,866,392 | ) | | | (13,441,206 | ) |
| | | | | | | | |
| | |
Distributions to shareholders from: | | | | | | | | |
Net realized gain | | | | | | | | |
Class A | | | (68,411 | ) | | | (3,191,745 | ) |
Class B | | | (15,241 | ) | | | (420,821 | ) |
Class C | | | (14,153 | ) | | | (306,607 | ) |
| | | | | | | | |
Total distributions to shareholders | | | (97,805 | ) | | | (3,919,173 | ) |
| | | | | | | | |
| | |
Capital share transactions: | | | | | | | | |
Proceeds from sale of shares | | | | | | | | |
Class A | | | 843,018 | | | | 5,720,827 | |
Class B | | | 139,357 | | | | 484,765 | |
Class C | | | 182,925 | | | | 862,243 | |
Distributions reinvested | | | | | | | | |
Class A | | | 67,917 | | | | 3,177,232 | |
Class B | | | 15,032 | | | | 416,649 | |
Class C | | | 14,130 | | | | 305,485 | |
Cost of shares redeemed | | | | | | | | |
Class A | | | (1,886,433 | ) | | | (28,269,263 | ) |
Class B | | | (461,462 | ) | | | (1,955,259 | ) |
Class C | | | (265,922 | ) | | | (1,160,706 | ) |
| | | | | | | | |
Net decrease from capital share transactions | | | (1,351,438 | ) | | | (20,418,027 | ) |
| | | | | | | | |
Net decrease in net assets | | | (7,315,635 | ) | | | (37,778,406 | ) |
| | | | | | | | |
| | |
Net assets: | | | | | | | | |
Beginning of period | | | 17,407,467 | | | | 55,185,873 | |
| | | | | | | | |
End of period | | $ | 10,091,832 | | | $ | 17,407,467 | |
| | | | | | | | |
| | |
Accumulated net investment loss at end of period | | $ | (121,113 | ) | | $ | – | |
| | | | | | | | |
| | |
Capital share activity: | | | | | | | | |
Shares sold | | | | | | | | |
Class A | | | 105,017 | | | | 2,568,429 | |
Class B | | | 19,426 | | | | 35,400 | |
Class C | | | 24,800 | | | | 58,495 | |
Shares reinvested | | | | | | | | |
Class A | | | 8,333 | | | | 199,200 | |
Class B | | | 2,056 | | | | 28,874 | |
Class C | | | 1,894 | | | | 20,753 | |
Shares redeemed | | | | | | | | |
Class A | | | (255,002 | ) | | | (4,133,462 | ) |
Class B | | | (64,688 | ) | | | (146,349 | ) |
Class C | | | (38,191 | ) | | | (88,178 | ) |
| | | | |
| | | 85 | | The accompanying notes are an integral part of the financial statements |
| | |
Financial Highlights Selected data for each share of capital stock outstanding throughout each period | | Security Equity Fund Small Cap Growth Series |
| |
| | | | | | | | | | | | |
| Class A | | Six Months
Ended March 31,
2009a,b | | 2008 | | 2007 | | 2006 | | 2005 | | Year Ended
September 30,
2004 |
Per Share Data | | | | | | | | | | | | |
Net asset value, beginning of period | | $11.43 | | $18.53 | | $15.63 | | $15.76 | | $13.11 | | $11.63 |
| |
Income (loss) from investment operations: | | | | | | | | | | | | |
Net investment lossc | | (0.07) | | (0.24) | | (0.23) | | (0.23) | | (0.24) | | (0.25) |
Net gain (loss) on securities (realized and unrealized) | | (3.71) | | (5.55) | | 3.13 | | 0.10 | | 2.89 | | 1.73 |
| | |
Total from investment operations | | (3.78) | | (5.79) | | 2.90 | | (0.13) | | 2.65 | | 1.48 |
| |
Less distributions: | | | | | | | | | | | | |
Distributions from realized gains | | (0.06) | | (1.31) | | – | | – | | – | | – |
| | |
Total distributions | | (0.06) | | (1.31) | | – | | – | | – | | – |
| |
Net asset value, end of period | | $7.59 | | $11.43 | | $18.53 | | $15.63 | | $15.76 | | $13.11 |
| | |
| | | | | | | | | | | | |
Total Return d | | (33.07%) | | (33.25%) | | 18.55% | | (0.82%) | | 20.21% | | 12.73% |
Ratios/Supplemental Data | | | | | | | | | | | | |
Net assets, end of period (in thousands) | | $7,165 | | $12,414 | | $45,430 | | $45,451 | | $22,637 | | $21,443 |
| |
Ratios to average net assets: | | | | | | | | | | | | |
Net investment loss | | (1.85%) | | (1.59%) | | (1.32%) | | (1.46%) | | (1.67%) | | (1.95%) |
Total expensese | | 2.65% | | 1.98% | | 1.80% | | 2.01% | | 2.10% | | 2.09% |
Net expensesf | | 2.51% | | 1.98% | | 1.80% | | 2.01% | | 2.10% | | 2.09% |
Net expenses prior to custodian earning credits and net of expense waivers | | 2.51% | | 1.98% | | 1.80% | | 2.01% | | 2.10% | | 2.09% |
| |
Portfolio turnover rate | | 297% g | | 169% | | 145% | | 136% | | 134% | | 157% |
| | | | | | |
| Class B | | Six Months
Ended March 31,
2009a,b | | 2008 | | 2007 | | 2006 | | 2005 | | Year Ended
September 30,
2004 |
Per Share Data | | | | | | | | | | | | |
Net asset value, beginning of period | | $10.28 | | $16.92 | | $14.38 | | $14.60 | | $12.24 | | $10.94 |
| |
Income (loss) from investment operations: | | | | | | | | | | | | |
Net investment lossc | | (0.09) | | (0.32) | | (0.33) | | (0.36) | | (0.33) | | (0.33) |
Net gain (loss) on securities (realized and unrealized) | | (3.34) | | (5.01) | | 2.87 | | 0.14 | | 2.69 | | 1.63 |
| | |
Total from investment operations | | (3.43) | | (5.33) | | 2.54 | | (0.22) | | 2.36 | | 1.30 |
| |
Less distributions: | | | | | | | | | | | | |
Distributions from realized gains | | (0.06) | | (1.31) | | – | | – | | – | | – |
| | |
Total distributions | | (0.06) | | (1.31) | | – | | – | | – | | – |
| |
Net asset value, end of period | | $6.79 | | $10.28 | | $16.92 | | $14.38 | | $14.60 | | $12.24 |
| | |
| | | | | | | | | | | | |
Total Return d | | (33.37%) | | (33.72%) | | 17.66% | | (1.51%) | | 19.28% | | 11.88% |
Ratios/Supplemental Data | | | | | | | | | | | | |
Net assets, end of period (in thousands) | | $1,475 | | $2,675 | | $5,792 | | $5,919 | | $8,283 | | $9,218 |
| |
Ratios to average net assets: | | | | | | | | | | | | |
Net investment loss | | (2.60%) | | (2.42%) | | (2.07%) | | (2.31%) | | (2.41%) | | (2.69%) |
Total expensese | | 3.40% | | 2.82% | | 2.56% | | 2.79% | | 2.85% | | 2.84% |
Net expensesf | | 3.25% | | 2.82% | | 2.55% | | 2.79% | | 2.85% | | 2.83% |
Net expenses prior to custodian earning credits and net of expense waivers | | 3.25% | | 2.82% | | 2.56% | | 2.79% | | 2.85% | | 2.84% |
| |
Portfolio turnover rate | | 297% g | | 169% | | 145% | | 136% | | 134% | | 157% |
| | | | |
| | | 86 | | The accompanying notes are an integral part of the financial statements |
| | |
Financial Highlights Selected data for each share of capital stock outstanding throughout each period | | Security Equity Fund
Small Cap Growth Series |
| |
| | | | | | | | | | | | |
| Class C | | Six Months
Ended March 31,
2009a,b | | 2008 | | 2007 | | 2006 | | 2005 | | Year Ended
September 30,
2004 |
Per Share Data | | | | | | | | | | | | |
Net asset value, beginning of period | | $10.48 | | $17.23 | | $14.64 | | $14.88 | | $12.47 | | $11.15 |
| |
Income (loss) from investment operations: | | | | | | | | | | | | |
Net investment lossc | | (0.10) | | (0.33) | | (0.33) | | (0.35) | | (0.33) | | (0.33) |
Net gain (loss) on securities (realized and unrealized) | | (3.39) | | (5.11) | | 2.92 | | 0.11 | | 2.74 | | 1.65 |
| | |
Total from investment operations | | (3.49) | | (5.44) | | 2.59 | | (0.24) | | 2.41 | | 1.32 |
| |
Less distributions: | | | | | | | | | | | | |
Distributions from realized gains | | (0.06) | | (1.31) | | – | | – | | – | | – |
| | |
Total distributions | | (0.06) | | (1.31) | | – | | – | | – | | – |
| |
Net asset value, end of period | | $6.93 | | $10.48 | | $17.23 | | $14.64 | | $14.88 | | $12.47 |
| | |
| | | | | | | | | | | | |
Total Return d | | (33.31%) | | (33.76%) | | 17.69% | | (1.61%) | | 19.33% | | 11.84% |
Ratios/Supplemental Data | | | | | | | | | | | | |
Net assets, end of period (in thousands) | | $1,452 | | $2,318 | | $3,964 | | $4,304 | | $4,420 | | $4,160 |
| |
Ratios to average net assets: | | | | | | | | | | | | |
Net investment loss | | (2.59%) | | (2.43%) | | (2.07%) | | (2.29%) | | (2.42%) | | (2.69%) |
Total expensese | | 3.40% | | 2.83% | | 2.56% | | 2.79% | | 2.85% | | 2.83% |
Net expensesf | | 3.25% | | 2.83% | | 2.55% | | 2.79% | | 2.85% | | 2.82% |
Net expenses prior to custodian earning credits and net of expense waivers | | 3.26% | | 2.83% | | 2.56% | | 2.79% | | 2.85% | | 2.83% |
| |
Portfolio turnover rate | | 297% g | | 169% | | 145% | | 136% | | 134% | | 157% |
a Unaudited figures for the six months ended March 31, 2009. Percentage amounts for the period, except total return, have been annualized.
b Security Global Investors, LLC became the advisor of Small Cap Growth Series effective November 24, 2008. Prior to November 24, 2008, SGI paid RS Investments, Inc. for sub-advisory services.
c Net investment income (loss) was computed using average shares outstanding throughout the period.
d Total return information does not reflect deduction of any sales charges imposed at the time of purchase for Class A shares or upon redemption for Class B and C shares.
e Total expense information reflects expense ratios absent expense reductions by the Investment Manager and custodian earnings credits, as applicable.
f Net expense information reflects the expense ratios after voluntary expense waivers, reimbursements and custodian earnings credits, as applicable.
g Significant variation in the portfolio turnover rate is due to the Investment Manager’s appointment of new portfolio managers for the series.
| | | | |
| | | 87 | | The accompanying notes are an integral part of the financial statements |
| | |
Performance Summary March 31, 2009 | | Security Equity Fund Small Cap Value Series (unaudited) |
| |
| |
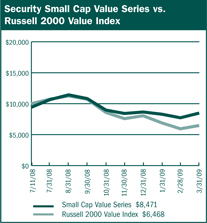
$10,000 Since Inception
This chart assumes a $10,000 investment in Class A shares of Small Cap Value Series on July 11, 2008 (date of inception), reflects deduction of the 5.75% sales load and assumes all dividends reinvested. The chart does not reflect the deduction of taxes that a shareholder would pay on distributions or the redemption of fund shares. The Russell 2000 Value Index is an unmanaged index that measures the performance of securities of small to mid cap U.S. companies with lower price-to-book ratios and lower forecasted growth values.
| | |
Average Annual Returns | | |
Periods Ended 3-31-09 | | Since Inception (7-11-08) |
A Shares | | (10.12%) |
A Shares with Sales Charge | | (15.29%) |
C Shares | | (10.64%) |
C Shares with CDSC | | (11.47%) |
Institutional Class | | (10.02%) |
The performance data above represents past performance that is not predictive of future results. The investment return and principal value of an investment in the Series will fluctuate so that an investor’s shares, when redeemed, may be worth more or less than their original cost. The figures above do not reflect deduction of the maximum front-end sales charge of 5.75% for Class A shares or the contingent deferred sales charge of 1% for Class C shares, as applicable, except where noted. The figures do not reflect the deduction of taxes that a shareholder would pay on distributions or redemption of shares. Such figures would be lower if the maximum sales charge and any applicable taxes were deducted. Fee waivers and/or reimbursements reduced expenses of the Series and in the absence of such waiver, the performance quoted would be reduced. |
| | | | | | |
| | | Portfolio Composition by Sector as of 3-31-09 |
| | | Consumer Discretionary | | 9.11% | | |
| | | Consumer Staples | | 5.88 | | |
| | | Energy | | 11.83 | | |
| | | Financials | | 8.17 | | |
| | | Health Care | | 6.26 | | |
| | | Industrials | | 19.33 | | |
| | | Information Technology | | 12.23 | | |
| | | Materials | | 11.78 | | |
| | | Utilities | | 7.09 | | |
| | | Cash & Other Assets, Less Liabilities | | 8.32 | | |
| | | Total Net Assets | | 100.00% | | |
| | | | | | | |
| | | | |
| | | 88 | | The accompanying notes are an integral part of the financial statements |
| | |
Performance Summary March 31, 2009 | | Security Equity Fund Small Cap Value Series (unaudited) |
| |
| |
Information About Your Series Expenses
Calculating your ongoing Series expenses
Example
As a shareholder of the Series, you incur two types of costs: (1) transaction costs, which may include sales charges (loads) on purchase payments; contingent deferred sales charges on redemptions; and redemption fees, if any; and (2) ongoing costs, including management fees; distribution and/or service fees (12b-1); and other Series expenses. This example is intended to help you understand your ongoing costs (in dollars) of investing in the Series and to compare these costs with ongoing costs of investing in other mutual funds. The example is based on an investment of $1,000 invested at the beginning of the period and held for the entire period October 1, 2008 through March 31, 2009.
Actual Expenses
The first line for each class of shares in the table provides information about actual account values and actual expenses. You may use the information in this table, together with the amount you invested, to estimate the expenses that you paid over the period. Simply divide your account value by $1,000 (for example, an $8,600 account value divided by $1,000 = 8.6), then multiply the result by the number in the table under the heading entitled “Expenses Paid During the Period” to estimate the expenses you paid on your account during this period.
Hypothetical Example for Comparison Purposes
The second line for each class of shares in the table provides information about hypothetical account values and hypothetical expenses based on the Series actual expense ratio and an assumed rate of return of 5% per year before expenses, which is not the Series actual return. The hypothetical account values and expenses may not be used to estimate the actual ending account balance or expenses you paid for the period. You may use this information to compare the ongoing costs of investing in the Series and other funds. To do so, compare this 5% hypothetical example with the 5% hypothetical examples that appear in the shareholder reports of the other mutual funds.
Please note that the expenses shown in the table are meant to highlight your ongoing costs only and do not reflect any transactional costs, such as sales charges (loads) on purchase payments, contingent deferred sales charges on redemptions, and redemption fees, if any. Therefore, the second line for each class of shares is useful in comparing ongoing costs only, and will not help you determine the relative total costs of owning different funds. In addition, if these transactional costs were included, your costs would have been higher.
| | | | | | |
Series Expenses |
| | | Beginning
Account
Value
10/1/2008 | | Ending
Account
Value
3/31/20091 | | Expenses
Paid
During
Period2 |
Small Cap Value | | | | | | |
Series - Class A | | | | | | |
Actual | | $1,000.00 | | $782.94 | | $6.89 |
Hypothetical | | 1,000.00 | | 1,017.20 | | 7.80 |
Small Cap Value | | | | | | |
Series - Class C | | | | | | |
Actual | | 1,000.00 | | 779.75 | | 10.21 |
Hypothetical | | 1,000.00 | | 1,013.46 | | 11.55 |
Small Cap Value | | | | | | |
Series - Institutional Class | | | | | | |
Actual | | 1,000.00 | | 783.13 | | 5.78 |
Hypothetical | | 1,000.00 | | 1,018.45 | | 6.54 |
1 The actual ending account value is based on the actual total return of the Series for the period October 1, 2008 to March 31, 2009 after actual expenses and will differ from the hypothetical ending account value which is based on the Series expense ratio and a hypothetical annual return of 5% before expenses. The actual cumulative return at net asset value for the period October 1, 2008 to March 31, 2009 was (21.71%), (22.03%) and (21.69%), for Class A, C and Institutional Class shares, respectively.
2 Expenses are equal to the Series annualized expense ratio (1.55%, 2.30% and 1.30% for Class A, C, and Institutional Class shares, respectively), net of any applicable fee waivers, multiplied by the average account value over the period, multiplied by 182/365 (to reflect the one-half year period).
| | |
Schedule of Investments March 31, 2009 (unaudited) | | Security Equity Fund Small Cap Value Series |
| |
| | | | |
| | | Shares | | Value |
COMMON STOCKS - 91.7% | | | | |
| Apparel Retail - 2.5% | | | | |
Brown Shoe Company, Inc. | | 2,300 | | $8,625 |
Chico’s FAS, Inc. * | | 3,000 | | 16,110 |
Talbots, Inc. | | 1,900 | | 6,669 |
| | | | |
| | | | 31,404 |
| | | | |
| | |
Apparel, Accessories & Luxury Goods - 2.5% | | | | |
Fossil, Inc. * | | 800 | | 12,560 |
Maidenform Brands, Inc. * | | 1,600 | | 14,656 |
Oxford Industries, Inc. | | 800 | | 4,936 |
| | | | |
| | | | 32,152 |
| | | | |
| | |
| Biotechnology - 0.1% | | | | |
Combinatorx, Inc. * | | 2,900 | | 1,798 |
| | | | |
| | |
| Building Products - 0.5% | | | | |
Trex Company, Inc. * | | 800 | | 6,104 |
| | | | |
| | |
| Coal & Consumable Fuels - 3.1% | | | | |
Evergreen Energy, Inc. * | | 17,000 | | 23,664 |
USEC, Inc. * | | 3,300 | | 15,840 |
| | | | |
| | | | 39,504 |
| | | | |
| | |
Communications Equipment - 1.3% | | | | |
Symmetricom, Inc. 1,* | | 4,800 | | 16,800 |
| | | | |
| | |
Computer & Electronics Retail - 1.3% | | | | |
Conn’s, Inc. * | | 1,200 | | 16,848 |
| | | | |
| | |
Computer Storage & Peripherals - 0.9% | | | | |
STEC, Inc. * | | 1,500 | | 11,055 |
| | | | |
| |
| Construction & Engineering - 1.7% | | |
Insituform Technologies, Inc. * | | 1,400 | | 21,896 |
| | | | |
| | |
| Construction Materials - 1.7% | | | | |
Eagle Materials, Inc. | | 900 | | 21,825 |
| | | | |
| | |
| Consumer Finance - 0.6% | | | | |
First Marblehead Corporation * | | 5,520 | | 7,121 |
| | | | |
| | |
Data Processing & Outsourced Services - 1.4% | | | | |
Heartland Payment Systems, Inc. | | 2,700 | | 17,847 |
| | | | |
| | |
| Electric Utilities - 3.2% | | | | |
Allete, Inc. | | 404 | | 10,783 |
Empire District Electric Company | | 1,000 | | 14,440 |
Westar Energy, Inc. | | 900 | | 15,777 |
| | | | |
| | | | 41,000 |
| | | | |
| | |
Electrical Components & Equipment - 2.7% | | | | |
LaBarge, Inc. * | | 1,700 | | 14,229 |
Power-One, Inc. 1,* | | 11,200 | | 9,856 |
UQM Technologies, Inc. 1,* | | 6,500 | | 10,660 |
| | | | |
| | | | 34,745 |
| | | | |
| | |
| Electronic Manufacturing Services - 1.6% | | | | |
Maxwell Technologies, Inc. 1,* | | 3,000 | | 20,850 |
| | | | |
| | | Shares | | Value |
COMMON STOCKS - 91.7% (continued) | | |
| Food Retail - 2.0% | | | | |
Winn-Dixie Stores, Inc. * | | 2,700 | | $25,812 |
| | | | |
| | |
| Forest Products - 2.3% | | | | |
Louisiana-Pacific Corporation | | 12,800 | | 28,544 |
| | | | |
| | |
| Gas Utilities - 1.5% | | | | |
Atmos Energy Corporation | | 800 | | 18,496 |
| | | | |
| | |
| Health Care Equipment - 0.6% | | | | |
Aspect Medical Systems, Inc. * | | 1,900 | | 7,961 |
| | | | |
| | |
| Health Care Facilities - 0.7% | | | | |
Health Management Associates, Inc. * | | 3,300 | | 8,514 |
| | | | |
| | |
| Health Care Services - 4.9% | | | | |
Mednax, Inc. * | | 900 | | 26,523 |
Providence Service Corporation * | | 1,700 | | 11,696 |
RehabCare Group, Inc. * | | 1,300 | | 22,672 |
| | | | |
| | | | 60,891 |
| | | | |
| | |
| Highways & Railtracks - 0.5% | | | | |
Quixote Corporation 1 | | 1,800 | | 6,246 |
| | | | |
| | |
| Human Resources & Employment Services - 1.0% | | | | |
Administaff, Inc. | | 600 | | 12,678 |
| | | | |
| | |
| Industrial Conglomerates - 2.5% | | | | |
McDermott International, Inc. * | | 2,400 | | 32,136 |
| | | | |
| | |
| Insurance Brokers - 0.5% | | | | |
Arthur J Gallagher & Company | | 350 | | 5,950 |
| | | | |
| | |
IT Consulting & Other Services - 2.0% | | | | |
CACI International, Inc. * | | 700 | | 25,543 |
| | | | |
| | |
| Mortgage REIT’s - 0.6% | | | | |
Redwood Trust, Inc. | | 500 | | 7,675 |
| | | | |
| | |
| Multi-Sector Holdings - 1.9% | | | | |
Pico Holdings, Inc. * | | 800 | | 24,056 |
| | | | |
| | |
| Multi-Utilities - 2.4% | | | | |
NorthWestern Corporation | | 1,400 | | 30,072 |
| | | | |
| | |
Oil & Gas Equipment & Services - 3.8% | | | | |
Global Industries, Ltd. * | | 6,852 | | 26,312 |
Tesco Corporation * | | 2,700 | | 21,114 |
| | | | |
| | | | 47,426 |
| | | | |
| | |
Oil & Gas Exploration & Production - 2.1% | | | | |
GMX Resources, Inc. * | | 800 | | 5,200 |
Goodrich Petroleum Corporation * | | 600 | | 11,616 |
Gulfport Energy Corporation * | | 1,000 | | 2,320 |
PetroHawk Energy Corporation * | | 400 | | 7,692 |
| | | | |
| | | | 26,828 |
| | | | |
| | | 90 | | The accompanying notes are an integral part of the financial statements |
| | |
Schedule of Investments March 31, 2009 (unaudited) | | Security Equity Fund Small Cap Value Series |
| |
| | | | |
| | | Shares | | Value |
COMMON STOCKS - 91.7% (continued) | | |
Oil & Gas Storage & Transportation - 2.8% | | | | |
Southern Union Company | | 2,350 | | $35,767 |
| | | | |
| | |
Packaged Foods & Meats - 3.9% | | | | |
Del Monte Foods Company | | 3,500 | | 25,515 |
TreeHouse Foods, Inc. * | | 800 | | 23,032 |
| | | | |
| | | | 48,547 |
| | | | |
Paper Packaging - 1.5% | | | | |
Bemis Company, Inc. | | 900 | | 18,873 |
| | | | |
| | |
Paper Products - 3.0% | | | | |
Clearwater Paper Corporation * | | 1,700 | | 13,651 |
Schweitzer-Mauduit International, Inc. | | 1,300 | | 23,998 |
| | | | |
| | | | 37,649 |
| | | | |
Property & Casualty Insurance - 2.5% | | | | |
Assured Guaranty, Ltd. | | 450 | | 3,047 |
Employers Holdings, Inc. | | 900 | | 8,586 |
Hanover Insurance Group, Inc. | | 700 | | 20,173 |
| | | | |
| | | | 31,806 |
| | | | |
Railroads - 0.7% | | | | |
Kansas City Southern 2,* | | 683 | | 8,681 |
| | | | |
| | |
Regional Banks - 2.1% | | | | |
Commerce Bancshares, Inc. | | 320 | | 11,616 |
Wilmington Trust Corporation | | 1,550 | | 15,020 |
| | | | |
| | | | 26,636 |
| | | | |
Research & Consulting Services - 4.6% | | | | |
ICF International, Inc. * | | 1,300 | | 29,860 |
Navigant Consulting, Inc. 2,* | | 1,300 | | 16,991 |
School Specialty, Inc. * | | 600 | | 10,554 |
| | | | |
| | | | 57,405 |
| | | | |
Restaurants - 2.8% | | | | |
BJ’s Restaurants, Inc. 2,* | | 2,500 | | 34,775 |
| | | | |
| | |
Security & Alarm Services - 2.5% | | | | |
GeoEye, Inc. * | | 1,600 | | 31,600 |
| | | | |
| | |
Semiconductors - 5.0% | | | | |
IXYS Corporation 1 | | 4,200 | | 33,852 |
RF Micro Devices, Inc. * | | 11,100 | | 14,763 |
Supertex, Inc. * | | 600 | | 13,860 |
| | | | |
| | | | 62,475 |
| | | | |
Specialty Chemicals - 3.3% | | | | |
Landec Corporation * | | 4,600 | | 25,622 |
Zoltek Companies, Inc. * | | 2,400 | | 16,344 |
| | | | |
| | | | 41,966 |
| | | | |
Trucking - 2.6% | | | | |
Old Dominion Freight Line, Inc. * | | 320 | | 7,517 |
Saia, Inc. * | | 1,700 | | 20,315 |
| | | | |
| | | Shares | | Value |
COMMON STOCKS - 91.7% (continued) |
Trucking - 2.6% (continued) | | |
Universal Truckload Services, Inc. | | 350 | | $5,019 |
| | | | |
| | | | |
| | | | | 32,851 |
TOTAL COMMON STOCKS | | | | |
(cost $1,330,633) | | | | $1,158,808 |
Total Investments - 91.7% | | | | |
(cost $1,330,633) | | | | $1,158,808 |
Cash & Other Assets, Less Liabilities - 8.3% | | | | 105,233 |
| | | | |
Total Net Assets - 100.0% | | | | $1,264,041 |
| | | | |
For federal income tax purposes the identified cost of investments owned at March 31, 2009 was $1,330,633.
* Non-income producing security
1 Security is deemed illiquid. The total market value of illiquid securities is $98,264 (cost $132,559), or 7.8% of total net assets.
2 Security is segregated as collateral for open written option contracts.
| | | | |
| | | 91 | | The accompanying notes are an integral part of the financial statements |
| | |
| | Security Equity Fund Small Cap Value Series (unaudited) |
| |
| |
| | |
| Statement of Assets and Liabilities |
March 31, 2009 |
Assets: | | |
Investments, at value* | | $1,158,808 |
Cash | | 81,344 |
| |
Receivables: | | |
Fund shares sold | | 150 |
Dividends | | 1,110 |
Security Investors | | 6,510 |
Prepaid expenses | | 25,284 |
| | |
Total assets | | 1,273,206 |
| | |
| |
Liabilities: | | |
Payable for: | | |
Written options, at value
(premiums received, $2,220) | | 1,230 |
Management fees | | 970 |
Custodian fees | | 379 |
Transfer agent/maintenance fees | | 126 |
Administration fees | | 452 |
Professional fees | | 4,190 |
12b-1 distribution plan fees | | 115 |
Directors’ fees | | 59 |
Other | | 1,644 |
| | |
Total liabilities | | 9,165 |
| | |
Net assets | | $1,264,041 |
| | |
| |
Net assets consist of: | | |
Paid in capital | | $1,447,232 |
Accumulated net investment loss | | (451) |
Accumulated net realized loss on sale of investments | | (11,905) |
Net unrealized depreciation in value of investments | | (170,835) |
| | |
Net assets | | $1,264,041 |
| | |
| |
Class A: | | |
Capital shares outstanding
(unlimited number of shares authorized) | | 73,246 |
Net assets | | $611,378 |
Net asset value and redemption price per share | | $8.35 |
| | |
Maximum offering price per share (net asset value divided by 94.25%) | | $8.86 |
| | |
| |
Class C: | | |
Capital shares outstanding
(unlimited number of shares authorized) | | 42,505 |
Net assets | | $352,758 |
Net asset value, offering and redemption price per share (excluding any applicable contingent deferred sales charge) | | $8.30 |
| | |
Institutional Class: | | |
Capital shares outstanding
(unlimited number of shares authorized) | | 35,878 |
Net assets | | $299,905 |
Net asset value, offering and redemption price per share (excluding any applicable contingent deferred sales charge) | | $8.36 |
| | |
| |
* Investments, at cost | | $1,330,633 |
| | | |
Statement of Operations |
| For the Six Months Ended March 31, 2009 |
Investment Income: | | | |
Dividends | | $ | 8,968 |
Interest | | | 166 |
| | | |
Total investment income | | | 9,134 |
| | | |
| |
Expenses: | | | |
Management fees | | | 5,592 |
Transfer agent/maintenance fees | | | 699 |
Administration fees | | | 1,050 |
Directors’ fees | | | 60 |
Professional fees | | | 6,562 |
Reports to shareholders | | | 1,351 |
Registration fees | | | 23,740 |
Other expenses | | | 910 |
12b-1 distribution fees - Class A | | | 608 |
12b-1 distribution fees - Class C | | | 1,695 |
| | | |
Total expenses | | | 42,267 |
Less: | | | |
Reimbursement of expenses - Class A | | | (14,122) |
Reimbursement of expenses - Class C | | | (9,851) |
Reimbursement of expenses - Institutional Class | | | (8,709) |
| | | |
Net expenses | | | 9,585 |
| | | |
Net investment loss | | | (451) |
| | | |
| |
Net Realized and Unrealized Gain (Loss): | | | |
Net realized gain (loss) during the period on: | | | |
Investments | | | (8,854) |
Options written | | | 1,569 |
| | | |
Net realized loss | | | (7,285) |
| | | |
| |
Net unrealized appreciation
(depreciation) during the period on: | | | |
Investments | | | (238,295) |
Options written | | | 837 |
| | | |
Net unrealized depreciation | | | (237,458) |
| | | |
Net loss | | | (244,743) |
| | | |
Net decrease in net assets resulting from operations | | $ | (245,194) |
| | | |
| | | | |
| | | 92 | | The accompanying notes are an integral part of the financial statements |
| | |
| Statement of Changes in Net Assets | | Security Equity Fund Small Cap Value Series |
| |
| | | | | | | | |
| | | Six Months Ended
March 31, 2009 (unaudited) | | | Period Ended
September 30, 2008* | |
| | |
Increase (decrease) in net assets from operations: | | | | | | | | |
Net investment loss | | $ | (451 | ) | | $ | (895 | ) |
Net realized gain (loss) during the period on investments | | | (7,285 | ) | | | 81,197 | |
Net unrealized appreciation (depreciation) during the period on investments | | | (237,458 | ) | | | 66,623 | |
| | | | | | | | |
Net increase (decrease) in net assets resulting from operations | | | (245,194 | ) | | | 146,925 | |
| | | | | | | | |
| | |
Distributions to shareholders from: | | | | | | | | |
Net realized gain | | | | | | | | |
Class A | | | (37,409 | ) | | | – | |
Class C | | | (26,547 | ) | | | – | |
Class Institutional Class | | | (20,966 | ) | | | – | |
| | | | | | | | |
Total distributions to shareholders | | | (84,922 | ) | | | – | |
| | | | | | | | |
| | |
Capital share transactions: | | | | | | | | |
Proceeds from sale of shares | | | | | | | | |
Class A | | | 290,800 | | | | 350,960 | |
Class C | | | 93,920 | | | | 343,156 | |
Institutional Class | | | – | | | | 333,333 | |
Distributions reinvested | | | | | | | | |
Class A | | | 37,409 | | | | – | |
Class C | | | 26,547 | | | | – | |
Institutional Class | | | 20,966 | | | | – | |
Cost of shares redeemed | | | | | | | | |
Class A | | | (16 | ) | | | – | |
Class C | | | (49,358 | ) | | | (485 | ) |
| | | | | | | | |
Net increase from capital share transactions | | | 420,268 | | | | 1,026,964 | |
| | | | | | | | |
Net increase in net assets | | | 90,152 | | | | 1,173,889 | |
| | | | | | | | |
| | |
Net assets: | | | | | | | | |
Beginning of period | | | 1,173,889 | | | | – | |
| | | | | | | | |
End of period | | $ | 1,264,041 | | | $ | 1,173,889 | |
| | | | | | | | |
| | |
Accumulated net investment loss at end of period | | $ | (451 | ) | | $ | – | |
| | | | | | | | |
| | |
Capital share activity: | | | | | | | | |
Shares sold | | | | | | | | |
Class A | | | 33,899 | | | | 34,804 | |
Class C | | | 11,358 | | | | 34,174 | |
Institutional Class | | | – | | | | 33,333 | |
Shares reinvested | | | | | | | | |
Class A | | | 4,545 | | | | – | |
Class C | | | 3,234 | | | | – | |
Institutional Class | | | 2,545 | | | | – | |
Shares redeemed | | | | | | | | |
Class A | | | (2 | ) | | | – | |
Class C | | | (6,220 | ) | | | (41 | ) |
* For the period July 11, 2008 (commencement of operations) to September 30, 2008.
| | | | |
| | 93 | | The accompanying notes are an integral part of the financial statements |
| | |
| Financial Highlights | | Security Equity Fund |
Selected data for each share of capital stock outstanding throughout each period | Small Cap Value Series |
| | | | |
| Class A | | Six Months Ended
March 31, 2009a | | Period Ended
September 30, 2008b |
Per Share Data | | | | |
Net asset value, beginning of period | | $11.48 | | $10.00 |
Income (loss) from investment operations: | | | | |
Net investment incomec | | – | | – |
Net gain (loss) on securities (realized and unrealized) | | (2.50) | | 1.48 |
| | |
Total from investment operations | | (2.50) | | 1.48 |
Less distributions: | | | | |
Distributions from realized gains | | (0.63) | | – |
| | |
Total distributions | | (0.63) | | – |
Net asset value, end of period | | $8.35 | | $11.48 |
| | |
| | | | |
Total Return d | | (21.71%) | | 14.80% |
Ratios/Supplemental Data | | | | |
Net assets, end of period (in thousands) | | $611 | | $400 |
Ratios to average net assets: | | | | |
Net investment income (loss) | | 0.12% | | (0.19%) |
Total expensese | | 7.33% | | 6.10% |
Net expensesf | | 1.55% | | 1.55% |
Net expenses prior to custodian earning credits and net of expense waivers | | 1.55% | | 1.55% |
Portfolio turnover rate | | 44% | | 86% |
| | |
| Class C | | Six Months Ended
March 31, 2009a | | Period Ended
September 30, 2008b |
Per Share Data | | | | |
Net asset value, beginning of period | | $11.46 | | $10.00 |
Income (loss) from investment operations: | | | | |
Net investment lossc | | (0.03) | | (0.02) |
Net gain (loss) on securities (realized and unrealized) | | (2.50) | | 1.48 |
| | |
Total from investment operations | | (2.53) | | 1.46 |
Less distributions: | | | | |
Distributions from realized gains | | (0.63) | | – |
| | |
Total distributions | | (0.63) | | – |
Net asset value, end of period | | $8.30 | | $11.46 |
| | |
| | | | |
Total Return d | | (22.03%) | | 14.60% |
Ratios/Supplemental Data | | | | |
Net assets, end of period (in thousands) | | $353 | | $391 |
Ratios to average net assets: | | | | |
Net investment loss | | (0.71%) | | (0.94%) |
Total expensese | | 8.10% | | 6.88% |
Net expensesf | | 2.30% | | 2.30% |
Net expenses prior to custodian earning credits and net of expense waivers | | 2.30% | | 2.30% |
Portfolio turnover rate | | 44% | | 86% |
| | | | |
| | 94 | | The accompanying notes are an integral part of the financial statements |
| | |
| Financial Highlights | | Security Equity Fund |
Selected data for each share of capital stock outstanding throughout each period | Small Cap Value Series |
| | | | |
| Institutional Class | | Six Months Ended
March 31, 2009a | | Period Ended
September 30,
2008b |
Per Share Data | | | | |
Net asset value, beginning of period | | $11.49 | | $10.00 |
Income (loss) from investment operations: | | | | |
Net investment incomec | | 0.01 | | – |
Net gain (loss) on securities (realized and unrealized) | | (2.51) | | 1.49 |
| | |
Total from investment operations | | (2.50) | | 1.49 |
Less distributions: | | | | |
Distributions from realized gains | | (0.63) | | – |
| | |
Total distributions | | (0.63) | | – |
Net asset value, end of period | | $8.36 | | $11.49 |
| | |
| | | | |
Total Return | | (21.69%) | | 14.90% |
Ratios/Supplemental Data | | | | |
Net assets, end of period (in thousands) | | $300 | | $383 |
Ratios to average net assets: | | | | |
Net investment income | | 0.32% | | 0.06% |
Total expensese | | 7.24% | | 5.90% |
Net expensesf | | 1.30% | | 1.30% |
Net expenses prior to custodian earning credits and net of expense waivers | | 1.30% | | 1.30% |
Portfolio turnover rate | | 44% | | 86% |
a Unaudited figures for the six months ended March 31, 2009. Percentage amounts for the period, except total return, have been annualized.
b Security Small Cap Value Series was initially capitalized on July 11, 2008 with a net asset value of $10 per share. Percentage amounts for the period, except total return have been annualized
c Net investment income (loss) was computed using average shares outstanding throughout the period.
d Total return information does not reflect deduction of any sales charges imposed at the time of purchase for Class A shares or upon redemption for Class C shares.
e Total expense information reflects expense ratios absent expense reductions by the Investment Manager and custodian earnings credits, as applicable.
f Net expense information reflects the expense ratios after voluntary expense waivers, reimbursements and custodian earnings credits, as applicable.
| | | | |
| | 95 | | The accompanying notes are an integral part of the financial statements |
| | |
Performance Summary March 31, 2009 | | Security Large Cap Value Fund (unaudited) |
| |
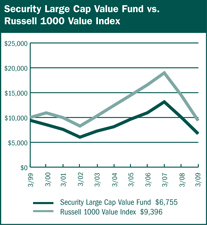
$10,000 Over Ten Years
This chart assumes a $10,000 investment in Class A shares of Large Cap Value Fund on March 31, 1999, reflects deduction of the 5.75% sales load and assumes all dividends reinvested. The chart does not reflect the deduction of taxes that a shareholder would pay on distributions or the redemption of fund shares. The Russell 1000 Value Index is an unmanaged index representing the performance of those Russell 1000 Index companies with lower price-to-book ratios and lower forecasted growth values.
| | | | | | |
Average Annual Returns |
Periods Ended | | | | | | |
| 3-31-09 | | 1 Year | | 5 Years | | 10 Years |
| | | | |
A Shares | | (41.41%) | | (4.33%) | | (3.28%) |
| | | | |
A Shares with sales charge | | (44.78%) | | (5.45%) | | (3.85%) |
| | | | |
B Shares | | (41.55%) | | (4.85%) | | (3.96%) |
| | | | |
B Shares with CDSC | | (44.40%) | | (5.21%) | | (3.96%) |
| | | | |
C Shares | | (42.13%) | | (5.16%) | | (4.17%) |
| | | | |
C Shares with CDSC | | (42.70%) | | (5.16%) | | (4.17%) |
The performance data above represents past performance that is not predictive of future results. The investment return and principal value of an investment in the Fund will fluctuate so that an investor's shares, when redeemed, may be worth more or less than their original cost. The figures above do not reflect deduction of the maximum front-end sales charge of 5.75% for Class A shares or the contingent deferred sales charge of 5% for Class B shares and 1% for Class C shares, as applicable, except where noted. The figures do not reflect the deduction of taxes that a shareholder would pay on distributions or redemption of Fund shares. Such figures would be lower if the maximum sales charge and any applicable taxes were deducted. |
| | | | | | |
| | | Portfolio Composition by Sector as of 3-31-09 |
| | | Consumer Discretionary | | 9.08% | | |
| | | Consumer Staples | | 11.30 | | |
| | | Energy | | 15.57 | | |
| | | Financials | | 12.31 | | |
| | | Health Care | | 11.52 | | |
| | | Industrials | | 21.65 | | |
| | | Information Technology | | 8.49 | | |
| | | Materials | | 3.07 | | |
| | | Telecommunication Services | | 1.21 | | |
| | | Utilities | | 4.96 | | |
| | | Cash & Other Assets, Less Liabilities | | 0.84 | | |
| | | Total Net Assets | | 100.00% | | |
| | | | | | | |
| | | | | | | |
| | | | |
| | | 96 | | The accompanying notes are an integral part of the financial statements |
| | |
Performance Summary March 31, 2009 | | Security Large Cap Value Fund (unaudited) |
| |
Information About Your Fund’s Expenses
Calculating your ongoing Fund expenses
Example
As a shareholder of the Fund, you incur two types of costs: (1) transaction costs, which may include sales charges (loads) on purchase payments; contingent deferred sales charges on redemptions; and redemption fees, if any; and (2) ongoing costs, including management fees; distribution and/or service fees (12b-1); and other Fund expenses. This example is intended to help you understand your ongoing costs (in dollars) of investing in the Series and to compare these costs with ongoing costs of investing in other mutual funds. The example is based on an investment of $1,000 invested at the beginning of the period and held for the entire period October 1, 2008 through March 31, 2009.
Actual Expenses
The first line for each class of shares in the table provides information about actual account values and actual expenses. You may use the information in this table, together with the amount you invested, to estimate the expenses that you paid over the period. Simply divide your account value by $1,000 (for example, an $8,600 account value divided by $1,000 = 8.6), then multiply the result by the number in the table under the heading entitled “Expenses Paid During the Period” to estimate the expenses you paid on your account during this period.
Hypothetical Example for Comparison Purposes
The second line for each class of shares in the table provides information about hypothetical account values and hypothetical expenses based on the Fund’s actual expense ratio and an assumed rate of return of 5% per year before expenses, which is not the Fund’s actual return. The hypothetical account values and expenses may not be used to estimate the actual ending account balance or expenses you paid for the period. You may use this information to compare the ongoing costs of investing in the Fund and other funds. To do so, compare this 5% hypothetical example with the 5% hypothetical examples that appear in the shareholder reports of the other mutual funds.
Please note that the expenses shown in the table are meant to highlight your ongoing costs only and do not reflect any transactional costs, such as sales charges (loads) on purchase payments, contingent deferred sales charges on redemptions, and redemption fees, if any. Therefore, the second line for each class of shares is useful in comparing ongoing costs only, and will not help you determine the relative total costs of owning different funds. In addition, if these transactional costs were included, your costs would have been higher.
| | | | | | |
Fund Expenses |
| | | Beginning
Account
Value
10/1/2008 | | Ending
Account
Value
3/31/2009 1 | | Expenses
Paid
During
Period 2 |
| | | | |
Large Cap Value | | | | | | |
Fund - Class A | | | | | | |
Actual | | $1,000.00 | | $671.30 | | $5.25 |
Hypothetical | | 1,000.00 | | 1,018.65 | | 6.34 |
| | | | |
Large Cap Value | | | | | | |
Fund - Class B | | | | | | |
Actual | | 1,000.00 | | 669.08 | | 4.16 |
Hypothetical | | 1,000.00 | | 1,019.95 | | 5.04 |
| | | | |
Large Cap Value | | | | | | |
Fund - Class C | | | | | | |
Actual | | 1,000.00 | | 665.28 | | 8.30 |
Hypothetical | | 1,000.00 | | 1,014.96 | | 10.05 |
1 The actual ending account value is based on the actual total return of the Fund for the period October 1, 2008 to March 31, 2009 after actual expenses and will differ from the hypothetical ending account value which is based on the Fund expense ratio and a hypothetical annual return of 5% before expenses. The actual cumulative return at net asset value for the period October 1, 2008 to March 31, 2009 was (32.87%), (33.09%) and (33.47%), for Class A, B and C shares, respectively.
2 Expenses are equal to the Fund annualized expense ratio (1.25%, 1.00% and 2.00% for Class A, B, and C shares, respectively), net of any applicable fee waivers, multiplied by the average account value over the period, multiplied by 182/365 (to reflect the one-half year period).
| | |
Schedule of Investments March 31, 2009 | | Security Large Cap Value Fund (unaudited) |
| |
| | | | | |
| | | Shares | | Value |
COMMON STOCKS - 99.2% |
Aerospace & Defense - 2.7% | | | | | |
United Technologies Corporation | | 24,000 | | $ | 1,031,520 |
| | | | | |
| | |
Air Freight & Logistics - 3.3% | | | | | |
FedEx Corporation | | 28,100 | | | 1,250,169 |
| | | | | |
| | |
Broadcasting - 0.8% | | | | | |
CBS Corporation (Cl.B) | | 77,100 | | | 296,064 |
| | | | | |
| | |
Building Products - 2.1% | | | | | |
USG Corporation * | | 104,000 | | | 791,440 |
| | | | | |
| | |
Cable & Satellite - 0.7% | | | | | |
Time Warner Cable, Inc. | | 10,509 | | | 260,622 |
| | | | | |
| | |
Computer Hardware - 2.4% | | | | | |
Hewlett-Packard Company | | 28,700 | | | 920,122 |
| | | | | |
| | |
Construction Materials - 1.4% | | | | | |
Vulcan Materials Company | | 11,000 | | | 487,190 |
| | | | | |
| | |
Consumer Finance - 0.4% | | | | | |
First Marblehead Corporation * | | 132,341 | | | 170,720 |
| | | | | |
| | |
Data Processing & Outsourced Services - 4.5% | | | | | |
Western Union Company | | 134,600 | | | 1,691,922 |
| | | | | |
| | |
Department Stores - 3.2% | | | | | |
JC Penney Company, Inc. | | 61,200 | | | 1,228,284 |
| | | | | |
| | |
Diversified Banks - 2.5% | | | | | |
U.S. Bancorp | | 39,078 | | | 570,930 |
Wells Fargo & Company | | 26,600 | | | 378,784 |
| | | | | |
| | | | | 949,714 |
| | | | | |
| | |
Diversified Chemicals - 0.7% | | | | | |
Dow Chemical Company | | 33,600 | | | 283,248 |
| | | | | |
| | |
Drug Retail - 2.2% | | | | | |
CVS Caremark Corporation | | 30,800 | | | 846,692 |
| | | | | |
| | |
Electric Utilities - 3.9% | | | | | |
Edison International | | 50,300 | | | 1,449,143 |
| | | | | |
| | |
Electronic Manufacturing Services - 1.6% | | | | | |
Tyco Electronics, Ltd. | | 55,150 | | | 608,856 |
| | | | | |
| | |
Health Care Equipment - 4.4% | | | | | |
Covidien, Ltd. | | 20,350 | | | 676,434 |
Hospira, Inc. * | | 31,700 | | | 978,262 |
| | | | | |
| | | | | 1,654,696 |
| | | | | |
| | |
Health Care Services - 2.3% | | | | | |
Medco Health Solutions, Inc. * | | 21,500 | | | 888,810 |
| | | | | |
| | |
Home Improvement Retail - 1.8% | | | | | |
Lowe’s Companies, Inc. | | 36,800 | | | 671,600 |
| | | | | |
| | |
Hypermarkets & Super Centers - 6.7% | | | | | |
Costco Wholesale Corporation | | 25,300 | | | 1,171,896 |
| | | | | |
| | | Shares | | Value |
COMMON STOCKS - 99.2% (continued) |
Hypermarkets & Super Centers - 6.7% (continued) | | | | | |
Wal-Mart Stores, Inc. | | 26,400 | | $ | 1,375,440 |
| | | | | |
| | | | | 2,547,336 |
| | | | | |
Independent Power Producers & Energy Traders - 1.1% | | | | | |
NRG Energy, Inc. * | | 24,500 | | | 431,200 |
| | | | | |
| | |
Industrial Conglomerates - 4.7% | | | | | |
General Electric Company | | 84,200 | | | 851,262 |
McDermott International, Inc. * | | 71,100 | | | 952,029 |
| | | | | |
| | | | | 1,803,291 |
| | | | | |
Industrial Machinery - 2.3% | | | | | |
Parker Hannifin Corporation | | 25,500 | | | 866,490 |
| | | | | |
| | |
Insurance Brokers - 1.9% | | | | | |
AON Corporation | | 18,100 | | | 738,842 |
| | | | | |
| | |
Integrated Oil & Gas - 9.8% | | | | | |
Chevron Corporation | | 21,000 | | | 1,412,040 |
ConocoPhillips | | 8,900 | | | 348,524 |
Exxon Mobil Corporation | | 28,700 | | | 1,954,470 |
| | | | | |
| | | | | 3,715,034 |
| | | | | |
Integrated Telecommunication Services - 1.2% | | | | | |
Windstream Corporation | | 56,976 | | | 459,227 |
| | | | | |
| | |
Managed Health Care - 1.9% | | | | | |
Aetna, Inc. | | 29,500 | | | 717,735 |
| | | | | |
| | |
Movies & Entertainment - 2.6% | | | | | |
News Corporation | | 27,500 | | | 182,050 |
Time Warner, Inc. | | 41,863 | | | 807,946 |
| | | | | |
| | | | | 989,996 |
| | | | | |
| | |
Oil & Gas Equipment & Services - 1.7% | | | | | |
Halliburton Company | | 42,000 | | | 649,740 |
| | | | | |
| | |
Oil & Gas Exploration & Production - 2.1% | | | | | |
Chesapeake Energy Corporation | | 46,800 | | | 798,408 |
| | | | | |
| | |
Oil & Gas Storage & Transportation - 2.0% | | | | | |
Williams Companies, Inc. | | 65,500 | | | 745,390 |
| | | | | |
| | |
Other Diversified Financial Services - 1.5% | | | | | |
JPMorgan Chase & Company 1 | | 20,963 | | | 557,197 |
| | | | | |
| | |
Pharmaceuticals - 2.9% | | | | | |
Schering-Plough Corporation | | 47,200 | | | 1,111,560 |
| | | | | |
| | |
Property & Casualty Insurance - 6.0% | | | | | |
Berkshire Hathaway, Inc. * | | 26 | | | 2,254,199 |
| | | | | |
| | |
Railroads - 3.9% | | | | | |
Union Pacific Corporation | | 35,700 | | | 1,467,627 |
| | | | | |
| | | | |
| | | 98 | | The accompanying notes are an integral part of the financial statements |
| | |
Schedule of Investments March 31, 2009 | | Security Large Cap Value Fund (unaudited) |
| |
| | | | |
| | | Shares | | Value |
COMMON STOCKS - 99.2% (continued) |
Research & Consulting Services - 2.6% | | | | |
Equifax, Inc. | | 41,100 | | $1,004,895 |
| | | | |
| | |
Specialty Chemicals - 1.0% | | | | |
Rohm & Haas Company | | 5,000 | | 394,200 |
| | | | |
| | |
Tobacco - 2.4% | | | | |
Altria Group, Inc. | | 18,600 | | 297,972 |
Philip Morris International, Inc. | | 16,800 | | 597,744 |
| | | | |
| | | | | 895,716 |
TOTAL COMMON STOCKS | | |
(cost $57,453,239) | | | | $37,628,895 |
Total Investments - 99.2% | | | | |
(cost $57,453,239) | | | | $37,628,895 |
Cash & Other Assets, Less Liabilities - 0.8% | | 318,625 |
| | | | |
Total Net Assets - 100.0% | | | | $37,947,520 |
| | | | |
For federal income tax purposes the identified cost of investments owned at March 31, 2009 was $58,587,099.
| * | Non-income producing security |
1 | Security is segregated as collateral for open written option contracts. |
| | | | |
| | | 99 | | The accompanying notes are an integral part of the financial statements |
| | |
| | Security Large Cap Value Fund (unaudited) |
| |
| | |
| Statement of Assets and Liabilities |
March 31, 2009 | | |
Assets: | | |
Investments, at value* | | $37,628,895 |
Receivables: | | |
Fund shares sold | | 16,691 |
Securities sold | | 664,522 |
Dividends | | 116,121 |
Security Investors | | 13,429 |
Prepaid expenses | | 45,524 |
| | |
Total assets | | 38,485,182 |
| | |
Liabilities: | | |
Cash overdraft | | 454,556 |
Payable for: | | |
Fund shares redeemed | | 20,875 |
Written options, at value (premiums received, $7,534) | | 2,775 |
Management fees | | 20,868 |
Custodian fees | | 993 |
Transfer agent/maintenance fees | | 9,796 |
Administration fees | | 3,110 |
Professional fees | | 7,961 |
12b-1 distribution plan fees | | 8,737 |
Directors’ fees | | 3,093 |
Other | | 4,898 |
| | |
Total liabilities | | 537,662 |
| | |
Net assets | | $37,947,520 |
| | |
Net assets consist of: | | |
Paid in capital | | $70,986,663 |
Undistributed net investment income | | 316,098 |
Accumulated net realized loss on sale of investments | | (13,535,655) |
Net unrealized depreciation in value of investments | | (19,819,586) |
| | |
Net assets | | $37,947,520 |
| | |
Class A: | | |
Capital shares outstanding
(unlimited number of shares authorized) | | 6,922,784 |
Net assets | | $30,685,037 |
Net asset value and redemption price per share | | $4.43 |
| | |
Maximum offering price per share (net asset value divided by 94.25%) | | $4.70 |
| | |
Class B: | | |
Capital shares outstanding
(unlimited number of shares authorized) | | 1,067,066 |
Net assets | | $4,383,902 |
Net asset value, offering and redemption price per share (excluding any applicable contingent deferred sales charge) | | $4.11 |
| | |
Class C: | | |
Capital shares outstanding
(unlimited number of shares authorized) | | 686,439 |
Net assets | | $2,878,581 |
Net asset value, offering and redemption price per share (excluding any applicable contingent deferred sales charge) | | $4.19 |
| | |
*Investments, at cost | | $57,453,239 |
| | |
Statement of Operations |
For the Six Months Ended March 31, 2009 |
Investment Income: | | |
Dividends | | $658,908 |
Interest | | 4,470 |
| | |
Total investment income | | 663,378 |
| | |
| |
Expenses: | | |
Management fees | | 172,196 |
Transfer agent/maintenance fees | | 128,200 |
Administration fees | | 25,237 |
Custodian fees | | 2,604 |
Directors’ fees | | 2,925 |
Professional fees | | 10,400 |
Reports to shareholders | | 8,503 |
Registration fees | | 21,447 |
Other expenses | | 12,652 |
12b-1 distribution fees - Class A | | 54,786 |
12b-1 distribution fees - Class C | | 16,489 |
| | |
Total expenses | | 455,439 |
Less: | | |
Reimbursement of expenses - Class A | | (96,763) |
Reimbursement of expenses - Class B | | (14,064) |
Reimbursement of expenses - Class C | | (7,889) |
| | |
Net expenses | | 336,723 |
| | |
Net investment income | | 326,655 |
| | |
| |
Net Realized and Unrealized Gain (Loss): | | |
Net realized gain (loss) during the period on: | | |
Investments | | (6,018,686) |
Options written | | 90,578 |
| | |
Net realized loss | | (5,928,108) |
| | |
| |
Net unrealized appreciation (depreciation) during the period on: | | |
Investments | | (19,486,619) |
Options written | | 4,758 |
| | |
Net unrealized depreciation | | (19,481,861) |
| | |
Net loss | | (25,409,969) |
| | |
Net decrease in net assets resulting from operations | | $(25,083,314) |
| | |
| | | | |
| | | 100 | | The accompanying notes are an integral part of the financial statements |
| | |
Statement of Changes in Net Assets | | Security |
| | Large Cap Value Fund |
| | | | | | |
| | | Six Months Ended
March 31, 2009
(unaudited) | | Year Ended
September 30, 2008 |
| | | | | | |
Increase (decrease) in net assets from operations: | | | | | | |
Net investment income | | $ | 326,655 | | $ | 639,605 |
Net realized (loss) during the period on investments | | | (5,928,108) | | | (4,539,850) |
Net unrealized depreciation during the period on investments | | | (19,481,861) | | | (19,633,290) |
| | | | | | |
Net (decrease) in net assets resulting from operations | | | (25,083,314) | | | (23,533,535) |
| | | | | | |
| | |
Distributions to shareholders from: | | | | | | |
Net investment income | | | | | | |
Class A | | | (503,277) | | | (378,053) |
Class B | | | (90,508) | | | (22,222) |
Net realized gain | | | | | | |
Class A | | | (377,458) | | | (2,835,403) |
Class B | | | (49,025) | | | (523,802) |
Class C | | | (28,172) | | | (232,292) |
| | | | | | |
Total distributions to shareholders | | | (1,048,440) | | | (3,991,772) |
| | | | | | |
| | |
Capital share transactions: | | | | | | |
Proceeds from sale of shares | | | | | | |
Class A | | | 6,875,451 | | | 42,964,106 |
Class B | | | 1,426,819 | | | 3,386,023 |
Class C | | | 938,989 | | | 2,180,812 |
Distributions reinvested | | | | | | |
Class A | | | 846,028 | | | 3,086,622 |
Class B | | | 138,475 | | | 540,480 |
Class C | | | 28,048 | | | 228,558 |
Cost of shares redeemed | | | | | | |
Class A | | | (22,171,142) | | | (36,583,296) |
Class B | | | (2,463,374) | | | (6,331,496) |
Class C | | | (949,408) | | | (2,035,897) |
| | | | | | |
Net increase (decrease) from capital share transactions | | | (15,330,114) | | | 7,435,912 |
| | | | | | |
Net decrease in net assets | | | (41,461,868) | | | (20,089,395) |
| | | | | | |
| | |
Net assets: | | | | | | |
Beginning of period | | | 79,409,388 | | | 99,498,783 |
| | | | | | |
End of period | | $ | 37,947,520 | | $ | 79,409,388 |
| | | | | | |
| | |
Undistributed net investment income at end of period | | $ | 316,098 | | $ | 583,228 |
| | | | | | |
| | |
Capital share activity: | | | | | | |
Shares sold | | | | | | |
Class A | | | 1,453,119 | | | 5,509,142 |
Class B | | | 320,160 | | | 457,814 |
Class C | | | 195,090 | | | 284,364 |
Shares reinvested | | | | | | |
Class A | | | 170,227 | | | 377,800 |
Class B | | | 29,908 | | | 70,743 |
Class C | | | 5,930 | | | 29,416 |
Shares redeemed | | | | | | |
Class A | | | (4,657,853) | | | (4,639,628) |
Class B | | | (569,240) | | | (849,539) |
Class C | | | (209,040) | | | (274,934) |
| | | | |
| | 101 | | The accompanying notes are an integral part of the financial statements |
| | |
Financial Highlights | | Security |
Selected data for each share of capital stock outstanding throughout each period | | Large Cap Value Fund |
| | | | | | | | | | | | |
| Class A | | Six Months Ended
March 31, 2009 a | | 2008 | | 2007 | | 2006 | | 2005b | | Year Ended
September 30,
2004 |
Per Share Data | | | | | | | | | | | | |
Net asset value, beginning of period | | $6.72 | | $9.18 | | $7.65 | | $6.78 | | $5.71 | | $5.11 |
Income (loss) from investment operations: | | | | | | | | | | | | |
Net investment incomec | | 0.03 | | 0.05 | | 0.04 | | 0.01 | | 0.03 | | 0.01 |
Net gain (loss) on securities (realized and unrealized) | | (2.23) | | (2.14) | | 1.49 | | 0.90 | | 1.04 | | 0.60 |
| | |
Total from investment operations | | (2.20) | | (2.09) | | 1.53 | | 0.91 | | 1.07 | | 0.61 |
Less distributions: | | | | | | | | | | | | |
Dividends from net investment income | | (0.05) | | (0.04) | | – | | (0.04) | | – | | (0.01) |
Distributions from realized gains | | (0.04) | | (0.33) | | – | | – | | – | | – |
| | |
Total distributions | | (0.09) | | (0.37) | | – | | (0.04) | | – | | (0.01) |
Net asset value, end of period | | $4.43 | | $6.72 | | $9.18 | | $7.65 | | $6.78 | | $5.71 |
| | |
| | | | | | | | | | | | |
Total Return d | | (32.87%) | | (23.45%) | | 20.04% | | 13.45% | | 18.74% | | 11.98% |
Ratios/Supplemental Data | | | | | | | | | | | | |
Net assets, end of period (in thousands) | | $30,685 | | $66,902 | | $79,998 | | $64,786 | | $45,295 | | $43,071 |
Ratios to average net assets: | | | | | | | | | | | | |
Net investment income | | 1.24% | | 0.68% | | 0.51% | | 0.17% | | 0.56% | | 0.19% |
Total expensese | | 1.70% | | 1.36% | | 1.35% | | 1.49% | | 1.61% | | 1.52% |
Net expensesf | | 1.25% | | 1.25% | | 1.27% | | 1.49% | | 1.61% | | 1.52% |
Net expenses prior to custodian earning credits and net of expense waivers | | 1.25% | | 1.25% | | 1.27% | | 1.49% | | 1.61% | | 1.52% |
Portfolio turnover rate | | 40% | | 48% | | 25% | | 54% | | 110% | | 75% |
| | | | | | |
| Class B | | Six Months Ended
March 31, 2009a,g | | 2008g | | 2007g | | 2006 | | 2005b | | Year Ended
September 30,
2004 |
Per Share Data | | | | | | | | | | | | |
Net asset value, beginning of period | | $6.29 | | $8.58 | | $7.18 | | $6.38 | | $5.42 | | $4.87 |
Income (loss) from investment operations: | | | | | | | | | | | | |
Net investment income (loss)c | | 0.04 | | 0.07 | | (0.01) | | (0.04) | | (0.01) | | (0.03) |
Net gain (loss) on securities (realized and unrealized) | | (2.11) | | (2.02) | | 1.41 | | 0.84 | | 0.97 | | 0.58 |
| | |
Total from investment operations | | (2.07) | | (1.95) | | 1.40 | | 0.80 | | 0.96 | | 0.55 |
Less distributions: | | | | | | | | | | | | |
Dividends from net investment income | | (0.07) | | (0.01) | | – | | – | | – | | – |
Distributions from realized gains | | (0.04) | | (0.33) | | – | | – | | – | | – |
| | |
Total distributions | | (0.11) | | (0.34) | | – | | – | | – | | – |
Net asset value, end of period | | $4.11 | | $6.29 | | $8.58 | | $7.18 | | $6.38 | | $5.42 |
| | |
| | | | | | | | | | | | |
Total Return d | | (33.09%) | | (23.39%) | | 19.50% | | 12.54% | | 17.71% | | 11.29% |
Ratios/Supplemental Data | | | | | | | | | | | | |
Net assets, end of period (in thousands) | | $4,384 | | $8,097 | | $13,784 | | $12,761 | | $8,500 | | $10,164 |
Ratios to average net assets: | | | | | | | | | | | | |
Net investment income (loss) | | 1.56% | | 0.93% | | (0.08%) | | (0.58%) | | (0.16%) | | (0.57%) |
Total expensese | | 1.48% | | 1.11% | | 1.92% | | 2.26% | | 2.36% | | 2.27% |
Net expensesf | | 1.00% | | 1.00% | | 1.85% | | 2.26% | | 2.36% | | 2.27% |
Net expenses prior to custodian earning credits and net of expense waivers | | 1.00% | | 1.00% | | 1.85% | | 2.26% | | 2.36% | | 2.27% |
Portfolio turnover rate | | 40% | | 48% | | 25% | | 54% | | 110% | | 75% |
| | | | |
| | 102 | | The accompanying notes are an integral part of the financial statements |
| | |
Financial Highlights | | Security |
Selected data for each share of capital stock outstanding throughout each period | | Large Cap Value Fund |
| | | | | | | | | | | | |
| Class C | | Six Months Ended March 31,
2009a | | 2008 | | 2007 | | 2006 | | 2005b | | Year Ended
September 30,
2004 |
Per Share Data | | | | | | | | | | | | |
Net asset value, beginning of period | | $6.35 | | $8.72 | | $7.31 | | $6.49 | | $5.52 | | $4.96 |
Income (loss) from investment operations: | | | | | | | | | | | | |
Net investment income (loss)c | | 0.01 | | – | | (0.02) | | (0.04) | | (0.01) | | (0.03) |
Net gain (loss) on securities (realized and unrealized) | | (2.13) | | (2.04) | | 1.43 | | 0.86 | | 0.98 | | 0.59 |
| | |
Total from investment operations | | (2.12) | | (2.04) | | 1.41 | | 0.82 | | 0.97 | | 0.56 |
Less distributions: | | | | | | | | | | | | |
Distributions from realized gains | | (0.04) | | (0.33) | | – | | – | | – | | – |
| | |
Total distributions | | (0.04) | | (0.33) | | – | | – | | – | | – |
Net asset value, end of period | | $4.19 | | $6.35 | | $8.72 | | $7.31 | | $6.49 | | $5.52 |
| | |
| | | | | | | | | | | | |
Total Return d | | (33.47%) | | (24.09%) | | 19.29% | | 12.63% | | 17.57% | | 11.29% |
Ratios/Supplemental Data | | | | | | | | | | | | |
Net assets, end of period (in thousands) | | $2,879 | | $4,410 | | $5,717 | | $3,536 | | $2,899 | | $2,561 |
Ratios to average net assets: | | | | | | | | | | | | |
Net investment income (loss) | | 0.56% | | (0.07%) | | (0.23%) | | (0.60%) | | (0.18%) | | (0.57%) |
Total expensese | | 2.49% | | 2.11% | | 2.10% | | 2.25% | | 2.36% | | 2.28% |
Net expensesf | | 2.00% | | 2.00% | | 2.02% | | 2.25% | | 2.36% | | 2.28% |
Net expenses prior to custodian earning credits and net of expense waivers | | 2.00% | | 2.00% | | 2.02% | | 2.25% | | 2.36% | | 2.28% |
Portfolio turnover rate | | 40% | | 48% | | 25% | | 54% | | 110% | | 75% |
a Unaudited figures for the six months ended March 31, 2009. Percentage amounts for the period, except total return, have been annualized.
b Security Investors (SI) became the advisor of Security Large Cap Value Fund effective June 30, 2005. Prior to June 30, 2005, SI paid Dreyfus Corporation for sub-advisory services.
c Net investment income (loss) was computed using average shares outstanding throughout the period.
d Total return information does not reflect deduction of any sales charges imposed at the time of purchase for Class A shares or upon redemption for Class B and C shares.
e Total expense information reflects expense ratios absent expense reductions by the Investment Manager and custodian earnings credits, as applicable.
f Net expense information reflects the expense ratios after voluntary expense waivers, reimbursements and custodian earnings credits, as applicable.
g Effective August 1, 2007, Class B shares ceased charging 12b-1 fees in accordance with FINRA (formerly NASD) sales cap regulations. Per share information reflects this change. This fee will be reinstated when sales exceed the sales cap limit.
| | | | |
| | 103 | | The accompanying notes are an integral part of the financial statements |
| | |
Performance Summary | | Security Large Cap Value Fund |
| | Large Cap Value Institutional Series |
March 31, 2009 | | (unaudited) |
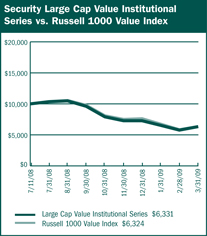
$10,000 Since Inception
This chart assumes a $10,000 investment in shares of Large Cap Value Institutional Series on July 11, 2008 (date of inception), and assumes all dividends reinvested. The chart does not reflect the deduction of taxes that a shareholder would pay on distributions or the redemption of fund shares. The Russell 1000 Value Index is an unmanaged index representing the performance of those Russell 1000 Index companies with lower price-to-book ratios and lower forecasted growth values.
| | |
Average Annual Returns | | |
Periods Ended 3-31-09 | | Since Inception
(7-11-08) |
Large Cap Value Institutional Series | | (36.69%) |
The performance data above represents past performance that is not predictive of future results. The investment return and principal value of an investment in the Series will fluctuate so that an investor's shares, when redeemed, may be worth more or less than their original cost. The figures do not reflect the deduction of taxes that a shareholder would pay on distributions or redemption of shares. Such figures would be lower if the maximum sales charge and any applicable taxes were deducted. Fee waivers and/or reimbursements reduced expenses of the Series and in the absence of such waiver, the performance quoted would be reduced. |
| | | | | | | | |
| | | Portfolio Composition by Sector as of 3-31-09 | | | | |
| | | Consumer Discretionary | | 10.11% | | | | |
| | | Consumer Staples | | 11.77 | | | | |
| | | Energy | | 15.64 | | | | |
| | | Financials | | 11.58 | | | | |
| | | Health Care | | 12.87 | | | | |
| | | Industrials | | 24.32 | | | | |
| | | Information Technology | | 9.23 | | | | |
| | | Materials | | 3.27 | | | | |
| | | Telecommunication Services | | 1.35 | | | | |
| | | Utilities | | 5.30 | | | | |
| | | Exchange Traded Funds | | 2.79 | | | | |
| | | Liabilities, Less Cash & Other Assets | | (8.23) | | | | |
| | | Total Net Assets | | 100.00% | | | | |
| | | | | | | | | |
| | | | | | | | | |
| | | | |
| | 104 | | The accompanying notes are an integral part of the financial statements |
| | |
Performance Summary March 31, 2009 | | Security Large Cap Value Fund Large Cap Value Institutional Series (unaudited) |
| |
| |
Information About Your Series Expenses
Calculating your ongoing Series expenses
Example
As a shareholder of the Series, you incur ongoing costs, including management fees and other Series expenses. This example is intended to help you understand your ongoing costs (in dollars) of investing in the Series and to compare these costs with ongoing costs of investing in other mutual funds. The example is based on an investment of $1,000 invested at the beginning of the period and held for the entire period October 1, 2008 through March 31, 2009.
Actual Expenses
The first line for each class of shares in the table provides information about actual account values and actual expenses. You may use the information in this table, together with the amount you invested, to estimate the expenses that you paid over the period. Simply divide your account value by $1,000 (for example, an $8,600 account value divided by $1,000 = 8.6), then multiply the result by the number in the table under the heading entitled “Expenses Paid During the Period” to estimate the expenses you paid on your account during this period.
Hypothetical Example for Comparison Purposes
The second line for each class of shares in the table provides information about hypothetical account values and hypothetical expenses based on the Series’ actual expense ratio and an assumed rate of return of 5% per year before expenses, which is not the Series’ actual return. The hypothetical account values and expenses may not be used to estimate the actual ending account balance or expenses you paid for the period. You may use this information to compare the ongoing costs of investing in the Series and other funds. To do so, compare this 5% hypothetical example with the 5% hypothetical examples that appear in the shareholder reports of the other mutual funds.
Please note that the expenses shown in the table are meant to highlight your ongoing costs. Therefore, the second line for each class of shares is useful in comparing ongoing costs only, and will not help you determine the relative total costs of owning different funds
| | | | | | |
| Series Expenses |
| | | Beginning
Account
Value
10/1/2008 | | Ending
Account
Value
3/31/20091 | | Expenses
Paid
During
Period2 |
Large Cap Value Institutional Series |
Actual | | $1,000.00 | | $658.77 | | $4.05 |
Hypothetical | | 1,000.00 | | 1,020.04 | | 4.94 |
1 The actual ending account value is based on the actual total return of the Series for the period October 1, 2008 to March 31, 2009 after actual expenses and will differ from the hypothetical ending account value which is based on the Series expense ratio and a hypothetical annual return of 5% before expenses. The actual cumulative return at net asset value for the period October 1, 2008 to March 31, 2009 was (34.12%).
2 Expenses are equal to the Series annualized expense ratio of 0.98%, net of any applicable fee waivers, multiplied by the average account value over the period, multiplied by 182/365 (to reflect the one-half year period).
| | |
Schedule of Investments March 31, 2009 | | Security Large Cap Value Fund Large Cap Value Institutional Series (unaudited) |
| |
| |
| | | | |
| | | Shares | | Value |
COMMON STOCKS - 108.2% | | | | |
Aerospace & Defense - 3.1% | | | | |
United Technologies Corporation | | 1,670 | | $71,777 |
| | | | |
| | |
Air Freight & Logistics - 3.0% | | | | |
FedEx Corporation | | 1,600 | | 71,184 |
| | | | |
| | |
Broadcasting - 0.5% | | | | |
CBS Corporation (Cl.B) | | 2,770 | | 10,637 |
| | | | |
| | |
Building Products - 1.9% | | | | |
USG Corporation * | | 5,890 | | 44,823 |
| | | | |
| | |
Cable & Satellite - 0.6% | | | | |
Time Warner Cable, Inc. | | 562 | | 13,944 |
| | | | |
| | |
Computer Hardware - 2.7% | | | | |
Hewlett-Packard Company | | 1,950 | | 62,517 |
| | | | |
| | |
Construction Materials - 1.5% | | | | |
Vulcan Materials Company | | 750 | | 33,217 |
| | | | |
| | |
Consumer Finance - 0.3% | | | | |
First Marblehead Corporation * | | 6,069 | | 7,829 |
| | | | |
| | |
Data Processing & Outsourced Services - 4.7% | | | | |
Western Union Company | | 8,870 | | 111,496 |
| | | | |
| | |
Department Stores - 3.2% | | | | |
JC Penney Company, Inc. | | 3,770 | | 75,664 |
| | | | |
| | |
Diversified Banks - 2.8% | | | | |
U.S. Bancorp | | 2,230 | | 32,580 |
Wells Fargo & Company | | 2,380 | | 33,892 |
| | | | |
| | | | 66,472 |
| | | | |
| | |
Diversified Chemicals - 0.7% | | | | |
Dow Chemical Company | | 2,050 | | 17,282 |
| | | | |
| | |
Drug Retail - 2.3% | | | | |
CVS Caremark Corporation | | 1,960 | | 53,880 |
| | | | |
| | |
Electric Utilities - 4.1% | | | | |
Edison International | | 3,330 | | 95,937 |
| | | | |
| | |
Electronic Manufacturing Services - 1.8% | | | | |
| | |
Tyco Electronics, Ltd. | | 3,810 | | 42,062 |
| | | | |
| | |
Exchange Traded Funds - 2.8% | | | | |
iShares Russell 1000 Value Index Fund | | 806 | | 32,716 |
iShares S&P 500 Value Index Fund | | 875 | | 32,550 |
| | | | |
| | | | 65,266 |
| | | | |
| | |
Health Care Equipment - 4.6% | | | | |
Covidien, Ltd. | | 1,150 | | 38,226 |
Hospira, Inc. * | | 2,230 | | 68,818 |
| | | | |
| | | | 107,044 |
| | | | |
| | |
Health Care Services - 2.6% | | | | |
Medco Health Solutions, Inc. * | | 1,480 | | 61,183 |
| | | | |
| | | | |
| | | Shares | | Value |
COMMON STOCKS - 108.2% (continued) |
Home Improvement Retail - 4.0% | | | | |
Lowe’s Companies, Inc. | | 5,110 | | $93,257 |
| | | | |
| | |
Hypermarkets & Super Centers - 6.4% | | | | |
Costco Wholesale Corporation | | 1,140 | | 52,805 |
Wal-Mart Stores, Inc. | | 1,840 | | 95,864 |
| | | | |
| | | | 148,669 |
| | | | |
| | |
Independent Power Producers & Energy Traders - 1.2% | | | | |
NRG Energy, Inc. * | | 1,600 | | 28,160 |
| | | | |
| | |
Industrial Conglomerates - 6.1% | | | | |
General Electric Company | | 5,340 | | 53,987 |
McDermott International, Inc. * | | 6,820 | | 91,319 |
| | | | |
| | | | 145,306 |
| | | | |
| | |
Industrial Machinery - 3.3% | | | | |
Parker Hannifin Corporation | | 2,300 | | 78,154 |
| | | | |
| | |
Insurance Brokers - 3.0% | | | | |
AON Corporation | | 1,700 | | 69,394 |
| | | | |
| | |
Integrated Oil & Gas - 9.8% | | | | |
Chevron Corporation | | 1,190 | | 80,016 |
ConocoPhillips | | 660 | | 25,846 |
Exxon Mobil Corporation | | 1,820 | | 123,942 |
| | | | |
| | | | 229,804 |
| | | | |
| | |
Integrated Telecommunication Services - 1.4% | | | | |
Windstream Corporation | | 3,930 | | 31,676 |
| | | | |
| | |
Managed Health Care - 2.3% | | | | |
Aetna, Inc. | | 2,200 | | 53,526 |
| | | | |
| | |
Movies & Entertainment - 1.8% | | | | |
Time Warner, Inc. | | 2,240 | | 43,228 |
| | | | |
| | |
Oil & Gas Equipment & Services - 2.0% | | | | |
Halliburton Company | | 3,060 | | 47,338 |
| | | | |
| | |
Oil & Gas Exploration & Production - 2.1% | | | | |
Chesapeake Energy Corporation | | 2,900 | | 49,474 |
| | | | |
| | |
Oil & Gas Storage & Transportation - 1.7% | | | | |
Williams Companies, Inc. | | 3,490 | | 39,716 |
| | | | |
| | |
Other Diversified Financial Services - 1.7% | | | | |
JPMorgan Chase & Company | | 1,536 | | 40,827 |
| | | | |
| | |
Pharmaceuticals - 3.4% | | | | |
Schering-Plough Corporation | | 3,380 | | 79,599 |
| | | | |
| | |
Property & Casualty Insurance - 3.8% | | | | |
Berkshire Hathaway, Inc. * | | 1 | | 86,699 |
| | | | |
| | | | |
| | | 106 | | The accompanying notes are an integral part of the financial statements |
| | |
Schedule of Investments March 31, 2009 | | Security Large Cap Value Fund Large Cap Value Institutional Series (unaudited) |
| |
| | | | | |
| | | Shares | | Value | |
COMMON STOCKS - 108.2% (continued) | |
Railroads - 4.0% | | | | | |
Union Pacific Corporation | | 2,260 | | $92,909 | |
| | | | | |
Research & Consulting Services - 2.8% | | | | | |
Equifax, Inc. | | 2,670 | | 65,282 | |
| | | | | |
Specialty Chemicals - 1.1% | | | | | |
Rohm & Haas Company | | 330 | | 26,017 | |
| | | | | |
Tobacco - 3.1% | | | | | |
Altria Group, Inc. | | 1,920 | | 30,758 | |
Philip Morris International, Inc. | | 1,190 | | 42,341 | |
| | | | | |
| | | | 73,099 | |
TOTAL COMMON STOCKS | | | | | |
(cost $3,618,643) | | | | $2,534,348 | |
Total Investments - 108.2% | | | | | |
(cost $3,618,643) | | | | $2,534,348 | |
Liabilities, Less Cash & Other Assets - (8.2)% | | | | (192,682 | ) |
| | | | | |
Total Net Assets - 100.0% | | | | $2,341,666 | |
| | | | | |
For federal income tax purposes the identified cost of investments owned at March 31, 2009 was $3,618,643.
* Non-income producing security
| | | | |
| | | 107 | | The accompanying notes are an integral part of the financial statements |
| | |
| | Security Large Cap Value Fund Large Cap Value Institutional Series (unaudited) |
| |
| |
| | |
| Statement of Assets and Liabilities |
March 31, 2009 |
Assets: | | |
Investments, at value* | | $2,534,348 |
Cash | | 164,663 |
Receivables: | | |
Fund shares sold | | 4,298 |
Securities sold | | 57 |
Dividends | | 7,330 |
Security Investors | | 3,210 |
Prepaid expenses | | 12,696 |
| | |
Total assets | | 2,726,602 |
| | |
| |
Liabilities: | | |
| |
Payable for: | | |
Fund shares redeemed | | 375,478 |
Management fees | | 1,387 |
Administration fees | | 293 |
Transfer agent/maintenance fees | | 25 |
Custodian fees | | 695 |
Directors’ fees | | 97 |
Professional fees | | 4,170 |
Other fees | | 2,791 |
| | |
Total liabilities | | 384,936 |
| | |
Net assets | | $2,341,666 |
| | |
| |
Net assets consist of: | | |
Paid in capital | | $3,597,503 |
Undistributed net investment income | | 11,238 |
Accumulated net realized loss on sale of investments | | (182,779) |
Net unrealized depreciation in value of investments | | (1,084,296) |
| | |
Net assets | | $2,341,666 |
| | |
| |
Capital shares authorized | | unlimited |
Capital shares outstanding | | 372,096 |
Net asset value per share | | |
(net assets divided by shares outstanding) | | $6.29 |
| | |
| |
*Investments, at cost | | $3,618,643 |
| | | |
Statement of Operations For the Six Months Ended March 31, 2009 |
Investment Income: | | | |
Dividends | | $ | 35,961 |
Interest | | | 219 |
| | | |
Total investment income | | | 36,180 |
| | | |
| |
Expenses: | | | |
Management fees | | | 8,871 |
Administration fees | | | 1,078 |
Transfer agent/maintenance fees | | | 192 |
Custodian fees | | | 84 |
Directors’ fees | | | 126 |
Professional fees | | | 6,583 |
Reports to shareholders | | | 2,364 |
Registration fees | | | 11,764 |
Other | | | 927 |
| | | |
Total expenses | | | 31,989 |
Less: | | | |
Reimbursement of expenses | | | (18,596) |
| | | |
Net expenses | | | 13,393 |
| | | |
Net investment income | | | 22,787 |
| | | |
| |
Net Realized and Unrealized Gain (Loss): | | | |
Net realized gain (loss) during the period on: | | | |
Investments | | | (141,961) |
Options written | | | 2,131 |
| | | |
Net realized loss | | | (139,830) |
| | | |
Net unrealized appreciation (depreciation) during the period on: | | | |
Investments | | | (1,002,024) |
| | | |
Net unrealized depreciation | | | (1,002,024) |
| | | |
Net realized and unrealized loss | | | (1,141,854) |
| | | |
Net decrease in net assets resulting from operations | | $ | (1,119,067) |
| | | |
| | | | |
| | 108 | | The accompanying notes are an integral part of the financial statements |
| | |
| Statement of Changes in Net Assets | | Security Large Cap Value Fund Large Cap Value Institutional Series |
| | | | | | | | |
| | | Six Months Ended
March 31, 2009
(unaudited) | | | Period Ended
September 30,
2008* | |
| | |
Increase (decrease) in net assets from operations: | | | | | | | | |
Net investment income | | $ | 22,787 | | | $ | 8,072 | |
Net realized loss during the period on investments | | | (139,830 | ) | | | (42,949 | ) |
Net unrealized depreciation during the period on investments | | | (1,002,024 | ) | | | (82,272 | ) |
| | | | | | | | |
| | | | | | | | |
Net decrease in net assets resulting from operations | | | (1,119,067 | ) | | | (117,149 | ) |
| | |
Distributions to shareholders from: | | | | | | | | |
Net investment income | | | (19,621 | ) | | | – | |
| | | | | | | | |
Total distributions to shareholders | | | (19,621 | ) | | | – | |
| | | | | | | | |
| | |
Capital share transactions: | | | | | | | | |
Proceeds from sale of shares | | | 2,247,378 | | | | 3,308,936 | |
Dividends reinvested | | | 19,621 | | | | – | |
Cost of shares redeemed | | | (1,664,841 | ) | | | (313,591 | ) |
| | | | | | | | |
Net increase from capital share transactions | | | 602,158 | | | | 2,995,345 | |
| | | | | | | | |
Net increase (decrease) in net assets | | | (536,530 | ) | | | 2,878,196 | |
| | | | | | | | |
| | |
Net assets: | | | | | | | | |
Beginning of period | | | 2,878,196 | | | | – | |
| | | | | | | | |
End of period | | $ | 2,341,666 | | | $ | 2,878,196 | |
| | | | | | | | |
Undistributed net investment income at end of period | | $ | 11,238 | | | $ | 8,072 | |
| | | | | | | | |
| | |
Capital share activity: | | | | | | | | |
Shares sold | | | 316,754 | | | | 330,636 | |
Shares reinvested | | | 2,764 | | | | – | |
Shares redeemed | | | (246,952 | ) | | | (31,106 | ) |
| | | | | | | | |
Total capital share activity | | | 72,566 | | | | 299,530 | |
| | | | | | | | |
* For the period July 11, 2008 (commencement of operations) to September 30, 2008.
| | | | |
| | 109 | | The accompanying notes are an integral part of the financial statements |
| | |
Financial Highlights Selected data for each share of capital stock outstanding throughout each period | | Security Large Cap Value Fund Large Cap Value Institutional Series |
| |
| | | | |
| | | Six Months
Ended
March 31,
2009 a | | Period Ended
September 30,
2008 b |
Per Share Data | | | | |
Net asset value, beginning of period | | $9.61 | | $10.00 |
Income (loss) from investment operations: | | | | |
Net investment incomec | | 0.06 | | 0.03 |
Net loss on securities (realized and unrealized) | | (3.33) | | (0.42) |
| | |
Total from investment operations | | (3.27) | | (0.39) |
Less distributions: | | | | |
Dividends from net investment income | | (0.05) | | – |
Total distributions | | (0.05) | | – |
Net asset value, end of period | | $6.29 | | $9.61 |
| | |
| | |
| | | | |
Total Return | | (34.12%) | | (3.90%) |
Ratios/Supplemental Data | | | | |
Net assets, end of period (in thousands) | | $2,342 | | $2,878 |
Ratios to average net assets: | | | | |
Net investment income | | 1.67% | | 1.17% |
Total expensesd | | 2.34% | | 2.33% |
Net expensese | | 0.98% | | 0.98% |
Net expenses prior to custodian earnings credits and net of expense waivers | | 0.98% | | 0.98% |
Portfolio turnover rate | | 104% | | 35% |
a Unaudited figures for the six months ended March 31, 2009. Percentage amounts, except total return, have been annualized.
b Security Large Cap Value Institutional Series was initially capitalized on July 11, 2008 with a net asset value of $10 per share. Percentage amounts for the period, except total return, have been annualized.
c Net investment income (loss) was computed using average shares outstanding throughout the period.
d Total expense information reflects the expense ratios absent expense reductions by the Investment Manager and earnings credits, as applicable.
e Net expense information reflects the expense ratios after voluntary expense waivers, reimbursements and custodian earnings credits, as applicable.
| | | | |
| | 110 | | The accompanying notes are an integral part of the financial statements |
This page left blank intentionally.
| | |
Performance Summary March 31, 2009 | | Security Mid Cap Growth Fund (unaudited) |
| |
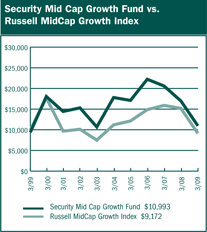
$10,000 Over Ten Years
This chart assumes a $10,000 investment in Class A shares of Security Mid Cap Growth Fund on March 31, 1999, reflects deduction of the 5.75% sales load and assumes all dividends reinvested. The chart does not reflect the deduction of taxes that a shareholder would pay on distributions of the redemption of fund shares. The Russell MidCap Growth Index is an unmanaged capitalization-weighted index that is designed to measure the performance of the 800 smallest companies in the Russell 1000 Index with higher price-to-book ratios and higher forecasted growth values.
| | | | | | |
Average Annual Returns |
| Periods Ended | | | | | | |
3-31-09 | | 1 Year | | 5 Years | | 10 Years |
A Shares | | (35.24%) | | (9.20%) | | 1.55% |
A Shares with sales charge | | (38.97%) | | (10.27%) | | 0.95% |
B Shares | | (35.59%) | | (9.85%) | | 0.86% |
B Shares with CDSC | | (38.76%) | | (10.05%) | | 0.86% |
C Shares | | (35.80%) | | (9.88%) | | 0.76% |
C Shares with CDSC | | (36.44%) | | (9.88%) | | 0.76% |
The performance data above represents past performance that is not predictive of future results. The investment return and principal value of an investment in the Fund will fluctuate so that an investor's shares, when redeemed, may be worth more or less than their original cost. The figures above do not reflect deduction of the maximum front-end sales charge of 5.75% for Class A shares or the contingent deferred sales charge of 5% for Class B shares and 1% for Class C shares, as applicable, except where noted. The figures do not reflect the deduction of taxes that a shareholder would pay on distributions or redemption of shares. Such figures would be lower if the maximum sales charge and any applicable taxes were deducted. |
| | | | | | |
| | | Portfolio Composition by Sector as of 3-31-09 |
| | | Consumer Discretionary | | 17.30% | | |
| | | Consumer Staples | | 2.51 | | |
| | | Energy | | 9.28 | | |
| | | Financials | | 5.72 | | |
| | | Health Care | | 13.01 | | |
| | | Industrials | | 9.41 | | |
| | | Information Technology | | 24.43 | | |
| | | Materials | | 9.36 | | |
| | | Exchange Traded Funds | | 5.29 | | |
| | | Warrants | | 0.02 | | |
| | | Cash & Other Assets, Less Liabilities | | 3.67 | | |
| | | Total Net Assets | | 100.00% | | |
| | | | | | | |
| | | | | | | |
| | | | |
| | | 112 | | The accompanying notes are an integral part of the financial statements |
| | |
Performance Summary March 31, 2009 | | Security Mid Cap Growth Fund (unaudited) |
| |
Information About Your Fund’s Expenses
Calculating your ongoing Fund expenses
Example
As a shareholder of the Fund, you incur two types of costs: (1) transaction costs, which may include sales charges (loads) on purchase payments; contingent deferred sales charges on redemptions; and redemption fees, if any; and (2) ongoing costs, including management fees; distribution and/or service fees (12b-1); and other Fund expenses. This example is intended to help you understand your ongoing costs (in dollars) of investing in the Series and to compare these costs with ongoing costs of investing in other mutual funds. The example is based on an investment of $1,000 invested at the beginning of the period and held for the entire period October 1, 2008 through March 31, 2009.
Actual Expenses
The first line for each class of shares in the table provides information about actual account values and actual expenses. You may use the information in this table, together with the amount you invested, to estimate the expenses that you paid over the period. Simply divide your account value by $1,000 (for example, an $8,600 account value divided by $1,000 = 8.6), then multiply the result by the number in the table under the heading entitled “Expenses Paid During the Period” to estimate the expenses you paid on your account during this period.
Hypothetical Example for Comparison Purposes
The second line for each class of shares in the table provides information about hypothetical account values and hypothetical expenses based on the Fund’s actual expense ratio and an assumed rate of return of 5% per year before expenses, which is not the Fund’s actual return. The hypothetical account values and expenses may not be used to estimate the actual ending account balance or expenses you paid for the period. You may use this information to compare the ongoing costs of investing in the Fund and other funds. To do so, compare this 5% hypothetical example with the 5% hypothetical examples that appear in the shareholder reports of the other mutual funds.
Please note that the expenses shown in the table are meant to highlight your ongoing costs only and do not reflect any transactional costs, such as sales charges (loads) on purchase payments, contingent deferred sales charges on redemptions, and redemption fees, if any. Therefore, the second line for each class of shares is useful in comparing ongoing costs only, and will not help you determine the relative total costs of owning different funds. In addition, if these transactional costs were included, your costs would have been higher.
| | | | | | |
| Fund Expenses |
| | | Beginning
Account
Value
10/1/2008 | | Ending
Account
Value
3/31/20091 | | Expenses
Paid
During
Period2 |
Mid Cap Growth |
Fund - Class A |
Actual | | $1,000.00 | | $736.87 | | $8.10 |
Hypothetical | | 1,000.00 | | 1,015.61 | | 9.40 |
Mid Cap Growth |
Fund - Class B |
Actual | | 1,000.00 | | 735.80 | | 11.34 |
Hypothetical | | 1,000.00 | | 1,011.87 | | 13.14 |
Mid Cap Growth |
Fund - Class C |
Actual | | 1,000.00 | | 733.70 | | 11.32 |
Hypothetical | | 1,000.00 | | 1,011.87 | | 13.14 |
1 The actual ending account value is based on the actual total return of the Fund for the period October 1, 2008 to March 31, 2009 after actual expenses and will differ from the hypothetical ending account value which is based on the Fund expense ratio and a hypothetical annual return of 5% before expenses. The actual cumulative return at net asset value for the period October 1, 2008 to March 31, 2009 was (26.31%), (26.42%) and (26.63%), for Class A, B and C shares, respectively.
2 Expenses are equal to the Fund annualized expense ratio (1.87%, 2.62% and 2.62% for Class A, B, and C shares, respectively), net of any applicable fee waivers, multiplied by the average account value over the period, multiplied by 182/365 (to reflect the one-half year period).
| | | | |
| | | 113 | | The accompanying notes are an integral part of the financial statements |
| | |
| | Security Mid Cap Growth Fund (unaudited) |
Schedule of Investments March 31, 2009 | |
| | | | |
| | | Shares | | Value |
COMMON STOCKS - 96.3% | | | | |
Aerospace & Defense - 6.6% | | | | |
Goodrich Corporation | | 49,430 | | $1,872,903 |
Precision Castparts Corporation | | 33,050 | | 1,979,695 |
| | | | |
| | | | 3,852,598 |
| | | | |
| | |
Application Software - 4.2% | | | | |
Amdocs, Ltd. * | | 57,720 | | 1,068,974 |
Nuance Communications, Inc. * | | 126,450 | | 1,373,247 |
| | | | |
| | | | 2,442,221 |
| | | | |
| | |
Asset Management & Custody Banks - 1.7% | | | | |
BlackRock, Inc. | | 7,850 | | 1,020,814 |
| | | | |
| | |
Biotechnology - 5.7% | | | | |
Genzyme Corporation * | | 38,100 | | 2,262,759 |
Gilead Sciences, Inc. * | | 23,460 | | 1,086,667 |
| | | | |
| | | | 3,349,426 |
| | | | |
| | |
Casinos & Gaming - 4.1% | | | | |
Penn National Gaming, Inc. * | | 51,640 | | 1,247,106 |
WMS Industries, Inc. * | | 55,125 | | 1,152,664 |
| | | | |
| | | | 2,399,770 |
| | | | |
| | |
Coal & Consumable Fuels - 0.9% | | | | |
Peabody Energy Corporation | | 21,745 | | 544,495 |
| | | | |
| | |
Construction & Engineering - 1.2% | | | | |
Aecom Technology Corporation * | | 25,950 | | 676,776 |
| | | | |
| | |
Data Processing & Outsourced Services - 3.7% | | | | |
Alliance Data Systems Corporation * | | 57,905 | | 2,139,590 |
| | | | |
| | |
Exchange Traded Funds - 5.3% | | | | |
iShares Russell Midcap Growth Index Fund | | 102,440 | | 3,083,444 |
| | | | |
| | |
Fertilizers & Agricultural Chemicals - 1.5% | | | | |
Mosaic Company | | 20,720 | | 869,826 |
| | | | |
| | |
Food Retail - 2.5% | | | | |
Kroger Company | | 69,070 | | 1,465,665 |
| | | | |
| | |
Health Care Equipment - 1.6% | | | | |
Beckman Coulter, Inc. | | 18,655 | | 951,592 |
| | | | |
| | |
Home Entertainment Software - 3.3% | | | | |
Activision Blizzard, Inc. * | | 183,080 | | 1,915,017 |
| | | | |
| | |
Homefurnishing Retail - 2.1% | | | | |
Bed Bath & Beyond, Inc. * | | 50,500 | | 1,249,875 |
| | | | |
| | |
Hotels, Resorts & Cruise Lines - 1.6% | | | | |
Marriott International, Inc. | | 55,850 | | 913,706 |
| | | | |
Housewares & Specialties - 2.3% | | | | |
Jarden Corporation * | | 105,830 | | 1,340,866 |
| | | | |
| | | | |
| | | Shares | | Value |
COMMON STOCKS - 96.3% (continued) |
Industrial Gases - 5.6% | | | | |
AirGas, Inc. | | 50,675 | | $1,713,321 |
Praxair, Inc. | | 22,735 | | 1,529,838 |
| | | | |
| | | | 3,243,159 |
| | | | |
| | |
IT Consulting & Other Services - 3.2% | | | | |
Cognizant Technology Solutions Corporation * | | 90,635 | | 1,884,302 |
| | | | |
| | |
Leisure Facilities - 1.3% | | | | |
Life Time Fitness, Inc. * | | 61,010 | | 766,286 |
| | | | |
| | |
Life Sciences Tools & Services - 2.6% | | | | |
Thermo Fisher Scientific, Inc. * | | 41,760 | | 1,489,579 |
| | | | |
| | |
Metal & Glass Containers - 2.3% | | | | |
Ball Corporation | | 31,022 | | 1,346,355 |
| | | | |
| | |
Multi-Line Insurance - 4.0% | | | | |
Assurant, Inc. | | 49,565 | | 1,079,526 |
HCC Insurance Holdings, Inc. | | 49,220 | | 1,239,852 |
| | | | |
| | | | 2,319,378 |
| | | | |
| | |
Oil & Gas Equipment & Services - 5.5% | | | | |
National Oilwell Varco, Inc. * | | 64,800 | | 1,860,408 |
Weatherford International, Ltd. * | | 121,100 | | 1,340,577 |
| | | | |
| | | | 3,200,985 |
| | | | |
| | |
Oil & Gas Exploration & Production - 1.5% | | | | |
Comstock Resources, Inc. * | | 29,170 | | 869,266 |
| | | | |
| | |
Oil & Gas Storage & Transportation - 1.4% | | | | |
Williams Companies, Inc. | | 70,310 | | 800,128 |
| | | | |
| | |
Pharmaceuticals - 3.1% | | | | |
Teva Pharmaceutical Industries, Ltd. ADR | | 40,025 | | 1,803,126 |
| | | | |
| | |
Railroads - 1.6% | | | | |
Union Pacific Corporation | | 23,330 | | 959,096 |
| | | | |
| | |
Restaurants - 5.9% | | | | |
Burger King Holdings, Inc. | | 79,340 | | 1,820,853 |
Darden Restaurants, Inc. | | 46,820 | | 1,604,053 |
| | | | |
| | | | 3,424,906 |
| | | | |
| | |
Semiconductors - 3.7% | | | | |
Fairchild Semiconductor International, Inc. * | | 48,750 | | 181,838 |
ON Semiconductor Corporation * | | 296,465 | | 1,156,213 |
Skyworks Solutions, Inc. * | | 101,830 | | 820,750 |
| | | | |
| | | | 2,158,801 |
| | | | |
Systems Software - 4.7% | | | | |
Sybase, Inc. * | | 23,040 | | 697,882 |
Symantec Corporation * | | 140,420 | | 2,097,874 |
| | | | |
| | | | 2,795,756 |
| | | | |
| | | | |
| | | 114 | | The accompanying notes are an integral part of the financial statements |
| | |
| | Security Mid Cap Growth Fund (unaudited) |
Schedule of Investments March 31, 2009 | |
| | | | |
| | | Shares | | Value |
COMMON STOCKS - 96.3% (continued) |
Technology Distributors - 1.6% | | |
Avnet, Inc. * | | 52,260 | | $915,073 |
| | | | |
| | | | |
TOTAL COMMON STOCKS (cost $70,169,792) | | | | $56,191,877 |
| | | Shares | | Value |
WARRANTS - 0.0% | | | | |
Nova Biosource Fuels, Inc. | | | | |
$2.40, 7/5/2011 | | 208,050 | | 11,497 |
TOTAL WARRANTS (cost $214,905) | | | | $11,497 |
Total Investments - 96.3% (cost $70,384,697) | | | | $56,203,374 |
Cash & Other Assets, Less Liabilities - 3.7% | | | | 2,140,125 |
| | | | |
Total Net Assets - 100.0% | | | | $58,343,499 |
| | | | |
For federal income tax purposes the identified cost of investments owned at March 31, 2009 was $70,977,789.
ADR American Depositary Receipt
* Non-income producing security
| | | | |
| | | 115 | | The accompanying notes are an integral part of the financial statements |
| | |
| | Security |
| | Mid Cap Growth Fund |
| | (unaudited) |
| | |
| Statement of Assets and Liabilities |
March 31, 2009 |
Assets: | | |
Investments, at value* | | $56,203,374 |
Cash | | 1,746,871 |
Receivables: | | |
Fund shares sold | | 13,137 |
Securities sold | | 1,156,498 |
Dividends | | 29,696 |
Prepaid expenses | | 45,012 |
| | |
Total assets | | 59,194,588 |
| | |
| |
Liabilities: | | |
| |
Payable for: | | |
Securities purchased | | 252,163 |
Fund shares redeemed | | 487,718 |
Management fees | | 35,356 |
Custodian fees | | 634 |
Transfer agent/maintenance fees | | 17,680 |
Administration fees | | 4,898 |
Professional fees | | 13,245 |
12b-1 distribution plan fees | | 17,200 |
Directors’ fees | | 3,629 |
Other | | 18,566 |
| | |
Total liabilities | | 851,089 |
| | |
Net assets | | $58,343,499 |
| | |
| |
Net assets consist of: | | |
Paid in capital | | $116,742,012 |
Accumulated net investment loss | | (322,969) |
Accumulated net realized loss on sale of investments | | (43,894,220) |
Net unrealized depreciation in value of investments | | (14,181,324) |
| | |
Net assets | | $58,343,499 |
| | |
| |
Class A: | | |
Capital shares outstanding
(unlimited number of shares authorized) | | 10,485,475 |
Net assets | | $49,422,784 |
Net asset value and redemption price per share | | $4.71 |
| | |
Maximum offering price per share (net asset value divided by 94.25%) | | $5.00 |
| | |
| |
Class B: | | |
Capital shares outstanding
(unlimited number of shares authorized) | | 1,398,786 |
Net assets | | $4,990,764 |
Net asset value, offering and redemption price per share (excluding any applicable contingent deferred sales charge) | | $3.57 |
| | |
| |
Class C: | | |
Capital shares outstanding
(unlimited number of shares authorized) | | 955,265 |
Net assets | | $3,929,951 |
Net asset value, offering and redemption price per share (excluding any applicable contingent deferred sales charge) | | $4.11 |
| | |
| |
*Investments, at cost | | $70,384,697 |
| | | |
| Statement of Operations |
For the Six Months Ended March 31, 2009 |
Investment Income: | | | |
Dividends | | $ | 271,188 |
Interest | | | 7,395 |
| | | |
Total investment income | | | 278,583 |
| | | |
| |
Expenses: | | | |
Management fees | | | 227,145 |
Transfer agent/maintenance fees | | | 164,032 |
Administration fees | | | 29,057 |
Custodian fees | | | 455 |
Directors’ fees | | | 3,565 |
Professional fees | | | 15,839 |
Reports to shareholders | | | 13,886 |
Registration fees | | | 20,772 |
Other expenses | | | 14,799 |
12b-1 distribution fees - Class A | | | 63,619 |
12b-1 distribution fees - Class B | | | 26,390 |
12b-1 distribution fees - Class C | | | 21,993 |
| | | |
Total expenses | | | 601,552 |
| | | |
Net investment loss | | | (322,969) |
| | | |
| |
Net Realized and Unrealized Gain (Loss): | | | |
Net realized gain (loss) during the period on: | | | |
Investments | | | (19,063,040) |
| | | |
Net realized loss | | | (19,063,040) |
| | | |
| |
Net unrealized appreciation (depreciation) during the period on: | | | |
Investments | | | (3,331,125) |
| | | |
Net unrealized depreciation | | | (3,331,125) |
| | | |
Net loss | | | (22,394,165) |
| | | |
Net decrease in net assets resulting from operations | | $ | (22,717,134) |
| | | |
| | | | |
| | | 116 | | The accompanying notes are an integral part of the financial statements |
| | |
Statement of Changes in Net Assets | | Security |
| | Mid Cap Growth Fund |
| | | | | | | | |
| | | Six Months Ended
March 31, 2009
(unaudited) | | | Year Ended September 30, 2008 | |
Increase (decrease) in net assets from operations: | | | | | | | | |
Net investment loss | | $ | (322,969 | ) | | $ | (988,218 | ) |
Net realized (loss) during the period on investments | | | (19,063,040 | ) | | | (22,363,569 | ) |
Net unrealized depreciation during the period on investments | | | (3,331,125 | ) | | | (13,666,899 | ) |
| | | | | | | | |
Net (decrease) in net assets resulting from operations | | | (22,717,134 | ) | | | (37,018,686 | ) |
| | | | | | | | |
| | |
Distributions to shareholders from: | | | | | | | | |
Net realized gain | | | | | | | | |
Class A | | | (535,743 | ) | | | (28,305,723 | ) |
Class B | | | (73,574 | ) | | | (3,379,810 | ) |
Class C | | | (53,571 | ) | | | (2,111,785 | ) |
| | | | | | | | |
Total distributions to shareholders | | | (662,888 | ) | | | (33,797,318 | ) |
| | | | | | | | |
| | |
Capital share transactions: | | | | | | | | |
Proceeds from sale of shares | | | | | | | | |
Class A | | | 3,227,274 | | | | 13,994,661 | |
Class B | | | 403,948 | | | | 1,239,490 | |
Class C | | | 497,187 | | | | 1,676,082 | |
Distributions reinvested | | | | | | | | |
Class A | | | 513,214 | | | | 27,267,564 | |
Class B | | | 72,606 | | | | 3,319,686 | |
Class C | | | 50,288 | | | | 1,945,651 | |
Cost of shares redeemed | | | | | | | | |
Class A | | | (6,527,262 | ) | | | (70,720,345 | ) |
Class B | | | (1,070,359 | ) | | | (4,954,737 | ) |
Class C | | | (1,260,527 | ) | | | (3,272,723 | ) |
| | | | | | | | |
Net decrease from capital share transactions | | | (4,093,631 | ) | | | (29,504,671 | ) |
| | | | | | | | |
Net decrease in net assets | | | (27,473,653 | ) | | | (100,320,675 | ) |
| | | | | | | | |
| | |
Net assets: | | | | | | | | |
Beginning of period | | | 85,817,152 | | | | 186,137,827 | |
| | | | | | | | |
End of period | | $ | 58,343,499 | | | $ | 85,817,152 | |
| | | | | | | | |
| | |
Accumulated net investment loss at end of period | | $ | (322,969 | ) | | $ | – | |
| | | | | | | | |
| | |
Capital share activity: | | | | | | | | |
Shares sold | | | | | | | | |
Class A | | | 678,903 | | | | 1,697,528 | |
Class B | | | 115,485 | | | | 186,925 | |
Class C | | | 118,199 | | | | 236,049 | |
Shares reinvested | | | | | | | | |
Class A | | | 111,569 | | | | 3,416,988 | |
Class B | | | 20,804 | | | | 542,432 | |
Class C | | | 12,510 | | | | 275,979 | |
Shares redeemed | | | | | | | | |
Class A | | | (1,404,338 | ) | | | (8,463,584 | ) |
Class B | | | (303,932 | ) | | | (800,385 | ) |
Class C | | | (313,171 | ) | | | (434,505 | ) |
| | | | |
| | | 117 | | The accompanying notes are an integral part of the financial statements |
| | |
| Financial Highlights | | Security |
Selected data for each share of capital stock outstanding throughout each period | | Mid Cap Growth Fund |
| | | | | | | | | | | | |
| Class A | | Six Months Ended
March 31, 2009 a | | 2008 | | 2007 | | 2006 | | 2005 | | Year Ended
September 30,
2004b |
Per Share Data | | | | | | | | | | | | |
Net asset value, beginning of period | | $6.46 | | $11.11 | | $12.03 | | $12.65 | | $11.02 | | $10.84 |
Income (loss) from investment operations: | | | | | | | | | | | | |
Net investment lossc | | (0.02) | | (0.05) | | (0.08) | | (0.12) | | (0.10) | | (0.13) |
Net gain (loss) on securities (realized and unrealized) | | (1.68) | | (2.46) | | 0.35 | | 0.47 | | 2.46 | | 0.71 |
| | |
Total from investment operations | | (1.70) | | (2.51) | | 0.27 | | 0.35 | | 2.36 | | 0.58 |
Less distributions: | | | | | | | | | | | | |
Distributions from realized gains | | (0.05) | | (2.14) | | (1.19) | | (0.97) | | (0.73) | | (0.40) |
| | |
Total distributions | | (0.05) | | (2.14) | | (1.19) | | (0.97) | | (0.73) | | (0.40) |
Net asset value, end of period | | $4.71
| | $6.46 | | $11.11 | | $12.03 | | $12.65 | | $11.02 |
| | |
| | | | | | | | | | | | |
Total Return d | | (26.31%) | | (26.24%) | | 2.10% | | 2.81% | | 21.76% | | 5.23% |
Ratios/Supplemental Data | | | | | | | | | | | | |
Net assets, end of period (in thousands) | | $49,423 | | $71,655 | | $160,544 | | $192,159 | | $183,676 | | $149,715 |
Ratios to average net assets: | | | | | | | | | | | | |
Net investment loss | | (0.95%) | | (0.63%) | | (0.67%) | | (0.93%) | | (0.85%) | | (1.11%) |
Total expensese | | 1.87% | | 1.50% | | 1.41% | | 1.40% | | 1.42% | | 1.41% |
Net expensesf | | 1.87% | | 1.50% | | 1.41% | | 1.40% | | 1.42% | | 1.41% |
Net expenses prior to custodian earning credits and net of expense waivers | | 1.87% | | 1.50% | | 1.41% | | 1.40% | | 1.42% | | 1.41% |
Portfolio turnover rate | | 141% | | 191%g | | 34% | | 41% | | 31% | | 50% |
| | | | | | |
| Class B | | Six Months Ended
March 31, 2009a | | 2008 | | 2007 | | 2006 | | 2005 | | Year Ended
September 30,
2004b |
Per Share Data | | | | | | | | | | | | |
Net asset value, beginning of period | | $4.92 | | $9.09 | | $10.12 | | $10.86 | | $9.61 | | $9.57 |
Income (loss) from investment operations: | | | | | | | | | | | | |
Net investment lossc | | (0.03) | | (0.09) | | (0.14) | | (0.18) | | (0.16) | | (0.19) |
Net gain (loss) on securities (realized and unrealized) | | (1.27) | | (1.94) | | 0.30 | | 0.41 | | 2.14 | | 0.63 |
| | |
Total from investment operations | | (1.30) | | (2.03) | | 0.16 | | 0.23 | | 1.98 | | 0.44 |
Less distributions: | | | | | | | | | | | | |
Distributions from realized gains | | (0.05) | | (2.14) | | (1.19) | | (0.97) | | (0.73) | | (0.40) |
| | |
Total distributions | | (0.05) | | (2.14) | | (1.19) | | (0.97) | | (0.73) | | (0.40) |
Net asset value, end of period | | $3.57 | | $4.92 | | $9.09 | | $10.12 | | $10.86 | | $9.61 |
| | |
| | | | | | | | | | | | |
Total Return d | | (26.42%) | | (26.92%) | | 1.34% | | 2.12% | | 20.95% | | 4.44% |
Ratios/Supplemental Data | | | | | | | | | | | | |
Net assets, end of period (in thousands) | | $4,991 | | $7,711 | | $14,877 | | $22,010 | | $27,115 | | $26,578 |
Ratios to average net assets: | | | | | | | | | | | | |
Net investment loss | | (1.70%) | | (1.40%) | | (1.43%) | | (1.68%) | | (1.61%) | | (1.86%) |
Total expensese | | 2.62% | | 2.26% | | 2.16% | | 2.15% | | 2.17% | | 2.16% |
Net expensesf | | 2.62% | | 2.26% | | 2.16% | | 2.15% | | 2.17% | | 2.16% |
Net expenses prior to custodian earning credits and net of expense waivers | | 2.62% | | 2.26% | | 2.16% | | 2.15% | | 2.17% | | 2.16% |
Portfolio turnover rate | | 141% | | 191%g
| | 34% | | 41% | | 31% | | 50% |
| | | | |
| | | 118 | | The accompanying notes are an integral part of the financial statements |
| | |
Financial Highlights Selected data for each share of capital stock outstanding throughout each period | | Security Mid Cap Growth Fund |
| |
| | | | | | | | | | | | |
| Class C | | Six Months
Ended March 31,
2009a | | 2008 | | 2007 | | 2006 | | 2005 | | Year Ended
September 30,
2004b |
Per Share Data | | | | | | | | | | | | |
Net asset value, beginning of period | | $5.67 | | $10.11 | | $11.13 | | $11.84 | | $10.43 | | $10.34 |
Income (loss) from investment operations: | | | | | | | | | | | | |
Net investment lossc | | (0.03) | | (0.10) | | (0.15) | | (0.19) | | (0.18) | | (0.21) |
Net gain (loss) on securities (realized and unrealized) | | (1.48) | | (2.20) | | 0.32 | | 0.45 | | 2.32 | | 0.70 |
| | |
Total from investment operations | | (1.51) | | (2.30) | | 0.17 | | 0.26 | | 2.14 | | 0.49 |
Less distributions: | | | | | | | | | | | | |
Distributions from realized gains | | (0.05) | | (2.14) | | (1.19) | | (0.97) | | (0.73) | | (0.40) |
| | |
Total distributions | | (0.05) | | (2.14) | | (1.19) | | (0.97) | | (0.73) | | (0.40) |
Net asset value, end of period | | $4.11 | | $5.67 | | $10.11 | | $11.13 | | $11.84 | | $10.43 |
| | |
| | |
Total Return d | | (26.63%) | | (26.87%) | | 1.31% | | 2.20% | | 20.83% | | 4.59% |
Ratios/Supplemental Data | | | | | | | | | | | | |
Net assets, end of period (in thousands) | | $3,930 | | $6,452 | | $10,717 | | $15,505 | | $16,330 | | $14,759 |
Ratios to average net assets: | | | | | | | | | | | | |
Net investment loss | | (1.70%) | | (1.40%) | | (1.43%) | | (1.68%) | | (1.60%) | | (1.86%) |
Total expensese | | 2.62% | | 2.26% | | 2.16% | | 2.15% | | 2.17% | | 2.16% |
Net expensesf | | 2.62% | | 2.26% | | 2.16% | | 2.15% | | 2.17% | | 2.16% |
Net expenses prior to custodian earning credits and net of expense waivers | | 2.62% | | 2.26% | | 2.16% | | 2.15% | | 2.17% | | 2.16% |
Portfolio turnover rate | | 141% | | 191%g | | 34% | | 41% | | 31% | | 50% |
a Unaudited figures for the six months ended March 31, 2009. Percentage amounts for the period, except total return, have been annualized.
b The financial highlights for the Security Mid Cap Growth Fund exclude the historical financial highlights of the Technology Series Class, A, B and C shares. The assets of the Technology Series were acquired by the Security Mid Cap Growth Fund on October 3, 2003.
c Net investment income (loss) was computed using average shares outstanding throughout the period.
d Total return information does not reflect deduction of any sales charges imposed at the time of purchase for Class A shares or upon redemption for Class B and C shares.
e Total expense information reflects expense ratios absent expense reductions by the Investment Manager and custodian earnings credits, as applicable.
f Net expense information reflects the expense ratios after voluntary expense waivers, reimbursements and custodian earnings credits, as applicable.
g Significant variation in the portfolio turnover rate is due to the Investment Manager's appointment of new portfolio managers for the fund.
| | | | |
| | 119 | | The accompanying notes are an integral part of the financial statements |
Notes to Financial Statements
March 31, 2009 (unaudited)
1. Significant Accounting Policies
Security Large Cap Value, Equity and Mid Cap Growth Funds (collectively referred to herein as the Funds) are registered under the Investment Company Act of 1940, as amended, as open-end management investment companies. The shares of Security Equity Fund and Large Cap Value Fund are currently issued in multiple series, with each series, in effect, representing a separate fund. The Security Equity Fund accounts for the assets of each series separately. Class “A” shares are generally sold with a sales charge at the time of purchase. Class “A” shares are not subject to a sales charge when they are redeemed, except for purchases of $1 million or more sold without a front-end sales charge are subject to a contingent deferred sales charge if redeemed within one year of purchase. Class “B” shares may be subject to a contingent deferred sales charge for six years and automatically convert to Class A shares after eight years. Redemptions of Class “B” shares within five years of acquisition incur a contingent deferred sales charge. Class “C” shares are offered without a front-end sales charge but incur additional class-specific expenses. Redemptions of Class “C” shares within one year of acquisition incur a contingent deferred sales charge. “Institutional” Class shares are offered primarily for direct investment by institutions, such as pension and profit sharing plans, endowments, foundations and corporations. Institutional class shares have a minimum initial investment of $2 million and a minimum account balance of $1 million. Institutional Class shares are offered without a front-end sales charge or a contingent deferred sales charge. The following is a summary of the significant accounting policies followed by the Funds in the preparation of their financial statements.
A. Security Valuation - Valuations of the Funds’ or Series’ securities are supplied by pricing services approved by the Board of Directors. The Funds’ officers, under the general super vision of the Board of Directors, regularly review procedures used by, and valuations provided by, the pricing services. Each security owned by the Funds or Series that is listed on a securities exchange is valued at its last sale price on that exchange on the date as of which assets are valued. Where the security is listed on more than one exchange, the Fund or Series will use the price of that exchange that it generally considers to be the principal exchange on which the stock is traded. Securities listed on the Nasdaq Stock Market, Inc. (“Nasdaq”) will be valued at the Nasdaq Official Closing Price, which may not necessarily represent the last sale price. If there has been no sale on such exchange or NASDAQ on such day, the security is valued at the closing bid price on such day. Securities for which market quotations are not readily available are valued taking into consideration securities with similar yields, quality, type of issue, coupon, duration and rating. If there is no bid price or if the bid price is deemed to be unsatisfactory by the Board of Directors or by the Funds’ or Series’ investment manager, then the securities are valued in good faith by such method as the Board of Directors determines will reflect the fair value. If events occur after the close of a foreign exchange that will affect the value of a Fund or Series portfolio securities before the time as of which the NAV is calculated (a “significant event”), the security will generally be priced using a fair value procedure. If the Valuation
Committee determines a significant event has occurred, it will evaluate the impact of that event on an affected security or securities, to determine whether a fair value adjustment would materially affect the Fund or Series net asset value per share. Some of the factors which may be considered by the Board of Directors in determining fair value are fundamental analytical data relating to the investment, the nature and duration of any restrictions on disposition, trading in similar securities of the same issuer or comparable companies, information from broker-dealers, and an evaluation of the forces that influence the market in which the securities are purchased and sold. The Funds or Series generally will value short-term debt securities at prices based on market quotations for such securities or securities of similar type, yield, quality and duration, except those securities purchased with 60 days or less to maturity are valued on the basis of amortized cost, which approximates market value.
Generally, trading in foreign securities markets is substantially completed each day at various times prior to the close of the New York Stock Exchange. The values of foreign securities are determined as of the close of such foreign markets or the close of the New York Stock Exchange, if earlier. All investments quoted in foreign currency are valued in U.S. dollars on the basis of the foreign currency exchange rates prevailing at the close of business. Investments in foreign securities may involve risks not present in domestic investments. The Valuation Committee will determine the current value of such foreign securities by taking into consideration certain factors which may include those discussed above, as well as the following factors, among others: the value of the securities traded on other foreign markets, ADR trading, closed-end fund trading, foreign currency exchange activity, and the trading prices of financial products that are tied to foreign securities such as WEBS®. In addition, the Board of Directors has authorized the Valuation Committee and Administrator to use prices and other information supplied by a third party pricing vendor in valuing foreign securities.
Effective October 1, 2008, the Funds adopted Statement of Financial Accounting Standards No. 157, Fair Value Measurements (“SFAS 157”). SFAS 157 defines fair value, establishes a framework for measuring fair value in accordance with U.S. generally accepted accounting principles and expands disclosures about fair value measurements. SFAS 157 is applicable in conjunction with other accounting pronouncements that require or permit fair value measurements but does not expand the use of fair value to any new circumstances. More specifically, SFAS 157 emphasizes that fair value is a market based measurement, not an entity-specific measurement, and sets out a fair value hierarchy with the highest priority given to quoted prices in active markets and the lowest priority to unobservable inputs. The Funds adoption of SFAS 157 did not have a material impact on its financial condition or results of operations. See Note 10 - Fair Value of Financial Instruments for further disclosure.
B. Repurchase Agreements - In connection with transactions in repurchase agreements, it is the Funds’ or Series’ policy that their custodian take possession of the underlying collateral and that the fair value of the collateral exceed the principal amount of the repurchase transaction, including accrued interest, at all
Notes to Financial Statements
March 31, 2009 (unaudited)
times. If the seller defaults, and the fair value of the collateral declines, realization of the collateral by the Fund or Series may be delayed or limited.
C. Foreign Currency Transactions - The accounting records of the Funds or Series are maintained in U.S. dollars. All assets and liabilities initially expressed in foreign currencies are converted into U.S. dollars at prevailing exchange rates. Purchases and sales of investment securities, dividend and interest income, and certain expenses are translated at the rates of exchange prevailing on the respective dates of such transactions. Changes in the relationship of these foreign currencies to the U.S. dollar can significantly affect the value of the investments and earnings of the Funds or Series. Foreign investments may also subject the Fund or Series to foreign government exchange restrictions, expropriation, taxation or other political, social or economic developments, all of which could affect the market and/or credit risk of the investments.
The Funds or Series do not isolate that portion of the results of operations resulting from changes in the foreign exchange rates on investments from the fluctuations arising from changes in the market prices of securities held. Such fluctuations are included with the net realized and unrealized gain or loss on investments.
Net realized foreign exchange gains or losses arise from sales of portfolio securities, sales of foreign currencies, and the difference between asset and liability amounts initially stated in foreign currencies and the U.S. dollar value of the amounts actually received or paid. Net unrealized foreign exchange gains or losses arise from changes in the value of portfolio securities and other assets and liabilities at the end of the reporting period, resulting from changes in the exchange rates.
D. Forward Foreign Currency Exchange Contracts - Certain Funds or Series may enter into forward foreign exchange contracts in order to manage foreign currency risk from purchase or sale of securities denominated in foreign currency. The Fund or Series may also enter into such contracts to manage the effect of changes in foreign currency exchange rates on portfolio positions. These contracts are marked to market daily, by recognizing the difference between the contract exchange rate and the current market rate as unrealized gains or losses. Realized gains or losses are recognized when contracts are settled and are reflected in the Statement of Operations. These contracts involve market risk in excess of the amount reflected in the Statement of Assets and Liabilities. The face or contract amount in U.S. dollars reflects the total exposure these Funds or Series have in that particular currency contract. Losses may arise due to changes in the value of the foreign currency or if the counterparty does not perform under the contract.
E. Futures - The Funds or Series may utilize futures contracts to a limited extent, with the objectives of maintaining full exposure to the underlying stock market, enhancing returns, maintaining liquidity, minimizing transaction costs and hedging possible variations in foreign exchange values. The Funds or Series, as applicable, may purchase or sell financial and foreign currency futures contracts to immediately position incoming cash in the market, thereby simulating a fully invested position in the underlying index while maintaining a cash balance for liquidity. In the event of redemptions, the Fund or Series, as applicable, may pay from its cash balances and reduce its
future positions accordingly. Returns may be enhanced by purchasing futures contracts instead of the underlying securities when futures are believed to be priced more attractively than the underlying securities. The primary risks associated with the use of futures contracts are imperfect correlation between changes in market values of stocks contained in the indexes and the prices of futures contracts, and the possibility of an illiquid market. Futures contracts are valued based upon their quoted daily settlement prices. Upon entering into a futures contract, the Funds or Series are required to deposit and maintain as collateral either cash or securities, representing the initial margin, equal to a certain percentage of the contract value. Cash deposits are shown as restricted cash on the Statement of Assets and Liabilities; securities held as collateral are noted in the Schedule of Investments. Subsequent changes in the value of the contract are recorded as unrealized gains or losses. The variation margin is paid or received in cash daily by the Funds or Series. The Funds or Series realize a gain or loss when the contract is closed or expires.
F. Options Purchased and Written - The Funds or Series may purchase put and call options and write such options on a covered basis on securities that are traded on recognized securities exchanges and over-the-counter markets. Call and put options on securities give the holder the right to purchase or sell (and the writer the obligation to sell or purchase), respectively, a security at a specified price, until a certain date. Options may be used to hedge the Funds’ or Series’ portfolio, to increase returns or to maintain exposure to the equity markets. The primary risks associated with the use of options are an imperfect correlation between the change in market value of the securities held by the Fund or Series and the price of the option, the possibility of an illiquid market, and the inability of the counterparty to meet the terms of the contract.
The premium received for a written option is recorded as an asset with an equal liability which is marked to market based on the option’s quoted daily settlement price. Fluctuations in the value of such instruments are recorded as unrealized appreciation (depreciation) until terminated, at which time realized gains and losses are recognized.
G. Securities Sold Short - Certain Funds or Series may make short sales “against the box,” in which the Fund or Series enters into a short sale of a security it owns. At no time will more than 15% of the value of the Funds’ or Series’ net assets be in deposits on short sales against the box. If a Fund or Series makes a short sale, the Fund or Series does not immediately deliver from its own account the securities sold and does not receive the proceeds from the sale. To complete the sale, the Fund or Series must borrow the security (generally from the broker through which the short sale is made) in order to make delivery to the buyer. The Fund or Series must replace the security borrowed by purchasing it at the market price at the time of replacement or delivering the security from its own portfolio. The Fund or Series is said to have a “short position” in securities sold until it delivers them to the broker, at which time it receives the proceeds of the sale. Certain Funds or Series may make short sales that are not “against the box,” which create opportunities to increase the Fund’s or Series’ return but, at the same time, involve specific risk considerations and may be considered a speculative technique.
Notes to Financial Statements
March 31, 2009 (unaudited)
Such short sales theoretically involve unlimited loss potential, as the market price of securities sold short may continually increase, although a Fund or Series may mitigate such losses by replacing the securities sold short before the market price has increased significantly. For financial statement purposes, an amount equal to the settlement amount is included in the Statement of Assets and Liabilities as an asset and an equivalent liability. The amount of the liability is subsequently marked-to-market to reflect the current value of the short position. Subsequent fluctuations in the market prices of securities sold, but not yet purchased, may require purchasing the securities at prices which differ from the market value reflected on the Statement of Assets and Liabilities. The Fund or Series are liable for any dividends or interest payable on securities while those securities are in a short position and are recorded as dividend expense in the statement of operations. As collateral for its short positions, the Fund or Series are required under the Investment Company Act of 1940 to maintain segregated assets consisting of cash, cash equivalents or liquid securities. These segregated assets are valued consistent with Note 1A above. These segregated assets are required to be adjusted daily to reflect changes in the market value of the securities sold short.
H. Security Transactions and Investment Income - Security transactions are accounted for on the date the securities are purchased or sold (trade date). Realized gains and losses are reported on an identified cost basis. Dividend income is accrued as of the ex-dividend date, except that certain dividends for foreign securities where the ex-dividend date may have passed are recorded as soon as the Fund or Series is informed of the dividend in the exercise of reasonable diligence. Interest income is recognized on the accrual basis, including the amortization of premiums and accretion of discounts on debt securities.
I. Expenses - Expenses that are directly related to one of the Funds or Series are charged directly to that Fund or Series. Other operating expenses are allocated to the Funds or Series on the basis of relative net assets. Class specific expenses, such as 12b-1 fees, are borne by that class. Income, other expenses and realized and unrealized gains and losses of a Fund or Series are allocated to each respective class in proportion to the relative net assets of each class.
J. Distributions to Shareholders - Distributions to shareholders are recorded on the ex-dividend date. The character of distributions made during the year from net investment income or net realized gains may differ from their ultimate characterization for federal income tax purposes.
K. Taxes - The Funds or Series intend to comply with the requirements of the Internal Revenue Code applicable to regulated investment companies and distribute all of their taxable net income and net realized gains sufficient to relieve them from all, or substantially all, federal income, excise and state income taxes. Therefore, no provision for federal or state income tax is required.
Management of the Funds has concluded that there are no significant uncertain tax positions that would require recognition in the financial statements. If applicable, the Funds would recognize interest and penalties accrued related to unrecognized tax benefits in “Other expenses” on the Statement of Operations. Generally, the tax authorities can
examine tax returns filed for all open tax years (September 30, 2005 - September 30, 2008).
L. Earnings Credits - Under the fee agreement with the custodian, the Funds or Series may earn credits based on overnight custody cash balances. These credits are utilized to reduce related custodial expenses. The custodian fees disclosed in the Statement of Operations are before the reduction in expense from the related earnings credits.
M. Use of Estimates - The preparation of financial statements in conformity with U.S. generally accepted accounting principles requires management to make estimates and assumptions that affect the reported amounts of assets and liabilities and disclosure of contingent assets and liabilities at the date of the financial statements and the reported amounts of increases and decreases in net assets from operations during the reporting period. Actual results could differ from those estimates.
N. Indemnifications - Under the Funds’ or Series’ organizational documents, its Officers and Directors are indemnified against certain liabilities arising out of the performance of their duties to the Funds or Series. In addition, in the normal course of business, the Funds or Series enter into contracts that provide general indemnification to other parties. The Funds’ or Series’ maximum exposure under these arrangements is unknown as this would involve future claims that may be made against the Funds or Series that have not yet occurred, and may not occur. However, the Funds have not had prior claims or losses pursuant to these contracts and expect the risk of loss to be remote.
O. Recent Accounting Pronouncements - In March 2008, the Financial Accounting Standards Board (“FASB”) issued Statement on Financial Accounting Standards No. 161 (SFAS “161”), “Disclosures about Derivative Instruments and Hedging Activities — an amendment of FASB Statement No. 133,” which requires enhanced disclosures about an entity’s derivative and hedging activities. Entities are required to provide enhanced disclosures about (a) how and why an entity uses derivative instruments, (b) how derivative instruments and related hedged items are accounted for under Statement 133 and its related interpretations, and (c) how derivative instruments and related hedged items affect an entity’s financial position and financial performance, SFAS 161 is effective for financial statements issued for fiscal years and interim periods beginning after November 15, 2008. The Funds or Series do not expect SFAS 161 to have a material impact on their financial statements.
On April 9, 2009, the FASB issued Staff Position No. 157-4, “Determining Fair Value When the Volume and Level of Activity for the Asset or Liability Have Significantly Decreased and Identifying Transactions That Are Not Orderly” (FSP 157-4). FSP 157-4 provides additional guidance for estimating fair value in accordance with SFAS 157 when the volume and level of activity for the asset or liability have significantly decreased. FSP 157-4 also requires additional disaggregation of the current SFAS 157 required disclosures. FSP 157-4 is effective for interim and annual reporting periods ending after June 15, 2009 and shall be applied prospectively. Management is currently evaluating the impact that the adoption of FSP 157-4 will have on the amounts and disclosures within the Funds’ Financial statements.
Notes to Financial Statements
March 31, 2009 (unaudited)
2. Management Fees and Other Transactions with Affiliates
Management fees are paid monthly to Security Investors (SI), (formerly known as Security Management Company) based on the following annual rates for the period ended March 31, 2009:
| | |
| | | Management
Fees (as a %
of net assets) |
Security Equity Fund: | | |
All Cap Value Series | | 0.70% |
Alpha Opportunity Series | | 1.25% |
Equity Series | | 0.75% |
Global Series | | 1.00% |
Global Institutional Series | | 1.00% |
Mid Cap Value Series | | 0.82%1 |
Mid Cap Value Institutional Series | | 0.75% |
Select 25 Series | | 0.75% |
Small Cap Growth Series | | 0.85%2 |
Small Cap Value Series | | 1.00% |
Security Large Cap Value Fund | | 0.65% |
Large Cap Value Institutional Series | | 0.65% |
Security Mid Cap Growth Fund | | 0.75% |
1Management fees are payable at an annual rate of 1.00% of the average daily net assets of $200 million or less, and 0.75% of the average daily net assets of the Mid Cap Value Series in excess of $200 million.
2Effective November 24, 2008, SI receives a management fee from the Small Cap Growth Series at an annual rate of 0.85% of the average daily net assets. Prior to November 24, 2008, SI received a management fee from Small Cap Growth Series of 1.00% of the average daily net assets.
SI also acts as the administrative agent and transfer agent for the Funds, and as such performs administrative functions, transfer agency and dividend disbursing services, and the bookkeeping, accounting and pricing functions for each Fund or Series. For these services, the Investment Manager receives the following:
| | |
| | | Administrative Fees (as a % of net assets) |
Security Equity Fund: | | |
All Cap Value Series | | 0.095% |
Alpha Opportunity Series | | 0.15% |
Equity Series | | 0.095% |
Global Series | | 0.05% + greater of 0.10%
or $60,000 |
Global Institutional Series | | 0.15% |
Mid Cap Value Series | | 0.095% |
Mid Cap Value Institutional Series | | 0.095% |
Select 25 Series | | 0.095% |
Small Cap Growth Series | | 0.095% |
Small Cap Value Series | | 0.095% |
Security Large Cap Value Fund | | 0.095% |
Large Cap Value Institutional Series | | 0.095% |
Security Mid Cap Growth Fund | | 0.095% |
Minimum charge per Series or Fund | | $25,0001 |
Certain out-of-pocket charges | | Varies |
1 SI has agreed not to charge the $25,000 minimum fee for the Global Institutional Series, Mid Cap Value Institutional Series, Small Cap Value Series and Large Cap Value Institutional Series through December 31, 2009, and on the All Cap Value Series indefinitely. |
SI is paid the following for providing transfer agent services to the Funds or Series:
| | |
Annual per account charge | | $5.00 - $8.00 |
Transaction fee | | $0.60 - $1.10 |
Annual minimum charge
(per Series or Fund) | | $25,0001 |
Certain out-of-pocket charges | | Varies |
1 SI has agreed not to charge the $25,000 minimum fee for the Global Institutional Series, Mid Cap Value Institutional Series, Small Cap Value Series and Large Cap Value Institutional Series through December 31, 2009, and on the All Cap Value Series indefinitely. |
Effective January 1, 2007, the investment advisory contract for Security Large Cap Value Fund provides that the total expenses be limited to 1.25% of average net assets for Class A shares and 2.00% of average net assets for both Class B and Class C shares, exclusive of brokerage costs, dividends on securities sold short, expenses of other investment companies in which a Fund invests interest, taxes, litigation, indemnification and extraordinary expenses (as determined under generally accepted accounting principles). Effective January 1, 2007, the investment advisory contract for the Select 25 Series provides that the total
Notes to Financial Statements
March 31, 2009 (unaudited)
expenses be limited to 1.35% of average net assets for Class A shares and 2.10% of average net assets for both Class B and C shares, exclusive of brokerage costs, dividends on securities sold short, expenses of other investment companies in which a Fund invests interest, taxes, litigation, indemnification and extraordinary expenses (as determined under generally accepted accounting principles). These contracts are in effect through January 31, 2010. Effective August 18, 2008, the investment advisory contract for the Alpha Opportunity Series, provides that the total expenses be limited to 1.95% of average net assets for Class A shares and 2.70% for both Class B and Class C shares, exclusive of brokerage costs, dividends on securities sold short, expenses of other investment companies in which a Fund invests interest, taxes, litigation, indemnification and extraordinary expenses (as determined under generally accepted accounting principles). This contract is in effect until February 1, 2011. Effective July 11, 2008, the investment advisory contract for the Global Institutional Series, Mid Cap Value Institutional Series and the Large Cap Value Institutional Series, provides that the total expenses be limited to 1.15%, 1.10% and 0.98%, respectively, of average net assets exclusive of brokerage costs, dividends on securities sold short, expenses of other investment companies in which a Fund or Series invests interest, taxes, litigation, indemnification and extraordinary expenses (as determined under generally accepted accounting principles). Also effective July 11, 2008, the investment advisory contract for the Small Cap Value Series, provides that the total expenses be limited to 1.55% of average net assets for Class A shares, 2.30% for Class B shares and 1.30% for the Institutional Class shares, exclusive of brokerage costs, dividends on securities sold short, expenses of other investment companies in which a Fund or Series invests interest, taxes, litigation, indemnification and extraordinary expenses (as determined under generally accepted accounting principles). Effective October 3, 2008 the investment advisory contract for the All Cap Value Series provides that the total expenses be limited to 1.35% of average net assets for Class A shares, 2.30% for Class B shares and 1.10% for the Institutional Class shares, exclusive of brokerage costs, dividends on securities sold short, expenses of other investment companies in which a Fund or Series invests, interest, taxes, litigation, indemnification and extraordinary expenses (as determined under generally accepted accounting principles). These contracts are in effect through January 31, 2010. The Investment Manager is entitled to reimbursement by the All Cap Value Series, Alpha Opportunity Series, Global Institutional Series, Mid Cap Value Institutional Series, Select 25 Series, Small Cap Value Series, Large Cap Value Fund and the Large Cap Value Institutional Series of fees waived or expenses reimbursed during any of the previous 36 months, beginning on the date of the expense limitation agreement, if on any day the estimated operating expenses are less than the indicated percentages. As of March 31, 2009, the amount of fees waived or expenses reimbursed in the All Cap Value Series, Alpha Opportunity Series, Global Institutional Series, Mid Cap Value Institutional Series, Select 25 Series, Small Cap Value Series, Large Cap Value Fund and the Large Cap Value Institutional Series were $29,199, $189,662, $41,801, $8,918, $103,618, $32,682, $118,716 and $18,596, respectively. As of March 31, 2009, no amounts were recouped by the Investment Manager.
The Funds have adopted Distribution Plans related to the offering of Class A, Class B and Class C shares pursuant to Rule 12b-1 under the Investment Company Act of 1940. The plans provide for payments at an annual rate of 1.00% of the average daily net assets of each Fund’s or Series’ Class B and Class C shares, and 0.25% of the average daily net assets of each Fund’s or Series’ Class A shares. Effective August 25, 2005, the Global Series ceased charging 12b-1 fees on Class B shares in accordance with the FINRA sales cap regulations. Effective August 1, 2007, the Security Large Cap Value Fund ceased charging 12b-1 fees on Class B shares in accordance with the FINRA sales cap regulations. These fees may be reinstated at any time.
Security Distributors, Inc. (SDI), an affiliate of the Funds and distributor of the Funds, retained underwriting commissions during the period ended March 31, 2009, on sales of shares after allowances to brokers an dealers in the following amounts:
| | | | | |
| | | | | SDI
Underwriting
Commissions |
Security Equity Fund: | | | | | |
All Cap Value Series | | | | $ | 467 |
Alpha Opportunity Series | | | | | 7,856 |
Equity Series | | | | | 5,842 |
Global Series | | | | | 44,151 |
Mid Cap Value Series | | | | | 53,056 |
Select 25 Series | | | | | 7,692 |
Small Cap Growth Series | | | | | 66,114 |
Small Cap Value Series | | | | | 497 |
Security Large Cap Value Fund | | | | | 15,760 |
Security Mid Cap Growth Fund | | | | | 14,737 |
Certain officers and directors of the Funds are also officers and/or directors of Security Benefit Life Insurance Company, a subsidiary of Security Benefit Corporation, and its affiliates, which include Security Global Investors (SGI) and SDI.
At March 31, 2009, Security Benefit Corporation and its subsidiaries owned over five percent of the outstanding shares of the Funds or Series, as follows:
| | |
| Fund or Series | | Percent of outstanding
shares owned |
Security Equity Fund: | | |
All Cap Value Series | | 92.04% |
Alpha Opportunity Series | | 14.19% |
Equity Series | | 15.07% |
Global Institutional Series | | 100% |
Mid Cap Value Institutional Series | | 33.56% |
Select 25 Series | | 8.55% |
Small Cap Growth Series | | 25.05% |
Small Cap Value Series | | 70.99% |
Security Large Cap Value Fund: | | |
Large Cap Value Fund | | 16.49% |
Large Cap Value Institutional Series | | 100% |
Security Mid Cap Growth Fund | | 8.67% |
Notes to Financial Statements
March 31, 2009 (unaudited)
3. Investment Transactions
Investment transactions for the period ended March 31, 2009, (excluding overnight investments and short-term commercial paper) were as follows:
| | | | | | |
| | | Purchases | | Proceeds
from Sales |
Security Equity Fund: | | | | | | |
All Cap Value Series | | $ | 938,153 | | $ | 91,183 |
Alpha Opportunity Series | | | 22,852,777 | | | 31,048,340 |
Equity Series | | | 56,398,259 | | | 61,228,610 |
Global Series | | | 175,361,871 | | | 186,670,502 |
Global Institutional Series | | | 12,157,738 | | | 12,645,229 |
Mid Cap Value Series | | | 175,027,593 | | | 107,594,146 |
Mid Cap Value Institutional Series | | | 26,833,472 | | | 4,802,865 |
Select 25 Series | | | 21,263,296 | | | 16,657,802 |
Small Cap Growth Series | | | 16,967,851 | | | 17,322,754 |
Small Cap Value Series | | | 600,586 | | | 239,826 |
Security Large Cap Value Fund: | | | | | | |
Large Cap Value Fund | | | 10,355,455 | | | 21,384,136 |
Large Cap Value Institutional Series | | | 1,382,595 | | | 439,060 |
Security Mid Cap Growth Fund | | | 42,584,836 | | | 43,633,804 |
4. Open Futures Contracts
Open futures contracts for Alpha Opportunity Series as of March 31, 2009, were as follows:
| | |
| | | Alpha Opportunity Series
S&P 500 Index Futures |
Position | | Long |
Number of Contracts | | 12 |
Expiration Date | | 6-19-2009 |
Contract Amount | | $2,177,608 |
Market Value | | $2,384,400 |
Unrealized Gain | | $206,792 |
5. Options Written
Information as to options written by the Funds or Series during the period ended March 31, 2009, and options outstanding at March 31, 2009 is provided below:
Equity Series Written Call Options Outstanding
| | | | | | | | | | |
| Common Stock | | Expiration
Date | | Exercise
Price | | Number of
Contracts | | Market
Value |
JPMorgan Chase & Company | | 04-17-09 | | $ | 32.50 | | 123 | | $ | 4,551 |
| | | | | | | | | | |
Total call options outstanding (premiums received, $12,355) | | 123 | | $ | 4,551 |
| | | | | | | | | | |
Equity Series Written Put Options
| | | | | | | |
| | | Number of
Contracts | | | Premium
Amount | |
Balance at September 30, 2008 | | – | | | $ | – | |
Opened | | 596 | | | | 105,028 | |
Expired | | (473 | ) | | | (92,673 | ) |
| | | | | | | |
Balance at March 31, 2009 | | 123 | | | $ | 12,355 | |
| | | | | | | |
Equity Series Written Put Options
| | | | | | | |
| | | Number of
Contracts | | | Premium
Amount | |
Balance at September 30, 2008 | | – | | | $ | – | |
Opened | | 588 | | | | 63,898 | |
Exercised | | (172 | ) | | | (32,422 | ) |
Expired | | (416 | ) | | | (31,476 | ) |
| | | | | | | |
Balance at March 31, 2009 | | – | | | $ | – | |
| | | | | | | |
Mid Cap Value Series Written Call Options Outstanding
| | | | | | | | | | |
| Common Stock | | Expiration
Date | | Exercise
Price | | Number of
Contracts | | Market
Value |
Commerce Bancshares, Inc. | | 05-15-09 | | $ | 45.00 | | 739 | | $ | 3,695 |
First Horizon National Corporation | | 08-21-09 | | | 12.50 | | 3,025 | | | 363,000 |
Helmerich & Payne, Inc. | | 06-19-09 | | | 25.00 | | 1,327 | | | 325,115 |
Kansas City Southern | | 06-19-09 | | | 15.00 | | 2,485 | | | 211,225 |
Navigant Consulting, Inc. | | 04-17-09 | | | 20.00 | | 1,816 | | | 18,160 |
| | | | | | | | | | |
Total call options outstanding
(premiums received, $1,928,858) | | 9,392 | | $ | 921,195 |
| | | | | | | | | | |
Mid Cap Value Series Written Call Options
| | | | | | | |
| | | Number of
Contracts | | | Premium
Amount | |
Balance at September 30, 2008 | | 4,997 | | | $ | 985,532 | |
Opened | | 19,101 | | | | 3,473,744 | |
Expired | | (14,706 | ) | | | (2,530,418 | ) |
| | | | | | | |
Balance at March 31, 2009 | | 9,392 | | | $ | 1,928,858 | |
| | | | | | | |
Mid Cap Value Series Written Put Options
| | | | | | | |
| | | Number of
Contracts | | | Premium
Amount | |
Balance at September 30, 2008 | | 8,932 | | | $ | 1,507,358 | |
Opened | | 18,621 | | | | 2,940,685 | |
Expired | | (18,621 | ) | | | (2,940,685 | ) |
Exercised | | (8,932 | ) | | | (1,507,358 | ) |
| | | | | | | |
Balance at March 31, 2009 | | – | | | $ | – | |
| | | | | | | |
Mid Cap Value Institutional Series Written
Call Options Outstanding
| | | | | | | | | | |
| Common Stock | | Expiration
Date | | Exercise
Price | | Number of
Contracts | | Market
Value |
Commerce Bancshares, Inc. | | 05-15-09 | | $ | 45.00 | | 18 | | $ | 90 |
First Horizon National Corporation | | 08-21-09 | | | 12.50 | | 160 | | | 19,200 |
Helmerich & Payne, Inc. | | 06-19-09 | | | 25.00 | | 73 | | | 17,885 |
Kansas City Southern | | 06-19-09 | | | 15.00 | | 140 | | | 11,900 |
Navigant Consulting, Inc. | | 04-17-09 | | | 20.00 | | 41 | | | 410 |
| | | | | | | | | | |
Total call options outstanding
(premiums received, $84,115) | | 432 | | $ | 49,485 |
| | | | | | | | | | |
Notes to Financial Statements
March 31, 2009 (unaudited)
Mid Cap Value Institutional Series Call Options
| | | | | | | |
| | | Number of
Contracts | | | Premium
Amount | |
Balance at September 30, 2008 | | 117 | | | $ | 23,422 | |
Opened | | 649 | | | | 112,419 | |
Exercised | | (334 | ) | | | (51,726 | ) |
| | | | | | | |
Balance at March 31, 2009 | | 432 | | | $ | 84,115 | |
| | | | | | | |
Mid Cap Value Institutional Series Written Put Options
| | | | | | | |
| | | Number of
Contracts | | | Premium
Amount | |
Balance at September 30, 2008 | | 222 | | | $ | 37,332 | |
Opened | | 442 | | | | 65,706 | |
Expired | | (442 | ) | | | (65,706 | ) |
Exercised | | (222 | ) | | | (37,332 | ) |
| | | | | | | |
Balance at March 31, 2009 | | – | | | $ | – | |
| | | | | | | |
Small Cap Value Series Written Call Options Outstanding
| | | | | | | | | | |
| Common Stock | | Expiration
Date | | Exercise
Price | | Number of
Contracts | | Market
Value |
BJ’s Restaurant, Inc. | | 07-17-09 | | $ | 15.00 | | 5 | | $ | 775 |
Kansas City Southern | | 06-19-09 | | | 15.00 | | 5 | | | 425 |
Navigant Consulting, Inc. | | 04-17-09 | | | 20.00 | | 3 | | | 30 |
| | | | | | | | | | |
Total call options outstanding (premiums received, $2,220) | | 13 | | $ | 1,230 |
| | | | | | | | | | |
Small Cap Value Series Written Call Options
| | | | | | | |
| | | Number of
Contracts | | | Premium
Amount | |
Balance at September 30, 2008 | | 1 | | | $ | 298 | |
Opened | | 16 | | | | 2,515 | |
Expired | | (4 | ) | | | (593 | ) |
| | | | | | | |
Balance at March 31, 2009 | | 13 | | | $ | 2,220 | |
| | | | | | | |
Small Cap Value Series Written Put Options
| | | | | | | |
| | | Number of
Contracts | | | Premium
Amount | |
Balance at September 30, 2008 | | – | | | $ | – | |
Opened | | 7 | | | | 976 | |
Expired | | (7 | ) | | | (976 | ) |
| | | | | | | |
Balance at March 31, 2009 | | – | | | $ | – | |
| | | | | | | |
Large Cap Value Fund Written Call Options Outstanding
| | | | | | | | | | |
| Common Stock | | Expiration
Date | | Exercise
Price | | Number of
Contracts | | Market
Value |
JPMorgan Chase & Company | | 04-17-09 | | $ | 32.50 | | 75 | | $ | 2,775 |
| | | | | | | | | | |
Total call options outstanding (premiums received, $7,534) | | 75 | | $ | 2,775 |
| | | | | | | | | | |
Large Cap Value Fund Written Call Options
| | | | | | | |
| | | Number of
Contracts | | | Premium
Amount | |
Balance at September 30, 2008 | | – | | | $ | – | |
Opened | | 418 | | | | 74,550 | |
Expired | | (343 | ) | | | (67,016 | ) |
| | | | | | | |
Balance at March 31, 2009 | | 75 | | | $ | 7,534 | |
| | | | | | | |
Large Cap Value Fund Written Put Options
| | | | | | | |
| | | Number of
Contracts | | | Premium
Amount | |
Balance at September 30, 2008 | | – | | | $ | – | |
Opened | | 429 | | | | 46,629 | |
Exercised | | (304 | ) | | | (23,067 | ) |
Expired | | (125 | ) | | | (23,562 | ) |
| | | | | | | |
Balance at March 31, 2009 | | – | | | $ | – | |
| | | | | | | |
Mid Cap Growth Fund Written Call Options
| | | | | | | |
| | | Number of
Contracts | | | Premium
Amount | |
Balance at September 30, 2008 | | – | | | $ | – | |
Opened | | 13 | | | | 1,943 | |
Expired | | (13 | ) | | | (1,943 | ) |
| | | | | | | |
Balance at March 31, 2009 | | – | | | $ | – | |
| | | | | | | |
Mid Cap Growth Fund Written Put Options
| | | | | | | |
| | | Number of
Contracts | | | Premium
Amount | |
Balance at September 30, 2008 | | – | | | $ | – | |
Opened | | 18 | | | | 1,534 | |
Exercised | | (17 | ) | | | (1,345 | ) |
Expired | | (1 | ) | | | (189 | ) |
| | | | | | | |
Balance at March 31, 2009 | | – | | | $ | – | |
| | | | | | | |
126
Notes to Financial Statements
March 31, 2009 (unaudited)
7. Federal Tax Matters
For federal income tax purposes, the amounts of unrealized appreciation (depreciation) on investments at March 31, 2009, were as follows:
| | | | | | | | | |
| | | Gross
unrealized
appreciation | | Gross
unrealized
(depreciation) | | Net unrealized
appreciation
(depreciation) |
Security Equity Fund: | | | | | | | | | |
All Cap Value Series | | $ | 16,286 | | $ | (216,730) | | $ | (200,444) |
Alpha Opportunity Series | | | 229,542 | | | (3,834,540) | | | (3,604,998) |
Equity Series | | | 3,543,913 | | | (61,006,590) | | | (57,462,677) |
Global Series | | | 1,774,873 | | | (3,683,831) | | | (1,908,958) |
Global Institutional Series | | | 177,272 | | | (266,063) | | | (88,791) |
Mid Cap Value Series | | | 18,722,452 | | | (330,578,911) | | | (311,856,459) |
Mid Cap Value Institutional Series | | | 834,924 | | | (5,380,074) | | | (4,545,150) |
Select 25 Series | | | 149,294 | | | (7,533,678) | | | (7,384,384) |
Small Cap Growth Series | | | 549,114 | | | (1,029,642) | | | (480,528) |
Small Cap Value Series | | | 110,103 | | | (281,928) | | | (171,825) |
Security Large Cap Value Fund: | | | | | | | | | |
Large Cap Value Fund | | | 784,536 | | | (21,742,740) | | | (20,958,204) |
Large Cap Value Institutional Series | | | 26,201 | | | (1,110,496) | | | (1,084,295) |
Security Mid Cap Growth Fund | | | 1,657,696 | | | (16,432,111) | | | (14,774,415) |
The tax character of distributions paid during the fiscal years ended September 30, 2008 was as follows:
| | | | | | | | | | | | | | | | |
| 2008 | | Ordinary
Income | | Capital Gain | | Return of
Capital | | Total | | | | |
Security Equity Fund: | | | | | | | | | | | | | | | | |
Alpha Opportunity Series | | $ | 5,776,326 | | $ | 538,039 | | $ | 694,650 | | $ | 7,009,015 | | | | |
Equity Series | | | 4,553,170 | | | 43,837,339 | | | 564,230 | | | 48,954,739 | | | | |
Global Series | | | 6,004,745 | | | 57,280,840 | | | – | | | 63,285,585 | | | | |
Mid Cap Value Series | | | 9,452,756 | | | 169,378,319 | | | – | | | 178,831,075 | | | | |
Select 25 Series | | | – | | | 4,176,834 | | | – | | | 4,176,834 | | | | |
Small Cap Growth Series | | | 841,392 | | | 3,077,781 | | | – | | | 3,919,173 | | | | |
Security Large Cap Value Fund: | | | | | | | | | | | | | | | | |
Large Cap Value Fund | | | 400,275 | | | 3,591,497 | | | – | | | 3,991,772 | | | | |
Security Mid Cap Growth Fund | | | 6,035,045 | | | 27,762,273 | | | – | | | 33,797,318 | | | | |
Note: For federal income tax purposes, short term capital gain distributions are treated as ordinary income distributions. As of September 30, 2008, the components of distributable earnings on a tax basis were:
| | | | | | | | | | | | | | | | | | | | | |
| | | Undistributed
Ordinary
Income | | Undistributed
Long-Term
Gain | | | Accumulated
Capital and
Other Losses* | | | Unrealized
Appreciation
(Depreciation)** | | | Total
Accumulated
Earnings/(Deficit) | | | |
Security Equity Fund: | | | | | | | | | | | | | | | | | | | | | |
Alpha Opportunity Series | | $ | – | | $ | – | | | $ | (3,948,213 | ) | | $ | (3,962,755 | ) | | $ | (7,910,968 | ) | | |
Equity Series | | | 282,643 | | | (564,229 | ) | | | – | | | | (25,860,523 | ) | | | (25,577,880 | ) | | |
Global Series | | | – | | | 225,469 | | | | (21,409,987 | ) | | | (18,614,503 | ) | | | (39,799,021 | ) | | |
Global Institutional Series | | | 14,698 | | | – | | | | (267,958 | ) | | | (898,864 | ) | | | (1,152,124 | ) | | |
Mid Cap Value Series | | | 2,696,500 | | | 86,413,567 | | | | – | | | | (130,285,990 | ) | | | (41,175,923 | ) | | |
Mid Cap Value Institutional Series | | | 1,011,813 | | | – | | | | – | | | | 132,419 | | | | 1,144,232 | | | |
Select 25 Series | | | – | | | 7,623 | | | | (13,697,165 | ) | | | (5,356,290 | ) | | | (19,045,832 | ) | | |
Small Cap Growth Series | | | – | | | 96,487 | | | | (3,475,815 | ) | | | (1,025,216 | ) | | | (4,404,544 | ) | | |
Small Cap Value Series | | | 80,302 | | | – | | | | – | | | | 66,623 | | | | 146,925 | | | |
Security Large Cap Value Fund: | | | | | | | | | | | | | | | | | | | | | |
Security Large Cap Value Fund | | | 602,734 | | | 427,733 | | | | (6,466,272 | ) | | | (1,471,584 | ) | | | (6,907,389 | ) | | |
Large Cap Value Institutional Series | | | 8,072 | | | – | | | | (42,949 | ) | | | (82,272 | ) | | | (117,149 | ) | | |
Security Mid Cap Growth Fund | | | – | | | 651,342 | | | | (24,226,541 | ) | | | (11,443,292 | ) | | | (35,018,491 | ) | | |
*Certain Funds had net capital loss carryovers and deferred post October losses as identified elsewhere in the Notes to the Financial Statements.
**The differences between book-basis and tax-basis unrealized appreciation (depreciation) are attributable primarily to the tax deferral of wash sale losses, the differences between book and tax basis passive foreign investment companies and bond discount accretion.
Notes to Financial Statements
March 31, 2009 (unaudited)
As of September 30, 2008, the capital loss carryovers utilized and expired in 2008 and the accumulated net realized loss on sales of investments for federal income tax purposes which are available to offset future taxable gains and post-October losses that are deferred to the first day of the next fiscal year are as follows:
| | | | | | | | | | | | | | | | | | | | | |
| | | Capital Loss
Carryovers
Utilized in 2008 | | | | Capital Loss
Carryovers
Expired In 2008 | | | | Capital Loss
Carryovers at 9/30/08 | | | | | Expires In | | Deferred Post- October Losses |
| | | | | | | | | |
Security Equity Fund: | | | | | | | | | | | | | | | | | | | | | |
Alpha Opportunity Series | | $ | – | | | | $ | – | | | | $ | – | | | | | | | $ | 3,948,213 |
| | | | | | | | | | | | |
Global Series | | | 208,547 | | | | | – | | | | | – | | | | | 2009 | | $ | 20,735,778 |
| | | | 234,431 | | | | | – | | | | | 674,209 | | | | | 2010 | | | |
| | | | | | | | | | | | |
| | | $ | 442,978 | | | | $ | – | | | | $ | 674,209 | | | | | | | | |
| | | | | | | | | | | | |
Global Institutional Series | | $ | – | | | | $ | – | | | | $ | – | | | | | | | $ | 267,958 |
| | | | | | | | | | | | |
Select 25 Series* | | $ | 1,740 | | | | $ | 158,259 | | | | $ | – | | | | | 2008 | | $ | 5,272,638 |
| | | | – | | | | | – | | | | | 2,412,936 | | | | | 2009 | | | |
| | | | – | | | | | – | | | | | 2,582,076 | | | | | 2010 | | | |
| | | | – | | | | | – | | | | | 3,390,876 | | | | | 2011 | | | |
| | | | – | | | | | – | | | | | 38,639 | | | | | 2012 | | | |
| | | | | | | | | | | | |
| | | $ | 1,740 | | | | $ | 158,259 | | | | $ | 8,424,527 | | | | | | | | |
| | | | | | | | | | | | |
Small Cap Growth Series | | $ | – | | | | $ | – | | | | $ | – | | | | | | | $ | 3,475,814 |
| | | | | | | | | | | | |
Security Large Cap Value Fund: | | | | | | | | | | | | | | | | | | | | | |
Large Cap Value Fund | | $ | – | | | | $ | – | | | | $ | – | | | | | | | $ | 6,466,270 |
Large Cap Value Institutional Series | | $ | – | | | | $ | – | | | | $ | – | | | | | | | $ | 42,949 |
| | | | | | | | | | | | |
Security Mid Cap Growth Fund | | $ | 567,035 | | | | $ | – | | | | $ | 567,035 | | | | | 2009 | | $ | 23,075,528 |
| | | | – | | | | | – | | | | | 567,035 | | | | | 2010 | | | |
| | | | – | | | | | – | | | | | 16,944 | | | | | 2011 | | | |
| | | | | | | | | | | | |
| | | $ | 567,035 | | | | $ | – | | | | $ | 1,151,014 | | | | | | | | |
| | | | | | | | | | | | |
| | | | | | | | | | | | | | | | | | | | | | |
* The Security Equity Fund - Select 25 Series obtained approximately $1,236,753, $3,140,789 and $1,728,838 of capital losses (included above) from its merger with Security Equity Fund - Social Awareness Series, Enhanced Index Series and Large Cap Growth Series, respectively, on June 16, 2006. Certain of these capital losses expired (as shown above) due to limitations imposed by Section 382 of the Internal Revenue Code. The remaining capital losses may be applied against future realized capital gains subject to annual limitations. |
128
Notes to Financial Statements
March 31, 2009 (unaudited)
Net investment income and net realized gains (losses) may differ for financial statement and tax purposes because of temporary or permanent book/tax differences. These differences are primarily due to post-October losses, losses deferred due to wash sales, foreign currency gains and losses, and the “mark-to-market” of certain passive foreign investment companies (PFICs) for tax purposes. To the extent these differences are permanent, reclassifications are made to the appropriate equity accounts in the period that the differences arise.
8. Affiliated Transactions*
Investments representing 5% or more of the outstanding voting securities of a portfolio company of a Fund or Series result in that portfolio company being considered an affiliated company of such Fund or Series, as defined in the 1940 Act. The aggregate market value of all securities of affiliated companies held in the Mid Cap Value Series of the Security Equity Fund as of March 31, 2009 amounted to $40,645,406, which represents 6.4% of net assets. There were no affiliated companies held in any other Fund or Series. Transactions in the Mid Cap Value Series during the period ended March 31, 2009, in which the portfolio company is an “affiliated person” are as follows:
| | | | | | | | | | | | | | | | | | | |
| | | Balance
9-30-08 | | Gross
Additions | | Gross
Reductions | | | Balance
3-31-09 | | Realized
Gain/(Loss) | | Investment
Income |
| | | | | | | |
Bimini Capital Management, Inc. (Shares) | | | 1,474,400 | | | – | | | – | | | | 1,474,400 | | | – | | | – |
Bimini Capital Management, Inc. (Cost) | | $ | 16,310,457 | | $ | – | | $ | – | | | $ | 16,310,457 | | $ | – | | $ | – |
| | | | | | | |
Hydrogen Corporation (Shares) | | | 1,260,000 | | | 5,700 | | | – | | | | 1,265,700 | | | – | | | – |
Hydrogen Corporation (Cost) | | $ | 5,225,328 | | $ | 45 | | $ | – | | | $ | 5,225,373 | | $ | – | | $ | – |
| | | | | | | |
IXYS Corporation (Shares) | | | 2,410,360 | | | 338,540 | | | (6,000 | ) | | | 2,742,900 | | | – | | | – |
IXYS Corporation (Cost) | | $ | 20,342,793 | | $ | 2,792,880 | | $ | (33,889 | ) | | $ | 23,101,784 | | $ | 9,311 | | $ | 242,704 |
| | | | | | | |
Maxwell Technologies, Inc,. (Shares) | | | 1,325,300 | | | 120,700 | | | – | | | | 1,446,000 | | | – | | | – |
Maxwell Technologies, Inc. (Cost) | | $ | 14,607,503 | | $ | 1,114,061 | | $ | – | | | $ | 15,721,564 | | $ | – | | $ | – |
| | | | | | | |
Power-One, Inc. (Shares) | | | 5,626,300 | | | – | | | – | | | | 5,626,300 | | | – | | | – |
Power-One, Inc. (Cost) | | $ | 26,663,702 | | $ | – | | $ | – | | | $ | 26,663,702 | | $ | – | | $ | – |
| | | | | | | |
Quixote Corporation (Shares) | | | 479,100 | | | – | | | – | | | | 479,100 | | | – | | | – |
Quixote Corporation (Cost) | | $ | 9,318,028 | | $ | – | | $ | – | | | $ | 9,318,028 | | $ | – | | $ | – |
| | | | | | | |
Thermoenergy Corporation (Shares) | | | 1,963,964 | | | 1,828,906 | | | – | | | | 3,792,870 | | | – | | | – |
Thermoenergy Corporation (Cost) | | $ | 2,094,000 | | $ | 878,581 | | $ | – | | | $ | 2,972,581 | | $ | – | | $ | – |
| | | | | | | | | | | | | | | | | | | | |
* As a result of the Security Mid Cap Values Series’ beneficial ownership of the common stock of these portfolio companies, applicable regulations require that the Series state that it may be deemed an affiliate of the respective portfolio company. The Series disclaims that the “affiliated persons” are affiliates of the Distributor, Advisor, Series or any other client of the Advisor.
9. Alpha Opportunity Series
Alpha Opportunity Series (the “Fund”) contracted with Lehman Brothers International Europe (“LBIE”) to provide prime brokerage services related to the Fund’s short selling. On September 15, 2008, LBIE was placed into administration and a third party administrator has been named (the “Administrator”). The Fund’s exposure to LBIE consists of short sale proceeds held by LBIE, and restricted long positions held at the Fund’s custodian, as collateral for said short sales. The Fund has delivered a Notice of Termination of Loans to LBIE and the Administrator. The Fund is working to resolve these issues with LBIE and the Administrator. As of March 31, 2009, included in the statement of net assets are the value of restricted long positions of $5,581,800, restricted cash representing the value of short sale proceeds of $3,376,624 and liabilities for short sales of $7,341,377 representing the value of securities sold short at the date of termination. Until such time as the liability for short sales is settled and all restrictions are removed, the Fund cannot sell such restricted long positions and/or utilize the restricted cash balances to achieve the Fund’s investment objectives and/or meet Fund redemption or other Fund obligations. As of the close of business on October 3, 2008, and until further notice, the Fund is not accepting subscriptions for shares from either new or existing shareholders.
10. Fair Value of Financial Instruments
In September 2006, the FASB issued Statement of Financial Accounting Standards No. 157, “Fair Value Measurements” (SFAS 157). This standard clarifies the definition of fair value for financial reporting, establishes a framework for measuring fair value and requires additional disclosure about the use of fair value requirements. SFAS 157 is effective for financial statements issued for fiscal years beginning after November 15, 2007 and interim periods within those fiscal years.
129
Notes to Financial Statements
March 31, 2009 (unaudited)
The three levels of fair value hierarchy under SFAS 157 are listed below:
| | |
Level 1 - | | quoted prices in active markets for identical securities. The types of assets and liabilities carried at Level 1 fair value generally are government and agency securities, equities listed in active markets, certain futures and certain options. |
Level 2 - | | other significant observable inputs (including quoted prices for similar securities, interest rates, prepayment speeds, credit risk, etc.). The types of assets and liabilities carried at Level 2 fair value generally are municipal bonds, certain mortgage and asset-backed securities, certain corporate debt, commercial paper and repurchase agreements. |
Level 3 - | | significant unobservable inputs (including the Fund’s own assumptions in determining the fair value of investments). The types of assets and liabilities carried at Level 3 fair value generally are certain mortgage and asset-backed securities, certain corporate debt and certain derivatives. |
Observable inputs are those based on market data obtained from sources independent of the Fund, and unobservable inputs reflect the Fund’s own assumptions based on the best information available.
The inputs or methodology used for valuing securities are not necessarily an indication of the risk association with investing in those securities.
The following table provides the fair value measurement of applicable Fund assets by level within the fair value hierarchy as of March 31, 2009. These assets are measured on a recurring basis.
| | | | | | | | | | | | | | | | | | | | |
| | | | | | | LEVEL 1 | | | | LEVEL 2 | | | | LEVEL 3 | | |
| Description | | Total | | | | Quoted prices in
active markets for
identical assets | | | | Significant
other
observable
inputs | | | | Significant
unobservable
inputs | | |
Security Equity Fund: | | | | | | | | | | | | | | | | | | | | |
All Cap Value Series | | | | | | | | | | | | | | | | | | | | |
Investments | | $ | 622,314 | | | | $ | 622,314 | | | | $ | – | | | | $ | – | | |
| | | | | | | | | |
Alpha Opportunity Series | | | | | | | | | | | | | | | | | | | | |
ASSETS: | | | | | | | | | | | | | | | | | | | | |
Investments | | | 19,412,255 | | | | | 12,216,699 | | | | | 7,195,556 | | | | | – | | |
Futures contracts | | | 206,792 | | | | | 206,792 | | | | | – | | | | | – | | |
| | | | | | | | | | | | | | | | | | | | | |
Total | | | 19,619,047 | | | | | 12,423,491 | | | | | 7,195,556 | | | | | – | | |
| | | | | | | | | | | | | | | | | | | | | |
| | | | | | | | | |
LIABILITIES: | | | | | | | | | | | | | | | | | | | | |
Investments (sold short) | | | 7,649,669 | | | | | 308,292 | | | | | – | | | | | 7,341,377 | | |
| | | | | | | | | |
Equity Series | | | | | | | | | | | | | | | | | | | | |
ASSETS: | | | | | | | | | | | | | | | | | | | | |
Investments | | | 139,967,121 | | | | | 139,967,121 | | | | | – | | | | | – | | |
| | | | | | | | | |
LIABILITIES: | | | | | | | | | | | | | | | | | | | | |
Options (net of premiums received) | | | 7,804 | | | | | 7,804 | | | | | – | | | | | – | | |
| | | | | | | | | |
Global Series | | | | | | | | | | | | | | | | | | | | |
Investments | | | 74,583,311 | | | | | 69,843,613 | | | | | 4,739,698 | | | | | – | | |
| | | | | | | | | |
Global Institutional Series | | | | | | | | | | | | | | | | | | | | |
Investments | | | 5,238,010 | | | | | 4,823,337 | | | | | 414,673 | | | | | – | | |
| | | | | | | | | |
Mid Cap Value Series | | | | | | | | | | | | | | | | | | | | |
ASSETS: | | | | | | | | | | | | | | | | | | | | |
Investments | | | 629,951,605 | | | | | 599,581,867 | | | | | 30,369,738 | | | | | – | | |
| | | | | | | | | |
LIABILITIES: | | | | | | | | | | | | | | | | | | | | |
Options (net of premiums received) | | | 1,007,663 | | | | | 1,007,663 | | | | | – | | | | | – | | |
| | | | | | | | | |
Mid Cap Value Institutional Series | | | | | | | | | | | | | | | | | | | | |
ASSETS: | | | | | | | | | | | | | | | | | | | | |
Investments | | | 33,787,995 | | | | | 33,787,995 | | | | | – | | | | | – | | |
LIABILITIES: | | | | | | | | | | | | | | | | | | | | |
Options (net of premiums received) | | | 34,630 | | | | | 34,630 | | | | | – | | | | | – | | |
130
Notes to Financial Statements
March 31, 2009 (unaudited)
| | | | | | | | | | | | | | | | | | | | |
| | | | | | | LEVEL 1 | | | | LEVEL 2 | | | | LEVEL 3 | | |
Description | | Total | | | | Quoted prices in
active markets for
identical assets | | | | Significant
other
observable
inputs | | | | Significant
unobservable
inputs | | |
Select 25 Series | | | | | | | | | | | | | | | | | | | | |
Investments | | $ | 30,202,556 | | | | $ | 30,202,556 | | | | $ | – | | | | $ | – | | |
| | | | | | | | | |
Small Cap Growth Series | | | | | | | | | | | | | | | | | | | | |
Investments | | | 9,765,969 | | | | | 9,765,969 | | | | | – | | | | | – | | |
| | | | | | | | | |
Small Cap Value Series | | | | | | | | | | | | | | | | | | | | |
ASSETS: | | | | | | | | | | | | | | | | | | | | |
Investments | | | 1,158,808 | | | | | 1,158,808 | | | | | – | | | | | – | | |
| | | | | | | | | |
LIABILITIES: | | | | | | | | | | | | | | | | | | | | |
Options (net of premiums received) | | | 990 | | | | | 990 | | | | | – | | | | | – | | |
| | | | | | | | | |
Security Large Cap Value Fund: | | | | | | | | | | | | | | | | | | | | |
Large Cap Value Fund | | | | | | | | | | | | | | | | | | | | |
ASSETS: | | | | | | | | | | | | | | | | | | | | |
Investments | | | 37,628,895 | | | | | 37,628,895 | | | | | – | | | | | – | | |
| | | | | | | | | |
LIABILITIES: | | | | | | | | | | | | | | | | | | | | |
Options (net of premiums received) | | | 4,759 | | | | | 4,759 | | | | | – | | | | | – | | |
| | | | | | | | | |
Large Cap Value Institutional Series | | | | | | | | | | | | | | | | | | | | |
Investments | | | 2,534,348 | | | | | 2,534,348 | | | | | – | | | | | – | | |
| | | | | | | | | |
Security Mid Cap Growth Fund | | | | | | | | | | | | | | | | | | | | |
Investments | | | 56,203,374 | | | | | 56,191,877 | | | | | 11,497 | | | | | – | | |
| | | | | | | | | | | | | | | | | | | | | |
Following is a reconciliation of Level 3 assets for which significant unobservable inputs were used to determine fair value for the period ended March 31, 2009:
| | | | | | |
| | | LEVEL 3 – Fair value measurement
using significant unobservable inputs
Securities |
Alpha Opportunity Series | | | | | | |
LIABILITIES: | | | | | | |
Beginning balance | | | | $ 7,122,424 | | |
| | | | |
Total realized gains or losses included in earnings | | | | – | | |
| | | | |
Total unrealized gains or losses included in earnings | | | | 218,953 | | |
| | | | |
Purchases, sales, issuances, and settlements (net) | | | | – | | |
| | | | |
Transfers in and/or out of Level 3 | | | | – | | |
| | | | | | | |
Ending balance | | | | $ 7,341,377 | | |
| | | | | | | |
| | | | | | | |
131
Notes to Financial Statements
March 31, 2009 (unaudited)
11. Other Liabilities
Security Equity Fund-Mid Cap Value Series, Security Equity Fund-Mid Cap Value Institutional Series and Security Equity Fund-Equity Series (collectively, the “Funds”) each wrote put option contracts through Lehman Brothers Inc., (“Lehman”) that were exercised prior to the option contracts’ expiration and prior to the bankruptcy filing by Lehman, during September, 2008. However, these transactions have not settled and the securities have not been delivered to the Funds as of March 31, 2009.
Although the ultimate resolution of these transactions is uncertain, the Funds have recorded a liability on their respective books equal to the difference between the strike price on the put options and the market price of the underlying security on the exercise date. The amount of the liability recorded by the Funds as of March 31, 2009 was $473,594 for Security Equity Fund-Mid Cap Value Series, $15,940 for Security Equity Fund-Mid Cap Value Institutional Series, and $18,615 for Security Equity Fund-Equity Series.
12. Subsequent Event
Effective April 13, 2009, the Mid Cap Value Institutional Series expense limit cap changed from 1.10% to 0.90%.
Directors’ Disclosure (unaudited)
Director Approval of Investment Advisory Agreement
At an in-person meeting of the Fund’s Boards of Directors held on November 20-21, 2008, called for the purpose of, among other things, voting on the renewal of the investment advisory and sub-advisory agreements applicable to the Funds, the Fund’s Board of Directors, including the Independent Directors, unanimously approved the continuation for a one year period of the investment advisory agreement between the Funds and Security Investors, LLC (“SI”), as well as each investment sub-advisory agreement applicable to the Fund. In reaching this conclusion, the Directors requested and obtained from SI and each investment sub-adviser such information as the Directors deemed reasonably necessary to evaluate the proposed renewal of the agreements. The Fund’s Board of Directors carefully evaluated this information and was advised by legal counsel with respect to its deliberations.
In considering the proposed continuation of the investment advisory and sub-advisory agreements, the Independent Directors evaluated a number of considerations, including, among others, (1) the nature, extent, and quality of the advisory services to be provided by SI and the investment sub-advisers; (2) the investment performance of the Fund, SI and the various investment sub-advisers; (3) the costs of services provided by SI and the profits derived by SI from its relationship with the Funds; (4) a comparison of each Series’ expense ratios and those of similarly situated funds; (5) benefits (such as soft dollars) to SI and its affiliates from their relationship with the funds (and any corresponding benefits to the Funds); (6) the expense limitation/fee waiver agreements between SI and certain of the funds; and (7) other factors of the Board deemed to be relevant. Each Board of Directors also took into account other considerations that it believed, in light of the legal advice furnished to the Independent Directors by their independent legal counsel and the Directors” own business judgment, to be relevant. Following its review, each Fund’s Board of Directors determined that the investment advisory agreement and each investment sub-advisory agreement applicable to the Fund (if any) will enable Fund or Series shareholders to obtain high quality services at a cost that is appropriate, reasonable and in the best interests of shareholders. Accordingly, the Directors, including the Independent Directors, unanimously approved the renewal of the investment advisory and investment sub-advisory agreements based upon the following considerations, among others:
| | • | | The nature, extent and quality of the advisory services to be provided. Each Board of Directors concluded that SI and the investment sub-advisers retained to provide portfolio management services with respect to the Fund are capable of providing high quality services to the Fund, as indicated by the nature and quality of services provided in the past, SI’s management capabilities demonstrated with respect to the Funds and other mutual funds managed by SI, the professional qualifications and experience of SI’s and the various sub-advisers’ portfolio managers, and SI’s investment ad management oversight processes. The Directors also determined that SI and the sub-advisers proposed to provide investment and related services that were of the same quality and quantity as services provided to the Funds in the past and that these services are appropriate in scope and extent in light of the Fund's operations, the competitive landscape of the investment company business and investor needs. |
| | • | | The investment performance of the Fund or Series. With respect to the Funds, the Directors concluded on the basis of information compiled by Morningstar that SI and the investment sub-advisers had achieved investment performance that was acceptable, and competitive or superior relative to comparable funds over trailing periods. |
| | • | | The cost of advisory services provided ant he level of profitability. On the basis of each Board’s review of the fees to be charged by SI for investment advisory and other ser vices, and the estimated profitability of SI’s relationship with each Fund or Series, each Board concluded that the level of investment advisory fees and SI’s profitability are appropriate in light of the management fees and overall expense ratios of comparable investment companies and the anticipated profitability of the relationship between each Fund or Series and SI and its affiliates. On the basis of comparative information compiled by Morningstar, the Directors determined that the advisory fees and estimated overall expense ratio of each Fund or Series are consistent with, and often below, industry medians, particularly with respect to mutual funds of comparable size. |
| | • | | Whether the advisory fees reflect economies of scale. The directors concluded that the Funds’ investment advisory fees appropriately reflect the current economic environment for SI and the competitive nature of the mutual fund market. |
| | • | | The extent to which economies of scale will be realized as the Fund grows. While the Funds’ investment advisory fees do not reduce should Fund assets grow meaningfully, the Directors determined that the investment advisory fees payable by the Funds already reflect potential future economies of scale to some extent by virtue of their competitive levels (determined with reference to industry standards as reported by Lipper and SI’s estimated profitability at current or foreseeable asset levels. The Directors also considered that they will have the opportunity to periodically reexamine whether each Fund or Series has achieved economies of scale, and the appropriateness of investment advisory fees payable to SI and fees payable by SI to the investment sub-advisers, in the future. |
| | • | | Benefits (such as soft dollars) to SI from its relationship with the Funds (and any corresponding benefits to the Funds). The Directors concluded that other benefits described by SI and the investment sub-advisers from their relationships with the Funds, including “soft dollar” benefits in connection with Funds’ brokerage transactions, are reasonable and fair, and consistent with industry practice and the best interests of the Funds and their shareholders. In addition, the Directors determined that |
Directors’ Disclosure (unaudited)
| | the administration, transfer agency and fund accounting fees paid by the Fund to SI are reasonable, fair and in the best interests of Funds’ shareholders in light of the nature and quality of the services provided, the associated costs, and the necessity of the ser vices for the Funds’ operations. |
| | • | | Other considerations: In approving the investment advisory and sub-advisory agreements the Directors determined that SI has made a substantial commitment to the recruitment and retention of high quality personnel, and maintains the financial, compliance and operational resources reasonably necessary to manage the Funds in a professional manner that is consistent with the best interests of the Funds and their shareholders. In this regard, the Directors favorably considered the compliance track record of the Funds and SI. The Directors also concluded that SI has made a significant entrepreneurial commitment to the management and success of the Funds, which entails a substantial financial and professional commitment, including investment advisory fee waivers and expense limitation arrangements with respect to the Funds to the benefit of Funds’ shareholders. |
Directors (unaudited)
The business address of each director is One Security Benefit Place, Topeka, KS 66636-0001
| | |
Name | | |
(Date of Birth) | | |
Year Elected*** | | Principal Occupation(s) During Past 5 Years |
Donald A. Chubb, Jr.** | | Business Broker - Griffith & Blair Realtors |
(12-14-46) | | Director - Jayhawk Area Boy Scouts Council |
1994 | | |
Harry W. Craig, Jr.** | | Chairman, CEO, Secretary & Director - The Martin Tractor Company, Inc. |
(05-11-39) | | Director - Stormont-Vail Corporation |
2004 | | Director - Concerned Citizens for Topeka |
| | | Director - Oscar S. Stauffer Executive in Residence |
Jerry B. Farley** | | President - Washburn University |
(09-20-46) | | President - J&J Bonanza |
2005 | | |
Penny A. Lumpkin** | | Partner - Vivian’s Gift Shop (Corporate Retail) |
(08-20-39) | | Vice President - Palmer Companies, Inc. (Small Business and Shopping |
1993 | | Center Development) |
| | Vice President - PLB (Real Estate Equipment Leasing) |
| | Vice President - Town Crier (Retail) |
| | Prior to 2002: |
| | Vice President - Bellaire Shopping Center (Managing and Leasing) |
| | | Partner - Goodwin Enterprises (Retail) |
Maynard F. Oliverius** | | President & Chief Executive Officer - Stormont-Vail HealthCare |
(12-18-43) | | Director - VHA Mid-America |
1998 | | Director - Go Topeka |
Richard M. Goldman* | | Senior Vice President - Security Benefit Corporation |
(03-04-61) | | President - Security Investors, LLC |
2008 (President, Director & | | Director - Security Distributors, Inc. |
Chairman of the Board) | | Director - First Security Benefit Life Insurance and Annuity Company of New York |
| | President & Manager - Security Global Investors, LLC |
| | President - Security Investments Corporation |
| | Managing Member - RM Goldman Partners, LLC |
| | President & CEO - ForstmannLeff |
| | | Managing Director - Head of the Americas Institutional Business, Deutsche Asset Management |
*This director is deemed to be an “interested person” of the Funds under the Investment Company Act of 1940, as amended, by reason of his position with the Funds’ Investment Manager and/or the parent of the Investment Manager. This director is also an officer of the funds.
**These directors serve on the Fund’s joint audit committee, the purpose of which is to meet with the independent registered public accounting firm, to review the work of the independent registered public accounting firm, and to oversee the handling by Security Investors of the accounting and financial reporting functions for the Funds.
***Each director oversees 31 Security Funds portfolios and serves until the next annual meeting, or until a successor has been duly elected and qualified.
Officers (unaudited)
The business address of each officer is One Security Benefit Place, Topeka, KS 66636-0001
| | |
Name | | |
(Date of Birth) | | |
Title - Year Elected | | Principal Occupation(s) During Past 5 Years |
Steven M. Bowser | | Vice President & Senior Portfolio Manager - Security Investors, LLC; |
(02-11-60) | | Vice President & Senior Portfolio Manager - Security Benefit Life Insurance Company |
Vice President - 2003 | | |
Mark P. Bronzo | | Portfolio Manager, Security Investors, LLC |
(11-01-60) | | Managing Director & Chief Compliance Officer, Nationwide Separate Accounts LLC |
Vice President - 2008 | | |
Christina Fletcher | | Vice President & Portfolio Manager - Security Investors, LLC |
(07-25-72) | | Credit Analyst/Portfolio Manager - Horizon Cash Management |
Vice President - 2005 | | Senior Money Market Trader - Scudder Investments |
Brenda M. Harwood | | Vice President, Chief Compliance Officer & Treasurer - Security Global Investors, LLC |
(11-03-63) | | Assistant Vice President - Security Benefit Life Insurance Company |
Chief Compliance Officer - 2004 | | Vice President, Assistant Treasurer & Director - Security Distributors, Inc. |
Treasurer - 1988 | | |
Amy J. Lee | | Secretary - Security Investors, LLC |
(06-05-61) | | Secretary & Chief Compliance Officer - Security Distributors, Inc. |
Secretary - 1987 | | Vice President, Associate General Counsel & Assistant Secretary - Security Benefit |
| | Corporation & Security Benefit Life Insurance Company |
| | | Director - Brecek & Young Advisors, Inc. |
Mark Mitchell | | Vice President & Portfolio Manager - Security Investors, LLC |
(08-24-64) | | Vice President & Portfolio Manager - Security Benefit Life Insurance Company |
Vice President - 2003 | | |
Joseph C. O’Connor | | Portfolio Manager, Security Investors, LLC |
(07-15-60) | | Managing Director, Nationwide Separate Accounts LLC |
Vice President - 2008 | | |
Christopher Phalen | | Vice President & Head of Fixed Income - Security Global Investors, LLC; |
(11-9-70) | | Assistant Vice President & Head of Fixed Income - Security Benefit Life Insurance |
Vice President - 2002 | | Company |
| | Vice President & Portfolio Manager - Security Investors, LLC |
| | | Vice President & Portfolio Manager - Security Benefit Life Insurance Company |
Daniel W. Portanova | | Portfolio Manager, Security Investors, LLC |
(10-02-60) | | Managing Director, Nationwide Separate Accounts LLC |
Vice President - 2008 | | |
James P. Schier | | Vice President & Senior Portfolio Manager - Security Investors, LLC; |
(12-28-57) | | Vice President & Senior Portfolio Manager - Security Benefit Life Insurance Company |
Vice President - 1998 | | |
Christopher D. Swickard | | Assistant Secretary - Security Investors, LLC |
(10-09-65) | | Second Vice President & Assistant General Counsel - Security Benefit |
Assistant Secretary - 1996 | | Corporation and Security Benefit Life Insurance Company |
| | | Assistant Secretary - Security Distributors, Inc. |
David G. Toussaint | | Vice President & Portfolio Manager - Security Investors, LLC |
(10-10-66) | | Assistant Vice President & Portfolio Manager - Security Benefit Life Insurance |
Vice President - 2001 | | Company |
* Officers serve until the next annual meeting or until a successor has been duly elected and qualified.
Other Information
Each of the Security Funds files a complete schedule of portfolio holdings with the U.S. Securities and Exchange Commission for the first and third quarters of each fiscal year on Form N-Q. The Forms N-Q of each such Fund are available on the Commission’s website at www.sec.gov. The Forms N-Q may be reviewed and copied at the Commission’s Public Reference Room in Washington, DC. Information on the operation of the Public Reference Room may be obtained by calling 1-800-SEC-0330. The portfolio holdings of each of the Security Funds are available on their website, www.securitybenefit.com or by calling 1-800-888-2461.
A description of the policies and procedures that the Security Funds use to determine how to vote proxies relating to portfolio securities is available upon request, free of charge by calling 1-800-888-2461, or accessing the U.S. Securities and Exchange Commission website at www.sec.gov. Information regarding how the Security Funds voted proxies relating to portfolio securities during the 12 month period ended June 30, 2008 is available upon request, free of charge by calling 1-800-888-2461, or accessing the U.S. Securities and Exchange Commission website at www.sec.gov.
The statement of additional information (“SAI”) includes additional information about the Funds’ Directors and is available upon request without charge by calling 1-800-888-2461.
Not required at this time.
| Item 3. | Audit Committee Financial Expert. |
Not required at this time.
| Item 4. | Principal Accountant Fees and Services. |
Not required at this time.
| Item 5. | Audit Committee of Listed Registrants. |
Not applicable.
| Item 6. | Schedule of Investments. |
The Schedule of Investments is included under Item 1 of this form.
| Item 7. | Disclosure of Proxy Voting Policies and Procedures for Closed-End Management Investment Companies. |
Not applicable.
| Item 8. | Purchases of Equity Securities by Closed-End Management Investment Company and Affiliated Purchasers. |
Not applicable.
| Item 9. | Submission of Matters to a Vote of Security Holders. |
The registrant does not currently have in place procedures by which shareholders may recommend nominees to the registrant’s board.
There have been no changes to the procedures by which shareholders may recommend nominees to the registrant’s board.
| Item 10. | Controls and Procedures. |
| | (a) | The registrant’s President and Treasurer have concluded that the registrant’s disclosure controls and procedures (as defined in rule 30a-3(c) under the Investment Company Act of 1940) are effective based on their evaluation of these disclosure controls and procedures within 90 days of the filing date of this report on Form N-CSR. |
| | (b) | There were no significant changes in the registrant’s internal controls, or in other factors that could significantly affect these controls subsequent to the date of their evaluation, including any corrective actions with regard to significant deficiencies and material weaknesses. |
| | (a) | (1) Not required at this time. |
| | (2) | Certifications pursuant to Section 302 of the Sarbanes-Oxley Act of 2002 and required by Rule 30a-2(a) under the Investment Company Act of 1940, are attached hereto. |
| | (b) | Certifications pursuant to Section 906 of the Sarbanes-Oxley Act of 2002 and required by Rule 30a-2(a) under the Investment Company Act of 1940, are attached hereto. |
SIGNATURES
Pursuant to the requirements of the Securities Exchange Act of 1934 and the Investment Company Act of 1940, the registrant has duly caused this report to be signed on its behalf by the undersigned, thereunto duly authorized.
| | |
| SECURITY EQUITY FUND |
| |
| By: | | /S/ RICHARD M. GOLDMAN |
| | Richard M. Goldman, President |
| |
| Date: | | June 8, 2009 |
Pursuant to the requirements of the Securities Exchange Act of 1934 and the Investment Company Act of 1940, this report has been signed below by the following persons on behalf of the registrant and in the capacities and on the dates indicated.
| | |
| |
| By: | | /S/ RICHARD M. GOLDMAN |
| | Richard M. Goldman, President |
| |
| Date: | | June 8, 2009 |
| | |
| |
| By: | | /S/ BRENDA M. HARWOOD |
| | Brenda M. Harwood, Treasurer |
| |
| Date: | | June 8, 2009 |