UNITED STATES
SECURITIES AND EXCHANGE COMMISSION
Washington, D.C. 20549
FORM N-CSR
CERTIFIED SHAREHOLDER REPORT OF REGISTERED
MANAGEMENT INVESTMENT COMPANIES
Investment Company Act file number 811-01136
SECURITY EQUITY FUND
(Exact name of registrant as specified in charter)
ONE SECURITY BENEFIT PLACE, TOPEKA, KANSAS 66636-0001
(Address of principal executive offices) (Zip code)
RICHARD M. GOLDMAN, PRESIDENT
SECURITY EQUITY FUND
ONE SECURITY BENEFIT PLACE
TOPEKA, KANSAS 66636-0001
(Name and address of agent for service)
Registrant’s telephone number, including area code: (785) 438-3000
Date of fiscal year end: September 30
Date of reporting period: September 30, 2009
Form N-CSR is to be used by management investment companies to file reports with the Commission not later than 10 days after the transmission to stockholders of any report that is required to be transmitted to stockholders under Rule 30e-1 under the Investment Company Act of 1940 (17 CFR 270.30e-1). The Commission may use the information provided on Form N-CSR in its regulatory, disclosure review, inspection, and policymaking roles.
A registrant is required to disclose the information specified by Form N-CSR, and the Commission will make this information public. A registrant is not required to respond to the collection of information contained in Form N-CSR unless the Form displays a currently valid Office of Management and Budget (“OMB”) control number. Please direct comments concerning the accuracy of the information collection burden estimate and any suggestions for reducing the burden to Secretary, Securities and Exchange Commission, 450 Fifth Street, NW, Washington, DC 20549-0609. The OMB has reviewed this collection of information under the clearance requirements of 44 U.S.C. §3507.
| Item 1. | Reports to Stockholders. |

Annual Report
September 30, 2009
| | • | | Rydex | SGI Equity Fund® |
| | • | | Alpha Opportunity Series |
| | • | | Global Institutional Series |
| | • | | Mid Cap Value Institutional Series |
| | • | | Small Cap Growth Series |
| | • | | Rydex | SGI Large Cap Value Fund |
| | • | | Large Cap Value Institutional Series |
| | • | | Rydex | SGI Mid Cap Growth Fund |
Rydex | SGI Equity Fund
Rydex | SGI Large Cap Value Fund
Rydex | SGI Mid Cap Growth Fund
September 30, 2009
Annual Report
Table of Contents
1
This page left blank intentionally.
2
Managers’ Commentary
November 16, 2009

To Our Shareholders:
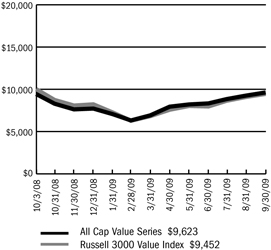
From its inception on October 3, 2008 through the fiscal year ended September 30, 2009, the Rydex| SGI Equity Fund All Cap Value Series gained 2.10%1 while the Series’ benchmark, the Russell 2000 Value Index, was down –5.48% during the same period.
Our strategy is to buy companies, across the market capitalization spectrum, trading at a significant discount to their intrinsic value. Our investment approach is a defined and disciplined process with three clear philosophical tenets that drive our investment decisions: a valuation focus, a long-term perspective and an opportunistic approach.
Our investment process is fundamentally driven and quantitatively aided. We use proprietary screens to identify potential companies for investment and then perform rigorous fundamental analysis to identify the best ideas. Through this fundamental research, we determine an estimate of intrinsic value and a valuation target for each idea. We construct the portfolios based on the level of conviction generated by the bottom-up analysis and the upside/downside profile associated with each company.
Industrials, Materials, and Health Care Top Performers
The Series’ industrials holdings, a large overweight position consisting of 19% of portfolio assets, gained approximately 2% compared to a 19% loss for the Index. Leading performers included McDermott International, Inc., URS Corporation (up around 40%), and United Technologies Corporation.
The materials sector contributed to portfolio performance though superior stock selection that allowed holdings to increase by approximately 55% versus a loss of about 5% for the benchmark. Leaders in the sector for the Series were Schweitzer-Mauduit International, Inc., which gained more than 200%, Eagle Materials, Inc., and Rohm & Hass Company.
Health care was an underweight position in the portfolio, but good stock picking led to a gain of approximately 23% for the sector while the Index lost 2%. Schering-Plough Corporation gained about 64% for the Series while Hospira, Inc. and Medco Health Solutions, Inc. contributed positive returns.
Financials and Utilities Disappoint
The largest drag on portfolio performance was due to cash. While in a fully invested position of around 6% during the fiscal year, the lack of any returns from the asset class hurt overall returns.
The financials sector was a large underweight position but fared no better in performance than the Index, each losing about 24%. Capital One Financial Corporation lost nearly 80%. Berkshire Hathaway, Inc. (Cl B), which was not a security in the Index, had a 3% average weighting during the fiscal year but was down more than 25%. Other detractors in the sector included JPMorgan Chase & Company and Wilmington Trust Corporation
The utilities sector in the Series had a nearly even weight and return with the Index, losing approximately 7%. The Series took a solid position of about 2.5% in Edison International but the security gave up 10% of its value for the period. Other securities holding down performance were Great Plains Energy, Inc. and Allete, Inc.
Market Outlook
While there are indications that the economy may be stabilizing from a macroeconomic standpoint, the economy and markets remain uncertain with contradictory information. Our bottom-up approach looks at market uncertainty in the context of the potential long-term impact on individual companies.
We are maintaining flexibility in the portfolios to take advantage of these opportunities as they arise. Our focus is on identifying companies with the ability to be substantially better over the next three to five years or have the potential to maintain their return on capital at current levels in a difficult economic environment. We are confident in our ability to find these companies.
We believe that investing is a long-term pursuit that requires patience and a consistent approach. We recognize there are many investment alternatives available today and thank you for your business and the confidence you place in us.
|
| Sincerely, |
|
| |
| James P. Schier, Portfolio Manager |
|
| |
| Mark A. Mitchell, Portfolio Manager |
| 1 | Performance figures are based on Class A shares and do not reflect deduction of the sales charges or taxes that a shareholder would pay on distributions or the redemption of shares. Fee waivers and/or reimbursements reduce Series expenses and in the absence of such waivers, the performance quoted would be reduced. |
| | The strategies discussed herein do not assure a profit. The Fund is distributed by Rydex Distributors, Inc. |
3
| | |
| | Rydex | SGI Equity Fund |
| Performance Summary | | All Cap Value Series |
| September 30, 2009 | | (unaudited) |
PERFORMANCE
All Cap Value Series vs. Russell 3000 Value Index
$10,000 Since Inception
This chart assumes a $10,000 investment in Class A shares of All Cap Value Series on October 3, 2008 (date of inception), reflects deduction of the 5.75% sales load and assumes all dividends reinvested. The chart does not reflect the deduction of taxes that a shareholder would pay on distributions or the redemption of fund shares. The Russell 3000 Value Index is an unmanaged index that measures the performance of the broad value segment of the U.S. equity universe. It includes those Russell 3000 companies with lower price-to-book ratios and lower forecasted growth values.
Average Annual Returns
| | | |
Periods Ended 9-30-09 | | Since Inception
(10-03-08) | |
A Shares | | 2.10 | % |
A Shares with sales charge | | (3.77 | %) |
C Shares | | 1.30 | % |
C Shares with CDSC | | 0.30 | % |
Institutional Class | | 2.40 | % |
The performance data above represents past performance that is not predictive of future results. The investment return and principal value of an investment in the Series will fluctuate so that an investor’s shares, when redeemed, may be worth more or less than their original cost. The figures above do not reflect deduction of the maximum front-end sales charge of 5.75% for Class A shares or the contingent deferred sales charge of 1% for Class C shares, as applicable, except where noted. The figures do not reflect the deduction of taxes that a shareholder would pay on distributions or redemption of shares. Such figures would be lower if the maximum sales charge and any applicable taxes were deducted. Fee waivers and/or reimbursements reduced expenses of the Series and in the absence of such waiver, the performance quoted would be reduced.
Portfolio Composition by Sector as of 9-30-09
| | | |
Consumer Discretionary | | 10.46 | % |
Consumer Staples | | 9.30 | |
Energy | | 10.01 | |
Financials | | 13.44 | |
Health Care | | 6.31 | |
Industrials | | 18.65 | |
Information Technology | | 9.86 | |
Materials | | 3.38 | |
Telecommunication Services | | 1.08 | |
Utilities | | 5.95 | |
Exchange Traded Funds | | 6.79 | |
Cash & Other Assets, Less Liabilities | | 4.77 | |
| | | |
Total Net Assets | | 100.00 | % |
| | | |
The accompanying notes are an integral part of the financial statements
4
| | |
| | Rydex | SGI Equity Fund |
| Performance Summary | | All Cap Value Series |
| September 30, 2009 | | (unaudited) |
Information About Your Series Expenses
Calculating your ongoing Series expenses
Example
As a shareholder of the Series, you incur two types of costs: (1) transaction costs, which may include sales charges (loads) on purchase payments; contingent deferred sales charges on redemptions; and redemption fees, if any; and (2) ongoing costs, including management fees; distribution and/or service fees (12b-1); and other Series expenses. This example is intended to help you understand your ongoing costs (in dollars) of investing in the Series and to compare these costs with ongoing costs of investing in other mutual funds. The example is based on an investment of $1,000 invested at the beginning of the period and held for the entire period April 1, 2009 through September 30, 2009.
Actual Expenses
The first line for each class of shares in the table provides information about actual account values and actual expenses. You may use the information in this table, together with the amount you invested, to estimate the expenses that you paid over the period. Simply divide your account value by $1,000 (for example, an $8,600 account value divided by $1,000 = 8.6), then multiply the result by the number in the table under the heading entitled “Expenses Paid During the Period” to estimate the expenses you paid on your account during this period.
Hypothetical Example for Comparison Purposes
The second line for each class of shares in the table provides information about hypothetical account values and hypothetical expenses based on the Series actual expense ratio and an assumed rate of return of 5% per year before expenses, which is not the Series actual return. The hypothetical account values and expenses may not be used to estimate the actual ending account balance or expenses you paid for the period. You may use this information to compare the ongoing costs of investing in the Series and other funds. To do so, compare this 5% hypothetical example with the 5% hypothetical examples that appear in the shareholder reports of the other mutual funds.
Please note that the expenses shown in the table are meant to highlight your ongoing costs only and do not reflect any transactional costs, such as sales charges (loads) on purchase payments, contingent deferred sales charges on redemptions, and redemption fees, if any. Therefore, the second line for each class of shares is useful in comparing ongoing costs only, and will not help you determine the relative total costs of owning different funds. In addition, if these transactional costs were included, your costs would have been higher.
Series Expenses
| | | | | | | | | |
| | | Beginning
Account
Value
4/1/2009 | | Ending
Account
Value
9/30/2009 1 | | Expenses
Paid
During
Period 2 |
All Cap Value Series - Class A | | | | | | | | | |
Actual | | $ | 1,000.00 | | $ | 1,391.01 | | $ | 8.09 |
Hypothetical | | | 1,000.00 | | | 1,018.30 | | | 6.83 |
All Cap Value Series - Class C | | | | | | | | | |
Actual | | | 1,000.00 | | | 1,383.88 | | | 12.55 |
Hypothetical | | | 1,000.00 | | | 1,014.54 | | | 10.61 |
All Cap Value Series - Institutional Class | | | | | | | | | |
Actual | | | 1,000.00 | | | 1,393.20 | | | 6.60 |
Hypothetical | | | 1,000.00 | | | 1,019.55 | | | 5.57 |
| 1 | The actual ending account value is based on the actual total return of the Series for the period April 1, 2009 to September 30, 2009 after actual expenses and will differ from the hypothetical ending account value which is based on the Series expense ratio and a hypothetical annual return of 5% before expenses. The actual cumulative return at net asset value for the period April 1, 2009 to September 30, 2009 was 39.10%, 38.39% and 39.32%, for Class A, C and Institutional Class shares, respectively. |
| 2 | Expenses are equal to the Series annualized expense ratio (1.35%, 2.10% and 1.10% for Class A, C, and Institutional Class shares, respectively), net of any applicable fee waivers, multiplied by the average account value over the period, multiplied by 183/365 (to reflect the one-half year period). |
| | |
| Schedule of Investments | | Rydex | SGI Equity Fund |
| September 30, 2009 | | All Cap Value Series |
| | | | | |
| | | Shares | | Value |
COMMON STOCKS - 95.2% | | | | | |
Aerospace & Defense - 2.8% | | | | | |
GeoEye, Inc. * | | 336 | | $ | 9,005 |
Orbital Sciences Corporation * | | 430 | | | 6,437 |
Precision Castparts Corporation | | 36 | | | 3,667 |
United Technologies Corporation | | 620 | | | 37,777 |
| | | | | |
| | | | | 56,886 |
| | | | | |
Air Freight & Logistics - 2.3% | | | | | |
FedEx Corporation | | 617 | | | 46,411 |
| | | | | |
Apparel Retail - 0.9% | | | | | |
Brown Shoe Company, Inc. | | 721 | | | 5,782 |
Chico’s FAS, Inc. 1,* | | 797 | | | 10,362 |
Talbots, Inc. | | 223 | | | 2,058 |
| | | | | |
| | | | | 18,202 |
| | | | | |
Apparel, Accessories & Luxury Goods - 0.6% | | | | | |
Fossil, Inc. 1,* | | 149 | | | 4,239 |
Maidenform Brands, Inc. * | | 517 | | | 8,303 |
| | | | | |
| | | | | 12,542 |
| | | | | |
Asset Management & Custody Banks - 0.6% | | | | | |
Bank of New York Mellon Corporation | | 107 | | | 3,102 |
Fifth Street Finance Corporation | | 762 | | | 8,329 |
| | | | | |
| | | | | 11,431 |
| | | | | |
Biotechnology - 0.0% | | | | | |
Combinatorx, Inc. * | | 521 | | | 729 |
| | | | | |
Building Products - 1.0% | | | | | |
Trex Company, Inc. * | | 289 | | | 5,260 |
USG Corporation * | | 934 | | | 16,046 |
| | | | | |
| | | | | 21,306 |
| | | | | |
Coal & Consumable Fuels - 0.4% | | | | | |
Evergreen Energy, Inc. * | | 5,429 | | | 3,366 |
USEC, Inc. 1,* | | 835 | | | 3,916 |
| | | | | |
| | | | | 7,282 |
| | | | | |
Communications Equipment - 0.4% | | | | | |
Symmetricom, Inc. 2,* | | 1,745 | | | 9,039 |
| | | | | |
Computer & Electronics Retail - 0.2% | | | | | |
Conn’s, Inc. * | | 289 | | | 3,263 |
| | | | | |
Computer Hardware - 1.7% | | | | | |
Hewlett-Packard Company | | 733 | | | 34,605 |
| | | | | |
Construction & Engineering - 1.0% | | | | | |
Insituform Technologies, Inc. * | | 649 | | | 12,422 |
URS Corporation * | | 183 | | | 7,988 |
| | | | | |
| | | | | 20,410 |
| | | | | |
Construction & Farm Machinery & Heavy Trucks - 0.2% | | | | | |
Force Protection, Inc. * | | 700 | | | 3,822 |
| | | | | |
Construction Materials - 0.8% | | | | | |
Eagle Materials, Inc. 1 | | 517 | | | 14,776 |
| | | | | |
Consumer Finance - 0.3% | | | | | |
First Marblehead Corporation * | | 2,329 | | | 5,124 |
| | | | | |
| | | | | |
| | | Shares | | Value |
COMMON STOCKS - 95.2% (continued) | | | | | |
Data Processing & Outsourced Services - 5.1% | | | | | |
Affiliated Computer Services, Inc. * | | 210 | | $ | 11,376 |
Computer Sciences Corporation * | | 593 | | | 31,257 |
Western Union Company | | 3,250 | | | 61,489 |
| | | | | |
| | | | | 104,122 |
| | | | | |
Department Stores - 3.0% | | | | | |
JC Penney Company, Inc. | | 1,821 | | | 61,458 |
| | | | | |
Diversified Banks - 1.5% | | | | | |
U.S. Bancorp | | 477 | | | 10,427 |
Wells Fargo & Company | | 726 | | | 20,459 |
| | | | | |
| | | | | 30,886 |
| | | | | |
Diversified Chemicals - 0.7% | | | | | |
Dow Chemical Company | | 546 | | | 14,234 |
| | | | | |
Drug Retail - 1.9% | | | | | |
CVS Caremark Corporation | | 1,088 | | | 38,885 |
| | | | | |
Electric Utilities - 3.6% | | | | | |
Allete, Inc. 1 | | 263 | | | 8,829 |
American Electric Power Company, Inc. | | 17 | | | 527 |
Edison International | | 1,360 | | | 45,668 |
Empire District Electric Company | | 87 | | | 1,574 |
Great Plains Energy, Inc. | | 507 | | | 9,100 |
Northeast Utilities | | 212 | | | 5,033 |
Westar Energy, Inc. | | 190 | | | 3,707 |
| | | | | |
| | | | | 74,438 |
| | | | | |
Electrical Components & Equipment - 0.2% | | | | | |
Power-One, Inc. 2,* | | 2,307 | | | 4,499 |
| | | | | |
Electronic Manufacturing Services - 2.0% | | | | | |
Maxwell Technologies, Inc. * | | 839 | | | 15,463 |
Tyco Electronics, Ltd. | | 1,132 | | | 25,221 |
| | | | | |
| | | | | 40,684 |
| | | | | |
Environmental & Facilities Services - 0.5% | | | | | |
Covanta Holding Corporation * | | 550 | | | 9,350 |
| | | | | |
Exchange Traded Funds - 6.8% | | | | | |
iShares Russell 1000 Value Index Fund | | 1,260 | | | 69,917 |
iShares S&P 500 Value Index Fund | | 1,350 | | | 69,107 |
| | | | | |
| | | | | 139,024 |
| | | | | |
Forest Products - 0.5% | | | | | |
Louisiana-Pacific Corporation 1,* | | 1,560 | | | 10,405 |
| | | | | |
Gas Utilities - 0.3% | | | | | |
Atmos Energy Corporation | | 216 | | | 6,087 |
| | | | | |
Health Care Equipment - 2.7% | | | | | |
Aspect Medical Systems, Inc. * | | 381 | | | 4,564 |
Covidien plc | | 328 | | | 14,190 |
Hologic, Inc. * | | 409 | | | 6,683 |
Hospira, Inc. * | | 609 | | | 27,162 |
| | | | | |
| | | | | 52,599 |
| | | | | |
The accompanying notes are an integral part of the financial statements
6
| | |
| Schedule of Investments | | Rydex | SGI Equity Fund |
| September 30, 2009 | | All Cap Value Series |
| | | | | |
| | | Shares | | Value |
COMMON STOCKS - 95.2% (continued) | | | | | |
Health Care Services - 1.4% | | | | | |
Amedisys, Inc. * | | 115 | | $ | 5,017 |
Medco Health Solutions, Inc. * | | 244 | | | 13,496 |
Mednax, Inc. * | | 149 | | | 8,183 |
Providence Service Corporation * | | 81 | | | 944 |
RehabCare Group, Inc. * | | 72 | | | 1,562 |
| | | | | |
| | | | | 29,202 |
| | | | | |
Highways & Railtracks - 0.0% | | | | | |
Quixote Corporation 2 | | 204 | | | 508 |
| | | | | |
Home Furnishings - 0.5% | | | | | |
Leggett & Platt, Inc. | | 567 | | | 11,000 |
| | | | | |
Home Improvement Retail - 2.3% | | | | | |
Lowe’s Companies, Inc. | | 2,219 | | | 46,466 |
| | | | | |
Human Resources & Employment Services - 0.2% | | | | | |
Administaff, Inc. | | 182 | | | 4,781 |
| | | | | |
Hypermarkets & Super Centers - 2.4% | | | | | |
Wal-Mart Stores, Inc. | | 980 | | | 48,108 |
| | | | | |
Independent Power Producers & Energy Traders - 1.0% | | | | | |
NRG Energy, Inc. * | | 729 | | | 20,551 |
| | | | | |
Industrial Conglomerates - 2.8% | | | | | |
General Electric Company | | 1,047 | | | 17,192 |
McDermott International, Inc. * | | 1,598 | | | 40,380 |
| | | | | |
| | | | | 57,572 |
| | | | | |
Industrial Machinery - 2.1% | | | | | |
Dover Corporation | | 357 | | | 13,837 |
Harsco Corporation | | 149 | | | 5,276 |
Parker Hannifin Corporation | | 442 | | | 22,914 |
| | | | | |
| | | | | 42,027 |
| | | | | |
Insurance Brokers - 0.8% | | | | | |
AON Corporation | | 359 | | | 14,607 |
Arthur J Gallagher & Company | | 107 | | | 2,608 |
| | | | | |
| | | | | 17,215 |
| | | | | |
Integrated Oil & Gas - 3.8% | | | | | |
Chevron Corporation | | 450 | | | 31,694 |
ConocoPhillips | | 440 | | | 19,870 |
Exxon Mobil Corporation | | 390 | | | 26,758 |
| | | | | |
| | | | | 78,322 |
| | | | | |
Integrated Telecommunication Services - 1.1% | | | | | |
Windstream Corporation | | 2,172 | | | 22,002 |
| | | | | |
IT Consulting & Other Services - 0.3% | | | | | |
Satyam Computer Services, Ltd. ADR | | 894 | | | 5,883 |
| | | | | |
Managed Health Care - 1.5% | | | | | |
Aetna, Inc. | | 1,129 | | | 31,420 |
| | | | | |
Movies & Entertainment - 1.8% | | | | | |
Time Warner, Inc. | | 1,297 | | | 37,328 |
| | | | | |
| | | | | |
| | | Shares | | Value |
COMMON STOCKS - 95.2% (continued) | | | | | |
Multi-Line Insurance - 0.8% | | | | | |
American Financial Group, Inc. | | 610 | | $ | 15,555 |
| | | | | |
Multi-Utilities - 1.0% | | | | | |
Alliant Energy Corporation | | 389 | | | 10,833 |
Black Hills Corporation | | 150 | | | 3,776 |
SCANA Corporation 1 | | 172 | | | 6,003 |
| | | | | |
| | | | | 20,612 |
| | | | | |
Office Services & Supplies - 0.1% | | | | | |
United Stationers, Inc. * | | 47 | | | 2,238 |
| | | | | |
Oil & Gas Equipment & Services - 2.4% | | | | | |
Global Industries, Ltd. * | | 2,584 | | | 24,548 |
Halliburton Company | | 929 | | | 25,194 |
| | | | | |
| | | | | 49,742 |
| | | | | |
Oil & Gas Exploration & Production - 1.7% | | | | | |
Chesapeake Energy Corporation | | 569 | | | 16,160 |
Goodrich Petroleum Corporation * | | 183 | | | 4,723 |
Gulfport Energy Corporation * | | 240 | | | 2,098 |
PetroHawk Energy Corporation * | | 520 | | | 12,589 |
| | | | | |
| | | | | 35,570 |
| | | | | |
Oil & Gas Storage & Transportation - 1.7% | | | | | |
Southern Union Company | | 483 | | | 10,042 |
Williams Companies, Inc. | | 1,340 | | | 23,945 |
| | | | | |
| | | | | 33,987 |
| | | | | |
Other Diversified Financial Services - 1.3% | | | | | |
JPMorgan Chase & Company | | 610 | | | 26,730 |
| | | | | |
Packaged Foods & Meats - 3.2% | | | | | |
Del Monte Foods Company | | 900 | | | 10,422 |
Hormel Foods Corporation 1 | | 369 | | | 13,107 |
JM Smucker Company | | 381 | | | 20,197 |
Ralcorp Holdings, Inc. * | | 100 | | | 5,847 |
TreeHouse Foods, Inc. 1,* | | 493 | | | 17,585 |
| | | | | |
| | | | | 67,158 |
| | | | | |
Paper Packaging - 0.7% | | | | | |
Bemis Company, Inc. | | 334 | | | 8,654 |
Sonoco Products Company | | 221 | | | 6,086 |
| | | | | |
| | | | | 14,740 |
| | | | | |
Paper Products - 0.6% | | | | | |
Schweitzer-Mauduit International, Inc. | | 235 | | | 12,775 |
| | | | | |
Personal Products - 0.5% | | | | | |
Elizabeth Arden, Inc. * | | 859 | | | 10,110 |
| | | | | |
Pharmaceuticals - 0.7% | | | | | |
Schering-Plough Corporation | | 539 | | | 15,227 |
| | | | | |
Property & Casualty Insurance - 5.5% | | | | | |
Alleghany Corporation * | | 33 | | | 8,549 |
Berkshire Hathaway, Inc. (Cl.B) * | | 17 | | | 56,490 |
Employers Holdings, Inc. | | 439 | | | 6,796 |
Hanover Insurance Group, Inc. | | 544 | | | 22,484 |
W.R. Berkley Corporation | | 816 | | | 20,628 |
| | | | | |
| | | | | 114,947 |
| | | | | |
The accompanying notes are an integral part of the financial statements
7
| | |
| Schedule of Investments | | Rydex | SGI Equity Fund |
| September 30, 2009 | | All Cap Value Series |
| | | | | |
| | | Shares | | Value |
COMMON STOCKS - 95.2% (continued) | | | | | |
Railroads - 1.5% | | | | | |
Union Pacific Corporation | | 510 | | $ | 29,759 |
| | | | | |
Regional Banks - 2.6% | | | | | |
Associated Banc-Corporation | | 509 | | | 5,813 |
Fifth Third Bancorp | | 500 | | | 5,065 |
First Horizon National Corporation * | | 360 | | | 4,758 |
Old National Bancorp | | 713 | | | 7,986 |
Regions Financial Corporation | | 4,750 | | | 29,497 |
| | | | | |
| | | | | 53,119 |
| | | | | |
Research & Consulting Services - 3.7% | | | | | |
Equifax, Inc. | | 2,160 | | | 62,941 |
ICF International, Inc. * | | 149 | | | 4,518 |
Navigant Consulting, Inc. * | | 715 | | | 9,653 |
| | | | | |
| | | | | 77,112 |
| | | | | |
Restaurants - 0.5% | | | | | |
Burger King Holdings, Inc. | | 578 | | | 10,167 |
| | | | | |
Semiconductors - 0.4% | | | | | |
IXYS Corporation 2 | | 884 | | | 7,523 |
| | | | | |
Specialty Chemicals - 0.1% | | | | | |
Zoltek Companies, Inc. * | | 214 | | | 2,247 |
| | | | | |
Specialty Stores - 0.7% | | | | | |
Cabela’s, Inc. * | | 1,023 | | | 13,647 |
| | | | | |
Tobacco - 1.3% | | | | | |
Philip Morris International, Inc. | | 532 | | | 25,930 |
| | | | | |
Trucking - 0.2% | | | | | |
Saia, Inc. * | | 302 | | | 4,856 |
| | | | | |
TOTAL COMMON STOCKS (cost $1,800,547) | | | | $ | 1,948,635 |
| | | | | |
Total Investments - 95.2% 3 (cost $1,800,547) | | | | $ | 1,948,635 |
Cash & Other Assets, Less Liabilities - 4.8% | | | | | 97,581 |
| | | | | |
Total Net Assets - 100.0% | | | | $ | 2,046,216 |
| | | | | |
For federal income tax purposes the identified cost of investments owned at September 30, 2009 was $1,801,574.
| ADR | American Depositary Receipt |
| plc | Public Limited Company |
| * | Non-income producing security |
| 1 | Security is segregated as collateral for open written option contracts. |
| 2 | Security is deemed illiquid. The total market value of illiquid securities is $21,569 (cost $21,127), or 1.1% of total net assets. |
| 3 | Unless otherwise indicated, the values of the securities of the Portfolio are determined based on Level 1 inputs established by ASC 820. |
The accompanying notes are an integral part of the financial statements
8
Rydex | SGI Equity Fund
All Cap Value Series
Statement of Assets and Liabilities
September 30, 2009
| | | | |
Assets: | | | | |
Investments, at value* | | $ | 1,948,635 | |
Cash | | | 170,987 | |
Receivables: | | | | |
Fund shares sold | | | 100 | |
Securities sold | | | 332 | |
Dividends | | | 2,302 | |
Security Investors | | | 3,181 | |
Prepaid expenses | | | 17,908 | |
| | | | |
Total assets | | | 2,143,445 | |
| | | | |
Liabilities: | | | | |
Payable for: | | | | |
Securities purchased | | | 82,856 | |
Written options, at value
(premiums received, $2,233) | | | 1,610 | |
Management fees | | | 1,128 | |
Custodian fees | | | 265 | |
Transfer agent/maintenance fees | | | 344 | |
Administration fees | | | 431 | |
Professional fees | | | 7,400 | |
12b-1 distribution plan fees | | | 591 | |
Directors’ fees | | | 163 | |
Other | | | 2,441 | |
| | | | |
Total liabilities | | | 97,229 | |
| | | | |
Net assets | | $ | 2,046,216 | |
| | | | |
Net assets consist of: | | | | |
Paid in capital | | $ | 1,917,712 | |
Undistributed net investment income | | | 3,576 | |
Accumulated net realized loss on sale of investments | | | (23,783 | ) |
Net unrealized appreciation in value of investments | | | 148,711 | |
| | | | |
Net assets | | $ | 2,046,216 | |
| | | | |
Class A: | | | | |
Capital shares outstanding
(unlimited number of shares authorized) | | | 129,256 | |
Net assets | | $ | 1,319,277 | |
Net asset value and redemption price per share | | $ | 10.21 | |
| | | | |
Maximum offering price per share (net asset value divided by 94.25%) | | $ | 10.83 | |
| | | | |
Class C: | | | | |
Capital shares outstanding
(unlimited number of shares authorized) | | | 42,982 | |
Net assets | | $ | 435,612 | |
Net asset value, offering and redemption price per share (excluding any applicable contingent deferred sales charge) | | $ | 10.13 | |
| | | | |
Institutional Class: | | | | |
Capital shares outstanding (unlimited number of shares authorized) | | | 28,464 | |
Net assets | | $ | 291,327 | |
Net asset value, offering and redemption price per share (excluding any applicable contingent deferred sales charge) | | $ | 10.24 | |
| | | | |
* Investments, at cost | | $ | 1,800,547 | |
Statement of Operations
For the Period Ended September 30, 2009*
| | | | |
Investment Income: | | | | |
Dividends | | $ | 17,025 | |
Interest | | | 144 | |
| | | | |
Total investment income | | | 17,169 | |
| | | | |
Expenses: | | | | |
Management fees | | | 6,241 | |
Transfer agent/maintenance fees | | | 977 | |
Administration fees | | | 1,553 | |
Custodian fees | | | 4,340 | |
Directors’ fees | | | 223 | |
Professional fees | | | 8,373 | |
Reports to shareholders | | | 2,281 | |
Registration fees | | | 39,483 | |
Other expenses | | | 2,986 | |
12b-1 distribution fees - Class A | | | 1,027 | |
12b-1 distribution fees - Class C | | | 2,597 | |
| | | | |
Total expenses | | | 70,081 | |
Less: | | | | |
Reimbursement of expenses - Class A | | | (22,184 | ) |
Reimbursement of expenses - Class C | | | (17,634 | ) |
Reimbursement of expenses - Institutional Class | | | (16,670 | ) |
| | | | |
Net expenses | | | 13,593 | |
| | | | |
Net investment income | | | 3,576 | |
| | | | |
Net Realized and Unrealized Gain (Loss): | | | | |
Net realized gain (loss) during the period on: | | | | |
Investments | | | (23,783 | ) |
| | | | |
Net realized loss | | | (23,783 | ) |
| | | | |
Net unrealized appreciation (depreciation) during the period on: | | | | |
Investments | | | 148,088 | |
Options written | | | 623 | |
| | | | |
Net unrealized appreciation | | | 148,711 | |
| | | | |
Net realized and unrealized gain | | | 124,928 | |
| | | | |
Net increase in net assets resulting from operations | | $ | 128,504 | |
| | | | |
| * | For the period from October 3, 2008 (commencement of operations) to September 30, 2009. |
The accompanying notes are an integral part of the financial statements
9
| | |
| | Rydex | SGI Equity Fund |
| Statement of Changes in Net Assets | | All Cap Value Series |
| | | | |
| | | Period Ended
September 30,
2009* | |
Increase (decrease) in net assets from operations: | | | | |
Net investment income | | $ | 3,576 | |
Net realized loss during the period on investments | | | (23,783 | ) |
Net unrealized appreciation during the period on investments | | | 148,711 | |
| | | | |
Net increase in net assets resulting from operations | | | 128,504 | |
| | | | |
Capital share transactions: | | | | |
Proceeds from sale of shares | | | | |
Class A | | | 1,271,992 | |
Class C | | | 418,597 | |
Institutional Class | | | 284,637 | |
Cost of shares redeemed | | | | |
Class A | | | (56,559 | ) |
Class C | | | (955 | ) |
| | | | |
Net increase from capital share transactions | | | 1,917,712 | |
| | | | |
Net increase in net assets | | | 2,046,216 | |
| | | | |
Net assets: | | | | |
Beginning of period | | | — | |
| | | | |
End of period | | $ | 2,046,216 | |
| | | | |
Undistributed net investment income at end of period | | $ | 3,576 | |
| | | | |
Capital share activity: | | | | |
Shares sold | | | | |
Class A | | | 134,995 | |
Class C | | | 43,096 | |
Institutional Class | | | 28,464 | |
Shares redeemed | | | | |
Class A | | | (5,739 | ) |
Class C | | | (114 | ) |
| * | For the period October 3, 2008 (commencement of operations) to September 30, 2009. |
The accompanying notes are an integral part of the financial statements
10
| | |
| Financial Highlights | | Rydex | SGI Equity Fund |
Selected data for each share of capital stock outstanding throughout each period | | All Cap Value Series |
| | | | |
Class A | | Year Ended
September 30,
2009 a | |
Per Share Data | | | | |
Net asset value, beginning of period | | $ | 10.00 | |
| | | | |
Income (loss) from investment operations: | | | | |
Net investment income b | | | 0.04 | |
Net gain on securities (realized and unrealized) | | | 0.17 | |
| | | | |
Total from investment operations | | | 0.21 | |
| | | | |
Net asset value, end of period | | $ | 10.21 | |
| | | | |
Total Return c | | | 2.10 | % |
| | | | |
Ratios/Supplemental Data | | | | |
Net assets, end of period (in thousands) | | $ | 1,319 | |
| | | | |
Ratios to average net assets: | | | | |
Net investment income | | | 0.51 | % |
Total expenses d | | | 6.75 | % |
Net expenses e | | | 1.35 | % |
Net expenses prior to custodian earning credits and net of expense waivers | | | 1.35 | % |
| | | | |
Portfolio turnover rate | | | 17 | % |
| | | | |
Class C | | Year Ended
September 30,
2009a | |
Per Share Data | | | | |
Net asset value, beginning of period | | $ | 10.00 | |
| | | | |
Income (loss) from investment operations: | | | | |
Net investment loss b | | | (0.02 | ) |
Net gain on securities (realized and unrealized) | | | 0.15 | |
| | | | |
Total from investment operations | | | 0.13 | |
| | | | |
Net asset value, end of period | | $ | 10.13 | |
| | | | |
Total Return c | | | 1.30 | % |
| | | | |
Ratios/Supplemental Data | | | | |
Net assets, end of period (in thousands) | | $ | 436 | |
| | | | |
Ratios to average net assets: | | | | |
Net investment loss | | | (0.18 | %) |
Total expenses d | | | 8.89 | % |
Net expenses e | | | 2.10 | % |
Net expenses prior to custodian earning credits and net of expense waivers | | | 2.10 | % |
| | | | |
Portfolio turnover rate | | | 17 | % |
The accompanying notes are an integral part of the financial statements
11
| | |
| Financial Highlights | | Rydex | SGI Equity Fund |
Selected data for each share of capital stock outstanding throughout each period | | All Cap Value Series |
| | | | |
Institutional Class | | Year Ended
September 30,
2009a | |
Per Share Data | | | | |
Net asset value, beginning of period | | $ | 10.00 | |
| | | | |
Income (loss) from investment operations: | | | | |
Net investment income b | | | 0.07 | |
Net gain on securities (realized and unrealized) | | | 0.17 | |
| | | | |
Total from investment operations | | | 0.24 | |
| | | | |
Net asset value, end of period | | $ | 10.24 | |
| | | | |
Total Return c | | | 2.40 | % |
| | | | |
Ratios/Supplemental Data | | | | |
Net assets, end of period (in thousands) | | $ | 291 | |
| | | | |
Ratios to average net assets: | | | | |
Net investment income | | | 0.82 | % |
Total expenses d | | | 8.19 | % |
Net expenses e | | | 1.10 | % |
Net expenses prior to custodian earning credits and net of expense waivers | | | 1.10 | % |
| | | | |
Portfolio turnover rate | | | 17 | % |
| a | The All Cap Value Series was initially capitalized on October 3, 2008 with a net asset value of $10 per share. Percentage amounts for the period, except total return, have been annualized. |
| b | Net investment income (loss) was computed using average shares outstanding throughout the period. |
| c | Total return information does not reflect deduction of any sales charges imposed at the time of purchase for Class A shares or upon redemption for Class C shares. |
| d | Total expense information reflects expense ratios absent expense reductions by the Investment Manager and custodian earnings credits, as applicable. |
| e | Net expense information reflects the expense ratios after voluntary expense waivers, reimbursements and custodian earnings credits, as applicable. |
The accompanying notes are an integral part of the financial statements
12
Managers’ Commentary
November 16, 2009

To Our Shareholders:
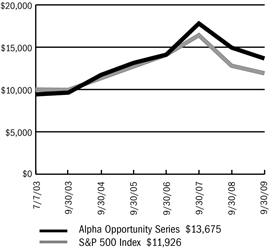
For the fiscal year ended September 30, 2009, the Rydex|SGI Equity Fund Alpha Opportunity Series returned –8.55%1 compared to –6.91% for the Series’ benchmark, the S&P 500 Index.
The Series pursues its objective by investing approximately 37.5% of its total assets according to a long/short strategy in domestic equity securities and 37.5% of its total assets according to a long/short strategy in non-U.S. securities. The manager invests the remaining 25% of total assets in a portfolio of equity securities, equity derivative securities, and fixed income securities intended to track the S&P 500 Index.
The Series pursues its domestic long/short strategy using fundamental and technical analysis to identify quality securities trading at attractive valuations. The domestic strategy uses a top-down perspective to formulate long-term themes and a bottom-up approach to identify individual securities. The Series pursues its global long/short strategy using quantitative and qualitative techniques to identify long and short investment opportunities.
Domestic Strategy Performance
For the domestic strategy, contributors to performance included the utilities and telecommunications sectors. Investments in utility companies Calpine Corporation and Dominion Reserves, Inc. added positive returns. In the telecommunications sector, leading holdings included MetroPCS Communications, Inc. and Vivo Participacoes S/A.
Sector detractors in the domestic strategy included industrials, financials, and consumer discretionary. Air transportation companies Southwest Airlines Company and Delta Air Lines, Inc. lowered performance in the industrials sector. Other laggards included Watson Wyatt Worldwide, Inc. (Cl A) and Granite City Construction, Inc. In the financials sector, holdings contributing negatively to performance were Wells Fargo & Company, JPMorgan Chase & Company, and Prudential Financial, Inc. Holdings in the consumer discretionary sector that hurt returns included Urban Outfitters, Inc., Lowe’s Companies, Best Buy Company, Inc., and 99 Cents Only Stores.
Global Strategy Performance
For the global strategy, top performing sectors included consumer discretionary, health care, and consumer staples. Leading securities in the consumer discretionary sector included Volkswagen AG, Shanda Interactive Entertainment, Ltd., and Marvel Entertainment. In the health care sector, Sequenom, Inc., Basilea Pharmaceutica AG, and XenoPort, Inc. added to overall returns. Philip Morris International, Inc. and Wal-Mart Stores, Inc. led holdings in the consumer staples sector.
The financials and information technology sectors hurt performance in the global strategy part of the portfolio. As in the United States, financial companies have been hit hard all around the globe. Financial holdings in the portfolio dragging down returns included Mizuho Financial Group, Inc., Erste Group Bank AG, Anglo Irish Bank, and UBI Banca. Negative contributors in the information technology sector included Cree, Inc., Baidu, Inc., VMware, Inc., ZTE Corporation, and Riverbed Technology, Inc.
Due to a previous brokerage relationship with Lehman Brothers International Europe (“LBIE”) (which was placed into administration on September 15, 2008), the Series has certain short sale positions that it is currently unable to settle and certain long positions held by its custodian that are pledged to LBIE which the Series currently cannot access. As a result, the Series is currently unable to actively pursue the global long/short portion of its investment strategy. The Series is unable to determine when it will resume its full investment program.
Market Outlook
There are signs that the economy may be stabilizing from a macroeconomic perspective. In September, the Federal Open Market Committee reported data indicating a slowly improving economy. Moody’s Investor Service lowered their outlook for corporate bond defaults, which will make owning riskier assets more rewarding as the implied default rate declines. Fixed income factors suggests improving economic growth as the yield curve remains historically steep and monetary policy continues to be accommodative.
We thank you for your investment and appreciate the trust and confidence you have placed in us.
Sincerely,
Bill Jenkins, Portfolio Manager
(Mainstream Investment Advisers)
Charles Craig, Portfolio Manager
(Mainstream Investment Advisers)
David Whittall, Portfolio Manager
(Security Global Investors, LLC
Scott Klimo, Portfolio Manager
(Security Global Investors, LLC)
Mark Kress, Portfolio/Risk Manager
(Security Global Investors, LLC)
Yon Perullo, Portfolio/Risk Manager
(Security Global Investors, LLC)
Christi Fletcher, Portfolio Manager
(Security Investors, LLC)
| 1 | Performance figures are based on Class A shares and do not reflect deduction of the sales charges or taxes that a shareholder would pay on distributions or the redemption of shares. Fee waivers and/or reimbursements reduce Series expenses and in the absence of such waivers, the performance quoted would be reduced. |
| | The strategies discussed herein do not assure a profit. The Fund is distributed by Rydex Distributors, Inc. |
13
| | |
| | Rydex | SGI Equity Fund |
| Performance Summary | | Alpha Opportunity Series |
| September 30, 2009 | | (unaudited) |
PERFORMANCE
Alpha Opportunity Series vs. S&P 500 Index
$10,000 Since Inception
This chart assumes a $10,000 investment in Class A shares of Alpha Opportunity Series on July 7, 2003 (date of inception), reflects deduction of the 5.75% sales load and assumes all dividends reinvested. The chart does not reflect the deduction of taxes that a shareholder would pay on distributions or the redemption of fund shares. The S&P 500 Index is a capitalization weighted index composed of 500 selected common stocks that represent the broad domestic economy and is a widely recognized unmanaged index of market performance.
Average Annual Returns
| | | | | | | | |
Periods Ended 9-30-09 | | 1 Year | | | 5 Years | | | Since Inception |
A Shares | | (8.55 | %) | | 3.14 | % | | 6.15% |
| | | | | | | | (7-07-03) |
A Shares with sales charge | | (13.80 | %) | | 1.92 | % | | 5.15% |
| | | | | | | | (7-07-03) |
B Shares | | (9.15 | %) | | 2.36 | % | | 5.36% |
| | | | | | | | (7-07-03) |
B Shares with CDSC | | (13.69 | %) | | 2.11 | % | | 5.36% |
| | | | | | | | (7-07-03) |
C Shares | | (9.48 | %) | | 2.31 | % | | 5.32% |
| | | | | | | | (7-07-03) |
C Shares with CDSC | | (10.39 | %) | | 2.31 | % | | 5.32% |
| | | | | | | | (7-07-03) |
Institutional Shares | | — | | | — | | | 17.30% |
| | | | | | | | (11-07-08) |
The performance data above represents past performance that is not predictive of future results. The investment return and principal value of an investment in the Series will fluctuate so that an investor’s shares, when redeemed, may be worth more or less than their original cost. The figures above do not reflect deduction of the maximum front-end sales charge of 5.75% for Class A shares or the contingent deferred sales charge of 5% for Class B shares and 1% for Class C shares, as applicable, except where noted. The figures do not reflect the deduction of taxes that a shareholder would pay on distributions or redemption of shares. Such figures would be lower if the maximum sales charge and any applicable taxes were deducted. Fee waivers and/or reimbursements reduced expenses of the Series and in the absence of such waiver, the performance quoted would be reduced.
Portfolio Composition by Sector as of 9-30-09*
| | | |
Consumer Discretionary | | (2.95 | %) |
Consumer Staples | | 8.88 | |
Energy | | 2.06 | |
Financials | | (1.95 | ) |
Health Care | | 2.08 | |
Industrials | | 7.29 | |
Information Technology | | 13.35 | |
Materials | | 4.98 | |
Telecommunication Services | | 0.20 | |
Utilities | | (0.53 | ) |
Exchange Traded Funds | | 3.54 | |
U.S. Government Sponsored Agencies | | 9.65 | |
Repurchase Agreement | | 10.79 | |
Short Term Investments | | 15.83 | |
Cash & Other Assets, Less Liabilities | | 26.78 | |
| | | |
Total Net Assets | | 100.00 | % |
| | | |
| * | Securities sold short are netted with long positions in common stocks in the appropriate sectors. |
The accompanying notes are an integral part of the financial statements
14
| | |
| | Rydex | SGI Equity Fund |
| Performance Summary | | Alpha Opportunity Series |
September 30, 2009 | | (unaudited) |
Information About Your Series Expenses
Calculating your ongoing Series expenses
Example
As a shareholder of the Series, you incur two types of costs: (1) transaction costs, which may include sales charges (loads) on purchase payments; contingent deferred sales charges on redemptions; and redemption fees, if any; and (2) ongoing costs, including management fees; distribution and/or service fees (12b-1); and other Series expenses. This example is intended to help you understand your ongoing costs (in dollars) of investing in the Series and to compare these costs with ongoing costs of investing in other mutual funds. The example is based on an investment of $1,000 invested at the beginning of the period and held for the entire period April 1, 2009 through September 30, 2009.
Actual Expenses
The first line for each class of shares in the table provides information about actual account values and actual expenses. You may use the information in this table, together with the amount you invested, to estimate the expenses that you paid over the period. Simply divide your account value by $1,000 (for example, an $8,600 account value divided by $1,000 = 8.6), then multiply the result by the number in the table under the heading entitled “Expenses Paid During the Period” to estimate the expenses you paid on your account during this period.
Hypothetical Example for Comparison Purposes
The second line for each class of shares in the table provides information about hypothetical account values and hypothetical expenses based on the Series actual expense ratio and an assumed rate of return of 5% per year before expenses, which is not the Series actual return. The hypothetical account values and expenses may not be used to estimate the actual ending account balance or expenses you paid for the period. You may use this information to compare the ongoing costs of investing in the Series and other funds. To do so, compare this 5% hypothetical example with the 5% hypothetical examples that appear in the shareholder reports of the other mutual funds.
Please note that the expenses shown in the table are meant to highlight your ongoing costs only and do not reflect any transactional costs, such as sales charges (loads) on purchase payments, contingent deferred sales charges on redemptions, and redemption fees, if any. Therefore, the second line for each class of shares is useful in comparing ongoing costs only, and will not help you determine the relative total costs of owning different funds. In addition, if these transactional costs were included, your costs would have been higher.
Series Expenses
| | | | | | | | | |
| | | Beginning
Account
Value
4/1/2009 | | Ending
Account
Value
9/30/2009 1 | | Expenses
Paid
During
Period 2 |
Alpha Opportunity Series - Class A | | | | | | | | | |
Actual | | $ | 1,000.00 | | $ | 1,329.19 | | $ | 11.39 |
Hypothetical | | | 1,000.00 | | | 1,015.29 | | | 9.85 |
Alpha Opportunity Series - Class B | | | | | | | | | |
Actual | | | 1,000.00 | | | 1,324.55 | | | 15.73 |
Hypothetical | | | 1,000.00 | | | 1,011.53 | | | 13.62 |
Alpha Opportunity Series - Class C | | | | | | | | | |
Actual | | | 1,000.00 | | | 1,323.43 | | | 15.73 |
Hypothetical | | | 1,000.00 | | | 1,011.53 | | | 13.62 |
Alpha Opportunity Series - Class Institutional | | | | | | | | | |
Actual | | | 1,000.00 | | | 1,329.93 | | | 9.93 |
Hypothetical | | | 1,000.00 | | | 1,016.55 | | | 8.59 |
| 1 | The actual ending account value is based on the actual total return of the Series for the period April 1, 2009 to September 30, 2009 after actual expenses and will differ from the hypothetical ending account value which is based on the Series expense ratio and a hypothetical annual return of 5% before expenses. The actual cumulative return at net asset value for the period April 1, 2009 to September 30, 2009 was 32.92%, 32.45%, 32.34% and 32.99%, for Class A, B, C and Institutional Class shares, respectively. |
| 2 | Expenses are equal to the Series annualized expense ratio (1.95%, 2.70%, 2.70% and 1.70% for Class A, B, C and Institutional Class shares, respectively), net of any applicable fee waivers, multiplied by the average account value over the period, multiplied by 183/365 (to reflect the one-half year period). |
| | |
| Schedule of Investments | | Rydex | SGI Equity Fund |
| September 30, 2009 | | Alpha Opportunity Series |
| | | | | |
| | | Shares | | Value |
COMMON STOCKS - 87.6% | | | | | |
Aerospace & Defense - 2.3% | | | | | |
Lockheed Martin Corporation 1,2 | | 3,753 | | $ | 293,034 |
Northrop Grumman Corporation 1,2 | | 1,100 | | | 56,925 |
| | | | | |
| | | | | 349,959 |
| | | | | |
Agricultural Products - 1.6% | | | | | |
AgFeed Industries, Inc. * | | 2,930 | | | 15,646 |
Archer-Daniels-Midland Company 3 | | 8,176 | | | 238,903 |
| | | | | |
| | | | | 254,549 |
| | | | | |
Airlines - 0.5% | | | | | |
Airtran Holdings, Inc. * | | 13,007 | | | 81,294 |
| | | | | |
Aluminum - 0.6% | | | | | |
Alcoa, Inc. | | 2,248 | | | 29,494 |
Century Aluminum Company * | | 6,336 | | | 59,241 |
| | | | | |
| | | | | 88,735 |
| | | | | |
Apparel Retail - 3.8% | | | | | |
Gap, Inc. 1,2 | | 6,000 | | | 128,400 |
Gymboree Corporation 1,2,* | | 3,000 | | | 145,140 |
Ltd. Brands, Inc. 1,2 | | 5,100 | | | 86,649 |
Ross Stores, Inc. 1,2 | | 2,100 | | | 100,317 |
TJX Companies, Inc. 1,2 | | 3,600 | | | 133,740 |
| | | | | |
| | | | | 594,246 |
| | | | | |
Apparel, Accessories & Luxury Goods - 0.2% | | | | | |
Phillips-Van Heusen Corporation 1,2 | | 800 | | | 34,232 |
| | | | | |
Automobile Manufacturers - 0.2% | | | | | |
Ford Motor Company * | | 4,088 | | | 29,474 |
| | | | | |
Biotechnology - 0.7% | | | | | |
Amgen, Inc. 1,2,* | | 1,800 | | | 108,414 |
| | | | | |
Coal & Consumable Fuels - 0.6% | | | | | |
Alpha Natural Resources, Inc. * | | 2,453 | | | 86,100 |
| | | | | |
Communications Equipment - 1.3% | | | | | |
ADC Telecommunications, Inc. * | | 4,701 | | | 39,206 |
Cisco Systems, Inc. * | | 409 | | | 9,628 |
Harmonic, Inc. 1,2,* | | 11,000 | | | 73,480 |
JDS Uniphase Corporation * | | 4,088 | | | 29,066 |
Oplink Communications, Inc. * | | 2,591 | | | 37,621 |
Opnext, Inc. * | | 2,084 | | | 6,106 |
| | | | | |
| | | | | 195,107 |
| | | | | |
Computer & Electronics Retail - 1.2% | | | | | |
Best Buy Company, Inc. | | 2,656 | | | 99,653 |
RadioShack Corporation 1,2 | | 5,100 | | | 84,507 |
| | | | | |
| | | | | 184,160 |
| | | | | |
Computer Hardware - 0.3% | | | | | |
International Business Machines Corporation | | 409 | | | 48,920 |
| | | | | |
Computer Storage & Peripherals - 0.4% | | | | | |
Logitech International S.A. * | | 381 | | | 7,003 |
Seagate Technology | | 2,044 | | | 31,089 |
| | | | | |
| | | Shares | | Value |
COMMON STOCKS - 87.6% (continued) | | | | | |
Computer Storage & Peripherals - 0.4% (continued) | | | | | |
Western Digital Corporation * | | 1,022 | | $ | 37,334 |
| | | | | |
| | | | | 75,426 |
| | | | | |
Construction & Engineering - 2.0% | | | | | |
Fluor Corporation 3 | | 4,291 | | | 218,197 |
Insituform Technologies, Inc. * | | 1,022 | | | 19,561 |
KBR, Inc. | | 3,065 | | | 71,384 |
| | | | | |
| | | | | 309,142 |
| | | | | |
Construction & Farm Machinery & Heavy Trucks - 4.1% | | | | | |
Joy Global, Inc. 1,2 | | 9,080 | | | 444,375 |
Lindsay Corporation | | 613 | | | 24,140 |
Trinity Industries, Inc. 1,2 | | 10,200 | | | 175,338 |
| | | | | |
| | | | | 643,853 |
| | | | | |
Construction Materials - 1.3% | | | | | |
Eagle Materials, Inc. | | 817 | | | 23,350 |
Martin Marietta Materials, Inc. | | 1,021 | | | 94,003 |
Texas Industries, Inc. | | 613 | | | 25,746 |
Vulcan Materials Company | | 1,226 | | | 66,290 |
| | | | | |
| | | | | 209,389 |
| | | | | |
Diversified Banks - 0.7% | | | | | |
Banco Latinoamericano de Comercio Exterior S.A. | | 586 | | | 8,333 |
Barclays plc ADR | | 3,662 | | | 86,570 |
| | | | | |
| | | | | 94,903 |
| | | | | |
Diversified Metals & Mining - 2.6% | | | | | |
Brush Engineered Materials, Inc. * | | 1,680 | | | 41,093 |
General Moly, Inc. * | | 3,950 | | | 12,443 |
Horsehead Holding Corporation * | | 5,986 | | | 70,156 |
iPath Dow Jones-UBS Copper Subindex Total Return ETN 1 | | 7,154 | | | 276,931 |
Titanium Metals Corporation | | 409 | | | 3,922 |
| | | | | |
| | | | | 404,545 |
| | | | | |
Diversified Real Estate Activities - 0.5% | | | | | |
St. Joe Company * | | 2,509 | | | 73,062 |
| | | | | |
Drug Retail - 1.1% | | | | | |
CVS Caremark Corporation 3 | | 4,701 | | | 168,014 |
| | | | | |
Electrical Components & Equipment - 1.7% | | | | | |
AO Smith Corporation 1,2 | | 2,800 | | | 106,680 |
General Cable Corporation * | | 2,453 | | | 96,035 |
GrafTech International, Ltd. * | | 4,088 | | | 60,094 |
| | | | | |
| | | | | 262,809 |
| | | | | |
Electronic Components - 0.7% | | | | | |
AVX Corporation | | 2,003 | | | 23,896 |
Corning, Inc. | | 5,314 | | | 81,357 |
| | | | | |
| | | | | 105,253 |
| | | | | |
Electronic Manufacturing Services - 0.1% | | | | | |
Flextronics International, Ltd. * | | 1,226 | | | 9,146 |
Sanmina-SCI Corporation * | | 564 | | | 4,850 |
| | | | | |
| | | | | 13,996 |
| | | | | |
The accompanying notes are an integral part of the financial statements
16
| | |
| Schedule of Investments | | Rydex | SGI Equity Fund |
| September 30, 2009 | | Alpha Opportunity Series |
| | | | | |
| | | Shares | | Value |
COMMON STOCKS - 87.6% (continued) | | | | | |
Environmental & Facilities Services - 0.4% | | | | | |
Industrial Services of America, Inc. * | | 109 | | $ | 943 |
Metalico, Inc. * | | 14,074 | | | 58,688 |
| | | | | |
| | | | | 59,631 |
| | | | | |
Exchange Traded Funds - 4.8% | | | | | |
iPath Dow Jones-UBS Commodity Index Total Return ETN | | 3,242 | | | 125,012 |
iShares Dow Jones US Regional Banks Index Fund | | 3,474 | | | 72,815 |
PowerShares DB Agriculture Fund | | 1,226 | | | 31,214 |
PowerShares DB Base Metals Fund | | 4,497 | | | 82,205 |
Regional Bank HOLDERs Trust * | | 876 | | | 70,150 |
SPDR KBW Regional Banking ETF | | 3,680 | | | 78,458 |
United States Oil Fund, LP 1,* | | 7,758 | | | 280,761 |
| | | | | |
| | | | | 740,615 |
| | | | | |
Fertilizers & Agricultural Chemicals - 0.4% | | | | | |
Potash Corporation of Saskatchewan, Inc. | | 732 | | | 66,129 |
| | | | | |
Food Retail - 0.5% | | | | | |
Safeway, Inc. 1,2 | | 3,900 | | | 76,908 |
| | | | | |
Forest Products - 0.1% | | | | | |
Weyerhaeuser Company | | 408 | | | 14,953 |
| | | | | |
General Merchandise Stores - 0.6% | | | | | |
Family Dollar Stores, Inc. 1,2 | | 3,700 | | | 97,680 |
| | | | | |
Gold - 0.8% | | | | | |
Iamgold Corporation | | 732 | | | 10,350 |
Jaguar Mining, Inc. * | | 3,310 | | | 29,526 |
Newmont Mining Corporation | | 1,634 | | | 71,929 |
| | | | | |
| | | | | 111,805 |
| | | | | |
Health Care Distributors - 0.8% | | | | | |
Owens & Minor, Inc. 1,2 | | 2,700 | | | 122,175 |
| | | | | |
Health Care Equipment - 0.7% | | | | | |
Baxter International, Inc. 1,2 | | 1,800 | | | 102,618 |
| | | | | |
Health Care Facilities - 0.4% | | | | | |
Kindred Healthcare, Inc. 1,2,* | | 3,900 | | | 63,297 |
| | | | | |
Health Care Services - 0.8% | | | | | |
Lincare Holdings, Inc. 1,2,* | | 3,800 | | | 118,750 |
| | | | | |
Health Care Technology - 0.9% | | | | | |
athenahealth, Inc. * | | 3,653 | | | 140,166 |
| | | | | |
Home Entertainment Software - 4.9% | | | | | |
Shanda Interactive Entertainment, Ltd. ADR 1,2,* | | 15,100 | | | 773,120 |
| | | | | |
| | | | | |
| | | Shares | | Value |
COMMON STOCKS - 87.6% (continued) | | | | | |
Human Resources & Employment Services - 0.6% | | | | | |
Watson Wyatt Worldwide, Inc. 1,2 | | 2,200 | | $ | 95,832 |
| | | | | |
Hypermarkets & Super Centers - 0.7% | | | | | |
Wal-Mart Stores, Inc. 1,2 | | 2,200 | | | 107,998 |
| | | | | |
Independent Power Producers & Energy Traders - 1.1% | | | | | |
Constellation Energy Group, Inc. 1,2 | | 5,100 | | | 165,087 |
| | | | | |
Industrial Conglomerates - 0.4% | | | | | |
General Electric Company 1,2 | | 4,200 | | | 68,964 |
| | | | | |
Industrial Machinery - 0.6% | | | | | |
LB Foster Company * | | 427 | | | 13,058 |
Watts Water Technologies, Inc. 1,2 | | 2,800 | | | 84,700 |
| | | | | |
| | | | | 97,758 |
| | | | | |
Integrated Oil & Gas - 1.7% | | | | | |
ConocoPhillips 1,2 | | 2,726 | | | 123,106 |
StatoilHydro ASA ADR | | 732 | | | 16,499 |
Suncor Energy, Inc. | | 3,662 | | | 126,558 |
| | | | | |
| | | | | 266,163 |
| | | | | |
Integrated Telecommunication Services - 1.8% | | | | | |
AT&T, Inc. 1,2 | | 10,600 | | | 286,306 |
| | | | | |
Internet Software & Services - 0.2% | | | | | |
Open Text Corporation * | | 732 | | | 27,326 |
| | | | | |
Investment Banking & Brokerage - 0.4% | | | | | |
Lazard, Ltd. | | 576 | | | 23,795 |
Nomura Holdings, Inc. ADR | | 3,834 | | | 23,464 |
| | | | | |
| | | | | 47,259 |
| | | | | |
IT Consulting & Other Services - 0.0% | | | | | |
Yucheng Technologies, Ltd. * | | 732 | | | 5,248 |
| | | | | |
Life & Health Insurance - 0.4% | | | | | |
MetLife, Inc. | | 818 | | | 31,141 |
Sun Life Financial, Inc. | | 1,095 | | | 34,208 |
| | | | | |
| | | | | 65,349 |
| | | | | |
Life Sciences Tools & Services - 2.1% | | | | | |
Charles River Laboratories International, Inc. 1,2,* | | 2,000 | | | 73,960 |
Life Technologies Corporation 1,2,* | | 2,800 | | | 130,340 |
Millipore Corporation 1,2,* | | 1,800 | | | 126,594 |
| | | | | |
| | | | | 330,894 |
| | | | | |
Managed Health Care - 0.7% | | | | | |
Centene Corporation * | | 3,065 | | | 58,051 |
WellCare Health Plans, Inc. 1,2,* | | 2,300 | | | 56,695 |
| | | | | |
| | | | | 114,746 |
| | | | | |
The accompanying notes are an integral part of the financial statements
17
| | |
| Schedule of Investments | | Rydex | SGI Equity Fund |
| September 30, 2009 | | Alpha Opportunity Series |
| | | | | |
| | | Shares | | Value |
COMMON STOCKS - 87.6% (continued) | | | | | |
Marine - 0.6% | | | | | |
Kirby Corporation * | | 2,655 | | $ | 97,757 |
| | | | | |
Movies & Entertainment - 1.7% | | | | | |
Marvel Entertainment, Inc.1,2,* | | 5,400 | | | 267,948 |
| | | | | |
Multi-Line Insurance - 0.3% | | | | | |
Genworth Financial, Inc.1,2 | | 4,000 | | | 47,800 |
| | | | | |
Oil & Gas Equipment & Services - 0.5% | | | | | |
Cameron International Corporation * | | 409 | | | 15,468 |
FMC Technologies, Inc. * | | 362 | | | 18,911 |
Matrix Service Company * | | 1,226 | | | 13,327 |
National Oilwell Varco, Inc. * | | 204 | | | 8,799 |
Oceaneering International, Inc. * | | 409 | | | 23,210 |
| | | | | |
| | | | | 79,715 |
| | | | | |
Oil & Gas Exploration & Production - 2.2% | | | | | |
Anadarko Petroleum Corporation1,2 | | 2,755 | | | 172,820 |
Encore Acquisition Company * | | 3,474 | | | 129,928 |
Georesources, Inc. * | | 1,835 | | | 20,277 |
Gran Tierra Energy, Inc. * | | 5,018 | | | 20,875 |
| | | | | |
| | | | | 343,900 |
| | | | | |
Paper Packaging - 0.6% | | | | | |
Bemis Company, Inc. | | 613 | | | 15,883 |
Rock-Tenn Company | | 1,637 | | | 77,119 |
Temple-Inland, Inc. | | 204 | | | 3,350 |
| | | | | |
| | | | | 96,352 |
| | | | | |
Paper Products - 0.1% | | | | | |
International Paper Company | | 612 | | | 13,605 |
| | | | | |
Personal Products - 0.6% | | | | | |
China-Biotics, Inc. * | | 732 | | | 11,712 |
Herbalife, Ltd. 1,2 | | 2,500 | | | 81,850 |
| | | | | |
| | | | | 93,562 |
| | | | | |
Pharmaceuticals - 4.2% | | | | | |
Forest Laboratories, Inc.1,2,* | | 3,400 | | | 100,096 |
Johnson & Johnson 1,2 | | 7,452 | | | 453,752 |
Viropharma, Inc. 1,2,* | | 9,900 | | | 95,238 |
| | | | | |
| | | | | 649,086 |
| | | | | |
Precious Metals & Minerals - 0.5% | | | | | |
E-TRACS UBS Long Platinum ETN * | | 5,410 | | | 84,450 |
| | | | | |
Property & Casualty Insurance - 1.8% | | | | | |
ACE, Ltd. | | 409 | | | 21,865 |
Amtrust Financial Services, Inc.1,2 | | 6,000 | | | 68,460 |
Berkshire Hathaway, Inc. (CI.B) * | | 36 | | | 119,628 |
Travelers Companies, Inc. | | 1,225 | | | 60,307 |
| | | | | |
| | | | | 270,260 |
| | | | | |
Railroads - 0.3% | | | | | |
Genesee & Wyoming, Inc. * | | 1,398 | | | 42,387 |
| | | | | |
Regional Banks - 0.5% | | | | | |
East West Bancorp, Inc. | | 2,453 | | | 20,360 |
| | | | | |
| | | Shares | | Value |
COMMON STOCKS - 87.6% (continued) | | | | | |
Regional Banks - 0.5% (continued) | | | | | |
First Horizon National Corporation * | | 3,511 | | $ | 46,449 |
Republic Bancorp, Inc. | | 595 | | | 11,876 |
| | | | | |
| | | | | 78,685 |
| | | | | |
Reinsurance - 0.8% | | | | | |
Endurance Specialty Holdings, Ltd.1,2 | | 3,000 | | | 109,410 |
Validus Holdings, Ltd. | | 613 | | | 15,815 |
| | | | | |
| | | | | 125,225 |
| | | | | |
Restaurants - 0.7% | | | | | |
BJ’s Restaurants, Inc. * | | 1,839 | | | 27,567 |
Jack in the Box, Inc.1,2,* | | 4,000 | | | 81,960 |
| | | | | |
| | | | | 109,527 |
| | | | | |
Semiconductor Equipment - 0.8% | | | | | |
Amkor Technology, Inc.1,2,* | | 9,200 | | | 63,295 |
Applied Materials, Inc. | | 2,044 | | | 27,390 |
Teradyne, Inc. * | | 2,931 | | | 27,112 |
Veeco Instruments, Inc. * | | 44 | | | 1,026 |
| | | | | |
| | | | | 118,823 |
| | | | | |
Semiconductors - 5.3% | | | | | |
Atmel Corporation3,* | | 42,133 | | | 176,538 |
Cypress Semiconductor Corporation * | | 6,950 | | | 71,794 |
Fairchild Semiconductor International, Inc. * | | 3,268 | | | 33,432 |
Intel Corporation3 | | 8,649 | | | 169,261 |
Linear Technology Corporation | | 3,269 | | | 90,322 |
LSI Corporation * | | 13,584 | | | 74,576 |
ON Semiconductor Corporation * | | 9,820 | | | 81,015 |
Skyworks Solutions, Inc. * | | 2,453 | | | 32,478 |
Taiwan Semiconductor Manufacturing Company, Ltd. ADR | | 3,397 | | | 37,231 |
Texas Instruments, Inc. | | 2,249 | | | 53,279 |
TriQuint Semiconductor, Inc. * | | 3,039 | | | 23,461 |
| | | | | |
| | | | | 843,387 |
| | | | | |
Specialized REIT’s - 0.4% | | | | | |
Potlatch Corporation | | 2,044 | | | 58,152 |
| | | | | |
Specialty Chemicals - 0.1% | | | | | |
OM Group, Inc. * | | 409 | | | 12,430 |
| | | | | |
Steel - 0.5% | | | | | |
Cliffs Natural Resources, Inc. | | 1,022 | | | 33,072 |
Steel Dynamics, Inc. | | 2,044 | | | 31,355 |
Universal Stainless & Alloy Products, Inc. * | | 1,079 | | | 19,692 |
| | | | | |
| | | | | 84,119 |
| | | | | |
Systems Software - 3.4% | | | | | |
CA, Inc.1,2 | | 19,362 | | | 425,770 |
Symantec Corporation1,2,* | | 5,900 | | | 97,173 |
| | | | | |
| | | | | 522,943 |
| | | | | |
Technology Distributors - 1.0% | | | | | |
Arrow Electronics, Inc.1,2,* | | 2,600 | | | 73,190 |
Avnet, Inc.1,2,* | | 3,100 | | | 80,507 |
| | | | | |
| | | | | 153,697 |
| | | | | |
Tobacco - 5.0% | | | | | |
Altria Group, Inc.1,2 | | 16,700 | | | 297,427 |
The accompanying notes are an integral part of the financial statements
18
| | |
| Schedule of Investments | | Rydex | SGI Equity Fund |
| September 30, 2009 | | Alpha Opportunity Series |
| | | | | | | | |
| | | Shares | | | Value | |
COMMON STOCKS - 87.6% (continued) | | | | | | | | |
Tobacco - 5.0% (continued) | | | | | | | | |
Philip Morris International, Inc. 1,2 | | | 9,800 | | | $ | 477,653 | |
| | | | | | | | |
| | | | | | | 775,080 | |
| | | | | | | | |
Trucking - 0.4% | | | | | | | | |
Con-Way, Inc.1,2 | | | 1,700 | | | | 65,144 | |
Quality Distribution, Inc. * | | | 1,225 | | | | 4,128 | |
| | | | | | | | |
| | | | | | | 69,272 | |
| | | | | | | | |
TOTAL COMMON STOCKS
(cost $14,695,794) | | | | | | $ | 13,620,521 | |
| | | | | | | | |
| | |
| | | Principal
Amount | | | Value | |
U.S. GOVERNMENT SPONSORED AGENCY BONDS & | | | | | | | | |
NOTES - 9.7% | | | | | | | | |
Federal Home Loan Bank 0.04%, 10/28/2009 3,4 | | $ | 1,500,000 | | | $ | 1,499,955 | |
| | | | | | | | |
TOTAL U.S. GOVERNMENT SPONSORED AGENCY BONDS & NOTES
(cost $1,499,955) | | | | | | $ | 1,499,955 | |
| | | | | | | | |
| | |
| | | Principal
Amount | | | Value | |
SHORT TERM INVESTMENTS - 15.8% | | | | | | | | |
State Street General Account U.S. | | | | | | | | |
Government Fund 4 | | $ | 2,458,882 | | | $ | 2,458,882 | |
| | | | | | | | |
TOTAL SHORT TERM INVESTMENTS
(cost $2,458,882) | | | | | | $ | 2,458,882 | |
| | | | | | | | |
| | |
| | | Principal
Amount | | | Value | |
REPURCHASE AGREEMENT - 10.8% | | | | | | | | |
State Street, 0.01%, dated 9/30/09, matures 10/1/09; repurchase amount $516,826 (Collateralized by U.S. Treasury Note, 12/24/09 with a value of $529,841) 4 | | $ | 516,826 | | | $ | 516,826 | |
State Street, 0.01%, dated 9/30/09, matures 10/01/09; repurchase amount $1,160,190 (Collateralized by U.S. Treasury Note, 3/18/10 with a value of $1,184,052) 4 | | | 1,160,190 | | | | 1,160,190 | |
| | | | | | | | |
TOTAL REPURCHASE AGREEMENT
(cost $1,677,016) | | | | | | $ | 1,677,016 | |
| | | | | | | | |
Total Investments - 123.9% 5
(cost $20,331,647) | | | | | | $ | 19,256,374 | |
Liabilities, Less Cash & Other Assets - (23.9)% | | | | | | | (3,718,876 | ) |
| | | | | | | | |
Total Net Assets - 100.0% | | | | | | $ | 15,537,498 | |
| | | | | | | | |
|
| Schedule of Securities Sold Short | |
| | |
| | | Shares | | | Value | |
COMMON STOCKS - (27.2)% | | | | | | | | |
Advertising - (0.5)% | | | | | | | | |
Focus Media Holding, Ltd. ADR 6,7,* | | | (2,130 | ) | | $ | (63,900 | ) |
| | | | | | | | |
Airlines - 0.0% | | | | | | | | |
UAL Corporation * | | | (619 | ) | | | (5,707 | ) |
| | | | | | | | |
Alternative Carriers - (0.4)% | | | | | | | | |
Clearwire Corporation 6,7,* | | | (2,530 | ) | | | (28,665 | ) |
| | | | | | | |
| | | Shares | | | Value | |
COMMON STOCKS - (27.2)% (continued) | | | | | | | |
Alternative Carriers - (0.4)% (continued) | | | | | | | |
Global Crossing, Ltd. 6,7,* | | (1,800 | ) | | $ | (28,746 | ) |
| | | | | | | |
| | | | | | (57,411 | ) |
| | | | | | | |
Auto Parts & Equipment - (0.1)% | | | | | | | |
BorgWarner, Inc. | | (465 | ) | | | (14,071 | ) |
| | | | | | | |
Biotechnology - (4.4)% | | | | | | | |
Acorda Therapeutics, Inc. 6,7,* | | (2,800 | ) | | | (74,900 | ) |
Alnylam Pharmaceuticals, Inc. 6,7,* | | (2,900 | ) | | | (85,288 | ) |
AMAG Pharmaceuticals, Inc. 6,7,* | | (1,900 | ) | | | (82,953 | ) |
Cepheid, Inc. 6,7,* | | (5,300 | ) | | | (81,620 | ) |
Exelixis, Inc. 6,7,* | | (4,500 | ) | | | (28,845 | ) |
Genzyme Corporation * | | (619 | ) | | | (35,116 | ) |
Gilead Sciences, Inc. * | | (310 | ) | | | (14,440 | ) |
Regeneron Pharmaceuticals, Inc. 6,7,* | | (3,180 | ) | | | (69,038 | ) |
Rigel Pharmaceuticals, Inc. 6,7,* | | (3,050 | ) | | | (78,324 | ) |
Savient Pharmaceuticals, Inc. 6,7,* | | (2,420 | ) | | | (48,013 | ) |
Vertex Pharmaceuticals, Inc. 6,7,* | | (2,600 | ) | | | (71,942 | ) |
| | | | | | | |
| | | | | | (670,479 | ) |
| | | | | | | |
Building Products - (0.9)% | | | | | | | |
USG Corporation6,7,* | | (4,940 | ) | | | (141,877 | ) |
| | | | | | | |
Communications Equipment - (0.3)% | | | | | | | |
Nokia Oyj ADR | | (310 | ) | | | (4,532 | ) |
Riverbed Technology, Inc. 6,7,* | | (3,280 | ) | | | (43,624 | ) |
| | | | | | | |
| | | | | | (48,156 | ) |
| | | | | | | |
Computer Storage & Peripherals - (0.4)% | | | | | | | |
Intermec, Inc. 6,7,* | | (2,740 | ) | | | (54,307 | ) |
Lexmark International, Inc. * | | (465 | ) | | | (10,016 | ) |
| | | | | | | |
| | | | | | (64,323 | ) |
| | | | | | | |
Department Stores - (0.2)% | | | | | | | |
Sears Holdings Corporation * | | (575 | ) | | | (37,553 | ) |
| | | | | | | |
Diversified Banks - (3.6)% | | | | | | | |
Wells Fargo & Company 6,7 | | (12,384 | ) | | | (539,688 | ) |
| | | | | | | |
Diversified Metals & Mining - (0.2)% | | | | | | | |
Ivanhoe Mines, Ltd. 6,7,* | | (4,440 | ) | | | (37,030 | ) |
| | | | | | | |
Diversified Real Estate Activities - 0.0% | | | | | | | |
Consolidated-Tomoka Land Company | | (83 | ) | | | (3,179 | ) |
| | | | | | | |
Electric Utilities - (1.6)% | | | | | | | |
Korea Electric Power Corporation ADR 6,7 | | (18,310 | ) | | | (247,734 | ) |
| | | | | | | |
Exchange Traded Funds - (1.2)% | | | | | | | |
iShares Barclays 20+ Year Treasury Bond Fund | | (1,859 | ) | | | (183,409 | ) |
United States Natural Gas Fund, LP * | | (619 | ) | | | (7,267 | ) |
| | | | | | (190,676 | ) |
Health Care Equipment - (0.4)% | | | | | | | |
Intuitive Surgical, Inc.6,7,* | | (200 | ) | | | (56,100 | ) |
The accompanying notes are an integral part of the financial statements
19
| | |
| Schedule of Investments | | Rydex | SGI Equity Fund |
| September 30, 2009 | | Alpha Opportunity Series |
| | | | | | | |
| | | Shares | | | Value | |
COMMON STOCKS - (27.2)% (continued) | | | | | | | |
Health Care Equipment - (0.4)% (continued) | | | | | | | |
Palomar Medical Technologies, Inc. * | | (480 | ) | | $ | (7,781 | ) |
| | | | | | | |
| | | | | | (63,881 | ) |
| | | | | | | |
Health Care Supplies - (0.5)% | | | | | | | |
Align Technology, Inc. 6,7,* | | (6,100 | ) | | | (74,420 | ) |
| | | | | | | |
Health Care Technology - (0.6)% | | | | | | | |
athenahealth, Inc. 6,7,* | | (2,500 | ) | | | (89,625 | ) |
IMS Health, Inc. | | (443 | ) | | | (6,800 | ) |
| | | | | | | |
| | | | | | (96,425 | ) |
| | | | | | | |
Home Entertainment Software - (0.2)% | | | | | | | |
Electronic Arts, Inc. 6,7,* | | (900 | ) | | | (36,720 | ) |
| | | | | | | |
Integrated Oil & Gas - (0.1)% | | | | | | | |
Exxon Mobil Corporation | | (155 | ) | | | (10,635 | ) |
Hess Corporation | | (155 | ) | | | (8,286 | ) |
| | | | | | | |
| | | | | | (18,921 | ) |
| | | | | | | |
Integrated Telecommunication Services - (0.2)% | | | | | | | |
Frontier Communications Corporation | | (2,478 | ) | | | (18,684 | ) |
Qwest Communications International, Inc. | | (1,394 | ) | | | (5,311 | ) |
Verizon Communications, Inc. | | (465 | ) | | | (14,076 | ) |
| | | | | | | |
| | | | | | (38,071 | ) |
| | | | | | | |
Internet Software & Services - (1.6)% | | | | | | | |
Baidu, Inc. ADR 6,7,* | | (200 | ) | | | (53,726 | ) |
Equinix, Inc. 6,7,* | | (1,000 | ) | | | (79,940 | ) |
SAVVIS, Inc. 6,7,* | | (5,700 | ) | | | (84,018 | ) |
VeriSign, Inc. 6,7,* | | (1,200 | ) | | | (30,756 | ) |
| | | | | | | |
| | | | | | (248,440 | ) |
| | | | | | | |
Leisure Products - (1.9)% | | | | | | | |
Callaway Golf Company | | (889 | ) | | | (6,765 | ) |
Pool Corporation 6,7 | | (11,639 | ) | | | (288,065 | ) |
| | | | | | | |
| | | | | | (294,830 | ) |
| | | | | | | |
Life Sciences Tools & Services - (1.1)% | | | | | | | |
Luminex Corporation 6,7,* | | (2,500 | ) | | | (63,725 | ) |
Pharmaceutical Product Development, Inc. | | (996 | ) | | | (21,852 | ) |
Sequenom, Inc. 6,7,* | | (3,810 | ) | | | (78,524 | ) |
| | | | | | | |
| | | | | | (164,101 | ) |
| | | | | | | |
Oil & Gas Exploration & Production - (0.7)% | | | | | | | |
BPZ Resources, Inc. 6,7,* | | (5,700 | ) | | | (107,160 | ) |
| | | | | | | |
Oil & Gas Refining & Marketing - (0.1)% | | | | | | | |
Sunoco, Inc. | | (458 | ) | | | (13,031 | ) |
Valero Energy Corporation | | (155 | ) | | | (3,005 | ) |
Western Refining, Inc. * | | (465 | ) | | | (2,999 | ) |
| | | | | | | |
| | | | | | (19,035 | ) |
| | | | | | | |
Pharmaceuticals - (0.9)% | | | | | | | |
Auxilium Pharmaceuticals, Inc. 6,7,* | | (1,540 | ) | | | (56,703 | ) |
Sepracor, Inc. 6,7,* | | (1,400 | ) | | | (24,500 | ) |
XenoPort, Inc. 6,7,* | | (1,376 | ) | | | (63,062 | ) |
| | | | | | | |
| | | | | | (144,265 | ) |
| | | | | | | |
| | | | | | | |
| | | Shares | | | Value | |
COMMON STOCKS - (27.2)% (continued) | | | | | | | |
Publishing - (0.1)% | | | | | | | |
Interactive Data Corporation | | (774 | ) | | $ | (20,286 | ) |
| | | | | | | |
Regional Banks - (0.7)% | | | | | | | |
PrivateBancorp, Inc. 6,7 | | (2,390 | ) | | | (102,770 | ) |
| | | | | | | |
Research & Consulting Services - (0.3)% | | | | | | | |
Dun & Bradstreet Corporation | | (465 | ) | | | (35,024 | ) |
Huron Consulting Group, Inc. * | | (465 | ) | | | (12,011 | ) |
| | | | | | | |
| | | | | | (47,035 | ) |
| | | | | | | |
Restaurants - (0.1)% | | | | | | | |
Burger King Holdings, Inc. | | (465 | ) | | | (8,180 | ) |
Ruby Tuesday, Inc. * | | (310 | ) | | | (2,610 | ) |
| | | | | | | |
| | | | | | (10,790 | ) |
| | | | | | | |
Semiconductor Equipment - (0.2)% | | | | | | | |
Varian Semiconductor Equipment Associates, Inc. 6,7,* | | (1,260 | ) | | | (33,037 | ) |
| | | | | | | |
Semiconductors - (1.1)% | | | | | | | |
Cree, Inc. 6,7,* | | (4,000 | ) | | | (109,840 | ) |
Rambus, Inc. 6,7,* | | (3,600 | ) | | | (55,224 | ) |
| | | | | | | |
| | | | | | (165,064 | ) |
| | | | | | | |
Soft Drinks - (0.6)% | | | | | | | |
Hansen Natural Corporation 6,7,* | | (3,250 | ) | | | (96,233 | ) |
| | | | | | | |
Specialty Chemicals - (0.3)% | | | | | | | |
Zoltek Companies, Inc. 6,7,* | | (2,700 | ) | | | (49,221 | ) |
| | | | | | | |
Systems Software - (0.7)% | | | | | | | |
Red Hat, Inc. 6,7,* | | (2,610 | ) | | | (46,589 | ) |
VMware, Inc. 6,7,* | | (2,400 | ) | | | (68,592 | ) |
| | | | | | | |
| | | | | | (115,181 | ) |
| | | | | | | |
Wireless Telecommunication Services - (1.0)% | | | | | | | |
Leap Wireless International, Inc. 6,7,* | | (1,500 | ) | | | (65,100 | ) |
MetroPCS Communications, Inc. * | | (619 | ) | | | (5,794 | ) |
SBA Communications Corporation 6,7,* | | (2,400 | ) | | | (69,096 | ) |
Telephone & Data Systems, Inc. | | (619 | ) | | | (19,195 | ) |
| | | | | | | |
| | | | | | (159,185 | ) |
| | | | | | | |
TOTAL COMMON STOCKS SOLD SHORT (proceeds $4,185,233) | | | | | $ | (4,226,856 | ) |
| | | | | | | |
| | |
| | | Shares | | | Value | |
FOREIGN STOCKS - (23.5)% | | | | | | | |
Airlines - (0.2)% | | | | | | | |
Ryanair Holdings plc 6,7,* | | (9,600 | ) | | $ | (35,971 | ) |
| | | | | | | |
Airport Services - (1.2)% | | | | | | | |
Beijing Capital International Airport Company, Ltd. 6,7 | | (218,000 | ) | | | (188,550 | ) |
| | | | | | | |
Apparel, Accessories & Luxury Goods - (0.1)% | | | | | | | |
C C Land Holdings, Ltd. 6,7 | | (50,000 | ) | | | (13,945 | ) |
| | | | | | | |
Automobile Manufacturers - (3.4)% | | | | | | | |
Volkswagen AG 6,7 | | (1,300 | ) | | | (539,375 | ) |
| | | | | | | |
Biotechnology - (1.5)% | | | | | | | |
Basilea Pharmaceutica 6,7,* | | (500 | ) | | | (83,364 | ) |
The accompanying notes are an integral part of the financial statements
20
| | |
| Schedule of Investments | | Rydex | SGI Equity Fund |
| September 30, 2009 | | Alpha Opportunity Series |
| | | | | | | |
| | | Shares | | | Value | |
FOREIGN STOCKS - (23.5)% (continued) | | | | | | | |
Biotechnology - (1.5)% (continued) | | | | | | | |
Intercell AG 6,7,* | | (1,900 | ) | | $ | (74,840 | ) |
Zeltia S.A. 6,7 | | (8,000 | ) | | | (54,559 | ) |
| | | | | | | |
| | | | | | (212,763 | ) |
| | | | | | | |
Broadcasting - (0.1)% | | | | | | | |
Tokyo Broadcasting System Holdings, Inc. 6,7 | | (1,300 | ) | | | (21,836 | ) |
| | | | | | | |
Cable & Satellite - (0.4)% | | | | | | | |
Sky Deutschland AG 6,7,* | | (4,000 | ) | | | (65,668 | ) |
| | | | | | | |
Casinos & Gaming - (1.0)% | | | | | | | |
bwin Interactive Entertainment AG 6,7,* | | (1,600 | ) | | | (45,582 | ) |
Genting Singapore plc 6,7,* | | (124,900 | ) | | | (41,123 | ) |
PartyGaming plc 6,7 | | (15,200 | ) | | | (57,210 | ) |
| | | | | | | |
| | | | | | (143,915 | ) |
| | | | | | | |
Coal & Consumable Fuels - (0.5)% | | | | | | | |
Aquila Resources, Ltd. 6,7,* | | (2,500 | ) | | | (21,907 | ) |
Riversdale Mining, Ltd. 6,7,* | | (6,700 | ) | | | (50,985 | ) |
| | | | | | | |
| | | | | | (72,892 | ) |
| | | | | | | |
Construction & Engineering - (0.2)% | | | | | | | |
Ausenco, Ltd. 6,7 | | (2,100 | ) | | | (22,659 | ) |
China Communications Construction Company, Ltd. 6,7 | | (15,000 | ) | | | (15,536 | ) |
| | | | | | | |
| | | | | | (38,195 | ) |
| | | | | | | |
Construction & Farm Machinery & Heavy Trucks - (0.1)% | | | | | | | |
China National Materials Company, Ltd. 6,7 | | (34,400 | ) | | | (17,537 | ) |
| | | | | | | |
Construction Materials - (0.3)% | | | | | | | |
Anhui Conch Cement Company, Ltd. 6,7 | | (4,500 | ) | | | (20,259 | ) |
China National Building Material Company, Ltd. 6,7 | | (14,700 | ) | | | (19,911 | ) |
| | | | | | | |
| | | | | | (40,169 | ) |
| | | | | | | |
Department Stores - (1.5)% | | | | | | | |
Marui Group Company, Ltd. 6,7 | | (29,100 | ) | | | (219,528 | ) |
| | | | | | | |
Diversified Banks - (2.6)% | | | | | | | |
Aozora Bank, Ltd. 6,7 | | (16,300 | ) | | | (26,250 | ) |
Erste Group Bank AG 6,7 | | (5,200 | ) | | | (319,535 | ) |
Mizuho Financial Group, Inc. 6,7 | | (11,000 | ) | | | (45,462 | ) |
Mizuho Trust & Banking Company, Ltd. 6,7 | | (17,700 | ) | | | (24,682 | ) |
| | | | | | | |
| | | | | | (415,929 | ) |
| | | | | | | |
Diversified Metals & Mining - (0.5)% | | | | | | | |
Fushan International Energy Group, Ltd. 6,7,* | | (66,000 | ) | | | (23,727 | ) |
Western Areas NL 6,7,* | | (6,200 | ) | | | (44,456 | ) |
| | | | | | | |
| | | | | | (68,183 | ) |
| | | | | | | |
Diversified Real Estate Activities - (0.1)% | | | | | | | |
Franshion Properties China, Ltd. 6,7 | | (79,400 | ) | | | (22,104 | ) |
| | | | | | | |
| | | | | | | |
| | | Shares | | | Value | |
FOREIGN STOCKS - (23.5)% (continued) | | | | | | | |
Electrical Components & Equipment - (0.2)% | | | | | | | |
Toyo Tanso Company, Ltd. 6,7 | | (500 | ) | | $ | (27,007 | ) |
| | | | | | | |
Gold - (1.0)% | | | | | | | |
Agnico-Eagle Mines, Ltd. 6,7,8 | | (1,800 | ) | | | (119,001 | ) |
Sino Gold Mining, Ltd. 6,7,* | | (8,600 | ) | | | (35,368 | ) |
| | | | | | | |
| | | | | | (154,369 | ) |
| | | | | | | |
Highways & Railtracks - (3.0)% | | | | | | | |
Brisa Auto-Estradas de Portugal S.A. 6,7 | | (44,400 | ) | | | (461,804 | ) |
| | | | | | | |
Household Appliances - (2.5)% | | | | | | | |
Electrolux AB 6,7 | | (30,100 | ) | | | (395,761 | ) |
| | | | | | | |
Industrial Machinery - (0.4)% | | | | | | | |
Japan Steel Works, Ltd. 6,7 | | (1,500 | ) | | | (20,809 | ) |
Meyer Burger Technology AG 6,7,* | | (200 | ) | | | (49,879 | ) |
| | | | | | | |
| | | | | | (70,688 | ) |
| | | | | | | |
Internet Software & Services - (0.2)% | | | | | | | |
Access Company, Ltd. 6,7,* | | (17 | ) | | | (32,755 | ) |
| | | | | | | |
Investment Banking & Brokerage - (0.2)% | | | | | | | |
Monex Group, Inc. 6,7 | | (78 | ) | | | (27,384 | ) |
| | | | | | | |
Marine Ports & Services - (0.1)% | | | | | | | |
China Merchants Holdings International Company, Ltd. 6,7 | | (3,100 | ) | | | (11,047 | ) |
| | | | | | | |
Oil & Gas Equipment & Services - (0.5)% | | | | | | | |
Modec, Inc. 6,7 | | (900 | ) | | | (23,195 | ) |
Sevan Marine ASA 6,7,* | | (5,900 | ) | | | (30,951 | ) |
Trican Well Service, Ltd. 6,7 | | (2,000 | ) | | | (34,043 | ) |
| | | | | | | |
| | | | | | (88,189 | ) |
| | | | | | | |
Oil & Gas Exploration & Production - (1.0)% | | | | | | | |
Arrow Energy, Ltd. 6,7,* | | (8,900 | ) | | | (22,965 | ) |
Imperial Energy Corporation plc 6,7,* | | (3,900 | ) | | | (77,681 | ) |
Queensland Gas Company, Ltd. 6,7,* | | (12,800 | ) | | | (49,787 | ) |
| | | | | | | |
| | | | | | (150,433 | ) |
| | | | | | | |
Precious Metals & Minerals - (0.4)% | | | | | | | |
Silver Wheaton Corporation 6,7,* | | (6,100 | ) | | | (64,046 | ) |
| | | | | | | |
Real Estate Operating Companies - (0.3)% | | | | | | | |
Aeon Mall Company, Ltd. 6,7 | | (1,700 | ) | | | (52,093 | ) |
| | | | | | | |
TOTAL FOREIGN STOCKS SOLD SHORT
(proceeds $3,495,580) | | | | | $ | (3,652,136 | ) |
| | | | | | | |
TOTAL SECURITIES SOLD SHORT - (50.7%)
(proceeds $7,680,813) | | | | | $ | (7,878,992 | ) |
| | | | | | | |
The accompanying notes are an integral part of the financial statements
21
| | |
| Schedule of Investments | | Rydex | SGI Equity Fund |
| September 30, 2009 | | Alpha Opportunity Series |
INVESTMENT CONCENTRATION
At September 30, 2009, the investment diversification of the Series was as follows:
| | | | | | | |
Country | | % of Net
Assets | | | Value | |
United States | | 89.5 | % | | $ | 13,920,651 | |
Cayman Islands | | 4.8 | | | | 768,433 | |
Bermuda | | 0.7 | | | | 106,329 | |
Canada | | 0.3 | | | | 39,977 | |
Taiwan | | 0.2 | | | | 37,231 | |
Singapore | | 0.1 | | | | 9,146 | |
United Kingdom | | 0.1 | | | | 8,889 | |
Panama | | 0.1 | | | | 8,333 | |
Virgin Islands (UK) | | 0.0 | | | | 5,248 | |
Finland | | 0.0 | | | | (4,532 | ) |
Norway | | (0.1 | ) | | | (14,452 | ) |
Ireland | | (0.2 | ) | | | (35,971 | ) |
Isle Of Man | | (0.3 | ) | | | (41,123 | ) |
Spain | | (0.4 | ) | | | (54,559 | ) |
Hong Kong | | (0.4 | ) | | | (56,878 | ) |
Gibraltar | | (0.4 | ) | | | (57,210 | ) |
Switzerland | | (0.7 | ) | | | (104,375 | ) |
Republic of Korea | | (1.6 | ) | | | (247,734 | ) |
Australia | | (1.6 | ) | | | (248,127 | ) |
China | | (1.7 | ) | | | (261,792 | ) |
Sweden | | (2.5 | ) | | | (395,761 | ) |
Austria | | (2.8 | ) | | | (439,957 | ) |
Portugal | | (3.0 | ) | | | (461,804 | ) |
Japan | | (3.1 | ) | | | (497,537 | ) |
Germany | | (3.8 | ) | | | (605,043 | ) |
| | | | | | | |
Total Investments | | 73.2 | | | $ | 11,377,382 | |
| | | | | | | |
For federal income tax purposes the identified cost of investments owned at September 30, 2009 was $20,383,910.
| ADR | American Depositary Receipt |
| plc | Public Limited Company |
| * | Non-income producing security |
| 1 | Security is segregated as collateral for open short positions. |
| 2 | Security is deemed illiquid. The total market value of illiquid securities is $7,704,854 (cost $8,705,066), or 49.6% of total net assets. The securities were liquid at time of purchase. This security is deemed illiquid due to the Series exposure to Lehman Brothers International Europe (“LBIE”) prime brokerage services. See Note 9 in the Notes to Financial Statements for additional information. |
| 3 | Security is segregated as collateral for open futures contracts. |
| 4 | Value determined based on Level 2 inputs established by ASC 820. |
| 5 | Unless otherwise indicated, the values of the securities of the Portfolio are determined based on Level 1 inputs established by ASC 820. |
| 6 | Security is fair valued by the Valuation Committee at September 30, 2009. The total market value of fair valued securities amounts to $(7,341,377) (cost $(7,166,693)), or (47.2%) of total net assets. |
| 7 | Value determined based on Level 3 inputs established by ASC 820. |
| 8 | Security was acquired through a private placement. |
The accompanying notes are an integral part of the financial statements
22
Rydex | SGI Equity Fund
Alpha Opportunity Series
Statement of Assets and Liabilities
September 30, 2009
| | | | |
Assets: | | | | |
Investments, at value* | | $ | 17,579,358 | |
Repurchase agreement, at value* | | | 1,677,016 | |
Cash | | | 551,277 | |
Cash denominated in a foreign currency, at value*** | | | 525 | |
Restricted cash | | | 708,516 | |
Restricted cash denominated in a foreign currency, at value**** | | | 3,568,782 | |
Receivables: | | | | |
Securities sold | | | 766,559 | |
Dividends | | | 17,036 | |
Security Investors | | | 46,941 | |
Foreign taxes recoverable | | | 582 | |
Prepaid expenses | | | 18,264 | |
| | | | |
Total assets | | | 24,934,856 | |
| | | | |
Liabilities: | | | | |
Securities sold short, at value** | | | 7,878,992 | |
Payable for: | | | | |
Securities purchased | | | 1,372,961 | |
Fund shares redeemed | | | 35,607 | |
Variation margin | | | 6,280 | |
Dividends on short sales | | | 2,861 | |
Management fees | | | 16,057 | |
Custodian fees | | | 12,000 | |
Transfer agent/maintenance fees | | | 3,180 | |
Administration fees | | | 6,697 | |
Professional fees | | | 51,607 | |
12b-1 distribution plan fees | | | 5,014 | |
Directors’ fees | | | 1,546 | |
Other | | | 4,556 | |
| | | | |
Total liabilities | | | 9,397,358 | |
| | | | |
Net assets | | $ | 15,537,498 | |
| | | | |
Net assets consist of: | | | | |
Paid in capital | | $ | 30,306,936 | |
Accumulated net investment loss | | | (29,427 | ) |
Accumulated net realized loss on sale of investments and foreign currency transactions | | | (13,686,600 | ) |
Net unrealized depreciation in value of investments and translation of assets and liabilities in foreign currencies | | | (1,053,411 | ) |
| | | | |
Net assets | | $ | 15,537,498 | |
| | | | |
Class A: | | | | |
Capital shares outstanding (unlimited number of shares authorized) | | | 1,139,719 | |
Net assets | | $ | 9,751,774 | |
Net asset value and redemption price per share | | $ | 8.56 | |
| | | | |
Maximum offering price per share (net asset value divided by 94.25%) | | $ | 9.08 | |
| | | | |
Class B: | | | | |
Capital shares outstanding (unlimited number of shares authorized) | | | 203,440 | |
Net assets | | $ | 1,634,834 | |
Net asset value, offering and redemption price per share (excluding any applicable contingent deferred sales charge) | | $ | 8.04 | |
| | | | |
Class C: | | | | |
Capital shares outstanding (unlimited number of shares authorized) | | | 248,922 | |
Net assets | | $ | 1,995,793 | |
Net asset value, offering and redemption price per share (excluding any applicable contingent deferred sales charge) | | $ | 8.02 | |
| | | | |
Institutional Class: | | | | |
Capital shares outstanding (unlimited number of shares authorized) | | | 183,744 | |
Net assets | | $ | 2,155,097 | |
Net asset value, offering and redemption price per share (excluding any applicable contingent deferred sales charge) | | $ | 11.73 | |
| | | | |
* Investments, at cost | | $ | 20,331,647 | |
** Securities sold short, proceeds | | | 7,680,813 | |
*** Cash denominated in a foreign currency, at cost | | | 498 | |
****Restricted cash denominated in a foreign currency, at cost | | | 3,383,982 | |
Statement of Operations
For the Year Ended September 30, 2009
| | | | |
Investment Income: | | | | |
Dividends (net of foreign withholding tax of $3,109) | | $ | 249,600 | |
Interest | | | 32,653 | |
| | | | |
Total investment income | | | 282,253 | |
| | | | |
Expenses: | | | | |
Management fees | | | 239,679 | |
Transfer agent/maintenance fees | | | 103,234 | |
Administration fees | | | 44,418 | |
Custodian fees | | | 54,144 | |
Directors’ fees | | | 2,374 | |
Professional fees | | | 179,304 | |
Reports to shareholders | | | 19,832 | |
Registration fees | | | 43,385 | |
Other expenses | | | 5,601 | |
Dividends on short sales | | | 4,601 | |
12b-1 distribution fees - Class A | | | 30,975 | |
12b-1 distribution fees - Class B | | | 20,379 | |
12b-1 distribution fees - Class C | | | 24,759 | |
| | | | |
Total expenses | | | 772,685 | |
Less: | | | | |
Reimbursement of expenses - Class A | | | (225,945 | ) |
Reimbursement of expenses - Class B | | | (37,104 | ) |
Reimbursement of expenses - Class C | | | (47,666 | ) |
Reimbursement of expenses - Class Institutional | | | (49,636 | ) |
Earnings credits applied | | | (6,363 | ) |
| | | | |
Net expenses | | | 405,971 | |
| | | | |
Net investment loss | | | (123,718 | ) |
| | | | |
Net Realized and Unrealized Gain (Loss): | | | | |
Net realized gain (loss) during the year on: | | | | |
Investments | | | (7,731,216 | ) |
Securities sold short | | | 41,332 | |
Foreign currency transactions | | | (133,577 | ) |
Futures | | | (2,673,119 | ) |
| | | | |
Net realized loss | | | (10,496,580 | ) |
| | | | |
Net unrealized appreciation (depreciation) during the year on: | | | | |
Investments | | | 2,556,098 | |
Securities sold short | | | (273,059 | ) |
Futures | | | 942,667 | |
Translation of assets and liabilities in foreign currencies | | | 272,683 | |
| | | | |
Net unrealized appreciation | | | 3,498,389 | |
| | | | |
Net loss | | | (6,998,191 | ) |
| | | | |
Net decrease in net assets resulting from operations | | $ | (7,121,909 | ) |
| | | | |
The accompanying notes are an integral part of the financial statements
23
| | |
| | Rydex | SGI Equity Fund |
| Statement of Changes in Net Assets | | Alpha Opportunity Series |
| | | | | | | | |
| | | Year Ended
September 30, 2009 | | | Year Ended
September 30, 2008 | |
Increase (decrease) in net assets from operations: | | | | | | | | |
Net investment loss | | $ | (123,718 | ) | | $ | (630,670 | ) |
Net realized loss during the year on investments and foreign currency transactions | | | (10,496,580 | ) | | | (1,900,322 | ) |
Net unrealized appreciation (depreciation) during the year on investments and translation of assets and liabilities in foreign currencies | | | 3,498,389 | | | | (5,203,245 | ) |
| | | | | | | | |
Net decrease in net assets resulting from operations | | | (7,121,909 | ) | | | (7,734,237 | ) |
| | | | | | | | |
Distributions to shareholders from: | | | | | | | | |
Net realized gain | | | | | | | | |
Class A | | | — | | | | (4,624,275 | ) |
Class B | | | — | | | | (730,879 | ) |
Class C | | | — | | | | (959,211 | ) |
Return of capital | | | | | | | | |
Class A | | | — | | | | (508,721 | ) |
Class B | | | — | | | | (80,405 | ) |
Class C | | | — | | | | (105,524 | ) |
| | | | | | | | |
Total distributions to shareholders | | | — | | | | (7,009,015 | ) |
| | | | | | | | |
Capital share transactions: | | | | | | | | |
Proceeds from sale of shares | | | | | | | | |
Class A | | | 1,524,278 | | | | 20,613,127 | |
Class B | | | 4,268 | | | | 5,409,786 | |
Class C | | | 7,933 | | | | 3,698,851 | |
Institutional Class | | | 4,980,476 | | | | — | |
Distributions reinvested | | | | | | | | |
Class A | | | — | | | | 5,033,793 | |
Class B | | | — | | | | 802,594 | |
Class C | | | — | | | | 960,779 | |
Cost of shares redeemed | | | | | | | | |
Class A | | | (16,913,028 | ) | | | (9,305,440 | ) |
Class B | | | (2,762,142 | ) | | | (2,099,606 | ) |
Class C | | | (2,096,985 | ) | | | (1,872,076 | ) |
Institutional Class | | | (3,025,562 | ) | | | — | |
| | | | | | | | |
Net increase (decrease) from capital share transactions | | | (18,280,762 | ) | | | 23,241,808 | |
| | | | | | | | |
Net increase (decrease) in net assets | | | (25,402,671 | ) | | | 8,498,556 | |
| | | | | | | | |
Net assets: | | | | | | | | |
Beginning of year | | | 40,940,169 | | | | 32,441,613 | |
| | | | | | | | |
End of year | | $ | 15,537,498 | | | $ | 40,940,169 | |
| | | | | | | | |
Accumulated net investment loss at end of year | | $ | (29,427 | ) | | $ | (35,571 | ) |
| | | | | | | | |
Capital share activity: | | | | | | | | |
Shares sold | | | | | | | | |
Class A | | | 208,127 | | | | 1,869,043 | |
Class B | | | 292 | | | | 505,963 | |
Class C | | | 796 | | | | 335,936 | |
Institutional Class | | | 502,702 | | | | — | |
Shares reinvested | | | | | | | | |
Class A | | | — | | | | 463,090 | |
Class B | | | — | | | | 77,545 | |
Class C | | | — | | | | 92,829 | |
Shares redeemed | | | | | | | | |
Class A | | | (2,335,782 | ) | | | (863,491 | ) |
Class B | | | (404,666 | ) | | | (210,696 | ) |
Class C | | | (308,317 | ) | | | (186,349 | ) |
Institutional Class | | | (318,958 | ) | | | — | |
The accompanying notes are an integral part of the financial statements
24
| | |
| Financial Highlights | | Rydex | SGI Equity Fund |
Selected data for each share of capital stock outstanding throughout each year | | Alpha Opportunity Series |
| | | | | | | | | | | | | | | | | | | | |
Class A | | 2009 | | | 2008 a | | | 2007 | | | 2006 | | | Year Ended
September 30,
2005 | |
Per Share Data | | | | | | | | | | | | | | | | | | | | |
Net asset value, beginning of period | | $ | 9.37 | | | $ | 13.94 | | | $ | 12.23 | | | $ | 12.37 | | | $ | 11.79 | |
| | | | | | | | | | | | | | | | | | | | |
Income (loss) from investment operations: | | | | | | | | | | | | | | | | | | | | |
Net investment loss b | | | (0.04 | ) | | | (0.16 | ) | | | (0.01 | ) | | | (0.06 | ) | | | (0.10 | ) |
Net gain (loss) on securities (realized and unrealized) | | | (0.77 | ) | | | (1.68 | ) | | | 2.99 | | | | 0.93 | | | | 1.50 | |
| | | | | | | | | | | | | | | | | | | | |
Total from investment operations | | | (0.81 | ) | | | (1.84 | ) | | | 2.98 | | | | 0.87 | | | | 1.40 | |
| | | | | | | | | | | | | | | | | | | | |
Less distributions: | | | | | | | | | | | | | | | | | | | | |
Distributions from realized gains | | | — | | | | (2.57 | ) | | | (1.27 | ) | | | (1.01 | ) | | | (0.82 | ) |
Return of capital | | | — | | | | (0.16 | ) | | | — | | | | — | | | | — | |
| | | | | | | | | | | | | | | | | | | | |
Total distributions | | | — | | | | (2.73 | ) | | | (1.27 | ) | | | (1.01 | ) | | | (0.82 | ) |
| | | | | | | | | | | | | | | | | | | | |
Net asset value, end of period | | $ | 8.56 | | | $ | 9.37 | | | $ | 13.94 | | | $ | 12.23 | | | $ | 12.37 | |
| | | | | | | | | | | | | | | | | | | | |
Total Return c | | | (8.64 | %) | | | (15.99 | %) | | | 26.10 | % | | | 7.39 | % | | | 12.26 | % |
| | | | | | | | | | | | | | | | | | | | |
Ratios/Supplemental Data | | | | | | | | | | | | | | | | | | | | |
Net assets, end of period (in thousands) | | $ | 9,752 | | | $ | 30,615 | | | $ | 25,072 | | | $ | 20,595 | | | $ | 14,622 | |
| | | | | | | | | | | | | | | | | | | | |
Ratios to average net assets: | | | | | | | | | | | | | | | | | | | | |
Net investment loss | | | (0.50 | %) | | | (1.44 | %) | | | (0.08 | %) | | | (0.50 | %) | | | (0.83 | %) |
Total expenses d | | | 3.82 | % | | | 3.41 | % e | | | 2.88 | % | | | 3.20 | % | | | 2.94 | % |
Net expenses f | | | 1.95 | % | | | 3.16 | % g | | | 2.68 | % | | | 3.01 | % | | | 2.86 | % |
Net expenses prior to custodian earning credits and net of expense waivers | | | 1.98 | % | | | 3.32 | % h | | | 2.88 | % | | | 3.10 | % | | | 2.86 | % |
Net expenses prior to performance fee adjustmenti | | | N/A | | | | 2.75 | % j | | | 2.77 | % | | | 2.82 | % | | | 2.78 | % |
| | | | | | | | | | | | | | | | | | | | |
Portfolio turnover rate | | | 422 | % | | | 1,248 | % | | | 1,697 | % | | | 1,302 | % | | | 1,502 | % |
| | | | | |
Class B | | 2009 | | | 2008a | | | 2007 | | | 2006 | | | Year Ended
September 30,
2005 | |
Per Share Data | | | | | | | | | | | | | | | | | | | | |
Net asset value, beginning of period | | $ | 8.87 | | | $ | 13.42 | | | $ | 11.90 | | | $ | 12.15 | | | $ | 11.68 | |
| | | | | | | | | | | | | | | | | | | | |
Income (loss) from investment operations: | | | | | | | | | | | | | | | | | | | | |
Net investment loss b | | | (0.09 | ) | | | (0.23 | ) | | | (0.09 | ) | | | (0.15 | ) | | | (0.18 | ) |
Net gain (loss) on securities (realized and unrealized) | | | (0.74 | ) | | | (1.59 | ) | | | 2.88 | | | | 0.91 | | | | 1.47 | |
| | | | | | | | | | | | | | | | | | | | |
Total from investment operations | | | (0.83 | ) | | | (1.82 | ) | | | 2.79 | | | | 0.76 | | | | 1.29 | |
| | | | | | | | | | | | | | | | | | | | |
Less distributions: | | | | | | | | | | | | | | | | | | | | |
Distributions from realized gains | | | — | | | | (2.57 | ) | | | (1.27 | ) | | | (1.01 | ) | | | (0.82 | ) |
Return of capital | | | — | | | | (0.16 | ) | | | — | | | | — | | | | — | |
| | | | | | | | | | | | | | | | | | | | |
Total distributions | | | — | | | | (2.73 | ) | | | (1.27 | ) | | | (1.01 | ) | | | (0.82 | ) |
| | | | | | | | | | | | | | | | | | | | |
Net asset value, end of period | | $ | 8.04 | | | $ | 8.87 | | | $ | 13.42 | | | $ | 11.90 | | | $ | 12.15 | |
| | | | | | | | | | | | | | | | | | | | |
Total Return c | | | (9.36 | %) | | | (16.66 | %) | | | 25.14 | % | | | 6.56 | % | | | 11.39 | % |
| | | | | | | | | | | | | | | | | | | | |
Ratios/Supplemental Data | | | | | | | | | | | | | | | | | | | | |
Net assets, end of period (in thousands) | | $ | 1,635 | | | $ | 5,391 | | | $ | 3,154 | | | $ | 4,846 | | | $ | 4,106 | |
| | | | | | | | | | | | | | | | | | | | |
Ratios to average net assets: | | | | | | | | | | | | | | | | | | | | |
Net investment loss | | | (1.24 | %) | | | (2.18 | %) | | | (0.77 | %) | | | (1.24 | %) | | | (1.60 | %) |
Total expenses d | | | 4.57 | % | | | 4.16 | %e | | | 3.59 | % | | | 3.95 | % | | | 3.69 | % |
Net expenses f | | | 2.70 | % | | | 3.89 | %g | | | 3.39 | % | | | 3.76 | % | | | 3.61 | % |
Net expenses prior to custodian earning credits and net of expense waivers | | | 2.73 | % | | | 4.04 | %h | | | 3.59 | % | | | 3.85 | % | | | 3.61 | % |
Net expenses prior to performance fee adjustmenti | | | N/A | | | | 3.49 | %j | | | 3.51 | % | | | 3.57 | % | | | 3.53 | % |
| | | | | | | | | | | | | | | | | | | | |
Portfolio turnover rate | | | 422 | % | | | 1,248 | % | | | 1,697 | % | | | 1,302 | % | | | 1,502 | % |
The accompanying notes are an integral part of the financial statements
25
| | |
| Financial Highlights | | Rydex | SGI Equity Fund |
Selected data for each share of capital stock outstanding throughout each year | | Alpha Opportunity Series |
| | | | | | | | | | | | | | | | | | | | |
Class C | | 2009 | | | 2008a | | | 2007 | | | 2006 | | | Year Ended
September 30,
2005 | |
Per Share Data | | | | | | | | | | | | | | | | | | | | |
Net asset value, beginning of period | | $ | 8.87 | | | $ | 13.43 | | | $ | 11.90 | | | $ | 12.15 | | | $ | 11.68 | |
| | | | | | | | | | | | | | | | | | | | |
Income (loss) from investment operations: | | | | | | | | | | | | | | | | | | | | |
Net investment loss b | | | (0.09 | ) | | | (0.23 | ) | | | (0.10 | ) | | | (0.15 | ) | | | (0.18 | ) |
Net gain (loss) on securities (realized and unrealized) | | | (0.76 | ) | | | (1.60 | ) | | | 2.90 | | | | 0.91 | | | | 1.47 | |
| | | | | | | | | | | | | | | | | | | | |
Total from investment operations | | | (0.85 | ) | | | (1.83 | ) | | | 2.80 | | | | 0.76 | | | | 1.29 | |
| | | | | | | | | | | | | | | | | | | | |
Less distributions: | | | | | | | | | | | | | | | | | | | | |
Distributions from realized gains | | | — | | | | (2.57 | ) | | | (1.27 | ) | | | (1.01 | ) | | | (0.82 | ) |
Return of capital | | | — | | | | (0.16 | ) | | | — | | | | — | | | | — | |
| | | | | | | | | | | | | | | | | | | | |
Total distributions | | | — | | | | (2.73 | ) | | | (1.27 | ) | | | (1.01 | ) | | | (0.82 | ) |
| | | | | | | | | | | | | | | | | | | | |
Net asset value, end of period | | $ | 8.02 | | | $ | 8.87 | | | $ | 13.43 | | | $ | 11.90 | | | $ | 12.15 | |
| | | | | | | | | | | | | | | | | | | | |
Total Return c | | | (9.58 | %) | | | (16.63 | %) | | | 25.24 | % | | | 6.56 | % | | | 11.39 | % |
| | | | | | | | | | | | | | | | | | | | |
Ratios/Supplemental Data | | | | | | | | | | | | | | | | | | | | |
Net assets, end of period (in thousands) | | $ | 1,996 | | | $ | 4,935 | | | $ | 4,216 | | | $ | 5,576 | | | $ | 7,813 | |
| | | | | | | | | | | | | | | | | | | | |
Ratios to average net assets: | | | | | | | | | | | | | | | | | | | | |
Net investment loss | | | (1.24 | %) | | | (2.21 | %) | | | (0.77 | %) | | | (1.18 | %) | | | (1.58 | %) |
Total expenses d | | | 4.67 | % | | | 4.16 | %e | | | 3.60 | % | | | 3.95 | % | | | 3.68 | % |
Net expenses f | | | 2.70 | % | | | 3.93 | %g | | | 3.40 | % | | | 3.75 | % | | | 3.61 | % |
Net expenses prior to custodian earning credits and net of expense waivers | | | 2.73 | % | | | 4.09 | %h | | | 3.60 | % | | | 3.83 | % | | | 3.61 | % |
Net expenses prior to performance fee adjustmenti | | | N/A | | | | 3.51 | %j | | | 3.51 | % | | | 3.57 | % | | | 3.53 | % |
| | | | | | | | | | | | | | | | | | | | |
Portfolio turnover rate | | | 422 | % | | | 1,248 | % | | | 1,697 | % | | | 1,302 | % | | | 1,502 | % |
| | | | |
Institutional Class | | Period Ended
September 30,
2009 k | |
Per Share Data | | | | |
Net asset value, beginning of period | | $ | 10.00 | |
| | | | |
Income (loss) from investment operations: | | | | |
Net investment loss b | | | (0.01 | ) |
Net gain on securities (realized and unrealized) | | | 1.74 | |
| | | | |
Total from investment operations | | | 1.73 | |
| | | | |
Net asset value, end of period | | $ | 11.73 | |
| | | | |
Total Return c | | | 17.30 | % |
| | | | |
Ratios/Supplemental Data | | | | |
Net assets, end of period (in thousands) | | $ | 2,155 | |
| | | | |
Ratios to average net assets: | | | | |
Net investment loss | | | (0.07 | %) |
Total expenses d | | | 3.94 | % |
Net expenses f | | | 1.70 | % |
Net expenses prior to custodian earning credits and net of expense waivers | | | 1.73 | % |
Net expenses prior to performance fee adjustment i | | | N/A | |
| | | | |
Portfolio turnover rate | | | 422 | % |
The accompanying notes are an integral part of the financial statements
26
| | |
| Financial Highlights | | Rydex | SGI Equity Fund |
Selected data for each share of capital stock outstanding throughout each year | | Alpha Opportunity Series |
| a | Security Global Investors, LLC (SGI) became the sub-adviser of 37.5% of the assets of the Alpha Opportunity Series effective August 18, 2008. Also effective August 18, 2008, Mainstream Investment Advisers, LLC (Mainstream) sub-advises 37.5% of the assets and Security Investors, LLC (SI) manages 25% of the assets. Prior to August 18, 2008, SI paid Mainstream sub-advisory fees for 60% of the assets. SI managed the remaining 40% of the assets. |
| b | Net investment income (loss) was computed using average shares outstanding throughout the period. |
| c | Total return information does not reflect deduction of any sales charges imposed at the time of purchase for Class A shares or upon redemption for Class B and C shares. |
| d | Total expense information reflects expense ratios absent expense reductions by the Investment Manager and custodian earnings credits, as applicable. |
| e | The Series has restated its financial highlights in order to properly present the Series’ total expense ratios. The effect of this restatement was to increase the ratios of total expenses to average net assets by 0.45% for Class A, 1.03% for Class B and 0.14% for Class C. |
| f | Net expense information reflects the expense ratios after voluntary expense waivers, reimbursements and custodian earnings credits, as applicable. |
| g | The Series has restated this ratio in order to properly present the Series’ net expense ratios. The effect of this restatement was to increase the ratios of net expenses to average net assets by 0.41% for Class A, 0.96% for Class B and 0.13% for Class C. |
| h | The Series has restated this ratio in order to properly present the Series’ net expense ratios prior to custodian earning credits and net of expense waivers. The effect of this restatement was to increase the ratios of net expenses prior to custodian earning credits and net of expense waivers to average net assets by 0.44% for Class A, 1.00% for Class B and 0.14% for Class C. |
| i | Net expenses prior to performance fee adjustment reflect ratios after voluntary expense waivers, reimbursements, custodian earnings credits, and before performance fees adjustments, as applicable. |
| j | The Series has restated this ratio in order to properly present the Series’ net expense ratios prior to performance fee adjustment. The effect of this restatement was to increase the ratios of net expenses prior to performance fee adjustment to average net assets by 0.36% for Class A, 0.87% for Class B and 0.11% for Class C. |
| k | The Institutional Class of Alpha Opportunity Series was initially capitalized on November 7, 2008 with a net asset value of $10 per share. Percentage amounts for the period, except total return, have been annualized. |
The accompanying notes are an integral part of the financial statements
27
This page left blank intentionally.
28
Manager’s Commentary
November 16, 2009
To Our Shareholders:
The Rydex|SGI Equity Fund Equity Series returned –4.32%1 for the year ended September 30, 2009, besting the benchmark S&P 500 Index’s return of –6.91% and the Series’ peer group median performance of –5.75%.
The Series pursues its objective by investing approximately 50% of its total assets according to a large cap growth strategy and approximately 50% to a large cap value strategy. The manager will rebalance the Series if either strategy equals or exceeds 60% of total assets. The manager uses a blended approach, investing in growth stocks and value stocks and may invest in a limited number of industries and sectors.
The large cap growth manager chooses growth-oriented companies through a combination of a qualitative top-down approach in reviewing growth trend. The large cap value manager chooses securities of companies that appear to be undervalued relative to assets, earnings, growth potential, and cash flow. The managers sell a security when the reasons for buying it no longer apply or when the company begins to show deteriorating fundamentals or poor performance.
Health Care and Financials Top Performers
The health care sector, while an underweight position, led Series performance with a 7% gain versus a 4% loss for the Index. Schering-Plough Corporation, a 1.26% position, surged more than 50% during the period. Teva Pharmaceutical Industries, Ltd., a security not in the Index, was a 1.95% weight in the Series and gained over 10%, well above the –4% overall return in the benchmark. Other significant holdings that contributed to performance in the sector were Hospira, Inc. and Medco Health Solutions, Inc.
Ironically, it was the worst performing sector in the Index that provided the next biggest lift for the Series. A slight underweight to the Index, security selection allowed the Series to hold losses in the sector to 18% compared to a 23% decline for the benchmark. Limited exposure to Bank of America Corporation, which plummeted approximately 50% during the period, helped to bolster relative performance for the Series. Holding U.S. Bancorp during a period of limited losses over the year benefited the Series. A solid weighting in JPMorgan Chase & Company, which lost only 4% against the 23% loss in the overall sector, provided a boost in relative performance.
Energy and Information Technology Disappoint
Security selection was a drag on Series performance in the energy sector, declining 20% against a 14% loss in the Index. The largest detractor was Nabors Industries, Ltd. as it lost over 50% of its value. Other holdings hurting returns in the sector were Sasol, Ltd. and Williams Companies, Inc.
Holdings in the information technology sector gained 13% compared to a 9% gain for the benchmark but it was an underweight position, consisting of 14% of total assets rather than the 17% composition of the Index. Holding Corning, Inc. at the wrong time during the year resulted in a loss of approximately 20% instead of the flat performance that would have occurred had it been held during the entire period. Further, the Series had a double weight in Corning, relative to the benchmark, compounding the effect. Other securities that hurt sector performance were Cisco Systems, Inc. and Research In Motion, Ltd., which both declined more than 30%.
Market Outlook
Our bottom-up approach looks at market uncertainty in the context of the potential long-term impact on individual companies. Our focus is on identifying companies with the ability to be substantially better over the next three to five years or have the potential to maintain their return on capital at current levels in a difficult economic environment. During these uncertain times and volatile market conditions, we are confident in our ability to find these companies by consistently applying our disciplined process to individual stock evaluations.
We believe that investing is a long-term pursuit that requires patience and a consistent approach. We thank you for your business and the confidence you place in us.
|
| Sincerely, |
|
| |
| Mark A. Mitchell |
| Portfolio Manager |
| 1 | Performance figures are based on Class A shares and do not reflect deduction of the sales charges or taxes that a shareholder would pay on distributions or the redemption of shares. |
| | The strategies discussed herein do not assure a profit. The Fund is distributed by Rydex Distributors, Inc. |
29
| | |
| | Rydex | SGI Equity Fund |
| Performance Summary | | Equity Series |
| September 30, 2009 | | (unaudited) |
PERFORMANCE
Equity Series vs. S&P 500 Index
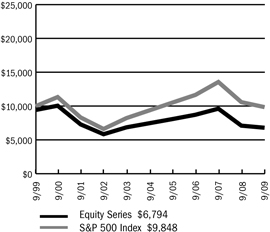
$10,000 Over Ten Years
This chart assumes a $10,000 investment in Class A shares of Equity Series on September 30, 1999, reflects deduction of the 5.75% sales load and assumes all dividends reinvested. The chart does not reflect the deduction of taxes that a shareholder would pay on distributions or the redemption of fund shares. The S&P 500 Index is a capitalization weighted index composed of 500 selected common stocks that represent the broad domestic economy and is a widely recognized unmanaged index on market performance.
Average Annual Returns
| | | | | | | | | |
Periods Ended 9-30-09 | | 1 Year | | | 5 Years | | | 10 Years | |
A Shares | | (4.32 | %) | | (1.86 | %) | | (3.22 | %) |
A Shares with sales charge | | (9.82 | %) | | (3.02 | %) | | (3.79 | %) |
B Shares | | (4.96 | %) | | (2.61 | %) | | (3.85 | %) |
B Shares with CDSC | | (9.69 | %) | | (2.86 | %) | | (3.85 | %) |
C Shares | | (4.60 | %) | | (2.55 | %) | | (4.00 | %) |
C Shares with CDSC | | (5.55 | %) | | (2.55 | %) | | (4.00 | %) |
The performance data above represents past performance that is not predictive of future results. The investment return and principal value of an investment in the Series will fluctuate so that an investor’s shares, when redeemed, may be worth more or less than their original cost. The figures above do not reflect deduction of the maximum front-end sales charge of 5.75% for Class A shares or the contingent deferred sales charge of 5% for Class B shares and 1% for Class C shares, as applicable, except where noted. The figures do not reflect the deduction of taxes that a shareholder would pay on distributions or redemption of shares. Such figures would be lower if the maximum sales charge and any applicable taxes were deducted.
Portfolio Composition by Sector as of 9-30-09
| | | |
Consumer Discretionary | | 13.97 | % |
Consumer Staples | | 10.06 | |
Energy | | 9.44 | |
Financials | | 10.27 | |
Health Care | | 8.78 | |
Industrials | | 18.77 | |
Information Technology | | 17.93 | |
Materials | | 4.12 | |
Telecommunication Services | | 0.54 | |
Utilities | | 2.21 | |
Exchange Traded Funds | | 1.00 | |
Cash & Other Assets, Less Liabilitities | | 2.91 | |
| | | |
Total Net Assets | | 100.00 | % |
| | | |
The accompanying notes are an integral part of the financial statements
30
| | |
| | Rydex | SGI Equity Fund |
| Performance Summary | | Equity Series |
| September 30, 2009 | | (unaudited) |
Information About Your Series Expenses
Calculating your ongoing Series expenses
Example
As a shareholder of the Series, you incur two types of costs: (1) transaction costs, which may include sales charges (loads) on purchase payments; contingent deferred sales charges on redemptions; and redemption fees, if any; and (2) ongoing costs, including management fees; distribution and/or service fees (12b-1); and other Series expenses. This example is intended to help you understand your ongoing costs (in dollars) of investing in the Series and to compare these costs with ongoing costs of investing in other mutual funds. The example is based on an investment of $1,000 invested at the beginning of the period and held for the entire period April 1, 2009 through September 30, 2009.
Actual Expenses
The first line for each class of shares in the table provides information about actual account values and actual expenses. You may use the information in this table, together with the amount you invested, to estimate the expenses that you paid over the period. Simply divide your account value by $1,000 (for example, an $8,600 account value divided by $1,000 = 8.6), then multiply the result by the number in the table under the heading entitled “Expenses Paid During the Period” to estimate the expenses you paid on your account during this period.
Hypothetical Example for Comparison Purposes
The second line for each class of shares in the table provides information about hypothetical account values and hypothetical expenses based on the Series actual expense ratio and an assumed rate of return of 5% per year before expenses, which is not the Series actual return. The hypothetical account values and expenses may not be used to estimate the actual ending account balance or expenses you paid for the period. You may use this information to compare the ongoing costs of investing in the Series and other funds. To do so, compare this 5% hypothetical example with the 5% hypothetical examples that appear in the shareholder reports of the other mutual funds.
Please note that the expenses shown in the table are meant to highlight your ongoing costs only and do not reflect any transactional costs, such as sales charges (loads) on purchase payments, contingent deferred sales charges on redemptions, and redemption fees, if any. Therefore, the second line for each class of shares is useful in comparing ongoing costs only, and will not help you determine the relative total costs of owning different funds. In addition, if these transactional costs were included, your costs would have been higher.
Series Expenses
| | | | | | | | | |
| | | Beginning
Account
Value
4/1/2009 | | Ending
Account
Value
9/30/2009 1 | | Expenses
Paid
During
Period 2 |
Equity Series - Class A | | | | | | | | | |
Actual | | $ | 1,000.00 | | $ | 1,345.51 | | $ | 8.53 |
Hypothetical | | | 1,000.00 | | | 1,017.80 | | | 7.33 |
Equity Series - Class B | | | | | | | | | |
Actual | | | 1,000.00 | | | 1,341.37 | | | 12.91 |
Hypothetical | | | 1,000.00 | | | 1,014.04 | | | 11.11 |
Equity Series - Class C | | | | | | | | | |
Actual | | | 1,000.00 | | | 1,345.72 | | | 12.94 |
Hypothetical | | | 1,000.00 | | | 1,014.04 | | | 11.11 |
| 1 | The actual ending account value is based on the actual total return of the Series for the period April 1, 2009 to September 30, 2009 after actual expenses and will differ from the hypothetical ending account value which is based on the Series expense ratio and a hypothetical annual return of 5% before expenses. The actual cumulative return at net asset value for the period April 1, 2009 to September 30, 2009 was 34.55%, 34.14% and 34.57%, for Class A, B and C shares, respectively. |
| 2 | Expenses are equal to the Series annualized expense ratio (1.45%, 2.20% and 2.20% for Class A, B, and C shares, respectively), net of any applicable fee waivers, multiplied by the average account value over the period, multiplied by 183/365 (to reflect the one-half year period). |
31
| | |
| Schedule of Investments | | Rydex | SGI Equity Fund |
| September 30, 2009 | | Equity Series |
| | | | | |
| | | Shares | | Value |
COMMON STOCKS - 97.1% | | | | | |
Advertising - 1.5% | | | | | |
Omnicom Group, Inc. | | 74,910 | | $ | 2,767,175 |
| | | | | |
Aerospace & Defense - 6.2% | | | | | |
Goodrich Corporation | | 52,150 | | | 2,833,831 |
Honeywell International, Inc. | | 77,770 | | | 2,889,156 |
ITT Corporation | | 59,230 | | | 3,088,844 |
Precision Castparts Corporation | | 1,359 | | | 138,441 |
United Technologies Corporation | | 39,600 | | | 2,412,828 |
| | | | | |
| | | | | 11,363,100 |
| | | | | |
Air Freight & Logistics - 1.7% | | | | | |
FedEx Corporation | | 42,800 | | | 3,219,416 |
| | | | | |
Asset Management & Custody Banks - 0.2% | | | | | |
Bank of New York Mellon Corporation | | 10,900 | | | 315,991 |
| | | | | |
Building Products - 1.4% | | | | | |
USG Corporation* | | 151,800 | | | 2,607,924 |
| | | | | |
Coal & Consumable Fuels - 1.3% | | | | | |
Peabody Energy Corporation | | 66,040 | | | 2,458,009 |
| | | | | |
Communications Equipment - 2.1% | | | | | |
Qualcomm, Inc. | | 86,225 | | | 3,878,401 |
| | | | | |
Computer Hardware - 3.4% | | | | | |
Apple, Inc.* | | 22,515 | | | 4,173,605 |
Hewlett-Packard Company | | 48,200 | | | 2,275,522 |
| | | | | |
| | | | | 6,449,127 |
| | | | | |
Construction Materials - 0.2% | | | | | |
Vulcan Materials Company | | 7,900 | | | 427,153 |
| | | | | |
Consumer Finance - 0.2% | | | | | |
First Marblehead Corporation * | | 133,960 | | | 294,712 |
| | | | | |
Data Processing & Outsourced Services - 2.3% | | | | | |
Western Union Company | | 232,200 | | | 4,393,224 |
| | | | | |
Department Stores - 3.2% | | | | | |
JC Penney Company, Inc. | | 84,300 | | | 2,845,125 |
Kohl’s Corporation * | | 54,850 | | | 3,129,193 |
| | | | | |
| | | | | 5,974,318 |
| | | | | |
Diversified Banks - 2.0% | | | | | |
U.S. Bancorp | | 87,775 | | | 1,918,761 |
Wells Fargo & Company | | 66,764 | | | 1,881,410 |
| | | | | |
| | | | | 3,800,171 |
| | | | | |
Diversified Chemicals - 0.7% | | | | | |
Dow Chemical Company | | 49,600 | | | 1,293,072 |
| | | | | |
Diversified Metals & Mining - 1.6% | | | | | |
Freeport-McMoRan Copper & Gold, Inc. (Cl.B) | | 43,710 | | | 2,998,943 |
| | | | | |
Drug Retail - 3.1% | | | | | |
CVS Caremark Corporation | | 160,455 | | | 5,734,662 |
| | | | | |
Electric Utilities - 1.6% | | | | | |
American Electric Power Company, Inc. | | 655 | | | 20,298 |
| | | | | |
| | | Shares | | Value |
COMMON STOCKS - 97.1% (continued) | | | | | |
Electric Utilities - 1.6% (continued) | | | | | |
Edison International | | 86,500 | | $ | 2,904,670 |
| | | | | |
| | | | | 2,924,968 |
| | | | | |
Electronic Components - 1.5% | | | | | |
Corning, Inc. | | 177,395 | | | 2,715,917 |
| | | | | |
Electronic Manufacturing Services - 1.0% | | | | | |
Tyco Electronics, Ltd. | | 85,600 | | | 1,907,168 |
| | | | | |
Exchange Traded Funds - 1.0% | | | | | |
iShares Russell 1000 Value Index Fund | | 17,100 | | | 948,879 |
iShares S&P 500 Value Index Fund | | 18,300 | | | 936,777 |
| | | | | |
| | | | | 1,885,656 |
| | | | | |
Footwear - 1.8% | | | | | |
Nike, Inc. (Cl.B) | | 50,930 | | | 3,295,171 |
| | | | | |
General Merchandise Stores - 1.6% | | | | | |
Target Corporation | | 64,850 | | | 3,027,198 |
| | | | | |
Health Care Equipment - 3.7% | | | | | |
Covidien plc | | 104,360 | | | 4,514,614 |
Hospira, Inc. * | | 49,500 | | | 2,207,700 |
| | | | | |
| | | | | 6,722,314 |
| | | | | |
Health Care Services - 1.0% | | | | | |
Medco Health Solutions, Inc. * | | 33,900 | | | 1,875,009 |
| | | | | |
Home Entertainment Software - 1.3% | | | | | |
Activision Blizzard, Inc. * | | 195,525 | | | 2,422,555 |
| | | | | |
Home Improvement Retail - 1.3% | | | | | |
Lowe’s Companies, Inc. | | 118,200 | | | 2,475,108 |
| | | | | |
Household Products - 1.1% | | | | | |
Colgate-Palmolive Company | | 26,600 | | | 2,029,048 |
| | | | | |
Hypermarkets & Super Centers - 2.6% | | | | | |
Costco Wholesale Corporation | | 42,500 | | | 2,399,550 |
Wal-Mart Stores, Inc. | | 48,100 | | | 2,361,229 |
| | | | | |
| | | | | 4,760,779 |
| | | | | |
Independent Power Producers & Energy Traders - 0.6% | | | | | |
NRG Energy, Inc. * | | 41,500 | | | 1,169,885 |
| | | | | |
Industrial Conglomerates - 4.1% | | | | | |
3M Company | | 39,400 | | | 2,907,720 |
General Electric Company | | 106,600 | | | 1,750,372 |
McDermott International, Inc. * | | 117,100 | | | 2,959,117 |
| | | | | |
| | | | | 7,617,209 |
| | | | | |
Industrial Gases - 1.6% | | | | | |
Air Products & Chemicals, Inc. | | 37,570 | | | 2,914,681 |
| | | | | |
Industrial Machinery - 1.1% | | | | | |
Parker Hannifin Corporation | | 38,300 | | | 1,985,472 |
| | | | | |
The accompanying notes are an integral part of the financial statements
32
| | |
| Schedule of Investments | | Rydex | SGI Equity Fund |
| September 30, 2009 | | Equity Series |
| | | | | |
| | | Shares | | Value |
COMMON STOCKS - 97.1% (continued) | | | | | |
Insurance Brokers - 0.7% | | | | | |
AON Corporation | | 32,900 | | $ | 1,338,701 |
| | | | | |
Integrated Oil & Gas - 3.1% | | | | | |
Chevron Corporation | | 29,900 | | | 2,105,857 |
ConocoPhillips | | 14,400 | | | 650,304 |
Exxon Mobil Corporation | | 45,700 | | | 3,135,476 |
| | | | | |
| | | | | 5,891,637 |
| | | | | |
Integrated Telecommunication Services - 0.5% | | | | | |
Windstream Corporation | | 98,400 | | | 996,792 |
| | | | | |
Internet Retail - 1.8% | | | | | |
Amazon.com, Inc. * | | 34,960 | | | 3,263,866 |
| | | | | |
Internet Software & Services - 2.3% | | | | | |
Google, Inc. * | | 8,470 | | | 4,199,850 |
| | | | | |
IT Consulting & Other Services - 1.9% | | | | | |
Cognizant Technology Solutions Corporation * | | 89,840 | | | 3,473,214 |
| | | | | |
Managed Health Care - 0.7% | | | | | |
Aetna, Inc. | | 49,600 | | | 1,380,368 |
| | | | | |
Movies & Entertainment - 1.0% | | | | | |
Time Warner, Inc. | | 61,700 | | | 1,775,726 |
| | | | | |
Oil & Gas Drilling - 2.0% | | | | | |
Transocean, Ltd. * | | 42,450 | | | 3,630,749 |
| | | | | |
Oil & Gas Equipment & Services - 1.1% | | | | | |
Halliburton Company | | 74,300 | | | 2,015,016 |
| | | | | |
Oil & Gas Exploration & Production - 1.0% | | | | | |
Chesapeake Energy Corporation | | 64,400 | | | 1,828,960 |
| | | | | |
Oil & Gas Storage & Transportation - 0.9% | | | | | |
Williams Companies, Inc. | | 93,900 | | | 1,677,993 |
| | | | | |
Other Diversified Financial Services - 4.1% | | | | | |
Bank of America Corporation | | 171,000 | | | 2,893,320 |
JPMorgan Chase & Company | | 105,055 | | | 4,603,510 |
| | | | | |
| | | | | 7,496,830 |
| | | | | |
Pharmaceuticals - 3.4% | | | | | |
Pfizer, Inc. | | 171,920 | | | 2,845,276 |
Schering-Plough Corporation | | 30,800 | | | 870,100 |
Teva Pharmaceutical Industries, Ltd. ADR | | 51,045 | | | 2,580,835 |
| | | | | |
| | | | | 6,296,211 |
| | | | | |
Property & Casualty Insurance - 2.3% | | | | | |
Berkshire Hathaway, Inc. * | | 42 | | | 4,242,000 |
| | | | | |
| | | | | |
| | | Shares | | Value |
COMMON STOCKS - 97.1% (continued) | | | | | |
Railroads - 2.8% | | | | | |
Burlington Northern Santa Fe Corporation | | 35,450 | | $ | 2,829,974 |
Union Pacific Corporation | | 42,000 | | | 2,450,700 |
| | | | | |
| | | | | 5,280,674 |
| | | | | |
Regional Banks - 0.8% | | | | | |
Fifth Third Bancorp | | 41,000 | | | 415,330 |
Regions Financial Corporation | | 182,200 | | | 1,131,462 |
| | | | | |
| | | | | 1,546,792 |
| | | | | |
Research & Consulting Services - 1.5% | | | | | |
Equifax, Inc. | | 93,700 | | | 2,730,418 |
| | | | | |
Restaurants - 1.8% | | | | | |
Darden Restaurants, Inc. | | 97,625 | | | 3,331,941 |
| | | | | |
Semiconductors - 2.1% | | | | | |
Intel Corporation | | 194,350 | | | 3,803,430 |
| | | | | |
Soft Drinks - 2.0% | | | | | |
PepsiCo, Inc. | | 64,640 | | | 3,791,782 |
| | | | | |
Tobacco - 1.3% | | | | | |
Altria Group, Inc. | | 47,700 | | | 849,537 |
Philip Morris International, Inc. | | 30,600 | | | 1,491,444 |
| | | | | |
| | | | | 2,340,981 |
| | | | | |
TOTAL COMMON STOCKS (cost $178,807,357) | | | | $ | 180,037,467 |
| | | | | |
Total Investments - 97.1% 1 (cost $178,807,357) | | | | $ | 180,037,467 |
Cash & Other Assets, Less Liabilities - 2.9% | | | | | 5,394,618 |
| | | | | |
Total Net Assets - 100.0% | | | | $ | 185,432,085 |
| | | | | |
For federal income tax purposes the identified cost of investments owned at September 30, 2009 was $179,632,503.
| ADR | American Depositary Receipt |
| plc | Public Limited Company |
| * | Non-income producing security |
| 1 | Unless otherwise indicated, the values of the securities of the Portfolio are determined based on Level 1 inputs established by ASC 820. |
The accompanying notes are an integral part of the financial statements
33
Rydex | SGI Equity Fund
Equity Series
Statement of Assets & Liabilities
September 30, 2009
| | | | |
Assets: | | | | |
Investments, at value* | | $ | 180,037,467 | |
Cash | | | 6,554,249 | |
Receivables: | | | | |
Fund shares sold | | | 3,024 | |
Dividends | | | 216,890 | |
Prepaid expenses | | | 15,676 | |
| | | | |
Total assets | | | 186,827,306 | |
| | | | |
Liabilities: | | | | |
Payable for: | | | | |
Securities purchased | | | 1,004,391 | |
Fund shares redeemed | | | 85,093 | |
Management fees | | | 113,344 | |
Custodian fees | | | 1,631 | |
Transfer agent/maintenance fees | | | 21,232 | |
Administration fees | | | 14,517 | |
Professional fees | | | 34,911 | |
12b-1 distribution plan fees | | | 43,942 | |
Directors’ fees | | | 10,464 | |
Other | | | 65,696 | |
| | | | |
Total liabilities | | | 1,395,221 | |
| | | | |
Net assets | | $ | 185,432,085 | |
| | | | |
Net assets consist of: | | | | |
Paid in capital | | $ | 225,546,285 | |
Accumulated net realized loss on sale of investments | | | (41,344,310 | ) |
Net unrealized appreciation in value of investments | | | 1,230,110 | |
| | | | |
Net assets | | $ | 185,432,085 | |
| | | | |
Class A: | | | | |
Capital shares outstanding
(unlimited number of shares authorized) | | | 43,288,028 | |
Net assets | | $ | 175,403,707 | |
Net asset value and redemption price per share | | $ | 4.05 | |
| | | | |
Maximum offering price per share (net asset value divided by 94.25%) | | $ | 4.30 | |
| | | | |
Class B: | | | | |
Capital shares outstanding
(unlimited number of shares authorized) | | | 2,328,208 | |
Net assets | | $ | 7,784,245 | |
Net asset value, offering and redemption price per share (excluding any applicable contingent deferred sales charge) | | $ | 3.34 | |
| | | | |
Class C: | | | | |
Capital shares outstanding
(unlimited number of shares authorized) | | | 620,442 | |
Net assets | | $ | 2,244,133 | |
Net asset value, offering and redemption price per share (excluding any applicable contingent deferred sales charge) | | $ | 3.62 | |
| | | | |
* Investments, at cost | | $ | 178,807,357 | |
Statement of Operations
For the Year Ended September 30, 2009
| | | | |
Investment Income: | | | | |
Dividends | | $ | 2,897,092 | |
Interest | | | 12,491 | |
| | | | |
Total investment income | | | 2,909,583 | |
| | | | |
Expenses: | | | | |
Management fees | | | 1,232,832 | |
Transfer agent/maintenance fees | | | 460,788 | |
Administration fees | | | 156,586 | |
Custodian fees | | | 9,008 | |
Directors’ fees | | | 18,364 | |
Professional fees | | | 47,044 | |
Reports to shareholders | | | 54,737 | |
Registration fees | | | 36,734 | |
Other expenses | | | 18,762 | |
12b-1 distribution fees - Class A | | | 387,160 | |
12b-1 distribution fees - Class B | | | 73,367 | |
12b-1 distribution fees - Class C | | | 21,767 | |
| | | | |
Total expenses | | | 2,517,149 | |
| | | | |
Net investment income | | | 392,434 | |
| | | | |
Net Realized and Unrealized Gain (Loss): | | | | |
Net realized gain (loss) during the year on: | | | | |
Investments | | | (40,059,945 | ) |
Options written | | | 132,192 | |
| | | | |
Net realized loss | | | (39,927,753 | ) |
| | | | |
Net unrealized appreciation (depreciation) during the year on: | | | | |
Investments | | | 25,674,075 | |
| | | | |
Net unrealized appreciation | | | 25,674,075 | |
| | | | |
Net loss | | | (14,253,678 | ) |
| | | | |
Net decrease in net assets resulting from operations | | $ | (13,861,244 | ) |
| | | | |
The accompanying notes are an integral part of the financial statements
34
| | |
| | Rydex | SGI Equity Fund |
| Statement of Changes in Net Assets | | Equity Series |
| | | | | | | | |
| | | Year Ended
September 30, 2009 | | | Year Ended
September 30, 2008 | |
Increase (decrease) in net assets from operations: | | | | | | | | |
Net investment income | | $ | 392,434 | | | $ | 282,642 | |
Net realized gain (loss) during the year on investments | | | (39,927,753 | ) | | | 2,814,005 | |
Net unrealized appreciation (depreciation) during the year on investments | | | 25,674,075 | | | | (86,550,394 | ) |
| | | | | | | | |
Net decrease in net assets resulting from operations | | | (13,861,244 | ) | | | (83,453,747 | ) |
| | | | | | | | |
Distributions to shareholders from: | | | | | | | | |
Net investment income | | | | | | | | |
Class A | | | (392,434 | ) | | | — | |
Net realized gain | | | | | | | | |
Class A | | | — | | | | (44,791,174 | )* |
Class B | | | — | | | | (3,131,399 | )* |
Class C | | | — | | | | (750,579 | )* |
Return of capital | | | | | | | | |
Class A | | | (596,632 | ) | | | (259,129 | ) * |
Class B | | | (33,423 | ) | | | (18,116 | ) * |
Class C | | | (9,223 | ) | | | (4,342 | ) * |
| | | | | | | | |
Total distributions to shareholders | | | (1,031,712 | ) | | | (48,954,739 | ) |
| | | | | | | | |
Capital share transactions: | | | | | | | | |
Proceeds from sale of shares | | | | | | | | |
Class A | | | 5,175,096 | | | | 9,417,273 | |
Class B | | | 913,069 | | | | 3,123,443 | |
Class C | | | 584,733 | | | | 474,151 | |
Distributions reinvested | | | | | | | | |
Class A | | | 906,902 | | | | 41,061,178 | |
Class B | | | 32,949 | | | | 3,104,258 | |
Class C | | | 9,093 | | | | 741,250 | |
Cost of shares redeemed | | | | | | | | |
Class A | | | (22,903,493 | ) | | | (44,578,317 | ) |
Class B | | | (2,826,140 | ) | | | (7,922,053 | ) |
Class C | | | (1,012,475 | ) | | | (1,393,138 | ) |
| | | | | | | | |
Net increase (decrease) from capital share transactions | | | (19,120,266 | ) | | | 4,028,045 | |
| | | | | | | | |
Net decrease in net assets | | | (34,013,222 | ) | | | (128,380,441 | ) |
| | | | | | | | |
Net assets: | | | | | | | | |
Beginning of year | | | 219,445,307 | | | | 347,825,748 | |
| | | | | | | | |
End of year | | $ | 185,432,085 | | | $ | 219,445,307 | |
| | | | | | | | |
Undistributed net investment income at end of year | | $ | — | | | $ | 282,642 | |
| | | | | | | | |
Capital share activity: | | | | | | | | |
Shares sold | | | | | | | | |
Class A | | | 1,556,038 | | | | 1,742,458 | |
Class B | | | 331,911 | | | | 703,547 | |
Class C | | | 194,316 | | | | 99,582 | |
Shares reinvested | | | | | | | | |
Class A | | | 279,047 | | | | 7,806,369 | |
Class B | | | 12,204 | | | | 707,120 | |
Class C | | | 3,114 | | | | 156,382 | |
Shares redeemed | | | | | | | | |
Class A | | | (6,925,030 | ) | | | (8,392,906 | ) |
Class B | | | (1,023,385 | ) | | | (1,784,812 | ) |
Class C | | | (341,567 | ) | | | (295,676 | ) |
| * | Subsequent to September 30, 2008, a reclassification was required that resulted in a recharacterization of distributions for the September 30, 2008 reporting period. See Note 7 in the Notes to Financial Statements for additional information. |
The accompanying notes are an integral part of the financial statements
35
| | |
| Financial Highlights | | Rydex | SGI Equity Fund |
Selected data for each share of capital stock outstanding throughout each year | | Equity Series |
| | | | | | | | | | | | | | | | | | | | |
Class A | | 2009 | | | 2008 | | | 2007 | | | 2006 | | | Year Ended
September 30,
2005 | |
Per Share Data | | | | | | | | | | | | | | | | | | | | |
Net asset value, beginning of period | | $ | 4.26 | | | $ | 6.84 | | | $ | 6.85 | | | $ | 6.58 | | | $ | 6.50 | |
| | | | | | | | | | | | | | | | | | | | |
Income (loss) from investment operations: | | | | | | | | | | | | | | | | | | | | |
Net investment income (loss) a | | | 0.01 | | | | 0.01 | | | | — | | | | (0.01 | ) | | | 0.04 | |
Net gain (loss) on securities (realized and unrealized) | | | (0.20 | ) | | | (1.61 | ) | | | 0.69 | | | | 0.52 | | | | 0.49 | |
| | | | | | | | | | | | | | | | | | | | |
Total from investment operations | | | (0.19 | ) | | | (1.60 | ) | | | 0.69 | | | | 0.51 | | | | 0.53 | |
| | | | | | | | | | | | | | | | | | | | |
Less distributions: | | | | | | | | | | | | | | | | | | | | |
Dividends from net investment income | | | (0.01 | ) | | | — | | | | — | | | | (0.04 | ) | | | — | |
Distributions from realized gains | | | — | | | | (0.97 | )f | | | (0.70 | ) | | | (0.20 | ) | | | (0.45 | ) |
Return of capital | | | (0.01 | ) | | | (0.01 | )f | | | — | | | | — | | | | — | |
| | | | | | | | | | | | | | | | | | | | |
Total distributions | | | (0.02 | ) | | | (0.98 | ) | | | (0.70 | ) | | | (0.24 | ) | | | (0.45 | ) |
| | | | | | | | | | | | | | | | | | | | |
Net asset value, end of period | | $ | 4.05 | | | $ | 4.26 | | | $ | 6.84 | | | $ | 6.85 | | | $ | 6.58 | |
| | | | | | | | | | | | | | | | | | | | |
Total Return b | | | (4.32 | %) | | | (26.12 | %) | | | 10.33 | % | | | 7.88 | % | | | 8.20 | % |
| | | | | | | | | | | | | | | | | | | | |
Ratios/Supplemental Data | | | | | | | | | | | | | | | | | | | | |
Net assets, end of period (in thousands) | | $ | 175,404 | | | $ | 205,908 | | | $ | 322,850 | | | $ | 371,006 | | | $ | 375,280 | |
| | | | | | | | | | | | | | | | | | | | |
Ratios to average net assets: | | | | | | | | | | | | | | | | | | | | |
Net investment income (loss) | | | 0.28 | % | | | 0.15 | % | | | 0.02 | % | | | (0.08 | %) | | | 0.57 | % |
Total expenses c | | | 1.49 | % | | | 1.36 | % | | | 1.34 | % | | | 1.34 | % | | | 1.30 | % |
Net expenses d | | | 1.49 | % | | | 1.36 | % | | | 1.34 | % | | | 1.34 | % | | | 1.30 | % |
Net expenses prior to custodian earning credits and net of expense waivers | | | 1.49 | % | | | 1.36 | % | | | 1.34 | % | | | 1.34 | % | | | 1.30 | % |
| | | | | | | | | | | | | | | | | | | | |
Portfolio turnover rate | | | 69 | % | | | 111 | %e | | | 20 | % | | | 34 | % | | | 32 | % |
| | | | | |
Class B | | 2009 | | | 2008 | | | 2007 | | | 2006 | | | Year Ended
September 30,
2005 | |
Per Share Data | | | | | | | | | | | | | | | | | | | | |
Net asset value, beginning of period | | $ | 3.53 | | | $ | 5.89 | | | $ | 6.04 | | | $ | 5.83 | | | $ | 5.85 | |
| | | | | | | | | | | | | | | | | | | | |
Income (loss) from investment operations: | | | | | | | | | | | | | | | | | | | | |
Net investment loss a | | | (0.01 | ) | | | (0.03 | ) | | | (0.04 | ) | | | (0.05 | ) | | | (0.01 | ) |
Net gain (loss) on securities (realized and unrealized) | | | (0.17 | ) | | | (1.35 | ) | | | 0.59 | | | | 0.46 | | | | 0.44 | |
| | | | | | | | | | | | | | | | | | | | |
Total from investment operations | | | (0.18 | ) | | | (1.38 | ) | | | 0.55 | | | | 0.41 | | | | 0.43 | |
| | | | | | | | | | | | | | | | | | | | |
Less distributions: | | | | | | | | | | | | | | | | | | | | |
Distributions from realized gains | | | — | | | | (0.97 | )f | | | (0.70 | ) | | | (0.20 | ) | | | (0.45 | ) |
Return of capital | | | (0.01 | ) | | | (0.01 | )f | | | — | | | | — | | | | — | |
| | | | | | | | | | | | | | | | | | | | |
Total distributions | | | (0.01 | ) | | | (0.98 | ) | | | (0.70 | ) | | | (0.20 | ) | | | (0.45 | ) |
| | | | | | | | | | | | | | | | | | | | |
Net asset value, end of period | | $ | 3.34 | | | $ | 3.53 | | | $ | 5.89 | | | $ | 6.04 | | | $ | 5.83 | |
| | | | | | | | | | | | | | | | | | | | |
Total Return b | | | (4.96 | %) | | | (26.69 | %) | | | 9.33 | % | | | 7.16 | % | | | 7.35 | % |
| | | | | | | | | | | | | | | | | | | | |
Ratios/Supplemental Data | | | | | | | | | | | | | | | | | | | | |
Net assets, end of period (in thousands) | | $ | 7,784 | | | $ | 10,621 | | | $ | 19,928 | | | $ | 27,842 | | | $ | 39,962 | |
| | | | | | | | | | | | | | | | | | | | |
Ratios to average net assets: | | | | | | | | | | | | | | | | | | | | |
Net investment loss | | | (0.46 | %) | | | (0.61 | %) | | | (0.74 | %) | | | (0.83 | %) | | | (0.16 | %) |
Total expenses c | | | 2.24 | % | | | 2.11 | % | | | 2.09 | % | | | 2.09 | % | | | 2.05 | % |
Net expenses d | | | 2.24 | % | | | 2.11 | % | | | 2.09 | % | | | 2.09 | % | | | 2.05 | % |
Net expenses prior to custodian earning credits and net of expense waivers | | | 2.24 | % | | | 2.11 | % | | | 2.09 | % | | | 2.09 | % | | | 2.05 | % |
| | | | | | | | | | | | | | | | | | | | |
Portfolio turnover rate | | | 69 | % | | | 111 | %e | | | 20 | % | | | 34 | % | | | 32 | % |
The accompanying notes are an integral part of the financial statements
36
| | |
| Financial Highlights | | Rydex | SGI Equity Fund |
Selected data for each share of capital stock outstanding throughout each year | | Equity Series |
| | | | | | | | | | | | | | | | | | | | |
Class C | | 2009 | | | 2008 | | | 2007 | | | 2006 | | | Year Ended
September 30,
2005 | |
Per Share Data | | | | | | | | | | | | | | | | | | | | |
Net asset value, beginning of period | | $ | 3.81 | | | $ | 6.28 | | | $ | 6.39 | | | $ | 6.16 | | | $ | 6.16 | |
| | | | | | | | | | | | | | | | | | | | |
Income (loss) from investment operations: | | | | | | | | | | | | | | | | | | | | |
Net investment loss a | | | (0.01 | ) | | | (0.03 | ) | | | (0.05 | ) | | | (0.05 | ) | | | (0.01 | ) |
Net gain (loss) on securities (realized and unrealized) | | | (0.17 | ) | | | (1.46 | ) | | | 0.64 | | | | 0.48 | | | | 0.46 | |
| | | | | | | | | | | | | | | | | | | | |
Total from investment operations | | | (0.18 | ) | | | (1.49 | ) | | | 0.59 | | | | 0.43 | | | | 0.45 | |
| | | | | | | | | | | | | | | | | | | | |
Less distributions: | | | | | | | | | | | | | | | | | | | | |
Distributions from realized gains | | | — | | | | (0.97 | ) f | | | (0.70 | ) | | | (0.20 | ) | | | (0.45 | ) |
Return of capital | | | (0.01 | ) | | | (0.01 | ) f | | | — | | | | — | | | | — | |
| | | | | | | | | | | | | | | | | | | | |
Total distributions | | | (0.01 | ) | | | (0.98 | ) | | | (0.70 | ) | | | (0.20 | ) | | | (0.45 | ) |
| | | | | | | | | | | | | | | | | | | | |
Net asset value, end of period | | $ | 3.62 | | | $ | 3.81 | | | $ | 6.28 | | | $ | 6.39 | | | $ | 6.16 | |
| | | | | | | | | | | | | | | | | | | | |
Total Returnb | | | (4.60 | %) | | | (26.79 | %) | | | 9.45 | % | | | 7.10 | % | | | 7.32 | % |
| | | | | | | | | | | | | | | | | | | | |
Ratios/Supplemental Data | | | | | | | | | | | | | | | | | | | | |
Net assets, end of period (in thousands) | | $ | 2,244 | | | $ | 2,915 | | | $ | 5,048 | | | $ | 5,794 | | | $ | 5,706 | |
| | | | | | | | | | | | | | | | | | | | |
Ratios to average net assets: | | | | | | | | | | | | | | | | | | | | |
Net investment loss | | | (0.47 | %) | | | (0.60 | %) | | | (0.73 | %) | | | (0.83 | %) | | | (0.18 | %) |
Total expenses c | | | 2.24 | % | | | 2.11 | % | | | 2.09 | % | | | 2.09 | % | | | 2.05 | % |
Net expenses d | | | 2.24 | % | | | 2.11 | % | | | 2.09 | % | | | 2.09 | % | | | 2.05 | % |
Net expenses prior to custodian earning credits and net of expense waivers | | | 2.24 | % | | | 2.11 | % | | | 2.09 | % | | | 2.09 | % | | | 2.05 | % |
| | | | | | | | | | | | | | | | | | | | |
Portfolio turnover rate | | | 69 | % | | | 111 | %e | | | 20 | % | | | 34 | % | | | 32 | % |
| a | Net investment income (loss) was computed using average shares outstanding throughout the period. |
| b | Total return information does not reflect deduction of any sales charges imposed at the time of purchase for Class A shares or upon redemption for Class B and C shares. |
| c | Total expense information reflects expense ratios absent expense reductions by the Investment Manager and custodian earnings credits, as applicable. |
| d | Net expense information reflects the expense ratios after voluntary expense waivers, reimbursements and custodian earnings credits, as applicable. |
| e | Significant variation in the portfolio turnover rate is due to the Investment Manager’s appointment of new portfolio managers for the series. |
| f | Subsequent to September 30, 2008, a reclassification was required that resulted in a recharacterization of the distributions for the September 30, 2008 reporting period. |
The accompanying notes are an integral part of the financial statements
37
This page left blank intentionally.
38
Managers’ Commentary
November 16, 2009
To Our Shareholders:
For the fiscal year ended September 30, 2009, the Rydex|SGI Equity Fund Global Series Class A shares underperformed its benchmark, the MSCI World Index, –2.71%1 to –2.29%.
At the core of the investment management team’s philosophy is the idea that excess return opportunities exist in global stock markets and can be identified and captured at the security level, regardless of country, region, or sector. Portfolio managers Scott Klimo and David Whittall lead the global equities team. In addition to the team’s extensive experience, competitive advantages include the execution of in-depth fundamental research using a proprietary database that provides a unique perspective of the world, a proprietary risk management module, and a well-defined and disciplined investment process.
Financials, Information Technology, and Materials Top Performers
The Series positioned the financials sector as an underweight to the Index, consisting of 11% of assets rather than 18%. Returns in the sector for the portfolio were 3%, compared to an 8% loss for the benchmark. Leading holdings included National City Corporation, AllianceBernstein Holding L.P., Citigroup, Inc., and Standard Chartered PLC.
Superior stock selection in the information technology sector boosted Series performance. The sector was an even weight against the benchmark but outperformed with a 42% versus 9% gain. An investment in Apple, Inc. surged more than 120% during the period. Top holdings in the sector included Netease. com, Inc., Check Point Software Technologies, Ltd., and Google, Inc.
Holdings in the materials sector added to overall performance during the fiscal year even as it was approximately half the weight of the Index. Randgold Resources, Ltd. and Agnico-Eagle Mines, Ltd. were leading holdings for the period.
Industrials, Consumer Discretionary, and Energy Disappoint
Industrials holdings declined 15% against a 2% loss for the Index making it the worst performing sector for the Series on a relative basis. Both Aveng, Ltd. and Foster Wheeler AG were down more than 60% over the period. Also bringing down Series performance in the sector were Lockhead Martin Corporation and Joy Global, Inc.
The Series held an over weight position in consumer discretionary securities, totaling 12% of portfolio assets against 10% in the Index. Securities in the Series lost 3% while holdings in the Index gained 6%, a disparity of 9%. The sector was one of the better performing in the Index during the year. Jarden Corporation and RadioShack Corporation both lost more than 50%. Other detractors in the sector were Ubisoft Entertainment S.A. and Harley-Davidson, Inc.
Energy holdings dropped more than 30% for the Series against the 4% loss for the Index. Bumi Resources declined over 70% while Consol Energy, Inc. and Anadarko Petroleum Corporation also contributed to the negative performance.
Market Outlook
From a sector perspective, financials remains our largest exposure, although it is now slightly below market weight as various positions have achieved price targets. Among other major sectors, we have a slight overweight in consumer non-durables, software & services and global hardware. We are underweight health care, materials & processing, utilities and producer manufacturing.
Geographically, we have normalized our exposures in Europe. Japan remains an equal weight relative to the benchmark, while Asia Ex-Japan is slightly overweight. As a result, the increased exposure to Europe has come out of North America. Currently, we do not have any significant regional biases. Europe’s periphery—primarily Portugal, Ireland, Italy, Greece and Spain—remains weak. Japanese exporters will have to deal with the effects of the strengthening Yen as companies struggle with anemic demand. In the U.S., we have seen improvements in various economic indicators. Nonetheless, the employment situation remains precarious and may hit double-digit unemployment by the end of the year.
We appreciate your confidence and trust. We will continue to seek out the best individual prospects from around the globe for the Series.
Sincerely,
|
| |
Scott Klimo, David Whittall Portfolio Managers |
| 1 | Performance figures are based on Class A shares and do not reflect deduction of the sales charges or taxes that a shareholder would pay on distributions or the redemption of shares. Investments in international securities entail greater risks than investment in domestic securities. |
| | The strategies discussed herein do not assure a profit. The Fund is distributed by Rydex Distributors, Inc. |
39
| | |
| | Rydex | SGI Equity Fund |
| Performance Summary | | Global Series |
| September 30, 2009 | | (unaudited) |
PERFORMANCE
Global Series vs. Morgan Stanley Capital International World Index
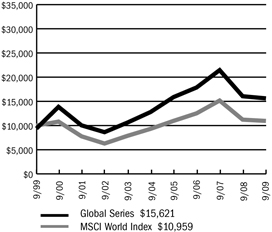
$10,000 Over Ten Years
This chart assumes a $10,000 investment in Class A shares of Global Series on September 30, 1999, reflects deduction of the 5.75% sales load and assumes all dividends reinvested. The chart does not reflect the deduction of taxes that a shareholder would pay on distributions or the redemption of fund shares. The MSCI World Index is an unmanaged capitalization-weighted index that is designed to measure global developed market equity performance.
Average Annual Returns
| | | | | | | | | |
Periods Ended 9-30-09 | | 1 Year | | | 5 Years | | | 10 Years | |
A Shares | | (2.71 | %) | | 4.28 | % | | 5.18 | % |
A Shares with sales charge | | (8.29 | %) | | 3.05 | % | | 4.56 | % |
B Shares | | (2.45 | %) | | 4.38 | % | | 4.96 | % |
B Shares with CDSC | | (7.25 | %) | | 4.15 | % | | 4.96 | % |
C Shares | | (3.39 | %) | | 3.52 | % | | 4.37 | % |
C Shares with CDSC | | (4.35 | %) | | 3.52 | % | | 4.37 | % |
The performance data above represents past performance that is not predictive of future results. The investment return and principal value of an investment in the Series will fluctuate so that an investor’s shares, when redeemed, may be worth more or less than their original cost. The figures above do not reflect deduction of the maximum front-end sales charge of 5.75% for Class A shares or the contingent deferred sales charge of 5% for Class B shares and 1% for Class C shares, as applicable, except where noted. The figures do not reflect the deduction of taxes that a shareholder would pay on distributions or redemption of shares. Such figures would be lower if the maximum sales charge and any applicable taxes were deducted. Fee waivers and/or reimbursements reduced expenses of the Series and in the absence of such waiver, the performance quoted would be reduced.
Portfolio Composition by Sector as of 9-30-09
| | | |
Consumer Discretionary | | 8.94 | % |
Consumer Staples | | 14.79 | |
Energy | | 11.23 | |
Financials | | 19.49 | |
Health Care | | 7.84 | |
Industrials | | 6.93 | |
Information Technology | | 19.07 | |
Materials | | 2.70 | |
Telecommunication Services | | 2.12 | |
Utilities | | 3.06 | |
Exchange Traded Funds | | 1.89 | |
Short Term Investments | | 2.54 | |
Liabilities, Less Cash & Other Assets | | (0.60 | ) |
| | | |
Total Net Assets | | 100.00 | % |
| | | |
The accompanying notes are an integral part of the financial statements
40
| | |
| | Rydex | SGI Equity Fund |
| Performance Summary | | Global Series |
| September 30, 2009 | | (unaudited) |
Information About Your Series Expenses
Calculating your ongoing Series expenses
Example
As a shareholder of the Series, you incur two types of costs: (1) transaction costs, which may include sales charges (loads) on purchase payments; contingent deferred sales charges on redemptions; and redemption fees, if any; and (2) ongoing costs, including management fees; distribution and/or service fees (12b-1); and other Series expenses. This example is intended to help you understand your ongoing costs (in dollars) of investing in the Series and to compare these costs with ongoing costs of investing in other mutual funds. The example is based on an investment of $1,000 invested at the beginning of the period and held for the entire period April 1, 2009 through September 30, 2009.
Actual Expenses
The first line for each class of shares in the table provides information about actual account values and actual expenses. You may use the information in this table, together with the amount you invested, to estimate the expenses that you paid over the period. Simply divide your account value by $1,000 (for example, an $8,600 account value divided by $1,000 = 8.6), then multiply the result by the number in the table under the heading entitled “Expenses Paid During the Period” to estimate the expenses you paid on your account during this period.
Hypothetical Example for Comparison Purposes
The second line for each class of shares in the table provides information about hypothetical account values and hypothetical expenses based on the Series actual expense ratio and an assumed rate of return of 5% per year before expenses, which is not the Series actual return. The hypothetical account values and expenses may not be used to estimate the actual ending account balance or expenses you paid for the period. You may use this information to compare the ongoing costs of investing in the Series and other funds. To do so, compare this 5% hypothetical example with the 5% hypothetical examples that appear in the shareholder reports of the other mutual funds.
Please note that the expenses shown in the table are meant to highlight your ongoing costs only and do not reflect any transactional costs, such as sales charges (loads) on purchase payments, contingent deferred sales charges on redemptions, and redemption fees, if any. Therefore, the second line for each class of shares is useful in comparing ongoing costs only, and will not help you determine the relative total costs of owning different funds. In addition, if these transactional costs were included, your costs would have been higher.
Series Expenses
| | | | | | | | | |
| | | Beginning
Account
Value
4/1/2009 | | Ending
Account
Value
9/30/2009 1 | | Expenses
Paid
During
Period 2 |
Global Series - Class A | | | | | | | | | |
Actual | | $ | 1,000.00 | | $ | 1,317.04 | | $ | 10.69 |
Hypothetical | | | 1,000.00 | | | 1,015.84 | | | 9.30 |
Global Series - Class B | | | | | | | | | |
Actual | | | 1,000.00 | | | 1,318.66 | | | 9.24 |
Hypothetical | | | 1,000.00 | | | 1,017.10 | | | 8.04 |
Global Series - Class C | | | | | | | | | |
Actual | | | 1,000.00 | | | 1,312.12 | | | 15.01 |
Hypothetical | | | 1,000.00 | | | 1,012.08 | | | 13.06 |
| 1 | The actual ending account value is based on the actual total return of the Series for the period April 1, 2009 to September 30, 2009 after actual expenses and will differ from the hypothetical ending account value which is based on the Series expense ratio and a hypothetical annual return of 5% before expenses. The actual cumulative return at net asset value for the period April 1, 2009 to September 30, 2009 was 31.70%, 31.87% and 31.21%, for Class A, B and C shares, respectively. |
| 2 | Expenses are equal to the Series annualized expense ratio (1.84%, 1.59% and 2.59% for Class A, B, and C shares, respectively), net of any applicable fee waivers, multiplied by the average account value over the period, multiplied by 183/365 (to reflect the one-half year period). |
41
| | |
| Schedule of Investments | | Rydex | SGI Equity Fund |
| September 30, 2009 | | Global Series |
| | | | | |
| | | Shares | | Value |
COMMON STOCKS - 48.7% | | | | | |
Airlines - 1.9% | | | | | |
Allegiant Travel Company * | | 56,388 | | $ | 2,147,819 |
| | | | | |
Asset Management & Custody | | | | | |
Banks - 0.5% | | | | | |
AllianceBernstein Holding, LP | | 20,800 | | | 567,424 |
| | | | | |
Cable & Satellite - 3.5% | | | | | |
Comcast Corporation | | 107,500 | | | 1,815,675 |
Time Warner Cable, Inc. | | 47,000 | | | 2,025,229 |
| | | | | |
| | | | | 3,840,904 |
| | | | | |
Communications Equipment - 1.4% | | | | | |
Cisco Systems, Inc. * | | 67,611 | | | 1,591,563 |
| | | | | |
Computer Hardware - 2.6% | | | | | |
Apple, Inc. * | | 15,748 | | | 2,919,207 |
| | | | | |
Construction & Farm Machinery & Heavy Trucks - 0.5% | | | | | |
Trinity Industries, Inc. | | 35,437 | | | 609,162 |
| | | | | |
Drug Retail - 0.6% | | | | | |
CVS Caremark Corporation | | 18,100 | | | 646,894 |
| | | | | |
Education Services - 2.8% | | | | | |
Apollo Group, Inc. * | | 10,000 | | | 736,700 |
ITT Educational Services, Inc. * | | 22,090 | | | 2,438,957 |
| | | | | |
| | | | | 3,175,657 |
| | | | | |
Electric Utilities - 0.7% | | | | | |
Allegheny Energy, Inc. | | 28,000 | | | 742,560 |
| | | | | |
Electrical Components & Equipment - 1.7% | | | | | |
Suntech Power Holdings Company, Ltd. ADR * | | 62,895 | | | 956,004 |
Thomas & Betts Corporation * | | 32,700 | | | 983,616 |
| | | | | |
| | | | | 1,939,620 |
| | | | | |
Exchange Traded Funds - 1.9% | | | | | |
iShares Russell 2000 Index Fund | | 35,600 | | | 2,144,188 |
| | | | | |
Food Retail - 0.4% | | | | | |
Kroger Company | | 20,800 | | | 429,312 |
| | | | | |
Gold - 1.7% | | | | | |
Randgold Resources, Ltd. ADR | | 26,902 | | | 1,879,912 |
| | | | | |
Health Care Services - 2.9% | | | | | |
Express Scripts, Inc. * | | 34,540 | | | 2,679,613 |
Medco Health Solutions, Inc. * | | 10,100 | | | 558,631 |
| | | | | |
| | | | | 3,238,244 |
| | | | | |
Home Entertainment Software - 0.8% | | | | | |
Shanda Interactive Entertainment, Ltd. ADR * | | 18,300 | | | 936,960 |
| | | | | |
Household Products - 1.4% | | | | | |
Kimberly-Clark Corporation | | 27,170 | | | 1,602,487 |
| | | | | |
| | | | | |
| | | Shares | | Value |
COMMON STOCKS - 48.7% (continued) | | | | | |
Independent Power Producers & Energy Traders - 0.4% | | | | | |
Mirant Corporation * | | 25,200 | | $ | 414,036 |
| | | | | |
Integrated Oil & Gas - 1.3% | | | | | |
Occidental Petroleum Corporation | | 19,100 | | | 1,497,440 |
| | | | | |
Internet Software & Services - 2.1% | | | | | |
Netease.com ADR * | | 50,594 | | | 2,311,134 |
| | | | | |
Investment Banking & Brokerage - 2.6% | | | | | |
Goldman Sachs Group, Inc. | | 15,782 | | | 2,909,412 |
| | | | | |
Life Sciences Tools & Services - 2.2% | | | | | |
Life Technologies Corporation * | | 53,840 | | | 2,506,252 |
| | | | | |
Multi-Line Insurance - 1.0% | | | | | |
Hartford Financial Services Group, Inc. | | 44,500 | | | 1,179,250 |
| | | | | |
Oil & Gas Exploration & Production - 1.5% | | | | | |
Forest Oil Corporation * | | 86,400 | | | 1,690,848 |
| | | | | |
Oil & Gas Refining & Marketing - 0.8% | | | | | |
World Fuel Services Corporation | | 19,700 | | | 946,979 |
| | | | | |
Other Diversified Financial Services - 1.6% | | | | | |
JPMorgan Chase & Company | | 40,840 | | | 1,789,609 |
| | | | | |
Packaged Foods & Meats - 0.3% | | | | | |
American Italian Pasta Company * | | 14,000 | | | 380,520 |
| | | | | |
Personal Products - 0.6% | | | | | |
Bare Escentuals, Inc. * | | 60,500 | | | 719,345 |
| | | | | |
Pharmaceuticals - 0.4% | | | | | |
Watson Pharmaceuticals, Inc. * | | 12,100 | | | 443,344 |
| | | | | |
Property & Casualty Insurance - 3.1% | | | | | |
ACE, Ltd. | | 51,552 | | | 2,755,970 |
Aspen Insurance Holdings, Ltd. | | 18,100 | | | 479,107 |
Tower Group, Inc. | | 13,200 | | | 321,948 |
| | | | | |
| | | | | 3,557,025 |
| | | | | |
Specialized Finance - 0.4% | | | | | |
PHH Corporation * | | 25,100 | | | 497,984 |
| | | | | |
Systems Software - 1.9% | | | | | |
Check Point Software | | | | | |
Technologies * | | 77,595 | | | 2,199,818 |
| | | | | |
Tobacco - 3.2% | | | | | |
Altria Group, Inc. | | 86,152 | | | 1,534,367 |
The accompanying notes are an integral part of the financial statements
42
| | |
| Schedule of Investments | | Rydex | SGI Equity Fund |
| September 30, 2009 | | Global Series |
| | | | | |
| | | Shares | | Value |
COMMON STOCKS - 48.7% (continued) | | | |
Tobacco - 3.2% (continued) | | | | | |
Philip Morris International, Inc. | | 42,852 | | $ | 2,088,606 |
| | | | | |
| | | | | 3,622,973 |
| | | | | |
TOTAL COMMON STOCKS
(cost $46,696,871) | | | | $ | 55,077,882 |
| | | | | |
| | |
| | | Shares | | Value |
FOREIGN STOCKS - 49.4% | | | | | |
Aerospace & Defense - 2.3% | | | | | |
BAE Systems plc | | 406,043 | | $ | 2,266,573 |
MTU Aero Engines Holding AG | | 7,849 | | | 371,689 |
| | | | | |
| | | | | 2,638,262 |
| | | | | |
Automobile Manufacturers - 1.7% | | | | | |
Honda Motor Company, Ltd. | | 67,100 | | | 2,066,628 |
| | | | | |
Casinos & Gaming - 0.9% | | | | | |
William Hill plc | | 367,227 | | | 1,034,632 |
| | | | | |
Communications Equipment - 2.2% | | | | | |
Tandberg ASA | | 105,100 | | | 2,516,330 |
| | | | | |
Construction & Engineering - 0.5% | | | | | |
Imtech N.V. | | 19,999 | | | 509,962 |
| | | | | |
Diversified Banks - 4.6% | | | | | |
DBS Group Holdings, Ltd. | | 245,000 | | | 2,309,647 |
Standard Chartered plc | | 118,763 | | | 2,928,508 |
| | | | | |
| | | | | 5,238,155 |
| | | | | |
Diversified Real Estate Activities - 0.7% | | | | | |
Tokyu Land Corporation | | 200,000 | | | 799,777 |
| | | | | |
Electric Utilities - 1.3% | | | | | |
Endesa S.A. | | 19,215 | | | 634,923 |
| | | | | |
Kyushu Electric Power Company, Inc. | | 35,832 | | | 812,232 |
| | | | | |
| | | | | 1,447,155 |
| | | | | |
Electronic Components - 1.7% | | | | | |
Hosiden Corporation | | 22,300 | | | 302,301 |
LG Innotek Company, Ltd. | | 14,649 | | | 1,582,800 |
| | | | | |
| | | | | 1,885,101 |
| | | | | |
Fertilizers & Agricultural Chemicals - 1.0% | | | | | |
Syngenta AG | | 5,129 | | | 1,178,438 |
| | | | | |
Food Retail - 1.0% | | | | | |
Empire Company, Ltd. | | 13,498 | | | 551,039 |
Metro, Inc. | | 16,300 | | | 532,677 |
| | | | | |
| | | | | 1,083,716 |
| | | | | |
Home Entertainment Software - 1.8% | | | | | |
UBISOFT Entertainment * | | 106,291 | | | 2,012,740 |
| | | | | |
Integrated Oil & Gas - 2.9% | | | | | |
BG Group plc | | 129,587 | | | 2,249,005 |
ENI SpA | | 14,923 | | | 372,993 |
Repsol YPF S.A. | | 26,398 | | | 718,137 |
| | | | | |
| | | | | 3,340,135 |
| | | | | |
Integrated Telecommunication Services - 2.1% | | | | | |
China Unicom Hong Kong, Ltd. | | 1,314,000 | | | 1,861,629 |
Telstra Corporation, Ltd. | | 187,961 | | | 542,267 |
| | | | | |
| | | | | 2,403,896 |
| | | | | |
| | | | | |
| | | Shares | | Value |
FOREIGN STOCKS - 49.4% (continued) | | | |
Internet Software & Services - 1.7% | | | | | |
Gree, Inc. | | 36,020 | | $ | 1,961,992 |
| | | | | |
IT Consulting & Other Services - 2.4% | | | | | |
Atos Origin S.A. | | 52,540 | | | 2,652,564 |
| | | | | |
Life & Health Insurance - 0.6% | | | | | |
CNP Assurances | | 7,071 | | | 720,500 |
| | | | | |
Life Sciences Tools & Services - 1.7% | | | | | |
Lonza Group AG | | 17,539 | | | 1,912,483 |
| | | | | |
Multi-Line Insurance - 1.3% | | | | | |
Allianz AG | | 8,051 | | | 1,005,800 |
RSA Insurance Group plc | | 222,009 | | | 475,062 |
| | | | | |
| | | | | 1,480,862 |
| | | | | |
Multi-Utilities - 0.8% | | | | | |
United Utilities Group plc | | 117,742 | | | 858,957 |
| | | | | |
Office Electronics - 0.5% | | | | | |
Neopost S.A. | | 6,674 | | | 598,985 |
| | | | | |
Oil & Gas Exploration & Production - 3.7% | | | | | |
CNOOC, Ltd. | | 808,000 | | | 1,086,362 |
Oil Search, Ltd. | | 533,941 | | | 3,038,440 |
| | | | | |
| | | | | 4,124,802 |
| | | | | |
Oil & Gas Refining & Marketing - 1.0% | | | | | |
Neste Oil Oyj | | 34,980 | | | 646,005 |
Nippon Mining Holdings, Inc. | | 95,000 | | | 467,725 |
| | | | | |
| | | | | 1,113,730 |
| | | | | |
Packaged Foods & Meats - 6.6% | | | | | |
Marine Harvest * | | 3,426,641 | | | 2,487,346 |
Parmalat SpA | | 839,854 | | | 2,321,628 |
Toyo Suisan Kaisha, Ltd. | | 99,088 | | | 2,682,081 |
| | | | | |
| | | | | 7,491,055 |
| | | | | |
Pharmaceuticals - 0.7% | | | | | |
Stada Arzneimittel AG | | 28,325 | | | 774,290 |
| | | | | |
Property & Casualty Insurance - 1.6% | | | | | |
Lancashire Holdings, Ltd. | | 217,222 | | | 1,773,878 |
| | | | | |
Regional Banks - 0.7% | | | | | |
Seven Bank, Ltd.3 | | 307 | | | 759,165 |
| | | | | |
Specialized Finance - 0.7% | | | | | |
Bolsas y Mercados Espanoles S.A. | | 9,751 | | | 379,709 |
Osaka Securities Exchange | | | | | |
Company, Ltd. | | 89 | | | 404,478 |
| | | | | |
| | | | | 784,187 |
| | | | | |
Tobacco - 0.7% | | | | | |
Japan Tobacco, Inc. | | 224 | | | 768,499 |
| | | | | |
TOTAL FOREIGN STOCKS
(cost $50,088,765) | | | | $ | 55,930,876 |
| | | | | |
The accompanying notes are an integral part of the financial statements
43
| | |
| Schedule of Investments | | Rydex | SGI Equity Fund |
| September 30, 2009 | | Global Series |
| | | | | | | |
| | | Principal
Amount | | Value | |
SHORT TERM INVESTMENTS - 2.5% | | | | | | | |
State Street General Account U.S. Government Fund1 | | $ | 2,875,778 | | $ | 2,875,778 | |
| | | | | | | |
TOTAL SHORT TERM INVESTMENTS
(cost $2,875,778) | | | | | $ | 2,875,778 | |
| | | | | | | |
Total Investments - 100.6% 2 (cost $99,661,414) | | | | | $ | 113,884,536 | |
Liabilities, Less Cash & Other Assets - (0.6%) | | | | | | (686,537 | ) |
| | | | | | | |
Total Net Assets - 100.0% | | | | | $ | 113,197,999 | |
| | | | | | | |
INVESTMENT CONCENTRATION
At September 30, 2009, the investment diversification of the Series was as follows:
| | | | | | |
Country | | % of Net
Assets | | | Value |
United States | | 41.0 | % | | $ | 46,434,755 |
Japan | | 9.7 | | | | 11,024,878 |
United Kingdom | | 8.7 | | | | 9,812,737 |
France | | 5.3 | | | | 5,984,789 |
Switzerland | | 5.1 | | | | 5,846,891 |
Norway | | 4.4 | | | | 5,003,676 |
Cayman Islands | | 3.7 | | | | 4,204,098 |
Papua New Guinea | | 2.7 | | | | 3,038,440 |
Hong Kong | | 2.6 | | | | 2,947,991 |
Italy | | 2.4 | | | | 2,694,621 |
Singapore | | 2.0 | | | | 2,309,647 |
Bermuda | | 2.0 | | | | 2,252,985 |
Israel | | 1.9 | | | | 2,199,818 |
Germany | | 1.9 | | | | 2,151,779 |
Jersey | | 1.7 | | | | 1,879,912 |
Spain | | 1.5 | | | | 1,732,769 |
Republic of Korea | | 1.4 | | | | 1,582,800 |
Canada | | 1.0 | | | | 1,083,716 |
Finland | | 0.6 | | | | 646,005 |
Australia | | 0.5 | | | | 542,267 |
Netherlands | | 0.5 | | | | 509,962 |
| | | | | | |
Total Investments | | 100.6 | | | $ | 113,884,536 |
| | | | | | |
For federal income tax purposes the identified cost of investments owned at September 30, 2009 was $99,994,266.
| ADR | American Depositary Receipt |
| plc | Public Limited Company |
| * | Non-income producing security |
| 1 | Value determined based on Level 2 inputs established by ASC 820. |
| 2 | Unless otherwise indicated, the values of the securities of the Portfolio are determined based on Level 1 inputs established by ASC 820. |
| 3 | Security is a PFIC (Passive Foreign Investment Company). |
The accompanying notes are an integral part of the financial statements
44
Rydex | SGI Equity Fund
Global Series
Statement of Assets and Liabilities
September 30, 2009
| | | | |
Assets: | | | | |
Investments, at value* | | $ | 113,884,536 | |
Cash denominated in a foreign currency, at value*** | | | 733,933 | |
Receivables: | | | | |
Fund shares sold | | | 30,920 | |
Securities sold | | | 1,578,340 | |
Dividends | | | 250,672 | |
Foreign taxes recoverable | | | 34,932 | |
Prepaid expenses | | | 22,048 | |
| | | | |
Total assets | | | 116,535,381 | |
| | | | |
Liabilities: | | | | |
Cash overdraft | | | 470,356 | |
Payable for: | | | | |
Securities purchased | | | 2,482,172 | |
Fund shares redeemed | | | 180,980 | |
Management fees | | | 91,927 | |
Custodian fees | | | 12,008 | |
Transfer agent/maintenance fees | | | 12,853 | |
Administration fees | | | 15,621 | |
Professional fees | | | 28,050 | |
12b-1 distribution plan fees | | | 23,660 | |
Directors’ fees | | | 6,331 | |
Other | | | 13,424 | |
| | | | |
Total liabilities | | | 3,337,382 | |
| | | | |
Net assets | | $ | 113,197,999 | |
| | | | |
Net assets consist of: | | | | |
Paid in capital | | $ | 154,951,293 | |
Accumulated net investment loss | | | (308,767 | ) |
Accumulated net realized loss on sale of investments and foreign currency transactions | | | (55,676,572 | ) |
Net unrealized appreciation in value of investments and translation of assets and liabilities in foreign currencies | | | 14,232,045 | |
| | | | |
Net assets | | $ | 113,197,999 | |
| | | | |
Class A: | | | | |
Capital shares outstanding (unlimited number of shares authorized) | | | 9,745,595 | |
Net assets | | $ | 97,204,647 | |
Net asset value and redemption price per share | | $ | 9.97 | |
| | | | |
Maximum offering price per share (net asset value divided by 94.25%) | | $ | 10.58 | |
| | | | |
Class B: | | | | |
Capital shares outstanding (unlimited number of shares authorized) | | | 1,283,860 | |
Net assets | | $ | 11,155,113 | |
Net asset value, offering and redemption price per share (excluding any applicable contingent deferred sales charge) | | $ | 8.69 | |
| | | | |
Class C: | | | | |
Capital shares outstanding
(unlimited number of shares authorized) | | | 558,950 | |
Net assets | | $ | 4,838,239 | |
Net asset value, offering and redemption price per share (excluding any applicable contingent deferred sales charge) | | $ | 8.66 | |
| | | | |
* Investments, at cost | | $ | 99,661,414 | |
*** Cash denominated in a foreign currency, at cost | | | 727,525 | |
Statement of Operations
For the Year Ended September 30, 2009
| | | | |
Investment Income: | | | | |
Dividends (net of foreign withholding tax of $118,839) | | $ | 2,399,853 | |
Interest | | | 1,342 | |
| | | | |
Total investment income | | | 2,401,195 | |
| | | | |
Expenses: | | | | |
Management fees | | | 950,941 | |
Transfer agent/maintenance fees | | | 279,019 | |
Administration fees | | | 146,768 | |
Custodian fees | | | 57,476 | |
Directors’ fees | | | 12,196 | |
Professional fees | | | 41,062 | |
Reports to shareholders | | | 24,896 | |
Registration fees | | | 38,408 | |
Other expenses | | | 14,333 | |
12b-1 distribution fees - Class A | | | 197,363 | |
12b-1 distribution fees - Class C | | | 50,450 | |
Total expenses | | | 1,812,912 | |
Less: | | | | |
Earnings credits applied | | | (443 | ) |
| | | | |
Net expenses | | | 1,812,469 | |
| | | | |
Net investment income | | | 588,726 | |
| | | | |
Net Realized and Unrealized Gain (Loss): | | | | |
Net realized gain (loss) during the year on: | | | | |
Investments | | | (31,986,400 | ) |
Foreign currency transactions | | | (320,431 | ) |
| | | | |
Net realized loss | | | (32,306,831 | ) |
| | | | |
Net unrealized appreciation (depreciation) during the year on: | | | | |
Investments | | | 30,272,692 | |
Translation of assets and liabilities in foreign currencies | | | (44,264 | ) |
| | | | |
Net unrealized appreciation | | | 30,228,428 | |
| | | | |
Net loss | | | (2,078,403 | ) |
| | | | |
Net decrease in net assets resulting from operations | | $ | (1,489,677 | ) |
| | | | |
The accompanying notes are an integral part of the financial statements
45
| | |
| | Rydex | SGI Equity Fund |
| Statement of Changes in Net Assets | | Global Series |
| | | | | | | | |
| | | Year Ended
September 30, 2009 | | | Year Ended
September 30, 2008 | |
Increase (decrease) in net assets from operations: | | | | | | | | |
Net investment income | | $ | 588,726 | | | $ | 520,278 | |
Net realized loss during the year on investments and foreign currency transactions | | | (32,306,831 | ) | | | (17,073,963 | ) |
Net unrealized appreciation (depreciation) during the year on investments and translation of assets and liabilities in foreign currencies | | | 30,228,428 | | | | (24,868,797 | ) |
| | | | | | | | |
Net decrease in net assets resulting from operations | | | (1,489,677 | ) | | | (41,422,482 | ) |
| | | | | | | | |
Distributions to shareholders from: | | | | | | | | |
Net investment income | | | | | | | | |
Class A | | | (163,957 | ) | | | (256,485 | ) |
Class B | | | (75,171 | ) | | | (137,990 | ) |
Net realized gain | | | | | | | | |
Class A | | | — | | | | (47,919,890 | ) |
Class B | | | — | | | | (10,546,794 | ) |
Class C | | | — | | | | (4,424,426 | ) |
Return of capital | | | | | | | | |
Class A | | | (535,384 | ) | | | — | |
Class B | | | (101,453 | ) | | | — | |
Class C | | | (46,236 | ) | | | — | |
| | | | | | | | |
Total distributions to shareholders | | | (922,201 | ) | | | (63,285,585 | ) |
| | | | | | | | |
Capital share transactions: | | | | | | | | |
Proceeds from sale of shares | | | | | | | | |
Class A | | | 34,945,358 | | | | 29,605,642 | |
Class B | | | 2,542,896 | | | | 4,778,339 | |
Class C | | | 988,149 | | | | 2,736,093 | |
Distributions reinvested | | | | | | | | |
Class A | | | 692,086 | | | | 47,766,576 | |
Class B | | | 175,483 | | | | 10,521,908 | |
Class C | | | 45,624 | | | | 4,347,344 | |
Cost of shares redeemed | | | | | | | | |
Class A | | | (26,643,873 | ) | | | (52,959,002 | ) |
Class B | | | (5,753,043 | ) | | | (13,096,148 | ) |
Class C | | | (3,334,066 | ) | | | (4,307,780 | ) |
| | | | | | | | |
Net increase from capital share transactions | | | 3,658,614 | | | | 29,392,972 | |
| | | | | | | | |
Net increase (decrease) in net assets | | | 1,246,736 | | | | (75,315,095 | ) |
| | | | | | | | |
Net assets: | | | | | | | | |
Beginning of year | | | 111,951,263 | | | | 187,266,358 | |
| | | | | | | | |
End of year | | $ | 113,197,999 | | | $ | 111,951,263 | |
| | | | | | | | |
Accumulated net investment loss at end of year | | $ | (308,767 | ) | | $ | (337,933 | ) |
| | | | | | | | |
Capital share activity: | | | | | | | | |
Shares sold | | | | | | | | |
Class A | | | 4,245,498 | | | | 2,084,793 | |
Class B | | | 355,824 | | | | 352,156 | |
Class C | | | 136,231 | | | | 213,727 | |
Shares reinvested | | | | | | | | |
Class A | | | 84,093 | | | | 3,504,518 | |
Class B | | | 24,543 | | | | 884,938 | |
Class C | | | 6,354 | | | | 363,187 | |
Shares redeemed | | | | | | | | |
Class A | | | (3,160,197 | ) | | | (4,030,409 | ) |
Class B | | | (787,666 | ) | | | (1,109,871 | ) |
Class C | | | (453,603 | ) | | | (362,050 | ) |
The accompanying notes are an integral part of the financial statements
46
| | |
| Financial Highlights | | Rydex | SGI Equity Fund |
Selected data for each share of capital stock outstanding throughout each year | | Global Series |
| | | | | | | | | | | | | | | | | | | | |
Class A | | 2009 | | | 2008 | | | 2007 a | | | 2006 | | | Year Ended
September 30,
2005 | |
Per Share Data | | | | | | | | | | | | | | | | | | | | |
Net asset value, beginning of period | | $ | 10.35 | | | $ | 20.69 | | | $ | 19.65 | | | $ | 17.47 | | | $ | 13.93 | |
| | | | | | | | | | | | | | | | | | | | |
Income (loss) from investment operations: | | | | | | | | | | | | | | | | | | | | |
Net investment income (loss)b | | | 0.05 | | | | 0.05 | | | | 0.06 | | | | (0.03 | ) | | | (0.02 | ) |
Net gain (loss) on securities (realized and unrealized) | | | (0.35 | ) | | | (3.63 | ) | | | 3.60 | | | | 2.21 | | | | 3.56 | |
| | | | | | | | | | | | | | | | | | | | |
Total from investment operations | | | (0.30 | ) | | | (3.58 | ) | | | 3.66 | | | | 2.18 | | | | 3.54 | |
| | | | | | | | | | | | | | | | | | | | |
Less distributions: | | | | | | | | | | | | | | | | | | | | |
Dividends from net investment income | | | (0.02 | ) | | | (0.04 | ) | | | — | | | | — | | | | — | |
Distributions from realized gains | | | — | | | | (6.72 | ) | | | (2.62 | ) | | | — | | | | — | |
Return of capital | | | (0.06 | ) | | | — | | | | — | | | | — | | | | — | |
Total distributions | | | (0.08 | ) | | | (6.76 | ) | | | (2.62 | ) | | | — | | | | — | |
| | | | | | | | | | | | | | | | | | | | |
Net asset value, end of period | | $ | 9.97 | | | $ | 10.35 | | | $ | 20.69 | | | $ | 19.65 | | | $ | 17.47 | |
| | | | | | | | | | | | | | | | | | | | |
Total Return c | | | (2.71 | %) | | | (25.16 | %) | | | 20.07 | % | | | 12.48 | % | | | 25.41 | % |
| | | | | | | | | | | | | | | | | | | | |
Ratios/Supplemental Data | | | | | | | | | | | | | | | | | | | | |
Net assets, end of period (in thousands) | | $ | 97,205 | | | $ | 88,782 | | | $ | 145,158 | | | $ | 119,176 | | | $ | 127,970 | |
| | | | | | | | | | | | | | | | | | | | |
Ratios to average net assets: | | | | | | | | | | | | | | | | | | | | |
Net investment income (loss) | | | 0.63 | % | | | 0.33 | % | | | 0.29 | % | | | (0.17 | %) | | | (0.14 | %) |
Total expensesd | | | 1.89 | % | | | 1.73 | % | | | 1.69 | % | | | 1.75 | % | | | 1.73 | % |
Net expensese | | | 1.89 | % | | | 1.72 | % | | | 1.69 | % | | | 1.75 | % | | | 1.73 | % |
Net expenses prior to custodian earning credits and net of expense waivers | | | 1.89 | % | | | 1.73 | % | | | 1.69 | % | | | 1.75 | % | | | 1.73 | % |
| | | | | | | | | | | | | | | | | | | | |
Portfolio turnover rate | | | 368 | % | | | 280 | %f | | | 162 | %f | | | 28 | % | | | 31 | % |
| | | | | |
Class B | | 2009g | | | 2008g | | | 2007a,g | | | 2006g | | | Year Ended
September 30,
2005g | |
Per Share Data | | | | | | | | | | | | | | | | | | | | |
Net asset value, beginning of period | | $ | 9.05 | | | $ | 18.96 | | | $ | 18.17 | | | $ | 16.12 | | | $ | 12.93 | |
| | | | | | | | | | | | | | | | | | | | |
Income (loss) from investment operations: | | | | | | | | | | | | | | | | | | | | |
Net investment income (loss) b | | | 0.07 | | | | 0.07 | | | | 0.09 | | | | 0.02 | | | | (0.12 | ) |
Net gain (loss) on securities (realized and unrealized) | | | (0.32 | ) | | | (3.17 | ) | | | 3.32 | | | | 2.03 | | | | 3.31 | |
| | | | | | | | | | | | | | | | | | | | |
Total from investment operations | | | (0.25 | ) | | | (3.10 | ) | | | 3.41 | | | | 2.05 | | | | 3.19 | |
| | | | | | | | | | | | | | | | | | | | |
Less distributions: | | | | | | | | | | | | | | | | | | | | |
Dividends from net investment income | | | (0.04 | ) | | | (0.09 | ) | | | — | | | | — | | | | — | |
Distributions from realized gains | | | — | | | | (6.72 | ) | | | (2.62 | ) | | | — | | | | — | |
Return of capital | | | (0.07 | ) | | | — | | | | — | | | | — | | | | — | |
| | | | | | | | | | | | | | | | | | | | |
Total distributions | | | (0.11 | ) | | | (6.81 | ) | | | (2.62 | ) | | | — | | | | — | |
| | | | | | | | | | | | | | | | | | | | |
Net asset value, end of period | | $ | 8.69 | | | $ | 9.05 | | | $ | 18.96 | | | $ | 18.17 | | | $ | 16.12 | |
| | | | | | | | | | | | | | | | | | | | |
Total Return c | | | (2.45 | %) | | | (24.91 | %) | | | 20.36 | % | | | 12.72 | % | | | 24.67 | % |
| | | | | | | | | | | | | | | | | | | | |
Ratios/Supplemental Data | | | | | | | | | | | | | | | | | | | | |
Net assets, end of period (in thousands) | | $ | 11,155 | | | $ | 15,303 | | | $ | 29,659 | | | $ | 27,494 | | | $ | 28,999 | |
| | | | | | | | | | | | | | | | | | | | |
Ratios to average net assets: | | | | | | | | | | | | | | | | | | | | |
Net investment income (loss) | | | 0.90 | % | | | 0.55 | % | | | 0.50 | % | | | 0.11 | % | | | (0.80 | %) |
Total expenses d | | | 1.65 | % | | | 1.48 | % | | | 1.44 | % | | | 1.50 | % | | | 2.38 | % |
Net expenses e | | | 1.65 | % | | | 1.47 | % | | | 1.44 | % | | | 1.50 | % | | | 2.38 | % |
Net expenses prior to custodian earning credits and net of expense waivers | | | 1.65 | % | | | 1.48 | % | | | 1.44 | % | | | 1.50 | % | | | 2.38 | % |
| | | | | | | | | | | | | | | | | | | | |
Portfolio turnover rate | | | 368 | % | | | 280 | %f | | | 162 | %f | | | 28 | % | | | 31 | % |
The accompanying notes are an integral part of the financial statements
47
| | |
| Financial Highlights | | Rydex | SGI Equity Fund |
Selected data for each share of capital stock outstanding throughout each year | | Global Series |
| | | | | | | | | | | | | | | | | | | | |
Class C | | 2009 | | | 2008 | | | 2007a | | | 2006 | | | Year Ended
September 30,
2005 | |
Per Share Data | | | | | | | | | | | | | | | | | | | | |
Net asset value, beginning of period | | $ | 9.04 | | | $ | 19.00 | | | $ | 18.37 | | | $ | 16.46 | | | $ | 13.22 | |
| | | | | | | | | | | | | | | | | | | | |
Income (loss) from investment operations: | | | | | | | | | | | | | | | | | | | | |
Net investment loss b | | | (0.01 | ) | | | (0.05 | ) | | | (0.09 | ) | | | (0.15 | ) | | | (0.13 | ) |
Net gain (loss) on securities (realized and unrealized) | | | (0.31 | ) | | | (3.18 | ) | | | 3.34 | | | | 2.06 | | | | 3.37 | |
| | | | | | | | | | | | | | | | | | | | |
Total from investment operations | | | (0.32 | ) | | | (3.23 | ) | | | 3.25 | | | | 1.91 | | | | 3.24 | |
| | | | | | | | | | | | | | | | | | | | |
Less distributions: | | | | | | | | | | | | | | | | | | | | |
Distributions from realized gains | | | — | | | | (6.73 | ) | | | (2.62 | ) | | | — | | | | — | |
Return of capital | | | (0.06 | ) | | | — | | | | — | | | | — | | | | — | |
| | | | | | | | | | | | | | | | | | | | |
Total distributions | | | (0.06 | ) | | | (6.73 | ) | | | (2.62 | ) | | | — | | | | — | |
| | | | | | | | | | | | | | | | | | | | |
Net asset value, end of period | | $ | 8.66 | | | $ | 9.04 | | | $ | 19.00 | | | $ | 18.37 | | | $ | 16.46 | |
| | | | | | | | | | | | | | | | | | | | |
Total Return c | | | (3.39 | %) | | | (25.69 | %) | | | 19.14 | % | | | 11.60 | % | | | 24.51 | % |
| | | | | | | | | | | | | | | | | | | | |
Ratios/Supplemental Data | | | | | | | | | | | | | | | | | | | | |
Net assets, end of period (in thousands) | | $ | 4,838 | | | $ | 7,866 | | | $ | 12,449 | | | $ | 10,361 | | | $ | 8,841 | |
| | | | | | | | | | | | | | | | | | | | |
Ratios to average net assets: | | | | | | | | | | | | | | | | | | | | |
Net investment loss | | | (0.11 | %) | | | (0.44 | %) | | | (0.48 | %) | | | (0.87 | %) | | | (0.90 | %) |
Total expenses d | | | 2.65 | % | | | 2.49 | % | | | 2.44 | % | | | 2.51 | % | | | 2.48 | % |
Net expenses e | | | 2.65 | % | | | 2.47 | % | | | 2.44 | % | | | 2.50 | % | | | 2.48 | % |
Net expenses prior to custodian earning credits and net of expense waivers | | | 2.65 | % | | | 2.49 | % | | | 2.44 | % | | | 2.51 | % | | | 2.48 | % |
| | | | | | | | | | | | | | | | | | | | |
Portfolio turnover rate | | | 368 | % | | | 280 | %f | | | 162 | %f | | | 28 | % | | | 31 | % |
| a | Security Global Investors, LLC (SGI) became the sub-advisor of the Global Series effective August 1, 2007. Prior to August 1, 2007, Security Investors (SI) paid Oppenheimer Funds for sub-advisory services. |
| b | Net investment income (loss) was computed using average shares outstanding throughout the period. |
| c | Total return information does not reflect deduction of any sales charges imposed at the time of purchase for Class A shares or upon redemption for Class B and C shares. |
| d | Total expense information reflects expense ratios absent expense reductions by the Investment Manager and custodian earnings credits, as applicable. |
| e | Net expense information reflects the expense ratios after voluntary expense waivers, reimbursements and custodian earnings credits, as applicable. |
| f | Significant variation in the portfolio turnover rate is due to the re-alignment of the Series’ portfolio following the appointment of SGI as sub-advisor. |
| g | Effective August 25, 2005, Class B shares ceased charging 12b-1 fees in accordance with FINRA sales cap regulations. Per share information reflects this change. This fee will be reinstated when sales exceed the sales cap limit. |
The accompanying notes are an integral part of the financial statements
48
Managers’ Commentary
November 16, 2009
To Our Shareholders:
For the fiscal year ended September 30, 2009, the Rydex|SGI Equity Fund Global Institutional Series outperformed its benchmark, the MSCI World Index, –0.90%1 to –2.29%.
At the core of the investment management team’s philosophy is the idea that excess return opportunities exist in global stock markets and can be identified and captured at the security level, regardless of country, region, or sector. Portfolio managers Scott Klimo and David Whittall lead the global equities team. In addition to the team’s extensive experience, competitive advantages include the execution of in-depth fundamental research using a proprietary database that provides a unique perspective of the world, a proprietary risk management module, and a well-defined and disciplined investment process.
Financials, Information Technology, and Materials Top Performers
The Series positioned the financials sector as an underweight to the Index, consisting of 11% of assets rather than 18%. Returns in the sector for the portfolio was 2%, compared to a 8% loss for the benchmark. Leading holdings included National City Corporation, AllianceBernstein Holding, L.P., Citigroup, Inc., and Standard Chartered PLC.
Superior stock selection in the information technology sector boosted Series performance. The sector was an even weight against the benchmark but outperformed with a 41% versus 9% gain. An investment in Apple, Inc. surged more than 120% during the period. Top holdings in the sector included Netease.com, Inc., Check Point Software Technologies, Ltd., and Google, Inc.
Holdings in the materials sector added to overall performance during the fiscal year even as it was approximately half the weight of the Index. Randgold Resources, Ltd. and Agnico-Eagle Mines, Ltd. were leading holdings for the period.
Industrials, Consumer Discretionary, and Energy Disappoint
Industrials holdings declined 15% against a 2% loss for the Index making it the worst performing sector for the Series on a relative basis. Both Aveng, Ltd. and Foster Wheeler AG were down more than 60% over the period. Also bringing down Series performance in the sector were Lockhead Martin Corporation and Joy Global, Inc.
The Series held an overweight position in consumer discretionary securities, totaling 12% of portfolio assets against 10% in the Index. Securities in the Series lost –3% while holdings in the Index gained 6%, a disparity of 9%. The sector was one of the better performing in the Index during the year. Jarden Corporation and RadioShack Corporation both lost more than 50%. Other detractors in the sector were Ubisoft Entertainment S.A. and Harley-Davidson, Inc.
Energy holdings dropped more than 30% for the Series against the 4% loss for the Index. Bumi Resources declined over 70% while Consol Energy, Inc. and Anadarko Petroleum Corporation also contributed to the negative performance.
Market Outlook
From a sector perspective, financials remains our largest exposure, although it is now slightly below market weight as various positions have achieved price targets. Among other major sectors, we have a slight overweight in consumer non-durables, software & services and global hardware. We are underweight health care, materials & processing, utilities and producer manufacturing.
Geographically, we have normalized our exposures in Europe. Japan remains an equal weight relative to the benchmark, while Asia Ex-Japan is slightly overweight. As a result, the increased exposure to Europe has come out of North America. Currently, we do not have any significant regional biases. Europe’s periphery—primarily Portugal, Ireland, Italy, Greece and Spain—remains weak. Japanese exporters will have to deal with the effects of the strengthening Yen as companies struggle with anemic demand. In the U.S., we have seen improvements in various economic indicators. Nonetheless, the employment situation remains precarious and may hit double-digit unemployment by the end of the year.
We appreciate your confidence and trust. We will continue to seek out the best individual prospects from around the globe for the Series.
|
| Sincerely, |
|
| |
| Scott Klimo, David Whittall |
| Portfolio Managers |
| 1 | Performance figures are based on Class I shares and do not reflect deduction of the sales charges or taxes that a shareholder would pay on distributions or the redemption of shares. Fee waivers and/or reimbursements reduce Series expenses and in the absence of such waivers, the performance quoted would be reduced. Investments in international securities entail greater risks than investment in domestic securities. |
| | The strategies discussed herein do not assure a profit. The Fund is distributed by Rydex Distributors, Inc. |
49
| | |
| | Rydex | SGI Equity Fund |
| Performance Summary | | Global Institutional Series |
September 30, 2009 | | (unaudited) |
PERFORMANCE
Global Institutional Series vs. Morgan Stanley Capital International World Index
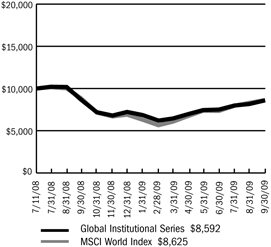
$10,000 Since Inception
This chart assumes a $10,000 investment in shares of Global Institutional Series on July 11, 2008 (date of inception), and reflects the fees and expenses of the Series and assumes all dividends reinvested. The chart does not reflect the deduction of taxes that a shareholder would pay on distributions or the redemption of fund shares. The MSCI World Index is an unmanaged capitalization-weighted index that is designed to measure global developed market equity performance.
Average Annual Returns
| | | | | | |
Periods Ended 9-30-09 | | 1 Year | | | Since Inception
(7-11-08) | |
Global Institutional Series | | (0.90 | %) | | (11.68 | %) |
The performance data above represents past performance that is not predictive of future results. The investment return and principal value of an investment in the Series will fluctuate so that an investor’s shares, when redeemed, may be worth more or less than their original cost. The figures do not reflect the deduction of taxes that a shareholder would pay on distributions or redemption of shares. Such figures would be lower any applicable taxes were deducted. Fee waivers and/or reimbursements reduced expenses of the Series and in the absence of such waiver, the performance quoted would be reduced.
Portfolio Composition by Sector as of 9-30-09
| | | |
Consumer Discretionary | | 8.81 | % |
Consumer Staples | | 14.45 | |
Energy | | 10.97 | |
Financials | | 19.29 | |
Health Care | | 7.75 | |
Industrials | | 6.81 | |
Information Technology | | 18.94 | |
Materials | | 2.68 | |
Telecommunication Services | | 2.06 | |
Utilities | | 3.03 | |
Exchange Traded Funds | | 3.93 | |
Cash & Other Assets, Less Liabilities | | 1.28 | |
| | | |
Total Net Assets | | 100.00 | % |
| | | |
The accompanying notes are an integral part of the financial statements
50
| | |
| | Rydex | SGI Equity Fund |
| Performance Summary | | Global Institutional Series |
September 30, 2009 | | (unaudited) |
Information About Your Series Expenses
Calculating your ongoing Series expenses
Example
As a shareholder of the Series, you incur ongoing costs, including management fees and other Series expenses. This example is intended to help you understand your ongoing costs (in dollars) of investing in the Series and to compare these costs with ongoing costs of investing in other mutual funds. The example is based on an investment of $1,000 invested at the beginning of the period and held for the entire period April 1, 2009 through September 30, 2009.
Actual Expenses
The first line for each class of shares in the table provides information about actual account values and actual expenses. You may use the information in this table, together with the amount you invested, to estimate the expenses that you paid over the period. Simply divide your account value by $1,000 (for example, an $8,600 account value divided by $1,000 = 8.6), then multiply the result by the number in the table under the heading entitled “Expenses Paid During the Period” to estimate the expenses you paid on your account during this period.
Hypothetical Example for Comparison Purposes
The second line for each class of shares in the table provides information about hypothetical account values and hypothetical expenses based on the Series actual expense ratio and an assumed rate of return of 5% per year before expenses, which is not the Series actual return. The hypothetical account values and expenses may not be used to estimate the actual ending account balance or expenses you paid for the period. You may use this information to compare the ongoing costs of investing in the Series and other funds. To do so, compare this 5% hypothetical example with the 5% hypothetical examples that appear in the shareholder reports of the other mutual funds.
Please note that the expenses shown in the table are meant to highlight your ongoing costs. Therefore, the second line for each class of shares is useful in comparing ongoing costs only, and will not help you determine the relative total costs of owning different funds.
Series Expenses
| | | | | | | | | |
| | | Beginning
Account
Value
4/1/2009 | | Ending
Account
Value
9/30/20091 | | Expenses
Paid
During
Period2 |
Global Institutional Series | | | | | | | | | |
Actual | | $ | 1,000.00 | | $ | 1,331.26 | | $ | 6.72 |
Hypothetical | | | 1,000.00 | | | 1,019.30 | | | 5.82 |
| 1 | The actual ending account value is based on the actual total return of the Series for the period April 1, 2009 to September 30, 2009 after actual expenses and will differ from the hypothetical ending account value which is based on the Series expense ratio and a hypothetical annual return of 5% before expenses. The actual cumulative return at net asset value for the period April 1, 2009 to September 30, 2009 was 33.13%. |
| 2 | Expenses are equal to the Series annualized expense ratio of 1.15%, net of any applicable fee waivers, multiplied by the average account value over the period, multiplied by 183/365 (to reflect the one-half year period). |
51
| | |
| Schedule of Investments | | Rydex | SGI Equity Fund |
| September 30, 2009 | | Global Institutional Series |
| | | | | |
| | | Shares | | Value |
COMMON STOCKS - 50.6% | | | | | |
Airlines - 1.9% | | | | | |
Allegiant Travel Company * | | 2,443 | | $ | 93,054 |
| | | | | |
Asset Management & Custody Banks - 0.5% | | | | | |
AllianceBernstein Holding, LP | | 900 | | | 24,552 |
| | | | | |
Cable & Satellite - 3.3% | | | | | |
Comcast Corporation | | 4,500 | | | 76,005 |
Time Warner Cable, Inc. | | 2,053 | | | 88,463 |
| | | | | |
| | | | | 164,468 |
| | | | | |
Communications Equipment - 1.4% | | | | | |
Cisco Systems, Inc. * | | 2,953 | | | 69,514 |
| | | | | |
Computer Hardware - 2.6% | | | | | |
Apple, Inc. * | | 687 | | | 127,349 |
| | | | | |
Construction & Farm Machinery & Heavy Trucks - 0.5% | | | | | |
Trinity Industries, Inc. | | 1,464 | | | 25,166 |
| | | | | |
Drug Retail - 0.5% | | | | | |
CVS Caremark Corporation | | 736 | | | 26,305 |
| | | | | |
Education Services - 2.8% | | | | | |
Apollo Group, Inc. * | | 433 | | | 31,899 |
ITT Educational Services, Inc. * | | 945 | | | 104,338 |
| | | | | |
| | | | | 136,237 |
| | | | | |
Electric Utilities - 0.7% | | | | | |
Allegheny Energy, Inc. | | 1,223 | | | 32,434 |
| | | | | |
Electrical Components & Equipment - 1.7% | | | | | |
Suntech Power Holdings Company, Ltd. ADR * | | 2,745 | | | 41,724 |
Thomas & Betts Corporation * | | 1,419 | | | 42,684 |
| | | | | |
| | | | | 84,408 |
| | | | | |
Exchange Traded Funds - 4.0% | | | | | |
iShares Russell 2000 Index Fund | | 3,200 | | | 192,735 |
| | | | | |
Food Retail - 0.4% | | | | | |
Kroger Company | | 857 | | | 17,688 |
| | | | | |
Gold - 1.7% | | | | | |
Randgold Resources, Ltd. ADR | | 1,160 | | | 81,061 |
| | | | | |
Health Care Services - 2.9% | | | | | |
Express Scripts, Inc. * | | 1,499 | | | 116,293 |
Medco Health Solutions, Inc. * | | 439 | | | 24,281 |
| | | | | |
| | | | | 140,574 |
| | | | | |
Home Entertainment Software - 0.8% | | | | | |
Shanda Interactive Entertainment, Ltd. ADR * | | 798 | | | 40,858 |
| | | | | |
Household Products - 1.4% | | | | | |
Kimberly-Clark Corporation | | 1,180 | | | 69,596 |
| | | | | |
| | | | | |
| | | Shares | | Value |
COMMON STOCKS - 50.6% (continued) | | | | | |
Independent Power Producers & Energy Traders - 0.4% | | | | | |
Mirant Corporation * | | 1,100 | | $ | 18,073 |
| | | | | |
Integrated Oil & Gas - 1.3% | | | | | |
Occidental Petroleum Corporation | | 839 | | | 65,778 |
| | | | | |
Internet Software & Services - 2.1% | | | | | |
Netease.com ADR * | | 2,222 | | | 101,501 |
| | | | | |
Investment Banking & Brokerage - 2.6% | | | | | |
Goldman Sachs Group, Inc. | | 689 | | | 127,017 |
| | | | | |
Life Sciences Tools & Services - 2.2% | | | | | |
Life Technologies Corporation * | | 2,315 | | | 107,763 |
| | | | | |
Multi-Line Insurance - 1.0% | | | | | |
Hartford Financial Services Group, Inc. | | 1,920 | | | 50,880 |
| | | | | |
Oil & Gas Exploration & Production - 1.5% | | | | | |
Forest Oil Corporation * | | 3,809 | | | 74,542 |
| | | | | |
Oil & Gas Refining & Marketing - 0.8% | | | | | |
World Fuel Services Corporation | | 805 | | | 38,696 |
| | | | | |
Other Diversified Financial Services - 1.6% | | | | | |
JPMorgan Chase & Company | | 1,778 | | | 77,912 |
| | | | | |
Packaged Foods & Meats - 0.3% | | | | | |
American Italian Pasta Company * | | 610 | | | 16,580 |
| | | | | |
Personal Products - 0.6% | | | | | |
Bare Escentuals, Inc. * | | 2,627 | | | 31,235 |
| | | | | |
Pharmaceuticals - 0.4% | | | | | |
Watson Pharmaceuticals, Inc. * | | 534 | | | 19,566 |
| | | | | |
Property & Casualty Insurance - 3.1% | | | | | |
ACE, Ltd. | | 2,246 | | | 120,071 |
Aspen Insurance Holdings, Ltd. | | 731 | | | 19,350 |
Tower Group, Inc. | | 574 | | | 14,000 |
| | | | | |
| | | | | 153,421 |
| | | | | |
Specialized Finance - 0.4% | | | | | |
PHH Corporation * | | 1,100 | | | 21,824 |
| | | | | |
Systems Software - 2.0% | | | | | |
Check Point Software Technologies * | | 3,386 | | | 95,993 |
| | | | | |
Tobacco - 3.2% | | | | | |
Altria Group, Inc. | | 3,776 | | | 67,251 |
The accompanying notes are an integral part of the financial statements
52
| | |
| Schedule of Investments | | Rydex | SGI Equity Fund |
| September 30, 2009 | | Global Institutional Series |
| | | | | |
| | | Shares | | Value |
COMMON STOCKS - 50.6% (continued) | | | | | |
Tobacco - 3.2% (continued) | | | | | |
Philip Morris International, Inc. | | 1,872 | | $ | 91,240 |
| | | | | |
| | | | | 158,491 |
| | | | | |
TOTAL COMMON STOCKS (cost $2,117,114) | | | | $ | 2,485,271 |
| | | | | |
| | |
| | | Shares | | Value |
FOREIGN STOCKS - 48.1% | | | | | |
Aerospace & Defense - 2.2% | | | | | |
BAE Systems plc | | 16,989 | | $ | 94,834 |
MTU Aero Engines Holding AG | | 338 | | | 16,006 |
| | | | | |
| | | | | 110,840 |
| | | | | |
Automobile Manufacturers - 1.7% | | | | | |
Honda Motor Company, Ltd. | | 2,900 | | | 89,318 |
| | | | | |
Casinos & Gaming - 0.9% | | | | | |
William Hill plc | | 15,214 | | | 42,864 |
| | | | | |
Communications Equipment - 2.1% | | | | | |
Tandberg ASA | | 4,400 | | | 105,346 |
| | | | | |
Construction & Engineering - 0.4% | | | | | |
Imtech N.V. | | 820 | | | 20,909 |
| | | | | |
Diversified Banks - 4.6% | | | | | |
DBS Group Holdings, Ltd. | | 10,600 | | | 99,928 |
Standard Chartered plc | | 5,094 | | | 125,611 |
| | | | | |
| | | | | 225,539 |
| | | | | |
Diversified Real Estate Activities - 0.7% | | | | | |
Tokyu Land Corporation | | 8,000 | | | 31,991 |
| | | | | |
Electric Utilities - 1.3% | | | | | |
Endesa S.A. | | 819 | | | 27,062 |
Kyushu Electric Power Company, Inc. | | 1,491 | | | 33,798 |
| | | | | |
| | | | | 60,860 |
| | | | | |
Electronic Components - 1.6% | | | | | |
Hosiden Corporation | | 1,000 | | | 13,556 |
LG Innotek Company, Ltd. | | 611 | | | 66,018 |
| | | | | |
| | | | | 79,574 |
| | | | | |
Fertilizers & Agricultural Chemicals - 1.0% | | | | | |
Syngenta AG | | 221 | | | 50,777 |
| | | | | |
Food Retail - 0.9% | | | | | |
Empire Company, Ltd. | | 520 | | | 21,228 |
Metro, Inc. | | 700 | | | 22,876 |
| | | | | |
| | | | | 44,104 |
| | | | | |
Home Entertainment Software - 1.8% | | | | | |
UBISOFT Entertainment * | | 4,582 | | | 86,765 |
| | | | | |
Integrated Oil & Gas - 2.8% | | | | | |
BG Group plc | | 5,422 | | | 94,100 |
ENI SpA | | 606 | | | 15,147 |
Repsol YPF S.A. | | 1,127 | | | 30,660 |
| | | | | |
| | | | | 139,907 |
| | | | | |
Integrated Telecommunication Services - 2.0% | | | | | |
China Unicom Hong Kong, Ltd. | | 56,000 | | | 79,339 |
Telstra Corporation, Ltd. | | 7,642 | | | 22,047 |
| | | | | |
| | | | | 101,386 |
| | | | | |
| | | | | |
| | | Shares | | Value |
FOREIGN STOCKS - 48.1% (continued) | | | | | |
Internet Software & Services - 1.8% | | | | | |
Gree, Inc. | | 1,586 | | $ | 86,389 |
| | | | | |
IT Consulting & Other Services - 2.3% | | | | | |
Atos Origin S.A. | | 2,196 | | | 110,869 |
| | | | | |
Life & Health Insurance - 0.6% | | | | | |
CNP Assurances | | 292 | | | 29,753 |
| | | | | |
Life Sciences Tools & Services - 1.7% | | | | | |
Lonza Group AG | | 738 | | | 80,473 |
| | | | | |
Multi-Line Insurance - 1.2% | | | | | |
Allianz AG | | 333 | | | 41,601 |
RSA Insurance Group plc | | 9,278 | | | 19,853 |
| | | | | |
| | | | | 61,454 |
| | | | | |
Multi-Utilities - 0.8% | | | | | |
United Utilities Group plc | | 5,116 | | | 37,322 |
| | | | | |
Office Electronics - 0.5% | | | | | |
Neopost S.A. | | 290 | | | 26,027 |
| | | | | |
Oil & Gas Exploration & Production - 3.6% | | | | | |
CNOOC, Ltd. | | 33,000 | | | 44,369 |
Oil Search, Ltd. | | 23,259 | | | 132,357 |
| | | | | |
| | | | | 176,726 |
| | | | | |
Oil & Gas Refining & Marketing - 0.9% | | | | | |
Neste Oil Oyj | | 1,394 | | | 25,744 |
Nippon Mining Holdings, Inc. | | 3,500 | | | 17,232 |
| | | | | |
| | | | | 42,976 |
| | | | | |
Packaged Foods & Meats - 6.3% | | | | | |
Marine Harvest * | | 147,648 | | | 107,175 |
Parmalat SpA | | 35,519 | | | 98,186 |
Toyo Suisan Kaisha, Ltd. | | 3,911 | | | 105,861 |
| | | | | |
| | | | | 311,222 |
| | | | | |
Pharmaceuticals - 0.7% | | | | | |
Stada Arzneimittel AG | | 1,170 | | | 31,983 |
| | | | | |
Property & Casualty Insurance - 1.6% | | | | | |
Lancashire Holdings, Ltd. | | 9,342 | | | 76,289 |
| | | | | |
Regional Banks - 0.7% | | | | | |
Seven Bank, Ltd.2 | | 13 | | | 32,147 |
| | | | | |
Specialized Finance - 0.7% | | | | | |
Bolsas y Mercados Espanoles S.A. | | 412 | | | 16,043 |
Osaka Securities Exchange Company, Ltd. | | 4 | | | 18,179 |
| | | | | |
| | | | | 34,222 |
| | | | | |
Tobacco - 0.7% | | | | | |
Japan Tobacco, Inc. | | 10 | | | 34,308 |
| | | | | |
TOTAL FOREIGN STOCKS (cost $2,127,660) | | | | $ | 2,362,340 |
| | | | | |
The accompanying notes are an integral part of the financial statements
53
| | |
| Schedule of Investments | | Rydex | SGI Equity Fund |
| September 30, 2009 | | Global Institutional Series |
| | | |
| | | Value |
Total Investments - 98.7% 1 (cost $4,244,774) | | $ | 4,847,611 |
Cash & Other Assets, Less Liabilities - 1.3% | | | 62,751 |
| | | |
Total Net Assets - 100.0% | | $ | 4,910,362 |
| | | |
INVESTMENT CONCENTRATION
At September 30, 2009, the investment diversification of the Series was as follows:
| | | | | | |
Country | | % of Net
Assets | | | Value |
United States | | 40.4 | % | | $ | 1,984,713 |
Japan | | 9.5 | | | | 462,779 |
United Kingdom | | 8.5 | | | | 414,584 |
France | | 5.2 | | | | 253,414 |
Switzerland | | 5.1 | | | | 251,321 |
Norway | | 4.3 | | | | 212,521 |
Cayman Islands | | 3.7 | | | | 184,083 |
Papua New Guinea | | 2.7 | | | | 132,357 |
Hong Kong | | 2.5 | | | | 123,708 |
Italy | | 2.3 | | | | 113,333 |
Singapore | | 2.0 | | | | 99,928 |
Israel | | 2.0 | | | | 95,993 |
Bermuda | | 2.0 | | | | 95,639 |
Germany | | 1.8 | | | | 89,590 |
Jersey | | 1.7 | | | | 81,061 |
Spain | | 1.5 | | | | 73,765 |
Republic of Korea | | 1.3 | | | | 66,018 |
Canada | | 0.9 | | | | 44,104 |
Finland | | 0.5 | | | | 25,744 |
Australia | | 0.4 | | | | 22,047 |
Netherlands | | 0.4 | | | | 20,909 |
| | | | | | |
Total Investments | | 98.7 | | | $ | 4,847,611 |
| | | | | | |
For federal income tax purposes the identified cost of investments owned at September 30, 2009 was $4,273,322.
| ADR | American Depositary Receipt |
| plc | Public Limited Company |
| * | Non-income producing security |
| 1 | Unless otherwise indicated, the values of the securities of the Portfolio are determined based on Level 1 inputs established by ASC 820. |
| 2 | Security is a PFIC (Passive Foreign Investment Company). |
The accompanying notes are an integral part of the financial statements
54
Rydex | SGI Equity Fund
Global Institutional Series
Statement of Assets and Liabilities
September 30, 2009
| | | | |
Assets: | | | | |
Investments, at value * | | $ | 4,847,611 | |
Cash denominated in a foreign currency, at value ** | | | 25,860 | |
Receivables: | | | | |
Fund shares sold | | | 22,061 | |
Securities sold | | | 820,523 | |
Dividends | | | 12,440 | |
Security Investors | | | 5,715 | |
Foreign taxes recoverable | | | 1,252 | |
Prepaid expenses | | | 7,762 | |
| | | | |
Total assets | | | 5,743,224 | |
| | | | |
Liabilities: | | | | |
Cash overdraft | | | 563,319 | |
Payable for: | | | | |
Fund shares redeemed | | | 32,046 | |
Securities purchased | | | 211,026 | |
Management fees | | | 4,503 | |
Administration fees | | | 2,408 | |
Custodian fees | | | 9,008 | |
Directors’ fees | | | 365 | |
Professional fees | | | 7,400 | |
Other fees | | | 2,787 | |
| | | | |
Total liabilities | | | 832,862 | |
| | | | |
Net assets | | $ | 4,910,362 | |
| | | | |
Net assets consist of: | | | | |
Paid in capital | | $ | 6,566,132 | |
Undistributed net investment income | | | 41,584 | |
Accumulated net realized loss on sale of investments | | | (2,300,294 | ) |
Net unrealized appreciation in value of investments | | | 602,940 | |
| | | | |
Net assets | | $ | 4,910,362 | |
| | | | |
Capital shares authorized | | | unlimited | |
Capital shares outstanding | | | 573,905 | |
Net asset value per share
(net assets divided by shares outstanding) | | $ | 8.56 | |
| | | | |
* Investments, at cost | | $ | 4,244,774 | |
** Cash denominated in a foreign currency, at cost | | | 25,838 | |
Statement of Operations
For the Year Ended September 30, 2009
| | | | |
Investment Income: | | | | |
Dividends (net of foreign withholding tax $6,566) | | $ | 140,212 | |
Interest | | | 205 | |
| | | | |
Total investment income | | | 140,417 | |
| | | | |
Expenses: | | | | |
Management fees | | | 54,932 | |
Administration fees | | | 12,913 | |
Transfer agent/maintenance fees | | | 350 | |
Custodian fees | | | 40,626 | |
Directors’ fees | | | 717 | |
Professional fees | | | 13,462 | |
Reports to shareholders | | | 3,107 | |
Registration fees | | | 23,256 | |
Other | | | 2,530 | |
| | | | |
Total expenses | | | 151,893 | |
Reimbursement of expenses | | | (88,806 | ) |
| | | | |
Net expenses | | | 63,087 | |
| | | | |
Net investment income | | | 77,330 | |
| | | | |
Net Realized and Unrealized Gain (Loss): | | | | |
Net realized gain (loss) during the year on: | | | | |
Investments | | | (1,914,629 | ) |
Foreign currency transactions | | | (21,394 | ) |
| | | | |
Net realized loss | | | (1,936,023 | ) |
| | | | |
Net unrealized appreciation (depreciation) during the year on: | | | | |
Investments | | | 1,379,427 | |
Translation of assets and liabilities in foreign currencies | | | (3,071 | ) |
| | | | |
Net unrealized appreciation | | | 1,376,356 | |
| | | | |
Net realized and unrealized loss | | | (559,667 | ) |
| | | | |
Net decrease in net assets resulting from operations | | $ | (482,337 | ) |
| | | | |
The accompanying notes are an integral part of the financial statements
55
| | |
| | Rydex | SGI Equity Fund |
| Statement of Changes in Net Assets | | Global Institutional Series |
| | | | | | | | |
| | | Year Ended
September 30,
2009 | | | Period Ended
September 30,
2008* | |
Increase (decrease) in net assets from operations: | | | | | | | | |
Net investment income | | $ | 77,330 | | | $ | 14,698 | |
Net realized loss during the year on investments and foreign currency transactions | | | (1,936,023 | ) | | | (393,406 | ) |
Net unrealized appreciation (depreciation) during the year on investments and translation of assets and liabilities in foreign currencies | | | 1,376,356 | | | | (773,416 | ) |
| | | | | | | | |
Net decrease in net assets resulting from operations | | | (482,337 | ) | | | (1,152,124 | ) |
| | | | | | | | |
Distributions to shareholders from: | | | | | | | | |
Net investment income | | | (21,309 | ) | | | — | |
| | | | | | | | |
Total distributions to shareholders | | | (21,309 | ) | | | — | |
| | | | | | | | |
Capital share transactions: | | | | | | | | |
Proceeds from sale of shares | | | 1,489,252 | | | | 8,934,232 | |
Dividends reinvested | | | 20,899 | | | | — | |
Cost of shares redeemed | | | (3,478,142 | ) | | | (400,109 | ) |
| | | | | | | | |
Net increase (decrease) from capital share transactions | | | (1,967,991 | ) | | | 8,534,123 | |
| | | | | | | | |
Net increase (decrease) in net assets | | | (2,471,637 | ) | | | 7,381,999 | |
| | | | | | | | |
Net assets: | | | | | | | | |
Beginning of year | | | 7,381,999 | | | | — | |
| | | | | | | | |
End of year | | $ | 4,910,362 | | | $ | 7,381,999 | |
| | | | | | | | |
Undistributed net investment income at end of year | | $ | 41,584 | | | $ | 6,957 | |
| | | | | | | | |
Capital share activity: | | | | | | | | |
Shares sold | | | 214,539 | | | | 893,198 | |
Shares reinvested | | | 2,998 | | | | — | |
Shares redeemed | | | (495,421 | ) | | | (41,409 | ) |
| | | | | | | | |
Total capital share activity | | | (277,884 | ) | | | 851,789 | |
| | | | | | | | |
| * | For the period July 11, 2008 (commencement of operations) to September 30, 2008. |
The accompanying notes are an integral part of the financial statements
56
| | |
| Financial Highlights | | Rydex | SGI Equity Fund |
Selected data for each share of capital stock outstanding throughout each year | | Global Institutional Series |
| | | | | | | | |
| | | Year Ended
September 30,
2009 | | | Period Ended
September 30,
2008 a | |
Per Share Data | | | | | | | | |
Net asset value, beginning of period | | $ | 8.67 | | | $ | 10.00 | |
| | | | | | | | |
Income (loss) from investment operations: | | | | | | | | |
Net investment income b | | | 0.17 | | | | 0.02 | |
Net loss on securities (realized and unrealized) | | | (0.25 | ) | | | (1.35 | ) |
| | | | | | | | |
Total from investment operations | | | (0.08 | ) | | | (1.33 | ) |
| | | | | | | | |
Less distributions: | | | | | | | | |
Dividends from net investment income | | | (0.03 | ) | | | — | |
| | | | | | | | |
Total distributions | | | (0.03 | ) | | | — | |
| | | | | | | | |
Net asset value, end of period | | $ | 8.56 | | | $ | 8.67 | |
| | | | | | | | |
Total Return | | | (0.90 | %) | | | (13.30 | %) |
| | | | | | | | |
Ratios/Supplemental Data | | | | | | | | |
Net assets, end of period (in thousands) | | $ | 4,910 | | | $ | 7,382 | |
| | | | | | | | |
Ratios to average net assets: | | | | | | | | |
Net investment income | | | 2.34 | % | | | 0.87 | % |
Total expenses c | | | 2.76 | % | | | 1.97 | % |
Net expenses d | | | 1.15 | % | | | 1.15 | % |
Net expenses prior to custodian earnings credits and net of expense waivers | | | 1.15 | % | | | 1.15 | % |
| | | | | | | | |
Portfolio turnover rate | | | 379 | % | | | 325 | % |
| a | The Global Institutional Series was initially capitalized on July 11, 2008 with a net asset value of $10 per share. Percentage amounts for the period, except total return, have been annualized. |
| b | Net investment income (loss) was computed using average shares outstanding throughout the period. |
| c | Total expense information reflects the expense ratios absent expense reductions by the Investment Manager and earnings credits, as applicable. |
| d | Net expense information reflects the expense ratios after voluntary expense waivers, reimbursements and custodian earnings credits, as applicable. |
The accompanying notes are an integral part of the financial statements
57
This page left blank intentionally.
58
Manager’s Commentary
November 16, 2009
To Our Shareholders:
For the fiscal year ended September 30, 2009, the Rydex|SGI Equity Fund Mid Cap Value Series gained 6.90%1 exceeding the –8.33% return of the Series’ benchmark, the Russell 2500 Value Index, and the –4.21% median return of the peer group.
Our approach with the Mid Cap Value Series is to seek companies that can increase shareholders’ return on capital. We hold such companies over three to five years to capture long-term improvements in profitability.
The investment process is fundamentally driven and quantitatively aided. We use proprietary screens to identify potential companies for investment and then perform rigorous fundamental analysis to identify the best ideas. Through this fundamental research, we determine an estimate of intrinsic value and thus a valuation target for each idea. We construct the portfolios based on the level of conviction generated by this bottom-up analysis and the upside / downside profile associated with each company.
Information Technology and Energy Top Performers
Superior stock selection in the information technology and energy sectors allowed the Mid Cap Value Series to outperform its benchmark during an annual period that witnessed extreme lows in mid-March followed by a strong rebound. In addition to solid stock-picking in the sectors, all were overweight positions in the portfolio.
Portfolio holdings in the information technology sector rose approximately 40% compared to a 7% gain for the Index while being a 4% overweight position. The leading securities in the sector, Satyam Computer Services, Ltd., Computer Sciences Corporation, and Maxwell Technologies, Inc., were all active bets that were not part of the Russell 2500 Value Index.
The portfolio had a double weight position in the energy sector while holdings outdistanced the benchmark with a 9% gain against a 22% loss, a spread of more than 30%. Global Industries, Ltd. led the portfolio with a gain of more than 30%. Petrohawk Energy Corporation and Southern Union Company were other energy holdings that benefited the Series.
Consumer Discretionary and Utilities Disappoint
The consumer discretionary sector was the biggest drag on Series performance during the period. The sector was a large underweight in the Series and its holdings could not keep pace with those in the Index. Brown Shoe Company, Inc. was down nearly 50% during the fiscal year while Talbots, Inc. and Oxford Industries, Inc. also pulled down performance.
The Series was slightly overweight the utilities sector but security selection detracted from overall returns. Series’ holdings that did not fair well in the sector include Great Plains Energy, Inc., Allete, Inc., and Pepco Holdings, Inc.
While the Series attempts to stay fully invested at all times, as it did during the year with less than 4% of total assets in cash, the almost non-existent returns on cash and cash equivalent assets hurt performance.
Market Outlook
The past fiscal year was one of the most difficult in more than a generation. In challenging times our core philosophy and disciplined process becomes paramount. We continue to use a rigorous fundamental research process to identify strong companies from a risk perspective, companies that can provide earnings sustainability and generate excess cash. Our portfolio continues to emphasize companies that are financially resilient in a world where capital is available on a sporadic basis.
With many industries going through a process of business and capacity rationalization in a lower demand environment, financial flexibility provides an advantage to those companies that have opportunities to gain market share or acquire desirable assets from disadvantaged competitors.
On behalf of Security Global Investors, I would like to thank you for trusting your investments and goals with us. As always, we continue to do our best to seek the potential available in small and mid capitalization companies.
|
| Sincerely, |
|
| |
James P. Schier Portfolio Manager |
| 1 | Performance figures are based on Class A shares and do not reflect deduction of the sales charges or taxes that a shareholder would pay on distributions or the redemption of shares. |
| | The strategies discussed herein do not assure a profit. The Fund is distributed by Rydex Distributors, Inc. |
59
| | |
| | Rydex | SGI Equity Fund |
| Performance Summary | | Mid Cap Value Series |
September 30, 2009 | | (unaudited) |
PERFORMANCE
Mid Cap Value Series vs. Russell 2500 Value Index
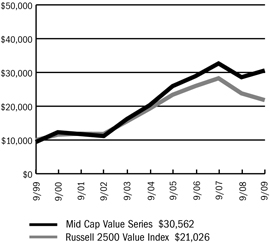
$10,000 Over 10 Years
This chart assumes a $10,000 investment in Class A shares of Mid Cap Value Series on September 30, 1999, reflects deduction of the 5.75% sales load and assumes all dividends reinvested. The chart does not reflect the deduction of taxes that a shareholder would pay on distributions or the redemption of fund shares. The Russell 2500 Value Index is an unmanaged index that measures the performance of securities of small-to-mid cap U.S. companies with greater-than-average value orientation.
Average Annual Returns
| | | | | | | | | |
Periods Ended 9-30-09 | | 1 Year | | | 5 Years | | | 10 Years | |
A Shares | | 6.90 | % | | 8.52 | % | | 12.48 | % |
A Shares with sales charge | | 0.77 | % | | 7.24 | % | | 11.82 | % |
B Shares | | 6.17 | % | | 7.72 | % | | 11.73 | % |
B Shares with CDSC | | 1.59 | % | | 7.48 | % | | 11.73 | % |
C Shares | | 6.13 | % | | 7.72 | % | | 11.55 | % |
C Shares with CDSC | | 5.21 | % | | 7.72 | % | | 11.55 | % |
The performance data above represents past performance that is not predictive of future results. The investment return and principal value of an investment in the Series will fluctuate so that an investor’s shares, when redeemed, may be worth more or less than their original cost. The figures above do not reflect deduction of the maximum front-end sales charge of 5.75% for Class A shares or the contingent deferred sales charge of 5% for Class B shares and 1% for Class C shares, as applicable, except where noted. The figures do not reflect the deduction of taxes that a shareholder would pay on distributions or redemption of shares. Such figures would be lower if the maximum sales charge and any applicable taxes were deducted.
Portfolio Composition by Sector as of 9-30-09
| | | |
Consumer Discretionary | | 10.07 | % |
Consumer Staples | | 4.86 | |
Energy | | 9.17 | |
Financials | | 12.94 | |
Health Care | | 5.67 | |
Industrials | | 17.53 | |
Information Technology | | 13.05 | |
Materials | | 8.81 | |
Utilities | | 12.66 | |
Exchange Traded Funds | | 1.88 | |
Convertible Bonds | | 0.54 | |
Commercial Paper | | 3.06 | |
Liabilities, Less Cash & Other Assets | | (0.24 | ) |
| | | |
Total Net Assets | | 100.00 | % |
| | | |
The accompanying notes are an integral part of the financial statements
60
| | |
| | Rydex | SGI Equity Fund |
| Performance Summary | | Mid Cap Value Series |
September 30, 2009 | | (unaudited) |
Information About Your Series Expenses
Calculating your ongoing Series expenses
Example
As a shareholder of the Series, you incur two types of costs: (1) transaction costs, which may include sales charges (loads) on purchase payments; contingent deferred sales charges on redemptions; and redemption fees, if any; and (2) ongoing costs, including management fees; distribution and/or service fees (12b-1); and other Series expenses. This example is intended to help you understand your ongoing costs (in dollars) of investing in the Series and to compare these costs with ongoing costs of investing in other mutual funds. The example is based on an investment of $1,000 invested at the beginning of the period and held for the entire period April 1, 2009 through September 30, 2009.
Actual Expenses
The first line for each class of shares in the table provides information about actual account values and actual expenses. You may use the information in this table, together with the amount you invested, to estimate the expenses that you paid over the period. Simply divide your account value by $1,000 (for example, an $8,600 account value divided by $1,000 = 8.6), then multiply the result by the number in the table under the heading entitled “Expenses Paid During the Period” to estimate the expenses you paid on your account during this period.
Hypothetical Example for Comparison Purposes
The second line for each class of shares in the table provides information about hypothetical account values and hypothetical expenses based on the Series actual expense ratio and an assumed rate of return of 5% per year before expenses, which is not the Series actual return. The hypothetical account values and expenses may not be used to estimate the actual ending account balance or expenses you paid for the period. You may use this information to compare the ongoing costs of investing in the Series and other funds. To do so, compare this 5% hypothetical example with the 5% hypothetical examples that appear in the shareholder reports of the other mutual funds.
Please note that the expenses shown in the table are meant to highlight your ongoing costs only and do not reflect any transactional costs, such as sales charges (loads) on purchase payments, contingent deferred sales charges on redemptions, and redemption fees, if any. Therefore, the second line for each class of shares is useful in comparing ongoing costs only, and will not help you determine the relative total costs of owning different funds. In addition, if these transactional costs were included, your costs would have been higher.
Series Expenses
| | | | | | | | | |
| | | Beginning
Account
Value
4/1/2009 | | Ending
Account
Value
9/30/2009 1 | | Expenses
Paid
During
Period 2 |
Mid Cap Value | | | | | | | | | |
Series - Class A | | | | | | | | | |
Actual | | $ | 1,000.00 | | $ | 1,459.64 | | $ | 8.88 |
Hypothetical | | | 1,000.00 | | | 1,017.85 | | | 7.28 |
Mid Cap Value | | | | | | | | | |
Series - Class B | | | | | | | | | |
Actual | | | 1,000.00 | | | 1,454.66 | | | 13.48 |
Hypothetical | | | 1,000.00 | | | 1,014.09 | | | 11.06 |
Mid Cap Value | | | | | | | | | |
Series - Class C | | | | | | | | | |
Actual | | | 1,000.00 | | | 1,455.05 | | | 13.48 |
Hypothetical | | | 1,000.00 | | | 1,014.09 | | | 11.06 |
| 1 | The actual ending account value is based on the actual total return of the Series for the period April 1, 2009 to September 30, 2009 after actual expenses and will differ from the hypothetical ending account value which is based on the Series expense ratio and a hypothetical annual return of 5% before expenses. The actual cumulative return at net asset value for the period April 1, 2009 to September 30, 2009 was 45.96%, 45.47% and 45.51%, for Class A, B and C shares, respectively. |
| 2 | Expenses are equal to the Series annualized expense ratio (1.44%, 2.19% and 2.19% for Class A, B, and C shares, respectively), net of any applicable fee waivers, multiplied by the average account value over the period, multiplied by 183/365 (to reflect the one-half year period). |
61
| | |
| Schedule of Investments | | Rydex | SGI Equity Fund |
| September 30, 2009 | | Mid Cap Value Series |
| | | | | |
| | | Shares | | Value |
COMMON STOCKS - 96.6% | | | | | |
Aerospace & Defense - 2.6% | | | | | |
GeoEye, Inc. * | | 587,647 | | $ | 15,748,939 |
Orbital Sciences Corporation * | | 671,227 | | | 10,048,268 |
| | | | | |
| | | | | 25,797,207 |
| | | | | |
Apparel Retail - 3.7% | | | | | |
Brown Shoe Company, Inc. | | 999,045 | | | 8,012,341 |
Chico’s FAS, Inc. 1,* | | 1,790,100 | | | 23,271,300 |
Talbots, Inc. | | 446,395 | | | 4,120,226 |
| | | | | |
| | | | | 35,403,867 |
| | | | | |
Apparel, Accessories & Luxury Goods - 1.7% | | | | | |
Fossil, Inc. 1,* | | 236,700 | | | 6,734,115 |
Maidenform Brands, Inc. * | | 635,900 | | | 10,212,554 |
| | | | | |
| | | | | 16,946,669 |
| | | | | |
Application Software - 0.4% | | | | | |
PLATO Learning, Inc. 2,* | | 845,700 | | | 3,653,424 |
| | | | | |
Asset Management & Custody Banks - 0.4% | | | | | |
Fifth Street Finance Corporation | | 359,455 | | | 3,928,843 |
| | | | | |
Auto Parts & Equipment - 0.0% | | | | | |
HydroGen Corporation 2,3,* | | 1,265,700 | | | 44,300 |
| | | | | |
Biotechnology - 0.1% | | | | | |
Combinatorx, Inc. * | | 714,377 | | | 1,000,128 |
| | | | | |
Building Products - 0.7% | | | | | |
Trex Company, Inc. * | | 359,900 | | | 6,550,180 |
| | | | | |
Coal & Consumable Fuels - 0.9% | | | | | |
Evergreen Energy, Inc. * | | 4,775,700 | | | 2,960,934 |
USEC, Inc. 1,* | | 1,214,730 | | | 5,697,084 |
| | | | | |
| | | | | 8,658,018 |
| | | | | |
Communications Equipment - 1.1% | | | | | |
EF Johnson Technologies, Inc. 2,* | | 870,000 | | | 1,165,800 |
Symmetricom, Inc. 2,* | | 1,910,270 | | | 9,895,199 |
| | | | | |
| | | | | 11,060,999 |
| | | | | |
Construction & Engineering - 4.3% | | | | | |
Insituform Technologies, Inc. * | | 984,300 | | | 18,839,501 |
Quanta Services, Inc. * | | 437,100 | | | 9,673,023 |
URS Corporation * | | 338,300 | | | 14,766,795 |
| | | | | |
| | | | | 43,279,319 |
| | | | | |
Construction & Farm Machinery & Heavy Trucks - 0.2% | | | | | |
Force Protection, Inc. * | | 436,000 | | | 2,380,560 |
| | | | | |
Construction Materials - 1.1% | | | | | |
Eagle Materials, Inc. 1 | | 361,403 | | | 10,328,898 |
| | | | | |
Consumer Finance - 0.2% | | | | | |
First Marblehead Corporation * | | 1,112,280 | | | 2,447,016 |
| | | | | |
Data Processing & Outsourced Services - 5.3% | | | | | |
Affiliated Computer Services, Inc. * | | 315,200 | | | 17,074,384 |
Computer Sciences Corporation * | | 670,500 | | | 35,342,055 |
| | | | | |
| | | | | 52,416,439 |
| | | | | |
| | | | | |
| | | Shares | | Value |
COMMON STOCKS - 96.6% (continued) | | | | | |
Electric Utilities - 7.0% | | | | | |
Allete, Inc. 1 | | 424,757 | | $ | 14,259,092 |
Empire District Electric Company | | 189,566 | | | 3,429,249 |
Great Plains Energy, Inc. | | 953,117 | | | 17,108,451 |
Northeast Utilities | | 542,060 | | | 12,868,504 |
Pepco Holdings, Inc. | | 408,400 | | | 6,076,992 |
Westar Energy, Inc. | | 739,800 | | | 14,433,498 |
| | | | | |
| | | | | 68,175,786 |
| | | | | |
Electrical Components & Equipment - 1.4% | | | | | |
Power-One, Inc. 2,3,* | | 5,626,300 | | | 10,971,285 |
UQM Technologies, Inc. * | | 517,722 | | | 2,976,902 |
| | | | | |
| | | | | 13,948,187 |
| | | | | |
Electronic Manufacturing Services - 2.7% | | | | | |
Maxwell Technologies, Inc. 3,* | | 1,446,000 | | | 26,649,780 |
| | | | | |
Environmental & Facilities Services - 0.5% | | | | | |
Covanta Holding Corporation * | | 270,000 | | | 4,590,000 |
| | | | | |
Exchange Traded Funds - 1.9% | | | | | |
iShares Russell 2000 Value Index Fund | | 97,600 | | | 5,517,328 |
iShares S&P MidCap 400 | | 204,700 | | | 12,906,335 |
| | | | | |
| | | | | 18,423,663 |
| | | | | |
Forest Products - 1.4% | | | | | |
Louisiana-Pacific Corporation 1,* | | 2,014,300 | | | 13,435,381 |
| | | | | |
Gas Utilities - 1.4% | | | | | |
Atmos Energy Corporation | | 493,000 | | | 13,892,740 |
| | | | | |
Health Care Equipment - 1.9% | | | | | |
Aspect Medical Systems, Inc. * | | 558,800 | | | 6,694,424 |
Hologic, Inc. * | | 715,801 | | | 11,696,188 |
| | | | | |
| | | | | 18,390,612 |
| | | | | |
Health Care Facilities - 0.5% | | | | | |
Community Health Systems, Inc. 1,* | | 160,000 | | | 5,108,800 |
| | | | | |
Health Care Services - 3.2% | | | | | |
Amedisys, Inc. * | | 138,400 | | | 6,038,392 |
Mednax, Inc. * | | 338,500 | | | 18,590,420 |
Providence Service Corporation * | | 48,701 | | | 567,854 |
RehabCare Group, Inc. * | | 268,530 | | | 5,824,416 |
| | | | | |
| | | | | 31,021,082 |
| | | | | |
Highways & Railtracks - 0.1% | | | | | |
Quixote Corporation 2,3 | | 469,100 | | | 1,168,059 |
| | | | | |
Home Furnishings - 1.3% | | | | | |
Leggett & Platt, Inc. | | 668,800 | | | 12,974,720 |
| | | | | |
Human Resources & Employment Services - 0.6% | | | | | |
Administaff, Inc. | | 232,000 | | | 6,094,640 |
| | | | | |
Industrial Conglomerates - 2.4% | | | | | |
McDermott International, Inc. * | | 921,300 | | | 23,281,251 |
| | | | | |
The accompanying notes are an integral part of the financial statements
62
| | |
| Schedule of Investments | | Rydex | SGI Equity Fund |
| September 30, 2009 | | Mid Cap Value Series |
| | | | | |
| | | Shares | | Value |
COMMON STOCKS - 96.6% (continued) | | | | | |
Industrial Machinery - 1.0% | | | | | |
Harsco Corporation | | 230,800 | | $ | 8,172,628 |
Thermoenergy Corporation 2,3,* | | 3,582,432 | | | 1,218,027 |
| | | | | |
| | | | | 9,390,655 |
| | | | | |
Insurance Brokers - 0.5% | | | | | |
Arthur J Gallagher & Company | | 189,000 | | | 4,605,930 |
| | | | | |
IT Consulting & Other Services - 1.0% | | | | | |
Satyam Computer Services, Ltd. ADR | | 1,482,112 | | | 9,752,297 |
| | | | | |
Mortgage REIT’s - 0.5% | | | | | |
Bimini Capital Management, Inc. 2,3,* | | 1,474,400 | | | 412,832 |
Redwood Trust, Inc. 1 | | 285,027 | | | 4,417,919 |
| | | | | |
| | | | | 4,830,751 |
| | | | | |
Multi-Line Insurance - 1.6% | | | | | |
American Financial Group, Inc. 1 | | 602,050 | | | 15,352,275 |
| | | | | |
Multi-Utilities - 4.3% | | | | | |
Alliant Energy Corporation | | 547,300 | | | 15,242,305 |
Black Hills Corporation | | 199,138 | | | 5,012,303 |
NorthWestern Corporation | | 586,100 | | | 14,318,423 |
SCANA Corporation 1 | | 210,000 | | | 7,329,000 |
| | | | | |
| | | | | 41,902,031 |
| | | | | |
Office Services & Supplies - 0.4% | | | | | |
United Stationers, Inc. * | | 77,729 | | | 3,700,678 |
| | | | | |
Oil & Gas Drilling - 0.6% | | | | | |
Helmerich & Payne, Inc. | | 141,600 | | | 5,597,448 |
| | | | | |
Oil & Gas Equipment & Services - 3.8% | | | | | |
Global Industries, Ltd. * | | 3,922,500 | | | 37,263,750 |
| | | | | |
Oil & Gas Exploration & Production - 2.1% | | | | | |
Goodrich Petroleum Corporation * | | 159,569 | | | 4,118,476 |
Gulfport Energy Corporation * | | 664,000 | | | 5,803,360 |
PetroHawk Energy Corporation * | | 453,600 | | | 10,981,656 |
| | | | | |
| | | | | 20,903,492 |
| | | | | |
Oil & Gas Storage & Transportation - 1.8% | | | | | |
Southern Union Company | | 833,660 | | | 17,331,791 |
| | | | | |
Packaged Foods & Meats - 4.9% | | | | | |
Del Monte Foods Company | | 688,300 | | | 7,970,514 |
Hormel Foods Corporation 1 | | 360,700 | | | 12,812,064 |
JM Smucker Company | | 381,300 | | | 20,212,713 |
Ralcorp Holdings, Inc. * | | 113,200 | | | 6,618,804 |
| | | | | |
| | | | | 47,614,095 |
| | | | | |
Paper Packaging - 3.5% | | | | | |
Bemis Company, Inc. 1 | | 802,800 | | | 20,800,548 |
Sonoco Products Company | | 503,200 | | | 13,858,128 |
| | | | | |
| | | | | 34,658,676 |
| | | | | |
Paper Products - 1.8% | | | | | |
Schweitzer-Mauduit International, Inc. | | 329,000 | | | 17,884,440 |
| | | | | |
| | | | | | |
| | | Shares | | Value |
COMMON STOCKS - 96.6% (continued) | | | | | | |
Property & Casualty Insurance - 6.4% | | | | | | |
Alleghany Corporation * | | | 57,744 | | $ | 14,958,583 |
Employers Holdings, Inc. | | | 382,300 | | | 5,918,004 |
Hanover Insurance Group, Inc. | | | 571,800 | | | 23,632,494 |
W.R. Berkley Corporation | | | 759,800 | | | 19,207,744 |
| | | | | | |
| | | | | | 63,716,825 |
| | | | | | |
Regional Banks - 3.3% | | | | | | |
Associated Banc-Corporation | | | 638,810 | | | 7,295,210 |
Commerce Bancshares, Inc. 1 | | | 311,745 | | | 11,609,384 |
First Horizon National Corporation * | | | 137,205 | | | 1,815,226 |
Old National Bancorp | | | 991,822 | | | 11,108,406 |
| | | | | | |
| | | | | | 31,828,226 |
| | | | | | |
Research & Consulting Services - 2.5% | | | | | | |
ICF International, Inc. * | | | 355,700 | | | 10,784,824 |
Navigant Consulting, Inc. * | | | 1,031,500 | | | 13,925,250 |
| | | | | | |
| | | | | | 24,710,074 |
| | | | | | |
Restaurants - 1.5% | | | | | | |
Burger King Holdings, Inc. | | | 838,651 | | | 14,751,871 |
| | | | | | |
Semiconductor Equipment - 0.4% | | | | | | |
Ultratech, Inc. * | | | 316,200 | | | 4,183,326 |
| | | | | | |
Semiconductors - 2.1% | | | | | | |
IXYS Corporation 2,3 | | | 2,361,300 | | | 20,094,663 |
| | | | | | |
Specialty Chemicals - 1.0% | | | | | | |
Landec Corporation * | | | 741,716 | | | 4,746,982 |
Zoltek Companies, Inc. * | | | 501,000 | | | 5,260,500 |
| | | | | | |
| | | | | | 10,007,482 |
| | | | | | |
Specialty Stores - 1.9% | | | | | | |
Cabela’s, Inc. * | | | 1,387,198 | | | 18,505,221 |
| | | | | | |
Trucking - 0.7% | | | | | | |
Saia, Inc. * | | | 417,270 | | | 6,709,702 |
| | | | | | |
TOTAL COMMON STOCKS (cost $916,959,116) | | | | | $ | 946,346,267 |
| | | | | | |
| | |
| | | Shares | | Value |
WARRANTS - 0.0% | | | | | | |
Nova Biosource Fuels, Inc. | | | | | | |
$2.40, 7/5/2011 4 | | | 677,450 | | | 6,861 |
| | | | | | |
TOTAL WARRANTS (cost $699,773) | | | | | $ | 6,861 |
| | | | | | |
| | |
| | | Principal
Amount | | Value |
CONVERTIBLE BONDS - 0.5% | | | | | | |
Metals & Minerals - 0.5% | | | | | | |
USEC, Inc. | | | | | | |
3.00%, 20144 | | $ | 7,600,000 | | $ | 5,263,000 |
| | | | | | |
TOTAL CONVERTIBLE BONDS (cost $7,600,000) | | | | | $ | 5,263,000 |
| | | | | | |
The accompanying notes are an integral part of the financial statements
63
| | |
| Schedule of Investments | | Rydex | SGI Equity Fund |
| September 30, 2009 | | Mid Cap Value Series |
| | | | | | | |
| | | Principal
Amount | | Value | |
COMMERCIAL PAPER - 3.1% | | | | | | | |
Banking - 1.2% | | | | | | | |
JP Morgan Chase & Company | | | | | | | |
0.12%, 10/02/2009 4 | | $ | 6,000,000 | | $ | 5,999,980 | |
0.15%, 10/05/2009 4 | | | 6,000,000 | | | 5,999,900 | |
| | | | | | | |
| | | | | | 11,999,880 | |
| | | | | | | |
Consumer Products - 0.6% | | | | | | | |
Procter & Gamble International Funding | | | | | | | |
0.10%, 10/07/2009 4,5 | | | 6,000,000 | | | 5,999,900 | |
| | | | | | | |
Food & Beverage - 1.3% | | | | | | | |
Nestle Capital Corporation | | | | | | | |
0.06%, 10/01/2009 4,5 | | | 6,000,000 | | | 6,000,000 | |
0.06%, 10/06/2009 4,5 | | | 6,000,000 | | | 5,999,950 | |
| | | | | | | |
| | | | | | 11,999,950 | |
| | | | | | | |
TOTAL COMMERCIAL PAPER (cost $29,999,730) | | | | | $ | 29,999,730 | |
| | | | | | | |
Total Investments - 100.2% 6 (cost $955,258,619) | | | | | $ | 981,615,858 | |
Liabilities, Less Cash & Other Assets - (0.2)% | | | | | | (2,390,733 | ) |
| | | | | | | |
Total Net Assets - 100.0% | | | | | $ | 979,225,125 | |
| | | | | | | |
For federal income tax purposes the identified cost of investments owned at September 30, 2009 was $965,479,411.
ADR American Depositary Receipt
| * | Non-income producing security |
| 1 | Security is segregated as collateral for open written option contracts. |
| 2 | Security is deemed illiquid. The total market value of illiquid securities is $48,623,589 (cost $99,945,666), or 5.0% of total net assets. |
| 3 | Investment in an affiliated issuer. See Note 8 in the Notes to Financial Statements. |
| 4 | Value determined based on Level 2 inputs established by ASC 820. |
| 5 | Security is a 144A or Section 4(2) security. The total market value of 144A or Section 4(2) securities is $17,999,850 (cost $17,999,850), or 1.8% of total net assets. |
| 6 | Unless otherwise indicated, the values of the securities of the Portfolio are determined based on Level 1 inputs established by ASC 820. |
The accompanying notes are an integral part of the financial statements
64
Rydex | SGI Equity Fund
Mid Cap Value Series
Statement of Assets and Liabilities
September 30, 2009
| | | | |
Assets: | | | | |
Investments in unaffiliated issues, at value* | | $ | 921,056,913 | |
Investments in affiliated issues, at value** | | | 60,558,945 | |
| | | | |
Total investments | | | 981,615,858 | |
Receivables: | | | | |
Fund shares sold | | | 8,458,453 | |
Securities sold | | | 447,841 | |
Interest | | | 114,000 | |
Dividends | | | 858,467 | |
Prepaid expenses | | | 47,862 | |
| | | | |
Total assets | | | 991,542,481 | |
| | | | |
Liabilities: | | | | |
Cash overdraft | | | 735,024 | |
Payable for: | | | | |
Securities purchased | | | 6,292,099 | |
Fund shares redeemed | | | 1,059,432 | |
Written options, at value (premiums received, $2,990,790) | | | 2,423,825 | |
Management fees | | | 631,432 | |
Custodian fees | | | 8,090 | |
Transfer agent/maintenance fees | | | 153,238 | |
Administration fees | | | 75,229 | |
Professional fees | | | 80,000 | |
12b-1 distribution plan fees | | | 313,852 | |
Directors’ fees | | | 27,665 | |
Other | | | 517,470 | |
| | | | |
Total liabilities | | | 12,317,356 | |
| | | | |
Net assets | | $ | 979,225,125 | |
| | | | |
Net assets consist of: | | | | |
Paid in capital | | $ | 1,036,616,163 | |
Undistributed net investment income | | | 1,105,623 | |
Accumulated net realized loss on sale of investments | | | (85,420,865 | ) |
Net unrealized appreciation in value of investments | | | 26,924,204 | |
| | | | |
Net assets | | $ | 979,225,125 | |
| | | | |
Class A: | | | | |
Capital shares outstanding
(unlimited number of shares authorized) | | | 29,411,178 | |
Net assets | | $ | 781,882,901 | |
Net asset value and redemption price per share | | $ | 26.58 | |
| | | | |
Maximum offering price per share (net asset value divided by 94.25%) | | $ | 28.20 | |
| | | | |
Class B: | | | | |
Capital shares outstanding
(unlimited number of shares authorized) | | | 2,556,002 | |
Net assets | | $ | 58,221,298 | |
Net asset value, offering and redemption price per share (excluding any applicable contingent deferred sales charge) | | $ | 22.78 | |
| | | | |
Class C: | | | | |
Capital shares outstanding
(unlimited number of shares authorized) | | | 5,927,892 | |
Net assets | | $ | 139,120,926 | |
Net asset value, offering and redemption price per share (excluding any applicable contingent deferred sales charge) | | $ | 23.47 | |
| | | | |
* Investments in unaffiliated issues, at cost | | $ | 859,137,772 | |
** Investments in affiliated issues, at cost | | | 96,120,847 | |
| | | | |
Total cost | | $ | 955,258,619 | |
Statement of Operations
For the Year Ended September 30, 2009
| | | | |
Investment Income: | | | | |
Dividends from securities of unaffiliated issuers | | $ | 13,101,243 | |
Dividends from securities of affiliated issuers | | | 242,704 | |
Interest | | | 625,466 | |
| | | | |
Total investment income | | | 13,969,413 | |
| | | | |
Expenses: | | | | |
Management fees | | | 6,087,439 | |
Transfer agent/maintenance fees | | | 1,795,195 | |
Administration fees | | | 708,652 | |
Custodian fees | | | 29,595 | |
Directors’ fees | | | 67,390 | |
Professional fees | | | 165,152 | |
Reports to shareholders | | | 152,135 | |
Registration fees | | | 84,054 | |
Other expenses | | | 57,624 | |
12b-1 distribution fees - Class A | | | 1,506,971 | |
12b-1 distribution fees - Class B | | | 496,508 | |
12b-1 distribution fees - Class C | | | 925,985 | |
| | | | |
Total expenses | | | 12,076,700 | |
Less: | | | | |
Earnings credits applied | | | (7 | ) |
| | | | |
Net expenses | | | 12,076,693 | |
| | | | |
Net investment income | | | 1,892,720 | |
| | | | |
Net Realized and Unrealized Gain (Loss): | | | | |
Net realized gain (loss) during the year on: | | | | |
Investments | | | (92,563,212 | ) |
Investment transactions of affiliated issuers | | | 578,099 | |
Options written | | | 7,830,282 | |
| | | | |
Net realized loss | | | (84,154,831 | ) |
| | | | |
Net unrealized appreciation (depreciation) during the year on: | | | | |
Investments | | | 154,686,736 | |
Options written | | | 1,257,425 | |
| | | | |
Net unrealized appreciation | | | 155,944,161 | |
| | | | |
Net realized and unrealized gain | | | 71,789,330 | |
| | | | |
Net increase in net assets resulting from operations | | | 73,682,050 | |
| | | | |
The accompanying notes are an integral part of the financial statements
65
| | |
| | Rydex | SGI Equity Fund |
| Statement of Changes in Net Assets | | Mid Cap Value Series |
| | | | | | | | |
| | | Year Ended
September 30,
2009 | | | Year Ended
September 30,
2008 | |
Increase (decrease) in net assets from operations: | | | | | | | | |
Net investment income | | $ | 1,892,720 | | | $ | 4,667,997 | |
Net realized gain (loss) during the year on investments | | | (84,154,831 | ) | | | 110,275,572 | |
Net unrealized appreciation (depreciation) during the year on investments | | | 155,944,161 | | | | (238,269,809 | ) |
| | | | | | | | |
Net increase (decrease) in net assets resulting from operations | | | 73,682,050 | | | | (123,326,240 | ) |
| | | | | | | | |
Distributions to shareholders from: | | | | | | | | |
Net investment income | | | | | | | | |
Class A | | | (3,569,957 | ) | | | (2,202,928 | ) |
Net realized gain | | | | | | | | |
Class A | | | (68,549,175 | ) | | | (121,470,120 | ) |
Class B | | | (6,651,443 | ) | | | (20,681,946 | ) |
Class C | | | (11,126,589 | ) | | | (34,476,081 | ) |
| | | | | | | | |
Total distributions to shareholders | | | (89,897,164 | ) | | | (178,831,075 | ) |
| | | | | | | | |
Capital share transactions: | | | | | | | | |
Proceeds from sale of shares | | | | | | | | |
Class A | | | 388,375,263 | | | | 371,736,030 | |
Class B | | | 7,862,714 | | | | 5,200,948 | |
Class C | | | 46,299,086 | | | | 15,042,995 | |
Distributions reinvested | | | | | | | | |
Class A | | | 67,810,290 | | | | 112,053,902 | |
Class B | | | 6,316,674 | | | | 19,668,106 | |
Class C | | | 10,539,574 | | | | 32,802,694 | |
Cost of shares redeemed | | | | | | | | |
Class A | | | (325,079,843 | ) | | | (301,963,588 | ) |
Class B | | | (16,824,893 | ) | | | (31,210,126 | ) |
Class C | | | (25,735,329 | ) | | | (55,705,793 | ) |
| | | | | | | | |
Net increase from capital share transactions | | | 159,563,536 | | | | 167,625,168 | |
| | | | | | | | |
Net increase (decrease) in net assets | | | 143,348,422 | | | | (134,532,147 | ) |
| | | | | | | | |
Net assets: | | | | | | | | |
Beginning of year | | | 835,876,703 | | | | 970,408,850 | |
| | | | | | | | |
End of year | | $ | 979,225,125 | | | $ | 835,876,703 | |
| | | | | | | | |
Undistributed net investment income at end of year | | $ | 1,105,623 | | | $ | 2,696,501 | |
| | | | | | | | |
Capital share activity: | | | | | | | | |
Shares sold | | | | | | | | |
Class A | | | 18,036,421 | | | | 12,267,686 | |
Class B | | | 420,635 | | | | 184,126 | |
Class C | | | 2,271,053 | | | | 518,567 | |
Shares reinvested | | | | | | | | |
Class A | | | 3,546,564 | | | | 3,657,110 | |
Class B | | | 383,293 | | | | 730,073 | |
Class C | | | 620,705 | | | | 1,185,925 | |
Shares redeemed | | | | | | | | |
Class A | | | (15,264,008 | ) | | | (9,688,641 | ) |
Class B | | | (931,362 | ) | | | (1,117,874 | ) |
Class C | | | (1,403,785 | ) | | | (1,973,041 | ) |
The accompanying notes are an integral part of the financial statements
66
| | |
| Financial Highlights | | Rydex | SGI Equity Fund |
Selected data for each share of capital stock outstanding throughout each year | | Mid Cap Value Series |
| | | | | | | | | | | | | | | | | | | | |
Class A | | 2009 | | | 2008 | | | 2007 | | | 2006 | | | Year Ended
September 30,
2005 | |
Per Share Data | | | | | | | | | | | | | | | | | | | | |
Net asset value, beginning of period | | $ | 28.41 | | | $ | 40.79 | | | $ | 38.27 | | | $ | 36.34 | | | $ | 30.45 | |
| | | | | | | | | | | | | | | | | | | | |
Income (loss) from investment operations: | | | | | | | | | | | | | | | | | | | | |
Net investment income a | | | 0.08 | | | | 0.25 | | | | 0.25 | | | | 0.04 | | | | 0.01 | |
Net gain (loss) on securities (realized and unrealized) | | | 0.82 | | | | (4.77 | ) | | | 4.59 | | | | 3.96 | | | | 8.16 | |
| | | | | | | | | | | | | | | | | | | | |
Total from investment operations | | | 0.90 | | | | (4.52 | ) | | | 4.84 | | | | 4.00 | | | | 8.17 | |
| | | | | | | | | | | | | | | | | | | | |
Less distributions: | | | | | | | | | | | | | | | | | | | | |
Dividends from net investment income | | | (0.14 | ) | | | (0.14 | ) | | | (0.23 | ) | | | — | | | | — | |
Distributions from realized gains | | | (2.59 | ) | | | (7.72 | ) | | | (2.09 | ) | | | (2.07 | ) | | | (2.28 | ) |
| | | | | | | | | | | | | | | | | | | | |
Total distributions | | | (2.73 | ) | | | (7.86 | ) | | | (2.32 | ) | | | (2.07 | ) | | | (2.28 | ) |
| | | | | | | | | | | | | | | | | | | | |
Net asset value, end of period | | $ | 26.58 | | | $ | 28.41 | | | $ | 40.79 | | | $ | 38.27 | | | $ | 36.34 | |
| | | | | | | | | | | | | | | | | | | | |
Total Return b | | | 6.90 | % | | | (12.48 | %) | | | 12.96 | % | | | 11.44 | % | | | 27.77 | % |
| | | | | | | | | | | | | | | | | | | | |
Ratios/Supplemental Data | | | | | | | | | | | | | | | | | | | | |
Net assets, end of period (in thousands) | | $ | 781,883 | | | $ | 656,044 | | | $ | 687,484 | | | $ | 596,074 | | | $ | 373,031 | |
| | | | | | | | | | | | | | | | | | | | |
Ratios to average net assets: | | | | | | | | | | | | | | | | | | | | |
Net investment income | | | 0.40 | % | | | 0.79 | % | | | 0.61 | % | | | 0.10 | % | | | 0.04 | % |
Total expenses c | | | 1.48 | % | | | 1.37 | % | | | 1.32 | % | | | 1.36 | % | | | 1.41 | % |
Net expenses d | | | 1.48 | % | | | 1.37 | % | | | 1.32 | % | | | 1.36 | % | | | 1.41 | % |
Net expenses prior to custodian earning credits and net of expense waivers | | | 1.48 | % | | | 1.37 | % | | | 1.32 | % | | | 1.36 | % | | | 1.41 | % |
| | | | | | | | | | | | | | | | | | | | |
Portfolio turnover rate | | | 31 | % | | | 68 | % | | | 44 | % | | | 33 | % | | | 19 | % |
| | | | | |
Class B | | 2009 | | | 2008 | | | 2007 | | | 2006 | | | Year Ended
September 30,
2005 | |
Per Share Data | | | | | | | | | | | | | | | | | | | | |
Net asset value, beginning of period | | $ | 24.83 | | | $ | 36.78 | | | $ | 34.76 | | | $ | 33.43 | | | $ | 28.37 | |
| | | | | | | | | | | | | | | | | | | | |
Income (loss) from investment operations: | | | | | | | | | | | | | | | | | | | | |
Net investment loss a | | | (0.06 | ) | | | — | | | | (0.04 | ) | | | (0.23 | ) | | | (0.22 | ) |
Net gain (loss) on securities (realized and unrealized) | | | 0.60 | | | | (4.23 | ) | | | 4.15 | | | | 3.63 | | | | 7.56 | |
| | | | | | | | | | | | | | | | | | | | |
Total from investment operations | | | 0.54 | | | | (4.23 | ) | | | 4.11 | | | | 3.40 | | | | 7.34 | |
| | | | | | | | | | | | | | | | | | | | |
Less distributions: | | | | | | | | | | | | | | | | | | | | |
Distributions from realized gains | | | (2.59 | ) | | | (7.72 | ) | | | (2.09 | ) | | | (2.07 | ) | | | (2.28 | ) |
| | | | | | | | | | | | | | | | | | | | |
Total distributions | | | (2.59 | ) | | | (7.72 | ) | | | (2.09 | ) | | | (2.07 | ) | | | (2.28 | ) |
| | | | | | | | | | | | | | | | | | | | |
Net asset value, end of period | | $ | 22.78 | | | $ | 24.83 | | | $ | 36.78 | | | $ | 34.76 | | | $ | 33.43 | |
| | | | | | | | | | | | | | | | | | | | |
Total Return b | | | 6.17 | % | | | (13.14 | %) | | | 12.10 | % | | | 10.60 | % | | | 26.83 | % |
| | | | | | | | | | | | | | | | | | | | |
Ratios/Supplemental Data | | | | | | | | | | | | | | | | | | | | |
Net assets, end of period (in thousands) | | $ | 58,221 | | | $ | 66,641 | | | $ | 106,179 | | | $ | 108,784 | | | $ | 97,664 | |
| | | | | | | | | | | | | | | | | | | | |
Ratios to average net assets: | | | | | | | | | | | | | | | | | | | | |
Net investment loss | | | (0.34 | %) | | | (0.01 | %) | | | (0.10 | %) | | | (0.68 | %) | | | (0.72 | %) |
Total expenses c | | | 2.23 | % | | | 2.12 | % | | | 2.07 | % | | | 2.11 | % | | | 2.16 | % |
Net expenses d | | | 2.23 | % | | | 2.12 | % | | | 2.07 | % | | | 2.11 | % | | | 2.16 | % |
Net expenses prior to custodian earning credits and net of expense waivers | | | 2.23 | % | | | 2.12 | % | | | 2.07 | % | | | 2.11 | % | | | 2.16 | % |
| | | | | | | | | | | | | | | | | | | | |
Portfolio turnover rate | | | 31 | % | | | 68 | % | | | 44 | % | | | 33 | % | | | 19 | % |
The accompanying notes are an integral part of the financial statements
67
| | |
| Financial Highlights | | Rydex | SGI Equity Fund |
Selected data for each share of capital stock outstanding throughout each year | | Mid Cap Value Series |
| | | | | | | | | | | | | | | | | | | | |
Class C | | 2009 | | | 2008 | | | 2007 | | | 2006 | | | Year Ended
September 30,
2005 | |
Per Share Data | | | | | | | | | | | | | | | | | | | | |
Net asset value, beginning of period | | $ | 25.49 | | | $ | 37.54 | | | $ | 35.43 | | | $ | 34.03 | | | $ | 28.85 | |
| | | | | | | | | | | | | | | | | | | | |
Income (loss) from investment operations: | | | | | | | | | | | | | | | | | | | | |
Net investment loss a | | | (0.07 | ) | | | — | | | | (0.05 | ) | | | (0.22 | ) | | | (0.21 | ) |
Net gain (loss) on securities (realized and unrealized) | | | 0.64 | | | | (4.33 | ) | | | 4.25 | | | | 3.69 | | | | 7.67 | |
| | | | | | | | | | | | | | | | | | | | |
Total from investment operations | | | 0.57 | | | | (4.33 | ) | | | 4.20 | | | | 3.47 | | | | 7.46 | |
| | | | | | | | | | | | | | | | | | | | |
Less distributions: | | | | | | | | | | | | | | | | | | | | |
Distributions from realized gains | | | (2.59 | ) | | | (7.72 | ) | | | (2.09 | ) | | | (2.07 | ) | | | (2.28 | ) |
| | | | | | | | | | | | | | | | | | | | |
Total distributions | | | (2.59 | ) | | | (7.72 | ) | | | (2.09 | ) | | | (2.07 | ) | | | (2.28 | ) |
| | | | | | | | | | | | | | | | | | | | |
Net asset value, end of period | | $ | 23.47 | | | $ | 25.49 | | | $ | 37.54 | | | $ | 35.43 | | | $ | 34.03 | |
| | | | | | | | | | | | | | | | | | | | |
Total Return b | | | 6.13 | % | | | (13.15 | %) | | | 12.13 | % | | | 10.62 | % | | | 26.80 | % |
| | | | | | | | | | | | | | | | | | | | |
Ratios/Supplemental Data | | | | | | | | | | | | | | | | | | | | |
Net assets, end of period (in thousands) | | $ | 139,121 | | | $ | 113,192 | | | $ | 176,746 | | | $ | 152,579 | | | $ | 93,887 | |
| | | | | | | | | | | | | | | | | | | | |
Ratios to average net assets: | | | | | | | | | | | | | | | | | | | | |
Net investment loss | | | (0.35 | %) | | | (0.01 | %) | | | (0.12 | %) | | | (0.65 | %) | | | (0.71 | %) |
Total expenses c | | | 2.22 | % | | | 2.12 | % | | | 2.07 | % | | | 2.11 | % | | | 2.16 | % |
Net expenses d | | | 2.22 | % | | | 2.12 | % | | | 2.07 | % | | | 2.11 | % | | | 2.16 | % |
Net expenses prior to custodian earning credits and net of expense waivers | | | 2.22 | % | | | 2.12 | % | | | 2.07 | % | | | 2.11 | % | | | 2.16 | % |
| | | | | | | | | | | | | | | | | | | | |
Portfolio turnover rate | | | 31 | % | | | 68 | % | | | 44 | % | | | 33 | % | | | 19 | % |
| a | Net investment income (loss) was computed using average shares outstanding throughout the period. |
| b | Total return information does not reflect deduction of any sales charges imposed at the time of purchase for Class A shares or upon redemption for Class B and C shares. |
| c | Total expense information reflects expense ratios absent expense reductions by the Investment Manager and custodian earnings credits, as applicable. |
| d | Net expense information reflects the expense ratios after voluntary expense waivers, reimbursements and custodian earnings credits, as applicable. |
The accompanying notes are an integral part of the financial statements
68
Manager’s Commentary
November 16, 2009
To Our Shareholders:
For the fiscal year ended September 30, 2009, the Rydex|SGI Equity Fund Mid Cap Value Institutional Series gained 5.30%1 exceeding the -8.33% return of the Series’ benchmark, the Russell 2500 Value Index.
Our approach with the Mid Cap Value Institutional Series is to seek companies that can increase shareholders’ return on capital. We hold such companies over three to five years to capture long-term improvements in profitability.
The investment process is fundamentally driven and quantitatively aided. We use proprietary screens to identify potential companies for investment and then perform rigorous fundamental analysis to identify the best ideas. Through this fundamental research, we determine an estimate of intrinsic value and a valuation target for each potential investment. We construct the portfolios based on the level of conviction generated by this bottom-up analysis and the upside / downside profile associated with each company.
Information Technology, Industrials, Energy, and Materials Top Performers
Outperforming the Index over the year by more than 13% was the result of consistent superior stock selection over all sectors with the exception of consumer discretionary. Leading sectors were information technology, industrials, energy, and materials.
The information technology sector led the Series’ returns with holdings in Maxwell Technologies, Inc., Computer Sciences Corporation, and EPIQ Systems, Inc. Satyam Computer Services, Ltd., which is not in the Russell 2500 Value Index, soared over 200% during the year. An overweight position, Series holdings in the sector returned approximately 50% against a 7% gain for the Index.
The industrials sector was overweight the Index 16% to 12% and outperformed with a gain of approximately 8% versus a loss of 9%. Holdings adding positive performance included Insituform Technologies, Inc., ICF International, Inc., and McDermott International, Inc.
Energy was a nearly double weight position for the portfolio and was able to gain about 5% against a 22% loss for the Index. Global Industries, Ltd. gained more than 30% during the year while Petrohawk Energy Corporation added to sector performance.
Stock selection in the materials sector boosted Series returns. While an even weight, the sector outperformed its benchmark, which was flat, by nearly 40%. With a 1.3% weighting, Schweitzer-Mauduit International, Inc. soared almost 200% while Louisiana-Pacific Corporation gained around 240%. Other leading holdings in the sector included Bemis Company, Inc. and Eagle Materials, Inc.
Consumer Discretionary Disappoints
Other than the cash position that was unable to generate any yield in a time of rising stock prices, the consumer discretionary sector was the only detractor for the portfolio during the fiscal year.
The Series had a position of nearly half that of the Index. Series holdings in the sector trailed those of the benchmark losing approximately 7% compared to 2%. Ironically, one of the Series’ best performing holdings, Florida based women’s apparel retailer Chico’s FAS, Inc. that gained close to 140%, was in the sector. However, it wasn’t enough to overcome the underperformance of Talbots, Inc., Brown Shoe Company, Inc., and Oxford Industries, Inc.
Market Outlook
The past fiscal year was one of the most difficult in more than a generation. In challenging times our core philosophy and disciplined process becomes paramount. We continue to use a rigorous fundamental research process to identify strong companies from a risk perspective, companies that can provide earnings sustainability and generate excess cash. Our portfolio continues to emphasize companies that are financially resilient in a world where capital is available on a sporadic basis.
On behalf of Security Global Investors, I would like to thank you for trusting your investments and financial goals with us. We will continue to do our best to identify companies with the greatest potential for returns with a focus on risk management.
|
| Sincerely, |
|
| |
| James P. Schier |
| Portfolio Manager |
| 1 | Performance figures are based on Class I shares and do not reflect deduction of the sales charges or taxes that a shareholder would pay on distributions or the redemption of shares. Fee waivers and/or reimbursements reduce Series expenses and in the absence of such waivers, the performance quoted would be reduced. |
| | The strategies discussed herein do not assure a profit. The Fund is distributed by Rydex Distributors, Inc. |
69
| | |
| | Rydex | SGI Equity Fund |
| Performance Summary | | Mid Cap Value Institutional Series |
September 30, 2009 | | (unaudited) |
PERFORMANCE
Mid Cap Value Institutional Series vs. Russell 2500 Value Index
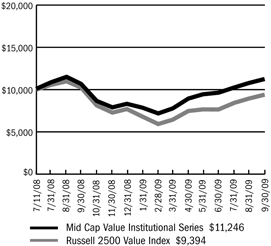
$10,000 Since Inception
This chart assumes a $10,000 investment in shares of Mid Cap Value Institutional Series on July 11, 2008 (date of Inception) and assumes all dividends reinvested. The chart does not reflect the deduction of taxes that a shareholder would pay on distributions or the redemption of fund shares. The Russell 2500 Value Index is an unmanaged index that measures the performance of securities of small-to-mid cap U.S. companies with greater-than-average value orientation.
Average Annual Returns
| | | | | | |
Periods Ended 9-30-09 | | 1 Year | | | Since Inception
(7-11-08) | |
Mid Cap Value Institutional Series | | 5.30 | % | | 10.09 | % |
The performance data above represents past performance that is not predictive of future results. The investment return and principal value of an investment in the Series will fluctuate so that an investor’s shares, when redeemed, may be worth more or less than their original cost. The figures do not reflect the deduction of taxes that a shareholder would pay on distributions or redemption of shares. Such figures would be lower any applicable taxes were deducted. Fee waivers and/or reimbursements reduced expenses of the Series and in the absence of such waiver, the performance quoted would be reduced.
Portfolio Composition by Sector as of 9-30-09
| | | |
Consumer Discretionary | | 9.91 | % |
Consumer Staples | | 5.18 | |
Energy | | 8.94 | |
Financials | | 13.34 | |
Health Care | | 5.42 | |
Industrials | | 17.70 | |
Information Technology | | 11.85 | |
Materials | | 8.98 | |
Utilities | | 12.82 | |
Exchange Traded Funds | | 4.80 | |
Repurchase Agreement | | 1.83 | |
Liabilities, Less Cash & Other Assets | | (0.77 | ) |
| | | |
Total Net Assets | | 100.00 | % |
| | | |
The accompanying notes are an integral part of the financial statements
70
| | |
| | Rydex | SGI Equity Fund |
| Performance Summary | | Mid Cap Value Institutional Series |
September 30, 2009 | | (unaudited) |
Information About Your Series Expenses
Calculating your ongoing Series expenses
Example
As a shareholder of the Series, you incur ongoing costs, including management fees and other Series expenses. This example is intended to help you understand your ongoing costs (in dollars) of investing in the Series and to compare these costs with ongoing costs of investing in other mutual funds. The example is based on an investment of $1,000 invested at the beginning of the period and held for the entire period April 1, 2009 through September 30, 2009.
Actual Expenses
The first line for each class of shares in the table provides information about actual account values and actual expenses. You may use the information in this table, together with the amount you invested, to estimate the expenses that you paid over the period. Simply divide your account value by $1,000 (for example, an $8,600 account value divided by $1,000 = 8.6), then multiply the result by the number in the table under the heading entitled “Expenses Paid During the Period” to estimate the expenses you paid on your account during this period.
Hypothetical Example for Comparison Purposes
The second line for each class of shares in the table provides information about hypothetical account values and hypothetical expenses based on the Series actual expense ratio and an assumed rate of return of 5% per year before expenses, which is not the Series actual return. The hypothetical account values and expenses may not be used to estimate the actual ending account balance or expenses you paid for the period. You may use this information to compare the ongoing costs of investing in the Series and other funds. To do so, compare this 5% hypothetical example with the 5% hypothetical examples that appear in the shareholder reports of the other mutual funds.
Please note that the expenses shown in the table are meant to highlight your ongoing costs. Therefore, the second line for each class of shares is useful in comparing ongoing costs only, and will not help you determine the relative total costs of owning different funds.
Series Expenses
| | | | | | | | | |
| | | Beginning
Account
Value
4/1/2009 | | Ending
Account
Value
9/30/20091 | | Expenses
Paid
During
Period2 |
Mid Cap Value Institutional Series | | | | | | | | | |
Actual | | $ | 1,000.00 | | $ | 1,446.90 | | $ | 5.52 |
Hypothetical | | | 1,000.00 | | | 1,020.56 | | | 4.56 |
| 1 | The actual ending account value is based on the actual total return of the Series for the period April 1, 2009 to September 30, 2009 after actual expenses and will differ from the hypothetical ending account value which is based on the Series expense ratio and a hypothetical annual return of 5% before expenses. The actual cumulative return at net asset value for the period April 1, 2009 to September 30, 2009 was 44.69%. |
| 2 | Expenses are equal to the Series annualized expense ratio of 0.90%, net of any applicable fee waivers, multiplied by the average account value over the period, multiplied by 183/365 (to reflect the one-half year period). |
71
| | |
| Schedule of Investments | | Rydex | SGI Equity Fund |
| September 30, 2009 | | Mid Cap Value Institutional Series |
| | | | | |
| | | Shares | | Value |
COMMON STOCKS - 99.0% | | | | | |
Aerospace & Defense - 2.9% | | | | | |
GeoEye, Inc. * | | 206,951 | | $ | 5,546,287 |
Orbital Sciences Corporation * | | 220,700 | | | 3,303,879 |
| | | | | |
| | | | | 8,850,166 |
| | | | | |
Apparel Retail - 3.4% | | | | | |
Brown Shoe Company, Inc. | | 330,271 | | | 2,648,773 |
Chico’s FAS, Inc. 1,* | | 579,400 | | | 7,532,201 |
Talbots, Inc. | | 55,987 | | | 516,760 |
| | | | | |
| | | | | 10,697,734 |
| | | | | |
Apparel, Accessories & Luxury Goods - 1.8% | | | | | |
Fossil, Inc. 1,* | | 77,500 | | | 2,204,875 |
Maidenform Brands, Inc. * | | 209,900 | | | 3,370,994 |
| | | | | |
| | | | | 5,575,869 |
| | | | | |
Application Software - 0.2% | | | | | |
PLATO Learning, Inc. 2,* | | 179,700 | | | 776,304 |
| | | | | |
Asset Management & Custody Banks - 0.4% | | | | | |
Fifth Street Finance Corporation | | 121,088 | | | 1,323,492 |
| | | | | |
Biotechnology - 0.1% | | | | | |
Combinatorx, Inc. * | | 154,040 | | | 215,656 |
| | | | | |
Building Products - 0.7% | | | | | |
Trex Company, Inc. * | | 129,200 | | | 2,351,440 |
| | | | | |
Coal & Consumable Fuels - 1.0% | | | | | |
Evergreen Energy, Inc. * | | 1,712,200 | | | 1,061,564 |
USEC, Inc. 1,* | | 435,800 | | | 2,043,902 |
| | | | | |
| | | | | 3,105,466 |
| | | | | |
Communications Equipment - 0.8% | | | | | |
EF Johnson Technologies, Inc. 2,* | | 120,000 | | | 160,800 |
Symmetricom, Inc. 2,* | | 467,900 | | | 2,423,722 |
| | | | | |
| | | | | 2,584,522 |
| | | | | |
Construction & Engineering - 4.6% | | | | | |
Insituform Technologies, Inc. * | | 309,100 | | | 5,916,173 |
Quanta Services, Inc. * | | 159,900 | | | 3,538,587 |
URS Corporation * | | 113,600 | | | 4,958,640 |
| | | | | |
| | | | | 14,413,400 |
| | | | | |
Construction & Farm Machinery & Heavy Trucks - 0.2% | | | | | |
Force Protection, Inc. * | | 145,000 | | | 791,700 |
| | | | | |
Construction Materials - 1.1% | | | | | |
Eagle Materials, Inc. 1 | | 119,049 | | | 3,402,420 |
| | | | | |
Consumer Finance - 0.0% | | | | | |
First Marblehead Corporation * | | 33,040 | | | 72,688 |
| | | | | |
Data Processing & Outsourced Services - 5.7% | | | | | |
Affiliated Computer Services, Inc. * | | 103,600 | | | 5,612,012 |
Computer Sciences Corporation * | | 231,800 | | | 12,218,178 |
| | | | | |
| | | | | 17,830,190 |
| | | | | |
Electric Utilities - 7.0% | | | | | |
Allete, Inc. 1 | | 147,854 | | | 4,963,459 |
Empire District Electric Company | | 6,600 | | | 119,394 |
| | | | | |
| | | Shares | | Value |
COMMON STOCKS - 99.0% (continued) | | | | | |
Electric Utilities - 7.0% (continued) | | | | | |
Great Plains Energy, Inc. | | 326,735 | | $ | 5,864,893 |
Northeast Utilities | | 179,100 | | | 4,251,834 |
Pepco Holdings, Inc. | | 135,500 | | | 2,016,240 |
Westar Energy, Inc. | | 246,100 | | | 4,801,411 |
| | | | | |
| | | | | 22,017,231 |
| | | | | |
Electrical Components & Equipment - 0.8% | | | | | |
Power-One, Inc. 2,* | | 892,200 | | | 1,739,790 |
UQM Technologies, Inc. * | | 153,200 | | | 880,900 |
| | | | | |
| | | | | 2,620,690 |
| | | | | |
Electronic Manufacturing Services - 1.8% | | | | | |
Maxwell Technologies, Inc. * | | 305,155 | | | 5,624,007 |
| | | | | |
Environmental & Facilities Services - 0.7% | | | | | |
Covanta Holding Corporation * | | 124,000 | | | 2,108,000 |
| | | | | |
| Exchange Traded Funds - 4.8% iShares Russell Midcap Value | | | | | |
Index Fund | | 430,600 | | | 15,251,852 |
| | | | | |
Forest Products - 1.5% | | | | | |
Louisiana-Pacific Corporation 1,* | | 694,200 | | | 4,630,314 |
| | | | | |
Gas Utilities - 1.4% | | | | | |
Atmos Energy Corporation | | 161,800 | | | 4,559,524 |
| | | | | |
Health Care Equipment - 1.7% | | | | | |
Aspect Medical Systems, Inc. * | | 118,900 | | | 1,424,422 |
Hologic, Inc. * | | 235,282 | | | 3,844,508 |
| | | | | |
| | | | | 5,268,930 |
| | | | | |
Health Care Facilities - 0.3% | | | | | |
Community Health Systems, Inc. 1,* | | 33,800 | | | 1,079,234 |
| | | | | |
Health Care Services - 3.3% | | | | | |
Amedisys, Inc. * | | 46,000 | | | 2,006,980 |
Mednax, Inc. * | | 110,500 | | | 6,068,660 |
Providence Service Corporation * | | 9,554 | | | 111,400 |
RehabCare Group, Inc. * | | 113,100 | | | 2,453,139 |
| | | | | |
| | | | | 10,640,179 |
| | | | | |
Highways & Railtracks - 0.1% | | | | | |
Quixote Corporation 2 | | 96,100 | | | 239,289 |
| | | | | |
Home Furnishings - 1.3% | | | | | |
Leggett & Platt, Inc. | | 216,200 | | | 4,194,280 |
| | | | | |
Human Resources & Employment Services - 0.7% | | | | | |
Administaff, Inc. | | 90,100 | | | 2,366,927 |
| | | | | |
Industrial Conglomerates - 2.3% | | | | | |
McDermott International, Inc. * | | 294,200 | | | 7,434,434 |
| | | | | |
Industrial Machinery - 0.9% | | | | | |
Harsco Corporation | | 79,000 | | | 2,797,390 |
| | | | | |
The accompanying notes are an integral part of the financial statements
72
| | |
| Schedule of Investments | | Rydex | SGI Equity Fund |
| September 30, 2009 | | Mid Cap Value Institutional Series |
| | | | | |
| | | Shares | | Value |
COMMON STOCKS - 99.0% (continued) | | | | | |
Insurance Brokers - 0.5% | | | | | |
Arthur J Gallagher & Company | | 62,400 | | $ | 1,520,688 |
| | | | | |
IT Consulting & Other Services - 1.0% | | | | | |
Satyam Computer Services, Ltd. ADR | | 489,680 | | | 3,222,094 |
| | | | | |
Mortgage REIT’s - 0.5% | | | | | |
Redwood Trust, Inc. 1 | | 93,900 | | | 1,455,450 |
| | | | | |
Multi-Line Insurance - 1.6% | | | | | |
American Financial Group, Inc. 1 | | 200,700 | | | 5,117,850 |
| | | | | |
Multi-Utilities - 4.4% | | | | | |
Alliant Energy Corporation | | 182,500 | | | 5,082,625 |
Black Hills Corporation | | 64,607 | | | 1,626,158 |
NorthWestern Corporation | | 203,200 | | | 4,964,176 |
SCANA Corporation 1 | | 69,700 | | | 2,432,530 |
| | | | | |
| | | | | 14,105,489 |
| | | | | |
Office Services & Supplies - 0.5% | | | | | |
United Stationers, Inc. * | | 33,678 | | | 1,603,410 |
| | | | | |
Oil & Gas Drilling - 0.3% | | | | | |
Helmerich & Payne, Inc. | | 27,500 | | | 1,087,075 |
| | | | | |
Oil & Gas Equipment & Services - 3.7% | | | | | |
Global Industries, Ltd. * | | 1,238,359 | | | 11,764,411 |
| | | | | |
Oil & Gas Exploration & Production - 2.1% | | | | | |
Goodrich Petroleum Corporation * | | 53,100 | | | 1,370,511 |
Gulfport Energy Corporation * | | 206,288 | | | 1,802,957 |
PetroHawk Energy Corporation * | | 144,900 | | | 3,508,029 |
| | | | | |
| | | | | 6,681,497 |
| | | | | |
Oil & Gas Storage & Transportation - 1.8% | | | | | |
Southern Union Company | | 276,900 | | | 5,756,751 |
| | | | | |
Packaged Foods & Meats - 5.2% | | | | | |
Del Monte Foods Company | | 226,100 | | | 2,618,238 |
Hormel Foods Corporation 1 | | 120,100 | | | 4,265,952 |
JM Smucker Company | | 134,500 | | | 7,129,845 |
Ralcorp Holdings, Inc. * | | 37,200 | | | 2,175,084 |
TreeHouse Foods, Inc. 1,* | | 7,500 | | | 267,525 |
| | | | | |
| | | | | 16,456,644 |
| | | | | |
Paper Packaging - 3.8% | | | | | |
Bemis Company, Inc. 1 | | 286,000 | | | 7,410,260 |
Sonoco Products Company | | 174,100 | | | 4,794,714 |
| | | | | |
| | | | | 12,204,974 |
| | | | | |
Paper Products - 1.4% | | | | | |
Schweitzer-Mauduit International, Inc. | | 84,400 | | | 4,587,984 |
| | | | | |
Property & Casualty Insurance - 6.6% | | | | | |
Alleghany Corporation * | | 18,996 | | | 4,920,914 |
Employers Holdings, Inc. | | 125,700 | | | 1,945,836 |
Hanover Insurance Group, Inc. | | 185,200 | | | 7,654,316 |
| | | | | | | |
| | | Shares | | Value | |
COMMON STOCKS - 99.0% (continued) | | | | | | | |
Property & Casualty Insurance - 6.6% (continued) | | | | | | | |
W.R. Berkley Corporation | | | 258,200 | | $ | 6,527,296 | |
| | | | | | | |
| | | | | | 21,048,362 | |
| | | | | | | |
Regional Banks - 3.7% | | | | | | | |
Associated Banc-Corporation | | | 210,230 | | | 2,400,827 | |
Commerce Bancshares, Inc. | | | 108,806 | | | 4,051,935 | |
First Horizon National Corporation * | | | 126,576 | | | 1,674,597 | |
Old National Bancorp | | | 328,645 | | | 3,680,824 | |
| | | | | | | |
| | | | | | 11,808,183 | |
| | | | | | | |
Research & Consulting Services - 2.7% | | | | | | | |
ICF International, Inc. * | | | 123,494 | | | 3,744,338 | |
Navigant Consulting, Inc. * | | | 339,300 | | | 4,580,550 | |
| | | | | | | |
| | | | | | 8,324,888 | |
| | | | | | | |
Restaurants - 1.5% | | | | | | | |
Burger King Holdings, Inc. | | | 276,900 | | | 4,870,671 | |
| | | | | | | |
Semiconductor Equipment - 0.4% | | | | | | | |
Ultratech, Inc. * | | | 104,900 | | | 1,387,827 | |
| | | | | | | |
Semiconductors - 2.0% | | | | | | | |
IXYS Corporation 2 | | | 728,800 | | | 6,202,088 | |
| | | | | | | |
Specialty Chemicals - 1.2% | | | | | | | |
Landec Corporation * | | | 304,600 | | | 1,949,440 | |
Zoltek Companies, Inc. * | | | 164,200 | | | 1,724,100 | |
| | | | | | | |
| | | | | | 3,673,540 | |
| | | | | | | |
Specialty Stores - 1.9% | | | | | | | |
Cabela’s, Inc. * | | | 458,157 | | | 6,111,814 | |
| | | | | | | |
Trucking - 0.7% | | | | | | | |
Saia, Inc. * | | | 142,500 | | | 2,291,400 | |
| | | | | | | |
TOTAL COMMON STOCKS (cost $276,951,492) | | | | | $ | 314,106,418 | |
| | | | | | | |
| | |
| | | Principal
Amount | | Value | |
REPURCHASE AGREEMENT - 1.8% | | | | | | | |
UMB Financial Corp, 0.05%, dated 9/30/09, matures 10/01/09; repurchase amount $5,791,008 (Collateralized by FFCB, 3.375%, 11/18/11 with a value of $5,791,327) 3 | | $ | 5,791,000 | | $ | 5,791,000 | |
| | | | | | | |
TOTAL REPURCHASE AGREEMENT
(cost $5,791,000) | | | | | $ | 5,791,000 | |
| | | | | | | |
Total Investments - 100.8% 4 (cost $282,742,492) | | | | | $ | 319,897,418 | |
Liabilities, Less Cash & Other Assets - (0.8)% | | | | | | (2,442,102 | ) |
| | | | | | | |
Total Net Assets - 100.0% | | | | | $ | 317,455,316 | |
| | | | | | | |
For federal income tax purposes the identified cost of investments owned at September 30, 2009 was $282,992,727.
| | |
ADR | | American Depositary Receipt |
The accompanying notes are an integral part of the financial statements
73
| | |
| Schedule of Investments | | Rydex | SGI Equity Fund |
| September 30, 2009 | | Mid Cap Value Institutional Series |
| * | Non-income producing security |
| 1 | Security is segregated as collateral for open written option contracts. |
| 2 | Security is deemed illiquid. The total market value of illiquid securities is $11,541,993 (cost $11,540,748), or 3.6% of total net assets. |
| 3 | Value determined based on Level 2 inputs established by ASC 820. |
| 4 | Unless otherwise indicated, the values of the securities of the Portfolio are determined based on Level 1 inputs established by ASC 820. |
The accompanying notes are an integral part of the financial statements
74
Rydex | SGI Equity Fund
Mid Cap Value Institutional Series
Statement of Assets and Liabilities
September 30, 2009
| | | |
Assets: | | | |
Investments, at value * | | $ | 319,897,418 |
Cash | | | 151 |
Receivables: | | | |
Fund shares sold | | | 835,364 |
Securities sold | | | 134,461 |
Dividends | | | 283,356 |
Security Investors | | | 18,742 |
Prepaid expenses | | | 13,932 |
| | | |
Total assets | | | 321,183,424 |
| | | |
Liabilities: | | | |
Payable for: | | | |
Fund shares redeemed | | | 831,707 |
Securities purchased | | | 2,048,799 |
Written options, at value (premiums received $600,562) | | | 581,815 |
Management fees | | | 194,548 |
Administration fees | | | 24,930 |
Transfer agent/maintenance fees | | | 3,494 |
Custodian fees | | | 1,209 |
Directors’ fees | | | 16,547 |
Professional fees | | | 7,650 |
Other fees | | | 17,409 |
| | | |
Total liabilities | | | 3,728,108 |
| | | |
Net assets | | $ | 317,455,316 |
| | | |
Net assets consist of: | | | |
Paid in capital | | $ | 271,991,433 |
Undistributed net investment income | | | 675,406 |
Undistributed net realized gain on sale of investments | | | 7,614,804 |
Net unrealized appreciation in value of investments | | | 37,173,673 |
| | | |
Net assets | | $ | 317,455,316 |
| | | |
Capital shares authorized | | | unlimited |
Capital shares outstanding | | | 30,258,306 |
Net asset value per share (net assets divided by shares outstanding) | | $ | 10.49 |
| | | |
* Investments, at cost | | $ | 282,742,492 |
Statement of Operations
For the Year Ended September 30, 2009
| | | | |
Investment Income: | | | | |
Dividends | | $ | 1,521,200 | |
Interest | | | 4,753 | |
| | | | |
Total investment income | | | 1,525,953 | |
| | | | |
Expenses: | | | | |
Management fees | | | 661,755 | |
Administration fees | | | 84,343 | |
Transfer agent/maintenance fees | | | 39,724 | |
Custodian fees | | | 4,311 | |
Directors’ fees | | | 19,009 | |
Professional fees | | | 16,820 | |
Reports to shareholders | | | 7,163 | |
Registration fees | | | 26,139 | |
Other | | | 2,007 | |
| | | | |
Total expenses | | | 861,271 | |
Reimbursement of expenses | | | (56,387 | ) |
| | | | |
Net expenses | | | 804,884 | |
| | | | |
Net investment income | | | 721,069 | |
| | | | |
Net Realized and Unrealized Gain (Loss): | | | | |
Net realized gain (loss) during the year on: | | | | |
Investments | | | 7,321,224 | |
Options written | | | 318,595 | |
| | | | |
Net realized gain | | | 7,639,819 | |
| | | | |
Net unrealized appreciation (depreciation) during the year on: | | | | |
Investments | | | 37,005,631 | |
Options written | | | 35,623 | |
| | | | |
Net unrealized appreciation | | | 37,041,254 | |
| | | | |
Net realized and unrealized gain | | | 44,681,073 | |
| | | | |
Net increase in net assets resulting from operations | | $ | 45,402,142 | |
| | | | |
The accompanying notes are an integral part of the financial statements
75
| | |
| | Rydex | SGI Equity Fund |
| Statement of Changes in Net Assets | | Mid Cap Value Institutional Series |
| | | | | | | | |
| | | Year Ended
September 30,
2009 | | | Period Ended
September 30,
2008* | |
Increase (decrease) in net assets from operations: | | | | | | | | |
Net investment income | | $ | 721,069 | | | $ | 70,820 | |
Net realized gain during the year on investments | | | 7,639,819 | | | | 940,993 | |
Net unrealized appreciation during the year on investments | | | 37,041,254 | | | | 132,419 | |
| | | | | | | | |
Net increase in net assets resulting from operations | | | 45,402,142 | | | | 1,144,232 | |
| | | | | | | | |
Distributions to shareholders from: | | | | | | | | |
Net investment income | | | (116,483 | ) | | | — | |
Net realized gain | | | (966,008 | ) | | | — | |
| | | | | | | | |
Total distributions to shareholders | | | (1,082,491 | ) | | | — | |
| | | | | | | | |
Capital share transactions: | | | | | | | | |
Proceeds from sale of shares | | | 285,643,830 | | | | 17,301,324 | |
Dividends reinvested | | | 946,155 | | | | — | |
Cost of shares redeemed | | | (30,890,230 | ) | | | (1,009,646 | ) |
| | | | | | | | |
Net increase from capital share transactions | | | 255,699,755 | | | | 16,291,678 | |
| | | | | | | | |
Net increase in net assets | | | 300,019,406 | | | | 17,435,910 | |
| | | | | | | | |
Net assets: | | | | | | | | |
Beginning of year | | | 17,435,910 | | | | — | |
| | | | | | | | |
End of year | | $ | 317,455,316 | | | $ | 17,435,910 | |
| | | | | | | | |
Undistributed net investment income at end of year | | $ | 675,406 | | | $ | 70,820 | |
| | | | | | | | |
Capital share activity: | | | | | | | | |
Shares sold | | | 31,844,224 | | | | 1,725,544 | |
Shares reinvested | | | 126,492 | | | | — | |
Shares redeemed | | | (3,344,963 | ) | | | (92,991 | ) |
| | | | | | | | |
Total capital share activity | | | 28,625,753 | | | | 1,632,553 | |
| | | | | | | | |
| * | For the period July 11, 2008 (commencement of operations) to September 30, 2008. |
The accompanying notes are an integral part of the financial statements
76
| | |
| Financial Highlights | | Rydex | SGI Equity Fund |
Selected data for each share of capital stock outstanding throughout each year | | Mid Cap Value Institutional Series |
| | | | | | | | |
| | | Year Ended
September 30,
2009 | | | Period Ended
September 30,
2008 a | |
Per Share Data | | | | | | | | |
Net asset value, beginning of period | | $ | 10.68 | | | $ | 10.00 | |
| | | | | | | | |
Income (loss) from investment operations: | | | | | | | | |
Net investment income b | | | 0.08 | | | | 0.04 | |
Net gain on securities (realized and unrealized) | | | 0.27 | | | | 0.64 | |
| | | | | | | | |
Total from investment operations | | | 0.35 | | | | 0.68 | |
| | | | | | | | |
Less distributions: | | | | | | | | |
Dividends from net investment income | | | (0.06 | ) | | | — | |
Distributions from realized gains | | | (0.48 | ) | | | — | |
| | | | | | | | |
Total distributions | | | (0.54 | ) | | | — | |
| | | | | | | | |
Net asset value, end of period | | $ | 10.49 | | | $ | 10.68 | |
| | | | | | | | |
Total Return | | | 5.30 | % | | | 6.80 | % |
| | | | | | | | |
Ratios/Supplemental Data | | | | | | | | |
Net assets, end of period (in thousands) | | $ | 317,455 | | | $ | 17,436 | |
| | | | | | | | |
Ratios to average net assets: | | | | | | | | |
Net investment income | | | 0.82 | % | | | 1.81 | % |
Total expenses c | | | 0.98 | % | | | 1.19 | % |
Net expenses d | | | 0.91 | % | | | 1.10 | % |
Net expenses prior to custodian earnings credits and net of expense waivers | | | 0.91 | % | | | 1.10 | % |
| | | | | | | | |
Portfolio turnover rate | | | 76 | % | | | 63 | % |
| a | The Mid Cap Value Institutional Series was initially capitalized on July 11, 2008 with a net asset value of $10 per share. Percentage amounts for the period, except total return, have been annualized. |
| b | Net investment income (loss) was computed using average shares outstanding throughout the period. |
| c | Total expense information reflects the expense ratios absent expense reductions by the Investment Manager and earnings credits, as applicable. |
| d | Net expense information reflects the expense ratios after voluntary expense waivers, reimbursements and custodian earnings credits, as applicable. |
The accompanying notes are an integral part of the financial statements
77
This page left blank intentionally.
78
Manager’s Commentary
November 16, 2009
To Our Shareholders:
The Rydex|SGI Equity Fund Select 25 Series returned 0.58%1 during the fiscal year ended September 30, 2009, outperforming the benchmark Russell 1000 Growth Index’s return of –1.85% and the Series’ peer group median return of –2.89%.
The Series pursues its objective by focusing on core holdings of common stocks of growth companies that have exhibited consistent above average earnings and/or revenue growth. We select what we believe to be premier growth companies using a combination of a qualitative top-down approach in reviewing growth trends that are based on several fixed income factors, such as bond spreads an interest rates, along with a quantitative fundamental bottom-up approach.
We structure the portfolio with 20–30 names. This philosophy is applied to a broad range of growth names. We will replace holdings in the portfolio when the fundamentals of a company or the original thesis for selecting the security changes.
Information Technology, Health Care, and Financials Top Performers
The Series’ information technology sector, at 23% of total assets, was still a material underweight to the Index’s nearly 30% allocation. Due to superior stock selection, it was the leading sector for the portfolio with a gain of approximately 20%. Apple, Inc. and Google, Inc. were significant holdings at 4% weights and contributed to overall returns. Apple, Inc. gained over 60% during the period while Cognizant Technology Solutions Corporation was up more than 70%.
The Series benefited from an underweight in health care combined with slight outperformance. Leading securities in the sector were Covidien PLC, Teva Pharmaceutical Industries, Ltd., and Pfizer, Inc.
The marketplace continued to punish the financials sector as a group, however, selectivity of holdings allowed the Series to gain relative to the Index. Goldman Sachs Group, Inc. was up approximately 50% for the fiscal year while JPMorgan Chase & Company increased around 20%. The positions allowed for a positive return in the sector for the Series even though the sector dropped by double-digits for the Index.
Energy Disappoints
The Series was consistent in its outperformance of the Index across sectors except for energy. While close to an even weight with the benchmark, poor security selection resulted in a decline of more than 30% for the Series, nearly twice the drop for the Index. The largest contributors to negative performance in the sector were Nabors Industries, Ltd., which was down about 50%, XTO Energy, Inc., and Transocean, Ltd.
Market Outlook
While markets historically rally in anticipation of a recovery, and experts consider unemployment a lagging indicator, these same factors give us pause. It is hard to imagine a stabilizing and growing economy as more people lose their jobs and consumers, which make up 70% of the economy, continue to pay down debt. The labor market remains very weak and unemployment continues to climb.
For the economy to have a sustained recovery, job creation will be the linchpin that will allow the consumer to increase spending. As the economy recovers, a central question is whether companies will be able to grow revenues rather than maintain profits with massive cost-cutting measures.
We continue to focus on identifying companies with the ability to be substantially better over the next three to five years. We are confident in our ability to identify these companies.
We believe that investing is a long-term pursuit that requires patience and a consistent approach. We recognize there are many investment fund alternatives available today and thank you for the confidence you place in us.
|
| Sincerely, |
|
| |
Mark P. Bronzo Portfolio Manager |
| 1 | Performance figures are based on Class A shares and do not reflect deductions of the sales charges or taxes that a shareholder would pay on distributions or the redemption of shares. Fee waivers and/or reimbursements reduce Series expenses and in the absence of such waivers, the performance quoted would be reduced. |
| | The strategies discussed herein do not assure a profit. The Fund is distributed by Rydex Distributors, Inc. |
79
| | |
| | Rydex | SGI Equity Fund |
| Performance Summary | | Select 25 Series |
September 30, 2009 | | (unaudited) |
PERFORMANCE
Select 25 Series vs. Russell 1000 Growth Index
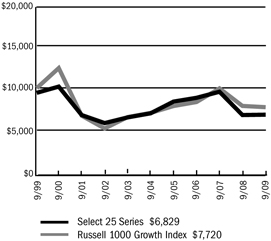
$10,000 Over 10 Years
This chart assumes a $10,000 investment in Class A shares of Select 25 Series on September 30, 1999 reflects deduction of the 5.75% sales load and assumes all dividends are reinvested. The chart does not reflect the deduction of taxes that a shareholder would pay on distributions or the redemption of fund shares. The Russell 1000 Growth Index is an unmanaged capitalization index which includes stocks incorporated in the United States and its territories and measures the performance of the Russell 1000 companies with higher price-to-book ratios and higher forecasted growth values.
Average Annual Returns
| | | | | | | | | |
Periods Ended 9-30-09 | | 1 Year | | | 5 Years | | | 10 Years | |
A Shares | | 0.58 | % | | (0.47 | %) | | (3.17 | %) |
A Shares with sales charge | | (5.18 | %) | | (1.65 | %) | | (3.74 | %) |
B Shares | | (0.16 | %) | | (1.20 | %) | | (3.76 | %) |
B Shares with CDSC | | (5.15 | %) | | (1.56 | %) | | (3.76 | %) |
C Shares | | (0.16 | %) | | (1.20 | %) | | (3.91 | %) |
C Shares with CDSC | | (1.15 | %) | | (1.20 | %) | | (3.91 | %) |
The performance data above represents past performance that is not predictive of future results. The investment return and principal value of an investment in the Series will fluctuate so that an investor’s shares, when redeemed, may be worth more or less than their original cost. The above do not reflect the maximum front-end sales charge of 5.75% for Class A shares or the contingent deferred sales charge of 5% for Class B shares and 1% for Class C shares, as applicable, except where noted. The figures do that a shareholder would pay on distributions or redemption of shares. Such figures would be lower if the maximum sales charge and any applicable taxes were deducted. Fee waivers and/or reimbursements reduced expenses of the Series and in the absence of such waiver, the performance quoted would be reduced.
Portfolio Composition by Sector as of 9-30-09
| | | |
Consumer Discretionary | | 19.30 | % |
Consumer Staples | | 9.76 | |
Energy | | 6.28 | |
Financials | | 6.45 | |
Health Care | | 8.85 | |
Industrials | | 15.11 | |
Information Technology | | 25.64 | |
Materials | | 6.37 | |
Cash & Other Assets, Less Liabilities | | 2.24 | |
| | | |
Total Net Assets | | 100.00 | % |
| | | |
The accompanying notes are an integral part of the financial statements
80
| | |
| | Rydex | SGI Equity Fund |
| Performance Summary | | Select 25 Series |
September 30, 2009 | | (unaudited) |
Information About Your Series Expenses
Calculating your ongoing Series expenses
Example
As a shareholder of the Series, you incur two types of costs: (1) transaction costs, which may include sales charges (loads) on purchase payments; contingent deferred sales charges on redemptions; and redemption fees, if any; and (2) ongoing costs, including management fees; distribution and/or service fees (12b-1); and other Series expenses. This example is intended to help you understand your ongoing costs (in dollars) of investing in the Series and to compare these costs with ongoing costs of investing in other mutual funds. The example is based on an investment of $1,000 invested at the beginning of the period and held for the entire period April 1, 2009 through September 30, 2009.
Actual Expenses
The first line for each class of shares in the table provides information about actual account values and actual expenses. You may use the information in this table, together with the amount you invested, to estimate the expenses that you paid over the period. Simply divide your account value by $1,000 (for example, an $8,600 account value divided by $1,000 = 8.6), then multiply the result by the number in the table under the heading entitled “Expenses Paid During the Period” to estimate the expenses you paid on your account during this period.
Hypothetical Example for Comparison Purposes
The second line for each class of shares in the table provides information about hypothetical account values and hypothetical expenses based on the Series actual expense ratio and an assumed rate of return of 5% per year before expenses, which is not the Series actual return. The hypothetical account values and expenses may not be used to estimate the actual ending account balance or expenses you paid for the period. You may use this information to compare the ongoing costs of investing in the Series and other funds. To do so, compare this 5% hypothetical example with the 5% hypothetical examples that appear in the shareholder reports of the other mutual funds.
Please note that the expenses shown in the table are meant to highlight your ongoing costs only and do not reflect any transactional costs, such as sales charges (loads) on purchase payments, contingent deferred sales charges on redemptions, and redemption fees, if any. Therefore, the second line for each class of shares is useful in comparing ongoing costs only, and will not help you determine the relative total costs of owning different funds. In addition, if these transactional costs were included, your costs would have been higher.
Series Expenses
| | | | | | | | | |
| | | Beginning
Account
Value
4/1/2009 | | Ending
Account
Value
9/30/2009 1 | | Expenses
Paid
During
Period 2 |
Select 25 Series - Class A | | | | | | | | | |
Actual | | $ | 1,000.00 | | $ | 1,328.87 | | $ | 7.88 |
Hypothetical | | | 1,000.00 | | | 1,018.30 | | | 6.83 |
Select 25 Series - Class B | | | | | | | | | |
Actual | | | 1,000.00 | | | 1,325.73 | | | 12.24 |
Hypothetical | | | 1,000.00 | | | 1,014.54 | | | 10.61 |
Select 25 Series - Class C | | | | | | | | | |
Actual | | | 1,000.00 | | | 1,324.38 | | | 12.24 |
Hypothetical | | | 1,000.00 | | | 1,014.54 | | | 10.61 |
| 1 | The actual ending account value is based on the actual total return of the Series for the period April 1, 2009 to September 30, 2009 after actual expenses and will differ from the hypothetical ending account value which is based on the Series expense ratio and a hypothetical annual return of 5% before expenses. The actual cumulative return at net asset value for the period April 1, 2009 to September 30, 2009 was 32.89%, 32.57% and 32.44%, for Class A, B and C shares, respectively. |
| 2 | Expenses are equal to the Series annualized expense ratio (1.35%, 2.10% and 2.10% for Class A, B, and C shares, respectively), net of any applicable fee waivers, multiplied by the average account value over the period, multiplied by 183/365 (to reflect the one-half year period). |
81
| | |
| Schedule of Investments | | Rydex | SGI Equity Fund |
| September 30, 2009 | | Select 25 Series |
| | | | | |
| | | Shares | | Value |
COMMON STOCKS - 97.8% | | | | | |
Advertising - 2.9% | | | | | |
Omnicom Group, Inc. | | 25,310 | | $ | 934,951 |
| | | | | |
Aerospace & Defense - 9.2% | | | | | |
Goodrich Corporation | | 16,880 | | | 917,259 |
Honeywell International, Inc. | | 26,350 | | | 978,903 |
ITT Corporation | | 19,650 | | | 1,024,747 |
| | | | | |
| | | | | 2,920,909 |
| | | | | |
Coal & Consumable Fuels - 2.5% | | | | | |
Peabody Energy Corporation | | 21,720 | | | 808,418 |
| | | | | |
Communications Equipment - 4.0% | | | | | |
Qualcomm, Inc. | | 28,350 | | | 1,275,183 |
| | | | | |
Computer Hardware - 4.3% | | | | | |
Apple, Inc. * | | 7,470 | | | 1,384,713 |
| | | | | |
Department Stores - 3.2% | | | | | |
Kohl’s Corporation * | | 17,730 | | | 1,011,497 |
| | | | | |
Diversified Metals & Mining - 3.1% | | | | | |
Freeport-McMoRan Copper & Gold, Inc. (Cl.B) | | 14,400 | | | 987,984 |
| | | | | |
Drug Retail - 3.7% | | | | | |
CVS Caremark Corporation | | 32,640 | | | 1,166,554 |
| | | | | |
Electronic Components - 2.8% | | | | | |
Corning, Inc. | | 58,405 | | | 894,181 |
| | | | | |
Footwear - 3.4% | | | | | |
Nike, Inc. (Cl.B) | | 16,875 | | | 1,091,812 |
| | | | | |
General Merchandise Stores - 3.0% | | | | | |
Target Corporation | | 20,270 | | | 946,204 |
| | | | | |
Health Care Equipment - 3.2% | | | | | |
Covidien plc | | 23,550 | | | 1,018,773 |
| | | | | |
Home Entertainment Software - 2.5% | | | | | |
Activision Blizzard, Inc. * | | 64,295 | | | 796,615 |
| | | | | |
Household Products - 2.1% | | | | | |
Colgate-Palmolive Company | | 8,800 | | | 671,264 |
| | | | | |
Industrial Conglomerates - 3.0% | | | | | |
3M Company | | 13,050 | | | 963,090 |
| | | | | |
Industrial Gases - 3.3% | | | | | |
Air Products & Chemicals, Inc. | | 13,465 | | | 1,044,615 |
| | | | | |
Internet Retail - 3.4% | | | | | |
Amazon.com, Inc. * | | 11,550 | | | 1,078,308 |
| | | | | |
Internet Software & Services - 4.5% | | | | | |
Google, Inc. * | | 2,880 | | | 1,428,047 |
| | | | | |
| | | | | |
| | | Shares | | Value |
COMMON STOCKS - 97.8% (continued) | | | | | |
IT Consulting & Other Services - 3.6% | | | | | |
Cognizant Technology Solutions Corporation * | | 29,525 | | $ | 1,141,437 |
| | | | | |
Oil & Gas Drilling - 3.8% | | | | | |
Transocean, Ltd. * | | 13,970 | | | 1,194,855 |
| | | | | |
Other Diversified Financial Services - 6.4% | | | | | |
Bank of America Corporation | | 56,620 | | | 958,010 |
JPMorgan Chase & Company | | 25,095 | | | 1,099,663 |
| | | | | |
| | | | | 2,057,673 |
| | | | | |
Pharmaceuticals - 5.6% | | | | | |
Pfizer, Inc. | | 57,330 | | | 948,812 |
Teva Pharmaceutical Industries, Ltd. ADR | | 16,915 | | | 855,222 |
| | | | | |
| | | | | 1,804,034 |
| | | | | |
Railroads - 2.9% | | | | | |
Burlington Northern Santa Fe Corporation | | 11,750 | | | 938,003 |
| | | | | |
Restaurants - 3.4% | | | | | |
Darden Restaurants, Inc. | | 32,085 | | | 1,095,060 |
| | | | | |
Semiconductors - 4.0% | | | | | |
Intel Corporation | | 64,450 | | | 1,261,287 |
| | | | | |
Soft Drinks - 4.0% | | | | | |
PepsiCo, Inc. | | 21,750 | | | 1,275,855 |
| | | | | |
TOTAL COMMON STOCKS (cost $27,194,359) | | | | $ | 31,191,322 |
| | | | | |
Total Investments - 97.8% 1 (cost $27,194,359) | | | | $ | 31,191,322 |
Cash & Other Assets, Less Liabilities - 2.2% | | | | | 716,107 |
| | | | | |
Total Net Assets - 100.0% | | | | $ | 31,907,429 |
| | | | | |
For federal income tax purposes the identified cost of investments owned at September 30, 2009 was $27,897,434.
| ADR | American Depositary Receipt |
| plc | Public Limited Company |
| * | Non-income producing security |
| 1 | Unless otherwise indicated, the values of the securities of the Portfolio are determined based on Level 1 inputs established by ASC 820. |
The accompanying notes are an integral part of the financial statements
82
Rydex | SGI Equity Fund
Select 25 Series
Statement of Assets and Liabilities
September 30, 2009
| | | | |
Assets: | | | | |
Investments, at value* | | $ | 31,191,322 | |
Cash | | | 1,106,898 | |
Receivables: | | | | |
Fund shares sold | | | 4,690 | |
Dividends | | | 27,170 | |
Security Investors | | | 9,093 | |
Prepaid expenses | | | 10,564 | |
| | | | |
Total assets | | | 32,349,737 | |
| | | | |
Liabilities: | | | | |
Payable for: | | | | |
Securities purchased | | | 324,768 | |
Fund shares redeemed | | | 44,617 | |
Management fees | | | 19,539 | |
Custodian fees | | | 900 | |
Transfer agent/maintenance fees | | | 9,283 | |
Administration fees | | | 2,537 | |
Professional fees | | | 17,026 | |
12b-1 distribution plan fees | | | 12,303 | |
Directors’ fees | | | 1,619 | |
Other | | | 9,716 | |
| | | | |
Total liabilities | | | 442,308 | |
| | | | |
Net assets | | $ | 31,907,429 | |
| | | | |
Net assets consist of: | | | | |
Paid in capital | | $ | 48,610,107 | |
Accumulated net realized loss on sale of investments | | | (20,699,641 | ) |
Net unrealized appreciation in value of investments | | | 3,996,963 | |
| | | | |
Net assets | | $ | 31,907,429 | |
| | | | |
Class A: | | | | |
Capital shares outstanding (unlimited number of shares authorized) | | | 3,227,896 | |
Net assets | | $ | 22,425,108 | |
Net asset value and redemption price per share | | $ | 6.95 | |
| | | | |
Maximum offering price per share (net asset value divided by 94.25%) | | $ | 7.37 | |
| | | | |
Class B: | | | | |
Capital shares outstanding (unlimited number of shares authorized) | | | 898,903 | |
Net assets | | $ | 5,740,316 | |
Net asset value, offering and redemption price per share (excluding any applicable contingent deferred sales charge) | | $ | 6.39 | |
| | | | |
Class C: | | | | |
Capital shares outstanding (unlimited number of shares authorized) | | | 583,645 | |
Net assets | | $ | 3,742,005 | |
Net asset value, offering and redemption price per share (excluding any applicable contingent deferred sales charge) | | $ | 6.41 | |
| | | | |
* Investments, at cost | | $ | 27,194,359 | |
Statement of Operations
For the Year Ended September 30, 2009
| | | | |
Investment Income: | | | | |
Dividends | | $ | 436,743 | |
Interest | | | 2,027 | |
| | | | |
Total investment income | | | 438,770 | |
| | | | |
Expenses: | | | | |
Management fees | | | 227,777 | |
Transfer agent/maintenance fees | | | 210,211 | |
Administration fees | | | 29,040 | |
Custodian fees | | | 3,752 | |
Directors’ fees | | | 3,355 | |
Professional fees | | | 19,076 | |
Reports to shareholders | | | 13,797 | |
Registration fees | | | 31,090 | |
Other expenses | | | 4,865 | |
12b-1 distribution fees - Class A | | | 51,681 | |
12b-1 distribution fees - Class B | | | 58,779 | |
12b-1 distribution fees - Class C | | | 38,199 | |
| | | | |
Total expenses | | | 691,622 | |
Less: | | | | |
Reimbursement of expenses - Class A | | | (142,247 | ) |
Reimbursement of expenses - Class B | | | (40,316 | ) |
Reimbursement of expenses - Class C | | | (26,001 | ) |
| | | | |
Net expenses | | | 483,058 | |
| | | | |
Net investment loss | | | (44,288 | ) |
| | | | |
Net Realized and Unrealized Gain (Loss): | | | | |
Net realized gain (loss) during the year on: | | | | |
Investments | | | (9,322,393 | ) |
| | | | |
Net realized loss | | | (9,322,393 | ) |
| | | | |
Net unrealized appreciation (depreciation) during the year on: | | | | |
Investments | | | 9,260,235 | |
| | | | |
Net unrealized appreciation | | | 9,260,235 | |
| | | | |
Net loss | | | (62,158 | ) |
| | | | |
Net decrease in net assets resulting from operations | | $ | (106,446 | ) |
| | | | |
The accompanying notes are an integral part of the financial statements
83
| | |
| | Rydex | SGI Equity Fund |
| Statement of Changes in Net Assets | | Select 25 Series |
| | | | | | | | |
| | | Year Ended
September 30,
2009 | | | Year Ended
September 30,
2008 | |
Increase (decrease) in net assets from operations: | | | | | | | | |
Net investment loss | | $ | (44,288 | ) | | $ | (231,859 | ) |
Net realized loss during the year on investments | | | (9,322,393 | ) | | | (5,269,391 | ) |
Net unrealized appreciation (depreciation) during the year on investments | | | 9,260,235 | | | | (10,067,708 | ) |
| | | | | | | | |
Net decrease in net assets resulting from operations | | | (106,446 | ) | | | (15,568,958 | ) |
| | | | | | | | |
Distributions to shareholders from: | | | | | | | | |
Net realized gain | | | | | | | | |
Class A | | | — | | | | (2,418,632 | ) |
Class B | | | — | | | | (850,835 | ) |
Class C | | | — | | | | (907,367 | ) |
| | | | | | | | |
Total distributions to shareholders | | | — | | | | (4,176,834 | ) |
| | | | | | | | |
Capital share transactions: | | | | | | | | |
Proceeds from sale of shares | | | | | | | | |
Class A | | | 8,421,946 | | | | 14,423,069 | |
Class B | | | 2,137,575 | | | | 4,664,269 | |
Class C | | | 463,278 | | | | 1,014,911 | |
Distributions reinvested | | | | | | | | |
Class A | | | — | | | | 2,377,173 | |
Class B | | | — | | | | 845,322 | |
Class C | | | — | | | | 902,367 | |
Cost of shares redeemed | | | | | | | | |
Class A | | | (10,110,314 | ) | | | (11,428,342 | ) |
Class B | | | (3,656,353 | ) | | | (4,903,980 | ) |
Class C | | | (1,859,843 | ) | | | (4,018,565 | ) |
| | | | | | | | |
Net increase (decrease) from capital share transactions | | | (4,603,711 | ) | | | 3,876,224 | |
| | | | | | | | |
Net decrease in net assets | | | (4,710,157 | ) | | | (15,869,568 | ) |
| | | | | | | | |
Net assets: | | | | | | | | |
Beginning of year | | | 36,617,586 | | | | 52,487,154 | |
| | | | | | | | |
End of year | | $ | 31,907,429 | | | $ | 36,617,586 | |
| | | | | | | | |
Accumulated net investment income at end of year | | $ | — | | | $ | — | |
| | | | | | | | |
Capital share activity: | | | | | | | | |
Shares sold | | | | | | | | |
Class A | | | 1,538,705 | | | | 1,645,603 | |
Class B | | | 427,040 | | | | 569,560 | |
Class C | | | 88,295 | | | | 122,944 | |
Shares reinvested | | | | | | | | |
Class A | | | — | | | | 269,520 | |
Class B | | | — | | | | 102,963 | |
Class C | | | — | | | | 109,511 | |
Shares redeemed | | | | | | | | |
Class A | | | (1,744,788 | ) | | | (1,330,365 | ) |
Class B | | | (683,944 | ) | | | (602,152 | ) |
Class C | | | (361,341 | ) | | | (495,291 | ) |
The accompanying notes are an integral part of the financial statements
84
| | |
| Financial Highlights | | Rydex | SGI Equity Fund |
Selected data for each share of capital stock outstanding throughout each year | | Select 25 Series |
| | | | | | | | | | | | | | | | | | | | |
Class A | | 2009 | | | 2008 | | | 2007 | | | 2006a | | | Year Ended
September 30,
2005 | |
Per Share Data | | | | | | | | | | | | | | | | | | | | |
Net asset value, beginning of period | | $ | 6.91 | | | $ | 10.66 | | | $ | 9.86 | | | $ | 9.36 | | | $ | 7.81 | |
| | | | | | | | | | | | | | | | | | | | |
Income (loss) from investment operations: | | | | | | | | | | | | | | | | | | | | |
Net investment income (loss) b | | | 0.01 | | | | (0.02 | ) | | | (0.01 | ) | | | (0.06 | ) | | | (0.07 | ) |
Net gain (loss) on securities (realized and unrealized) | | | 0.03 | | | | (2.87 | ) | | | 0.81 | | | | 0.56 | | | | 1.62 | |
| | | | | | | | | | | | | | | | | | | | |
Total from investment operations | | | 0.04 | | | | (2.89 | ) | | | 0.80 | | | | 0.50 | | | | 1.55 | |
| | | | | | | | | | | | | | | | | | | | |
Less distributions: | | | | | | | | | | | | | | | | | | | | |
Distributions from realized gains | | | — | | | | (0.86 | ) | | | — | | | | — | | | | — | |
| | | | | | | | | | | | | | | | | | | | |
Total distributions | | | — | | | | (0.86 | ) | | | — | | | | — | | | | — | |
| | | | | | | | | | | | | | | | | | | | |
Net asset value, end of period | | $ | 6.95 | | | $ | 6.91 | | | $ | 10.66 | | | $ | 9.86 | | | $ | 9.36 | |
| | | | | | | | | | | | | | | | | | | | |
Total Return c | | | 0.58 | % | | | (28.85 | %) | | | 8.11 | % | | | 5.34 | % | | | 19.85 | % |
| | | | | | | | | | | | | | | | | | | | |
Ratios/Supplemental Data | | | | | | | | | | | | | | | | | | | | |
Net assets, end of period (in thousands) | | $ | 22,425 | | | $ | 23,723 | | | $ | 30,375 | | | $ | 30,078 | | | $ | 8,912 | |
| | | | | | | | | | | | | | | | | | | | |
Ratios to average net assets: | | | | | | | | | | | | | | | | | | | | |
Net investment income (loss) | | | 0.09 | % | | | (0.20 | %) | | | (0.10 | %) | | | (0.68 | %) | | | (0.79 | %) |
Total expenses d | | | 2.04 | % | | | 1.72 | % | | | 1.57 | % | | | 1.76 | % | | | 1.67 | % |
Net expenses e | | | 1.35 | % | | | 1.35 | % | | | 1.40 | % | | | 1.76 | % | | | 1.67 | % |
Net expenses prior to custodian earning credits and net of expense waivers | | | 1.35 | % | | | 1.35 | % | | | 1.40 | % | | | 1.76 | % | | | 1.67 | % |
| | | | | | | | | | | | | | | | | | | | |
Portfolio turnover rate | | | 134 | % | | | 198 | %f | | | 21 | % | | | 39 | % | | | 13 | % |
| | | | | |
Class B | | 2009 | | | 2008 | | | 2007 | | | 2006a | | | Year Ended
September 30,
2005 | |
Per Share Data | | | | | | | | | | | | | | | | | | | | |
Net asset value, beginning of period | | $ | 6.40 | | | $ | 10.01 | | | $ | 9.33 | | | $ | 8.92 | | | $ | 7.50 | |
| | | | | | | | | | | | | | | | | | | | |
Income (loss) from investment operations: | | | | | | | | | | | | | | | | | | | | |
Net investment loss b | | | (0.03 | ) | | | (0.08 | ) | | | (0.09 | ) | | | (0.13 | ) | | | (0.13 | ) |
Net gain (loss) on securities (realized and unrealized) | | | 0.02 | | | | (2.67 | ) | | | 0.77 | | | | 0.54 | | | | 1.55 | |
| | | | | | | | | | | | | | | | | | | | |
Total from investment operations | | | (0.01 | ) | | | (2.75 | ) | | | 0.68 | | | | 0.41 | | | | 1.42 | |
| | | | | | | | | | | | | | | | | | | | |
Less distributions: | | | | | | | | | | | | | | | | | | | | |
Distributions from realized gains | | | — | | | | (0.86 | ) | | | — | | | | — | | | | — | |
| | | | | | | | | | | | | | | | | | | | |
Total distributions | | | — | | | | (0.86 | ) | | | — | | | | — | | | | — | |
| | | | | | | | | | | | | | | | | | | | |
Net asset value, end of period | | $ | 6.39 | | | $ | 6.40 | | | $ | 10.01 | | | $ | 9.33 | | | $ | 8.92 | |
| | | | | | | | | | | | | | | | | | | | |
Total Return c | | | (0.16 | %) | | | (29.36 | %) | | | 7.29 | % | | | 4.60 | % | | | 18.93 | % |
| | | | | | | | | | | | | | | | | | | | |
Ratios/Supplemental Data | | | | | | | | | | | | | | | | | | | | |
Net assets, end of period (in thousands) | | $ | 5,740 | | | $ | 7,394 | | | $ | 10,868 | | | $ | 16,073 | | | $ | 7,000 | |
| | | | | | | | | | | | | | | | | | | | |
Ratios to average net assets: | | | | | | | | | | | | | | | | | | | | |
Net investment loss | | | (0.66 | %) | | | (0.95 | %) | | | (0.88 | %) | | | (1.46 | %) | | | (1.54 | %) |
Total expenses d | | | 2.79 | % | | | 2.47 | % | | | 2.32 | % | | | 2.53 | % | | | 2.42 | % |
Net expenses e | | | 2.10 | % | | | 2.10 | % | | | 2.15 | % | | | 2.53 | % | | | 2.42 | % |
Net expenses prior to custodian earning credits and net of expense waivers | | | 2.10 | % | | | 2.10 | % | | | 2.15 | % | | | 2.53 | % | | | 2.42 | % |
| | | | | | | | | | | | | | | | | | | | |
Portfolio turnover rate | | | 134 | % | | | 198 | %f | | | 21 | % | | | 39 | % | | | 13 | % |
The accompanying notes are an integral part of the financial statements
85
| | |
| Financial Highlights | | Rydex | SGI Equity Fund |
Selected data for each share of capital stock outstanding throughout each year | | Select 25 Series |
| | | | | | | | | | | | | | | | | | | | |
Class C | | 2009 | | | 2008 | | | 2007 | | | 2006a | | | Year Ended
September 30,
2005 | |
Per Share Data | | | | | | | | | | | | | | | | | | | | |
Net asset value, beginning of period | | $ | 6.42 | | | $ | 10.04 | | | $ | 9.36 | | | $ | 8.94 | | | $ | 7.52 | |
| | | | | | | | | | | | | | | | | | | | |
Income (loss) from investment operations: | | | | | | | | | | | | | | | | | | | | |
Net investment loss b | | | (0.03 | ) | | | (0.08 | ) | | | (0.08 | ) | | | (0.13 | ) | | | (0.13 | ) |
Net gain (loss) on securities (realized and unrealized) | | | 0.02 | | | | (2.68 | ) | | | 0.76 | | | | 0.55 | | | | 1.55 | |
| | | | | | | | | | | | | | | | | | | | |
Total from investment operations | | | (0.01 | ) | | | (2.76 | ) | | | 0.68 | | | | 0.42 | | | | 1.42 | |
| | | | | | | | | | | | | | | | | | | | |
Less distributions: | | | | | | | | | | | | | | | | | | | | |
Distributions from realized gains | | | — | | | | (0.86 | ) | | | — | | | | — | | | | — | |
| | | | | | | | | | | | | | | | | | | | |
Total distributions | | | — | | | | (0.86 | ) | | | — | | | | — | | | | — | |
| | | | | | | | | | | | | | | | | | | | |
Net asset value, end of period | | $ | 6.41 | | | $ | 6.42 | | | $ | 10.04 | | | $ | 9.36 | | | $ | 8.94 | |
| | | | | | | | | | | | | | | | | | | | |
Total Return c | | | (0.16 | %) | | | (29.37 | %) | | | 7.26 | % | | | 4.70 | % | | | 18.88 | % |
| | | | | | | | | | | | | | | | | | | | |
Ratios/Supplemental Data | | | | | | | | | | | | | | | | | | | | |
Net assets, end of period (in thousands) | | $ | 3,742 | | | $ | 5,501 | | | $ | 11,245 | | | $ | 12,777 | | | $ | 5,029 | |
| | | | | | | | | | | | | | | | | | | | |
Ratios to average net assets: | | | | | | | | | | | | | | | | | | | | |
Net investment loss | | | (0.66 | %) | | | (0.92 | %) | | | (0.86 | %) | | | (1.44 | %) | | | (1.54 | %) |
Total expenses d | | | 2.78 | % | | | 2.46 | % | | | 2.32 | % | | | 2.52 | % | | | 2.42 | % |
Net expenses e | | | 2.10 | % | | | 2.10 | % | | | 2.15 | % | | | 2.52 | % | | | 2.42 | % |
Net expenses prior to custodian earning credits and net of expense waivers | | | 2.10 | % | | | 2.10 | % | | | 2.15 | % | | | 2.52 | % | | | 2.42 | % |
| | | | | | | | | | | | | | | | | | | | |
Portfolio turnover rate | | | 134 | % | | | 198 | % f | | | 21 | % | | | 39 | % | | | 13 | % |
| a | The financial highlights for the Select 25 Series exclude the historical financial highlights of the Enhanced Index Series, Class A, B and C shares, the Large Cap Growth Series, Class A, B and C shares and the Social Awareness Series, Class A, B and C shares. A total of $29,412,366 was excluded from purchases in the portfolio turnover calculation. This was the cost of the securities Select 25 received as a result of the merger. The assets of the Enhanced Index, Large Cap Growth and Social Awareness Series’ were acquired by the Select 25 Series on June 16, 2006. |
| b | Net investment income (loss) was computed using average shares outstanding throughout the period. |
| c | Total return information does not reflect deduction of any sales charges imposed at the time of purchase for Class A shares or upon redemption for Class B and C shares. |
| d | Total expense information reflects expense ratios absent expense reductions by the Investment Manager and custodian earnings credits, as applicable. |
| e | Net expense information reflects the expense ratios after voluntary expense waivers, reimbursements and custodian earnings credits, as applicable. |
| f | Significant variation in the portfolio turnover rate is due to the Investment Manager’s appointment of new portfolio managers for the series. |
The accompanying notes are an integral part of the financial statements
86
Manager’s Commentary
November 16, 2009
To Our Shareholders:
For the fiscal year ended September 30, 2009, the Rydex|SGI Equity Fund Small Cap Growth Series returned –6.89%1, slightly underperforming the benchmark Russell 2000 Growth Index’s return of –6.32% and its peer group median of –6.18%.
The Series uses a combination of a qualitative macroeconomic approach in reviewing growth trends that is based upon several fixed income factors, such as bond spreads and interest rates, along with a quantitative fundamental bottom-up approach in selecting growth stocks. The manager chooses securities that it believes are attractively valued with the greatest potential for long-term growth of capital.
The manager identifies the securities of companies that are in the early to middle stages of growth and are valued at a reasonable price. Equity securities considered to have appreciation potential may include securities of smaller and less mature companies, which have unique proprietary products or profitable market niches and the potential to grow very rapidly. The Series typically sells a stock if its growth prospects diminish, or if better opportunities become available.
Consumer Discretionary, Materials, Industrials, and Information Technology Top Performers
While the Series had an even weight in the consumer discretionary sector, holdings gained approximately 28% compared to 6% for the Index. Life Time Fitness, Inc., Jarden Corporation, and WMS Industries, Inc. all gained more than 100% during the fiscal year.
In addition to being an overweight position, securities in the materials sector soared around 60% against a 6% loss for the Index. The top three performers, Terra Industries, Inc., Kaiser Aluminum Corporation, and Agrium, Inc., were active bets not part of the Series’ benchmark.
An underweight position in industrials helped boost overall performance for the Series while returns in the sector were slightly better than the Index. Portfolio holding BE Aerospace, Inc. gained over 100% during the period while Bucyrus International, Inc. was up more than 80%.
Superior stock selection in the information technology sector, which was 20% of total Series assets, contributed to portfolio returns. Skyworks Solutions, Inc. and Alliance Data Systems Corporation both gained more than 150% during the period. Other performing securities included Fairchild Semiconductor International, Inc. and QLogic Corporation.
Health Care and Consumer Staples Disappoint
Poor stock selection in the health care sector hurt the Series as holdings lost approximately 35% relative to a 6% loss in the Index. Both CardioNet, Inc. and RTI Biologics, Inc. dropped more than 70% during the period. Other securities detracting from performance were Psychiatric Solutions, Inc. and Wright Medical Group, Inc.
While not a large weight in the Series, holdings in the consumer staples sector lost around 30% as the sector for the Index gained 3%. The largest drags in the sector were Bare Escentuals, Inc. and Church & Dwight Company.
Market Outlook
While there are indications that the economy is stabilizing from a macroeconomic standpoint, the economy and markets remain uncertain with contradictory information. The statement released by the FOMC from their meeting on September 23, 2009 showed an economy that was slowly improving. A positive indicator for the equity markets is the direction of earnings revisions, which is higher. The cost of capital is cheap, as interest rates remain very low with no sign of inflation. Therefore, companies are able to expand but it is through merger and acquisition activity rather than organic growth.
We believe that it is more important that ever that we maintain discipline in our investment approach based on our core philosophy and rigorous fundamental process to identify the securities that can provide the best long-term performance for shareholders.
On behalf of Security Global Investors, I would like to thank you for trusting your funds with us.
|
| Sincerely, |
|
| |
| Joseph O’Connor |
| Portfolio Manager |
| 1 | Performance figures are based on Class A shares and do not reflect deduction of the sales charges or taxes that a shareholder would pay on distributions or redemptions of shares. |
| | The strategies discussed herein do not assure a profit. The Fund is distributed by Rydex Distributors, Inc. |
87
| | |
| | Rydex | SGI Equity Fund |
| Performance Summary | | Small Cap Growth Series |
September 30, 2009 | | (unaudited) |
PERFORMANCE
Small Cap Growth Series vs. Russell 2000 Growth Index
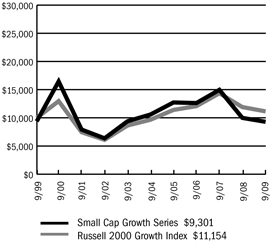
$10,000 Over 10 Years
This chart assumes a $10,000 investment in Class A shares of Small Cap Growth Series on September 30, 1999, reflects deduction of the 5.75% sales load and assumes all dividends reinvested. The chart does not reflect the deduction of taxes that a shareholder would pay on distributions or the redemption of fund shares. The Russell 2000 Growth Index measures the performance of those Russell 2000 companies with higher price-to-book ratios and higher forecasted growth values.
Average Annual Returns
| | | | | | | | | |
Periods Ended 9-30-09 | | 1 Year | | | 5 Years | | | 10 Years | |
A Shares | | (6.89 | %) | | (2.56 | %) | | (0.13 | %) |
A Shares with sales charge | | (12.26 | %) | | (3.70 | %) | | (0.72 | %) |
B Shares | | (7.47 | %) | | (3.25 | %) | | (0.78 | %) |
B Shares with CDSC | | (12.05 | %) | | (3.60 | %) | | (0.78 | %) |
C Shares | | (7.51 | %) | | (3.28 | %) | | (0.89 | %) |
C Shares with CDSC | | (8.43 | %) | | (3.28 | %) | | (0.89 | %) |
The performance data above represents past performance that is not predictive of future results. The investment return and principal value of an investment in the Series will fluctuate so that an investor’s shares, when redeemed, may be worth more or less than their original cost. The figures above do not reflect deduction of the maximum front-end sales charge of 5.75% for Class A shares or the contingent deferred sales charge of 5% for Class B shares and 1% for Class C shares, as applicable, except where noted. The figures do not reflect the deduction of taxes that a shareholder would pay on distributions or redemption of shares. Such figures would be lower if the maximum sales charge and any applicable taxes were deducted. Fee waivers reduced expenses of the Series and in the absence of such waiver, the performance quoted would be reduced.
Portfolio Composition by Sector as of 9-30-09
| | | |
Consumer Discretionary | | 14.73 | % |
Consumer Staples | | 3.81 | |
Energy | | 5.58 | |
Financials | | 6.45 | |
Health Care | | 11.75 | |
Industrials | | 11.81 | |
Information Technology | | 26.56 | |
Materials | | 4.80 | |
Utilities | | 1.97 | |
Exchange Traded Funds | | 8.84 | |
Cash & Other Assets, Less Liabilities | | 3.70 | |
| | | |
Total Net Assets | | 100.00 | % |
| | | |
The accompanying notes are an integral part of the financial statements
88
| | |
| | Rydex | SGI Equity Fund |
| Performance Summary | | Small Cap Growth Series |
September 30, 2009 | | (unaudited) |
Information About Your Series Expenses
Calculating your ongoing Series expenses
Example
As a shareholder of the Series, you incur two types of costs: (1) transaction costs, which may include sales charges (loads) on purchase payments; contingent deferred sales charges on redemptions; and redemption fees, if any; and (2) ongoing costs, including management fees; distribution and/or service fees (12b-1); and other Series expenses. This example is intended to help you understand your ongoing costs (in dollars) of investing in the Series and to compare these costs with ongoing costs of investing in other mutual funds. The example is based on an investment of $1,000 invested at the beginning of the period and held for the entire period April 1, 2009 through September 30, 2009.
Actual Expenses
The first line for each class of shares in the table provides information about actual account values and actual expenses. You may use the information in this table, together with the amount you invested, to estimate the expenses that you paid over the period. Simply divide your account value by $1,000 (for example, an $8,600 account value divided by $1,000 = 8.6), then multiply the result by the number in the table under the heading entitled “Expenses Paid During the Period” to estimate the expenses you paid on your account during this period.
Hypothetical Example for Comparison Purposes
The second line for each class of shares in the table provides information about hypothetical account values and hypothetical expenses based on the Series actual expense ratio and an assumed rate of return of 5% per year before expenses, which is not the Series actual return. The hypothetical account values and expenses may not be used to estimate the actual ending account balance or expenses you paid for the period. You may use this information to compare the ongoing costs of investing in the Series and other funds. To do so, compare this 5% hypothetical example with the 5% hypothetical examples that appear in the shareholder reports of the other mutual funds.
Please note that the expenses shown in the table are meant to highlight your ongoing costs only and do not reflect any transactional costs, such as sales charges (loads) on purchase payments, contingent deferred sales charges on redemptions, and redemption fees, if any. Therefore, the second line for each class of shares is useful in comparing ongoing costs only, and will not help you determine the relative total costs of owning different funds. In addition, if these transactional costs were included, your costs would have been higher.
Series Expenses
| | | | | | | | | |
| | | Beginning
Account
Value
4/1/2009 | | Ending
Account
Value
9/30/2009 1 | | Expenses
Paid
During
Period 2 |
Small Cap Growth Series - Class A | | | | | | | | | |
Actual | | $ | 1,000.00 | | $ | 1,391.30 | | $ | 16.07 |
Hypothetical | | | 1,000.00 | | | 1,011.63 | | | 13.51 |
Small Cap Growth Series - Class B | | | | | | | | | |
Actual | | | 1,000.00 | | | 1,388.81 | | | 20.42 |
Hypothetical | | | 1,000.00 | | | 1,007.97 | | | 17.16 |
Small Cap Growth Series - Class C | | | | | | | | | |
Actual | | | 1,000.00 | | | 1,386.72 | | | 20.28 |
Hypothetical | | | 1,000.00 | | | 1,008.07 | | | 17.07 |
| 1 | The actual ending account value is based on the actual total return of the Series for the period April 1, 2009 to September 30, 2009 after actual expenses and will differ from the hypothetical ending account value which is based on the Series expense ratio and a hypothetical annual return of 5% before expenses. The actual cumulative return at net asset value for the period April 1, 2009 to September 30, 2009 was 39.13%, 38.88% and 38.67%, for Class A, B and C shares, respectively. |
| 2 | Expenses are equal to the Series annualized expense ratio (2.68%, 3.41% and 3.39% for Class A, B, and C shares, respectively), net of any applicable fee waivers, multiplied by the average account value over the period, multiplied by 183/365 (to reflect the one-half year period). |
89
| | |
| Schedule of Investments | | Rydex | SGI Equity Fund |
| September 30, 2009 | | Small Cap Growth Series |
| | | | | |
| | | Shares | | Value |
COMMON STOCKS - 96.3% | | | | | |
Aerospace & Defense - 1.8% | | | | | |
BE Aerospace, Inc. * | | 8,490 | | $ | 170,989 |
DigitalGlobe, Inc. * | | 3,120 | | | 69,794 |
| | | | | |
| | | | | 240,783 |
| | | | | |
Aluminum - 0.5% | | | | | |
Kaiser Aluminum Corporation | | 1,650 | | | 59,994 |
| | | | | |
Apparel Retail - 1.3% | | | | | |
Jos A. Bank Clothiers, Inc. * | | 3,710 | | | 166,097 |
| | | | | |
Apparel, Accessories & Luxury Goods - 4.4% | | | | | |
Carter’s, Inc. * | | 4,700 | | | 125,490 |
FGX International Holdings, Ltd. * | | 15,100 | | | 210,645 |
Hanesbrands, Inc. * | | 7,700 | | | 164,780 |
Lululemon Athletica, Inc. * | | 4,200 | | | 95,550 |
| | | | | |
| | | | | 596,465 |
| | | | | |
Application Software - 8.3% | | | | | |
Informatica Corporation * | | 8,200 | | | 185,156 |
JDA Software Group, Inc. * | | 3,824 | | | 83,899 |
Longtop Financial Technologies, Ltd. ADR * | | 2,100 | | | 59,766 |
Nuance Communications, Inc. * | | 11,265 | | | 168,524 |
Solera Holdings, Inc. | | 8,650 | | | 269,102 |
VanceInfo Technologies, Inc. ADR * | | 16,150 | | | 313,956 |
| | | | | |
| | | | | 1,080,403 |
| | | | | |
Biotechnology - 1.1% | | | | | |
Halozyme Therapeutics, Inc. * | | 9,240 | | | 65,696 |
Martek Biosciences Corporation * | | 3,450 | | | 77,936 |
| | | | | |
| | | | | 143,632 |
| | | | | |
Casinos & Gaming - 1.2% | | | | | |
WMS Industries, Inc. * | | 3,540 | | | 157,742 |
| | | | | |
Coal & Consumable Fuels - 1.0% | | | | | |
Massey Energy Company | | 4,850 | | | 135,267 |
| | | | | |
Communications Equipment - 1.4% | | | | | |
InterDigital, Inc. * | | 7,820 | | | 181,111 |
| | | | | |
Computer Storage & Peripherals - 3.1% | | | | | |
Novatel Wireless, Inc. * | | 16,325 | | | 185,452 |
QLogic Corporation * | | 13,170 | | | 226,524 |
| | | | | |
| | | | | 411,976 |
| | | | | |
Construction & Engineering - 0.3% | | | | | |
Aecom Technology Corporation * | | 1,500 | | | 40,710 |
| | | | | |
Construction & Farm Machinery & Heavy Trucks - 2.3% | | | | | |
Bucyrus International, Inc. | | 3,000 | | | 106,860 |
Wabtec Corporation | | 5,300 | | | 198,909 |
| | | | | |
| | | | | 305,769 |
| | | | | |
Data Processing & Outsourced Services - 2.0% | | | | | |
Alliance Data Systems Corporation * | | 4,425 | | | 270,279 |
| | | | | |
| | | | | |
| | | Shares | | Value |
COMMON STOCKS - 96.3% (continued) | | | | | |
Diversified Metals & Mining - 1.0% | | | | | |
Thompson Creek Metals Company, Inc. * | | 10,500 | | $ | 126,735 |
| | | | | |
Diversified Support Services - 0.9% | | | | | |
Ritchie Bros Auctioneers, Inc. | | 4,800 | | | 117,792 |
| | | | | |
Education Services - 1.0% | | | | | |
DeVry, Inc. | | 2,400 | | | 132,768 |
| | | | | |
Electric Utilities - 1.0% | | | | | |
ITC Holdings Corporation | | 2,870 | | | 130,441 |
| | | | | |
Electrical Components & Equipment - 2.4% | | | | | |
Baldor Electric Company | | 9,180 | | | 250,980 |
Regal-Beloit Corporation | | 1,350 | | | 61,709 |
| | | | | |
| | | | | 312,689 |
| | | | | |
Electronic Equipment & Instruments - 2.0% | | | | | |
Flir Systems, Inc. * | | 5,700 | | | 159,429 |
Rofin-Sinar Technologies, Inc. * | | 4,870 | | | 111,815 |
| | | | | |
| | | | | 271,244 |
| | | | | |
Exchange Traded Funds - 8.8% | | | | | |
iShares Russell 2000 Growth Index Fund | | 17,880 | | | 1,171,319 |
| | | | | |
Fertilizers & Agricultural Chemicals - 1.3% | | | | | |
Terra Industries, Inc. | | 4,825 | | | 167,283 |
| | | | | |
Health Care Equipment - 2.0% | | | | | |
Integra LifeSciences Holdings Corporation * | | 3,670 | | | 125,331 |
Wright Medical Group, Inc. * | | 7,800 | | | 139,308 |
| | | | | |
| | | | | 264,639 |
| | | | | |
Health Care Services - 2.8% | | | | | |
CardioNet, Inc. * | | 9,710 | | | 65,251 |
Clarient, Inc. * | | 8,000 | | | 33,680 |
LHC Group, Inc. * | | 4,390 | | | 131,393 |
Mednax, Inc. * | | 2,650 | | | 145,538 |
| | | | | |
| | | | | 375,862 |
| | | | | |
Health Care Supplies - 1.5% | | | | | |
Haemonetics Corporation * | | 3,465 | | | 194,456 |
| | | | | |
Household Products - 1.7% | | | | | |
Church & Dwight Company, Inc. | | 3,950 | | | 224,123 |
| | | | | |
Housewares & Specialties - 2.4% | | | | | |
Jarden Corporation | | 11,375 | | | 319,296 |
| | | | | |
Human Resources & Employment Services - 0.8% | | | | | |
Watson Wyatt Worldwide, Inc. | | 2,500 | | | 108,900 |
| | | | | |
Hypermarkets & Super Centers - 0.7% | | | | | |
BJ’s Wholesale Club, Inc. * | | 2,630 | | | 95,259 |
| | | | | |
The accompanying notes are an integral part of the financial statements
90
| | |
| Schedule of Investments | | Rydex | SGI Equity Fund |
| September 30, 2009 | | Small Cap Growth Series |
| | | | | |
| | | Shares | | Value |
COMMON STOCKS - 96.3% (continued) | | | | | |
Industrial Machinery - 1.4% | | | | | |
IDEX Corporation | | 6,820 | | $ | 190,619 |
| | | | | |
Internet Software & Services - 0.8% | | | | | |
Constant Contact, Inc. * | | 5,450 | | | 104,913 |
| | | | | |
Investment Banking & Brokerage - 3.0% | | | | | |
Knight Capital Group, Inc. * | | 8,100 | | | 176,175 |
Stifel Financial Corporation * | | 3,500 | | | 192,150 |
TradeStation Group, Inc. * | | 5,625 | | | 45,844 |
| | | | | |
| | | | | 414,169 |
| | | | | |
Leisure Facilities - 1.7% | | | | | |
Life Time Fitness, Inc. * | | 7,880 | | | 221,034 |
| | | | | |
Life Sciences Tools & Services - 1.1% | | | | | |
Charles River Laboratories International, Inc. * | | 4,000 | | | 147,920 |
| | | | | |
Metal & Glass Containers - 2.0% | | | | | |
Silgan Holdings, Inc. | | 5,350 | | | 282,105 |
| | | | | |
Movies & Entertainment - 0.7% | | | | | |
Imax Corporation * | | 10,475 | | | 98,570 |
| | | | | |
Multi-Line Insurance - 1.9% | | | | | |
HCC Insurance Holdings, Inc. | | 9,000 | | | 246,150 |
| | | | | |
Multi-Utilities - 1.0% | | | | | |
NorthWestern Corporation | | 5,330 | | | 130,212 |
| | | | | |
Oil & Gas Equipment & Services - 2.4% | | | | | |
Oil States International, Inc. * | | 4,700 | | | 165,110 |
Superior Energy Services, Inc. * | | 6,710 | | | 151,109 |
| | | | | |
| | | | | 316,219 |
| | | | | |
Oil & Gas Exploration & Production - 2.2% | | | | | |
Bill Barrett Corporation * | | 4,300 | | | 140,997 |
Comstock Resources, Inc. * | | 3,670 | | | 147,094 |
| | | | | |
| | | | | 288,091 |
| | | | | |
Packaged Foods & Meats - 1.4% | | | | | |
Flowers Foods, Inc. | | 7,070 | | | 185,870 |
| | | | | |
Pharmaceuticals - 3.3% | | | | | |
Endo Pharmaceuticals Holdings, Inc. * | | 5,350 | | | 121,070 |
Perrigo Company | | 9,120 | | | 309,988 |
| | | | | |
| | | | | 431,058 |
| | | | | |
Railroads - 1.5% | | | | | |
Kansas City Southern * | | 7,385 | | | 195,629 |
| | | | | |
Regional Banks - 1.5% | | | | | |
TCF Financial Corporation | | 14,870 | | | 193,905 |
| | | | | |
Research & Consulting Services - 0.4% | | | | | |
ICF International, Inc. * | | 1,700 | | | 51,544 |
| | | | | |
| | | | | |
| | | Shares | | Value |
COMMON STOCKS - 96.3% (continued) | | | | | |
Restaurants - 2.0% | | | | | |
Einstein Noah Restaurant Group, Inc. * | | 6,300 | | $ | 75,852 |
McCormick & Schmick’s Seafood Restaurants, Inc. * | | 6,150 | | | 45,756 |
Panera Bread Company * | | 2,500 | | | 137,500 |
| | | | | |
| | | | | 259,108 |
| | | | | |
Semiconductor Equipment - 1.8% | | | | | |
Formfactor, Inc. * | | 7,055 | | | 168,755 |
Tessera Technologies, Inc. * | | 2,520 | | | 70,283 |
| | | | | |
| | | | | 239,038 |
| | | | | |
Semiconductors - 4.9% | | | | | |
ON Semiconductor Corporation * | | 35,265 | | | 290,936 |
Skyworks Solutions, Inc. * | | 27,190 | | | 359,997 |
| | | | | |
| | | | | 650,933 |
| | | | | |
Systems Software - 2.3% | | | | | |
Rovi Corporation * | | 9,200 | | | 309,120 |
| | | | | |
TOTAL COMMON STOCKS (cost $9,843,956) | | | | $ | 12,759,241 |
| | | | | |
Total Investments - 96.3% 1
(cost $9,843,956) | | | | $ | 12,759,241 |
Cash & Other Assets, Less Liabilities - 3.7% | | | | | 490,074 |
| | | | | |
Total Net Assets - 100.0% | | | | $ | 13,249,315 |
| | | | | |
For federal income tax purposes the identified cost of investments owned at September 30, 2009 was $10,122,490.
| ADR | American Depositary Receipt |
| * | Non-income producing security |
| 1 | Unless otherwise indicated, the values of the securities of the Portfolio are determined based on Level 1 inputs established by ASC 820. |
The accompanying notes are an integral part of the financial statements
91
Rydex | SGI Equity Fund
Small Cap Growth Series
Statement of Assets and Liabilities
September 30, 2009
| | | | |
Assets: | | | | |
Investments, at value * | | $ | 12,759,241 | |
Cash | | | 414,646 | |
Receivables: | | | | |
Fund shares sold | | | 11,060 | |
Securities sold | | | 163,090 | |
Dividends | | | 2,472 | |
Prepaid expenses | | | 17,009 | |
| | | | |
Total assets | | | 13,367,518 | |
| | | | |
Liabilities: | | | | |
Payable for: | | | | |
Securities purchased | | | 79,482 | |
Fund shares redeemed | | | 1,749 | |
Management fees | | | 9,167 | |
Custodian fees | | | 3,000 | |
Transfer agent/maintenance fees | | | 5,064 | |
Administration fees | | | 1,423 | |
Professional fees | | | 10,650 | |
12b-1 distribution plan fees | | | 4,696 | |
Directors’ fees | | | 775 | |
Other | | | 2,197 | |
| | | | |
Total liabilities | | | 118,203 | |
| | | | |
Net assets | | $ | 13,249,315 | |
| | | | |
Net assets consist of: | | | | |
Paid in capital | | $ | 19,493,381 | |
Accumulated net realized loss on sale of investments | | | (9,159,351 | ) |
Net unrealized appreciation in value of investments | | | 2,915,285 | |
| | | | |
Net assets | | $ | 13,249,315 | |
| | | | |
Class A: | | | | |
Capital shares outstanding
(unlimited number of shares authorized) | | | 943,385 | |
Net assets | | $ | 9,965,517 | |
Net asset value and redemption price per share | | $ | 10.56 | |
| | | | |
Maximum offering price per share (net asset value divided by 94.25%) | | $ | 11.20 | |
| | | | |
Class B: | | | | |
Capital shares outstanding | | | | |
(unlimited number of shares authorized) | | | 187,350 | |
Net assets | | $ | 1,766,270 | |
Net asset value, offering and redemption price per share (excluding any applicable contingent deferred sales charge) | | $ | 9.43 | |
| | | | |
Class C: | | | | |
Capital shares outstanding
(unlimited number of shares authorized) | | | 157,902 | |
Net assets | | $ | 1,517,528 | |
Net asset value, offering and redemption price per share (excluding any applicable contingent deferred sales charge) | | $ | 9.61 | |
| | | | |
* Investments, at cost | | $ | 9,843,956 | |
Statement of Operations
For the Year Ended September 30, 2009
| | | | |
Investment Income: | | | | |
Dividends | | $ | 64,464 | |
Interest | | | 2,217 | |
| | | | |
Total investment income | | | 66,681 | |
| | | | |
Expenses: | | | | |
Management fees | | | 104,632 | |
Transfer agent/maintenance fees | | | 92,540 | |
Administration fees | | | 25,000 | |
Custodian fees | | | 7,435 | |
Directors’ fees | | | 1,446 | |
Professional fees | | | 18,028 | |
Reports to shareholders | | | 3,959 | |
Registration fees | | | 32,021 | |
Other expenses | | | 2,984 | |
12b-1 distribution fees - Class A | | | 21,577 | |
12b-1 distribution fees - Class B | | | 16,915 | |
12b-1 distribution fees - Class C | | | 16,010 | |
| | | | |
Total expenses | | | 342,547 | |
Less: | | | | |
Reimbursement of expenses - Class A | | | (6,028 | ) |
Reimbursement of expenses - Class B | | | (1,247 | ) |
Reimbursement of expenses - Class C | | | (1,148 | ) |
Earnings credits applied | | | (152 | ) |
| | | | |
Net expenses | | | 333,972 | |
| | | | |
Net investment loss | | | (267,291 | ) |
| | | | |
Net Realized and Unrealized Gain (Loss): | | | | |
Net realized gain (loss) during the year on: | | | | |
Investments | | | (5,298,229 | ) |
| | | | |
Net realized loss | | | (5,298,229 | ) |
| | | | |
Net unrealized appreciation (depreciation) during the year on: | | | | |
Investments | | | 3,555,194 | |
| | | | |
Net unrealized appreciation | | | 3,555,194 | |
| | | | |
Net loss | | | (1,743,035 | ) |
| | | | |
Net decrease in net assets resulting from operations | | $ | (2,010,326 | ) |
| | | | |
The accompanying notes are an integral part of the financial statements
92
| | |
| | Rydex | SGI Equity Fund |
| Statement of Changes in Net Assets | | Small Cap Growth Series |
| | | | | | | | |
| | | Year Ended
September 30, 2009 | | | Year Ended
September 30, 2008 | |
Increase (decrease) in net assets from operations: | | | | | | | | |
Net investment loss | | $ | (267,291 | ) | | $ | (561,834 | ) |
Net realized loss during the year on investments | | | (5,298,229 | ) | | | (3,033,923 | ) |
Net unrealized appreciation (depreciation) during the year on investments | | | 3,555,194 | | | | (9,845,449 | ) |
| | | | | | | | |
Net decrease in net assets resulting from operations | | | (2,010,326 | ) | | | (13,441,206 | ) |
| | | | | | | | |
Distributions to shareholders from: | | | | | | | | |
Net realized gain | | | | | | | | |
Class A | | | (68,412 | ) | | | (3,191,745 | ) |
Class B | | | (15,241 | ) | | | (420,821 | ) |
Class C | | | (14,153 | ) | | | (306,607 | ) |
| | | | | | | | |
Total distributions to shareholders | | | (97,806 | ) | | | (3,919,173 | ) |
| | | | | | | | |
Capital share transactions: | | | | | | | | |
Proceeds from sale of shares | | | | | | | | |
Class A | | | 2,029,895 | | | | 5,720,827 | |
Class B | | | 248,049 | | | | 484,765 | |
Class C | | | 317,482 | | | | 862,243 | |
Distributions reinvested | | | | | | | | |
Class A | | | 67,918 | | | | 3,177,232 | |
Class B | | | 15,032 | | | | 416,649 | |
Class C | | | 14,129 | | | | 305,485 | |
Cost of shares redeemed | | | | | | | | |
Class A | | | (3,116,009 | ) | | | (28,269,263 | ) |
Class B | | | (805,709 | ) | | | (1,955,259 | ) |
Class C | | | (820,807 | ) | | | (1,160,706 | ) |
| | | | | | | | |
Net decrease from capital share transactions | | | (2,050,020 | ) | | | (20,418,027 | ) |
| | | | | | | | |
Net decrease in net assets | | | (4,158,152 | ) | | | (37,778,406 | ) |
| | | | | | | | |
Net assets: | | | | | | | | |
Beginning of year | | | 17,407,467 | | | | 55,185,873 | |
| | | | | | | | |
End of year | | $ | 13,249,315 | | | $ | 17,407,467 | |
| | | | | | | | |
Accumulated net investment income at end of year | | $ | — | | | $ | — | |
| | | | | | | | |
Capital share activity: | | | | | | | | |
Shares sold | | | | | | | | |
Class A | | | 233,845 | | | | 2,568,429 | |
Class B | | | 32,329 | | | | 35,400 | |
Class C | | | 41,277 | | | | 58,495 | |
Shares reinvested | | | | | | | | |
Class A | | | 8,334 | | | | 199,200 | |
Class B | | | 2,056 | | | | 28,874 | |
Class C | | | 1,894 | | | | 20,753 | |
Shares redeemed | | | | | | | | |
Class A | | | (384,736 | ) | | | (4,133,463 | ) |
Class B | | | (107,295 | ) | | | (146,349 | ) |
Class C | | | (106,372 | ) | | | (88,178 | ) |
The accompanying notes are an integral part of the financial statements
93
| | |
| Financial Highlights | | Rydex | SGI Equity Fund |
Selected data for each share of capital stock outstanding throughout each year | | Small Cap Growth Series |
| | | | | | | | | | | | | | | | | | | | |
Class A | | 2009 | | | 2008 | | | 2007 | | | 2006 | | | Year Ended
September 30,
2005 | |
Per Share Data | | | | | | | | | | | | | | | | | | | | |
Net asset value, beginning of period | | $ | 11.43 | | | $ | 18.53 | | | $ | 15.63 | | | $ | 15.76 | | | $ | 13.11 | |
Income (loss) from investment operations: | | | | | | | | | | | | | | | | | | | | |
Net investment loss a | | | (0.18 | ) | | | (0.24 | ) | | | (0.23 | ) | | | (0.23 | ) | | | (0.24 | ) |
Net gain (loss) on securities (realized and unrealized) | | | (0.63 | ) | | | (5.55 | ) | | | 3.13 | | | | 0.10 | | | | 2.89 | |
| | | | | | | | | | | | | | | | | | | | |
Total from investment operations | | | (0.81 | ) | | | (5.79 | ) | | | 2.90 | | | | (0.13 | ) | | | 2.65 | |
| | | | | | | | | | | | | | | | | | | | |
Less distributions: | | | | | | | | | | | | | | | | | | | | |
Distributions from realized gains | | | (0.06 | ) | | | (1.31 | ) | | | — | | | | — | | | | — | |
| | | | | | | | | | | | | | | | | | | | |
Total distributions | | | (0.06 | ) | | | (1.31 | ) | | | — | | | | — | | | | — | |
| | | | | | | | | | | | | | | | | | | | |
Net asset value, end of period | | $ | 10.56 | | | $ | 11.43 | | | $ | 18.53 | | | $ | 15.63 | | | $ | 15.76 | |
| | | | | | | | | | | | | | | | | | | | |
Total Return b | | | (6.89 | %) | | | (33.25 | %) | | | 18.55 | % | | | (0.82 | %) | | | 20.21 | % |
| | | | | | | | | | | | | | | | | | | | |
Ratios/Supplemental Data | | | | | | | | | | | | | | | | | | | | |
Net assets, end of period (in thousands) | | $ | 9,966 | | | $ | 12,414 | | | $ | 45,430 | | | $ | 45,451 | | | $ | 22,637 | |
Ratios to average net assets: | | | | | | | | | | | | | | | | | | | | |
Net investment loss | | | (2.04 | %) | | | (1.59 | %) | | | (1.32 | %) | | | (1.46 | %) | | | (1.67 | %) |
Total expenses c | | | 2.67 | % | | | 1.98 | % | | | 1.80 | % | | | 2.01 | % | | | 2.10 | % |
Net expenses d | | | 2.60 | % | | | 1.98 | % | | | 1.80 | % | | | 2.01 | % | | | 2.10 | % |
Net expenses prior to custodian earning credits and net of expense waivers | | | 2.60 | % | | | 1.98 | % | | | 1.80 | % | | | 2.01 | % | | | 2.10 | % |
| | | | | | | | | | | | | | | | | | | | |
Portfolio turnover rate | | | 200 | % | | | 169 | % | | | 145 | % | | | 136 | % | | | 134 | % |
| | | | | |
Class B | | 2009 | | | 2008 | | | 2007 | | | 2006 | | | Year Ended
September 30,
2005 | |
Per Share Data | | | | | | | | | | | | | | | | | | | | |
Net asset value, beginning of period | | $ | 10.28 | | | $ | 16.92 | | | $ | 14.38 | | | $ | 14.60 | | | $ | 12.24 | |
| | | | | | | | | | | | | | | | | | | | |
Income (loss) from investment operations: | | | | | | | | | | | | | | | | | | | | |
Net investment loss a | | | (0.21 | ) | | | (0.32 | ) | | | (0.33 | ) | | | (0.36 | ) | | | (0.33 | ) |
Net gain (loss) on securities (realized and unrealized) | | | (0.58 | ) | | | (5.01 | ) | | | 2.87 | | | | 0.14 | | | | 2.69 | |
| | | | | | | | | | | | | | | | | | | | |
Total from investment operations | | | (0.79 | ) | | | (5.33 | ) | | | 2.54 | | | | (0.22 | ) | | | 2.36 | |
| | | | | | | | | | | | | | | | | | | | |
Less distributions: | | | | | | | | | | | | | | | | | | | | |
Distributions from realized gains | | | (0.06 | ) | | | (1.31 | ) | | | — | | | | — | | | | — | |
| | | | | | | | | | | | | | | | | | | | |
Total distributions | | | (0.06 | ) | | | (1.31 | ) | | | — | | | | — | | | | — | |
| | | | | | | | | | | | | | | | | | | | |
Net asset value, end of period | | $ | 9.43 | | | $ | 10.28 | | | $ | 16.92 | | | $ | 14.38 | | | $ | 14.60 | |
| | | | | | | | | | | | | | | | | | | | |
Total Return b | | | (7.47 | %) | | | (33.72 | %) | | | 17.66 | % | | | (1.51 | %) | | | 19.28 | % |
| | | | | | | | | | | | | | | | | | | | |
Ratios/Supplemental Data | | | | | | | | | | | | | | | | | | | | |
Net assets, end of period (in thousands) | | $ | 1,766 | | | $ | 2,675 | | | $ | 5,792 | | | $ | 5,919 | | | $ | 8,283 | |
| | | | | | | | | | | | | | | | | | | | |
Ratios to average net assets: | | | | | | | | | | | | | | | | | | | | |
Net investment loss | | | (2.77 | %) | | | (2.42 | %) | | | (2.07 | %) | | | (2.31 | %) | | | (2.41 | %) |
Total expenses c | | | 3.41 | % | | | 2.82 | % | | | 2.56 | % | | | 2.79 | % | | | 2.85 | % |
Net expenses d | | | 3.33 | % | | | 2.82 | % | | | 2.55 | % | | | 2.79 | % | | | 2.85 | % |
Net expenses prior to custodian earning credits and net of expense waivers | | | 3.33 | % | | | 2.82 | % | | | 2.56 | % | | | 2.79 | % | | | 2.85 | % |
| | | | | | | | | | | | | | | | | | | | |
Portfolio turnover rate | | | 200 | % | | | 169 | % | | | 145 | % | | | 136 | % | | | 134 | % |
The accompanying notes are an integral part of the financial statements
94
| | |
| Financial Highlights | | Rydex | SGI Equity Fund |
Selected data for each share of capital stock outstanding throughout each year | | Small Cap Growth Series |
| | | | | | | | | | | | | | | | | | | | |
Class C | | 2009 | | | 2008 | | | 2007 | | | 2006 | | | Year Ended
September 30,
2005 | |
Per Share Data | | | | | | | | | | | | | | | | | | | | |
Net asset value, beginning of period | | $ | 10.48 | | | $ | 17.23 | | | $ | 14.64 | | | $ | 14.88 | | | $ | 12.47 | |
| | | | | | | | | | | | | | | | | | | | |
Income (loss) from investment operations: | | | | | | | | | | | | | | | | | | | | |
Net investment loss a | | | (0.22 | ) | | | (0.33 | ) | | | (0.33 | ) | | | (0.35 | ) | | | (0.33 | ) |
Net gain (loss) on securities (realized and unrealized) | | | (0.59 | ) | | | (5.11 | ) | | | 2.92 | | | | 0.11 | | | | 2.74 | |
| | | | | | | | | | | | | | | | | | | | |
Total from investment operations | | | (0.81 | ) | | | (5.44 | ) | | | 2.59 | | | | (0.24 | ) | | | 2.41 | |
| | | | | | | | | | | | | | | | | | | | |
Less distributions: | | | | | | | | | | | | | | | | | | | | |
Distributions from realized gains | | | (0.06 | ) | | | (1.31 | ) | | | – | | | | – | | | | – | |
| | | | | | | | | | | | | | | | | | | | |
Total distributions | | | (0.06 | ) | | | (1.31 | ) | | | – | | | | – | | | | – | |
| | | | | | | | | | | | | | | | | | | | |
Net asset value, end of period | | $ | 9.61 | | | $ | 10.48 | | | $ | 17.23 | | | $ | 14.64 | | | $ | 14.88 | |
| | | | | | | | | | | | | | | | | | | | |
Total Return b | | | (7.51 | %) | | | (33.76 | %) | | | 17.69 | % | | | (1.61 | %) | | | 19.33 | % |
| | | | | | | | | | | | | | | | | | | | |
Ratios/Supplemental Data | | | | | | | | | | | | | | | | | | | | |
Net assets, end of period (in thousands) | | $ | 1,518 | | | $ | 2,318 | | | $ | 3,964 | | | $ | 4,304 | | | $ | 4,420 | |
| | | | | | | | | | | | | | | | | | | | |
Ratios to average net assets: | | | | | | | | | | | | | | | | | | | | |
Net investment loss | | | (2.77 | %) | | | (2.43 | %) | | | (2.07 | %) | | | (2.29 | %) | | | (2.42 | %) |
Total expenses c | | | 3.40 | % | | | 2.83 | % | | | 2.56 | % | | | 2.79 | % | | | 2.85 | % |
Net expenses d | | | 3.32 | % | | | 2.83 | % | | | 2.55 | % | | | 2.79 | % | | | 2.85 | % |
Net expenses prior to custodian earning credits and net of expense waivers | | | 3.33 | % | | | 2.83 | % | | | 2.56 | % | | | 2.79 | % | | | 2.85 | % |
| | | | | | | | | | | | | | | | | | | | |
Portfolio turnover rate | | | 200 | % | | | 169 | % | | | 145 | % | | | 136 | % | | | 134 | % |
| a | Net investment income (loss) was computed using average shares outstanding throughout the period. |
| b | Total return information does not reflect deduction of any sales charges imposed at the time of purchase for Class A shares or upon redemption for Class B and C shares. |
| c | Total expense information reflects expense ratios absent expense reductions by the Investment Manager and custodian earnings credits, as applicable. |
| d | Net expense information reflects the expense ratios after voluntary expense waivers, reimbursements and custodian earnings credits, as applicable. |
The accompanying notes are an integral part of the financial statements
95
This page left blank intentionally.
96
Manager’s Commentary
November 16, 2009
To Our Shareholders:
For the fiscal year ended September 30, 2009, the Rydex|SGI Equity Fund Small Cap Value Series gained 24.15%1. The Series’ benchmark, the Russell 2000 Value index, was down –12.61% during the same period, a difference of nearly 37%. Superior stock selection accounted for the difference in returns.
The development of the Small Cap Value Series was a natural extension of our long-term success with the Mid Cap Value Series. The same portfolio manager and research team manage the Series using the same approach but focusing on small capitalization companies. We seek companies that can increase shareholders’ return on capital and then hold companies over three to five years to capture long-term improvements in profitability. We focus on investing in companies rather than securities and the size of the holding is reflective of our confidence in the opportunity.
Industrials, Materials, Information Technology, and Financials Top Performers
The Series benefited from strong performance across sectors led by industrials, materials, information technology, and financials.
The industrials sector was a large overweight position relative to the benchmark. Additionally, portfolio holdings outperformed with a return of approximately 19% compared to a 14% loss in the Index. McDermott International, Inc., a holding not in the Index, increased around 180% over the period. Other industrials securities contributing to performance included ICF International Inc., Insituform Technologies, Inc., and GeoEye. Inc.
The Series’ best performing sector was materials, which gained approximately 100% over the fiscal year versus a 5% gain for the Index. Louisiana-Pacific Corporation was up more than 200%, as Schweitzer-Mauduit International, Inc. gained nearly 200%, and Clearwater Paper Corporation soared over 300% during the period.
Holdings in the information technology sector increased approximately 70%, well above the 7% gain for the benchmark. On a relative basis, top performers included IXYS Corporation, ANADIGICS, Inc., RF Micro Devices, Inc., and Maxwell Technologies, Inc.
Limiting exposure to certain sectors helped the Series. With a 36% weighting in financials for the Index, a weight of less than one-third of that helped to mitigate losses. In addition, Series
holdings lost around 8% against the 24% drop in the benchmark. Pico Holdings, Inc., which was up over 60%, was the best performer in the Series.
Consumer Discretionary and Utilities Disappoint
With strong performance from nearly every sector in the portfolio, only the consumer discretionary and utilities holdings did not add to positive performance. While the Series had a strong showing from Chico’s FAS, Inc. and BJ’s Restaurants, Inc., it was not enough to overcome the losses generated from Talbots, Inc., Oxford Industries, Inc., and Brown Shoe Company, Inc.
The Series had an even weight in the utilities sector and, overall, was even with the Index. Detracting from performance were allocations to Allete, Inc., Westar Energy, Inc., and Empire District Electric Company.
Market Outlook
While there are indications that the economy may be stabilizing from a macroeconomic standpoint in the third quarter, the economy and markets remain uncertain with contradictory information. We recognize that these are unprecedented times and therefore will require the successful long-term investor to remain focused and disciplined. We intend to do just that.
As with our Large Cap Value and Mid Cap Value Series, the core investment approach and rigorous bottom-up analysis focusing on return on invested capital will continue to be our focus. We will continue to seek the best companies with solid financial statements that will be able to perform well over the next three to five year market cycle.
On behalf of Security Global Investors, I would like to thank you for trusting your funds with us. As always, we continue to do our best to seek the potential available in small capitalization companies.
|
| Sincerely, |
|
| |
James P. Schier Portfolio Manager |
| 1 | Performance figures are based on Class A shares and do not reflect deduction of the sales charges or taxes that a shareholder would pay on distributions or the redemption of shares. Fee waivers and/or reimbursements reduce Series expenses and in the absence of such waivers, the performance quoted would be reduced. |
| | The strategies discussed herein do not assure a profit. The Fund is distributed by Rydex Distributors, Inc. |
97
| | |
| | Rydex | SGI Equity Fund |
| Performance Summary | | Small Cap Value Series |
| September 30, 2009 | | (unaudited) |
PERFORMANCE
Small Cap Value Series vs. Russell 2000 Value Index
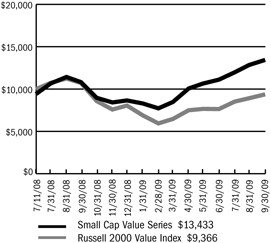
$10,000 Since Inception
This chart assumes a $10,000 investment in Class A shares of Small Cap Value Series on July 11, 2008 (date of inception), reflects deduction of the 5.75% sales load and assumes all dividends reinvested. The chart does not reflect the deduction of taxes that a shareholder would pay on distributions or the redemption of fund shares. The Russell 2000 Value Index is an unmanaged index that measures the performance of securities of small to mid cap U.S. companies with lower price-to-book ratios and lower forecasted growth values.
Average Annual Returns
| | | | | | |
Periods Ended 9-30-09 | | 1 Year | | | Since Inception
(7-11-08) | |
A Shares | | 24.15 | % | | 33.64 | % |
A Shares with Sales Charge | | 17.01 | % | | 27.32 | % |
C Shares | | 23.16 | % | | 32.58 | % |
C Shares with CDSC | | 22.16 | % | | 32.58 | % |
Institutional Class | | 24.40 | % | | 33.96 | % |
The performance data above represents past performance that is not predictive of future results. The investment return and principal value of an investment in the Series will fluctuate so that an investor’s shares, when redeemed, may be worth more or less than their original cost. The figures above do not reflect deduction of the maximum front-end sales charge of 5.75% for Class A shares or the contingent deferred sales charge of 1% for Class C shares, as applicable, except where noted. The figures do not reflect the deduction of taxes that a shareholder would pay on distributions or redemption of shares. Such figures would be lower if the maximum sales charge and any applicable taxes were deducted. Fee waivers and/or reimbursements reduced expenses of the Series and in the absence of such waiver, the performance quoted would be reduced.
Portfolio Composition by Sector as of 9-30-09
| | | |
Consumer Discretionary | | 9.34 | % |
Consumer Staples | | 8.18 | |
Energy | | 12.05 | |
Financials | | 11.79 | |
Health Care | | 4.85 | |
Industrials | | 19.76 | |
Information Technology | | 10.49 | |
Materials | | 9.97 | |
Utilities | | 6.45 | |
Exchange Traded Funds | | 4.81 | |
Cash & Other Assets, Less Liabilities | | 2.31 | |
| | | |
Total Net Assets | | 100.00 | % |
| | | |
The accompanying notes are an integral part of the financial statements
98
| | |
| | Rydex | SGI Equity Fund |
| Performance Summary | | Small Cap Value Series |
September 30, 2009 | | (unaudited) |
Information About Your Series Expenses
Calculating your ongoing Series expenses
Example
As a shareholder of the Series, you incur two types of costs: (1) transaction costs, which may include sales charges (loads) on purchase payments; contingent deferred sales charges on redemptions; and redemption fees, if any; and (2) ongoing costs, including management fees; distribution and/or service fees (12b-1); and other Series expenses. This example is intended to help you understand your ongoing costs (in dollars) of investing in the Series and to compare these costs with ongoing costs of investing in other mutual funds. The example is based on an investment of $1,000 invested at the beginning of the period and held for the entire period April 1, 2009 through September 30, 2009.
Actual Expenses
The first line for each class of shares in the table provides information about actual account values and actual expenses. You may use the information in this table, together with the amount you invested, to estimate the expenses that you paid over the period. Simply divide your account value by $1,000 (for example, an $8,600 account value divided by $1,000 = 8.6), then multiply the result by the number in the table under the heading entitled “Expenses Paid During the Period” to estimate the expenses you paid on your account during this period.
Hypothetical Example for Comparison Purposes
The second line for each class of shares in the table provides information about hypothetical account values and hypothetical expenses based on the Series actual expense ratio and an assumed rate of return of 5% per year before expenses, which is not the Series actual return. The hypothetical account values and expenses may not be used to estimate the actual ending account balance or expenses you paid for the period. You may use this information to compare the ongoing costs of investing in the Series and other funds. To do so, compare this 5% hypothetical example with the 5% hypothetical examples that appear in the shareholder reports of the other mutual funds.
Please note that the expenses shown in the table are meant to highlight your ongoing costs only and do not reflect any transactional costs, such as sales charges (loads) on purchase payments, contingent deferred sales charges on redemptions, and redemption fees, if any. Therefore, the second line for each class of shares is useful in comparing ongoing costs only, and will not help you determine the relative total costs of owning different funds. In addition, if these transactional costs were included, your costs would have been higher.
Series Expenses
| | | | | | | | | |
| | | Beginning
Account
Value
4/1/2009 | | Ending
Account
Value
9/30/2009 1 | | Expenses
Paid
During
Period 2 |
Small Cap Value Series - Class A | | | | | | | | | |
Actual | | $ | 1,000.00 | | $ | 1,585.63 | | $ | 10.05 |
Hypothetical | | | 1,000.00 | | | 1,017.30 | | | 7.84 |
Small Cap Value Series - Class C | | | | | | | | | |
Actual | | | 1,000.00 | | | 1,579.52 | | | 14.87 |
Hypothetical | | | 1,000.00 | | | 1,013.54 | | | 11.61 |
Small Cap Value Series - Institutional Class | | | | | | | | | |
Actual | | | 1,000.00 | | | 1,588.52 | | | 8.44 |
Hypothetical | | | 1,000.00 | | | 1,018.55 | | | 6.58 |
| 1 | The actual ending account value is based on the actual total return of the Series for the period April 1, 2009 to September 30, 2009 after actual expenses and will differ from the hypothetical ending account value which is based on the Series expense ratio and a hypothetical annual return of 5% before expenses. The actual cumulative return at net asset value for the period April 1, 2009 to September 30, 2009 was 58.56%, 57.95% and 58.85%, for Class A, C and Institutional Class shares, respectively. |
| 2 | Expenses are equal to the Series annualized expense ratio (1.55%, 2.30% and 1.30% for Class A, C and Institutional Class shares, respectively), net of any applicable fee waivers, multiplied by the average account value over the period, multiplied by 183/365 (to reflect the one-half year period). |
99
| | |
| Schedule of Investments | | Rydex | SGI Equity Fund |
| September 30, 2009 | | Small Cap Value Series |
| | | | | |
| | | Shares | | Value |
COMMON STOCKS - 97.7% | | | | | |
Aerospace & Defense - 4.0% | | | | | |
Ceradyne, Inc.* | | 1,000 | | $ | 18,330 |
GeoEye, Inc.* | | 4,000 | | | 107,200 |
Orbital Sciences Corporation* | | 3,581 | | | 53,608 |
| | | | | |
| | | | | 179,138 |
| | | | | |
Apparel Retail - 2.9% | | | | | |
Brown Shoe Company, Inc. | | 5,700 | | | 45,714 |
Chico’s FAS, Inc. 1,* | | 5,700 | | | 74,099 |
Talbots, Inc. | | 1,473 | | | 13,596 |
| | | | | |
| | | | | 133,409 |
| | | | | |
Apparel, Accessories & Luxury Goods - 2.2% | | | | | |
Fossil, Inc. 1,* | | 800 | | | 22,760 |
Maidenform Brands, Inc.* | | 5,000 | | | 80,300 |
| | | | | |
| | | | | 103,060 |
| | | | | |
Asset Management & Custody Banks - 1.5% | | | | | |
Fifth Street Finance Corporation | | 6,324 | | | 69,121 |
| | | | | |
Biotechnology - 0.1% | | | | | |
Combinatorx, Inc.* | | 2,392 | | | 3,349 |
| | | | | |
Building Products - 1.0% | | | | | |
Trex Company, Inc.* | | 2,500 | | | 45,500 |
| | | | | |
Coal & Consumable Fuels - 1.1% | | | | | |
Evergreen Energy, Inc.* | | 40,900 | | | 25,358 |
USEC, Inc. 1,* | | 5,500 | | | 25,795 |
| | | | | |
| | | | | 51,153 |
| | | | | |
Communications Equipment - 0.8% | | | | | |
Symmetricom, Inc. 2,* | | 7,500 | | | 38,850 |
| | | | | |
Computer & Electronics Retail - 0.9% | | | | | |
Conn’s, Inc.* | | 3,800 | | | 42,902 |
| | | | | |
Computer Hardware - 0.2% | | | | | |
Silicon Graphics International Corporation * | | 1,706 | | | 11,447 |
| | | | | |
Computer Storage & Peripherals - 1.5% | | | | | |
Adaptec, Inc.* | | 19,900 | | | 66,466 |
| | | | | |
Construction & Engineering - 2.3% | | | | | |
Insituform Technologies, Inc.* | | 5,500 | | | 105,270 |
| | | | | |
Construction & Farm Machinery & Heavy Trucks - 1.4% | | | | | |
Force Protection, Inc.* | | 11,800 | | | 64,428 |
| | | | | |
Construction Materials - 0.5% | | | | | |
Eagle Materials, Inc. 1 | | 822 | | | 23,493 |
| | | | | |
Consumer Finance - 0.3% | | | | | |
First Marblehead Corporation * | | 5,520 | | | 12,144 |
| | | | | |
Electric Utilities - 3.2% | | | | | |
Allete, Inc. 1 | | 1,904 | | | 63,917 |
Empire District Electric Company | | 2,400 | | | 43,416 |
| | | | | |
| | | Shares | | Value |
COMMON STOCKS - 97.7% (continued) | | | | | |
Electric Utilities - 3.2% (continued) | | | | | |
Westar Energy, Inc. | | 2,300 | | $ | 44,873 |
| | | | | |
| | | | | 152,206 |
| | | | | |
Electrical Components & Equipment - 2.3% | | | | | |
LaBarge, Inc.* | | 4,200 | | | 47,250 |
Power-One, Inc. 2,* | | 12,700 | | | 24,765 |
UQM Technologies, Inc.* | | 5,500 | | | 31,625 |
| | | | | |
| | | | | 103,640 |
| | | | | |
Electronic Manufacturing Services - 3.2% | | | | | |
Maxwell Technologies, Inc.* | | 5,700 | | | 105,051 |
Methode Electronics, Inc. | | 4,474 | | | 38,790 |
| | | | | |
| | | | | 143,841 |
| | | | | |
Exchange Traded Funds - 4.8% | | | | | |
iShares Russell 2000 Value Index Fund | | 3,900 | | | 220,467 |
| | | | | |
Food Retail - 1.7% | | | | | |
Winn-Dixie Stores, Inc.* | | 6,000 | | | 78,720 |
| | | | | |
Forest Products - 2.8% | | | | | |
Louisiana-Pacific Corporation 1,* | | 19,300 | | | 128,731 |
| | | | | |
Gas Utilities - 1.5% | | | | | |
Atmos Energy Corporation 1 | | 2,400 | | | 67,632 |
| | | | | |
Health Care Equipment - 0.9% | | | | | |
Aspect Medical Systems, Inc.* | | 3,400 | | | 40,732 |
| | | | | |
Health Care Services - 3.8% | | | | | |
Amedisys, Inc.* | | 550 | | | 23,997 |
Mednax, Inc.* | | 1,500 | | | 82,379 |
Providence Service Corporation * | | 2,435 | | | 28,392 |
RehabCare Group, Inc.* | | 2,000 | | | 43,380 |
| | | | | |
| | | | | 178,148 |
| | | | | |
Highways & Railtracks - 0.2% | | | | | |
Quixote Corporation 2 | | 3,500 | | | 8,715 |
| | | | | |
Human Resources & Employment Services - 0.7% | | | | | |
Administaff, Inc. | | 1,200 | | | 31,524 |
| | | | | |
Industrial Conglomerates - 1.5% | | | | | |
McDermott International, Inc. 1,* | | 2,700 | | | 68,229 |
| | | | | |
Industrial Machinery - 1.0% | | | | | |
Flow International Corporation* | | 17,822 | | | 46,159 |
| | | | | |
Insurance Brokers - 0.2% | | | | | |
Arthur J Gallagher & Company | | 350 | | | 8,530 |
| | | | | |
IT Consulting & Other Services - 2.7% | | | | | |
CACI International, Inc.* | | 1,700 | | | 80,359 |
Satyam Computer Services, Ltd. ADR | | 6,478 | | | 42,625 |
| | | | | |
| | | | | 122,984 |
| | | | | |
The accompanying notes are an integral part of the financial statements
100
| | |
| Schedule of Investments | | Rydex | SGI Equity Fund |
| September 30, 2009 | | Small Cap Value Series |
| | | | | |
| | | Shares | | Value |
COMMON STOCKS - 97.7% (continued) | | | | | |
Mortgage REIT’s - 0.4% | | | | | |
Redwood Trust, Inc. | | 1,300 | | $ | 20,150 |
| | | | | |
Multi-Line Insurance - 1.6% | | | | | |
Horace Mann Educators Corporation | | 5,100 | | | 71,247 |
| | | | | |
Multi-Sector Holdings - 0.8% | | | | | |
Pico Holdings, Inc. 1,* | | 1,100 | | | 36,685 |
| | | | | |
Multi-Utilities - 1.7% | | | | | |
NorthWestern Corporation | | 3,100 | | | 75,733 |
| | | | | |
Office Services & Supplies - 0.2% | | | | | |
United Stationers, Inc.* | | 231 | | | 10,998 |
| | | | | |
Oil & Gas Drilling - 0.7% | | | | | |
Vantage Drilling Company * | | 17,300 | | | 31,659 |
| | | | | |
Oil & Gas Equipment & Services - 4.0% | | | | | |
Global Industries, Ltd.* | | 13,352 | | | 126,843 |
Tesco Corporation* | | 7,400 | | | 59,052 |
| | | | | |
| | | | | 185,895 |
| | | | | |
Oil & Gas Exploration & Production - 3.7% | | | | | |
GMX Resources, Inc.* | | 3,300 | | | 51,843 |
Goodrich Petroleum Corporation* | | 2,554 | | | 65,919 |
Gulfport Energy Corporation* | | 2,700 | | | 23,598 |
PetroHawk Energy Corporation* | | 1,100 | | | 26,631 |
| | | | | |
| | | | | 167,991 |
| | | | | |
Oil & Gas Storage & Transportation - 2.5% | | | | | |
Southern Union Company | | 5,550 | | | 115,385 |
| | | | | |
Packaged Foods & Meats - 4.7% | | | | | |
Del Monte Foods Company | | 8,100 | | | 93,798 |
Smart Balance, Inc.* | | 6,600 | | | 40,524 |
TreeHouse Foods, Inc. 1,* | | 2,200 | | | 78,474 |
| | | | | |
| | | | | 212,796 |
| | | | | |
Paper Packaging - 1.4% | | | | | |
Bemis Company, Inc. 1 | | 2,400 | | | 62,184 |
| | | | | |
Paper Products - 2.3% | | | | | |
Clearwater Paper Corporation 1,* | | 800 | | | 33,064 |
Schweitzer-Mauduit International, Inc. | | 1,300 | | | 70,668 |
| | | | | |
| | | | | 103,732 |
| | | | | |
Personal Products - 1.8% | | | | | |
Elizabeth Arden, Inc.* | | 7,100 | | | 83,567 |
| | | | | |
Property & Casualty Insurance - 3.3% | | | | | |
Employers Holdings, Inc. | | 2,800 | | | 43,344 |
Hanover Insurance Group, Inc. | | 2,600 | | | 107,458 |
| | | | | |
| | | | | 150,802 |
| | | | | |
Regional Banks - 3.7% | | | | | |
Associated Banc-Corporation | | 3,038 | | | 34,694 |
Bancfirst Corporation | | 600 | | | 22,158 |
Commerce Bancshares, Inc. 1 | | 1,220 | | | 45,433 |
Heritage Financial Corporation | | 1,213 | | | 15,951 |
| | | | | |
| | | Shares | | Value |
COMMON STOCKS - 97.7% (continued) | | | | | |
Regional Banks - 3.7% (continued) | | | | | |
Old National Bancorp | | 4,789 | | $ | 53,636 |
| | | | | |
| | | | | 171,872 |
| | | | | |
Research & Consulting Services - 3.7% | | | | | |
ICF International, Inc.* | | 2,500 | | | 75,800 |
Navigant Consulting, Inc.* | | 5,000 | | | 67,500 |
School Specialty, Inc.* | | 1,000 | | | 23,720 |
| | | | | |
| | | | | 167,020 |
| | | | | |
Restaurants - 1.4% | | | | | |
Burger King Holdings, Inc. | | 3,630 | | | 63,852 |
| | | | | |
Semiconductors - 2.1% | | | | | |
IXYS Corporation 2 | | 9,300 | | | 79,143 |
Supertex, Inc.* | | 600 | | | 18,000 |
| | | | | |
| | | | | 97,143 |
| | | | | |
Specialty Chemicals - 3.0% | | | | | |
Landec Corporation* | | 10,900 | | | 69,760 |
Zoltek Companies, Inc.* | | 6,600 | | | 69,300 |
| | | | | |
| | | | | 139,060 |
| | | | | |
Specialty Stores - 1.9% | | | | | |
Cabela’s, Inc.* | | 6,378 | | | 85,083 |
| | | | | |
Trucking - 1.6% | | | | | |
Saia, Inc.* | | 4,100 | | | 65,928 |
Universal Truckload Services, Inc. | | 550 | | | 9,081 |
| | | | | |
| | | | | 75,009 |
| | | | | |
TOTAL COMMON STOCKS (cost $3,760,580) | | | | $ | 4,477,851 |
Total Investments - 97.7% 3 (cost $3,760,580) | | | | $ | 4,477,851 |
| | | | | |
Cash & Other Assets, Less Liabilities - 2.3% | | | | | 105,837 |
| | | | | |
Total Net Assets - 100.0% | | | | $ | 4,583,688 |
| | | | | |
For federal income tax purposes the identified cost of investments owned at September 30, 2009 was $3,763,318.
| ADR | American Depositary Receipt |
| * | Non-income producing security |
| 1 | Security is segregated as collateral for open written option contracts. |
| 2 | Security is deemed illiquid. The total market value of illiquid securities is $151,473 (cost $148,314), or 3.3% of total net assets. |
| 3 | Unless otherwise indicated, the values of the securities of the Portfolio are determined based on Level 1 inputs established by ASC 820. |
The accompanying notes are an integral part of the financial statements
101
Rydex | SGI Equity Fund
Small Cap Value Series
Statement of Assets and Liabilities
September 30, 2009
| | | |
Assets: | | | |
Investments, at value* | | $ | 4,477,851 |
Cash | | | 103,179 |
Receivables: | | | |
Fund shares sold | | | 65,117 |
Securities sold | | | 50,849 |
Dividends | | | 2,226 |
Security Investors | | | 3,231 |
Prepaid expenses | | | 15,910 |
| | | |
Total assets | | | 4,718,363 |
| | | |
Liabilities: | | | |
Payable for: | | | |
Securities purchased | | | 102,933 |
Fund shares redeemed | | | 11 |
Written options, at value (premiums received, $20,226) | | | 16,535 |
Management fees | | | 3,393 |
Custodian fees | | | 495 |
Transfer agent/maintenance fees | | | 503 |
Administration fees | | | 682 |
Professional fees | | | 7,400 |
12b-1 distribution plan fees | | | 1,126 |
Directors’ fees | | | 197 |
Other | | | 1,400 |
| | | |
Total liabilities | | | 134,675 |
| | | |
Net assets | | $ | 4,583,688 |
| | | |
Net assets consist of: | | | |
Paid in capital | | $ | 3,726,616 |
Undistributed net realized gain on sale of investments | | | 136,110 |
Net unrealized appreciation in value of investments | | | 720,962 |
| | | |
Net assets | | $ | 4,583,688 |
| | | |
Class A: | | | |
Capital shares outstanding (unlimited number of shares authorized) | | | 245,181 |
Net assets | | $ | 3,244,986 |
Net asset value and redemption price per share | | $ | 13.24 |
| | | |
Maximum offering price per share (net asset value divided by 94.25%) | | $ | 14.05 |
| | | |
Class C: | | | |
Capital shares outstanding (unlimited number of shares authorized) | | | 54,083 |
Net assets | | $ | 708,923 |
Net asset value, offering and redemption price per share (excluding any applicable contingent deferred sales charge) | | $ | 13.11 |
| | | |
Institutional Class: | | | |
Capital shares outstanding (unlimited number of shares authorized) | | | 47,431 |
Net assets | | $ | 629,779 |
Net asset value, offering and redemption price per share (excluding any applicable contingent deferred sales charge) | | $ | 13.28 |
| | | |
* Investments, at cost | | $ | 3,760,580 |
Statement of Operations
For the Year Ended September 30, 2009
| | | | |
Investment Income: | | | | |
Dividends | | $ | 20,650 | |
Interest | | | 211 | |
| | | | |
Total investment income | | | 20,861 | |
| | | | |
Expenses: | | | | |
Management fees | | | 18,673 | |
Transfer agent/maintenance fees | | | 2,723 | |
Administration fees | | | 2,573 | |
Custodian fees | | | 1,115 | |
Directors’ fees | | | 293 | |
Professional fees | | | 12,292 | |
Reports to shareholders | | | 1,341 | |
Registration fees | | | 51,305 | |
Other expenses | | | 2,840 | |
12b-1 distribution fees - Class A | | | 2,693 | |
12b-1 distribution fees - Class C | | | 4,272 | |
| | | | |
Total expenses | | | 100,120 | |
Less: | | | | |
Reimbursement of expenses - Class A | | | (36,326 | ) |
Reimbursement of expenses - Class C | | | (17,505 | ) |
Reimbursement of expenses - Institutional Class | | | (15,036 | ) |
| | | | |
Net expenses | | | 31,253 | |
| | | | |
Net investment loss | | | (10,392 | ) |
| | | | |
Net Realized and Unrealized Gain (Loss): | | | | |
Net realized gain (loss) during the year on: | | | | |
Investments | | | 146,791 | |
Options written | | | 4,332 | |
| | | | |
Net realized gain | | | 151,123 | |
| | | | |
Net unrealized appreciation (depreciation) during the year on: | | | | |
Investments | | | 650,801 | |
Options written | | | 3,538 | |
| | | | |
Net unrealized appreciation | | | 654,339 | |
| | | | |
Net realized and unrealized gain | | | 805,462 | |
| | | | |
Net increase in net assets resulting from operations | | $ | 795,070 | |
| | | | |
The accompanying notes are an integral part of the financial statements
102
| | |
| | Rydex | SGI Equity Fund |
| Statement of Changes in Net Assets | | Small Cap Value Series |
| | | | | | | | |
| | | Year Ended
September 30,
2009 | | | Period Ended
September 30,
2008* | |
Increase (decrease) in net assets from operations: | | | | | | | | |
Net investment loss | | $ | (10,392 | ) | | $ | (895 | ) |
Net realized gain during the year on investments | | | 151,123 | | | | 81,197 | |
Net unrealized appreciation during the year on investments | | | 654,339 | | | | 66,623 | |
| | | | | | | | |
Net increase in net assets resulting from operations | | | 795,070 | | | | 146,925 | |
| | | | | | | | |
Distributions to shareholders from: | | | | | | | | |
Net realized gain | | | | | | | | |
Class A | | | (37,409 | ) | | | — | |
Class C | | | (26,547 | ) | | | — | |
Institutional Class | | | (20,967 | ) | | | — | |
| | | | | | | | |
Total distributions to shareholders | | | (84,923 | ) | | | — | |
| | | | | | | | |
Capital share transactions: | | | | | | | | |
Proceeds from sale of shares | | | | | | | | |
Class A | | | 2,415,545 | | | | 350,960 | |
Class C | | | 242,210 | | | | 343,156 | |
Institutional Class | | | 144,125 | | | | 333,333 | |
Distributions reinvested | | | | | | | | |
Class A | | | 37,409 | | | | — | |
Class C | | | 26,547 | | | | — | |
Institutional Class | | | 20,967 | | | | — | |
Cost of shares redeemed | | | | | | | | |
Class A | | | (126,867 | ) | | | — | |
Class C | | | (59,944 | ) | | | (485 | ) |
Institutional Class | | | (340 | ) | | | — | |
| | | | | | | | |
Net increase from capital share transactions | | | 2,699,652 | | | | 1,026,964 | |
| | | | | | | | |
Net increase in net assets | | | 3,409,799 | | | | 1,173,889 | |
| | | | | | | | |
Net assets: | | | | | | | | |
Beginning of year | | | 1,173,889 | | | | — | |
| | | | | | | | |
End of year | | $ | 4,583,688 | | | $ | 1,173,889 | |
| | | | | | | | |
Accumulated net investment income at end of year | | $ | — | | | $ | — | |
| | | | | | | | |
Capital share activity: | | | | | | | | |
Shares sold | | | | | | | | |
Class A | | | 216,245 | | | | 34,804 | |
Class C | | | 23,833 | | | | 34,174 | |
Institutional Class | | | 11,584 | | | | 33,333 | |
Shares reinvested | | | | | | | | |
Class A | | | 4,545 | | | | — | |
Class C | | | 3,234 | | | | — | |
Institutional Class | | | 2,545 | | | | — | |
Shares redeemed | | | | | | | | |
Class A | | | (10,413 | ) | | | — | |
Class C | | | (7,117 | ) | | | (41 | ) |
Institutional Class | | | (31 | ) | | | — | |
| * | For the period July 11, 2008 (commencement of operations) to September 30, 2008. |
The accompanying notes are an integral part of the financial statements
103
| | |
| Financial Highlights | | Rydex | SGI Equity Fund |
Selected data for each share of capital stock outstanding throughout each year | | Small Cap Value Series |
| | | | | | | | |
Class A | | Year Ended
September 30,
2009 | | | Period Ended
September 30,
2008a | |
Per Share Data | | | | | | | | |
Net asset value, beginning of period | | $ | 11.48 | | | $ | 10.00 | |
| | | | | | | | |
Income (loss) from investment operations: | | | | | | | | |
Net investment loss b | | | (0.05 | ) | | | — | |
Net gain on securities (realized and unrealized) | | | 2.44 | | | | 1.48 | |
| | | | | | | | |
Total from investment operations | | | 2.39 | | | | 1.48 | |
| | | | | | | | |
Less distributions: | | | | | | | | |
Distributions from realized gains | | | (0.63 | ) | | | — | |
| | | | | | | | |
Total distributions | | | (0.63 | ) | | | — | |
| | | | | | | | |
Net asset value, end of period | | $ | 13.24 | | | $ | 11.48 | |
| | | | | | | | |
Total Return c | | | 24.15 | % | | | 14.80 | % |
| | | | | | | | |
Ratios/Supplemental Data | | | | | | | | |
Net assets, end of period (in thousands) | | $ | 3,245 | | | $ | 400 | |
| | | | | | | | |
Ratios to average net assets: | | | | | | | | |
Net investment loss | | | (0.46 | %) | | | (0.19 | %) |
Total expenses d | | | 4.92 | % | | | 6.10 | % |
Net expenses e | | | 1.55 | % | | | 1.55 | % |
Net expenses prior to custodian earning credits and net of expense waivers | | | 1.55 | % | | | 1.55 | % |
| | | | | | | | |
Portfolio turnover rate | | | 58 | % | | | 86 | % |
| | | | | | | | |
Class C | | Year Ended
September 30,
2009 | | | Period Ended
September 30,
2008a | |
Per Share Data | | | | | | | | |
Net asset value, beginning of period | | $ | 11.46 | | | $ | 10.00 | |
| | | | | | | | |
Income (loss) from investment operations: | | | | | | | | |
Net investment loss b | | | (0.11 | ) | | | (0.02 | ) |
Net gain on securities (realized and unrealized) | | | 2.39 | | | | 1.48 | |
| | | | | | | | |
Total from investment operations | | | 2.28 | | | | 1.46 | |
| | | | | | | | |
Less distributions: | | | | | | | | |
Distributions from realized gains | | | (0.63 | ) | | | — | |
| | | | | | | | |
Total distributions | | | (0.63 | ) | | | — | |
| | | | | | | | |
Net asset value, end of period | | $ | 13.11 | | | $ | 11.46 | |
| | | | | | | | |
Total Return c | | | 23.16 | % | | | 14.60 | % |
| | | | | | | | |
Ratios/Supplemental Data | | | | | | | | |
Net assets, end of period (in thousands) | | $ | 709 | | | $ | 391 | |
| | | | | | | | |
Ratios to average net assets: | | | | | | | | |
Net investment loss | | | (1.15 | %) | | | (0.94 | %) |
Total expenses d | | | 6.40 | % | | | 6.88 | % |
Net expenses e | | | 2.30 | % | | | 2.30 | % |
Net expenses prior to custodian earning credits and net of expense waivers | | | 2.30 | % | | | 2.30 | % |
| | | | | | | | |
Portfolio turnover rate | | | 58 | % | | | 86 | % |
The accompanying notes are an integral part of the financial statements
104
| | |
| Financial Highlights | | Rydex | SGI Equity Fund |
Selected data for each share of capital stock outstanding throughout each year | | Small Cap Value Series |
| | | | | | | | |
Institutional Class | | Year Ended
September 30,
2009 | | | Period Ended
September 30,
2008a | |
Per Share Data | | | | | | | | |
Net asset value, beginning of period | | $ | 11.49 | | | $ | 10.00 | |
| | | | | | | | |
Income (loss) from investment operations: | | | | | | | | |
Net investment loss b | | | (0.01 | ) | | | — | |
Net gain on securities (realized and unrealized) | | | 2.43 | | | | 1.49 | |
| | | | | | | | |
Total from investment operations | | | 2.42 | | | | 1.49 | |
| | | | | | | | |
Less distributions: | | | | | | | | |
Distributions from realized gains | | | (0.63 | ) | | | — | |
| | | | | | | | |
Total distributions | | | (0.63 | ) | | | — | |
| | | | | | | | |
Net asset value, end of period | | $ | 13.28 | | | $ | 11.49 | |
| | | | | | | | |
Total Return c | | | 24.40 | % | | | 14.90 | % |
| | | | | | | | |
Ratios/Supplemental Data | | | | | | | | |
Net assets, end of period (in thousands) | | $ | 630 | | | $ | 383 | |
| | | | | | | | |
Ratios to average net assets: | | | | | | | | |
Net investment income (loss) | | | (0.14 | %) | | | 0.06 | % |
Total expenses d | | | 5.44 | % | | | 5.90 | % |
Net expenses e | | | 1.30 | % | | | 1.30 | % |
Net expenses prior to custodian earning credits and net of expense waivers | | | 1.30 | % | | | 1.30 | % |
| | | | | | | | |
Portfolio turnover rate | | | 58 | % | | | 86 | % |
| a | Security Small Cap Value Series was initially capitalized on July 11, 2008 with a net asset value of $10 per share. Percentage amounts for the period, except total return have been annualized. |
| b | Net investment income (loss) was computed using average shares outstanding throughout the period. |
| c | Total return information does not reflect deduction of any sales charges imposed at the time of purchase for Class A shares or upon redemption for Class C shares. |
| d | Total expense information reflects expense ratios absent expense reductions by the Investment Manager and custodian earnings credits, as applicable. |
| e | Net expense information reflects the expense ratios after voluntary expense waivers, reimbursements and custodian earnings credits, as applicable. |
The accompanying notes are an integral part of the financial statements
105
This page left blank intentionally.
106
Manager’s Commentary
November 16, 2009
To Our Shareholders:
The Rydex|SGI Large Cap Value Fund returned –5.59%1 in the period, outperforming the benchmark Russell 1000 Value Index’s return of –10.62% and the Fund’s peer group median return of –7.42%. Security selection was the determining factor in overall performance in fiscal year ending September 30, 2009.
Our strategy is to buy companies that are trading at a significant discount to their intrinsic value. Our investment approach is a defined and disciplined process of three clear philosophical tenets that drive our investment decisions: a valuation focus, a long-term perspective and an opportunistic approach.
This investment process is fundamentally driven and quantitatively aided. We use proprietary screens to identify potential companies for investment and then perform rigorous fundamental analysis to identify the best ideas. Through this fundamental research, we determine an estimate of intrinsic value and thus a valuation target for each idea. We construct the portfolios based on the level of conviction generated by this bottom-up analysis and the upside/downside profile associated with each company.
Health Care, Industrials, and Consumer Discretionary Top Performers
In aggregate, the health care sector accounted for nearly all the Fund’s excess performance. While it was a slightly underweight position, holdings in the portfolio gained over 20% compared to a 2% loss for the Index. Leading the way were significant positions in Schering-Plough Corporation (up more than 50%), Medco Health Solutions, Inc., and Hospira, Inc.
The Fund had a large overweight position in industrials, 22% to 9%, and was able to hold losses to approximately 10% compared to a 20% decline for the Index. McDermott International, Inc. lost just 1% allowing it to add value on a relative basis. An underweight position in General Electric Company helped performance, as did a more than 20% return on holding Parker Hannifin Corporation.
The consumer discretionary sector was positioned as an even weight but produced a positive return of about 4% versus a 2% loss in the Index. Top contributors to the Fund were J.C. Penney Company, Inc. and Time Warner, Inc., both of which were substantial holdings during the period.
Financials, Energy, and Information Technology Disappoint
Even as an underweight position, the financials sector made up 18% of total assets. Fund holdings declined more than 20%, several percentage points more than the loss for the Index. The largest detractor was Capital One Financial Corporation, which declined over 80%. Berkshire Hathaway, Inc., (Cl A), with an average period weight of more than 5%, lost over 20%. JPMorgan Chase & Company and Wells Fargo & Company also dragged down portfolio performance in the sector.
The Fund had a 14% weight in energy, still an underweight position, but holdings dropped approximately 15% compared to an 11% loss for the Index. Exxon Mobil Corporation, Williams Companies, Inc. and Chevron Corporation negatively contributed to Fund performance.
The Fund was slightly overweight information technology but holdings declined about 4% against a rise of 9% for the benchmark. A retreat of more than 15% in Tyco Electronics, Ltd. pulled down performance in the sector.
Market Outlook
With many industries going through a process of business and capacity rationalization in a lower demand environment, financial flexibility provides an advantage to those companies that have opportunities to gain market share or acquire desirable assets from disadvantaged competitors.
Our bottom-up approach views opportunity in the context of the potential long-term impact on individual companies. Our focus is on applying a bottom-up approach to identifying individual companies with the ability to be substantially better and have a positive impact on the portfolio over the next three to five years. We remain confident in our ability to uncover these companies.
Current markets reinforce that investing is a long-term pursuit that requires patience and a consistent approach. We recognize there are many investment fund alternatives available today and thank you for your business and the confidence you place in us.
|
| Sincerely, |
|
| |
Mark A. Mitchell Portfolio Manager |
| 1 | Performance figures are based on Class A shares and do not reflect deduction of the sales charges or taxes that a shareholder would pay on distributions or the redemption of shares. Fee waivers and/or reimbursements reduce Series expenses and in the absence of such waivers, the performance quoted would be reduced. |
| | The strategies discussed herein do not assure a profit. The Fund is distributed by Rydex Distributors, Inc. |
107
| | |
| | Rydex | SGI |
| Performance Summary | | Large Cap Value Fund |
September 30, 2009 | | (unaudited) |
PERFORMANCE
Large Cap Value Fund vs. Russell 1000 Value Index
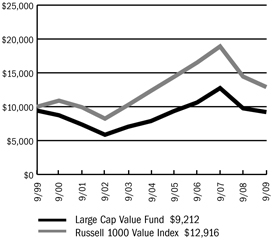
$10,000 Over Ten Years
This chart assumes a $10,000 investment in Class A shares of Large Cap Value Fund on September 30, 1999, reflects deduction of the 5.75% sales load and assumes all dividends reinvested. The chart does not reflect the deduction of taxes that a shareholder would pay on distributions or the redemption of fund shares. The Russell 1000 Value Index is an unmanaged index representing the performance of those Russell 1000 Index companies with lower price-to-book ratios and lower forecasted growth values.
Average Annual Returns
| | | | | | | | | |
Periods Ended 9-30-09 | | 1 Year | | | 5 Years | | | 10 Years | |
A Shares | | (5.59 | %) | | 3.17 | % | | (0.22 | %) |
A Shares with sales charge | | (11.02 | %) | | 1.95 | % | | (0.82 | %) |
B Shares | | (5.91 | %) | | 2.68 | % | | (0.89 | %) |
B Shares with CDSC | | (10.50 | %) | | 2.31 | % | | (0.89 | %) |
C Shares | | (6.80 | %) | | 2.25 | % | | (1.08 | %) |
C Shares with CDSC | | (7.72 | %) | | 2.25 | % | | (1.08 | %) |
The performance data above represents past performance that is not predictive of future results. The investment return and principal value of an investment in the Fund will fluctuate so that an investor’s shares, when redeemed, may be worth more or less than their original cost. The figures above do not reflect deduction of the maximum front-end sales charge of 5.75% for Class A shares or the contingent deferred sales charge of 5% for Class B shares and 1% for Class C shares, as applicable, except where noted. The figures do not reflect the deduction of taxes that a shareholder would pay on distributions or redemption of Fund shares. Such figures would be lower if the maximum sales charge and any applicable taxes were deducted. Fee waivers and/or reimbursements reduced expenses of the Fund and in the absence of such waiver, the performance quoted would be reduced.
Portfolio Composition by Sector as of 9-30-09
| | | |
Consumer Discretionary | | 8.03 | % |
Consumer Staples | | 9.71 | |
Energy | | 14.20 | |
Financials | | 15.40 | |
Health Care | | 9.23 | |
Industrials | | 22.87 | |
Information Technology | | 10.13 | |
Materials | | 1.38 | |
Telecommunication Services | | 1.03 | |
Utilities | | 5.20 | |
Cash & Other Assets, Less Liabilities | | 2.82 | |
| | | |
Total Net Assets | | 100.00 | % |
| | | |
The accompanying notes are an integral part of the financial statements
108
| | |
| | Rydex | SGI |
| Performance Summary | | Large Cap Value Fund |
September 30, 2009 | | (unaudited) |
Information About Your Fund’s Expenses
Calculating your ongoing Fund expenses
Example
As a shareholder of the Fund, you incur two types of costs: (1) transaction costs, which may include sales charges (loads) on purchase payments; contingent deferred sales charges on redemptions; and redemption fees, if any; and (2) ongoing costs, including management fees; distribution and/or service fees (12b-1); and other Fund expenses. This example is intended to help you understand your ongoing costs (in dollars) of investing in the Series and to compare these costs with ongoing costs of investing in other mutual funds. The example is based on an investment of $1,000 invested at the beginning of the period and held for the entire period April 1, 2009 through September 30, 2009.
Actual Expenses
The first line for each class of shares in the table provides information about actual account values and actual expenses. You may use the information in this table, together with the amount you invested, to estimate the expenses that you paid over the period. Simply divide your account value by $1,000 (for example, an $8,600 account value divided by $1,000 = 8.6), then multiply the result by the number in the table under the heading entitled “Expenses Paid During the Period” to estimate the expenses you paid on your account during this period.
Hypothetical Example for Comparison Purposes
The second line for each class of shares in the table provides information about hypothetical account values and hypothetical expenses based on the Fund’s actual expense ratio and an assumed rate of return of 5% per year before expenses, which is not the Fund’s actual return. The hypothetical account values and expenses may not be used to estimate the actual ending account balance or expenses you paid for the period. You may use this information to compare the ongoing costs of investing in the Fund and other funds. To do so, compare this 5% hypothetical example with the 5% hypothetical examples that appear in the shareholder reports of the other mutual funds.
Please note that the expenses shown in the table are meant to highlight your ongoing costs only and do not reflect any transactional costs, such as sales charges (loads) on purchase payments, contingent deferred sales charges on redemptions, and redemption fees, if any. Therefore, the second line for each class of shares is useful in comparing ongoing costs only, and will not help you determine the relative total costs of owning different funds. In addition, if these transactional costs were included, your costs would have been higher.
Fund Expenses
| | | | | | | | | |
| | | Beginning
Account
Value
4/1/2009 | | Ending
Account
Value
9/30/2009 1 | | Expenses
Paid
During
Period 2 |
Large Cap Value | | | | | | | | | |
Fund - Class A | | | | | | | | | |
Actual | | $ | 1,000.00 | | $ | 1,406.32 | | $ | 7.54 |
Hypothetical | | | 1,000.00 | | | 1,018.80 | | | 6.33 |
Large Cap Value | | | | | | | | | |
Fund - Class B | | | | | | | | | |
Actual | | | 1,000.00 | | | 1,406.33 | | | 6.03 |
Hypothetical | | | 1,000.00 | | | 1,020.05 | | | 5.06 |
Large Cap Value | | | | | | | | | |
Fund - Class C | | | | | | | | | |
Actual | | | 1,000.00 | | | 1,400.95 | | | 12.04 |
Hypothetical | | | 1,000.00 | | | 1,015.04 | | | 10.10 |
| 1 | The actual ending account value is based on the actual total return of the Fund for the period April 1, 2009 to September 30, 2009 after actual expenses and will differ from the hypothetical ending account value which is based on the Fund expense ratio and a hypothetical annual return of 5% before expenses. The actual cumulative return at net asset value for the period April 1, 2009 to September 30, 2009 was 40.63%, 40.63% and 40.10%, for Class A, B and C shares, respectively. |
| 2 | Expenses are equal to the Fund annualized expense ratio (1.25%, 1.00% and 2.00% for Class A, B, and C shares, respectively), net of any applicable fee waivers, multiplied by the average account value over the period, multiplied by 183/365 (to reflect the one-half year period). |
109
| | |
| Schedule of Investments | | Rydex | SGI |
| September 30, 2009 | | Large Cap Value Fund |
| | | | | |
| | | Shares | | Value |
COMMON STOCKS - 97.2% | | | | | |
Aerospace & Defense - 2.7% | | | | | |
Precision Castparts Corporation | | 692 | | $ | 70,494 |
United Technologies Corporation | | 19,300 | | | 1,175,949 |
| | | | | |
| | | | | 1,246,443 |
| | | | | |
Air Freight & Logistics - 3.6% | | | | | |
FedEx Corporation | | 22,200 | | | 1,669,884 |
| | | | | |
Asset Management & Custody Banks - 0.2% | | | | | |
Bank of New York Mellon Corporation | | 2,800 | | | 81,172 |
| | | | | |
Building Products - 3.0% | | | | | |
USG Corporation * | | 79,000 | | | 1,357,220 |
| | | | | |
Computer Hardware - 2.3% | | | | | |
Hewlett-Packard Company | | 22,500 | | | 1,062,225 |
| | | | | |
Consumer Finance - 0.5% | | | | | |
First Marblehead Corporation * | | 101,980 | | | 224,356 |
| | | | | |
Data Processing & Outsourced Services - 5.5% | | | | | |
Western Union Company | | 134,600 | | | 2,546,632 |
| | | | | |
Department Stores - 3.7% | | | | | |
JC Penney Company, Inc. | | 50,700 | | | 1,711,125 |
| | | | | |
Diversified Banks - 4.3% | | | | | |
U.S. Bancorp | | 48,327 | | | 1,056,428 |
Wells Fargo & Company | | 32,116 | | | 905,029 |
| | | | | |
| | | | | 1,961,457 |
| | | | | |
Diversified Chemicals - 1.4% | | | | | |
Dow Chemical Company | | 24,300 | | | 633,501 |
| | | | | |
Drug Retail - 2.4% | | | | | |
CVS Caremark Corporation | | 30,800 | | | 1,100,792 |
| | | | | |
Electric Utilities - 3.7% | | | | | |
American Electric Power Company, Inc. | | 365 | | | 11,311 |
Edison International | | 50,300 | | | 1,689,074 |
| | | | | |
| | | | | 1,700,385 |
| | | | | |
Electronic Manufacturing Services -2.3% | | | | | |
Tyco Electronics, Ltd. | | 46,950 | | | 1,046,046 |
| | | | | |
Health Care Equipment - 4.2% | | | | | |
Covidien plc | | 20,350 | | | 880,341 |
Hospira, Inc. * | | 24,400 | | | 1,088,240 |
| | | | | |
| | | | | 1,968,581 |
| | | | | |
Health Care Services - 2.2% | | | | | |
Medco Health Solutions, Inc. * | | 18,100 | | | 1,001,111 |
| | | | | |
Home Improvement Retail - 1.7% | | | | | |
Lowe’s Companies, Inc. | | 36,800 | | | 770,592 |
| | | | | |
Hypermarkets & Super Centers -4.8% | | | | | |
Costco Wholesale Corporation | | 19,500 | | | 1,100,970 |
Wal-Mart Stores, Inc. | | 22,600 | | | 1,109,434 |
| | | | | |
| | | | | 2,210,404 |
| | | | | |
| | | | | |
| | | Shares | | Value |
COMMON STOCKS - 97.2% (continued) | | | | | |
Independent Power Producers & Energy Traders - 1.5% | | | | | |
NRG Energy, Inc. * | | 24,500 | | $ | 690,655 |
| | | | | |
Industrial Conglomerates - 5.5% | | | | | |
General Electric Company | | 55,100 | | | 904,742 |
McDermott International, Inc. * | | 62,600 | | | 1,581,903 |
| | | | | |
| | | | | 2,486,645 |
| | | | | |
Industrial Machinery - 2.3% | | | | | |
Parker Hannifin Corporation | | 20,300 | | | 1,052,352 |
| | | | | |
Insurance Brokers - 1.6% | | | | | |
AON Corporation | | 18,100 | | | 736,489 |
| | | | | |
Integrated Oil & Gas - 7.7% | | | | | |
Chevron Corporation | | 18,600 | | | 1,309,998 |
ConocoPhillips | | 8,900 | | | 401,924 |
Exxon Mobil Corporation | | 26,800 | | | 1,838,748 |
| | | | | |
| | | | | 3,550,670 |
| | | | | |
Integrated Telecommunication Services - 1.0% | | | | | |
Windstream Corporation | | 46,776 | | | 473,841 |
| | | | | |
Managed Health Care - 1.8% | | | | | |
Aetna, Inc. | | 29,500 | | | 820,985 |
| | | | | |
Movies & Entertainment - 2.6% | | | | | |
Time Warner, Inc. | | 41,866 | | | 1,204,903 |
| | | | | |
Oil & Gas Equipment & Services -2.5% | | | | | |
Halliburton Company | | 42,000 | | | 1,139,040 |
| | | | | |
Oil & Gas Exploration & Production -1.8% | | | | | |
Chesapeake Energy Corporation | | 29,600 | | | 840,640 |
| | | | | |
Oil & Gas Storage & Transportation -2.2% | | | | | |
Williams Companies, Inc. | | 55,600 | | | 993,572 |
| | | | | |
Other Diversified Financial Services -1.4% | | | | | |
JPMorgan Chase & Company | | 14,563 | | | 638,151 |
| | | | | |
Pharmaceuticals - 1.0% | | | | | |
Schering-Plough Corporation | | 15,900 | | | 449,175 |
| | | | | |
Property & Casualty Insurance -5.6% | | | | | |
Berkshire Hathaway, Inc. * | | 26 | | | 2,626,000 |
| | | | | |
Railroads - 2.8% | | | | | |
Union Pacific Corporation | | 21,800 | | | 1,272,030 |
| | | | | |
Regional Banks - 1.8% | | | | | |
Fifth Third Bancorp | | 22,000 | | | 222,860 |
Regions Financial Corporation | | 94,000 | | | 583,740 |
| | | | | |
| | | | | 806,600 |
| | | | | |
The accompanying notes are an integral part of the financial statements
110
| | |
| Schedule of Investments | | Rydex | SGI |
| September 30, 2009 | | Large Cap Value Fund |
| | | | | |
| | | Shares | | Value |
COMMON STOCKS - 97.2% (continued) | | | | | |
Research & Consulting Services -3.1% | | | | | |
Equifax, Inc. | | 48,700 | | $ | 1,419,118 |
| | | | | |
Tobacco - 2.5% | | | | | |
Altria Group, Inc. | | 18,600 | | | 331,266 |
Philip Morris International, Inc. | | 16,800 | | | 818,832 |
| | | | | |
| | | | | 1,150,098 |
| | | | | |
TOTAL COMMON STOCKS (cost $47,032,848) | | | | $ | 44,642,890 |
| | | | | |
Total Investments - 97.2% 1 (cost $47,032,848) | | | | $ | 44,642,890 |
Cash & Other Assets, Less Liabilities - 2.8% | | | | | 1,295,495 |
| | | | | |
Total Net Assets - 100.0% | | | | $ | 45,938,385 |
| | | | | |
For federal income tax purposes the identified cost of investments owned at September 30, 2009 was $47,043,215.
| plc | Public Limited Company |
| * | Non-income producing security |
| 1 | Unless otherwise indicated, the values of the securities of the Portfolio are determined based on Level 1 inputs established by ASC 820. |
The accompanying notes are an integral part of the financial statements
111
Rydex | SGI
Large Cap Value Fund
Statement of Assets and Liabilities
September 30, 2009
| | | | |
Assets: | | | | |
Investments, at value * | | $ | 44,642,890 | |
Cash | | | 1,312,665 | |
Receivables: | | | | |
Fund shares sold | | | 45,877 | |
Dividends | | | 68,434 | |
Security Investors | | | 8,629 | |
Prepaid expenses | | | 23,432 | |
| | | | |
Total assets | | | 46,101,927 | |
| | | | |
Liabilities: | | | | |
Payable for: | | | | |
Fund shares redeemed | | | 95,210 | |
Management fees | | | 24,347 | |
Custodian fees | | | 1,027 | |
Transfer agent/maintenance fees | | | 8,421 | |
Administration fees | | | 3,635 | |
Professional fees | | | 10,600 | |
12b-1 distribution plan fees | | | 10,327 | |
Directors’ fees | | | 3,939 | |
Other | | | 6,036 | |
| | | | |
Total liabilities | | | 163,542 | |
| | | | |
Net assets | | $ | 45,938,385 | |
| | | | |
Net assets consist of: | | | | |
Paid in capital | | $ | 64,679,559 | |
Undistributed net investment income | | | 396,085 | |
Accumulated net realized loss on sale of investments | | | (16,747,301 | ) |
Net unrealized depreciation in value of investments | | | (2,389,958 | ) |
| | | | |
Net assets | | $ | 45,938,385 | |
| | | | |
Class A: | | | | |
Capital shares outstanding (unlimited number of shares authorized) | | | 6,104,397 | |
Net assets | | $ | 38,008,016 | |
Net asset value and redemption price per share | | $ | 6.23 | |
| | | | |
Maximum offering price per share (net asset value divided by 94.25%) | | $ | 6.61 | |
| | | | |
Class B: | | | | |
Capital shares outstanding (unlimited number of shares authorized) | | | 831,059 | |
Net assets | | $ | 4,802,127 | |
Net asset value, offering and redemption price per share (excluding any applicable contingent deferred sales charge) | | $ | 5.78 | |
| | | | |
Class C: | | | | |
Capital shares outstanding (unlimited number of shares authorized) | | | 533,135 | |
Net assets | | $ | 3,128,242 | |
Net asset value, offering and redemption price per share (excluding any applicable contingent deferred sales charge) | | $ | 5.87 | |
| | | | |
* Investments, at cost | | $ | 47,032,848 | |
Statement of Operations
For the Year Ended September 30, 2009
| | | | |
Investment Income: | | | | |
Dividends | | $ | 1,021,735 | |
Interest | | | 4,701 | |
| | | | |
Total investment income | | | 1,026,436 | |
| | | | |
Expenses: | | | | |
Management fees | | | 312,763 | |
Transfer agent/maintenance fees | | | 221,025 | |
Administration fees | | | 45,884 | |
Custodian fees | | | 4,205 | |
Directors’ fees | | | 6,356 | |
Professional fees | | | 18,092 | |
Reports to shareholders | | | 18,669 | |
Registration fees | | | 44,840 | |
Other expenses | | | 26,005 | |
12b-1 distribution fees - Class A | | | 99,135 | |
12b-1 distribution fees - Class C | | | 31,864 | |
| | | | |
Total expenses | | | 828,838 | |
Less: | | | | |
Reimbursement of expenses - Class A | | | (176,684 | ) |
Reimbursement of expenses - Class B | | | (24,652 | ) |
Reimbursement of expenses - Class C | | | (15,127 | ) |
| | | | |
Net expenses | | | 612,375 | |
| | | | |
Net investment income | | | 414,061 | |
| | | | |
Net Realized and Unrealized Gain (Loss): | | | | |
Net realized gain (loss) during the year on: | | | | |
Investments | | | (9,241,804 | ) |
Options written | | | 94,634 | |
| | | | |
Net realized loss | | | (9,147,170 | ) |
| | | | |
Net unrealized appreciation (depreciation) during the year on: | | | | |
Investments | | | (2,052,233 | ) |
| | | | |
Net unrealized depreciation | | | (2,052,233 | ) |
| | | | |
Net loss | | | (11,199,403 | ) |
| | | | |
Net decrease in net assets resulting from operations | | $ | (10,785,342 | ) |
| | | | |
The accompanying notes are an integral part of the financial statements
112
| | |
| | Rydex | SGI |
| Statement of Changes in Net Assets | | Large Cap Value Fund |
| | | | | | | | |
| | | Year Ended
September 30, 2009 | | | Year Ended
September 30, 2008 | |
Increase (decrease) in net assets from operations: | | | | | | | | |
Net investment income | | $ | 414,061 | | | $ | 639,605 | |
Net realized loss during the year on investments | | | (9,147,170 | ) | | | (4,539,850 | ) |
Net unrealized depreciation during the year on investments | | | (2,052,233 | ) | | | (19,633,290 | ) |
| | | | | | | | |
Net decrease in net assets resulting from operations | | | (10,785,342 | ) | | | (23,533,535 | ) |
| | | | | | | | |
Distributions to shareholders from: | | | | | | | | |
Net investment income | | | | | | | | |
Class A | | | (503,278 | ) | | | (378,053 | ) |
Class B | | | (90,508 | ) | | | (22,222 | ) |
Net realized gain | | | | | | | | |
Class A | | | (377,459 | ) | | | (2,835,403 | ) |
Class B | | | (49,025 | ) | | | (523,802 | ) |
Class C | | | (28,173 | ) | | | (232,292 | ) |
| | | | | | | | |
Total distributions to shareholders | | | (1,048,443 | ) | | | (3,991,772 | ) |
| | | | | | | | |
Capital share transactions: | | | | | | | | |
Proceeds from sale of shares | | | | | | | | |
Class A | | | 9,579,824 | | | | 42,964,106 | |
Class B | | | 2,086,370 | | | | 3,386,023 | |
Class C | | | 1,077,179 | | | | 2,180,812 | |
Distributions reinvested | | | | | | | | |
Class A | | | 846,030 | | | | 3,086,622 | |
Class B | | | 138,477 | | | | 540,480 | |
Class C | | | 28,048 | | | | 228,558 | |
Cost of shares redeemed | | | | | | | | |
Class A | | | (29,267,639 | ) | | | (36,583,296 | ) |
Class B | | | (4,280,914 | ) | | | (6,331,496 | ) |
Class C | | | (1,844,593 | ) | | | (2,035,897 | ) |
| | | | | | | | |
Net increase (decrease) from capital share transactions | | | (21,637,218 | ) | | | 7,435,912 | |
| | | | | | | | |
Net decrease in net assets | | | (33,471,003 | ) | | | (20,089,395 | ) |
| | | | | | | | |
Net assets: | | | | | | | | |
Beginning of year | | | 79,409,388 | | | | 99,498,783 | |
| | | | | | | | |
End of year | | $ | 45,938,385 | | | $ | 79,409,388 | |
| | | | | | | | |
Undistributed net investment income at end of year | | $ | 396,085 | | | $ | 583,228 | |
| | | | | | | | |
Capital share activity: | | | | | | | | |
Shares sold | | | | | | | | |
Class A | | | 1,952,259 | | | | 5,509,142 | |
Class B | | | 449,727 | | | | 457,814 | |
Class C | | | 222,048 | | | | 284,364 | |
Shares reinvested | | | | | | | | |
Class A | | | 170,227 | | | | 377,800 | |
Class B | | | 29,908 | | | | 70,743 | |
Class C | | | 5,930 | | | | 29,416 | |
Shares redeemed | | | | | | | | |
Class A | | | (5,975,380 | ) | | | (4,639,628 | ) |
Class B | | | (934,814 | ) | | | (849,539 | ) |
Class C | | | (389,302 | ) | | | (274,934 | ) |
The accompanying notes are an integral part of the financial statements
113
| | |
| Financial Highlights | | Rydex | SGI |
Selected data for each share of capital stock outstanding throughout each year | | Large Cap Value Fund |
| | | | | | | | | | | | | | | | | | | | |
Class A | | 2009 | | | 2008 | | | 2007 | | | 2006 | | | Year Ended
September 30,
2005 a | |
Per Share Data | | | | | | | | | | | | | | | | | | | | |
Net asset value, beginning of period | | $ | 6.72 | | | $ | 9.18 | | | $ | 7.65 | | | $ | 6.78 | | | $ | 5.71 | |
Income (loss) from investment operations: | | | | | | | | | | | | | | | | | | | | |
Net investment income b | | | 0.05 | | | | 0.05 | | | | 0.04 | | | | 0.01 | | | | 0.03 | |
Net gain (loss) on securities (realized and unrealized) | | | (0.45 | ) | | | (2.14 | ) | | | 1.49 | | | | 0.90 | | | | 1.04 | |
| | | | | | | | | | | | | | | | | | | | |
Total from investment operations | | | (0.40 | ) | | | (2.09 | ) | | | 1.53 | | | | 0.91 | | | | 1.07 | |
| | | | | | | | | | | | | | | | | | | | |
Less distributions: | | | | | | | | | | | | | | | | | | | | |
Dividends from net investment income | | | (0.05 | ) | | | (0.04 | ) | | | — | | | | (0.04 | ) | | | — | |
Distributions from realized gains | | | (0.04 | ) | | | (0.33 | ) | | | — | | | | — | | | | — | |
| | | | | | | | | | | | | | | | | | | | |
Total distributions | | | (0.09 | ) | | | (0.37 | ) | | | — | | | | (0.04 | ) | | | — | |
| | | | | | | | | | | | | | | | | | | | |
Net asset value, end of period | | $ | 6.23 | | | $ | 6.72 | | | $ | 9.18 | | | $ | 7.65 | | | $ | 6.78 | |
| | | | | | | | | | | | | | | | | | | | |
Total Return c | | | (5.59 | %) | | | (23.45 | %) | | | 20.04 | % | | | 13.45 | % | | | 18.74 | % |
| | | | | | | | | | | | | | | | | | | | |
Ratios/Supplemental Data | | | | | | | | | | | | | | | | | | | | |
Net assets, end of period (in thousands) | | $ | 38,008 | | | $ | 66,902 | | | $ | 79,998 | | | $ | 64,786 | | | $ | 45,295 | |
| | | | | | | | | | | | | | | | | | | | |
Ratios to average net assets: | | | | | | | | | | | | | | | | | | | | |
Net investment income | | | 0.88 | % | | | 0.68 | % | | | 0.51 | % | | | 0.17 | % | | | 0.56 | % |
Total expenses d | | | 1.70 | % | | | 1.36 | % | | | 1.35 | % | | | 1.49 | % | | | 1.61 | % |
Net expenses e | | | 1.25 | % | | | 1.25 | % | | | 1.27 | % | | | 1.49 | % | | | 1.61 | % |
Net expenses prior to custodian earning credits and net of expense waivers | | | 1.25 | % | | | 1.25 | % | | | 1.27 | % | | | 1.49 | % | | | 1.61 | % |
| | | | | | | | | | | | | | | | | | | | |
Portfolio turnover rate | | | 25 | % | | | 48 | % | | | 25 | % | | | 54 | % | | | 110 | % |
| | | | | | | | | | | | | | | | | | | | |
Class B | | 2009f | | | 2008f | | | 2007f | | | 2006 | | | Year Ended
September 30,
2005a | |
Per Share Data | | | | | | | | | | | | | | | | | | | | |
Net asset value, beginning of period | | $ | 6.29 | | | $ | 8.58 | | | $ | 7.18 | | | $ | 6.38 | | | $ | 5.42 | |
| | | | | | | | | | | | | | | | | | | | |
Income (loss) from investment operations: | | | | | | | | | | | | | | | | | | | | |
Net investment income (loss) b | | | 0.06 | | | | 0.07 | | | | (0.01 | ) | | | (0.04 | ) | | | (0.01 | ) |
Net gain (loss) on securities (realized and unrealized) | | | (0.46 | ) | | | (2.02 | ) | | | 1.41 | | | | 0.84 | | | | 0.97 | |
| | | | | | | | | | | | | | | | | | | | |
Total from investment operations | | | (0.40 | ) | | | (1.95 | ) | | | 1.40 | | | | 0.80 | | | | 0.96 | |
| | | | | | | | | | | | | | | | | | | | |
Less distributions: | | | | | | | | | | | | | | | | | | | | |
Dividends from net investment income | | | (0.07 | ) | | | (0.01 | ) | | | — | | | | — | | | | — | |
Distributions from realized gains | | | (0.04 | ) | | | (0.33 | ) | | | — | | | | — | | | | — | |
| | | | | | | | | | | | | | | | | | | | |
Total distributions | | | (0.11 | ) | | | (0.34 | ) | | | — | | | | — | | | | — | |
| | | | | | | | | | | | | | | | | | | | |
Net asset value, end of period | | $ | 5.78 | | | $ | 6.29 | | | $ | 8.58 | | | $ | 7.18 | | | $ | 6.38 | |
| | | | | | | | | | | | | | | | | | | | |
Total Return c | | | (5.91 | %) | | | (23.39 | %) | | | 19.50 | % | | | 12.54 | % | | | 17.71 | % |
| | | | | | | | | | | | | | | | | | | | |
Ratios/Supplemental Data | | | | | | | | | | | | | | | | | | | | |
Net assets, end of period (in thousands) | | $ | 4,802 | | | $ | 8,097 | | | $ | 13,784 | | | $ | 12,761 | | | $ | 8,500 | |
| | | | | | | | | | | | | | | | | | | | |
Ratios to average net assets: | | | | | | | | | | | | | | | | | | | | |
Net investment income (loss) | | | 1.16 | % | | | 0.93 | % | | | (0.08 | %) | | | (0.58 | %) | | | (0.16 | %) |
Total expenses d | | | 1.47 | % | | | 1.11 | % | | | 1.92 | % | | | 2.26 | % | | | 2.36 | % |
Net expenses e | | | 1.00 | % | | | 1.00 | % | | | 1.85 | % | | | 2.26 | % | | | 2.36 | % |
Net expenses prior to custodian earning credits and net of expense waivers | | | 1.00 | % | | | 1.00 | % | | | 1.85 | % | | | 2.26 | % | | | 2.36 | % |
| | | | | | | | | | | | | | | | | | | | |
Portfolio turnover rate | | | 25 | % | | | 48 | % | | | 25 | % | | | 54 | % | | | 110 | % |
The accompanying notes are an integral part of the financial statements
114
| | |
| Financial Highlights | | Rydex | SGI |
Selected data for each share of capital stock outstanding throughout each year | | Large Cap Value Fund |
| | | | | | | | | | | | | | | | | | | | |
Class C | | 2009 | | | 2008 | | | 2007 | | | 2006 | | | Year Ended
September 30,
2005a | |
Per Share Data | | | | | | | | | | | | | | | | | | | | |
Net asset value, beginning of period | | $ | 6.35 | | | $ | 8.72 | | | $ | 7.31 | | | $ | 6.49 | | | $ | 5.52 | |
| | | | | | | | | | | | | | | | | | | | |
Income (loss) from investment operations: | | | | | | | | | | | | | | | | | | | | |
Net investment income (loss) b | | | 0.01 | | | | — | | | | (0.02 | ) | | | (0.04 | ) | | | (0.01 | ) |
Net gain (loss) on securities (realized and unrealized) | | | (0.45 | ) | | | (2.04 | ) | | | 1.43 | | | | 0.86 | | | | 0.98 | |
| | | | | | | | | | | | | | | | | | | | |
Total from investment operations | | | (0.44 | ) | | | (2.04 | ) | | | 1.41 | | | | 0.82 | | | | 0.97 | |
| | | | | | | | | | | | | | | | | | | | |
Less distributions: | | | | | | | | | | | | | | | | | | | | |
Distributions from realized gains | | | (0.04 | ) | | | (0.33 | ) | | | — | | | | — | | | | — | |
| | | | | | | | | | | | | | | | | | | | |
Total distributions | | | (0.04 | ) | | | (0.33 | ) | | | — | | | | — | | | | — | |
| | | | | | | | | | | | | | | | | | | | |
Net asset value, end of period | | $ | 5.87 | | | $ | 6.35 | | | $ | 8.72 | | | $ | 7.31 | | | $ | 6.49 | |
| | | | | | | | | | | | | | | | | | | | |
Total Return c | | | (6.80 | %) | | | (24.09 | %) | | | 19.29 | % | | | 12.63 | % | | | 17.57 | % |
| | | | | | | | | | | | | | | | | | | | |
Ratios/Supplemental Data | | | | | | | | | | | | | | | | | | | | |
Net assets, end of period (in thousands) | | $ | 3,128 | | | $ | 4,410 | | | $ | 5,717 | | | $ | 3,536 | | | $ | 2,899 | |
| | | | | | | | | | | | | | | | | | | | |
Ratios to average net assets: | | | | | | | | | | | | | | | | | | | | |
Net investment income (loss) | | | 0.14 | % | | | (0.07 | %) | | | (0.23 | %) | | | (0.60 | %) | | | (0.18 | %) |
Total expenses d | | | 2.46 | % | | | 2.11 | % | | | 2.10 | % | | | 2.25 | % | | | 2.36 | % |
Net expenses e | | | 2.00 | % | | | 2.00 | % | | | 2.02 | % | | | 2.25 | % | | | 2.36 | % |
Net expenses prior to custodian earning credits and net of expense waivers | | | 2.00 | % | | | 2.00 | % | | | 2.02 | % | | | 2.25 | % | | | 2.36 | % |
| | | | | | | | | | | | | | | | | | | | |
Portfolio turnover rate | | | 25 | % | | | 48 | % | | | 25 | % | | | 54 | % | | | 110 | % |
| a | Security Investors (SI) became the advisor of the Large Cap Value Fund effective June 30, 2005. Prior to June 30, 2005, SI paid Dreyfus Corporation for sub-advisory services. |
| b | Net investment income (loss) was computed using average shares outstanding throughout the period. |
| c | Total return information does not reflect deduction of any sales charges imposed at the time of purchase for Class A shares or upon redemption for Class B and C shares. |
| d | Total expense information reflects expense ratios absent expense reductions by the Investment Manager and custodian earnings credits, as applicable. |
| e | Net expense information reflects the expense ratios after voluntary expense waivers, reimbursements and custodian earnings credits, as applicable. |
| f | Effective August 1, 2007, Class B shares ceased charging 12b-1 fees in accordance with FINRA (formerly NASD) sales cap regulations. Per share information reflects this change. This fee will be reinstated when sales exceed the sales cap limit. |
The accompanying notes are an integral part of the financial statements
115
This page left blank intentionally.
116
Manager’s Commentary
November 16, 2009
To Our Shareholders:
For the fiscal year ended September 30, 2009, the Rydex|SGI Large Cap Value Fund Large Cap Value Institutional Series declined –6.89%1, less than the –10.62% return of its benchmark, the Russell 1000 Value Index.
Our strategy is to buy companies that are trading at a significant discount to their intrinsic value. Our investment approach is a defined and disciplined process of three clear philosophical tenants that drive our investment decisions: a valuation focus, a long-term perspective and an opportunistic approach.
This investment process is fundamentally driven and quantitatively aided. We use proprietary screens to identify potential companies for investment and then perform rigorous fundamental analysis to identify the best ideas. Through this fundamental research, we determine an estimate of intrinsic value and a valuation target for each potential investment. We construct the portfolio based on the level of conviction generated by this bottom-up analysis and the upside/downside profile associated with each company.
Health Care, Industrials, and Consumer Staples Top Performers
In aggregate, the health care sector accounted for all the Series’ excess performance. While it was a slightly underweight position, holdings in the portfolio gained over 20% compared to a 2% loss for the Index. Leading the way were significant positions in Schering-Plough Corporation (up more than 50%), Medco Health Solutions, Inc., and Hospira, Inc.
The Series had a large overweight position in Industrials, 22% to 9%, and was able to hold losses to approximately 10% compared to a 20% decline for the Index. McDermott International, Inc. lost just 1% allowing it to add value on a relative basis. An underweight position in General Electric Company helped performance, as did a more than 20% return on holding Parker Hannifin Corporation
The consumer staples sector was a slight overweight position that added relative performance to the Series with investments in Philip Morris International, Inc. and CVS Caremark Corporation.
Information Technology, Energy, and Financials Disappoint
The Series was slightly overweight in the information technology sector, but holdings declined about 5% against a rise of 9% for the benchmark. A retreat of more than 15% in Tyco Electronics, Ltd. pulled down performance in the sector.
The Series had a 14% weight in energy, still an underweight position, but holdings dropped 14% compared to a 11% loss for the Index. Exxon Mobil Corporation, Williams Companies, Inc., and Chevron Corporation negatively contributed to Series performance.
Even as an underweight position, the financials sector made up 16% of total assets. Series holdings declined more than 20%. The largest detractor was Capital One Financial Corporation, which declined over 80%. Berkshire Hathaway, Inc. (Cl A) lost over 20%. JPMorgan Chase & Company and First Marblehead Corporation also dragged down portfolio performance in the sector.
Market Outlook
With many industries going through a process of business and capacity rationalization in a lower demand environment, financial flexibility provides an advantage to those companies that have opportunities to gain market share or acquire desirable assets from disadvantaged competitors.
Our bottom-up approach views opportunity in the context of the potential long-term impact on individual companies. Our focus is on applying a bottom-up approach to identifying individual companies with the ability to be substantially better and have a positive impact on the portfolio over the next three to five years. We remain confident in our ability to uncover these companies.
Current markets reinforce that investing is a long-term pursuit that requires patience and a consistent approach. We recognize there are many investment fund alternatives available today and thank you for your business and the confidence you place in us.
|
| Sincerely, |
|
| |
| Mark A. Mitchell |
| Portfolio Manager |
| 1 | Performance figures are based on Class I shares and do not reflect deduction of the sales charges or taxes that a shareholder would pay on distributions or the redemption of shares. Fee waivers and/or reimbursements reduce Series expenses and in the absence of such waivers, the performance quoted would be reduced. |
| | The strategies discussed herein do not assure a profit. The Fund is distributed by Rydex Distributors, Inc. |
117
| | |
| | Rydex | SGI Large Cap Value Fund |
| Performance Summary | | Large Cap Value Institutional Series |
September 30, 2009 | | (unaudited) |
PERFORMANCE
Large Cap Value Institutional Series vs. Russell 1000 Value Index
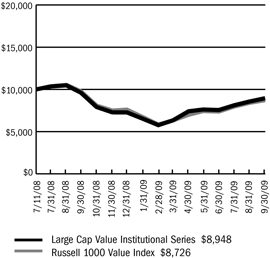
$10,000 Since Inception
This chart assumes a $10,000 investment in shares of Large Cap Value Institutional Series on July 11, 2008 (date of inception), and assumes all dividends reinvested. The chart does not reflect the deduction of taxes that a shareholder would pay on distributions or the redemption of fund shares. The Russell 1000 Value Index is an unmanaged index representing the performance of those Russell 1000 Index companies with lower price-to-book ratios and lower forecasted growth values.
Average Annual Returns
| | | | | | |
Periods Ended 9-30-09 | | 1 Year | | | Since Inception
(7-11-08) | |
Large Cap Value Institutional Series | | (6.89 | %) | | (36.69 | %) |
The performance data above represents past performance that is not predictive of future results. The investment return and principal value of an investment in the Series will fluctuate so that an investor’s shares, when redeemed, may be worth more or less than their original cost. The figures do not reflect the deduction of taxes that a shareholder would pay on distributions or redemption of shares. Such figures would be lower if the maximum sales charge and any applicable taxes were deducted. Fee waivers and/or reimbursements reduced expenses of the Series and in the absence of such waiver, the performance quoted would be reduced.
Portfolio Composition by Sector as of 9-30-09
| | | |
Consumer Discretionary | | 8.37 | % |
Consumer Staples | | 10.74 | |
Energy | | 15.61 | |
Financials | | 14.83 | |
Health Care | | 9.97 | |
Industrials | | 23.38 | |
Information Technology | | 10.18 | |
Materials | | 1.58 | |
Telecommunication Services | | 1.17 | |
Utilities | | 5.80 | |
Liabilities, Less Cash & Other Assets | | (1.63 | ) |
| | | |
Total Net Assets | | 100.00 | % |
| | | |
The accompanying notes are an integral part of the financial statements
118
| | |
| | Rydex | SGI Large Cap Value Fund |
| Performance Summary | | Large Cap Value Institutional Series |
September 30, 2009 | | (unaudited) |
Information About Your Series Expenses
Calculating your ongoing Series expenses
Example
As a shareholder of the Series, you incur ongoing costs, including management fees and other Series expenses. This example is intended to help you understand your ongoing costs (in dollars) of investing in the Series and to compare these costs with ongoing costs of investing in other mutual funds. The example is based on an investment of $1,000 invested at the beginning of the period and held for the entire period April 1, 2009 through September 30, 2009.
Actual Expenses
The first line for each class of shares in the table provides information about actual account values and actual expenses. You may use the information in this table, together with the amount you invested, to estimate the expenses that you paid over the period. Simply divide your account value by $1,000 (for example, an $8,600 account value divided by $1,000 = 8.6), then multiply the result by the number in the table under the heading entitled “Expenses Paid During the Period” to estimate the expenses you paid on your account during this period.
Hypothetical Example for Comparison Purposes
The second line for each class of shares in the table provides information about hypothetical account values and hypothetical expenses based on the Series’ actual expense ratio and an assumed rate of return of 5% per year before expenses, which is not the Series’ actual return. The hypothetical account values and expenses may not be used to estimate the actual ending account balance or expenses you paid for the period. You may use this information to compare the ongoing costs of investing in the Series and other funds. To do so, compare this 5% hypothetical example with the 5% hypothetical examples that appear in the shareholder reports of the other mutual funds.
Please note that the expenses shown in the table are meant to highlight your ongoing costs. Therefore, the second line for each class of shares is useful in comparing ongoing costs only, and will not help you determine the relative total costs of owning different funds
Series Expenses
| | | | | | | | | |
| | | Beginning
Account
Value
4/1/2009 | | Ending
Account
Value
9/30/20091 | | Expenses
Paid
During
Period2 |
Large Cap Value Institutional Series | | | | | | | | | |
Actual | | $ | 1,000.00 | | $ | 1,413.35 | | $ | 5.93 |
Hypothetical | | | 1,000.00 | | | 1,020.16 | | | 4.96 |
| 1 | The actual ending account value is based on the actual total return of the Series for the period April 1, 2009 to September 30, 2009 after actual expenses and will differ from the hypothetical ending account value which is based on the Series expense ratio and a hypothetical annual return of 5% before expenses. The actual cumulative return at net asset value for the period April 1, 2009 to September 30, 2009 was 41.34%. |
| 2 | Expenses are equal to the Series annualized expense ratio of 0.98%, net of any applicable fee waivers, multiplied by the average account value over the period, multiplied by 183/365 (to reflect the one-half year period). |
119
| | |
| Schedule of Investments | | Rydex | SGI Large Cap Value Fund |
| September 30, 2009 | | Large Cap Value Institutional Series |
| | | | | |
| | | Shares | | Value |
COMMON STOCKS - 101.6% | | | | | |
Aerospace & Defense - 2.8% | | | | | |
United Technologies Corporation | | 1,230 | | $ | 74,944 |
| | | | | |
Air Freight & Logistics - 3.8% | | | | | |
FedEx Corporation | | 1,400 | | | 105,308 |
| | | | | |
Asset Management & Custody Banks - 0.4% | | | | | |
Bank of New York Mellon Corporation | | 400 | | | 11,596 |
| | | | | |
Building Products - 2.9% | | | | | |
USG Corporation * | | 4,590 | | | 78,856 |
| | | | | |
Computer Hardware - 2.3% | | | | | |
Hewlett-Packard Company | | 1,350 | | | 63,734 |
| | | | | |
Consumer Finance - 0.4% | | | | | |
First Marblehead Corporation * | | 4,676 | | | 10,287 |
| | | | | |
Data Processing & Outsourced Services - 5.6% | | | | | |
Western Union Company | | 7,940 | | | 150,224 |
| | | | | |
Department Stores - 3.9% | | | | | |
JC Penney Company, Inc. | | 3,170 | | | 106,988 |
| | | | | |
Diversified Banks - 5.0% | | | | | |
U.S. Bancorp | | 3,041 | | | 66,476 |
Wells Fargo & Company | | 2,517 | | | 70,930 |
| | | | | |
| | | | | 137,406 |
| | | | | |
Diversified Chemicals - 1.6% | | | | | |
Dow Chemical Company | | 1,650 | | | 43,016 |
| | | | | |
Drug Retail - 2.6% | | | | | |
CVS Caremark Corporation | | 1,960 | | | 70,050 |
| | | | | |
Electric Utilities - 4.1% | | | | | |
American Electric Power Company, Inc. | | 26 | | | 806 |
Edison International | | 3,330 | | | 111,821 |
| | | | | |
| | | | | 112,627 |
| | | | | |
Electronic Manufacturing Services - 2.3% | | | | | |
Tyco Electronics, Ltd. | | 2,810 | | | 62,607 |
| | | | | |
Health Care Equipment - 4.7% | | | | | |
Covidien plc | | 1,150 | | | 49,749 |
Hospira, Inc. * | | 1,760 | | | 78,495 |
| | | | | |
| | | | | 128,244 |
| | | | | |
Health Care Services - 2.4% | | | | | |
Medco Health Solutions, Inc. * | | 1,180 | | | 65,266 |
| | | | | |
Home Improvement Retail - 2.1% | | | | | |
Lowe’s Companies, Inc. | | 2,680 | | | 56,119 |
| | | | | |
Hypermarkets & Super Centers - 5.3% | | | | | |
Costco Wholesale Corporation | | 1,140 | | | 64,364 |
Wal-Mart Stores, Inc. | | 1,660 | | | 81,490 |
| | | | | |
| | | | | 145,854 |
| | | | | |
| | | | | |
| | | Shares | | Value |
COMMON STOCKS - 101.6% (continued) | | | | | |
Independent Power Producers & Energy Traders - 1.7% | | | | | |
NRG Energy, Inc. * | | 1,600 | | $ | 45,104 |
| | | | | |
Industrial Conglomerates - 5.4% | | | | | |
General Electric Company | | 3,540 | | | 58,127 |
McDermott International, Inc. * | | 3,570 | | | 90,213 |
| | | | | |
| | | | | 148,340 |
| | | | | |
Industrial Machinery - 2.2% | | | | | |
Parker Hannifin Corporation | | 1,140 | | | 59,098 |
| | | | | |
Insurance Brokers - 1.8% | | | | | |
AON Corporation | | 1,170 | | | 47,607 |
| | | | | |
Integrated Oil & Gas - 8.2% | | | | | |
Chevron Corporation | | 1,190 | | | 83,812 |
ConocoPhillips | | 660 | | | 29,806 |
Exxon Mobil Corporation | | 1,620 | | | 111,148 |
| | | | | |
| | | | | 224,766 |
| | | | | |
Integrated Telecommunication Services - 1.2% | | | | | |
Windstream Corporation | | 3,130 | | | 31,707 |
| | | | | |
Managed Health Care - 1.8% | | | | | |
Aetna, Inc. | | 1,720 | | | 47,868 |
| | | | | |
Movies & Entertainment - 2.4% | | | | | |
Time Warner, Inc. | | 2,240 | | | 64,467 |
| | | | | |
Oil & Gas Equipment & Services - 3.1% | | | | | |
Halliburton Company | | 3,060 | | | 82,987 |
| | | | | |
Oil & Gas Exploration & Production - 2.0% | | | | | |
Chesapeake Energy Corporation | | 1,900 | | | 53,960 |
| | | | | |
Oil & Gas Storage & Transportation - 2.3% | | | | | |
Williams Companies, Inc. | | 3,490 | | | 62,366 |
| | | | | |
Other Diversified Financial Services - 1.6% | | | | | |
JPMorgan Chase & Company | | 976 | | | 42,768 |
| | | | | |
Pharmaceuticals - 1.1% | | | | | |
Schering-Plough Corporation | | 1,050 | | | 29,663 |
| | | | | |
Property & Casualty Insurance - 3.7% | | | | | |
Berkshire Hathaway, Inc. * | | 1 | | | 101,000 |
| | | | | |
Railroads - 2.9% | | | | | |
Union Pacific Corporation | | 1,360 | | | 79,356 |
| | | | | |
Regional Banks - 1.9% | | | | | |
Fifth Third Bancorp | | 1,500 | | | 15,195 |
Regions Financial Corporation | | 6,000 | | | 37,260 |
| | | | | |
| | | | | 52,455 |
| | | | | |
The accompanying notes are an integral part of the financial statements
120
| | |
| Schedule of Investments | | Rydex | SGI Large Cap Value Fund |
| September 30, 2009 | | Large Cap Value Institutional Series |
| | | | | | |
| | | Shares | | Value | |
COMMON STOCKS - 101.6% (continued) | | | | | | |
Research & Consulting Services - 3.3% | | | | | | |
Equifax, Inc. | | 3,070 | | $ | 89,460 | |
| | | | | | |
Tobacco - 2.8% | | | | | | |
Altria Group, Inc. | | 1,450 | | | 25,825 | |
Philip Morris International, Inc. | | 1,030 | | | 50,202 | |
| | | | | | |
| | | | | 76,027 | |
| | | | | | |
TOTAL COMMON STOCKS (cost $2,801,506) | | | | $ | 2,762,125 | |
| | | | | | |
Total Investments - 101.6% 1 (cost $2,801,506) | | | | $ | 2,762,125 | |
Liabilities, Less Cash & Other Assets - (1.6)% | | | | | (44,482 | ) |
| | | | | | |
Total Net Assets - 100.0% | | | | $ | 2,717,643 | |
| | | | | | |
For federal income tax purposes the identified cost of investments owned at September 30, 2009 was $2,806,808.
| plc | Public Limited Company |
| * | Non-income producing security |
| 1 | Unless otherwise indicated, the values of the securities of the Portfolio are determined based on Level 1 inputs established by ASC 820. |
The accompanying notes are an integral part of the financial statements
121
Rydex | SGI Large Cap Value Fund
Large Cap Value Institutional Series
Statement of Assets and Liabilities
September 30, 2009
| | | | |
Assets: | | | | |
Investments, at value* | | $ | 2,762,125 | |
Cash | | | 2,908 | |
Receivables: | | | | |
Dividends | | | 4,529 | |
Security Investors | | | 1,203 | |
Prepaid expenses | | | 9,257 | |
| | | | |
Total assets | | | 2,780,022 | |
| | | | |
Liabilities: | | | | |
Payable for: | | | | |
Fund shares redeemed | | | 49,288 | |
Management fees | | | 1,505 | |
Administration fees | | | 327 | |
Transfer agent/maintenance fees | | | 30 | |
Custodian fees | | | 999 | |
Directors’ fees | | | 162 | |
Professional fees | | | 7,350 | |
Other fees | | | 2,718 | |
| | | | |
Total liabilities | | | 62,379 | |
| | | | |
Net assets | | $ | 2,717,643 | |
| | | | |
Net assets consist of: | | | | |
Paid in capital | | $ | 3,058,558 | |
Undistributed net investment income | | | 21,709 | |
Accumulated net realized loss on sale of investments | | | (323,243 | ) |
Net unrealized depreciation in value of investments | | | (39,381 | ) |
| | | | |
Net assets | | $ | 2,717,643 | |
| | | | |
Capital shares authorized | | | unlimited | |
Capital shares outstanding | | | 305,541 | |
Net asset value per share (net assets divided by shares outstanding) | | $ | 8.89 | |
| | | | |
* Investments, at cost | | $ | 2,801,506 | |
Statement of Operations
For the Year Ended September 30, 2009
| | | | |
Investment Income: | | | | |
Dividends | | $ | 59,807 | |
Interest | | | 243 | |
| | | | |
Total investment income | | | 60,050 | |
| | | | |
Expenses: | | | | |
Management fees | | | 17,758 | |
Administration fees | | | 2,476 | |
Transfer agent/maintenance fees | | | 377 | |
Custodian fees | | | 1,487 | |
Directors’ fees | | | 352 | |
Professional fees | | | 12,367 | |
Reports to shareholders | | | 2,672 | |
Registration fees | | | 25,507 | |
Other | | | 1,830 | |
| | | | |
Total expenses | | | 64,826 | |
Reimbursement of expenses | | | (38,034 | ) |
| | | | |
Net expenses | | | 26,792 | |
| | | | |
Net investment income | | | 33,258 | |
| | | | |
Net Realized and Unrealized Gain (Loss): | | | | |
Net realized gain (loss) during the year on: | | | | |
Investments | | | (282,659 | ) |
Options written | | | 2,365 | |
| | | | |
Net realized loss | | | (280,294 | ) |
| | | | |
Net unrealized appreciation (depreciation) during the year on: | | | | |
Investments | | | 42,891 | |
| | | | |
Net unrealized appreciation | | | 42,891 | |
| | | | |
Net realized and unrealized loss | | | (237,403 | ) |
| | | | |
Net decrease in net assets resulting from operations | | $ | (204,145 | ) |
| | | | |
The accompanying notes are an integral part of the financial statements
122
| | |
| | Rydex | SGI Large Cap Value Fund |
| Statement of Changes in Net Assets | | Large Cap Value Institutional Series |
| | | | | | | | |
| | | Year Ended
September 30,
2009 | | | Period Ended
September 30,
2008* | |
Increase (decrease) in net assets from operations: | | | | | | | | |
Net investment income | | $ | 33,258 | | | $ | 8,072 | |
Net realized loss during the year on investments | | | (280,294 | ) | | | (42,949 | ) |
Net unrealized appreciation (depreciation) during the year on investments | | | 42,891 | | | | (82,272 | ) |
| | | | | | | | |
Net decrease in net assets resulting from operations | | | (204,145 | ) | | | (117,149 | ) |
| | | | | | | | |
Distributions to shareholders from: | | | | | | | | |
Net investment income | | | (19,621 | ) | | | — | |
| | | | | | | | |
Total distributions to shareholders | | | (19,621 | ) | | | — | |
| | | | | | | | |
Capital share transactions: | | | | | | | | |
Proceeds from sale of shares | | | 2,460,110 | | | | 3,308,936 | |
Dividends reinvested | | | 19,622 | | | | — | |
Cost of shares redeemed | | | (2,416,519 | ) | | | (313,591 | ) |
| | | | | | | | |
Net increase from capital share transactions | | | 63,213 | | | | 2,995,345 | |
| | | | | | | | |
Net increase (decrease) in net assets | | | (160,553 | ) | | | 2,878,196 | |
| | | | | | | | |
Net assets: | | | | | | | | |
Beginning of year | | | 2,878,196 | | | | — | |
| | | | | | | | |
End of year | | $ | 2,717,643 | | | $ | 2,878,196 | |
| | | | | | | | |
Undistributed net investment income at end of year | | $ | 21,709 | | | $ | 8,072 | |
| | | | | | | | |
Capital share activity: | | | | | | | | |
Shares sold | | | 343,781 | | | | 330,636 | |
Shares reinvested | | | 2,763 | | | | — | |
Shares redeemed | | | (340,533 | ) | | | (31,106 | ) |
| | | | | | | | |
Total capital share activity | | | 6,011 | | | | 299,530 | |
| | | | | | | | |
| * | For the period July 11, 2008 (commencement of operations) to September 30, 2008. |
The accompanying notes are an integral part of the financial statements
123
| | |
| Financial Highlights | | Rydex | SGI Large Cap Value Fund |
Selected data for each share of capital stock outstanding throughout each year | | Large Cap Value Institutional Series |
| | | | | | | | |
| | | Year Ended
September 30,
2009 | | | Period Ended
September 30,
2008 a | |
Per Share Data | | | | | | | | |
Net asset value, beginning of period | | $ | 9.61 | | | $ | 10.00 | |
| | | | | | | | |
Income (loss) from investment operations: | | | | | | | | |
Net investment income b | | | 0.09 | | | | 0.03 | |
Net loss on securities (realized and unrealized) | | | (0.76 | ) | | | (0.42 | ) |
| | | | | | | | |
Total from investment operations | | | (0.67 | ) | | | (0.39 | ) |
| | | | | | | | |
Less distributions: | | | | | | | | |
Dividends from net investment income | | | (0.05 | ) | | | — | |
| | | | | | | | |
Total distributions | | | (0.05 | ) | | | — | |
| | | | | | | | |
Net asset value, end of period | | $ | 8.89 | | | $ | 9.61 | |
| | | | | | | | |
Total Return | | | (6.89 | %) | | | (3.90 | %) |
| | | | | | | | |
Ratios/Supplemental Data | | | | | | | | |
Net assets, end of period (in thousands) | | $ | 2,718 | | | $ | 2,878 | |
| | | | | | | | |
Ratios to average net assets: | | | | | | | | |
Net investment income | | | 1.22 | % | | | 1.17 | % |
Total expenses c | | | 2.37 | % | | | 2.33 | % |
Net expenses d | | | 0.98 | % | | | 0.98 | % |
Net expenses prior to custodian earnings credits and net of expense waivers | | | 0.98 | % | | | 0.98 | % |
| | | | | | | | |
Portfolio turnover rate | | | 45 | % | | | 35 | % |
| a | The Large Cap Value Institutional Series was initially capitalized on July 11, 2008 with a net asset value of $10 per share. Percentage amounts for the period, except total return, have been annualized. |
| b | Net investment income (loss) was computed using average shares outstanding throughout the period. |
| c | Total expense information reflects the expense ratios absent expense reductions by the Investment Manager and earnings credits, as applicable. |
| d | Net expense information reflects the expense ratios after voluntary expense waivers, reimbursements and custodian earnings credits, as applicable. |
The accompanying notes are an integral part of the financial statements
124
Manager’s Commentary
November 16, 2009
To Our Shareholders:
For the fiscal year ended September 30, 2009, the Rydex|SGI Mid Cap Growth Fund returned 2.32%1, beating the Russell MidCap Growth Index’s return of –0.40% and its peer group median return of –3.14%.
The Fund uses a combination of a qualitative macroeconomic approach in reviewing growth trends that is based upon several fixed income factors, such as bond spreads and interest rates, along with a quantitative fundamental bottom-up approach in selecting growth stocks. The manager chooses securities that it believes are attractively valued with the greatest potential for long-term growth of capital.
The manager seeks to identify securities of companies that are able to grow and reinvest in increasingly profitable ventures and hold them over three to five years to capture the best part of the improvements in profits or profitability. We target securities of companies that appear likely to generate above average profitability at prices that do not reflect that potential.
Consumer Discretionary, Industrials, and Information Technology, Top Performers
The consumer discretionary sector consisted of 22% total Fund assets, which was a 3% overweight position. Holdings for the Fund returned approximately 17%, exceeding the 6% of the Index. Leading positions included Jarden Corporation (up more than 100%), Penn National Gaming, Inc., Darden Restaurants, Inc., and WMS Industries, Inc.
While an underweight position, holdings in the industrials sector increased about 14% against a 6% drop for the Russell MidCap Growth Index. Goodrich Corporation was a 3% weight and gained over 30% during the period. Precision Castparts Corporation, while half that weight, gained more than 80%.
Superior stock selection in the even weighted information technology sector boosted Fund performance. Securities in the Fund gained approximately 18% relative to a 10% increase in the benchmark. Cognizant Technology Solutions, Inc. was a material position in the portfolio and gained nearly 70%. Skyworks Solutions, Inc. gained over 100% while ON Semiconductor Corporation contributed to positive returns.
Energy, Financials, and Consumer Staples Disappoint
The energy, financials, and consumer staples sectors were three of the smaller weightings in the portfolio. Each sector suffered during the fiscal year due to poor stock selection.
The energy sector was an even weight position but lost 24% compared to a 6% decline for the Index. Hurting overall returns were allocations to Williams Companies, Inc. and Peabody Energy Corporation.
The financials sector continued to suffer during the fiscal year as there were no industries in which to find cover and Fund holdings lost nearly 20%. Fund holdings in the sector that detracted from overall returns were Assurant, Inc., BB&T Corporation, and T. Rowe Price Group, Inc.
The Fund held only 4% of assets in the consumer staples sector but security selection produced a loss of about 25%. All four holdings in the sector, Kroger Company, J.M. Smucker Company, Clorox Company, and Kellogg Company, had a negative impact on returns.
Market Outlook
As the economy recovers, a central question is whether companies will be able to grow revenues rather than maintain profits with massive cost-cutting measures. If so, it is more likely to be at what investors are referring to as the “new normal”—increasing revenues from the now lower levels rather than returning to the higher revenue levels of the past.
We are overweight basic materials and energy as global demand improves with renewed growth in China and India. We are overweight Industrials in anticipation of better economic growth later in 2009. We remain overweight financials as we expect strong third quarter EPS reports due to the record fixed income and equity issuance during the quarter. We are also overweight the consumer discretionary sector as we anticipate that the job losses will begin to stabilize and spending will improve later in 2009.
On behalf of Security Global Investors, I would like to thank you for trusting your funds with us. As always, we continue to do our best to seek the potential available in mid capitalization companies.
|
| Sincerely, |
|
| |
| Joseph O’Connor |
| Portfolio Manager |
| 1 | Performance figures are based on Class A shares and do not reflect deduction of the sales charges or taxes that a shareholder would pay on distributions or redemptions of shares. |
| | The strategies discussed herein do not assure a profit. The Fund is distributed by Rydex Distributors, Inc. |
125
| | |
| | Rydex | SGI |
| Performance Summary | | Mid Cap Growth Fund |
September 30, 2009 | | (unaudited) |
PERFORMANCE
Mid Cap Growth Fund vs. Russell MidCap Growth Index
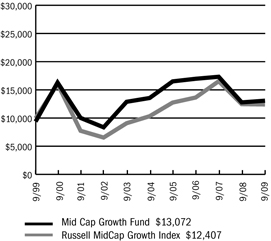
$10,000 Over Ten Years
This chart assumes a $10,000 investment in Class A shares of Mid Cap Growth Fund on September 30, 1999, reflects deduction of the 5.75% sales load and assumes all dividends reinvested. The chart does not reflect the deduction of taxes that a shareholder would pay on distributions of the redemption of fund shares. The Russell MidCap Growth Index is an unmanaged capitalization-weighted index that is designed to measure the performance of the 800 smallest companies in the Russell 1000 Index with higher price-to-book ratios and higher forecasted growth values.
Average Annual Returns
| | | | | | | | | |
Periods Ended 9-30-09 | | 1 Year | | | 5 Years | | | 10 Years | |
A Shares | | 2.32 | % | | (0.72 | %) | | 3.32 | % |
A Shares with sales charge | | (3.51 | %) | | (1.89 | %) | | 2.72 | % |
B Shares | | 1.61 | % | | (1.45 | %) | | 2.65 | % |
B Shares with CDSC | | (3.39 | %) | | (1.67 | %) | | 2.65 | % |
C Shares | | 1.58 | % | | (1.46 | %) | | 2.56 | % |
C Shares with CDSC | | 0.58 | % | | (1.46 | %) | | 2.56 | % |
The performance data above represents past performance that is not predictive of future results. The investment return and principal value of an investment in the Fund will fluctuate so that an investor’s shares, when redeemed, may be worth more or less than their original cost. The figures above do not reflect deduction of the maximum front-end sales charge of 5.75% for Class A shares or the contingent deferred sales charge of 5% for Class B shares and 1% for Class C shares, as applicable, except where noted. The figures do not reflect the deduction of taxes that a shareholder would pay on distributions or redemption of shares. Such figures would be lower if the maximum sales charge and any applicable taxes were deducted.
Portfolio Composition by Sector as of 9-30-09
| | | |
Consumer Discretionary | | 17.78 | % |
Consumer Staples | | 1.78 | |
Energy | | 7.33 | |
Financials | | 3.70 | |
Health Care | | 11.18 | |
Industrials | | 12.00 | |
Information Technology | | 28.39 | |
Materials | | 7.81 | |
Exchange Traded Funds | | 5.00 | |
Repurchase Agreement | | 5.08 | |
Liabilities, Less Cash & Other Assets | | (0.05 | ) |
| | | |
Total Net Assets | | 100.00 | % |
| | | |
The accompanying notes are an integral part of the financial statements
126
| | |
| | Rydex | SGI |
| Performance Summary | | Mid Cap Growth Fund |
September 30, 2009 | | (unaudited) |
Information About Your Fund’s Expenses
Calculating your ongoing Fund expenses
Example
As a shareholder of the Fund, you incur two types of costs: (1) transaction costs, which may include sales charges (loads) on purchase payments; contingent deferred sales charges on redemptions; and redemption fees, if any; and (2) ongoing costs, including management fees; distribution and/or service fees (12b-1); and other Fund expenses. This example is intended to help you understand your ongoing costs (in dollars) of investing in the Series and to compare these costs with ongoing costs of investing in other mutual funds. The example is based on an investment of $1,000 invested at the beginning of the period and held for the entire period April 1, 2009 through September 30, 2009.
Actual Expenses
The first line for each class of shares in the table provides information about actual account values and actual expenses. You may use the information in this table, together with the amount you invested, to estimate the expenses that you paid over the period. Simply divide your account value by $1,000 (for example, an $8,600 account value divided by $1,000 = 8.6), then multiply the result by the number in the table under the heading entitled “Expenses Paid During the Period” to estimate the expenses you paid on your account during this period.
Hypothetical Example for Comparison Purposes
The second line for each class of shares in the table provides information about hypothetical account values and hypothetical expenses based on the Fund’s actual expense ratio and an assumed rate of return of 5% per year before expenses, which is not the Fund’s actual return. The hypothetical account values and expenses may not be used to estimate the actual ending account balance or expenses you paid for the period. You may use this information to compare the ongoing costs of investing in the Fund and other funds. To do so, compare this 5% hypothetical example with the 5% hypothetical examples that appear in the shareholder reports of the other mutual funds.
Please note that the expenses shown in the table are meant to highlight your ongoing costs only and do not reflect any transactional costs, such as sales charges (loads) on purchase payments, contingent deferred sales charges on redemptions, and redemption fees, if any. Therefore, the second line for each class of shares is useful in comparing ongoing costs only, and will not help you determine the relative total costs of owning different funds. In addition, if these transactional costs were included, your costs would have been higher.
Fund Expenses
| | | | | | | | | |
| | | Beginning
Account
Value
4/1/2009 | | Ending
Account
Value
9/30/2009 1 | | Expenses
Paid
During
Period 2 |
Mid Cap Growth Fund - Class A | | | | | | | | | |
Actual | | $ | 1,000.00 | | $ | 1,388.53 | | $ | 10.30 |
Hypothetical | | | 1,000.00 | | | 1,016.44 | | | 8.69 |
Mid Cap Growth Fund - Class B | | | | | | | | | |
Actual | | | 1,000.00 | | | 1,380.95 | | | 14.68 |
Hypothetical | | | 1,000.00 | | | 1,012.73 | | | 12.41 |
Mid Cap Growth Fund - Class C | | | | | | | | | |
Actual | | | 1,000.00 | | | 1,384.43 | | | 14.76 |
Hypothetical | | | 1,000.00 | | | 1,012.68 | | | 12.46 |
| 1 | The actual ending account value is based on the actual total return of the Fund for the period April 1, 2009 to September 30, 2009 after actual expenses and will differ from the hypothetical ending account value which is based on the Fund expense ratio and a hypothetical annual return of 5% before expenses. The actual cumulative return at net asset value for the period April 1, 2009 to September 30, 2009 was 38.85%, 38.10% and 38.44%, for Class A, B and C shares, respectively. |
| 2 | Expenses are equal to the Fund annualized expense ratio (1.72%, 2.47% and 2.47% for Class A, B, and C shares, respectively), net of any applicable fee waivers, multiplied by the average account value over the period, multiplied by 183/365 (to reflect the one-half year period). |
127
| | |
| Schedule of Investments | | Rydex | SGI |
| September 30, 2009 | | Mid Cap Growth Fund |
| | | | | |
| | | Shares | | Value |
COMMON STOCKS - 94.9% | | | | | |
Advertising - 2.1% | | | | | |
Omnicom Group, Inc. | | 49,270 | | $ | 1,820,034 |
| | | | | |
Aerospace & Defense - 4.6% | | | | | |
Goodrich Corporation | | 16,050 | | | 872,157 |
ITT Corporation | | 32,900 | | | 1,715,735 |
Precision Castparts Corporation | | 12,615 | | | 1,285,090 |
| | | | | |
| | | | | 3,872,982 |
| | | | | |
Apparel Retail - 3.4% | | | | | |
Gap, Inc. | | 68,730 | | | 1,470,822 |
TJX Companies, Inc. | | 37,630 | | | 1,397,955 |
| | | | | |
| | | | | 2,868,777 |
| | | | | |
Application Software - 1.3% | | | | | |
Nuance Communications, Inc. * | | 74,085 | | | 1,108,312 |
| | | | | |
Asset Management & Custody Banks - 2.1% | | | | | |
BlackRock, Inc. | | 8,340 | | | 1,808,278 |
| | | | | |
Casinos & Gaming - 1.6% | | | | | |
WMS Industries, Inc. * | | 30,815 | | | 1,373,116 |
| | | | | |
Coal & Consumable Fuels - 1.0% | | | | | |
Peabody Energy Corporation | | 21,730 | | | 808,791 |
| | | | | |
Computer Storage & Peripherals - 1.7% | | | | | |
QLogic Corporation * | | 83,205 | | | 1,431,126 |
| | | | | |
Data Processing & Outsourced Services - 5.7% | | | | | |
Alliance Data Systems Corporation * | | 32,570 | | | 1,989,376 |
Global Payments, Inc. | | 43,485 | | | 2,030,749 |
Western Union Company | | 42,750 | | | 808,830 |
| | | | | |
| | | | | 4,828,955 |
| | | | | |
Electrical Components & Equipment - 2.7% | | | | | |
Baldor Electric Company | | 54,200 | | | 1,481,828 |
Roper Industries, Inc. | | 16,370 | | | 834,543 |
| | | | | |
| | | | | 2,316,371 |
| | | | | |
Exchange Traded Funds - 5.0% | | | | | |
iShares Russell Midcap Growth Index Fund | | 100,065 | | | 4,255,764 |
| | | | | |
Health Care Equipment - 4.5% | | | | | |
Beckman Coulter, Inc. | | 34,370 | | | 2,369,468 |
Zimmer Holdings, Inc. * | | 26,500 | | | 1,416,425 |
| | | | | |
| | | | | 3,785,893 |
| | | | | |
Home Entertainment Software - 2.6% | | | | | |
Activision Blizzard, Inc. * | | 180,180 | | | 2,232,430 |
| | | | | |
Homefurnishing Retail - 2.5% | | | | | |
Bed Bath & Beyond, Inc. * | | 57,370 | | | 2,153,670 |
| | | | | |
Hotels, Resorts & Cruise Lines - 1.4% | | | | | |
Starwood Hotels & Resorts Worldwide, Inc. | | 36,700 | | | 1,212,201 |
| | | | | |
| | | | | |
| | | Shares | | Value |
COMMON STOCKS - 94.9% (continued) | | | | | |
Household Products - 1.8% | | | | | |
Clorox Company | | 25,700 | | $ | 1,511,674 |
| | | | | |
Housewares & Specialties - 5.1% | | | | | |
Fortune Brands, Inc. | | 35,400 | | | 1,521,492 |
Jarden Corporation | | 98,380 | | | 2,761,526 |
| | | | | |
| | | | | 4,283,018 |
| | | | | |
Industrial Gases - 4.7% | | | | | |
AirGas, Inc. | | 42,005 | | | 2,031,783 |
Praxair, Inc. | | 24,025 | | | 1,962,602 |
| | | | | |
| | | | | 3,994,385 |
| | | | | |
Industrial Machinery - 3.0% | | | | | |
Dover Corporation | | 66,500 | | | 2,577,540 |
| | | | | |
IT Consulting & Other Services - 5.3% | | | | | |
Amdocs, Ltd. * | | 67,200 | | | 1,806,336 |
Cognizant Technology Solutions Corporation * | | 69,545 | | | 2,688,610 |
| | | | | |
| | | | | 4,494,946 |
| | | | | |
Leisure Facilities - 1.7% | | | | | |
Life Time Fitness, Inc. * | | 50,365 | | | 1,412,738 |
| | | | | |
Life Sciences Tools & Services - 4.2% | | | | | |
Illumina, Inc. * | | 46,100 | | | 1,959,250 |
Thermo Fisher Scientific, Inc. * | | 37,215 | | | 1,625,179 |
| | | | | |
| | | | | 3,584,429 |
| | | | | |
Metal & Glass Containers - 3.1% | | | | | |
Ball Corporation | | 53,822 | | | 2,648,042 |
| | | | | |
Multi-Line Insurance - 1.6% | | | | | |
HCC Insurance Holdings, Inc. | | 48,850 | | | 1,336,048 |
| | | | | |
Oil & Gas Drilling - 1.3% | | | | | |
Noble Corporation | | 28,515 | | | 1,082,429 |
| | | | | |
Oil & Gas Equipment & Services - 3.5% | | | | | |
National Oilwell Varco, Inc. * | | 36,150 | | | 1,559,150 |
Weatherford International, Ltd. * | | 72,100 | | | 1,494,633 |
| | | | | |
| | | | | 3,053,783 |
| | | | | |
Oil & Gas Storage & Transportation - 1.5% | | | | | |
Williams Companies, Inc. | | 72,005 | | | 1,286,729 |
| | | | | |
Pharmaceuticals - 2.5% | | | | | |
Teva Pharmaceutical Industries, Ltd. ADR | | 42,365 | | | 2,141,974 |
| | | | | |
Railroads - 1.7% | | | | | |
Union Pacific Corporation | | 24,620 | | | 1,436,577 |
| | | | | |
Semiconductors - 5.5% | | | | | |
ON Semiconductor Corporation * | | 314,465 | | | 2,594,336 |
Skyworks Solutions, Inc. * | | 157,025 | | | 2,079,011 |
| | | | | |
| | | | | 4,673,347 |
| | | | | |
Systems Software - 6.2% | | | | | |
Check Point Software Technologies * | | 60,885 | | | 1,726,090 |
Rovi Corporation * | | 44,400 | | | 1,491,840 |
The accompanying notes are an integral part of the financial statements
128
| | |
| Schedule of Investments | | Rydex | SGI |
| September 30, 2009 | | Mid Cap Growth Fund |
| | | | | | | |
| | | Shares | | Value | |
COMMON STOCKS - 94.9% (continued) | | | | | | | |
Systems Software - 6.2% (continued) | | | | | | | |
Sybase, Inc. * | | | 55,660 | | $ | 2,165,174 | |
| | | | | | | |
| | | | | | 5,383,104 | |
| | | | | | | |
TOTAL COMMON STOCKS (cost $68,626,203) | | | | | $ | 80,777,463 | |
| | | | | | | |
| | |
| | | Shares | | Value | |
WARRANTS - 0.0% | | | | | | | |
Nova Biosource Fuels, Inc. $2.40, 7/5/2011 1 | | | 208,050 | | | 2,107 | |
| | | | | | | |
TOTAL WARRANTS (cost $214,905) | | | | | $ | 2,107 | |
| | | | | | | |
| | |
| | | Principal
Amount | | Value | |
REPURCHASE AGREEMENT - 5.1% | | | | | | | |
UMB Financial Corp, 0.05%, dated 9/30/09, matures 10/01/09; repurchase amount $4,319,006 (Collateralized by GNR, 3.50%, 5/16/39 with a value of $4,405,380) 1 | | $ | 4,319,000 | | $ | 4,319,000 | |
| | | | | | | |
TOTAL REPURCHASE AGREEMENT (cost $4,319,000) | | | | | $ | 4,319,000 | |
| | | | | | | |
Total Investments - 100.0% 2 (cost $73,160,108) | | | | | $ | 85,098,570 | |
| | | | | | | |
Liabilities, Less Cash & Other Assets - 0.0% | | | | | | (38,638 | ) |
| | | | | | | |
Total Net Assets - 100.0% | | | | | $ | 85,059,932 | |
| | | | | | | |
For federal income tax purposes the identified cost of investments owned at September 30, 2009 was $73,848,150.
| ADR | American Depositary Receipt |
| * | Non-income producing security |
| 1 | Value determined based on Level 2 inputs established by ASC 820. |
| 2 | Unless otherwise indicated, the values of the securities of the Portfolio are determined based on Level 1 inputs established by ASC 820. |
The accompanying notes are an integral part of the financial statements
129
Rydex | SGI
Mid Cap Growth Fund
Statement of Assets and Liabilities
September 30, 2009
| | | | |
Assets: | | | | |
Investments, at value * | | $ | 85,098,570 | |
Cash | | | 11 | |
Receivables: | | | | |
Fund shares sold | | | 14,260 | |
Securities sold | | | 4,610,812 | |
Dividends | | | 43,090 | |
Prepaid expenses | | | 22,049 | |
| | | | |
Total assets | | | 89,788,792 | |
| | | | |
Liabilities: | | | | |
Payable for: | | | | |
Securities purchased | | | 4,410,759 | |
Fund shares redeemed | | | 180,192 | |
Management fees | | | 51,866 | |
Custodian fees | | | 712 | |
Transfer agent/maintenance fees | | | 16,343 | |
Administration fees | | | 6,910 | |
Professional fees | | | 18,850 | |
12b-1 distribution plan fees | | | 25,289 | |
Directors’ fees | | | 4,763 | |
Other | | | 13,176 | |
| | | | |
Total liabilities | | | 4,728,860 | |
| | | | |
Net assets | | $ | 85,059,932 | |
| | | | |
Net assets consist of: | | | | |
Paid in capital | | $ | 118,817,348 | |
Accumulated net realized loss on sale of investments | | | (45,695,878 | ) |
Net unrealized appreciation in value of investments | | | 11,938,462 | |
| | | | |
Net assets | | $ | 85,059,932 | |
| | | | |
Class A: | | | | |
Capital shares outstanding
(unlimited number of shares authorized) | | | 11,006,954 | |
Net assets | | $ | 71,984,712 | |
Net asset value and redemption price per share | | $ | 6.54 | |
| | | | |
Maximum offering price per share
(net asset value divided by 94.25%) | | $ | 6.94 | |
| | | | |
Class B: | | | | |
Capital shares outstanding
(unlimited number of shares authorized) | | | 1,511,097 | |
Net assets | | $ | 7,453,636 | |
Net asset value, offering and redemption price per share (excluding any applicable contingent deferred sales charge) | | $ | 4.93 | |
| | | | |
Class C: | | | | |
Capital shares outstanding
(unlimited number of shares authorized) | | | 988,727 | |
Net assets | | $ | 5,621,584 | |
Net asset value, offering and redemption price per share (excluding any applicable contingent deferred sales charge) | | $ | 5.69 | |
| | | | |
* Investments, at cost | | $ | 73,160,108 | |
Statement of Operations
For the Year Ended September 30, 2009
| | | | |
Investment Income: | | | | |
Dividends | | $ | 531,293 | |
Interest | | | 8,795 | |
| | | | |
Total investment income | | | 540,088 | |
| | | | |
Expenses: | | | | |
Management fees | | | 508,100 | |
Transfer agent/maintenance fees | | | 334,742 | |
Administration fees | | | 64,752 | |
Custodian fees | | | 2,520 | |
Directors’ fees | | | 8,514 | |
Professional fees | | | 27,300 | |
Reports to shareholders | | | 20,723 | |
Registration fees | | | 42,607 | |
Other expenses | | | 30,879 | |
12b-1 distribution fees - Class A | | | 142,453 | |
12b-1 distribution fees - Class B | | | 59,573 | |
12b-1 distribution fees - Class C | | | 48,083 | |
| | | | |
Total expenses | | | 1,290,246 | |
| | | | |
Net investment loss | | | (750,158 | ) |
| | | | |
Net Realized and Unrealized Gain (Loss): | | | | |
Net realized gain (loss) during the year on: | | | | |
Investments | | | (21,443,279 | ) |
| | | | |
Net realized loss | | | (21,443,279 | ) |
| | | | |
Net unrealized appreciation (depreciation) during the year on: | | | | |
Investments | | | 22,788,661 | |
| | | | |
Net unrealized appreciation | | | 22,788,661 | |
| | | | |
Net realized and unrealized gain | | | 1,345,382 | |
| | | | |
Net increase in net assets resulting from operations | | $ | 595,224 | |
| | | | |
The accompanying notes are an integral part of the financial statements
130
| | |
| | Rydex | SGI |
| Statement of Changes in Net Assets | | Mid Cap Growth Fund |
| | | | | | | | |
| | | Year Ended
September 30, 2009 | | | Year Ended
September 30, 2008 | |
Increase (decrease) in net assets from operations: | | | | | | | | |
Net investment loss | | $ | (750,158 | ) | | $ | (988,218 | ) |
Net realized loss during the year on investments | | | (21,443,279 | ) | | | (22,363,569 | ) |
Net unrealized appreciation (depreciation) during the year on investments | | | 22,788,661 | | | | (13,666,899 | ) |
| | | | | | | | |
Net increase (decrease) in net assets resulting from operations | | | 595,224 | | | | (37,018,686 | ) |
| | | | | | | | |
Distributions to shareholders from: | | | | | | | | |
Net realized gain | | | | | | | | |
Class A | | | (535,743 | ) | | | (28,305,723 | ) |
Class B | | | (73,574 | ) | | | (3,379,810 | ) |
Class C | | | (53,571 | ) | | | (2,111,785 | ) |
| | | | | | | | |
Total distributions to shareholders | | | (662,888 | ) | | | (33,797,318 | ) |
| | | | | | | | |
Capital share transactions: | | | | | | | | |
Proceeds from sale of shares | | | | | | | | |
Class A | | | 12,472,300 | | | | 13,994,661 | |
Class B | | | 2,327,638 | | | | 1,239,490 | |
Class C | | | 1,992,612 | | | | 1,676,082 | |
Distributions reinvested | | | | | | | | |
Class A | | | 513,214 | | | | 27,267,564 | |
Class B | | | 72,606 | | | | 3,319,686 | |
Class C | | | 50,288 | | | | 1,945,651 | |
Cost of shares redeemed | | | | | | | | |
Class A | | | (12,908,354 | ) | | | (70,720,345 | ) |
Class B | | | (2,576,449 | ) | | | (4,954,737 | ) |
Class C | | | (2,633,411 | ) | | | (3,272,723 | ) |
| | | | | | | | |
Net decrease from capital share transactions | | | (689,556 | ) | | | (29,504,671 | ) |
| | | | | | | | |
Net decrease in net assets | | | (757,220 | ) | | | (100,320,675 | ) |
| | | | | | | | |
Net assets: | | | | | | | | |
Beginning of year | | | 85,817,152 | | | | 186,137,827 | |
| | | | | | | | |
End of year | | $ | 85,059,932 | | | $ | 85,817,152 | |
| | | | | | | | |
Accumulated net investment income at end of year | | $ | — | | | $ | — | |
| | | | | | | | |
Capital share activity: | | | | | | | | |
Shares sold | | | | | | | | |
Class A | | | 2,324,333 | | | | 1,697,528 | |
Class B | | | 571,695 | | | | 186,925 | |
Class C | | | 344,666 | | | | 236,049 | |
Shares reinvested | | | | | | | | |
Class A | | | 111,569 | | | | 3,416,988 | |
Class B | | | 20,804 | | | | 542,432 | |
Class C | | | 12,509 | | | | 275,979 | |
Shares redeemed | | | | | | | | |
Class A | | | (2,528,289 | ) | | | (8,463,584 | ) |
Class B | | | (647,831 | ) | | | (800,385 | ) |
Class C | | | (506,175 | ) | | | (434,505 | ) |
The accompanying notes are an integral part of the financial statements
131
| | |
| Financial Highlights | | Rydex | SGI |
Selected data for each share of capital stock outstanding throughout each year | | Mid Cap Growth Fund |
| | | | | | | | | | | | | | | | | | | | |
Class A | | 2009 | | | 2008 | | | 2007 | | | 2006 | | | Year Ended
September 30,
2005 | |
Per Share Data | | | | | | | | | | | | | | | | | | | | |
Net asset value, beginning of period | | $ | 6.46 | | | $ | 11.11 | | | $ | 12.03 | | | $ | 12.65 | | | $ | 11.02 | |
| | | | | | | | | | | | | | | | | | | | |
Income (loss) from investment operations: | | | | | | | | | | | | | | | | | | | | |
Net investment loss a | | | (0.05 | ) | | | (0.05 | ) | | | (0.08 | ) | | | (0.12 | ) | | | (0.10 | ) |
| | | | | | | | | | | | | | | | | | | | |
Net gain (loss) on securities (realized and unrealized) | | | 0.18 | | | | (2.46 | ) | | | 0.35 | | | | 0.47 | | | | 2.46 | |
| | | | | | | | | | | | | | | | | | | | |
Total from investment operations | | | 0.13 | | | | (2.51 | ) | | | 0.27 | | | | 0.35 | | | | 2.36 | |
| | | | | | | | | | | | | | | | | | | | |
Less distributions: | | | | | | | | | | | | | | | | | | | | |
Distributions from realized gains | | | (0.05 | ) | | | (2.14 | ) | | | (1.19 | ) | | | (0.97 | ) | | | (0.73 | ) |
| | | | | | | | | | | | | | | | | | | | |
Total distributions | | | (0.05 | ) | | | (2.14 | ) | | | (1.19 | ) | | | (0.97 | ) | | | (0.73 | ) |
| | | | | | | | | | | | | | | | | | | | |
Net asset value, end of period | | $ | 6.54 | | | $ | 6.46 | | | $ | 11.11 | | | $ | 12.03 | | | $ | 12.65 | |
| | | | | | | | | | | | | | | | | | | | |
Total Return b | | | 2.32 | % | | | (26.24 | %) | | | 2.10 | % | | | 2.81 | % | | | 21.76 | % |
| | | | | | | | | | | | | | | | | | | | |
Ratios/Supplemental Data | | | | | | | | | | | | | | | | | | | | |
Net assets, end of period (in thousands) | | $ | 71,985 | | | $ | 71,655 | | | $ | 160,544 | | | $ | 192,159 | | | $ | 183,676 | |
| | | | | | | | | | | | | | | | | | | | |
Ratios to average net assets: | | | | | | | | | | | | | | | | | | | | |
Net investment loss | | | (0.99 | %) | | | (0.63 | %) | | | (0.67 | %) | | | (0.93 | %) | | | (0.85 | %) |
Total expenses c | | | 1.78 | % | | | 1.50 | % | | | 1.41 | % | | | 1.40 | % | | | 1.42 | % |
Net expenses d | | | 1.78 | % | | | 1.50 | % | | | 1.41 | % | | | 1.40 | % | | | 1.42 | % |
Net expenses prior to custodian earning credits and net of expense waivers | | | 1.78 | % | | | 1.50 | % | | | 1.41 | % | | | 1.40 | % | | | 1.42 | % |
| | | | | | | | | | | | | | | | | | | | |
Portfolio turnover rate | | | 138 | % | | | 191 | %e | | | 34 | % | | | 41 | % | | | 31 | % |
| | | | | |
Class B | | 2009 | | | 2008 | | | 2007 | | | 2006 | | | Year Ended
September 30,
2005 | |
Per Share Data | | | | | | | | | | | | | | | | | | | | |
Net asset value, beginning of period | | $ | 4.92 | | | $ | 9.09 | | | $ | 10.12 | | | $ | 10.86 | | | $ | 9.61 | |
| | | | | | | | | | | | | | | | | | | | |
Income (loss) from investment operations: | | | | | | | | | | | | | | | | | | | | |
Net investment loss a | | | (0.07 | ) | | | (0.09 | ) | | | (0.14 | ) | | | (0.18 | ) | | | (0.16 | ) |
Net gain (loss) on securities (realized and unrealized) | | | 0.13 | | | | (1.94 | ) | | | 0.30 | | | | 0.41 | | | | 2.14 | |
| | | | | | | | | | | | | | | | | | | | |
Total from investment operations | | | 0.06 | | | | (2.03 | ) | | | 0.16 | | | | 0.23 | | | | 1.98 | |
| | | | | | | | | | | | | | | | | | | | |
Less distributions: | | | | | | | | | | | | | | | | | | | | |
Distributions from realized gains | | | (0.05 | ) | | | (2.14 | ) | | | (1.19 | ) | | | (0.97 | ) | | | (0.73 | ) |
| | | | | | | | | | | | | | | | | | | | |
Total distributions | | | (0.05 | ) | | | (2.14 | ) | | | (1.19 | ) | | | (0.97 | ) | | | (0.73 | ) |
| | | | | | | | | | | | | | | | | | | | |
Net asset value, end of period | | $ | 4.93 | | | $ | 4.92 | | | $ | 9.09 | | | $ | 10.12 | | | $ | 10.86 | |
| | | | | | | | | | | | | | | | | | | | |
Total Return b | | | 1.61 | % | | | (26.92 | %) | | | 1.34 | % | | | 2.12 | % | | | 20.95 | % |
| | | | | | | | | | | | | | | | | | | | |
Ratios/Supplemental Data | | | | | | | | | | | | | | | | | | | | |
Net assets, end of period (in thousands) | | $ | 7,454 | | | $ | 7,711 | | | $ | 14,877 | | | $ | 22,010 | | | $ | 27,115 | |
| | | | | | | | | | | | | | | | | | | | |
Ratios to average net assets: | | | | | | | | | | | | | | | | | | | | |
Net investment loss | | | (1.73 | %) | | | (1.40 | %) | | | (1.43 | %) | | | (1.68 | %) | | | (1.61 | %) |
Total expenses c | | | 2.53 | % | | | 2.26 | % | | | 2.16 | % | | | 2.15 | % | | | 2.17 | % |
Net expenses d | | | 2.53 | % | | | 2.26 | % | | | 2.16 | % | | | 2.15 | % | | | 2.17 | % |
Net expenses prior to custodian earning credits and net of expense waivers | | | 2.53 | % | | | 2.26 | % | | | 2.16 | % | | | 2.15 | % | | | 2.17 | % |
| | | | | | | | | | | | | | | | | | | | |
Portfolio turnover rate | | | 138 | % | | | 191 | %e | | | 34 | % | | | 41 | % | | | 31 | % |
The accompanying notes are an integral part of the financial statements
132
| | |
| Financial Highlights | | Rydex | SGI |
Selected data for each share of capital stock outstanding throughout each year | | Mid Cap Growth Fund |
| | | | | | | | | | | | | | | | | | | | |
Class C | | 2009 | | | 2008 | | | 2007 | | | 2006 | | | Year Ended
September 30,
2005 | |
Per Share Data | | | | | | | | | | | | | | | | | | | | |
Net asset value, beginning of period | | $ | 5.67 | | | $ | 10.11 | | | $ | 11.13 | | | $ | 11.84 | | | $ | 10.43 | |
| | | | | | | | | | | | | | | | | | | | |
Income (loss) from investment operations: | | | | | | | | | | | | | | | | | | | | |
Net investment loss a | | | (0.08 | ) | | | (0.10 | ) | | | (0.15 | ) | | | (0.19 | ) | | | (0.18 | ) |
Net gain (loss) on securities (realized and unrealized) | | | 0.15 | | | | (2.20 | ) | | | 0.32 | | | | 0.45 | | | | 2.32 | |
| | | | | | | | | | | | | | | | | | | | |
Total from investment operations | | | 0.07 | | | | (2.30 | ) | | | 0.17 | | | | 0.26 | | | | 2.14 | |
| | | | | | | | | | | | | | | | | | | | |
Less distributions: | | | | | | | | | | | | | | | | | | | | |
Distributions from realized gains | | | (0.05 | ) | | | (2.14 | ) | | | (1.19 | ) | | | (0.97 | ) | | | (0.73 | ) |
| | | | | | | | | | | | | | | | | | | | |
Total distributions | | | (0.05 | ) | | | (2.14 | ) | | | (1.19 | ) | | | (0.97 | ) | | | (0.73 | ) |
| | | | | | | | | | | | | | | | | | | | |
Net asset value, end of period | | $ | 5.69 | | | $ | 5.67 | | | $ | 10.11 | | | $ | 11.13 | | | $ | 11.84 | |
| | | | | | | | | | | | | | | | | | | | |
Total Return b | | | 1.58 | % | | | (26.87 | %) | | | 1.31 | % | | | 2.20 | % | | | 20.83 | % |
| | | | | | | | | | | | | | | | | | | | |
Ratios/Supplemental Data | | | | | | | | | | | | | | | | | | | | |
Net assets, end of period (in thousands) | | $ | 5,622 | | | $ | 6,452 | | | $ | 10,717 | | | $ | 15,505 | | | $ | 16,330 | |
| | | | | | | | | | | | | | | | | | | | |
Ratios to average net assets: | | | | | | | | | | | | | | | | | | | | |
Net investment loss | | | (1.74 | %) | | | (1.40 | %) | | | (1.43 | %) | | | (1.68 | %) | | | (1.60 | %) |
Total expenses c | | | 2.54 | % | | | 2.26 | % | | | 2.16 | % | | | 2.15 | % | | | 2.17 | % |
Net expenses d | | | 2.54 | % | | | 2.26 | % | | | 2.16 | % | | | 2.15 | % | | | 2.17 | % |
Net expenses prior to custodian earning credits and net of expense waivers | | | 2.54 | % | | | 2.26 | % | | | 2.16 | % | | | 2.15 | % | | | 2.17 | % |
| | | | | | | | | | | | | | | | | | | | |
Portfolio turnover rate | | | 138 | % | | | 191 | % e | | | 34 | % | | | 41 | % | | | 31 | % |
| a | Net investment income (loss) was computed using average shares outstanding throughout the period. |
| b | Total return information does not reflect deduction of any sales charges imposed at the time of purchase for Class A shares or upon redemption for Class B and C shares. |
| c | Total expense information reflects expense ratios absent expense reductions by the Investment Manager and custodian earnings credits, as applicable. |
| d | Net expense information reflects the expense ratios after voluntary expense waivers, reimbursements and custodian earnings credits, as applicable. |
| e | Significant variation in the portfolio turnover rate is due to the Investment Manager’s appointment of new portfolio managers for the fund. |
The accompanying notes are an integral part of the financial statements
133
Notes to Financial Statements
September 30, 2009
1. Significant Accounting Policies
Rydex | SGI Large Cap Value, Equity and Mid Cap Growth Funds (formerly Security Large Cap Value Fund, Security Equity Fund and Security Mid Cap Growth Fund, respectively), (collectively referred to herein as the Funds) are registered under the Investment Company Act of 1940 (the “1940 Act”), as amended, as open-end management investment companies. The shares of Rydex | SGI Equity Fund and Large Cap Value Fund are currently issued in multiple series, with each series, in effect, representing a separate fund. The Rydex | SGI Equity Fund and Large Cap Value Fund account for the assets of each series separately. Class “A” shares are generally sold with a sales charge at the time of purchase. Class “A” shares are not subject to a sales charge when they are redeemed, except for purchases of $1 million or more sold without a front-end sales charge are subject to a contingent deferred sales charge if redeemed within one year of purchase. Class “B” shares may be subject to a contingent deferred sales charge for six years and automatically convert to Class A shares after eight years. Redemptions of Class “B” shares within five years of acquisition incur a contingent deferred sales charge. Class “C” shares are offered without a front-end sales charge but incur additional class-specific expenses. Redemptions of Class “C” shares within one year of acquisition incur a contingent deferred sales charge. “Institutional” Class shares are offered primarily for direct investment by institutions, such as pension and profit sharing plans, endowments, foundations and corporations. Institutional class shares have a minimum initial investment of $2 million and a minimum account balance of $1 million. Institutional Class shares are offered without a front-end sales charge or a contingent deferred sales charge. The following is a summary of the significant accounting policies followed by the Funds in the preparation of their financial statements.
In June 2009, the Financial Accounting Standards Board (FASB) established the FASB Accounting Standards Codification TM (ASC) as the single source of authoritative accounting principles recognized by the FASB in the preparation of financial statements in conformity with GAAP. The ASC supersedes existing non-grandfathered, non-SEC accounting and reporting standards. The ASC did not change GAAP but rather organized it into a hierarchy where all guidance within the ASC carries an equal level of authority. The ASC became effective for financial statements issued for interim and annual periods ending after September 15, 2009. The ASC had no material effect on the Funds’ financial statements.
A. Security Valuation – Valuations of the Funds’ or Series’ securities are supplied by pricing services approved by the Board of Directors. The Funds’ officers, under the general supervision of the Board of Directors, regularly review procedures used by, and valuations provided by, the pricing services. Each security owned by the Funds or Series that is listed on a securities exchange is valued at its last sale price on that exchange on the date as of which assets are valued. Where the security is listed on more than one exchange, the Fund or Series will use the price of that exchange that it generally considers to be the principal exchange on which the stock is traded. Securities listed on the NASDAQ Stock Market, Inc. (“NASDAQ”) will be valued at the NASDAQ Official Closing Price, which may not necessarily represent the last
sale price. If there has been no sale on such exchange or NASDAQ on such day, the security is valued at the closing bid price on such day. Securities for which market quotations are not readily available are valued taking into consideration securities with similar yields, quality, type of issue, coupon, duration and rating. If there is no bid price or if the bid price is deemed to be unsatisfactory by the Board of Directors or by the Funds’ or Series’ investment manager, then the securities are valued in good faith by such method as the Board of Directors determines will reflect the fair value. If events occur after the close of a foreign exchange that will affect the value of a Fund or Series portfolio securities before the time as of which the NAV is calculated (a “significant event”), the security will generally be priced using a fair value procedure. If the Valuation Committee determines a significant event has occurred, it will evaluate the impact of that event on an affected security or securities, to determine whether a fair value adjustment would materially affect the Fund or Series net asset value per share. Some of the factors which may be considered by the Board of Directors in determining fair value are fundamental analytical data relating to the investment, the nature and duration of any restrictions on disposition, trading in similar securities of the same issuer or comparable companies, information from broker-dealers, and an evaluation of the forces that influence the market in which the securities are purchased and sold. The Funds or Series generally will value short-term debt securities at prices based on market quotations for such securities or securities of similar type, yield, quality and duration, except those securities purchased with 60 days or less to maturity are valued on the basis of amortized cost, which approximates market value.
Generally, trading in foreign securities markets is substantially completed each day at various times prior to the close of the New York Stock Exchange. The values of foreign securities are determined as of the close of such foreign markets or the close of the New York Stock Exchange, if earlier. All investments quoted in foreign currency are valued in U.S. dollars on the basis of the foreign currency exchange rates prevailing at the close of business. Investments in foreign securities may involve risks not present in domestic investments. The Valuation Committee will determine the current value of such foreign securities by taking into consideration certain factors which may include those discussed above, as well as the following factors, among others: the value of the securities traded on other foreign markets, ADR trading, closed-end fund trading, foreign currency exchange activity, and the trading prices of financial products that are tied to foreign securities such as WEBS®. In addition, the Board of Directors has authorized the Valuation Committee and Administrator to use prices and other information supplied by a third party pricing vendor in valuing foreign securities.
B. Repurchase Agreements - In connection with transactions in repurchase agreements, it is the Funds’ or Series’ policy that their custodian take possession of the underlying collateral and that the fair value of the collateral exceed the principal amount of the repurchase transaction, including accrued interest, at all times. If the seller defaults, and the fair value of the collateral declines, realization of the collateral by the Fund or Series may be delayed or limited.
134
Notes to Financial Statements
September 30, 2009
C. Foreign Currency Transactions – The accounting records of the Funds or Series are maintained in U.S. dollars. All assets and liabilities initially expressed in foreign currencies are converted into U.S. dollars at prevailing exchange rates. Purchases and sales of investment securities, dividend and interest income, and certain expenses are translated at the rates of exchange prevailing on the respective dates of such transactions. Changes in the relationship of these foreign currencies to the U.S. dollar can significantly affect the value of the investments and earnings of the Funds or Series. Foreign investments may also subject the Fund or Series to foreign government exchange restrictions, expropriation, taxation or other political, social or economic developments, all of which could affect the market and/or credit risk of the investments.
The Funds or Series do not isolate that portion of the results of operations resulting from changes in the foreign exchange rates on investments from the fluctuations arising from changes in the market prices of securities held. Such fluctuations are included with the net realized and unrealized gain or loss on investments.
Net realized foreign exchange gains or losses arise from sales of portfolio securities, sales of foreign currencies, and the difference between asset and liability amounts initially stated in foreign currencies and the U.S. dollar value of the amounts actually received or paid. Net unrealized foreign exchange gains or losses arise from changes in the value of portfolio securities and other assets and liabilities at the end of the reporting period, resulting from changes in the exchange rates.
D. Forward Foreign Currency Exchange Contracts – Certain Funds or Series may enter into forward foreign exchange contracts in order to manage foreign currency risk from purchase or sale of securities denominated in foreign currency. The Fund or Series may also enter into such contracts to manage the effect of changes in foreign currency exchange rates on portfolio positions. These contracts are marked to market daily, by recognizing the difference between the contract exchange rate and the current market rate as unrealized gains or losses. Realized gains or losses are recognized when contracts are settled and are reflected in the Statement of Operations. These contracts involve market risk in excess of the amount reflected in the Statement of Assets and Liabilities. The face or contract amount in U.S. dollars reflects the total exposure these Funds or Series have in that particular currency contract. Losses may arise due to changes in the value of the foreign currency or if the counterparty does not perform under the contract.
E. Futures - The Funds or Series may utilize futures contracts to a limited extent, with the objectives of maintaining full exposure to the underlying stock market, enhancing returns, maintaining liquidity, minimizing transaction costs and hedging possible variations in foreign exchange values. The Funds or Series, as applicable, may purchase or sell financial and foreign currency futures contracts to immediately position incoming cash in the market, thereby simulating a fully invested position in the underlying index while maintaining a cash balance for liquidity. In the event of redemptions, the Fund or Series, as applicable, may pay from its cash balances and reduce its future positions accordingly. Returns may be enhanced by purchasing futures contracts instead of the underlying securities
when futures are believed to be priced more attractively than the underlying securities. The primary risks associated with the use of futures contracts are imperfect correlation between changes in market values of stocks contained in the indexes and the prices of futures contracts, and the possibility of an illiquid market. Futures contracts are valued based upon their quoted daily settlement prices. Upon entering into a futures contract, the Funds or Series are required to deposit and maintain as collateral either cash or securities, representing the initial margin, equal to a certain percentage of the contract value. Cash deposits are shown as restricted cash on the Statement of Assets and Liabilities; securities held as collateral are noted in the Schedule of Investments. Subsequent changes in the value of the contract are recorded as unrealized gains or losses. The variation margin is paid or received in cash daily by the Funds or Series. The Funds or Series realize a gain or loss when the contract is closed or expires.
F. Options Purchased and Written – The Funds or Series may purchase put and call options and write such options on a covered basis on securities that are traded on recognized securities exchanges and over-the-counter markets. Call and put options on securities give the holder the right to purchase or sell (and the writer the obligation to sell or purchase), respectively, a security at a specified price, until a certain date. Options may be used to hedge the Funds’ or Series’ portfolio, to increase returns or to maintain exposure to the equity markets. The primary risks associated with the use of options are an imperfect correlation between the change in market value of the securities held by the Fund or Series and the price of the option, the possibility of an illiquid market, and the inability of the counterparty to meet the terms of the contract.
The premium received for a written option is recorded as an asset with an equal liability which is marked to market based on the option’s quoted daily settlement price. Fluctuations in the value of such instruments are recorded as unrealized appreciation (depreciation) until terminated, at which time realized gains and losses are recognized.
G. Securities Sold Short – Certain Funds or Series may make short sales “against the box,” in which the Fund or Series enters into a short sale of a security it owns. At no time will more than 15% of the value of the Funds’ or Series’ net assets be in deposits on short sales against the box. If a Fund or Series makes a short sale, the Fund or Series does not immediately deliver from its own account the securities sold and does not receive the proceeds from the sale. To complete the sale, the Fund or Series must borrow the security (generally from the broker through which the short sale is made) in order to make delivery to the buyer. The Fund or Series must replace the security borrowed by purchasing it at the market price at the time of replacement or delivering the security from its own portfolio. The Fund or Series is said to have a “short position” in securities sold until it delivers them to the broker, at which time it receives the proceeds of the sale. Certain Funds or Series may make short sales that are not “against the box,” which create opportunities to increase the Fund’s or Series’ return but, at the same time, involve specific risk considerations and may be considered a speculative technique. Such short sales theoretically involve unlimited loss potential, as the market price of securities sold short may continually
135
Notes to Financial Statements
September 30, 2009
increase, although a Fund or Series may mitigate such losses by replacing the securities sold short before the market price has increased significantly. For financial statement purposes, an amount equal to the settlement amount is included in the Statement of Assets and Liabilities as an asset and an equivalent liability. The amount of the liability is subsequently marked-to-market to reflect the current value of the short position. Subsequent fluctuations in the market prices of securities sold, but not yet purchased, may require purchasing the securities at prices which differ from the market value reflected on the Statement of Assets and Liabilities. The Fund or Series are liable for any dividends or interest payable on securities while those securities are in a short position and are recorded as dividend expense in the statement of operations. As collateral for its short positions, the Fund or Series are required under the 1940 Act to maintain segregated assets consisting of cash, cash equivalents or liquid securities. These segregated assets are valued consistent with Note 1A above. These segregated assets are required to be adjusted daily to reflect changes in the market value of the securities sold short.
H. Security Transactions and Investment Income – Security transactions are accounted for on the date the securities are purchased or sold (trade date). Realized gains and losses are reported on an identified cost basis. Dividend income is accrued as of the ex-dividend date, except that certain dividends for foreign securities where the ex-dividend date may have passed are recorded as soon as the Fund or Series is informed of the dividend in the exercise of reasonable diligence. Interest income is recognized on the accrual basis, including the amortization of premiums and accretion of discounts on debt securities.
I. Expenses – Expenses that are directly related to one of the Funds or Series are charged directly to that Fund or Series. Other operating expenses are allocated to the Funds or Series on the basis of relative net assets. Class specific expenses, such as 12b-1 fees, are borne by that class. Income, other expenses and realized and unrealized gains and losses of a Fund or Series are allocated to each respective class in proportion to the relative net assets of each class.
J. Distributions to Shareholders – Distributions to shareholders are recorded on the ex-dividend date. The character of distributions made during the year from net investment income or net realized gains may differ from their ultimate characterization for federal income tax purposes.
K. Taxes – The Funds or Series intend to comply with the requirements of the Internal Revenue Code applicable to regulated investment companies and distribute all of their taxable net income and net realized gains sufficient to relieve them from all, or substantially all, federal income, excise and state income taxes. Therefore, no provision for federal or state income tax is required.
The evaluation of tax positions taken or expected to be taken in the course of preparing the Fund’s or Series’ tax returns is required to determine whether the tax positions are “more-likely-than-not” of being sustained by the applicable tax authority. For all open tax years (September 30, 2006 - September 30, 2009) and all major taxing jurisdictions through the end of the reporting period, the Fund’s or Series’ management has completed a review and evaluation and has determined that no tax liability is required and no additional disclosures are needed as of September 30, 2009.
L. Earnings Credits – Under the fee agreement with the custodian, the Funds or Series may earn credits based on overnight custody cash balances. These credits are utilized to reduce related custodial expenses. The custodian fees disclosed in the Statement of Operations are before the reduction in expense from the related earnings credits.
M. Use of Estimates – The preparation of financial statements in conformity with U.S. generally accepted accounting principles requires management to make estimates and assumptions that affect the reported amounts of assets and liabilities and disclosure of contingent assets and liabilities at the date of the financial statements and the reported amounts of increases and decreases in net assets from operations during the reporting period. Actual results could differ from those estimates.
N. Indemnifications - Under the Funds’ or Series’ organizational documents, its Officers and Directors are indemnified against certain liabilities arising out of the performance of their duties to the Funds or Series. In addition, in the normal course of business, the Funds or Series enter into contracts that provide general indemnification to other parties. The Funds’ or Series’ maximum exposure under these arrangements is unknown as this would involve future claims that may be made against the Funds or Series that have not yet occurred, and may not occur. However, the Funds have not had prior claims or losses pursuant to these contracts and expect the risk of loss to be remote.
136
Notes to Financial Statements
September 30, 2009
2. Management Fees and Other Transactions with Affiliates
Management fees are paid monthly to Security Investors (SI), based on the following annual rates for the year ended September 30, 2009:
| | | |
| | | Management
Fees (as a %
of net assets) | |
Rydex | SGI Equity Fund: | | | |
All Cap Value Series | | 0.70 | % |
Alpha Opportunity Series | | 1.25 | % |
Equity Series | | 0.75 | % |
Global Series | | 1.00 | % |
Global Institutional Series | | 1.00 | % |
Mid Cap Value Series | | 0.82 | %1 |
Mid Cap Value Institutional Series | | 0.75 | % |
Select 25 Series | | 0.75 | % |
Small Cap Growth Series | | 0.85 | %2 |
Small Cap Value Series | | 1.00 | % |
Rydex | SGI Large Cap Value Fund: | | | |
Large Cap Value Fund | | 0.65 | % |
Large Cap Value Institutional Series | | 0.65 | % |
Rydex | SGI Mid Cap Growth Fund | | 0.75 | % |
| 1 | Management fees are payable at an annual rate of 1.00% of the average daily net assets of $200 million or less, and 0.75% of the average daily net assets of the Mid Cap Value Series in excess of $ 200 million. |
| 2 | Effective November 24, 2008, SI receives a management fee from the Small Cap Growth Series at an annual rate of 0.85% of the average daily net assets. Prior to November 24, 2008, SI received a management fee from Small Cap Growth Series of 1.00% of the average daily net assets. |
SI also acts as the administrative agent and transfer agent for the Funds, and as such performs administrative functions, transfer agency and dividend disbursing services, and the bookkeeping, accounting and pricing functions for each Fund or Series. For these services, the Investment Manager receives the following:
| | | | |
| | | Administrative Fees
(as a % of net assets) | |
Rydex | SGI Equity Fund: | | | | |
All Cap Value Series | | | 0.095 | % |
Alpha Opportunity Series | | | 0.15 | % |
Equity Series | | | 0.095 | % |
Global Series | |
| 0.05% + greater of
0.10% or $60,000 |
|
Global Institutional Series | | | 0.15 | % |
Mid Cap Value Series | | | 0.095 | % |
Mid Cap Value Institutional Series | | | 0.095 | % |
Select 25 Series | | | 0.095 | % |
Small Cap Growth Series | | | 0.095 | % |
Small Cap Value Series | | | 0.095 | % |
Rydex | SGI Large Cap Value Fund: | | | | |
Large Cap Value Fund | | | 0.095 | % |
Large Cap Value Institutional Series | | | 0.095 | % |
Rydex | SGI Mid Cap Growth Fund | | | 0.095 | % |
Minimum charge per Series or Fund | | $ | 25,000 | 1 |
Certain out-of-pocket charges | | | Varies | |
| 1 | SI has agreed not to charge the $25,000 minimum fee for the Global Institutional Series, Mid Cap Value Institutional Series, Small Cap Value Series and Large Cap Value Institutional Series through December 31, 2009, and on all the Cap Value Series indefinitely. |
SI is paid the following for providing transfer agent services to the Funds or Series:
| | | | |
Annual per account charge | | $ | 5.00 - $8.00 | |
Transaction fee | | $ | 0.60 - $1.10 | |
Annual minimum charge
(per Series or Fund) | | $ | 25,000 | 1 |
Certain out-of-pocket charges | | | Varies | |
| 1 | SI has agreed not to charge the $25,000 minimum fee for the Global Institutional Series, Mid Cap Value Institutional Series, Small Cap Value Series and Large Cap Value Institutional Series through December 31, 2009, and on all the Cap Value Series indefinitely. |
137
Notes to Financial Statements
September 30, 2009
The investment advisory contracts for the following Funds or Series provides that the total expenses be limited to a percentage of average net assets for each class of shares, exclusive of brokerage costs, dividends on securities sold short, expenses of other investment companies in which a Fund or Series invests, interest, taxes, litigation, indemnification and extraordinary expenses (as determined under generally accepted accounting principles) The limits are listed below:
| | | | | | | | |
| | | Limit | | | Effective
Date | | | Contract
End Date |
Rydex | SGI Equity Fund: | | | | | | | | |
All Cap Value Series - Class A | | 1.35 | % | | 10/3/2008 | | | 1/31/2010 |
All Cap Value Series - Class C | | 2.10 | % | | 10/3/2008 | | | 1/31/2010 |
All Cap Value Series - Institutional Class | | 1.10 | % | | 10/3/2008 | | | 1/31/2010 |
Alpha Opportunity Series - Class A | | 1.95 | % | | 8/18/2008 | | | 1/31/2010 |
Alpha Opportunity Series - Class B | | 2.70 | % | | 8/18/2008 | | | 1/31/2010 |
Alpha Opportunity Series - Class C | | 2.70 | % | | 8/18/2008 | | | 1/31/2010 |
Alpha Opportunity Series - Institutional Class | | 1.70 | % | | 11/7/2008 | | | 1/31/2010 |
Global Institutional Series | | 1.15 | % | | 7/11/2008 | | | 1/31/2011 |
Mid Cap Value Institutional Series | | 0.90 | % | | 4/13/2009 | 1 | | 4/30/2010 |
Select 25 Series - Class A | | 1.35 | % | | 1/11/2007 | | | 1/31/2010 |
Select 25 Series - Class B | | 2.10 | % | | 1/11/2007 | | | 1/31/2010 |
Select 25 Series - Class C | | 2.10 | % | | 1/11/2007 | | | 1/31/2010 |
Small Cap Value Series - Class A | | 1.55 | % | | 7/11/2008 | | | 1/31/2011 |
Small Cap Value Series - Class C | | 2.30 | % | | 7/11/2008 | | | 1/31/2011 |
Small Cap Value Series - Institutional Class | | 1.30 | % | | 7/11/2008 | | | 1/31/2011 |
Rydex | SGI Large Cap Value Fund: | | | | | | | | |
Large Cap Value Fund - Class A | | 1.25 | % | | 1/1/2007 | | | 1/31/2010 |
Large Cap Value Fund - Class B | | 2.00 | % | | 1/1/2007 | | | 1/31/2010 |
Large Cap Value Fund - Class C | | 2.00 | % | | 1/1/2007 | | | 1/31/2010 |
Large Cap Value Institutional Series | | 0.98 | % | | 7/11/2008 | | | 1/31/2010 |
| 1 | Prior to April 13, 2009 the expense limit was 1.10% |
The Investment Manager is entitled to reimbursement by the All Cap Value Series, Alpha Opportunity Series, Global Institutional Series, Mid Cap Value Institutional Series, Select 25 Series, Small Cap Value Series, Large Cap Value Fund and the Large Cap Value Institutional Series of fees waived or expenses reimbursed during any of the previous 36 months, beginning on the date of the expense limitation agreement, if on any day the estimated operating expenses are less than the indicated percentages. As of September 30, 2009, the amount of fees waived or expenses reimbursed in the All Cap Value Series, Alpha Opportunity Series, Global Institutional Series, Mid Cap Value Institutional Series, Select 25 Series, Small Cap Value Series, Large Cap Value Fund and the Large Cap Value Institutional Series were $56,488, $360,351, $88,806, $56,387, $208,564, $68,867, $216,463 and $38,034, respectively. As of September 30, 2009, no amounts were recouped by the Investment Manager.
The Funds have adopted Distribution Plans related to the offering of Class A, Class B and Class C shares pursuant to Rule 12b-1 under the Investment Company Act of 1940. The plans provide for payments at an annual rate of 1.00% of the average daily net assets of each Fund’s or Series’ Class B and Class C shares, and 0.25% of the average daily net assets of each Fund’s or Series’ Class A shares. Effective August 25, 2005, the Global Series ceased charging 12b-1 fees on Class B shares in accordance with the FINRA sales cap regulations. Effective August 1, 2007, the Rydex | SGI Large Cap Value Fund ceased charging 12b-1 fees on Class B shares in accordance with the FINRA sales cap regulations. These fees may be reinstated at any time.
138
Notes to Financial Statements
September 30, 2009
Security Distributors, Inc. (SDI), an affiliate and a distributor of the Funds, retained underwriting commissions during the year ended September 30, 2009, on sales of shares after allowances to brokers an dealers in the following amounts:
| | | |
| | | SDI
Underwriting
Commissions |
Rydex | SGI Equity Fund: | | | |
All Cap Value Series | | $ | 6,147 |
Alpha Opportunity Series | | | 7,840 |
Equity Series | | | 23,820 |
Global Series | | | 84,281 |
Mid Cap Value Series | | | 293,004 |
Select 25 Series | | | 11,545 |
Small Cap Growth Series | | | 69,527 |
Small Cap Value Series | | | 1,114 |
Rydex | SGI Large Cap Value Fund | | | 28,805 |
Rydex | SGI Mid Cap Growth Fund | | | 27,378 |
Certain officers and directors of the Funds are also officers and/or directors of Security Benefit Life Insurance Company, a subsidiary of Security Benefit Corporation, and its affiliates, which include Security Global Investors (SGI) and SDI.
At September 30, 2009, Security Benefit Corporation and its subsidiaries owned over five percent of the outstanding shares of the Funds or Series, as follows:
| | | |
Fund or Series | | Percent of outstanding
shares owned | |
Rydex | SGI Equity Fund: | | | |
All Cap Value Series | | 42.55 | % |
Alpha Opportunity Series | | 14.29 | % |
Equity Series | | 15.16 | % |
Global Institutional Series | | 100 | % |
Select 25 Series | | 9.17 | % |
Small Cap Growth Series | | 21.35 | % |
Small Cap Value Series | | 31.05 | % |
Rydex | SGI Large Cap Value Fund: | | | |
Large Cap Value Fund | | 18.06 | % |
Large Cap Value Institutional Series | | 100 | % |
Rydex | SGI Mid Cap Growth Fund | | 6.91 | % |
3. Investment Transactions
Investment transactions for the year ended September 30, 2009, (excluding overnight investments and short-term commercial paper) were as follows:
| | | | | | |
| | | Purchases | | Proceeds
from Sales |
Rydex | SGI Equity Fund: | | | | | | |
All Cap Value Series | | $ | 1,979,376 | | $ | 155,046 |
Alpha Opportunity Series | | | 63,952,071 | | | 74,105,104 |
Equity Series | | | 112,813,399 | | | 126,589,073 |
Global Series | | | 343,068,877 | | | 340,469,496 |
Global Institutional Series | | | 20,174,547 | | | 22,052,273 |
Mid Cap Value Series | | | 342,017,437 | | | 225,644,782 |
Mid Cap Value Institutional Series | | | 321,524,940 | | | 68,478,407 |
Select 25 Series | | | 40,300,968 | | | 43,715,108 |
Small Cap Growth Series | | | 23,153,639 | | | 24,500,513 |
Small Cap Value Series | | | 3,691,437 | | | 1,054,196 |
Rydex | SGI Large Cap Value Fund: | | | | | | |
Large Cap Value Fund | | | 11,760,285 | | | 29,938,563 |
Large Cap Value Institutional Series | | | 1,473,091 | | | 1,205,996 |
Rydex | SGI Mid Cap Growth Fund | | | 91,448,303 | | | 91,624,454 |
4. Open Futures Contracts
Open futures contracts for Alpha Opportunity Series as of September 30, 2009, were as follows:
| | | |
| | | Alpha Opportunity Series |
| | | S&P 500 Index Futures |
Position | | | Long |
Number of Contracts | | | 9 |
Expiration Date | | | 12-18-2009 |
Contract Amount | | $ | 2,333,856 |
Market Value | | $ | 2,369,025 |
Unrealized Gain | | $ | 35,169 |
5. Options Written
Information as to options written by the Funds or Series during the year ended September 30, 2009, and options outstanding at September 30, 2009 is provided below:
All Cap Value Series Written Call Options Outstanding
| | | | | | | | | | |
Common Stock | | Expiration
Date | | Exercise
Price | | Number of
Contracts | | Market
Value |
Allette, Inc. | | 10-16-09 | | $ | 35.00 | | 2 | | $ | 60 |
Chico’s FAS, Inc. | | 11-20-09 | | | 15.00 | | 7 | | | 245 |
Eagle Materials, Inc. | | 10-16-09 | | | 30.00 | | 1 | | | 45 |
Fossil, Inc. | | 10-16-09 | | | 25.00 | | 1 | | | 300 |
Louisiana-Pacific Corporation | | 11-20-09 | | | 7.50 | | 13 | | | 780 |
SCANA Corporation | | 11-20-09 | | | 35.00 | | 1 | | | 80 |
TreeHouse Foods, Inc. | | 11-20-09 | | | 40.00 | | 2 | | | 60 |
USEC, Inc. | | 10-16-09 | | | 5.00 | | 1 | | | 15 |
| | | | | | | | | | |
Total call options outstanding
(premiums received, $1,701) | | | | | | | 28 | | $ | 1,585 |
| | | | | | | | | | |
139
Notes to Financial Statements
September 30, 2009
All Cap Value Series Written Put Options Outstanding
| | | | | | | | | | |
Common Stock | | Expiration
Date | | Exercise
Price | | Number of
Contracts | | Market
Value |
Great Plains Energy, Inc. | | 12/18/09 | | $ | 15.00 | | 5 | | $ | 25 |
| | | | | | | | | | |
Total call options outstanding (premiums received, $532) | | | | | | | 5 | | $ | 25 |
| | | | | | | | | | |
All Cap Value Series Written Call Options
| | | | | | | |
| | | Number of
Contracts | | | Market
Value | |
Balance at September 30, 2008 | | — | | | $ | — | |
Opened | | 28 | | | | 1,701 | |
| | | | | | | |
Balance at September 30, 2009 | | 28 | | | $ | 1,701 | |
| | | | | | | |
|
| All Cap Value Series Written Put Options | |
| | |
| | | Number of
Contracts | | | Market
Value | |
Balance at September 30, 2008 | | — | | | $ | — | |
Opened | | 5 | | | | 532 | |
| | | | | | | |
Balance at September 30, 2009 | | 5 | | | $ | 532 | |
| | | | | | | |
|
| Equity Series Written Call Options | |
| | |
| | | Number of
Contracts | | | Market
Value | |
Balance at September 30, 2008 | | — | | | $ | — | |
Opened | | 596 | | | | 105,028 | |
Exercise | | (123 | ) | | | (12,355 | ) |
Expired | | (473 | ) | | | (92,673 | ) |
| | | | | | | |
Balance at September 30, 2009 | | — | | | $ | — | |
| | | | | | | |
|
| Equity Series Written Put Options | |
| | |
| | | Number of
Contracts | | | Market
Value | |
Balance at September 30, 2008 | | — | | | $ | — | |
Opened | | 679 | | | | 70,996 | |
Exercised | | (416 | ) | | | (31,476 | ) |
Expired | | (263 | ) | | | (39,520 | ) |
| | | | | | | |
Balance at September 30, 2009 | | — | | | $ | — | |
| | | | | | | |
Mid Cap Value Series Written Call Options Outstanding
| | | | | | | | | | |
Common Stock | | Expiration
Date | | Exercise
Price | | Number of
Contracts | | Market
Value |
Allette, Inc. | | 10-16-09 | | $ | 35.00 | | 1,427 | | $ | 42,810 |
Bemis Company, Inc. | | 10-16-09 | | | 25.00 | | 1,628 | | | 179,080 |
Chico’s FAS, Inc. | | 11-20-09 | | | 15.00 | | 3,600 | | | 126,000 |
Commerce Bancshares, Inc. | | 11-20-09 | | | 40.00 | | 800 | | | 40,000 |
Community Health Systems, Inc. | | 12-18-09 | | | 30.00 | | 1,600 | | | 576,000 |
Eagle Materials, Inc. | | 10-16-09 | | | 30.00 | | 517 | | | 23,265 |
Fossil, Inc. | | 10-16-09 | | | 25.00 | | 1,095 | | | 328,500 |
Louisiana-Pacific Corporation | | 11-20-09 | | | 7.50 | | 10,000 | | | 600,000 |
Redwood Trust, Inc. | | 01-15-10 | | | 17.50 | | 1,222 | | | 73,320 |
SCANA Corporation | | 11-20-09 | | | 35.00 | | 2,100 | | | 168,000 |
USEC, Inc. | | 10-16-09 | | | 5.00 | | 1,136 | | | 17,040 |
| | | | | | | | | | |
Total call options outstanding (premiums received, $2,200,451) | | | | | | | 25,125 | | $ | 2,174,015 |
| | | | | | | | | | |
Mid Cap Value Series Written Put Options Outstanding
| | | | | | | | | | |
Common Stock | | Expiration
Date | | Exercise
Price | | Number of
Contracts | | Market
Value |
Bemis Company, Inc. | | 01-15-10 | | $ | 25.00 | | 1,521 | | $ | 190,125 |
GMX Resources, Inc. | | 11-20-09 | | | 10.00 | | 2,173 | | | 43,460 |
Great Plains Energy, Inc. | | 12-18-09 | | | 15.00 | | 3,245 | | | 16,225 |
| | | | | | | | | | |
Total call options outstanding (premiums received, $790,339) | | | | | | | 6,939 | | $ | 249,810 |
| | | | | | | | | | |
Mid Cap Value Series Written Call Options
| | | | | | | |
| | | Number of
Contracts | | | Market
Value | |
Balance at September 30, 2008 | | 4,997 | | | $ | 985,532 | |
Opened | | 50,287 | | | | 7,238,720 | |
Exercised | | (9,726 | ) | | | (2,083,573 | ) |
Expired | | (20,433 | ) | | | (3,940,228 | ) |
| | | | | | | |
Balance at September 30, 2009 | | 25,125 | | | $ | 2,200,451 | |
| | | | | | | |
Mid Cap Value Series Written Put Options
| | | | | | | |
| | | Number of
Contracts | | | Market
Value | |
Balance at September 30, 2008 | | 8,932 | | | $ | 1,507,358 | |
Opened | | 29,659 | | | | 4,680,393 | |
Exercised | | (8,932 | ) | | | (1,507,358 | ) |
Expired | | (22,720 | ) | | | (3,890,054 | ) |
| | | | | | | |
Balance at September 30, 2009 | | 6,939 | | | $ | 790,339 | |
| | | | | | | |
Mid Cap Value Institutional Series
Written Call Options Outstanding
| | | | | | | | | | |
Common Stock | | Expiration
Date | | Exercise
Price | | Number of
Contracts | | Market
Value |
Allette, Inc. | | 10-16-09 | | $ | 35.00 | | 470 | | $ | 14,100 |
Bemis Company, Inc. | | 10-16-09 | | | 25.00 | | 96 | | | 10,560 |
Chico’s FAS, Inc. | | 11-20-09 | | | 15.00 | | 1,274 | | | 44,590 |
Community Health Systems, Inc. | | 12-18-09 | | | 30.00 | | 338 | | | 121,680 |
Eagle Materials, Inc. | | 10-16-09 | | | 30.00 | | 170 | | | 7,650 |
Fossil, Inc. | | 10-16-09 | | | 25.00 | | 358 | | | 107,400 |
Louisiana-Pacific Corporation | | 11-20-09 | | | 7.50 | | 2,500 | | | 150,000 |
Redwood Trust, Inc. | | 01-15-10 | | | 17.50 | | 403 | | | 24,180 |
SCANA Corporation | | 11-20-09 | | | 35.00 | | 697 | | | 55,760 |
TreeHouse Foods, Inc. | | 11-20-09 | | | 40.00 | | 75 | | | 2,250 |
USEC, Inc. | | 10-16-09 | | | 5.00 | | 256 | | | 3,840 |
| | | | | | | | | | |
Total call options outstanding (premiums received, $519,263) | | | | | | | 6,637 | | $ | 542,010 |
| | | | | | | | | | |
Mid Cap Value Institutional Series Written
Put Options Outstanding
| | | | | | | | | | |
Common Stock | | Expiration
Date | | Exercise
Price | | Number of
Contracts | | Market
Value |
Bemis Company, Inc. | | 01-15-10 | | $ | 25.00 | | 249 | | $ | 31,125 |
GMS Resources, Inc. | | 11-20-09 | | | 10.00 | | 434 | | | 8,680 |
| | | | | | | | | | |
Total call options outstanding (premiums received, $81,299) | | | | | | | 683 | | $ | 39,805 |
| | | | | | | | | | |
140
Notes to Financial Statements
September 30, 2009
Mid Cap Value Institutional Series Written Call Options
| | | | | | | |
| | | Number of
Contracts | | | Market
Value | |
Balance at September 30, 2008 | | 117 | | | $ | 23,422 | |
Opened | | 7,582 | | | | 710,494 | |
Exercised | | (542 | ) | | | (117,792 | ) |
Expired | | (520 | ) | | | (96,861 | ) |
| | | | | | | |
Balance at September 30, 2009 | | 6,637 | | | $ | 519,263 | |
| | | | | | | |
Mid Cap Value Institutional Series Written Put Options
| | | | | | | |
| | | Number of
Contracts | | | Market
Value | |
Balance at September 30, 2008 | | 222 | | | $ | 37,332 | |
Opened | | 1,882 | | | | 303,034 | |
Exercised | | (222 | ) | | | (37,332 | ) |
Expired | | (1,199 | ) | | | (221,734 | ) |
| | | | | | | |
Balance at September 30, 2009 | | 683 | | | $ | 81,300 | |
| | | | | | | |
Small Cap Value Series Written Call Options Outstanding
| | | | | | | | | | |
Common Stock | | Expiration
Date | | Exercise
Price | | Number of
Contracts | | Market
Value |
Allete, Inc. | | 10-16-09 | | $ | 35.00 | | 5 | | $ | 150 |
Bemis Company, Inc. | | 10-16-09 | | | 25.00 | | 6 | | | 660 |
Chico’s FAS, Inc. | | 11-20-09 | | | 15.00 | | 12 | | | 420 |
Clearwater Paper Corporation | | 01-15-10 | | | 50.00 | | 4 | | | 1,020 |
Commerce Bancshares, Inc. | | 11-20-09 | | | 40.00 | | 2 | | | 100 |
Eagle Materials, Inc. | | 10-16-09 | | | 30.00 | | 2 | | | 90 |
Fossil, Inc. | | 10-16-09 | | | 25.00 | | 4 | | | 1,200 |
Louisiana Pacific Corporation | | 11-20-09 | | | 7.50 | | 76 | | | 4,560 |
McDermott International, Inc. | | 11-20-09 | | | 25.00 | | 7 | | | 1,435 |
Pico Holdings, Inc. | | 01-15-10 | | | 30.00 | | 8 | | | 3,680 |
TreeHouse Foods, Inc. | | 11-20-09 | | | 40.00 | | 5 | | | 150 |
USEC, Inc. | | 10-16-09 | | | 5.00 | | 3 | | | 45 |
| | | | | | | | | | |
Total call options outstanding (premiums received, $12,682) | | | | | | | 134 | | $ | 13,510 |
| | | | | | | | | | |
Small Cap Value Series Written Put Options Outstanding
| | | | | | | | | | |
Common Stock | | Expiration
Date | | Exercise
Price | | Number of
Contracts | | Market
Value |
Force Protection, Inc. | | 12-18-09 | | $ | 5.00 | | 30 | | $ | 1,200 |
Great Plains Energy, Inc. | | 12-18-09 | | | 15.00 | | 10 | | | 50 |
Methode Electronics, Inc. | | 01-15-10 | | | 7.50 | | 20 | | | 1,100 |
Tesco Corporation | | 12-18-09 | | | 7.50 | | 15 | | | 675 |
| | | | | | | | | | |
Total call options outstanding (premiums received, $7,544) | | | | | | | 75 | | $ | 3,025 |
| | | | | | | | | | |
Small Cap Value Series Written Call Options
| | | | | | | |
| | | Number of
Contracts | | | Market
Value | |
Balance at September 30, 2008 | | 1 | | | $ | 298 | |
Opened | | 158 | | | | 16,898 | |
Exercised | | (13 | ) | | | (2,180 | ) |
Expired | | (12 | ) | | | (2,334 | ) |
| | | | | | | |
Balance at September 30, 2009 | | 134 | | | $ | 12,682 | |
| | | | | | | |
Small Cap Value Series Written Put Options
| | | | | | | |
| | | Number of
Contracts | | | Market
Value | |
Balance at September 30, 2008 | | — | | | $ | — | |
Opened | | 86 | | | | 9,542 | |
Expired | | (11 | ) | | | (1,998 | ) |
| | | | | | | |
Balance at September 30, 2009 | | 75 | | | | 7,544 | |
| | | | | | | |
Large Cap Value Fund Written Call Options
| | | | | | | |
| | | Number of
Contracts | | | Market
Value | |
Balance at September 30, 2008 | | — | | | $ | — | |
Opened | | 418 | | | | 74,550 | |
Exercised | | (75 | ) | | | (7,534 | ) |
Expired | | (343 | ) | | | (67,016 | ) |
| | | | | | | |
Balance at September 30, 2009 | | — | | | $ | — | |
| | | | | | | |
Large Cap Value Fund Written Put Options
| | | | | | | |
| | | Number of
Contracts | | | Market
Value | |
Balance at September 30, 2008 | | — | | | $ | — | |
Opened | | 481 | | | | 50,685 | |
Exercised | | (304 | ) | | | (23,067 | ) |
Expired | | (177 | ) | | | (27,618 | ) |
| | | | | | | |
Balance at September 30, 2009 | | — | | | $ | — | |
| | | | | | | |
Large Cap Value Institutional Series Written Call Options
| | | | | | | |
| | | Number of
Contracts | | | Market
Value | |
Balance at September 30, 2008 | | — | | | $ | — | |
Opened | | 13 | | | | 1,943 | |
Expired | | (13 | ) | | | (1,943 | ) |
| | | | | | | |
Balance at September 30, 2009 | | — | | | $ | — | |
| | | | | | | |
|
| Large Cap Value Institutional Series Written Put Options | |
| | |
| | | Number of
Contracts | | | Market
Value | |
Balance at September 30, 2008 | | — | | | $ | — | |
Opened | | 21 | | | | 1,768 | |
Exercised | | (17 | ) | | | (1,345 | ) |
Expired | | (4 | ) | | | (423 | ) |
| | | | | | | |
Balance at September 30, 2009 | | — | | | $ | — | |
| | | | | | | |
141
Notes to Financial Statements
September 30, 2009
6. Derivative Investment Holdings Categorized by Risk Exposure
The Funds adopted FASB ASC 815, Derivatives and Hedging (ASC 815) (formerly known as FAS 161), effective March 31, 2009. ASC 815 is intended to improve financial reporting about derivative instruments by requiring enhanced disclosures to enable investors to better understand how and why the Funds use derivative instruments, how these derivative instruments are accounted for and their effects on the Funds’ financial position and results of operations. None of the derivatives currently held by the Funds are being used as hedging instruments.
The following is a summary of the location of derivative investments on the Funds’ Statements of Assets and Liabilities as of September 30, 2009:
Location on the Statements of Assets and Liabilities
| | | | |
Derivative Investments Type | | Asset Derivatives | | Liability Derivatives |
| Futures - equity contracts | | Receivable: Variation margin | | Payable: Variation margin |
| Options - equity contracts | | Investments, at value | | Outstanding options written, at value |
The following table sets forth the fair value of the Funds’ derivative contracts by primary risk exposure as of September 30, 2009:
Asset Derivative Investments Value
| | | | | | | | | |
Fund | | Futures
Equity
Contracts* | | Options
Equity
Contracts | | Total Value at
September 30,
2009 |
Rydex | SGI Equity Fund: | | | | | | | | | |
Alpha Opportunity Series | | $ | 35,169 | | $ | — | | $ | 35,169 |
| | | |
| Liability Derivative Investments Value | | | | | | | | | |
| | | |
Fund | | Futures
Equity
Contracts* | | Options
Equity
Contracts | | Total Value at
September 30,
2009 |
Rydex | SGI Equity Fund: | | | | | | | | | |
All Cap Value Series | | $ | — | | $ | 1,610 | | $ | 1,610 |
Mid Cap Value Series | | | — | | | 2,423,825 | | | 2,423,825 |
Mid Cap Value Institutional Series | | | — | | | 581,815 | | | 581,815 |
Small Cap Value Series | | | — | | | 16,535 | | | 16,535 |
| * | Includes cumulative appreciation (depreciation) of futures contracts as reported in the Notes to Financial Statements. |
| | Only current day’s variation margin is reported within the Statement of Assets and Liabilities. |
142
Notes to Financial Statements
September 30, 2009
The following is a summary of the location of derivative investments on the Funds’ Statements of Operations as of September 30, 2009:
| | |
Derivative Investment Type | | Location of Gain (Loss) on Derivatives |
| Futures - equity contracts | | Net realized gain (loss) on futures contracts and change in net unrealized appreciation (depreciation) on futures contracts |
| |
| Options - equity contracts | | Net realized gain (loss) on options written and change in net unrealized appreciation (depreciation) on options written |
The following is a summary of the Fund’s realized gain (loss) and change in unrealized appreciation (depreciation) on derivative investments recognized in the Statements of Operations categorized by primary risk exposure as of September 30, 2009:
Realized Gain (Loss) on Derivative Investments Recognized in the Statement of Operations
| | | | | | | | | | | |
Fund | | Futures
Equity
Contracts | | | Options
Equity
Contracts | | Total Value at
September 30,
2009 | |
Rydex | SGI Equity Funds: | | | | | | | | | | | |
Alpha Opportunity Series | | $ | (2,673,119 | ) | | $ | — | | $ | (2,673,119 | ) |
Equity Series | | | — | | | | 132,192 | | | 132,192 | |
Mid Cap Value Series | | | — | | | | 7,830,282 | | | 7,830,282 | |
Mid Cap Value Institutional Series | | | — | | | | 318,595 | | | 318,595 | |
Small Cap Value Series | | | — | | | | 4,332 | | | 4,332 | |
Rydex | SGI Large Cap Value Fund: | | | | | | | | | | | |
Large Cap Value Fund | | | — | | | | 94,634 | | | 94,634 | |
Large Cap Value Institutional Series | | | — | | | | 2,365 | | | 2,365 | |
Change in Unrealized Appreciation (Depreciation) on Derivative Investments Recognized in the Statement of Operations
| | | | | | | | | |
Fund | | Futures
Equity
Contracts | | Options
Equity
Contracts | | Total Value at
September 30,
2009 |
Rydex | SGI Equity Fund: | | | | | | | | | |
All Cap Value Series | | $ | — | | $ | 623 | | $ | 623 |
Alpha Opportunity Series | | | 942,667 | | | — | | | 942,667 |
Mid Cap Value Series | | | — | | | 1,257,425 | | | 1,257,425 |
Mid Cap Value Institutional Series | | | — | | | 35,623 | | | 35,623 |
Small Cap Value Series | | | — | | | 3,538 | | | 3,538 |
143
Notes to Financial Statements
September 30, 2009
7. Federal Tax Matters
For federal income tax purposes, the amounts of unrealized appreciation (depreciation) on investments at September 30, 2009, were as follows:
| | | | | | | | | | | |
| | | Gross
unrealized
appreciation | | Gross
unrealized
(depreciation) | | | Net unrealized
appreciation
(depreciation) | |
Rydex | SGI Equity Fund: | | | | | | | | | | | |
All Cap Value Series | | $ | 183,007 | | $ | (35,946 | ) | | $ | 147,061 | |
Alpha Opportunity Series | | | 563,235 | | | (1,690,771 | ) | | | (1,127,536 | ) |
Equity Series | | | 21,434,031 | | | (21,029,067 | ) | | | 404,964 | |
Global Series | | | 15,147,231 | | | (1,256,961 | ) | | | 13,890,270 | |
Global Institutional Series | | | 629,239 | | | (54,950 | ) | | | 574,289 | |
Mid Cap Value Series | | | 137,266,271 | | | (121,129,824 | ) | | | 16,136,447 | |
Mid Cap Value Institutional Series | | | 39,751,420 | | | (2,846,729 | ) | | | 36,904,691 | |
Select 25 Series | | | 3,756,486 | | | (462,598 | ) | | | 3,293,888 | |
Small Cap Growth Series | | | 2,915,787 | | | (279,036 | ) | | | 2,636,751 | |
Small Cap Value Series | | | 782,316 | | | (67,783 | ) | | | 714,533 | |
Rydex | SGI Large Cap Value Fund | | | | | | | | | | | |
Large Cap Value Fund | | | 4,507,461 | | | (6,907,786 | ) | | | (2,400,325 | ) |
Large Cap Value Institutional Series | | | 243,157 | | | (287,840 | ) | | | (44,683 | ) |
Rydex | SGI Mid Cap Growth Fund | | | 12,514,806 | | | (1,264,386 | ) | | | 11,250,420 | |
The tax character of distributions paid during the fiscal years ended September 30, 2009 and 2008 are as follows:
| | | | | | | | | | | | |
2009 | | Ordinary
Income | | Capital
Gain | | Return of
Capital | | Total |
Rydex | SGI Equity Fund: | | | | | | | | | | | | |
Equity Series | | $ | 392,434 | | $ | — | | $ | 639,278 | | $ | 1,031,712 |
Global Series | | | 239,128 | | | — | | | 683,073 | | | 922,201 |
Global Institutional Series | | | 21,309 | | | — | | | — | | | 21,309 |
Mid Cap Value Series | | | 3,483,597 | | | 86,413,567 | | | — | | | 89,897,164 |
Mid Cap Value Institutional Series | | | 1,082,491 | | | — | | | — | | | 1,082,491 |
Small Cap Growth Series | | | — | | | 97,806 | | | — | | | 97,806 |
Small Cap Value Series | | | 84,923 | | | — | | | — | | | 84,923 |
Rydex | SGI Large Cap Value Fund: | | | | | | | | | | | | |
Large Cap Value Fund | | | 620,709 | | | 427,734 | | | — | | | 1,048,443 |
Large Cap Value Institutional Series | | | 19,621 | | | — | | | — | | | 19,621 |
Rydex | SGI Mid Cap Growth Fund | | | — | | | 651,342 | | | 11,546 | | | 662,888 |
| | | | |
2008 | | Ordinary
Income | | Capital
Gain | | Return of
Capital | | Total |
Rydex | SGI Equity Fund: | | | | | | | | | | | | |
Alpha Opportunity Series | | $ | 5,776,326 | | $ | 538,039 | | $ | 694,650 | | $ | 7,009,015 |
Equity Series | | | 4,835,812 | | | 43,837,340 | | | 281,587 | | | 48,954,739 |
Global Series | | | 5,659,144 | | | 57,506,309 | | | 120,132 | | | 63,285,585 |
Mid Cap Value Series | | | 9,452,756 | | | 169,378,319 | | | — | | | 178,831,075 |
Select 25 Series | | | — | | | 4,176,834 | | | — | | | 4,176,834 |
Small Cap Growth Series | | | 841,392 | | | 3,077,781 | | | — | | | 3,919,173 |
Rydex | SGI Large Cap Value Fund: | | | | | | | | | | | | |
Large Cap Value Fund | | | 400,275 | | | 3,591,497 | | | — | | | 3,991,772 |
Rydex | SGI Mid Cap Growth Fund | | | 6,035,045 | | | 27,762,273 | | | — | | | 33,797,318 |
In the Rydex | SGI Equity Fund - Equity Series, subsequent to the September 30, 2008 reporting period, it was determined that a recharacterization of $282,643 was required between distributions paid from ordinary income and distributions paid from return of capital.
Note: For federal income tax purposes, short term capital gain distributions are treated as ordinary income distributions.
144
Notes to Financial Statements
September 30, 2009
As of September 30, 2009, the components of distributable earnings on a tax basis were:
| | | | | | | | | | | | | | | | | | |
| | | Undistributed
Ordinary
Income | | Undistributed
Long-Term
Capital Gain | | Accumulated
Capital and
Other Losses* | | | Unrealized
Appreciation
(Depreciation)** | | | Total
Accumulated
Earnings/(Deficit) | |
Rydex | SGI Equity Fund: | | | | | | | | | | | | | | | | | | |
All Cap Value Series | | $ | 3,576 | | $ | — | | $ | (22,756 | ) | | $ | 147,684 | | | $ | 128,504 | |
Alpha Opportunity Series | | | — | | | — | | | (13,628,594 | ) | | | (1,140,844 | ) | | | (14,769,438 | ) |
Equity Series | | | — | | | — | | | (40,519,164 | ) | | | 404,964 | | | | (40,114,200 | ) |
Global Series | | | — | | | — | | | (55,652,487 | ) | | | 13,899,193 | | | | (41,753,294 | ) |
Global Institutional Series | | | 61,382 | | | — | | | (2,291,544 | ) | | | 574,392 | | | | (1,655,770 | ) |
Mid Cap Value Series | | | 1,105,623 | | | — | | | (75,200,073 | ) | | | 16,703,412 | | | | (57,391,038 | ) |
Mid Cap Value Institutional Series | | | 8,586,009 | | | — | | | (45,564 | ) | | | 36,923,438 | | | | 45,463,883 | |
Select 25 Series | | | — | | | — | | | (19,996,566 | ) | | | 3,293,888 | | | | (16,702,678 | ) |
Small Cap Growth Series | | | — | | | — | | | (8,880,816 | ) | | | 2,636,750 | | | | (6,244,066 | ) |
Small Cap Value Series | | | 133,540 | | | 5,308 | | | — | | | | 718,224 | | | | 857,072 | |
Rydex | SGI Large Cap Value Fund: | | | | | | | | | | | | | | | | | | |
Large Cap Value Fund | | | 396,085 | | | — | | | (16,736,934 | ) | | | (2,400,325 | ) | | | (18,741,174 | ) |
Large Cap Value Institutional Series | | | 21,709 | | | — | | | (317,941 | ) | | | (44,683 | ) | | | (340,915 | ) |
Rydex | SGI Mid Cap Growth Fund | | | — | | | — | | | (45,007,835 | ) | | | 11,250,419 | | | | (33,757,416 | ) |
| * | Certain Funds had net capital loss carryovers and deferred post October losses as identified elsewhere in the Notes to the Financial Statements. |
| ** | The differences between book-basis and tax-basis unrealized appreciation (depreciation) are attributable primarily to the tax deferral of wash sale losses, the differences between book and tax basis passive foreign investment companies and bond discount accretion. |
145
Notes to Financial Statements
September 30, 2009
For the year ended September 30, 2009, the capital loss carryovers utilized or expired and the accumulated net realized loss on sales of investments for federal income tax purposes which are available to offset future taxable gains are shown in the table below. The post-October losses that are deferred to the first day of the next fiscal year are as follows:
| | | | | | | | | | | | | | |
| | | Capital Loss
Carryovers
Utilized | | Capital Loss
Carryovers
Expired | | Remaining
Capital Loss
Carryovers | | Expires In | | Deferred
Post-
October
Losses |
Rydex | SGI Equity Fund: | | | | | | | | | | | | | | |
All Cap Value Series | | $ | — | | $ | — | | $ | 4,080 | | 2017 | | $ | 18,676 |
| | | | | | | | | | | | | | |
Alpha Opportunity Series | | $ | — | | $ | — | | $ | 8,215,458 | | 2017 | | $ | 5,413,137 |
| | | | | | | | | | | | | | |
Equity Series | | $ | — | | $ | — | | $ | 10,341,572 | | 2017 | | $ | 30,177,593 |
| | | | | | | | | | | | | | |
Global Series | | $ | — | | $ | — | | $ | 674,209 | | 2010 | | $ | 17,677,910 |
| | | — | | | — | | | 37,300,368 | | 2017 | | | 37,300,368 |
| | | | | | | | | | | | | | |
| | $ | — | | $ | — | | $ | 37,974,577 | | | | | |
| | | | | | | | | | | | | | |
Global Institutional Series | | $ | — | | $ | — | | $ | 1,263,838 | | 2017 | | $ | 1,027,707 |
| | | | | | | | | | | | | | |
Mid Cap Value Series | | $ | — | | $ | — | | $ | 3,357,672 | | 2017 | | $ | 71,842,401 |
| | | | | | | | | | | | | | |
Mid Cap Value Institutional Series | | $ | — | | $ | — | | $ | — | | | | $ | 45,464 |
| | | | | | | | | | | | | | |
Select 25 Series * | | $ | — | | $ | 2,412,936 | | $ | — | | 2009 | | $ | 6,543,280 |
| | | — | | | — | | | 2,582,076 | | 2010 | | | |
| | | — | | | — | | | 3,390,876 | | 2011 | | | |
| | | — | | | — | | | 38,639 | | 2012 | | | |
| | | — | | | — | | | 7,441,695 | | 2017 | | | |
| | | | | | | | | | | | | | |
| | $ | — | | $ | 2,412,936 | | $ | 13,453,286 | | | | | |
| | | | | | | | | | | | | | |
Small Cap Growth Series | | $ | — | | $ | — | | $ | 4,589,755 | | 2017 | | $ | 4,291,061 |
| | | | | | | | | | | | | | |
Rydex | SGI Large Cap Value Fund: | | | | | | | | | | | | | | |
Large Cap Value Fund | | $ | — | | $ | — | | $ | 7,053,807 | | 2017 | | $ | 9,683,127 |
| | | | | | | | | | | | | | |
Large Cap Value Institutional Series | | $ | — | | $ | — | | $ | 70,714 | | 2017 | | $ | 247,227 |
| | | | | | | | | | | | | | |
Rydex | SGI Mid Cap Growth Fund | | $ | — | | $ | 567,035 | | $ | — | | 2009 | | $ | 17,668,750 |
| | | — | | | — | | | 567,035 | | 2010 | | | |
| | | — | | | — | | | 16,944 | | 2011 | | | |
| | | — | | | — | | | 26,755,106 | | 2017 | | | |
| | | | | | | | | | | | | | |
| | $ | — | | $ | 567,035 | | $ | 27,339,085 | | | | | |
| | | | | | | | | | | | | | |
| * | Subject to limitations pursuant to Section 382 of the Internal Revenue Code. |
146
Notes to Financial Statements
September 30, 2009
Net investment income and net realized gains (losses) may differ for financial statement and tax purposes because of temporary or permanent book/tax differences. These differences are primarily due to post-October losses, losses deferred due to wash sales, foreign currency gains and losses, and the “mark-to-market” of certain passive foreign investment companies (PFICs) for tax purposes. To the extent these differences are permanent, reclassifications are made to the appropriate equity accounts in the period that the differences arise.
On the Statement of Assets and Liabilities the following adjustments were made for permanent book/tax differences:
| | | | | | | | | | | | |
| | | Accumulated
Net Realized
Gain (Loss) | | | Undistributed
Net Investment
Income | | | Paid-in-
Capital | |
Rydex | SGI Equity Fund: | | | | | | | | | | | | |
Alpha Opportunity Series | | $ | 133,577 | | | $ | 129,862 | | | $ | (263,439 | ) |
Equity Series | | | 607,809 | | | | (251,173 | ) | | | (356,636 | ) |
Global Series | | | 755,951 | | | | (298,347 | ) | | | (457,604 | ) |
Global Institutional Series | | | 21,394 | | | | (21,394 | ) | | | — | |
Mid Cap Value Series | | | (86,360 | ) | | | 86,359 | | | | 1 | |
Select 25 Series | | | 2,405,312 | | | | 44,288 | | | | (2,449,600 | ) |
Small Cap Growth Series | | | 1,319 | | | | 267,291 | | | | (268,610 | ) |
Small Cap Value Series | | | (10,392 | ) | | | 10,392 | | | | — | |
Rydex | SGI Large Cap Value Fund | | | | | | | | | | | | |
Large Cap Value Fund | | | 7,418 | | | | (7,418 | ) | | | — | |
Rydex | SGI Mid Cap Growth Fund | | | 578,581 | | | | 750,158 | | | | (1,328,739 | ) |
8. Affiliated Transactions*
Investments representing 5% or more of the outstanding voting securities of a portfolio company of a Fund or Series result in that portfolio company being considered an affiliated company of such Fund or Series, as defined in the 1940 Act. The aggregate market value of all securities of affiliated companies held in the Mid Cap Value Series of the Rydex | SGI Equity Fund as of September 30, 2009 amounted to $60,558,946, which represents 6.2% of net assets. There were no affiliated companies held in any other Fund or Series. Transactions in the Mid Cap Value Series during the year ended September 30, 2009, in which the portfolio company is an “affiliated person” are as follows:
| | | | | | | | | | | | | | | | | | | | |
| | | Balance
9-30-08 | | Gross
Additions | | Gross
Reductions | | | Balance
9-30-09 | | Realized
Gain/(Loss) | | | Investment
Income |
Bimini Capital Management, Inc. (Shares) | | | 1,474,400 | | | — | | | — | | | | 1,474,400 | | | — | | | | — |
Bimini Capital Management, Inc. (Cost) | | $ | 16,310,457 | | $ | — | | $ | — | | | $ | 16,310,457 | | $ | — | | | $ | — |
Hydrogen Corporation (Shares) | | | 1,260,000 | | | 5,700 | | | — | | | | 1,265,700 | | | — | | | | — |
Hydrogen Corporation (Cost) | | $ | 5,225,328 | | $ | 45 | | $ | — | | | $ | 5,225,373 | | $ | — | | | $ | — |
IXYS Corporation (Shares) | | | 2,410,360 | | | 338,540 | | | (387,600 | ) | | | 2,361,300 | | | — | | | | — |
IXYS Corporation (Cost) | | $ | 20,342,793 | | $ | 2,792,880 | | $ | (2,807,170 | ) | | $ | 20,328,503 | | $ | 905,453 | | | $ | 242,704 |
Maxwell Technologies, Inc. (Shares) | | | 1,325,300 | | | 120,700 | | | — | | | | 1,446,000 | | | — | | | | — |
Maxwell Technologies, Inc. (Cost) | | $ | 14,607,503 | | $ | 1,114,061 | | $ | — | | | $ | 15,721,564 | | $ | — | | | $ | — |
Power-One, Inc. (Shares) | | | 5,626,300 | | | — | | | — | | | | 5,626,300 | | | — | | | | — |
Power-One, Inc. (Cost) | | $ | 26,663,702 | | $ | — | | $ | — | | | $ | 26,663,702 | | $ | — | | | $ | — |
Quixote Corporation (Shares) | | | 479,100 | | | — | | | (10,000 | ) | | | 469,100 | | | — | | | | — |
Quixote Corporation (Cost) | | $ | 9,318,028 | | $ | — | | $ | (220,800 | ) | | $ | 9,097,228 | | $ | (191,900 | ) | | $ | — |
Thermoenergy Corporation (Shares) | | | 1,963,964 | | | 1,828,906 | | | (210,438 | ) | | | 3,582,432 | | | — | | | | |
Thermoenergy Corporation (Cost) | | $ | 2,094,000 | | $ | 878,580 | | $ | (198,559 | ) | | $ | 2,774,021 | | $ | (135,454 | ) | | | |
| * | As a result of the Rydex | SGI Mid Cap Values Series’ beneficial ownership of the common stock of these portfolio companies, applicable regulations require that the Series state that it may be deemed an affiliate of the respective portfolio company. The Series disclaims that the “affiliated persons” are affiliates of the Distributor, Advisor, Series or any other client of the Advisor. |
147
Notes to Financial Statements
September 30, 2009
9. Alpha Opportunity Series
Alpha Opportunity Series (the “Fund”) contracted with Lehman Brothers International Europe (“LBIE”) to provide prime brokerage services related to the Fund’s short selling. On September 15, 2008, LBIE was placed into administration and a third party administrator has been named (the “Administrator”). The Fund’s exposure to LBIE consists of short sale proceeds held by LBIE, and restricted long positions held at the Fund’s custodian, as collateral for said short sales. The Fund has delivered a Notice of Termination of Loans to LBIE and the Administrator. The Fund is working to resolve these issues with LBIE and the Administrator. As of September 30, 2009, included in the statement of net assets are the value of restricted long positions of $7,704,854, restricted cash representing the value of short sale proceeds of $4,277,298 and liabilities for short sales of $7,341,377 representing the value of securities sold short at the date of termination. Until such time as the liability for short sales is settled and all restrictions are removed, the Fund cannot sell such restricted long positions and/or utilize the restricted cash balances to achieve the Fund’s investment objectives and/or meet Fund redemption or other Fund obligations. As of the close of business on October 3, 2008, and until further notice, the Fund is not accepting subscriptions for shares from either new or existing shareholders.
10. Fair Value of Financial Instruments
The Funds adopted FASB ASC 820, Fair Value Measurements and Disclosure (ASC 820) (formerly known as FASB 157) effective October 1, 2008. In accordance with ASC 820, fair value is defined as the price that the Fund would receive to sell an investment or pay to transfer a liability in an orderly transaction with an independent buyer in the principal market, or in the absence of a principal market the most advantageous market for the investment or liability. ASC 820 establishes a three-tier hierarchy to distinguish between (1) inputs that reflect the assumptions market participants would use in pricing an asset or liability developed based on market data obtained from sources independent of the reporting entity (observable inputs) and (2) inputs that reflect the reporting entity’s own assumptions about the assumptions market participants would use in pricing an asset or liability developed based on the best information available in the circumstances (unobservable inputs) and to establish classification of fair value measurements for disclosure purposes. Various inputs are used in determining the value of the Funds’ investments. The inputs are summarized in the three broad levels listed below:
| | | | |
| Level 1 | | - | | quoted prices in active markets for identical securities. The types of assets and liabilities carried at Level 1 fair value generally are government and agency securities, equities listed in active markets, certain futures and certain options. |
| | |
| Level 2 | | - | | other significant observable inputs (including quoted prices for similar securities, interest rates, prepayment speeds, credit risk, etc.). The types of assets and liabilities carried at Level 2 fair value generally are municipal bonds, certain mortgage and asset-backed securities, certain corporate debt, commercial paper and repurchase agreements. |
| | |
| Level 3 | | - | | significant unobservable inputs (including the Fund’s own assumptions in determining the fair value of investments). The types of assets and liabilities carried at Level 3 fair value generally are certain mortgage and asset-backed securities, certain corporate debt and certain derivatives. |
Observable inputs are those based on market data obtained from sources independent of the Fund, and unobservable inputs reflect the Fund’s own assumptions based on the best information available.
The inputs or methodology used for valuing securities are not necessarily an indication of the risk association with investing in those securities.
148
Notes to Financial Statements
September 30, 2009
The following table provides the fair value measurement of applicable Fund assets by level within the fair value hierarchy as of September 30, 2009. These assets are measured on a recurring basis.
| | | | | | | | | | | | | |
| | | | | LEVEL 1 | | LEVEL 2 | | LEVEL 3 | |
Description | | Total | | Quoted prices
in active
markets for
identical assets | | Significant
other
observable
inputs | | Significant
unobservable
inputs | |
Rydex | SGI Equity Fund: | | | | | | | | | | | | | |
All Cap Value Series | | | | | | | | | | | | | |
ASSETS: | | | | | | | | | | | | | |
Common Stocks | | $ | 1,948,635 | | $ | 1,948,635 | | $ | — | | $ | — | |
| | | | |
LIABILITIES: | | | | | | | | | | | | | |
Options (net of premiums received) | | | 623 | | | 623 | | | — | | | — | |
| | | | |
Alpha Opportunity Series | | | | | | | | | | | | | |
ASSETS: | | | | | | | | | | | | | |
Common Stocks | | | 13,620,521 | | | 13,620,521 | | | — | | | — | |
U.S. Government Sponsored Agency Bonds & Notes | | | 1,499,955 | | | — | | | 1,499,955 | | | — | |
Short Term Investments | | | 2,458,882 | | | — | | | 2,458,882 | | | — | |
Repurchase Agreement | | | 1,677,016 | | | — | | | 1,677,016 | | | — | |
Futures Contracts | | | 35,169 | | | 35,169 | | | — | | | — | |
| | | | | | | | | | | | | |
Total | | | 19,291,543 | | | 13,655,690 | | | 5,635,853 | | | — | |
| | | | | | | | | | | | | |
| | | | |
LIABILITIES: | | | | | | | | | | | | | |
Common Stocks (sold short) | | | 4,226,856 | | | 537,615 | | | — | | | 3,689,241 | |
Foreign Stocks (sold short) | | | 3,652,136 | | | — | | | — | | | 3,652,136 | |
| | | | | | | | | | | | | |
Total | | | 7,878,992 | | | 537,615 | | | — | | | 7,341,377 | |
| | | | | | | | | | | | | |
| | | | |
Equity Series | | | | | | | | | | | | | |
ASSETS: | | | | | | | | | | | | | |
Common Stocks | | | 180,037,467 | | | 180,037,467 | | | — | | | — | |
| | | | |
Global Series | | | | | | | | | | | | | |
Common Stocks | | | 55,077,882 | | | 55,077,882 | | | — | | | — | |
Foreign Stocks | | | 55,930,876 | | | 55,930,876 | | | — | | | — | |
Short Term Investments | | | 2,875,778 | | | — | | | 2,875,778 | | | — | |
| | | | | | | | | | | | | |
Total | | | 113,884,536 | | | 111,008,758 | | | 2,875,778 | | | — | |
| | | | | | | | | | | | | |
| | | | |
Global Institutional Series | | | | | | | | | | | | | |
Common Stocks | | | 2,485,271 | | | 2,485,271 | | | — | | | — | |
Foreign Stocks | | | 2,362,340 | | | 2,362,340 | | | — | | | — | |
| | | | | | | | | | | | | |
Total | | | 4,847,611 | | | 4,847,611 | | | — | | | — | |
| | | | | | | | | | | | | |
| | | | |
Mid Cap Value Series | | | | | | | | | | | | | |
ASSETS: | | | | | | | | | | | | | |
Common Stocks | | | 946,346,267 | | | 946,346,267 | | | — | | | — | |
Warrants | | | 6,861 | | | — | | | 6,861 | | | — | |
Convertible Bonds | | | 5,263,000 | | | — | | | 5,263,000 | | | — | |
Commercial Paper | | | 29,999,730 | | | — | | | 29,999,730 | | | — | |
| | | | | | | | | | | | | |
Total | | | 981,615,858 | | | 946,346,267 | | | 35,269,591 | | | — | |
| | | | | | | | | | | | | |
| | | | | | | | | | | | (continued | ) |
149
Notes to Financial Statements
September 30, 2009
| | | | | | | | | | | | |
| (continued) | | | | LEVEL 1 | | LEVEL 2 | | LEVEL 3 |
Description | | Total | | Quoted prices
in active
markets for
identical assets | | Significant
other
observable
inputs | | Significant
unobservable
inputs |
LIABILITIES: | | | | | | | | | | | | |
Options (net of premiums received) | | $ | 566,965 | | $ | 566,965 | | $ | — | | $ | — |
| | | | |
Mid Cap Value Institutional Series | | | | | | | | | | | | |
ASSETS: | | | | | | | | | | | | |
Common Stocks | | | 314,106,418 | | | 314,106,418 | | | — | | | — |
Repurchase Agreement | | | 5,791,000 | | | — | | | 5,791,000 | | | — |
| | | | | | | | | | | | |
| | | 319,897,418 | | | 314,106,418 | | | 5,791,000 | | | — |
| | | | | | | | | | | | |
| | | | |
LIABILITIES: | | | | | | | | | | | | |
Options (net of premiums received) | | | 18,748 | | | 18,748 | | | — | | | — |
| | | | |
Select 25 Series | | | | | | | | | | | | |
Common Stocks | | | 31,191,322 | | | 31,191,322 | | | — | | | — |
| | | | |
Small Cap Growth Series | | | | | | | | | | | | |
Common Stocks | | | 12,759,241 | | | 12,759,241 | | | — | | | — |
| | | | |
Small Cap Value Series | | | | | | | | | | | | |
ASSETS: | | | | | | | | | | | | |
Common Stocks | | | 4,477,851 | | | 4,477,851 | | | — | | | — |
| | | | |
LIABILITIES: | | | | | | | | | | | | |
Options (net of premiums received) | | | 3,691 | | | 3,691 | | | — | | | — |
| | | | |
Rydex | SGI Large Cap Value Fund: | | | | | | | | | | | | |
Large Cap Value Fund | | | | | | | | | | | | |
Common Stocks | | | 44,642,890 | | | 44,642,890 | | | — | | | — |
| | | | |
Large Cap Value Institutional Series | | | | | | | | | | | | |
Common Stocks | | | 2,762,125 | | | 2,762,125 | | | — | | | — |
| | | | |
Rydex | SGI Mid Cap Growth Fund | | | | | | | | | | | | |
ASSETS: | | | | | | | | | | | | |
Common Stocks | | | 80,777,463 | | | 80,777,463 | | | — | | | — |
Warrants | | | 2,107 | | | — | | | 2,107 | | | — |
Repurchase Agreement | | | 4,319,000 | | | — | | | 4,319,000 | | | — |
| | | | | | | | | | | | |
Total | | | 85,098,570 | | | 80,777,463 | | | 4,321,107 | | | — |
| | | | | | | | | | | | |
150
Notes to Financial Statements
September 30, 2009
Following is a reconciliation of Level 3 assets for which significant unobservable inputs were used to determine fair value for the year ended September 30, 2009:
| | | | | | | | | |
| | | LEVEL 3 – Fair value measurement using significant
unobservable inputs |
| | | Securities | | Derivatives | | Total |
Alpha Opportunity Series | | | | | | | | | |
LIABILITIES: | | | | | | | | | |
Beginning Balance | | $ | 7,122,424 | | $ | — | | $ | 7,122,425 |
Total realized gains or losses included in earnings | | | — | | | — | | | — |
Total unrealized gains or losses included in earnings | | | 163,246 | | | — | | | 163,245 |
Purchases, sales, issuances, and settlements (net) | | | — | | | — | | | — |
Transfers in and/or out of Level 3 | | | 55,707 | | | — | | | 55,707 |
| | | | | | | | | |
Ending Balance | | $ | 7,341,377 | | $ | — | | $ | 7,341,377 |
| | | | | | | | | |
11. Other Liabilities
Rydex | SGI Equity Fund-Mid Cap Value Series, Rydex | SGI Equity Fund-Mid Cap Value Institutional Series and Rydex | SGI Equity Fund-Equity Series (collectively, the “Funds”) each wrote put option contracts through Lehman Brothers Inc., (“Lehman”) that were exercised prior to the option contracts’ expiration and prior to the bankruptcy filing by Lehman, during September, 2008. However, these transactions have not settled and the securities have not been delivered to the Funds as of September 30, 2009.
Although the ultimate resolution of these transactions is uncertain, the Funds have recorded a liability on their respective books equal to the difference between the strike price on the put options and the market price of the underlying security on the exercise date. The amount of the liability recorded by the Funds as of September 30, 2009 was $473,594 for Rydex | SGI Equity Fund-Mid Cap Value Series, $15,940 for Rydex | SGI Equity Fund-Mid Cap Value Institutional Series, and $18,615 for Rydex | SGI Equity Fund-Equity Series.
12. Subsequent Events
Management has evaluated events or transactions that may have occurred since September 30, 2009, that would merit recognition of disclosure in the financial statements. This evaluation was completed through November 24, 2009, the date the financial statements were issued.
Effective October 1, 2009, the Global Institutional Series expense limit changed from 1.15% to 1.00%.
Effective October 1, 2009, the Small Cap Value Series expense limit changed for Class A shares, Class C shares and the Institutional class of shares from 1.55%, 2.30% and 1.30% to 1.30%, 2.05% and 1.05%, respectively.
Effective October 16, 2009, Rydex Distributors, Inc. (“Rydex Distributors”) is the sole distributor to Rydex | SGI Equity Fund, Rydex | SGI Large Cap Value Fund and Rydex | Mid Cap Growth Fund.
Effective January 4, 2010, Rydex | SGI Equity Fund, Rydex | SGI Large Cap Value Fund and Rydex | SGI Mid Cap Growth Fund and their underlying Series will no longer be accepting subscriptions for shares from either existing shareholder or from new shareholders in Class B shares.
151
Report of Independent Registered Public Accounting Firm
To the Board of Directors and Shareholders
Rydex | SGI Equity Fund, Rydex | SGI Large Cap Value Fund and Rydex | SGI Mid Cap Growth Fund
We have audited the accompanying statements of assets and liabilities, including the schedules of investments, of Rydex | SGI Equity Fund (formerly Security Equity Fund, comprised of All Cap Value, Alpha Opportunity, Equity, Global, Global Institutional, Mid Cap Value, Mid Cap Value Institutional, Select 25, Small Cap Growth and Small Cap Value Series), Rydex | SGI Large Cap Value Fund (formerly Security Large Cap Value Fund, comprised of Large Cap Value Fund and Large Cap Value Institutional Series) and Rydex | SGI Mid Cap Growth Fund (formerly Security Mid Cap Growth Fund) (the Funds) as of September 30, 2009, and the related statements of operations for each of the periods then ended, and the statements of changes in net assets, and the financial highlights for each of the periods indicated therein. These financial statements and financial highlights are the responsibility of the Funds’ management. Our responsibility is to express an opinion on these financial statements and financial highlights based on our audits.
We conducted our audits in accordance with the standards of the Public Company Accounting Oversight Board (United States). Those standards require that we plan and perform the audit to obtain reasonable assurance about whether the financial statements and financial highlights are free of material misstatement. We were not engaged to perform an audit of the Funds’ internal control over financial reporting. Our audits included consideration of internal control over financial reporting as a basis for designing audit procedures that are appropriate in the circumstances, but not for the purpose of expressing an opinion on the effectiveness of the Funds’ internal control over financial reporting. Accordingly, we express no such opinion. An audit also includes examining, on a test basis, evidence supporting the amounts and disclosures in the financial statements and financial highlights, assessing the accounting principles used and significant estimates made by management, and evaluating the overall financial statement presentation. Our procedures included confirmation of securities owned as of September 30, 2009, by correspondence with the custodians and brokers, or by other appropriate auditing procedures where replies from brokers were not received. We believe that our audits provide a reasonable basis for our opinion.
As more fully discussed in Note 9 to the financial statements, the Alpha Opportunity Series of the Rydex | SGI Equity Fund (“Alpha Opportunity”) previously utilized the services of Lehman Brothers International (Europe) (“Lehman”) to provide prime broker services related to Alpha Opportunity’s securities sold short. On September 15, 2008, Lehman was placed into administration. The financial records of Lehman are now being handled by the administrators. Information flow to Alpha Opportunity from the administrators has been limited. Management has recorded in the financial statements its best estimate of the liability for securities sold short due to Lehman, based upon management’s assessment of all available evidence, including information supplied by the administrators. Significant uncertainly exists regarding the ultimate timing of settlement, as well as the ultimate liability for securities sold short due to Lehman, and the difference between amounts currently recorded and that which may ultimately be due may be material.
In our opinion, the financial statements and financial highlights referred to above present fairly, in all material respects, the financial position of each of the respective series constituting the Funds at September 30, 2009, and the results of their operations for each of the periods then ended, and the changes in their net assets and financial highlights for each of the periods indicated therein, in conformity with U.S. generally accepted accounting principles.
Chicago, Illinois
November 24, 2009
152
Directors (unaudited)
The business address of each director is One Security Benefit Place, Topeka, KS 66636-0001
| | |
Name (Date of Birth) Year Elected*** | | Principal Occupation(s) During Past 5 Years |
| Donald A. Chubb, Jr.** | | Business Broker - Griffith & Blair Realtors |
| (12-14-46) | | Director - Jayhawk Area Boy Scouts Council |
| 1994 | | |
| |
| Harry W. Craig, Jr.** | | Chairman, CEO, Secretary & Director - The Martin Tractor Company, Inc. |
| (05-11-39) | | Director - Stormont-Vail Corporation |
| 2004 | | Director - Concerned Citizens for Topeka |
| | Director - Oscar S. Stauffer Executive in Residence |
| |
| Jerry B. Farley** | | President - Washburn University |
| (09-20-46) | | President - J&J Bonanza |
| 2005 | | |
| |
| Penny A. Lumpkin** | | Partner – Vivian’s Gift Shop (Corporate Retail) |
| (08-20-39) | | Vice President - Palmer Companies, Inc. (Small Business and Shopping |
| 1993 | | Center Development) |
| | Vice President - PLB (Real Estate Equipment Leasing) |
| | Vice President - Town Crier (Retail) |
| | Prior to 2002: |
| | Vice President - Bellaire Shopping Center (Managing and Leasing) |
| | Partner - Goodwin Enterprises (Retail) |
| |
| Maynard F. Oliverius** | | President & Chief Executive Officer - Stormont-Vail HealthCare |
| (12-18-43) | | Director - VHA Mid-America |
| 1998 | | Director - Go Topeka |
| |
| Richard M. Goldman* | | Senior Vice President - Security Benefit Corporation |
| (03-04-61) | | President & CEO – Rydex Holdings, LLC |
| 2008 (President, Director & | | President – Security Investors, LLC |
| Chairman of the Board) | | Director – Security Distributors, Inc. |
| | Director – First Security Benefit Life Insurance and Annuity Company of New York |
| | President & Manager – Security Global Investors, LLC |
| | President – Security Investments Corporation |
| | Managing Member – RM Goldman Partners, LLC |
| | President & CEO – ForstmannLeff |
| | Managing Director – Head of the Americas Institutional Business, Deutsche |
| | Asset Management |
| * | This director is deemed to be an “interested person” of the Funds under the 1940 Act, as amended, by reason of his position with the Funds’ Investment Manager and/or the parent of the Investment Manager. This director is also an officer of the funds. |
| ** | These directors serve on the Fund’s joint audit committee, the purpose of which is to meet with the independent registered public accounting firm, to review the work of the independent registered public accounting firm, and to oversee the handling by Security Investors of the accounting and financial reporting functions for the Funds. |
| *** | Each director oversees 30 Security Funds portfolios and serves until the next annual meeting, or until a successor has been duly elected and qualified. |
153
Officers (unaudited)
The business address of each officer is One Security Benefit Place, Topeka, KS 66636-0001
| | |
Name (Date of Birth) Title - Year Elected | | Principal Occupation(s) During Past 5 Years |
| Mark P. Bronzo | | Portfolio Manager, Security Investors, LLC |
| (11-01-60) | | Managing Director & Chief Compliance Officer, Nationwide Separate |
| Vice President – 2008 | | Accounts LLC |
| |
| Christina Fletcher | | Vice President & Portfolio Manager - Security Investors, LLC |
| (07-25-72) | | Credit Analyst/Portfolio Manager - Horizon Cash Management |
| Vice President - 2005 | | Senior Money Market Trader - Scudder Investments |
| |
| Brenda M. Harwood | | Vice President, Chief Compliance Officer & Treasurer - Security Global |
| (11-03-63) | | Investors, LLC |
| Chief Compliance Officer - 2004 | | Assistant Vice President - Security Benefit Life Insurance Company |
| Treasurer – 1988 | | Vice President, Assistant Treasurer & Director - Security Distributors, Inc. |
| |
| Amy J. Lee | | Secretary - Security Investors, LLC |
| (06-05-61) | | Secretary & Chief Compliance Officer - Security Distributors, Inc. |
| Secretary - 1987 | | Vice President, Associate General Counsel & Assistant Secretary - Security Benefit |
| | Corporation & Security Benefit Life Insurance Company |
| | Director - Brecek & Young Advisors, Inc. |
| |
| Mark Mitchell | | Vice President & Portfolio Manager - Security Investors, LLC |
| (08-24-64) | | Vice President & Portfolio Manager - Security Benefit Life Insurance Company |
| Vice President – 2003 | | |
| |
| Joseph C. O’Connor | | Portfolio Manager, Security Investors, LLC |
| (07-15-60) | | Managing Director, Nationwide Separate Accounts LLC |
| Vice President – 2008 | | |
| |
| Christopher Phalen | | Vice President & Head of Fixed Income - Security Global Investors, LLC; |
(11-9-70) Vice President – 2002 | | Assistant Vice President & Head of Fixed Income - Security Benefit Life Insurance Company |
| | Vice President & Portfolio Manager - Security Investors, LLC |
| | Vice President & Portfolio Manager - Security Benefit Life Insurance Company |
| |
| Daniel W. Portanova | | Portfolio Manager, Security Investors, LLC |
| (10-02-60) | | Managing Director, Nationwide Separate Accounts LLC |
| Vice President – 2008 | | |
| |
| James P. Schier | | Vice President & Senior Portfolio Manager - Security Investors, LLC; |
| (12-28-57) | | Vice President & Senior Portfolio Manager - Security Benefit Life Insurance |
| Vice President – 1998 | | Company |
| |
| Christopher D. Swickard | | Assistant Secretary - Security Investors, LLC |
| (10-09-65) | | Second Vice President & Assistant General Counsel - Security Benefit |
| Assistant Secretary – 1996 | | Corporation and Security Benefit Life Insurance Company |
| | Assistant Secretary - Security Distributors, Inc. |
| |
| David G. Toussaint | | Vice President & Portfolio Manager - Security Investors, LLC |
| (10-10-66) | | Assistant Vice President & Portfolio Manager - Security Benefit Life Insurance |
| Vice President – 2001 | | Company |
| * | Officers serve until the next annual meeting or until a successor has been duly elected and qualified. |
154
Tax Information (unaudited)
In accordance with the provisions of the Internal Revenue Code, the percentage of ordinary dividends (including short-term capital gains) attributable to the fiscal year ended September 30, 2009 which qualify for the dividends received deduction for corporate shareholders is as follows:
| | | |
Rydex | SGI Equity Fund: | | | |
Equity Series | | 100 | % |
Global Series | | 100 | % |
Global Institutional Series | | 95 | % |
Mid Cap Value Series | | 100 | % |
Mid Cap Value Institutional Series | | 11 | % |
Small Cap Value Series | | 5 | % |
Rydex | SGI Large Cap Value Fund: | | | |
Large Cap Value Fund | | 100 | % |
Large Cap Value Institutional Series | | 100 | % |
Certain dividends paid by the Funds may be subject to a maximum tax rate of 15%, as provided by the Jobs and Growth Tax Relief Reconciliation Act of 2003. The percentage of ordinary income distributions for the fiscal year ended September 30, 2009, taxed at the maximum rate of 15% is as follows:
| | | |
Rydex | SGI Equity Fund: | | | |
Equity Series | | 100 | % |
Global Series | | 100 | % |
Global Institutional Series | | 100 | % |
Mid Cap Value Series | | 100 | % |
Mid Cap Value Institutional Series | | 11 | % |
Small Cap Value Series | | 5 | % |
Rydex | SGI Large Cap Value Fund: | | | |
Large Cap Value Fund | | 100 | % |
Large Cap Value Institutional Series | | 100 | % |
For federal income tax purposes, the Funds designate capital gain dividends for the fiscal year ended September 30, 2009 as follows:
| | | |
Rydex | SGI Equity Fund: | | | |
Mid Cap Value Series | | $ | 86,413,567 |
Small Cap Growth Series | | | 97,806 |
Rydex | SGI Large Cap Value Fund: | | | |
Large Cap Value Fund | | | 427,734 |
Rydex | SGI Mid Cap Growth Fund | | | 651,342 |
Additional information for foreign shareholders only:
For the year ended September 30, 2009, the following ordinary distributions paid qualified as interest related dividends under the Internal Revenue Code Section 871(k)(1)(C):
| | | |
Rydex | SGI Equity Fund: | | | |
Global Institutional Series | | 11 | % |
Mid Cap Value Series | | 7 | % |
Rydex | SGI Large Cap Value Fund: | | | |
Large Cap Value Fund | | 8 | % |
Large Cap Value Institutional Series | | 3 | % |
For the year ended September 30, 2009, the following ordinary distributions paid qualified as short term capital gain dividends under the Internal Revenue Code Section 871(k)(2)(C):
| | | |
Rydex | SGI Equity Fund: | | | |
Mid Cap Value Institutional Series | | 93 | % |
Small Cap Value Series | | 100 | % |
Other Information
Each of the Rydex | SGI Funds files a complete schedule of portfolio holdings with the U.S. Securities and Exchange Commission for the first and third quarters of each fiscal year on Form N-Q. The Forms N-Q of each such Fund are available on the Commission’s website at www.sec.gov. The Forms N-Q may be reviewed and copied at the Commission’s Public Reference Room in Washington, DC. Information on the operation of the Public Reference Room may be obtained by calling 1-800-SEC-0330. The portfolio holdings of each of the Security Funds are available on their website, www.securitybenefit.com or by calling 1-800-888-2461.
A description of the policies and procedures that the Rydex | SGI Funds use to determine how to vote proxies relating to portfolio securities is available upon request, free of charge by calling 1-800-888-2461, or accessing the U.S. Securities and Exchange Commission website at www.sec.gov. Information regarding how the Rydex | SGI Funds voted proxies relating to portfolio securities during the 12 month period ended June 30, 2009 is available upon request, free of charge by calling 1-800-888-2461, or accessing the U.S. Securities and Exchange Commission website at www.sec.gov.
The statement of additional information (“SAI”) includes additional information about the Funds’ Directors and is available upon request without charge by calling 1-800-888-2461.
This report is submitted for the general information of the shareholders of the Funds. The report is not authorized for distribution to prospective investors in the Funds unless preceded or accompanied by an effective prospectus which contains details concerning the sales charges and other pertinent information.
155
Rydex | SGI Privacy Policies
Rydex Funds, Rydex | SGI Funds, Rydex Investments, Rydex Distributors, Inc., Security Investors, LLC, Security Global Investors, LLC, Security Distributors, Inc. and Rydex Advisory Services (Collectively “Rydex”)
Our Commitment to You
When you become a Rydex | SGI investor, you entrust us with not only your hard-earned money but also with personal and financial information about you. We recognize that your relationship with us is based on trust and that you expect us to act responsibly and in your best interests. Because we have access to this private information about you, we hold ourselves to the highest standards in its safekeeping and use. This means, most importantly, that we do not sell client information to anyone—whether it is your personal information or if you are a current or former Rydex | SGI client.
The Information We Collect About You
In the course of doing business with shareholders and investors, we collect nonpublic personal information about you. You typically provide personal information when you complete a Rydex | SGI account application or when you request a transaction that involves Rydex and Rydex | SGI funds or one of the Rydex | SGI affiliated companies. “Nonpublic personal information” is personally identifiable private information about you. For example, it includes information regarding your name and address, Social Security or taxpayer identification number, assets, income, account balance, bank account information and investment activity (e.g., purchase and redemption history).
How We Handle Your Personal Information
As emphasized above, we do not sell information about current or former clients or their accounts to third parties. Nor do we share such information, except when necessary to complete transactions at your request or to make you aware of related investment products and services that we offer. Additional details about how we handle your personal information are provided below. To complete certain transactions or account changes that you direct, it may be necessary to provide identifying information to companies, individuals or groups that are not affiliated with Rydex | SGI. For example, if you ask to transfer assets from another financial institution to Rydex | SGI, we will need to provide certain information about you to that company to complete the transaction. To alert you to other Rydex | SGI investment products and services, we may share your information within the Rydex | SGI family of affiliated companies. This would include, for example, sharing your information within Rydex | SGI so we can make you aware of new Rydex and Rydex | SGI funds or the services offered through another Rydex | SGI affiliated company. In certain instances, we may contract with nonaffiliated companies to perform services for us. Where necessary, we will disclose information we have about you to these third parties. In all such cases, we provide the third party with only the information necessary to carry out its assigned responsibilities and only for that purpose. And we require these third parties to treat your private information with the same high degree of confidentiality that we do. In certain instances, we may share information with other financial institutions regarding individuals and entities in response to the U.S.A. Patriot Act. Finally, we will release information about you if you direct us to do so, if we are compelled by law to do so or in other circumstances permitted by law.
Opt Out Provisions
We do not sell your personal information to anyone. The law allows you to “opt out” of only certain kinds of information sharing with third parties. The firm does not share personal information about you with any third parties that triggers this opt-out right. This means YOU ARE ALREADY OPTED OUT.
How We Protect Privacy Online
Our concern for the privacy of our shareholders also extends to those who use our web site, www.rydex-sgi.com. Our web site uses some of the most secure forms of online communication available, including encryption technology, Secure Socket Layer (SSL) protocol, firewalls and user names and passwords. These technologies provide a high level of security and privacy when you access your account information or initiate online transactions. The Rydex | SGI web site offers customized features that require our use of “http cookies”—tiny pieces of information that we ask your browser to store. However, we make very limited use of these cookies. We only use cookies for session management and security features on the Rydex | SGI web site. We do not use them to pull data from your hard drive, to learn your email address, or to view data in cookies created by other web sites. We will not share the information in our cookies
156
Rydex | SGI Privacy Policies (continued)
or give others access to it. See the legal information area on our web site for more details about web site security and privacy features.
How We Safeguard Your Personal Information
We restrict access to nonpublic personal information about shareholders to our employees and in some cases to third parties (for example, the service providers described above) as permitted by law. We maintain strict physical, electronic and procedural safeguards that comply with federal standards to guard your nonpublic personal information.
We’ll Keep You Informed
As required by federal law, we will notify shareholders of our privacy policy annually. We reserve the right to modify this policy at any time, but rest assured that if we do change it, we will tell you promptly. You will also be able to access our privacy policy from our web site at www.rydex-sgi.com. Should you have any questions regarding our privacy policy, contact us at 800.820.0888 or 301.296.5100.
157
| | | | |
| | | | PRSRT STD U.S. POSTAGE PAID LANCASTER, PA PERMIT NO. 732 |
One Security Benefit Place — Topeka, Kansas 66636-0001 — securitybenefit.com | |
| Rydex Distributors, Inc. | |
| | | | |
| SDI 604 | | | | 46-06043-00 2009/09/30 |
The Registrant has adopted a code of ethics that applies to its principal executive officer and principal financial officer. A copy of the Registrant’s code of ethics is filed herewith as Exhibit 10(a)(1). No amendments were made to the provisions of the code of ethics during the period covered by this report. No implicit or explicit waivers to the provisions of the code of ethics were granted during the period covered by this report. The Registrant hereby undertakes to provide any person without charge, upon request, a copy of its Code by calling the Registrant at 1-800-888-2461.
| Item 3. | Audit Committee Financial Expert. |
The Registrant’s Board of Directors has determined that Maynard Oliverius, a member of the Audit Committee of the Board, is an audit committee financial expert. Mr. Oliverius is “independent” for purposes of this item.
| Item 4. | Principal Accountant Fees and Services. |
| (a) | Audit Fees. The aggregate fees billed for each of the last two fiscal years (the “Reporting Periods”) for professional services rendered by the Registrant’s principal accountant (the “Auditor”) for the audit of the Registrant’s annual financial statements, or services that are normally provided by the Auditor in connection with the statutory and regulatory filings or engagements for the Reporting Periods, were $172,800 in 2008 and $170,700 in 2009. |
| (b) | Audit-Related Fees. The aggregate fees billed in the Reporting Periods for assurance and related services by the Auditor that are reasonably related to the performance of the audit of the Registrant’s financial statements and are not reported under paragraph (a) of this Item 4 were $5,100 in 2008 and $14,300 in 2009. These services consisted of financial reporting advisory services. |
The aggregate fees billed in the Reporting Periods for assurance and related services by the Auditor to the Registrant’s investment adviser (not including any sub-investment adviser whose role is primarily portfolio management and is subcontracted with or overseen by another investment adviser), and any entity controlling, controlled by or under common control with the investment adviser that provides ongoing services to the Registrant (“Service Affiliates”) which required pre-approval by the Audit Committee were $9,250 in 2008 and $9,250 in 2009, which related to the review of the transfer agent function.
| (c) | Tax Fees. The aggregate fees billed to the Registrant in the Reporting Periods for professional services rendered by the Auditor for tax compliance, tax advice and tax planning (“Tax Services”) were $28,600 in 2008 and $33,500 in 2009. These services consisted of (i) preparation of U.S. federal, state and excise tax returns; (ii) U.S. federal and state tax planning, advice and assistance regarding statutory, regulatory or administrative developments, (iii) tax advice regarding tax qualification matters and/or treatment of various financial instruments held or proposed to be acquired and (iv) review of U.S. federal excise distribution calculations. |
The aggregate fees billed in the Reporting Periods for Tax Services by the Auditor to Service Affiliates which required pre-approval by the Audit Committee were $0 in 2008 and $0 in 2009.
| (d) | All Other Fees. The aggregate fees billed to the Registrant in the Reporting Periods for products and services provided by the Auditor, other than the services reported in paragraphs (a) through (c) of this Item, were $0 in 2008 and $0 in 2009. |
The aggregate fees billed in the Reporting Periods for Non-Audit Services by the Auditor to Service Affiliates, other than the services reported in paragraphs (b) through (d) of this Item, which required pre-approval by the Audit Committee were $0 in 2008 and $0 in 2009.
| (e) (1) | Audit Committee Pre-Approval Policies and Procedures. The Registrant’s Audit Committee has established policies and procedures for pre-approval of the auditor’s engagements for audit and non-audit services to the Registrant. Pre-approval considerations include whether the proposed services are compatible with maintaining the auditor’s independence as specified in applicable rules. |
| (e) (2) | Percentage of Non-Audit Services Approved under (c)(7)(i)(C). The percentage of the services described in each of (b) through (d) of this Item 4 (only those that relate to the Registrant) that were approved by the Audit Committee pursuant to paragraph (c)(7)(i)(C) of Rule 2-01 of Regulation S-X was 0%, 0% and 0%, respectively. |
| (g) | Non-Audit Fees. The aggregate non-audit fees were for audit-related and tax services rendered to the Registrant, and rendered to Service Affiliates, for the Reporting Periods were $42,950 in 2008 and $57,050 in 2009. |
| (h) | Auditor Independence. The Registrant’s Audit Committee was provided with information relating to the provision of non-audit services by Ernst & Young, LLP to the Registrant (and its affiliates) that were not pre-approved by the Audit Committee so that a determination could be made whether the provision of such services is compatible with maintaining Ernst & Young, LLP’s independence. |
| Item 5. | Audit Committee of Listed Registrants. |
Not applicable.
| Item 6. | Schedule of Investments. |
The Schedule of Investments is included under Item 1 of this form.
| Item 7. | Disclosure of Proxy Voting Policies and Procedures for Closed-End Management Investment Companies. |
Not applicable.
| Item 8. | Portfolio Managers of Closed-End Management Investment Companies. |
Not applicable.
| Item 9. | Purchases of Equity Securities by Closed-End Management Investment Company and Affiliated Purchasers. |
Not applicable.
| Item 10. | Submission of Matters to a Vote of Security Holders. |
The registrant does not currently have in place procedures by which shareholders may recommend nominees to the registrant’s board.
There have been no changes to the procedures by which shareholders may recommend nominees to the registrant’s board.
| Item 11. | Controls and Procedures. |
| (a) | The registrant’s President and Treasurer have concluded that the registrant’s disclosure controls and procedures (as defined in rule 30a-3(c) under the Investment Company Act of 1940) are effective based on their evaluation of these disclosure controls and procedures within 90 days of the filing date of this report on Form N-CSR. |
| (b) | There were no significant changes in the registrant’s internal controls, or in other factors that could significantly affect these controls subsequent to the date of their evaluation, including any corrective actions with regard to significant deficiencies and material weaknesses. |
| (a) (1) | Code of Ethics pursuant to Item 2 above. |
| (2) | Certifications pursuant to Section 302 of the Sarbanes-Oxley Act of 2002 and required by Rule 30a-2(a) under the Investment Company Act of 1940, are attached hereto. |
| (b) | Certifications pursuant to Section 906 of the Sarbanes-Oxley Act of 2002 and required by Rule 30a-2(a) under the Investment Company Act of 1940, are attached hereto. |
SIGNATURES
Pursuant to the requirements of the Securities Exchange Act of 1934 and the Investment Company Act of 1940, the registrant has duly caused this report to be signed on its behalf by the undersigned, thereunto duly authorized.
| | |
| SECURITY EQUITY FUND |
| |
| By: | | /s/ RICHARD M. GOLDMAN |
| | Richard M. Goldman, President |
|
Date: December 7, 2009 |
Pursuant to the requirements of the Securities Exchange Act of 1934 and the Investment Company Act of 1940, this report has been signed below by the following persons on behalf of the registrant and in the capacities and on the dates indicated.
| | |
| By: | | /s/ RICHARD M. GOLDMAN |
| | Richard M. Goldman, President |
|
| Date: December 7, 2009 |
| |
| By: | | /s/ BRENDA M. HARWOOD |
| | Brenda M. Harwood, Treasurer |
|
| Date: December 7, 2009 |