the Jensen Portfolio
Letter from The Investment Adviser
DEAR FELLOW SHAREHOLDERS:
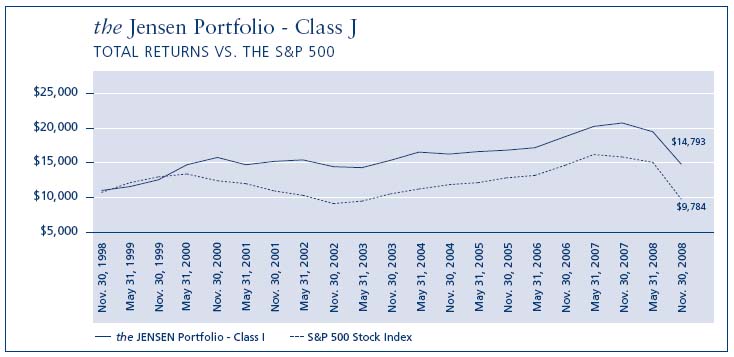
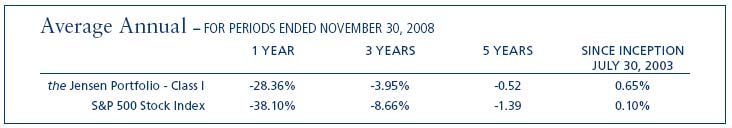
The Jensen Portfolio -- Class J Shares – declined 23.92% for the six months ended November 30, 2008, compared to a decline of 35.20% over this period for the Standard & Poor’s 500 Index. Please see pages 4 through 6 of this report for complete standardized performance information for the Portfolio.
Market Perspective
While Bear Stearns’ collapse occurred before the start of a new fiscal year for The Jensen Portfolio, it represented a turning point for the markets as the risks of excess – liquidity, cheap credit, inflated home prices – came home to roost. Markets have only become more volatile since then.
The last few months’ volatility allowed The Jensen Portfolio to outperform its benchmark due to the downside protection we expected (and received) from the quality growth companies we purchased at discounts to our estimates of their intrinsic values. While quality growth companies had significantly outperformed the benchmark during the first few months of the new fiscal year, they were seen as a source of liquidity in the latter portion of the first six months as investors fled to cash. Even companies traditionally seen as defensive fell at double-digit rates in the latter months. Redemptions from mutual funds and hedge funds spiked, contributing to falling prices for virtually every asset class. The U.S. passed the first anniversary of the current recession, just after having been alerted that we were officially in one.
Faced with these challenges, consumers are deleveraging their personal balance sheets, with loan demand and retail sales falling considerably. Businesses are responding with lower capital expenditures and job cuts. Government, mindful of policy lessons from the past, has cut interest rates, increased the supply of money and prepared a massive fiscal stimulus package that includes acquiring troubled assets, providing loan guarantees and taking stakes in key businesses.
The Effect at Jensen
At Jensen, stock selection added value in the Industrial, Financial and Information Technology sectors, while detracting from returns in the Healthcare sector. In particular, Medtronic and Stryker were major detractors. However, the underlying fundamental strength of both of these companies and their solid long-term opportunities give us confidence that our patience should be rewarded once short-term concerns dissipate.
The earnings outlook for U.S. companies remains uncertain as the impact of a slowing global economy continues. As a result, we anticipate continued volatility in the markets and further uncertainty over the financial health of consumers and businesses alike. We believe that stock selection, particularly of quality growth companies, will continue to be of added importance to long-term investors in the months to come and we are constantly striving to upgrade the portfolio of companies in which we invest.
Portfolio Additions and Eliminations
At mid-year we sold our remaining position in the McGraw-Hill Companies. While the education and media segments of McGraw-Hill’s business have provided a stable foundation, the more significant growth in recent years has come from the Standard & Poor’s brand financial services business. As Standard & Poor’s business of rating fixed income issuances has slowed considerably, we do not have the clarity desired to determine the future growth of the business. Thus, our decision to sell was made.
We also exited our position in Bed, Bath & Beyond. We have long considered the company one of the best retail industry operators in part due to store managers’ autonomy to tailor purchasing decisions and inventories to the needs of their particular customers. While we hold the management of Bed, Bath & Beyond in high regard, worries about reduced consumer spending prompted a decision earlier in 2008 to trim the position significantly. In the Fall, with the outlook for the consumer growing weaker, we exited the position to pursue more attractive alternatives.
We are pleased to have added Cognizant Technology Solutions and United Technologies to The Jensen Portfolio during this period. While the two companies are quite different, both are strong examples of the quality growth companies we look for and we believe they are upgrades to the portfolio.
Cognizant Technology is a small, New Jersey-based provider of custom IT consulting and technology services as well as outsourcing services for North American companies and, to a lesser extent, ones in Europe and Asia. As an Indian Offshore IT Service Provider, Cognizant enjoys competitive advantages relative to traditional IT service providers such as wage arbitrage, its global delivery model and its small size. Although India is experiencing wage inflation, the typical Indian software engineer still earns one-eighth the salary of his/her U.S. or European counterpart. As customers shift their IT outsourcing, Cognizant is ideally suited to smaller, shorter duration projects. Jensen anticipates a slower but very robust growth rate for Cognizant’s future business.
United Technologies is a large industrial conglomerate with leadership positions in six distinct segments. These include Otis, the global manufacturer and distributor of elevators, escalators and moving sidewalks; Carrier, which services commercial, residential and industrial clients with heating ventilation and air conditioning systems; Pratt & Whitney, a provider of commercial, general aviation and military engines, parts and service; and Hamilton Sundstrand, which provides aerospace and industrial products and services. United Technologies is broadly diversified both in its business lines and geographically. Approximately 60% of the firm’s revenues are derived outside the U.S. Management has continually focused on improving margins and continues to utilize its free cash flow to fund both organic growth and opportunistic acquisitions.
Jensen acquired both positions at what we believe to be a significant discount to the companies’ respective intrinsic values.
1
The Jensen Perspective
As this is being written, the New Year has just begun and the nettles of 2008 are fresh upon our mind. Warren Buffett’s prediction of derivatives as “financial weapons of mass destruction” came to bear. Financial innovation became rife with such instruments as collateralized debt and mortgaged obligations, tranched and squared. The widespread abuse of leverage will likely be a hallmark of the present version of the gilded age.
In our view, this is an appropriate time to discuss how Jensen Investment Management, as advisor to The Jensen Portfolio, seeks to mitigate risk and preserve capital in the management of shareholders’ assets. Foremost in this process – and absent in the oversight of many financial vehicles that have recently proven troublesome for investors – is our desire to always provide transparency into the investment discipline we have followed since the inception of our firm over twenty years ago.
Since a mutual fund is a corporation, its shareholders have a pro rata stake in the securities held within its portfolio. While it is unfortunate that mutual fund shareholders have only a remote relationship with the individual companies, the research and analysis conducted by Jensen on those businesses strives to understand the positives and negatives of each enterprise, rather than just numbers flashing by on a ticker tape.
Jensen’s Process to Mitigate Risk
We believe the security selection process used in The Jensen Portfolio, as required by its prospectus, can help reduce investment risk. Shares of the fund offer investors the opportunity to own a selection of common stocks that have exhibited a minimum of 15% return on equity for at least the last ten consecutive years. That is a level of accomplishment that less than 200 publicly held domestic corporations at any one time typically meet. This metric does not guarantee that a company might not falter in the future. But we believe it is a strong indication that a qualifying company has achieved a level of success obtainable only by possessing a sustainable competitive advantage.
Examining that competitive advantage closely, and researching the business to help reach an opinion as to the sustainability of its growth, are vital components of our process. We buy a concentrated group of quality businesses which we believe can moderate the business risk of the entire portfolio. Furthermore, we strive to mitigate pricing risk (the risk of overpaying for these quality growth companies) through deliberate valuation work on each company. We buy only when a company’s shares are selling at a significant discount to our measure of its intrinsic value. As we all are painfully aware, markets can become irrationally apathetic just as they can become irrationally exuberant. In our opinion, the events of 2008, while painful, did offer us excellent entry points into the stocks of many quality businesses.
The operation of The Jensen Portfolio relies upon several different service providers. Key among them is US Bancorp Fund Services, LLC located in Milwaukee, Wisconsin which serves as the Fund’s administrator, and its parent company, U.S. Bank N.A., is the custodian of all the Portfolio’s assets. Their services range from determining the Portfolio’s daily net asset value to balancing the Portfolio’s books. Brokers, in whom Jensen Investment Management has no financial interest, execute all security buy and sell transactions.
As noted earlier, Jensen has always sought to provide as much transparency as possible to shareholders in The Jensen Portfolio, sharing insights and fund holdings on a timely basis. While documents such as this one may seem a bit stale once they reach shareholder mailboxes, we invite you to seek out more timely communications at www.jenseninvestment.com.
The Jensen Outlook
While 2009 represents a new calendar year, the challenges of the past year will not vanish immediately. Further declines in employment, GDP growth and the growth in earnings for U.S. companies are likely. We believe, however, that positives exist for long-term investors in quality growth businesses.
Earnings growth, while slower, should continue to be positive. Strong cash flows should enable management teams to reinvest in their businesses and make acquisitions, fueling gains in market share. Growing dividends currently provide a yield above that of 10-year Treasuries, offering current compensation to patient shareholders. Finally, valuations may offer a wealth of opportunities to upgrade investment portfolios with the stocks of quality firms.
2
In closing, the economy in the New Year augurs to be challenging. In our opinion, the companies held in The Jensen Portfolio are adequately capitalized for the stresses ahead and will be focusing their energies on improving their businesses just as we believe they have in the past.
We appreciate your continued support and we hope you’ll consider adding to your positions as the contagion from the credit markets may provide opportunities to long-term equity investors.
Cordially,
Val Jensen, Chairman
The Jensen Porfolio
and
The Jensen Investment Committee
This discussion and analysis of the Fund is as of November 2008 and is subject to change, and any forecasts made cannot be guaranteed.
Past performance is no guarantee of future results. Fund holdings and sector weightings are subject to change and are not recommendations to buy or sell any security. The S&P 500 Stock Index is an unmanaged but commonly used measure of common stock total return performance. One cannot invest directly in an index. For more complete information regarding performance and holdings, please refer to the financial statements and schedule of investments headings of this report. Current and future portfolio holdings are subject to risk.
The Fund is nondiversified, meaning that it may concentrate its assets in fewer individual holdings than a diversified fund and is therefore more exposed to individual stock volatility than a diversified fund.
Free Cash Flow: Is equal to the after-tax net income of a company plus depreciation and amortization less capital expenditures.
Return on Equity: Is equal to a company’s after-tax earnings (excluding non-recurring items) divided by its average stockholder equity for the year.
3
The S&P 500 Stock Index is an unmanaged but commonly used measure of common stock total return performance. This chart assumes an initial gross investment of $10,000 made on November 30, 1998 for Class J, the original share class of the fund. Returns shown include the reinvestment of all dividends. Returns shown do not reflect the deduction of taxes that a shareholder would pay on fund distributions or the redemption of fund shares.
Performance data shown represents past performance; Past performance does not guarantee future results. The investment return and principal value of an investment will fluctuate so that an investor’s shares, when redeemed, may be worth more or less than their original cost. Current performance of the fund may be lower or higher than the performance shown. Performance data current to the most recent month end may be obtained by calling 1-800-992-4144 or by visiting www.jenseninvestment.com.
4
The S&P 500 Stock Index is an unmanaged but commonly used measure of common stock total return performance. This chart assumes an initial gross investment of $10,000 made on July 30, 2003, the inception date for Class R shares. Returns shown include the reinvestment of all dividends. Returns shown do not reflect the deduction of taxes that a shareholder would pay on fund distributions or the redemption of fund shares.
Performance data shown represents past performance; Past performance does not guarantee future results. The investment return and principal value of an investment will fluctuate so that an investor’s shares, when redeemed, may be worth more or less than their original cost. Current performance of the fund may be lower or higher than the performance shown. Performance data current to the most recent month end may be obtained by calling 1-800-992-4144 or by visiting www.jenseninvestment.com.
The S&P 500 Stock Index is an unmanaged but commonly used measure of common stock total return performance. This chart assumes an initial gross investment of $1,000,000 made on July 30, 2003, the inception date for Class I shares. Returns shown include the reinvestment of all dividends. Returns shown do not reflect the deduction of taxes that a shareholder would pay on fund distributions or the redemption of fund shares.
Performance data shown represents past performance; Past performance does not guarantee future results. The investment return and principal value of an investment will fluctuate so that an investor’s shares, when redeemed, may be worth more or less than their original cost. Current performance of the fund may be lower or higher than the performance shown. Performance data current to the most recent month end may be obtained by calling 1-800-992-4144 or by visiting www.jenseninvestment.com.

| Statement of Assets & Liabilities | | |
| November 30, 2008 (UNAUDITED) | | |
| | | |
| Assets: | | |
| Investments, at value (cost $1,850,700,224 | $ | 1,743,859,225 |
| Income receivable | | 4,582,974 |
| Receivable for capital stock | | 6,766,374 |
| Other assets | | 221,592 |
| Total Assets | | 1,755,430,165 |
| | | |
| Liabilities: | | |
| Payable to Investment Adviser | | 699,212 |
| Payable for capital stock redeemed | | 1,317,142 |
| Other accrued expenses | | 836,087 |
| Total Liabilities | | 2,852,441 |
| NET ASSETS | | $1,752,577,724 |
| | | |
| NET ASSETS CONSIST OF: | | |
| Capital stock | | 1,852,189,500 |
| Unrealized depreciation on investments | | (106,840,999) |
| Accumulated undistributed net investment income | | 6,237,965 |
| Accumulated undistributed net realized gain | | 991,258 |
| Total Net Assets | | $1,752,577,724 |
| | | |
| NET ASSETS CONSIST OF: | | |
| Class J Shares: | | |
| Net assets | $ | 1,436,813,434 |
| Shares outstanding | | 73,047,882 |
| Net Asset Value Per Share | | |
| (2,000,000,000 shares authorized, $.001 par value) | $ | 19.67 |
| | | |
| Class R Shares: | | |
| Net assets | $ | 5,369,472 |
| Shares outstanding | | 273,834 |
| Net Asset Value Per Share | | |
| (1,000,000,000 shares authorized, $.001 par value) | | $19.61 |
| | | |
| Class I Shares: | | |
| Net assets | $ | 310,394,818 |
| Shares outstanding | | 15,774,799 |
| Net Asset Value Per Share | | |
| (1,000,000,000 shares authorized, $.001 par value) | $ | 19.68 |
| | | |
| 8 | THE ACCOMPANYING NOTES ARE AN INTEGRAL PART OF THESE FINANCIAL STATEMENTS. |
| Schedule of Investments | | |
| November 30, 2008 (UNAUDITED) | | |
| | | | | |
| SHARES | | | | VALUE |
| | | Common Stocks - 98.76% | | |
| | | Aerospace & Defense - 2.56% | | |
| 924,000 | | United Technologies | | |
| | | Corporation | $ | 44,841,720 |
| | | Beverages - 7.48% | | |
| 921,000 | | The Coca-Cola Company | | 43,167,270 |
| 1,551,000 | | PepsiCo, Inc. | | 87,941,700 |
| | | | | 131,108,970 |
| | | Capital Markets - 2.01% | | |
| 1,032,000 | | T. Rowe Price Group, Inc. | | 35,304,720 |
| | | Chemicals - 4.75% | | |
| 1,103,000 | | Ecolab, Inc. | | 42,344,170 |
| 694,000 | | Praxair, Inc. | | 40,980,700 |
| | | | | 83,324,870 |
| | | Commercial Banks - 5.01% | | |
| 3,038,000 | | Wells Fargo & Company | | 87,767,820 |
| | | Commercial Services & Supplies - 3.15% |
| 2,170,000 | | Equifax, Inc. | | 55,226,500 |
| | | Electrical Equipment - 4.82% | | |
| 2,352,000 | | Emerson Electric Company | | 84,413,280 |
| | | Food & Staples Retailing - 3.12% | |
| 2,333,000 | | Sysco Corporation | | 54,708,850 |
| | | Health Care Equipment & Supplies - 7.86% |
| 2,234,400 | | Medtronic, Inc. | | 68,193,888 |
| 1,789,000 | | Stryker Corporation | | 69,627,880 |
| | | | | 137,821,768 |
| | | Health Care Providers & Services - 1.46% |
| 1,359,000 | | Patterson Companies, Inc. (a) | | 25,576,380 |
| | | Household Products - 9.86% | | |
| 524,000 | | The Clorox Company | | 30,999,840 |
| 777,000 | | Colgate-Palmolive Company | | 50,559,390 |
| 1,419,000 | | The Procter & Gamble | | |
| | | Company | | 91,312,650 |
| | | | | 172,871,880 |
| | | Industrial Conglomerates - 8.00% | |
| 1,286,500 | | 3M Company | | 86,105,445 |
| 3,152,800 | | General Electric Company | | 54,133,576 |
| | | | | 140,239,021 |
| SHARES | | | | VALUE |
| | | IT Services - 9.04% | | |
| 1,792,500 | | Automatic Data Processing, Inc. | | 73,600,050 |
| 2,646,000 | | Cognizant Technology | | |
| | | Solutions Corporation (a) | | 50,803,200 |
| 1,203,000 | | Paychex, Inc. | | 33,996,780 |
| | | | | 158,400,030 |
| | | Life Science Tools & Services - 3.77% |
| 1,604,000 | | Waters Corporation (a) | | 66,132,920 |
| | | Machinery - 4.35% | | |
| 1,370,000 | | Danaher Corporation | | 76,226,800 |
| | | Media - 3.60% | | |
| 2,228,000 | | Omnicom Group, Inc. | | 63,030,120 |
| | | Pharmaceuticals - 10.41% | | |
| 1,746,000 | | Abbott Laboratories | | 91,472,940 |
| 1,551,500 | | Johnson & Johnson | | 90,886,870 |
| | | | | 182,359,810 |
| | | Software - 7.51% | | |
| 1,951,000 | | Adobe Systems, Inc. (a) | | 45,185,160 |
| 4,271,200 | | Microsoft Corporation | | 86,363,664 |
| | | | | 131,548,824 |
| | | Total Common Stocks | | |
| | | (Cost $1,837,745,282) | | 1,730,904,283 |
| | | | | |
| PRINCIPAL AMOUNT | | |
| | | Short Term Investments - 0.74% |
| | | Commercial Paper - 0.74% | | |
| $12,954,000 | | Wells Fargo - 0.20%, 12/01/2008 | | 12,954,000 |
| | | Variable Rate Demand Note (b) - 0.00% |
| 942 | | Wisconsin Corporate Central | | |
| | | Credit Union, 1.36% | | 942 |
| | | Total Short-Term Investments | | |
| | | (Cost $12,954,942) | | 12,954,942 |
| | | Total Investments (Cost | | |
| | | $1,850,700,224) - 99.50% | | 1,743,859,225 |
| | | Other Assets in Excess of | | |
| | | Liabilities - 0.50% | | 8,718,499 |
| | | TOTAL NET ASSETS - 100.00% | $ | 1,752,577,724 |
| (a) Non-income producing security. | | |
| (b) Variable rate demand notes are considered short-term |
| obligations and are payable on demand. Interest rates |
| change periodically on specified dates. The rate shown is |
| as of November 30, 2008. | | |
| THE ACCOMPANYING NOTES ARE AN INTEGRAL PART OF THESE FINANCIAL STATEMENTS. | 9 |
| FAS 157 - Summary of Fair Value Exposure at November 30, 2008 |
Various inputs are used in determining the value of the Fund’s investments. These inputs are summarized in the three broad levels listed below: |
| |
| Level 1 - Quoted prices in active markets for identical securities. |
| |
Level 2 - Other significant observable inputs (including quoted prices for similar securities, interest rates, prepayment speeds, credit risk, etc.) |
| |
| Level 3 - Significant unobservable inputs (including the Fund’s own assumptions in determining the fair value of investments) |
| |
The inputs or methodology used for valuing securities are not an indication of the risk associated with investing in those securities. |
| |
The following is a summary of the inputs used, as of November 30, 2008, in valuing the Fund’s investments carried at fair value: |
| | | | | LEVEL 1 - QUOTED PRICES | | LEVEL 2 - SIGNIFICANT | | |
| | | | | IN ACTIVE MARKETS FOR | | OTHER OBSERVABLE | | LEVEL 3 - SIGNIFICANT |
| DESCRIPTION | | TOTAL | | IDENTICAL ASSETS | | INPUTS | | UNOBSERVABLE INPUTS |
| Assets: | | | | | | | | |
| Investments | | $1,743,859,225 | | $1,730,904,283 | | $12,954,942 | | $— |
| Total | | $1,743,859,225 | | $1,730,904,283 | | $12,954,942 | | $— |
| 10 | THE ACCOMPANYING NOTES ARE AN INTEGRAL PART OF THESE FINANCIAL STATEMENTS. |
| Statement of Operations | | |
| Six Months Ended November 30, 2008 (UNAUDITED) | |
| | | |
| Investment Income: | | |
| | | |
| Dividend income | $ | 20,898,257 |
| Interest income | | 268,494 |
| | | 21,166,751 |
| Expenses (1): | | |
| | | |
| Investment advisory fees | | 4,921,227 |
| 12b-1 fees - Class J | | 2,041,441 |
| Administration fees | | 398,866 |
| Transfer agent fees - Class J | | 67,835 |
| Custody fees | | 97,955 |
| Directors’ fees and expenses | | 52,036 |
| Reports to shareholders - Class J | | 73,920 |
| Fund accounting fees | | 67,309 |
| Federal and state registration fees | | 55,871 |
| Professional fees | | 40,513 |
| 12b-1 fees - Class R | | 22,592 |
| Transfer agent expenses | | 67,507 |
| Shareholder servicing fees - Class I | | 101,997 |
| Reports to shareholders - Class I | | 5,266 |
| Reports to shareholders - Class R | | 1,196 |
| Transfer agent fees - Class I | | 384 |
| Transfer agent fees - Class R | | 549 |
| Other | | 24,025 |
| Total expenses | | 8,040,489 |
| | | |
| NET INVESTMENT INCOME | | 13,126,262 |
| | | |
| REALIZED AND UNREALIZED GAIN | | |
| ON INVESTMENTS: | | |
| Net realized gain on investment | | |
| transactions | | 6,768,618 |
| Change in unrealized depreciation on | | |
| investments | | (570,113,023) |
| Net loss on investments | | (563,344,405) |
| | | |
| NET DECREASE IN NET ASSETS RESULTING | | |
| FROM OPERATIONS | $ | (550,218,143) |
| (1) See Note 1 (g) in the Notes to the Financial Statements |
| for information about the allocation of expenses to each |
| class of shares. | | |
| Statements of Changes in | | |
| Net Assets | | | | |
| | | SIX MONTHS | | |
| | | ENDED NOV. 30, ‘08 | | YEAR ENDED |
| | | ( UNAUDITED) | | MAY 31, ‘08 |
| Operations: | | | | |
| Net investment income | $ | 13,126,262 | $ | 21,666,573 |
| Net realized gain on | | | | |
| investment transactions | | 6,768,618 | | 89,551,484 |
| Change in unrealized | | | | |
| depreciation on | | | | |
| investments | | (570,113,023) | | (201,296,791) |
| Net decrease in | | | | |
| net assets resulting | | | | |
| from operations | | (550,218,143) | | (90,078,734) |
| Capital Share Transactions: | | | | |
| Shares sold - Class J | | 487,097,689 | | 326,193,682 |
| Shares sold - Class R | | 1,060,975 | | 6,357,612 |
| Shares sold - Class I | | 133,200,970 | | 127,102,066 |
| Shares issued to holders in | | | | |
| reinvestment of | | | | |
| dividends - Class J | | 52,701,054 | | 29,935,277 |
| Shares issued to holders in | | | | |
| reinvestment of | | | | |
| dividends - Class R | | 208,207 | | 289,339 |
| Shares issued to holders in | | | | |
| reinvestment of | | | | |
| dividends - Class I | | 11,211,481 | | 6,125,614 |
| Shares redeemed - Class J | | (302,377,614) | | (505,722,375) |
| Shares redeemed - Class R | | (11,881,781) | | (9,094,633) |
| Shares redeemed - Class I | | (70,685,348) | | (111,653,034) |
| Net increase (decrease) | | 300,535,633 | | (130,466,452) |
| DIVIDENDS AND DISTRIBUTIONS | | | | |
| TO SHAREHOLDERS: | | | | |
| Net investment income - Class J | | (8,117,437) | | (17,371,282) |
| Net investment income - Class R | | (36,983) | | (139,969) |
| Net investment income - Class I | | (1,796,903) | | (4,034,303) |
| Net realized capital gains - Class J | | (46,293,910) | | (13,887,735) |
| Net realized capital gains - Class R | | (171,219) | | (2,576,922) |
| Net realized capital gains - Class I | | (10,000,090) | | (149,385) |
| Total dividends and | | | | |
| distributions | | (66,416,542) | | (38,159,596) |
| DECREASE IN NET ASSETS | | (316,099,052) | | (258,704,782) |
| NET ASSETS: | | | | |
| Beginning of period | | 2,068,676,776 | | 2,327,381,558 |
| End of period (including | | | | |
| undistributed net | | | | |
| investment income of | | | | |
| $6,237,965 and $3,063,026, | | | | |
| respectively) | $ | 1,752,577,724 | $ | 2,068,676,776 |
| THE ACCOMPANYING NOTES ARE AN INTEGRAL PART OF THESE FINANCIAL STATEMENTS. | 11 |
| Financial Highlights | | | | | | | | | | | | | | | | | | |
| Class J | | | | | | | | | | | | | | | | | | |
| | | SIX MONTHS | | | | | | | | | | | | | | | | |
| | | ENDED | | | | | | | | | | | | | | | | |
| | | NOV. 30, ‘08 | | | YEAR ENDED | | | YEAR ENDED | | | YEAR ENDED | | | YEAR ENDED | | | YEAR ENDED | |
| | | (UNAUDITED) | | | MAY 31, ‘08 | | | MAY 31, ‘07 | | | MAY 31, ‘06 | | | MAY 31, ‘05 | | | MAY 31, ‘04 | |
| Per Share Data: | | | | | | | | | | | | | | | | | | |
| Net asset value, beginning of period | | $ | 26.91 | | | $ | 28.53 | | | $ | 24.37 | | | $ | 23.79 | | | $ | 23.82 | | | $ | 20.80 | |
| Income from investment operations: | | | | | | | | | | | | | | | | | | | | | | | | |
| Net investment income | | | 0.15 | | | | 0.27 | | | | 0.22 | | | | 0.22 | | | | 0.18 | | | | 0.16 | |
| Net realized and unrealized gains | | | | | | | | | | | | | | | | | | | | | | | | |
| (losses) on investments | | | (6.62) | | | | (1.42) | | | | 4.16 | | | | 0.56 | | | | (0.03) | (1) | | | 3.01 | |
| Total from investment operations | | | (6.47) | | | | (1.15) | | | | 4.38 | | | | 0.78 | | | | 0.15 | | | | 3.17 | |
| Less distributions: | | | | | | | | | | | | | | | | | | | | | | | | |
| Dividends from net | | | | | | | | | | | | | | | | | | | | | | | | |
| investment income | | | (0.12) | | | | (0.26) | | | | (0.22) | | | | (0.20) | | | | (0.18) | | | | (0.15) | |
| Dividends from net realized | | | | | | | | | | | | | | | | | | | | | | | | |
| capital gains | | | (0.65) | | | | (0.21) | | | | — | | | | — | | | | — | | | | — | |
| Total distributions | | | (0.77) | | | | (0.47) | | | | (0.22) | | | | (0.20) | | | | (0.18) | | | | (0.15) | |
| Net asset value, end of period | | $ | 19.67 | | | $ | 26.91 | | | $ | 28.53 | | | $ | 24.37 | | | $ | 23.79 | | | $ | 23.82 | |
Total return(2) | | | (23.92) | % | | | (4.08) | % | | | 18.05 | % | | | 3.30 | % | | | 0.61 | % | | | 15.28 | % |
| Supplemental data and ratios: | | | | | | | | | | | | | | | | | | | | | | | | |
| Net assets, end of period (000’s) | | $ | 1,436,813 | | | $ | 1,706,765 | | | $ | 1,963,520 | | | $ | 1,764,212 | | | $ | 2,680,169 | | | $ | 2,046,288 | |
| Ratio of expenses to average | | | | | | | | | | | | | | | | | | | | | | | | |
net assets(3) | | | 0.85 | % | | | 0.85 | % | | | 0.85 | % | | | 0.85 | % | | | 0.85 | % | | | 0.88 | % |
| Ratio of net investment income | | | | | | | | | | | | | | | | | | | | | | | | |
to average net assets(3) | | | 1.30 | % | | | 0.95 | % | | | 0.83 | % | | | 0.85 | % | | | 0.77 | % | | | 0.71 | % |
Portfolio turnover rate(2) | | | 8.27 | % | | | 8.25 | % | | | 13.77 | % | | | 10.20 | % | | | 8.81 | % | | | 5.32 | % |
| | | | | | | | | | | | | | | | | | | | | | | | | |
(1) The amount shown may not correlate with the aggregate gains (losses) of portfolio securities due to timing of subscriptions and redemption of fund shares. | |
| (2) Not annualized for the six months ended November 30, 2008. | |
| (3) Annualized for the six months ended November 30, 2008. | |
| 12 | THE ACCOMPANYING NOTES ARE AN INTEGRAL PART OF THESE FINANCIAL STATEMENTS. |
| Financial Highlights | | | | | | | | | | | | | | | | | | |
| Class R | | | | | | | | | | | | | | | | | | |
| | | SIX MONTHS | | | | | | | | | | | | | | | | |
| | | ENDED | | | | | | | | | | | | | | | PERIOD FROM | |
| | | NOV. 30, ‘08 | | | YEAR ENDED | | | YEAR ENDED | | | YEAR ENDED | | | YEAR ENDED | | | JUL. 30, ‘03(1) | |
| | | (UNAUDITED) | | | MAY 31, ‘08 | | | MAY 31, ‘07 | | | MAY 31, ‘06 | | | MAY 31, ‘05 | | | TO MAY 31, ‘04 | |
| Per Share Data: | | | | | | | | | | | | | | | | | | |
| Net asset value, beginning of period | | $ | 26.81 | | | $ | 28.43 | | | $ | 24.29 | | | $ | 23.71 | | | $ | 23.76 | | | $ | 20.93 | |
| Income from investment operations: | | | | | | | | | | | | | | | | | | | | | | | | |
| Net investment income | | | 0.14 | | | | 0.22 | | | | 0.15 | | | | 0.14 | | | | 0.14 | | | | 0.13 | |
| Net realized and unrealized gains | | | | | | | | | | | | | | | | | | | | | | | | |
| (losses) on investments. | | | (6.62) | | | | (1.44) | | | | 4.14 | | | | 0.59 | | | | (0.05) | (2) | | | 2.83 | |
| Total from investment operations | | | (6.48) | | | | (1.22) | | | | 4.29 | | | | 0.73 | | | | 0.09 | | | | 2.96 | |
| Less distributions: | | | | | | | | | | | | | | | | | | | | | | | | |
| Dividends from net | | | | | | | | | | | | | | | | | | | | | | | | |
| investment income | | | (0.07) | | | | (0.19) | | | | (0.15) | | | | (0.15) | | | | (0.14) | | | | (0.13) | |
| Dividends from net realized | | | | | | | | | | | | | | | | | | | | | | | | |
| capital gains | | | (0.65) | | | | (0.21) | | | | 0.00 | | | | 0.00 | | | | 0.00 | | | | 0.00 | |
| Total distributions | | | (0.72) | | | | (0.40) | | | | (0.15) | | | | (0.15) | | | | (0.14) | | | | (0.13) | |
| Net asset value, end of period | | $ | 19.61 | | | $ | 26.81 | | | $ | 28.43 | | | $ | 24.29 | | | $ | 23.71 | | | $ | 23.76 | |
Total return(3) | | | (24.01) | % | | | (4.34) | % | | | 17.73 | % | | | 3.07 | % | | | 0.40 | % | | | 14.13 | % |
| Supplemental data and ratios: | | | | | | | | | | | | | | | | | | | | | | | | |
| Net assets, end of period (000’s) | | $ | 5,369 | | | $ | 18,662 | | | $ | 22,272 | | | $ | 21,100 | | | $ | 23,884 | | | $ | 799 | |
| Ratio of expenses to average | | | | | | | | | | | | | | | | | | | | | | | | |
net assets(4) | | | 1.11 | % | | | 1.10 | % | | | 1.10 | % | | | 1.10 | % | | | 1.10 | % | | | 1.12 | % |
| Ratio of net investment income | | | | | | | | | | | | | | | | | | | | | | | | |
to average net assets(4) | | | 0.96 | % | | | 0.70 | % | | | 0.58 | % | | | 0.60 | % | | | 0.54 | % | | | 0.45 | % |
Portfolio turnover rate(3) | | | 8.27 | % | | | 8.25 | % | | | 13.77 | % | | | 10.20 | % | | | 8.81 | % | | | 5.32 | % |
| | | | | | | | | | | | | | | | | | | | | | | | | |
| (1) Commencement of operations. | | | | | | | | | | | | | | | | | | | | | | | | |
(2) The amount shown may not correlate with the aggregate gains (losses) of portfolio securities due to timing of subscriptions and redemption of fund shares. | |
| (3) Not annualized for periods less than one year. | | | | | | | | | | | | | | | | | | | | | | | | |
| (4) Annualized for periods less than one year. | | | | | | | | | | | | | | | | | | | | | | | | |
| THE ACCOMPANYING NOTES ARE AN INTEGRAL PART OF THESE FINANCIAL STATEMENTS. | 13 |
| Financial Highlights | | | | | | | | | | | | | | | | | | |
| Class I | | | | | | | | | | | | | | | | | | |
| | | SIX MONTHS | | | | | | | | | | | | | | | | |
| | | ENDED | | | | | | | | | | | | | | | PERIOD FROM | |
| | | NOV. 30, ‘08 | | | YEAR ENDED | | | YEAR ENDED | | | YEAR ENDED | | | YEAR ENDED | | | JUL. 30, ‘03(1) | |
| | | (UNAUDITED) | | | MAY 31, ‘08 | | | MAY 31, ‘07 | | | MAY 31, ‘06 | | | MAY 31, ‘05 | | | TO MAY 31, ‘04 | |
| Per Share Data: | | | | | | | | | | | | | | | | | | |
| Net asset value, beginning of period | | $ | 26.91 | | | $ | 28.53 | | | $ | 24.38 | | | $ | 23.80 | | | $ | 23.82 | | | $ | 20.93 | |
| Income from investment operations: | | | | | | | | | | | | | | | | | | | | | | | | |
| Net investment income | | | 0.19 | | | | 0.30 | | | | 0.25 | | | | 0.24 | | | | 0.23 | | | | 0.12 | |
| Net realized and unrealized gains | | | | | | | | | | | | | | | | | | | | | | | | |
| (losses) on investments | | | (6.63) | | | | (1.38) | | | | 4.16 | | | | 0.59 | | | | (0.04) | (2) | | | 2.92 | |
| Total from investment operations | | | (6.44) | | | | (1.08) | | | | 4.41 | | | | 0.83 | | | | 0.19 | | | | 3.04 | |
| Less distributions: | | | | | | | | | | | | | | | | | | | | | | | | |
| Dividends from net | | | | | | | | | | | | | | | | | | | | | | | | |
| investment income | | | (0.14) | | | | (0.33) | | | | (0.26) | | | | (0.25) | | | | (0.21) | | | | (0.15) | |
| Dividends from net realized | | | | | | | | | | | | | | | | | | | | | | | | |
| capital gains | | | (0.65) | | | | (0.21) | | | | 0.00 | | | | 0.00 | | | | 0.00 | | | | 0.00 | |
| Total distributions | | | (0.79) | | | | (0.54) | | | | (0.26) | | | | (0.25) | | | | (0.21) | | | | (0.15) | |
| Net asset value, end of period | | $ | 19.68 | | | $ | 26.91 | | | $ | 28.53 | | | $ | 24.38 | | | $ | 23.80 | | | $ | 23.82 | |
Total return(3) | | | ( 23.83) | % | | | (3.86) | % | | | 18.23 | % | | | 3.56 | % | | | 0.77 | % | | | 14.54 | % |
| Supplemental data and ratios: | | | | | | | | | | | | | | | | | | | | | | | | |
| Net assets, end of period (000’s) | | $ | 310,395 | | | $ | 343,250 | | | $ | 341,589 | | | $ | 309,587 | | | $ | 288,428 | | | $ | 227,561 | |
| Ratio of expenses to average | | | | | | | | | | | | | | | | | | | | | | | | |
net assets(4) | | | 0.65 | % | | | 0.61 | %(5) | | | 0.65 | % | | | 0.67 | % | | | 0.67 | % | | | 0.70 | % |
| Ratio of net investment income | | | | | | | | | | | | | | | | | | | | | | | | |
to average net assets(4) | | | 1.50 | % | | | 1.20 | % | | | 1.03 | % | | | 1.03 | % | | | 0.95 | % | | | 0.87 | % |
Portfolio turnover rate(3) | | | 8.27 | % | | | 8.25 | % | | | 13.77 | % | | | 10.20 | % | | | 8.81 | % | | | 5.32 | % |
| | | | | | | | | | | | | | | | | | | | | | | | | |
| (1) Commencement of operations. | | | | | | | | | | | | | | | | | | | | | | | | |
(2) The amount shown may not correlate with the aggregate gains (losses) of portfolio securities due to timing of subscriptions and redemption of fund shares. | |
| (3) Not annualized for periods less than one year. | | | | | | | | | | | | | | | | | | | | | |
| (4) Annualized for periods less than one year. | | | | | | | | | | | | | | | | | | | | | | | | |
| (5) Due to a clerical error, this number appeared as 0.59% in the Fund’s annual report for the year ended May 31, 2008 and | |
| should have been reported as 0.61%. | | | | | | | | | | | | | | | | | | | | | | | | |
| 14 | THE ACCOMPANYING NOTES ARE AN INTEGRAL PART OF THESE FINANCIAL STATEMENTS. |
Notes to the Financial Statements
November 30, 2008 (UNAUDITED)
1. Organization and Significant Accounting Policies
The Jensen Portfolio, Inc. (the “Fund”) was organized as an Oregon Corporation on April 17, 1992, and is registered as an open-end, nondiversified management investment company under the Investment Company Act of 1940 (the “1940 Act”). The Fund commenced operations on August 3, 1992. Effective July 30, 2003, the Fund issued two new classes of shares, Class R and Class I, and renamed the existing class as Class J. Class J shares are subject to a 0.25% 12b-1 fee; Class R shares are subject to a 0.50% 12b-1 fee and Class I shares are subject to a 0.10% shareholder servicing fee, as described in each Class’ prospectus. Each class of shares has identical rights and privileges except with respect to the 12b-1 fees and shareholder servicing fee, and voting rights on matters affecting a single class of shares. The principal investment objective of the Fund is long-term capital appreciation.
The following is a summary of significant accounting policies consistently followed by the Fund. The policies are in conformity with accounting principles generally accepted in the United States of America.
a) Investment Valuation – Securities that are listed on United States stock exchanges or the Nasdaq Stock Market are valued at the last sale price on the day the securities are valued or, if there has been no sale on that day, at their current bid price. Quotations are taken from the market in which the security is primarily traded. Over-the-counter securities are valued at current bid price. Securities for which market quotations are not readily available (e.g., trading in a security is suspended by a stock exchange and trading is not resumed by the end of the day) are valued at fair value as determined by the Investment Adviser at or under the direction of the Fund’s Board of Directors in accordance with the Fund’s fair valuation procedures. Variable rate demand notes are valued at cost which approximates fair value.
There is no definitive set of circumstances under which the Fund may elect to use the fair value method to value a security. Although the Fund invests only in publicly traded securities, the large majority of which are large capitalization, highly liquid securities, they nonetheless may become securities for which market quotations are not readily available, such as in instances where the market quotation for a security has become stale, sales of a security have been infrequent, trading in the security has been suspended, or where there is a thin market in the security. Securities for which market quotations are not readily available will be valued at their fair value as determined under the Fund’s fair valuation procedures. The Fund is prohibited from investing in restricted securities (securities issued in private placement transactions that may not be offered or sold to the public without registration under the securities laws); therefore, fair value pricing considerations for restricted securities are not applicable to the Fund. There were no securities fair valued by the Board of Directors as of November 30, 2008.
b) Federal Income Taxes – No provision for federal income taxes has been made since the Fund has complied to date with the requirements of Subchapter M of the Internal Revenue Code applicable to regulated investment companies and intends to continue to so comply in the future and to distribute substantially all of its net investment income and realized capital gains in order to relieve the Fund from all federal income taxes.
Effective November 30, 2007, the Fund adopted Financial Accounting Standards Board (FASB) Interpretation No. 48 (FIN 48), “Accounting for Uncertainty in Income Taxes”. FIN 48 requires the evaluation of tax positions taken on previously filed tax returns or expected to be taken on future returns. These positions must meet a “more-likely-than-not” standard that, based on the technical merits, have a more than fifty percent likelihood of being sustained by the applicable tax authority. In evaluating whether a tax position has met the recognition threshold, the Fund must presume that the position will be examined by the appropriate taxing authority that has full knowledge of all relevant information. Tax positions not deemed to meet the “more-likely-than-not” threshold are recorded as a tax expense in the current year.
FIN 48 requires the Fund to analyze all open tax years, as defined by the Statute of Limitations, for all major jurisdictions. Open tax years are those that are open for exam by taxing authorities. As of November 30, 2008, open Federal tax years include the tax years ended May 31, 2005 through 2007. The Fund has no examination in progress.
The Fund has reviewed all open tax years and major jurisdictions and concluded that the adoption of FIN 48 resulted in no effect to the Fund’s financial position or results of operations. There is no tax liability resulting from unrecognized tax benefits relating to uncertain income tax positions taken or expected to be taken for the period ended November 30, 2008. The Fund is also not aware of any tax positions for which it is reasonably possible that the total amounts of unrecognized tax benefits will significantly change in the next twelve months.
c) Accounting Pronouncements – In September 2006, the Financial Accounting Standards Board (FASB) issued Statement on Financial Accounting Standards (SFAS) No. 157, “Fair Value Measurements.” This standard establishes a single authoritative definition of fair value, sets out a framework for measuring fair value and requires additional disclosures about fair value measurements. SFAS No. 157 applies to fair value measurements already required or permitted by existing standards. SFAS No. 157 is effective for financial statements issued for fiscal years beginning after November 15, 2007 and interim periods within those fiscal years. The changes to current generally accepted accounting principles from the application of this Statement relate to the definition of fair value, the methods used to measure fair value, and the expanded disclosures about fair value measurements. The adoption of SFAS No. 157 has made no impact to the financial statement amounts; however, additional disclosures have been added about the inputs used to develop the measurements and the effect of certain measurements on changes in net assets for the period.
In March 2008, Statement of Financial Accounting Standards No. 161, “Disclosures about Derivative Instruments and Hedging Activities” (“SFAS 161”) was issued and is effective for fiscal years beginning after November 15, 2008. SFAS 161 is intended to improve financial reporting for derivative instruments by requiring enhanced disclosure that enables investors to understand how and why an entity uses derivatives, how derivatives are accounted for, and how derivative instruments affect an entity’s results of operations and financial position. Management is currently evaluating the implications of SFAS 161. The impact on the Fund’s financial statement disclosures, if any, is currently being assessed.
15
d) Distributions to Shareholders – Dividends to shareholders are recorded on ex-dividend date. Dividends from net investment income are declared and paid quarterly by the Fund. Distributions of net realized capital gains, if any, will be declared and paid at least annually. Income and capital gain distributions are determined in accordance with income tax regulations which may differ from generally accepted accounting principles. Permanent differences between financial reporting and tax are reclassified to capital stock.
e) Use of Estimates – The preparation of financial statements in conformity with accounting principles generally accepted in the United States of America requires management to make estimates and assumptions that affect the reported amounts of assets and liabilities and disclosure of contingent assets and liabilities at the date of the financial statements and the reported amounts of revenues and expenses during the reporting period. Actual results could differ from those estimates. f) Guarantees and Indemnifications – Under the Fund’s organizational documents, each Director, officer, employee or other agent of the Fund is indemnified, to the extent permitted by the Act, against certain liabilities that may arise out of performance of their duties to the Fund. Additionally, in the normal course of business, the Fund enters into contracts that contain a variety of indemnification clauses. The Fund’s maximum exposure under these arrangements is unknown as this would involve future claims that may be made against the Fund that have not yet occurred. However, the Fund has not had prior claims or losses pursuant to these contracts and believes the risk of loss to be remote.
(g) Allocation of Income, Expenses and Gains/Losses – Income, expenses (other than those deemed attributable to a specific share class), and gains and losses of the Fund are allocated daily to each class of shares based upon the ratio of net assets represented by each class as a percentage of the net assets of the Fund. Expenses deemed directly attributable to a specific class of shares are charged against the operations of such class. Most Fund expenses are allocated by class based on relative net assets. Transfer Agent Fees and Reports to Shareholders are allocated based on the number of shareholder accounts in each class. 12b-1 Fees are expensed at 0.25% of daily net assets of Class J shares and 0.50% of daily net assets of Class R shares. Shareholder Servicing Fees are expensed at up to 0.10% of the daily net assets of Class I shares.
h) Other – Investment and shareholder transactions are recorded on trade date. Gains or losses from investment transactions are determined on the basis of identified carrying value. Dividend income is recognized on the ex-dividend date and interest income is recognized on an accrual basis. The Fund has investments in short-term variable rate demand notes, which are unsecured instruments. These notes may present credit risk to the extent the issuer defaults on its payment obligation. The credit-worthiness of the issuer is monitored, and these notes are considered to present minimal credit risk in the opinion of the Investment Adviser.
| 2. Capital Share Transactions | | | |
| Transactions in shares of the Fund were as follows: |
| | SIX MONTHS | | |
| | ENDED | | YEAR ENDED |
| | NOV. 30, ‘08 | | MAY 31, ‘08 |
| Class J | | | |
| Shares sold | 19,855,154 | | 11,906,634 |
| Shares issued to holders in | | | |
| reinvestment of dividends | 2,777,201 | | 1,067,519 |
| Shares redeemed | (13,015,926) | | (18,374,345) |
| Net increase (decrease) | 9,616,429 | | (5,400,192) |
| Shares outstanding: | | | |
| Beginning of period | 63,431,453 | | 68,831,645 |
| End of period | 73,047,882 | | 63,431,453 |
| | | | |
| Class R | | | |
| Shares sold | 43,014 | | 230,410 |
| Shares issued to holders in | | | |
| reinvestment of dividends | 10,894 | | 10,341 |
| Shares redeemed | (476,114) | | (328,249) |
| Net decrease | (422,206) | | (87,498) |
| Shares outstanding: | | | |
| Beginning of period | 696,040 | | 783,538 |
| End of period | 273,834 | | 696,040 |
| | | | |
| Class I | | | |
| Shares sold | 5,448,628 | | 4,611,371 |
| Shares issued to holders in | | | |
| reinvestment of dividends | 590,542 | | 218,956 |
| Shares redeemed | (3,019,881) | | (4,049,823) |
| Net increase | 3,019,289 | | 780,504 |
| Shares outstanding: | | | |
| Beginning of period | 12,755,510 | | 11,975,006 |
| End of period | 15,774,799 | | 12,755,510 |
3. Investment Transactions
The aggregate purchases and aggregate sales of securities, excluding short-term investments, by the Fund for the period ended November 30, 2008, were $399,896,559 and 160,764,688 respectively.
4. Income Taxes
The cost of investments differ for financial statement and tax purposes primarily due to differing treatments of wash sales.
The distributions of $21,545,554 and $19,044,930 paid during the years ended May 31, 2008 and 2007, respectively, were classified as ordinary for income tax purposes. Distributions of $16,614,042 paid during the year ended May 31, 2008 were classified as long term capital gain for income tax purposes.
At May 31, 2008, the cost of investments, net unrealized appreciation (depreciation) and undistributed ordinary income and undistributed long term capital gains for income tax purposes were as follows:
| Cost of investments | $ | 1,603,883,662 |
| Gross unrealized appreciation | | 496,698,110 |
| Gross unrealized depreciation | | (33,434,901) |
| Net unrealized appreciation | $ | 463,263,209 |
| Undistributed ordinary income | | 3,063,026 |
| Undistributed long-term capital gain | | 50,696,674 |
| Total distributable earnings | $ | 53,759,700 |
| Other accumulated losses | | — |
| Total accumulated earnings | $ | 517,022,909 |
5. Line of Credit
The Fund has a $250 million revolving credit facility for temporary emergency purposes, including the meeting of redemption requests that otherwise might require the untimely disposition of securities. The interest rate on the outstanding principal amount is equal to the prime rate less 1/2%. The Fund borrowed on the line of credit during the six months ended November 30, 2008, resulting in an interest expense of $2,770 by the Fund.
6. Investment Advisory Agreement
The Fund has entered into an Investment Advisory and Service Contract with Jensen Investment Management, Inc. Pursuant to its advisory agreement with the Fund, the Investment Adviser is entitled to receive a fee, calculated daily and payable monthly, at the annual rate of 0.50% as applied to the Fund’s daily net assets.
Certain officers of the Fund are also officers and directors of the Investment Adviser.
7. Distribution and Shareholder Servicing
The Fund has adopted a distribution and shareholder servicing plan pursuant to Rule 12b-1 under the 1940 Act (the “12b-1 Plan”), which provides that the Fund may make payments to the Fund’s distributor or others at an annual rate of up to 0.25% of the average daily net assets attributable to Class J shares and up to 0.50% of the average daily net assets attributable to Class R shares. Payments under the 12b-1 Plan shall be used to compensate or reimburse the Fund’s distributor or others for services provided and expenses incurred in connection with the sale and/or servicing of shares.
In addition, the Fund has adopted a Shareholder Servicing Plan (the “Servicing Plan”) under which the Fund can pay for shareholder support services from the Fund’s assets pursuant to a Shareholder Servicing Agreement in an amount not to exceed 0.10% of the Fund’s average daily net assets attributable to Class I shares.
Expense Example – November 30, 2008 (Unaudited)
As a shareholder of The Jensen Portfolio (the “Fund”), you incur ongoing costs, including investment advisory fees, distribution and/or shareholder servicing fees, and other Fund expenses, which are indirectly paid by shareholders. This example is intended to help you understand your ongoing costs (in dollars) of investing in the Fund and to compare these costs with the ongoing costs of investing in other mutual funds.
The Example is based on an investment of $1,000 invested at the beginning of the period and held for the entire six month period (June 1, 2008 – November 30, 2008).
Actual Expenses
The first line of the table below for each share class of the Fund provides information about actual account values and actual expenses. However, the table does not include shareholder specific fees, such as the $15.00 fee charged to IRA accounts, or the $12.00 fee charged for wire redemptions. The table also does not include portfolio trading commissions and related trading costs. You may use the information in this line, together with the amount you invested, to estimate the expenses that you paid over the period. Simply divide your account value by $1,000 (for example, an $8,600 account value divided by $1,000 = 8.6), then multiply the result by the number in the first line under the heading entitled “Expenses Paid During Period” to estimate the expenses you paid on your account during this period.
Hypothetical Example for Comparison Purposes
The second line of the table below provides information about hypothetical account values and hypothetical expenses based on the actual expense ratios for each share class of the Fund and an assumed rate of return of 5% per year before expenses, which is not the Fund’s actual return. The hypothetical account values and expenses may not be used to estimate the actual ending account balance or expenses you paid for the period. You may use this information to compare the ongoing costs of investing in the Fund and other funds. To do so, compare this 5% hypothetical example with the 5% hypothetical examples that appear in the shareholder reports of the other funds.
Please note that the expenses shown in the table are meant to highlight your ongoing costs only and do not reflect any transactional costs, such as sales charges (loads), redemption fees, or exchange fees which, although not charged by the Fund, may be charged by other funds. Therefore, the second line of the table is useful in comparing ongoing costs only, and will not help you determine the relative total costs of owning different funds.
Expense Example Tables
| The Jensen Portfolio–Class J | | | | | |
| | BEGINNING | | ENDING | | EXPENSES PAID |
| | ACCOUNT VALUE | | ACCOUNT VALUE | | DURING PERIOD* |
| | JUNE 1, 2008 | | NOVEMBER 30, 2008 | | JUNE 1, 2008 – NOVEMBER 30, 2008 |
| Actual | $1,000.00 | | $ 760.80 | | $3.75 |
| Hypothetical (5% annual return before expenses) | 1,000.00 | | 1,020.81 | | 4.31 |
| * Expenses are equal to the Fund’s annualized expense ratio of 0.85%, multiplied by the average account value over the period, multiplied by 183/365 to reflect the one-half year period. |
| The Jensen Portfolio–Class R | | | | | |
| | BEGINNING | | ENDING | | EXPENSES PAID |
| | ACCOUNT VALUE | | ACCOUNT VALUE | | DURING PERIOD* |
| | JUNE 1, 2008 | | NOVEMBER 30, 2008 | | JUNE 1, 2008 – NOVEMBER 30 , 2008 |
| Actual | $1,000.00 | | $ 759.90 | | $4.90 |
| Hypothetical (5% annual return before expenses) | 1,000.00 | | 1,019.49 | | 5.63 |
| * Expenses are equal to the Fund’s annualized expense ratio of 1.11%, multiplied by the average account value over the period, multiplied by 183/365 to reflect the one-half year period. |
| The Jensen Portfolio–Class I | | | | | |
| | BEGINNING | | ENDING | | EXPENSES PAID |
| | ACCOUNT VALUE | | ACCOUNT VALUE | | DURING PERIOD* |
| | JUNE 1, 2008 | | NOVEMBER 30, 2008 | | JUNE 1, 2008 – NOVEMBER 30, 2008 |
| Actual | $1,000.00 | | $ 761.70 | | $2.87 |
| Hypothetical (5% annual return before expenses) | 1,000.00 | | 1,021.81 | | 3.29 |
| * Expenses are equal to the Fund’s annualized expense ratio of 0.65%, multiplied by the average account value over the period, multiplied by 183/365 to reflect the one-half year period. |
Additional Information (Unaudited)
1. INVESTMENT ADVISORY AGREEMENT DISCLOSURE
Section 15(c) of the Investment Company Act of 1940 (the “1940 Act”) requires that a fund’s board of directors, including a majority of disinterested directors voting separately, review and approve the terms of the fund’s investment advisory agreement on an annual basis.
In its most recent deliberations concerning whether to renew The Jensen Portfolio’s (the “Fund”) Amended and Restated Investment Advisory and Service Contract (the “Agreement”) with Jensen Investment Management, Inc., the Fund’s investment adviser (the “Adviser”), the Fund’s Board of Directors, including the Fund’s disinterested directors (the “Board”), conducted a review and made the determinations that are described below. During its deliberations, the Board requested from the Adviser, and the Adviser furnished, all information reasonably necessary for the Board to assess the reasonableness of the advisory fee payable under the Agreement and to evaluate whether to continuation the Agreement.
The entire Board first met in person on April 9, 2008 to consider the information provided by the Adviser and discuss the proposed renewal of the Agreement. The Board’s disinterested directors (the “Independent Directors”) met separately with their legal counsel on April 9, 2008 to review the Adviser’s presentation and identify additional information they needed to evaluate the Advisory Agreement. The Independent Directors reconvened in person in a separate meeting on July 16, 2008 to consider additional materials provided by the Adviser at their request. The meeting of the Independent Directors was immediately followed by a meeting of the entire Board to consider the continuation of the Agreement. At those meetings, the Board considered the factors and reached the conclusions described below, among others. The Board did not identify any single factor as controlling. Moreover, not every factor was given the same weight by each director.
Nature, Extent and Quality of Services
The Board considered the nature, extent and quality of services provided to the Fund by the Adviser under the Agreement. The Board reviewed the terms of the Agreement, as well as the history of the Adviser and its investment discipline, its investment performance, and its day-to-day management of the Fund. The Board noted the Adviser’s focus on the business of the Fund, the
18 the Jensen Portfolio recent additions to the Adviser’s staff to support research activities, compliance and other servicing aspects of the Fund, and the Adviser’s oversight of the Fund’s service providers. The Board also noted the Adviser’s acquisition of new investment databases and analysis services, increasing the resources available to manage the Fund and enhance the Adviser’s research capabilities.
The Board analyzed the Adviser’s business continuity plans, its organizational and ownership structure, and the composition of its five-person investment committee, which makes all investment decisions for the Fund. The Board noted that the Adviser added a new employee shareholder, bringing the total number of owners to seven. Based on these and other factors, including the additional factors described below, the Board concluded that the services provided to the Fund under the Agreement continued to be satisfactory.
Investment Performance
The Board examined the investment performance of the Fund compared to appropriate securities indices, to appropriate Lipper and Morningstar categories, and to other mutual funds of similar asset size and with similar investment objectives and strategies. Performance over one-, three-, five- and ten-year periods for the Fund was analyzed. The Board noted the favorable performance of the Fund for the one- and ten-year periods compared to its benchmark index and comparable funds, but noted that the Fund’s results for the three- and five-year periods underperformed its benchmark index and comparable funds. Moreover, the Board found that redemptions of Fund shares during the last 12 months exceeded sales of new Fund shares, resulting in lower overall assets in the Fund from the prior year. The Board considered the Adviser’s view that the Fund’s lack of exposure to the energy and utility sectors, which contained no companies that qualified under the Fund’s investment criteria, contributed to the Fund’s underperformance during these periods. The Board also understood, based on the data presented, that due to strong economic activity during the three- and five-year periods, lower quality companies (as ranked by Standard & Poor’s) outperformed the higher quality companies found in the Fund’s portfolio.
The Board observed that the Adviser appeared to have adhered to its strict investment discipline. The Board also considered the Fund’s long-term investment strategy and the Adviser’s belief that over time the favorable business performance of the Fund’s portfolio companies would be reflected in similar market returns. As a result of these and other factors, the Board concluded that the long-term investment performance of the Fund continued to be satisfactory, though it encouraged the Adviser to continue to address the net redemption of Fund shares.
Advisory Fee and Expense Ratio
The Board compared the Fund’s advisory fee with those of other comparable mutual funds in the Fund’s Lipper category. The Board noted that the Fund’s advisory fee of 0.50% was slightly below the median, but slightly above the average for its category. When compared against retail class shares only of actively managed funds in the same category, the Board observed that the fee was below both the median and average. The Board also noted that the Fund is a single fund (as opposed to one of a larger complex of funds) and that, while the Adviser employs a relatively straightforward investment discipline, the Fund appeared to be an efficiently run operation with a high service component for shareholders.
The Board compared the fees charged to the Fund with the advisory fees charged to the non-Fund advisory clients of the Adviser. The Board observed that, with the exception of a few existing clients where the competitive market required a lower fee, the Adviser charges its separate accounts a minimum of 0.50%.
The Board considered the Fund’s expense ratio and the expense ratios of other comparable mutual funds in the Fund’s Lipper and Morningstar categories. The Board noted that the Fund’s expense ratio was slightly higher than the average in its Lipper category but significantly below the average of its Morningstar category, and that the Fund had a low portfolio turnover rate. The Board also noted that when compared to retail class shares of actively managed funds in the Fund’s Lipper category, the Fund’s expense ratio was lower.
Based on these considerations and other factors, the Board concluded that the Fund’s advisory fee and expense ratio were reasonable relative to the Fund’s peer group.
Profitability of the Adviser
The Board considered the profitability of the Agreement to the Adviser, including an analysis of the Adviser’s profitability for 2007 and the methodology used to calculate that profitability, and compared the Adviser’s profitability to that of selected publicly traded mutual fund advisers. When appropriate adjustments for certain marketing revenues and expenses were made, it appeared that the Adviser’s pre-tax profit was not significantly higher than the average pre-tax profit margin of the group of publicly traded investment advisory firms. It was noted that the Adviser’s profitability may have been overstated due to the relatively low salaries and bonuses paid to its investment professionals, who may receive distributions of profits through their equity ownership in the firm. The Board also considered the facts that the Adviser pays certain administrative expenses of the Fund, including certain sub-transfer agency costs and the cost of the Fund’s Chief Compliance Officer, that the Fund had been subsidized by the Adviser during the early years of the Fund’s existence, and that only in the most recent five years, as the Fund’s assets under management have grown, has the Fund contributed significantly to the Adviser’s profits.
The Board also examined the Adviser’s profitability from the Fund on a stand-alone basis against the Adviser’s profitability from its separate account advisory business and found that the Fund provided a higher profit margin to the Adviser. The Board understood that economies of scale are realized from managing one fund compared to managing over 100 separate accounts. The Board also understood that in calculating its profitability from the Fund, the Adviser had been conservative in its method of allocating expenses to its Fund business relative to other acceptable allocation methodologies. The Board noted that Adviser’s profitability from the Fund for 2008 was projected to be lower as a result of the declining asset levels of the Fund. The Board acknowledged the inherent limitations of profitability analyses, including the use of comparative data that is incomplete or dissimilar, such as financial information of publicly traded mutual fund advisers which have more diversified business lines and different cost structures than those of the Adviser, and the uncertainty of the various allocations and other assumptions used. Based on this and other information, the Board concluded that profits earned by the Adviser were not excessive.
Economies of Scale
The Board considered whether there have been economies of scale with respect to the management of the Fund, whether the Fund has benefited from any such economies, and whether the implementation of breakpoints in the Fund’s advisory fee was appropriate. The Board observed that, during a period of rapid Fund growth, the Fund’s expense ratio (for the Class J shares) had fallen from about 1% for the fiscal year ended May 31, 2002 to 0.85% for the nine months ended February 28, 2008. Regarding the issue of breakpoints, the Board observed from the data presented that most funds with breakpoints below the Fund’s 0.50% advisory fee had higher overall advisory fees at the same asset levels. The Board acknowledged the decline in Fund assets in the past year, making economies of scale less likely since the last time the Board considered a breakpoint in the Fund’s advisory fee. Based on the data presented, the Board concluded that a breakpoint in the Fund’s advisory fee was not warranted at this time.
Other Benefits
The Board considered the potential fall-out benefits realized by the Adviser from services as investment manager of the Fund. The Board noted that the Adviser has no affiliated entities that provide services to the Fund and that the Adviser prohibits the receipt of third-party research for “soft dollars”. The Board understood that the Adviser’s non-Fund business was approximately 33% of the Adviser’s total business. The Board concluded that, while the Adviser’s non-Fund business might benefit from any favorable publicity received by the Fund, any such benefit was difficult to quantify and likely not significant.
Other Factors and Considerations
The Board acknowledged that it periodically reviews and considers other material information throughout the year relating to the quality of services provided to the Fund, such as the allocation of Fund brokerage, the marketing, administration and compliance program of the Fund, the Adviser’s management of its relationship with the Fund’s administrator, custodian, transfer agent and other service providers, and the expenses paid to those service providers. At its regular meetings, the Board also reviews detailed information relating to the Fund’s portfolio and performance against various metrics, and participates in discussions with the Fund’s portfolio managers.
After considering all the relevant factors, none of which was identified by any Director as controlling, the Board of Directors, including all of the Independent Directors, voted unanimously on July 16, 2008 to renew the Agreement for a one-year term.
2. SHAREHOLDER NOTIFICATION OF FEDERAL TAX STATUS
The Fund designates 100% of dividends declared during the fiscal year ended May 31, 2008 as dividends qualifying for the dividends received deduction available to corporate shareholders.
The Fund designates 100% of dividends declared from net investment income during the fiscal year ended May 31, 2008 as qualified dividend income under the Jobs and Growth Tax Relief Reconciliation Act of 2003.
Additional Information Applicable to Foreign Shareholders Only:
The Fund designates 2.13% of ordinary income distributions as interest-related dividends under Internal Revenue Code Section 871(k)(1)(c).
3. AVAILABILITY OF PROXY VOTING INFORMATION
Information regarding how the Fund votes proxies relating to portfolio securities is available without charge, upon request by calling toll-free, 1-800-221-4384, or by accessing the SEC’s website at www.sec.gov.
4. PORTFOLIO HOLDINGS
The Jensen Portfolio will file its complete schedule of portfolio holdings with the SEC for the first and third quarters of each fiscal year on Form N-Q. The Fund’s Form N-Q will be available on the EDGAR database on the SEC’s website at www.sec.gov. These Forms may also be reviewed and copied at the SEC’s Public Reference Room in Washington D.C. Information about the operation of the Public Reference Room may be obtained by calling 1-800-SEC-0330.
5. ADDITIONAL DISCLOSURE REGARDING FUND DIRECTORS AND OFFICERS
Independent Directors
| | | | | | | | | # OF | | |
| | | | | | | | | PORTFOLIOS | | |
| | | | | TERM OF | | PRINCIPAL | | IN FUND | | OTHER |
| | | POSITION(S) | | OFFICE AND | | OCCUPATION | | COMPLEX | | DIRECTORSHIPS |
| | | HELD WITH | | LENGTH OF | | DURING PAST | | OVERSEEN | | HELD BY |
| NAME, AGE AND ADDRESS | | THE COMPANY | | TIME SERVED** | | FIVE YEARS | | BY DIRECTOR | | DIRECTOR |
| | | | | | | | | | | |
| Roger A. Cooke J.D., 60 | | Independent | | Indefinite Term; | | Vice President – Regulatory | | 1 | | None |
| The Jensen Portfolio, Inc. | | Director | | since June 1999. | | and Legal Affairs of | | | | |
| 5300 Meadows Road | | | | | | Precision Castparts Corp., | | | | |
| Suite 250 | | | | | | an investment casting and | | | | |
| Lake Oswego, OR 97035 | | | | | | forging company, | | | | |
| | | | | | | (2000 – present); | | | | |
| | | | | | | Executive Vice President – | | | | |
| | | | | | | Regulatory and Legal | | | | |
| | | | | | | Affairs of Fred Meyer, Inc., | | | | |
| | | | | | | a grocery and general | | | | |
| | | | | | | merchandise company, | | | | |
| | | | | | | (1992 – 2000). | | | | |
| | | | | | | | | | | |
| | | | | | | | | | | |
| Robert E. Harold | | Independent | | Indefinite Term; | | Retired. Senior Director of | | 1 | | Director of |
| C.P.A. (Retired), 61 | | Director | | since | | Financial Planning | | | | StoriedLearning, |
| The Jensen Portfolio, Inc. | | | | September | | of Nike, Inc., a footwear | | | | Inc. (2000 – 2003); |
| 5300 Meadows Road | | | | 2000. | | and apparel company | | | | Director of St. Mary’s |
| Suite 250 | | | | | | (2001 – 2002); Global | | | | Academy, a non-profit |
| Lake Oswego, OR 97035 | | | | | | Brand Controller for Nike, | | | | high school |
| | | | | | | Inc. (1996, 1997, 2000 – | | | | (2000 – present); |
| | | | | | | 2001); Interim Chief | | | | Director of Laika, Inc. |
| | | | | | | Financial Officer for Nike, | | | | (formerly Will Vinton |
| | | | | | | Inc. (1998 – 1999); Interim | | | | Studios), an animation |
| | | | | | | Chief Executive Officer | | | | studio (2002 – present); |
| | | | | | | for Laika, Inc. (formerly | | | | Director of The |
| | | | | | | Will Vinton Studios), an | | | | Sisters of the Holy |
| | | | | | | animation studio (March | | | | Names Foundation |
| | | | | | | 2005 – October 2005). | | | | (2004 – present); |
| | | | | | | | | | | Director of the Holy |
| | | | | | | | | | | Names Heritage |
| | | | | | | | | | | Center (2007 – present). |
| | | | | | | | | # OF | | |
| | | | | | | | | PORTFOLIOS | | |
| | | | | TERM OF | | PRINCIPAL | | IN FUND | | OTHER |
| | | POSITION(S) | | OFFICE AND | | OCCUPATION | | COMPLEX | | DIRECTORSHIPS |
| | | HELD WITH | | LENGTH OF | | DURING PAST | | OVERSEEN | | HELD BY |
| NAME, AGE AND ADDRESS | | THE COMPANY | | TIME SERVED** | | FIVE YEARS | | BY DIRECTOR | | DIRECTOR |
| | | | | | | | | | | |
| Thomas L. Thomsen, Jr., 64 | | Independent | | Indefinite Term; | | Private rancher and | | 1 | | None |
| The Jensen Portfolio, Inc. | | Director | | since | | real estate investor | | | | |
| 5300 Meadows Road | | | | December 2003 | | (2002 – Present); | | | | |
| Suite 250 | | | | | | Chief Executive Officer | | | | |
| Lake Oswego, OR 97035 | | | | | | (2000 – 2002) | | | | |
| | | | | | | and President (1998 – | | | | |
| | | | | | | 2000) of Columbia | | | | |
| | | | | | | Management Company | | | | |
| | | | | | | (now called Columbia | | | | |
| | | | | | | Management Advisors, | | | | |
| | | | | | | Inc.), investment adviser to | | | | |
| | | | | | | the Columbia Funds family | | | | |
| | | | | | | of mutual funds and to | | | | |
| | | | | | | institutional and individual | | | | |
| | | | | | | investors. | | | | |
| | | | | | | | | | | |
| | | | | | | | | | | |
| Kenneth Thrasher, 59 | | Independent | | Indefinite | | Chairman and CEO | | 1 | | NW Natural (a natural |
| The Jensen Portfolio, Inc. | | Director | | Term; | | of Complí, a web- | | | | gas distribution and |
| 5300 Meadows Road | | | | since July 2007. | | based automotive | | | | service provider). |
| Suite 250 | | | | | | dealership software | | | | |
| Lake Oswego, OR 97035 | | | | | | solution company | | | | |
| | | | | | | (2002 – present). | | | | |
| | | | | | | | | | | |
| DIRECTOR EMERITUS | | | | | | | | | | |
| | | | | | | | | | | |
| Louis B. Perry, Ph.D, 90 | | Director | | Indefinite Term; | | Retired | | 1 | | None |
| The Jensen Portfolio, Inc. | | Emeritus | | Served since | | | | | | |
| 5300 Meadows Road | | | | inception | | | | | | |
| Suite 250 | | | | (at times as | | | | | | |
| Lake Oswego, OR 97035 | | | | Director | | | | | | |
| | | | | Emeritus). | | | | | | |
Interested Directors and Officers
| | | | | | | | | # OF | | |
| | | | | | | | | PORTFOLIOS | | |
| | | | | TERM OF | | PRINCIPAL | | IN FUND | | OTHER |
| | | POSITION(S) | | OFFICE AND | | OCCUPATION | | COMPLEX | | DIRECTORSHIPS |
| | | HELD WITH | | LENGTH OF | | DURING PAST | | OVERSEEN | | HELD BY |
| NAME, AGE AND ADDRESS | | THE COMPANY | | TIME SERVED** | | FIVE YEARS | | BY DIRECTOR | | DIRECTOR |
| | | | | | | | | | | |
| Val E. Jensen,* 79 | | Director and | | Indefinite Term; | | Chairman and Director | | 1 | | None |
| The Jensen Portfolio, Inc. | | Chairman | | Served as | | of Jensen Investment | | | | |
| 5300 Meadows Road | | | | Director since | | Management, Inc. | | | | |
| Suite 250 | | | | inception; Served as | | (1988 – 2004). | | | | |
| Lake Oswego, OR 97035 | | | | President from inception | | | | | | |
| | | | | to March 2002; | | | | | | |
| | | | | Served as Chairman since | | | | | | |
| | | | | March 2002. | | | | | | |
| | | | | | | | | | | |
| | | | | | | | | | | |
| Gary W. Hibler,* Ph.D., 65 | | Director | | Indefinite Term; | | President and Director | | 1 | | None |
| The Jensen Portfolio, Inc. | | | | Served as Director since | | of Jensen Investment | | | | |
| 5300 Meadows Road | | | | inception; Served as | | Management, Inc. | | | | |
| Suite 250 | | | | Secretary from | | (1999 – February 2007); | | | | |
| Lake Oswego, OR 97035 | | | | inception to | | Secretary and Director | | | | |
| | | | | March 2002; | | of Jensen Investment | | | | |
| | | | | Served as Treasurer | | Management, Inc. | | | | |
| | | | | from December 2002 | | (1994 – 1999). | | | | |
| | | | | to March 2004; | | | | | | |
| | | | | Served as | | | | | | |
| | | | | President from | | | | | | |
| | | | | March 2002 to | | | | | | |
| | | | | February 2007. | | | | | | |
| | | | | | | | | | | |
| | | | | | | | | | | |
| Robert D. McIver,* 42 | | President | | 1 Year Term; | | President of Jensen | | N/A | | N/A |
| Jensen Investment | | | | Served since | | Investment Management, | | | | |
| Management, Inc. | | | | February 2007. | | Inc. (February | | | | |
| 5300 Meadows Road | | | | | | 2007-present); Director | | | | |
| Suite 250 | | | | | | of Operations of Jensen | | | | |
| Lake Oswego, OR 97035 | | | | | | Investment Management, | | | | |
| | | | | | | Inc. (2004-February | | | | |
| | | | | | | 2007); General Manager | | | | |
| | | | | | | of Fairmont Villa | | | | |
| | | | | | | Management and Vice | | | | |
| | | | | | | President of Fairmont | | | | |
| | | | | | | Riverside Golf Estates | | | | |
| | | | | | | Ltd (2001-2004); Chief | | | | |
| | | | | | | Investment Officer, | | | | |
| | | | | | | Schroder & Co. Trust Bank | | | | |
| | | | | | | (1999-2001); Portfolio | | | | |
| | | | | | | Manager, Schroder | | | | |
| | | | | | | Investment Management | | | | |
| | | | | | | (1989-1999). | | | | |
| | | | | | | | | # OF | | |
| | | | | | | | | PORTFOLIOS | | |
| | | | | TERM OF | | PRINCIPAL | | IN FUND | | OTHER |
| | | POSITION(S) | | OFFICE AND | | OCCUPATION | | COMPLEX | | DIRECTORSHIPS |
| | | HELD WITH | | LENGTH OF | | DURING PAST | | OVERSEEN | | HELD BY |
| NAME, AGE AND ADDRESS | | THE COMPANY | | TIME SERVED** | | FIVE YEARS | | BY DIRECTOR | | DIRECTOR |
| | | | | | | | | | | |
| Robert F. Zagunis,* 55 | | Vice President | | 1 Year Term; | | Vice President and Director | | N/A | | N/A |
| Jensen Investment | | | | Served since | | (1993 – present) and | | | | |
| Management, Inc. | | | | inception. | | Secretary (1999 – present) | | | | |
| 5300 Meadows Road | | | | | | of Jensen Investment | | | | |
| Suite 250 | | | | | | Management, Inc. | | | | |
| Lake Oswego, OR 97035 | | | | | | | | | | |
| | | | | | | | | | |
| | | | | | | | | | | |
| Robert G. Millen,* 61 | | Vice President | | 1 Year Term; | | Vice President and | | N/A | | N/A |
| Jensen Investment | | and Secretary | | Served as Vice | | Director (2000 – February | | | | |
| Management, Inc. | | | | President from July | | 2007) and Chairman and | | | | |
| 5300 Meadows Road | | | | 2001 to March | | Director (February 2007 – | | | | |
| Suite 250 | | | | 2002 and since June | | present) of Jensen | | | | |
| Lake Oswego, OR 97035 | | | | 2005; Served as | | Investment Management, | | | | |
| | | | | Secretary since | | Inc.; Vice President of | | | | |
| | | | | March 2002. | | Principal Financial | | | | |
| | | | | | | Group, an insurance | | | | |
| | | | | | | company (1997 – 2000). | | | | |
| | | | | | | | | | | |
| | | | | | | | | | | |
| Brian S. Ferrie,* 50 | | Treasurer and | | 1 Year Term; Served | | Director of Finance and | | N/A | | N/A |
| Jensen Investment | | Chief | | since March 2004. | | Chief Compliance Officer | | | | |
| Management, Inc. | | Compliance | | | | (2003 – February 2007) | | | | |
| 5300 Meadows Road | | Officer | | | | and Vice President, | | | | |
| Suite 250 | | | | | | Treasurer and Chief | | | | |
| Lake Oswego, OR 97035 | | | | | | Compliance Officer, | | | | |
| | | | | | | and Director (February | | | | |
| | | | | | | 2007 – present) of Jensen | | | | |
| | | | | | | Investment Management, | | | | |
| | | | | | | Inc.; Vice President and | | | | |
| | | | | | | CFO of Berger Financial | | | | |
| | | | | | | Group LLC (2001 – 2003); | | | | |
| | | | | | | Vice President and Chief | | | | |
| | | | | | | Compliance Officer of | | | | |
| | | | | | | Berger Financial Group | | | | |
| | | | | | | LLC (1994 – 2001). | | | | |
| | | | | | | | | | | |
| * This individual is an “interested person” of the Fund within the meaning of the 1940 Act. | | | | |
** Each Director serves for an indefinite term in accordance with the Bylaws of the Fund until the date a Director resigns, retires or is removed in accordance with the Bylaws of the Fund. |
Item 2. Code of Ethics.
Not applicable for semi-annual reports.
Item 3. Audit Committee Financial Expert.
Not applicable for semi-annual reports.
Item 4. Principal Accountant Fees and Services.
Not applicable for semi-annual reports.
Item 5. Audit Committee of Listed Registrants.
Not applicable to registrants who are not listed issuers (as defined in Rule 10A-3 under the Securities Exchange Act of 1934).
Item 6. Schedule of Investments.
Schedule of Investments is included as part of the report to shareholders filed under Item 1 of this Form.
Item 7. Disclosure of Proxy Voting Policies and Procedures for Closed-End Management Investment Companies.
Not applicable to open-end investment companies.
Item 8. Portfolio Managers of Closed-End Management Investment Companies.
Not applicable to open-end investment companies.
Item 9. Purchases of Equity Securities by Closed-End Management Investment Company and Affiliated Purchasers.
Not applicable to open-end investment companies.
Item 10. Submission of Matters to a Vote of Security Holders.
There have been no material changes to the procedures by which shareholders may recommend nominees to the registrant’s board of directors.
Item 11. Controls and Procedures.
| (a) | The Registrant’s President/Chief Executive Officer and Treasurer/Chief Financial Officer have reviewed the Registrant's disclosure controls and procedures (as defined in Rule 30a-3(c) under the Investment Company Act of 1940 (the “Act”)) as of a date within 90 days of the filing of this report, as required by Rule 30a-3(b) under the Act and Rules 13a-15(b) or 15d-15(b) under the Securities Exchange Act of 1934. Based on their review, such officers have concluded that the disclosure controls and procedures are effective in ensuring that information required to be disclosed in this report is appropriately recorded, processed, summarized and reported and made known to them by others within the Registrant and by the Registrant’s service provider. |
| (b) | There were no changes in the Registrant's internal control over financial reporting (as defined in Rule 30a-3(d) under the Act) that occurred during the Registrant’s last fiscal half-year that has materially affected, or is reasonably likely to materially affect, the Registrant's internal control over financial reporting. |
Item 12. Exhibits.
| (a) | (1) Any code of ethics or amendment thereto, that is subject of the disclosure required by Item 2, to the extent that the registrant intends to satisfy Item 2 requirements through filing an exhibit. Incorporated by reference to the Registrant’s Form N-CSR filed August 9, 2004. |
(2) Certifications pursuant to Section 302 of the Sarbanes-Oxley Act of 2002. Filed herewith.
(3) Any written solicitation to purchase securities under Rule 23c-1 under the Act sent or given during the period covered by the report by or on behalf of the registrant to 10 or more persons. Not applicable to open-end investment companies.
| (b) | Certification pursuant to Section 906 of the Sarbanes-Oxley Act of 2002. Filed herewith. |
SIGNATURES
Pursuant to the requirements of the Securities Exchange Act of 1934 and the Investment Company Act of 1940, the registrant has duly caused this report to be signed on its behalf by the undersigned, thereunto duly authorized.
(Registrant) The Jensen Portfolio, Inc.
By (Signature and Title)* /s/ Robert McIver
Robert McIver, President
Date February 5, 2009
Pursuant to the requirements of the Securities Exchange Act of 1934 and the Investment Company Act of 1940, this report has been signed below by the following persons on behalf of the registrant and in the capacities and on the dates indicated.
By (Signature and Title)* /s/ Robert McIver
Robert McIver, President
Date February 5, 2009
By (Signature and Title)* /s/ Brian Ferrie
Brian Ferrie, Treasurer
Date February 5, 2009
* Print the name and title of each signing officer under his or her signature.