UNITED STATES
SECURITIES AND EXCHANGE COMMISSION
Washington, D.C. 20549
FORM N-CSR
CERTIFIED SHAREHOLDER REPORT OF REGISTERED
MANAGEMENT INVESTMENT COMPANIES
Investment Company Act file number 811-6653
The Jensen Quality Growth Fund Inc.
(Exact name of registrant as specified in charter)
5500 Meadows Road, Suite 200
Lake Oswego, OR 97035-8234
(Address of principal executive offices) (Zip code)
Robert McIver
5500 Meadows Road, Suite 200
Lake Oswego, OR 97035-8234
(Name and address of agent for service)
(800) 221-4384
Registrant’s telephone number, including area code
Date of fiscal year end: May 31
Date of reporting period: May 31, 2023
Item 1. Reports to Stockholders.
(a)
![]()
| ANNUAL REPORT | Jensen Quality Growth Fund Inc. | |||||
| 5/31/2023 | ||||||
| Class I Shares JENIX | Class J Shares JENSX | Class R Shares JENRX | Class Y Shares JENYX | |||
![]()
Letter from the Investment Adviser (Unaudited)
Dear Fellow Shareholders,
The Jensen Quality Growth Fund Inc. (the “Fund”) — Class I Shares — returned 2.51% for the year ended May 31, 2023, compared to a return of 2.92% for the Standard & Poor’s 500 Index (“Index”) over the period. Please see pages 7 through 10 of this report for complete standardized performance information for the Fund, including the Fund’s other share classes.
Market Perspective
In the face of the substantial headwinds impacting global economies, the second half of calendar year 2022 proved challenging. Domestic stock markets struggled to find direction in the face of persistently high inflationary pressures, steadily rising interest rates, a less accommodative policy from the U.S. Federal Reserve and ongoing geopolitical risk, combined with the Energy sector no longer representing the tailwind it had been early in 2022. Despite the global economic headwinds, the Fund benefited from its focus on higher-quality stocks during the period, as investment performance from higher-quality stocks (A+, A and A-, as measured by the S&P Quality & Dividend Rankings) was stronger than that of lower-quality stocks (B+ and lower, as measured by the S&P Quality & Dividend Rankings).
As the calendar turned to 2023, investors’ focus shifted as well. Momentum stocks bounced back, in some cases strongly, after a lackluster performance in the prior year. Investment performance for the S&P 500 Index during the 12-month period ended May 31, 2023, has also been concentrated within just a handful of companies: According to a recent article on Morningstar.com, the five largest companies by market capitalization have accounted for 78% of the market return of the Index in the first five months of 2023. Consequently, the last five months’ performance for the Fund have been characterized as much by the stocks that we don’t own as much as by what stocks we do. A lack of exposure to more momentum-driven stocks such as Nvidia in the IT sector, Meta in the Communications Services sector, and Tesla and Amazon in the Consumer Discretionary sector contributed materially to the Fund’s relative underperformance in the first five months of 2023. None of these companies meet the Fund’s investment eligibility criteria due to a pattern of inconsistent returns on equity.
Overall, the performance of the Fund for the year ended May 31, 2023, lagged the performance of the Index. We note that without the concentration of returns in 2023, particularly from those stocks which the Fund does not own, we would have likely seen outperformance against the Index for the overall period. This is not an excuse for underperformance over the shorter term, but rather a noteworthy symptom of a market that has been struggling to find meaningful direction over the last year. This lack of direction may continue as the economic concerns could endure for the remainder of 2023.
The Effect at Jensen
During the review period, specific stock selection contributed positively to the Fund’s relative performance in the Financials, Consumer Staples and Consumer Discretionary sectors, while detracting from returns primarily in the Information Technology and Health Care sectors. From a sector perspective, our relative overweight in the Industrials and Health Care sectors detracted from the
| Annual Report | The Jensen Quality Growth Fund Inc. | 1 |
Fund’s relative performance, due in part to the higher-quality nature of the companies in this space that are owned by the Fund. Conversely, the Fund’s lack of exposure to the Energy and Real Estate sectors and lesser exposure to the Financials sector contributed to performance as these were among the weaker-performing sectors for the period. Typically, very few, if any, companies in the Energy, Real Estate and Financials sectors qualify for investment in the Fund due to our strict requirement for high and prolonged profitability, as measured by consistently strong return on equity (ROE).
Leading contributors to performance during the period were Microsoft (MSFT) and Apple (AAPL), both of which continued to provide solid earnings reports and positive outlooks despite the uncertain economic climate. Microsoft benefited from strong performance in its core cloud services in Enterprise, namely Azure services and Office 365. Offsetting this was a slowdown in PC sales and gaming revenue due to challenging comparisons to the prior year given robust performance during the COVID pandemic. More recently, the market reacted positively to the company’s announcement of its $10 billion investment in OpenAI and the subsequent inclusion of OpenAI’s ChatGPT in its search results. ChatGPT represents a key advancement in generative Artificial Intelligence (“AI”), enabling Microsoft to jump ahead of the current AI leader, Google, which stumbled in its attempt to respond too quickly to Microsoft’s initiative. Alphabet Inc., Google’s parent and a Fund holding, has since recovered.
Apple has been a strong performer over the last 12 months. For much of the year, the company faced supply chain headwinds in China due to extended COVID lockdowns experienced in the country. The supply chain difficulties exacerbated tough comparisons the company experienced due to high demand for its products during COVID the year before, although the supply chain issues abated in late 2022 after China repealed its zero-COVID restrictions. The more recent appreciation in Apple’s stock price reflects more positive long-term sentiment for its products and services. We also believe the company’s stock benefited toward the end of the Fund’s fiscal year from the anticipated reveal of Vision Pro, its long-awaited mixed-reality AR/VR headset.
Significant detractors from the Fund’s performance for the period included Pfizer (PFE) and Cognizant Technology Solutions (CTSH). Pfizer, a multinational pharmaceutical and biotechnology corporation, was the largest detractor from Fund performance for the Fund’s fiscal year. Pfizer shares were pressured during the period due primarily to a sharp sales decline and future demand uncertainty for the company’s COVID-19 franchises. Calendar 2022 COVID-19-related sales totaled approximately $57 billion, accounting for more than 50% of Pfizer’s consolidated revenue. In 2023, COVID-19 franchise sales are expected to decline by more than 60% due in part to the expected transition from direct government purchases to the traditional healthcare marketplace. The company expects sales of COVID-19 products to increase from 2023 levels over time, but confidence in this expectation is clouded by the unpredictable demand pattern for COVID-19 treatments. Longer term, we are encouraged to see the company using cash flow from its COVID-19 product success to bolster its drug portfolio and pipeline through a number of promising acquisitions. While we are monitoring the implications of short-term financial performance, Pfizer shares remain a core holding due to the company’s diverse drug portfolio and improving drug pipeline.
| 2 | The Jensen Quality Growth Fund Inc. | Annual Report |
Cognizant Technology Solutions was sold during the year ended May 31, 2023, and is discussed further below.
We are constantly evaluating all businesses owned by the Fund, as well as other investment candidates, to determine whether better opportunities exist in our investable universe which comprises businesses that have delivered at least a 15% ROE for 10 consecutive years. Such determinations ultimately reflect a combination of fundamental considerations, valuation opportunities and overall risk profiles for the companies.
Fund Additions and Eliminations
During the period, the Jensen Investment Team added a new position in Ball Corporation (BALL) and sold its positions in 3M (MMM) and Cognizant Technology Solutions (CTSH). A brief synopsis of these changes follows.
Ball Corporation manufactures and sells aluminum beverage cans, aluminum aerosol cans and a variety of aerospace products including satellites, sensors and cameras for unmanned aerial systems. Aluminum beverage cans account for approximately 80% of the company’s sales. Ball Corporation and its two main competitors, Crown Holdings and Ardagh Metal Packaging, dominate the global aluminum beverage can market with a combined share of approximately 65%. Of the three, Ball is the largest, with a market share in excess of 40% in North America, Central America, Europe and South America. Ball’s customers in this business include well-known beverage producers such as AB InBev, Molson Coors, PepsiCo, Coca-Cola and Red Bull.
Owing to their attractive environmental profile, aluminum beverage cans are currently taking share from both plastic and glass containers. Aluminum is collected and recycled more than any other packaging material because it is infinitely recyclable, does not degrade and is significantly cheaper to use compared to sourcing newly refined aluminum. Of all aluminum ever produced, 75% is still in use today, and the average aluminum can contains 73% recycled content. The same cannot be said for other substrates, such as plastic. Only approximately 10% of all plastic ever produced since 1950 has been recycled, and most of the recycled content is used to make downcycle products such as shoes and carpet fibers, the vast majority of which are ultimately landfilled or discarded.
Ball Corporation is run by a well-tenured management team executing a strategy consisting of building new plants, adding production lines to existing facilities, developing new products and expanding geographically. In our opinion, significant barriers to entry exist in the aluminum beverage can business. These include three- to-five-year contracts with customers, high contract renewal rates, significant economies of scale, and the time and capital required to construct new beverage can plants. Given these factors and our estimate of Ball’s stock valuation, we were pleased to add the name to the Fund.
3M is a diversified industrial conglomerate that manufactures products based on core material science, process technologies and manufacturing expertise. Their products have applications in safety, industrial, transportation, healthcare and consumer products. Over time, we monitored the negative cash flow implications arising from mounting product liability and environmental claims, which influenced our decision to exit the position. The company also announced in the fall of 2022
| Annual Report | The Jensen Quality Growth Fund Inc. | 3 |
that it intends to spin out its highly profitable healthcare business, which we consider to be one of its best segments. Lastly, we had questions about the viability of 3M’s historical competitive advantages — scale, innovation and brand strength — due to an ongoing pattern of growth below our expectations.
Cognizant Technology Solutions is a provider of IT consulting and technology outsourcing services. The company operates globally, but most of its employees are based in India. Cognizant has updated its suite of services to be more competitive and to tap into faster-growing markets. From a strategic perspective, we are supportive of these efforts, but this attempted transition took place in a challenging technology employment environment in which recruiting the talent the company sought was difficult due to high demand. The result was persistently high employee turnover and an inability to book new work due to a shortage of workers. In our opinion, this lack of progress represented a degradation in what had been a fundamental competitive advantage. Ultimately, this prompted us to exit the position in favor of opportunities where we have a higher degree of confidence, such as Accenture, a global leader in IT services and one of our core positions due to the strength of its fundamentals and attractive valuation.
In addition to the changes noted above, the Investment Team remained active in trimming positions considered more fully valued or fundamentally challenged to reflect Jensen’s convictions in the businesses and relative valuation opportunities within the context of the ongoing economic volatility.
The Jensen Outlook
As we look forward to the remainder of 2023 and into next year, we maintain a more cautious outlook for market returns in the coming months. Returns in the overall market thus far in 2023 have been solid but we are mindful that those returns have been concentrated in just a few of the largest stocks based on market capitalization.
The economic challenges that have been building over the last couple of years are still very much present today. While there are some signs of improvement, particularly with softening inflation from the generationally high levels reached in the middle of 2022, overall inflation remains well above long-term targets of the U.S. Federal Reserve. Recently, the Federal Reserve paused its path of increasing interest rates — which was seen as a positive sign by many investors. However, the message accompanying the pause indicated that two additional rate increases could be expected later in 2023 and that any tapering of interest rates may not occur until 2025. This will keep interest costs at higher levels, reducing the cash available for more productive use by highly leveraged businesses. The full effect of higher interest rates has likely not yet fully impacted the economy, and with additional rate increases to come this remains a substantial headwind for many companies. There also remain increased tensions that threaten the geopolitical status quo of the last 40 years.
In addition to, or perhaps because of, these factors, we note that the business performance of companies and recent market return patterns could influence the outlook for the remainder of the year, and reverse or at least pause the “risk-on” character of the last few months. Earnings growth for S&P 500 Index companies in 2023 is currently expected to increase by slightly less than 11%, which is impressive given the ongoing economic challenges. It is worth noting that estimated 2023 earnings growth is essentially unchanged from three months ago, despite a first-quarter earnings
| 4 | The Jensen Quality Growth Fund Inc. | Annual Report |
performance that was more than three times better than what had been forecast. This suggests that either some of the earnings growth in the first quarter was pulled forward from future quarters or that the economic challenges still concern many companies, where higher volatility will perhaps become part of the narrative over the coming months.
We would also note that the threat of an economic recession in the U.S. has not disappeared. The Treasury yield curve has been inverted since early July 2022 with the yield on 2-year Treasury bonds exceeding the yield on 10-year Treasury bonds. Such occurrences are relatively rare and have accurately predicted the 10 most recent economic recessions. While the economy currently appears to be weathering the threat of a recession, there is still much debate about when one may occur given that the contributing factors have not diminished and are unlikely to in the coming months.
In our view, given the current concentration in the markets and focus on a few momentum-driven, more-speculative companies, we believe there are many opportunities for higher-quality, more-resilient businesses to garner favor from investors looking for lower volatility in the face of the issues discussed here. We continue to have confidence in the high-quality businesses owned in the Fund because of our focus that favors characteristics such as strong and resilient business models, durable competitive advantages, pricing power, steady operating margins, and strong free cash flow that is consistently reinvested into future growth opportunities and rewards shareholders via growing dividends and stock buybacks. Likewise, our disciplined approach to valuation, which utilizes our deep research to construct discounted cash flow models reflecting the opportunities for (and threats to) the companies in which we invest, provides us confidence to invest in these sound businesses.
While the economic uncertainty and the corresponding volatility of market returns has been worrying for many investors over the last year, the Jensen Investment Team remains convinced that the strategy and process guiding our management of the Fund is sound. Our goal remains the ownership of a portfolio of companies positioned to grow and accrue business value. We seek to participate in this value creation as investors via the long-term ownership of fairly priced, high-quality stocks. We believe the attributes noted above allow quality companies to generate business returns consistently above their cost of capital, ultimately resulting in shareholder value creation.
Lastly, we remain steadfast in our belief that paying attention to company fundamentals can help investors manage risk. This focus should offer a measure of capital protection in more volatile or generally lower-market-return environments and provide the opportunity for long-term capital appreciation.
We are tremendously grateful for the ongoing support of our firm and investment strategies from our partners and fellow shareholders. Thank you.
We invite you to seek additional information about the Jensen Quality Growth Fund at www. jenseninvestment.com, where additional content, including updated holdings and performance information, is available. We take our investment responsibilities seriously and appreciate the trust you have placed in us. As always, we welcome your feedback.
Sincerely,
The Jensen Investment Team
| Annual Report | The Jensen Quality Growth Fund Inc. | 5 |
This discussion and analysis of the Fund is as of May 31, 2023, and is subject to change, and any forecasts made cannot be guaranteed. The views expressed by the Jensen Investment Team are not intended as investment advice and are subject to change without notice.
Past performance is no guarantee of future results. Fund holdings and sector weightings are subject to change and are not recommendations to buy or sell any security.
All investments are subject to risk, including the loss of principal. Please refer to the Fund’s prospectus for a description of risk factors associated with investments in securities the Fund may hold. There is no assurance that the Fund will achieve its investment objective.
The S&P 500 Index is an unmanaged but commonly used measure of common stock total return performance. One cannot invest directly in an index.
Certain information contained in this material represents or is based upon forward-looking statements, which can be identified by the use of terminology such as “may,” “will,” “should,” “expect,” “anticipate,” “target,” “project,” “estimate,” “intend,” “continue” or “believe,” or the negatives thereof or other variations thereon or comparable terminology.
For more complete information regarding the Fund’s performance and holdings, please refer to the financial statements and schedule of investments headings of this report. The Fund’s current and future portfolio holdings are subject to risk.
The Fund is nondiversified, meaning that it may concentrate its assets in fewer individual holdings than a diversified fund and is therefore more exposed to individual stock volatility than a diversified fund.
Definitions
Return on Equity: Is equal to a company’s after-tax earnings (excluding non-recurring items) divided by its average stockholder equity for the year.
Free Cash Flow: Is equal to the after-tax net income of a company plus depreciation and amortization less capital expenditures.
Yield Curve: A line that plots yields, or interest rates, of bonds that have equal credit quality but differing maturity dates. The slope of the yield curve can predict future interest rate changes and economic activity.
This material is for use only when preceded or accompanied by a current prospectus for the Fund.
The Jensen Quality Growth Fund is distributed by Quasar Distributors, LLC.
| 6 | The Jensen Quality Growth Fund Inc. | Annual Report |
Jensen Quality Growth Fund Inc. - Class J (Unaudited)
Total Returns vs. The S&P 500
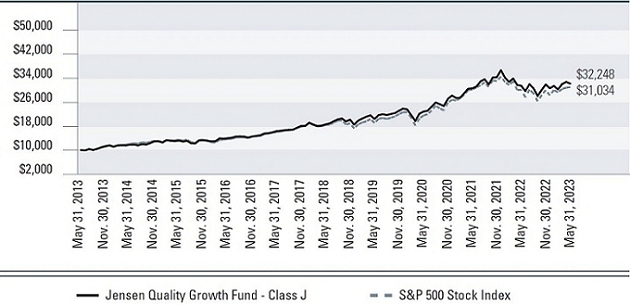
| Average Annual Returns – For years ended May 31, 2023 | 1 year | 3 years | 5 years | 10 years |
| Jensen Quality Growth Fund - Class J | 2.29% | 12.14% | 11.62% | 12.42% |
| S&P 500 Stock Index | 2.92% | 12.92% | 11.01% | 11.99% |
The S&P 500 Stock Index is an unmanaged but commonly used measure of common stock total return performance. This chart assumes an initial gross investment of $10,000 made on May 31, 2013 for Class J. Returns shown include the reinvestment of all dividends. Returns shown do not reflect the deduction of taxes that a shareholder would pay on fund distributions or the redemption of fund shares.
Performance data shown represents past performance; Past performance does not guarantee future results. The investment return and principal value of an investment will fluctuate so that an investor’s shares, when redeemed, may be worth more or less than their original cost. Current performance of the fund may be lower or higher than the performance shown. Performance data current to the most recent month end may be obtained by calling 1-800-992-4144 or by visiting www.jenseninvestment.com.
| Annual Report | The Jensen Quality Growth Fund Inc. | 7 |
Jensen Quality Growth Fund Inc. - Class R (Unaudited)
Total Returns vs. The S&P 500
![]()
| Average Annual Returns – For years ended May 31, 2023 | 1 year | 3 years | 5 years | 10 years |
| Jensen Quality Growth Fund - Class R | 1.83% | 11.63% | 11.14% | 11.97% |
| S&P 500 Stock Index | 2.92% | 12.92% | 11.01% | 11.99% |
The S&P 500 Stock Index is an unmanaged but commonly used measure of common stock total return performance. This chart assumes an initial gross investment of $10,000 made on May 31, 2013 for Class R. Returns shown include the reinvestment of all dividends. Returns shown do not reflect the deduction of taxes that a shareholder would pay on fund distributions or the redemption of fund shares.
Performance data shown represents past performance; Past performance does not guarantee future results. The investment return and principal value of an investment will fluctuate so that an investor’s shares, when redeemed, may be worth more or less than their original cost. Current performance of the fund may be lower or higher than the performance shown. Performance data current to the most recent month end may be obtained by calling 1-800-992-4144 or by visiting www.jenseninvestment.com.
| 8 | The Jensen Quality Growth Fund Inc. | Annual Report |
Jensen Quality Growth Fund Inc. - Class I (Unaudited)
Total Returns vs. The S&P 500
![]()
| Average Annual Returns – For years ended May 31, 2023 | 1 year | 3 years | 5 years | 10 years |
| Jensen Quality Growth Fund - Class I | 2.51% | 12.38% | 11.88% | 12.69% |
| S&P 500 Stock Index | 2.92% | 12.92% | 11.01% | 11.99% |
The S&P 500 Stock Index is an unmanaged but commonly used measure of common stock total return performance. This chart assumes an initial gross investment of $250,000 made on May 31, 2013 for Class I. Returns shown include the reinvestment of all dividends. Returns shown do not reflect the deduction of taxes that a shareholder would pay on fund distributions or the redemption of fund shares.
Performance data shown represents past performance; Past performance does not guarantee future results. The investment return and principal value of an investment will fluctuate so that an investor’s shares, when redeemed, may be worth more or less than their original cost. Current performance of the fund may be lower or higher than the performance shown. Performance data current to the most recent month end may be obtained by calling 1-800-992-4144 or by visiting www.jenseninvestment.com.
| Annual Report | The Jensen Quality Growth Fund Inc. | 9 |
Jensen Quality Growth Fund Inc. - Class Y (Unaudited)
Total Returns vs. The S&P 500
![]()
| Total Returns – For periods ended May 31, 2023 | 1 year | 3 years | 5 years | Since Inception (September 30, 2016) |
| Jensen Quality Growth Fund - Class Y | 2.59% | 12.47% | 11.96% | 13.06% |
| S&P 500 Stock Index | 2.92% | 12.92% | 11.01% | 12.37% |
The S&P 500 Stock Index is an unmanaged but commonly used measure of common stock total return performance. This chart assumes an initial gross investment of $1,000,000 made on September 30, 2016 (commencement of operations for Class Y). Returns shown include the reinvestment of all dividends. Returns shown do not reflect the deduction of taxes that a shareholder would pay on fund distributions or the redemption of fund shares.
Performance data shown represents past performance; Past performance does not guarantee future results. The investment return and principal value of an investment will fluctuate so that an investor’s shares, when redeemed, may be worth more or less than their original cost. Current performance of the fund may be lower or higher than the performance shown. Performance data current to the most recent month end may be obtained by calling 1-800-992-4144 or by visiting www.jenseninvestment.com.
| 10 | The Jensen Quality Growth Fund Inc. | Annual Report |
Investments by Sector as of May 31, 2023
(as a Percentage of Total Investments) (Unaudited)
![]()
The Global Industry Classification Standard (GICS®) was developed by and/or is the exclusive property of MSCI, Inc. and Standard & Poor’s Financial Services LLC (“S&P”). GICS is a service mark of MSCI and S&P and has been licensed for use by U.S. Bancorp Fund Services, LLC doing business as U.S. Bank Global Fund Services.
| Annual Report | The Jensen Quality Growth Fund Inc. | 11 |
Statement of Assets & Liabilities
As of May 31, 2023
| Assets: | |
| Investment, at value (Cost $5,880,076,749) | $10,093,179,691 |
| Dividend and interest income receivable | 14,789,226 |
| Receivable for capital stock issued | 13,234,244 |
| Other assets | 243,168 |
| Total assets | $10,121,446,329 |
| Liabilities: | |
| Payable to Investment Adviser | $3,968,113 |
| Payable for capital stock redeemed | 6,737,347 |
| Accrued distribution fees | 495,364 |
| Accrued director fees | 105,446 |
| Accrued expenses and other liabilities | 1,189,432 |
| Total liabilities | 12,495,702 |
| Total Net Assets | $10,108,950,627 |
| Net Assets Consist of: | |
| Capital stock | $ 5,586,784,399 |
| Total distributable earnings | 4,522,166,228 |
| Total Net Assets | $10,108,950,627 |
| Net Assets Consist of: | |
| Class J Shares | |
| Net Assets | $2,363,726,389 |
| Shares outstanding | 41,155,198 |
| Net Asset Value - Offering Price and Redemption Price Per Share (2,000,000,000 shares authorized) | $57.43 |
| Class R Shares | |
| Net Assets | $13,531,492 |
| Shares outstanding | 236,986 |
| Net Asset Value - Offering Price and Redemption Price Per Share (1,000,000,000 shares authorized) | $57.10 |
| Class I Shares | |
| Net Assets | $4,909,179,886 |
| Shares outstanding | 85,556,761 |
| Net Asset Value - Offering Price and Redemption Price Per Share (1,000,000,000 shares authorized) | $57.38 |
| Class Y Shares | |
| Net Assets | $2,822,512,860 |
| Shares outstanding | 49,196,176 |
| Net Asset Value - Offering Price and Redemption Price Per Share (1,000,000,000 shares authorized) | $57.37 |
The accompanying notes are an integral part of these financial statements.
| 12 | The Jensen Quality Growth Fund Inc. | Annual Report |
Schedule of Investments
May 31, 2023 (showing percentage of total net assets)
| Common Stocks - 97.66% | ||||
| shares | Air Freight & Logistics - 1.92% | value | ||
| 1,162,000 | United Parcel Service, Inc.- Class B | $194,054,000 | ||
| shares | Beverages - 6.76% | value | ||
| 3,748,000 | PepsiCo, Inc. | $683,447,800 | ||
| shares | Capital Markets - 1.81% | value | ||
| 577,000 | Moody’s Corporation | $182,839,760 | ||
| shares | Commercial Services & Supplies - 2.19% | value | ||
| 1,368,000 | Waste Management, Inc. | $221,506,560 | ||
| shares | Containers & Packaging - 1.23% | value | ||
| 2,426,000 | Ball Corporation | $124,114,160 | ||
| shares | Electronic Equipment, Instruments & Components - 1.98% | value | ||
| 2,653,000 | Amphenol Corporation - Class A | $200,168,850 | ||
| shares | Health Care Equipment & Supplies - 7.24% | value | ||
| 736,000 | Becton Dickinson and Company | $177,935,360 | ||
| 2,008,000 | Stryker Corporation | $553,364,640 | ||
| $731,300,000 | ||||
| shares | Health Care Providers & Services - 5.25% | value | ||
| 1,090,000 | UnitedHealth Group, Inc. | $531,091,600 | ||
| shares | Hotels, Restaurants & Leisure - 3.71% | value | ||
| 3,842,000 | Starbucks Corporation | $375,132,880 | ||
| shares | Household Products - 2.70% | value | ||
| 1,913,000 | The Procter & Gamble Company | $272,602,500 | ||
| shares | Insurance - 4.02% | value | ||
| 2,346,000 | Marsh & McLennan Companies, Inc. | $406,280,280 | ||
The accompanying footnotes are an integral part of these financial statements.
| Annual Report | The Jensen Quality Growth Fund Inc. | 13 |
Schedule of Investments continued
May 31, 2023 (showing percentage of total net assets)
| shares | Interactive Media & Services - 6.01% | value | ||
| 4,947,000 | Alphabet, Inc. - Class A (a) | $607,837,890 | ||
| shares | IT Services - 14.23% | value | ||
| 1,968,000 | Accenture PLC - Class A (b) | $602,050,560 | ||
| 1,578,000 | Automatic Data Processing, Inc. | $329,786,220 | ||
| 1,390,000 | Broadridge Financial Solutions, Inc. | $203,940,800 | ||
| 829,000 | Mastercard, Inc. - Class A | $302,601,580 | ||
| $1,438,379,160 | ||||
| shares | Pharmaceuticals - 7.05% | value | ||
| 2,263,000 | Johnson & Johnson | $350,900,780 | ||
| 9,507,000 | Pfizer, Inc. | $361,456,140 | ||
| $712,356,920 | ||||
| shares | Professional Services - 4.00% | value | ||
| 1,149,000 | Equifax, Inc. | $239,704,380 | ||
| 748,000 | Verisk Analytics, Inc. | $163,894,280 | ||
| $403,598,660 | ||||
| shares | Semiconductors & Semiconductor Equipment - 3.03% | value | ||
| 1,764,000 | Texas Instruments, Inc. | $306,724,320 | ||
| shares | Software - 11.27% | value | ||
| 868,000 | Intuit, Inc. | $363,796,160 | ||
| 2,362,000 | Microsoft Corporation | $775,657,180 | ||
| $1,139,453,340 | ||||
| shares | Specialty Retail - 3.71% | value | ||
| 827,000 | The Home Depot, Inc. | $234,413,150 | ||
| 1,836,600 | The TJX Companies, Inc. | $141,032,514 | ||
| $375,445,664 | ||||
| shares | Technology Hardware, Storage & Peripherals - 5.62% | value | ||
| 3,207,000 | Apple, Inc. | $568,440,750 | ||
The accompanying footnotes are an integral part of these financial statements.
| 14 | The Jensen Quality Growth Fund Inc. | Annual Report |
Schedule of Investments continued
May 31, 2023 (showing percentage of total net assets)
| shares | Textiles, Apparel & Luxury Goods - 3.93% | value | ||
| 3,776,000 | NIKE, Inc. - Class B | $397,461,760 | ||
| Total Common Stocks | value | |||
| (Cost $5,659,133,912) | $9,872,236,854 | |||
| Short-Term Investment - 2.18% | ||||
| shares | Money Market Fund - 2.18% | value | ||
| 220,942,837 | First American Treasury Obligations Fund - Class X, 5.013% (c) | $220,942,837 | ||
| Total Short-Term Investment (Cost $220,942,837) | $220,942,837 | |||
| Total Investments | value | |||
| (Cost $5,880,076,749) - 99.84% | $10,093,179,691 | |||
| Other Assets in Excess of Liabilities - 0.16% | $15,770,936 | |||
| TOTAL NET ASSETS - 100.00% | $10,108,950,627 | |||
PLC - Public Limited Company
| (a) | Non-income producing security. |
| (b) | Foreign issued security. Foreign concentration (including ADRs) was as follows: Ireland 5.96% as a percentage of net assets. |
| (c) | Variable rate security. Rate listed is the 7-day effective yield as of May 31, 2023. |
The accompanying footnotes are an integral part of these financial statements.
| Annual Report | The Jensen Quality Growth Fund Inc. | 15 |
Statement of Operations
Year Ended May 31, 2023
| Investment Income: | |
| Dividend income | $161,680,647 |
| Interest income | 6,270,104 |
| Total investment income | 167,950,751 |
| Expenses: | |
| Investment advisory fees | 47,517,961 |
| 12b-1 - Class J | 5,821,902 |
| Shareholder servicing fees - Class I | 3,959,060 |
| Administration fees | 1,511,478 |
| Sub-transfer agent expenses - Class J | 1,092,988 |
| Fund Accounting fees | 531,003 |
| Directors’ fees and expenses | 411,075 |
| Federal and state registration fees | 285,869 |
| Transfer agent expenses | 269,063 |
| Reports to shareholders - Class I | 260,828 |
| Custody fees | 252,681 |
| Other | 160,709 |
| Reports to shareholders - Class Y | 154,065 |
| Transfer agent fees - Class I | 136,727 |
| Professional fees | 133,053 |
| Chief Compliance Officer Fees | 99,997 |
| Reports to shareholders - Class J | 84,828 |
| 12b-1 fees - Class R | 77,787 |
| Transfer agent fees - Class J | 45,983 |
| Shareholder servicing fees - Class R | 26,483 |
| Transfer agent fees - Class Y | 24,283 |
| Transfer agent fees - Class R | 15,279 |
| Reports to shareholders - Class R | 578 |
| Total expenses | 62,873,680 |
| Net Investment Income | 105,077,071 |
| Realized and Unrealized Gain (Loss) on Investments: | |
| Net realized gain on investment transactions | 338,979,430 |
| Change in unrealized appreciation/depreciation on investments | (200,761,543) |
| Net realized and unrealized gain on investments | 138,217,887 |
| Net Increase in Net Assets Resulting from Operations | $243,294,958 |
The accompanying notes are an integral part of these financial statements.
| 16 | The Jensen Quality Growth Fund Inc. | Annual Report |
Statements of Changes in Net Assets
| Operations: | Year Ended May 31, 2023 | Year Ended May 31, 2022 |
| Net investment income | $105,077,071 | $90,145,430 |
| Net realized gain on investment transactions | 338,979,430 | 677,159,951 |
| Change in unrealized appreciation/depreciation on investments | (200,761,543) | (430,638,092) |
| Net increase in net assets resulting from operations | 243,294,958 | 336,667,289 |
| Capital Share Transactions: | ||
| Shares Sold - Class J | 225,858,703 | 401,280,727 |
| Shares Sold - Class R | 2,231,395 | 5,985,161 |
| Shares Sold - Class I | 1,029,928,367 | 1,322,729,183 |
| Shares Sold - Class Y | 882,978,110 | 547,113,529 |
| Shares issued in reinvestment of dividends - Class J | 68,403,205 | 174,216,986 |
| Shares issued in reinvestment of dividends - Class R | 380,075 | 1,814,929 |
| Shares issued in reinvestment of dividends - Class I | 142,409,876 | 323,174,881 |
| Shares issued in reinvestment of dividends - Class Y | 74,379,953 | 159,101,621 |
| Shares redeemed - Class J | (366,840,232) | (556,057,624) |
| Shares redeemed - Class R | (6,604,069) | (15,452,425) |
| Shares redeemed - Class I | (989,100,871) | (1,723,574,584) |
| Shares redeemed - Class Y | (873,801,273) | (599,223,007) |
| Net Increase | 190,223,239 | 41,109,377 |
| Dividends and Distributions to Shareholders: | ||
| Net dividends and distributions to shareholders - Class J | (69,452,241) | (176,692,760) |
| Net dividends and distributions to shareholders - Class R | (380,078) | (1,814,930) |
| Net dividends and distributions to shareholders - Class I | (149,818,028) | (338,418,833) |
| Net dividends and distributions to shareholders - Class Y | (96,681,208) | (203,889,816) |
| Total dividends and distributions | (316,331,555) | (720,816,339) |
| Increase (Decrease) in Net Assets | 117,186,642 | (343,039,673) |
| Net Assets: | ||
| Beginning of Year | 9,991,763,985 | 10,334,803,658 |
| End of Year | $10,108,950,627 | $9,991,763,985 |
The accompanying notes are an integral part of these financial statements.
| Annual Report | The Jensen Quality Growth Fund Inc. | 17 |
Financial Highlights
Class J
| Per Share Data: | Year ended May 31, 2023 | Year ended May 31, 2022 | Year ended May 31, 2021 | Year ended May 31, 2020 | Year ended May 31, 2019 |
| Net asset value, beginning of year | $57.86 | $60.00 | $49.46 | $47.79 | $47.87 |
| Income from investment operations: | |||||
| Net investment income(1) | 0.50 | 0.44 | 0.52 | 0.58 | 0.47 |
| Net realized and unrealized gains on investments | 0.75 | 1.83 | 15.63 | 5.30 | 3.88 |
| Total from investment operations | 1.25 | 2.27 | 16.15 | 5.88 | 4.35 |
| Less distributions: | |||||
| Dividends from net investment income | (0.49) | (0.40) | (0.52) | (0.54) | (0.46) |
| Distributions from capital gains | (1.19) | (4.01) | (5.09) | (3.67) | (3.97) |
| Total distributions | $(1.68) | $(4.41) | $(5.61) | $(4.21) | $(4.43) |
| Net asset value, end of year | $57.43 | $57.86 | $60.00 | $49.46 | $47.79 |
| Total return | 2.29% | 2.92% | 33.95% | 12.15% | 9.58% |
| Supplemental data and ratios: | |||||
| Net assets, end of year (000’s) | $2,363,726 | $2,455,146 | $2,549,594 | $2,422,553 | $2,700,303 |
| Ratio of expenses to average net assets | 0.82% | 0.81% | 0.82% | 0.84% | 0.86% |
| Ratio of net investment income to average net assets | 0.88% | 0.69% | 0.89% | 1.11% | 0.97% |
| Porfolio turnover rate | 15.67% | 10.87% | 12.33% | 23.38% | 17.50% |
| (1) | Net investment income per share is calculated using the ending accumulated net investment income balances prior to consideration or adjustments for permanent book-to-tax differences. |
The accompanying notes are an integral part of these financial statements.
| 18 | The Jensen Quality Growth Fund Inc. | Annual Report |
Financial Highlights
Class R
| Per Share Data: | Year ended May 31, 2023 | Year ended May 31, 2022 | Year ended May 31, 2021 | Year ended May 31, 2020 | Year ended May 31, 2019 |
| Net asset value, beginning of year | $57.49 | $59.66 | $49.18 | $47.53 | $47.62 |
| Income from investment operations: | |||||
| Net investment income(1) | 0.26 | 0.16 | 0.25 | 0.34 | 0.28 |
| Net realized and unrealized gains on investments | 0.74 | 1.81 | 15.57 | 5.30 | 3.86 |
| Total from investment operations | 1.00 | 1.97 | 15.82 | 5.64 | 4.14 |
| Less distributions: | |||||
| Dividends from net investment income | (0.20) | (0.13) | (0.25) | (0.32) | (0.26) |
| Distributions from capital gains | (1.19) | (4.01) | (5.09) | (3.67) | (3.97) |
| Total distributions | $(1.39) | $(4.14) | $(5.34) | $(3.99) | $(4.23) |
| Net asset value, end of year | $57.10 | $57.49 | $59.66 | $49.18 | $47.53 |
| Total return | 1.83% | 2.44% | 33.36% | 11.66% | 9.17% |
| Supplemental data and ratios: | |||||
| Net assets, end of year (000’s) | $13,531 | $17,801 | $26,380 | $23,995 | $28,197 |
| Ratio of expenses to average net assets | 1.29% | 1.26% | 1.26% | 1.27% | 1.24% |
| Ratio of net investment income to average net assets | 0.41% | 0.23% | 0.44% | 0.68% | 0.58% |
| Porfolio turnover rate | 15.67% | 10.87% | 12.33% | 23.38% | 17.50% |
| (1) | Net investment income per share is calculated using the ending accumulated net investment income balances prior to consideration or adjustments for permanent book-to-tax differences. |
The accompanying notes are an integral part of these financial statements.
| Annual Report | The Jensen Quality Growth Fund Inc. | 19 |
Financial Highlights
Class I
| Per Share Data: | Year ended May 31, 2023 | Year ended May 31, 2022 | Year ended May 31, 2021 | Year ended May 31, 2020 | Year ended May 31, 2019 |
| Net asset value, beginning of year | $57.82 | $59.99 | $49.46 | $47.81 | $47.90 |
| Income from investment operations: | |||||
| Net investment income(1) | 0.61 | 0.57 | 0.61 | 0.66 | 0.60 |
| Net realized and unrealized gains on investments | 0.76 | 1.84 | 15.65 | 5.34 | 3.87 |
| Total from investment operations | 1.37 | 2.41 | 16.26 | 6.00 | 4.47 |
| Less distributions: | |||||
| Dividends from net investment income | (0.62) | (0.57) | (0.64) | (0.68) | (0.59) |
| Distributions from capital gains | (1.19) | (4.01) | (5.09) | (3.67) | (3.97) |
| Total distributions | $(1.81) | $(4.58) | $(5.73) | $(4.35) | $(4.56) |
| Net asset value, end of year | $57.38 | $57.82 | $59.99 | $49.46 | $47.81 |
| Total return | 2.51% | 3.14% | 34.24% | 12.41% | 9.85% |
| Supplemental data and ratios: | |||||
| Net assets, end of year (000’s) | $4,909,180 | $4,762,505 | $5,003,474 | $4,002,485 | $3,454,461 |
| Ratio of expenses to average net assets | 0.61% | 0.61% | 0.61% | 0.60% | 0.61% |
| Ratio of net investment income to average net assets | 1.09% | 0.89% | 1.10% | 1.37% | 1.22% |
| Porfolio turnover rate | 15.67% | 10.87% | 12.33% | 23.38% | 17.50% |
| (1) | Net investment income per share is calculated using the ending accumulated net investment income balances prior to consideration or adjustments for permanent book-to-tax differences. |
The accompanying notes are an integral part of these financial statements.
| 20 | The Jensen Quality Growth Fund Inc. | Annual Report |
Financial Highlights
Class Y
| Per Share Data: | Year ended May 31, 2023 | Year ended May 31, 2022 | Year ended May 31, 2021 | Year ended May 31, 2020 | Year ended May 31, 2019 |
| Net asset value, beginning of year | $57.82 | $59.98 | $49.46 | $47.80 | $47.90 |
| Income from investment operations: | |||||
| Net investment income(1) | 0.66 | 0.62 | 0.66 | 0.73 | 0.63 |
| Net realized and unrealized gains on investments | 0.75 | 1.84 | 15.64 | 5.31 | 3.87 |
| Total from investment operations | 1.41 | 2.46 | 16.30 | 6.04 | 4.50 |
| Less distributions: | |||||
| Dividends from net investment income | (0.67) | (0.61) | (0.69) | (0.71) | (0.63) |
| Distributions from capital gains | (1.19) | (4.01) | (5.09) | (3.67) | (3.97) |
| Total distributions | $(1.86) | $(4.62) | $(5.78) | $(4.38) | $(4.60) |
| Net asset value, end of year | $57.37 | $57.82 | $59.98 | $49.46 | $47.80 |
| Total return | 2.59% | 3.23% | 34.34% | 12.51% | 9.90% |
| Supplemental data and ratios: | |||||
| Net assets, end of year (000’s) | $2,822,513 | $2,756,312 | $2,755,356 | $2,306,038 | $916,705 |
| Ratio of expenses to average net assets | 0.52% | 0.52% | 0.52% | 0.54% | 0.55% |
| Ratio of net investment income to average net assets | 1.17% | 0.98% | 1.18% | 1.46% | 1.31% |
| Porfolio turnover rate | 15.67% | 10.87% | 12.33% | 23.38% | 17.50% |
| (1) | Net investment income per share is calculated using the ending accumulated net investment income balances prior to consideration or adjustments for permanent book-to-tax differences. |
The accompanying notes are an integral part of these financial statements.
| Annual Report | The Jensen Quality Growth Fund Inc. | 21 |
Notes to the Financial Statements
May 31, 2023
1. Organization and Significant Accounting Policies
The Jensen Quality Growth Fund Inc. (the “Fund”), was incorporated as an Oregon corporation on April 17, 1992, and is registered as an open-end, non-diversified management investment company under the Investment Company Act of 1940 (the “1940 Act”). The Fund commenced operations on August 3, 1992. Effective March 1, 2018, the name of the Fund was changed from The Jensen Portfolio, Inc. doing business as Jensen Quality Growth Fund to The Jensen Quality Growth Fund Inc. The Fund is authorized to issue 5,000,000,000 shares of common stock, all of which have been authorized for the existing share classes. The Fund currently offers four different classes of shares; Class J, Class R, Class I, and Class Y. Class J shares are subject to a 0.25% 12b-1 fee and a sub-transfer agency fee, Class R shares are subject to a 0.50% 12b-1 fee and up to a 0.25% shareholder servicing fee, Class I shares are subject to a shareholder servicing fee of up to 0.10%, and Class Y shares are not subject to any 12b-1, shareholder servicing or sub transfer agency fee as described in the separate prospectuses for each of the Fund’s share classes. Each class of shares has identical rights and privileges except with respect to the 12b-1 fees, sub-transfer agency fees, shareholder servicing fees, and voting rights on matters affecting a single class of shares. The principal investment objective of the Fund is long-term capital appreciation.
The Fund is an investment company and accordingly follows the investment company accounting and reporting guidance of the Financial Accounting Standards Board (“FASB”) Accounting Standards Codification Topic 946 “Financial Services Investment Companies”.
The following is a summary of significant accounting policies consistently followed by the Fund. The policies are in conformity with accounting principles generally accepted in the United States of America (“GAAP”).
a) Investment Valuation – Securities that are listed on United States stock exchanges are valued at the last sale price at the close of the exchange. Equity securities listed on the NASDAQ Stock Market are valued at the NASDAQ Official Closing Price or, if there has been no sale on that day, at their current bid price. Investments in open-end and closed-end registered investment companies, including money market funds, that do not trade on an exchange are valued at the end of day net asset value per share. Quotations are taken from the market in which the security is primarily traded. Over-the-counter securities are valued at the current bid price in the absence of a closing price. Securities for which market quotations are not readily available are valued at fair value as determined by Jensen Investment Management, Inc. (the “Investment Adviser”) at or under the direction of the Fund’s Board of Directors.
There is no definitive set of circumstances under which the Fund may elect to use fair value procedures to value a security. Although the Fund only invests in publicly traded securities, the large majority of which are large capitalization, highly liquid securities, they nonetheless may become securities for which market quotations are not readily available, such as in instances where the
| 22 | The Jensen Quality Growth Fund Inc. | Annual Report |
market quotation for a security has become stale, sales of a security have been infrequent, trading in the security has been suspended, or where there is a thin market in the security. Securities for which market quotations are not readily available will be valued at their fair value as determined under the Fund’s fair valuation procedures established by the Board of Directors. The Fund is prohibited from investing in restricted securities (securities issued in private placement transactions that may not be offered or sold to the public without registration under the securities laws); therefore, fair value pricing considerations for restricted securities are generally not applicable to the Fund.
Fair Value Measurement – The Fund has adopted authoritative fair valuation accounting standards which establish an authoritative definition of fair value and set out a hierarchy for measuring fair value. These standards require additional disclosures about the various inputs and valuation techniques used to develop the measurements of fair value and a discussion of changes in valuation techniques and related inputs during the year. The three levels of the fair value hierarchy are as follows:
| Level 1 | Inputs that reflect unadjusted quoted prices in active markets for identical assets or liabilities that the Fund has the ability to access at the measurement date. |
| Level 2 | Inputs other than quoted prices that are observable for the asset or liability either directly or indirectly, including inputs in markets that are not considered to be active and prices for similar securities, interest rates, credit risk, etc. |
| Level 3 | Inputs that are unobservable (including the Fund’s own assumptions in determining the fair value of investments). |
Inputs refer broadly to the assumptions that market participants use to make valuation decisions, including assumptions about risk. Inputs may include price information, volatility statistics, specific and broad credit data, liquidity statistics, and other factors. A financial instrument’s level within the fair value hierarchy is based on the lowest level of input that is significant to the fair value measurement. However, the determination of what constitutes “observable” requires significant judgment by the Fund. The Fund considers observable data to be that market data which is readily available, regularly distributed or updated, reliable and verifiable, not proprietary, and provided by independent sources that are actively involved in the relevant market. The categorization of a financial instrument within the hierarchy is based upon the pricing transparency of the instrument and does not necessarily correspond to the Fund’s perceived risk of that instrument.
Investments whose values are based on quoted market prices in active markets, include common stocks and certain money market securities, and are classified within Level 1. Investments that trade in markets that are not considered to be active, but are valued based on quoted market prices, dealer quotations or alternative pricing sources supported by observable inputs are classified within Level 2. Investments classified within Level 3 have significant unobservable inputs, as they trade infrequently or not at all.
| Annual Report | The Jensen Quality Growth Fund Inc. | 23 |
The following is a summary of the inputs used, as of May 31, 2023, to value the Fund’s investments carried at fair value. The inputs and methodology used for valuing securities may not be an indication of the risk associated with investing in those securities.
| Investments at Value | Total | Level 1 | Level 2 | Level 3 | ||||||||||||||||
| Total Common Stocks* | $ | 9,872,236,854 | $ | 9,872,236,854 | $ | — | $ | — | ||||||||||||
| Total Money Market Fund | $ | 220,942,837 | $ | 220,942,837 | — | — | ||||||||||||||
| Total Investments | $ | 10,093,179,691 | $ | 10,093,179,691 | $ | — | $ | — | ||||||||||||
| * | For further information regarding security characteristics and industry classifications, please see the Schedule of Investments. |
The Fund did not hold any investments during the period ended May 31, 2023 with significant unobservable inputs which would be classified as Level 3. The Fund did not hold any derivative instruments during the reporting year.
b) Federal Income Taxes – No provision has been made for Federal income taxes since the Fund has elected to be taxed as a “regulated investment company” and intends to distribute substantially all net investment company taxable income and net capital gains to its shareholders and otherwise comply with the provision of the Internal Revenue Code applicable to regulated investment companies.
The Fund has reviewed all open tax years and major jurisdictions and concluded that there is no tax liability resulting from unrecognized tax benefits relating to uncertain income tax positions taken or expected to be taken as of and for the year ended May 31, 2023. The Fund recognizes interest and penalties, if any, related to uncertain tax benefits in the Statement of Operations. During the year, the Fund did not incur any interest or penalties. Open tax years are those that are open for exam by taxing authorities. The Fund has no examination in progress. The Fund is also not aware of any tax positions for which it is reasonably possible that the total amounts of unrecognized tax benefits will significantly change in the next twelve months.
c) Distributions to Shareholders – Dividends to shareholders are recorded on the ex-dividend date. Dividends from net investment income are declared and paid quarterly by the Fund. Distributions of net realized capital gains, if any, will be declared and paid at least annually. Income and capital gain distributions are determined in accordance with income tax regulations which may differ from GAAP. The Fund may utilize earnings and profits distributed to shareholders on redemption of shares as part of the dividend paid deduction.
d) Use of Estimates – The preparation of financial statements in conformity with GAAP requires management to make estimates and assumptions that affect the reported amounts of assets and liabilities and disclosure of contingent assets and liabilities at the date of the financial statements and the reported amounts of revenues and expenses during the reporting period. Actual results could differ from those estimates.
| 24 | The Jensen Quality Growth Fund Inc. | Annual Report |
e) Guarantees and Indemnifications – Under the Fund’s organizational documents, each director, officer, employee or other agent of the Fund is indemnified, to the extent permitted by the 1940 Act, against certain liabilities that may arise out of performance of their duties to the Fund. Additionally, in the normal course of business, the Fund enters into contracts that contain a variety of indemnification clauses. The Fund’s maximum exposure under these arrangements is unknown as this would involve future claims that may be made against the Fund that have not yet occurred. However, the Fund has not had prior claims or losses pursuant to these contracts and believes the risk of loss to be remote.
f) Allocation of Income, Expenses and Gains/Losses – Income, expenses (other than those deemed attributable to a specific share class), and gains and losses of the Fund are allocated daily to each class of shares based upon the ratio of net assets represented by each class as a percentage of the net assets of the Fund. Expenses deemed directly attributable to a class of shares are recorded by the specific class. Most Fund expenses are allocated by class based on relative net assets. Transfer agent fees and reports to shareholders are allocated based on the number of shareholder accounts in each class. Sub-transfer agency fees are expensed and approved by the Fund’s Board of Directors to the Class J shares based on the yearly average of five published per-account rates from five known brokerages. 12b-1 fees are expensed at 0.25% of average daily net assets of Class J shares and 0.50% of average daily net assets of Class R shares. Shareholder servicing fees are expensed at up to 0.10% and up to 0.25% of the average daily net assets of Class I shares and Class R shares, respectively.
g) Other – Investment and shareholder transactions are recorded on trade date. Gains or losses from investment transactions are determined on the basis of identified carrying value using the specific identification method. Dividend income is recognized on the ex-dividend date and interest income is recognized on an accrual basis.
2. Capital Share Transactions
Transactions in shares of the Fund were as follows:
| Class J | year ended May 31, 2023 | year ended May 31, 2022 | ||||||||
| Shares sold | 4,031,942 | 6,240,788 | ||||||||
| Shares issued in reinvestment of dividends | 1,237,255 | 2,643,294 | ||||||||
| Shares redeemed | (6,546,978 | ) | (8,944,731 | ) | ||||||
| Net decrease | (1,277,781 | ) | (60,649 | ) | ||||||
| Shares outstanding: | ||||||||||
| Beginning of year | 42,432,979 | 42,493,628 | ||||||||
| End of year | 41,155,198 | 42,432,979 | ||||||||
| Annual Report | The Jensen Quality Growth Fund Inc. | 25 |
| Class R | year ended May 31, 2023 | year ended May 31, 2022 | ||||||||
| Shares sold | 40,376 | 93,940 | ||||||||
| Shares issued in reinvestment of dividends | 6,892 | 27,582 | ||||||||
| Shares redeemed | (119,902 | ) | (254,100 | ) | ||||||
| Net decrease | (72,634 | ) | (132,578 | ) | ||||||
| Shares outstanding: | ||||||||||
| Beginning of year | 309,620 | 442,198 | ||||||||
| End of year | 236,986 | 309,620 | ||||||||
| Class I | year ended May 31, 2023 | year ended May 31, 2022 | ||||||||
| Shares sold | 18,407,562 | 21,236,916 | ||||||||
| Shares issued in reinvestment of dividends | 2,581,241 | 4,917,309 | ||||||||
| Shares redeemed | (17,801,411 | ) | (27,183,390 | ) | ||||||
| Net increase (decrease) | 3,187,392 | (1,029,165 | ) | |||||||
| Shares outstanding: | ||||||||||
| Beginning of year | 82,369,369 | 83,398,534 | ||||||||
| End of year | 85,556,761 | 82,369,369 | ||||||||
| Class Y | year ended May 31, 2023 | year ended May 31, 2022 | ||||||||
| Shares sold | 15,935,174 | 8,766,766 | ||||||||
| Shares issued in reinvestment of dividends | 1,348,362 | 2,421,386 | ||||||||
| Shares redeemed | (15,759,798 | ) | (9,451,335 | ) | ||||||
| Net increase | 1,523,738 | 1,736,817 | ||||||||
| Shares outstanding: | ||||||||||
| Beginning of year | 47,672,438 | 45,935,621 | ||||||||
| End of year | 49,196,176 | 47,672,438 | ||||||||
3. Investment Transactions
The aggregate purchases and aggregate sales of securities, excluding short-term investments, by the Fund for the year ended May 31, 2023, were $1,522,930,899 and $1,548,719,216, respectively.
| 26 | The Jensen Quality Growth Fund Inc. | Annual Report |
4. Income Taxes
The distributions of $106,314,260 and $93,525,514 paid during the years ended May 31, 2023 and 2022, respectively, were classified as ordinary income for tax purposes. The distributions of $210,017,295 and $627,290,825 paid during the years ended May 31, 2023 and 2022, respectively, were classified as long-term capital gain for income tax purposes.
Additionally, U.S. generally accepted accounting principles require that certain components of net assets relating to permanent differences be reclassified between financial and tax reporting. These reclassifications have no effect on net assets or net asset value per share. For the year ended May 31, 2023, distributable earnings decreased by $40,963,116 and capital stock increased by $40,963,116. The permanent difference relates to tax equalization.
At May 31, 2023, the cost of investments, net unrealized appreciation (depreciation) and undistributed ordinary income and undistributed long term capital gains for income tax purposes were as follows:
| Cost of investments | $ | 5,896,034,957 | ||
| Gross unrealized appreciation | $ | 4,326,273,913 | ||
| Gross unrealized depreciation | $ | (129,129,179 | ) | |
| Net unrealized appreciation | $ | 4,197,144,734 | ||
| Undistributed ordinary income | $ | 15,951,425 | ||
| Undistributed long-term capital gain | $ | 309,070,069 | ||
| Distributable earnings | $ | 325,021,494 | ||
| Other accumulated gains | $ | — | ||
| Total distributable earnings | $ | 4,522,166,228 | ||
The cost of investments differ for financial statement and tax purposes primarily due to the deferral of losses on wash sales.
5. Line of Credit
The Fund has the lesser of (i) $400 million, (ii) 20% of the gross market value of the Fund, or (iii) 33.33% of the net market value of the unencumbered assets of the Fund available under a revolving credit facility, subject to certain restrictions, for temporary emergency purposes, including the meeting of redemption requests that otherwise might require the untimely disposition of securities. The secured line of credit has a one-year term and is reviewed annually by the Board of Directors. The credit facility is with the Fund’s custodian, U.S. Bank. The current credit facility runs through December 11, 2023. The interest rate on the outstanding principal amount is equal to the prime rate less 1%. As of May 31, 2023 the interest rate on the Fund’s line of credit was 7.25%. The Fund did not borrow on the line of credit during the year ended May 31, 2023.
| Annual Report | The Jensen Quality Growth Fund Inc. | 27 |
6. Investment Advisory Agreement
The Fund is a party to an Investment Advisory and Service Contract with the Investment Adviser. Pursuant to the terms of the Investment Advisory and Service Contract approved by Fund shareholders, the Investment Adviser is entitled to receive a fee, calculated daily and payable monthly, at the annual rate of 0.50% as applied to the Fund’s average daily net assets of $4 billion or less, 0.475% as applied to the Fund’s average daily net assets of more than $4 billion and up to $8 billion, 0.45% as applied to the Fund’s average daily net assets of more than $8 billion and up to $12 billion, and 0.425% as applied to the Fund’s average daily net assets of more than $12 billion.
Certain officers and a director of the Fund are also officers and directors of the Investment Adviser.
7. Distribution and Shareholder Servicing
The Fund has adopted a distribution and shareholder servicing plan pursuant to Rule 12b-1 under the 1940 Act (the “12b-1 Plan”), which provides that the Fund make payments to the Fund’s distributor at an annual rate of 0.25% of average daily net assets attributable to Class J shares and 0.50% of the average daily net assets attributable to Class R shares. The Fund’s distributor may then make payments to financial intermediaries or others at an annual rate of up to 0.25% of the average daily net assets attributable to Class J shares and up to 0.50% of the average daily net assets attributable to Class R shares. Payments under the 12b-1 Plan shall be used to compensate the Fund’s distributor or others for services provided and expenses incurred in connection with the sale and/or servicing of shares. 12b-1 fees incurred for the year ended May 31, 2023, are disclosed on the Statement of Operations and the amount payable at year end is disclosed on the Statement of Assets and Liabilities.
In addition, the Fund has adopted a Shareholder Servicing Plan for Class I shares under which the Fund can pay for shareholder support services from the Fund’s assets pursuant to a Shareholder Servicing Agreement in an amount not to exceed 0.10% of the Fund’s average daily net assets attributable to Class I shares. The amount actually incurred for the year ended May 31, 2023 was 0.08% on an annualized basis.
The Fund has also adopted a Shareholder Servicing Plan for the Class R shares. Under the Shareholder Servicing Plan, the Fund can pay for shareholder support services, which include the recordkeeping and administrative services provided by retirement plan administrators to retirement plans (and their participants) that are shareholders of the class. Payments will be made pursuant to a Shareholder Servicing Agreement in an amount not to exceed 0.25% of the Fund’s average daily net assets attributable to Class R shares. The amount actually incurred for the year ended May 31, 2023 was 0.17% on an annualized basis.
| 28 | The Jensen Quality Growth Fund Inc. | Annual Report |
8. Beneficial Ownership
The beneficial ownership, either directly or indirectly, of more than 25% of the voting securities of a fund creates presumption of control of the fund, under Section 2(a)(9) of the 1940 Act. At May 31, 2023, Charles Schwab & Co., Inc., for the benefit of its customers, held 41.55% of the outstanding shares of the Class J share class. At May 31, 2023, Wells Fargo Clearing Services LLC, for the benefit of its customers, held 37.91% of the outstanding shares of the Class I share class. At May 31, 2023, State Street Bank & Trust Co., for the benefit of its customers, hold 25.54% of the outstanding shares of the Class R share class, respectively. At May 31, 2023, Edward D Jones and Co., for the benefit of its customers, held 38.83% of the outstanding shares of the Class Y share class.
9. Subsequent Events
On June 8, 2023, The Fund declared and paid a distribution from ordinary income of $4,086,594, $6,494, $11,019,745, $6,791,163.62 for Class J, Class R, Class I, and Class Y, respectively, to shareholders of record as of June 7, 2023.
In preparing these financial statements, the Fund has evaluated events and transactions for potential recognition or disclosure resulting from subsequent events after the Statement of Assets and Liabilities date of May 31, 2023 through the date the financial statements were available for issue.
| Annual Report | The Jensen Quality Growth Fund Inc. | 29 |
Report of Independent Registered Public Accounting Firm
To the Shareholders and Board of Directors of
The Jensen Quality Growth Fund Inc.
Opinion on the Financial Statements
We have audited the accompanying statement of assets and liabilities, including the schedule of investments, of The Jensen Quality Growth Fund Inc. (the “Fund”) as of May 31, 2023, the related statement of operations for the year then ended, the statements of changes in net assets for each of the two years in the period then ended, the related notes, and the financial highlights for each of the five years in the period then ended (collectively referred to as the “financial statements”). In our opinion, the financial statements present fairly, in all material respects, the financial position of the Fund as of May 31, 2023, the results of its operations for the year then ended, the changes in net assets for each of the two years in the period then ended, and the financial highlights for each of the five years in the period then ended, in conformity with accounting principles generally accepted in the United States of America.
Basis for Opinion
These financial statements are the responsibility of the Fund’s management. Our responsibility is to express an opinion on the Fund’s financial statements based on our audits. We are a public accounting firm registered with the Public Company Accounting Oversight Board (United States) (“PCAOB”) and are required to be independent with respect to the Fund in accordance with the U.S. federal securities laws and the applicable rules and regulations of the Securities and Exchange Commission and the PCAOB.
We conducted our audits in accordance with the standards of the PCAOB. Those standards require that we plan and perform the audit to obtain reasonable assurance about whether the financial statements are free of material misstatement whether due to error or fraud.
Our audits included performing procedures to assess the risks of material misstatement of the financial statements, whether due to error or fraud, and performing procedures that respond to those risks. Such procedures included examining, on a test basis, evidence regarding the amounts and disclosures in the financial statements. Our procedures included confirmation of securities owned as of May 31, 2023, by correspondence with the custodian. Our audits also included evaluating the accounting principles used and significant estimates made by management, as well as evaluating the overall presentation of the financial statements. We believe that our audits provide a reasonable basis for our opinion.
We have served as the Fund’s auditor since 2010.

COHEN & COMPANY, LTD.
Milwaukee, Wisconsin
July 27, 2023
| 30 | The Jensen Quality Growth Fund Inc. | Annual Report |
Expense Example – May 31, 2023 (Unaudited)
As a shareholder of The Jensen Quality Growth Fund Inc. (the “Fund”), you incur ongoing costs, including investment advisory fees, distribution and/or shareholder servicing fees, and other Fund expenses, which are indirectly paid by shareholders. This example is intended to help you understand your ongoing costs (in dollars) of investing in the Fund and to compare these costs with the ongoing costs of investing in other mutual funds.
The Example is based on an investment of $1,000 invested at the beginning of the period and held for the entire six-month period (December 1, 2022 - May 31, 2023)
Actual Expenses
The first line of the table below for each share class of the Fund provides information about actual account values and actual expenses. However, the table does not include shareholder specific fees, such as the $15.00 fee charged to IRA accounts, or the $15.00 fee charged for wire redemptions. The table also does not include portfolio trading commissions and related trading costs. You may use the information in this line, together with the amount you invested, to estimate the expenses that you paid over the period. Simply divide your account value by $1,000 (for example, an $8,600 account value divided by $1,000 = 8.6), then multiply the result by the number in the first line under the heading entitled “Expenses Paid During Period” to estimate the expenses you paid on your account during this period.
Hypothetical Example for Comparison Purposes
The second line of the table below provides information about hypothetical account values and hypothetical expenses based on the actual expense ratios for each share class of the Fund and an assumed rate of return of 5% per year before expenses, which is not the Fund’s actual return. The hypothetical account values and expenses may not be used to estimate the actual ending account balance or expenses you paid for the period. You may use this information to compare the ongoing costs of investing in the Fund and other funds. To do so, compare this 5% hypothetical example with the 5% hypothetical examples that appear in the shareholder reports of the other funds.
Please note that the expenses shown in the table are meant to highlight your ongoing costs only and do not reflect any transactional costs, such as sales charges (loads), redemption fees, or exchange fees which, although not charged by the Fund, may be charged by other funds. Therefore, the second line of the table is useful in comparing ongoing costs only, and will not help you determine the relative total costs of owning different funds.
| Annual Report | The Jensen Quality Growth Fund Inc. | 31 |
Expense Example Tables (Unaudited)
| Jensen Quality Growth Fund – Class J | Beginning Account Value December 1, 2022 | Ending Account Value May 31, 2023 | Expenses Paid During Period* Dec 1, 2022 – May 31, 2023 | ||||||||||||
| Actual | $1,000.00 | $1,008.60 | $4.11 | ||||||||||||
| Hypothetical (5% annual return before expenses) | 1,000.00 | 1,020.84 | 4.13 | ||||||||||||
| * | Expenses are equal to the Fund’s annualized six-month expense ratio of 0.82%, multiplied by the average account value over the period, multiplied by 182/365 to reflect the one-half year period. |
| Jensen Quality Growth Fund – Class R | Beginning Account Value December 1, 2022 | Ending Account Value May 31, 2023 | Expenses Paid During Period* Dec 1, 2022 – May 31, 2023 | ||||||||||||
| Actual | $1,000.00 | $1,006.20 | $6.50 | ||||||||||||
| Hypothetical (5% annual return before expenses) | 1,000.00 | 1,018.45 | 6.54 | ||||||||||||
| * | Expenses are equal to the Fund’s annualized six-month expense ratio of 1.30%, multiplied by the average account value over the period, multiplied by 182/365 to reflect the one-half year period. |
| Jensen Quality Growth Fund – Class I | Beginning Account Value December 1, 2022 | Ending Account Value May 31, 2023 | Expenses Paid During Period* Dec 1, 2022 – May 31, 2023 | ||||||||||||
| Actual | $1,000.00 | $1,009.80 | $3.06 | ||||||||||||
| Hypothetical (5% annual return before expenses) | 1,000.00 | 1,021.89 | 3.07 | ||||||||||||
| * | Expenses are equal to the Fund’s annualized six-month expense ratio of 0.61%, multiplied by the average account value over the period, multiplied by 182/365 to reflect the one-half year period. |
| Jensen Quality Growth Fund – Class Y | Beginning Account Value December 1, 2022 | Ending Account Value May 31, 2023 | Expenses Paid During Period* Dec 1, 2022 – May 31, 2023 | ||||||||||||
| Actual | $1,000.00 | $1,010.10 | $2.61 | ||||||||||||
| Hypothetical (5% annual return before expenses) | 1,000.00 | 1,022.34 | 2.62 | ||||||||||||
| * | Expenses are equal to the Fund’s annualized six-month expense ratio of 0.52%, multiplied by the average account value over the period, multiplied by 182/365 to reflect the one-half year period. |
| 32 | The Jensen Quality Growth Fund Inc. | Annual Report |
Additional Information (Unaudited)
1. Shareholder Notification of Federal Tax Status
The Fund designates 100% of dividends declared during the fiscal year ended May 31, 2023 as dividends qualifying for the dividends received deduction available to corporate shareholders.
The Fund designates 100% of dividends declared from net investment income during the fiscal year ended May 31, 2023 as qualified dividend income under the Jobs and Growth Tax Relief Reconciliation Act of 2003.
The Fund designates as a long-term capital gain dividend, pursuant to the Internal Revenue Code Section 852(b)(3), the amount necessary to reduce earnings and profits of the Fund related to net capital gain to zero for the fiscal year ended May 31, 2023.
Additional Information Applicable to Foreign Shareholders Only:
The Fund designates 3.15% of ordinary income distributions as interest-related dividends under Internal Revenue Code Section 871(k)(1)(c).
The Fund designates 0.00% of ordinary income distributions as short-term capital gain distributions under Internal Revenue Section 871(k)(2)(c).
2. Availability of Proxy Voting Information
Information regarding how the Fund votes proxies relating to portfolio securities is available without charge, upon request by calling toll-free, 1-800-221-4384, or by accessing the SEC’s website at www.sec.gov.
3. Portfolio Holdings
The Fund will file its complete schedule of portfolio holdings with the SEC for the first and third quarters of each fiscal year on Part F of Form N-PORT. The Fund’s Part F of Form N-PORT will be available on the EDGAR database on the SEC’s website at www.sec.gov. These Forms may also be reviewed and copied at the SEC’s Public Reference Room in Washington D.C. Information about the operation of the Public Reference Room may be obtained by calling 1-800-SEC-0330. Quarterly portfolio holdings are also available on the website for Jensen Quality Growth Fund, www.JensenInvestment.com.
4. Liquidity Risk Management Program
Consistent with Rule 22e-4 under the Investment Company Act of 1940, the Fund has established a liquidity risk management program to manage “liquidity risk” (the “LRMP”). “Liquidity Risk” is defined as the risk that the Fund could not meet requests to redeem shares issued by a Fund without significant dilution of remaining investors’ interest in the Fund. The LRMP is overseen by the Program Administrator, a committee comprised of representatives of the Fund’s Investment Adviser and officers of the Fund. The Fund’s Board of Directors has approved the designation of the Program Administrator to oversee the LRMP.
| Annual Report | The Jensen Quality Growth Fund Inc. | 33 |
The LRMP’s principal objectives include supporting the Fund’s compliance with limits on investments in illiquid assets and mitigating the risk that the Fund will be unable to meet its redemption obligations timely. The LRMP also includes a number of elements that support the management and assessment of liquidity risk, including an annual assessment of factors that influence the Fund’s liquidity and the periodic classification and re-classification of the Fund’s investments into groupings that reflect the Program Administrator’s assessment of their relative liquidity under current market conditions.
During the period covered by the report, it was determined that that: (1) the LRMP continues to be reasonably designed to effectively assess and manage the Funds’ Liquidity Risk; and (2) the LRMP has been adequately and effectively implemented with respect to the Fund during the reporting period. There can be no assurance that the LRMP will achieve its objectives in the future. Please refer to the Fund’s prospectus for more information regarding the Fund’s exposure to liquidity risk and other principal risks to which an investment in the Fund may be subject.
5. Additional Disclosure Regarding Fund Directors and Officers
Independent Directors
| Name, Address and Age | Position(s) Held with the Fund | Term of Office and Length of Time Served** | Principal Occupation During Past Five Years | #of Portfolios in Fund Complex Overseen by Director | Other Directorships Held by Director During the Past Five Years |
| Roger A. Cooke The Jensen Quality Growth Fund Inc. 5500 Meadows Road Suite 200 Lake Oswego, OR 97035 Year of Birth: 1948 | Independent Director | Indefinite Term; since June 1999. | Retired. Senior Vice President, General Counsel and Secretary of Precision Castparts Corp., a diversified manufacturer of complex metal products, (2000 – 2013); Executive Vice President – Regulatory and Legal Affairs of Fred Meyer, Inc. (now a division of Kroger), a retail grocery and general merchandise company (1992 – 2000). | 1 | None |
| Kenneth Thrasher The Jensen Quality Growth Fund Inc. 5500 Meadows Road Suite 200 Lake Oswego, OR 97035 Year of Birth: 1949 | Chairperson and Independent Director | Indefinite Term; since July 2007 and Chairman since July 2022. | Retired. Chairman (2002 – 2018) and CEO (2002 – 2009) of Complí, a web-based compliance and risk management software solution company; President and CEO of Fred Meyer, Inc. (now a division of Kroger), a retail grocery and general merchandise company, from 1999-2001, and other executive positions at Fred Meyer, Inc., including EVP and Chief Administrations Officer and SVP and Chief Financial Officer, from 1982-1999. | 1 | Northwest Natural Holding and Northwest Natural Gas Company (a natural gas distribution and service provider). |
| 34 | The Jensen Quality Growth Fund Inc. | Annual Report |
| Name, Address and Age | Position(s) Held with the Fund | Term of Office and Length of Time Served** | Principal Occupation During Past Five Years | #of Portfolios in Fund Complex Overseen by Director | Other Directorships Held by Director During the Past Five Years |
| Janet G. Hamilton, PhD, CFA The Jensen Quality Growth Fund Inc. 5500 Meadows Road Suite 200 Lake Oswego, OR 97035 Year of Birth: 1955 | Independent Director | Indefinite Term; since October 2016. | Associate Professor, Finance, Portland State University’s School of Business (1986 – present) and Area Director (2016-present). | 1 | None |
| Kathleen J. Kee, CFP The Jensen Quality Growth Fund Inc. 5500 Meadows Road Suite 200 Lake Oswego, OR 97035 Year of Birth: 1961 | Independent Director | Indefinite Term; since October 2021. | Senior Wealth Advisor, Buckingham Strategic Wealth (2020 – present); Chief Executive Officer, Confluence Wealth Management LLC (2011 – 2020) | 1 | None |
| Charles A. Wilhoitte, CPA The Jensen Quality Growth Fund Inc. 5500 Meadows Road, Suite 200 Lake Oswego, OR 97035-3625 Year of Birth: 1964 | Independent Director | Indefinite Term; since January 2023. | Managing Director (1995 – present) of Willamette Management Associates, a Citizens Company, a financial advisory services firm. | 1 | Northwest Natural Gas Holding Company and Northwest Natural Gas Company (a natural gas distribution and service provider). |
Interested Director
| Name, Address and Age | Position(s) Held with the Fund | Term of Office and Length of Time Served** | Principal Occupation During Past Five Years | #of Portfolios in Fund Complex Overseen by Director | Other Directorships Held by Director During the Past Five Years |
| Robert D.McIver* Jensen Investment Management, Inc. 5500 Meadows Road Suite 200 Lake Oswego, OR 97035 Year of Birth: 1965 | Director and President | Indefinite Term; since July 2015; 1 Year Term as President of the Fund; Served as President since February 2007. | Director (since July 2015) of the Fund; President and Director (February 2007 – present) and Director of Operations (2004 – February 2007) of Jensen Investment Management, Inc. | 1 | Jensen Investment Management, Inc. (since February 2007) |
| Annual Report | The Jensen Quality Growth Fund Inc. | 35 |
Officers of the Fund
| Name, Address and Age | Position(s) Held with the Fund | Term of Office and Length of Time Served** | Principal Occupation During Past Five Years | #of Portfolios in Fund Complex Overseen by Director | Other Directorships Held by Director During the Past Five Years |
| Robert D.McIver* SEE ABOVE | |||||
| Eric H. Schoenstein* Jensen Investment Management, Inc. 5500 Meadows Road Suite 200 Lake Oswego, OR 97035 Year of Birth: 1965 | Vice President | 1 Year Term; Served since January 2011. | Chief Investment Officer and Portfolio Manager (since 2021); and Director and Vice President of Business Analysis (2002-2021) for Jensen Investment Management, Inc. | N/A | Trustee of the Oregon State University Foundation (2008-present) |
| Richard W. Clark*** Jensen Investment Management, Inc. 5500 Meadows Road Suite 200 Lake Oswego, OR 97035 Year of Birth: 1969 | Vice President | 1 Year Term; Served since April 2017. | Director - Business Development (since August 2022), Director - Sales and Marketing for Jensen Investment Management, Inc. (2001-2022). | N/A | N/A |
| Shannon Contreras* Jensen Investment Management, Inc. 5500 Meadows Road Suite 200 Lake Oswego, OR 97035 Year of Birth: 1973 | Treasurer and Vice President | 1 Year Term; Served since February 2020. | Director (since 2022), Director of Finance and Treasurer (February 2020 - present), Senior Compliance Officer and Associate - Finance (October 2014 - February 2020) of Jensen Investment Management, Inc. | N/A | N/A |
| Gabriel L. Goddard* Jensen Investment Management, Inc. 5500 Meadows Road Suite 200 Lake Oswego, OR 97035 Year of Birth: 1972 | Chief Compliance Officer and AML Officer; Vice President and Secretary | 1 Year Term; Served since January 2018 (as Vice President and Secretary) and since February 2020 as Chief Compliance Officer and AML Officer. | Vice President and Secretary (January 2018-present), Secretary, General Counsel, Chief Compliance Officer (2012-present), and Director (2017-present) of Jensen Investment Management, Inc. | N/A | N/A |
| * | This individual is an “interested person” of the Fund within the meaning of the 1940 Act because they also serve as an officer of the Investment Adviser and own securities of the Investment Adviser. |
| ** | Each Director serves for an indefinite term in accordance with the Bylaws of the Fund until the date a Director dies, resigns, retires or is removed in accordance with the Bylaws of the Fund. |
| *** | This individual is an “interested person” of the Fund within the meaning of the 1940 Act because they own securities of the Adviser. |
| 36 | The Jensen Quality Growth Fund Inc. | Annual Report |
Notice of Privacy Policy (Unaudited)
The Jensen Quality Growth Fund Inc. (the “Fund”) has had a long-standing policy of maintaining strict confidentiality over customer information. The Fund’s policy is as follows:
Confidentiality and Security
All nonpublic personal information about our customers (“you”) will be kept strictly confidential. We maintain physical, electronic and operational safeguards to protect customer nonpublic personal information.
Categories of information the Fund discloses and parties to whom the Fund discloses that information:
The Fund does not disclose any nonpublic personal information about its current or former shareholders to nonaffiliated third parties without the shareholder’s authorization, except as permitted or required by law. For example, the Fund is permitted by law to disclose all of the information it collects, as described below, to its Transfer Agent to process your transactions. The Fund is also permitted by law (and may be required by law) to disclose any nonpublic personal information it collects from you to law enforcement agencies, the Securities and Exchange Commission, and other federal and state regulatory authorities.
Categories of information the Fund collects:
The Fund collects nonpublic personal information about you from the following sources:
| ● | Information the Fund receives from you on or in applications or other forms, correspondence, or conversations, including, but not limited to, your name, address, telephone number, social security number, and date of birth; and |
| ● | Information about your transactions with the Fund, its affiliates, or others, including, but not limited to, your account number and balance, investment history, parties to transactions, and information about our communications with you, such as account statements and trade confirmations. |
| ● | In the event that you hold shares of the Fund through a financial intermediary, including, but not limited to, a broker-dealer, bank, or trust company, the privacy policy of your financial intermediary will govern how your nonpublic personal information would be shared with nonaffiliated third parties. |
| Annual Report | The Jensen Quality Growth Fund Inc. | 37 |
| Jensen Quality Growth Fund Inc. | ||||
| Class I Shares | Class J Shares | Class R Shares | Class Y Shares | |
Investment Adviser Fund Administrator, Transfer Agent and Fund Accountant Custodian Legal Counsel Independent Registered Public Accounting Firm Distributor This report has been prepared for shareholders and may be distributed to others only if preceded or accompanied by a current prospectus. | ||||
JN-ANNUALQG | jenseninvestment.com |  | ||
| (b) | Not applicable. |
Item 2. Code of Ethics.
The registrant has adopted a code of ethics that applies to the registrant’s principal executive officer and principal financial officer. The registrant has not made any substantive amendments to its code of ethics during the period covered by this report. The registrant has not granted any waivers from any provisions of the code of ethics during the period covered by this report.
Item 3. Audit Committee Financial Expert.
The registrant’s board of directors has determined that there are three audit committee financial expert serving on its audit committee. Kathleen J. Kee, Kenneth Thrasher, and Janet G. Hamilton PhD, CFA, are the “audit committee financial experts” and are considered to be “independent” as each term is defined in Item 3 of Form N-CSR.
Item 4. Principal Accountant Fees and Services.
The registrant has engaged its principal accountant to perform audit services, audit-related services, tax services and other services during the past two fiscal years. “Audit services” refer to performing an audit of the registrant’s annual financial statements or services that are normally provided by the accountant in connection with statutory and regulatory filings or engagements for those fiscal years. “Audit-related services” refer to the assurance and related services by the principal accountant that are reasonably related to the performance of the audit. “Tax services” refer to professional services rendered by the principal accountant for tax compliance, tax advice, and tax planning. “Other services” provided by the principal accountant. The following table details the aggregate fees billed or expected to be billed for each of the last two fiscal years for audit fees, audit-related fees, tax fees and other fees by the principal accountant.
| FYE 5/31/2023 | FYE 5/31/2022 | |
| ( a ) Audit Fees | 23,100 | 22,700 |
| ( b ) Audit-Related Fees | 0 | 0 |
| ( c ) Tax Fees | 4,500 | 4,250 |
| ( d ) All Other Fees | 0 | 0 |
The audit committee has adopted pre-approval policies and procedures that require the audit committee to pre-approve all audit and non-audit services of the registrant, including services provided to any entity affiliated with the registrant.
The percentage of fees billed by Cohen & Company, Ltd. applicable to non-audit services pursuant to waiver of pre-approval requirement were as follows:
| FYE 5/31/2023 | FYE 5/31/2022 | |
| Audit-Related Fees | 0% | 0% |
| Tax Fees | 0% | 0% |
| All Other Fees | 0% | 0% |
All of the principal accountant’s hours spent on auditing the registrant’s financial statements were attributed to work performed by full-time permanent employees of the principal accountant.
The following table indicates the non-audit fees billed or expected to be billed by the registrant’s accountant for services to the registrant and to the registrant’s investment adviser (and any other controlling entity, etc.—not sub-adviser) for the last two years.
| Non-Audit Related Fees | FYE 5/31/2023 | FYE 5/31/2022 |
| Registrant | 4,500 | 4,250 |
| Registrant’s Investment Adviser | 28,000 | 67,000 |
The audit committee of the board of directors has considered whether the provision of non-audit services that were rendered to the registrant’s investment adviser is compatible with maintaining the principal accountant’s independence and has concluded that the provision of such non-audit services by the accountant has not compromised the accountant’s independence.
| ( i ) | Not applicable |
Item 5. Audit Committee of Listed Registrants.
Not applicable to registrants who are not listed issuers (as defined in Rule 10A-3 under the Securities Exchange Act of 1934).
Item 6. Investments.
Schedule of Investments is included as part of the report to shareholders filed under Item 1 of this Form.
Item 7. Disclosure of Proxy Voting Policies and Procedures for Closed-End Management Investment Companies.
Not applicable to open-end investment companies.
Item 8. Portfolio Managers of Closed-End Management Investment Companies.
Not applicable to open-end investment companies.
Item 9. Purchases of Equity Securities by Closed-End Management Investment Company and Affiliated Purchasers.
Not applicable to open-end investment companies.
Item 10. Submission of Matters to a Vote of Security Holders.
There have been no material changes to the procedures by which shareholders may recommend nominees to the registrant’s board of directors.
Item 11. Controls and Procedures.
| (a) | The Registrant’s President and Treasurer have reviewed the Registrant’s disclosure controls and procedures (as defined in Rule 30a-3(c) under the Investment Company Act of 1940 (the “Act”)) as of a date within 90 days of the filing of this report, as required by Rule 30a-3(b) under the Act and Rules 13a-15(b) or 15d-15(b) under the Securities Exchange Act of 1934. Based on their review, such officers have concluded that the disclosure controls and procedures are effective in ensuring that information required to be disclosed in this report is appropriately recorded, processed, summarized and reported and made known to them by others within the Registrant and by the Registrant’s service provider. |
| (b) | There were no changes in the Registrant’s internal control over financial reporting (as defined in Rule 30a-3(d) under the Act) that occurred during the period covered by this report that have materially affected, or are reasonably likely to materially affect, the Registrant’s internal control over financial reporting. |
Item 12. Disclosure of Securities Lending Activities for Closed-End Management Investment Companies
Not applicable to open-end investment companies.
Item 13. Exhibits.
| (a) | (1) Any code of ethics or amendment thereto, that is the subject of the disclosure required by Item 2, to the extent that the registrant intends to satisfy Item 2 requirements through filing an exhibit. Incorporated by reference to the Registrant’s Form N-CSR filed August 4, 2017. |
(2) A separate certification for each principal executive officer and principal financial officer pursuant to Section 302 of the Sarbanes-Oxley Act of 2002. Filed herewith.
(3) Any written solicitation to purchase securities under Rule 23c-1 under the Act sent or given during the period covered by the report by or on behalf of the registrant to 10 or more persons. Not applicable to open-end investment companies.
(4) Change in the registrant’s independent public accountant. There was no change in the registrant’s independent public accountant for the period covered by this report.
| (b) | Certifications pursuant to Section 906 of the Sarbanes-Oxley Act of 2002. Furnished herewith. | |
SIGNATURES
Pursuant to the requirements of the Securities Exchange Act of 1934 and the Investment Company Act of 1940, the registrant has duly caused this report to be signed on its behalf by the undersigned, thereunto duly authorized.
| (Registrant) The Jensen Quality Growth Fund Inc. | ||||
| By (Signature and Title)* | /s/ Robert McIver | |||
| Robert McIver, President | ||||
| Date | 8/3/2023 |
Pursuant to the requirements of the Securities Exchange Act of 1934 and the Investment Company Act of 1940, this report has been signed below by the following persons on behalf of the registrant and in the capacities and on the dates indicated.
| By (Signature and Title)* | /s/ Robert McIver | ||
| Robert McIver, President | |||
| Date | 8/3/2023 | ||
| By (Signature and Title)* | /s/ Shannon Contreras | ||
| Shannon Contreras, Treasurer | |||
| Date | 8/3/2023 |
* Print the name and title of each signing officer under his or her signature.