UNITED STATES
SECURITIES AND EXCHANGE COMMISSION
Washington, D.C. 20549
FORM N-CSR
CERTIFIED SHAREHOLDER REPORT OF REGISTERED
MANAGEMENT INVESTMENT COMPANIES
Investment Company Act file number 811-6653
The Jensen Quality Growth Fund
(Exact name of registrant as specified in charter)
5500 Meadows Road, Suite 200 Lake Oswego, OR 97035-8234
(Address of principal executive offices) (Zip code)
Robert McIver
5500 Meadows Road, Suite 200 Lake Oswego, OR 97035-8234
(Name and address of agent for service)
(800) 221 - 4384
Registrant's telephone number, including area code
Date of fiscal year end: May 31
Date of reporting period: May 31, 2022
Item 1. Reports to Stockholders.
(a)
Letter from The Investment Adviser
Dear Fellow Shareholders,
The Jensen Quality Growth Fund—Class I Shares—returned 3.14% for the year ended May 31, 2022, compared to a return of -0.30% for the Standard & Poor’s 500 Index over this period. Please see pages 9 through 12 of this report for complete standardized performance information for the Fund.
Market Perspective
“It was the best of times, it was the worst of times” is the opening line of Charles Dicken’s A Tale of Two Cities. The line has inspired occasional confusion as to its meaning. One interpretation that currently seems on point is the idea of strong opposites taking place nearly simultaneously.
For the last seven months of 2021, markets were buoyant as investors cheered the robust rebound in corporate earnings growth; solid consumer confidence and spending on the heels of substantial monetary and fiscal support provided by the Federal Reserve and U.S. executive and legislative branches; and continuing economic normalization as the pandemic eased from its most difficult moments. While warning signs of more challenges ahead were already evident and part of the outlook for most public companies, such signals were largely set aside by investors against the background of rising stock markets.
The first five months of 2022 saw those warning signs become reality, and anxiety marked the end of the last calendar year. These realities included strong inflation not seen for a generation, together with associated rising wage costs and labor shortages, supply chain disruptions, rising interest rates, and plans for tapered stimulus. Further, there were renewed economic shutdowns—primarily in Asia—due to variants of the COVID-19 virus, negative shifts in geopolitical tensions with China, and the Russian invasion of Ukraine and related knock-on effects, including the threat of recession in many economies. These simultaneous headwinds resulted in substantial market drawdowns that wiped out much, if not all, of the market gains from the first part of the one-year period ending May 31, 2022.
Despite the volatile conditions in the markets, the Fund’s quality focus helped mitigate negative sentiment during the period. One indication of this resilience from consistent, quality businesses can be found by reviewing market returns for the period as measured by the S&P Earnings and Dividend Quality Rankings. Companies with more consistent earnings and dividend payments are ranked higher by S&P than those companies that are typically more volatile. Given the nature of the rankings, companies rated A- or above are considered higher-quality businesses. Attribution comparisons to the S&P 500 Index indicate that over the last twelve months, the Fund’s outperformance in the A- and above categories improved the Fund’s overall returns by more than 200 basis points (bps). More recently, the wholesale nature of the market drawdown has impacted quality businesses at a similar rate to the overall markets as the uncertainties continue without apparent near-term resolution.
Annual Report | The Jensen Quality Growth Fund Inc. | 1 |
The Effect at Jensen
During the period, specific stock selection added value in the Information Technology and Communication Services sectors while detracting from returns primarily in the Industrials and Consumer Discretionary sectors, as global growth and inflation concerns pressured stocks in these two areas. From a sector perspective, the Fund’s relative overweight in Health Care and relative underweight in Communication Services added to performance for the period. In contrast, the Fund’s lack of exposure to Energy and Utilities detracted from performance, as these two sectors were positively impacted by the geopolitical crisis in Europe that caused oil prices to spike dramatically in the last few months. Typically, very few companies in the Energy and Utilities sectors qualify for our strict requirement for high and prolonged profitability, as measured by return on equity; consequently, our lack of exposure to sectors that do not deliver consistently high business returns will periodically add or detract value.
Leading contributors to performance during the period were Pfizer (PFE) and UnitedHealth Group (UNH). Pfizer is a global biopharmaceutical company with a diversified portfolio of pharmaceutical and vaccine products. During the one-year period ending May 31, 2022, the company’s stock price reacted favorably to the success of its COVID-19 vaccine, Comirnaty, and the approval of its COVID-19 therapeutic, Paxlovid. Additionally, the company made progress bolstering its drug pipeline via multiple positive existing pipeline updates, and the announcement of several transactions focused on future pipeline candidates.
UnitedHealth Group is the largest managed care company in the United States, offering health insurance, medical care, prescription drug management, and consulting services. In the past twelve months, the company demonstrated strong revenue and earnings growth acceleration as healthcare utilization patterns normalized after disruption during the early stages of the COVID-19 pandemic. Notably, UnitedHealth Group was successful at growing its healthcare delivery network, allowing for improved efficiency and profitability.
Two holdings detracted from the Fund’s performance for the period—3M (MMM) and Starbucks (SBUX). Business performance at 3M continues to endure in both the divisional and geographic segments, a testament to the broad-based and global footprint of the company. Stock performance, however, reflects more recent concerns over supply chain disruptions, raw material and logistics headwinds, and litigation. We believe the market underappreciates the relative strength of the company’s short-cycle businesses. We recognize that pressure stemming from the margin impact of supply chain bottlenecks and raw materials costs. Nonetheless, we believe our long-term model appropriately accounts for these risks, providing confidence that the health of the overall business continues to meet expectations.
2 | The Jensen Quality Growth Fund Inc. | Annual Report |
Starbucks, a roaster, marketer, and retailer of specialty coffee worldwide, saw a strong recovery in its business in calendar year 2021 as the global economy reopened after the pandemic-mandated shutdowns of its stores. However, stock price returns have been more recently challenged as the company reported weaker short-term margins and issued disappointing guidance in the face of higher wage and supply chain costs that are expected to continue for the coming months. Inflation is also hampering near-term expectations as consumers become more cautious in their discretionary spending. Additionally, the company has faced renewed pandemic-induced shutdowns of its stores in China, the closure of its stores in Russia, and an announced transition and search for a new CEO. We continue to monitor current events closely at Starbucks. Despite these short-term headwinds, we maintain our long-term conviction in the company given its strong fundamentals, market dominance, and customer affinity that should provide a level of resilience and long-term growth.
We are constantly evaluating all of the businesses owned by the Fund alongside other investment candidates to determine whether better opportunities exist in our investable universe. Such determinations ultimately reflect a combination of fundamental considerations, valuation opportunities, and overall risk profiles for our companies.
Fund Additions and Eliminations
During the one-year period ending May 31, 2022, the Jensen Investment Team enacted the purchase of three additional holdings and sold one holding. We initiated new positions in Marsh McLennan (MMC) and Moody’s Corporation (MCO) and reentered a position in Amphenol (APH) due to solid business fundamentals and attractive valuations for those companies. We sold our position in General Mills (GIS) as part of ongoing efforts to upgrade the overall quality of the Fund. A brief synopsis of the changes follows.
Founded over 150 years ago, Marsh McLennan is a leading professional services firm, offering its clients advice and solutions in areas of risk, strategy, and people. Marsh McLennan operates four distinct businesses in two segments, Risk & Insurance Services (RIS, 60% of sales) and Consulting (40% of sales).
Within RIS, Marsh McLennan (50% of sales) is the premier insurance broker, and Guy Carpenter (10% of sales) is tied as the leading global reinsurance broker. Within Consulting, Mercer (28% of sales) is the leading health & benefits broker, the number one retirement advisor, and the leading Outsourced Chief Investment Officer (OCIO), while Oliver Wyman (12% of sales) is a leading strategy consultant.
Across its range of businesses, economies of scale and switching costs represent the company’s two main competitive advantages. For example, in insurance brokerage, Marsh McLennan is one of only two companies with the global scale necessary to effectively serve Fortune 1000 multinational clients with its local operations established across more than 130 countries. Insurance brokers also benefit from high customer switching costs due to the combination of in-depth client knowledge and their role as independent fiduciaries in matching risk exposures with insurance coverages. In consulting, Mercer clients include over 95% of Fortune 500 companies, a testament to its strong brand and leadership position in health, wealth, and career advice and solutions.
Annual Report | The Jensen Quality Growth Fund Inc. | 3 |
Marsh McLennan’s revenue model, primarily consisting of sales commissions for brokerage services and advisory fees for consulting services, is a critical component of our investment thesis. Unlike insurers, brokers do not take underwriting risk, resulting in a much less volatile organic growth profile relative to insurance pricing cycles and minimal capital intensity. Consequently, Marsh McLennan’s business model has attractive characteristics, including low capital intensity, good margins at scale, and high recurring revenues due to sticky advisory relationships and annual policy renewals.
We expect Marsh McLennan to continue to grow through a combination of organic growth arising from strong underlying demand for its brokerage and consulting services, together with opportunistic and accretive bolt-on acquisitions to expand its service offerings and geographic footprint.
The investment case for Amphenol is largely unchanged from that of our 2008 purchase, which was based on the company’s strong competitive position in the global market for interconnect and sensor products. These systems are used in a broad variety of end markets and applications, including mobile devices, information technology systems, automotive design, and industrial manufacturing. The products are typically critical components to end-product design, placing Amphenol in an advantageous position within the OEM (original equipment manufacturer) supply chain.
We expect Amphenol to grow and create business value due to end market growth and technological leadership. End market activity is boosted by secular growth drivers, including mobile device development, cloud computing, electronic vehicle manufacturing, and industrial automation. Amphenol’s manufacturing scale and reputation as a technology leader are also beneficial in end markets with shorter product cycles and product design lead times.
We previously exited the Fund’s holding in Amphenol due to elevated stock price valuation. However, due to an improved growth outlook, we now view the shares as attractively valued and are pleased to resume a stake in what we consider a quality growth business.
Founded in 1909, Moody’s Corporation is a global risk assessment firm focused on helping clients make better decisions. The company is best known for its investor services business, where it is a global leader in the issuance of credit ratings. Moody’s also boasts a growing analytics business that provides credit opinions, private company information, and commercial real estate data. Moody’s is a geographically diverse company, deriving approximately 45% of its revenue outside the United States.
The investment case for Moody’s is based on its global dominance in credit ratings, high customer retention rates, and high degree of recurring revenue. In our view, Moody’s global scale and brand strength combined with the essential role of credit ratings for capital markets activity creates a powerful competitive advantage. The analytics business provides key information for increasingly prevalent “know-your-customer” requirements for banks and insurance companies, resulting in customer retention rates in excess of 90%.
4 | The Jensen Quality Growth Fund Inc. | Annual Report |
In our view, Moody’s demonstrates many of the quality growth attributes we favor, including competitive advantages, high returns on capital, and consistent free cash flow generation. We expect Moody’s to grow and create business value due to increasing capital markets activity and regulatory complexity.
As part of our disciplined investment process, we continually seek to improve the quality of our holdings. This involves liquidating companies when better investment opportunities arise. Such is the case with General Mills. Even though it competes in the relatively slow-growth packaged foods industry, we believe General Mills is a strong company with well-known brands, strong market positions, meaningful economies of scale versus its smaller competitors, and a sound strategy designed to drive sales growth and profitability over time. However, we believe that selling the position in General Mills to fund a new position in Moody’s Corporation enabled us to upgrade the Fund’s growth profile while maintaining an adequate margin of safety.
In addition to these changes, the Investment Team remained active in trimming positions seen as more fully valued or fundamentally challenged to reflect Jensen’s convictions in the businesses and relative valuation opportunities within the context of the ongoing economic and market volatility.
The Jensen Outlook
As investors, we are keenly aware of the global economic challenges facing companies as we look toward the rest of the year and beyond. Such challenges began impacting markets (and more speculative investments) early in 2022 and look unlikely to taper in the coming months. Domestic inflation is currently over 8% on an annualized basis, the highest rate in forty years. The Federal Reserve has raised the fed funds interest rate twice this year-to-date as of May 31, 2022, totaling 75 bps, and has communicated that several additional increases are likely during the remainder of 2022 and into next year. The domestic job market remains very tight, driving wage costs higher, thus impacting company margins and cash flows. Commodity and energy prices are at much higher levels than those seen in recent years, spurred by demand but also by crimped supply because of the Russian invasion of Ukraine and sanctions on the Russian economy. These higher prices are also pressuring company margins.
Looking forward, the United States has midterm elections in the fall—historically a cause of volatility regardless of the economic environment, and this year looks likely to follow this historical pattern. Uncertainty has increased, and as investors know, uncertainty makes for volatile markets. As a result of the aforementioned challenges, we are, unsurprisingly, maintaining a more cautious outlook for market returns in the shorter term.
As active, high-conviction equity investors, we cannot control the level of inflation, the pace or direction of interest rate changes, or the volatility in energy and commodity markets, not to mention elections and geopolitical events. What we can do is what we have done for more than three decades: focus on a unique collection of high-quality businesses that have historically provided durable competitive advantages, balance sheet strength, and free cash flow consistency that our experience indicates could provide a framework for resilience and long-term growth regardless of the economic environment.
Annual Report | The Jensen Quality Growth Fund Inc. | 5 |
It should be noted that positives remain, notwithstanding the difficulties noted earlier, such as relatively healthy household balance sheets in developed economies; plentiful job opportunities alongside low unemployment, making for stronger wage growth; and continued consumer demand driving economic activity, albeit tempered recently due to inflationary pressures.
The quality businesses we favor face the same pressures as many other companies. To us, the difference is their foundations of strength that provided pricing power to offset rising costs, strong growth in cash flow that muted the impact of higher interest rates, and competitive profiles that has kept their products and services in high demand with customers.
We believe that the underpinnings for long-term stock returns include earnings and cash flow growth. Here, too, pressure is causing uncertainty as earnings growth for S&P 500 Index companies is currently forecast to slow meaningfully in 2022, from some 70% in 2021 to approximately 7.5% in 2022. The difficult year-over-year comparisons for 2022 earnings may prove challenging and result in further downward revisions for the rest of the year, as much of the future guidance may not yet reflect the ongoing impact of rising costs on many businesses.
As noted earlier, in reaction to higher inflation, the U.S. Federal Reserve has commenced its long-expected reduction of fiscal stimulus and raising the fed funds rate, beginning with a 25 bps increase in March. The Fed has stated that several additional increases are likely throughout this year and 2023, which will likely produce additional pressure on companies and their business performance in the coming quarters.
Clearly, investors have much to consider, and it appears very unlikely that 2022 will see a repeat of the strong market returns of the last few years. At Jensen, we believe uncertainty and the volatility this can cause in the economy and the stock markets can provide opportunities for higher-quality, more resilient businesses to garner favor from investors who are seeking lower volatility in the face of the many issues noted above.
We believe the fiscal stimulus and low interest rate environment over the last decade has made investors less discriminating when it comes to investing in stocks of public companies. Now that the accommodative support is in the rearview mirror, investors are facing a less certain environment and are searching for new ways to generate positive returns. The current concerns regarding inflation and rising rates and the like are justified. However, timing market swings due to uncertainties is difficult and can be detrimental to capital appreciation and preservation, creating additional stress and risk for investors. We continue to believe that paying attention to company fundamentals can help investors manage risk. This should offer a measure of capital preservation in more volatile or generally lower market return environments and provide the opportunity for long-term capital appreciation.
6 | The Jensen Quality Growth Fund Inc. | Annual Report |
While the companies in our strategies are not immune from economic stresses, the durability of their competitive advantages provides consistency in their business performance. Additionally, we believe those advantages provide pricing power that can mitigate inflationary headwinds. Likewise, the substantial cash on their balance sheets together with ongoing cash flow generated by their business models provides the financial robustness to manage higher interest rates while continuing to invest in organic business growth initiatives, make strategic acquisitions, and provide shorter-term shareholder returns in the form of dividends and share buybacks. In our opinion, these solid foundational business characteristics are a sound way to offset volatility and provide a less stressful investment alternative to the inevitable risk-taking that often happens in lower market return environments.
At Jensen, we remain focused on the long term, investing in individual companies we deem to be of highest quality as evidenced by strong and durable business characteristics. Our research prizes dominant competitive advantages, balance sheet strength, and free cash flow consistency, and provides a framework to understand the companies in which we invest. Our decision-making is driven by this critical bottom-up fundamental business analysis. Our goal has been, and remains, to produce strong long-term capital appreciation while seeking to minimize the risk of permanent loss of capital. Such an approach may not always be in favor with investors, particularly in high market return environments where volatility is low.
Now that uncertainties are higher than they’ve been for many years and markets are contracting, the temptation to sell stocks is perhaps heightened. However, we believe that equities can potentially continue to provide attractive risk-adjusted performance and that a focus on quality can help manage risk. We recognize that investing involves risk, and while history is no guarantee, we believe our constant focus on the construction of an active, high-conviction collection of companies with sound business fundamentals and attractive valuations can provide our clients with the investing outcomes they seek and help them achieve their financial goals. The ride may be bumpy, yet the destination remains attractive, in our minds.
We are tremendously grateful for the ongoing support of our firm and investment strategies from our shareholders, partners, and clients, and we trust that we will continue to deliver the results you expect of us.
We invite you to seek additional information about the Jensen Quality Growth Fund at www.jenseninvestment.com where additional content, including updated holdings and performance information, is available. We take our investment responsibilities seriously and appreciate the trust you have placed in us. As always, we welcome your feedback.
Sincerely,
The Jensen Quality Growth Investment Team
Annual Report | The Jensen Quality Growth Fund Inc. | 7 |
This discussion and analysis of the Fund is as of May 2022 and is subject to change, and any forecasts made cannot be guaranteed. Past performance is no guarantee of future results. Fund holdings and sector weightings are subject to change and are not recommendations to buy or sell any security. The S&P 500 Stock Index is an unmanaged but commonly used measure of common stock total return performance. One cannot invest directly in an index. For more complete information regarding performance and holdings, please refer to the financial statements and schedule of investments headings of this report. Current and future portfolio holdings are subject to risk. Mutual Fund investing involves risk, and principal loss is possible. The Fund is nondiversified, meaning that it may concentrate its assets in fewer individual holdings than a diversified fund and is therefore more exposed to individual stock volatility than a diversified fund. The prices of growth stocks may be sensitive to changes in current or expected earnings, may experience larger price swings and may be out of favor with investors at different periods of time. S&P Earnings and Dividend Rankings: (also known as “quality rankings”) S&P Earnings and Dividend Rankings score the financial quality of several thousand U.S. stocks from A+ through D with data going back to 1956. The company rankings are based on the most recent 10 years (40 quarters) of earnings and dividend data. The better the growth and stability of earnings and dividends, the higher the ranking. Basis Point: Is a value equaling one one-hundredth of a percent (1/100 of 1%). Margin of Safety: A principle of investing in which an investor only purchases securities when their market price is significantly below their intrinsic value. Return on Equity: Is equal to a company's after-tax earnings (excluding non-recurring items) divided by its average stockholder equity for the year. Free Cash Flow: Is equal to the cash from operations of a company less capital expenditures. For use only when preceded or accompanied by a current prospectus for the Fund. The Jensen Quality Growth Fund is distributed by Quasar Distributors, LLC. |
8 | The Jensen Quality Growth Fund Inc. | Annual Report |
Jensen Quality Growth Fund Inc. - Class J (Unaudited)

Average Annual Returns – For year ended May 31, 2022 | 1 year | 3 years | 5 years | 10 years |
Jensen Quality Growth Fund - Class J | 2.92% | 15.63% | 14.03% | 14.77% |
S&P 500 Stock Index | -0.30% | 16.44% | 13.38% | 14.40% |
The S&P 500 Stock Index is an unmanaged but commonly used measure of common stock total return performance. This chart assumes an initial gross investment of $10,000 made on May 31, 2012 for Class J. Returns shown include the reinvestment of all dividends. Returns shown do not reflect the deduction of taxes that a shareholder would pay on fund distributions or the redemption of fund shares.
Performance data shown represents past performance; Past performance does not guarantee future results. The investment return and principal value of an investment will fluctuate so that an investor’s shares, when redeemed, may be worth more or less than their original cost. Current performance of the fund may be lower or higher than the performance shown. Performance data current to the most recent month end may be obtained by calling 1-800-992-4144 or by visiting www.jenseninvestment.com.
Annual Report | The Jensen Quality Growth Fund Inc. | 9 |
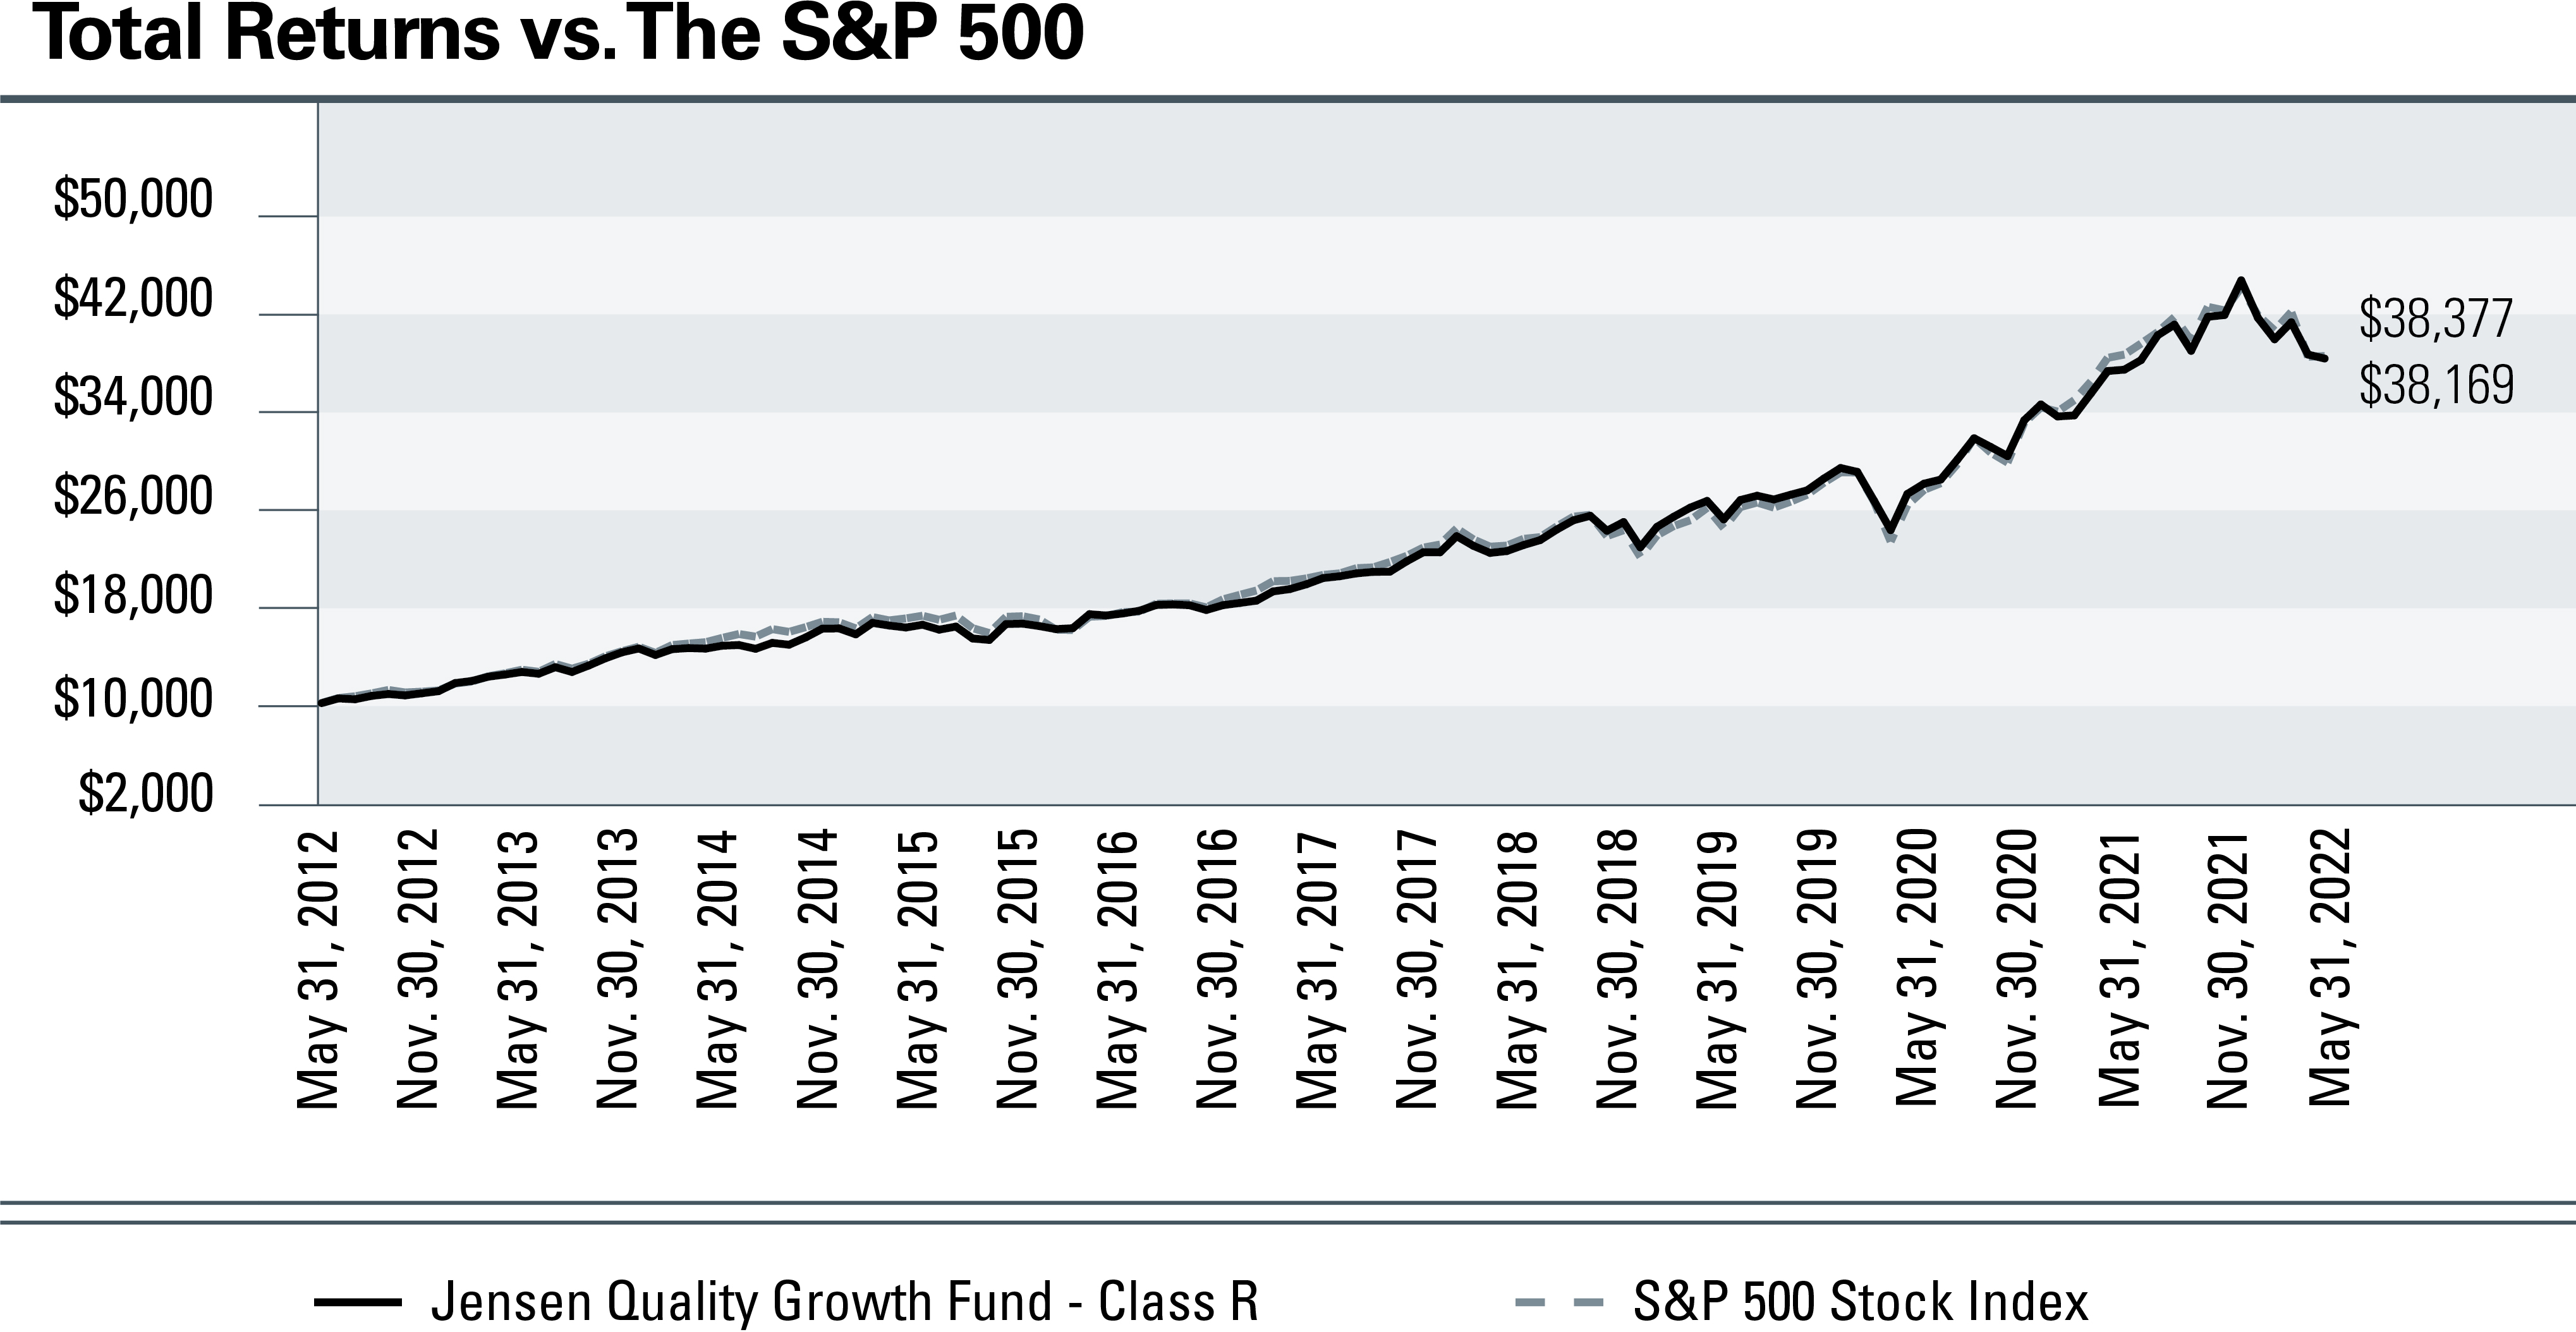
Jensen Quality Growth Fund Inc. - Class R (Unaudited)
Average Annual Returns – For year ended May 31, 2022 | 1 year | 3 years | 5 years | 10 years |
Jensen Quality Growth Fund - Class R | 2.44% | 15.12% | 13.55% | 14.33% |
S&P 500 Stock Index | -0.30% | 16.44% | 13.38% | 14.40% |
The S&P 500 Stock Index is an unmanaged but commonly used measure of common stock total return performance. This chart assumes an initial gross investment of $10,000 made on May 31, 2012 for Class R. Returns shown include the reinvestment of all dividends. Returns shown do not reflect the deduction of taxes that a shareholder would pay on fund distributions or the redemption of fund shares.
Performance data shown represents past performance; Past performance does not guarantee future results. The investment return and principal value of an investment will fluctuate so that an investor’s shares, when redeemed, may be worth more or less than their original cost. Current performance of the fund may be lower or higher than the performance shown. Performance data current to the most recent month end may be obtained by calling 1-800-992-4144 or by visiting www.jenseninvestment.com.
10 | The Jensen Quality Growth Fund Inc. | Annual Report |
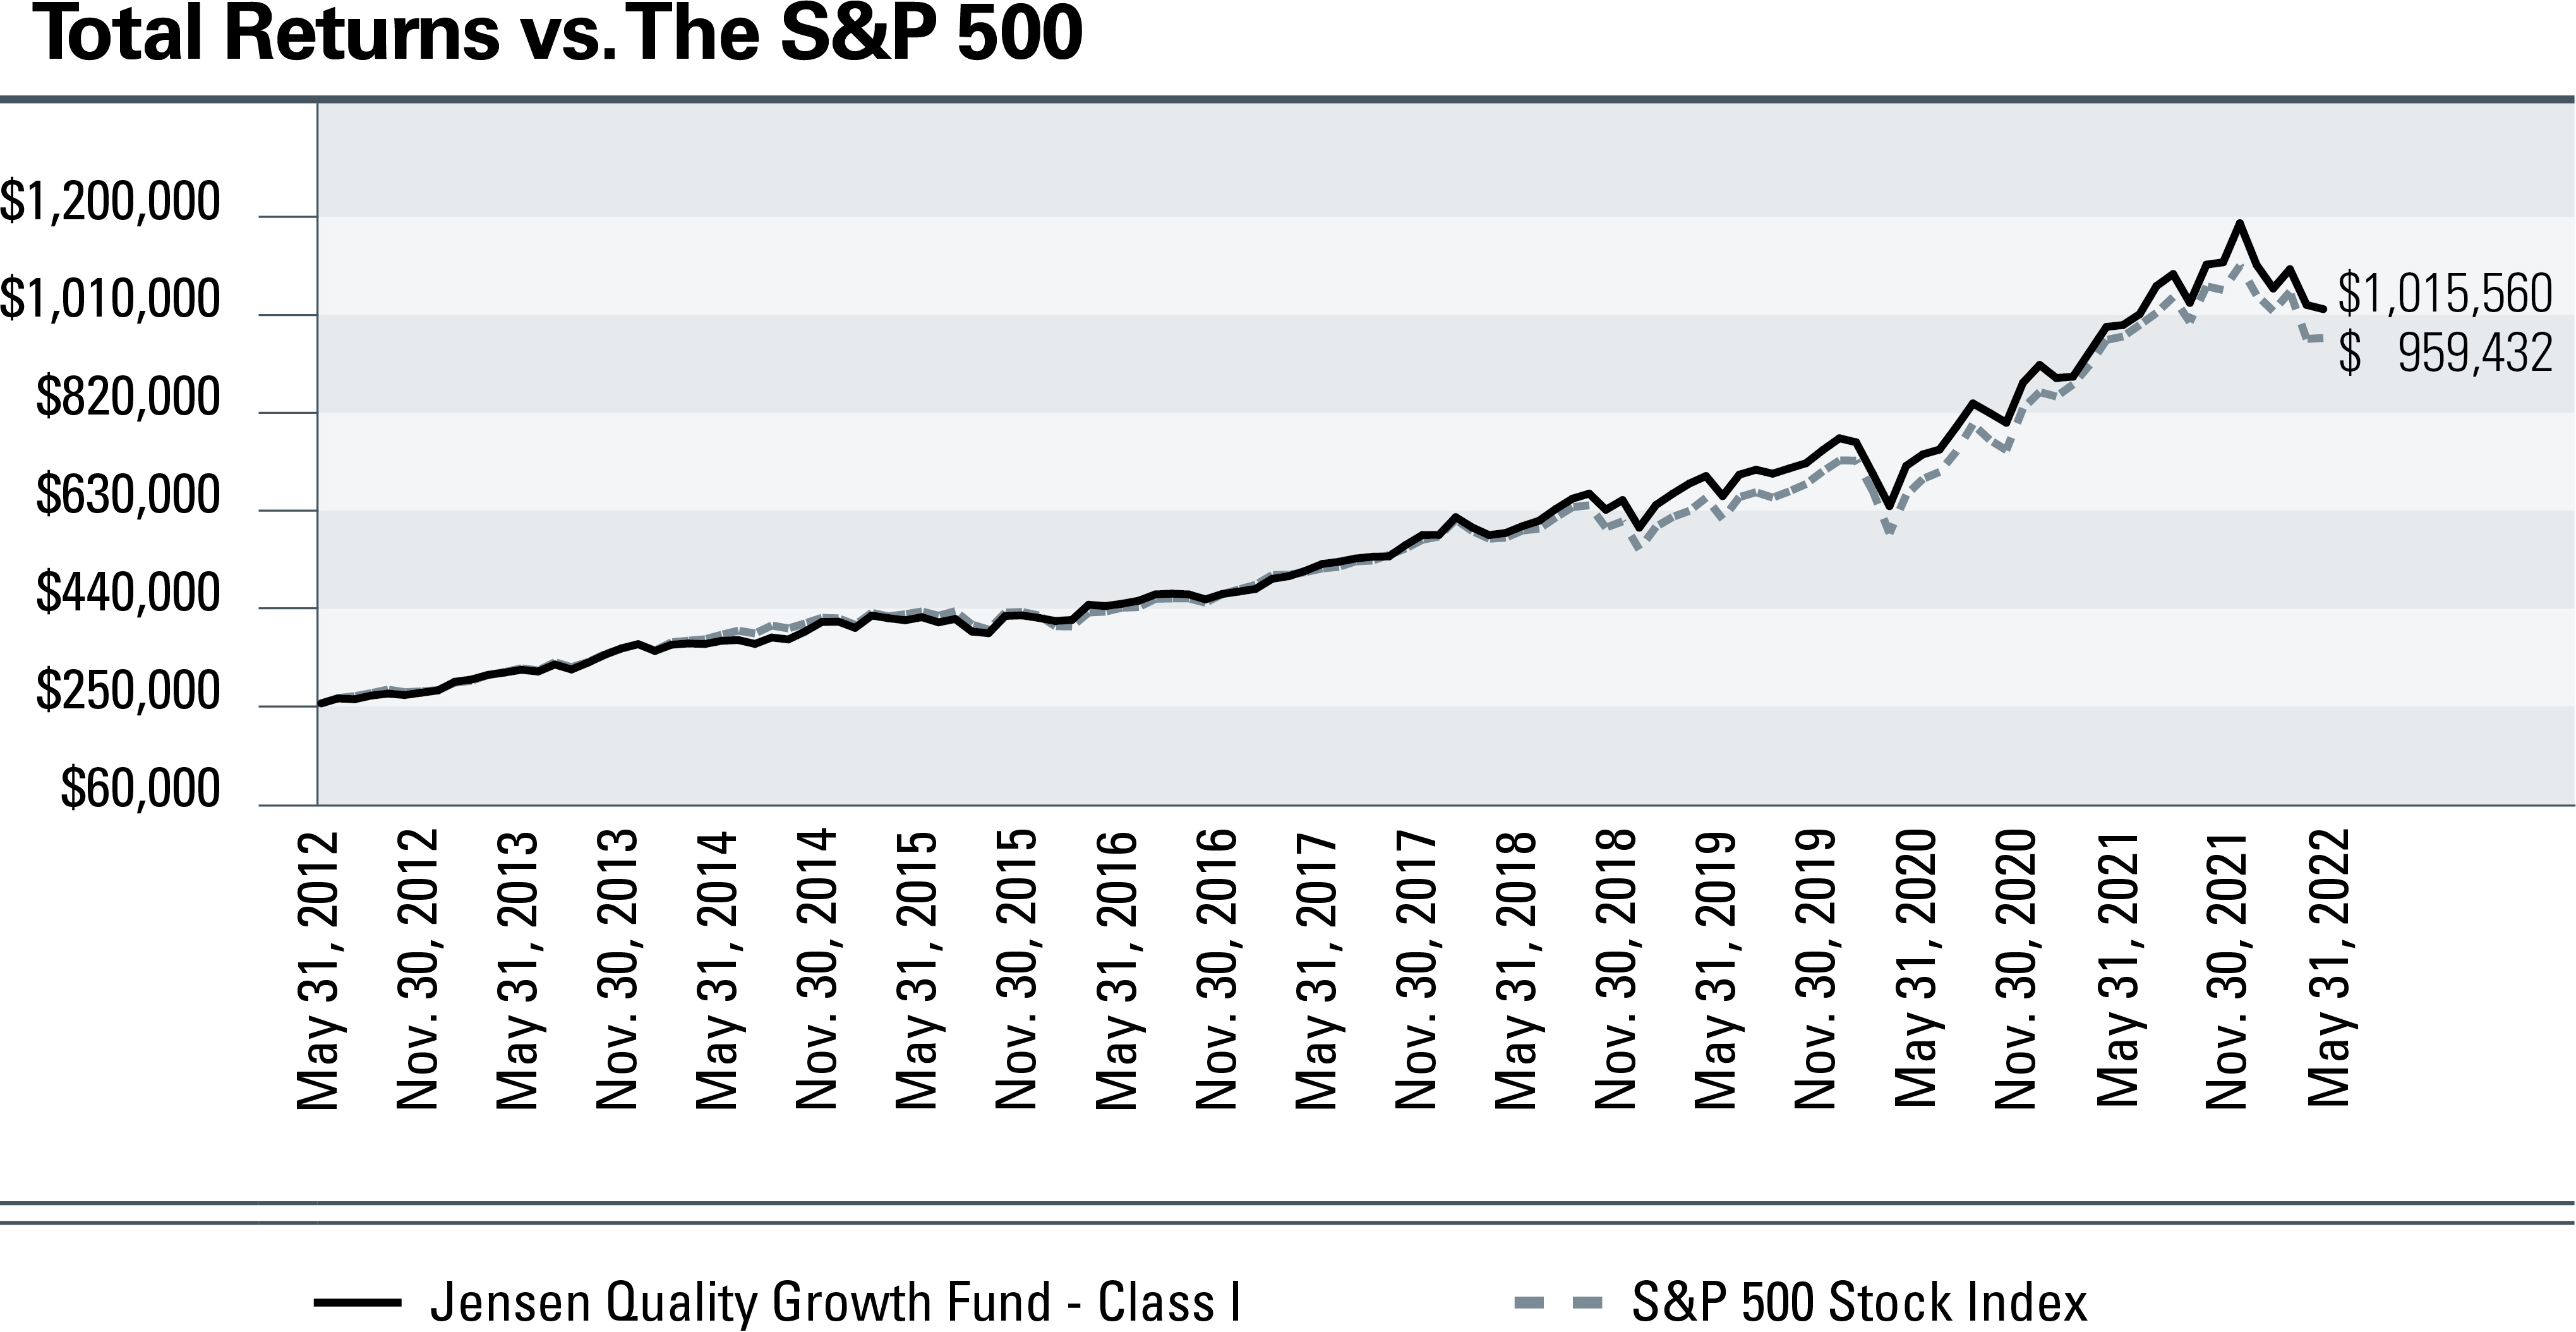
Jensen Quality Growth Fund Inc. - Class I (Unaudited)
Average Annual Returns – For year ended May 31, 2022 | 1 year | 3 years | 5 years | 10 years |
Jensen Quality Growth Fund - Class I | 3.14% | 15.89% | 14.29% | 15.05% |
S&P 500 Stock Index | -0.30% | 16.44% | 13.38% | 14.40% |
The S&P 500 Stock Index is an unmanaged but commonly used measure of common stock total return performance. This chart assumes an initial gross investment of $250,000 made on May 31, 2012 for Class I. Returns shown include the reinvestment of all dividends. Returns shown do not reflect the deduction of taxes that a shareholder would pay on fund distributions or the redemption of fund shares.
Performance data shown represents past performance; Past performance does not guarantee future results. The investment return and principal value of an investment will fluctuate so that an investor’s shares, when redeemed, may be worth more or less than their original cost. Current performance of the fund may be lower or higher than the performance shown. Performance data current to the most recent month end may be obtained by calling 1-800-992-4144 or by visiting www.jenseninvestment.com.
Annual Report | The Jensen Quality Growth Fund Inc. | 11 |
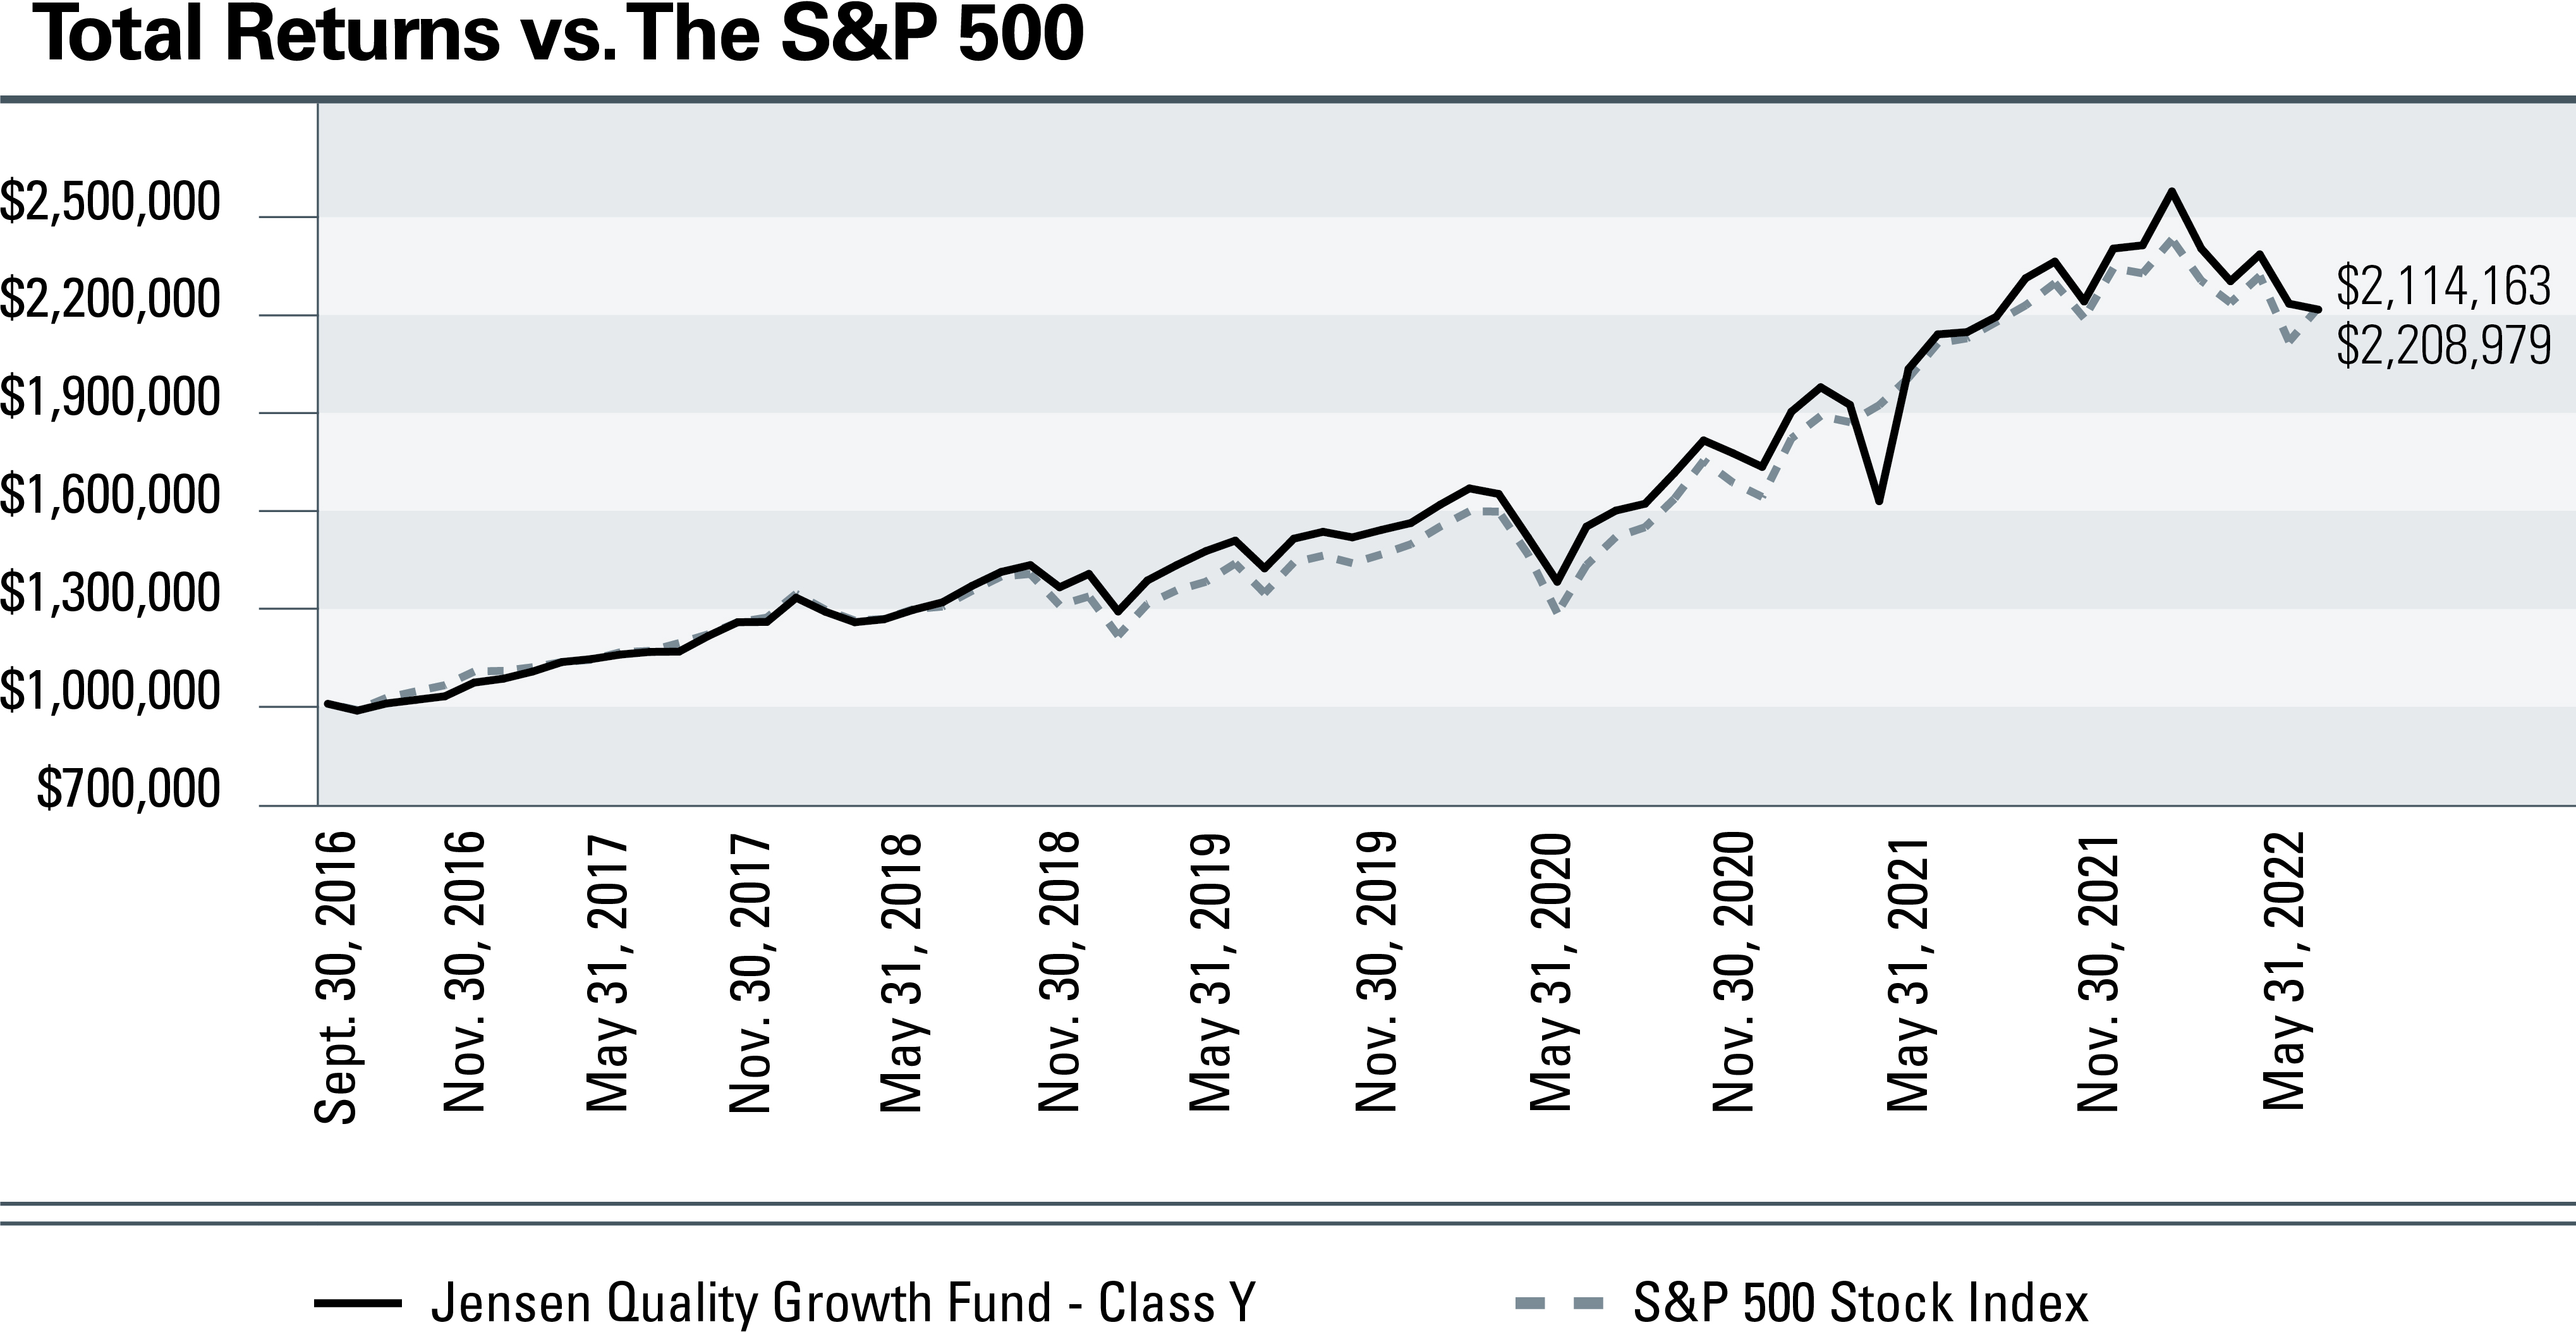
Jensen Quality Growth Fund Inc. - Class Y (Unaudited)
Total Returns – For periods ended May 31, 2022 | 1 Year | 3 Year | 5 Year | Since Inception |
Jensen Quality Growth Fund - Class Y | 3.23% | 15.98% | 14.38% | 15.01% |
S&P 500 Stock Index | -0.30% | 16.44% | 13.38% | 14.13% |
The S&P 500 Stock Index is an unmanaged but commonly used measure of common stock total return performance. This chart assumes an initial gross investment of $1,000,000 made on September 30, 2016 (commencement of operations for Class Y). Returns shown include the reinvestment of all dividends. Returns shown do not reflect the deduction of taxes that a shareholder would pay on fund distributions or the redemption of fund shares.
Performance data shown represents past performance; Past performance does not guarantee future results. The investment return and principal value of an investment will fluctuate so that an investor’s shares, when redeemed, may be worth more or less than their original cost. Current performance of the fund may be lower or higher than the performance shown. Performance data current to the most recent month end may be obtained by calling 1-800-992-4144 or by visiting www.jenseninvestment.com.
12 | The Jensen Quality Growth Fund Inc. | Annual Report |
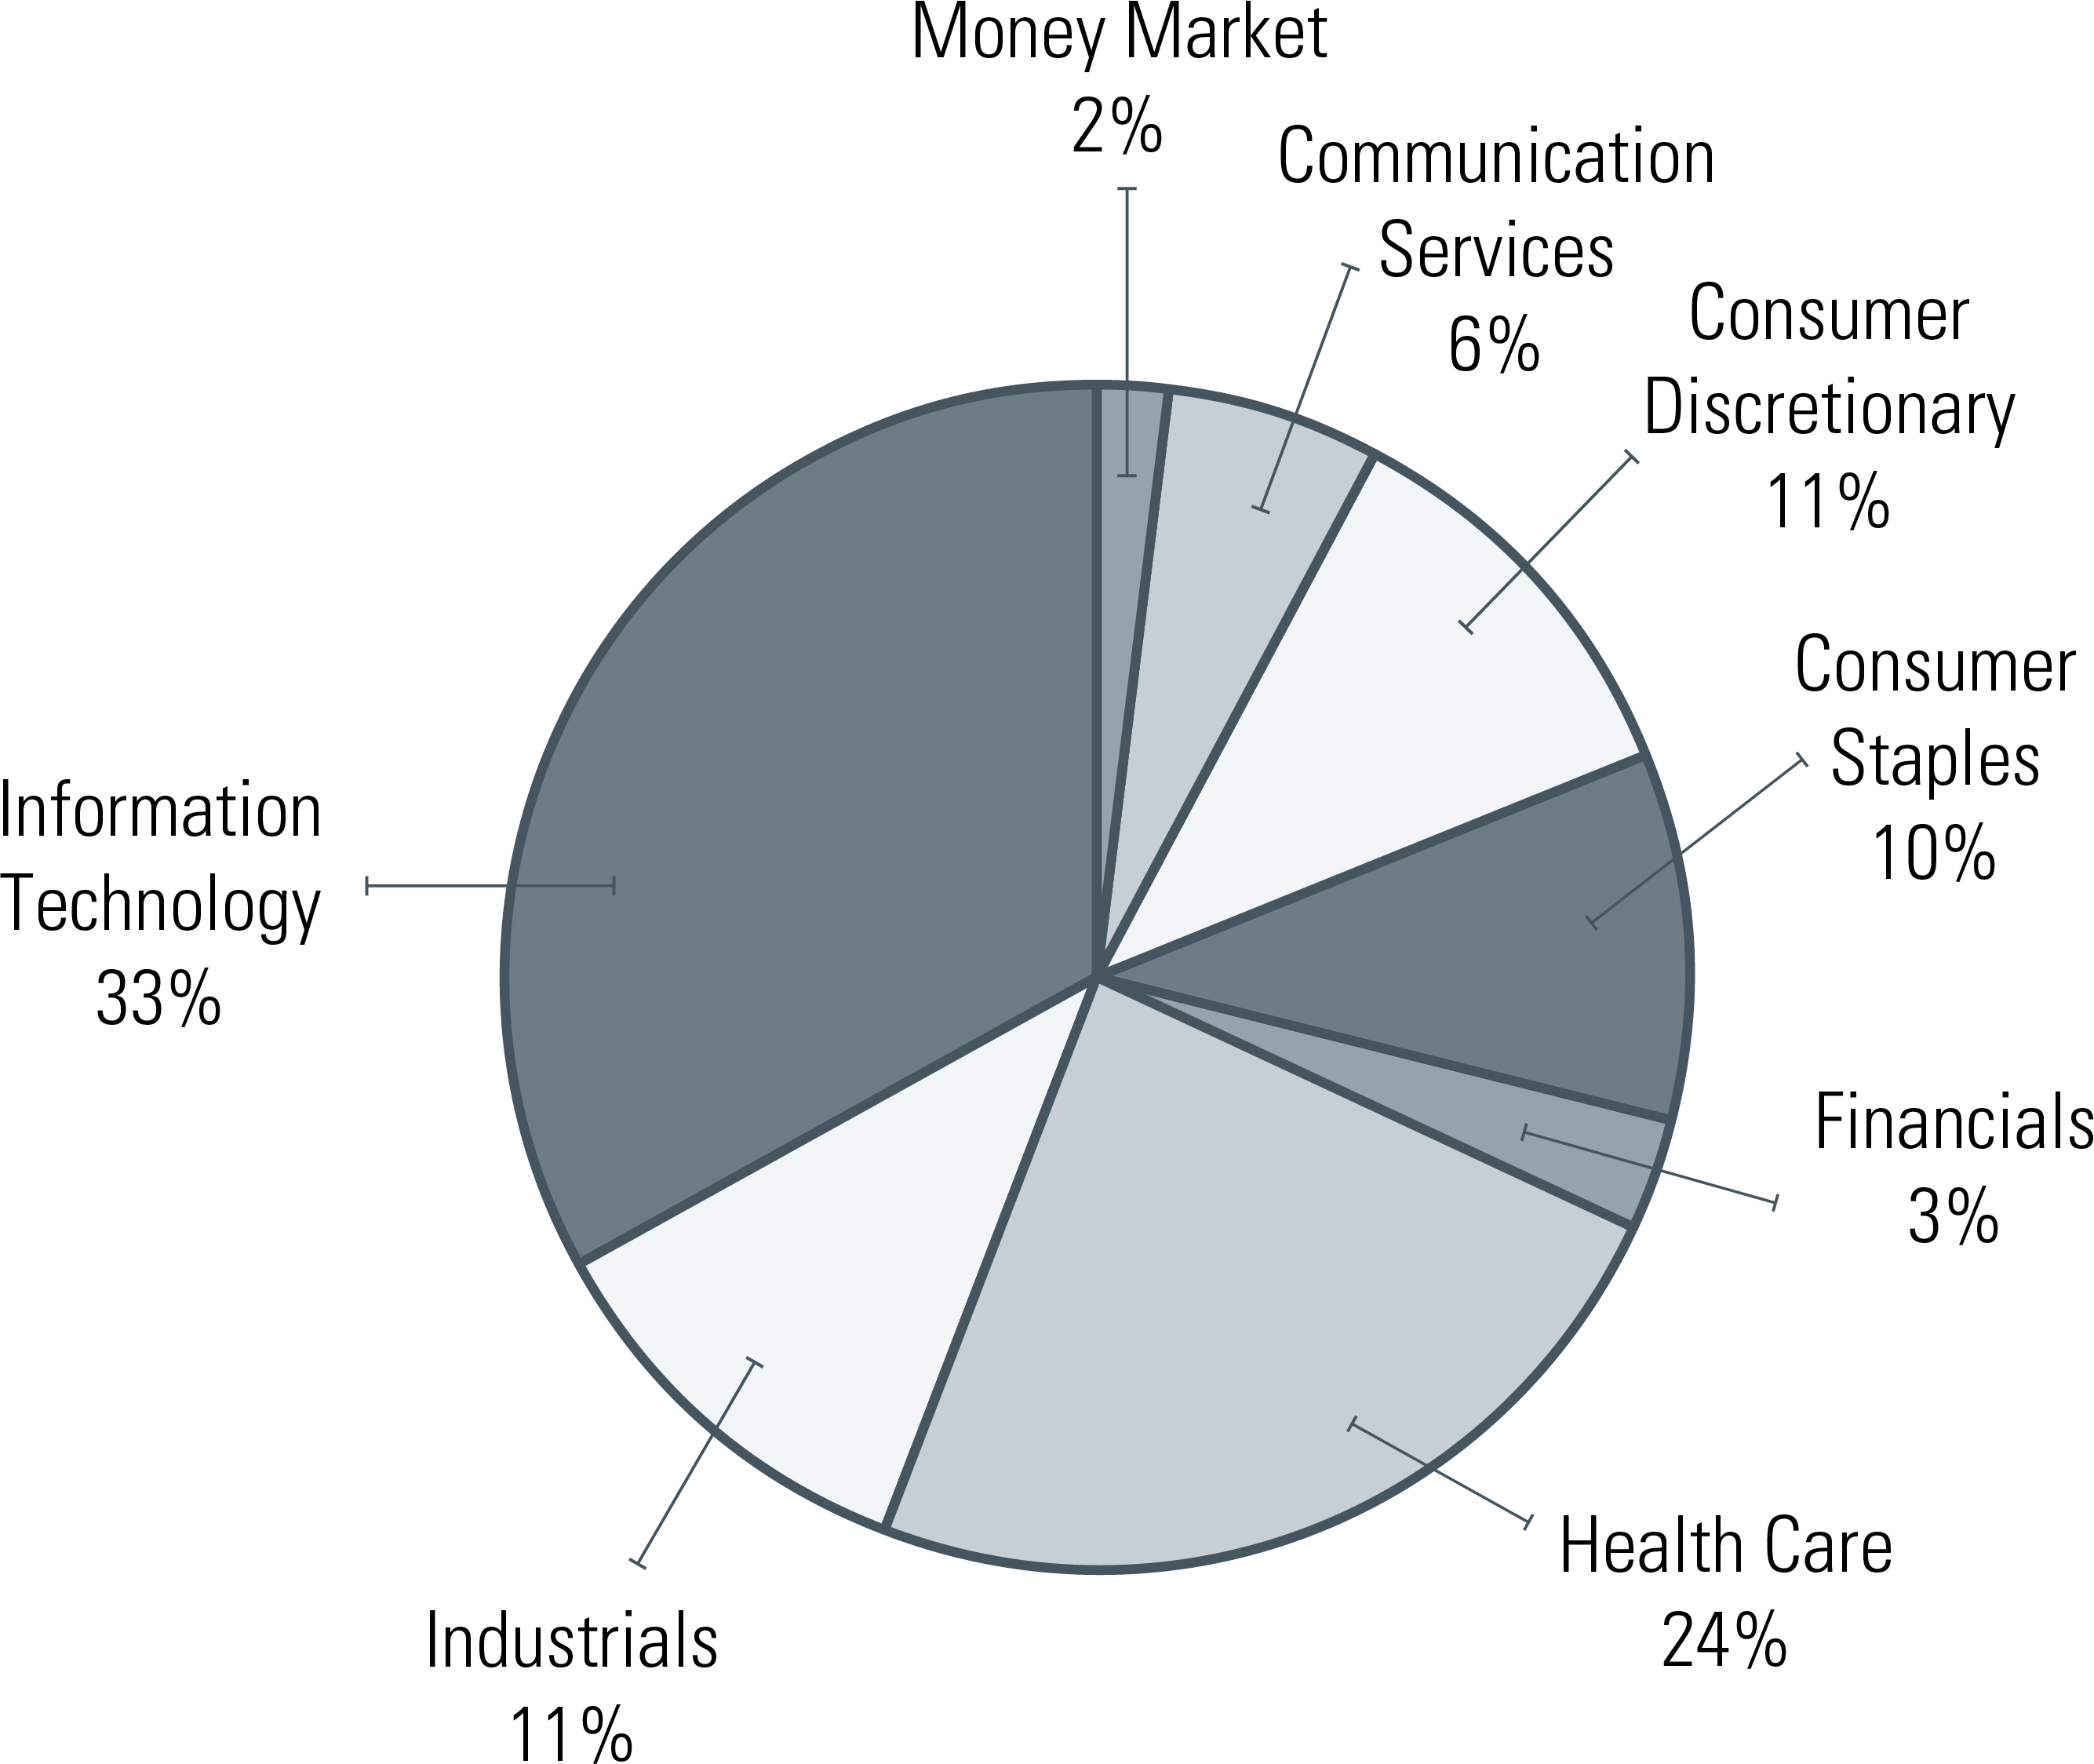
Investments by Sector as of May 31, 2022
(as a Percentage of Total Investments) (Unaudited)
The Global Industry Classification Standard (GICS®) was developed by and/or is the exclusive property of MSCI, Inc. and
Standard & Poor’s Financial Services LLC (“S&P”). GICS is a service mark of MSCI and S&P and has been licensed for use by
U.S. Bancorp Fund Services, LLC doing business as U.S. Bank Global Fund Services.
Annual Report | The Jensen Quality Growth Fund Inc. | 13 |
Statement of Assets & Liabilities
As of May 31, 2022
Assets: | |
Investment, at value (cost $5,562,380,747) | $9,976,245,232 |
Dividend and interest income receivable | 15,340,268 |
Receivable for capital stock issued | 12,756,370 |
Other assets | 227,304 |
Total assets | $10,004,569,174 |
Liabilities: | |
Payable to Investment Adviser | $4,108,082 |
Payable for capital stock redeemed | 6,171,514 |
Accrued distribution fees | 925,390 |
Accrued director fees | 100,953 |
Accrued expenses and other liabilities | 1,499,250 |
Total liabilities | 12,805,189 |
Total Net Assets | $9,991,763,985 |
Net Assets Consist of: | |
Capital stock | $5,355,598,044 |
Total distributable earnings | 4,636,165,941 |
Total Net Assets | $9,991,763,985 |
Net Assets Consist of: | |
Class J Shares | |
Net Assets | $2,455,145,959 |
Shares outstanding | 42,432,979 |
Net Asset Value - Offering Price and Redemption Price Per Share (2,000,000,000 shares authorized) | $57.86 |
Class R Shares | |
Net Assets | $17,801,066 |
Shares outstanding | 309,620 |
Net Asset Value - Offering Price and Redemption Price Per Share (1,000,000,000 shares authorized) | $57.49 |
Class I Shares | |
Net Assets | $4,762,505,190 |
Shares outstanding | 82,369,369 |
Net Asset Value - Offering Price and Redemption Price Per Share (1,000,000,000 shares authorized) | $57.82 |
Class Y Shares | |
Net Assets | $2,756,311,770 |
Shares outstanding | 47,672,438 |
Net Asset Value - Offering Price and Redemption Price Per Share (1,000,000,000 shares authorized) | $57.82 |
The accompanying notes are an integral part of these financial statements.
14 | The Jensen Quality Growth Fund Inc. | Annual Report |
Schedule of Investments
May 31, 2022 (showing percentage of total net assets)
Common Stocks - 97.68%
shares | Air Freight & Logistics - 1.80% | value |
986,000 | United Parcel Service, Inc. - Class B | $179,698,500 |
shares | Beverages - 6.81% | value |
4,057,000 | PepsiCo, Inc. | $680,561,750 |
shares | Commercial Services & Supplies - 2.11% | value |
1,332,000 | Waste Management, Inc. | $211,135,320 |
shares | Diversified Financial Services - 1.27% | value |
422,000 | Moody's Corporation | $127,262,540 |
shares | Electronic Equipment, Instruments & Components - 0.98% | value |
1,377,000 | Amphenol Corporation - Class A | $97,574,220 |
shares | Health Care Equipment & Supplies - 8.87% | value |
1,673,000 | Becton Dickinson and Company | $427,953,400 |
1,955,000 | Stryker Corporation | $458,447,500 |
| $886,400,900 | |
shares | Health Care Providers & Services - 4.73% | value |
952,000 | UnitedHealth Group, Inc. | $472,934,560 |
shares | Hotels, Restaurants & Leisure - 2.72% | value |
3,462,000 | Starbucks Corporation | $271,767,000 |
shares | Household Products - 2.76% | value |
1,863,000 | The Procter & Gamble Company | $275,500,440 |
shares | Industrial Conglomerates - 3.93% | value |
2,631,600 | 3M Company | $392,871,564 |
shares | Insurance - 2.11% | value |
1,320,000 | Marsh & McLennan Companies, Inc. | $211,134,000 |
The accompanying footnotes are an integral part of the Financial Statements.
Annual Report | The Jensen Quality Growth Fund Inc. | 15 |
Schedule of Investments continued
May 31, 2022 (showing percentage of total net assets)
shares | Interactive Media & Services - 6.06% | value |
266,000 | Alphabet, Inc. - Class A (a) | $605,213,840 |
shares | IT Services - 15.91% | value |
1,398,000 | Accenture PLC - Class A (b) | $417,247,080 |
1,732,000 | Automatic Data Processing, Inc. | $386,132,080 |
1,354,000 | Broadridge Financial Solutions, Inc. | $197,981,880 |
4,005,000 | Cognizant Technology Solutions Corporation - Class A | $299,173,500 |
807,000 | Mastercard, Inc. - Class A | $288,801,090 |
| $1,589,335,630 | |
shares | Pharmaceuticals - 9.81% | value |
3,075,000 | Johnson & Johnson | $552,054,750 |
8,074,000 | Pfizer, Inc. | $428,244,960 |
| $980,299,710 | |
shares | Professional Services - 2.99% | value |
967,000 | Equifax, Inc. | $195,894,860 |
585,000 | Verisk Analytics, Inc. | $102,328,200 |
| $298,223,060 | |
shares | Semiconductors & Semiconductor Equipment - 2.54% | value |
1,436,000 | Texas Instruments, Inc. | $253,827,360 |
shares | Software - 8.99% | value |
657,000 | Intuit, Inc. | $272,300,220 |
2,301,000 | Microsoft Corporation | $625,572,870 |
| $897,873,090 | |
shares | Specialty Retail - 4.36% | value |
722,000 | The Home Depot, Inc. | $218,585,500 |
3,412,600 | The TJX Companies, Inc. | $216,938,982 |
| $435,524,482 | |
The accompanying footnotes are an integral part of the Financial Statements.
16 | The Jensen Quality Growth Fund Inc. | Annual Report |
Schedule of Investments continued
May 31, 2022 (showing percentage of total net assets)
shares | Technology Hardware, Storage & Peripherals - 4.88% | value |
3,277,000 | Apple, Inc. | $487,748,680 |
shares | Textiles, Apparel & Luxury Goods - 4.05% | value |
3,407,000 | NIKE, Inc. - Class B | $404,921,950 |
Total Common Stocks | value |
(Cost $5,345,944,111) | $9,759,808,596 |
Short-Term Investment - 2.17%
shares | Money Market Fund - 2.17% | value |
216,436,636 | First American Treasury Obligations Fund - Class X, 0.699% (c) | $216,436,636 |
Total Short-Term Investment | value |
(Cost $216,436,636) | $216,436,636 |
Total Investments | value |
(Cost $5,562,380,747) - 99.85% | $9,976,245,232 |
Other Assets in Excess of Liabilities - 0.15% | $15,518,753 |
TOTAL NET ASSETS - 100.00% | $9,991,763,985 |
Percentages are stated as a percent of net assets.
PLC - Public Limited Company | |
(a) | Non-income producing security. |
(b) | Foreign issued security. Foreign concentration (including ADRs) was as follows: Ireland 4.18% as a percentage of net assets. |
(c) | Variable rate security. Rate listed is the 7-day effective yield as of May 31, 2022. |
The accompanying footnotes are an integral part of the Financial Statements.
Annual Report | The Jensen Quality Growth Fund Inc. | 17 |
Statement of Operations
Year Ended May 31, 2022
Investment Income: | |
Dividend income | $156,418,215 |
Interest income | 163,810 |
Total investment income | 156,582,025 |
Expenses: | |
Investment advisory fees | 50,101,016 |
12b-1 fees - Class J | 6,585,115 |
Shareholder servicing fees - Class I | 3,813,318 |
Administration fees | 1,604,883 |
Sub-transfer agent expenses - Class J | 1,033,776 |
Fund Accounting fees | 564,208 |
Transfer agent fees - Class I | 417,779 |
Directors' fees and expenses | 343,766 |
Reports to shareholders - Class I | 275,968 |
Transfer agent expenses | 273,362 |
Custody fees | 266,681 |
Federal and state registration fees | 242,566 |
Other | 190,604 |
Professional fees | 140,266 |
12b-1 fees - Class R | 131,635 |
Reports to shareholders - Class Y | 129,422 |
Chief Compliance Officer Fees | 96,594 |
Reports to shareholders - Class J | 81,092 |
Transfer agent fees - Class J | 61,036 |
Shareholder servicing fees - Class R | 45,988 |
Transfer agent fees - Class R | 18,461 |
Transfer agent fees - Class Y | 17,795 |
Reports to shareholders - Class R | 1,264 |
Total expenses | 66,436,595 |
Net Investment Income | 90,145,430 |
Realized and Unrealized Gain(Loss) on Investments: | |
Net realized gain on investment transactions | 677,159,951 |
Change in unrealized appreciation/depreciation on investments | (430,638,092) |
Net realized and unrealized gain on investments | 246,521,859 |
Net Increase in Net Assets Resulting from Operations | $336,667,289 |
The accompanying notes are an integral part of these financial statements.
18 | The Jensen Quality Growth Fund Inc. | Annual Report |
Statements of Changes in Net Assets
Operations: | Year Ended | Year Ended |
Net investment income | $90,145,430 | $102,833,889 |
Net realized gain on investment transactions | 677,159,951 | 754,073,361 |
Change in unrealized appreciation/depreciation on investments | (430,638,092) | 1,973,675,055 |
Net increase in net assets resulting from operations | 336,667,289 | 2,830,582,305 |
Capital Share Transactions: |
|
|
Shares Sold - Class J | 401,280,727 | 154,063,153 |
Shares Sold - Class R | 5,985,161 | 3,286,762 |
Shares Sold - Class I | 1,322,729,183 | 961,148,978 |
Shares Sold - Class Y | 547,113,529 | 426,227,232 |
Shares issued in reinvestment of dividends - Class J | 174,216,986 | 241,204,504 |
Shares issued in reinvestment of dividends - Class R | 1,814,929 | 2,328,246 |
Shares issued in reinvestment of dividends - Class I | 323,174,881 | 443,377,575 |
Shares issued in reinvestment of dividends - Class Y | 159,101,621 | 196,499,842 |
Shares redeemed - Class J | (556,057,624) | (756,653,996) |
Shares redeemed - Class R | (15,452,425) | (8,158,234) |
Shares redeemed - Class I | (1,723,574,584) | (1,280,407,831) |
Shares redeemed - Class Y | (599,223,007) | (665,921,652) |
Net Increase (decrease) | 41,109,377 | (283,005,421) |
Dividends and Distributions to Shareholders: |
|
|
Net dividends and distributions to shareholders - Class J | (176,692,760) | (244,438,799) |
Net dividends and distributions to shareholders - Class R | (1,814,930) | (2,328,720) |
Net dividends and distributions to shareholders - Class I | (338,418,833) | (465,739,568) |
Net dividends and distributions to shareholders - Class Y | (203,889,816) | (255,336,769) |
Total dividends and distributions | (720,816,339) | (967,843,856) |
Increase (decrease) in Net Assets | (343,039,673) | 1,579,733,028 |
Net Assets: |
|
|
Beginning of Year | 10,334,803,658 | 8,755,070,630 |
End of Year | $9,991,763,985 | $10,334,803,658 |
The accompanying notes are an integral part of these financial statements.
Annual Report | The Jensen Quality Growth Fund Inc. | 19 |
Financial Highlights
Class J
Per Share Data: | year | year | year | year | year |
Net asset value, beginning of year | $60.00 | $49.46 | $47.79 | $47.87 | $43.44 |
Income from investment |
|
|
|
|
|
Net investment income(1) | 0.44 | 0.52 | 0.58 | 0.47 | 0.44 |
Net realized and unrealized gains on investments | 1.83 | 15.63 | 5.30 | 3.88 | 5.49 |
Total from investment operations | 2.27 | 16.15 | 5.88 | 4.35 | 5.93 |
Less distributions: |
|
|
|
|
|
Dividends from net investment income | (0.40) | (0.52) | (0.54) | (0.46) | (0.41) |
Distributions from capital gains | (4.01) | (5.09) | (3.67) | (3.97) | (1.09) |
Total distributions | $(4.41) | $(5.61) | $(4.21) | $(4.43) | $(1.50) |
Net asset value, end of year | $57.86 | $60.00 | $49.46 | $47.79 | $47.87 |
Total return | 2.92% | 33.95% | 12.15% | 9.58% | 13.77% |
Supplemental data and ratios: |
|
|
|
|
|
Net assets, end of year(000’s) | $2,455,146 | $2,549,594 | $2,422,553 | $2,700,303 | $2,594,126 |
Ratio of expenses to average net assets | 0.81% | 0.82% | 0.84% | 0.86% | 0.87% |
Ratio of net investment income to average net assets | 0.69% | 0.89% | 1.11% | 0.97% | 0.92% |
Portfolio turnover rate | 10.87% | 12.33% | 23.38% | 17.50% | 9.06% |
| (1) | Net investment income per share is calculated using the ending accumulated net investment income balances prior to consideration or adjustments for permanent book-to-tax differences. |
The accompanying notes are an integral part of these financial statements.
20 | The Jensen Quality Growth Fund Inc. | Annual Report |
Financial Highlights
Class R
Per Share Data: | year | year | year | year | year |
Net asset value, beginning of year | $59.66 | $49.18 | $47.53 | $47.62 | $43.23 |
Income from investment |
|
|
|
|
|
Net investment income(1) | 0.16 | 0.25 | 0.34 | 0.28 | 0.26 |
Net realized and unrealized gains on investments | 1.81 | 15.57 | 5.30 | 3.86 | 5.47 |
Total from investment operations | 1.97 | 15.82 | 5.64 | 4.14 | 5.73 |
Less distributions: |
|
|
|
|
|
Dividends from net investment income | (0.13) | (0.25) | (0.32) | (0.26) | (0.25) |
Distributions from capital gains | (4.01) | (5.09) | (3.67) | (3.97) | (1.09) |
Total distributions | $(4.14) | $(5.34) | $(3.99) | $(4.23) | $(1.34) |
Net asset value, end of year | $57.49 | $59.66 | $49.18 | $47.53 | $47.62 |
Total return | 2.44% | 33.36% | 11.66% | 9.17% | 13.34% |
Supplemental data and ratios: |
|
|
|
|
|
Net assets, end of year(000’s) | $17,801 | $26,380 | $23,995 | $28,197 | $31,597 |
Ratio of expenses to average net assets | 1.26% | 1.26% | 1.27% | 1.24% | 1.24% |
Ratio of net investment income to average net assets | 0.23% | 0.44% | 0.68% | 0.58% | 0.56% |
Portfolio turnover rate | 10.87% | 12.33% | 23.38% | 17.50% | 9.06% |
| (1) | Net investment income per share is calculated using the ending accumulated net investment income balances prior to consideration or adjustments for permanent book-to-tax differences. |
The accompanying notes are an integral part of these financial statements.
Annual Report | The Jensen Quality Growth Fund Inc. | 21 |
Financial Highlights
Class I
Per Share Data: | year | year | year | year | year |
Net asset value, beginning of year | $59.99 | $49.46 | $47.81 | $47.90 | $43.46 |
Income from investment |
|
|
|
|
|
Net investment income(1) | 0.57 | 0.61 | 0.66 | 0.60 | 0.55 |
Net realized and unrealized gains on investments | 1.84 | 15.65 | 5.34 | 3.87 | 5.51 |
Total from investment operations | 2.41 | 16.26 | 6.00 | 4.47 | 6.06 |
Less distributions: |
|
|
|
|
|
Dividends from net investment income | (0.57) | (0.64) | (0.68) | (0.59) | (0.53) |
Distributions from capital gains | (4.01) | (5.09) | (3.67) | (3.97) | (1.09) |
Total distributions | $(4.58) | $(5.73) | $(4.35) | $(4.56) | $(1.62) |
Net asset value, end of year | $57.82 | $59.99 | $49.46 | $47.81 | $47.90 |
Total return | 3.14% | 34.24% | 12.41% | 9.85% | 14.08% |
Supplemental data and ratios: |
|
|
|
|
|
Net assets, end of year(000’s) | $4,762,505 | $5,003,474 | $4,002,485 | $3,454,461 | $3,261,893 |
Ratio of expenses to average net assets | 0.61% | 0.61% | 0.60% | 0.61% | 0.62% |
Ratio of net investment income to average net assets | 0.89% | 1.10% | 1.37% | 1.22% | 1.18% |
Portfolio turnover rate | 10.87% | 12.33% | 23.38% | 17.50% | 9.06% |
| (1) | Net investment income per share is calculated using the ending accumulated net investment income balances prior to consideration or adjustments for permanent book-to-tax differences. |
The accompanying notes are an integral part of these financial statements.
22 | The Jensen Quality Growth Fund Inc. | Annual Report |
Financial Highlights
Class Y
Per Share Data: | year | year | year | year | year |
Net asset value, beginning of year | $59.98 | $49.46 | $47.80 | $47.90 | $43.46 |
Income from investment |
|
|
|
|
|
Net investment income(1) | 0.62 | 0.66 | 0.73 | 0.63 | 0.58 |
Net realized and unrealized gains on investments | 1.84 | 15.64 | 5.31 | 3.87 | 5.51 |
Total from investment operations | 2.46 | 16.30 | 6.04 | 4.50 | 6.09 |
Less distributions: |
|
|
|
|
|
Dividends from net investment income | (0.61) | (0.69) | (0.71) | (0.63) | (0.56) |
Distributions from capital gains | (4.01) | (5.09) | (3.67) | (3.97) | (1.09) |
Total distributions | $(4.62) | $(5.78) | $(4.38) | $(4.60) | $(1.65) |
Net asset value, end of year | $57.82 | $59.98 | $49.46 | $47.80 | $47.90 |
Total return | 3.23% | 34.34% | 12.51% | 9.90% | 14.16% |
Supplemental data and ratios: |
|
|
|
|
|
Net assets, end of year(000’s) | $2,756,312 | $2,755,356 | $2,306,038 | $916,705 | $536,621 |
Ratio of expenses to average net assets | 0.52% | 0.52% | 0.54% | 0.55% | 0.55% |
Ratio of net investment income to average net assets | 0.98% | 1.18% | 1.46% | 1.31% | 1.25% |
Portfolio turnover rate | 10.87% | 12.33% | 23.38% | 17.50% | 9.06% |
| (1) | Net investment income per share is calculated using the ending accumulated net investment income balances prior to consideration or adjustments for permanent book-to-tax differences. |
The accompanying notes are an integral part of these financial statements.
Annual Report | The Jensen Quality Growth Fund Inc. | 23 |
Notes to the Financial Statements
May 31, 2022
1. Organization and Significant Accounting Policies
The Jensen Quality Growth Fund Inc. (the “Fund”), was incorporated as an Oregon corporation on April 17, 1992, and is registered as an open-end, nondiversified management investment company under the Investment Company Act of 1940 (the “1940 Act”). The Fund commenced operations on August 3, 1992. Effective March 1, 2018, the name of the Fund was changed from The Jensen Portfolio, Inc. doing business as Jensen Quality Growth Fund to The Jensen Quality Growth Fund Inc. The Fund is authorized to issue 5,000,000,000 shares of common stock, all of which have been authorized for the existing share classes. The Fund currently offers four different classes of shares; Class J, Class I, Class R, and Class Y. Class J shares are subject to a 0.25% 12b-1 fee and a sub-transfer agency fee, Class R shares are subject to a 0.50% 12b-1 fee and up to a 0.25% shareholder servicing fee, Class I shares are subject to a shareholder servicing fee up to 0.10%, and Class Y shares are not subject to any 12b-1, shareholder servicing or sub transfer agency fee as described in the separate prospectuses for each of the funds share classes. Each class of shares has identical rights and privileges except with respect to the 12b-1 fees, sub-transfer agency fees, shareholder servicing fees, and voting rights on matters affecting a single class of shares. The principal investment objective of the Fund is long-term capital appreciation.
The Fund is an investment company and accordingly follows the investment company accounting and reporting guidance of the Financial Accounting Standards Board (“FASB”) Accounting Standards Codification Topic 946 “Financial Services Investment Companies”.
The following is a summary of significant accounting policies consistently followed by the Fund. The policies are in conformity with accounting principles generally accepted in United States of America (“GAAP”).
a) Investment Valuation – Securities that are listed on United States stock exchanges are valued at the last sale price at the close of the exchange. Equity securities listed on the NASDAQ Stock Market are valued at the NASDAQ Official Closing Price or, if there has been no sale on that day, at their current bid price. Investments in open-end and closed-end registered investment companies, including money market funds, that do not trade on an exchange are valued at the end of day net asset value per share. Quotations are taken from the market in which the security is primarily traded. Over-the-counter securities are valued at the current bid price in the absence of a closing price. Securities for which market quotations are not readily available are valued at fair value as determined by Jensen Investment Management, Inc. (the “Investment Adviser”) at or under the direction of the Fund’s Board of Directors.
There is no definitive set of circumstances under which the Fund may elect to use fair value procedures to value a security. Although the Fund only invests in publicly traded securities, the large majority of which are large capitalization, highly liquid securities, they nonetheless may become securities for which market quotations are not readily available, such as in instances where the
24 | The Jensen Quality Growth Fund Inc. | Annual Report |
market quotation for a security has become stale, sales of a security have been infrequent, trading in the security has been suspended, or where there is a thin market in the security. Securities for which market quotations are not readily available will be valued at their fair value as determined under the Fund’s fair valuation procedures established by the Board of Directors. The Fund is prohibited from investing in restricted securities (securities issued in private placement transactions that may not be offered or sold to the public without registration under the securities laws); therefore, fair value pricing considerations for restricted securities are generally not applicable to the Fund.
Fair Value Measurement – The Fund has adopted authoritative fair valuation accounting standards which establish an authoritative definition of fair value and set out a hierarchy for measuring fair value. These standards require additional disclosures about the various inputs and valuation techniques used to develop the measurements of fair value and a discussion of changes in valuation techniques and related inputs during the year. The three levels of the fair value hierarchy are as follows:
Level 1 | Inputs that reflect unadjusted quoted prices in active markets for identical assets or liabilities that the Fund has the ability to access at the measurement date. |
Level 2 | Inputs other than quoted prices that are observable for the asset or liability either directly or indirectly, including inputs in markets that are not considered to be active and prices for similar securities, interest rates, credit risk, etc. |
Level 3 | Inputs that are unobservable (including the Fund’s own assumptions in determining the fair value of investments). |
Inputs refer broadly to the assumptions that market participants use to make valuation decisions, including assumptions about risk. Inputs may include price information, volatility statistics, specific and broad credit data, liquidity statistics, and other factors. A financial instrument’s level within the fair value hierarchy is based on the lowest level of input that is significant to the fair value measurement. However, the determination of what constitutes “observable” requires significant judgment by the Fund. The Fund considers observable data to be that market data which is readily available, regularly distributed or updated, reliable and verifiable, not proprietary, and provided by independent sources that are actively involved in the relevant market. The categorization of a financial instrument within the hierarchy is based upon the pricing transparency of the instrument and does not necessarily correspond to the Fund’s perceived risk of that instrument.
Investments whose values are based on quoted market prices in active markets, include common stocks and certain money market securities, and are classified within Level 1. Investments that trade in markets that are not considered to be active, but are valued based on quoted market prices, dealer quotations or alternative pricing sources supported by observable inputs are classified within Level 2. Investments classified within Level 3 have significant unobservable inputs, as they trade infrequently or not at all.
Annual Report | The Jensen Quality Growth Fund Inc. | 25 |
The following is a summary of the inputs used, as of May 31, 2022, to value the Fund’s investments carried at fair value. The inputs and methodology used for valuing securities may not be an indication of the risk associated with investing in those securities.
Investments at Value | Total | Level 1 | Level 2 | Level 3 | ||||||||
Total Common Stocks* | $ | 9,759,808,596 | $ | 9,759,808,596 | $ | — | $ | — | ||||
Total Money Market Fund | $ | 216,436,636 | $ | 216,436,636 | — | — | ||||||
Total Investments | $ | 9,976,245,232 | $ | 9,976,245,232 | $ | — | $ | — | ||||
* For further information regarding security characteristics and industry classifications, please see the Schedule of Investments.
The Fund did not hold any investments during the period ended May 31, 2022 with significant unobservable inputs which would be classified as Level 3. The Fund did not hold any derivative instruments during the reporting year.
b) Federal Income Taxes – No provision has been made for Federal income taxes since the Fund has elected to be taxed as a “regulated investment company” and intends to distribute substantially all net investment company taxable income and net capital gains to its shareholders and otherwise comply with the provision of the Internal Revenue Code applicable to regulated investment companies.
The Fund has reviewed all open tax years and major jurisdictions and concluded that there is no tax liability resulting from unrecognized tax benefits relating to uncertain income tax positions taken or expected to be taken as of and for the year ended May 31, 2022. The Fund recognizes interest and penalties, if any, related to uncertain tax benefits in the Statement of Operations. During the year, the Fund did not incur any interest or penalties. Open tax years are those that are open for exam by taxing authorities. The Fund has no examination in progress. The Fund is also not aware of any tax positions for which it is reasonably possible that the total amounts of unrecognized tax benefits will significantly change in the next twelve months.
c) Distributions to Shareholders – Dividends to shareholders are recorded on the ex-dividend date. Dividends from net investment income are declared and paid quarterly by the Fund. Distributions of net realized capital gains, if any, will be declared and paid at least annually. Income and capital gain distributions are determined in accordance with income tax regulations which may differ from GAAP. The Fund may utilize earnings and profits distributed to shareholders on redemption of shares as part of the dividend paid deduction.
d) Use of Estimates – The preparation of financial statements in conformity with GAAP requires management to make estimates and assumptions that affect the reported amounts of assets and liabilities and disclosure of contingent assets and liabilities at the date of the financial statements and the reported amounts of revenues and expenses during the reporting period. Actual results could differ from those estimates.
26 | The Jensen Quality Growth Fund Inc. | Annual Report |
e) Guarantees and Indemnifications – Under the Fund’s organizational documents, each director, officer, employee or other agent of the Fund is indemnified, to the extent permitted by the 1940 Act, against certain liabilities that may arise out of performance of their duties to the Fund. Additionally, in the normal course of business, the Fund enters into contracts that contain a variety of indemnification clauses. The Fund’s maximum exposure under these arrangements is unknown as this would involve future claims that may be made against the Fund that have not yet occurred. However, the Fund has not had prior claims or losses pursuant to these contracts and believes the risk of loss to be remote.
f) Allocation of Income, Expenses and Gains/Losses – Income, expenses (other than those deemed attributable to a specific share class), and gains and losses of the Fund are allocated daily to each class of shares based upon the ratio of net assets represented by each class as a percentage of the net assets of the Fund. Expenses deemed directly attributable to a class of shares are recorded by the specific class. Most Fund expenses are allocated by class based on relative net assets. Transfer agent fees and reports to shareholders are allocated based on the number of shareholder accounts in each class. Sub-transfer agency fees are expensed to the Class J shares based on the average of two published per-account rates from two known brokerages. 12b-1 fees are expensed at 0.25% of average daily net assets of Class J shares and 0.50% of average daily net assets of Class R shares. Shareholder servicing fees are expensed at up to 0.10% and up to 0.25% of the average daily net assets of Class I shares and Class R shares, respectively.
g) Other – Investment and shareholder transactions are recorded on trade date. Gains or losses from investment transactions are determined on the basis of identified carrying value using the specific identification method. Dividend income is recognized on the ex-dividend date and interest income is recognized on an accrual basis.
2. Capital Share Transactions
Transactions in shares of the Fund were as follows:
Class J | year ended | year ended | ||||
Shares sold | 6,240,788 | 2,789,619 | ||||
Shares issued in reinvestment of dividends | 2,643,294 | 4,452,045 | ||||
Shares redeemed | (8,944,731 | ) | (13,730,284 | ) | ||
Net decrease | (60,649 | ) | (6,488,620 | ) | ||
Shares outstanding: | ||||||
Beginning of year | 42,493,628 | 48,982,248 | ||||
End of year | 42,432,979 | 42,493,628 | ||||
Annual Report | The Jensen Quality Growth Fund Inc. | 27 |
Class R | year ended | year ended | ||||
Shares sold | 93,940 | 59,842 | ||||
Shares issued in reinvestment of dividends | 27,582 | 43,132 | ||||
Shares redeemed | (254,100 | ) | (148,707 | ) | ||
Net decrease | (132,578 | ) | (45,733 | ) | ||
Shares outstanding: | ||||||
Beginning of year | 442,198 | 487,931 | ||||
End of year | 309,620 | 442,198 | ||||
Class I | year ended | year ended | ||||
Shares sold | 21,236,916 | 17,470,732 | ||||
Shares issued in reinvestment of dividends | 4,917,309 | 8,186,385 | ||||
Shares redeemed | (27,183,390 | ) | (23,177,801 | ) | ||
Net increase (decrease) | (1,029,165 | ) | 2,479,316 | |||
Shares outstanding: | ||||||
Beginning of year | 83,398,534 | 80,919,218 | ||||
End of year | 82,369,369 | 83,398,534 | ||||
Class Y | year ended | year ended | ||||
Shares sold | 8,766,766 | 7,775,824 | ||||
Shares issued in reinvestment of dividends | 2,421,386 | 3,630,317 | ||||
Shares redeemed | (9,451,335 | ) | (12,098,519 | ) | ||
Net increase (decrease) | 1,736,817 | (692,378 | ) | |||
Shares outstanding: | ||||||
Beginning of year | 45,935,621 | 46,627,999 | ||||
End of year | 47,672,438 | 45,935,621 | ||||
3. Investment Transactions
The aggregate purchases and aggregate sales of securities, excluding short-term investments, by the Fund for the year ended May 31, 2022, were $1,123,860,588 and $1,843,325,864, respectively.
28 | The Jensen Quality Growth Fund Inc. | Annual Report |
4. Income Taxes
The distributions of $93,525,514 and $107,389,201 paid during the years ended May 31, 2022 and 2021, respectively, were classified as ordinary income for tax purposes. The distributions of $627,290,825 and $860,454,655 paid during the years ended May 31, 2022 and 2021, respectively, were classified as long-term capital gain for income tax purposes.
Additionally, U.S. generally accepted accounting principles require that certain components of net assets relating to permanent differences be reclassified between financial and tax reporting. These reclassifications have no effect on net assets or net asset value per share. For the year ended May 31, 2022, distributable earnings decreased by $78,974,490 and capital stock increased by $78,974,490. The permanent difference relates to tax equalization.
At May 31, 2022, the cost of investments, net unrealized appreciation (depreciation) and undistributed ordinary income and undistributed long term capital gains for income tax purposes were as follows:
Cost of investments | $5,567,284,523 | ||
Gross unrealized appreciation | $4,532,317,175 | ||
Gross unrealized depreciation | $(123,356,466 | ) | |
Net unrealized appreciation | $4,408,960,709 | ||
Undistributed ordinary income | $17,188,614 | ||
Undistributed long-term capital gain | $210,016,618 | ||
Distributable earnings | $227,205,232 | ||
Other accumulated gains | $— | ||
Total distributable earnings | $4,636,165,941 |
The cost of investments differ for financial statement and tax purposes primarily due to the deferral of losses on wash sales.
5. Line of Credit
The Fund has the lesser of (i) $400 million, (ii) 20% of the gross market value of the Fund, or (iii) 33.33% of the net market value of the unencumbered assets of the Fund available under a revolving credit facility, subject to certain restrictions, for temporary emergency purposes, including the meeting of redemption requests that otherwise might require the untimely disposition of securities. The secured line of credit has a one-year term and is reviewed annually by the Board of Directors. The credit facility is with the Fund’s custodian, U.S. Bank. The current credit facility runs through December 13, 2022. The interest rate on the outstanding principal amount is equal to the prime rate less 1%. As of May 31, 2022 the interest rate on the Fund’s line of credit was 3%. The Fund did not borrow on the line of credit during the year ended May 31, 2022.
Annual Report | The Jensen Quality Growth Fund Inc. | 29 |
6. Investment Advisory Agreement
The Fund is a party to an Investment Advisory and Service Contract with the Investment Adviser. Pursuant to the terms of the Investment Advisory and Service Contract approved by Fund shareholders, the Investment Adviser is entitled to receive a fee, calculated daily and payable monthly, at the annual rate of 0.50% as applied to the Fund’s average daily net assets of $4 billion or less, 0.475% as applied to the Fund’s average daily net assets of more than $4 billion and up to $8 billion, 0.45% as applied to the Fund’s average daily net assets of more than $8 billion and up to $12 billion, and 0.425% as applied to the Fund’s average daily net assets of more than $12 billion.
Certain officers and a director of the Fund are also officers and directors of the Investment Adviser.
7. Distribution and Shareholder Servicing
The Fund has adopted a distribution and shareholder servicing plan pursuant to Rule 12b-1 under the 1940 Act (the “12b-1 Plan”), which provides that the Fund make payments to the Fund’s distributor at an annual rate of 0.25% of average daily net assets attributable to Class J shares and 0.50% of the average daily net assets attributable to Class R shares. The Fund’s distributor may then make payments to financial intermediaries or others at an annual rate of up to 0.25% of the average daily net assets attributable to Class J shares and up to 0.50% of the average daily net assets attributable to Class R shares. Payments under the 12b-1 Plan shall be used to compensate the Fund’s distributor or others for services provided and expenses incurred in connection with the sale and/or servicing of shares. 12b-1 fees incurred for the year ended May 31, 2022, are disclosed on the Statement of Operations and the amount payable at year end is disclosed on the Statement of Assets and Liabilities.
In addition, the Fund has adopted a Shareholder Servicing Plan for Class I shares under which the Fund can pay for shareholder support services from the Fund’s assets pursuant to a Shareholder Servicing Agreement in an amount not to exceed 0.10% of the Fund’s average daily net assets attributable to Class I shares. The amount actually incurred for the year ended May 31, 2022 was 0.08% on an annualized basis.
The Fund has also adopted a Shareholder Servicing Plan for the Class R shares. Under the Shareholder Servicing Plan, the Fund can pay for shareholder support services, which include the recordkeeping and administrative services provided by retirement plan administrators to retirement plans (and their participants) that are shareholders of the class. Payments will be made pursuant to a Shareholder Servicing Agreement in an amount not to exceed 0.25% of the Fund’s average daily net assets attributable to Class R shares. The amount actually incurred for the year ended May 31, 2022 was 0.17% on an annualized basis.
30 | The Jensen Quality Growth Fund Inc. | Annual Report |
8. Beneficial Ownership
The beneficial ownership, either directly or indirectly, of more than 25% of the voting securities of a fund creates presumption of control of the fund, under Section 2(a)(9) of the 1940 Act. At May 31, 2022, Charles Schwab & Co., Inc., for the benefit of its customers, held 46.62% of the outstanding shares of the Class J share class. At May 31, 2022, Wells Fargo Clearing Services LLC, for the benefit of its customers, held 38.67% of the outstanding shares of the Class I share class. At May 31, 2022, Great-West Trust Company LLC, and Great West Life & Annuity, for the benefit of its customers, held 27.26% and 26.77%, of the outstanding shares of the Class R share class, respectively. At May 31, 2022, Edward D Jones and Co., for the benefit of its customers, held 33.35% of the outstanding shares of the Class Y share class.
9. COVID-19
The global outbreak of coronavirus disease 2019 (“COVID-19”) has disrupted global economic markets and adversely affected individual companies and investment products. The prolonged economic impact of COVID-19 is uncertain. The operational and financial performance of the issuers of securities in which the Fund invests depends on future developments, including the duration and spread of the outbreak, and such uncertainty may in turn impact the value of the Fund’s investments.
10. Subsequent Events
On June 16, 2022, The Fund declared and paid a distribution from ordinary income of $0.12699238, $0.16163614, $0.04766419, and $0.17484347 for Class J, Class I, Class R and Class Y, respectively, to shareholders of record as of June 15, 2022.
Robert Harold (Fund Independent Director and Chairman) informed the Fund’s Board of Directors that he will be retiring from service as a director to the Fund, effective as of October 19, 2022. In anticipation of his planned retirement, Mr. Harold resigned as Chairman of the Fund’s Board of Directors effective July 20, 2022, and will remain a director of the Fund and member of each committee of the Board of Directors until his retirement from service and resignation as a director. Kenneth Thrasher, an Independent Director of the Fund, was appointed as Chairman of the Board of Directors and also a member of the Pricing Committee of the Board of Directors and removed as Chair of the Audit Committee of the Board of Directors, all effective July 20, 2022. Kathleen Kee, an Independent Director, and member of the Audit Committee, was appointed as Chair of the Audit Committee of the Board of Directors effective July 20, 2022.
In preparing these financial statements, the Fund has evaluated events and transactions for potential recognition or disclosure resulting from subsequent events after the Statements of Assets and Liabilities date of May 31, 2022 through the date the financial statements were available for issue.
Annual Report | The Jensen Quality Growth Fund Inc. | 31 |
Report of Independent Registered Public Accounting Firm
To the Shareholders and Board of Directors of
The Jensen Quality Growth Fund Inc.
Opinion on the Financial Statements
We have audited the accompanying statement of assets and liabilities, including the schedule of investments, of The Jensen Quality Growth Fund Inc. (the “Fund”) as of May 31, 2022, the related statement of operations for the year then ended, the statements of changes in net assets for each of the two years in the period then ended, the related notes, and the financial highlights for each of the five years in the period then ended (collectively referred to as the “financial statements”). In our opinion, the financial statements present fairly, in all material respects, the financial position of the Fund as of May 31, 2022, the results of its operations for the year then ended, the changes in net assets for each of the two years in the period then ended, and the financial highlights for each of the five years in the period then ended, in conformity with accounting principles generally accepted in the United States of America.
Basis for Opinion
These financial statements are the responsibility of the Fund’s management. Our responsibility is to express an opinion on the Fund’s financial statements based on our audits. We are a public accounting firm registered with the Public Company Accounting Oversight Board (United States) (“PCAOB”) and are required to be independent with respect to the Fund in accordance with the U.S. federal securities laws and the applicable rules and regulations of the Securities and Exchange Commission and the PCAOB.
We conducted our audits in accordance with the standards of the PCAOB. Those standards require that we plan and perform the audit to obtain reasonable assurance about whether the financial statements are free of material misstatement whether due to error or fraud.
Our audits included performing procedures to assess the risks of material misstatement of the financial statements, whether due to error or fraud, and performing procedures that respond to those risks. Such procedures included examining, on a test basis, evidence regarding the amounts and disclosures in the financial statements. Our procedures included confirmation of securities owned as of May 31, 2022, by correspondence with the custodian. Our audits also included evaluating the accounting principles used and significant estimates made by management, as well as evaluating the overall presentation of the financial statements. We believe that our audits provide a reasonable basis for our opinion.
We have served as the Fund’s auditor since 2010.

COHEN & COMPANY, LTD.
Milwaukee, Wisconsin
July 28, 2022
32 | The Jensen Quality Growth Fund Inc. | Annual Report |
Expense Example - May 31, 2022 (Unaudited)
As a shareholder of The Jensen Quality Growth Fund Inc. (the “Fund”), you incur ongoing costs, including investment advisory fees, distribution and/or shareholder servicing fees, and other Fund expenses, which are indirectly paid by shareholders. This example is intended to help you understand your ongoing costs (in dollars) of investing in the Fund and to compare these costs with the ongoing costs of investing in other mutual funds.
The Example is based on an investment of $1,000 invested at the beginning of the period and held for the entire six-month period (December 1, 2021, - May 31, 2022).
Actual Expenses
The first line of the table below for each share class of the Fund provides information about actual account values and actual expenses. However, the table does not include shareholder specific fees, such as the $15.00 fee charged to IRA accounts, or the $15.00 fee charged for wire redemptions. The table also does not include portfolio trading commissions and related trading costs. You may use the information in this line, together with the amount you invested, to estimate the expenses that you paid over the period. Simply divide your account value by $1,000 (for example, an $8,600 account value divided by $1,000 = 8.6), then multiply the result by the number in the first line under the heading entitled “Expenses Paid During Period” to estimate the expenses you paid on your account during this period.
Hypothetical Example for Comparison Purposes
The second line of the table below provides information about hypothetical account values and hypothetical expenses based on the actual expense ratios for each share class of the Fund and an assumed rate of return of 5% per year before expenses, which is not the Fund’s actual return. The hypothetical account values and expenses may not be used to estimate the actual ending account balance or expenses you paid for the period. You may use this information to compare the ongoing costs of investing in the Fund and other funds. To do so, compare this 5% hypothetical example with the 5% hypothetical examples that appear in the shareholder reports of the other funds.
Please note that the expenses shown in the table are meant to highlight your ongoing costs only and do not reflect any transactional costs, such as sales charges (loads), redemption fees, or exchange fees which, although not charged by the Fund, may be charged by other funds. Therefore, the second line of the table is useful in comparing ongoing costs only, and will not help you determine the relative total costs of owning different funds.
Annual Report | The Jensen Quality Growth Fund Inc. | 33 |
Expense Example Tables (Unaudited)
Jensen Quality Growth Fund – Class J | Beginning | Ending | Expenses Paid | ||||||
Actual | $ | 1,000.00 | $ | 917.00 | $ | 3.87 | |||
Hypothetical (5% annual return before expenses) | 1,000.00 | 1,020.89 | 4.08 | ||||||
* | Expenses are equal to the Fund’s annualized six-month expense ratio of 0.81%, multiplied by the average account value over the period, multiplied by 182/365 to reflect the one-half year period. |
Jensen Quality Growth Fund – Class R | Beginning | Ending | Expenses Paid | ||||||
Actual | $ | 1,000.00 | $ | 914.70 | $ | 6.06 | |||
Hypothetical (5% annual return before expenses) | 1,000.00 | 1,018.60 | 6.39 | ||||||
* | Expenses are equal to the Fund’s annualized six-month expense ratio of 1.27%, multiplied by the average account value over the period, multiplied by 182/365 to reflect the one-half year period. |
Jensen Quality Growth Fund – Class I | Beginning | Ending | Expenses Paid | ||||||
Actual | $ | 1,000.00 | $ | 917.80 | $ | 2.92 | |||
Hypothetical (5% annual return before expenses) | 1,000.00 | 1,021.89 | 3.07 | ||||||
* | Expenses are equal to the Fund’s annualized six-month expense ratio of 0.61%, multiplied by the average account value over the period, multiplied by 182/365 to reflect the one-half year period. |
Jensen Quality Growth Fund – Class Y | Beginning | Ending | Expenses Paid | ||||||
Actual | $ | 1,000.00 | $ | 918.30 | $ | 2.49 | |||
Hypothetical (5% annual return before expenses) | 1,000.00 | 1,022.34 | 2.62 | ||||||
* | Expenses are equal to the Fund’s annualized six-month expense ratio of 0.52%, multiplied by the average account value over the period, multiplied by 182/365 to reflect the one-half year period. |
34 | The Jensen Quality Growth Fund Inc. | Annual Report |
Additional Information (Unaudited)
1. Shareholder Notification of Federal Tax Status
The Fund designates 100% of dividends declared during the fiscal year ended May 31, 2022 as dividends qualifying for the dividends received deduction available to corporate shareholders.
The Fund designates 100% of dividends declared from net investment income during the fiscal year ended May 31, 2022 as qualified dividend income under the Jobs and Growth Tax Relief Reconciliation Act of 2003.
The Fund designates as a long-term capital gain dividend, pursuant to the Internal Revenue Code Section 852(b)(3), the amount necessary to reduce earnings and profits of the Fund related to net capital gain to zero for the fiscal year ended May 31, 2022.
Additional Information Applicable to Foreign Shareholders Only:
The Fund designates 0.09% of ordinary income distributions as interest-related dividends under Internal Revenue Code Section 871(k)(1)(c).
The Fund designates 6.10% of ordinary income distributions as short-term capital gain distributions under Internal Revenue Section 871(k)(2)(c).
2. Availability of Proxy Voting Information
Information regarding how the Fund votes proxies relating to portfolio securities is available without charge, upon request by calling toll-free, 1-800-221-4384, or by accessing the SEC’s website at www.sec.gov.
3. Portfolio Holdings
The Fund will file its complete schedule of portfolio holdings with the SEC for the first and third quarters of each fiscal year on Part F of Form N-PORT. The Fund’s Part F of Form N-PORT will be available on the EDGAR database on the SEC’s website at www.sec.gov. These Forms may also be reviewed and copied at the SEC’s Public Reference Room in Washington D.C. Information about the operation of the Public Reference Room may be obtained by calling 1-800-SEC-0330. Quarterly portfolio holdings are also available on the website for Jensen Quality Growth Fund, www.JensenInvestment.com.
Annual Report | The Jensen Quality Growth Fund Inc. | 35 |
4. Liquidity Risk Management Program
Consistent with Rule 22e-4 under the Investment Company Act of 1940, the Fund has established a liquidity risk management program to manage “liquidity risk” (the “LRMP”). “Liquidity Risk” is defined as the risk that the Fund could not meet requests to redeem shares issued by a Fund without significant dilution of remaining investors’ interest in the Fund. The LRMP is overseen by the Program Administrator, a committee comprised of representatives of the Fund’s Investment Adviser and officers of the Fund. The Fund’s Board of Directors has approved the designation of the Program Administrator to oversee the LRMP.
The LRMP’s principal objectives include supporting the Fund’s compliance with limits on investments in illiquid assets and mitigating the risk that the Fund will be unable to meet its redemption obligations timely. The LRMP also includes a number of elements that support the management and assessment of liquidity risk, including an annual assessment of factors that influence the Fund’s liquidity and the periodic classification and re-classification of the Fund’s investments into groupings that reflect the Program Administrator’s assessment of their relative liquidity under current market conditions.
During the period covered by the report, it was determined that that: (1) the LRMP continues to be reasonably designed to effectively assess and manage the Funds’ Liquidity Risk; and (2) the LRMP has been adequately and effectively implemented with respect to the Fund during the reporting period. There can be no assurance that the LRMP will achieve its objectives in the future. Please refer to the Fund’s prospectus for more information regarding the Fund’s exposure to liquidity risk and other principal risks to which an investment in the Fund may be subject.
36 | The Jensen Quality Growth Fund Inc. | Annual Report |
5. Additional Disclosure Regarding Fund Directors and Officers
Independent Directors
Name, Address | Position(s) | Term of Office | Principal Occupation During | # of | Other |
Roger A. Cooke | Independent Director | Indefinite Term; since June 1999. | Retired. Senior Vice President, General Counsel and Secretary of Precision Castparts Corp., a diversified manufacturer of complex metal products, (2000 – 2013); Executive Vice President – Regulatory and Legal Affairs of Fred Meyer, Inc. (now a division of Kroger), a retail grocery and general merchandise company (1992 – 2000). | 1 | None |
Robert E. Harold | Independent Director | Indefinite Term; since September 2000 and Chairman since | Retired. Senior Director of Financial Planning of Nike, Inc., a footwear and apparel company (2001 – 2002); Global Brand Controller for Nike, Inc. (1996, 1997, 2000 – 2001); Interim Chief Financial Officer for Nike, Inc. (1998 – 1999); Interim Chief Executive Officer for Laika, Inc., an animation studio (March 2005 – October 2005). | 1 | Director of Laika, Inc., an animation studio (2002 – present). |
Kenneth Thrasher | Chairman and Independent Director | Indefinite Term; since July 2007 and Chairman since July 2022. | Retired. Chairman (2002 – 2018) and CEO (2002 – 2009) of Complí, a web-based compliance and risk management software solution company; President and CEO of Fred Meyer, Inc. (now a division of Kroger), a retail grocery and general merchandise company, from 1999-2001, and other executive positions at Fred Meyer, Inc., including EVP and Chief Administrations Officer and SVP and Chief Financial Officer, from 1982-1999. | 1 | Northwest Natural Gas Company (a natural gas distribution and service provider). |
Janet G. Hamilton, | Independent Director | Indefinite Term; since October 2016. | Associate Professor, Finance, Portland State University’s School of Business (1986 – present) and Area Director (2016-present). | 1 | None |
Annual Report | The Jensen Quality Growth Fund Inc. | 37 |
Name, Address | Position(s) | Term of Office | Principal Occupation During | # of | Other |
Kathleen J. Kee, | Independent Director | Indefinite Term; since October 2021. | Senior Wealth Advisor, Buckingham Strategic Wealth (2020 – present); Chief Executive Officer, Confluence Wealth Management LLC (2011 – 2020) | 1 | None |
38 | The Jensen Quality Growth Fund Inc. | Annual Report |
Interested Director
Name, Address | Position(s) | Term of Office | Principal Occupation During | # of | Other |
Robert D. McIver* | Director and President | Indefinite Term; since July 2015; 1 Year Term as President of the Fund; Served as President since February 2007. | Director (since July 2015) of the Fund; President and Director (February 2007 – present) and Director of Operations (2004 – February 2007) of Jensen Investment Management, Inc. | 1 | Jensen Investment Management, Inc. (since February 2007) |
Annual Report | The Jensen Quality Growth Fund Inc. | 39 |
Officers of the Fund
Name, Address | Position(s) | Term of Office | Principal Occupation During | # of | Other |
Robert D. McIver* |
|
|
|
|
|
Eric H. Schoenstein* | Vice President | 1 Year Term; Served since January 2011. | Chief Investment Officer and Portfolio Manager (since 2021); and Director and Vice President of Business Analysis (2002-2021) for Jensen Investment Management, Inc. | N/A | Trustee of the Oregon State University Foundation (2008-present) |
Richard W. Clark*** | Vice President | 1 Year Term; Served since April 2017. | Director – Sales and Marketing for Jensen Investment Management, Inc. (2001-present). | N/A | N/A |
Shannon Contreras* | Treasurer and Vice President | 1 Year Term; Served since February 2020. | Director of Finance, Treasurer and Senior Compliance Officer (February 2020 – Present), Senior Compliance Officer and Associate - Finance (October 2014 – February 2020) of Jensen Investment Management, Inc. | N/A | N/A |
Gabriel L. Goddard* | Chief Compliance Officer and AML Officer; Vice President and Secretary | 1 Year Term; Served since January 2018 (as Vice President and Secretary) and since February 2020 as Chief Compliance Officer and AML Officer. | Vice President and Secretary (January 2018-present) of the Fund; Secretary, General Counsel, Chief Compliance Officer (2012-present), and Director (2017-present) of Jensen Investment Management, Inc. | N/A | N/A |
* | This individual is an “interested person” of the Fund within the meaning of the 1940 Act because they also serve as an officer of the Investment Adviser and own securities of the Investment Adviser. | ||
** | Each Director serves for an indefinite term in accordance with the Bylaws of the Fund until the date a Director dies, resigns, retires or is removed in accordance with the Bylaws of the Fund. | ||
*** | This individual is an “interested person” of the Fund within the meaning of the 1940 Act because they own securities of the Adviser. | ||
40 | The Jensen Quality Growth Fund Inc. | Annual Report |
Notice of Privacy Policy (Unaudited)
The Jensen Quality Growth Fund Inc. (the “Fund”) has had a long-standing policy of maintaining strict confidentiality over customer information. The Fund’s policy is as follows:
Confidentiality and Security
All nonpublic personal information about our customers (“you”) will be kept strictly confidential. We maintain physical, electronic and operational safeguards to protect customer nonpublic personal information.
Categories of information the Fund discloses and parties to whom the Fund discloses that information:
The Fund does not disclose any nonpublic personal information about its current or former shareholders to nonaffiliated third parties without the shareholder’s authorization, except as permitted or required by law. For example, the Fund is permitted by law to disclose all of the information it collects, as described below, to its Transfer Agent to process your transactions. The Fund is also permitted by law (and may be required by law) to disclose any nonpublic personal information it collects from you to law enforcement agencies, the Securities and Exchange Commission, and other federal and state regulatory authorities.
Categories of information the Fund collects:
The Fund collects nonpublic personal information about you from the following sources:
Annual Report | The Jensen Quality Growth Fund Inc. | 41 |
JN-ANNUALQG
| |||
Jensen Quality Growth Fund Inc. | |||
Class I Shares | Class J Shares | Class R Shares | Class Y Shares |
| |||
Investment Adviser Fund Administrator, Transfer Agent and Fund Accountant Custodian Legal Counsel Independent Registered Public Accounting Firm Distributor | |||
This report has been prepared for shareholders and may be distributed to others only if preceded or accompanied by a current prospectus. | |||
jenseninvestment.com |
|

(b) Not applicable.
Item 2. Code of Ethics.
The registrant has adopted a code of ethics that applies to the registrant’s principal executive officer and principal financial officer. The registrant has not made any substantive amendments to its code of ethics during the period covered by this report. The registrant has not granted any waivers from any provisions of the code of ethics during the period covered by this report.
Item 3. Audit Committee Financial Expert.
The registrant’s board of directors has determined that there are three audit committee financial expert serving on its audit committee. Robert E. Harold, Kenneth Thrasher, and Janet G. Hamilton PhD, CFA, are the “audit committee financial experts” and are considered to be “independent” as each term is defined in Item 3 of Form N-CSR.
Item 4. Principal Accountant Fees and Services.
The registrant has engaged its principal accountant to perform audit services, audit-related services, tax services and other services during the past two fiscal years. “Audit services” refer to performing an audit of the registrant's annual financial statements or services that are normally provided by the accountant in connection with statutory and regulatory filings or engagements for those fiscal years. “Audit-related services” refer to the assurance and related services by the principal accountant that are reasonably related to the performance of the audit. “Tax services” refer to professional services rendered by the principal accountant for tax compliance, tax advice, and tax planning. There were no “Other services” provided by the principal accountant. The following table details the aggregate fees billed or expected to be billed for each of the last two fiscal years for audit fees, audit-related fees, tax fees and other fees by the principal accountant.
| FYE 5/31/2022 | FYE 5/31/2021 | |||||||
| ( a ) Audit Fees | 22,700 | 22,300 | ||||||
| ( b ) Audit-Related Fees | 0 | 0 | ||||||
| ( c ) Tax Fees | 4,250 | 4,000 | ||||||
| ( d ) All Other Fees | 0 | 0 | ||||||
1
The audit committee has adopted pre-approval policies and procedures that require the audit committee to pre-approve all audit and non-audit services of the registrant, including services provided to any entity affiliated with the registrant.
The percentage of fees billed by Cohen & Company, Ltd. applicable to non-audit services pursuant to waiver of pre-approval requirement were as follows:
| FYE 5/31/2022 | FYE 5/31/2021 | |||
| Audit-Related Fees | 0% | 0% | ||
| Tax Fees | 0% | 0% | ||
| All Other Fees | 0% | 0% |
All of the principal accountant’s hours spent on auditing the registrant’s financial statements were attributed to work performed by full-time permanent employees of the principal accountant.
The following table indicates the non-audit fees billed or expected to be billed by the registrant’s accountant for services to the registrant and to the registrant’s investment adviser (and any other controlling entity, etc.—not sub-adviser) for the last two years.
| Non-Audit Related Fees | FYE 5/31/2022 | FYE 5/31/2021 | ||||||
| Registrant | 4,250 | 4,000 | ||||||
| Registrant’s Investment Adviser | 67,000 | 26,000 | ||||||
The audit committee of the board of directors has considered whether the provision of non-audit services that were rendered to the registrant's investment adviser is compatible with maintaining the principal accountant's independence and has concluded that the provision of such non-audit services by the accountant has not compromised the accountant’s independence.
( i ) Not applicable
Item 5. Audit Committee of Listed Registrants.
Not applicable to registrants who are not listed issuers (as defined in Rule 10A-3 under the Securities Exchange Act of 1934).
Item 6. Investments.
Schedule of Investments is included as part of the report to shareholders filed under Item 1 of this Form.
Item 7. Disclosure of Proxy Voting Policies and Procedures for Closed-End Management Investment Companies.
Not applicable to open-end investment companies.
2
Item 8. Portfolio Managers of Closed-End Management Investment Companies.
Not applicable to open-end investment companies.
Item 9. Purchases of Equity Securities by Closed-End Management Investment Company and Affiliated Purchasers.
Not applicable to open-end investment companies.
Item 10. Submission of Matters to a Vote of Security Holders.
There have been no material changes to the procedures by which shareholders may recommend nominees to the registrant’s board of directors.
Item 11. Controls and Procedures.
| (a) | The Registrant’s President and Treasurer have reviewed the Registrant's disclosure controls and procedures (as defined in Rule 30a-3(c) under the Investment Company Act of 1940 (the “Act”)) as of a date within 90 days of the filing of this report, as required by Rule 30a-3(b) under the Act and Rules 13a-15(b) or 15d-15(b) under the Securities Exchange Act of 1934. Based on their review, such officers have concluded that the disclosure controls and procedures are effective in ensuring that information required to be disclosed in this report is appropriately recorded, processed, summarized and reported and made known to them by others within the Registrant and by the Registrant’s service provider. |
| (b) | There were no changes in the Registrant's internal control over financial reporting (as defined in Rule 30a-3(d) under the Act) that occurred during the period covered by this report that have materially affected, or are reasonably likely to materially affect, the Registrant's internal control over financial reporting. |
Item 12. Disclosure of Securities Lending Activities for Closed-End Management Investment Companies
Not applicable to open-end investment companies.
Item 13. Exhibits.
| (a) | (1) Any code of ethics or amendment thereto, that is the subject of the disclosure required by Item 2, to the extent that the registrant intends to satisfy Item 2 requirements through filing an exhibit. Incorporated by reference to the Registrant’s Form N-CSR filed August 4, 2017. |
| (2) A separate certification for each principal executive officer and principal financial officer pursuant to Section 302 of the Sarbanes-Oxley Act of 2002. Filed herewith. | |
| (3) Any written solicitation to purchase securities under Rule 23c-1 under the Act sent or given during the period covered by the report by or on behalf of the registrant to 10 or more persons. Not applicable to open-end investment companies. |
3
| (4) Change in the registrant’s independent public accountant. There was no change in the registrant’s independent public accountant for the period covered by this report. | |
| (b) | Certifications pursuant to Section 906 of the Sarbanes-Oxley Act of 2002. Furnished herewith. |
4
SIGNATURES
Pursuant to the requirements of the Securities Exchange Act of 1934 and the Investment Company Act of 1940, the registrant has duly caused this report to be signed on its behalf by the undersigned, thereunto duly authorized.
| (Registrant) | The Jensen Quality Growth Fund Inc. | ||
| By (Signature and Title | /s/ Robert McIver | ||
| Robert McIver, President | |||
| Date | 7/29/22 | ||
Pursuant to the requirements of the Securities Exchange Act of 1934 and the Investment Company Act of 1940, this report has been signed below by the following persons on behalf of the registrant and in the capacities and on the dates indicated.
| By (Signature and Title)* | /s/ Robert McIver | |
| Robert McIver, President | ||
| Date | 7/29/22 | |
| By (Signature and Title)* | /s/ Shannon Contreras | |
| Shannon Contreras, Treasurer | ||
| Date | 7/29/22 |
* Print the name and title of each signing officer under his or her signature
5