UNITED STATES
SECURITIES AND EXCHANGE COMMISSION
Washington, D.C. 20549
FORM N-CSR
CERTIFIED SHAREHOLDER REPORT OF REGISTERED
MANAGEMENT INVESTMENT COMPANIES
Investment Company Act file number811-6653
The Jensen Quality Growth Fund Inc.
(Exact name of registrant as specified in charter)
5500 Meadows Road, Suite 200
Lake Oswego, OR 97035-8234
(Address of principal executive offices) (Zip code)
Robert McIver
5500 Meadows Road, Suite 200
Lake Oswego, OR 97035-8234
(Name and address of agent for service)
(800) 221-4384
Registrant's telephone number, including area code
Date of fiscal year end:May 31
Date of reporting period:May 31, 2019
Item 1. Reports to Stockholders.
Beginning on January 1, 2021, as permitted by regulations adopted by the SEC, paper copies of shareholder reports from The Jensen Quality Growth Fund Inc. (“the Fund”) like this one will no longer be sent by mail, unless you specifically request paper copies of the reports from the Fund or from your financial intermediary, such as a broker-dealer or bank. Instead, the reports will be made available on the Fund’s website (www.jenseninvestment.com), and you will be notified by mail each time a report is posted and provided with a website link to access the report.
If you already elected to receive shareholder reports electronically, you will not be affected by this change and you need not take any action. You may elect to receive shareholder reports and other communications from the Fund by contacting your financial intermediary (such as a broker-dealer or bank) or, if you are a direct investor, by calling 1-800-992-4144 or by sending an e-mail request to funds@jenseninvestment.com.
You may elect to receive all future reports in paper free of charge. If you invest through a financial intermediary, you can contact your financial intermediary to request that you continue to receive paper copies of your shareholder reports. If you invest directly with the Fund, you can call 1-800-992-4144 or by sending an e-mail request to funds@jenseninvestment.com to let the Fund know you wish to continue receiving paper copies of your shareholder reports. Your election to receive reports in paper will apply to all funds held in your account if you invest through your financial intermediary.
Letter from The Investment Adviser
Dear Fellow Shareholders,
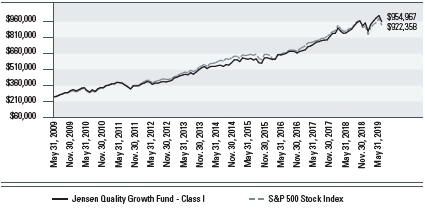
The Jensen Quality Growth Fund – Class I Shares – returned 9.85% for the year ended May 31, 2019, compared to a return of 3.78% for the Standard & Poor’s 500 Index over this period. Please see pages 7 through 10 of this report for complete standardized performance information for the Fund.
Market Perspective
For the twelve months ended May 31, 2019, the U.S. continued to enjoy low unemployment and inflation rates, and the Federal Reserve continued its cautious approach to “normalization” by slowly raising interest rates. However, in October 2018, markets pulled back, with negative returns largely driven by fears of an escalation of the trade dispute between the U.S. and China. The fourth quarter of 2018 saw a spike in volatility leading to a nearly 20% peak-to-trough drawdown of the S&P 500. Evidence of the increased volatility included the number of trading days that the market return from the S&P 500 was greater or less than 1%, which for the last three months of 2018 was nearly half the trading days. However, stock prices rebounded with a strong start in 2019, and the S&P 500 Index produced a first quarter return of 13.65%. More recent returns have been muted as investors look for direction given the rapidly changing geopolitical and policy uncertainties.
We are pleased that the companies in the Fund executed well in the face of this challenging environment and continued to create value for shareholders. We believe that the companies in the Fund demonstrated their resilience, and the Fund – Class I Shares – outperformed the S&P 500 Index by over six percentage points over the twelve-month period.
Overall, we continue to be impressed by the underlying business performance of the companies owned by the Fund. The Fund seeks to invest in businesses with quality attributes that we believe are highly correlated to sustainable value creation – durable competitive advantages, strong free cash flow generation, attractive long-term growth prospects, and business models that have demonstrated resiliency in a variety of market and economic environments.
The Effect at Jensen
During the Fund’s fiscal year, specific stock selection added value in the Materials and Information Technology sectors, while the Industrials sector was the primary stock selection detractor. From a sector perspective, our relative overweight in Health Care as well as our lack of presence in the Energy and Financials sectors added value. Typically, very few companies in the Utilities sector qualify for our strict requirement for high and prolonged profitability, as measured by Return on Equity.
The Fund’s top contributors to performance for the fiscal year werePepsi, MicrosoftandEcolab, all of which continued to issue reasonably strong earnings reports and reassuring guidance indicating they are successfully navigating economic challenges in each of their varied businesses.
| | |
| Annual Report | The Jensen Quality Growth Fund Inc. | 1 |
Significant detractors from the Fund’s performance for the fiscal year included3MandCognizant Technology Solutions, as the market reacted to concerns about slowing growth and missed earnings expectations.
While we believe the underlying business fundamentals at 3M remain solid, investors were less enthusiastic about the most recent quarter which revealed a surprising shortfall in company performance due to weak topline revenue and earnings growth, corporate restructuring and additional reserves for environmental and safety litigation. As a short-cycle industrial company, sudden shifts in end markets can cause challenges in the short term. Overall, we believe the company is in sound shape fundamentally and will work its way through near-term end market weakness and its litigation liabilities and return to more consistent business performance in the long-term. We continue to believe that 3M warrants a position in the Fund and will monitor the progress of the company.
Revenue growth at Cognizant Technology Solutions has slowed in recent quarters, and the company’s most recent earnings release prompted decline in reaction to a slowdown in sales and earnings. The selloff was further exacerbated by an unexpected reduction in near-term guidance. Additionally, a new CEO began leading the company on April 1. We expect the company to remediate its short-term challenges and we are confident that its business model remains fundamentally robust.
Fund Additions and Eliminations
During the fiscal year, Jensen purchased positions inPfizer, Texas InstrumentsandVF Corporationwhile selling its positions inCoca-ColaandLinde (held as Praxair prior to the merger).Additionally,Broadridge Financial Solutionswas sold from the Fund and subsequently repurchased later in the reporting period. These changes were in addition to normal add and trim trades during the period executed to take advantage of valuation opportunities. A brief synopsis of the changes follows:
At the beginning of the period, Jensen completed the purchase ofPfizerand the sale ofBroadridge.Both of these trades commenced in late May but were not completed until early in the reporting period.
Broadridge Financial Solutions (BR)is a North American market leader in investor communications and trade processing. The company’s shares appreciated rapidly after our initial purchase in 2017, resulting in a stock price in excess of our estimate of full value. In keeping with our valuation discipline, we exited the position despite a relatively short holding period of approximately one year. We continued to monitor Broadridge and as discussed below, repurchased the company’s shares once the valuation of said shares became more attractive.
Pfizer (PFE)is a global biopharmaceutical company, operating a broad set of businesses including Pharmaceuticals, Biosimilars, and Consumer Healthcare. The investment case for Pfizer is bolstered by its diversified drug portfolio and an underappreciated drug pipeline. The company benefits from longstanding competitive advantages including drug development resources, intellectual property protection, and a global distribution infrastructure. Although Pfizer is a mature, slower-growth
| | |
| 2 | The Jensen Quality Growth Fund Inc. | Annual Report |
company, our analysis indicates the company is nearing an inflection point where visible top-line growth headwinds will abate and revenues should be enhanced by contributions from the company’s robust drug pipeline.
In August 2018, Jensen’s investment team soldCoca-Cola (KO), a long-time Fund holding, due primarily to the rich valuation of the company’s stock against a backdrop of challenging business growth.
Despite weakness in its core carbonated soft drink business over the past few years due to changing consumer preferences, we believe Coca-Cola remains a high quality company given its strong market positions, well-known brand names, solid balance sheet, economies of scale and ability to generate significant amounts of free cash flow.
While it is never easy to sell a strong business, we believe investors must remain disciplined when it comes to the price at which they are willing to purchase and hold a company’s stock. Our goal is to always own shares in outstanding businesses, but only if those shares are attractively priced. As Coca-Cola possesses many of the characteristics we look for in a high quality business, we will continue to monitor its fundamentals as well as the valuation of its stock.
In December 2018, Jensen’s investment team initiated a position inTexas Instruments (TXN), a leading designer and manufacturer of global analog and embedded semiconductor chips. Analog chips convert physical phenomena such as temperature, pressure, and light into digital signals and embedded chips process those signals. Both types of chips are used in almost every “smart” device including computers, cell phones, automobiles, and industrial systems.
The company’s business case is driven by its shift in analog chip manufacturing, its focus on automotive and industrial end markets, and new technology trends. Semiconductor demand for these markets is typically more stable than other markets, such as consumer electronics, because the platforms in, for example, automotive product lines and industrial systems tend to have much longer product life cycles. These systems are mostly custom designed, and once TXN’s semiconductors are designed into the system, they cannot be easily substituted.
We believe TXN is well positioned to capitalize on important technology trends, including increasing semiconductor content in products to make them more “smart”, autonomous vehicles, the Internet of Things (IoT), and the global adoption of 5G wireless systems.
Our analysis indicates that Texas Instruments benefits from strong competitive advantages, a consistently high return on equity, and robust free cash flow generation. Importantly, our valuation metrics indicate the stock price does not fully value the strengths of the enterprise and its growth and profitability opportunities, even with our relatively conservative assumptions.
In March, Jensen’s investment team added positions inBroadridge Financial Solutions (BR)andVF Corporation (VFC).
| | |
| Annual Report | The Jensen Quality Growth Fund Inc. | 3 |
Broadridge is best known for proxy services, in which it processes nearly 80% of proxy votes in the domestic market. In this business, BR works with broker-dealers, corporate issuers, and investors to facilitate proxy voting and tabulation. In its trade processing business, BR processes an average $5 trillion in daily trading volume primarily for mid-sized capital market firms.
The investment case for BR is unchanged since our original purchase in 2017 and is bolstered by intertwined competitive advantages. The company’s core competency is the management of complex tasks for its clients. As a result, scale and scope of operations are critical business success factors, allowing BR to perform proxy voting and trade processing more efficiently than any one client individually. This leads to high customer switching costs, the second competitive advantage.
We expect BR to grow and create business value due to increasing capital markets activity and regulatory complexity. Additionally, the company has an ongoing acquisition program aimed at identifying new technologies that can benefit from BR’s established customer network and strong brand equity. Finally, BR collects a vast amount of data as part of its ongoing business efforts, and we believe the company’s effort to analyze, package and monetize this data represents an underappreciated long-term opportunity.
VF Corporationis one of the world’s largest apparel and footwear companies, with multiple brands organized into four categories: Outdoor, Active and Work.
Key to the investment case for VFC is the strength of its brand portfolio, which covers the spectrum of outerwear, performance apparel, casualwear, footwear, and occupational categories, including The North Face, Vans, Timberland, Dickies, Icebreaker, Smartwool, Altra, and others. With the JanSport, Eastpak, and Eagle Creek brands VFC also enjoys a strong position in the U.S. backpack and luggage market.
We also favor VFC’s growing diversity of revenue sources. Approximately two-thirds of the company’s sales are to resellers, including a rapidly-growing online channel, in addition to the more traditional department and specialty stores. The remaining third of sales represent VFC’s direct-to-consumer business, including retail stores, outlet stores, and e-commerce sites. VFC’s sales are primarily in the U.S. (57% of revenues), with the balance mostly in Europe (24%) and Asia-Pacific (11%).
That said, we are mindful of the risks that VFC faces. The industry is competitive and exposed to cyclical factors including consumer spending and consumer tastes, although VFC has mitigated this concern with a track record of continual innovation. Additionally, the company is exposed to fashion and weather risks: for example, if the company has the wrong product on the shelves, sales can suffer. VFC addresses these risks with the increased use of data mining and analytics, such as point-of-sale data, social media trends, and weather data. Finally, while the company has had several success stories with its acquisitions, not all have worked out flawlessly. However, the company’s acquisitions in recent years appear considerably more promising than some of those made in the early 2000s.
| | |
| 4 | The Jensen Quality Growth Fund Inc. | Annual Report |
Overall, we believe VFC possesses many of the characteristics we look for in a quality company, including solid competitive advantages, strong free cash flow, good growth drivers, a stable balance sheet, and consistently high returns on shareholder capital.
In April, 2019, we completed the liquidation ofLinde plc (Linde)from the Jensen Quality Growth Fund due to its return on equity (ROE) falling below our required hurdle rate of 15%. Linde was formed in October 2018 via the merger of Linde AG, an industrial gas company based in Germany, and Praxair, Inc. (Praxair), a long term portfolio holding. From an accounting perspective, Praxair was considered the acquirer in the merger. Generally Accepted Accounting Principles require the assets, liabilities and equity of a business to be marked to fair market value if it is acquired. This accounting rule resulted in a significant increase in Linde AG’s equity. When combined with Praxair’s equity, this increase caused the combined entity’s ROE to fall below our longstanding 15% requirement.
The Jensen Outlook
As we move into the second half of 2019, our overall outlook remains mixed. Stock valuations are supported by generally positive economic indicators, including low unemployment and elevated consumer confidence, and by expectations of reasonably solid corporate earnings growth in 2019. Earnings growth does appear to be “back-loaded” and therefore dependent on a strong fourth quarter, which could make for additional volatility should expectations revise downward. Other data signals the top of the economic cycle, characterized by frothy corporate credit markets, inverted yield curves, an extended bull market, and weakening industrial and residential construction indicators. Concerns over rising interest rates appear to have dissipated in favor of interest rate reductions, and many “recession risk” indicators have increased due to fears over slowing global growth accentuated by threats to global trade.
Other concerns remain, including geopolitical turmoil, U.S. policy uncertainty, a stronger U.S. dollar, regulatory threats, and high asset valuations. While it appears likely that low unemployment and stable economic conditions will characterize the US economy for the remainder of the year, we recognize that unforeseen events can rapidly change the outlook. Growth concerns remain for 2020 and beyond, primarily due to softening global trade, geopolitical issues and the forthcoming US election cycle. Consequently, we believe our investment in high-quality companies and our emphasis on risk management remains as important as ever.
Overall, we continue to expect the potential for strong fundamental performance from the companies held in the Fund given their competitive strengths, wide economic moats, strong cash flow generation and attractive growth prospects. We constantly seek information that will inform and enhance our decision making in mitigating business, pricing and positioning risk in the Fund and continue to believe that, as has been the case in recent quarters, stock market volatility can provide an opportunity for focused, active investment managers such as Jensen to make a positive difference on behalf of our investors.
| | |
| Annual Report | The Jensen Quality Growth Fund Inc. | 5 |
We invite you to seek additional information about The Jensen Quality Growth Fund at www.jenseninvestment.com where additional content, including updated holdings and performance information, is available. We take our investment responsibilities seriously and appreciate the trust you have placed in us. As always, we welcome your feedback.
Sincerely,
The Jensen Investment Committee
This discussion and analysis of the Fund is as of May 2019 and is subject to change, and any forecasts made cannot be guaranteed. Past performance is no guarantee of future results.Fund holdings and sector weightings are subject to change and are not recommendations to buy or sell any security. For more complete information regarding performance and holdings, please refer to the financial statements and schedule of investments headings of this report.Current and future portfolio holdings are subject to risk. The Fund is nondiversified, meaning that it may concentrate its assets in fewer individual holdings than a diversified fund and is therefore more exposed to individual stock volatility than a diversified fund. The prices of growth stocks may be sensitive to changes in current or expected earnings, may experience larger price swings and may be out of favor with investors at different periods of time. Earnings growth is not a measure of the fund’s future performance. The S&P 500 Stock Index: is an unmanaged but commonly used measure of common stock total return performance. One cannot invest directly in an index. Return on Equity: Is equal to a company’s after-tax earnings (excluding non-recurring items) divided by its average stockholder equity for the year. Return on Invested Capital: a calculation used to assess a company’s efficiency at allocating the capital under its control to profitable investments. Return on invested capital gives a sense of how well a company is using its money to generate returns. Free Cash Flow: Is equal to the after-tax net income of a company plus depreciation and amortization less capital expenditures. For use only when preceded or accompanied by a current prospectus for the Fund. The Jensen Quality Growth Fund is distributed by Quasar Distributors, LLC. |
| | |
| 6 | The Jensen Quality Growth Fund Inc. | Annual Report |
Jensen Quality Growth Fund Inc. - Class J (Unaudited)
Total Returns vs.The S&P 500
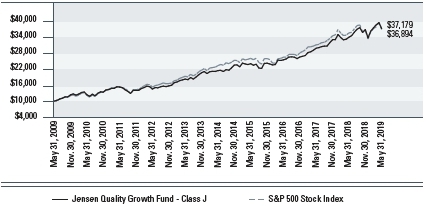
Average Annual Returns–
For periods ended May 31, 2019 | | 1 year | 3 years | 5 years | 10 years |
| Jensen Quality Growth Fund - Class J | | 9.58% | 13.45% | 11.64% | 14.03% |
| S&P 500 Stock Index | | 3.78% | 11.72% | 9.66% | 13.95% |
The S&P 500 Stock Index is an unmanaged but commonly used measure of common stock total return performance. This chart assumes an initial gross investment of $10,000 made on May 31, 2009 for Class J. Returns shown include the reinvestment of all dividends. Returns shown do not reflect the deduction of taxes that a shareholder would pay on fund distributions or the redemption of fund shares.
Performance data shown represents past performance; Past performance does not guarantee future results. The investment return and principal value of an investment will fluctuate so that an investor’s shares, when redeemed, may be worth more or less than their original cost. Current performance of the fund may be lower or higher than the performance shown. Performance data current to the most recent month end may be obtained by calling 1-800-992-4144 or by visiting www.jenseninvestment.com.
| | |
| Annual Report | The Jensen Quality Growth Fund Inc. | 7 |
Jensen Quality Growth Fund Inc. - Class R (Unaudited)
Total Returns vs.The S&P 500
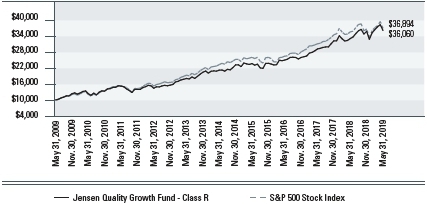
Average Annual Returns–
For periods ended May 31, 2019 | | 1 year | 3 years | 5 years | 10 years |
| Jensen Quality Growth Fund - Class R | | 9.17% | 13.02% | 11.24% | 13.68% |
| S&P 500 Stock Index | | 3.78% | 11.72% | 9.66% | 13.95% |
The S&P 500 Stock Index is an unmanaged but commonly used measure of common stock total return performance. This chart assumes an initial gross investment of $10,000 made on May 31, 2009 for Class R. Returns shown include the reinvestment of all dividends. Returns shown do not reflect the deduction of taxes that a shareholder would pay on fund distributions or the redemption of fund shares.
Performance data shown represents past performance; Past performance does not guarantee future results. The investment return and principal value of an investment will fluctuate so that an investor’s shares, when redeemed, may be worth more or less than their original cost. Current performance of the fund may be lower or higher than the performance shown. Performance data current to the most recent month end may be obtained by calling 1-800-992-4144 or by visiting www.jenseninvestment.com.
| | |
| 8 | The Jensen Quality Growth Fund Inc. | Annual Report |
Jensen Quality Growth Fund Inc. - Class I (Unaudited)
Total Returns vs.The S&P 500
Average Annual Returns–
For periods ended May 31, 2019 | | 1 year | 3 years | 5 years | 10 years |
| Jensen Quality Growth Fund - Class I | | 9.85% | 13.74% | 11.92% | 14.34% |
| S&P 500 Stock Index | | 3.78% | 11.72% | 9.66% | 13.95% |
The S&P 500 Stock Index is an unmanaged but commonly used measure of common stock total return performance. This chart assumes an initial gross investment of $250,000 made on May 31, 2009 for Class I. Returns shown include the reinvestment of all dividends. Returns shown do not reflect the deduction of taxes that a shareholder would pay on fund distributions or the redemption of fund shares.
Performance data shown represents past performance; Past performance does not guarantee future results. The investment return and principal value of an investment will fluctuate so that an investor’s shares, when redeemed, may be worth more or less than their original cost. Current performance of the fund may be lower or higher than the performance shown. Performance data current to the most recent month end may be obtained by calling 1-800-992-4144 or by visiting www.jenseninvestment.com.
| | |
| Annual Report | The Jensen Quality Growth Fund Inc. | 9 |
Jensen Quality Growth Fund Inc. - Class Y (Unaudited)
Total Returns vs. The S&P 500
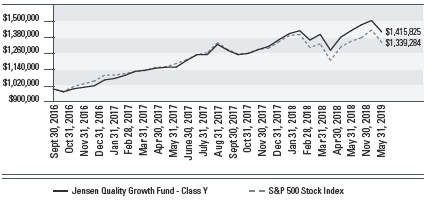
| Total Returns– | | 1 Year | Since Inception |
| For periods ended May 31, 2019 | | | (September 30, 2016) |
| Jensen Quality Growth Fund - Class Y | | 9.90% | 13.93% |
| S&P 500 Stock Index | | 3.78% | 11.58% |
The S&P 500 Stock Index is an unmanaged but commonly used measure of common stock total return performance. This chart assumes an initial gross investment of $1,000,000 made on September 30, 2016 (commencement of operations for Class Y). Returns shown include the reinvestment of all dividends. Returns shown do not reflect the deduction of taxes that a shareholder would pay on fund distributions or the redemption of fund shares.
Performance data shown represents past performance; Past performance does not guarantee future results. The investment return and principal value of an investment will fluctuate so that an investor’s shares, when redeemed, may be worth more or less than their original cost. Current performance of the fund may be lower or higher than the performance shown. Performance data current to the most recent month end may be obtained by calling 1-800-992-4144 or by visiting www.jenseninvestment.com.
| | |
| 10 | The Jensen Quality Growth Fund Inc. | Annual Report |
Investments by Sector as of May 31, 2019
(as a Percentage of Total Investments) (Unaudited)
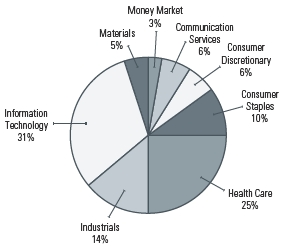
The Global Industry Classification Standard (GICS®) was developed by and/or is the exclusive property of MSCI, Inc. and Standard & Poor’s Financial Services LLC (“S&P”). GICS is a service mark of MSCI and S&P and has been licensed for use by U.S. Bancorp Fund Services, LLC doing business as U.S. Bank Global Fund Services.
| | |
| Annual Report | The Jensen Quality Growth Fund Inc. | 11 |
Statement of Assets & Liabilities
May 31, 2019
| Assets: | | |
| Investments, at value (cost $4,181,783,367) | | $7,089,583,641 |
| Dividend and interest income receivable | | 15,434,536 |
| Receivable for capital stock issued | | 6,802,624 |
| Other assets | | 161,675 |
| Total assets | | 7,111,982,476 |
| |
| Liabilities: | | |
| Payable to Investment Adviser | | 3,135,979 |
| Payable for capital stock redeemed | | 7,112,262 |
| Accrued distribution fees | | 970,224 |
| Accrued director fees | | 53,930 |
| Accrued custodian fees | | 71,691 |
| Accrued expenses and other liabilities | | 971,887 |
| Total liabilities | | 12,315,973 |
| Total Net Assets | | $7,099,666,503 |
| |
| Net Assets Consist of: | | |
| Capital stock | | 3,891,255,515 |
| Total distributable earnings | | 3,208,410,988 |
| Total Net Assets | | $7,099,666,503 |
| |
| Net Assets Consist of: | | |
| Class J Shares | | |
| Net Assets | | $2,700,302,744 |
| Shares outstanding | | 56,506,605 |
| Net Asset Value - Offering Price and Redemption Price Per Share | | |
| (2,000,000,000 shares authorized) | | $47.79 |
| |
| Class R Shares | | |
| Net Assets | | $28,197,179 |
| Shares outstanding | | 593,266 |
| Net Asset Value - Offering Price and Redemption Price Per Share | | |
| (1,000,000,000 shares authorized) | | $47.53 |
| |
| Class I Shares | | |
| Net Assets | | $3,454,461,330 |
| Shares outstanding | | 72,258,148 |
| Net Asset Value - Offering Price and Redemption Price Per Share | | |
| (1,000,000,000 shares authorized) | | $47.81 |
| |
| Class Y Shares | | |
| Net Assets | | $916,705,250 |
| Shares outstanding | | 19,177,084 |
| Net Asset Value - Offering Price and Redemption Price Per Share | | |
| (1,000,000,000 shares authorized) | | $47.80 |
The accompanying notes are an integral part of these financial statements.
| | |
| 12 | The Jensen Quality Growth Fund Inc. | Annual Report |
Schedule of Investments
May 31, 2019 (showing percentage of total net assets)
Common Stocks - 96.94%
| shares | Aerospace & Defense - 6.00% | value |
| 3,371,000 | United Technologies Corporation | $425,757,300 |
| |
| shares | Air Freight & Logistics - 2.24% | value |
| 1,714,000 | United Parcel Service, Inc. - Class B | $159,264,880 |
| |
| shares | Beverages - 6.93% | value |
| 3,843,000 | PepsiCo, Inc. | $491,904,000 |
| |
| shares | Chemicals - 4.79% | value |
| 1,846,000 | Ecolab, Inc. | $339,830,140 |
| |
| shares | Electrical Equipment - 2.40% | value |
| 2,826,000 | Emerson Electric Company | $170,238,240 |
| |
| shares | Electronic Equipment, Instruments & Components - 1.78% | value |
| 1,451,000 | Amphenol Corporation - Class A | $126,237,000 |
| |
| shares | Health Care Equipment & Supplies - 10.93% | value |
| 1,954,000 | Becton Dickinson & Company | $456,141,760 |
| 1,746,000 | Stryker Corporation | $319,937,040 |
| | $776,078,800 |
| |
| shares | Health Care Providers & Services - 5.88% | value |
| 1,726,000 | UnitedHealth Group, Inc. | $417,346,800 |
| |
| shares | Household Products - 3.28% | value |
| 2,266,000 | The Procter & Gamble Company | $233,194,060 |
| |
| shares | Industrial Conglomerates - 3.76% | value |
| 1,672,600 | 3M Company | $267,197,850 |
| |
| shares | Interactive Media & Services - 2.98% | value |
| 191,000 | Alphabet, Inc. - Class A (a) | $211,341,500 |
The accompanying footnotes are an integral part of the Financial Statements.
| | |
| Annual Report | The Jensen Quality Growth Fund Inc. | 13 |
Schedule of Investmentscontinued
May 31, 2019 (showing percentage of total net assets)
| shares | IT Services - 11.33% | value |
| 1,595,000 | Accenture PLC - Class A (b) | $284,021,650 |
| 1,007,000 | Broadridge Financial Solutions, Inc. | $125,744,090 |
| 3,665,000 | Cognizant Technology Solutions Corporation - Class A | $226,973,450 |
| 668,000 | Mastercard, Inc. - Class A | $167,995,320 |
| | $804,734,510 |
| |
| shares | Life Sciences Tools & Services - 0.43% | value |
| 151,300 | Waters Corporation (a) | $30,367,423 |
| |
| shares | Media - 2.99% | value |
| 2,740,000 | Omnicom Group, Inc. | $211,966,400 |
| |
| shares | Pharmaceuticals - 7.95% | value |
| 2,531,000 | Johnson & Johnson | $331,940,650 |
| 5,607,000 | Pfizer, Inc. | $232,802,640 |
| | $564,743,290 |
| |
| shares | Semiconductors & Semiconductor Equipment - 1.00% | value |
| 683,000 | Texas Instruments, Inc. | $71,243,730 |
| |
| shares | Software - 13.03% | value |
| 457,000 | Intuit, Inc. | $111,896,450 |
| 3,809,000 | Microsoft Corporation | $471,097,120 |
| 6,756,000 | Oracle Corporation | $341,853,600 |
| | $924,847,170 |
| |
| shares | Specialty Retail - 1.92% | value |
| 2,710,600 | The TJX Companies, Inc. | $136,316,074 |
| |
| shares | Technology Hardware, Storage & Peripherals - 3.78% | value |
| 1,531,000 | Apple, Inc. | $268,032,170 |
The accompanying footnotes are an integral part of the Financial Statements.
| | |
| 14 | The Jensen Quality Growth Fund Inc. | Annual Report |
Schedule of Investmentscontinued
May 31, 2019 (showing percentage of total net assets)
| shares | Textiles, Apparel & Luxury Goods - 3.54% | value |
| 1 | Kontoor Brands, Inc. (a) | $25 |
| 1,945,000 | NIKE, Inc. - Class B | $150,037,300 |
| 1,240,000 | VF Corporation | $101,531,200 |
| | $251,568,525 |
| |
| Total Common Stocks | value |
| (Cost $ 3,974,409,588) | $6,882,209,862 |
| |
| Short-Term Investment - 2.92% | |
| |
| shares | Money Market Fund - 2.92% | value |
| 207,373,779 | First American Treasury Obligations Fund - | |
| Class X, 2.30% (c) | $207,373,779 |
| |
| Total Short-Term Investment | value |
| (Cost $207,373,779) | $207,373,779 |
| |
| Total Investments | value |
| (Cost $ 4,181,783,367) - 99.86% | $7,089,583,641 |
| Other Assets in Excess of Liabilities - 0.14% | $10,082,862 |
| TOTAL NET ASSETS - 100.00% | $7,099,666,503 |
Percentages are stated as a percent of net assets.
| (a) | Non-income producing security. |
| (b) | Foreign issued security. Foreign concentration (including ADRs) was as follows: Ireland 4.00% as a percentage of net assets. |
| (c) | Variable rate security. Rate listed is the 7-day effective yield as of May 31, 2019. |
The accompanying footnotes are an integral part of the Financial Statements.
| | |
| Annual Report | The Jensen Quality Growth Fund Inc. | 15 |
Statement of Operations
Year Ended May 31, 2019
| Investment Income: | |
| Dividend income | $119,184,938 |
| Interest income | 5,015,803 |
| Total investment income | 124,200,741 |
| | |
| Expenses: | |
| Investment advisory fees | 33,222,026 |
| 12b-1 fees - Class J | 6,746,394 |
| Administration fees | 2,124,118 |
| Shareholder servicing fees - Class I | 1,738,634 |
| Sub-transfer agent expenses - Class J | 1,520,236 |
| Custody fees | 398,898 |
| Fund Accounting fees | 378,323 |
| Federal and state registration fees | 233,289 |
| Directors' fees and expenses | 225,267 |
| Reports to shareholders - Class I | 220,134 |
| Transfer agent fees - Class I | 196,878 |
| 12b-1 fees - Class R | 157,741 |
| Reports to shareholders - Class J | 133,416 |
| Other | 123,329 |
| Transfer agent fees - Class J | 121,905 |
| Transfer agent expenses | 104,708 |
| Professional fees | 90,961 |
| Shareholder servicing fees - Class R | 55,148 |
| Reports to shareholders - Class Y | 12,939 |
| Transfer agent fees - Class Y | 4,610 |
| Transfer agent fees - Class R | 3,916 |
| Reports to shareholders - Class R | 2,392 |
| Total expenses | 47,815,262 |
| |
| Net Investment Income | 76,385,479 |
| | |
| Realized and Unrealized Gain on Investments: | |
| Net realized gain on investment transactions | 580,075,042 |
| Change in unrealized depreciation on investments | (46,229,226) |
| Net realized and unrealized gain on investments | 533,845,816 |
| Net Increase in Net Assets Resulting from Operations | $610,231,295 |
The accompanying notes are an integral part of these financial statements.
| | |
| 16 | The Jensen Quality Growth Fund Inc. | Annual Report |
Statements of Changes in Net Assets
| Operations: | Year Ended
May 31, 2019 | Year Ended
May 31, 2018 |
| Net investment income | 76,385,479 | 69,013,380 |
| Net realized gain on investment transactions | 580,075,042 | 379,440,936 |
| Change in unrealized appreciation(depreciation) on investments | (46,229,226) | 387,963,164 |
| Net increase in net assets resulting from operations | 610,231,295 | 836,417,480 |
| | |
| Capital Share Transactions: | Year Ended
May 31, 2019 | Year Ended
May 31, 2018 |
| Shares Sold - Class J | 533,926,355 | 318,777,023 |
| Shares Sold - Class R | 7,530,735 | 11,103,721 |
| Shares Sold - Class I | 1,049,002,736 | 601,695,778 |
| Shares Sold - Class Y | 534,927,566 | 133,538,669 |
| Shares issued in reinvestment of dividends - Class J | 230,092,588 | 85,647,642 |
| Shares issued in reinvestment of dividends - Class R | 2,552,375 | 967,593 |
| Shares issued in reinvestment of dividends - Class I | 273,739,108 | 104,958,206 |
| Shares issued in reinvestment of dividends - Class Y | 55,807,450 | 16,537,081 |
| Shares redeemed - Class J | (668,700,938) | (672,727,820) |
| Shares redeemed - Class R | (14,033,851) | (10,941,650) |
| Shares redeemed - Class I | (1,146,065,109) | (807,098,857) |
| Shares redeemed - Class Y | (194,596,353) | (103,110,798) |
| Net increase (decrease) | 664,182,662 | (320,653,412) |
| | |
| Dividends and Distributions to Shareholders: | Year Ended
May 31, 2019 | Year Ended
May 31, 2018 |
| Net dividends and distributions to shareholders - Class J | (234,506,653) | (87,149,019) |
| Net dividends and distributions to shareholders - Class R | (2,566,702) | (972,120) |
| Net dividends and distributions to shareholders - Class I | (298,290,314) | (112,196,567) |
| Net dividends and distributions to shareholders - Class Y | (63,619,985) | (17,064,479) |
| Total dividends and distributions | (598,983,654) | (217,382,185)(1) |
| | |
| Increase in Net Assets | Year Ended
May 31, 2019 | Year Ended
May 31, 2018 |
| 675,430,303 | 298,381,883 |
| | | |
| Net Assets: | Year Ended
May 31, 2019 | Year Ended
May 31, 2018 |
| Beginning of Year | 6,424,236,200 | 6,125,854,317 |
| End of Year | $7,099,666,503 | $6,424,236,200(2) |
| (1) | Includes net investment income distributions of $24,194,817, $174,830, $37,011,500, and $5,824,051 and net realized gain distributions of $62,954,202, $797,290, $75,185,067 and $11,240,428 for Class J, Class R, Class I and Class Y, respectively. |
| (2) | Includes accumulated net investment income of $13,768,569. |
The accompanying notes are an integral part of these financial statements.
| | |
| Annual Report | The Jensen Quality Growth Fund Inc. | 17 |
Financial Highlights
Class J
| Per Share Data: | year ended
May 31, 2019 | year ended
May 31, 2018 | year ended
May 31, 2017 | year ended
May 31, 2016 | year ended
May 31, 2015 |
| Net asset value, beginning | | | | | |
| of year | $47.87 | $43.44 | $38.78 | $40.88 | $38.33 |
| Income from investment | | | | | |
| operations: | | | | | |
| Net investment income(1) | 0.47 | 0.44 | 0.45 | 0.46 | 0.44 |
| Net realized and unrealized | | | | | |
| gains on investments | 3.88 | 5.49 | 6.00 | 1.72 | 4.14 |
| Total from investment | | | | | |
| operations | 4.35 | 5.93 | 6.45 | 2.18 | 4.58 |
| Less distributions: | | | | | |
| Dividends from net | | | | | |
| investment income | (0.46) | (0.41) | (0.43) | (0.49) | (0.40) |
| Distributions from | | | | | |
| capital gains | (3.97) | (1.09) | (1.36) | (3.79) | (1.63) |
| Total distributions | $(4.43) | $(1.50) | $(1.79) | $(4.28) | $(2.03) |
| Net asset value, end of year | $47.79 | $47.87 | $43.44 | $38.78 | $40.88 |
| Total return | 9.58% | 13.77% | 17.12% | 5.99% | 12.07% |
| Supplemental data and ratios: | | | | | |
| Net assets, end of | | | | | |
| year (000’s) | $2,700,303 | $2,594,126 | $2,604,964 | $2,317,939 | $2,273,979 |
| Ratio of expenses to | | | | | |
| average net assets | 0.86% | 0.87% | 0.87% | 0.87% | 0.87% |
| Ratio of net investment | | | | | |
| income to average | | | | | |
| net assets | 0.97% | 0.92% | 1.12% | 1.18% | 1.08% |
| Portfolio turnover rate | 17.50% | 9.06% | 6.80% | 14.12% | 14.42% |
| (1) | Net investment income per share is calculated using the ending accumulated net investment income balances prior to consideration or adjustments for permanent book-to-tax differences. |
The accompanying notes are an integral part of these financial statements.
| | |
| 18 | The Jensen Quality Growth Fund Inc. | Annual Report |
Financial Highlights
Class R
| Per Share Data: | year ended
May 31, 2019 | year ended
May 31, 2018 | year ended
May 31, 2017 | year ended
May 31, 2016 | year ended
May 31, 2015 |
| Net asset value, beginning | | | | | |
| of year | $47.62 | $43.23 | $38.59 | $40.69 | $38.16 |
| Income from investment | | | | | |
| operations: | | | | | |
| Net investment income(1) | 0.28 | 0.26 | 0.29 | 0.32 | 0.28 |
| Net realized and unrealized | | | | | |
| gains on investments | 3.86 | 5.47 | 5.98 | 1.72 | 4.14 |
| Total from investment | | | | | |
| operations | 4.14 | 5.73 | 6.27 | 2.04 | 4.42 |
| Less distributions: | | | | | |
| Dividends from net | | | | | |
| investment income | (0.26) | (0.25) | (0.27) | (0.35) | (0.26) |
| Distributions from | | | | | |
| capital gains | (3.97) | (1.09) | (1.36) | (3.79) | (1.63) |
| Total distributions | $(4.23) | $(1.34) | $(1.63) | $(4.14) | $(1.89) |
| Net asset value, end of year | $47.53 | $47.62 | $43.23 | $38.59 | $40.69 |
| Total return | 9.17% | 13.34% | 16.69% | 5.63% | 11.67% |
| Supplemental data and ratios: | | | | | |
| Net assets, end of | | | | | |
| year (000’s) | $28,197 | $31,597 | $27,300 | $29,181 | $38,976 |
| Ratio of expenses to | | | | | |
| average net assets | 1.24% | 1.24% | 1.24% | 1.22% | 1.22% |
| Ratio of net investment | | | | | |
| income to average | | | | | |
| net assets | 0.58% | 0.56% | 0.75% | 0.83% | 0.71% |
| Portfolio turnover rate | 17.50% | 9.06% | 6.80% | 14.12% | 14.42% |
| (1) | Net investment income per share is calculated using the ending accumulated net investment income balances prior to consideration or adjustments for permanent book-to-tax differences. |
The accompanying notes are an integral part of these financial statements.
| | |
| Annual Report | The Jensen Quality Growth Fund Inc. | 19 |
Financial Highlights
Class I
| Per Share Data: | year ended
May 31, 2019 | year ended
May 31, 2018 | year ended
May 31, 2017 | year ended
May 31, 2016 | year ended
May 31, 2015 |
| Net asset value, beginning | | | | | |
| of year | $47.90 | $43.46 | $38.80 | $40.90 | $38.35 |
| Income from investment | | | | | |
| operations: | | | | | |
| Net investment income(1) | 0.60 | 0.55 | 0.56 | 0.56 | 0.53 |
| Net realized and unrealized | | | | | |
| gains on investments | 3.87 | 5.51 | 6.00 | 1.72 | 4.14 |
| Total from investment | | | | | |
| operations | 4.47 | 6.06 | 6.56 | 2.28 | 4.67 |
| Less distributions: | | | | | |
| Dividends from net | | | | | |
| investment income | (0.59) | (0.53) | (0.54) | (0.59) | (0.49) |
| Distributions from | | | | | |
| capital gains | (3.97) | (1.09) | (1.36) | (3.79) | (1.63) |
| Total distributions | $(4.56) | $(1.62) | $(1.90) | $(4.38) | $(2.12) |
| Net asset value, end of year | $47.81 | $47.90 | $43.46 | $38.80 | $40.90 |
| Total return | 9.85% | 14.08% | 17.42% | 6.25% | 12.32% |
| Supplemental data and ratios: | | | | | |
| Net assets, end of | | | | | |
| year (000’s) | $3,454,461 | $3,261,893 | $3,052,698 | $2,799,657 | $3,062,182 |
| Ratio of expenses to | | | | | |
| average net assets | 0.61% | 0.62% | 0.60% | 0.63% | 0.62% |
| Ratio of net investment | | | | | |
| income to average | | | | | |
| net assets | 1.22% | 1.18% | 1.38% | 1.42% | 1.33% |
| Portfolio turnover rate | 17.50% | 9.06% | 6.80% | 14.12% | 14.42% |
| (1) | Net investment income per share is calculated using the ending accumulated net investment income balances prior to consideration or adjustments for permanent book-to-tax differences. |
The accompanying notes are an integral part of these financial statements.
| | |
| 20 | The Jensen Quality Growth Fund Inc. | Annual Report |
Financial Highlights
Class Y
| year ended | year ended | September 30, 2016(1) |
| Per Share Data: | May 31, 2019 | May 31, 2018 | through May 31, 2017 |
| Net asset value, beginning of year | $47.90 | $43.46 | $40.12 |
| Income from investment operations: | | | |
| Net investment income(2) | 0.63 | 0.58 | 0.34 |
| Net realized and unrealized gains on investments | 3.87 | 5.51 | 4.65 |
| Total from investment operations | 4.50 | 6.09 | 4.99 |
| Less distributions: | | | |
| Dividends from net investment income | (0.63) | (0.56) | (0.29) |
| Distributions from capital gains | (3.97) | (1.09) | (1.36) |
| Total distributions | $(4.60) | $(1.65) | $(1.65) |
| Net asset value, end of year | $47.80 | $47.90 | $43.46 |
| Total return | 9.90% | 14.16% | 12.85%(3) |
| Supplemental data and ratios: | | | |
| Net assets, end of year (000’s) | $916,705 | $536,621 | $440,892 |
| Ratio of expenses to average net assets | 0.55% | 0.55% | 0.56%(4) |
| Ratio of net investment income to average | | | |
| net assets | 1.31% | 1.25% | 1.55%(4) |
| Portfolio turnover rate | 17.50% | 9.06% | 6.80%(3) |
| (1) | Commencement of Operations |
| (2) | Net investment income per share is calculated using the ending accumulated net investment income balances prior to consideration or adjustments for permanent book-to-tax differences. |
| (3) | Not annualized |
| (4) | Annualized |
The accompanying notes are an integral part of these financial statements.
| | |
| Annual Report | The Jensen Quality Growth Fund Inc. | 21 |
Notes to the Financial Statements
May 31, 2019
1. Organization and Significant Accounting Policies
The Jensen Quality Growth Fund Inc. (the “Fund”), was incorporated as an Oregon corporation on April 17, 1992, and is registered as an open-end, nondiversified management investment company under the Investment Company Act of 1940 (the “1940 Act”). The Fund commenced operations on August 3, 1992. Effective March 1, 2018, the name of the Fund was changed from The Jensen Portfolio, Inc. doing business as Jensen Quality Growth Fund to The Jensen Quality Growth Fund Inc. The Fund is authorized to issue 5,000,000,000 shares of common stock, all of which have been authorized for the existing share classes. The Fund currently offers four different classes of shares. Effective July 30, 2003, the Fund issued two new classes of shares, Class R and Class I, and renamed the existing class as Class J. Effective September 30, 2016, the Fund issued a new class of shares, Class Y. Class J shares are subject to a 0.25% 12b-1 fee and a sub-transfer agency fee, Class R shares are subject to a 0.50% 12b-1 fee and up to a 0.25% shareholder servicing fee, and Class I shares are subject to a shareholder servicing fee up to 0.10%, as described in each Class’ prospectus. Each class of shares has identical rights and privileges except with respect to the 12b-1 fees, sub-transfer agency fees, shareholder servicing fees, and voting rights on matters affecting a single class of shares. The principal investment objective of the Fund is long-term capital appreciation.
The Fund is an investment company and accordingly follows the investment company accounting and reporting guidance of the Financial Accounting Standards Board (“FASB”) Accounting Standard Codification Topic 946 “Financial Services Investment Companies”.
The following is a summary of significant accounting policies consistently followed by the Fund. The policies are in conformity with accounting principles generally accepted in United States of America (“GAAP”).
a) Investment Valuation –Securities that are listed on United States stock exchanges are valued at the last sale price at the close of the exchange. Equity securities listed on the NASDAQ Stock Market are valued at the NASDAQ Official Closing Price or, if there has been no sale on that day, at their current bid price. Investments in open-end and closed-end registered investment companies, including money market funds, that do not trade on an exchange are valued at the end of day net asset value per share. Quotations are taken from the market in which the security is primarily traded. Over-the-counter securities are valued at the current bid price in the absence of a closing price. Securities for which market quotations are not readily available are valued at fair value as determined by Jensen Investment Management, Inc. (the “Investment Adviser”) at or under the direction of the Fund’s Board of Directors.
There is no definitive set of circumstances under which the Fund may elect to use fair value procedures to value a security. Although the Fund only invests in publicly traded securities, the large majority of which are large capitalization, highly liquid securities, they nonetheless may become
| | |
| 22 | The Jensen Quality Growth Fund Inc. | Annual Report |
securities for which market quotations are not readily available, such as in instances where the market quotation for a security has become stale, sales of a security have been infrequent, trading in the security has been suspended, or where there is a thin market in the security. Securities for which market quotations are not readily available will be valued at their fair value as determined under the Fund’s fair valuation procedures established by the Board of Directors. The Fund is prohibited from investing in restricted securities (securities issued in private placement transactions that may not be offered or sold to the public without registration under the securities laws); therefore, fair value pricing considerations for restricted securities are generally not applicable to the Fund.
Fair Value Measurement –The Fund has adopted authoritative fair valuation accounting standards which establish an authoritative definition of fair value and set out a hierarchy for measuring fair value. These standards require additional disclosures about the various inputs and valuation techniques used to develop the measurements of fair value and a discussion of changes in valuation techniques and related inputs during the year. The three levels of the fair value hierarchy are as follows:
| Level 1 | Inputs that reflect unadjusted quoted prices in active markets for identical assets or liabilities that the Fund has the ability to access at the measurement date. |
| | |
| Level 2 | Inputs other than quoted prices that are observable for the asset or liability either directly or indirectly, including inputs in markets that are not considered to be active and prices for similar securities, interest rates, credit risk, etc. |
| | |
| Level 3 | Inputs that are unobservable (including the Fund’s own assumptions in determining the fair value of investments). |
Inputs refer broadly to the assumptions that market participants use to make valuation decisions, including assumptions about risk. Inputs may include price information, volatility statistics, specific and broad credit data, liquidity statistics, and other factors. A financial instrument’s level within the fair value hierarchy is based on the lowest level of input that is significant to the fair value measurement. However, the determination of what constitutes “observable” requires significant judgment by the Fund. The Fund considers observable data to be that market data which is readily available, regularly distributed or updated, reliable and verifiable, not proprietary, and provided by independent sources that are actively involved in the relevant market. The categorization of a financial instrument within the hierarchy is based upon the pricing transparency of the instrument and does not necessarily correspond to the Fund’s perceived risk of that instrument.
Investments whose values are based on quoted market prices in active markets, include common stocks and certain money market securities, and are classified within Level 1. Investments that trade in markets that are not considered to be active, but are valued based on quoted market prices, dealer quotations or alternative pricing sources supported by observable inputs are classified within Level 2. Investments classified within Level 3 have significant unobservable inputs, as they trade infrequently or not at all.
| | |
| Annual Report | The Jensen Quality Growth Fund Inc. | 23 |
The following is a summary of the inputs used, as of May 31, 2019, to value the Fund’s investments carried at fair value. The inputs and methodology used for valuing securities may not be an indication of the risk associated with investing in those securities.
| Investments at Value | Total | Level 1 | Level 2 | Level 3 |
| Total Common Stocks* | $6,882,209,862 | $6,882,209,862 | $— | $— |
| Total Money Market Fund | 207,373,779 | 207,373,779 | — | — |
| Total Investments | $7,089,583,641 | $7,089,583,641 | $— | $— |
| * | For further information regarding security characteristics and industry classifications, please see the Schedule of Investments. |
The Fund did not hold any investments during the year ended May 31, 2019 with significant unobservable inputs which would be classified as Level 3. The Fund did not hold any derivative instruments during the reporting year.
b) Federal Income Taxes –No provision has been made for Federal income taxes since the Fund has elected to be taxed as a “regulated investment company” and intends to distribute substantially all net investment company taxable income and net capital gains to its shareholders and otherwise comply with the provision of the Internal Revenue Code applicable to regulated investment companies.
The Fund has reviewed all open tax years and major jurisdictions and concluded that there is no tax liability resulting from unrecognized tax benefits relating to uncertain income tax positions taken or expected to be taken as of and for the year ended May 31, 2019. The Fund recognizes interest and penalties, if any, related to uncertain tax benefits in the Statement of Operations. During the year, the Fund did not incur any interest or penalties. Open tax years are those that are open for exam by taxing authorities. The Fund has no examination in progress. The Fund is also not aware of any tax positions for which it is reasonably possible that the total amounts of unrecognized tax benefits will significantly change in the next twelve months.
c) Distributions to Shareholders –Dividends to shareholders are recorded on the ex-dividend date. Dividends from net investment income are declared and paid quarterly by the Fund. Distributions of net realized capital gains, if any, will be declared and paid at least annually. Income and capital gain distributions are determined in accordance with income tax regulations which may differ from GAAP. The Fund may utilize earnings and profits distributed to shareholders on redemption of shares as part of the dividend paid deduction.
d) Use of Estimates –The preparation of financial statements in conformity with GAAP requires management to make estimates and assumptions that affect the reported amounts of assets and liabilities and disclosure of contingent assets and liabilities at the date of the financial statements and the reported amounts of revenues and expenses during the reporting period. Actual results could differ from those estimates.
| | |
| 24 | The Jensen Quality Growth Fund Inc. | Annual Report |
e) Guarantees and Indemnifications –Under the Fund’s organizational documents, each director, officer, employee or other agent of the Fund is indemnified, to the extent permitted by the 1940 Act, against certain liabilities that may arise out of performance of their duties to the Fund. Additionally, in the normal course of business, the Fund enters into contracts that contain a variety of indemnification clauses. The Fund’s maximum exposure under these arrangements is unknown as this would involve future claims that may be made against the Fund that have not yet occurred. However, the Fund has not had prior claims or losses pursuant to these contracts and believes the risk of loss to be remote.
f) Allocation of Income, Expenses and Gains/Losses –Income, expenses (other than those deemed attributable to a specific share class), and gains and losses of the Fund are allocated daily to each class of shares based upon the ratio of net assets represented by each class as a percentage of the net assets of the Fund. Expenses deemed directly attributable to a class of shares are recorded by the specific class. Most Fund expenses are allocated by class based on relative net assets. Transfer agent fees and reports to shareholders are allocated based on the number of shareholder accounts in each class. Sub-transfer agency fees are expensed to the Class J shares based on the actual number of shareholder accounts held and serviced by certain financial intermediaries as described in the Class J shares’ prospectus. 12b-1 fees are expensed at 0.25% of average daily net assets of Class J shares and 0.50% of average daily net assets of Class R shares. Shareholder servicing fees are expensed at up to 0.10% and up to 0.25% of the average daily net assets of Class I shares and Class R shares, respectively.
g) Other –Investment and shareholder transactions are recorded on trade date. Gains or losses from investment transactions are determined on the basis of identified carrying value using the specific identification method. Dividend income is recognized on the ex-dividend date and interest income is recognized on an accrual basis.
2. Capital Share Transactions
Transactions in shares of the Fund were as follows:
| year ended | year ended |
| Class J | May 31, 2019 | May 31, 2018 |
| Shares sold | 11,046,211 | 6,916,189 |
| Shares issued in reinvestment of dividends | 5,035,431 | 1,839,471 |
| Shares redeemed | (13,764,699) | (14,534,746) |
| Net increase (decrease) | 2,316,943 | (5,779,086) |
| Shares outstanding: | | |
| Beginning of year | 54,189,662 | 59,968,748 |
| End of year | 56,506,605 | 54,189,662 |
| | |
| Annual Report | The Jensen Quality Growth Fund Inc. | 25 |
| year ended | year ended |
| Class R | May 31, 2019 | May 31, 2018 |
| Shares sold | 157,385 | 247,836 |
| Shares issued in reinvestment of dividends | 56,253 | 20,824 |
| Shares redeemed | (283,845) | (236,737) |
| Net increase (decrease) | (70,207) | 31,923 |
| Shares outstanding: | | |
| Beginning of year | 663,473 | 631,550 |
| End of year | 593,266 | 663,473 |
| |
| year ended | year ended |
| Class I | May 31, 2019 | May 31, 2018 |
| Shares sold | 21,513,214 | 12,998,023 |
| Shares issued in reinvestment of dividends | 5,979,462 | 2,256,807 |
| Shares redeemed | (23,335,950) | (17,387,620) |
| Net increase (decrease) | 4,156,726 | (2,132,790) |
| Shares outstanding: | | |
| Beginning of year | 68,101,422 | 70,234,212 |
| End of year | 72,258,148 | 68,101,422 |
| |
| | year ended | year ended |
| Class Y | May 31, 2019 | May 31, 2018 |
| Shares sold | 10,783,455 | 2,895,833 |
| Shares issued in reinvestment of dividends | 1,220,077 | 355,721 |
| Shares redeemed | (4,029,913) | (2,192,051) |
| Net increase | 7,973,619 | 1,059,503 |
| Shares outstanding: | | |
| Beginning of year | 11,203,465 | 10,143,962 |
| End of year | 19,177,084 | 11,203,465 |
3. Investment Transactions
The aggregate purchases and aggregate sales of securities, excluding short-term investments, by the Fund for the year ended May 31, 2019, were $1,325,301,628 and $1,147,186,131, respectively.
| | |
| 26 | The Jensen Quality Growth Fund Inc. | Annual Report |
4. Income Taxes
The cost of investments differ for financial statement and tax purposes primarily due to the deferral of losses on wash sales.
The distributions of $74,982,000 and $67,221,763 paid during the years ended May 31, 2019 and 2018, respectively, were classified as ordinary income for tax purposes. The distributions of $524,001,654 and $150,160,422 paid during the years ended May 31, 2019 and 2018, respectively, were classified as long-term capital gain for income tax purposes.
Additionally, U.S. generally accepted accounting principles require that certain components of net assets relating to permanent differences be reclassified between financial and tax reporting. These reclassifications have no effect on net assets or net asset value per share. For the year ended May 31, 2019, distributable earnings decreased by $52,230,847 and capital stock increased by $52,230,847. The permanent difference relates to tax equalization.
At May 31, 2019, the cost of investments, net unrealized appreciation (depreciation) and undistributed ordinary income and undistributed long term capital gains for income tax purposes were as follows:
| Cost of investments | 4,181,838,269 | |
| Gross unrealized appreciation | 3,000,940,252 | |
| Gross unrealized depreciation | (93,194,880 | ) |
| Net unrealized appreciation | 2,907,745,372 | |
| Undistributed ordinary income | 17,483,911 | |
| Undistributed long-term capital gain | 283,181,705 | |
| Distributable earnings | 300,665,616 | |
| Other accumulated gains | — | |
| Total distributable earnings | 3,208,410,988 | |
On June 14, 2019, The Fund declared and paid a distribution from ordinary income of $7,450,289, $11,873,998, $45,606, and $3,285,261 for Class J, Class I, Class R and Class Y, respectively, to shareholders of record as of June 13, 2019.
5. Line of Credit
The Fund has the lesser of (i) $400 million, (ii) 20% of the gross market value of the Fund, or (iii) 33.33% of the net market value of the unencumbered assets of the Fund available under a revolving credit facility, subject to certain restrictions, for temporary emergency purposes, including the meeting of redemption requests that otherwise might require the untimely disposition of securities. The unsecured line of credit has a one-year term and is reviewed annually by the Board of Directors. The credit facility is with the Funds’ custodian, U.S. Bank. The current agreement runs through December 15, 2019. The interest rate on the outstanding principal amount is equal to the prime rate less 1%. As of May 31, 2019, the rate on the Fund’s line of credit was 4.50%. The Fund did not borrow on the line of credit during the year ended May 31, 2019.
| | |
| Annual Report | The Jensen Quality Growth Fund Inc. | 27 |
6. Investment Advisory Agreement
The Fund is a party to an Investment Advisory and Service Contract with the Investment Adviser. Pursuant to the terms of the Investment Advisory and Service Contract approved by Fund shareholders, the Investment Adviser is entitled to receive a fee, calculated daily and payable monthly, at the annual rate of 0.50% as applied to the Fund’s average daily net assets of $4 billion or less, 0.475% as applied to the Fund’s average daily net assets of more than $4 billion and up to $8 billion, 0.45% as applied to the Fund’s average daily net assets of more than $8 billion and up to $12 billion, and 0.425% as applied to the Fund’s average daily net assets of more than $12 billion.
Certain officers and a director of the Fund are also officers and directors of the Investment Adviser.
7. Distribution and Shareholder Servicing
The Fund has adopted a distribution and shareholder servicing plan pursuant to Rule 12b-1 under the 1940 Act (the “12b-1 Plan”), which provides that the Fund make payments to the Fund’s distributor at an annual rate of 0.25% of average daily net assets attributable to Class J shares and 0.50% of the average daily net assets attributable to Class R shares. The Fund’s distributor may then make payments to financial intermediaries or others at an annual rate of up to 0.25% of the average daily net assets attributable to Class J shares and up to 0.50% of the average daily net assets attributable to Class R shares. Payments under the 12b-1 Plan shall be used to compensate the Fund’s distributor or others for services provided and expenses incurred in connection with the sale and/or servicing of shares. 12b-1 fees incurred for the year ended May 31, 2019, are disclosed on the Statement of Operations and the amount payable at year end is disclosed on the Statement of Assets and Liabilities.
In addition, the Fund has adopted a Shareholder Servicing Plan for Class I shares under which the Fund can pay for shareholder support services from the Fund’s assets pursuant to a Shareholder Servicing Agreement in an amount not to exceed 0.10% of the Fund’s average daily net assets attributable to Class I shares. The amount actually incurred for the year ended May 31, 2019 was 0.05% on an annualized basis.
The Fund has also adopted a Shareholder Servicing Plan for the Class R shares. Under the Shareholder Servicing Plan, the Fund can pay for shareholder support services, which include the recordkeeping and administrative services provided by retirement plan administrators to retirement plans (and their participants) that are shareholders of the class. Payments will be made pursuant to a Shareholder Servicing Agreement in an amount not to exceed 0.25% of the Fund’s average daily net assets attributable to Class R shares. The amount actually incurred for the year ended May 31, 2019 was 0.17% on an annualized basis.
8. Beneficial Ownership
The beneficial ownership, either directly or indirectly, of more than 25% of the voting securities of a fund creates presumption of control of the fund, under Section 2(a)(9) of the 1940 Act. At May 31, 2019, Charles Schwab & Co., Inc. and National Financial Services LLC, for the benefit of its customers, held 47.00% and 25.38% of the outstanding shares of the Class J share class, respectively. At May 31, 2019, Edward D Jones and Co., for the benefit of its customers, held 26.44% of the outstanding shares of the Class I share class. At May 31, 2019, Great-West Trust Company LLC, for the benefit of its customers, held 41.58% of the outstanding shares of the Class R share class.
| | |
| 28 | The Jensen Quality Growth Fund Inc. | Annual Report |
9. Recent Accounting Pronouncement
In August 2018, FASB issued ASU 2018-13,Fair Value Measurement(Topic 820):Disclosure Framework—Changes to the Disclosure Requirements for Fair Value Measurement(“ASU 2018-13”). The primary focus of ASU 2018-13 is to improve the effectiveness of the disclosure requirements for fair value measurements. The changes affect all companies that are required to include fair value measurement disclosures. In general, the amendments in ASU 2018-13 are effective for all entities for fiscal years and interim periods within those fiscal years, beginning after December 15, 2019. An entity is permitted to early adopt the removed or modified disclosures upon the issuance of ASU 2018-13 and may delay adoption of the additional disclosures, which are required for public companies only, until their effective date. Management has chosen to early adopt the eliminated or modified disclosures for the year ended May 31, 2019.
| | |
| Annual Report | The Jensen Quality Growth Fund Inc. | 29 |
Report of Independent Registered Public Accounting Firm
To the Shareholders and Board of Directors of
The Jensen Quality Growth Fund Inc.
Opinion on the Financial Statements
We have audited the accompanying statement of assets and liabilities, including the schedule of investments, of The Jensen Quality Growth Fund Inc. (the “Fund”) as of May 31, 2019, and the related statement of operations for the year then ended, the statements of changes in net assets for each of the two years in the period then ended, including the related notes, and the financial highlights for each of the five years in the period then ended (collectively referred to as the “financial statements”). In our opinion, the financial statements present fairly, in all material respects, the financial position of the Fund as of May 31, 2019, the results of its operations for the year then ended, the changes in its net assets for each of the two years in the period then ended, and the financial highlights for each of the five years in the period then ended, in conformity with accounting principles generally accepted in the United States of America.
Basis for Opinion
These financial statements are the responsibility of the Fund’s management. Our responsibility is to express an opinion on the Fund’s financial statements based on our audits. We are a public accounting firm registered with the Public Company Accounting Oversight Board (United States) (“PCAOB”) and are required to be independent with respect to the Fund in accordance with the U.S. federal securities laws and the applicable rules and regulations of the Securities and Exchange Commission and the PCAOB.
We conducted our audits in accordance with the standards of the PCAOB. Those standards require that we plan and perform the audit to obtain reasonable assurance about whether the financial statements are free of material misstatement, whether due to error or fraud.
Our audits included performing procedures to assess the risks of material misstatement of the financial statements, whether due to error or fraud, and performing procedures that respond to those risks. Such procedures included examining, on a test basis, evidence regarding the amounts and disclosures in the financial statements. Our procedures included confirmation of securities owned as of May 31, 2019, by correspondence with the custodian. Our audits also included evaluating the accounting principles used and significant estimates made by management, as well as evaluating the overall presentation of the financial statements. We believe that our audits provide a reasonable basis for our opinion.
We have served as the Fund’s auditor since 2010.
COHEN & COMPANY, LTD.
Cleveland, Ohio
July 23, 2019
| | |
| 30 | The Jensen Quality Growth Fund Inc. | Annual Report |
Expense Example - May 31, 2019 (Unaudited)
As a shareholder of The Jensen Quality Growth Fund Inc. (the “Fund”), you incur ongoing costs, including investment advisory fees, distribution and/or shareholder servicing fees, and other Fund expenses, which are indirectly paid by shareholders. This example is intended to help you understand your ongoing costs (in dollars) of investing in the Fund and to compare these costs with the ongoing costs of investing in other mutual funds.
The Example is based on an investment of $1,000 invested at the beginning of the period and held for the entire six-month period (December 1, 2018 - May 31, 2019).
Actual Expenses
The first line of the table below for each share class of the Fund provides information about actual account values and actual expenses. However, the table does not include shareholder specific fees, such as the $15.00 fee charged to IRA accounts, or the $15.00 fee charged for wire redemptions. The table also does not include portfolio trading commissions and related trading costs. You may use the information in this line, together with the amount you invested, to estimate the expenses that you paid over the period. Simply divide your account value by $1,000 (for example, an $8,600 account value divided by $1,000 = 8.6), then multiply the result by the number in the first line under the heading entitled “Expenses Paid During Period” to estimate the expenses you paid on your account during this period.
Hypothetical Example for Comparison Purposes
The second line of the table below provides information about hypothetical account values and hypothetical expenses based on the actual expense ratios for each share class of the Fund and an assumed rate of return of 5% per year before expenses, which is not the Fund’s actual return. The hypothetical account values and expenses may not be used to estimate the actual ending account balance or expenses you paid for the period. You may use this information to compare the ongoing costs of investing in the Fund and other funds. To do so, compare this 5% hypothetical example with the 5% hypothetical examples that appear in the shareholder reports of the other funds.
Please note that the expenses shown in the table are meant to highlight your ongoing costs only and do not reflect any transactional costs, such as sales charges (loads), redemption fees, or exchange fees which, although not charged by the Fund, may be charged by other funds. Therefore, the second line of the table is useful in comparing ongoing costs only, and will not help you determine the relative total costs of owning different funds.
| | |
| Annual Report | The Jensen Quality Growth Fund Inc. | 31 |
Expense Example Tables
| Jensen Quality Growth Fund – Class J | Beginning
Account Value
Dec. 1, 2018 | Ending
Account Value
May 31, 2019 | Expenses Paid
During Period*
Dec. 1, 2018 –
May 31, 2019 |
| Actual | $ | 1,000.00 | | $ | 1,010.80 | | $ | 4.31 | |
Hypothetical (5% annual return
before expenses) | | 1,000.00 | | | 1,020.64 | | | 4.33 | |
| * | Expenses are equal to the Fund’s annualized six-month expense ratio of 0.86%, multiplied by the average account value over the period, multiplied by 182/365 to reflect the one-half year period. |
| Jensen Quality Growth Fund – Class R | Beginning
Account Value
Dec. 1, 2018 | Ending
Account Value
May 31, 2019 | Expenses Paid
During Period*
Dec. 1, 2018 –
May 31, 2019 |
| Actual | $ | 1,000.00 | | $ | 1,008.90 | | $ | 6.21 | |
Hypothetical (5% annual return
before expenses) | | 1,000.00 | | | 1,018.75 | | | 6.24 | |
| * | Expenses are equal to the Fund’s annualized six-month expense ratio of 1.24%, multiplied by the average account value over the period, multiplied by 182/365 to reflect the one-half year period. |
| Jensen Quality Growth Fund – Class I | Beginning
Account Value
Dec. 1, 2018 | Ending
Account Value
May 31, 2019 | Expenses Paid
During Period*
Dec. 1, 2018 –
May 31, 2019 |
| Actual | $ | 1,000.00 | | $ | 1,012.00 | | $ | 3.01 | |
Hypothetical (5% annual return
before expenses) | | 1,000.00 | | | 1,021.94 | | | 3.02 | |
| * | Expenses are equal to the Fund’s annualized six-month expense ratio of 0.60%, multiplied by the average account value over the period, multiplied by 182/365 to reflect the one-half year period. |
| Jensen Quality Growth Fund – Class Y | Beginning
Account Value
Dec. 1, 2018 | Ending
Account Value
May 31, 2019 | Expenses Paid
During Period*
Dec. 1, 2018 –
May 31, 2019 |
| Actual | $ | 1,000.00 | | $ | 1,012.30 | | $ | 2.76 | |
Hypothetical (5% annual return
before expenses) | | 1,000.00 | | | 1,022.19 | | | 2.77 | |
| * | Expenses are equal to the Fund’s annualized six-month expense ratio of 0.55%, multiplied by the average account value over the period, multiplied by 182/365 to reflect the one-half year period. |
| | |
| 32 | The Jensen Quality Growth Fund Inc. | Annual Report |
Additional Information (Unaudited)
1. Shareholder Notification of Federal Tax Status
The Fund designates 100% of dividends declared during the fiscal year ended May 31, 2019 as dividends qualifying for the dividends received deduction available to corporate shareholders.
The Fund designates 100% of dividends declared from net investment income during the fiscal year ended May 31, 2019 as qualified dividend income under the Jobs and Growth Tax Relief Reconciliation Act of 2003.
The Fund designates as a long-term capital gain dividend, pursuant to the Internal Revenue Code Section 852(b)(3), the amount necessary to reduce earnings and profits of the Fund related to net capital gain to zero for the fiscal year ended May 31, 2019.
Additional Information Applicable to Foreign Shareholders Only:
The Fund designates 3.59% of ordinary income distributions as interest-related dividends under Internal Revenue Code Section 871(k)(1)(c).
The Fund designates 1.389% of ordinary income distributions as short-term capital gain distributions under Internal Revenue Section 871(k)(2)(c).
2. Availability of Proxy Voting Information
Information regarding how the Fund votes proxies relating to portfolio securities is available without charge, upon request by calling toll-free, 1-800-221-4384, or by accessing the SEC’s website at www.sec.gov.
3. Portfolio Holdings
The Fund will file its complete schedule of portfolio holdings with the SEC for the first and third quarters of each fiscal year on Part F of Form N-PORT. The Fund’s Part F of Form N-PORT will be available on the EDGAR database on the SEC’s website at www.sec.gov. These Forms may also be reviewed and copied at the SEC’s Public Reference Room in Washington D.C. Information about the operation of the Public Reference Room may be obtained by calling 1-800-SEC-0330.
| | |
| Annual Report | The Jensen Quality Growth Fund Inc. | 33 |
4. Additional Disclosure Regarding Fund Directors and Officers
Independent Directors
Name, Address
and Age | Position(s)
Held with
the Fund | Term of Office
and Length of
Time Served** | Principal Occupation During
Past Five Years | # of
Portfolios
in Fund
Complex
Overseen
by Director | Other
Directorships
Held by Director
During the Past
Five Years |
| | | | | | |
Roger A. Cooke
The Jensen Quality
Growth Fund Inc.
5500 Meadows Road
Suite 200
Lake Oswego, OR
97035
Year of Birth: 1948 | Independent
Director | Indefinite
Term; since
June 1999. | Retired. Senior Vice President, General Counsel and Secretary of Precision Castparts Corp., a diversified manufacturer of complex metal products, (2000 – 2013); Executive Vice President – Regulatory and Legal Affairs of Fred Meyer, Inc. (now a division of Kroger), a retail grocery and general merchandise company (1992 – 2000). | 1 | None |
| | | | | | |
Robert E. Harold
The Jensen Quality
Growth Fund Inc.
5500 Meadows Road
Suite 200Lake
Oswego, OR 97035
Year of Birth: 1947 | Chairman
and
Independent
Director | Indefinite
Term; since
September
2000 and
Chairman
since
July 2015. | Retired. Senior Director of Financial Planning of Nike, Inc., a footwear and apparel company (2001 – 2002); Global Brand Controller for Nike, Inc. (1996, 1997, 2000 – 2001); Interim Chief Financial Officer for Nike, Inc. (1998 – 1999); Interim Chief Executive Officer for Laika, Inc., an animation studio (March 2005 – October 2005). | 1 | Director of St. Mary’s Academy, a non-profit high school (2000 – 2013, and 2015-present); Director
of Laika, Inc., an animation studio (2002 – present). |
| | | | | | |
Kenneth Thrasher
The Jensen Quality
Growth Fund Inc.
5500 Meadows Road
Suite 200 Lake
Oswego, OR 97035
Year of Birth: 1949 | Independent
Director | Indefinite Term;
since July 2007. | Chairman (2002 – 2018) and CEO (2002 – 2009) of Complí, a web-based compliance and risk management software solution company; President and CEO of Fred Meyer, Inc. (now a division of Kroger), a retail grocery and general merchandise company, from 1999-2001, and other executive positions at Fred Meyer, Inc., including EVP and Chief Administrations Officer and SVP and Chief Financial Officer, from 1982-1999. | 1 | Northwest Natural Gas Company (a natural gas distribution and service provider). |
| | | | | | |
Janet G. Hamilton,
PhD, CFA The Jensen
Quality Growth Fund
Inc. 5500 Meadows
Road Suite 200
Lake Oswego,
OR 97035 Year of
Birth: 1955 | Independent
Director | Indefinite
Term; since
October 2016. | Associate Professor, Finance, Portland State University’s School of Business (1986 – present); Finance Faculty, Oregon Executive MBA, University of Oregon (1989 – 2012). | 1 | None |
| | | | | | |
| | |
| 34 | The Jensen Quality Growth Fund Inc. | Annual Report |
Interested Director
Name, Address
and Age | Position(s)
Held with
the Fund | Term of Office
and Length of
Time Served** | Principal Occupation During
Past Five Years | # of
Portfolios
in Fund
Complex
Overseen
by Director | Other
Directorships
Held by Director
During the Past
Five Years |
Robert D. McIver*
Jensen Investment
Management, Inc.
5500 Meadows Road
Suite 200 Lake Oswego,
OR 97035 Year
of Birth: 1965 | Director and
President | Indefinite Term;
since July 2015;
1 Year Term as
President of the
Fund; Served as
President since
February 2007. | Director (since July 2015) of the Fund; President and Director (February 2007 – present) and Director of Operations (2004 – February 2007) of Jensen Investment Management, Inc.; General Manager of Fairmont Villa Management and Vice President of Fairmont Riverside Golf Estates Ltd (2001 – 2004); Chief Investment Officer, Schroder & Co. Trust Bank (1999 – 2001); Portfolio Manager, Schroder Investment Management (1989 – 1999). | 1 | Jensen Investment Management, Inc. (since February 2007) |
| | |
| Annual Report | The Jensen Quality Growth Fund Inc. | 35 |
Officers of the Fund
Name, Address
and Age | Position(s)
Held with
the Fund | Term of Office
and Length
of Time
Served** | Principal Occupation During
Past Five Years | # of
Portfolios
in Fund
Complex
Overseen
by Director | Other
Directorships
Held by
Director During
the Past
Five Years |
| | | | | | |
Robert D. McIver*
SEE ABOVE | | | | | |
| | | | | | |
Brian S. Ferrie*
Jensen Investment
Management, Inc.
5500 Meadows Road
Suite 200 Lake
Oswego, OR 97035
Year of Birth: 1958 | Treasurer
and Chief
Compliance
Officer | 1 Year Term;
Served since
March 2004. | Vice President, Treasurer and Director (February 2007 – present), Chief Compliance Officer (February 2007 – March 2011, and July 2012 – September 2012), and Director of Finance and Chief Compliance Officer (2003 – February 2007) of Jensen Investment Management, Inc.; Vice President and CFO of Berger Financial Group LLC (2001 – 2003); Vice President and Chief Compliance Officer of Berger Financial Group LLC (1994 – 2001). | N/A | N/A |
| | | | | | |
Eric H. Schoenstein*
Jensen Investment
Management, Inc.
5500 Meadows Road
Suite 200 Lake
Oswego, OR 97035
Year of Birth: 1965 | Vice
President | 1 Year Term;
Served since
January 2011. | Director and Vice President of Business Analysis for Jensen Investment Management, Inc. (2002 – present); various audit positions, most recently Senior Audit Manager, with Arthur Andersen LLP (1988 – 2001). | N/A | Trustee of the Oregon State University Foundation (2008-present) |
| | | | | | |
Richard W. Clark***
Jensen Investment
Management, Inc.
5500 Meadows Road
Suite 200 Lake
Oswego, OR 97035
Year of Birth: 1969 | Vice
President | 1 Year Term;
Served since
April 2017. | Director – Sales and Marketing for Jensen Investment Management, Inc. (2001-present). | N/A | N/A |
| | | | | | |
Gabriel L. Goddard*
Jensen Investment
Management, Inc.
5500 Meadows Road
Suite 200 Lake
Oswego, OR 97035
Year of Birth: 1972 | Vice
President
and
Secretary | 1 Year Term;
Served since
January 2018. | Vice President and Secretary (January 2018- present), Secretary, General Counsel, Chief Compliance Officer (2012- present), and Director (2017-present) of Jensen Investment Management, Inc. | N/A | N/A |
| * | This individual is an “interested person” of the Fund within the meaning of the 1940 Act because he also serves as an officer of the Investment Adviser and owns securities of the Investment Adviser. |
| ** | Each Director serves for an indefinite term in accordance with the Bylaws of the Fund until the date a Director dies, resigns, retires or is removed in accordance with the Bylaws of the Fund. |
| *** | This individual is an “interested person” of the Fund within the meaning of the 1940 Act because he owns securities of the Adviser. |
| | |
| 36 | The Jensen Quality Growth Fund Inc. | Annual Report |

JN-ANNUALQG
| Jensen Quality Growth Fund Inc. |
| | | | |
| Class J Shares | Class I Shares | Class R Shares | Class Y Shares |
Investment Adviser
Jensen Investment Management, Inc.
5500 Meadows Road, Suite 200
Lake Oswego, OR 97035
800.992.4144
Fund Administrator, Transfer Agent,
and Fund Accountant
U.S. Bancorp Fund Services, LLC doing business as
U.S. Bank Global Fund Services
615 East Michigan Street
Milwaukee, WI 53202 Custodian
U.S. Bank, N.A.
Custody Operations
1555 N. RiverCenter Drive, Suite 300
Milwaukee, WI 53212 Legal Counsel
Stoel Rives LLP
760 SW Ninth Ave.
Suite 3000
Portland, OR 97205 Independent Registered Public Accounting Firm
Cohen & Company, Ltd.
1350 Euclid Avenue, Suite 800
Cleveland, OH 44115 Distributor
Quasar Distributors, LLC
777 East Wisconsin Avenue
Milwaukee, WI 53202
jenseninvestment.com
|
| |
This report has been prepared for shareholders and may be distributed to others only if preceded or accompanied by a current prospectus. |
Item 2. Code of Ethics.
The registrant has adopted a code of ethics that applies to the registrant’s principal executive officer and principal financial officer. The registrant has not made any substantive amendments to its code of ethics during the period covered by this report. The registrant has not granted any waivers from any provisions of the code of ethics during the period covered by this report.Incorporated by reference to the registrant’s N-CSR filed on 8/4/2017.
Item 3. Audit Committee Financial Expert.
The registrant’s board of directors has determined that there is at least one audit committee financial expert serving on its audit committee. Robert E. Harold is the “audit committee financial expert” and is considered to be “independent” as each term is defined in Item 3 of Form N-CSR.
Item 4. Principal Accountant Fees and Services.
The registrant has engaged its principal accountant to perform audit services, audit-related services, tax services and other services during the past two fiscal years. “Audit services” refer to performing an audit of the registrant's annual financial statements or services that are normally provided by the accountant in connection with statutory and regulatory filings or engagements for those fiscal years. “Audit-related services” refer to the assurance and related services by the principal accountant that are reasonably related to the performance of the audit. “Tax services” refer to professional services rendered by the principal accountant for tax compliance, tax advice, and tax planning, and relate to Cohen’s review of the registrant’s federal and state tax returns. There were no “Other services” provided by the principal accountant. The following table details the aggregate fees billed or expected to be billed for each of the last two fiscal years for audit fees, audit-related fees, tax fees and other fees by the principal accountant.
| | FYE 5/31/2019 | | FYE 5/31/2018 |
| Audit Fees | | 21,500 | | 21,000 |
| Audit-Related Fees | | 0 | | 0 |
| Tax Fees | | 3,000 | | 3,000 |
| All Other Fees | | 0 | | 0 |
The audit committee has adopted pre-approval policies and procedures that require the audit committee to pre-approve all audit and non-audit services of the registrant, including services provided to any entity affiliated with the registrant.
The percentage of fees billed by Cohen & Company, Ltd. applicable to non-audit services pursuant to waiver of pre-approval requirement were as follows:
| | FYE 5/31/2019 | | FYE 5/31/2018 |
| Audit-Related Fees | | 0% | | 0% |
| Tax Fees | | 0% | | 0% |
| All Other Fees | | 0% | | 0% |
1
All of the principal accountant’s hours spent on auditing the registrant’s financial statements were attributed to work performed by full-time permanent employees of the principal accountant. The following table indicates the non-audit fees billed or expected to be billed by the registrant’s accountant for services to the registrant and to the registrant’s investment adviser (and any other controlling entity, etc.—not sub-adviser) for the last two years. The audit committee of the board of directors has considered whether the provision of non-audit services that were rendered to the registrant's investment adviser is compatible with maintaining the principal accountant's independence and has concluded that the provision of such non-audit services by the accountant has not compromised the accountant’s independence.
| Non-Audit Related Fees | | FYE 5/31/2019 | | FYE 5/31/2018 |
| Registrant | | 3,000 | | 3,000 |
| Registrant’s Investment Adviser | | 24,000 | | 23,500 |
Item 5. Audit Committee of Listed Registrants.
Not applicable to registrants who are not listed issuers (as defined in Rule 10A-3 under the Securities Exchange Act of 1934).
Item 6. Investments.
Schedule of Investments is included as part of the report to shareholders filed under Item 1 of this Form.
Item 7. Disclosure of Proxy Voting Policies and Procedures for Closed-End Management Investment Companies.
Not applicable to open-end investment companies.
Item 8. Portfolio Managers of Closed-End Management Investment Companies.
Not applicable to open-end investment companies.
Item 9. Purchases of Equity Securities by Closed-End Management Investment Company and Affiliated Purchasers.
Not applicable to open-end investment companies.
Item 10. Submission of Matters to a Vote of Security Holders.
There have been no material changes to the procedures by which shareholders may recommend nominees to the registrant’s board of directors
Item 11. Controls and Procedures.
| (a) | The Registrant’s President and Treasurer have reviewed the Registrant's disclosure controls and procedures (as defined in Rule 30a-3(c) under the Investment Company Act of 1940 (the “Act”)) as of a date within 90 days of the filing of this report, as required by Rule 30a-3(b) under the Act and Rules 13a-15(b) or 15d-15(b) under the Securities Exchange Act of 1934. Based on their review, such officers have concluded that the disclosure controls and procedures are effective in ensuring that information required to be disclosed in this report is appropriately recorded, processed, summarized and reported and made known to them by others within the Registrant and by the Registrant’s service provider. |
2
| (b) | There were no changes in the Registrant's internal control over financial reporting (as defined in Rule 30a-3(d) under the Act) that occurred during the second fiscal quarter of the period covered by this report that have materially affected, or are reasonably likely to materially affect, the Registrant's internal control over financial reporting. |
Item 12. Disclosure of Securities Lending Activities for Closed-End Management Investment Companies
Not applicable to open-end investment companies.
Item 13. Exhibits.
| (a) | (1) Any code of ethics or amendment thereto, that is the subject of the disclosure required by Item 2, to the extent that the registrant intends to satisfy Item 2 requirements through filing an exhibit.Incorporated by reference to the Registrant’s Form N-CSR filed August 4, 2017. |
| |
| (2) A separate certification for each principal executive officer and principal financial officer pursuant to Section 302 of the Sarbanes-Oxley Act of 2002.Filed herewith. |
| |
| (3)Any written solicitation to purchase securities under Rule 23c-1 under the Act sent or given during the period covered by the report by or on behalf of the registrant to 10 or more persons.Not applicable to open-end investment companies. |
| |
| (4)Change in the registrant’s independent public accountant.There was no change in the registrant’s independent public accountant for the period covered by this report. |
| |
| (b) | Certifications pursuant to Section 906 of the Sarbanes-Oxley Act of 2002.Furnished herewith. |
3
SIGNATURES
Pursuant to the requirements of the Securities Exchange Act of 1934 and the Investment Company Act of 1940, the registrant has duly caused this report to be signed on its behalf by the undersigned, thereunto duly authorized.
| | (Registrant) | The Jensen Quality Growth Fund Inc. |
| By (Signature and Title)* | /s/ Robert McIver |
| | Robert McIver, President |
Pursuant to the requirements of the Securities Exchange Act of 1934 and the Investment Company Act of 1940, this report has been signed below by the following persons on behalf of the registrant and in the capacities and on the dates indicated.
| By (Signature and Title)* | /s/ Robert McIver |
| | Robert McIver, President |
| By (Signature and Title)* | /s/ Brian Ferrie |
| | Brian Ferrie, Treasurer |
* Print the name and title of each signing officer under his or her signature.
4