If you have already elected to receive shareholder reports electronically, you will not be affected by this change and you need not take any action. You may elect to receive shareholder reports and other communications from the Hennessy Funds electronically by visiting www.hennessyfunds.com/account or by calling U.S. Bank Global Fund Services at 1-800-261-6950. If you own shares in a Fund through a financial intermediary, please contact your financial intermediary to make this election.
What a year it has been. I am reassured by the resiliency of the U.S. financial markets as companies continue to thrive in the midst of policy challenges and political turbulence. Trade tariffs, impeachment, and interest rates have dominated the news headlines, while Brexit and protests in Hong Kong have also been major concerns internationally.
While the financial markets were characterized by volatility during the twelve months ended October 31, 2019, U.S. equities posted double-digit positive performance for the period, with a total return of 14.3% for the S&P 500® Index and 10.3% for the Dow Jones Industrial Average. As I sat down to write this letter, all three major indices, the S&P 500® Index, the Dow Jones Industrial Average, and the NASDAQ Composite Index, recently reached all-time highs.
Every bull market experiences volatility and pullbacks, and this extended bull market is no different. Since 2010, there have been 16 pullbacks of 5-10% and six corrections of over 10%. But what is interesting is not how quickly the declines take place, but rather how swiftly the market regains and surpasses its prior highs. With each decline, many investors and commentators predict that finally this bull market is out of steam. But I ask myself, “Why?”
What I see is a healthy economy and stock market, with fundamentals in place to support a continued bull market. Although slightly above long-term averages, I believe stocks are trading at reasonable valuations, with the Dow Jones Industrial Average trading at 16x forward earnings per share and the S&P 500® Index at 17x forward earnings. At the same time, the U.S. economy is growing at a sustainable pace of 2-3%, corporate profits continue to outperform expectations, and cash continues to build on corporate balance sheets. With over $5 trillion in cash and marketable securities on the balance sheets of the S&P 500® Index companies alone, corporations are returning cash to shareholders through share buybacks and dividends. Share buybacks by S&P 500® Index companies could hit $1 trillion in 2019, surpassing 2018’s record $800 billion, and dividend payments by S&P 500® Index companies are estimated to increase 8-9%. Unemployment continues to be at historically low levels, while wages are growing. Interest rates are also at very low levels, which should support equity prices. Finally, overall consumer confidence remains positive.
To quote Sir John Templeton’s famous saying, “Bull markets are born on pessimism, grow on skepticism, mature on optimism, and die on euphoria.” If you look back to the beginning of the great bull market that began in 1982, only six of the past 37 years ended with negative total returns: 1990, 2000, 2001, 2002, 2008, and 2018. With the exception of 2018, which was characterized by volatility but no euphoria, the other down years were marked by euphoria in either real estate or dot coms. I have been saying for a number of years that I see no signs of euphoria in the market, and I remain confident in the strength of the market today.
Thank you for your continued trust and investment in the Hennessy Funds. We believe that there continue to be great opportunities throughout all parts of the market, and we remain steadfastly focused on managing our high-conviction portfolios for the long-term benefit of our shareholders. Should you have any questions or would like to speak with us directly, please don’t hesitate to call us at (800) 966-4354.
Neil J. Hennessy
Past performance does not guarantee future results.
Mutual fund investing involves risk. Principal loss is possible.
Forward price to earnings is a valuation measure calculated by dividing a company’s market price per share by its expected earnings per share over the following 12 months.
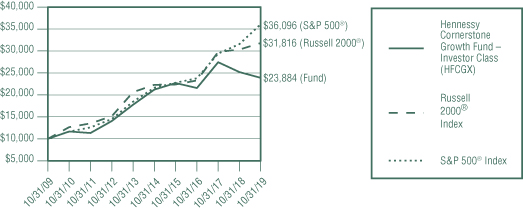
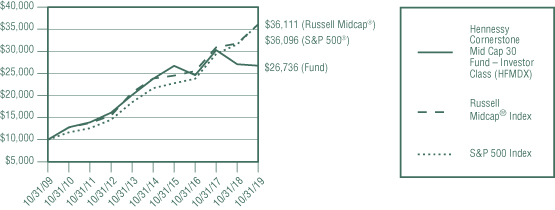
This graph illustrates the performance of an initial investment of $10,000 made in the Fund ten years ago and assumes the reinvestment of dividends.
Performance data quoted represents past performance; past performance does not guarantee future results. The investment return and principal value of an investment will fluctuate so that an investor’s shares, when redeemed, may be worth more or less than their original cost. The performance table does not reflect the deduction of taxes that a shareholder would pay on Fund distributions or the redemption of Fund shares. Current performance of the Fund may be lower or higher than the performance quoted. Performance data current to the most recent month end may be obtained by visiting www.hennessyfunds.com.
The 50/50 Blended DJIA/Treasury Index consists of 50% common stocks represented by the Dow Jones Industrial Average and 50% short-duration Treasury securities represented by the ICE BofAML 1-Year U.S. Treasury Note Index, which comprises U.S. Treasury securities maturing in approximately one year. The Dow Jones Industrial Average is a price-weighted average of 30 significant stocks traded on the New York Stock Exchange or The NASDAQ Stock Market. One cannot invest directly in an index. These indices are used herein for comparative purposes in accordance with SEC regulations.
The Dow Jones Industrial Average is the property of the Dow Jones & Company, Inc. Dow Jones & Company, Inc. is not affiliated with the Fund or its investment advisor. Dow Jones & Company, Inc. has not participated in any way in the creation of the Fund or in the selection of stocks included in the Fund and has not approved any information included in this report.
The expense ratio presented is from the most recent prospectus. The expense ratio for the current reporting period is available in the Financial Highlights section of this report.
Portfolio Managers Neil J. Hennessy, Ryan C. Kelley, CFA, and L. Joshua Wein, CAIA
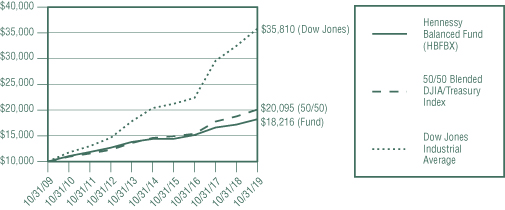
For the 12-month period ended October 31, 2019, the Hennessy Balanced Fund returned 6.05%, underperforming both the 50/50 Blended DJIA/Treasury Index (the Fund’s primary benchmark) and the Dow Jones Industrial Average, which returned 7.08% and 10.32%, respectively, for the same period.
The Fund underperformed its primary benchmark predominantly as a result of sector selection with an underweight position in Consumer Discretionary and an overweight position in Energy. Stock selection in the Consumer Staples and Information Technology sector contributed to Fund performance with International Business Machines Corporation and The Procter & Gamble Company performing well. Exxon Mobil Corporation and Pfizer, Inc. detracted from performance during the period.
The Fund continues to hold all the companies mentioned.
The Fund invests approximately 50% of its assets in the “Dogs of the Dow,” the 10 highest dividend-yielding Dow stocks, and 50% of its assets in U.S. Treasuries. As a result of this “balanced” strategy, the Fund may be expected to underperform equities in periods when equity markets rise and outperform in periods when equity markets fall. The Fund is designed to allow investors to gain some exposure to the equity market while maintaining a significant share of their investment in fixed income securities. We believe the Fund is well positioned for the more conservative investor, as the equity portion of the portfolio is invested in what we would deem to be high-quality companies, each with a historically high dividend yield, while the balance of the Fund is invested in lower-risk, short-duration U.S. Treasuries.
We continue to believe that the outlook for U.S. stocks is positive. In our view, the U.S. economy is growing at a healthy rate, unemployment is low, and growth in both consumption and capital spending has remained strong. While corporate earnings rose only moderately over the 12-month period, they are expected to rise meaningfully over the next 12 months due to continued economic growth.
Should the market experience a correction, we would expect our more defensive holdings to perform well relative to the market. The relatively short duration of the 50% weighting of U.S. Treasuries in the portfolio (all less than one year) may allow us the ability to roll into higher-yielding Treasuries in the event yields continue to rise.
Opinions expressed are those of the Portfolio Managers as of the date written and are subject to change, are not guaranteed, and should not be considered investment advice or an indication of trading intent.
The Fund is non-diversified, meaning it may concentrate its assets in fewer individual holdings than a diversified fund, making it more exposed to individual stock volatility than a diversified fund. The Fund’s formula-based strategy may cause the Fund to buy or sell securities at times when it may not be advantageous. Please see the Fund’s prospectus for a more complete discussion of these and other risks.
References to specific securities should not be considered a recommendation to buy or sell any security. Fund holdings and sector allocations are subject to change. Please refer to the Schedule of Investments included in this report for additional portfolio information.
Dividend yield is calculated by dividing a company’s dividends per share by its market price per share.
Note: For presentation purposes, the Fund has grouped some of the industry categories. For purposes of categorizing securities for compliance with Section 8(b)(1) of the Investment Company Act of 1940, as amended, the Fund uses more specific industry classifications.
The accompanying notes are an integral part of these financial statements.
Percentages are stated as a percent of net assets.
The following is a summary of the inputs used to value the Fund’s net assets as of October 31, 2019 (See Note 3 in the accompanying Notes to the Financial Statements):
The accompanying notes are an integral part of these financial statements.
The accompanying notes are an integral part of these financial statements.
The accompanying notes are an integral part of these financial statements.
The accompanying notes are an integral part of these financial statements.
The accompanying notes are an integral part of these financial statements.
The accompanying notes are an integral part of these financial statements.
The Hennessy Balanced Fund (the “Fund”) is a series of Hennessy Funds Trust (the “Trust”), which was organized as a Delaware statutory trust on September 17, 1992. The Fund is an open-end management investment company registered under the Investment Company Act of 1940, as amended. The investment objective of the Fund is a combination of capital appreciation and current income. The Fund is a non-diversified fund and offers Investor Class shares.
As an investment company, the Fund follows the investment company accounting and reporting guidance of the Financial Accounting Standards Board (“FASB”) Accounting Standard Codification Topic 946 “Financial Services—Investment Companies.”
The following is a summary of significant accounting policies consistently followed by the Fund in the preparation of the financial statements. These policies conform to U.S. generally accepted accounting principles (“GAAP”).
The Fund follows fair value accounting standards that establish an authoritative definition of fair value and set out a hierarchy for measuring fair value. These standards require additional disclosures about the various inputs and valuation techniques used to develop the measurements of fair value and a discussion of changes in valuation techniques and related inputs during the period. These inputs are summarized in the three broad levels listed below:
The following is a description of the valuation techniques applied to the Fund’s major categories of assets and liabilities measured at fair value on a recurring basis:
The Board of Trustees of the Fund (the “Board”) has adopted fair value pricing procedures that are followed when a price for a security is not readily available or if a significant event has occurred that indicates the closing price of a security no longer represents the true value of that security. Fair value pricing determinations are made in good faith in accordance with these procedures. There are numerous criteria that will be given consideration in determining a fair value of a security, such as the trading volume of a security and markets, the values of other similar securities, and news events with direct bearing on a security or markets. Fair value pricing results in an estimated price for a security that reflects the amount the Fund might reasonably expect to receive in a current sale. Depending on the relative significance of the valuation inputs, these securities may be classified in either Level 2 or Level 3 of the fair value hierarchy.
The Board has delegated day-to-day valuation matters to the Valuation and Liquidity Committee comprising representatives from Hennessy Advisors, Inc., the Fund’s investment advisor (the “Advisor”). The function of the Valuation and Liquidity Committee is to value securities where current and reliable market quotations are not readily available. All actions taken by the Valuation and Liquidity Committee are reviewed by the Board.
The Fund has performed an analysis of all existing investments to determine the significance and character of all inputs to their fair value determinations. Various inputs are used to determine the value of the Fund’s investments. The inputs or methodology used for valuing securities are not necessarily an indication of the risk associated with investing in those securities. Details related to the fair value hierarchy of the Fund’s securities as of October 31, 2019, are included in the Schedule of Investments.
Purchases and sales of investment securities (excluding government and short-term investments) for the Fund during fiscal year 2019 were $3,151,481 and $3,269,481, respectively.
There were no purchases or sales/maturities of long-term U.S. government securities for the Fund during fiscal year 2019.
The Fund is permitted to purchase or sell securities from or to another fund in the Hennessy Funds family of funds (collectively, the “Hennessy Funds”) under specified conditions outlined in procedures adopted by the Board. The procedures have been designed to ensure that any purchase or sale of securities by the Fund from or to another Hennessy Fund complies with Rule 17a-7 of the Investment Company Act of 1940, as amended. During fiscal year 2019, the Fund did not engage in purchases or sales of securities pursuant to Rule 17a-7 of the Investment Company Act of 1940, as amended.
The Advisor provides the Fund with investment advisory services under an Investment Advisory Agreement. The Advisor furnishes all investment advice, office space, and facilities and most of the personnel needed by the Fund. As compensation for its services, the Advisor is entitled to a monthly fee from the Fund. The fee is based on the average daily net assets of the Fund at an annual rate of 0.60%. The net investment advisory fees expensed by the Fund during fiscal year 2019 are included in the Statement of Operations.
The Board has approved a Shareholder Servicing Agreement for the Fund, which was instituted to compensate the Advisor for the non-investment advisory services it provides to the Fund. The Shareholder Servicing Agreement provides for a monthly fee paid to the Advisor at an annual rate of 0.10% of the average daily net assets of the Fund. The shareholder service fees expensed by the Fund during fiscal year 2019 are included in the Statement of Operations.
The Fund has adopted a plan pursuant to Rule 12b-1 under the Investment Company Act of 1940, as amended, that authorizes payments in connection with the distribution of the Fund’s shares at an annual rate of up to 0.25% of the Fund’s average daily net assets. Even though the authorized rate is up to 0.25%, the Fund is currently only using up to 0.15% of its average daily net assets for such purpose. Amounts paid under the plan may be spent on any activities or expenses primarily intended to result in the sale of shares, including, but not limited to, advertising, shareholder account servicing, printing and mailing of prospectuses to other than current shareholders, printing and mailing of sales literature, and compensation for sales and marketing activities or to financial institutions and others, such as dealers and distributors. The distribution fees expensed by the Fund during fiscal year 2019 are included in the Statement of Operations.
The Fund has entered into agreements with various brokers, dealers, and financial intermediaries in connection with the sale of shares of the Fund. The agreements provide for periodic payments of sub-transfer agent expenses by the Fund to the brokers, dealers, and financial intermediaries for providing certain shareholder maintenance services. These shareholder services include the pre-processing and quality control of new accounts, shareholder correspondence, answering customer inquiries regarding account status, and facilitating shareholder telephone transactions. The sub-transfer agent fees expensed by the Fund during fiscal year 2019 are included in the Statement of Operations.
U.S. Bancorp Fund Services, LLC, d/b/a U.S. Bank Global Fund Services (“Fund Services”) provides the Fund with administrative, accounting, and transfer agent services. As administrator, Fund Services is responsible for activities such as (i) preparing various federal and state regulatory filings, reports, and returns for the Fund, (ii) preparing reports and materials to be supplied to the Board, (iii) monitoring the activities of the Fund’s custodian, transfer agent, and accountants, and (iv) coordinating the preparation and payment of the Fund’s expenses and reviewing the Fund’s expense accruals. U.S. Bank N.A., an affiliate of Fund Services, serves as the Fund’s custodian. The servicing agreements between the Trust and Fund Services and U.S. Bank N.A. contain a fee schedule that is inclusive of administrative, accounting, custody, and transfer agent fees. The administrative, accounting, custody, and transfer agent fees expensed by the Fund during fiscal year 2019 are included in the Statement of Operations.
Quasar Distributors, LLC (“Quasar”) acts as the Fund’s principal underwriter in a continuous public offering of the Fund’s shares. Quasar is an affiliate of Fund Services and U.S. Bank N.A.
The officers of the Fund are affiliated with the Advisor. With the exception of the Chief Compliance Officer and the Senior Compliance Officer, such officers receive no compensation from the Fund for serving in their respective roles. The Fund, along with the other Hennessy Funds, makes reimbursement payments on an equal basis to the Advisor for a portion of the salary and benefits associated with the office of the Chief Compliance Officer and for all of the salary and benefits associated with the office of the Senior Compliance Officer. The compliance fees expensed by the Fund during fiscal year 2019 are included in the Statement of Operations.
Under the Hennessy Funds’ organizational documents, their officers and trustees are indemnified by the Hennessy Funds against certain liabilities arising out of the performance of their duties to the Hennessy Funds. Additionally, in the normal course of business, the Hennessy Funds enter into contracts with service providers that contain general indemnification clauses. The Fund’s maximum exposure under these arrangements is unknown as this would involve future claims that may be made against the Fund that have not yet occurred. Currently, the Fund expects the risk of loss to be remote.
The Fund has an uncommitted line of credit with the other Hennessy Funds in the amount of the lesser of (i) $100,000,000 or (ii) 33.33% of each Hennessy Fund’s net assets, or 30% for the Hennessy Gas Utility Fund and 10% for the Fund, intended to provide short-term financing, if necessary, subject to certain restrictions, in connection with shareholder redemptions. The credit facility is with the Hennessy Funds’ custodian bank, U.S. Bank N.A. Borrowings under this arrangement bear interest at the bank’s prime rate and are secured by all of the Fund’s assets (as to its own borrowings only). During fiscal year 2019, the Fund had an outstanding average daily balance and a weighted average interest rate of $36 and 5.50%, respectively. The interest expensed by the Fund during fiscal year 2019 is included in the Statement of Operations. The maximum amount outstanding for the Fund during fiscal year 2019 was $13,000. As of October 31, 2019, the Fund did not have any borrowings outstanding under the line of credit.
As of October 31, 2019, the components of accumulated earnings (losses) for income tax purposes were as follows:
The difference between book-basis unrealized appreciation/depreciation and tax-basis unrealized appreciation/depreciation (as shown above) is attributable primarily to wash sales.
As of October 31, 2019, the Fund had no tax basis capital losses to offset future capital gains.
As of October 31, 2019, the Fund did not defer, on a tax basis, any late-year ordinary losses. Late-year ordinary losses are net ordinary losses incurred after December 31, 2018, but within the taxable year, that are deemed to arise on the first day of the Fund’s next taxable year.
During fiscal year 2019 and fiscal year 2018, the tax character of distributions paid by the Fund was as follows:
Management has evaluated the Fund’s related events and transactions that occurred subsequent to October 31, 2019, through the date of issuance of the Fund’s financial statements. Other than as disclosed below, management has determined that there were no subsequent events requiring recognition or disclosure in the financial statements.
On November 25, 2019, U.S. Bancorp, the parent company of Quasar, announced that it had signed a purchase agreement to sell Quasar to Foreside Financial Group, LLC, such that Quasar will become a wholly-owned broker-dealer subsidiary of Foreside. The transaction is expected to close by the end of March 2020. Quasar will remain the Fund’s distributor at the close of the transaction, subject to Board approval.
On December 6, 2019, capital gains were declared and paid to shareholders of record on December 5, 2019, as follows:
We have audited the accompanying statement of assets and liabilities of the Hennessy Balanced Fund (the “Fund”), a series of Hennessy Funds Trust, including the schedule of investments, as of October 31, 2019, the related statement of operations for the year then ended, the statements of changes in net assets for each of the two years in the period then ended, the financial highlights for each of the three years in the period then ended, and the related notes (collectively referred to as the “financial statements”). In our opinion, the financial statements present fairly, in all material respects, the financial position of the Fund as of October 31, 2019, the results of its operations for the year then ended, the changes in its net assets for each of the two years in the period then ended, and the financial highlights for each of the three years in the period then ended in conformity with accounting principles generally accepted in the United States of America.
The financial highlights for each of the two years in the period ended October 31, 2016, have been audited by other auditors, whose report dated December 22, 2016, expressed unqualified opinions on such financial highlights.
These financial statements are the responsibility of the Fund’s management. Our responsibility is to express an opinion on the Fund’s financial statements based on our audits. We are a public accounting firm registered with the Public Company Accounting Oversight Board (United States) (“PCAOB”) and are required to be independent with respect to the Fund in accordance with the U.S. federal securities laws and the applicable rules and regulations of the Securities and Exchange Commission and the PCAOB. We have served as the auditor of one or more of the funds in the Trust since 2002.
We conducted our audits in accordance with the standards of the PCAOB. Those standards require that we plan and perform the audit to obtain reasonable assurance about whether the financial statements are free of material misstatement, whether due to error or fraud. The Fund is not required to have, nor were we engaged to perform, an audit of its internal control over financial reporting. As part of our audits we are required to obtain an understanding of internal control over financial reporting, but not for the purpose of expressing an opinion on the effectiveness of the Fund’s internal control over financial reporting. Accordingly, we express no such opinion.
Our audits included performing procedures to assess the risks of material misstatement of the financial statements, whether due to error or fraud, and performing procedures that respond to those risks. Such procedures included examining, on a test basis, evidence regarding the amounts and disclosures in the financial statements. Our audits also included evaluating the accounting principles used and significant estimates made by management, as well as evaluating the overall presentation of the financial statements. Our procedures included confirmation of securities owned as of October 31, 2019, by correspondence with the custodian. We believe that our audits provide a reasonable basis for our opinion.
The business and affairs of the Funds are managed under the direction of the Board of Trustees of the Trust, and the Board of Trustees elects the officers of the Trust. From time to time, the Board of Trustees also has appointed advisers to the Board of Trustees (“Advisers”) with the intention of having qualified individuals serve in an advisory capacity in order to garner experience in the mutual fund and asset management industry and be considered as potential Trustees in the future. There are currently three Advisers: Brian Alexander, Doug Franklin, and Claire Knoles. As Advisers, Mr. Alexander, Mr. Franklin, and Ms. Knoles attend meetings of the Board of Trustees and act as non-voting participants. Information pertaining to the Trustees, Advisers, and the officers of the Trust is set forth below. The Trustees and officers serve until their successors are duly elected and qualified or until their earlier death, resignation, or removal. Each Trustee oversees the 16 Hennessy Funds. Unless otherwise indicated, the address of all persons listed below is 7250 Redwood Boulevard, Suite 200, Novato, CA 94945. The Fund’s Statement of Additional Information includes more information about the persons listed below and is available without charge by calling 1-800-966-4354 or by visiting www.hennessyfunds.com.
As a shareholder of the Fund, you incur ongoing costs, including management fees, service fees, and other Fund expenses. This Example is intended to help you understand your ongoing costs (in dollars) of investing in the Fund and to compare these costs with the ongoing costs of investing in other mutual funds. The Example is based on an investment of $1,000 invested at the beginning of the period and held for the entire period from May 1, 2019, through October 31, 2019.
The first line of the table below provides information about actual account values and actual expenses. Although the Fund charges no sales loads or transaction fees, you will be assessed fees for outgoing wire transfers, returned checks and stop payment orders at prevailing rates charged by U.S. Bank Global Fund Services, the Fund’s transfer agent. If you request that a redemption be made by wire transfer, currently a $15 fee is charged by the Fund’s transfer agent. IRA accounts will be charged a $15 annual maintenance fee. The example below includes, but is not limited to, management fees, shareholder servicing fees, accounting, custody, and transfer agent fees. However, the example below does not include portfolio trading commissions and related expenses. You may use the information in this line, together with the amount you invested, to estimate the expenses that you paid over the period. Simply divide your account value by $1,000 (for example, an $8,600 account value divided by $1,000 = 8.6), then multiply the result by the number in the first line of the table under the heading entitled “Expenses Paid During Period” to estimate the expenses you paid on your account during this period.
The second line of the table below provides information about hypothetical account values and hypothetical expenses based on the Fund’s actual expense ratio and an assumed rate of return of 5% per year before expenses, which is not the Fund’s actual return. The hypothetical account values and expenses may not be used to estimate the actual ending account balance or expenses you paid for the period. You may use this information to compare the ongoing costs of investing in the Fund and other funds. To do so, compare this 5% hypothetical example with the 5% hypothetical examples that appear in the shareholder reports of the other funds. Please note that the expenses shown in the table are meant to highlight your ongoing costs only. Therefore, the second line of the table is useful in comparing ongoing costs only and will not help you determine the relative total costs of owning different funds.
A description of the policies and procedures the Fund uses to determine how to vote proxies relating to portfolio securities is available without charge: (1) by calling 1-800-966-4354; (2) on the Hennessy Funds’ website at www.hennessyfunds.com/proxy-voting/voting-policy; or (3) on the U.S. Securities and Exchange Commission’s (the “SEC”) website at www.sec.gov. The Fund’s proxy voting record is available without charge on both the Hennessy Funds’ website at www.hennessyfunds.com/proxy-voting/voting-record and the SEC’s website at www.sec.gov no later than August 31 for the prior 12 months ending June 30.
For periods ending on or prior to January 31, 2019, the Fund has filed a complete schedule of portfolio holdings with the SEC for the first and third quarters of each fiscal year on Form N-Q. For periods ending on or after April 30, 2019, the Fund files a complete schedule of portfolio holdings with the SEC for the first and third quarters of each fiscal year as an exhibit to its reports on Form N-PORT. The Fund’s Forms N-Q and Forms N-PORT are available on the SEC’s website at www.sec.gov or on request by calling 1-800-966-4354.
For fiscal year 2019, certain dividends paid by the Fund may be subject to a maximum tax rate of 23.8%, as provided for by the Jobs and Growth Tax Relief Reconciliation Act of 2003. The percentage of dividends declared from ordinary income designated as qualified dividend income was 100.00%.
For corporate shareholders, the percent of ordinary income distributions that qualified for the corporate dividends received deduction for fiscal year 2019 was 100.00%.
The percentage of taxable ordinary income distributions that were designated as short-term capital gain distributions under Section 871(k)(2)(C) of the Internal Revenue Code of 1986, as amended, for the Fund was 0.00%.
To help keep the Fund’s costs as low as possible, we generally deliver a single copy of shareholder reports, proxy statements, and prospectuses to shareholders who share an address and have the same last name. This process does not apply to account statements. You may request an individual copy of a shareholder document at any time. If you would like to receive separate mailings of shareholder documents, please call U.S. Bank Global Fund Services at 1-800-261-6950 or 1-414-765-4124, and individual delivery will begin within 30 days of your request. If your account is held through a financial institution or other intermediary, please contact such intermediary directly to request individual delivery.
The Funds offer shareholders the option to receive account statements, Prospectuses, tax forms, and reports online. To sign up for eDelivery, please visit www.hennessyfunds.com. You may change your delivery preference at any time by visiting our website or contacting the Funds at 1-800-261-6950.
We do not disclose any non-public personal information about our current or former shareholders to non-affiliated third parties, except as permitted by law. For example, we are permitted by law to disclose all of the information we collect, as described above, to our Transfer Agent to process your transactions. Furthermore, we restrict access to your non-public personal information to those persons who require such information to provide products or services to you. We maintain physical, electronic, and procedural safeguards that comply with federal standards to guard your non-public personal information.
In the event that you hold shares of the Fund through a financial intermediary, including, but not limited to, a broker-dealer, bank, or trust company, the privacy policy of your financial intermediary would govern how your non-public personal information will be shared with non-affiliated third parties.
Hennessy Advisors, Inc.
U.S. Bancorp Fund Services, LLC
d/b/a U.S. Bank Global Fund Services
P.O. Box 701
U.S. Bank N.A.
Neil J. Hennessy
Robert T. Doyle
J. Dennis DeSousa
Gerald P. Richardson
others only if preceded or accompanied by a current prospectus.
ANNUAL REPORT
OCTOBER 31, 2019
HENNESSY BP ENERGY FUND
Investor Class HNRGX
Institutional Class HNRIX
IMPORTANT NOTICE REGARDING ELECTRONIC DELIVERY OF SHAREHOLDER REPORTS
Beginning on January 1, 2021, as permitted by regulations adopted by the Securities and Exchange Commission, paper copies of the annual and semi-annual reports will no longer be sent by mail unless you specifically request paper copies from the Hennessy Funds or from your financial intermediary. Instead, the reports will be made available on a website, and you will be notified by mail each time a report is posted and provided with a website link to access the report.
If you have already elected to receive shareholder reports electronically, you will not be affected by this change and you need not take any action. You may elect to receive shareholder reports and other communications from the Hennessy Funds electronically by visiting www.hennessyfunds.com/account or by calling U.S. Bank Global Fund Services at 1-800-261-6950. If you own shares in a Fund through a financial intermediary, please contact your financial intermediary to make this election.
You may elect to receive paper copies of all future reports free of charge by calling U.S. Bank Global Fund Services at 1-800-261-6950 or, if you own your shares through a financial intermediary, by contacting your financial intermediary. Your election to receive paper copies of reports will apply to all Funds in the Hennessy Funds family.
hennessyfunds.com | 1-800-966-4354
(This Page Intentionally Left Blank.)
Contents
| Letter to Shareholders | 2 |
| Performance Overview | 4 |
| Financial Statements | |
| Schedule of Investments | 7 |
| Statement of Assets and Liabilities | 11 |
| Statement of Operations | 12 |
| Statements of Changes in Net Assets | 14 |
| Financial Highlights | 16 |
| Notes to the Financial Statements | 20 |
| Report of Independent Registered Public Accounting Firm | 29 |
| Trustees and Officers of the Fund | 30 |
| Expense Example | 34 |
| Proxy Voting Policy and Proxy Voting Records | 36 |
| Availability of Quarterly Portfolio Schedule | 36 |
| Important Notice Regarding Delivery of Shareholder Documents | 36 |
| Electronic Delivery | 36 |
| Privacy Policy | 37 |
| HENNESSY FUNDS | 1-800-966-4354 | |
December 2019
Dear Hennessy Funds Shareholder:
What a year it has been. I am reassured by the resiliency of the U.S. financial markets as companies continue to thrive in the midst of policy challenges and political turbulence. Trade tariffs, impeachment, and interest rates have dominated the news headlines, while Brexit and protests in Hong Kong have also been major concerns internationally.
While the financial markets were characterized by volatility during the twelve months ended October 31, 2019, U.S. equities posted double-digit positive performance for the period, with a total return of 14.3% for the S&P 500® Index and 10.3% for the Dow Jones Industrial Average. As I sat down to write this letter, all three major indices, the S&P 500® Index, the Dow Jones Industrial Average, and the NASDAQ Composite Index, recently reached all-time highs.
Every bull market experiences volatility and pullbacks, and this extended bull market is no different. Since 2010, there have been 16 pullbacks of 5-10% and six corrections of over 10%. But what is interesting is not how quickly the declines take place, but rather how swiftly the market regains and surpasses its prior highs. With each decline, many investors and commentators predict that finally this bull market is out of steam. But I ask myself, “Why?”
What I see is a healthy economy and stock market, with fundamentals in place to support a continued bull market. Although slightly above long-term averages, I believe stocks are trading at reasonable valuations, with the Dow Jones Industrial Average trading at 16x forward earnings per share and the S&P 500® Index at 17x forward earnings. At the same time, the U.S. economy is growing at a sustainable pace of 2-3%, corporate profits continue to outperform expectations, and cash continues to build on corporate balance sheets. With over $5 trillion in cash and marketable securities on the balance sheets of the S&P 500® Index companies alone, corporations are returning cash to shareholders through share buybacks and dividends. Share buybacks by S&P 500® Index companies could hit $1 trillion in 2019, surpassing 2018’s record $800 billion, and dividend payments by S&P 500® Index companies are estimated to increase 8-9%. Unemployment continues to be at historically low levels, while wages are growing. Interest rates are also at very low levels, which should support equity prices. Finally, overall consumer confidence remains positive.
To quote Sir John Templeton’s famous saying, “Bull markets are born on pessimism, grow on skepticism, mature on optimism, and die on euphoria.” If you look back to the beginning of the great bull market that began in 1982, only six of the past 37 years ended with negative total returns: 1990, 2000, 2001, 2002, 2008, and 2018. With the exception of 2018, which was characterized by volatility but no euphoria, the other down years were marked by euphoria in either real estate or dot coms. I have been saying for a number of years that I see no signs of euphoria in the market, and I remain confident in the strength of the market today.
Thank you for your continued trust and investment in the Hennessy Funds. We believe that there continue to be great opportunities throughout all parts of the market, and we remain steadfastly focused on managing our high-conviction portfolios for the long-term benefit of our shareholders. Should you have any questions or would like to speak with us directly, please don’t hesitate to call us at (800) 966-4354.
Best regards,
Neil J. Hennessy
President and Chief Investment Officer
Past performance does not guarantee future results.
Mutual fund investing involves risk. Principal loss is possible.
The Dow Jones Industrial Average and S&P 500® Index are commonly used to measure the performance of U.S. stocks. The NASDAQ Composite Index is a broad-based capitalization-weighted index of all the NASDAQ National Market and Small Cap stocks. One cannot invest directly in an index.
Forward price to earnings is a valuation measure calculated by dividing a company’s market price per share by its expected earnings per share over the following 12 months.
| HENNESSY FUNDS | 1-800-966-4354 | |
Performance Overview (Unaudited)
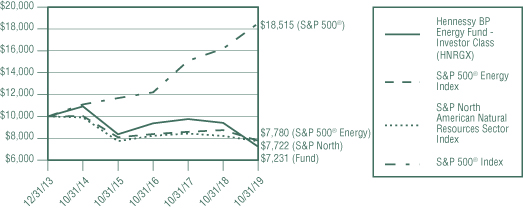
CHANGE IN VALUE OF $10,000 INVESTMENT
This graph illustrates the performance of an initial investment of $10,000 made in the Fund on its inception date and assumes the reinvestment of dividends.
AVERAGE ANNUAL TOTAL RETURN FOR PERIODS ENDED OCTOBER 31, 2019
| | One | Five | Since Inception |
| | Year | Years | (12/31/13) |
| Hennessy BP Energy Fund – | | | |
| Investor Class (HNRGX) | -23.14% | -7.90% | -5.41% |
| Hennessy BP Energy Fund – | | | |
| Institutional Class (HNRIX) | -22.92% | -7.65% | -5.17% |
S&P 500® Energy Index | -11.04% | -4.95% | -4.21% |
| S&P North American Natural | | | |
| Resources Sector Index | -6.01% | -4.85% | -4.33% |
S&P 500® Index | 14.33% | 10.78%
| 11.14%
|
Expense ratios: 1.82% (Investor Class); 1.57% (Institutional Class)
Performance data quoted represents past performance; past performance does not guarantee future results. The investment return and principal value of an investment will fluctuate so that an investor’s shares, when redeemed, may be worth more or less than their original cost. The performance table does not reflect the deduction of taxes that a shareholder would pay on Fund distributions or the redemption of Fund shares. Current performance of the Fund may be lower or higher than the performance quoted. Performance data current to the most recent month end may be obtained by visiting www.hennessyfunds.com. Performance for periods on or prior to October 26, 2018, is that of the BP Capital TwinLine Energy Fund.
The S&P 500® Energy Index comprises those companies included in the S&P 500® that are classified in the Energy sector. The S&P North American Natural Resources Sector Index represents U.S.-traded securities classified in the Energy and Materials sectors, excluding the chemicals industry and steel sub-industry. The S&P 500® Index is a capitalization-weighted index that is designed to represent the broad domestic economy through changes in the aggregate market value of 500 stocks across all major industries. One cannot invest directly in an index. These indices are used herein for comparative purposes in accordance with SEC regulations.
Standard & Poor’s Financial Services LLC is the source and owner of the S&P® and S&P 500® trademarks.
The expense ratios presented are from the most recent prospectus. The expense ratios for the current reporting period are available in the Financial Highlights section of this report.
PERFORMANCE NARRATIVE
Portfolio Managers Toby Loftin and Ben Cook, CFA
BP Capital Fund Advisors, LLC (sub-advisor)
Performance:
For the 12-month period ended October 31, 2019, the Investor Class of the Hennessy BP Energy Fund returned -23.14%, underperforming the S&P 500® Energy Index (the Fund’s primary benchmark), the S&P North American Natural Resources Sector Index, and the S&P 500® Index, which returned -11.04%, -6.01%, and 14.33%, respectively, for the same period.
The Fund’s underperformance relative to its primary benchmark was primarily due to its overweight position in oilfield service equities, as well as its exposure to small and midsize oil producers that performed poorly, particularly in the beginning of period. The Fund’s holdings in energy end-user groups also detracted from relative performance, as a result of weak performance from stocks in the Materials and Industrials sectors.
Portfolio Strategy:
The Fund seeks to invest in companies across the energy value chain. This includes crude oil and natural gas exploration and production companies, oilfield service providers, midstream companies, refiners, and energy end users. In particular, we believe the inclusion of energy end users, such as materials, industrials, and transportation companies, differentiates the Fund from traditional energy funds. Including such companies in the investment universe enables the Fund to hold a broader range of energy-related themes and provides greater flexibility to adjust sub-sector weightings based on our investment outlook. The Fund typically owns 25-40 securities and historically has had little overlap with the top holdings of commonly-used energy and commodity equity benchmarks.
Investment Commentary:
At the start of the period, oil prices retreated as investors worried that a stronger U.S. dollar and slower growth outside the United States could lead to a softening in demand for crude oil. Investors also feared that robust production growth in the United States and the discussion of temporary waivers to be given to select countries relating to Iranian oil import restrictions could boost supply. However, supply concerns were mostly alleviated in early 2019 as supply from Iran, Venezuela, Russia, and OPEC declined significantly. Nonetheless, trade war headwinds remained a concern for lowered crude oil demand in the latter half of the period. As a result, crude oil prices remained mostly range-bound during the period as supply declines were largely offset by demand concerns.
In this range-bound period of crude oil prices, the Fund was positioned more defensively going into the second half of the period. Oilfield services exposure was reduced as signs of a U.S. drilling activity slowdown appeared. Exposure to smaller, more growth-oriented producers was also reduced as we expected underperformance of these producers to continue as activity slowed down and commodity price upside was limited by demand fears. Exposure was increased to larger, more integrated companies that have the ability to maintain positive free cash flow generation at lower commodity prices. Midstream exposure in the Fund was also increased as these companies benefitted from increased U.S. volume throughput. Additionally, the Fund maintained significant exposure to refining companies that benefitted from low cost feedstock and strong margins.
Since its inception, the Fund has maintained a preference for low-cost shale oil producers. This has resulted in an overweight positioning of the Fund in U.S.-focused oil producers. Many of these companies have continued to significantly lower their operating
| HENNESSY FUNDS | 1-800-966-4354 | |
costs and greatly expand their production and reserves in recent years. We also note that the Fund has maintained little to no exposure in the natural gas-weighted producers. Natural gas producers continue to face headwinds associated with a supply overhang in the U.S. natural gas market.
We continue to see attractive investment opportunities in integrated and midstream companies. As a result of their economies of scale, we believe the integrated companies are likely to outperform in a lower commodity price environment. Integrated companies also have generally paid attractive dividends to shareholders, which has become an increasingly important component of the investment thesis for energy companies. Similar to integrated companies, midstream companies also tend to offer an attractive dividend yield to investors. Midstream companies continue to enable the critical flow of crude oil and natural gas from production centers to end-user markets, both in the United States and abroad. As such, their cash flows have increased, and these companies are becoming less reliant on the capital markets to fund operations. Distribution coverage remains strong for midstream companies, and leverage is being reduced in many cases.
Overall, we remain optimistic regarding companies in the energy sector, as many companies in the investment universe have adopted more shareholder-friendly strategies. We believe management teams are more focused today on spending only as much as they generate from operating cash flows and on returning free cash flow to shareholders through dividends and share repurchases. Finally, we expect consolidation to remain a major sector theme in upcoming years, as U.S. companies seek to increase economies of scale, lower corporate costs, and deliver stronger corporate level returns on capital.
_______________
Opinions expressed are those of the Portfolio Managers as of the date written and are subject to change, are not guaranteed, and should not be considered investment advice or an indication of trading intent.
The Fund invests in small-capitalization and medium-capitalization companies, which involves additional risks such as limited liquidity and greater volatility. Funds that concentrate in a single sector may be subject to a higher degree of risk. Energy-related companies are subject to specific risks, including fluctuations in commodity prices and consumer demand, substantial government regulation, and depletion of reserves. Investments in lower-rated and non-rated securities present a greater risk of loss to principal and interest than higher-rated securities. Use of derivatives can increase the volatility of the Fund.
MLPs and MLP investments have unique characteristics. The Fund does not receive the same tax benefits as a direct investment in an MLP.
The prices of MLP units may fluctuate abruptly and trading volume may be low, making it difficult for the Fund to sell its units at a favorable price. MLP general partners have the power to take actions that adversely affect the interests of unit holders. Most MLPs do not pay U.S. federal income tax at the partnership level, but an adverse change in tax laws could result in MLPs being treated as corporations for federal income tax purposes, which could reduce or eliminate distributions paid by MLPs to the Fund. If the Fund’s MLP investments exceed 25% of its assets, the Fund may not qualify for treatment as a regulated investment company under the Internal Revenue Code. The Fund would be taxed as an ordinary corporation, which could substantially reduce the Fund’s net assets and its distributions to shareholders. Please see the Fund’s prospectus for a more complete discussion of these and other risks.
References to specific securities should not be considered a recommendation to buy or sell any security. Fund holdings and sector allocations are subject to change. Please refer to the Schedule of Investments included in this report for additional portfolio information.
Cash flow refers to the net amount of cash and cash equivalents transferred into and out of a company. Dividend yield is calculated by dividing a company’s dividends per share by its market price per share. Distribution coverage is a ratio of distributable cash flow divided by distributions paid. Return on capital is a ratio measuring the profitability of a firm expressed as a percentage of funds acquired from investors and lenders.
| PERFORMANCE OVERVIEW/SCHEDULE OF INVESTMENTS |
Financial Statements
Schedule of Investments as of October 31, 2019 |
HENNESSY BP ENERGY FUND
(% of Total Assets)
| TOP TEN HOLDINGS (EXCLUDING MONEY MARKET FUNDS) | % TOTAL ASSETS |
| Marathon Petroleum Corp. | 4.71% |
| Valero Energy Corp. | 4.53% |
| Energy Transfer LP | 4.32% |
| ConocoPhillips | 4.27% |
| Diamondback Energy, Inc. | 4.20% |
| Parsley Energy, Inc., Class A | 3.90% |
| Delek U.S. Holdings, Inc. | 3.87% |
| Targa Resources Corp. | 3.65% |
| Enterprise Products Partners LP | 3.53% |
| Plains All American Pipeline LP | 3.46% |
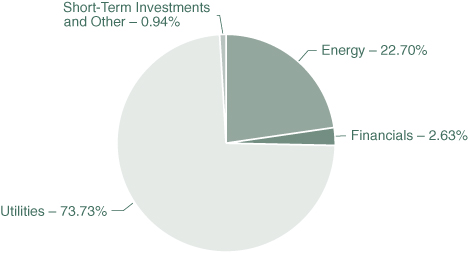
Note: The Fund concentrates its investments in the Energy industry. For presentation purposes, the Fund uses custom categories.
| HENNESSY FUNDS | 1-800-966-4354 | |
| COMMON STOCKS – 78.27% | | Number | | | | | | % of | |
| | | of Shares | | | Value | | | Net Assets | |
| Agricultural Products – 2.96% | | | | | | | | | |
| Nutrien Ltd. (a) | | | 31,700 | | | $ | 1,514,943 | | | | 2.96 | % |
| | | | | | | | | | | | | |
| Chemicals – 3.17% | | | | | | | | | | | | |
| Huntsman Corp. | | | 73,367 | | | | 1,623,612 | | | | 3.17 | % |
| | | | | | | | | | | | | |
| Downstream – 13.16% | | | | | | | | | | | | |
| Delek U.S. Holdings, Inc. | | | 49,766 | | | | 1,988,152 | | | | 3.88 | % |
| Marathon Petroleum Corp. | | | 37,850 | | | | 2,420,507 | | | | 4.73 | % |
| Valero Energy Corp. | | | 24,000 | | | | 2,327,520 | | | | 4.55 | % |
| | | | | | | | 6,736,179 | | | | 13.16 | % |
| | | | | | | | | | | | | |
| Exploration & Production – 36.47% | | | | | | | | | | | | |
| Chevron Corp. | | | 13,800 | | | | 1,602,732 | | | | 3.13 | % |
| Concho Resources, Inc. | | | 24,500 | | | | 1,654,240 | | | | 3.23 | % |
| ConocoPhillips | | | 39,725 | | | | 2,192,820 | | | | 4.28 | % |
| Continental Resources, Inc. (b) | | | 35,800 | | | | 1,055,026 | | | | 2.06 | % |
| Diamondback Energy, Inc. | | | 25,194 | | | | 2,160,637 | | | | 4.22 | % |
| EOG Resources, Inc. | | | 17,000 | | | | 1,178,270 | | | | 2.30 | % |
| Marathon Oil Corp. | | | 136,000 | | | | 1,568,080 | | | | 3.06 | % |
| Noble Energy, Inc. | | | 54,275 | | | | 1,045,336 | | | | 2.04 | % |
| Occidental Petroleum Corp. | | | 24,763 | | | | 1,002,902 | | | | 1.96 | % |
| Parsley Energy, Inc., – Class A | | | 126,873 | | | | 2,005,862 | | | | 3.92 | % |
| Pioneer Natural Resources Co. | | | 13,092 | | | | 1,610,578 | | | | 3.15 | % |
| WPX Energy, Inc. (b) | | | 159,750 | | | | 1,594,305 | | | | 3.12 | % |
| | | | | | | | 18,670,788 | | | | 36.47 | % |
| | | | | | | | | | | | | |
| Integrated – 9.00% | | | | | | | | | | | | |
| BP PLC – ADR (a) | | | 42,500 | | | | 1,611,175 | | | | 3.14 | % |
| Exxon Mobil Corp. | | | 24,000 | | | | 1,621,680 | | | | 3.17 | % |
| Royal Dutch Shell PLC – ADR (a) | | | 23,750 | | | | 1,376,787 | | | | 2.69 | % |
| | | | | | | | 4,609,642 | | | | 9.00 | % |
| | | | | | | | | | | | | |
| Midstream – 8.69% | | | | | | | | | | | | |
| ONEOK, Inc. | | | 18,750 | | | | 1,309,313 | | | | 2.56 | % |
| Targa Resources Corp. | | | 48,300 | | | | 1,877,904 | | | | 3.67 | % |
| The Williams Companies, Inc. | | | 56,600 | | | | 1,262,746 | | | | 2.46 | % |
| | | | | | | | 4,449,963 | | | | 8.69 | % |
The accompanying notes are an integral part of these financial statements.
| COMMON STOCKS | | Number | | | | | | % of | |
| | | of Shares | | | Value | | | Net Assets | |
| Oil Services – 4.82% | | | | | | | | | |
| Schlumberger Ltd. (a) | | | 37,500 | | | $ | 1,225,875 | | | | 2.39 | % |
| TechnipFMC PLC (a) | | | 63,000 | | | | 1,242,990 | | | | 2.43 | % |
| | | | | | | | 2,468,865 | | | | 4.82 | % |
| Total Common Stocks | | | | | | | | | | | | |
| (Cost $45,569,374) | | | | | | | 40,073,992 | | | | 78.27 | % |
| | | | | | | | | | | | | |
| PARTNERSHIPS & TRUSTS – 16.25% | | | | | | | | | | | | |
| | | | | | | | | | | | | |
| Midstream – 16.25% | | | | | | | | | | | | |
| Energy Transfer Equity LP | | | 176,256 | | | | 2,219,063 | | | | 4.33 | % |
| Enterprise Products Partners LP | | | 69,729 | | | | 1,815,046 | | | | 3.54 | % |
| Magellan Midstream Partners LP | | | 19,700 | | | | 1,227,704 | | | | 2.40 | % |
| MPLX LP | | | 48,794 | | | | 1,286,698 | | | | 2.51 | % |
| Plains All American Pipeline LP | | | 97,940 | | | | 1,775,652 | | | | 3.47 | % |
| | | | | | | | 8,324,163 | | | | 16.25 | % |
| Total Partnerships & Trusts | | | | | | | | | | | | |
| (Cost $9,320,417) | | | | | | | 8,324,163 | | | | 16.25 | % |
| | | | | | | | | | | | | |
| SHORT-TERM INVESTMENTS- 5.54% | | | | | | | | | | | | |
| | | | | | | | | | | | | |
| Money Market Funds – 5.54% | | | | | | | | | | | | |
| First American Government Obligations Fund, | | | | | | | | | | | | |
| Institutional Class, 1.74% (c) | | | 2,582,000 | | | | 2,582,000 | | | | 5.05 | % |
| First American Treasury Obligations Fund, | | | | | | | | | | | | |
| Institutional Class, 1.73% (c) | | | 252,120 | | | | 252,120 | | | | 0.49 | % |
| | | | | | | | 2,834,120 | | | | 5.54 | % |
| Total Short-Term Investments | | | | | | | | | | | | |
| (Cost $2,834,120) | | | | | | | 2,834,120 | | | | 5.54 | % |
| | | | | | | | | | | | | |
| Total Investments | | | | | | | | | | | | |
| (Cost $57,723,911) – 100.06% | | | | | | | 51,232,275 | | | | 100.06 | % |
| Liabilities in Excess of Other Assets – (0.06)% | | | | | | | (31,561 | ) | | | (0.06 | )% |
| | | | | | | | | | | | | |
TOTAL NET ASSETS – 100.00% | | | | | | $ | 51,200,714 | | | | 100.00 | % |
Percentages are stated as a percent of net assets.
| (a) | U.S.-traded security of a foreign corporation. |
| (b) | Non-income-producing security. |
| (c) | The rate listed is the fund’s seven-day yield as of October 31, 2019. |
The accompanying notes are an integral part of these financial statements.
| HENNESSY FUNDS | 1-800-966-4354 | |
Summary of Fair Value Exposure as of October 31, 2019
The following is a summary of the inputs used to value the Fund’s net assets as of October 31, 2019 (See Note 3 in the accompanying Notes to the Financial Statements):
| Common Stocks | | Level 1 | | | Level 2 | | | Level 3 | | | Total | |
| Agricultural Products | | $ | 1,514,943 | | | $ | — | | | $ | — | | | $ | 1,514,943 | |
| Chemicals | | | 1,623,612 | | | | — | | | | — | | | | 1,623,612 | |
| Downstream | | | 6,736,179 | | | | — | | | | — | | | | 6,736,179 | |
| Exploration & Production | | | 18,670,788 | | | | — | | | | — | | | | 18,670,788 | |
| Integrated | | | 4,609,642 | | | | — | | | | — | | | | 4,609,642 | |
| Midstream | | | 4,449,963 | | | | — | | | | — | | | | 4,449,963 | |
| Oil Services | | | 2,468,865 | | | | — | | | | — | | | | 2,468,865 | |
| Total Common Stocks | | $ | 40,073,992 | | | $ | — | | | $ | — | | | $ | 40,073,992 | |
| Partnerships & Trusts | | | | | | | | | | | | | | | | |
| Midstream | | $ | 8,324,163 | | | $ | — | | | $ | — | | | $ | 8,324,163 | |
| Total Partnerships & Trusts | | $ | 8,324,163 | | | $ | — | | | $ | — | | | $ | 8,324,163 | |
| Short-Term Investments | | | | | | | | | | | | | | | | |
| Money Market Funds | | $ | 2,834,120 | | | $ | — | | | $ | — | | | $ | 2,834,120 | |
| Total Short-Term Investments | | $ | 2,834,120 | | | $ | — | | | $ | — | | | $ | 2,834,120 | |
| Total Investments | | $ | 51,232,275 | | | $ | — | | | $ | — | | | $ | 51,232,275 | |
The accompanying notes are an integral part of these financial statements.
| SCHEDULE OF INVESTMENTS/STATEMENT OF ASSETS AND LIABILITIES |
Financial Statements
Statement of Assets and Liabilities as of October 31, 2019 |
| ASSETS: | | | |
| Investments in securities, at value (cost $57,723,911) | | $ | 51,232,275 | |
| Dividends and interest receivable | | | 29,770 | |
| Return of capital receivable | | | 103,474 | |
| Receivable for fund shares sold | | | 1,228 | |
| Prepaid expenses and other assets | | | 20,037 | |
| Total assets | | | 51,386,784 | |
| | | | | |
| LIABILITIES: | | | | |
| Payable for fund shares redeemed | | | 59,686 | |
| Payable to advisor | | | 56,810 | |
| Payable to administrator | | | 10,805 | |
| Payable to auditor | | | 22,548 | |
| Accrued distribution fees | | | 2,192 | |
| Accrued service fees | | | 609 | |
| Accrued trustees fees | | | 6,598 | |
| Accrued expenses and other payables | | | 26,822 | |
| Total liabilities | | | 186,070 | |
| NET ASSETS | | $ | 51,200,714 | |
| | | | | |
| NET ASSETS CONSISTS OF: | | | | |
| Capital stock | | $ | 80,346,386 | |
| Accumulated deficit | | | (29,145,672 | ) |
| Total net assets | | $ | 51,200,714 | |
| | | | | |
| NET ASSETS: | | | | |
| Investor Class | | | | |
| Shares authorized (no par value) | | Unlimited | |
| Net assets applicable to outstanding shares | | $ | 6,828,628 | |
| Shares issued and outstanding | | | 484,930 | |
| Net asset value, offering price, and redemption price per share | | $ | 14.08 | |
| | | | | |
| Institutional Class | | | | |
| Shares authorized (no par value) | | Unlimited | |
| Net assets applicable to outstanding shares | | $ | 44,372,086 | |
| Shares issued and outstanding | | | 3,111,693 | |
| Net asset value, offering price, and redemption price per share | | $ | 14.26 | |
The accompanying notes are an integral part of these financial statements.
| HENNESSY FUNDS | 1-800-966-4354 | |
Financial Statements
Statement of Operations for the year ended October 31, 2019 |
| INVESTMENT INCOME: | | | |
| Distributions received from master limited partnerships | | $ | 624,147 | |
| Return of capital on distributions received | | | (624,147 | ) |
Dividend income from common stock(1) | | | 984,444 | |
| Interest income | | | 52,055 | |
| Total investment income | | | 1,036,499 | |
| | | | | |
| EXPENSES: | | | | |
| Investment advisory fees (See Note 5) | | | 847,193 | |
| Sub-transfer agent expenses – Investor Class (See Note 5) | | | 19,287 | |
| Sub-transfer agent expenses – Institutional Class (See Note 5) | | | 57,688 | |
| Administration, accounting, custody, and transfer agent fees (See Note 5) | | | 76,697 | |
| Federal and state registration fees | | | 35,963 | |
| Compliance expense (See Note 5) | | | 25,843 | |
| Audit fees | | | 22,548 | |
| Trustees’ fees and expenses | | | 17,747 | |
| Distribution fees – Investor Class (See Note 5) | | | 17,675 | |
| Reports to shareholders | | | 13,413 | |
| Service fees – Investor Class (See Note 5) | | | 11,784 | |
| Interest expense (See Note 7) | | | 8,481 | |
| Legal fees | | | 528 | |
| Other expenses | | | 4,525 | |
| Total expenses | | | 1,159,372 | |
| NET INVESTMENT LOSS | | $ | (122,873 | ) |
| | | | | |
| REALIZED AND UNREALIZED GAINS (LOSSES): | | | | |
| Net realized loss on investments | | $ | (21,032,537 | ) |
| Net change in unrealized appreciation/depreciation on investments | | | 1,070,019 | |
| Net loss on investments | | | (19,962,518 | ) |
| NET DECREASE IN NET ASSETS RESULTING FROM OPERATIONS | | $ | (20,085,391 | ) |
(1) | Net of foreign taxes withheld of $10,084. |
The accompanying notes are an integral part of these financial statements.
(This Page Intentionally Left Blank.)
| HENNESSY FUNDS | 1-800-966-4354 | |
Financial Statements
| Statements of Changes in Net Assets |
OPERATIONS:
Net investment loss
Net realized gain (loss) on investments
Net change in unrealized appreciation/depreciation on investments
Net decrease in net assets resulting from operations
CAPITAL SHARE TRANSACTIONS:
Proceeds from shares subscribed – Investor Class
Proceeds from shares subscribed – Class C(2)
Proceeds from shares subscribed – Institutional Class
Proceeds from shares sold in connection with the conversion of Class C shares into Investor Class shares(2)
Cost of shares redeemed – Investor Class
Cost of shares redeemed – Class C(2)
Cost of shares redeemed – Institutional Class
Cost of shares redeemed in connection with the conversion of Class C shares into Investor Class shares(2)
Net decrease in net assets derived from capital share transactions
TOTAL DECREASE IN NET ASSETS
NET ASSETS:
Beginning of period
End of period
CHANGES IN SHARES OUTSTANDING:
Shares sold – Investor Class
Shares sold – Class C(2)
Shares sold – Institutional Class
Shares sold in connection with the conversion of Class C shares into Investor Class shares(2)
Shares redeemed in connection with the conversion of Class C shares into Investor Class shares(2)
Shares redeemed – Investor Class
Shares redeemed – Class C (2)
Shares redeemed – Institutional Class
Net decrease in shares outstanding
(1) | The period ended October 31, 2018, consists of 11 months due to the Fund’s fiscal year end change from November 30 to October 31, effective October 26, 2018. |
(2) | Effective November 28, 2017, Class C shares converted into Class A shares (redesignated as Investor Class shares). |
(3) | Includes accumulated net investment loss of $(3,269,605). |
The accompanying notes are an integral part of these financial statements.
| STATEMENTS OF CHANGES IN NET ASSETS |
| Year Ended | | | Eleven Months Ended | | | Year Ended | |
| October 31, 2019 | | | October 31, 2018(1) | | | November 30, 2017 | |
| | | | | | | | |
| $ | (122,873 | ) | | $ | (1,016,734 | ) | | $ | (1,504,624 | ) |
| | (21,032,537 | ) | | | 12,791,029 | | | | 14,710,227 | |
| | 1,070,019 | | | | (15,177,094 | ) | | | (20,430,679 | ) |
| | (20,085,391 | ) | | | (3,402,799 | ) | | | (7,225,076 | ) |
| | | | | | | | | | | |
| | 1,329,654 | | | | 4,580,057 | | | | 4,800,150 | |
| | — | | | | — | | | | 1,716,520 | |
| | 21,431,696 | | | | 27,159,764 | | | | 38,623,311 | |
| | — | | | | — | | | | 7,420,979 | |
| | (9,317,247 | ) | | | (8,125,374 | ) | | | (8,176,184 | ) |
| | — | | | | — | | | | (4,155,967 | ) |
| | (39,120,012 | ) | | | (68,363,869 | ) | | | (37,713,776 | ) |
| | — | | | | — | | | | (7,420,979 | ) |
| | (25,675,909 | ) | | | (44,749,422 | ) | | | (4,905,946 | ) |
| | (45,761,300 | ) | | | (48,152,221 | ) | | | (12,131,022 | ) |
| | | | | | | | | | | |
| | 96,962,014 | | | | 145,114,235 | | | | 157,245,257 | |
| $ | 51,200,714 | | | $ | 96,962,014 | | | $ | 145,114,235 | (3) |
| | | | | | | | | | | |
| | 83,075 | | | | 216,063 | | | | 244,584 | |
| | — | | | | — | | | | 88,930 | |
| | 1,375,469 | | | | 1,279,785 | | | | 2,010,365 | |
| | — | | | | — | | | | 389,181 | |
| | — | | | | — | | | | (394,345 | ) |
| | (588,930 | ) | | | (389,081 | ) | | | (425,815 | ) |
| | — | | | | — | | | | (219,288 | ) |
| | (2,524,419 | ) | | | (3,263,694 | ) | | | (1,916,043 | ) |
| | (1,654,805 | ) | | | (2,156,927 | ) | | | (222,431 | ) |
The accompanying notes are an integral part of these financial statements.
| HENNESSY FUNDS | 1-800-966-4354 | |
Financial Statements
For an Investor Class share outstanding throughout each period
PER SHARE DATA:
Net asset value, beginning of period
Income from investment operations:
Net investment loss(3)
Net realized and unrealized gains (losses) on investments
Total from investment operations
Less distributions:
Dividends from net realized gains
Total distributions
Net asset value, end of period
TOTAL RETURN
SUPPLEMENTAL DATA AND RATIOS:
Net assets, end of period (millions)
Ratio of expenses to average net assets
Ratio of net investment loss to average net assets
Portfolio turnover rate(6)
(1) | The period ended October 31, 2018, consists of 11 months due to the Fund’s fiscal year end change from November 30 to October 31, effective October 26, 2018. |
(2) | Fund commenced operations on December 31, 2013. |
(3) | Calculated using the average shares outstanding method. |
(4) | Not annualized. |
(5) | Annualized. |
(6) | Calculated on the basis of the Fund as a whole. |
The accompanying notes are an integral part of these financial statements.
| FINANCIAL HIGHLIGHTS — INVESTOR CLASS |
| Year Ended | | | Period Ended | | | | | | Period Ended | |
| October 31, | | | October 31, | | | Year Ended November 30, | | | November 30, | |
| 2019 | | | 2018(1) | | | 2017 | | | 2016 | | | 2015 | | | 2014(2) | |
| | | | | | | | | | | | | | | | | |
| $ | 18.32 | | | $ | 19.47 | | | $ | 20.54 | | | $ | 16.41 | | | $ | 20.45 | | | $ | 20.00 | |
| | | | | | | | | | | | | | | | | | | | | | | |
| | | | | | | | | | | | | | | | | | | | | | | |
| | (0.07 | ) | | | (0.20 | ) | | | (0.23 | ) | | | (0.15 | ) | | | (0.10 | ) | | | (0.11 | ) |
| | (4.17 | ) | | | (0.95 | ) | | | (0.84 | ) | | | 4.28 | | | | (3.46 | ) | | | 0.56 | |
| | (4.24 | ) | | | (1.15 | ) | | | (1.07 | ) | | | 4.13 | | | | (3.56 | ) | | | 0.45 | |
| | | | | | | | | | | | | | | | | | | | | | | |
| | | | | | | | | | | | | | | | | | | | | | | |
| | — | | | | — | | | | — | | | | — | | | | (0.48 | ) | | | — | |
| | — | | | | — | | | | — | | | | — | | | | (0.48 | ) | | | — | |
| $ | 14.08 | | | $ | 18.32 | | | $ | 19.47 | | | $ | 20.54 | | | $ | 16.41 | | | $ | 20.45 | |
| | | | | | | | | | | | | | | | | | | | | | | |
| | (23.14 | )% | | | (5.91 | )%(4) | | | (5.21 | )% | | | 25.17 | % | | | (17.57 | )% | | | 2.25 | %(4) |
| | | | | | | | | | | | | | | | | | | | | | | |
| | | | | | | | | | | | | | | | | | | | | | | |
| $ | 6.83 | | | $ | 18.16 | | | $ | 22.66 | | | $ | 19.64 | | | $ | 18.72 | | | $ | 15.14 | |
| | 1.97 | % | | | 1.82 | %(5) | | | 1.87 | % | | | 1.89 | % | | | 1.87 | % | | | 1.98 | %(5) |
| | (0.46 | )% | | | (1.05 | )%(5) | | | (1.21 | )% | | | (0.92 | )% | | | (0.51 | )% | | | (0.53 | )%(5) |
| | 87 | % | | | 72 | %(4) | | | 84 | % | | | 83 | % | | | 79 | % | | | 72 | %(4) |
The accompanying notes are an integral part of these financial statements.
| HENNESSY FUNDS | 1-800-966-4354 | |
Financial Statements
For an Institutional Class share outstanding throughout each period
PER SHARE DATA:
Net asset value, beginning of period
Income from investment operations:
Net investment loss(3)
Net realized and unrealized gains (losses) on investments
Total from investment operations
Less distributions:
Dividends from net investment income
Dividends from net realized gains
Total distributions
Net asset value, end of period
TOTAL RETURN
SUPPLEMENTAL DATA AND RATIOS:
Net assets, end of period (millions)
Ratio of expenses to average net assets
Ratio of net investment loss to average net assets
Portfolio turnover rate(6)
(1) | The period ended October 31, 2018, consists of 11 months due to the Fund’s fiscal year end change from November 30 to October 31, effective October 26, 2018. |
(2) | Fund commenced operations on December 31, 2013. |
(3) | Calculated using the average shares outstanding method. |
(4) | Not annualized. |
(5) | Annualized. |
(6) | Calculated on the basis of the Fund as a whole. |
The accompanying notes are an integral part of these financial statements.
| FINANCIAL HIGHLIGHTS — INSTITUTIONAL CLASS |
| Year Ended | | | Period Ended | | | | | | Period Ended | |
| October 31, | | | October 31, | | | Year Ended November 30, | | | November 30, | |
| 2019 | | | 2018(1) | | | 2017 | | | 2016 | | | 2015 | | | 2014(2) | |
| | | | | | | | | | | | | | | | | |
| $ | 18.50 | | | $ | 19.61 | | | $ | 20.64 | | | $ | 16.46 | | | $ | 20.45 | | | $ | 20.00 | |
| | | | | | | | | | | | | | | | | | | | | | | |
| | | | | | | | | | | | | | | | | | | | | | | |
| | (0.02 | ) | | | (0.15 | ) | | | (0.19 | ) | | | (0.11 | ) | | | (0.04 | ) | | | (0.06 | ) |
| | (4.22 | ) | | | (0.96 | ) | | | (0.84 | ) | | | 4.32 | | | | (3.47 | ) | | | 0.51 | |
| | (4.24 | ) | | | (1.11 | ) | | | (1.03 | ) | | | 4.21 | | | | (3.51 | ) | | | 0.45 | |
| | | | | | | | | | | | | | | | | | | | | | | |
| | | | | | | | | | | | | | | | | | | | | | | |
| | — | | | | — | | | | — | | | | (0.03 | ) | | | — | | | | — | |
| | — | | | | — | | | | — | | | | — | | | | (0.48 | ) | | | — | |
| | — | | | | — | | | | — | | | | (0.03 | ) | | | (0.48 | ) | | | — | |
| $ | 14.26 | | | $ | 18.50 | | | $ | 19.61 | | | $ | 20.64 | | | $ | 16.46 | | | $ | 20.45 | |
| | | | | | | | | | | | | | | | | | | | | | | |
| | (22.92 | )% | | | (5.66 | )%(4) | | | (4.99 | )% | | | 25.61 | % | | | (17.32 | )% | | | 2.25 | %(4) |
| | | | | | | | | | | | | | | | | | | | | | | |
| | | | | | | | | | | | | | | | | | | | | | | |
| $ | 44.37 | | | $ | 78.81 | | | $ | 122.45 | | | $ | 126.92 | | | $ | 100.05 | | | $ | 68.31 | |
| | 1.66 | % | | | 1.57 | %(5) | | | 1.62 | % | | | 1.60 | % | | | 1.54 | % | | | 1.73 | %(5) |
| | (0.12 | )% | | | (0.79 | )%(5) | | | (0.98 | )% | | | (0.65 | )% | | | (0.20 | )% | | | (0.28 | )%(5) |
| | 87 | % | | | 72 | %(4) | | | 84 | % | | | 83 | % | | | 79 | % | | | 72 | %(4) |
The accompanying notes are an integral part of these financial statements.
| HENNESSY FUNDS | 1-800-966-4354 | |
Financial Statements
Notes to the Financial Statements October 31, 2019 |
1). ORGANIZATION
The Hennessy BP Energy Fund (the “Fund”) is a series of Hennessy Funds Trust (the “Trust”), which was organized as a Delaware statutory trust on September 17, 1992. The Fund is an open-end management investment company registered under the Investment Company Act of 1940, as amended. Pursuant to a reorganization that took place after the close of business on October 26, 2018, the Fund is the legal, accounting, and performance information successor to the BP Capital TwinLine Energy Fund (the “Predecessor Fund”). Prior to October 26, 2018, the Fund had no investment operations. As a result of the reorganization, holders of Class A shares of the Predecessor Fund received Investor Class shares of the Fund, and holders of Class I shares of the Predecessor Fund received Institutional Class shares of the Fund. The investment objective of the Fund is to seek total return. The Fund is a diversified fund. Effective October 26, 2018, the Fund changed its fiscal year end from November 30 to October 31.
The Fund offers Investor Class and Institutional Class shares. Each class of shares differs principally in its respective 12b-1 distribution and service, shareholder servicing, and sub-transfer agent expenses. There are no sales charges. Each class has identical rights to earnings, assets, and voting privileges, except for class-specific expenses and exclusive rights to vote on matters affecting only one class.
As an investment company, the Fund follows the investment company accounting and reporting guidance of the Financial Accounting Standards Board (“FASB”) Accounting Standard Codification Topic 946 “Financial Services—Investment Companies.”
2). SIGNIFICANT ACCOUNTING POLICIES
The following is a summary of significant accounting policies consistently followed by the Fund in the preparation of the financial statements. These policies conform to U.S. generally accepted accounting principles (“GAAP”).
| a). | Securities Valuation – All investments in securities are recorded at their estimated fair value, as described in Note 3. |
| | |
| b). | Federal Income Taxes –No provision for federal income taxes or excise taxes has been made because the Fund has elected to be taxed as a regulated investment company and intends to distribute substantially all of its taxable income to its shareholders and otherwise comply with the provisions of the Internal Revenue Code of 1986, as amended, applicable to regulated investment companies. Net investment income/loss and realized gains/losses for federal income tax purposes may differ from those reported in the financial statements because of temporary book and tax basis differences. Temporary differences are primarily the result of the treatment of wash sales for tax reporting purposes and investments in companies organized as partnerships for tax purposes. The Fund recognizes interest and penalties related to income tax benefits, if any, in the Statement of Operations as an income tax expense. Distributions from net realized gains for book purposes may include short-term capital gains, which are included as ordinary income to shareholders for tax purposes. The Fund may utilize equalization accounting for tax purposes and designate earnings and profits, including net realized gains distributed to shareholders on redemption of shares, as part of the dividends paid deduction for income tax purposes. |
| NOTES TO THE FINANCIAL STATEMENTS |
| | Due to inherent differences in the recognition of income, expenses, and realized gains/losses under GAAP and federal income tax regulations, permanent differences between book and tax basis for reporting for fiscal year 2019 have been identified and appropriately reclassified in the Statement of Assets and Liabilities. The adjustments are as follows: |
| Accumulated | |
Deficit | Capital Stock |
| $509 | $(509) |
| c). | Accounting for Uncertainty in Income Taxes – The Fund has accounting policies regarding recognition and measurement of tax positions taken or expected to be taken on a tax return. The tax returns of the Fund for the prior three fiscal years are open for examination. The Fund has reviewed all open tax years in major jurisdictions and concluded that there is no impact on the Fund’s net assets and no tax liability resulting from unrecognized tax benefits relating to uncertain income tax positions taken or expected to be taken on a tax return. The Fund’s major tax jurisdictions are U.S. federal and Delaware. |
| | |
| d). | Income and Expenses – Dividend income is recognized on the ex-dividend date or as soon as information is available to the Fund. Interest income, which includes the amortization of premium and accretion of discount, is recognized on an accrual basis. Other non-cash dividends are recognized as investment income at the fair value of the property received. The Fund is charged for those expenses that are directly attributable to its portfolio, such as advisory, administration, and certain shareholder service fees. Income, expenses (other than expenses attributable to a specific class), and realized and unrealized gains/losses on investments are allocated to each class of shares based on such class’s net assets. Distributions received from the Fund’s investments in master limited partnerships (“MLPs”) generally consist of ordinary income, capital gains, and return of capital. The Fund records investment income on the ex-date of the distributions. For financial statement purposes, the Fund uses return of capital and income estimates to allocate the dividend income received. Such estimates are based on historical information available from the MLPs and other industry sources. These estimates may subsequently be revised based on information received from the MLPs after their tax reporting periods are concluded, as the actual character of these distributions is not known until after the fiscal year end of the Fund. |
| | |
| e). | Distributions to Shareholders – Dividends from net investment income for the Fund, if any, are declared and paid annually, usually in December. Distributions of net realized capital gains, if any, are declared and paid annually, usually in December. |
| | |
| f). | Security Transactions – Investment and shareholder transactions are recorded on the trade date. The Fund determines the realized gain/loss from an investment transaction by comparing the original cost of the security lot sold with the net sale proceeds. Discounts and premiums on securities purchased are accreted or amortized, respectively, over the life of each such security. |
| | |
| g). | Use of Estimates – The preparation of financial statements in conformity with GAAP requires management to make estimates and assumptions that affect the reported amounts of assets and liabilities and disclosure of contingent assets and liabilities at the date of the financial statements and the reported change in net assets during the reporting period. Actual results could differ from those estimates. |
| | |
| h). | Share Valuation – The net asset value (“NAV”) per share of the Fund is calculated by dividing (i) the total value of the securities held by the Fund, plus cash and other assets, minus all liabilities (including estimated accrued expenses) by (ii) the total number of |
| HENNESSY FUNDS | 1-800-966-4354 | |
| | shares outstanding for the Fund, rounded to the nearest $0.01. The Fund’s shares will not be priced on days the New York Stock Exchange is closed for trading. The offering and redemption price per share for the Fund is equal to the Fund’s NAV per share. |
| | |
| i). | Partnership Accounting Policy – To the extent the Fund receives distributions from underlying partnerships in which it invests, the Fund records its pro rata share of income/loss and capital gains/losses and accordingly adjusts the cost basis of the underlying partnerships for return of capital. |
| | |
| j). | New Accounting Pronouncements – In August 2018, the FASB issued Accounting Standards Update No. 2018-13 “Disclosure Framework—Changes to the Disclosure Requirements for Fair Value Measurement” (“ASU 2018-13”). ASU 2018-13 eliminates the requirement to disclose the amount of and reasons for transfers between Level 1 and Level 2 of the fair value hierarchy, the timing of transfers between levels of the fair value hierarchy, and the valuation processes for Level 3 fair value measurements. ASU 2018-13 does not eliminate the requirement to disclose the range and weighted average used to develop significant unobservable inputs for Level 3 fair value measurements, and the changes in unrealized gains and losses for recurring Level 3 fair value measurements. ASU 2018-13 requires that information is provided about the measurement uncertainty of Level 3 fair value measurements as of the reporting date. The guidance is effective for fiscal years beginning after December 15, 2019, and interim periods within those fiscal years. Management has evaluated the impact of this change in guidance and, due to the permissibility of early adoption, modified the Fund’s fair value disclosures for the current reporting period. |
3). SECURITIES VALUATION
The Fund follows fair value accounting standards that establish an authoritative definition of fair value and set out a hierarchy for measuring fair value. These standards require additional disclosures about the various inputs and valuation techniques used to develop the measurements of fair value and a discussion of changes in valuation techniques and related inputs during the period. These inputs are summarized in the three broad levels listed below:
| | Level 1 – | Unadjusted, quoted prices in active markets for identical instruments that the Fund has the ability to access at the date of measurement. |
| | | |
| | Level 2 – | Other significant observable inputs (including, but not limited to, quoted prices in active markets for similar instruments, quoted prices in markets that are not active for identical or similar instruments, and model-derived valuations in which all significant inputs and significant value drivers are observable in active markets, such as interest rates, prepayment speeds, credit risk curves, default rates, and similar data). |
| | | |
| | Level 3 – | Significant unobservable inputs (including the Fund’s own assumptions about what market participants would use to price the asset or liability based on the best available information) when observable inputs are unavailable. |
The following is a description of the valuation techniques applied to the Fund’s major categories of assets and liabilities measured at fair value on a recurring basis:
| | Equity Securities – Equity securities, including common stocks, preferred stocks, foreign-issued common stocks, exchange-traded funds, closed-end mutual funds, partnerships, rights, MLPs, and real estate investment trusts, that are traded on a securities exchange for which a last-quoted sales price is readily available will generally be valued at the last sales price as reported by the primary exchange on which the securities are listed. Securities listed on The NASDAQ Stock Market |
| NOTES TO THE FINANCIAL STATEMENTS |
| | (“NASDAQ”) will generally be valued at the NASDAQ Official Closing Price, which may differ from the last sales price reported. Securities traded on a securities exchange for which a last-quoted sales price is not readily available will generally be valued at the mean between the bid and ask prices. To the extent these securities are actively traded and valuation adjustments are not applied, they are classified in Level 1 of the fair value hierarchy. Securities traded on foreign exchanges generally are not valued at the same time the Fund calculates its NAV because most foreign markets close well before such time. The earlier close of most foreign markets gives rise to the possibility that significant events, including broad market moves, may have occurred in the interim. In certain circumstances, it may be determined that a foreign security needs to be fair valued because it appears that the value of the security might have been materially affected by events occurring after the close of the market in which the security is principally traded, but before the time the Fund calculates its NAV, such as by a development that affects an entire market or region (e.g., a weather-related event) or a potentially global development (e.g., a terrorist attack that may be expected to have an effect on investor expectations worldwide). |
| | |
| | Registered Investment Companies – Investments in open-end registered investment companies, commonly referred to as mutual funds, generally are priced at the ending NAV provided by the applicable mutual fund’s service agent and will be classified in Level 1 of the fair value hierarchy. |
| | |
| | Debt Securities – Debt securities, including corporate bonds, asset-backed securities, mortgage-backed securities, municipal bonds, U.S. Treasuries, and U.S. government agency issues, are generally valued at market on the basis of valuations furnished by an independent pricing service that utilizes both dealer-supplied valuations and formula-based techniques. The pricing service may consider recently executed transactions in securities of the issuer or comparable issuers, market price quotations (where observable), bond spreads, and fundamental data relating to the issuer. In addition, the model may incorporate observable market data, such as reported sales of similar securities, broker quotes, yields, bids, offers, and reference data. Certain securities are valued primarily using dealer quotations. These securities are generally classified in Level 2 of the fair value hierarchy. |
| | |
| | Short-Term Securities – Short-term equity investments, including money market funds, are valued in the manner specified above. Short-term debt investments with an original term to maturity of 60 days or less are valued at amortized cost, which approximates fair market value. If the original term to maturity of a short-term debt investment exceeded 60 days, then the values as of the 61st day prior to maturity are amortized. Amortized cost is not used if its use would be inappropriate due to credit or other impairments of the issuer, in which case the security’s fair value would be determined, as described below. Short-term securities are generally classified in Level 1 or Level 2 of the fair value hierarchy depending on the inputs used and market activity levels for specific securities. |
The Board of Trustees of the Fund (the “Board”) has adopted fair value pricing procedures that are followed when a price for a security is not readily available or if a significant event has occurred that indicates the closing price of a security no longer represents the true value of that security. Fair value pricing determinations are made in good faith in accordance with these procedures. There are numerous criteria that will be given consideration in determining a fair value of a security, such as the trading volume of a security and markets, the values of other similar securities, and news events with direct bearing on a security or markets. Fair value pricing results in an estimated price for a security that reflects the amount the Fund might reasonably expect to receive in a current
| HENNESSY FUNDS | 1-800-966-4354 | |
sale. Depending on the relative significance of the valuation inputs, these securities may be classified in either Level 2 or Level 3 of the fair value hierarchy.
The fair value of foreign securities may be determined with the assistance of a pricing service using correlations between the movement of prices of such securities and indices of domestic securities and other appropriate indicators, such as closing market prices of relevant American Depositary Receipts or futures contracts. The effect of using fair value pricing is that the Fund’s NAV will reflect the affected portfolio securities’ values as determined by the Board or its designee, pursuant to the fair value pricing procedures adopted by the Board, instead of being determined by the market. Using a fair value pricing methodology to price a foreign security may result in a value that is different from such foreign security’s most recent closing price and from the value used by other investment companies to calculate their NAVs. Such securities are generally classified in Level 2 of the fair value hierarchy. Because the Fund may invest in foreign securities, the value of the Fund’s portfolio securities may change on days when you will not be able to purchase or redeem your shares.
The Board has delegated day-to-day valuation matters to the Valuation and Liquidity Committee comprising representatives from Hennessy Advisors, Inc., the Fund’s investment advisor (the “Advisor”). The function of the Valuation and Liquidity Committee is to value securities where current and reliable market quotations are not readily available. All actions taken by the Valuation and Liquidity Committee are reviewed by the Board.
The Fund has performed an analysis of all existing investments to determine the significance and character of all inputs to their fair value determinations. Various inputs are used to determine the value of the Fund’s investments. The inputs or methodology used for valuing securities are not necessarily an indication of the risk associated with investing in those securities. Details related to the fair value hierarchy of the Fund’s securities as of October 31, 2019, are included in the Schedule of Investments.
4). INVESTMENT TRANSACTIONS
Purchases and sales of investment securities (excluding government and short-term investments) for the Fund during fiscal year 2019 were $57,139,716 and $84,120,959, respectively.
There were no purchases or sales/maturities of long-term U.S. government securities for the Fund during fiscal year 2019.
The Fund is permitted to purchase or sell securities from or to another fund in the Hennessy Funds family of funds (collectively, the “Hennessy Funds”) under specified conditions outlined in procedures adopted by the Board. The procedures have been designed to ensure that any purchase or sale of securities by the Fund from or to another Hennessy Fund complies with Rule 17a-7 of the Investment Company Act of 1940, as amended. During fiscal year 2019, the Fund did not engage in purchases or sales of securities pursuant to Rule 17a-7 of the Investment Company Act of 1940, as amended.
5). INVESTMENT ADVISORY FEE AND OTHER TRANSACTIONS WITH AFFILIATES
The Advisor provides the Fund with investment advisory services under an Investment Advisory Agreement. The Advisor oversees the provision of investment advice and furnishes office space, facilities, and most of the personnel needed by the Fund. As compensation for its services, the Advisor is entitled to a monthly fee from the Fund. The fee is based on the average daily net assets of the Fund at an annual rate of 1.25 %. The net investment advisory fees expensed by the Fund during fiscal year 2019 are included in the Statement of Operations.
| NOTES TO THE FINANCIAL STATEMENTS |
The Advisor has delegated the day-to-day management of the Fund to a sub-advisor, BP Capital Fund Advisors, LLC (“BP Capital”). The Advisor pays the sub-advisory fees from its own assets, and these fees are not an additional expense of the Fund. During fiscal year 2019, the Advisor (not the Fund) paid a sub-advisory fee at the rate of 0.40% of the daily net assets of the Fund.
The Advisor has contractually agreed to limit total annual operating expenses to 2.00% of the Fund’s net assets for Investor Class shares and 1.75% of the Fund’s net assets for Institutional Class shares (in each case, excluding all federal, state, and local taxes, interest, brokerage commissions, dividend and interest expenses on short sales, extraordinary items, and acquired fund fees and expenses and other costs incurred in connection with the purchase and sale of securities) through October 25, 2020.
For three years following the date on which expenses were waived or incurred, the Advisor may recoup waived or reimbursed expenses from the Fund if total operating expenses, including such recoupment, does not exceed the expense limitation in effect (i) at the time the Advisor waived or reimbursed such expenses and (ii) at the time the Advisor recoups such expenses. There are no recoverable amounts, and the Advisor did not recoup expenses during fiscal year 2019.
The Board has approved a Shareholder Servicing Agreement for Investor Class shares of the Fund, which was instituted to compensate the Advisor for the non-investment advisory services it provides to the Fund. The Shareholder Servicing Agreement provides for a monthly fee paid to the Advisor at an annual rate of 0.10% of the average daily net assets of the Fund attributable to Investor Class shares. The shareholder service fees expensed by the Fund during fiscal year 2019 are included in the Statement of Operations.
The Fund has adopted a plan pursuant to Rule 12b-1 under the Investment Company Act of 1940, as amended, that authorizes payments in connection with the distribution of the Fund’s shares at an annual rate of up to 0.25% of the Fund’s average daily net assets attributable to Investor Class shares. Even though the authorized rate is up to 0.25%, the Fund is currently only using up to 0.15% of its average daily net assets attributable to Investor Class shares for such purpose. Amounts paid under the plan may be spent on any activities or expenses primarily intended to result in the sale of shares, including, but not limited to, advertising, shareholder account servicing, printing and mailing of prospectuses to other than current shareholders, printing and mailing of sales literature, and compensation for sales and marketing activities or to financial institutions and others, such as dealers and distributors. The distribution fees expensed by the Fund during fiscal year 2019 are included in the Statement of Operations.
The Fund has entered into agreements with various brokers, dealers, and financial intermediaries in connection with the sale of shares of the Fund. The agreements provide for periodic payments of sub-transfer agent expenses by the Fund to the brokers, dealers, and financial intermediaries for providing certain shareholder maintenance services. These shareholder services include the pre-processing and quality control of new accounts, shareholder correspondence, answering customer inquiries regarding account status, and facilitating shareholder telephone transactions. The sub-transfer agent fees expensed by the Fund during fiscal year 2019 are included in the Statement of Operations.
U.S. Bancorp Fund Services, LLC, d/b/a U.S. Bank Global Fund Services (“Fund Services”) provides the Fund with administrative, accounting, and transfer agent services. As administrator, Fund Services is responsible for activities such as (i) preparing various federal and state regulatory filings, reports, and returns for the Fund, (ii) preparing reports and materials to be supplied to the Board, (iii) monitoring the activities of the Fund’s custodian, transfer agent, and accountants, and (iv) coordinating the preparation
| HENNESSY FUNDS | 1-800-966-4354 | |
and payment of the Fund’s expenses and reviewing the Fund’s expense accruals. U.S. Bank N.A., an affiliate of Fund Services, serves as the Fund’s custodian. The servicing agreements between the Trust and Fund Services and U.S. Bank N.A. contain a fee schedule that is inclusive of administrative, accounting, custody, and transfer agent fees. The administrative, accounting, custody, and transfer agent fees expensed by the Fund during fiscal year 2019 are included in the Statement of Operations.
Quasar Distributors, LLC (“Quasar”) acts as the Fund’s principal underwriter in a continuous public offering of the Fund’s shares. Quasar is an affiliate of Fund Services and U.S. Bank N.A.
The officers of the Fund are affiliated with the Advisor. With the exception of the Chief Compliance Officer and the Senior Compliance Officer, such officers receive no compensation from the Fund for serving in their respective roles. The Fund, along with the other Hennessy Funds, makes reimbursement payments on an equal basis to the Advisor for a portion of the salary and benefits associated with the office of the Chief Compliance Officer and for all of the salary and benefits associated with the office of the Senior Compliance Officer. The compliance fees expensed by the Fund during fiscal year 2019 are included in the Statement of Operations.
6). GUARANTEES AND INDEMNIFICATIONS
Under the Hennessy Funds’ organizational documents, their officers and trustees are indemnified by the Hennessy Funds against certain liabilities arising out of the performance of their duties to the Hennessy Funds. Additionally, in the normal course of business, the Hennessy Funds enter into contracts with service providers that contain general indemnification clauses. The Fund’s maximum exposure under these arrangements is unknown as this would involve future claims that may be made against the Fund that have not yet occurred. Currently, the Fund expects the risk of loss to be remote.
7). LINE OF CREDIT
The Fund has an uncommitted line of credit with the other Hennessy Funds in the amount of the lesser of (i) $100,000,000 or (ii) 33.33% of each Hennessy Fund’s net assets, or 30% for the Hennessy Gas Utility Fund and 10% for the Hennessy Balanced Fund, intended to provide short-term financing, if necessary, subject to certain restrictions, in connection with shareholder redemptions. The credit facility is with the Hennessy Funds’ custodian bank, U.S. Bank N.A. Borrowings under this arrangement bear interest at the bank’s prime rate and are secured by all of the Fund’s assets (as to its own borrowings only). During fiscal year 2019, the Fund had an outstanding average daily balance and a weighted average interest rate of $153,244 and 5.46%, respectively. The interest expensed by the Fund during fiscal year 2019 is included in the Statement of Operations. The maximum amount outstanding for the Fund during fiscal year 2019 was $5,978,000. As of October 31, 2019, the Fund did not have any borrowings outstanding under the line of credit.
| NOTES TO THE FINANCIAL STATEMENTS |
8). FEDERAL TAX INFORMATION
As of October 31, 2019, the components of accumulated earnings (losses) for income tax purposes were as follows:
| | | Investments | |
| Cost of investments for tax purposes | | $ | 58,501,243 | |
| Gross tax unrealized appreciation | | $ | 1,872,760 | |
| Gross tax unrealized depreciation | | | (9,141,728 | ) |
| Net tax unrealized appreciation/(depreciation) | | $ | (7,268,968 | ) |
| Undistributed ordinary income | | $ | 79,002 | |
| Undistributed long-term capital gains | | | — | |
| Total distributable earnings | | $ | 79,002 | |
| Other accumulated gain/(loss) | | $ | (21,955,706 | ) |
| Total accumulated gain/(loss) | | $ | (29,145,672 | ) |
The difference between book-basis unrealized appreciation/depreciation and tax-basis unrealized appreciation/depreciation (as shown above) is attributable primarily to wash sales, and partnership adjustments.
As of October 31, 2019, the Fund had capital loss carryforwards as follows:
| | $ | 9,883,167 | | Unlimited Long-Term |
| | | 12,072,539 | | Unlimited Short-Term |
As of October 31, 2019, the Fund did not defer, on a tax basis, any late-year ordinary losses. Late-year ordinary losses are net ordinary losses incurred after December 31, 2018, but within the taxable year, that are deemed to arise on the first day of the Fund’s next taxable year.
During fiscal year 2019, the 11-month period ended October 31, 2018, and the year ended November 30, 2017, the Fund did not pay any distributions.
9). AGREEMENT AND PLAN OF REORGANIZATION
On October 22, 2018, shareholders of the Predecessor Fund approved an Agreement and Plan of Reorganization between the Trust, on behalf of the Fund, and Professionally Managed Portfolios, a Massachusetts business Trust, on behalf of the Predecessor Fund. The Agreement and Plan of Reorganization provided for the transfer of all of the assets of the Predecessor Fund to the Fund and the assumption of the liabilities (other than any excluded liabilities) of the Predecessor Fund by the Fund. The Fund was created to carry out the reorganization and has a substantially similar investment objective and substantially similar principal investment strategies as the Predecessor Fund. The reorganization was effective as of the close of business on October 26, 2018. The following table illustrates the specifics of the reorganization of the Predecessor Fund into the Fund:
| | | Net Assets of the Fund | | |
| | Shares Issued to | | | | |
| Predecessor Fund | Shareholders of the | | | Tax Status | |
Net Assets | Predecessor Fund | Pre-Merger | Post-Merger | of Transfer | |
$96,818,691(1) | 5,275,159 | $0 | $96,818,691 | Non-taxable | |
| | (1) | Includes accumulated net investment loss, accumulated realized gains, and unrealized appreciation in the amounts of $(4,224,600), $821,745, and $(8,461,891), respectively. |
| HENNESSY FUNDS | 1-800-966-4354 | |
10). EVENTS SUBSEQUENT TO YEAR END
Management has evaluated the Fund’s related events and transactions that occurred subsequent to October 31, 2019, through the date of issuance of the Fund’s financial statements. Other than as disclosed below, management has determined that there were no subsequent events requiring recognition or disclosure in the financial statements.
On November 25, 2019, U.S. Bancorp, the parent company of Quasar, announced that it had signed a purchase agreement to sell Quasar to Foreside Financial Group, LLC, such that Quasar will become a wholly-owned broker-dealer subsidiary of Foreside. The transaction is expected to close by the end of March 2020. Quasar will remain the Fund’s distributor at the close of the transaction, subject to Board approval.
| NOTES/REPORT OF INDEPENDENT REGISTERED PUBLIC ACCOUNTING FIRM |
Report of Independent Registered Public
Accounting Firm
To the Board of Trustees of Hennessy Funds Trust
and the shareholders of the Hennessy BP Energy Fund
Novato, CA
Opinion on the Financial Statements
We have audited the accompanying statement of assets and liabilities of the Hennessy BP Energy Fund (the “Fund”), a series of Hennessy Funds Trust, including the schedule of investments, as of October 31, 2019, the related statements of operations for the year then ended, the statements of changes in net assets for the year then ended, for the eleven months ended October 31, 2018, and for the year ended November 30, 2017, the financial highlights for the year then ended, for the eleven months ended October 31, 2018, each of the three years in the period ended November 30, 2017, and for the period from December 31, 2013 (commencement of operations) to November 30, 2014, and the related notes (collectively referred to as the “financial statements”). In our opinion, the financial statements present fairly, in all material respects, the financial position of the Fund as of October 31, 2019, the results of its operations for the year then ended, the changes in its net assets and the financial highlights for each of the periods noted above, in conformity with accounting principles generally accepted in the United States of America.
Basis for Opinion
These financial statements are the responsibility of the Fund’s management. Our responsibility is to express an opinion on the Fund’s financial statements based on our audits. We are a public accounting firm registered with the Public Company Accounting Oversight Board (United States) (“PCAOB”) and are required to be independent with respect to the Fund in accordance with the U.S. federal securities laws and the applicable rules and regulations of the Securities and Exchange Commission and the PCAOB. We have served as the auditor of one or more of the funds in the Trust since 2002.
We conducted our audits in accordance with the standards of the PCAOB. Those standards require that we plan and perform the audit to obtain reasonable assurance about whether the financial statements are free of material misstatement, whether due to error or fraud. The Fund is not required to have, nor were we engaged to perform, an audit of its internal control over financial reporting. As part of our audits we are required to obtain an understanding of internal control over financial reporting, but not for the purpose of expressing an opinion on the effectiveness of the Fund’s internal control over financial reporting. Accordingly, we express no such opinion.
Our audits included performing procedures to assess the risks of material misstatement of the financial statements, whether due to error or fraud, and performing procedures that respond to those risks. Such procedures included examining, on a test basis, evidence regarding the amounts and disclosures in the financial statements. Our audits also included evaluating the accounting principles used and significant estimates made by management, as well as evaluating the overall presentation of the financial statements. Our procedures included confirmation of securities owned as of October 31, 2019, by correspondence with the custodian. We believe that our audits provide a reasonable basis for our opinion.
| |  |
| | TAIT, WELLER & BAKER LLP |
Philadelphia, Pennsylvania
December 24, 2019
| HENNESSY FUNDS | 1-800-966-4354 | |
Trustees and Officers of the Fund (Unaudited)
The business and affairs of the Funds are managed under the direction of the Board of Trustees of the Trust, and the Board of Trustees elects the officers of the Trust. From time to time, the Board of Trustees also has appointed advisers to the Board of Trustees (“Advisers”) with the intention of having qualified individuals serve in an advisory capacity in order to garner experience in the mutual fund and asset management industry and be considered as potential Trustees in the future. There are currently three Advisers: Brian Alexander, Doug Franklin, and Claire Knoles. As Advisers, Mr. Alexander, Mr. Franklin, and Ms. Knoles attend meetings of the Board of Trustees and act as non-voting participants. Information pertaining to the Trustees, Advisers, and the officers of the Trust is set forth below. The Trustees and officers serve until their successors are duly elected and qualified or until their earlier death, resignation, or removal. Each Trustee oversees the 16 Hennessy Funds. Unless otherwise indicated, the address of all persons listed below is 7250 Redwood Boulevard, Suite 200, Novato, CA 94945. The Fund’s Statement of Additional Information includes more information about the persons listed below and is available without charge by calling 1-800-966-4354 or by visiting www.hennessyfunds.com.
| | | | Other |
| | | | Directorships |
| | | | Held Outside |
| Name, (Year of Birth), | | | of Fund |
| and Position Held | Start Date | Principal Occupation(s) | Complex During |
with the Trust | of Service | During Past Five Years | Past Five Years |
| | | | |
| Disinterested Trustees and Advisers | | | |
| | | | |
| J. Dennis DeSousa | January 1996 | Mr. DeSousa is a real estate investor. | None. |
| (1936) | | | |
| Trustee | | | |
| | | | |
| Robert T. Doyle | January 1996 | Mr. Doyle has been the Sheriff of | None. |
| (1947) | | Marin County, California since 1996. | |
| Trustee | | | |
| | | | |
| Gerald P. Richardson | May 2004 | Mr. Richardson is an independent | None. |
| (1945) | | consultant in the securities industry. | |
| Trustee | | | |
| | | | |
| Brian Alexander | March 2015 | Mr. Alexander has worked for the | None. |
| (1981) | | Sutter Health organization since | |
| Adviser to the Board | | 2011 in various positions. He has | |
| | | served as the Chief Executive Officer | |
| | | of the Sutter Roseville Medical | |
| | | Center since 2018. From 2016 through | |
| | | 2018, he served as the Vice President | |
| | | of Strategy for the Sutter Health Valley | |
| | | Area, which includes 11 hospitals, | |
| | | 13 ambulatory surgery centers, | |
| | | 16,000 employees, and 1,900 physicians. | |
| | | From 2013 through 2016, Mr. Alexander | |
| | | served as Sutter Novato Community | |
| | | Hospital’s Chief Administrative Officer. | |
| TRUSTEES AND OFFICERS OF THE FUND |
| | | | Other |
| | | | Directorships |
| | | | Held Outside |
| Name, (Year of Birth), | | | of Fund |
| and Position Held | Start Date | Principal Occupation(s) | Complex During |
with the Trust | of Service | During Past Five Years | Past Five Years |
| | | | |
| Doug Franklin | March 2016 | Mr. Franklin is a retired insurance | None. |
| (1964) | | industry executive. From 1987 | |
| Adviser to the Board | | through 2015, he was employed | |
| | | by the Allianz-Fireman’s Fund | |
| | | Insurance Company in various | |
| | | positions, including as its Chief | |
| | | Actuary and Chief Risk Officer. | |
| | | | |
| Claire Knoles | December 2015 | Ms. Knoles is a founder of Kiosk and | None. |
| (1974) | | has served as its Chief Operating | |
| Adviser to the Board | | Officer since 2004. Kiosk is a full- | |
| | | service marketing agency with | |
| | | offices in the San Francisco Bay | |
| | | Area, Toronto, and Liverpool, UK. | |
| | | | |
Interested Trustee(1) | | | |
| | | | |
| Neil J. Hennessy | January 1996 as | Mr. Hennessy has been employed | Hennessy |
| (1956) | a Trustee and | by Hennessy Advisors, Inc. since | Advisors, Inc. |
| Trustee, Chairman of | June 2008 as | 1989 and currently serves as its | |
| the Board, Chief | an officer | Chairman and Chief Executive Officer. | |
| Investment Officer, | | | |
| Portfolio Manager, | | | |
| and President | | | |
| Name, (Year of Birth), | | |
| and Position Held | Start Date | Principal Occupation(s) |
with the Trust | of Service | During Past Five Years |
| | | |
| Officers | | |
| | | |
| Teresa M. Nilsen | January 1996 | Ms. Nilsen has been employed by Hennessy Advisors, Inc. |
| (1966) | | since 1989 and currently serves as its President, Chief Operating |
| Executive Vice President | | Officer, and Secretary. |
| and Treasurer | | |
| | | |
| Daniel B. Steadman | March 2000 | Mr. Steadman has been employed by Hennessy Advisors, Inc. |
| (1956) | | since 2000 and currently serves as its Executive Vice President. |
| Executive Vice President | | |
| and Secretary | | |
| | | |
| Brian Carlson | December 2013 | Mr. Carlson has been employed by Hennessy Advisors, Inc. |
| (1972) | | since December 2013 and currently serves as its Chief |
| Senior Vice President | | Compliance Officer and Senior Vice President. |
| and Head of Distribution | | |
| | | |
| Jennifer Cheskiewicz | June 2013 | Ms. Cheskiewicz has been employed by Hennessy Advisors, Inc. |
(1977)(2) | | as its General Counsel since June 2013. |
| Senior Vice President and | | |
| Chief Compliance Officer | | |
| HENNESSY FUNDS | 1-800-966-4354 | |
| Name, (Year of Birth), | | |
| and Position Held | Start Date | Principal Occupation(s) |
with the Trust | of Service | During Past Five Years |
| | | |
| David Ellison | October 2012 | Mr. Ellison has been employed by Hennessy Advisors, Inc. since |
(1958)(3) | | October 2012. He has served as a Portfolio Manager of the |
| Senior Vice President | | Hennessy Large Cap Financial Fund and the Hennessy Small |
| and Portfolio Manager | | Cap Financial Fund since their inception. Mr. Ellison also served |
| | | as a Portfolio Manager of the Hennessy Technology Fund from |
| | | its inception until February 2017. Mr. Ellison served as Director, |
| | | CIO and President of FBR Fund Advisers, Inc. from December |
| | | 1999 to October 2012. |
| | | |
| Ryan Kelley | March 2013 | Mr. Kelley has been employed by Hennessy Advisors, Inc. since |
(1972)(4) | | October 2012. He has served as a Portfolio Manager of the |
| Senior Vice President | | Hennessy Gas Utility Fund, the Hennessy Large Cap Financial |
| and Portfolio Manager | | Fund, and the Hennessy Small Cap Financial Fund since |
| | | October 2014. He served as Co- Portfolio Manager of these |
| | | same funds from March 2013 through September 2014 and as |
| | | a Portfolio Analyst for the Hennessy Funds from October 2012 |
| | | through February 2013. Mr. Kelley has also served as a Portfolio |
| | | Manager of the Hennessy Cornerstone Growth Fund, the |
| | | Hennessy Cornerstone Mid Cap 30 Fund, the Hennessy |
| | | Cornerstone Large Growth Fund, and the Hennessy |
| | | Cornerstone Value Fund since February 2017 and as a Portfolio |
| | | Manager of the Hennessy Total Return Fund, the Hennessy |
| | | Balanced Fund, and the Hennessy Technology Fund since May |
| | | 2018. He served as Co- Portfolio Manager of the Hennessy |
| | | Technology Fund from February 2017 until May 2018. Mr. Kelley |
| | | served as Portfolio Manager of FBR Fund Advisers, Inc. from |
| | | January 2008 to October 2012. |
| | | |
| Tania Kelley | October 2003 | Ms. Kelley has been employed by Hennessy Advisors, Inc. since |
| (1965) | | October 2003. |
| Senior Vice President | | |
| and Head of Marketing | | |
| | | |
| L. Joshua Wein | September 2018 | Mr. Wein has been employed by Hennessy Advisors, Inc. |
(1973)(4) | | since 2018. He has served as Co-Portfolio Manager of the |
| Vice President and | | Hennessy Cornerstone Growth Fund, the Hennessy |
| Co-Portfolio Manager | | Cornerstone Mid Cap 30 Fund, the Hennessy Cornerstone Large |
| | | Growth Fund, the Hennessy Cornerstone Value Fund, Hennessy |
| | | Total Return Fund, the Hennessy Balanced Fund, the Hennessy |
| | | Gas Utility Fund, and the Hennessy Technology Fund since |
| | | February 2019. Prior to that, he served as a Senior Analyst of |
| | | those same funds since September 2018. Mr. Wein served as |
| | | Director of Alternative Investments and Co-Portfolio Manager |
| | | at Sterling Capital Management from 2008 to 2018. |
_______________
(1) | Mr. Hennessy is considered an “interested person,” as defined in the Investment Company Act of 1940, as amended, because he is an officer of the Trust. |
(2) | The address of this officer is 4800 Bee Caves Road, Suite 100, Austin, TX 78746. |
(3) | The address of this officer is 101 Federal Street, Suite 1900, Boston, MA 02110. |
(4) | The address of this officer is 1340 Environ Way, Chapel Hill, NC 27517. |
| TRUSTEES AND OFFICERS OF THE FUND |
(This Page Intentionally Left Blank.)
| HENNESSY FUNDS | 1-800-966-4354 | |
Expense Example (Unaudited)
October 31, 2019
As a shareholder of the Fund, you incur ongoing costs, including management fees, service fees, and other Fund expenses. This Example is intended to help you understand your ongoing costs (in dollars) of investing in the Fund and to compare these costs with the ongoing costs of investing in other mutual funds. The Example is based on an investment of $1,000 invested at the beginning of the period and held for the entire period from May 1, 2019, through October 31, 2019.
Actual Expenses
The first line of the table below under the “Investor Class” and “Institutional Class” headings provides information about actual account values and actual expenses. Although the Fund charges no sales loads or transaction fees, you will be assessed fees for outgoing wire transfers, returned checks and stop payment orders at prevailing rates charged by U.S. Bank Global Fund Services, the Fund’s transfer agent. If you request that a redemption be made by wire transfer, currently a $15 fee is charged by the Fund’s transfer agent. IRA accounts will be charged a $15 annual maintenance fee. The example below includes, but is not limited to, management fees, shareholder servicing fees, accounting, custody, and transfer agent fees. However, the example below does not include portfolio trading commissions and related expenses. You may use the information in this line, together with the amount you invested, to estimate the expenses that you paid over the period. Simply divide your account value by $1,000 (for example, an $8,600 account value divided by $1,000 = 8.6), then multiply the result by the number in the first line of the table under the “Investor Class” or “Institutional Class” headings in the column entitled “Expenses Paid During Period” to estimate the expenses you paid on your account during this period.
Hypothetical Example for Comparison Purposes
The second line of the table below under the “Investor Class” and “Institutional Class” headings provides information about hypothetical account values and hypothetical expenses based on the Fund’s actual expense ratios and an assumed rate of return of 5% per year before expenses, which is not the Fund’s actual return. The hypothetical account values and expenses may not be used to estimate the actual ending account balance or expenses you paid for the period. You may use this information to compare the ongoing costs of investing in the Fund and other funds. To do so, compare this 5% hypothetical example with the 5% hypothetical examples that appear in the shareholder reports of the other funds. Please note that the expenses shown in the table are meant to highlight your ongoing costs only. Therefore, the second line of the table under the “Investor Class” and “Institutional Class” headings is useful in comparing ongoing costs only and will not help you determine the relative total costs of owning different funds.
| | | | Expenses Paid |
| | Beginning | Ending | During Period(1) |
| | Account Value | Account Value | May 1, 2019 – |
| | May 1, 2019 | October 31, 2019 | October 31, 2019 |
| Investor Class | | | |
| Actual | $1,000.00 | $ 814.80 | $ 9.03 |
| Hypothetical (5% return before expenses) | $1,000.00 | $1,015.25 | $10.03 |
| | | | |
| Institutional Class | | | |
| Actual | $1,000.00 | $ 816.30 | $ 7.65 |
| Hypothetical (5% return before expenses) | $1,000.00 | $1,016.78 | $ 8.49 |
(1) | Expenses are equal to the Fund’s annualized expense ratio of 1.97% for Investor Class shares or 1.67% for Institutional Class shares, as applicable, multiplied by the average account value over the period, multiplied by 184/365 days (to reflect one-half year period). |
| HENNESSY FUNDS | 1-800-966-4354 | |
How to Obtain a Copy of the Fund’s
Proxy Voting Policy and Proxy Voting Records
A description of the policies and procedures the Fund uses to determine how to vote proxies relating to portfolio securities is available without charge: (1) by calling 1-800-966-4354; (2) on the Hennessy Funds’ website at www.hennessyfunds.com/proxy-voting/voting-policy; or (3) on the U.S. Securities and Exchange Commission’s (the “SEC”) website at www.sec.gov. The Fund’s proxy voting record is available without charge on both the Hennessy Funds’ website at www.hennessyfunds.com/proxy-voting/voting-record and the SEC’s website at www.sec.gov no later than August 31 for the prior 12 months ending June 30.
Availability of Quarterly Portfolio Schedule
For periods ending on or prior to January 31, 2019, the Fund has filed a complete schedule of portfolio holdings with the SEC for the first and third quarters of each fiscal year on Form N-Q. For periods ending on or after April 30, 2019, the Fund files a complete schedule of portfolio holdings with the SEC for the first and third quarters of each fiscal year as an exhibit to its reports on Form N-PORT. The Fund’s Forms N-Q and Forms N-PORT are available on the SEC’s website at www.sec.gov or on request by calling 1-800-966-4354.
Important Notice Regarding Delivery
of Shareholder Documents
To help keep the Fund’s costs as low as possible, we generally deliver a single copy of shareholder reports, proxy statements, and prospectuses to shareholders who share an address and have the same last name. This process does not apply to account statements. You may request an individual copy of a shareholder document at any time. If you would like to receive separate mailings of shareholder documents, please call U.S. Bank Global Fund Services at 1-800-261-6950 or 1-414-765-4124, and individual delivery will begin within 30 days of your request. If your account is held through a financial institution or other intermediary, please contact such intermediary directly to request individual delivery.
Electronic Delivery
The Funds offer shareholders the option to receive account statements, Prospectuses, tax forms, and reports online. To sign up for eDelivery, please visit www.hennessyfunds.com. You may change your delivery preference at any time by visiting our website or contacting the Funds at 1-800-261-6950.
| PROXY VOTING — PRIVACY POLICY |
Privacy Policy
We collect the following non-public personal information about you:
| | • | information we receive from you on or in applications or other forms, correspondence, or conversations, including, but not limited to, your name, address, phone number, social security number, assets, income, and date of birth; and |
| | | |
| | • | information about your transactions with us, our affiliates, or others, including, but not limited to, your account number and balance, payment history, parties to transactions, cost basis information, and other financial information. |
We do not disclose any non-public personal information about our current or former shareholders to non-affiliated third parties, except as permitted by law. For example, we are permitted by law to disclose all of the information we collect, as described above, to our Transfer Agent to process your transactions. Furthermore, we restrict access to your non-public personal information to those persons who require such information to provide products or services to you. We maintain physical, electronic, and procedural safeguards that comply with federal standards to guard your non-public personal information.
In the event that you hold shares of the Fund through a financial intermediary, including, but not limited to, a broker-dealer, bank, or trust company, the privacy policy of your financial intermediary would govern how your non-public personal information will be shared with non-affiliated third parties.
| HENNESSY FUNDS | 1-800-966-4354 | |
For information, questions or assistance, please call
The Hennessy Funds
1-800-966-4354 or 1-415-899-1555
INVESTMENT ADVISOR
Hennessy Advisors, Inc.
7250 Redwood Boulevard, Suite 200
Novato, California 94945
ADMINISTRATOR,
TRANSFER AGENT,
DIVIDEND PAYING AGENT, &
SHAREHOLDER SERVICING AGENT
U.S. Bancorp Fund Services, LLC
d/b/a U.S. Bank Global Fund Services
P.O. Box 701
Milwaukee, Wisconsin 53201-0701
CUSTODIAN
U.S. Bank N.A.
Custody Operations
1555 North River Center Drive, Suite 302
Milwaukee, Wisconsin 53212
TRUSTEES
Neil J. Hennessy
Robert T. Doyle
J. Dennis DeSousa
Gerald P. Richardson
COUNSEL
Foley & Lardner LLP
777 East Wisconsin Avenue
Milwaukee, Wisconsin 53202-5306
INDEPENDENT REGISTERED
PUBLIC ACCOUNTING FIRM
Tait, Weller & Baker LLP
Two Liberty Place
50 South 16th Street, Suite 2900
Philadelphia, Pennsylvania 19103-2529
DISTRIBUTOR
Quasar Distributors, LLC
777 East Wisconsin Avenue
Milwaukee, Wisconsin 53202
www.hennessyfunds.com | 1-800-966-4354
This report has been prepared for shareholders and may be distributed to
others only if preceded or accompanied by a current prospectus.

ANNUAL REPORT
OCTOBER 31, 2019
HENNESSY BP MIDSTREAM FUND
Investor Class HMSFX
Institutional Class HMSIX
IMPORTANT NOTICE REGARDING ELECTRONIC DELIVERY OF SHAREHOLDER REPORTS
Beginning on January 1, 2021, as permitted by regulations adopted by the Securities and Exchange Commission, paper copies of the annual and semi-annual reports will no longer be sent by mail unless you specifically request paper copies from the Hennessy Funds or from your financial intermediary. Instead, the reports will be made available on a website, and you will be notified by mail each time a report is posted and provided with a website link to access the report.
If you have already elected to receive shareholder reports electronically, you will not be affected by this change and you need not take any action. You may elect to receive shareholder reports and other communications from the Hennessy Funds electronically by visiting www.hennessyfunds.com/account or by calling U.S. Bank Global Fund Services at 1-800-261-6950. If you own shares in a Fund through a financial intermediary, please contact your financial intermediary to make this election.
You may elect to receive paper copies of all future reports free of charge by calling U.S. Bank Global Fund Services at 1-800-261-6950 or, if you own your shares through a financial intermediary, by contacting your financial intermediary. Your election to receive paper copies of reports will apply to all Funds in the Hennessy Funds family.
hennessyfunds.com | 1-800-966-4354
(This Page Intentionally Left Blank.)
Contents
| Letter to Shareholders | 2 |
| Performance Overview | 4 |
| Financial Statements | |
| Schedule of Investments | 7 |
| Statement of Assets and Liabilities | 10 |
| Statement of Operations | 11 |
| Statements of Changes in Net Assets | 12 |
| Financial Highlights | 14 |
| Notes to the Financial Statements | 18 |
| Report of Independent Registered Public Accounting Firm | 28 |
| Trustees and Officers of the Fund | 29 |
| Expense Example | 32 |
| Proxy Voting Policy and Proxy Voting Records | 34 |
| Availability of Quarterly Portfolio Schedule | 34 |
| Federal Tax Distribution Information | 34 |
| Important Notice Regarding Delivery of Shareholder Documents | 34 |
| Electronic Delivery | 34 |
| Privacy Policy | 35 |
| HENNESSY FUNDS | 1-800-966-4354 | |
December 2019
Dear Hennessy Funds Shareholder:
What a year it has been. I am reassured by the resiliency of the U.S. financial markets as companies continue to thrive in the midst of policy challenges and political turbulence. Trade tariffs, impeachment, and interest rates have dominated the news headlines, while Brexit and protests in Hong Kong have also been major concerns internationally.
While the financial markets were characterized by volatility during the twelve months ended October 31, 2019, U.S. equities posted double-digit positive performance for the period, with a total return of 14.3% for the S&P 500® Index and 10.3% for the Dow Jones Industrial Average. As I sat down to write this letter, all three major indices, the S&P 500® Index, the Dow Jones Industrial Average, and the NASDAQ Composite Index, recently reached all-time highs.
Every bull market experiences volatility and pullbacks, and this extended bull market is no different. Since 2010, there have been 16 pullbacks of 5-10% and six corrections of over 10%. But what is interesting is not how quickly the declines take place, but rather how swiftly the market regains and surpasses its prior highs. With each decline, many investors and commentators predict that finally this bull market is out of steam. But I ask myself, “Why?”
What I see is a healthy economy and stock market, with fundamentals in place to support a continued bull market. Although slightly above long-term averages, I believe stocks are trading at reasonable valuations, with the Dow Jones Industrial Average trading at 16x forward earnings per share and the S&P 500® Index at 17x forward earnings. At the same time, the U.S. economy is growing at a sustainable pace of 2-3%, corporate profits continue to outperform expectations, and cash continues to build on corporate balance sheets. With over $5 trillion in cash and marketable securities on the balance sheets of the S&P 500® Index companies alone, corporations are returning cash to shareholders through share buybacks and dividends. Share buybacks by S&P 500® Index companies could hit $1 trillion in 2019, surpassing 2018’s record $800 billion, and dividend payments by S&P 500® Index companies are estimated to increase 8-9%. Unemployment continues to be at historically low levels, while wages are growing. Interest rates are also at very low levels, which should support equity prices. Finally, overall consumer confidence remains positive.
To quote Sir John Templeton’s famous saying, “Bull markets are born on pessimism, grow on skepticism, mature on optimism, and die on euphoria.” If you look back to the beginning of the great bull market that began in 1982, only six of the past 37 years ended with negative total returns: 1990, 2000, 2001, 2002, 2008, and 2018. With the exception of 2018, which was characterized by volatility but no euphoria, the other down years were marked by euphoria in either real estate or dot coms. I have been saying for a number of years that I see no signs of euphoria in the market, and I remain confident in the strength of the market today.
Thank you for your continued trust and investment in the Hennessy Funds. We believe that there continue to be great opportunities throughout all parts of the market, and we remain steadfastly focused on managing our high-conviction portfolios for the long-term benefit of our shareholders. Should you have any questions or would like to speak with us directly, please don’t hesitate to call us at (800) 966-4354.
Best regards,
Neil J. Hennessy
President and Chief Investment Officer
Past performance does not guarantee future results.
Mutual fund investing involves risk. Principal loss is possible.
The Dow Jones Industrial Average and S&P 500® Index are commonly used to measure the performance of U.S. stocks. The NASDAQ Composite Index is a broad-based capitalization-weighted index of all the NASDAQ National Market and Small Cap stocks. One cannot invest directly in an index.
Forward price to earnings is a valuation measure calculated by dividing a company’s market price per share by its expected earnings per share over the following 12 months.
| HENNESSY FUNDS | 1-800-966-4354 | |
Performance Overview (Unaudited)
CHANGE IN VALUE OF $10,000 INVESTMENT
This graph illustrates the performance of an initial investment of $10,000 made in the Fund on its inception date and assumes the reinvestment of dividends.
AVERAGE ANNUAL TOTAL RETURN FOR PERIODS ENDED OCTOBER 31, 2019
| | One | Five | Since Inception |
| | Year | Years | (12/31/13) |
| Hennessy BP Midstream Fund – | | | |
| Investor Class (HMSFX) | -6.28% | -7.47% | -4.18% |
| Hennessy BP Midstream Fund – | | | |
| Institutional Class (HMSIX) | -6.10% | -7.23% | -3.94% |
| Alerian MLP Index | -6.36% | -8.96% | -5.64% |
S&P 500® Index | 14.33%
| 10.78%
| 11.14%
|
| Expense ratios: | Gross 1.86%, Net 1.78%(1) (Investor Class); |
| | Gross 1.58%, Net 1.52%(1) (Institutional Class) |
(1) | The Fund’s investment advisor has contractually agreed to limit expenses until October 25, 2020. |
Performance data quoted represents past performance; past performance does not guarantee future results. The investment return and principal value of an investment will fluctuate so that an investor’s shares, when redeemed, may be worth more or less than their original cost. The performance table does not reflect the deduction of taxes that a shareholder would pay on Fund distributions or the redemption of Fund shares. Current performance of the Fund may be lower or higher than the performance quoted. Performance data current to the most recent month end may be obtained by visiting www.hennessyfunds.com. Performance for periods on or prior to October 26, 2018, is that of the BP Capital TwinLine MLP Fund.
The Alerian MLP Index comprises companies that earn a majority of their cash flow from midstream activities involving energy commodities. The S&P 500® Index is a capitalization-weighted index that is designed to represent the broad domestic economy through changes in the aggregate market value of 500 stocks across all major industries. One cannot invest directly in an index. These indices are used herein for comparative purposes in accordance with SEC regulations.
Standard & Poor’s Financial Services LLC is the source and owner of the S&P® and S&P 500® trademarks.
The expense ratios presented are from the most recent prospectus. The expense ratios for the current reporting period are available in the Financial Highlights section of this report.
PERFORMANCE NARRATIVE
Portfolio Managers Toby Loftin and Ben Cook, CFA
BP Capital Fund Advisors, LLC (sub-advisor)
Performance:
For the 12-month period ended October 31, 2019, the Investor Class of the Hennessy BP Midstream Fund returned -6.28%, outperforming the Alerian MLP Index (the Fund’s primary benchmark), which returned -6.36%, but underperforming the S&P 500® Index, which returned 14.33%, for the same period.
Despite continued growth in U.S. lower 48 crude oil, natural gas, and natural gas liquids production during the period, market concern with commodity price weakness attributed to fears of softening crude oil demand and rapidly growing U.S. natural gas production prompted a defensive stance by midstream energy equity investors, who generally sought to reduce sector exposure.
Similarly, diverging sub-sector performance during the period signaled investor migration toward midstream companies traditionally viewed as “safe havens.” Outperformance was evident among diversified midstream companies operating integrated assets. Linkage across the midstream value chain affords those possessing integrated businesses with the ability to generate revenues by charging fees along multiple “touch-points,” ultimately allowing them to capitalize on rising throughput volume even in a muted pricing environment.
Conversely, midstream companies operating assets residing closer to the source of hydrocarbon production, namely gathering and processing (G&P) assets, underperformed during the period. G&P assets represent greater risk given their dependence upon drilling activity, which tends to track upstream capital spending which in turn is influenced by commodity price direction.
The Fund’s slight outperformance relative to its primary benchmark was due to its overweight position in several large–cap, diversified midstream companies operating integrated assets. The Fund’s holdings in a small number of companies with exposure to G&P activities geographically focused in areas experiencing slowing drilling activity detracted from its relative performance.
On an individual company basis, major contributors to the Fund’s relative performance included Oneok, Inc., Kinder Morgan, Inc., and Phillips 66 Partners, LP, while major detractors included Antero Midstream Corp., Targa Resources Corp., and BP Midstream Partners, LP.
With the exception of BP Midstream Partners, LP, the Fund continues to own the companies mentioned.
Portfolio Strategy:
The Fund seeks to build a portfolio of midstream energy companies with the following characteristics: cash flows linked to non-price factors, such as volumes consumed; long-term agreements with customers, such as utilities or power consumers; and strong balance sheets. We believe our intensive, fundamental, “boots-on-the-ground” research process, coupled with proprietary financial modeling, differentiates us from our competitors and allows us to uncover potential equity mispricings that can meaningfully drive performance.
| HENNESSY FUNDS | 1-800-966-4354 | |
Investment Commentary:
We believe the outlook for midstream energy companies remains bright and that midstream companies can benefit from the current rapid growth in the production and exportation of U.S. crude oil, natural gas, and natural gas liquids. We also believe midstream companies can benefit from higher energy commodity prices.
Two holdings were added to the Fund this year, including Oneok, Inc. and Tallgrass Energy Partners, LP. Five companies are no longer in the Fund, including EQT Midstream Partners, LP, Hess Midstream Partners, LP, Holly Energy Partners, LP, BP Midstream Partners, LP, and Cheniere Energy Partners, LP. During the period, Andeavor Logistics, LP was acquired by MPLX, LP, and Antero Midstream Partners, LP was acquired by Antero Midstream Corp.
_______________
Opinions expressed are those of the Portfolio Managers as of the date written and are subject to change, are not guaranteed, and should not be considered investment advice or an indication of trading intent.
The Fund is non-diversified, meaning it may concentrate its assets in fewer individual holdings than a diversified fund, making it more exposed to individual stock volatility than a diversified fund. The Fund invests in small-capitalization and medium-capitalization companies, which involves additional risks such as limited liquidity and greater volatility. Funds that concentrate in a single sector may be subject to a higher degree of risk. Energy-related companies are subject to specific risks, including fluctuations in commodity prices and consumer demand, substantial government regulation, and depletion of reserves. Investments in lower-rated and non-rated securities present a greater risk of loss to principal and interest than higher-rated securities. Use of derivatives can increase the volatility of the Fund.
MLPs and MLP investments have unique characteristics. The Fund does not receive the same tax benefits as a direct investment in an MLP.
The prices of MLP units may fluctuate abruptly and trading volume may be low, making it difficult for the Fund to sell its units at a favorable price. MLP general partners have the power to take actions that adversely affect the interests of unit holders. Most MLPs do not pay U.S. federal income tax at the partnership level, but an adverse change in tax laws could result in MLPs being treated as corporations for federal income tax purposes, which could reduce or eliminate distributions paid by MLPs to the Fund. The Fund is treated as a regular corporation, or “C” corporation, for U.S. federal income tax purposes, and therefore, is subject to U.S. federal income tax on its taxable income at the graduated rates applicable to corporations (currently a maximum rate of 21%), as well as state and local income taxes. The Fund will not benefit from current favorable federal income tax rates on long-term capital gains, and Fund income and losses will not be passed on to shareholders. The Fund accrues deferred income taxes for future tax liabilities associated with the portion of MLP distributions considered to be a tax-deferred return of capital and for any net operating gains as well as capital appreciation of its investments. This deferred tax liability is reflected in the daily net asset value of the Fund and as a result the Fund’s after-tax performance could differ significantly from the underlying assets even if the pre-tax performance is closely tracked. Please see the Fund’s prospectus for a more complete discussion of these and other risks.
References to specific securities should not be considered a recommendation to buy or sell any security. Fund holdings and sector allocations are subject to change. Please refer to the Schedule of Investments included in this report for additional portfolio information.
Cash flow refers to the net amount of cash and cash equivalents transferred into and out of a company.
| PERFORMANCE OVERVIEW/SCHEDULE OF INVESTMENTS |
Financial Statements
Schedule of Investments as of October 31, 2019 |
HENNESSY BP MIDSTREAM FUND
(% of Total Assets)
| TOP TEN HOLDINGS (EXCLUDING MONEY MARKET FUNDS) | % TOTAL ASSETS |
| Energy Transfer LP | 14.63% |
| Enterprise Products Partners LP | 12.21% |
| MPLX LP | 10.81% |
| The Williams Companies, Inc. | 9.14% |
| Magellan Midstream Partners LP | 7.15% |
| Phillips 66 Partners LP | 6.81% |
| Kinder Morgan, Inc. | 6.02% |
| Plains All American Pipeline LP | 5.78% |
| Shell Midstream Partners LP | 5.58% |
| ONEOK, Inc. | 5.32% |
Note: The Fund concentrates its investments in the Energy industry. For presentation purposes, the Fund uses custom categories.
| HENNESSY FUNDS | 1-800-966-4354 | |
| COMMON STOCKS – 28.32% | | Number | | | | | | % of | |
| | | of Shares | | | Value | | | Net Assets | |
| Gathering & Processing – 5.08% | | | | | | | | | |
| Antero Midstream Corp. | | | 45,000 | | | $ | 289,800 | | | | 0.71 | % |
| Targa Resources Corp. | | | 46,064 | | | | 1,790,968 | | | | 4.37 | % |
| | | | | | | | 2,080,768 | | | | 5.08 | % |
| | | | | | | | | | | | | |
| Natural Gas/NGL Transportation – 23.24% | | | | | | | | | | | | |
| Kinder Morgan, Inc. | | | 123,940 | | | | 2,476,321 | | | | 6.04 | % |
| ONEOK, Inc. | | | 31,326 | | | | 2,187,495 | | | | 5.34 | % |
| Tallgrass Energy LP | | | 58,900 | | | | 1,099,074 | | | | 2.68 | % |
| The Williams Companies, Inc. | | | 168,552 | | | | 3,760,395 | | | | 9.18 | % |
| | | | | | | | 9,523,285 | | | | 23.24 | % |
| Total Common Stocks | | | | | | | | | | | | |
| (Cost $11,962,455) | | | | | | | 11,604,053 | | | | 28.32 | % |
| | | | | | | | | | | | | |
| PARTNERSHIPS & TRUSTS – 70.88% | | | | | | | | | | | | |
| | | | | | | | | | | | | |
| Crude Oil & Refined Products – 36.26% | | | | | | | | | | | | |
| Magellan Midstream Partners LP | | | 47,198 | | | | 2,941,379 | | | | 7.18 | % |
| MPLX LP | | | 168,549 | | | | 4,444,637 | | | | 10.85 | % |
| Phillips 66 Partners LP | | | 50,119 | | | | 2,801,151 | | | | 6.83 | % |
| Plains All American Pipeline LP | | | 131,226 | | | | 2,379,128 | | | | 5.80 | % |
| Shell Midstream Partners LP | | | 111,764 | | | | 2,293,397 | | | | 5.60 | % |
| | | | | | | | 14,859,692 | | | | 36.26 | % |
| | | | | | | | | | | | | |
| Gathering & Processing – 7.68% | | | | | | | | | | | | |
| CNX Midstream Partners LP | | | 96,460 | | | | 1,478,732 | | | | 3.61 | % |
| Noble Midstream Partners LP | | | 36,500 | | | | 880,380 | | | | 2.15 | % |
| Western Midstream Partners LP | | | 37,000 | | | | 786,620 | | | | 1.92 | % |
| | | | | | | | 3,145,732 | | | | 7.68 | % |
| | | | | | | | | | | | | |
| Natural Gas/NGL Transportation – 26.94% | | | | | | | | | | | | |
| Energy Transfer LP | | | 477,915 | | | | 6,016,950 | | | | 14.68 | % |
| Enterprise Products Partners LP | | | 192,956 | | | | 5,022,644 | | | | 12.26 | % |
| | | | | | | | 11,039,594 | | | | 26.94 | % |
| Total Partnerships & Trusts | | | | | | | | | | | | |
| (Cost $29,520,418) | | | | | | | 29,045,018 | | | | 70.88 | % |
The accompanying notes are an integral part of these financial statements.
| SHORT-TERM INVESTMENTS – 0.21% | | Number | | | | | | % of | |
| | | of Shares | | | Value | | | Net Assets | |
| Money Market Funds – 0.21% | | | | | | | | | |
| First American Government Obligations Fund, | | | | | | | | | |
| Institutional Class, 1.74% (a) | | | 84,407 | | | $ | 84,407 | | | | 0.21 | % |
| | | | | | | | | | | | | |
| Total Short-Term Investments | | | | | | | | | | | | |
| (Cost $84,407) | | | | | | | 84,407 | | | | 0.21 | % |
| | | | | | | | | | | | | |
| Total Investments | | | | | | | | | | | | |
| (Cost $41,567,280) – 99.41% | | | | | | | 40,733,478 | | | | 99.41 | % |
| Other Assets in Excess of Liabilities – 0.59% | | | | | | | 243,159 | | | | 0.59 | % |
| | | | | | | | | | | | | |
TOTAL NET ASSETS – 100.00% | | | | | | $ | 40,976,637 | | | | 100.00 | % |
Percentages are stated as a percent of net assets.
| (a) | The rate listed is the fund’s seven-day yield as of October 31, 2019. |
Summary of Fair Value Exposure as of October 31, 2019
The following is a summary of the inputs used to value the Fund’s net assets as of October 31, 2019 (See Note 3 in the accompanying Notes to the Financial Statements):
| Common Stocks | | Level 1 | | | Level 2 | | | Level 3 | | | Total | |
| Gathering & Processing | | $ | 2,080,768 | | | $ | — | | | $ | — | | | $ | 2,080,768 | |
| Natural Gas/NGL Transportation | | | 9,523,285 | | | | — | | | | — | | | | 9,523,285 | |
| Total Common Stocks | | $ | 11,604,053 | | | $ | — | | | $ | — | | | $ | 11,604,053 | |
| Partnerships & Trusts | | | | | | | | | | | | | | | | |
| Crude Oil & Refined Products | | $ | 14,859,692 | | | $ | — | | | $ | — | | | $ | 14,859,692 | |
| Gathering & Processing | | | 3,145,732 | | | | — | | | | — | | | | 3,145,732 | |
| Natural Gas/NGL Transportation | | | 11,039,594 | | | | — | | | | — | | | | 11,039,594 | |
| Total Partnerships & Trusts | | $ | 29,045,018 | | | $ | — | | | $ | — | | | $ | 29,045,018 | |
| Short-Term Investments | | | | | | | | | | | | | | | | |
| Money Market Funds | | $ | 84,407 | | | $ | — | | | $ | — | | | $ | 84,407 | |
| Total Short-Term Investments | | $ | 84,407 | | | $ | — | | | $ | — | | | $ | 84,407 | |
| Total Investments | | $ | 40,733,478 | | | $ | — | | | $ | — | | | $ | 40,733,478 | |
The accompanying notes are an integral part of these financial statements.
| HENNESSY FUNDS | 1-800-966-4354 | |
Financial Statements
Statement of Assets and Liabilities as of October 31, 2019 |
| ASSETS: | | | |
| Investments in securities, at value (cost $41,567,280) | | $ | 40,733,478 | |
| Dividends and interest receivable | | | 9,651 | |
| Receivable for fund shares sold | | | 52,973 | |
| Return of capital receivable | | | 308,444 | |
| Prepaid expenses and other assets | | | 20,582 | |
| Total assets | | | 41,125,128 | |
| | | | | |
| | | | | |
| LIABILITIES: | | | | |
| Payable for fund shares redeemed | | | 21,695 | |
| Payable to advisor | | | 34,441 | |
| Payable to administrator | | | 11,235 | |
| Payable to auditor | | | 41,000 | |
| Accrued distribution fees | | | 1,140 | |
| Accrued service fees | | | 818 | |
| Accrued trustees fees | | | 6,594 | |
| Accrued expenses and other payables | | | 31,568 | |
| Total liabilities | | | 148,491 | |
| NET ASSETS | | $ | 40,976,637 | |
| | | | | |
| NET ASSETS CONSISTS OF: | | | | |
| Capital stock | | $ | 59,506,524 | |
| Accumulated deficit | | | (18,529,887 | ) |
| Total net assets | | $ | 40,976,637 | |
| | | | | |
| NET ASSETS: | | | | |
| Investor Class | | | | |
| Shares authorized (no par value) | | Unlimited | |
| Net assets applicable to outstanding shares | | $ | 9,195,734 | |
| Shares issued and outstanding | | | 843,474 | |
| Net asset value, offering price, and redemption price per share | | $ | 10.90 | |
| | | | | |
| Institutional Class | | | | |
| Shares authorized (no par value) | | Unlimited | |
| Net assets applicable to outstanding shares | | $ | 31,780,903 | |
| Shares issued and outstanding | | | 2,866,389 | |
| Net asset value, offering price, and redemption price per share | | $ | 11.09 | |
The accompanying notes are an integral part of these financial statements.
| STATEMENT OF ASSETS AND LIABILITIES/STATEMENT OF OPERATIONS |
Financial Statements
Statement of Operations for the year ended October 31, 2019 |
| INVESTMENT INCOME: | | | |
| Distributions received from master limited partnerships | | $ | 3,024,289 | |
| Return of capital on distributions received | | | (2,979,214 | ) |
| Dividend income | | | 421,562 | |
| Interest income | | | 14,232 | |
| Total investment income | | | 480,869 | |
| | | | | |
| EXPENSES: | | | | |
| Investment advisory fees (See Note 5) | | | 624,286 | |
| Sub-transfer agent expenses – Investor Class (See Note 5) | | | 29,344 | |
| Sub-transfer agent expenses – Institutional Class (See Note 5) | | | 39,117 | |
| Administration, accounting, custody, and transfer agent fees (See Note 5) | | | 67,866 | |
| Federal and state registration fees | | | 40,994 | |
| Audit fees | | | 30,020 | |
| Compliance expense (See Note 5) | | | 25,837 | |
| Distribution fees – Investor Class (See Note 5) | | | 24,300 | |
| Interest expense (See Note 7) | | | 21,915 | |
| Trustees’ fees and expenses | | | 17,720 | |
| Service fees – Investor Class (See Note 5) | | | 16,200 | |
| Reports to shareholders | | | 13,709 | |
| Legal fees | | | 594 | |
| State franchise tax refund, net of income tax expense | | | (15,895 | ) |
| Other expenses | | | 4,083 | |
| Total expenses before reimbursement by advisor | | | 940,090 | |
| Expense reimbursement by advisor – Investor Class (See Note 5) | | | (21,678 | ) |
| Expense reimbursement by advisor – Institutional Class (See Note 5) | | | (20,660 | ) |
| Net expenses | | | 897,752 | |
| NET INVESTMENT LOSS | | $ | (416,883 | ) |
| | | | | |
| REALIZED AND UNREALIZED GAINS (LOSSES): | | | | |
| Net realized loss on investments | | $ | (7,333,710 | ) |
| Net change in unrealized appreciation/depreciation on investments | | | 4,667,798 | |
| Net loss on investments | | | (2,665,912 | ) |
| NET DECREASE IN NET ASSETS RESULTING FROM OPERATIONS | | $ | (3,082,795 | ) |
The accompanying notes are an integral part of these financial statements.
| HENNESSY FUNDS | 1-800-966-4354 | |
Financial Statements
| Statements of Changes in Net Assets |
OPERATIONS:
Net investment loss
Net realized gain (loss) on investments
Net change in unrealized appreciation/deprecation on investments
Net decrease in net assets resulting from operations
DISTRIBUTIONS TO SHAREHOLDERS FROM:
Return of capital – Investor Class
Return of capital – Class C(2)
Return of capital – Institutional Class
Total distributions
CAPITAL SHARE TRANSACTIONS:
Proceeds from shares subscribed – Investor Class
Proceeds from shares subscribed – Class C(2)
Proceeds from shares subscribed – Institutional Class
Proceeds from shares sold in connection with the conversion of Class C shares into Investor Class shares(2)
Dividends reinvested – Investor Class
Dividends reinvested – Class C(2)
Dividends reinvested – Institutional Class
Cost of shares redeemed – Investor Class
Cost of shares redeemed – Class C(2)
Cost of shares redeemed – Institutional Class
Cost of shares redeemed in connection with the conversion of Class C shares into Investor Class shares(2)
Net increase (decrease) in net assets derived from capital share transactions
TOTAL INCREASE (DECREASE) IN NET ASSETS
NET ASSETS:
Beginning of period
End of period
CHANGES IN SHARES OUTSTANDING:
Shares sold – Investor Class
Shares sold – Class C(2)
Shares sold – Institutional Class
Shares sold in connection with the conversion of Class C shares into Investor Class shares(2)
Shares issued to holders as reinvestment of dividends – Investor Class
Shares issued to holders as reinvestment of dividends – Class C(2)
Shares issued to holders as reinvestment of dividends – Institutional Class
Shares redeemed – Investor Class
Shares redeemed – Class C(2)
Shares redeemed – Institutional Class
Shares redeemed in connection with the conversion of Class C shares into Investor Class shares(2)
Net increase (decrease) in shares outstanding
(1) | The period ended October 31, 2018, consists of 11 months due to the Fund’s fiscal year end change from November 30 to October 31, effective October 26, 2018. |
(2) | Effective November 28, 2017, Class C shares converted into Class A shares (redesignated as Investor Class shares). |
(3) | Includes accumulated net investment loss of $(1,594,345). |
The accompanying notes are an integral part of these financial statements.
| STATEMENTS OF CHANGES IN NET ASSETS |
| Year Ended | | | Eleven Months Ended | | | Year Ended | |
| October 31, 2019 | | | October 31, 2018(1) | | | November 30, 2017 | |
| | | | | | | | |
| $ | (416,883 | ) | | $ | (1,116,192 | ) | | $ | (979,009 | ) |
| | (7,333,710 | ) | | | (4,616,225 | ) | | | 2,579,686 | |
| | 4,667,798 | | | | (2,268,476 | ) | | | (7,705,161 | ) |
| | (3,082,795 | ) | | | (8,000,893 | ) | | | (6,104,484 | ) |
| | | | | | | | | | | |
| | (1,434,045 | ) | | | (1,237,326 | ) | | | (878,781 | ) |
| | — | | | | — | | | | (159,349 | ) |
| | (3,424,486 | ) | | | (6,588,759 | ) | | | (3,683,962 | ) |
| | (4,858,531 | ) | | | (7,826,085 | ) | | | (4,722,092 | ) |
| | | | | | | | | | | |
| | 4,058,933 | | | | 12,908,692 | | | | 9,320,726 | |
| | — | | | | — | | | | 881,860 | |
| | 12,131,475 | | | | 61,536,519 | | | | 65,450,965 | |
| | — | | | | — | | | | 2,418,423 | |
| | 1,406,032 | | | | 1,178,239 | | | | 824,902 | |
| | — | | | | — | | | | 134,926 | |
| | 3,358,312 | | | | 5,538,251 | | | | 2,907,358 | |
| | (14,125,321 | ) | | | (8,575,706 | ) | | | (7,382,602 | ) |
| | — | | | | — | | | | (395,943 | ) |
| | (39,908,798 | ) | | | (74,214,680 | ) | | | (10,344,313 | ) |
| | — | | | | — | | | | (2,418,423 | ) |
| | (33,079,367 | ) | | | (1,628,685 | ) | | | 61,397,879 | |
| | (41,020,693 | ) | | | (17,455,663 | ) | | | 50,571,303 | |
| | | | | | | | | | | |
| | 81,997,330 | | | | 99,452,993 | | | | 48,881,690 | |
| $ | 40,976,637 | | | $ | 81,997,330 | | | $ | 99,452,993 | (3) |
| | | | | | | | | | | |
| | 324,948 | | | | 943,640 | | | | 172,119 | |
| | — | | | | — | | | | 54,624 | |
| | 1,014,731 | | | | 4,254,660 | | | | 4,105,091 | |
| | — | | | | — | | | | 582,014 | |
| | 116,121 | | | | 84,132 | | | | 51,651 | |
| | — | | | | — | | | | 8,532 | |
| | 273,922 | | | | 391,738 | | | | 180,611 | |
| | (1,182,757 | ) | | | (605,087 | ) | | | (455,427 | ) |
| | — | | | | — | | | | (25,294 | ) |
| | (3,247,364 | ) | | | (5,454,423 | ) | | | (646,034 | ) |
| | — | | | | — | | | | (174,005 | ) |
| | (2,700,399 | ) | | | (385,340 | ) | | | 3,853,882 | |
The accompanying notes are an integral part of these financial statements.
| HENNESSY FUNDS | 1-800-966-4354 | |
Financial Statements
For an Investor Class share outstanding throughout each period
PER SHARE DATA:
Net asset value, beginning of period
Income from investment operations:
Net investment loss(3)(4)
Net realized and unrealized gains (losses) on investments
Total from investment operations
Less distributions:
Dividends from return of capital
Total distributions
Net asset value, end of period
TOTAL RETURN
SUPPLEMENTAL DATA AND RATIOS:
Net assets, end of period (millions)
Ratio of expenses to average net assets:
Before expense reimbursement
After expense reimbursement
Ratio of net investment loss to average net assets:
Before expense reimbursement(4)
After expense reimbursement(4)
Portfolio turnover rate(8)
(1) | The period ended October 31, 2018, consists of 11 months due to the Fund’s fiscal year end change from November 30 to October 31, effective October 26, 2018. |
(2) | Fund commenced operations on December 31, 2013. |
(3) | Calculated using the average shares outstanding method. |
(4) | Includes current and deferred tax benefit/expense from net investment income/loss only. |
(5) | Not annualized. |
(6) | Annualized. |
(7) | Includes an estimated deferred tax expense/benefit of -1.32% for fiscal year 2015 or 3.98% for the period ended November 30, 2014. See Note 2.b in the Notes to the Financial Statements. |
(8) | Calculated on the basis of the Fund as a whole. |
The accompanying notes are an integral part of these financial statements.
| FINANCIAL HIGHLIGHTS — INVESTOR CLASS |
| Year Ended | | | Period Ended | | | | | | Period Ended | |
| October 31, | | | October 31, | | | Year Ended November 30, | | | November 30, | |
| 2019 | | | 2018(1) | | | 2017 | | | 2016 | | | 2015 | | | 2014(2) | |
| | | | | | | | | | | | | | | | | |
| $ | 12.66 | | | $ | 14.51 | | | $ | 16.54 | | | $ | 15.45 | | | $ | 22.25 | | | $ | 20.00 | |
| | | | | | | | | | | | | | | | | | | | | | | |
| | | | | | | | | | | | | | | | | | | | | | | |
| | (0.10 | ) | | | (0.16 | ) | | | (0.22 | ) | | | (0.17 | ) | | | (0.20 | ) | | | (0.20 | ) |
| | (0.63 | ) | | | (0.66 | ) | | | (0.78 | ) | | | 2.29 | | | | (5.60 | ) | | | 2.87 | |
| | (0.73 | ) | | | (0.82 | ) | | | (1.00 | ) | | | 2.12 | | | | (5.80 | ) | | | 2.67 | |
| | | | | | | | | | | | | | | | | | | | | | | |
| | | | | | | | | | | | | | | | | | | | | | | |
| | (1.03 | ) | | | (1.03 | ) | | | (1.03 | ) | | | (1.03 | ) | | | (1.00 | ) | | | (0.42 | ) |
| | (1.03 | ) | | | (1.03 | ) | | | (1.03 | ) | | | (1.03 | ) | | | (1.00 | ) | | | (0.42 | ) |
| $ | 10.90 | | | $ | 12.66 | | | $ | 14.51 | | | $ | 16.54 | | | $ | 15.45 | | | $ | 22.25 | |
| | | | | | | | | | | | | | | | | | | | | | | |
| | (6.28 | )% | | | (6.15 | )%(5) | | | (6.49 | )% | | | 14.78 | % | | | (27.17 | )% | | | 13.37 | %(5) |
| | | | | | | | | | | | | | | | | | | | | | | |
| | | | | | | | | | | | | | | | | | | | | | | |
| $ | 9.20 | | | $ | 20.07 | | | $ | 16.86 | | | $ | 13.43 | | | $ | 8.76 | | | $ | 7.17 | |
| | | | | | | | | | | | | | | | | | | | | | | |
| | 1.89 | % | | | 1.86 | %(6) | | | 1.91 | % | | | 2.21 | % | | | 1.38 | %(7) | | | 8.02 | %(6)(7) |
| | 1.76 | % | | | 1.78 | %(6) | | | 1.77 | % | | | 1.74 | % | | | 0.42 | %(7) | | | 5.73 | %(6)(7) |
| | | | | | | | | | | | | | | | | | | | | | | |
| | (0.92 | )% | | | (1.34 | )%(6) | | | (1.50 | )% | | | (1.60 | )% | | | (1.97 | )% | | | (3.28 | )%(6) |
| | (0.79 | )% | | | (1.26 | )%(6) | | | (1.36 | )% | | | (1.13 | )% | | | (1.01 | )% | | | (0.99 | )%(6) |
| | 41 | % | | | 64 | %(5) | | | 63 | % | | | 139 | % | | | 96 | % | | | 70 | %(5) |
The accompanying notes are an integral part of these financial statements.
| HENNESSY FUNDS | 1-800-966-4354 | |
Financial Statements
For an Institutional Class share outstanding throughout each period
PER SHARE DATA:
Net asset value, beginning of period
Income from investment operations:
Net investment loss(3)(4)
Net realized and unrealized gains (losses) on investments
Total from investment operations
Less distributions:
Dividends from return of capital
Total distributions
Net asset value, end of period
TOTAL RETURN
SUPPLEMENTAL DATA AND RATIOS:
Net assets, end of period (millions)
Ratio of expenses to average net assets:
Before expense reimbursement
After expense reimbursement
Ratio of net investment loss to average net assets:
Before expense reimbursement(4)
After expense reimbursement(4)
Portfolio turnover rate(8)
(1) | The period ended October 31, 2018, consists of 11 months due to the Fund’s fiscal year end change from November 30 to October 31, effective October 26, 2018. |
(2) | Fund commenced operations on December 31, 2013. |
(3) | Calculated using the average shares outstanding method. |
(4) | Includes current and deferred tax benefit/expense from net investment income/loss only. |
(5) | Not annualized. |
(6) | Annualized. |
(7) | Includes an estimated deferred tax expense/benefit of -1.32% for fiscal year 2015 or 3.98% for the period ended November 30, 2014. See Note 2.b in the Notes to the Financial Statements. |
(8) | Calculated on the basis of the Fund as a whole. |
The accompanying notes are an integral part of these financial statements.
| FINANCIAL HIGHLIGHTS — INSTITUTIONAL CLASS |
| Year Ended | | | Period Ended | | | | | | Period Ended | |
| October 31, | | | October 31, | | | Year Ended November 30, | | | November 30, | |
| 2019 | | | 2018(1) | | | 2017 | | | 2016 | | | 2015 | | | 2014(2) | |
| | | | | | | | | | | | | | | | | |
| $ | 12.83 | | | $ | 14.66 | | | $ | 16.66 | | | $ | 15.53 | | | $ | 22.28 | | | $ | 20.00 | |
| | | | | | | | | | | | | | | | | | | | | | | |
| | | | | | | | | | | | | | | | | | | | | | | |
| | (0.09 | ) | | | (0.14 | ) | | | (0.18 | ) | | | (0.12 | ) | | | (0.14 | ) | | | (0.15 | ) |
| | (0.62 | ) | | | (0.66 | ) | | | (0.79 | ) | | | 2.28 | | | | (5.61 | ) | | | 2.87 | |
| | (0.71 | ) | | | (0.80 | ) | | | (0.97 | ) | | | 2.16 | | | | (5.75 | ) | | | 2.72 | |
| | | | | | | | | | | | | | | | | | | | | | | |
| | | | | | | | | | | | | | | | | | | | | | | |
| | (1.03 | ) | | | (1.03 | ) | | | (1.03 | ) | | | (1.03 | ) | | | (1.00 | ) | | | (0.44 | ) |
| | (1.03 | ) | | | (1.03 | ) | | | (1.03 | ) | | | (1.03 | ) | | | (1.00 | ) | | | (0.44 | ) |
| $ | 11.09 | | | $ | 12.83 | | | $ | 14.66 | | | $ | 16.66 | | | $ | 15.53 | | | $ | 22.28 | |
| | | | | | | | | | | | | | | | | | | | | | | |
| | (6.10 | )% | | | (5.94 | )%(5) | | | (6.25 | )% | | | 14.97 | % | | | (26.90 | )% | | | 13.60 | %(5) |
| | | | | | | | | | | | | | | | | | | | | | | |
| | | | | | | | | | | | | | | | | | | | | | | |
| $ | 31.78 | | | $ | 61.92 | | | $ | 82.59 | | | $ | 33.22 | | | $ | 15.72 | | | $ | 7.79 | |
| | | | | | | | | | | | | | | | | | | | | | | |
| | 1.56 | % | | | 1.58 | %(6) | | | 1.66 | % | | | 1.95 | % | | | 1.10 | %(7) | | | 7.77 | %(6)(7) |
| | 1.51 | % | | | 1.52 | %(6) | | | 1.52 | % | | | 1.48 | % | | | 0.18 | %(7) | | | 5.48 | %(6)(7) |
| | | | | | | | | | | | | | | | | | | | | | | |
| | (0.76 | )% | | | (1.15 | )%(6) | | | (1.28 | )% | | | (1.28 | )% | | | (1.63 | )% | | | (3.03 | )%(6) |
| | (0.71 | )% | | | (1.09 | )%(6) | | | (1.14 | )% | | | (0.81 | )% | | | (0.71 | )% | | | (0.74 | )%(6) |
| | 41 | % | | | 64 | %(5) | | | 63 | % | | | 139 | % | | | 96 | % | | | 70 | %(5) |
The accompanying notes are an integral part of these financial statements.
| HENNESSY FUNDS | 1-800-966-4354 | |
Financial Statements
Notes to the Financial Statements October 31, 2019 |
1). ORGANIZATION
The Hennessy BP Midstream Fund (the “Fund”) is a series of Hennessy Funds Trust (the “Trust”), which was organized as a Delaware statutory trust on September 17, 1992. The Fund is an open-end management investment company registered under the Investment Company Act of 1940, as amended. Pursuant to a reorganization that took place after the close of business on October 26, 2018, the Fund is the legal, accounting, and performance information successor to the BP Capital TwinLine MLP Fund (the “Predecessor Fund”). Prior to October 26, 2018, the Fund had no investment operations. As a result of the reorganization, holders of Class A shares of the Predecessor Fund received Investor Class shares of the Fund, and holders of Class I shares of the Predecessor Fund received Institutional Class shares of the Fund. The investment objective of the Fund is to seek capital appreciation through distribution growth along with current income. The Fund is treated as a regular corporation, or “C” corporation, for U.S. federal income tax purposes. Because the Fund is treated as a “C” corporation, it will not be taxed as a regulated investment company under Subchapter M of the Code and is not required to comply with the diversification requirements applicable to regulated investment companies. The Fund is a non-diversified fund. Effective October 26, 2018, the Fund changed its fiscal year end from November 30 to October 31.
The Fund offers Investor Class and Institutional Class shares. Each class of shares differs principally in its respective 12b-1 distribution and service, shareholder servicing, and sub-transfer agent expenses. There are no sales charges. Each class has identical rights to earnings, assets, and voting privileges, except for class-specific expenses and exclusive rights to vote on matters affecting only one class.
As an investment company, the Fund follows the investment company accounting and reporting guidance of the Financial Accounting Standards Board (“FASB”) Accounting Standard Codification Topic 946 “Financial Services—Investment Companies.”
2). SIGNIFICANT ACCOUNTING POLICIES
The following is a summary of significant accounting policies consistently followed by the Fund in the preparation of the financial statements. These policies conform to U.S. generally accepted accounting principles (“GAAP”).
| a). | Securities Valuation – All investments in securities are recorded at their estimated fair value, as described in Note 3. |
| | |
| b). | Federal Income Taxes – The Fund is taxed as a corporation and is obligated to pay U.S. federal and state income tax on its taxable income. Currently, the maximum marginal regular federal income tax rate for a corporation is 21%. The Fund invests a substantial portion of its assets in master limited partnerships (“MLPs”), which are treated as partnerships for federal income tax purposes. As a limited partner in MLPs, the Fund reports its allocable share of each MLP’s taxable income in computing its own taxable income. |
| | |
| | In calculating the Fund’s daily net asset value, the Fund will account for its deferred tax asset and liability balances. In accordance with GAAP, the Fund will accrue a deferred income tax liability balance for its future tax liability associated with the capital appreciation of its investments and the distributions received by the |
| NOTES TO THE FINANCIAL STATEMENTS |
| | Fund on equity securities of MLPs considered to be return of capital and for any net operating gains. This accrual will be based on the current effective federal income tax rate plus an estimated state income tax rate. |
| | |
| | Deferred income taxes reflect the net tax effect of temporary differences between the carrying amount of assets and liabilities for financial reporting and tax purposes. A valuation allowance is recognized if, based on the weight of available evidence, it is more likely than not that at least some portion of a deferred income tax asset will not be realized. From time to time as new information becomes available, the Fund will modify its estimates or assumption regarding the deferred tax liabilities or assets. As of October 31, 2019, the Fund has placed a full valuation allowance on its deferred tax assets. |
| | |
| c). | Accounting for Uncertainty in Income Taxes – The Fund has accounting policies regarding recognition and measurement of tax positions taken or expected to be taken on a tax return. The tax returns of the Fund for the prior three fiscal years are open for examination. The Fund has reviewed all open tax years in major jurisdictions and concluded that there is no impact on the Fund’s net assets and no tax liability resulting from unrecognized tax benefits relating to uncertain income tax positions taken or expected to be taken on a tax return. The Fund files U.S. federal income tax returns and income tax returns in various states. |
| | |
| d). | Income and Expenses – Dividend income is recognized on the ex-dividend date or as soon as information is available to the Fund. Interest income, which includes the amortization of premium and accretion of discount, is recognized on an accrual basis. Other non-cash dividends are recognized as investment income at the fair value of the property received. The Fund is charged for those expenses that are directly attributable to its portfolio, such as advisory, administration, and certain shareholder service fees. Income, expenses (other than expenses attributable to a specific class), and realized and unrealized gains/losses on investments are allocated to each class of shares based on such class’s net assets. Distributions received from the Fund’s investments in MLPs generally consist of ordinary income, capital gains, and return of capital. The Fund records investment income on the ex-date of the distributions. For financial statement purposes, the Fund uses return of capital and income estimates to allocate the dividend income received. Such estimates are based on historical information available from the MLPs and other industry sources. These estimates may subsequently be revised based on information received from the MLPs after their tax reporting periods are concluded, as the actual character of these distributions is not known until after the fiscal year end of the Fund. |
| | |
| e). | Distributions to Shareholders – The Fund typically makes quarterly cash distributions to its shareholders. Due to the tax treatment of the Fund’s allocations and distributions from MLPs, a significant portion of the Fund’s distributions to shareholders typically is treated as return of capital to shareholders for U.S. federal income tax purposes (i.e., as distributions in excess of the Fund’s current and accumulated earnings and profits as described below). However, no assurance can be given in this regard; just as the Fund’s corporate income tax liability can fluctuate materially from year to year, the extent to which the Fund is able to make return-of-capital distributions also can vary materially from year to year depending on a number of different factors, including the composition of the Fund’s portfolio, the level of allocations of net income and other tax items for the Fund from its underlying MLP investments during a particular taxable year, the length of time the Fund has owned the MLP equity securities in its portfolio, and the extent to which the Fund disposes of MLP equity securities during a particular year, including, if necessary, to meet Fund shareholder redemption requests. |
| HENNESSY FUNDS | 1-800-966-4354 | |
| | In general, a distribution will constitute a return of capital to a shareholder rather than a dividend to the extent such distribution exceeds the Fund’s current and accumulated earnings and profits. The portion of any distribution treated as a return of capital will constitute a tax-free return of capital to the extent of the shareholder’s basis in its Fund shares and thereafter generally will be taxable to the shareholder as a capital gain. Any such distribution, in turn, will result in a reduction in a shareholder’s basis in the Fund’s shares (but not below zero) to the extent of the return of capital and in the shareholder’s recognizing more gain or less loss (that is, increase of a shareholder’s tax liability) when the shareholder later sells shares of the Fund. To maintain a more stable distribution rate, the Fund may distribute less or more than the entire amount of cash it receives from its investments in a particular period. Any undistributed cash would be available to supplement future distributions, and until distributed would add to the Fund’s net asset value. Correspondingly, such amounts, once distributed, will be deducted from the Fund’s net asset value. In addition, the Fund may opt not to make distributions in quarters in which the Fund believes that a distribution could cause adverse tax consequences to shareholders, including when the Fund believes that a distribution may not constitute a tax-free return of capital as described above. |
| | |
| f). | Security Transactions – Investment and shareholder transactions are recorded on the trade date. The Fund determines the realized gain/loss from an investment transaction by comparing the original cost of the security lot sold with the net sale proceeds. Discounts and premiums on securities purchased are accreted or amortized, respectively, over the life of each such security. |
| | |
| g). | Use of Estimates – The preparation of financial statements in conformity with GAAP requires management to make estimates and assumptions that affect the reported amounts of assets and liabilities and disclosure of contingent assets and liabilities at the date of the financial statements and the reported change in net assets during the reporting period. Actual results could differ from those estimates. |
| | |
| h). | Share Valuation – The net asset value (“NAV”) per share of the Fund is calculated by dividing (i) the total value of the securities held by the Fund, plus cash and other assets, minus all liabilities (including estimated accrued expenses) by (ii) the total number of shares outstanding for the Fund, rounded to the nearest $0.01. The Fund’s shares will not be priced on days the New York Stock Exchange is closed for trading. The offering and redemption price per share for the Fund is equal to the Fund’s NAV per share. |
| | |
| i). | Partnership Accounting Policy – To the extent the Fund receives distributions from underlying partnerships in which it invests, the Fund records its pro rata share of income/loss and capital gains/losses and accordingly adjusts the cost basis of the underlying partnerships for return of capital. |
| | |
| j). | New Accounting Pronouncements – In August 2018, the FASB issued Accounting Standards Update No. 2018-13 “Disclosure Framework—Changes to the Disclosure Requirements for Fair Value Measurement” (“ASU 2018-13”). ASU 2018-13 eliminates the requirement to disclose the amount of and reasons for transfers between Level 1 and Level 2 of the fair value hierarchy, the timing of transfers between levels of the fair value hierarchy, and the valuation processes for Level 3 fair value measurements. ASU 2018-13 does not eliminate the requirement to disclose the range and weighted average used to develop significant unobservable inputs for Level 3 fair value measurements, and the changes in unrealized gains and losses for recurring Level 3 fair value measurements. ASU 2018-13 requires that information is provided about the measurement uncertainty of Level 3 fair value measurements as of |
| NOTES TO THE FINANCIAL STATEMENTS |
| | the reporting date. The guidance is effective for fiscal years beginning after December 15, 2019, and interim periods within those fiscal years. Management has evaluated the impact of this change in guidance and, due to the permissibility of early adoption, modified the Fund’s fair value disclosures for the current reporting period. |
3). SECURITIES VALUATION
The Fund follows fair value accounting standards that establish an authoritative definition of fair value and set out a hierarchy for measuring fair value. These standards require additional disclosures about the various inputs and valuation techniques used to develop the measurements of fair value and a discussion of changes in valuation techniques and related inputs during the period. These inputs are summarized in the three broad levels listed below:
| | Level 1 – | Unadjusted, quoted prices in active markets for identical instruments that the Fund has the ability to access at the date of measurement. |
| | | |
| | Level 2 – | Other significant observable inputs (including, but not limited to, quoted prices in active markets for similar instruments, quoted prices in markets that are not active for identical or similar instruments, and model-derived valuations in which all significant inputs and significant value drivers are observable in active markets, such as interest rates, prepayment speeds, credit risk curves, default rates, and similar data). |
| | | |
| | Level 3 – | Significant unobservable inputs (including the Fund’s own assumptions about what market participants would use to price the asset or liability based on the best available information) when observable inputs are unavailable. |
The following is a description of the valuation techniques applied to the Fund’s major categories of assets and liabilities measured at fair value on a recurring basis:
| | Equity Securities – Equity securities, including common stocks, preferred stocks, foreign-issued common stocks, exchange-traded funds, closed-end mutual funds, partnerships, rights, MLPs, and real estate investment trusts, that are traded on a securities exchange for which a last-quoted sales price is readily available will generally be valued at the last sales price as reported by the primary exchange on which the securities are listed. Securities listed on The NASDAQ Stock Market (“NASDAQ”) will generally be valued at the NASDAQ Official Closing Price, which may differ from the last sales price reported. Securities traded on a securities exchange for which a last-quoted sales price is not readily available will generally be valued at the mean between the bid and ask prices. To the extent these securities are actively traded and valuation adjustments are not applied, they are classified in Level 1 of the fair value hierarchy. Securities traded on foreign exchanges generally are not valued at the same time the Fund calculates its NAV because most foreign markets close well before such time. The earlier close of most foreign markets gives rise to the possibility that significant events, including broad market moves, may have occurred in the interim. In certain circumstances, it may be determined that a foreign security needs to be fair valued because it appears that the value of the security might have been materially affected by events occurring after the close of the market in which the security is principally traded, but before the time the Fund calculates its NAV, such as by a development that affects an entire market or region (e.g., a weather-related event) or a potentially global development (e.g., a terrorist attack that may be expected to have an effect on investor expectations worldwide). |
| | |
| | Registered Investment Companies – Investments in open-end registered investment companies, commonly referred to as mutual funds, generally are priced at the ending NAV provided by the applicable mutual fund’s service agent and will be classified in Level 1 of the fair value hierarchy. |
| HENNESSY FUNDS | 1-800-966-4354 | |
| | Debt Securities – Debt securities, including corporate bonds, asset-backed securities, mortgage-backed securities, municipal bonds, U.S. Treasuries, and U.S. government agency issues, are generally valued at market on the basis of valuations furnished by an independent pricing service that utilizes both dealer-supplied valuations and formula-based techniques. The pricing service may consider recently executed transactions in securities of the issuer or comparable issuers, market price quotations (where observable), bond spreads, and fundamental data relating to the issuer. In addition, the model may incorporate observable market data, such as reported sales of similar securities, broker quotes, yields, bids, offers, and reference data. Certain securities are valued primarily using dealer quotations. These securities are generally classified in Level 2 of the fair value hierarchy. |
| | |
| | Short-Term Securities – Short-term equity investments, including money market funds, are valued in the manner specified above. Short-term debt investments with an original term to maturity of 60 days or less are valued at amortized cost, which approximates fair market value. If the original term to maturity of a short-term debt investment exceeded 60 days, then the values as of the 61st day prior to maturity are amortized. Amortized cost is not used if its use would be inappropriate due to credit or other impairments of the issuer, in which case the security’s fair value would be determined, as described below. Short-term securities are generally classified in Level 1 or Level 2 of the fair value hierarchy depending on the inputs used and market activity levels for specific securities. |
The Board of Trustees of the Fund (the “Board”) has adopted fair value pricing procedures that are followed when a price for a security is not readily available or if a significant event has occurred that indicates the closing price of a security no longer represents the true value of that security. Fair value pricing determinations are made in good faith in accordance with these procedures. There are numerous criteria that will be given consideration in determining a fair value of a security, such as the trading volume of a security and markets, the values of other similar securities, and news events with direct bearing on a security or markets. Fair value pricing results in an estimated price for a security that reflects the amount the Fund might reasonably expect to receive in a current sale. Depending on the relative significance of the valuation inputs, these securities may be classified in either Level 2 or Level 3 of the fair value hierarchy.
The fair value of foreign securities may be determined with the assistance of a pricing service using correlations between the movement of prices of such securities and indices of domestic securities and other appropriate indicators, such as closing market prices of relevant American Depositary Receipts or futures contracts. The effect of using fair value pricing is that the Fund’s NAV will reflect the affected portfolio securities’ values as determined by the Board or its designee, pursuant to the fair value pricing procedures adopted by the Board, instead of being determined by the market. Using a fair value pricing methodology to price a foreign security may result in a value that is different from such foreign security’s most recent closing price and from the value used by other investment companies to calculate their NAVs. Such securities are generally classified in Level 2 of the fair value hierarchy. Because the Fund may invest in foreign securities, the value of the Fund’s portfolio securities may change on days when you will not be able to purchase or redeem your shares.
The Board has delegated day-to-day valuation matters to the Valuation and Liquidity Committee comprising representatives from Hennessy Advisors, Inc., the Fund’s investment advisor (the “Advisor”). The function of the Valuation and Liquidity Committee is to value securities where current and reliable market quotations are not readily available. All actions taken by the Valuation and Liquidity Committee are reviewed by the Board.
| NOTES TO THE FINANCIAL STATEMENTS |
The Fund has performed an analysis of all existing investments to determine the significance and character of all inputs to their fair value determinations. Various inputs are used to determine the value of the Fund’s investments. The inputs or methodology used for valuing securities are not necessarily an indication of the risk associated with investing in those securities. Details related to the fair value hierarchy of the Fund’s securities as of October 31, 2019, are included in the Schedule of Investments.
4). INVESTMENT TRANSACTIONS
Purchases and sales of investment securities (excluding government and short-term investments) for the Fund during fiscal year 2019 were $23,867,754 and $74,543,243, respectively.
There were no purchases or sales/maturities of long-term U.S. government securities for the Fund during fiscal year 2019.
The Fund is permitted to purchase or sell securities from or to another fund in the Hennessy Funds family of funds (collectively, the “Hennessy Funds”) under specified conditions outlined in procedures adopted by the Board. The procedures have been designed to ensure that any purchase or sale of securities by the Fund from or to another Hennessy Fund complies with Rule 17a-7 of the Investment Company Act of 1940, as amended. During fiscal year 2019, the Fund did not engage in purchases or sales of securities pursuant to Rule 17a-7 of the Investment Company Act of 1940, as amended.
5). INVESTMENT ADVISORY FEE AND OTHER TRANSACTIONS WITH AFFILIATES
The Advisor provides the Fund with investment advisory services under an Investment Advisory Agreement. The Advisor oversees the provision of investment advice and furnishes office space, facilities, and most of the personnel needed by the Fund. As compensation for its services, the Advisor is entitled to a monthly fee from the Fund. The fee is based on the average daily net assets of the Fund at an annual rate of 1.10%. The net investment advisory fees expensed by the Fund during fiscal year 2019 are included in the Statement of Operations. The Advisor has delegated the day-to-day management of the Fund to a sub-advisor, BP Capital Fund Advisors, LLC (“BP Capital”). The Advisor pays the sub-advisory fees from its own assets, and these fees are not an additional expense of the Fund. During fiscal year 2019, the Advisor (not the Fund) paid a sub-advisory fee at the rate of 0.40% of the daily net assets of the Fund.
The Advisor has contractually agreed to limit total annual operating expenses to 1.75% of the Fund’s net assets for Investor Class shares and 1.50% of the Fund’s net assets for Institutional Class shares (in each case, excluding all federal, state, and local taxes, interest, brokerage commissions, dividend and interest expenses on short sales, extraordinary items, and acquired fund fees and expenses and other costs incurred in connection with the purchase and sale of securities) through October 25, 2020.
For three years following the date on which expenses were waived or incurred, the Advisor may recoup waived or reimbursed expenses from the Fund if total operating expenses, including such recoupment, does not exceed the expense limitation in effect (i) at the time the Advisor waived or reimbursed such expenses and (ii) at the time the Advisor recoups such expenses. As of October 31, 2019, expenses subject to potential recovery for Investor Class and Institutional Class shares and the fiscal years in which they expire were as follows:
| | | Fiscal Year | | | Fiscal Year | | | | |
| | | 2021 | | | 2022 | | | Total | |
| Investor Class | | $ | 597 | | | $ | 21,678 | | | $ | 22,275 | |
| Institutional Class | | $ | 2,321 | | | $ | 20,660 | | | $ | 22,981 | |
The Advisor did not recoup expenses during fiscal year 2019.
| HENNESSY FUNDS | 1-800-966-4354 | |
The Board has approved a Shareholder Servicing Agreement for Investor Class shares of the Fund, which was instituted to compensate the Advisor for the non-investment advisory services it provides to the Fund. The Shareholder Servicing Agreement provides for a monthly fee paid to the Advisor at an annual rate of 0.10% of the average daily net assets of the Fund attributable to Investor Class shares. The shareholder service fees expensed by the Fund during fiscal year 2019 are included in the Statement of Operations.
The Fund has adopted a plan pursuant to Rule 12b-1 under the Investment Company Act of 1940, as amended, that authorizes payments in connection with the distribution of the Fund’s shares at an annual rate of up to 0.25% of the Fund’s average daily net assets attributable to Investor Class shares. Even though the authorized rate is up to 0.25%, the Fund is currently only using up to 0.15% of its average daily net assets attributable to Investor Class shares for such purpose. Amounts paid under the plan may be spent on any activities or expenses primarily intended to result in the sale of shares, including, but not limited to, advertising, shareholder account servicing, printing and mailing of prospectuses to other than current shareholders, printing and mailing of sales literature, and compensation for sales and marketing activities or to financial institutions and others, such as dealers and distributors. The distribution fees expensed by the Fund during fiscal year 2019 are included in the Statement of Operations.
The Fund has entered into agreements with various brokers, dealers, and financial intermediaries in connection with the sale of shares of the Fund. The agreements provide for periodic payments of sub-transfer agent expenses by the Fund to the brokers, dealers, and financial intermediaries for providing certain shareholder maintenance services. These shareholder services include the pre-processing and quality control of new accounts, shareholder correspondence, answering customer inquiries regarding account status, and facilitating shareholder telephone transactions. The sub-transfer agent fees expensed by the Fund during fiscal year 2019 are included in the Statement of Operations.
U.S. Bancorp Fund Services, LLC, d/b/a U.S. Bank Global Fund Services (“Fund Services”) provides the Fund with administrative, accounting, and transfer agent services. As administrator, Fund Services is responsible for activities such as (i) preparing various federal and state regulatory filings, reports, and returns for the Fund, (ii) preparing reports and materials to be supplied to the Board, (iii) monitoring the activities of the Fund’s custodian, transfer agent, and accountants, and (iv) coordinating the preparation and payment of the Fund’s expenses and reviewing the Fund’s expense accruals. U.S. Bank N.A., an affiliate of Fund Services, serves as the Fund’s custodian. The servicing agreements between the Trust and Fund Services and U.S. Bank N.A. contain a fee schedule that is inclusive of administrative, accounting, custody, and transfer agent fees. The administrative, accounting, custody, and transfer agent fees expensed by the Fund during fiscal year 2019 are included in the Statement of Operations.
Quasar Distributors, LLC (“Quasar”) acts as the Fund’s principal underwriter in a continuous public offering of the Fund’s shares. Quasar is an affiliate of Fund Services and U.S. Bank N.A.
The officers of the Fund are affiliated with the Advisor. With the exception of the Chief Compliance Officer and the Senior Compliance Officer, such officers receive no compensation from the Fund for serving in their respective roles. The Fund, along with the other Hennessy Funds, makes reimbursement payments on an equal basis to the Advisor for a portion of the salary and benefits associated with the office of the Chief Compliance Officer and for all of the salary and benefits associated with the office of the Senior Compliance Officer. The compliance fees expensed by the Fund during fiscal year 2019 are included in the Statement of Operations.
| NOTES TO THE FINANCIAL STATEMENTS |
6). GUARANTEES AND INDEMNIFICATIONS
Under the Hennessy Funds’ organizational documents, their officers and trustees are indemnified by the Hennessy Funds against certain liabilities arising out of the performance of their duties to the Hennessy Funds. Additionally, in the normal course of business, the Hennessy Funds enter into contracts with service providers that contain general indemnification clauses. The Fund’s maximum exposure under these arrangements is unknown as this would involve future claims that may be made against the Fund that have not yet occurred. Currently, the Fund expects the risk of loss to be remote.
7). LINE OF CREDIT
The Fund has an uncommitted line of credit with the other Hennessy Funds in the amount of the lesser of (i) $100,000,000 or (ii) 33.33% of each Hennessy Fund’s net assets, or 30% for the Hennessy Gas Utility Fund and 10% for the Hennessy Balanced Fund, intended to provide short-term financing, if necessary, subject to certain restrictions, in connection with shareholder redemptions. The credit facility is with the Hennessy Funds’ custodian bank, U.S. Bank N.A. Borrowings under this arrangement bear interest at the bank’s prime rate and are secured by all of the Fund’s assets (as to its own borrowings only). During fiscal year 2019, the Fund had an outstanding average daily balance and a weighted average interest rate of $403,641 and 5.35%, respectively. The interest expensed by the Fund during fiscal year 2019 is included in the Statement of Operations. The maximum amount outstanding for the Fund during fiscal year 2019 was $16,075,000. As of October 31, 2019, the Fund did not have any borrowings outstanding under the line of credit.
8). FEDERAL TAX INFORMATION
As of October 31, 2019, the components of accumulated earnings (losses) for income tax purposes were as follows:
| | | Investments | |
| Cost of investments for tax purposes | | $ | 38,257,071 | |
| Gross tax unrealized appreciation | | $ | 4,333,242 | |
| Gross tax unrealized depreciation | | | (1,856,835 | ) |
| Net tax unrealized appreciation/(depreciation) | | $ | 2,476,407 | |
As of October 31, 2019, deferred tax assets consisted of the following:
| Deferred tax assets (liabilities): | | | |
| Net operating losses | | $ | 589,822 | |
| Capital loss | | | 4,281,346 | |
| Unrealized (gain) loss on investments | | | (411,665 | ) |
| Total deferred tax assets, net | | | 4,459,503 | |
| Valuation allowance | | | (4,459,503 | ) |
| Net | | $ | — | |
For the year ended October 31, 2019, the Fund had an effective tax rate of 0% and a federal statutory rate of 21%, with the difference resulting from a change in the valuation allowance of the deferred tax assets.
Deferred income tax assets and liabilities are recorded for differences between the financial statement and tax basis of the assets and liabilities that will result in taxable or deductible amounts in the future based on enacted laws and rates applicable to the periods in which the differences are expected to affect taxable income. Valuation allowances are established when necessary to reduce deferred tax assets to the amount
| HENNESSY FUNDS | 1-800-966-4354 | |
expected to be realized. The Fund has evaluated the available evidence supporting the realization of its gross deferred tax assets, including the amount and timing of future taxable income, and has determined that, based on net losses to date, it may not utilize all of its deferred tax assets in the future. At October 31, 2019, the Fund established a valuation allowance in the amount of $4,459,503 against its deferred tax assets.
To the extent the Fund has a net capital loss in any tax year, the net capital loss may be carried forward five years to offset any future realized capital gains. To the extent the Fund had a net operating loss that arose in a tax year ending prior to January 1, 2018, the effective date of the Tax Cuts and Jobs Act of 2017, the net operating loss may be carried forward 20 years to offset any future ordinary income. Any net operating loss arising in a tax year ending after December 31, 2017, may be carried forward indefinitely. As of October 31, 2019, the Fund had capital loss carryforwards of $18,360,793 that expire as follows:
| | Amount | | Expiration | |
| | $ | 1,511,860 | | 11/30/2020 | |
| | | 2,137,300 | | 11/30/2021 | |
| | | 6,130,957 | | 10/31/2023 | |
| | | 8,580,676 | | 10/31/2024 | |
As of October 31, 2019, the Fund had net operating loss carryforwards of $2,309,111 that expire as follows:
| | Amount | | Expiration | |
| | $ | 950,543 | | 11/30/2037 | |
| | | 1,358,568 | | Indefinite | |
Total income taxes have been computed by applying the federal statutory income tax rate of 21% plus a blended state income tax rate. The Fund applied this effective rate to net investment income and realized and unrealized gains on investments before taxes in computing its total income taxes.
| Tax expense (benefit) at statutory rates | | $ | (644,050 | ) |
| State income tax expense, net of federal benefit | | | (64,404 | ) |
Tax expense (benefit) on permanent items(1) | | | (46,348 | ) |
| Tax expense (benefit) due to change in effective state rates | | | — | |
| Total current tax expense (benefit) | | | (15,895 | ) |
| Change in valuation allowance | | | 754,802 | |
| Total tax expense | | $ | (15,895 | ) |
| | | | | |
(1) Permanent items consist of dividends-received deductions. | | | | |
The Fund recognizes the tax benefits of uncertain tax positions only where the position is “more likely than not” to be sustained assuming examination by tax authorities. Management has analyzed the Fund’s tax positions and has concluded that no liability for unrecognized tax benefits should be recorded related to uncertain tax positions taken on U.S. federal tax returns and state tax returns filed or expected to be filed since inception of the Fund. No income tax returns are currently under examination. Generally, tax authorities can examine all tax returns filed for the last three years. Due to the nature of the Fund’s investments, the Fund may be required to file income tax returns in several states. The Fund is not aware of any tax positions for which it is reasonably possible that the total amounts of unrecognized tax benefits will change materially.
| NOTES TO THE FINANCIAL STATEMENTS |
During fiscal year 2019, the 11-month period ended October 31, 2018, and the year ended November 30, 2017, the tax character of distributions paid by the Fund was as follows:
| | | | Year Ended | | | 11-Month Period Ended | | | Year Ended | |
| | | | October 31, 2019 | | | October 31, 2018 | | | November 30, 2017 | |
| | Ordinary income(1) | | $ | — | | | $ | — | | | $ | 637,466 | |
| | Long-term capital gain | | | — | | | | — | | | | — | |
| | Return of capital | | | 4,858,531 | | | | 7,826,085 | | | | 4,084,626 | |
| | | | $ | 4,858,531 | | | $ | 7,826,085 | | | $ | 4,722,092 | |
| | | | | | | | | | | | | | |
| | (1) Ordinary income includes short-term capital gain. | | | | | | | | | | | | |
9). AGREEMENT AND PLAN OF REORGANIZATION
On October 22, 2018, shareholders of the Predecessor Fund approved an Agreement and Plan of Reorganization between the Trust, on behalf of the Fund, and Professionally Managed Portfolios, a Massachusetts business Trust, on behalf of the Predecessor Fund. The Agreement and Plan of Reorganization provided for the transfer of all of the assets of the Predecessor Fund to the Fund and the assumption of the liabilities (other than any excluded liabilities) of the Predecessor Fund by the Fund. The Fund was created to carry out the reorganization and has a substantially similar investment objective and substantially similar principal investment strategies as the Predecessor Fund.The reorganization was effective as of the close of business on October 26, 2018. The following table illustrates the specifics of the reorganization of the Predecessor Fund into the Fund:
| | | | Net Assets of the Fund | |
| | | Shares Issued to | | | |
| | Predecessor Fund | Shareholders of the | | | Tax Status |
| | Net Assets | Predecessor Fund | Pre-Merger | Post-Merger | of Transfer |
| | $98,129,391(1) | 7,698,159 | $0 | $98,129,391 | Non-taxable |
| | (1) | Includes accumulated net investment loss, accumulated realized gains, and unrealized appreciation in the amounts of $(15,348,815), $(7,211,324), and $(5,832,377), respectively. |
10). EVENTS SUBSEQUENT TO YEAR END
Management has evaluated the Fund’s related events and transactions that occurred subsequent to October 31, 2019, through the date of issuance of the Fund’s financial statements. Other than as disclosed below, management has determined that there were no subsequent events requiring recognition or disclosure in the financial statements.
On November 25, 2019, U.S. Bancorp, the parent company of Quasar, announced that it had signed a purchase agreement to sell Quasar to Foreside Financial Group, LLC, such that Quasar will become a wholly-owned broker-dealer subsidiary of Foreside. The transaction is expected to close by the end of March 2020. Quasar will remain the Fund’s distributor at the close of the transaction, subject to Board approval.
On December 2, 2019, distributions were declared and paid to shareholders of record on November 30, 2019, as follows:
| | Investor Class | $0.2575 | |
| | Institutional Class | $0.2575 | |
| HENNESSY FUNDS | 1-800-966-4354 | |
Report of Independent Registered Public
Accounting Firm
To the Board of Trustees of Hennessy Funds Trust
and the shareholders of the Hennessy BP Midstream Fund
Novato, CA
Opinion on the Financial Statements
We have audited the accompanying statement of assets and liabilities of the Hennessy BP Midstream Fund (the “Fund”), a series of Hennessy Funds Trust, including the schedule of investments, as of October 31, 2019, the related statement of operations for the year then ended, the statements of changes in net assets for the year then ended, for the eleven months ended October 31, 2018, and for the year ended November 30, 2017, financial highlights for the year then ended, for the eleven months ended October 31, 2018, each of the three years in the period ended November 30, 2017, and for the period from December 31, 2013 (commencement of operations) to November 30, 2014, and the related notes (collectively referred to as the “financial statements”). In our opinion, the financial statements present fairly, in all material respects, the financial position of the Fund as of October 31, 2019, the results of its operations for the year then ended, the changes in its net assets and the financial highlights for each of the periods noted above, in conformity with accounting principles generally accepted in the United States of America.
Basis for Opinion
These financial statements are the responsibility of the Fund’s management. Our responsibility is to express an opinion on the Fund’s financial statements based on our audits. We are a public accounting firm registered with the Public Company Accounting Oversight Board (United States) (“PCAOB”) and are required to be independent with respect to the Fund in accordance with the U.S. federal securities laws and the applicable rules and regulations of the Securities and Exchange Commission and the PCAOB. We have served as the auditor of one or more of the funds in the Trust since 2002.
We conducted our audits in accordance with the standards of the PCAOB. Those standards require that we plan and perform the audit to obtain reasonable assurance about whether the financial statements are free of material misstatement, whether due to error or fraud. The Fund is not required to have, nor were we engaged to perform, an audit of its internal control over financial reporting. As part of our audits we are required to obtain an understanding of internal control over financial reporting, but not for the purpose of expressing an opinion on the effectiveness of the Fund’s internal control over financial reporting. Accordingly, we express no such opinion.
Our audits included performing procedures to assess the risks of material misstatement of the financial statements, whether due to error or fraud, and performing procedures that respond to those risks. Such procedures included examining, on a test basis, evidence regarding the amounts and disclosures in the financial statements. Our audits also included evaluating the accounting principles used and significant estimates made by management, as well as evaluating the overall presentation of the financial statements. Our procedures included confirmation of securities owned as of October 31, 2019, by correspondence with the custodian. We believe that our audits provide a reasonable basis for our opinion.
| | |
| | TAIT, WELLER & BAKER LLP |
Philadelphia, Pennsylvania
December 24, 2019
| REPORT OF INDEPENDENT REGISTERED PUBLIC ACCOUNTING FIRM/TRUSTEES AND OFFICERS |
Trustees and Officers of the Fund (Unaudited)
The business and affairs of the Funds are managed under the direction of the Board of Trustees of the Trust, and the Board of Trustees elects the officers of the Trust. From time to time, the Board of Trustees also has appointed advisers to the Board of Trustees (“Advisers”) with the intention of having qualified individuals serve in an advisory capacity in order to garner experience in the mutual fund and asset management industry and be considered as potential Trustees in the future. There are currently three Advisers: Brian Alexander, Doug Franklin, and Claire Knoles. As Advisers, Mr. Alexander, Mr. Franklin, and Ms. Knoles attend meetings of the Board of Trustees and act as non-voting participants. Information pertaining to the Trustees, Advisers, and the officers of the Trust is set forth below. The Trustees and officers serve until their successors are duly elected and qualified or until their earlier death, resignation, or removal. Each Trustee oversees the 16 Hennessy Funds. Unless otherwise indicated, the address of all persons listed below is 7250 Redwood Boulevard, Suite 200, Novato, CA 94945. The Fund’s Statement of Additional Information includes more information about the persons listed below and is available without charge by calling 1-800-966-4354 or by visiting www.hennessyfunds.com.
| | | | Other |
| | | | Directorships |
| | | | Held Outside |
| Name, (Year of Birth), | | | of Fund |
| and Position Held | Start Date | Principal Occupation(s) | Complex During |
with the Trust | of Service | During Past Five Years | Past Five Years |
| | | | |
| Disinterested Trustees and Advisers | | | |
| | | | |
| J. Dennis DeSousa | January 1996 | Mr. DeSousa is a real estate investor. | None. |
| (1936) | | | |
| Trustee | | | |
| | | | |
| Robert T. Doyle | January 1996 | Mr. Doyle has been the Sheriff of | None. |
| (1947) | | Marin County, California since 1996. | |
| Trustee | | | |
| | | | |
| Gerald P. Richardson | May 2004 | Mr. Richardson is an independent | None. |
| (1945) | | consultant in the securities industry. | |
| Trustee | | | |
| | | | |
| Brian Alexander | March 2015 | Mr. Alexander has worked for the | None. |
| (1981) | | Sutter Health organization since | |
| Adviser to the Board | | 2011 in various positions. He has | |
| | | served as the Chief Executive Officer | |
| | | of the Sutter Roseville Medical | |
| | | Center since 2018. From 2016 through | |
| | | 2018, he served as the Vice President | |
| | | of Strategy for the Sutter Health Valley | |
| | | Area, which includes 11 hospitals, | |
| | | 13 ambulatory surgery centers, | |
| | | 16,000 employees, and 1,900 physicians. | |
| | | From 2013 through 2016, Mr. Alexander | |
| | | served as Sutter Novato Community | |
| | | Hospital’s Chief Administrative Officer. | |
| HENNESSY FUNDS | 1-800-966-4354 | |
| | | | Other |
| | | | Directorships |
| | | | Held Outside |
| Name, (Year of Birth), | | | of Fund |
| and Position Held | Start Date | Principal Occupation(s) | Complex During |
with the Trust | of Service | During Past Five Years | Past Five Years |
| | | | |
| Doug Franklin | March 2016 | Mr. Franklin is a retired insurance | None. |
| (1964) | | industry executive. From 1987 | |
| Adviser to the Board | | through 2015, he was employed | |
| | | by the Allianz-Fireman’s Fund | |
| | | Insurance Company in various | |
| | | positions, including as its Chief | |
| | | Actuary and Chief Risk Officer. | |
| | | | |
| Claire Knoles | December 2015 | Ms. Knoles is a founder of Kiosk and | None. |
| (1974) | | has served as its Chief Operating | |
| Adviser to the Board | | Officer since 2004. Kiosk is a full- | |
| | | service marketing agency with | |
| | | offices in the San Francisco Bay | |
| | | Area, Toronto, and Liverpool, UK. | |
| | | | |
Interested Trustee(1) | | | |
| | | | |
| Neil J. Hennessy | January 1996 as | Mr. Hennessy has been employed | Hennessy |
| (1956) | a Trustee and | by Hennessy Advisors, Inc. since | Advisors, Inc. |
| Trustee, Chairman of | June 2008 as | 1989 and currently serves as its | |
| the Board, Chief | an officer | Chairman and Chief Executive Officer. | |
| Investment Officer, | | | |
| Portfolio Manager, | | | |
| and President | | | |
| Name, (Year of Birth), | | |
| and Position Held | Start Date | Principal Occupation(s) |
with the Trust | of Service | During Past Five Years |
| | | |
| Officers | | |
| | | |
| Teresa M. Nilsen | January 1996 | Ms. Nilsen has been employed by Hennessy Advisors, Inc. |
| (1966) | | since 1989 and currently serves as its President, Chief Operating |
| Executive Vice President | | Officer, and Secretary. |
| and Treasurer | | |
| | | |
| Daniel B. Steadman | March 2000 | Mr. Steadman has been employed by Hennessy Advisors, Inc. |
| (1956) | | since 2000 and currently serves as its Executive Vice President. |
| Executive Vice President | | |
| and Secretary | | |
| | | |
| Brian Carlson | December 2013 | Mr. Carlson has been employed by Hennessy Advisors, Inc. |
| (1972) | | since December 2013 and currently serves as its Chief |
| Senior Vice President | | Compliance Officer and Senior Vice President. |
| and Head of Distribution | | |
| | | |
| Jennifer Cheskiewicz | June 2013 | Ms. Cheskiewicz has been employed by Hennessy Advisors, Inc. |
(1977)(2) | | as its General Counsel since June 2013. |
| Senior Vice President and | | |
| Chief Compliance Officer | | |
| TRUSTEES AND OFFICERS OF THE FUND |
| Name, (Year of Birth), | | |
| and Position Held | Start Date | Principal Occupation(s) |
with the Trust | of Service | During Past Five Years |
| | | |
| David Ellison | October 2012 | Mr. Ellison has been employed by Hennessy Advisors, Inc. since |
(1958)(3) | | October 2012. He has served as a Portfolio Manager of the |
| Senior Vice President | | Hennessy Large Cap Financial Fund and the Hennessy Small |
| and Portfolio Manager | | Cap Financial Fund since their inception. Mr. Ellison also served |
| | | as a Portfolio Manager of the Hennessy Technology Fund from |
| | | its inception until February 2017. Mr. Ellison served as Director, |
| | | CIO and President of FBR Fund Advisers, Inc. from December |
| | | 1999 to October 2012. |
| | | |
| Ryan Kelley | March 2013 | Mr. Kelley has been employed by Hennessy Advisors, Inc. since |
(1972)(4) | | October 2012. He has served as a Portfolio Manager of the |
| Senior Vice President | | Hennessy Gas Utility Fund, the Hennessy Large Cap Financial |
| and Portfolio Manager | | Fund, and the Hennessy Small Cap Financial Fund since |
| | | October 2014. He served as Co- Portfolio Manager of these |
| | | same funds from March 2013 through September 2014 and as |
| | | a Portfolio Analyst for the Hennessy Funds from October 2012 |
| | | through February 2013. Mr. Kelley has also served as a Portfolio |
| | | Manager of the Hennessy Cornerstone Growth Fund, the |
| | | Hennessy Cornerstone Mid Cap 30 Fund, the Hennessy |
| | | Cornerstone Large Growth Fund, and the Hennessy |
| | | Cornerstone Value Fund since February 2017 and as a Portfolio |
| | | Manager of the Hennessy Total Return Fund, the Hennessy |
| | | Balanced Fund, and the Hennessy Technology Fund since May |
| | | 2018. He served as Co- Portfolio Manager of the Hennessy |
| | | Technology Fund from February 2017 until May 2018. Mr. Kelley s |
| | | erved as Portfolio Manager of FBR Fund Advisers, Inc. from |
| | | January 2008 to October 2012. |
| | | |
| Tania Kelley | October 2003 | Ms. Kelley has been employed by Hennessy Advisors, Inc. since |
| (1965) | | October 2003. |
| Senior Vice President | | |
| and Head of Marketing | | |
| | | |
| L. Joshua Wein | September 2018 | Mr. Wein has been employed by Hennessy Advisors, Inc. |
(1973)(4) | | since 2018. He has served as Co-Portfolio Manager of the |
| Vice President and | | Hennessy Cornerstone Growth Fund, the Hennessy |
| Co-Portfolio Manager | | Cornerstone Mid Cap 30 Fund, the Hennessy Cornerstone Large |
| | | Growth Fund, the Hennessy Cornerstone Value Fund, Hennessy |
| | | Total Return Fund, the Hennessy Balanced Fund, the Hennessy |
| | | Gas Utility Fund, and the Hennessy Technology Fund since |
| | | February 2019. Prior to that, he served as a Senior Analyst of |
| | | those same funds since September 2018. Mr. Wein served as |
| | | Director of Alternative Investments and Co-Portfolio Manager |
| | | at Sterling Capital Management from 2008 to 2018. |
_______________
(1) | Mr. Hennessy is considered an “interested person,” as defined in the Investment Company Act of 1940, as amended, because he is an officer of the Trust. |
(2) | The address of this officer is 4800 Bee Caves Road, Suite 100, Austin, TX 78746. |
(3) | The address of this officer is 101 Federal Street, Suite 1900, Boston, MA 02110. |
(4) | The address of this officer is 1340 Environ Way, Chapel Hill, NC 27517. |
| HENNESSY FUNDS | 1-800-966-4354 | |
Expense Example (Unaudited)
October 31, 2019
As a shareholder of the Fund, you incur ongoing costs, including management fees, service fees, and other Fund expenses. This Example is intended to help you understand your ongoing costs (in dollars) of investing in the Fund and to compare these costs with the ongoing costs of investing in other mutual funds. The Example is based on an investment of $1,000 invested at the beginning of the period and held for the entire period from May 1, 2019, through October 31, 2019.
Actual Expenses
The first line of the table below under the “Investor Class” and “Institutional Class” headings provides information about actual account values and actual expenses. Although the Fund charges no sales loads or transaction fees, you will be assessed fees for outgoing wire transfers, returned checks and stop payment orders at prevailing rates charged by U.S. Bank Global Fund Services, the Fund’s transfer agent. If you request that a redemption be made by wire transfer, currently a $15 fee is charged by the Fund’s transfer agent. IRA accounts will be charged a $15 annual maintenance fee. The example below includes, but is not limited to, management fees, shareholder servicing fees, accounting, custody, and transfer agent fees. However, the example below does not include portfolio trading commissions and related expenses. You may use the information in this line, together with the amount you invested, to estimate the expenses that you paid over the period. Simply divide your account value by $1,000 (for example, an $8,600 account value divided by $1,000 = 8.6), then multiply the result by the number in the first line of the table under the “Investor Class” or “Institutional Class” headings in the column entitled “Expenses Paid During Period” to estimate the expenses you paid on your account during this period.
Hypothetical Example for Comparison Purposes
The second line of the table below under the “Investor Class” and “Institutional Class” headings provides information about hypothetical account values and hypothetical expenses based on the Fund’s actual expense ratios and an assumed rate of return of 5% per year before expenses, which is not the Fund’s actual return. The hypothetical account values and expenses may not be used to estimate the actual ending account balance or expenses you paid for the period. You may use this information to compare the ongoing costs of investing in the Fund and other funds. To do so, compare this 5% hypothetical example with the 5% hypothetical examples that appear in the shareholder reports of the other funds. Please note that the expenses shown in the table are meant to highlight your ongoing costs only. Therefore, the second line of the table under the “Investor Class” and “Institutional Class” headings is useful in comparing ongoing costs only and will not help you determine the relative total costs of owning different funds.
| | | | Expenses Paid |
| | Beginning | Ending | During Period(1) |
| | Account Value | Account Value | May 1, 2019 – |
| | May 1, 2019 | October 31, 2019 | October 31, 2019 |
| Investor Class | | | |
| Actual | $1,000.00 | $ 904.70 | $8.46 |
| Hypothetical (5% return before expenses) | $1,000.00 | $1,016.32 | $8.95 |
| | | | |
| Institutional Class | | | |
| Actual | $1,000.00 | $ 905.40 | $7.28 |
| Hypothetical (5% return before expenses) | $1,000.00 | $1,017.57 | $7.70 |
(1) | Expenses are equal to the Fund’s annualized expense ratio of 1.76% for Investor Class shares or 1.52% for Institutional Class shares, as applicable, multiplied by the average account value over the period, multiplied by 184/365 days (to reflect one-half year period). |
| HENNESSY FUNDS | 1-800-966-4354 | |
How to Obtain a Copy of the Fund’s
Proxy Voting Policy and Proxy Voting Records
A description of the policies and procedures the Fund uses to determine how to vote proxies relating to portfolio securities is available without charge: (1) by calling 1-800-966-4354; (2) on the Hennessy Funds’ website at www.hennessyfunds.com/proxy-voting/voting-policy; or (3) on the U.S. Securities and Exchange Commission’s (the “SEC”) website at www.sec.gov. The Fund’s proxy voting record is available without charge on both the Hennessy Funds’ website at www.hennessyfunds.com/proxy-voting/voting-record and the SEC’s website at www.sec.gov no later than August 31 for the prior 12 months ending June 30.
Availability of Quarterly Portfolio Schedule
For periods ending on or prior to January 31, 2019, the Fund has filed a complete schedule of portfolio holdings with the SEC for the first and third quarters of each fiscal year on Form N-Q. For periods ending on or after April 30, 2019, the Fund files a complete schedule of portfolio holdings with the SEC for the first and third quarters of each fiscal year as an exhibit to its reports on Form N-PORT. The Fund’s Forms N-Q and Forms N-PORT are available on the SEC’s website at www.sec.gov or on request by calling 1-800-966-4354.
Federal Tax Distribution Information (Unaudited)
For fiscal year 2019, certain dividends paid by the Fund may be subject to a maximum tax rate of 23.8%, as provided for by the Jobs and Growth Tax Relief Reconciliation Act of 2003. The percentage of dividends declared from ordinary income designated as qualified dividend income was 0.00%.
For corporate shareholders, the percent of ordinary income distributions that qualified for the corporate dividends received deduction for fiscal year 2019 was 0.00%.
The percentage of taxable ordinary income distributions that were designated as short-term capital gain distributions under Section 871(k)(2)(C) of the Internal Revenue Code of 1986, as amended, for the Fund was 0.00%.
Important Notice Regarding Delivery
of Shareholder Documents
To help keep the Fund’s costs as low as possible, we generally deliver a single copy of shareholder reports, proxy statements, and prospectuses to shareholders who share an address and have the same last name. This process does not apply to account statements. You may request an individual copy of a shareholder document at any time. If you would like to receive separate mailings of shareholder documents, please call U.S. Bank Global Fund Services at 1-800-261-6950 or 1-414-765-4124, and individual delivery will begin within 30 days of your request. If your account is held through a financial institution or other intermediary, please contact such intermediary directly to request individual delivery.
Electronic Delivery
The Funds offer shareholders the option to receive account statements, Prospectuses, tax forms, and reports online. To sign up for eDelivery, please visit www.hennessyfunds.com. You may change your delivery preference at any time by visiting our website or contacting the Funds at 1-800-261-6950.
| PROXY VOTING — PRIVACY POLICY |
Privacy Policy
We collect the following non-public personal information about you:
| | • | information we receive from you on or in applications or other forms, correspondence, or conversations, including, but not limited to, your name, address, phone number, social security number, assets, income, and date of birth; and |
| | | |
| | • | information about your transactions with us, our affiliates, or others, including, but not limited to, your account number and balance, payment history, parties to transactions, cost basis information, and other financial information. |
We do not disclose any non-public personal information about our current or former shareholders to non-affiliated third parties, except as permitted by law. For example, we are permitted by law to disclose all of the information we collect, as described above, to our Transfer Agent to process your transactions. Furthermore, we restrict access to your non-public personal information to those persons who require such information to provide products or services to you. We maintain physical, electronic, and procedural safeguards that comply with federal standards to guard your non-public personal information.
In the event that you hold shares of the Fund through a financial intermediary, including, but not limited to, a broker-dealer, bank, or trust company, the privacy policy of your financial intermediary would govern how your non-public personal information will be shared with non-affiliated third parties.
| HENNESSY FUNDS | 1-800-966-4354 | |
(This Page Intentionally Left Blank.)
For information, questions or assistance, please call
The Hennessy Funds
1-800-966-4354 or 1-415-899-1555
INVESTMENT ADVISOR
Hennessy Advisors, Inc.
7250 Redwood Boulevard, Suite 200
Novato, California 94945
ADMINISTRATOR,
TRANSFER AGENT,
DIVIDEND PAYING AGENT, &
SHAREHOLDER SERVICING AGENT
U.S. Bancorp Fund Services, LLC
d/b/a U.S. Bank Global Fund Services
P.O. Box 701
Milwaukee, Wisconsin 53201-0701
CUSTODIAN
U.S. Bank N.A.
Custody Operations
1555 North River Center Drive, Suite 302
Milwaukee, Wisconsin 53212
TRUSTEES
Neil J. Hennessy
Robert T. Doyle
J. Dennis DeSousa
Gerald P. Richardson
COUNSEL
Foley & Lardner LLP
777 East Wisconsin Avenue
Milwaukee, Wisconsin 53202-5306
INDEPENDENT REGISTERED
PUBLIC ACCOUNTING FIRM
Tait, Weller & Baker LLP
Two Liberty Place
50 South 16th Street, Suite 2900
Philadelphia, Pennsylvania 19103-2529
DISTRIBUTOR
Quasar Distributors, LLC
777 East Wisconsin Avenue
Milwaukee, Wisconsin 53202
www.hennessyfunds.com | 1-800-966-4354
This report has been prepared for shareholders and may be distributed to
others only if preceded or accompanied by a current prospectus.
ANNUAL REPORT
OCTOBER 31, 2019
HENNESSY GAS UTILITY FUND
Investor Class GASFX
Institutional Class HGASX
IMPORTANT NOTICE REGARDING ELECTRONIC DELIVERY OF SHAREHOLDER REPORTS
Beginning on January 1, 2021, as permitted by regulations adopted by the Securities and Exchange Commission, paper copies of the annual and semi-annual reports will no longer be sent by mail unless you specifically request paper copies from the Hennessy Funds or from your financial intermediary. Instead, the reports will be made available on a website, and you will be notified by mail each time a report is posted and provided with a website link to access the report.
If you have already elected to receive shareholder reports electronically, you will not be affected by this change and you need not take any action. You may elect to receive shareholder reports and other communications from the Hennessy Funds electronically by visiting www.hennessyfunds.com/account or by calling U.S. Bank Global Fund Services at 1-800-261-6950. If you own shares in a Fund through a financial intermediary, please contact your financial intermediary to make this election.
You may elect to receive paper copies of all future reports free of charge by calling U.S. Bank Global Fund Services at 1-800-261-6950 or, if you own your shares through a financial intermediary, by contacting your financial intermediary. Your election to receive paper copies of reports will apply to all Funds in the Hennessy Funds family.
hennessyfunds.com | 1-800-966-4354
(This Page Intentionally Left Blank.)
Contents
| Letter to Shareholders | 2 |
| Performance Overview | 4 |
| Financial Statements | |
| Schedule of Investments | 7 |
| Statement of Assets and Liabilities | 11 |
| Statement of Operations | 12 |
| Statements of Changes in Net Assets | 13 |
| Financial Highlights | 14 |
| Notes to the Financial Statements | 17 |
| Report of Independent Registered Public Accounting Firm | 25 |
| Trustees and Officers of the Fund | 26 |
| Expense Example | 30 |
| Proxy Voting Policy and Proxy Voting Records | 32 |
| Availability of Quarterly Portfolio Schedule | 32 |
| Federal Tax Distribution Information | 32 |
| Important Notice Regarding Delivery of Shareholder Documents | 32 |
| Electronic Delivery | 32 |
| Privacy Policy | 33 |
| HENNESSY FUNDS | 1-800-966-4354 | |
December 2019
Dear Hennessy Funds Shareholder:
What a year it has been. I am reassured by the resiliency of the U.S. financial markets as companies continue to thrive in the midst of policy challenges and political turbulence. Trade tariffs, impeachment, and interest rates have dominated the news headlines, while Brexit and protests in Hong Kong have also been major concerns internationally.
While the financial markets were characterized by volatility during the twelve months ended October 31, 2019, U.S. equities posted double-digit positive performance for the period, with a total return of 14.3% for the S&P 500® Index and 10.3% for the Dow Jones Industrial Average. As I sat down to write this letter, all three major indices, the S&P 500® Index, the Dow Jones Industrial Average, and the NASDAQ Composite Index, recently reached all-time highs.
Every bull market experiences volatility and pullbacks, and this extended bull market is no different. Since 2010, there have been 16 pullbacks of 5-10% and six corrections of over 10%. But what is interesting is not how quickly the declines take place, but rather how swiftly the market regains and surpasses its prior highs. With each decline, many investors and commentators predict that finally this bull market is out of steam. But I ask myself, “Why?”
What I see is a healthy economy and stock market, with fundamentals in place to support a continued bull market. Although slightly above long-term averages, I believe stocks are trading at reasonable valuations, with the Dow Jones Industrial Average trading at 16x forward earnings per share and the S&P 500® Index at 17x forward earnings. At the same time, the U.S. economy is growing at a sustainable pace of 2-3%, corporate profits continue to outperform expectations, and cash continues to build on corporate balance sheets. With over $5 trillion in cash and marketable securities on the balance sheets of the S&P 500® Index companies alone, corporations are returning cash to shareholders through share buybacks and dividends. Share buybacks by S&P 500® Index companies could hit $1 trillion in 2019, surpassing 2018’s record $800 billion, and dividend payments by S&P 500® Index companies are estimated to increase 8-9%. Unemployment continues to be at historically low levels, while wages are growing. Interest rates are also at very low levels, which should support equity prices. Finally, overall consumer confidence remains positive.
To quote Sir John Templeton’s famous saying, “Bull markets are born on pessimism, grow on skepticism, mature on optimism, and die on euphoria.” If you look back to the beginning of the great bull market that began in 1982, only six of the past 37 years ended with negative total returns: 1990, 2000, 2001, 2002, 2008, and 2018. With the exception of 2018, which was characterized by volatility but no euphoria, the other down years were marked by euphoria in either real estate or dot coms. I have been saying for a number of years that I see no signs of euphoria in the market, and I remain confident in the strength of the market today.
Thank you for your continued trust and investment in the Hennessy Funds. We believe that there continue to be great opportunities throughout all parts of the market, and we remain steadfastly focused on managing our high-conviction portfolios for the long-term benefit of our shareholders. Should you have any questions or would like to speak with us directly, please don’t hesitate to call us at (800) 966-4354.
Best regards,
Neil J. Hennessy
President and Chief Investment Officer
Past performance does not guarantee future results.
Mutual fund investing involves risk. Principal loss is possible.
The Dow Jones Industrial Average and S&P 500® Index are commonly used to measure the performance of U.S. stocks. The NASDAQ Composite Index is a broad-based capitalization-weighted index of all the NASDAQ National Market and Small Cap stocks. One cannot invest directly in an index.
Forward price to earnings is a valuation measure calculated by dividing a company’s market price per share by its expected earnings per share over the following 12 months.
| HENNESSY FUNDS | 1-800-966-4354 | |
Performance Overview (Unaudited)
CHANGE IN VALUE OF $10,000 INVESTMENT
This graph illustrates the performance of an initial investment of $10,000 made in the Fund ten years ago and assumes the reinvestment of dividends.
AVERAGE ANNUAL TOTAL RETURN FOR PERIODS ENDED OCTOBER 31, 2019
| | One | Five | Ten |
| | Year | Years | Years |
| Hennessy Gas Utility Fund – | | | |
| Investor Class (GASFX) | 15.28% | 4.62% | 12.23% |
| Hennessy Gas Utility Fund – | | | |
Institutional Class (HGASX)(1) | 15.63% | 4.80% | 12.33% |
| AGA Stock Index | 16.69% | 5.88% | 13.23% |
S&P 500® Index | 14.33% | 10.78% | 13.70% |
Expense ratios: 1.01% (Investor Class); 0.65% (Institutional Class)
(1) | The inception date of Institutional Class shares is March 1, 2017. Performance shown prior to the inception of Institutional Class shares reflects the performance of Investor Class shares and includes expenses that are not applicable to, and are higher than, those of Institutional Class shares. |
Performance data quoted represents past performance; past performance does not guarantee future results. The investment return and principal value of an investment will fluctuate so that an investor’s shares, when redeemed, may be worth more or less than their original cost. The performance table does not reflect the deduction of taxes that a shareholder would pay on Fund distributions or the redemption of Fund shares. Current performance of the Fund may be lower or higher than the performance quoted. Performance data current to the most recent month end may be obtained by visiting www.hennessyfunds.com. Performance for periods on or prior to October 26, 2012, is that of the FBR Gas Utility Index Fund.
The AGA Stock Index is a capitalization-weighted index consisting of publicly traded members of the American Gas Association whose securities are traded on a U.S. stock exchange. The S&P 500® Index is a capitalization-weighted index that is designed to represent the broad domestic economy through changes in the aggregate market value of 500 stocks across all major industries. One cannot invest directly in an index. These indices are used herein for comparative purposes in accordance with SEC regulations.
Standard & Poor’s Financial Services LLC is the source and owner of the S&P® and S&P 500® trademarks.
The expense ratios presented are from the most recent prospectus. The expense ratios for the current reporting period are available in the Financial Highlights section of this report.
PERFORMANCE NARRATIVE
Portfolio Managers Ryan C. Kelley, CFA, and L. Joshua Wein, CAIA
Performance:
For the 12-month period ended October 31, 2019, the Investor Class of the Hennessy Gas Utility Fund returned 15.28%, underperforming the AGA Stock Index (the Fund’s primary benchmark), which returned 16.69%, but outperforming the S&P 500® Index, which returned 14.33%, for the same period.
The Fund slightly underperformed its primary benchmark due to Fund expenses, the timing of cash flows, trading costs, and the impact of holding cash. The Fund outperformed the broader domestic equity market, as represented by the S&P 500® Index, as a result of strong fundamentals within the Utilities sector as well as increased investor interest in income-oriented securities during a time when interest rates decreased meaningfully. Electric utility The Southern Company, pipeline company TC Energy Corporation, and energy services company Sempra Energy were among the holdings that contributed positively to Fund performance. Utility company PG&E Corporation, midstream distribution company Equitrans Midstream Corporation, and integrated natural gas company National Fuel Gas Company performed poorly and were among the holdings that detracted most from performance over the period.
The Fund continues to hold all of the companies mentioned.
Portfolio Strategy:
The Fund’s objective is to maintain a high correlation with its primary benchmark, the AGA Stock Index. The Fund seeks to achieve this goal by owning all of the companies in the AGA Stock Index in substantially the same proportion as the AGA Stock Index. The investment thesis of the Fund is that competitive and stable pricing, abundant domestic supply, and new sources and uses of natural gas should lead to long-term, steady growth in demand and drive growth in natural gas distribution. This should, in turn, drive long-term growth in earnings of the companies in the Fund. In addition, we believe that natural gas’s position as the cleanest of the fossil fuels should lead to additional increased demand, particularly from the electricity generation industry.
Investment Commentary:
We believe the strategy of the Fund remains compelling. The production of natural gas in the United States, in particular from shale producers, continues to grow steadily. Demand for natural gas from domestic sources, especially the power industry, also continues to grow. In addition, exports of natural gas via pipelines to Mexico and in the form of liquid natural gas to the rest of the world are increasing steadily. The Fund continues to seek acceptable total returns by investing in natural gas distribution companies with the potential for both income and long-term capital appreciation.
_______________
Opinions expressed are those of the Portfolio Managers as of the date written and are subject to change, are not guaranteed, and should not be considered investment advice or an indication of trading intent.
Investments in foreign securities may involve political, economic, and currency risks, greater volatility, and differences in accounting methods. Investments are focused in the natural gas distribution and transmission industry; sector funds may be subject to a higher degree of market risk. Please see the Fund’s prospectus for a more complete discussion of these and other risks.
| HENNESSY FUNDS | 1-800-966-4354 | |
References to specific securities should not be considered a recommendation to buy or sell any security. Fund holdings and sector allocations are subject to change. Please refer to the Schedule of Investments included in this report for additional portfolio information.
Cash flow refers to the net amount of cash and cash equivalents transferred into and out of a company. Correlation measures the relationship between the changes of two or more financial variables over time.
| PERFORMANCE OVERVIEW/SCHEDULE OF INVESTMENTS |
Financial Statements
Schedule of Investments as of October 31, 2019 |
HENNESSY GAS UTILITY FUND
(% of Net Assets)
| TOP TEN HOLDINGS (EXCLUDING MONEY MARKET FUNDS) | % NET ASSETS |
| The Southern Co. | 5.13% |
| Atmos Energy Corp. | 5.00% |
| Dominion Resources, Inc. | 5.00% |
| Sempra Energy | 4.97% |
| Enbridge, Inc. | 4.96% |
| Kinder Morgan, Inc. | 4.92% |
| TC Energy Corp. | 4.89% |
| Cheniere Energy, Inc. | 4.82% |
| National Grid PLC – ADR | 4.62% |
| WEC Energy Group, Inc. | 4.59% |
Note: For presentation purposes, the Fund has grouped some of the industry categories. For purposes of categorizing securities for compliance with Section 8(b)(1) of the Investment Company Act of 1940, as amended, the Fund uses more specific industry classifications.
The Global Industry Classification Standard (GICS®) was developed by and is the exclusive property and a service mark of MSCI, Inc. and Standard & Poor’s Financial Services LLC. It has been licensed for use by the Hennessy Funds.
| HENNESSY FUNDS | 1-800-966-4354 | |
| COMMON STOCKS – 98.15% | | Number | | | | | | % of | |
| | | of Shares | | | Value | | | Net Assets | |
| Energy – 21.79% | | | | | | | | | |
| Cheniere Energy, Inc. (a) | | | 682,917 | | | $ | 42,033,541 | | | | 4.82 | % |
| Enbridge, Inc. (b) | | | 1,185,765 | | | | 43,173,704 | | | | 4.96 | % |
| Equitrans Midstream Corp. | | | 918,345 | | | | 12,783,362 | | | | 1.47 | % |
| Kinder Morgan, Inc. | | | 2,145,101 | | | | 42,859,118 | | | | 4.92 | % |
| TC Energy Corp. (b) | | | 847,353 | | | | 42,647,277 | | | | 4.89 | % |
| Tellurian, Inc. (a) | | | 795,690 | | | | 6,341,649 | | | | 0.73 | % |
| | | | | | | | 189,838,651 | | | | 21.79 | % |
| | | | | | | | | | | | | |
| Financials – 2.63% | | | | | | | | | | | | |
| Berkshire Hathaway, Inc., Class A (a) | | | 72 | | | | 22,963,608 | | | | 2.63 | % |
| | | | | | | | | | | | | |
| Utilities – 73.73% | | | | | | | | | | | | |
| Algonquin Power & Utilities Corp. (b) | | | 235,664 | | | | 3,233,310 | | | | 0.37 | % |
| ALLETE, Inc. | | | 875 | | | | 75,303 | | | | 0.01 | % |
| Ameren Corp. | | | 101,240 | | | | 7,866,348 | | | | 0.90 | % |
| Atmos Energy Corp. | | | 387,586 | | | | 43,595,673 | | | | 5.00 | % |
| Avangrid, Inc. | | | 177,700 | | | | 8,893,885 | | | | 1.02 | % |
| Avista Corp. | | | 54,572 | | | | 2,621,093 | | | | 0.30 | % |
| Black Hills Corp. | | | 134,547 | | | | 10,606,340 | | | | 1.22 | % |
| Centerpoint Energy, Inc. | | | 536,828 | | | | 15,605,590 | | | | 1.79 | % |
| Chesapeake Utilities Corp. | | | 53,158 | | | | 5,039,379 | | | | 0.58 | % |
| CMS Energy Corp. | | | 381,998 | | | | 24,417,312 | | | | 2.80 | % |
| Consolidated Edison, Inc. | | | 274,936 | | | | 25,354,598 | | | | 2.91 | % |
| Corning Natural Gas Holding Corp. | | | 11,099 | | | | 206,441 | | | | 0.02 | % |
| Dominion Resources, Inc. | | | 527,877 | | | | 43,576,246 | | | | 5.00 | % |
| DTE Energy Co. | | | 182,304 | | | | 23,210,945 | | | | 2.66 | % |
| Duke Energy Corp. | | | 258,787 | | | | 24,393,263 | | | | 2.80 | % |
| Entergy Corp. | | | 7,360 | | | | 894,093 | | | | 0.10 | % |
| Eversource Energy | | | 97,075 | | | | 8,129,061 | | | | 0.93 | % |
| Exelon Corp. | | | 229,631 | | | | 10,445,914 | | | | 1.20 | % |
| Fortis, Inc. (b) | | | 284,276 | | | | 11,817,353 | | | | 1.36 | % |
| MDU Resources Group, Inc. | | | 359,407 | | | | 10,383,268 | | | | 1.19 | % |
| MGE Energy, Inc. | | | 30,229 | | | | 2,328,842 | | | | 0.27 | % |
| National Fuel Gas Co. | | | 226,924 | | | | 10,281,927 | | | | 1.18 | % |
| National Grid PLC – ADR (b) | | | 688,844 | | | | 40,207,824 | | | | 4.62 | % |
| New Jersey Resources Corp. | | | 241,634 | | | | 10,535,242 | | | | 1.21 | % |
The accompanying notes are an integral part of these financial statements.
| COMMON STOCKS | | Number | | | | | | % of | |
| | | of Shares | | | Value | | | Net Assets | |
| Utilities (Continued) | | | | | | | | | |
| NiSource, Inc. | | | 979,781 | | | $ | 27,473,059 | | | | 3.15 | % |
| Northwest Natural Holding Co. | | | 128,803 | | | | 8,933,776 | | | | 1.03 | % |
| NorthWestern Corp. | | | 42,398 | | | | 3,074,703 | | | | 0.35 | % |
| ONE Gas, Inc. | | | 220,175 | | | | 20,441,047 | | | | 2.35 | % |
| PG&E Corp. (a) | | | 287,449 | | | | 1,773,560 | | | | 0.20 | % |
| PPL Corp. | | | 270,419 | | | | 9,056,332 | | | | 1.04 | % |
| Public Service Enterprise Group, Inc. | | | 430,990 | | | | 27,285,977 | | | | 3.13 | % |
| RGC Resources, Inc. | | | 34,254 | | | | 999,189 | | | | 0.12 | % |
| Sempra Energy | | | 299,340 | | | | 43,257,623 | | | | 4.97 | % |
| South Jersey Industries, Inc. | | | 336,171 | | | | 10,811,259 | | | | 1.24 | % |
| Southwest Gas Holdings, Inc. | | | 184,817 | | | | 16,134,524 | | | | 1.85 | % |
| Spire, Inc. | | | 173,491 | | | | 14,583,654 | | | | 1.67 | % |
| The Southern Co. | | | 713,200 | | | | 44,689,112 | | | | 5.13 | % |
| UGI Corp. | | | 239,752 | | | | 11,428,978 | | | | 1.31 | % |
| Unitil Corp. | | | 37,198 | | | | 2,316,320 | | | | 0.27 | % |
| WEC Energy Group, Inc. | | | 423,240 | | | | 39,953,856 | | | | 4.59 | % |
| Xcel Energy, Inc. | | | 258,899 | | | | 16,442,676 | | | | 1.89 | % |
| | | | | | | | 642,374,895 | | | | 73.73 | % |
| Total Common Stocks | | | | | | | | | | | | |
| (Cost $450,000,902) | | | | | | | 855,177,154 | | | | 98.15 | % |
| | | | | | | | | | | | | |
| PARTNERSHIPS – 0.91% | | | | | | | | | | | | |
| | | | | | | | | | | | | |
| Energy – 0.91%% | | | | | | | | | | | | |
| Plains GP Holdings LP, Class A | | | 426,255 | | | | 7,911,293 | | | | 0.91 | % |
| | | | | | | | | | | | | |
| Total Partnerships | | | | | | | | | | | | |
| (Cost $8,792,197) | | | | | | | 7,911,293 | | | | 0.91 | % |
The accompanying notes are an integral part of these financial statements.
| HENNESSY FUNDS | 1-800-966-4354 | |
| SHORT-TERM INVESTMENTS – 0.94% | | Number | | | | | | % of | |
| | | of Shares | | | Value | | | Net Assets | |
| Money Market Funds – 0.94% | | | | | | | | | |
| First American Government Obligations Fund, | | | | | | | | | |
| Institutional Class, 1.74% (c) | | | 8,226,130 | | | $ | 8,226,130 | | | | 0.94 | % |
| | | | | | | | | | | | | |
| Total Short-Term Investments | | | | | | | | | | | | |
| (Cost $8,226,130) | | | | | | | 8,226,130 | | | | 0.94 | % |
| | | | | | | | | | | | | |
| Total Investments | | | | | | | | | | | | |
| (Cost $467,019,229) – 100.00% | | | | | | | 871,314,577 | | | | 100.00 | % |
| Liabilities in Excess of Other Assets – 0.00% | | | | | | | (24,888 | ) | | | 0.00 | % |
| | | | | | | | | | | | | |
TOTAL NET ASSETS – 100.00% | | | | | | $ | 871,289,689 | | | | 100.00 | % |
Percentages are stated as a percent of net assets.
PLC – Public Limited Company
ADR – American Depository Receipt
| (a) | Non-income-producing security. |
| (b) | U.S.-traded security of a foreign corporation. |
| (c) | The rate listed is the fund’s seven-day yield as of October 31, 2019. |
Summary of Fair Value Exposure as of October 31, 2019
The following is a summary of the inputs used to value the Fund’s net assets as of October 31, 2019 (See Note 3 in the accompanying Notes to the Financial Statements):
| Common Stocks | | Level 1 | | | Level 2 | | | Level 3 | | | Total | |
| Energy | | $ | 189,838,651 | | | $ | — | | | $ | — | | | $ | 189,838,651 | |
| Financials | | | 22,963,608 | | | | — | | | | — | | | | 22,963,608 | |
| Utilities | | | 642,168,454 | | | | 206,441 | | | | — | | | | 642,374,895 | |
| Total Common Stocks | | $ | 854,970,713 | | | $ | 206,441 | | | $ | — | | | $ | 855,177,154 | |
| Partnerships | | | | | | | | | | | | | | | | |
| Energy | | $ | 7,911,293 | | | $ | — | | | $ | — | | | $ | 7,911,293 | |
| Total Partnerships | | $ | 7,911,293 | | | $ | — | | | $ | — | | | $ | 7,911,293 | |
| Short-Term Investments | | | | | | | | | | | | | | | | |
| Money Market Funds | | $ | 8,226,130 | | | $ | — | | | $ | — | | | $ | 8,226,130 | |
| Total Short-Term Investments | | $ | 8,226,130 | | | $ | — | | | $ | — | | | $ | 8,226,130 | |
| Total Investments | | $ | 871,108,136 | | | $ | 206,441 | | | $ | — | | | $ | 871,314,577 | |
The accompanying notes are an integral part of these financial statements.
| SCHEDULE OF INVESTMENTS/STATEMENT OF ASSETS AND LIABILITIES |
Financial Statements
Statement of Assets and Liabilities as of October 31, 2019 |
| ASSETS: | | | |
| Investments in securities, at value (cost $467,019,229) | | $ | 871,314,577 | |
| Dividends and interest receivable | | | 423,410 | |
| Receivable for fund shares sold | | | 128,205 | |
| Return of capital receivable | | | 689,727 | |
| Prepaid expenses and other assets | | | 47,650 | |
| Total assets | | | 872,603,569 | |
| | | | | |
| LIABILITIES: | | | | |
| Payable for fund shares redeemed | | | 418,440 | |
| Payable to advisor | | | 298,732 | |
| Payable to sub-transfer agents | | | 161,810 | |
| Payable to administrator | | | 151,239 | |
| Payable to auditor | | | 22,553 | |
| Accrued distribution fees | | | 128,521 | |
| Accrued service fees | | | 65,667 | |
| Accrued trustees fees | | | 6,599 | |
| Accrued expenses and other payables | | | 60,319 | |
| Total liabilities | | | 1,313,880 | |
| NET ASSETS | | $ | 871,289,689 | |
| | | | | |
| NET ASSETS CONSISTS OF: | | | | |
| Capital stock | | $ | 483,078,751 | |
| Total distributable earnings | | | 388,210,938 | |
| Total net assets | | $ | 871,289,689 | |
| | | | | |
| NET ASSETS: | | | | |
| Investor Class | | | | |
| Shares authorized (no par value) | | Unlimited | |
| Net assets applicable to outstanding shares | | $ | 764,104,957 | |
| Shares issued and outstanding | | | 25,779,412 | |
| Net asset value, offering price, and redemption price per share | | $ | 29.64 | |
| | | | | |
| Institutional Class | | | | |
| Shares authorized (no par value) | | Unlimited | |
| Net assets applicable to outstanding shares | | $ | 107,184,732 | |
| Shares issued and outstanding | | | 3,625,608 | |
| Net asset value, offering price, and redemption price per share | | $ | 29.56 | |
The accompanying notes are an integral part of these financial statements.
| HENNESSY FUNDS | 1-800-966-4354 | |
Financial Statements
Statement of Operations for the year ended October 31, 2019 |
| INVESTMENT INCOME: | | | |
Dividend income(1) | | $ | 26,604,950 | |
| Interest income | | | 162,442 | |
| Total investment income | | | 26,767,392 | |
| | | | | |
| EXPENSES: | | | | |
| Investment advisory fees (See Note 5) | | | 3,599,062 | |
| Sub-transfer agent expenses – Investor Class (See Note 5) | | | 1,482,935 | |
| Sub-transfer agent expenses – Institutional Class (See Note 5) | | | 118,286 | |
| Distribution fees – Investor Class (See Note 5) | | | 1,203,602 | |
| Administration, accounting, custody, and transfer agent fees (See Note 5) | | | 895,140 | |
| Service fees – Investor Class (See Note 5) | | | 802,402 | |
| Reports to shareholders | | | 58,698 | |
| Federal and state registration fees | | | 54,287 | |
| Compliance expense (See Note 5) | | | 25,810 | |
| Audit fees | | | 22,557 | |
| Trustees’ fees and expenses | | | 21,975 | |
| Legal fees | | | 7,525 | |
| Interest expense (See Note 7) | | | 2,503 | |
| Other expenses | | | 429,442 | |
| Total expenses | | | 8,724,224 | |
| NET INVESTMENT INCOME | | $ | 18,043,168 | |
| | | | | |
| REALIZED AND UNREALIZED GAINS (LOSSES): | | | | |
| Net realized gain on investments | | $ | 63,413,446 | |
| Net change in unrealized appreciation/depreciation on investments | | | 46,797,092 | |
| Net gain on investments | | | 110,210,538 | |
| NET INCREASE IN NET ASSETS RESULTING FROM OPERATIONS | | $ | 128,253,706 | |
(1) | Net of foreign taxes withheld and issuance fees of $848,482. |
The accompanying notes are an integral part of these financial statements.
| STATEMENT OF OPERATIONS/STATEMENTS OF CHANGES IN NET ASSETS |
Financial Statements
| Statements of Changes in Net Assets |
| | | Year Ended | | | Year Ended | |
| | | October 31, 2019 | | | October 31, 2018 | |
| OPERATIONS: | | | | | | |
| Net investment income | | $ | 18,043,168 | | | $ | 24,446,971 | |
| Net realized gain on investments | | | 63,413,446 | | | | 108,812,839 | |
| Net change in unrealized | | | | | | | | |
| appreciation/depreciation on investments | | | 46,797,092 | | | | (180,455,187 | ) |
| Net increase (decrease) in net | | | | | | | | |
| assets resulting from operations | | | 128,253,706 | | | | (47,195,377 | ) |
| | | | | | | | | |
| DISTRIBUTIONS TO SHAREHOLDERS: | | | | | | | | |
| Distributable earnings – Investor Class | | | (87,242,469 | ) | | | (28,287,790 | ) |
| Distributable earnings – Institutional Class | | | (10,746,642 | ) | | | (3,147,794 | ) |
| Total distributions | | | (97,989,111 | ) | | | (31,435,584 | ) |
| | | | | | | | | |
| CAPITAL SHARE TRANSACTIONS: | | | | | | | | |
| Proceeds from shares subscribed – Investor Class | | | 27,141,120 | | | | 47,357,112 | |
| Proceeds from shares subscribed – Institutional Class | | | 29,423,854 | | | | 91,140,382 | |
| Dividends reinvested – Investor Class | | | 83,615,102 | | | | 27,211,310 | |
| Dividends reinvested – Institutional Class | | | 9,491,172 | | | | 2,284,927 | |
| Cost of shares redeemed – Investor Class | | | (198,693,830 | ) | | | (483,654,388 | ) |
| Cost of shares redeemed – Institutional Class | | | (42,887,435 | ) | | | (64,094,803 | ) |
| Net decrease in net assets derived | | | | | | | | |
| from capital share transactions | | | (91,910,017 | ) | | | (379,755,460 | ) |
| TOTAL DECREASE IN NET ASSETS | | | (61,645,422 | ) | | | (458,386,421 | ) |
| | | | | | | | | |
| NET ASSETS: | | | | | | | | |
| Beginning of year | | | 932,935,111 | | | | 1,391,321,532 | |
| End of year | | $ | 871,289,689 | | | $ | 932,935,111 | |
| | | | | | | | | |
| CHANGES IN SHARES OUTSTANDING: | | | | | | | | |
| Shares sold – Investor Class | | | 951,713 | | | | 1,647,747 | |
| Shares sold – Institutional Class | | | 1,020,364 | | | | 3,149,149 | |
| Shares issued to holders as reinvestment | | | | | | | | |
| of dividends – Investor Class | | | 3,050,796 | | | | 938,546 | |
| Shares issued to holders as reinvestment | | | | | | | | |
| of dividends – Institutional Class | | | 346,698 | | | | 79,037 | |
| Shares redeemed – Investor Class | | | (6,995,506 | ) | | | (16,873,463 | ) |
| Shares redeemed – Institutional Class | | | (1,502,291 | ) | | | (2,258,650 | ) |
| Net decrease in shares outstanding | | | (3,128,226 | ) | | | (13,317,634 | ) |
The accompanying notes are an integral part of these financial statements.
| HENNESSY FUNDS | 1-800-966-4354 | |
Financial Statements
For an Investor Class share outstanding throughout each year
PER SHARE DATA:
Net asset value, beginning of year
Income from investment operations:
Net investment income
Net realized and unrealized gains (losses) on investments
Total from investment operations
Less distributions:
Dividends from net investment income
Dividends from net realized gains
Total distributions
Net asset value, end of year
TOTAL RETURN
SUPPLEMENTAL DATA AND RATIOS:
Net assets, end of year (millions)
Ratio of expenses to average net assets
Ratio of net investment income to average net assets
Portfolio turnover rate(2)
(1) | Calculated using the average shares outstanding method. |
(2) | Calculated on the basis of the Fund as a whole. |
The accompanying notes are an integral part of these financial statements.
| FINANCIAL HIGHLIGHTS — INVESTOR CLASS |
| Year Ended October 31, | |
| 2019 | | | 2018 | | | 2017 | | | 2016 | | | 2015 | |
| | | | | | | | | | | | | | |
| $ | 28.68 | | | $ | 30.35 | | | $ | 28.57 | | | $ | 27.69 | | | $ | 31.30 | |
| | | | | | | | | | | | | | | | | | | |
| | | | | | | | | | | | | | | | | | | |
| | 0.56 | (1) | | | 0.65 | | | | 0.70 | | | | 0.62 | | | | 0.69 | |
| | 3.50 | | | | (1.52 | ) | | | 2.20 | | | | 1.58 | | | | (2.69 | ) |
| | 4.06 | | | | (0.87 | ) | | | 2.90 | | | | 2.20 | | | | (2.00 | ) |
| | | | | | | | | | | | | | | | | | | |
| | | | | | | | | | | | | | | | | | | |
| | (0.62 | ) | | | (0.64 | ) | | | (0.72 | ) | | | (0.69 | ) | | | (0.70 | ) |
| | (2.48 | ) | | | (0.16 | ) | | | (0.40 | ) | | | (0.63 | ) | | | (0.91 | ) |
| | (3.10 | ) | | | (0.80 | ) | | | (1.12 | ) | | | (1.32 | ) | | | (1.61 | ) |
| $ | 29.64 | | | $ | 28.68 | | | $ | 30.35 | | | $ | 28.57 | | | $ | 27.69 | |
| | | | | | | | | | | | | | | | | | | |
| | 15.28 | % | | | (2.86 | )% | | | 10.39 | % | | | 8.52 | % | | | (6.59 | )% |
| | | | | | | | | | | | | | | | | | | |
| | | | | | | | | | | | | | | | | | | |
| $ | 764.10 | | | $ | 825.18 | | | $ | 1,306.70 | | | $ | 1,454.93 | | | $ | 1,649.21 | |
| | 1.00 | % | | | 1.01 | % | | | 1.01 | % | | | 1.01 | % | | | 0.93 | % |
| | 1.98 | % | | | 2.18 | % | | | 2.34 | % | | | 2.25 | % | | | 2.33 | % |
| | 12 | % | | | 14 | % | | | 18 | % | | | 38 | % | | | 37 | % |
The accompanying notes are an integral part of these financial statements.
| HENNESSY FUNDS | 1-800-966-4354 | |
Financial Statements
For an Institutional Class share outstanding throughout each period
| | | Year Ended October 31, | | | Period Ended | |
| | | 2019 | | | 2018 | | | October 31, 2017(1) | |
| PER SHARE DATA: | | | | | | | | | |
| Net asset value, beginning of period | | $ | 28.65 | | | $ | 30.32 | | | $ | 29.68 | |
| | | | | | | | | | | | | |
| Income from investment operations: | | | | | | | | | | | | |
| Net investment income | | | 0.64 | (2) | | | 0.71 | | | | 0.62 | |
| Net realized and unrealized | | | | | | | | | | | | |
| gains (losses) on investments | | | 3.50 | | | | (1.47 | ) | | | 0.72 | |
| Total from investment operations | | | 4.14 | | | | (0.76 | ) | | | 1.34 | |
| | | | | | | | | | | | | |
| Less distributions: | | | | | | | | | | | | |
| Dividends from net investment income | | | (0.73 | ) | | | (0.75 | ) | | | (0.70 | ) |
| Dividends from net realized gains | | | (2.50 | ) | | | (0.16 | ) | | | — | |
| Total distributions | | | (3.23 | ) | | | (0.91 | ) | | | (0.70 | ) |
| Net asset value, end of period | | $ | 29.56 | | | $ | 28.65 | | | $ | 30.32 | |
| | | | | | | | | | | | | |
| TOTAL RETURN | | | 15.63 | % | | | (2.51 | )% | | | 4.56 | %(3)(4) |
| | | | | | | | | | | | | |
| SUPPLEMENTAL DATA AND RATIOS: | | | | | | | | | | | | |
| Net assets, end of period (millions) | | $ | 107.18 | | | $ | 107.75 | | | $ | 84.62 | |
| Ratio of expenses to average net assets | | | 0.69 | % | | | 0.65 | % | | | 0.64 | %(5) |
| Ratio of net investment income | | | | | | | | | | | | |
| to average net assets | | | 2.25 | % | | | 2.47 | % | | | 1.23 | %(5) |
Portfolio turnover rate(6) | | | 12 | % | | | 14 | % | | | 18 | %(4) |
(1) | Institutional Class shares commenced operations on March 1, 2017. |
(2) | Calculated using the average shares outstanding method. |
(3) | Actual return from inception date of March 1, 2017, to the year end of October 31, 2017. |
(4) | Not annualized. |
(5) | Annualized. |
(6) | Calculated on the basis of the Fund as a whole. |
The accompanying notes are an integral part of these financial statements.
| FINANCIAL HIGHLIGHTS — INSTITUTIONAL CLASS/NOTES TO THE FINANCIAL STATEMENTS |
Financial Statements
Notes to the Financial Statements October 31, 2019 |
1). ORGANIZATION
The Hennessy Gas Utility Fund (the “Fund”) is a series of Hennessy Funds Trust (the “Trust”), which was organized as a Delaware statutory trust on September 17, 1992. The Fund is an open-end management investment company registered under the Investment Company Act of 1940, as amended. The investment objective of the Fund is income and capital appreciation. The Fund is a diversified fund.
The Fund offers Investor Class and Institutional Class shares. Each class of shares differs principally in its respective 12b-1 distribution and service, shareholder servicing, and sub-transfer agent expenses. There are no sales charges. Each class has identical rights to earnings, assets, and voting privileges, except for class-specific expenses and exclusive rights to vote on matters affecting only one class.
As an investment company, the Fund follows the investment company accounting and reporting guidance of the Financial Accounting Standards Board (“FASB”) Accounting Standard Codification Topic 946 “Financial Services—Investment Companies.”
2). SIGNIFICANT ACCOUNTING POLICIES
The following is a summary of significant accounting policies consistently followed by the Fund in the preparation of the financial statements. These policies conform to U.S. generally accepted accounting principles (“GAAP”).
| a). | Securities Valuation – All investments in securities are recorded at their estimated fair value, as described in Note 3. |
| | |
| b). | Federal Income Taxes – No provision for federal income taxes or excise taxes has been made because the Fund has elected to be taxed as a regulated investment company and intends to distribute substantially all of its taxable income to its shareholders and otherwise comply with the provisions of the Internal Revenue Code of 1986, as amended, applicable to regulated investment companies. Net investment income/loss and realized gains/losses for federal income tax purposes may differ from those reported in the financial statements because of temporary book and tax basis differences. Temporary differences are primarily the result of the treatment of wash sales for tax reporting purposes. The Fund recognizes interest and penalties related to income tax benefits, if any, in the Statement of Operations as an income tax expense. Distributions from net realized gains for book purposes may include short-term capital gains, which are included as ordinary income to shareholders for tax purposes. The Fund may utilize equalization accounting for tax purposes and designate earnings and profits, including net realized gains distributed to shareholders on redemption of shares, as part of the dividends paid deduction for income tax purposes. |
| | |
| | Due to inherent differences in the recognition of income, expenses, and realized gains/losses under GAAP and federal income tax regulations, permanent differences between book and tax basis for reporting for fiscal year 2019 have been identified and appropriately reclassified in the Statement of Assets and Liabilities. The adjustments are as follows: |
| Total | |
| Distributable | |
Earnings | Capital Stock |
| $(9,204,326) | $9,204,326 |
| HENNESSY FUNDS | 1-800-966-4354 | |
| c). | Accounting for Uncertainty in Income Taxes – The Fund has accounting policies regarding recognition and measurement of tax positions taken or expected to be taken on a tax return. The tax returns of the Fund for the prior three fiscal years are open for examination. The Fund has reviewed all open tax years in major jurisdictions and concluded that there is no impact on the Fund’s net assets and no tax liability resulting from unrecognized tax benefits relating to uncertain income tax positions taken or expected to be taken on a tax return. The Fund’s major tax jurisdictions are U.S. federal and Delaware. |
| | |
| d). | Income and Expenses – Dividend income is recognized on the ex-dividend date or as soon as information is available to the Fund. Interest income, which includes the amortization of premium and accretion of discount, is recognized on an accrual basis. Other non-cash dividends are recognized as investment income at the fair value of the property received. The Fund is charged for those expenses that are directly attributable to its portfolio, such as advisory, administration, and certain shareholder service fees. Income, expenses (other than expenses attributable to a specific class), and realized and unrealized gains/losses on investments are allocated to each class of shares based on such class’s net assets. |
| | |
| e). | Distributions to Shareholders – Dividends from net investment income for the Fund, if any, are declared and paid at the end of each calendar quarter. Distributions of net realized capital gains, if any, are declared and paid annually, usually in December. |
| | |
| f). | Security Transactions – Investment and shareholder transactions are recorded on the trade date. The Fund determines the realized gain/loss from an investment transaction by comparing the original cost of the security lot sold with the net sale proceeds. Discounts and premiums on securities purchased are accreted or amortized, respectively, over the life of each such security. |
| | |
| g). | Use of Estimates – The preparation of financial statements in conformity with GAAP requires management to make estimates and assumptions that affect the reported amounts of assets and liabilities and disclosure of contingent assets and liabilities at the date of the financial statements and the reported change in net assets during the reporting period. Actual results could differ from those estimates. |
| | |
| h). | Share Valuation – The net asset value (“NAV”) per share of the Fund is calculated by dividing (i) the total value of the securities held by the Fund, plus cash and other assets, minus all liabilities (including estimated accrued expenses) by (ii) the total number of shares outstanding for the Fund, rounded to the nearest $0.01. The Fund’s shares will not be priced on days the New York Stock Exchange is closed for trading. The offering and redemption price per share for the Fund is equal to the Fund’s NAV per share. |
| | |
| i). | New Accounting Pronouncements – In August 2018, the FASB issued Accounting Standards Update No. 2018-13 “Disclosure Framework—Changes to the Disclosure Requirements for Fair Value Measurement” (“ASU 2018-13”). ASU 2018-13 eliminates the requirement to disclose the amount of and reasons for transfers between Level 1 and Level 2 of the fair value hierarchy, the timing of transfers between levels of the fair value hierarchy, and the valuation processes for Level 3 fair value measurements. ASU 2018-13 does not eliminate the requirement to disclose the range and weighted average used to develop significant unobservable inputs for Level 3 fair value measurements, and the changes in unrealized gains and losses for recurring Level 3 fair value measurements. ASU 2018-13 requires that information is provided about the measurement uncertainty of Level 3 fair value measurements as of the reporting date. The guidance is effective for fiscal years beginning after |
| NOTES TO THE FINANCIAL STATEMENTS |
| | December 15, 2019, and interim periods within those fiscal years. Management has evaluated the impact of this change in guidance and, due to the permissibility of early adoption, modified the Fund’s fair value disclosures for the current reporting period. |
3). SECURITIES VALUATION
The Fund follows fair value accounting standards that establish an authoritative definition of fair value and set out a hierarchy for measuring fair value. These standards require additional disclosures about the various inputs and valuation techniques used to develop the measurements of fair value and a discussion of changes in valuation techniques and related inputs during the period. These inputs are summarized in the three broad levels listed below:
| | Level 1 – | Unadjusted, quoted prices in active markets for identical instruments that the Fund has the ability to access at the date of measurement. |
| | | |
| | Level 2 – | Other significant observable inputs (including, but not limited to, quoted prices in active markets for similar instruments, quoted prices in markets that are not active for identical or similar instruments, and model-derived valuations in which all significant inputs and significant value drivers are observable in active markets, such as interest rates, prepayment speeds, credit risk curves, default rates, and similar data). |
| | | |
| | Level 3 – | Significant unobservable inputs (including the Fund’s own assumptions about what market participants would use to price the asset or liability based on the best available information) when observable inputs are unavailable. |
The following is a description of the valuation techniques applied to the Fund’s major categories of assets and liabilities measured at fair value on a recurring basis:
| | Equity Securities – Equity securities, including common stocks, preferred stocks, foreign-issued common stocks, exchange-traded funds, closed-end mutual funds, partnerships, rights, and real estate investment trusts, that are traded on a securities exchange for which a last-quoted sales price is readily available will generally be valued at the last sales price as reported by the primary exchange on which the securities are listed. Securities listed on The NASDAQ Stock Market (“NASDAQ”) will generally be valued at the NASDAQ Official Closing Price, which may differ from the last sales price reported. Securities traded on a securities exchange for which a last-quoted sales price is not readily available will generally be valued at the mean between the bid and ask prices. To the extent these securities are actively traded and valuation adjustments are not applied, they are classified in Level 1 of the fair value hierarchy. Securities traded on foreign exchanges generally are not valued at the same time the Fund calculates its NAV because most foreign markets close well before such time. The earlier close of most foreign markets gives rise to the possibility that significant events, including broad market moves, may have occurred in the interim. In certain circumstances, it may be determined that a foreign security needs to be fair valued because it appears that the value of the security might have been materially affected by events occurring after the close of the market in which the security is principally traded, but before the time the Fund calculates its NAV, such as by a development that affects an entire market or region (e.g., a weather-related event) or a potentially global development (e.g., a terrorist attack that may be expected to have an effect on investor expectations worldwide). |
| | |
| | Registered Investment Companies – Investments in open-end registered investment companies, commonly referred to as mutual funds, generally are priced at the ending NAV provided by the applicable mutual fund’s service agent and will be classified in Level 1 of the fair value hierarchy. |
| HENNESSY FUNDS | 1-800-966-4354 | |
| | Debt Securities – Debt securities, including corporate bonds, asset-backed securities, mortgage-backed securities, municipal bonds, U.S. Treasuries, and U.S. government agency issues, are generally valued at market on the basis of valuations furnished by an independent pricing service that utilizes both dealer-supplied valuations and formula-based techniques. The pricing service may consider recently executed transactions in securities of the issuer or comparable issuers, market price quotations (where observable), bond spreads, and fundamental data relating to the issuer. In addition, the model may incorporate observable market data, such as reported sales of similar securities, broker quotes, yields, bids, offers, and reference data. Certain securities are valued primarily using dealer quotations. These securities are generally classified in Level 2 of the fair value hierarchy. |
| | |
| | Short-Term Securities – Short-term equity investments, including money market funds, are valued in the manner specified above. Short-term debt investments with an original term to maturity of 60 days or less are valued at amortized cost, which approximates fair market value. If the original term to maturity of a short-term debt investment exceeded 60 days, then the values as of the 61st day prior to maturity are amortized. Amortized cost is not used if its use would be inappropriate due to credit or other impairments of the issuer, in which case the security’s fair value would be determined, as described below. Short-term securities are generally classified in Level 1 or Level 2 of the fair value hierarchy depending on the inputs used and market activity levels for specific securities. |
The Board of Trustees of the Fund (the “Board”) has adopted fair value pricing procedures that are followed when a price for a security is not readily available or if a significant event has occurred that indicates the closing price of a security no longer represents the true value of that security. Fair value pricing determinations are made in good faith in accordance with these procedures. There are numerous criteria that will be given consideration in determining a fair value of a security, such as the trading volume of a security and markets, the values of other similar securities, and news events with direct bearing on a security or markets. Fair value pricing results in an estimated price for a security that reflects the amount the Fund might reasonably expect to receive in a current sale. Depending on the relative significance of the valuation inputs, these securities may be classified in either Level 2 or Level 3 of the fair value hierarchy.
The fair value of foreign securities may be determined with the assistance of a pricing service using correlations between the movement of prices of such securities and indices of domestic securities and other appropriate indicators, such as closing market prices of relevant American Depositary Receipts or futures contracts. The effect of using fair value pricing is that the Fund’s NAV will reflect the affected portfolio securities’ values as determined by the Board or its designee, pursuant to the fair value pricing procedures adopted by the Board, instead of being determined by the market. Using a fair value pricing methodology to price a foreign security may result in a value that is different from such foreign security’s most recent closing price and from the value used by other investment companies to calculate their NAVs. Such securities are generally classified in Level 2 of the fair value hierarchy. Because the Fund may invest in foreign securities, the value of the Fund’s portfolio securities may change on days when you will not be able to purchase or redeem your shares.
The Board has delegated day-to-day valuation matters to the Valuation and Liquidity Committee comprising representatives from Hennessy Advisors, Inc., the Fund’s investment advisor (the “Advisor”). The function of the Valuation and Liquidity Committee is to value securities where current and reliable market quotations are not readily available. All actions taken by the Valuation and Liquidity Committee are reviewed by the Board.
| NOTES TO THE FINANCIAL STATEMENTS |
The Fund has performed an analysis of all existing investments to determine the significance and character of all inputs to their fair value determinations. Various inputs are used to determine the value of the Fund’s investments. The inputs or methodology used for valuing securities are not necessarily an indication of the risk associated with investing in those securities. Details related to the fair value hierarchy of the Fund’s securities as of October 31, 2019, are included in the Schedule of Investments.
4). INVESTMENT TRANSACTIONS
Purchases and sales of investment securities (excluding government and short-term investments) for the Fund during fiscal year 2019 were $110,255,215 and $275,674,855, respectively.
There were no purchases or sales/maturities of long-term U.S. government securities for the Fund during fiscal year 2019.
The Fund is permitted to purchase or sell securities from or to another fund in the Hennessy Funds family of funds (collectively, the “Hennessy Funds”) under specified conditions outlined in procedures adopted by the Board. The procedures have been designed to ensure that any purchase or sale of securities by the Fund from or to another Hennessy Fund complies with Rule 17a-7 of the Investment Company Act of 1940, as amended. During fiscal year 2019, the Fund did not engage in purchases or sales of securities pursuant to Rule 17a-7 of the Investment Company Act of 1940, as amended.
5). INVESTMENT ADVISORY FEE AND OTHER TRANSACTIONS WITH AFFILIATES
The Advisor provides the Fund with investment advisory services under an Investment Advisory Agreement. The Advisor furnishes all investment advice, office space, and facilities and most of the personnel needed by the Fund. As compensation for its services, the Advisor is entitled to a monthly fee from the Fund. The fee is based on the average daily net assets of the Fund at an annual rate of 0.40%. The net investment advisory fees expensed by the Fund during fiscal year 2019 are included in the Statement of Operations.
The Board has approved a Shareholder Servicing Agreement for Investor Class shares of the Fund, which was instituted to compensate the Advisor for the non-investment advisory services it provides to the Fund. The Shareholder Servicing Agreement provides for a monthly fee paid to the Advisor at an annual rate of 0.10% of the average daily net assets of the Fund attributable to Investor Class shares. The shareholder service fees expensed by the Fund during fiscal year 2019 are included in the Statement of Operations.
The Fund has adopted a plan pursuant to Rule 12b-1 under the Investment Company Act of 1940, as amended, that authorizes payments in connection with the distribution of the Fund’s shares at an annual rate of up to 0.25% of the Fund’s average daily net assets attributable to Investor Class shares. Even though the authorized rate is up to 0.25%, the Fund is currently only using up to 0.15% of its average daily net assets attributable to Investor Class shares for such purpose. Amounts paid under the plan may be spent on any activities or expenses primarily intended to result in the sale of shares, including, but not limited to, advertising, shareholder account servicing, printing and mailing of prospectuses to other than current shareholders, printing and mailing of sales literature, and compensation for sales and marketing activities or to financial institutions and others, such as dealers and distributors. The distribution fees expensed by the Fund during fiscal year 2019 are included in the Statement of Operations.
The Fund has entered into agreements with various brokers, dealers, and financial intermediaries in connection with the sale of shares of the Fund. The agreements provide for periodic payments of sub-transfer agent expenses by the Fund to the brokers, dealers, and financial intermediaries for providing certain shareholder maintenance services. These
| HENNESSY FUNDS | 1-800-966-4354 | |
shareholder services include the pre-processing and quality control of new accounts, shareholder correspondence, answering customer inquiries regarding account status, and facilitating shareholder telephone transactions. The sub-transfer agent fees expensed by the Fund during fiscal year 2019 are included in the Statement of Operations.
The Fund has entered into an Administrative Services Agreement among the Fund, the Advisor, and the American Gas Association (“AGA”), pursuant to which the AGA provides administrative services to the Fund, including overseeing the calculation of the AGA Stock Index. ScottMadden, Inc. performs the actual computations required to produce the AGA Stock Index and receives a fee for such calculations pursuant to a contractual arrangement with AGA. AGA does not furnish other securities advice to the Fund or the Advisor or make recommendations regarding the purchase or sale of securities by the Fund. Under the terms of the Administrative Services Agreement, which has been approved by the Board, AGA provides the Fund with current information regarding the common stock composition of the AGA Stock Index at least monthly. In addition, on request, AGA provides the Fund and the Advisor with information on the natural gas industry. The Fund pays AGA a fee at an annual rate of 0.04% of the average daily net assets of the Fund.
U.S. Bancorp Fund Services, LLC, d/b/a U.S. Bank Global Fund Services (“Fund Services”) provides the Fund with administrative, accounting, and transfer agent services. As administrator, Fund Services is responsible for activities such as (i) preparing various federal and state regulatory filings, reports, and returns for the Fund, (ii) preparing reports and materials to be supplied to the Board, (iii) monitoring the activities of the Fund’s custodian, transfer agent, and accountants, and (iv) coordinating the preparation and payment of the Fund’s expenses and reviewing the Fund’s expense accruals. U.S. Bank N.A., an affiliate of Fund Services, serves as the Fund’s custodian. The servicing agreements between the Trust and Fund Services and U.S. Bank N.A. contain a fee schedule that is inclusive of administrative, accounting, custody, and transfer agent fees. The administrative, accounting, custody, and transfer agent fees expensed by the Fund during fiscal year 2019 are included in the Statement of Operations.
Quasar Distributors, LLC (“Quasar”) acts as the Fund’s principal underwriter in a continuous public offering of the Fund’s shares. Quasar is an affiliate of Fund Services and U.S. Bank N.A.
The officers of the Fund are affiliated with the Advisor. With the exception of the Chief Compliance Officer and the Senior Compliance Officer, such officers receive no compensation from the Fund for serving in their respective roles. The Fund, along with the other Hennessy Funds, makes reimbursement payments on an equal basis to the Advisor for a portion of the salary and benefits associated with the office of the Chief Compliance Officer and for all of the salary and benefits associated with the office of the Senior Compliance Officer. The compliance fees expensed by the Fund during fiscal year 2019 are included in the Statement of Operations.
6). GUARANTEES AND INDEMNIFICATIONS
Under the Hennessy Funds’ organizational documents, their officers and trustees are indemnified by the Hennessy Funds against certain liabilities arising out of the performance of their duties to the Hennessy Funds. Additionally, in the normal course of business, the Hennessy Funds enter into contracts with service providers that contain general indemnification clauses. The Fund’s maximum exposure under these arrangements is unknown as this would involve future claims that may be made against the Fund that have not yet occurred. Currently, the Fund expects the risk of loss to be remote.
| NOTES TO THE FINANCIAL STATEMENTS |
7). LINE OF CREDIT
The Fund has an uncommitted line of credit with the other Hennessy Funds in the amount of the lesser of (i) $100,000,000 or (ii) 33.33% of each Hennessy Fund’s net assets, or 30% for the Fund and 10% for the Hennessy Balanced Fund, intended to provide short-term financing, if necessary, subject to certain restrictions, in connection with shareholder redemptions. The credit facility is with the Hennessy Funds’ custodian bank, U.S. Bank N.A. Borrowings under this arrangement bear interest at the bank’s prime rate and are secured by all of the Fund’s assets (as to its own borrowings only). During fiscal year 2019, the Fund had an outstanding average daily balance and a weighted average interest rate of $47,025 and 5.25%, respectively. The interest expensed by the Fund during fiscal year 2019 is included in the Statement of Operations. The maximum amount outstanding for the Fund during fiscal year 2019 was $7,401,000. As of October 31, 2019, the Fund did not have any borrowings outstanding under the line of credit.
8). FEDERAL TAX INFORMATION
As of October 31, 2019, the components of accumulated earnings (losses) for income tax purposes were as follows:
| | | Investments | |
| Cost of investments for tax purposes | | $ | 524,740,694 | |
| Gross tax unrealized appreciation | | $ | 421,155,305 | |
| Gross tax unrealized depreciation | | | (74,581,422 | ) |
| Net tax unrealized appreciation/(depreciation) | | $ | 346,573,883 | |
| Undistributed ordinary income | | $ | — | |
| Undistributed long-term capital gains | | | 41,637,055 | |
| Total distributable earnings | | $ | 41,637,055 | |
| Other accumulated gain/(loss) | | $ | — | |
| Total accumulated gain/(loss) | | $ | 388,210,938 | |
The difference between book-basis unrealized appreciation/depreciation and tax-basis unrealized appreciation/depreciation (as shown above) is attributable primarily to wash sales.
As of October 31, 2019, the Fund had no tax basis capital losses to offset future capital gains.
As of October 31, 2019, the Fund did not defer, on a tax basis, any late-year ordinary losses. Late-year ordinary losses are net ordinary losses incurred after December 31, 2018, but within the taxable year, that are deemed to arise on the first day of the Fund’s next taxable year.
During fiscal year 2019 and fiscal year 2018, the tax character of distributions paid by the Fund was as follows:
| | | Year Ended | | | Year Ended | |
| | | October 31, 2019 | | | October 31, 2018 | |
Ordinary income(1) | | $ | 18,139,310 | | | $ | 27,292,416 | |
| Long-term capital gain | | | 79,849,801 | | | | 4,143,168 | |
| | | $ | 97,989,111 | | | $ | 31,435,584 | |
| | (1) Ordinary income includes short-term capital gain. |
| HENNESSY FUNDS | 1-800-966-4354 | |
9). EVENTS SUBSEQUENT TO YEAR END
Management has evaluated the Fund’s related events and transactions that occurred subsequent to October 31, 2019, through the date of issuance of the Fund’s financial statements. Other than as disclosed below, management has determined that there were no subsequent events requiring recognition or disclosure in the financial statements.
On November 25, 2019, U.S. Bancorp, the parent company of Quasar, announced that it had signed a purchase agreement to sell Quasar to Foreside Financial Group, LLC, such that Quasar will become a wholly-owned broker-dealer subsidiary of Foreside. The transaction is expected to close by the end of March 2020. Quasar will remain the Fund’s distributor at the close of the transaction, subject to Board approval.
On December 6, 2019, capital gains were declared and paid to shareholders of record on December 5, 2019, as follows:
| | | Long-term | |
| | Investor Class | $1.44077 | |
| | Institutional Class | $1.43757 | |
| NOTES/REPORT OF INDEPENDENT REGISTERED PUBLIC ACCOUNTING FIRM |
Report of Independent Registered Public
Accounting Firm
To the Board of Trustees of Hennessy Funds Trust
and the shareholders of the Hennessy Gas Utility Fund
Novato, CA
Opinion on the Financial Statements
We have audited the accompanying statement of assets and liabilities of the Hennessy Gas Utility Fund (the “Fund”), a series of Hennessy Funds Trust, including the schedule of investments, as of October 31, 2019, the related statement of operations for the year then ended, the statements of changes in net assets for each of the two years in the period then ended, the financial highlights for each of the five years in the period then ended, and the related notes (collectively referred to as the “financial statements”). In our opinion, the financial statements present fairly, in all material respects, the financial position of the Fund as of October 31, 2019, the results of its operations for the year then ended, the changes in its net assets for each of the two years in the period then ended, and the financial highlights for each of the five years in the period then ended in conformity with accounting principles generally accepted in the United States of America.
Basis for Opinion
These financial statements are the responsibility of the Fund’s management. Our responsibility is to express an opinion on the Fund’s financial statements based on our audits. We are a public accounting firm registered with the Public Company Accounting Oversight Board (United States) (“PCAOB”) and are required to be independent with respect to the Fund in accordance with the U.S. federal securities laws and the applicable rules and regulations of the Securities and Exchange Commission and the PCAOB. We have served as the auditor of one or more of the funds in the Trust since 2002.
We conducted our audits in accordance with the standards of the PCAOB. Those standards require that we plan and perform the audit to obtain reasonable assurance about whether the financial statements are free of material misstatement, whether due to error or fraud. The Fund is not required to have, nor were we engaged to perform, an audit of its internal control over financial reporting. As part of our audits we are required to obtain an understanding of internal control over financial reporting, but not for the purpose of expressing an opinion on the effectiveness of the Fund’s internal control over financial reporting. Accordingly, we express no such opinion.
Our audits included performing procedures to assess the risks of material misstatement of the financial statements, whether due to error or fraud, and performing procedures that respond to those risks. Such procedures included examining, on a test basis, evidence regarding the amounts and disclosures in the financial statements. Our audits also included evaluating the accounting principles used and significant estimates made by management, as well as evaluating the overall presentation of the financial statements. Our procedures included confirmation of securities owned as of October 31, 2019, by correspondence with the custodian. We believe that our audits provide a reasonable basis for our opinion.
| |  |
| | TAIT, WELLER & BAKER LLP |
Philadelphia, Pennsylvania
December 24, 2019
| HENNESSY FUNDS | 1-800-966-4354 | |
Trustees and Officers of the Fund (Unaudited)
The business and affairs of the Funds are managed under the direction of the Board of Trustees of the Trust, and the Board of Trustees elects the officers of the Trust. From time to time, the Board of Trustees also has appointed advisers to the Board of Trustees (“Advisers”) with the intention of having qualified individuals serve in an advisory capacity in order to garner experience in the mutual fund and asset management industry and be considered as potential Trustees in the future. There are currently three Advisers: Brian Alexander, Doug Franklin, and Claire Knoles. As Advisers, Mr. Alexander, Mr. Franklin, and Ms. Knoles attend meetings of the Board of Trustees and act as non-voting participants. Information pertaining to the Trustees, Advisers, and the officers of the Trust is set forth below. The Trustees and officers serve until their successors are duly elected and qualified or until their earlier death, resignation, or removal. Each Trustee oversees the 16 Hennessy Funds. Unless otherwise indicated, the address of all persons listed below is 7250 Redwood Boulevard, Suite 200, Novato, CA 94945. The Fund’s Statement of Additional Information includes more information about the persons listed below and is available without charge by calling 1-800-966-4354 or by visiting www.hennessyfunds.com.
| | | | Other |
| | | | Directorships |
| | | | Held Outside |
| Name, (Year of Birth), | | | of Fund |
| and Position Held | Start Date | Principal Occupation(s) | Complex During |
with the Trust | of Service | During Past Five Years | Past Five Years |
| | | | |
| Disinterested Trustees and Advisers | | | |
| | | | |
| J. Dennis DeSousa | January 1996 | Mr. DeSousa is a real estate investor. | None. |
| (1936) | | | |
| Trustee | | | |
| | | | |
| Robert T. Doyle | January 1996 | Mr. Doyle has been the Sheriff of | None. |
| (1947) | | Marin County, California since 1996. | |
| Trustee | | | |
| | | | |
| Gerald P. Richardson | May 2004 | Mr. Richardson is an independent | None. |
| (1945) | | consultant in the securities industry. | |
| Trustee | | | |
| | | | |
| Brian Alexander | March 2015 | Mr. Alexander has worked for the | None. |
| (1981) | | Sutter Health organization since | |
| Adviser to the Board | | 2011 in various positions. He has | |
| | | served as the Chief Executive Officer | |
| | | of the Sutter Roseville Medical | |
| | | Center since 2018. From 2016 through | |
| | | 2018, he served as the Vice President | |
| | | of Strategy for the Sutter Health Valley | |
| | | Area, which includes 11 hospitals, | |
| | | 13 ambulatory surgery centers, | |
| | | 16,000 employees, and 1,900 physicians. | |
| | | From 2013 through 2016, Mr. Alexander | |
| | | served as Sutter Novato Community | |
| | | Hospital’s Chief Administrative Officer. | |
| TRUSTEES AND OFFICERS OF THE FUND |
| | | | Other |
| | | | Directorships |
| | | | Held Outside |
| Name, (Year of Birth), | | | of Fund |
| and Position Held | Start Date | Principal Occupation(s) | Complex During |
with the Trust | of Service | During Past Five Years | Past Five Years |
| | | | |
| Doug Franklin | March 2016 | Mr. Franklin is a retired insurance | None. |
| (1964) | | industry executive. From 1987 | |
| Adviser to the Board | | through 2015, he was employed | |
| | | by the Allianz-Fireman’s Fund | |
| | | Insurance Company in various | |
| | | positions, including as its Chief | |
| | | Actuary and Chief Risk Officer. | |
| | | | |
| Claire Knoles | December 2015 | Ms. Knoles is a founder of Kiosk and | None. |
| (1974) | | has served as its Chief Operating | |
| Adviser to the Board | | Officer since 2004. Kiosk is a full- | |
| | | service marketing agency with | |
| | | offices in the San Francisco Bay | |
| | | Area, Toronto, and Liverpool, UK. | |
| | | | |
Interested Trustee(1) | | | |
| | | | |
| Neil J. Hennessy | January 1996 as | Mr. Hennessy has been employed | Hennessy |
| (1956) | a Trustee and | by Hennessy Advisors, Inc. since | Advisors, Inc. |
| Trustee, Chairman of | June 2008 as | 1989 and currently serves as its | |
| the Board, Chief | an officer | Chairman and Chief Executive Officer. | |
| Investment Officer, | | | |
| Portfolio Manager, | | | |
| and President | | | |
| Name, (Year of Birth), | | |
| and Position Held | Start Date | Principal Occupation(s) |
with the Trust | of Service | During Past Five Years |
| | | |
| Officers | | |
| | | |
| Teresa M. Nilsen | January 1996 | Ms. Nilsen has been employed by Hennessy Advisors, Inc. |
| (1966) | | since 1989 and currently serves as its President, Chief Operating |
| Executive Vice President | | Officer, and Secretary. |
| and Treasurer | | |
| | | |
| Daniel B. Steadman | March 2000 | Mr. Steadman has been employed by Hennessy Advisors, Inc. |
| (1956) | | since 2000 and currently serves as its Executive Vice President. |
| Executive Vice President | | |
| and Secretary | | |
| | | |
| Brian Carlson | December 2013 | Mr. Carlson has been employed by Hennessy Advisors, Inc. |
| (1972) | | since December 2013 and currently serves as its Chief |
| Senior Vice President | | Compliance Officer and Senior Vice President. |
| and Head of Distribution | | |
| | | |
| Jennifer Cheskiewicz | June 2013 | Ms. Cheskiewicz has been employed by Hennessy Advisors, Inc. |
(1977)(2) | | as its General Counsel since June 2013. |
| Senior Vice President and | | |
| Chief Compliance Officer | | |
| HENNESSY FUNDS | 1-800-966-4354 | |
| Name, (Year of Birth), | | |
| and Position Held | Start Date | Principal Occupation(s) |
with the Trust | of Service | During Past Five Years |
| | | |
| David Ellison | October 2012 | Mr. Ellison has been employed by Hennessy Advisors, Inc. since |
(1958)(3) | | October 2012. He has served as a Portfolio Manager of the |
| Senior Vice President | | Hennessy Large Cap Financial Fund and the Hennessy Small |
| and Portfolio Manager | | Cap Financial Fund since their inception. Mr. Ellison also served |
| | | as a Portfolio Manager of the Hennessy Technology Fund from |
| | | its inception until February 2017. Mr. Ellison served as Director, |
| | | CIO and President of FBR Fund Advisers, Inc. from December |
| | | 1999 to October 2012. |
| | | |
| Ryan Kelley | March 2013 | Mr. Kelley has been employed by Hennessy Advisors, Inc. since |
(1972)(4) | | October 2012. He has served as a Portfolio Manager of the |
| Senior Vice President | | Hennessy Gas Utility Fund, the Hennessy Large Cap Financial |
| and Portfolio Manager | | Fund, and the Hennessy Small Cap Financial Fund since |
| | | October 2014. He served as Co- Portfolio Manager of these |
| | | same funds from March 2013 through September 2014 and as |
| | | a Portfolio Analyst for the Hennessy Funds from October 2012 |
| | | through February 2013. Mr. Kelley has also served as a Portfolio |
| | | Manager of the Hennessy Cornerstone Growth Fund, the |
| | | Hennessy Cornerstone Mid Cap 30 Fund, the Hennessy |
| | | Cornerstone Large Growth Fund, and the Hennessy |
| | | Cornerstone Value Fund since February 2017 and as a Portfolio |
| | | Manager of the Hennessy Total Return Fund, the Hennessy |
| | | Balanced Fund, and the Hennessy Technology Fund since May |
| | | 2018. He served as Co- Portfolio Manager of the Hennessy |
| | | Technology Fund from February 2017 until May 2018. Mr. Kelley |
| | | served as Portfolio Manager of FBR Fund Advisers, Inc. from |
| | | January 2008 to October 2012. |
| | | |
| Tania Kelley | October 2003 | Ms. Kelley has been employed by Hennessy Advisors, Inc. since |
| (1965) | | October 2003. |
| Senior Vice President | | |
| and Head of Marketing | | |
| | | |
| L. Joshua Wein | September 2018 | Mr. Wein has been employed by Hennessy Advisors, Inc. |
(1973)(4) | | since 2018. He has served as Co-Portfolio Manager of the |
| Vice President and | | Hennessy Cornerstone Growth Fund, the Hennessy |
| Co-Portfolio Manager | | Cornerstone Mid Cap 30 Fund, the Hennessy Cornerstone Large |
| | | Growth Fund, the Hennessy Cornerstone Value Fund, Hennessy |
| | | Total Return Fund, the Hennessy Balanced Fund, the Hennessy |
| | | Gas Utility Fund, and the Hennessy Technology Fund since |
| | | February 2019. Prior to that, he served as a Senior Analyst of |
| | | those same funds since September 2018. Mr. Wein served as |
| | | Director of Alternative Investments and Co-Portfolio Manager |
| | | at Sterling Capital Management from 2008 to 2018. |
_______________
(1) | Mr. Hennessy is considered an “interested person,” as defined in the Investment Company Act of 1940, as amended, because he is an officer of the Trust. |
(2) | The address of this officer is 4800 Bee Caves Road, Suite 100, Austin, TX 78746. |
(3) | The address of this officer is 101 Federal Street, Suite 1900, Boston, MA 02110. |
(4) | The address of this officer is 1340 Environ Way, Chapel Hill, NC 27517. |
| TRUSTEES AND OFFICERS OF THE FUND |
(This Page Intentionally Left Blank.)
| HENNESSY FUNDS | 1-800-966-4354 | |
Expense Example (Unaudited)
October 31, 2019
As a shareholder of the Fund, you incur ongoing costs, including management fees, service fees, and other Fund expenses. This Example is intended to help you understand your ongoing costs (in dollars) of investing in the Fund and to compare these costs with the ongoing costs of investing in other mutual funds. The Example is based on an investment of $1,000 invested at the beginning of the period and held for the entire period from May 1, 2019, through October 31, 2019.
Actual Expenses
The first line of the table below under the “Investor Class” and “Institutional Class” headings provides information about actual account values and actual expenses. Although the Fund charges no sales loads or transaction fees, you will be assessed fees for outgoing wire transfers, returned checks and stop payment orders at prevailing rates charged by U.S. Bank Global Fund Services, the Fund’s transfer agent. If you request that a redemption be made by wire transfer, currently a $15 fee is charged by the Fund’s transfer agent. IRA accounts will be charged a $15 annual maintenance fee. The example below includes, but is not limited to, management fees, shareholder servicing fees, accounting, custody, and transfer agent fees. However, the example below does not include portfolio trading commissions and related expenses. You may use the information in this line, together with the amount you invested, to estimate the expenses that you paid over the period. Simply divide your account value by $1,000 (for example, an $8,600 account value divided by $1,000 = 8.6), then multiply the result by the number in the first line of the table under the “Investor Class” or “Institutional Class” headings in the column entitled “Expenses Paid During Period” to estimate the expenses you paid on your account during this period.
Hypothetical Example for Comparison Purposes
The second line of the table below under the “Investor Class” and “Institutional Class” headings provides information about hypothetical account values and hypothetical expenses based on the Fund’s actual expense ratios and an assumed rate of return of 5% per year before expenses, which is not the Fund’s actual return. The hypothetical account values and expenses may not be used to estimate the actual ending account balance or expenses you paid for the period. You may use this information to compare the ongoing costs of investing in the Fund and other funds. To do so, compare this 5% hypothetical example with the 5% hypothetical examples that appear in the shareholder reports of the other funds. Please note that the expenses shown in the table are meant to highlight your ongoing costs only. Therefore, the second line of the table under the “Investor Class” and “Institutional Class” headings is useful in comparing ongoing costs only and will not help you determine the relative total costs of owning different funds.
| | | | Expenses Paid |
| | Beginning | Ending | During Period(1) |
| | Account Value | Account Value | May 1, 2019 – |
| | May 1, 2019 | October 31, 2019 | October 31, 2019 |
| Investor Class | | | |
| Actual | $1,000.00 | $1,035.40 | $5.03 |
| Hypothetical (5% return before expenses) | $1,000.00 | $1,020.26 | $5.00 |
| | | | |
| Institutional Class | | | |
| Actual | $1,000.00 | $1,036.60 | $3.79 |
| Hypothetical (5% return before expenses) | $1,000.00 | $1,021.48 | $3.77 |
(1) | Expenses are equal to the Fund’s annualized expense ratio of 0.98% for Investor Class shares or 0.74% for Institutional Class shares, as applicable, multiplied by the average account value over the period, multiplied by 184/365 days (to reflect one-half year period). |
| HENNESSY FUNDS | 1-800-966-4354 | |
How to Obtain a Copy of the Fund’s
Proxy Voting Policy and Proxy Voting Records
A description of the policies and procedures the Fund uses to determine how to vote proxies relating to portfolio securities is available without charge: (1) by calling 1-800-966-4354; (2) on the Hennessy Funds’ website at www.hennessyfunds.com/proxy-voting/voting-policy; or (3) on the U.S. Securities and Exchange Commission’s (the “SEC”) website at www.sec.gov. The Fund’s proxy voting record is available without charge on both the Hennessy Funds’ website at www.hennessyfunds.com/proxy-voting/voting-record and the SEC’s website at www.sec.gov no later than August 31 for the prior 12 months ending June 30.
Availability of Quarterly Portfolio Schedule
For periods ending on or prior to January 31, 2019, the Fund has filed a complete schedule of portfolio holdings with the SEC for the first and third quarters of each fiscal year on Form N-Q. For periods ending on or after April 30, 2019, the Fund files a complete schedule of portfolio holdings with the SEC for the first and third quarters of each fiscal year as an exhibit to its reports on Form N-PORT. The Fund’s Forms N-Q and Forms N-PORT are available on the SEC’s website at www.sec.gov or on request by calling 1-800-966-4354.
Federal Tax Distribution Information (Unaudited)
For fiscal year 2019, certain dividends paid by the Fund may be subject to a maximum tax rate of 23.8%, as provided for by the Jobs and Growth Tax Relief Reconciliation Act of 2003. The percentage of dividends declared from ordinary income designated as qualified dividend income was 100.00%.
For corporate shareholders, the percent of ordinary income distributions that qualified for the corporate dividends received deduction for fiscal year 2019 was 100.00%.
The percentage of taxable ordinary income distributions that were designated as short-term capital gain distributions under Section 871(k)(2)(C) of the Internal Revenue Code of 1986, as amended, for the Fund was 0.00%.
Important Notice Regarding Delivery
of Shareholder Documents
To help keep the Fund’s costs as low as possible, we generally deliver a single copy of shareholder reports, proxy statements, and prospectuses to shareholders who share an address and have the same last name. This process does not apply to account statements. You may request an individual copy of a shareholder document at any time. If you would like to receive separate mailings of shareholder documents, please call U.S. Bank Global Fund Services at 1-800-261-6950 or 1-414-765-4124, and individual delivery will begin within 30 days of your request. If your account is held through a financial institution or other intermediary, please contact such intermediary directly to request individual delivery.
Electronic Delivery
The Funds offer shareholders the option to receive account statements, Prospectuses, tax forms, and reports online. To sign up for eDelivery, please visit www.hennessyfunds.com. You may change your delivery preference at any time by visiting our website or contacting the Funds at 1-800-261-6950.
| PROXY VOTING — PRIVACY POLICY |
Privacy Policy
We collect the following non-public personal information about you:
| | • | information we receive from you on or in applications or other forms, correspondence, or conversations, including, but not limited to, your name, address, phone number, social security number, assets, income, and date of birth; and |
| | | |
| | • | information about your transactions with us, our affiliates, or others, including, but not limited to, your account number and balance, payment history, parties to transactions, cost basis information, and other financial information. |
We do not disclose any non-public personal information about our current or former shareholders to non-affiliated third parties, except as permitted by law. For example, we are permitted by law to disclose all of the information we collect, as described above, to our Transfer Agent to process your transactions. Furthermore, we restrict access to your non-public personal information to those persons who require such information to provide products or services to you. We maintain physical, electronic, and procedural safeguards that comply with federal standards to guard your non-public personal information.
In the event that you hold shares of the Fund through a financial intermediary, including, but not limited to, a broker-dealer, bank, or trust company, the privacy policy of your financial intermediary would govern how your non-public personal information will be shared with non-affiliated third parties.
| HENNESSY FUNDS | 1-800-966-4354 | |
For information, questions or assistance, please call
The Hennessy Funds
1-800-966-4354 or 1-415-899-1555
INVESTMENT ADVISOR
Hennessy Advisors, Inc.
7250 Redwood Boulevard, Suite 200
Novato, California 94945
ADMINISTRATOR,
TRANSFER AGENT,
DIVIDEND PAYING AGENT, &
SHAREHOLDER SERVICING AGENT
U.S. Bancorp Fund Services, LLC
d/b/a U.S. Bank Global Fund Services
P.O. Box 701
Milwaukee, Wisconsin 53201-0701
CUSTODIAN
U.S. Bank N.A.
Custody Operations
1555 North River Center Drive, Suite 302
Milwaukee, Wisconsin 53212
TRUSTEES
Neil J. Hennessy
Robert T. Doyle
J. Dennis DeSousa
Gerald P. Richardson
COUNSEL
Foley & Lardner LLP
777 East Wisconsin Avenue
Milwaukee, Wisconsin 53202-5306
INDEPENDENT REGISTERED
PUBLIC ACCOUNTING FIRM
Tait, Weller & Baker LLP
Two Liberty Place
50 South 16th Street, Suite 2900
Philadelphia, Pennsylvania 19103-2529
DISTRIBUTOR
Quasar Distributors, LLC
777 East Wisconsin Avenue
Milwaukee, Wisconsin 53202
www.hennessyfunds.com | 1-800-966-4354
This report has been prepared for shareholders and may be distributed to
others only if preceded or accompanied by a current prospectus.
ANNUAL REPORT
OCTOBER 31, 2019
HENNESSY JAPAN FUND
Investor Class HJPNX
Institutional Class HJPIX
IMPORTANT NOTICE REGARDING ELECTRONIC DELIVERY OF SHAREHOLDER REPORTS
Beginning on January 1, 2021, as permitted by regulations adopted by the Securities and Exchange Commission, paper copies of the annual and semi-annual reports will no longer be sent by mail unless you specifically request paper copies from the Hennessy Funds or from your financial intermediary. Instead, the reports will be made available on a website, and you will be notified by mail each time a report is posted and provided with a website link to access the report.
If you have already elected to receive shareholder reports electronically, you will not be affected by this change and you need not take any action. You may elect to receive shareholder reports and other communications from the Hennessy Funds electronically by visiting www.hennessyfunds.com/account or by calling U.S. Bank Global Fund Services at 1-800-261-6950. If you own shares in a Fund through a financial intermediary, please contact your financial intermediary to make this election.
You may elect to receive paper copies of all future reports free of charge by calling U.S. Bank Global Fund Services at 1-800-261-6950 or, if you own your shares through a financial intermediary, by contacting your financial intermediary. Your election to receive paper copies of reports will apply to all Funds in the Hennessy Funds family.
hennessyfunds.com | 1-800-966-4354
(This Page Intentionally Left Blank.)
Contents
| Letter to Shareholders | 2 |
| Performance Overview | 4 |
| Financial Statements | |
| Schedule of Investments | 7 |
| Statement of Assets and Liabilities | 10 |
| Statement of Operations | 11 |
| Statements of Changes in Net Assets | 13 |
| Financial Highlights | 14 |
| Notes to the Financial Statements | 18 |
| Report of Independent Registered Public Accounting Firm | 26 |
| Trustees and Officers of the Fund | 27 |
| Expense Example | 30 |
| Proxy Voting Policy and Proxy Voting Records | 32 |
| Availability of Quarterly Portfolio Schedule | 32 |
| Federal Tax Distribution Information | 32 |
| Important Notice Regarding Delivery of Shareholder Documents | 32 |
| Electronic Delivery | 33 |
| Privacy Policy | 33 |
| HENNESSY FUNDS | 1-800-966-4354 | |
December 2019
Dear Hennessy Funds Shareholder:
The Japanese stock market gained 8.45% in U.S. dollar terms as measured by the Tokyo Stock Price Index (TOPIX) over the 12 months ended October 31, 2019. Geopolitical developments affected Japanese stocks throughout the year, and a number of companies made downward corrections to their performance primarily due to the U.S.-China trade dispute and concerns over the declining Chinese economy.
It is nearly impossible to completely steer clear of anything related to China, directly or indirectly, as it is the world’s second largest economy. You may choose to eliminate companies having operations in China from your portfolio, but then there are second order effects, such as declining inbound Chinese tourists hurting the Japanese domestic economy, and so forth. Such second order effects may also impact your portfolio. Moreover, we believe China will remain an important market over the long run that will be hard to ignore.
Nonetheless, the Japanese economy continued to exhibit relatively strong growth, and the inflation rate remained positive over the past year. Prime Minister Shinzo Abe, now in his 7th year and serving longer than the previous six leaders combined, continued to provide much needed policy continuity and a pro-reform stance. The Japanese stock market closed the 12 months ended October 31, 2019, on a positive note thanks to robust economic metrics in the U.S., the belief that the U.S.-China trade dispute would be settled, and expectations that U.S. interest rates had bottomed out, which led to a return to a weaker yen.
Moreover, we believe the structural reform program in Japan continues to progress well. In October 2019, the government implemented a consumption tax increase from 8% to 10%. Compared to the previous hike in April 2014 from 5% to 8%, there seems to be a much smaller pre-tax increase in consumer demand this time. We may, therefore, see a much smaller post-tax negative impact on consumer demand than the last time. One of the possible reasons is because the government offered several consumer subsidy schemes that will remain in effect for more than six months to support consumption. In the labor market, unemployment remains low while the numbers of female, older, and foreign workers in Japan have grown. The country is also making progress on corporate governance reform. The percentage of independent directors exceeded 30% for the first time among listed companies (on the First Section of the Tokyo Stock Exchange, including Financials), and that of female directors is increasing as well, reaching 6%. Last but not least, the Japanese stock market is seeing a record pace of share buybacks and dividend payouts, partly due to unwinding cross share-holdings.
We remain optimistic about the long-term prospects for Japan and its stock market. Thank you for your continued confidence and investment in the Hennessy Funds.
Sincerely,
 |  |
| Tadahiro Fujimura | Masakazu Takeda |
| Portfolio Manager, | Portfolio Manager, |
| Hennessy Japan Small Cap Fund; | Hennessy Japan Fund; |
| Chief Investment Officer | Fund Manager |
| SPARX Asset Management Co., Ltd. | SPARX Asset Management Co., Ltd. |
SPARX Asset Management Co., Ltd., located in Tokyo, Japan, is the sub-advisor to the Hennessy Japan Fund and the Hennessy Japan Small Cap Fund.
Past performance does not guarantee future results.
Mutual fund investing involves risk. Principal loss is possible.
Opinions expressed are those of Tadahiro Fujimura and Masakazu Takeda and are subject to change, are not guaranteed, and should not be considered investment advice.
The Tokyo Stock Price Index (TOPIX) is a capitalization-weighted index of all the companies listed on the First Section of the Tokyo Stock Exchange. One cannot invest directly in an index.
| HENNESSY FUNDS | 1-800-966-4354 | |
Performance Overview (Unaudited)
CHANGE IN VALUE OF $10,000 INVESTMENT
This graph illustrates the performance of an initial investment of $10,000 made in the Fund ten years ago and assumes the reinvestment of dividends.
AVERAGE ANNUAL TOTAL RETURN FOR PERIODS ENDED OCTOBER 31, 2019
| | One | Five | Ten |
| | Year | Years | Years |
| Hennessy Japan Fund – | | | |
| Investor Class (HJPNX) | 10.60% | 11.30% | 12.60% |
| Hennessy Japan Fund – | | | |
| Institutional Class (HJPIX) | 11.02% | 11.70% | 12.94% |
Russell/Nomura Total MarketTM Index | 8.54% | 7.50% | 6.94% |
| Tokyo Price Index (TOPIX) | 8.45% | 7.65% | 6.81% |
Expense ratios: 1.44% (Investor Class); 1.02% (Institutional Class)
Performance data quoted represents past performance; past performance does not guarantee future results. The investment return and principal value of an investment will fluctuate so that an investor’s shares, when redeemed, may be worth more or less than their original cost. The performance table does not reflect the deduction of taxes that a shareholder would pay on Fund distributions or the redemption of Fund shares. Current performance of the Fund may be lower or higher than the performance quoted. Performance data current to the most recent month end may be obtained by visiting www.hennessyfunds.com.
The Russell/Nomura Total Market™ Index contains the top 98% of all stocks listed on Japan’s stock exchanges and registered on Japan’s over-the-counter market based on market capitalization. The Tokyo Price Index (TOPIX) is a market capitalization-weighted index of all of the companies listed on the First Section of the Tokyo Stock Exchange. One cannot invest directly in an index. These indices are used herein for comparative purposes in accordance with SEC regulations.
Frank Russell Company (“Russell”) is the source and owner of the trademarks, service marks, and copyrights related to the Russell Indexes. Russell® is a trademark of Russell. Neither Russell nor its licensors accept any liability for any errors or omissions in the Russell Indexes or Russell ratings or underlying data and no party may rely on any Russell Indexes or Russell ratings or underlying data contained in this communication.
No further distribution of Russell data is permitted without Russell’s express written consent. Russell does not promote, sponsor, or endorse the content of this communication.
The expense ratios presented are from the most recent prospectus. The expense ratios for the current reporting period are available in the Financial Highlights section of this report.
PERFORMANCE NARRATIVE
Portfolio Managers Masakazu Takeda, CFA and CMA*, and Yu Shimizu, CMA*
SPARX Asset Management Co., Ltd. (sub-advisor)
Performance:
For the 12-month period ended October 31, 2019, the Investor Class of the Hennessy Japan Fund returned 10.60%, outperforming both the Russell/Nomura Total Market™ Index (the Fund’s primary benchmark) and the Tokyo Stock Price Index (TOPIX), which returned 8.54% and 8.45%, respectively, for the same period, in U.S. dollar terms.
The largest positive contributors to the Fund’s performance relative to its primary benchmark were Consumer Discretionary, Industrials, and Consumer Staples. The largest detractors to the Fund’s performance were Financials, Materials, and Real Estate.
Among the best performing stocks in the Fund during the period were KEYENCE Corporation, the supplier of factory automation related sensors, Fast Retailing Co. Ltd., the operator of “UNIQLO” brand casual wear stores, and Terumo Corp., one of the world’s leading medical device manufacturers. Shares of KEYENCE have done well on the back of the company’s strong performance in China compared to rivals that are struggling. Shares of Fast Retailing performed well due to continued overseas business expansion across Southeast Asia that has helped the company’s overseas operating profit exceed income in Japan for the first time on record. Lastly, shares of Terumo advanced as the company’s Cardiac and Vascular Company returned to double-digit revenue growth. The Fund continues to hold all of the companies mentioned.
The main detractors to the Fund’s performance were Rohto Pharmaceutical Co., a leading skincare cosmetics and over-the-counter ophthalmic medicines producer, Mitsubishi UFJ Financial Group, Inc., a large financial services provider, and Japan Tobacco Inc., one of the largest global tobacco manufacturers. Rohto saw its shares tumble during the period following earnings results that showed operating income falling sharply on the back of an increase in strategic spending for new growth areas and costs for comprehensive operational streamlining. Mitsubishi UFJ’s share price declined as negative interest rates and the shift to online banking hurt profitability. Japan Tobacco performed poorly because of weaker-than-expected sales of its e-cigarettes amid strong competition. The Fund continues to hold all of the companies mentioned.
Portfolio Strategy:
The Fund seeks long-term capital appreciation by investing in Japanese companies regardless of market capitalization. We screen for companies that we believe have strong businesses and management, and are trading at an attractive price. Through in-depth and rigorous analysis and on-site research, we identify stocks with a “value gap.” The portfolio is limited to our best ideas and maintains a concentrated number of holdings.
Investment Commentary:
Concerns over escalating trade tensions between the U.S. and China took a toll on equity markets for the better part of the 12-month period ended October 31, 2019. These tensions affected the Fund as well. Regular market participants would probably agree that
| HENNESSY FUNDS | 1-800-966-4354 | |
stock markets are efficient over the long term, in that they reward share prices of companies who create value in excess of cost of capital and grow earnings at higher than average rates. The tricky part of this cliché, however, is that the word “long term” usually exceeds what an ordinary investor can stomach. Humans are prone to take quick profit in order to secure their gains or realize the losses when their investments go south even temporarily. As such, in the short run, the share price of a company can fluctuate independent of the company’s true intrinsic value.
We make a conscious decision to invest in businesses with significant international growth opportunities given the mature state of their home market, in which declining demographics and shrinking demand are the norm. This brings an inevitable headwind from the current Chinese economic slowdown. Some of the Fund’s holdings have exposure to China, ranging anywhere from 10-30% of total revenues. The companies considered to be near the top end of this range (about 30% of revenues) are Unicharm Corporation and Rohto. These companies are in the personal care items/toiletries business with products that are highly sought after by local Chinese consumers and manufactured in Japan for export or produced locally. Thus, we do not view them as being at high-risk.
The companies with lower/moderate exposure to China (about 10-20% of revenues) are NIDEC Corporation, Misumi Group, and KEYENCE, which have more economically sensitive demand for their products. We intend to continue holding these names since their revenue base is more globalized than the likes of Unicharm and Rohto. As such, revenue from other geographies (U.S., Europe, rest of Asia, Japan) should be able to offset in the long run. Furthermore, we believe these industrial companies have excellent track records of navigating through past economic crises thanks to the strong leadership of their respective management teams.
As the world’s second largest economy, it is nearly impossible to completely avoid anything related to China, directly or indirectly. You may choose to eliminate companies having operations in China from your portfolio, but then there are second-order effects, such as declining inbound Chinese tourists hurting the Japanese domestic economy, etc., which may also impact your portfolio. Moreover, we believe China will remain an important market over the long run that will be hard to ignore. We therefore believe that the key is to manage this headwind by spreading investments in your portfolio broadly so as not to rely too much on any one country, region, or industry.
______________
* Chartered Member of the Security Analysts Association of Japan
Opinions expressed are those of the Portfolio Managers as of the date written and are subject to change, are not guaranteed, and should not be considered investment advice or an indication of trading intent.
The Fund invests in small-capitalization and medium-capitalization companies, which may have more limited liquidity and greater price volatility than large-capitalization companies. The Fund invests in the stocks of companies operating in Japan; single-country funds may be subject to a higher degree of risk. The Fund may experience higher fees due to investments in pooled investment vehicles (including ETFs). Please see the Fund’s prospectus for a more complete discussion of these and other risks.
References to specific securities should not be considered a recommendation to buy or sell any security. Fund holdings and sector allocations are subject to change. Please refer to the Schedule of Investments included in this report for additional portfolio information.
| PERFORMANCE OVERVIEW/SCHEDULE OF INVESTMENTS |
Financial Statements
Schedule of Investments as of October 31, 2019 |
HENNESSY JAPAN FUND
(% of Net Assets)
| TOP TEN HOLDINGS (EXCLUDING MONEY MARKET FUNDS) | % NET ASSETS |
| Daikin Industries | 5.61% |
| Shimano, Inc. | 5.52% |
| Nidec Corp. | 5.49% |
| Recruit Holdings Co., Ltd. | 5.42% |
| Rohto Pharmaceutical Co., Ltd. | 5.33% |
| Kubota Corp. | 5.06% |
| Fast Retailing Co., Ltd. | 5.04% |
| Terumo Corp. | 4.96% |
| Unicharm Corp. | 4.92% |
| Keyence Corp. | 4.80% |
Note: For presentation purposes, the Fund has grouped some of the industry categories. For purposes of categorizing securities for compliance with Section 8(b)(1) of the Investment Company Act of 1940, as amended, the Fund uses more specific industry classifications.
The Global Industry Classification Standard (GICS®) was developed by and is the exclusive property and a service mark of MSCI, Inc. and Standard & Poor’s Financial Services LLC. It has been licensed for use by the Hennessy Funds.
| HENNESSY FUNDS | 1-800-966-4354 | |
| COMMON STOCKS – 96.60% | | Number | | | | | | % of | |
| | | of Shares | | | Value | | | Net Assets | |
| Communication Services – 4.31% | | | | | | | | | |
| Softbank Group Corp. | | | 782,800 | | | $ | 30,111,510 | | | | 4.31 | % |
| | | | | | | | | | | | | |
| Consumer Discretionary – 18.58% | | | | | | | | | | | | |
| Asics Corp. | | | 930,000 | | | | 15,966,548 | | | | 2.28 | % |
| Fast Retailing Co., Ltd. | | | 57,100 | | | | 35,213,120 | | | | 5.04 | % |
| Isuzu Motors, Ltd. | | | 475,000 | | | | 5,519,457 | | | | 0.79 | % |
| Nitori Holdings Co Ltd. | | | 184,000 | | | | 28,006,848 | | | | 4.01 | % |
| Ryohin Keikaku Co., Ltd. | | | 296,000 | | | | 6,589,633 | | | | 0.94 | % |
| Shimano, Inc. | | | 231,500 | | | | 38,533,351 | | | | 5.52 | % |
| | | | | | | | 129,828,957 | | | | 18.58 | % |
| | | | | | | | | | | | | |
| Consumer Staples – 19.87% | | | | | | | | | | | | |
| Ariake Japan Co., Ltd. | | | 205,300 | | | | 15,936,991 | | | | 2.28 | % |
| Japan Tobacco, Inc. | | | 816,300 | | | | 18,450,594 | | | | 2.64 | % |
| Kao Corp. | | | 408,100 | | | | 32,810,704 | | | | 4.70 | % |
| Rohto Pharmaceutical Co., Ltd. | | | 1,239,200 | | | | 37,228,716 | | | | 5.33 | % |
| Unicharm Corp. | | | 1,014,000 | | | | 34,365,345 | | | | 4.92 | % |
| | | | | | | | 138,792,350 | | | | 19.87 | % |
| | | | | | | | | | | | | |
| Financials – 7.98% | | | | | | | | | | | | |
| Anicom Holdings, Inc. | | | 494,100 | | | | 18,164,168 | | | | 2.60 | % |
| Mitsubishi UFJ Financial Group, Inc. | | | 6,140,700 | | | | 31,835,159 | | | | 4.55 | % |
| Sumitomo Mitsui Financial Group, Inc. | | | 162,900 | | | | 5,783,471 | | | | 0.83 | % |
| | | | | | | | 55,782,798 | | | | 7.98 | % |
| | | | | | | | | | | | | |
| Health Care – 8.21% | | | | | | | | | | | | |
| Takeda Pharmaceutical Co Ltd. | | | 628,000 | | | | 22,691,573 | | | | 3.25 | % |
| Terumo Corp. | | | 1,061,300 | | | | 34,637,357 | | | | 4.96 | % |
| | | | | | | | 57,328,930 | | | | 8.21 | % |
| | | | | | | | | | | | | |
| Industrials – 30.31% | | | | | | | | | | | | |
| Daikin Industries | | | 280,300 | | | | 39,230,687 | | | | 5.61 | % |
| Kubota Corp. | | | 2,224,200 | | | | 35,327,542 | | | | 5.06 | % |
| Misumi Group, Inc. | | | 1,271,600 | | | | 31,966,450 | | | | 4.58 | % |
| Mitsubishi Corp. | | | 1,139,100 | | | | 28,972,343 | | | | 4.15 | % |
| Nidec Corp. | | | 260,400 | | | | 38,337,595 | | | | 5.49 | % |
| Recruit Holdings Co., Ltd. | | | 1,140,200 | | | | 37,893,456 | | | | 5.42 | % |
| | | | | | | | 211,728,073 | | | | 30.31 | % |
| | | | | | | | | | | | | |
| Information Technology – 4.80% | | | | | | | | | | | | |
| Keyence Corp. | | | 53,000 | | | | 33,511,710 | | | | 4.80 | % |
The accompanying notes are an integral part of these financial statements.
| COMMON STOCKS | | Number | | | | | | % of | |
| | | of Shares | | | Value | | | Net Assets | |
| Materials – 0.83% | | | | | | | | | |
| Fuji Seal International, Inc. | | | 232,200 | | | $ | 5,767,781 | | | | 0.83 | % |
| | | | | | | | | | | | | |
| Real Estate – 1.71% | | | | | | | | | | | | |
| Relo Group, Inc. | | | 489,000 | | | | 11,967,509 | | | | 1.71 | % |
| | | | | | | | | | | | | |
| Total Common Stocks | | | | | | | | | | | | |
| (Cost $540,599,775) | | | | | | | 674,819,618 | | | | 96.60 | % |
| | | | | | | | | | | | | |
| SHORT-TERM INVESTMENTS – 2.95% | | | | | | | | | | | | |
| | | | | | | | | | | | | |
| Money Market Funds – 2.95% | | | | | | | | | | | | |
| First American Government Obligations Fund, | | | | | | | | | | | | |
| Institutional Class, 1.74% (a) | | | 20,641,769 | | | | 20,641,769 | | | | 2.95 | % |
| | | | | | | | | | | | | |
| Total Short-Term Investments | | | | | | | | | | | | |
| (Cost $20,641,769) | | | | | | | 20,641,769 | | | | 2.95 | % |
| | | | | | | | | | | | | |
| Total Investments | | | | | | | | | | | | |
| (Cost $561,241,544) – 99.55% | | | | | | | 695,461,387 | | | | 99.55 | % |
| Other Assets in Excess of Liabilities – 0.45% | | | | | | | 3,173,792 | | | | 0.45 | % |
| | | | | | | | | | | | | |
TOTAL NET ASSETS – 100.00% | | | | | | $ | 698,635,179 | | | | 100.00 | % |
Percentages are stated as a percent of net assets.
| (a) | The rate listed is the fund’s seven-day yield as of October 31, 2019. |
Summary of Fair Value Exposure as of October 31, 2019
The following is a summary of the inputs used to value the Fund’s net assets as of October 31, 2019 (See Note 3 in the accompanying Notes to the Financial Statements):
| Common Stocks | | Level 1 | | | Level 2 | | | Level 3 | | | Total | |
| Communication Services | | $ | — | | | $ | 30,111,510 | | | $ | — | | | $ | 30,111,510 | |
| Consumer Discretionary | | | — | | | | 129,828,957 | | | | — | | | | 129,828,957 | |
| Consumer Staples | | | — | | | | 138,792,350 | | | | — | | | | 138,792,350 | |
| Financials | | | — | | | | 55,782,798 | | | | — | | | | 55,782,798 | |
| Health Care | | | — | | | | 57,328,930 | | | | — | | | | 57,328,930 | |
| Industrials | | | — | | | | 211,728,073 | | | | — | | | | 211,728,073 | |
| Information Technology | | | — | | | | 33,511,710 | | | | — | | | | 33,511,710 | |
| Materials | | | — | | | | 5,767,781 | | | | — | | | | 5,767,781 | |
| Real Estate | | | — | | | | 11,967,509 | | | | — | | | | 11,967,509 | |
| Total Common Stocks | | $ | — | | | $ | 674,819,618 | | | $ | — | | | $ | 674,819,618 | |
| Short-Term Investments | | | | | | | | | | | | | | | | |
| Money Market Funds | | $ | 20,641,769 | | | $ | — | | | $ | — | | | $ | 20,641,769 | |
| Total Short-Term Investments | | $ | 20,641,769 | | | $ | — | | | $ | — | | | $ | 20,641,769 | |
| Total Investments | | $ | 20,641,769 | | | $ | 674,819,618 | | | $ | — | | | $ | 695,461,387 | |
The accompanying notes are an integral part of these financial statements.
| HENNESSY FUNDS | 1-800-966-4354 | |
Financial Statements
Statement of Assets and Liabilities as of October 31, 2019 |
| ASSETS: | | | |
| Investments in securities, at value (cost $561,241,544) | | $ | 695,461,387 | |
| Dividends and interest receivable | | | 3,228,463 | |
| Receivable for fund shares sold | | | 929,722 | |
| Prepaid expenses and other assets | | | 62,476 | |
| Total assets | | | 699,682,048 | |
| | | | | |
| LIABILITIES: | | | | |
| Payable for fund shares redeemed | | | 333,763 | |
| Payable to advisor | | | 455,878 | |
| Payable to administrator | | | 117,626 | |
| Payable to auditor | | | 22,547 | |
| Accrued distribution fees | | | 12,789 | |
| Accrued service fees | | | 7,098 | |
| Accrued trustees fees | | | 6,596 | |
| Accrued expenses and other payables | | | 90,572 | |
| Total liabilities | | | 1,046,869 | |
| NET ASSETS | | $ | 698,635,179 | |
| | | | | |
| NET ASSETS CONSISTS OF: | | | | |
| Capital stock | | $ | 561,480,005 | |
| Total distributable earnings | | | 137,155,174 | |
| Total net assets | | $ | 698,635,179 | |
| | | | | |
| NET ASSETS: | | | | |
| Investor Class | | | | |
| Shares authorized (no par value) | | Unlimited | |
| Net assets applicable to outstanding shares | | $ | 87,220,684 | |
| Shares issued and outstanding | | | 2,346,715 | |
| Net asset value, offering price, and redemption price per share | | $ | 37.17 | |
| | | | | |
| Institutional Class | | | | |
| Shares authorized (no par value) | | Unlimited | |
| Net assets applicable to outstanding shares | | $ | 611,414,495 | |
| Shares issued and outstanding | | | 15,934,023 | |
| Net asset value, offering price, and redemption price per share | | $ | 38.37 | |
The accompanying notes are an integral part of these financial statements.
| STATEMENT OF ASSETS AND LIABILITIES/STATEMENT OF OPERATIONS |
Financial Statements
Statement of Operations for the year ended October 31, 2019 |
| INVESTMENT INCOME: | | | |
Dividend income(1) | | $ | 9,261,259 | |
| Interest income | | | 744,652 | |
| Total investment income | | | 10,005,911 | |
| | | | | |
| EXPENSES: | | | | |
| Investment advisory fees (See Note 5) | | | 4,955,455 | |
| Sub-transfer agent expenses – Investor Class (See Note 5) | | | 224,271 | |
| Sub-transfer agent expenses – Institutional Class (See Note 5) | | | 476,083 | |
| Administration, accounting, custody, and transfer agent fees (See Note 5) | | | 629,289 | |
| Distribution fees – Investor Class (See Note 5) | | | 138,764 | |
| Service fees – Investor Class (See Note 5) | | | 92,510 | |
| Federal and state registration fees | | | 74,240 | |
| Reports to shareholders | | | 42,040 | |
| Compliance expense (See Note 5) | | | 25,810 | |
| Audit fees | | | 22,548 | |
| Trustees’ fees and expenses | | | 20,495 | |
| Legal fees | | | 5,242 | |
| Other expenses | | | 37,148 | |
| Total expenses | | | 6,743,895 | |
| NET INVESTMENT INCOME | | $ | 3,262,016 | |
| | | | | |
| REALIZED AND UNREALIZED GAINS (LOSSES): | | | | |
| Net realized gain on investments | | $ | 941,773 | |
| Net change in unrealized appreciation/depreciation on investments | | | 64,311,703 | |
| Net gain on investments | | | 65,253,476 | |
| NET INCREASE IN NET ASSETS RESULTING FROM OPERATIONS | | $ | 68,515,492 | |
(1) | Net of foreign taxes withheld of $1,029,031. |
The accompanying notes are an integral part of these financial statements.
| HENNESSY FUNDS | 1-800-966-4354 | |
(This Page Intentionally Left Blank.)
| STATEMENTS OF CHANGES IN NET ASSETS |
Financial Statements
| Statements of Changes in Net Assets |
| | | Year Ended | | | Year Ended | |
| | | October 31, 2019 | | | October 31, 2018 | |
| OPERATIONS: | | | | | | |
| Net investment income | | $ | 3,262,016 | | | $ | 1,562,238 | |
| Net realized gain (loss) on investments | | | 941,773 | | | | (652,030 | ) |
| Net change in unrealized | | | | | | | | |
| appreciation/depreciation on investments | | | 64,311,703 | | | | (3,199,977 | ) |
| Net increase (decrease) in net | | | | | | | | |
| assets resulting from operations | | | 68,515,492 | | | | (2,289,769 | ) |
| | | | | | | | | |
| DISTRIBUTIONS TO SHAREHOLDERS: | | | | | | | | |
| Distributable earnings – Investor Class | | | (35,216 | ) | | | (15,953 | ) |
| Distributable earnings – Institutional Class | | | (1,309,459 | ) | | | (192,575 | ) |
| Total distributions | | | (1,344,675 | ) | | | (208,528 | ) |
| | | | | | | | | |
| CAPITAL SHARE TRANSACTIONS: | | | | | | | | |
| Proceeds from shares subscribed – Investor Class | | | 35,974,622 | | | | 68,964,189 | |
| Proceeds from shares subscribed – Institutional Class | | | 382,329,976 | | | | 371,916,788 | |
| Dividends reinvested – Investor Class | | | 34,287 | | | | 15,517 | |
| Dividends reinvested – Institutional Class | | | 1,275,785 | | | | 171,054 | |
| Cost of shares redeemed – Investor Class | | | (60,746,390 | ) | | | (51,079,674 | ) |
| Cost of shares redeemed – Institutional Class | | | (230,489,467 | ) | | | (146,269,372 | ) |
| Net increase in net assets derived | | | | | | | | |
| from capital share transactions | | | 128,378,813 | | | | 243,718,502 | |
| TOTAL INCREASE IN NET ASSETS | | | 195,549,630 | | | | 241,220,205 | |
| | | | | | | | | |
| NET ASSETS: | | | | | | | | |
| Beginning of year | | | 503,085,549 | | | | 261,865,344 | |
| End of year | | $ | 698,635,179 | | | $ | 503,085,549 | |
| | | | | | | | | |
| CHANGES IN SHARES OUTSTANDING: | | | | | | | | |
| Shares sold – Investor Class | | | 1,043,125 | | | | 1,945,260 | |
| Shares sold – Institutional Class | | | 10,907,846 | | | | 10,243,014 | |
| Shares issued to holders as reinvestment | | | | | | | | |
| of dividends – Investor Class | | | 1,053 | | | | 445 | |
| Shares issued to holders as reinvestment | | | | | | | | |
| of dividends – Institutional Class | | | 38,071 | | | | 4,774 | |
| Shares redeemed – Investor Class | | | (1,770,416 | ) | | | (1,451,162 | ) |
| Shares redeemed – Institutional Class | | | (6,541,834 | ) | | | (3,991,370 | ) |
| Net increase in shares outstanding | | | 3,677,845 | | | | 6,750,961 | |
The accompanying notes are an integral part of these financial statements.
| HENNESSY FUNDS | 1-800-966-4354 | |
Financial Statements
For an Investor Class share outstanding throughout each year
PER SHARE DATA:
Net asset value, beginning of year
Income from investment operations:
Net investment income (loss)
Net realized and unrealized gains on investments
Total from investment operations
Less distributions:
Dividends from net investment income
Total distributions
Net asset value, end of year
TOTAL RETURN
SUPPLEMENTAL DATA AND RATIOS:
Net assets, end of year (millions)
Ratio of expenses to average net assets
Ratio of net investment income (loss) to average net assets
Portfolio turnover rate(3)
(1) | Calculated using the average shares outstanding method. |
(2) | Amount is between $(0.005) and $0.005. |
(3) | Calculated on the basis of the Fund as a whole. |
The accompanying notes are an integral part of these financial statements.
| FINANCIAL HIGHLIGHTS — INVESTOR CLASS |
| Year Ended October 31, | |
| 2019 | | | 2018 | | | 2017 | | | 2016 | | | 2015 | |
| | | | | | | | | | | | | | |
| $ | 33.63 | | | $ | 32.75 | | | $ | 27.81 | | | $ | 24.07 | | | $ | 21.77 | |
| | | | | | | | | | | | | | | | | | | |
| | | | | | | | | | | | | | | | | | | |
| | 0.05 | (1) | | | (0.00 | )(2) | | | (0.03 | ) | | | (0.11 | ) | | | (0.10 | ) |
| | 3.50 | | | | 0.89 | | | | 4.97 | | | | 3.85 | | | | 2.40 | |
| | 3.55 | | | | 0.89 | | | | 4.94 | | | | 3.74 | | | | 2.30 | |
| | | | | | | | | | | | | | | | | | | |
| | | | | | | | | | | | | | | | | | | |
| | (0.01 | ) | | | (0.01 | ) | | | — | | | | — | | | | — | |
| | (0.01 | ) | | | (0.01 | ) | | | — | | | | — | | | | — | |
| $ | 37.17 | | | $ | 33.63 | | | $ | 32.75 | | | $ | 27.81 | | | $ | 24.07 | |
| | | | | | | | | | | | | | | | | | | |
| | 10.60 | % | | | 2.70 | % | | | 17.76 | % | | | 15.54 | % | | | 10.56 | % |
| | | | | | | | | | | | | | | | | | | |
| | | | | | | | | | | | | | | | | | | |
| $ | 87.22 | | | $ | 103.33 | | | $ | 84.44 | | | $ | 61.85 | | | $ | 61.56 | |
| | 1.43 | % | | | 1.43 | % | | | 1.46 | % | | | 1.50 | % | | | 1.53 | % |
| | 0.14 | % | | | (0.02 | )% | | | (0.15 | )% | | | (0.38 | )% | | | (0.44 | )% |
| | 9 | % | | | 1 | % | | | 0 | % | | | 5 | % | | | 21 | % |
The accompanying notes are an integral part of these financial statements.
| HENNESSY FUNDS | 1-800-966-4354 | |
Financial Statements
For an Institutional Class share outstanding throughout each year
PER SHARE DATA:
Net asset value, beginning of year
Income from investment operations:
Net investment income (loss)
Net realized and unrealized gains on investments
Total from investment operations
Less distributions:
Dividends from net investment income
Total distributions
Net asset value, end of year
TOTAL RETURN
SUPPLEMENTAL DATA AND RATIOS:
Net assets, end of year (millions)
Ratio of expenses to average net assets
Ratio of net investment income (loss) to average net assets
Portfolio turnover rate(2)
(1) | Calculated using the average shares outstanding method. |
(2) | Calculated on the basis of the Fund as a whole. |
The accompanying notes are an integral part of these financial statements.
| FINANCIAL HIGHLIGHTS — INSTITUTIONAL CLASS |
| Year Ended October 31, | |
| 2019 | | | 2018 | | | 2017 | | | 2016 | | | 2015 | |
| | | | | | | | | | | | | | |
| $ | 34.67 | | | $ | 33.64 | | | $ | 28.45 | | | $ | 24.55 | | | $ | 22.15 | |
| | | | | | | | | | | | | | | | | | | |
| | | | | | | | | | | | | | | | | | | |
| | 0.21 | (1) | | | 0.15 | | | | 0.03 | | | | (0.01 | ) | | | (0.02 | ) |
| | 3.60 | | | | 0.91 | | | | 5.16 | | | | 3.91 | | | | 2.42 | |
| | 3.81 | | | | 1.06 | | | | 5.19 | | | | 3.90 | | | | 2.40 | |
| | | | | | | | | | | | | | | | | | | |
| | | | | | | | | | | | | | | | | | | |
| | (0.11 | ) | | | (0.03 | ) | | | — | | | | — | | | | — | |
| | (0.11 | ) | | | (0.03 | ) | | | — | | | | — | | | | — | |
| $ | 38.37 | | | $ | 34.67 | | | $ | 33.64 | | | $ | 28.45 | | | $ | 24.55 | |
| | | | | | | | | | | | | | | | | | | |
| | 11.02 | % | | | 3.14 | % | | | 18.24 | % | | | 15.89 | % | | | 10.84 | % |
| | | | | | | | | | | | | | | | | | | |
| | | | | | | | | | | | | | | | | | | |
| $ | 611.41 | | | $ | 399.76 | | | $ | 177.42 | | | $ | 67.78 | | | $ | 54.13 | |
| | 1.03 | % | | | 1.01 | % | | | 1.05 | % | | | 1.17 | % | | | 1.27 | % |
| | 0.59 | % | | | 0.49 | % | | | 0.30 | % | | | (0.03 | )% | | | (0.08 | )% |
| | 9 | % | | | 1 | % | | | 0 | % | | | 5 | % | | | 21 | % |
The accompanying notes are an integral part of these financial statements.
| HENNESSY FUNDS | 1-800-966-4354 | |
Financial Statements
Notes to the Financial Statements October 31, 2019 |
1). ORGANIZATION
The Hennessy Japan Fund (the “Fund”) is a series of Hennessy Funds Trust (the “Trust”), which was organized as a Delaware statutory trust on September 17, 1992. The Fund is an open-end management investment company registered under the Investment Company Act of 1940, as amended. The investment objective of the Fund is long-term capital appreciation. The Fund is a diversified fund, but employs a relatively concentrated investment strategy and may hold securities of fewer issuers than other diversified funds.
The Fund offers Investor Class and Institutional Class shares. Each class of shares differs principally in its respective 12b-1 distribution and service, shareholder servicing, and sub-transfer agent expenses. There are no sales charges. Each class has identical rights to earnings, assets, and voting privileges, except for class-specific expenses and exclusive rights to vote on matters affecting only one class.
As an investment company, the Fund follows the investment company accounting and reporting guidance of the Financial Accounting Standards Board (“FASB”) Accounting Standard Codification Topic 946 “Financial Services—Investment Companies.”
2). SIGNIFICANT ACCOUNTING POLICIES
The following is a summary of significant accounting policies consistently followed by the Fund in the preparation of the financial statements. These policies conform to U.S. generally accepted accounting principles (“GAAP”).
| a). | Securities Valuation – All investments in securities are recorded at their estimated fair value, as described in Note 3. |
| | |
| b). | Federal Income Taxes – No provision for federal income taxes or excise taxes has been made because the Fund has elected to be taxed as a regulated investment company and intends to distribute substantially all of its taxable income to its shareholders and otherwise comply with the provisions of the Internal Revenue Code of 1986, as amended, applicable to regulated investment companies. Net investment income/loss and realized gains/losses for federal income tax purposes may differ from those reported in the financial statements because of temporary book and tax basis differences. Temporary differences are primarily the result of the treatment of wash sales for tax reporting purposes. The Fund recognizes interest and penalties related to income tax benefits, if any, in the Statement of Operations as an income tax expense. Distributions from net realized gains for book purposes may include short-term capital gains, which are included as ordinary income to shareholders for tax purposes. The Fund may utilize equalization accounting for tax purposes and designate earnings and profits, including net realized gains distributed to shareholders on redemption of shares, as part of the dividends paid deduction for income tax purposes. |
| | |
| | Due to inherent differences in the recognition of income, expenses, and realized gains/losses under GAAP and federal income tax regulations, permanent differences between book and tax basis for reporting for fiscal year 2019 have been identified and appropriately reclassified in the Statement of Assets and Liabilities. The adjustments are as follows: |
| Total | |
| Distributable | |
Earnings | Capital Stock |
| $(369,098) | $369,098 |
| NOTES TO THE FINANCIAL STATEMENTS |
| c). | Accounting for Uncertainty in Income Taxes – The Fund has accounting policies regarding recognition and measurement of tax positions taken or expected to be taken on a tax return. The tax returns of the Fund for the prior three fiscal years are open for examination. The Fund has reviewed all open tax years in major jurisdictions and concluded that there is no impact on the Fund’s net assets and no tax liability resulting from unrecognized tax benefits relating to uncertain income tax positions taken or expected to be taken on a tax return. The Fund’s major tax jurisdictions are U.S. federal and Delaware. |
| | |
| d). | Income and Expenses – Dividend income is recognized on the ex-dividend date or as soon as information is available to the Fund. Interest income, which includes the amortization of premium and accretion of discount, is recognized on an accrual basis. Other non-cash dividends are recognized as investment income at the fair value of the property received. The Fund is charged for those expenses that are directly attributable to its portfolio, such as advisory, administration, and certain shareholder service fees. Income, expenses (other than expenses attributable to a specific class), and realized and unrealized gains/losses on investments are allocated to each class of shares based on such class’s net assets. |
| | |
| e). | Distributions to Shareholders – Dividends from net investment income for the Fund, if any, are declared and paid annually, usually in December. Distributions of net realized capital gains, if any, are declared and paid annually, usually in December. |
| | |
| f). | Security Transactions – Investment and shareholder transactions are recorded on the trade date. The Fund determines the realized gain/loss from an investment transaction by comparing the original cost of the security lot sold with the net sale proceeds. Discounts and premiums on securities purchased are accreted or amortized, respectively, over the life of each such security. |
| | |
| g). | Use of Estimates – The preparation of financial statements in conformity with GAAP requires management to make estimates and assumptions that affect the reported amounts of assets and liabilities and disclosure of contingent assets and liabilities at the date of the financial statements and the reported change in net assets during the reporting period. Actual results could differ from those estimates. |
| | |
| h). | Share Valuation – The net asset value (“NAV”) per share of the Fund is calculated by dividing (i) the total value of the securities held by the Fund, plus cash and other assets, minus all liabilities (including estimated accrued expenses) by (ii) the total number of shares outstanding for the Fund, rounded to the nearest $0.01. The Fund’s shares will not be priced on days the New York Stock Exchange is closed for trading. The offering and redemption price per share for the Fund is equal to the Fund’s NAV per share. |
| | |
| i). | Foreign Currency – Values of investments denominated in foreign currencies are converted into U.S. dollars using the spot market rate of exchange at the time of valuation. Purchases and sales of investments and income are translated into U.S. dollars using the spot market rate of exchange prevailing on the respective dates of such transactions. The Fund does not isolate the portion of the results of operations resulting from fluctuations in foreign exchange rates on investments from fluctuations resulting from changes in the market prices of securities held. Such fluctuations are included with the net realized and unrealized gain/loss on investments. Foreign investments present additional risks due to currency fluctuations, economic and political factors, lower liquidity, government regulations, differences in accounting standards, and other factors. |
| HENNESSY FUNDS | 1-800-966-4354 | |
| j). | New Accounting Pronouncements – In August 2018, the FASB issued Accounting Standards Update No. 2018-13 “Disclosure Framework—Changes to the Disclosure Requirements for Fair Value Measurement” (“ASU 2018-13”). ASU 2018-13 eliminates the requirement to disclose the amount of and reasons for transfers between Level 1 and Level 2 of the fair value hierarchy, the timing of transfers between levels of the fair value hierarchy, and the valuation processes for Level 3 fair value measurements. ASU 2018-13 does not eliminate the requirement to disclose the range and weighted average used to develop significant unobservable inputs for Level 3 fair value measurements, and the changes in unrealized gains and losses for recurring Level 3 fair value measurements. ASU 2018-13 requires that information is provided about the measurement uncertainty of Level 3 fair value measurements as of the reporting date. The guidance is effective for fiscal years beginning after December 15, 2019, and interim periods within those fiscal years. Management has evaluated the impact of this change in guidance and, due to the permissibility of early adoption, modified the Fund’s fair value disclosures for the current reporting period. |
3). SECURITIES VALUATION
The Fund follows fair value accounting standards that establish an authoritative definition of fair value and set out a hierarchy for measuring fair value. These standards require additional disclosures about the various inputs and valuation techniques used to develop the measurements of fair value and a discussion of changes in valuation techniques and related inputs during the period. These inputs are summarized in the three broad levels listed below:
| | Level 1 – | Unadjusted, quoted prices in active markets for identical instruments that the Fund has the ability to access at the date of measurement. |
| | | |
| | Level 2 – | Other significant observable inputs (including, but not limited to, quoted prices in active markets for similar instruments, quoted prices in markets that are not active for identical or similar instruments, and model-derived valuations in which all significant inputs and significant value drivers are observable in active markets, such as interest rates, prepayment speeds, credit risk curves, default rates, and similar data). |
| | | |
| | Level 3 – | Significant unobservable inputs (including the Fund’s own assumptions about what market participants would use to price the asset or liability based on the best available information) when observable inputs are unavailable. |
The following is a description of the valuation techniques applied to the Fund’s major categories of assets and liabilities measured at fair value on a recurring basis:
| | Equity Securities – Equity securities, including common stocks, preferred stocks, foreign-issued common stocks, exchange-traded funds, closed-end mutual funds, partnerships, rights, and real estate investment trusts, that are traded on a securities exchange for which a last-quoted sales price is readily available will generally be valued at the last sales price as reported by the primary exchange on which the securities are listed. Securities listed on The NASDAQ Stock Market (“NASDAQ”) will generally be valued at the NASDAQ Official Closing Price, which may differ from the last sales price reported. Securities traded on a securities exchange for which a last-quoted sales price is not readily available will generally be valued at the mean between the bid and ask prices. To the extent these securities are actively traded and valuation adjustments are not applied, they are classified in Level 1 of the fair value hierarchy. Securities traded on foreign exchanges generally are not valued at the same time the Fund calculates its NAV because most foreign markets close well before such time. The earlier close of most foreign markets gives rise to the possibility that |
| NOTES TO THE FINANCIAL STATEMENTS |
| | significant events, including broad market moves, may have occurred in the interim. In certain circumstances, it may be determined that a foreign security needs to be fair valued because it appears that the value of the security might have been materially affected by events occurring after the close of the market in which the security is principally traded, but before the time the Fund calculates its NAV, such as by a development that affects an entire market or region (e.g., a weather-related event) or a potentially global development (e.g., a terrorist attack that may be expected to have an effect on investor expectations worldwide). |
| | |
| | Registered Investment Companies – Investments in open-end registered investment companies, commonly referred to as mutual funds, generally are priced at the ending NAV provided by the applicable mutual fund’s service agent and will be classified in Level 1 of the fair value hierarchy. |
| | |
| | Debt Securities – Debt securities, including corporate bonds, asset-backed securities, mortgage-backed securities, municipal bonds, U.S. Treasuries, and U.S. government agency issues, are generally valued at market on the basis of valuations furnished by an independent pricing service that utilizes both dealer-supplied valuations and formula-based techniques. The pricing service may consider recently executed transactions in securities of the issuer or comparable issuers, market price quotations (where observable), bond spreads, and fundamental data relating to the issuer. In addition, the model may incorporate observable market data, such as reported sales of similar securities, broker quotes, yields, bids, offers, and reference data. Certain securities are valued primarily using dealer quotations. These securities are generally classified in Level 2 of the fair value hierarchy. |
| | |
| | Short-Term Securities – Short-term equity investments, including money market funds, are valued in the manner specified above. Short-term debt investments with an original term to maturity of 60 days or less are valued at amortized cost, which approximates fair market value. If the original term to maturity of a short-term debt investment exceeded 60 days, then the values as of the 61st day prior to maturity are amortized. Amortized cost is not used if its use would be inappropriate due to credit or other impairments of the issuer, in which case the security’s fair value would be determined, as described below. Short-term securities are generally classified in Level 1 or Level 2 of the fair value hierarchy depending on the inputs used and market activity levels for specific securities. |
The Board of Trustees of the Fund (the “Board”) has adopted fair value pricing procedures that are followed when a price for a security is not readily available or if a significant event has occurred that indicates the closing price of a security no longer represents the true value of that security. Fair value pricing determinations are made in good faith in accordance with these procedures. There are numerous criteria that will be given consideration in determining a fair value of a security, such as the trading volume of a security and markets, the values of other similar securities, and news events with direct bearing on a security or markets. Fair value pricing results in an estimated price for a security that reflects the amount the Fund might reasonably expect to receive in a current sale. Depending on the relative significance of the valuation inputs, these securities may be classified in either Level 2 or Level 3 of the fair value hierarchy.
The fair value of foreign securities may be determined with the assistance of a pricing service using correlations between the movement of prices of such securities and indices of domestic securities and other appropriate indicators, such as closing market prices of relevant American Depositary Receipts or futures contracts. The effect of using fair value pricing is that the Fund’s NAV will reflect the affected portfolio securities’ values as
| HENNESSY FUNDS | 1-800-966-4354 | |
determined by the Board or its designee, pursuant to the fair value pricing procedures adopted by the Board, instead of being determined by the market. Using a fair value pricing methodology to price a foreign security may result in a value that is different from such foreign security’s most recent closing price and from the value used by other investment companies to calculate their NAVs. Such securities are generally classified in Level 2 of the fair value hierarchy. Because the Fund may invest in foreign securities, the value of the Fund’s portfolio securities may change on days when you will not be able to purchase or redeem your shares.
The Board has delegated day-to-day valuation matters to the Valuation and Liquidity Committee comprising representatives from Hennessy Advisors, Inc., the Fund’s investment advisor (the “Advisor”). The function of the Valuation and Liquidity Committee is to value securities where current and reliable market quotations are not readily available. All actions taken by the Valuation and Liquidity Committee are reviewed by the Board.
The Fund has performed an analysis of all existing investments to determine the significance and character of all inputs to their fair value determinations. Various inputs are used to determine the value of the Fund’s investments. The inputs or methodology used for valuing securities are not necessarily an indication of the risk associated with investing in those securities. Details related to the fair value hierarchy of the Fund’s securities as of October 31, 2019, are included in the Schedule of Investments.
4). INVESTMENT TRANSACTIONS
Purchases and sales of investment securities (excluding government and short-term investments) for the Fund during fiscal year 2019 were $191,957,767 and $50,699,805 respectively.
There were no purchases or sales/maturities of long-term U.S. government securities for the Fund during fiscal year 2019.
The Fund is permitted to purchase or sell securities from or to another fund in the Hennessy Funds family of funds (collectively, the “Hennessy Funds”) under specified conditions outlined in procedures adopted by the Board. The procedures have been designed to ensure that any purchase or sale of securities by the Fund from or to another Hennessy Fund complies with Rule 17a-7 of the Investment Company Act of 1940, as amended. During fiscal year 2019, the Fund did not engage in purchases or sales of securities pursuant to Rule 17a-7 of the Investment Company Act of 1940, as amended.
5). INVESTMENT ADVISORY FEE AND OTHER TRANSACTIONS WITH AFFILIATES
The Advisor provides the Fund with investment advisory services under an Investment Advisory Agreement. The Advisor oversees the provision of investment advice and furnishes office space, facilities, and most of the personnel needed by the Fund. As compensation for its services, the Advisor is entitled to a monthly fee from the Fund. The fee is based on the average daily net assets of the Fund at an annual rate of 0.80%. The net investment advisory fees expensed by the Fund during fiscal year 2019 are included in the Statement of Operations.
The Advisor has delegated the day-to-day management of the Fund to a sub-advisor, SPARX Asset Management Co., Ltd. The Advisor pays the sub-advisory fees from its own assets, and these fees are not an additional expense of the Fund. During fiscal year 2019, the Advisor (not the Fund) paid a sub-advisory fee at the average rate of 0.36% of the daily net assets of the Fund. Pursuant to the sub-advisory agreement, the Advisor pays sub-advisory fees at the rate of 0.35% of the first $500 million of daily net assets, 0.40% of daily net assets between $500 million and $1 billion, and 0.42% of daily net assets over $1 billion.
| NOTES TO THE FINANCIAL STATEMENTS |
The Board has approved a Shareholder Servicing Agreement for Investor Class shares of the Fund, which was instituted to compensate the Advisor for the non-investment advisory services it provides to the Fund. The Shareholder Servicing Agreement provides for a monthly fee paid to the Advisor at an annual rate of 0.10% of the average daily net assets of the Fund attributable to Investor Class shares. The shareholder service fees expensed by the Fund during fiscal year 2019 are included in the Statement of Operations.
The Fund has adopted a plan pursuant to Rule 12b-1 under the Investment Company Act of 1940, as amended, that authorizes payments in connection with the distribution of the Fund’s shares at an annual rate of up to 0.25% of the Fund’s average daily net assets attributable to Investor Class shares. Even though the authorized rate is up to 0.25%, the Fund is currently only using up to 0.15% of its average daily net assets attributable to Investor Class shares for such purpose. Amounts paid under the plan may be spent on any activities or expenses primarily intended to result in the sale of shares, including, but not limited to, advertising, shareholder account servicing, printing and mailing of prospectuses to other than current shareholders, printing and mailing of sales literature, and compensation for sales and marketing activities or to financial institutions and others, such as dealers and distributors. The distribution fees expensed by the Fund during fiscal year 2019 are included in the Statement of Operations.
The Fund has entered into agreements with various brokers, dealers, and financial intermediaries in connection with the sale of shares of the Fund. The agreements provide for periodic payments of sub-transfer agent expenses by the Fund to the brokers, dealers, and financial intermediaries for providing certain shareholder maintenance services. These shareholder services include the pre-processing and quality control of new accounts, shareholder correspondence, answering customer inquiries regarding account status, and facilitating shareholder telephone transactions. The sub-transfer agent fees expensed by the Fund during fiscal year 2019 are included in the Statement of Operations.
U.S. Bancorp Fund Services, LLC, d/b/a U.S. Bank Global Fund Services (“Fund Services”) provides the Fund with administrative, accounting, and transfer agent services. As administrator, Fund Services is responsible for activities such as (i) preparing various federal and state regulatory filings, reports, and returns for the Fund, (ii) preparing reports and materials to be supplied to the Board, (iii) monitoring the activities of the Fund’s custodian, transfer agent, and accountants, and (iv) coordinating the preparation and payment of the Fund’s expenses and reviewing the Fund’s expense accruals. U.S. Bank N.A., an affiliate of Fund Services, serves as the Fund’s custodian. The servicing agreements between the Trust and Fund Services and U.S. Bank N.A. contain a fee schedule that is inclusive of administrative, accounting, custody, and transfer agent fees. The administrative, accounting, custody, and transfer agent fees expensed by the Fund during fiscal year 2019 are included in the Statement of Operations.
Quasar Distributors, LLC (“Quasar”) acts as the Fund’s principal underwriter in a continuous public offering of the Fund’s shares. Quasar is an affiliate of Fund Services and U.S. Bank N.A.
The officers of the Fund are affiliated with the Advisor. With the exception of the Chief Compliance Officer and the Senior Compliance Officer, such officers receive no compensation from the Fund for serving in their respective roles. The Fund, along with the other Hennessy Funds, makes reimbursement payments on an equal basis to the Advisor for a portion of the salary and benefits associated with the office of the Chief Compliance Officer and for all of the salary and benefits associated with the office of the Senior Compliance Officer. The compliance fees expensed by the Fund during fiscal year 2019 are included in the Statement of Operations.
| HENNESSY FUNDS | 1-800-966-4354 | |
6). GUARANTEES AND INDEMNIFICATIONS
Under the Hennessy Funds’ organizational documents, their officers and trustees are indemnified by the Hennessy Funds against certain liabilities arising out of the performance of their duties to the Hennessy Funds. Additionally, in the normal course of business, the Hennessy Funds enter into contracts with service providers that contain general indemnification clauses. The Fund’s maximum exposure under these arrangements is unknown as this would involve future claims that may be made against the Fund that have not yet occurred. Currently, the Fund expects the risk of loss to be remote.
7). LINE OF CREDIT
The Fund has an uncommitted line of credit with the other Hennessy Funds in the amount of the lesser of (i) $100,000,000 or (ii) 33.33% of each Hennessy Fund’s net assets, or 30% for the Hennessy Gas Utility Fund and 10% for the Hennessy Balanced Fund, intended to provide short-term financing, if necessary, subject to certain restrictions, in connection with shareholder redemptions. The credit facility is with the Hennessy Funds’ custodian bank, U.S. Bank N.A. Borrowings under this arrangement bear interest at the bank’s prime rate and are secured by all of the Fund’s assets (as to its own borrowings only). During fiscal year 2019, the Fund did not have any borrowings outstanding under the line of credit.
8). FEDERAL TAX INFORMATION
As of October 31, 2019, the components of accumulated earnings (losses) for income tax purposes were as follows:
| | | Investments | |
| Cost of investments for tax purposes | | $ | 561,371,434 | |
| Gross tax unrealized appreciation | | $ | 154,957,601 | |
| Gross tax unrealized depreciation | | | (20,873,572 | ) |
| Net tax unrealized appreciation/(depreciation) | | $ | 134,084,029 | |
| Undistributed ordinary income | | $ | 2,548,524 | |
| Undistributed long-term capital gains | | | 522,621 | |
| Total distributable earnings | | $ | 3,071,145 | |
| Other accumulated gain/(loss) | | $ | — | |
| Total accumulated gain/(loss) | | $ | 137,155,174 | |
The difference between book-basis unrealized appreciation/depreciation and tax-basis unrealized appreciation/depreciation (as shown above) is attributable primarily to wash sales.
As of October 31, 2019, the Fund had no tax basis capital losses to offset future capital gains.
During fiscal year 2019, the capital losses utilized by the Fund were $279,907.
As of October 31, 2019, the Fund did not defer, on a tax basis, any late-year ordinary losses. Late-year ordinary losses are net ordinary losses incurred after December 31, 2018, but within the taxable year, that are deemed to arise on the first day of the Fund’s next taxable year.
| NOTES TO THE FINANCIAL STATEMENTS |
During fiscal year 2019 and fiscal year 2018, the tax character of distributions paid by the Fund was as follows:
| | | Year Ended | | | Year Ended | |
| | | October 31, 2019 | | | October 31, 2018 | |
Ordinary income(1) | | $ | 1,344,675 | | | $ | 208,528 | |
| Long-term capital gain | | | — | | | | — | |
| | | $ | 1,344,675 | | | $ | 208,528 | |
| | (1) Ordinary income includes short-term capital gain. |
9). EVENTS SUBSEQUENT TO YEAR END
Management has evaluated the Fund’s related events and transactions that occurred subsequent to October 31, 2019, through the date of issuance of the Fund’s financial statements. Other than as disclosed below, management has determined that there were no subsequent events requiring recognition or disclosure in the financial statements.
On November 25, 2019, U.S. Bancorp, the parent company of Quasar, announced that it had signed a purchase agreement to sell Quasar to Foreside Financial Group, LLC, such that Quasar will become a wholly-owned broker-dealer subsidiary of Foreside. The transaction is expected to close by the end of March 2020. Quasar will remain the Fund’s distributor at the close of the transaction, subject to Board approval.
On December 6, 2019, capital gains were declared and paid to shareholders of record on December 5, 2019, as follows:
| | | Long-term | |
| | Investor Class | $0.02769 | |
| | Institutional Class | $0.02860 | |
| HENNESSY FUNDS | 1-800-966-4354 | |
Report of Independent Registered Public
Accounting Firm
To the Board of Trustees of Hennessy Funds Trust
and the shareholders of the Hennessy Japan Fund
Novato, CA
Opinion on the Financial Statements
We have audited the accompanying statement of assets and liabilities of the Hennessy Japan Fund (the “Fund”), a series of Hennessy Funds Trust, including the schedule of investments, as of October 31, 2019, the related statement of operations for the year then ended, the statements of changes in net assets for each of the two years in the period then ended, the financial highlights for each of the three years in the period then ended, and the related notes (collectively referred to as the “financial statements”). In our opinion, the financial statements present fairly, in all material respects, the financial position of the Fund as of October 31, 2019, the results of its operations for the year then ended, the changes in its net assets for each of the two years in the period then ended, and the financial highlights for each of the three years in the period then ended in conformity with accounting principles generally accepted in the United States of America.
The financial highlights for each of the two years in the period ended October 31, 2016, have been audited by other auditors, whose report dated December 22, 2016, expressed unqualified opinions on such financial highlights.
Basis for Opinion
These financial statements are the responsibility of the Fund’s management. Our responsibility is to express an opinion on the Fund’s financial statements based on our audits. We are a public accounting firm registered with the Public Company Accounting Oversight Board (United States) (“PCAOB”) and are required to be independent with respect to the Fund in accordance with the U.S. federal securities laws and the applicable rules and regulations of the Securities and Exchange Commission and the PCAOB. We have served as the auditor of one or more of the funds in the Trust since 2002.
We conducted our audits in accordance with the standards of the PCAOB. Those standards require that we plan and perform the audit to obtain reasonable assurance about whether the financial statements are free of material misstatement, whether due to error or fraud. The Fund is not required to have, nor were we engaged to perform, an audit of its internal control over financial reporting. As part of our audits we are required to obtain an understanding of internal control over financial reporting, but not for the purpose of expressing an opinion on the effectiveness of the Fund’s internal control over financial reporting. Accordingly, we express no such opinion.
Our audits included performing procedures to assess the risks of material misstatement of the financial statements, whether due to error or fraud, and performing procedures that respond to those risks. Such procedures included examining, on a test basis, evidence regarding the amounts and disclosures in the financial statements. Our audits also included evaluating the accounting principles used and significant estimates made by management, as well as evaluating the overall presentation of the financial statements. Our procedures included confirmation of securities owned as of October 31, 2019, by correspondence with the custodian. We believe that our audits provide a reasonable basis for our opinion.
| | |
| | TAIT, WELLER & BAKER LLP |
Philadelphia, Pennsylvania
December 24, 2019
| REPORT OF INDEPENDENT REGISTERED PUBLIC ACCOUNTING FIRM/TRUSTEES AND OFFICERS |
Trustees and Officers of the Fund (Unaudited)
The business and affairs of the Funds are managed under the direction of the Board of Trustees of the Trust, and the Board of Trustees elects the officers of the Trust. From time to time, the Board of Trustees also has appointed advisers to the Board of Trustees (“Advisers”) with the intention of having qualified individuals serve in an advisory capacity in order to garner experience in the mutual fund and asset management industry and be considered as potential Trustees in the future. There are currently three Advisers: Brian Alexander, Doug Franklin, and Claire Knoles. As Advisers, Mr. Alexander, Mr. Franklin, and Ms. Knoles attend meetings of the Board of Trustees and act as non-voting participants. Information pertaining to the Trustees, Advisers, and the officers of the Trust is set forth below. The Trustees and officers serve until their successors are duly elected and qualified or until their earlier death, resignation, or removal. Each Trustee oversees the 16 Hennessy Funds. Unless otherwise indicated, the address of all persons listed below is 7250 Redwood Boulevard, Suite 200, Novato, CA 94945. The Fund’s Statement of Additional Information includes more information about the persons listed below and is available without charge by calling 1-800-966-4354 or by visiting www.hennessyfunds.com.
| | | | Other |
| | | | Directorships |
| | | | Held Outside |
| Name, (Year of Birth), | | | of Fund |
| and Position Held | Start Date | Principal Occupation(s) | Complex During |
with the Trust | of Service | During Past Five Years | Past Five Years |
| | | | |
| Disinterested Trustees and Advisers | | | |
| | | | |
| J. Dennis DeSousa | January 1996 | Mr. DeSousa is a real estate investor. | None. |
| (1936) | | | |
| Trustee | | | |
| | | | |
| Robert T. Doyle | January 1996 | Mr. Doyle has been the Sheriff of | None. |
| (1947) | | Marin County, California since 1996. | |
| Trustee | | | |
| | | | |
| Gerald P. Richardson | May 2004 | Mr. Richardson is an independent | None. |
| (1945) | | consultant in the securities industry. | |
| Trustee | | | |
| Brian Alexander | March 2015 | Mr. Alexander has worked for the | None. |
| (1981) | | Sutter Health organization since | |
| Adviser to the Board | | 2011 in various positions. He has | |
| | | served as the Chief Executive Officer | |
| | | of the Sutter Roseville Medical | |
| | | Center since 2018. From 2016 through | |
| | | 2018, he served as the Vice President | |
| | | of Strategy for the Sutter Health Valley | |
| | | Area, which includes 11 hospitals, | |
| | | 13 ambulatory surgery centers, | |
| | | 16,000 employees, and 1,900 physicians. | |
| | | From 2013 through 2016, Mr. Alexander | |
| | | served as Sutter Novato Community | |
| | | Hospital’s Chief Administrative Officer. | |
| HENNESSY FUNDS | 1-800-966-4354 | |
| | | | Other |
| | | | Directorships |
| | | | Held Outside |
| Name, (Year of Birth), | | | of Fund |
| and Position Held | Start Date | Principal Occupation(s) | Complex During |
with the Trust | of Service | During Past Five Years | Past Five Years |
| | | | |
| Doug Franklin | March 2016 | Mr. Franklin is a retired insurance | None. |
| (1964) | | industry executive. From 1987 | |
| Adviser to the Board | | through 2015, he was employed | |
| | | by the Allianz-Fireman’s Fund | |
| | | Insurance Company in various | |
| | | positions, including as its Chief | |
| | | Actuary and Chief Risk Officer. | |
| | | | |
| Claire Knoles | December 2015 | Ms. Knoles is a founder of Kiosk and | None. |
| (1974) | | has served as its Chief Operating | |
| Adviser to the Board | | Officer since 2004. Kiosk is a full- | |
| | | service marketing agency with | |
| | | offices in the San Francisco Bay | |
| | | Area, Toronto, and Liverpool, UK. | |
| | | | |
Interested Trustee(1) | | | |
| | | | |
| Neil J. Hennessy | January 1996 as | Mr. Hennessy has been employed | Hennessy |
| (1956) | a Trustee and | by Hennessy Advisors, Inc. since | Advisors, Inc. |
| Trustee, Chairman of | June 2008 as | 1989 and currently serves as its | |
| the Board, Chief | an officer | Chairman and Chief Executive Officer. | |
| Investment Officer, | | | |
| Portfolio Manager, | | | |
| and President | | | |
| Name, (Year of Birth), | | |
| and Position Held | Start Date | Principal Occupation(s) |
with the Trust | of Service | During Past Five Years |
| | | |
| Officers | | |
| | | |
| Teresa M. Nilsen | January 1996 | Ms. Nilsen has been employed by Hennessy Advisors, Inc. |
| (1966) | | since 1989 and currently serves as its President, Chief Operating |
| Executive Vice President | | Officer, and Secretary. |
| and Treasurer | | |
| | | |
| Daniel B. Steadman | March 2000 | Mr. Steadman has been employed by Hennessy Advisors, Inc. |
| (1956) | | since 2000 and currently serves as its Executive Vice President. |
| Executive Vice President | | |
| and Secretary | | |
| | | |
| Brian Carlson | December 2013 | Mr. Carlson has been employed by Hennessy Advisors, Inc. |
| (1972) | | since December 2013 and currently serves as its Chief |
| Senior Vice President | | Compliance Officer and Senior Vice President. |
| and Head of Distribution | | |
| | | |
| Jennifer Cheskiewicz | June 2013 | Ms. Cheskiewicz has been employed by Hennessy Advisors, Inc. |
(1977)(2) | | as its General Counsel since June 2013. |
| Senior Vice President and | | |
| Chief Compliance Officer | | |
| TRUSTEES AND OFFICERS OF THE FUND |
| Name, (Year of Birth), | | |
| and Position Held | Start Date | Principal Occupation(s) |
with the Trust | of Service | During Past Five Years |
| | | |
| David Ellison | October 2012 | Mr. Ellison has been employed by Hennessy Advisors, Inc. since |
(1958)(3) | | October 2012. He has served as a Portfolio Manager of the |
| Senior Vice President | | Hennessy Large Cap Financial Fund and the Hennessy Small |
| and Portfolio Manager | | Cap Financial Fund since their inception. Mr. Ellison also served |
| | | as a Portfolio Manager of the Hennessy Technology Fund from |
| | | its inception until February 2017. Mr. Ellison served as Director, |
| | | CIO and President of FBR Fund Advisers, Inc. from December |
| | | 1999 to October 2012. |
| | | |
| Ryan Kelley | March 2013 | Mr. Kelley has been employed by Hennessy Advisors, Inc. since |
(1972)(4) | | October 2012. He has served as a Portfolio Manager of the |
| Senior Vice President | | Hennessy Gas Utility Fund, the Hennessy Large Cap Financial |
| and Portfolio Manager | | Fund, and the Hennessy Small Cap Financial Fund since |
| | | October 2014. He served as Co- Portfolio Manager of these |
| | | same funds from March 2013 through September 2014 and as |
| | | a Portfolio Analyst for the Hennessy Funds from October 2012 |
| | | through February 2013. Mr. Kelley has also served as a Portfolio |
| | | Manager of the Hennessy Cornerstone Growth Fund, the |
| | | Hennessy Cornerstone Mid Cap 30 Fund, the Hennessy |
| | | Cornerstone Large Growth Fund, and the Hennessy |
| | | Cornerstone Value Fund since February 2017 and as a Portfolio |
| | | Manager of the Hennessy Total Return Fund, the Hennessy |
| | | Balanced Fund, and the Hennessy Technology Fund since May |
| | | 2018. He served as Co- Portfolio Manager of the Hennessy |
| | | Technology Fund from February 2017 until May 2018. Mr. Kelley |
| | | served as Portfolio Manager of FBR Fund Advisers, Inc. from |
| | | January 2008 to October 2012. |
| | | |
| Tania Kelley | October 2003 | Ms. Kelley has been employed by Hennessy Advisors, Inc. since |
| (1965) | | October 2003. |
| Senior Vice President | | |
| and Head of Marketing | | |
| | | |
| L. Joshua Wein | September 2018 | Mr. Wein has been employed by Hennessy Advisors, Inc. |
(1973)(4) | | since 2018. He has served as Co-Portfolio Manager of the |
| Vice President and | | Hennessy Cornerstone Growth Fund, the Hennessy |
| Co-Portfolio Manager | | Cornerstone Mid Cap 30 Fund, the Hennessy Cornerstone Large |
| | | Growth Fund, the Hennessy Cornerstone Value Fund, Hennessy |
| | | Total Return Fund, the Hennessy Balanced Fund, the Hennessy |
| | | Gas Utility Fund, and the Hennessy Technology Fund since |
| | | February 2019. Prior to that, he served as a Senior Analyst of |
| | | those same funds since September 2018. Mr. Wein served as |
| | | Director of Alternative Investments and Co-Portfolio Manager |
| | | at Sterling Capital Management from 2008 to 2018. |
_______________
(1) | Mr. Hennessy is considered an “interested person,” as defined in the Investment Company Act of 1940, as amended, because he is an officer of the Trust. |
(2) | The address of this officer is 4800 Bee Caves Road, Suite 100, Austin, TX 78746. |
(3) | The address of this officer is 101 Federal Street, Suite 1900, Boston, MA 02110. |
(4) | The address of this officer is 1340 Environ Way, Chapel Hill, NC 27517. |
| HENNESSY FUNDS | 1-800-966-4354 | |
Expense Example (Unaudited)
October 31, 2019
As a shareholder of the Fund, you incur ongoing costs, including management fees, service fees, and other Fund expenses. This Example is intended to help you understand your ongoing costs (in dollars) of investing in the Fund and to compare these costs with the ongoing costs of investing in other mutual funds. The Example is based on an investment of $1,000 invested at the beginning of the period and held for the entire period from May 1, 2019, through October 31, 2019.
Actual Expenses
The first line of the table below under the “Investor Class” and “Institutional Class” headings provides information about actual account values and actual expenses. Although the Fund charges no sales loads or transaction fees, you will be assessed fees for outgoing wire transfers, returned checks and stop payment orders at prevailing rates charged by U.S. Bank Global Fund Services, the Fund’s transfer agent. If you request that a redemption be made by wire transfer, currently a $15 fee is charged by the Fund’s transfer agent. IRA accounts will be charged a $15 annual maintenance fee. The example below includes, but is not limited to, management fees, shareholder servicing fees, accounting, custody, and transfer agent fees. However, the example below does not include portfolio trading commissions and related expenses. You may use the information in this line, together with the amount you invested, to estimate the expenses that you paid over the period. Simply divide your account value by $1,000 (for example, an $8,600 account value divided by $1,000 = 8.6), then multiply the result by the number in the first line of the table under the “Investor Class” or “Institutional Class” headings in the column entitled “Expenses Paid During Period” to estimate the expenses you paid on your account during this period.
Hypothetical Example for Comparison Purposes
The second line of the table below under the “Investor Class” and “Institutional Class” headings provides information about hypothetical account values and hypothetical expenses based on the Fund’s actual expense ratios and an assumed rate of return of 5% per year before expenses, which is not the Fund’s actual return. The hypothetical account values and expenses may not be used to estimate the actual ending account balance or expenses you paid for the period. You may use this information to compare the ongoing costs of investing in the Fund and other funds. To do so, compare this 5% hypothetical example with the 5% hypothetical examples that appear in the shareholder reports of the other funds. Please note that the expenses shown in the table are meant to highlight your ongoing costs only. Therefore, the second line of the table under the “Investor Class” and “Institutional Class” headings is useful in comparing ongoing costs only and will not help you determine the relative total costs of owning different funds.
| | | | Expenses Paid |
| | Beginning | Ending | During Period(1) |
| | Account Value | Account Value | May 1, 2019 – |
| | May 1, 2019 | October 31, 2019 | October 31, 2019 |
| Investor Class | | | |
| Actual | $1,000.00 | $1,032.50 | $7.47 |
| Hypothetical (5% return before expenses) | $1,000.00 | $1,017.86 | $7.42 |
| | | | |
| Institutional Class | | | |
| Actual | $1,000.00 | $1,034.20 | $5.47 |
| Hypothetical (5% return before expenses) | $1,000.00 | $1,019.83 | $5.43 |
(1) | Expenses are equal to the Fund’s annualized expense ratio of 1.46% for Investor Class shares or 1.07% for Institutional Class shares, as applicable, multiplied by the average account value over the period, multiplied by 184/365 days (to reflect one-half year period). |
| HENNESSY FUNDS | 1-800-966-4354 | |
How to Obtain a Copy of the Fund’s
Proxy Voting Policy and Proxy Voting Records
A description of the policies and procedures the Fund uses to determine how to vote proxies relating to portfolio securities is available without charge: (1) by calling 1-800-966-4354; (2) on the Hennessy Funds’ website at www.hennessyfunds.com/proxy-voting/voting-policy; or (3) on the U.S. Securities and Exchange Commission’s (the “SEC”) website at www.sec.gov. The Fund’s proxy voting record is available without charge on both the Hennessy Funds’ website at www.hennessyfunds.com/proxy-voting/voting-record and the SEC’s website at www.sec.gov no later than August 31 for the prior 12 months ending June 30.
Availability of Quarterly Portfolio Schedule
For periods ending on or prior to January 31, 2019, the Fund has filed a complete schedule of portfolio holdings with the SEC for the first and third quarters of each fiscal year on Form N-Q. For periods ending on or after April 30, 2019, the Fund files a complete schedule of portfolio holdings with the SEC for the first and third quarters of each fiscal year as an exhibit to its reports on Form N-PORT. The Fund’s Forms N-Q and Forms N-PORT are available on the SEC’s website at www.sec.gov or on request by calling 1-800-966-4354.
Federal Tax Distribution Information (Unaudited)
For fiscal year 2019, certain dividends paid by the Fund may be subject to a maximum tax rate of 23.8%, as provided for by the Jobs and Growth Tax Relief Reconciliation Act of 2003. The percentage of dividends declared from ordinary income designated as qualified dividend income was 100.00%.
For corporate shareholders, the percent of ordinary income distributions that qualified for the corporate dividends received deduction for fiscal year 2019 was 0.00%.
The percentage of taxable ordinary income distributions that were designated as short-term capital gain distributions under Section 871(k)(2)(C) of the Internal Revenue Code of 1986, as amended, for the Fund was 0.00%.
For the year ended October 31, 2019, the Fund earned foreign-source income and paid foreign taxes as noted below, which it intends to pass through to its shareholders pursuant to Section 853 of the Internal Revenue Code.
| | | Gross Foreign Income | Foreign Tax Paid | |
| | Japan | $10,290,290 | $1,029,031 | |
Important Notice Regarding Delivery
of Shareholder Documents
To help keep the Fund’s costs as low as possible, we generally deliver a single copy of shareholder reports, proxy statements, and prospectuses to shareholders who share an address and have the same last name. This process does not apply to account statements. You may request an individual copy of a shareholder document at any time. If you would like to receive separate mailings of shareholder documents, please call U.S. Bank Global Fund Services at 1-800-261-6950 or 1-414-765-4124, and individual delivery will begin within 30 days of your request. If your account is held through a financial institution or other intermediary, please contact such intermediary directly to request individual delivery.
| PROXY VOTING — PRIVACY POLICY |
Electronic Delivery
The Funds offer shareholders the option to receive account statements, Prospectuses, tax forms, and reports online. To sign up for eDelivery, please visit www.hennessyfunds.com. You may change your delivery preference at any time by visiting our website or contacting the Funds at 1-800-261-6950.
Privacy Policy
We collect the following non-public personal information about you:
| | • | information we receive from you on or in applications or other forms, correspondence, or conversations, including, but not limited to, your name, address, phone number, social security number, assets, income, and date of birth; and |
| | | |
| | • | information about your transactions with us, our affiliates, or others, including, but not limited to, your account number and balance, payment history, parties to transactions, cost basis information, and other financial information. |
We do not disclose any non-public personal information about our current or former shareholders to non-affiliated third parties, except as permitted by law. For example, we are permitted by law to disclose all of the information we collect, as described above, to our Transfer Agent to process your transactions. Furthermore, we restrict access to your non-public personal information to those persons who require such information to provide products or services to you. We maintain physical, electronic, and procedural safeguards that comply with federal standards to guard your non-public personal information.
In the event that you hold shares of the Fund through a financial intermediary, including, but not limited to, a broker-dealer, bank, or trust company, the privacy policy of your financial intermediary would govern how your non-public personal information will be shared with non-affiliated third parties.
| HENNESSY FUNDS | 1-800-966-4354 | |
For information, questions or assistance, please call
The Hennessy Funds
1-800-966-4354 or 1-415-899-1555
INVESTMENT ADVISOR
Hennessy Advisors, Inc.
7250 Redwood Boulevard, Suite 200
Novato, California 94945
ADMINISTRATOR,
TRANSFER AGENT,
DIVIDEND PAYING AGENT, &
SHAREHOLDER SERVICING AGENT
U.S. Bancorp Fund Services, LLC
d/b/a U.S. Bank Global Fund Services
P.O. Box 701
Milwaukee, Wisconsin 53201-0701
CUSTODIAN
U.S. Bank N.A.
Custody Operations
1555 North River Center Drive, Suite 302
Milwaukee, Wisconsin 53212
TRUSTEES
Neil J. Hennessy
Robert T. Doyle
J. Dennis DeSousa
Gerald P. Richardson
COUNSEL
Foley & Lardner LLP
777 East Wisconsin Avenue
Milwaukee, Wisconsin 53202-5306
INDEPENDENT REGISTERED
PUBLIC ACCOUNTING FIRM
Tait, Weller & Baker LLP
Two Liberty Place
50 South 16th Street, Suite 2900
Philadelphia, Pennsylvania 19103-2529
DISTRIBUTOR
Quasar Distributors, LLC
777 East Wisconsin Avenue
Milwaukee, Wisconsin 53202
www.hennessyfunds.com | 1-800-966-4354
This report has been prepared for shareholders and may be distributed to
others only if preceded or accompanied by a current prospectus.
ANNUAL REPORT
OCTOBER 31, 2019
HENNESSY JAPAN SMALL CAP FUND
Investor Class HJPSX
Institutional Class HJSIX
IMPORTANT NOTICE REGARDING ELECTRONIC DELIVERY OF SHAREHOLDER REPORTS
Beginning on January 1, 2021, as permitted by regulations adopted by the Securities and Exchange Commission, paper copies of the annual and semi-annual reports will no longer be sent by mail unless you specifically request paper copies from the Hennessy Funds or from your financial intermediary. Instead, the reports will be made available on a website, and you will be notified by mail each time a report is posted and provided with a website link to access the report.
If you have already elected to receive shareholder reports electronically, you will not be affected by this change and you need not take any action. You may elect to receive shareholder reports and other communications from the Hennessy Funds electronically by visiting www.hennessyfunds.com/account or by calling U.S. Bank Global Fund Services at 1-800-261-6950. If you own shares in a Fund through a financial intermediary, please contact your financial intermediary to make this election.
You may elect to receive paper copies of all future reports free of charge by calling U.S. Bank Global Fund Services at 1-800-261-6950 or, if you own your shares through a financial intermediary, by contacting your financial intermediary. Your election to receive paper copies of reports will apply to all Funds in the Hennessy Funds family.
hennessyfunds.com | 1-800-966-4354
(This Page Intentionally Left Blank.)
Contents
| Letter to Shareholders | 2 |
| Performance Overview | 4 |
| Financial Statements | |
| Schedule of Investments | 7 |
| Statement of Assets and Liabilities | 12 |
| Statement of Operations | 13 |
| Statements of Changes in Net Assets | 15 |
| Financial Highlights | 16 |
| Notes to the Financial Statements | 20 |
| Report of Independent Registered Public Accounting Firm | 28 |
| Trustees and Officers of the Fund | 29 |
| Expense Example | 32 |
| Proxy Voting Policy and Proxy Voting Records | 34 |
| Availability of Quarterly Portfolio Schedule | 34 |
| Federal Tax Distribution Information | 34 |
| Important Notice Regarding Delivery of Shareholder Documents | 34 |
| Electronic Delivery | 35 |
| Privacy Policy | 35 |
| HENNESSY FUNDS | 1-800-966-4354 | |
December 2019
Dear Hennessy Funds Shareholder:
The Japanese stock market gained 8.45% in U.S. dollar terms as measured by the Tokyo Stock Price Index (TOPIX) over the 12 months ended October 31, 2019. Geopolitical developments affected Japanese stocks throughout the year, and a number of companies made downward corrections to their performance primarily due to the U.S.-China trade dispute and concerns over the declining Chinese economy.
It is nearly impossible to completely steer clear of anything related to China, directly or indirectly, as it is the world’s second largest economy. You may choose to eliminate companies having operations in China from your portfolio, but then there are second order effects, such as declining inbound Chinese tourists hurting the Japanese domestic economy, and so forth. Such second order effects may also impact your portfolio. Moreover, we believe China will remain an important market over the long run that will be hard to ignore.
Nonetheless, the Japanese economy continued to exhibit relatively strong growth, and the inflation rate remained positive over the past year. Prime Minister Shinzo Abe, now in his 7th year and serving longer than the previous six leaders combined, continued to provide much needed policy continuity and a pro-reform stance. The Japanese stock market closed the 12 months ended October 31, 2019, on a positive note thanks to robust economic metrics in the U.S., the belief that the U.S.-China trade dispute would be settled, and expectations that U.S. interest rates had bottomed out, which led to a return to a weaker yen.
Moreover, we believe the structural reform program in Japan continues to progress well. In October 2019, the government implemented a consumption tax increase from 8% to 10%. Compared to the previous hike in April 2014 from 5% to 8%, there seems to be a much smaller pre-tax increase in consumer demand this time. We may, therefore, see a much smaller post-tax negative impact on consumer demand than the last time. One of the possible reasons is because the government offered several consumer subsidy schemes that will remain in effect for more than six months to support consumption. In the labor market, unemployment remains low while the numbers of female, older, and foreign workers in Japan have grown. The country is also making progress on corporate governance reform. The percentage of independent directors exceeded 30% for the first time among listed companies (on the First Section of the Tokyo Stock Exchange, including Financials), and that of female directors is increasing as well, reaching 6%. Last but not least, the Japanese stock market is seeing a record pace of share buybacks and dividend payouts, partly due to unwinding cross share-holdings.
We remain optimistic about the long-term prospects for Japan and its stock market. Thank you for your continued confidence and investment in the Hennessy Funds.
Sincerely,
| |
| Tadahiro Fujimura | Masakazu Takeda |
| Portfolio Manager, | Portfolio Manager, |
| Hennessy Japan Small Cap Fund; | Hennessy Japan Fund; |
| Chief Investment Officer | Fund Manager |
| SPARX Asset Management Co., Ltd. | SPARX Asset Management Co., Ltd. |
SPARX Asset Management Co., Ltd., located in Tokyo, Japan, is the sub-advisor to the Hennessy Japan Fund and the Hennessy Japan Small Cap Fund.
Past performance does not guarantee future results.
Mutual fund investing involves risk. Principal loss is possible.
Opinions expressed are those of Tadahiro Fujimura and Masakazu Takeda and are subject to change, are not guaranteed, and should not be considered investment advice.
The Tokyo Stock Price Index (TOPIX) is a capitalization-weighted index of all the companies listed on the First Section of the Tokyo Stock Exchange. One cannot invest directly in an index.
| HENNESSY FUNDS | 1-800-966-4354 | |
Performance Overview (Unaudited)
CHANGE IN VALUE OF $10,000 INVESTMENT
This graph illustrates the performance of an initial investment of $10,000 made in the Fund ten years ago and assumes the reinvestment of dividends.
AVERAGE ANNUAL TOTAL RETURN FOR PERIODS ENDED OCTOBER 31, 2019
| | One | Five | Ten |
| | Year | Years | Years |
| Hennessy Japan Small Cap Fund – | | | |
| Investor Class (HJPSX) | 6.30% | 12.35% | 12.58% |
| Hennessy Japan Small Cap Fund – | | | |
Institutional Class (HJSIX)(1) | 6.73% | 12.68% | 12.74% |
Russell/Nomura Small CapTM Index | 5.36% | 9.21% | 8.75% |
| Tokyo Price Index (TOPIX) | 8.45% | 7.65% | 6.81% |
Expense ratios: 1.47% (Investor Class); 1.05% (Institutional Class)
(1) | The inception date of Institutional Class shares is June 15, 2015. Performance shown prior to the inception of Institutional Class shares reflects the performance of Investor Class shares and includes expenses that are not applicable to, and are higher than, those of Institutional Class shares. |
Performance data quoted represents past performance; past performance does not guarantee future results. The investment return and principal value of an investment will fluctuate so that an investor’s shares, when redeemed, may be worth more or less than their original cost. The performance table does not reflect the deduction of taxes that a shareholder would pay on Fund distributions or the redemption of Fund shares. Current performance of the Fund may be lower or higher than the performance quoted. Performance data current to the most recent month end may be obtained by visiting www.hennessyfunds.com.
The Russell/Nomura Small Cap™ Index contains the bottom 15% of the Russell/Nomura Total Market™ Index based on market capitalization. The Russell/Nomura Total Market™ Index contains the top 98% of all stocks listed on Japan’s stock exchanges and registered on Japan’s over-the-counter market based on market capitalization. The Tokyo Price Index (TOPIX) is a market capitalization-weighted index of all of the companies listed on the First Section of the Tokyo Stock Exchange. One cannot invest directly in an index. These indices are used herein for comparative purposes in accordance with SEC regulations.
Frank Russell Company (“Russell”) is the source and owner of the trademarks, service marks, and copyrights related to the Russell Indexes. Russell® is a trademark of Russell. Neither Russell nor its licensors accept any liability for any errors or omissions in the
Russell Indexes or Russell ratings or underlying data and no party may rely on any Russell Indexes or Russell ratings or underlying data contained in this communication. No further distribution of Russell data is permitted without Russell’s express written consent. Russell does not promote, sponsor, or endorse the content of this communication.
The expense ratios presented are from the most recent prospectus. The expense ratios for the current reporting period are available in the Financial Highlights section of this report.
PERFORMANCE NARRATIVE
Portfolio Managers Tadahiro Fujimura, CFA and CMA*, and Tetsuya Hirano, CMA*
SPARX Asset Management Co., Ltd. (sub-advisor)
Performance:
For the 12-month period ended October 31, 2019, the Investor Class of the Hennessy Japan Small Cap Fund returned 6.30%, outperforming the Russell/Nomura Small Cap™ Index (the Fund’s primary benchmark), which returned 5.36%, but underperforming the Tokyo Stock Price Index (TOPIX), which returned 8.45%, for the same period, in U.S. dollar terms.
Over the past year, domestic, non-manufacturing names have performed better than manufacturers who have more exposure of overseas sales. We believe valuation differences and trade and geopolitical conflicts have caused this market phenomena. We increased exposure to domestic stocks toward the middle of 2019 during this uncertain overseas environment, but started reducing domestic exposure after September because of narrowing valuation gaps.
In terms of individual stocks, Kobe Bussan Co. Ltd., a food production and distribution company that operates discount retail stores, was the best contributor to Fund performance. Consumer preference for low prices led to increased demand for the company’s products, and we expect this trend to continue. The company is able to provide quality products at competitive prices through continuous improvement not only in their supply chain management but also in their store operational efficiency. Electronics, communications, and visual content production provider SUNCORPORATION also contributed positively to Fund performance as investors expected significant profits growth from an acquired Israeli company that is a market leader in forensic software. Benefit One, Inc., an administration service provider for benefits, health checkups, and health guidance, also performed well as their BPO (business process outsourcing) business contributed significantly to providing solutions to labor-market issues.
The worst contributor to Fund performance was UMC Electronics Co., Ltd., an electronics manufacturing services company. The company experienced accounting problems in its Chinese subsidiary in July 2019, which led to the risk of delisting due to the delay in submitting financial statements. Mimaki Engineering Co., Ltd., a provider of industrial inkjet printers, cutting plotters, and inks, also performed poorly due to weak sales, especially in the European Union, and intensifying competition among their existing products. Shares of global market research and digital marketing solutions provider Macromill, Inc. also declined due to worse than expected overseas operations and decreased earnings from traditional marketing due to their client’s rapid shift toward digital marketing.
The Fund has fully divested from UMC Electronics Co., Ltd. and Macromill, Inc.
| HENNESSY FUNDS | 1-800-966-4354 | |
Portfolio Strategy and Investment Commentary:
Looking at the Japanese economy, we may face a short correction due to worsening consumer sentiment caused by a consumption tax increase, which occurred from October 1, 2019. However, looking at the business environment, the worst seems to be behind us. The decline in global production due to trade conflicts between China and the U.S. has already bottomed, and we expect a recovery. The agreement between Japan and the U.S. has been a relief for Japanese manufacturers, and they expect to increase investments in coming months. We also expect global smartphone and semiconductor markets to recover after the inventory correction. Earnings of Japanese companies should recover following these trends. Japanese small-caps have underperformed the broader market over the past six months, mainly due to profit taking and concerns over fundamentals. Valuations overall hit multi-year lows, and in general, small-cap stocks became cheaper than large caps. Therefore, we expect the Japanese stock market to perform favorably, with better performance of small-cap stocks in particular.
The investment strategy of the Fund remains the same. The Fund seeks companies with strong business models and exceptional management trading at attractive valuations. In addition, considering the environment described above, we will focus more on manufacturing sectors whose valuations have become relatively more attractive with a more promising long-term growth scenario.
_______________
* Chartered Member of the Security Analysts Association of Japan
Opinions expressed are those of the Portfolio Managers as of the date written and are subject to change, are not guaranteed, and should not be considered investment advice or an indication of trading intent.
The Fund invests in small-capitalization and medium-capitalization companies, which may have more limited liquidity and greater price volatility than large-capitalization companies. The Fund invests in the stocks of companies operating in Japan; single-country funds may be subject to a higher degree of risk. The Fund may experience higher fees due to investments in pooled investment vehicles (including ETFs). Please see the Fund’s prospectus for a more complete discussion of these and other risks.
References to specific securities should not be considered a recommendation to buy or sell any security. Fund holdings and sector allocations are subject to change. Please refer to the Schedule of Investments included in this report for additional portfolio information.
| PERFORMANCE OVERVIEW/SCHEDULE OF INVESTMENTS |
Financial Statements
Schedule of Investments as of October 31, 2019 |
HENNESSY JAPAN SMALL CAP FUND
(% of Net Assets)
| TOP TEN HOLDINGS (EXCLUDING MONEY MARKET FUNDS) | % NET ASSETS |
| Takeei Corp. | 2.74% |
| Sato Holdings Corp. | 2.51% |
| Daihen Corp. | 2.37% |
| Nippon Koei Co., Ltd. | 2.27% |
| NS Solutions Corp. | 2.25% |
| Elecom Co., Ltd. | 2.25% |
| METAWATER Co., Ltd. | 2.21% |
| Kobe Bussan Co., Ltd. | 2.21% |
| Kito Corp. | 2.19% |
| Hanwa Co., Ltd. | 2.17% |
Note: For presentation purposes, the Fund has grouped some of the industry categories. For purposes of categorizing securities for compliance with Section 8(b)(1) of the Investment Company Act of 1940, as amended, the Fund uses more specific industry classifications.
The Global Industry Classification Standard (GICS®) was developed by and is the exclusive property and a service mark of MSCI, Inc. and Standard & Poor’s Financial Services LLC. It has been licensed for use by the Hennessy Funds.
| HENNESSY FUNDS | 1-800-966-4354 | |
| COMMON STOCKS – 96.35% | | Number | | | | | | % of | |
| | | of Shares | | | Value | | | Net Assets | |
| Communication Services – 2.03% | | | | | | | | | |
| Kakaku.com., Inc. | | | 113,700 | | | $ | 2,640,102 | | | | 2.03 | % |
| | | | | | | | | | | | | |
| Consumer Discretionary – 14.47% | | | | | | | | | | | | |
| Bic Camera, Inc. | | | 125,300 | | | | 1,368,036 | | | | 1.05 | % |
| DCM Holdings Co., Ltd. | | | 207,900 | | | | 2,058,043 | | | | 1.58 | % |
| Hiramatsu, Inc. | | | 199,900 | | | | 587,418 | | | | 0.45 | % |
| Kasai Kogyo Co., Ltd. | | | 213,400 | | | | 1,727,169 | | | | 1.33 | % |
| Kushikatsu Tanaka Holdings Co. | | | 33,800 | | | | 742,617 | | | | 0.57 | % |
| Matsuoka Corp. | | | 65,500 | | | | 1,198,122 | | | | 0.92 | % |
| Nojima Corp. | | | 74,700 | | | | 1,325,123 | | | | 1.02 | % |
| Pacific Industrial Co., Ltd. | | | 183,300 | | | | 2,501,176 | | | | 1.92 | % |
| Parco Co., Ltd. | | | 120,900 | | | | 1,456,955 | | | | 1.12 | % |
| Saizeriya Co., Ltd. | | | 111,900 | | | | 2,540,594 | | | | 1.95 | % |
| Seiren Co., Ltd. | | | 106,400 | | | | 1,311,721 | | | | 1.01 | % |
| Studio Atao Co., Ltd. | | | 82,900 | | | | 475,572 | | | | 0.37 | % |
| TPR Co., Ltd. | | | 85,600 | | | | 1,532,416 | | | | 1.18 | % |
| | | | | | | | 18,824,962 | | | | 14.47 | % |
| | | | | | | | | | | | | |
| Consumer Staples – 6.25% | | | | | | | | | | | | |
| Cosmos Pharmaceutical Corp. | | | 9,500 | | | | 1,961,854 | | | | 1.51 | % |
| Kobe Bussan Co., Ltd. | | | 97,200 | | | | 2,876,223 | | | | 2.21 | % |
| Nishimoto Co., Ltd. | | | 69,000 | | | | 2,224,703 | | | | 1.71 | % |
| Starzen Co., Ltd. | | | 25,300 | | | | 1,066,430 | | | | 0.82 | % |
| | | | | | | | 8,129,210 | | | | 6.25 | % |
| | | | | | | | | | | | | |
| Financials – 1.64% | | | | | | | | | | | | |
| Lifenet Insurance Co. (a) | | | 330,700 | | | | 2,139,508 | | | | 1.64 | % |
| | | | | | | | | | | | | |
| Health Care – 2.40% | | | | | | | | | | | | |
| CYBERDYNE, Inc. (a) | | | 95,800 | | | | 616,781 | | | | 0.48 | % |
| Ship Healthcare Holdings, Inc. | | | 58,700 | | | | 2,501,897 | | | | 1.92 | % |
| | | | | | | | 3,118,678 | | | | 2.40 | % |
| | | | | | | | | | | | | |
| Industrials – 40.50% | | | | | | | | | | | | |
| Bell System24 Holdings, Inc. | | | 137,000 | | | | 2,237,709 | | | | 1.72 | % |
| Benefit One, Inc. | | | 134,500 | | | | 2,722,614 | | | | 2.09 | % |
| Daihen Corp. | | | 98,300 | | | | 3,080,728 | | | | 2.37 | % |
| Fugi Corp. | | | 83,600 | | | | 1,388,199 | | | | 1.07 | % |
| Hamakyorex Co., Ltd. | | | 23,100 | | | | 788,187 | | | | 0.61 | % |
The accompanying notes are an integral part of these financial statements.
| COMMON STOCKS | | Number | | | | | | % of | |
| | | of Shares | | | Value | | | Net Assets | |
| Industrials (Continued) | | | | | | | | | |
| Hanwa Co., Ltd. | | | 96,900 | | | $ | 2,823,037 | | | | 2.17 | % |
| Hito Communications Holdings, Inc. | | | 155,800 | | | | 2,389,923 | | | | 1.84 | % |
| Hoshizaki Corp. | | | 16,000 | | | | 1,360,037 | | | | 1.05 | % |
| Juki Corp. | | | 125,800 | | | | 1,134,715 | | | | 0.87 | % |
| KAWADA TECHNOLOGIES, Inc. | | | 28,300 | | | | 1,865,341 | | | | 1.43 | % |
| Kito Corp. | | | 187,500 | | | | 2,853,219 | | | | 2.19 | % |
| METAWATER Co., Ltd. | | | 73,500 | | | | 2,880,274 | | | | 2.21 | % |
| MIRAIT Holdings Corp. | | | 124,400 | | | | 1,997,492 | | | | 1.54 | % |
| Mitsubishi Logisnext Co., Ltd. | | | 227,200 | | | | 2,444,597 | | | | 1.88 | % |
| Nihon Flush Co., Ltd. | | | 94,500 | | | | 2,135,962 | | | | 1.64 | % |
| Nippon Koei Co., Ltd. | | | 95,400 | | | | 2,951,348 | | | | 2.27 | % |
| Okamura Corp. | | | 271,100 | | | | 2,718,728 | | | | 2.09 | % |
| Sato Holdings Corp. | | | 110,700 | | | | 3,258,615 | | | | 2.51 | % |
| SBS Holdings, Inc. | | | 168,900 | | | | 2,775,906 | | | | 2.13 | % |
| Senko Group Holdings Co., Ltd. | | | 317,500 | | | | 2,553,838 | | | | 1.96 | % |
| Takeei Corp. | | | 306,900 | | | | 3,563,660 | | | | 2.74 | % |
| Tocalo Co., Ltd. | | | 279,400 | | | | 2,754,513 | | | | 2.12 | % |
| | | | | | | | 52,678,642 | | | | 40.50 | % |
| | | | | | | | | | | | | |
| Information Technology – 18.22% | | | | | | | | | | | | |
| Digital Garage, Inc. | | | 76,600 | | | | 2,507,481 | | | | 1.93 | % |
| Elecom Co., Ltd. | | | 75,400 | | | | 2,927,871 | | | | 2.25 | % |
| Macnica Fuji Electronics Holdings, Inc. | | | 156,300 | | | | 2,649,406 | | | | 2.04 | % |
| Mimaki Engineering Co., Ltd. | | | 209,200 | | | | 1,048,965 | | | | 0.80 | % |
| Nihon Unisys Ltd. | | | 78,000 | | | | 2,574,739 | | | | 1.98 | % |
| Nippon Signal Company, Ltd. | | | 224,600 | | | | 2,588,198 | | | | 1.99 | % |
| NS Solutions Corp. | | | 86,200 | | | | 2,930,639 | | | | 2.25 | % |
| Sun Corp. | | | 141,800 | | | | 1,930,528 | | | | 1.48 | % |
| Towa Corp. | | | 240,400 | | | | 2,364,145 | | | | 1.82 | % |
| Transcosmos, Inc. | | | 86,800 | | | | 2,183,571 | | | | 1.68 | % |
| | | | | | | | 23,705,543 | | | | 18.22 | % |
| | | | | | | | | | | | | |
| Materials – 7.04% | | | | | | | | | | | | |
| Asia Pile Holdings Co. | | | 452,100 | | | | 2,444,167 | | | | 1.88 | % |
| Kuriyama Holdings Corp. | | | 239,800 | | | | 1,833,031 | | | | 1.41 | % |
| Sanyo Chemical Industries Ltd. | | | 27,300 | | | | 1,302,519 | | | | 1.00 | % |
The accompanying notes are an integral part of these financial statements.
| HENNESSY FUNDS | 1-800-966-4354 | |
| COMMON STOCKS | | Number | | | | | | % of | |
| | | of Shares | | | Value | | | Net Assets | |
| Materials (Continued) | | | | | | | | | |
| Stella Chemifa Corp. | | | 89,000 | | | $ | 2,589,478 | | | | 1.99 | % |
| Tokyo Ohka Kogyo Co., Ltd. | | | 25,100 | | | | 994,046 | | | | 0.76 | % |
| | | | | | | | 9,163,241 | | | | 7.04 | % |
| | | | | | | | | | | | | |
| Real Estate – 2.29% | | | | | | | | | | | | |
| Star Mica Holdings Co., Ltd. | | | 94,700 | | | | 1,713,270 | | | | 1.32 | % |
| Tosei Corp. | | | 100,300 | | | | 1,265,161 | | | | 0.97 | % |
| | | | | | | | 2,978,431 | | | | 2.29 | % |
| | | | | | | | | | | | | |
| Utilities – 1.51% | | | | | | | | | | | | |
| EF-ON, Inc. | | | 292,800 | | | | 1,970,525 | | | | 1.51 | % |
| | | | | | | | | | | | | |
| Total Common Stocks | | | | | | | | | | | | |
| (Cost $112,343,382) | | | | | | | 125,348,842 | | | | 96.35 | % |
| | | | | | | | | | | | | |
| SHORT-TERM INVESTMENTS – 3.17% | | | | | | | | | | | | |
| | | | | | | | | | | | | |
| Money Market Funds – 3.17% | | | | | | | | | | | | |
| First American Government Obligations Fund, | | | | | | | | | | | | |
| Institutional Class, 1.74% (b) | | | 4,118,277 | | | | 4,118,277 | | | | 3.17 | % |
| | | | | | | | | | | | | |
| Total Short-Term Investments | | | | | | | | | | | | |
| (Cost $4,118,277) | | | | | | | 4,118,277 | | | | 3.17 | % |
| | | | | | | | | | | | | |
| Total Investments | | | | | | | | | | | | |
| (Cost $116,461,659) – 99.52% | | | | | | | 129,467,119 | | | | 99.52 | % |
| Other Assets in Excess of Liabilities – 0.48% | | | | | | | 619,407 | | | | 0.48 | % |
| | | | | | | | | | | | | |
TOTAL NET ASSETS – 100.00% | | | | | | $ | 130,086,526 | | | | 100.00 | % |
Percentages are stated as a percent of net assets.
| (a) | Non-income-producing security. |
| (b) | The rate listed is the fund’s seven-day yield as of October 31, 2019. |
The accompanying notes are an integral part of these financial statements.
Summary of Fair Value Exposure as of October 31, 2019
The following is a summary of the inputs used to value the Fund’s net assets as of October 31, 2019 (See Note 3 in the accompanying Notes to the Financial Statements):
| Common Stocks | | Level 1 | | | Level 2 | | | Level 3 | | | Total | |
| Communication Services | | $ | — | | | $ | 2,640,102 | | | $ | — | | | $ | 2,640,102 | |
| Consumer Discretionary | | | — | | | | 18,824,962 | | | | — | | | | 18,824,962 | |
| Consumer Staples | | | — | | | | 8,129,210 | | | | — | | | | 8,129,210 | |
| Financials | | | — | | | | 2,139,508 | | | | — | | | | 2,139,508 | |
| Health Care | | | — | | | | 3,118,678 | | | | — | | | | 3,118,678 | |
| Industrials | | | — | | | | 52,678,642 | | | | — | | | | 52,678,642 | |
| Information Technology | | | — | | | | 23,705,543 | | | | — | | | | 23,705,543 | |
| Materials | | | — | | | | 9,163,241 | | | | — | | | | 9,163,241 | |
| Real Estate | | | — | | | | 2,978,431 | | | | — | | | | 2,978,431 | |
| Utilities | | | — | | | | 1,970,525 | | | | — | | | | 1,970,525 | |
| Total Common Stocks | | $ | — | | | $ | 125,348,842 | | | $ | — | | | $ | 125,348,842 | |
| Short-Term Investments | | | | | | | | | | | | | | | | |
| Money Market Funds | | $ | 4,118,277 | | | $ | — | | | $ | — | | | $ | 4,118,277 | |
| Total Short-Term Investments | | $ | 4,118,277 | | | $ | — | | | $ | — | | | $ | 4,118,277 | |
| Total Investments | | $ | 4,118,277 | | | $ | 125,348,842 | | | $ | — | | | $ | 129,467,119 | |
The accompanying notes are an integral part of these financial statements.
| HENNESSY FUNDS | 1-800-966-4354 | |
Financial Statements
Statement of Assets and Liabilities as of October 31, 2019 |
| ASSETS: | | | |
| Investments in securities, at value (cost $116,461,659) | | $ | 129,467,119 | |
| Dividends and interest receivable | | | 887,243 | |
| Receivable for fund shares sold | | | 103,663 | |
| Prepaid expenses and other assets | | | 29,013 | |
| Total assets | | | 130,487,038 | |
| | | | | |
| LIABILITIES: | | | | |
| Payable for fund shares redeemed | | | 207,453 | |
| Payable to advisor | | | 86,238 | |
| Payable to administrator | | | 21,923 | |
| Payable to auditor | | | 22,551 | |
| Accrued distribution fees | | | 11,000 | |
| Accrued service fees | | | 5,533 | |
| Accrued trustees fees | | | 6,598 | |
| Accrued expenses and other payables | | | 39,216 | |
| Total liabilities | | | 400,512 | |
| NET ASSETS | | $ | 130,086,526 | |
| | | | | |
| NET ASSETS CONSISTS OF: | | | | |
| Capital stock | | $ | 120,392,867 | |
| Total distributable earnings | | | 9,693,659 | |
| Total net assets | | $ | 130,086,526 | |
| | | | | |
| NET ASSETS: | | | | |
| Investor Class | | | | |
| Shares authorized (no par value) | | Unlimited | |
| Net assets applicable to outstanding shares | | $ | 66,304,571 | |
| Shares issued and outstanding | | | 4,296,333 | |
| Net asset value, offering price, and redemption price per share | | $ | 15.43 | |
| | | | | |
| Institutional Class | | | | |
| Shares authorized (no par value) | | Unlimited | |
| Net assets applicable to outstanding shares | | $ | 63,781,955 | |
| Shares issued and outstanding | | | 4,172,952 | |
| Net asset value, offering price, and redemption price per share | | $ | 15.28 | |
The accompanying notes are an integral part of these financial statements.
| STATEMENT OF ASSETS AND LIABILITIES/STATEMENT OF OPERATIONS |
Financial Statements
Statement of Operations for the year ended October 31, 2019 |
| INVESTMENT INCOME: | | | |
Dividend income(1) | | $ | 2,566,127 | |
| Interest income | | | 82,266 | |
| Total investment income | | | 2,648,393 | |
| | | | | |
| EXPENSES: | | | | |
| Investment advisory fees (See Note 5) | | | 1,220,115 | |
| Sub-transfer agent expenses – Investor Class (See Note 5) | | | 195,823 | |
| Sub-transfer agent expenses – Institutional Class (See Note 5) | | | 71,414 | |
| Administration, accounting, custody, and transfer agent fees (See Note 5) | | | 161,422 | |
| Distribution fees – Investor Class (See Note 5) | | | 117,494 | |
| Service fees – Investor Class (See Note 5) | | | 78,329 | |
| Federal and state registration fees | | | 56,503 | |
| Compliance expense (See Note 5) | | | 25,810 | |
| Audit fees | | | 22,552 | |
| Trustees’ fees and expenses | | | 18,716 | |
| Interest expense (See Note 7) | | | 18,570 | |
| Reports to shareholders | | | 17,667 | |
| Legal fees | | | 1,260 | |
| Other expenses | | | 14,046 | |
| Total expenses | | | 2,019,721 | |
| NET INVESTMENT INCOME | | $ | 628,672 | |
| | | | | |
| REALIZED AND UNREALIZED GAINS (LOSSES): | | | | |
| Net realized loss on investments | | $ | (3,898,603 | ) |
| Net change in unrealized appreciation/depreciation on investments | | | 9,297,065 | |
| Net gain on investments | | | 5,398,462 | |
| NET INCREASE IN NET ASSETS RESULTING FROM OPERATIONS | | $ | 6,027,134 | |
(1) | Net of foreign taxes withheld of $285,661. |
The accompanying notes are an integral part of these financial statements.
| HENNESSY FUNDS | 1-800-966-4354 | |
(This Page Intentionally Left Blank.)
| STATEMENTS OF CHANGES IN NET ASSETS |
Financial Statements
| Statements of Changes in Net Assets |
| | | Year Ended | | | Year Ended | |
| | | October 31, 2019 | | | October 31, 2018 | |
| OPERATIONS: | | | | | | |
| Net investment income | | $ | 628,672 | | | $ | 953,265 | |
| Net realized gain (loss) on investments | | | (3,898,603 | ) | | | 8,566,596 | |
| Net change in unrealized | | | | | | | | |
| appreciation/depreciation on investments | | | 9,297,065 | | | | (13,684,693 | ) |
| Net increase (decrease) in net | | | | | | | | |
| assets resulting from operations | | | 6,027,134 | | | | (4,164,832 | ) |
| | | | | | | | | |
| DISTRIBUTIONS TO SHAREHOLDERS: | | | | | | | | |
| Distributable earnings – Investor Class | | | (3,091,719 | ) | | | (1,780,476 | ) |
| Distributable earnings – Institutional Class | | | (3,196,949 | ) | | | (1,109,923 | ) |
| Total distributions | | | (6,288,668 | ) | | | (2,890,399 | ) |
| | | | | | | | | |
| CAPITAL SHARE TRANSACTIONS: | | | | | | | | |
| Proceeds from shares subscribed – Investor Class | | | 16,258,683 | | | | 111,702,386 | |
| Proceeds from shares subscribed – Institutional Class | | | 30,397,388 | | | | 137,676,100 | |
| Dividends reinvested – Investor Class | | | 3,007,874 | | | | 1,748,813 | |
| Dividends reinvested – Institutional Class | | | 2,892,147 | | | | 1,109,776 | |
| Cost of shares redeemed – Investor Class | | | (54,044,581 | ) | | | (80,170,785 | ) |
| Cost of shares redeemed – Institutional Class | | | (67,515,691 | ) | | | (64,230,751 | ) |
| Net increase (decrease) in net assets derived | | | | | | | | |
| from capital share transactions | | | (69,004,180 | ) | | | 107,835,539 | |
| TOTAL INCREASE (DECREASE) IN NET ASSETS | | | (69,265,714 | ) | | | 100,780,308 | |
| | | | | | | | | |
| NET ASSETS: | | | | | | | | |
| Beginning of year | | | 199,352,240 | | | | 98,571,932 | |
| End of year | | $ | 130,086,526 | | | $ | 199,352,240 | |
| | | | | | | | | |
| CHANGES IN SHARES OUTSTANDING: | | | | | | | | |
| Shares sold – Investor Class | | | 1,129,349 | | | | 6,964,885 | |
| Shares sold – Institutional Class | | | 2,150,721 | | | | 8,685,841 | |
| Shares issued to holders as reinvestment | | | | | | | | |
| of dividends – Investor Class | | | 211,079 | | | | 113,712 | |
| Shares issued to holders as reinvestment | | | | | | | | |
| of dividends – Institutional Class | | | 206,255 | | | | 72,917 | |
| Shares redeemed – Investor Class | | | (3,779,544 | ) | | | (5,026,572 | ) |
| Shares redeemed – Institutional Class | | | (4,821,215 | ) | | | (4,071,372 | ) |
| Net increase (decrease) in shares outstanding | | | (4,903,355 | ) | | | 6,739,411 | |
The accompanying notes are an integral part of these financial statements.
| HENNESSY FUNDS | 1-800-966-4354 | |
Financial Statements
For an Investor Class share outstanding throughout each year
PER SHARE DATA:
Net asset value, beginning of year
Income from investment operations:
Net investment income (loss)
Net realized and unrealized gains on investments
Total from investment operations
Less distributions:
Dividends from net investment income
Dividends from net realized gains
Total distributions
Net asset value, end of year
TOTAL RETURN
SUPPLEMENTAL DATA AND RATIOS:
Net assets, end of year (millions)
Ratio of expenses to average net assets
Ratio of net investment income (loss) to average net assets
Portfolio turnover rate(2)
(1) | Calculated using the average shares outstanding method. |
(2) | Calculated on the basis of the Fund as a whole. |
The accompanying notes are an integral part of these financial statements.
| FINANCIAL HIGHLIGHTS — INVESTOR CLASS |
| Year Ended October 31, | |
| 2019 | | | 2018 | | | 2017 | | | 2016 | | | 2015 | |
| | | | | | | | | | | | | | |
| $ | 14.99 | | | $ | 14.92 | | | $ | 11.29 | | | $ | 10.29 | | | $ | 10.51 | |
| | | | | | | | | | | | | | | | | | | |
| | | | | | | | | | | | | | | | | | | |
| | 0.03 | (1) | | | 0.05 | | | | 0.08 | | | | 0.03 | | | | (0.02 | ) |
| | 0.88 | | | | 0.35 | | | | 3.77 | | | | 1.31 | | | | 0.71 | |
| | 0.91 | | | | 0.40 | | | | 3.85 | | | | 1.34 | | | | 0.69 | |
| | | | | | | | | | | | | | | | | | | |
| | | | | | | | | | | | | | | | | | | |
| | — | | | | (0.05 | ) | | | (0.12 | ) | | | — | | | | — | |
| | (0.47 | ) | | | (0.28 | ) | | | (0.10 | ) | | | (0.34 | ) | | | (0.91 | ) |
| | (0.47 | ) | | | (0.33 | ) | | | (0.22 | ) | | | (0.34 | ) | | | (0.91 | ) |
| $ | 15.43 | | | $ | 14.99 | | | $ | 14.92 | | | $ | 11.29 | | | $ | 10.29 | |
| | | | | | | | | | | | | | | | | | | |
| | 6.30 | % | | | 2.64 | % | | | 34.82 | % | | | 13.44 | % | | | 7.37 | % |
| | | | | | | | | | | | | | | | | | | |
| | | | | | | | | | | | | | | | | | | |
| $ | 66.30 | | | $ | 100.93 | | | $ | 69.86 | | | $ | 26.23 | | | $ | 22.68 | |
| | 1.52 | % | | | 1.46 | % | | | 1.60 | % | | | 1.91 | % | | | 2.12 | % |
| | 0.23 | % | | | 0.21 | % | | | 0.26 | % | | | 0.25 | % | | | (0.38 | )% |
| | 21 | % | | | 35 | % | | | 41 | % | | | 22 | % | | | 75 | % |
The accompanying notes are an integral part of these financial statements.
| HENNESSY FUNDS | 1-800-966-4354 | |
Financial Statements
For an Institutional Class share outstanding throughout each period
PER SHARE DATA:
Net asset value, beginning of period
Income from investment operations:
Net investment income (loss)
Net realized and unrealized gains (losses) on investments
Total from investment operations
Less distributions:
Dividends from net investment income
Dividends from net realized gains
Total distributions
Net asset value, end of period
TOTAL RETURN
SUPPLEMENTAL DATA AND RATIOS:
Net assets, end of period (millions)
Ratio of expenses to average net assets
Ratio of net investment income (loss) to average net assets
Portfolio turnover rate(5)
(1) | Institutional Class shares commenced operations on June 15, 2015. |
(2) | Calculated using the average shares outstanding method. |
(3) | Not annualized. |
(4) | Annualized. |
(5) | Calculated on the basis of the Fund as a whole. |
The accompanying notes are an integral part of these financial statements.
| FINANCIAL HIGHLIGHTS — INSTITUTIONAL CLASS |
| | | Period Ended | |
| Year Ended October 31, | | | October 31, | |
| 2019 | | | 2018 | | | 2017 | | | 2016 | | | 2015(1) | |
| | | | | | | | | | | | | | |
| $ | 14.83 | | | $ | 14.72 | | | $ | 11.33 | | | $ | 10.30 | | | $ | 10.89 | |
| | | | | | | | | | | | | | | | | | | |
| | | | | | | | | | | | | | | | | | | |
| | 0.09 | (2) | | | 0.11 | | | | 0.05 | | | | 0.06 | | | | (0.01 | ) |
| | 0.86 | | | | 0.36 | | | | 3.78 | | | | 1.31 | | | | (0.58 | ) |
| | 0.95 | | | | 0.47 | | | | 3.83 | | | | 1.37 | | | | (0.59 | ) |
| | | | | | | | | | | | | | | | | | | |
| | | | | | | | | | | | | | | | | | | |
| | (0.04 | ) | | | (0.08 | ) | | | (0.10 | ) | | | — | | | | — | |
| | (0.46 | ) | | | (0.28 | ) | | | (0.34 | ) | | | (0.34 | ) | | | — | |
| | (0.50 | ) | | | (0.36 | ) | | | (0.44 | ) | | | (0.34 | ) | | | — | |
| $ | 15.28 | | | $ | 14.83 | | | $ | 14.72 | | | $ | 11.33 | | | $ | 10.30 | |
| | | | | | | | | | | | | | | | | | | |
| | 6.73 | % | | | 3.12 | % | | | 35.17 | % | | | 13.73 | % | | | (5.42 | )%(3) |
| | | | | | | | | | | | | | | | | | | |
| | | | | | | | | | | | | | | | | | | |
| $ | 63.78 | | | $ | 98.42 | | | $ | 28.71 | | | $ | 3.42 | | | $ | 2.65 | |
| | 1.12 | % | | | 1.04 | % | | | 1.19 | % | | | 1.63 | % | | | 1.86 | %(4) |
| | 0.61 | % | | | 0.77 | % | | | 0.80 | % | | | 0.63 | % | | | (1.04 | )%(4) |
| | 21 | % | | | 35 | % | | | 41 | % | | | 22 | % | | | 75 | %(3) |
The accompanying notes are an integral part of these financial statements.
| HENNESSY FUNDS | 1-800-966-4354 | |
Financial Statements
Notes to the Financial Statements October 31, 2019 |
1). ORGANIZATION
The Hennessy Japan Small Cap Fund (the “Fund”) is a series of Hennessy Funds Trust (the “Trust”), which was organized as a Delaware statutory trust on September 17, 1992. The Fund is an open-end management investment company registered under the Investment Company Act of 1940, as amended. The investment objective of the Fund is long-term capital appreciation. The Fund is a diversified fund.
The Fund offers Investor Class and Institutional Class shares. Each class of shares differs principally in its respective 12b-1 distribution and service, shareholder servicing, and sub-transfer agent expenses. There are no sales charges. Each class has identical rights to earnings, assets, and voting privileges, except for class-specific expenses and exclusive rights to vote on matters affecting only one class.
As an investment company, the Fund follows the investment company accounting and reporting guidance of the Financial Accounting Standards Board (“FASB”) Accounting Standard Codification Topic 946 “Financial Services—Investment Companies.”
2). SIGNIFICANT ACCOUNTING POLICIES
The following is a summary of significant accounting policies consistently followed by the Fund in the preparation of the financial statements. These policies conform to U.S. generally accepted accounting principles (“GAAP”).
| a). | Securities Valuation – All investments in securities are recorded at their estimated fair value, as described in Note 3. |
| | |
| b). | Federal Income Taxes – No provision for federal income taxes or excise taxes has been made because the Fund has elected to be taxed as a regulated investment company and intends to distribute substantially all of its taxable income to its shareholders and otherwise comply with the provisions of the Internal Revenue Code of 1986, as amended, applicable to regulated investment companies. Net investment income/loss and realized gains/losses for federal income tax purposes may differ from those reported in the financial statements because of temporary book and tax basis differences. Temporary differences are primarily the result of the treatment of wash sales for tax reporting purposes. The Fund recognizes interest and penalties related to income tax benefits, if any, in the Statement of Operations as an income tax expense. Distributions from net realized gains for book purposes may include short-term capital gains, which are included as ordinary income to shareholders for tax purposes. The Fund may utilize equalization accounting for tax purposes and designate earnings and profits, including net realized gains distributed to shareholders on redemption of shares, as part of the dividends paid deduction for income tax purposes. |
| | |
| | Due to inherent differences in the recognition of income, expenses, and realized gains/losses under GAAP and federal income tax regulations, permanent differences between book and tax basis for reporting for fiscal year 2019 have been identified and appropriately reclassified in the Statement of Assets and Liabilities. The adjustments are as follows: |
| Total | |
| Distributable | |
Earnings | Capital Stock |
| $ — | $ — |
| NOTES TO THE FINANCIAL STATEMENTS |
| c). | Accounting for Uncertainty in Income Taxes – The Fund has accounting policies regarding recognition and measurement of tax positions taken or expected to be taken on a tax return. The tax returns of the Fund for the prior three fiscal years are open for examination. The Fund has reviewed all open tax years in major jurisdictions and concluded that there is no impact on the Fund’s net assets and no tax liability resulting from unrecognized tax benefits relating to uncertain income tax positions taken or expected to be taken on a tax return. The Fund’s major tax jurisdictions are U.S. federal and Delaware. |
| | |
| d). | Income and Expenses – Dividend income is recognized on the ex-dividend date or as soon as information is available to the Fund. Interest income, which includes the amortization of premium and accretion of discount, is recognized on an accrual basis. Other non-cash dividends are recognized as investment income at the fair value of the property received. The Fund is charged for those expenses that are directly attributable to its portfolio, such as advisory, administration, and certain shareholder service fees. Income, expenses (other than expenses attributable to a specific class), and realized and unrealized gains/losses on investments are allocated to each class of shares based on such class’s net assets. |
| | |
| e). | Distributions to Shareholders – Dividends from net investment income for the Fund, if any, are declared and paid annually, usually in December. Distributions of net realized capital gains, if any, are declared and paid annually, usually in December. |
| | |
| f). | Security Transactions – Investment and shareholder transactions are recorded on the trade date. The Fund determines the realized gain/loss from an investment transaction by comparing the original cost of the security lot sold with the net sale proceeds. Discounts and premiums on securities purchased are accreted or amortized, respectively, over the life of each such security. |
| | |
| g). | Use of Estimates – The preparation of financial statements in conformity with GAAP requires management to make estimates and assumptions that affect the reported amounts of assets and liabilities and disclosure of contingent assets and liabilities at the date of the financial statements and the reported change in net assets during the reporting period. Actual results could differ from those estimates. |
| | |
| h). | Share Valuation – The net asset value (“NAV”) per share of the Fund is calculated by dividing (i) the total value of the securities held by the Fund, plus cash and other assets, minus all liabilities (including estimated accrued expenses) by (ii) the total number of shares outstanding for the Fund, rounded to the nearest $0.01. The Fund’s shares will not be priced on days the New York Stock Exchange is closed for trading. The offering and redemption price per share for the Fund is equal to the Fund’s NAV per share. |
| | |
| i). | Foreign Currency – Values of investments denominated in foreign currencies are converted into U.S. dollars using the spot market rate of exchange at the time of valuation. Purchases and sales of investments and income are translated into U.S. dollars using the spot market rate of exchange prevailing on the respective dates of such transactions. The Fund does not isolate the portion of the results of operations resulting from fluctuations in foreign exchange rates on investments from fluctuations resulting from changes in the market prices of securities held. Such fluctuations are included with the net realized and unrealized gain/loss on investments. Foreign investments present additional risks due to currency fluctuations, economic and political factors, lower liquidity, government regulations, differences in accounting standards, and other factors. |
| HENNESSY FUNDS | 1-800-966-4354 | |
| j). | REIT Equity Securities – The Fund may invest in the equity securities of real estate investment trusts (“REITs”). Distributions received from REITs may be classified as dividends, capital gains, or return of capital. Investments in REITs may require the Fund to accrue and distribute income not yet received. To generate sufficient cash to make the requisite distributions, the Fund may be required to sell securities in its portfolio (including when it is not advantageous to do so) that it otherwise would have continued to hold. At other times, investments in a REIT may result in the Fund’s receipt of cash in excess of the REIT’s earnings. If the Fund distributes these amounts, these distributions could constitute a return of capital to Fund shareholders for U.S. federal income tax purposes. Dividends received by the Fund from a REIT generally will not constitute qualified dividend income and will not qualify for the dividends-received deduction. |
| | |
| k). | New Accounting Pronouncements – In August 2018, the FASB issued Accounting Standards Update No. 2018-13 “Disclosure Framework—Changes to the Disclosure Requirements for Fair Value Measurement” (“ASU 2018-13”). ASU 2018-13 eliminates the requirement to disclose the amount of and reasons for transfers between Level 1 and Level 2 of the fair value hierarchy, the timing of transfers between levels of the fair value hierarchy, and the valuation processes for Level 3 fair value measurements. ASU 2018-13 does not eliminate the requirement to disclose the range and weighted average used to develop significant unobservable inputs for Level 3 fair value measurements, and the changes in unrealized gains and losses for recurring Level 3 fair value measurements. ASU 2018-13 requires that information is provided about the measurement uncertainty of Level 3 fair value measurements as of the reporting date. The guidance is effective for fiscal years beginning after December 15, 2019, and interim periods within those fiscal years. Management has evaluated the impact of this change in guidance and, due to the permissibility of early adoption, modified the Fund’s fair value disclosures for the current reporting period. |
3). SECURITIES VALUATION
The Fund follows fair value accounting standards that establish an authoritative definition of fair value and set out a hierarchy for measuring fair value. These standards require additional disclosures about the various inputs and valuation techniques used to develop the measurements of fair value and a discussion of changes in valuation techniques and related inputs during the period. These inputs are summarized in the three broad levels listed below:
| | Level 1 – | Unadjusted, quoted prices in active markets for identical instruments that the Fund has the ability to access at the date of measurement. |
| | | |
| | Level 2 – | Other significant observable inputs (including, but not limited to, quoted prices in active markets for similar instruments, quoted prices in markets that are not active for identical or similar instruments, and model-derived valuations in which all significant inputs and significant value drivers are observable in active markets, such as interest rates, prepayment speeds, credit risk curves, default rates, and similar data). |
| | | |
| | Level 3 – | Significant unobservable inputs (including the Fund’s own assumptions about what market participants would use to price the asset or liability based on the best available information) when observable inputs are unavailable. |
The following is a description of the valuation techniques applied to the Fund’s major categories of assets and liabilities measured at fair value on a recurring basis:
| | Equity Securities – Equity securities, including common stocks, preferred stocks, foreign-issued common stocks, exchange-traded funds, closed-end mutual funds, partnerships, rights, and real estate investment trusts, that are traded on a securities |
| NOTES TO THE FINANCIAL STATEMENTS |
| | exchange for which a last-quoted sales price is readily available will generally be valued at the last sales price as reported by the primary exchange on which the securities are listed. Securities listed on The NASDAQ Stock Market (“NASDAQ”) will generally be valued at the NASDAQ Official Closing Price, which may differ from the last sales price reported. Securities traded on a securities exchange for which a last-quoted sales price is not readily available will generally be valued at the mean between the bid and ask prices. To the extent these securities are actively traded and valuation adjustments are not applied, they are classified in Level 1 of the fair value hierarchy. Securities traded on foreign exchanges generally are not valued at the same time the Fund calculates its NAV because most foreign markets close well before such time. The earlier close of most foreign markets gives rise to the possibility that significant events, including broad market moves, may have occurred in the interim. In certain circumstances, it may be determined that a foreign security needs to be fair valued because it appears that the value of the security might have been materially affected by events occurring after the close of the market in which the security is principally traded, but before the time the Fund calculates its NAV, such as by a development that affects an entire market or region (e.g., a weather-related event) or a potentially global development (e.g., a terrorist attack that may be expected to have an effect on investor expectations worldwide). |
| | |
| | Registered Investment Companies – Investments in open-end registered investment companies, commonly referred to as mutual funds, generally are priced at the ending NAV provided by the applicable mutual fund’s service agent and will be classified in Level 1 of the fair value hierarchy. |
| | |
| | Debt Securities – Debt securities, including corporate bonds, asset-backed securities, mortgage-backed securities, municipal bonds, U.S. Treasuries, and U.S. government agency issues, are generally valued at market on the basis of valuations furnished by an independent pricing service that utilizes both dealer-supplied valuations and formula-based techniques. The pricing service may consider recently executed transactions in securities of the issuer or comparable issuers, market price quotations (where observable), bond spreads, and fundamental data relating to the issuer. In addition, the model may incorporate observable market data, such as reported sales of similar securities, broker quotes, yields, bids, offers, and reference data. Certain securities are valued primarily using dealer quotations. These securities are generally classified in Level 2 of the fair value hierarchy. |
| | |
| | Short-Term Securities – Short-term equity investments, including money market funds, are valued in the manner specified above. Short-term debt investments with an original term to maturity of 60 days or less are valued at amortized cost, which approximates fair market value. If the original term to maturity of a short-term debt investment exceeded 60 days, then the values as of the 61st day prior to maturity are amortized. Amortized cost is not used if its use would be inappropriate due to credit or other impairments of the issuer, in which case the security’s fair value would be determined, as described below. Short-term securities are generally classified in Level 1 or Level 2 of the fair value hierarchy depending on the inputs used and market activity levels for specific securities. |
The Board of Trustees of the Fund (the “Board”) has adopted fair value pricing procedures that are followed when a price for a security is not readily available or if a significant event has occurred that indicates the closing price of a security no longer represents the true value of that security. Fair value pricing determinations are made in good faith in accordance with these procedures. There are numerous criteria that will be
| HENNESSY FUNDS | 1-800-966-4354 | |
given consideration in determining a fair value of a security, such as the trading volume of a security and markets, the values of other similar securities, and news events with direct bearing on a security or markets. Fair value pricing results in an estimated price for a security that reflects the amount the Fund might reasonably expect to receive in a current sale. Depending on the relative significance of the valuation inputs, these securities may be classified in either Level 2 or Level 3 of the fair value hierarchy.
The fair value of foreign securities may be determined with the assistance of a pricing service using correlations between the movement of prices of such securities and indices of domestic securities and other appropriate indicators, such as closing market prices of relevant American Depositary Receipts or futures contracts. The effect of using fair value pricing is that the Fund’s NAV will reflect the affected portfolio securities’ values as determined by the Board or its designee, pursuant to the fair value pricing procedures adopted by the Board, instead of being determined by the market. Using a fair value pricing methodology to price a foreign security may result in a value that is different from such foreign security’s most recent closing price and from the value used by other investment companies to calculate their NAVs. Such securities are generally classified in Level 2 of the fair value hierarchy. Because the Fund may invest in foreign securities, the value of the Fund’s portfolio securities may change on days when you will not be able to purchase or redeem your shares.
The Board has delegated day-to-day valuation matters to the Valuation and Liquidity Committee comprising representatives from Hennessy Advisors, Inc., the Fund’s investment advisor (the “Advisor”). The function of the Valuation and Liquidity Committee is to value securities where current and reliable market quotations are not readily available. All actions taken by the Valuation and Liquidity Committee are reviewed by the Board.
The Fund has performed an analysis of all existing investments to determine the significance and character of all inputs to their fair value determinations. Various inputs are used to determine the value of the Fund’s investments. The inputs or methodology used for valuing securities are not necessarily an indication of the risk associated with investing in those securities. Details related to the fair value hierarchy of the Fund’s securities as of October 31, 2019, are included in the Schedule of Investments.
4). INVESTMENT TRANSACTIONS
Purchases and sales of investment securities (excluding government and short-term investments) for the Fund during fiscal year 2019 were $31,272,226 and $109,529,430, respectively.
There were no purchases or sales/maturities of long-term U.S. government securities for the Fund during fiscal year 2019.
The Fund is permitted to purchase or sell securities from or to another fund in the Hennessy Funds family of funds (collectively, the “Hennessy Funds”) under specified conditions outlined in procedures adopted by the Board. The procedures have been designed to ensure that any purchase or sale of securities by the Fund from or to another Hennessy Fund complies with Rule 17a-7 of the Investment Company Act of 1940, as amended. During fiscal year 2019, the Fund did not engage in purchases or sales of securities pursuant to Rule 17a-7 of the Investment Company Act of 1940, as amended.
5). INVESTMENT ADVISORY FEE AND OTHER TRANSACTIONS WITH AFFILIATES
The Advisor provides the Fund with investment advisory services under an Investment Advisory Agreement. The Advisor oversees the provision of investment advice and furnishes office space, facilities, and most of the personnel needed by the Fund. As compensation for its services, the Advisor is entitled to a monthly fee from the Fund.
| NOTES TO THE FINANCIAL STATEMENTS |
The fee is based on the average daily net assets of the Fund at an annual rate of 0.80%. The net investment advisory fees expensed by the Fund during fiscal year 2019 are included in the Statement of Operations.
The Advisor has delegated the day-to-day management of the Fund to a sub-advisor, SPARX Asset Management Co., Ltd. The Advisor pays the sub-advisory fees from its own assets, and these fees are not an additional expense of the Fund. During fiscal year 2019, the Advisor (not the Fund) paid a sub-advisory fee at the average rate of 0.35% of the daily net assets of the Fund. Pursuant to the sub-advisory agreement, the Advisor pays sub-advisory fees at the rate of 0.35% of the first $500 million of daily net assets, 0.40% of daily net assets between $500 million and $1 billion, and 0.42% of daily net assets over $1 billion.
The Board has approved a Shareholder Servicing Agreement for Investor Class shares of the Fund, which was instituted to compensate the Advisor for the non-investment advisory services it provides to the Fund. The Shareholder Servicing Agreement provides for a monthly fee paid to the Advisor at an annual rate of 0.10% of the average daily net assets of the Fund attributable to Investor Class shares. The shareholder service fees expensed by the Fund during fiscal year 2019 are included in the Statement of Operations.
The Fund has adopted a plan pursuant to Rule 12b-1 under the Investment Company Act of 1940, as amended, that authorizes payments in connection with the distribution of the Fund’s shares at an annual rate of up to 0.25% of the Fund’s average daily net assets attributable to Investor Class shares. Even though the authorized rate is up to 0.25%, the Fund is currently only using up to 0.15% of its average daily net assets attributable to Investor Class shares for such purpose. Amounts paid under the plan may be spent on any activities or expenses primarily intended to result in the sale of shares, including, but not limited to, advertising, shareholder account servicing, printing and mailing of prospectuses to other than current shareholders, printing and mailing of sales literature, and compensation for sales and marketing activities or to financial institutions and others, such as dealers and distributors. The distribution fees expensed by the Fund during fiscal year 2019 are included in the Statement of Operations.
The Fund has entered into agreements with various brokers, dealers, and financial intermediaries in connection with the sale of shares of the Fund. The agreements provide for periodic payments of sub-transfer agent expenses by the Fund to the brokers, dealers, and financial intermediaries for providing certain shareholder maintenance services. These shareholder services include the pre-processing and quality control of new accounts, shareholder correspondence, answering customer inquiries regarding account status, and facilitating shareholder telephone transactions. The sub-transfer agent fees expensed by the Fund during fiscal year 2019 are included in the Statement of Operations.
U.S. Bancorp Fund Services, LLC, d/b/a U.S. Bank Global Fund Services (“Fund Services”) provides the Fund with administrative, accounting, and transfer agent services. As administrator, Fund Services is responsible for activities such as (i) preparing various federal and state regulatory filings, reports, and returns for the Fund, (ii) preparing reports and materials to be supplied to the Board, (iii) monitoring the activities of the Fund’s custodian, transfer agent, and accountants, and (iv) coordinating the preparation and payment of the Fund’s expenses and reviewing the Fund’s expense accruals. U.S. Bank N.A., an affiliate of Fund Services, serves as the Fund’s custodian. The servicing agreements between the Trust and Fund Services and U.S. Bank N.A. contain a fee schedule that is inclusive of administrative, accounting, custody, and transfer agent fees. The administrative, accounting, custody, and transfer agent fees expensed by the Fund during fiscal year 2019 are included in the Statement of Operations.
| HENNESSY FUNDS | 1-800-966-4354 | |
Quasar Distributors, LLC (“Quasar”) acts as the Fund’s principal underwriter in a continuous public offering of the Fund’s shares. Quasar is an affiliate of Fund Services and U.S. Bank N.A.
The officers of the Fund are affiliated with the Advisor. With the exception of the Chief Compliance Officer and the Senior Compliance Officer, such officers receive no compensation from the Fund for serving in their respective roles. The Fund, along with the other Hennessy Funds, makes reimbursement payments on an equal basis to the Advisor for a portion of the salary and benefits associated with the office of the Chief Compliance Officer and for all of the salary and benefits associated with the office of the Senior Compliance Officer. The compliance fees expensed by the Fund during fiscal year 2019 are included in the Statement of Operations.
6). GUARANTEES AND INDEMNIFICATIONS
Under the Hennessy Funds’ organizational documents, their officers and trustees are indemnified by the Hennessy Funds against certain liabilities arising out of the performance of their duties to the Hennessy Funds. Additionally, in the normal course of business, the Hennessy Funds enter into contracts with service providers that contain general indemnification clauses. The Fund’s maximum exposure under these arrangements is unknown as this would involve future claims that may be made against the Fund that have not yet occurred. Currently, the Fund expects the risk of loss to be remote.
7). LINE OF CREDIT
The Fund has an uncommitted line of credit with the other Hennessy Funds in the amount of the lesser of (i) $100,000,000 or (ii) 33.33% of each Hennessy Fund’s net assets, or 30% for the Hennessy Gas Utility Fund and 10% for the Hennessy Balanced Fund, intended to provide short-term financing, if necessary, subject to certain restrictions, in connection with shareholder redemptions. The credit facility is with the Hennessy Funds’ custodian bank, U.S. Bank N.A. Borrowings under this arrangement bear interest at the bank’s prime rate and are secured by all of the Fund’s assets (as to its own borrowings only). During fiscal year 2019, the Fund had an outstanding average daily balance and a weighted average interest rate of $335,164 and 5.46%, respectively. The interest expensed by the Fund during fiscal year 2019 is included in the Statement of Operations. The maximum amount outstanding for the Fund during fiscal year was $12,102,000. As of October 31, 2019, the Fund did not have any borrowings outstanding under the line of credit.
8). FEDERAL TAX INFORMATION
As of October 31, 2019, the components of accumulated earnings (losses) for income tax purposes were as follows:
| | | Investments | |
| Cost of investments for tax purposes | | $ | 117,570,374 | |
| Gross tax unrealized appreciation | | $ | 23,229,518 | |
| Gross tax unrealized depreciation | | | (11,332,904 | ) |
| Net tax unrealized appreciation/(depreciation) | | $ | 11,896,614 | |
| Undistributed ordinary income | | $ | 1,959,489 | |
| Undistributed long-term capital gains | | | — | |
| Total distributable earnings | | $ | 1,959,489 | |
| Other accumulated gain/(loss) | | $ | (4,162,444 | ) |
| Total accumulated gain/(loss) | | $ | 9,693,659 | |
| NOTES TO THE FINANCIAL STATEMENTS |
The difference between book-basis unrealized appreciation/depreciation and tax-basis unrealized appreciation/depreciation (as shown above) is attributable primarily to wash sales and investments in passive foreign investment companies.
As of October 31, 2019, the Fund had capital loss carryforwards as follows:
| | $4,162,444 | Unlimited Short-Term |
As of October 31, 2019, the Fund did not defer, on a tax basis, any late-year ordinary losses. Late-year ordinary losses are net ordinary losses incurred after December 31, 2018, but within the taxable year, that are deemed to arise on the first day of the Fund’s next taxable year.
During fiscal year 2019 and fiscal year 2018, the tax character of distributions paid by the Fund was as follows:
| | | Year Ended | | | Year Ended | |
| | | October 31, 2019 | | | October 31, 2018 | |
Ordinary income(1) | | $ | 275,405 | | | $ | 583,714 | |
| Long-term capital gain | | | 6,013,263 | | | | 2,306,685 | |
| | | $ | 6,288,668 | | | $ | 2,890,399 | |
(1) Ordinary income includes short-term capital gain.
9). EVENTS SUBSEQUENT TO YEAR END
Management has evaluated the Fund’s related events and transactions that occurred subsequent to October 31, 2019, through the date of issuance of the Fund’s financial statements. Other than as disclosed below, management has determined that there were no subsequent events requiring recognition or disclosure in the financial statements.
On November 25, 2019, U.S. Bancorp, the parent company of Quasar, announced that it had signed a purchase agreement to sell Quasar to Foreside Financial Group, LLC, such that Quasar will become a wholly-owned broker-dealer subsidiary of Foreside. The transaction is expected to close by the end of March 2020. Quasar will remain the Fund’s distributor at the close of the transaction, subject to Board approval.
| HENNESSY FUNDS | 1-800-966-4354 | |
Report of Independent Registered Public
Accounting Firm
To the Board of Trustees of Hennessy Funds Trust
and the shareholders of the Hennessy Japan Small Cap Fund
Novato, CA
Opinion on the Financial Statements
We have audited the accompanying statement of assets and liabilities of the Hennessy Japan Small Cap Fund (the “Fund”), a series of Hennessy Funds Trust, including the schedule of investments, as of October 31, 2019, the related statement of operations for the year then ended, the statements of changes in net assets for each of the two years in the period then ended, the financial highlights for each of the three years in the period then ended, and the related notes (collectively referred to as the “financial statements”). In our opinion, the financial statements present fairly, in all material respects, the financial position of the Fund as of October 31, 2019, the results of its operations for the year then ended, the changes in its net assets for each of the two years in the period then ended, and the financial highlights for each of the three years in the period then ended in conformity with accounting principles generally accepted in the United States of America.
The financial highlights for each of the two years in the period ended October 31, 2016, have been audited by other auditors, whose report dated December 22, 2016, expressed unqualified opinions on such financial highlights.
Basis for Opinion
These financial statements are the responsibility of the Fund’s management. Our responsibility is to express an opinion on the Fund’s financial statements based on our audits. We are a public accounting firm registered with the Public Company Accounting Oversight Board (United States) (“PCAOB”) and are required to be independent with respect to the Fund in accordance with the U.S. federal securities laws and the applicable rules and regulations of the Securities and Exchange Commission and the PCAOB. We have served as the auditor of one or more of the funds in the Trust since 2002.
We conducted our audits in accordance with the standards of the PCAOB. Those standards require that we plan and perform the audit to obtain reasonable assurance about whether the financial statements are free of material misstatement, whether due to error or fraud. The Fund is not required to have, nor were we engaged to perform, an audit of its internal control over financial reporting. As part of our audits we are required to obtain an understanding of internal control over financial reporting, but not for the purpose of expressing an opinion on the effectiveness of the Fund’s internal control over financial reporting. Accordingly, we express no such opinion.
Our audits included performing procedures to assess the risks of material misstatement of the financial statements, whether due to error or fraud, and performing procedures that respond to those risks. Such procedures included examining, on a test basis, evidence regarding the amounts and disclosures in the financial statements. Our audits also included evaluating the accounting principles used and significant estimates made by management, as well as evaluating the overall presentation of the financial statements. Our procedures included confirmation of securities owned as of October 31, 2019, by correspondence with the custodian. We believe that our audits provide a reasonable basis for our opinion.
| | |
| | TAIT, WELLER & BAKER LLP |
Philadelphia, Pennsylvania
December 24, 2019
| REPORT OF INDEPENDENT REGISTERED PUBLIC ACCOUNTING FIRM/TRUSTEES AND OFFICERS |
Trustees and Officers of the Fund (Unaudited)
The business and affairs of the Funds are managed under the direction of the Board of Trustees of the Trust, and the Board of Trustees elects the officers of the Trust. From time to time, the Board of Trustees also has appointed advisers to the Board of Trustees (“Advisers”) with the intention of having qualified individuals serve in an advisory capacity in order to garner experience in the mutual fund and asset management industry and be considered as potential Trustees in the future. There are currently three Advisers: Brian Alexander, Doug Franklin, and Claire Knoles. As Advisers, Mr. Alexander, Mr. Franklin, and Ms. Knoles attend meetings of the Board of Trustees and act as non-voting participants. Information pertaining to the Trustees, Advisers, and the officers of the Trust is set forth below. The Trustees and officers serve until their successors are duly elected and qualified or until their earlier death, resignation, or removal. Each Trustee oversees the 16 Hennessy Funds. Unless otherwise indicated, the address of all persons listed below is 7250 Redwood Boulevard, Suite 200, Novato, CA 94945. The Fund’s Statement of Additional Information includes more information about the persons listed below and is available without charge by calling 1-800-966-4354 or by visiting www.hennessyfunds.com.
| | | | Other |
| | | | Directorships |
| | | | Held Outside |
| Name, (Year of Birth), | | | of Fund |
| and Position Held | Start Date | Principal Occupation(s) | Complex During |
with the Trust | of Service | During Past Five Years | Past Five Years |
| | | | |
| Disinterested Trustees and Advisers | | | |
| | | | |
| J. Dennis DeSousa | January 1996 | Mr. DeSousa is a real estate investor. | None. |
| (1936) | | | |
| Trustee | | | |
| | | | |
| Robert T. Doyle | January 1996 | Mr. Doyle has been the Sheriff of | None. |
| (1947) | | Marin County, California since 1996. | |
| Trustee | | | |
| | | | |
| Gerald P. Richardson | May 2004 | Mr. Richardson is an independent | None. |
| (1945) | | consultant in the securities industry. | |
| Trustee | | | |
| | | | |
| Brian Alexander | March 2015 | Mr. Alexander has worked for the | None. |
| (1981) | | Sutter Health organization since | |
| Adviser to the Board | | 2011 in various positions. He has | |
| | | served as the Chief Executive Officer | |
| | | of the Sutter Roseville Medical | |
| | | Center since 2018. From 2016 through | |
| | | 2018, he served as the Vice President | |
| | | of Strategy for the Sutter Health Valley | |
| | | Area, which includes 11 hospitals, | |
| | | 13 ambulatory surgery centers, | |
| | | 16,000 employees, and 1,900 physicians. | |
| | | From 2013 through 2016, Mr. Alexander | |
| | | served as Sutter Novato Community | |
| | | Hospital’s Chief Administrative Officer. | |
| HENNESSY FUNDS | 1-800-966-4354 | |
| | | | Other |
| | | | Directorships |
| | | | Held Outside |
| Name, (Year of Birth), | | | of Fund |
| and Position Held | Start Date | Principal Occupation(s) | Complex During |
with the Trust | of Service | During Past Five Years | Past Five Years |
| | | | |
| Doug Franklin | March 2016 | Mr. Franklin is a retired insurance | None. |
| (1964) | | industry executive. From 1987 | |
| Adviser to the Board | | through 2015, he was employed | |
| | | by the Allianz-Fireman’s Fund | |
| | | Insurance Company in various | |
| | | positions, including as its Chief | |
| | | Actuary and Chief Risk Officer. | |
| | | | |
| Claire Knoles | December 2015 | Ms. Knoles is a founder of Kiosk and | None. |
| (1974) | | has served as its Chief Operating | |
| Adviser to the Board | | Officer since 2004. Kiosk is a full- | |
| | | service marketing agency with | |
| | | offices in the San Francisco Bay | |
| | | Area, Toronto, and Liverpool, UK. | |
| | | | |
Interested Trustee(1) | | | |
| | | | |
| Neil J. Hennessy | January 1996 as | Mr. Hennessy has been employed | Hennessy |
| (1956) | a Trustee and | by Hennessy Advisors, Inc. since | Advisors, Inc. |
| Trustee, Chairman of | June 2008 as | 1989 and currently serves as its | |
| the Board, Chief | an officer | Chairman and Chief Executive Officer. | |
| Investment Officer, | | | |
| Portfolio Manager, | | | |
| and President | | | |
| Name, (Year of Birth), | | |
| and Position Held | Start Date | Principal Occupation(s) |
with the Trust | of Service | During Past Five Years |
| | | |
| Officers | | |
| | | |
| Teresa M. Nilsen | January 1996 | Ms. Nilsen has been employed by Hennessy Advisors, Inc. |
| (1966) | | since 1989 and currently serves as its President, Chief Operating |
| Executive Vice President | | Officer, and Secretary. |
| and Treasurer | | |
| | | |
| Daniel B. Steadman | March 2000 | Mr. Steadman has been employed by Hennessy Advisors, Inc. |
| (1956) | | since 2000 and currently serves as its Executive Vice President. |
| Executive Vice President | | |
| and Secretary | | |
| | | |
| Brian Carlson | December 2013 | Mr. Carlson has been employed by Hennessy Advisors, Inc. |
| (1972) | | since December 2013 and currently serves as its Chief |
| Senior Vice President | | Compliance Officer and Senior Vice President. |
| and Head of Distribution | | |
| | | |
| Jennifer Cheskiewicz | June 2013 | Ms. Cheskiewicz has been employed by Hennessy Advisors, Inc. |
(1977)(2) | | as its General Counsel since June 2013. |
| Senior Vice President and | | |
| Chief Compliance Officer | | |
| TRUSTEES AND OFFICERS OF THE FUND |
| Name, (Year of Birth), | | |
| and Position Held | Start Date | Principal Occupation(s) |
with the Trust | of Service | During Past Five Years |
| | | |
| David Ellison | October 2012 | Mr. Ellison has been employed by Hennessy Advisors, Inc. since |
(1958)(3) | | October 2012. He has served as a Portfolio Manager of the |
| Senior Vice President | | Hennessy Large Cap Financial Fund and the Hennessy Small |
| and Portfolio Manager | | Cap Financial Fund since their inception. Mr. Ellison also served |
| | | as a Portfolio Manager of the Hennessy Technology Fund from |
| | | its inception until February 2017. Mr. Ellison served as Director, |
| | | CIO and President of FBR Fund Advisers, Inc. from December |
| | | 1999 to October 2012. |
| | | |
| Ryan Kelley | March 2013 | Mr. Kelley has been employed by Hennessy Advisors, Inc. since |
(1972)(4) | | October 2012. He has served as a Portfolio Manager of the |
| Senior Vice President | | Hennessy Gas Utility Fund, the Hennessy Large Cap Financial |
| and Portfolio Manager | | Fund, and the Hennessy Small Cap Financial Fund since |
| | | October 2014. He served as Co- Portfolio Manager of these |
| | | same funds from March 2013 through September 2014 and as |
| | | a Portfolio Analyst for the Hennessy Funds from October 2012 |
| | | through February 2013. Mr. Kelley has also served as a Portfolio |
| | | Manager of the Hennessy Cornerstone Growth Fund, the |
| | | Hennessy Cornerstone Mid Cap 30 Fund, the Hennessy |
| | | Cornerstone Large Growth Fund, and the Hennessy |
| | | Cornerstone Value Fund since February 2017 and as a Portfolio |
| | | Manager of the Hennessy Total Return Fund, the Hennessy |
| | | Balanced Fund, and the Hennessy Technology Fund since May |
| | | 2018. He served as Co- Portfolio Manager of the Hennessy |
| | | Technology Fund from February 2017 until May 2018. Mr. Kelley |
| | | served as Portfolio Manager of FBR Fund Advisers, Inc. from |
| | | January 2008 to October 2012. |
| | | |
| Tania Kelley | October 2003 | Ms. Kelley has been employed by Hennessy Advisors, Inc. since |
| (1965) | | October 2003. |
| Senior Vice President | | |
| and Head of Marketing | | |
| | | |
| L. Joshua Wein | September 2018 | Mr. Wein has been employed by Hennessy Advisors, Inc. |
(1973)(4) | | since 2018. He has served as Co-Portfolio Manager of the |
| Vice President and | | Hennessy Cornerstone Growth Fund, the Hennessy |
| Co-Portfolio Manager | | Cornerstone Mid Cap 30 Fund, the Hennessy Cornerstone Large |
| | | Growth Fund, the Hennessy Cornerstone Value Fund, Hennessy |
| | | Total Return Fund, the Hennessy Balanced Fund, the Hennessy |
| | | Gas Utility Fund, and the Hennessy Technology Fund since |
| | | February 2019. Prior to that, he served as a Senior Analyst of |
| | | those same funds since September 2018. Mr. Wein served as |
| | | Director of Alternative Investments and Co-Portfolio Manager |
| | | at Sterling Capital Management from 2008 to 2018. |
_______________
(1) | Mr. Hennessy is considered an “interested person,” as defined in the Investment Company Act of 1940, as amended, because he is an officer of the Trust. |
(2) | The address of this officer is 4800 Bee Caves Road, Suite 100, Austin, TX 78746. |
(3) | The address of this officer is 101 Federal Street, Suite 1900, Boston, MA 02110. |
(4) | The address of this officer is 1340 Environ Way, Chapel Hill, NC 27517. |
| HENNESSY FUNDS | 1-800-966-4354 | |
Expense Example (Unaudited)
October 31, 2019
As a shareholder of the Fund, you incur ongoing costs, including management fees, service fees, and other Fund expenses. This Example is intended to help you understand your ongoing costs (in dollars) of investing in the Fund and to compare these costs with the ongoing costs of investing in other mutual funds. The Example is based on an investment of $1,000 invested at the beginning of the period and held for the entire period from May 1, 2019, through October 31, 2019.
Actual Expenses
The first line of the table below under the “Investor Class” and “Institutional Class” headings provides information about actual account values and actual expenses. Although the Fund charges no sales loads or transaction fees, you will be assessed fees for outgoing wire transfers, returned checks and stop payment orders at prevailing rates charged by U.S. Bank Global Fund Services, the Fund’s transfer agent. If you request that a redemption be made by wire transfer, currently a $15 fee is charged by the Fund’s transfer agent. IRA accounts will be charged a $15 annual maintenance fee. The example below includes, but is not limited to, management fees, shareholder servicing fees, accounting, custody, and transfer agent fees. However, the example below does not include portfolio trading commissions and related expenses. You may use the information in this line, together with the amount you invested, to estimate the expenses that you paid over the period. Simply divide your account value by $1,000 (for example, an $8,600 account value divided by $1,000 = 8.6), then multiply the result by the number in the first line of the table under the “Investor Class” or “Institutional Class” headings in the column entitled “Expenses Paid During Period” to estimate the expenses you paid on your account during this period.
Hypothetical Example for Comparison Purposes
The second line of the table below under the “Investor Class” and “Institutional Class” headings provides information about hypothetical account values and hypothetical expenses based on the Fund’s actual expense ratios and an assumed rate of return of 5% per year before expenses, which is not the Fund’s actual return. The hypothetical account values and expenses may not be used to estimate the actual ending account balance or expenses you paid for the period. You may use this information to compare the ongoing costs of investing in the Fund and other funds. To do so, compare this 5% hypothetical example with the 5% hypothetical examples that appear in the shareholder reports of the other funds. Please note that the expenses shown in the table are meant to highlight your ongoing costs only. Therefore, the second line of the table under the “Investor Class” and “Institutional Class” headings is useful in comparing ongoing costs only and will not help you determine the relative total costs of owning different funds.
| | | | Expenses Paid |
| | Beginning | Ending | During Period(1) |
| | Account Value | Account Value | May 1, 2019 – |
| | May 1, 2019 | October 31, 2019 | October 31, 2019 |
| Investor Class | | | |
| Actual | $1,000.00 | $1,064.10 | $7.97 |
| Hypothetical (5% return before expenses) | $1,000.00 | $1,017.49 | $7.79 |
| | | | |
| Institutional Class | | | |
| Actual | $1,000.00 | $1,065.60 | $6.06 |
| Hypothetical (5% return before expenses) | $1,000.00 | $1,019.34 | $5.92 |
(1) | Expenses are equal to the Fund’s annualized expense ratio of 1.53% for Investor Class shares or 1.16% for Institutional Class shares, as applicable, multiplied by the average account value over the period, multiplied by 184/365 days (to reflect one-half year period). |
| HENNESSY FUNDS | 1-800-966-4354 | |
How to Obtain a Copy of the Fund’s
Proxy Voting Policy and Proxy Voting Records
A description of the policies and procedures the Fund uses to determine how to vote proxies relating to portfolio securities is available without charge: (1) by calling 1-800-966-4354; (2) on the Hennessy Funds’ website at www.hennessyfunds.com/proxy-voting/voting-policy; or (3) on the U.S. Securities and Exchange Commission’s (the “SEC”) website at www.sec.gov. The Fund’s proxy voting record is available without charge on both the Hennessy Funds’ website at www.hennessyfunds.com/proxy-voting/voting-record and the SEC’s website at www.sec.gov no later than August 31 for the prior 12 months ending June 30.
Availability of Quarterly Portfolio Schedule
For periods ending on or prior to January 31, 2019, the Fund has filed a complete schedule of portfolio holdings with the SEC for the first and third quarters of each fiscal year on Form N-Q. For periods ending on or after April 30, 2019, the Fund files a complete schedule of portfolio holdings with the SEC for the first and third quarters of each fiscal year as an exhibit to its reports on Form N-PORT. The Fund’s Forms N-Q and Forms N-PORT are available on the SEC’s website at www.sec.gov or on request by calling 1-800-966-4354.
Federal Tax Distribution Information (Unaudited)
For fiscal year 2019, certain dividends paid by the Fund may be subject to a maximum tax rate of 23.8%, as provided for by the Jobs and Growth Tax Relief Reconciliation Act of 2003. The percentage of dividends declared from ordinary income designated as qualified dividend income was 100.00%.
For corporate shareholders, the percent of ordinary income distributions that qualified for the corporate dividends received deduction for fiscal year 2019 was 0.00%.
The percentage of taxable ordinary income distributions that were designated as short-term capital gain distributions under Section 871(k)(2)(C) of the Internal Revenue Code of 1986, as amended, for the Fund was 0.94%.
For the year ended October 31, 2019, the Fund earned foreign-source income and paid foreign taxes as noted below, which it intends to pass through to its shareholders pursuant to Section 853 of the Internal Revenue Code.
| | | Gross Foreign Income | Foreign Tax Paid | |
| | Japan | $2,851,789 | $285,661 | |
Important Notice Regarding Delivery
of Shareholder Documents
To help keep the Fund’s costs as low as possible, we generally deliver a single copy of shareholder reports, proxy statements, and prospectuses to shareholders who share an address and have the same last name. This process does not apply to account statements. You may request an individual copy of a shareholder document at any time. If you would like to receive separate mailings of shareholder documents, please call U.S. Bank Global Fund Services at 1-800-261-6950 or 1-414-765-4124, and individual delivery will begin within 30 days of your request. If your account is held through a financial institution or other intermediary, please contact such intermediary directly to request individual delivery.
| PROXY VOTING — PRIVACY POLICY |
Electronic Delivery
The Funds offer shareholders the option to receive account statements, Prospectuses, tax forms, and reports online. To sign up for eDelivery, please visit www.hennessyfunds.com. You may change your delivery preference at any time by visiting our website or contacting the Funds at 1-800-261-6950.
Privacy Policy
We collect the following non-public personal information about you:
| | • | information we receive from you on or in applications or other forms, correspondence, or conversations, including, but not limited to, your name, address, phone number, social security number, assets, income, and date of birth; and |
| | | |
| | • | information about your transactions with us, our affiliates, or others, including, but not limited to, your account number and balance, payment history, parties to transactions, cost basis information, and other financial information. |
We do not disclose any non-public personal information about our current or former shareholders to non-affiliated third parties, except as permitted by law. For example, we are permitted by law to disclose all of the information we collect, as described above, to our Transfer Agent to process your transactions. Furthermore, we restrict access to your non-public personal information to those persons who require such information to provide products or services to you. We maintain physical, electronic, and procedural safeguards that comply with federal standards to guard your non-public personal information.
In the event that you hold shares of the Fund through a financial intermediary, including, but not limited to, a broker-dealer, bank, or trust company, the privacy policy of your financial intermediary would govern how your non-public personal information will be shared with non-affiliated third parties.
| HENNESSY FUNDS | 1-800-966-4354 | |
(This Page Intentionally Left Blank.)
For information, questions or assistance, please call
The Hennessy Funds
1-800-966-4354 or 1-415-899-1555
INVESTMENT ADVISOR
Hennessy Advisors, Inc.
7250 Redwood Boulevard, Suite 200
Novato, California 94945
ADMINISTRATOR,
TRANSFER AGENT,
DIVIDEND PAYING AGENT, &
SHAREHOLDER SERVICING AGENT
U.S. Bancorp Fund Services, LLC
d/b/a U.S. Bank Global Fund Services
P.O. Box 701
Milwaukee, Wisconsin 53201-0701
CUSTODIAN
U.S. Bank N.A.
Custody Operations
1555 North River Center Drive, Suite 302
Milwaukee, Wisconsin 53212
TRUSTEES
Neil J. Hennessy
Robert T. Doyle
J. Dennis DeSousa
Gerald P. Richardson
COUNSEL
Foley & Lardner LLP
777 East Wisconsin Avenue
Milwaukee, Wisconsin 53202-5306
INDEPENDENT REGISTERED
PUBLIC ACCOUNTING FIRM
Tait, Weller & Baker LLP
Two Liberty Place
50 South 16th Street, Suite 2900
Philadelphia, Pennsylvania 19103-2529
DISTRIBUTOR
Quasar Distributors, LLC
777 East Wisconsin Avenue
Milwaukee, Wisconsin 53202
www.hennessyfunds.com | 1-800-966-4354
This report has been prepared for shareholders and may be distributed to
others only if preceded or accompanied by a current prospectus.
ANNUAL REPORT
OCTOBER 31, 2019
HENNESSY LARGE CAP FINANCIAL FUND
Investor Class HLFNX
Institutional Class HILFX
IMPORTANT NOTICE REGARDING ELECTRONIC DELIVERY OF SHAREHOLDER REPORTS
Beginning on January 1, 2021, as permitted by regulations adopted by the Securities and Exchange Commission, paper copies of the annual and semi-annual reports will no longer be sent by mail unless you specifically request paper copies from the Hennessy Funds or from your financial intermediary. Instead, the reports will be made available on a website, and you will be notified by mail each time a report is posted and provided with a website link to access the report.
If you have already elected to receive shareholder reports electronically, you will not be affected by this change and you need not take any action. You may elect to receive shareholder reports and other communications from the Hennessy Funds electronically by visiting www.hennessyfunds.com/account or by calling U.S. Bank Global Fund Services at 1-800-261-6950. If you own shares in a Fund through a financial intermediary, please contact your financial intermediary to make this election.
You may elect to receive paper copies of all future reports free of charge by calling U.S. Bank Global Fund Services at 1-800-261-6950 or, if you own your shares through a financial intermediary, by contacting your financial intermediary. Your election to receive paper copies of reports will apply to all Funds in the Hennessy Funds family.
hennessyfunds.com | 1-800-966-4354
(This Page Intentionally Left Blank.)
Contents
| Letter to Shareholders | 2 |
| Performance Overview | 4 |
| Financial Statements | |
| Schedule of Investments | 7 |
| Statement of Assets and Liabilities | 10 |
| Statement of Operations | 11 |
| Statements of Changes in Net Assets | 13 |
| Financial Highlights | 14 |
| Notes to the Financial Statements | 18 |
| Report of Independent Registered Public Accounting Firm | 25 |
| Trustees and Officers of the Fund | 26 |
| Expense Example | 30 |
| Proxy Voting Policy and Proxy Voting Records | 32 |
| Availability of Quarterly Portfolio Schedule | 32 |
| Federal Tax Distribution Information | 32 |
| Important Notice Regarding Delivery of Shareholder Documents | 32 |
| Electronic Delivery | 32 |
| Privacy Policy | 33 |
| HENNESSY FUNDS | 1-800-966-4354 | |
December 2019
Dear Hennessy Funds Shareholder:
What a year it has been. I am reassured by the resiliency of the U.S. financial markets as companies continue to thrive in the midst of policy challenges and political turbulence. Trade tariffs, impeachment, and interest rates have dominated the news headlines, while Brexit and protests in Hong Kong have also been major concerns internationally.
While the financial markets were characterized by volatility during the twelve months ended October 31, 2019, U.S. equities posted double-digit positive performance for the period, with a total return of 14.3% for the S&P 500® Index and 10.3% for the Dow Jones Industrial Average. As I sat down to write this letter, all three major indices, the S&P 500® Index, the Dow Jones Industrial Average, and the NASDAQ Composite Index, recently reached all-time highs.
Every bull market experiences volatility and pullbacks, and this extended bull market is no different. Since 2010, there have been 16 pullbacks of 5-10% and six corrections of over 10%. But what is interesting is not how quickly the declines take place, but rather how swiftly the market regains and surpasses its prior highs. With each decline, many investors and commentators predict that finally this bull market is out of steam. But I ask myself, “Why?”
What I see is a healthy economy and stock market, with fundamentals in place to support a continued bull market. Although slightly above long-term averages, I believe stocks are trading at reasonable valuations, with the Dow Jones Industrial Average trading at 16x forward earnings per share and the S&P 500® Index at 17x forward earnings. At the same time, the U.S. economy is growing at a sustainable pace of 2-3%, corporate profits continue to outperform expectations, and cash continues to build on corporate balance sheets. With over $5 trillion in cash and marketable securities on the balance sheets of the S&P 500® Index companies alone, corporations are returning cash to shareholders through share buybacks and dividends. Share buybacks by S&P 500® Index companies could hit $1 trillion in 2019, surpassing 2018’s record $800 billion, and dividend payments by S&P 500® Index companies are estimated to increase 8-9%. Unemployment continues to be at historically low levels, while wages are growing. Interest rates are also at very low levels, which should support equity prices. Finally, overall consumer confidence remains positive.
To quote Sir John Templeton’s famous saying, “Bull markets are born on pessimism, grow on skepticism, mature on optimism, and die on euphoria.” If you look back to the beginning of the great bull market that began in 1982, only six of the past 37 years ended with negative total returns: 1990, 2000, 2001, 2002, 2008, and 2018. With the exception of 2018, which was characterized by volatility but no euphoria, the other down years were marked by euphoria in either real estate or dot coms. I have been saying for a number of years that I see no signs of euphoria in the market, and I remain confident in the strength of the market today.
Thank you for your continued trust and investment in the Hennessy Funds. We believe that there continue to be great opportunities throughout all parts of the market, and we remain steadfastly focused on managing our high-conviction portfolios for the long-term benefit of our shareholders. Should you have any questions or would like to speak with us directly, please don’t hesitate to call us at (800) 966-4354.
Best regards,
Neil J. Hennessy
President and Chief Investment Officer
Past performance does not guarantee future results.
Mutual fund investing involves risk. Principal loss is possible.
The Dow Jones Industrial Average and S&P 500® Index are commonly used to measure the performance of U.S. stocks. The NASDAQ Composite Index is a broad-based capitalization-weighted index of all the NASDAQ National Market and Small Cap stocks. One cannot invest directly in an index.
Forward price to earnings is a valuation measure calculated by dividing a company’s market price per share by its expected earnings per share over the following 12 months.
| HENNESSY FUNDS | 1-800-966-4354 | |
Performance Overview (Unaudited)
CHANGE IN VALUE OF $10,000 INVESTMENT
This graph illustrates the performance of an initial investment of $10,000 made in the Fund ten years ago and assumes the reinvestment of dividends.
AVERAGE ANNUAL TOTAL RETURN FOR PERIODS ENDED OCTOBER 31, 2019
| | One | Five | Ten |
| | Year | Years | Years |
| Hennessy Large Cap Financial Fund – | | | |
| Investor Class (HLFNX) | 8.75% | 7.47% | 9.36% |
| Hennessy Large Cap Financial Fund – | | | |
Institutional Class (HILFX)(1) | 9.16% | 7.85% | 9.54% |
Russell 1000® Financial Services Index | 17.12% | 11.50% | 12.66% |
Russell 1000® Index | 14.15% | 10.55% | 13.72% |
Expense ratios: 1.70% (Investor Class); 1.35% (Institutional Class)
(1) | The inception date of Institutional Class shares is June 15, 2015. Performance shown prior to the inception of Institutional Class shares reflects the performance of Investor Class shares and includes expenses that are not applicable to, and are higher than, those of Institutional Class shares. |
Performance data quoted represents past performance; past performance does not guarantee future results. The investment return and principal value of an investment will fluctuate so that an investor’s shares, when redeemed, may be worth more or less than their original cost. The performance table does not reflect the deduction of taxes that a shareholder would pay on Fund distributions or the redemption of Fund shares. Current performance of the Fund may be lower or higher than the performance quoted. Performance data current to the most recent month end may be obtained by visiting www.hennessyfunds.com. Performance for periods on or prior to October 26, 2012, is that of the FBR Large Cap Financial Fund.
The Russell 1000® Financial Services Index is a subset of the Russell 1000® Index that measures the performance of the securities classified in the financial services sector of the large-capitalization U.S. equity market. The Russell 1000® Index comprises the 1,000 largest companies in the Russell 3000® Index based on market capitalization. One cannot invest directly in an index. These indices are used herein for comparative purposes in accordance with SEC regulations.
Frank Russell Company (“Russell”) is the source and owner of the trademarks, service marks, and copyrights related to the Russell Indexes. Russell® is a trademark of Russell. Neither Russell nor its licensors accept any liability for any errors or omissions in the
Russell Indexes or Russell ratings or underlying data and no party may rely on any Russell Indexes or Russell ratings or underlying data contained in this communication. No further distribution of Russell data is permitted without Russell’s express written consent. Russell does not promote, sponsor, or endorse the content of this communication.
The expense ratios presented are from the most recent prospectus. The expense ratios for the current reporting period are available in the Financial Highlights section of this report.
PERFORMANCE NARRATIVE
Portfolio Managers David H. Ellison and Ryan C. Kelley, CFA
Performance:
For the 12-month period ended October 31, 2019, the Investor Class of the Hennessy Large Cap Financial Fund returned 8.75%, underperforming both the Russell 1000® Financial Services Index (the Fund’s primary benchmark) and the Russell 1000® Index, which returned 17.12% and 14.15%, respectively, for the same period.
The Fund’s underperformance relative to its primary benchmark predominantly resulted from its holdings within Diversified Financials as well as its lack of exposure to REITs (Real Estate Investment Trusts), which performed well during the time period. This underperformance was offset, to some degree, by positive contributions from the Fund’s overweight position in Software and Services. Mastercard, Inc., Moody’s Corporation, Visa, Inc., and PayPal Holdings, Inc. contributed to performance during the period. Green Dot Corporation, Square, Inc., and Zillow Group, Inc. were the biggest detractors during the period.
The Fund continues to hold the companies mentioned except for Green Dot and Zillow.
Portfolio Strategy:
Historically, the Fund has tilted its investments more heavily toward regional banks and diversified global banks and to a lesser degree toward insurance, real estate, asset managers, and software service providers. However, we have increased our exposure to electronic payment companies over the last few years. We believe that growth in the electronic payment industry will continue as the use of mobile payment methods spreads.
In general, we seek companies that we believe have high-quality management teams, less complex business models, and the prospect of sustainable earnings growth over time. We also try to identify companies that we expect will do well in the current environment, which is characterized by low interest rates, competitive loan markets, evolving electronic payment platforms, growing attention to costs, and business model repositioning. We are less interested in focusing solely on companies that appear to promise an increase in profitability when interest rates rise, loan demand increases, or product pricing becomes more favorable. We believe the timing of these macro industry dynamics is difficult to predict and not a long-term investment strategy.
Investment Commentary:
We continue to believe that the outlook for large-cap financial companies is good. The macroeconomic environment in the United States is positive. In our view, the U.S. economy is growing at a healthy rate, unemployment is low, and growth in both consumption and capital spending has remained steady. We believe the recent interest rate cuts by the Federal Reserve are intended to prolong the economic expansion. This should help large financial service providers continue their earnings growth and investment plans.
| HENNESSY FUNDS | 1-800-966-4354 | |
The Fund remains overweight in fee-based electronic service providers. We believe these companies will continue to grow their revenues and earnings, driven by the global shift towards cashless forms of payment. We also believe the outlook for larger banks is favorable. We believe the bigger banks have the ability to restructure their business lines and over time develop more stable profit models that are less sensitive to interest rates, yield curve steepness, credit trends, loan demand, and regulatory constraints.
_______________
Opinions expressed are those of the Portfolio Managers as of the date written and are subject to change, are not guaranteed, and should not be considered investment advice or an indication of trading intent.
The Fund is non-diversified, meaning it may concentrate its assets in fewer individual holdings than a diversified fund, making it more exposed to individual stock volatility than a diversified fund. Investments are focused in the financial services industry; sector funds may be subject to a higher degree of market risk. The Fund invests in medium-sized companies, which may have limited liquidity and greater volatility compared to larger companies. Please see the Fund’s prospectus for a more complete discussion of these and other risks.
References to specific securities should not be considered a recommendation to buy or sell any security. Fund holdings and sector allocations are subject to change. Please refer to the Schedule of Investments included in this report for additional portfolio information.
Earnings growth is not a measure of the Fund’s future performance. The yield curve is the graphical depiction of the relationship between the yield on bonds of the same credit quality but different maturities.
| PERFORMANCE OVERVIEW/SCHEDULE OF INVESTMENTS |
Financial Statements
Schedule of Investments as of October 31, 2019 |
HENNESSY LARGE CAP FINANCIAL FUND
(% of Net Assets)
| TOP TEN HOLDINGS (EXCLUDING MONEY MARKET FUNDS) | % NET ASSETS |
| Visa, Inc., Class A | 6.08% |
| Mastercard, Inc., Class A | 6.07% |
| Fiserv, Inc. | 5.94% |
| Moody’s Corp. | 5.81% |
| Berkshire Hathaway, Inc., Class B | 5.59% |
| Bank of America Corp. | 5.49% |
| PayPal Holdings, Inc. | 5.25% |
| Citigroup, Inc. | 5.20% |
| Automatic Data Processing, Inc. | 4.80% |
| JPMorgan Chase & Co. | 4.79% |
Note: For presentation purposes, the Fund has grouped some of the industry categories. For purposes of categorizing securities for compliance with Section 8(b)(1) of the Investment Company Act of 1940, as amended, the Fund uses more specific industry classifications.
The Global Industry Classification Standard (GICS®) was developed by and is the exclusive property and a service mark of MSCI, Inc. and Standard & Poor’s Financial Services LLC. It has been licensed for use by the Hennessy Funds.
| HENNESSY FUNDS | 1-800-966-4354 | |
| COMMON STOCKS – 97.29% | | Number | | | | | | % of | |
| | | of Shares | | | Value | | | Net Assets | |
| Financials – 54.31% | | | | | | | | | |
| American Express Co. | | | 16,500 | | | $ | 1,935,120 | | | | 4.24 | % |
| Bank of America Corp. | | | 80,000 | | | | 2,501,600 | | | | 5.49 | % |
| Berkshire Hathaway, Inc., Class B (a) | | | 12,000 | | | | 2,550,960 | | | | 5.59 | % |
| Capital One Financial Corp. | | | 23,000 | | | | 2,144,750 | | | | 4.70 | % |
| Cboe Global Markets, Inc. | | | 17,000 | | | | 1,957,550 | | | | 4.29 | % |
| Citigroup, Inc. | | | 33,000 | | | | 2,371,380 | | | | 5.20 | % |
| CME Group, Inc. | | | 9,000 | | | | 1,851,750 | | | | 4.06 | % |
| JPMorgan Chase & Co. | | | 17,500 | | | | 2,186,100 | | | | 4.79 | % |
| M&T Bank Corp. | | | 5,000 | | | | 782,650 | | | | 1.72 | % |
| Moody’s Corp. | | | 12,000 | | | | 2,648,280 | | | | 5.81 | % |
| Morgan Stanley | | | 7,000 | | | | 322,350 | | | | 0.71 | % |
| The Charles Schwab Corp. | | | 22,500 | | | | 915,975 | | | | 2.01 | % |
| The Goldman Sachs Group, Inc. | | | 6,500 | | | | 1,386,970 | | | | 3.04 | % |
| U.S. Bancorp (c) | | | 9,000 | | | | 513,180 | | | | 1.13 | % |
| Wells Fargo & Co. | | | 13,500 | | | | 697,005 | | | | 1.53 | % |
| | | | | | | | 24,765,620 | | | | 54.31 | % |
| | | | | | | | | | | | | |
| Information Technology – 42.98% | | | | | | | | | | | | |
| Automatic Data Processing, Inc. | | | 13,500 | | | | 2,190,105 | | | | 4.80 | % |
| Fair Isaac Corp. (a) | | | 6,000 | | | | 1,824,240 | | | | 4.00 | % |
| Fidelity National Information Services, Inc. | | | 6,000 | | | | 790,560 | | | | 1.74 | % |
| Fiserv, Inc. (a) | | | 25,500 | | | | 2,706,570 | | | | 5.94 | % |
| Intuit, Inc. | | | 8,000 | | | | 2,060,000 | | | | 4.52 | % |
| Mastercard, Inc., Class A | | | 10,000 | | | | 2,768,100 | | | | 6.07 | % |
| PayPal Holdings, Inc. (a) | | | 23,000 | | | | 2,394,300 | | | | 5.25 | % |
| Square, Inc., Class A (a) | | | 34,000 | | | | 2,088,620 | | | | 4.58 | % |
| Visa, Inc., Class A | | | 15,500 | | | | 2,772,330 | | | | 6.08 | % |
| | | | | | | | 19,594,825 | | | | 42.98 | % |
| Total Common Stocks | | | | | | | | | | | | |
| (Cost $35,173,503) | | | | | | | 44,360,445 | | | | 97.29 | % |
The accompanying notes are an integral part of these financial statements.
| SHORT-TERM INVESTMENTS – 1.84% | | Number | | | | | | % of | |
| | | of Shares | | | Value | | | Net Assets | |
| Money Market Funds – 1.84% | | | | | | | | | |
| First American Government Obligations Fund, | | | | | | | | | |
| Institutional Class, 1.74% (b) | | | 840,861 | | | $ | 840,861 | | | | 1.84 | % |
| | | | | | | | | | | | | |
| Total Short-Term Investments | | | | | | | | | | | | |
| (Cost $840,861) | | | | | | | 840,861 | | | | 1.84 | % |
| | | | | | | | | | | | | |
| Total Investments | | | | | | | | | | | | |
| (Cost $36,014,364) – 99.13% | | | | | | | 45,201,306 | | | | 99.13 | % |
| Other Assets in Excess of Liabilities – 0.87% | | | | | | | 397,419 | | | | 0.87 | % |
| | | | | | | | | | | | | |
TOTAL NET ASSETS – 100.00% | | | | | | $ | 45,598,725 | | | | 100.00 | % |
Percentages are stated as a percent of net assets.
| (a) | Non-income-producing security. |
| (b) | The rate listed is the fund’s seven-day yield as of October 31, 2019. |
| (c) | Investment in affiliated security. Quasar Distributors, LLC, which serves as the Fund’s distributor, is a subsidiary of U.S. Bancorp. Details of transactions with this affiliated company for the year ended October 31, 2019, are as follows: |
| | | Common Stocks | |
Issuer | | U.S. Bancorp | |
| Beginning Cost – November 1, 2018 | | $ | 1,145,644 | |
| Purchase Cost | | $ | 864,525 | |
| Sales Cost | | $ | (1,521,139 | ) |
| Ending Cost – October 31, 2019 | | $ | 489,030 | |
| Dividend Income | | $ | 15,780 | |
| Net Change in Unrealized Appreciation/Depreciation | | $ | 19,854 | |
| Realized Loss | | $ | (56,759 | ) |
| Shares | | | 9,000 | |
| Market Value – October 31, 2019 | | $ | 513,180 | |
Summary of Fair Value Exposure as of October 31, 2019
The following is a summary of the inputs used to value the Fund’s net assets as of October 31, 2019 (See Note 3 in the accompanying Notes to the Financial Statements):
| Common Stocks | | Level 1 | | | Level 2 | | | Level 3 | | | Total | |
| Financials | | $ | 24,765,620 | | | $ | — | | | $ | — | | | $ | 24,765,620 | |
| Information Technology | | | 19,594,825 | | | | — | | | | — | | | | 19,594,825 | |
| Total Common Stocks | | $ | 44,360,445 | | | $ | — | | | $ | — | | | $ | 44,360,445 | |
| Short-Term Investments | | | | | | | | | | | | | | | | |
| Money Market Funds | | $ | 840,861 | | | $ | — | | | $ | — | | | $ | 840,861 | |
| Total Short-Term Investments | | $ | 840,861 | | | $ | — | | | $ | — | | | $ | 840,861 | |
| Total Investments | | $ | 45,201,306 | | | $ | — | | | $ | — | | | $ | 45,201,306 | |
The accompanying notes are an integral part of these financial statements.
| HENNESSY FUNDS | 1-800-966-4354 | |
Financial Statements
Statement of Assets and Liabilities as of October 31, 2019 |
| ASSETS: | | | |
| Investments in unaffiliated securities, at value (cost $35,525,334) | | $ | 44,688,126 | |
| Investments in affiliated securities, at value (cost $489,030) | | | 513,180 | |
| Total investments in securities, at value (cost $36,014,364) | | | 45,201,306 | |
| Dividends and interest receivable | | | 16,036 | |
| Receivable for fund shares sold | | | 187 | |
| Receivable for securities sold | | | 462,349 | |
| Prepaid expenses and other assets | | | 21,924 | |
| Total assets | | | 45,701,802 | |
| | | | | |
| LIABILITIES: | | | | |
| Payable for fund shares redeemed | | | 5,209 | |
| Payable to advisor | | | 34,578 | |
| Payable to administrator | | | 11,269 | |
| Payable to auditor | | | 22,548 | |
| Accrued distribution fees | | | 5,337 | |
| Accrued service fees | | | 1,986 | |
| Accrued trustees fees | | | 6,600 | |
| Accrued expenses and other payables | | | 15,550 | |
| Total liabilities | | | 103,077 | |
| NET ASSETS | | $ | 45,598,725 | |
| | | | | |
| NET ASSETS CONSISTS OF: | | | | |
| Capital stock | | $ | 39,356,294 | |
| Total distributable earnings | | | 6,242,431 | |
| Total net assets | | $ | 45,598,725 | |
| | | | | |
| NET ASSETS: | | | | |
| Investor Class | | | | |
| Shares authorized (no par value) | | Unlimited | |
| Net assets applicable to outstanding shares | | $ | 23,627,898 | |
| Shares issued and outstanding | | | 1,043,974 | |
| Net asset value, offering price, and redemption price per share | | $ | 22.63 | |
| | | | | |
| Institutional Class | | | | |
| Shares authorized (no par value) | | Unlimited | |
| Net assets applicable to outstanding shares | | $ | 21,970,827 | |
| Shares issued and outstanding | | | 968,739 | |
| Net asset value, offering price, and redemption price per share | | $ | 22.68 | |
The accompanying notes are an integral part of these financial statements.
| STATEMENT OF ASSETS AND LIABILITIES/STATEMENT OF OPERATIONS |
Financial Statements
Statement of Operations for the year ended October 31, 2019 |
| INVESTMENT INCOME: | | | |
| Dividend income from unaffiliated securities | | $ | 553,514 | |
| Dividend income from affiliated securities | | | 15,780 | |
| Interest income | | | 39,464 | |
| Total investment income | | | 608,758 | |
| | | | | |
| EXPENSES: | | | | |
| Investment advisory fees (See Note 5) | | | 352,992 | |
| Sub-transfer agent expenses – Investor Class (See Note 5) | | | 63,899 | |
| Sub-transfer agent expenses – Institutional Class (See Note 5) | | | 12,994 | |
| Administration, accounting, custody, and transfer agent fees (See Note 5) | | | 53,188 | |
| Distribution fees – Investor Class (See Note 5) | | | 39,693 | |
| Federal and state registration fees | | | 34,892 | |
| Service fees – Investor Class (See Note 5) | | | 26,462 | |
| Compliance expense (See Note 5) | | | 25,810 | |
| Audit fees | | | 22,314 | |
| Trustees’ fees and expenses | | | 18,126 | |
| Reports to shareholders | | | 9,851 | |
| Interest expense (See Note 7) | | | 652 | |
| Legal fees | | | 101 | |
| Other expenses | | | 2,566 | |
| Total expenses | | | 663,540 | |
| NET INVESTMENT LOSS | | $ | (54,782 | ) |
| | | | | |
| REALIZED AND UNREALIZED GAINS (LOSSES): | | | | |
| Net realized loss on investments: | | | | |
| Unaffiliated investments | | $ | (2,097,009 | ) |
| Affiliated investments | | | (56,759 | ) |
| Net change in unrealized appreciation/deprecation on investments: | | | | |
| Unaffiliated investments | | | 3,566,211 | |
| Affiliated investments | | | 19,854 | |
| Net gain on investments | | | 1,432,297 | |
| NET INCREASE IN NET ASSETS RESULTING FROM OPERATIONS | | $ | 1,377,515 | |
The accompanying notes are an integral part of these financial statements.
| HENNESSY FUNDS | 1-800-966-4354 | |
(This Page Intentionally Left Blank.)
| STATEMENTS OF CHANGES IN NET ASSETS |
Financial Statements
| Statements of Changes in Net Assets |
| | | Year Ended | | | Year Ended | |
| | | October 31, 2019 | | | October 31, 2018 | |
| OPERATIONS: | | | | | | |
| Net investment loss | | $ | (54,782 | ) | | $ | (177,736 | ) |
| Net realized gain (loss) on investments | | | (2,153,768 | ) | | | 1,201,419 | |
| Net change in unrealized | | | | | | | | |
| appreciation/depreciation on investments | | | 3,586,065 | | | | (1,658,090 | ) |
| Net increase (decrease) in net | | | | | | | | |
| assets resulting from operations | | | 1,377,515 | | | | (634,407 | ) |
| | | | | | | | | |
| DISTRIBUTIONS TO SHAREHOLDERS: | | | | | | | | |
| Distributable earnings – Investor Class | | | (982,872 | ) | | | (1,219,312 | ) |
| Distributable earnings – Institutional Class | | | (250,041 | ) | | | (296,176 | ) |
| Total distributions | | | (1,232,913 | ) | | | (1,515,488 | ) |
| | | | | | | | | |
| CAPITAL SHARE TRANSACTIONS: | | | | | | | | |
| Proceeds from shares subscribed – Investor Class | | | 2,668,470 | | | | 24,589,903 | |
| Proceeds from shares subscribed – Institutional Class | | | 19,568,396 | | | | 7,641,988 | |
| Dividends reinvested – Investor Class | | | 961,534 | | | | 1,178,036 | |
| Dividends reinvested – Institutional Class | | | 249,016 | | | | 296,176 | |
| Cost of shares redeemed – Investor Class | | | (21,047,821 | ) | | | (9,240,403 | ) |
| Cost of shares redeemed – Institutional Class | | | (6,788,374 | ) | | | (4,636,260 | ) |
| Net increase (decrease) in net assets derived | | | | | | | | |
| from capital share transactions | | | (4,388,779 | ) | | | 19,829,440 | |
| TOTAL INCREASE (DECREASE) IN NET ASSETS | | | (4,244,177 | ) | | | 17,679,545 | |
| | | | | | | | | |
| NET ASSETS: | | | | | | | | |
| Beginning of year | | | 49,842,902 | | | | 32,163,357 | |
| End of year | | $ | 45,598,725 | | | $ | 49,842,902 | |
| | | | | | | | | |
| CHANGES IN SHARES OUTSTANDING: | | | | | | | | |
| Shares sold – Investor Class | | | 122,976 | | | | 1,072,989 | |
| Shares sold – Institutional Class | | | 863,528 | | | | 339,855 | |
| Shares issued to holders as reinvestment | | | | | | | | |
| of dividends – Investor Class | | | 48,710 | | | | 54,162 | |
| Shares issued to holders as reinvestment | | | | | | | | |
| of dividends – Institutional Class | | | 12,634 | | | | 13,686 | |
| Shares redeemed – Investor Class | | | (1,040,638 | ) | | | (410,285 | ) |
| Shares redeemed – Institutional Class | | | (321,223 | ) | | | (205,942 | ) |
| Net increase (decrease) in shares outstanding | | | (314,013 | ) | | | 864,465 | |
The accompanying notes are an integral part of these financial statements.
| HENNESSY FUNDS | 1-800-966-4354 | |
Financial Statements
For an Investor Class share outstanding throughout each year
PER SHARE DATA:
Net asset value, beginning of year
Income from investment operations:
Net investment income (loss)
Net realized and unrealized gains (losses) on investments
Total from investment operations
Less distributions:
Dividends from net investment income
Dividends from net realized gains
Total distributions
Net asset value, end of year
TOTAL RETURN
SUPPLEMENTAL DATA AND RATIOS:
Net assets, end of year (millions)
Ratio of expenses to average net assets
Ratio of net investment income (loss) to average net assets
Portfolio turnover rate(2)
(1) | Calculated using the average shares outstanding method. |
(2) | Calculated on the basis of the Fund as a whole. |
The accompanying notes are an integral part of these financial statements.
| FINANCIAL HIGHLIGHTS — INVESTOR CLASS |
| Year Ended October 31, | |
| 2019 | | | 2018 | | | 2017 | | | 2016 | | | 2015 | |
| | | | | | | | | | | | | | |
| $ | 21.43 | | | $ | 22.02 | | | $ | 16.23 | | | $ | 18.36 | | | $ | 20.87 | |
| | | | | | | | | | | | | | | | | | | |
| | | | | | | | | | | | | | | | | | | |
| | (0.05 | )(1) | | | (0.07 | ) | | | (0.08 | ) | | | 0.07 | | | | 0.01 | |
| | 1.84 | | | | 0.48 | | | | 5.97 | | | | (0.49 | ) | | | (0.40 | ) |
| | 1.79 | | | | 0.41 | | | | 5.89 | | | | (0.42 | ) | | | (0.39 | ) |
| | | | | | | | | | | | | | | | | | | |
| | | | | | | | | | | | | | | | | | | |
| | — | | | | — | | | | (0.10 | ) | | | (0.02 | ) | | | — | |
| | (0.59 | ) | | | (1.00 | ) | | | — | | | | (1.69 | ) | | | (2.12 | ) |
| | (0.59 | ) | | | (1.00 | ) | | | (0.10 | ) | | | (1.71 | ) | | | (2.12 | ) |
| $ | 22.63 | | | $ | 21.43 | | | $ | 22.02 | | | $ | 16.23 | | | $ | 18.36 | |
| | | | | | | | | | | | | | | | | | | |
| | 8.75 | % | | | 1.82 | % | | | 36.41 | % | | | (2.57 | )% | | | (2.57 | )% |
| | | | | | | | | | | | | | | | | | | |
| | | | | | | | | | | | | | | | | | | |
| $ | 23.63 | | | $ | 40.99 | | | $ | 26.33 | | | $ | 26.67 | | | $ | 100.73 | |
| | 1.82 | % | | | 1.69 | % | | | 1.81 | % | | | 1.66 | % | | | 1.57 | % |
| | (0.23 | )% | | | (0.44 | )% | | | (0.41 | )% | | | 0.16 | % | | | 0.03 | % |
| | 83 | % | | | 64 | % | | | 76 | % | | | 141 | % | | | 74 | % |
The accompanying notes are an integral part of these financial statements.
| HENNESSY FUNDS | 1-800-966-4354 | |
Financial Statements
For an Institutional Class share outstanding throughout each period
PER SHARE DATA:
Net asset value, beginning of period
Income from investment operations:
Net investment income
Net realized and unrealized gains (losses) on investments
Total from investment operations
Less distributions:
Dividends from net investment income
Dividends from net realized gains
Total distributions
Net asset value, end of period
TOTAL RETURN
SUPPLEMENTAL DATA AND RATIOS:
Net assets, end of period (millions)
Ratio of expenses to average net assets
Ratio of net investment income (loss) to average net assets
Portfolio turnover rate(5)
(1) | Institutional Class shares commenced operations on June 15, 2015. |
(2) | Calculated using the average shares outstanding method. |
(3) | Not annualized. |
(4) | Annualized. |
(5) | Calculated on the basis of the Fund as a whole. |
The accompanying notes are an integral part of these financial statements.
| FINANCIAL HIGHLIGHTS — INSTITUTIONAL CLASS |
| | | Period Ended | |
| Year Ended October 31, | | | October 31, | |
| 2019 | | | 2018 | | | 2017 | | | 2016 | | | 2015(1) | |
| | | | | | | | | | | | | | |
| $ | 21.39 | | | $ | 21.91 | | | $ | 16.26 | | | $ | 18.39 | | | $ | 19.72 | |
| | | | | | | | | | | | | | | | | | | |
| | | | | | | | | | | | | | | | | | | |
| | 0.01 | (2) | | | 0.03 | | | | 0.18 | | | | 0.02 | | | | 0.01 | |
| | 1.87 | | | | 0.45 | | | | 5.78 | | | | (0.36 | ) | | | (1.34 | ) |
| | 1.88 | | | | 0.48 | | | | 5.96 | | | | (0.34 | ) | | | (1.33 | ) |
| | | | | | | | | | | | | | | | | | | |
| | | | | | | | | | | | | | | | | | | |
| | — | | | | — | | | | (0.31 | ) | | | (0.09 | ) | | | — | |
| | (0.59 | ) | | | (1.00 | ) | | | — | | | | (1.70 | ) | | | — | |
| | (0.59 | ) | | | (1.00 | ) | | | (0.31 | ) | | | (1.79 | ) | | | — | |
| $ | 22.68 | | | $ | 21.39 | | | $ | 21.91 | | | $ | 16.26 | | | $ | 18.39 | |
| | | | | | | | | | | | | | | | | | | |
| | 9.16 | % | | | 2.16 | % | | | 36.92 | % | | | (2.14 | )% | | | (6.74 | )%(3) |
| | | | | | | | | | | | | | | | | | | |
| | | | | | | | | | | | | | | | | | | |
| $ | 21.97 | | | $ | 8.85 | | | $ | 5.83 | | | $ | 0.35 | | | $ | 0.29 | |
| | 1.43 | % | | | 1.34 | % | | | 1.50 | % | | | 1.24 | % | | | 1.19 | %(4) |
| | 0.05 | % | | | (0.07 | )% | | | (0.17 | )% | | | 0.52 | % | | | 0.25 | %(4) |
| | 83 | % | | | 64 | % | | | 76 | % | | | 141 | % | | | 74 | %(3) |
The accompanying notes are an integral part of these financial statements.
| HENNESSY FUNDS | 1-800-966-4354 | |
Financial Statements
Notes to the Financial Statements October 31, 2019 |
1). ORGANIZATION
The Hennessy Large Cap Financial Fund (the “Fund”) is a series of Hennessy Funds Trust (the “Trust”), which was organized as a Delaware statutory trust on September 17, 1992. The Fund is an open-end management investment company registered under the Investment Company Act of 1940, as amended. The investment objective of the Fund is capital appreciation. The Fund is a non-diversified fund.
The Fund offers Investor Class and Institutional Class shares. Each class of shares differs principally in its respective 12b-1 distribution and service, shareholder servicing, and sub-transfer agent expenses. There are no sales charges. Each class has identical rights to earnings, assets, and voting privileges, except for class-specific expenses and exclusive rights to vote on matters affecting only one class.
As an investment company, the Fund follows the investment company accounting and reporting guidance of the Financial Accounting Standards Board (“FASB”) Accounting Standard Codification Topic 946 “Financial Services—Investment Companies.”
2). SIGNIFICANT ACCOUNTING POLICIES
The following is a summary of significant accounting policies consistently followed by the Fund in the preparation of the financial statements. These policies conform to U.S. generally accepted accounting principles (“GAAP”).
| a). | Securities Valuation – All investments in securities are recorded at their estimated fair value, as described in Note 3. |
| | |
| b). | Federal Income Taxes – No provision for federal income taxes or excise taxes has been made because the Fund has elected to be taxed as a regulated investment company and intends to distribute substantially all of its taxable income to its shareholders and otherwise comply with the provisions of the Internal Revenue Code of 1986, as amended, applicable to regulated investment companies. Net investment income/loss and realized gains/losses for federal income tax purposes may differ from those reported in the financial statements because of temporary book and tax basis differences. Temporary differences are primarily the result of the treatment of wash sales for tax reporting purposes. The Fund recognizes interest and penalties related to income tax benefits, if any, in the Statement of Operations as an income tax expense. Distributions from net realized gains for book purposes may include short-term capital gains, which are included as ordinary income to shareholders for tax purposes. The Fund may utilize equalization accounting for tax purposes and designate earnings and profits, including net realized gains distributed to shareholders on redemption of shares, as part of the dividends paid deduction for income tax purposes. |
| | |
| | Due to inherent differences in the recognition of income, expenses, and realized gains/losses under GAAP and federal income tax regulations, permanent differences between book and tax basis for reporting for fiscal year 2019 have been identified and appropriately reclassified in the Statement of Assets and Liabilities. The adjustments are as follows: |
| Total | |
| Distributable | |
Earnings | Capital Stock |
| $131,195 | $(131,195) |
| NOTES TO THE FINANCIAL STATEMENTS |
| c). | Accounting for Uncertainty in Income Taxes – The Fund has accounting policies regarding recognition and measurement of tax positions taken or expected to be taken on a tax return. The tax returns of the Fund for the prior three fiscal years are open for examination. The Fund has reviewed all open tax years in major jurisdictions and concluded that there is no impact on the Fund’s net assets and no tax liability resulting from unrecognized tax benefits relating to uncertain income tax positions taken or expected to be taken on a tax return. The Fund’s major tax jurisdictions are U.S. federal and Delaware. |
| | |
| d). | Income and Expenses – Dividend income is recognized on the ex-dividend date or as soon as information is available to the Fund. Interest income, which includes the amortization of premium and accretion of discount, is recognized on an accrual basis. Other non-cash dividends are recognized as investment income at the fair value of the property received. The Fund is charged for those expenses that are directly attributable to its portfolio, such as advisory, administration, and certain shareholder service fees. Income, expenses (other than expenses attributable to a specific class), and realized and unrealized gains/losses on investments are allocated to each class of shares based on such class’s net assets. |
| | |
| e). | Distributions to Shareholders – Dividends from net investment income for the Fund, if any, are declared and paid annually, usually in December. Distributions of net realized capital gains, if any, are declared and paid annually, usually in December. |
| | |
| f). | Security Transactions – Investment and shareholder transactions are recorded on the trade date. The Fund determines the realized gain/loss from an investment transaction by comparing the original cost of the security lot sold with the net sale proceeds. Discounts and premiums on securities purchased are accreted or amortized, respectively, over the life of each such security. |
| | |
| g). | Use of Estimates – The preparation of financial statements in conformity with GAAP requires management to make estimates and assumptions that affect the reported amounts of assets and liabilities and disclosure of contingent assets and liabilities at the date of the financial statements and the reported change in net assets during the reporting period. Actual results could differ from those estimates. |
| | |
| h). | Share Valuation – The net asset value (“NAV”) per share of the Fund is calculated by dividing (i) the total value of the securities held by the Fund, plus cash and other assets, minus all liabilities (including estimated accrued expenses) by (ii) the total number of shares outstanding for the Fund, rounded to the nearest $0.01. The Fund’s shares will not be priced on days the New York Stock Exchange is closed for trading. The offering and redemption price per share for the Fund is equal to the Fund’s NAV per share. |
| | |
| i). | New Accounting Pronouncements – In August 2018, the FASB issued Accounting Standards Update No. 2018-13 “Disclosure Framework—Changes to the Disclosure Requirements for Fair Value Measurement” (“ASU 2018-13”). ASU 2018-13 eliminates the requirement to disclose the amount of and reasons for transfers between Level 1 and Level 2 of the fair value hierarchy, the timing of transfers between levels of the fair value hierarchy, and the valuation processes for Level 3 fair value measurements. ASU 2018-13 does not eliminate the requirement to disclose the range and weighted average used to develop significant unobservable inputs for Level 3 fair value measurements, and the changes in unrealized gains and losses for recurring Level 3 fair value measurements. ASU 2018-13 requires that information is provided about the measurement uncertainty of Level 3 fair value measurements as of the reporting date. The guidance is effective for fiscal years beginning after |
| HENNESSY FUNDS | 1-800-966-4354 | |
| | December 15, 2019, and interim periods within those fiscal years. Management has evaluated the impact of this change in guidance and, due to the permissibility of early adoption, modified the Fund’s fair value disclosures for the current reporting period. |
3). SECURITIES VALUATION
The Fund follows fair value accounting standards that establish an authoritative definition of fair value and set out a hierarchy for measuring fair value. These standards require additional disclosures about the various inputs and valuation techniques used to develop the measurements of fair value and a discussion of changes in valuation techniques and related inputs during the period. These inputs are summarized in the three broad levels listed below:
| | Level 1 – | Unadjusted, quoted prices in active markets for identical instruments that the Fund has the ability to access at the date of measurement. |
| | | |
| | Level 2 – | Other significant observable inputs (including, but not limited to, quoted prices in active markets for similar instruments, quoted prices in markets that are not active for identical or similar instruments, and model-derived valuations in which all significant inputs and significant value drivers are observable in active markets, such as interest rates, prepayment speeds, credit risk curves, default rates, and similar data). |
| | | |
| | Level 3 – | Significant unobservable inputs (including the Fund’s own assumptions about what market participants would use to price the asset or liability based on the best available information) when observable inputs are unavailable. |
The following is a description of the valuation techniques applied to the Fund’s major categories of assets and liabilities measured at fair value on a recurring basis:
| | Equity Securities – Equity securities, including common stocks, preferred stocks, foreign-issued common stocks, exchange-traded funds, closed-end mutual funds, partnerships, rights, and real estate investment trusts, that are traded on a securities exchange for which a last-quoted sales price is readily available will generally be valued at the last sales price as reported by the primary exchange on which the securities are listed. Securities listed on The NASDAQ Stock Market (“NASDAQ”) will generally be valued at the NASDAQ Official Closing Price, which may differ from the last sales price reported. Securities traded on a securities exchange for which a last-quoted sales price is not readily available will generally be valued at the mean between the bid and ask prices. To the extent these securities are actively traded and valuation adjustments are not applied, they are classified in Level 1 of the fair value hierarchy. Securities traded on foreign exchanges generally are not valued at the same time the Fund calculates its NAV because most foreign markets close well before such time. The earlier close of most foreign markets gives rise to the possibility that significant events, including broad market moves, may have occurred in the interim. In certain circumstances, it may be determined that a foreign security needs to be fair valued because it appears that the value of the security might have been materially affected by events occurring after the close of the market in which the security is principally traded, but before the time the Fund calculates its NAV, such as by a development that affects an entire market or region (e.g., a weather-related event) or a potentially global development (e.g., a terrorist attack that may be expected to have an effect on investor expectations worldwide). |
| | |
| | Registered Investment Companies – Investments in open-end registered investment companies, commonly referred to as mutual funds, generally are priced at the ending NAV provided by the applicable mutual fund’s service agent and will be classified in Level 1 of the fair value hierarchy. |
| NOTES TO THE FINANCIAL STATEMENTS |
| | Debt Securities – Debt securities, including corporate bonds, asset-backed securities, mortgage-backed securities, municipal bonds, U.S. Treasuries, and U.S. government agency issues, are generally valued at market on the basis of valuations furnished by an independent pricing service that utilizes both dealer-supplied valuations and formula-based techniques. The pricing service may consider recently executed transactions in securities of the issuer or comparable issuers, market price quotations (where observable), bond spreads, and fundamental data relating to the issuer. In addition, the model may incorporate observable market data, such as reported sales of similar securities, broker quotes, yields, bids, offers, and reference data. Certain securities are valued primarily using dealer quotations. These securities are generally classified in Level 2 of the fair value hierarchy. |
| | |
| | Short-Term Securities – Short-term equity investments, including money market funds, are valued in the manner specified above. Short-term debt investments with an original term to maturity of 60 days or less are valued at amortized cost, which approximates fair market value. If the original term to maturity of a short-term debt investment exceeded 60 days, then the values as of the 61st day prior to maturity are amortized. Amortized cost is not used if its use would be inappropriate due to credit or other impairments of the issuer, in which case the security’s fair value would be determined, as described below. Short-term securities are generally classified in Level 1 or Level 2 of the fair value hierarchy depending on the inputs used and market activity levels for specific securities. |
The Board of Trustees of the Fund (the “Board”) has adopted fair value pricing procedures that are followed when a price for a security is not readily available or if a significant event has occurred that indicates the closing price of a security no longer represents the true value of that security. Fair value pricing determinations are made in good faith in accordance with these procedures. There are numerous criteria that will be given consideration in determining a fair value of a security, such as the trading volume of a security and markets, the values of other similar securities, and news events with direct bearing on a security or markets. Fair value pricing results in an estimated price for a security that reflects the amount the Fund might reasonably expect to receive in a current sale. Depending on the relative significance of the valuation inputs, these securities may be classified in either Level 2 or Level 3 of the fair value hierarchy.
The fair value of foreign securities may be determined with the assistance of a pricing service using correlations between the movement of prices of such securities and indices of domestic securities and other appropriate indicators, such as closing market prices of relevant American Depositary Receipts or futures contracts. The effect of using fair value pricing is that the Fund’s NAV will reflect the affected portfolio securities’ values as determined by the Board or its designee, pursuant to the fair value pricing procedures adopted by the Board, instead of being determined by the market. Using a fair value pricing methodology to price a foreign security may result in a value that is different from such foreign security’s most recent closing price and from the value used by other investment companies to calculate their NAVs. Such securities are generally classified in Level 2 of the fair value hierarchy. Because the Fund may invest in foreign securities, the value of the Fund’s portfolio securities may change on days when you will not be able to purchase or redeem your shares.
The Board has delegated day-to-day valuation matters to the Valuation and Liquidity Committee comprising representatives from Hennessy Advisors, Inc., the Fund’s investment advisor (the “Advisor”). The function of the Valuation and Liquidity Committee is to value securities where current and reliable market quotations are not readily available. All actions taken by the Valuation and Liquidity Committee are reviewed by the Board.
| HENNESSY FUNDS | 1-800-966-4354 | |
The Fund has performed an analysis of all existing investments to determine the significance and character of all inputs to their fair value determinations. Various inputs are used to determine the value of the Fund’s investments. The inputs or methodology used for valuing securities are not necessarily an indication of the risk associated with investing in those securities. Details related to the fair value hierarchy of the Fund’s securities as of October 31, 2019, are included in the Schedule of Investments.
4). INVESTMENT TRANSACTIONS
Purchases and sales of investment securities (excluding government and short-term investments) for the Fund during fiscal year 2019 were $31,886,939 and $33,871,576, respectively.
There were no purchases or sales/maturities of long-term U.S. government securities for the Fund during fiscal year 2019.
The Fund is permitted to purchase or sell securities from or to another fund in the Hennessy Funds family of funds (collectively, the “Hennessy Funds”) under specified conditions outlined in procedures adopted by the Board. The procedures have been designed to ensure that any purchase or sale of securities by the Fund from or to another Hennessy Fund complies with Rule 17a-7 of the Investment Company Act of 1940, as amended. During fiscal year 2019, the Fund did not engage in purchases or sales of securities pursuant to Rule 17a-7 of the Investment Company Act of 1940, as amended.
5). INVESTMENT ADVISORY FEE AND OTHER TRANSACTIONS WITH AFFILIATES
The Advisor provides the Fund with investment advisory services under an Investment Advisory Agreement. The Advisor furnishes all investment advice, office space, and facilities and most of the personnel needed by the Fund. As compensation for its services, the Advisor is entitled to a monthly fee from the Fund. The fee is based on the average daily net assets of the Fund at an annual rate of 0.90%. The net investment advisory fees expensed by the Fund during fiscal year 2019 are included in the Statement of Operations.
The Board has approved a Shareholder Servicing Agreement for Investor Class shares of the Fund, which was instituted to compensate the Advisor for the non-investment advisory services it provides to the Fund. The Shareholder Servicing Agreement provides for a monthly fee paid to the Advisor at an annual rate of 0.10% of the average daily net assets of the Fund attributable to Investor Class shares. The shareholder service fees expensed by the Fund during fiscal year 2019 are included in the Statement of Operations.
The Fund has adopted a plan pursuant to Rule 12b-1 under the Investment Company Act of 1940, as amended, that authorizes payments in connection with the distribution of the Fund’s shares at an annual rate of up to 0.25% of the Fund’s average daily net assets attributable to Investor Class shares. Even though the authorized rate is up to 0.25%, the Fund is currently only using up to 0.15% of its average daily net assets attributable to Investor Class shares for such purpose. Amounts paid under the plan may be spent on any activities or expenses primarily intended to result in the sale of shares, including, but not limited to, advertising, shareholder account servicing, printing and mailing of prospectuses to other than current shareholders, printing and mailing of sales literature, and compensation for sales and marketing activities or to financial institutions and others, such as dealers and distributors. The distribution fees expensed by the Fund during fiscal year 2019 are included in the Statement of Operations.
The Fund has entered into agreements with various brokers, dealers, and financial intermediaries in connection with the sale of shares of the Fund. The agreements provide for periodic payments of sub-transfer agent expenses by the Fund to the brokers, dealers, and financial intermediaries for providing certain shareholder maintenance services. These
| NOTES TO THE FINANCIAL STATEMENTS |
shareholder services include the pre-processing and quality control of new accounts, shareholder correspondence, answering customer inquiries regarding account status, and facilitating shareholder telephone transactions. The sub-transfer agent fees expensed by the Fund during fiscal year 2019 are included in the Statement of Operations.
U.S. Bancorp Fund Services, LLC, d/b/a U.S. Bank Global Fund Services (“Fund Services”) provides the Fund with administrative, accounting, and transfer agent services. As administrator, Fund Services is responsible for activities such as (i) preparing various federal and state regulatory filings, reports, and returns for the Fund, (ii) preparing reports and materials to be supplied to the Board, (iii) monitoring the activities of the Fund’s custodian, transfer agent, and accountants, and (iv) coordinating the preparation and payment of the Fund’s expenses and reviewing the Fund’s expense accruals. U.S. Bank N.A., an affiliate of Fund Services, serves as the Fund’s custodian. The servicing agreements between the Trust and Fund Services and U.S. Bank N.A. contain a fee schedule that is inclusive of administrative, accounting, custody, and transfer agent fees. The administrative, accounting, custody, and transfer agent fees expensed by the Fund during fiscal year 2019 are included in the Statement of Operations.
Quasar Distributors, LLC (“Quasar”) acts as the Fund’s principal underwriter in a continuous public offering of the Fund’s shares. Quasar is an affiliate of Fund Services and U.S. Bank N.A.
The officers of the Fund are affiliated with the Advisor. With the exception of the Chief Compliance Officer and the Senior Compliance Officer, such officers receive no compensation from the Fund for serving in their respective roles. The Fund, along with the other Hennessy Funds, makes reimbursement payments on an equal basis to the Advisor for a portion of the salary and benefits associated with the office of the Chief Compliance Officer and for all of the salary and benefits associated with the office of the Senior Compliance Officer. The compliance fees expensed by the Fund during fiscal year 2019 are included in the Statement of Operations.
6). GUARANTEES AND INDEMNIFICATIONS
Under the Hennessy Funds’ organizational documents, their officers and trustees are indemnified by the Hennessy Funds against certain liabilities arising out of the performance of their duties to the Hennessy Funds. Additionally, in the normal course of business, the Hennessy Funds enter into contracts with service providers that contain general indemnification clauses. The Fund’s maximum exposure under these arrangements is unknown as this would involve future claims that may be made against the Fund that have not yet occurred. Currently, the Fund expects the risk of loss to be remote.
7). LINE OF CREDIT
The Fund has an uncommitted line of credit with the other Hennessy Funds in the amount of the lesser of (i) $100,000,000 or (ii) 33.33% of each Hennessy Fund’s net assets, or 30% for the Hennessy Gas Utility Fund and 10% for the Hennessy Balanced Fund, intended to provide short-term financing, if necessary, subject to certain restrictions, in connection with shareholder redemptions. The credit facility is with the Hennessy Funds’ custodian bank, U.S. Bank N.A. Borrowings under this arrangement bear interest at the bank’s prime rate and are secured by all of the Fund’s assets (as to its own borrowings only). During fiscal year 2019, the Fund had an outstanding average daily balance and a weighted average interest rate of $11,937 and 5.39%, respectively. The interest expensed by the Fund during fiscal year 2019 is included in the Statement of Operations. The maximum amount outstanding for the Fund during fiscal year 2019 was $1,144,000. As of October 31, 2019, the Fund did not have any borrowings outstanding under the line of credit.
| HENNESSY FUNDS | 1-800-966-4354 | |
8). FEDERAL TAX INFORMATION
As of October 31, 2019, the components of accumulated earnings (losses) for income tax purposes were as follows:
| | | Investments | |
| Cost of investments for tax purposes | | $ | 36,407,512 | |
| Gross tax unrealized appreciation | | $ | 9,841,735 | |
| Gross tax unrealized depreciation | | | (1,047,941 | ) |
| Net tax unrealized appreciation/(depreciation) | | $ | 8,793,794 | |
| Undistributed ordinary income | | $ | — | |
| Undistributed long-term capital gains | | | — | |
| Total distributable earnings | | $ | — | |
| Other accumulated gain/(loss) | | $ | (2,551,363 | ) |
| Total accumulated gain/(loss) | | $ | 6,242,431 | |
The difference between book-basis unrealized appreciation/depreciation and tax-basis unrealized appreciation/depreciation (as shown above) is attributable primarily to wash sales and late-year ordinary losses.
As of October 31, 2019, the Fund had capital loss carryforwards as follows:
| | $2,487,109 | Unlimited Short-Term |
As of October 31, 2019, the Fund deferred, on a tax basis, a late-year ordinary loss of $64,254. Late-year ordinary losses are net ordinary losses incurred after December 31, 2018, but within the taxable year, that are deemed to arise on the first day of the Fund’s next taxable year.
During fiscal year 2019 and fiscal year 2018, the tax character of distributions paid by the Fund was as follows:
| | | Year Ended | | | Year Ended | |
| | | October 31, 2019 | | | October 31, 2018 | |
Ordinary income(1) | | $ | — | | | $ | — | |
| Long-term capital gain | | | 1,232,913 | | | | 1,515,488 | |
| | | $ | 1,232,913 | | | $ | 1,515,488 | |
(1) Ordinary income includes short-term capital gain.
9). EVENTS SUBSEQUENT TO YEAR END
Management has evaluated the Fund’s related events and transactions that occurred subsequent to October 31, 2019, through the date of issuance of the Fund’s financial statements. Other than as disclosed below, management has determined that there were no subsequent events requiring recognition or disclosure in the financial statements.
On November 25, 2019, U.S. Bancorp, the parent company of Quasar, announced that it had signed a purchase agreement to sell Quasar to Foreside Financial Group, LLC, such that Quasar will become a wholly-owned broker-dealer subsidiary of Foreside. The transaction is expected to close by the end of March 2020. Quasar will remain the Fund’s distributor at the close of the transaction, subject to Board approval.
| NOTES/REPORT OF INDEPENDENT REGISTERED PUBLIC ACCOUNTING FIRM |
Report of Independent Registered Public
Accounting Firm
To the Board of Trustees of Hennessy Funds Trust
and the shareholders of the Hennessy Large Cap Financial Fund
Novato, CA
Opinion on the Financial Statements
We have audited the accompanying statement of assets and liabilities of the Hennessy Large Cap Financial Fund (the “Fund”), a series of Hennessy Funds Trust, including the schedule of investments, as of October 31, 2019, the related statement of operations for the year then ended, the statements of changes in net assets for each of the two years in the period then ended, financial highlights for each of the five years in the period then ended, and the related notes (collectively referred to as the “financial statements”). In our opinion, the financial statements present fairly, in all material respects, the financial position of the Fund as of October 31, 2019, the results of its operations for the year then ended, the changes in its net assets for each of the two years in the period then ended, and the financial highlights for each of the five years in the period then ended, in conformity with accounting principles generally accepted in the United States of America.
Basis for Opinion
These financial statements are the responsibility of the Fund’s management. Our responsibility is to express an opinion on the Fund’s financial statements based on our audits. We are a public accounting firm registered with the Public Company Accounting Oversight Board (United States) (“PCAOB”) and are required to be independent with respect to the Fund in accordance with the U.S. federal securities laws and the applicable rules and regulations of the Securities and Exchange Commission and the PCAOB. We have served as the auditor of one or more of the funds in the Trust since 2002.
We conducted our audits in accordance with the standards of the PCAOB. Those standards require that we plan and perform the audit to obtain reasonable assurance about whether the financial statements are free of material misstatement, whether due to error or fraud. The Fund is not required to have, nor were we engaged to perform, an audit of its internal control over financial reporting. As part of our audits we are required to obtain an understanding of internal control over financial reporting, but not for the purpose of expressing an opinion on the effectiveness of the Fund’s internal control over financial reporting. Accordingly, we express no such opinion.
Our audits included performing procedures to assess the risks of material misstatement of the financial statements, whether due to error or fraud, and performing procedures that respond to those risks. Such procedures included examining, on a test basis, evidence regarding the amounts and disclosures in the financial statements. Our audits also included evaluating the accounting principles used and significant estimates made by management, as well as evaluating the overall presentation of the financial statements. Our procedures included confirmation of securities owned as of October 31, 2019, by correspondence with the custodian. We believe that our audits provide a reasonable basis for our opinion.
| | |
| | TAIT, WELLER & BAKER LLP |
Philadelphia, Pennsylvania
December 24, 2019
| HENNESSY FUNDS | 1-800-966-4354 | |
Trustees and Officers of the Fund (Unaudited)
The business and affairs of the Funds are managed under the direction of the Board of Trustees of the Trust, and the Board of Trustees elects the officers of the Trust. From time to time, the Board of Trustees also has appointed advisers to the Board of Trustees (“Advisers”) with the intention of having qualified individuals serve in an advisory capacity in order to garner experience in the mutual fund and asset management industry and be considered as potential Trustees in the future. There are currently three Advisers: Brian Alexander, Doug Franklin, and Claire Knoles. As Advisers, Mr. Alexander, Mr. Franklin, and Ms. Knoles attend meetings of the Board of Trustees and act as non-voting participants. Information pertaining to the Trustees, Advisers, and the officers of the Trust is set forth below. The Trustees and officers serve until their successors are duly elected and qualified or until their earlier death, resignation, or removal. Each Trustee oversees the 16 Hennessy Funds. Unless otherwise indicated, the address of all persons listed below is 7250 Redwood Boulevard, Suite 200, Novato, CA 94945. The Fund’s Statement of Additional Information includes more information about the persons listed below and is available without charge by calling 1-800-966-4354 or by visiting www.hennessyfunds.com.
| | | | Other |
| | | | Directorships |
| | | | Held Outside |
| Name, (Year of Birth), | | | of Fund |
| and Position Held | Start Date | Principal Occupation(s) | Complex During |
with the Trust | of Service | During Past Five Years | Past Five Years |
| | | | |
| Disinterested Trustees and Advisers | | | |
| | | | |
| J. Dennis DeSousa | January 1996 | Mr. DeSousa is a real estate investor. | None. |
| (1936) | | | |
| Trustee | | | |
| | | | |
| Robert T. Doyle | January 1996 | Mr. Doyle has been the Sheriff of | None. |
| (1947) | | Marin County, California since 1996. | |
| Trustee | | | |
| | | | |
| Gerald P. Richardson | May 2004 | Mr. Richardson is an independent | None. |
| (1945) | | consultant in the securities industry. | |
| Trustee | | | |
| | | | |
| Brian Alexander | March 2015 | Mr. Alexander has worked for the | None. |
| (1981) | | Sutter Health organization since | |
| Adviser to the Board | | 2011 in various positions. He has | |
| | | served as the Chief Executive Officer | |
| | | of the Sutter Roseville Medical | |
| | | Center since 2018. From 2016 through | |
| | | 2018, he served as the Vice President | |
| | | of Strategy for the Sutter Health Valley | |
| | | Area, which includes 11 hospitals, | |
| | | 13 ambulatory surgery centers, | |
| | | 16,000 employees, and 1,900 physicians. | |
| | | From 2013 through 2016, Mr. Alexander | |
| | | served as Sutter Novato Community | |
| | | Hospital’s Chief Administrative Officer. | |
| TRUSTEES AND OFFICERS OF THE FUND |
| | | | Other |
| | | | Directorships |
| | | | Held Outside |
| Name, (Year of Birth), | | | of Fund |
| and Position Held | Start Date | Principal Occupation(s) | Complex During |
with the Trust | of Service | During Past Five Years | Past Five Years |
| | | | |
| Doug Franklin | March 2016 | Mr. Franklin is a retired insurance | None. |
| (1964) | | industry executive. From 1987 | |
| Adviser to the Board | | through 2015, he was employed | |
| | | by the Allianz-Fireman’s Fund | |
| | | Insurance Company in various | |
| | | positions, including as its Chief | |
| | | Actuary and Chief Risk Officer. | |
| | | | |
| Claire Knoles | December 2015 | Ms. Knoles is a founder of Kiosk and | None. |
| (1974) | | has served as its Chief Operating | |
| Adviser to the Board | | Officer since 2004. Kiosk is a full- | |
| | | service marketing agency with | |
| | | offices in the San Francisco Bay | |
| | | Area, Toronto, and Liverpool, UK. | |
| | | | |
Interested Trustee(1) | | | |
| | | | |
| Neil J. Hennessy | January 1996 as | Mr. Hennessy has been employed | Hennessy |
| (1956) | a Trustee and | by Hennessy Advisors, Inc. since | Advisors, Inc. |
| Trustee, Chairman of | June 2008 as | 1989 and currently serves as its | |
| the Board, Chief | an officer | Chairman and Chief Executive Officer. | |
| Investment Officer, | | | |
| Portfolio Manager, | | | |
| and President | | | |
| Name, (Year of Birth), | | |
| and Position Held | Start Date | Principal Occupation(s) |
with the Trust | of Service | During Past Five Years |
| | | |
| Officers | | |
| | | |
| Teresa M. Nilsen | January 1996 | Ms. Nilsen has been employed by Hennessy Advisors, Inc. |
| (1966) | | since 1989 and currently serves as its President, Chief Operating |
| Executive Vice President | | Officer, and Secretary. |
| and Treasurer | | |
| | | |
| Daniel B. Steadman | March 2000 | Mr. Steadman has been employed by Hennessy Advisors, Inc. |
| (1956) | | since 2000 and currently serves as its Executive Vice President. |
| Executive Vice President | | |
| and Secretary | | |
| | | |
| Brian Carlson | December 2013 | Mr. Carlson has been employed by Hennessy Advisors, Inc. |
| (1972) | | since December 2013 and currently serves as its Chief |
| Senior Vice President | | Compliance Officer and Senior Vice President. |
| and Head of Distribution | | |
| | | |
| Jennifer Cheskiewicz | June 2013 | Ms. Cheskiewicz has been employed by Hennessy Advisors, Inc. |
(1977)(2) | | as its General Counsel since June 2013. |
| Senior Vice President and | | |
| Chief Compliance Officer | | |
| HENNESSY FUNDS | 1-800-966-4354 | |
| Name, (Year of Birth), | | |
| and Position Held | Start Date | Principal Occupation(s) |
with the Trust | of Service | During Past Five Years |
| | | |
| David Ellison | October 2012 | Mr. Ellison has been employed by Hennessy Advisors, Inc. since |
(1958)(3) | | October 2012. He has served as a Portfolio Manager of the |
| Senior Vice President | | Hennessy Large Cap Financial Fund and the Hennessy Small |
| and Portfolio Manager | | Cap Financial Fund since their inception. Mr. Ellison also served |
| | | as a Portfolio Manager of the Hennessy Technology Fund from |
| | | its inception until February 2017. Mr. Ellison served as Director, |
| | | CIO and President of FBR Fund Advisers, Inc. from December |
| | | 1999 to October 2012. |
| | | |
| Ryan Kelley | March 2013 | Mr. Kelley has been employed by Hennessy Advisors, Inc. since |
(1972)(4) | | October 2012. He has served as a Portfolio Manager of the |
| Senior Vice President | | Hennessy Gas Utility Fund, the Hennessy Large Cap Financial |
| and Portfolio Manager | | Fund, and the Hennessy Small Cap Financial Fund since |
| | | October 2014. He served as Co- Portfolio Manager of these |
| | | same funds from March 2013 through September 2014 and as |
| | | a Portfolio Analyst for the Hennessy Funds from October 2012 |
| | | through February 2013. Mr. Kelley has also served as a Portfolio |
| | | Manager of the Hennessy Cornerstone Growth Fund, the |
| | | Hennessy Cornerstone Mid Cap 30 Fund, the Hennessy |
| | | Cornerstone Large Growth Fund, and the Hennessy |
| | | Cornerstone Value Fund since February 2017 and as a Portfolio |
| | | Manager of the Hennessy Total Return Fund, the Hennessy |
| | | Balanced Fund, and the Hennessy Technology Fund since May |
| | | 2018. He served as Co- Portfolio Manager of the Hennessy |
| | | Technology Fund from February 2017 until May 2018. Mr. Kelley |
| | | served as Portfolio Manager of FBR Fund Advisers, Inc. from |
| | | January 2008 to October 2012. |
| | | |
| Tania Kelley | October 2003 | Ms. Kelley has been employed by Hennessy Advisors, Inc. since |
| (1965) | | October 2003. |
| Senior Vice President | | |
| and Head of Marketing | | |
| | | |
| L. Joshua Wein | September 2018 | Mr. Wein has been employed by Hennessy Advisors, Inc. |
(1973)(4) | | since 2018. He has served as Co-Portfolio Manager of the |
| Vice President and | | Hennessy Cornerstone Growth Fund, the Hennessy |
| Co-Portfolio Manager | | Cornerstone Mid Cap 30 Fund, the Hennessy Cornerstone Large |
| | | Growth Fund, the Hennessy Cornerstone Value Fund, Hennessy |
| | | Total Return Fund, the Hennessy Balanced Fund, the Hennessy |
| | | Gas Utility Fund, and the Hennessy Technology Fund since |
| | | February 2019. Prior to that, he served as a Senior Analyst of |
| | | those same funds since September 2018. Mr. Wein served as |
| | | Director of Alternative Investments and Co-Portfolio Manager |
| | | at Sterling Capital Management from 2008 to 2018. |
_______________
(1) | Mr. Hennessy is considered an “interested person,” as defined in the Investment Company Act of 1940, as amended, because he is an officer of the Trust. |
(2) | The address of this officer is 4800 Bee Caves Road, Suite 100, Austin, TX 78746. |
(3) | The address of this officer is 101 Federal Street, Suite 1900, Boston, MA 02110. |
(4) | The address of this officer is 1340 Environ Way, Chapel Hill, NC 27517. |
| TRUSTEES AND OFFICERS OF THE FUND |
(This Page Intentionally Left Blank.)
| HENNESSY FUNDS | 1-800-966-4354 | |
Expense Example (Unaudited)
October 31, 2019
As a shareholder of the Fund, you incur ongoing costs, including management fees, service fees, and other Fund expenses. This Example is intended to help you understand your ongoing costs (in dollars) of investing in the Fund and to compare these costs with the ongoing costs of investing in other mutual funds. The Example is based on an investment of $1,000 invested at the beginning of the period and held for the entire period from May 1, 2019, through October 31, 2019.
Actual Expenses
The first line of the table below under the “Investor Class” and “Institutional Class” headings provides information about actual account values and actual expenses. Although the Fund charges no sales loads or transaction fees, you will be assessed fees for outgoing wire transfers, returned checks and stop payment orders at prevailing rates charged by U.S. Bank Global Fund Services, the Fund’s transfer agent. If you request that a redemption be made by wire transfer, currently a $15 fee is charged by the Fund’s transfer agent. IRA accounts will be charged a $15 annual maintenance fee. The example below includes, but is not limited to, management fees, shareholder servicing fees, accounting, custody, and transfer agent fees. However, the example below does not include portfolio trading commissions and related expenses. You may use the information in this line, together with the amount you invested, to estimate the expenses that you paid over the period. Simply divide your account value by $1,000 (for example, an $8,600 account value divided by $1,000 = 8.6), then multiply the result by the number in the first line of the table under the “Investor Class” or “Institutional Class” headings in the column entitled “Expenses Paid During Period” to estimate the expenses you paid on your account during this period.
Hypothetical Example for Comparison Purposes
The second line of the table below under the “Investor Class” and “Institutional Class” headings provides information about hypothetical account values and hypothetical expenses based on the Fund’s actual expense ratios and an assumed rate of return of 5% per year before expenses, which is not the Fund’s actual return. The hypothetical account values and expenses may not be used to estimate the actual ending account balance or expenses you paid for the period. You may use this information to compare the ongoing costs of investing in the Fund and other funds. To do so, compare this 5% hypothetical example with the 5% hypothetical examples that appear in the shareholder reports of the other funds. Please note that the expenses shown in the table are meant to highlight your ongoing costs only. Therefore, the second line of the table under the “Investor Class” and “Institutional Class” headings is useful in comparing ongoing costs only and will not help you determine the relative total costs of owning different funds.
| | | | Expenses Paid |
| | Beginning | Ending | During Period(1) |
| | Account Value | Account Value | May 1, 2019 – |
| | May 1, 2019 | October 31, 2019 | October 31, 2019 |
| Investor Class | | | |
| Actual | $1,000.00 | $ 996.50 | $9.37 |
| Hypothetical (5% return before expenses) | $1,000.00 | $1,015.82 | $9.46 |
| | | | |
| Institutional Class | | | |
| Actual | $1,000.00 | $ 998.70 | $7.26 |
| Hypothetical (5% return before expenses) | $1,000.00 | $1,017.94 | $7.33 |
(1) | Expenses are equal to the Fund’s annualized expense ratio of 1.86% for Investor Class shares or 1.44% for Institutional Class shares, as applicable, multiplied by the average account value over the period, multiplied by 184/365 days (to reflect one-half year period). |
| HENNESSY FUNDS | 1-800-966-4354 | |
How to Obtain a Copy of the Fund’s
Proxy Voting Policy and Proxy Voting Records
A description of the policies and procedures the Fund uses to determine how to vote proxies relating to portfolio securities is available without charge: (1) by calling 1-800-966-4354; (2) on the Hennessy Funds’ website at www.hennessyfunds.com/proxy-voting/voting-policy; or (3) on the U.S. Securities and Exchange Commission’s (the “SEC”) website at www.sec.gov. The Fund’s proxy voting record is available without charge on both the Hennessy Funds’ website at www.hennessyfunds.com/proxy-voting/voting-record and the SEC’s website at www.sec.gov no later than August 31 for the prior 12 months ending June 30.
Availability of Quarterly Portfolio Schedule
For periods ending on or prior to January 31, 2019, the Fund has filed a complete schedule of portfolio holdings with the SEC for the first and third quarters of each fiscal year on Form N-Q. For periods ending on or after April 30, 2019, the Fund files a complete schedule of portfolio holdings with the SEC for the first and third quarters of each fiscal year as an exhibit to its reports on Form N-PORT. The Fund’s Forms N-Q and Forms N-PORT are available on the SEC’s website at www.sec.gov or on request by calling 1-800-966-4354.
Federal Tax Distribution Information (Unaudited)
For fiscal year 2019, certain dividends paid by the Fund may be subject to a maximum tax rate of 23.8%, as provided for by the Jobs and Growth Tax Relief Reconciliation Act of 2003. The percentage of dividends declared from ordinary income designated as qualified dividend income was 0.00%.
For corporate shareholders, the percent of ordinary income distributions that qualified for the corporate dividends received deduction for fiscal year 2019 was 0.00%.
The percentage of taxable ordinary income distributions that were designated as short-term capital gain distributions under Section 871(k)(2)(C) of the Internal Revenue Code of 1986, as amended, for the Fund was 0.00%.
Important Notice Regarding Delivery
of Shareholder Documents
To help keep the Fund’s costs as low as possible, we generally deliver a single copy of shareholder reports, proxy statements, and prospectuses to shareholders who share an address and have the same last name. This process does not apply to account statements. You may request an individual copy of a shareholder document at any time. If you would like to receive separate mailings of shareholder documents, please call U.S. Bank Global Fund Services at 1-800-261-6950 or 1-414-765-4124, and individual delivery will begin within 30 days of your request. If your account is held through a financial institution or other intermediary, please contact such intermediary directly to request individual delivery.
Electronic Delivery
The Funds offer shareholders the option to receive account statements, Prospectuses, tax forms, and reports online. To sign up for eDelivery, please visit www.hennessyfunds.com. You may change your delivery preference at any time by visiting our website or contacting the Funds at 1-800-261-6950.
| PROXY VOTING — PRIVACY POLICY |
Privacy Policy
We collect the following non-public personal information about you:
| | • | information we receive from you on or in applications or other forms, correspondence, or conversations, including, but not limited to, your name, address, phone number, social security number, assets, income, and date of birth; and |
| | | |
| | • | information about your transactions with us, our affiliates, or others, including, but not limited to, your account number and balance, payment history, parties to transactions, cost basis information, and other financial information. |
We do not disclose any non-public personal information about our current or former shareholders to non-affiliated third parties, except as permitted by law. For example, we are permitted by law to disclose all of the information we collect, as described above, to our Transfer Agent to process your transactions. Furthermore, we restrict access to your non-public personal information to those persons who require such information to provide products or services to you. We maintain physical, electronic, and procedural safeguards that comply with federal standards to guard your non-public personal information.
In the event that you hold shares of the Fund through a financial intermediary, including, but not limited to, a broker-dealer, bank, or trust company, the privacy policy of your financial intermediary would govern how your non-public personal information will be shared with non-affiliated third parties.
| HENNESSY FUNDS | 1-800-966-4354 | |
For information, questions or assistance, please call
The Hennessy Funds
1-800-966-4354 or 1-415-899-1555
INVESTMENT ADVISOR
Hennessy Advisors, Inc.
7250 Redwood Boulevard, Suite 200
Novato, California 94945
ADMINISTRATOR,
TRANSFER AGENT,
DIVIDEND PAYING AGENT, &
SHAREHOLDER SERVICING AGENT
U.S. Bancorp Fund Services, LLC
d/b/a U.S. Bank Global Fund Services
P.O. Box 701
Milwaukee, Wisconsin 53201-0701
CUSTODIAN
U.S. Bank N.A.
Custody Operations
1555 North River Center Drive, Suite 302
Milwaukee, Wisconsin 53212
TRUSTEES
Neil J. Hennessy
Robert T. Doyle
J. Dennis DeSousa
Gerald P. Richardson
COUNSEL
Foley & Lardner LLP
777 East Wisconsin Avenue
Milwaukee, Wisconsin 53202-5306
INDEPENDENT REGISTERED
PUBLIC ACCOUNTING FIRM
Tait, Weller & Baker LLP
Two Liberty Place
50 South 16th Street, Suite 2900
Philadelphia, Pennsylvania 19103-2529
DISTRIBUTOR
Quasar Distributors, LLC
777 East Wisconsin Avenue
Milwaukee, Wisconsin 53202
www.hennessyfunds.com | 1-800-966-4354
This report has been prepared for shareholders and may be distributed to
others only if preceded or accompanied by a current prospectus.
ANNUAL REPORT
OCTOBER 31, 2019
HENNESSY SMALL CAP FINANCIAL FUND
Investor Class HSFNX
Institutional Class HISFX
IMPORTANT NOTICE REGARDING ELECTRONIC DELIVERY OF SHAREHOLDER REPORTS
Beginning on January 1, 2021, as permitted by regulations adopted by the Securities and Exchange Commission, paper copies of the annual and semi-annual reports will no longer be sent by mail unless you specifically request paper copies from the Hennessy Funds or from your financial intermediary. Instead, the reports will be made available on a website, and you will be notified by mail each time a report is posted and provided with a website link to access the report.
If you have already elected to receive shareholder reports electronically, you will not be affected by this change and you need not take any action. You may elect to receive shareholder reports and other communications from the Hennessy Funds electronically by visiting www.hennessyfunds.com/account or by calling U.S. Bank Global Fund Services at 1-800-261-6950. If you own shares in a Fund through a financial intermediary, please contact your financial intermediary to make this election.
You may elect to receive paper copies of all future reports free of charge by calling U.S. Bank Global Fund Services at 1-800-261-6950 or, if you own your shares through a financial intermediary, by contacting your financial intermediary. Your election to receive paper copies of reports will apply to all Funds in the Hennessy Funds family.
hennessyfunds.com | 1-800-966-4354
(This Page Intentionally Left Blank.)
Contents
| Letter to Shareholders | 2 |
| Performance Overview | 4 |
| Financial Statements | |
| Schedule of Investments | 7 |
| Statement of Assets and Liabilities | 10 |
| Statement of Operations | 11 |
| Statements of Changes in Net Assets | 13 |
| Financial Highlights | 14 |
| Notes to the Financial Statements | 18 |
| Report of Independent Registered Public Accounting Firm | 25 |
| Trustees and Officers of the Fund | 26 |
| Expense Example | 30 |
| Proxy Voting Policy and Proxy Voting Records | 32 |
| Availability of Quarterly Portfolio Schedule | 32 |
| Federal Tax Distribution Information | 32 |
| Important Notice Regarding Delivery of Shareholder Documents | 32 |
| Electronic Delivery | 32 |
| Privacy Policy | 33 |
| HENNESSY FUNDS | 1-800-966-4354 | |
December 2019
Dear Hennessy Funds Shareholder:
What a year it has been. I am reassured by the resiliency of the U.S. financial markets as companies continue to thrive in the midst of policy challenges and political turbulence. Trade tariffs, impeachment, and interest rates have dominated the news headlines, while Brexit and protests in Hong Kong have also been major concerns internationally.
While the financial markets were characterized by volatility during the twelve months ended October 31, 2019, U.S. equities posted double-digit positive performance for the period, with a total return of 14.3% for the S&P 500® Index and 10.3% for the Dow Jones Industrial Average. As I sat down to write this letter, all three major indices, the S&P 500® Index, the Dow Jones Industrial Average, and the NASDAQ Composite Index, recently reached all-time highs.
Every bull market experiences volatility and pullbacks, and this extended bull market is no different. Since 2010, there have been 16 pullbacks of 5-10% and six corrections of over 10%. But what is interesting is not how quickly the declines take place, but rather how swiftly the market regains and surpasses its prior highs. With each decline, many investors and commentators predict that finally this bull market is out of steam. But I ask myself, “Why?”
What I see is a healthy economy and stock market, with fundamentals in place to support a continued bull market. Although slightly above long-term averages, I believe stocks are trading at reasonable valuations, with the Dow Jones Industrial Average trading at 16x forward earnings per share and the S&P 500® Index at 17x forward earnings. At the same time, the U.S. economy is growing at a sustainable pace of 2-3%, corporate profits continue to outperform expectations, and cash continues to build on corporate balance sheets. With over $5 trillion in cash and marketable securities on the balance sheets of the S&P 500® Index companies alone, corporations are returning cash to shareholders through share buybacks and dividends. Share buybacks by S&P 500® Index companies could hit $1 trillion in 2019, surpassing 2018’s record $800 billion, and dividend payments by S&P 500® Index companies are estimated to increase 8-9%. Unemployment continues to be at historically low levels, while wages are growing. Interest rates are also at very low levels, which should support equity prices. Finally, overall consumer confidence remains positive.
To quote Sir John Templeton’s famous saying, “Bull markets are born on pessimism, grow on skepticism, mature on optimism, and die on euphoria.” If you look back to the beginning of the great bull market that began in 1982, only six of the past 37 years ended with negative total returns: 1990, 2000, 2001, 2002, 2008, and 2018. With the exception of 2018, which was characterized by volatility but no euphoria, the other down years were marked by euphoria in either real estate or dot coms. I have been saying for a number of years that I see no signs of euphoria in the market, and I remain confident in the strength of the market today.
Thank you for your continued trust and investment in the Hennessy Funds. We believe that there continue to be great opportunities throughout all parts of the market, and we remain steadfastly focused on managing our high-conviction portfolios for the long-term benefit of our shareholders. Should you have any questions or would like to speak with us directly, please don’t hesitate to call us at (800) 966-4354.
Best regards,
Neil J. Hennessy
President and Chief Investment Officer
Past performance does not guarantee future results.
Mutual fund investing involves risk. Principal loss is possible.
The Dow Jones Industrial Average and S&P 500® Index are commonly used to measure the performance of U.S. stocks. The NASDAQ Composite Index is a broad-based capitalization-weighted index of all the NASDAQ National Market and Small Cap stocks. One cannot invest directly in an index.
Forward price to earnings is a valuation measure calculated by dividing a company’s market price per share by its expected earnings per share over the following 12 months.
| HENNESSY FUNDS | 1-800-966-4354 | |
Performance Overview (Unaudited)
CHANGE IN VALUE OF $10,000 INVESTMENT
This graph illustrates the performance of an initial investment of $10,000 made in the Fund ten years ago and assumes the reinvestment of dividends.
AVERAGE ANNUAL TOTAL RETURN FOR PERIODS ENDED OCTOBER 31, 2019
| | One | Five | Ten |
| | Year | Years | Years |
| Hennessy Small Cap Financial Fund – | | | |
| Investor Class (HSFNX) | 5.27% | 7.78% | 9.35% |
| Hennessy Small Cap Financial Fund – | | | |
| Institutional Class (HISFX) | 5.57% | 8.18% | 9.68% |
Russell 2000® Financial Services Index | 9.63% | 8.79% | 12.65% |
Russell 2000® Index | 4.90% | 7.37% | 12.27% |
Expense ratios: 1.55% (Investor Class); 1.16% (Institutional Class)
Performance data quoted represents past performance; past performance does not guarantee future results. The investment return and principal value of an investment will fluctuate so that an investor’s shares, when redeemed, may be worth more or less than their original cost. The performance table does not reflect the deduction of taxes that a shareholder would pay on Fund distributions or the redemption of Fund shares. Current performance of the Fund may be lower or higher than the performance quoted. Performance data current to the most recent month end may be obtained by visiting www.hennessyfunds.com. Performance for periods on or prior to October 26, 2012, is that of the FBR Small Cap Financial Fund.
The Russell 2000® Financial Services Index is a subset of the Russell 2000® Index that measures the performance of the securities classified in the financial services sector of the small-capitalization U.S. equity market. The Russell 2000® Index comprises the smallest 2,000 companies in the Russell 3000® Index based on market capitalization, representing approximately 8% of the Russell 3000® Index in terms of total market capitalization. One cannot invest directly in an index. These indices are used herein for comparative purposes in accordance with SEC regulations.
Frank Russell Company (“Russell”) is the source and owner of the trademarks, service marks, and copyrights related to the Russell Indexes. Russell® is a trademark of Russell. Neither Russell nor its licensors accept any liability for any errors or omissions in the Russell Indexes or Russell ratings or underlying data and no party may rely on any Russell Indexes or Russell ratings or underlying data contained in this communication.
No further distribution of Russell data is permitted without Russell’s express written consent. Russell does not promote, sponsor, or endorse the content of this communication.
The expense ratios presented are from the most recent prospectus. The expense ratios for the current reporting period are available in the Financial Highlights section of this report.
PERFORMANCE NARRATIVE
Portfolio Managers David H. Ellison and Ryan C. Kelley, CFA
Performance:
For the 12-month period ended October 31, 2019, the Investor Class of the Hennessy Small Cap Financial Fund returned 5.27%, underperforming the Russell 2000® Financial Services Index (the Fund’s primary benchmark), which returned 9.63%, but outperforming the Russell 2000® Index, which returned 4.90%, for the same period.
The Fund’s underperformance relative to its primary benchmark predominantly resulted from sector selection and being underweight in REITs (Real Estate Investment Trusts), which performed well during the period. The Fund primarily invests in traditional depository franchises, and investors have had growing concerns regarding asset quality trends, lack of net interest margin expansion, and slower loan growth. Eagle Bancorp, Inc., FCB Financial Holdings, Inc., and Green Dot Corporation were among the holdings that detracted most from performance during the period. Opus Bank, Meridian Bancorp, Inc., and ConnectOne Bancorp, Inc., were among the Fund’s best performing holdings and contributed positively to performance.
The Fund continues to hold the companies mentioned except for FCB Financial, which was acquired on January 2, 2019.
Portfolio Strategy:
Generally, the Fund tilts its investments more heavily toward regional banks, thrifts, and, at times, mortgage finance companies. Within these preferred sub-industries, we seek companies that we believe have high-quality management teams, uncomplicated business models, and sustainable earnings growth opportunities. Moreover, we identify companies that we expect will do well in the existing environment, which is currently characterized by low interest rates, competitive loan markets, high regulatory costs, and pressure on product pricing. We are less interested in companies that appear to promise an increase in profitability when interest rates rise or loan demand and pricing becomes more favorable. We believe these industry dynamics are difficult to predict and prefer to focus on management teams that are working to remain competitive in the long term.
Investment Commentary:
We continue to believe that the outlook for small-cap financial companies is good. The macroeconomic environment in the United States is positive. In our view, the U.S. economy is growing at a healthy rate, unemployment is low, and growth in both consumption and capital spending has remained steady. We believe the recent interest rate cuts by the Federal Reserve are intended to prolong the economic expansion and should help banks maintain their favorable earnings trends. Also, merger activity remains strong and has been a positive factor in Fund performance over the long term.
We believe that our concentration in traditional banks offers the best risk-adjusted opportunities in the small-cap financial sector, and there are a large number of companies
| HENNESSY FUNDS | 1-800-966-4354 | |
with which to build a portfolio. We seek companies that offer stable funding sources, transparent pricing, regional concentration, and merger opportunities.
_______________
Opinions expressed are those of the Portfolio Managers as of the date written and are subject to change, are not guaranteed, and should not be considered investment advice or an indication of trading intent.
The Fund is non-diversified, meaning it may concentrate its assets in fewer individual holdings than a diversified fund, making it more exposed to individual stock volatility than a diversified fund. Investments are focused in the financial services industry; sector funds may be subject to a higher degree of market risk. The Fund invests in smaller companies, which may have more limited liquidity and greater volatility compared to larger companies. Please see the Fund’s prospectus for a more complete discussion of these and other risks.
References to specific securities should not be considered a recommendation to buy or sell any security. Fund holdings and sector allocations are subject to change. Please refer to the Schedule of Investments included in this report for additional portfolio information.
Earnings growth is not a measure of the Fund’s future performance. Net interest margin is the ratio of net interest income to invested assets.
| PERFORMANCE OVERVIEW/SCHEDULE OF INVESTMENTS |
Financial Statements
Schedule of Investments as of October 31, 2019 |
HENNESSY SMALL CAP FINANCIAL FUND
(% of Net Assets)
| TOP TEN HOLDINGS (EXCLUDING MONEY MARKET FUNDS) | % NET ASSETS |
| Meridian Bancorp, Inc. | 5.33% |
| Independent Bank Corp. | 5.22% |
| Berkshire Hills Bancorp, Inc. | 5.21% |
| ConnectOne Bancorp, Inc. | 5.18% |
| First BanCorp. | 5.02% |
| Opus Bank | 4.95% |
| Hingham Institution for Savings | 4.66% |
| Lakeland Bancorp, Inc. | 4.36% |
| Franklin Financial Network, Inc. | 4.08% |
| Brookline Bancorp, Inc. | 4.07% |
Note: For presentation purposes, the Fund has grouped some of the industry categories. For purposes of categorizing securities for compliance with Section 8(b)(1) of the Investment Company Act of 1940, as amended, the Fund uses more specific industry classifications.
The Global Industry Classification Standard (GICS®) was developed by and is the exclusive property and a service mark of MSCI, Inc. and Standard & Poor’s Financial Services LLC. It has been licensed for use by the Hennessy Funds.
| HENNESSY FUNDS | 1-800-966-4354 | |
| COMMON STOCKS – 90.68% | | Number | | | | | | % of | |
| | | of Shares | | | Value | | | Net Assets | |
| Financials – 86.99% | | | | | | | | | |
| Atlantic Union Bankshares Corp. | | | 42,500 | | | $ | 1,566,550 | | | | 1.42 | % |
| Banc of California, Inc. | | | 315,000 | | | | 4,337,550 | | | | 3.94 | % |
| Berkshire Hills Bancorp, Inc. | | | 185,000 | | | | 5,740,550 | | | | 5.21 | % |
| Brookline Bancorp, Inc. | | | 285,000 | | | | 4,474,500 | | | | 4.07 | % |
| Cadence BanCorp | | | 215,000 | | | | 3,306,700 | | | | 3.00 | % |
| Columbia Financial, Inc. (a) | | | 125,000 | | | | 2,061,250 | | | | 1.87 | % |
| ConnectOne Bancorp, Inc. | | | 235,000 | | | | 5,705,800 | | | | 5.18 | % |
| Eagle Bancorp, Inc. | | | 60,000 | | | | 2,708,400 | | | | 2.46 | % |
| First BanCorp. (b) | | | 525,000 | | | | 5,523,000 | | | | 5.02 | % |
| First Midwest Bancorp, Inc. | | | 180,000 | | | | 3,697,200 | | | | 3.36 | % |
| Franklin Financial Network, Inc. | | | 135,000 | | | | 4,491,450 | | | | 4.08 | % |
| Green Dot Corp., Class A (a) | | | 100,000 | | | | 2,884,000 | | | | 2.62 | % |
| HarborOne Bancorp, Inc. (a) | | | 120,000 | | | | 1,225,200 | | | | 1.11 | % |
| Hingham Institution for Savings | | | 27,000 | | | | 5,129,730 | | | | 4.66 | % |
| Independent Bank Corp. | | | 70,000 | | | | 5,745,600 | | | | 5.22 | % |
| Kearny Financial Corp. of Maryland | | | 155,000 | | | | 2,174,650 | | | | 1.98 | % |
| Lakeland Bancorp, Inc. | | | 290,000 | | | | 4,799,500 | | | | 4.36 | % |
| Meridian Bancorp, Inc. | | | 300,000 | | | | 5,868,000 | | | | 5.33 | % |
| Midland States Bancorp, Inc. | | | 35,000 | | | | 938,000 | | | | 0.85 | % |
| OceanFirst Financial Corp. | | | 150,000 | | | | 3,589,500 | | | | 3.26 | % |
| Opus Bank | | | 220,000 | | | | 5,453,800 | | | | 4.95 | % |
| PacWest Bancorp | | | 20,000 | | | | 739,800 | | | | 0.67 | % |
| ServisFirst Bancshares, Inc. | | | 80,000 | | | | 2,800,000 | | | | 2.54 | % |
| Sterling Bancorp | | | 105,000 | | | | 2,063,250 | | | | 1.87 | % |
| Texas Capital Bancshares, Inc. (a) | | | 40,000 | | | | 2,162,400 | | | | 1.96 | % |
| TriCo Bancshares | | | 45,000 | | | | 1,693,350 | | | | 1.54 | % |
| United Financial Bancorp, Inc. | | | 260,000 | | | | 3,671,200 | | | | 3.34 | % |
| Washington Federal, Inc. | | | 25,000 | | | | 911,500 | | | | 0.83 | % |
| Wintrust Financial Corp. | | | 5,000 | | | | 319,100 | | | | 0.29 | % |
| | | | | | | | 95,781,530 | | | | 86.99 | % |
| | | | | | | | | | | | | |
| Information Technology – 2.51% | | | | | | | | | | | | |
| International Money Express, Inc. (a) | | | 90,000 | | | | 1,378,800 | | | | 1.25 | % |
| MoneyGram International, Inc. (a) | | | 90,000 | | | | 356,400 | | | | 0.33 | % |
| Paysign, Inc. (a) | | | 95,000 | | | | 1,024,100 | | | | 0.93 | % |
| | | | | | | | 2,759,300 | | | | 2.51 | % |
The accompanying notes are an integral part of these financial statements.
| COMMON STOCKS | | Number | | | | | | % of | |
| | | of Shares | | | Value | | | Net Assets | |
| Real Estate – 1.18% | | | | | | | | | |
| eXp World Holdings, Inc. (a) | | | 145,000 | | | $ | 1,300,650 | | | | 1.18 | % |
| | | | | | | | | | | | | |
| Total Common Stocks | | | | | | | | | | | | |
| (Cost $85,989,987) | | | | | | | 99,841,480 | | | | 90.68 | % |
| | | | | | | | | | | | | |
| SHORT-TERM INVESTMENTS – 7.67% | | | | | | | | | | | | |
| | | | | | | | | | | | | |
| Money Market Funds – 7.67% | | | | | | | | | | | | |
| First American Government Obligations Fund, | | | | | | | | | | | | |
| Institutional Class, 1.74% (c) | | | 5,587,000 | | | | 5,587,000 | | | | 5.08 | % |
| First American Treasury Obligations Fund, | | | | | | | | | | | | |
| Institutional Class, 1.73% (c) | | | 2,856,400 | | | | 2,856,400 | | | | 2.59 | % |
| | | | | | | | 8,443,400 | | | | 7.67 | % |
| Total Short-Term Investments | | | | | | | | | | | | |
| (Cost $8,443,400) | | | | | | | 8,443,400 | | | | 7.67 | % |
| | | | | | | | | | | | | |
| Total Investments | | | | | | | | | | | | |
| (Cost $94,433,387) – 98.35% | | | | | | | 108,284,880 | | | | 98.35 | % |
| Other Assets in Excess of Liabilities – 1.65% | | | | | | | 1,815,117 | | | | 1.65 | % |
| | | | | | | | | | | | | |
TOTAL NET ASSETS – 100.00% | | | | | | $ | 110,099,997 | | | | 100.00 | % |
Percentages are stated as a percent of net assets.
| (a) | Non-income-producing security. |
| (b) | U.S.-traded security of a foreign corporation. |
| (c) | The rate listed is the fund’s seven-day yield as of October 31, 2019. |
Summary of Fair Value Exposure as of October 31, 2019
The following is a summary of the inputs used to value the Fund’s net assets as of October 31, 2019 (See Note 3 in the accompanying Notes to the Financial Statements):
| Common Stocks | | Level 1 | | | Level 2 | | | Level 3 | | | Total | |
| Financials | | $ | 95,781,530 | | | $ | — | | | $ | — | | | $ | 95,781,530 | |
| Information Technology | | | 2,759,300 | | | | — | | | | — | | | | 2,759,300 | |
| Real Estate | | | 1,300,650 | | | | — | | | | — | | | | 1,300,650 | |
| Total Common Stocks | | $ | 99,841,480 | | | $ | — | | | $ | — | | | $ | 99,841,480 | |
| Short-Term Investments | | | | | | | | | | | | | | | | |
| Money Market Funds | | $ | 8,443,400 | | | $ | — | | | $ | — | | | $ | 8,443,400 | |
| Total Short-Term Investments | | $ | 8,443,400 | | | $ | — | | | $ | — | | | $ | 8,443,400 | |
| Total Investments | | $ | 108,284,880 | | | $ | — | | | $ | — | | | $ | 108,284,880 | |
The accompanying notes are an integral part of these financial statements.
| HENNESSY FUNDS | 1-800-966-4354 | |
Financial Statements
Statement of Assets and Liabilities as of October 31, 2019 |
| ASSETS: | | | |
| Investments in securities, at value (cost $94,433,387) | | $ | 108,284,880 | |
| Dividends and interest receivable | | | 37,083 | |
| Receivable for fund shares sold | | | 8,454 | |
| Receivable for securities sold | | | 2,042,279 | |
| Prepaid expenses and other assets | | | 29,603 | |
| Total assets | | | 110,402,299 | |
| | | | | |
| LIABILITIES: | | | | |
| Payable for fund shares redeemed | | | 110,342 | |
| Payable to advisor | | | 82,470 | |
| Payable to administrator | | | 19,485 | |
| Payable to auditor | | | 22,546 | |
| Accrued distribution fees | | | 14,608 | |
| Accrued service fees | | | 7,431 | |
| Accrued trustees fees | | | 6,596 | |
| Accrued expenses and other payables | | | 38,824 | |
| Total liabilities | | | 302,302 | |
| NET ASSETS | | $ | 110,099,997 | |
| | | | | |
| NET ASSETS CONSISTS OF: | | | | |
| Capital stock | | $ | 93,338,923 | |
| Total distributable earnings | | | 16,761,074 | |
| Total net assets | | $ | 110,099,997 | |
| | | | | |
| NET ASSETS: | | | | |
| Investor Class | | | | |
| Shares authorized (no par value) | | Unlimited | |
| Net assets applicable to outstanding shares | | $ | 89,364,236 | |
| Shares issued and outstanding | | | 4,136,520 | |
| Net asset value, offering price, and redemption price per share | | $ | 21.60 | |
| | | | | |
| Institutional Class | | | | |
| Shares authorized (no par value) | | Unlimited | |
| Net assets applicable to outstanding shares | | $ | 20,735,761 | |
| Shares issued and outstanding | | | 1,604,633 | |
| Net asset value, offering price, and redemption price per share | | $ | 12.92 | |
The accompanying notes are an integral part of these financial statements.
| STATEMENT OF ASSETS AND LIABILITIES/STATEMENT OF OPERATIONS |
Financial Statements
Statement of Operations for the year ended October 31, 2019 |
| INVESTMENT INCOME: | | | |
Dividend income(1) | | $ | 2,480,714 | |
| Interest income | | | 218,067 | |
| Total investment income | | | 2,698,781 | |
| | | | | |
| EXPENSES: | | | | |
| Investment advisory fees (See Note 5) | | | 1,182,342 | |
| Sub-transfer agent expenses – Investor Class (See Note 5) | | | 225,312 | |
| Sub-transfer agent expenses – Institutional Class (See Note 5) | | | 27,581 | |
| Distribution fees – Investor Class (See Note 5) | | | 158,783 | |
| Administration, accounting, custody, and transfer agent fees (See Note 5) | | | 140,486 | |
| Service fees – Investor Class (See Note 5) | | | 105,855 | |
| Federal and state registration fees | | | 44,237 | |
| Compliance expense (See Note 5) | | | 25,810 | |
| Audit fees | | | 22,548 | |
| Trustees’ fees and expenses | | | 18,614 | |
| Reports to shareholders | | | 18,193 | |
| Legal fees | | | 1,158 | |
| Other expenses | | | 16,744 | |
| Total expenses | | | 1,987,663 | |
| NET INVESTMENT INCOME | | $ | 711,118 | |
| | | | | |
| REALIZED AND UNREALIZED GAINS (LOSSES): | | | | |
| Net realized gain on investments | | $ | 4,257,379 | |
| Net change in unrealized appreciation/depreciation on investments | | | 849,952 | |
| Net gain on investments | | | 5,107,331 | |
| NET INCREASE IN NET ASSETS RESULTING FROM OPERATIONS | | $ | 5,818,449 | |
(1) | Net of foreign taxes withheld of $7,065. |
The accompanying notes are an integral part of these financial statements.
| HENNESSY FUNDS | 1-800-966-4354 | |
(This Page Intentionally Left Blank.)
| STATEMENTS OF CHANGES IN NET ASSETS |
Financial Statements
| Statements of Changes in Net Assets |
| | | Year Ended | | | Year Ended | |
| | | October 31, 2019 | | | October 31, 2018 | |
| OPERATIONS: | | | | | | |
| Net investment income | | $ | 711,118 | | | $ | 362,610 | |
| Net realized gain on investments | | | 4,257,379 | | | | 12,332,055 | |
| Net change in unrealized | | | | | | | | |
| appreciation/depreciation on investments | | | 849,952 | | | | (27,410,886 | ) |
| Net increase (decrease) in net | | | | | | | | |
| assets resulting from operations | | | 5,818,449 | | | | (14,716,221 | ) |
| | | | | | | | | |
| DISTRIBUTIONS TO SHAREHOLDERS: | | | | | | | | |
| Distributable earnings – Investor Class | | | (7,622,114 | ) | | | (12,667,248 | ) |
| Distributable earnings – Institutional Class | | | (2,386,465 | ) | | | (2,810,391 | ) |
| Total distributions | | | (10,008,579 | ) | | | (15,477,639 | ) |
| | | | | | | | | |
| CAPITAL SHARE TRANSACTIONS: | | | | | | | | |
| Proceeds from shares subscribed – Investor Class | | | 7,715,297 | | | | 21,302,624 | |
| Proceeds from shares subscribed – Institutional Class | | | 5,904,217 | | | | 22,839,938 | |
| Dividends reinvested – Investor Class | | | 7,476,720 | | | | 12,401,989 | |
| Dividends reinvested – Institutional Class | | | 2,340,222 | | | | 2,696,156 | |
| Cost of shares redeemed – Investor Class | | | (45,169,956 | ) | | | (62,443,809 | ) |
| Cost of shares redeemed – Institutional Class | | | (21,638,108 | ) | | | (20,874,270 | ) |
| Net decrease in net assets derived | | | | | | | | |
| from capital share transactions | | | (43,371,608 | ) | | | (24,077,372 | ) |
| TOTAL DECREASE IN NET ASSETS | | | (47,561,738 | ) | | | (54,271,232 | ) |
| | | | | | | | | |
| NET ASSETS: | | | | | | | | |
| Beginning of year | | | 157,661,735 | | | | 211,932,967 | |
| End of year | | $ | 110,099,997 | | | $ | 157,661,735 | |
| | | | | | | | | |
| CHANGES IN SHARES OUTSTANDING: | | | | | | | | |
| Shares sold – Investor Class | | | 400,923 | | | | 852,589 | |
| Shares sold – Institutional Class | | | 477,781 | | | | 1,489,112 | |
| Shares issued to holders as reinvestment | | | | | | | | |
| of dividends – Investor Class | | | 373,487 | | | | 506,624 | |
| Shares issued to holders as reinvestment | | | | | | | | |
| of dividends – Institutional Class | | | 195,642 | | | | 182,573 | |
| Shares redeemed – Investor Class | | | (2,193,955 | ) | | | (2,490,267 | ) |
| Shares redeemed – Institutional Class | | | (1,754,857 | ) | | | (1,402,574 | ) |
| Net decrease in shares outstanding | | | (2,500,979 | ) | | | (861,943 | ) |
The accompanying notes are an integral part of these financial statements.
| HENNESSY FUNDS | 1-800-966-4354 | |
Financial Statements
For an Investor Class share outstanding throughout each year
PER SHARE DATA:
Net asset value, beginning of year
Income from investment operations:
Net investment income (loss)
Net realized and unrealized gains (losses) on investments
Total from investment operations
Less distributions:
Dividends from net investment income
Dividends from net realized gains
Total distributions
Net asset value, end of year
TOTAL RETURN
SUPPLEMENTAL DATA AND RATIOS:
Net assets, end of year (millions)
Ratio of expenses to average net assets
Ratio of net investment income (loss) to average net assets
Portfolio turnover rate(3)
(1) | Calculated using the average shares outstanding method. |
(2) | Amount is between $(0.005) and $0.005. |
(3) | Calculated on the basis of the Fund as a whole. |
The accompanying notes are an integral part of these financial statements.
| FINANCIAL HIGHLIGHTS — INVESTOR CLASS |
| Year Ended October 31, | |
| 2019 | | | 2018 | | | 2017 | | | 2016 | | | 2015 | |
| | | | | | | | | | | | | | |
| $ | 21.96 | | | $ | 26.02 | | | $ | 23.48 | | | $ | 23.81 | | | $ | 24.13 | |
| | | | | | | | | | | | | | | | | | | |
| | | | | | | | | | | | | | | | | | | |
| | 0.10 | (1) | | | 0.03 | | | | (0.04 | ) | | | 0.10 | | | | 0.03 | (1) |
| | 0.93 | | | | (2.12 | ) | | | 5.83 | | | | 1.20 | | | | 2.99 | |
| | 1.03 | | | | (2.09 | ) | | | 5.79 | | | | 1.30 | | | | 3.02 | |
| | | | | | | | | | | | | | | | | | | |
| | | | | | | | | | | | | | | | | | | |
| | (0.07 | ) | | | 0.00 | (2) | | | (0.06 | ) | | | (0.03 | ) | | | — | |
| | (1.32 | ) | | | (1.97 | ) | | | (3.19 | ) | | | (1.60 | ) | | | (3.34 | ) |
| | (1.39 | ) | | | (1.97 | ) | | | (3.25 | ) | | | (1.63 | ) | | | (3.34 | ) |
| $ | 21.60 | | | $ | 21.96 | | | $ | 26.02 | | | $ | 23.48 | | | $ | 23.81 | |
| | | | | | | | | | | | | | | | | | | |
| | 5.27 | % | | | (8.79 | )% | | | 25.03 | % | | | 5.80 | % | | | 14.51 | % |
| | | | | | | | | | | | | | | | | | | |
| | | | | | | | | | | | | | | | | | | |
| $ | 89.36 | | | $ | 122.00 | | | $ | 174.01 | | | $ | 132.09 | | | $ | 218.50 | |
| | 1.58 | % | | | 1.54 | % | | | 1.52 | % | | | 1.54 | % | | | 1.50 | % |
| | 0.47 | % | | | 0.11 | % | | | (0.06 | )% | | | 0.38 | % | | | 0.17 | % |
| | 46 | % | | | 28 | % | | | 46 | % | | | 46 | % | | | 49 | % |
The accompanying notes are an integral part of these financial statements.
| HENNESSY FUNDS | 1-800-966-4354 | |
Financial Statements
For an Institutional Class share outstanding throughout each year
PER SHARE DATA:
Net asset value, beginning of year
Income from investment operations:
Net investment income
Net realized and unrealized gains (losses) on investments
Total from investment operations
Less distributions:
Dividends from net investment income
Dividends from net realized gains
Total distributions
Net asset value, end of year
TOTAL RETURN
SUPPLEMENTAL DATA AND RATIOS:
Net assets, end of year (millions)
Ratio of expenses to average net assets
Ratio of net investment income to average net assets
Portfolio turnover rate(2)
(1) | Calculated using the average shares outstanding method. |
(2) | Calculated on the basis of the Fund as a whole. |
The accompanying notes are an integral part of these financial statements.
| FINANCIAL HIGHLIGHTS — INSTITUTIONAL CLASS |
| Year Ended October 31, | |
| 2019 | | | 2018 | | | 2017 | | | 2016 | | | 2015 | |
| | | | | | | | | | | | | | |
| $ | 13.28 | | | $ | 15.69 | | | $ | 14.23 | | | $ | 14.39 | | | $ | 14.53 | |
| | | | | | | | | | | | | | | | | | | |
| | | | | | | | | | | | | | | | | | | |
| | 0.10 | (1) | | | 0.07 | | | | 0.02 | | | | 0.09 | | | | 0.06 | (1) |
| | 0.54 | | | | (1.27 | ) | | | 3.56 | | | | 0.75 | | | | 1.81 | |
| | 0.64 | | | | (1.20 | ) | | | 3.58 | | | | 0.84 | | | | 1.87 | |
| | | | | | | | | | | | | | | | | | | |
| | | | | | | | | | | | | | | | | | | |
| | (0.18 | ) | | | (0.02 | ) | | | (0.17 | ) | | | (0.04 | ) | | | — | |
| | (0.82 | ) | | | (1.19 | ) | | | (1.95 | ) | | | (0.96 | ) | | | (2.01 | ) |
| | (1.00 | ) | | | (1.21 | ) | | | (2.12 | ) | | | (1.00 | ) | | | (2.01 | ) |
| $ | 12.92 | | | $ | 13.28 | | | $ | 15.69 | | | $ | 14.23 | | | $ | 14.39 | |
| | | | | | | | | | | | | | | | | | | |
| | 5.57 | % | | | (8.42 | )% | | | 25.56 | % | | | 6.22 | % | | | 14.91 | % |
| | | | | | | | | | | | | | | | | | | |
| | | | | | | | | | | | | | | | | | | |
| $ | 20.74 | | | $ | 35.66 | | | $ | 37.92 | | | $ | 21.27 | | | $ | 25.94 | |
| | 1.23 | % | | | 1.15 | % | | | 1.15 | % | | | 1.17 | % | | | 1.17 | % |
| | 0.84 | % | | | 0.51 | % | | | 0.30 | % | | | 0.72 | % | | | 0.48 | % |
| | 46 | % | | | 28 | % | | | 46 | % | | | 46 | % | | | 49 | % |
The accompanying notes are an integral part of these financial statements.
| HENNESSY FUNDS | 1-800-966-4354 | |
Financial Statements
Notes to the Financial Statements October 31, 2019 |
1). ORGANIZATION
The Hennessy Small Cap Financial Fund (the “Fund”) is a series of Hennessy Funds Trust (the “Trust”), which was organized as a Delaware statutory trust on September 17, 1992. The Fund is an open-end management investment company registered under the Investment Company Act of 1940, as amended. The investment objective of the Fund is capital appreciation. The Fund is a non-diversified fund.
The Fund offers Investor Class and Institutional Class shares. Each class of shares differs principally in its respective 12b-1 distribution and service, shareholder servicing, and sub-transfer agent expenses. There are no sales charges. Each class has identical rights to earnings, assets, and voting privileges, except for class-specific expenses and exclusive rights to vote on matters affecting only one class.
As an investment company, the Fund follows the investment company accounting and reporting guidance of the Financial Accounting Standards Board (“FASB”) Accounting Standard Codification Topic 946 “Financial Services—Investment Companies.”
2). SIGNIFICANT ACCOUNTING POLICIES
The following is a summary of significant accounting policies consistently followed by the Fund in the preparation of the financial statements. These policies conform to U.S. generally accepted accounting principles (“GAAP”).
| a). | Securities Valuation – All investments in securities are recorded at their estimated fair value, as described in Note 3. |
| | |
| b). | Federal Income Taxes – No provision for federal income taxes or excise taxes has been made because the Fund has elected to be taxed as a regulated investment company and intends to distribute substantially all of its taxable income to its shareholders and otherwise comply with the provisions of the Internal Revenue Code of 1986, as amended, applicable to regulated investment companies. Net investment income/loss and realized gains/losses for federal income tax purposes may differ from those reported in the financial statements because of temporary book and tax basis differences. Temporary differences are primarily the result of the treatment of wash sales for tax reporting purposes. The Fund recognizes interest and penalties related to income tax benefits, if any, in the Statement of Operations as an income tax expense. Distributions from net realized gains for book purposes may include short-term capital gains, which are included as ordinary income to shareholders for tax purposes. The Fund may utilize equalization accounting for tax purposes and designate earnings and profits, including net realized gains distributed to shareholders on redemption of shares, as part of the dividends paid deduction for income tax purposes. |
| | |
| | Due to inherent differences in the recognition of income, expenses, and realized gains/losses under GAAP and federal income tax regulations, permanent differences between book and tax basis for reporting for fiscal year 2019 have been identified and appropriately reclassified in the Statement of Assets and Liabilities. The adjustments are as follows: |
| Total | |
| Distributable | |
Earnings | Capital Stock |
| $(826,733) | $826,733 |
| NOTES TO THE FINANCIAL STATEMENTS |
| c). | Accounting for Uncertainty in Income Taxes – The Fund has accounting policies regarding recognition and measurement of tax positions taken or expected to be taken on a tax return. The tax returns of the Fund for the prior three fiscal years are open for examination. The Fund has reviewed all open tax years in major jurisdictions and concluded that there is no impact on the Fund’s net assets and no tax liability resulting from unrecognized tax benefits relating to uncertain income tax positions taken or expected to be taken on a tax return. The Fund’s major tax jurisdictions are U.S. federal and Delaware. |
| | |
| d). | Income and Expenses – Dividend income is recognized on the ex-dividend date or as soon as information is available to the Fund. Interest income, which includes the amortization of premium and accretion of discount, is recognized on an accrual basis. Other non-cash dividends are recognized as investment income at the fair value of the property received. The Fund is charged for those expenses that are directly attributable to its portfolio, such as advisory, administration, and certain shareholder service fees. Income, expenses (other than expenses attributable to a specific class), and realized and unrealized gains/losses on investments are allocated to each class of shares based on such class’s net assets. |
| | |
| e). | Distributions to Shareholders – Dividends from net investment income for the Fund, if any, are declared and paid annually, usually in December. Distributions of net realized capital gains, if any, are declared and paid annually, usually in December. |
| | |
| f). | Security Transactions – Investment and shareholder transactions are recorded on the trade date. The Fund determines the realized gain/loss from an investment transaction by comparing the original cost of the security lot sold with the net sale proceeds. Discounts and premiums on securities purchased are accreted or amortized, respectively, over the life of each such security. |
| | |
| g). | Use of Estimates – The preparation of financial statements in conformity with GAAP requires management to make estimates and assumptions that affect the reported amounts of assets and liabilities and disclosure of contingent assets and liabilities at the date of the financial statements and the reported change in net assets during the reporting period. Actual results could differ from those estimates. |
| | |
| h). | Share Valuation – The net asset value (“NAV”) per share of the Fund is calculated by dividing (i) the total value of the securities held by the Fund, plus cash and other assets, minus all liabilities (including estimated accrued expenses) by (ii) the total number of shares outstanding for the Fund, rounded to the nearest $0.01. The Fund’s shares will not be priced on days the New York Stock Exchange is closed for trading. The offering and redemption price per share for the Fund is equal to the Fund’s NAV per share. |
| | |
| i). | New Accounting Pronouncements – In August 2018, the FASB issued Accounting Standards Update No. 2018-13 “Disclosure Framework—Changes to the Disclosure Requirements for Fair Value Measurement” (“ASU 2018-13”). ASU 2018-13 eliminates the requirement to disclose the amount of and reasons for transfers between Level 1 and Level 2 of the fair value hierarchy, the timing of transfers between levels of the fair value hierarchy, and the valuation processes for Level 3 fair value measurements. ASU 2018-13 does not eliminate the requirement to disclose the range and weighted average used to develop significant unobservable inputs for Level 3 fair value measurements, and the changes in unrealized gains and losses for recurring Level 3 fair value measurements. ASU 2018-13 requires that information is provided about the measurement uncertainty of Level 3 fair value measurements as of the reporting date. The guidance is effective for fiscal years beginning after |
| HENNESSY FUNDS | 1-800-966-4354 | |
| | December 15, 2019, and interim periods within those fiscal years. Management has evaluated the impact of this change in guidance and, due to the permissibility of early adoption, modified the Fund’s fair value disclosures for the current reporting period. |
3). SECURITIES VALUATION
The Fund follows fair value accounting standards that establish an authoritative definition of fair value and set out a hierarchy for measuring fair value. These standards require additional disclosures about the various inputs and valuation techniques used to develop the measurements of fair value and a discussion of changes in valuation techniques and related inputs during the period. These inputs are summarized in the three broad levels listed below:
| | Level 1 – | Unadjusted, quoted prices in active markets for identical instruments that the Fund has the ability to access at the date of measurement. |
| | | |
| | Level 2 – | Other significant observable inputs (including, but not limited to, quoted prices in active markets for similar instruments, quoted prices in markets that are not active for identical or similar instruments, and model-derived valuations in which all significant inputs and significant value drivers are observable in active markets, such as interest rates, prepayment speeds, credit risk curves, default rates, and similar data). |
| | | |
| | Level 3 – | Significant unobservable inputs (including the Fund’s own assumptions about what market participants would use to price the asset or liability based on the best available information) when observable inputs are unavailable. |
The following is a description of the valuation techniques applied to the Fund’s major categories of assets and liabilities measured at fair value on a recurring basis:
| | Equity Securities – Equity securities, including common stocks, preferred stocks, foreign-issued common stocks, exchange-traded funds, closed-end mutual funds, partnerships, rights, and real estate investment trusts, that are traded on a securities exchange for which a last-quoted sales price is readily available will generally be valued at the last sales price as reported by the primary exchange on which the securities are listed. Securities listed on The NASDAQ Stock Market (“NASDAQ”) will generally be valued at the NASDAQ Official Closing Price, which may differ from the last sales price reported. Securities traded on a securities exchange for which a last-quoted sales price is not readily available will generally be valued at the mean between the bid and ask prices. To the extent these securities are actively traded and valuation adjustments are not applied, they are classified in Level 1 of the fair value hierarchy. Securities traded on foreign exchanges generally are not valued at the same time the Fund calculates its NAV because most foreign markets close well before such time. The earlier close of most foreign markets gives rise to the possibility that significant events, including broad market moves, may have occurred in the interim. In certain circumstances, it may be determined that a foreign security needs to be fair valued because it appears that the value of the security might have been materially affected by events occurring after the close of the market in which the security is principally traded, but before the time the Fund calculates its NAV, such as by a development that affects an entire market or region (e.g., a weather-related event) or a potentially global development (e.g., a terrorist attack that may be expected to have an effect on investor expectations worldwide). |
| | |
| | Registered Investment Companies – Investments in open-end registered investment companies, commonly referred to as mutual funds, generally are priced at the ending NAV provided by the applicable mutual fund’s service agent and will be classified in Level 1 of the fair value hierarchy. |
| NOTES TO THE FINANCIAL STATEMENTS |
| | Debt Securities – Debt securities, including corporate bonds, asset-backed securities, mortgage-backed securities, municipal bonds, U.S. Treasuries, and U.S. government agency issues, are generally valued at market on the basis of valuations furnished by an independent pricing service that utilizes both dealer-supplied valuations and formula-based techniques. The pricing service may consider recently executed transactions in securities of the issuer or comparable issuers, market price quotations (where observable), bond spreads, and fundamental data relating to the issuer. In addition, the model may incorporate observable market data, such as reported sales of similar securities, broker quotes, yields, bids, offers, and reference data. Certain securities are valued primarily using dealer quotations. These securities are generally classified in Level 2 of the fair value hierarchy. |
| | |
| | Short-Term Securities – Short-term equity investments, including money market funds, are valued in the manner specified above. Short-term debt investments with an original term to maturity of 60 days or less are valued at amortized cost, which approximates fair market value. If the original term to maturity of a short-term debt investment exceeded 60 days, then the values as of the 61st day prior to maturity are amortized. Amortized cost is not used if its use would be inappropriate due to credit or other impairments of the issuer, in which case the security’s fair value would be determined, as described below. Short-term securities are generally classified in Level 1 or Level 2 of the fair value hierarchy depending on the inputs used and market activity levels for specific securities. |
The Board of Trustees of the Fund (the “Board”) has adopted fair value pricing procedures that are followed when a price for a security is not readily available or if a significant event has occurred that indicates the closing price of a security no longer represents the true value of that security. Fair value pricing determinations are made in good faith in accordance with these procedures. There are numerous criteria that will be given consideration in determining a fair value of a security, such as the trading volume of a security and markets, the values of other similar securities, and news events with direct bearing on a security or markets. Fair value pricing results in an estimated price for a security that reflects the amount the Fund might reasonably expect to receive in a current sale. Depending on the relative significance of the valuation inputs, these securities may be classified in either Level 2 or Level 3 of the fair value hierarchy.
The fair value of foreign securities may be determined with the assistance of a pricing service using correlations between the movement of prices of such securities and indices of domestic securities and other appropriate indicators, such as closing market prices of relevant American Depositary Receipts or futures contracts. The effect of using fair value pricing is that the Fund’s NAV will reflect the affected portfolio securities’ values as determined by the Board or its designee, pursuant to the fair value pricing procedures adopted by the Board, instead of being determined by the market. Using a fair value pricing methodology to price a foreign security may result in a value that is different from such foreign security’s most recent closing price and from the value used by other investment companies to calculate their NAVs. Such securities are generally classified in Level 2 of the fair value hierarchy. Because the Fund may invest in foreign securities, the value of the Fund’s portfolio securities may change on days when you will not be able to purchase or redeem your shares.
The Board has delegated day-to-day valuation matters to the Valuation and Liquidity Committee comprising representatives from Hennessy Advisors, Inc., the Fund’s investment advisor (the “Advisor”). The function of the Valuation and Liquidity Committee is to value securities where current and reliable market quotations are not readily available. All actions taken by the Valuation and Liquidity Committee are reviewed by the Board.
| HENNESSY FUNDS | 1-800-966-4354 | |
The Fund has performed an analysis of all existing investments to determine the significance and character of all inputs to their fair value determinations. Various inputs are used to determine the value of the Fund’s investments. The inputs or methodology used for valuing securities are not necessarily an indication of the risk associated with investing in those securities. Details related to the fair value hierarchy of the Fund’s securities as of October 31, 2019, are included in the Schedule of Investments.
4). INVESTMENT TRANSACTIONS
Purchases and sales of investment securities (excluding government and short-term investments) for the Fund during fiscal year 2019 were $56,051,556 and $101,688,472, respectively.
There were no purchases or sales/maturities of long-term U.S. government securities for the Fund during fiscal year 2019.
The Fund is permitted to purchase or sell securities from or to another fund in the Hennessy Funds family of funds (collectively, the “Hennessy Funds”) under specified conditions outlined in procedures adopted by the Board. The procedures have been designed to ensure that any purchase or sale of securities by the Fund from or to another Hennessy Fund complies with Rule 17a-7 of the Investment Company Act of 1940, as amended. During fiscal year 2019, the Fund did not engage in purchases or sales of securities pursuant to Rule 17a-7 of the Investment Company Act of 1940, as amended.
5). INVESTMENT ADVISORY FEE AND OTHER TRANSACTIONS WITH AFFILIATES
The Advisor provides the Fund with investment advisory services under an Investment Advisory Agreement. The Advisor furnishes all investment advice, office space, and facilities and most of the personnel needed by the Fund. As compensation for its services, the Advisor is entitled to a monthly fee from the Fund. The fee is based on the average daily net assets of the Fund at an annual rate of 0.90%. The net investment advisory fees expensed by the Fund during fiscal year 2019 are included in the Statement of Operations.
The Board has approved a Shareholder Servicing Agreement for Investor Class shares of the Fund, which was instituted to compensate the Advisor for the non-investment advisory services it provides to the Fund. The Shareholder Servicing Agreement provides for a monthly fee paid to the Advisor at an annual rate of 0.10% of the average daily net assets of the Fund attributable to Investor Class shares. The shareholder service fees expensed by the Fund during fiscal year 2019 are included in the Statement of Operations.
The Fund has adopted a plan pursuant to Rule 12b-1 under the Investment Company Act of 1940, as amended, that authorizes payments in connection with the distribution of the Fund’s shares at an annual rate of up to 0.25% of the Fund’s average daily net assets attributable to Investor Class shares. Even though the authorized rate is up to 0.25%, the Fund is currently only using up to 0.15% of its average daily net assets attributable to Investor Class shares for such purpose. Amounts paid under the plan may be spent on any activities or expenses primarily intended to result in the sale of shares, including, but not limited to, advertising, shareholder account servicing, printing and mailing of prospectuses to other than current shareholders, printing and mailing of sales literature, and compensation for sales and marketing activities or to financial institutions and others, such as dealers and distributors. The distribution fees expensed by the Fund during fiscal year 2019 are included in the Statement of Operations.
The Fund has entered into agreements with various brokers, dealers, and financial intermediaries in connection with the sale of shares of the Fund. The agreements provide for periodic payments of sub-transfer agent expenses by the Fund to the brokers, dealers, and financial intermediaries for providing certain shareholder maintenance services. These
| NOTES TO THE FINANCIAL STATEMENTS |
shareholder services include the pre-processing and quality control of new accounts, shareholder correspondence, answering customer inquiries regarding account status, and facilitating shareholder telephone transactions. The sub-transfer agent fees expensed by the Fund during fiscal year 2019 are included in the Statement of Operations.
U.S. Bancorp Fund Services, LLC, d/b/a U.S. Bank Global Fund Services (“Fund Services”) provides the Fund with administrative, accounting, and transfer agent services. As administrator, Fund Services is responsible for activities such as (i) preparing various federal and state regulatory filings, reports, and returns for the Fund, (ii) preparing reports and materials to be supplied to the Board, (iii) monitoring the activities of the Fund’s custodian, transfer agent, and accountants, and (iv) coordinating the preparation and payment of the Fund’s expenses and reviewing the Fund’s expense accruals. U.S. Bank N.A., an affiliate of Fund Services, serves as the Fund’s custodian. The servicing agreements between the Trust and Fund Services and U.S. Bank N.A. contain a fee schedule that is inclusive of administrative, accounting, custody, and transfer agent fees. The administrative, accounting, custody, and transfer agent fees expensed by the Fund during fiscal year 2019 are included in the Statement of Operations.
Quasar Distributors, LLC (“Quasar”) acts as the Fund’s principal underwriter in a continuous public offering of the Fund’s shares. Quasar is an affiliate of Fund Services and U.S. Bank N.A.
The officers of the Fund are affiliated with the Advisor. With the exception of the Chief Compliance Officer and the Senior Compliance Officer, such officers receive no compensation from the Fund for serving in their respective roles. The Fund, along with the other Hennessy Funds, makes reimbursement payments on an equal basis to the Advisor for a portion of the salary and benefits associated with the office of the Chief Compliance Officer and for all of the salary and benefits associated with the office of the Senior Compliance Officer. The compliance fees expensed by the Fund during fiscal year 2019 are included in the Statement of Operations.
6). GUARANTEES AND INDEMNIFICATIONS
Under the Hennessy Funds’ organizational documents, their officers and trustees are indemnified by the Hennessy Funds against certain liabilities arising out of the performance of their duties to the Hennessy Funds. Additionally, in the normal course of business, the Hennessy Funds enter into contracts with service providers that contain general indemnification clauses. The Fund’s maximum exposure under these arrangements is unknown as this would involve future claims that may be made against the Fund that have not yet occurred. Currently, the Fund expects the risk of loss to be remote.
7). LINE OF CREDIT
The Fund has an uncommitted line of credit with the other Hennessy Funds in the amount of the lesser of (i) $100,000,000 or (ii) 33.33% of each Hennessy Fund’s net assets, or 30% for the Hennessy Gas Utility Fund and 10% for the Hennessy Balanced Fund, intended to provide short-term financing, if necessary, subject to certain restrictions, in connection with shareholder redemptions. The credit facility is with the Hennessy Funds’ custodian bank, U.S. Bank N.A. Borrowings under this arrangement bear interest at the bank’s prime rate and are secured by all of the Fund’s assets (as to its own borrowings only). During fiscal year 2019, the Fund did not have any borrowings outstanding under the line of credit.
| HENNESSY FUNDS | 1-800-966-4354 | |
8). FEDERAL TAX INFORMATION
As of October 31, 2019, the components of accumulated earnings (losses) for income tax purposes were as follows:
| | | Investments | |
| Cost of investments for tax purposes | | $ | 94,969,593 | |
| Gross tax unrealized appreciation | | $ | 17,543,168 | |
| Gross tax unrealized depreciation | | | (4,227,881 | ) |
| Net tax unrealized appreciation/(depreciation) | | $ | 13,315,287 | |
| Undistributed ordinary income | | $ | 166,556 | |
| Undistributed long-term capital gains | | | 3,279,231 | |
| Total distributable earnings | | $ | 3,445,787 | |
| Other accumulated gain/(loss) | | $ | — | |
| Total accumulated gain/(loss) | | $ | 16,761,074 | |
The difference between book-basis unrealized appreciation/depreciation and tax-basis unrealized appreciation/depreciation (as shown above) is attributable primarily to wash sales.
As of October 31, 2019, the Fund had no tax basis capital losses to offset future capital gains.
As of October 31, 2019, the Fund did not defer, on a tax basis, any late-year ordinary losses. Late-year ordinary losses are net ordinary losses incurred after December 31, 2018, but within the taxable year, that are deemed to arise on the first day of the Fund’s next taxable year.
During fiscal year 2019 and fiscal year 2018, the tax character of distributions paid by the Fund was as follows:
| | | Year Ended | | | Year Ended | |
| | | October 31, 2019 | | | October 31, 2018 | |
Ordinary income(1) | | $ | 848,924 | | | $ | 1,372,736 | |
| Long-term capital gain | | | 9,159,655 | | | | 14,104,903 | |
| | | $ | 10,008,579 | | | $ | 15,477,639 | |
(1) Ordinary income includes short-term capital gain.
9). EVENTS SUBSEQUENT TO YEAR END
Management has evaluated the Fund’s related events and transactions that occurred subsequent to October 31, 2019, through the date of issuance of the Fund’s financial statements. Other than as disclosed below, management has determined that there were no subsequent events requiring recognition or disclosure in the financial statements.
On November 25, 2019, U.S. Bancorp, the parent company of Quasar, announced that it had signed a purchase agreement to sell Quasar to Foreside Financial Group, LLC, such that Quasar will become a wholly-owned broker-dealer subsidiary of Foreside. The transaction is expected to close by the end of March 2020. Quasar will remain the Fund’s distributor at the close of the transaction, subject to Board approval.
On December 6, 2019, capital gains were declared and paid to shareholders of record on December 5, 2019, as follows:
| | | Long-term | |
| | Investor Class | $0.65961 | |
| | Institutional Class | $0.39469 | |
| NOTES/REPORT OF INDEPENDENT REGISTERED PUBLIC ACCOUNTING FIRM |
Report of Independent Registered Public
Accounting Firm
To the Board of Trustees of Hennessy Funds Trust
and the shareholders of the Hennessy Small Cap Financial Fund
Novato, CA
Opinion on the Financial Statements
We have audited the accompanying statement of assets and liabilities of the Hennessy Small Cap Financial Fund (the “Fund”), a series of Hennessy Funds Trust, including the schedule of investments, as of October 31, 2019, the related statement of operations for the year then ended, the statements of changes in net assets for each of the two years in the period then ended, financial highlights for each of the five years in the period then ended, and the related notes (collectively referred to as the “financial statements”). In our opinion, the financial statements present fairly, in all material respects, the financial position of the Fund as of October 31, 2019, the results of its operations for the year then ended, the changes in its net assets for each of the two years in the period then ended, and the financial highlights for each of the five years in the period then ended, in conformity with accounting principles generally accepted in the United States of America.
Basis for Opinion
These financial statements are the responsibility of the Fund’s management. Our responsibility is to express an opinion on the Fund’s financial statements based on our audits. We are a public accounting firm registered with the Public Company Accounting Oversight Board (United States) (“PCAOB”) and are required to be independent with respect to the Fund in accordance with the U.S. federal securities laws and the applicable rules and regulations of the Securities and Exchange Commission and the PCAOB. We have served as the auditor of one or more of the funds in the Trust since 2002.
We conducted our audits in accordance with the standards of the PCAOB. Those standards require that we plan and perform the audit to obtain reasonable assurance about whether the financial statements are free of material misstatement, whether due to error or fraud. The Fund is not required to have, nor were we engaged to perform, an audit of its internal control over financial reporting. As part of our audits we are required to obtain an understanding of internal control over financial reporting, but not for the purpose of expressing an opinion on the effectiveness of the Fund’s internal control over financial reporting. Accordingly, we express no such opinion.
Our audits included performing procedures to assess the risks of material misstatement of the financial statements, whether due to error or fraud, and performing procedures that respond to those risks. Such procedures included examining, on a test basis, evidence regarding the amounts and disclosures in the financial statements. Our audits also included evaluating the accounting principles used and significant estimates made by management, as well as evaluating the overall presentation of the financial statements. Our procedures included confirmation of securities owned as of October 31, 2019, by correspondence with the custodian. We believe that our audits provide a reasonable basis for our opinion.
| | |
| | TAIT, WELLER & BAKER LLP |
Philadelphia, Pennsylvania
December 24, 2019
| HENNESSY FUNDS | 1-800-966-4354 | |
Trustees and Officers of the Fund (Unaudited)
The business and affairs of the Funds are managed under the direction of the Board of Trustees of the Trust, and the Board of Trustees elects the officers of the Trust. From time to time, the Board of Trustees also has appointed advisers to the Board of Trustees (“Advisers”) with the intention of having qualified individuals serve in an advisory capacity in order to garner experience in the mutual fund and asset management industry and be considered as potential Trustees in the future. There are currently three Advisers: Brian Alexander, Doug Franklin, and Claire Knoles. As Advisers, Mr. Alexander, Mr. Franklin, and Ms. Knoles attend meetings of the Board of Trustees and act as non-voting participants. Information pertaining to the Trustees, Advisers, and the officers of the Trust is set forth below. The Trustees and officers serve until their successors are duly elected and qualified or until their earlier death, resignation, or removal. Each Trustee oversees the 16 Hennessy Funds. Unless otherwise indicated, the address of all persons listed below is 7250 Redwood Boulevard, Suite 200, Novato, CA 94945. The Fund’s Statement of Additional Information includes more information about the persons listed below and is available without charge by calling 1-800-966-4354 or by visiting www.hennessyfunds.com.
| | | | Other |
| | | | Directorships |
| | | | Held Outside |
| Name, (Year of Birth), | | | of Fund |
| and Position Held | Start Date | Principal Occupation(s) | Complex During |
with the Trust | of Service | During Past Five Years | Past Five Years |
| | | | |
| Disinterested Trustees and Advisers | | | |
| | | | |
| J. Dennis DeSousa | January 1996 | Mr. DeSousa is a real estate investor. | None. |
| (1936) | | | |
| Trustee | | | |
| | | | |
| Robert T. Doyle | January 1996 | Mr. Doyle has been the Sheriff of | None. |
| (1947) | | Marin County, California since 1996. | |
| Trustee | | | |
| | | | |
| Gerald P. Richardson | May 2004 | Mr. Richardson is an independent | None. |
| (1945) | | consultant in the securities industry. | |
| Trustee | | | |
| | | | |
| Brian Alexander | March 2015 | Mr. Alexander has worked for the | None. |
| (1981) | | Sutter Health organization since | |
| Adviser to the Board | | 2011 in various positions. He has | |
| | | served as the Chief Executive Officer | |
| | | of the Sutter Roseville Medical | |
| | | Center since 2018. From 2016 through | |
| | | 2018, he served as the Vice President | |
| | | of Strategy for the Sutter Health Valley | |
| | | Area, which includes 11 hospitals, | |
| | | 13 ambulatory surgery centers, | |
| | | 16,000 employees, and 1,900 physicians. | |
| | | From 2013 through 2016, Mr. Alexander | |
| | | served as Sutter Novato Community | |
| | | Hospital’s Chief Administrative Officer. | |
| TRUSTEES AND OFFICERS OF THE FUND |
| | | | Other |
| | | | Directorships |
| | | | Held Outside |
| Name, (Year of Birth), | | | of Fund |
| and Position Held | Start Date | Principal Occupation(s) | Complex During |
with the Trust | of Service | During Past Five Years | Past Five Years |
| | | | |
| Doug Franklin | March 2016 | Mr. Franklin is a retired insurance | None. |
| (1964) | | industry executive. From 1987 | |
| Adviser to the Board | | through 2015, he was employed | |
| | | by the Allianz-Fireman’s Fund | |
| | | Insurance Company in various | |
| | | positions, including as its Chief | |
| | | Actuary and Chief Risk Officer. | |
| | | | |
| Claire Knoles | December 2015 | Ms. Knoles is a founder of Kiosk and | None. |
| (1974) | | has served as its Chief Operating | |
| Adviser to the Board | | Officer since 2004. Kiosk is a full- | |
| | | service marketing agency with | |
| | | offices in the San Francisco Bay | |
| | | Area, Toronto, and Liverpool, UK. | |
| | | | |
Interested Trustee(1) | | | |
| | | | |
| Neil J. Hennessy | January 1996 as | Mr. Hennessy has been employed | Hennessy |
| (1956) | a Trustee and | by Hennessy Advisors, Inc. since | Advisors, Inc. |
| Trustee, Chairman of | June 2008 as | 1989 and currently serves as its | |
| the Board, Chief | an officer | Chairman and Chief Executive Officer. | |
| Investment Officer, | | | |
| Portfolio Manager, | | | |
| and President | | | |
| Name, (Year of Birth), | | |
| and Position Held | Start Date | Principal Occupation(s) |
with the Trust | of Service | During Past Five Years |
| | | |
| Officers | | |
| | | |
| Teresa M. Nilsen | January 1996 | Ms. Nilsen has been employed by Hennessy Advisors, Inc. |
| (1966) | | since 1989 and currently serves as its President, Chief Operating |
| Executive Vice President | | Officer, and Secretary. |
| and Treasurer | | |
| | | |
| Daniel B. Steadman | March 2000 | Mr. Steadman has been employed by Hennessy Advisors, Inc. |
| (1956) | | since 2000 and currently serves as its Executive Vice President. |
| Executive Vice President | | |
| and Secretary | | |
| | | |
| Brian Carlson | December 2013 | Mr. Carlson has been employed by Hennessy Advisors, Inc. |
| (1972) | | since December 2013 and currently serves as its Chief |
| Senior Vice President | | Compliance Officer and Senior Vice President. |
| and Head of Distribution | | |
| | | |
| Jennifer Cheskiewicz | June 2013 | Ms. Cheskiewicz has been employed by Hennessy Advisors, Inc. |
(1977)(2) | | as its General Counsel since June 2013. |
| Senior Vice President and | | |
| Chief Compliance Officer | | |
| HENNESSY FUNDS | 1-800-966-4354 | |
| Name, (Year of Birth), | | |
| and Position Held | Start Date | Principal Occupation(s) |
with the Trust | of Service | During Past Five Years |
| | | |
| David Ellison | October 2012 | Mr. Ellison has been employed by Hennessy Advisors, Inc. since |
(1958)(3) | | October 2012. He has served as a Portfolio Manager of the |
| Senior Vice President | | Hennessy Large Cap Financial Fund and the Hennessy Small |
| and Portfolio Manager | | Cap Financial Fund since their inception. Mr. Ellison also served |
| | | as a Portfolio Manager of the Hennessy Technology Fund from |
| | | its inception until February 2017. Mr. Ellison served as Director, |
| | | CIO and President of FBR Fund Advisers, Inc. from December |
| | | 1999 to October 2012. |
| | | |
| Ryan Kelley | March 2013 | Mr. Kelley has been employed by Hennessy Advisors, Inc. since |
(1972)(4) | | October 2012. He has served as a Portfolio Manager of the |
| Senior Vice President | | Hennessy Gas Utility Fund, the Hennessy Large Cap Financial |
| and Portfolio Manager | | Fund, and the Hennessy Small Cap Financial Fund since |
| | | October 2014. He served as Co- Portfolio Manager of these |
| | | same funds from March 2013 through September 2014 and as |
| | | a Portfolio Analyst for the Hennessy Funds from October 2012 |
| | | through February 2013. Mr. Kelley has also served as a Portfolio |
| | | Manager of the Hennessy Cornerstone Growth Fund, the |
| | | Hennessy Cornerstone Mid Cap 30 Fund, the Hennessy |
| | | Cornerstone Large Growth Fund, and the Hennessy |
| | | Cornerstone Value Fund since February 2017 and as a Portfolio |
| | | Manager of the Hennessy Total Return Fund, the Hennessy |
| | | Balanced Fund, and the Hennessy Technology Fund since May |
| | | 2018. He served as Co- Portfolio Manager of the Hennessy |
| | | Technology Fund from February 2017 until May 2018. Mr. Kelley |
| | | served as Portfolio Manager of FBR Fund Advisers, Inc. from |
| | | January 2008 to October 2012. |
| | | |
| Tania Kelley | October 2003 | Ms. Kelley has been employed by Hennessy Advisors, Inc. since |
| (1965) | | October 2003. |
| Senior Vice President | | |
| and Head of Marketing | | |
| | | |
| L. Joshua Wein | September 2018 | Mr. Wein has been employed by Hennessy Advisors, Inc. |
(1973)(4) | | since 2018. He has served as Co-Portfolio Manager of the |
| Vice President and | | Hennessy Cornerstone Growth Fund, the Hennessy |
| Co-Portfolio Manager | | Cornerstone Mid Cap 30 Fund, the Hennessy Cornerstone Large |
| | | Growth Fund, the Hennessy Cornerstone Value Fund, Hennessy |
| | | Total Return Fund, the Hennessy Balanced Fund, the Hennessy |
| | | Gas Utility Fund, and the Hennessy Technology Fund since |
| | | February 2019. Prior to that, he served as a Senior Analyst of |
| | | those same funds since September 2018. Mr. Wein served as |
| | | Director of Alternative Investments and Co-Portfolio Manager |
| | | at Sterling Capital Management from 2008 to 2018. |
_______________
(1) | Mr. Hennessy is considered an “interested person,” as defined in the Investment Company Act of 1940, as amended, because he is an officer of the Trust. |
(2) | The address of this officer is 4800 Bee Caves Road, Suite 100, Austin, TX 78746. |
(3) | The address of this officer is 101 Federal Street, Suite 1900, Boston, MA 02110. |
(4) | The address of this officer is 1340 Environ Way, Chapel Hill, NC 27517. |
| TRUSTEES AND OFFICERS OF THE FUND |
(This Page Intentionally Left Blank.)
| HENNESSY FUNDS | 1-800-966-4354 | |
Expense Example (Unaudited)
October 31, 2019
As a shareholder of the Fund, you incur ongoing costs, including management fees, service fees, and other Fund expenses. This Example is intended to help you understand your ongoing costs (in dollars) of investing in the Fund and to compare these costs with the ongoing costs of investing in other mutual funds. The Example is based on an investment of $1,000 invested at the beginning of the period and held for the entire period from May 1, 2019, through October 31, 2019.
Actual Expenses
The first line of the table below under the “Investor Class” and “Institutional Class” headings provides information about actual account values and actual expenses. Although the Fund charges no sales loads or transaction fees, you will be assessed fees for outgoing wire transfers, returned checks and stop payment orders at prevailing rates charged by U.S. Bank Global Fund Services, the Fund’s transfer agent. If you request that a redemption be made by wire transfer, currently a $15 fee is charged by the Fund’s transfer agent. IRA accounts will be charged a $15 annual maintenance fee. The example below includes, but is not limited to, management fees, shareholder servicing fees, accounting, custody, and transfer agent fees. However, the example below does not include portfolio trading commissions and related expenses. You may use the information in this line, together with the amount you invested, to estimate the expenses that you paid over the period. Simply divide your account value by $1,000 (for example, an $8,600 account value divided by $1,000 = 8.6), then multiply the result by the number in the first line of the table under the “Investor Class” or “Institutional Class” headings in the column entitled “Expenses Paid During Period” to estimate the expenses you paid on your account during this period.
Hypothetical Example for Comparison Purposes
The second line of the table below under the “Investor Class” and “Institutional Class” headings provides information about hypothetical account values and hypothetical expenses based on the Fund’s actual expense ratios and an assumed rate of return of 5% per year before expenses, which is not the Fund’s actual return. The hypothetical account values and expenses may not be used to estimate the actual ending account balance or expenses you paid for the period. You may use this information to compare the ongoing costs of investing in the Fund and other funds. To do so, compare this 5% hypothetical example with the 5% hypothetical examples that appear in the shareholder reports of the other funds. Please note that the expenses shown in the table are meant to highlight your ongoing costs only. Therefore, the second line of the table under the “Investor Class” and “Institutional Class” headings is useful in comparing ongoing costs only and will not help you determine the relative total costs of owning different funds.
| | | | Expenses Paid |
| | Beginning | Ending | During Period(1) |
| | Account Value | Account Value | May 1, 2019 – |
| | May 1, 2019 | October 31, 2019 | October 31, 2019 |
| Investor Class | | | |
| Actual | $1,000.00 | $1,008.90 | $8.01 |
| Hypothetical (5% return before expenses) | $1,000.00 | $1,017.23 | $8.04 |
| | | | |
| Institutional Class | | | |
| Actual | $1,000.00 | $1,009.40 | $6.62 |
| Hypothetical (5% return before expenses) | $1,000.00 | $1,018.62 | $6.65 |
(1) | Expenses are equal to the Fund’s annualized expense ratio of 1.58% for Investor Class shares or 1.31% for Institutional Class shares, as applicable, multiplied by the average account value over the period, multiplied by 184/365 days (to reflect one-half year period). |
| HENNESSY FUNDS | 1-800-966-4354 | |
How to Obtain a Copy of the Fund’s
Proxy Voting Policy and Proxy Voting Records
A description of the policies and procedures the Fund uses to determine how to vote proxies relating to portfolio securities is available without charge: (1) by calling 1-800-966-4354; (2) on the Hennessy Funds’ website at www.hennessyfunds.com/proxy-voting/voting-policy; or (3) on the U.S. Securities and Exchange Commission’s (the “SEC”) website at www.sec.gov. The Fund’s proxy voting record is available without charge on both the Hennessy Funds’ website at www.hennessyfunds.com/proxy-voting/voting-record and the SEC’s website at www.sec.gov no later than August 31 for the prior 12 months ending June 30.
Availability of Quarterly Portfolio Schedule
For periods ending on or prior to January 31, 2019, the Fund has filed a complete schedule of portfolio holdings with the SEC for the first and third quarters of each fiscal year on Form N-Q. For periods ending on or after April 30, 2019, the Fund files a complete schedule of portfolio holdings with the SEC for the first and third quarters of each fiscal year as an exhibit to its reports on Form N-PORT. The Fund’s Forms N-Q and Forms N-PORT are available on the SEC’s website at www.sec.gov or on request by calling 1-800-966-4354.
Federal Tax Distribution Information (Unaudited)
For fiscal year 2019, certain dividends paid by the Fund may be subject to a maximum tax rate of 23.8%, as provided for by the Jobs and Growth Tax Relief Reconciliation Act of 2003. The percentage of dividends declared from ordinary income designated as qualified dividend income was 100.00%.
For corporate shareholders, the percent of ordinary income distributions that qualified for the corporate dividends received deduction for fiscal year 2019 was 100.00%.
The percentage of taxable ordinary income distributions that were designated as short-term capital gain distributions under Section 871(k)(2)(C) of the Internal Revenue Code of 1986, as amended, for the Fund was 0.00%.
Important Notice Regarding Delivery
of Shareholder Documents
To help keep the Fund’s costs as low as possible, we generally deliver a single copy of shareholder reports, proxy statements, and prospectuses to shareholders who share an address and have the same last name. This process does not apply to account statements. You may request an individual copy of a shareholder document at any time. If you would like to receive separate mailings of shareholder documents, please call U.S. Bank Global Fund Services at 1-800-261-6950 or 1-414-765-4124, and individual delivery will begin within 30 days of your request. If your account is held through a financial institution or other intermediary, please contact such intermediary directly to request individual delivery.
Electronic Delivery
The Funds offer shareholders the option to receive account statements, Prospectuses, tax forms, and reports online. To sign up for eDelivery, please visit www.hennessyfunds.com. You may change your delivery preference at any time by visiting our website or contacting the Funds at 1-800-261-6950.
| PROXY VOTING — PRIVACY POLICY |
Privacy Policy
We collect the following non-public personal information about you:
| | • | information we receive from you on or in applications or other forms, correspondence, or conversations, including, but not limited to, your name, address, phone number, social security number, assets, income, and date of birth; and |
| | | |
| | • | information about your transactions with us, our affiliates, or others, including, but not limited to, your account number and balance, payment history, parties to transactions, cost basis information, and other financial information. |
We do not disclose any non-public personal information about our current or former shareholders to non-affiliated third parties, except as permitted by law. For example, we are permitted by law to disclose all of the information we collect, as described above, to our Transfer Agent to process your transactions. Furthermore, we restrict access to your non-public personal information to those persons who require such information to provide products or services to you. We maintain physical, electronic, and procedural safeguards that comply with federal standards to guard your non-public personal information.
In the event that you hold shares of the Fund through a financial intermediary, including, but not limited to, a broker-dealer, bank, or trust company, the privacy policy of your financial intermediary would govern how your non-public personal information will be shared with non-affiliated third parties.
| HENNESSY FUNDS | 1-800-966-4354 | |
For information, questions or assistance, please call
The Hennessy Funds
1-800-966-4354 or 1-415-899-1555
INVESTMENT ADVISOR
Hennessy Advisors, Inc.
7250 Redwood Boulevard, Suite 200
Novato, California 94945
ADMINISTRATOR,
TRANSFER AGENT,
DIVIDEND PAYING AGENT, &
SHAREHOLDER SERVICING AGENT
U.S. Bancorp Fund Services, LLC
d/b/a U.S. Bank Global Fund Services
P.O. Box 701
Milwaukee, Wisconsin 53201-0701
CUSTODIAN
U.S. Bank N.A.
Custody Operations
1555 North River Center Drive, Suite 302
Milwaukee, Wisconsin 53212
TRUSTEES
Neil J. Hennessy
Robert T. Doyle
J. Dennis DeSousa
Gerald P. Richardson
COUNSEL
Foley & Lardner LLP
777 East Wisconsin Avenue
Milwaukee, Wisconsin 53202-5306
INDEPENDENT REGISTERED
PUBLIC ACCOUNTING FIRM
Tait, Weller & Baker LLP
Two Liberty Place
50 South 16th Street, Suite 2900
Philadelphia, Pennsylvania 19103-2529
DISTRIBUTOR
Quasar Distributors, LLC
777 East Wisconsin Avenue
Milwaukee, Wisconsin 53202
www.hennessyfunds.com | 1-800-966-4354
This report has been prepared for shareholders and may be distributed to
others only if preceded or accompanied by a current prospectus.
ANNUAL REPORT
OCTOBER 31, 2019
HENNESSY TECHNOLOGY FUND
Investor Class HTECX
Institutional Class HTCIX
IMPORTANT NOTICE REGARDING ELECTRONIC DELIVERY OF SHAREHOLDER REPORTS
Beginning on January 1, 2021, as permitted by regulations adopted by the Securities and Exchange Commission, paper copies of the annual and semi-annual reports will no longer be sent by mail unless you specifically request paper copies from the Hennessy Funds or from your financial intermediary. Instead, the reports will be made available on a website, and you will be notified by mail each time a report is posted and provided with a website link to access the report.
If you have already elected to receive shareholder reports electronically, you will not be affected by this change and you need not take any action. You may elect to receive shareholder reports and other communications from the Hennessy Funds electronically by visiting www.hennessyfunds.com/account or by calling U.S. Bank Global Fund Services at 1-800-261-6950. If you own shares in a Fund through a financial intermediary, please contact your financial intermediary to make this election.
You may elect to receive paper copies of all future reports free of charge by calling U.S. Bank Global Fund Services at 1-800-261-6950 or, if you own your shares through a financial intermediary, by contacting your financial intermediary. Your election to receive paper copies of reports will apply to all Funds in the Hennessy Funds family.
hennessyfunds.com | 1-800-966-4354
(This Page Intentionally Left Blank.)
Contents
| Letter to Shareholders | 2 |
| Performance Overview | 4 |
| Financial Statements | |
| Schedule of Investments | 7 |
| Statement of Assets and Liabilities | 11 |
| Statement of Operations | 12 |
| Statements of Changes in Net Assets | 13 |
| Financial Highlights | 14 |
| Notes to the Financial Statements | 18 |
| Report of Independent Registered Public Accounting Firm | 26 |
| Trustees and Officers of the Fund | 27 |
| Expense Example | 30 |
| Proxy Voting Policy and Proxy Voting Records | 32 |
| Availability of Quarterly Portfolio Schedule | 32 |
| Federal Tax Distribution Information | 32 |
| Important Notice Regarding Delivery of Shareholder Documents | 32 |
| Electronic Delivery | 32 |
| Privacy Policy | 33 |
| HENNESSY FUNDS | 1-800-966-4354 | |
December 2019
Dear Hennessy Funds Shareholder:
What a year it has been. I am reassured by the resiliency of the U.S. financial markets as companies continue to thrive in the midst of policy challenges and political turbulence. Trade tariffs, impeachment, and interest rates have dominated the news headlines, while Brexit and protests in Hong Kong have also been major concerns internationally.
While the financial markets were characterized by volatility during the twelve months ended October 31, 2019, U.S. equities posted double-digit positive performance for the period, with a total return of 14.3% for the S&P 500® Index and 10.3% for the Dow Jones Industrial Average. As I sat down to write this letter, all three major indices, the S&P 500® Index, the Dow Jones Industrial Average, and the NASDAQ Composite Index, recently reached all-time highs.
Every bull market experiences volatility and pullbacks, and this extended bull market is no different. Since 2010, there have been 16 pullbacks of 5-10% and six corrections of over 10%. But what is interesting is not how quickly the declines take place, but rather how swiftly the market regains and surpasses its prior highs. With each decline, many investors and commentators predict that finally this bull market is out of steam. But I ask myself, “Why?”
What I see is a healthy economy and stock market, with fundamentals in place to support a continued bull market. Although slightly above long-term averages, I believe stocks are trading at reasonable valuations, with the Dow Jones Industrial Average trading at 16x forward earnings per share and the S&P 500® Index at 17x forward earnings. At the same time, the U.S. economy is growing at a sustainable pace of 2-3%, corporate profits continue to outperform expectations, and cash continues to build on corporate balance sheets. With over $5 trillion in cash and marketable securities on the balance sheets of the S&P 500® Index companies alone, corporations are returning cash to shareholders through share buybacks and dividends. Share buybacks by S&P 500® Index companies could hit $1 trillion in 2019, surpassing 2018’s record $800 billion, and dividend payments by S&P 500® Index companies are estimated to increase 8-9%. Unemployment continues to be at historically low levels, while wages are growing. Interest rates are also at very low levels, which should support equity prices. Finally, overall consumer confidence remains positive.
To quote Sir John Templeton’s famous saying, “Bull markets are born on pessimism, grow on skepticism, mature on optimism, and die on euphoria.” If you look back to the beginning of the great bull market that began in 1982, only six of the past 37 years ended with negative total returns: 1990, 2000, 2001, 2002, 2008, and 2018. With the exception of 2018, which was characterized by volatility but no euphoria, the other down years were marked by euphoria in either real estate or dot coms. I have been saying for a number of years that I see no signs of euphoria in the market, and I remain confident in the strength of the market today.
Thank you for your continued trust and investment in the Hennessy Funds. We believe that there continue to be great opportunities throughout all parts of the market, and we remain steadfastly focused on managing our high-conviction portfolios for the long-term benefit of our shareholders. Should you have any questions or would like to speak with us directly, please don’t hesitate to call us at (800) 966-4354.
Best regards,
Neil J. Hennessy
President and Chief Investment Officer
Past performance does not guarantee future results.
Mutual fund investing involves risk. Principal loss is possible.
The Dow Jones Industrial Average and S&P 500® Index are commonly used to measure the performance of U.S. stocks. The NASDAQ Composite Index is a broad-based capitalization-weighted index of all the NASDAQ National Market and Small Cap stocks. One cannot invest directly in an index.
Forward price to earnings is a valuation measure calculated by dividing a company’s market price per share by its expected earnings per share over the following 12 months.
| HENNESSY FUNDS | 1-800-966-4354 | |
Performance Overview (Unaudited)
CHANGE IN VALUE OF $10,000 INVESTMENT
This graph illustrates the performance of an initial investment of $10,000 made in the Fund ten years ago and assumes the reinvestment of dividends.
AVERAGE ANNUAL TOTAL RETURN FOR PERIODS ENDED OCTOBER 31, 2019
| | One | Five | Ten |
| | Year | Years | Years |
| Hennessy Technology Fund – | | | |
| Investor Class (HTECX) | 20.47% | 9.93% | 10.18% |
| Hennessy Technology Fund – | | | |
Institutional Class (HTCIX)(1) | 20.77% | 10.27% | 10.46% |
| NASDAQ Composite Index | 14.77% | 13.64% | 16.39% |
S&P 500® Index | 14.33% | 10.78% | 13.70% |
| Expense ratios: | Gross 3.71%, Net 1.24%(2) (Investor Class); |
| | Gross 3.28%, Net 0.99%(2) (Institutional Class) |
(1) | The inception date of Institutional Class shares is March 12, 2010. Performance shown prior to the inception of Institutional Class shares reflects the performance of Investor Class shares and includes expenses that are not applicable to, and are higher than, those of Institutional Class shares. |
(2) | The Fund’s investment advisor has contractually agreed to limit expenses until February 28, 2020. |
Performance data quoted represents past performance; past performance does not guarantee future results. The investment return and principal value of an investment will fluctuate so that an investor’s shares, when redeemed, may be worth more or less than their original cost. The performance table does not reflect the deduction of taxes that a shareholder would pay on Fund distributions or the redemption of Fund shares. Current performance of the Fund may be lower or higher than the performance quoted. Performance data current to the most recent month end may be obtained by visiting www.hennessyfunds.com. Performance for periods on or prior to October 26, 2012, is that of the FBR Technology Fund.
The NASDAQ Composite Index comprises all common stocks listed on The NASDAQ Stock Market. The S&P 500® Index is a capitalization-weighted index that is designed to represent the broad domestic economy through changes in the aggregate market value of 500 stocks across all major industries. One cannot invest directly in an index. These indices are used herein for comparative purposes in accordance with SEC regulations.
Standard & Poor’s Financial Services LLC is the source and owner of the S&P® and S&P 500® trademarks.
The expense ratios presented are from the most recent prospectus. The expense ratios for the current reporting period are available in the Financial Highlights section of this report.
PERFORMANCE NARRATIVE
Portfolio Managers Ryan C. Kelley, CFA, and L. Joshua Wein, CAIA
Performance:
For the 12-month period ended October 31, 2019, the Investor Class of the Hennessy Technology Fund returned 20.47%, outperforming the NASDAQ Composite Index (the Fund’s primary benchmark) and the S&P 500® Index, which returned 14.77% and 14.33%, respectively, for the same period.
The Fund’s outperformance relative to its primary benchmark resulted from stock selection within the Information Technology sector. Lam Research Corporation and KLA Corporation, both semiconductor manufacturing companies, and Amkor Technology, Inc., a semiconductor packing and test services company, were among the holdings that contributed the most to Fund performance. The Fund’s positions in Stamps.com Inc., a service for printing and purchasing postage, DXC Technology Company, an information technology services provider, and Celestica, Inc., a designer and manufacturer of electronic components, were among the holdings that detracted the most from performance.
Of the companies mentioned, the Fund continues to hold Lam Research, KLA Corporation, and Amkor Technology.
Portfolio Strategy:
The Fund utilizes a formula-based investment strategy designed to identify technology-related stocks that have strong cash flows and the ability to sustain profitability. The Fund seeks companies that have historically delivered returns in excess of their cost of capital, exhibit strong cash flows and profits, and trade at attractive relative valuations.
Investment Commentary:
We continue to believe that the outlook for U.S. stocks is positive. The U.S. economy is growing at a healthy rate, unemployment is low, and growth in both consumption and capital spending has remained strong. While corporate earnings rose only moderately over the 12-month period, they are expected to rise meaningfully over the next 12 months, due to continued economic growth.
We believe the outlook for technology-related stocks is also positive. Earnings growth for technology companies has been outpacing earnings growth for the market as a whole by a significant margin. While Information Technology stocks continue to trade at a premium to the broader market on a PE basis, they are expected to grow earnings at a rate meaningfully higher than the broader market. Given the strong economic backdrop and investors’ continued preference for growth-oriented companies, we feel that many technology stocks may still represent value in the context of the broader stock market.
_______________
Opinions expressed are those of the Portfolio Managers as of the date written and are subject to change, are not guaranteed, and should not be considered investment advice or an indication of trading intent.
Investments are focused in the Technology sector as well as the following sub-industries: Internet & Direct Marketing Retail, Interactive Home Entertainment, and Interactive Media Services. Sector funds may be subject to a higher degree of market risk. Investments in foreign securities may involve political, economic, and currency risks, greater volatility, and differences in accounting methods. The Fund invests in small-sized and medium-sized companies, which may
| HENNESSY FUNDS | 1-800-966-4354 | |
have more limited liquidity and greater volatility compared to larger companies. Please see the Fund’s prospectus for a more complete discussion of these and other risks.
References to specific securities should not be considered a recommendation to buy or sell any security. Fund holdings and sector allocations are subject to change. Please refer to the Schedule of Investments included in this report for additional portfolio information.
PE, or price to earnings, is calculated by dividing a company’s market price per share by its earnings per share. Cash flow refers to the net amount of cash and cash equivalents being transferred into and out of a company. Earnings growth is not a measure of the Fund’s future performance.
| PERFORMANCE OVERVIEW/SCHEDULE OF INVESTMENTS |
Financial Statements
Schedule of Investments as of October 31, 2019 |
HENNESSY TECHNOLOGY FUND
(% of Net Assets)
| TOP TEN HOLDINGS (EXCLUDING MONEY MARKET FUNDS) | % NET ASSETS |
| Amkor Technology, Inc. | 2.10% |
| Benchmark Electronics, Inc. | 1.91% |
| Lam Research Corp. | 1.89% |
| Vishay Intertechnology, Inc. | 1.88% |
| Tech Data Corp. | 1.84% |
| SMART Global Holdings, Inc. | 1.82% |
| Ubiquiti Networks, Inc. | 1.75% |
| Shutterstock, Inc. | 1.75% |
| Palo Alto Networks, Inc. | 1.74% |
| The Western Union Co. | 1.74% |
Note: For presentation purposes, the Fund has grouped some of the industry categories. For purposes of categorizing securities for compliance with Section 8(b)(1) of the Investment Company Act of 1940, as amended, the Fund uses more specific industry classifications.
The Global Industry Classification Standard (GICS®) was developed by and is the exclusive property and a service mark of MSCI, Inc. and Standard & Poor’s Financial Services LLC. It has been licensed for use by the Hennessy Funds.
| HENNESSY FUNDS | 1-800-966-4354 | |
| COMMON STOCKS – 97.01% | | Number | | | | | | % of | |
| | | of Shares | | | Value | | | Net Assets | |
| Communication Services – 3.08% | | | | | | | | | |
| Match Group, Inc. | | | 1,109 | | | $ | 80,946 | | | | 1.55 | % |
| SciPlay Corp. (a) | | | 8,278 | | | | 80,048 | | | | 1.53 | % |
| | | | | | | | 160,994 | | | | 3.08 | % |
| | | | | | | | | | | | | |
| Consumer Discretionary – 4.61% | | | | | | | | | | | | |
| Amazon.com, Inc. (a) | | | 47 | | | | 83,503 | | | | 1.60 | % |
| Booking Holdings, Inc. (a) | | | 42 | | | | 86,048 | | | | 1.64 | % |
| Revolve Group, Inc. (a) | | | 3,452 | | | | 71,664 | | | | 1.37 | % |
| | | | | | | | 241,215 | | | | 4.61 | % |
| | | | | | | | | | | | | |
| Information Technology – 89.32% | | | | | | | | | | | | |
| Accenture PLC, Class A (b) | | | 418 | | | | 77,506 | | | | 1.48 | % |
| Amkor Technology, Inc. (a) | | | 8,836 | | | | 109,831 | | | | 2.10 | % |
| Apple, Inc. | | | 360 | | | | 89,554 | | | | 1.71 | % |
| Arrow Electronics, Inc. (a) | | | 1,123 | | | | 89,031 | | | | 1.70 | % |
| Aspen Technology, Inc. (a) | | | 668 | | | | 76,893 | | | | 1.47 | % |
| Atlassian Corp. PLC (a)(b) | | | 651 | | | | 78,634 | | | | 1.50 | % |
| Automatic Data Processing, Inc. | | | 487 | | | | 79,006 | | | | 1.51 | % |
| Avnet, Inc. | | | 1,895 | | | | 74,966 | | | | 1.43 | % |
| Benchmark Electronics, Inc. | | | 2,942 | | | | 99,734 | | | | 1.91 | % |
| Booz Allen Hamilton Holding Corp., Class A | | | 1,153 | | | | 81,137 | | | | 1.55 | % |
| Cadence Design Systems, Inc. (a) | | | 1,180 | | | | 77,113 | | | | 1.47 | % |
| CDW Corp. | | | 668 | | | | 85,444 | | | | 1.63 | % |
| Citrix Systems, Inc. | | | 832 | | | | 90,572 | | | | 1.73 | % |
| Conduent, Inc. (a) | | | 13,130 | | | | 81,143 | | | | 1.55 | % |
| Dropbox, Inc. (a) | | | 4,054 | | | | 80,350 | | | | 1.54 | % |
| eGain Corp. (a) | | | 10,204 | | | | 76,785 | | | | 1.47 | % |
| EVERTEC, Inc. (b) | | | 2,639 | | | | 80,727 | | | | 1.54 | % |
| Extreme Networks, Inc. (a) | | | 11,688 | | | | 75,271 | | | | 1.44 | % |
| F5 Networks, Inc. (a) | | | 596 | | | | 85,872 | | | | 1.64 | % |
| Fair Isaac Corp. (a) | | | 267 | | | | 81,179 | | | | 1.55 | % |
| Fortinet, Inc. (a) | | | 1,033 | | | | 84,251 | | | | 1.61 | % |
| GreenSky, Inc. (a) | | | 11,717 | | | | 89,635 | | | | 1.71 | % |
| Hewlett Packard Enterprise Co. | | | 5,521 | | | | 90,600 | | | | 1.73 | % |
| Intel Corp. | | | 1,593 | | | | 90,052 | | | | 1.72 | % |
| International Business Machines Corp. | | | 563 | | | | 75,290 | | | | 1.44 | % |
The accompanying notes are an integral part of these financial statements.
| COMMON STOCKS | | Number | | | | | | % of | |
| | | of Shares | | | Value | | | Net Assets | |
| Information Technology (Continued) | | | | | | | | | |
| Intuit, Inc. | | | 306 | | | $ | 78,795 | | | | 1.51 | % |
| Jabil, Inc. | | | 2,314 | | | | 85,201 | | | | 1.63 | % |
| KLA-Tencor Corp. | | | 535 | | | | 90,436 | | | | 1.73 | % |
| Lam Research Corp. | | | 364 | | | | 98,659 | | | | 1.89 | % |
| Mastercard, Inc., Class A | | | 292 | | | | 80,829 | | | | 1.55 | % |
| Maxim Integrated Products, Inc. | | | 1,462 | | | | 85,761 | | | | 1.64 | % |
| Microsoft Corp. | | | 582 | | | | 83,441 | | | | 1.60 | % |
| NetApp, Inc. | | | 1,556 | | | | 86,949 | | | | 1.66 | % |
| Oracle Corp. | | | 1,524 | | | | 83,043 | | | | 1.59 | % |
| Palo Alto Networks, Inc. (a) | | | 400 | | | | 90,956 | | | | 1.74 | % |
| Paychex, Inc. | | | 944 | | | | 78,956 | | | | 1.51 | % |
| Paycom Software, Inc. (a) | | | 389 | | | | 82,285 | | | | 1.57 | % |
| Paylocity Holding Corp. (a) | | | 842 | | | | 86,389 | | | | 1.65 | % |
| PayPal Holdings, Inc. (a) | | | 789 | | | | 82,135 | | | | 1.57 | % |
| Proofpoint, Inc. (a) | | | 637 | | | | 73,491 | | | | 1.40 | % |
| Qualcomm, Inc. | | | 1,051 | | | | 84,542 | | | | 1.62 | % |
| Sanmina Corp. (a) | | | 2,568 | | | | 78,915 | | | | 1.51 | % |
| ScanSource, Inc. (a) | | | 2,714 | | | | 87,662 | | | | 1.68 | % |
| Seagate Technology PLC (b) | | | 1,560 | | | | 90,527 | | | | 1.73 | % |
| ServiceNow, Inc. (a) | | | 323 | | | | 79,865 | | | | 1.53 | % |
| Shutterstock, Inc. (a) | | | 2,250 | | | | 91,305 | | | | 1.75 | % |
| SMART Global Holdings, Inc. (a)(b) | | | 3,212 | | | | 95,396 | | | | 1.82 | % |
| Take-Two Interactive Software, Inc. (a) | | | 658 | | | | 79,190 | | | | 1.51 | % |
| Tech Data Corp. (a) | | | 791 | | | | 96,107 | | | | 1.84 | % |
| Texas Instruments, Inc. | | | 646 | | | | 76,222 | | | | 1.46 | % |
| The Western Union Co. | | | 3,624 | | | | 90,817 | | | | 1.74 | % |
| Ubiquiti Networks, Inc. | | | 725 | | | | 91,778 | | | | 1.75 | % |
| Visa, Inc., Class A | | | 451 | | | | 80,666 | | | | 1.54 | % |
| Vishay Intertechnology, Inc. | | | 4,881 | | | | 98,352 | | | | 1.88 | % |
| VMware, Inc., Class A | | | 526 | | | | 83,250 | | | | 1.59 | % |
| | | | | | | | 4,672,496 | | | | 89.32 | % |
| Total Common Stocks | | | | | | | | | | | | |
| (Cost $4,297,575) | | | | | | | 5,074,705 | | | | 97.01 | % |
The accompanying notes are an integral part of these financial statements.
| HENNESSY FUNDS | 1-800-966-4354 | |
| SHORT-TERM INVESTMENTS – 3.18% | | Number | | | | | | % of | |
| | | of Shares | | | Value | | | Net Assets | |
| Money Market Funds – 3.18% | | | | | | | | | |
| First American Government Obligations Fund, | | | | | | | | | |
| Institutional Class, 1.74% (c) | | | 166,350 | | | $ | 166,350 | | | | 3.18 | % |
| | | | | | | | | | | | | |
| Total Short-Term Investments | | | | | | | | | | | | |
| (Cost $166,350) | | | | | | | 166,350 | | | | 3.18 | % |
| | | | | | | | | | | | | |
| Total Investments | | | | | | | | | | | | |
| (Cost $4,463,925) – 100.19% | | | | | | | 5,241,055 | | | | 100.19 | % |
| Liabilities in Excess of Other Assets – (0.19)% | | | | | | | (9,849 | ) | | | (0.19 | )% |
| | | | | | | | | | | | | |
TOTAL NET ASSETS – 100.00% | | | | | | $ | 5,231,206 | | | | 100.00 | % |
Percentages are stated as a percent of net assets.
PLC – Public Limited Company
| (a) | Non-income-producing security. |
| (b) | U.S.-traded security of a foreign corporation. |
| (c) | The rate listed is the fund’s seven-day yield as of October 31, 2019. |
Summary of Fair Value Exposure as of October 31, 2019
The following is a summary of the inputs used to value the Fund’s net assets as of October 31, 2019 (See Note 3 in the accompanying Notes to the Financial Statements):
| Common Stocks | | Level 1 | | | Level 2 | | | Level 3 | | | Total | |
| Communication Services | | $ | 160,994 | | | $ | — | | | $ | — | | | $ | 160,994 | |
| Consumer Discretionary | | | 241,215 | | | | — | | | | — | | | | 241,215 | |
| Information Technology | | | 4,672,496 | | | | — | | | | — | | | | 4,672,496 | |
| Total Common Stocks | | $ | 5,074,705 | | | $ | — | | | $ | — | | | $ | 5,074,705 | |
| Short-Term Investments | | | | | | | | | | | | | | | | |
| Money Market Funds | | $ | 166,350 | | | $ | — | | | $ | — | | | $ | 166,350 | |
| Total Short-Term Investments | | $ | 166,350 | | | $ | — | | | $ | — | | | $ | 166,350 | |
| Total Investments | | $ | 5,241,055 | | | $ | — | | | $ | — | | | $ | 5,241,055 | |
The accompanying notes are an integral part of these financial statements.
| SCHEDULE OF INVESTMENTS/STATEMENT OF ASSETS AND LIABILITIES |
Financial Statements
Statement of Assets and Liabilities as of October 31, 2019 |
| ASSETS: | | | |
| Investments in securities, at value (cost $4,463,925) | | $ | 5,241,055 | |
| Dividends and interest receivable | | | 2,317 | |
| Receivable for fund shares sold | | | 202 | |
| Prepaid expenses and other assets | | | 18,806 | |
| Due from advisor | | | 9,009 | |
| Total assets | | | 5,271,389 | |
| | | | | |
| LIABILITIES: | | | | |
| Payable for fund shares redeemed | | | 13 | |
| Payable to administrator | | | 3,855 | |
| Payable to auditor | | | 22,546 | |
| Accrued distribution fees | | | 1,077 | |
| Accrued service fees | | | 322 | |
| Accrued trustees fees | | | 6,596 | |
| Accrued expenses and other payables | | | 5,774 | |
| Total liabilities | | | 40,183 | |
| NET ASSETS | | $ | 5,231,206 | |
| | | | | |
| NET ASSETS CONSISTS OF: | | | | |
| Capital stock | | $ | 4,336,578 | |
| Total distributable earnings | | | 894,628 | |
| Total net assets | | $ | 5,231,206 | |
| | | | | |
| NET ASSETS: | | | | |
| Investor Class | | | | |
| Shares authorized (no par value) | | Unlimited | |
| Net assets applicable to outstanding shares | | $ | 3,892,305 | |
| Shares issued and outstanding | | | 205,891 | |
| Net asset value, offering price, and redemption price per share | | $ | 18.90 | |
| | | | | |
| Institutional Class | | | | |
| Shares authorized (no par value) | | Unlimited | |
| Net assets applicable to outstanding shares | | $ | 1,338,901 | |
| Shares issued and outstanding | | | 69,017 | |
| Net asset value, offering price, and redemption price per share | | $ | 19.40 | |
The accompanying notes are an integral part of these financial statements.
| HENNESSY FUNDS | 1-800-966-4354 | |
Financial Statements
Statement of Operations for the year ended October 31, 2019 |
| INVESTMENT INCOME: | | | |
Dividend income(1) | | $ | 45,948 | |
| Interest income | | | 3,218 | |
| Total investment income | | | 49,166 | |
| | | | | |
| EXPENSES: | | | | |
| Investment advisory fees (See Note 5) | | | 34,937 | |
| Federal and state registration fees | | | 33,211 | |
| Compliance expense (See Note 5) | | | 25,810 | |
| Audit fees | | | 22,020 | |
| Administration, accounting, custody, and transfer agent fees (See Note 5) | | | 18,889 | |
| Trustees’ fees and expenses | | | 17,982 | |
| Sub-transfer agent expenses – Investor Class (See Note 5) | | | 6,060 | |
| Sub-transfer agent expenses – Institutional Class (See Note 5) | | | 628 | |
| Reports to shareholders | | | 6,216 | |
| Distribution fees – Investor Class (See Note 5) | | | 5,308 | |
| Service fees – Investor Class (See Note 5) | | | 3,538 | |
| Interest expense (See Note 7) | | | 10 | |
| Legal fees | | | 9 | |
| Other expenses | | | 2,208 | |
| Total expenses before reimbursement by advisor | | | 176,826 | |
| Expense reimbursement by advisor – Investor Class (See Note 5) | | | (92,255 | ) |
| Expense reimbursement by advisor – Institutional Class (See Note 5) | | | (29,447 | ) |
| Net expenses | | | 55,124 | |
| NET INVESTMENT LOSS | | $ | (5,958 | ) |
| | | | | |
| REALIZED AND UNREALIZED GAINS (LOSSES): | | | | |
| Net realized gain on investments | | $ | 156,775 | |
| Net change in unrealized appreciation/depreciation on investments | | | 729,890 | |
| Net gain on investments | | | 886,665 | |
| NET INCREASE IN NET ASSETS RESULTING FROM OPERATIONS | | $ | 880,707 | |
(1) | Net of foreign taxes withheld and issuance fees of $982. |
The accompanying notes are an integral part of these financial statements.
| STATEMENT OF OPERATIONS/STATEMENTS OF CHANGES IN NET ASSETS |
Financial Statements
| Statements of Changes in Net Assets |
| | | Year Ended | | | Year Ended | |
| | | October 31, 2019 | | | October 31, 2018 | |
| OPERATIONS: | | | | | | |
| Net investment loss | | $ | (5,958 | ) | | $ | (13,817 | ) |
| Net realized gain on investments | | | 156,775 | | | | 629,547 | |
| Net change in unrealized | | | | | | | | |
| appreciation/depreciation on investments | | | 729,890 | | | | (302,826 | ) |
| Net increase in net assets resulting from operations | | | 880,707 | | | | 312,904 | |
| | | | | | | | | |
| DISTRIBUTIONS TO SHAREHOLDERS: | | | | | | | | |
| Distributable earnings – Investor Class | | | (408,753 | ) | | | (284,124 | ) |
| Distributable earnings – Institutional Class | | | (138,693 | ) | | | (107,305 | ) |
| Total distributions | | | (547,446 | ) | | | (391,429 | ) |
| | | | | | | | | |
| CAPITAL SHARE TRANSACTIONS: | | | | | | | | |
| Proceeds from shares subscribed – Investor Class | | | 371,583 | | | | 552,927 | |
| Proceeds from shares subscribed – Institutional Class | | | 149,605 | | | | 88,271 | |
| Dividends reinvested – Investor Class | | | 401,355 | | | | 278,793 | |
| Dividends reinvested – Institutional Class | | | 137,038 | | | | 106,216 | |
| Cost of shares redeemed – Investor Class | | | (435,464 | ) | | | (654,226 | ) |
| Cost of shares redeemed – Institutional Class | | | (124,774 | ) | | | (308,951 | ) |
| Net increase in net assets derived | | | | | | | | |
| from capital share transactions | | | 499,343 | | | | 63,030 | |
| TOTAL INCREASE (DECREASE) IN NET ASSETS | | | 832,604 | | | | (15,495 | ) |
| | | | | | | | | |
| NET ASSETS: | | | | | | | | |
| Beginning of year | | | 4,398,602 | | | | 4,414,097 | |
| End of year | | $ | 5,231,206 | | | $ | 4,398,602 | |
| | | | | | | | | |
| CHANGES IN SHARES OUTSTANDING: | | | | | | | | |
| Shares sold – Investor Class | | | 21,608 | | | | 29,132 | |
| Shares sold – Institutional Class | | | 8,241 | | | | 4,606 | |
| Shares issued to holders as reinvestment | | | | | | | | |
| of dividends – Investor Class | | | 26,633 | | | | 16,634 | |
| Shares issued to holders as reinvestment | | | | | | | | |
| of dividends – Institutional Class | | | 8,882 | | | | 6,208 | |
| Shares redeemed – Investor Class | | | (25,732 | ) | | | (35,601 | ) |
| Shares redeemed – Institutional Class | | | (7,113 | ) | | | (16,346 | ) |
| Net increase in shares outstanding | | | 32,519 | | | | 4,633 | |
The accompanying notes are an integral part of these financial statements.
| HENNESSY FUNDS | 1-800-966-4354 | |
Financial Statements
For an Investor Class share outstanding throughout each year
PER SHARE DATA:
Net asset value, beginning of year
Income from investment operations:
Net investment loss
Net realized and unrealized gains on investments
Total from investment operations
Less distributions:
Dividends from net realized gains
Total distributions
Net asset value, end of year
TOTAL RETURN
SUPPLEMENTAL DATA AND RATIOS:
Net assets, end of year (millions)
Ratio of expenses to average net assets:
Before expense reimbursement
After expense reimbursement
Ratio of net investment loss to average net assets:
Before expense reimbursement
After expense reimbursement
Portfolio turnover rate(3)
(1) | Calculated using the average shares outstanding method. |
(2) | The Fund’s current expense limitation agreement, which became effective on February 28, 2017, was in effect for eight months of the year ended October 31, 2017. The Fund previously had an expense limitation agreement in effect from October 26, 2012, to February 28, 2015. |
(3) | Calculated on the basis of the Fund as a whole. |
The accompanying notes are an integral part of these financial statements.
| FINANCIAL HIGHLIGHTS — INVESTOR CLASS |
| Year Ended October 31, | |
| 2019 | | | 2018 | | | 2017 | | | 2016 | | | 2015 | |
| | | | | | | | | | | | | | |
| $ | 18.04 | | | $ | 18.46 | | | $ | 15.82 | | | $ | 15.36 | | | $ | 14.86 | |
| | | | | | | | | | | | | | | | | | | |
| | | | | | | | | | | | | | | | | | | |
| | (0.03 | )(1) | | | (0.05 | ) | | | (0.23 | ) | | | (0.68 | ) | | | (0.38 | ) |
| | 3.15 | | | | 1.26 | | | | 2.87 | | | | 1.14 | | | | 0.88 | |
| | 3.12 | | | | 1.21 | | | | 2.64 | | | | 0.46 | | | | 0.50 | |
| | | | | | | | | | | | | | | | | | | |
| | | | | | | | | | | | | | | | | | | |
| | (2.26 | ) | | | (1.63 | ) | | | — | | | | — | | | | — | |
| | (2.26 | ) | | | (1.63 | ) | | | — | | | | — | | | | — | |
| $ | 18.90 | | | $ | 18.04 | | | $ | 18.46 | | | $ | 15.82 | | | $ | 15.36 | |
| | | | | | | | | | | | | | | | | | | |
| | 20.47 | % | | | 7.25 | % | | | 16.69 | % | | | 2.99 | % | | | 3.36 | % |
| | | | | | | | | | | | | | | | | | | |
| | | | | | | | | | | | | | | | | | | |
| $ | 3.89 | | | $ | 3.31 | | | $ | 3.20 | | | $ | 2.91 | | | $ | 4.04 | |
| | | | | | | | | | | | | | | | | | | |
| | 3.84 | % | | | 3.70 | % | | | 4.16 | % | | | 3.61 | % | | | 3.13 | % |
| | 1.23 | % | | | 1.23 | % | | | 2.15 | %(2) | | | 3.61 | % | | | 2.75 | % |
| | | | | | | | | | | | | | | | | | | |
| | (2.80 | )% | | | (2.83 | )% | | | (3.16 | )% | | | (2.92 | )% | | | (2.30 | )% |
| | (0.19 | )% | | | (0.36 | )% | | | (1.15 | )%(2) | | | (2.92 | )% | | | (1.92 | )% |
| | 185 | % | | | 225 | % | | | 267 | % | | | 80 | % | | | 163 | % |
The accompanying notes are an integral part of these financial statements.
| HENNESSY FUNDS | 1-800-966-4354 | |
Financial Statements
For an Institutional Class share outstanding throughout each year
PER SHARE DATA:
Net asset value, beginning of year
Income from investment operations:
Net investment income (loss)
Net realized and unrealized gains on investments
Total from investment operations
Less distributions:
Dividends from net realized gains
Total distributions
Net asset value, end of year
TOTAL RETURN
SUPPLEMENTAL DATA AND RATIOS:
Net assets, end of year (millions)
Ratio of expenses to average net assets:
Before expense reimbursement
After expense reimbursement
Ratio of net investment loss to average net assets:
Before expense reimbursement
After expense reimbursement
Portfolio turnover rate(3)
(1) | Calculated using the average shares outstanding method. |
(2) | The Fund’s current expense limitation agreement, which became effective on February 28, 2017, was in effect for eight months of the year ended October 31, 2017. The Fund previously had an expense limitation agreement in effect from October 26, 2012, to February 28, 2015. |
(3) | Portfolio turnover is calculated on the basis of the Fund as a whole. |
The accompanying notes are an integral part of these financial statements.
| FINANCIAL HIGHLIGHTS — INSTITUTIONAL CLASS |
| Year Ended October 31, | |
| 2019 | | | 2018 | | | 2017 | | | 2016 | | | 2015 | |
| | | | | | | | | | | | | | |
| $ | 18.47 | | | $ | 18.85 | | | $ | 16.11 | | | $ | 15.58 | | | $ | 15.02 | |
| | | | | | | | | | | | | | | | | | | |
| | | | | | | | | | | | | | | | | | | |
| | 0.01 | (1) | | | 0.01 | | | | (0.12 | ) | | | (0.43 | ) | | | (0.25 | ) |
| | 3.23 | | | | 1.28 | | | | 2.86 | | | | 0.96 | | | | 0.81 | |
| | 3.24 | | | | 1.29 | | | | 2.74 | | | | 0.53 | | | | 0.56 | |
| | | | | | | | | | | | | | | | | | | |
| | | | | | | | | | | | | | | | | | | |
| | (2.31 | ) | | | (1.67 | ) | | | — | | | | — | | | | — | |
| | (2.31 | ) | | | (1.67 | ) | | | — | | | | — | | | | — | |
| $ | 19.40 | | | $ | 18.47 | | | $ | 18.85 | | | $ | 16.11 | | | $ | 15.58 | |
| | | | | | | | | | | | | | | | | | | |
| | 20.77 | % | | | 7.54 | % | | | 17.01 | % | | | 3.40 | % | | | 3.73 | % |
| | | | | | | | | | | | | | | | | | | |
| | | | | | | | | | | | | | | | | | | |
| $ | 1.34 | | | $ | 1.09 | | | $ | 1.22 | | | $ | 0.90 | | | $ | 0.95 | |
| | | | | | | | | | | | | | | | | | | |
| | 3.47 | % | | | 3.27 | % | | | 3.74 | % | | | 3.28 | % | | | 2.76 | % |
| | 0.98 | % | | | 0.98 | % | | | 1.77 | %(2) | | | 3.28 | % | | | 2.44 | % |
| | | | | | | | | | | | | | | | | | | |
| | (2.43 | )% | | | (2.41 | )% | | | (2.74 | )% | | | (2.59 | )% | | | (1.92 | )% |
| | 0.06 | % | | | (0.12 | )% | | | (0.77 | )%(2) | | | (2.59 | )% | | | (1.60 | )% |
| | 185 | % | | | 225 | % | | | 267 | % | | | 80 | % | | | 163 | % |
The accompanying notes are an integral part of these financial statements.
| HENNESSY FUNDS | 1-800-966-4354 | |
Financial Statements
Notes to the Financial Statements October 31, 2019 |
1). ORGANIZATION
The Hennessy Technology Fund (the “Fund”) is a series of Hennessy Funds Trust (the “Trust”), which was organized as a Delaware statutory trust on September 17, 1992. The Fund is an open-end management investment company registered under the Investment Company Act of 1940, as amended. The investment objective of the Fund is long-term capital appreciation. The Fund is a diversified fund.
The Fund offers Investor Class and Institutional Class shares. Each class of shares differs principally in its respective 12b-1 distribution and service, shareholder servicing, and sub-transfer agent expenses. There are no sales charges. Each class has identical rights to earnings, assets, and voting privileges, except for class-specific expenses and exclusive rights to vote on matters affecting only one class.
As an investment company, the Fund follows the investment company accounting and reporting guidance of the Financial Accounting Standards Board (“FASB”) Accounting Standard Codification Topic 946 “Financial Services—Investment Companies.”
2). SIGNIFICANT ACCOUNTING POLICIES
The following is a summary of significant accounting policies consistently followed by the Fund in the preparation of the financial statements. These policies conform to U.S. generally accepted accounting principles (“GAAP”).
| a). | Securities Valuation – All investments in securities are recorded at their estimated fair value, as described in Note 3. |
| | |
| b). | Federal Income Taxes – No provision for federal income taxes or excise taxes has been made because the Fund has elected to be taxed as a regulated investment company and intends to distribute substantially all of its taxable income to its shareholders and otherwise comply with the provisions of the Internal Revenue Code of 1986, as amended, applicable to regulated investment companies. Net investment income/loss and realized gains/losses for federal income tax purposes may differ from those reported in the financial statements because of temporary book and tax basis differences. Temporary differences are primarily the result of the treatment of wash sales for tax reporting purposes. The Fund recognizes interest and penalties related to income tax benefits, if any, in the Statement of Operations as an income tax expense. Distributions from net realized gains for book purposes may include short-term capital gains, which are included as ordinary income to shareholders for tax purposes. The Fund may utilize equalization accounting for tax purposes and designate earnings and profits, including net realized gains distributed to shareholders on redemption of shares, as part of the dividends paid deduction for income tax purposes. |
| | |
| | Due to inherent differences in the recognition of income, expenses, and realized gains/losses under GAAP and federal income tax regulations, permanent differences between book and tax basis for reporting for fiscal year 2019 have been identified and appropriately reclassified in the Statement of Assets and Liabilities. The adjustments are as follows: |
| Total | |
| Distributable | |
Earnings | Capital Stock |
| $(7,613) | $7,613 |
| NOTES TO THE FINANCIAL STATEMENTS |
| c). | Accounting for Uncertainty in Income Taxes – The Fund has accounting policies regarding recognition and measurement of tax positions taken or expected to be taken on a tax return. The tax returns of the Fund for the prior three fiscal years are open for examination. The Fund has reviewed all open tax years in major jurisdictions and concluded that there is no impact on the Fund’s net assets and no tax liability resulting from unrecognized tax benefits relating to uncertain income tax positions taken or expected to be taken on a tax return. The Fund’s major tax jurisdictions are U.S. federal and Delaware. |
| | |
| d). | Income and Expenses – Dividend income is recognized on the ex-dividend date or as soon as information is available to the Fund. Interest income, which includes the amortization of premium and accretion of discount, is recognized on an accrual basis. Other non-cash dividends are recognized as investment income at the fair value of the property received. The Fund is charged for those expenses that are directly attributable to its portfolio, such as advisory, administration, and certain shareholder service fees. Income, expenses (other than expenses attributable to a specific class), and realized and unrealized gains/losses on investments are allocated to each class of shares based on such class’s net assets. |
| | |
| e). | Distributions to Shareholders – Dividends from net investment income for the Fund, if any, are declared and paid annually, usually in December. Distributions of net realized capital gains, if any, are declared and paid annually, usually in December. |
| | |
| f). | Security Transactions – Investment and shareholder transactions are recorded on the trade date. The Fund determines the realized gain/loss from an investment transaction by comparing the original cost of the security lot sold with the net sale proceeds. Discounts and premiums on securities purchased are accreted or amortized, respectively, over the life of each such security. |
| | |
| g). | Use of Estimates – The preparation of financial statements in conformity with GAAP requires management to make estimates and assumptions that affect the reported amounts of assets and liabilities and disclosure of contingent assets and liabilities at the date of the financial statements and the reported change in net assets during the reporting period. Actual results could differ from those estimates. |
| | |
| h). | Share Valuation – The net asset value (“NAV��) per share of the Fund is calculated by dividing (i) the total value of the securities held by the Fund, plus cash and other assets, minus all liabilities (including estimated accrued expenses) by (ii) the total number of shares outstanding for the Fund, rounded to the nearest $0.01. The Fund’s shares will not be priced on days the New York Stock Exchange is closed for trading. The offering and redemption price per share for the Fund is equal to the Fund’s NAV per share. |
| | |
| i). | New Accounting Pronouncements – In August 2018, the FASB issued Accounting Standards Update No. 2018-13 “Disclosure Framework—Changes to the Disclosure Requirements for Fair Value Measurement” (“ASU 2018-13”). ASU 2018-13 eliminates the requirement to disclose the amount of and reasons for transfers between Level 1 and Level 2 of the fair value hierarchy, the timing of transfers between levels of the fair value hierarchy, and the valuation processes for Level 3 fair value measurements. ASU 2018-13 does not eliminate the requirement to disclose the range and weighted average used to develop significant unobservable inputs for Level 3 fair value measurements, and the changes in unrealized gains and losses for recurring Level 3 fair value measurements. ASU 2018-13 requires that information is provided about the measurement uncertainty of Level 3 fair value measurements as of the reporting date. The guidance is effective for fiscal years beginning after |
| HENNESSY FUNDS | 1-800-966-4354 | |
| | December 15, 2019, and interim periods within those fiscal years. Management has evaluated the impact of this change in guidance and, due to the permissibility of early adoption, modified the Fund’s fair value disclosures for the current reporting period. |
3). SECURITIES VALUATION
The Fund follows fair value accounting standards that establish an authoritative definition of fair value and set out a hierarchy for measuring fair value. These standards require additional disclosures about the various inputs and valuation techniques used to develop the measurements of fair value and a discussion of changes in valuation techniques and related inputs during the period. These inputs are summarized in the three broad levels listed below:
| | Level 1 – | Unadjusted, quoted prices in active markets for identical instruments that the Fund has the ability to access at the date of measurement. |
| | | |
| | Level 2 – | Other significant observable inputs (including, but not limited to, quoted prices in active markets for similar instruments, quoted prices in markets that are not active for identical or similar instruments, and model-derived valuations in which all significant inputs and significant value drivers are observable in active markets, such as interest rates, prepayment speeds, credit risk curves, default rates, and similar data). |
| | | |
| | Level 3 – | Significant unobservable inputs (including the Fund’s own assumptions about what market participants would use to price the asset or liability based on the best available information) when observable inputs are unavailable. |
The following is a description of the valuation techniques applied to the Fund’s major categories of assets and liabilities measured at fair value on a recurring basis:
| | Equity Securities – Equity securities, including common stocks, preferred stocks, foreign-issued common stocks, exchange-traded funds, closed-end mutual funds, partnerships, rights, and real estate investment trusts, that are traded on a securities exchange for which a last-quoted sales price is readily available will generally be valued at the last sales price as reported by the primary exchange on which the securities are listed. Securities listed on The NASDAQ Stock Market (“NASDAQ”) will generally be valued at the NASDAQ Official Closing Price, which may differ from the last sales price reported. Securities traded on a securities exchange for which a last-quoted sales price is not readily available will generally be valued at the mean between the bid and ask prices. To the extent these securities are actively traded and valuation adjustments are not applied, they are classified in Level 1 of the fair value hierarchy. Securities traded on foreign exchanges generally are not valued at the same time the Fund calculates its NAV because most foreign markets close well before such time. The earlier close of most foreign markets gives rise to the possibility that significant events, including broad market moves, may have occurred in the interim. In certain circumstances, it may be determined that a foreign security needs to be fair valued because it appears that the value of the security might have been materially affected by events occurring after the close of the market in which the security is principally traded, but before the time the Fund calculates its NAV, such as by a development that affects an entire market or region (e.g., a weather-related event) or a potentially global development (e.g., a terrorist attack that may be expected to have an effect on investor expectations worldwide). |
| | |
| | Registered Investment Companies – Investments in open-end registered investment companies, commonly referred to as mutual funds, generally are priced at the ending NAV provided by the applicable mutual fund’s service agent and will be classified in Level 1 of the fair value hierarchy. |
| NOTES TO THE FINANCIAL STATEMENTS |
| | Debt Securities – Debt securities, including corporate bonds, asset-backed securities, mortgage-backed securities, municipal bonds, U.S. Treasuries, and U.S. government agency issues, are generally valued at market on the basis of valuations furnished by an independent pricing service that utilizes both dealer-supplied valuations and formula-based techniques. The pricing service may consider recently executed transactions in securities of the issuer or comparable issuers, market price quotations (where observable), bond spreads, and fundamental data relating to the issuer. In addition, the model may incorporate observable market data, such as reported sales of similar securities, broker quotes, yields, bids, offers, and reference data. Certain securities are valued primarily using dealer quotations. These securities are generally classified in Level 2 of the fair value hierarchy. |
| | |
| | Short-Term Securities – Short-term equity investments, including money market funds, are valued in the manner specified above. Short-term debt investments with an original term to maturity of 60 days or less are valued at amortized cost, which approximates fair market value. If the original term to maturity of a short-term debt investment exceeded 60 days, then the values as of the 61st day prior to maturity are amortized. Amortized cost is not used if its use would be inappropriate due to credit or other impairments of the issuer, in which case the security’s fair value would be determined, as described below. Short-term securities are generally classified in Level 1 or Level 2 of the fair value hierarchy depending on the inputs used and market activity levels for specific securities. |
The Board of Trustees of the Fund (the “Board”) has adopted fair value pricing procedures that are followed when a price for a security is not readily available or if a significant event has occurred that indicates the closing price of a security no longer represents the true value of that security. Fair value pricing determinations are made in good faith in accordance with these procedures. There are numerous criteria that will be given consideration in determining a fair value of a security, such as the trading volume of a security and markets, the values of other similar securities, and news events with direct bearing on a security or markets. Fair value pricing results in an estimated price for a security that reflects the amount the Fund might reasonably expect to receive in a current sale. Depending on the relative significance of the valuation inputs, these securities may be classified in either Level 2 or Level 3 of the fair value hierarchy.
The fair value of foreign securities may be determined with the assistance of a pricing service using correlations between the movement of prices of such securities and indices of domestic securities and other appropriate indicators, such as closing market prices of relevant American Depositary Receipts or futures contracts. The effect of using fair value pricing is that the Fund’s NAV will reflect the affected portfolio securities’ values as determined by the Board or its designee, pursuant to the fair value pricing procedures adopted by the Board, instead of being determined by the market. Using a fair value pricing methodology to price a foreign security may result in a value that is different from such foreign security’s most recent closing price and from the value used by other investment companies to calculate their NAVs. Such securities are generally classified in Level 2 of the fair value hierarchy. Because the Fund may invest in foreign securities, the value of the Fund’s portfolio securities may change on days when you will not be able to purchase or redeem your shares.
The Board has delegated day-to-day valuation matters to the Valuation and Liquidity Committee comprising representatives from Hennessy Advisors, Inc., the Fund’s investment advisor (the “Advisor”). The function of the Valuation and Liquidity Committee is to value securities where current and reliable market quotations are not readily available. All actions taken by the Valuation and Liquidity Committee are reviewed by the Board.
| HENNESSY FUNDS | 1-800-966-4354 | |
The Fund has performed an analysis of all existing investments to determine the significance and character of all inputs to their fair value determinations. Various inputs are used to determine the value of the Fund’s investments. The inputs or methodology used for valuing securities are not necessarily an indication of the risk associated with investing in those securities. Details related to the fair value hierarchy of the Fund’s securities as of October 31, 2019, are included in the Schedule of Investments.
4). INVESTMENT TRANSACTIONS
Purchases and sales of investment securities (excluding government and short-term investments) for the Fund during fiscal year 2019 were $8,586,430 and $8,531,929, respectively.
There were no purchases or sales/maturities of long-term U.S. government securities for the Fund during fiscal year 2019.
The Fund is permitted to purchase or sell securities from or to another fund in the Hennessy Funds family of funds (collectively, the “Hennessy Funds”) under specified conditions outlined in procedures adopted by the Board. The procedures have been designed to ensure that any purchase or sale of securities by the Fund from or to another Hennessy Fund complies with Rule 17a-7 of the Investment Company Act of 1940, as amended. During fiscal year 2019, the Fund did not engage in purchases or sales of securities pursuant to Rule 17a-7 of the Investment Company Act of 1940, as amended.
5). INVESTMENT ADVISORY FEE AND OTHER TRANSACTIONS WITH AFFILIATES
The Advisor provides the Fund with investment advisory services under an Investment Advisory Agreement. The Advisor furnishes all investment advice, office space, and facilities and most of the personnel needed by the Fund. As compensation for its services, the Advisor is entitled to a monthly fee from the Fund. The fee is based on the average daily net assets of the Fund at an annual rate of 0.74%. The net investment advisory fees expensed by the Fund during fiscal year 2019 are included in the Statement of Operations.
The Advisor has contractually agreed to limit total annual operating expenses to 0.98% of the Fund’s net assets for both Investor Class shares and Institutional Class shares (excluding all federal, state and local taxes, interest, brokerage commissions, 12b-1 fees, shareholder servicing fees payable to the Advisor, extraordinary items, and acquired fund fees and expenses and other costs incurred in connection with the purchase and sale of securities) through February 28, 2020.
For three years following the date on which expenses were waived or incurred, the Advisor may recoup waived or reimbursed expenses from the Fund if total operating expenses, including such recoupment, does not exceed the expense limitation in effect (i) at the time the Advisor waived or reimbursed such expenses and (ii) at the time the Advisor recoups such expenses. As of October 31, 2019, expenses subject to potential recovery for Investor Class and Institutional Class shares and the fiscal years in which they expire were as follows:
| | | Fiscal Year | Fiscal Year | Fiscal Year | |
| | | 2020 | 2021 | 2022 | Total |
| | Investor Class | $58,612 | $83,351 | $92,255 | $234,218 |
| | Institutional Class | $20,906 | $26,820 | $29,447 | $ 77,173 |
The Advisor did not recoup expenses during fiscal year 2019.
The Board has approved a Shareholder Servicing Agreement for Investor Class shares of the Fund, which was instituted to compensate the Advisor for the non-investment advisory services it provides to the Fund. The Shareholder Servicing Agreement provides
| NOTES TO THE FINANCIAL STATEMENTS |
for a monthly fee paid to the Advisor at an annual rate of 0.10% of the average daily net assets of the Fund attributable to Investor Class shares. The shareholder service fees expensed by the Fund during fiscal year 2019 are included in the Statement of Operations.
The Fund has adopted a plan pursuant to Rule 12b-1 under the Investment Company Act of 1940, as amended, that authorizes payments in connection with the distribution of the Fund’s shares at an annual rate of up to 0.25% of the Fund’s average daily net assets attributable to Investor Class shares. Even though the authorized rate is up to 0.25%, the Fund is currently only using up to 0.15% of its average daily net assets attributable to Investor Class shares for such purpose. Amounts paid under the plan may be spent on any activities or expenses primarily intended to result in the sale of shares, including, but not limited to, advertising, shareholder account servicing, printing and mailing of prospectuses to other than current shareholders, printing and mailing of sales literature, and compensation for sales and marketing activities or to financial institutions and others, such as dealers and distributors. The distribution fees expensed by the Fund during fiscal year 2019 are included in the Statement of Operations.
The Fund has entered into agreements with various brokers, dealers, and financial intermediaries in connection with the sale of shares of the Fund. The agreements provide for periodic payments of sub-transfer agent expenses by the Fund to the brokers, dealers, and financial intermediaries for providing certain shareholder maintenance services. These shareholder services include the pre-processing and quality control of new accounts, shareholder correspondence, answering customer inquiries regarding account status, and facilitating shareholder telephone transactions. The sub-transfer agent fees expensed by the Fund during fiscal year 2019 are included in the Statement of Operations.
U.S. Bancorp Fund Services, LLC, d/b/a U.S. Bank Global Fund Services (“Fund Services”) provides the Fund with administrative, accounting, and transfer agent services. As administrator, Fund Services is responsible for activities such as (i) preparing various federal and state regulatory filings, reports, and returns for the Fund, (ii) preparing reports and materials to be supplied to the Board, (iii) monitoring the activities of the Fund’s custodian, transfer agent, and accountants, and (iv) coordinating the preparation and payment of the Fund’s expenses and reviewing the Fund’s expense accruals. U.S. Bank N.A., an affiliate of Fund Services, serves as the Fund’s custodian. The servicing agreements between the Trust and Fund Services and U.S. Bank N.A. contain a fee schedule that is inclusive of administrative, accounting, custody, and transfer agent fees. The administrative, accounting, custody, and transfer agent fees expensed by the Fund during fiscal year 2019 are included in the Statement of Operations.
Quasar Distributors, LLC (“Quasar”) acts as the Fund’s principal underwriter in a continuous public offering of the Fund’s shares. Quasar is an affiliate of Fund Services and U.S. Bank N.A.
The officers of the Fund are affiliated with the Advisor. With the exception of the Chief Compliance Officer and the Senior Compliance Officer, such officers receive no compensation from the Fund for serving in their respective roles. The Fund, along with the other Hennessy Funds, makes reimbursement payments on an equal basis to the Advisor for a portion of the salary and benefits associated with the office of the Chief Compliance Officer and for all of the salary and benefits associated with the office of the Senior Compliance Officer. The compliance fees expensed by the Fund during fiscal year 2019 are included in the Statement of Operations.
| HENNESSY FUNDS | 1-800-966-4354 | |
6). GUARANTEES AND INDEMNIFICATIONS
Under the Hennessy Funds’ organizational documents, their officers and trustees are indemnified by the Hennessy Funds against certain liabilities arising out of the performance of their duties to the Hennessy Funds. Additionally, in the normal course of business, the Hennessy Funds enter into contracts with service providers that contain general indemnification clauses. The Fund’s maximum exposure under these arrangements is unknown as this would involve future claims that may be made against the Fund that have not yet occurred. Currently, the Fund expects the risk of loss to be remote.
7). LINE OF CREDIT
The Fund has an uncommitted line of credit with the other Hennessy Funds in the amount of the lesser of (i) $100,000,000 or (ii) 33.33% of each Hennessy Fund’s net assets, or 30% for the Hennessy Gas Utility Fund and 10% for the Hennessy Balanced Fund, intended to provide short-term financing, if necessary, subject to certain restrictions, in connection with shareholder redemptions. The credit facility is with the Hennessy Funds’ custodian bank, U.S. Bank N.A. Borrowings under this arrangement bear interest at the bank’s prime rate and are secured by all of the Fund’s assets (as to its own borrowings only). During fiscal year 2019, the Fund had an outstanding average daily balance and a weighted average interest rate of $184 and 5.50%, respectively. The interest expensed by the Fund during fiscal year 2019 is included in the Statement of Operations. The maximum amount outstanding for the Fund during fiscal year 2019 was $17,000. As of October 31, 2019, the Fund did not have any borrowings outstanding under the line of credit.
8). FEDERAL TAX INFORMATION
As of October 31, 2019, the components of accumulated earnings (losses) for income tax purposes were as follows:
| | | Investments | |
| Cost of investments for tax purposes | | $ | 4,492,391 | |
| Gross tax unrealized appreciation | | $ | 881,203 | |
| Gross tax unrealized depreciation | | | (132,544 | ) |
| Net tax unrealized appreciation/(depreciation) | | $ | 748,659 | |
| Undistributed ordinary income | | $ | 61,674 | |
| Undistributed long-term capital gains | | | 84,295 | |
| Total distributable earnings | | $ | 145,969 | |
| Other accumulated gain/(loss) | | $ | — | |
| Total accumulated gain/(loss) | | $ | 894,628 | |
The difference between book-basis unrealized appreciation/depreciation and tax-basis unrealized appreciation/depreciation (as shown above) is attributable primarily to wash sales.
As of October 31, 2019, the Fund had no tax basis capital losses to offset future capital gains.
As of October 31, 2019, the Fund did not defer, on a tax basis, any late-year ordinary losses. Late-year ordinary losses are net ordinary losses incurred after December 31, 2018, but within the taxable year, that are deemed to arise on the first day of the Fund’s next taxable year.
| NOTES TO THE FINANCIAL STATEMENTS |
During fiscal year 2019 and fiscal year 2018, the tax character of distributions paid by the Fund was as follows:
| | | Year Ended | | | Year Ended | |
| | | October 31, 2019 | | | October 31, 2018 | |
Ordinary income(1) | | $ | 381,139 | | | $ | — | |
| Long-term capital gain | | | 166,307 | | | | 391,429 | |
| | | $ | 547,446 | | | $ | 391,429 | |
| | (1) Ordinary income includes short-term capital gain. |
9). EVENTS SUBSEQUENT TO YEAR END
Management has evaluated the Fund’s related events and transactions that occurred subsequent to October 31, 2019, through the date of issuance of the Fund’s financial statements. Other than as disclosed below, management has determined that there were no subsequent events requiring recognition or disclosure in the financial statements.
On November 25, 2019, U.S. Bancorp, the parent company of Quasar, announced that it had signed a purchase agreement to sell Quasar to Foreside Financial Group, LLC, such that Quasar will become a wholly-owned broker-dealer subsidiary of Foreside. The transaction is expected to close by the end of March 2020. Quasar will remain the Fund’s distributor at the close of the transaction, subject to Board approval.
On December 6, 2019, capital gains were declared and paid to shareholders of record on December 5, 2019, as follows:
| | | Long-term | Short-term |
| | Investor Class | $0.30216 | $0.21868 |
| | Institutional Class | $0.31014 | $0.22446 |
| HENNESSY FUNDS | 1-800-966-4354 | |
Report of Independent Registered Public
Accounting Firm
To the Board of Trustees of Hennessy Funds Trust
and the shareholders of the Hennessy Technology Fund
Novato, CA
Opinion on the Financial Statements
We have audited the accompanying statement of assets and liabilities of the Hennessy Technology Fund (the “Fund”), a series of Hennessy Funds Trust, including the schedule of investments, as of October 31, 2019, the related statement of operations for the year then ended, the statements of changes in net assets for each of the two years in the period then ended, financial highlights for each of the five years in the period then ended, and the related notes (collectively referred to as the “financial statements”). In our opinion, the financial statements present fairly, in all material respects, the financial position of the Fund as of October 31, 2019, the results of its operations for the year then ended, the changes in its net assets for each of the two years in the period then ended, and the financial highlights for each of the five years in the period then ended, in conformity with accounting principles generally accepted in the United States of America.
Basis for Opinion
These financial statements are the responsibility of the Fund’s management. Our responsibility is to express an opinion on the Fund’s financial statements based on our audits. We are a public accounting firm registered with the Public Company Accounting Oversight Board (United States) (“PCAOB”) and are required to be independent with respect to the Fund in accordance with the U.S. federal securities laws and the applicable rules and regulations of the Securities and Exchange Commission and the PCAOB. We have served as the auditor of one or more of the funds in the Trust since 2002.
We conducted our audits in accordance with the standards of the PCAOB. Those standards require that we plan and perform the audit to obtain reasonable assurance about whether the financial statements are free of material misstatement, whether due to error or fraud. The Fund is not required to have, nor were we engaged to perform, an audit of its internal control over financial reporting. As part of our audits we are required to obtain an understanding of internal control over financial reporting, but not for the purpose of expressing an opinion on the effectiveness of the Fund’s internal control over financial reporting. Accordingly, we express no such opinion.
Our audits included performing procedures to assess the risks of material misstatement of the financial statements, whether due to error or fraud, and performing procedures that respond to those risks. Such procedures included examining, on a test basis, evidence regarding the amounts and disclosures in the financial statements. Our audits also included evaluating the accounting principles used and significant estimates made by management, as well as evaluating the overall presentation of the financial statements. Our procedures included confirmation of securities owned as of October 31, 2019, by correspondence with the custodian. We believe that our audits provide a reasonable basis for our opinion.
| | |
| | TAIT, WELLER & BAKER LLP |
Philadelphia, Pennsylvania
December 24, 2019
| REPORT OF INDEPENDENT REGISTERED PUBLIC ACCOUNTING FIRM/TRUSTEES AND OFFICERS |
Trustees and Officers of the Fund (Unaudited)
The business and affairs of the Funds are managed under the direction of the Board of Trustees of the Trust, and the Board of Trustees elects the officers of the Trust. From time to time, the Board of Trustees also has appointed advisers to the Board of Trustees (“Advisers”) with the intention of having qualified individuals serve in an advisory capacity in order to garner experience in the mutual fund and asset management industry and be considered as potential Trustees in the future. There are currently three Advisers: Brian Alexander, Doug Franklin, and Claire Knoles. As Advisers, Mr. Alexander, Mr. Franklin, and Ms. Knoles attend meetings of the Board of Trustees and act as non-voting participants. Information pertaining to the Trustees, Advisers, and the officers of the Trust is set forth below. The Trustees and officers serve until their successors are duly elected and qualified or until their earlier death, resignation, or removal. Each Trustee oversees the 16 Hennessy Funds. Unless otherwise indicated, the address of all persons listed below is 7250 Redwood Boulevard, Suite 200, Novato, CA 94945. The Fund’s Statement of Additional Information includes more information about the persons listed below and is available without charge by calling 1-800-966-4354 or by visiting www.hennessyfunds.com.
| | | | Other |
| | | | Directorships |
| | | | Held Outside |
| Name, (Year of Birth), | | | of Fund |
| and Position Held | Start Date | Principal Occupation(s) | Complex During |
with the Trust | of Service | During Past Five Years | Past Five Years |
| | | | |
| Disinterested Trustees and Advisers | | | |
| | | | |
| J. Dennis DeSousa | January 1996 | Mr. DeSousa is a real estate investor. | None. |
| (1936) | | | |
| Trustee | | | |
| | | | |
| Robert T. Doyle | January 1996 | Mr. Doyle has been the Sheriff of | None. |
| (1947) | | Marin County, California since 1996. | |
| Trustee | | | |
| | | | |
| Gerald P. Richardson | May 2004 | Mr. Richardson is an independent | None. |
| (1945) | | consultant in the securities industry. | |
| Trustee | | | |
| | | | |
| Brian Alexander | March 2015 | Mr. Alexander has worked for the | None. |
| (1981) | | Sutter Health organization since | |
| Adviser to the Board | | 2011 in various positions. He has | |
| | | served as the Chief Executive Officer | |
| | | of the Sutter Roseville Medical | |
| | | Center since 2018. From 2016 through | |
| | | 2018, he served as the Vice President | |
| | | of Strategy for the Sutter Health Valley | |
| | | Area, which includes 11 hospitals, | |
| | | 13 ambulatory surgery centers, | |
| | | 16,000 employees, and 1,900 physicians. | |
| | | From 2013 through 2016, Mr. Alexander | |
| | | served as Sutter Novato Community | |
| | | Hospital’s Chief Administrative Officer. | |
| HENNESSY FUNDS | 1-800-966-4354 | |
| | | | Other |
| | | | Directorships |
| | | | Held Outside |
| Name, (Year of Birth), | | | of Fund |
| and Position Held | Start Date | Principal Occupation(s) | Complex During |
with the Trust | of Service | During Past Five Years | Past Five Years |
| | | | |
| Doug Franklin | March 2016 | Mr. Franklin is a retired insurance | None. |
| (1964) | | industry executive. From 1987 | |
| Adviser to the Board | | through 2015, he was employed | |
| | | by the Allianz-Fireman’s Fund | |
| | | Insurance Company in various | |
| | | positions, including as its Chief | |
| | | Actuary and Chief Risk Officer. | |
| | | | |
| Claire Knoles | December 2015 | Ms. Knoles is a founder of Kiosk and | None. |
| (1974) | | has served as its Chief Operating | |
| Adviser to the Board | | Officer since 2004. Kiosk is a full- | |
| | | service marketing agency with | |
| | | offices in the San Francisco Bay | |
| | | Area, Toronto, and Liverpool, UK. | |
| | | | |
Interested Trustee(1) | | | |
| | | | |
| Neil J. Hennessy | January 1996 as | Mr. Hennessy has been employed | Hennessy |
| (1956) | a Trustee and | by Hennessy Advisors, Inc. since | Advisors, Inc. |
| Trustee, Chairman of | June 2008 as | 1989 and currently serves as its | |
| the Board, Chief | an officer | Chairman and Chief Executive Officer. | |
| Investment Officer, | | | |
| Portfolio Manager, | | | |
| and President | | | |
| Name, (Year of Birth), | | |
| and Position Held | Start Date | Principal Occupation(s) |
with the Trust | of Service | During Past Five Years |
| | | |
| Officers | | |
| | | |
| Teresa M. Nilsen | January 1996 | Ms. Nilsen has been employed by Hennessy Advisors, Inc. |
| (1966) | | since 1989 and currently serves as its President, Chief Operating |
| Executive Vice President | | Officer, and Secretary. |
| and Treasurer | | |
| | | |
| Daniel B. Steadman | March 2000 | Mr. Steadman has been employed by Hennessy Advisors, Inc. |
| (1956) | | since 2000 and currently serves as its Executive Vice President. |
| Executive Vice President | | |
| and Secretary | | |
| | | |
| Brian Carlson | December 2013 | Mr. Carlson has been employed by Hennessy Advisors, Inc. |
| (1972) | | since December 2013 and currently serves as its Chief |
| Senior Vice President | | Compliance Officer and Senior Vice President. |
| and Head of Distribution | | |
| | | |
| Jennifer Cheskiewicz | June 2013 | Ms. Cheskiewicz has been employed by Hennessy Advisors, Inc. |
(1977)(2) | | as its General Counsel since June 2013. |
| Senior Vice President and | | |
| Chief Compliance Officer | | |
| TRUSTEES AND OFFICERS OF THE FUND |
| Name, (Year of Birth), | | |
| and Position Held | Start Date | Principal Occupation(s) |
with the Trust | of Service | During Past Five Years |
| | | |
| David Ellison | October 2012 | Mr. Ellison has been employed by Hennessy Advisors, Inc. since |
(1958)(3) | | October 2012. He has served as a Portfolio Manager of the |
| Senior Vice President | | Hennessy Large Cap Financial Fund and the Hennessy Small |
| and Portfolio Manager | | Cap Financial Fund since their inception. Mr. Ellison also served |
| | | as a Portfolio Manager of the Hennessy Technology Fund from |
| | | its inception until February 2017. Mr. Ellison served as Director, |
| | | CIO and President of FBR Fund Advisers, Inc. from December |
| | | 1999 to October 2012. |
| | | |
| Ryan Kelley | March 2013 | Mr. Kelley has been employed by Hennessy Advisors, Inc. since |
(1972)(4) | | October 2012. He has served as a Portfolio Manager of the |
| Senior Vice President | | Hennessy Gas Utility Fund, the Hennessy Large Cap Financial |
| and Portfolio Manager | | Fund, and the Hennessy Small Cap Financial Fund since |
| | | October 2014. He served as Co- Portfolio Manager of these |
| | | same funds from March 2013 through September 2014 and as |
| | | a Portfolio Analyst for the Hennessy Funds from October 2012 |
| | | through February 2013. Mr. Kelley has also served as a Portfolio |
| | | Manager of the Hennessy Cornerstone Growth Fund, the |
| | | Hennessy Cornerstone Mid Cap 30 Fund, the Hennessy |
| | | Cornerstone Large Growth Fund, and the Hennessy |
| | | Cornerstone Value Fund since February 2017 and as a Portfolio |
| | | Manager of the Hennessy Total Return Fund, the Hennessy |
| | | Balanced Fund, and the Hennessy Technology Fund since May |
| | | 2018. He served as Co- Portfolio Manager of the Hennessy |
| | | Technology Fund from February 2017 until May 2018. Mr. Kelley |
| | | served as Portfolio Manager of FBR Fund Advisers, Inc. from |
| | | January 2008 to October 2012. |
| | | |
| Tania Kelley | October 2003 | Ms. Kelley has been employed by Hennessy Advisors, Inc. since |
| (1965) | | October 2003. |
| Senior Vice President | | |
| and Head of Marketing | | |
| | | |
| L. Joshua Wein | September 2018 | Mr. Wein has been employed by Hennessy Advisors, Inc. |
(1973)(4) | | since 2018. He has served as Co-Portfolio Manager of the |
| Vice President and | | Hennessy Cornerstone Growth Fund, the Hennessy |
| Co-Portfolio Manager | | Cornerstone Mid Cap 30 Fund, the Hennessy Cornerstone Large |
| | | Growth Fund, the Hennessy Cornerstone Value Fund, Hennessy |
| | | Total Return Fund, the Hennessy Balanced Fund, the Hennessy |
| | | Gas Utility Fund, and the Hennessy Technology Fund since |
| | | February 2019. Prior to that, he served as a Senior Analyst of |
| | | those same funds since September 2018. Mr. Wein served as |
| | | Director of Alternative Investments and Co-Portfolio Manager |
| | | at Sterling Capital Management from 2008 to 2018. |
_______________
(1) | Mr. Hennessy is considered an “interested person,” as defined in the Investment Company Act of 1940, as amended, because he is an officer of the Trust. |
(2) | The address of this officer is 4800 Bee Caves Road, Suite 100, Austin, TX 78746. |
(3) | The address of this officer is 101 Federal Street, Suite 1900, Boston, MA 02110. |
(4) | The address of this officer is 1340 Environ Way, Chapel Hill, NC 27517. |
| HENNESSY FUNDS | 1-800-966-4354 | |
Expense Example (Unaudited)
October 31, 2019
As a shareholder of the Fund, you incur ongoing costs, including management fees, service fees, and other Fund expenses. This Example is intended to help you understand your ongoing costs (in dollars) of investing in the Fund and to compare these costs with the ongoing costs of investing in other mutual funds. The Example is based on an investment of $1,000 invested at the beginning of the period and held for the entire period from May 1, 2019, through October 31, 2019.
Actual Expenses
The first line of the table below under the “Investor Class” and “Institutional Class” headings provides information about actual account values and actual expenses. Although the Fund charges no sales loads or transaction fees, you will be assessed fees for outgoing wire transfers, returned checks and stop payment orders at prevailing rates charged by U.S. Bank Global Fund Services, the Fund’s transfer agent. If you request that a redemption be made by wire transfer, currently a $15 fee is charged by the Fund’s transfer agent. IRA accounts will be charged a $15 annual maintenance fee. The example below includes, but is not limited to, management fees, shareholder servicing fees, accounting, custody, and transfer agent fees. However, the example below does not include portfolio trading commissions and related expenses. You may use the information in this line, together with the amount you invested, to estimate the expenses that you paid over the period. Simply divide your account value by $1,000 (for example, an $8,600 account value divided by $1,000 = 8.6), then multiply the result by the number in the first line of the table under the “Investor Class” or “Institutional Class” headings in the column entitled “Expenses Paid During Period” to estimate the expenses you paid on your account during this period.
Hypothetical Example for Comparison Purposes
The second line of the table below under the “Investor Class” and “Institutional Class” headings provides information about hypothetical account values and hypothetical expenses based on the Fund’s actual expense ratios and an assumed rate of return of 5% per year before expenses, which is not the Fund’s actual return. The hypothetical account values and expenses may not be used to estimate the actual ending account balance or expenses you paid for the period. You may use this information to compare the ongoing costs of investing in the Fund and other funds. To do so, compare this 5% hypothetical example with the 5% hypothetical examples that appear in the shareholder reports of the other funds. Please note that the expenses shown in the table are meant to highlight your ongoing costs only. Therefore, the second line of the table under the “Investor Class” and “Institutional Class” headings is useful in comparing ongoing costs only and will not help you determine the relative total costs of owning different funds.
| | | | Expenses Paid |
| | Beginning | Ending | During Period(1) |
| | Account Value | Account Value | May 1, 2019 – |
| | May 1, 2019 | October 31, 2019 | October 31, 2019 |
| Investor Class | | | |
| Actual | $1,000.00 | $1,006.90 | $6.22 |
| Hypothetical (5% return before expenses) | $1,000.00 | $1,019.00 | $6.26 |
| | | | |
| Institutional Class | | | |
| Actual | $1,000.00 | $1,008.80 | $4.96 |
| Hypothetical (5% return before expenses) | $1,000.00 | $1,020.27 | $4.99 |
(1) | Expenses are equal to the Fund’s annualized expense ratio of 1.23% for Investor Class shares or 0.98% for Institutional Class shares, as applicable, multiplied by the average account value over the period, multiplied by 184/365 days (to reflect one-half year period). |
| HENNESSY FUNDS | 1-800-966-4354 | |
How to Obtain a Copy of the Fund’s
Proxy Voting Policy and Proxy Voting Records
A description of the policies and procedures the Fund uses to determine how to vote proxies relating to portfolio securities is available without charge: (1) by calling 1-800-966-4354; (2) on the Hennessy Funds’ website at www.hennessyfunds.com/proxy-voting/voting-policy; or (3) on the U.S. Securities and Exchange Commission’s (the “SEC”) website at www.sec.gov. The Fund’s proxy voting record is available without charge on both the Hennessy Funds’ website at www.hennessyfunds.com/proxy-voting/voting-record and the SEC’s website at www.sec.gov no later than August 31 for the prior 12 months ending June 30.
Availability of Quarterly Portfolio Schedule
For periods ending on or prior to January 31, 2019, the Fund has filed a complete schedule of portfolio holdings with the SEC for the first and third quarters of each fiscal year on Form N-Q. For periods ending on or after April 30, 2019, the Fund files a complete schedule of portfolio holdings with the SEC for the first and third quarters of each fiscal year as an exhibit to its reports on Form N-PORT. The Fund’s Forms N-Q and Forms N-PORT are available on the SEC’s website at www.sec.gov or on request by calling 1-800-966-4354.
Federal Tax Distribution Information (Unaudited)
For fiscal year 2019, certain dividends paid by the Fund may be subject to a maximum tax rate of 23.8%, as provided for by the Jobs and Growth Tax Relief Reconciliation Act of 2003. The percentage of dividends declared from ordinary income designated as qualified dividend income was 8.73%.
For corporate shareholders, the percent of ordinary income distributions that qualified for the corporate dividends received deduction for fiscal year 2019 was 0.00%.
The percentage of taxable ordinary income distributions that were designated as short-term capital gain distributions under Section 871(k)(2)(C) of the Internal Revenue Code of 1986, as amended, for the Fund was 100.00%.
Important Notice Regarding Delivery
of Shareholder Documents
To help keep the Fund’s costs as low as possible, we generally deliver a single copy of shareholder reports, proxy statements, and prospectuses to shareholders who share an address and have the same last name. This process does not apply to account statements. You may request an individual copy of a shareholder document at any time. If you would like to receive separate mailings of shareholder documents, please call U.S. Bank Global Fund Services at 1-800-261-6950 or 1-414-765-4124, and individual delivery will begin within 30 days of your request. If your account is held through a financial institution or other intermediary, please contact such intermediary directly to request individual delivery.
Electronic Delivery
The Funds offer shareholders the option to receive account statements, Prospectuses, tax forms, and reports online. To sign up for eDelivery, please visit www.hennessyfunds.com. You may change your delivery preference at any time by visiting our website or contacting the Funds at 1-800-261-6950.
| PROXY VOTING — PRIVACY POLICY |
Privacy Policy
We collect the following non-public personal information about you:
| | • | information we receive from you on or in applications or other forms, correspondence, or conversations, including, but not limited to, your name, address, phone number, social security number, assets, income, and date of birth; and |
| | | |
| | • | information about your transactions with us, our affiliates, or others, including, but not limited to, your account number and balance, payment history, parties to transactions, cost basis information, and other financial information. |
We do not disclose any non-public personal information about our current or former shareholders to non-affiliated third parties, except as permitted by law. For example, we are permitted by law to disclose all of the information we collect, as described above, to our Transfer Agent to process your transactions. Furthermore, we restrict access to your non-public personal information to those persons who require such information to provide products or services to you. We maintain physical, electronic, and procedural safeguards that comply with federal standards to guard your non-public personal information.
In the event that you hold shares of the Fund through a financial intermediary, including, but not limited to, a broker-dealer, bank, or trust company, the privacy policy of your financial intermediary would govern how your non-public personal information will be shared with non-affiliated third parties.
| HENNESSY FUNDS | 1-800-966-4354 | |
For information, questions or assistance, please call
The Hennessy Funds
1-800-966-4354 or 1-415-899-1555
INVESTMENT ADVISOR
Hennessy Advisors, Inc.
7250 Redwood Boulevard, Suite 200
Novato, California 94945
ADMINISTRATOR,
TRANSFER AGENT,
DIVIDEND PAYING AGENT, &
SHAREHOLDER SERVICING AGENT
U.S. Bancorp Fund Services, LLC
d/b/a U.S. Bank Global Fund Services
P.O. Box 701
Milwaukee, Wisconsin 53201-0701
CUSTODIAN
U.S. Bank N.A.
Custody Operations
1555 North River Center Drive, Suite 302
Milwaukee, Wisconsin 53212
TRUSTEES
Neil J. Hennessy
Robert T. Doyle
J. Dennis DeSousa
Gerald P. Richardson
COUNSEL
Foley & Lardner LLP
777 East Wisconsin Avenue
Milwaukee, Wisconsin 53202-5306
INDEPENDENT REGISTERED
PUBLIC ACCOUNTING FIRM
Tait, Weller & Baker LLP
Two Liberty Place
50 South 16th Street, Suite 2900
Philadelphia, Pennsylvania 19103-2529
DISTRIBUTOR
Quasar Distributors, LLC
777 East Wisconsin Avenue
Milwaukee, Wisconsin 53202
www.hennessyfunds.com | 1-800-966-4354
This report has been prepared for shareholders and may be distributed to
others only if preceded or accompanied by a current prospectus.