If you have already elected to receive shareholder reports electronically, you will not be affected by this change and you need not take any action. You may elect to receive shareholder reports and other communications from the Hennessy Funds electronically by visiting www.hennessyfunds.com/account or by calling U.S. Bank Global Fund Services at 1-800-261-6950. If you own shares in a Fund through a financial intermediary, please contact your financial intermediary to make this election.
As a new year and new decade dawned in January, no one could have imagined that the world would quickly plunge into one of the worst health crises in history. Throughout this pandemic, our thoughts have remained with those most deeply affected by COVID-19, and we thank our frontline healthcare and essential workers. At Hennessy Funds, we adapted quickly to the impact of COVID-19 to maintain business continuity. We focused on our employees and on you, the shareholders of the Hennessy Funds, and I am pleased that we have been able to navigate successfully during this unprecedented time.
The year was defined by a global pandemic and the ensuing economic shutdowns and by a highly charged presidential election that caused tremendous volatility. Yet the stock market has continued to show its resiliency and strength, as the major indices hit new all-time highs in November and again in December. For the 12 months ended October 31, 2020, U.S. equities posted positive performance, with the S&P 500® Index returning 9.71% and the Dow Jones Industrial Average returning 0.34% for the period. There were extreme differences in how various sectors performed during the period. For instance, the technology-focused NASDAQ Composite Index performed strongly, returning 32.84%, whereas the Energy sector (as represented by the S&P 500® Energy Sector Index) struggled with a loss of -46.43%. The Financials sector also performed relatively poorly during the period, with the Russell 1000® Index Financials losing -8.04% and the Russell 2000® Index Financials losing -17.87%. In addition, large cap stocks significantly outperformed small caps, and growth stocks reigned over value stocks during the period. Moreover, approximately half of the NASDAQ’s return for the period was comprised of just three behemoth technology stocks – Apple, Microsoft, and Amazon. Therefore, while the overall U.S. equities market improved, mutual fund returns varied drastically due to the disparate performance of specific sectors, differently sized companies, and different types of companies.
Optimism about the approval and distribution of effective COVID-19 vaccines appears to be buoying investor confidence. Low interest rates, and the expectation that they will remain low for the foreseeable future, have also provided a tailwind to equity prices. In my opinion, stocks are trading at reasonable valuations given this low interest rate environment, with the Dow Jones Industrial Average trading at 20.1x estimated earnings for 2021 and the S&P 500® Index trading at 21.6x estimated earnings for 2021. The U.S. economy looks to be on the road to recovery and is experiencing moderate inflation, and our banking industry appears healthy. The unemployment rate is dropping, albeit slowly, and I expect it to continue to improve once businesses reopen. There are high levels of cash on corporate balance sheets, which could support rising dividends and stock buybacks.
I believe our corporate business leaders will continue to adapt and find ways to drive growth and value for their shareholders, but I also feel that the uncertainty created by the continued health crisis and the stalemate over fiscal relief will lead to additional bouts of market volatility. I remain confident, however, that the markets can and will thrive in the long run.
Thank you for your continued trust and investment in the Hennessy Funds. We believe that there continue to be strong opportunities throughout many segments of the market, and we are focused on managing our high-conviction portfolios for the long-term
benefit of our shareholders. Should you have any questions or would like to speak with us directly, please reach out and call us at (800) 966-4354.
Neil J. Hennessy
Past performance does not guarantee future results.
Mutual fund investing involves risk. Principal loss is possible.
Forward price to earnings (PE) is a valuation measure calculated by dividing a company’s market price per share by its expected earnings per share over the following 12 months. PEs noted are sourced from Bloomberg as of December 9, 2020.
This graph illustrates the performance of an initial investment of $10,000 made in the Fund ten years ago and assumes the reinvestment of dividends.
Performance data quoted represents past performance; past performance does not guarantee future results. The investment return and principal value of an investment will fluctuate so that an investor’s shares, when redeemed, may be worth more or less than their original cost. The performance table does not reflect the deduction of taxes that a shareholder would pay on Fund distributions or the redemption of Fund shares. Current performance of the Fund may be lower or higher than the performance quoted. Performance data current to the most recent month end may be obtained by visiting www.hennessyfunds.com.
The 75/25 Blended DJIA/Treasury Index consists of 75% common stocks represented by the Dow Jones Industrial Average and 25% short-duration Treasury securities represented by the ICE BofAML U.S. 3-Month Treasury Bill Index, which comprises U.S. Treasury securities maturing in three months. The Dow Jones Industrial Average is a price-weighted average of 30 significant stocks traded on the New York Stock Exchange or The NASDAQ Stock Market. One cannot invest directly in an index. These indices are used herein for comparative purposes in accordance with Securities and Exchange Commission regulations.
The expense ratio presented is from the most recent prospectus. The expense ratio for the current reporting period is available in the Financial Highlights section of this report.
Portfolio Managers Neil J. Hennessy, Ryan C. Kelley, CFA, and L. Joshua Wein, CAIA
For the 12-month period ended October 31, 2020, the Hennessy Total Return Fund returned -12.36%, underperforming both the 75/25 Blended DJIA/Treasury Index (the
Fund’s primary benchmark) and the Dow Jones Industrial Average, which returned 1.04% and 0.34%, respectively, for the same period.
The Fund underperformed its primary benchmark predominantly as a result of stock selection in the Energy, Consumer Staples, and Information Technology sectors, with Exxon Mobil Corporation, Walgreens Boots Alliance, Inc., and Cisco Systems, Inc. detracting from performance during the period. Offsetting these losses were investments in Financials and Health Care sectors, with companies such as JPMorgan Chase & Company and Johnson & Johnson advancing during the period. Sector selection detracted from the Fund’s return on a relative basis, with an underweight position in Consumer Discretionary and an overweight position in Energy.
The Fund continues to hold all the companies mentioned with the exception of Johnson & Johnson.
The Fund invests approximately 75% of its assets in the “Dogs of the Dow,” the 10 highest dividend-yielding Dow stocks, and 25% of its assets in U.S. Treasuries. As a result of this “blended” strategy, we expect the Fund to underperform equities in periods when equity markets rise and outperform in periods when equity markets fall. The Fund is designed to allow its investors to gain exposure to the equity market while maintaining a percentage of its investment in fixed income securities. We believe the Fund is well positioned for the more conservative investor because the equity portion of the portfolio is invested in what we deem to be high-quality companies, each of which pays a quarterly dividend, while the balance of the Fund is invested in lower-risk, short-duration U.S. Treasuries.
We continue to believe that the outlook for U.S. stocks is positive. In our view, despite a sharp contraction in economic activity as a result of the COVID-19 pandemic, the U.S. economy is in the early stages of growing once again. The Federal Reserve’s low interest rate policy, which is expected to last through 2021, together with the anticipated release of a COVID-19 vaccine in the first half of 2021, may give rise to increased employment, wage gains, and economic growth. While corporate earnings declined over the 12-month period, they are expected to rise meaningfully over the next 12 months as economies around the world recover from the COVID-19 pandemic.
If the market experiences a correction, we would expect our more defensive holdings to perform well relative to the market. The relatively short duration of the 25% weighting of U.S. Treasuries in the portfolio (all less than three months) may allow us the ability to roll into higher-yielding Treasuries in the event dividends rise.
Opinions expressed are those of the Portfolio Managers as of the date written and are subject to change, are not guaranteed, and should not be considered investment advice or an indication of trading intent.
The Fund is non-diversified, meaning it may concentrate its assets in fewer individual holdings than a diversified fund, making it more exposed to individual stock volatility than a diversified fund. The Fund’s formula-based strategy may cause the Fund to buy or sell securities at times when it may not be advantageous. Please see the Fund’s prospectus for a more complete discussion of these and other risks.
References to specific securities should not be considered a recommendation to buy or sell any security. Fund holdings and sector allocations are subject to change. Please refer to the Schedule of Investments included in this report for additional portfolio information.
Earnings growth is not a measure of the Fund’s future performance.
Note: For presentation purposes, the Fund has grouped some of the industry categories. For purposes of categorizing securities for compliance with Section 8(b)(1) of the Investment Company Act of 1940, as amended, the Fund uses more specific industry classifications.
The accompanying notes are an integral part of these financial statements.
Percentages are stated as a percent of net assets.
The following is a summary of the inputs used to value the Fund’s net assets as of October 31, 2020 (see Note 3 in the accompanying Notes to the Financial Statements):
The accompanying notes are an integral part of these financial statements.
As of October 31, 2020, the fair value of securities held as collateral for reverse repurchase agreements was $23,997,384, as noted on the Schedule of Investments.
Reverse repurchase agreements are not included in the fair value hierarchy because they are carried at face value. Due to the short-term nature of the reverse repurchase agreements, face value approximates fair value. The face value of the reverse repurchase agreements as of October 31, 2020, was $21,588,000. The face value plus interest due at maturity is equal to $21,604,191.
The accompanying notes are an integral part of these financial statements.
The accompanying notes are an integral part of these financial statements.
The accompanying notes are an integral part of these financial statements.
The accompanying notes are an integral part of these financial statements.
The accompanying notes are an integral part of these financial statements.
The accompanying notes are an integral part of these financial statements.
The accompanying notes are an integral part of these financial statements.
The Hennessy Total Return Fund (the “Fund”) is a series of Hennessy Funds Trust (the “Trust”), which was organized as a Delaware statutory trust on September 17, 1992. The Fund is an open-end management investment company registered under the Investment Company Act of 1940, as amended. The investment objective of the Fund is total return, consisting of capital appreciation and current income. The Fund is a non-diversified fund and offers Investor Class shares.
As an investment company, the Fund follows the investment company accounting and reporting guidance of the Financial Accounting Standards Board (“FASB”) Accounting Standard Codification Topic 946 “Financial Services—Investment Companies.”
The following is a summary of significant accounting policies consistently followed by the Fund in the preparation of the financial statements. These policies conform to U.S. generally accepted accounting principles (“GAAP”).
The Fund follows its valuation policies and procedures in determining its net asset value and, in preparing these financial statements, the fair value accounting standards that establish an authoritative definition of fair value and set out a hierarchy for measuring fair value. These standards require additional disclosures about the various inputs and valuation techniques used to develop the measurements of fair value and a discussion of changes in valuation techniques and related inputs during the period. These inputs are summarized in the three broad levels listed below:
The following is a description of the valuation techniques applied to the Fund’s major categories of assets and liabilities on a recurring basis:
The Board of Trustees of the Fund (the “Board”) has adopted fair value pricing procedures that are followed when a price for a security is not readily available or if a significant event has occurred that indicates the closing price of a security no longer represents the true value of that security. Fair value pricing determinations are made in good faith in accordance with these procedures. There are numerous criteria that will be given consideration in determining a fair value of a security, such as the trading volume of a security and markets, the values of other similar securities, and news events with direct bearing on a security or markets. Fair value pricing results in an estimated price for a security that reflects the amount the Fund might reasonably expect to receive in a current sale. Depending on the relative significance of the valuation inputs, these securities may be classified in either Level 2 or Level 3 of the fair value hierarchy.
The Board has delegated day-to-day valuation matters to the Valuation and Liquidity Committee comprising representatives from Hennessy Advisors, Inc., the Fund’s investment advisor (the “Advisor”). The function of the Valuation and Liquidity Committee is to value securities where current and reliable market quotations are not readily available. All actions taken by the Valuation and Liquidity Committee are reviewed by the Board.
The Fund has performed an analysis of all existing investments to determine the significance and character of all inputs to their fair value determinations. Various inputs are used to determine the value of the Fund’s investments. The inputs or methodology used for valuing securities are not necessarily an indication of the risk associated with investing in those securities. Details related to the fair value hierarchy of the Fund’s securities as of October 31, 2020, are included in the Schedule of Investments.
Purchases and sales of investment securities (excluding government and short-term investments) for the Fund during fiscal year 2020 were $16,654,015 and $24,807,128, respectively.
There were no purchases or sales/maturities of long-term U.S. government securities for the Fund during fiscal year 2020.
The Fund is permitted to purchase or sell securities from or to another fund in the Hennessy Funds family of funds (collectively, the “Hennessy Funds”) under specified conditions outlined in procedures adopted by the Board. The procedures have been designed to ensure that any purchase or sale of securities by the Fund from or to another Hennessy Fund complies with Rule 17a-7 of the Investment Company Act of 1940, as amended. During fiscal year 2020, the Fund did not engage in purchases or sales of securities pursuant to Rule 17a-7 of the Investment Company Act of 1940, as amended.
The Advisor provides the Fund with investment advisory services under an Investment Advisory Agreement. The Advisor furnishes all investment advice, office space, and
facilities and most of the personnel needed by the Fund. As compensation for its services, the Advisor is entitled to a monthly fee from the Fund. The fee is based on the average daily net assets of the Fund at an annual rate of 0.60%. The net investment advisory fees expensed by the Fund during fiscal year 2020 are included in the Statement of Operations.
The Board has approved a Shareholder Servicing Agreement for the Fund, which was instituted to compensate the Advisor for the non-investment advisory services it provides to the Fund. The Shareholder Servicing Agreement provides for a monthly fee paid to the Advisor at an annual rate of 0.10% of the average daily net assets of the Fund. The shareholder service fees expensed by the Fund during fiscal year 2020 are included in the Statement of Operations.
The Fund has adopted a plan pursuant to Rule 12b-1 under the Investment Company Act of 1940, as amended, that authorizes payments in connection with the distribution of the Fund’s shares at an annual rate of up to 0.25% of the Fund’s average daily net assets. Even though the authorized rate is up to 0.25%, the Fund is currently only using up to 0.15% of its average daily net assets for such purpose. Amounts paid under the plan may be spent on any activities or expenses primarily intended to result in the sale of shares, including, but not limited to, advertising, shareholder account servicing, printing and mailing of prospectuses to other than current shareholders, printing and mailing of sales literature, and compensation for sales and marketing activities or to financial institutions and others, such as dealers and distributors. The distribution fees expensed by the Fund during fiscal year 2020 are included in the Statement of Operations.
The Fund has entered into agreements with various brokers, dealers, and financial intermediaries in connection with the sale of shares of the Fund. The agreements provide for periodic payments of sub-transfer agent expenses by the Fund to the brokers, dealers, and financial intermediaries for providing certain shareholder maintenance services. These shareholder services include the pre-processing and quality control of new accounts, shareholder correspondence, answering customer inquiries regarding account status, and facilitating shareholder telephone transactions. The sub-transfer agent fees expensed by the Fund during fiscal year 2020 are included in the Statement of Operations.
U.S. Bancorp Fund Services, LLC, d/b/a U.S. Bank Global Fund Services (“Fund Services”) provides the Fund with administrative, accounting, and transfer agent services. As administrator, Fund Services is responsible for activities such as (i) preparing various federal and state regulatory filings, reports, and returns for the Fund, (ii) preparing reports and materials to be supplied to the Board, (iii) monitoring the activities of the Fund’s custodian, transfer agent, and accountants, and (iv) coordinating the preparation and payment of the Fund’s expenses and reviewing the Fund’s expense accruals. U.S. Bank N.A., an affiliate of Fund Services, serves as the Fund’s custodian. The servicing agreements between the Trust and Fund Services and U.S. Bank N.A. contain a fee schedule that is inclusive of administrative, accounting, custody, and transfer agent fees. The administrative, accounting, custody, and transfer agent fees expensed by the Fund during fiscal year 2020 are included in the Statement of Operations.
Quasar Distributors, LLC (“Quasar”) acts as the Fund’s principal underwriter in a continuous public offering of the Fund’s shares. Quasar was an affiliate of Fund Services and U.S. Bank N.A. through March 30, 2020. Effective March 31, 2020, Foreside Financial Group, LLC (“Foreside”) acquired Quasar from Fund Services. As a result of the acquisition, Quasar became a wholly owned broker-dealer subsidiary of Foreside and is no longer affiliated with Fund Services or U.S. Bank N.A. The Board approved a new Distribution Agreement to enable Quasar to continue serving as the Fund’s distributor.
The officers of the Fund are affiliated with the Advisor. With the exception of the Chief Compliance Officer and the Senior Compliance Officer, such officers receive no compensation from the Fund for serving in their respective roles. The Fund, along with the other Hennessy Funds, makes reimbursement payments on an equal basis to the Advisor for a portion of the salary and benefits associated with the office of the Chief Compliance Officer and for all of the salary and benefits associated with the office of the Senior Compliance Officer. The compliance fees expensed by the Fund during fiscal year 2020 are included in the Statement of Operations.
Under the Hennessy Funds’ organizational documents, their officers and trustees are indemnified by the Hennessy Funds against certain liabilities arising out of the performance of their duties to the Hennessy Funds. Additionally, in the normal course of business, the Hennessy Funds enter into contracts with service providers that contain general indemnification clauses. The Fund’s maximum exposure under these arrangements is unknown as this would involve future claims that may be made against the Fund that have not yet occurred. Currently, the Fund expects the risk of loss to be remote.
The Fund has an uncommitted line of credit with the other Hennessy Funds in the amount of the lesser of (i) $100,000,000 or (ii) 33.33% of each Hennessy Fund’s net assets, or 30% for the Hennessy Gas Utility Fund and 10% for the Hennessy Balanced Fund, intended to provide short-term financing, if necessary, subject to certain restrictions, in connection with shareholder redemptions. The credit facility is with the Hennessy Funds’ custodian bank, U.S. Bank N.A. Borrowings under this arrangement bear interest at the bank’s prime rate and are secured by all of the Fund’s assets (as to its own borrowings only). During fiscal year 2020, the Fund had an outstanding average daily balance and a weighted average interest rate of $27,989 and 3.36%, respectively. The interest expensed by the Fund during fiscal year 2020 is included in the Statement of Operations. The maximum amount outstanding for the Fund during fiscal year 2020 was $840,000. As of October 31, 2020, the Fund did not have any borrowings outstanding under the line of credit.
As of October 31, 2020, the components of accumulated earnings (losses) for income tax purposes were as follows:
The difference between book-basis unrealized appreciation/depreciation and tax-basis unrealized appreciation/depreciation (as shown above) is attributable primarily to wash sales.
As of October 31, 2020, the Fund had no tax basis capital losses to offset future capital gains.
As of October 31, 2020, the Fund did not defer, on a tax basis, any late-year ordinary losses. Late-year ordinary losses are net ordinary losses incurred after December 31, 2019, but within the taxable year, that are deemed to arise on the first day of the Fund’s next taxable year.
During fiscal years 2020 and 2019, the tax character of distributions paid by the Fund was as follows:
The Fund may enter into reverse repurchase agreements with the same parties with which it may enter into repurchase agreements. Under a reverse repurchase agreement, the Fund sells securities and agrees to repurchase them at a mutually agreed date and price. Reverse repurchase agreements are regarded as a form of secured borrowing by the Fund. Securities sold under reverse repurchase agreements are reflected as a liability in the Statement of Assets and Liabilities. Interest payments made under reverse repurchase agreements during fiscal year 2020 totaled $295,221 and are recorded as a component of interest expense in the Statement of Operations.
During fiscal year 2020, the average daily balance and average interest rate in effect for reverse repurchase agreements were $24,605,995 and 1.11%, respectively. Below is information about the scheduled maturity date, amount, and interest rate for outstanding reverse repurchase agreements as of October 31, 2020:
Outstanding reverse repurchase agreements as of October 31, 2020, comprised 42.61% of the Fund’s net assets.
Below is information about reverse repurchase agreements eligible for offset in the Statement of Assets and Liabilities, on both a gross and net basis:
For additional information, please refer to the “Offsetting Assets and Liabilities” section in Note 2.
The COVID-19 pandemic has adversely impacted global commercial activity and contributed to significant volatility in global equity and debt markets. The pandemic has resulted in quarantines, stay-at-home orders, travel prohibitions, and closures, disrupting supply chains and economic activity. The duration of the pandemic’s effects remain uncertain and difficult to assess. The effects of the pandemic may adversely impact the Fund’s performance and its ability to achieve its investment objective.
Management has evaluated the Fund’s related events and transactions that occurred subsequent to October 31, 2020, through the date of issuance of the Fund’s financial statements. Other than as disclosed below, management has determined that there were no subsequent events requiring recognition or disclosure in the financial statements.
On December 8, 2020, capital gains were declared and paid to shareholders of record on December 7, 2020, as follows:
We have audited the accompanying statement of assets and liabilities of the Hennessy Total Return Fund (the “Fund”), a series of Hennessy Funds Trust, including the schedule of investments, as of October 31, 2020, the related statement of operations for the year then ended, the statements of changes in net assets for each of the two years in the period then ended, the financial highlights for each of the four years in the period then ended, and the related notes (collectively referred to as the “financial statements”). In our opinion, the financial statements present fairly, in all material respects, the financial position of the Fund as of October 31, 2020, the results of its operations for the year then ended, the changes in its net assets for each of the two years in the period then ended, and the financial highlights for each of the four years in the period then ended in conformity with accounting principles generally accepted in the United States of America.
The financial highlights for the year ended October 31, 2016 have been audited by other auditors, whose report dated December 22, 2016 expressed unqualified opinion on such financial highlights.
These financial statements are the responsibility of the Fund’s management. Our responsibility is to express an opinion on the Fund’s financial statements based on our audits. We are a public accounting firm registered with the Public Company Accounting Oversight Board (United States) (“PCAOB”) and are required to be independent with respect to the Fund in accordance with the U.S. federal securities laws and the applicable rules and regulations of the Securities and Exchange Commission and the PCAOB. We have served as the auditor of one or more of the funds in the Trust since 2002.
We conducted our audits in accordance with the standards of the PCAOB. Those standards require that we plan and perform the audit to obtain reasonable assurance about whether the financial statements are free of material misstatement, whether due to error or fraud. The Fund is not required to have, nor were we engaged to perform, an audit of its internal control over financial reporting. As part of our audits we are required to obtain an understanding of internal control over financial reporting, but not for the purpose of expressing an opinion on the effectiveness of the Fund’s internal control over financial reporting. Accordingly, we express no such opinion.
Our audits included performing procedures to assess the risks of material misstatement of the financial statements, whether due to error or fraud, and performing procedures that respond to those risks. Such procedures included examining, on a test basis, evidence regarding the amounts and disclosures in the financial statements. Our audits also included evaluating the accounting principles used and significant estimates made by management, as well as evaluating the overall presentation of the financial statements. Our procedures included confirmation of securities owned as of October 31, 2020 by correspondence with the custodian. We believe that our audits provide a reasonable basis for our opinion.
The business and affairs of the Funds are managed under the direction of the Board of Trustees of the Trust, and the Board of Trustees elects the officers of the Trust. From time to time, the Board of Trustees also has appointed advisers to the Board of Trustees (“Advisers”) with the intention of having qualified individuals serve in an advisory capacity to garner experience in the mutual fund and asset management industry and be considered as potential Trustees in the future. There are currently three Advisers: Brian Alexander, Doug Franklin, and Claire Knoles. As Advisers, Mr. Alexander, Mr. Franklin, and Ms. Knoles attend meetings of the Board of Trustees and act as non-voting participants. Information pertaining to the Trustees, Advisers, and the officers of the Trust is set forth below. The Trustees and officers serve until their successors are duly elected and qualified or until their earlier death, resignation, or removal. Each Trustee oversees all 16 Hennessy Funds. Unless otherwise indicated, the address of all persons listed below is 7250 Redwood Boulevard, Suite 200, Novato, CA 94945. The Fund’s Statement of Additional Information includes more information about the persons listed below and is available without charge by calling 1-800-966-4354 or by visiting www.hennessyfunds.com.
As a shareholder of the Fund, you incur ongoing costs, including management fees, service fees, and other Fund expenses. This Example is intended to help you understand your ongoing costs (in dollars) of investing in the Fund and to compare these costs with the ongoing costs of investing in other mutual funds. The Example is based on an investment of $1,000 invested at the beginning of the period and held for the entire period from May 1, 2020, through October 31, 2020.
The first line of the table below provides information about actual account values and actual expenses. You may use the information in this line, together with the amount you invested, to estimate the expenses that you paid over the period. Simply divide your account value by $1,000 (for example, an $8,600 account value divided by $1,000 = 8.6), then multiply the result by the number in the first line under the heading entitled “Expenses Paid During Period” to estimate the expenses you paid on your account during this period. Although the Fund charges no sales loads or transaction fees, you will be assessed fees for outgoing wire transfers, returned checks, and stop payment orders at prevailing rates charged by U.S. Bank Global Fund Services, the Fund’s transfer agent. If you request that a redemption be made by wire transfer, the Fund’s transfer agent charges a $15 fee. IRAs are charged a $15 annual maintenance fee (up to $30 maximum per shareholder for shareholders with multiple IRAs). The example below includes, but is not limited to, management fees, shareholder servicing fees, accounting, custody, and transfer agent fees. However, the example below does not include portfolio trading commissions and related expenses.
The second line of the table below provides information about hypothetical account values and hypothetical expenses based on the Fund’s actual expense ratio and an assumed rate of return of 5% per year before expenses, which is not the Fund’s actual return. The hypothetical account values and expenses may not be used to estimate the actual ending account balance or expenses you paid for the period. You may use this information to compare the ongoing costs of investing in the Fund and other funds. To do so, compare this 5% hypothetical example with the 5% hypothetical examples that appear in the shareholder reports of the other funds. Please note that the expenses shown in the table are meant to highlight your ongoing costs only. Therefore, the second line of the table is useful in comparing ongoing costs only and will not help you determine the relative total costs of owning different funds.
A description of the policies and procedures the Fund uses to determine how to vote proxies relating to portfolio securities is available without charge (1) by calling 1-800-966-4354, (2) on the Hennessy Funds’ website at www.hennessyfunds.com/proxy-voting/voting-policy, or (3) on the U.S. Securities and Exchange Commission’s (the “SEC”) website at www.sec.gov. The Fund’s proxy voting record is available without charge on both the Hennessy Funds’ website at www.hennessyfunds.com/proxy-voting/voting-record and the SEC’s website at www.sec.gov no later than August 31 for the prior 12 months ending June 30.
The Fund files a complete schedule of portfolio holdings with the SEC for the first and third quarters of each fiscal year as an exhibit to its reports on Form N-PORT. The Fund’s Form N-PORT reports are available on the SEC’s website at www.sec.gov or on request by calling 1-800-966-4354.
For fiscal year 2020, certain dividends paid by the Fund may be subject to a maximum tax rate of 23.8%, as provided for by the Jobs and Growth Tax Relief Reconciliation Act of 2003. The percentage of dividends declared from ordinary income designated as qualified dividend income was 100.00%.
For corporate shareholders, the percent of ordinary income distributions that qualified for the corporate dividends received deduction for fiscal year 2020 was 100.00%.
The percentage of taxable ordinary income distributions that were designated as short-term capital gain distributions under Section 871(k)(2)(C) of the Internal Revenue Code of 1986, as amended, for the Fund was 0.00%.
To help keep the Fund’s costs as low as possible, we generally deliver a single copy of shareholder reports, proxy statements, and prospectuses to shareholders who share an address and have the same last name. This process does not apply to account statements. You may request an individual copy of a shareholder document at any time. If you would like to receive separate mailings of shareholder documents, please call U.S. Bank Global Fund Services at 1-800-261-6950 or 1-414-765-4124, and individual delivery will begin within 30 days of your request. If your account is held through a financial institution or other intermediary, please contact such intermediary directly to request individual delivery.
The Fund offers shareholders the option to receive account statements, prospectuses, tax forms, and shareholder reports online. To sign up for eDelivery, please visit www.hennessyfunds.com/account. You may change your delivery preference at any time by visiting our website or calling U.S. Bank Global Fund Services at 1-800-261-6950 or 1-414-765-4124.
In accordance with Rule 22e-4 under the Investment Company Act of 1940, as amended (the “Liquidity Rule”), we have adopted and implemented a liquidity risk management program (the “Liquidity Program”). The purpose of the Liquidity Program is to assess and manage the Fund’s liquidity risk, which is the risk that the Fund would not be able to meet requests to redeem Fund shares without significant dilution of the remaining shareholders’ interests in the Fund. The Board of Trustees of the Fund (the “Board”) designated a committee comprising representatives of Hennessy Advisors, Inc., the investment adviser to the Fund, as the administrator of the Liquidity Program (the “Program Administrator”).
The Program Administrator provided a written report regarding the Liquidity Program to the Board in advance of its meeting on June 3, 2020. The report covered the period from June 1, 2019, through May 31, 2020. The report addressed the operation of the Liquidity Program, assessed the adequacy and effectiveness of its implementation, and described any material changes to the Liquidity Program during the review period. The Trust’s chief compliance officer presented the report to the Board at the meeting and provided additional information regarding the Liquidity Program. The Board reviewed the Liquidity Program and considered, among other items, the following:
We collect this information directly from you, indirectly in the course of providing services to you, directly and indirectly from your activity on our website, from broker dealers, marketing agencies, and other third parties that interact with us in connection with the services we perform and products we offer, and from anonymized and aggregated consumer information.
We use this information to fulfill the reason you provided the information to us, to provide you with other relevant products that you request from us, to provide you with information about products that may interest you, to improve our website or present our website’s contents to you, and as otherwise described to you when collecting your personal information.
We do not disclose any personal information to unaffiliated third parties, except as permitted by law. We may disclose your personal information to our affiliates, vendors, and service providers for a business purpose. For example, we are permitted by law to disclose all of the information we collect, as described above, to our transfer agent to process your transactions. When disclosing your personal information to third parties, we enter into a contract with each third party describing the purpose of such disclosure and requiring that such personal information be kept confidential and not used for any purpose except to perform the services contracted or respond to regulatory or law enforcement requests.
Furthermore, we restrict access to your personal information to those persons who require such information to provide products or services to you. As a result, we do not provide a means for opting out of our limited sharing of your information. We maintain physical, electronic, and procedural safeguards that comply with federal standards to guard your personal information.
If you hold shares of the Funds through a financial intermediary, including, but not limited to, a broker-dealer, bank, or trust company, the privacy policy of your financial intermediary governs how your personal information is shared with unaffiliated third parties.
The California Consumer Privacy Act of 2018 (the “CCPA”) provides you, as a California resident, with certain additional rights relating to your personal information.
Under the CCPA, you have the right to request that we disclose to you the categories of personal information we have collected about you over the past 12 months, the categories of sources of such information, our business purpose for collecting the
information, the categories of third parties, if any, with whom we shared the information, and the specific information we have collected about you. You also have the right to request that we delete any of your personal information, and, unless an exception applies, we will delete such information upon receiving and confirming your request. To make a request, call us at 1-800-966-4354, email us at privacy@hennessyfunds.com, or go to www.hennessyfunds.com/contact. We will not discriminate against you for exercising your rights under the CCPA. Further, we will not collect additional categories of your personal information or use the personal information we collected for materially different, unrelated, or incompatible purposes without providing you notice.
Hennessy Advisors, Inc.
U.S. Bancorp Fund Services, LLC
d/b/a U.S. Bank Global Fund Services
P.O. Box 701
U.S. Bank N.A.
Neil J. Hennessy
Robert T. Doyle
J. Dennis DeSousa
Gerald P. Richardson
others only if preceded or accompanied by a current prospectus.
ANNUAL REPORT
OCTOBER 31, 2020
HENNESSY EQUITY AND INCOME FUND
Investor Class HEIFX
Institutional Class HEIIX
IMPORTANT NOTICE REGARDING ELECTRONIC DELIVERY OF SHAREHOLDER REPORTS
Beginning on January 1, 2021, as permitted by regulations adopted by the Securities and Exchange Commission, paper copies of the annual and semi-annual reports will no longer be sent by mail unless you specifically request paper copies from the Hennessy Funds or from your financial intermediary. Instead, the reports will be made available on a website, and you will be notified by mail each time a report is posted and provided with a website link to access the report.
If you have already elected to receive shareholder reports electronically, you will not be affected by this change and you need not take any action. You may elect to receive shareholder reports and other communications from the Hennessy Funds electronically by visiting www.hennessyfunds.com/account or by calling U.S. Bank Global Fund Services at 1-800-261-6950. If you own shares in a Fund through a financial intermediary, please contact your financial intermediary to make this election.
You may elect to receive paper copies of all future reports free of charge by calling U.S. Bank Global Fund Services at 1-800-261-6950 or, if you own your shares through a financial intermediary, by contacting your financial intermediary. Your election to receive paper copies of reports will apply to all Funds in the Hennessy Funds family.
www.hennessyfunds.com | 1-800-966-4354
(This Page Intentionally Left Blank.)
Contents
| Letter to Shareholders | | 2 |
| Performance Overview | | 4 |
| Financial Statements | | |
| Schedule of Investments | | 8 |
| Statement of Assets and Liabilities | | 18 |
| Statement of Operations | | 19 |
| Statements of Changes in Net Assets | | 21 |
| Financial Highlights | | 22 |
| Notes to the Financial Statements | | 26 |
| Report of Independent Registered Public Accounting Firm | | 35 |
| Trustees and Officers of the Fund | | 36 |
| Expense Example | | 40 |
| Proxy Voting Policy and Proxy Voting Records | | 42 |
| Availability of Quarterly Portfolio Schedule | | 42 |
| Federal Tax Distribution Information | | 42 |
| Important Notice Regarding Delivery of Shareholder Documents | | 42 |
| Electronic Delivery | | 42 |
| Liquidity Risk Management Program | | 43 |
| Privacy Policy | | 43 |
| HENNESSY FUNDS | 1-800-966-4354 | |
December 2020
Dear Hennessy Funds Shareholder:
As a new year and new decade dawned in January, no one could have imagined that the world would quickly plunge into one of the worst health crises in history. Throughout this pandemic, our thoughts have remained with those most deeply affected by COVID-19, and we thank our frontline healthcare and essential workers. At Hennessy Funds, we adapted quickly to the impact of COVID-19 to maintain business continuity. We focused on our employees and on you, the shareholders of the Hennessy Funds, and I am pleased that we have been able to navigate successfully during this unprecedented time.
The year was defined by a global pandemic and the ensuing economic shutdowns and by a highly charged presidential election that caused tremendous volatility. Yet the stock market has continued to show its resiliency and strength, as the major indices hit new all-time highs in November and again in December. For the 12 months ended October 31, 2020, U.S. equities posted positive performance, with the S&P 500® Index returning 9.71% and the Dow Jones Industrial Average returning 0.34% for the period. There were extreme differences in how various sectors performed during the period. For instance, the technology-focused NASDAQ Composite Index performed strongly, returning 32.84%, whereas the Energy sector (as represented by the S&P 500® Energy Sector Index) struggled with a loss of -46.43%. The Financials sector also performed relatively poorly during the period, with the Russell 1000® Index Financials losing -8.04% and the Russell 2000® Index Financials losing -17.87%. In addition, large cap stocks significantly outperformed small caps, and growth stocks reigned over value stocks during the period. Moreover, approximately half of the NASDAQ’s return for the period was comprised of just three behemoth technology stocks – Apple, Microsoft, and Amazon. Therefore, while the overall U.S. equities market improved, mutual fund returns varied drastically due to the disparate performance of specific sectors, differently sized companies, and different types of companies.
Optimism about the approval and distribution of effective COVID-19 vaccines appears to be buoying investor confidence. Low interest rates, and the expectation that they will remain low for the foreseeable future, have also provided a tailwind to equity prices. In my opinion, stocks are trading at reasonable valuations given this low interest rate environment, with the Dow Jones Industrial Average trading at 20.1x estimated earnings for 2021 and the S&P 500® Index trading at 21.6x estimated earnings for 2021. The U.S. economy looks to be on the road to recovery and is experiencing moderate inflation, and our banking industry appears healthy. The unemployment rate is dropping, albeit slowly, and I expect it to continue to improve once businesses reopen. There are high levels of cash on corporate balance sheets, which could support rising dividends and stock buybacks.
I believe our corporate business leaders will continue to adapt and find ways to drive growth and value for their shareholders, but I also feel that the uncertainty created by the continued health crisis and the stalemate over fiscal relief will lead to additional bouts of market volatility. I remain confident, however, that the markets can and will thrive in the long run.
Thank you for your continued trust and investment in the Hennessy Funds. We believe that there continue to be strong opportunities throughout many segments of the market, and we are focused on managing our high-conviction portfolios for the long-term
benefit of our shareholders. Should you have any questions or would like to speak with us directly, please reach out and call us at (800) 966-4354.
Best regards,
Neil J. Hennessy
President and Chief Investment Officer
Past performance does not guarantee future results.
Mutual fund investing involves risk. Principal loss is possible.
The Dow Jones Industrial Average and S&P 500® Index are commonly used to measure the performance of U.S. stocks. The NASDAQ Composite Index comprises all common stocks listed on The NASDAQ Stock Market and is commonly used to measure the performance of technology-related stocks. The S&P 500® Energy Sector Index is comprised of companies included in the S&P 500® Index that are classified in the Energy sector. The Russell 1000® Index Financials and Russell 2000® Index Financials are subsets of the Russell 1000® Index and Russell 2000® Index, respectively, that measure the performance of securities classified in the Financials sector of the large-cap and small-cap U.S. equity market, respectively. One cannot invest directly in an index. All returns are shown on a total return basis.
Forward price to earnings (PE) is a valuation measure calculated by dividing a company’s market price per share by its expected earnings per share over the following 12 months. PEs noted are sourced from Bloomberg as of December 9, 2020.
| HENNESSY FUNDS | 1-800-966-4354 | |
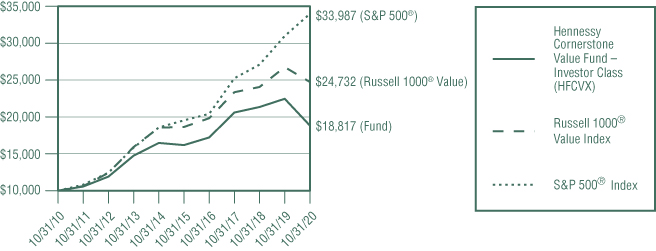
Performance Overview (Unaudited)
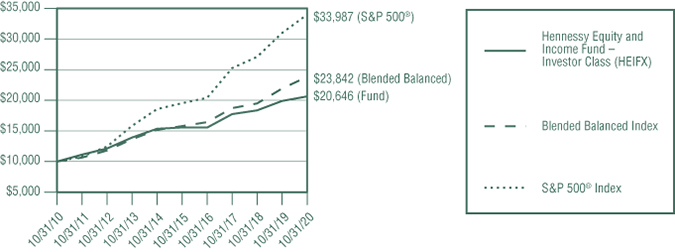
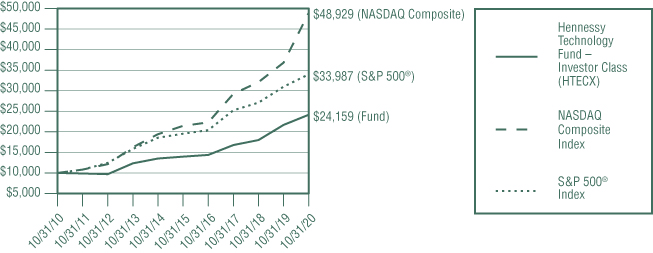
CHANGE IN VALUE OF $10,000 INVESTMENT
This graph illustrates the performance of an initial investment of $10,000 made in the Fund ten years ago and assumes the reinvestment of dividends.
AVERAGE ANNUAL TOTAL RETURN FOR PERIODS ENDED OCTOBER 31, 2020
| | One | Five | Ten |
| | Year
| Years
| Years
|
| Hennessy Equity and Income Fund – | | | |
| Investor Class (HEIFX) | 3.74% | 5.81% | 7.52% |
| Hennessy Equity and Income Fund – | | | |
| Institutional Class (HEIIX) | 4.16% | 6.22% | 7.87% |
| Blended Balanced Index | 8.74% | 8.59% | 9.08% |
S&P 500® Index | 9.71% | 11.71% | 13.01% |
Expense ratios: 1.55% (Investor Class); 1.18% (Institutional Class)
Performance data quoted represents past performance; past performance does not guarantee future results. The investment return and principal value of an investment will fluctuate so that an investor’s shares, when redeemed, may be worth more or less than their original cost. The performance table does not reflect the deduction of taxes that a shareholder would pay on Fund distributions or the redemption of Fund shares. Current performance of the Fund may be lower or higher than the performance quoted. Performance data current to the most recent month end may be obtained by visiting www.hennessyfunds.com. Performance shown for periods including or prior to October 26, 2012, is that of the FBR Balanced Fund.
The Blended Balanced Index consists of 60% common stocks represented by the S&P 500® Index and 40% bonds represented by the Bloomberg Barclays Intermediate U.S. Government/Credit Index, which measures the performance of U.S. dollar-denominated Treasury securities and government-related and investment grade corporate securities that have $250 million or more of outstanding face value, are fixed rate and non-convertible, and have remaining maturities of greater than or equal to one year and less than 10 years. The S&P 500® Index is a capitalization-weighted index that is designed to represent the broad domestic economy through changes in the aggregate market value of 500 stocks across all major industries. One cannot invest directly in an index. These indices are used herein for comparative purposes in accordance with Securities and Exchange Commission regulations.
Standard & Poor’s Financial Services is the source and owner of the S&P® and S&P 500® trademarks.
The expense ratios presented are from the most recent prospectus. The expense ratios for the current reporting period are available in the Financial Highlights section of this report.
PERFORMANCE NARRATIVE
Portfolio Managers for Equity Allocation: Stephen M. Goddard, CFA, Jonathan T. Moody, CFA, J. Brian Campbell, CFA, Mark E. DeVaul, CFA, CPA and Samuel D. Hutchings, CFA
The London Company of Virginia, LLC (sub-advisor)
Portfolio Managers for Fixed Income Allocation: Gary B. Cloud, CFA, and Peter G. Greig, CFA
FCI Advisors (sub-advisor)
Performance:
For the 12-month period ended October 31, 2020, the Investor Class of the Hennessy Equity and Income Fund returned 3.74%, underperforming both the Blended Balanced Index (the Fund’s primary benchmark) and the S&P 500® Index, which returned 8.74% and 9.71%, respectively, for the same period.
Equities: It was a volatile 12-month period for stocks. The market rallied late in 2019, reflecting solid economic data. However, with the initial spread of COVID-19 during the first quarter of 2020, stocks fell significantly as many businesses shut down in response to the virus, pushing the U.S. economy into recession. The Federal Reserve and U.S. Government provided significant monetary and fiscal stimulus to buoy the economy and labor market began to recover, lifting equities beginning in April 2020. The Federal Reserve reduced the federal funds rate to near zero and was very accommodating with quantitative easing and a variety of lending programs. The broader market finished higher for the 12-month period.
In terms of factors impacting stocks over the 12-month period, growth stocks significantly outperformed value stocks across the market cap spectrum. Size and momentum also had positive impacts, while yield and quality had negative impacts. These factors were headwinds to the relative performance of the equity portion of the Fund, reflecting its more defensive positioning and focus on downside protection.
Both stock selection and sector allocation were headwinds to the Fund’s relative performance. The weakest names over the 12-month period included Southwest Airlines Co., Wells Fargo & Company, NewMarket Corporation, Carnival Corporation, and STORE Capital Corporation. The best performing stocks included Apple, Inc., FedEx Corporation, BlackRock, Inc., Alphabet, Inc. (Class C), and Progressive Corporation. The Fund no longer owns Southwest Airlines Co., Wells Fargo & Company, and Carnival Corporation. The Fund still owns the other listed securities.
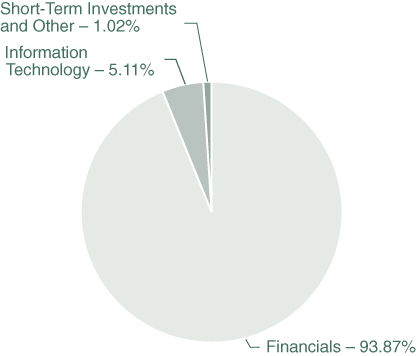
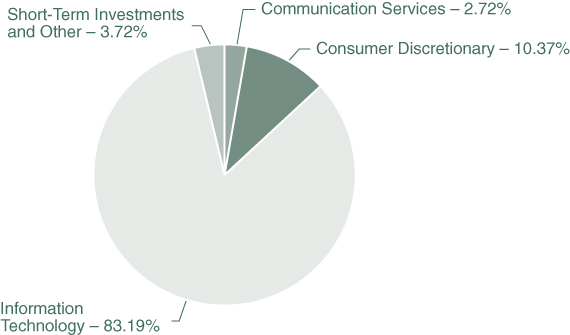
Sector allocation had a slightly negative impact on the Fund’s relative performance. The Fund’s overweight position in Financials and underweight position in Information Technology had a negative impact on relative performance, partially offset by the positive impact of the Fund’s overweight position in Consumer Discretionary and underweight position in Utilities.
Fixed Income: The overweight positions in investment grade corporate credit and core plus holdings were the largest negative contributors to performance within the fixed income allocation over the 12-month period. The extra income and aging from these higher-yielding investment grade securities exceeded the amount represented in the benchmark but underperformed Treasury securities by a wide margin. Core plus securities, consisting mostly of preferred stocks and higher yielding credit-sensitive securities, have
| HENNESSY FUNDS | 1-800-966-4354 | |
added significant value over prior years, but were re-rated lower in light of the COVID-19 pandemic. They underperformed Treasury securities, which have over a 55% weight in the Bloomberg Barclays Capital Intermediate U.S. Government/Credit Index, which is the benchmark for fixed income within the Blended Balanced Index. Portfolio duration, convexity, and non-parallel yield curve factors were fairly neutral compared to the benchmark, while sector and quality variables were negative contributors to performance.
Portfolio Strategy:
The Fund seeks a balanced portfolio with the goal of maintaining broad market exposure with lower volatility. Our bottom-up equity selection strategy seeks companies with strong returns on capital and the flexibility to enhance shareholder value by using their balance sheets. The Fund’s fixed income allocation focuses on high-quality domestic corporate, agency, and government bonds.
Investment Commentary:
Equities: While we are encouraged by the recent improvement in the economic data, we note that risks remain. In the near term, the U.S. economy faces the dual risks of a spike in COVID-19 across parts of the country that could potentially lead to delayed openings or business closings and reduced unemployment benefits that could limit consumer income and consumer spending. Other risks include relatively high valuations for stocks and rising corporate and government debt. Longer term, we remain optimistic about the prospects for the U.S. economy.
Turning to monetary policy, the Federal Reserve has maintained the federal funds rate at 0-0.25% and remains committed to expanding its balance sheet to aid economic growth. We believe the Fed will remain very accommodative going forward, including using emergency lending facilities, if needed. Fed Chair Powell acknowledged that economic indicators continued to show improvement. While economic activity has improved since the lockdown, overall activity and employment remain below pre-pandemic levels. Looking ahead, we believe the chance of the Fed raising rates is very low. The dot plots suggest no rate hikes until 2023 at the earliest. The Federal Open Market Committee expects to keep rates in the current range until labor market conditions have reached maximum employment and inflation has risen to 2% and is on track to moderately exceed 2% for some time.
In terms of the equity market, we continue to believe that quality attributes and strong company fundamentals will lead to strong risk-adjusted returns over time. We believe investors in the Fund have the opportunity to own a group of competitively advantaged businesses (judged by return on capital) with stronger balance sheets (lower net debt/EBITDA) at a valuation roughly in line with the broader market. In an environment of potentially lower expected returns and greater volatility, we believe the Fund offers an attractive option for equity investors.
Fixed Income: It has been a tumultuous year in the fixed income markets as the COVID-19 pandemic and its associated economic lockdowns caused an immediate recession/depression in the global economy. Short-term interest rates were cut to zero once again, while the Fed deployed an expanded playbook to fight a sharp economic downturn and loss of investor confidence. In addition, the Fed completed a multi-year listening tour geared toward trying to better understand why reported inflation statistics have been stubbornly below their 2% target over the past decade or longer. The Fed acknowledged the breakdown in the relationship between employment and inflation and has initiated an average inflation targeting scheme going forward.
The upshot of the new policy framework suggests that short-term rates could be held at the zero bound for an extended period, which may contribute to a steeper yield curve. The primary goal here is to generate a sustainable economic recovery that leads to full employment and some uptick in long-term inflation outcomes. We expect additional stimulus from elected officials will help ensure the economic recovery, which in turn should be supportive of investment grade and below investment grade borrowers. We believe the Fund’s overweight position in investment grade issuers will benefit from these developments.
As we look forward, we believe it is hard not to get excited about the opportunities in a post-COVID-19 world where some level of therapeutic or vaccine becomes widely available. It may be a longer recovery than normal in order to provide all economic stakeholders an opportunity to fully participate in the current economic expansion. The United States offers investors some of the highest government bond rates and the deepest financial markets in the world. The fixed income securities in the Fund should be able to participate in this expansion and provide a cushion in the portfolio when risk markets have their inevitable bouts of volatility.
_______________
Opinions expressed are those of the Portfolio Managers as of the date written and are subject to change, are not guaranteed, and should not be considered investment advice or an indication of trading intent.
Investments in debt securities typically decrease in value when interest rates rise. The risk is greater for longer-term debt securities. Investments by the Fund in lower-rated and non-rated securities presents a greater risk of loss to principal and interest than higher-rated securities. Investments in asset-backed and mortgage-backed securities include additional risks that investors should be aware of including credit risk, prepayment risk, possible illiquidity, and default, as well as increased susceptibility to adverse economic developments. Investments in foreign securities may involve political, economic, and currency risks, greater volatility, and differences in accounting methods. The Fund may experience higher fees due to investments in pooled investment vehicles (including exchange-traded funds). Please see the Fund’s prospectus for a more complete discussion of these and other risks.
References to specific securities should not be considered a recommendation to buy or sell any security. Fund holdings and sector allocations are subject to change. Please refer to the Schedule of Investments included in this report for additional portfolio information.
Duration is a measure of the sensitivity of the price (the value of the principal) of a fixed-income investment to a change in interest rates and is expressed as a number of years. Yield curve is a line that plots the interest rates, at a set point in time, of bonds having equal credit quality, but differing maturity dates. Investment grade is a rating that indicates that a municipal or corporate bond has a relatively low risk of default. Return on capital is a ratio measuring the profitability of a firm expressed as a percentage of funds acquired from investors and lenders. Net Debt to EBITDA is a measurement of leverage, calculated as a company’s liabilities minus cash or cash equivalents, divided by its EBITDA. EBITDA is the acronym for earnings before interest, taxes, depreciation, and amortization, and it is a measure of a company’s operating performance.
| HENNESSY FUNDS | 1-800-966-4354 | |
Financial Statements
Schedule of Investments as of October 31, 2020 |
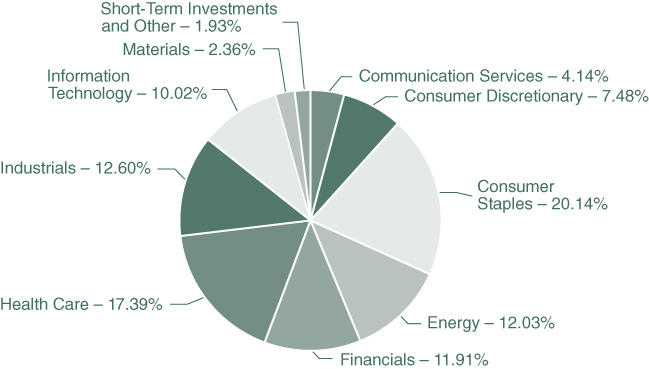
HENNESSY EQUITY AND INCOME FUND
(% of Net Assets)
| TOP TEN HOLDINGS (EXCLUDING MONEY MARKET FUNDS) | % NET ASSETS |
| Apple, Inc. | 4.14% |
| Berkshire Hathaway, Inc., Class B | 3.93% |
| Alphabet, Inc., Class C | 3.62% |
| FedEx Corp. | 2.87% |
| Visa, Inc., Class A | 2.51% |
| Home Depot, Inc. | 2.48% |
| Texas Instruments, Inc. | 2.43% |
| Nestlé S.A. – ADR | 2.34% |
| Norfolk Southern Corp. | 2.31% |
| The Charles Schwab Corp. | 2.27% |
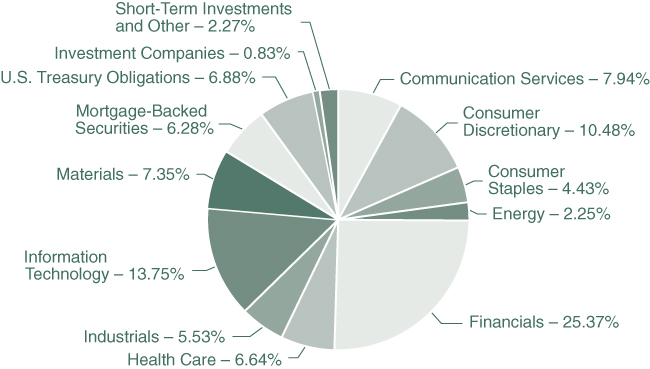
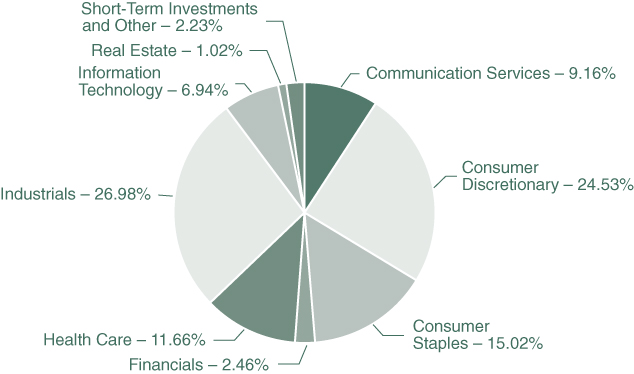
Note: For presentation purposes, the Fund has grouped some of the industry categories. For purposes of categorizing securities for compliance with Section 8(b)(1) of the Investment Company Act of 1940, as amended, the Fund uses more specific industry classifications.
The Global Industry Classification Standard (GICS®) was developed by and is the exclusive property and a service mark of MSCI, Inc. and Standard & Poor’s Financial Services LLC. It has been licensed for use by the Hennessy Funds.
| COMMON STOCKS – 58.14% | | Number | | | | | | % of | |
| | | of Shares | | | Value | | | Net Assets | |
| Communication Services – 6.86% | | | | | | | | | |
| Alphabet, Inc., Class C (a) | | | 2,524 | | | $ | 4,091,429 | | | | 3.62 | % |
| Fox Corp. | | | 52,576 | | | | 1,394,316 | | | | 1.23 | % |
| Verizon Communications, Inc. | | | 39,808 | | | | 2,268,658 | | | | 2.01 | % |
| | | | | | | | 7,754,403 | | | | 6.86 | % |
| | | | | | | | | | | | | |
| Consumer Discretionary – 9.30% | | | | | | | | | | | | |
| CarMax, Inc. (a) | | | 27,236 | | | | 2,354,280 | | | | 2.08 | % |
| Dollar Tree, Inc. (a) | | | 16,397 | | | | 1,480,977 | | | | 1.31 | % |
| Home Depot, Inc. | | | 10,528 | | | | 2,807,923 | | | | 2.48 | % |
| Lowe’s Companies, Inc. | | | 9,021 | | | | 1,426,220 | | | | 1.26 | % |
| O’Reilly Automotive, Inc. (a) | | | 5,613 | | | | 2,450,636 | | | | 2.17 | % |
| | | | | | | | 10,520,036 | | | | 9.30 | % |
| | | | | | | | | | | | | |
| Consumer Staples – 4.28% | | | | | | | | | | | | |
| Altria Group, Inc. | | | 60,604 | | | | 2,186,592 | | | | 1.94 | % |
| Nestlé S.A. – ADR (b) | | | 23,599 | | | | 2,649,460 | | | | 2.34 | % |
| | | | | | | | 4,836,052 | | | | 4.28 | % |
| | | | | | | | | | | | | |
| Energy – 0.16% | | | | | | | | | | | | |
| Enbridge, Inc. (b) | | | 1,575 | | | | 43,407 | | | | 0.04 | % |
| Kinder Morgan, Inc. | | | 3,300 | | | | 39,270 | | | | 0.03 | % |
| Targa Resources Corp. | | | 2,500 | | | | 40,125 | | | | 0.04 | % |
| The Williams Companies, Inc. | | | 3,100 | | | | 59,489 | | | | 0.05 | % |
| | | | | | | | 182,291 | | | | 0.16 | % |
| | | | | | | | | | | | | |
| Financials – 10.30% | | | | | | | | | | | | |
| Berkshire Hathaway, Inc., Class B (a) | | | 21,972 | | | | 4,436,147 | | | | 3.93 | % |
| BlackRock, Inc. | | | 4,076 | | | | 2,442,380 | | | | 2.16 | % |
| The Charles Schwab Corp. | | | 62,455 | | | | 2,567,525 | | | | 2.27 | % |
| The Progressive Corp. | | | 23,912 | | | | 2,197,513 | | | | 1.94 | % |
| | | | | | | | 11,643,565 | | | | 10.30 | % |
| | | | | | | | | | | | | |
| Health Care – 4.27% | | | | | | | | | | | | |
| Bristol-Myers Squibb Co. | | | 21,186 | | | | 1,238,322 | | | | 1.09 | % |
| Johnson & Johnson | | | 14,574 | | | | 1,998,241 | | | | 1.77 | % |
| Pfizer, Inc. | | | 44,780 | | | | 1,588,794 | | | | 1.41 | % |
| | | | | | | | 4,825,357 | | | | 4.27 | % |
| | | | | | | | | | | | | |
| Industrials – 5.18% | | | | | | | | | | | | |
| FedEx Corp. | | | 12,502 | | | | 3,243,894 | | | | 2.87 | % |
| Norfolk Southern Corp. | | | 12,500 | | | | 2,614,000 | | | | 2.31 | % |
| | | | | | | | 5,857,894 | | | | 5.18 | % |
The accompanying notes are an integral part of these financial statements.
| HENNESSY FUNDS | 1-800-966-4354 | |
| COMMON STOCKS | | Number | | | | | | % of | |
| | | of Shares | | | Value | | | Net Assets | |
| Information Technology – 12.05% | | | | | | | | | |
| Apple, Inc. | | | 43,034 | | | $ | 4,684,681 | | | | 4.14 | % |
| Cisco Systems, Inc. | | | 41,330 | | | | 1,483,747 | | | | 1.31 | % |
| Citrix Systems, Inc. | | | 16,534 | | | | 1,872,806 | | | | 1.66 | % |
| Texas Instruments, Inc. | | | 18,966 | | | | 2,742,294 | | | | 2.43 | % |
| Visa, Inc., Class A | | | 15,621 | | | | 2,838,492 | | | | 2.51 | % |
| | | | | | | | 13,622,020 | | | | 12.05 | % |
| | | | | | | | | | | | | |
| Materials – 5.74% | | | | | | | | | | | | |
| Air Products and Chemicals, Inc. | | | 9,113 | | | | 2,517,375 | | | | 2.23 | % |
| Martin Marietta Materials, Inc. | | | 9,159 | | | | 2,439,500 | | | | 2.16 | % |
| NewMarket Corp. | | | 4,279 | | | | 1,530,555 | | | | 1.35 | % |
| | | | | | | | 6,487,430 | | | | 5.74 | % |
| | | | | | | | | | | | | |
| Total Common Stocks | | | | | | | | | | | | |
| (Cost $47,037,851) | | | | | | | 65,729,048 | | | | 58.14 | % |
| | | | | | | | | | | | | |
| PREFERRED STOCKS – 3.13% | | | | | | | | | | | | |
| | | | | | | | | | | | | |
| Communication Services – 0.08% | | | | | | | | | | | | |
| AT&T, Inc., Series C, 4.750%, Perpetual | | | 3,450 | | | | 87,251 | | | | 0.08 | % |
| | | | | | | | | | | | | |
| Consumer Discretionary – 0.02% | | | | | | | | | | | | |
| Ford Motor Co., 6.000%, 12/01/2059 | | | 1,125 | | | | 28,440 | | | | 0.02 | % |
| | | | | | | | | | | | | |
| Consumer Staples – 0.15% | | | | | | | | | | | | |
| CHS, Inc., Series 3, 6.750% to 09/30/2024 then | | | | | | | | | | | | |
| 3 Month LIBOR USD + 4.155%, Perpetual (f) | | | 750 | | | | 19,867 | | | | 0.02 | % |
| CHS, Inc., Series 4, 7.500%, Perpetual | | | 5,280 | | | | 147,946 | | | | 0.13 | % |
| | | | | | | | 167,813 | | | | 0.15 | % |
| | | | | | | | | | | | | |
| Energy – 0.09% | | | | | | | | | | | | |
| Enbridge, Inc., Series B, 6.375% to 04/15/2023 then | | | | | | | | | | | | |
| 3 Month LIBOR USD + 3.593%, 04/15/2078 (b)(f) | | | 4,020 | | | | 102,590 | | | | 0.09 | % |
| | | | | | | | | | | | | |
| Financials – 2.79% | | | | | | | | | | | | |
| AEGON Funding Co. LLC, 5.100%, 12/15/2049 | | | 1,555 | | | | 40,523 | | | | 0.04 | % |
| American International Group, Inc., Series A, 5.850%, Perpetual | | | 2,995 | | | | 81,164 | | | | 0.07 | % |
| Arch Capital Group Ltd., Series F, 5.450%, Perpetual (b) | | | 3,465 | | | | 90,436 | | | | 0.08 | % |
| Axis Capital Holdings Ltd., Series E, 5.500%, Perpetual (b) | | | 1,845 | | | | 47,011 | | | | 0.04 | % |
| BancorpSouth Bank, Series A, 5.500%, Perpetual | | | 1,155 | | | | 30,145 | | | | 0.03 | % |
| Bank of America Corp. | | | | | | | | | | | | |
| Series KK, 5.375%, Perpetual | | | 1,630 | | | | 43,146 | | | | 0.04 | % |
| Series GG, 6.000%, Perpetual | | | 2,455 | | | | 65,868 | | | | 0.06 | % |
The accompanying notes are an integral part of these financial statements.
| PREFERRED STOCKS | | Number | | | | | | % of | |
| | | of Shares | | | Value | | | Net Assets | |
| Financials (Continued) | | | | | | | | | |
| Capital One Financial Corp. | | | | | | | | | |
| Series J, 4.800%, Perpetual | | | 3,660 | | | $ | 90,658 | | | | 0.08 | % |
| Series I, 5.000%, Perpetual | | | 3,650 | | | | 91,798 | | | | 0.08 | % |
| Citigroup, Inc. | | | | | | | | | | | | |
| Series K, 6.875% to 11/15/2023 then | | | | | | | | | | | | |
| 3 Month LIBOR USD + 4.130%, Perpetual (f) | | | 1,645 | | | | 45,632 | | | | 0.04 | % |
| Series J, 7.125% to 09/30/2023 then | | | | | | | | | | | | |
| 3 Month LIBOR USD + 4.040%, Perpetual (f) | | | 2,410 | | | | 68,155 | | | | 0.06 | % |
| Citizens Financial Group, Inc., Series D, 6.350% to 04/06/2024 then | | | | | | | | | | | | |
| 3 Month LIBOR USD + 3.642%, Perpetual (f) | | | 2,075 | | | | 55,195 | | | | 0.05 | % |
| Equitable Holdings, Inc., Series A, 5.250%, Perpetual | | | 2,480 | | | | 62,719 | | | | 0.05 | % |
| Federal Agricultural Mortgage Corp., Series F, 5.250%, Perpetual | | | 1,560 | | | | 41,262 | | | | 0.04 | % |
| Fifth Third Bancorp | | | | | | | | | | | | |
| Series K, 4.950%, Perpetual | | | 3,200 | | | | 83,776 | | | | 0.07 | % |
| Series I, 6.625% to 12/31/2023 then | | | | | | | | | | | | |
| 3 Month LIBOR USD + 3.710%, Perpetual (f) | | | 1,750 | | | | 49,490 | | | | 0.04 | % |
| First Citizens BancShares, Inc., Series A, 5.375%, Perpetual | | | 3,470 | | | | 93,100 | | | | 0.08 | % |
| First Horizon National Corp. | | | | | | | | | | | | |
| Series D, 6.100% to 05/01/2024 then | | | | | | | | | | | | |
| 3 Month LIBOR USD + 3.859%, Perpetual (f) | | | 1,185 | | | | 30,549 | | | | 0.03 | % |
| Series B, 6.625% to 08/01/2025 then | | | | | | | | | | | | |
| 3 Month LIBOR USD + 4.262%, Perpetual (f) | | | 1,920 | | | | 49,383 | | | | 0.04 | % |
| First Republic Bank, Series J, 4.700%, Perpetual | | | 1,025 | | | | 26,691 | | | | 0.02 | % |
| Hartford Financial Services Group, Inc., Series G, 6.000%, Perpetual | | | 2,940 | | | | 80,762 | | | | 0.07 | % |
| Huntington Bancshares, Inc., Series D, 6.250%, Perpetual | | | 4,335 | | | | 111,063 | | | | 0.10 | % |
| JPMorgan Chase & Co., Series GG, 4.750%, Perpetual | | | 3,365 | | | | 89,307 | | | | 0.08 | % |
| KeyCorp | | | | | | | | | | | | |
| Series F, 5.650%, Perpetual | | | 1,455 | | | | 38,543 | | | | 0.03 | % |
| Series E, 6.125% to 12/15/2026 then | | | | | | | | | | | | |
| 3 Month LIBOR USD + 3.892%, Perpetual (f) | | | 2,995 | | | | 84,669 | | | | 0.08 | % |
| Legg Mason, Inc., 5.450%, 09/15/2056 | | | 1,570 | | | | 40,365 | | | | 0.04 | % |
| MetLife, Inc., Series F, 4.750%, Perpetual | | | 2,950 | | | | 77,467 | | | | 0.07 | % |
| Morgan Stanley | | | | | | | | | | | | |
| Series K, 5.850% to 04/15/2027 then | | | | | | | | | | | | |
| 3 Month LIBOR USD + 3.491%, Perpetual (f) | | | 750 | | | | 21,135 | | | | 0.02 | % |
| Series I, 6.375% to 10/15/2024 then | | | | | | | | | | | | |
| 3 Month LIBOR USD + 3.708%, Perpetual (f) | | | 5,420 | | | | 153,169 | | | | 0.13 | % |
| Regions Financial Corp. | | | | | | | | | | | | |
| Series C, 5.700% to 05/15/2029 then | | | | | | | | | | | | |
| 3 Month LIBOR USD + 3.148%, Perpetual (f) | | | 1,840 | | | | 50,508 | | | | 0.04 | % |
| Series B, 6.375% to 09/15/2024 then | | | | | | | | | | | | |
| 3 Month LIBOR USD + 3.536%, Perpetual (f) | | | 3,270 | | | | 92,868 | | | | 0.08 | % |
| State Street Corp., Series D, 5.900% to 03/15/2024 then | | | | | | | | | | | | |
| 3 Month LIBOR USD + 3.108%, Perpetual (f) | | | 4,360 | | | | 119,900 | | | | 0.11 | % |
The accompanying notes are an integral part of these financial statements.
| HENNESSY FUNDS | 1-800-966-4354 | |
| PREFERRED STOCKS | | Number | | | | | | % of | |
| | | of Shares | | | Value | | | Net Assets | |
| Financials (Continued) | | | | | | | | | |
| SVB Financial Group, Series A, 5.250%, Perpetual | | | 2,415 | | | $ | 62,742 | | | | 0.06 | % |
| Synchrony Financial, Series A, 5.625%, Perpetual | | | 3,890 | | | | 97,600 | | | | 0.09 | % |
| Synovus Financial Corp. | | | | | | | | | | | | |
| Series E, 5.875% to 07/01/2024 then | | | | | | | | | | | | |
| 5 Year CMT Rate + 4.127%, Perpetual (f) | | | 1,615 | | | | 41,619 | | | | 0.04 | % |
| Series D, 6.300% to 06/21/2023 then | | | | | | | | | | | | |
| 3 Month LIBOR USD + 3.352%, Perpetual (f) | | | 1,520 | | | | 39,079 | | | | 0.03 | % |
| TCF Financial Corp., Series C, 5.700%, Perpetual | | | 1,510 | | | | 39,562 | | | | 0.03 | % |
| The Allstate Corp. | | | | | | | | | | | | |
| Series H, 5.100%, Perpetual | | | 2,305 | | | | 61,728 | | | | 0.06 | % |
| Series G, 5.625%, Perpetual | | | 3,375 | | | | 93,352 | | | | 0.08 | % |
| The Goldman Sachs Group, Inc. | | | | | | | | | | | | |
| Series K, 6.375% to 05/10/2024 then | | | | | | | | | | | | |
| 3 Month LIBOR USD + 3.550%, Perpetual (f) | | | 1,930 | | | | 53,615 | | | | 0.05 | % |
| Series J, 5.500% to 05/10/2023 then | | | | | | | | | | | | |
| 3 Month LIBOR USD + 3.640%, Perpetual (f) | | | 2,020 | | | | 52,944 | | | | 0.05 | % |
| Truist Financial Corp. | | | | | | | | | | | | |
| Series R, 4.750%, Perpetual (a) | | | 3,200 | | | | 83,488 | | | | 0.07 | % |
| Series O, 5.250%, Perpetual | | | 3,250 | | | | 87,588 | | | | 0.08 | % |
| U.S. Bancorp | | | | | | | | | | | | |
| Series F, 6.500% to 01/15/2022 then | | | | | | | | | | | | |
| 3 Month LIBOR USD + 4.468%, Perpetual (d)(f) | | | 2,090 | | | | 55,740 | | | | 0.05 | % |
| Series B, 3.500% to 12/01/2020 then | | | | | | | | | | | | |
| 3 Month LIBOR USD + 0.600%, Perpetual (f) | | | 2,980 | | | | 67,765 | | | | 0.06 | % |
| Wells Fargo & Co. | | | | | | | | | | | | |
| Series Z, 4.750%, Perpetual | | | 3,490 | | | | 87,180 | | | | 0.08 | % |
| Series R, 6.625% to 03/15/2024 then | | | | | | | | | | | | |
| 3 Month LIBOR USD + 3.690%, Perpetual (f) | | | 3,045 | | | | 85,230 | | | | 0.07 | % |
| | | | | | | | 3,155,689 | | | | 2.79 | % |
| | | | | | | | | | | | | |
| Total Preferred Stocks | | | | | | | | | | | | |
| (Cost $3,373,049) | | | | | | | 3,541,783 | | | | 3.13 | % |
| | | | | | | | | | | | | |
| REITS – 2.58% | | | | | | | | | | | | |
| | | | | | | | | | | | | |
| Financials – 2.58% | | | | | | | | | | | | |
| Annaly Capital Management, Inc., Series F, 6.950% to 09/30/2022 | | | | | | | | | | | | |
| then 3 Month LIBOR USD + 4.993%, Perpetual (f) | | | 2,720 | | | | 61,227 | | | | 0.05 | % |
| Apollo Commercial Real Estate Finance, Inc. | | | 4,130 | | | | 35,931 | | | | 0.03 | % |
| Chimera Investment Corp. | | | 2,930 | | | | 24,465 | | | | 0.02 | % |
| Chimera Investment Corp. | | | | | | | | | | | | |
| Series A, 8.000%, Perpetual | | | 2,635 | | | | 59,525 | | | | 0.05 | % |
| Series B, 8.000% to 03/30/2024 then | | | | | | | | | | | | |
| 3 Month LIBOR USD + 5.791%, Perpetual (f) | | | 1,320 | | | | 27,324 | | | | 0.03 | % |
The accompanying notes are an integral part of these financial statements.
| REITS | Number of Shares/ | | | | | % of | |
| | | Par Amount | | | Value | | | Net Assets | |
| Financials (Continued) | | | | | | | | | |
| Kimco Realty Corp. Series M, 5.250%, Perpetual | | | 1,835 | | | $ | 47,031 | | | | 0.04 | % |
| Monmouth Real Estate Investment Corp., Series C, 6.125%, Perpetual | | | 3,195 | | | | 79,556 | | | | 0.07 | % |
| Starwood Property Trust, Inc. | | | 2,730 | | | | 38,138 | | | | 0.03 | % |
| STORE Capital Corp. | | | 96,523 | | | | 2,480,641 | | | | 2.20 | % |
| Vornado Realty Trust, Series M, 5.250%, Perpetual | | | 2,565 | | | | 62,432 | | | | 0.06 | % |
| | | | | | | | | | | | | |
| Total REITS | | | | | | | | | | | | |
| (Cost $2,977,326) | | | | | | | 2,916,270 | | | | 2.58 | % |
| | | | | | | | | | | | | |
| CORPORATE BONDS – 19.89% | | | | | | | | | | | | |
| | | | | | | | | | | | | |
| Communication Services – 1.00% | | | | | | | | | | | | |
| AT&T, Inc., 4.250%, 03/01/2027 | | | 980,000 | | | | 1,128,018 | | | | 1.00 | % |
| | | | | | | | | | | | | |
| Consumer Discretionary – 1.16% | | | | | | | | | | | | |
| Alibaba Group Holding Ltd., 3.600%, 11/28/2024 (b) | | | 1,000,000 | | | | 1,095,270 | | | | 0.97 | % |
| Starbucks Corp., 4.450%, 08/15/2049 | | | 175,000 | | | | 213,328 | | | | 0.19 | % |
| | | | | | | | 1,308,598 | | | | 1.16 | % |
| | | | | | | | | | | | | |
| Energy – 2.00% | | | | | | | | | | | | |
| Canadian Natural Resources Ltd., 3.900%, 02/01/2025 (b) | | | 1,000,000 | | | | 1,080,324 | | | | 0.96 | % |
| Husky Energy, Inc., 4.000%, 04/15/2024 (b) | | | 750,000 | | | | 778,303 | | | | 0.69 | % |
| Ovintiv, Inc., 3.900%, 11/15/2021 | | | 400,000 | | | | 400,955 | | | | 0.35 | % |
| | | | | | | | 2,259,582 | | | | 2.00 | % |
| | | | | | | | | | | | | |
| Financials – 9.70% | | | | | | | | | | | | |
| Aflac, Inc., 3.600%, 04/01/2030 | | | 300,000 | | | | 348,346 | | | | 0.31 | % |
| Dell International LLC / EMC Corp., 5.450%, 06/15/2023 (e) | | | 1,220,000 | | | | 1,342,878 | | | | 1.19 | % |
| Discover Financial Services, 5.200%, 04/27/2022 | | | 900,000 | | | | 958,114 | | | | 0.85 | % |
| General Motors Financial Co, Inc., 3.700%, 05/09/2023 | | | 1,075,000 | | | | 1,130,403 | | | | 1.00 | % |
| Huntington Bancshares, Inc. | | | | | | | | | | | | |
| 2.550%, 02/04/2030 | | | 525,000 | | | | 547,575 | | | | 0.48 | % |
| 4.000%, 05/15/2025 | | | 365,000 | | | | 413,580 | | | | 0.37 | % |
| Prudential Financial, Inc., 3.878%, 03/27/2028 | | | 400,000 | | | | 467,721 | | | | 0.41 | % |
| Raymond James Financial, Inc. | | | | | | | | | | | | |
| 3.625%, 09/15/2026 | | | 1,500,000 | | | | 1,723,689 | | | | 1.53 | % |
| 5.625%, 04/01/2024 | | | 700,000 | | | | 807,142 | | | | 0.71 | % |
| Synchrony Financial | | | | | | | | | | | | |
| 3.750%, 08/15/2021 | | | 350,000 | | | | 356,404 | | | | 0.31 | % |
| 3.950%, 12/01/2027 | | | 650,000 | | | | 709,450 | | | | 0.63 | % |
| Synovus Financial Corp., 3.125%, 11/01/2022 | | | 1,300,000 | | | | 1,343,857 | | | | 1.19 | % |
The accompanying notes are an integral part of these financial statements.
| HENNESSY FUNDS | 1-800-966-4354 | |
| CORPORATE BONDS | | | | | | | | % of | |
| | | Par Amount | | | Value | | | Net Assets | |
| Financials (Continued) | | | | | | | | | |
| Willis North America, Inc., 3.600%, 05/15/2024 | | | 750,000 | | | $ | 818,722 | | | | 0.72 | % |
| | | | | | | | 10,967,881 | | | | 9.70 | % |
| | | | | | | | | | | | | |
| Health Care – 2.37% | | | | | | | | | | | | |
| Bristol-Myers Squibb Co., 3.625%, 05/15/2024 | | | 1,000,000 | | | | 1,098,769 | | | | 0.97 | % |
| Edwards Lifesciences Corp., 4.300%, 06/15/2028 | | | 700,000 | | | | 828,604 | | | | 0.73 | % |
| Evernorth Health, Inc., 3.500%, 06/15/2024 | | | 700,000 | | | | 755,299 | | | | 0.67 | % |
| | | | | | | | 2,682,672 | | | | 2.37 | % |
| | | | | | | | | | | | | |
| Industrials – 0.35% | | | | | | | | | | | | |
| General Electric Co., 3.625%, 05/01/2030 | | | 380,000 | | | | 401,769 | | | | 0.35 | % |
| | | | | | | | | | | | | |
| Information Technology – 1.70% | | | | | | | | | | | | |
| Autodesk, Inc., 2.850%, 01/15/2030 | | | 675,000 | | | | 743,615 | | | | 0.66 | % |
| Corning, Inc., 6.850%, 03/01/2029 | | | 275,000 | | | | 359,952 | | | | 0.32 | % |
| PayPal Holdings, Inc., 2.850%, 10/01/2029 | | | 750,000 | | | | 819,860 | | | | 0.72 | % |
| | | | | | | | 1,923,427 | | | | 1.70 | % |
| | | | | | | | | | | | | |
| Materials – 1.61% | | | | | | | | | | | | |
| AngloGold Ashanti Holdings PLC, 5.125%, 08/01/2022 (b) | | | 1,000,000 | | | | 1,057,370 | | | | 0.94 | % |
| Goldcorp, Inc., 3.625%, 06/09/2021 | | | 750,000 | | | | 757,613 | | | | 0.67 | % |
| | | | | | | | 1,814,983 | | | | 1.61 | % |
| | | | | | | | | | | | | |
| Total Corporate Bonds | | | | | | | | | | | | |
| (Cost $20,766,667) | | | | | | | 22,486,930 | | | | 19.89 | % |
| | | | | | | | | | | | | |
| MORTGAGE-BACKED SECURITIES – 6.28% | | | | | | | | | | | | |
| | | | | | | | | | | | | |
| Fannie Mae Pool | | | | | | | | | | | | |
| 3.000%, 10/01/2043 | | | 1,644,889 | | | | 1,747,987 | | | | 1.55 | % |
| 3.500%, 01/01/2042 | | | 326,958 | | | | 352,141 | | | | 0.31 | % |
| 4.000%, 10/01/2041 | | | 373,460 | | | | 410,043 | | | | 0.36 | % |
| 4.000%, 12/01/2041 | | | 329,898 | | | | 362,606 | | | | 0.32 | % |
| 6.000%, 10/01/2037 | | | 120,529 | | | | 140,971 | | | | 0.13 | % |
| Fannie Mae REMICS | | | | | | | | | | | | |
| Series 2013-52, 1.250%, 06/25/2043 | | | 96,946 | | | | 96,199 | | | | 0.08 | % |
| Series 2012-22, 2.000%, 11/25/2040 | | | 62,983 | | | | 64,176 | | | | 0.06 | % |
| Series 2012-16, 2.000%, 11/25/2041 | | | 76,185 | | | | 78,902 | | | | 0.07 | % |
| Series 2010-134, 2.250%, 03/25/2039 | | | 47,992 | | | | 48,601 | | | | 0.04 | % |
| Freddie Mac Gold Pool | | | | | | | | | | | | |
| 3.000%, 05/01/2042 | | | 625,248 | | | | 663,039 | | | | 0.59 | % |
| 3.000%, 09/01/2042 | | | 1,170,477 | | | | 1,242,550 | | | | 1.10 | % |
| 3.500%, 01/01/2048 | | | 1,055,268 | | | | 1,132,731 | | | | 1.00 | % |
| 5.500%, 04/01/2037 | | | 52,156 | | | | 60,802 | | | | 0.05 | % |
The accompanying notes are an integral part of these financial statements.
| MORTGAGE-BACKED SECURITIES | Number of Shares/ | | | | | % of | |
| | | Par Amount | | | Value | | | Net Assets | |
| Freddie Mac REMICS | | | | | | | | | |
| Series 4146, 1.500%, 10/15/2042 | | | 31,674 | | | $ | 31,888 | | | | 0.03 | % |
| Series 4309, 2.000%, 10/15/2043 | | | 65,034 | | | | 66,951 | | | | 0.06 | % |
| Series 3928, 2.500%, 08/15/2040 | | | 91,765 | | | | 93,645 | | | | 0.08 | % |
| Series 3870, 2.750%, 01/15/2041 | | | 39,233 | | | | 40,615 | | | | 0.04 | % |
| Series 4016, 3.000%, 09/15/2039 | | | 125,754 | | | | 126,650 | | | | 0.11 | % |
| Series 4322, 3.000%, 05/15/2043 | | | 167,620 | | | | 174,498 | | | | 0.15 | % |
| Government National Mortgage Association, | | | | | | | | | | | | |
| Series 2013-24. 1.750%, 02/16/2043 | | | 159,984 | | | | 163,702 | | | | 0.15 | % |
| | | | | | | | | | | | | |
| Total Mortgage-Backed Securities | | | | | | | | | | | | |
| (Cost $6,700,322) | | | | | | | 7,098,697 | | | | 6.28 | % |
| | | | | | | | | | | | | |
| U.S. TREASURY OBLIGATIONS – 6.88% | | | | | | | | | | | | |
| | | | | | | | | | | | | |
| U.S. Treasury Notes – 6.88% | | | | | | | | | | | | |
| U.S. Treasury Notes | | | | | | | | | | | | |
| 0.625%, 03/31/2027 | | | 1,250,000 | | | | 1,254,492 | | | | 1.11 | % |
| 0.625%, 08/15/2030 | | | 750,000 | | | | 733,652 | | | | 0.65 | % |
| 1.750%, 05/15/2023 | | | 1,000,000 | | | | 1,040,000 | | | | 0.92 | % |
| 1.875%, 07/31/2026 | | | 1,775,000 | | | | 1,915,059 | | | | 1.69 | % |
| 2.750%, 02/15/2024 | | | 1,575,000 | | | | 1,705,860 | | | | 1.51 | % |
| 3.000%, 10/31/2025 | | | 450,000 | | | | 508,184 | | | | 0.45 | % |
| 3.125%, 11/15/2028 | | | 520,000 | | | | 617,825 | | | | 0.55 | % |
| | | | | | | | | | | | | |
| Total U.S. Treasury Obligations | | | | | | | | | | | | |
| (Cost $7,431,910) | | | | | | | 7,775,072 | | | | 6.88 | % |
| | | | | | | | | | | | | |
| INVESTMENT COMPANIES (EXCLUDING | | | | | | | | | | | | |
| MONEY MARKET FUNDS) – 0.83% | | | | | | | | | | | | |
| | | | | | | | | | | | | |
| Financials – 0.51% | | | | | | | | | | | | |
| Apollo Investment Corp. | | | 4,375 | | | | 33,119 | | | | 0.03 | % |
| Ares Capital Corp. | | | 3,345 | | | | 46,261 | | | | 0.04 | % |
| Bain Capital Specialty Finance, Inc. | | | 3,380 | | | | 30,961 | | | | 0.03 | % |
| BlackRock TCP Capital Corp. | | | 4,790 | | | | 44,307 | | | | 0.04 | % |
| FS KKR Capital Corp. | | | 3,013 | | | | 43,990 | | | | 0.04 | % |
| Golub Capital BDC, Inc. | | | 3,200 | | | | 40,672 | | | | 0.03 | % |
| Hercules Capital, Inc. | | | 4,625 | | | | 51,800 | | | | 0.05 | % |
| Monroe Capital Corp. | | | 6,150 | | | | 40,283 | | | | 0.03 | % |
| New Mountain Finance Corp. | | | 4,755 | | | | 43,104 | | | | 0.04 | % |
| Oaktree Specialty Lending Corp. | | | 11,905 | | | | 54,287 | | | | 0.05 | % |
| Sixth Street Specialty Lending, Inc. | | | 2,650 | | | | 43,619 | | | | 0.04 | % |
| TCG BDC, Inc. | | | 5,235 | | | | 43,031 | | | | 0.04 | % |
| TriplePoint Venture Growth BDC Corp. | | | 5,675 | | | | 59,871 | | | | 0.05 | % |
| | | | | | | | 575,305 | | | | 0.51 | % |
The accompanying notes are an integral part of these financial statements.
| HENNESSY FUNDS | 1-800-966-4354 | |
| INVESTMENT COMPANIES (EXCLUDING | | Number | | | | | | % of | |
| MONEY MARKET FUNDS) | | of Shares | | | Value | | | Net Assets | |
| | | | | | | | | | |
| Other Investment Companies – 0.32% | | | | | | | | | |
| Vanguard High-Yield Corporate Fund | | | 62,348 | | | $ | 360,369 | | | | 0.32 | % |
| | | | | | | | | | | | | |
| Total Investment Companies (Excluding | | | | | | | | | | | | |
| Money Market Funds) | | | | | | | | | | | | |
| (Cost $1,247,696) | | | | | | | 935,674 | | | | 0.83 | % |
| | | | | | | | | | | | | |
| SHORT-TERM INVESTMENTS – 2.07% | | | | | | | | | | | | |
| | | | | | | | | | | | | |
| Money Market Funds – 2.07% | | | | | | | | | | | | |
| First American Government Obligations Fund, | | | | | | | | | | | | |
| Institutional Class, 0.05% (c) | | | 2,338,843 | | | | 2,338,843 | | | | 2.07 | % |
| | | | | | | | | | | | | |
| Total Short-Term Investments | | | | | | | | | | | | |
| (Cost $2,338,843) | | | | | | | 2,338,843 | | | | 2.07 | % |
| | | | | | | | | | | | | |
| Total Investments | | | | | | | | | | | | |
| (Cost $91,873,664) – 99.80% | | | | | | | 112,822,317 | | | | 99.80 | % |
| Other Assets in Excess of Liabilities – 0.20% | | | | | | | 223,071 | | | | 0.20 | % |
| | | | | | | | | | | | | |
TOTAL NET ASSETS – 100.00% | | | | | | $ | 113,045,388 | | | | 100.00 | % |
Percentages are stated as a percent of net assets.
ADR – American Depositary Receipt
PLC – Public Limited Company
REIT – Real Estate Investment Trust
| (a) | Non-income-producing security. |
| (b) | U.S.-traded security of a foreign corporation. |
| (c) | The rate listed is the fund’s seven-day yield as of October 31, 2020. |
| (d) | Investment in affiliated security for the period from November 1, 2019, through March 30, 2020. Quasar Distributors, LLC, which serves as the Fund’s distributor, was a subsidiary of U.S. Bancorp Fund Services, LLC through March 30, 2020. Details of transactions with this affiliated company for the period November 1, 2019, through March 30, 2020, are as follows: |
| | | | Preferred Stocks | | |
| | | | U.S. Bancorp | | |
| | Beginning Cost – November 1, 2019 | | $ | 79,260 | | |
| | Purchase Cost | | $ | 9,634 | | |
| | Sales Cost | | $ | (28,766 | ) | |
| | Ending Cost – March 30, 2020 | | $ | 60,128 | | |
| | Dividend Income | | $ | 2,110 | | |
| | Net Change in Unrealized Appreciation/Depreciation | | $ | (1,592 | ) | |
| | Realized Gain/Loss | | $ | (3,290 | ) | |
| | Shares | | | 2,090 | | |
| | Market Value – March 30, 2020 | | $ | 54,653 | | |
| (e) | Rule 144A security. Security is exempt from registration pursuant to Rule 144A under the Securities Act of 1933, as amended. Rule 144A securities may be resold in transactions exempt from registration to qualified institutional investors. As of October 31, 2020, the market value of this security totaled $1,342,878 which represents 1.19% of net assets. |
| (f) | Variable rate security; rate disclosed is the rate as of October 31, 2020. |
The accompanying notes are an integral part of these financial statements.
Summary of Fair Value Exposure as of October 31, 2020
The following is a summary of the inputs used to value the Fund’s net assets as of October 31, 2020 (see Note 3 in the accompanying Notes to the Financial Statements):
| Common Stocks | | Level 1 | | | Level 2 | | | Level 3 | | | Total | |
| Communication Services | | $ | 7,754,403 | | | $ | — | | | $ | — | | | $ | 7,754,403 | |
| Consumer Discretionary | | | 10,520,036 | | | | — | | | | — | | | | 10,520,036 | |
| Consumer Staples | | | 4,836,052 | | | | — | | | | — | | | | 4,836,052 | |
| Energy | | | 182,291 | | | | — | | | | — | | | | 182,291 | |
| Financials | | | 11,643,565 | | | | — | | | | — | | | | 11,643,565 | |
| Health Care | | | 4,825,357 | | | | — | | | | — | | | | 4,825,357 | |
| Industrials | | | 5,857,894 | | | | — | | | | — | | | | 5,857,894 | |
| Information Technology | | | 13,622,020 | | | | — | | | | — | | | | 13,622,020 | |
| Materials | | | 6,487,430 | | | | — | | | | — | | | | 6,487,430 | |
| Total Common Stocks | | $ | 65,729,048 | | | $ | — | | | $ | — | | | $ | 65,729,048 | |
| Preferred Stocks | | | | | | | | | | | | | | | | |
| Communication Services | | $ | 87,251 | | | $ | — | | | $ | — | | | $ | 87,251 | |
| Consumer Discretionary | | | 28,440 | | | | — | | | | — | | | | 28,440 | |
| Consumer Staples | | | 167,813 | | | | — | | | | — | | | | 167,813 | |
| Energy | | | 102,590 | | | | — | | | | — | | | | 102,590 | |
| Financials | | | 3,155,689 | | | | — | | | | — | | | | 3,155,689 | |
| Total Preferred Stocks | | $ | 3,541,783 | | | $ | — | | | $ | — | | | $ | 3,541,783 | |
| REITS | | | | | | | | | | | | | | | | |
| Financials | | $ | 2,916,270 | | | $ | — | | | $ | — | | | $ | 2,916,270 | |
| Total REITS | | $ | 2,916,270 | | | $ | — | | | $ | — | | | $ | 2,916,270 | |
| Corporate Bonds | | | | | | | | | | | | | | | | |
| Communication Services | | $ | — | | | $ | 1,128,018 | | | $ | — | | | $ | 1,128,018 | |
| Consumer Discretionary | | | — | | | | 1,308,598 | | | | — | | | | 1,308,598 | |
| Energy | | | — | | | | 2,259,582 | | | | — | | | | 2,259,582 | |
| Financials | | | — | | | | 10,967,881 | | | | — | | | | 10,967,881 | |
| Health Care | | | — | | | | 2,682,672 | | | | — | | | | 2,682,672 | |
| Industrials | | | — | | | | 401,769 | | | | — | | | | 401,769 | |
| Information Technology | | | — | | | | 1,923,427 | | | | — | | | | 1,923,427 | |
| Materials | | | — | | | | 1,814,983 | | | | — | | | | 1,814,983 | |
| Total Corporate Bonds | | $ | — | | | $ | 22,486,930 | | | $ | — | | | $ | 22,486,930 | |
| Mortgage-Backed Securities | | $ | — | | | $ | 7,098,697 | | | $ | — | | | $ | 7,098,697 | |
| U.S. Treasury Obligations | | | | | | | | | | | | | | | | |
| U.S. Treasury Notes | | $ | — | | | $ | 7,775,072 | | | $ | — | | | $ | 7,775,072 | |
| Total U.S. Treasury Obligations | | $ | — | | | $ | 7,775,072 | | | $ | — | | | $ | 7,775,072 | |
| Investment Companies (Excluding | | | | | | | | | | | | | | | | |
| Money Market Funds) | | | | | | | | | | | | | | | | |
| Financials | | $ | 575,305 | | | $ | — | | | $ | — | | | $ | 575,305 | |
| Other Investment Companies | | | 360,369 | | | | — | | | | — | | | | 360,369 | |
| Total Investment Companies (Excluding | | | | | | | | | | | | | | | | |
| Money Market Funds) | | $ | 935,674 | | | $ | — | | | $ | — | | | $ | 935,674 | |
| Short-Term Investments | | | | | | | | | | | | | | | | |
| Money Market Funds | | $ | 2,338,843 | | | $ | — | | | $ | — | | | $ | 2,338,843 | |
| Total Short-Term Investments | | $ | 2,338,843 | | | $ | — | | | $ | — | | | $ | 2,338,843 | |
| Total Investments | | $ | 75,461,618 | | | $ | 37,360,699 | | | $ | — | | | $ | 112,822,317 | |
The accompanying notes are an integral part of these financial statements.
| HENNESSY FUNDS | 1-800-966-4354 | |
Financial Statements
Statement of Assets and Liabilities as of October 31, 2020 |
| ASSETS: | | | |
| Investments in securities, at value (cost $91,873,664) | | $ | 112,822,317 | |
| Dividends and interest receivable | | | 398,527 | |
| Receivable for fund shares sold | | | 172,477 | |
| Prepaid expenses and other assets | | | 21,235 | |
| Total assets | | | 113,414,556 | |
| | | | | |
| LIABILITIES: | | | | |
| Payable for fund shares redeemed | | | 190,884 | |
| Payable to advisor | | | 79,533 | |
| Payable to administrator | | | 24,276 | |
| Payable to auditor | | | 23,104 | |
| Accrued distribution fees | | | 8,144 | |
| Accrued service fees | | | 4,548 | |
| Accrued trustees fees | | | 3,937 | |
| Accrued expenses and other payables | | | 34,742 | |
| Total liabilities | | | 369,168 | |
| NET ASSETS | | $ | 113,045,388 | |
| | | | | |
| NET ASSETS CONSISTS OF: | | | | |
| Capital stock | | $ | 85,981,123 | |
| Total distributable earnings | | | 27,064,265 | |
| Total net assets | | $ | 113,045,388 | |
| | | | | |
| NET ASSETS: | | | | |
| Investor Class | | | | |
| Shares authorized (no par value) | | Unlimited | |
| Net assets applicable to outstanding shares | | $ | 51,291,589 | |
| Shares issued and outstanding | | | 3,391,553 | |
| Net asset value, offering price, and redemption price per share | | $ | 15.12 | |
| | | | | |
| Institutional Class | | | | |
| Shares authorized (no par value) | | Unlimited | |
| Net assets applicable to outstanding shares | | $ | 61,753,799 | |
| Shares issued and outstanding | | | 4,342,884 | |
| Net asset value, offering price, and redemption price per share | | $ | 14.22 | |
The accompanying notes are an integral part of these financial statements.
| STATEMENT OF ASSETS AND LIABILITIES/STATEMENT OF OPERATIONS |
Financial Statements
Statement of Operations for the year ended October 31, 2020 |
| INVESTMENT INCOME: | | | |
Dividend income from unaffiliated securities(1) | | $ | 1,970,215 | |
Dividend income from affiliated securities(2) | | | 2,110 | |
| Interest income | | | 1,384,354 | |
| Total investment income | | | 3,356,679 | |
| | | | | |
| EXPENSES: | | | | |
| Investment advisory fees (See Note 5) | | | 1,046,354 | |
| Sub-transfer agent expenses – Investor Class (See Note 5) | | | 137,167 | |
| Sub-transfer agent expenses – Institutional Class (See Note 5) | | | 63,062 | |
| Administration, accounting, custody, and transfer agent fees (See Note 5) | | | 153,536 | |
| Distribution fees – Investor Class (See Note 5) | | | 94,391 | |
| Service fees – Investor Class (See Note 5) | | | 62,927 | |
| Federal and state registration fees | | | 38,335 | |
| Compliance expense (See Note 5) | | | 27,706 | |
| Audit fees | | | 23,107 | |
| Reports to shareholders | | | 15,616 | |
| Trustees’ fees and expenses | | | 15,491 | |
| Legal fees | | | 3,130 | |
| Interest expense (See Note 7) | | | 90 | |
| Other expenses | | | 17,469 | |
| Total expenses | | | 1,698,381 | |
| NET INVESTMENT INCOME | | $ | 1,658,298 | |
| | | | | |
| REALIZED AND UNREALIZED GAINS (LOSSES): | | | | |
| Net realized gain (loss) on investments: | | | | |
| Unaffiliated investments | | $ | 8,397,229 | |
Affiliated investments(2) | | | (3,290 | ) |
| Net change in unrealized appreciation/depreciation on investments: | | | | |
| Unaffiliated investments | | | (5,502,106 | ) |
Affiliated investments(2) | | | (1,592 | ) |
| Net gain on investments | | | 2,890,241 | |
| NET INCREASE IN NET ASSETS RESULTING FROM OPERATIONS | | $ | 4,548,539 | |
(1) | Net of foreign taxes withheld of $12,014. |
(2) | Investment in affiliated security for the period from November 1, 2019, through March 30, 2020. |
The accompanying notes are an integral part of these financial statements.
| HENNESSY FUNDS | 1-800-966-4354 | |
(This Page Intentionally Left Blank.)
| STATEMENTS OF CHANGES IN NET ASSETS |
Financial Statements
| Statements of Changes in Net Assets |
| | | Year Ended | | | Year Ended | |
| | | October 31, 2020 | | | October 31, 2019 | |
| OPERATIONS: | | | | | | |
| Net investment income | | $ | 1,658,298 | | | $ | 2,527,023 | |
| Net realized gain on investments | | | 8,393,939 | | | | 12,163,724 | |
| Net change in unrealized | | | | | | | | |
| appreciation/depreciation on investments | | | (5,503,698 | ) | | | 257,624 | |
| Net increase in net assets resulting from operations | | | 4,548,539 | | | | 14,948,371 | |
| | | | | | | | | |
| DISTRIBUTIONS TO SHAREHOLDERS: | | | | | | | | |
| Distributable earnings – Investor Class | | | (5,790,228 | ) | | | (9,623,337 | ) |
| Distributable earnings – Institutional Class | | | (6,055,327 | ) | | | (8,312,271 | ) |
| Total distributions | | | (11,845,555 | ) | | | (17,935,608 | ) |
| | | | | | | | | |
| CAPITAL SHARE TRANSACTIONS: | | | | | | | | |
| Proceeds from shares subscribed – Investor Class | | | 1,170,684 | | | | 4,045,914 | |
| Proceeds from shares subscribed – Institutional Class | | | 6,516,349 | | | | 9,963,578 | |
| Dividends reinvested – Investor Class | | | 5,588,214 | | | | 9,369,182 | |
| Dividends reinvested – Institutional Class | | | 4,764,063 | | | | 6,581,032 | |
| Cost of shares redeemed – Investor Class | | | (45,400,919 | ) | | | (39,659,654 | ) |
| Cost of shares redeemed – Institutional Class | | | (26,206,237 | ) | | | (32,586,017 | ) |
| Net decrease in net assets derived | | | | | | | | |
| from capital share transactions | | | (53,567,846 | ) | | | (42,285,965 | ) |
| TOTAL DECREASE IN NET ASSETS | | | (60,864,862 | ) | | | (45,273,202 | ) |
| | | | | | | | | |
| NET ASSETS: | | | | | | | | |
| Beginning of year | | | 173,910,250 | | | | 219,183,452 | |
| End of year | | $ | 113,045,388 | | | $ | 173,910,250 | |
| | | | | | | | | |
| CHANGES IN SHARES OUTSTANDING: | | | | | | | | |
| Shares sold – Investor Class | | | 79,272 | | | | 268,813 | |
| Shares sold – Institutional Class | | | 471,407 | | | | 702,865 | |
| Shares issued to holders as reinvestment | | | | | | | | |
| of dividends – Investor Class | | | 374,820 | | | | 647,946 | |
| Shares issued to holders as reinvestment | | | | | | | | |
| of dividends – Institutional Class | | | 340,132 | | | | 481,833 | |
| Shares redeemed – Investor Class | | | (3,009,794 | ) | | | (2,637,769 | ) |
| Shares redeemed – Institutional Class | | | (1,899,718 | ) | | | (2,309,628 | ) |
| Net decrease in shares outstanding | | | (3,643,881 | ) | | | (2,845,940 | ) |
The accompanying notes are an integral part of these financial statements.
| HENNESSY FUNDS | 1-800-966-4354 | |
Financial Statements
For an Investor Class share outstanding throughout each year
PER SHARE DATA:
Net asset value, beginning of year
Income from investment operations:
Net investment income
Net realized and unrealized gains (losses) on investments
Total from investment operations
Less distributions:
Dividends from net investment income
Dividends from net realized gains
Total distributions
Net asset value, end of year
TOTAL RETURN
SUPPLEMENTAL DATA AND RATIOS:
Net assets, end of year (millions)
Ratio of expenses to average net assets
Ratio of net investment income to average net assets
Portfolio turnover rate(2)
(1) | Calculated using the average shares outstanding method. |
(2) | Calculated on the basis of the Fund as a whole. |
The accompanying notes are an integral part of these financial statements.
| FINANCIAL HIGHLIGHTS — INVESTOR CLASS |
| Year Ended October 31, | |
| 2020 | | | 2019 | | | 2018 | | | 2017 | | | 2016 | |
| | | | | | | | | | | | | | |
| $ | 15.72 | | | $ | 15.82 | | | $ | 16.24 | | | $ | 15.61 | | | $ | 16.15 | |
| | | | | | | | | | | | | | | | | | | |
| | | | | | | | | | | | | | | | | | | |
| | 0.16 | (1) | | | 0.18 | (1) | | | 0.16 | | | | 0.14 | | | | 0.14 | |
| | 0.40 | | | | 1.02 | | | | 0.40 | | | | 1.95 | | | | (0.16 | ) |
| | 0.56 | | | | 1.20 | | | | 0.56 | | | | 2.09 | | | | (0.02 | ) |
| | | | | | | | | | | | | | | | | | | |
| | | | | | | | | | | | | | | | | | | |
| | (0.16 | ) | | | (0.17 | ) | | | (0.14 | ) | | | (0.12 | ) | | | (0.13 | ) |
| | (1.00 | ) | | | (1.13 | ) | | | (0.84 | ) | | | (1.34 | ) | | | (0.39 | ) |
| | (1.16 | ) | | | (1.30 | ) | | | (0.98 | ) | | | (1.46 | ) | | | (0.52 | ) |
| $ | 15.12 | | | $ | 15.72 | | | $ | 15.82 | | | $ | 16.24 | | | $ | 15.61 | |
| | | | | | | | | | | | | | | | | | | |
| | 3.74 | % | | | 8.39 | % | | | 3.44 | % | | | 14.16 | % | | | -0.12 | % |
| | | | | | | | | | | | | | | | | | | |
| | | | | | | | | | | | | | | | | | | |
| $ | 51.29 | | | $ | 93.51 | | | $ | 121.32 | | | $ | 155.33 | | | $ | 202.04 | |
| | 1.49 | % | | | 1.46 | % | | | 1.42 | % | | | 1.43 | % | | | 1.43 | % |
| | 1.08 | % | | | 1.16 | % | | | 0.89 | % | | | 0.78 | % | | | 0.84 | % |
| | 22 | % | | | 16 | % | | | 18 | % | | | 15 | % | | | 24 | % |
The accompanying notes are an integral part of these financial statements.
| HENNESSY FUNDS | 1-800-966-4354 | |
Financial Statements
For an Institutional Class share outstanding throughout each year
PER SHARE DATA:
Net asset value, beginning of year
Income from investment operations:
Net investment income
Net realized and unrealized gains (losses) on investments
Total from investment operations
Less distributions:
Dividends from net investment income
Dividends from net realized gains
Total distributions
Net asset value, end of year
TOTAL RETURN
SUPPLEMENTAL DATA AND RATIOS:
Net assets, end of year (millions)
Ratio of expenses to average net assets
Ratio of net investment income to average net assets
Portfolio turnover rate(2)
(1) | Calculated using the average shares outstanding method. |
(2) | Calculated on the basis of the Fund as a whole. |
The accompanying notes are an integral part of these financial statements.
| FINANCIAL HIGHLIGHTS — INSTITUTIONAL CLASS |
| Year Ended October 31, | |
| 2020 | | | 2019 | | | 2018 | | | 2017 | | | 2016 | |
| | | | | | | | | | | | | | |
| $ | 14.80 | | | $ | 14.93 | | | $ | 15.34 | | | $ | 14.76 | | | $ | 15.28 | |
| | | | | | | | | | | | | | | | | | | |
| | | | | | | | | | | | | | | | | | | |
| | 0.20 | (1) | | | 0.22 | (1) | | | 0.19 | | | | 0.16 | | | | 0.18 | |
| | 0.38 | | | | 0.96 | | | | 0.39 | | | | 1.87 | | | | (0.13 | ) |
| | 0.58 | | | | 1.18 | | | | 0.58 | | | | 2.03 | | | | 0.05 | |
| | | | | | | | | | | | | | | | | | | |
| | | | | | | | | | | | | | | | | | | |
| | (0.22 | ) | | | (0.24 | ) | | | (0.20 | ) | | | (0.18 | ) | | | (0.20 | ) |
| | (0.94 | ) | | | (1.07 | ) | | | (0.79 | ) | | | (1.27 | ) | | | (0.37 | ) |
| | (1.16 | ) | | | (1.31 | ) | | | (0.99 | ) | | | (1.45 | ) | | | (0.57 | ) |
| $ | 14.22 | | | $ | 14.80 | | | $ | 14.93 | | | $ | 15.34 | | | $ | 14.76 | |
| | | | | | | | | | | | | | | | | | | |
| | 4.16 | % | | | 8.76 | % | | | 3.86 | % | | | 14.60 | % | | | 0.30 | % |
| | | | | | | | | | | | | | | | | | | |
| | | | | | | | | | | | | | | | | | | |
| $ | 61.75 | | | $ | 80.40 | | | $ | 97.86 | | | $ | 110.74 | | | $ | 129.91 | |
| | 1.12 | % | | | 1.09 | % | | | 1.02 | % | | | 1.05 | % | | | 1.03 | % |
| | 1.44 | % | | | 1.53 | % | | | 1.28 | % | | | 1.16 | % | | | 1.23 | % |
| | 22 | % | | | 16 | % | | | 18 | % | | | 15 | % | | | 24 | % |
The accompanying notes are an integral part of these financial statements.
| HENNESSY FUNDS | 1-800-966-4354 | |
Financial Statements
Notes to the Financial Statements October 31, 2020 |
1). ORGANIZATION
The Hennessy Equity and Income Fund (the “Fund”) is a series of Hennessy Funds Trust (the “Trust”), which was organized as a Delaware statutory trust on September 17, 1992. The Fund is an open-end management investment company registered under the Investment Company Act of 1940, as amended. The investment objective of the Fund is long-term capital growth and current income. The Fund is a diversified fund.
The Fund offers Investor Class and Institutional Class shares. Each class of shares differs principally in its respective 12b-1 distribution and service, shareholder servicing, and sub-transfer agent expenses. There are no sales charges. Each class has identical rights to earnings, assets, and voting privileges, except for class-specific expenses and exclusive rights to vote on matters affecting only one class.
As an investment company, the Fund follows the investment company accounting and reporting guidance of the Financial Accounting Standards Board (“FASB”) Accounting Standard Codification Topic 946 “Financial Services—Investment Companies.”
2). SIGNIFICANT ACCOUNTING POLICIES
The following is a summary of significant accounting policies consistently followed by the Fund in the preparation of the financial statements. These policies conform to U.S. generally accepted accounting principles (“GAAP”).
| a). | Securities Valuation – All investments in securities are valued in accordance with the Fund’s valuation policies and procedures, as described in Note 3. |
| | |
| b). | Federal Income Taxes – No provision for federal income taxes or excise taxes has been made because the Fund has elected to be taxed as a regulated investment company and intends to distribute substantially all of its taxable income to its shareholders and otherwise comply with the provisions of the Internal Revenue Code of 1986, as amended, applicable to regulated investment companies. Net investment income/loss and realized gains/losses for federal income tax purposes may differ from those reported in the financial statements because of temporary book and tax basis differences. Temporary differences are primarily the result of the treatment of wash sales for tax reporting purposes. The Fund recognizes interest and penalties related to income tax benefits, if any, in the Statement of Operations as an income tax expense. Distributions from net realized gains for book purposes may include short-term capital gains, which are included as ordinary income to shareholders for tax purposes. The Fund may utilize equalization accounting for tax purposes and designate earnings and profits, including net realized gains distributed to shareholders on redemption of shares, as part of the dividends paid deduction for income tax purposes. |
| | |
| | Due to inherent differences in the recognition of income, expenses, and realized gains/losses under GAAP and federal income tax regulations, permanent differences between book and tax basis for reporting are identified and appropriately reclassified in the Statement of Assets and Liabilities, as needed. The adjustments for fiscal year 2020 are as follows: |
| | Total | | |
| | Distributable | | |
| | Earnings
| Capital Stock | |
| | $(2,292,412) | $2,292,412 | |
| NOTES TO THE FINANCIAL STATEMENTS |
| c). | Accounting for Uncertainty in Income Taxes – The Fund has accounting policies regarding recognition and measurement of tax positions taken or expected to be taken on a tax return. The tax returns of the Fund for the prior three fiscal years are open for examination. The Fund has reviewed all open tax years in major jurisdictions and concluded that there is no impact on the Fund’s net assets and no tax liability resulting from unrecognized tax benefits relating to uncertain income tax positions taken or expected to be taken on a tax return. The Fund’s major tax jurisdictions are U.S. federal and Delaware. |
| | |
| d). | Income and Expenses – Dividend income is recognized on the ex-dividend date or as soon as information is available to the Fund. Interest income, which includes the amortization of premium and accretion of discount, is recognized on an accrual basis. Market discounts, original issue discounts, and market premiums on debt securities are accreted or amortized to interest income over the life of a security with a corresponding increase or decrease, as applicable, in the cost basis of such security using the yield to maturity method, or where applicable, the first call date of the security. Other non-cash dividends are recognized as investment income at the fair value of the property received. The Fund is charged for those expenses that are directly attributable to its portfolio, such as advisory, administration, and certain shareholder service fees. Income, expenses (other than expenses attributable to a specific class), and realized and unrealized gains/losses on investments are allocated to each class of shares based on such class’s net assets. |
| | |
| e). | Distributions to Shareholders – Dividends from net investment income for the Fund, if any, are declared and paid at the end of each calendar quarter. Distributions of net realized capital gains, if any, are declared and paid annually, usually in December. |
| | |
| f). | Security Transactions – Investment and shareholder transactions are recorded on the trade date. The Fund determines the realized gain/loss from an investment transaction by comparing the original cost of the security lot sold with the net sale proceeds. Discounts and premiums on securities purchased are accreted or amortized, respectively, over the life of each such security. |
| | |
| g). | Use of Estimates – The preparation of financial statements in conformity with GAAP requires management to make estimates and assumptions that affect the reported amounts of assets and liabilities and disclosure of contingent assets and liabilities at the date of the financial statements and the reported change in net assets during the reporting period. Actual results could differ from those estimates. |
| | |
| h). | Share Valuation – The net asset value (“NAV”) per share of the Fund is calculated by dividing (i) the total value of the securities held by the Fund, plus cash and other assets, minus all liabilities (including estimated accrued expenses) by (ii) the total number of shares outstanding for the Fund, rounded to the nearest $0.01. The Fund’s shares will not be priced on days the New York Stock Exchange is closed for trading. The offering and redemption price per share for the Fund is equal to the Fund’s NAV per share. |
| | |
| i). | REIT Equity Securities – The Fund may invest in the equity securities of real estate investment trusts (“REITs”). Distributions received from REITs may be classified as dividends, capital gains, or return of capital. Investments in REITs may require the Fund to accrue and distribute income not yet received. To generate sufficient cash to make the requisite distributions, the Fund may be required to sell securities in its portfolio (including when it is not advantageous to do so) that it otherwise would have continued to hold. At other times, investments in a REIT may result in the Fund’s receipt of cash in excess of the REIT’s earnings. If the Fund distributes these |
| HENNESSY FUNDS | 1-800-966-4354 | |
| | amounts, these distributions could constitute a return of capital to Fund shareholders for U.S. federal income tax purposes. Dividends received by the Fund from a REIT generally will not constitute qualified dividend income and will not qualify for the dividends-received deduction. |
| | |
| j). | New Accounting Pronouncements – In March 2017, the Financial Accounting Standards Board (“FASB”) issued Accounting Standards Update (“ASU”) No. 2017-08 “Premium Amortization on Purchased Callable Debt Securities” (“ASU 2017-08”), which shortens the premium amortization period for purchased noncontingently callable debt securities, specifying that such period ends at the earliest call date. The Fund has adopted and applied ASU 2017-08 on a modified retrospective basis. Management evaluated the impact of this change in guidance and concluded that it did not have a material impact on the Fund’s financial statements. |
| | |
| | In August 2018, the FASB issued Accounting Standards Update No. 2018-13 “Disclosure Framework—Changes to the Disclosure Requirements for Fair Value Measurement” (“ASU 2018-13”). ASU 2018-13 eliminates the requirement to disclose the amount of and reasons for transfers between Level 1 and Level 2 of the fair value hierarchy, the timing of transfers between levels of the fair value hierarchy, and the valuation processes for Level 3 fair value measurements. ASU 2018-13 does not eliminate the requirement to disclose the range and weighted average used to develop significant unobservable inputs for Level 3 fair value measurements, and the changes in unrealized gains and losses for recurring Level 3 fair value measurements. ASU 2018-13 requires that information is provided about the measurement uncertainty of Level 3 fair value measurements as of the reporting date. The guidance is effective for fiscal years beginning after December 15, 2019, and interim periods within those fiscal years. Management evaluated the impact of this change in guidance and, due to the permissibility of early adoption, modified the Fund’s fair value disclosures beginning with its fiscal year 2019. |
3). SECURITIES VALUATION
The Fund follows its valuation policies and procedures in determining its net asset value and, in preparing these financial statements, the fair value accounting standards that establish an authoritative definition of fair value and set out a hierarchy for measuring fair value. These standards require additional disclosures about the various inputs and valuation techniques used to develop the measurements of fair value and a discussion of changes in valuation techniques and related inputs during the period. These inputs are summarized in the three broad levels listed below:
| | Level 1 – | Unadjusted, quoted prices in active markets for identical instruments that the Fund has the ability to access at the date of measurement. |
| | | |
| | Level 2 – | Other significant observable inputs (including, but not limited to, quoted prices in active markets for similar instruments, quoted prices in markets that are not active for identical or similar instruments, and model-derived valuations in which all significant inputs and significant value drivers are observable in active markets, such as interest rates, prepayment speeds, credit risk curves, default rates, and similar data). |
| | | |
| | Level 3 – | Significant unobservable inputs (including the Fund’s own assumptions about what market participants would use to price the asset or liability based on the best available information) when observable inputs are unavailable. |
| NOTES TO THE FINANCIAL STATEMENTS |
The following is a description of the valuation techniques applied to the Fund’s major categories of assets and liabilities on a recurring basis:
| | Equity Securities – Equity securities, including common stocks, preferred stocks, foreign-issued common stocks, exchange-traded funds, closed-end mutual funds, partnerships, rights, and real estate investment trusts, that are traded on a securities exchange for which a last-quoted sales price is readily available will generally be valued at the last sales price as reported by the primary exchange on which the securities are listed. Securities listed on The NASDAQ Stock Market (“NASDAQ”) will generally be valued at the NASDAQ Official Closing Price, which may differ from the last sales price reported. Securities traded on a securities exchange for which a last-quoted sales price is not readily available will generally be valued at the mean between the bid and ask prices. To the extent these securities are actively traded and valuation adjustments are not applied, they are classified in Level 1 of the fair value hierarchy. Securities traded on foreign exchanges generally are not valued at the same time the Fund calculates its NAV because most foreign markets close well before such time. The earlier close of most foreign markets gives rise to the possibility that significant events, including broad market moves, may have occurred in the interim. In certain circumstances, it may be determined that a foreign security needs to be fair valued because it appears that the value of the security might have been materially affected by events occurring after the close of the market in which the security is principally traded, but before the time the Fund calculates its NAV, such as by a development that affects an entire market or region (e.g., a weather-related event) or a potentially global development (e.g., a terrorist attack that may be expected to have an effect on investor expectations worldwide). |
| | |
| | Registered Investment Companies – Investments in open-end registered investment companies, commonly referred to as mutual funds, generally are priced at the ending NAV provided by the applicable mutual fund’s service agent and will be classified in Level 1 of the fair value hierarchy. |
| | |
| | Debt Securities – Debt securities, including corporate bonds, asset-backed securities, mortgage-backed securities, municipal bonds, U.S. Treasuries, and U.S. government agency issues, are generally valued at market on the basis of valuations furnished by an independent pricing service that utilizes both dealer-supplied valuations and formula-based techniques. The pricing service may consider recently executed transactions in securities of the issuer or comparable issuers, market price quotations (where observable), bond spreads, and fundamental data relating to the issuer. In addition, the model may incorporate observable market data, such as reported sales of similar securities, broker quotes, yields, bids, offers, and reference data. Certain securities are valued primarily using dealer quotations. These securities are generally classified in Level 2 of the fair value hierarchy. |
| | |
| | Short-Term Securities – Short-term equity investments, including money market funds, are valued in the manner specified above. Short-term debt investments with an original term to maturity of 60 days or less are valued at amortized cost, which approximates fair market value. If the original term to maturity of a short-term debt investment exceeded 60 days, then the values as of the 61st day prior to maturity are amortized. Amortized cost is not used if its use would be inappropriate due to credit or other impairments of the issuer, in which case the security’s fair value would be determined, as described below. Short-term securities are generally classified in Level 1 or Level 2 of the fair value hierarchy depending on the inputs used and market activity levels for specific securities. |
| HENNESSY FUNDS | 1-800-966-4354 | |
The Board of Trustees of the Fund (the “Board”) has adopted fair value pricing procedures that are followed when a price for a security is not readily available or if a significant event has occurred that indicates the closing price of a security no longer represents the true value of that security. Fair value pricing determinations are made in good faith in accordance with these procedures. There are numerous criteria that will be given consideration in determining a fair value of a security, such as the trading volume of a security and markets, the values of other similar securities, and news events with direct bearing on a security or markets. Fair value pricing results in an estimated price for a security that reflects the amount the Fund might reasonably expect to receive in a current sale. Depending on the relative significance of the valuation inputs, these securities may be classified in either Level 2 or Level 3 of the fair value hierarchy.
The fair value of foreign securities may be determined with the assistance of a pricing service using correlations between the movement of prices of such securities and indices of domestic securities and other appropriate indicators, such as closing market prices of relevant American Depositary Receipts or futures contracts. Using fair value pricing means that the Fund’s NAV reflects the affected portfolio securities’ values as determined by the Board or its designee, pursuant to the fair value pricing procedures adopted by the Board, instead of being determined by the market. Using a fair value pricing methodology to price a foreign security may result in a value that is different from such foreign security’s most recent closing price and from the value used by other investment companies to calculate their NAVs. Such securities are generally classified in Level 2 of the fair value hierarchy. Because the Fund may invest in foreign securities, the value of the Fund’s portfolio securities may change on days when you will not be able to purchase or redeem your shares.
The Board has delegated day-to-day valuation matters to the Valuation and Liquidity Committee comprising representatives from Hennessy Advisors, Inc., the Fund’s investment advisor (the “Advisor”). The function of the Valuation and Liquidity Committee is to value securities where current and reliable market quotations are not readily available. All actions taken by the Valuation and Liquidity Committee are reviewed by the Board.
The Fund has performed an analysis of all existing investments to determine the significance and character of all inputs to their fair value determinations. Various inputs are used to determine the value of the Fund’s investments. The inputs or methodology used for valuing securities are not necessarily an indication of the risk associated with investing in those securities. Details related to the fair value hierarchy of the Fund’s securities as of October 31, 2020, are included in the Schedule of Investments.
4). INVESTMENT TRANSACTIONS
Purchases and sales of investment securities (excluding government and short-term investments) for the Fund during fiscal year 2020 were $25,121,758 and $73,740,063, respectively.
Purchases and sales/maturities of long-term U.S. government securities for the Fund during fiscal year 2020 were $3,088,738 and $15,022,674, respectively.
The Fund is permitted to purchase or sell securities from or to another fund in the Hennessy Funds family of funds (collectively, the “Hennessy Funds”) under specified conditions outlined in procedures adopted by the Board. The procedures have been designed to ensure that any purchase or sale of securities by the Fund from or to another Hennessy Fund complies with Rule 17a-7 of the Investment Company Act of 1940, as amended. During fiscal year 2020, the Fund did not engage in purchases or sales of securities pursuant to Rule 17a-7 of the Investment Company Act of 1940, as amended.
| NOTES TO THE FINANCIAL STATEMENTS |
5). INVESTMENT ADVISORY FEE AND OTHER TRANSACTIONS WITH AFFILIATES
The Advisor provides the Fund with investment advisory services under an Investment Advisory Agreement. The Advisor oversees the provision of investment advice and furnishes office space, facilities, and most of the personnel needed by the Fund. As compensation for its services, the Advisor is entitled to a monthly fee from the Fund. The fee is based on the average daily net assets of the Fund at an annual rate of 0.80%. The net investment advisory fees expensed by the Fund during fiscal year 2020 are included in the Statement of Operations.
The Advisor has delegated the day-to-day management of the equity allocation of the Fund to a sub-advisor, The London Company of Virginia, LLC, and has delegated the day-to-day management of the fixed income allocation of the Fund to a sub-advisor, FCI Advisors. The Advisor pays the sub-advisory fees from its own assets, and these fees are not an additional expense of the Fund. During fiscal year 2020, the Advisor (not the Fund) paid a sub-advisory fee at the rate of 0.33% of the daily net assets of the equity allocation of the Fund and 0.27% of the daily net assets of the fixed income allocation of the Fund.
The Board has approved a Shareholder Servicing Agreement for Investor Class shares of the Fund, which was instituted to compensate the Advisor for the non-investment advisory services it provides to the Fund. The Shareholder Servicing Agreement provides for a monthly fee paid to the Advisor at an annual rate of 0.10% of the average daily net assets of the Fund attributable to Investor Class shares. The shareholder service fees expensed by the Fund during fiscal year 2020 are included in the Statement of Operations.
The Fund has adopted a plan pursuant to Rule 12b-1 under the Investment Company Act of 1940, as amended, that authorizes payments in connection with the distribution of the Fund’s shares at an annual rate of up to 0.25% of the Fund’s average daily net assets attributable to Investor Class shares. Even though the authorized rate is up to 0.25%, the Fund is currently only using up to 0.15% of its average daily net assets attributable to Investor Class shares for such purpose. Amounts paid under the plan may be spent on any activities or expenses primarily intended to result in the sale of shares, including, but not limited to, advertising, shareholder account servicing, printing and mailing of prospectuses to other than current shareholders, printing and mailing of sales literature, and compensation for sales and marketing activities or to financial institutions and others, such as dealers and distributors. The distribution fees expensed by the Fund during fiscal year 2020 are included in the Statement of Operations.
The Fund has entered into agreements with various brokers, dealers, and financial intermediaries in connection with the sale of shares of the Fund. The agreements provide for periodic payments of sub-transfer agent expenses by the Fund to the brokers, dealers, and financial intermediaries for providing certain shareholder maintenance services. These shareholder services include the pre-processing and quality control of new accounts, shareholder correspondence, answering customer inquiries regarding account status, and facilitating shareholder telephone transactions. The sub-transfer agent fees expensed by the Fund during fiscal year 2020 are included in the Statement of Operations.
U.S. Bancorp Fund Services, LLC, d/b/a U.S. Bank Global Fund Services (“Fund Services”) provides the Fund with administrative, accounting, and transfer agent services. As administrator, Fund Services is responsible for activities such as (i) preparing various federal and state regulatory filings, reports, and returns for the Fund, (ii) preparing reports and materials to be supplied to the Board, (iii) monitoring the activities of the Fund’s custodian, transfer agent, and accountants, and (iv) coordinating the preparation and payment of the Fund’s expenses and reviewing the Fund’s expense accruals. U.S. Bank N.A., an affiliate of Fund Services, serves as the Fund’s custodian. The servicing
| HENNESSY FUNDS | 1-800-966-4354 | |
agreements between the Trust and Fund Services and U.S. Bank N.A. contain a fee schedule that is inclusive of administrative, accounting, custody, and transfer agent fees. The administrative, accounting, custody, and transfer agent fees expensed by the Fund during fiscal year 2020 are included in the Statement of Operations.
Quasar Distributors, LLC (“Quasar”) acts as the Fund’s principal underwriter in a continuous public offering of the Fund’s shares. Quasar was an affiliate of Fund Services and U.S. Bank N.A. through March 30, 2020. Effective March 31, 2020, Foreside Financial Group, LLC (“Foreside”) acquired Quasar from Fund Services. As a result of the acquisition, Quasar became a wholly owned broker-dealer subsidiary of Foreside and is no longer affiliated with Fund Services or U.S. Bank N.A. The Board approved a new Distribution Agreement to enable Quasar to continue serving as the Fund’s distributor.
The officers of the Fund are affiliated with the Advisor. With the exception of the Chief Compliance Officer and the Senior Compliance Officer, such officers receive no compensation from the Fund for serving in their respective roles. The Fund, along with the other Hennessy Funds, makes reimbursement payments on an equal basis to the Advisor for a portion of the salary and benefits associated with the office of the Chief Compliance Officer and for all of the salary and benefits associated with the office of the Senior Compliance Officer. The compliance fees expensed by the Fund during fiscal year 2020 are included in the Statement of Operations.
6). GUARANTEES AND INDEMNIFICATIONS
Under the Hennessy Funds’ organizational documents, their officers and trustees are indemnified by the Hennessy Funds against certain liabilities arising out of the performance of their duties to the Hennessy Funds. Additionally, in the normal course of business, the Hennessy Funds enter into contracts with service providers that contain general indemnification clauses. The Fund’s maximum exposure under these arrangements is unknown as this would involve future claims that may be made against the Fund that have not yet occurred. Currently, the Fund expects the risk of loss to be remote.
7). LINE OF CREDIT
The Fund has an uncommitted line of credit with the other Hennessy Funds in the amount of the lesser of (i) $100,000,000 or (ii) 33.33% of each Hennessy Fund’s net assets, or 30% for the Hennessy Gas Utility Fund and 10% for the Hennessy Balanced Fund, intended to provide short-term financing, if necessary, subject to certain restrictions, in connection with shareholder redemptions. The credit facility is with the Hennessy Funds’ custodian bank, U.S. Bank N.A. Borrowings under this arrangement bear interest at the bank’s prime rate and are secured by all of the Fund’s assets (as to its own borrowings only). During fiscal year 2020, the Fund had an outstanding average daily balance and a weighted average interest rate of $1,954 and 4.53%, respectively. The interest expensed by the Fund during fiscal year 2020 is included in the Statement of Operations. The maximum amount outstanding for the Fund during fiscal year 2020 was $608,000. As of October 31, 2020, the Fund did not have any borrowings outstanding under the line of credit.
| NOTES TO THE FINANCIAL STATEMENTS |
8). FEDERAL TAX INFORMATION
As of October 31, 2020, the components of accumulated earnings (losses) for income tax purposes were as follows:
| | | | Investments | |
| | Cost of investments for tax purposes | | $ | 92,160,292 | |
| | Gross tax unrealized appreciation | | $ | 23,864,959 | |
| | Gross tax unrealized depreciation | | | (3,202,934 | ) |
| | Net tax unrealized appreciation/(depreciation) | | $ | 20,662,025 | |
| | Undistributed ordinary income | | $ | 53,097 | |
| | Undistributed long-term capital gains | | | 6,349,143 | |
| | Total distributable earnings | | $ | 6,402,240 | |
| | Other accumulated gain/(loss) | | $ | — | |
| | Total accumulated gain/(loss) | | $ | 27,064,265 | |
The difference between book-basis unrealized appreciation/depreciation and tax-basis unrealized appreciation/depreciation (as shown above) is attributable primarily to wash sales.
As of October 31, 2020, the Fund had no tax basis capital losses to offset future capital gains.
As of October 31, 2020, the Fund did not defer, on a tax basis, any late-year ordinary losses. Late-year ordinary losses are net ordinary losses incurred after December 31, 2019, but within the taxable year, that are deemed to arise on the first day of the Fund’s next taxable year.
During fiscal years 2020 and 2019, the tax character of distributions paid by the Fund was as follows:
| | | | Year Ended | | | Year Ended | |
| | | | October 31, 2020 | | | October 31, 2019 | |
| | Ordinary income(1) | | $ | 1,715,695 | | | $ | 2,694,614 | |
| | Long-term capital gain | | | 10,129,860 | | | | 15,240,994 | |
| | Total distributions | | $ | 11,845,555 | | | $ | 17,935,608 | |
| | (1) Ordinary income includes short-term capital gains. |
9). COVID-19 PANDEMIC
The COVID-19 pandemic has adversely impacted global commercial activity and contributed to significant volatility in global equity and debt markets. The pandemic has resulted in quarantines, stay-at-home orders, travel prohibitions, and closures, disrupting supply chains and economic activity. The duration of the pandemic’s effects remain uncertain and difficult to assess. The effects of the pandemic may adversely impact the Fund’s performance and its ability to achieve its investment objective.
10). LIBOR TRANSITION
The Fund invests in financial instruments with payment obligations, financing terms, hedging strategies, or investment values based on, among other floating rates, the London Interbank Offered Rate (“LIBOR”). LIBOR is the offered rate for short-term Eurodollar deposits between major international banks. On July 27, 2017, the UK Financial Conduct Authority, which regulates LIBOR, announced that it would no longer persuade or compel banks to submit rates for the calculation of LIBOR after 2021, meaning that LIBOR cannot continue on its current basis and will not be guaranteed after 2021. Regulators and industry working groups have suggested alternative reference rates, but global consensus is lacking, and the process for amending existing contracts or instruments to transition away from
| HENNESSY FUNDS | 1-800-966-4354 | |
LIBOR remains unclear. The transition away from LIBOR may lead to increased volatility and illiquidity in markets tied to LIBOR, reduce the value of LIBOR-related instruments, and reduce the effectiveness of hedging strategies, which could adversely affect the Fund’s performance. Additionally, any alternative reference rate may be an ineffective substitute, resulting in prolonged adverse market conditions for the Fund’s investments.
11). EVENTS SUBSEQUENT TO YEAR END
Management has evaluated the Fund’s related events and transactions that occurred subsequent to October 31, 2020, through the date of issuance of the Fund’s financial statements. Other than as disclosed below, management has determined that there were no subsequent events requiring recognition or disclosure in the financial statements.
On December 8, 2020, capital gains were declared and paid to shareholders of record on December 7, 2020, as follows:
| | | Long-term | |
| | Investor Class | $0.86006 | |
| | Institutional Class | $0.80897 | |
| NOTES/REPORT OF INDEPENDENT REGISTERED PUBLIC ACCOUNTING FIRM |
Report of Independent Registered Public
Accounting Firm
To the Board of Trustees of Hennessy Funds Trust
and the shareholders of the Hennessy Equity and Income Fund
Novato, CA
Opinion on the Financial Statements
We have audited the accompanying statement of assets and liabilities of the Hennessy Equity and Income Fund (the “Fund”), a series of Hennessy Funds Trust, including the schedule of investments, as of October 31, 2020, the related statement of operations for the year then ended, the statements of changes in net assets for each of the two years in the period then ended, financial highlights for each of the five years in the period then ended, and the related notes (collectively referred to as the “financial statements”). In our opinion, the financial statements present fairly, in all material respects, the financial position of the Fund as of October 31, 2020, the results of its operations for the year then ended, the changes in its net assets for each of the two years in the period then ended, and the financial highlights for each of the five years in the period then ended, in conformity with accounting principles generally accepted in the United States of America.
Basis for Opinion
These financial statements are the responsibility of the Fund’s management. Our responsibility is to express an opinion on the Fund’s financial statements based on our audits. We are a public accounting firm registered with the Public Company Accounting Oversight Board (United States) (“PCAOB”) and are required to be independent with respect to the Fund in accordance with the U.S. federal securities laws and the applicable rules and regulations of the Securities and Exchange Commission and the PCAOB. We have served as the auditor of one or more of the funds in the Trust since 2002.
We conducted our audits in accordance with the standards of the PCAOB. Those standards require that we plan and perform the audit to obtain reasonable assurance about whether the financial statements are free of material misstatement, whether due to error or fraud. The Fund is not required to have, nor were we engaged to perform, an audit of its internal control over financial reporting. As part of our audits we are required to obtain an understanding of internal control over financial reporting, but not for the purpose of expressing an opinion on the effectiveness of the Fund’s internal control over financial reporting. Accordingly, we express no such opinion.
Our audits included performing procedures to assess the risks of material misstatement of the financial statements, whether due to error or fraud, and performing procedures that respond to those risks. Such procedures included examining, on a test basis, evidence regarding the amounts and disclosures in the financial statements. Our audits also included evaluating the accounting principles used and significant estimates made by management, as well as evaluating the overall presentation of the financial statements. Our procedures included confirmation of securities owned as of October 31, 2020 by correspondence with the custodian. We believe that our audits provide a reasonable basis for our opinion.
| |  |
| | TAIT, WELLER & BAKER LLP |
Philadelphia, Pennsylvania
December 23, 2020
| HENNESSY FUNDS | 1-800-966-4354 | |
Trustees and Officers of the Fund (Unaudited)
The business and affairs of the Funds are managed under the direction of the Board of Trustees of the Trust, and the Board of Trustees elects the officers of the Trust. From time to time, the Board of Trustees also has appointed advisers to the Board of Trustees (“Advisers”) with the intention of having qualified individuals serve in an advisory capacity to garner experience in the mutual fund and asset management industry and be considered as potential Trustees in the future. There are currently three Advisers: Brian Alexander, Doug Franklin, and Claire Knoles. As Advisers, Mr. Alexander, Mr. Franklin, and Ms. Knoles attend meetings of the Board of Trustees and act as non-voting participants. Information pertaining to the Trustees, Advisers, and the officers of the Trust is set forth below. The Trustees and officers serve until their successors are duly elected and qualified or until their earlier death, resignation, or removal. Each Trustee oversees all 16 Hennessy Funds. Unless otherwise indicated, the address of all persons listed below is 7250 Redwood Boulevard, Suite 200, Novato, CA 94945. The Fund’s Statement of Additional Information includes more information about the persons listed below and is available without charge by calling 1-800-966-4354 or by visiting www.hennessyfunds.com.
| | | | Other |
| | | | Directorships |
| | | | Held Outside |
| Name, Age, | | | of Fund |
| and Position Held | Start Date | Principal Occupation(s) | Complex During |
with the Trust
| of Service
| During Past Five Years
| Past Five Years
|
| Disinterested Trustees and Advisers | | | |
| | | | |
| J. Dennis DeSousa | January 1996 | Mr. DeSousa is a real estate investor. | None. |
| 84 | | | |
| Trustee | | | |
| | | | |
| Robert T. Doyle | January 1996 | Mr. Doyle has been the Sheriff of | None. |
| 73 | | Marin County, California since 1996. | |
| Trustee | | | |
| | | | |
| Gerald P. Richardson | May 2004 | Mr. Richardson is an independent | None. |
| 75 | | consultant in the securities industry. | |
| Trustee | | | |
| | | | |
| Brian Alexander | March 2015 | Mr. Alexander has worked for the | None. |
| 39 | | Sutter Health organization since | |
| Adviser to the Board | | 2011 in various positions. He has | |
| | | served as the Chief Executive Officer | |
| | | of the Sutter Roseville Medical | |
| | | Center since 2018. From 2016 through | |
| | | 2018, he served as the Vice President | |
| | | of Strategy for the Sutter Health Valley | |
| | | Area, which includes 11 hospitals, | |
| | | 13 ambulatory surgery centers, | |
| | | 16,000 employees, and 1,900 physicians. | |
| | | From 2013 through 2016, Mr. Alexander | |
| | | served as Sutter Novato Community | |
| | | Hospital’s Chief Administrative Officer. | |
| TRUSTEES AND OFFICERS OF THE FUND |
| | | | Other |
| | | | Directorships |
| | | | Held Outside |
| Name, Age, | | | of Fund |
| and Position Held | Start Date | Principal Occupation(s) | Complex During |
with the Trust
| of Service
| During Past Five Years
| Past Five Years
|
| Doug Franklin | March 2016 | Mr. Franklin is a retired insurance | None. |
| 56 | | industry executive. From 1987 | |
| Adviser to the Board | | through 2015, he was employed | |
| | | by the Allianz-Fireman’s Fund | |
| | | Insurance Company in various | |
| | | positions, including as its Chief | |
| | | Actuary and Chief Risk Officer. | |
| | | | |
| Claire Knoles | December 2015 | Ms. Knoles is a founder of Kiosk and | None. |
| 46 | | has served as its Chief Operating | |
| Adviser to the Board | | Officer since 2004. Kiosk is a full- | |
| | | service marketing agency with | |
| | | offices in the San Francisco Bay | |
| | | Area, Toronto, and Liverpool, UK. | |
| | | | |
Interested Trustee(1) | | | |
| | | | |
| Neil J. Hennessy | January 1996 as | Mr. Hennessy has been employed | Hennessy |
| 64 | a Trustee and | by Hennessy Advisors, Inc. since | Advisors, Inc. |
| Trustee, Chairman of | June 2008 as | 1989 and currently serves as its | |
| the Board, Chief | an officer | Chairman and Chief Executive Officer. | |
| Investment Officer, | | | |
| Portfolio Manager, | | | |
| and President | | | |
| Name, Age, | | |
| and Position Held | Start Date | Principal Occupation(s) |
with the Trust
| of Service
| During Past Five Years
|
| Officers | | |
| | | |
| Teresa M. Nilsen | January 1996 | Ms. Nilsen has been employed by Hennessy Advisors, Inc. |
| 54 | | since 1989 and currently serves as its President, Chief Operating |
| Executive Vice President | | Officer, and Secretary. |
| and Treasurer | | |
| | | |
| Daniel B. Steadman | March 2000 | Mr. Steadman has been employed by Hennessy Advisors, Inc. |
| 64 | | since 2000 and currently serves as its Executive Vice President. |
| Executive Vice President | | |
| and Secretary | | |
| | | |
| Brian Carlson | December 2013 | Mr. Carlson has been employed by Hennessy Advisors, Inc. |
| 48 | | since December 2013 and currently serves as its Chief |
| Senior Vice President | | Compliance Officer and Senior Vice President. |
| and Head of Distribution | | |
| | | |
Jennifer Cheskiewicz(2) | June 2013 | Ms. Cheskiewicz has been employed by Hennessy Advisors, Inc. |
| 43 | | as its General Counsel since June 2013. |
| Senior Vice President and | | |
| Chief Compliance Officer | | |
| HENNESSY FUNDS | 1-800-966-4354 | |
| Name, Age, | | |
| and Position Held | Start Date | Principal Occupation(s) |
with the Trust
| of Service
| During Past Five Years
|
David Ellison(3) | October 2012 | Mr. Ellison has been employed by Hennessy Advisors, Inc. since |
| 62 | | October 2012. He has served as a Portfolio Manager of the |
| Senior Vice President | | Hennessy Large Cap Financial Fund and the Hennessy Small |
| and Portfolio Manager | | Cap Financial Fund since their inception. Mr. Ellison also served |
| | | as a Portfolio Manager of the Hennessy Technology Fund from |
| | | its inception until February 2017. Mr. Ellison served as Director, |
| | | CIO, and President of FBR Fund Advisers, Inc. from December |
| | | 1999 to October 2012. |
| | | |
Ryan Kelley(4) | March 2013 | Mr. Kelley has been employed by Hennessy Advisors, Inc. since |
| 48 | | October 2012. He has served as a Portfolio Manager of the |
| Senior Vice President | | Hennessy Gas Utility Fund, the Hennessy Large Cap Financial |
| and Portfolio Manager | | Fund, and the Hennessy Small Cap Financial Fund since |
| | | October 2014. He served as Co-Portfolio Manager of these |
| | | same funds from March 2013 through September 2014 and as |
| | | a Portfolio Analyst for the Hennessy Funds from October 2012 |
| | | through February 2013. Mr. Kelley has also served as a Portfolio |
| | | Manager of the Hennessy Cornerstone Growth Fund, the |
| | | Hennessy Cornerstone Mid Cap 30 Fund, the Hennessy |
| | | Cornerstone Large Growth Fund, and the Hennessy |
| | | Cornerstone Value Fund since February 2017 and as a Portfolio |
| | | Manager of the Hennessy Total Return Fund, the Hennessy |
| | | Balanced Fund, and the Hennessy Technology Fund since May |
| | | 2018. He served as Co-Portfolio Manager of the Hennessy |
| | | Technology Fund from February 2017 until May 2018. Mr. Kelley |
| | | served as Portfolio Manager of FBR Fund Advisers, Inc. from |
| | | January 2008 to October 2012. |
| | | |
| Tania Kelley | October 2003 | Ms. Kelley has been employed by Hennessy Advisors, Inc. since |
| 55 | | October 2003. |
| Senior Vice President | | |
| and Head of Marketing | | |
| | | |
L. Joshua Wein(4) | September 2018 | Mr. Wein has been employed by Hennessy Advisors, Inc. since |
| 47 | | 2018. He has served as Co-Portfolio Manager of the Hennessy |
| Vice President and | | Cornerstone Growth Fund, the Hennessy Cornerstone |
| Co-Portfolio Manager | | Mid Cap 30 Fund, the Hennessy Cornerstone Large Growth |
| | | Fund, the Hennessy Cornerstone Value Fund, Hennessy Total |
| | | Return Fund, the Hennessy Balanced Fund, the Hennessy Gas |
| | | Utility Fund, and the Hennessy Technology Fund since February |
| | | 2019. He served as a Senior Analyst of these same funds from |
| | | September 2018 through February 2019. Mr. Wein served as |
| | | Director of Alternative Investments and Co-Portfolio Manager |
| | | at Sterling Capital Management from 2008 to 2018. |
_______________
(1) | Mr. Hennessy is considered an “interested person,” as defined in the Investment Company Act of 1940, as amended, because he is an officer of the Trust. |
(2) | The address of this officer is 4800 Bee Caves Road, Suite 100, Austin, TX 78746. |
(3) | The address of this officer is 101 Federal Street, Suite 1615B, Boston, MA 02110. |
(4) | The address of this officer is 1340 Environ Way, Chapel Hill, NC 27517. |
| TRUSTEES AND OFFICERS OF THE FUND |
(This Page Intentionally Left Blank.)
| HENNESSY FUNDS | 1-800-966-4354 | |
Expense Example (Unaudited)
October 31, 2020
As a shareholder of the Fund, you incur ongoing costs, including management fees, service fees, and other Fund expenses. This Example is intended to help you understand your ongoing costs (in dollars) of investing in the Fund and to compare these costs with the ongoing costs of investing in other mutual funds. The Example is based on an investment of $1,000 invested at the beginning of the period and held for the entire period from May 1, 2020, through October 31, 2020.
Actual Expenses
The first line of the table below under the “Investor Class” and “Institutional Class” headings provides information about actual account values and actual expenses. You may use the information in this line, together with the amount you invested, to estimate the expenses that you paid over the period. Simply divide your account value by $1,000 (for example, an $8,600 account value divided by $1,000 = 8.6), then multiply the result by the number in the first line below the “Investor Class” or “Institutional Class” heading under the column entitled “Expenses Paid During Period” to estimate the expenses you paid on your account during this period. Although the Fund charges no sales loads or transaction fees, you will be assessed fees for outgoing wire transfers, returned checks, and stop payment orders at prevailing rates charged by U.S. Bank Global Fund Services, the Fund’s transfer agent. If you request that a redemption be made by wire transfer, the Fund’s transfer agent charges a $15 fee. IRAs are charged a $15 annual maintenance fee (up to $30 maximum per shareholder for shareholders with multiple IRAs). The example below includes, but is not limited to, management fees, shareholder servicing fees, accounting, custody, and transfer agent fees. However, the example below does not include portfolio trading commissions and related expenses.
Hypothetical Example for Comparison Purposes
The second line of the table below under the “Investor Class” and “Institutional Class” headings provides information about hypothetical account values and hypothetical expenses based on the Fund’s actual expense ratios and an assumed rate of return of 5% per year before expenses, which is not the Fund’s actual return. The hypothetical account values and expenses may not be used to estimate the actual ending account balance or expenses you paid for the period. You may use this information to compare the ongoing costs of investing in the Fund and other funds. To do so, compare this 5% hypothetical example with the 5% hypothetical examples that appear in the shareholder reports of the other funds. Please note that the expenses shown in the table are meant to highlight your ongoing costs only. Therefore, the second line of the table under the “Investor Class” and “Institutional Class” headings is useful in comparing ongoing costs only and will not help you determine the relative total costs of owning different funds.
| | | | Expenses Paid |
| | Beginning | Ending | During Period(1) |
| | Account Value | Account Value | May 1, 2020 – |
| | May 1, 2020
| October 31, 2020 | October 31, 2020 |
| Investor Class | | | |
| Actual | $1,000.00 | $1,100.10 | $7.87 |
| Hypothetical (5% return before expenses) | $1,000.00 | $1,017.65 | $7.56 |
| | | | |
| Institutional Class | | | |
| Actual | $1,000.00 | $1,102.50 | $5.92 |
| Hypothetical (5% return before expenses) | $1,000.00 | $1,019.51 | $5.69 |
(1) | Expenses are equal to the Fund’s annualized expense ratio of 1.49% for Investor Class shares or 1.12% for Institutional Class shares, as applicable, multiplied by the average account value over the period, multiplied by 184/366 days (to reflect the half-year period). |
| HENNESSY FUNDS | 1-800-966-4354 | |
How to Obtain a Copy of the Fund’s Proxy
Voting Policy and Proxy Voting Records
A description of the policies and procedures the Fund uses to determine how to vote proxies relating to portfolio securities is available without charge (1) by calling 1-800-966-4354, (2) on the Hennessy Funds’ website at www.hennessyfunds.com/proxy-voting/voting-policy, or (3) on the U.S. Securities and Exchange Commission’s (the “SEC”) website at www.sec.gov. The Fund’s proxy voting record is available without charge on both the Hennessy Funds’ website at www.hennessyfunds.com/proxy-voting/voting-record and the SEC’s website at www.sec.gov no later than August 31 for the prior 12 months ending June 30.
Availability of Quarterly Portfolio Schedule
The Fund files a complete schedule of portfolio holdings with the SEC for the first and third quarters of each fiscal year as an exhibit to its reports on Form N-PORT. The Fund’s Form N-PORT reports are available on the SEC’s website at www.sec.gov or on request by calling 1-800-966-4354.
Federal Tax Distribution Information
(Unaudited)
For fiscal year 2020, certain dividends paid by the Fund may be subject to a maximum tax rate of 23.8%, as provided for by the Jobs and Growth Tax Relief Reconciliation Act of 2003. The percentage of dividends declared from ordinary income designated as qualified dividend income was 100.00%.
For corporate shareholders, the percent of ordinary income distributions that qualified for the corporate dividends received deduction for fiscal year 2020 was 100.00%.
The percentage of taxable ordinary income distributions that were designated as short-term capital gain distributions under Section 871(k)(2)(C) of the Internal Revenue Code of 1986, as amended, for the Fund was 0.00%.
Important Notice Regarding Delivery
of Shareholder Documents
To help keep the Fund’s costs as low as possible, we generally deliver a single copy of shareholder reports, proxy statements, and prospectuses to shareholders who share an address and have the same last name. This process does not apply to account statements. You may request an individual copy of a shareholder document at any time. If you would like to receive separate mailings of shareholder documents, please call U.S. Bank Global Fund Services at 1-800-261-6950 or 1-414-765-4124, and individual delivery will begin within 30 days of your request. If your account is held through a financial institution or other intermediary, please contact such intermediary directly to request individual delivery.
Electronic Delivery
The Fund offers shareholders the option to receive account statements, prospectuses, tax forms, and shareholder reports online. To sign up for eDelivery, please visit www.hennessyfunds.com/account. You may change your delivery preference at any time by visiting our website or calling U.S. Bank Global Fund Services at 1-800-261-6950 or 1-414-765-4124.
| PROXY VOTING — PRIVACY POLICY |
Liquidity Risk Management Program
In accordance with Rule 22e-4 under the Investment Company Act of 1940, as amended (the “Liquidity Rule”), we have adopted and implemented a liquidity risk management program (the “Liquidity Program”). The purpose of the Liquidity Program is to assess and manage the Fund’s liquidity risk, which is the risk that the Fund would not be able to meet requests to redeem Fund shares without significant dilution of the remaining shareholders’ interests in the Fund. The Board of Trustees of the Fund (the “Board”) designated a committee comprising representatives of Hennessy Advisors, Inc., the investment adviser to the Fund, as the administrator of the Liquidity Program (the “Program Administrator”).
The Program Administrator provided a written report regarding the Liquidity Program to the Board in advance of its meeting on June 3, 2020. The report covered the period from June 1, 2019, through May 31, 2020. The report addressed the operation of the Liquidity Program, assessed the adequacy and effectiveness of its implementation, and described any material changes to the Liquidity Program during the review period. The Trust’s chief compliance officer presented the report to the Board at the meeting and provided additional information regarding the Liquidity Program. The Board reviewed the Liquidity Program and considered, among other items, the following:
| | 1. | The Program Administrator reviewed daily historical net redemption activity during the review period and during prior periods with higher-than-average redemption activity and concluded that the Fund has historically been able to meet requests to redeem Fund shares without significant dilution to the Fund’s remaining shareholders, and the Program Administrator expects the Fund to be able to continue to do so in the future during both normal and reasonably foreseeable stressed conditions. |
| | | |
| | 2. | The Fund primarily holds assets that are highly liquid investments and is therefore not required to establish a highly liquid investment minimum for the Fund or adopt policies and procedures for responding to a highly liquid investment minimum shortfall. |
| | | |
| | 3. | The Program Administrator did not make any material changes to the Liquidity Program during the review period and was not recommending any changes to the Liquidity Program or the model inputs used to determine the liquidity classification of each security held by the Fund. |
| | | |
| | 4. | The Program Administrator concluded that the Liquidity Program was reasonably designed to assess and manage the Fund’s liquidity risk, complies with the requirements of the Liquidity Rule, and was effectively implemented, having operated as intended during the review period. |
Privacy Policy
We collect the following personal information about you:
| | 1. | Information we receive from you in applications or other forms, correspondence, or conversations, including, but not limited to, your name, address, phone number, social security number, assets, income, and date of birth; |
| | | |
| | 2. | Information about your transactions with us, our affiliates, or others, including, but not limited to, your account number and balance, payments history, parties to transactions, cost basis information, and other financial information; and |
| HENNESSY FUNDS | 1-800-966-4354 | |
| | 3. | Other personal information we collect from various sources, even if you have not entered into a prior transaction with us, including the following: |
| | • | Name, alias, address, unique personal identifier, online identifier, IP address, email address, telephone number, account name, and other similar identifiers; |
| | | |
| | • | Age and marital status; |
| | | |
| | • | Commercial information, including records of products purchased; |
| | | |
| | • | Browsing history, search history, and information on interaction with our website; |
| | | |
| | • | Geolocation data; |
| | | |
| | • | Employment and employment history, educational history, financial information, and purchasing and consuming histories or tendencies; and |
| | | |
| | • | Inferences drawn from the above-listed information to create a profile about your preferences, characteristics, predispositions, and behavior. |
We collect this information directly from you, indirectly in the course of providing services to you, directly and indirectly from your activity on our website, from broker dealers, marketing agencies, and other third parties that interact with us in connection with the services we perform and products we offer, and from anonymized and aggregated consumer information.
We use this information to fulfill the reason you provided the information to us, to provide you with other relevant products that you request from us, to provide you with information about products that may interest you, to improve our website or present our website’s contents to you, and as otherwise described to you when collecting your personal information.
We do not disclose any personal information to unaffiliated third parties, except as permitted by law. We may disclose your personal information to our affiliates, vendors, and service providers for a business purpose. For example, we are permitted by law to disclose all of the information we collect, as described above, to our transfer agent to process your transactions. When disclosing your personal information to third parties, we enter into a contract with each third party describing the purpose of such disclosure and requiring that such personal information be kept confidential and not used for any purpose except to perform the services contracted or respond to regulatory or law enforcement requests.
Furthermore, we restrict access to your personal information to those persons who require such information to provide products or services to you. As a result, we do not provide a means for opting out of our limited sharing of your information. We maintain physical, electronic, and procedural safeguards that comply with federal standards to guard your personal information.
If you hold shares of the Funds through a financial intermediary, including, but not limited to, a broker-dealer, bank, or trust company, the privacy policy of your financial intermediary governs how your personal information is shared with unaffiliated third parties.
Supplemental Privacy Notice for Residents of California
The California Consumer Privacy Act of 2018 (the “CCPA”) provides you, as a California resident, with certain additional rights relating to your personal information.
Under the CCPA, you have the right to request that we disclose to you the categories of personal information we have collected about you over the past 12 months, the categories of sources of such information, our business purpose for collecting the
information, the categories of third parties, if any, with whom we shared the information, and the specific information we have collected about you. You also have the right to request that we delete any of your personal information, and, unless an exception applies, we will delete such information upon receiving and confirming your request. To make a request, call us at 1-800-966-4354, email us at privacy@hennessyfunds.com, or go to www.hennessyfunds.com/contact. We will not discriminate against you for exercising your rights under the CCPA. Further, we will not collect additional categories of your personal information or use the personal information we collected for materially different, unrelated, or incompatible purposes without providing you notice.
| HENNESSY FUNDS | 1-800-966-4354 | |
For information, questions, or assistance, please call
The Hennessy Funds
1-800-966-4354 or 1-415-899-1555
INVESTMENT ADVISOR
Hennessy Advisors, Inc.
7250 Redwood Boulevard, Suite 200
Novato, California 94945
ADMINISTRATOR,
TRANSFER AGENT,
DIVIDEND PAYING AGENT, &
SHAREHOLDER SERVICING AGENT
U.S. Bancorp Fund Services, LLC
d/b/a U.S. Bank Global Fund Services
P.O. Box 701
Milwaukee, Wisconsin 53201-0701
CUSTODIAN
U.S. Bank N.A.
Custody Operations
1555 North River Center Drive, Suite 302
Milwaukee, Wisconsin 53212
TRUSTEES
Neil J. Hennessy
Robert T. Doyle
J. Dennis DeSousa
Gerald P. Richardson
COUNSEL
Foley & Lardner LLP
777 East Wisconsin Avenue
Milwaukee, Wisconsin 53202-5306
INDEPENDENT REGISTERED
PUBLIC ACCOUNTING FIRM
Tait, Weller & Baker LLP
Two Liberty Place
50 South 16th Street, Suite 2900
Philadelphia, Pennsylvania 19102-2529
DISTRIBUTOR
Quasar Distributors, LLC
111 East Kilbourn Avenue, Suite 2200
Milwaukee, Wisconsin 53202
www.hennessyfunds.com | 1-800-966-4354
This report has been prepared for shareholders and may be distributed to
others only if preceded or accompanied by a current prospectus.

ANNUAL REPORT
OCTOBER 31, 2020
HENNESSY BALANCED FUND
Investor Class HBFBX
IMPORTANT NOTICE REGARDING ELECTRONIC DELIVERY OF SHAREHOLDER REPORTS
Beginning on January 1, 2021, as permitted by regulations adopted by the Securities and Exchange Commission, paper copies of the annual and semi-annual reports will no longer be sent by mail unless you specifically request paper copies from the Hennessy Funds or from your financial intermediary. Instead, the reports will be made available on a website, and you will be notified by mail each time a report is posted and provided with a website link to access the report.
If you have already elected to receive shareholder reports electronically, you will not be affected by this change and you need not take any action. You may elect to receive shareholder reports and other communications from the Hennessy Funds electronically by visiting www.hennessyfunds.com/account or by calling U.S. Bank Global Fund Services at 1-800-261-6950. If you own shares in a Fund through a financial intermediary, please contact your financial intermediary to make this election.
You may elect to receive paper copies of all future reports free of charge by calling U.S. Bank Global Fund Services at 1-800-261-6950 or, if you own your shares through a financial intermediary, by contacting your financial intermediary. Your election to receive paper copies of reports will apply to all Funds in the Hennessy Funds family.
www.hennessyfunds.com | 1-800-966-4354
(This Page Intentionally Left Blank.)
Contents
| Letter to Shareholders | | 2 |
| Performance Overview | | 4 |
| Financial Statements | | |
| Schedule of Investments | | 6 |
| Statement of Assets and Liabilities | | 9 |
| Statement of Operations | | 10 |
| Statements of Changes in Net Assets | | 11 |
| Financial Highlights | | 12 |
| Notes to the Financial Statements | | 14 |
| Report of Independent Registered Public Accounting Firm | | 21 |
| Trustees and Officers of the Fund | | 22 |
| Expense Example | | 25 |
| Proxy Voting Policy and Proxy Voting Records | | 26 |
| Availability of Quarterly Portfolio Schedule | | 26 |
| Federal Tax Distribution Information | | 26 |
| Important Notice Regarding Delivery of Shareholder Documents | | 26 |
| Electronic Delivery | | 26 |
| Liquidity Risk Management Program | | 27 |
| Privacy Policy | | 27 |
| HENNESSY FUNDS | 1-800-966-4354 | |
December 2020
Dear Hennessy Funds Shareholder:
As a new year and new decade dawned in January, no one could have imagined that the world would quickly plunge into one of the worst health crises in history. Throughout this pandemic, our thoughts have remained with those most deeply affected by COVID-19, and we thank our frontline healthcare and essential workers. At Hennessy Funds, we adapted quickly to the impact of COVID-19 to maintain business continuity. We focused on our employees and on you, the shareholders of the Hennessy Funds, and I am pleased that we have been able to navigate successfully during this unprecedented time.
The year was defined by a global pandemic and the ensuing economic shutdowns and by a highly charged presidential election that caused tremendous volatility. Yet the stock market has continued to show its resiliency and strength, as the major indices hit new all-time highs in November and again in December. For the 12 months ended October 31, 2020, U.S. equities posted positive performance, with the S&P 500® Index returning 9.71% and the Dow Jones Industrial Average returning 0.34% for the period. There were extreme differences in how various sectors performed during the period. For instance, the technology-focused NASDAQ Composite Index performed strongly, returning 32.84%, whereas the Energy sector (as represented by the S&P 500® Energy Sector Index) struggled with a loss of -46.43%. The Financials sector also performed relatively poorly during the period, with the Russell 1000® Index Financials losing -8.04% and the Russell 2000® Index Financials losing -17.87%. In addition, large cap stocks significantly outperformed small caps, and growth stocks reigned over value stocks during the period. Moreover, approximately half of the NASDAQ’s return for the period was comprised of just three behemoth technology stocks – Apple, Microsoft, and Amazon. Therefore, while the overall U.S. equities market improved, mutual fund returns varied drastically due to the disparate performance of specific sectors, differently sized companies, and different types of companies.
Optimism about the approval and distribution of effective COVID-19 vaccines appears to be buoying investor confidence. Low interest rates, and the expectation that they will remain low for the foreseeable future, have also provided a tailwind to equity prices. In my opinion, stocks are trading at reasonable valuations given this low interest rate environment, with the Dow Jones Industrial Average trading at 20.1x estimated earnings for 2021 and the S&P 500® Index trading at 21.6x estimated earnings for 2021. The U.S. economy looks to be on the road to recovery and is experiencing moderate inflation, and our banking industry appears healthy. The unemployment rate is dropping, albeit slowly, and I expect it to continue to improve once businesses reopen. There are high levels of cash on corporate balance sheets, which could support rising dividends and stock buybacks.
I believe our corporate business leaders will continue to adapt and find ways to drive growth and value for their shareholders, but I also feel that the uncertainty created by the continued health crisis and the stalemate over fiscal relief will lead to additional bouts of market volatility. I remain confident, however, that the markets can and will thrive in the long run.
Thank you for your continued trust and investment in the Hennessy Funds. We believe that there continue to be strong opportunities throughout many segments of the market, and we are focused on managing our high-conviction portfolios for the long-term
benefit of our shareholders. Should you have any questions or would like to speak with us directly, please reach out and call us at (800) 966-4354.
Best regards,
Neil J. Hennessy
President and Chief Investment Officer
Past performance does not guarantee future results.
Mutual fund investing involves risk. Principal loss is possible.
The Dow Jones Industrial Average and S&P 500® Index are commonly used to measure the performance of U.S. stocks. The NASDAQ Composite Index comprises all common stocks listed on The NASDAQ Stock Market and is commonly used to measure the performance of technology-related stocks. The S&P 500® Energy Sector Index is comprised of companies included in the S&P 500® Index that are classified in the Energy sector. The Russell 1000® Index Financials and Russell 2000® Index Financials are subsets of the Russell 1000® Index and Russell 2000® Index, respectively, that measure the performance of securities classified in the Financials sector of the large-cap and small-cap U.S. equity market, respectively. One cannot invest directly in an index. All returns are shown on a total return basis.
Forward price to earnings (PE) is a valuation measure calculated by dividing a company’s market price per share by its expected earnings per share over the following 12 months. PEs noted are sourced from Bloomberg as of December 9, 2020.
| HENNESSY FUNDS | 1-800-966-4354 | |
Performance Overview (Unaudited)
CHANGE IN VALUE OF $10,000 INVESTMENT
This graph illustrates the performance of an initial investment of $10,000 made in the Fund ten years ago and assumes the reinvestment of dividends.
AVERAGE ANNUAL TOTAL RETURN FOR PERIODS ENDED OCTOBER 31, 2020
| | One | Five | Ten |
| | Year
| Years
| Years
|
| Hennessy Balanced Fund (HBFBX) | -7.84% | 3.11% | 4.27% |
| 50/50 Blended DJIA/Treasury Index | 1.95% | 6.54% | 6.48% |
| Dow Jones Industrial Average | 0.34% | 11.12% | 11.82% |
Expense ratio: 1.89%
Performance data quoted represents past performance; past performance does not guarantee future results. The investment return and principal value of an investment will fluctuate so that an investor’s shares, when redeemed, may be worth more or less than their original cost. The performance table does not reflect the deduction of taxes that a shareholder would pay on Fund distributions or the redemption of Fund shares. Current performance of the Fund may be lower or higher than the performance quoted. Performance data current to the most recent month end may be obtained by visiting www.hennessyfunds.com.
The 50/50 Blended DJIA/Treasury Index consists of 50% common stocks represented by the Dow Jones Industrial Average and 50% short-duration Treasury securities represented by the ICE BofAML 1-Year U.S. Treasury Note Index, which comprises U.S. Treasury securities maturing in approximately one year. The Dow Jones Industrial Average is a price-weighted average of 30 significant stocks traded on the New York Stock Exchange or The NASDAQ Stock Market. One cannot invest directly in an index. These indices are used herein for comparative purposes in accordance with Securities and Exchange Commission regulations.
The expense ratio presented is from the most recent prospectus. The expense ratio for the current reporting period is available in the Financial Highlights section of this report.
PERFORMANCE NARRATIVE
Portfolio Managers Neil J. Hennessy, Ryan C. Kelley, CFA, and L. Joshua Wein, CAIA
Performance:
For the 12-month period ended October 31, 2020, the Hennessy Balanced Fund returned -7.84%, underperforming both the 50/50 Blended DJIA/Treasury Index (the Fund’s
primary benchmark) and the Dow Jones Industrial Average, which returned 1.95% and 0.34%, respectively, for the same period.
The Fund underperformed its primary benchmark predominantly as a result of stock selection in the Energy, Consumer Staples, and Information Technology sectors, with Exxon Mobil Corporation, Walgreens Boots Alliance, Inc., and International Business Machines Corporation detracting from performance during the period. Offsetting these losses somewhat were investments in the Financials, Industrials, and Materials sectors, as JPMorgan Chase & Company, Caterpillar, Inc., and Dow, Inc. advanced during the period. Sector selection detracted from the Fund’s return on a relative basis with underweight positions in Information Technology and Consumer Discretionary and an overweight position in Energy.
The Fund continues to hold all the companies mentioned with the exception of Caterpillar, Inc.
Portfolio Strategy:
The Fund invests approximately 50% of its assets in the “Dogs of the Dow,” the 10 highest dividend-yielding Dow stocks, and 50% of its assets in U.S. Treasuries. As a result of this “balanced” strategy, the Fund may be expected to underperform equities in periods when equity markets rise and outperform equities in periods when equity markets fall. The Fund is designed to allow its investors to gain some exposure to the equity market while maintaining a significant share of its investment in fixed income securities. We believe the Fund is well positioned for the more conservative investor because the equity portion of the portfolio is invested in what we deem to be high-quality companies, each of which pays a quarterly dividend, while the balance of the Fund is invested in lower-risk, short-duration U.S. Treasuries.
Investment Commentary:
We continue to believe that the outlook for U.S. stocks is positive. In our view, despite a sharp contraction in economic activity as a result of the COVID-19 pandemic, the U.S. economy is in the early stages of growing once again. The Federal Reserve’s low interest rate policy, which is expected to last through 2021, together with the anticipated release of a COVID-19 vaccine in the first half of 2021, may give rise to increased employment, wage gains, and economic growth. While corporate earnings declined over the 12-month period, they are expected to rise meaningfully over the next 12 months as economies around the world recover from the COVID-19 pandemic.
If the market experiences a correction, we would expect our more defensive holdings to perform well relative to the market. The relatively short duration of the 50% weighting of U.S. Treasuries in the portfolio (all less than one year) may allow us the ability to roll into higher-yielding Treasuries in the event dividends rise.
_______________
Opinions expressed are those of the Portfolio Managers as of the date written and are subject to change, are not guaranteed, and should not be considered investment advice or an indication of trading intent.
The Fund is non-diversified, meaning it may concentrate its assets in fewer individual holdings than a diversified fund, making it more exposed to individual stock volatility than a diversified fund. The Fund’s formula-based strategy may cause the Fund to buy or sell securities at times when it may not be advantageous. Please see the Fund’s prospectus for a more complete discussion of these and other risks.
References to specific securities should not be considered a recommendation to buy or sell any security. Fund holdings and sector allocations are subject to change. Please refer to the Schedule of Investments included in this report for additional portfolio information.
Earnings growth is not a measure of the Fund’s future performance.
Dividend yield is calculated by dividing a company’s dividends per share by its market price per share.
| HENNESSY FUNDS | 1-800-966-4354 | |
Financial Statements
Schedule of Investments as of October 31, 2020 |
HENNESSY BALANCED FUND
(% of Net Assets)
| TOP TEN HOLDINGS (EXCLUDING MONEY MARKET FUNDS) | % NET ASSETS |
| U.S. Treasury Bill, 0.100%, 01/28/2021 | 20.85%
|
| U.S. Treasury Bill, 0.200%, 06/17/2021 | 9.17% |
| U.S. Treasury Bill, 0.090%, 12/03/2020 | 8.33% |
| U.S. Treasury Bill, 0.085%, 11/05/2020 | 5.84% |
| Dow, Inc. | 5.22% |
| JPMorgan Chase & Co. | 5.15% |
| The Coca-Cola Co. | 5.15% |
| 3M Co. | 5.00% |
| Verizon Communications, Inc. | 4.94% |
| International Business Machines Corp. | 4.70% |
Note: For presentation purposes, the Fund has grouped some of the industry categories. For purposes of categorizing securities for compliance with Section 8(b)(1) of the Investment Company Act of 1940, as amended, the Fund uses more specific industry classifications.
The Global Industry Classification Standard (GICS®) was developed by and is the exclusive property and a service mark of MSCI, Inc. and Standard & Poor’s Financial Services LLC. It has been licensed for use by the Hennessy Funds.
| COMMON STOCKS – 47.04% | | Number | | | | | | % of | |
| | | of Shares | | | Value | | | Net Assets | |
| Communication Services – 4.94% | | | | | | | | | |
| Verizon Communications, Inc. | | | 10,400 | | | $ | 592,696 | | | | 4.94 | % |
| | | | | | | | | | | | | |
| Consumer Staples – 9.44% | | | | | | | | | | | | |
| The Coca-Cola Co. | | | 12,850 | | | | 617,571 | | | | 5.15 | % |
| Walgreens Boots Alliance, Inc. | | | 15,100 | | | | 514,004 | | | | 4.29 | % |
| | | | | | | | 1,131,575 | | | | 9.44 | % |
| | | | | | | | | | | | | |
| Energy – 4.79% | | | | | | | | | | | | |
| Chevron Corp. | | | 7,050 | | | | 489,975 | | | | 4.08 | % |
| Exxon Mobil Corp. | | | 2,600 | | | | 84,812 | | | | 0.71 | % |
| | | | | | | | 574,787 | | | | 4.79 | % |
| | | | | | | | | | | | | |
| Financials – 7.52% | | | | | | | | | | | | |
| JPMorgan Chase & Co. | | | 6,300 | | | | 617,652 | | | | 5.15 | % |
| Travelers Companies, Inc. | | | 2,350 | | | | 283,669 | | | | 2.37 | % |
| | | | | | | | 901,321 | | | | 7.52 | % |
| | | | | | | | | | | | | |
| Health Care – 2.49% | | | | | | | | | | | | |
| Pfizer, Inc. | | | 8,400 | | | | 298,032 | | | | 2.49 | % |
| | | | | | | | | | | | | |
| Industrials – 5.00% | | | | | | | | | | | | |
| 3M Co. | | | 3,750 | | | | 599,850 | | | | 5.00 | % |
| | | | | | | | | | | | | |
| Information Technology – 7.64% | | | | | | | | | | | | |
| Cisco Systems, Inc. | | | 9,800 | | | | 351,820 | | | | 2.94 | % |
| International Business Machines Corp. | | | 5,050 | | | | 563,883 | | | | 4.70 | % |
| | | | | | | | 915,703 | | | | 7.64 | % |
| | | | | | | | | | | | | |
| Materials – 5.22% | | | | | | | | | | | | |
| Dow, Inc. | | | 13,750 | | | | 625,487 | | | | 5.22 | % |
| | | | | | | | | | | | | |
| Total Common Stocks | | | | | | | | | | | | |
| (Cost $6,094,963) | | | | | | | 5,639,451 | | | | 47.04 | % |
The accompanying notes are an integral part of these financial statements.
| HENNESSY FUNDS | 1-800-966-4354 | |
| SHORT-TERM INVESTMENTS – 53.68% | Number of Shares/ | | | | | % of | |
| | | Par Amount | | | Value | | | Net Assets | |
| Money Market Funds – 2.82% | | | | | | | | | |
| First American Government Obligations | | | | | | | | | |
| Fund, Institutional Class, 0.05% (a) | | | 338,463 | | | $ | 338,463 | | | | 2.82 | % |
| | | | | | | | | | | | | |
| U.S. Treasury Bills – 50.86% | | | | | | | | | | | | |
| 0.085%, 11/05/2020 (b) | | | 700,000 | | | | 699,880 | | | | 5.84 | % |
| 0.090%, 12/03/2020 (b) | | | 1,000,000 | | | | 998,667 | | | | 8.33 | % |
| 0.100%, 01/28/2021 (b) | | | 2,500,000 | | | | 2,499,486 | | | | 20.85 | % |
| 0.160%, 05/20/2021 (b) | | | 300,000 | | | | 299,847 | | | | 2.50 | % |
| 0.200%, 06/17/2021 (b) | | | 1,100,000 | | | | 1,099,358 | | | | 9.17 | % |
| 0.155%, 07/15/2021 (b) | | | 500,000 | | | | 499,664 | | | | 4.17 | % |
| | | | | | | | 6,096,902 | | | | 50.86 | % |
| | | | | | | | | | | | | |
| Total Short-Term Investments | | | | | | | | | | | | |
| (Cost $6,426,304) | | | | | | | 6,435,365 | | | | 53.68 | % |
| | | | | | | | | | | | | |
| Total Investments | | | | | | | | | | | | |
| (Cost $12,521,267) – 100.72% | | | | | | | 12,074,816 | | | | 100.72 | % |
| Liabilities in Excess of Other Assets – (0.72)% | | | | | | | (86,609 | ) | | | (0.72 | )% |
| | | | | | | | | | | | | |
TOTAL NET ASSETS – 100.00% | | | | | | $ | 11,988,207 | | | | 100.00 | % |
Percentages are stated as a percent of net assets.
| (a) | The rate listed is the fund’s seven-day yield as of October 31, 2020. |
| (b) | The rate listed is the discount rate at issue. |
Summary of Fair Value Exposure as of October 31, 2020
The following is a summary of the inputs used to value the Fund’s net assets as of October 31, 2020 (see Note 3 in the accompanying Notes to the Financial Statements):
| Common Stocks | | Level 1 | | | Level 2 | | | Level 3 | | | Total | |
| Communication Services | | $ | 592,696 | | | $ | — | | | $ | — | | | $ | 592,696 | |
| Consumer Staples | | | 1,131,575 | | | | — | | | | — | | | | 1,131,575 | |
| Energy | | | 574,787 | | | | — | | | | — | | | | 574,787 | |
| Financials | | | 901,321 | | | | — | | | | — | | | | 901,321 | |
| Health Care | | | 298,032 | | | | — | | | | — | | | | 298,032 | |
| Industrials | | | 599,850 | | | | — | | | | — | | | | 599,850 | |
| Information Technology | | | 915,703 | | | | — | | | | — | | | | 915,703 | |
| Materials | | | 625,487 | | | | — | | | | — | | | | 625,487 | |
| Total Common Stocks | | $ | 5,639,451 | | | $ | — | | | $ | — | | | $ | 5,639,451 | |
| Short-Term Investments | | | | | | | | | | | | | | | | |
| Money Market Funds | | $ | 338,463 | | | $ | — | | | $ | — | | | $ | 338,463 | |
| U.S. Treasury Bills | | | — | | | | 6,096,902 | | | | — | | | | 6,096,902 | |
| Total Short-Term Investments | | $ | 338,463 | | | $ | 6,096,902 | | | $ | — | | | $ | 6,435,365 | |
| Total Investments | | $ | 5,977,914 | | | $ | 6,096,902 | | | $ | — | | | $ | 12,074,816 | |
The accompanying notes are an integral part of these financial statements.
| SCHEDULE OF INVESTMENTS/STATEMENT OF ASSETS AND LIABILITIES |
Financial Statements
Statement of Assets and Liabilities as of October 31, 2020 |
| ASSETS: | | | |
| Investments in securities, at value (cost $12,521,267) | | $ | 12,074,816 | |
| Dividends and interest receivable | | | 12,203 | |
| Prepaid expenses and other assets | | | 7,796 | |
| Total assets | | | 12,094,815 | |
| | | | | |
| LIABILITIES: | | | | |
| Payable for fund shares redeemed | | | 57,405 | |
| Payable to advisor | | | 6,267 | |
| Payable to administrator | | | 4,344 | |
| Payable to auditor | | | 23,100 | |
| Accrued distribution fees | | | 4,976 | |
| Accrued service fees | | | 1,045 | |
| Accrued trustees fees | | | 3,938 | |
| Accrued expenses and other payables | | | 5,533 | |
| Total liabilities | | | 106,608 | |
| NET ASSETS | | $ | 11,988,207 | |
| | | | | |
| NET ASSETS CONSISTS OF: | | | | |
| Capital stock | | $ | 12,478,288 | |
| Accumulated deficit | | | (490,081 | ) |
| Total net assets | | $ | 11,988,207 | |
| | | | | |
| NET ASSETS: | | | | |
| Investor Class | | | | |
| Shares authorized (no par value) | | Unlimited | |
| Net assets applicable to outstanding shares | | $ | 11,988,207 | |
| Shares issued and outstanding | | | 1,106,143 | |
| Net asset value, offering price, and redemption price per share | | $ | 10.84 | |
The accompanying notes are an integral part of these financial statements.
| HENNESSY FUNDS | 1-800-966-4354 | |
Financial Statements
Statement of Operations for the year ended October 31, 2020 |
| INVESTMENT INCOME: | | | |
| Dividend income | | $ | 263,545 | |
| Interest income | | | 96,275 | |
| Total investment income | | | 359,820 | |
| | | | | |
| EXPENSES: | | | | |
| Investment advisory fees (See Note 5) | | | 73,265 | |
| Compliance expense (See Note 5) | | | 27,710 | |
| Administration, accounting, custody, and transfer agent fees (See Note 5) | | | 24,432 | |
| Audit fees | | | 23,104 | |
| Federal and state registration fees | | | 21,673 | |
| Distribution fees – Investor Class (See Note 5) | | | 18,316 | |
| Trustees’ fees and expenses | | | 13,268 | |
| Service fees – Investor Class (See Note 5) | | | 12,211 | |
| Sub-transfer agent expenses – Investor Class (See Note 5) | | | 7,378 | |
| Reports to shareholders | | | 5,811 | |
| Legal fees | | | 169 | |
| Other expenses | | | 3,888 | |
| Total expenses | | | 231,225 | |
| NET INVESTMENT INCOME | | $ | 128,595 | |
| | | | | |
| REALIZED AND UNREALIZED GAINS (LOSSES): | | | | |
| Net realized loss on investments | | $ | (37,345 | ) |
| Net change in unrealized appreciation/depreciation on investments | | | (1,068,334 | ) |
| Net loss on investments | | | (1,105,679 | ) |
| NET DECREASE IN NET ASSETS RESULTING FROM OPERATIONS | | $ | (977,084 | ) |
The accompanying notes are an integral part of these financial statements.
| STATEMENT OF OPERATIONS/STATEMENTS OF CHANGES IN NET ASSETS |
Financial Statements
| Statements of Changes in Net Assets |
| | | Year Ended | | | Year Ended | |
| | | October 31, 2020 | | | October 31, 2019 | |
| OPERATIONS: | | | | | | |
| Net investment income | | $ | 128,595 | | | $ | 130,489 | |
| Net realized gain (loss) on investments | | | (37,345 | ) | | | 507,439 | |
| Net change in unrealized | | | | | | | | |
| appreciation/depreciation on investments | | | (1,068,334 | ) | | | 107,778 | |
| Net increase (decrease) in net | | | | | | | | |
| assets resulting from operations | | | (977,084 | ) | | | 745,706 | |
| | | | | | | | | |
| DISTRIBUTIONS TO SHAREHOLDERS: | | | | | | | | |
| Distributable earnings – Investor Class | | | (623,540 | ) | | | (681,988 | ) |
| Total distributions | | | (623,540 | ) | | | (681,988 | ) |
| | | | | | | | | |
| CAPITAL SHARE TRANSACTIONS: | | | | | | | | |
| Proceeds from shares subscribed – Investor Class | | | 1,953,092 | | | | 2,194,903 | |
| Dividends reinvested – Investor Class | | | 613,858 | | | | 673,592 | |
| Cost of shares redeemed – Investor Class | | | (1,281,653 | ) | | | (2,249,250 | ) |
| Net increase in net assets derived | | | | | | | | |
| from capital share transactions | | | 1,285,297 | | | | 619,245 | |
| TOTAL INCREASE (DECREASE) IN NET ASSETS | | | (315,327 | ) | | | 682,963 | |
| | | | | | | | | |
| NET ASSETS: | | | | | | | | |
| Beginning of year | | | 12,303,534 | | | | 11,620,571 | |
| End of year | | $ | 11,988,207 | | | $ | 12,303,534 | |
| | | | | | | | | |
| CHANGES IN SHARES OUTSTANDING: | | | | | | | | |
| Shares sold – Investor Class | | | 173,324 | | | | 179,722 | |
| Shares issued to holders as reinvestment | | | | | | | | |
| of dividends – Investor Class | | | 51,675 | | | | 56,316 | |
| Shares redeemed – Investor Class | | | (112,932 | ) | | | (183,674 | ) |
| Net increase in shares outstanding | | | 112,067 | | | | 52,364 | |
The accompanying notes are an integral part of these financial statements.
| HENNESSY FUNDS | 1-800-966-4354 | |
Financial Statements
For an Investor Class share outstanding throughout each year
PER SHARE DATA:
Net asset value, beginning of year
Income from investment operations:
Net investment income
Net realized and unrealized gains (losses) on investments
Total from investment operations
Less distributions:
Dividends from net investment income
Dividends from net realized gains
Total distributions
Net asset value, end of year
TOTAL RETURN
SUPPLEMENTAL DATA AND RATIOS:
Net assets, end of year (millions)
Ratio of expenses to average net assets
Ratio of net investment income to average net assets
Portfolio turnover rate
(1) | Calculated using the average shares outstanding method. |
The accompanying notes are an integral part of these financial statements.
| FINANCIAL HIGHLIGHTS — INVESTOR CLASS |
| Year Ended October 31, | |
| 2020 | | | 2019 | | | 2018 | | | 2017 | | | 2016 | |
| | | | | | | | | | | | | | |
| $ | 12.38 | | | $ | 12.34 | | | $ | 12.88 | | | $ | 12.68 | | | $ | 12.37 | |
| | | | | | | | | | | | | | | | | | | |
| | | | | | | | | | | | | | | | | | | |
| | 0.12 | (1) | | | 0.13 | (1) | | | 0.09 | | | | 0.06 | | | | 0.04 | |
| | (1.04 | ) | | | 0.59 | | | | 0.33 | | | | 1.09 | | | | 0.58 | |
| | (0.92 | ) | | | 0.72 | | | | 0.42 | | | | 1.15 | | | | 0.62 | |
| | | | | | | | | | | | | | | | | | | |
| | | | | | | | | | | | | | | | | | | |
| | (0.12 | ) | | | (0.13 | ) | | | (0.08 | ) | | | (0.05 | ) | | | (0.04 | ) |
| | (0.50 | ) | | | (0.55 | ) | | | (0.88 | ) | | | (0.90 | ) | | | (0.27 | ) |
| | (0.62 | ) | | | (0.68 | ) | | | (0.96 | ) | | | (0.95 | ) | | | (0.31 | ) |
| $ | 10.84 | | | $ | 12.38 | | | $ | 12.34 | | | $ | 12.88 | | | $ | 12.68 | |
| | | | | | | | | | | | | | | | | | | |
| | -7.84 | % | | | 6.05 | % | | | 3.46 | % | | | 9.56 | % | | | 5.20 | % |
| | | | | | | | | | | | | | | | | | | |
| | | | | | | | | | | | | | | | | | | |
| $ | 11.99 | | | $ | 12.30 | | | $ | 11.62 | | | $ | 12.24 | | | $ | 12.08 | |
| | 1.89 | % | | | 1.88 | % | | | 1.84 | % | | | 1.82 | % | | | 1.68 | % |
| | 1.05 | % | | | 1.04 | % | | | 0.70 | % | | | 0.45 | % | | | 0.33 | % |
| | 42 | % | | | 52 | % | | | 21 | % | | | 31 | % | | | 51 | % |
The accompanying notes are an integral part of these financial statements.
| HENNESSY FUNDS | 1-800-966-4354 | |
Financial Statements
Notes to the Financial Statements October 31, 2020 |
1). ORGANIZATION
The Hennessy Balanced Fund (the “Fund”) is a series of Hennessy Funds Trust (the “Trust”), which was organized as a Delaware statutory trust on September 17, 1992. The Fund is an open-end management investment company registered under the Investment Company Act of 1940, as amended. The investment objective of the Fund is a combination of capital appreciation and current income. The Fund is a non-diversified fund and offers Investor Class shares.
As an investment company, the Fund follows the investment company accounting and reporting guidance of the Financial Accounting Standards Board (“FASB”) Accounting Standard Codification Topic 946 “Financial Services—Investment Companies.”
2). SIGNIFICANT ACCOUNTING POLICIES
The following is a summary of significant accounting policies consistently followed by the Fund in the preparation of the financial statements. These policies conform to U.S. generally accepted accounting principles (“GAAP”).
| a). | Securities Valuation – All investments in securities are valued in accordance with the Fund’s valuation policies and procedures, as described in Note 3. |
| | |
| b). | Federal Income Taxes – No provision for federal income taxes or excise taxes has been made because the Fund has elected to be taxed as a regulated investment company and intends to distribute substantially all of its taxable income to its shareholders and otherwise comply with the provisions of the Internal Revenue Code of 1986, as amended, applicable to regulated investment companies. Net investment income/loss and realized gains/losses for federal income tax purposes may differ from those reported in the financial statements because of temporary book and tax basis differences. Temporary differences are primarily the result of the treatment of wash sales for tax reporting purposes. The Fund recognizes interest and penalties related to income tax benefits, if any, in the Statement of Operations as an income tax expense. Distributions from net realized gains for book purposes may include short-term capital gains, which are included as ordinary income to shareholders for tax purposes. The Fund may utilize equalization accounting for tax purposes and designate earnings and profits, including net realized gains distributed to shareholders on redemption of shares, as part of the dividends paid deduction for income tax purposes. |
| | |
| | Due to inherent differences in the recognition of income, expenses, and realized gains/losses under GAAP and federal income tax regulations, permanent differences between book and tax basis for reporting are identified and appropriately reclassified in the Statement of Assets and Liabilities, as needed. As of October 31, 2020, no such reclassifications were required for fiscal year 2020. |
| | |
| c). | Accounting for Uncertainty in Income Taxes – The Fund has accounting policies regarding recognition and measurement of tax positions taken or expected to be taken on a tax return. The tax returns of the Fund for the prior three fiscal years are open for examination. The Fund has reviewed all open tax years in major jurisdictions and concluded that there is no impact on the Fund’s net assets and no |
| NOTES TO THE FINANCIAL STATEMENTS |
| | tax liability resulting from unrecognized tax benefits relating to uncertain income tax positions taken or expected to be taken on a tax return. The Fund’s major tax jurisdictions are U.S. federal and Delaware. |
| | |
| d). | Income and Expenses – Dividend income is recognized on the ex-dividend date or as soon as information is available to the Fund. Interest income, which includes the amortization of premium and accretion of discount, is recognized on an accrual basis. Market discounts, original issue discounts, and market premiums on debt securities are accreted or amortized to interest income over the life of a security with a corresponding increase or decrease, as applicable, in the cost basis of such security using the yield to maturity method, or where applicable, the first call date of the security. Other non-cash dividends are recognized as investment income at the fair value of the property received. The Fund is charged for those expenses that are directly attributable to its portfolio, such as advisory, administration, and certain shareholder service fees. |
| | |
| e). | Distributions to Shareholders – Dividends from net investment income for the Fund, if any, are declared and paid at the end of each calendar quarter. Distributions of net realized capital gains, if any, are declared and paid annually, usually in December. |
| | |
| f). | Security Transactions – Investment and shareholder transactions are recorded on the trade date. The Fund determines the realized gain/loss from an investment transaction by comparing the original cost of the security lot sold with the net sale proceeds. Discounts and premiums on securities purchased are accreted or amortized, respectively, over the life of each such security. |
| | |
| g). | Use of Estimates – The preparation of financial statements in conformity with GAAP requires management to make estimates and assumptions that affect the reported amounts of assets and liabilities and disclosure of contingent assets and liabilities at the date of the financial statements and the reported change in net assets during the reporting period. Actual results could differ from those estimates. |
| | |
| h). | Share Valuation – The net asset value (“NAV”) per share of the Fund is calculated by dividing (i) the total value of the securities held by the Fund, plus cash and other assets, minus all liabilities (including estimated accrued expenses) by (ii) the total number of shares outstanding for the Fund, rounded to the nearest $0.01. The Fund’s shares will not be priced on days the New York Stock Exchange is closed for trading. The offering and redemption price per share for the Fund is equal to the Fund’s NAV per share. |
| | |
| i). | New Accounting Pronouncements – In August 2018, the FASB issued Accounting Standards Update No. 2018-13 “Disclosure Framework—Changes to the Disclosure Requirements for Fair Value Measurement” (“ASU 2018-13”). ASU 2018-13 eliminates the requirement to disclose the amount of and reasons for transfers between Level 1 and Level 2 of the fair value hierarchy, the timing of transfers between levels of the fair value hierarchy, and the valuation processes for Level 3 fair value measurements. ASU 2018-13 does not eliminate the requirement to disclose the range and weighted average used to develop significant unobservable inputs for Level 3 fair value measurements, and the changes in unrealized gains and losses for recurring Level 3 fair value measurements. ASU 2018-13 requires that information is provided about the measurement uncertainty of Level 3 fair value measurements as of the reporting date. The guidance is effective for fiscal years beginning after December 15, 2019, and interim periods within those fiscal years. Management evaluated the impact of this change in guidance and, due to the permissibility of early adoption, modified the Fund’s fair value disclosures beginning with its fiscal year 2019. |
| HENNESSY FUNDS | 1-800-966-4354 | |
3). SECURITIES VALUATION
The Fund follows its valuation policies and procedures in determining its net asset value and, in preparing these financial statements, the fair value accounting standards that establish an authoritative definition of fair value and set out a hierarchy for measuring fair value. These standards require additional disclosures about the various inputs and valuation techniques used to develop the measurements of fair value and a discussion of changes in valuation techniques and related inputs during the period. These inputs are summarized in the three broad levels listed below:
| | Level 1 – | Unadjusted, quoted prices in active markets for identical instruments that the Fund has the ability to access at the date of measurement. |
| | | |
| | Level 2 – | Other significant observable inputs (including, but not limited to, quoted prices in active markets for similar instruments, quoted prices in markets that are not active for identical or similar instruments, and model-derived valuations in which all significant inputs and significant value drivers are observable in active markets, such as interest rates, prepayment speeds, credit risk curves, default rates, and similar data). |
| | | |
| | Level 3 – | Significant unobservable inputs (including the Fund’s own assumptions about what market participants would use to price the asset or liability based on the best available information) when observable inputs are unavailable. |
The following is a description of the valuation techniques applied to the Fund’s major categories of assets and liabilities on a recurring basis:
| | Equity Securities – Equity securities, including common stocks, preferred stocks, exchange-traded funds, closed-end mutual funds, partnerships, rights, and real estate investment trusts, that are traded on a securities exchange for which a last-quoted sales price is readily available will generally be valued at the last sales price as reported by the primary exchange on which the securities are listed. Securities listed on The NASDAQ Stock Market (“NASDAQ”) will generally be valued at the NASDAQ Official Closing Price, which may differ from the last sales price reported. Securities traded on a securities exchange for which a last-quoted sales price is not readily available will generally be valued at the mean between the bid and ask prices. To the extent these securities are actively traded and valuation adjustments are not applied, they are classified in Level 1 of the fair value hierarchy. |
| | |
| | Registered Investment Companies – Investments in open-end registered investment companies, commonly referred to as mutual funds, generally are priced at the ending NAV provided by the applicable mutual fund’s service agent and will be classified in Level 1 of the fair value hierarchy. |
| | |
| | Debt Securities – Debt securities, including corporate bonds, asset-backed securities, mortgage-backed securities, municipal bonds, U.S. Treasuries, and U.S. government agency issues, are generally valued at market on the basis of valuations furnished by an independent pricing service that utilizes both dealer-supplied valuations and formula-based techniques. The pricing service may consider recently executed transactions in securities of the issuer or comparable issuers, market price quotations (where observable), bond spreads, and fundamental data relating to the issuer. In addition, the model may incorporate observable market data, such as reported sales of similar securities, broker quotes, yields, bids, offers, and reference data. Certain securities are valued primarily using dealer quotations. These securities are generally classified in Level 2 of the fair value hierarchy. |
| NOTES TO THE FINANCIAL STATEMENTS |
| | Short-Term Securities – Short-term equity investments, including money market funds, are valued in the manner specified above. Short-term debt investments with an original term to maturity of 60 days or less are valued at amortized cost, which approximates fair market value. If the original term to maturity of a short-term debt investment exceeded 60 days, then the values as of the 61st day prior to maturity are amortized. Amortized cost is not used if its use would be inappropriate due to credit or other impairments of the issuer, in which case the security’s fair value would be determined, as described below. Short-term securities are generally classified in Level 1 or Level 2 of the fair value hierarchy depending on the inputs used and market activity levels for specific securities. |
The Board of Trustees of the Fund (the “Board”) has adopted fair value pricing procedures that are followed when a price for a security is not readily available or if a significant event has occurred that indicates the closing price of a security no longer represents the true value of that security. Fair value pricing determinations are made in good faith in accordance with these procedures. There are numerous criteria that will be given consideration in determining a fair value of a security, such as the trading volume of a security and markets, the values of other similar securities, and news events with direct bearing on a security or markets. Fair value pricing results in an estimated price for a security that reflects the amount the Fund might reasonably expect to receive in a current sale. Depending on the relative significance of the valuation inputs, these securities may be classified in either Level 2 or Level 3 of the fair value hierarchy.
The Board has delegated day-to-day valuation matters to the Valuation and Liquidity Committee comprising representatives from Hennessy Advisors, Inc., the Fund’s investment advisor (the “Advisor”). The function of the Valuation and Liquidity Committee is to value securities where current and reliable market quotations are not readily available. All actions taken by the Valuation and Liquidity Committee are reviewed by the Board.
The Fund has performed an analysis of all existing investments to determine the significance and character of all inputs to their fair value determinations. Various inputs are used to determine the value of the Fund’s investments. The inputs or methodology used for valuing securities are not necessarily an indication of the risk associated with investing in those securities. Details related to the fair value hierarchy of the Fund’s securities as of October 31, 2020, are included in the Schedule of Investments.
4). INVESTMENT TRANSACTIONS
Purchases and sales of investment securities (excluding government and short-term investments) for the Fund during fiscal year 2020 were $3,150,361 and $2,473,399, respectively.
There were no purchases or sales/maturities of long-term U.S. government securities for the Fund during fiscal year 2020.
The Fund is permitted to purchase or sell securities from or to another fund in the Hennessy Funds family of funds (collectively, the “Hennessy Funds”) under specified conditions outlined in procedures adopted by the Board. The procedures have been designed to ensure that any purchase or sale of securities by the Fund from or to another Hennessy Fund complies with Rule 17a-7 of the Investment Company Act of 1940, as amended. During fiscal year 2020, the Fund did not engage in purchases or sales of securities pursuant to Rule 17a-7 of the Investment Company Act of 1940, as amended.
| HENNESSY FUNDS | 1-800-966-4354 | |
5). INVESTMENT ADVISORY FEE AND OTHER TRANSACTIONS WITH AFFILIATES
The Advisor provides the Fund with investment advisory services under an Investment Advisory Agreement. The Advisor furnishes all investment advice, office space, and facilities and most of the personnel needed by the Fund. As compensation for its services, the Advisor is entitled to a monthly fee from the Fund. The fee is based on the average daily net assets of the Fund at an annual rate of 0.60%. The net investment advisory fees expensed by the Fund during fiscal year 2020 are included in the Statement of Operations.
The Board has approved a Shareholder Servicing Agreement for the Fund, which was instituted to compensate the Advisor for the non-investment advisory services it provides to the Fund. The Shareholder Servicing Agreement provides for a monthly fee paid to the Advisor at an annual rate of 0.10% of the average daily net assets of the Fund. The shareholder service fees expensed by the Fund during fiscal year 2020 are included in the Statement of Operations.
The Fund has adopted a plan pursuant to Rule 12b-1 under the Investment Company Act of 1940, as amended, that authorizes payments in connection with the distribution of the Fund’s shares at an annual rate of up to 0.25% of the Fund’s average daily net assets. Even though the authorized rate is up to 0.25%, the Fund is currently only using up to 0.15% of its average daily net assets for such purpose. Amounts paid under the plan may be spent on any activities or expenses primarily intended to result in the sale of shares, including, but not limited to, advertising, shareholder account servicing, printing and mailing of prospectuses to other than current shareholders, printing and mailing of sales literature, and compensation for sales and marketing activities or to financial institutions and others, such as dealers and distributors. The distribution fees expensed by the Fund during fiscal year 2020 are included in the Statement of Operations.
The Fund has entered into agreements with various brokers, dealers, and financial intermediaries in connection with the sale of shares of the Fund. The agreements provide for periodic payments of sub-transfer agent expenses by the Fund to the brokers, dealers, and financial intermediaries for providing certain shareholder maintenance services. These shareholder services include the pre-processing and quality control of new accounts, shareholder correspondence, answering customer inquiries regarding account status, and facilitating shareholder telephone transactions. The sub-transfer agent fees expensed by the Fund during fiscal year 2020 are included in the Statement of Operations.
U.S. Bancorp Fund Services, LLC, d/b/a U.S. Bank Global Fund Services (“Fund Services”) provides the Fund with administrative, accounting, and transfer agent services. As administrator, Fund Services is responsible for activities such as (i) preparing various federal and state regulatory filings, reports, and returns for the Fund, (ii) preparing reports and materials to be supplied to the Board, (iii) monitoring the activities of the Fund’s custodian, transfer agent, and accountants, and (iv) coordinating the preparation and payment of the Fund’s expenses and reviewing the Fund’s expense accruals. U.S. Bank N.A., an affiliate of Fund Services, serves as the Fund’s custodian. The servicing agreements between the Trust and Fund Services and U.S. Bank N.A. contain a fee schedule that is inclusive of administrative, accounting, custody, and transfer agent fees. The administrative, accounting, custody, and transfer agent fees expensed by the Fund during fiscal year 2020 are included in the Statement of Operations.
Quasar Distributors, LLC (“Quasar”) acts as the Fund’s principal underwriter in a continuous public offering of the Fund’s shares. Quasar was an affiliate of Fund Services and U.S. Bank N.A. through March 30, 2020. Effective March 31, 2020, Foreside Financial Group, LLC (“Foreside”) acquired Quasar from Fund Services. As a result of the
| NOTES TO THE FINANCIAL STATEMENTS |
acquisition, Quasar became a wholly owned broker-dealer subsidiary of Foreside and is no longer affiliated with Fund Services or U.S. Bank N.A. The Board approved a new Distribution Agreement to enable Quasar to continue serving as the Fund’s distributor.
The officers of the Fund are affiliated with the Advisor. With the exception of the Chief Compliance Officer and the Senior Compliance Officer, such officers receive no compensation from the Fund for serving in their respective roles. The Fund, along with the other Hennessy Funds, makes reimbursement payments on an equal basis to the Advisor for a portion of the salary and benefits associated with the office of the Chief Compliance Officer and for all of the salary and benefits associated with the office of the Senior Compliance Officer. The compliance fees expensed by the Fund during fiscal year 2020 are included in the Statement of Operations.
6). GUARANTEES AND INDEMNIFICATIONS
Under the Hennessy Funds’ organizational documents, their officers and trustees are indemnified by the Hennessy Funds against certain liabilities arising out of the performance of their duties to the Hennessy Funds. Additionally, in the normal course of business, the Hennessy Funds enter into contracts with service providers that contain general indemnification clauses. The Fund’s maximum exposure under these arrangements is unknown as this would involve future claims that may be made against the Fund that have not yet occurred. Currently, the Fund expects the risk of loss to be remote.
7). LINE OF CREDIT
The Fund has an uncommitted line of credit with the other Hennessy Funds in the amount of the lesser of (i) $100,000,000 or (ii) 33.33% of each Hennessy Fund’s net assets, or 30% for the Hennessy Gas Utility Fund and 10% for the Fund, intended to provide short-term financing, if necessary, subject to certain restrictions, in connection with shareholder redemptions. The credit facility is with the Hennessy Funds’ custodian bank, U.S. Bank N.A. Borrowings under this arrangement bear interest at the bank’s prime rate and are secured by all of the Fund’s assets (as to its own borrowings only). During fiscal year 2020, the Fund did not have any borrowings outstanding under the line of credit.
8). FEDERAL TAX INFORMATION
As of October 31, 2020, the components of accumulated earnings (losses) for income tax purposes were as follows:
| | | | Investments | |
| | Cost of investments for tax purposes | | $ | 12,539,947 | |
| | Gross tax unrealized appreciation | | $ | 274,863 | |
| | Gross tax unrealized depreciation | | | (739,994 | ) |
| | Net tax unrealized appreciation/(depreciation) | | $ | (465,131 | ) |
| | Undistributed ordinary income | | $ | 2,835 | |
| | Undistributed long-term capital gains | | | — | |
| | Total distributable earnings | | $ | 2,835 | |
| | Other accumulated gain/(loss) | | $ | (27,785 | ) |
| | Total accumulated gain/(loss) | | $ | (490,081 | ) |
The difference between book-basis unrealized appreciation/depreciation and tax-basis unrealized appreciation/depreciation (as shown above) is attributable primarily to wash sales.
As of October 31, 2020, the Fund had capital loss carryforwards as follows:
| | $27,785 | Unlimited short-term |
| HENNESSY FUNDS | 1-800-966-4354 | |
As of October 31, 2020, the Fund did not defer, on a tax basis, any late-year ordinary losses. Late-year ordinary losses are net ordinary losses incurred after December 31, 2019, but within the taxable year, that are deemed to arise on the first day of the Fund’s next taxable year.
During fiscal years 2020 and 2019, the tax character of distributions paid by the Fund was as follows:
| | | | Year Ended | | | Year Ended | |
| | | | October 31, 2020 | | | October 31, 2019 | |
| | Ordinary income(1) | | $ | 154,117 | | | $ | 133,769 | |
| | Long-term capital gain | | | 469,423 | | | | 548,219 | |
| | Total distributions | | $ | 623,540 | | | $ | 681,988 | |
| | (1) Ordinary income includes short-term capital gains. |
9). COVID-19 PANDEMIC
The COVID-19 pandemic has adversely impacted global commercial activity and contributed to significant volatility in global equity and debt markets. The pandemic has resulted in quarantines, stay-at-home orders, travel prohibitions, and closures, disrupting supply chains and economic activity. The duration of the pandemic’s effects remain uncertain and difficult to assess. The effects of the pandemic may adversely impact the Fund’s performance and its ability to achieve its investment objective.
10). EVENTS SUBSEQUENT TO YEAR END
Management has evaluated the Fund’s related events and transactions that occurred subsequent to October 31, 2020, through the date of issuance of the Fund’s financial statements. Management has determined that there were no subsequent events requiring recognition or disclosure in the financial statements.
| NOTES/REPORT OF INDEPENDENT REGISTERED PUBLIC ACCOUNTING FIRM |
Report of Independent Registered Public
Accounting Firm
To the Board of Trustees of Hennessy Funds Trust
and the shareholders of the Hennessy Balanced Fund
Novato, CA
Opinion on the Financial Statements
We have audited the accompanying statement of assets and liabilities of the Hennessy Balanced Fund (the “Fund”), a series of Hennessy Funds Trust, including the schedule of investments, as of October 31, 2020, the related statement of operations for the year then ended, the statements of changes in net assets for each of the two years in the period then ended, the financial highlights for each of the four years in the period then ended, and the related notes (collectively referred to as the “financial statements”). In our opinion, the financial statements present fairly, in all material respects, the financial position of the Fund as of October 31, 2020, the results of its operations for the year then ended, the changes in its net assets for each of the two years in the period then ended, and the financial highlights for each of the four years in the period then ended in conformity with accounting principles generally accepted in the United States of America.
The financial highlights for the year ended October 31, 2016 have been audited by other auditors, whose report dated December 22, 2016 expressed unqualified opinion on such financial highlights.
Basis for Opinion
These financial statements are the responsibility of the Fund’s management. Our responsibility is to express an opinion on the Fund’s financial statements based on our audits. We are a public accounting firm registered with the Public Company Accounting Oversight Board (United States) (“PCAOB”) and are required to be independent with respect to the Fund in accordance with the U.S. federal securities laws and the applicable rules and regulations of the Securities and Exchange Commission and the PCAOB. We have served as the auditor of one or more of the funds in the Trust since 2002.
We conducted our audits in accordance with the standards of the PCAOB. Those standards require that we plan and perform the audit to obtain reasonable assurance about whether the financial statements are free of material misstatement, whether due to error or fraud. The Fund is not required to have, nor were we engaged to perform, an audit of its internal control over financial reporting. As part of our audits we are required to obtain an understanding of internal control over financial reporting, but not for the purpose of expressing an opinion on the effectiveness of the Fund’s internal control over financial reporting. Accordingly, we express no such opinion.
Our audits included performing procedures to assess the risks of material misstatement of the financial statements, whether due to error or fraud, and performing procedures that respond to those risks. Such procedures included examining, on a test basis, evidence regarding the amounts and disclosures in the financial statements. Our audits also included evaluating the accounting principles used and significant estimates made by management, as well as evaluating the overall presentation of the financial statements. Our procedures included confirmation of securities owned as of October 31, 2020 by correspondence with the custodian. We believe that our audits provide a reasonable basis for our opinion.
| | |
| | TAIT, WELLER & BAKER LLP |
Philadelphia, Pennsylvania
December 23, 2020
| HENNESSY FUNDS | 1-800-966-4354 | |
Trustees and Officers of the Fund (Unaudited)
The business and affairs of the Funds are managed under the direction of the Board of Trustees of the Trust, and the Board of Trustees elects the officers of the Trust. From time to time, the Board of Trustees also has appointed advisers to the Board of Trustees (“Advisers”) with the intention of having qualified individuals serve in an advisory capacity to garner experience in the mutual fund and asset management industry and be considered as potential Trustees in the future. There are currently three Advisers: Brian Alexander, Doug Franklin, and Claire Knoles. As Advisers, Mr. Alexander, Mr. Franklin, and Ms. Knoles attend meetings of the Board of Trustees and act as non-voting participants. Information pertaining to the Trustees, Advisers, and the officers of the Trust is set forth below. The Trustees and officers serve until their successors are duly elected and qualified or until their earlier death, resignation, or removal. Each Trustee oversees all 16 Hennessy Funds. Unless otherwise indicated, the address of all persons listed below is 7250 Redwood Boulevard, Suite 200, Novato, CA 94945. The Fund’s Statement of Additional Information includes more information about the persons listed below and is available without charge by calling 1-800-966-4354 or by visiting www.hennessyfunds.com.
| | | | Other |
| | | | Directorships |
| | | | Held Outside |
| Name, Age, | | | of Fund |
| and Position Held | Start Date | Principal Occupation(s) | Complex During |
with the Trust
| of Service
| During Past Five Years
| Past Five Years
|
| Disinterested Trustees and Advisers | | | |
| | | | |
| J. Dennis DeSousa | January 1996 | Mr. DeSousa is a real estate investor. | None. |
| 84 | | | |
| Trustee | | | |
| | | | |
| Robert T. Doyle | January 1996 | Mr. Doyle has been the Sheriff of | None. |
| 73 | | Marin County, California since 1996. | |
| Trustee | | | |
| | | | |
| Gerald P. Richardson | May 2004 | Mr. Richardson is an independent | None. |
| 75 | | consultant in the securities industry. | |
| Trustee | | | |
| | | | |
| Brian Alexander | March 2015 | Mr. Alexander has worked for the | None. |
| 39 | | Sutter Health organization since | |
| Adviser to the Board | | 2011 in various positions. He has | |
| | | served as the Chief Executive Officer | |
| | | of the Sutter Roseville Medical | |
| | | Center since 2018. From 2016 through | |
| | | 2018, he served as the Vice President | |
| | | of Strategy for the Sutter Health Valley | |
| | | Area, which includes 11 hospitals, | |
| | | 13 ambulatory surgery centers, | |
| | | 16,000 employees, and 1,900 physicians. | |
| | | From 2013 through 2016, Mr. Alexander | |
| | | served as Sutter Novato Community | |
| | | Hospital’s Chief Administrative Officer. | |
| TRUSTEES AND OFFICERS OF THE FUND |
| | | | Other |
| | | | Directorships |
| | | | Held Outside |
| Name, Age, | | | of Fund |
| and Position Held | Start Date | Principal Occupation(s) | Complex During |
with the Trust
| of Service
| During Past Five Years
| Past Five Years
|
| Doug Franklin | March 2016 | Mr. Franklin is a retired insurance | None. |
| 56 | | industry executive. From 1987 | |
| Adviser to the Board | | through 2015, he was employed | |
| | | by the Allianz-Fireman’s Fund | |
| | | Insurance Company in various | |
| | | positions, including as its Chief | |
| | | Actuary and Chief Risk Officer. | |
| | | | |
| Claire Knoles | December 2015 | Ms. Knoles is a founder of Kiosk and | None. |
| 46 | | has served as its Chief Operating | |
| Adviser to the Board | | Officer since 2004. Kiosk is a full- | |
| | | service marketing agency with | |
| | | offices in the San Francisco Bay | |
| | | Area, Toronto, and Liverpool, UK. | |
| | | | |
Interested Trustee(1) | | | |
| | | | |
| Neil J. Hennessy | January 1996 as | Mr. Hennessy has been employed | Hennessy |
| 64 | a Trustee and | by Hennessy Advisors, Inc. since | Advisors, Inc. |
| Trustee, Chairman of | June 2008 as | 1989 and currently serves as its | |
| the Board, Chief | an officer | Chairman and Chief Executive Officer. | |
| Investment Officer, | | | |
| Portfolio Manager, | | | |
| and President | | | |
| Name, Age, | | |
| and Position Held | Start Date | Principal Occupation(s) |
with the Trust
| of Service
| During Past Five Years
|
| Officers | | |
| | | |
| Teresa M. Nilsen | January 1996 | Ms. Nilsen has been employed by Hennessy Advisors, Inc. |
| 54 | | since 1989 and currently serves as its President, Chief Operating |
| Executive Vice President | | Officer, and Secretary. |
| and Treasurer | | |
| | | |
| Daniel B. Steadman | March 2000 | Mr. Steadman has been employed by Hennessy Advisors, Inc. |
| 64 | | since 2000 and currently serves as its Executive Vice President. |
| Executive Vice President | | |
| and Secretary | | |
| | | |
| Brian Carlson | December 2013 | Mr. Carlson has been employed by Hennessy Advisors, Inc. |
| 48 | | since December 2013 and currently serves as its Chief |
| Senior Vice President | | Compliance Officer and Senior Vice President. |
| and Head of Distribution | | |
| | | |
Jennifer Cheskiewicz(2) | June 2013 | Ms. Cheskiewicz has been employed by Hennessy Advisors, Inc. |
| 43 | | as its General Counsel since June 2013. |
| Senior Vice President and | | |
| Chief Compliance Officer | | |
| HENNESSY FUNDS | 1-800-966-4354 | |
| Name, Age, | | |
| and Position Held | Start Date | Principal Occupation(s) |
with the Trust
| of Service
| During Past Five Years
|
David Ellison(3) | October 2012 | Mr. Ellison has been employed by Hennessy Advisors, Inc. since |
| 62 | | October 2012. He has served as a Portfolio Manager of the |
| Senior Vice President | | Hennessy Large Cap Financial Fund and the Hennessy Small |
| and Portfolio Manager | | Cap Financial Fund since their inception. Mr. Ellison also served |
| | | as a Portfolio Manager of the Hennessy Technology Fund from |
| | | its inception until February 2017. Mr. Ellison served as Director, |
| | | CIO, and President of FBR Fund Advisers, Inc. from December |
| | | 1999 to October 2012. |
| | | |
Ryan Kelley(4) | March 2013 | Mr. Kelley has been employed by Hennessy Advisors, Inc. since |
| 48 | | October 2012. He has served as a Portfolio Manager of the |
| Senior Vice President | | Hennessy Gas Utility Fund, the Hennessy Large Cap Financial |
| and Portfolio Manager | | Fund, and the Hennessy Small Cap Financial Fund since |
| | | October 2014. He served as Co-Portfolio Manager of these |
| | | same funds from March 2013 through September 2014 and as |
| | | a Portfolio Analyst for the Hennessy Funds from October 2012 |
| | | through February 2013. Mr. Kelley has also served as a Portfolio |
| | | Manager of the Hennessy Cornerstone Growth Fund, the |
| | | Hennessy Cornerstone Mid Cap 30 Fund, the Hennessy |
| | | Cornerstone Large Growth Fund, and the Hennessy |
| | | Cornerstone Value Fund since February 2017 and as a Portfolio |
| | | Manager of the Hennessy Total Return Fund, the Hennessy |
| | | Balanced Fund, and the Hennessy Technology Fund since May |
| | | 2018. He served as Co-Portfolio Manager of the Hennessy |
| | | Technology Fund from February 2017 until May 2018. Mr. Kelley |
| | | served as Portfolio Manager of FBR Fund Advisers, Inc. from |
| | | January 2008 to October 2012. |
| | | |
| Tania Kelley | October 2003 | Ms. Kelley has been employed by Hennessy Advisors, Inc. since |
| 55 | | October 2003. |
| Senior Vice President | | |
| and Head of Marketing | | |
| | | |
L. Joshua Wein(4) | September 2018 | Mr. Wein has been employed by Hennessy Advisors, Inc. since |
| 47 | | 2018. He has served as Co-Portfolio Manager of the Hennessy |
| Vice President and | | Cornerstone Growth Fund, the Hennessy Cornerstone |
| Co-Portfolio Manager | | Mid Cap 30 Fund, the Hennessy Cornerstone Large Growth |
| | | Fund, the Hennessy Cornerstone Value Fund, Hennessy Total |
| | | Return Fund, the Hennessy Balanced Fund, the Hennessy Gas |
| | | Utility Fund, and the Hennessy Technology Fund since February |
| | | 2019. He served as a Senior Analyst of these same funds from |
| | | September 2018 through February 2019. Mr. Wein served as |
| | | Director of Alternative Investments and Co-Portfolio Manager |
| | | at Sterling Capital Management from 2008 to 2018. |
_______________
(1) | Mr. Hennessy is considered an “interested person,” as defined in the Investment Company Act of 1940, as amended, because he is an officer of the Trust. |
(2) | The address of this officer is 4800 Bee Caves Road, Suite 100, Austin, TX 78746. |
(3) | The address of this officer is 101 Federal Street, Suite 1615B, Boston, MA 02110. |
(4) | The address of this officer is 1340 Environ Way, Chapel Hill, NC 27517. |
| TRUSTEES AND OFFICERS OF THE FUND/EXPENSE EXAMPLE |
Expense Example (Unaudited)
October 31, 2020
As a shareholder of the Fund, you incur ongoing costs, including management fees, service fees, and other Fund expenses. This Example is intended to help you understand your ongoing costs (in dollars) of investing in the Fund and to compare these costs with the ongoing costs of investing in other mutual funds. The Example is based on an investment of $1,000 invested at the beginning of the period and held for the entire period from May 1, 2020, through October 31, 2020.
Actual Expenses
The first line of the table below provides information about actual account values and actual expenses. You may use the information in this line, together with the amount you invested, to estimate the expenses that you paid over the period. Simply divide your account value by $1,000 (for example, an $8,600 account value divided by $1,000 = 8.6), then multiply the result by the number in the first line under the heading entitled “Expenses Paid During Period” to estimate the expenses you paid on your account during this period. Although the Fund charges no sales loads or transaction fees, you will be assessed fees for outgoing wire transfers, returned checks, and stop payment orders at prevailing rates charged by U.S. Bank Global Fund Services, the Fund’s transfer agent. If you request that a redemption be made by wire transfer, the Fund’s transfer agent charges a $15 fee. IRAs are charged a $15 annual maintenance fee (up to $30 maximum per shareholder for shareholders with multiple IRAs). The example below includes, but is not limited to, management fees, shareholder servicing fees, accounting, custody, and transfer agent fees. However, the example below does not include portfolio trading commissions and related expenses.
Hypothetical Example for Comparison Purposes
The second line of the table below provides information about hypothetical account values and hypothetical expenses based on the Fund’s actual expense ratio and an assumed rate of return of 5% per year before expenses, which is not the Fund’s actual return. The hypothetical account values and expenses may not be used to estimate the actual ending account balance or expenses you paid for the period. You may use this information to compare the ongoing costs of investing in the Fund and other funds. To do so, compare this 5% hypothetical example with the 5% hypothetical examples that appear in the shareholder reports of the other funds. Please note that the expenses shown in the table are meant to highlight your ongoing costs only. Therefore, the second line of the table is useful in comparing ongoing costs only and will not help you determine the relative total costs of owning different funds.
| | | | Expenses Paid |
| | Beginning | Ending | During Period(1) |
| | Account Value | Account Value | May 1, 2020 – |
| | May 1, 2020
| October 31, 2020 | October 31, 2020 |
| Investor Class | | | |
| Actual | $1,000.00 | $ 980.80 | $9.26 |
| Hypothetical (5% return before expenses) | $1,000.00 | $1,015.79 | $9.42 |
(1) | Expenses are equal to the Fund’s annualized expense ratio of 1.86%, multiplied by the average account value over the period, multiplied by 184/366 days (to reflect the half-year period). |
| HENNESSY FUNDS | 1-800-966-4354 | |
How to Obtain a Copy of the Fund’s Proxy
Voting Policy and Proxy Voting Records
A description of the policies and procedures the Fund uses to determine how to vote proxies relating to portfolio securities is available without charge (1) by calling 1-800-966-4354, (2) on the Hennessy Funds’ website at www.hennessyfunds.com/proxy-voting/voting-policy, or (3) on the U.S. Securities and Exchange Commission’s (the “SEC”) website at www.sec.gov. The Fund’s proxy voting record is available without charge on both the Hennessy Funds’ website at www.hennessyfunds.com/proxy-voting/voting-record and the SEC’s website at www.sec.gov no later than August 31 for the prior 12 months ending June 30.
Availability of Quarterly Portfolio Schedule
The Fund files a complete schedule of portfolio holdings with the SEC for the first and third quarters of each fiscal year as an exhibit to its reports on Form N-PORT. The Fund’s Form N-PORT reports are available on the SEC’s website at www.sec.gov or on request by calling 1-800-966-4354.
Federal Tax Distribution Information
(Unaudited)
For fiscal year 2020, certain dividends paid by the Fund may be subject to a maximum tax rate of 23.8%, as provided for by the Jobs and Growth Tax Relief Reconciliation Act of 2003. The percentage of dividends declared from ordinary income designated as qualified dividend income was 100.00%.
For corporate shareholders, the percent of ordinary income distributions that qualified for the corporate dividends received deduction for fiscal year 2020 was 100.00%.
The percentage of taxable ordinary income distributions that were designated as short-term capital gain distributions under Section 871(k)(2)(C) of the Internal Revenue Code of 1986, as amended, for the Fund was 15.41%.
Important Notice Regarding Delivery
of Shareholder Documents
To help keep the Fund’s costs as low as possible, we generally deliver a single copy of shareholder reports, proxy statements, and prospectuses to shareholders who share an address and have the same last name. This process does not apply to account statements. You may request an individual copy of a shareholder document at any time. If you would like to receive separate mailings of shareholder documents, please call U.S. Bank Global Fund Services at 1-800-261-6950 or 1-414-765-4124, and individual delivery will begin within 30 days of your request. If your account is held through a financial institution or other intermediary, please contact such intermediary directly to request individual delivery.
Electronic Delivery
The Fund offers shareholders the option to receive account statements, prospectuses, tax forms, and shareholder reports online. To sign up for eDelivery, please visit www.hennessyfunds.com/account. You may change your delivery preference at any time by visiting our website or calling U.S. Bank Global Fund Services at 1-800-261-6950 or 1-414-765-4124.
| PROXY VOTING — PRIVACY POLICY |
Liquidity Risk Management Program
In accordance with Rule 22e-4 under the Investment Company Act of 1940, as amended (the “Liquidity Rule”), we have adopted and implemented a liquidity risk management program (the “Liquidity Program”). The purpose of the Liquidity Program is to assess and manage the Fund’s liquidity risk, which is the risk that the Fund would not be able to meet requests to redeem Fund shares without significant dilution of the remaining shareholders’ interests in the Fund. The Board of Trustees of the Fund (the “Board”) designated a committee comprising representatives of Hennessy Advisors, Inc., the investment adviser to the Fund, as the administrator of the Liquidity Program (the “Program Administrator”).
The Program Administrator provided a written report regarding the Liquidity Program to the Board in advance of its meeting on June 3, 2020. The report covered the period from June 1, 2019, through May 31, 2020. The report addressed the operation of the Liquidity Program, assessed the adequacy and effectiveness of its implementation, and described any material changes to the Liquidity Program during the review period. The Trust’s chief compliance officer presented the report to the Board at the meeting and provided additional information regarding the Liquidity Program. The Board reviewed the Liquidity Program and considered, among other items, the following:
| | 1. | The Program Administrator reviewed daily historical net redemption activity during the review period and during prior periods with higher-than-average redemption activity and concluded that the Fund has historically been able to meet requests to redeem Fund shares without significant dilution to the Fund’s remaining shareholders, and the Program Administrator expects the Fund to be able to continue to do so in the future during both normal and reasonably foreseeable stressed conditions. |
| | | |
| | 2. | The Fund primarily holds assets that are highly liquid investments and is therefore not required to establish a highly liquid investment minimum for the Fund or adopt policies and procedures for responding to a highly liquid investment minimum shortfall. |
| | | |
| | 3. | The Program Administrator did not make any material changes to the Liquidity Program during the review period and was not recommending any changes to the Liquidity Program or the model inputs used to determine the liquidity classification of each security held by the Fund. |
| | | |
| | 4. | The Program Administrator concluded that the Liquidity Program was reasonably designed to assess and manage the Fund’s liquidity risk, complies with the requirements of the Liquidity Rule, and was effectively implemented, having operated as intended during the review period. |
Privacy Policy
We collect the following personal information about you:
| | 1. | Information we receive from you in applications or other forms, correspondence, or conversations, including, but not limited to, your name, address, phone number, social security number, assets, income, and date of birth; |
| | | |
| | 2. | Information about your transactions with us, our affiliates, or others, including, but not limited to, your account number and balance, payments history, parties to transactions, cost basis information, and other financial information; and |
| HENNESSY FUNDS | 1-800-966-4354 | |
| | 3. | Other personal information we collect from various sources, even if you have not entered into a prior transaction with us, including the following: |
| | • | Name, alias, address, unique personal identifier, online identifier, IP address, email address, telephone number, account name, and other similar identifiers; |
| | | |
| | • | Age and marital status; |
| | | |
| | • | Commercial information, including records of products purchased; |
| | | |
| | • | Browsing history, search history, and information on interaction with our website; |
| | | |
| | • | Geolocation data; |
| | | |
| | • | Employment and employment history, educational history, financial information, and purchasing and consuming histories or tendencies; and |
| | | |
| | • | Inferences drawn from the above-listed information to create a profile about your preferences, characteristics, predispositions, and behavior. |
We collect this information directly from you, indirectly in the course of providing services to you, directly and indirectly from your activity on our website, from broker dealers, marketing agencies, and other third parties that interact with us in connection with the services we perform and products we offer, and from anonymized and aggregated consumer information.
We use this information to fulfill the reason you provided the information to us, to provide you with other relevant products that you request from us, to provide you with information about products that may interest you, to improve our website or present our website’s contents to you, and as otherwise described to you when collecting your personal information.
We do not disclose any personal information to unaffiliated third parties, except as permitted by law. We may disclose your personal information to our affiliates, vendors, and service providers for a business purpose. For example, we are permitted by law to disclose all of the information we collect, as described above, to our transfer agent to process your transactions. When disclosing your personal information to third parties, we enter into a contract with each third party describing the purpose of such disclosure and requiring that such personal information be kept confidential and not used for any purpose except to perform the services contracted or respond to regulatory or law enforcement requests.
Furthermore, we restrict access to your personal information to those persons who require such information to provide products or services to you. As a result, we do not provide a means for opting out of our limited sharing of your information. We maintain physical, electronic, and procedural safeguards that comply with federal standards to guard your personal information.
If you hold shares of the Funds through a financial intermediary, including, but not limited to, a broker-dealer, bank, or trust company, the privacy policy of your financial intermediary governs how your personal information is shared with unaffiliated third parties.
Supplemental Privacy Notice for Residents of California
The California Consumer Privacy Act of 2018 (the “CCPA”) provides you, as a California resident, with certain additional rights relating to your personal information.
Under the CCPA, you have the right to request that we disclose to you the categories of personal information we have collected about you over the past 12 months, the categories of sources of such information, our business purpose for collecting the
information, the categories of third parties, if any, with whom we shared the information, and the specific information we have collected about you. You also have the right to request that we delete any of your personal information, and, unless an exception applies, we will delete such information upon receiving and confirming your request. To make a request, call us at 1-800-966-4354, email us at privacy@hennessyfunds.com, or go to www.hennessyfunds.com/contact. We will not discriminate against you for exercising your rights under the CCPA. Further, we will not collect additional categories of your personal information or use the personal information we collected for materially different, unrelated, or incompatible purposes without providing you notice.
| HENNESSY FUNDS | 1-800-966-4354 | |
For information, questions, or assistance, please call
The Hennessy Funds
1-800-966-4354 or 1-415-899-1555
INVESTMENT ADVISOR
Hennessy Advisors, Inc.
7250 Redwood Boulevard, Suite 200
Novato, California 94945
ADMINISTRATOR,
TRANSFER AGENT,
DIVIDEND PAYING AGENT, &
SHAREHOLDER SERVICING AGENT
U.S. Bancorp Fund Services, LLC
d/b/a U.S. Bank Global Fund Services
P.O. Box 701
Milwaukee, Wisconsin 53201-0701
CUSTODIAN
U.S. Bank N.A.
Custody Operations
1555 North River Center Drive, Suite 302
Milwaukee, Wisconsin 53212
TRUSTEES
Neil J. Hennessy
Robert T. Doyle
J. Dennis DeSousa
Gerald P. Richardson
COUNSEL
Foley & Lardner LLP
777 East Wisconsin Avenue
Milwaukee, Wisconsin 53202-5306
INDEPENDENT REGISTERED
PUBLIC ACCOUNTING FIRM
Tait, Weller & Baker LLP
Two Liberty Place
50 South 16th Street, Suite 2900
Philadelphia, Pennsylvania 19102-2529
DISTRIBUTOR
Quasar Distributors, LLC
111 East Kilbourn Avenue, Suite 2200
Milwaukee, Wisconsin 53202
www.hennessyfunds.com | 1-800-966-4354
This report has been prepared for shareholders and may be distributed to
others only if preceded or accompanied by a current prospectus.
ANNUAL REPORT
OCTOBER 31, 2020
HENNESSY BP ENERGY FUND
Investor Class HNRGX
Institutional Class HNRIX
IMPORTANT NOTICE REGARDING ELECTRONIC DELIVERY OF SHAREHOLDER REPORTS
Beginning on January 1, 2021, as permitted by regulations adopted by the Securities and Exchange Commission, paper copies of the annual and semi-annual reports will no longer be sent by mail unless you specifically request paper copies from the Hennessy Funds or from your financial intermediary. Instead, the reports will be made available on a website, and you will be notified by mail each time a report is posted and provided with a website link to access the report.
If you have already elected to receive shareholder reports electronically, you will not be affected by this change and you need not take any action. You may elect to receive shareholder reports and other communications from the Hennessy Funds electronically by visiting www.hennessyfunds.com/account or by calling U.S. Bank Global Fund Services at 1-800-261-6950. If you own shares in a Fund through a financial intermediary, please contact your financial intermediary to make this election.
You may elect to receive paper copies of all future reports free of charge by calling U.S. Bank Global Fund Services at 1-800-261-6950 or, if you own your shares through a financial intermediary, by contacting your financial intermediary. Your election to receive paper copies of reports will apply to all Funds in the Hennessy Funds family.
www.hennessyfunds.com | 1-800-966-4354
(This Page Intentionally Left Blank.)
Contents
| Letter to Shareholders | | 2 |
| Performance Overview | | 4 |
| Financial Statements | | |
| Schedule of Investments | | 8 |
| Statement of Assets and Liabilities | | 12 |
| Statement of Operations | | 13 |
| Statements of Changes in Net Assets | | 15 |
| Financial Highlights | | 16 |
| Notes to the Financial Statements | | 20 |
| Report of Independent Registered Public Accounting Firm | | 28 |
| Trustees and Officers of the Fund | | 29 |
| Expense Example | | 32 |
| Proxy Voting Policy and Proxy Voting Records | | 34 |
| Availability of Quarterly Portfolio Schedule | | 34 |
| Federal Tax Distribution Information | | 34 |
| Important Notice Regarding Delivery of Shareholder Documents | | 34 |
| Electronic Delivery | | 34 |
| Liquidity Risk Management Program | | 35 |
| Privacy Policy | | 35 |
| HENNESSY FUNDS | 1-800-966-4354 | |
December 2020
Dear Hennessy Funds Shareholder:
As a new year and new decade dawned in January, no one could have imagined that the world would quickly plunge into one of the worst health crises in history. Throughout this pandemic, our thoughts have remained with those most deeply affected by COVID-19, and we thank our frontline healthcare and essential workers. At Hennessy Funds, we adapted quickly to the impact of COVID-19 to maintain business continuity. We focused on our employees and on you, the shareholders of the Hennessy Funds, and I am pleased that we have been able to navigate successfully during this unprecedented time.
The year was defined by a global pandemic and the ensuing economic shutdowns and by a highly charged presidential election that caused tremendous volatility. Yet the stock market has continued to show its resiliency and strength, as the major indices hit new all-time highs in November and again in December. For the 12 months ended October 31, 2020, U.S. equities posted positive performance, with the S&P 500® Index returning 9.71% and the Dow Jones Industrial Average returning 0.34% for the period. There were extreme differences in how various sectors performed during the period. For instance, the technology-focused NASDAQ Composite Index performed strongly, returning 32.84%, whereas the Energy sector (as represented by the S&P 500® Energy Sector Index) struggled with a loss of -46.43%. The Financials sector also performed relatively poorly during the period, with the Russell 1000® Index Financials losing -8.04% and the Russell 2000® Index Financials losing -17.87%. In addition, large cap stocks significantly outperformed small caps, and growth stocks reigned over value stocks during the period. Moreover, approximately half of the NASDAQ’s return for the period was comprised of just three behemoth technology stocks – Apple, Microsoft, and Amazon. Therefore, while the overall U.S. equities market improved, mutual fund returns varied drastically due to the disparate performance of specific sectors, differently sized companies, and different types of companies.
Optimism about the approval and distribution of effective COVID-19 vaccines appears to be buoying investor confidence. Low interest rates, and the expectation that they will remain low for the foreseeable future, have also provided a tailwind to equity prices. In my opinion, stocks are trading at reasonable valuations given this low interest rate environment, with the Dow Jones Industrial Average trading at 20.1x estimated earnings for 2021 and the S&P 500® Index trading at 21.6x estimated earnings for 2021. The U.S. economy looks to be on the road to recovery and is experiencing moderate inflation, and our banking industry appears healthy. The unemployment rate is dropping, albeit slowly, and I expect it to continue to improve once businesses reopen. There are high levels of cash on corporate balance sheets, which could support rising dividends and stock buybacks.
I believe our corporate business leaders will continue to adapt and find ways to drive growth and value for their shareholders, but I also feel that the uncertainty created by the continued health crisis and the stalemate over fiscal relief will lead to additional bouts of market volatility. I remain confident, however, that the markets can and will thrive in the long run.
Thank you for your continued trust and investment in the Hennessy Funds. We believe that there continue to be strong opportunities throughout many segments of the market, and we are focused on managing our high-conviction portfolios for the long-term
benefit of our shareholders. Should you have any questions or would like to speak with us directly, please reach out and call us at (800) 966-4354.
Best regards,
Neil J. Hennessy
President and Chief Investment Officer
Past performance does not guarantee future results.
Mutual fund investing involves risk. Principal loss is possible.
The Dow Jones Industrial Average and S&P 500® Index are commonly used to measure the performance of U.S. stocks. The NASDAQ Composite Index comprises all common stocks listed on The NASDAQ Stock Market and is commonly used to measure the performance of technology-related stocks. The S&P 500® Energy Sector Index is comprised of companies included in the S&P 500® Index that are classified in the Energy sector. The Russell 1000® Index Financials and Russell 2000® Index Financials are subsets of the Russell 1000® Index and Russell 2000® Index, respectively, that measure the performance of securities classified in the Financials sector of the large-cap and small-cap U.S. equity market, respectively. One cannot invest directly in an index. All returns are shown on a total return basis.
Forward price to earnings (PE) is a valuation measure calculated by dividing a company’s market price per share by its expected earnings per share over the following 12 months. PEs noted are sourced from Bloomberg as of December 9, 2020.
| HENNESSY FUNDS | 1-800-966-4354 | |
Performance Overview (Unaudited)
CHANGE IN VALUE OF $10,000 INVESTMENT
This graph illustrates the performance of an initial investment of $10,000 made in the Fund on its inception date and assumes the reinvestment of dividends.
AVERAGE ANNUAL TOTAL RETURN FOR PERIODS ENDED OCTOBER 31, 2020
| | One | Five | Since Inception |
| | Year
| Years
| (12/31/13)
|
| Hennessy BP Energy Fund – | | | |
| Investor Class (HNRGX) | -37.93% | -11.71% | -11.06% |
| Hennessy BP Energy Fund – | | | |
| Institutional Class (HNRIX) | -37.80% | -11.46% | -10.85% |
S&P 500® Energy Index | -46.43% | -12.43% | -12.02% |
S&P 500® Index | 9.71% | 11.71% | 10.93% |
Expense ratios: 1.98% (Investor Class); 1.67% (Institutional Class)
Performance data quoted represents past performance; past performance does not guarantee future results. The investment return and principal value of an investment will fluctuate so that an investor’s shares, when redeemed, may be worth more or less than their original cost. The performance table does not reflect the deduction of taxes that a shareholder would pay on Fund distributions or the redemption of Fund shares. Current performance of the Fund may be lower or higher than the performance quoted. Performance data current to the most recent month end may be obtained by visiting www.hennessyfunds.com. Performance for periods including or prior to October 26, 2018, is that of the BP Capital TwinLine Energy Fund.
The S&P 500® Energy Index comprises those companies included in the S&P 500® that are classified in the Energy sector. The S&P 500® Index is a capitalization-weighted index that is designed to represent the broad domestic economy through changes in the aggregate market value of 500 stocks across all major industries. One cannot invest directly in an index. These indices are used herein for comparative purposes in accordance with Securities and Exchange Commission regulations.
Standard & Poor’s Financial Services is the source and owner of the S&P® and S&P 500® trademarks.
The expense ratios presented are from the most recent prospectus. The expense ratios for the current reporting period are available in the Financial Highlights section of this report.
PERFORMANCE NARRATIVE
Portfolio Managers Toby Loftin, and Ben Cook, CFA
BP Capital Fund Advisors, LLC (sub-advisor)
Performance:
For the 12-month period ended October 31, 2020, the Investor Class of the Hennessy BP Energy Fund returned -37.93%, outperforming the S&P 500 Energy Index (the Fund’s primary benchmark), which returned -46.43% for the same period, but underperforming the S&P 500 Index, which returned 9.71% for the same period.
The Fund’s outperformance relative to its primary benchmark was primarily due to its overweight position in renewable energy equities. Additionally, Fund performance benefited from holdings of natural gas producers, which generally performed better than crude oil producers because crude oil fundamentals deteriorated meaningfully in the first quarter of 2020. The Fund’s holdings in midstream companies detracted from relative performance as declining upstream sector activity and corresponding weakness in U.S. lower 48 crude oil and natural gas production volumes weighed negatively on pipeline operating company financial results.
Portfolio Strategy:
The Fund seeks to invest in companies across the energy value chain, including both hydrocarbons and renewable energy sources. This investible universe includes crude oil and natural gas exploration and production companies, oilfield service providers, midstream companies, refiners, and energy end users. The renewable energy value chain is composed of materials producers, machinery and equipment manufacturers, service providers, and utilities. We believe the inclusion of energy end users, such as industrials and transportation companies, differentiates the Fund from traditional energy funds that do not include such companies. We believe including such companies in the investment universe enables the Fund to hold a broader range of energy-related themes and provides greater flexibility to adjust sub-sector weightings based on our investment outlook. The Fund typically owns 25 to 40 securities and historically has had little overlap with the top holdings of commonly used energy and commodity equity benchmarks.
Investment Commentary:
Market conditions early in the period were relatively calm as supply restraint demonstrated by OPEC quota alliance members offset softening demand for crude oil associated with the lingering trade dispute between China and the United States. In March, crude oil market volatility jumped as a breakdown in OPEC’s quota alliance sent supplies higher while, at the same time, the onset of the COVID-19 pandemic triggered a rapid decline in demand. OPEC and non-OPEC quota alliance member countries were quick to reverse course and enact steep supply reductions in order to stabilize oil markets, but not before oil traded to historic lows, with NYMEX WTI pricing even reaching negative territory during April 2020. OPEC output restraint and volume curtailment in the United States and other non-OPEC countries improved the supply side of the equation. This, combined with improving global economic activity including rebounding demand in Asia, allowed for a modest price recovery during the remainder of the period, with NYMEX WTI pricing generally rangebound between $35 and $45 per barrel.
In contrast to the volatility in crude oil pricing, U.S. natural gas prices were relatively stable during the period due in part to the decline in natural gas drilling prior to the COVID-19 pandemic, as well as the steep decline in crude oil and associated gas production during the pandemic. This weighed on natural gas supplies and helped to
| HENNESSY FUNDS | 1-800-966-4354 | |
balance market conditions as industrial and commercial demand began to decline. During the period, NYMEX Henry Hub natural gas prices traded within a range of $1.50 to $2.50 per thousand cubic feet (mcf).
Relative energy equity performance during the period generally tracked the directional influence of commodity prices, but also reflected an increasing investor preference for companies engaged in the development of renewable energy resources. Companies that facilitate the generation, transmission, or storage of renewable power of all sorts enjoyed meaningful outperformance relative to hydrocarbon-oriented peers.
The Fund took a defensive posture in March and April by reducing portfolio exposure to the large, integrated energy companies and crude oil producers with higher production costs in anticipation of lingering weakness in crude oil and refined product demand. Exposure to midstream companies was also modestly reduced as continued weakness in upstream production volumes was anticipated to weigh on U.S. lower 48 pipeline throughput volume. We increased portfolio exposure to natural gas producers due to relatively favorable supply and demand fundamentals, and we increased exposure to renewable energy to capture tailwinds associated with the improved renewable energy fundamentals.
We have been encouraged by the U.S. energy industry’s ability to adapt to difficult market conditions during the current downturn. Across the hydrocarbon energy value chain, companies have reduced capital spending and diminished workforce headcount to preserve financial flexibility. In the upstream sector, the pursuit of further cost reduction has prompted a wave of consolidation activity where operating cost redundancy presents meaningful cost saving opportunity. We are optimistic that the industry will not only endure but emerge as a more cost-efficient sector, capable of generating significant return once commodity prices improve.
We are also encouraged by the growth in the renewable energy market, which is being driven by technological advancement, cost reduction, and rising consumer preference for sustainable forms of power. We believe global efforts to reduce greenhouse gas emissions will provide attractive investment opportunities because the move away from carbon-intensive fuels will require significant capital to develop wind, solar, biofuel, and hydrogen energy resources. We expect that this transition will take place over the next several decades.
Overall, we remain optimistic regarding companies in the Energy sector, as many companies in the investment universe have adopted shareholder-friendly strategies. We believe management teams are more focused today on spending only as much as they generate from operating cash flows and on returning free cash flow to shareholders through dividends and share repurchases. Finally, we expect consolidation to remain a major sector theme in upcoming years, as U.S. companies seek to increase economies of scale, lower corporate costs, and deliver stronger corporate level returns on capital.
_______________
Opinions expressed are those of the Portfolio Managers as of the date written and are subject to change, are not guaranteed, and should not be considered investment advice or an indication of trading intent.
The Fund invests in small-capitalization and medium-capitalization companies, which involves additional risks such as limited liquidity and greater volatility. Funds that concentrate in a single sector may be subject to a higher degree of risk. Energy-related companies are subject to specific risks, including fluctuations in commodity prices and consumer demand, substantial government regulation, and depletion of reserves. Investments in lower-rated and non-rated securities present a greater risk of loss to principal and interest than higher-rated securities. Use of derivatives can increase the volatility of the Fund.
MLPs and MLP investments have unique characteristics. The Fund does not receive the same tax benefits as a direct investment in an MLP.
The prices of MLP units may fluctuate abruptly and trading volume may be low, making it difficult for the Fund to sell its units at a favorable price. MLP general partners have the power to take actions that adversely affect the interests of unit holders. Most MLPs do not pay U.S. federal income tax at the partnership level, but an adverse change in tax laws could result in MLPs being treated as corporations for federal income tax purposes, which could reduce or eliminate distributions paid by MLPs to the Fund. If the Fund’s MLP investments exceed 25% of its assets, the Fund may not qualify for treatment as a regulated investment company under the Internal Revenue Code. The Fund would be taxed as an ordinary corporation, which could substantially reduce the Fund’s net assets and its distributions to shareholders. Please see the Fund’s prospectus for a more complete discussion of these and other risks.
References to specific securities should not be considered a recommendation to buy or sell any security. Fund holdings and sector allocations are subject to change. Please refer to the Schedule of Investments included in this report for additional portfolio information.
Cash flow refers to the net amount of cash and cash equivalents transferred into and out of a company. Free cash flow is a measure of financial performance calculated as operating cash flow minus capital expenditures.
| HENNESSY FUNDS | 1-800-966-4354 | |
Financial Statements
Schedule of Investments as of October 31, 2020 |
HENNESSY BP ENERGY FUND
(% of Total Assets)
| TOP TEN HOLDINGS (EXCLUDING MONEY MARKET FUNDS) | % TOTAL ASSETS |
| Comstock Resources, Inc. | 8.35% |
| TPI Composites, Inc. | 5.74% |
| Cabot Oil & Gas Corp. | 5.68% |
| Cheniere Energy, Inc. | 5.61% |
| Enterprise Products Partners LP | 5.50% |
| Freeport-McMoRan, Inc. | 5.40% |
| PDC Energy, Inc. | 5.38% |
| MPLX LP | 5.25% |
| Livent Corp. | 5.02% |
| Valero Energy Corp. | 4.69% |
Note: The Fund concentrates its investments in the Energy industry. For presentation purposes, the Fund uses custom categories.
| COMMON STOCKS – 85.10% | | Number | | | | | | % of | |
| | | of Shares | | | Value | | | Net Assets | |
| Chemicals – 5.11% | | | | | | | | | |
| Livent Corp. (a) | | | 30,000 | | | $ | 322,500 | | | | 5.11 | % |
| | | | | | | | | | | | | |
| Downstream – 4.77% | | | | | | | | | | | | |
| Valero Energy Corp. | | | 7,800 | | | | 301,158 | | | | 4.77 | % |
| | | | | | | | | | | | | |
| Exploration & Production – 42.56% | | | | | | | | | | | | |
| Cabot Oil & Gas Corp. | | | 20,510 | | | | 364,873 | | | | 5.78 | % |
| Comstock Resources, Inc. (a) | | | 101,000 | | | | 536,310 | | | | 8.49 | % |
| Concho Resources, Inc. | | | 4,560 | | | | 189,285 | | | | 3.00 | % |
| Diamondback Energy, Inc. | | | 8,520 | | | | 221,179 | | | | 3.50 | % |
| EOG Resources, Inc. | | | 8,590 | | | | 294,122 | | | | 4.66 | % |
| EQT Corp. | | | 14,300 | | | | 216,502 | | | | 3.43 | % |
| Parsley Energy, Inc., – Class A | | | 22,620 | | | | 226,426 | | | | 3.59 | % |
| PDC Energy, Inc. (a) | | | 28,980 | | | | 345,442 | | | | 5.47 | % |
| Pioneer Natural Resources Co. | | | 3,680 | | | | 292,781 | | | | 4.64 | % |
| | | | | | | | 2,686,920 | | | | 42.56 | % |
| | | | | | | | | | | | | |
| Metals & Mining – 5.49% | | | | | | | | | | | | |
| Freeport-McMoRan, Inc. | | | 20,000 | | | | 346,800 | | | | 5.49 | % |
| | | | | | | | | | | | | |
| Midstream – 5.70% | | | | | | | | | | | | |
| Cheniere Energy, Inc. (a) | | | 7,520 | | | | 359,982 | | | | 5.70 | % |
| | | | | | | | | | | | | |
| Oil Services – 6.72% | | | | | | | | | | | | |
| Schlumberger Ltd. (b) | | | 18,770 | | | | 280,424 | | | | 4.44 | % |
| TechnipFMC PLC (b) | | | 26,000 | | | | 143,780 | | | | 2.28 | % |
| | | | | | | | 424,204 | | | | 6.72 | % |
| | | | | | | | | | | | | |
| Renewable – 10.06% | | | | | | | | | | | | |
| First Solar, Inc. (a) | | | 3,060 | | | | 266,358 | | | | 4.22 | % |
| TPI Composites, Inc. (a) | | | 11,140 | | | | 368,957 | | | | 5.84 | % |
| | | | | | | | 635,315 | | | | 10.06 | % |
| | | | | | | | | | | | | |
| Utility – 4.69% | | | | | | | | | | | | |
| NextEra Energy, Inc. | | | 4,040 | | | | 295,768 | | | | 4.69 | % |
| | | | | | | | | | | | | |
| Total Common Stocks | | | | | | | | | | | | |
| (Cost $7,181,343) | | | | | | | 5,372,647 | | | | 85.10 | % |
The accompanying notes are an integral part of these financial statements.
| HENNESSY FUNDS | 1-800-966-4354 | |
| PARTNERSHIPS & TRUSTS – 14.78% | | Number | | | | | | % of | |
| | | of Shares | | | Value | | | Net Assets | |
| Midstream – 14.78% | | | | | | | | | |
| Enterprise Products Partners LP | | | 21,309 | | | $ | 353,090 | | | | 5.59 | % |
| MPLX LP | | | 19,574 | | | | 336,869 | | | | 5.34 | % |
| Plains All American Pipeline LP | | | 38,940 | | | | 243,375 | | | | 3.85 | % |
| | | | | | | | 933,334 | | | | 14.78 | % |
| Total Partnerships & Trusts | | | | | | | | | | | | |
| (Cost $1,771,772) | | | | | | | 933,334 | | | | 14.78 | % |
| | | | | | | | | | | | | |
| SHORT-TERM INVESTMENTS – 0.00% | | | | | | | | | | | | |
| | | | | | | | | | | | | |
| Money Market Funds – 0.00% | | | | | | | | | | | | |
| First American Government Obligations Fund, | | | | | | | | | | | | |
| Institutional Class, 0.05% (c) | | | 185 | | | | 185 | | | | 0.00 | % |
| | | | | | | | | | | | | |
| Total Short-Term Investments | | | | | | | | | | | | |
| (Cost $185) | | | | | | | 185 | | | | 0.00 | % |
| | | | | | | | | | | | | |
| Total Investments | | | | | | | | | | | | |
| (Cost $8,953,300) – 99.88% | | | | | | | 6,306,166 | | | | 99.88 | % |
| Other Assets in Excess of Liabilities – 0.12% | | | | | | | 7,315 | | | | 0.12 | % |
| | | | | | | | | | | | | |
TOTAL NET ASSETS – 100.00% | | | | | | $ | 6,313,481 | | | | 100.00 | % |
Percentages are stated as a percent of net assets.
| (a) | Non-income-producing security. |
| (b) | U.S.-traded security of a foreign corporation. |
| (c) | The rate listed is the fund’s seven-day yield as of October 31, 2020. |
The accompanying notes are an integral part of these financial statements.
Summary of Fair Value Exposure as of October 31, 2020
The following is a summary of the inputs used to value the Fund’s net assets as of October 31, 2020 (see Note 3 in the accompanying Notes to the Financial Statements):
| Common Stocks | | Level 1 | | | Level 2 | | | Level 3 | | | Total | |
| Chemicals | | $ | 322,500 | | | $ | — | | | $ | — | | | $ | 322,500 | |
| Downstream | | | 301,158 | | | | — | | | | — | | | | 301,158 | |
| Exploration & Production | | | 2,686,920 | | | | — | | | | — | | | | 2,686,920 | |
| Metals & Mining | | | 346,800 | | | | — | | | | — | | | | 346,800 | |
| Midstream | | | 359,982 | | | | — | | | | — | | | | 359,982 | |
| Oil Services | | | 424,204 | | | | — | | | | — | | | | 424,204 | |
| Renewable | | | 635,315 | | | | — | | | | — | | | | 635,315 | |
| Utility | | | 295,768 | | | | — | | | | — | | | | 295,768 | |
| Total Common Stocks | | $ | 5,372,647 | | | $ | — | | | $ | — | | | $ | 5,372,647 | |
| Partnerships & Trusts | | | | | | | | | | | | | | | | |
| Midstream | | $ | 933,334 | | | $ | — | | | $ | — | | | $ | 933,334 | |
| Total Partnerships & Trusts | | $ | 933,334 | | | $ | — | | | $ | — | | | $ | 933,334 | |
| Short-Term Investments | | | | | | | | | | | | | | | | |
| Money Market Funds | | $ | 185 | | | $ | — | | | $ | — | | | $ | 185 | |
| Total Short-Term Investments | | $ | 185 | | | $ | — | | | $ | — | | | $ | 185 | |
| Total Investments | | $ | 6,306,166 | | | $ | — | | | $ | — | | | $ | 6,306,166 | |
The accompanying notes are an integral part of these financial statements.
| HENNESSY FUNDS | 1-800-966-4354 | |
Financial Statements
Statement of Assets and Liabilities as of October 31, 2020 |
| ASSETS: | | | |
| Investments in securities, at value (cost $8,953,300) | | $ | 6,306,166 | |
| Receivable for fund shares sold | | | 475 | |
| Receivable for securities sold | | | 91,154 | |
| Return of capital receivable | | | 18,292 | |
| Prepaid expenses and other assets | | | 6,218 | |
| Total assets | | | 6,422,305 | |
| | | | | |
| LIABILITIES: | | | | |
| Payable for securities purchased | | | 56,310 | |
| Payable for fund shares redeemed | | | 7,111 | |
| Payable to advisor | | | 4,005 | |
| Payable to auditor | | | 23,100 | |
| Accrued distribution fees | | | 1,603 | |
| Accrued service fees | | | 227 | |
| Loans payable | | | 1,000 | |
| Accrued trustees fees | | | 3,938 | |
| Accrued expenses and other payables | | | 11,530 | |
| Total liabilities | | | 108,824 | |
| NET ASSETS | | $ | 6,313,481 | |
| | | | | |
| NET ASSETS CONSISTS OF: | | | | |
| Capital stock | | $ | 51,046,948 | |
| Accumulated deficit | | | (44,733,467 | ) |
| Total net assets | | $ | 6,313,481 | |
| | | | | |
| NET ASSETS: | | | | |
| Investor Class | | | | |
| Shares authorized (no par value) | | Unlimited | |
| Net assets applicable to outstanding shares | | $ | 2,497,607 | |
| Shares issued and outstanding | | | 285,653 | |
| Net asset value, offering price, and redemption price per share | | $ | 8.74 | |
| | | | | |
| Institutional Class | | | | |
| Shares authorized (no par value) | | Unlimited | |
| Net assets applicable to outstanding shares | | $ | 3,815,874 | |
| Shares issued and outstanding | | | 431,215 | |
| Net asset value, offering price, and redemption price per share | | $ | 8.85 | |
The accompanying notes are an integral part of these financial statements.
| STATEMENT OF ASSETS AND LIABILITIES/STATEMENT OF OPERATIONS |
Financial Statements
Statement of Operations for the year ended October 31, 2020 |
| INVESTMENT INCOME: | | | |
| Distributions received from master limited partnerships | | $ | 398,979 | |
| Return of capital on distributions received | | | (398,979 | ) |
Dividend income from common stock(1) | | | 585,544 | |
| Interest income | | | 6,093 | |
| Total investment income | | | 591,637 | |
| | | | | |
| EXPENSES: | | | | |
| Investment advisory fees (See Note 5) | | | 271,834 | |
| Administration, accounting, custody, and transfer agent fees (See Note 5) | | | 35,510 | |
| Federal and state registration fees | | | 34,015 | |
| Compliance expense (See Note 5) | | | 27,714 | |
| Audit fees | | | 23,102 | |
| Sub-transfer agent expenses – Investor Class (See Note 5) | | | 7,037 | |
| Sub-transfer agent expenses – Institutional Class (See Note 5) | | | 14,619 | |
| Trustees’ fees and expenses | | | 13,829 | |
| Reports to shareholders | | | 9,923 | |
| Distribution fees – Investor Class (See Note 5) | | | 6,382 | |
| Interest expense (See Note 7) | | | 4,524 | |
| Service fees – Investor Class (See Note 5) | | | 4,255 | |
| Legal fees | | | 1,868 | |
| Other expenses | | | 7,427 | |
| Total expenses before waivers and reimbursements | | | 462,039 | |
| Service provider expense waiver (See Note 5) | | | (4,981 | ) |
| Expense reimbursement by advisor – Investor Class (See Note 5) | | | (22,749 | ) |
| Expense reimbursement by advisor – Institutional Class (See Note 5) | | | (38,580 | ) |
| Net expenses | | | 395,729 | |
| NET INVESTMENT INCOME | | $ | 195,908 | |
| | | | | |
| REALIZED AND UNREALIZED GAINS (LOSSES): | | | | |
| Net realized loss on investments | | $ | (19,552,986 | ) |
| Net change in unrealized appreciation/depreciation on investments | | | 3,844,502 | |
| Net loss on investments | | | (15,708,484 | ) |
| NET DECREASE IN NET ASSETS RESULTING FROM OPERATIONS | | $ | (15,512,576 | ) |
(1) | Net of foreign taxes withheld and issuance fees of $4,578. |
The accompanying notes are an integral part of these financial statements.
| HENNESSY FUNDS | 1-800-966-4354 | |
(This Page Intentionally Left Blank.)
| STATEMENTS OF CHANGES IN NET ASSETS |
Financial Statements
| Statements of Changes in Net Assets |
| | | Year Ended | | | Year Ended | |
| | | October 31, 2020 | | | October 31, 2019 | |
| OPERATIONS: | | | | | | |
| Net investment income (loss) | | $ | 195,908 | | | $ | (122,873 | ) |
| Net realized loss on investments | | | (19,552,986 | ) | | | (21,032,537 | ) |
| Net change in unrealized | | | | | | | | |
| appreciation/depreciation on investments | | | 3,844,502 | | | | 1,070,019 | |
| Net decrease in net assets resulting from operations | | | (15,512,576 | ) | | | (20,085,391 | ) |
| | | | | | | | | |
| DISTRIBUTIONS TO SHAREHOLDERS: | | | | | | | | |
| Distributable earnings – Institutional Class | | | (79,003 | ) | | | — | |
| Total distributions | | | (79,003 | ) | | | — | |
| | | | | | | | | |
| CAPITAL SHARE TRANSACTIONS: | | | | | | | | |
| Proceeds from shares subscribed – Investor Class | | | 2,364,355 | | | | 1,329,654 | |
| Proceeds from shares subscribed – Institutional Class | | | 2,010,096 | | | | 21,431,696 | |
| Dividends reinvested – Institutional Class | | | 77,299 | | | | — | |
| Cost of shares redeemed – Investor Class | | | (4,505,031 | ) | | | (9,317,247 | ) |
| Cost of shares redeemed – Institutional Class | | | (29,242,373 | ) | | | (39,120,012 | ) |
| Net decrease in net assets derived | | | | | | | | |
| from capital share transactions | | | (29,295,654 | ) | | | (25,675,909 | ) |
| TOTAL DECREASE IN NET ASSETS | | | (44,887,233 | ) | | | (45,761,300 | ) |
| | | | | | | | | |
| NET ASSETS: | | | | | | | | |
| Beginning of year | | | 51,200,714 | | | | 96,962,014 | |
| End of year | | $ | 6,313,481 | | | $ | 51,200,714 | |
| | | | | | | | | |
| CHANGES IN SHARES OUTSTANDING: | | | | | | | | |
| Shares sold – Investor Class | | | 265,356 | | | | 83,075 | |
| Shares sold – Institutional Class | | | 207,448 | | | | 1,375,469 | |
| Shares issued to holders as reinvestment | | | | | | | | |
| of dividends – Institutional Class | | | 5,019 | | | | — | |
| Shares redeemed – Investor Class | | | (464,633 | ) | | | (588,930 | ) |
| Shares redeemed – Institutional Class | | | (2,892,945 | ) | | | (2,524,419 | ) |
| Net decrease in shares outstanding | | | (2,879,755 | ) | | | (1,654,805 | ) |
The accompanying notes are an integral part of these financial statements.
| HENNESSY FUNDS | 1-800-966-4354 | |
Financial Statements
For an Investor Class share outstanding throughout each period
PER SHARE DATA:
Net asset value, beginning of period
Income from investment operations:
Net investment income (loss)(2)
Net realized and unrealized gains (losses) on investments
Total from investment operations
Less distributions:
Dividends from net realized gains
Total distributions
Net asset value, end of period
TOTAL RETURN
SUPPLEMENTAL DATA AND RATIOS:
Net assets, end of period (millions)
Ratio of expenses to average net assets:
Before expense reimbursement
After expense reimbursement
Ratio of net investment income (loss) to average net assets:
Before expense reimbursement
After expense reimbursement
Portfolio turnover rate(6)
(1) | The period ended October 31, 2018, consists of 11 months due to the Fund’s fiscal year end change from November 30 to October 31, effective October 26, 2018. |
(2) | Calculated using the average shares outstanding method. |
(3) | Not annualized. |
(4) | Annualized. |
(5) | The Fund had an expense limitation agreement in place through October 25, 2020. |
(6) | Calculated on the basis of the Fund as a whole. |
The accompanying notes are an integral part of these financial statements.
| FINANCIAL HIGHLIGHTS — INVESTOR CLASS |
| Year Ended | | | Period Ended | | | | | | | | | | |
| October 31, | | | October 31, | | | Year Ended November 30, | |
| 2020 | | | 2019 | | | 2018(1) | | | 2017 | | | 2016 | | | 2015 | |
| | | | | | | | | | | | | | | | | |
| $ | 14.08 | | | $ | 18.32 | | | $ | 19.47 | | | $ | 20.54 | | | $ | 16.41 | | | $ | 20.45 | |
| | | | | | | | | | | | | | | | | | | | | | | |
| | | | | | | | | | | | | | | | | | | | | | | |
| | 0.04 | | | | (0.07 | ) | | | (0.20 | ) | | | (0.23 | ) | | | (0.15 | ) | | | (0.10 | ) |
| | (5.38 | ) | | | (4.17 | ) | | | (0.95 | ) | | | (0.84 | ) | | | 4.28 | | | | (3.46 | ) |
| | (5.34 | ) | | | (4.24 | ) | | | (1.15 | ) | | | (1.07 | ) | | | 4.13 | | | | (3.56 | ) |
| | | | | | | | | | | | | | | | | | | | | | | |
| | | | | | | | | | | | | | | | | | | | | | | |
| | — | | | | — | | | | — | | | | — | | | | — | | | | (0.48 | ) |
| | — | | | | — | | | | — | | | | — | | | | — | | | | (0.48 | ) |
| $ | 8.74 | | | $ | 14.08 | | | $ | 18.32 | | | $ | 19.47 | | | $ | 20.54 | | | $ | 16.41 | |
| | | | | | | | | | | | | | | | | | | | | | | |
| | -37.93 | % | | | -23.14 | % | | | -5.91 | %(3) | | | -5.21 | % | | | 25.17 | % | | | -17.57 | % |
| | | | | | | | | | | | | | | | | | | | | | | |
| | | | | | | | | | | | | | | | | | | | | | | |
| $ | 2.50 | | | $ | 6.83 | | | $ | 18.16 | | | $ | 22.66 | | | $ | 19.64 | | | $ | 18.72 | |
| | | | | | | | | | | | | | | | | | | | | | | |
| | 2.59 | % | | | 1.97 | % | | | 1.82 | %(4) | | | 1.87 | % | | | 1.89 | % | | | 1.87 | % |
| | 2.03 | %(5) | | | 1.97 | % | | | 1.82 | %(4) | | | 1.87 | % | | | 1.89 | % | | | 1.87 | % |
| | | | | | | | | | | | | | | | | | | | | | | |
| | (0.18 | )% | | | (0.46 | )% | | | (1.05 | )%(4) | | | (1.21 | )% | | | (0.92 | )% | | | (0.51 | )% |
| | 0.38 | % | | | (0.46 | )% | | | (1.05 | )%(4) | | | (1.21 | )% | | | (0.92 | )% | | | (0.51 | )% |
| | 73 | % | | | 87 | % | | | 72 | %(3) | | | 84 | % | | | 83 | % | | | 79 | % |
The accompanying notes are an integral part of these financial statements.
| HENNESSY FUNDS | 1-800-966-4354 | |
Financial Statements
For an Institutional Class share outstanding throughout each period
PER SHARE DATA:
Net asset value, beginning of period
Income from investment operations:
Net investment income (loss)(2)
Net realized and unrealized gains (losses) on investments
Total from investment operations
Less distributions:
Dividends from net investment income
Dividends from net realized gains
Total distributions
Net asset value, end of period
TOTAL RETURN
SUPPLEMENTAL DATA AND RATIOS:
Net assets, end of period (millions)
Ratio of expenses to average net assets:
Before expense reimbursement
After expense reimbursement
Ratio of net investment income (loss) to average net assets:
Before expense reimbursement
After expense reimbursement
Portfolio turnover rate(6)
(1) | The period ended October 31, 2018, consists of 11 months due to the Fund’s fiscal year end change from November 30 to October 31, effective October 26, 2018. |
(2) | Calculated using the average shares outstanding method. |
(3) | Not annualized. |
(4) | Annualized. |
(5) | The Fund had an expense limitation agreement in place through October 25, 2020. |
(6) | Calculated on the basis of the Fund as a whole. |
The accompanying notes are an integral part of these financial statements.
| FINANCIAL HIGHLIGHTS — INSTITUTIONAL CLASS |
| Year Ended | | | Period Ended | | | | | | | | | | |
| October 31, | | | October 31, | | | Year Ended November 30, | |
| 2020 | | | 2019 | | | 2018(1) | | | 2017 | | | 2016 | | | 2015 | |
| | | | | | | | | | | | | | | | | |
| $ | 14.26 | | | $ | 18.50 | | | $ | 19.61 | | | $ | 20.64 | | | $ | 16.46 | | | $ | 20.45 | |
| | | | | | | | | | | | | | | | | | | | | | | |
| | | | | | | | | | | | | | | | | | | | | | | |
| | 0.12 | | | | (0.02 | ) | | | (0.15 | ) | | | (0.19 | ) | | | (0.11 | ) | | | (0.04 | ) |
| | (5.50 | ) | | | (4.22 | ) | | | (0.96 | ) | | | (0.84 | ) | | | 4.32 | | | | (3.47 | ) |
| | (5.38 | ) | | | (4.24 | ) | | | (1.11 | ) | | | (1.03 | ) | | | 4.21 | | | | (3.51 | ) |
| | | | | | | | | | | | | | | | | | | | | | | |
| | | | | | | | | | | | | | | | | | | | | | | |
| | (0.03 | ) | | | — | | | | — | | | | — | | | | (0.03 | ) | | | — | |
| | — | | | | — | | | | — | | | | — | | | | — | | | | (0.48 | ) |
| | (0.03 | ) | | | — | | | | — | | | | — | | | | (0.03 | ) | | | (0.48 | ) |
| $ | 8.85 | | | $ | 14.26 | | | $ | 18.50 | | | $ | 19.61 | | | $ | 20.64 | | | $ | 16.46 | |
| | | | | | | | | | | | | | | | | | | | | | | |
| | -37.80 | % | | | -22.92 | % | | | -5.66 | %(3) | | | -4.99 | % | | | 25.61 | % | | | -17.32 | % |
| | | | | | | | | | | | | | | | | | | | | | | |
| | | | | | | | | | | | | | | | | | | | | | | |
| $ | 3.82 | | | $ | 44.37 | | | $ | 78.81 | | | $ | 122.45 | | | $ | 126.92 | | | $ | 100.05 | |
| | | | | | | | | | | | | | | | | | | | | | | |
| | 2.01 | % | | | 1.66 | % | | | 1.57 | %(4) | | | 1.62 | % | | | 1.60 | % | | | 1.54 | % |
| | 1.77 | %(5) | | | 1.66 | % | | | 1.57 | %(4) | | | 1.62 | % | | | 1.60 | % | | | 1.54 | % |
| | | | | | | | | | | | | | | | | | | | | | | |
| | 0.79 | % | | | (0.12 | )% | | | (0.79 | )%(4) | | | (0.98 | )% | | | (0.65 | )% | | | (0.20 | )% |
| | 1.03 | % | | | (0.12 | )% | | | (0.79 | )%(4) | | | (0.98 | )% | | | (0.65 | )% | | | (0.20 | )% |
| | 73 | % | | | 87 | % | | | 72 | %(3) | | | 84 | % | | | 83 | % | | | 79 | % |
The accompanying notes are an integral part of these financial statements.
| HENNESSY FUNDS | 1-800-966-4354 | |
Financial Statements
Notes to the Financial Statements October 31, 2020 |
1). ORGANIZATION
The Hennessy BP Energy Fund (the “Fund”) is a series of Hennessy Funds Trust (the “Trust”), which was organized as a Delaware statutory trust on September 17, 1992. The Fund is an open-end management investment company registered under the Investment Company Act of 1940, as amended. The investment objective of the Fund is to seek total return. The Fund is a diversified fund.
The Fund offers Investor Class and Institutional Class shares. Each class of shares differs principally in its respective 12b-1 distribution and service, shareholder servicing, and sub-transfer agent expenses. There are no sales charges. Each class has identical rights to earnings, assets, and voting privileges, except for class-specific expenses and exclusive rights to vote on matters affecting only one class.
As an investment company, the Fund follows the investment company accounting and reporting guidance of the Financial Accounting Standards Board (“FASB”) Accounting Standard Codification Topic 946 “Financial Services—Investment Companies.”
2). SIGNIFICANT ACCOUNTING POLICIES
The following is a summary of significant accounting policies consistently followed by the Fund in the preparation of the financial statements. These policies conform to U.S. generally accepted accounting principles (“GAAP”).
| a). | Securities Valuation – All investments in securities are valued in accordance with the Fund’s valuation policies and procedures, as described in Note 3. |
| | |
| b). | Federal Income Taxes – No provision for federal income taxes or excise taxes has been made because the Fund has elected to be taxed as a regulated investment company and intends to distribute substantially all of its taxable income to its shareholders and otherwise comply with the provisions of the Internal Revenue Code of 1986, as amended, applicable to regulated investment companies. Net investment income/loss and realized gains/losses for federal income tax purposes may differ from those reported in the financial statements because of temporary book and tax basis differences. Temporary differences are primarily the result of the treatment of wash sales for tax reporting purposes and investments in companies organized as partnerships for tax purposes. The Fund recognizes interest and penalties related to income tax benefits, if any, in the Statement of Operations as an income tax expense. Distributions from net realized gains for book purposes may include short-term capital gains, which are included as ordinary income to shareholders for tax purposes. The Fund may utilize equalization accounting for tax purposes and designate earnings and profits, including net realized gains distributed to shareholders on redemption of shares, as part of the dividends paid deduction for income tax purposes. |
| | |
| | Due to inherent differences in the recognition of income, expenses, and realized gains/losses under GAAP and federal income tax regulations, permanent differences between book and tax basis for reporting are identified and appropriately reclassified in the Statement of Assets and Liabilities, as needed. The adjustments for fiscal year 2020 are as follows: |
| | Total | | |
| | Distributable | | |
| | Earnings
| Capital Stock | |
| | $3,784 | $(3,784) | |
| NOTES TO THE FINANCIAL STATEMENTS |
| c). | Accounting for Uncertainty in Income Taxes – The Fund has accounting policies regarding recognition and measurement of tax positions taken or expected to be taken on a tax return. The tax returns of the Fund for the prior three fiscal years are open for examination. The Fund has reviewed all open tax years in major jurisdictions and concluded that there is no impact on the Fund’s net assets and no tax liability resulting from unrecognized tax benefits relating to uncertain income tax positions taken or expected to be taken on a tax return. The Fund’s major tax jurisdictions are U.S. federal and Delaware. |
| | |
| d). | Income and Expenses – Dividend income is recognized on the ex-dividend date or as soon as information is available to the Fund. Interest income, which includes the amortization of premium and accretion of discount, is recognized on an accrual basis. Market discounts, original issue discounts, and market premiums on debt securities are accreted or amortized to interest income over the life of a security with a corresponding increase or decrease, as applicable, in the cost basis of such security using the yield to maturity method, or where applicable, the first call date of the security. Other non-cash dividends are recognized as investment income at the fair value of the property received. The Fund is charged for those expenses that are directly attributable to its portfolio, such as advisory, administration, and certain shareholder service fees. Income, expenses (other than expenses attributable to a specific class), and realized and unrealized gains/losses on investments are allocated to each class of shares based on such class’s net assets. Distributions received from the Fund’s investments in master limited partnerships (“MLPs”) generally consist of ordinary income, capital gains, and return of capital. The Fund records investment income on the ex-date of the distributions. For financial statement purposes, the Fund uses return of capital and income estimates to allocate the dividend income received. Such estimates are based on historical information available from the MLPs and other industry sources. These estimates may subsequently be revised based on information received from the MLPs after their tax reporting periods are concluded, as the actual character of these distributions is not known until after the fiscal year end of the Fund. |
| | |
| e). | Distributions to Shareholders – Dividends from net investment income for the Fund, if any, are declared and paid annually, usually in December. Distributions of net realized capital gains, if any, are declared and paid annually, usually in December. |
| | |
| f). | Security Transactions – Investment and shareholder transactions are recorded on the trade date. The Fund determines the realized gain/loss from an investment transaction by comparing the original cost of the security lot sold with the net sale proceeds. Discounts and premiums on securities purchased are accreted or amortized, respectively, over the life of each such security. |
| | |
| g). | Use of Estimates – The preparation of financial statements in conformity with GAAP requires management to make estimates and assumptions that affect the reported amounts of assets and liabilities and disclosure of contingent assets and liabilities at the date of the financial statements and the reported change in net assets during the reporting period. Actual results could differ from those estimates. |
| | |
| h). | Share Valuation – The net asset value (“NAV”) per share of the Fund is calculated by dividing (i) the total value of the securities held by the Fund, plus cash and other assets, minus all liabilities (including estimated accrued expenses) by (ii) the total number of shares outstanding for the Fund, rounded to the nearest $0.01. The Fund’s shares will not be priced on days the New York Stock Exchange is closed for trading. The offering and redemption price per share for the Fund is equal to the Fund’s NAV per share. |
| HENNESSY FUNDS | 1-800-966-4354 | |
| i). | Partnership Accounting Policy – To the extent the Fund receives distributions from underlying partnerships in which it invests, the Fund records its pro rata share of income/loss and capital gains/losses and accordingly adjusts the cost basis of the underlying partnerships for return of capital. |
| | |
| j). | New Accounting Pronouncements – In August 2018, the FASB issued Accounting Standards Update No. 2018-13 “Disclosure Framework—Changes to the Disclosure Requirements for Fair Value Measurement” (“ASU 2018-13”). ASU 2018-13 eliminates the requirement to disclose the amount of and reasons for transfers between Level 1 and Level 2 of the fair value hierarchy, the timing of transfers between levels of the fair value hierarchy, and the valuation processes for Level 3 fair value measurements. ASU 2018-13 does not eliminate the requirement to disclose the range and weighted average used to develop significant unobservable inputs for Level 3 fair value measurements, and the changes in unrealized gains and losses for recurring Level 3 fair value measurements. ASU 2018-13 requires that information is provided about the measurement uncertainty of Level 3 fair value measurements as of the reporting date. The guidance is effective for fiscal years beginning after December 15, 2019, and interim periods within those fiscal years. Management evaluated the impact of this change in guidance and, due to the permissibility of early adoption, modified the Fund’s fair value disclosures beginning with its fiscal year 2019. |
3). SECURITIES VALUATION
The Fund follows its valuation policies and procedures in determining its net asset value and, in preparing these financial statements, the fair value accounting standards that establish an authoritative definition of fair value and set out a hierarchy for measuring fair value. These standards require additional disclosures about the various inputs and valuation techniques used to develop the measurements of fair value and a discussion of changes in valuation techniques and related inputs during the period. These inputs are summarized in the three broad levels listed below:
| | Level 1 – | Unadjusted, quoted prices in active markets for identical instruments that the Fund has the ability to access at the date of measurement. |
| | | |
| | Level 2 – | Other significant observable inputs (including, but not limited to, quoted prices in active markets for similar instruments, quoted prices in markets that are not active for identical or similar instruments, and model-derived valuations in which all significant inputs and significant value drivers are observable in active markets, such as interest rates, prepayment speeds, credit risk curves, default rates, and similar data). |
| | | |
| | Level 3 – | Significant unobservable inputs (including the Fund’s own assumptions about what market participants would use to price the asset or liability based on the best available information) when observable inputs are unavailable. |
The following is a description of the valuation techniques applied to the Fund’s major categories of assets and liabilities on a recurring basis:
| | Equity Securities – Equity securities, including common stocks, preferred stocks, foreign-issued common stocks, exchange-traded funds, closed-end mutual funds, partnerships, rights, MLPs, and real estate investment trusts, that are traded on a securities exchange for which a last-quoted sales price is readily available will generally be valued at the last sales price as reported by the primary exchange on which the securities are listed. Securities listed on The NASDAQ Stock Market (“NASDAQ”) will generally be valued at the NASDAQ Official Closing Price, which may differ from the last sales price reported. Securities traded on a securities exchange for which a last-quoted sales price is not readily available will generally be |
| NOTES TO THE FINANCIAL STATEMENTS |
| | valued at the mean between the bid and ask prices. To the extent these securities are actively traded and valuation adjustments are not applied, they are classified in Level 1 of the fair value hierarchy. Securities traded on foreign exchanges generally are not valued at the same time the Fund calculates its NAV because most foreign markets close well before such time. The earlier close of most foreign markets gives rise to the possibility that significant events, including broad market moves, may have occurred in the interim. In certain circumstances, it may be determined that a foreign security needs to be fair valued because it appears that the value of the security might have been materially affected by events occurring after the close of the market in which the security is principally traded, but before the time the Fund calculates its NAV, such as by a development that affects an entire market or region (e.g., a weather-related event) or a potentially global development (e.g., a terrorist attack that may be expected to have an effect on investor expectations worldwide). |
| | |
| | Registered Investment Companies – Investments in open-end registered investment companies, commonly referred to as mutual funds, generally are priced at the ending NAV provided by the applicable mutual fund’s service agent and will be classified in Level 1 of the fair value hierarchy. |
| | |
| | Debt Securities – Debt securities, including corporate bonds, asset-backed securities, mortgage-backed securities, municipal bonds, U.S. Treasuries, and U.S. government agency issues, are generally valued at market on the basis of valuations furnished by an independent pricing service that utilizes both dealer-supplied valuations and formula-based techniques. The pricing service may consider recently executed transactions in securities of the issuer or comparable issuers, market price quotations (where observable), bond spreads, and fundamental data relating to the issuer. In addition, the model may incorporate observable market data, such as reported sales of similar securities, broker quotes, yields, bids, offers, and reference data. Certain securities are valued primarily using dealer quotations. These securities are generally classified in Level 2 of the fair value hierarchy. |
| | |
| | Short-Term Securities – Short-term equity investments, including money market funds, are valued in the manner specified above. Short-term debt investments with an original term to maturity of 60 days or less are valued at amortized cost, which approximates fair market value. If the original term to maturity of a short-term debt investment exceeded 60 days, then the values as of the 61st day prior to maturity are amortized. Amortized cost is not used if its use would be inappropriate due to credit or other impairments of the issuer, in which case the security’s fair value would be determined, as described below. Short-term securities are generally classified in Level 1 or Level 2 of the fair value hierarchy depending on the inputs used and market activity levels for specific securities. |
The Board of Trustees of the Fund (the “Board”) has adopted fair value pricing procedures that are followed when a price for a security is not readily available or if a significant event has occurred that indicates the closing price of a security no longer represents the true value of that security. Fair value pricing determinations are made in good faith in accordance with these procedures. There are numerous criteria that will be given consideration in determining a fair value of a security, such as the trading volume of a security and markets, the values of other similar securities, and news events with direct bearing on a security or markets. Fair value pricing results in an estimated price for a security that reflects the amount the Fund might reasonably expect to receive in a current sale. Depending on the relative significance of the valuation inputs, these securities may be classified in either Level 2 or Level 3 of the fair value hierarchy.
| HENNESSY FUNDS | 1-800-966-4354 | |
The fair value of foreign securities may be determined with the assistance of a pricing service using correlations between the movement of prices of such securities and indices of domestic securities and other appropriate indicators, such as closing market prices of relevant American Depositary Receipts or futures contracts. Using fair value pricing means that the Fund’s NAV reflects the affected portfolio securities’ values as determined by the Board or its designee, pursuant to the fair value pricing procedures adopted by the Board, instead of being determined by the market. Using a fair value pricing methodology to price a foreign security may result in a value that is different from such foreign security’s most recent closing price and from the value used by other investment companies to calculate their NAVs. Such securities are generally classified in Level 2 of the fair value hierarchy. Because the Fund may invest in foreign securities, the value of the Fund’s portfolio securities may change on days when you will not be able to purchase or redeem your shares.
The Board has delegated day-to-day valuation matters to the Valuation and Liquidity Committee comprising representatives from Hennessy Advisors, Inc., the Fund’s investment advisor (the “Advisor”). The function of the Valuation and Liquidity Committee is to value securities where current and reliable market quotations are not readily available. All actions taken by the Valuation and Liquidity Committee are reviewed by the Board.
The Fund has performed an analysis of all existing investments to determine the significance and character of all inputs to their fair value determinations. Various inputs are used to determine the value of the Fund’s investments. The inputs or methodology used for valuing securities are not necessarily an indication of the risk associated with investing in those securities. Details related to the fair value hierarchy of the Fund’s securities as of October 31, 2020, are included in the Schedule of Investments.
4). INVESTMENT TRANSACTIONS
Purchases and sales of investment securities (excluding government and short-term investments) for the Fund during fiscal year 2020 were $15,771,986 and $41,779,987, respectively.
There were no purchases or sales/maturities of long-term U.S. government securities for the Fund during fiscal year 2020.
The Fund is permitted to purchase or sell securities from or to another fund in the Hennessy Funds family of funds (collectively, the “Hennessy Funds”) under specified conditions outlined in procedures adopted by the Board. The procedures have been designed to ensure that any purchase or sale of securities by the Fund from or to another Hennessy Fund complies with Rule 17a-7 of the Investment Company Act of 1940, as amended. During fiscal year 2020, the Fund did not engage in purchases or sales of securities pursuant to Rule 17a-7 of the Investment Company Act of 1940, as amended.
5). INVESTMENT ADVISORY FEE AND OTHER TRANSACTIONS WITH AFFILIATES
The Advisor provides the Fund with investment advisory services under an Investment Advisory Agreement. The Advisor oversees the provision of investment advice and furnishes office space, facilities, and most of the personnel needed by the Fund. As compensation for its services, the Advisor is entitled to a monthly fee from the Fund. The fee is based on the average daily net assets of the Fund at an annual rate of 1.25 %. The net investment advisory fees expensed by the Fund during fiscal year 2020 are included in the Statement of Operations.
The Advisor has delegated the day-to-day management of the Fund to a sub-advisor, BP Capital Fund Advisors, LLC. The Advisor pays the sub-advisory fees from its own assets, and these fees are not an additional expense of the Fund. During fiscal year 2020, the Advisor (not the Fund) paid a sub-advisory fee at the rate of 0.40% of the daily net assets of the Fund.
| NOTES TO THE FINANCIAL STATEMENTS |
From October 26, 2018, through October 25, 2020, the Advisor contractually agreed to limit total annual operating expenses to 2.00% of the Fund’s net assets for Investor Class shares and 1.75% of the Fund’s net assets for Institutional Class shares (in each case, excluding all federal, state, and local taxes, interest, brokerage commissions, dividend and interest expenses on short sales, extraordinary items, and acquired fund fees and expenses and other costs incurred in connection with the purchase and sale of securities).
For three years following the date on which expenses were waived or incurred, the Advisor may recoup waived or reimbursed expenses from the Fund if total operating expenses, including such recoupment, does not exceed the expense limitation in effect (i) at the time the Advisor waived or reimbursed such expenses and (ii) at the time the Advisor recoups such expenses. As of October 31, 2020, expenses subject to potential recovery were $22,749 for Investor Class shares and $38,580 for Institutional Class shares, which will expire in fiscal year 2023. The Advisor did not recoup expenses from the Fund during fiscal year 2020.
The Board has approved a Shareholder Servicing Agreement for Investor Class shares of the Fund, which was instituted to compensate the Advisor for the non-investment advisory services it provides to the Fund. The Shareholder Servicing Agreement provides for a monthly fee paid to the Advisor at an annual rate of 0.10% of the average daily net assets of the Fund attributable to Investor Class shares. The shareholder service fees expensed by the Fund during fiscal year 2020 are included in the Statement of Operations.
The Fund has adopted a plan pursuant to Rule 12b-1 under the Investment Company Act of 1940, as amended, that authorizes payments in connection with the distribution of the Fund’s shares at an annual rate of up to 0.25% of the Fund’s average daily net assets attributable to Investor Class shares. Even though the authorized rate is up to 0.25%, the Fund is currently only using up to 0.15% of its average daily net assets attributable to Investor Class shares for such purpose. Amounts paid under the plan may be spent on any activities or expenses primarily intended to result in the sale of shares, including, but not limited to, advertising, shareholder account servicing, printing and mailing of prospectuses to other than current shareholders, printing and mailing of sales literature, and compensation for sales and marketing activities or to financial institutions and others, such as dealers and distributors. The distribution fees expensed by the Fund during fiscal year 2020 are included in the Statement of Operations.
The Fund has entered into agreements with various brokers, dealers, and financial intermediaries in connection with the sale of shares of the Fund. The agreements provide for periodic payments of sub-transfer agent expenses by the Fund to the brokers, dealers, and financial intermediaries for providing certain shareholder maintenance services. These shareholder services include the pre-processing and quality control of new accounts, shareholder correspondence, answering customer inquiries regarding account status, and facilitating shareholder telephone transactions. The sub-transfer agent fees expensed by the Fund during fiscal year 2020 are included in the Statement of Operations.
U.S. Bancorp Fund Services, LLC, d/b/a U.S. Bank Global Fund Services (“Fund Services”) provides the Fund with administrative, accounting, and transfer agent services. As administrator, Fund Services is responsible for activities such as (i) preparing various federal and state regulatory filings, reports, and returns for the Fund, (ii) preparing reports and materials to be supplied to the Board, (iii) monitoring the activities of the Fund’s custodian, transfer agent, and accountants, and (iv) coordinating the preparation and payment of the Fund’s expenses and reviewing the Fund’s expense accruals. U.S. Bank N.A., an affiliate of Fund Services, serves as the Fund’s custodian. The servicing agreements between the Trust and Fund Services and U.S. Bank N.A. contain a fee
| HENNESSY FUNDS | 1-800-966-4354 | |
schedule that is inclusive of administrative, accounting, custody, and transfer agent fees. The administrative, accounting, custody, and transfer agent fees expensed by the Fund during fiscal year 2020 are included in the Statement of Operations. Fund Services has voluntarily waived all or a portion of its fees for the Fund. The fees voluntarily waived by Fund Services during fiscal year 2020 are included in the Statement of Operations.
Quasar Distributors, LLC (“Quasar”) acts as the Fund’s principal underwriter in a continuous public offering of the Fund’s shares. Quasar was an affiliate of Fund Services and U.S. Bank N.A. through March 30, 2020. Effective March 31, 2020, Foreside Financial Group, LLC (“Foreside”) acquired Quasar from Fund Services. As a result of the acquisition, Quasar became a wholly owned broker-dealer subsidiary of Foreside and is no longer affiliated with Fund Services or U.S. Bank N.A. The Board approved a new Distribution Agreement to enable Quasar to continue serving as the Fund’s distributor.
The officers of the Fund are affiliated with the Advisor. With the exception of the Chief Compliance Officer and the Senior Compliance Officer, such officers receive no compensation from the Fund for serving in their respective roles. The Fund, along with the other Hennessy Funds, makes reimbursement payments on an equal basis to the Advisor for a portion of the salary and benefits associated with the office of the Chief Compliance Officer and for all of the salary and benefits associated with the office of the Senior Compliance Officer. The compliance fees expensed by the Fund during fiscal year 2020 are included in the Statement of Operations.
6). GUARANTEES AND INDEMNIFICATIONS
Under the Hennessy Funds’ organizational documents, their officers and trustees are indemnified by the Hennessy Funds against certain liabilities arising out of the performance of their duties to the Hennessy Funds. Additionally, in the normal course of business, the Hennessy Funds enter into contracts with service providers that contain general indemnification clauses. The Fund’s maximum exposure under these arrangements is unknown as this would involve future claims that may be made against the Fund that have not yet occurred. Currently, the Fund expects the risk of loss to be remote.
7). LINE OF CREDIT
The Fund has an uncommitted line of credit with the other Hennessy Funds in the amount of the lesser of (i) $100,000,000 or (ii) 33.33% of each Hennessy Fund’s net assets, or 30% for the Hennessy Gas Utility Fund and 10% for the Hennessy Balanced Fund, intended to provide short-term financing, if necessary, subject to certain restrictions, in connection with shareholder redemptions. The credit facility is with the Hennessy Funds’ custodian bank, U.S. Bank N.A. Borrowings under this arrangement bear interest at the bank’s prime rate and are secured by all of the Fund’s assets (as to its own borrowings only). During fiscal year 2020, the Fund had an outstanding average daily balance and a weighted average interest rate of $121,954 and 3.65%, respectively. The interest expensed by the Fund during fiscal year 2020 is included in the Statement of Operations. The maximum amount outstanding for the Fund during fiscal year 2020 was $4,353,000. As of October 31, 2020, the Fund had a loan payable of $1,000.
| NOTES TO THE FINANCIAL STATEMENTS |
8). FEDERAL TAX INFORMATION
As of October 31, 2020, the components of accumulated earnings (losses) for income tax purposes were as follows:
| | | | Investments | |
| | Cost of investments for tax purposes | | $ | 9,881,106 | |
| | Gross tax unrealized appreciation | | $ | 668,142 | |
| | Gross tax unrealized depreciation | | | (4,243,082 | ) |
| | Net tax unrealized appreciation/(depreciation) | | $ | (3,574,940 | ) |
| | Undistributed ordinary income | | $ | — | |
| | Undistributed long-term capital gains | | | — | |
| | Total distributable earnings | | $ | — | |
| | Other accumulated gain/(loss) | | $ | (41,158,527 | ) |
| | Total accumulated gain/(loss) | | $ | (44,733,467 | ) |
The difference between book-basis unrealized appreciation/depreciation and tax-basis unrealized appreciation/depreciation (as shown above) is attributable primarily to wash sales and partnership adjustments.
As of October 31, 2020, the Fund had capital loss carryforwards as follows:
| | $21,071,206 | | Unlimited long-term |
| | 19,658,006 | | Unlimited short-term |
As of October 31, 2020, the Fund deferred, on a tax basis, a late-year ordinary loss of $429,315. Late-year ordinary losses are net ordinary losses incurred after December 31, 2019, but within the taxable year, that are deemed to arise on the first day of the Fund’s next taxable year.
During fiscal years 2020 and 2019, the tax character of distributions paid by the Fund was as follows:
| | | | Year Ended | | | Year Ended | |
| | | | October 31, 2020 | | | October 31, 2019 | |
| | Ordinary income(1) | | $ | 79,003 | | | $ | — | |
| | Long-term capital gain | | | — | | | | — | |
| | Total distributions | | $ | 79,003 | | | $ | — | |
| | (1) Ordinary income includes short-term capital gains. |
9). COVID-19 PANDEMIC
The COVID-19 pandemic has adversely impacted global commercial activity and contributed to significant volatility in global equity and debt markets. The pandemic has resulted in quarantines, stay-at-home orders, travel prohibitions, and closures, disrupting supply chains and economic activity. The duration of the pandemic’s effects remain uncertain and difficult to assess. The effects of the pandemic may adversely impact the Fund’s performance and its ability to achieve its investment objective.
10). EVENTS SUBSEQUENT TO YEAR END
Management has evaluated the Fund’s related events and transactions that occurred subsequent to October 31, 2020, through the date of issuance of the Fund’s financial statements. Management has determined that there were no subsequent events requiring recognition or disclosure in the financial statements.
| HENNESSY FUNDS | 1-800-966-4354 | |
Report of Independent Registered Public
Accounting Firm
To the Board of Trustees of Hennessy Funds Trust
and the shareholders of the Hennessy BP Energy Fund
Novato, CA
Opinion on the Financial Statements
We have audited the accompanying statement of assets and liabilities of the Hennessy BP Energy Fund (the “Fund”), a series of Hennessy Funds Trust, including the schedule of investments, as of October 31, 2020, the related statements of operations for the year then ended, the statements of changes in net assets for each of the two years in the period then ended, the financial highlights for each of the two years in the period then ended, for the eleven months ended October 31, 2018, and each of the three years in the period ended November 30, 2017, and the related notes (collectively referred to as the “financial statements”). In our opinion, the financial statements present fairly, in all material respects, the financial position of the Fund as of October 31, 2020, the results of its operations for the year then ended, the changes in its net assets for each of the two years in the period then ended and the financial highlights for each of the three years in the period ended November 30, 2017, in conformity with accounting principles generally accepted in the United States of America.
Basis for Opinion
These financial statements are the responsibility of the Fund’s management. Our responsibility is to express an opinion on the Fund’s financial statements based on our audits. We are a public accounting firm registered with the Public Company Accounting Oversight Board (United States) (“PCAOB”) and are required to be independent with respect to the Fund in accordance with the U.S. federal securities laws and the applicable rules and regulations of the Securities and Exchange Commission and the PCAOB. We have served as the auditor of one or more of the funds in the Trust since 2002.
We conducted our audits in accordance with the standards of the PCAOB. Those standards require that we plan and perform the audit to obtain reasonable assurance about whether the financial statements are free of material misstatement, whether due to error or fraud. The Fund is not required to have, nor were we engaged to perform, an audit of its internal control over financial reporting. As part of our audits we are required to obtain an understanding of internal control over financial reporting, but not for the purpose of expressing an opinion on the effectiveness of the Fund’s internal control over financial reporting. Accordingly, we express no such opinion.
Our audits included performing procedures to assess the risks of material misstatement of the financial statements, whether due to error or fraud, and performing procedures that respond to those risks. Such procedures included examining, on a test basis, evidence regarding the amounts and disclosures in the financial statements. Our audits also included evaluating the accounting principles used and significant estimates made by management, as well as evaluating the overall presentation of the financial statements. Our procedures included confirmation of securities owned as of October 31, 2020, by correspondence with the custodian and brokers; when replies were not received from brokers, we performed other auditing procedures. We believe that our audits provide a reasonable basis for our opinion.
| |  |
| | TAIT, WELLER & BAKER LLP |
Philadelphia, Pennsylvania
December 23, 2020
| REPORT OF INDEPENDENT REGISTERED PUBLIC ACCOUNTING FIRM/TRUSTEES AND OFFICERS |
Trustees and Officers of the Fund (Unaudited)
The business and affairs of the Funds are managed under the direction of the Board of Trustees of the Trust, and the Board of Trustees elects the officers of the Trust. From time to time, the Board of Trustees also has appointed advisers to the Board of Trustees (“Advisers”) with the intention of having qualified individuals serve in an advisory capacity to garner experience in the mutual fund and asset management industry and be considered as potential Trustees in the future. There are currently three Advisers: Brian Alexander, Doug Franklin, and Claire Knoles. As Advisers, Mr. Alexander, Mr. Franklin, and Ms. Knoles attend meetings of the Board of Trustees and act as non-voting participants. Information pertaining to the Trustees, Advisers, and the officers of the Trust is set forth below. The Trustees and officers serve until their successors are duly elected and qualified or until their earlier death, resignation, or removal. Each Trustee oversees all 16 Hennessy Funds. Unless otherwise indicated, the address of all persons listed below is 7250 Redwood Boulevard, Suite 200, Novato, CA 94945. The Fund’s Statement of Additional Information includes more information about the persons listed below and is available without charge by calling 1-800-966-4354 or by visiting www.hennessyfunds.com.
| | | | Other |
| | | | Directorships |
| | | | Held Outside |
| Name, Age, | | | of Fund |
| and Position Held | Start Date | Principal Occupation(s) | Complex During |
with the Trust
| of Service
| During Past Five Years
| Past Five Years
|
| Disinterested Trustees and Advisers | |
| | | | |
| J. Dennis DeSousa | January 1996 | Mr. DeSousa is a real estate investor. | None. |
| 84 | | | |
| Trustee | | | |
| | | | |
| Robert T. Doyle | January 1996 | Mr. Doyle has been the Sheriff of | None. |
| 73 | | Marin County, California since 1996. | |
| Trustee | | | |
| | | | |
| Gerald P. Richardson | May 2004 | Mr. Richardson is an independent | None. |
| 75 | | consultant in the securities industry. | |
| Trustee | | | |
| | | | |
| Brian Alexander | March 2015 | Mr. Alexander has worked for the | None. |
| 39 | | Sutter Health organization since | |
| Adviser to the Board | | 2011 in various positions. He has | |
| | | served as the Chief Executive Officer | |
| | | of the Sutter Roseville Medical | |
| | | Center since 2018. From 2016 through | |
| | | 2018, he served as the Vice President | |
| | | of Strategy for the Sutter Health Valley | |
| | | Area, which includes 11 hospitals, | |
| | | 13 ambulatory surgery centers, | |
| | | 16,000 employees, and 1,900 physicians. | |
| | | From 2013 through 2016, Mr. Alexander | |
| | | served as Sutter Novato Community | |
| | | Hospital’s Chief Administrative Officer. | |
| HENNESSY FUNDS | 1-800-966-4354 | |
| | | | Other |
| | | | Directorships |
| | | | Held Outside |
| Name, Age, | | | of Fund |
| and Position Held | Start Date | Principal Occupation(s) | Complex During |
with the Trust
| of Service
| During Past Five Years
| Past Five Years
|
| Doug Franklin | March 2016 | Mr. Franklin is a retired insurance | None. |
| 56 | | industry executive. From 1987 | |
| Adviser to the Board | | through 2015, he was employed | |
| | | by the Allianz-Fireman’s Fund | |
| | | Insurance Company in various | |
| | | positions, including as its Chief | |
| | | Actuary and Chief Risk Officer. | |
| | | | |
| Claire Knoles | December 2015 | Ms. Knoles is a founder of Kiosk and | None. |
| 46 | | has served as its Chief Operating | |
| Adviser to the Board | | Officer since 2004. Kiosk is a full- | |
| | | service marketing agency with | |
| | | offices in the San Francisco Bay | |
| | | Area, Toronto, and Liverpool, UK. | |
| | | | |
Interested Trustee(1) | | | |
| | | | |
| Neil J. Hennessy | January 1996 as | Mr. Hennessy has been employed | Hennessy |
| 64 | a Trustee and | by Hennessy Advisors, Inc. since | Advisors, Inc. |
| Trustee, Chairman of | June 2008 as | 1989 and currently serves as its | |
| the Board, Chief | an officer | Chairman and Chief Executive Officer. | |
| Investment Officer, | | | |
| Portfolio Manager, | | | |
| and President | | | |
| Name, Age, | | |
| and Position Held | Start Date | Principal Occupation(s) |
with the Trust
| of Service
| During Past Five Years
|
| Officers | | |
| | | |
| Teresa M. Nilsen | January 1996 | Ms. Nilsen has been employed by Hennessy Advisors, Inc. |
| 54 | | since 1989 and currently serves as its President, Chief Operating |
| Executive Vice President | | Officer, and Secretary. |
| and Treasurer | | |
| | | |
| Daniel B. Steadman | March 2000 | Mr. Steadman has been employed by Hennessy Advisors, Inc. |
| 64 | | since 2000 and currently serves as its Executive Vice President. |
| Executive Vice President | | |
| and Secretary | | |
| | | |
| Brian Carlson | December 2013 | Mr. Carlson has been employed by Hennessy Advisors, Inc. |
| 48 | | since December 2013 and currently serves as its Chief |
| Senior Vice President | | Compliance Officer and Senior Vice President. |
| and Head of Distribution | | |
| | | |
Jennifer Cheskiewicz(2) | June 2013 | Ms. Cheskiewicz has been employed by Hennessy Advisors, Inc. |
| 43 | | as its General Counsel since June 2013. |
| Senior Vice President and | | |
| Chief Compliance Officer | | |
| TRUSTEES AND OFFICERS OF THE FUND |
| Name, Age, | | |
| and Position Held | Start Date | Principal Occupation(s) |
with the Trust
| of Service
| During Past Five Years
|
David Ellison(3) | October 2012 | Mr. Ellison has been employed by Hennessy Advisors, Inc. since |
| 62 | | October 2012. He has served as a Portfolio Manager of the |
| Senior Vice President | | Hennessy Large Cap Financial Fund and the Hennessy Small |
| and Portfolio Manager | | Cap Financial Fund since their inception. Mr. Ellison also served |
| | | as a Portfolio Manager of the Hennessy Technology Fund from |
| | | its inception until February 2017. Mr. Ellison served as Director, |
| | | CIO, and President of FBR Fund Advisers, Inc. from December |
| | | 1999 to October 2012. |
| | | |
Ryan Kelley(4) | March 2013 | Mr. Kelley has been employed by Hennessy Advisors, Inc. since |
| 48 | | October 2012. He has served as a Portfolio Manager of the |
| Senior Vice President | | Hennessy Gas Utility Fund, the Hennessy Large Cap Financial |
| and Portfolio Manager | | Fund, and the Hennessy Small Cap Financial Fund since |
| | | October 2014. He served as Co-Portfolio Manager of these |
| | | same funds from March 2013 through September 2014 and as |
| | | a Portfolio Analyst for the Hennessy Funds from October 2012 |
| | | through February 2013. Mr. Kelley has also served as a Portfolio |
| | | Manager of the Hennessy Cornerstone Growth Fund, the |
| | | Hennessy Cornerstone Mid Cap 30 Fund, the Hennessy |
| | | Cornerstone Large Growth Fund, and the Hennessy |
| | | Cornerstone Value Fund since February 2017 and as a Portfolio |
| | | Manager of the Hennessy Total Return Fund, the Hennessy |
| | | Balanced Fund, and the Hennessy Technology Fund since May |
| | | 2018. He served as Co-Portfolio Manager of the Hennessy |
| | | Technology Fund from February 2017 until May 2018. Mr. Kelley |
| | | served as Portfolio Manager of FBR Fund Advisers, Inc. from |
| | | January 2008 to October 2012. |
| | | |
| Tania Kelley | October 2003 | Ms. Kelley has been employed by Hennessy Advisors, Inc. since |
| 55 | | October 2003. |
| Senior Vice President | | |
| and Head of Marketing | | |
| | | |
L. Joshua Wein(4) | September 2018 | Mr. Wein has been employed by Hennessy Advisors, Inc. since |
| 47 | | 2018. He has served as Co-Portfolio Manager of the Hennessy |
| Vice President and | | Cornerstone Growth Fund, the Hennessy Cornerstone |
| Co-Portfolio Manager | | Mid Cap 30 Fund, the Hennessy Cornerstone Large Growth |
| | | Fund, the Hennessy Cornerstone Value Fund, Hennessy Total |
| | | Return Fund, the Hennessy Balanced Fund, the Hennessy Gas |
| | | Utility Fund, and the Hennessy Technology Fund since February |
| | | 2019. He served as a Senior Analyst of these same funds from |
| | | September 2018 through February 2019. Mr. Wein served as |
| | | Director of Alternative Investments and Co-Portfolio Manager |
| | | at Sterling Capital Management from 2008 to 2018. |
_______________
(1) | Mr. Hennessy is considered an “interested person,” as defined in the Investment Company Act of 1940, as amended, because he is an officer of the Trust. |
(2) | The address of this officer is 4800 Bee Caves Road, Suite 100, Austin, TX 78746. |
(3) | The address of this officer is 101 Federal Street, Suite 1615B, Boston, MA 02110. |
(4) | The address of this officer is 1340 Environ Way, Chapel Hill, NC 27517. |
| HENNESSY FUNDS | 1-800-966-4354 | |
Expense Example (Unaudited)
October 31, 2020
As a shareholder of the Fund, you incur ongoing costs, including management fees, service fees, and other Fund expenses. This Example is intended to help you understand your ongoing costs (in dollars) of investing in the Fund and to compare these costs with the ongoing costs of investing in other mutual funds. The Example is based on an investment of $1,000 invested at the beginning of the period and held for the entire period from May 1, 2020, through October 31, 2020.
Actual Expenses
The first line of the table below under the “Investor Class” and “Institutional Class” headings provides information about actual account values and actual expenses. You may use the information in this line, together with the amount you invested, to estimate the expenses that you paid over the period. Simply divide your account value by $1,000 (for example, an $8,600 account value divided by $1,000 = 8.6), then multiply the result by the number in the first line below the “Investor Class” or “Institutional Class” heading under the column entitled “Expenses Paid During Period” to estimate the expenses you paid on your account during this period. Although the Fund charges no sales loads or transaction fees, you will be assessed fees for outgoing wire transfers, returned checks, and stop payment orders at prevailing rates charged by U.S. Bank Global Fund Services, the Fund’s transfer agent. If you request that a redemption be made by wire transfer, the Fund’s transfer agent charges a $15 fee. IRAs are charged a $15 annual maintenance fee (up to $30 maximum per shareholder for shareholders with multiple IRAs). The example below includes, but is not limited to, management fees, shareholder servicing fees, accounting, custody, and transfer agent fees. However, the example below does not include portfolio trading commissions and related expenses.
Hypothetical Example for Comparison Purposes
The second line of the table below under the “Investor Class” and “Institutional Class” headings provides information about hypothetical account values and hypothetical expenses based on the Fund’s actual expense ratios and an assumed rate of return of 5% per year before expenses, which is not the Fund’s actual return. The hypothetical account values and expenses may not be used to estimate the actual ending account balance or expenses you paid for the period. You may use this information to compare the ongoing costs of investing in the Fund and other funds. To do so, compare this 5% hypothetical example with the 5% hypothetical examples that appear in the shareholder reports of the other funds. Please note that the expenses shown in the table are meant to highlight your ongoing costs only. Therefore, the second line of the table under the “Investor Class” and “Institutional Class” headings is useful in comparing ongoing costs only and will not help you determine the relative total costs of owning different funds.
| | | | Expenses Paid |
| | Beginning | Ending | During Period(1) |
| | Account Value | Account Value | May 1, 2020 – |
| | May 1, 2020
| October 31, 2020 | October 31, 2020 |
| Investor Class | | | |
| Actual | $1,000.00 | $ 980.90 | $16.23 |
| Hypothetical (5% return before expenses) | $1,000.00 | $1,008.75 | $16.46 |
| | | | |
| Institutional Class | | | |
| Actual | $1,000.00 | $ 982.20 | $14.60 |
| Hypothetical (5% return before expenses) | $1,000.00 | $1,010.41 | $14.81 |
(1) | Expenses are equal to the Fund’s annualized expense ratio of 3.26% for Investor Class shares or 2.93% for Institutional Class shares, as applicable, multiplied by the average account value over the period, multiplied by 184/366 days (to reflect the half-year period). |
| HENNESSY FUNDS | 1-800-966-4354 | |
How to Obtain a Copy of the Fund’s Proxy
Voting Policy and Proxy Voting Records
A description of the policies and procedures the Fund uses to determine how to vote proxies relating to portfolio securities is available without charge (1) by calling 1-800-966-4354, (2) on the Hennessy Funds’ website at www.hennessyfunds.com/proxy-voting/voting-policy, or (3) on the U.S. Securities and Exchange Commission’s (the “SEC”) website at www.sec.gov. The Fund’s proxy voting record is available without charge on both the Hennessy Funds’ website at www.hennessyfunds.com/proxy-voting/voting-record and the SEC’s website at www.sec.gov no later than August 31 for the prior 12 months ending June 30.
Availability of Quarterly Portfolio Schedule
The Fund files a complete schedule of portfolio holdings with the SEC for the first and third quarters of each fiscal year as an exhibit to its reports on Form N-PORT. The Fund’s Form N-PORT reports are available on the SEC’s website at www.sec.gov or on request by calling 1-800-966-4354.
Federal Tax Distribution Information
(Unaudited)
For fiscal year 2020, certain dividends paid by the Fund may be subject to a maximum tax rate of 23.8%, as provided for by the Jobs and Growth Tax Relief Reconciliation Act of 2003. The percentage of dividends declared from ordinary income designated as qualified dividend income was 0.00%.
For corporate shareholders, the percent of ordinary income distributions that qualified for the corporate dividends received deduction for fiscal year 2020 was 0.00%.
The percentage of taxable ordinary income distributions that were designated as short-term capital gain distributions under Section 871(k)(2)(C) of the Internal Revenue Code of 1986, as amended, for the Fund was 0.00%.
Important Notice Regarding Delivery
of Shareholder Documents
To help keep the Fund’s costs as low as possible, we generally deliver a single copy of shareholder reports, proxy statements, and prospectuses to shareholders who share an address and have the same last name. This process does not apply to account statements. You may request an individual copy of a shareholder document at any time. If you would like to receive separate mailings of shareholder documents, please call U.S. Bank Global Fund Services at 1-800-261-6950 or 1-414-765-4124, and individual delivery will begin within 30 days of your request. If your account is held through a financial institution or other intermediary, please contact such intermediary directly to request individual delivery.
Electronic Delivery
The Fund offers shareholders the option to receive account statements, prospectuses, tax forms, and shareholder reports online. To sign up for eDelivery, please visit www.hennessyfunds.com/account. You may change your delivery preference at any time by visiting our website or calling U.S. Bank Global Fund Services at 1-800-261-6950 or 1-414-765-4124.
| PROXY VOTING — PRIVACY POLICY |
Liquidity Risk Management Program
In accordance with Rule 22e-4 under the Investment Company Act of 1940, as amended (the “Liquidity Rule”), we have adopted and implemented a liquidity risk management program (the “Liquidity Program”). The purpose of the Liquidity Program is to assess and manage the Fund’s liquidity risk, which is the risk that the Fund would not be able to meet requests to redeem Fund shares without significant dilution of the remaining shareholders’ interests in the Fund. The Board of Trustees of the Fund (the “Board”) designated a committee comprising representatives of Hennessy Advisors, Inc., the investment adviser to the Fund, as the administrator of the Liquidity Program (the “Program Administrator”).
The Program Administrator provided a written report regarding the Liquidity Program to the Board in advance of its meeting on June 3, 2020. The report covered the period from June 1, 2019, through May 31, 2020. The report addressed the operation of the Liquidity Program, assessed the adequacy and effectiveness of its implementation, and described any material changes to the Liquidity Program during the review period. The Trust’s chief compliance officer presented the report to the Board at the meeting and provided additional information regarding the Liquidity Program. The Board reviewed the Liquidity Program and considered, among other items, the following:
| | 1. | The Program Administrator reviewed daily historical net redemption activity during the review period and during prior periods with higher-than-average redemption activity and concluded that the Fund has historically been able to meet requests to redeem Fund shares without significant dilution to the Fund’s remaining shareholders, and the Program Administrator expects the Fund to be able to continue to do so in the future during both normal and reasonably foreseeable stressed conditions. |
| | | |
| | 2. | The Fund primarily holds assets that are highly liquid investments and is therefore not required to establish a highly liquid investment minimum for the Fund or adopt policies and procedures for responding to a highly liquid investment minimum shortfall. |
| | | |
| | 3. | The Program Administrator did not make any material changes to the Liquidity Program during the review period and was not recommending any changes to the Liquidity Program or the model inputs used to determine the liquidity classification of each security held by the Fund. |
| | | |
| | 4. | The Program Administrator concluded that the Liquidity Program was reasonably designed to assess and manage the Fund’s liquidity risk, complies with the requirements of the Liquidity Rule, and was effectively implemented, having operated as intended during the review period. |
Privacy Policy
We collect the following personal information about you:
| | 1. | Information we receive from you in applications or other forms, correspondence, or conversations, including, but not limited to, your name, address, phone number, social security number, assets, income, and date of birth; |
| | | |
| | 2. | Information about your transactions with us, our affiliates, or others, including, but not limited to, your account number and balance, payments history, parties to transactions, cost basis information, and other financial information; and |
| HENNESSY FUNDS | 1-800-966-4354 | |
| | 3. | Other personal information we collect from various sources, even if you have not entered into a prior transaction with us, including the following: |
| | • | Name, alias, address, unique personal identifier, online identifier, IP address, email address, telephone number, account name, and other similar identifiers; |
| | | |
| | • | Age and marital status; |
| | | |
| | • | Commercial information, including records of products purchased; |
| | | |
| | • | Browsing history, search history, and information on interaction with our website; |
| | | |
| | • | Geolocation data; |
| | | |
| | • | Employment and employment history, educational history, financial information, and purchasing and consuming histories or tendencies; and |
| | | |
| | • | Inferences drawn from the above-listed information to create a profile about your preferences, characteristics, predispositions, and behavior. |
We collect this information directly from you, indirectly in the course of providing services to you, directly and indirectly from your activity on our website, from broker dealers, marketing agencies, and other third parties that interact with us in connection with the services we perform and products we offer, and from anonymized and aggregated consumer information.
We use this information to fulfill the reason you provided the information to us, to provide you with other relevant products that you request from us, to provide you with information about products that may interest you, to improve our website or present our website’s contents to you, and as otherwise described to you when collecting your personal information.
We do not disclose any personal information to unaffiliated third parties, except as permitted by law. We may disclose your personal information to our affiliates, vendors, and service providers for a business purpose. For example, we are permitted by law to disclose all of the information we collect, as described above, to our transfer agent to process your transactions. When disclosing your personal information to third parties, we enter into a contract with each third party describing the purpose of such disclosure and requiring that such personal information be kept confidential and not used for any purpose except to perform the services contracted or respond to regulatory or law enforcement requests.
Furthermore, we restrict access to your personal information to those persons who require such information to provide products or services to you. As a result, we do not provide a means for opting out of our limited sharing of your information. We maintain physical, electronic, and procedural safeguards that comply with federal standards to guard your personal information.
If you hold shares of the Funds through a financial intermediary, including, but not limited to, a broker-dealer, bank, or trust company, the privacy policy of your financial intermediary governs how your personal information is shared with unaffiliated third parties.
Supplemental Privacy Notice for Residents of California
The California Consumer Privacy Act of 2018 (the “CCPA”) provides you, as a California resident, with certain additional rights relating to your personal information.
Under the CCPA, you have the right to request that we disclose to you the categories of personal information we have collected about you over the past 12 months, the categories of sources of such information, our business purpose for collecting the
information, the categories of third parties, if any, with whom we shared the information, and the specific information we have collected about you. You also have the right to request that we delete any of your personal information, and, unless an exception applies, we will delete such information upon receiving and confirming your request. To make a request, call us at 1-800-966-4354, email us at privacy@hennessyfunds.com, or go to www.hennessyfunds.com/contact. We will not discriminate against you for exercising your rights under the CCPA. Further, we will not collect additional categories of your personal information or use the personal information we collected for materially different, unrelated, or incompatible purposes without providing you notice.
| HENNESSY FUNDS | 1-800-966-4354 | |
For information, questions, or assistance, please call
The Hennessy Funds
1-800-966-4354 or 1-415-899-1555
INVESTMENT ADVISOR
Hennessy Advisors, Inc.
7250 Redwood Boulevard, Suite 200
Novato, California 94945
ADMINISTRATOR,
TRANSFER AGENT,
DIVIDEND PAYING AGENT, &
SHAREHOLDER SERVICING AGENT
U.S. Bancorp Fund Services, LLC
d/b/a U.S. Bank Global Fund Services
P.O. Box 701
Milwaukee, Wisconsin 53201-0701
CUSTODIAN
U.S. Bank N.A.
Custody Operations
1555 North River Center Drive, Suite 302
Milwaukee, Wisconsin 53212
TRUSTEES
Neil J. Hennessy
Robert T. Doyle
J. Dennis DeSousa
Gerald P. Richardson
COUNSEL
Foley & Lardner LLP
777 East Wisconsin Avenue
Milwaukee, Wisconsin 53202-5306
INDEPENDENT REGISTERED
PUBLIC ACCOUNTING FIRM
Tait, Weller & Baker LLP
Two Liberty Place
50 South 16th Street, Suite 2900
Philadelphia, Pennsylvania 19102-2529
DISTRIBUTOR
Quasar Distributors, LLC
111 East Kilbourn Avenue, Suite 2200
Milwaukee, Wisconsin 53202
www.hennessyfunds.com | 1-800-966-4354
This report has been prepared for shareholders and may be distributed to
others only if preceded or accompanied by a current prospectus.
ANNUAL REPORT
OCTOBER 31, 2020
HENNESSY BP MIDSTREAM FUND
Investor Class HMSFX
Institutional Class HMSIX
IMPORTANT NOTICE REGARDING ELECTRONIC DELIVERY OF SHAREHOLDER REPORTS
Beginning on January 1, 2021, as permitted by regulations adopted by the Securities and Exchange Commission, paper copies of the annual and semi-annual reports will no longer be sent by mail unless you specifically request paper copies from the Hennessy Funds or from your financial intermediary. Instead, the reports will be made available on a website, and you will be notified by mail each time a report is posted and provided with a website link to access the report.
If you have already elected to receive shareholder reports electronically, you will not be affected by this change and you need not take any action. You may elect to receive shareholder reports and other communications from the Hennessy Funds electronically by visiting www.hennessyfunds.com/account or by calling U.S. Bank Global Fund Services at 1-800-261-6950. If you own shares in a Fund through a financial intermediary, please contact your financial intermediary to make this election.
You may elect to receive paper copies of all future reports free of charge by calling U.S. Bank Global Fund Services at 1-800-261-6950 or, if you own your shares through a financial intermediary, by contacting your financial intermediary. Your election to receive paper copies of reports will apply to all Funds in the Hennessy Funds family.
www.hennessyfunds.com | 1-800-966-4354
(This Page Intentionally Left Blank.)
Contents
| Letter to Shareholders | | 2 |
| Performance Overview | | 4 |
| Financial Statements | | |
| Schedule of Investments | | 8 |
| Statement of Assets and Liabilities | | 11 |
| Statement of Operations | | 12 |
| Statements of Changes in Net Assets | | 13 |
| Financial Highlights | | 14 |
| Notes to the Financial Statements | | 18 |
| Report of Independent Registered Public Accounting Firm | | 28 |
| Trustees and Officers of the Fund | | 29 |
| Expense Example | | 32 |
| Proxy Voting Policy and Proxy Voting Records | | 34 |
| Availability of Quarterly Portfolio Schedule | | 34 |
| Federal Tax Distribution Information | | 34 |
| Important Notice Regarding Delivery of Shareholder Documents | | 34 |
| Electronic Delivery | | 34 |
| Liquidity Risk Management Program | | 35 |
| Privacy Policy | | 35 |
| HENNESSY FUNDS | 1-800-966-4354 | |
December 2020
Dear Hennessy Funds Shareholder:
As a new year and new decade dawned in January, no one could have imagined that the world would quickly plunge into one of the worst health crises in history. Throughout this pandemic, our thoughts have remained with those most deeply affected by COVID-19, and we thank our frontline healthcare and essential workers. At Hennessy Funds, we adapted quickly to the impact of COVID-19 to maintain business continuity. We focused on our employees and on you, the shareholders of the Hennessy Funds, and I am pleased that we have been able to navigate successfully during this unprecedented time.
The year was defined by a global pandemic and the ensuing economic shutdowns and by a highly charged presidential election that caused tremendous volatility. Yet the stock market has continued to show its resiliency and strength, as the major indices hit new all-time highs in November and again in December. For the 12 months ended October 31, 2020, U.S. equities posted positive performance, with the S&P 500® Index returning 9.71% and the Dow Jones Industrial Average returning 0.34% for the period. There were extreme differences in how various sectors performed during the period. For instance, the technology-focused NASDAQ Composite Index performed strongly, returning 32.84%, whereas the Energy sector (as represented by the S&P 500® Energy Sector Index) struggled with a loss of -46.43%. The Financials sector also performed relatively poorly during the period, with the Russell 1000® Index Financials losing -8.04% and the Russell 2000® Index Financials losing -17.87%. In addition, large cap stocks significantly outperformed small caps, and growth stocks reigned over value stocks during the period. Moreover, approximately half of the NASDAQ’s return for the period was comprised of just three behemoth technology stocks – Apple, Microsoft, and Amazon. Therefore, while the overall U.S. equities market improved, mutual fund returns varied drastically due to the disparate performance of specific sectors, differently sized companies, and different types of companies.
Optimism about the approval and distribution of effective COVID-19 vaccines appears to be buoying investor confidence. Low interest rates, and the expectation that they will remain low for the foreseeable future, have also provided a tailwind to equity prices. In my opinion, stocks are trading at reasonable valuations given this low interest rate environment, with the Dow Jones Industrial Average trading at 20.1x estimated earnings for 2021 and the S&P 500® Index trading at 21.6x estimated earnings for 2021. The U.S. economy looks to be on the road to recovery and is experiencing moderate inflation, and our banking industry appears healthy. The unemployment rate is dropping, albeit slowly, and I expect it to continue to improve once businesses reopen. There are high levels of cash on corporate balance sheets, which could support rising dividends and stock buybacks.
I believe our corporate business leaders will continue to adapt and find ways to drive growth and value for their shareholders, but I also feel that the uncertainty created by the continued health crisis and the stalemate over fiscal relief will lead to additional bouts of market volatility. I remain confident, however, that the markets can and will thrive in the long run.
Thank you for your continued trust and investment in the Hennessy Funds. We believe that there continue to be strong opportunities throughout many segments of the market, and we are focused on managing our high-conviction portfolios for the long-term
benefit of our shareholders. Should you have any questions or would like to speak with us directly, please reach out and call us at (800) 966-4354.
Best regards,
Neil J. Hennessy
President and Chief Investment Officer
Past performance does not guarantee future results.
Mutual fund investing involves risk. Principal loss is possible.
The Dow Jones Industrial Average and S&P 500® Index are commonly used to measure the performance of U.S. stocks. The NASDAQ Composite Index comprises all common stocks listed on The NASDAQ Stock Market and is commonly used to measure the performance of technology-related stocks. The S&P 500® Energy Sector Index is comprised of companies included in the S&P 500® Index that are classified in the Energy sector. The Russell 1000® Index Financials and Russell 2000® Index Financials are subsets of the Russell 1000® Index and Russell 2000® Index, respectively, that measure the performance of securities classified in the Financials sector of the large-cap and small-cap U.S. equity market, respectively. One cannot invest directly in an index. All returns are shown on a total return basis.
Forward price to earnings (PE) is a valuation measure calculated by dividing a company’s market price per share by its expected earnings per share over the following 12 months. PEs noted are sourced from Bloomberg as of December 9, 2020.
| HENNESSY FUNDS | 1-800-966-4354 | |
Performance Overview (Unaudited)
CHANGE IN VALUE OF $10,000 INVESTMENT
This graph illustrates the performance of an initial investment of $10,000 made in the Fund on its inception date and assumes the reinvestment of dividends.
AVERAGE ANNUAL TOTAL RETURN FOR PERIODS ENDED OCTOBER 31, 2020
| | One | Five | Since Inception |
| | Year
| Years
| (12/31/13)
|
| Hennessy BP Midstream Fund – | | | |
| Investor Class (HMSFX) | -42.13% | -12.53% | -11.00% |
| Hennessy BP Midstream Fund – | | | |
| Institutional Class (HMSIX) | -41.93% | -12.29% | -10.76% |
Alerian US Midstream Energy Index(1) | -37.09% | -8.67% | -8.02% |
S&P 500® Index | 9.71% | 11.71% | 10.93% |
Expense ratios:
| Gross 1.89%, Net 1.76%(2) (Investor Class); |
| Gross 1.56%, Net 1.51%(2) (Institutional Class) |
(1) | The Fund’s primary index has changed from the Alerian MLP Index to the Alerian US Midstream Energy Index, which better reflects the underlying holdings of the Fund. Each such index comprises energy infrastructure companies that earn a majority of their cash flows from midstream activities involving energy commodities. The Alerian US Midstream Energy Index includes a broad range of types of energy companies, and the Alerian MLP Index focuses solely on master limited partnerships. The average annual total returns of the Alerian MLP Index for the one-year, five-year, and since inception periods ended October 31, 2020, were -42.52%, -12.46%, and -12.24%, respectively. |
(2) | The Fund’s investment advisor has contractually agreed to limit expenses until February 28, 2021. |
Performance data quoted represents past performance; past performance does not guarantee future results. The investment return and principal value of an investment will fluctuate so that an investor’s shares, when redeemed, may be worth more or less than their original cost. The performance table does not reflect the deduction of taxes that a shareholder would pay on Fund distributions or the redemption of Fund shares. Current performance of the Fund may be lower or higher than the performance quoted. Performance data current to the most recent month end may be obtained by visiting www.hennessyfunds.com. Performance for periods including or prior to October 26, 2018, is that of the BP Capital TwinLine MLP Fund.
The Alerian US Midstream Energy Index and the Alerian MLP Index each comprise companies that earn a majority of their cash flows from midstream activities involving energy commodities. The S&P 500® Index is a capitalization-weighted index that is
designed to represent the broad domestic economy through changes in the aggregate market value of 500 stocks across all major industries. One cannot invest directly in an index. These indices are used herein for comparative purposes in accordance with Securities and Exchange Commission regulations.
Standard & Poor’s Financial Services is the source and owner of the S&P® and S&P 500® trademarks.
The Alerian MLP Index and the Alerian US Midstream Energy Index are servicemarks of GKD Index Partners, LLC d/b/a Alerian (“Alerian”), and their use is granted under a license from Alerian. Alerian makes no express or implied warranties, representations, or promises regarding the originality, merchantability, suitability, or fitness for a particular purpose or use with respect to the Alerian indices. No party may rely on, and Alerian does not accept any liability for any errors, omissions, interruptions, or defects in, the Alerian indices or underlying data. In no event shall Alerian have any liability for any direct, indirect, special, incidental, punitive, consequential, or other damages (including lost profits), even if notified of the possibility of such damages.
The expense ratios presented are from the most recent prospectus. The expense ratios for the current reporting period are available in the Financial Highlights section of this report.
PERFORMANCE NARRATIVE
Portfolio Managers Toby Loftin and Ben Cook, CFA
BP Capital Fund Advisors, LLC (sub-advisor)
Performance:
For the 12-month period ended October 31, 2020, the Investor Class of the Hennessy BP Midstream Fund returned -42.13%, in line with the performance of the Alerian MLP Index (the Fund’s previous primary benchmark), which returned -42.52%, but underperforming both the Alerian US Midstream Energy Index (the Fund's new primary benchmark) and the S&P 500® Index, which returned -37.09% and 9.71%, respectively, for the same period.
The onset of the global COVID-19 pandemic negatively and dramatically affected energy supply and demand fundamentals and absolute performance of traditional hydrocarbon-based energy equities, including midstream equities held by the Fund. The significant decline in upstream sector activity and corresponding weakness in U.S. lower 48 crude oil and natural gas production volumes weighed on operating company financial results for many midstream businesses.
Midstream equities that outperformed during this period included large, diversified companies with integrated value chains, contracted fee-based cash flows with strong counterparties, exposure to better positioned assets or basins, strong balance sheets, and adequate liquidity. In addition, natural gas-focused midstream companies (particularly in better positioned dry gas basins like the Marcellus shale) with long-term “take or pay” contracts, also generally performed better relative to the overall midstream group. Conversely, “supply-push,” commodity-sensitive, less diversified businesses with elevated financial leverage, such as those in the natural gas gathering and processing (G&P) subsector, performed worse relative to the overall group. G&P assets often represent greater risk given their dependence on drilling activity, which tends to track upstream capital spending, which in turn is influenced by commodity price direction. As a result, plummeting oil prices due to the COVID-19 outbreak hurt these companies. Dedicated crude oil pipeline systems also experienced lower throughput from significantly lower rig activity. While “demand pull” assets have historically fared well, the pandemic also
| HENNESSY FUNDS | 1-800-966-4354 | |
negatively impacted refined products systems and related equities, as they experienced lower throughput with lower motor gasoline demand and jet fuel demand, as examples.
As the impact of the COVID-19 pandemic became apparent, the Fund increased its exposure to “safe haven” diversified businesses as well as contracted, long-haul natural gas-focused midstream companies. New positions established during the period included TC Pipelines LP, Equitrans Midstream Corp., Enbridge Inc., and Holly Energy Partners LP. The Fund reduced its exposure to G&P equities and exited CNX Midstream Partners LP, Noble Midstream Partners LP, Western Midstream Partners LP, and Antero Midstream Corp. The Fund also exited Shell Midstream Partners LP and Phillips 66 Partners LP due to declining refined products demand (and regulatory risk in the case of Phillips 66 Partners LP). During the period, Tallgrass Energy LP was acquired and taken private.
Portfolio Strategy:
The Fund generally seeks to build a portfolio of midstream energy companies with the following characteristics: (i) large and strategically protected integrated businesses, linking economic basins to strong demand centers, (ii) contracted and visible cash flows with strong counterparties such as utilities or power consumers, and (iii) strong balance sheets. As the economic recovery unfolds, the Fund will likely continue to include “risked, quality beta” companies. We believe our industry experience and intensive, fundamental, “boots-on-the-ground” research process allows us to uncover potential equity mispricings that can meaningfully drive performance.
Investment Commentary:
We are optimistic about the investment return potential for midstream equities. Negative investor sentiment and the COVID-19 pandemic led to historically deep discounts on valuations, with outsized yields in a very low rate environment. Nonetheless, as midstream companies have worked to lower operating cost structures and optimize their businesses, many are now generating positive free cash flow after dividends and will be in position to further pay down debt, increase distributions or dividends, or potentially buy back stock. With greatly reduced capital expenditures and generally underutilized midstream assets, we also expect benefits related to operating leverage as system volumes improve. Additionally, we believe certain technical headwinds (such as MLP product fund outflows related to apparent tax loss selling and uncertainties related to the presidential election) have subsided. We expect the economy to continue to strengthen and benefit from businesses reopening, and as the impact of COVID-19 diminishes with treatments and expected vaccines, we believe these and other drivers should benefit energy fundamentals and equities.
_______________
Opinions expressed are those of the Portfolio Managers as of the date written and are subject to change, are not guaranteed, and should not be considered investment advice or an indication of trading intent.
The Fund is non-diversified, meaning it may concentrate its assets in fewer individual holdings than a diversified fund, making it more exposed to individual stock volatility than a diversified fund. The Fund invests in small-capitalization and medium-capitalization companies, which involves additional risks such as limited liquidity and greater volatility. Funds that concentrate in a single sector may be subject to a higher degree of risk. Energy-related companies are subject to specific risks, including fluctuations in commodity prices and consumer demand, substantial government regulation, and depletion of reserves. Investments in lower-rated and non-rated securities present a greater risk of loss to principal and interest than higher-rated securities. Use of derivatives can increase the volatility of the Fund.
MLPs and MLP investments have unique characteristics. The Fund does not receive the same tax benefits as a direct investment in an MLP.
The prices of MLP units may fluctuate abruptly and trading volume may be low, making it difficult for the Fund to sell its units at a favorable price. MLP general partners have the power to take actions that adversely affect the interests of unit holders. Most MLPs do not pay U.S. federal income tax at the partnership level, but an adverse change in tax laws could result in MLPs being treated as corporations for federal income tax purposes, which could reduce or eliminate distributions paid by MLPs to the Fund. The Fund is treated as a regular corporation, or “C” corporation, for U.S. federal income tax purposes, and therefore, is subject to U.S. federal income tax on its taxable income at the graduated rates applicable to corporations (currently a maximum rate of 21%), as well as state and local income taxes. The Fund will not benefit from current favorable federal income tax rates on long-term capital gains, and Fund income and losses will not be passed on to shareholders. The Fund accrues deferred income taxes for future tax liabilities associated with the portion of MLP distributions considered to be a tax-deferred return of capital and for any net operating gains as well as capital appreciation of its investments. This deferred tax liability is reflected in the daily net asset value of the Fund and as a result the Fund’s after-tax performance could differ significantly from the underlying assets even if the pre-tax performance is closely tracked. Please see the Fund’s prospectus for a more complete discussion of these and other risks.
References to specific securities should not be considered a recommendation to buy or sell any security. Fund holdings and sector allocations are subject to change. Please refer to the Schedule of Investments included in this report for additional portfolio information.
Free cash flow is a measure of financial performance calculated as operating cash flow minus capital expenditures.
| HENNESSY FUNDS | 1-800-966-4354 | |
Financial Statements
Schedule of Investments as of October 31, 2020 |
HENNESSY BP MIDSTREAM FUND
(% of Total Assets)
| TOP TEN HOLDINGS (EXCLUDING MONEY MARKET FUNDS) | % TOTAL ASSETS |
| Enterprise Products Partners LP | 13.04% |
| MPLX LP | 11.04% |
| Plains All American Pipeline LP | 10.42% |
| Energy Transfer LP | 9.46% |
| Targa Resources Corp. | 8.37% |
| The Williams Companies, Inc. | 7.56% |
| Magellan Midstream Partners LP | 7.41% |
| Equitrans Midstream Corp. | 6.88% |
| Kinder Morgan, Inc. | 6.85% |
| ONEOK, Inc. | 5.48% |
Note: The Fund concentrates its investments in the Energy industry. For presentation purposes, the Fund uses custom categories.
| COMMON STOCKS – 39.59% | | Number | | | | | | % of | |
| | | of Shares | | | Value | | | Net Assets | |
| Crude Oil & Refined Products – 4.29% | | | | | | | | | |
| Enbridge, Inc. (a) | | | 34,500 | | | $ | 950,820 | | | | 4.29 | % |
| | | | | | | | | | | | | |
| Gathering & Processing – 8.41% | | | | | | | | | | | | |
| Targa Resources Corp. | | | 116,000 | | | | 1,861,800 | | | | 8.41 | % |
| | | | | | | | | | | | | |
| Natural Gas/NGL Transportation – 26.89% | | | | | | | | | | | | |
| Equitrans Midstream Corp. | | | 210,800 | | | | 1,530,408 | | | | 6.91 | % |
| Kinder Morgan, Inc. | | | 128,090 | | | | 1,524,271 | | | | 6.88 | % |
| ONEOK, Inc. | | | 42,026 | | | | 1,218,754 | | | | 5.50 | % |
| The Williams Companies, Inc. | | | 87,652 | | | | 1,682,042 | | | | 7.60 | % |
| | | | | | | | 5,955,475 | | | | 26.89 | % |
| Total Common Stocks | | | | | | | | | | | | |
| (Cost $10,568,053) | | | | | | | 8,768,095 | | | | 39.59 | % |
| | | | | | | | | | | | | |
| PARTNERSHIPS & TRUSTS – 57.72% | | | | | | | | | | | | |
| | | | | | | | | | | | | |
| Crude Oil & Refined Products – 31.99% | | | | | | | | | | | | |
| Holly Energy Partners LP | | | 57,700 | | | | 661,242 | | | | 2.98 | % |
| Magellan Midstream Partners LP | | | 46,400 | | | | 1,649,056 | | | | 7.45 | % |
| MPLX LP | | | 142,749 | | | | 2,456,710 | | | | 11.09 | % |
| Plains All American Pipeline LP | | | 371,026 | | | | 2,318,912 | | | | 10.47 | % |
| | | | | | | | 7,085,920 | | | | 31.99 | % |
| | | | | | | | | | | | | |
| Natural Gas/NGL Transportation – 25.73% | | | | | | | | | | | | |
| Energy Transfer LP | | | 408,700 | | | | 2,104,805 | | | | 9.51 | % |
| Enterprise Products Partners LP | | | 175,100 | | | | 2,901,407 | | | | 13.10 | % |
| TC PipeLines LP | | | 24,560 | | | | 691,364 | | | | 3.12 | % |
| | | | | | | | 5,697,576 | | | | 25.73 | % |
| Total Partnerships & Trusts | | | | | | | | | | | | |
| (Cost $17,611,059) | | | | | | | 12,783,496 | | | | 57.72 | % |
The accompanying notes are an integral part of these financial statements.
| HENNESSY FUNDS | 1-800-966-4354 | |
| SHORT-TERM INVESTMENTS – 1.88% | | Number | | | | | | % of | |
| | | of Shares | | | Value | | | Net Assets | |
| Money Market Funds – 1.88% | | | | | | | | | |
| First American Government Obligations Fund, | | | | | | | | | |
| Institutional Class, 0.05% (b) | | | 415,919 | | | $ | 415,919 | | | | 1.88 | % |
| | | | | | | | | | | | | |
| Total Short-Term Investments | | | | | | | | | �� | | | |
| (Cost $415,919) | | | | | | | 415,919 | | | | 1.88 | % |
| | | | | | | | | | | | | |
| Total Investments | | | | | | | | | | | | |
| (Cost $28,595,031) – 99.19% | | | | | | | 21,967,510 | | | | 99.19 | % |
| Other Assets in Excess of Liabilities – 0.81% | | | | | | | 178,773 | | | | 0.81 | % |
| | | | | | | | | | | | | |
TOTAL NET ASSETS – 100.00% | | | | | | $ | 22,146,283 | | | | 100.00 | % |
Percentages are stated as a percent of net assets.
| (a) | U.S.-traded security of a foreign corporation. |
| (b) | The rate listed is the fund’s seven-day yield as of October 31, 2020. |
Summary of Fair Value Exposure as of October 31, 2020
The following is a summary of the inputs used to value the Fund’s net assets as of October 31, 2020 (see Note 3 in the accompanying Notes to the Financial Statements):
| Common Stocks | | Level 1 | | | Level 2 | | | Level 3 | | | Total | |
| Crude Oil & Refined Products | | $ | 950,820 | | | $ | — | | | $ | — | | | $ | 950,820 | |
| Gathering & Processing | | | 1,861,800 | | | | — | | | | — | | | | 1,861,800 | |
| Natural Gas/NGL Transportation | | | 5,955,475 | | | | — | | | | — | | | | 5,955,475 | |
| Total Common Stocks | | $ | 8,768,095 | | | $ | — | | | $ | — | | | $ | 8,768,095 | |
| Partnerships & Trusts | | | | | | | | | | | | | | | | |
| Crude Oil & Refined Products | | $ | 7,085,920 | | | $ | — | | | $ | — | | | $ | 7,085,920 | |
| Natural Gas/NGL Transportation | | | 5,697,576 | | | | — | | | | — | | | | 5,697,576 | |
| Total Partnerships & Trusts | | $ | 12,783,496 | | | $ | — | | | $ | — | | | $ | 12,783,496 | |
| Short-Term Investments | | | | | | | | | | | | | | | | |
| Money Market Funds | | $ | 415,919 | | | $ | — | | | $ | — | | | $ | 415,919 | |
| Total Short-Term Investments | | $ | 415,919 | | | $ | — | | | $ | — | | | $ | 415,919 | |
| Total Investments | | $ | 21,967,510 | | | $ | — | | | $ | — | | | $ | 21,967,510 | |
The accompanying notes are an integral part of these financial statements.
| SCHEDULE OF INVESTMENTS/STATEMENT OF ASSETS AND LIABILITIES |
Financial Statements
Statement of Assets and Liabilities as of October 31, 2020 |
| ASSETS: | | | |
| Investments in securities, at value (cost $28,595,031) | | $ | 21,967,510 | |
| Dividends and interest receivable | | | 46 | |
| Receivable for fund shares sold | | | 6,563 | |
| Return of capital receivable | | | 265,381 | |
| Deferred income tax | | | — | |
| Prepaid expenses and other assets | | | 6,498 | |
| Total assets | | | 22,245,998 | |
| | | | | |
| LIABILITIES: | | | | |
| Payable for fund shares redeemed | | | 7,626 | |
| Payable to advisor | | | 18,907 | |
| Payable to auditor | | | 40,994 | |
| Accrued distribution fees | | | 1,423 | |
| Accrued service fees | | | 400 | |
| Accrued trustees fees | | | 3,938 | |
| Accrued expenses and other payables | | | 26,427 | |
| Total liabilities | | | 99,715 | |
| NET ASSETS | | $ | 22,146,283 | |
| | | | | |
| NET ASSETS CONSISTS OF: | | | | |
| Capital stock | | $ | 54,566,092 | |
| Accumulated deficit | | | (32,419,809 | ) |
| Total net assets | | $ | 22,146,283 | |
| | | | | |
| NET ASSETS: | | | | |
| Investor Class | | | | |
| Shares authorized (no par value) | | Unlimited | |
| Net assets applicable to outstanding shares | | $ | 3,811,775 | |
| Shares issued and outstanding | | | 686,298 | |
| Net asset value, offering price, and redemption price per share | | $ | 5.55 | |
| | | | | |
| Institutional Class | | | | |
| Shares authorized (no par value) | | Unlimited | |
| Net assets applicable to outstanding shares | | $ | 18,334,508 | |
| Shares issued and outstanding | | | 3,229,707 | |
| Net asset value, offering price, and redemption price per share | | $ | 5.68 | |
The accompanying notes are an integral part of these financial statements.
| HENNESSY FUNDS | 1-800-966-4354 | |
Financial Statements
Statement of Operations for the year ended October 31, 2020 |
| INVESTMENT INCOME: | | | |
| Distributions received from master limited partnerships | | $ | 2,387,176 | |
| Return of capital on distributions received | | | (2,387,176 | ) |
Dividend income(1) | | | 90,195 | |
| Interest income | | | 1,256 | |
| Total investment income | | | 91,451 | |
| | | | | |
| EXPENSES: | | | | |
| Investment advisory fees (See Note 5) | | | 344,842 | |
| Administration, accounting, custody, and transfer agent fees (See Note 5) | | | 45,264 | |
| Audit fees | | | 40,993 | |
| Federal and state registration fees | | | 35,043 | |
| Sub-transfer agent expenses – Investor Class (See Note 5) | | | 12,103 | |
| Sub-transfer agent expenses – Institutional Class (See Note 5) | | | 22,891 | |
| Compliance expense (See Note 5) | | | 27,353 | |
| Trustees’ fees and expenses | | | 13,710 | |
| Distribution fees – Investor Class (See Note 5) | | | 10,330 | |
| Reports to shareholders | | | 8,895 | |
| Service fees – Investor Class (See Note 5) | | | 6,887 | |
| Interest expense (See Note 7) | | | 2,911 | |
| Legal fees | | | 826 | |
| Other expenses | | | 11,951 | |
| Income tax expense | | | — | |
| Total expenses before waivers and reimbursements | | | 583,999 | |
| Service provider expense waiver (See Note 5) | | | (10,552 | ) |
| Expense reimbursement by advisor – Investor Class (See Note 5) | | | (22,658 | ) |
| Expense reimbursement by advisor – Institutional Class (See Note 5) | | | (60,422 | ) |
| Net expenses | | | 490,367 | |
| NET INVESTMENT LOSS | | $ | (398,916 | ) |
| | | | | |
| REALIZED AND UNREALIZED GAINS (LOSSES): | | | | |
| Net realized loss on investments | | $ | (7,697,287 | ) |
| Net change in unrealized appreciation/depreciation on investments | | | (5,793,719 | ) |
| Income tax expense | | | — | |
| Net loss on investments | | | (13,491,006 | ) |
| NET DECREASE IN NET ASSETS RESULTING FROM OPERATIONS | | $ | (13,889,922 | ) |
(1) | Net of foreign taxes withheld of $3,162. |
The accompanying notes are an integral part of these financial statements.
| STATEMENT OF OPERATIONS/STATEMENTS OF CHANGES IN NET ASSETS |
Financial Statements
| Statements of Changes in Net Assets |
| | | Year Ended | | | Year Ended | |
| | | October 31, 2020 | | | October 31, 2019 | |
| OPERATIONS: | | | | | | |
| Net investment loss | | $ | (398,916 | ) | | $ | (416,883 | ) |
| Net realized loss on investments | | | (7,697,287 | ) | | | (7,333,710 | ) |
| Net change in unrealized | | | | | | | | |
| appreciation/deprecation on investments | | | (5,793,719 | ) | | | 4,667,798 | |
| Net decrease in net assets resulting from operations | | | (13,889,922 | ) | | | (3,082,795 | ) |
| | | | | | | | | |
| DISTRIBUTIONS TO SHAREHOLDERS FROM: | | | | | | | | |
| Return of capital – Investor Class | | | (901,142 | ) | | | (1,434,045 | ) |
| Return of capital – Institutional Class | | | (3,075,804 | ) | | | (3,424,486 | ) |
| Total distributions | | | (3,976,946 | ) | | | (4,858,531 | ) |
| | | | | | | | | |
| CAPITAL SHARE TRANSACTIONS: | | | | | | | | |
| Proceeds from shares subscribed – Investor Class | | | 1,902,264 | | | | 4,058,933 | |
| Proceeds from shares subscribed – Institutional Class | | | 9,560,813 | | | | 12,131,475 | |
| Dividends reinvested – Investor Class | | | 876,530 | | | | 1,406,032 | |
| Dividends reinvested – Institutional Class | | | 2,999,051 | | | | 3,358,312 | |
| Cost of shares redeemed – Investor Class | | | (3,867,332 | ) | | | (14,125,321 | ) |
| Cost of shares redeemed – Institutional Class | | | (12,434,812 | ) | | | (39,908,798 | ) |
| Net decrease in net assets derived | | | | | | | | |
| from capital share transactions | | | (963,486 | ) | | | (33,079,367 | ) |
| TOTAL DECREASE IN NET ASSETS | | | (18,830,354 | ) | | | (41,020,693 | ) |
| | | | | | | | | |
| NET ASSETS: | | | | | | | | |
| Beginning of year | | | 40,976,637 | | | | 81,997,330 | |
| End of year | | $ | 22,146,283 | | | $ | 40,976,637 | |
| | | | | | | | | |
| CHANGES IN SHARES OUTSTANDING: | | | | | | | | |
| Shares sold – Investor Class | | | 312,671 | | | | 324,948 | |
| Shares sold – Institutional Class | | | 1,568,094 | | | | 1,014,731 | |
| Shares issued to holders as reinvestment | | | | | | | | |
| of dividends – Investor Class | | | 112,216 | | | | 116,121 | |
| Shares issued to holders as reinvestment | | | | | | | | |
| of dividends – Institutional Class | | | 380,829 | | | | 273,922 | |
| Shares redeemed – Investor Class | | | (582,063 | ) | | | (1,182,757 | ) |
| Shares redeemed – Institutional Class | | | (1,585,605 | ) | | | (3,247,364 | ) |
| Net increase (decrease) in shares outstanding | | | 206,142 | | | | (2,700,399 | ) |
The accompanying notes are an integral part of these financial statements.
| HENNESSY FUNDS | 1-800-966-4354 | |
Financial Statements
For an Investor Class share outstanding throughout each period
PER SHARE DATA:
Net asset value, beginning of period
Income from investment operations:
Net investment loss(2)(3)
Net realized and unrealized gains (losses) on investments
Total from investment operations
Less distributions:
Dividends from return of capital
Total distributions
Net asset value, end of period
TOTAL RETURN
SUPPLEMENTAL DATA AND RATIOS:
Net assets, end of period (millions)
Ratio of expenses to average net assets:
Before expense reimbursement
After expense reimbursement
Ratio of net investment loss to average net assets:
Before expense reimbursement(3)
After expense reimbursement(3)
Portfolio turnover rate(7)
(1) | The period ended October 31, 2018, consists of 11 months due to the Fund’s fiscal year end change from November 30 to October 31, effective October 26, 2018. |
(2) | Calculated using the average shares outstanding method. |
(3) | Includes current and deferred tax benefit/expense from net investment income/loss only. |
(4) | Not annualized. |
(5) | Annualized. |
(6) | Includes an estimated deferred tax expense/benefit of -1.32%. See Note 2.b in the Notes to the Financial Statements. |
(7) | Calculated on the basis of the Fund as a whole. |
The accompanying notes are an integral part of these financial statements.
| FINANCIAL HIGHLIGHTS — INVESTOR CLASS |
| Year Ended | | | Period Ended | | | | | | | | | | |
| October 31, | | | October 31, | | | Year Ended November 30, | |
| 2020 | | | 2019 | | | 2018(1) | | | 2017 | | | 2016 | | | 2015 | |
| | | | | | | | | | | | | | | | | |
| $ | 10.90 | | | $ | 12.66 | | | $ | 14.51 | | | $ | 16.54 | | | $ | 15.45 | | | $ | 22.25 | |
| | | | | | | | | | | | | | | | | | | | | | | |
| | | | | | | | | | | | | | | | | | | | | | | |
| | (0.10 | ) | | | (0.10 | ) | | | (0.16 | ) | | | (0.22 | ) | | | (0.17 | ) | | | (0.20 | ) |
| | (4.22 | ) | | | (0.63 | ) | | | (0.66 | ) | | | (0.78 | ) | | | 2.29 | | | | (5.60 | ) |
| | (4.32 | ) | | | (0.73 | ) | | | (0.82 | ) | | | (1.00 | ) | | | 2.12 | | | | (5.80 | ) |
| | | | | | | | | | | | | | | | | | | | | | | |
| | | | | | | | | | | | | | | | | | | | | | | |
| | (1.03 | ) | | | (1.03 | ) | | | (1.03 | ) | | | (1.03 | ) | | | (1.03 | ) | | | (1.00 | ) |
| | (1.03 | ) | | | (1.03 | ) | | | (1.03 | ) | | | (1.03 | ) | | | (1.03 | ) | | | (1.00 | ) |
| $ | 5.55 | | | $ | 10.90 | | | $ | 12.66 | | | $ | 14.51 | | | $ | 16.54 | | | $ | 15.45 | |
| | | | | | | | | | | | | | | | | | | | | | | |
| | -42.13 | % | | | -6.28 | % | | | -6.15 | %(4) | | | -6.49 | % | | | 14.78 | % | | | -27.17 | % |
| | | | | | | | | | | | | | | | | | | | | | | |
| | | | | | | | | | | | | | | | | | | | | | | |
| $ | 3.81 | | | $ | 9.20 | | | $ | 20.07 | | | $ | 16.86 | | | $ | 13.43 | | | $ | 8.76 | |
| | | | | | | | | | | | | | | | | | | | | | | |
| | 2.12 | % | | | 1.89 | % | | | 1.86 | %(5) | | | 1.91 | % | | | 2.21 | % | | | 1.38 | %(6) |
| | 1.76 | % | | | 1.76 | % | | | 1.78 | %(5) | | | 1.77 | % | | | 1.74 | % | | | 0.42 | %(6) |
| | | | | | | | | | | | | | | | | | | | | | | |
| | (1.63 | )% | | | (0.92 | )% | | | (1.34 | )%(5) | | | (1.50 | )% | | | (1.60 | )% | | | (1.97 | )% |
| | (1.27 | )% | | | (0.79 | )% | | | (1.26 | )%(5) | | | (1.36 | )% | | | (1.13 | )% | | | (1.01 | )% |
| | 53 | % | | | 41 | % | | | 64 | %(4) | | | 63 | % | | | 139 | % | | | 96 | % |
The accompanying notes are an integral part of these financial statements.
| HENNESSY FUNDS | 1-800-966-4354 | |
Financial Statements
For an Institutional Class share outstanding throughout each period
PER SHARE DATA:
Net asset value, beginning of period
Income from investment operations:
Net investment loss(2)(3)
Net realized and unrealized gains (losses) on investments
Total from investment operations
Less distributions:
Dividends from return of capital
Total distributions
Net asset value, end of period
TOTAL RETURN
SUPPLEMENTAL DATA AND RATIOS:
Net assets, end of period (millions)
Ratio of expenses to average net assets:
Before expense reimbursement
After expense reimbursement
Ratio of net investment loss to average net assets:
Before expense reimbursement(3)
After expense reimbursement(3)
Portfolio turnover rate(7)
(1) | The period ended October 31, 2018, consists of 11 months due to the Fund’s fiscal year end change from November 30 to October 31, effective October 26, 2018. |
(2) | Calculated using the average shares outstanding method. |
(3) | Includes current and deferred tax benefit/expense from net investment income/loss only. |
(4) | Not annualized. |
(5) | Annualized. |
(6) | Includes an estimated deferred tax expense/benefit of -1.32%. See Note 2.b in the Notes to the Financial Statements. |
(7) | Calculated on the basis of the Fund as a whole. |
The accompanying notes are an integral part of these financial statements.
| FINANCIAL HIGHLIGHTS — INSTITUTIONAL CLASS |
| Year Ended | | | Period Ended | | | | | | | | | | |
| October 31, | | | October 31, | | | Year Ended November 30, | |
| 2020 | | | 2019 | | | 2018(1) | | | 2017 | | | 2016 | | | 2015 | |
| | | | | | | | | | | | | | | | | |
| $ | 11.09 | | | $ | 12.83 | | | $ | 14.66 | | | $ | 16.66 | | | $ | 15.53 | | | $ | 22.28 | |
| | | | | | | | | | | | | | | | | | | | | | | |
| | | | | | | | | | | | | | | | | | | | | | | |
| | (0.10 | ) | | | (0.09 | ) | | | (0.14 | ) | | | (0.18 | ) | | | (0.12 | ) | | | (0.14 | ) |
| | (4.28 | ) | | | (0.62 | ) | | | (0.66 | ) | | | (0.79 | ) | | | 2.28 | | | | (5.61 | ) |
| | (4.38 | ) | | | (0.71 | ) | | | (0.80 | ) | | | (0.97 | ) | | | 2.16 | | | | (5.75 | ) |
| | | | | | | | | | | | | | | | | | | | | | | |
| | | | | | | | | | | | | | | | | | | | | | | |
| | (1.03 | ) | | | (1.03 | ) | | | (1.03 | ) | | | (1.03 | ) | | | (1.03 | ) | | | (1.00 | ) |
| | (1.03 | ) | | | (1.03 | ) | | | (1.03 | ) | | | (1.03 | ) | | | (1.03 | ) | | | (1.00 | ) |
| $ | 5.68 | | | $ | 11.09 | | | $ | 12.83 | | | $ | 14.66 | | | $ | 16.66 | | | $ | 15.53 | |
| | | | | | | | | | | | | | | | | | | | | | | |
| | -41.93 | % | | | -6.10 | % | | | -5.94 | %(4) | | | -6.25 | % | | | 14.97 | % | | | -26.90 | % |
| | | | | | | | | | | | | | | | | | | | | | | |
| | | | | | | | | | | | | | | | | | | | | | | |
| $ | 18.33 | | | $ | 31.78 | | | $ | 61.92 | | | $ | 82.59 | | | $ | 33.22 | | | $ | 15.72 | |
| | | | | | | | | | | | | | | | | | | | | | | |
| | 1.79 | % | | | 1.56 | % | | | 1.58 | %(5) | | | 1.66 | % | | | 1.95 | % | | | 1.10 | %(6) |
| | 1.51 | % | | | 1.51 | % | | | 1.52 | %(5) | | | 1.52 | % | | | 1.48 | % | | | 0.18 | %(6) |
| | | | | | | | | | | | | | | | | | | | | | | |
| | (1.55 | )% | | | (0.76 | )% | | | (1.15 | )%(5) | | | (1.28 | )% | | | (1.28 | )% | | | (1.63 | )% |
| | (1.27 | )% | | | (0.71 | )% | | | (1.09 | )%(5) | | | (1.14 | )% | | | (0.81 | )% | | | (0.71 | )% |
| | 53 | % | | | 41 | % | | | 64 | %(4) | | | 63 | % | | | 139 | % | | | 96 | % |
The accompanying notes are an integral part of these financial statements.
| HENNESSY FUNDS | 1-800-966-4354 | |
Financial Statements
Notes to the Financial Statements October 31, 2020 |
1). ORGANIZATION
The Hennessy BP Midstream Fund (the “Fund”) is a series of Hennessy Funds Trust (the “Trust”), which was organized as a Delaware statutory trust on September 17, 1992. The Fund is an open-end management investment company registered under the Investment Company Act of 1940, as amended. The investment objective of the Fund is to seek capital appreciation through distribution growth along with current income. The Fund is treated as a regular corporation, or “C” corporation, for U.S. federal income tax purposes. Because the Fund is treated as a “C” corporation, it will not be taxed as a regulated investment company under Subchapter M of the Code and is not required to comply with the diversification requirements applicable to regulated investment companies. The Fund is a non-diversified fund.
The Fund offers Investor Class and Institutional Class shares. Each class of shares differs principally in its respective 12b-1 distribution and service, shareholder servicing, and sub-transfer agent expenses. There are no sales charges. Each class has identical rights to earnings, assets, and voting privileges, except for class-specific expenses and exclusive rights to vote on matters affecting only one class.
As an investment company, the Fund follows the investment company accounting and reporting guidance of the Financial Accounting Standards Board (“FASB”) Accounting Standard Codification Topic 946 “Financial Services—Investment Companies.”
2). SIGNIFICANT ACCOUNTING POLICIES
The following is a summary of significant accounting policies consistently followed by the Fund in the preparation of the financial statements. These policies conform to U.S. generally accepted accounting principles (“GAAP”).
| a). | Securities Valuation – All investments in securities are valued in accordance with the Fund’s valuation policies and procedures, as described in Note 3. |
| | |
| b). | Federal Income Taxes – The Fund is taxed as a corporation and is obligated to pay U.S. federal and state income tax on its taxable income. Currently, the maximum marginal regular federal income tax rate for a corporation is 21%. The Fund invests a substantial portion of its assets in master limited partnerships (“MLPs”), which are treated as partnerships for federal income tax purposes. As a limited partner in MLPs, the Fund reports its allocable share of each MLP’s taxable income in computing its own taxable income. |
| | |
| | In calculating the Fund’s daily net asset value, the Fund will account for its deferred tax asset and liability balances. In accordance with GAAP, the Fund will accrue a deferred income tax liability balance for its future tax liability associated with the capital appreciation of its investments and the distributions received by the Fund on equity securities of MLPs considered to be return of capital and for any net operating gains. This accrual will be based on the current effective federal income tax rate plus an estimated state income tax rate. |
| | |
| | Deferred income taxes reflect the net tax effect of temporary differences between the carrying amount of assets and liabilities for financial reporting and tax purposes. A valuation allowance is recognized if, based on the weight of available evidence, it is more likely than not that at least some portion of a deferred income tax asset will not |
| NOTES TO THE FINANCIAL STATEMENTS |
| | be realized. From time to time as new information becomes available, the Fund will modify its estimates or assumption regarding the deferred tax liabilities or assets. As of October 31, 2020, the Fund has placed a full valuation allowance on its deferred tax assets. |
| | |
| c). | Accounting for Uncertainty in Income Taxes – The Fund has accounting policies regarding recognition and measurement of tax positions taken or expected to be taken on a tax return. The tax returns of the Fund for the prior three fiscal years are open for examination. The Fund has reviewed all open tax years in major jurisdictions and concluded that there is no impact on the Fund’s net assets and no tax liability resulting from unrecognized tax benefits relating to uncertain income tax positions taken or expected to be taken on a tax return. The Fund files U.S. federal income tax returns and income tax returns in various states. |
| | |
| d). | Income and Expenses – Dividend income is recognized on the ex-dividend date or as soon as information is available to the Fund. Interest income, which includes the amortization of premium and accretion of discount, is recognized on an accrual basis. Market discounts, original issue discounts, and market premiums on debt securities are accreted or amortized to interest income over the life of a security with a corresponding increase or decrease, as applicable, in the cost basis of such security using the yield to maturity method, or where applicable, the first call date of the security. Other non-cash dividends are recognized as investment income at the fair value of the property received. The Fund is charged for those expenses that are directly attributable to its portfolio, such as advisory, administration, and certain shareholder service fees. Income, expenses (other than expenses attributable to a specific class), and realized and unrealized gains/losses on investments are allocated to each class of shares based on such class’s net assets. Distributions received from the Fund’s investments in MLPs generally consist of ordinary income, capital gains, and return of capital. The Fund records investment income on the ex-date of the distributions. For financial statement purposes, the Fund uses return of capital and income estimates to allocate the dividend income received. Such estimates are based on historical information available from the MLPs and other industry sources. These estimates may subsequently be revised based on information received from the MLPs after their tax reporting periods are concluded, as the actual character of these distributions is not known until after the fiscal year end of the Fund. |
| | |
| e). | Distributions to Shareholders – The Fund typically makes cash distributions to its shareholders quarterly at the beginning of the months of March, June, September, and December. Due to the tax treatment of the Fund’s allocations and distributions from MLPs, a significant portion of the Fund’s distributions to shareholders typically is treated as return of capital to shareholders for U.S. federal income tax purposes (i.e., as distributions in excess of the Fund’s current and accumulated earnings and profits as described below). However, no assurance can be given in this regard; just as the Fund’s corporate income tax liability can fluctuate materially from year to year, the extent to which the Fund is able to make return-of-capital distributions also can vary materially from year to year depending on a number of different factors, including the composition of the Fund’s portfolio, the level of allocations of net income and other tax items for the Fund from its underlying MLP investments during a particular taxable year, the length of time the Fund has owned the MLP equity securities in its portfolio, and the extent to which the Fund disposes of MLP equity securities during a particular year, including, if necessary, to meet Fund shareholder redemption requests. |
| HENNESSY FUNDS | 1-800-966-4354 | |
| | In general, a distribution will constitute a return of capital to a shareholder rather than a dividend to the extent such distribution exceeds the Fund’s current and accumulated earnings and profits. The portion of any distribution treated as a return of capital will constitute a tax-free return of capital to the extent of the shareholder’s cost basis in its Fund shares and thereafter generally will be taxable to the shareholder as a capital gain. Any such distribution, in turn, will result in a reduction in a shareholder’s cost basis in the Fund’s shares (but not below zero) to the extent of the return of capital and in the shareholder’s recognizing more gain or less loss (that is, increase of a shareholder’s tax liability) when the shareholder later sells shares of the Fund. To maintain a more stable distribution rate, the Fund may distribute less or more than the entire amount of cash it receives from its investments in a particular period. Any undistributed cash would be available to supplement future distributions, and until distributed would add to the Fund’s net asset value. Correspondingly, such amounts, once distributed, will be deducted from the Fund’s net asset value. In addition, the Fund may opt not to make distributions in quarters in which the Fund believes that a distribution could cause adverse tax consequences to shareholders, including when the Fund believes that a distribution may not constitute a tax-free return of capital as described above. |
| | |
| f). | Security Transactions – Investment and shareholder transactions are recorded on the trade date. The Fund determines the realized gain/loss from an investment transaction by comparing the original cost of the security lot sold with the net sale proceeds. Discounts and premiums on securities purchased are accreted or amortized, respectively, over the life of each such security. |
| | |
| g). | Use of Estimates – The preparation of financial statements in conformity with GAAP requires management to make estimates and assumptions that affect the reported amounts of assets and liabilities and disclosure of contingent assets and liabilities at the date of the financial statements and the reported change in net assets during the reporting period. Actual results could differ from those estimates. |
| | |
| h). | Share Valuation – The net asset value (“NAV”) per share of the Fund is calculated by dividing (i) the total value of the securities held by the Fund, plus cash and other assets, minus all liabilities (including estimated accrued expenses) by (ii) the total number of shares outstanding for the Fund, rounded to the nearest $0.01. The Fund’s shares will not be priced on days the New York Stock Exchange is closed for trading. The offering and redemption price per share for the Fund is equal to the Fund’s NAV per share. |
| | |
| i). | Partnership Accounting Policy – To the extent the Fund receives distributions from underlying partnerships in which it invests, the Fund records its pro rata share of income/loss and capital gains/losses and accordingly adjusts the cost basis of the underlying partnerships for return of capital. |
| | |
| j). | New Accounting Pronouncements – In August 2018, the FASB issued Accounting Standards Update No. 2018-13 “Disclosure Framework—Changes to the Disclosure Requirements for Fair Value Measurement” (“ASU 2018-13”). ASU 2018-13 eliminates the requirement to disclose the amount of and reasons for transfers between Level 1 and Level 2 of the fair value hierarchy, the timing of transfers between levels of the fair value hierarchy, and the valuation processes for Level 3 fair value measurements. ASU 2018-13 does not eliminate the requirement to disclose the range and weighted average used to develop significant unobservable inputs for Level 3 fair value measurements, and the changes in unrealized gains and losses for recurring Level 3 fair value measurements. ASU 2018-13 requires that information is provided about the measurement uncertainty of Level 3 fair value measurements as of the reporting date. The guidance is effective for fiscal years beginning after December 15, 2019, and |
| NOTES TO THE FINANCIAL STATEMENTS |
| | interim periods within those fiscal years. Management evaluated the impact of this change in guidance and, due to the permissibility of early adoption, modified the Fund’s fair value disclosures beginning with its fiscal year 2019. |
3). SECURITIES VALUATION
The Fund follows its valuation policies and procedures in determining its net asset value and, in preparing these financial statements, the fair value accounting standards that establish an authoritative definition of fair value and set out a hierarchy for measuring fair value. These standards require additional disclosures about the various inputs and valuation techniques used to develop the measurements of fair value and a discussion of changes in valuation techniques and related inputs during the period. These inputs are summarized in the three broad levels listed below:
| | Level 1 – | Unadjusted, quoted prices in active markets for identical instruments that the Fund has the ability to access at the date of measurement. |
| | | |
| | Level 2 – | Other significant observable inputs (including, but not limited to, quoted prices in active markets for similar instruments, quoted prices in markets that are not active for identical or similar instruments, and model-derived valuations in which all significant inputs and significant value drivers are observable in active markets, such as interest rates, prepayment speeds, credit risk curves, default rates, and similar data). |
| | | |
| | Level 3 – | Significant unobservable inputs (including the Fund’s own assumptions about what market participants would use to price the asset or liability based on the best available information) when observable inputs are unavailable. |
The following is a description of the valuation techniques applied to the Fund’s major categories of assets and liabilities on a recurring basis:
| | Equity Securities – Equity securities, including common stocks, preferred stocks, foreign-issued common stocks, exchange-traded funds, closed-end mutual funds, partnerships, rights, MLPs, and real estate investment trusts, that are traded on a securities exchange for which a last-quoted sales price is readily available will generally be valued at the last sales price as reported by the primary exchange on which the securities are listed. Securities listed on The NASDAQ Stock Market (“NASDAQ”) will generally be valued at the NASDAQ Official Closing Price, which may differ from the last sales price reported. Securities traded on a securities exchange for which a last-quoted sales price is not readily available will generally be valued at the mean between the bid and ask prices. To the extent these securities are actively traded and valuation adjustments are not applied, they are classified in Level 1 of the fair value hierarchy. Securities traded on foreign exchanges generally are not valued at the same time the Fund calculates its NAV because most foreign markets close well before such time. The earlier close of most foreign markets gives rise to the possibility that significant events, including broad market moves, may have occurred in the interim. In certain circumstances, it may be determined that a foreign security needs to be fair valued because it appears that the value of the security might have been materially affected by events occurring after the close of the market in which the security is principally traded, but before the time the Fund calculates its NAV, such as by a development that affects an entire market or region (e.g., a weather-related event) or a potentially global development (e.g., a terrorist attack that may be expected to have an effect on investor expectations worldwide). |
| | |
| | Registered Investment Companies – Investments in open-end registered investment companies, commonly referred to as mutual funds, generally are priced at the ending NAV provided by the applicable mutual fund’s service agent and will be classified in Level 1 of the fair value hierarchy. |
| HENNESSY FUNDS | 1-800-966-4354 | |
| | Debt Securities – Debt securities, including corporate bonds, asset-backed securities, mortgage-backed securities, municipal bonds, U.S. Treasuries, and U.S. government agency issues, are generally valued at market on the basis of valuations furnished by an independent pricing service that utilizes both dealer-supplied valuations and formula-based techniques. The pricing service may consider recently executed transactions in securities of the issuer or comparable issuers, market price quotations (where observable), bond spreads, and fundamental data relating to the issuer. In addition, the model may incorporate observable market data, such as reported sales of similar securities, broker quotes, yields, bids, offers, and reference data. Certain securities are valued primarily using dealer quotations. These securities are generally classified in Level 2 of the fair value hierarchy. |
| | |
| | Short-Term Securities – Short-term equity investments, including money market funds, are valued in the manner specified above. Short-term debt investments with an original term to maturity of 60 days or less are valued at amortized cost, which approximates fair market value. If the original term to maturity of a short-term debt investment exceeded 60 days, then the values as of the 61st day prior to maturity are amortized. Amortized cost is not used if its use would be inappropriate due to credit or other impairments of the issuer, in which case the security’s fair value would be determined, as described below. Short-term securities are generally classified in Level 1 or Level 2 of the fair value hierarchy depending on the inputs used and market activity levels for specific securities. |
The Board of Trustees of the Fund (the “Board”) has adopted fair value pricing procedures that are followed when a price for a security is not readily available or if a significant event has occurred that indicates the closing price of a security no longer represents the true value of that security. Fair value pricing determinations are made in good faith in accordance with these procedures. There are numerous criteria that will be given consideration in determining a fair value of a security, such as the trading volume of a security and markets, the values of other similar securities, and news events with direct bearing on a security or markets. Fair value pricing results in an estimated price for a security that reflects the amount the Fund might reasonably expect to receive in a current sale. Depending on the relative significance of the valuation inputs, these securities may be classified in either Level 2 or Level 3 of the fair value hierarchy.
The fair value of foreign securities may be determined with the assistance of a pricing service using correlations between the movement of prices of such securities and indices of domestic securities and other appropriate indicators, such as closing market prices of relevant American Depositary Receipts or futures contracts. Using fair value pricing means that the Fund’s NAV reflects the affected portfolio securities’ values as determined by the Board or its designee, pursuant to the fair value pricing procedures adopted by the Board, instead of being determined by the market. Using a fair value pricing methodology to price a foreign security may result in a value that is different from such foreign security’s most recent closing price and from the value used by other investment companies to calculate their NAVs. Such securities are generally classified in Level 2 of the fair value hierarchy. Because the Fund may invest in foreign securities, the value of the Fund’s portfolio securities may change on days when you will not be able to purchase or redeem your shares.
The Board has delegated day-to-day valuation matters to the Valuation and Liquidity Committee comprising representatives from Hennessy Advisors, Inc., the Fund’s investment advisor (the “Advisor”). The function of the Valuation and Liquidity Committee is to value securities where current and reliable market quotations are not readily available. All actions taken by the Valuation and Liquidity Committee are reviewed by the Board.
| NOTES TO THE FINANCIAL STATEMENTS |
The Fund has performed an analysis of all existing investments to determine the significance and character of all inputs to their fair value determinations. Various inputs are used to determine the value of the Fund’s investments. The inputs or methodology used for valuing securities are not necessarily an indication of the risk associated with investing in those securities. Details related to the fair value hierarchy of the Fund’s securities as of October 31, 2020, are included in the Schedule of Investments.
4). INVESTMENT TRANSACTIONS
Purchases and sales of investment securities (excluding government and short-term investments) for the Fund during fiscal year 2020 were $16,243,462 and $18,900,140, respectively.
There were no purchases or sales/maturities of long-term U.S. government securities for the Fund during fiscal year 2020.
The Fund is permitted to purchase or sell securities from or to another fund in the Hennessy Funds family of funds (collectively, the “Hennessy Funds”) under specified conditions outlined in procedures adopted by the Board. The procedures have been designed to ensure that any purchase or sale of securities by the Fund from or to another Hennessy Fund complies with Rule 17a-7 of the Investment Company Act of 1940, as amended. During fiscal year 2020, the Fund did not engage in purchases or sales of securities pursuant to Rule 17a-7 of the Investment Company Act of 1940, as amended.
5). INVESTMENT ADVISORY FEE AND OTHER TRANSACTIONS WITH AFFILIATES
The Advisor provides the Fund with investment advisory services under an Investment Advisory Agreement. The Advisor oversees the provision of investment advice and furnishes office space, facilities, and most of the personnel needed by the Fund. As compensation for its services, the Advisor is entitled to a monthly fee from the Fund. The fee is based on the average daily net assets of the Fund at an annual rate of 1.10%. The net investment advisory fees expensed by the Fund during fiscal year 2020 are included in the Statement of Operations.
The Advisor has delegated the day-to-day management of the Fund to a sub-advisor, BP Capital Fund Advisors, LLC. The Advisor pays the sub-advisory fees from its own assets, and these fees are not an additional expense of the Fund. During fiscal year 2020, the Advisor (not the Fund) paid a sub-advisory fee at the rate of 0.40% of the daily net assets of the Fund.
The Advisor has contractually agreed to limit total annual operating expenses to 1.75% of the Fund’s net assets for Investor Class shares and 1.50% of the Fund’s net assets for Institutional Class shares (in each case, excluding all federal, state, and local taxes, interest, brokerage commissions, dividend and interest expenses on short sales, extraordinary items, and acquired fund fees and expenses and other costs incurred in connection with the purchase and sale of securities) through February 28, 2021.
For three years following the date on which expenses were waived or incurred, the Advisor may recoup waived or reimbursed expenses from the Fund if total operating expenses, including such recoupment, does not exceed the expense limitation in effect (i) at the time the Advisor waived or reimbursed such expenses and (ii) at the time the Advisor recoups such expenses. As of October 31, 2020, expenses subject to potential recovery for Investor Class and Institutional Class shares and the fiscal years in which they expire were as follows:
| | | | Fiscal Year | | | Fiscal Year | | | | |
| | | | 2022 | | | 2023 | | | Total | |
| | Investor Class | | $ | 22,275 | | | $ | 22,658 | | | $ | 44,933 | |
| | Institutional Class | | $ | 22,981 | | | $ | 60,422 | | | $ | 83,403 | |
| HENNESSY FUNDS | 1-800-966-4354 | |
The Advisor did not recoup expenses from the Fund during fiscal year 2020.
The Board has approved a Shareholder Servicing Agreement for Investor Class shares of the Fund, which was instituted to compensate the Advisor for the non-investment advisory services it provides to the Fund. The Shareholder Servicing Agreement provides for a monthly fee paid to the Advisor at an annual rate of 0.10% of the average daily net assets of the Fund attributable to Investor Class shares. The shareholder service fees expensed by the Fund during fiscal year 2020 are included in the Statement of Operations.
The Fund has adopted a plan pursuant to Rule 12b-1 under the Investment Company Act of 1940, as amended, that authorizes payments in connection with the distribution of the Fund’s shares at an annual rate of up to 0.25% of the Fund’s average daily net assets attributable to Investor Class shares. Even though the authorized rate is up to 0.25%, the Fund is currently only using up to 0.15% of its average daily net assets attributable to Investor Class shares for such purpose. Amounts paid under the plan may be spent on any activities or expenses primarily intended to result in the sale of shares, including, but not limited to, advertising, shareholder account servicing, printing and mailing of prospectuses to other than current shareholders, printing and mailing of sales literature, and compensation for sales and marketing activities or to financial institutions and others, such as dealers and distributors. The distribution fees expensed by the Fund during fiscal year 2020 are included in the Statement of Operations.
The Fund has entered into agreements with various brokers, dealers, and financial intermediaries in connection with the sale of shares of the Fund. The agreements provide for periodic payments of sub-transfer agent expenses by the Fund to the brokers, dealers, and financial intermediaries for providing certain shareholder maintenance services. These shareholder services include the pre-processing and quality control of new accounts, shareholder correspondence, answering customer inquiries regarding account status, and facilitating shareholder telephone transactions. The sub-transfer agent fees expensed by the Fund during fiscal year 2020 are included in the Statement of Operations.
U.S. Bancorp Fund Services, LLC, d/b/a U.S. Bank Global Fund Services (“Fund Services”) provides the Fund with administrative, accounting, and transfer agent services. As administrator, Fund Services is responsible for activities such as (i) preparing various federal and state regulatory filings, reports, and returns for the Fund, (ii) preparing reports and materials to be supplied to the Board, (iii) monitoring the activities of the Fund’s custodian, transfer agent, and accountants, and (iv) coordinating the preparation and payment of the Fund’s expenses and reviewing the Fund’s expense accruals. U.S. Bank N.A., an affiliate of Fund Services, serves as the Fund’s custodian. The servicing agreements between the Trust and Fund Services and U.S. Bank N.A. contain a fee schedule that is inclusive of administrative, accounting, custody, and transfer agent fees. The administrative, accounting, custody, and transfer agent fees expensed by the Fund during fiscal year 2020 are included in the Statement of Operations. Fund Services has voluntarily waived all or a portion of its fees for the Fund. The fees voluntarily waived by Fund Services during fiscal year 2020 are included in the Statement of Operations.
Quasar Distributors, LLC (“Quasar”) acts as the Fund’s principal underwriter in a continuous public offering of the Fund’s shares. Quasar was an affiliate of Fund Services and U.S. Bank N.A. through March 30, 2020. Effective March 31, 2020, Foreside Financial Group, LLC (“Foreside”) acquired Quasar from Fund Services. As a result of the acquisition, Quasar became a wholly owned broker-dealer subsidiary of Foreside and is no longer affiliated with Fund Services or U.S. Bank N.A. The Board approved a new Distribution Agreement to enable Quasar to continue serving as the Fund’s distributor.
| NOTES TO THE FINANCIAL STATEMENTS |
The officers of the Fund are affiliated with the Advisor. With the exception of the Chief Compliance Officer and the Senior Compliance Officer, such officers receive no compensation from the Fund for serving in their respective roles. The Fund, along with the other Hennessy Funds, makes reimbursement payments on an equal basis to the Advisor for a portion of the salary and benefits associated with the office of the Chief Compliance Officer and for all of the salary and benefits associated with the office of the Senior Compliance Officer. The compliance fees expensed by the Fund during fiscal year 2020 are included in the Statement of Operations.
6). GUARANTEES AND INDEMNIFICATIONS
Under the Hennessy Funds’ organizational documents, their officers and trustees are indemnified by the Hennessy Funds against certain liabilities arising out of the performance of their duties to the Hennessy Funds. Additionally, in the normal course of business, the Hennessy Funds enter into contracts with service providers that contain general indemnification clauses. The Fund’s maximum exposure under these arrangements is unknown as this would involve future claims that may be made against the Fund that have not yet occurred. Currently, the Fund expects the risk of loss to be remote.
7). LINE OF CREDIT
The Fund has an uncommitted line of credit with the other Hennessy Funds in the amount of the lesser of (i) $100,000,000 or (ii) 33.33% of each Hennessy Fund’s net assets, or 30% for the Hennessy Gas Utility Fund and 10% for the Hennessy Balanced Fund, intended to provide short-term financing, if necessary, subject to certain restrictions, in connection with shareholder redemptions. The credit facility is with the Hennessy Funds’ custodian bank, U.S. Bank N.A. Borrowings under this arrangement bear interest at the bank’s prime rate and are secured by all of the Fund’s assets (as to its own borrowings only). During fiscal year 2020, the Fund had an outstanding average daily balance and a weighted average interest rate of $71,839 and 3.99%, respectively. The interest expensed by the Fund during fiscal year 2020 is included in the Statement of Operations. The maximum amount outstanding for the Fund during fiscal year 2020 was $1,950,000. As of October 31, 2020, the Fund did not have any borrowings outstanding under the line of credit.
8). FEDERAL TAX INFORMATION
As of October 31, 2020, the components of accumulated earnings (losses) for income tax purposes were as follows:
| | | | Investments | |
| | Cost of investments for tax purposes | | $ | 26,208,465 | |
| | Gross tax unrealized appreciation | | $ | 742,852 | |
| | Gross tax unrealized depreciation | | | (4,983,807 | ) |
| | Net tax unrealized appreciation/(depreciation) | | $ | (4,240,955 | ) |
As of October 31, 2020, deferred tax assets consisted of the following:
| | Deferred tax assets (liabilities): | | | |
| | Net operating losses | | $ | 151,284 | |
| | Capital loss | | | 6,218,192 | |
| | Unrealized (gain) loss on investments | | | 1,243,698 | |
| | Total deferred tax assets, net | | | 7,613,174 | |
| | Valuation allowance | | | (7,613,174 | ) |
| | Net | | $ | — | |
| HENNESSY FUNDS | 1-800-966-4354 | |
For fiscal year 2020, the Fund had an effective tax rate of 0% and a federal statutory rate of 21%, with the difference resulting from a change in the valuation allowance of the deferred tax assets.
Deferred income tax assets and liabilities are recorded for differences between the financial statement and tax basis of the assets and liabilities that will result in taxable or deductible amounts in the future based on enacted laws and rates applicable to the periods in which the differences are expected to affect taxable income. Valuation allowances are established when necessary to reduce deferred tax assets to the amount expected to be realized. The Fund has evaluated the available evidence supporting the realization of its gross deferred tax assets, including the amount and timing of future taxable income, and has determined that, based on net losses to date, it may not utilize all of its deferred tax assets in the future. As of October 31, 2020, the Fund established a valuation allowance in the amount of $7,613,174 against its deferred tax assets.
To the extent the Fund has a net capital loss in any tax year, the net capital loss may be carried forward five years to offset any future realized capital gains. To the extent the Fund had a net operating loss that arose in a tax year ending prior to January 1, 2018, the effective date of the Tax Cuts and Jobs Act of 2017, the net operating loss may be carried forward 20 years to offset any future ordinary income. Any net operating loss arising in a tax year ending after December 31, 2017, may be carried forward indefinitely. As of October 31, 2020, the Fund had capital loss carryforwards of $27,066,100 that expire as follows:
| | Amount | | Expiration | |
| | $1,511,860 | | 11/30/2020 | |
| | 2,137,300 | | 11/30/2021 | |
| | 6,130,957 | | 10/31/2023 | |
| | 8,971,423 | | 10/31/2024 | |
| | 8,314,560 | | 10/31/2025 | |
As of October 31, 2020, the Fund had net operating loss carryforwards of $671,187 that expire as follows:
| | Amount | | Expiration | |
| | $671,187 | | Indefinite | |
Total income taxes have been computed by applying the federal statutory income tax rate of 21% plus a blended state income tax rate. The Fund applied this effective rate to net investment income and realized and unrealized gains on investments before taxes in computing its total income taxes.
| | Tax expense (benefit) at statutory rates | | $ | (2,916,885 | ) |
| | State income tax expense, net of federal benefit | | | (234,770 | ) |
| | Tax expense (benefit) on permanent items(1) | | | (2,017 | ) |
| | Tax expense (benefit) due to change in effective state rates | | | — | |
| | Total current tax expense (benefit) | | | — | |
| | Change in valuation allowance | | | 3,153,672 | |
| | Total tax expense | | $ | — | |
| | (1) Permanent items consist of dividends-received deductions. |
The Fund recognizes the tax benefits of uncertain tax positions only where the position is “more likely than not” to be sustained assuming examination by tax authorities. Management has analyzed the Fund’s tax positions and has concluded that no liability for unrecognized tax benefits should be recorded related to uncertain tax positions taken on U.S. federal tax returns and state tax returns filed or expected to be
| NOTES TO THE FINANCIAL STATEMENTS |
filed since inception of the Fund. No income tax returns are currently under examination. Generally, tax authorities can examine all tax returns filed for the last three years. Due to the nature of the Fund’s investments, the Fund may be required to file income tax returns in several states. The Fund is not aware of any tax positions for which it is reasonably possible that the total amounts of unrecognized tax benefits will change materially.
During fiscal years 2020 and 2019, the tax character of distributions paid by the Fund was as follows:
| | | | Year Ended | | | Year Ended | |
| | | | October 31, 2020 | | | October 31, 2019 | |
| | Ordinary income(1) | | $ | — | | | $ | — | |
| | Long-term capital gain | | | — | | | | — | |
| | Return of capital | | | 3,976,946 | | | | 4,858,531 | |
| | Total distributions | | $ | 3,976,946 | | | $ | 4,858,531 | |
| | (1) Ordinary income includes short-term capital gains. |
9). COVID-19 PANDEMIC
The COVID-19 pandemic has adversely impacted global commercial activity and contributed to significant volatility in global equity and debt markets. The pandemic has resulted in quarantines, stay-at-home orders, travel prohibitions, and closures, disrupting supply chains and economic activity. The duration of the pandemic’s effects remain uncertain and difficult to assess. The effects of the pandemic may adversely impact the Fund’s performance and its ability to achieve its investment objective.
10). EVENTS SUBSEQUENT TO YEAR END
Management has evaluated the Fund’s related events and transactions that occurred subsequent to October 31, 2020, through the date of issuance of the Fund’s financial statements. Other than as disclosed below, management has determined that there were no subsequent events requiring recognition or disclosure in the financial statements.
On December 1, 2020, distributions were declared and paid to shareholders of record on November 30, 2020, as follows:
| | | Return of Capital | |
| | Investor Class | $0.2575 | |
| | Institutional Class | $0.2575 | |
| HENNESSY FUNDS | 1-800-966-4354 | |
Report of Independent Registered Public
Accounting Firm
To the Board of Trustees of Hennessy Funds Trust
and the shareholders of the Hennessy BP Midstream Fund
Novato, CA
Opinion on the Financial Statements
We have audited the accompanying statement of assets and liabilities of the Hennessy BP Midstream Fund (the “Fund”), a series of Hennessy Funds Trust, including the schedule of investments, as of October 31, 2020, the related statement of operations for the year then ended, the statements of changes in net assets for each of the two years in the period then ended, financial highlights for each of the two years in the period then ended, for the eleven months ended October 31, 2018, and each of the three years in the period ended November 30, 2017, and the related notes (collectively referred to as the “financial statements”). In our opinion, the financial statements present fairly, in all material respects, the financial position of the Fund as of October 31, 2020, the results of its operations for the year then ended, the changes in its net assets for each of the two years in the period then ended and the financial highlights for each of the two years in the period then ended, for the eleven months ended October 31, 2018, and each of the three years in the period ended November 30, 2017, in conformity with accounting principles generally accepted in the United States of America.
Basis for Opinion
These financial statements are the responsibility of the Fund’s management. Our responsibility is to express an opinion on the Fund’s financial statements based on our audits. We are a public accounting firm registered with the Public Company Accounting Oversight Board (United States) (“PCAOB”) and are required to be independent with respect to the Fund in accordance with the U.S. federal securities laws and the applicable rules and regulations of the Securities and Exchange Commission and the PCAOB. We have served as the auditor of one or more of the funds in the Trust since 2002.
We conducted our audits in accordance with the standards of the PCAOB. Those standards require that we plan and perform the audit to obtain reasonable assurance about whether the financial statements are free of material misstatement, whether due to error or fraud. The Fund is not required to have, nor were we engaged to perform, an audit of its internal control over financial reporting. As part of our audits we are required to obtain an understanding of internal control over financial reporting, but not for the purpose of expressing an opinion on the effectiveness of the Fund’s internal control over financial reporting. Accordingly, we express no such opinion.
Our audits included performing procedures to assess the risks of material misstatement of the financial statements, whether due to error or fraud, and performing procedures that respond to those risks. Such procedures included examining, on a test basis, evidence regarding the amounts and disclosures in the financial statements. Our audits also included evaluating the accounting principles used and significant estimates made by management, as well as evaluating the overall presentation of the financial statements. Our procedures included confirmation of securities owned as of October 31, 2020, by correspondence with the custodian. We believe that our audits provide a reasonable basis for our opinion.
| | |
| | TAIT, WELLER & BAKER LLP |
Philadelphia, Pennsylvania
December 23, 2020
| REPORT OF INDEPENDENT REGISTERED PUBLIC ACCOUNTING FIRM/TRUSTEES AND OFFICERS |
Trustees and Officers of the Fund (Unaudited)
The business and affairs of the Funds are managed under the direction of the Board of Trustees of the Trust, and the Board of Trustees elects the officers of the Trust. From time to time, the Board of Trustees also has appointed advisers to the Board of Trustees (“Advisers”) with the intention of having qualified individuals serve in an advisory capacity to garner experience in the mutual fund and asset management industry and be considered as potential Trustees in the future. There are currently three Advisers: Brian Alexander, Doug Franklin, and Claire Knoles. As Advisers, Mr. Alexander, Mr. Franklin, and Ms. Knoles attend meetings of the Board of Trustees and act as non-voting participants. Information pertaining to the Trustees, Advisers, and the officers of the Trust is set forth below. The Trustees and officers serve until their successors are duly elected and qualified or until their earlier death, resignation, or removal. Each Trustee oversees all 16 Hennessy Funds. Unless otherwise indicated, the address of all persons listed below is 7250 Redwood Boulevard, Suite 200, Novato, CA 94945. The Fund’s Statement of Additional Information includes more information about the persons listed below and is available without charge by calling 1-800-966-4354 or by visiting www.hennessyfunds.com.
| | | | Other |
| | | | Directorships |
| | | | Held Outside |
| Name, Age, | | | of Fund |
| and Position Held | Start Date | Principal Occupation(s) | Complex During |
with the Trust
| of Service
| During Past Five Years
| Past Five Years
|
| Disinterested Trustees and Advisers | | |
| | | | |
| J. Dennis DeSousa | January 1996 | Mr. DeSousa is a real estate investor. | None. |
| 84 | | | |
| Trustee | | | |
| | | | |
| Robert T. Doyle | January 1996 | Mr. Doyle has been the Sheriff of | None. |
| 73 | | Marin County, California since 1996. | |
| Trustee | | | |
| | | | |
| Gerald P. Richardson | May 2004 | Mr. Richardson is an independent | None. |
| 75 | | consultant in the securities industry. | |
| Trustee | | | |
| | | | |
| Brian Alexander | March 2015 | Mr. Alexander has worked for the | None. |
| 39 | | Sutter Health organization since | |
| Adviser to the Board | | 2011 in various positions. He has | |
| | | served as the Chief Executive Officer | |
| | | of the Sutter Roseville Medical | |
| | | Center since 2018. From 2016 through | |
| | | 2018, he served as the Vice President | |
| | | of Strategy for the Sutter Health Valley | |
| | | Area, which includes 11 hospitals, | |
| | | 13 ambulatory surgery centers, | |
| | | 16,000 employees, and 1,900 physicians. | |
| | | From 2013 through 2016, Mr. Alexander | |
| | | served as Sutter Novato Community | |
| | | Hospital’s Chief Administrative Officer. | |
| HENNESSY FUNDS | 1-800-966-4354 | |
| | | | Other |
| | | | Directorships |
| | | | Held Outside |
| Name, Age, | | | of Fund |
| and Position Held | Start Date | Principal Occupation(s) | Complex During |
with the Trust
| of Service
| During Past Five Years
| Past Five Years
|
| Doug Franklin | March 2016 | Mr. Franklin is a retired insurance | None. |
| 56 | | industry executive. From 1987 | |
| Adviser to the Board | | through 2015, he was employed | |
| | | by the Allianz-Fireman’s Fund | |
| | | Insurance Company in various | |
| | | positions, including as its Chief | |
| | | Actuary and Chief Risk Officer. | |
| | | | |
| Claire Knoles | December 2015 | Ms. Knoles is a founder of Kiosk and | None. |
| 46 | | has served as its Chief Operating | |
| Adviser to the Board | | Officer since 2004. Kiosk is a full- | |
| | | service marketing agency with | |
| | | offices in the San Francisco Bay | |
| | | Area, Toronto, and Liverpool, UK. | |
| | | | |
Interested Trustee(1) | | | |
| | | | |
| Neil J. Hennessy | January 1996 as | Mr. Hennessy has been employed | Hennessy |
| 64 | a Trustee and | by Hennessy Advisors, Inc. since | Advisors, Inc. |
| Trustee, Chairman of | June 2008 as | 1989 and currently serves as its | |
| the Board, Chief | an officer | Chairman and Chief Executive Officer. | |
| Investment Officer, | | | |
| Portfolio Manager, | | | |
| and President | | | |
| Name, Age, | | |
| and Position Held | Start Date | Principal Occupation(s) |
with the Trust
| of Service
| During Past Five Years
|
| Officers | | |
| | | |
| Teresa M. Nilsen | January 1996 | Ms. Nilsen has been employed by Hennessy Advisors, Inc. |
| 54 | | since 1989 and currently serves as its President, Chief Operating |
| Executive Vice President | | Officer, and Secretary. |
| and Treasurer | | |
| | | |
| Daniel B. Steadman | March 2000 | Mr. Steadman has been employed by Hennessy Advisors, Inc. |
| 64 | | since 2000 and currently serves as its Executive Vice President. |
| Executive Vice President | | |
| and Secretary | | |
| | | |
| Brian Carlson | December 2013 | Mr. Carlson has been employed by Hennessy Advisors, Inc. |
| 48 | | since December 2013 and currently serves as its Chief |
| Senior Vice President | | Compliance Officer and Senior Vice President. |
| and Head of Distribution | | |
| | | |
Jennifer Cheskiewicz(2) | June 2013 | Ms. Cheskiewicz has been employed by Hennessy Advisors, Inc. |
| 43 | | as its General Counsel since June 2013. |
| Senior Vice President and | | |
| Chief Compliance Officer | | |
| TRUSTEES AND OFFICERS OF THE FUND |
| Name, Age, | | |
| and Position Held | Start Date | Principal Occupation(s) |
with the Trust
| of Service
| During Past Five Years
|
David Ellison(3) | October 2012 | Mr. Ellison has been employed by Hennessy Advisors, Inc. since |
| 62 | | October 2012. He has served as a Portfolio Manager of the |
| Senior Vice President | | Hennessy Large Cap Financial Fund and the Hennessy Small |
| and Portfolio Manager | | Cap Financial Fund since their inception. Mr. Ellison also served |
| | | as a Portfolio Manager of the Hennessy Technology Fund from |
| | | its inception until February 2017. Mr. Ellison served as Director, |
| | | CIO, and President of FBR Fund Advisers, Inc. from December |
| | | 1999 to October 2012. |
| | | |
Ryan Kelley(4) | March 2013 | Mr. Kelley has been employed by Hennessy Advisors, Inc. since |
| 48 | | October 2012. He has served as a Portfolio Manager of the |
| Senior Vice President | | Hennessy Gas Utility Fund, the Hennessy Large Cap Financial |
| and Portfolio Manager | | Fund, and the Hennessy Small Cap Financial Fund since |
| | | October 2014. He served as Co-Portfolio Manager of these |
| | | same funds from March 2013 through September 2014 and as |
| | | a Portfolio Analyst for the Hennessy Funds from October 2012 |
| | | through February 2013. Mr. Kelley has also served as a Portfolio |
| | | Manager of the Hennessy Cornerstone Growth Fund, the |
| | | Hennessy Cornerstone Mid Cap 30 Fund, the Hennessy |
| | | Cornerstone Large Growth Fund, and the Hennessy |
| | | Cornerstone Value Fund since February 2017 and as a Portfolio |
| | | Manager of the Hennessy Total Return Fund, the Hennessy |
| | | Balanced Fund, and the Hennessy Technology Fund since May |
| | | 2018. He served as Co-Portfolio Manager of the Hennessy |
| | | Technology Fund from February 2017 until May 2018. Mr. Kelley |
| | | served as Portfolio Manager of FBR Fund Advisers, Inc. from |
| | | January 2008 to October 2012. |
| | | |
| Tania Kelley | October 2003 | Ms. Kelley has been employed by Hennessy Advisors, Inc. since |
| 55 | | October 2003. |
| Senior Vice President | | |
| and Head of Marketing | | |
| | | |
L. Joshua Wein(4) | September 2018 | Mr. Wein has been employed by Hennessy Advisors, Inc. since |
| 47 | | 2018. He has served as Co-Portfolio Manager of the Hennessy |
| Vice President and | | Cornerstone Growth Fund, the Hennessy Cornerstone |
| Co-Portfolio Manager | | Mid Cap 30 Fund, the Hennessy Cornerstone Large Growth |
| | | Fund, the Hennessy Cornerstone Value Fund, Hennessy Total |
| | | Return Fund, the Hennessy Balanced Fund, the Hennessy Gas |
| | | Utility Fund, and the Hennessy Technology Fund since February |
| | | 2019. He served as a Senior Analyst of these same funds from |
| | | September 2018 through February 2019. Mr. Wein served as |
| | | Director of Alternative Investments and Co-Portfolio Manager |
| | | at Sterling Capital Management from 2008 to 2018. |
_______________
(1) | Mr. Hennessy is considered an “interested person,” as defined in the Investment Company Act of 1940, as amended, because he is an officer of the Trust. |
(2) | The address of this officer is 4800 Bee Caves Road, Suite 100, Austin, TX 78746. |
(3) | The address of this officer is 101 Federal Street, Suite 1615B, Boston, MA 02110. |
(4) | The address of this officer is 1340 Environ Way, Chapel Hill, NC 27517. |
| HENNESSY FUNDS | 1-800-966-4354 | |
Expense Example (Unaudited)
October 31, 2020
As a shareholder of the Fund, you incur ongoing costs, including management fees, service fees, and other Fund expenses. This Example is intended to help you understand your ongoing costs (in dollars) of investing in the Fund and to compare these costs with the ongoing costs of investing in other mutual funds. The Example is based on an investment of $1,000 invested at the beginning of the period and held for the entire period from May 1, 2020, through October 31, 2020.
Actual Expenses
The first line of the table below under the “Investor Class” and “Institutional Class” headings provides information about actual account values and actual expenses. You may use the information in this line, together with the amount you invested, to estimate the expenses that you paid over the period. Simply divide your account value by $1,000 (for example, an $8,600 account value divided by $1,000 = 8.6), then multiply the result by the number in the first line below the “Investor Class” or “Institutional Class” heading under the column entitled “Expenses Paid During Period” to estimate the expenses you paid on your account during this period. Although the Fund charges no sales loads or transaction fees, you will be assessed fees for outgoing wire transfers, returned checks, and stop payment orders at prevailing rates charged by U.S. Bank Global Fund Services, the Fund’s transfer agent. If you request that a redemption be made by wire transfer, the Fund’s transfer agent charges a $15 fee. IRAs are charged a $15 annual maintenance fee (up to $30 maximum per shareholder for shareholders with multiple IRAs). The example below includes, but is not limited to, management fees, shareholder servicing fees, accounting, custody, and transfer agent fees. However, the example below does not include portfolio trading commissions and related expenses.
Hypothetical Example for Comparison Purposes
The second line of the table below under the “Investor Class” and “Institutional Class” headings provides information about hypothetical account values and hypothetical expenses based on the Fund’s actual expense ratios and an assumed rate of return of 5% per year before expenses, which is not the Fund’s actual return. The hypothetical account values and expenses may not be used to estimate the actual ending account balance or expenses you paid for the period. You may use this information to compare the ongoing costs of investing in the Fund and other funds. To do so, compare this 5% hypothetical example with the 5% hypothetical examples that appear in the shareholder reports of the other funds. Please note that the expenses shown in the table are meant to highlight your ongoing costs only. Therefore, the second line of the table under the “Investor Class” and “Institutional Class” headings is useful in comparing ongoing costs only and will not help you determine the relative total costs of owning different funds.
| | | | Expenses Paid |
| | Beginning | Ending | During Period(1) |
| | Account Value | Account Value | May 1, 2020 – |
| | May 1, 2020
| October 31, 2020 | October 31, 2020 |
| Investor Class | | | |
| Actual | $1,000.00 | $ 849.40 | $8.18 |
| Hypothetical (5% return before expenses) | $1,000.00 | $1,016.29 | $8.92 |
| | | | |
| Institutional Class | | | |
| Actual | $1,000.00 | $ 851.10 | $7.03 |
| Hypothetical (5% return before expenses) | $1,000.00 | $1,017.55 | $7.66 |
(1) | Expenses are equal to the Fund’s annualized expense ratio of 1.76% for Investor Class shares or 1.51% for Institutional Class shares, as applicable, multiplied by the average account value over the period, multiplied by 184/366 days (to reflect the half-year period). |
| HENNESSY FUNDS | 1-800-966-4354 | |
How to Obtain a Copy of the Fund’s Proxy
Voting Policy and Proxy Voting Records
A description of the policies and procedures the Fund uses to determine how to vote proxies relating to portfolio securities is available without charge (1) by calling 1-800-966-4354, (2) on the Hennessy Funds’ website at www.hennessyfunds.com/proxy-voting/voting-policy, or (3) on the U.S. Securities and Exchange Commission’s (the “SEC”) website at www.sec.gov. The Fund’s proxy voting record is available without charge on both the Hennessy Funds’ website at www.hennessyfunds.com/proxy-voting/voting-record and the SEC’s website at www.sec.gov no later than August 31 for the prior 12 months ending June 30.
Availability of Quarterly Portfolio Schedule
The Fund files a complete schedule of portfolio holdings with the SEC for the first and third quarters of each fiscal year as an exhibit to its reports on Form N-PORT. The Fund’s Form N-PORT reports are available on the SEC’s website at www.sec.gov or on request by calling 1-800-966-4354.
Federal Tax Distribution Information
(Unaudited)
For fiscal year 2020, certain dividends paid by the Fund may be subject to a maximum tax rate of 23.8%, as provided for by the Jobs and Growth Tax Relief Reconciliation Act of 2003. The percentage of dividends declared from ordinary income designated as qualified dividend income was 0.00%.
For corporate shareholders, the percent of ordinary income distributions that qualified for the corporate dividends received deduction for fiscal year 2020 was 0.00%.
The percentage of taxable ordinary income distributions that were designated as short-term capital gain distributions under Section 871(k)(2)(C) of the Internal Revenue Code of 1986, as amended, for the Fund was 0.00%.
Important Notice Regarding Delivery
of Shareholder Documents
To help keep the Fund’s costs as low as possible, we generally deliver a single copy of shareholder reports, proxy statements, and prospectuses to shareholders who share an address and have the same last name. This process does not apply to account statements. You may request an individual copy of a shareholder document at any time. If you would like to receive separate mailings of shareholder documents, please call U.S. Bank Global Fund Services at 1-800-261-6950 or 1-414-765-4124, and individual delivery will begin within 30 days of your request. If your account is held through a financial institution or other intermediary, please contact such intermediary directly to request individual delivery.
Electronic Delivery
The Fund offers shareholders the option to receive account statements, prospectuses, tax forms, and shareholder reports online. To sign up for eDelivery, please visit www.hennessyfunds.com/account. You may change your delivery preference at any time by visiting our website or calling U.S. Bank Global Fund Services at 1-800-261-6950 or 1-414-765-4124.
| PROXY VOTING — PRIVACY POLICY |
Liquidity Risk Management Program
In accordance with Rule 22e-4 under the Investment Company Act of 1940, as amended (the “Liquidity Rule”), we have adopted and implemented a liquidity risk management program (the “Liquidity Program”). The purpose of the Liquidity Program is to assess and manage the Fund’s liquidity risk, which is the risk that the Fund would not be able to meet requests to redeem Fund shares without significant dilution of the remaining shareholders’ interests in the Fund. The Board of Trustees of the Fund (the “Board”) designated a committee comprising representatives of Hennessy Advisors, Inc., the investment adviser to the Fund, as the administrator of the Liquidity Program (the “Program Administrator”).
The Program Administrator provided a written report regarding the Liquidity Program to the Board in advance of its meeting on June 3, 2020. The report covered the period from June 1, 2019, through May 31, 2020. The report addressed the operation of the Liquidity Program, assessed the adequacy and effectiveness of its implementation, and described any material changes to the Liquidity Program during the review period. The Trust’s chief compliance officer presented the report to the Board at the meeting and provided additional information regarding the Liquidity Program. The Board reviewed the Liquidity Program and considered, among other items, the following:
| | 1. | The Program Administrator reviewed daily historical net redemption activity during the review period and during prior periods with higher-than-average redemption activity and concluded that the Fund has historically been able to meet requests to redeem Fund shares without significant dilution to the Fund’s remaining shareholders, and the Program Administrator expects the Fund to be able to continue to do so in the future during both normal and reasonably foreseeable stressed conditions. |
| | | |
| | 2. | The Fund primarily holds assets that are highly liquid investments and is therefore not required to establish a highly liquid investment minimum for the Fund or adopt policies and procedures for responding to a highly liquid investment minimum shortfall. |
| | | |
| | 3. | The Program Administrator did not make any material changes to the Liquidity Program during the review period and was not recommending any changes to the Liquidity Program or the model inputs used to determine the liquidity classification of each security held by the Fund. |
| | | |
| | 4. | The Program Administrator concluded that the Liquidity Program was reasonably designed to assess and manage the Fund’s liquidity risk, complies with the requirements of the Liquidity Rule, and was effectively implemented, having operated as intended during the review period. |
Privacy Policy
We collect the following personal information about you:
| | 1. | Information we receive from you in applications or other forms, correspondence, or conversations, including, but not limited to, your name, address, phone number, social security number, assets, income, and date of birth; |
| | | |
| | 2. | Information about your transactions with us, our affiliates, or others, including, but not limited to, your account number and balance, payments history, parties to transactions, cost basis information, and other financial information; and |
| HENNESSY FUNDS | 1-800-966-4354 | |
| | 3. | Other personal information we collect from various sources, even if you have not entered into a prior transaction with us, including the following: |
| | • | Name, alias, address, unique personal identifier, online identifier, IP address, email address, telephone number, account name, and other similar identifiers; |
| | | |
| | • | Age and marital status; |
| | | |
| | • | Commercial information, including records of products purchased; |
| | | |
| | • | Browsing history, search history, and information on interaction with our website; |
| | | |
| | • | Geolocation data; |
| | | |
| | • | Employment and employment history, educational history, financial information, and purchasing and consuming histories or tendencies; and |
| | | |
| | • | Inferences drawn from the above-listed information to create a profile about your preferences, characteristics, predispositions, and behavior. |
We collect this information directly from you, indirectly in the course of providing services to you, directly and indirectly from your activity on our website, from broker dealers, marketing agencies, and other third parties that interact with us in connection with the services we perform and products we offer, and from anonymized and aggregated consumer information.
We use this information to fulfill the reason you provided the information to us, to provide you with other relevant products that you request from us, to provide you with information about products that may interest you, to improve our website or present our website’s contents to you, and as otherwise described to you when collecting your personal information.
We do not disclose any personal information to unaffiliated third parties, except as permitted by law. We may disclose your personal information to our affiliates, vendors, and service providers for a business purpose. For example, we are permitted by law to disclose all of the information we collect, as described above, to our transfer agent to process your transactions. When disclosing your personal information to third parties, we enter into a contract with each third party describing the purpose of such disclosure and requiring that such personal information be kept confidential and not used for any purpose except to perform the services contracted or respond to regulatory or law enforcement requests.
Furthermore, we restrict access to your personal information to those persons who require such information to provide products or services to you. As a result, we do not provide a means for opting out of our limited sharing of your information. We maintain physical, electronic, and procedural safeguards that comply with federal standards to guard your personal information.
If you hold shares of the Funds through a financial intermediary, including, but not limited to, a broker-dealer, bank, or trust company, the privacy policy of your financial intermediary governs how your personal information is shared with unaffiliated third parties.
Supplemental Privacy Notice for Residents of California
The California Consumer Privacy Act of 2018 (the “CCPA”) provides you, as a California resident, with certain additional rights relating to your personal information.
Under the CCPA, you have the right to request that we disclose to you the categories of personal information we have collected about you over the past 12 months, the categories of sources of such information, our business purpose for collecting the
information, the categories of third parties, if any, with whom we shared the information, and the specific information we have collected about you. You also have the right to request that we delete any of your personal information, and, unless an exception applies, we will delete such information upon receiving and confirming your request. To make a request, call us at 1-800-966-4354, email us at privacy@hennessyfunds.com, or go to www.hennessyfunds.com/contact. We will not discriminate against you for exercising your rights under the CCPA. Further, we will not collect additional categories of your personal information or use the personal information we collected for materially different, unrelated, or incompatible purposes without providing you notice.
| HENNESSY FUNDS | 1-800-966-4354 | |
For information, questions, or assistance, please call
The Hennessy Funds
1-800-966-4354 or 1-415-899-1555
INVESTMENT ADVISOR
Hennessy Advisors, Inc.
7250 Redwood Boulevard, Suite 200
Novato, California 94945
ADMINISTRATOR,
TRANSFER AGENT,
DIVIDEND PAYING AGENT, &
SHAREHOLDER SERVICING AGENT
U.S. Bancorp Fund Services, LLC
d/b/a U.S. Bank Global Fund Services
P.O. Box 701
Milwaukee, Wisconsin 53201-0701
CUSTODIAN
U.S. Bank N.A.
Custody Operations
1555 North River Center Drive, Suite 302
Milwaukee, Wisconsin 53212
TRUSTEES
Neil J. Hennessy
Robert T. Doyle
J. Dennis DeSousa
Gerald P. Richardson
COUNSEL
Foley & Lardner LLP
777 East Wisconsin Avenue
Milwaukee, Wisconsin 53202-5306
INDEPENDENT REGISTERED
PUBLIC ACCOUNTING FIRM
Tait, Weller & Baker LLP
Two Liberty Place
50 South 16th Street, Suite 2900
Philadelphia, Pennsylvania 19102-2529
DISTRIBUTOR
Quasar Distributors, LLC
111 East Kilbourn Avenue, Suite 2200
Milwaukee, Wisconsin 53202
www.hennessyfunds.com | 1-800-966-4354
This report has been prepared for shareholders and may be distributed to
others only if preceded or accompanied by a current prospectus.
ANNUAL REPORT
OCTOBER 31, 2020
HENNESSY GAS UTILITY FUND
Investor Class GASFX
Institutional Class HGASX
IMPORTANT NOTICE REGARDING ELECTRONIC DELIVERY OF SHAREHOLDER REPORTS
Beginning on January 1, 2021, as permitted by regulations adopted by the Securities and Exchange Commission, paper copies of the annual and semi-annual reports will no longer be sent by mail unless you specifically request paper copies from the Hennessy Funds or from your financial intermediary. Instead, the reports will be made available on a website, and you will be notified by mail each time a report is posted and provided with a website link to access the report.
If you have already elected to receive shareholder reports electronically, you will not be affected by this change and you need not take any action. You may elect to receive shareholder reports and other communications from the Hennessy Funds electronically by visiting www.hennessyfunds.com/account or by calling U.S. Bank Global Fund Services at 1-800-261-6950. If you own shares in a Fund through a financial intermediary, please contact your financial intermediary to make this election.
You may elect to receive paper copies of all future reports free of charge by calling U.S. Bank Global Fund Services at 1-800-261-6950 or, if you own your shares through a financial intermediary, by contacting your financial intermediary. Your election to receive paper copies of reports will apply to all Funds in the Hennessy Funds family.
www.hennessyfunds.com | 1-800-966-4354
(This Page Intentionally Left Blank.)
Contents
| Letter to Shareholders | | 2 |
| Performance Overview | | 4 |
| Financial Statements | | |
| Schedule of Investments | | 7 |
| Statement of Assets and Liabilities | | 11 |
| Statement of Operations | | 12 |
| Statements of Changes in Net Assets | | 13 |
| Financial Highlights | | 14 |
| Notes to the Financial Statements | | 18 |
| Report of Independent Registered Public Accounting Firm | | 26 |
| Trustees and Officers of the Fund | | 27 |
| Expense Example | | 30 |
| Proxy Voting Policy and Proxy Voting Records | | 32 |
| Availability of Quarterly Portfolio Schedule | | 32 |
| Federal Tax Distribution Information | | 32 |
| Important Notice Regarding Delivery of Shareholder Documents | | 32 |
| Electronic Delivery | | 32 |
| Liquidity Risk Management Program | | 33 |
| Privacy Policy | | 33 |
| HENNESSY FUNDS | 1-800-966-4354 | |
December 2020
Dear Hennessy Funds Shareholder:
As a new year and new decade dawned in January, no one could have imagined that the world would quickly plunge into one of the worst health crises in history. Throughout this pandemic, our thoughts have remained with those most deeply affected by COVID-19, and we thank our frontline healthcare and essential workers. At Hennessy Funds, we adapted quickly to the impact of COVID-19 to maintain business continuity. We focused on our employees and on you, the shareholders of the Hennessy Funds, and I am pleased that we have been able to navigate successfully during this unprecedented time.
The year was defined by a global pandemic and the ensuing economic shutdowns and by a highly charged presidential election that caused tremendous volatility. Yet the stock market has continued to show its resiliency and strength, as the major indices hit new all-time highs in November and again in December. For the 12 months ended October 31, 2020, U.S. equities posted positive performance, with the S&P 500® Index returning 9.71% and the Dow Jones Industrial Average returning 0.34% for the period. There were extreme differences in how various sectors performed during the period. For instance, the technology-focused NASDAQ Composite Index performed strongly, returning 32.84%, whereas the Energy sector (as represented by the S&P 500® Energy Sector Index) struggled with a loss of -46.43%. The Financials sector also performed relatively poorly during the period, with the Russell 1000® Index Financials losing -8.04% and the Russell 2000® Index Financials losing -17.87%. In addition, large cap stocks significantly outperformed small caps, and growth stocks reigned over value stocks during the period. Moreover, approximately half of the NASDAQ’s return for the period was comprised of just three behemoth technology stocks – Apple, Microsoft, and Amazon. Therefore, while the overall U.S. equities market improved, mutual fund returns varied drastically due to the disparate performance of specific sectors, differently sized companies, and different types of companies.
Optimism about the approval and distribution of effective COVID-19 vaccines appears to be buoying investor confidence. Low interest rates, and the expectation that they will remain low for the foreseeable future, have also provided a tailwind to equity prices. In my opinion, stocks are trading at reasonable valuations given this low interest rate environment, with the Dow Jones Industrial Average trading at 20.1x estimated earnings for 2021 and the S&P 500® Index trading at 21.6x estimated earnings for 2021. The U.S. economy looks to be on the road to recovery and is experiencing moderate inflation, and our banking industry appears healthy. The unemployment rate is dropping, albeit slowly, and I expect it to continue to improve once businesses reopen. There are high levels of cash on corporate balance sheets, which could support rising dividends and stock buybacks.
I believe our corporate business leaders will continue to adapt and find ways to drive growth and value for their shareholders, but I also feel that the uncertainty created by the continued health crisis and the stalemate over fiscal relief will lead to additional bouts of market volatility. I remain confident, however, that the markets can and will thrive in the long run.
Thank you for your continued trust and investment in the Hennessy Funds. We believe that there continue to be strong opportunities throughout many segments of the market, and we are focused on managing our high-conviction portfolios for the long-term
benefit of our shareholders. Should you have any questions or would like to speak with us directly, please reach out and call us at (800) 966-4354.
Best regards,
Neil J. Hennessy
President and Chief Investment Officer
Past performance does not guarantee future results.
Mutual fund investing involves risk. Principal loss is possible.
The Dow Jones Industrial Average and S&P 500® Index are commonly used to measure the performance of U.S. stocks. The NASDAQ Composite Index comprises all common stocks listed on The NASDAQ Stock Market and is commonly used to measure the performance of technology-related stocks. The S&P 500® Energy Sector Index is comprised of companies included in the S&P 500® Index that are classified in the Energy sector. The Russell 1000® Index Financials and Russell 2000® Index Financials are subsets of the Russell 1000® Index and Russell 2000® Index, respectively, that measure the performance of securities classified in the Financials sector of the large-cap and small-cap U.S. equity market, respectively. One cannot invest directly in an index. All returns are shown on a total return basis.
Forward price to earnings (PE) is a valuation measure calculated by dividing a company’s market price per share by its expected earnings per share over the following 12 months. PEs noted are sourced from Bloomberg as of December 9, 2020.
| HENNESSY FUNDS | 1-800-966-4354 | |
Performance Overview (Unaudited)
CHANGE IN VALUE OF $10,000 INVESTMENT
This graph illustrates the performance of an initial investment of $10,000 made in the Fund ten years ago and assumes the reinvestment of dividends.
AVERAGE ANNUAL TOTAL RETURN FOR PERIODS ENDED OCTOBER 31, 2020
| | One | Five | Ten |
| | Year
| Years
| Years
|
| Hennessy Gas Utility Fund – | | | |
| Investor Class (GASFX) | -12.49% | 3.26% | 8.54% |
| Hennessy Gas Utility Fund – | | | |
Institutional Class (HGASX)(1) | -12.22% | 3.51% | 8.67% |
| AGA Stock Index | -11.56% | 4.56% | 9.45% |
S&P 500® Index | 9.71% | 11.71% | 13.01% |
Expense ratios: 1.00% (Investor Class); 0.69% (Institutional Class)
(1) | The inception date of Institutional Class shares is March 1, 2017. Performance shown prior to the inception of Institutional Class shares reflects the performance of Investor Class shares and includes expenses that are not applicable to, and are higher than, those of Institutional Class shares. |
Performance data quoted represents past performance; past performance does not guarantee future results. The investment return and principal value of an investment will fluctuate so that an investor’s shares, when redeemed, may be worth more or less than their original cost. The performance table does not reflect the deduction of taxes that a shareholder would pay on Fund distributions or the redemption of Fund shares. Current performance of the Fund may be lower or higher than the performance quoted. Performance data current to the most recent month end may be obtained by visiting www.hennessyfunds.com. Performance for periods including or prior to October 26, 2012, is that of the FBR Gas Utility Index Fund.
The AGA Stock Index is a capitalization-weighted index, adjusted monthly, consisting of member companies of the American Gas Association. The S&P 500® Index is a capitalization-weighted index that is designed to represent the broad domestic economy through changes in the aggregate market value of 500 stocks across all major industries. One cannot invest directly in an index. These indices are used herein for comparative purposes in accordance with Securities and Exchange Commission regulations.
Standard & Poor’s Financial Services is the source and owner of the S&P® and S&P 500® trademarks.
The expense ratios presented are from the most recent prospectus. The expense ratios for the current reporting period are available in the Financial Highlights section of this report.
PERFORMANCE NARRATIVE
Portfolio Managers Ryan C. Kelley, CFA, and L. Joshua Wein, CAIA
Performance:
For the 12-month period ended October 31, 2020, the Investor Class of the Hennessy Gas Utility Fund returned -12.49%, underperforming both the AGA Stock Index (the Fund’s primary benchmark) and the S&P 500® Index, which returned -11.56% and 9.71%, respectively, for the same period.
The Fund slightly underperformed its primary benchmark due to Fund expenses, the timing of cash flows, trading costs, and the impact of holding cash. The Fund underperformed the broader domestic equity market, as represented by the S&P 500® Index, in part due to strong investor preference for higher growth information technology equities in the wake of the COVID-19 pandemic. Among the holdings that detracted the most from Fund performance were Midstream company Kinder Morgan, Inc., natural gas utility Atmos Energy Corporation, and pipeline company TC Energy Corporation. Among the holdings that contributed the most to performance over the period were multi-utility companies WEC Energy Group, Inc. and National Grid PLC and electric utility Xcel Energy, Inc.
The Fund continues to hold all the companies mentioned because they all continue to be included in the AGA Stock Index.
Portfolio Strategy:
The Fund’s objective is to maintain a high correlation with its primary benchmark, the AGA Stock Index. The Fund seeks to achieve this goal by owning all of the companies in the AGA Stock Index in substantially the same proportion as their weightings in the AGA Stock Index. The Fund seeks total returns by investing in natural gas distribution companies with the potential for both income and long-term capital appreciation.
The investment thesis of the Fund is that competitive and stable pricing, abundant domestic supply, and new sources and uses of natural gas should lead to long-term, steady growth in demand that should drive growth in natural gas distribution. In turn, this should drive long-term growth in earnings of the companies held by the Fund. In addition, we believe that natural gas’s position as the cleanest of the fossil fuels should lead to additional increased demand, particularly from the electricity generation industry.
Investment Commentary:
We believe the strategy of the Fund remains compelling. The production of natural gas in the United States, in particular from shale producers, continues to grow steadily. Demand for natural gas from domestic sources, especially the power industry, also continues to trend upwards, despite softness due to the COVID-19 pandemic. In addition, exports of natural gas via pipelines to Mexico and in the form of liquid natural gas to the rest of the world remain a key demand component.
_______________
Opinions expressed are those of the Portfolio Manager as of the date written and are subject to change, are not guaranteed, and should not be considered investment advice or an indication of trading intent.
Investments in foreign securities may involve political, economic, and currency risks, greater volatility, and differences in accounting methods. Investments are focused in the natural gas distribution and transmission industry; sector funds may be subject to a higher degree of market risk. Please see the Fund’s prospectus for a more complete discussion of these and other risks.
| HENNESSY FUNDS | 1-800-966-4354 | |
References to specific securities should not be considered a recommendation to buy or sell any security. Fund holdings and sector allocations are subject to change. Please refer to the Schedule of Investments included in this report for additional portfolio information.
Cash flow refers to the net amount of cash and cash equivalents transferred into and out of a company. Correlation measures the relationship between the changes of two or more financial variables over time.
| PERFORMANCE OVERVIEW/SCHEDULE OF INVESTMENTS |
Financial Statements
Schedule of Investments as of October 31, 2020 |
HENNESSY GAS UTILITY FUND
(% of Net Assets)
| TOP TEN HOLDINGS (EXCLUDING MONEY MARKET FUNDS) | % NET ASSETS |
| Cheniere Energy, Inc. | 5.14% |
| Dominion Energy, Inc. | 5.09% |
| WEC Energy Group, Inc. | 5.07% |
| National Grid PLC – ADR | 4.97% |
| Enbridge, Inc. | 4.96% |
| Kinder Morgan, Inc. | 4.94% |
| Sempra Energy | 4.92% |
| The Southern Co. | 4.88% |
| TC Energy Corp. | 4.86% |
| Atmos Energy Corp. | 4.82% |
Note: For presentation purposes, the Fund has grouped some of the industry categories. For purposes of categorizing securities for compliance with Section 8(b)(1) of the Investment Company Act of 1940, as amended, the Fund uses more specific industry classifications.
The Global Industry Classification Standard (GICS®) was developed by and is the exclusive property and a service mark of MSCI, Inc. and Standard & Poor’s Financial Services LLC. It has been licensed for use by the Hennessy Funds.
| HENNESSY FUNDS | 1-800-966-4354 | |
| COMMON STOCKS – 98.96% | | Number | | | | | | % of | |
| | | of Shares | | | Value | | | Net Assets | |
| Energy – 20.05% | | | | | | | | | |
| Cheniere Energy, Inc. (a) | | | 590,917 | | | $ | 28,287,197 | | | | 5.14 | % |
| Enbridge, Inc. (b) | | | 989,565 | | | | 27,272,412 | | | | 4.96 | % |
| Kinder Morgan, Inc. | | | 2,282,101 | | | | 27,157,002 | | | | 4.94 | % |
| TC Energy Corp. (b) | | | 678,153 | | | | 26,759,917 | | | | 4.86 | % |
| Tellurian, Inc. (a) | | | 846,690 | | | | 812,822 | | | | 0.15 | % |
| | | | | | | | 110,289,350 | | | | 20.05 | % |
| | | | | | | | | | | | | |
| Financials – 2.64% | | | | | | | | | | | | |
| Berkshire Hathaway, Inc., Class A (a) | | | 48 | | | | 14,520,001 | | | | 2.64 | % |
| | | | | | | | | | | | | |
| Utilities – 76.27% | | | | | | | | | | | | |
| Algonquin Power & Utilities Corp. (b) | | | 227,864 | | | | 3,452,140 | | | | 0.63 | % |
| ALLETE, Inc. | | | 675 | | | | 34,816 | | | | 0.01 | % |
| Ameren Corp. | | | 72,940 | | | | 5,916,893 | | | | 1.08 | % |
| Atmos Energy Corp. | | | 288,886 | | | | 26,482,180 | | | | 4.82 | % |
| Avangrid, Inc. | | | 128,700 | | | | 6,350,058 | | | | 1.15 | % |
| Avista Corp. | | | 40,572 | | | | 1,347,802 | | | | 0.25 | % |
| Black Hills Corp. | | | 102,047 | | | | 5,781,983 | | | | 1.05 | % |
| Centerpoint Energy, Inc. | | | 594,028 | | | | 12,551,812 | | | | 2.28 | % |
| Chesapeake Utilities Corp. | | | 34,758 | | | | 3,378,825 | | | | 0.61 | % |
| CMS Energy Corp. | | | 275,098 | | | | 17,421,956 | | | | 3.17 | % |
| Consolidated Edison, Inc. | | | 205,236 | | | | 16,108,974 | | | | 2.93 | % |
| Corning Natural Gas Holding Corp. | | | 7,099 | | | | 108,970 | | | | 0.02 | % |
| Dominion Energy, Inc. | | | 348,477 | | | | 27,996,642 | | | | 5.09 | % |
| DTE Energy Co. | | | 136,504 | | | | 16,847,324 | | | | 3.06 | % |
| Duke Energy Corp. | | | 192,087 | | | | 17,693,133 | | | | 3.22 | % |
| Entergy Corp. | | | 5,960 | | | | 603,271 | | | | 0.11 | % |
| Eversource Energy | | | 74,775 | | | | 6,525,614 | | | | 1.19 | % |
| Exelon Corp. | | | 175,131 | | | | 6,985,976 | | | | 1.27 | % |
| Fortis, Inc. (b) | | | 225,076 | | | | 8,890,502 | | | | 1.62 | % |
| MDU Resources Group, Inc. | | | 258,807 | | | | 6,149,254 | | | | 1.12 | % |
| MGE Energy, Inc. | | | 22,829 | | | | 1,484,342 | | | | 0.27 | % |
| National Fuel Gas Co. | | | 165,024 | | | | 6,594,359 | | | | 1.20 | % |
| National Grid PLC – ADR (b) | | | 460,244 | | | | 27,361,506 | | | | 4.97 | % |
| New Jersey Resources Corp. | | | 221,134 | | | | 6,452,690 | | | | 1.17 | % |
| NiSource, Inc. | | | 716,181 | | | | 16,450,678 | | | | 2.99 | % |
The accompanying notes are an integral part of these financial statements.
| COMMON STOCKS | | Number | | | | | | % of | |
| | | of Shares | | | Value | | | Net Assets | |
| Utilities (Continued) | | | | | | | | | |
| Northwest Natural Holding Co. | | | 90,503 | | | $ | 4,021,953 | | | | 0.73 | % |
| NorthWestern Corp. | | | 31,798 | | | | 1,657,630 | | | | 0.30 | % |
| ONE Gas, Inc. | | | 157,575 | | | | 10,878,978 | | | | 1.98 | % |
| PG&E Corp. (a) | | | 1,489,649 | | | | 14,241,044 | | | | 2.59 | % |
| PPL Corp. | | | 70,919 | | | | 1,950,272 | | | | 0.35 | % |
| Public Service Enterprise Group, Inc. | | | 276,290 | | | | 16,066,263 | | | | 2.92 | % |
| RGC Resources, Inc. | | | 26,254 | | | | 624,845 | | | | 0.11 | % |
| Sempra Energy | | | 215,940 | | | | 27,070,238 | | | | 4.92 | % |
| South Jersey Industries, Inc. | | | 270,671 | | | | 5,215,830 | | | | 0.95 | % |
| Southwest Gas Holdings, Inc. | | | 136,317 | | | | 8,958,753 | | | | 1.63 | % |
| Spire, Inc. | | | 106,291 | | | | 5,956,548 | | | | 1.08 | % |
| The Southern Co. | | | 466,900 | | | | 26,823,405 | | | | 4.88 | % |
| UGI Corp. | | | 165,152 | | | | 5,341,016 | | | | 0.97 | % |
| Unitil Corp. | | | 27,498 | | | | 950,056 | | | | 0.17 | % |
| WEC Energy Group, Inc. | | | 277,440 | | | | 27,896,592 | | | | 5.07 | % |
| Xcel Energy, Inc. | | | 183,799 | | | | 12,871,444 | | | | 2.34 | % |
| | | | | | | | 419,496,567 | | | | 76.27 | % |
| Total Common Stocks | | | | | | | | | | | | |
| Cost $307,689,408) | | | | | | | 544,305,918 | | | | 98.96 | % |
| | | | | | | | | | | | | |
| PARTNERSHIPS – 0.37% | | | | | | | | | | | | |
| | | | | | | | | | | | | |
| Energy – 0.37% | | | | | | | | | | | | |
| Plains GP Holdings LP, Class A | | | 322,255 | | | | 2,059,209 | | | | 0.37 | % |
| | | | | | | | | | | | | |
| Total Partnerships | | | | | | | | | | | | |
| (Cost $5,734,667) | | | | | | | 2,059,209 | | | | 0.37 | % |
The accompanying notes are an integral part of these financial statements.
| HENNESSY FUNDS | 1-800-966-4354 | |
| SHORT-TERM INVESTMENTS – 0.73% | | Number | | | | | | % of | |
| | | of Shares | | | Value | | | Net Assets | |
| Money Market Funds – 0.73% | | | | | | | | | |
| First American Government Obligations Fund, | | | | | | | | | |
| Institutional Class, 0.05% (c) | | | 3,995,401 | | | $ | 3,995,401 | | | | 0.73 | % |
| | | | | | | | | | | | | |
| Total Short-Term Investments | | | | | | | | | | | | |
| (Cost $3,995,401) | | | | | | | 3,995,401 | | | | 0.73 | % |
| | | | | | | | | | | | | |
| Total Investments | | | | | | | | | | | | |
| (Cost $317,419,476) – 100.06% | | | | | | | 550,360,528 | | | | 100.06 | % |
| Liabilities in Excess of Other Assets – (0.06)% | | | | | | | (336,289 | ) | | | (0.06 | )% |
| | | | | | | | | | | | | |
TOTAL NET ASSETS – 100.00% | | | | | | $ | 550,024,239 | | | | 100.00 | % |
Percentages are stated as a percent of net assets.
ADR – American Depositary Receipt
PLC – Public Limited Company
| (a) | Non-income-producing security. |
| (b) | U.S.-traded security of a foreign corporation. |
| (c) | The rate listed is the fund’s seven-day yield as of October 31, 2020. |
Summary of Fair Value Exposure as of October 31, 2020
The following is a summary of the inputs used to value the Fund’s net assets as of October 31, 2020 (see Note 3 in the accompanying Notes to the Financial Statements):
| Common Stocks | | Level 1 | | | Level 2 | | | Level 3 | | | Total | |
| Energy | | $ | 110,289,350 | | | $ | — | | | $ | — | | | $ | 110,289,350 | |
| Financials | | | 14,520,001 | | | | — | | | | — | | | | 14,520,001 | |
| Utilities | | | 419,496,567 | | | | — | | | | — | | | | 419,496,567 | |
| Total Common Stocks | | $ | 544,305,918 | | | $ | — | | | $ | — | | | $ | 544,305,918 | |
| Partnerships | | | | | | | | | | | | | | | | |
| Energy | | $ | 2,059,209 | | | $ | — | | | $ | — | | | $ | 2,059,209 | |
| Total Partnerships | | $ | 2,059,209 | | | $ | — | | | $ | — | | | $ | 2,059,209 | |
| Short-Term Investments | | | | | | | | | | | | | | | | |
| Money Market Funds | | $ | 3,995,401 | | | $ | — | | | $ | — | | | $ | 3,995,401 | |
| Total Short-Term Investments | | $ | 3,995,401 | | | $ | — | | | $ | — | | | $ | 3,995,401 | |
| Total Investments | | $ | 550,360,528 | | | $ | — | | | $ | — | | | $ | 550,360,528 | |
The accompanying notes are an integral part of these financial statements.
| SCHEDULE OF INVESTMENTS/STATEMENT OF ASSETS AND LIABILITIES |
Financial Statements
Statement of Assets and Liabilities as of October 31, 2020 |
| ASSETS: | | | |
| Investments in securities, at value (cost $317,419,476) | | $ | 550,360,528 | |
| Dividends and interest receivable | | | 198,555 | |
| Receivable for fund shares sold | | �� | 63,071 | |
| Return of capital receivable | | | 657,057 | |
| Prepaid expenses and other assets | | | 41,076 | |
| Total assets | | | 551,320,287 | |
| | | | | |
| LIABILITIES: | | | | |
| Payable for fund shares redeemed | | | 659,669 | |
| Payable to advisor | | | 193,111 | |
| Payable to administrator | | | 110,154 | |
| Payable to auditor | | | 23,100 | |
| Accrued distribution fees | | | 98,206 | |
| Accrued service fees | | | 42,405 | |
| Accrued trustees fees | | | 3,938 | |
| Accrued expenses and other payables | | | 165,465 | |
| Total liabilities | | | 1,296,048 | |
| NET ASSETS | | $ | 550,024,239 | |
| | | | | |
| NET ASSETS CONSISTS OF: | | | | |
| Capital stock | | $ | 327,209,215 | |
| Total distributable earnings | | | 222,815,024 | |
| Total net assets | | $ | 550,024,239 | |
| | | | | |
| NET ASSETS: | | | | |
| Investor Class | | | | |
| Shares authorized (no par value) | | Unlimited | |
| Net assets applicable to outstanding shares | | $ | 483,561,636 | |
| Shares issued and outstanding | | | 20,081,511 | |
| Net asset value, offering price, and redemption price per share | | $ | 24.08 | |
| | | | | |
| Institutional Class | | | | |
| Shares authorized (no par value) | | Unlimited | |
| Net assets applicable to outstanding shares | | $ | 66,462,603 | |
| Shares issued and outstanding | | | 2,767,622 | |
| Net asset value, offering price, and redemption price per share | | $ | 24.01 | |
The accompanying notes are an integral part of these financial statements.
| HENNESSY FUNDS | 1-800-966-4354 | |
Financial Statements
Statement of Operations for the year ended October 31, 2020 |
| INVESTMENT INCOME: | | | |
Dividend income(1) | | $ | 22,437,519 | |
| Interest income | | | 25,685 | |
| Total investment income | | | 22,463,204 | |
| | | | | |
| EXPENSES: | | | | |
| Investment advisory fees (See Note 5) | | | 2,753,609 | |
| Sub-transfer agent expenses – Investor Class (See Note 5) | | | 1,104,223 | |
| Sub-transfer agent expenses – Institutional Class (See Note 5) | | | 92,422 | |
| Distribution fees – Investor Class (See Note 5) | | | 902,360 | |
| Administration, accounting, custody, and transfer agent fees (See Note 5) | | | 752,394 | |
| Service fees – Investor Class (See Note 5) | | | 601,574 | |
| Reports to shareholders | | | 58,434 | |
| Federal and state registration fees | | | 46,344 | |
| Compliance expense (See Note 5) | | | 27,706 | |
| Trustees’ fees and expenses | | | 25,581 | |
| Audit fees | | | 23,097 | |
| Interest expense (See Note 7) | | | 12,879 | |
| Legal fees | | | 10,575 | |
| Other expenses | | | 349,022 | |
| Total expenses | | | 6,760,220 | |
| NET INVESTMENT INCOME | | $ | 15,702,984 | |
| | | | | |
| REALIZED AND UNREALIZED GAINS (LOSSES): | | | | |
| Net realized gain on investments | | $ | 54,725,195 | |
| Net change in unrealized appreciation/depreciation on investments | | | (171,354,296 | ) |
| Net loss on investments | | | (116,629,101 | ) |
| NET DECREASE IN NET ASSETS RESULTING FROM OPERATIONS | | $ | (100,926,117 | ) |
(1) | Net of foreign taxes withheld and issuance fees of $715,067. |
The accompanying notes are an integral part of these financial statements.
| STATEMENT OF OPERATIONS/STATEMENTS OF CHANGES IN NET ASSETS |
Financial Statements
| Statements of Changes in Net Assets |
| | | Year Ended | | | Year Ended | |
| | | October 31, 2020 | | | October 31, 2019 | |
| OPERATIONS: | | | | | | |
| Net investment income | | $ | 15,702,984 | | | $ | 18,043,168 | |
| Net realized gain on investments | | | 54,725,195 | | | | 63,413,446 | |
| Net change in unrealized | | | | | | | | |
| appreciation/depreciation on investments | | | (171,354,296 | ) | | | 46,797,092 | |
| Net increase (decrease) in net assets | | | | | | | | |
| resulting from operations | | | (100,926,117 | ) | | | 128,253,706 | |
| | | | | | | | | |
| DISTRIBUTIONS TO SHAREHOLDERS: | | | | | | | | |
| Distributable earnings – Investor Class | | | (49,160,002 | ) | | | (87,242,469 | ) |
| Distributable earnings – Institutional Class | | | (7,345,698 | ) | | | (10,746,642 | ) |
| Total distributions | | | (56,505,700 | ) | | | (97,989,111 | ) |
| | | | | | | | | |
| CAPITAL SHARE TRANSACTIONS: | | | | | | | | |
| Proceeds from shares subscribed – Investor Class | | | 14,476,846 | | | | 27,141,120 | |
| Proceeds from shares subscribed – Institutional Class | | | 14,135,940 | | | | 29,423,854 | |
| Dividends reinvested – Investor Class | | | 46,815,183 | | | | 83,615,102 | |
| Dividends reinvested – Institutional Class | | | 6,501,998 | | | | 9,491,172 | |
| Cost of shares redeemed – Investor Class | | | (204,352,983 | ) | | | (198,693,830 | ) |
| Cost of shares redeemed – Institutional Class | | | (41,410,617 | ) | | | (42,887,435 | ) |
| Net decrease in net assets derived | | | | | | | | |
| from capital share transactions | | | (163,833,633 | ) | | | (91,910,017 | ) |
| TOTAL DECREASE IN NET ASSETS | | | (321,265,450 | ) | | | (61,645,422 | ) |
| | | | | | | | | |
| NET ASSETS: | | | | | | | | |
| Beginning of year | | | 871,289,689 | | | | 932,935,111 | |
| End of year | | $ | 550,024,239 | | | $ | 871,289,689 | |
| | | | | | | | | |
| CHANGES IN SHARES OUTSTANDING: | | | | | | | | |
| Shares sold – Investor Class | | | 561,691 | | | | 951,713 | |
| Shares sold – Institutional Class | | | 539,370 | | | | 1,020,364 | |
| Shares issued to holders as reinvestment | | | | | | | | |
| of dividends – Investor Class | | | 1,761,437 | | | | 3,050,796 | |
| Shares issued to holders as reinvestment | | | | | | | | |
| of dividends – Institutional Class | | | 245,860 | | | | 346,698 | |
| Shares redeemed – Investor Class | | | (8,021,029 | ) | | | (6,995,506 | ) |
| Shares redeemed – Institutional Class | | | (1,643,216 | ) | | | (1,502,291 | ) |
| Net decrease in shares outstanding | | | (6,555,887 | ) | | | (3,128,226 | ) |
The accompanying notes are an integral part of these financial statements.
| HENNESSY FUNDS | 1-800-966-4354 | |
Financial Statements
For an Investor Class share outstanding throughout each year
PER SHARE DATA:
Net asset value, beginning of year
Income from investment operations:
Net investment income
Net realized and unrealized gains (losses) on investments
Total from investment operations
Less distributions:
Dividends from net investment income
Dividends from net realized gains
Total distributions
Net asset value, end of year
TOTAL RETURN
SUPPLEMENTAL DATA AND RATIOS:
Net assets, end of year (millions)
Ratio of expenses to average net assets
Ratio of net investment income to average net assets
Portfolio turnover rate(2)
(1) | Calculated using the average shares outstanding method. |
(2) | Calculated on the basis of the Fund as a whole. |
The accompanying notes are an integral part of these financial statements.
| FINANCIAL HIGHLIGHTS — INVESTOR CLASS |
| Year Ended October 31, | |
| 2020 | | | 2019 | | | 2018 | | | 2017 | | | 2016 | |
| | | | | | | | | | | | | | |
| $ | 29.64 | | | $ | 28.68 | | | $ | 30.35 | | | $ | 28.57 | | | $ | 27.69 | |
| | | | | | | | | | | | | | | | | | | |
| | | | | | | | | | | | | | | | | | | |
| | 0.58 | (1) | | | 0.56 | (1) | | | 0.65 | | | | 0.70 | | | | 0.62 | |
| | (4.14 | ) | | | 3.50 | | | | (1.52 | ) | | | 2.20 | | | | 1.58 | |
| | (3.56 | ) | | | 4.06 | | | | (0.87 | ) | | | 2.90 | | | | 2.20 | |
| | | | | | | | | | | | | | | | | | | |
| | | | | | | | | | | | | | | | | | | |
| | (0.56 | ) | | | (0.62 | ) | | | (0.64 | ) | | | (0.72 | ) | | | (0.69 | ) |
| | (1.44 | ) | | | (2.48 | ) | | | (0.16 | ) | | | (0.40 | ) | | | (0.63 | ) |
| | (2.00 | ) | | | (3.10 | ) | | | (0.80 | ) | | | (1.12 | ) | | | (1.32 | ) |
| $ | 24.08 | | | $ | 29.64 | | | $ | 28.68 | | | $ | 30.35 | | | $ | 28.57 | |
| | | | | | | | | | | | | | | | | | | |
| | -12.49 | % | | | 15.28 | % | | | -2.86 | % | | | 10.39 | % | | | 8.52 | % |
| | | | | | | | | | | | | | | | | | | |
| | | | | | | | | | | | | | | | | | | |
| $ | 483.56 | | | $ | 764.10 | | | $ | 825.18 | | | $ | 1,306.70 | | | $ | 1,454.93 | |
| | 1.02 | % | | | 1.00 | % | | | 1.01 | % | | | 1.01 | % | | | 1.01 | % |
| | 2.24 | % | | | 1.98 | % | | | 2.18 | % | | | 2.34 | % | | | 2.25 | % |
| | 16 | % | | | 12 | % | | | 14 | % | | | 18 | % | | | 38 | % |
The accompanying notes are an integral part of these financial statements.
| HENNESSY FUNDS | 1-800-966-4354 | |
Financial Statements
For an Institutional Class share outstanding throughout each period
PER SHARE DATA:
Net asset value, beginning of period
Income from investment operations:
Net investment income
Net realized and unrealized gains (losses) on investments
Total from investment operations
Less distributions:
Dividends from net investment income
Dividends from net realized gains
Total distributions
Net asset value, end of period
TOTAL RETURN
SUPPLEMENTAL DATA AND RATIOS:
Net assets, end of period (millions)
Ratio of expenses to average net assets
Ratio of net investment income to average net assets
Portfolio turnover rate(6)
(1) | Institutional Class shares commenced operations on March 1, 2017. |
(2) | Calculated using the average shares outstanding method. |
(3) | Actual return from inception date of March 1, 2017, to the year end of October 31, 2017. |
(4) | Not annualized. |
(5) | Annualized. |
(6) | Calculated on the basis of the Fund as a whole. |
The accompanying notes are an integral part of these financial statements.
| FINANCIAL HIGHLIGHTS — INSTITUTIONAL CLASS |
| | | | | | | | | | Period Ended | |
| Year Ended October 31, | | | October 31, | |
| 2020 | | | 2019 | | | 2018 | | | 2017(1) | |
| | | | | | | | | | | |
| $ | 29.56 | | | $ | 28.65 | | | $ | 30.32 | | | $ | 29.68 | |
| | | | | | | | | | | | | | | |
| | | | | | | | | | | | | | | |
| | 0.66 | (2) | | | 0.64 | (2) | | | 0.71 | | | | 0.62 | |
| | (4.13 | ) | | | 3.50 | | | | (1.47 | ) | | | 0.72 | |
| | (3.47 | ) | | | 4.14 | | | | (0.76 | ) | | | 1.34 | |
| | | | | | | | | | | | | | | |
| | | | | | | | | | | | | | | |
| | (0.64 | ) | | | (0.73 | ) | | | (0.75 | ) | | | (0.70 | ) |
| | (1.44 | ) | | | (2.50 | ) | | | (0.16 | ) | | | — | |
| | (2.08 | ) | | | (3.23 | ) | | | (0.91 | ) | | | (0.70 | ) |
| $ | 24.01 | | | $ | 29.56 | | | $ | 28.65 | | | $ | 30.32 | |
| | | | | | | | | | | | | | | |
| | -12.22 | % | | | 15.63 | % | | | -2.51 | % | | | 4.56 | %(3)(4) |
| | | | | | | | | | | | | | | |
| | | | | | | | | | | | | | | |
| $ | 66.46 | | | $ | 107.18 | | | $ | 107.75 | | | $ | 84.62 | |
| | 0.70 | % | | | 0.69 | % | | | 0.65 | % | | | 0.64 | %(5) |
| | 2.57 | % | | | 2.25 | % | | | 2.47 | % | | | 1.23 | %(5) |
| | 16 | % | | | 12 | % | | | 14 | % | | | 18 | %(4) |
The accompanying notes are an integral part of these financial statements.
| HENNESSY FUNDS | 1-800-966-4354 | |
Financial Statements
Notes to the Financial Statements October 31, 2020 |
1). ORGANIZATION
The Hennessy Gas Utility Fund (the “Fund”) is a series of Hennessy Funds Trust (the “Trust”), which was organized as a Delaware statutory trust on September 17, 1992. The Fund is an open-end management investment company registered under the Investment Company Act of 1940, as amended. The investment objective of the Fund is income and capital appreciation. The Fund is a diversified fund.
The Fund offers Investor Class and Institutional Class shares. Each class of shares differs principally in its respective 12b-1 distribution and service, shareholder servicing, and sub-transfer agent expenses. There are no sales charges. Each class has identical rights to earnings, assets, and voting privileges, except for class-specific expenses and exclusive rights to vote on matters affecting only one class.
As an investment company, the Fund follows the investment company accounting and reporting guidance of the Financial Accounting Standards Board (“FASB”) Accounting Standard Codification Topic 946 “Financial Services—Investment Companies.”
2). SIGNIFICANT ACCOUNTING POLICIES
The following is a summary of significant accounting policies consistently followed by the Fund in the preparation of the financial statements. These policies conform to U.S. generally accepted accounting principles (“GAAP”).
| a). | Securities Valuation – All investments in securities are valued in accordance with the Fund’s valuation policies and procedures, as described in Note 3. |
| | |
| b). | Federal Income Taxes – No provision for federal income taxes or excise taxes has been made because the Fund has elected to be taxed as a regulated investment company and intends to distribute substantially all of its taxable income to its shareholders and otherwise comply with the provisions of the Internal Revenue Code of 1986, as amended, applicable to regulated investment companies. Net investment income/loss and realized gains/losses for federal income tax purposes may differ from those reported in the financial statements because of temporary book and tax basis differences. Temporary differences are primarily the result of the treatment of wash sales for tax reporting purposes. The Fund recognizes interest and penalties related to income tax benefits, if any, in the Statement of Operations as an income tax expense. Distributions from net realized gains for book purposes may include short-term capital gains, which are included as ordinary income to shareholders for tax purposes. The Fund may utilize equalization accounting for tax purposes and designate earnings and profits, including net realized gains distributed to shareholders on redemption of shares, as part of the dividends paid deduction for income tax purposes. |
| | |
| | Due to inherent differences in the recognition of income, expenses, and realized gains/losses under GAAP and federal income tax regulations, permanent differences between book and tax basis for reporting are identified and appropriately reclassified in the Statement of Assets and Liabilities, as needed. The adjustments for fiscal year 2020 are as follows: |
| | Total | | |
| | Distributable | | |
| | Earnings
| Capital Stock | |
| | $(7,964,097) | $7,964,097 | |
| NOTES TO THE FINANCIAL STATEMENTS |
| c). | Accounting for Uncertainty in Income Taxes – The Fund has accounting policies regarding recognition and measurement of tax positions taken or expected to be taken on a tax return. The tax returns of the Fund for the prior three fiscal years are open for examination. The Fund has reviewed all open tax years in major jurisdictions and concluded that there is no impact on the Fund’s net assets and no tax liability resulting from unrecognized tax benefits relating to uncertain income tax positions taken or expected to be taken on a tax return. The Fund’s major tax jurisdictions are U.S. federal and Delaware. |
| | |
| d). | Income and Expenses – Dividend income is recognized on the ex-dividend date or as soon as information is available to the Fund. Interest income, which includes the amortization of premium and accretion of discount, is recognized on an accrual basis. Market discounts, original issue discounts, and market premiums on debt securities are accreted or amortized to interest income over the life of a security with a corresponding increase or decrease, as applicable, in the cost basis of such security using the yield to maturity method, or where applicable, the first call date of the security. Other non-cash dividends are recognized as investment income at the fair value of the property received. The Fund is charged for those expenses that are directly attributable to its portfolio, such as advisory, administration, and certain shareholder service fees. Income, expenses (other than expenses attributable to a specific class), and realized and unrealized gains/losses on investments are allocated to each class of shares based on such class’s net assets. |
| | |
| e). | Distributions to Shareholders – Dividends from net investment income for the Fund, if any, are declared and paid at the end of each calendar quarter. Distributions of net realized capital gains, if any, are declared and paid annually, usually in December. |
| | |
| f). | Security Transactions – Investment and shareholder transactions are recorded on the trade date. The Fund determines the realized gain/loss from an investment transaction by comparing the original cost of the security lot sold with the net sale proceeds. Discounts and premiums on securities purchased are accreted or amortized, respectively, over the life of each such security. |
| | |
| g). | Use of Estimates – The preparation of financial statements in conformity with GAAP requires management to make estimates and assumptions that affect the reported amounts of assets and liabilities and disclosure of contingent assets and liabilities at the date of the financial statements and the reported change in net assets during the reporting period. Actual results could differ from those estimates. |
| | |
| h). | Share Valuation – The net asset value (“NAV”) per share of the Fund is calculated by dividing (i) the total value of the securities held by the Fund, plus cash and other assets, minus all liabilities (including estimated accrued expenses) by (ii) the total number of shares outstanding for the Fund, rounded to the nearest $0.01. The Fund’s shares will not be priced on days the New York Stock Exchange is closed for trading. The offering and redemption price per share for the Fund is equal to the Fund’s NAV per share. |
| | |
| i). | New Accounting Pronouncements – In August 2018, the FASB issued Accounting Standards Update No. 2018-13 “Disclosure Framework—Changes to the Disclosure Requirements for Fair Value Measurement” (“ASU 2018-13”). ASU 2018-13 eliminates the requirement to disclose the amount of and reasons for transfers between Level 1 and Level 2 of the fair value hierarchy, the timing of transfers between levels of the fair value hierarchy, and the valuation processes for Level 3 fair value measurements. ASU 2018-13 does not eliminate the requirement to disclose the range and weighted average used to develop significant unobservable inputs for Level 3 fair value measurements, |
| HENNESSY FUNDS | 1-800-966-4354 | |
| | and the changes in unrealized gains and losses for recurring Level 3 fair value measurements. ASU 2018-13 requires that information is provided about the measurement uncertainty of Level 3 fair value measurements as of the reporting date. The guidance is effective for fiscal years beginning after December 15, 2019, and interim periods within those fiscal years. Management evaluated the impact of this change in guidance and, due to the permissibility of early adoption, modified the Fund’s fair value disclosures beginning with its fiscal year 2019. |
3). SECURITIES VALUATION
The Fund follows its valuation policies and procedures in determining its net asset value and, in preparing these financial statements, the fair value accounting standards that establish an authoritative definition of fair value and set out a hierarchy for measuring fair value. These standards require additional disclosures about the various inputs and valuation techniques used to develop the measurements of fair value and a discussion of changes in valuation techniques and related inputs during the period. These inputs are summarized in the three broad levels listed below:
| | Level 1 – | Unadjusted, quoted prices in active markets for identical instruments that the Fund has the ability to access at the date of measurement. |
| | | |
| | Level 2 – | Other significant observable inputs (including, but not limited to, quoted prices in active markets for similar instruments, quoted prices in markets that are not active for identical or similar instruments, and model-derived valuations in which all significant inputs and significant value drivers are observable in active markets, such as interest rates, prepayment speeds, credit risk curves, default rates, and similar data). |
| | | |
| | Level 3 – | Significant unobservable inputs (including the Fund’s own assumptions about what market participants would use to price the asset or liability based on the best available information) when observable inputs are unavailable. |
The following is a description of the valuation techniques applied to the Fund’s major categories of assets and liabilities on a recurring basis:
| | Equity Securities – Equity securities, including common stocks, preferred stocks, foreign-issued common stocks, exchange-traded funds, closed-end mutual funds, partnerships, rights, and real estate investment trusts, that are traded on a securities exchange for which a last-quoted sales price is readily available will generally be valued at the last sales price as reported by the primary exchange on which the securities are listed. Securities listed on The NASDAQ Stock Market (“NASDAQ”) will generally be valued at the NASDAQ Official Closing Price, which may differ from the last sales price reported. Securities traded on a securities exchange for which a last-quoted sales price is not readily available will generally be valued at the mean between the bid and ask prices. To the extent these securities are actively traded and valuation adjustments are not applied, they are classified in Level 1 of the fair value hierarchy. Securities traded on foreign exchanges generally are not valued at the same time the Fund calculates its NAV because most foreign markets close well before such time. The earlier close of most foreign markets gives rise to the possibility that significant events, including broad market moves, may have occurred in the interim. In certain circumstances, it may be determined that a foreign security needs to be fair valued because it appears that the value of the security might have been materially affected by events occurring after the close of the market in which the security is principally traded, but before the time the Fund calculates its NAV, such as by a development that affects an entire market or region (e.g., a weather-related event) or a potentially global development (e.g., a terrorist attack that may be expected to have an effect on investor expectations worldwide). |
| NOTES TO THE FINANCIAL STATEMENTS |
| | Registered Investment Companies – Investments in open-end registered investment companies, commonly referred to as mutual funds, generally are priced at the ending NAV provided by the applicable mutual fund’s service agent and will be classified in Level 1 of the fair value hierarchy. |
| | |
| | Debt Securities – Debt securities, including corporate bonds, asset-backed securities, mortgage-backed securities, municipal bonds, U.S. Treasuries, and U.S. government agency issues, are generally valued at market on the basis of valuations furnished by an independent pricing service that utilizes both dealer-supplied valuations and formula-based techniques. The pricing service may consider recently executed transactions in securities of the issuer or comparable issuers, market price quotations (where observable), bond spreads, and fundamental data relating to the issuer. In addition, the model may incorporate observable market data, such as reported sales of similar securities, broker quotes, yields, bids, offers, and reference data. Certain securities are valued primarily using dealer quotations. These securities are generally classified in Level 2 of the fair value hierarchy. |
| | |
| | Short-Term Securities – Short-term equity investments, including money market funds, are valued in the manner specified above. Short-term debt investments with an original term to maturity of 60 days or less are valued at amortized cost, which approximates fair market value. If the original term to maturity of a short-term debt investment exceeded 60 days, then the values as of the 61st day prior to maturity are amortized. Amortized cost is not used if its use would be inappropriate due to credit or other impairments of the issuer, in which case the security’s fair value would be determined, as described below. Short-term securities are generally classified in Level 1 or Level 2 of the fair value hierarchy depending on the inputs used and market activity levels for specific securities. |
The Board of Trustees of the Fund (the “Board”) has adopted fair value pricing procedures that are followed when a price for a security is not readily available or if a significant event has occurred that indicates the closing price of a security no longer represents the true value of that security. Fair value pricing determinations are made in good faith in accordance with these procedures. There are numerous criteria that will be given consideration in determining a fair value of a security, such as the trading volume of a security and markets, the values of other similar securities, and news events with direct bearing on a security or markets. Fair value pricing results in an estimated price for a security that reflects the amount the Fund might reasonably expect to receive in a current sale. Depending on the relative significance of the valuation inputs, these securities may be classified in either Level 2 or Level 3 of the fair value hierarchy.
The fair value of foreign securities may be determined with the assistance of a pricing service using correlations between the movement of prices of such securities and indices of domestic securities and other appropriate indicators, such as closing market prices of relevant American Depositary Receipts or futures contracts. Using fair value pricing means that the Fund’s NAV reflects the affected portfolio securities’ values as determined by the Board or its designee, pursuant to the fair value pricing procedures adopted by the Board, instead of being determined by the market. Using a fair value pricing methodology to price a foreign security may result in a value that is different from such foreign security’s most recent closing price and from the value used by other investment companies to calculate their NAVs. Such securities are generally classified in Level 2 of the fair value hierarchy. Because the Fund may invest in foreign securities, the value of the Fund’s portfolio securities may change on days when you will not be able to purchase or redeem your shares.
| HENNESSY FUNDS | 1-800-966-4354 | |
The Board has delegated day-to-day valuation matters to the Valuation and Liquidity Committee comprising representatives from Hennessy Advisors, Inc., the Fund’s investment advisor (the “Advisor”). The function of the Valuation and Liquidity Committee is to value securities where current and reliable market quotations are not readily available. All actions taken by the Valuation and Liquidity Committee are reviewed by the Board.
The Fund has performed an analysis of all existing investments to determine the significance and character of all inputs to their fair value determinations. Various inputs are used to determine the value of the Fund’s investments. The inputs or methodology used for valuing securities are not necessarily an indication of the risk associated with investing in those securities. Details related to the fair value hierarchy of the Fund’s securities as of October 31, 2020, are included in the Schedule of Investments.
4). INVESTMENT TRANSACTIONS
Purchases and sales of investment securities (excluding government and short-term investments) for the Fund during fiscal year 2020 were $106,951,393 and $304,915,085, respectively.
There were no purchases or sales/maturities of long-term U.S. government securities for the Fund during fiscal year 2020.
The Fund is permitted to purchase or sell securities from or to another fund in the Hennessy Funds family of funds (collectively, the “Hennessy Funds”) under specified conditions outlined in procedures adopted by the Board. The procedures have been designed to ensure that any purchase or sale of securities by the Fund from or to another Hennessy Fund complies with Rule 17a-7 of the Investment Company Act of 1940, as amended. During fiscal year 2020, the Fund did not engage in purchases or sales of securities pursuant to Rule 17a-7 of the Investment Company Act of 1940, as amended.
5). INVESTMENT ADVISORY FEE AND OTHER TRANSACTIONS WITH AFFILIATES
The Advisor provides the Fund with investment advisory services under an Investment Advisory Agreement. The Advisor furnishes all investment advice, office space, and facilities and most of the personnel needed by the Fund. As compensation for its services, the Advisor is entitled to a monthly fee from the Fund. The fee is based on the average daily net assets of the Fund at an annual rate of 0.40%. The net investment advisory fees expensed by the Fund during fiscal year 2020 are included in the Statement of Operations.
The Board has approved a Shareholder Servicing Agreement for Investor Class shares of the Fund, which was instituted to compensate the Advisor for the non-investment advisory services it provides to the Fund. The Shareholder Servicing Agreement provides for a monthly fee paid to the Advisor at an annual rate of 0.10% of the average daily net assets of the Fund attributable to Investor Class shares. The shareholder service fees expensed by the Fund during fiscal year 2020 are included in the Statement of Operations.
The Fund has adopted a plan pursuant to Rule 12b-1 under the Investment Company Act of 1940, as amended, that authorizes payments in connection with the distribution of the Fund’s shares at an annual rate of up to 0.25% of the Fund’s average daily net assets attributable to Investor Class shares. Even though the authorized rate is up to 0.25%, the Fund is currently only using up to 0.15% of its average daily net assets attributable to Investor Class shares for such purpose. Amounts paid under the plan may be spent on any activities or expenses primarily intended to result in the sale of shares, including, but not limited to, advertising, shareholder account servicing, printing and mailing of prospectuses to other than current shareholders, printing and mailing of sales literature, and compensation for sales and marketing activities or to financial institutions and others, such as dealers and distributors. The distribution fees expensed by the Fund during fiscal year 2020 are included in the Statement of Operations.
| NOTES TO THE FINANCIAL STATEMENTS |
The Fund has entered into agreements with various brokers, dealers, and financial intermediaries in connection with the sale of shares of the Fund. The agreements provide for periodic payments of sub-transfer agent expenses by the Fund to the brokers, dealers, and financial intermediaries for providing certain shareholder maintenance services. These shareholder services include the pre-processing and quality control of new accounts, shareholder correspondence, answering customer inquiries regarding account status, and facilitating shareholder telephone transactions. The sub-transfer agent fees expensed by the Fund during fiscal year 2020 are included in the Statement of Operations.
The Fund has entered into an Administrative Services Agreement among the Fund, the Advisor, and the American Gas Association (“AGA”), pursuant to which the AGA provides administrative services to the Fund, including overseeing the calculation of the AGA Stock Index. ScottMadden, Inc. performs the actual computations required to produce the AGA Stock Index and receives a fee for such calculations pursuant to a contractual arrangement with AGA. AGA does not furnish other securities advice to the Fund or the Advisor or make recommendations regarding the purchase or sale of securities by the Fund. Under the terms of the Administrative Services Agreement, which has been approved by the Board, AGA provides the Fund with current information regarding the common stock composition of the AGA Stock Index at least monthly. In addition, on request, AGA provides the Fund and the Advisor with information on the natural gas industry. The Fund pays AGA a fee at an annual rate of 0.04% of the average daily net assets of the Fund.
U.S. Bancorp Fund Services, LLC, d/b/a U.S. Bank Global Fund Services (“Fund Services”) provides the Fund with administrative, accounting, and transfer agent services. As administrator, Fund Services is responsible for activities such as (i) preparing various federal and state regulatory filings, reports, and returns for the Fund, (ii) preparing reports and materials to be supplied to the Board, (iii) monitoring the activities of the Fund’s custodian, transfer agent, and accountants, and (iv) coordinating the preparation and payment of the Fund’s expenses and reviewing the Fund’s expense accruals. U.S. Bank N.A., an affiliate of Fund Services, serves as the Fund’s custodian. The servicing agreements between the Trust and Fund Services and U.S. Bank N.A. contain a fee schedule that is inclusive of administrative, accounting, custody, and transfer agent fees. The administrative, accounting, custody, and transfer agent fees expensed by the Fund during fiscal year 2020 are included in the Statement of Operations.
Quasar Distributors, LLC (“Quasar”) acts as the Fund’s principal underwriter in a continuous public offering of the Fund’s shares. Quasar was an affiliate of Fund Services and U.S. Bank N.A. through March 30, 2020. Effective March 31, 2020, Foreside Financial Group, LLC (“Foreside”) acquired Quasar from Fund Services. As a result of the acquisition, Quasar became a wholly owned broker-dealer subsidiary of Foreside and is no longer affiliated with Fund Services or U.S. Bank N.A. The Board approved a new Distribution Agreement to enable Quasar to continue serving as the Fund’s distributor.
The officers of the Fund are affiliated with the Advisor. With the exception of the Chief Compliance Officer and the Senior Compliance Officer, such officers receive no compensation from the Fund for serving in their respective roles. The Fund, along with the other Hennessy Funds, makes reimbursement payments on an equal basis to the Advisor for a portion of the salary and benefits associated with the office of the Chief Compliance Officer and for all of the salary and benefits associated with the office of the Senior Compliance Officer. The compliance fees expensed by the Fund during fiscal year 2020 are included in the Statement of Operations.
| HENNESSY FUNDS | 1-800-966-4354 | |
6). GUARANTEES AND INDEMNIFICATIONS
Under the Hennessy Funds’ organizational documents, their officers and trustees are indemnified by the Hennessy Funds against certain liabilities arising out of the performance of their duties to the Hennessy Funds. Additionally, in the normal course of business, the Hennessy Funds enter into contracts with service providers that contain general indemnification clauses. The Fund’s maximum exposure under these arrangements is unknown as this would involve future claims that may be made against the Fund that have not yet occurred. Currently, the Fund expects the risk of loss to be remote.
7). LINE OF CREDIT
The Fund has an uncommitted line of credit with the other Hennessy Funds in the amount of the lesser of (i) $100,000,000 or (ii) 33.33% of each Hennessy Fund��s net assets, or 30% for the Fund and 10% for the Hennessy Balanced Fund, intended to provide short-term financing, if necessary, subject to certain restrictions, in connection with shareholder redemptions. The credit facility is with the Hennessy Funds’ custodian bank, U.S. Bank N.A. Borrowings under this arrangement bear interest at the bank’s prime rate and are secured by all of the Fund’s assets (as to its own borrowings only). During fiscal year 2020, the Fund had an outstanding average daily balance and a weighted average interest rate of $328,648 and 3.85%, respectively. The interest expensed by the Fund during fiscal year 2020 is included in the Statement of Operations. The maximum amount outstanding for the Fund during fiscal year 2020 was $8,078,000. As of October 31, 2020, the Fund did not have any borrowings outstanding under the line of credit.
8). FEDERAL TAX INFORMATION
As of October 31, 2020, the components of accumulated earnings (losses) for income tax purposes were as follows:
| | | | Investments | |
| | Cost of investments for tax purposes | | $ | 371,183,621 | |
| | Gross tax unrealized appreciation | | $ | 247,252,665 | |
| | Gross tax unrealized depreciation | | | (68,075,758 | ) |
| | Net tax unrealized appreciation/(depreciation) | | $ | 179,176,907 | |
| | Undistributed ordinary income | | $ | 860,991 | |
| | Undistributed long-term capital gains | | | 42,777,126 | |
| | Total distributable earnings | | $ | 43,638,117 | |
| | Other accumulated gain/(loss) | | $ | — | |
| | Total accumulated gain/(loss) | | $ | 222,815,024 | |
The difference between book-basis unrealized appreciation/depreciation and tax-basis unrealized appreciation/depreciation (as shown above) is attributable primarily to wash sales.
As of October 31, 2020, the Fund had no tax basis capital losses to offset future capital gains.
As of October 31, 2020, the Fund did not defer, on a tax basis, any late-year ordinary losses. Late-year ordinary losses are net ordinary losses incurred after December 31, 2019, but within the taxable year, that are deemed to arise on the first day of the Fund’s next taxable year.
| NOTES TO THE FINANCIAL STATEMENTS |
During fiscal years 2020 and 2019, the tax character of distributions paid by the Fund was as follows:
| | | | Year Ended | | | Year Ended | |
| | | | October 31, 2020 | | | October 31, 2019 | |
| | Ordinary income(1) | | $ | 14,868,613 | | | $ | 18,139,310 | |
| | Long-term capital gain | | | 41,637,087 | | | | 79,849,801 | |
| | Total distributions | | $ | 56,505,700 | | | $ | 97,989,111 | |
| | (1) Ordinary income includes short-term capital gains. |
9). COVID-19 PANDEMIC
The COVID-19 pandemic has adversely impacted global commercial activity and contributed to significant volatility in global equity and debt markets. The pandemic has resulted in quarantines, stay-at-home orders, travel prohibitions, and closures, disrupting supply chains and economic activity. The duration of the pandemic’s effects remain uncertain and difficult to assess. The effects of the pandemic may adversely impact the Fund’s performance and its ability to achieve its investment objective.
10). EVENTS SUBSEQUENT TO YEAR END
Management has evaluated the Fund’s related events and transactions that occurred subsequent to October 31, 2020, through the date of issuance of the Fund’s financial statements. Other than as disclosed below, management has determined that there were no subsequent events requiring recognition or disclosure in the financial statements.
On December 8, 2020, capital gains were declared and paid to shareholders of record on December 7, 2020, as follows:
| | | Long-term |
| | Investor Class | $1.93799 |
| | Institutional Class | $1.93335 |
| HENNESSY FUNDS | 1-800-966-4354 | |
Report of Independent Registered Public
Accounting Firm
To the Board of Trustees of Hennessy Funds Trust
and the shareholders of the Hennessy Gas Utility Fund
Novato, CA
Opinion on the Financial Statements
We have audited the accompanying statement of assets and liabilities of the Hennessy Gas Utility Fund (the “Fund”), a series of Hennessy Funds Trust, including the schedule of investments, as of October 31, 2020, the related statement of operations for the year then ended, the statements of changes in net assets for each of the two years in the period then ended, the financial highlights for each of the five years in the period then ended, and the related notes (collectively referred to as the “financial statements”). In our opinion, the financial statements present fairly, in all material respects, the financial position of the Fund as of October 31, 2020, the results of its operations for the year then ended, the changes in its net assets for each of the two years in the period then ended, and the financial highlights for each of the five years in the period then ended in conformity with accounting principles generally accepted in the United States of America.
Basis for Opinion
These financial statements are the responsibility of the Fund’s management. Our responsibility is to express an opinion on the Fund’s financial statements based on our audits. We are a public accounting firm registered with the Public Company Accounting Oversight Board (United States) (“PCAOB”) and are required to be independent with respect to the Fund in accordance with the U.S. federal securities laws and the applicable rules and regulations of the Securities and Exchange Commission and the PCAOB. We have served as the auditor of one or more of the funds in the Trust since 2002.
We conducted our audits in accordance with the standards of the PCAOB. Those standards require that we plan and perform the audit to obtain reasonable assurance about whether the financial statements are free of material misstatement, whether due to error or fraud. The Fund is not required to have, nor were we engaged to perform, an audit of its internal control over financial reporting. As part of our audits we are required to obtain an understanding of internal control over financial reporting, but not for the purpose of expressing an opinion on the effectiveness of the Fund’s internal control over financial reporting. Accordingly, we express no such opinion.
Our audits included performing procedures to assess the risks of material misstatement of the financial statements, whether due to error or fraud, and performing procedures that respond to those risks. Such procedures included examining, on a test basis, evidence regarding the amounts and disclosures in the financial statements. Our audits also included evaluating the accounting principles used and significant estimates made by management, as well as evaluating the overall presentation of the financial statements. Our procedures included confirmation of securities owned as of October 31, 2020 by correspondence with the custodian. We believe that our audits provide a reasonable basis for our opinion.
| | |
| | TAIT, WELLER & BAKER LLP |
Philadelphia, Pennsylvania
December 23, 2020
| REPORT OF INDEPENDENT REGISTERED PUBLIC ACCOUNTING FIRM/TRUSTEES AND OFFICERS |
Trustees and Officers of the Fund (Unaudited)
The business and affairs of the Funds are managed under the direction of the Board of Trustees of the Trust, and the Board of Trustees elects the officers of the Trust. From time to time, the Board of Trustees also has appointed advisers to the Board of Trustees (“Advisers”) with the intention of having qualified individuals serve in an advisory capacity to garner experience in the mutual fund and asset management industry and be considered as potential Trustees in the future. There are currently three Advisers: Brian Alexander, Doug Franklin, and Claire Knoles. As Advisers, Mr. Alexander, Mr. Franklin, and Ms. Knoles attend meetings of the Board of Trustees and act as non-voting participants. Information pertaining to the Trustees, Advisers, and the officers of the Trust is set forth below. The Trustees and officers serve until their successors are duly elected and qualified or until their earlier death, resignation, or removal. Each Trustee oversees all 16 Hennessy Funds. Unless otherwise indicated, the address of all persons listed below is 7250 Redwood Boulevard, Suite 200, Novato, CA 94945. The Fund’s Statement of Additional Information includes more information about the persons listed below and is available without charge by calling 1-800-966-4354 or by visiting www.hennessyfunds.com.
| | | | Other |
| | | | Directorships |
| | | | Held Outside |
| Name, Age, | | | of Fund |
| and Position Held | Start Date | Principal Occupation(s) | Complex During |
with the Trust
| of Service
| During Past Five Years
| Past Five Years
|
| Disinterested Trustees and Advisers | | | |
| | | | |
| J. Dennis DeSousa | January 1996 | Mr. DeSousa is a real estate investor. | None. |
| 84 | | | |
| Trustee | | | |
| | | | |
| Robert T. Doyle | January 1996 | Mr. Doyle has been the Sheriff of | None. |
| 73 | | Marin County, California since 1996. | |
| Trustee | | | |
| | | | |
| Gerald P. Richardson | May 2004 | Mr. Richardson is an independent | None. |
| 75 | | consultant in the securities industry. | |
| Trustee | | | |
| | | | |
| Brian Alexander | March 2015 | Mr. Alexander has worked for the | None. |
| 39 | | Sutter Health organization since | |
| Adviser to the Board | | 2011 in various positions. He has | |
| | | served as the Chief Executive Officer | |
| | | of the Sutter Roseville Medical | |
| | | Center since 2018. From 2016 through | |
| | | 2018, he served as the Vice President | |
| | | of Strategy for the Sutter Health Valley | |
| | | Area, which includes 11 hospitals, | |
| | | 13 ambulatory surgery centers, | |
| | | 16,000 employees, and 1,900 physicians. | |
| | | From 2013 through 2016, Mr. Alexander | |
| | | served as Sutter Novato Community | |
| | | Hospital’s Chief Administrative Officer. | |
| HENNESSY FUNDS | 1-800-966-4354 | |
| | | | Other |
| | | | Directorships |
| | | | Held Outside |
| Name, Age, | | | of Fund |
| and Position Held | Start Date | Principal Occupation(s) | Complex During |
with the Trust
| of Service
| During Past Five Years
| Past Five Years
|
| Doug Franklin | March 2016 | Mr. Franklin is a retired insurance | None. |
| 56 | | industry executive. From 1987 | |
| Adviser to the Board | | through 2015, he was employed | |
| | | by the Allianz-Fireman’s Fund | |
| | | Insurance Company in various | |
| | | positions, including as its Chief | |
| | | Actuary and Chief Risk Officer. | |
| | | | |
| Claire Knoles | December 2015 | Ms. Knoles is a founder of Kiosk and | None. |
| 46 | | has served as its Chief Operating | |
| Adviser to the Board | | Officer since 2004. Kiosk is a full- | |
| | | service marketing agency with | |
| | | offices in the San Francisco Bay | |
| | | Area, Toronto, and Liverpool, UK. | |
| | | | |
Interested Trustee(1) | | | |
| | | | |
| Neil J. Hennessy | January 1996 as | Mr. Hennessy has been employed | Hennessy |
| 64 | a Trustee and | by Hennessy Advisors, Inc. since | Advisors, Inc. |
| Trustee, Chairman of | June 2008 as | 1989 and currently serves as its | |
| the Board, Chief | an officer | Chairman and Chief Executive Officer. | |
| Investment Officer, | | | |
| Portfolio Manager, | | | |
| and President | | | |
| Name, Age, | | |
| and Position Held | Start Date | Principal Occupation(s) |
with the Trust
| of Service
| During Past Five Years
|
| Officers | | |
| | | |
| Teresa M. Nilsen | January 1996 | Ms. Nilsen has been employed by Hennessy Advisors, Inc. |
| 54 | | since 1989 and currently serves as its President, Chief Operating |
| Executive Vice President | | Officer, and Secretary. |
| and Treasurer | | |
| | | |
| Daniel B. Steadman | March 2000 | Mr. Steadman has been employed by Hennessy Advisors, Inc. |
| 64 | | since 2000 and currently serves as its Executive Vice President. |
| Executive Vice President | | |
| and Secretary | | |
| | | |
| Brian Carlson | December 2013 | Mr. Carlson has been employed by Hennessy Advisors, Inc. |
| 48 | | since December 2013 and currently serves as its Chief |
| Senior Vice President | | Compliance Officer and Senior Vice President. |
| and Head of Distribution | | |
| | | |
Jennifer Cheskiewicz(2) | June 2013 | Ms. Cheskiewicz has been employed by Hennessy Advisors, Inc. |
| 43 | | as its General Counsel since June 2013. |
| Senior Vice President and | | |
| Chief Compliance Officer | | |
| TRUSTEES AND OFFICERS OF THE FUND |
| Name, Age, | | |
| and Position Held | Start Date | Principal Occupation(s) |
with the Trust
| of Service
| During Past Five Years
|
David Ellison(3) | October 2012 | Mr. Ellison has been employed by Hennessy Advisors, Inc. since |
| 62 | | October 2012. He has served as a Portfolio Manager of the |
| Senior Vice President | | Hennessy Large Cap Financial Fund and the Hennessy Small |
| and Portfolio Manager | | Cap Financial Fund since their inception. Mr. Ellison also served |
| | | as a Portfolio Manager of the Hennessy Technology Fund from |
| | | its inception until February 2017. Mr. Ellison served as Director, |
| | | CIO, and President of FBR Fund Advisers, Inc. from December |
| | | 1999 to October 2012. |
| | | |
Ryan Kelley(4) | March 2013 | Mr. Kelley has been employed by Hennessy Advisors, Inc. since |
| 48 | | October 2012. He has served as a Portfolio Manager of the |
| Senior Vice President | | Hennessy Gas Utility Fund, the Hennessy Large Cap Financial |
| and Portfolio Manager | | Fund, and the Hennessy Small Cap Financial Fund since |
| | | October 2014. He served as Co-Portfolio Manager of these |
| | | same funds from March 2013 through September 2014 and as |
| | | a Portfolio Analyst for the Hennessy Funds from October 2012 |
| | | through February 2013. Mr. Kelley has also served as a Portfolio |
| | | Manager of the Hennessy Cornerstone Growth Fund, the |
| | | Hennessy Cornerstone Mid Cap 30 Fund, the Hennessy |
| | | Cornerstone Large Growth Fund, and the Hennessy |
| | | Cornerstone Value Fund since February 2017 and as a Portfolio |
| | | Manager of the Hennessy Total Return Fund, the Hennessy |
| | | Balanced Fund, and the Hennessy Technology Fund since May |
| | | 2018. He served as Co-Portfolio Manager of the Hennessy |
| | | Technology Fund from February 2017 until May 2018. Mr. Kelley |
| | | served as Portfolio Manager of FBR Fund Advisers, Inc. from |
| | | January 2008 to October 2012. |
| | | |
| Tania Kelley | October 2003 | Ms. Kelley has been employed by Hennessy Advisors, Inc. since |
| 55 | | October 2003. |
| Senior Vice President | | |
| and Head of Marketing | | |
| | | |
L. Joshua Wein(4) | September 2018 | Mr. Wein has been employed by Hennessy Advisors, Inc. since |
| 47 | | 2018. He has served as Co-Portfolio Manager of the Hennessy |
| Vice President and | | Cornerstone Growth Fund, the Hennessy Cornerstone |
| Co-Portfolio Manager | | Mid Cap 30 Fund, the Hennessy Cornerstone Large Growth |
| | | Fund, the Hennessy Cornerstone Value Fund, Hennessy Total |
| | | Return Fund, the Hennessy Balanced Fund, the Hennessy Gas |
| | | Utility Fund, and the Hennessy Technology Fund since February |
| | | 2019. He served as a Senior Analyst of these same funds from |
| | | September 2018 through February 2019. Mr. Wein served as |
| | | Director of Alternative Investments and Co-Portfolio Manager |
| | | at Sterling Capital Management from 2008 to 2018. |
_______________
(1) | Mr. Hennessy is considered an “interested person,” as defined in the Investment Company Act of 1940, as amended, because he is an officer of the Trust. |
(2) | The address of this officer is 4800 Bee Caves Road, Suite 100, Austin, TX 78746. |
(3) | The address of this officer is 101 Federal Street, Suite 1615B, Boston, MA 02110. |
(4) | The address of this officer is 1340 Environ Way, Chapel Hill, NC 27517. |
| HENNESSY FUNDS | 1-800-966-4354 | |
Expense Example (Unaudited)
October 31, 2020
As a shareholder of the Fund, you incur ongoing costs, including management fees, service fees, and other Fund expenses. This Example is intended to help you understand your ongoing costs (in dollars) of investing in the Fund and to compare these costs with the ongoing costs of investing in other mutual funds. The Example is based on an investment of $1,000 invested at the beginning of the period and held for the entire period from May 1, 2020, through October 31, 2020.
Actual Expenses
The first line of the table below under the “Investor Class” and “Institutional Class” headings provides information about actual account values and actual expenses. You may use the information in this line, together with the amount you invested, to estimate the expenses that you paid over the period. Simply divide your account value by $1,000 (for example, an $8,600 account value divided by $1,000 = 8.6), then multiply the result by the number in the first line below the “Investor Class” or “Institutional Class” heading under the column entitled “Expenses Paid During Period” to estimate the expenses you paid on your account during this period. Although the Fund charges no sales loads or transaction fees, you will be assessed fees for outgoing wire transfers, returned checks, and stop payment orders at prevailing rates charged by U.S. Bank Global Fund Services, the Fund’s transfer agent. If you request that a redemption be made by wire transfer, the Fund’s transfer agent charges a $15 fee. IRAs are charged a $15 annual maintenance fee (up to $30 maximum per shareholder for shareholders with multiple IRAs). The example below includes, but is not limited to, management fees, shareholder servicing fees, accounting, custody, and transfer agent fees. However, the example below does not include portfolio trading commissions and related expenses.
Hypothetical Example for Comparison Purposes
The second line of the table below under the “Investor Class” and “Institutional Class” headings provides information about hypothetical account values and hypothetical expenses based on the Fund’s actual expense ratios and an assumed rate of return of 5% per year before expenses, which is not the Fund’s actual return. The hypothetical account values and expenses may not be used to estimate the actual ending account balance or expenses you paid for the period. You may use this information to compare the ongoing costs of investing in the Fund and other funds. To do so, compare this 5% hypothetical example with the 5% hypothetical examples that appear in the shareholder reports of the other funds. Please note that the expenses shown in the table are meant to highlight your ongoing costs only. Therefore, the second line of the table under the “Investor Class” and “Institutional Class” headings is useful in comparing ongoing costs only and will not help you determine the relative total costs of owning different funds.
| | | | Expenses Paid |
| | Beginning | Ending | During Period(1) |
| | Account Value | Account Value | May 1, 2020 – |
| | May 1, 2020
| October 31, 2020 | October 31, 2020 |
| Investor Class | | | |
| Actual | $1,000.00 | $1,000.70 | $5.13 |
| Hypothetical (5% return before expenses) | $1,000.00 | $1,020.01 | $5.18 |
| | | | |
| Institutional Class | | | |
| Actual | $1,000.00 | $1,002.40 | $3.57 |
| Hypothetical (5% return before expenses) | $1,000.00 | $1,021.57 | $3.61 |
(1) | Expenses are equal to the Fund’s annualized expense ratio of 1.02% for Investor Class shares or 0.71% for Institutional Class shares, as applicable, multiplied by the average account value over the period, multiplied by 184/366 days (to reflect the half-year period). |
| HENNESSY FUNDS | 1-800-966-4354 | |
How to Obtain a Copy of the Fund’s Proxy
Voting Policy and Proxy Voting Records
A description of the policies and procedures the Fund uses to determine how to vote proxies relating to portfolio securities is available without charge (1) by calling 1-800-966-4354, (2) on the Hennessy Funds’ website at www.hennessyfunds.com/proxy-voting/voting-policy, or (3) on the U.S. Securities and Exchange Commission’s (the “SEC”) website at www.sec.gov. The Fund’s proxy voting record is available without charge on both the Hennessy Funds’ website at www.hennessyfunds.com/proxy-voting/voting-record and the SEC’s website at www.sec.gov no later than August 31 for the prior 12 months ending June 30.
Availability of Quarterly Portfolio Schedule
The Fund files a complete schedule of portfolio holdings with the SEC for the first and third quarters of each fiscal year as an exhibit to its reports on Form N-PORT. The Fund’s Form N-PORT reports are available on the SEC’s website at www.sec.gov or on request by calling 1-800-966-4354.
Federal Tax Distribution Information
(Unaudited)
For fiscal year 2020, certain dividends paid by the Fund may be subject to a maximum tax rate of 23.8%, as provided for by the Jobs and Growth Tax Relief Reconciliation Act of 2003. The percentage of dividends declared from ordinary income designated as qualified dividend income was 100.00%.
For corporate shareholders, the percent of ordinary income distributions that qualified for the corporate dividends received deduction for fiscal year 2020 was 100.00%.
The percentage of taxable ordinary income distributions that were designated as short-term capital gain distributions under Section 871(k)(2)(C) of the Internal Revenue Code of 1986, as amended, for the Fund was 0.00%.
Important Notice Regarding Delivery
of Shareholder Documents
To help keep the Fund’s costs as low as possible, we generally deliver a single copy of shareholder reports, proxy statements, and prospectuses to shareholders who share an address and have the same last name. This process does not apply to account statements. You may request an individual copy of a shareholder document at any time. If you would like to receive separate mailings of shareholder documents, please call U.S. Bank Global Fund Services at 1-800-261-6950 or 1-414-765-4124, and individual delivery will begin within 30 days of your request. If your account is held through a financial institution or other intermediary, please contact such intermediary directly to request individual delivery.
Electronic Delivery
The Fund offers shareholders the option to receive account statements, prospectuses, tax forms, and shareholder reports online. To sign up for eDelivery, please visit www.hennessyfunds.com/account. You may change your delivery preference at any time by visiting our website or calling U.S. Bank Global Fund Services at 1-800-261-6950 or 1-414-765-4124.
| PROXY VOTING — PRIVACY POLICY |
Liquidity Risk Management Program
In accordance with Rule 22e-4 under the Investment Company Act of 1940, as amended (the “Liquidity Rule”), we have adopted and implemented a liquidity risk management program (the “Liquidity Program”). The purpose of the Liquidity Program is to assess and manage the Fund’s liquidity risk, which is the risk that the Fund would not be able to meet requests to redeem Fund shares without significant dilution of the remaining shareholders’ interests in the Fund. The Board of Trustees of the Fund (the “Board”) designated a committee comprising representatives of Hennessy Advisors, Inc., the investment adviser to the Fund, as the administrator of the Liquidity Program (the “Program Administrator”).
The Program Administrator provided a written report regarding the Liquidity Program to the Board in advance of its meeting on June 3, 2020. The report covered the period from June 1, 2019, through May 31, 2020. The report addressed the operation of the Liquidity Program, assessed the adequacy and effectiveness of its implementation, and described any material changes to the Liquidity Program during the review period. The Trust’s chief compliance officer presented the report to the Board at the meeting and provided additional information regarding the Liquidity Program. The Board reviewed the Liquidity Program and considered, among other items, the following:
| | 1. | The Program Administrator reviewed daily historical net redemption activity during the review period and during prior periods with higher-than-average redemption activity and concluded that the Fund has historically been able to meet requests to redeem Fund shares without significant dilution to the Fund’s remaining shareholders, and the Program Administrator expects the Fund to be able to continue to do so in the future during both normal and reasonably foreseeable stressed conditions. |
| | | |
| | 2. | The Fund primarily holds assets that are highly liquid investments and is therefore not required to establish a highly liquid investment minimum for the Fund or adopt policies and procedures for responding to a highly liquid investment minimum shortfall. |
| | | |
| | 3. | The Program Administrator did not make any material changes to the Liquidity Program during the review period and was not recommending any changes to the Liquidity Program or the model inputs used to determine the liquidity classification of each security held by the Fund. |
| | | |
| | 4. | The Program Administrator concluded that the Liquidity Program was reasonably designed to assess and manage the Fund’s liquidity risk, complies with the requirements of the Liquidity Rule, and was effectively implemented, having operated as intended during the review period. |
Privacy Policy
We collect the following personal information about you:
| | 1. | Information we receive from you in applications or other forms, correspondence, or conversations, including, but not limited to, your name, address, phone number, social security number, assets, income, and date of birth; |
| | | |
| | 2. | Information about your transactions with us, our affiliates, or others, including, but not limited to, your account number and balance, payments history, parties to transactions, cost basis information, and other financial information; and |
| HENNESSY FUNDS | 1-800-966-4354 | |
| | 3. | Other personal information we collect from various sources, even if you have not entered into a prior transaction with us, including the following: |
| | • | Name, alias, address, unique personal identifier, online identifier, IP address, email address, telephone number, account name, and other similar identifiers; |
| | | |
| | • | Age and marital status; |
| | | |
| | • | Commercial information, including records of products purchased; |
| | | |
| | • | Browsing history, search history, and information on interaction with our website; |
| | | |
| | • | Geolocation data; |
| | | |
| | • | Employment and employment history, educational history, financial information, and purchasing and consuming histories or tendencies; and |
| | | |
| | • | Inferences drawn from the above-listed information to create a profile about your preferences, characteristics, predispositions, and behavior. |
We collect this information directly from you, indirectly in the course of providing services to you, directly and indirectly from your activity on our website, from broker dealers, marketing agencies, and other third parties that interact with us in connection with the services we perform and products we offer, and from anonymized and aggregated consumer information.
We use this information to fulfill the reason you provided the information to us, to provide you with other relevant products that you request from us, to provide you with information about products that may interest you, to improve our website or present our website’s contents to you, and as otherwise described to you when collecting your personal information.
We do not disclose any personal information to unaffiliated third parties, except as permitted by law. We may disclose your personal information to our affiliates, vendors, and service providers for a business purpose. For example, we are permitted by law to disclose all of the information we collect, as described above, to our transfer agent to process your transactions. When disclosing your personal information to third parties, we enter into a contract with each third party describing the purpose of such disclosure and requiring that such personal information be kept confidential and not used for any purpose except to perform the services contracted or respond to regulatory or law enforcement requests.
Furthermore, we restrict access to your personal information to those persons who require such information to provide products or services to you. As a result, we do not provide a means for opting out of our limited sharing of your information. We maintain physical, electronic, and procedural safeguards that comply with federal standards to guard your personal information.
If you hold shares of the Funds through a financial intermediary, including, but not limited to, a broker-dealer, bank, or trust company, the privacy policy of your financial intermediary governs how your personal information is shared with unaffiliated third parties.
Supplemental Privacy Notice for Residents of California
The California Consumer Privacy Act of 2018 (the “CCPA”) provides you, as a California resident, with certain additional rights relating to your personal information.
Under the CCPA, you have the right to request that we disclose to you the categories of personal information we have collected about you over the past 12 months, the categories of sources of such information, our business purpose for collecting the
information, the categories of third parties, if any, with whom we shared the information, and the specific information we have collected about you. You also have the right to request that we delete any of your personal information, and, unless an exception applies, we will delete such information upon receiving and confirming your request. To make a request, call us at 1-800-966-4354, email us at privacy@hennessyfunds.com, or go to www.hennessyfunds.com/contact. We will not discriminate against you for exercising your rights under the CCPA. Further, we will not collect additional categories of your personal information or use the personal information we collected for materially different, unrelated, or incompatible purposes without providing you notice.
| HENNESSY FUNDS | 1-800-966-4354 | |
(This Page Intentionally Left Blank.)
For information, questions, or assistance, please call
The Hennessy Funds
1-800-966-4354 or 1-415-899-1555
INVESTMENT ADVISOR
Hennessy Advisors, Inc.
7250 Redwood Boulevard, Suite 200
Novato, California 94945
ADMINISTRATOR,
TRANSFER AGENT,
DIVIDEND PAYING AGENT, &
SHAREHOLDER SERVICING AGENT
U.S. Bancorp Fund Services, LLC
d/b/a U.S. Bank Global Fund Services
P.O. Box 701
Milwaukee, Wisconsin 53201-0701
CUSTODIAN
U.S. Bank N.A.
Custody Operations
1555 North River Center Drive, Suite 302
Milwaukee, Wisconsin 53212
TRUSTEES
Neil J. Hennessy
Robert T. Doyle
J. Dennis DeSousa
Gerald P. Richardson
COUNSEL
Foley & Lardner LLP
777 East Wisconsin Avenue
Milwaukee, Wisconsin 53202-5306
INDEPENDENT REGISTERED
PUBLIC ACCOUNTING FIRM
Tait, Weller & Baker LLP
Two Liberty Place
50 South 16th Street, Suite 2900
Philadelphia, Pennsylvania 19102-2529
DISTRIBUTOR
Quasar Distributors, LLC
111 East Kilbourn Avenue, Suite 2200
Milwaukee, Wisconsin 53202
www.hennessyfunds.com | 1-800-966-4354
This report has been prepared for shareholders and may be distributed to
others only if preceded or accompanied by a current prospectus.
ANNUAL REPORT
OCTOBER 31, 2020
HENNESSY JAPAN FUND
Investor Class HJPNX
Institutional Class HJPIX
IMPORTANT NOTICE REGARDING ELECTRONIC DELIVERY OF SHAREHOLDER REPORTS
Beginning on January 1, 2021, as permitted by regulations adopted by the Securities and Exchange Commission, paper copies of the annual and semi-annual reports will no longer be sent by mail unless you specifically request paper copies from the Hennessy Funds or from your financial intermediary. Instead, the reports will be made available on a website, and you will be notified by mail each time a report is posted and provided with a website link to access the report.
If you have already elected to receive shareholder reports electronically, you will not be affected by this change and you need not take any action. You may elect to receive shareholder reports and other communications from the Hennessy Funds electronically by visiting www.hennessyfunds.com/account or by calling U.S. Bank Global Fund Services at 1-800-261-6950. If you own shares in a Fund through a financial intermediary, please contact your financial intermediary to make this election.
You may elect to receive paper copies of all future reports free of charge by calling U.S. Bank Global Fund Services at 1-800-261-6950 or, if you own your shares through a financial intermediary, by contacting your financial intermediary. Your election to receive paper copies of reports will apply to all Funds in the Hennessy Funds family.
www.hennessyfunds.com | 1-800-966-4354
(This Page Intentionally Left Blank.)
Contents
| Letter to Shareholders | | 2 |
| Performance Overview | | 4 |
| Financial Statements | | |
| Schedule of Investments | | 7 |
| Statement of Assets and Liabilities | | 11 |
| Statement of Operations | | 12 |
| Statements of Changes in Net Assets | | 13 |
| Financial Highlights | | 14 |
| Notes to the Financial Statements | | 18 |
| Report of Independent Registered Public Accounting Firm | | 26 |
| Trustees and Officers of the Fund | | 27 |
| Expense Example | | 30 |
| Proxy Voting Policy and Proxy Voting Records | | 32 |
| Availability of Quarterly Portfolio Schedule | | 32 |
| Federal Tax Distribution Information | | 32 |
| Important Notice Regarding Delivery of Shareholder Documents | | 32 |
| Electronic Delivery | | 33 |
| Liquidity Risk Management Program | | 33 |
| Privacy Policy | | 34 |
| HENNESSY FUNDS | 1-800-966-4354 | |
December 2020
Dear Hennessy Funds Shareholder:
The Japanese stock market gained 0.35% in U.S. dollar terms as measured by the Tokyo Stock Price Index (TOPIX) over the 12 months ended October 31, 2020. Earlier in this period, just as China was starting to regain its footing after the U.S.-China trade agreement in late 2019, it was tripped up by yet another risk event: the outbreak of COVID-19. The Japanese market did not escape the substantial negative impact of the initial onset of COVID-19, but it rebounded throughout the remainder of the fiscal year, almost to the level before the sharp decline.
The health impact of the COVID-19 pandemic has been less severe in Japan compared to many other parts of the world. According to Financial Times, the seven-day rolling average of new COVID-19-related deaths per million as of October 31, 2020, was 3.5 for the European Union and 2.5 for the United States, while this figure for Japan was less than 0.1. This is surprising, especially given that the Japanese government never implemented the stringent lockdown measures that were put in place elsewhere. The Japanese cultural norms of wearing masks and greeting others by bowing instead of shaking hands or exchanging kisses may have played a key role in mitigating the spread of the virus.
Although Japan experienced a second wave of COVID-19 infections in August 2020, it appears to be subsiding. To help the economy recover, the government reacted swiftly to pass two stimulus packages totaling 40% of Japan’s GDP. The government’s reaction to the pandemic was far greater in scale and speed compared to its response to the 2008 financial crisis. As a result, Japan has been relatively unaffected by job and wage losses to date. In fact, the unemployment rate in September was just 3.0%. How quickly will things return to normal? It is very hard to say, but at least from a health crisis standpoint, it appears that Japan has been managing the situation quite well.
The economic reform policies of Japan’s new Prime Minister, Yoshihide Suga, are consistent thus far with those of the former Prime Minister, Shinzo Abe, who resigned in August for health reasons. For the longer term, we believe that the combination of a reform-minded government and a pro-inflation, pro-business central bank should continue to serve as a structural tailwind to the Japanese economy because they ensure (i) Japan’s low interest rate regime, (ii) a continuous push for better corporate governance, (iii) a benign currency environment, and (iv) the progress of other structural reforms, such as labor market reforms, to boost labor productivity.
If history is any guide, humankind has coped with pandemics and overcome the crises over many centuries. We remain optimistic about the long-term prospects for Japan and its stock market. Thank you for your continued confidence and investment in the Hennessy Funds.
Sincerely,
 |  |
| Tadahiro Fujimura | Masakazu Takeda |
| Portfolio Manager, | Portfolio Manager, |
| Hennessy Japan Small Cap Fund; | Hennessy Japan Fund; |
| Chief Investment Officer | Fund Manager |
| SPARX Asset Management Co., Ltd. | SPARX Asset Management Co., Ltd. |
SPARX Asset Management Co., Ltd., located in Tokyo, Japan, is the sub-advisor to the Hennessy Japan Fund and the Hennessy Japan Small Cap Fund.
Past performance does not guarantee future results.
Mutual fund investing involves risk. Principal loss is possible.
The outbreak of the COVID-19 pandemic and the resulting actions to control or slow the spread of the virus have had significant detrimental effects on global and domestic economies and on financial markets and industries. Hennessy Funds continues to monitor the impact of COVID-19, but we cannot determine the full impact this virus may have on Japanese stocks. In the future, this macroeconomic risk could have an adverse material financial impact on the Hennessy Funds.
Opinions expressed are those of Tadahiro Fujimura and Masakazu Takeda and are subject to change, are not guaranteed, and should not be considered investment advice.
The Tokyo Stock Price Index (TOPIX) is a capitalization-weighted index of all of the companies listed on the First Section of the Tokyo Stock Exchange. One cannot invest directly in an index.
| HENNESSY FUNDS | 1-800-966-4354 | |
Performance Overview (Unaudited)
CHANGE IN VALUE OF $10,000 INVESTMENT
This graph illustrates the performance of an initial investment of $10,000 made in the Fund ten years ago and assumes the reinvestment of dividends.
AVERAGE ANNUAL TOTAL RETURN FOR PERIODS ENDED OCTOBER 31, 2020
| | One | Five | Ten |
| | Year
| Years
| Years
|
| Hennessy Japan Fund – | | | |
| Investor Class (HJPNX) | 15.27% | 12.24% | 13.02% |
| Hennessy Japan Fund – | | | |
| Institutional Class (HJPIX) | 15.72% | 12.67% | 13.41% |
Russell/Nomura Total MarketTM Index | 1.38% | 5.80% | 6.56% |
| Tokyo Price Index (TOPIX) | 0.35% | 5.57% | 6.46% |
Expense ratios: 1.44% (Investor Class); 1.04% (Institutional Class)
Performance data quoted represents past performance; past performance does not guarantee future results. The investment return and principal value of an investment will fluctuate so that an investor’s shares, when redeemed, may be worth more or less than their original cost. The performance table does not reflect the deduction of taxes that a shareholder would pay on Fund distributions or the redemption of Fund shares. Current performance of the Fund may be lower or higher than the performance quoted. Performance data current to the most recent month end may be obtained by visiting www.hennessyfunds.com.
The Russell/Nomura Total Market™ Index contains the top 98% of all stocks listed on Japan’s stock exchanges and registered on Japan’s over-the-counter market based on market capitalization. The Tokyo Price Index (TOPIX) is a capitalization-weighted index of all of the companies listed on the First Section of the Tokyo Stock Exchange. One cannot invest directly in an index. These indices are used herein for comparative purposes in accordance with Securities and Exchange Commission regulations.
Frank Russell Company (“Russell”) is the source and owner of the trademarks, service marks, and copyrights related to the Russell Indexes. Russell® is a trademark of Frank Russell Company. Neither Russell nor its licensors accept any liability for any errors or omissions in the Russell Indexes or Russell ratings or underlying data and no party may rely on any Russell Indexes or Russell ratings or underlying data contained in this communication. No further distribution of Russell data is permitted without Russell’s express written consent. Russell does not promote, sponsor, or endorse the content of this communication.
The expense ratios presented are from the most recent prospectus. The expense ratios for the current reporting period are available in the Financial Highlights section of this report.
PERFORMANCE NARRATIVE
Portfolio Managers Masakazu Takeda, CFA and CMA*, and Yu Shimizu, CMA*
SPARX Asset Management Co., Ltd. (sub-advisor)
Performance:
For the 12-month period ended October 31, 2020, the Investor Class of the Hennessy Japan Fund returned 15.27%, outperforming both the Russell/Nomura Total Market™ Index (the Fund’s primary benchmark) and the Tokyo Stock Price Index (TOPIX), which returned 1.38% and 0.35%, respectively, for the same period in U.S. dollar terms.
Among positive contributors to the Fund’s performance during the period were telecom and internet conglomerate SoftBank Group Corp., the supplier of factory automation related sensors Keyence Corp., and global top market share bicycle parts manufacturer Shimano, Inc. The market cap of SoftBank Group Corp. has swelled thanks to its unprecedented share repurchasing program, as well as a continuous rally in shares of its key investment holdings. Keyence Corp. contributed positively to performance due to the expectation of growth of global sales. Shimano, Inc.’s stock price advanced as investors have recently started taking note of the possibility of acceleration in industry sales driven by consumers considering taking up cycling as a way of exercising in the COVID-19 social distancing world.
Main detractors to the Fund’s performance included financial services provider Mitsubishi UFJ Financial Group, Inc., trading company Mitsubishi Corp., and high-performance running shoemaker Asics Corp. The share price of Mitsubishi UFJ Financial Group, Inc. declined as the banking industry became mired in the COVID-19-led downward economic spiral this year after an already challenging period during 2018-2019 that was further exacerbated by U.S.-China trade tensions. Mitsubishi Corp. performed poorly because its businesses are exposed to global macro trends and its earnings were affected by the COVID-19-induced economic slump this year. Shares of Asics Corp. continued to lose ground on concerns of market share losses in key markets such as Europe, the United States, and China.
Of the companies mentioned, the Fund continues to hold SoftBank Group Corp., Keyence Corp., Shimano, Inc., Asics Corp. and Mitsubishi Corp.
Portfolio Strategy:
The Fund seeks long-term capital appreciation by investing in equity securities of Japanese companies regardless of market capitalization. We screen for companies that we believe have strong businesses and management and are trading at an attractive price. Through in-depth and rigorous analysis and on-site research, we identify stocks with a potential “value gap.” The portfolio is limited to our best ideas and maintains a concentrated number of holdings.
Investment Commentary:
Our portfolio approach is to construct a concentrated portfolio of what we believe are great Japan-based, global companies, and we hold these companies for the long term to capture the potential capital compounding effect. Seeking out great companies means looking not just for businesses with sustainably high returns on invested capital, but also for those that can grow consistently regardless of macroeconomic conditions. We think of
| HENNESSY FUNDS | 1-800-966-4354 | |
such businesses as safe and sound businesses. In our portfolio, you will find consumer stocks that we consider defensive, economically-sensitive but high-quality industrials, and recession-resistant healthcare and internet stocks, as well as companies with diversified business portfolios. We aim to blend these types of businesses in the best way possible to pursue our goal of a portfolio that can be expected to perform better than average in both strong and weak markets. This serves as our first line of defense against the downside risk to the Fund’s performance in absolute as well as relative terms.
Despite our selective stock picking, our portfolio may be impacted by unexpected macroeconomic events. For example, a health crisis like the COVID-19 pandemic hits not just economically-sensitive companies but also more defensive consumer businesses as consumers curtail their spending even for small-ticket essentials. When this happens, we turn to another line of defense to attempt to limit the downside risk of the portfolio: the ability of our companies to overcome external headwinds. Our prior experience managing portfolios during prior economic challenges is helpful to us in managing through the current environment. Revisiting how the business fared during and after the 2008 financial crisis, the Asian Currency Crisis of the late 1990s, or the 2001 dot-com bubble crash is a very helpful exercise because it gives us insight into how the business will likely perform in the future when another crisis emerges. Through this, we find comfort in maintaining the existing holdings even when the stock price is under pressure for a prolonged period.
______________
* Chartered Member of the Security Analysts Association of Japan
Opinions expressed are those of the Portfolio Managers as of the date written and are subject to change, are not guaranteed, and should not be considered investment advice or an indication of trading intent.
The Fund invests in small-capitalization and medium-capitalization companies, which may have more limited liquidity and greater price volatility than large-capitalization companies. The Fund invests in the stocks of companies operating in Japan; single-country funds may be subject to a higher degree of risk. The Fund may experience higher fees due to investments in pooled investment vehicles (including ETFs). Please see the Fund’s prospectus for a more complete discussion of these and other risks.
References to specific securities should not be considered a recommendation to buy or sell any security. Fund holdings and sector allocations are subject to change. Please refer to the Schedule of Investments included in this report for additional portfolio information.
| PERFORMANCE OVERVIEW/SCHEDULE OF INVESTMENTS |
Financial Statements
Schedule of Investments as of October 31, 2020 |
HENNESSY JAPAN FUND
(% of Net Assets)
| TOP TEN HOLDINGS (EXCLUDING MONEY MARKET FUNDS) | % NET ASSETS |
| Nidec Corp. | 6.13% |
| Daikin Industries, Ltd. | 5.97% |
| Keyence Corp. | 5.94% |
| Shimano, Inc. | 5.92% |
| Sony Corp. | 5.91% |
| SoftBank Group Corp. | 5.77% |
| Unicharm Corp. | 5.17% |
| Recruit Holdings Co., Ltd. | 4.98% |
| Terumo Corp. | 4.75% |
| MISUMI Group, Inc. | 4.65% |
Note: For presentation purposes, the Fund has grouped some of the industry categories. For purposes of categorizing securities for compliance with Section 8(b)(1) of the Investment Company Act of 1940, as amended, the Fund uses more specific industry classifications.
The Global Industry Classification Standard (GICS®) was developed by and is the exclusive property and a service mark of MSCI, Inc. and Standard & Poor’s Financial Services LLC. It has been licensed for use by the Hennessy Funds.
| HENNESSY FUNDS | 1-800-966-4354 | |
| COMMON STOCKS – 97.77% | | Number | | | | | | % of | |
| | | of Shares | | | Value | | | Net Assets | |
| Communication Services – 9.16% | | | | | | | | | |
| SoftBank Group Corp. | | | 664,900 | | | $ | 43,307,470 | | | | 5.77 | % |
| Z Holdings Corp. | | | 3,644,600 | | | | 25,414,015 | | | | 3.39 | % |
| | | | | | | | 68,721,485 | | | | 9.16 | % |
| | | | | | | | | | | | | |
| Consumer Discretionary – 24.53% | | | | | | | | | | | | |
| Asics Corp. | | | 591,200 | | | | 7,386,154 | | | | 0.98 | % |
| Fast Retailing Co., Ltd. | | | 49,100 | | | | 34,249,306 | | | | 4.56 | % |
| Mercari, Inc. (a) | | | 500,900 | | | | 21,059,018 | | | | 2.81 | % |
| Nitori Holdings Co., Ltd. | | | 158,700 | | | | 32,621,845 | | | | 4.35 | % |
| Shimano, Inc. | | | 194,200 | | | | 44,416,563 | | | | 5.92 | % |
| Sony Corp. | | | 532,000 | | | | 44,350,968 | | | | 5.91 | % |
| | | | | | | | 184,083,854 | | | | 24.53 | % |
| | | | | | | | | | | | | |
| Consumer Staples – 15.02% | | | | | | | | | | | | |
| Ariake Japan Co., Ltd. | | | 195,000 | | | | 12,491,730 | | | | 1.66 | % |
| Kao Corp. | | | 395,200 | | | | 28,137,730 | | | | 3.75 | % |
| Rohto Pharmaceutical Co., Ltd. | | | 1,064,500 | | | | 33,279,460 | | | | 4.44 | % |
| Unicharm Corp. | | | 838,100 | | | | 38,779,641 | | | | 5.17 | % |
| | | | | | | | 112,688,561 | | | | 15.02 | % |
| | | | | | | | | | | | | |
| Financials – 2.46% | | | | | | | | | | | | |
| Anicom Holdings, Inc. | | | 1,748,400 | | | | 18,468,809 | | | | 2.46 | % |
| | | | | | | | | | | | | |
| Health Care – 11.66% | | | | | | | | | �� | | | |
| Asahi Intecc Co. Ltd. | | | 181,800 | | | | 5,633,650 | | | | 0.75 | % |
| Olympus Corp. | | | 894,000 | | | | 17,114,809 | | | | 2.28 | % |
| PeptiDream, Inc. (a) | | | 127,600 | | | | 5,896,790 | | | | 0.79 | % |
| Takeda Pharmaceutical Co., Ltd. | | | 751,300 | | | | 23,217,133 | | | | 3.09 | % |
| Terumo Corp. | | | 969,300 | | | | 35,674,118 | | | | 4.75 | % |
| | | | | | | | 87,536,500 | | | | 11.66 | % |
| | | | | | | | | | | | | |
| Industrials – 26.98% | | | | | | | | | | | | |
| Daikin Industries, Ltd. | | | 239,400 | | | | 44,799,702 | | | | 5.97 | % |
| Kubota Corp. | | | 1,234,300 | | | | 21,449,749 | | | | 2.86 | % |
| MISUMI Group, Inc. | | | 1,174,300 | | | | 34,876,209 | | | | 4.65 | % |
| Mitsubishi Corp. | | | 804,700 | | | | 17,953,964 | | | | 2.39 | % |
| Nidec Corp. | | | 455,400 | | | | 45,996,346 | | | | 6.13 | % |
| Recruit Holdings Co., Ltd. | | | 982,100 | | | | 37,369,569 | | | | 4.98 | % |
| | | | | | | | 202,445,539 | | | | 26.98 | % |
The accompanying notes are an integral part of these financial statements.
| COMMON STOCKS | | Number | | | | | | % of | |
| | | of Shares | | | Value | | | Net Assets | |
| Information Technology – 6.94% | | | | | | | | | |
| Keyence Corp. | | | 98,200 | | | $ | 44,565,369 | | | | 5.94 | % |
| Murata Manufacturing Co. Ltd. | | | 106,800 | | | | 7,489,741 | | | | 1.00 | % |
| | | | | | | | 52,055,110 | | | | 6.94 | % |
| | | | | | | | | | | | | |
| Real Estate – 1.02% | | | | | | | | | | | | |
| Relo Group, Inc. | | | 320,600 | | | | 7,694,008 | | | | 1.02 | % |
| | | | | | | | | | | | | |
| Total Common Stocks | | | | | | | | | | | | |
| (Cost $493,386,325) | | | | | | | 733,693,866 | | | | 97.77 | % |
| | | | | | | | | | | | | |
| SHORT-TERM INVESTMENTS – 2.56% | | | | | | | | | | | | |
| | | | | | | | | | | | | |
| Money Market Funds – 2.56% | | | | | | | | | | | | |
| First American Government Obligations Fund, | | | | | | | | | | | | |
| Institutional Class, 0.05% (b) | | | 19,228,874 | | | | 19,228,874 | | | | 2.56 | % |
| | | | | | | | | | | | | |
| Total Short-Term Investments | | | | | | | | | | | | |
| (Cost $19,228,874) | | | | | | | 19,228,874 | | | | 2.56 | % |
| | | | | | | | | | | | | |
| Total Investments | | | | | | | | | | | | |
| (Cost $512,615,199) – 100.33% | | | | | | | 752,922,740 | | | | 100.33 | % |
| Liabilities in Excess of Other Assets – (0.33)% | | | | | | | (2,512,959 | ) | | | (0.33 | )% |
| | | | | | | | | | | | | |
TOTAL NET ASSETS – 100.00% | | | | | | $ | 750,409,781 | | | | 100.00 | % |
Percentages are stated as a percent of net assets.
| (a) | Non-income-producing security. |
| (b) | The rate listed is the fund’s seven-day yield as of October 31, 2020. |
The accompanying notes are an integral part of these financial statements.
| HENNESSY FUNDS | 1-800-966-4354 | |
Summary of Fair Value Exposure as of October 31, 2020
The following is a summary of the inputs used to value the Fund’s net assets as of October 31, 2020 (see Note 3 in the accompanying Notes to the Financial Statements):
| Common Stocks | | Level 1 | | | Level 2 | | | Level 3 | | | Total | |
| Communication Services | | $ | — | | | $ | 68,721,485 | | | $ | — | | | $ | 68,721,485 | |
| Consumer Discretionary | | | — | | | | 184,083,854 | | | | — | | | | 184,083,854 | |
| Consumer Staples | | | — | | | | 112,688,561 | | | | — | | | | 112,688,561 | |
| Financials | | | — | | | | 18,468,809 | | | | — | | | | 18,468,809 | |
| Health Care | | | — | | | | 87,536,500 | | | | — | | | | 87,536,500 | |
| Industrials | | | — | | | | 202,445,539 | | | | — | | | | 202,445,539 | |
| Information Technology | | | — | | | | 52,055,110 | | | | — | | | | 52,055,110 | |
| Real Estate | | | — | | | | 7,694,008 | | | | — | | | | 7,694,008 | |
| Total Common Stocks | | $ | — | | | $ | 733,693,866 | | | $ | — | | | $ | 733,693,866 | |
| Short-Term Investments | | | | | | | | | | | | | | | | |
| Money Market Funds | | $ | 19,228,874 | | | $ | — | | | $ | — | | | $ | 19,228,874 | |
| Total Short-Term Investments | | $ | 19,228,874 | | | $ | — | | | $ | — | | | $ | 19,228,874 | |
| Total Investments | | $ | 19,228,874 | | | $ | 733,693,866 | | | $ | — | | | $ | 752,922,740 | |
The accompanying notes are an integral part of these financial statements.
| SCHEDULE OF INVESTMENTS/STATEMENT OF ASSETS AND LIABILITIES |
Financial Statements
Statement of Assets and Liabilities as of October 31, 2020 |
| ASSETS: | | | |
| Investments in securities, at value (cost $512,615,199) | | $ | 752,922,740 | |
| Dividends and interest receivable | | | 1,912,829 | |
| Receivable for fund shares sold | | | 1,157,188 | |
| Prepaid expenses and other assets | | | 76,969 | |
| Total assets | | | 756,069,726 | |
| | | | | |
| LIABILITIES: | | | | |
| Payable for securities purchased | | | 4,096,995 | |
| Payable for fund shares redeemed | | | 757,332 | |
| Payable to advisor | | | 498,472 | |
| Payable to administrator | | | 135,424 | |
| Payable to auditor | | | 23,100 | |
| Accrued distribution fees | | | 19,420 | |
| Accrued service fees | | | 10,458 | |
| Accrued trustees fees | | | 3,938 | |
| Accrued expenses and other payables | | | 114,806 | |
| Total liabilities | | | 5,659,945 | |
| NET ASSETS | | $ | 750,409,781 | |
| | | | | |
| NET ASSETS CONSISTS OF: | | | | |
| Capital stock | | $ | 536,810,069 | |
| Total distributable earnings | | | 213,599,712 | |
| Total net assets | | $ | 750,409,781 | |
| | | | | |
| NET ASSETS: | | | | |
| Investor Class | | | | |
| Shares authorized (no par value) | | Unlimited | |
| Net assets applicable to outstanding shares | | $ | 142,300,562 | |
| Shares issued and outstanding | | | 3,325,827 | |
| Net asset value, offering price, and redemption price per share | | $ | 42.79 | |
| | | | | |
| Institutional Class | | | | |
| Shares authorized (no par value) | | Unlimited | |
| Net assets applicable to outstanding shares | | $ | 608,109,219 | |
| Shares issued and outstanding | | | 13,759,873 | |
| Net asset value, offering price, and redemption price per share | | $ | 44.19 | |
The accompanying notes are an integral part of these financial statements.
| HENNESSY FUNDS | 1-800-966-4354 | |
Financial Statements
Statement of Operations for the year ended October 31, 2020 |
| INVESTMENT INCOME: | | | |
Dividend income(1) | | $ | 7,038,451 | |
| Interest income | | | 99,787 | |
| Total investment income | | | 7,138,238 | |
| | | | | |
| EXPENSES: | | | | |
| Investment advisory fees (See Note 5) | | | 5,299,898 | |
| Administration, accounting, custody, and transfer agent fees (See Note 5) | | | 723,092 | |
| Sub-transfer agent expenses – Investor Class (See Note 5) | | | 189,246 | |
| Sub-transfer agent expenses – Institutional Class (See Note 5) | | | 499,801 | |
| Distribution fees – Investor Class (See Note 5) | | | 124,372 | |
| Service fees – Investor Class (See Note 5) | | | 82,914 | |
| Federal and state registration fees | | | 62,571 | |
| Reports to shareholders | | | 41,171 | |
| Compliance expense (See Note 5) | | | 27,711 | |
| Audit fees | | | 23,103 | |
| Trustees’ fees and expenses | | | 22,826 | |
| Interest expense (See Note 7) | | | 19,759 | |
| Legal fees | | | 9,358 | |
| Other expenses | | | 60,764 | |
| Total expenses | | | 7,186,586 | |
| NET INVESTMENT LOSS | | $ | (48,348 | ) |
| | | | | |
| REALIZED AND UNREALIZED GAINS (LOSSES): | | | | |
| Net realized loss on investments | | $ | (26,459,008 | ) |
| Net change in unrealized appreciation/depreciation on investments | | | 106,104,850 | |
| Net gain on investments | | | 79,645,842 | |
| NET INCREASE IN NET ASSETS RESULTING FROM OPERATIONS | | $ | 79,597,494 | |
(1) | Net of foreign taxes withheld of $782,050. |
The accompanying notes are an integral part of these financial statements.
| STATEMENT OF OPERATIONS/STATEMENTS OF CHANGES IN NET ASSETS |
Financial Statements
| Statements of Changes in Net Assets |
| | | Year Ended | | | Year Ended | |
| | | October 31, 2020 | | | October 31, 2019 | |
| OPERATIONS: | | | | | | |
| Net investment income (loss) | | $ | (48,348 | ) | | $ | 3,262,016 | |
| Net realized gain (loss) on investments | | | (26,459,008 | ) | | | 941,773 | |
| Net change in unrealized | | | | | | | | |
| appreciation/depreciation on investments | | | 106,104,850 | | | | 64,311,703 | |
| Net increase in net assets resulting from operations | | | 79,597,494 | | | | 68,515,492 | |
| | | | | | | | | |
| DISTRIBUTIONS TO SHAREHOLDERS: | | | | | | | | |
| Distributable earnings – Investor Class | | | (117,483 | ) | | | (35,216 | ) |
| Distributable earnings – Institutional Class | | | (3,035,473 | ) | | | (1,309,459 | ) |
| Total distributions | | | (3,152,956 | ) | | | (1,344,675 | ) |
| | | | | | | | | |
| CAPITAL SHARE TRANSACTIONS: | | | | | | | | |
| Proceeds from shares subscribed – Investor Class | | | 83,467,464 | | | | 35,974,622 | |
| Proceeds from shares subscribed – Institutional Class | | | 203,244,073 | | | | 382,329,976 | |
| Dividends reinvested – Investor Class | | | 113,374 | | | | 34,287 | |
| Dividends reinvested – Institutional Class | | | 2,957,410 | | | | 1,275,785 | |
| Cost of shares redeemed – Investor Class | | | (37,788,252 | ) | | | (60,746,390 | ) |
| Cost of shares redeemed – Institutional Class | | | (276,664,005 | ) | | | (230,489,467 | ) |
| Net increase (decrease) in net assets derived | | | | | | | | |
| from capital share transactions | | | (24,669,936 | ) | | | 128,378,813 | |
| TOTAL INCREASE IN NET ASSETS | | | 51,774,602 | | | | 195,549,630 | |
| | | | | | | | | |
| NET ASSETS: | | | | | | | | |
| Beginning of year | | | 698,635,179 | | | | 503,085,549 | |
| End of year | | $ | 750,409,781 | | | $ | 698,635,179 | |
| | | | | | | | | |
| CHANGES IN SHARES OUTSTANDING: | | | | | | | | |
| Shares sold – Investor Class | | | 2,016,527 | | | | 1,043,125 | |
| Shares sold – Institutional Class | | | 5,338,605 | | | | 10,907,846 | |
| Shares issued to holders as reinvestment | | | | | | | | |
| of dividends – Investor Class | | | 2,962 | | | | 1,053 | |
| Shares issued to holders as reinvestment | | | | | | | | |
| of dividends – Institutional Class | | | 75,037 | | | | 38,071 | |
| Shares redeemed – Investor Class | | | (1,040,377 | ) | | | (1,770,416 | ) |
| Shares redeemed – Institutional Class | | | (7,587,792 | ) | | | (6,541,834 | ) |
| Net increase (decrease) in shares outstanding | | | (1,195,038 | ) | | | 3,677,845 | |
The accompanying notes are an integral part of these financial statements.
| HENNESSY FUNDS | 1-800-966-4354 | |
Financial Statements
For an Investor Class share outstanding throughout each year
PER SHARE DATA:
Net asset value, beginning of year
Income from investment operations:
Net investment income (loss)
Net realized and unrealized gains on investments
Total from investment operations
Less distributions:
Dividends from net investment income
Dividends from net realized gains
Total distributions
Net asset value, end of year
TOTAL RETURN
SUPPLEMENTAL DATA AND RATIOS:
Net assets, end of year (millions)
Ratio of expenses to average net assets
Ratio of net investment income (loss) to average net assets
Portfolio turnover rate(3)
(1) | Calculated using the average shares outstanding method. |
(2) | Amount is between $(0.005) and $0.005. |
(3) | Calculated on the basis of the Fund as a whole. |
The accompanying notes are an integral part of these financial statements.
| FINANCIAL HIGHLIGHTS — INVESTOR CLASS |
| Year Ended October 31, | |
| 2020 | | | 2019 | | | 2018 | | | 2017 | | | 2016 | |
| | | | | | | | | | | | | | |
| $ | 37.17 | | | $ | 33.63 | | | $ | 32.75 | | | $ | 27.81 | | | $ | 24.07 | |
| | | | | | | | | | | | | | | | | | | |
| | | | | | | | | | | | | | | | | | | |
| | (0.14 | )(1) | | | 0.05 | (1) | | | (0.00 | )(2) | | | (0.03 | ) | | | (0.11 | ) |
| | 5.81 | | | | 3.50 | | | | 0.89 | | | | 4.97 | | | | 3.85 | |
| | 5.67 | | | | 3.55 | | | | 0.89 | | | | 4.94 | | | | 3.74 | |
| | | | | | | | | | | | | | | | | | | |
| | | | | | | | | | | | | | | | | | | |
| | (0.02 | ) | | | (0.01 | ) | | | (0.01 | ) | | | — | | | | — | |
| | (0.03 | ) | | | — | | | | — | | | | — | | | | — | |
| | (0.05 | ) | | | (0.01 | ) | | | (0.01 | ) | | | — | | | | — | |
| $ | 42.79 | | | $ | 37.17 | | | $ | 33.63 | | | $ | 32.75 | | | $ | 27.81 | |
| | | | | | | | | | | | | | | | | | | |
| | 15.27 | % | | | 10.60 | % | | | 2.70 | % | | | 17.76 | % | | | 15.54 | % |
| | | | | | | | | | | | | | | | | | | |
| | | | | | | | | | | | | | | | | | | |
| $ | 142.30 | | | $ | 87.22 | | | $ | 103.33 | | | $ | 84.44 | | | $ | 61.85 | |
| | 1.43 | % | | | 1.43 | % | | | 1.43 | % | | | 1.46 | % | | | 1.50 | % |
| | (0.37 | )% | | | 0.14 | % | | | (0.02 | )% | | | (0.15 | )% | | | (0.38 | )% |
| | 23 | % | | | 9 | % | | | 1 | % | | | 0 | % | | | 5 | % |
The accompanying notes are an integral part of these financial statements.
| HENNESSY FUNDS | 1-800-966-4354 | |
Financial Statements
For an Institutional Class share outstanding throughout each year
PER SHARE DATA:
Net asset value, beginning of year
Income from investment operations:
Net investment income (loss)
Net realized and unrealized gains on investments
Total from investment operations
Less distributions:
Dividends from net investment income
Dividends from net realized gains
Total distributions
Net asset value, end of year
TOTAL RETURN
SUPPLEMENTAL DATA AND RATIOS:
Net assets, end of year (millions)
Ratio of expenses to average net assets
Ratio of net investment income (loss) to average net assets
Portfolio turnover rate(2)
(1) | Calculated using the average shares outstanding method. |
(2) | Calculated on the basis of the Fund as a whole. |
The accompanying notes are an integral part of these financial statements.
| FINANCIAL HIGHLIGHTS — INSTITUTIONAL CLASS |
| Year Ended October 31, | |
| 2020 | | | 2019 | | | 2018 | | | 2017 | | | 2016 | |
| | | | | | | | | | | | | | |
| $ | 38.37 | | | $ | 34.67 | | | $ | 33.64 | | | $ | 28.45 | | | $ | 24.55 | |
| | | | | | | | | | | | | | | | | | | |
| | | | | | | | | | | | | | | | | | | |
| | 0.02 | (1) | | | 0.21 | (1) | | | 0.15 | | | | 0.03 | | | | (0.01 | ) |
| | 5.99 | | | | 3.60 | | | | 0.91 | | | | 5.16 | | | | 3.91 | |
| | 6.01 | | | | 3.81 | | | | 1.06 | | | | 5.19 | | | | 3.90 | |
| | | | | | | | | | | | | | | | | | | |
| | | | | | | | | | | | | | | | | | | |
| | (0.16 | ) | | | (0.11 | ) | | | (0.03 | ) | | | — | | | | — | |
| | (0.03 | ) | | | — | | | | — | | | | — | | | | — | |
| | (0.19 | ) | | | (0.11 | ) | | | (0.03 | ) | | | — | | | | — | |
| $ | 44.19 | | | $ | 38.37 | | | $ | 34.67 | | | $ | 33.64 | | | $ | 28.45 | |
| | | | | | | | | | | | | | | | | | | |
| | 15.72 | % | | | 11.02 | % | | | 3.14 | % | | | 18.24 | % | | | 15.89 | % |
| | | | | | | | | | | | | | | | | | | |
| | | | | | | | | | | | | | | | | | | |
| $ | 608.11 | | | $ | 611.41 | | | $ | 399.76 | | | $ | 177.42 | | | $ | 67.78 | |
| | 1.04 | % | | | 1.03 | % | | | 1.01 | % | | | 1.05 | % | | | 1.17 | % |
| | 0.04 | % | | | 0.59 | % | | | 0.49 | % | | | 0.30 | % | | | (0.03 | )% |
| | 23 | % | | | 9 | % | | | 1 | % | | | 0 | % | | | 5 | % |
The accompanying notes are an integral part of these financial statements.
| HENNESSY FUNDS | 1-800-966-4354 | |
Financial Statements
Notes to the Financial Statements October 31, 2020 |
1). ORGANIZATION
The Hennessy Japan Fund (the “Fund”) is a series of Hennessy Funds Trust (the “Trust”), which was organized as a Delaware statutory trust on September 17, 1992. The Fund is an open-end management investment company registered under the Investment Company Act of 1940, as amended. The investment objective of the Fund is long-term capital appreciation. The Fund is a diversified fund, but employs a relatively concentrated investment strategy and may hold securities of fewer issuers than other diversified funds.
The Fund offers Investor Class and Institutional Class shares. Each class of shares differs principally in its respective 12b-1 distribution and service, shareholder servicing, and sub-transfer agent expenses. There are no sales charges. Each class has identical rights to earnings, assets, and voting privileges, except for class-specific expenses and exclusive rights to vote on matters affecting only one class.
As an investment company, the Fund follows the investment company accounting and reporting guidance of the Financial Accounting Standards Board (“FASB”) Accounting Standard Codification Topic 946 “Financial Services—Investment Companies.”
2). SIGNIFICANT ACCOUNTING POLICIES
The following is a summary of significant accounting policies consistently followed by the Fund in the preparation of the financial statements. These policies conform to U.S. generally accepted accounting principles (“GAAP”).
| a). | Securities Valuation – All investments in securities are valued in accordance with the Fund’s valuation policies and procedures, as described in Note 3. |
| | |
| b). | Federal Income Taxes – No provision for federal income taxes or excise taxes has been made because the Fund has elected to be taxed as a regulated investment company and intends to distribute substantially all of its taxable income to its shareholders and otherwise comply with the provisions of the Internal Revenue Code of 1986, as amended, applicable to regulated investment companies. Net investment income/loss and realized gains/losses for federal income tax purposes may differ from those reported in the financial statements because of temporary book and tax basis differences. Temporary differences are primarily the result of the treatment of wash sales for tax reporting purposes. The Fund recognizes interest and penalties related to income tax benefits, if any, in the Statement of Operations as an income tax expense. Distributions from net realized gains for book purposes may include short-term capital gains, which are included as ordinary income to shareholders for tax purposes. The Fund may utilize equalization accounting for tax purposes and designate earnings and profits, including net realized gains distributed to shareholders on redemption of shares, as part of the dividends paid deduction for income tax purposes. |
| | |
| | Due to inherent differences in the recognition of income, expenses, and realized gains/losses under GAAP and federal income tax regulations, permanent differences between book and tax basis for reporting are identified and appropriately reclassified in the Statement of Assets and Liabilities, as needed. As of October 31, 2020, no such reclassifications were required for fiscal year 2020. |
| | |
| c). | Accounting for Uncertainty in Income Taxes – The Fund has accounting policies regarding recognition and measurement of tax positions taken or expected to be taken on a tax return. The tax returns of the Fund for the prior three fiscal years are |
| NOTES TO THE FINANCIAL STATEMENTS |
| | open for examination. The Fund has reviewed all open tax years in major jurisdictions and concluded that there is no impact on the Fund’s net assets and no tax liability resulting from unrecognized tax benefits relating to uncertain income tax positions taken or expected to be taken on a tax return. The Fund’s major tax jurisdictions are U.S. federal and Delaware. |
| | |
| d). | Income and Expenses – Dividend income is recognized on the ex-dividend date or as soon as information is available to the Fund. Interest income, which includes the amortization of premium and accretion of discount, is recognized on an accrual basis. Market discounts, original issue discounts, and market premiums on debt securities are accreted or amortized to interest income over the life of a security with a corresponding increase or decrease, as applicable, in the cost basis of such security using the yield to maturity method, or where applicable, the first call date of the security. Other non-cash dividends are recognized as investment income at the fair value of the property received. The Fund is charged for those expenses that are directly attributable to its portfolio, such as advisory, administration, and certain shareholder service fees. Income, expenses (other than expenses attributable to a specific class), and realized and unrealized gains/losses on investments are allocated to each class of shares based on such class’s net assets. |
| | |
| e). | Distributions to Shareholders – Dividends from net investment income for the Fund, if any, are declared and paid annually, usually in December. Distributions of net realized capital gains, if any, are declared and paid annually, usually in December. |
| | |
| f). | Security Transactions – Investment and shareholder transactions are recorded on the trade date. The Fund determines the realized gain/loss from an investment transaction by comparing the original cost of the security lot sold with the net sale proceeds. Discounts and premiums on securities purchased are accreted or amortized, respectively, over the life of each such security. |
| | |
| g). | Use of Estimates – The preparation of financial statements in conformity with GAAP requires management to make estimates and assumptions that affect the reported amounts of assets and liabilities and disclosure of contingent assets and liabilities at the date of the financial statements and the reported change in net assets during the reporting period. Actual results could differ from those estimates. |
| | |
| h). | Share Valuation – The net asset value (“NAV”) per share of the Fund is calculated by dividing (i) the total value of the securities held by the Fund, plus cash and other assets, minus all liabilities (including estimated accrued expenses) by (ii) the total number of shares outstanding for the Fund, rounded to the nearest $0.01. The Fund’s shares will not be priced on days the New York Stock Exchange is closed for trading. The offering and redemption price per share for the Fund is equal to the Fund’s NAV per share. |
| | |
| i). | Foreign Currency – Values of investments denominated in foreign currencies are converted into U.S. dollars using the spot market rate of exchange at the time of valuation. Purchases and sales of investments and income are translated into U.S. dollars using the spot market rate of exchange prevailing on the respective dates of such transactions. The Fund does not isolate the portion of the results of operations resulting from fluctuations in foreign exchange rates on investments from fluctuations resulting from changes in the market prices of securities held. Such fluctuations are included with the net realized and unrealized gain/loss on investments. Foreign investments present additional risks due to currency fluctuations, economic and political factors, lower liquidity, government regulations, differences in accounting standards, and other factors. |
| HENNESSY FUNDS | 1-800-966-4354 | |
| j). | REIT Equity Securities – The Fund may invest in the equity securities of real estate investment trusts (“REITs”). Distributions received from REITs may be classified as dividends, capital gains, or return of capital. Investments in REITs may require the Fund to accrue and distribute income not yet received. To generate sufficient cash to make the requisite distributions, the Fund may be required to sell securities in its portfolio (including when it is not advantageous to do so) that it otherwise would have continued to hold. At other times, investments in a REIT may result in the Fund’s receipt of cash in excess of the REIT’s earnings. If the Fund distributes these amounts, these distributions could constitute a return of capital to Fund shareholders for U.S. federal income tax purposes. Dividends received by the Fund from a REIT generally will not constitute qualified dividend income and will not qualify for the dividends-received deduction. |
| | |
| k). | New Accounting Pronouncements – In August 2018, the FASB issued Accounting Standards Update No. 2018-13 “Disclosure Framework—Changes to the Disclosure Requirements for Fair Value Measurement” (“ASU 2018-13”). ASU 2018-13 eliminates the requirement to disclose the amount of and reasons for transfers between Level 1 and Level 2 of the fair value hierarchy, the timing of transfers between levels of the fair value hierarchy, and the valuation processes for Level 3 fair value measurements. ASU 2018-13 does not eliminate the requirement to disclose the range and weighted average used to develop significant unobservable inputs for Level 3 fair value measurements, and the changes in unrealized gains and losses for recurring Level 3 fair value measurements. ASU 2018-13 requires that information is provided about the measurement uncertainty of Level 3 fair value measurements as of the reporting date. The guidance is effective for fiscal years beginning after December 15, 2019, and interim periods within those fiscal years. Management evaluated the impact of this change in guidance and, due to the permissibility of early adoption, modified the Fund’s fair value disclosures beginning with its fiscal year 2019. |
3). SECURITIES VALUATION
The Fund follows its valuation policies and procedures in determining its net asset value and, in preparing these financial statements, the fair value accounting standards that establish an authoritative definition of fair value and set out a hierarchy for measuring fair value. These standards require additional disclosures about the various inputs and valuation techniques used to develop the measurements of fair value and a discussion of changes in valuation techniques and related inputs during the period. These inputs are summarized in the three broad levels listed below:
| | Level 1 – | Unadjusted, quoted prices in active markets for identical instruments that the Fund has the ability to access at the date of measurement. |
| | | |
| | Level 2 – | Other significant observable inputs (including, but not limited to, quoted prices in active markets for similar instruments, quoted prices in markets that are not active for identical or similar instruments, and model-derived valuations in which all significant inputs and significant value drivers are observable in active markets, such as interest rates, prepayment speeds, credit risk curves, default rates, and similar data). |
| | | |
| | Level 3 – | Significant unobservable inputs (including the Fund’s own assumptions about what market participants would use to price the asset or liability based on the best available information) when observable inputs are unavailable. |
| NOTES TO THE FINANCIAL STATEMENTS |
The following is a description of the valuation techniques applied to the Fund’s major categories of assets and liabilities on a recurring basis:
| | Equity Securities – Equity securities, including common stocks, preferred stocks, foreign-issued common stocks, exchange-traded funds, closed-end mutual funds, partnerships, rights, and real estate investment trusts, that are traded on a securities exchange for which a last-quoted sales price is readily available will generally be valued at the last sales price as reported by the primary exchange on which the securities are listed. Securities listed on The NASDAQ Stock Market (“NASDAQ”) will generally be valued at the NASDAQ Official Closing Price, which may differ from the last sales price reported. Securities traded on a securities exchange for which a last-quoted sales price is not readily available will generally be valued at the mean between the bid and ask prices. To the extent these securities are actively traded and valuation adjustments are not applied, they are classified in Level 1 of the fair value hierarchy. Securities traded on foreign exchanges generally are not valued at the same time the Fund calculates its NAV because most foreign markets close well before such time. The earlier close of most foreign markets gives rise to the possibility that significant events, including broad market moves, may have occurred in the interim. In certain circumstances, it may be determined that a foreign security needs to be fair valued because it appears that the value of the security might have been materially affected by events occurring after the close of the market in which the security is principally traded, but before the time the Fund calculates its NAV, such as by a development that affects an entire market or region (e.g., a weather-related event) or a potentially global development (e.g., a terrorist attack that may be expected to have an effect on investor expectations worldwide). |
| | |
| | Registered Investment Companies – Investments in open-end registered investment companies, commonly referred to as mutual funds, generally are priced at the ending NAV provided by the applicable mutual fund’s service agent and will be classified in Level 1 of the fair value hierarchy. |
| | |
| | Debt Securities – Debt securities, including corporate bonds, asset-backed securities, mortgage-backed securities, municipal bonds, U.S. Treasuries, and U.S. government agency issues, are generally valued at market on the basis of valuations furnished by an independent pricing service that utilizes both dealer-supplied valuations and formula-based techniques. The pricing service may consider recently executed transactions in securities of the issuer or comparable issuers, market price quotations (where observable), bond spreads, and fundamental data relating to the issuer. In addition, the model may incorporate observable market data, such as reported sales of similar securities, broker quotes, yields, bids, offers, and reference data. Certain securities are valued primarily using dealer quotations. These securities are generally classified in Level 2 of the fair value hierarchy. |
| | |
| | Short-Term Securities – Short-term equity investments, including money market funds, are valued in the manner specified above. Short-term debt investments with an original term to maturity of 60 days or less are valued at amortized cost, which approximates fair market value. If the original term to maturity of a short-term debt investment exceeded 60 days, then the values as of the 61st day prior to maturity are amortized. Amortized cost is not used if its use would be inappropriate due to credit or other impairments of the issuer, in which case the security’s fair value would be determined, as described below. Short-term securities are generally classified in Level 1 or Level 2 of the fair value hierarchy depending on the inputs used and market activity levels for specific securities. |
| HENNESSY FUNDS | 1-800-966-4354 | |
The Board of Trustees of the Fund (the “Board”) has adopted fair value pricing procedures that are followed when a price for a security is not readily available or if a significant event has occurred that indicates the closing price of a security no longer represents the true value of that security. Fair value pricing determinations are made in good faith in accordance with these procedures. There are numerous criteria that will be given consideration in determining a fair value of a security, such as the trading volume of a security and markets, the values of other similar securities, and news events with direct bearing on a security or markets. Fair value pricing results in an estimated price for a security that reflects the amount the Fund might reasonably expect to receive in a current sale. Depending on the relative significance of the valuation inputs, these securities may be classified in either Level 2 or Level 3 of the fair value hierarchy.
The fair value of foreign securities may be determined with the assistance of a pricing service using correlations between the movement of prices of such securities and indices of domestic securities and other appropriate indicators, such as closing market prices of relevant American Depositary Receipts or futures contracts. Using fair value pricing means that the Fund’s NAV reflects the affected portfolio securities’ values as determined by the Board or its designee, pursuant to the fair value pricing procedures adopted by the Board, instead of being determined by the market. Using a fair value pricing methodology to price a foreign security may result in a value that is different from such foreign security’s most recent closing price and from the value used by other investment companies to calculate their NAVs. Such securities are generally classified in Level 2 of the fair value hierarchy. Because the Fund invests in foreign securities, the value of the Fund’s portfolio securities may change on days when you will not be able to purchase or redeem your shares.
The Board has delegated day-to-day valuation matters to the Valuation and Liquidity Committee comprising representatives from Hennessy Advisors, Inc., the Fund’s investment advisor (the “Advisor”). The function of the Valuation and Liquidity Committee is to value securities where current and reliable market quotations are not readily available. All actions taken by the Valuation and Liquidity Committee are reviewed by the Board.
The Fund has performed an analysis of all existing investments to determine the significance and character of all inputs to their fair value determinations. Various inputs are used to determine the value of the Fund’s investments. The inputs or methodology used for valuing securities are not necessarily an indication of the risk associated with investing in those securities. Details related to the fair value hierarchy of the Fund’s securities as of October 31, 2020, are included in the Schedule of Investments.
4). INVESTMENT TRANSACTIONS
Purchases and sales of investment securities (excluding government and short-term investments) for the Fund during fiscal year 2020 were $148,027,933 and $169,158,053, respectively.
There were no purchases or sales/maturities of long-term U.S. government securities for the Fund during fiscal year 2020.
The Fund is permitted to purchase or sell securities from or to another fund in the Hennessy Funds family of funds (collectively, the “Hennessy Funds”) under specified conditions outlined in procedures adopted by the Board. The procedures have been designed to ensure that any purchase or sale of securities by the Fund from or to another Hennessy Fund complies with Rule 17a-7 of the Investment Company Act of 1940, as amended. During fiscal year 2020, the Fund did not engage in purchases or sales of securities pursuant to Rule 17a-7 of the Investment Company Act of 1940, as amended.
| NOTES TO THE FINANCIAL STATEMENTS |
5). INVESTMENT ADVISORY FEE AND OTHER TRANSACTIONS WITH AFFILIATES
The Advisor provides the Fund with investment advisory services under an Investment Advisory Agreement. The Advisor oversees the provision of investment advice and furnishes office space, facilities, and most of the personnel needed by the Fund. As compensation for its services, the Advisor is entitled to a monthly fee from the Fund. The fee is based on the average daily net assets of the Fund at an annual rate of 0.80%. The net investment advisory fees expensed by the Fund during fiscal year 2020 are included in the Statement of Operations.
The Advisor has delegated the day-to-day management of the Fund to a sub-advisor, SPARX Asset Management Co., Ltd. The Advisor pays the sub-advisory fees from its own assets, and these fees are not an additional expense of the Fund. During fiscal year 2020, the Advisor (not the Fund) paid a sub-advisory fee at the average rate of 0.36% of the daily net assets of the Fund. Pursuant to the sub-advisory agreement, the Advisor pays sub-advisory fees at the rate of 0.35% of the first $500 million of daily net assets, 0.40% of daily net assets between $500 million and $1 billion, and 0.42% of daily net assets over $1 billion.
The Board has approved a Shareholder Servicing Agreement for Investor Class shares of the Fund, which was instituted to compensate the Advisor for the non-investment advisory services it provides to the Fund. The Shareholder Servicing Agreement provides for a monthly fee paid to the Advisor at an annual rate of 0.10% of the average daily net assets of the Fund attributable to Investor Class shares. The shareholder service fees expensed by the Fund during fiscal year 2020 are included in the Statement of Operations.
The Fund has adopted a plan pursuant to Rule 12b-1 under the Investment Company Act of 1940, as amended, that authorizes payments in connection with the distribution of the Fund’s shares at an annual rate of up to 0.25% of the Fund’s average daily net assets attributable to Investor Class shares. Even though the authorized rate is up to 0.25%, the Fund is currently only using up to 0.15% of its average daily net assets attributable to Investor Class shares for such purpose. Amounts paid under the plan may be spent on any activities or expenses primarily intended to result in the sale of shares, including, but not limited to, advertising, shareholder account servicing, printing and mailing of prospectuses to other than current shareholders, printing and mailing of sales literature, and compensation for sales and marketing activities or to financial institutions and others, such as dealers and distributors. The distribution fees expensed by the Fund during fiscal year 2020 are included in the Statement of Operations.
The Fund has entered into agreements with various brokers, dealers, and financial intermediaries in connection with the sale of shares of the Fund. The agreements provide for periodic payments of sub-transfer agent expenses by the Fund to the brokers, dealers, and financial intermediaries for providing certain shareholder maintenance services. These shareholder services include the pre-processing and quality control of new accounts, shareholder correspondence, answering customer inquiries regarding account status, and facilitating shareholder telephone transactions. The sub-transfer agent fees expensed by the Fund during fiscal year 2020 are included in the Statement of Operations.
U.S. Bancorp Fund Services, LLC, d/b/a U.S. Bank Global Fund Services (“Fund Services”) provides the Fund with administrative, accounting, and transfer agent services. As administrator, Fund Services is responsible for activities such as (i) preparing various federal and state regulatory filings, reports, and returns for the Fund, (ii) preparing reports and materials to be supplied to the Board, (iii) monitoring the activities of the Fund’s custodian, transfer agent, and accountants, and (iv) coordinating the preparation and payment of the Fund’s expenses and reviewing the Fund’s expense accruals. U.S. Bank N.A., an affiliate of Fund Services, serves as the Fund’s custodian. The servicing
| HENNESSY FUNDS | 1-800-966-4354 | |
agreements between the Trust and Fund Services and U.S. Bank N.A. contain a fee schedule that is inclusive of administrative, accounting, custody, and transfer agent fees. The administrative, accounting, custody, and transfer agent fees expensed by the Fund during fiscal year 2020 are included in the Statement of Operations.
Quasar Distributors, LLC (“Quasar”) acts as the Fund’s principal underwriter in a continuous public offering of the Fund’s shares. Quasar was an affiliate of Fund Services and U.S. Bank N.A. through March 30, 2020. Effective March 31, 2020, Foreside Financial Group, LLC (“Foreside”) acquired Quasar from Fund Services. As a result of the acquisition, Quasar became a wholly owned broker-dealer subsidiary of Foreside and is no longer affiliated with Fund Services or U.S. Bank N.A. The Board approved a new Distribution Agreement to enable Quasar to continue serving as the Fund’s distributor.
The officers of the Fund are affiliated with the Advisor. With the exception of the Chief Compliance Officer and the Senior Compliance Officer, such officers receive no compensation from the Fund for serving in their respective roles. The Fund, along with the other Hennessy Funds, makes reimbursement payments on an equal basis to the Advisor for a portion of the salary and benefits associated with the office of the Chief Compliance Officer and for all of the salary and benefits associated with the office of the Senior Compliance Officer. The compliance fees expensed by the Fund during fiscal year 2020 are included in the Statement of Operations.
6). GUARANTEES AND INDEMNIFICATIONS
Under the Hennessy Funds’ organizational documents, their officers and trustees are indemnified by the Hennessy Funds against certain liabilities arising out of the performance of their duties to the Hennessy Funds. Additionally, in the normal course of business, the Hennessy Funds enter into contracts with service providers that contain general indemnification clauses. The Fund’s maximum exposure under these arrangements is unknown as this would involve future claims that may be made against the Fund that have not yet occurred. Currently, the Fund expects the risk of loss to be remote.
7). LINE OF CREDIT
The Fund has an uncommitted line of credit with the other Hennessy Funds in the amount of the lesser of (i) $100,000,000 or (ii) 33.33% of each Hennessy Fund’s net assets, or 30% for the Hennessy Gas Utility Fund and 10% for the Hennessy Balanced Fund, intended to provide short-term financing, if necessary, subject to certain restrictions, in connection with shareholder redemptions. The credit facility is with the Hennessy Funds’ custodian bank, U.S. Bank N.A. Borrowings under this arrangement bear interest at the bank’s prime rate and are secured by all of the Fund’s assets (as to its own borrowings only). During fiscal year 2020, the Fund had an outstanding average daily balance and a weighted average interest rate of $586,628 and 3.31%, respectively. The interest expensed by the Fund during fiscal year 2020 is included in the Statement of Operations. The maximum amount outstanding for the Fund during fiscal year 2020 was $30,500,000. As of October 31, 2020, the Fund did not have any borrowings outstanding under the line of credit.
| NOTES TO THE FINANCIAL STATEMENTS |
8). FEDERAL TAX INFORMATION
As of October 31, 2020, the components of accumulated earnings (losses) for income tax purposes were as follows:
| | | Investments | |
| Cost of investments for tax purposes | | $ | 513,053,167 | |
| Gross tax unrealized appreciation | | $ | 251,274,283 | |
| Gross tax unrealized depreciation | | | (11,393,482 | ) |
| Net tax unrealized appreciation/(depreciation) | | $ | 239,880,801 | |
| Undistributed ordinary income | | $ | — | |
| Undistributed long-term capital gains | | | — | |
| Total distributable earnings | | $ | — | |
| Other accumulated gain/(loss) | | $ | (26,281,089 | ) |
| Total accumulated gain/(loss) | | $ | 213,599,712 | |
The difference between book-basis unrealized appreciation/depreciation and tax-basis unrealized appreciation/depreciation (as shown above) is attributable primarily to wash sales.
As of October 31, 2020, the Fund had capital loss carryforwards as follows:
| | $22,090,536 | | Unlimited long-term |
| | 3,684,715 | | Unlimited short-term |
As of October 31, 2020, the Fund deferred, on a tax basis, a late-year ordinary loss of $505,838. Late-year ordinary losses are net ordinary losses incurred after December 31, 2019, but within the taxable year, that are deemed to arise on the first day of the Fund’s next taxable year.
During fiscal years 2020 and 2019, the tax character of distributions paid by the Fund was as follows:
| | | | Year Ended | | | Year Ended | |
| | | | October 31, 2020 | | | October 31, 2019 | |
| | Ordinary income(1) | | $ | 2,630,335 | | | $ | 1,344,675 | |
| | Long-term capital gain | | | 522,621 | | | | — | |
| | Total distributions | | $ | 3,152,956 | | | $ | 1,344,675 | |
| | (1) Ordinary income includes short-term capital gains. |
9). COVID-19 PANDEMIC
The COVID-19 pandemic has adversely impacted global commercial activity and contributed to significant volatility in global equity and debt markets. The pandemic has resulted in quarantines, stay-at-home orders, travel prohibitions, and closures, disrupting supply chains and economic activity. The duration of the pandemic’s effects remain uncertain and difficult to assess. The effects of the pandemic may adversely impact the Fund’s performance and its ability to achieve its investment objective.
10). EVENTS SUBSEQUENT TO YEAR END
Management has evaluated the Fund’s related events and transactions that occurred subsequent to October 31, 2020, through the date of issuance of the Fund’s financial statements. Management has determined that there were no subsequent events requiring recognition or disclosure in the financial statements.
| HENNESSY FUNDS | 1-800-966-4354 | |
Report of Independent Registered Public
Accounting Firm
To the Board of Trustees of Hennessy Funds Trust
and the shareholders of the Hennessy Japan Fund
Novato, CA
Opinion on the Financial Statements
We have audited the accompanying statement of assets and liabilities of the Hennessy Japan Fund (the “Fund”), a series of Hennessy Funds Trust, including the schedule of investments, as of October 31, 2020, the related statement of operations for the year then ended, the statements of changes in net assets for each of the two years in the period then ended, the financial highlights for each of the four years in the period then ended, and the related notes (collectively referred to as the “financial statements”). In our opinion, the financial statements present fairly, in all material respects, the financial position of the Fund as of October 31, 2020, the results of its operations for the year then ended, the changes in its net assets for each of the two years in the period then ended, and the financial highlights for each of the four years in the period then ended in conformity with accounting principles generally accepted in the United States of America.
The financial highlights for year ended October 31, 2016 have been audited by other auditors, whose report dated December 22, 2016 expressed unqualified opinion on such financial highlights.
Basis for Opinion
These financial statements are the responsibility of the Fund’s management. Our responsibility is to express an opinion on the Fund’s financial statements based on our audits. We are a public accounting firm registered with the Public Company Accounting Oversight Board (United States) (“PCAOB”) and are required to be independent with respect to the Fund in accordance with the U.S. federal securities laws and the applicable rules and regulations of the Securities and Exchange Commission and the PCAOB. We have served as the auditor of one or more of the funds in the Trust since 2002.
We conducted our audits in accordance with the standards of the PCAOB. Those standards require that we plan and perform the audit to obtain reasonable assurance about whether the financial statements are free of material misstatement, whether due to error or fraud. The Fund is not required to have, nor were we engaged to perform, an audit of its internal control over financial reporting. As part of our audits we are required to obtain an understanding of internal control over financial reporting, but not for the purpose of expressing an opinion on the effectiveness of the Fund’s internal control over financial reporting. Accordingly, we express no such opinion.
Our audits included performing procedures to assess the risks of material misstatement of the financial statements, whether due to error or fraud, and performing procedures that respond to those risks. Such procedures included examining, on a test basis, evidence regarding the amounts and disclosures in the financial statements. Our audits also included evaluating the accounting principles used and significant estimates made by management, as well as evaluating the overall presentation of the financial statements. Our procedures included confirmation of securities owned as of October 31, 2020 by correspondence with the custodian and brokers; when replies were not received from brokers, we performed other auditing procedures. We believe that our audits provide a reasonable basis for our opinion.
| | |
| | TAIT, WELLER & BAKER LLP |
Philadelphia, Pennsylvania
December 23, 2020
| REPORT OF INDEPENDENT REGISTERED PUBLIC ACCOUNTING FIRM/TRUSTEES AND OFFICERS |
Trustees and Officers of the Fund (Unaudited)
The business and affairs of the Funds are managed under the direction of the Board of Trustees of the Trust, and the Board of Trustees elects the officers of the Trust. From time to time, the Board of Trustees also has appointed advisers to the Board of Trustees (“Advisers”) with the intention of having qualified individuals serve in an advisory capacity to garner experience in the mutual fund and asset management industry and be considered as potential Trustees in the future. There are currently three Advisers: Brian Alexander, Doug Franklin, and Claire Knoles. As Advisers, Mr. Alexander, Mr. Franklin, and Ms. Knoles attend meetings of the Board of Trustees and act as non-voting participants. Information pertaining to the Trustees, Advisers, and the officers of the Trust is set forth below. The Trustees and officers serve until their successors are duly elected and qualified or until their earlier death, resignation, or removal. Each Trustee oversees all 16 Hennessy Funds. Unless otherwise indicated, the address of all persons listed below is 7250 Redwood Boulevard, Suite 200, Novato, CA 94945. The Fund’s Statement of Additional Information includes more information about the persons listed below and is available without charge by calling 1-800-966-4354 or by visiting www.hennessyfunds.com.
| | | | Other |
| | | | Directorships |
| | | | Held Outside |
| Name, Age, | | | of Fund |
| and Position Held | Start Date | Principal Occupation(s) | Complex During |
with the Trust
| of Service
| During Past Five Years
| Past Five Years
|
| Disinterested Trustees and Advisers | | | |
| | | | |
| J. Dennis DeSousa | January 1996 | Mr. DeSousa is a real estate investor. | None. |
| 84 | | | |
| Trustee | | | |
| | | | |
| Robert T. Doyle | January 1996 | Mr. Doyle has been the Sheriff of | None. |
| 73 | | Marin County, California since 1996. | |
| Trustee | | | |
| | | | |
| Gerald P. Richardson | May 2004 | Mr. Richardson is an independent | None. |
| 75 | | consultant in the securities industry. | |
| Trustee | | | |
| | | | |
| Brian Alexander | March 2015 | Mr. Alexander has worked for the | None. |
| 39 | | Sutter Health organization since | |
| Adviser to the Board | | 2011 in various positions. He has | |
| | | served as the Chief Executive Officer | |
| | | of the Sutter Roseville Medical | |
| | | Center since 2018. From 2016 through | |
| | | 2018, he served as the Vice President | |
| | | of Strategy for the Sutter Health Valley | |
| | | Area, which includes 11 hospitals, | |
| | | 13 ambulatory surgery centers, | |
| | | 16,000 employees, and 1,900 physicians. | |
| | | From 2013 through 2016, Mr. Alexander | |
| | | served as Sutter Novato Community | |
| | | Hospital’s Chief Administrative Officer. | |
| HENNESSY FUNDS | 1-800-966-4354 | |
| | | | Other |
| | | | Directorships |
| | | | Held Outside |
| Name, Age, | | | of Fund |
| and Position Held | Start Date | Principal Occupation(s) | Complex During |
with the Trust
| of Service
| During Past Five Years
| Past Five Years
|
| Doug Franklin | March 2016 | Mr. Franklin is a retired insurance | None. |
| 56 | | industry executive. From 1987 | |
| Adviser to the Board | | through 2015, he was employed | |
| | | by the Allianz-Fireman’s Fund | |
| | | Insurance Company in various | |
| | | positions, including as its Chief | |
| | | Actuary and Chief Risk Officer. | |
| | | | |
| Claire Knoles | December 2015 | Ms. Knoles is a founder of Kiosk and | None. |
| 46 | | has served as its Chief Operating | |
| Adviser to the Board | | Officer since 2004. Kiosk is a full- | |
| | | service marketing agency with | |
| | | offices in the San Francisco Bay | |
| | | Area, Toronto, and Liverpool, UK. | |
| | | | |
Interested Trustee(1) | | | |
| | | | |
| Neil J. Hennessy | January 1996 as | Mr. Hennessy has been employed | Hennessy |
| 64 | a Trustee and | by Hennessy Advisors, Inc. since | Advisors, Inc. |
| Trustee, Chairman of | June 2008 as | 1989 and currently serves as its | |
| the Board, Chief | an officer | Chairman and Chief Executive Officer. | |
| Investment Officer, | | | |
| Portfolio Manager, | | | |
| and President | | | |
| Name, Age, | | |
| and Position Held | Start Date | Principal Occupation(s) |
with the Trust
| of Service
| During Past Five Years
|
| Officers | | |
| | | |
| Teresa M. Nilsen | January 1996 | Ms. Nilsen has been employed by Hennessy Advisors, Inc. |
| 54 | | since 1989 and currently serves as its President, Chief Operating |
| Executive Vice President | | Officer, and Secretary. |
| and Treasurer | | |
| | | |
| Daniel B. Steadman | March 2000 | Mr. Steadman has been employed by Hennessy Advisors, Inc. |
| 64 | | since 2000 and currently serves as its Executive Vice President. |
| Executive Vice President | | |
| and Secretary | | |
| | | |
| Brian Carlson | December 2013 | Mr. Carlson has been employed by Hennessy Advisors, Inc. |
| 48 | | since December 2013 and currently serves as its Chief |
| Senior Vice President | | Compliance Officer and Senior Vice President. |
| and Head of Distribution | | |
| | | |
Jennifer Cheskiewicz(2) | June 2013 | Ms. Cheskiewicz has been employed by Hennessy Advisors, Inc. |
| 43 | | as its General Counsel since June 2013. |
| Senior Vice President and | | |
| Chief Compliance Officer | | |
| TRUSTEES AND OFFICERS OF THE FUND |
| Name, Age, | | |
| and Position Held | Start Date | Principal Occupation(s) |
with the Trust
| of Service
| During Past Five Years
|
David Ellison(3) | October 2012 | Mr. Ellison has been employed by Hennessy Advisors, Inc. since |
| 62 | | October 2012. He has served as a Portfolio Manager of the |
| Senior Vice President | | Hennessy Large Cap Financial Fund and the Hennessy Small |
| and Portfolio Manager | | Cap Financial Fund since their inception. Mr. Ellison also served |
| | | as a Portfolio Manager of the Hennessy Technology Fund from |
| | | its inception until February 2017. Mr. Ellison served as Director, |
| | | CIO, and President of FBR Fund Advisers, Inc. from December |
| | | 1999 to October 2012. |
| | | |
Ryan Kelley(4) | March 2013 | Mr. Kelley has been employed by Hennessy Advisors, Inc. since |
| 48 | | October 2012. He has served as a Portfolio Manager of the |
| Senior Vice President | | Hennessy Gas Utility Fund, the Hennessy Large Cap Financial |
| and Portfolio Manager | | Fund, and the Hennessy Small Cap Financial Fund since |
| | | October 2014. He served as Co-Portfolio Manager of these |
| | | same funds from March 2013 through September 2014 and as |
| | | a Portfolio Analyst for the Hennessy Funds from October 2012 |
| | | through February 2013. Mr. Kelley has also served as a Portfolio |
| | | Manager of the Hennessy Cornerstone Growth Fund, the |
| | | Hennessy Cornerstone Mid Cap 30 Fund, the Hennessy |
| | | Cornerstone Large Growth Fund, and the Hennessy |
| | | Cornerstone Value Fund since February 2017 and as a Portfolio |
| | | Manager of the Hennessy Total Return Fund, the Hennessy |
| | | Balanced Fund, and the Hennessy Technology Fund since May |
| | | 2018. He served as Co-Portfolio Manager of the Hennessy |
| | | Technology Fund from February 2017 until May 2018. Mr. Kelley |
| | | served as Portfolio Manager of FBR Fund Advisers, Inc. from |
| | | January 2008 to October 2012. |
| | | |
| Tania Kelley | October 2003 | Ms. Kelley has been employed by Hennessy Advisors, Inc. since |
| 55 | | October 2003. |
| Senior Vice President | | |
| and Head of Marketing | | |
| | | |
L. Joshua Wein(4) | September 2018 | Mr. Wein has been employed by Hennessy Advisors, Inc. since |
| 47 | | 2018. He has served as Co-Portfolio Manager of the Hennessy |
| Vice President and | | Cornerstone Growth Fund, the Hennessy Cornerstone |
| Co-Portfolio Manager | | Mid Cap 30 Fund, the Hennessy Cornerstone Large Growth |
| | | Fund, the Hennessy Cornerstone Value Fund, Hennessy Total |
| | | Return Fund, the Hennessy Balanced Fund, the Hennessy Gas |
| | | Utility Fund, and the Hennessy Technology Fund since February |
| | | 2019. He served as a Senior Analyst of these same funds from |
| | | September 2018 through February 2019. Mr. Wein served as |
| | | Director of Alternative Investments and Co-Portfolio Manager |
| | | at Sterling Capital Management from 2008 to 2018. |
_______________
(1) | Mr. Hennessy is considered an “interested person,” as defined in the Investment Company Act of 1940, as amended, because he is an officer of the Trust. |
(2) | The address of this officer is 4800 Bee Caves Road, Suite 100, Austin, TX 78746. |
(3) | The address of this officer is 101 Federal Street, Suite 1615B, Boston, MA 02110. |
(4) | The address of this officer is 1340 Environ Way, Chapel Hill, NC 27517. |
| HENNESSY FUNDS | 1-800-966-4354 | |
Expense Example (Unaudited)
October 31, 2020
As a shareholder of the Fund, you incur ongoing costs, including management fees, service fees, and other Fund expenses. This Example is intended to help you understand your ongoing costs (in dollars) of investing in the Fund and to compare these costs with the ongoing costs of investing in other mutual funds. The Example is based on an investment of $1,000 invested at the beginning of the period and held for the entire period from May 1, 2020, through October 31, 2020.
Actual Expenses
The first line of the table below under the “Investor Class” and “Institutional Class” headings provides information about actual account values and actual expenses. You may use the information in this line, together with the amount you invested, to estimate the expenses that you paid over the period. Simply divide your account value by $1,000 (for example, an $8,600 account value divided by $1,000 = 8.6), then multiply the result by the number in the first line below the “Investor Class” or “Institutional Class” heading under the column entitled “Expenses Paid During Period” to estimate the expenses you paid on your account during this period. Although the Fund charges no sales loads or transaction fees, you will be assessed fees for outgoing wire transfers, returned checks, and stop payment orders at prevailing rates charged by U.S. Bank Global Fund Services, the Fund’s transfer agent. If you request that a redemption be made by wire transfer, the Fund’s transfer agent charges a $15 fee. IRAs are charged a $15 annual maintenance fee (up to $30 maximum per shareholder for shareholders with multiple IRAs). The example below includes, but is not limited to, management fees, shareholder servicing fees, accounting, custody, and transfer agent fees. However, the example below does not include portfolio trading commissions and related expenses.
Hypothetical Example for Comparison Purposes
The second line of the table below under the “Investor Class” and “Institutional Class” headings provides information about hypothetical account values and hypothetical expenses based on the Fund’s actual expense ratios and an assumed rate of return of 5% per year before expenses, which is not the Fund’s actual return. The hypothetical account values and expenses may not be used to estimate the actual ending account balance or expenses you paid for the period. You may use this information to compare the ongoing costs of investing in the Fund and other funds. To do so, compare this 5% hypothetical example with the 5% hypothetical examples that appear in the shareholder reports of the other funds. Please note that the expenses shown in the table are meant to highlight your ongoing costs only. Therefore, the second line of the table under the “Investor Class” and “Institutional Class” headings is useful in comparing ongoing costs only and will not help you determine the relative total costs of owning different funds.
��
| | | | Expenses Paid |
| | Beginning | Ending | During Period(1) |
| | Account Value | Account Value | May 1, 2020 – |
| | May 1, 2020
| October 31, 2020 | October 31, 2020 |
| Investor Class | | | |
| Actual | $1,000.00 | $1,252.60 | $8.15 |
| Hypothetical (5% return before expenses) | $1,000.00 | $1,017.90 | $7.30 |
| | | | |
| Institutional Class | | | |
| Actual | $1,000.00 | $1,255.00 | $5.84 |
| Hypothetical (5% return before expenses) | $1,000.00 | $1,019.96 | $5.23 |
(1) | Expenses are equal to the Fund’s annualized expense ratio of 1.44% for Investor Class shares or 1.03% for Institutional Class shares, as applicable, multiplied by the average account value over the period, multiplied by 184/366 days (to reflect the half-year period). |
| HENNESSY FUNDS | 1-800-966-4354 | |
How to Obtain a Copy of the Fund’s Proxy
Voting Policy and Proxy Voting Records
A description of the policies and procedures the Fund uses to determine how to vote proxies relating to portfolio securities is available without charge (1) by calling 1-800-966-4354, (2) on the Hennessy Funds’ website at www.hennessyfunds.com/proxy-voting/voting-policy, or (3) on the U.S. Securities and Exchange Commission’s (the “SEC”) website at www.sec.gov. The Fund’s proxy voting record is available without charge on both the Hennessy Funds’ website at www.hennessyfunds.com/proxy-voting/voting-record and the SEC’s website at www.sec.gov no later than August 31 for the prior 12 months ending June 30.
Availability of Quarterly Portfolio Schedule
The Fund files a complete schedule of portfolio holdings with the SEC for the first and third quarters of each fiscal year as an exhibit to its reports on Form N-PORT. The Fund’s Form N-PORT reports are available on the SEC’s website at www.sec.gov or on request by calling 1-800-966-4354.
Federal Tax Distribution Information
(Unaudited)
For fiscal year 2020, certain dividends paid by the Fund may be subject to a maximum tax rate of 23.8%, as provided for by the Jobs and Growth Tax Relief Reconciliation Act of 2003. The percentage of dividends declared from ordinary income designated as qualified dividend income was 100.00%.
For corporate shareholders, the percent of ordinary income distributions that qualified for the corporate dividends received deduction for fiscal year 2020 was 0.00%.
The percentage of taxable ordinary income distributions that were designated as short-term capital gain distributions under Section 871(k)(2)(C) of the Internal Revenue Code of 1986, as amended, for the Fund was 0.00%.
For the year ended October 31, 2020, the Fund earned no foreign-source income and paid no foreign taxes.
Important Notice Regarding Delivery
of Shareholder Documents
To help keep the Fund’s costs as low as possible, we generally deliver a single copy of shareholder reports, proxy statements, and prospectuses to shareholders who share an address and have the same last name. This process does not apply to account statements. You may request an individual copy of a shareholder document at any time. If you would like to receive separate mailings of shareholder documents, please call U.S. Bank Global Fund Services at 1-800-261-6950 or 1-414-765-4124, and individual delivery will begin within 30 days of your request. If your account is held through a financial institution or other intermediary, please contact such intermediary directly to request individual delivery.
| PROXY VOTING — LIQUIDITY RISK MANAGEMENT PROGRAM |
Electronic Delivery
The Fund offers shareholders the option to receive account statements, prospectuses, tax forms, and shareholder reports online. To sign up for eDelivery, please visit www.hennessyfunds.com/account. You may change your delivery preference at any time by visiting our website or calling U.S. Bank Global Fund Services at 1-800-261-6950 or 1-414-765-4124.
Liquidity Risk Management Program
In accordance with Rule 22e-4 under the Investment Company Act of 1940, as amended (the “Liquidity Rule”), we have adopted and implemented a liquidity risk management program (the “Liquidity Program”). The purpose of the Liquidity Program is to assess and manage the Fund’s liquidity risk, which is the risk that the Fund would not be able to meet requests to redeem Fund shares without significant dilution of the remaining shareholders’ interests in the Fund. The Board of Trustees of the Fund (the “Board”) designated a committee comprising representatives of Hennessy Advisors, Inc., the investment adviser to the Fund, as the administrator of the Liquidity Program (the “Program Administrator”).
The Program Administrator provided a written report regarding the Liquidity Program to the Board in advance of its meeting on June 3, 2020. The report covered the period from June 1, 2019, through May 31, 2020. The report addressed the operation of the Liquidity Program, assessed the adequacy and effectiveness of its implementation, and described any material changes to the Liquidity Program during the review period. The Trust’s chief compliance officer presented the report to the Board at the meeting and provided additional information regarding the Liquidity Program. The Board reviewed the Liquidity Program and considered, among other items, the following:
| | 1. | The Program Administrator reviewed daily historical net redemption activity during the review period and during prior periods with higher-than-average redemption activity and concluded that the Fund has historically been able to meet requests to redeem Fund shares without significant dilution to the Fund’s remaining shareholders, and the Program Administrator expects the Fund to be able to continue to do so in the future during both normal and reasonably foreseeable stressed conditions. |
| | | |
| | 2. | The Fund primarily holds assets that are highly liquid investments and is therefore not required to establish a highly liquid investment minimum for the Fund or adopt policies and procedures for responding to a highly liquid investment minimum shortfall. |
| | | |
| | 3. | The Program Administrator did not make any material changes to the Liquidity Program during the review period and was not recommending any changes to the Liquidity Program or the model inputs used to determine the liquidity classification of each security held by the Fund. |
| | | |
| | 4. | The Program Administrator concluded that the Liquidity Program was reasonably designed to assess and manage the Fund’s liquidity risk, complies with the requirements of the Liquidity Rule, and was effectively implemented, having operated as intended during the review period. |
| HENNESSY FUNDS | 1-800-966-4354 | |
Privacy Policy
We collect the following personal information about you:
| | 1. | Information we receive from you in applications or other forms, correspondence, or conversations, including, but not limited to, your name, address, phone number, social security number, assets, income, and date of birth; |
| | | |
| | 2. | Information about your transactions with us, our affiliates, or others, including, but not limited to, your account number and balance, payments history, parties to transactions, cost basis information, and other financial information; and |
| | | |
| | 3. | Other personal information we collect from various sources, even if you have not entered into a prior transaction with us, including the following: |
| | • | Name, alias, address, unique personal identifier, online identifier, IP address, email address, telephone number, account name, and other similar identifiers; |
| | | |
| | • | Age and marital status; |
| | | |
| | • | Commercial information, including records of products purchased; |
| | | |
| | • | Browsing history, search history, and information on interaction with our website; |
| | | |
| | • | Geolocation data; |
| | | |
| | • | Employment and employment history, educational history, financial information, and purchasing and consuming histories or tendencies; and |
| | | |
| | • | Inferences drawn from the above-listed information to create a profile about your preferences, characteristics, predispositions, and behavior. |
We collect this information directly from you, indirectly in the course of providing services to you, directly and indirectly from your activity on our website, from broker dealers, marketing agencies, and other third parties that interact with us in connection with the services we perform and products we offer, and from anonymized and aggregated consumer information.
We use this information to fulfill the reason you provided the information to us, to provide you with other relevant products that you request from us, to provide you with information about products that may interest you, to improve our website or present our website’s contents to you, and as otherwise described to you when collecting your personal information.
We do not disclose any personal information to unaffiliated third parties, except as permitted by law. We may disclose your personal information to our affiliates, vendors, and service providers for a business purpose. For example, we are permitted by law to disclose all of the information we collect, as described above, to our transfer agent to process your transactions. When disclosing your personal information to third parties, we enter into a contract with each third party describing the purpose of such disclosure and requiring that such personal information be kept confidential and not used for any purpose except to perform the services contracted or respond to regulatory or law enforcement requests.
Furthermore, we restrict access to your personal information to those persons who require such information to provide products or services to you. As a result, we do not provide a means for opting out of our limited sharing of your information. We maintain physical, electronic, and procedural safeguards that comply with federal standards to guard your personal information.
If you hold shares of the Funds through a financial intermediary, including, but not limited to, a broker-dealer, bank, or trust company, the privacy policy of your financial intermediary governs how your personal information is shared with unaffiliated third parties.
Supplemental Privacy Notice for Residents of California
The California Consumer Privacy Act of 2018 (the “CCPA”) provides you, as a California resident, with certain additional rights relating to your personal information.
Under the CCPA, you have the right to request that we disclose to you the categories of personal information we have collected about you over the past 12 months, the categories of sources of such information, our business purpose for collecting the information, the categories of third parties, if any, with whom we shared the information, and the specific information we have collected about you. You also have the right to request that we delete any of your personal information, and, unless an exception applies, we will delete such information upon receiving and confirming your request. To make a request, call us at 1-800-966-4354, email us at privacy@hennessyfunds.com, or go to www.hennessyfunds.com/contact. We will not discriminate against you for exercising your rights under the CCPA. Further, we will not collect additional categories of your personal information or use the personal information we collected for materially different, unrelated, or incompatible purposes without providing you notice.
| HENNESSY FUNDS | 1-800-966-4354 | |
(This Page Intentionally Left Blank.)
For information, questions, or assistance, please call
The Hennessy Funds
1-800-966-4354 or 1-415-899-1555
INVESTMENT ADVISOR
Hennessy Advisors, Inc.
7250 Redwood Boulevard, Suite 200
Novato, California 94945
ADMINISTRATOR,
TRANSFER AGENT,
DIVIDEND PAYING AGENT, &
SHAREHOLDER SERVICING AGENT
U.S. Bancorp Fund Services, LLC
d/b/a U.S. Bank Global Fund Services
P.O. Box 701
Milwaukee, Wisconsin 53201-0701
CUSTODIAN
U.S. Bank N.A.
Custody Operations
1555 North River Center Drive, Suite 302
Milwaukee, Wisconsin 53212
TRUSTEES
Neil J. Hennessy
Robert T. Doyle
J. Dennis DeSousa
Gerald P. Richardson
COUNSEL
Foley & Lardner LLP
777 East Wisconsin Avenue
Milwaukee, Wisconsin 53202-5306
INDEPENDENT REGISTERED
PUBLIC ACCOUNTING FIRM
Tait, Weller & Baker LLP
Two Liberty Place
50 South 16th Street, Suite 2900
Philadelphia, Pennsylvania 19102-2529
DISTRIBUTOR
Quasar Distributors, LLC
111 East Kilbourn Avenue, Suite 2200
Milwaukee, Wisconsin 53202
www.hennessyfunds.com | 1-800-966-4354
This report has been prepared for shareholders and may be distributed to
others only if preceded or accompanied by a current prospectus.
ANNUAL REPORT
OCTOBER 31, 2020
HENNESSY JAPAN SMALL CAP FUND
Investor Class HJPSX
Institutional Class HJSIX
IMPORTANT NOTICE REGARDING ELECTRONIC DELIVERY OF SHAREHOLDER REPORTS
Beginning on January 1, 2021, as permitted by regulations adopted by the Securities and Exchange Commission, paper copies of the annual and semi-annual reports will no longer be sent by mail unless you specifically request paper copies from the Hennessy Funds or from your financial intermediary. Instead, the reports will be made available on a website, and you will be notified by mail each time a report is posted and provided with a website link to access the report.
If you have already elected to receive shareholder reports electronically, you will not be affected by this change and you need not take any action. You may elect to receive shareholder reports and other communications from the Hennessy Funds electronically by visiting www.hennessyfunds.com/account or by calling U.S. Bank Global Fund Services at 1-800-261-6950. If you own shares in a Fund through a financial intermediary, please contact your financial intermediary to make this election.
You may elect to receive paper copies of all future reports free of charge by calling U.S. Bank Global Fund Services at 1-800-261-6950 or, if you own your shares through a financial intermediary, by contacting your financial intermediary. Your election to receive paper copies of reports will apply to all Funds in the Hennessy Funds family.
www.hennessyfunds.com | 1-800-966-4354
(This Page Intentionally Left Blank.)
Contents
| Letter to Shareholders | | 2 |
| Performance Overview | | 4 |
| Financial Statements | | |
| Schedule of Investments | | 7 |
| Statement of Assets and Liabilities | | 12 |
| Statement of Operations | | 13 |
| Statements of Changes in Net Assets | | 15 |
| Financial Highlights | | 16 |
| Notes to the Financial Statements | | 20 |
| Report of Independent Registered Public Accounting Firm | | 28 |
| Trustees and Officers of the Fund | | 29 |
| Expense Example | | 32 |
| Proxy Voting Policy and Proxy Voting Records | | 34 |
| Availability of Quarterly Portfolio Schedule | | 34 |
| Federal Tax Distribution Information | | 34 |
| Important Notice Regarding Delivery of Shareholder Documents | | 34 |
| Electronic Delivery | | 35 |
| Liquidity Risk Management Program | | 35 |
| Privacy Policy | | 36 |
| HENNESSY FUNDS | 1-800-966-4354 | |
December 2020
Dear Hennessy Funds Shareholder:
The Japanese stock market gained 0.35% in U.S. dollar terms as measured by the Tokyo Stock Price Index (TOPIX) over the 12 months ended October 31, 2020. Earlier in this period, just as China was starting to regain its footing after the U.S.-China trade agreement in late 2019, it was tripped up by yet another risk event: the outbreak of COVID-19. The Japanese market did not escape the substantial negative impact of the initial onset of COVID-19, but it rebounded throughout the remainder of the fiscal year, almost to the level before the sharp decline.
The health impact of the COVID-19 pandemic has been less severe in Japan compared to many other parts of the world. According to Financial Times, the seven-day rolling average of new COVID-19-related deaths per million as of October 31, 2020, was 3.5 for the European Union and 2.5 for the United States, while this figure for Japan was less than 0.1. This is surprising, especially given that the Japanese government never implemented the stringent lockdown measures that were put in place elsewhere. The Japanese cultural norms of wearing masks and greeting others by bowing instead of shaking hands or exchanging kisses may have played a key role in mitigating the spread of the virus.
Although Japan experienced a second wave of COVID-19 infections in August 2020, it appears to be subsiding. To help the economy recover, the government reacted swiftly to pass two stimulus packages totaling 40% of Japan’s GDP. The government’s reaction to the pandemic was far greater in scale and speed compared to its response to the 2008 financial crisis. As a result, Japan has been relatively unaffected by job and wage losses to date. In fact, the unemployment rate in September was just 3.0%. How quickly will things return to normal? It is very hard to say, but at least from a health crisis standpoint, it appears that Japan has been managing the situation quite well.
The economic reform policies of Japan’s new Prime Minister, Yoshihide Suga, are consistent thus far with those of the former Prime Minister, Shinzo Abe, who resigned in August for health reasons. For the longer term, we believe that the combination of a reform-minded government and a pro-inflation, pro-business central bank should continue to serve as a structural tailwind to the Japanese economy because they ensure (i) Japan’s low interest rate regime, (ii) a continuous push for better corporate governance, (iii) a benign currency environment, and (iv) the progress of other structural reforms, such as labor market reforms, to boost labor productivity.
If history is any guide, humankind has coped with pandemics and overcome the crises over many centuries. We remain optimistic about the long-term prospects for Japan and its stock market. Thank you for your continued confidence and investment in the Hennessy Funds.
Sincerely,
| |
| Tadahiro Fujimura | Masakazu Takeda |
| Portfolio Manager, | Portfolio Manager, |
| Hennessy Japan Small Cap Fund; | Hennessy Japan Fund; |
| Chief Investment Officer | Fund Manager |
| SPARX Asset Management Co., Ltd. | SPARX Asset Management Co., Ltd. |
SPARX Asset Management Co., Ltd., located in Tokyo, Japan, is the sub-advisor to the Hennessy Japan Fund and the Hennessy Japan Small Cap Fund.
Past performance does not guarantee future results.
Mutual fund investing involves risk. Principal loss is possible.
The outbreak of the COVID-19 pandemic and the resulting actions to control or slow the spread of the virus have had significant detrimental effects on global and domestic economies and on financial markets and industries. Hennessy Funds continues to monitor the impact of COVID-19, but we cannot determine the full impact this virus may have on Japanese stocks. In the future, this macroeconomic risk could have an adverse material financial impact on the Hennessy Funds.
Opinions expressed are those of Tadahiro Fujimura and Masakazu Takeda and are subject to change, are not guaranteed, and should not be considered investment advice.
The Tokyo Stock Price Index (TOPIX) is a capitalization-weighted index of all of the companies listed on the First Section of the Tokyo Stock Exchange. One cannot invest directly in an index.
| HENNESSY FUNDS | 1-800-966-4354 | |
Performance Overview (Unaudited)
CHANGE IN VALUE OF $10,000 INVESTMENT
This graph illustrates the performance of an initial investment of $10,000 made in the Fund ten years ago and assumes the reinvestment of dividends.
AVERAGE ANNUAL TOTAL RETURN FOR PERIODS ENDED OCTOBER 31, 2020
| | One | Five | Ten |
| | Year
| Years
| Years
|
| Hennessy Japan Small Cap Fund – | | | |
| Investor Class (HJPSX) | 3.27% | 11.50% | 13.02% |
| Hennessy Japan Small Cap Fund – | | | |
Institutional Class (HJSIX)(1) | 3.69% | 11.90% | 13.23% |
Russell/Nomura Small CapTM Index | -0.65% | 6.74% | 8.56% |
| Tokyo Price Index (TOPIX) | 0.35% | 5.57% | 6.46% |
Expense ratios: 1.52% (Investor Class); 1.12% (Institutional Class)
(1) | The inception date of Institutional Class shares is June 15, 2015. Performance shown prior to the inception of Institutional Class shares reflects the performance of Investor Class shares and includes expenses that are not applicable to, and are higher than, those of Institutional Class shares. |
Performance data quoted represents past performance; past performance does not guarantee future results. The investment return and principal value of an investment will fluctuate so that an investor’s shares, when redeemed, may be worth more or less than their original cost. The performance table does not reflect the deduction of taxes that a shareholder would pay on Fund distributions or the redemption of Fund shares. Current performance of the Fund may be lower or higher than the performance quoted. Performance data current to the most recent month end may be obtained by visiting www.hennessyfunds.com.
The Russell/Nomura Small Cap™ Index contains the bottom 15% of the Russell/Nomura Total Market™ Index based on market capitalization. The Tokyo Price Index (TOPIX) is a capitalization-weighted index of all of the companies listed on the First Section of the Tokyo Stock Exchange. One cannot invest directly in an index. These indices are used herein for comparative purposes in accordance with Securities and Exchange Commission regulations.
Frank Russell Company (“Russell”) is the source and owner of the trademarks, service marks, and copyrights related to the Russell Indexes. Russell® is a trademark of Frank Russell Company. Neither Russell nor its licensors accept any liability for any errors or omissions in the Russell Indexes or Russell ratings or underlying data and no party may rely on any Russell Indexes or Russell ratings or underlying data contained in this communication.
No further distribution of Russell data is permitted without Russell’s express written consent. Russell does not promote, sponsor, or endorse the content of this communication.
The expense ratios presented are from the most recent prospectus. The expense ratios for the current reporting period are available in the Financial Highlights section of this report.
PERFORMANCE NARRATIVE
Portfolio Managers Tadahiro Fujimura, CFA and CMA*, and Takenari Okumura, CMA*
SPARX Asset Management Co., Ltd. (sub-advisor)
Performance:
For the 12-month period ended October 31, 2020, the Investor Class of the Hennessy Japan Small Cap Fund returned 3.27%, outperforming both the Russell/Nomura Small Cap™ Index (the Fund’s primary benchmark), and the Tokyo Stock Price Index (TOPIX), which returned -0.65% and 0.35%, respectively, for the same period in U.S. dollar terms.
Although the COVID-19 pandemic dramatically impacted the market environment in the early part of 2020, the stock market rebounded throughout the remainder of the period. For the 12 months ended October 31, 2020, small-cap and mid-cap stocks underperformed large-cap stocks. We believe this is because the rebound was driven primarily by large-cap stocks and indices and because of the slow recovery of domestic demand in Japan compared to other countries.
In terms of individual stocks, internet-based life insurance company Lifenet Insurance Co. was the best contributor to the Fund’s performance. The company benefited from the rapid increase in online life insurance purchases and in the number of subscribers gained through advertising amidst the COVID-19 pandemic. Kobe Bussan Co., Ltd., a low-priced wholesale food production and distribution company, also contributed positively to Fund performance again this year. The company enjoyed strong sales because more people chose to cook at home due to COVID-19 and preferred low-priced products in the uncertain economy. The stock price of Cosmos Pharmaceutical Corp., a drug store operator, also performed well. The company benefitted from increased sales of masks, disinfectants, and related items, and a higher frequency of store visits resulted in increased sales of other products as well.
The stock that contributed most negatively to the Fund’s performance was Nishimoto Co., Ltd. The company’s main business is the export of food products to supermarkets and restaurants in Europe and the United States, which were negatively impacted by COVID-19 related restrictions. Sato Holdings Corp., which manufactures barcode-related equipment, also contributed negatively. Their sales suffered from the effects of COVID-19, which decreased existing customer usage and new sales. The stock of Hanwa Co., Ltd., a steel-related trading company, performed poorly as they announced that the steel market was deteriorating and that the losses from the company’s South African mine were increasing.
The Fund continues to hold all the companies mentioned.
Portfolio Strategy and Investment Commentary:
Japanese companies’ performance appears to have bottomed out in a wide range of industries, partly due to the recovery of the Chinese economy. Although there are concerns about a further rise in COVID-19 infections, the virus appears to have subsided in Japan and Asia, and the impact on the Japanese economy is thought to be small. On the other hand, continued friction between the United States and China and the uncertainty surrounding the impact of the results of the U.S. presidential election continue to be a risk.
| HENNESSY FUNDS | 1-800-966-4354 | |
In this environment, the Japanese stock market has a large investment capacity for foreign investors, and we believe that the possibility of foreign investors shifting funds to Japanese stocks is high. We also believe that there are many Japanese stocks whose stock prices have been sluggish despite the recovery in business performance, as the rising stocks so far have been mostly digital-related names. If COVID-19 infections remain under control in Japan, we will proceed with the sale of stocks that have risen significantly so far and will continue to invest in stocks that have remained attractive in valuation relative to their expected performance after recovery. In addition, we seek to invest in companies that can respond positively to structural changes due to digitalization and deregulation.
_______________
* Chartered Member of the Security Analysts Association of Japan
Opinions expressed are those of the Portfolio Managers as of the date written and are subject to change, are not guaranteed, and should not be considered investment advice or an indication of trading intent.
The Fund invests in small-capitalization and medium-capitalization companies, which may have more limited liquidity and greater price volatility than large-capitalization companies. The Fund invests in the stocks of companies operating in Japan; single-country funds may be subject to a higher degree of risk. The Fund may experience higher fees due to investments in pooled investment vehicles (including ETFs). Please see the Fund’s prospectus for a more complete discussion of these and other risks.
References to specific securities should not be considered a recommendation to buy or sell any security. Fund holdings and sector allocations are subject to change. Please refer to the Schedule of Investments included in this report for additional portfolio information.
| PERFORMANCE OVERVIEW/SCHEDULE OF INVESTMENTS |
Financial Statements
Schedule of Investments as of October 31, 2020 |
HENNESSY JAPAN SMALL CAP FUND
(% of Net Assets)
| TOP TEN HOLDINGS (EXCLUDING MONEY MARKET FUNDS) | % NET ASSETS |
| EF-ON, Inc. | 2.40% |
| Hito Communications Holdings, Inc. | 2.30% |
| Pacific Industrial Co., Ltd. | 2.27% |
| METAWATER Co., Ltd. | 2.25% |
| SBS Holdings, Inc. | 2.21% |
| Digital Garage, Inc. | 2.18% |
| Ship Healthcare Holdings, Inc. | 2.18% |
| Kito Corp. | 2.14% |
| Iwatani Corp. | 2.13% |
| Senko Group Holdings Co., Ltd. | 2.11% |
Note: For presentation purposes, the Fund has grouped some of the industry categories. For purposes of categorizing securities for compliance with Section 8(b)(1) of the Investment Company Act of 1940, as amended, the Fund uses more specific industry classifications.
The Global Industry Classification Standard (GICS®) was developed by and is the exclusive property and a service mark of MSCI, Inc. and Standard & Poor’s Financial Services LLC. It has been licensed for use by the Hennessy Funds.
| HENNESSY FUNDS | 1-800-966-4354 | |
| COMMON STOCKS – 97.81% | | Number | | | | | | % of | |
| | | of Shares | | | Value | | | Net Assets | |
| Communication Services – 1.77% | | | | | | | | | |
| Kakaku.com, Inc. | | | 22,600 | | | $ | 597,260 | | | | 0.74 | % |
| Septeni Holdings Co., Ltd. | | | 226,300 | | | | 836,142 | | | | 1.03 | % |
| | | | | | | | 1,433,402 | | | | 1.77 | % |
| | | | | | | | | | | | | |
| Consumer Discretionary – 12.13% | | | | | | | | | | | | |
| Matsuoka Corp. | | | 72,700 | | | | 1,550,347 | | | | 1.92 | % |
| Musashi Seimitsu Industry Co., Ltd. | | | 150,600 | | | | 1,574,194 | | | | 1.94 | % |
| NGK Spark Plug Co. Ltd. | | | 26,900 | | | | 473,089 | | | | 0.59 | % |
| Nojima Corp. | | | 58,000 | | | | 1,627,771 | | | | 2.01 | % |
| Pacific Industrial Co., Ltd. | | | 183,300 | | | | 1,840,829 | | | | 2.27 | % |
| Saizeriya Co., Ltd. | | | 61,700 | | | | 1,070,959 | | | | 1.32 | % |
| Seiren Co., Ltd. | | | 106,400 | | | | 1,686,218 | | | | 2.08 | % |
| | | | | | | | 9,823,407 | | | | 12.13 | % |
| | | | | | | | | | | | | |
| Consumer Staples – 6.58% | | | | | | | | | | | | |
| Cosmos Pharmaceutical Corp. | | | 9,400 | | | | 1,596,491 | | | | 1.97 | % |
| Kobe Bussan Co., Ltd. | | | 29,800 | | | | 838,425 | | | | 1.03 | % |
| Nippon Flour Mills Co. Ltd. | | | 50,300 | | | | 806,803 | | | | 1.00 | % |
| Nishimoto Co., Ltd. | | | 61,700 | | | | 1,103,791 | | | | 1.36 | % |
| Starzen Co., Ltd. | | | 10,300 | | | | 383,366 | | | | 0.47 | % |
| Yoshimura Food Holdings KK (a) | | | 75,100 | | | | 605,109 | | | | 0.75 | % |
| | | | | | | | 5,333,985 | | | | 6.58 | % |
| | | | | | | | | | | | | |
| Energy – 2.13% | | | | | | | | | | | | |
| Iwatani Corp. | | | 38,100 | | | | 1,728,695 | | | | 2.13 | % |
| | | | | | | | | | | | | |
| Financials – 3.85% | | | | | | | | | | | | |
| AEON Financial Service Co., Ltd. | | | 137,600 | | | | 1,409,279 | | | | 1.74 | % |
| Lifenet Insurance Co. (a) | | | 115,900 | | | | 1,706,795 | | | | 2.11 | % |
| | | | | | | | 3,116,074 | | | | 3.85 | % |
| | | | | | | | | | | | | |
| Health Care – 3.35% | | | | | | | | | | | | |
| CYBERDYNE, Inc. (a) | | | 138,100 | | | | 947,065 | | | | 1.17 | % |
| Ship Healthcare Holdings, Inc. | | | 37,300 | | | | 1,769,973 | | | | 2.18 | % |
| | | | | | | | 2,717,038 | | | | 3.35 | % |
| | | | | | | | | | | | | |
| Industrials – 39.42% | | | | | | | | | | | | |
| Bell System24 Holdings, Inc. | | | 102,400 | | | | 1,545,519 | | | | 1.91 | % |
| Benefit One, Inc. | | | 67,100 | | | | 1,679,156 | | | | 2.07 | % |
| Daihen Corp. | | | 43,800 | | | | 1,693,878 | | | | 2.09 | % |
The accompanying notes are an integral part of these financial statements.
| COMMON STOCKS | | Number | | | | | | % of | |
| | | of Shares | | | Value | | | Net Assets | |
| Industrials (Continued) | | | | | | | | | |
| Fugi Corp. | | | 83,600 | | | $ | 1,680,692 | | | | 2.07 | % |
| Hanwa Co., Ltd. | | | 86,500 | | | | 1,677,035 | | | | 2.07 | % |
| Hito Communications Holdings, Inc. | | | 143,100 | | | | 1,859,190 | | | | 2.30 | % |
| Juki Corp. | | | 125,800 | | | | 533,243 | | | | 0.66 | % |
| Kawada Technologies, Inc. | | | 33,900 | | | | 1,415,191 | | | | 1.75 | % |
| Kito Corp. | | | 140,700 | | | | 1,734,822 | | | | 2.14 | % |
| METAWATER Co., Ltd. | | | 77,600 | | | | 1,819,332 | | | | 2.25 | % |
| MIRAIT Holdings Corp. | | | 111,200 | | | | 1,583,059 | | | | 1.95 | % |
| Mitsubishi Logisnext Co., Ltd. | | | 175,800 | | | | 1,483,828 | | | | 1.83 | % |
| Morita Holdings Corp. | | | 38,900 | | | | 711,133 | | | | 0.88 | % |
| Nichiha Corp. | | | 15,900 | | | | 463,312 | | | | 0.57 | % |
| Nihon Flush Co., Ltd. | | | 110,600 | | | | 1,426,281 | | | | 1.76 | % |
| Nippon Koei Co., Ltd. | | | 59,500 | | | | 1,568,579 | | | | 1.94 | % |
| Okamura Corp. | | | 57,800 | | | | 441,421 | | | | 0.54 | % |
| Sato Holdings Corp. | | | 74,300 | | | | 1,414,795 | | | | 1.75 | % |
| SBS Holdings, Inc. | | | 78,400 | | | | 1,786,836 | | | | 2.21 | % |
| Senko Group Holdings Co., Ltd. | | | 191,200 | | | | 1,709,914 | | | | 2.11 | % |
| Takeei Corp. | | | 157,000 | | | | 1,530,431 | | | | 1.89 | % |
| Tatsuta Electric Wire and Cable Co., Ltd. | | | 121,000 | | | | 652,272 | | | | 0.81 | % |
| Tocalo Co., Ltd. | | | 152,200 | | | | 1,517,180 | | | | 1.87 | % |
| | | | | | | | 31,927,099 | | | | 39.42 | % |
| | | | | | | | | | | | | |
| Information Technology – 16.44% | | | | | | | | | | | | |
| Digital Garage, Inc. | | | 49,600 | | | | 1,763,538 | | | | 2.18 | % |
| Elecom Co., Ltd. | | | 33,200 | | | | 1,662,671 | | | | 2.05 | % |
| Macnica Fuji Electronics Holdings, Inc. | | | 91,200 | | | | 1,630,993 | | | | 2.01 | % |
| Mimaki Engineering Co., Ltd. (a) | | | 209,200 | | | | 816,131 | | | | 1.01 | % |
| Nihon Unisys Ltd. | | | 49,500 | | | | 1,459,084 | | | | 1.80 | % |
| Nippon Signal Company, Ltd. | | | 153,600 | | | | 1,337,689 | | | | 1.65 | % |
| Poletowin Pitcrew Holdings, Inc. | | | 89,900 | | | | 783,181 | | | | 0.97 | % |
| Rorze Corp. | | | 12,700 | | | | 565,635 | | | | 0.70 | % |
| SIIX Corp. | | | 73,500 | | | | 870,968 | | | | 1.08 | % |
| Towa Corp. | | | 74,400 | | | | 860,350 | | | | 1.06 | % |
| Transcosmos, Inc. | | | 57,300 | | | | 1,563,147 | | | | 1.93 | % |
| | | | | | | | 13,313,387 | | | | 16.44 | % |
The accompanying notes are an integral part of these financial statements.
| HENNESSY FUNDS | 1-800-966-4354 | |
| COMMON STOCKS | | Number | | | | | | % of | |
| | | of Shares | | | Value | | | Net Assets | |
| Materials – 6.58% | | | | | | | | | |
| Asia Pile Holdings Corp. | | | 355,700 | | | $ | 1,549,607 | | | | 1.91 | % |
| Kanto Denka Kogyo Co., Ltd. | | | 111,400 | | | | 751,733 | | | | 0.93 | % |
| Sanyo Chemical Industries Ltd. | | | 34,800 | | | | 1,474,750 | | | | 1.82 | % |
| Tokyo Ohka Kogyo Co., Ltd. | | | 26,200 | | | | 1,551,295 | | | | 1.92 | % |
| | | | | | | | 5,327,385 | | | | 6.58 | % |
| | | | | | | | | | | | | |
| Real Estate – 3.16% | | | | | | | | | | | | |
| Star Mica Holdings Co., Ltd. | | | 115,400 | | | | 1,555,114 | | | | 1.92 | % |
| Tosei Corp. | | | 100,300 | | | | 1,005,074 | | | | 1.24 | % |
| | | | | | | | 2,560,188 | | | | 3.16 | % |
| | | | | | | | | | | | | |
| Utilities – 2.40% | | | | | | | | | | | | |
| EF-ON, Inc. | | | 260,200 | | | | 1,947,814 | | | | 2.40 | % |
| | | | | | | | | | | | | |
| Total Common Stocks | | | | | | | | | | | | |
| (Cost $72,453,818) | | | | | | | 79,228,474 | | | | 97.81 | % |
| | | | | | | | | | | | | |
| SHORT-TERM INVESTMENTS – 1.95% | | | | | | | | | | | | |
| | | | | | | | | | | | | |
| Money Market Funds – 1.95% | | | | | | | | | | | | |
| First American Government Obligations Fund, | | | | | | | | | | | | |
| Institutional Class, 0.05% (b) | | | 1,577,366 | | | | 1,577,366 | | | | 1.95 | % |
| | | | | | | | | | | | | |
| Total Short-Term Investments | | | | | | | | | | | | |
| (Cost $1,577,366) | | | | | | | 1,577,366 | | | | 1.95 | % |
| | | | | | | | | | | | | |
| Total Investments | | | | | | | | | | | | |
| (Cost $74,031,184) – 99.76% | | | | | | | 80,805,840 | | | | 99.76 | % |
| Other Assets in Excess of Liabilities – 0.24% | | | | | | | 192,178 | | | | 0.24 | % |
| | | | | | | | | | | | | |
TOTAL NET ASSETS – 100.00% | | | | | | $ | 80,998,018 | | | | 100.00 | % |
Percentages are stated as a percent of net assets.
| (a) | Non-income-producing security. |
| (b) | The rate listed is the fund’s seven-day yield as of October 31, 2020. |
The accompanying notes are an integral part of these financial statements.
Summary of Fair Value Exposure as of October 31, 2020
The following is a summary of the inputs used to value the Fund’s net assets as of October 31, 2020 (see Note 3 in the accompanying Notes to the Financial Statements):
| Common Stocks | | Level 1 | | | Level 2 | | | Level 3 | | | Total | |
| Communication Services | | $ | — | | | $ | 1,433,402 | | | $ | — | | | $ | 1,433,402 | |
| Consumer Discretionary | | | — | | | | 9,823,407 | | | | — | | | | 9,823,407 | |
| Consumer Staples | | | — | | | | 5,333,985 | | | | — | | | | 5,333,985 | |
| Energy | | | — | | | | 1,728,695 | | | | — | | | | 1,728,695 | |
| Financials | | | — | | | | 3,116,074 | | | | — | | | | 3,116,074 | |
| Health Care | | | — | | | | 2,717,038 | | | | — | | | | 2,717,038 | |
| Industrials | | | — | | | | 31,927,099 | | | | — | | | | 31,927,099 | |
| Information Technology | | | — | | | | 13,313,387 | | | | — | | | | 13,313,387 | |
| Materials | | | — | | | | 5,327,385 | | | | — | | | | 5,327,385 | |
| Real Estate | | | — | | | | 2,560,188 | | | | — | | | | 2,560,188 | |
| Utilities | | | — | | | | 1,947,814 | | | | — | | | | 1,947,814 | |
| Total Common Stocks | | $ | — | | | $ | 79,228,474 | | | $ | — | | | $ | 79,228,474 | |
| Short-Term Investments | | | | | | | | | | | | | | | | |
| Money Market Funds | | $ | 1,577,366 | | | $ | — | | | $ | — | | | $ | 1,577,366 | |
| Total Short-Term Investments | | $ | 1,577,366 | | | $ | — | | | $ | — | | | $ | 1,577,366 | |
| Total Investments | | $ | 1,577,366 | | | $ | 79,228,474 | | | $ | — | | | $ | 80,805,840 | |
The accompanying notes are an integral part of these financial statements.
| HENNESSY FUNDS | 1-800-966-4354 | |
Financial Statements
Statement of Assets and Liabilities as of October 31, 2020 |
| ASSETS: | | | |
| Investments in securities, at value (cost $74,031,184) | | $ | 80,805,840 | |
| Dividends and interest receivable | | | 428,511 | |
| Receivable for fund shares sold | | | 60,456 | |
| Prepaid expenses and other assets | | | 15,545 | |
| Total assets | | | 81,310,352 | |
| | | | | |
| LIABILITIES: | | | | |
| Payable for securities purchased | | | 87,017 | |
| Payable for fund shares redeemed | | | 87,360 | |
| Payable to advisor | | | 55,735 | |
| Payable to administrator | | | 17,579 | |
| Payable to auditor | | | 23,100 | |
| Accrued distribution fees | | | 8,553 | |
| Accrued service fees | | | 3,985 | |
| Accrued trustees fees | | | 3,937 | |
| Accrued expenses and other payables | | | 25,068 | |
| Total liabilities | | | 312,334 | |
| NET ASSETS | | $ | 80,998,018 | |
| | | | | |
| NET ASSETS CONSISTS OF: | | | | |
| Capital stock | | $ | 74,791,843 | |
| Total distributable earnings | | | 6,206,175 | |
| Total net assets | | $ | 80,998,018 | |
| | | | | |
| NET ASSETS: | | | | |
| Investor Class | | | | |
| Shares authorized (no par value) | | Unlimited | |
| Net assets applicable to outstanding shares | | $ | 46,413,365 | |
| Shares issued and outstanding | | | 2,951,291 | |
| Net asset value, offering price, and redemption price per share | | $ | 15.73 | |
| | | | | |
| Institutional Class | | | | |
| Shares authorized (no par value) | | Unlimited | |
| Net assets applicable to outstanding shares | | $ | 34,584,653 | |
| Shares issued and outstanding | | | 2,219,943 | |
| Net asset value, offering price, and redemption price per share | | $ | 15.58 | |
The accompanying notes are an integral part of these financial statements.
| STATEMENT OF ASSETS AND LIABILITIES/STATEMENT OF OPERATIONS |
Financial Statements
Statement of Operations for the year ended October 31, 2020 |
| INVESTMENT INCOME: | | | |
Dividend income(1) | | $ | 1,555,076 | |
| Interest income | | | 23,344 | |
| Total investment income | | | 1,578,420 | |
| | | | | |
| EXPENSES: | | | | |
| Investment advisory fees (See Note 5) | | | 780,324 | |
| Sub-transfer agent expenses – Investor Class (See Note 5) | | | 122,827 | |
| Sub-transfer agent expenses – Institutional Class (See Note 5) | | | 29,989 | |
| Administration, accounting, custody, and transfer agent fees (See Note 5) | | | 118,242 | |
| Distribution fees – Investor Class (See Note 5) | | | 79,752 | |
| Service fees – Investor Class (See Note 5) | | | 53,168 | |
| Federal and state registration fees | | | 44,586 | |
| Compliance expense (See Note 5) | | | 27,712 | |
| Audit fees | | | 23,099 | |
| Trustees’ fees and expenses | | | 14,904 | |
| Reports to shareholders | | | 14,868 | |
| Interest expense (See Note 7) | | | 3,305 | |
| Legal fees | | | 1,514 | |
| Other expenses | | | 14,027 | |
| Total expenses | | | 1,328,317 | |
| NET INVESTMENT INCOME | | $ | 250,103 | |
| | | | | |
| REALIZED AND UNREALIZED GAINS (LOSSES): | | | | |
| Net realized gain on investments | | $ | 4,449,101 | |
| Net change in unrealized appreciation/depreciation on investments | | | (6,227,200 | ) |
| Net loss on investments | | | (1,778,099 | ) |
| NET DECREASE IN NET ASSETS RESULTING FROM OPERATIONS | | $ | (1,527,996 | ) |
(1) | Net of foreign taxes withheld of $172,786. |
The accompanying notes are an integral part of these financial statements.
| HENNESSY FUNDS | 1-800-966-4354 | |
(This Page Intentionally Left Blank.)
| STATEMENTS OF CHANGES IN NET ASSETS |
Financial Statements
| Statements of Changes in Net Assets |
| | | Year Ended | | | Year Ended | |
| | | October 31, 2020 | | | October 31, 2019 | |
| OPERATIONS: | | | | | | |
| Net investment income | | $ | 250,103 | | | $ | 628,672 | |
| Net realized gain (loss) on investments | | | 4,449,101 | | | | (3,898,603 | ) |
| Net change in unrealized | | | | | | | | |
| appreciation/depreciation on investments | | | (6,227,200 | ) | | | 9,297,065 | |
| Net increase (decrease) in net assets | | | | | | | | |
| resulting from operations | | | (1,527,996 | ) | | | 6,027,134 | |
| | | | | | | | | |
| DISTRIBUTIONS TO SHAREHOLDERS: | | | | | | | | |
| Distributable earnings – Investor Class | | | (876,351 | ) | | | (3,091,719 | ) |
| Distributable earnings – Institutional Class | | | (1,083,137 | ) | | | (3,196,949 | ) |
| Total distributions | | | (1,959,488 | ) | | | (6,288,668 | ) |
| | | | | | | | | |
| CAPITAL SHARE TRANSACTIONS: | | | | | | | | |
| Proceeds from shares subscribed – Investor Class | | | 10,928,761 | | | | 16,258,683 | |
| Proceeds from shares subscribed – Institutional Class | | | 17,157,226 | | | | 30,397,388 | |
| Dividends reinvested – Investor Class | | | 843,742 | | | | 3,007,874 | |
| Dividends reinvested – Institutional Class | | | 990,566 | | | | 2,892,147 | |
| Cost of shares redeemed – Investor Class | | | (30,850,983 | ) | | | (54,044,581 | ) |
| Cost of shares redeemed – Institutional Class | | | (44,670,336 | ) | | | (67,515,691 | ) |
| Net decrease in net assets derived | | | | | | | | |
| from capital share transactions | | | (45,601,024 | ) | | | (69,004,180 | ) |
| TOTAL DECREASE IN NET ASSETS | | | (49,088,508 | ) | | | (69,265,714 | ) |
| | | | | | | | | |
| NET ASSETS: | | | | | | | | |
| Beginning of year | | | 130,086,526 | | | | 199,352,240 | |
| End of year | | $ | 80,998,018 | | | $ | 130,086,526 | |
| | | | | | | | | |
| CHANGES IN SHARES OUTSTANDING: | | | | | | | | |
| Shares sold – Investor Class | | | 740,416 | | | | 1,129,349 | |
| Shares sold – Institutional Class | | | 1,237,542 | | | | 2,150,721 | |
| Shares issued to holders as reinvestment | | | | | | | | |
| of dividends – Investor Class | | | 52,999 | | | | 211,079 | |
| Shares issued to holders as reinvestment | | | | | | | | |
| of dividends – Institutional Class | | | 63,013 | | | | 206,255 | |
| Shares redeemed – Investor Class | | | (2,138,457 | ) | | | (3,779,544 | ) |
| Shares redeemed – Institutional Class | | | (3,253,564 | ) | | | (4,821,215 | ) |
| Net decrease in shares outstanding | | | (3,298,051 | ) | | | (4,903,355 | ) |
The accompanying notes are an integral part of these financial statements.
| HENNESSY FUNDS | 1-800-966-4354 | |
Financial Statements
For an Investor Class share outstanding throughout each year
PER SHARE DATA:
Net asset value, beginning of year
Income from investment operations:
Net investment income
Net realized and unrealized gains on investments
Total from investment operations
Less distributions:
Dividends from net investment income
Dividends from net realized gains
Total distributions
Net asset value, end of year
TOTAL RETURN
SUPPLEMENTAL DATA AND RATIOS:
Net assets, end of year (millions)
Ratio of expenses to average net assets
Ratio of net investment income to average net assets
Portfolio turnover rate(2)
(1) | Calculated using the average shares outstanding method. |
(2) | Calculated on the basis of the Fund as a whole. |
The accompanying notes are an integral part of these financial statements.
| FINANCIAL HIGHLIGHTS — INVESTOR CLASS |
| Year Ended October 31, | |
| 2020 | | | 2019 | | | 2018 | | | 2017 | | | 2016 | |
| | | | | | | | | | | | | | |
| $ | 15.43 | | | $ | 14.99 | | | $ | 14.92 | | | $ | 11.29 | | | $ | 10.29 | |
| | | | | | | | | | | | | | | | | | | |
| | | | | | | | | | | | | | | | | | | |
| | 0.01 | (1) | | | 0.03 | (1) | | | 0.05 | | | | 0.08 | | | | 0.03 | |
| | 0.50 | | | | 0.88 | | | | 0.35 | | | | 3.77 | | | | 1.31 | |
| | 0.51 | | | | 0.91 | | | | 0.40 | | | | 3.85 | | | | 1.34 | |
| | | | | | | | | | | | | | | | | | | |
| | | | | | | | | | | | | | | | | | | |
| | (0.21 | ) | | | — | | | | (0.05 | ) | | | (0.12 | ) | | | — | |
| | — | | | | (0.47 | ) | | | (0.28 | ) | | | (0.10 | ) | | | (0.34 | ) |
| | (0.21 | ) | | | (0.47 | ) | | | (0.33 | ) | | | (0.22 | ) | | | (0.34 | ) |
| $ | 15.73 | | | $ | 15.43 | | | $ | 14.99 | | | $ | 14.92 | | | $ | 11.29 | |
| | | | | | | | | | | | | | | | | | | |
| | 3.27 | % | | | 6.30 | % | | | 2.64 | % | | | 34.82 | % | | | 13.44 | % |
| | | | | | | | | | | | | | | | | | | |
| | | | | | | | | | | | | | | | | | | |
| $ | 46.41 | | | $ | 66.30 | | | $ | 100.93 | | | $ | 69.86 | | | $ | 26.23 | |
| | 1.55 | % | | | 1.52 | % | | | 1.46 | % | | | 1.60 | % | | | 1.91 | % |
| | 0.09 | % | | | 0.23 | % | | | 0.21 | % | | | 0.26 | % | | | 0.25 | % |
| | 17 | % | | | 21 | % | | | 35 | % | | | 41 | % | | | 22 | % |
The accompanying notes are an integral part of these financial statements.
| HENNESSY FUNDS | 1-800-966-4354 | |
Financial Statements
For an Institutional Class share outstanding throughout each year
PER SHARE DATA:
Net asset value, beginning of year
Income from investment operations:
Net investment income
Net realized and unrealized gains on investments
Total from investment operations
Less distributions:
Dividends from net investment income
Dividends from net realized gains
Total distributions
Net asset value, end of year
TOTAL RETURN
SUPPLEMENTAL DATA AND RATIOS:
Net assets, end of year (millions)
Ratio of expenses to average net assets
Ratio of net investment income to average net assets
Portfolio turnover rate(2)
(1) | Calculated using the average shares outstanding method. |
(2) | Calculated on the basis of the Fund as a whole. |
The accompanying notes are an integral part of these financial statements.
| FINANCIAL HIGHLIGHTS — INSTITUTIONAL CLASS |
| Year Ended October 31, | |
| 2020 | | | 2019 | | | 2018 | | | 2017 | | | 2016 | |
| | | | | | | | | | | | | | |
| $ | 15.28 | | | $ | 14.83 | | | $ | 14.72 | | | $ | 11.33 | | | $ | 10.30 | |
| | | | | | | | | | | | | | | | | | | |
| | | | | | | | | | | | | | | | | | | |
| | 0.07 | (1) | | | 0.09 | (1) | | | 0.11 | | | | 0.05 | | | | 0.06 | |
| | 0.50 | | | | 0.86 | | | | 0.36 | | | | 3.78 | | | | 1.31 | |
| | 0.57 | | | | 0.95 | | | | 0.47 | | | | 3.83 | | | | 1.37 | |
| | | | | | | | | | | | | | | | | | | |
| | | | | | | | | | | | | | | | | | | |
| | (0.27 | ) | | | (0.04 | ) | | | (0.08 | ) | | | (0.10 | ) | | | — | |
| | — | | | | (0.46 | ) | | | (0.28 | ) | | | (0.34 | ) | | | (0.34 | ) |
| | (0.27 | ) | | | (0.50 | ) | | | (0.36 | ) | | | (0.44 | ) | | | (0.34 | ) |
| $ | 15.58 | | | $ | 15.28 | | | $ | 14.83 | | | $ | 14.72 | | | $ | 11.33 | |
| | | | | | | | | | | | | | | | | | | |
| | 3.69 | % | | | 6.73 | % | | | 3.12 | % | | | 35.17 | % | | | 13.73 | % |
| | | | | | | | | | | | | | | | | | | |
| | | | | | | | | | | | | | | | | | | |
| $ | 34.58 | | | $ | 63.78 | | | $ | 98.42 | | | $ | 28.71 | | | $ | 3.42 | |
| | 1.13 | % | | | 1.12 | % | | | 1.04 | % | | | 1.19 | % | | | 1.63 | % |
| | 0.45 | % | | | 0.61 | % | | | 0.77 | % | | | 0.80 | % | | | 0.63 | % |
| | 17 | % | | | 21 | % | | | 35 | % | | | 41 | % | | | 22 | % |
The accompanying notes are an integral part of these financial statements.
| HENNESSY FUNDS | 1-800-966-4354 | |
Financial Statements
Notes to the Financial Statements October 31, 2020 |
1). ORGANIZATION
The Hennessy Japan Small Cap Fund (the “Fund”) is a series of Hennessy Funds Trust (the “Trust”), which was organized as a Delaware statutory trust on September 17, 1992. The Fund is an open-end management investment company registered under the Investment Company Act of 1940, as amended. The investment objective of the Fund is long-term capital appreciation. The Fund is a diversified fund.
The Fund offers Investor Class and Institutional Class shares. Each class of shares differs principally in its respective 12b-1 distribution and service, shareholder servicing, and sub-transfer agent expenses. There are no sales charges. Each class has identical rights to earnings, assets, and voting privileges, except for class-specific expenses and exclusive rights to vote on matters affecting only one class.
As an investment company, the Fund follows the investment company accounting and reporting guidance of the Financial Accounting Standards Board (“FASB”) Accounting Standard Codification Topic 946 “Financial Services—Investment Companies.”
2). SIGNIFICANT ACCOUNTING POLICIES
The following is a summary of significant accounting policies consistently followed by the Fund in the preparation of the financial statements. These policies conform to U.S. generally accepted accounting principles (“GAAP”).
| a). | Securities Valuation – All investments in securities are valued in accordance with the Fund’s valuation policies and procedures, as described in Note 3. |
| | |
| b). | Federal Income Taxes – No provision for federal income taxes or excise taxes has been made because the Fund has elected to be taxed as a regulated investment company and intends to distribute substantially all of its taxable income to its shareholders and otherwise comply with the provisions of the Internal Revenue Code of 1986, as amended, applicable to regulated investment companies. Net investment income/loss and realized gains/losses for federal income tax purposes may differ from those reported in the financial statements because of temporary book and tax basis differences. Temporary differences are primarily the result of the treatment of wash sales for tax reporting purposes. The Fund recognizes interest and penalties related to income tax benefits, if any, in the Statement of Operations as an income tax expense. Distributions from net realized gains for book purposes may include short-term capital gains, which are included as ordinary income to shareholders for tax purposes. The Fund may utilize equalization accounting for tax purposes and designate earnings and profits, including net realized gains distributed to shareholders on redemption of shares, as part of the dividends paid deduction for income tax purposes. |
| | |
| | Due to inherent differences in the recognition of income, expenses, and realized gains/losses under GAAP and federal income tax regulations, permanent differences between book and tax basis for reporting are identified and appropriately reclassified in the Statement of Assets and Liabilities, as needed. As of October 31, 2020, no such reclassifications were required for fiscal year 2020. |
| | |
| c). | Accounting for Uncertainty in Income Taxes – The Fund has accounting policies regarding recognition and measurement of tax positions taken or expected to be taken on a tax return. The tax returns of the Fund for the prior three fiscal years are |
| NOTES TO THE FINANCIAL STATEMENTS |
| | open for examination. The Fund has reviewed all open tax years in major jurisdictions and concluded that there is no impact on the Fund’s net assets and no tax liability resulting from unrecognized tax benefits relating to uncertain income tax positions taken or expected to be taken on a tax return. The Fund’s major tax jurisdictions are U.S. federal and Delaware. |
| | |
| d). | Income and Expenses – Dividend income is recognized on the ex-dividend date or as soon as information is available to the Fund. Interest income, which includes the amortization of premium and accretion of discount, is recognized on an accrual basis. Market discounts, original issue discounts, and market premiums on debt securities are accreted or amortized to interest income over the life of a security with a corresponding increase or decrease, as applicable, in the cost basis of such security using the yield to maturity method, or where applicable, the first call date of the security. Other non-cash dividends are recognized as investment income at the fair value of the property received. The Fund is charged for those expenses that are directly attributable to its portfolio, such as advisory, administration, and certain shareholder service fees. Income, expenses (other than expenses attributable to a specific class), and realized and unrealized gains/losses on investments are allocated to each class of shares based on such class’s net assets. |
| | |
| e). | Distributions to Shareholders – Dividends from net investment income for the Fund, if any, are declared and paid annually, usually in December. Distributions of net realized capital gains, if any, are declared and paid annually, usually in December. |
| | |
| f). | Security Transactions – Investment and shareholder transactions are recorded on the trade date. The Fund determines the realized gain/loss from an investment transaction by comparing the original cost of the security lot sold with the net sale proceeds. Discounts and premiums on securities purchased are accreted or amortized, respectively, over the life of each such security. |
| | |
| g). | Use of Estimates – The preparation of financial statements in conformity with GAAP requires management to make estimates and assumptions that affect the reported amounts of assets and liabilities and disclosure of contingent assets and liabilities at the date of the financial statements and the reported change in net assets during the reporting period. Actual results could differ from those estimates. |
| | |
| h). | Share Valuation – The net asset value (“NAV”) per share of the Fund is calculated by dividing (i) the total value of the securities held by the Fund, plus cash and other assets, minus all liabilities (including estimated accrued expenses) by (ii) the total number of shares outstanding for the Fund, rounded to the nearest $0.01. The Fund’s shares will not be priced on days the New York Stock Exchange is closed for trading. The offering and redemption price per share for the Fund is equal to the Fund’s NAV per share. |
| | |
| i). | Foreign Currency – Values of investments denominated in foreign currencies are converted into U.S. dollars using the spot market rate of exchange at the time of valuation. Purchases and sales of investments and income are translated into U.S. dollars using the spot market rate of exchange prevailing on the respective dates of such transactions. The Fund does not isolate the portion of the results of operations resulting from fluctuations in foreign exchange rates on investments from fluctuations resulting from changes in the market prices of securities held. Such fluctuations are included with the net realized and unrealized gain/loss on investments. Foreign investments present additional risks due to currency fluctuations, economic and political factors, lower liquidity, government regulations, differences in accounting standards, and other factors. |
| HENNESSY FUNDS | 1-800-966-4354 | |
| j). | REIT Equity Securities – The Fund may invest in the equity securities of real estate investment trusts (“REITs”). Distributions received from REITs may be classified as dividends, capital gains, or return of capital. Investments in REITs may require the Fund to accrue and distribute income not yet received. To generate sufficient cash to make the requisite distributions, the Fund may be required to sell securities in its portfolio (including when it is not advantageous to do so) that it otherwise would have continued to hold. At other times, investments in a REIT may result in the Fund’s receipt of cash in excess of the REIT’s earnings. If the Fund distributes these amounts, these distributions could constitute a return of capital to Fund shareholders for U.S. federal income tax purposes. Dividends received by the Fund from a REIT generally will not constitute qualified dividend income and will not qualify for the dividends-received deduction. |
| | |
| k). | New Accounting Pronouncements – In August 2018, the FASB issued Accounting Standards Update No. 2018-13 “Disclosure Framework—Changes to the Disclosure Requirements for Fair Value Measurement” (“ASU 2018-13”). ASU 2018-13 eliminates the requirement to disclose the amount of and reasons for transfers between Level 1 and Level 2 of the fair value hierarchy, the timing of transfers between levels of the fair value hierarchy, and the valuation processes for Level 3 fair value measurements. ASU 2018-13 does not eliminate the requirement to disclose the range and weighted average used to develop significant unobservable inputs for Level 3 fair value measurements, and the changes in unrealized gains and losses for recurring Level 3 fair value measurements. ASU 2018-13 requires that information is provided about the measurement uncertainty of Level 3 fair value measurements as of the reporting date. The guidance is effective for fiscal years beginning after December 15, 2019, and interim periods within those fiscal years. Management evaluated the impact of this change in guidance and, due to the permissibility of early adoption, modified the Fund’s fair value disclosures beginning with its fiscal year 2019. |
3). SECURITIES VALUATION
The Fund follows its valuation policies and procedures in determining its net asset value and, in preparing these financial statements, the fair value accounting standards that establish an authoritative definition of fair value and set out a hierarchy for measuring fair value. These standards require additional disclosures about the various inputs and valuation techniques used to develop the measurements of fair value and a discussion of changes in valuation techniques and related inputs during the period. These inputs are summarized in the three broad levels listed below:
| | Level 1 – | Unadjusted, quoted prices in active markets for identical instruments that the Fund has the ability to access at the date of measurement. |
| | | |
| | Level 2 – | Other significant observable inputs (including, but not limited to, quoted prices in active markets for similar instruments, quoted prices in markets that are not active for identical or similar instruments, and model-derived valuations in which all significant inputs and significant value drivers are observable in active markets, such as interest rates, prepayment speeds, credit risk curves, default rates, and similar data). |
| | | |
| | Level 3 – | Significant unobservable inputs (including the Fund’s own assumptions about what market participants would use to price the asset or liability based on the best available information) when observable inputs are unavailable. |
| NOTES TO THE FINANCIAL STATEMENTS |
The following is a description of the valuation techniques applied to the Fund’s major categories of assets and liabilities on a recurring basis:
| | Equity Securities – Equity securities, including common stocks, preferred stocks, foreign-issued common stocks, exchange-traded funds, closed-end mutual funds, partnerships, rights, and real estate investment trusts, that are traded on a securities exchange for which a last-quoted sales price is readily available will generally be valued at the last sales price as reported by the primary exchange on which the securities are listed. Securities listed on The NASDAQ Stock Market (“NASDAQ”) will generally be valued at the NASDAQ Official Closing Price, which may differ from the last sales price reported. Securities traded on a securities exchange for which a last-quoted sales price is not readily available will generally be valued at the mean between the bid and ask prices. To the extent these securities are actively traded and valuation adjustments are not applied, they are classified in Level 1 of the fair value hierarchy. Securities traded on foreign exchanges generally are not valued at the same time the Fund calculates its NAV because most foreign markets close well before such time. The earlier close of most foreign markets gives rise to the possibility that significant events, including broad market moves, may have occurred in the interim. In certain circumstances, it may be determined that a foreign security needs to be fair valued because it appears that the value of the security might have been materially affected by events occurring after the close of the market in which the security is principally traded, but before the time the Fund calculates its NAV, such as by a development that affects an entire market or region (e.g., a weather-related event) or a potentially global development (e.g., a terrorist attack that may be expected to have an effect on investor expectations worldwide). |
| | |
| | Registered Investment Companies – Investments in open-end registered investment companies, commonly referred to as mutual funds, generally are priced at the ending NAV provided by the applicable mutual fund’s service agent and will be classified in Level 1 of the fair value hierarchy. |
| | |
| | Debt Securities – Debt securities, including corporate bonds, asset-backed securities, mortgage-backed securities, municipal bonds, U.S. Treasuries, and U.S. government agency issues, are generally valued at market on the basis of valuations furnished by an independent pricing service that utilizes both dealer-supplied valuations and formula-based techniques. The pricing service may consider recently executed transactions in securities of the issuer or comparable issuers, market price quotations (where observable), bond spreads, and fundamental data relating to the issuer. In addition, the model may incorporate observable market data, such as reported sales of similar securities, broker quotes, yields, bids, offers, and reference data. Certain securities are valued primarily using dealer quotations. These securities are generally classified in Level 2 of the fair value hierarchy. |
| | |
| | Short-Term Securities – Short-term equity investments, including money market funds, are valued in the manner specified above. Short-term debt investments with an original term to maturity of 60 days or less are valued at amortized cost, which approximates fair market value. If the original term to maturity of a short-term debt investment exceeded 60 days, then the values as of the 61st day prior to maturity are amortized. Amortized cost is not used if its use would be inappropriate due to credit or other impairments of the issuer, in which case the security’s fair value would be determined, as described below. Short-term securities are generally classified in Level 1 or Level 2 of the fair value hierarchy depending on the inputs used and market activity levels for specific securities. |
| HENNESSY FUNDS | 1-800-966-4354 | |
The Board of Trustees of the Fund (the “Board”) has adopted fair value pricing procedures that are followed when a price for a security is not readily available or if a significant event has occurred that indicates the closing price of a security no longer represents the true value of that security. Fair value pricing determinations are made in good faith in accordance with these procedures. There are numerous criteria that will be given consideration in determining a fair value of a security, such as the trading volume of a security and markets, the values of other similar securities, and news events with direct bearing on a security or markets. Fair value pricing results in an estimated price for a security that reflects the amount the Fund might reasonably expect to receive in a current sale. Depending on the relative significance of the valuation inputs, these securities may be classified in either Level 2 or Level 3 of the fair value hierarchy.
The fair value of foreign securities may be determined with the assistance of a pricing service using correlations between the movement of prices of such securities and indices of domestic securities and other appropriate indicators, such as closing market prices of relevant American Depositary Receipts or futures contracts. Using fair value pricing means that the Fund’s NAV reflects the affected portfolio securities’ values as determined by the Board or its designee, pursuant to the fair value pricing procedures adopted by the Board, instead of being determined by the market. Using a fair value pricing methodology to price a foreign security may result in a value that is different from such foreign security’s most recent closing price and from the value used by other investment companies to calculate their NAVs. Such securities are generally classified in Level 2 of the fair value hierarchy. Because the Fund invests in foreign securities, the value of the Fund’s portfolio securities may change on days when you will not be able to purchase or redeem your shares.
The Board has delegated day-to-day valuation matters to the Valuation and Liquidity Committee comprising representatives from Hennessy Advisors, Inc., the Fund’s investment advisor (the “Advisor”). The function of the Valuation and Liquidity Committee is to value securities where current and reliable market quotations are not readily available. All actions taken by the Valuation and Liquidity Committee are reviewed by the Board.
The Fund has performed an analysis of all existing investments to determine the significance and character of all inputs to their fair value determinations. Various inputs are used to determine the value of the Fund’s investments. The inputs or methodology used for valuing securities are not necessarily an indication of the risk associated with investing in those securities. Details related to the fair value hierarchy of the Fund’s securities as of October 31, 2020, are included in the Schedule of Investments.
4). INVESTMENT TRANSACTIONS
Purchases and sales of investment securities (excluding government and short-term investments) for the Fund during fiscal year 2020 were $16,412,380 and $60,886,618, respectively.
There were no purchases or sales/maturities of long-term U.S. government securities for the Fund during fiscal year 2020.
The Fund is permitted to purchase or sell securities from or to another fund in the Hennessy Funds family of funds (collectively, the “Hennessy Funds”) under specified conditions outlined in procedures adopted by the Board. The procedures have been designed to ensure that any purchase or sale of securities by the Fund from or to another Hennessy Fund complies with Rule 17a-7 of the Investment Company Act of 1940, as amended. During fiscal year 2020, the Fund did not engage in purchases or sales of securities pursuant to Rule 17a-7 of the Investment Company Act of 1940, as amended.
| NOTES TO THE FINANCIAL STATEMENTS |
5). INVESTMENT ADVISORY FEE AND OTHER TRANSACTIONS WITH AFFILIATES
The Advisor provides the Fund with investment advisory services under an Investment Advisory Agreement. The Advisor oversees the provision of investment advice and furnishes office space, facilities, and most of the personnel needed by the Fund. As compensation for its services, the Advisor is entitled to a monthly fee from the Fund. The fee is based on the average daily net assets of the Fund at an annual rate of 0.80%. The net investment advisory fees expensed by the Fund during fiscal year 2020 are included in the Statement of Operations.
The Advisor has delegated the day-to-day management of the Fund to a sub-advisor, SPARX Asset Management Co., Ltd. The Advisor pays the sub-advisory fees from its own assets, and these fees are not an additional expense of the Fund. During fiscal year 2020, the Advisor (not the Fund) paid a sub-advisory fee at the average rate of 0.35% of the daily net assets of the Fund. Pursuant to the sub-advisory agreement, the Advisor pays sub-advisory fees at the rate of 0.35% of the first $500 million of daily net assets, 0.40% of daily net assets between $500 million and $1 billion, and 0.42% of daily net assets over $1 billion.
The Board has approved a Shareholder Servicing Agreement for Investor Class shares of the Fund, which was instituted to compensate the Advisor for the non-investment advisory services it provides to the Fund. The Shareholder Servicing Agreement provides for a monthly fee paid to the Advisor at an annual rate of 0.10% of the average daily net assets of the Fund attributable to Investor Class shares. The shareholder service fees expensed by the Fund during fiscal year 2020 are included in the Statement of Operations.
The Fund has adopted a plan pursuant to Rule 12b-1 under the Investment Company Act of 1940, as amended, that authorizes payments in connection with the distribution of the Fund’s shares at an annual rate of up to 0.25% of the Fund’s average daily net assets attributable to Investor Class shares. Even though the authorized rate is up to 0.25%, the Fund is currently only using up to 0.15% of its average daily net assets attributable to Investor Class shares for such purpose. Amounts paid under the plan may be spent on any activities or expenses primarily intended to result in the sale of shares, including, but not limited to, advertising, shareholder account servicing, printing and mailing of prospectuses to other than current shareholders, printing and mailing of sales literature, and compensation for sales and marketing activities or to financial institutions and others, such as dealers and distributors. The distribution fees expensed by the Fund during fiscal year 2020 are included in the Statement of Operations.
The Fund has entered into agreements with various brokers, dealers, and financial intermediaries in connection with the sale of shares of the Fund. The agreements provide for periodic payments of sub-transfer agent expenses by the Fund to the brokers, dealers, and financial intermediaries for providing certain shareholder maintenance services. These shareholder services include the pre-processing and quality control of new accounts, shareholder correspondence, answering customer inquiries regarding account status, and facilitating shareholder telephone transactions. The sub-transfer agent fees expensed by the Fund during fiscal year 2020 are included in the Statement of Operations.
U.S. Bancorp Fund Services, LLC, d/b/a U.S. Bank Global Fund Services (“Fund Services”) provides the Fund with administrative, accounting, and transfer agent services. As administrator, Fund Services is responsible for activities such as (i) preparing various federal and state regulatory filings, reports, and returns for the Fund, (ii) preparing reports and materials to be supplied to the Board, (iii) monitoring the activities of the Fund’s custodian, transfer agent, and accountants, and (iv) coordinating the preparation and payment of the Fund’s expenses and reviewing the Fund’s expense accruals. U.S. Bank N.A., an affiliate of Fund Services, serves as the Fund’s custodian. The servicing
| HENNESSY FUNDS | 1-800-966-4354 | |
agreements between the Trust and Fund Services and U.S. Bank N.A. contain a fee schedule that is inclusive of administrative, accounting, custody, and transfer agent fees. The administrative, accounting, custody, and transfer agent fees expensed by the Fund during fiscal year 2020 are included in the Statement of Operations.
Quasar Distributors, LLC (“Quasar”) acts as the Fund’s principal underwriter in a continuous public offering of the Fund’s shares. Quasar was an affiliate of Fund Services and U.S. Bank N.A. through March 30, 2020. Effective March 31, 2020, Foreside Financial Group, LLC (“Foreside”) acquired Quasar from Fund Services. As a result of the acquisition, Quasar became a wholly owned broker-dealer subsidiary of Foreside and is no longer affiliated with Fund Services or U.S. Bank N.A. The Board approved a new Distribution Agreement to enable Quasar to continue serving as the Fund’s distributor.
The officers of the Fund are affiliated with the Advisor. With the exception of the Chief Compliance Officer and the Senior Compliance Officer, such officers receive no compensation from the Fund for serving in their respective roles. The Fund, along with the other Hennessy Funds, makes reimbursement payments on an equal basis to the Advisor for a portion of the salary and benefits associated with the office of the Chief Compliance Officer and for all of the salary and benefits associated with the office of the Senior Compliance Officer. The compliance fees expensed by the Fund during fiscal year 2020 are included in the Statement of Operations.
6). GUARANTEES AND INDEMNIFICATIONS
Under the Hennessy Funds’ organizational documents, their officers and trustees are indemnified by the Hennessy Funds against certain liabilities arising out of the performance of their duties to the Hennessy Funds. Additionally, in the normal course of business, the Hennessy Funds enter into contracts with service providers that contain general indemnification clauses. The Fund’s maximum exposure under these arrangements is unknown as this would involve future claims that may be made against the Fund that have not yet occurred. Currently, the Fund expects the risk of loss to be remote.
7). LINE OF CREDIT
The Fund has an uncommitted line of credit with the other Hennessy Funds in the amount of the lesser of (i) $100,000,000 or (ii) 33.33% of each Hennessy Fund’s net assets, or 30% for the Hennessy Gas Utility Fund and 10% for the Hennessy Balanced Fund, intended to provide short-term financing, if necessary, subject to certain restrictions, in connection with shareholder redemptions. The credit facility is with the Hennessy Funds’ custodian bank, U.S. Bank N.A. Borrowings under this arrangement bear interest at the bank’s prime rate and are secured by all of the Fund’s assets (as to its own borrowings only). During fiscal year 2020, the Fund had an outstanding average daily balance and a weighted average interest rate of $72,205 and 4.50%, respectively. The interest expensed by the Fund during fiscal year 2020 is included in the Statement of Operations. The maximum amount outstanding for the Fund during fiscal year 2020 was $9,020,000. As of October 31, 2020, the Fund did not have any borrowings outstanding under the line of credit.
| NOTES TO THE FINANCIAL STATEMENTS |
8). FEDERAL TAX INFORMATION
As of October 31, 2020, the components of accumulated earnings (losses) for income tax purposes were as follows:
| | | | Investments | |
| | Cost of investments for tax purposes | | $ | 74,114,181 | |
| | Gross tax unrealized appreciation | | $ | 17,412,208 | |
| | Gross tax unrealized depreciation | | | (10,717,076 | ) |
| | Net tax unrealized appreciation/(depreciation) | | $ | 6,695,132 | |
| | Undistributed ordinary income | | $ | 382,610 | |
| | Undistributed long-term capital gains | | | — | |
| | Total distributable earnings | | $ | 382,610 | |
| | Other accumulated gain/(loss) | | $ | (871,567 | ) |
| | Total accumulated gain/(loss) | | $ | 6,206,175 | |
The difference between book-basis unrealized appreciation/depreciation and tax-basis unrealized appreciation/depreciation (as shown above) is attributable primarily to wash sales and investments in passive foreign investment companies.
As of October 31, 2020, the Fund had capital loss carryforwards as follows:
| | $871,567 | | Unlimited short-term |
As of October 31, 2020, the Fund did not defer, on a tax basis, any late-year ordinary losses. Late-year ordinary losses are net ordinary losses incurred after December 31, 2019, but within the taxable year, that are deemed to arise on the first day of the Fund’s next taxable year.
During fiscal years 2020 and 2019, the tax character of distributions paid by the Fund was as follows:
| | | | Year Ended | | | Year Ended | |
| | | | October 31, 2020 | | | October 31, 2019 | |
| | Ordinary income(1) | | $ | 1,959,488 | | | $ | 275,405 | |
| | Long-term capital gain | | | — | | | | 6,013,263 | |
| | Total distributions | | $ | 1,959,488 | | | $ | 6,288,668 | |
| | (1) Ordinary income includes short-term capital gains. |
9). COVID-19 PANDEMIC
The COVID-19 pandemic has adversely impacted global commercial activity and contributed to significant volatility in global equity and debt markets. The pandemic has resulted in quarantines, stay-at-home orders, travel prohibitions, and closures, disrupting supply chains and economic activity. The duration of the pandemic’s effects remain uncertain and difficult to assess. The effects of the pandemic may adversely impact the Fund’s performance and its ability to achieve its investment objective.
10). EVENTS SUBSEQUENT TO YEAR END
Management has evaluated the Fund’s related events and transactions that occurred subsequent to October 31, 2020, through the date of issuance of the Fund’s financial statements. Management has determined that there were no subsequent events requiring recognition or disclosure in the financial statements.
| HENNESSY FUNDS | 1-800-966-4354 | |
Report of Independent Registered Public
Accounting Firm
To the Board of Trustees of Hennessy Funds Trust
and the shareholders of the Hennessy Japan Small Cap Fund
Novato, CA
Opinion on the Financial Statements
We have audited the accompanying statement of assets and liabilities of the Hennessy Japan Small Cap Fund (the “Fund”), a series of Hennessy Funds Trust, including the schedule of investments, as of October 31, 2020, the related statement of operations for the year then ended, the statements of changes in net assets for each of the two years in the period then ended, the financial highlights for each of the four years in the period then ended, and the related notes (collectively referred to as the “financial statements”). In our opinion, the financial statements present fairly, in all material respects, the financial position of the Fund as of October 31, 2020, the results of its operations for the year then ended, the changes in its net assets for each of the two years in the period then ended, and the financial highlights for each of the four years in the period then ended in conformity with accounting principles generally accepted in the United States of America.
The financial highlights for the year ended October 31, 2016 have been audited by other auditors, whose report dated December 22, 2016 expressed unqualified opinion on such financial highlights.
Basis for Opinion
These financial statements are the responsibility of the Fund’s management. Our responsibility is to express an opinion on the Fund’s financial statements based on our audits. We are a public accounting firm registered with the Public Company Accounting Oversight Board (United States) (“PCAOB”) and are required to be independent with respect to the Fund in accordance with the U.S. federal securities laws and the applicable rules and regulations of the Securities and Exchange Commission and the PCAOB. We have served as the auditor of one or more of the funds in the Trust since 2002.
We conducted our audits in accordance with the standards of the PCAOB. Those standards require that we plan and perform the audit to obtain reasonable assurance about whether the financial statements are free of material misstatement, whether due to error or fraud. The Fund is not required to have, nor were we engaged to perform, an audit of its internal control over financial reporting. As part of our audits we are required to obtain an understanding of internal control over financial reporting, but not for the purpose of expressing an opinion on the effectiveness of the Fund’s internal control over financial reporting. Accordingly, we express no such opinion.
Our audits included performing procedures to assess the risks of material misstatement of the financial statements, whether due to error or fraud, and performing procedures that respond to those risks. Such procedures included examining, on a test basis, evidence regarding the amounts and disclosures in the financial statements. Our audits also included evaluating the accounting principles used and significant estimates made by management, as well as evaluating the overall presentation of the financial statements. Our procedures included confirmation of securities owned as of October 31, 2020 by correspondence with the custodian and brokers; when replies were not received from brokers, we performed other auditing procedures. We believe that our audits provide a reasonable basis for our opinion.
| | |
| | TAIT, WELLER & BAKER LLP |
Philadelphia, Pennsylvania
December 23, 2020
| REPORT OF INDEPENDENT REGISTERED PUBLIC ACCOUNTING FIRM/TRUSTEES AND OFFICERS |
Trustees and Officers of the Fund (Unaudited)
The business and affairs of the Funds are managed under the direction of the Board of Trustees of the Trust, and the Board of Trustees elects the officers of the Trust. From time to time, the Board of Trustees also has appointed advisers to the Board of Trustees (“Advisers”) with the intention of having qualified individuals serve in an advisory capacity to garner experience in the mutual fund and asset management industry and be considered as potential Trustees in the future. There are currently three Advisers: Brian Alexander, Doug Franklin, and Claire Knoles. As Advisers, Mr. Alexander, Mr. Franklin, and Ms. Knoles attend meetings of the Board of Trustees and act as non-voting participants. Information pertaining to the Trustees, Advisers, and the officers of the Trust is set forth below. The Trustees and officers serve until their successors are duly elected and qualified or until their earlier death, resignation, or removal. Each Trustee oversees all 16 Hennessy Funds. Unless otherwise indicated, the address of all persons listed below is 7250 Redwood Boulevard, Suite 200, Novato, CA 94945. The Fund’s Statement of Additional Information includes more information about the persons listed below and is available without charge by calling 1-800-966-4354 or by visiting www.hennessyfunds.com.
| | | | Other |
| | | | Directorships |
| | | | Held Outside |
| Name, Age, | | | of Fund |
| and Position Held | Start Date | Principal Occupation(s) | Complex During |
with the Trust
| of Service
| During Past Five Years
| Past Five Years
|
| Disinterested Trustees and Advisers | | | |
| | | | |
| J. Dennis DeSousa | January 1996 | Mr. DeSousa is a real estate investor. | None. |
| 84 | | | |
| Trustee | | | |
| | | | |
| Robert T. Doyle | January 1996 | Mr. Doyle has been the Sheriff of | None. |
| 73 | | Marin County, California since 1996. | |
| Trustee | | | |
| | | | |
| Gerald P. Richardson | May 2004 | Mr. Richardson is an independent | None. |
| 75 | | consultant in the securities industry. | |
| Trustee | | | |
| | | | |
| Brian Alexander | March 2015 | Mr. Alexander has worked for the | None. |
| 39 | | Sutter Health organization since | |
| Adviser to the Board | | 2011 in various positions. He has | |
| | | served as the Chief Executive Officer | |
| | | of the Sutter Roseville Medical | |
| | | Center since 2018. From 2016 through | |
| | | 2018, he served as the Vice President | |
| | | of Strategy for the Sutter Health Valley | |
| | | Area, which includes 11 hospitals, | |
| | | 13 ambulatory surgery centers, | |
| | | 16,000 employees, and 1,900 physicians. | |
| | | From 2013 through 2016, Mr. Alexander | |
| | | served as Sutter Novato Community | |
| | | Hospital’s Chief Administrative Officer. | |
| HENNESSY FUNDS | 1-800-966-4354 | |
| | | | Other |
| | | | Directorships |
| | | | Held Outside |
| Name, Age, | | | of Fund |
| and Position Held | Start Date | Principal Occupation(s) | Complex During |
with the Trust
| of Service
| During Past Five Years
| Past Five Years
|
| Doug Franklin | March 2016 | Mr. Franklin is a retired insurance | None. |
| 56 | | industry executive. From 1987 | |
| Adviser to the Board | | through 2015, he was employed | |
| | | by the Allianz-Fireman’s Fund | |
| | | Insurance Company in various | |
| | | positions, including as its Chief | |
| | | Actuary and Chief Risk Officer. | |
| | | | |
| Claire Knoles | December 2015 | Ms. Knoles is a founder of Kiosk and | None. |
| 46 | | has served as its Chief Operating | |
| Adviser to the Board | | Officer since 2004. Kiosk is a full- | |
| | | service marketing agency with | |
| | | offices in the San Francisco Bay | |
| | | Area, Toronto, and Liverpool, UK. | |
| | | | |
Interested Trustee(1) | | | |
| | | | |
| Neil J. Hennessy | January 1996 as | Mr. Hennessy has been employed | Hennessy |
| 64 | a Trustee and | by Hennessy Advisors, Inc. since | Advisors, Inc. |
| Trustee, Chairman of | June 2008 as | 1989 and currently serves as its | |
| the Board, Chief | an officer | Chairman and Chief Executive Officer. | |
| Investment Officer, | | | |
| Portfolio Manager, | | | |
| and President | | | |
| Name, Age, | | |
| and Position Held | Start Date | Principal Occupation(s) |
with the Trust
| of Service
| During Past Five Years
|
| Officers | | |
| | | |
| Teresa M. Nilsen | January 1996 | Ms. Nilsen has been employed by Hennessy Advisors, Inc. |
| 54 | | since 1989 and currently serves as its President, Chief Operating |
| Executive Vice President | | Officer, and Secretary. |
| and Treasurer | | |
| | | |
| Daniel B. Steadman | March 2000 | Mr. Steadman has been employed by Hennessy Advisors, Inc. |
| 64 | | since 2000 and currently serves as its Executive Vice President. |
| Executive Vice President | | |
| and Secretary | | |
| | | |
| Brian Carlson | December 2013 | Mr. Carlson has been employed by Hennessy Advisors, Inc. |
| 48 | | since December 2013 and currently serves as its Chief |
| Senior Vice President | | Compliance Officer and Senior Vice President. |
| and Head of Distribution | | |
| | | |
Jennifer Cheskiewicz(2) | June 2013 | Ms. Cheskiewicz has been employed by Hennessy Advisors, Inc. |
| 43 | | as its General Counsel since June 2013. |
| Senior Vice President and | | |
| Chief Compliance Officer | | |
| TRUSTEES AND OFFICERS OF THE FUND |
| Name, Age, | | |
| and Position Held | Start Date | Principal Occupation(s) |
with the Trust
| of Service
| During Past Five Years
|
David Ellison(3) | October 2012 | Mr. Ellison has been employed by Hennessy Advisors, Inc. since |
| 62 | | October 2012. He has served as a Portfolio Manager of the |
| Senior Vice President | | Hennessy Large Cap Financial Fund and the Hennessy Small |
| and Portfolio Manager | | Cap Financial Fund since their inception. Mr. Ellison also served |
| | | as a Portfolio Manager of the Hennessy Technology Fund from |
| | | its inception until February 2017. Mr. Ellison served as Director, |
| | | CIO, and President of FBR Fund Advisers, Inc. from December |
| | | 1999 to October 2012. |
| | | |
Ryan Kelley(4) | March 2013 | Mr. Kelley has been employed by Hennessy Advisors, Inc. since |
| 48 | | October 2012. He has served as a Portfolio Manager of the |
| Senior Vice President | | Hennessy Gas Utility Fund, the Hennessy Large Cap Financial |
| and Portfolio Manager | | Fund, and the Hennessy Small Cap Financial Fund since |
| | | October 2014. He served as Co-Portfolio Manager of these |
| | | same funds from March 2013 through September 2014 and as |
| | | a Portfolio Analyst for the Hennessy Funds from October 2012 |
| | | through February 2013. Mr. Kelley has also served as a Portfolio |
| | | Manager of the Hennessy Cornerstone Growth Fund, the |
| | | Hennessy Cornerstone Mid Cap 30 Fund, the Hennessy |
| | | Cornerstone Large Growth Fund, and the Hennessy |
| | | Cornerstone Value Fund since February 2017 and as a Portfolio |
| | | Manager of the Hennessy Total Return Fund, the Hennessy |
| | | Balanced Fund, and the Hennessy Technology Fund since May |
| | | 2018. He served as Co-Portfolio Manager of the Hennessy |
| | | Technology Fund from February 2017 until May 2018. Mr. Kelley |
| | | served as Portfolio Manager of FBR Fund Advisers, Inc. from |
| | | January 2008 to October 2012. |
| | | |
| Tania Kelley | October 2003 | Ms. Kelley has been employed by Hennessy Advisors, Inc. since |
| 55 | | October 2003. |
| Senior Vice President | | |
| and Head of Marketing | | |
| | | |
L. Joshua Wein(4) | September 2018 | Mr. Wein has been employed by Hennessy Advisors, Inc. since |
| 47 | | 2018. He has served as Co-Portfolio Manager of the Hennessy |
| Vice President and | | Cornerstone Growth Fund, the Hennessy Cornerstone |
| Co-Portfolio Manager | | Mid Cap 30 Fund, the Hennessy Cornerstone Large Growth |
| | | Fund, the Hennessy Cornerstone Value Fund, Hennessy Total |
| | | Return Fund, the Hennessy Balanced Fund, the Hennessy Gas |
| | | Utility Fund, and the Hennessy Technology Fund since February |
| | | 2019. He served as a Senior Analyst of these same funds from |
| | | September 2018 through February 2019. Mr. Wein served as |
| | | Director of Alternative Investments and Co-Portfolio Manager |
| | | at Sterling Capital Management from 2008 to 2018. |
_______________
(1) | Mr. Hennessy is considered an “interested person,” as defined in the Investment Company Act of 1940, as amended, because he is an officer of the Trust. |
(2) | The address of this officer is 4800 Bee Caves Road, Suite 100, Austin, TX 78746. |
(3) | The address of this officer is 101 Federal Street, Suite 1615B, Boston, MA 02110. |
(4) | The address of this officer is 1340 Environ Way, Chapel Hill, NC 27517. |
| HENNESSY FUNDS | 1-800-966-4354 | |
Expense Example (Unaudited)
October 31, 2020
As a shareholder of the Fund, you incur ongoing costs, including management fees, service fees, and other Fund expenses. This Example is intended to help you understand your ongoing costs (in dollars) of investing in the Fund and to compare these costs with the ongoing costs of investing in other mutual funds. The Example is based on an investment of $1,000 invested at the beginning of the period and held for the entire period from May 1, 2020, through October 31, 2020.
Actual Expenses
The first line of the table below under the “Investor Class” and “Institutional Class” headings provides information about actual account values and actual expenses. You may use the information in this line, together with the amount you invested, to estimate the expenses that you paid over the period. Simply divide your account value by $1,000 (for example, an $8,600 account value divided by $1,000 = 8.6), then multiply the result by the number in the first line below the “Investor Class” or “Institutional Class” heading under the column entitled “Expenses Paid During Period” to estimate the expenses you paid on your account during this period. Although the Fund charges no sales loads or transaction fees, you will be assessed fees for outgoing wire transfers, returned checks, and stop payment orders at prevailing rates charged by U.S. Bank Global Fund Services, the Fund’s transfer agent. If you request that a redemption be made by wire transfer, the Fund’s transfer agent charges a $15 fee. IRAs are charged a $15 annual maintenance fee (up to $30 maximum per shareholder for shareholders with multiple IRAs). The example below includes, but is not limited to, management fees, shareholder servicing fees, accounting, custody, and transfer agent fees. However, the example below does not include portfolio trading commissions and related expenses.
Hypothetical Example for Comparison Purposes
The second line of the table below under the “Investor Class” and “Institutional Class” headings provides information about hypothetical account values and hypothetical expenses based on the Fund’s actual expense ratios and an assumed rate of return of 5% per year before expenses, which is not the Fund’s actual return. The hypothetical account values and expenses may not be used to estimate the actual ending account balance or expenses you paid for the period. You may use this information to compare the ongoing costs of investing in the Fund and other funds. To do so, compare this 5% hypothetical example with the 5% hypothetical examples that appear in the shareholder reports of the other funds. Please note that the expenses shown in the table are meant to highlight your ongoing costs only. Therefore, the second line of the table under the “Investor Class” and “Institutional Class” headings is useful in comparing ongoing costs only and will not help you determine the relative total costs of owning different funds.
| | | | Expenses Paid |
| | Beginning | Ending | During Period(1) |
| | Account Value | Account Value | May 1, 2020 – |
| | May 1, 2020
| October 31, 2020 | October 31, 2020 |
| Investor Class | | | |
| Actual | $1,000.00 | $1,191.70 | $8.70 |
| Hypothetical (5% return before expenses) | $1,000.00 | $1,017.19 | $8.01 |
| | | | |
| Institutional Class | | | |
| Actual | $1,000.00 | $1,193.90 | $6.34 |
| Hypothetical (5% return before expenses) | $1,000.00 | $1,019.36 | $5.84 |
(1) | Expenses are equal to the Fund’s annualized expense ratio of 1.58% for Investor Class shares or 1.15% for Institutional Class shares, as applicable, multiplied by the average account value over the period, multiplied by 184/366 days (to reflect the half-year period). |
| HENNESSY FUNDS | 1-800-966-4354 | |
How to Obtain a Copy of the Fund’s Proxy
Voting Policy and Proxy Voting Records
A description of the policies and procedures the Fund uses to determine how to vote proxies relating to portfolio securities is available without charge (1) by calling 1-800-966-4354, (2) on the Hennessy Funds’ website at www.hennessyfunds.com/proxy-voting/voting-policy, or (3) on the U.S. Securities and Exchange Commission’s (the “SEC”) website at www.sec.gov. The Fund’s proxy voting record is available without charge on both the Hennessy Funds’ website at www.hennessyfunds.com/proxy-voting/voting-record and the SEC’s website at www.sec.gov no later than August 31 for the prior 12 months ending June 30.
Availability of Quarterly Portfolio Schedule
The Fund files a complete schedule of portfolio holdings with the SEC for the first and third quarters of each fiscal year as an exhibit to its reports on Form N-PORT. The Fund’s Form N-PORT reports are available on the SEC’s website at www.sec.gov or on request by calling 1-800-966-4354.
Federal Tax Distribution Information
(Unaudited)
For fiscal year 2020, certain dividends paid by the Fund may be subject to a maximum tax rate of 23.8%, as provided for by the Jobs and Growth Tax Relief Reconciliation Act of 2003. The percentage of dividends declared from ordinary income designated as qualified dividend income was 100.00%.
For corporate shareholders, the percent of ordinary income distributions that qualified for the corporate dividends received deduction for fiscal year 2020 was 0.00%.
The percentage of taxable ordinary income distributions that were designated as short-term capital gain distributions under Section 871(k)(2)(C) of the Internal Revenue Code of 1986, as amended, for the Fund was 0.00%.
For the year ended October 31, 2020, the Fund earned foreign-source income and paid foreign taxes as noted below, which it intends to pass through to its shareholders pursuant to Section 853 of the Internal Revenue Code.
| | | Gross Foreign Income | Foreign Tax Paid | |
| | Japan | $1,727,862 | $172,786 | |
Important Notice Regarding Delivery
of Shareholder Documents
To help keep the Fund’s costs as low as possible, we generally deliver a single copy of shareholder reports, proxy statements, and prospectuses to shareholders who share an address and have the same last name. This process does not apply to account statements. You may request an individual copy of a shareholder document at any time. If you would like to receive separate mailings of shareholder documents, please call U.S. Bank Global Fund Services at 1-800-261-6950 or 1-414-765-4124, and individual delivery will begin within 30 days of your request. If your account is held through a financial institution or other intermediary, please contact such intermediary directly to request individual delivery.
| PROXY VOTING — LIQUIDITY RISK MANAGEMENT PROGRAM |
Electronic Delivery
The Fund offers shareholders the option to receive account statements, prospectuses, tax forms, and shareholder reports online. To sign up for eDelivery, please visit www.hennessyfunds.com/account. You may change your delivery preference at any time by visiting our website or calling U.S. Bank Global Fund Services at 1-800-261-6950 or 1-414-765-4124.
Liquidity Risk Management Program
In accordance with Rule 22e-4 under the Investment Company Act of 1940, as amended (the “Liquidity Rule”), we have adopted and implemented a liquidity risk management program (the “Liquidity Program”). The purpose of the Liquidity Program is to assess and manage the Fund’s liquidity risk, which is the risk that the Fund would not be able to meet requests to redeem Fund shares without significant dilution of the remaining shareholders’ interests in the Fund. The Board of Trustees of the Fund (the “Board”) designated a committee comprising representatives of Hennessy Advisors, Inc., the investment adviser to the Fund, as the administrator of the Liquidity Program (the “Program Administrator”).
The Program Administrator provided a written report regarding the Liquidity Program to the Board in advance of its meeting on June 3, 2020. The report covered the period from June 1, 2019, through May 31, 2020. The report addressed the operation of the Liquidity Program, assessed the adequacy and effectiveness of its implementation, and described any material changes to the Liquidity Program during the review period. The Trust’s chief compliance officer presented the report to the Board at the meeting and provided additional information regarding the Liquidity Program. The Board reviewed the Liquidity Program and considered, among other items, the following:
| | 1. | The Program Administrator reviewed daily historical net redemption activity during the review period and during prior periods with higher-than-average redemption activity and concluded that the Fund has historically been able to meet requests to redeem Fund shares without significant dilution to the Fund’s remaining shareholders, and the Program Administrator expects the Fund to be able to continue to do so in the future during both normal and reasonably foreseeable stressed conditions. |
| | | |
| | 2. | The Fund primarily holds assets that are highly liquid investments and is therefore not required to establish a highly liquid investment minimum for the Fund or adopt policies and procedures for responding to a highly liquid investment minimum shortfall. |
| | | |
| | 3. | The Program Administrator did not make any material changes to the Liquidity Program during the review period and was not recommending any changes to the Liquidity Program or the model inputs used to determine the liquidity classification of each security held by the Fund. |
| | | |
| | 4. | The Program Administrator concluded that the Liquidity Program was reasonably designed to assess and manage the Fund’s liquidity risk, complies with the requirements of the Liquidity Rule, and was effectively implemented, having operated as intended during the review period. |
| HENNESSY FUNDS | 1-800-966-4354 | |
Privacy Policy
We collect the following personal information about you:
| | 1. | Information we receive from you in applications or other forms, correspondence, or conversations, including, but not limited to, your name, address, phone number, social security number, assets, income, and date of birth; |
| | | |
| | 2. | Information about your transactions with us, our affiliates, or others, including, but not limited to, your account number and balance, payments history, parties to transactions, cost basis information, and other financial information; and |
| | | |
| | 3. | Other personal information we collect from various sources, even if you have not entered into a prior transaction with us, including the following: |
| | • | Name, alias, address, unique personal identifier, online identifier, IP address, email address, telephone number, account name, and other similar identifiers; |
| | | |
| | • | Age and marital status; |
| | | |
| | • | Commercial information, including records of products purchased; |
| | | |
| | • | Browsing history, search history, and information on interaction with our website; |
| | | |
| | • | Geolocation data; |
| | | |
| | • | Employment and employment history, educational history, financial information, and purchasing and consuming histories or tendencies; and |
| | | |
| | • | Inferences drawn from the above-listed information to create a profile about your preferences, characteristics, predispositions, and behavior. |
We collect this information directly from you, indirectly in the course of providing services to you, directly and indirectly from your activity on our website, from broker dealers, marketing agencies, and other third parties that interact with us in connection with the services we perform and products we offer, and from anonymized and aggregated consumer information.
We use this information to fulfill the reason you provided the information to us, to provide you with other relevant products that you request from us, to provide you with information about products that may interest you, to improve our website or present our website’s contents to you, and as otherwise described to you when collecting your personal information.
We do not disclose any personal information to unaffiliated third parties, except as permitted by law. We may disclose your personal information to our affiliates, vendors, and service providers for a business purpose. For example, we are permitted by law to disclose all of the information we collect, as described above, to our transfer agent to process your transactions. When disclosing your personal information to third parties, we enter into a contract with each third party describing the purpose of such disclosure and requiring that such personal information be kept confidential and not used for any purpose except to perform the services contracted or respond to regulatory or law enforcement requests.
Furthermore, we restrict access to your personal information to those persons who require such information to provide products or services to you. As a result, we do not provide a means for opting out of our limited sharing of your information. We maintain physical, electronic, and procedural safeguards that comply with federal standards to guard your personal information.
If you hold shares of the Funds through a financial intermediary, including, but not limited to, a broker-dealer, bank, or trust company, the privacy policy of your financial intermediary governs how your personal information is shared with unaffiliated third parties.
Supplemental Privacy Notice for Residents of California
The California Consumer Privacy Act of 2018 (the “CCPA”) provides you, as a California resident, with certain additional rights relating to your personal information.
Under the CCPA, you have the right to request that we disclose to you the categories of personal information we have collected about you over the past 12 months, the categories of sources of such information, our business purpose for collecting the information, the categories of third parties, if any, with whom we shared the information, and the specific information we have collected about you. You also have the right to request that we delete any of your personal information, and, unless an exception applies, we will delete such information upon receiving and confirming your request. To make a request, call us at 1-800-966-4354, email us at privacy@hennessyfunds.com, or go to www.hennessyfunds.com/contact. We will not discriminate against you for exercising your rights under the CCPA. Further, we will not collect additional categories of your personal information or use the personal information we collected for materially different, unrelated, or incompatible purposes without providing you notice.
| HENNESSY FUNDS | 1-800-966-4354 | |
For information, questions, or assistance, please call
The Hennessy Funds
1-800-966-4354 or 1-415-899-1555
INVESTMENT ADVISOR
Hennessy Advisors, Inc.
7250 Redwood Boulevard, Suite 200
Novato, California 94945
ADMINISTRATOR,
TRANSFER AGENT,
DIVIDEND PAYING AGENT, &
SHAREHOLDER SERVICING AGENT
U.S. Bancorp Fund Services, LLC
d/b/a U.S. Bank Global Fund Services
P.O. Box 701
Milwaukee, Wisconsin 53201-0701
CUSTODIAN
U.S. Bank N.A.
Custody Operations
1555 North River Center Drive, Suite 302
Milwaukee, Wisconsin 53212
TRUSTEES
Neil J. Hennessy
Robert T. Doyle
J. Dennis DeSousa
Gerald P. Richardson
COUNSEL
Foley & Lardner LLP
777 East Wisconsin Avenue
Milwaukee, Wisconsin 53202-5306
INDEPENDENT REGISTERED
PUBLIC ACCOUNTING FIRM
Tait, Weller & Baker LLP
Two Liberty Place
50 South 16th Street, Suite 2900
Philadelphia, Pennsylvania 19102-2529
DISTRIBUTOR
Quasar Distributors, LLC
111 East Kilbourn Avenue, Suite 2200
Milwaukee, Wisconsin 53202
www.hennessyfunds.com | 1-800-966-4354
This report has been prepared for shareholders and may be distributed to
others only if preceded or accompanied by a current prospectus.
ANNUAL REPORT
OCTOBER 31, 2020
HENNESSY LARGE CAP FINANCIAL FUND
Investor Class HLFNX
Institutional Class HILFX
IMPORTANT NOTICE REGARDING ELECTRONIC DELIVERY OF SHAREHOLDER REPORTS
Beginning on January 1, 2021, as permitted by regulations adopted by the Securities and Exchange Commission, paper copies of the annual and semi-annual reports will no longer be sent by mail unless you specifically request paper copies from the Hennessy Funds or from your financial intermediary. Instead, the reports will be made available on a website, and you will be notified by mail each time a report is posted and provided with a website link to access the report.
If you have already elected to receive shareholder reports electronically, you will not be affected by this change and you need not take any action. You may elect to receive shareholder reports and other communications from the Hennessy Funds electronically by visiting www.hennessyfunds.com/account or by calling U.S. Bank Global Fund Services at 1-800-261-6950. If you own shares in a Fund through a financial intermediary, please contact your financial intermediary to make this election.
You may elect to receive paper copies of all future reports free of charge by calling U.S. Bank Global Fund Services at 1-800-261-6950 or, if you own your shares through a financial intermediary, by contacting your financial intermediary. Your election to receive paper copies of reports will apply to all Funds in the Hennessy Funds family.
www.hennessyfunds.com | 1-800-966-4354
(This Page Intentionally Left Blank.)
Contents
| Letter to Shareholders | | 2 |
| Performance Overview | | 4 |
| Financial Statements | | |
| Schedule of Investments | | 7 |
| Statement of Assets and Liabilities | | 10 |
| Statement of Operations | | 11 |
| Statements of Changes in Net Assets | | 13 |
| Financial Highlights | | 14 |
| Notes to the Financial Statements | | 18 |
| Report of Independent Registered Public Accounting Firm | | 26 |
| Trustees and Officers of the Fund | | 27 |
| Expense Example | | 30 |
| Proxy Voting Policy and Proxy Voting Records | | 32 |
| Availability of Quarterly Portfolio Schedule | | 32 |
| Important Notice Regarding Delivery of Shareholder Documents | | 32 |
| Electronic Delivery | | 32 |
| Liquidity Risk Management Program | | 32 |
| Privacy Policy | | 33 |
| HENNESSY FUNDS | 1-800-966-4354 | |
December 2020
Dear Hennessy Funds Shareholder:
As a new year and new decade dawned in January, no one could have imagined that the world would quickly plunge into one of the worst health crises in history. Throughout this pandemic, our thoughts have remained with those most deeply affected by COVID-19, and we thank our frontline healthcare and essential workers. At Hennessy Funds, we adapted quickly to the impact of COVID-19 to maintain business continuity. We focused on our employees and on you, the shareholders of the Hennessy Funds, and I am pleased that we have been able to navigate successfully during this unprecedented time.
The year was defined by a global pandemic and the ensuing economic shutdowns and by a highly charged presidential election that caused tremendous volatility. Yet the stock market has continued to show its resiliency and strength, as the major indices hit new all-time highs in November and again in December. For the 12 months ended October 31, 2020, U.S. equities posted positive performance, with the S&P 500® Index returning 9.71% and the Dow Jones Industrial Average returning 0.34% for the period. There were extreme differences in how various sectors performed during the period. For instance, the technology-focused NASDAQ Composite Index performed strongly, returning 32.84%, whereas the Energy sector (as represented by the S&P 500® Energy Sector Index) struggled with a loss of -46.43%. The Financials sector also performed relatively poorly during the period, with the Russell 1000® Index Financials losing -8.04% and the Russell 2000® Index Financials losing -17.87%. In addition, large cap stocks significantly outperformed small caps, and growth stocks reigned over value stocks during the period. Moreover, approximately half of the NASDAQ’s return for the period was comprised of just three behemoth technology stocks – Apple, Microsoft, and Amazon. Therefore, while the overall U.S. equities market improved, mutual fund returns varied drastically due to the disparate performance of specific sectors, differently sized companies, and different types of companies.
Optimism about the approval and distribution of effective COVID-19 vaccines appears to be buoying investor confidence. Low interest rates, and the expectation that they will remain low for the foreseeable future, have also provided a tailwind to equity prices. In my opinion, stocks are trading at reasonable valuations given this low interest rate environment, with the Dow Jones Industrial Average trading at 20.1x estimated earnings for 2021 and the S&P 500® Index trading at 21.6x estimated earnings for 2021. The U.S. economy looks to be on the road to recovery and is experiencing moderate inflation, and our banking industry appears healthy. The unemployment rate is dropping, albeit slowly, and I expect it to continue to improve once businesses reopen. There are high levels of cash on corporate balance sheets, which could support rising dividends and stock buybacks.
I believe our corporate business leaders will continue to adapt and find ways to drive growth and value for their shareholders, but I also feel that the uncertainty created by the continued health crisis and the stalemate over fiscal relief will lead to additional bouts of market volatility. I remain confident, however, that the markets can and will thrive in the long run.
Thank you for your continued trust and investment in the Hennessy Funds. We believe that there continue to be strong opportunities throughout many segments of the market, and we are focused on managing our high-conviction portfolios for the long-term
benefit of our shareholders. Should you have any questions or would like to speak with us directly, please reach out and call us at (800) 966-4354.
Best regards,
Neil J. Hennessy
President and Chief Investment Officer
Past performance does not guarantee future results.
Mutual fund investing involves risk. Principal loss is possible.
The Dow Jones Industrial Average and S&P 500® Index are commonly used to measure the performance of U.S. stocks. The NASDAQ Composite Index comprises all common stocks listed on The NASDAQ Stock Market and is commonly used to measure the performance of technology-related stocks. The S&P 500® Energy Sector Index is comprised of companies included in the S&P 500® Index that are classified in the Energy sector. The Russell 1000® Index Financials and Russell 2000® Index Financials are subsets of the Russell 1000® Index and Russell 2000® Index, respectively, that measure the performance of securities classified in the Financials sector of the large-cap and small-cap U.S. equity market, respectively. One cannot invest directly in an index. All returns are shown on a total return basis.
Forward price to earnings (PE) is a valuation measure calculated by dividing a company’s market price per share by its expected earnings per share over the following 12 months. PEs noted are sourced from Bloomberg as of December 9, 2020.
| HENNESSY FUNDS | 1-800-966-4354 | |
Performance Overview (Unaudited)
CHANGE IN VALUE OF $10,000 INVESTMENT
This graph illustrates the performance of an initial investment of $10,000 made in the Fund ten years ago and assumes the reinvestment of dividends.
AVERAGE ANNUAL TOTAL RETURN FOR PERIODS ENDED OCTOBER 31, 2020
| | One | Five | Ten |
| | Year
| Years
| Years
|
| Hennessy Large Cap Financial Fund – | | | |
| Investor Class (HLFNX) | -1.33% | 7.74% | 8.98% |
| Hennessy Large Cap Financial Fund – | | | |
Institutional Class (HILFX)(1) | -1.06% | 8.14% | 9.20% |
Russell 1000® Index Financials | -8.04% | 8.50% | 10.97% |
Russell 1000® Index | 10.87% | 11.79% | 13.05% |
Expense ratios: 1.83% (Investor Class); 1.44% (Institutional Class)
(1) | The inception date of Institutional Class shares is June 15, 2015. Performance shown prior to the inception of Institutional Class shares reflects the performance of Investor Class shares and includes expenses that are not applicable to, and are higher than, those of Institutional Class shares. |
Performance data quoted represents past performance; past performance does not guarantee future results. The investment return and principal value of an investment will fluctuate so that an investor’s shares, when redeemed, may be worth more or less than their original cost. The performance table does not reflect the deduction of taxes that a shareholder would pay on Fund distributions or the redemption of Fund shares. Current performance of the Fund may be lower or higher than the performance quoted. Performance data current to the most recent month end may be obtained by visiting www.hennessyfunds.com. Performance for periods including or prior to October 26, 2012, is that of the FBR Large Cap Financial Fund.
The Russell 1000® Index Financials is a subset of the Russell 1000® Index that measures the performance of the securities classified in the financials sector of the large-cap U.S. equity market. The Russell 1000® Index comprises the 1,000 largest companies in the Russell 3000® Index based on market capitalization. One cannot invest directly in an index. These indices are used herein for comparative purposes in accordance with Securities and Exchange Commission regulations.
Frank Russell Company (“Russell”) is the source and owner of the trademarks, service marks, and copyrights related to the Russell Indexes. Russell® is a trademark of Frank Russell Company. Neither Russell nor its licensors accept any liability for any errors or omissions in
the Russell Indexes or Russell ratings or underlying data and no party may rely on any Russell Indexes or Russell ratings or underlying data contained in this communication. No further distribution of Russell data is permitted without Russell’s express written consent. Russell does not promote, sponsor, or endorse the content of this communication.
The expense ratios presented are from the most recent prospectus. The expense ratios for the current reporting period are available in the Financial Highlights section of this report.
PERFORMANCE NARRATIVE
Portfolio Managers David H. Ellison and Ryan C. Kelley, CFA
Performance:
For the 12-month period ended October 31, 2020, the Investor Class of the Hennessy Large Cap Financial Fund returned -1.33%, outperforming the Russell 1000® Index Financials (the Fund’s primary benchmark), which returned -8.04%, but underperforming the Russell 1000® Index, which returned 10.87%, for the same period.
The Fund’s outperformance relative to its primary benchmark predominantly stemmed from its holdings of financial technology companies within the Information Technology sector, specifically certain payment processing companies. Top positive contributors included Square, Inc. (Class A), PayPal Holdings, Inc., and Apple, Inc. Insurance brokers and banks, including SelectQuote, Inc., Citigroup, Inc., and Wells Fargo & Company, were among the biggest detractors from performance during the period.
The Fund continues to hold all the companies mentioned.
Portfolio Strategy:
Historically, the Fund has been invested primarily in large-cap banks and, to a lesser degree, in insurance, real estate, and asset managers. However, we have increased our exposure to electronic payment companies and other financial technology companies over the last few years. We believe that growth in the electronic payment industry will continue as the use of mobile payment methods spreads.
In general, we seek companies that we believe have high-quality management teams, less complex business models, and the prospect of sustainable earnings growth over time. We also try to identify companies that we expect will do better relative to peers in the current environment, which is characterized by low interest rates, competitive loan markets, evolving electronic payment platforms, growing attention to costs, and business model repositioning. We are less interested in focusing solely on traditional banks that appear to promise an increase in profitability when interest rates rise, loan demand increases, or product pricing becomes more favorable. We believe the timing of these macro industry dynamics is difficult to predict and believe greater opportunity in the short and medium terms exists elsewhere in financially related large-cap companies.
Investment Commentary:
We believe that the environment for large-cap financial companies is challenging, and we favor those companies with more diverse business models that are less dependent solely on interest rates. The macroeconomic environment in the United States is improving after a tumultuous 2020, but we believe that there are still many potential challenges in the months to come related to the COVID-19 pandemic, unemployment recovery, and potential asset quality issues. However, we are encouraged that banks have been building reserves aggressively and retaining historically high levels of capital in anticipation of potential loan charge-offs.
| HENNESSY FUNDS | 1-800-966-4354 | |
The Fund remains overweight in fee-based electronic service providers and other financial technology companies. We believe these companies will continue to grow their revenues and earnings, driven in part by the global shift towards cashless forms of payment.
_______________
Opinions expressed are those of the Portfolio Managers as of the date written and are subject to change, are not guaranteed, and should not be considered investment advice or an indication of trading intent.
The Fund is non-diversified, meaning it may concentrate its assets in fewer individual holdings than a diversified fund, making it more exposed to individual stock volatility than a diversified fund. Investments are focused in the financial services industry; sector funds may be subject to a higher degree of market risk. The Fund invests in medium-sized companies, which may have limited liquidity and greater volatility compared to larger companies. Please see the Fund’s prospectus for a more complete discussion of these and other risks.
References to specific securities should not be considered a recommendation to buy or sell any security. Fund holdings and sector allocations are subject to change. Please refer to the Schedule of Investments included in this report for additional portfolio information.
Earnings growth is not a measure of the Fund’s future performance.
| PERFORMANCE OVERVIEW/SCHEDULE OF INVESTMENTS |
Financial Statements
Schedule of Investments as of October 31, 2020 |
HENNESSY LARGE CAP FINANCIAL FUND
(% of Net Assets)
| TOP TEN HOLDINGS (EXCLUDING MONEY MARKET FUNDS) | % NET ASSETS |
| Apple, Inc. | 5.73% |
| Square, Inc., Class A | 5.68% |
| PayPal Holdings, Inc. | 5.54% |
| Fiserv, Inc. | 4.90% |
| Adyen NV – ADR | 4.85% |
| Bank of America Corp. | 4.83% |
| Moody’s Corp. | 4.82% |
| The Goldman Sachs Group, Inc. | 4.76% |
| Visa, Inc., Class A | 4.74% |
| Capital One Financial Corp. | 4.69% |
Note: For presentation purposes, the Fund has grouped some of the industry categories. For purposes of categorizing securities for compliance with Section 8(b)(1) of the Investment Company Act of 1940, as amended, the Fund uses more specific industry classifications.
The Global Industry Classification Standard (GICS®) was developed by and is the exclusive property and a service mark of MSCI, Inc. and Standard & Poor’s Financial Services LLC. It has been licensed for use by the Hennessy Funds.
| HENNESSY FUNDS | 1-800-966-4354 | |
| COMMON STOCKS – 97.33% | | Number | | | | | | % of | |
| | | of Shares | | | Value | | | Net Assets | |
| Communication Services – 2.96% | | | | | | | | | |
| Alphabet, Inc., Class A (a) | | | 800 | | | $ | 1,292,888 | | | | 2.96 | % |
| | | | | | | | | | | | | |
| Financials – 49.13% | | | | | | | | | | | | |
| Bank of America Corp. | | | 89,000 | | | | 2,109,300 | | | | 4.83 | % |
| Berkshire Hathaway, Inc., Class B (a) | | | 4,000 | | | | 807,600 | | | | 1.85 | % |
| Capital One Financial Corp. | | | 28,000 | | | | 2,046,240 | | | | 4.69 | % |
| Citigroup, Inc. | | | 38,000 | | | | 1,573,960 | | | | 3.61 | % |
| Citizens Financial Group, Inc. | | | 9,000 | | | | 245,250 | | | | 0.56 | % |
| JPMorgan Chase & Co. | | | 17,000 | | | | 1,666,680 | | | | 3.82 | % |
| Moody’s Corp. | | | 8,000 | | | | 2,103,200 | | | | 4.82 | % |
| MSCI, Inc. | | | 1,000 | | | | 349,840 | | | | 0.80 | % |
| SelectQuote, Inc. (a) | | | 105,000 | | | | 1,808,100 | | | | 4.14 | % |
| The Blackstone Group, Inc. | | | 40,000 | | | | 2,016,800 | | | | 4.62 | % |
| The Charles Schwab Corp. | | | 15,000 | | | | 616,650 | | | | 1.41 | % |
| The Goldman Sachs Group, Inc. | | | 11,000 | | | | 2,079,440 | | | | 4.76 | % |
| The PNC Financial Services Group, Inc. | | | 5,000 | | | | 559,400 | | | | 1.28 | % |
| Tradeweb Markets, Inc. | | | 27,000 | | | | 1,470,960 | | | | 3.37 | % |
| Wells Fargo & Co. | | | 93,000 | | | | 1,994,850 | | | | 4.57 | % |
| | | | | | | | 21,448,270 | | | | 49.13 | % |
| | | | | | | | | | | | | |
| Information Technology – 45.24% | | | | | | | | | | | | |
| Adyen NV – ADR (a)(b) | | | 63,000 | | | | 2,116,170 | | | | 4.85 | % |
| Apple, Inc. | | | 23,000 | | | | 2,503,780 | | | | 5.73 | % |
| Fidelity National Information Services, Inc. | | | 15,800 | | | | 1,968,522 | | | | 4.51 | % |
| Fiserv, Inc. (a) | | | 22,400 | | | | 2,138,528 | | | | 4.90 | % |
| Global Payments, Inc. | | | 12,900 | | | | 2,034,846 | | | | 4.66 | % |
| Mastercard, Inc., Class A | | | 7,000 | | | | 2,020,480 | | | | 4.63 | % |
| PayPal Holdings, Inc. (a) | | | 13,000 | | | | 2,419,690 | | | | 5.54 | % |
| Square, Inc., Class A (a) | | | 16,000 | | | | 2,478,080 | | | | 5.68 | % |
| Visa, Inc., Class A | | | 11,400 | | | | 2,071,494 | | | | 4.74 | % |
| | | | | | | | 19,751,590 | | | | 45.24 | % |
| | | | | | | | | | | | | |
| Total Common Stocks | | | | | | | | | | | | |
| (Cost $34,763,181) | | | | | | | 42,492,748 | | | | 97.33 | % |
The accompanying notes are an integral part of these financial statements.
| SHORT-TERM INVESTMENTS – 2.82% | | Number | | | | | | % of | |
| | | of Shares | | | Value | | | Net Assets | |
| Money Market Funds – 2.82% | | | | | | | | | |
| First American Government Obligations Fund, | | | | | | | | | |
| Institutional Class, 0.05% (c) | | | 1,231,127 | | | $ | 1,231,127 | | | | 2.82 | % |
| | | | | | | | | | | | | |
| Total Short-Term Investments | | | | | | | | | | | | |
| (Cost $1,231,127) | | | | | | | 1,231,127 | | | | 2.82 | % |
| | | | | | | | | | | | | |
| Total Investments | | | | | | | | | | | | |
| (Cost $35,994,308) – 100.15% | | | | | | | 43,723,875 | | | | 100.15 | % |
| Liabilities in Excess of Other Assets – (0.15)% | | | | | | | (64,167 | ) | | | (0.15 | )% |
| | | | | | | | | | | | | |
TOTAL NET ASSETS – 100.00% | | | | | | $ | 43,659,708 | | | | 100.00 | % |
Percentages are stated as a percent of net assets.
ADR – American Depositary Receipt
NV – Naamloze Vennootschap is a Dutch term for publicly traded companies.
| (a) | Non-income-producing security. |
| (b) | U.S.-traded security of a foreign corporation. |
| (c) | The rate listed is the fund’s seven-day yield as of October 31, 2020. |
The Fund invested in an affiliated security during the year ended October 31, 2020. Quasar Distributors, LLC, which serves as the Fund’s distributor, was a subsidiary of U.S. Bancorp Fund Services, LLC, through March 30, 2020. Details of transactions with this affiliated company for the period November 1, 2019 through March 30, 2020, are as follows:
| | | | Common Stocks | |
| | | | U.S. Bancorp | |
| | Beginning Cost – November 1, 2019 | | $ | 489,030 | |
| | Purchase Cost | | | — | |
| | Sales Cost | | | (489,030 | ) |
| | Ending Cost – March 30, 2020 | | $ | — | |
| | Dividend Income | | $ | 2,100 | |
| | Net Change in Unrealized Appreciation/Depreciation | | $ | (24,150 | ) |
| | Realized Gain/Loss | | $ | 31,875 | |
| | Shares | | | — | |
| | Market Value – March 30, 2020 | | $ | — | |
Summary of Fair Value Exposure as of October 31, 2020
The following is a summary of the inputs used to value the Fund’s net assets as of October 31, 2020 (see Note 3 in the accompanying Notes to the Financial Statements):
| Common Stocks | | Level 1 | | | Level 2 | | | Level 3 | | | Total | |
| Communication Services | | $ | 1,292,888 | | | $ | — | | | $ | — | | | $ | 1,292,888 | |
| Financials | | | 21,448,270 | | | | — | | | | — | | | | 21,448,270 | |
| Information Technology | | | 19,751,590 | | | | — | | | | — | | | | 19,751,590 | |
| Total Common Stocks | | $ | 42,492,748 | | | $ | — | | | $ | — | | | $ | 42,492,748 | |
| Short-Term Investments | | | | | | | | | | | | | | | | |
| Money Market Funds | | $ | 1,231,127 | | | $ | — | | | $ | — | | | $ | 1,231,127 | |
| Total Short-Term Investments | | $ | 1,231,127 | | | $ | — | | | $ | — | | | $ | 1,231,127 | |
| Total Investments | | $ | 43,723,875 | | | $ | — | | | $ | — | | | $ | 43,723,875 | |
The accompanying notes are an integral part of these financial statements.
| HENNESSY FUNDS | 1-800-966-4354 | |
Financial Statements
Statement of Assets and Liabilities as of October 31, 2020 |
| ASSETS: | | | |
| Investments in securities, at value (cost $35,994,308) | | $ | 43,723,875 | |
| Dividends and interest receivable | | | 53,323 | |
| Receivable for fund shares sold | | | 43,572 | |
| Receivable for securities sold | | | 92,424 | |
| Prepaid expenses and other assets | | | 15,966 | |
| Total assets | | | 43,929,160 | |
| | | | | |
| LIABILITIES: | | | | |
| Payable for securities purchased | | | 162,857 | |
| Payable for fund shares redeemed | | | 7,392 | |
| Payable to advisor | | | 35,072 | |
| Payable to administrator | | | 10,443 | |
| Payable to auditor | | | 23,100 | |
| Accrued distribution fees | | | 3,621 | |
| Accrued service fees | | | 2,061 | |
| Accrued trustees fees | | | 3,938 | |
| Accrued expenses and other payables | | | 20,968 | |
| Total liabilities | | | 269,452 | |
| NET ASSETS | | $ | 43,659,708 | |
| | | | | |
| NET ASSETS CONSISTS OF: | | | | |
| Capital stock | | $ | 38,022,298 | |
| Total distributable earnings | | | 5,637,410 | |
| Total net assets | | $ | 43,659,708 | |
| | | | | |
| NET ASSETS: | | | | |
| Investor Class | | | | |
| Shares authorized (no par value) | | Unlimited | |
| Net assets applicable to outstanding shares | | $ | 22,511,366 | |
| Shares issued and outstanding | | | 1,008,179 | |
| Net asset value, offering price, and redemption price per share | | $ | 22.33 | |
| | | | | |
| Institutional Class | | | | |
| Shares authorized (no par value) | | Unlimited | |
| Net assets applicable to outstanding shares | | $ | 21,148,342 | |
| Shares issued and outstanding | | | 942,454 | |
| Net asset value, offering price, and redemption price per share | | $ | 22.44 | |
The accompanying notes are an integral part of these financial statements.
| STATEMENT OF ASSETS AND LIABILITIES/STATEMENT OF OPERATIONS |
Financial Statements
Statement of Operations for the year ended October 31, 2020 |
| INVESTMENT INCOME: | | | |
| Dividend income from unaffiliated securities | | $ | 658,260 | |
Dividend income from affiliated securities(1) | | | 2,100 | |
| Interest income | | | 7,334 | |
| Total investment income | | | 667,694 | |
| | | | | |
| EXPENSES: | | | | |
| Investment advisory fees (See Note 5) | | | 391,691 | |
| Sub-transfer agent expenses – Investor Class (See Note 5) | | | 44,475 | |
| Sub-transfer agent expenses – Institutional Class (See Note 5) | | | 29,303 | |
| Administration, accounting, custody, and transfer agent fees (See Note 5) | | | 57,584 | |
| Federal and state registration fees | | | 36,871 | |
| Distribution fees – Investor Class (See Note 5) | | | 34,914 | |
| Compliance expense (See Note 5) | | | 27,710 | |
| Service fees – Investor Class (See Note 5) | | | 23,276 | |
| Audit fees | | | 23,102 | |
| Trustees’ fees and expenses | | | 13,762 | |
| Reports to shareholders | | | 8,013 | |
| Interest expense (See Note 7) | | | 717 | |
| Legal fees | | | 628 | |
| Other expenses | | | 8,505 | |
| Total expenses | | | 700,551 | |
| NET INVESTMENT LOSS | | $ | (32,857 | ) |
| | | | | |
| REALIZED AND UNREALIZED GAINS (LOSSES): | | | | |
| Net realized gain on investments: | | | | |
| Unaffiliated investments | | $ | 853,336 | |
Affiliated investments(1) | | | 31,875 | |
| Net change in unrealized appreciation/deprecation on investments: | | | | |
| Unaffiliated investments | | | (1,433,225 | ) |
Affiliated investments(1) | | | (24,150 | ) |
| Net loss on investments | | | (572,164 | ) |
| NET DECREASE IN NET ASSETS RESULTING FROM OPERATIONS | | $ | (605,021 | ) |
(1) | Investment in affiliated security for the period from November 1, 2019, through March 30, 2020. |
The accompanying notes are an integral part of these financial statements.
| HENNESSY FUNDS | 1-800-966-4354 | |
(This Page Intentionally Left Blank.)
| STATEMENTS OF CHANGES IN NET ASSETS |
Financial Statements
| Statements of Changes in Net Assets |
| | | Year Ended | | | Year Ended | |
| | | October 31, 2020 | | | October 31, 2019 | |
| OPERATIONS: | | | | | | |
| Net investment loss | | $ | (32,857 | ) | | $ | (54,782 | ) |
| Net realized gain (loss) on investments | | | 885,211 | | | | (2,153,768 | ) |
| Net change in unrealized | | | | | | | | |
| appreciation/depreciation on investments | | | (1,457,375 | ) | | | 3,586,065 | |
| Net increase (decrease) in net assets | | | | | | | | |
| resulting from operations | | | (605,021 | ) | | | 1,377,515 | |
| | | | | | | | | |
| DISTRIBUTIONS TO SHAREHOLDERS: | | | | | | | | |
| Distributable earnings – Investor Class | | | — | | | | (982,872 | ) |
| Distributable earnings – Institutional Class | | | — | | | | (250,041 | ) |
| Total distributions | | | — | | | | (1,232,913 | ) |
| | | | | | | | | |
| CAPITAL SHARE TRANSACTIONS: | | | | | | | | |
| Proceeds from shares subscribed – Investor Class | | | 5,673,827 | | | | 2,668,470 | |
| Proceeds from shares subscribed – Institutional Class | | | 11,305,560 | | | | 19,568,396 | |
| Dividends reinvested – Investor Class | | | — | | | | 961,534 | |
| Dividends reinvested – Institutional Class | | | — | | | | 249,016 | |
| Cost of shares redeemed – Investor Class | | | (6,851,490 | ) | | | (21,047,821 | ) |
| Cost of shares redeemed – Institutional Class | | | (11,461,893 | ) | | | (6,788,374 | ) |
| Net decrease in net assets derived | | | | | | | | |
| from capital share transactions | | | (1,333,996 | ) | | | (4,388,779 | ) |
| TOTAL DECREASE IN NET ASSETS | | | (1,939,017 | ) | | | (4,244,177 | ) |
| | | | | | | | | |
| NET ASSETS: | | | | | | | | |
| Beginning of year | | | 45,598,725 | | | | 49,842,902 | |
| End of year | | $ | 43,659,708 | | | $ | 45,598,725 | |
| | | | | | | | | |
| CHANGES IN SHARES OUTSTANDING: | | | | | | | | |
| Shares sold – Investor Class | | | 276,712 | | | | 122,976 | |
| Shares sold – Institutional Class | | | 544,138 | | | | 863,528 | |
| Shares issued to holders as reinvestment | | | | | | | | |
| of dividends – Investor Class | | | — | | | | 48,710 | |
| Shares issued to holders as reinvestment | | | | | | | | |
| of dividends – Institutional Class | | | — | | | | 12,634 | |
| Shares redeemed – Investor Class | | | (312,507 | ) | | | (1,040,638 | ) |
| Shares redeemed – Institutional Class | | | (570,423 | ) | | | (321,223 | ) |
| Net decrease in shares outstanding | | | (62,080 | ) | | | (314,013 | ) |
The accompanying notes are an integral part of these financial statements.
| HENNESSY FUNDS | 1-800-966-4354 | |
Financial Statements
For an Investor Class share outstanding throughout each year
PER SHARE DATA:
Net asset value, beginning of year
Income from investment operations:
Net investment income (loss)
Net realized and unrealized gains (losses) on investments
Total from investment operations
Less distributions:
Dividends from net investment income
Dividends from net realized gains
Total distributions
Net asset value, end of year
TOTAL RETURN
SUPPLEMENTAL DATA AND RATIOS:
Net assets, end of year (millions)
Ratio of expenses to average net assets
Ratio of net investment income (loss) to average net assets
Portfolio turnover rate(2)
(1) | Calculated using the average shares outstanding method. |
(2) | Calculated on the basis of the Fund as a whole. |
The accompanying notes are an integral part of these financial statements.
| FINANCIAL HIGHLIGHTS — INVESTOR CLASS |
| Year Ended October 31, | |
| 2020 | | | 2019 | | | 2018 | | | 2017 | | | 2016 | |
| | | | | | | | | | | | | | |
| $ | 22.63 | | | $ | 21.43 | | | $ | 22.02 | | | $ | 16.23 | | | $ | 18.36 | |
| | | | | | | | | | | | | | | | | | | |
| | | | | | | | | | | | | | | | | | | |
| | (0.05 | )(1) | | | (0.05 | )(1) | | | (0.07 | ) | | | (0.08 | ) | | | 0.07 | |
| | (0.25 | ) | | | 1.84 | | | | 0.48 | | | | 5.97 | | | | (0.49 | ) |
| | (0.30 | ) | | | 1.79 | | | | 0.41 | | | | 5.89 | | | | (0.42 | ) |
| | | | | | | | | | | | | | | | | | | |
| | | | | | | | | | | | | | | | | | | |
| | — | | | | — | | | | — | | | | (0.10 | ) | | | (0.02 | ) |
| | — | | | | (0.59 | ) | | | (1.00 | ) | | | — | | | | (1.69 | ) |
| | — | | | | (0.59 | ) | | | (1.00 | ) | | | (0.10 | ) | | | (1.71 | ) |
| $ | 22.33 | | | $ | 22.63 | | | $ | 21.43 | | | $ | 22.02 | | | $ | 16.23 | |
| | | | | | | | | | | | | | | | | | | |
| | -1.33 | % | | | 8.75 | % | | | 1.82 | % | | | 36.41 | % | | | -2.57 | % |
| | | | | | | | | | | | | | | | | | | |
| | | | | | | | | | | | | | | | | | | |
| $ | 22.51 | | | $ | 23.63 | | | $ | 40.99 | | | $ | 26.33 | | | $ | 26.67 | |
| | 1.75 | % | | | 1.82 | % | | | 1.69 | % | | | 1.81 | % | | | 1.66 | % |
| | (0.21 | )% | | | (0.23 | )% | | | (0.44 | )% | | | (0.41 | )% | | | 0.16 | % |
| | 88 | % | | | 83 | % | | | 64 | % | | | 76 | % | | | 141 | % |
The accompanying notes are an integral part of these financial statements.
| HENNESSY FUNDS | 1-800-966-4354 | |
Financial Statements
For an Institutional Class share outstanding throughout each year
PER SHARE DATA:
Net asset value, beginning of year
Income from investment operations:
Net investment income
Net realized and unrealized gains (losses) on investments
Total from investment operations
Less distributions:
Dividends from net investment income
Dividends from net realized gains
Total distributions
Net asset value, end of year
TOTAL RETURN
SUPPLEMENTAL DATA AND RATIOS:
Net assets, end of year (millions)
Ratio of expenses to average net assets
Ratio of net investment income (loss) to average net assets
Portfolio turnover rate(2)
(1) | Calculated using the average shares outstanding method. |
(2) | Calculated on the basis of the Fund as a whole. |
The accompanying notes are an integral part of these financial statements.
| FINANCIAL HIGHLIGHTS — INSTITUTIONAL CLASS |
| Year Ended October 31, | |
| 2020 | | | 2019 | | | 2018 | | | 2017 | | | 2016 | |
| | | | | | | | | | | | | | |
| $ | 22.68 | | | $ | 21.39 | | | $ | 21.91 | | | $ | 16.26 | | | $ | 18.39 | |
| | | | | | | | | | | | | | | | | | | |
| | | | | | | | | | | | | | | | | | | |
| | 0.02 | (1) | | | 0.01 | (1) | | | 0.03 | | | | 0.18 | | | | 0.02 | |
| | (0.26 | ) | | | 1.87 | | | | 0.45 | | | | 5.78 | | | | (0.36 | ) |
| | (0.24 | ) | | | 1.88 | | | | 0.48 | | | | 5.96 | | | | (0.34 | ) |
| | | | | | | | | | | | | | | | | | | |
| | | | | | | | | | | | | | | | | | | |
| | — | | | | — | | | | — | | | | (0.31 | ) | | | (0.09 | ) |
| | — | | | | (0.59 | ) | | | (1.00 | ) | | | — | | | | (1.70 | ) |
| | — | | | | (0.59 | ) | | | (1.00 | ) | | | (0.31 | ) | | | (1.79 | ) |
| $ | 22.44 | | | $ | 22.68 | | | $ | 21.39 | | | $ | 21.91 | | | $ | 16.26 | |
| | | | | | | | | | | | | | | | | | | |
| | -1.06 | % | | | 9.16 | % | | | 2.16 | % | | | 36.92 | % | | | -2.14 | % |
| | | | | | | | | | | | | | | | | | | |
| | | | | | | | | | | | | | | | | | | |
| $ | 21.15 | | | $ | 21.97 | | | $ | 8.85 | | | $ | 5.83 | | | $ | 0.35 | |
| | 1.45 | % | | | 1.43 | % | | | 1.34 | % | | | 1.50 | % | | | 1.24 | % |
| | 0.08 | % | | | 0.05 | % | | | (0.07 | )% | | | (0.17 | )% | | | 0.52 | % |
| | 88 | % | | | 83 | % | | | 64 | % | | | 76 | % | | | 141 | % |
The accompanying notes are an integral part of these financial statements.
| HENNESSY FUNDS | 1-800-966-4354 | |
Financial Statements
Notes to the Financial Statements October 31, 2020 |
1). ORGANIZATION
The Hennessy Large Cap Financial Fund (the “Fund”) is a series of Hennessy Funds Trust (the “Trust”), which was organized as a Delaware statutory trust on September 17, 1992. The Fund is an open-end management investment company registered under the Investment Company Act of 1940, as amended. The investment objective of the Fund is capital appreciation. The Fund is a non-diversified fund.
The Fund offers Investor Class and Institutional Class shares. Each class of shares differs principally in its respective 12b-1 distribution and service, shareholder servicing, and sub-transfer agent expenses. There are no sales charges. Each class has identical rights to earnings, assets, and voting privileges, except for class-specific expenses and exclusive rights to vote on matters affecting only one class.
As an investment company, the Fund follows the investment company accounting and reporting guidance of the Financial Accounting Standards Board (“FASB”) Accounting Standard Codification Topic 946 “Financial Services—Investment Companies.”
2). SIGNIFICANT ACCOUNTING POLICIES
The following is a summary of significant accounting policies consistently followed by the Fund in the preparation of the financial statements. These policies conform to U.S. generally accepted accounting principles (“GAAP”).
| a). | Securities Valuation – All investments in securities are valued in accordance with the Fund’s valuation policies and procedures, as described in Note 3. |
| | |
| b). | Federal Income Taxes – No provision for federal income taxes or excise taxes has been made because the Fund has elected to be taxed as a regulated investment company and intends to distribute substantially all of its taxable income to its shareholders and otherwise comply with the provisions of the Internal Revenue Code of 1986, as amended, applicable to regulated investment companies. Net investment income/loss and realized gains/losses for federal income tax purposes may differ from those reported in the financial statements because of temporary book and tax basis differences. Temporary differences are primarily the result of the treatment of wash sales for tax reporting purposes. The Fund recognizes interest and penalties related to income tax benefits, if any, in the Statement of Operations as an income tax expense. Distributions from net realized gains for book purposes may include short-term capital gains, which are included as ordinary income to shareholders for tax purposes. The Fund may utilize equalization accounting for tax purposes and designate earnings and profits, including net realized gains distributed to shareholders on redemption of shares, as part of the dividends paid deduction for income tax purposes. |
| | |
| | Due to inherent differences in the recognition of income, expenses, and realized gains/losses under GAAP and federal income tax regulations, permanent differences between book and tax basis for reporting are identified and appropriately reclassified in the Statement of Assets and Liabilities, as needed. As of October 31, 2020, no such reclassifications were required for fiscal year 2020. |
| | |
| c). | Accounting for Uncertainty in Income Taxes – The Fund has accounting policies regarding recognition and measurement of tax positions taken or expected to be taken on a tax return. The tax returns of the Fund for the prior three fiscal years are |
| NOTES TO THE FINANCIAL STATEMENTS |
| | open for examination. The Fund has reviewed all open tax years in major jurisdictions and concluded that there is no impact on the Fund’s net assets and no tax liability resulting from unrecognized tax benefits relating to uncertain income tax positions taken or expected to be taken on a tax return. The Fund’s major tax jurisdictions are U.S. federal and Delaware. |
| | |
| d). | Income and Expenses – Dividend income is recognized on the ex-dividend date or as soon as information is available to the Fund. Interest income, which includes the amortization of premium and accretion of discount, is recognized on an accrual basis. Market discounts, original issue discounts, and market premiums on debt securities are accreted or amortized to interest income over the life of a security with a corresponding increase or decrease, as applicable, in the cost basis of such security using the yield to maturity method, or where applicable, the first call date of the security. Other non-cash dividends are recognized as investment income at the fair value of the property received. The Fund is charged for those expenses that are directly attributable to its portfolio, such as advisory, administration, and certain shareholder service fees. Income, expenses (other than expenses attributable to a specific class), and realized and unrealized gains/losses on investments are allocated to each class of shares based on such class’s net assets. |
| | |
| e). | Distributions to Shareholders – Dividends from net investment income for the Fund, if any, are declared and paid annually, usually in December. Distributions of net realized capital gains, if any, are declared and paid annually, usually in December. |
| | |
| f). | Security Transactions – Investment and shareholder transactions are recorded on the trade date. The Fund determines the realized gain/loss from an investment transaction by comparing the original cost of the security lot sold with the net sale proceeds. Discounts and premiums on securities purchased are accreted or amortized, respectively, over the life of each such security. |
| | |
| g). | Use of Estimates – The preparation of financial statements in conformity with GAAP requires management to make estimates and assumptions that affect the reported amounts of assets and liabilities and disclosure of contingent assets and liabilities at the date of the financial statements and the reported change in net assets during the reporting period. Actual results could differ from those estimates. |
| | |
| h). | Share Valuation – The net asset value (“NAV”) per share of the Fund is calculated by dividing (i) the total value of the securities held by the Fund, plus cash and other assets, minus all liabilities (including estimated accrued expenses) by (ii) the total number of shares outstanding for the Fund, rounded to the nearest $0.01. The Fund’s shares will not be priced on days the New York Stock Exchange is closed for trading. The offering and redemption price per share for the Fund is equal to the Fund’s NAV per share. |
| | |
| i). | New Accounting Pronouncements – In August 2018, the FASB issued Accounting Standards Update No. 2018-13 “Disclosure Framework—Changes to the Disclosure Requirements for Fair Value Measurement” (“ASU 2018-13”). ASU 2018-13 eliminates the requirement to disclose the amount of and reasons for transfers between Level 1 and Level 2 of the fair value hierarchy, the timing of transfers between levels of the fair value hierarchy, and the valuation processes for Level 3 fair value measurements. ASU 2018-13 does not eliminate the requirement to disclose the range and weighted average used to develop significant unobservable inputs for Level 3 fair value measurements, and the changes in unrealized gains and losses for recurring Level 3 fair value measurements. ASU 2018-13 requires that information is provided about the measurement uncertainty of Level 3 fair value measurements as of the reporting date. |
| HENNESSY FUNDS | 1-800-966-4354 | |
| | The guidance is effective for fiscal years beginning after December 15, 2019, and interim periods within those fiscal years. Management evaluated the impact of this change in guidance and, due to the permissibility of early adoption, modified the Fund’s fair value disclosures beginning with its fiscal year 2019. |
3). SECURITIES VALUATION
The Fund follows its valuation policies and procedures in determining its net asset value and, in preparing these financial statements, the fair value accounting standards that establish an authoritative definition of fair value and set out a hierarchy for measuring fair value. These standards require additional disclosures about the various inputs and valuation techniques used to develop the measurements of fair value and a discussion of changes in valuation techniques and related inputs during the period. These inputs are summarized in the three broad levels listed below:
| | Level 1 – | Unadjusted, quoted prices in active markets for identical instruments that the Fund has the ability to access at the date of measurement. |
| | | |
| | Level 2 – | Other significant observable inputs (including, but not limited to, quoted prices in active markets for similar instruments, quoted prices in markets that are not active for identical or similar instruments, and model-derived valuations in which all significant inputs and significant value drivers are observable in active markets, such as interest rates, prepayment speeds, credit risk curves, default rates, and similar data). |
| | | |
| | Level 3 – | Significant unobservable inputs (including the Fund’s own assumptions about what market participants would use to price the asset or liability based on the best available information) when observable inputs are unavailable. |
The following is a description of the valuation techniques applied to the Fund’s major categories of assets and liabilities on a recurring basis:
| | Equity Securities – Equity securities, including common stocks, preferred stocks, foreign-issued common stocks, exchange-traded funds, closed-end mutual funds, partnerships, rights, and real estate investment trusts, that are traded on a securities exchange for which a last-quoted sales price is readily available will generally be valued at the last sales price as reported by the primary exchange on which the securities are listed. Securities listed on The NASDAQ Stock Market (“NASDAQ”) will generally be valued at the NASDAQ Official Closing Price, which may differ from the last sales price reported. Securities traded on a securities exchange for which a last-quoted sales price is not readily available will generally be valued at the mean between the bid and ask prices. To the extent these securities are actively traded and valuation adjustments are not applied, they are classified in Level 1 of the fair value hierarchy. Securities traded on foreign exchanges generally are not valued at the same time the Fund calculates its NAV because most foreign markets close well before such time. The earlier close of most foreign markets gives rise to the possibility that significant events, including broad market moves, may have occurred in the interim. In certain circumstances, it may be determined that a foreign security needs to be fair valued because it appears that the value of the security might have been materially affected by events occurring after the close of the market in which the security is principally traded, but before the time the Fund calculates its NAV, such as by a development that affects an entire market or region (e.g., a weather-related event) or a potentially global development (e.g., a terrorist attack that may be expected to have an effect on investor expectations worldwide). |
| NOTES TO THE FINANCIAL STATEMENTS |
| | Registered Investment Companies – Investments in open-end registered investment companies, commonly referred to as mutual funds, generally are priced at the ending NAV provided by the applicable mutual fund’s service agent and will be classified in Level 1 of the fair value hierarchy. |
| | |
| | Debt Securities – Debt securities, including corporate bonds, asset-backed securities, mortgage-backed securities, municipal bonds, U.S. Treasuries, and U.S. government agency issues, are generally valued at market on the basis of valuations furnished by an independent pricing service that utilizes both dealer-supplied valuations and formula-based techniques. The pricing service may consider recently executed transactions in securities of the issuer or comparable issuers, market price quotations (where observable), bond spreads, and fundamental data relating to the issuer. In addition, the model may incorporate observable market data, such as reported sales of similar securities, broker quotes, yields, bids, offers, and reference data. Certain securities are valued primarily using dealer quotations. These securities are generally classified in Level 2 of the fair value hierarchy. |
| | |
| | Short-Term Securities – Short-term equity investments, including money market funds, are valued in the manner specified above. Short-term debt investments with an original term to maturity of 60 days or less are valued at amortized cost, which approximates fair market value. If the original term to maturity of a short-term debt investment exceeded 60 days, then the values as of the 61st day prior to maturity are amortized. Amortized cost is not used if its use would be inappropriate due to credit or other impairments of the issuer, in which case the security’s fair value would be determined, as described below. Short-term securities are generally classified in Level 1 or Level 2 of the fair value hierarchy depending on the inputs used and market activity levels for specific securities. |
The Board of Trustees of the Fund (the “Board”) has adopted fair value pricing procedures that are followed when a price for a security is not readily available or if a significant event has occurred that indicates the closing price of a security no longer represents the true value of that security. Fair value pricing determinations are made in good faith in accordance with these procedures. There are numerous criteria that will be given consideration in determining a fair value of a security, such as the trading volume of a security and markets, the values of other similar securities, and news events with direct bearing on a security or markets. Fair value pricing results in an estimated price for a security that reflects the amount the Fund might reasonably expect to receive in a current sale. Depending on the relative significance of the valuation inputs, these securities may be classified in either Level 2 or Level 3 of the fair value hierarchy.
The fair value of foreign securities may be determined with the assistance of a pricing service using correlations between the movement of prices of such securities and indices of domestic securities and other appropriate indicators, such as closing market prices of relevant American Depositary Receipts or futures contracts. Using fair value pricing means that the Fund’s NAV reflects the affected portfolio securities’ values as determined by the Board or its designee, pursuant to the fair value pricing procedures adopted by the Board, instead of being determined by the market. Using a fair value pricing methodology to price a foreign security may result in a value that is different from such foreign security’s most recent closing price and from the value used by other investment companies to calculate their NAVs. Such securities are generally classified in Level 2 of the fair value hierarchy. Because the Fund may invest in foreign securities, the value of the Fund’s portfolio securities may change on days when you will not be able to purchase or redeem your shares.
| HENNESSY FUNDS | 1-800-966-4354 | |
The Board has delegated day-to-day valuation matters to the Valuation and Liquidity Committee comprising representatives from Hennessy Advisors, Inc., the Fund’s investment advisor (the “Advisor”). The function of the Valuation and Liquidity Committee is to value securities where current and reliable market quotations are not readily available. All actions taken by the Valuation and Liquidity Committee are reviewed by the Board.
The Fund has performed an analysis of all existing investments to determine the significance and character of all inputs to their fair value determinations. Various inputs are used to determine the value of the Fund’s investments. The inputs or methodology used for valuing securities are not necessarily an indication of the risk associated with investing in those securities. Details related to the fair value hierarchy of the Fund’s securities as of October 31, 2020, are included in the Schedule of Investments.
4). INVESTMENT TRANSACTIONS
Purchases and sales of investment securities (excluding government and short-term investments) for the Fund during fiscal year 2020 were $37,054,667 and $38,323,523, respectively.
There were no purchases or sales/maturities of long-term U.S. government securities for the Fund during fiscal year 2020.
The Fund is permitted to purchase or sell securities from or to another fund in the Hennessy Funds family of funds (collectively, the “Hennessy Funds”) under specified conditions outlined in procedures adopted by the Board. The procedures have been designed to ensure that any purchase or sale of securities by the Fund from or to another Hennessy Fund complies with Rule 17a-7 of the Investment Company Act of 1940, as amended. During fiscal year 2020, the Fund did not engage in purchases or sales of securities pursuant to Rule 17a-7 of the Investment Company Act of 1940, as amended.
5). INVESTMENT ADVISORY FEE AND OTHER TRANSACTIONS WITH AFFILIATES
The Advisor provides the Fund with investment advisory services under an Investment Advisory Agreement. The Advisor furnishes all investment advice, office space, and facilities and most of the personnel needed by the Fund. As compensation for its services, the Advisor is entitled to a monthly fee from the Fund. The fee is based on the average daily net assets of the Fund at an annual rate of 0.90%. The net investment advisory fees expensed by the Fund during fiscal year 2020 are included in the Statement of Operations.
The Board has approved a Shareholder Servicing Agreement for Investor Class shares of the Fund, which was instituted to compensate the Advisor for the non-investment advisory services it provides to the Fund. The Shareholder Servicing Agreement provides for a monthly fee paid to the Advisor at an annual rate of 0.10% of the average daily net assets of the Fund attributable to Investor Class shares. The shareholder service fees expensed by the Fund during fiscal year 2020 are included in the Statement of Operations.
The Fund has adopted a plan pursuant to Rule 12b-1 under the Investment Company Act of 1940, as amended, that authorizes payments in connection with the distribution of the Fund’s shares at an annual rate of up to 0.25% of the Fund’s average daily net assets attributable to Investor Class shares. Even though the authorized rate is up to 0.25%, the Fund is currently only using up to 0.15% of its average daily net assets attributable to Investor Class shares for such purpose. Amounts paid under the plan may be spent on any activities or expenses primarily intended to result in the sale of shares, including, but not limited to, advertising, shareholder account servicing, printing and mailing of prospectuses to other than current shareholders, printing and mailing of sales literature, and compensation for sales and marketing activities or to financial institutions and others, such as dealers and distributors. The distribution fees expensed by the Fund during fiscal year 2020 are included in the Statement of Operations.
| NOTES TO THE FINANCIAL STATEMENTS |
The Fund has entered into agreements with various brokers, dealers, and financial intermediaries in connection with the sale of shares of the Fund. The agreements provide for periodic payments of sub-transfer agent expenses by the Fund to the brokers, dealers, and financial intermediaries for providing certain shareholder maintenance services. These shareholder services include the pre-processing and quality control of new accounts, shareholder correspondence, answering customer inquiries regarding account status, and facilitating shareholder telephone transactions. The sub-transfer agent fees expensed by the Fund during fiscal year 2020 are included in the Statement of Operations.
U.S. Bancorp Fund Services, LLC, d/b/a U.S. Bank Global Fund Services (“Fund Services”) provides the Fund with administrative, accounting, and transfer agent services. As administrator, Fund Services is responsible for activities such as (i) preparing various federal and state regulatory filings, reports, and returns for the Fund, (ii) preparing reports and materials to be supplied to the Board, (iii) monitoring the activities of the Fund’s custodian, transfer agent, and accountants, and (iv) coordinating the preparation and payment of the Fund’s expenses and reviewing the Fund’s expense accruals. U.S. Bank N.A., an affiliate of Fund Services, serves as the Fund’s custodian. The servicing agreements between the Trust and Fund Services and U.S. Bank N.A. contain a fee schedule that is inclusive of administrative, accounting, custody, and transfer agent fees. The administrative, accounting, custody, and transfer agent fees expensed by the Fund during fiscal year 2020 are included in the Statement of Operations.
Quasar Distributors, LLC (“Quasar”) acts as the Fund’s principal underwriter in a continuous public offering of the Fund’s shares. Quasar was an affiliate of Fund Services and U.S. Bank N.A. through March 30, 2020. Effective March 31, 2020, Foreside Financial Group, LLC (“Foreside”) acquired Quasar from Fund Services. As a result of the acquisition, Quasar became a wholly owned broker-dealer subsidiary of Foreside and is no longer affiliated with Fund Services or U.S. Bank N.A. The Board approved a new Distribution Agreement to enable Quasar to continue serving as the Fund’s distributor.
The officers of the Fund are affiliated with the Advisor. With the exception of the Chief Compliance Officer and the Senior Compliance Officer, such officers receive no compensation from the Fund for serving in their respective roles. The Fund, along with the other Hennessy Funds, makes reimbursement payments on an equal basis to the Advisor for a portion of the salary and benefits associated with the office of the Chief Compliance Officer and for all of the salary and benefits associated with the office of the Senior Compliance Officer. The compliance fees expensed by the Fund during fiscal year 2020 are included in the Statement of Operations.
6). GUARANTEES AND INDEMNIFICATIONS
Under the Hennessy Funds’ organizational documents, their officers and trustees are indemnified by the Hennessy Funds against certain liabilities arising out of the performance of their duties to the Hennessy Funds. Additionally, in the normal course of business, the Hennessy Funds enter into contracts with service providers that contain general indemnification clauses. The Fund’s maximum exposure under these arrangements is unknown as this would involve future claims that may be made against the Fund that have not yet occurred. Currently, the Fund expects the risk of loss to be remote.
7). LINE OF CREDIT
The Fund has an uncommitted line of credit with the other Hennessy Funds in the amount of the lesser of (i) $100,000,000 or (ii) 33.33% of each Hennessy Fund’s net assets, or 30% for the Hennessy Gas Utility Fund and 10% for the Hennessy Balanced Fund, intended to provide short-term financing, if necessary, subject to certain
| HENNESSY FUNDS | 1-800-966-4354 | |
restrictions, in connection with shareholder redemptions. The credit facility is with the Hennessy Funds’ custodian bank, U.S. Bank N.A. Borrowings under this arrangement bear interest at the bank’s prime rate and are secured by all of the Fund’s assets (as to its own borrowings only). During fiscal year 2020, the Fund had an outstanding average daily balance and a weighted average interest rate of $21,710 and 3.25%, respectively. The interest expensed by the Fund during fiscal year 2020 is included in the Statement of Operations. The maximum amount outstanding for the Fund during fiscal year 2020 was $2,375,000. As of October 31, 2020, the Fund did not have any borrowings outstanding under the line of credit.
8). FEDERAL TAX INFORMATION
As of October 31, 2020, the components of accumulated earnings (losses) for income tax purposes were as follows:
| | | | Investments | |
| | Cost of investments for tax purposes | | $ | 37,074,652 | |
| | Gross tax unrealized appreciation | | $ | 10,484,842 | |
| | Gross tax unrealized depreciation | | | (3,835,619 | ) |
| | Net tax unrealized appreciation/(depreciation) | | $ | 6,649,223 | |
| | Undistributed ordinary income | | $ | — | |
| | Undistributed long-term capital gains | | | — | |
| | Total distributable earnings | | $ | — | |
| | Other accumulated gain/(loss) | | $ | (1,011,813 | ) |
| | Total accumulated gain/(loss) | | $ | 5,637,410 | |
The difference between book-basis unrealized appreciation/depreciation and tax-basis unrealized appreciation/depreciation (as shown above) is attributable primarily to wash sales.
As of October 31, 2020, the Fund had capital loss carryforwards as follows:
| | $914,702 | Unlimited short-term |
As of October 31, 2020, the Fund deferred, on a tax basis, a late-year ordinary loss of $97,112. Late-year ordinary losses are net ordinary losses incurred after December 31, 2019, but within the taxable year, that are deemed to arise on the first day of the Fund’s next taxable year.
During fiscal years 2020 and 2019, the tax character of distributions paid by the Fund was as follows:
| | | | Year Ended | | | Year Ended | |
| | | | October 31, 2020 | | | October 31, 2019 | |
| | Ordinary income(1) | | $ | — | | | $ | — | |
| | Long-term capital gain | | | — | | | | 1,232,913 | |
| | Total distributions | | $ | — | | | $ | 1,232,913 | |
| | (1) Ordinary income includes short-term capital gains. |
9). COVID-19 PANDEMIC
The COVID-19 pandemic has adversely impacted global commercial activity and contributed to significant volatility in global equity and debt markets. The pandemic has resulted in quarantines, stay-at-home orders, travel prohibitions, and closures, disrupting supply chains and economic activity. The duration of the pandemic’s effects remain uncertain and difficult to assess. The effects of the pandemic may adversely impact the Fund’s performance and its ability to achieve its investment objective.
| NOTES TO THE FINANCIAL STATEMENTS |
10). LIBOR TRANSITION
The Fund invests in securities of financial institutions that may be involved in financings based on, among other floating rates, the London Interbank Offered Rate (“LIBOR”). LIBOR is the offered rate for short-term Eurodollar deposits between major international banks. On July 27, 2017, the UK Financial Conduct Authority, which regulates LIBOR, announced that it would no longer persuade or compel banks to submit rates for the calculation of LIBOR after 2021, meaning that LIBOR cannot continue on its current basis and will not be guaranteed after 2021. Regulators and industry working groups have suggested alternative reference rates, but global consensus is lacking, and the process for amending existing contracts or instruments to transition away from LIBOR remains unclear. The transition away from LIBOR may lead to increased volatility and illiquidity in markets tied to LIBOR, reduce the value of LIBOR-related instruments, and reduce the effectiveness of hedging strategies, which could adversely affect the Fund’s performance. Additionally, any alternative reference rate may be an ineffective substitute, resulting in prolonged adverse market conditions for the Fund’s investments.
11). EVENTS SUBSEQUENT TO YEAR END
Management has evaluated the Fund’s related events and transactions that occurred subsequent to October 31, 2020, through the date of issuance of the Fund’s financial statements. Management has determined that there were no subsequent events requiring recognition or disclosure in the financial statements.
| HENNESSY FUNDS | 1-800-966-4354 | |
Report of Independent Registered Public
Accounting Firm
To the Board of Trustees of Hennessy Funds Trust
and the shareholders of the Hennessy Large Cap Financial Fund
Novato, CA
Opinion on the Financial Statements
We have audited the accompanying statement of assets and liabilities of the Hennessy Large Cap Financial Fund (the “Fund”), a series of Hennessy Funds Trust, including the schedule of investments, as of October 31, 2020, the related statement of operations for the year then ended, the statements of changes in net assets for each of the two years in the period then ended, financial highlights for each of the five years in the period then ended, and the related notes (collectively referred to as the “financial statements”). In our opinion, the financial statements present fairly, in all material respects, the financial position of the Fund as of October 31, 2020, the results of its operations for the year then ended, the changes in its net assets for each of the two years in the period then ended, and the financial highlights for each of the five years in the period then ended, in conformity with accounting principles generally accepted in the United States of America.
Basis for Opinion
These financial statements are the responsibility of the Fund’s management. Our responsibility is to express an opinion on the Fund’s financial statements based on our audits. We are a public accounting firm registered with the Public Company Accounting Oversight Board (United States) (“PCAOB”) and are required to be independent with respect to the Fund in accordance with the U.S. federal securities laws and the applicable rules and regulations of the Securities and Exchange Commission and the PCAOB. We have served as the auditor of one or more of the funds in the Trust since 2002.
We conducted our audits in accordance with the standards of the PCAOB. Those standards require that we plan and perform the audit to obtain reasonable assurance about whether the financial statements are free of material misstatement, whether due to error or fraud. The Fund is not required to have, nor were we engaged to perform, an audit of its internal control over financial reporting. As part of our audits we are required to obtain an understanding of internal control over financial reporting, but not for the purpose of expressing an opinion on the effectiveness of the Fund’s internal control over financial reporting. Accordingly, we express no such opinion.
Our audits included performing procedures to assess the risks of material misstatement of the financial statements, whether due to error or fraud, and performing procedures that respond to those risks. Such procedures included examining, on a test basis, evidence regarding the amounts and disclosures in the financial statements. Our audits also included evaluating the accounting principles used and significant estimates made by management, as well as evaluating the overall presentation of the financial statements. Our procedures included confirmation of securities owned as of October 31, 2020 by correspondence with the custodian and brokers; when replies were not received from brokers, we performed other auditing procedures. We believe that our audits provide a reasonable basis for our opinion.
| | |
| | TAIT, WELLER & BAKER LLP |
Philadelphia, Pennsylvania
December 23, 2020
| REPORT OF INDEPENDENT REGISTERED PUBLIC ACCOUNTING FIRM/TRUSTEES AND OFFICERS |
Trustees and Officers of the Fund (Unaudited)
The business and affairs of the Funds are managed under the direction of the Board of Trustees of the Trust, and the Board of Trustees elects the officers of the Trust. From time to time, the Board of Trustees also has appointed advisers to the Board of Trustees (“Advisers”) with the intention of having qualified individuals serve in an advisory capacity to garner experience in the mutual fund and asset management industry and be considered as potential Trustees in the future. There are currently three Advisers: Brian Alexander, Doug Franklin, and Claire Knoles. As Advisers, Mr. Alexander, Mr. Franklin, and Ms. Knoles attend meetings of the Board of Trustees and act as non-voting participants. Information pertaining to the Trustees, Advisers, and the officers of the Trust is set forth below. The Trustees and officers serve until their successors are duly elected and qualified or until their earlier death, resignation, or removal. Each Trustee oversees all 16 Hennessy Funds. Unless otherwise indicated, the address of all persons listed below is 7250 Redwood Boulevard, Suite 200, Novato, CA 94945. The Fund’s Statement of Additional Information includes more information about the persons listed below and is available without charge by calling 1-800-966-4354 or by visiting www.hennessyfunds.com.
| | | | Other |
| | | | Directorships |
| | | | Held Outside |
| Name, Age, | | | of Fund |
| and Position Held | Start Date | Principal Occupation(s) | Complex During |
with the Trust
| of Service
| During Past Five Years
| Past Five Years
|
| Disinterested Trustees and Advisers | | | |
| | | | |
| J. Dennis DeSousa | January 1996 | Mr. DeSousa is a real estate investor. | None. |
| 84 | | | |
| Trustee | | | |
| | | | |
| Robert T. Doyle | January 1996 | Mr. Doyle has been the Sheriff of | None. |
| 73 | | Marin County, California since 1996. | |
| Trustee | | | |
| | | | |
| Gerald P. Richardson | May 2004 | Mr. Richardson is an independent | None. |
| 75 | | consultant in the securities industry. | |
| Trustee | | | |
| | | | |
| Brian Alexander | March 2015 | Mr. Alexander has worked for the | None. |
| 39 | | Sutter Health organization since | |
| Adviser to the Board | | 2011 in various positions. He has | |
| | | served as the Chief Executive Officer | |
| | | of the Sutter Roseville Medical | |
| | | Center since 2018. From 2016 through | |
| | | 2018, he served as the Vice President | |
| | | of Strategy for the Sutter Health Valley | |
| | | Area, which includes 11 hospitals, | |
| | | 13 ambulatory surgery centers, | |
| | | 16,000 employees, and 1,900 physicians. | |
| | | From 2013 through 2016, Mr. Alexander | |
| | | served as Sutter Novato Community | |
| | | Hospital’s Chief Administrative Officer. | |
| HENNESSY FUNDS | 1-800-966-4354 | |
| | | | Other |
| | | | Directorships |
| | | | Held Outside |
| Name, Age, | | | of Fund |
| and Position Held | Start Date | Principal Occupation(s) | Complex During |
with the Trust
| of Service
| During Past Five Years
| Past Five Years
|
| Doug Franklin | March 2016 | Mr. Franklin is a retired insurance | None. |
| 56 | | industry executive. From 1987 | |
| Adviser to the Board | | through 2015, he was employed | |
| | | by the Allianz-Fireman’s Fund | |
| | | Insurance Company in various | |
| | | positions, including as its Chief | |
| | | Actuary and Chief Risk Officer. | |
| | | | |
| Claire Knoles | December 2015 | Ms. Knoles is a founder of Kiosk and | None. |
| 46 | | has served as its Chief Operating | |
| Adviser to the Board | | Officer since 2004. Kiosk is a full- | |
| | | service marketing agency with | |
| | | offices in the San Francisco Bay | |
| | | Area, Toronto, and Liverpool, UK. | |
| | | | |
Interested Trustee(1) | | | |
| | | | |
| Neil J. Hennessy | January 1996 as | Mr. Hennessy has been employed | Hennessy |
| 64 | a Trustee and | by Hennessy Advisors, Inc. since | Advisors, Inc. |
| Trustee, Chairman of | June 2008 as | 1989 and currently serves as its | |
| the Board, Chief | an officer | Chairman and Chief Executive Officer. | |
| Investment Officer, | | | |
| Portfolio Manager, | | | |
| and President | | | |
| Name, Age, | | |
| and Position Held | Start Date | Principal Occupation(s) |
with the Trust
| of Service
| During Past Five Years
|
| Officers | | |
| | | |
| Teresa M. Nilsen | January 1996 | Ms. Nilsen has been employed by Hennessy Advisors, Inc. |
| 54 | | since 1989 and currently serves as its President, Chief Operating |
| Executive Vice President | | Officer, and Secretary. |
| and Treasurer | | |
| | | |
| Daniel B. Steadman | March 2000 | Mr. Steadman has been employed by Hennessy Advisors, Inc. |
| 64 | | since 2000 and currently serves as its Executive Vice President. |
| Executive Vice President | | |
| and Secretary | | |
| | | |
| Brian Carlson | December 2013 | Mr. Carlson has been employed by Hennessy Advisors, Inc. |
| 48 | | since December 2013 and currently serves as its Chief |
| Senior Vice President | | Compliance Officer and Senior Vice President. |
| and Head of Distribution | | |
| | | |
Jennifer Cheskiewicz(2) | June 2013 | Ms. Cheskiewicz has been employed by Hennessy Advisors, Inc. |
| 43 | | as its General Counsel since June 2013. |
| Senior Vice President and | | |
| Chief Compliance Officer | | |
| TRUSTEES AND OFFICERS OF THE FUND |
| Name, Age, | | |
| and Position Held | Start Date | Principal Occupation(s) |
with the Trust
| of Service
| During Past Five Years
|
David Ellison(3) | October 2012 | Mr. Ellison has been employed by Hennessy Advisors, Inc. since |
| 62 | | October 2012. He has served as a Portfolio Manager of the |
| Senior Vice President | | Hennessy Large Cap Financial Fund and the Hennessy Small |
| and Portfolio Manager | | Cap Financial Fund since their inception. Mr. Ellison also served |
| | | as a Portfolio Manager of the Hennessy Technology Fund from |
| | | its inception until February 2017. Mr. Ellison served as Director, |
| | | CIO, and President of FBR Fund Advisers, Inc. from December |
| | | 1999 to October 2012. |
| | | |
Ryan Kelley(4) | March 2013 | Mr. Kelley has been employed by Hennessy Advisors, Inc. since |
| 48 | | October 2012. He has served as a Portfolio Manager of the |
| Senior Vice President | | Hennessy Gas Utility Fund, the Hennessy Large Cap Financial |
| and Portfolio Manager | | Fund, and the Hennessy Small Cap Financial Fund since |
| | | October 2014. He served as Co-Portfolio Manager of these |
| | | same funds from March 2013 through September 2014 and as |
| | | a Portfolio Analyst for the Hennessy Funds from October 2012 |
| | | through February 2013. Mr. Kelley has also served as a Portfolio |
| | | Manager of the Hennessy Cornerstone Growth Fund, the |
| | | Hennessy Cornerstone Mid Cap 30 Fund, the Hennessy |
| | | Cornerstone Large Growth Fund, and the Hennessy |
| | | Cornerstone Value Fund since February 2017 and as a Portfolio |
| | | Manager of the Hennessy Total Return Fund, the Hennessy |
| | | Balanced Fund, and the Hennessy Technology Fund since May |
| | | 2018. He served as Co-Portfolio Manager of the Hennessy |
| | | Technology Fund from February 2017 until May 2018. Mr. Kelley |
| | | served as Portfolio Manager of FBR Fund Advisers, Inc. from |
| | | January 2008 to October 2012. |
| | | |
| Tania Kelley | October 2003 | Ms. Kelley has been employed by Hennessy Advisors, Inc. since |
| 55 | | October 2003. |
| Senior Vice President | | |
| and Head of Marketing | | |
| | | |
L. Joshua Wein(4) | September 2018 | Mr. Wein has been employed by Hennessy Advisors, Inc. since |
| 47 | | 2018. He has served as Co-Portfolio Manager of the Hennessy |
| Vice President and | | Cornerstone Growth Fund, the Hennessy Cornerstone |
| Co-Portfolio Manager | | Mid Cap 30 Fund, the Hennessy Cornerstone Large Growth |
| | | Fund, the Hennessy Cornerstone Value Fund, Hennessy Total |
| | | Return Fund, the Hennessy Balanced Fund, the Hennessy Gas |
| | | Utility Fund, and the Hennessy Technology Fund since February |
| | | 2019. He served as a Senior Analyst of these same funds from |
| | | September 2018 through February 2019. Mr. Wein served as |
| | | Director of Alternative Investments and Co-Portfolio Manager |
| | | at Sterling Capital Management from 2008 to 2018. |
_______________
(1) | Mr. Hennessy is considered an “interested person,” as defined in the Investment Company Act of 1940, as amended, because he is an officer of the Trust. |
(2) | The address of this officer is 4800 Bee Caves Road, Suite 100, Austin, TX 78746. |
(3) | The address of this officer is 101 Federal Street, Suite 1615B, Boston, MA 02110. |
(4) | The address of this officer is 1340 Environ Way, Chapel Hill, NC 27517. |
| HENNESSY FUNDS | 1-800-966-4354 | |
Expense Example (Unaudited)
October 31, 2020
As a shareholder of the Fund, you incur ongoing costs, including management fees, service fees, and other Fund expenses. This Example is intended to help you understand your ongoing costs (in dollars) of investing in the Fund and to compare these costs with the ongoing costs of investing in other mutual funds. The Example is based on an investment of $1,000 invested at the beginning of the period and held for the entire period from May 1, 2020, through October 31, 2020.
Actual Expenses
The first line of the table below under the “Investor Class” and “Institutional Class” headings provides information about actual account values and actual expenses. You may use the information in this line, together with the amount you invested, to estimate the expenses that you paid over the period. Simply divide your account value by $1,000 (for example, an $8,600 account value divided by $1,000 = 8.6), then multiply the result by the number in the first line below the “Investor Class” or “Institutional Class” heading under the column entitled “Expenses Paid During Period” to estimate the expenses you paid on your account during this period. Although the Fund charges no sales loads or transaction fees, you will be assessed fees for outgoing wire transfers, returned checks, and stop payment orders at prevailing rates charged by U.S. Bank Global Fund Services, the Fund’s transfer agent. If you request that a redemption be made by wire transfer, the Fund’s transfer agent charges a $15 fee. IRAs are charged a $15 annual maintenance fee (up to $30 maximum per shareholder for shareholders with multiple IRAs). The example below includes, but is not limited to, management fees, shareholder servicing fees, accounting, custody, and transfer agent fees. However, the example below does not include portfolio trading commissions and related expenses.
Hypothetical Example for Comparison Purposes
The second line of the table below under the “Investor Class” and “Institutional Class” headings provides information about hypothetical account values and hypothetical expenses based on the Fund’s actual expense ratios and an assumed rate of return of 5% per year before expenses, which is not the Fund’s actual return. The hypothetical account values and expenses may not be used to estimate the actual ending account balance or expenses you paid for the period. You may use this information to compare the ongoing costs of investing in the Fund and other funds. To do so, compare this 5% hypothetical example with the 5% hypothetical examples that appear in the shareholder reports of the other funds. Please note that the expenses shown in the table are meant to highlight your ongoing costs only. Therefore, the second line of the table under the “Investor Class” and “Institutional Class” headings is useful in comparing ongoing costs only and will not help you determine the relative total costs of owning different funds.
| | | | Expenses Paid |
| | Beginning | Ending | During Period(1) |
| | Account Value | Account Value | May 1, 2020 – |
| | May 1, 2020
| October 31, 2020 | October 31, 2020 |
| Investor Class | | | |
| Actual | $1,000.00 | $1,093.50 | $9.21 |
| Hypothetical (5% return before expenses) | $1,000.00 | $1,016.34 | $8.87 |
| | | | |
| Institutional Class | | | |
| Actual | $1,000.00 | $1,095.20 | $7.90 |
| Hypothetical (5% return before expenses) | $1,000.00 | $1,017.60 | $7.61 |
(1) | Expenses are equal to the Fund’s annualized expense ratio of 1.75% for Investor Class shares or 1.50% for Institutional Class shares, as applicable, multiplied by the average account value over the period, multiplied by 184/366 days (to reflect the half-year period). |
| HENNESSY FUNDS | 1-800-966-4354 | |
How to Obtain a Copy of the Fund’s Proxy
Voting Policy and Proxy Voting Records
A description of the policies and procedures the Fund uses to determine how to vote proxies relating to portfolio securities is available without charge (1) by calling 1-800-966-4354, (2) on the Hennessy Funds’ website at www.hennessyfunds.com/proxy-voting/voting-policy, or (3) on the U.S. Securities and Exchange Commission’s (the “SEC”) website at www.sec.gov. The Fund’s proxy voting record is available without charge on both the Hennessy Funds’ website at www.hennessyfunds.com/proxy-voting/voting-record and the SEC’s website at www.sec.gov no later than August 31 for the prior 12 months ending June 30.
Availability of Quarterly Portfolio Schedule
The Fund files a complete schedule of portfolio holdings with the SEC for the first and third quarters of each fiscal year as an exhibit to its reports on Form N-PORT. The Fund’s Form N-PORT reports are available on the SEC’s website at www.sec.gov or on request by calling 1-800-966-4354.
Important Notice Regarding Delivery
of Shareholder Documents
To help keep the Fund’s costs as low as possible, we generally deliver a single copy of shareholder reports, proxy statements, and prospectuses to shareholders who share an address and have the same last name. This process does not apply to account statements. You may request an individual copy of a shareholder document at any time. If you would like to receive separate mailings of shareholder documents, please call U.S. Bank Global Fund Services at 1-800-261-6950 or 1-414-765-4124, and individual delivery will begin within 30 days of your request. If your account is held through a financial institution or other intermediary, please contact such intermediary directly to request individual delivery.
Electronic Delivery
The Fund offers shareholders the option to receive account statements, prospectuses, tax forms, and shareholder reports online. To sign up for eDelivery, please visit www.hennessyfunds.com/account. You may change your delivery preference at any time by visiting our website or calling U.S. Bank Global Fund Services at 1-800-261-6950 or 1-414-765-4124.
Liquidity Risk Management Program
In accordance with Rule 22e-4 under the Investment Company Act of 1940, as amended (the “Liquidity Rule”), we have adopted and implemented a liquidity risk management program (the “Liquidity Program”). The purpose of the Liquidity Program is to assess and manage the Fund’s liquidity risk, which is the risk that the Fund would not be able to meet requests to redeem Fund shares without significant dilution of the remaining shareholders’ interests in the Fund. The Board of Trustees of the Fund (the “Board”) designated a committee comprising representatives of Hennessy Advisors, Inc., the investment adviser to the Fund, as the administrator of the Liquidity Program (the “Program Administrator”).
| PROXY VOTING — PRIVACY POLICY |
The Program Administrator provided a written report regarding the Liquidity Program to the Board in advance of its meeting on June 3, 2020. The report covered the period from June 1, 2019, through May 31, 2020. The report addressed the operation of the Liquidity Program, assessed the adequacy and effectiveness of its implementation, and described any material changes to the Liquidity Program during the review period. The Trust’s chief compliance officer presented the report to the Board at the meeting and provided additional information regarding the Liquidity Program. The Board reviewed the Liquidity Program and considered, among other items, the following:
| | 1. | The Program Administrator reviewed daily historical net redemption activity during the review period and during prior periods with higher-than-average redemption activity and concluded that the Fund has historically been able to meet requests to redeem Fund shares without significant dilution to the Fund’s remaining shareholders, and the Program Administrator expects the Fund to be able to continue to do so in the future during both normal and reasonably foreseeable stressed conditions. |
| | | |
| | 2. | The Fund primarily holds assets that are highly liquid investments and is therefore not required to establish a highly liquid investment minimum for the Fund or adopt policies and procedures for responding to a highly liquid investment minimum shortfall. |
| | | |
| | 3. | The Program Administrator did not make any material changes to the Liquidity Program during the review period and was not recommending any changes to the Liquidity Program or the model inputs used to determine the liquidity classification of each security held by the Fund. |
| | | |
| | 4. | The Program Administrator concluded that the Liquidity Program was reasonably designed to assess and manage the Fund’s liquidity risk, complies with the requirements of the Liquidity Rule, and was effectively implemented, having operated as intended during the review period. |
Privacy Policy
We collect the following personal information about you:
| | 1. | Information we receive from you in applications or other forms, correspondence, or conversations, including, but not limited to, your name, address, phone number, social security number, assets, income, and date of birth; |
| | | |
| | 2. | Information about your transactions with us, our affiliates, or others, including, but not limited to, your account number and balance, payments history, parties to transactions, cost basis information, and other financial information; and |
| | | |
| | 3. | Other personal information we collect from various sources, even if you have not entered into a prior transaction with us, including the following: |
| | • | Name, alias, address, unique personal identifier, online identifier, IP address, email address, telephone number, account name, and other similar identifiers; |
| | | |
| | • | Age and marital status; |
| | | |
| | • | Commercial information, including records of products purchased; |
| | | |
| | • | Browsing history, search history, and information on interaction with our website; |
| | | |
| | • | Geolocation data; |
| | | |
| | • | Employment and employment history, educational history, financial information, and purchasing and consuming histories or tendencies; and |
| HENNESSY FUNDS | 1-800-966-4354 | |
| | • | Inferences drawn from the above-listed information to create a profile about your preferences, characteristics, predispositions, and behavior. |
We collect this information directly from you, indirectly in the course of providing services to you, directly and indirectly from your activity on our website, from broker dealers, marketing agencies, and other third parties that interact with us in connection with the services we perform and products we offer, and from anonymized and aggregated consumer information.
We use this information to fulfill the reason you provided the information to us, to provide you with other relevant products that you request from us, to provide you with information about products that may interest you, to improve our website or present our website’s contents to you, and as otherwise described to you when collecting your personal information.
We do not disclose any personal information to unaffiliated third parties, except as permitted by law. We may disclose your personal information to our affiliates, vendors, and service providers for a business purpose. For example, we are permitted by law to disclose all of the information we collect, as described above, to our transfer agent to process your transactions. When disclosing your personal information to third parties, we enter into a contract with each third party describing the purpose of such disclosure and requiring that such personal information be kept confidential and not used for any purpose except to perform the services contracted or respond to regulatory or law enforcement requests.
Furthermore, we restrict access to your personal information to those persons who require such information to provide products or services to you. As a result, we do not provide a means for opting out of our limited sharing of your information. We maintain physical, electronic, and procedural safeguards that comply with federal standards to guard your personal information.
If you hold shares of the Funds through a financial intermediary, including, but not limited to, a broker-dealer, bank, or trust company, the privacy policy of your financial intermediary governs how your personal information is shared with unaffiliated third parties.
Supplemental Privacy Notice for Residents of California
The California Consumer Privacy Act of 2018 (the “CCPA”) provides you, as a California resident, with certain additional rights relating to your personal information.
Under the CCPA, you have the right to request that we disclose to you the categories of personal information we have collected about you over the past 12 months, the categories of sources of such information, our business purpose for collecting the information, the categories of third parties, if any, with whom we shared the information, and the specific information we have collected about you. You also have the right to request that we delete any of your personal information, and, unless an exception applies, we will delete such information upon receiving and confirming your request. To make a request, call us at 1-800-966-4354, email us at privacy@hennessyfunds.com, or go to www.hennessyfunds.com/contact. We will not discriminate against you for exercising your rights under the CCPA. Further, we will not collect additional categories of your personal information or use the personal information we collected for materially different, unrelated, or incompatible purposes without providing you notice.
(This Page Intentionally Left Blank.)
For information, questions, or assistance, please call
The Hennessy Funds
1-800-966-4354 or 1-415-899-1555
INVESTMENT ADVISOR
Hennessy Advisors, Inc.
7250 Redwood Boulevard, Suite 200
Novato, California 94945
ADMINISTRATOR,
TRANSFER AGENT,
DIVIDEND PAYING AGENT, &
SHAREHOLDER SERVICING AGENT
U.S. Bancorp Fund Services, LLC
d/b/a U.S. Bank Global Fund Services
P.O. Box 701
Milwaukee, Wisconsin 53201-0701
CUSTODIAN
U.S. Bank N.A.
Custody Operations
1555 North River Center Drive, Suite 302
Milwaukee, Wisconsin 53212
TRUSTEES
Neil J. Hennessy
Robert T. Doyle
J. Dennis DeSousa
Gerald P. Richardson
COUNSEL
Foley & Lardner LLP
777 East Wisconsin Avenue
Milwaukee, Wisconsin 53202-5306
INDEPENDENT REGISTERED
PUBLIC ACCOUNTING FIRM
Tait, Weller & Baker LLP
Two Liberty Place
50 South 16th Street, Suite 2900
Philadelphia, Pennsylvania 19102-2529
DISTRIBUTOR
Quasar Distributors, LLC
111 East Kilbourn Avenue, Suite 2200
Milwaukee, Wisconsin 53202
www.hennessyfunds.com | 1-800-966-4354
This report has been prepared for shareholders and may be distributed to
others only if preceded or accompanied by a current prospectus.
ANNUAL REPORT
OCTOBER 31, 2020
HENNESSY SMALL CAP FINANCIAL FUND
Investor Class HSFNX
Institutional Class HISFX
IMPORTANT NOTICE REGARDING ELECTRONIC DELIVERY OF SHAREHOLDER REPORTS
Beginning on January 1, 2021, as permitted by regulations adopted by the Securities and Exchange Commission, paper copies of the annual and semi-annual reports will no longer be sent by mail unless you specifically request paper copies from the Hennessy Funds or from your financial intermediary. Instead, the reports will be made available on a website, and you will be notified by mail each time a report is posted and provided with a website link to access the report.
If you have already elected to receive shareholder reports electronically, you will not be affected by this change and you need not take any action. You may elect to receive shareholder reports and other communications from the Hennessy Funds electronically by visiting www.hennessyfunds.com/account or by calling U.S. Bank Global Fund Services at 1-800-261-6950. If you own shares in a Fund through a financial intermediary, please contact your financial intermediary to make this election.
You may elect to receive paper copies of all future reports free of charge by calling U.S. Bank Global Fund Services at 1-800-261-6950 or, if you own your shares through a financial intermediary, by contacting your financial intermediary. Your election to receive paper copies of reports will apply to all Funds in the Hennessy Funds family.
www.hennessyfunds.com | 1-800-966-4354
(This Page Intentionally Left Blank.)
Contents
| Letter to Shareholders | | 2 |
| Performance Overview | | 4 |
| Financial Statements | | |
| Schedule of Investments | | 7 |
| Statement of Assets and Liabilities | | 10 |
| Statement of Operations | | 11 |
| Statements of Changes in Net Assets | | 13 |
| Financial Highlights | | 14 |
| Notes to the Financial Statements | | 18 |
| Report of Independent Registered Public Accounting Firm | | 26 |
| Trustees and Officers of the Fund | | 27 |
| Expense Example | | 30 |
| Proxy Voting Policy and Proxy Voting Records | | 32 |
| Availability of Quarterly Portfolio Schedule | | 32 |
| Federal Tax Distribution Information | | 32 |
| Important Notice Regarding Delivery of Shareholder Documents | | 32 |
| Electronic Delivery | | 32 |
| Liquidity Risk Management Program | | 33 |
| Privacy Policy | | 33 |
| HENNESSY FUNDS | 1-800-966-4354 | |
December 2020
Dear Hennessy Funds Shareholder:
As a new year and new decade dawned in January, no one could have imagined that the world would quickly plunge into one of the worst health crises in history. Throughout this pandemic, our thoughts have remained with those most deeply affected by COVID-19, and we thank our frontline healthcare and essential workers. At Hennessy Funds, we adapted quickly to the impact of COVID-19 to maintain business continuity. We focused on our employees and on you, the shareholders of the Hennessy Funds, and I am pleased that we have been able to navigate successfully during this unprecedented time.
The year was defined by a global pandemic and the ensuing economic shutdowns and by a highly charged presidential election that caused tremendous volatility. Yet the stock market has continued to show its resiliency and strength, as the major indices hit new all-time highs in November and again in December. For the 12 months ended October 31, 2020, U.S. equities posted positive performance, with the S&P 500® Index returning 9.71% and the Dow Jones Industrial Average returning 0.34% for the period. There were extreme differences in how various sectors performed during the period. For instance, the technology-focused NASDAQ Composite Index performed strongly, returning 32.84%, whereas the Energy sector (as represented by the S&P 500® Energy Sector Index) struggled with a loss of -46.43%. The Financials sector also performed relatively poorly during the period, with the Russell 1000® Index Financials losing -8.04% and the Russell 2000® Index Financials losing -17.87%. In addition, large cap stocks significantly outperformed small caps, and growth stocks reigned over value stocks during the period. Moreover, approximately half of the NASDAQ’s return for the period was comprised of just three behemoth technology stocks – Apple, Microsoft, and Amazon. Therefore, while the overall U.S. equities market improved, mutual fund returns varied drastically due to the disparate performance of specific sectors, differently sized companies, and different types of companies.
Optimism about the approval and distribution of effective COVID-19 vaccines appears to be buoying investor confidence. Low interest rates, and the expectation that they will remain low for the foreseeable future, have also provided a tailwind to equity prices. In my opinion, stocks are trading at reasonable valuations given this low interest rate environment, with the Dow Jones Industrial Average trading at 20.1x estimated earnings for 2021 and the S&P 500® Index trading at 21.6x estimated earnings for 2021. The U.S. economy looks to be on the road to recovery and is experiencing moderate inflation, and our banking industry appears healthy. The unemployment rate is dropping, albeit slowly, and I expect it to continue to improve once businesses reopen. There are high levels of cash on corporate balance sheets, which could support rising dividends and stock buybacks.
I believe our corporate business leaders will continue to adapt and find ways to drive growth and value for their shareholders, but I also feel that the uncertainty created by the continued health crisis and the stalemate over fiscal relief will lead to additional bouts of market volatility. I remain confident, however, that the markets can and will thrive in the long run.
Thank you for your continued trust and investment in the Hennessy Funds. We believe that there continue to be strong opportunities throughout many segments of the market, and we are focused on managing our high-conviction portfolios for the long-term
benefit of our shareholders. Should you have any questions or would like to speak with us directly, please reach out and call us at (800) 966-4354.
Best regards,
Neil J. Hennessy
President and Chief Investment Officer
Past performance does not guarantee future results.
Mutual fund investing involves risk. Principal loss is possible.
The Dow Jones Industrial Average and S&P 500® Index are commonly used to measure the performance of U.S. stocks. The NASDAQ Composite Index comprises all common stocks listed on The NASDAQ Stock Market and is commonly used to measure the performance of technology-related stocks. The S&P 500® Energy Sector Index is comprised of companies included in the S&P 500® Index that are classified in the Energy sector. The Russell 1000® Index Financials and Russell 2000® Index Financials are subsets of the Russell 1000® Index and Russell 2000® Index, respectively, that measure the performance of securities classified in the Financials sector of the large-cap and small-cap U.S. equity market, respectively. One cannot invest directly in an index. All returns are shown on a total return basis.
Forward price to earnings (PE) is a valuation measure calculated by dividing a company’s market price per share by its expected earnings per share over the following 12 months. PEs noted are sourced from Bloomberg as of December 9, 2020.
| HENNESSY FUNDS | 1-800-966-4354 | |
Performance Overview (Unaudited)
CHANGE IN VALUE OF $10,000 INVESTMENT
This graph illustrates the performance of an initial investment of $10,000 made in the Fund ten years ago and assumes the reinvestment of dividends.
AVERAGE ANNUAL TOTAL RETURN FOR PERIODS ENDED OCTOBER 31, 2020
| | One | Five | Ten |
| | Year
| Years
| Years
|
| Hennessy Small Cap Financial Fund – | | | |
| Investor Class (HSFNX) | -16.37% | 1.22% | 5.98% |
| Hennessy Small Cap Financial Fund – | | | |
| Institutional Class (HISFX) | -16.05% | 1.58% | 6.32% |
Russell 2000® Index Financials | -17.87% | 3.71% | 8.47% |
Russell 2000® Index | -0.14% | 7.27% | 9.64% |
Expense ratios: 1.59% (Investor Class); 1.24% (Institutional Class)
Performance data quoted represents past performance; past performance does not guarantee future results. The investment return and principal value of an investment will fluctuate so that an investor’s shares, when redeemed, may be worth more or less than their original cost. The performance table does not reflect the deduction of taxes that a shareholder would pay on Fund distributions or the redemption of Fund shares. Current performance of the Fund may be lower or higher than the performance quoted. Performance data current to the most recent month end may be obtained by visiting www.hennessyfunds.com. Performance for periods including or prior to October 26, 2012, is that of the FBR Small Cap Financial Fund.
The Russell 2000® Index Financials is a subset of the Russell 2000® Index that measures the performance of the securities classified in the financials sector of the small-cap U.S. equity market. The Russell 2000® Index comprises the smallest 2,000 companies in the Russell 3000® Index based on market capitalization, representing approximately 8% of the Russell 3000® Index in terms of total market capitalization. One cannot invest directly in an index. These indices are used herein for comparative purposes in accordance with Securities and Exchange Commission regulations.
Frank Russell Company (“Russell”) is the source and owner of the trademarks, service marks, and copyrights related to the Russell Indexes. Russell® is a trademark of Frank Russell Company. Neither Russell nor its licensors accept any liability for any errors or omissions in the Russell Indexes or Russell ratings or underlying data and no party may rely on any Russell Indexes or Russell ratings or underlying data contained in this communication.
No further distribution of Russell data is permitted without Russell’s express written consent. Russell does not promote, sponsor, or endorse the content of this communication.
The expense ratios presented are from the most recent prospectus. The expense ratios for the current reporting period are available in the Financial Highlights section of this report.
PERFORMANCE NARRATIVE
Portfolio Managers David H. Ellison and Ryan C. Kelley, CFA
Performance:
For the 12-month period ended October 31, 2020, the Investor Class of the Hennessy Small Cap Financial Fund returned -16.37%, outperforming the Russell 2000® Index Financials (the Fund’s primary benchmark), which returned -17.87%, but underperforming the Russell 2000® Index, which returned -0.14%, for the same period.
The Fund’s outperformance relative to its primary benchmark resulted predominantly from favorable stock selection within small and regional banks. Top contributors in the Fund included PennyMac Financial Services, Inc., CIT Group, Inc., and Wintrust Financial Corporation. Conversely, the largest detractors from performance were certain small and medium sized banks, specifically Meridian Bancorp, Inc., First BanCorp., and Berkshire Hills Bancorp, Inc. In general, small-cap financials performed poorly in 2020 compared to the broader stock market.
The Fund continues to hold all the companies mentioned.
Portfolio Strategy:
Generally, the Fund tilts its investments more heavily toward regional banks, thrifts, and, at times, mortgage finance companies. Within these preferred sub-industries, we seek companies that we believe have high-quality management teams, uncomplicated business models, strong balance sheets, and sustainable earnings growth opportunities. Moreover, we identify companies that we expect will do better than peers in challenging environments, which are characterized by low interest rates, slow loan growth, and potential for increased loan charge-offs. We are less interested in focusing solely on companies that appear to promise an increase in profitability when interest rates rise, loan demand increases, or product pricing becomes more favorable. We believe these industry dynamics are difficult to predict, and we prefer to focus on management teams that are working to remain competitive in the long term.
Investment Commentary:
We continue to believe that the outlook for small-cap financial companies is challenging, but that attractive long-term opportunities exist within the sector. In the past fiscal year, performance of small-cap financials has been disappointing. We attribute this to a challenging environment characterized by low interest rates, low loan demand, and potential for significant asset quality problems due to the COVID-19 pandemic. The macroeconomic environment in the United States is improving after a tumultuous 2020, but we believe that there are still many potential challenges in the months to come related to the COVID-19 pandemic, unemployment recovery, and potential asset quality issues. However, we are encouraged that banks have been building reserves aggressively and retaining historically high levels of capital in anticipation of potential loan charge-offs. Also, we believe that merger activity could increase in the coming years, which could be a positive contributor to Fund performance.
| HENNESSY FUNDS | 1-800-966-4354 | |
_______________
Opinions expressed are those of the Portfolio Managers as of the date written and are subject to change, are not guaranteed, and should not be considered investment advice or an indication of trading intent.
The Fund is non-diversified, meaning it may concentrate its assets in fewer individual holdings than a diversified fund, making it more exposed to individual stock volatility than a diversified fund. Investments are focused in the financial services industry; sector funds may be subject to a higher degree of market risk. The Fund invests in smaller companies, which may have more limited liquidity and greater volatility compared to larger companies. Please see the Fund’s prospectus for a more complete discussion of these and other risks.
References to specific securities should not be considered a recommendation to buy or sell any security. Fund holdings and sector allocations are subject to change. Please refer to the Schedule of Investments included in this report for additional portfolio information.
Earnings growth is not a measure of the Fund’s future performance.
| PERFORMANCE OVERVIEW/SCHEDULE OF INVESTMENTS |
Financial Statements
Schedule of Investments as of October 31, 2020 |
HENNESSY SMALL CAP FINANCIAL FUND
(% of Net Assets)
| TOP TEN HOLDINGS (EXCLUDING MONEY MARKET FUNDS) | % NET ASSETS |
| CIT Group, Inc. | 5.84% |
| Texas Capital Bancshares, Inc. | 5.49% |
| Synovus Financial Corp. | 5.35% |
| Alliance Data Systems Corp. | 5.11% |
| Hancock Whitney Corp. | 4.88% |
| Berkshire Hills Bancorp, Inc. | 4.77% |
| Wintrust Financial Corp. | 4.73% |
| Pacific Premier Bancorp, Inc. | 4.67% |
| Independent Bank Corp. | 4.37% |
| First BanCorp. | 4.21% |
Note: For presentation purposes, the Fund has grouped some of the industry categories. For purposes of categorizing securities for compliance with Section 8(b)(1) of the Investment Company Act of 1940, as amended, the Fund uses more specific industry classifications.
The Global Industry Classification Standard (GICS®) was developed by and is the exclusive property and a service mark of MSCI, Inc. and Standard & Poor’s Financial Services LLC. It has been licensed for use by the Hennessy Funds.
| HENNESSY FUNDS | 1-800-966-4354 | |
| COMMON STOCKS – 98.98% | | Number | | | | | | % of | |
| | | of Shares | | | Value | | | Net Assets | |
| Financials – 93.87% | | | | | | | | | |
| Associated Banc-Corp. | | | 90,000 | | | $ | 1,232,100 | | | | 1.88 | % |
| Atlantic Union Bankshares Corp. | | | 42,500 | | | | 1,074,825 | | | | 1.64 | % |
| Banc of California, Inc. | | | 75,000 | | | | 900,000 | | | | 1.37 | % |
| BankUnited, Inc. | | | 75,000 | | | | 1,893,750 | | | | 2.89 | % |
| Berkshire Hills Bancorp, Inc. | | | 240,000 | | | | 3,127,200 | | | | 4.77 | % |
| Brookline Bancorp, Inc. | | | 145,000 | | | | 1,389,100 | | | | 2.12 | % |
| Cadence BanCorp | | | 215,000 | | | | 2,412,300 | | | | 3.68 | % |
| CIT Group, Inc. | | | 130,000 | | | | 3,828,500 | | | | 5.84 | % |
| ConnectOne Bancorp, Inc. | | | 100,000 | | | | 1,543,000 | | | | 2.35 | % |
| First BanCorp. (a) | | | 425,000 | | | | 2,758,250 | | | | 4.21 | % |
| First Midwest Bancorp, Inc. | | | 215,000 | | | | 2,698,250 | | | | 4.12 | % |
| Hancock Whitney Corp. | | | 140,000 | | | | 3,201,800 | | | | 4.88 | % |
| HarborOne Bancorp, Inc. | | | 130,000 | | | | 1,222,000 | | | | 1.86 | % |
| Hingham Institution for Savings | | | 12,000 | | | | 2,423,640 | | | | 3.70 | % |
| HomeTrust Bancshares, Inc. | | | 170,000 | | | | 2,714,900 | | | | 4.14 | % |
| Independent Bank Corp. | | | 50,000 | | | | 2,864,500 | | | | 4.37 | % |
| Kearny Financial Corp. of Maryland | | | 100,000 | | | | 840,000 | | | | 1.28 | % |
| Lakeland Bancorp, Inc. | | | 185,000 | | | | 2,059,050 | | | | 3.14 | % |
| Meridian Bancorp, Inc. | | | 210,000 | | | | 2,614,500 | | | | 3.99 | % |
| Nicolet Bankshares, Inc. (b) | | | 10,000 | | | | 617,000 | | | | 0.94 | % |
| Pacific Premier Bancorp, Inc. | | | 120,000 | | | | 3,060,000 | | | | 4.67 | % |
| PacWest Bancorp | | | 100,000 | | | | 1,924,000 | | | | 2.93 | % |
| PennyMac Financial Services, Inc. | | | 10,000 | | | | 508,200 | | | | 0.78 | % |
| Sterling Bancorp | | | 135,000 | | | | 1,806,300 | | | | 2.75 | % |
| Synovus Financial Corp. | | | 135,000 | | | | 3,510,000 | | | | 5.35 | % |
| Texas Capital Bancshares, Inc. (b) | | | 80,000 | | | | 3,600,000 | | | | 5.49 | % |
| Umpqua Holdings Corp. | | | 60,000 | | | | 753,600 | | | | 1.15 | % |
| Webster Financial Corp. | | | 58,000 | | | | 1,868,180 | | | | 2.85 | % |
| Wintrust Financial Corp. | | | 63,000 | | | | 3,101,490 | | | | 4.73 | % |
| | | | | | | | 61,546,435 | | | | 93.87 | % |
| | | | | | | | | | | | | |
| Information Technology – 5.11% | | | | | | | | | | | | |
| Alliance Data Systems Corp. | | | 65,000 | | | | 3,350,100 | | | | 5.11 | % |
| | | | | | | | | | | | | |
| Total Common Stocks | | | | | | | | | | | | |
| (Cost $60,589,782) | | | | | | | 64,896,535 | | | | 98.98 | % |
The accompanying notes are an integral part of these financial statements.
| SHORT-TERM INVESTMENTS – 1.11% | | Number | | | | | | % of | |
| | | of Shares | | | Value | | | Net Assets | |
| Money Market Funds – 1.11% | | | | | | | | | |
| First American Government Obligations Fund, | | | | | | | | | |
| Institutional Class, 0.05% (c) | | | 729,305 | | | $ | 729,305 | | | | 1.11 | % |
| | | | | | | | | | | | | |
| Total Short-Term Investments | | | | | | | | | | | | |
| (Cost $729,305) | | | | | | | 729,305 | | | | 1.11 | % |
| | | | | | | | | | | | | |
| Total Investments | | | | | | | | | | | | |
| (Cost $61,319,087) – 100.09% | | | | | | | 65,625,840 | | | | 100.09 | % |
| Liabilities in Excess of Other Assets – (0.09)% | | | | | | | (55,971 | ) | | | (0.09 | )% |
| | | | | | | | | | | | | |
TOTAL NET ASSETS – 100.00% | | | | | | $ | 65,569,869 | | | | 100.00 | % |
Percentages are stated as a percent of net assets.
| (a) | U.S.-traded security of a foreign corporation. |
| (b) | Non-income-producing security. |
| (c) | The rate listed is the fund’s seven-day yield as of October 31, 2020. |
Summary of Fair Value Exposure as of October 31, 2020
The following is a summary of the inputs used to value the Fund’s net assets as of October 31, 2020 (see Note 3 in the accompanying Notes to the Financial Statements):
| Common Stocks | | Level 1 | | | Level 2 | | | Level 3 | | | Total | |
| Financials | | $ | 61,546,435 | | | $ | — | | | $ | — | | | $ | 61,546,435 | |
| Information Technology | | | 3,350,100 | | | | — | | | | — | | | | 3,350,100 | |
| Total Common Stocks | | $ | 64,896,535 | | | $ | — | | | $ | — | | | $ | 64,896,535 | |
| Short-Term Investments | | | | | | | | | | | | | | | | |
| Money Market Funds | | $ | 729,305 | | | $ | — | | | $ | — | | | $ | 729,305 | |
| Total Short-Term Investments | | $ | 729,305 | | | $ | — | | | $ | — | | | $ | 729,305 | |
| Total Investments | | $ | 65,625,840 | | | $ | — | | | $ | — | | | $ | 65,625,840 | |
The accompanying notes are an integral part of these financial statements.
| HENNESSY FUNDS | 1-800-966-4354 | |
Financial Statements
Statement of Assets and Liabilities as of October 31, 2020 |
| ASSETS: | | | |
| Investments in securities, at value (cost $61,319,087) | | $ | 65,625,840 | |
| Dividends and interest receivable | | | 25,597 | |
| Receivable for fund shares sold | | | 44,896 | |
| Prepaid expenses and other assets | | | 16,481 | |
| Total assets | | | 65,712,814 | |
| | | | | |
| LIABILITIES: | | | | |
| Payable for fund shares redeemed | | | 17,479 | |
| Payable to advisor | | | 47,269 | |
| Payable to administrator | | | 13,498 | |
| Payable to auditor | | | 23,100 | |
| Accrued distribution fees | | | 9,005 | |
| Accrued service fees | | | 4,394 | |
| Accrued trustees fees | | | 3,937 | |
| Accrued expenses and other payables | | | 24,263 | |
| Total liabilities | | | 142,945 | |
| NET ASSETS | | $ | 65,569,869 | |
| | | | | |
| NET ASSETS CONSISTS OF: | | | | |
| Capital stock | | $ | 69,873,551 | |
| Accumulated deficit | | | (4,303,682 | ) |
| Total net assets | | $ | 65,569,869 | |
| | | | | |
| NET ASSETS: | | | | |
| Investor Class | | | | |
| Shares authorized (no par value) | | Unlimited | |
| Net assets applicable to outstanding shares | | $ | 54,955,154 | |
| Shares issued and outstanding | | | 3,147,599 | |
| Net asset value, offering price, and redemption price per share | | $ | 17.46 | |
| | | | | |
| Institutional Class | | | | |
| Shares authorized (no par value) | | Unlimited | |
| Net assets applicable to outstanding shares | | $ | 10,614,715 | |
| Shares issued and outstanding | | | 1,023,617 | |
| Net asset value, offering price, and redemption price per share | | $ | 10.37 | |
The accompanying notes are an integral part of these financial statements.
| STATEMENT OF ASSETS AND LIABILITIES/STATEMENT OF OPERATIONS |
Financial Statements
Statement of Operations for the year ended October 31, 2020 |
| INVESTMENT INCOME: | | | |
Dividend income(1) | | $ | 1,955,164 | |
| Interest income | | | 28,387 | |
| Total investment income | | | 1,983,551 | |
| | | | | |
| EXPENSES: | | | | |
| Investment advisory fees (See Note 5) | | | 686,363 | |
| Sub-transfer agent expenses – Investor Class (See Note 5) | | | 121,732 | |
| Sub-transfer agent expenses – Institutional Class (See Note 5) | | | 12,544 | |
| Administration, accounting, custody, and transfer agent fees (See Note 5) | | | 94,730 | |
| Distribution fees – Investor Class (See Note 5) | | | 94,501 | |
| Service fees – Investor Class (See Note 5) | | | 63,000 | |
| Federal and state registration fees | | | 40,518 | |
| Compliance expense (See Note 5) | | | 27,717 | |
| Audit fees | | | 23,104 | |
| Trustees’ fees and expenses | | | 14,638 | |
| Reports to shareholders | | | 13,983 | |
| Legal fees | | | 1,232 | |
| Interest expense (See Note 7) | | | 34 | |
| Other expenses | | | 14,606 | |
| Total expenses | | | 1,208,702 | |
| NET INVESTMENT INCOME | | $ | 774,849 | |
| | | | | |
| REALIZED AND UNREALIZED GAINS (LOSSES): | | | | |
| Net realized loss on investments | | $ | (8,317,125 | ) |
| Net change in unrealized appreciation/depreciation on investments | | | (9,544,740 | ) |
| Net loss on investments | | | (17,861,865 | ) |
| NET DECREASE IN NET ASSETS RESULTING FROM OPERATIONS | | $ | (17,087,016 | ) |
(1) | Net of foreign taxes withheld of $9,675. |
The accompanying notes are an integral part of these financial statements.
| HENNESSY FUNDS | 1-800-966-4354 | |
(This Page Intentionally Left Blank.)
| STATEMENTS OF CHANGES IN NET ASSETS |
Financial Statements
| Statements of Changes in Net Assets |
| | | Year Ended | | | Year Ended | |
| | | October 31, 2020 | | | October 31, 2019 | |
| OPERATIONS: | | | | | | |
| Net investment income | | $ | 774,849 | | | $ | 711,118 | |
| Net realized gain (loss) on investments | | | (8,317,125 | ) | | | 4,257,379 | |
| Net change in unrealized | | | | | | | | |
| appreciation/depreciation on investments | | | (9,544,740 | ) | | | 849,952 | |
| Net increase (decrease) in net assets | | | | | | | | |
| resulting from operations | | | (17,087,016 | ) | | | 5,818,449 | |
| | | | | | | | | |
| DISTRIBUTIONS TO SHAREHOLDERS: | | | | | | | | |
| Distributable earnings – Investor Class | | | (3,014,018 | ) | | | (7,622,114 | ) |
| Distributable earnings – Institutional Class | | | (963,722 | ) | | | (2,386,465 | ) |
| Total distributions | | | (3,977,740 | ) | | | (10,008,579 | ) |
| | | | | | | | | |
| CAPITAL SHARE TRANSACTIONS: | | | | | | | | |
| Proceeds from shares subscribed – Investor Class | | | 1,461,277 | | | | 7,715,297 | |
| Proceeds from shares subscribed – Institutional Class | | | 4,656,510 | | | | 5,904,217 | |
| Dividends reinvested – Investor Class | | | 2,952,871 | | | | 7,476,720 | |
| Dividends reinvested – Institutional Class | | | 935,074 | | | | 2,340,222 | |
| Cost of shares redeemed – Investor Class | | | (21,427,965 | ) | | | (45,169,956 | ) |
| Cost of shares redeemed – Institutional Class | | | (12,043,139 | ) | | | (21,638,108 | ) |
| Net decrease in net assets derived | | | | | | | | |
| from capital share transactions | | | (23,465,372 | ) | | | (43,371,608 | ) |
| TOTAL DECREASE IN NET ASSETS | | | (44,530,128 | ) | | | (47,561,738 | ) |
| | | | | | | | | |
| NET ASSETS: | | | | | | | | |
| Beginning of year | | | 110,099,997 | | | | 157,661,735 | |
| End of year | | $ | 65,569,869 | | | $ | 110,099,997 | |
| | | | | | | | | |
| CHANGES IN SHARES OUTSTANDING: | | | | | | | | |
| Shares sold – Investor Class | | | 90,621 | | | | 400,923 | |
| Shares sold – Institutional Class | | | 483,086 | | | | 477,781 | |
| Shares issued to holders as reinvestment | | | | | | | | |
| of dividends – Investor Class | | | 136,924 | | | | 373,487 | |
| Shares issued to holders as reinvestment | | | | | | | | |
| of dividends – Institutional Class | | | 72,426 | | | | 195,642 | |
| Shares redeemed – Investor Class | | | (1,216,466 | ) | | | (2,193,955 | ) |
| Shares redeemed – Institutional Class | | | (1,136,528 | ) | | | (1,754,857 | ) |
| Net decrease in shares outstanding | | | (1,569,937 | ) | | | (2,500,979 | ) |
The accompanying notes are an integral part of these financial statements.
| HENNESSY FUNDS | 1-800-966-4354 | |
Financial Statements
For an Investor Class share outstanding throughout each year
PER SHARE DATA:
Net asset value, beginning of year
Income from investment operations:
Net investment income (loss)
Net realized and unrealized gains (losses) on investments
Total from investment operations
Less distributions:
Dividends from net investment income
Dividends from net realized gains
Total distributions
Net asset value, end of year
TOTAL RETURN
SUPPLEMENTAL DATA AND RATIOS:
Net assets, end of year (millions)
Ratio of expenses to average net assets
Ratio of net investment income (loss) to average net assets
Portfolio turnover rate(3)
(1) | Calculated using the average shares outstanding method. |
(2) | Amount is between $(0.005) and $0.005. |
(3) | Calculated on the basis of the Fund as a whole. |
The accompanying notes are an integral part of these financial statements.
| FINANCIAL HIGHLIGHTS — INVESTOR CLASS |
| Year Ended October 31, | |
| 2020 | | | 2019 | | | 2018 | | | 2017 | | | 2016 | |
| | | | | | | | | | | | | | |
| $ | 21.60 | | | $ | 21.96 | | | $ | 26.02 | | | $ | 23.48 | | | $ | 23.81 | |
| | | | | | | | | | | | | | | | | | | |
| | | | | | | | | | | | | | | | | | | |
| | 0.16 | (1) | | | 0.10 | (1) | | | 0.03 | | | | (0.04 | ) | | | 0.10 | |
| | (3.55 | ) | | | 0.93 | | | | (2.12 | ) | | | 5.83 | | | | 1.20 | |
| | (3.39 | ) | | | 1.03 | | | | (2.09 | ) | | | 5.79 | | | | 1.30 | |
| | | | | | | | | | | | | | | | | | | |
| | | | | | | | | | | | | | | | | | | |
| | (0.09 | ) | | | (0.07 | ) | | | 0.00 | (2) | | | (0.06 | ) | | | (0.03 | ) |
| | (0.66 | ) | | | (1.32 | ) | | | (1.97 | ) | | | (3.19 | ) | | | (1.60 | ) |
| | (0.75 | ) | | | (1.39 | ) | | | (1.97 | ) | | | (3.25 | ) | | | (1.63 | ) |
| $ | 17.46 | | | $ | 21.60 | | | $ | 21.96 | | | $ | 26.02 | | | $ | 23.48 | |
| | | | | | | | | | | | | | | | | | | |
| | -16.37 | % | | | 5.27 | % | | | -8.79 | % | | | 25.03 | % | | | 5.80 | % |
| | | | | | | | | | | | | | | | | | | |
| | | | | | | | | | | | | | | | | | | |
| $ | 54.96 | | | $ | 89.36 | | | $ | 122.00 | | | $ | 174.01 | | | $ | 132.09 | |
| | 1.65 | % | | | 1.58 | % | | | 1.54 | % | | | 1.52 | % | | | 1.54 | % |
| | 0.96 | % | | | 0.47 | % | | | 0.11 | % | | | (0.06 | )% | | | 0.38 | % |
| | 75 | % | | | 46 | % | | | 28 | % | | | 46 | % | | | 46 | % |
The accompanying notes are an integral part of these financial statements.
| HENNESSY FUNDS | 1-800-966-4354 | |
Financial Statements
For an Institutional Class share outstanding throughout each year
PER SHARE DATA:
Net asset value, beginning of year
Income from investment operations:
Net investment income
Net realized and unrealized gains (losses) on investments
Total from investment operations
Less distributions:
Dividends from net investment income
Dividends from net realized gains
Total distributions
Net asset value, end of year
TOTAL RETURN
SUPPLEMENTAL DATA AND RATIOS:
Net assets, end of year (millions)
Ratio of expenses to average net assets
Ratio of net investment income to average net assets
Portfolio turnover rate(2)
(1) | Calculated using the average shares outstanding method. |
(2) | Calculated on the basis of the Fund as a whole. |
The accompanying notes are an integral part of these financial statements.
| FINANCIAL HIGHLIGHTS — INSTITUTIONAL CLASS |
| Year Ended October 31, | |
| 2020 | | | 2019 | | | 2018 | | | 2017 | | | 2016 | |
| | | | | | | | | | | | | | |
| $ | 12.92 | | | $ | 13.28 | | | $ | 15.69 | | | $ | 14.23 | | | $ | 14.39 | |
| | | | | | | | | | | | | | | | | | | |
| | | | | | | | | | | | | | | | | | | |
| | 0.13 | (1) | | | 0.10 | (1) | | | 0.07 | | | | 0.02 | | | | 0.09 | |
| | (2.10 | ) | | | 0.54 | | | | (1.27 | ) | | | 3.56 | | | | 0.75 | |
| | (1.97 | ) | | | 0.64 | | | | (1.20 | ) | | | 3.58 | | | | 0.84 | |
| | | | | | | | | | | | | | | | | | | |
| | | | | | | | | | | | | | | | | | | |
| | (0.19 | ) | | | (0.18 | ) | | | (0.02 | ) | | | (0.17 | ) | | | (0.04 | ) |
| | (0.39 | ) | | | (0.82 | ) | | | (1.19 | ) | | | (1.95 | ) | | | (0.96 | ) |
| | (0.58 | ) | | | (1.00 | ) | | | (1.21 | ) | | | (2.12 | ) | | | (1.00 | ) |
| $ | 10.37 | | | $ | 12.92 | | | $ | 13.28 | | | $ | 15.69 | | | $ | 14.23 | |
| | | | | | | | | | | | | | | | | | | |
| | -16.05 | % | | | 5.57 | % | | | -8.42 | % | | | 25.56 | % | | | 6.22 | % |
| | | | | | | | | | | | | | | | | | | |
| | | | | | | | | | | | | | | | | | | |
| $ | 10.61 | | | $ | 20.74 | | | $ | 35.66 | | | $ | 37.92 | | | $ | 21.27 | |
| | 1.29 | % | | | 1.23 | % | | | 1.15 | % | | | 1.15 | % | | | 1.17 | % |
| | 1.27 | % | | | 0.84 | % | | | 0.51 | % | | | 0.30 | % | | | 0.72 | % |
| | 75 | % | | | 46 | % | | | 28 | % | | | 46 | % | | | 46 | % |
The accompanying notes are an integral part of these financial statements.
| HENNESSY FUNDS | 1-800-966-4354 | |
Financial Statements
Notes to the Financial Statements October 31, 2020 |
1). ORGANIZATION
The Hennessy Small Cap Financial Fund (the “Fund”) is a series of Hennessy Funds Trust (the “Trust”), which was organized as a Delaware statutory trust on September 17, 1992. The Fund is an open-end management investment company registered under the Investment Company Act of 1940, as amended. The investment objective of the Fund is capital appreciation. The Fund is a non-diversified fund.
The Fund offers Investor Class and Institutional Class shares. Each class of shares differs principally in its respective 12b-1 distribution and service, shareholder servicing, and sub-transfer agent expenses. There are no sales charges. Each class has identical rights to earnings, assets, and voting privileges, except for class-specific expenses and exclusive rights to vote on matters affecting only one class.
As an investment company, the Fund follows the investment company accounting and reporting guidance of the Financial Accounting Standards Board (“FASB”) Accounting Standard Codification Topic 946 “Financial Services—Investment Companies.”
2). SIGNIFICANT ACCOUNTING POLICIES
The following is a summary of significant accounting policies consistently followed by the Fund in the preparation of the financial statements. These policies conform to U.S. generally accepted accounting principles (“GAAP”).
| a). | Securities Valuation – All investments in securities are valued in accordance with the Fund’s valuation policies and procedures, as described in Note 3. |
| | |
| b). | Federal Income Taxes – No provision for federal income taxes or excise taxes has been made because the Fund has elected to be taxed as a regulated investment company and intends to distribute substantially all of its taxable income to its shareholders and otherwise comply with the provisions of the Internal Revenue Code of 1986, as amended, applicable to regulated investment companies. Net investment income/loss and realized gains/losses for federal income tax purposes may differ from those reported in the financial statements because of temporary book and tax basis differences. Temporary differences are primarily the result of the treatment of wash sales for tax reporting purposes. The Fund recognizes interest and penalties related to income tax benefits, if any, in the Statement of Operations as an income tax expense. Distributions from net realized gains for book purposes may include short-term capital gains, which are included as ordinary income to shareholders for tax purposes. The Fund may utilize equalization accounting for tax purposes and designate earnings and profits, including net realized gains distributed to shareholders on redemption of shares, as part of the dividends paid deduction for income tax purposes. |
| | |
| | Due to inherent differences in the recognition of income, expenses, and realized gains/losses under GAAP and federal income tax regulations, permanent differences between book and tax basis for reporting are identified and appropriately reclassified in the Statement of Assets and Liabilities, as needed. As of October 31, 2020, no such reclassifications were required for fiscal year 2020. |
| | |
| c). | Accounting for Uncertainty in Income Taxes – The Fund has accounting policies regarding recognition and measurement of tax positions taken or expected to be taken on a tax return. The tax returns of the Fund for the prior three fiscal years are |
| NOTES TO THE FINANCIAL STATEMENTS |
| | open for examination. The Fund has reviewed all open tax years in major jurisdictions and concluded that there is no impact on the Fund’s net assets and no tax liability resulting from unrecognized tax benefits relating to uncertain income tax positions taken or expected to be taken on a tax return. The Fund’s major tax jurisdictions are U.S. federal and Delaware. |
| | |
| d). | Income and Expenses – Dividend income is recognized on the ex-dividend date or as soon as information is available to the Fund. Interest income, which includes the amortization of premium and accretion of discount, is recognized on an accrual basis. Market discounts, original issue discounts, and market premiums on debt securities are accreted or amortized to interest income over the life of a security with a corresponding increase or decrease, as applicable, in the cost basis of such security using the yield to maturity method, or where applicable, the first call date of the security. Other non-cash dividends are recognized as investment income at the fair value of the property received. The Fund is charged for those expenses that are directly attributable to its portfolio, such as advisory, administration, and certain shareholder service fees. Income, expenses (other than expenses attributable to a specific class), and realized and unrealized gains/losses on investments are allocated to each class of shares based on such class’s net assets. |
| | |
| e). | Distributions to Shareholders – Dividends from net investment income for the Fund, if any, are declared and paid annually, usually in December. Distributions of net realized capital gains, if any, are declared and paid annually, usually in December. |
| | |
| f). | Security Transactions – Investment and shareholder transactions are recorded on the trade date. The Fund determines the realized gain/loss from an investment transaction by comparing the original cost of the security lot sold with the net sale proceeds. Discounts and premiums on securities purchased are accreted or amortized, respectively, over the life of each such security. |
| | |
| g). | Use of Estimates – The preparation of financial statements in conformity with GAAP requires management to make estimates and assumptions that affect the reported amounts of assets and liabilities and disclosure of contingent assets and liabilities at the date of the financial statements and the reported change in net assets during the reporting period. Actual results could differ from those estimates. |
| | |
| h). | Share Valuation – The net asset value (“NAV”) per share of the Fund is calculated by dividing (i) the total value of the securities held by the Fund, plus cash and other assets, minus all liabilities (including estimated accrued expenses) by (ii) the total number of shares outstanding for the Fund, rounded to the nearest $0.01. The Fund’s shares will not be priced on days the New York Stock Exchange is closed for trading. The offering and redemption price per share for the Fund is equal to the Fund’s NAV per share. |
| | |
| i). | New Accounting Pronouncements – In August 2018, the FASB issued Accounting Standards Update No. 2018-13 “Disclosure Framework—Changes to the Disclosure Requirements for Fair Value Measurement” (“ASU 2018-13”). ASU 2018-13 eliminates the requirement to disclose the amount of and reasons for transfers between Level 1 and Level 2 of the fair value hierarchy, the timing of transfers between levels of the fair value hierarchy, and the valuation processes for Level 3 fair value measurements. ASU 2018-13 does not eliminate the requirement to disclose the range and weighted average used to develop significant unobservable inputs for Level 3 fair value measurements, and the changes in unrealized gains and losses for recurring Level 3 fair value measurements. ASU 2018-13 requires that information is provided about the measurement uncertainty of Level 3 fair value measurements as of the reporting date. |
| HENNESSY FUNDS | 1-800-966-4354 | |
| | The guidance is effective for fiscal years beginning after December 15, 2019, and interim periods within those fiscal years. Management evaluated the impact of this change in guidance and, due to the permissibility of early adoption, modified the Fund’s fair value disclosures beginning with its fiscal year 2019. |
3). SECURITIES VALUATION
The Fund follows its valuation policies and procedures in determining its net asset value and, in preparing these financial statements, the fair value accounting standards that establish an authoritative definition of fair value and set out a hierarchy for measuring fair value. These standards require additional disclosures about the various inputs and valuation techniques used to develop the measurements of fair value and a discussion of changes in valuation techniques and related inputs during the period. These inputs are summarized in the three broad levels listed below:
| | Level 1 – | Unadjusted, quoted prices in active markets for identical instruments that the Fund has the ability to access at the date of measurement. |
| | | |
| | Level 2 – | Other significant observable inputs (including, but not limited to, quoted prices in active markets for similar instruments, quoted prices in markets that are not active for identical or similar instruments, and model-derived valuations in which all significant inputs and significant value drivers are observable in active markets, such as interest rates, prepayment speeds, credit risk curves, default rates, and similar data). |
| | | |
| | Level 3 – | Significant unobservable inputs (including the Fund’s own assumptions about what market participants would use to price the asset or liability based on the best available information) when observable inputs are unavailable. |
The following is a description of the valuation techniques applied to the Fund’s major categories of assets and liabilities on a recurring basis:
| | Equity Securities – Equity securities, including common stocks, preferred stocks, foreign-issued common stocks, exchange-traded funds, closed-end mutual funds, partnerships, rights, and real estate investment trusts, that are traded on a securities exchange for which a last-quoted sales price is readily available will generally be valued at the last sales price as reported by the primary exchange on which the securities are listed. Securities listed on The NASDAQ Stock Market (“NASDAQ”) will generally be valued at the NASDAQ Official Closing Price, which may differ from the last sales price reported. Securities traded on a securities exchange for which a last-quoted sales price is not readily available will generally be valued at the mean between the bid and ask prices. To the extent these securities are actively traded and valuation adjustments are not applied, they are classified in Level 1 of the fair value hierarchy. Securities traded on foreign exchanges generally are not valued at the same time the Fund calculates its NAV because most foreign markets close well before such time. The earlier close of most foreign markets gives rise to the possibility that significant events, including broad market moves, may have occurred in the interim. In certain circumstances, it may be determined that a foreign security needs to be fair valued because it appears that the value of the security might have been materially affected by events occurring after the close of the market in which the security is principally traded, but before the time the Fund calculates its NAV, such as by a development that affects an entire market or region (e.g., a weather-related event) or a potentially global development (e.g., a terrorist attack that may be expected to have an effect on investor expectations worldwide). |
| NOTES TO THE FINANCIAL STATEMENTS |
| | Registered Investment Companies – Investments in open-end registered investment companies, commonly referred to as mutual funds, generally are priced at the ending NAV provided by the applicable mutual fund’s service agent and will be classified in Level 1 of the fair value hierarchy. |
| | |
| | Debt Securities – Debt securities, including corporate bonds, asset-backed securities, mortgage-backed securities, municipal bonds, U.S. Treasuries, and U.S. government agency issues, are generally valued at market on the basis of valuations furnished by an independent pricing service that utilizes both dealer-supplied valuations and formula-based techniques. The pricing service may consider recently executed transactions in securities of the issuer or comparable issuers, market price quotations (where observable), bond spreads, and fundamental data relating to the issuer. In addition, the model may incorporate observable market data, such as reported sales of similar securities, broker quotes, yields, bids, offers, and reference data. Certain securities are valued primarily using dealer quotations. These securities are generally classified in Level 2 of the fair value hierarchy. |
| | |
| | Short-Term Securities – Short-term equity investments, including money market funds, are valued in the manner specified above. Short-term debt investments with an original term to maturity of 60 days or less are valued at amortized cost, which approximates fair market value. If the original term to maturity of a short-term debt investment exceeded 60 days, then the values as of the 61st day prior to maturity are amortized. Amortized cost is not used if its use would be inappropriate due to credit or other impairments of the issuer, in which case the security’s fair value would be determined, as described below. Short-term securities are generally classified in Level 1 or Level 2 of the fair value hierarchy depending on the inputs used and market activity levels for specific securities. |
The Board of Trustees of the Fund (the “Board”) has adopted fair value pricing procedures that are followed when a price for a security is not readily available or if a significant event has occurred that indicates the closing price of a security no longer represents the true value of that security. Fair value pricing determinations are made in good faith in accordance with these procedures. There are numerous criteria that will be given consideration in determining a fair value of a security, such as the trading volume of a security and markets, the values of other similar securities, and news events with direct bearing on a security or markets. Fair value pricing results in an estimated price for a security that reflects the amount the Fund might reasonably expect to receive in a current sale. Depending on the relative significance of the valuation inputs, these securities may be classified in either Level 2 or Level 3 of the fair value hierarchy.
The fair value of foreign securities may be determined with the assistance of a pricing service using correlations between the movement of prices of such securities and indices of domestic securities and other appropriate indicators, such as closing market prices of relevant American Depositary Receipts or futures contracts. Using fair value pricing means that the Fund’s NAV reflects the affected portfolio securities’ values as determined by the Board or its designee, pursuant to the fair value pricing procedures adopted by the Board, instead of being determined by the market. Using a fair value pricing methodology to price a foreign security may result in a value that is different from such foreign security’s most recent closing price and from the value used by other investment companies to calculate their NAVs. Such securities are generally classified in Level 2 of the fair value hierarchy. Because the Fund may invest in foreign securities, the value of the Fund’s portfolio securities may change on days when you will not be able to purchase or redeem your shares.
| HENNESSY FUNDS | 1-800-966-4354 | |
The Board has delegated day-to-day valuation matters to the Valuation and Liquidity Committee comprising representatives from Hennessy Advisors, Inc., the Fund’s investment advisor (the “Advisor”). The function of the Valuation and Liquidity Committee is to value securities where current and reliable market quotations are not readily available. All actions taken by the Valuation and Liquidity Committee are reviewed by the Board.
The Fund has performed an analysis of all existing investments to determine the significance and character of all inputs to their fair value determinations. Various inputs are used to determine the value of the Fund’s investments. The inputs or methodology used for valuing securities are not necessarily an indication of the risk associated with investing in those securities. Details related to the fair value hierarchy of the Fund’s securities as of October 31, 2020, are included in the Schedule of Investments.
4). INVESTMENT TRANSACTIONS
Purchases and sales of investment securities (excluding government and short-term investments) for the Fund during fiscal year 2020 were $55,224,165 and $72,305,800, respectively.
There were no purchases or sales/maturities of long-term U.S. government securities for the Fund during fiscal year 2020.
The Fund is permitted to purchase or sell securities from or to another fund in the Hennessy Funds family of funds (collectively, the “Hennessy Funds”) under specified conditions outlined in procedures adopted by the Board. The procedures have been designed to ensure that any purchase or sale of securities by the Fund from or to another Hennessy Fund complies with Rule 17a-7 of the Investment Company Act of 1940, as amended. During fiscal year 2020, the Fund did not engage in purchases or sales of securities pursuant to Rule 17a-7 of the Investment Company Act of 1940, as amended.
5). INVESTMENT ADVISORY FEE AND OTHER TRANSACTIONS WITH AFFILIATES
The Advisor provides the Fund with investment advisory services under an Investment Advisory Agreement. The Advisor furnishes all investment advice, office space, and facilities and most of the personnel needed by the Fund. As compensation for its services, the Advisor is entitled to a monthly fee from the Fund. The fee is based on the average daily net assets of the Fund at an annual rate of 0.90%. The net investment advisory fees expensed by the Fund during fiscal year 2020 are included in the Statement of Operations.
The Board has approved a Shareholder Servicing Agreement for Investor Class shares of the Fund, which was instituted to compensate the Advisor for the non-investment advisory services it provides to the Fund. The Shareholder Servicing Agreement provides for a monthly fee paid to the Advisor at an annual rate of 0.10% of the average daily net assets of the Fund attributable to Investor Class shares. The shareholder service fees expensed by the Fund during fiscal year 2020 are included in the Statement of Operations.
The Fund has adopted a plan pursuant to Rule 12b-1 under the Investment Company Act of 1940, as amended, that authorizes payments in connection with the distribution of the Fund’s shares at an annual rate of up to 0.25% of the Fund’s average daily net assets attributable to Investor Class shares. Even though the authorized rate is up to 0.25%, the Fund is currently only using up to 0.15% of its average daily net assets attributable to Investor Class shares for such purpose. Amounts paid under the plan may be spent on any activities or expenses primarily intended to result in the sale of shares, including, but not limited to, advertising, shareholder account servicing, printing and mailing of prospectuses to other than current shareholders, printing and mailing of sales literature, and compensation for sales and marketing activities or to financial institutions and others, such as dealers and distributors. The distribution fees expensed by the Fund during fiscal year 2020 are included in the Statement of Operations.
| NOTES TO THE FINANCIAL STATEMENTS |
The Fund has entered into agreements with various brokers, dealers, and financial intermediaries in connection with the sale of shares of the Fund. The agreements provide for periodic payments of sub-transfer agent expenses by the Fund to the brokers, dealers, and financial intermediaries for providing certain shareholder maintenance services. These shareholder services include the pre-processing and quality control of new accounts, shareholder correspondence, answering customer inquiries regarding account status, and facilitating shareholder telephone transactions. The sub-transfer agent fees expensed by the Fund during fiscal year 2020 are included in the Statement of Operations.
U.S. Bancorp Fund Services, LLC, d/b/a U.S. Bank Global Fund Services (“Fund Services”) provides the Fund with administrative, accounting, and transfer agent services. As administrator, Fund Services is responsible for activities such as (i) preparing various federal and state regulatory filings, reports, and returns for the Fund, (ii) preparing reports and materials to be supplied to the Board, (iii) monitoring the activities of the Fund’s custodian, transfer agent, and accountants, and (iv) coordinating the preparation and payment of the Fund’s expenses and reviewing the Fund’s expense accruals. U.S. Bank N.A., an affiliate of Fund Services, serves as the Fund’s custodian. The servicing agreements between the Trust and Fund Services and U.S. Bank N.A. contain a fee schedule that is inclusive of administrative, accounting, custody, and transfer agent fees. The administrative, accounting, custody, and transfer agent fees expensed by the Fund during fiscal year 2020 are included in the Statement of Operations.
Quasar Distributors, LLC (“Quasar”) acts as the Fund’s principal underwriter in a continuous public offering of the Fund’s shares. Quasar was an affiliate of Fund Services and U.S. Bank N.A. through March 30, 2020. Effective March 31, 2020, Foreside Financial Group, LLC (“Foreside”) acquired Quasar from Fund Services. As a result of the acquisition, Quasar became a wholly owned broker-dealer subsidiary of Foreside and is no longer affiliated with Fund Services or U.S. Bank N.A. The Board approved a new Distribution Agreement to enable Quasar to continue serving as the Fund’s distributor.
The officers of the Fund are affiliated with the Advisor. With the exception of the Chief Compliance Officer and the Senior Compliance Officer, such officers receive no compensation from the Fund for serving in their respective roles. The Fund, along with the other Hennessy Funds, makes reimbursement payments on an equal basis to the Advisor for a portion of the salary and benefits associated with the office of the Chief Compliance Officer and for all of the salary and benefits associated with the office of the Senior Compliance Officer. The compliance fees expensed by the Fund during fiscal year 2020 are included in the Statement of Operations.
6). GUARANTEES AND INDEMNIFICATIONS
Under the Hennessy Funds’ organizational documents, their officers and trustees are indemnified by the Hennessy Funds against certain liabilities arising out of the performance of their duties to the Hennessy Funds. Additionally, in the normal course of business, the Hennessy Funds enter into contracts with service providers that contain general indemnification clauses. The Fund’s maximum exposure under these arrangements is unknown as this would involve future claims that may be made against the Fund that have not yet occurred. Currently, the Fund expects the risk of loss to be remote.
7). LINE OF CREDIT
The Fund has an uncommitted line of credit with the other Hennessy Funds in the amount of the lesser of (i) $100,000,000 or (ii) 33.33% of each Hennessy Fund’s net assets, or 30% for the Hennessy Gas Utility Fund and 10% for the Hennessy Balanced Fund, intended to provide short-term financing, if necessary, subject to certain
| HENNESSY FUNDS | 1-800-966-4354 | |
restrictions, in connection with shareholder redemptions. The credit facility is with the Hennessy Funds’ custodian bank, U.S. Bank N.A. Borrowings under this arrangement bear interest at the bank’s prime rate and are secured by all of the Fund’s assets (as to its own borrowings only). During fiscal year 2020, the Fund had an outstanding average daily balance and a weighted average interest rate of $1,022 and 3.25%, respectively. The interest expensed by the Fund during fiscal year 2020 is included in the Statement of Operations. The maximum amount outstanding for the Fund during fiscal year 2020 was $102,000. As of October 31, 2020, the Fund did not have any borrowings outstanding under the line of credit.
8). FEDERAL TAX INFORMATION
As of October 31, 2020, the components of accumulated earnings (losses) for income tax purposes were as follows:
| | | | Investments | |
| | Cost of investments for tax purposes | | $ | 63,533,123 | |
| | Gross tax unrealized appreciation | | $ | 11,645,918 | |
| | Gross tax unrealized depreciation | | | (9,553,201 | ) |
| | Net tax unrealized appreciation/(depreciation) | | $ | 2,092,717 | |
| | Undistributed ordinary income | | $ | 242,896 | |
| | Undistributed long-term capital gains | | | — | |
| | Total distributable earnings | | $ | 242,896 | |
| | Other accumulated gain/(loss) | | $ | (6,639,295 | ) |
| | Total accumulated gain/(loss) | | $ | (4,303,682 | ) |
The difference between book-basis unrealized appreciation/depreciation and tax-basis unrealized appreciation/depreciation (as shown above) is attributable primarily to wash sales.
As of October 31, 2020, the Fund had capital loss carryforwards as follows:
| | $2,735,116 | | Unlimited long-term |
| | 3,904,179 | | Unlimited short-term |
As of October 31, 2020, the Fund did not defer, on a tax basis, any late-year ordinary losses. Late-year ordinary losses are net ordinary losses incurred after December 31, 2019, but within the taxable year, that are deemed to arise on the first day of the Fund’s next taxable year.
During fiscal years 2020 and 2019, the tax character of distributions paid by the Fund was as follows:
| | | | Year Ended | | | Year Ended | |
| | | | October 31, 2020 | | | October 31, 2019 | |
| | Ordinary income(1) | | $ | 698,496 | | | $ | 848,924 | |
| | Long-term capital gain | | | 3,279,244 | | | | 9,159,655 | |
| | Total distributions | | $ | 3,977,740 | | | $ | 10,008,579 | |
| | (1) Ordinary income includes short-term capital gains. |
9). COVID-19 PANDEMIC
The COVID-19 pandemic has adversely impacted global commercial activity and contributed to significant volatility in global equity and debt markets. The pandemic has resulted in quarantines, stay-at-home orders, travel prohibitions, and closures, disrupting
| NOTES TO THE FINANCIAL STATEMENTS |
supply chains and economic activity. The duration of the pandemic’s effects remain uncertain and difficult to assess. The effects of the pandemic may adversely impact the Fund’s performance and its ability to achieve its investment objective.
10). LIBOR TRANSITION
The Fund invests in securities of financial institutions that may be involved in financings based on, among other floating rates, the London Interbank Offered Rate (“LIBOR”). LIBOR is the offered rate for short-term Eurodollar deposits between major international banks. On July 27, 2017, the UK Financial Conduct Authority, which regulates LIBOR, announced that it would no longer persuade or compel banks to submit rates for the calculation of LIBOR after 2021, meaning that LIBOR cannot continue on its current basis and will not be guaranteed after 2021. Regulators and industry working groups have suggested alternative reference rates, but global consensus is lacking, and the process for amending existing contracts or instruments to transition away from LIBOR remains unclear. The transition away from LIBOR may lead to increased volatility and illiquidity in markets tied to LIBOR, reduce the value of LIBOR-related instruments, and reduce the effectiveness of hedging strategies, which could adversely affect the Fund’s performance. Additionally, any alternative reference rate may be an ineffective substitute, resulting in prolonged adverse market conditions for the Fund’s investments.
11). EVENTS SUBSEQUENT TO YEAR END
Management has evaluated the Fund’s related events and transactions that occurred subsequent to October 31, 2020, through the date of issuance of the Fund’s financial statements. Management has determined that there were no subsequent events requiring recognition or disclosure in the financial statements.
| HENNESSY FUNDS | 1-800-966-4354 | |
Report of Independent Registered Public
Accounting Firm
To the Board of Trustees of Hennessy Funds Trust
and the shareholders of the Hennessy Small Cap Financial Fund
Novato, CA
Opinion on the Financial Statements
We have audited the accompanying statement of assets and liabilities of the Hennessy Small Cap Financial Fund (the “Fund”), a series of Hennessy Funds Trust, including the schedule of investments, as of October 31, 2020, the related statement of operations for the year then ended, the statements of changes in net assets for each of the two years in the period then ended, financial highlights for each of the five years in the period then ended, and the related notes (collectively referred to as the “financial statements”). In our opinion, the financial statements present fairly, in all material respects, the financial position of the Fund as of October 31, 2020, the results of its operations for the year then ended, the changes in its net assets for each of the two years in the period then ended, and the financial highlights for each of the five years in the period then ended, in conformity with accounting principles generally accepted in the United States of America.
Basis for Opinion
These financial statements are the responsibility of the Fund’s management. Our responsibility is to express an opinion on the Fund’s financial statements based on our audits. We are a public accounting firm registered with the Public Company Accounting Oversight Board (United States) (“PCAOB”) and are required to be independent with respect to the Fund in accordance with the U.S. federal securities laws and the applicable rules and regulations of the Securities and Exchange Commission and the PCAOB. We have served as the auditor of one or more of the funds in the Trust since 2002.
We conducted our audits in accordance with the standards of the PCAOB. Those standards require that we plan and perform the audit to obtain reasonable assurance about whether the financial statements are free of material misstatement, whether due to error or fraud. The Fund is not required to have, nor were we engaged to perform, an audit of its internal control over financial reporting. As part of our audits we are required to obtain an understanding of internal control over financial reporting, but not for the purpose of expressing an opinion on the effectiveness of the Fund’s internal control over financial reporting. Accordingly, we express no such opinion.
Our audits included performing procedures to assess the risks of material misstatement of the financial statements, whether due to error or fraud, and performing procedures that respond to those risks. Such procedures included examining, on a test basis, evidence regarding the amounts and disclosures in the financial statements. Our audits also included evaluating the accounting principles used and significant estimates made by management, as well as evaluating the overall presentation of the financial statements. Our procedures included confirmation of securities owned as of October 31, 2020 by correspondence with the custodian. We believe that our audits provide a reasonable basis for our opinion.
| | |
| | TAIT, WELLER & BAKER LLP |
Philadelphia, Pennsylvania
December 23, 2020
| REPORT OF INDEPENDENT REGISTERED PUBLIC ACCOUNTING FIRM/TRUSTEES AND OFFICERS |
Trustees and Officers of the Fund (Unaudited)
The business and affairs of the Funds are managed under the direction of the Board of Trustees of the Trust, and the Board of Trustees elects the officers of the Trust. From time to time, the Board of Trustees also has appointed advisers to the Board of Trustees (“Advisers”) with the intention of having qualified individuals serve in an advisory capacity to garner experience in the mutual fund and asset management industry and be considered as potential Trustees in the future. There are currently three Advisers: Brian Alexander, Doug Franklin, and Claire Knoles. As Advisers, Mr. Alexander, Mr. Franklin, and Ms. Knoles attend meetings of the Board of Trustees and act as non-voting participants. Information pertaining to the Trustees, Advisers, and the officers of the Trust is set forth below. The Trustees and officers serve until their successors are duly elected and qualified or until their earlier death, resignation, or removal. Each Trustee oversees all 16 Hennessy Funds. Unless otherwise indicated, the address of all persons listed below is 7250 Redwood Boulevard, Suite 200, Novato, CA 94945. The Fund’s Statement of Additional Information includes more information about the persons listed below and is available without charge by calling 1-800-966-4354 or by visiting www.hennessyfunds.com.
| | | | Other |
| | | | Directorships |
| | | | Held Outside |
| Name, Age, | | | of Fund |
| and Position Held | Start Date | Principal Occupation(s) | Complex During |
with the Trust
| of Service
| During Past Five Years
| Past Five Years
|
| Disinterested Trustees and Advisers | | | |
| | | | |
| J. Dennis DeSousa | January 1996 | Mr. DeSousa is a real estate investor. | None. |
| 84 | | | |
| Trustee | | | |
| | | | |
| Robert T. Doyle | January 1996 | Mr. Doyle has been the Sheriff of | None. |
| 73 | | Marin County, California since 1996. | |
| Trustee | | | |
| | | | |
| Gerald P. Richardson | May 2004 | Mr. Richardson is an independent | None. |
| 75 | | consultant in the securities industry. | |
| Trustee | | | |
| | | | |
| Brian Alexander | March 2015 | Mr. Alexander has worked for the | None. |
| 39 | | Sutter Health organization since | |
| Adviser to the Board | | 2011 in various positions. He has | |
| | | served as the Chief Executive Officer | |
| | | of the Sutter Roseville Medical | |
| | | Center since 2018. From 2016 through | |
| | | 2018, he served as the Vice President | |
| | | of Strategy for the Sutter Health Valley | |
| | | Area, which includes 11 hospitals, | |
| | | 13 ambulatory surgery centers, | |
| | | 16,000 employees, and 1,900 physicians. | |
| | | From 2013 through 2016, Mr. Alexander | |
| | | served as Sutter Novato Community | |
| | | Hospital’s Chief Administrative Officer. | |
| HENNESSY FUNDS | 1-800-966-4354 | |
| | | | Other |
| | | | Directorships |
| | | | Held Outside |
| Name, Age, | | | of Fund |
| and Position Held | Start Date | Principal Occupation(s) | Complex During |
with the Trust
| of Service
| During Past Five Years
| Past Five Years
|
| Doug Franklin | March 2016 | Mr. Franklin is a retired insurance | None. |
| 56 | | industry executive. From 1987 | |
| Adviser to the Board | | through 2015, he was employed | |
| | | by the Allianz-Fireman’s Fund | |
| | | Insurance Company in various | |
| | | positions, including as its Chief | |
| | | Actuary and Chief Risk Officer. | |
| | | | |
| Claire Knoles | December 2015 | Ms. Knoles is a founder of Kiosk and | None. |
| 46 | | has served as its Chief Operating | |
| Adviser to the Board | | Officer since 2004. Kiosk is a full- | |
| | | service marketing agency with | |
| | | offices in the San Francisco Bay | |
| | | Area, Toronto, and Liverpool, UK. | |
| | | | |
Interested Trustee(1) | | | |
| | | | |
| Neil J. Hennessy | January 1996 as | Mr. Hennessy has been employed | Hennessy |
| 64 | a Trustee and | by Hennessy Advisors, Inc. since | Advisors, Inc. |
| Trustee, Chairman of | June 2008 as | 1989 and currently serves as its | |
| the Board, Chief | an officer | Chairman and Chief Executive Officer. | |
| Investment Officer, | | | |
| Portfolio Manager, | | | |
| and President | | | |
| Name, Age, | | |
| and Position Held | Start Date | Principal Occupation(s) |
with the Trust
| of Service
| During Past Five Years
|
| Officers | | |
| | | |
| Teresa M. Nilsen | January 1996 | Ms. Nilsen has been employed by Hennessy Advisors, Inc. |
| 54 | | since 1989 and currently serves as its President, Chief Operating |
| Executive Vice President | | Officer, and Secretary. |
| and Treasurer | | |
| | | |
| Daniel B. Steadman | March 2000 | Mr. Steadman has been employed by Hennessy Advisors, Inc. |
| 64 | | since 2000 and currently serves as its Executive Vice President. |
| Executive Vice President | | |
| and Secretary | | |
| | | |
| Brian Carlson | December 2013 | Mr. Carlson has been employed by Hennessy Advisors, Inc. |
| 48 | | since December 2013 and currently serves as its Chief |
| Senior Vice President | | Compliance Officer and Senior Vice President. |
| and Head of Distribution | | |
| | | |
Jennifer Cheskiewicz(2) | June 2013 | Ms. Cheskiewicz has been employed by Hennessy Advisors, Inc. |
| 43 | | as its General Counsel since June 2013. |
| Senior Vice President and | | |
| Chief Compliance Officer | | |
| TRUSTEES AND OFFICERS OF THE FUND |
| Name, Age, | | |
| and Position Held | Start Date | Principal Occupation(s) |
with the Trust
| of Service
| During Past Five Years
|
David Ellison(3) | October 2012 | Mr. Ellison has been employed by Hennessy Advisors, Inc. since |
| 62 | | October 2012. He has served as a Portfolio Manager of the |
| Senior Vice President | | Hennessy Large Cap Financial Fund and the Hennessy Small |
| and Portfolio Manager | | Cap Financial Fund since their inception. Mr. Ellison also served |
| | | as a Portfolio Manager of the Hennessy Technology Fund from |
| | | its inception until February 2017. Mr. Ellison served as Director, |
| | | CIO, and President of FBR Fund Advisers, Inc. from December |
| | | 1999 to October 2012. |
| | | |
Ryan Kelley(4) | March 2013 | Mr. Kelley has been employed by Hennessy Advisors, Inc. since |
| 48 | | October 2012. He has served as a Portfolio Manager of the |
| Senior Vice President | | Hennessy Gas Utility Fund, the Hennessy Large Cap Financial |
| and Portfolio Manager | | Fund, and the Hennessy Small Cap Financial Fund since |
| | | October 2014. He served as Co-Portfolio Manager of these |
| | | same funds from March 2013 through September 2014 and as |
| | | a Portfolio Analyst for the Hennessy Funds from October 2012 |
| | | through February 2013. Mr. Kelley has also served as a Portfolio |
| | | Manager of the Hennessy Cornerstone Growth Fund, the |
| | | Hennessy Cornerstone Mid Cap 30 Fund, the Hennessy |
| | | Cornerstone Large Growth Fund, and the Hennessy |
| | | Cornerstone Value Fund since February 2017 and as a Portfolio |
| | | Manager of the Hennessy Total Return Fund, the Hennessy |
| | | Balanced Fund, and the Hennessy Technology Fund since May |
| | | 2018. He served as Co-Portfolio Manager of the Hennessy |
| | | Technology Fund from February 2017 until May 2018. Mr. Kelley |
| | | served as Portfolio Manager of FBR Fund Advisers, Inc. from |
| | | January 2008 to October 2012. |
| | | |
| Tania Kelley | October 2003 | Ms. Kelley has been employed by Hennessy Advisors, Inc. since |
| 55 | | October 2003. |
| Senior Vice President | | |
| and Head of Marketing | | |
| | | |
L. Joshua Wein(4) | September 2018 | Mr. Wein has been employed by Hennessy Advisors, Inc. since |
| 47 | | 2018. He has served as Co-Portfolio Manager of the Hennessy |
| Vice President and | | Cornerstone Growth Fund, the Hennessy Cornerstone |
| Co-Portfolio Manager | | Mid Cap 30 Fund, the Hennessy Cornerstone Large Growth |
| | | Fund, the Hennessy Cornerstone Value Fund, Hennessy Total |
| | | Return Fund, the Hennessy Balanced Fund, the Hennessy Gas |
| | | Utility Fund, and the Hennessy Technology Fund since February |
| | | 2019. He served as a Senior Analyst of these same funds from |
| | | September 2018 through February 2019. Mr. Wein served as |
| | | Director of Alternative Investments and Co-Portfolio Manager |
| | | at Sterling Capital Management from 2008 to 2018. |
_______________
(1) | Mr. Hennessy is considered an “interested person,” as defined in the Investment Company Act of 1940, as amended, because he is an officer of the Trust. |
(2) | The address of this officer is 4800 Bee Caves Road, Suite 100, Austin, TX 78746. |
(3) | The address of this officer is 101 Federal Street, Suite 1615B, Boston, MA 02110. |
(4) | The address of this officer is 1340 Environ Way, Chapel Hill, NC 27517. |
| HENNESSY FUNDS | 1-800-966-4354 | |
Expense Example (Unaudited)
October 31, 2020
As a shareholder of the Fund, you incur ongoing costs, including management fees, service fees, and other Fund expenses. This Example is intended to help you understand your ongoing costs (in dollars) of investing in the Fund and to compare these costs with the ongoing costs of investing in other mutual funds. The Example is based on an investment of $1,000 invested at the beginning of the period and held for the entire period from May 1, 2020, through October 31, 2020.
Actual Expenses
The first line of the table below under the “Investor Class” and “Institutional Class” headings provides information about actual account values and actual expenses. You may use the information in this line, together with the amount you invested, to estimate the expenses that you paid over the period. Simply divide your account value by $1,000 (for example, an $8,600 account value divided by $1,000 = 8.6), then multiply the result by the number in the first line below the “Investor Class” or “Institutional Class” heading under the column entitled “Expenses Paid During Period” to estimate the expenses you paid on your account during this period. Although the Fund charges no sales loads or transaction fees, you will be assessed fees for outgoing wire transfers, returned checks, and stop payment orders at prevailing rates charged by U.S. Bank Global Fund Services, the Fund’s transfer agent. If you request that a redemption be made by wire transfer, the Fund’s transfer agent charges a $15 fee. IRAs are charged a $15 annual maintenance fee (up to $30 maximum per shareholder for shareholders with multiple IRAs). The example below includes, but is not limited to, management fees, shareholder servicing fees, accounting, custody, and transfer agent fees. However, the example below does not include portfolio trading commissions and related expenses.
Hypothetical Example for Comparison Purposes
The second line of the table below under the “Investor Class” and “Institutional Class” headings provides information about hypothetical account values and hypothetical expenses based on the Fund’s actual expense ratios and an assumed rate of return of 5% per year before expenses, which is not the Fund’s actual return. The hypothetical account values and expenses may not be used to estimate the actual ending account balance or expenses you paid for the period. You may use this information to compare the ongoing costs of investing in the Fund and other funds. To do so, compare this 5% hypothetical example with the 5% hypothetical examples that appear in the shareholder reports of the other funds. Please note that the expenses shown in the table are meant to highlight your ongoing costs only. Therefore, the second line of the table under the “Investor Class” and “Institutional Class” headings is useful in comparing ongoing costs only and will not help you determine the relative total costs of owning different funds.
| | | | Expenses Paid |
| | Beginning | Ending | During Period(1) |
| | Account Value | Account Value | May 1, 2020 – |
| | May 1, 2020
| October 31, 2020 | October 31, 2020 |
| Investor Class | | | |
| Actual | $1,000.00 | $1,148.70 | $9.02 |
| Hypothetical (5% return before expenses) | $1,000.00 | $1,016.74 | $8.47 |
| | | | |
| Institutional Class | | | |
| Actual | $1,000.00 | $1,150.90 | $7.35 |
| Hypothetical (5% return before expenses) | $1,000.00 | $1,018.30 | $6.90 |
(1) | Expenses are equal to the Fund’s annualized expense ratio of 1.67% for Investor Class shares or 1.36% for Institutional Class shares, as applicable, multiplied by the average account value over the period, multiplied by 184/366 days (to reflect the half-year period). |
| HENNESSY FUNDS | 1-800-966-4354 | |
How to Obtain a Copy of the Fund’s Proxy
Voting Policy and Proxy Voting Records
A description of the policies and procedures the Fund uses to determine how to vote proxies relating to portfolio securities is available without charge (1) by calling 1-800-966-4354, (2) on the Hennessy Funds’ website at www.hennessyfunds.com/proxy-voting/voting-policy, or (3) on the U.S. Securities and Exchange Commission’s (the “SEC”) website at www.sec.gov. The Fund’s proxy voting record is available without charge on both the Hennessy Funds’ website at www.hennessyfunds.com/proxy-voting/voting-record and the SEC’s website at www.sec.gov no later than August 31 for the prior 12 months ending June 30.
Availability of Quarterly Portfolio Schedule
The Fund files a complete schedule of portfolio holdings with the SEC for the first and third quarters of each fiscal year as an exhibit to its reports on Form N-PORT. The Fund’s Form N-PORT reports are available on the SEC’s website at www.sec.gov or on request by calling 1-800-966-4354.
Federal Tax Distribution Information
(Unaudited)
For fiscal year 2020, certain dividends paid by the Fund may be subject to a maximum tax rate of 23.8%, as provided for by the Jobs and Growth Tax Relief Reconciliation Act of 2003. The percentage of dividends declared from ordinary income designated as qualified dividend income was 100.00%.
For corporate shareholders, the percent of ordinary income distributions that qualified for the corporate dividends received deduction for fiscal year 2020 was 100.00%.
The percentage of taxable ordinary income distributions that were designated as short-term capital gain distributions under Section 871(k)(2)(C) of the Internal Revenue Code of 1986, as amended, for the Fund was 0.00%.
Important Notice Regarding Delivery
of Shareholder Documents
To help keep the Fund’s costs as low as possible, we generally deliver a single copy of shareholder reports, proxy statements, and prospectuses to shareholders who share an address and have the same last name. This process does not apply to account statements. You may request an individual copy of a shareholder document at any time. If you would like to receive separate mailings of shareholder documents, please call U.S. Bank Global Fund Services at 1-800-261-6950 or 1-414-765-4124, and individual delivery will begin within 30 days of your request. If your account is held through a financial institution or other intermediary, please contact such intermediary directly to request individual delivery.
Electronic Delivery
The Fund offers shareholders the option to receive account statements, prospectuses, tax forms, and shareholder reports online. To sign up for eDelivery, please visit www.hennessyfunds.com/account. You may change your delivery preference at any time by visiting our website or calling U.S. Bank Global Fund Services at 1-800-261-6950 or 1-414-765-4124.
| PROXY VOTING — PRIVACY POLICY |
Liquidity Risk Management Program
In accordance with Rule 22e-4 under the Investment Company Act of 1940, as amended (the “Liquidity Rule”), we have adopted and implemented a liquidity risk management program (the “Liquidity Program”). The purpose of the Liquidity Program is to assess and manage the Fund’s liquidity risk, which is the risk that the Fund would not be able to meet requests to redeem Fund shares without significant dilution of the remaining shareholders’ interests in the Fund. The Board of Trustees of the Fund (the “Board”) designated a committee comprising representatives of Hennessy Advisors, Inc., the investment adviser to the Fund, as the administrator of the Liquidity Program (the “Program Administrator”).
The Program Administrator provided a written report regarding the Liquidity Program to the Board in advance of its meeting on June 3, 2020. The report covered the period from June 1, 2019, through May 31, 2020. The report addressed the operation of the Liquidity Program, assessed the adequacy and effectiveness of its implementation, and described any material changes to the Liquidity Program during the review period. The Trust’s chief compliance officer presented the report to the Board at the meeting and provided additional information regarding the Liquidity Program. The Board reviewed the Liquidity Program and considered, among other items, the following:
| | 1. | The Program Administrator reviewed daily historical net redemption activity during the review period and during prior periods with higher-than-average redemption activity and concluded that the Fund has historically been able to meet requests to redeem Fund shares without significant dilution to the Fund’s remaining shareholders, and the Program Administrator expects the Fund to be able to continue to do so in the future during both normal and reasonably foreseeable stressed conditions. |
| | | |
| | 2. | The Fund primarily holds assets that are highly liquid investments and is therefore not required to establish a highly liquid investment minimum for the Fund or adopt policies and procedures for responding to a highly liquid investment minimum shortfall. |
| | | |
| | 3. | The Program Administrator did not make any material changes to the Liquidity Program during the review period and was not recommending any changes to the Liquidity Program or the model inputs used to determine the liquidity classification of each security held by the Fund. |
| | | |
| | 4. | The Program Administrator concluded that the Liquidity Program was reasonably designed to assess and manage the Fund’s liquidity risk, complies with the requirements of the Liquidity Rule, and was effectively implemented, having operated as intended during the review period. |
Privacy Policy
We collect the following personal information about you:
| | 1. | Information we receive from you in applications or other forms, correspondence, or conversations, including, but not limited to, your name, address, phone number, social security number, assets, income, and date of birth; |
| | | |
| | 2. | Information about your transactions with us, our affiliates, or others, including, but not limited to, your account number and balance, payments history, parties to transactions, cost basis information, and other financial information; and |
| HENNESSY FUNDS | 1-800-966-4354 | |
| | 3. | Other personal information we collect from various sources, even if you have not entered into a prior transaction with us, including the following: |
| | • | Name, alias, address, unique personal identifier, online identifier, IP address, email address, telephone number, account name, and other similar identifiers; |
| | | |
| | • | Age and marital status; |
| | | |
| | • | Commercial information, including records of products purchased; |
| | | |
| | • | Browsing history, search history, and information on interaction with our website; |
| | | |
| | • | Geolocation data; |
| | | |
| | • | Employment and employment history, educational history, financial information, and purchasing and consuming histories or tendencies; and |
| | | |
| | • | Inferences drawn from the above-listed information to create a profile about your preferences, characteristics, predispositions, and behavior. |
We collect this information directly from you, indirectly in the course of providing services to you, directly and indirectly from your activity on our website, from broker dealers, marketing agencies, and other third parties that interact with us in connection with the services we perform and products we offer, and from anonymized and aggregated consumer information.
We use this information to fulfill the reason you provided the information to us, to provide you with other relevant products that you request from us, to provide you with information about products that may interest you, to improve our website or present our website’s contents to you, and as otherwise described to you when collecting your personal information.
We do not disclose any personal information to unaffiliated third parties, except as permitted by law. We may disclose your personal information to our affiliates, vendors, and service providers for a business purpose. For example, we are permitted by law to disclose all of the information we collect, as described above, to our transfer agent to process your transactions. When disclosing your personal information to third parties, we enter into a contract with each third party describing the purpose of such disclosure and requiring that such personal information be kept confidential and not used for any purpose except to perform the services contracted or respond to regulatory or law enforcement requests.
Furthermore, we restrict access to your personal information to those persons who require such information to provide products or services to you. As a result, we do not provide a means for opting out of our limited sharing of your information. We maintain physical, electronic, and procedural safeguards that comply with federal standards to guard your personal information.
If you hold shares of the Funds through a financial intermediary, including, but not limited to, a broker-dealer, bank, or trust company, the privacy policy of your financial intermediary governs how your personal information is shared with unaffiliated third parties.
Supplemental Privacy Notice for Residents of California
The California Consumer Privacy Act of 2018 (the “CCPA”) provides you, as a California resident, with certain additional rights relating to your personal information.
Under the CCPA, you have the right to request that we disclose to you the categories of personal information we have collected about you over the past 12 months, the categories of sources of such information, our business purpose for collecting the
information, the categories of third parties, if any, with whom we shared the information, and the specific information we have collected about you. You also have the right to request that we delete any of your personal information, and, unless an exception applies, we will delete such information upon receiving and confirming your request. To make a request, call us at 1-800-966-4354, email us at privacy@hennessyfunds.com, or go to www.hennessyfunds.com/contact. We will not discriminate against you for exercising your rights under the CCPA. Further, we will not collect additional categories of your personal information or use the personal information we collected for materially different, unrelated, or incompatible purposes without providing you notice.
| HENNESSY FUNDS | 1-800-966-4354 | |
(This Page Intentionally Left Blank.)
For information, questions, or assistance, please call
The Hennessy Funds
1-800-966-4354 or 1-415-899-1555
INVESTMENT ADVISOR
Hennessy Advisors, Inc.
7250 Redwood Boulevard, Suite 200
Novato, California 94945
ADMINISTRATOR,
TRANSFER AGENT,
DIVIDEND PAYING AGENT, &
SHAREHOLDER SERVICING AGENT
U.S. Bancorp Fund Services, LLC
d/b/a U.S. Bank Global Fund Services
P.O. Box 701
Milwaukee, Wisconsin 53201-0701
CUSTODIAN
U.S. Bank N.A.
Custody Operations
1555 North River Center Drive, Suite 302
Milwaukee, Wisconsin 53212
TRUSTEES
Neil J. Hennessy
Robert T. Doyle
J. Dennis DeSousa
Gerald P. Richardson
COUNSEL
Foley & Lardner LLP
777 East Wisconsin Avenue
Milwaukee, Wisconsin 53202-5306
INDEPENDENT REGISTERED
PUBLIC ACCOUNTING FIRM
Tait, Weller & Baker LLP
Two Liberty Place
50 South 16th Street, Suite 2900
Philadelphia, Pennsylvania 19102-2529
DISTRIBUTOR
Quasar Distributors, LLC
111 East Kilbourn Avenue, Suite 2200
Milwaukee, Wisconsin 53202
www.hennessyfunds.com | 1-800-966-4354
This report has been prepared for shareholders and may be distributed to
others only if preceded or accompanied by a current prospectus.
ANNUAL REPORT
OCTOBER 31, 2020
HENNESSY TECHNOLOGY FUND
Investor Class HTECX
Institutional Class HTCIX
IMPORTANT NOTICE REGARDING ELECTRONIC DELIVERY OF SHAREHOLDER REPORTS
Beginning on January 1, 2021, as permitted by regulations adopted by the Securities and Exchange Commission, paper copies of the annual and semi-annual reports will no longer be sent by mail unless you specifically request paper copies from the Hennessy Funds or from your financial intermediary. Instead, the reports will be made available on a website, and you will be notified by mail each time a report is posted and provided with a website link to access the report.
If you have already elected to receive shareholder reports electronically, you will not be affected by this change and you need not take any action. You may elect to receive shareholder reports and other communications from the Hennessy Funds electronically by visiting www.hennessyfunds.com/account or by calling U.S. Bank Global Fund Services at 1-800-261-6950. If you own shares in a Fund through a financial intermediary, please contact your financial intermediary to make this election.
You may elect to receive paper copies of all future reports free of charge by calling U.S. Bank Global Fund Services at 1-800-261-6950 or, if you own your shares through a financial intermediary, by contacting your financial intermediary. Your election to receive paper copies of reports will apply to all Funds in the Hennessy Funds family.
www.hennessyfunds.com | 1-800-966-4354
(This Page Intentionally Left Blank.)
Contents
| Letter to Shareholders | | 2 |
| Performance Overview | | 4 |
| Financial Statements | | |
| Schedule of Investments | | 7 |
| Statement of Assets and Liabilities | | 11 |
| Statement of Operations | | 12 |
| Statements of Changes in Net Assets | | 13 |
| Financial Highlights | | 14 |
| Notes to the Financial Statements | | 18 |
| Report of Independent Registered Public Accounting Firm | | 26 |
| Trustees and Officers of the Fund | | 27 |
| Expense Example | | 30 |
| Proxy Voting Policy and Proxy Voting Records | | 32 |
| Availability of Quarterly Portfolio Schedule | | 32 |
| Federal Tax Distribution Information | | 32 |
| Important Notice Regarding Delivery of Shareholder Documents | | 32 |
| Electronic Delivery | | 32 |
| Liquidity Risk Management Program | | 33 |
| Privacy Policy | | 33 |
| HENNESSY FUNDS | 1-800-966-4354 | |
December 2020
Dear Hennessy Funds Shareholder:
As a new year and new decade dawned in January, no one could have imagined that the world would quickly plunge into one of the worst health crises in history. Throughout this pandemic, our thoughts have remained with those most deeply affected by COVID-19, and we thank our frontline healthcare and essential workers. At Hennessy Funds, we adapted quickly to the impact of COVID-19 to maintain business continuity. We focused on our employees and on you, the shareholders of the Hennessy Funds, and I am pleased that we have been able to navigate successfully during this unprecedented time.
The year was defined by a global pandemic and the ensuing economic shutdowns and by a highly charged presidential election that caused tremendous volatility. Yet the stock market has continued to show its resiliency and strength, as the major indices hit new all-time highs in November and again in December. For the 12 months ended October 31, 2020, U.S. equities posted positive performance, with the S&P 500® Index returning 9.71% and the Dow Jones Industrial Average returning 0.34% for the period. There were extreme differences in how various sectors performed during the period. For instance, the technology-focused NASDAQ Composite Index performed strongly, returning 32.84%, whereas the Energy sector (as represented by the S&P 500® Energy Sector Index) struggled with a loss of -46.43%. The Financials sector also performed relatively poorly during the period, with the Russell 1000® Index Financials losing -8.04% and the Russell 2000® Index Financials losing -17.87%. In addition, large cap stocks significantly outperformed small caps, and growth stocks reigned over value stocks during the period. Moreover, approximately half of the NASDAQ’s return for the period was comprised of just three behemoth technology stocks – Apple, Microsoft, and Amazon. Therefore, while the overall U.S. equities market improved, mutual fund returns varied drastically due to the disparate performance of specific sectors, differently sized companies, and different types of companies.
Optimism about the approval and distribution of effective COVID-19 vaccines appears to be buoying investor confidence. Low interest rates, and the expectation that they will remain low for the foreseeable future, have also provided a tailwind to equity prices. In my opinion, stocks are trading at reasonable valuations given this low interest rate environment, with the Dow Jones Industrial Average trading at 20.1x estimated earnings for 2021 and the S&P 500® Index trading at 21.6x estimated earnings for 2021. The U.S. economy looks to be on the road to recovery and is experiencing moderate inflation, and our banking industry appears healthy. The unemployment rate is dropping, albeit slowly, and I expect it to continue to improve once businesses reopen. There are high levels of cash on corporate balance sheets, which could support rising dividends and stock buybacks.
I believe our corporate business leaders will continue to adapt and find ways to drive growth and value for their shareholders, but I also feel that the uncertainty created by the continued health crisis and the stalemate over fiscal relief will lead to additional bouts of market volatility. I remain confident, however, that the markets can and will thrive in the long run.
Thank you for your continued trust and investment in the Hennessy Funds. We believe that there continue to be strong opportunities throughout many segments of the market, and we are focused on managing our high-conviction portfolios for the long-term
benefit of our shareholders. Should you have any questions or would like to speak with us directly, please reach out and call us at (800) 966-4354.
Best regards,
Neil J. Hennessy
President and Chief Investment Officer
Past performance does not guarantee future results.
Mutual fund investing involves risk. Principal loss is possible.
The Dow Jones Industrial Average and S&P 500® Index are commonly used to measure the performance of U.S. stocks. The NASDAQ Composite Index comprises all common stocks listed on The NASDAQ Stock Market and is commonly used to measure the performance of technology-related stocks. The S&P 500® Energy Sector Index is comprised of companies included in the S&P 500® Index that are classified in the Energy sector. The Russell 1000® Index Financials and Russell 2000® Index Financials are subsets of the Russell 1000® Index and Russell 2000® Index, respectively, that measure the performance of securities classified in the Financials sector of the large-cap and small-cap U.S. equity market, respectively. One cannot invest directly in an index. All returns are shown on a total return basis.
Forward price to earnings (PE) is a valuation measure calculated by dividing a company’s market price per share by its expected earnings per share over the following 12 months. PEs noted are sourced from Bloomberg as of December 9, 2020.
| HENNESSY FUNDS | 1-800-966-4354 | |
Performance Overview (Unaudited)
CHANGE IN VALUE OF $10,000 INVESTMENT
This graph illustrates the performance of an initial investment of $10,000 made in the Fund ten years ago and assumes the reinvestment of dividends.
AVERAGE ANNUAL TOTAL RETURN FOR PERIODS ENDED OCTOBER 31, 2020
| | One | Five | Ten |
| | Year
| Years
| Years
|
| Hennessy Technology Fund – | | | |
| Investor Class (HTECX) | 11.42% | 11.59% | 9.22% |
| Hennessy Technology Fund – | | | |
| Institutional Class (HTCIX) | 11.67% | 11.90% | 9.53% |
| NASDAQ Composite Index | 32.84% | 17.93% | 17.21% |
S&P 500® Index | 9.71% | 11.71% | 13.01% |
| Expense ratios: | Gross 3.85%, Net 1.24%(1) (Investor Class); |
| Gross 3.48%, Net 0.99%(1) (Institutional Class) |
(1) | The Fund’s investment advisor has contractually agreed to limit expenses until February 28, 2021. |
Performance data quoted represents past performance; past performance does not guarantee future results. The investment return and principal value of an investment will fluctuate so that an investor’s shares, when redeemed, may be worth more or less than their original cost. The performance table does not reflect the deduction of taxes that a shareholder would pay on Fund distributions or the redemption of Fund shares. Current performance of the Fund may be lower or higher than the performance quoted. Performance data current to the most recent month end may be obtained by visiting www.hennessyfunds.com. Performance for periods including or prior to October 26, 2012, is that of the FBR Technology Fund.
The NASDAQ Composite Index is a broad-based capitalization-weighted index of all common stocks listed on The NASDAQ Stock Market. The S&P 500® Index is a capitalization-weighted index that is designed to represent the broad domestic economy through changes in the aggregate market value of 500 stocks across all major industries. One cannot invest directly in an index. These indices are used herein for comparative purposes in accordance with Securities and Exchange Commission regulations.
Standard & Poor’s Financial Services is the source and owner of the S&P® and S&P 500® trademarks.
The expense ratios presented are from the most recent prospectus. The expense ratios for the current reporting period are available in the Financial Highlights section of this report.
PERFORMANCE NARRATIVE
Portfolio Managers Ryan C. Kelley, CFA, and L. Joshua Wein, CAIA
Performance:
For the 12-month period ended October 31, 2020, the Investor Class of the Hennessy Technology Fund returned 11.42%, underperforming the NASDAQ Composite Index (the Fund’s primary benchmark), which returned 32.84%, but outperforming the S&P 500® Index, which returned 9.71%, for the same period.
The Fund’s underperformance relative to its primary benchmark resulted predominantly from our stock selection within the Information Technology sector. Among the holdings that detracted the most from Fund performance were Celestica, Inc., a designer and manufacturer of electronic components, GreenSky, Inc. (Class A), a payment processing company, and Hewlett Packard Enterprise Company, a provider of enterprise software, services, and equipment. Among the holdings that contributed the most to Fund performance were Digital Turbine, Inc., a mobile services platform, SolarEdge Technologies, Inc., a provider of solar power optimization and monitoring, and ServiceNow, Inc., a provider of enterprise management software.
Of the companies mentioned, the Fund continues to hold Hewlett Packard Enterprise Company, Digital Turbine, Inc., and ServiceNow, Inc.
Portfolio Strategy:
The Fund utilizes a formula-based investment strategy designed to identify technology-related stocks that exhibit strong cash flows and profits, the ability to sustain profitability, have historically delivered returns in excess of their cost of capital, have attractive balance sheet risk profiles, and trade at attractive relative valuations.
Investment Commentary:
We continue to believe that the outlook for U.S. stocks is positive. In our view, despite a sharp contraction in economic activity as a result of the COVID-19 pandemic, the U.S. economy is in the early stages of growing once again. The Federal Reserve’s low interest rate policy, which is expected to last through 2021, together with the anticipated release of a COVID-19 vaccine in the first half of 2021, may give rise to increased employment, wage gains, and economic growth. While corporate earnings declined over the 12-month period, they are expected to rise meaningfully over the next 12 months as economies around the world recover from the COVID-19 pandemic.
We believe the outlook for technology-related stocks is also positive. Earnings growth for technology companies, as measured by the NASDAQ Composite Index, has been outpacing earnings growth for the market as a whole by a significant margin. While Information Technology stocks continue to trade at a premium to the broader market on a price-to-earnings basis, they are expected to grow earnings at a rate meaningfully higher than the broader market. Given investors’ continued preference for growth-oriented companies, we feel that many technology stocks may still represent value in the context of the broader stock market.
_______________
Opinions expressed are those of the Portfolio Manager as of the date written and are subject to change, are not guaranteed, and should not be considered investment advice or an indication of trading intent.
Investments are focused in the Technology sector as well as the following sub-industries: Internet & Direct Marketing Retail, Interactive Home Entertainment, and Interactive Media Services. Sector funds may be subject to a higher degree of market risk. Investments in foreign securities
| HENNESSY FUNDS | 1-800-966-4354 | |
may involve political, economic, and currency risks, greater volatility, and differences in accounting methods. The Fund invests in small-sized and medium-sized companies, which may have more limited liquidity and greater volatility compared to larger companies. Please see the Fund’s prospectus for a more complete discussion of these and other risks.
References to specific securities should not be considered a recommendation to buy or sell any security. Fund holdings and sector allocations are subject to change. Please refer to the Schedule of Investments included in this report for additional portfolio information.
Earnings growth is not a measure of the Fund’s future performance.
Price to earnings is calculated by dividing a company’s market price per share by its earnings per share. Cash flow refers to the net amount of cash and cash equivalents being transferred into and out of a company.
| PERFORMANCE OVERVIEW/SCHEDULE OF INVESTMENTS |
Financial Statements
Schedule of Investments as of October 31, 2020 |
HENNESSY TECHNOLOGY FUND
(% of Net Assets)
| TOP TEN HOLDINGS (EXCLUDING MONEY MARKET FUNDS) | % NET ASSETS |
| Vipshop Holdings Ltd. – ADR | 2.38% |
| Automatic Data Processing, Inc | 1.89% |
| Paycom Software, Inc. | 1.79% |
| eGain Corp. | 1.78% |
| Methode Electronics, Inc. | 1.77% |
| Paychex, Inc. | 1.75% |
| Teradyne, Inc. | 1.75% |
| Revolve Group, Inc. | 1.74% |
| ServiceNow, Inc. | 1.74% |
| Ubiquiti Networks, Inc. | 1.74% |
Note: For presentation purposes, the Fund has grouped some of the industry categories. For purposes of categorizing securities for compliance with Section 8(b)(1) of the Investment Company Act of 1940, as amended, the Fund uses more specific industry classifications.
The Global Industry Classification Standard (GICS®) was developed by and is the exclusive property and a service mark of MSCI, Inc. and Standard & Poor’s Financial Services LLC. It has been licensed for use by the Hennessy Funds.
| HENNESSY FUNDS | 1-800-966-4354 | |
| COMMON STOCKS – 96.28% | | Number | | | | | | % of | |
| | | of Shares | | | Value | | | Net Assets | |
| Communication Services – 2.72% | | | | | | | | | |
| SciPlay Corp. (a) | | | 5,623 | | | $ | 75,067 | | | | 1.31 | % |
| ZoomInfo Technologies, Inc. (a) | | | 2,134 | | | | 81,071 | | | | 1.41 | % |
| | | | | | | | 156,138 | | | | 2.72 | % |
| | | | | | | | | | | | | |
| Consumer Discretionary – 10.37% | | | | | | | | | | | | |
| Amazon.com, Inc. (a) | | | 31 | | | | 94,121 | | | | 1.64 | % |
| Booking Holdings, Inc. (a) | | | 56 | | | | 90,860 | | | | 1.59 | % |
| Etsy, Inc. (a) | | | 709 | | | | 86,207 | | | | 1.50 | % |
| Qurate Retail Group, Inc. | | | 12,853 | | | | 87,015 | | | | 1.52 | % |
| Revolve Group, Inc. (a) | | | 5,500 | | | | 99,440 | | | | 1.74 | % |
| Vipshop Holdings Ltd. – ADR (a)(b) | | | 6,359 | | | | 136,082 | | | | 2.38 | % |
| | | | | | | | 593,725 | | | | 10.37 | % |
| | | | | | | | | | | | | |
| Information Technology – 83.19% | | | | | | | | | | | | |
| Accenture PLC, Class A (b) | | | 434 | | | | 94,139 | | | | 1.64 | % |
| Adobe Systems, Inc. (a) | | | 197 | | | | 88,079 | | | | 1.54 | % |
| Apple, Inc. | | | 837 | | | | 91,116 | | | | 1.59 | % |
| Applied Materials, Inc. | | | 1,579 | | | | 93,524 | | | | 1.63 | % |
| Aspen Technology, Inc. (a) | | | 729 | | | | 80,051 | | | | 1.40 | % |
| Atlassian Corp. PLC (a)(b) | | | 502 | | | | 96,193 | | | | 1.68 | % |
| Autodesk, Inc. (a) | | | 418 | | | | 98,456 | | | | 1.72 | % |
| Automatic Data Processing, Inc. | | | 687 | | | | 108,519 | | | | 1.89 | % |
| Booz Allen Hamilton Holding Corp., Class A | | | 1,181 | | | | 92,708 | | | | 1.62 | % |
| Cadence Design Systems, Inc. (a) | | | 897 | | | | 98,105 | | | | 1.71 | % |
| Cardtronics PLC (a)(b) | | | 4,592 | | | | 81,784 | | | | 1.43 | % |
| CDW Corp. | | | 793 | | | | 97,222 | | | | 1.70 | % |
| Celestica, Inc. (a)(b) | | | 13,369 | | | | 78,476 | | | | 1.37 | % |
| Citrix Systems, Inc. | | | 704 | | | | 79,742 | | | | 1.39 | % |
| Digital Turbine, Inc. (a) | | | 2,670 | | | | 76,522 | | | | 1.34 | % |
| DXC Technology Co. | | | 5,133 | | | | 94,550 | | | | 1.65 | % |
| eGain Corp. (a) | | | 6,431 | | | | 101,931 | | | | 1.78 | % |
| Enphase Energy, Inc. (a) | | | 1,002 | | | | 98,286 | | | | 1.72 | % |
| Fair Isaac Corp. (a) | | | 220 | | | | 86,119 | | | | 1.50 | % |
| Fortinet, Inc. (a) | | | 771 | | | | 85,095 | | | | 1.49 | % |
| Hewlett Packard Enterprise Co. | | | 9,783 | | | | 84,525 | | | | 1.48 | % |
| Intel Corp. | | | 1,828 | | | | 80,944 | | | | 1.41 | % |
The accompanying notes are an integral part of these financial statements.
| COMMON STOCKS | | Number | | | | | | % of | |
| | | of Shares | | | Value | | | Net Assets | |
| Information Technology (Continued) | | | | | | | | | |
| Intuit, Inc. | | | 290 | | | $ | 91,257 | | | | 1.59 | % |
| KLA-Tencor Corp. | | | 474 | | | | 93,463 | | | | 1.63 | % |
| Lam Research Corp. | | | 272 | | | | 93,046 | | | | 1.62 | % |
| Mastercard, Inc., Class A | | | 270 | | | | 77,933 | | | | 1.36 | % |
| Maxim Integrated Products, Inc. | | | 1,354 | | | | 94,306 | | | | 1.65 | % |
| Methode Electronics, Inc. | | | 3,300 | | | | 101,541 | | | | 1.77 | % |
| Microsoft Corp. | | | 442 | | | | 89,492 | | | | 1.56 | % |
| NCR Corp. (a) | | | 4,167 | | | | 84,673 | | | | 1.48 | % |
| NeoPhotonics Corp. (a) | | | 14,341 | | | | 97,662 | | | | 1.71 | % |
| NetApp, Inc. | | | 2,207 | | | | 96,865 | | | | 1.69 | % |
| Oracle Corp. | | | 1,608 | | | | 90,225 | | | | 1.58 | % |
| Paychex, Inc. | | | 1,220 | | | | 100,345 | | | | 1.75 | % |
| Paycom Software, Inc. (a) | | | 282 | | | | 102,673 | | | | 1.79 | % |
| Qualcomm, Inc. | | | 792 | | | | 97,701 | | | | 1.71 | % |
| Sanmina Corp. (a) | | | 3,565 | | | | 87,129 | | | | 1.52 | % |
| ScanSource, Inc. (a) | | | 4,605 | | | | 92,561 | | | | 1.62 | % |
| Seagate Technology PLC (b) | | | 1,952 | | | | 93,345 | | | | 1.63 | % |
| ServiceNow, Inc. (a) | | | 200 | | | | 99,514 | | | | 1.74 | % |
| ShotSpotter, Inc. (a) | | | 3,209 | | | | 94,056 | | | | 1.64 | % |
| SINA Corp. (a)(b) | | | 2,311 | | | | 99,026 | | | | 1.73 | % |
| Super Micro Computer, Inc. (a) | | | 3,565 | | | | 80,997 | | | | 1.41 | % |
| Take-Two Interactive Software, Inc. (a) | | | 563 | | | | 87,220 | | | | 1.52 | % |
| Teradata Corp. (a) | | | 4,216 | | | | 77,448 | | | | 1.35 | % |
| Teradyne, Inc. | | | 1,141 | | | | 100,237 | | | | 1.75 | % |
| Texas Instruments, Inc. | | | 656 | | | | 94,851 | | | | 1.66 | % |
| Ubiquiti Networks, Inc. | | | 536 | | | | 99,487 | | | | 1.74 | % |
| Visa, Inc., Class A | | | 472 | | | | 85,767 | | | | 1.50 | % |
| Vishay Intertechnology, Inc. | | | 5,894 | | | | 95,601 | | | | 1.67 | % |
| Xerox Holdings Corp. | | | 4,993 | | | | 86,778 | | | | 1.52 | % |
| Zoom Video Communications, Inc. (a) | | | 201 | | | | 92,643 | | | | 1.62 | % |
| | | | | | | | 4,763,928 | | | | 83.19 | % |
| Total Common Stocks | | | | | | | | | | | | |
| (Cost $4,821,060) | | | | | | | 5,513,791 | | | | 96.28 | % |
The accompanying notes are an integral part of these financial statements.
| HENNESSY FUNDS | 1-800-966-4354 | |
| SHORT-TERM INVESTMENTS – 4.01% | | Number | | | | | | % of | |
| | | of Shares | | | Value | | | Net Assets | |
| Money Market Funds – 4.01% | | | | | | | | | |
| First American Government Obligations Fund, | | | | | | | | | |
| Institutional Class, 0.05% (c) | | | 229,470 | | | $ | 229,470 | | | | 4.01 | % |
| | | | | | | | | | | | | |
| Total Short-Term Investments | | | | | | | | | | | | |
| (Cost $229,470) | | | | | | | 229,470 | | | | 4.01 | % |
| | | | | | | | | | | | | |
| Total Investments | | | | | | | | | | | | |
| (Cost $5,050,530) – 100.29% | | | | | | | 5,743,261 | | | | 100.29 | % |
| Liabilities in Excess of Other Assets – (0.29)% | | | | | | | (16,794 | ) | | | (0.29 | )% |
| | | | | | | | | | | | | |
TOTAL NET ASSETS – 100.00% | | | | | | $ | 5,726,467 | | | | 100.00 | % |
Percentages are stated as a percent of net assets.
ADR – American Depositary Receipt
PLC – Public Limited Company
| (a) | Non-income-producing security. |
| (b) | U.S.-traded security of a foreign corporation. |
| (c) | The rate listed is the fund’s seven-day yield as of October 31, 2020. |
Summary of Fair Value Exposure as of October 31, 2020
The following is a summary of the inputs used to value the Fund’s net assets as of October 31, 2020 (see Note 3 in the accompanying Notes to the Financial Statements):
| Common Stocks | | Level 1 | | | Level 2 | | | Level 3 | | | Total | |
| Communication Services | | $ | 156,138 | | | $ | — | | | $ | — | | | $ | 156,138 | |
| Consumer Discretionary | | | 593,725 | | | | — | | | | — | | | | 593,725 | |
| Information Technology | | | 4,763,928 | | | | — | | | | — | | | | 4,763,928 | |
| Total Common Stocks | | $ | 5,513,791 | | | $ | — | | | $ | — | | | $ | 5,513,791 | |
| Short-Term Investments | | | | | | | | | | | | | | | | |
| Money Market Funds | | $ | 229,470 | | | $ | — | | | $ | — | | | $ | 229,470 | |
| Total Short-Term Investments | | $ | 229,470 | | | $ | — | | | $ | — | | | $ | 229,470 | |
| Total Investments | | $ | 5,743,261 | | | $ | — | | | $ | — | | | $ | 5,743,261 | |
The accompanying notes are an integral part of these financial statements.
| SCHEDULE OF INVESTMENTS/STATEMENT OF ASSETS AND LIABILITIES |
Financial Statements
Statement of Assets and Liabilities as of October 31, 2020 |
| ASSETS: | | | |
| Investments in securities, at value (cost $5,050,530) | | $ | 5,743,261 | |
| Dividends and interest receivable | | | 2,402 | |
| Receivable for fund shares sold | | | 939 | |
| Prepaid expenses and other assets | | | 12,967 | |
| Due from advisor | | | 1,239 | |
| Total assets | | | 5,760,808 | |
| | | | | |
| LIABILITIES: | | | | |
| Payable to auditor | | | 23,100 | |
| Accrued distribution fees | | | 957 | |
| Accrued service fees | | | 380 | |
| Accrued trustees fees | | | 3,937 | |
| Accrued expenses and other payables | | | 5,967 | |
| Total liabilities | | | 34,341 | |
| NET ASSETS | | $ | 5,726,467 | |
| | | | | |
| NET ASSETS CONSISTS OF: | | | | |
| Capital stock | | $ | 4,425,790 | |
| Total distributable earnings | | | 1,300,677 | |
| Total net assets | | $ | 5,726,467 | |
| | | | | |
| NET ASSETS: | | | | |
| Investor Class | | | | |
| Shares authorized (no par value) | | Unlimited | |
| Net assets applicable to outstanding shares | | $ | 4,256,625 | |
| Shares issued and outstanding | | | 207,626 | |
| Net asset value, offering price, and redemption price per share | | $ | 20.50 | |
| | | | | |
| Institutional Class | | | | |
| Shares authorized (no par value) | | Unlimited | |
| Net assets applicable to outstanding shares | | $ | 1,469,842 | |
| Shares issued and outstanding | | | 69,725 | |
| Net asset value, offering price, and redemption price per share | | $ | 21.08 | |
The accompanying notes are an integral part of these financial statements.
| HENNESSY FUNDS | 1-800-966-4354 | |
Financial Statements
Statement of Operations for the year ended October 31, 2020 |
| INVESTMENT INCOME: | | | |
| Dividend income | | $ | 71,681 | |
| Interest income | | | 1,061 | |
| Total investment income | | | 72,742 | |
| | | | | |
| EXPENSES: | | | | |
| Investment advisory fees (See Note 5) | | | 40,325 | |
| Federal and state registration fees | | | 33,404 | |
| Compliance expense (See Note 5) | | | 27,703 | |
| Audit fees | | | 23,104 | |
| Administration, accounting, custody, and transfer agent fees (See Note 5) | | | 17,118 | |
| Trustees’ fees and expenses | | | 13,167 | |
| Sub-transfer agent expenses – Investor Class (See Note 5) | | | 6,619 | |
| Sub-transfer agent expenses – Institutional Class (See Note 5) | | | 672 | |
| Reports to shareholders | | | 6,223 | |
| Distribution fees – Investor Class (See Note 5) | | | 6,116 | |
| Service fees – Investor Class (See Note 5) | | | 4,077 | |
| Legal fees | | | 76 | |
| Interest expense (See Note 7) | | | 9 | |
| Other expenses | | | 4,149 | |
| Total expenses before waivers and reimbursements | | | 182,762 | |
| Service provider expense waiver (See Note 5) | | | (4,622 | ) |
| Expense reimbursement by advisor – Investor Class (See Note 5) | | | (86,892 | ) |
| Expense reimbursement by advisor – Institutional Class (See Note 5) | | | (27,643 | ) |
| Net expenses | | | 63,605 | |
| NET INVESTMENT INCOME | | $ | 9,137 | |
| | | | | |
| REALIZED AND UNREALIZED GAINS (LOSSES): | | | | |
| Net realized gain on investments | | $ | 677,479 | |
| Net change in unrealized appreciation/depreciation on investments | | | (84,382 | ) |
| Net gain on investments | | | 593,097 | |
| NET INCREASE IN NET ASSETS RESULTING FROM OPERATIONS | | $ | 602,234 | |
The accompanying notes are an integral part of these financial statements.
| STATEMENT OF OPERATIONS/STATEMENTS OF CHANGES IN NET ASSETS |
Financial Statements
| Statements of Changes in Net Assets |
| | | Year Ended | | | Year Ended | |
| | | October 31, 2020 | | | October 31, 2019 | |
| OPERATIONS: | | | | | | |
| Net investment income (loss) | | $ | 9,137 | | | $ | (5,958 | ) |
| Net realized gain on investments | | | 677,479 | | | | 156,775 | |
| Net change in unrealized | | | | | | | | |
| appreciation/depreciation on investments | | | (84,382 | ) | | | 729,890 | |
| Net increase in net assets resulting from operations | | | 602,234 | | | | 880,707 | |
| | | | | | | | | |
| DISTRIBUTIONS TO SHAREHOLDERS: | | | | | | | | |
| Distributable earnings – Investor Class | | | (108,418 | ) | | | (408,753 | ) |
| Distributable earnings – Institutional Class | | | (37,553 | ) | | | (138,693 | ) |
| Total distributions | | | (145,971 | ) | | | (547,446 | ) |
| | | | | | | | | |
| CAPITAL SHARE TRANSACTIONS: | | | | | | | | |
| Proceeds from shares subscribed – Investor Class | | | 731,750 | | | | 371,583 | |
| Proceeds from shares subscribed – Institutional Class | | | 67,473 | | | | 149,605 | |
| Dividends reinvested – Investor Class | | | 106,748 | | | | 401,355 | |
| Dividends reinvested – Institutional Class | | | 37,105 | | | | 137,038 | |
| Cost of shares redeemed – Investor Class | | | (811,778 | ) | | | (435,464 | ) |
| Cost of shares redeemed – Institutional Class | | | (92,300 | ) | | | (124,774 | ) |
| Net increase in net assets derived | | | | | | | | |
| from capital share transactions | | | 38,998 | | | | 499,343 | |
| TOTAL INCREASE IN NET ASSETS | | | 495,261 | | | | 832,604 | |
| | | | | | | | | |
| NET ASSETS: | | | | | | | | |
| Beginning of year | | | 5,231,206 | | | | 4,398,602 | |
| End of year | | $ | 5,726,467 | | | $ | 5,231,206 | |
| | | | | | | | | |
| CHANGES IN SHARES OUTSTANDING: | | | | | | | | |
| Shares sold – Investor Class | | | 39,530 | | | | 21,608 | |
| Shares sold – Institutional Class | | | 3,356 | | | | 8,241 | |
| Shares issued to holders as reinvestment | | | | | | | | |
| of dividends – Investor Class | | | 5,574 | | | | 26,633 | |
| Shares issued to holders as reinvestment | | | | | | | | |
| of dividends – Institutional Class | | | 1,887 | | | | 8,882 | |
| Shares redeemed – Investor Class | | | (43,369 | ) | | | (25,732 | ) |
| Shares redeemed – Institutional Class | | | (4,535 | ) | | | (7,113 | ) |
| Net increase in shares outstanding | | | 2,443 | | | | 32,519 | |
The accompanying notes are an integral part of these financial statements.
| HENNESSY FUNDS | 1-800-966-4354 | |
Financial Statements
For an Investor Class share outstanding throughout each year
PER SHARE DATA:
Net asset value, beginning of year
Income from investment operations:
Net investment income (loss)
Net realized and unrealized gains on investments
Total from investment operations
Less distributions:
Dividends from net realized gains
Total distributions
Net asset value, end of year
TOTAL RETURN
SUPPLEMENTAL DATA AND RATIOS:
Net assets, end of year (millions)
Ratio of expenses to average net assets:
Before expense reimbursement
After expense reimbursement
Ratio of net investment income (loss) to average net assets:
Before expense reimbursement
After expense reimbursement
Portfolio turnover rate(3)
(1) | Calculated using the average shares outstanding method. |
(2) | The Fund’s current expense limitation agreement, which became effective on February 28, 2017, was in effect for eight months of the year ended October 31, 2017. |
(3) | Calculated on the basis of the Fund as a whole. |
The accompanying notes are an integral part of these financial statements.
| FINANCIAL HIGHLIGHTS — INVESTOR CLASS |
| Year Ended October 31, | |
| 2020 | | | 2019 | | | 2018 | | | 2017 | | | 2016 | |
| | | | | | | | | | | | | | |
| $ | 18.90 | | | $ | 18.04 | | | $ | 18.46 | | | $ | 15.82 | | | $ | 15.36 | |
| | | | | | | | | | | | | | | | | | | |
| | | | | | | | | | | | | | | | | | | |
| | 0.02 | (1) | | | (0.03 | )(1) | | | (0.05 | ) | | | (0.23 | ) | | | (0.68 | ) |
| | 2.10 | | | | 3.15 | | | | 1.26 | | | | 2.87 | | | | 1.14 | |
| | 2.12 | | | | 3.12 | | | | 1.21 | | | | 2.64 | | | | 0.46 | |
| | | | | | | | | | | | | | | | | | | |
| | | | | | | | | | | | | | | | | | | |
| | (0.52 | ) | | | (2.26 | ) | | | (1.63 | ) | | | — | | | | — | |
| | (0.52 | ) | | | (2.26 | ) | | | (1.63 | ) | | | — | | | | — | |
| $ | 20.50 | | | $ | 18.90 | | | $ | 18.04 | | | $ | 18.46 | | | $ | 15.82 | |
| | | | | | | | | | | | | | | | | | | |
| | 11.42 | % | | | 20.47 | % | | | 7.25 | % | | | 16.69 | % | | | 2.99 | % |
| | | | | | | | | | | | | | | | | | | |
| | | | | | | | | | | | | | | | | | | |
| $ | 4.26 | | | $ | 3.89 | | | $ | 3.31 | | | $ | 3.20 | | | $ | 2.91 | |
| | | | | | | | | | | | | | | | | | | |
| | 3.45 | % | | | 3.84 | % | | | 3.70 | % | | | 4.16 | % | | | 3.61 | % |
| | 1.23 | % | | | 1.23 | % | | | 1.23 | % | | | 2.15 | %(2) | | | 3.61 | % |
| | | | | | | | | | | | | | | | | | | |
| | (2.12 | )% | | | (2.80 | )% | | | (2.83 | )% | | | (3.16 | )% | | | (2.92 | )% |
| | 0.10 | % | | | (0.19 | )% | | | (0.36 | )% | | | (1.15 | )%(2) | | | (2.92 | )% |
| | 192 | % | | | 185 | % | | | 225 | % | | | 267 | % | | | 80 | % |
The accompanying notes are an integral part of these financial statements.
| HENNESSY FUNDS | 1-800-966-4354 | |
Financial Statements
For an Institutional Class share outstanding throughout each year
PER SHARE DATA:
Net asset value, beginning of year
Income from investment operations:
Net investment income (loss)
Net realized and unrealized gains on investments
Total from investment operations
Less distributions:
Dividends from net investment income
Dividends from net realized gains
Total distributions
Net asset value, end of year
TOTAL RETURN
SUPPLEMENTAL DATA AND RATIOS:
Net assets, end of year (millions)
Ratio of expenses to average net assets:
Before expense reimbursement
After expense reimbursement
Ratio of net investment income (loss) to average net assets:
Before expense reimbursement
After expense reimbursement
Portfolio turnover rate(3)
(1) | Calculated using the average shares outstanding method. |
(2) | The Fund’s current expense limitation agreement, which became effective on February 28, 2017, was in effect for eight months of the year ended October 31, 2017. |
(3) | Calculated on the basis of the Fund as a whole. |
The accompanying notes are an integral part of these financial statements.
| FINANCIAL HIGHLIGHTS — INSTITUTIONAL CLASS |
| Year Ended October 31, | |
| 2020 | | | 2019 | | | 2018 | | | 2017 | | | 2016 | |
| | | | | | | | | | | | | | |
| $ | 19.40 | | | $ | 18.47 | | | $ | 18.85 | | | $ | 16.11 | | | $ | 15.58 | |
| | | | | | | | | | | | | | | | | | | |
| | | | | | | | | | | | | | | | | | | |
| | 0.07 | (1) | | | 0.01 | (1) | | | 0.01 | | | | (0.12 | ) | | | (0.43 | ) |
| | 2.15 | | | | 3.23 | | | | 1.28 | | | | 2.86 | | | | 0.96 | |
| | 2.22 | | | | 3.24 | | | | 1.29 | | | | 2.74 | | | | 0.53 | |
| | | | | | | | | | | | | | | | | | | |
| | | | | | | | | | | | | | | | | | | |
| | (0.01 | ) | | | — | | | | — | | | | — | | | | — | |
| | (0.53 | ) | | | (2.31 | ) | | | (1.67 | ) | | | — | | | | — | |
| | (0.54 | ) | | | (2.31 | ) | | | (1.67 | ) | | | — | | | | — | |
| $ | 21.08 | | | $ | 19.40 | | | $ | 18.47 | | | $ | 18.85 | | | $ | 16.11 | |
| | | | | | | | | | | | | | | | | | | |
| | 11.67 | % | | | 20.77 | % | | | 7.54 | % | | | 17.01 | % | | | 3.40 | % |
| | | | | | | | | | | | | | | | | | | |
| | | | | | | | | | | | | | | | | | | |
| $ | 1.47 | | | $ | 1.34 | | | $ | 1.09 | | | $ | 1.22 | | | $ | 0.90 | |
| | | | | | | | | | | | | | | | | | | |
| | 3.08 | % | | | 3.47 | % | | | 3.27 | % | | | 3.74 | % | | | 3.28 | % |
| | 0.98 | % | | | 0.98 | % | | | 0.98 | % | | | 1.77 | %(2) | | | 3.28 | % |
| | | | | | | | | | | | | | | | | | | |
| | (1.74 | )% | | | (2.43 | )% | | | (2.41 | )% | | | (2.74 | )% | | | (2.59 | )% |
| | 0.36 | % | | | 0.06 | % | | | (0.12 | )% | | | (0.77 | )%(2) | | | (2.59 | )% |
| | 192 | % | | | 185 | % | | | 225 | % | | | 267 | % | | | 80 | % |
The accompanying notes are an integral part of these financial statements.
| HENNESSY FUNDS | 1-800-966-4354 | |
Financial Statements
Notes to the Financial Statements October 31, 2020 |
1). ORGANIZATION
The Hennessy Technology Fund (the “Fund”) is a series of Hennessy Funds Trust (the “Trust”), which was organized as a Delaware statutory trust on September 17, 1992. The Fund is an open-end management investment company registered under the Investment Company Act of 1940, as amended. The investment objective of the Fund is long-term capital appreciation. The Fund is a diversified fund.
The Fund offers Investor Class and Institutional Class shares. Each class of shares differs principally in its respective 12b-1 distribution and service, shareholder servicing, and sub-transfer agent expenses. There are no sales charges. Each class has identical rights to earnings, assets, and voting privileges, except for class-specific expenses and exclusive rights to vote on matters affecting only one class.
As an investment company, the Fund follows the investment company accounting and reporting guidance of the Financial Accounting Standards Board (“FASB”) Accounting Standard Codification Topic 946 “Financial Services—Investment Companies.”
2). SIGNIFICANT ACCOUNTING POLICIES
The following is a summary of significant accounting policies consistently followed by the Fund in the preparation of the financial statements. These policies conform to U.S. generally accepted accounting principles (“GAAP”).
| a). | Securities Valuation – All investments in securities are valued in accordance with the Fund’s valuation policies and procedures, as described in Note 3. |
| | |
| b). | Federal Income Taxes – No provision for federal income taxes or excise taxes has been made because the Fund has elected to be taxed as a regulated investment company and intends to distribute substantially all of its taxable income to its shareholders and otherwise comply with the provisions of the Internal Revenue Code of 1986, as amended, applicable to regulated investment companies. Net investment income/loss and realized gains/losses for federal income tax purposes may differ from those reported in the financial statements because of temporary book and tax basis differences. Temporary differences are primarily the result of the treatment of wash sales for tax reporting purposes. The Fund recognizes interest and penalties related to income tax benefits, if any, in the Statement of Operations as an income tax expense. Distributions from net realized gains for book purposes may include short-term capital gains, which are included as ordinary income to shareholders for tax purposes. The Fund may utilize equalization accounting for tax purposes and designate earnings and profits, including net realized gains distributed to shareholders on redemption of shares, as part of the dividends paid deduction for income tax purposes. |
| | |
| | Due to inherent differences in the recognition of income, expenses, and realized gains/losses under GAAP and federal income tax regulations, permanent differences between book and tax basis for reporting are identified and appropriately reclassified in the Statement of Assets and Liabilities, as needed. The adjustments for fiscal year 2020 are as follows: |
| | Total | | |
| | Distributable | | |
| | Earnings
| Capital Stock | |
| | $(50,214) | $50,214 | |
| NOTES TO THE FINANCIAL STATEMENTS |
| c). | Accounting for Uncertainty in Income Taxes – The Fund has accounting policies regarding recognition and measurement of tax positions taken or expected to be taken on a tax return. The tax returns of the Fund for the prior three fiscal years are open for examination. The Fund has reviewed all open tax years in major jurisdictions and concluded that there is no impact on the Fund’s net assets and no tax liability resulting from unrecognized tax benefits relating to uncertain income tax positions taken or expected to be taken on a tax return. The Fund’s major tax jurisdictions are U.S. federal and Delaware. |
| | |
| d). | Income and Expenses – Dividend income is recognized on the ex-dividend date or as soon as information is available to the Fund. Interest income, which includes the amortization of premium and accretion of discount, is recognized on an accrual basis. Market discounts, original issue discounts, and market premiums on debt securities are accreted or amortized to interest income over the life of a security with a corresponding increase or decrease, as applicable, in the cost basis of such security using the yield to maturity method, or where applicable, the first call date of the security. Other non-cash dividends are recognized as investment income at the fair value of the property received. The Fund is charged for those expenses that are directly attributable to its portfolio, such as advisory, administration, and certain shareholder service fees. Income, expenses (other than expenses attributable to a specific class), and realized and unrealized gains/losses on investments are allocated to each class of shares based on such class’s net assets. |
| | |
| e). | Distributions to Shareholders – Dividends from net investment income for the Fund, if any, are declared and paid annually, usually in December. Distributions of net realized capital gains, if any, are declared and paid annually, usually in December. |
| | |
| f). | Security Transactions – Investment and shareholder transactions are recorded on the trade date. The Fund determines the realized gain/loss from an investment transaction by comparing the original cost of the security lot sold with the net sale proceeds. Discounts and premiums on securities purchased are accreted or amortized, respectively, over the life of each such security. |
| | |
| g). | Use of Estimates – The preparation of financial statements in conformity with GAAP requires management to make estimates and assumptions that affect the reported amounts of assets and liabilities and disclosure of contingent assets and liabilities at the date of the financial statements and the reported change in net assets during the reporting period. Actual results could differ from those estimates. |
| | |
| h). | Share Valuation – The net asset value (“NAV”) per share of the Fund is calculated by dividing (i) the total value of the securities held by the Fund, plus cash and other assets, minus all liabilities (including estimated accrued expenses) by (ii) the total number of shares outstanding for the Fund, rounded to the nearest $0.01. The Fund’s shares will not be priced on days the New York Stock Exchange is closed for trading. The offering and redemption price per share for the Fund is equal to the Fund’s NAV per share. |
| | |
| i). | New Accounting Pronouncements – In August 2018, the FASB issued Accounting Standards Update No. 2018-13 “Disclosure Framework—Changes to the Disclosure Requirements for Fair Value Measurement” (“ASU 2018-13”). ASU 2018-13 eliminates the requirement to disclose the amount of and reasons for transfers between Level 1 and Level 2 of the fair value hierarchy, the timing of transfers between levels of the fair value hierarchy, and the valuation processes for Level 3 fair value measurements. ASU 2018-13 does not eliminate the requirement to disclose the range and weighted average used to develop significant unobservable inputs for Level 3 fair value |
| HENNESSY FUNDS | 1-800-966-4354 | |
| | measurements, and the changes in unrealized gains and losses for recurring Level 3 fair value measurements. ASU 2018-13 requires that information is provided about the measurement uncertainty of Level 3 fair value measurements as of the reporting date. The guidance is effective for fiscal years beginning after December 15, 2019, and interim periods within those fiscal years. Management evaluated the impact of this change in guidance and, due to the permissibility of early adoption, modified the Fund’s fair value disclosures beginning with its fiscal year 2019. |
3). SECURITIES VALUATION
The Fund follows its valuation policies and procedures in determining its net asset value and, in preparing these financial statements, the fair value accounting standards that establish an authoritative definition of fair value and set out a hierarchy for measuring fair value. These standards require additional disclosures about the various inputs and valuation techniques used to develop the measurements of fair value and a discussion of changes in valuation techniques and related inputs during the period. These inputs are summarized in the three broad levels listed below:
| | Level 1 – | Unadjusted, quoted prices in active markets for identical instruments that the Fund has the ability to access at the date of measurement. |
| | | |
| | Level 2 – | Other significant observable inputs (including, but not limited to, quoted prices in active markets for similar instruments, quoted prices in markets that are not active for identical or similar instruments, and model-derived valuations in which all significant inputs and significant value drivers are observable in active markets, such as interest rates, prepayment speeds, credit risk curves, default rates, and similar data). |
| | | |
| | Level 3 – | Significant unobservable inputs (including the Fund’s own assumptions about what market participants would use to price the asset or liability based on the best available information) when observable inputs are unavailable. |
The following is a description of the valuation techniques applied to the Fund’s major categories of assets and liabilities on a recurring basis:
| | Equity Securities – Equity securities, including common stocks, preferred stocks, foreign-issued common stocks, exchange-traded funds, closed-end mutual funds, partnerships, rights, and real estate investment trusts, that are traded on a securities exchange for which a last-quoted sales price is readily available will generally be valued at the last sales price as reported by the primary exchange on which the securities are listed. Securities listed on The NASDAQ Stock Market (“NASDAQ”) will generally be valued at the NASDAQ Official Closing Price, which may differ from the last sales price reported. Securities traded on a securities exchange for which a last-quoted sales price is not readily available will generally be valued at the mean between the bid and ask prices. To the extent these securities are actively traded and valuation adjustments are not applied, they are classified in Level 1 of the fair value hierarchy. Securities traded on foreign exchanges generally are not valued at the same time the Fund calculates its NAV because most foreign markets close well before such time. The earlier close of most foreign markets gives rise to the possibility that significant events, including broad market moves, may have occurred in the interim. In certain circumstances, it may be determined that a foreign security needs to be fair valued because it appears that the value of the security might have been materially affected by events occurring after the close of the market in which the security is principally traded, but before the time the Fund calculates its NAV, such as by a development that affects an entire market or region (e.g., a weather-related event) or a potentially global development (e.g., a terrorist attack that may be expected to have an effect on investor expectations worldwide). |
| NOTES TO THE FINANCIAL STATEMENTS |
| | Registered Investment Companies – Investments in open-end registered investment companies, commonly referred to as mutual funds, generally are priced at the ending NAV provided by the applicable mutual fund’s service agent and will be classified in Level 1 of the fair value hierarchy. |
| | |
| | Debt Securities – Debt securities, including corporate bonds, asset-backed securities, mortgage-backed securities, municipal bonds, U.S. Treasuries, and U.S. government agency issues, are generally valued at market on the basis of valuations furnished by an independent pricing service that utilizes both dealer-supplied valuations and formula-based techniques. The pricing service may consider recently executed transactions in securities of the issuer or comparable issuers, market price quotations (where observable), bond spreads, and fundamental data relating to the issuer. In addition, the model may incorporate observable market data, such as reported sales of similar securities, broker quotes, yields, bids, offers, and reference data. Certain securities are valued primarily using dealer quotations. These securities are generally classified in Level 2 of the fair value hierarchy. |
| | |
| | Short-Term Securities – Short-term equity investments, including money market funds, are valued in the manner specified above. Short-term debt investments with an original term to maturity of 60 days or less are valued at amortized cost, which approximates fair market value. If the original term to maturity of a short-term debt investment exceeded 60 days, then the values as of the 61st day prior to maturity are amortized. Amortized cost is not used if its use would be inappropriate due to credit or other impairments of the issuer, in which case the security’s fair value would be determined, as described below. Short-term securities are generally classified in Level 1 or Level 2 of the fair value hierarchy depending on the inputs used and market activity levels for specific securities. |
The Board of Trustees of the Fund (the “Board”) has adopted fair value pricing procedures that are followed when a price for a security is not readily available or if a significant event has occurred that indicates the closing price of a security no longer represents the true value of that security. Fair value pricing determinations are made in good faith in accordance with these procedures. There are numerous criteria that will be given consideration in determining a fair value of a security, such as the trading volume of a security and markets, the values of other similar securities, and news events with direct bearing on a security or markets. Fair value pricing results in an estimated price for a security that reflects the amount the Fund might reasonably expect to receive in a current sale. Depending on the relative significance of the valuation inputs, these securities may be classified in either Level 2 or Level 3 of the fair value hierarchy.
The fair value of foreign securities may be determined with the assistance of a pricing service using correlations between the movement of prices of such securities and indices of domestic securities and other appropriate indicators, such as closing market prices of relevant American Depositary Receipts or futures contracts. Using fair value pricing means that the Fund’s NAV reflects the affected portfolio securities’ values as determined by the Board or its designee, pursuant to the fair value pricing procedures adopted by the Board, instead of being determined by the market. Using a fair value pricing methodology to price a foreign security may result in a value that is different from such foreign security’s most recent closing price and from the value used by other investment companies to calculate their NAVs. Such securities are generally classified in Level 2 of the fair value hierarchy. Because the Fund may invest in foreign securities, the value of the Fund’s portfolio securities may change on days when you will not be able to purchase or redeem your shares.
| HENNESSY FUNDS | 1-800-966-4354 | |
The Board has delegated day-to-day valuation matters to the Valuation and Liquidity Committee comprising representatives from Hennessy Advisors, Inc., the Fund’s investment advisor (the “Advisor”). The function of the Valuation and Liquidity Committee is to value securities where current and reliable market quotations are not readily available. All actions taken by the Valuation and Liquidity Committee are reviewed by the Board.
The Fund has performed an analysis of all existing investments to determine the significance and character of all inputs to their fair value determinations. Various inputs are used to determine the value of the Fund’s investments. The inputs or methodology used for valuing securities are not necessarily an indication of the risk associated with investing in those securities. Details related to the fair value hierarchy of the Fund’s securities as of October 31, 2020, are included in the Schedule of Investments.
4). INVESTMENT TRANSACTIONS
Purchases and sales of investment securities (excluding government and short-term investments) for the Fund during fiscal year 2020 were $10,126,456 and $10,279,513, respectively.
There were no purchases or sales/maturities of long-term U.S. government securities for the Fund during fiscal year 2020.
The Fund is permitted to purchase or sell securities from or to another fund in the Hennessy Funds family of funds (collectively, the “Hennessy Funds”) under specified conditions outlined in procedures adopted by the Board. The procedures have been designed to ensure that any purchase or sale of securities by the Fund from or to another Hennessy Fund complies with Rule 17a-7 of the Investment Company Act of 1940, as amended. During fiscal year 2020, the Fund did not engage in purchases or sales of securities pursuant to Rule 17a-7 of the Investment Company Act of 1940, as amended.
5). INVESTMENT ADVISORY FEE AND OTHER TRANSACTIONS WITH AFFILIATES
The Advisor provides the Fund with investment advisory services under an Investment Advisory Agreement. The Advisor furnishes all investment advice, office space, and facilities and most of the personnel needed by the Fund. As compensation for its services, the Advisor is entitled to a monthly fee from the Fund. The fee is based on the average daily net assets of the Fund at an annual rate of 0.74%. The net investment advisory fees expensed by the Fund during fiscal year 2020 are included in the Statement of Operations.
The Advisor has contractually agreed to limit total annual operating expenses to 0.98% of the Fund’s net assets for both Investor Class shares and Institutional Class shares (excluding all federal, state and local taxes, interest, brokerage commissions, 12b-1 fees, shareholder servicing fees payable to the Advisor, extraordinary items, and acquired fund fees and expenses and other costs incurred in connection with the purchase and sale of securities) through February 28, 2021.
For three years following the date on which expenses were waived or incurred, the Advisor may recoup waived or reimbursed expenses from the Fund if total operating expenses, including such recoupment, does not exceed the expense limitation in effect (i) at the time the Advisor waived or reimbursed such expenses and (ii) at the time the Advisor recoups such expenses. As of October 31, 2020, expenses subject to potential recovery for Investor Class and Institutional Class shares and the fiscal years in which they expire were as follows:
| | | | Fiscal Year | | | Fiscal Year | | | Fiscal Year | | | | |
| | | | 2021 | | | 2022 | | | 2023 | | | Total | |
| | Investor Class | | $ | 83,351 | | | $ | 92,255 | | | $ | 86,892 | | | $ | 262,498 | |
| | Institutional Class | | $ | 26,820 | | | $ | 29,447 | | | $ | 27,643 | | | $ | 83,910 | |
| NOTES TO THE FINANCIAL STATEMENTS |
The Advisor did not recoup expenses from the Fund during fiscal year 2020.
The Board has approved a Shareholder Servicing Agreement for Investor Class shares of the Fund, which was instituted to compensate the Advisor for the non-investment advisory services it provides to the Fund. The Shareholder Servicing Agreement provides for a monthly fee paid to the Advisor at an annual rate of 0.10% of the average daily net assets of the Fund attributable to Investor Class shares. The shareholder service fees expensed by the Fund during fiscal year 2020 are included in the Statement of Operations.
The Fund has adopted a plan pursuant to Rule 12b-1 under the Investment Company Act of 1940, as amended, that authorizes payments in connection with the distribution of the Fund’s shares at an annual rate of up to 0.25% of the Fund’s average daily net assets attributable to Investor Class shares. Even though the authorized rate is up to 0.25%, the Fund is currently only using up to 0.15% of its average daily net assets attributable to Investor Class shares for such purpose. Amounts paid under the plan may be spent on any activities or expenses primarily intended to result in the sale of shares, including, but not limited to, advertising, shareholder account servicing, printing and mailing of prospectuses to other than current shareholders, printing and mailing of sales literature, and compensation for sales and marketing activities or to financial institutions and others, such as dealers and distributors. The distribution fees expensed by the Fund during fiscal year 2020 are included in the Statement of Operations.
The Fund has entered into agreements with various brokers, dealers, and financial intermediaries in connection with the sale of shares of the Fund. The agreements provide for periodic payments of sub-transfer agent expenses by the Fund to the brokers, dealers, and financial intermediaries for providing certain shareholder maintenance services. These shareholder services include the pre-processing and quality control of new accounts, shareholder correspondence, answering customer inquiries regarding account status, and facilitating shareholder telephone transactions. The sub-transfer agent fees expensed by the Fund during fiscal year 2020 are included in the Statement of Operations.
U.S. Bancorp Fund Services, LLC, d/b/a U.S. Bank Global Fund Services (“Fund Services”) provides the Fund with administrative, accounting, and transfer agent services. As administrator, Fund Services is responsible for activities such as (i) preparing various federal and state regulatory filings, reports, and returns for the Fund, (ii) preparing reports and materials to be supplied to the Board, (iii) monitoring the activities of the Fund’s custodian, transfer agent, and accountants, and (iv) coordinating the preparation and payment of the Fund’s expenses and reviewing the Fund’s expense accruals. U.S. Bank N.A., an affiliate of Fund Services, serves as the Fund’s custodian. The servicing agreements between the Trust and Fund Services and U.S. Bank N.A. contain a fee schedule that is inclusive of administrative, accounting, custody, and transfer agent fees. The administrative, accounting, custody, and transfer agent fees expensed by the Fund during fiscal year 2020 are included in the Statement of Operations. Fund Services has voluntarily waived all or a portion of its fees for the Fund. The fees voluntarily waived by Fund Services during fiscal year 2020 are included in the Statement of Operations.
Quasar Distributors, LLC (“Quasar”) acts as the Fund’s principal underwriter in a continuous public offering of the Fund’s shares. Quasar was an affiliate of Fund Services and U.S. Bank N.A. through March 30, 2020. Effective March 31, 2020, Foreside Financial Group, LLC (“Foreside”) acquired Quasar from Fund Services. As a result of the acquisition, Quasar became a wholly owned broker-dealer subsidiary of Foreside and is no longer affiliated with Fund Services or U.S. Bank N.A. The Board approved a new Distribution Agreement to enable Quasar to continue serving as the Fund’s distributor.
| HENNESSY FUNDS | 1-800-966-4354 | |
The officers of the Fund are affiliated with the Advisor. With the exception of the Chief Compliance Officer and the Senior Compliance Officer, such officers receive no compensation from the Fund for serving in their respective roles. The Fund, along with the other Hennessy Funds, makes reimbursement payments on an equal basis to the Advisor for a portion of the salary and benefits associated with the office of the Chief Compliance Officer and for all of the salary and benefits associated with the office of the Senior Compliance Officer. The compliance fees expensed by the Fund during fiscal year 2020 are included in the Statement of Operations.
6). GUARANTEES AND INDEMNIFICATIONS
Under the Hennessy Funds’ organizational documents, their officers and trustees are indemnified by the Hennessy Funds against certain liabilities arising out of the performance of their duties to the Hennessy Funds. Additionally, in the normal course of business, the Hennessy Funds enter into contracts with service providers that contain general indemnification clauses. The Fund’s maximum exposure under these arrangements is unknown as this would involve future claims that may be made against the Fund that have not yet occurred. Currently, the Fund expects the risk of loss to be remote.
7). LINE OF CREDIT
The Fund has an uncommitted line of credit with the other Hennessy Funds in the amount of the lesser of (i) $100,000,000 or (ii) 33.33% of each Hennessy Fund’s net assets, or 30% for the Hennessy Gas Utility Fund and 10% for the Hennessy Balanced Fund, intended to provide short-term financing, if necessary, subject to certain restrictions, in connection with shareholder redemptions. The credit facility is with the Hennessy Funds’ custodian bank, U.S. Bank N.A. Borrowings under this arrangement bear interest at the bank’s prime rate and are secured by all of the Fund’s assets (as to its own borrowings only). During fiscal year 2020, the Fund had an outstanding average daily balance and a weighted average interest rate of $260 and 3.25%, respectively. The interest expensed by the Fund during fiscal year 2020 is included in the Statement of Operations. The maximum amount outstanding for the Fund during fiscal year 2020 was $15,000. As of October 31, 2020, the Fund did not have any borrowings outstanding under the line of credit.
8). FEDERAL TAX INFORMATION
As of October 31, 2020, the components of accumulated earnings (losses) for income tax purposes were as follows:
| | | | Investments | |
| | Cost of investments for tax purposes | | $ | 5,113,211 | |
| | Gross tax unrealized appreciation | | $ | 1,023,207 | |
| | Gross tax unrealized depreciation | | | (393,145 | ) |
| | Net tax unrealized appreciation/(depreciation) | | $ | 630,062 | |
| | Undistributed ordinary income | | $ | 239,745 | |
| | Undistributed long-term capital gains | | | 430,870 | |
| | Total distributable earnings | | $ | 670,615 | |
| | Other accumulated gain/(loss) | | $ | — | |
| | Total accumulated gain/(loss) | | $ | 1,300,677 | |
The difference between book-basis unrealized appreciation/depreciation and tax-basis unrealized appreciation/depreciation (as shown above) is attributable primarily to wash sales.
As of October 31, 2020, the Fund had no tax basis capital losses to offset future capital gains.
| NOTES TO THE FINANCIAL STATEMENTS |
As of October 31, 2020, the Fund did not defer, on a tax basis, any late-year ordinary losses. Late-year ordinary losses are net ordinary losses incurred after December 31, 2019, but within the taxable year, that are deemed to arise on the first day of the Fund’s next taxable year.
During fiscal years 2020 and 2019, the tax character of distributions paid by the Fund was as follows:
| | | | Year Ended | | | Year Ended | |
| | | | October 31, 2020 | | | October 31, 2019 | |
| | Ordinary income(1) | | $ | 61,675 | | | $ | 381,139 | |
| | Long-term capital gain | | | 84,296 | | | | 166,307 | |
| | Total distributions | | $ | 145,971 | | | $ | 547,446 | |
| | (1) Ordinary income includes short-term capital gains. |
9). COVID-19 PANDEMIC
The COVID-19 pandemic has adversely impacted global commercial activity and contributed to significant volatility in global equity and debt markets. The pandemic has resulted in quarantines, stay-at-home orders, travel prohibitions, and closures, disrupting supply chains and economic activity. The duration of the pandemic’s effects remain uncertain and difficult to assess. The effects of the pandemic may adversely impact the Fund’s performance and its ability to achieve its investment objective.
10). EVENTS SUBSEQUENT TO YEAR END
Management has evaluated the Fund’s related events and transactions that occurred subsequent to October 31, 2020, through the date of issuance of the Fund’s financial statements. Other than as disclosed below, management has determined that there were no subsequent events requiring recognition or disclosure in the financial statements.
On December 8, 2020, capital gains were declared and paid to shareholders of record on December 7, 2020, as follows:
| | | Long-term | Short-term |
| | Investor Class | $1.55971 | $0.80473 |
| | Institutional Class | $1.60417 | $0.82768 |
| HENNESSY FUNDS | 1-800-966-4354 | |
Report of Independent Registered Public
Accounting Firm
To the Board of Trustees of Hennessy Funds Trust
and the shareholders of the Hennessy Technology Fund
Novato, CA
Opinion on the Financial Statements
We have audited the accompanying statement of assets and liabilities of the Hennessy Technology Fund (the “Fund”), a series of Hennessy Funds Trust, including the schedule of investments, as of October 31, 2020, the related statement of operations for the year then ended, the statements of changes in net assets for each of the two years in the period then ended, financial highlights for each of the five years in the period then ended, and the related notes (collectively referred to as the “financial statements”). In our opinion, the financial statements present fairly, in all material respects, the financial position of the Fund as of October 31, 2020, the results of its operations for the year then ended, the changes in its net assets for each of the two years in the period then ended, and the financial highlights for each of the five years in the period then ended, in conformity with accounting principles generally accepted in the United States of America.
Basis for Opinion
These financial statements are the responsibility of the Fund’s management. Our responsibility is to express an opinion on the Fund’s financial statements based on our audits. We are a public accounting firm registered with the Public Company Accounting Oversight Board (United States) (“PCAOB”) and are required to be independent with respect to the Fund in accordance with the U.S. federal securities laws and the applicable rules and regulations of the Securities and Exchange Commission and the PCAOB. We have served as the auditor of one or more of the funds in the Trust since 2002.
We conducted our audits in accordance with the standards of the PCAOB. Those standards require that we plan and perform the audit to obtain reasonable assurance about whether the financial statements are free of material misstatement, whether due to error or fraud. The Fund is not required to have, nor were we engaged to perform, an audit of its internal control over financial reporting. As part of our audits we are required to obtain an understanding of internal control over financial reporting, but not for the purpose of expressing an opinion on the effectiveness of the Fund’s internal control over financial reporting. Accordingly, we express no such opinion.
Our audits included performing procedures to assess the risks of material misstatement of the financial statements, whether due to error or fraud, and performing procedures that respond to those risks. Such procedures included examining, on a test basis, evidence regarding the amounts and disclosures in the financial statements. Our audits also included evaluating the accounting principles used and significant estimates made by management, as well as evaluating the overall presentation of the financial statements. Our procedures included confirmation of securities owned as of October 31, 2020 by correspondence with the custodian. We believe that our audits provide a reasonable basis for our opinion.
| | |
| | TAIT, WELLER & BAKER LLP |
Philadelphia, Pennsylvania
December 23, 2020
| REPORT OF INDEPENDENT REGISTERED PUBLIC ACCOUNTING FIRM/TRUSTEES AND OFFICERS |
Trustees and Officers of the Fund (Unaudited)
The business and affairs of the Funds are managed under the direction of the Board of Trustees of the Trust, and the Board of Trustees elects the officers of the Trust. From time to time, the Board of Trustees also has appointed advisers to the Board of Trustees (“Advisers”) with the intention of having qualified individuals serve in an advisory capacity to garner experience in the mutual fund and asset management industry and be considered as potential Trustees in the future. There are currently three Advisers: Brian Alexander, Doug Franklin, and Claire Knoles. As Advisers, Mr. Alexander, Mr. Franklin, and Ms. Knoles attend meetings of the Board of Trustees and act as non-voting participants. Information pertaining to the Trustees, Advisers, and the officers of the Trust is set forth below. The Trustees and officers serve until their successors are duly elected and qualified or until their earlier death, resignation, or removal. Each Trustee oversees all 16 Hennessy Funds. Unless otherwise indicated, the address of all persons listed below is 7250 Redwood Boulevard, Suite 200, Novato, CA 94945. The Fund’s Statement of Additional Information includes more information about the persons listed below and is available without charge by calling 1-800-966-4354 or by visiting www.hennessyfunds.com.
| | | | Other |
| | | | Directorships |
| | | | Held Outside |
| Name, Age, | | | of Fund |
| and Position Held | Start Date | Principal Occupation(s) | Complex During |
with the Trust
| of Service
| During Past Five Years
| Past Five Years
|
| Disinterested Trustees and Advisers | | | |
| | | | |
| J. Dennis DeSousa | January 1996 | Mr. DeSousa is a real estate investor. | None. |
| 84 | | | |
| Trustee | | | |
| | | | |
| Robert T. Doyle | January 1996 | Mr. Doyle has been the Sheriff of | None. |
| 73 | | Marin County, California since 1996. | |
| Trustee | | | |
| | | | |
| Gerald P. Richardson | May 2004 | Mr. Richardson is an independent | None. |
| 75 | | consultant in the securities industry. | |
| Trustee | | | |
| | | | |
| Brian Alexander | March 2015 | Mr. Alexander has worked for the | None. |
| 39 | | Sutter Health organization since | |
| Adviser to the Board | | 2011 in various positions. He has | |
| | | served as the Chief Executive Officer | |
| | | of the Sutter Roseville Medical | |
| | | Center since 2018. From 2016 through | |
| | | 2018, he served as the Vice President | |
| | | of Strategy for the Sutter Health Valley | |
| | | Area, which includes 11 hospitals, | |
| | | 13 ambulatory surgery centers, | |
| | | 16,000 employees, and 1,900 physicians. | |
| | | From 2013 through 2016, Mr. Alexander | |
| | | served as Sutter Novato Community | |
| | | Hospital’s Chief Administrative Officer. | |
| HENNESSY FUNDS | 1-800-966-4354 | |
| | | | Other |
| | | | Directorships |
| | | | Held Outside |
| Name, Age, | | | of Fund |
| and Position Held | Start Date | Principal Occupation(s) | Complex During |
with the Trust
| of Service
| During Past Five Years
| Past Five Years
|
| Doug Franklin | March 2016 | Mr. Franklin is a retired insurance | None. |
| 56 | | industry executive. From 1987 | |
| Adviser to the Board | | through 2015, he was employed | |
| | | by the Allianz-Fireman’s Fund | |
| | | Insurance Company in various | |
| | | positions, including as its Chief | |
| | | Actuary and Chief Risk Officer. | |
| | | | |
| Claire Knoles | December 2015 | Ms. Knoles is a founder of Kiosk and | None. |
| 46 | | has served as its Chief Operating | |
| Adviser to the Board | | Officer since 2004. Kiosk is a full- | |
| | | service marketing agency with | |
| | | offices in the San Francisco Bay | |
| | | Area, Toronto, and Liverpool, UK. | |
| | | | |
Interested Trustee(1) | | | |
| | | | |
| Neil J. Hennessy | January 1996 as | Mr. Hennessy has been employed | Hennessy |
| 64 | a Trustee and | by Hennessy Advisors, Inc. since | Advisors, Inc. |
| Trustee, Chairman of | June 2008 as | 1989 and currently serves as its | |
| the Board, Chief | an officer | Chairman and Chief Executive Officer. | |
| Investment Officer, | | | |
| Portfolio Manager, | | | |
| and President | | | |
| Name, Age, | | |
| and Position Held | Start Date | Principal Occupation(s) |
with the Trust
| of Service
| During Past Five Years
|
| Officers | | |
| | | |
| Teresa M. Nilsen | January 1996 | Ms. Nilsen has been employed by Hennessy Advisors, Inc. |
| 54 | | since 1989 and currently serves as its President, Chief Operating |
| Executive Vice President | | Officer, and Secretary. |
| and Treasurer | | |
| | | |
| Daniel B. Steadman | March 2000 | Mr. Steadman has been employed by Hennessy Advisors, Inc. |
| 64 | | since 2000 and currently serves as its Executive Vice President. |
| Executive Vice President | | |
| and Secretary | | |
| | | |
| Brian Carlson | December 2013 | Mr. Carlson has been employed by Hennessy Advisors, Inc. |
| 48 | | since December 2013 and currently serves as its Chief |
| Senior Vice President | | Compliance Officer and Senior Vice President. |
| and Head of Distribution | | |
| | | |
Jennifer Cheskiewicz(2) | June 2013 | Ms. Cheskiewicz has been employed by Hennessy Advisors, Inc. |
| 43 | | as its General Counsel since June 2013. |
| Senior Vice President and | | |
| Chief Compliance Officer | | |
| TRUSTEES AND OFFICERS OF THE FUND |
| Name, Age, | | |
| and Position Held | Start Date | Principal Occupation(s) |
with the Trust
| of Service
| During Past Five Years
|
David Ellison(3) | October 2012 | Mr. Ellison has been employed by Hennessy Advisors, Inc. since |
| 62 | | October 2012. He has served as a Portfolio Manager of the |
| Senior Vice President | | Hennessy Large Cap Financial Fund and the Hennessy Small |
| and Portfolio Manager | | Cap Financial Fund since their inception. Mr. Ellison also served |
| | | as a Portfolio Manager of the Hennessy Technology Fund from |
| | | its inception until February 2017. Mr. Ellison served as Director, |
| | | CIO, and President of FBR Fund Advisers, Inc. from December |
| | | 1999 to October 2012. |
| | | |
Ryan Kelley(4) | March 2013 | Mr. Kelley has been employed by Hennessy Advisors, Inc. since |
| 48 | | October 2012. He has served as a Portfolio Manager of the |
| Senior Vice President | | Hennessy Gas Utility Fund, the Hennessy Large Cap Financial |
| and Portfolio Manager | | Fund, and the Hennessy Small Cap Financial Fund since |
| | | October 2014. He served as Co-Portfolio Manager of these |
| | | same funds from March 2013 through September 2014 and as |
| | | a Portfolio Analyst for the Hennessy Funds from October 2012 |
| | | through February 2013. Mr. Kelley has also served as a Portfolio |
| | | Manager of the Hennessy Cornerstone Growth Fund, the |
| | | Hennessy Cornerstone Mid Cap 30 Fund, the Hennessy |
| | | Cornerstone Large Growth Fund, and the Hennessy |
| | | Cornerstone Value Fund since February 2017 and as a Portfolio |
| | | Manager of the Hennessy Total Return Fund, the Hennessy |
| | | Balanced Fund, and the Hennessy Technology Fund since May |
| | | 2018. He served as Co-Portfolio Manager of the Hennessy |
| | | Technology Fund from February 2017 until May 2018. Mr. Kelley |
| | | served as Portfolio Manager of FBR Fund Advisers, Inc. from |
| | | January 2008 to October 2012. |
| | | |
| Tania Kelley | October 2003 | Ms. Kelley has been employed by Hennessy Advisors, Inc. since |
| 55 | | October 2003. |
| Senior Vice President | | |
| and Head of Marketing | | |
| | | |
L. Joshua Wein(4) | September 2018 | Mr. Wein has been employed by Hennessy Advisors, Inc. since |
| 47 | | 2018. He has served as Co-Portfolio Manager of the Hennessy |
| Vice President and | | Cornerstone Growth Fund, the Hennessy Cornerstone |
| Co-Portfolio Manager | | Mid Cap 30 Fund, the Hennessy Cornerstone Large Growth |
| | | Fund, the Hennessy Cornerstone Value Fund, Hennessy Total |
| | | Return Fund, the Hennessy Balanced Fund, the Hennessy Gas |
| | | Utility Fund, and the Hennessy Technology Fund since February |
| | | 2019. He served as a Senior Analyst of these same funds from |
| | | September 2018 through February 2019. Mr. Wein served as |
| | | Director of Alternative Investments and Co-Portfolio Manager |
| | | at Sterling Capital Management from 2008 to 2018. |
_______________
(1) | Mr. Hennessy is considered an “interested person,” as defined in the Investment Company Act of 1940, as amended, because he is an officer of the Trust. |
(2) | The address of this officer is 4800 Bee Caves Road, Suite 100, Austin, TX 78746. |
(3) | The address of this officer is 101 Federal Street, Suite 1615B, Boston, MA 02110. |
(4) | The address of this officer is 1340 Environ Way, Chapel Hill, NC 27517. |
| HENNESSY FUNDS | 1-800-966-4354 | |
Expense Example (Unaudited)
October 31, 2020
As a shareholder of the Fund, you incur ongoing costs, including management fees, service fees, and other Fund expenses. This Example is intended to help you understand your ongoing costs (in dollars) of investing in the Fund and to compare these costs with the ongoing costs of investing in other mutual funds. The Example is based on an investment of $1,000 invested at the beginning of the period and held for the entire period from May 1, 2020, through October 31, 2020.
Actual Expenses
The first line of the table below under the “Investor Class” and “Institutional Class” headings provides information about actual account values and actual expenses. You may use the information in this line, together with the amount you invested, to estimate the expenses that you paid over the period. Simply divide your account value by $1,000 (for example, an $8,600 account value divided by $1,000 = 8.6), then multiply the result by the number in the first line below the “Investor Class” or “Institutional Class” heading under the column entitled “Expenses Paid During Period” to estimate the expenses you paid on your account during this period. Although the Fund charges no sales loads or transaction fees, you will be assessed fees for outgoing wire transfers, returned checks, and stop payment orders at prevailing rates charged by U.S. Bank Global Fund Services, the Fund’s transfer agent. If you request that a redemption be made by wire transfer, the Fund’s transfer agent charges a $15 fee. IRAs are charged a $15 annual maintenance fee (up to $30 maximum per shareholder for shareholders with multiple IRAs). The example below includes, but is not limited to, management fees, shareholder servicing fees, accounting, custody, and transfer agent fees. However, the example below does not include portfolio trading commissions and related expenses.
Hypothetical Example for Comparison Purposes
The second line of the table below under the “Investor Class” and “Institutional Class” headings provides information about hypothetical account values and hypothetical expenses based on the Fund’s actual expense ratios and an assumed rate of return of 5% per year before expenses, which is not the Fund’s actual return. The hypothetical account values and expenses may not be used to estimate the actual ending account balance or expenses you paid for the period. You may use this information to compare the ongoing costs of investing in the Fund and other funds. To do so, compare this 5% hypothetical example with the 5% hypothetical examples that appear in the shareholder reports of the other funds. Please note that the expenses shown in the table are meant to highlight your ongoing costs only. Therefore, the second line of the table under the “Investor Class” and “Institutional Class” headings is useful in comparing ongoing costs only and will not help you determine the relative total costs of owning different funds.
| | | | Expenses Paid |
| | Beginning | Ending | During Period(1) |
| | Account Value | Account Value | May 1, 2020 – |
| | May 1, 2020
| October 31, 2020 | October 31, 2020 |
| Investor Class | | | |
| Actual | $1,000.00 | $1,174.80 | $6.72 |
| Hypothetical (5% return before expenses) | $1,000.00 | $1,018.95 | $6.24 |
| | | | |
| Institutional Class | | | |
| Actual | $1,000.00 | $1,176.30 | $5.36 |
| Hypothetical (5% return before expenses) | $1,000.00 | $1,020.21 | $4.98 |
(1) | Expenses are equal to the Fund’s annualized expense ratio of 1.23% for Investor Class shares or 0.98% for Institutional Class shares, as applicable, multiplied by the average account value over the period, multiplied by 184/366 days (to reflect the half-year period). |
| HENNESSY FUNDS | 1-800-966-4354 | |
How to Obtain a Copy of the Fund’s Proxy
Voting Policy and Proxy Voting Records
A description of the policies and procedures the Fund uses to determine how to vote proxies relating to portfolio securities is available without charge (1) by calling 1-800-966-4354, (2) on the Hennessy Funds’ website at www.hennessyfunds.com/proxy-voting/voting-policy, or (3) on the U.S. Securities and Exchange Commission’s (the “SEC”) website at www.sec.gov. The Fund’s proxy voting record is available without charge on both the Hennessy Funds’ website at www.hennessyfunds.com/proxy-voting/voting-record and the SEC’s website at www.sec.gov no later than August 31 for the prior 12 months ending June 30.
Availability of Quarterly Portfolio Schedule
The Fund files a complete schedule of portfolio holdings with the SEC for the first and third quarters of each fiscal year as an exhibit to its reports on Form N-PORT. The Fund’s Form N-PORT reports are available on the SEC’s website at www.sec.gov or on request by calling 1-800-966-4354.
Federal Tax Distribution Information
(Unaudited)
For fiscal year 2020, certain dividends paid by the Fund may be subject to a maximum tax rate of 23.8%, as provided for by the Jobs and Growth Tax Relief Reconciliation Act of 2003. The percentage of dividends declared from ordinary income designated as qualified dividend income was 72.00%.
For corporate shareholders, the percent of ordinary income distributions that qualified for the corporate dividends received deduction for fiscal year 2020 was 0.00%.
The percentage of taxable ordinary income distributions that were designated as short-term capital gain distributions under Section 871(k)(2)(C) of the Internal Revenue Code of 1986, as amended, for the Fund was 98.92%.
Important Notice Regarding Delivery
of Shareholder Documents
To help keep the Fund’s costs as low as possible, we generally deliver a single copy of shareholder reports, proxy statements, and prospectuses to shareholders who share an address and have the same last name. This process does not apply to account statements. You may request an individual copy of a shareholder document at any time. If you would like to receive separate mailings of shareholder documents, please call U.S. Bank Global Fund Services at 1-800-261-6950 or 1-414-765-4124, and individual delivery will begin within 30 days of your request. If your account is held through a financial institution or other intermediary, please contact such intermediary directly to request individual delivery.
Electronic Delivery
The Fund offers shareholders the option to receive account statements, prospectuses, tax forms, and shareholder reports online. To sign up for eDelivery, please visit www.hennessyfunds.com/account. You may change your delivery preference at any time by visiting our website or calling U.S. Bank Global Fund Services at 1-800-261-6950 or 1-414-765-4124.
| PROXY VOTING — PRIVACY POLICY |
Liquidity Risk Management Program
In accordance with Rule 22e-4 under the Investment Company Act of 1940, as amended (the “Liquidity Rule”), we have adopted and implemented a liquidity risk management program (the “Liquidity Program”). The purpose of the Liquidity Program is to assess and manage the Fund’s liquidity risk, which is the risk that the Fund would not be able to meet requests to redeem Fund shares without significant dilution of the remaining shareholders’ interests in the Fund. The Board of Trustees of the Fund (the “Board”) designated a committee comprising representatives of Hennessy Advisors, Inc., the investment adviser to the Fund, as the administrator of the Liquidity Program (the “Program Administrator”).
The Program Administrator provided a written report regarding the Liquidity Program to the Board in advance of its meeting on June 3, 2020. The report covered the period from June 1, 2019, through May 31, 2020. The report addressed the operation of the Liquidity Program, assessed the adequacy and effectiveness of its implementation, and described any material changes to the Liquidity Program during the review period. The Trust’s chief compliance officer presented the report to the Board at the meeting and provided additional information regarding the Liquidity Program. The Board reviewed the Liquidity Program and considered, among other items, the following:
| | 1. | The Program Administrator reviewed daily historical net redemption activity during the review period and during prior periods with higher-than-average redemption activity and concluded that the Fund has historically been able to meet requests to redeem Fund shares without significant dilution to the Fund’s remaining shareholders, and the Program Administrator expects the Fund to be able to continue to do so in the future during both normal and reasonably foreseeable stressed conditions. |
| | | |
| | 2. | The Fund primarily holds assets that are highly liquid investments and is therefore not required to establish a highly liquid investment minimum for the Fund or adopt policies and procedures for responding to a highly liquid investment minimum shortfall. |
| | | |
| | 3. | The Program Administrator did not make any material changes to the Liquidity Program during the review period and was not recommending any changes to the Liquidity Program or the model inputs used to determine the liquidity classification of each security held by the Fund. |
| | | |
| | 4. | The Program Administrator concluded that the Liquidity Program was reasonably designed to assess and manage the Fund’s liquidity risk, complies with the requirements of the Liquidity Rule, and was effectively implemented, having operated as intended during the review period. |
Privacy Policy
We collect the following personal information about you:
| | 1. | Information we receive from you in applications or other forms, correspondence, or conversations, including, but not limited to, your name, address, phone number, social security number, assets, income, and date of birth; |
| | | |
| | 2. | Information about your transactions with us, our affiliates, or others, including, but not limited to, your account number and balance, payments history, parties to transactions, cost basis information, and other financial information; and |
| HENNESSY FUNDS | 1-800-966-4354 | |
| | 3. | Other personal information we collect from various sources, even if you have not entered into a prior transaction with us, including the following: |
| | • | Name, alias, address, unique personal identifier, online identifier, IP address, email address, telephone number, account name, and other similar identifiers; |
| | | |
| | • | Age and marital status; |
| | | |
| | • | Commercial information, including records of products purchased; |
| | | |
| | • | Browsing history, search history, and information on interaction with our website; |
| | | |
| | • | Geolocation data; |
| | | |
| | • | Employment and employment history, educational history, financial information, and purchasing and consuming histories or tendencies; and |
| | | |
| | • | Inferences drawn from the above-listed information to create a profile about your preferences, characteristics, predispositions, and behavior. |
We collect this information directly from you, indirectly in the course of providing services to you, directly and indirectly from your activity on our website, from broker dealers, marketing agencies, and other third parties that interact with us in connection with the services we perform and products we offer, and from anonymized and aggregated consumer information.
We use this information to fulfill the reason you provided the information to us, to provide you with other relevant products that you request from us, to provide you with information about products that may interest you, to improve our website or present our website’s contents to you, and as otherwise described to you when collecting your personal information.
We do not disclose any personal information to unaffiliated third parties, except as permitted by law. We may disclose your personal information to our affiliates, vendors, and service providers for a business purpose. For example, we are permitted by law to disclose all of the information we collect, as described above, to our transfer agent to process your transactions. When disclosing your personal information to third parties, we enter into a contract with each third party describing the purpose of such disclosure and requiring that such personal information be kept confidential and not used for any purpose except to perform the services contracted or respond to regulatory or law enforcement requests.
Furthermore, we restrict access to your personal information to those persons who require such information to provide products or services to you. As a result, we do not provide a means for opting out of our limited sharing of your information. We maintain physical, electronic, and procedural safeguards that comply with federal standards to guard your personal information.
If you hold shares of the Funds through a financial intermediary, including, but not limited to, a broker-dealer, bank, or trust company, the privacy policy of your financial intermediary governs how your personal information is shared with unaffiliated third parties.
Supplemental Privacy Notice for Residents of California
The California Consumer Privacy Act of 2018 (the “CCPA”) provides you, as a California resident, with certain additional rights relating to your personal information.
Under the CCPA, you have the right to request that we disclose to you the categories of personal information we have collected about you over the past 12 months, the categories of sources of such information, our business purpose for collecting the
information, the categories of third parties, if any, with whom we shared the information, and the specific information we have collected about you. You also have the right to request that we delete any of your personal information, and, unless an exception applies, we will delete such information upon receiving and confirming your request. To make a request, call us at 1-800-966-4354, email us at privacy@hennessyfunds.com, or go to www.hennessyfunds.com/contact. We will not discriminate against you for exercising your rights under the CCPA. Further, we will not collect additional categories of your personal information or use the personal information we collected for materially different, unrelated, or incompatible purposes without providing you notice.
| HENNESSY FUNDS | 1-800-966-4354 | |
(This Page Intentionally Left Blank.)
For information, questions, or assistance, please call
The Hennessy Funds
1-800-966-4354 or 1-415-899-1555
INVESTMENT ADVISOR
Hennessy Advisors, Inc.
7250 Redwood Boulevard, Suite 200
Novato, California 94945
ADMINISTRATOR,
TRANSFER AGENT,
DIVIDEND PAYING AGENT, &
SHAREHOLDER SERVICING AGENT
U.S. Bancorp Fund Services, LLC
d/b/a U.S. Bank Global Fund Services
P.O. Box 701
Milwaukee, Wisconsin 53201-0701
CUSTODIAN
U.S. Bank N.A.
Custody Operations
1555 North River Center Drive, Suite 302
Milwaukee, Wisconsin 53212
TRUSTEES
Neil J. Hennessy
Robert T. Doyle
J. Dennis DeSousa
Gerald P. Richardson
COUNSEL
Foley & Lardner LLP
777 East Wisconsin Avenue
Milwaukee, Wisconsin 53202-5306
INDEPENDENT REGISTERED
PUBLIC ACCOUNTING FIRM
Tait, Weller & Baker LLP
Two Liberty Place
50 South 16th Street, Suite 2900
Philadelphia, Pennsylvania 19102-2529
DISTRIBUTOR
Quasar Distributors, LLC
111 East Kilbourn Avenue, Suite 2200
Milwaukee, Wisconsin 53202
www.hennessyfunds.com | 1-800-966-4354
This report has been prepared for shareholders and may be distributed to
others only if preceded or accompanied by a current prospectus.