SECURITIES AND EXCHANGE COMMISSION
Washington, D.C. 20549
Form 6-K
REPORT OF FOREIGN PRIVATE ISSUER
PURSUANT TO RULE 13a-16 OR 15d-16 OF
THE SECURITIES EXCHANGE ACT OF 1934
For the month of April 2016
Commission File Number 1-14926
KT Corporation
(Translation of registrant’s name into English)
KT Gwanghwamun Building East
33, Jongno 3-gil, Jongno-gu
03155 Seoul, Korea
(Address of principal executive offices)
Indicate by check mark whether the registrant files or will file annual reports under cover of Form 20-F orForm 40-F:
Form 20-F x Form 40-F ¨
Indicate by check mark if the registrant is submitting the Form 6-K in paper as permitted by Regulation S-T Rule 101(b)(1): ¨
Indicate by check mark if the registrant is submitting the Form 6-K in paper as permitted by Regulation S-T Rule 101(b)(7): ¨
Indicate by check mark whether by furnishing the information contained in this Form, the registrant is also thereby furnishing the information to the Commission pursuant to Rule 12g3-2(b) under the Securities Exchange Act of 1934.
Yes ¨ No x
If “Yes” is marked, indicate below the file number assigned to the registrant in connection with Rule 12g3-2(b): 82-
SIGNATURES
Pursuant to the requirements of the Securities Exchange Act of 1934, the registrant has duly caused this report to be signed on its behalf by the undersigned, thereunto duly authorized.
| Dated: April 29, 2016 | ||
| KT Corporation | ||
| By: | /s/ Youngwoo Kim | |
| Name: Youngwoo Kim | ||
| Title: Vice President | ||
| By: | /s/ Jungsup Jung | |
| Name: Jungsup Jung | ||
| Title: Director | ||
2016 1Q Preliminary Earnings Release
We hereby announce our 2016 1Q preliminary earnings conference material used for conference call, which was held on April 29, 2016.
Attachment: 2016 1Q Earnings Conference Call material

KT 1Q16 Earnings Release Global No. 1 KT Investor Relations 2016. 4. 29 KT
Disclaimer This presentation has been prepared by KT Corp.(the Company”). This presentation contains forward-looking statements, which are subject to risks, uncertainties, and assumptions. This presentation is being presented solely for your information and is subject to changewithout notice. No presentation or warranty, expressed or implied, is made and no reliance should be placed on the accuracy, actuality, fairness, or completeness of the information presented. Please be informed that items included in our operating income have been prepared in accordance with K-IFRS 1001 released on October 17, 2012, which was revised to coincidewith the Korean AccountingStandards for Non-Public Entities (“KAS-NPEs”). As such, our disposal gains from real estate and others have been excluded from our operating income. The Company, its affiliates or representatives accept no liability whatsoever for any losses arising from any information contained in the presentation. This presentation does not constitute an offer or invitation to purchase or subscribe for any shares of the Company, and no part of this presentation shall form the Basis of or be relied upon in connection with any contract or commitment. Any decision to purchase shares o the Company could be made solely on the Basis of information, which has been publicly filed with the Securities and Exchange Commission or the Korea Stock Exchange and distributed to all investors. The contents of this presentation may not be reproduced, redistributed or passed on, directly or indirectly, to any other person or published, in whole or in part, for any purpose. If you have any related questions to this material, please contact IR department. Tel : 82-2-3495-3557, 3558, 3564, 5529, 5343, 5344 Fax : 82-2-3495-5917 2
Contents 1 Financial Highlights 2 Business Overview 3 Q&A 4 Appendix 3
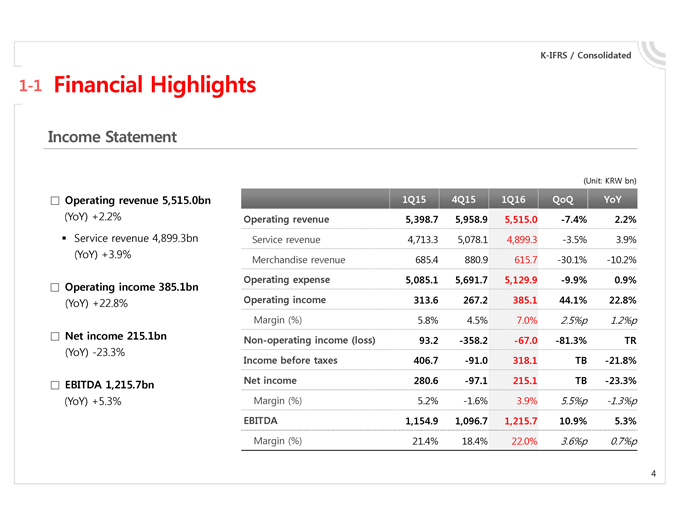
K-IFRS / Consolidated 1-1 Financial Highlights Income Statement (Unit: KRW bn) Operating revenue 5,515.0bn 1Q15 4Q15 1Q16 QoQ YoY (YoY) +2.2% Operating revenue 5,398.7 5,958.9 5,515.0 -7.4% 2.2% ?Service revenue 4,899.3bn Service revenue 4,713.3 5,078.1 4,899.3 -3.5% 3.9% (YoY) +3.9% Merchandise revenue 685.4 880.9 615.7 -30.1% -10.2% Operating expense 5,085.1 5,691.7 5,129.9 -9.9% 0.9% Operating income 385.1bn (YoY) +22.8% Operating income 313.6 267.2 385.1 44.1% 22.8% Margin (%) 5.8% 4.5% 7.0% 2.5%p 1.2%p Net income 215.1bn Non-operating income (loss) 93.2 -358.2 -67.0 -81.3% TR (YoY) -23.3% Income before taxes 406.7 -91.0 318.1 TB -21.8% EBITDA 1,215.7bn Net income 280.6 -97.1 215.1 TB -23.3% (YoY) +5.3% Margin (%) 5.2% -1.6% 3.9% 5.5%p -1.3%p EBITDA 1,154.9 1,096.7 1,215.7 10.9% 5.3% Margin (%) 21.4% 18.4% 22.0% 3.6%p 0.7%p 4
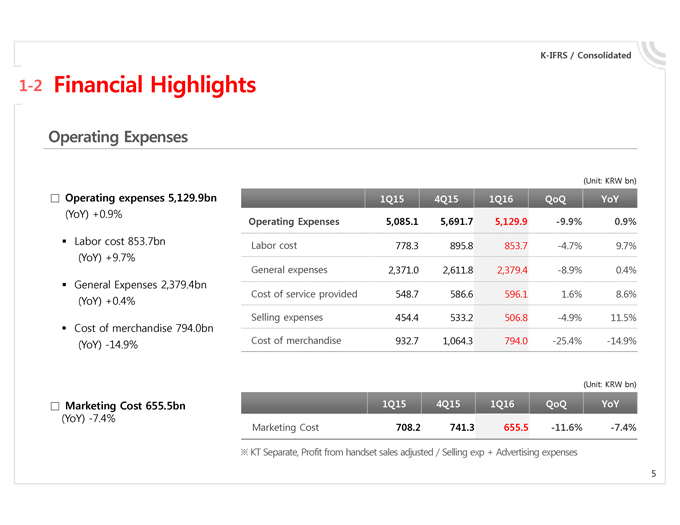
K-IFRS / Consolidated 1-2 Financial Highlights Operating Expenses (Unit: KRW bn) Operating expenses 5,129.9bn 1Q15 4Q15 1Q16 QoQ YoY (YoY) +0.9% Operating Expenses 5,085.1 5,691.7 5,129.9 -9.9% 0.9% ?Labor cost 853.7bn Labor cost 778.3 895.8 853.7 -4.7% 9.7% (YoY) +9.7% General expenses 2,371.0 2,611.8 2,379.4 -8.9% 0.4% ?General Expenses 2,379.4bn Cost of service provided 5487. 5866. 5961. 16% . 86% . (YoY) +0.4% Cost of merchandise Selling expenses 454.4 533.2 506.8 -4.9% 11.5% 794.0bn (YoY) -14.9% Cost of merchandise 932.7 1,064.3 794.0 -25.4% -14.9% (Unit: KRW bn) Marketing Cost 655.5bn 1Q15 4Q15 1Q16 QoQ YoY (YoY) -7.4% Marketing Cost 708.2 741.3 655.5 -11.6% -7.4% ? KT Separate, Profit from handset sales adjusted / Selling exp + Advertising expenses 5
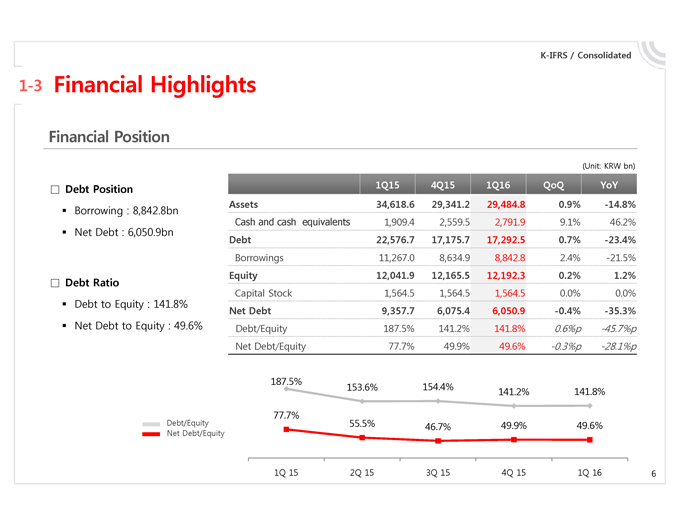
K-IFRS / Consolidated 1-3 Financial Highlights Financial Position (Unit: KRW bn) Debt Position 1Q15 4Q15 1Q16 QoQ YoY Assets 34,618.6 29,341.2 29,484.8 0.9% -14.8% ?Borrowing : 8,842.8bn Cash and cash equivalents 1,909.4 2,559.5 2,791.9 9.1% 46.2% ?Net Debt : 6,050.9bn Debt 22,576.7 17,175.7 17,292.5 0.7% -23.4% Borrowings 11,267.0 8,634.9 8,842.8 2.4% -21.5% Equity 12,041.9 12,165.5 12,192.3 0.2% 1.2% Debt Ratio Capital Stock 1,564.5 1,564.5 1,564.5 0.0% 0.0% ?Debt to Equity : 141.8% Net Debt 9,357.7 6,075.4 6,050.9 -0.4% -35.3% ?Net Debt to Equity : 49.6% Debt/Equity 187.5% 141.2% 141.8% 0.6%p -45.7%p Net Debt/Equity 77.7% 49.9% 49.6% -0.3%p -28.1%p 187.5% 153.6% 154.4% 141.2% 141.8% 77.7% Debt/Equity 55.5% 46.7% 49.9% 49.6% Net Debt/Equity 1Q 15 2Q 15 3Q 15 4Q 15 1Q 16 6
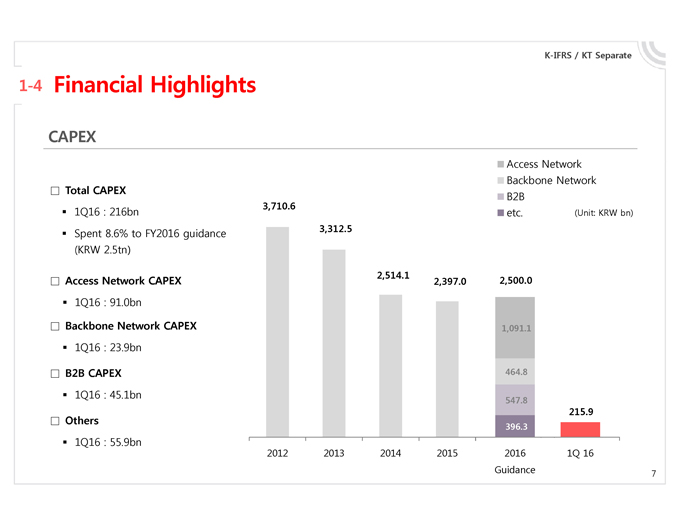
K-IFRS / KT Separate 1-4 Financial Highlights CAPEX Access Network Backbone Network Total CAPEX B2B 1Q16 : 216bn 3,710.6 etc. (Unit: KRW bn) 8.6% FY2016 guidance 3,312.5 ?Spent to (KRW 2.5tn) Access Network CAPEX 2,514.1 2,500.0 2,397.0 ?1Q16 : 91.0bn Backbone Network CAPEX 1,091.1 ?1Q16 : 23.9bn B2B CAPEX 464.8 ?1Q16 : 45.1bn 547.8 215.9 Others 396.3 ?1Q16 : 55.9bn 2012 2013 2014 2015 1Q 16 2016 Guidance 7
1 |
| Financial Highlights 2 Business Overview 3 Q&A 4 Appendix 8 |
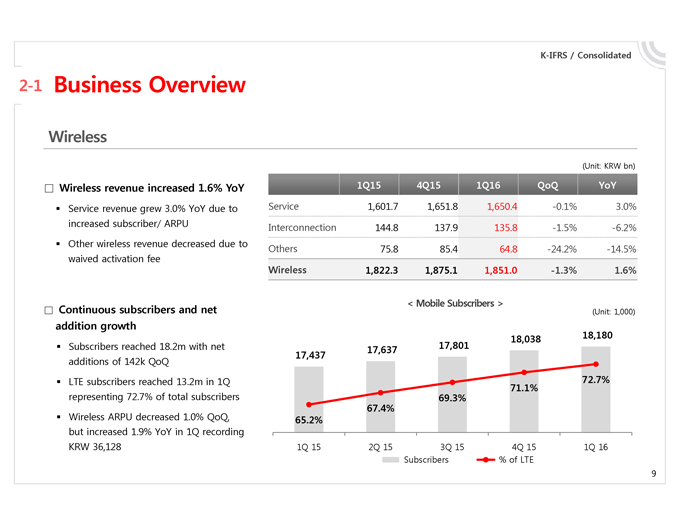
K-IFRS / Consolidated 2-1 Business Overview Wireless (Unit: KRW bn) Wireless revenue increased 1.6% YoY 1Q15 4Q15 1Q16 QoQ YoY ?Service revenue grew 3.0% YoY due to Service 1,601.7 1,651.8 1,650.4 -0.1% 3.0% increased subscriber/ ARPU Interconnection 1448 . 1379 . 1358 . -15% . -62% . ?Other wireless revenue decreased due to Others 75.8 85.4 64.8 -24.2% -14.5% waived activation fee Wireless 1,822.3 1,875.1 1,851.0 -1.3% 1.6% < Mobile Subscribers > Continuous subscribers and net (Unit: 1,000) addition growth 17,801 18,038 18,180 ?Subscribers reached 18.2m with net 17,637 17,437 additions of 142k QoQ ?LTE subscribers reached 13.2m in 1Q 72.7% 71.1% representing 72.7% of total subscribers 69.3% 67.4% ?Wireless ARPU decreased 1.0% QoQ, 65.2% but increased 19% . YoY in 1Q recording KRW 36,128 1Q 15 2Q 15 3Q 15 4Q 15 1Q 16 Subscribers % of LTE 9
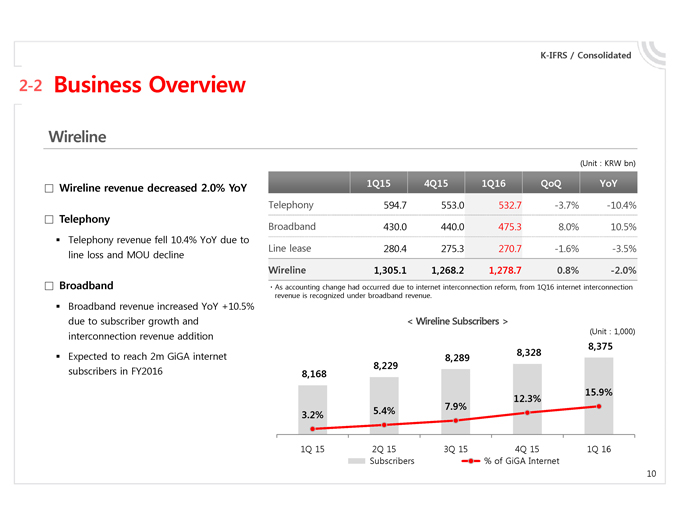
K-IFRS / Consolidated 2-2 Business Overview Wireline (Unit : KRW bn) Wireline revenue decreased 2.0% YoY 1Q15 4Q15 1Q16 QoQ YoY Telephony 594.7 553.0 532.7 -3.7% -10.4% Telephony Broadband 4300 . 4400 . 4753 . 80% . 105% . ?Telephony revenue fell 10.4% YoY due to Line lease 280.4 275.3 270.7 -1.6% -3.5% line loss and MOU decline Wireline 1,305.1 1,268.2 1,278.7 0.8% -2.0% Broadband??As accounting change had occurred due to internet interconnection reform, from 1Q16 internet interconnection revenue is recognized under broadband revenue. ?Broadband revenue increased YoY +10.5% due to subscriber growth and < Wireline Subscribers > interconnection revenue addition (Unit : 1,000) 8,375 ?Expected to reach 2m GiGA internet 8,328 8,289 8,229 subscribers in FY2016 8,168 15.9% 12.3% 5.4% 7.9% 3.2% 1Q 15 2Q 15 3Q 15 4Q 15 1Q 16 Subscribers % of GiGA Internet 10
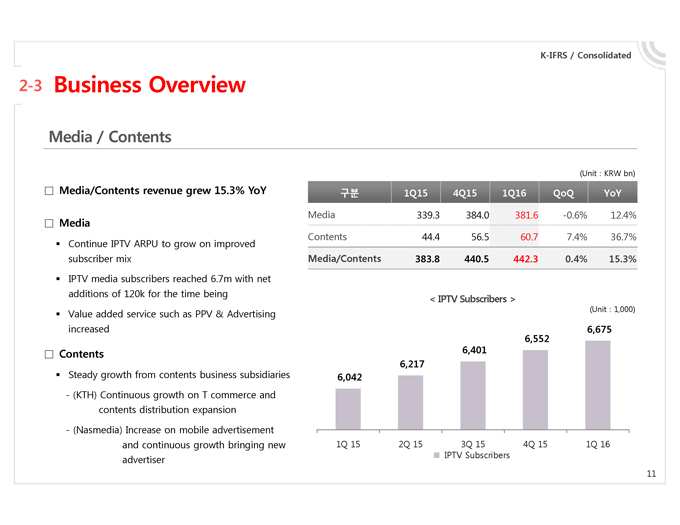
K-IFRS / Consolidated 2-3 Business Overview Media / Contents (Unit : KRW bn) Media/Contents revenue grew 15.3% YoY?? 1Q15 4Q15 1Q16 QoQ YoY Media 339.3 384.0 381.6 -0.6% 12.4% Media Contents 44.4 56.5 60.7 7.4% 36.7% ?Continue IPTV ARPU to grow on improved subscriber mix Media/Contents 383.8 440.5 442.3 0.4% 15.3% ?IPTV media subscribers reached 6.7m with net additions of 120k for the time being < IPTV Subscribers > (Unit : 1,000) ?Value added service such as PPV & Advertising increased 6,675 6,552 Contents 6,401 Steady from contents business subsidiaries 6,217 ?growth 6,042—(KTH) Continuous growth on T commerce and contents distribution expansion—(Nasmedia) Increase on mobile advertisement and continuous growth bringing new 1Q 15 2Q 15 3Q 15 4Q 15 1Q 16 advertiser IPTV Subscribers 11
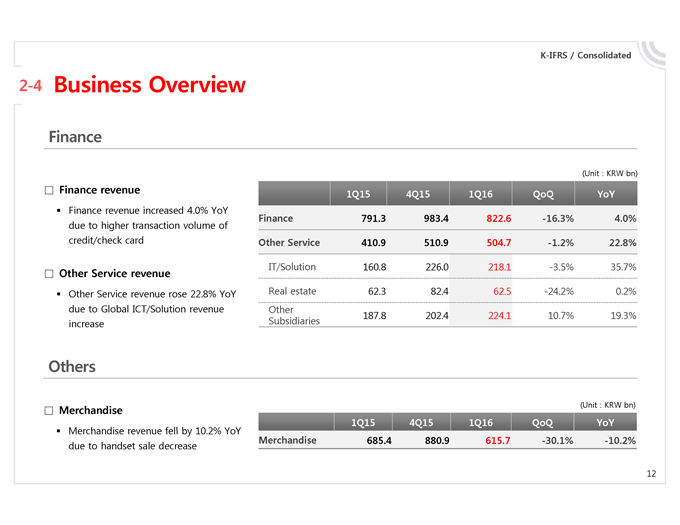
K-IFRS / Consolidated 2-4 Business Overview Finance (Unit : KRW bn) Finance revenue 1Q15 4Q15 1Q16 QoQ YoY ?Finance revenue increased 4.0% YoY Finance 791.3 983.4 822.6 -16.3% 4.0% due to higher transaction volume of credit/check card Other Service 410.9 510.9 504.7 -1.2% 22.8% IT/Solution 160.8 226.0 218.1 -3.5% 35.7% Other Service revenue ?Other Service revenue rose 228% . YoY Real estate 62.3 82.4 62.5 -24.2% 0.2% due to Global ICT/Solution revenue Other 187.8 202.4 224.1 10.7% 19.3% increase Subsidiaries Other Merchandise (Unit : KRW bn) 1Q15 4Q15 1Q16 QoQ YoY Merchandise revenue fell by 102% . YoY Merchandise 685.4 880.9 615.7 -30.1% -10.2% due to handset sale decrease 12
Q & A 1 Financial Highlights 2 Business Overview 3 Q&A 4 Appendix 13
1 |
| Financial Highlights 2 Business Overview 3 Q&A 4 Appendix 14 |
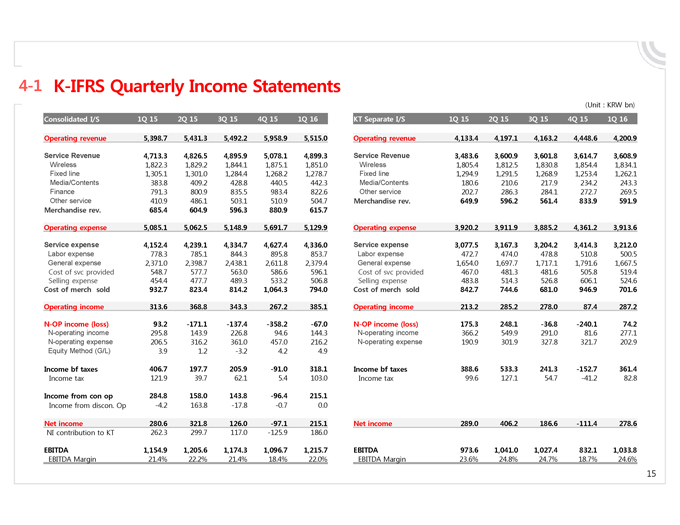
4-1 K-IFRS Quarterly Income Statements (Unit : KRW bn) Consolidated I/S 1Q 15 2Q 15 3Q 15 4Q 15 1Q 16 KT Separate I/S 1Q 15 2Q 15 3Q 15 4Q 15 1Q 16 Operating revenue 5,398.7 5,431.3 5,492.2 5,958.9 5,515.0 Operating revenue 4,133.4 4,197.1 4,163.2 4,448.6 4,200.9 Service Revenue 4,713.3 4,826.5 4,895.9 5,078.1 4,899.3 Service Revenue 3,483.6 3,600.9 3,601.8 3,614.7 3,608.9 Wireless 1,822.3 1,829.2 1,844.1 1,875.1 1,851.0 Wireless 1,805.4 1,812.5 1,830.8 1,854.4 1,834.1 Fixed line 1,305.1 1,301.0 1,284.4 1,268.2 1,278.7 Fixed line 1,294.9 1,291.5 1,268.9 1,253.4 1,262.1 Media/Contents 383.8 409.2 428.8 440.5 442.3 Media/Contents 180.6 210.6 217.9 234.2 243.3 Finance 791.3 800.9 835.5 983.4 822.6 Other service 202.7 286.3 284.1 272.7 269.5 Other service 410.9 486.1 503.1 510.9 504.7 Merchandise rev. 649.9 596.2 561.4 833.9 591.9 Merchandise rev. 685.4 604.9 596.3 880.9 615.7 Operating expense 5,085.1 5,062.5 5,148.9 5,691.7 5,129.9 Operating expense 3,920.2 3,911.9 3,885.2 4,361.2 3,913.6 Service expense 4,152.4 4,239.1 4,334.7 4,627.4 4,336.0 Service expense 3,077.5 3,167.3 3,204.2 3,414.3 3,212.0 Labor expense 778.3 785.1 844.3 895.8 853.7 Labor expense 472.7 474.0 478.8 510.8 500.5 General expense 2,371.0 2,398.7 2,438.1 2,611.8 2,379.4 General expense 1,654.0 1,697.7 1,717.1 1,791.6 1,667.5 Cost of svc provided 548.7 577.7 563.0 586.6 596.1 Cost of svc provided 467.0 481.3 481.6 505.8 519.4 Selling expense 454.4 477.7 489.3 533.2 506.8 Selling expense 483.8 514.3 526.8 606.1 524.6 Cost of merch sold 932.7 823.4 814.2 1,064.3 794.0 Cost of merch sold 842.7 744.6 681.0 946.9 701.6 Operating income 313.6 368.8 343.3 267.2 385.1 Operating income 213.2 285.2 278.0 87.4 287.2 N-OP income (loss) 93.2 -171.1 -137.4 -358.2 -67.0 N-OP income (loss) 175.3 248.1 -36.8 -240.1 74.2 N-operating income 295.8 143.9 226.8 94.6 144.3 N-operating income 366.2 549.9 291.0 81.6 277.1 N-operating expense 206.5 316.2 361.0 457.0 216.2 N-operating expense 190.9 301.9 327.8 321.7 202.9 Equity Method (G/L) 3.9 1.2 -3.2 4.2 4.9 Income bf taxes 406.7 197.7 205.9 -91.0 318.1 Income bf taxes 388.6 533.3 241.3 -152.7 361.4 Income tax 121.9 39.7 62.1 5.4 103.0 Income tax 99.6 127.1 54.7 -41.2 82.8 Income from con op 284.8 158.0 143.8 -96.4 215.1 Income from discon. Op -4.2 163.8 -17.8 -0.7 0.0 Net income 280.6 321.8 126.0 -97.1 215.1 Net income 289.0 406.2 186.6 -111.4 278.6 NI contribution to KT 262.3 299.7 117.0 -125.9 186.0 EBITDA 1,154.9 1,205.6 1,174.3 1,096.7 1,215.7 EBITDA 973.6 1,041.0 1,027.4 832.1 1,033.8 EBITDA Margin 21.4% 22.2% 21.4% 18.4% 22.0% EBITDA Margin 23.6% 24.8% 24.7% 18.7% 24.6% 15
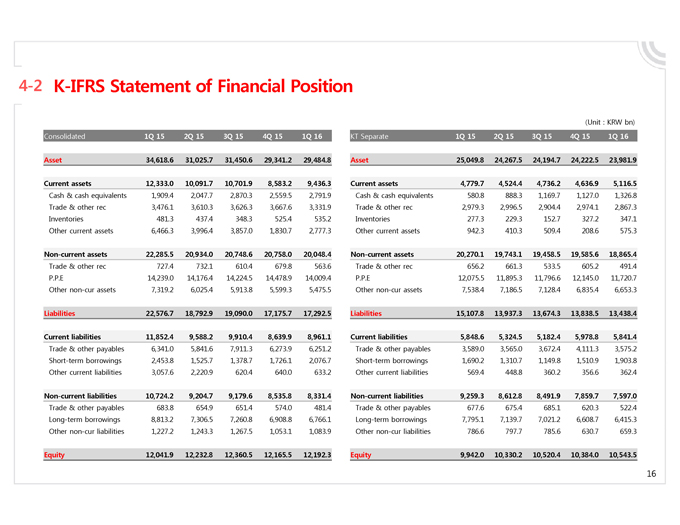
4-2 K-IFRS Statement of Financial Position (Unit : KRW bn) Consolidated 1Q 15 2Q 15 3Q 15 4Q 15 1Q 16 KT Separate 1Q 15 2Q 15 3Q 15 4Q 15 1Q 16 Asset 34,618.6 31,025.7 31,450.6 29,341.2 29,484.8 Asset 25,049.8 24,267.5 24,194.7 24,222.5 23,981.9 Current assets 12,333.0 10,091.7 10,701.9 8,583.2 9,436.3 Current assets 4,779.7 4,524.4 4,736.2 4,636.9 5,116.5 Cash & cash equivalents 1,909.4 2,047.7 2,870.3 2,559.5 2,791.9 Cash & cash equivalents 580.8 888.3 1,169.7 1,127.0 1,326.8 Trade & other rec 3,476.1 3,610.3 3,626.3 3,667.6 3,331.9 Trade & other rec 2,979.3 2,996.5 2,904.4 2,974.1 2,867.3 Inventories 481.3 437.4 348.3 525.4 535.2 Inventories 277.3 229.3 152.7 327.2 347.1 Other current assets 6,466.3 3,996.4 3,857.0 1,830.7 2,777.3 Other current assets 942.3 410.3 509.4 208.6 575.3 Non-current assets 22,285.5 20,934.0 20,748.6 20,758.0 20,048.4 Non-current assets 20,270.1 19,743.1 19,458.5 19,585.6 18,865.4 Trade & other rec 727.4 732.1 610.4 679.8 563.6 Trade & other rec 656.2 661.3 533.5 605.2 491.4 P.P.E 14,239.0 14,176.4 14,224.5 14,478.9 14,009.4 P.P.E 12,075.5 11,895.3 11,796.6 12,145.0 11,720.7 Other non-cur assets 7,319.2 6,025.4 5,913.8 5,599.3 5,475.5 Other non-cur assets 7,538.4 7,186.5 7,128.4 6,835.4 6,653.3 Liabilities 22,576.7 18,792.9 19,090.0 17,175.7 17,292.5 Liabilities 15,107.8 13,937.3 13,674.3 13,838.5 13,438.4 Current liabilities 11,852.4 9,588.2 9,910.4 8,639.9 8,961.1 Current liabilities 5,848.6 5,324.5 5,182.4 5,978.8 5,841.4 Trade & other payables 6,341.0 5,841.6 7,911.3 6,273.9 6,251.2 Trade & other payables 3,589.0 3,565.0 3,672.4 4,111.3 3,575.2 Short-term borrowings 2,453.8 1,525.7 1,378.7 1,726.1 2,076.7 Short-term borrowings 1,690.2 1,310.7 1,149.8 1,510.9 1,903.8 Other current liabilities 3,057.6 2,220.9 620.4 640.0 633.2 Other current liabilities 569.4 448.8 360.2 356.6 362.4 Non-current liabilities 10,724.2 9,204.7 9,179.6 8,535.8 8,331.4 Non-current liabilities 9,259.3 8,612.8 8,491.9 7,859.7 7,597.0 Trade & other payables 683.8 654.9 651.4 574.0 481.4 Trade & other payables 677.6 675.4 685.1 620.3 522.4 Long-term borrowings 8,813.2 7,306.5 7,260.8 6,908.8 6,766.1 Long-term borrowings 7,795.1 7,139.7 7,021.2 6,608.7 6,415.3 Other non-cur liabilities 1,227.2 1,243.3 1,267.5 1,083.9 Other non-cur liabilities 786.6 797.7 785.6 630.7 659.3 Equity 12,041.9 12,232.8 12,360.5 12,165.5 12,192.3 Equity 9,942.0 10,330.2 10,520.4 10,384.0 10,543.5 16
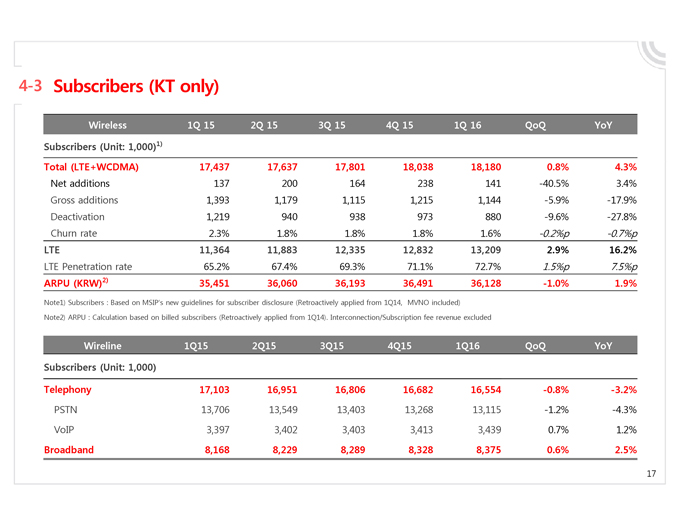
4-3 Subscribers (KT only) Wireless 1Q 15 2Q 15 3Q 15 4Q 15 1Q 16 QoQ YoY Subscribers (Unit: 1,000)1) Total (LTE+WCDMA) 17,437 17,637 17,801 18,038 18,180 0.8% 4.3% Net additions 137 200 164 238 141 -40.5% 3.4% Gross additions 1,393 1,179 1,115 1,215 1,144 -5.9% -17.9% Deactivation 1,219 940 938 973 880 -9.6% -27.8% Churn rate 2.3% 1.8% 1.8% 1.8% 1.6% -0.2%p -0.7%p LTE 11,364 11,883 12,335 12,832 13,209 2.9% 16.2% LTE Penetration rate 65.2% 67.4% 69.3% 71.1% 72.7% 1.5%p 7.5%p ARPU (KRW)2) 35,451 36,060 36,193 36,491 36,128 -1.0% 1.9% Note1) Subscribers : Based on MSIP’s new guidelines for subscriber disclosure (Retroactively applied from 1Q14, MVNO included) Note2) ARPU : Calculation based on billed subscribers (Retroactively applied from 1Q14). Interconnection/Subscription fee revenue excluded Wireline 1Q15 2Q15 3Q15 4Q15 1Q16 QoQ YoY Subscribers (Unit: 1,000) Telephony 17,103 16,951 16,806 16,682 16,554 -0.8% -3.2% PSTN 13,706 13,549 13,403 13,268 13,115 -1.2% -4.3% VoIP 3397 , 3402 , 3403 , 3413 , 3439 , 07% . 12% . Broadband 8,168 8,229 8,289 8,328 8,375 0.6% 2.5% 17

Thank you kt