UNITED STATES
SECURITIES AND EXCHANGE COMMISSION
Washington, D.C. 20549
FORM N-CSR
CERTIFIED SHAREHOLDER REPORT OF REGISTERED
MANAGEMENT INVESTMENT COMPANIES
Investment Company Act File Number: 811-07538
LORD ABBETT SECURITIES TRUST
(Exact name of Registrant as specified in charter)
90 Hudson Street, Jersey City, NJ 07302
(Address of principal executive offices) (Zip code)
John T. Fitzgerald, Esq., Vice President & Assistant Secretary
90 Hudson Street, Jersey City, NJ 07302
(Name and address of agent for service)
Registrant’s telephone number, including area code: (888) 522-2388
Date of fiscal year end: 10/31
Date of reporting period: 10/31/2021
| Item 1: | Report to Shareholders. |
![]()
LORD ABBETT
ANNUAL REPORT
| Lord Abbett | |
| Alpha Strategy Fund | Growth Leaders Fund |
| Durable Growth Fund | Health Care Fund |
| Focused Growth Fund | International Equity Fund |
| Focused Large Cap Value Fund | International Opportunities Fund |
| Focused Small Cap Value Fund | International Value Fund |
| Fundamental Equity Fund | Micro Cap Growth Fund |
| Global Equity Fund* | Value Opportunities Fund |
* formerly Global Equity Research Fund
For the fiscal year ended October 31, 2021
Lord Abbett Alpha Strategy Fund, Lord Abbett Durable Growth Fund, Lord Abbett Focused Growth Fund, Lord Abbett Focused Large Cap Value Fund, Lord Abbett Focused Small Cap Value Fund, Lord Abbett Fundamental Equity Fund, Lord Abbett Global Equity Fund, Lord Abbett Growth Leaders Fund, Lord Abbett Health Care Fund, Lord Abbett International Equity Fund, Lord Abbett International Opportunities Fund, Lord Abbett International Value Fund, Lord Abbett Micro Cap Growth Fund, and Lord Abbett Value Opportunities Fund
Annual Report
For the fiscal year ended October 31, 2021
From left to right: James L.L. Tullis, Independent Chairman of the Lord Abbett Funds and Douglas B. Sieg, Trustee, President, and Chief Executive Officer of the Lord Abbett Funds. | Dear Shareholders: We are pleased to provide you with this overview of the performance of the Funds for the fiscal year ended October 31, 2021. On this page and the following pages, we discuss the major factors that influenced fiscal year performance. For detailed and timely information about the Funds, please visit our website at www.lordabbett.com, where you can also access the quarterly commentaries that provide updates on each Fund’s performance and other portfolio related updates. Thank you for investing in Lord Abbett mutual funds. We value the trust that you place in us and look forward to serving your investment needs in the years to come.
Best regards,
Douglas B. Sieg Trustee, President and Chief Executive Officer |


1
Lord Abbett Alpha Strategy Fund
For the fiscal year ended October 31, 2021, the Fund returned 45.31%, reflecting performance at the net asset value (NAV) of Class A shares with all distributions reinvested, compared to its benchmark, the Russell 2000® Index,1 which returned 50.80% over the same period.
The trailing twelve-month period was primarily a story of the dramatic economic and market recovery that occurred within the U.S., despite the persistent presence of COVID-19. The S&P 500® Index2 and the tech-heavy Nasdaq Composite3 returned 42.91% and 42.99%, respectively. Small cap stocks4 outperformed large cap stocks5 (50.80% vs. 43.51%), while value6 outperformed growth7 (44.97% vs. 42.81%).
Following volatility throughout the fall of 2020, markets rallied in November with the Dow Jones Industrial Average having its best month since 1987. The rally was largely attributed to the conclusion of the U.S. Presidential election and positive vaccine news. Pfizer and BioNTech announced in November that an initial analysis of a late-stage study showed that their vaccine was over 90% effective. Follow-up data concluded that the efficacy rate for the vaccine was 95%. Shortly thereafter, both Moderna and AstraZeneca announced studies indicating their vaccines were over 90% effective. These positive vaccine developments helped bolster optimism about the economy reopening which drove a rotation from growth and momentum stocks to value and cyclical stocks.
To start the new year, various factors impacted markets, although the longstanding bullish narrative surrounding stimulus and vaccine optimism remained largely intact. Momentum continued behind the pro-cyclical and value rotation on the back of the Democrats’ surprise victory in the Georgia U.S. Senate runoff elections. As such, value outperformed growth during the first quarter by the largest margin in two decades. Overall, the S&P 500® Index reported growth in earnings of 52% during the first quarter of 2021.
Inflation fears and renewed concerns over variants of the coronavirus did little to slow the market down during the second quarter of 2021, as the S&P 500® Index and Nasdaq Composite returned 8.55% and 9.68%, respectively, with both indexes breaching all-time highs. After lagging meaningfully since the announcement of the vaccine news, growth outperformed value during the quarter. Second quarter reported earnings were even stronger than the first quarter, with the blended growth rate for the S&P 500® Index at 88%, which was the highest year-over-year growth since fourth quarter of 2009. In aggregate, companies were reporting earnings 17.1% ahead of consensus in the second quarter, the fourth highest on record, and revenues 4.9% ahead of consensus, the highest on record.
The bullish narrative continued into the start of the third quarter. For most of July and August, investor focus was largely centered around themes such as a central bank liquidity tailwind, continued vaccine progress, upside in corporate earnings
2
surprises, and reopening momentum. However, U.S. markets were met with increasing headwinds towards the latter half of the quarter, which included the increased spread of the Delta variant, rising concerns over supply chain and input price pressures on corporate earnings. This was reflected by consumer prices rising 5.4% year-over-year, in both June and July (the fastest pace since August 2008). Inflation maintained its record pace in August as consumer prices rose 5.3% year-over-year, albeit below economist expectations for the month. Uncertainty around the U.S. Federal Reserve (the “Fed”) tapering presented additional headwinds to the market. Toward the end of the third quarter, the Fed indicated that a reduction in its $120B per month asset-purchase plan might soon be warranted. U.S. markets were also affected by negative headlines overseas, most notably China’s regulatory crackdown of the private education and technology sectors and broad worries about a default by Chinese real estate developer Evergrande. These headwinds culminated in a volatile September, with all major U.S. indices finishing in negative territory. Specifically, the S&P 500® Index snapped a streak of seven consecutive months of positive returns and had its worst performing month since March 2020.
The U.S. equity market started the fourth quarter strong as all major indices exhibited positive performance and reached record highs. Both the S&P 500® Index and the Nasdaq Composite returned over 7% in October, with the Dow Jones
Industrial Average posting a return of 5.93%. This followed four straight weeks of gains for each index, as there were more tailwinds than headwinds – which pushed stocks generally higher throughout October. Strong consumer demand, underpinned by robust corporate and consumer balance sheets, has helped keep operating leverage and margins elevated for corporations, despite increased supply chain and input price pressures. The bullish narrative in U.S. markets has also been driven by the continued trend of outsized inflows, a decline in Delta variant cases and a pickup in expectations for additional fiscal stimulus. However, areas of concern continued to revolve around the shift in the transient versus persistent inflation debate and dampened earnings revision momentum.
The Fund is a “fund of funds” that invests in affiliated mutual funds managed by Lord Abbett. Under normal conditions, through the underlying funds, the Fund indirectly invests in the equity securities of U.S. and foreign micro-cap, small, and mid-sized companies. The Fund uses a “blend” strategy to gain exposure to both growth and value stocks.
The portfolio’s exposure to domestic small-cap growth stocks within the Lord Abbett Developing Growth Fund was the largest detractor from relative performance over the period. As mentioned above, positive vaccine developments at the end of 2020 helped bolster optimism about the economy reopening, which drove a rotation from growth and momentum stocks to value
3
and cyclical stocks. Within small cap growth, exposure to highly innovative industries such as the biotechnology sector detracted since they generally lack strong earnings and revenue growth while their drugs and therapies are still in the early stages of development. The stocks of such companies came under pressure during this period of uncertainty as investors showed a strong preference for larger cash-rich companies.
In addition, the portfolio’s allocation to international small-cap stocks within the Lord Abbett International Opportunities Fund was also a notable detractor from relative performance, as domestic equities outperformed international equities over the period.
The portfolio’s weightings in domestic small-cap value stocks within the Lord Abbett Focused Small Cap Value Fund and the Lord Abbett Small Cap Value Fund were the largest contributors to relative performance over the period. In particular, security selection within the financials sector benefited both Funds, as rising interest rates and a healthy consumer were both major tailwinds throughout the period.
Lord Abbett Durable Growth Fund
For the fiscal year ended October 31, 2021, the Fund returned 36.00% reflecting performance at the net asset value (NAV) of Class A shares with all distributions reinvested, compared to its benchmark, the Russell 1000® Growth Index,8 which returned 43.21% over the same period.
The trailing twelve-month period was primarily a story of the dramatic economic and market recovery that occurred within the U.S., despite the persistent presence of COVID-19. The S&P 500® Index2 and the tech-heavy Nasdaq Composite3 returned 42.91% and 42.99%, respectively. Small cap stocks4 outperformed large cap stocks5 (50.80% vs. 43.51%), while value6 outperformed growth7 (44.97% vs. 42.81%).
Following volatility throughout the fall of 2020, markets rallied in November with the Dow Jones Industrial Average having its best month since 1987. The rally was largely attributed to the conclusion of the U.S. Presidential election and positive vaccine news. Pfizer and BioNTech announced in November that an initial analysis of a late-stage study showed that their vaccine was over 90% effective. Follow-up data concluded that the efficacy rate for the vaccine was 95%. Shortly thereafter, both Moderna and AstraZeneca announced studies indicating their vaccines were over 90% effective. These positive vaccine developments helped bolster optimism about the economy reopening which drove a rotation from growth and momentum stocks to value and cyclical stocks.
To start the new year, various factors impacted markets, although the longstanding bullish narrative surrounding stimulus and vaccine optimism remained largely intact. Momentum continued behind the pro-cyclical and value rotation on the back of the Democrats’ surprise victory in the Georgia U.S. Senate runoff elections. As such, value outperformed growth during
4
the first quarter by the largest margin in two decades. Overall, the S&P 500® Index reported growth in earnings of 52% during the first quarter of 2021.
Inflation fears and renewed concerns over variants of the coronavirus did little to slow the market down during the second quarter of 2021, as the S&P 500® Index and Nasdaq Composite returned 8.55% and 9.68%, respectively, with both indexes breaching all-time highs. After lagging meaningfully since the announcement of the vaccine news, growth outperformed value during the quarter. Second quarter reported earnings were even stronger than the first quarter, with the blended growth rate for the S&P 500® Index at 88%, which was the highest year-over-year growth since fourth quarter of 2009. In aggregate, companies were reporting earnings 17.1% ahead of consensus in the second quarter, the fourth highest on record, and revenues 4.9% ahead of consensus, the highest on record.
The bullish narrative continued into the start of the third quarter. For most of July and August, investor focus was largely centered around themes such as a central bank liquidity tailwind, continued vaccine progress, upside in corporate earnings surprises, and reopening momentum. However, U.S. markets were met with increasing headwinds towards the latter half of the quarter, which included the increased spread of the Delta variant, rising concerns over supply chain and input price pressures on corporate earnings. This was reflected by consumer prices rising 5.4% year-over-year, in both June and July (the
fastest pace since August 2008). Inflation maintained its record pace in August as consumer prices rose 5.3% year-over-year, albeit below economist expectations for the month. Uncertainty around the U.S. Federal Reserve (the “Fed”) tapering presented additional headwinds to the market. Toward the end of the third quarter, the Fed indicated that a reduction in its $120B per month asset-purchase plan might soon be warranted. U.S. markets were also affected by negative headlines overseas, most notably China’s regulatory crackdown of the private education and technology sectors and broad worries about a default by Chinese real estate developer Evergrande. These headwinds culminated in a volatile September, with all major U.S. indices finishing in negative territory. Specifically, the S&P 500® Index snapped a streak of seven consecutive months of positive returns and had its worst performing month since March 2020.
The U.S. equity market started the fourth quarter strong as all major indices exhibited positive performance and reached record highs. Both the S&P 500® Index and the Nasdaq Composite returned over 7% in October, with the Dow Jones Industrial Average posting a return of 5.93%. This followed four straight weeks of gains for each index, as there were more tailwinds than headwinds – which pushed stocks generally higher throughout October. Strong consumer demand, underpinned by robust corporate and consumer balance sheets, has helped keep operating leverage and margins elevated
5
for corporations, despite increased supply chain and input price pressures. The bullish narrative in U.S. markets has also been driven by the continued trend of outsized inflows, a decline in Delta variant cases and a pickup in expectations for additional fiscal stimulus. However, areas of concern continued to revolve around the shift in the transient versus persistent inflation debate and dampened earnings revision momentum.
Our investment philosophy is focused on identifying durable franchises that exhibit a compelling combination of strong growth prospects and seasoned management teams that are mispriced by the market. We believe we can deliver consistently strong returns by constructing a portfolio of durable growth companies that have seen growth trends and adoption trends structurally accelerate, supporting current valuations. In addition, we seek to invest in companies that have developed a stronger competitive position or have been temporarily negatively impacted by the current environment potentially creating an attractive entry point.
Security selection within the information technology sector was the primary detractor from relative performance over the period. Specifically, the Fund’s overweight position in Amazon.com, Inc., a global leader in online retail shopping services, was the largest individual drag on performance. After a relatively strong first half of 2021, shares of the company fell following second quarter earnings results and guidance for the remainder of the year that were softer
than expected. Amazon has also dealt with obstacles in its logistics chain that led to delivery delays, and high turnover in warehouses, where some workers staged walkouts in protest of Amazon’s handling of safety. The Fund’s position in Meta Platforms, Inc. (formerly Facebook), was also a notable detractor within the sector, as regulatory concerns increased volatility for the stock.
RingCentral, Inc., an operator of global enterprise cloud communications and collaboration solutions, also detracted from relative performance. Despite strong quarterly earnings results throughout the period, shares of RingCentral fell following the initial announcement that Zoom had come to an agreement to acquire Five9, a leading cloud contact center software.
Conversely, security selection within the Fund’s allocation to the healthcare sector was a primary contributor to relative performance. Specifically, security selection within biotechnology and medical devices drove performance, as more people have been able to get elective procedures compared to earlier in the year. Within the subsectors, Dexcom, Inc., Repligen Corp., and Intuitive Surgical, Inc. were all notable contributors and all three positions are active overweights within the portfolio.
The Fund’s position in Alphabet, Inc. was also a notable contributor to relative performance over the period as the company has consistently reported exceedingly strong growth in several metrics, led by search, YouTube, and cloud communications. The Fund remains
6
overweight in Alphabet, Inc. relative to the benchmark.
Lord Abbett Focused Growth Fund
For the fiscal year ended October 31, 2021, the Fund returned 43.48%, reflecting performance at the net asset value (NAV) of Class A shares with all distributions reinvested, compared to its benchmark, the Russell 1000® Growth Index,8 which returned 43.21% over the same period.
The trailing twelve-month period was primarily a story of the dramatic economic and market recovery that occurred within the U.S., despite the persistent presence of COVID-19. The S&P 500® Index2 and the tech-heavy Nasdaq Composite3 returned 42.91% and 42.99%, respectively. Small cap stocks4 outperformed large cap stocks5 (50.80% vs. 43.51%), while value6 outperformed growth7 (44.97% vs. 42.81%).
Following volatility throughout the fall of 2020, markets rallied in November with the Dow Jones Industrial Average having its best month since 1987. The rally was largely attributed to the conclusion of the U.S. Presidential election and positive vaccine news. Pfizer and BioNTech announced in November that an initial analysis of a late-stage study showed that their vaccine was over 90% effective. Follow-up data concluded that the efficacy rate for the vaccine was 95%. Shortly thereafter, both Moderna and AstraZeneca announced studies indicating their vaccines were over 90% effective. These positive vaccine developments helped bolster optimism about the economy
reopening which drove a rotation from growth and momentum stocks to value and cyclical stocks.
To start the new year, various factors impacted markets, although the longstanding bullish narrative surrounding stimulus and vaccine optimism remained largely intact. Momentum continued behind the pro-cyclical and value rotation on the back of the Democrats’ surprise victory in the Georgia U.S. Senate runoff elections. As such, value outperformed growth during the first quarter by the largest margin in two decades. Overall, the S&P 500® Index reported growth in earnings of 52% during the first quarter of 2021.
Inflation fears and renewed concerns over variants of the coronavirus did little to slow the market down during the second quarter of 2021, as the S&P 500® Index and Nasdaq Composite returned 8.55% and 9.68%, respectively, with both indexes breaching all-time highs. After lagging meaningfully since the announcement of the vaccine news, growth outperformed value during the quarter. Second quarter reported earnings were even stronger than the first quarter, with the blended growth rate for the S&P 500® Index at 88%, which was the highest year-over-year growth since fourth quarter of 2009. In aggregate, companies were reporting earnings 17.1% ahead of consensus in the second quarter, the fourth highest on record, and revenues 4.9% ahead of consensus, the highest on record.
The bullish narrative continued into the start of the third quarter. For most of July and August, investor focus was largely
7
centered around themes such as a central bank liquidity tailwind, continued vaccine progress, upside in corporate earnings surprises, and reopening momentum. However, U.S. markets were met with increasing headwinds towards the latter half of the quarter, which included the increased spread of the Delta variant, rising concerns over supply chain and input price pressures on corporate earnings. This was reflected by consumer prices rising 5.4% year-over-year, in both June and July (the fastest pace since August 2008). Inflation maintained its record pace in August as consumer prices rose 5.3% year-over-year, albeit below economist expectations for the month. Uncertainty around the U.S. Federal Reserve (the “Fed”) tapering presented additional headwinds to the market. Toward the end of the third quarter, the Fed indicated that a reduction in its $120B per month asset-purchase plan might soon be warranted. U.S. markets were also affected by negative headlines overseas, most notably China’s regulatory crackdown of the private education and technology sectors and broad worries about a default by Chinese real estate developer Evergrande. These headwinds culminated in a volatile September, with all major U.S. indices finishing in negative territory. Specifically, the S&P 500® Index snapped a streak of seven consecutive months of positive returns and had its worst performing month since March 2020.
The U.S. equity market started the fourth quarter strong as all major indices exhibited positive performance and reached record
highs. Both the S&P 500® Index and the Nasdaq Composite returned over 7% in October, with the Dow Jones Industrial Average posting a return of 5.93%. This followed four straight weeks of gains for each index, as there were more tailwinds than headwinds – which pushed stocks generally higher throughout October. Strong consumer demand, underpinned by robust corporate and consumer balance sheets, has helped keep operating leverage and margins elevated for corporations, despite increased supply chain and input price pressures. The bullish narrative in U.S. markets has also been driven by the continued trend of outsized inflows, a decline in Delta variant cases and a pickup in expectations for additional fiscal stimulus. However, areas of concern continued to revolve around the shift in the transient versus persistent inflation debate and dampened earnings revision momentum.
The portfolio’s underweight to prominent mega cap companies contributed to relative performance during the period, as the possibility of a faster-than-expected reopening of the U.S. economy, along with the unprecedented fiscal and monetary stimulus, restored investor confidence in smaller capitalized companies throughout first quarter of 2021. Looking ahead, we believe the market is starting to look through the current strength of cyclicals towards innovation stocks with sustained, secular growth and we would expect market leadership to start to come from outside mega cap stocks, which have dominated even as some growth is slowing.
8
The portfolio’s position in Tesla, Inc., a designer and manufacturer of electric vehicles and energy storage systems, was the largest individual contributor to relative performance. Tesla’s strong run has been well documented, as the company attained a $1 trillion market cap in late October. Shares of the company have rapidly climbed as the company’s execution, capital expenditure discipline, and strong orders drove the advance in the stock price. We maintain our high conviction in the stock and it remains one of the portfolio’s largest active overweights.
The portfolio’s position in NVIDIA Corporation, a designer and manufacturer of computer graphics processors, chipsets, and related multimedia software, was also a notable contributor to relative performance over the period. Similar to Tesla, NVIDIA is among the largest active overweights in the portfolio. While shares of the company were relatively flat during the market rotation from growth to value throughout the first half of the fiscal year, shares soared throughout the summer after the company reported 30% year-over-year growth for the second quarter of 2021 in their all-important datacenter segment and raised its full year earnings guidance.
Conversely, stock selection within the biotechnology sector was a primary detractor from relative performance during the period. Due to increased uncertainty from global supply chain issues, inflationary concerns, and the Delta variant headwind, among other factors, investors overwhelmingly favored larger cash-rich companies generating high levels
of current profits. As a result, smaller biotechnology companies mostly struggled, as they generally lack strong earnings and revenue growth while their drugs and therapies are still in the developmental stage. Specifically, the portfolio’s positions in Arena Pharmaceuticals and Turning Point Therapeutics were among the largest detractors from performance and we have since exited out of both stocks.
The portfolio’s underweight position in Amazon.com, Inc., the world’s leading online retail shopping platform, also detracted from relative performance as, in our view, the company has continued to execute well throughout the recovery. While we believe the company has continued to execute well throughout the recovery it remains one of the portfolio’s largest active underweights.
Lord Abbett Focused Large Cap Value Fund
For the fiscal year ended October 31, 2021, the Fund returned 56.50%, reflecting performance at the net asset value (“NAV”) of Class A shares with all distributions reinvested, compared to its benchmark, the Russell 1000® Value Index,9 which returned 43.76% over the same period.
The trailing twelve-month period was primarily a story of the dramatic economic and market recovery that occurred within the U.S., despite the persistent presence of COVID-19. The S&P 500® Index2 and the tech-heavy Nasdaq returned3 42.91% and 42.99%, respectively. Small cap stocks4 outperformed large cap stocks5 (50.80% vs.
9
43.51%), while value6 outperformed growth7 (44.97% vs. 42.81%).
Following volatility throughout the fall of 2020, markets rallied in November with the Dow Jones Industrial Average having its best month since 1987. The rally was largely attributed to the conclusion of the U.S. Presidential election and positive vaccine news. Pfizer and BioNTech announced in November that an initial analysis of a late-stage study showed that their vaccine was over 90% effective. Follow- up data concluded that the efficacy rate for the vaccine was 95%. Following the Pfizer/BioNTech announcement, Moderna announced that its COVID-19 vaccine was 94.5% effective, and AstraZeneca said the vaccine the company developed with the University of Oxford was 90% effective. These positive vaccine developments helped bolster optimism about the economy reopening which drove a rotation from growth and momentum stocks to value and cyclical stocks.
To start the new year, various factors impacted markets, although the longstanding bullish narrative surrounding stimulus and vaccine optimism remained largely intact. Momentum continued behind the pro-cyclical and value rotation on the back of the Democrats’ surprise victory in the Georgia U.S. Senate runoff elections. As such, value outperformed growth during the first quarter by the largest margin in two decades. Overall, the S&P 500® Index reported growth in earnings of 52% during the first quarter of 2021.
Inflation fears and renewed concerns over variants of the coronavirus did little to
slow the market down during the second quarter of 2021, as the S&P® 500 Index and Nasdaq Composite returned 8.55% and 9.68%, respectively, with both indexes breaching all-time highs. After lagging meaningfully since the announcement of the vaccine news, growth outperformed value during the quarter. Second quarter earnings were even stronger than the first quarter, with the blended growth rate for the S&P 500® Index at 88%, which was the highest year-over-year growth since fourth quarter of 2009. In aggregate, companies were reporting earnings 17.1% ahead of consensus in the second quarter, the fourth highest on record, and revenues 4.9% ahead of consensus, the highest on record.
The bullish narrative continued into the start of the third quarter. For most of July and August, investor focus was largely centered around themes such as a central bank liquidity tailwind, continued vaccine progress, upside in corporate earnings surprises, and reopening momentum. However, U.S. markets were met with increasing headwinds towards the latter half of the quarter, which included the increased spread of the Delta variant, rising concerns over supply chain and input price pressures on corporate earnings. This was reflected by consumer prices rising 5.4% year-over-year, in both June and July (the fastest pace since August 2008). Inflation maintained its record pace in August as consumer prices rose 5.3% year-over-year, albeit below economist expectations for the month. Uncertainty around the U.S. Federal Reserve (the “Fed”) tapering presented additional headwinds to the
10
market. Toward the end of the third quarter, the Fed indicated that a reduction in its $120B per month asset-purchase plan might soon be warranted. U.S. markets were also affected by negative headlines overseas, most notably China’s regulatory crackdown of the private education and technology sectors and broad worries about a default by Chinese real estate developer Evergrande. These headwinds culminated in a volatile September, with all major U.S. indices finishing in negative territory. Specifically, the S&P 500® Index snapped a streak of seven consecutive months of positive returns and had its worst performing month since March 2020.
The U.S. equity market started the fourth quarter strong as all major indices exhibited positive performance and reached record highs. Both the S&P 500® Index and the Nasdaq Composite returned over 7% in October, with the Dow Jones Industrial Average posting a return of 5.93%. This followed four straight weeks of gains for each index, as there were more tailwinds than headwinds, which pushed stocks generally higher throughout October. Strong consumer demand, underpinned by robust corporate and consumer balance sheets, has helped keep operating leverage and margins elevated for corporations, despite increased supply chain and input price pressures. The bullish narrative in U.S. markets has also been driven by the continued trend of outsized inflows, a decline in Delta variant cases and a pickup in expectations for additional fiscal stimulus. However, areas of concern
continued to revolve around the shift in the transient versus persistent inflation debate and dampened earnings revision momentum.
During the 12-month period ending October 31, 2021, the Fund’s position in Caesars Entertainment, a casino management company, contributed most to relative performance. Shares of Caesars increased over the period as the company was a beneficiary of widespread vaccine distribution and fiscal stimulus. The economy reopening aided the company as occupancies in Las Vegas surged from 60% in the fourth quarter 2020 to 89% in the second quarter of 2021. The Fund’s position in McAfee Corp. also contributed to relative performance. Shares of the security software company rose after it was announced that it had entered into a definitive agreement to sell its Enterprise business to a consortium led by Symphony Technology Group in an all-cash transaction for $4.0 billion. The stock rallied as the company became a pure play consumer cybersecurity company. The Fund’s allocation to Spectrum Brands Holdings Inc., a manufacturing company, also contributed to relative performance. The stock rose following the announcement that the company had entered into a definitive agreement to sell its hardware and home improvement segment to Assa Abloy, a manufacturing company, for $4.3 billion in an all-cash transaction. We believe the transaction simplifies the company’s business segments to three areas, which is expected to allow management to devote resources
11
and prioritize innovation to accelerate long-term sustainable growth.
Conversely, the largest detractor from relative performance during the 12-month period ending October 31, 2021 was Sabre Corp., a travel technology company. The stock plummeted after first quarter earnings fell short of expectations due to international government restrictions and lower fees caused by a higher mix of domestic leisure in North America. Shares continued to lag over the rest of the year as the spread of the Delta variant hindered optimism around global travel. The Fund’s position in Allison Transmission Holdings Inc., an American manufacturer and distributor of vehicle propulsion solutions, also detracted from relative performance. Shares came under pressure at the start of the summer as industry supply chain constraints and higher spending costs created headwinds for the company. The Fund’s position in Euronet Worldwide Inc., detracted from relative performance. Shares of the electronic payment provider came under pressure in the summer as the economic recovery continued to be rocky, especially in regard to cross-border travel, due to the spread of the delta variant. This weighed on the higher margin EFT (electronic funds transfer) segment which led to a drag on earnings and thus the stock lagged.
Lord Abbett Focused Small Cap Value Fund
For the fiscal year ended October 31, 2021, the Fund returned 64.27%, reflecting performance at the net asset value (“NAV”)
of Class A shares with all distributions reinvested, compared to its benchmark, the Russell 2000® Value Index,10 which returned 64.30% over the same period.
The trailing twelve-month period was primarily a story of the dramatic economic and market recovery that occurred within the U.S., despite the persistent presence of COVID-19. The S&P 500® Index2 and the tech-heavy Nasdaq3 returned 42.91% and 42.99%, respectively. Small cap stocks4 outperformed large cap stocks5 (50.80% vs. 43.51%), while value6 outperformed growth7 (44.97% vs. 42.81%).
Following volatility throughout the fall of 2020, markets rallied in November with the Dow Jones Industrial Average having its best month since 1987. The rally was largely attributed to the conclusion of the U.S. Presidential election and positive vaccine news. Pfizer and BioNTech announced in November that an initial analysis of a late-stage study showed that their vaccine was over 90% effective. Follow-up data concluded that the efficacy rate for the vaccine was 95%. Following the Pfizer/BioNTech announcement, Moderna announced that its COVID-19 vaccine was 94.5% effective, and AstraZeneca said the vaccine the company developed with the University of Oxford was 90% effective. These positive vaccine developments helped bolster optimism about the economy reopening which drove a rotation from growth and momentum stocks to value and cyclical stocks.
To start the new year, various factors impacted markets, although the longstanding bullish narrative surrounding
12
stimulus and vaccine optimism remained largely intact. Momentum continued behind the pro-cyclical and value rotation on the back of the Democrats’ surprise victory in the Georgia U.S. Senate runoff elections. As such, value outperformed growth during the first quarter by the largest margin in two decades. Overall, the S&P 500® Index reported growth in earnings of 52% during the first quarter of 2021.
Inflation fears and renewed concerns over variants of the coronavirus did little to slow the market down during the second quarter of 2021, as the S&P 500® Index and Nasdaq Composite returned 8.55% and 9.68%, respectively, with both indexes breaching all-time highs. After lagging meaningfully since the announcement of the vaccine news, growth outperformed value during the quarter. Second quarter earnings were even stronger than the first quarter, with the blended growth rate for the S&P 500® Index at 88%, which was the highest year-over-year growth since fourth quarter of 2009. In aggregate, companies were reporting earnings 17.1% ahead of consensus in the second quarter, the fourth highest on record, and revenues 4.9% ahead of consensus, the highest on record.
The bullish narrative continued into the start of the third quarter. For most of July and August, investor focus was largely centered around themes such as a central bank liquidity tailwind, continued vaccine progress, upside in corporate earnings surprises, and reopening momentum. However, U.S. markets were met with increasing headwinds towards the latter half of the quarter, which included the
increased spread of the Delta variant, rising concerns over supply chain and input price pressures on corporate earnings. This was reflected by consumer prices rising 5.4% year-over-year, in both June and July (the fastest pace since August 2008). Inflation maintained its record pace in August as consumer prices rose 5.3% year-over-year, albeit below economist expectations for the month. Uncertainty around the U.S. Federal Reserve (the “Fed”) tapering presented additional headwinds to the market. Toward the end of the third quarter, the Fed indicated that a reduction in its $120B per month asset-purchase plan might soon be warranted. U.S. markets were also affected by negative headlines overseas, most notably China’s regulatory crackdown of the private education and technology sectors and broad worries about a default by Chinese real estate developer Evergrande. These headwinds culminated in a volatile September, with all major U.S. indices finishing in negative territory. Specifically, the S&P 500® Index snapped a streak of seven consecutive months of positive returns and had its worst performing month since March 2020.
The U.S. equity market started the fourth quarter strong as all major indices exhibited positive performance and reached record highs. Both the S&P 500® Index and the Nasdaq Composite returned over 7% in October, with the Dow Jones Industrial Average posting a return of 5.93%. This followed four straight weeks of gains for each index, as there were more tailwinds than headwinds, which pushed
13
stocks generally higher throughout October. Strong consumer demand, underpinned by robust corporate and consumer balance sheets, has helped keep operating leverage and margins elevated for corporations, despite increased supply chain and input price pressures. The bullish narrative in U.S. markets has also been driven by the continued trend of outsized inflows, a decline in Delta variant cases and a pickup in expectations for additional fiscal stimulus. However, areas of concern continued to revolve around the shift in the transient versus persistent inflation debate and dampened earnings revision momentum.
The largest detractor from relative performance during the 12-month period ending October 31, 2021, was the Fund’s position in Purple Innovation Inc, a mattress company. Shares of Purple fell significantly in March after the company missed earnings estimates due to a deceleration of demand in December for both the direct-to consumer and wholesale businesses. The company faced further headwinds when there was a product accident in May which caused production to be shut down and sales expectations to be lowered. The Fund’s position in Alliance Data Systems Corp., a payment and lending provider, also detracted from relative performance. Shares of the company lagged since the summer as a greater percentage of customers paid off their credit cards in full, which resulted in lower-than-expected loan growth. Additionally, there was an acceleration in “Buy Now Pay Later” entrants, which created a headwind
for the stock. The Fund’s position in Bally’s Corporation also detracted from relative performance. Shares of the global casino-entertainment company lagged since May as the company announced a series of acquisitions. Additionally, the uncertainty around the launch of a full-scale U.S. online gaming system created a headwind for the stock.
Conversely, the Fund’s position in Bancorp, Inc., a financial holding company, was the largest contributor to relative performance. Shares rose steadily throughout the period as banks benefitted from an improving economy, rising interest rates and easing of restrictions on capital return to shareholders. Additionally, the stock benefitted from the announcement that the company would replace R1 RCM, a healthcare manager, in the S&P SmallCap 600. The Fund’s position in Western Alliance Bancorp, a bank holding company, also contributed to relative performance. The firm exceeded earnings expectations throughout the year but largely in the second quarter due to strong loan and deposit growth. Additionally, shares rose significantly in February after the company announced that it had signed a definitive agreement to acquire AmeriHome, a national multi-channel mortgage purchaser and servicer. The acquisition is expected to add 30% to consensus 2022 EPS (earnings per share) estimates. The Fund’s position in R.R. Donnelley & Sons Co., a communication solutions company, also contributed to relative performance. Shares rose after it was announced that Chatham Asset Management, a private
14
investment firm, had offered to acquire the company at $7.50 per share, a 62.1% premium to the previous day’s closing price.
Lord Abbett Fundamental Equity Fund
For the fiscal year ended October 31, 2021, the Fund returned 44.87%, reflecting performance at the net asset value (“NAV”) of Class A shares with all distributions reinvested, compared to its benchmark, the Russell 1000® Value Index9, which returned 43.76% over the same period.
The trailing twelve-month period was primarily a story of the dramatic economic and market recovery that occurred within the U.S., despite the persistent presence of COVID-19. The S&P 500®2 Index and the tech-heavy Nasdaq Composite3 returned 42.91% and 42.99%, respectively. Small cap stocks4 outperformed large cap stocks5 (50.80% vs. 43.51%), while value6 outperformed growth7 (44.97% vs. 42.81%).
Following volatility throughout the fall of 2020, markets rallied in November with the Dow Jones Industrial Average having its best month since 1987. The rally was largely attributed to the conclusion of the U.S. Presidential election and positive vaccine news. Pfizer and BioNTech announced in November that an initial analysis of a late-stage study showed that their vaccine was over 90% effective. Follow-up data concluded that the efficacy rate for the vaccine was 95%. Following the Pfizer/BioNTech announcement, Moderna announced that its COVID-19 vaccine was 94.5% effective, and AstraZeneca said the vaccine the company
developed with the University of Oxford was 90% effective. These positive vaccine developments helped bolster optimism about the economy reopening which drove a rotation from growth and momentum stocks to value and cyclical stocks.
To start the new year, various factors impacted markets, although the longstanding bullish narrative surrounding stimulus and vaccine optimism remained largely intact. Momentum continued behind the pro-cyclical and value rotation on the back of the Democrats’ surprise victory in the Georgia U.S. Senate runoff elections. As such, value outperformed growth during the first quarter by the largest margin in two decades. Overall, the S&P 500® Index reported growth in earnings of 52% during the first quarter of 2021.
Inflation fears and renewed concerns over variants of the coronavirus did little to slow the market down during the second quarter of 2021, as the S&P 500® Index and Nasdaq Composite returned 8.55% and 9.68%, respectively, with both indexes breaching all-time highs. After lagging meaningfully since the announcement of the vaccine news, growth outperformed value during the quarter. Second quarter earnings were even stronger than the first quarter, with the blended growth rate for the S&P 500® Index at 88%, which was the highest year-over-year growth since fourth quarter of 2009. In aggregate, companies were reporting earnings 17.1% ahead of consensus in the second quarter, the fourth highest on record, and revenues 4.9% ahead of consensus, the highest on record.
15
The bullish narrative continued into the start of the third quarter. For most of July and August, investor focus was largely centered around themes such as a central bank liquidity tailwind, continued vaccine progress, upside in corporate earnings surprises, and reopening momentum. However, U.S. markets were met with increasing headwinds towards the latter half of the quarter, which included the increased spread of the Delta variant, rising concerns over supply chain and input price pressures on corporate earnings. This was reflected by consumer prices rising 5.4% year-over-year, in both June and July (the fastest pace since August 2008). Inflation maintained its record pace in August as consumer prices rose 5.3% year-over-year, albeit below economist expectations for the month. Uncertainty around the U.S. Federal Reserve (the “Fed”) tapering presented additional headwinds to the market. Toward the end of the third quarter, the Fed indicated that a reduction in its $120B per month asset-purchase plan might soon be warranted. U.S. markets were also affected by negative headlines overseas, most notably China’s regulatory crackdown of the private education and technology sectors and broad worries about a default by Chinese real estate developer Evergrande. These headwinds culminated in a volatile September, with all major U.S. indices finishing in negative territory. Specifically, the S&P 500® Index snapped a streak of seven consecutive months of positive returns and had its worst performing month since March 2020.
The U.S. equity market started the fourth quarter strong as all major indices exhibited positive performance and reached record highs. Both the S&P 500® Index and the Nasdaq Composite returned over 7% in October, with the Dow Jones Industrial Average posting a return of 5.93%. This followed four straight weeks of gains for each index, as there were more tailwinds than headwinds, which pushed stocks generally higher throughout October. Strong consumer demand, underpinned by robust corporate and consumer balance sheets, has helped keep operating leverage and margins elevated for corporations, despite increased supply chain and input price pressures. The bullish narrative in U.S. markets has also been driven by the continued trend of outsized inflows, a decline in Delta variant cases and a pickup in expectations for additional fiscal stimulus. However, areas of concern continued to revolve around the shift in the transient versus persistent inflation debate and dampened earnings revision momentum.
The largest contributor to relative performance during the 12-month period ending October 31, 2021, was the Fund’s position in Alphabet Inc., a multinational technology conglomerate. Shares of Alphabet rose throughout the year but rallied after each of its quarterly earnings reports. As of the end of the third quarter, advertising revenue within its search and YouTube segments grew 6% and 32%, year-over-year, respectively. Additionally, the Fund’s position in NetApp, Inc., an American hybrid cloud data service and
16
data management company, contributed to relative performance. The company reported earnings per share above consensus throughout the year driven mainly by cloud growth and on-premise share gains. As of the third quarter, the public cloud ARR (annual recurring revenue) was up 89% year-over-year and on-premise all-flash array (AFA) system sales were up 23% year-over-year. The Fund’s allocation to Morgan Stanley, an American multinational investment bank, contributed to relative performance. Shares of Morgan Stanley rose throughout the year as financials benefitted from a healthy consumer and rising rates. Additionally, the company continued to experience positive idiosyncratic trends within nearly every business line. This included growing market share in the institutional trading business and growing assets and loan balances within both the global wealth management and investment management businesses.
Conversely, during the 12-month period ending October 31, 2021 the Fund’s position in Verizon Communications Inc., a multinational telecommunications conglomerate, detracted most from relative performance. Shares fell significantly in late January after the company reported fourth quarter earnings which revealed that the company was losing market share as competition in the space intensified. During the first quarter of 2021, we exited our position in favor of other opportunities consistent with our normalized free cash flow methodology. Bristol Myers Squibb, a global
biopharmaceutical company, also detracted from relative performance. Shares of the company came under pressure during the fall after the FDA (Food and Drug Administration) announced that new warning labels needed to be added to JAK (Janus Kinase) ventilators. The Fund’s position in Allison Transmission Holdings Inc., an American manufacturer and distributor of vehicle propulsion solutions, also detracted from relative performance. Shares came under pressure at the start of the summer as industry supply chain constraints and higher cost spending created headwinds for the stock.
Lord Abbett Global Equity Fund
For the fiscal year ended October 31, 2021, the Fund returned 38.37%, reflecting performance at the net asset value (“NAV”) of Class A Shares with all distributions reinvested, compared to its benchmark, the MSCI All Country World Index with Net Dividends,11 which returned 37.28% over the same period.
The trailing twelve-month period was characterized by several market-moving events. A bullish narrative dominated for the better part of the period. Investor focus remained on the U.S. central bank liquidity tailwind, fiscal stimulus, vaccine progress, reopening momentum, a strong corporate profit backdrop and robust equity inflows. However, inflation was the bigger story from a risk sentiment perspective. There was an unrelenting flurry of headlines and corporate commentary about upward pressure on prices from supply chain
17
disruptions, higher raw-materials costs, shipping constraints and a tightening labor market. Headline U.S. consumer prices rose 0.4% in September, following gains of 0.3% month-on-month in August. In September, core consumer prices increased 0.2% month-on-month, following a 0.1% gain in August. Headline prices were up 5.4% year-on-year in September, while core prices were up 4.0% year-on-year.
While concerns about an inflation overshoot were pervasive, the U.S. Federal Reserve (the “Fed”) remained consistent in its messaging earlier in 2021 around expectations that price pressures would be transitory, and the peak inflation theme gained traction through the second quarter, even as economists suggested that ‘transitory’ may be longer than expected. In the Fed’s latest meeting, in October 2021, Fed Chairman Jerome Powell reiterated the most recent rhetorical shift among policymakers toward a recognition that inflationary pressures may remain for longer than first thought. While the base case is that supply difficulties will be resolved, Powell noted that policymakers must be patient and watch the economy carefully. In addition, the Chairman noted that despite the likely need to begin tapering asset purchases, it is not time for the Fed to raise rates, as the U.S. labor market only holds approximately five million jobs below the 2020 high and still has room to recover further. Also of note, U.S. Treasury yields rose meaningfully throughout the period. The 10-year U.S. Treasury yield rose from 0.88%, as of October 31, 2020, to 1.56% as of one year
later, while reaching a high of 1.75% in March 2021. The quick rise in rates, followed by a period of rate moderation, and finally a late 3rd quarter escalation in rate volatility, led to similarly variable equity market movement, as the growth versus value equity dynamic shifted several times throughout the year.
Meanwhile, the European Central Bank (the “ECB”) also maintained interest rates at 0% during this twelve-month period. At its most recent meeting, in October 2021, the ECB reiterated that it expected the current rise in inflation to be transitory. A decision on how to conduct asset purchases following the end of the Pandemic Emergency Purchase Programme (PEPP) was postponed until December. The central bank currently purchases assets at €20 billion per month. Similar to other global central banks, the Bank of Japan (the “BoJ”) introduced several measures to combat the pressures from COVID-19, including aggressive purchases of corporate debt and a new lending facility to funnel money to smaller firms via financial institutions. However, Japan was hit by 5 waves of the virus, and lockdowns and closures had a particularly dampening effect on economic activity. While other major central banks have begun to unwind their easing policies - or have indicated that they are ready to do so - the BoJ did not look set to pursue a path toward the normalization of policy anytime soon, given price momentum in Japan was much weaker than in other countries. In its latest meeting, the BoJ kept interest rates and its asset purchase program unchanged.
18
Risk assets continued to recover through the spring of 2021 on the back of progress with respect to COVID-19 treatments and vaccines, commentary from several corporations that indicated stabilization, a continuation of massive monetary and fiscal policy globally, and the Democrats’ surprise victory in the Georgia U.S. Senate runoff elections. Markets became more cautious towards the summer, as the spread of the Delta variant of COVID-19 dominated the headlines and the U.S. case count reached over 100k a day by the end of July. However, many economists and strategists were fairly sanguine about the global recovery and market risks, given vaccine efficacy, high vaccination rates in the most vulnerable populations, higher natural immunity, reluctance to impose new restrictions, and broader fatigue surrounding social distancing and other behavioral changes.
Sentiment overseas moved largely in line with that of the U.S., and non-U.S. equity markets continued their ascent. Two of the major outliers were Japan and China. Japanese equities closed out the 12-month period underperforming broader global developed markets by 1700 basis points, as flare-ups of COVID-19 cases in the country continued to occur and the government extended a state of emergency to combat the spread of the virus all the way through November 2021. As such, Japan was one of the few major developed economies that continued to show year-over-year gross domestic product declines through first quarter of 2021, before finally experiencing growth in the second quarter. Chinese
equities were choppy throughout the period before closing out at a modest gain. In late February and early March, China’s stock market fell sharply on the heels of rising U.S. yields and inflation expectations, sending high-flying technology shares plummeting. Most recently, in June and July, reforms to the private tutoring sector triggered volatility, with the changes coming hot on the heels of increased scrutiny being applied to the technology sector, as well as actions taken to stabilize the housing market. Finally, in September, worsening debt problems at Evergrande, China’s third-largest real estate developer, dominated headlines as concerns grew about a potential debt restructuring of the company, whose debt load exceeded USD 300 billion. China’s Ministry of Housing and Urban Rural Development told banks that Evergrande would not be able to make its interest payments due on September 20. This sparked fear of contagion and a global fallout akin to the Lehman downfall in 2008. Meanwhile, Eurozone equity markets rose steadily during the period with the tailwind of strong macroeconomic data and as vaccine distribution continued to head in the right direction.
During the period, the Fund’s outperformance relative to the benchmark was driven by stock selection within the information technology and financials sectors. Within information technology, holdings in NVIDIA Corp. contributed to relative performance as the American manufacturer of computer graphics processors and chipsets benefitted from strong tailwinds in the video gaming and
19
data center markets. The company has shown broad-based strength in all segments, while continuing to deliver impressive earnings results. An overweight position in Microsoft Corp. also contributed to relative performance as the company’s stock rose throughout the year. The American multinational technology corporation, which produces computer software, consumer electronics, and personal computers, continued to benefit from global populations staying home more often and increased remote working arrangements.
Within the financials sector, an overweight position in The Bancorp, Inc. contributed to relative performance. The U.S. private label bank’s stock rose tremendously given its favorable niche positioning in the banking subsector. The company offers private-label banking services to online and nonbank lenders. The company also has an institutional banking business for financial professions and a commercial banking arm for small-business lending - all parts of the financial sector that have been growing. Government stimulus, an increase in consumer spending, and a recovering economy have all propelled the business over the past year.
Conversely, stock selection within the consumer discretionary and health care sectors detracted from relative performance. Within the consumer discretionary sector, shares of Alibaba Group Holdings, Ltd., a Chinese online and mobile marketplace in retail and wholesale trade, fell meaningfully throughout the year. In April 2021, the
company was fined $2.8 billion for violating anti-monopoly rules. In mid-August, the State Administration for Market Regulation issued a comprehensive list of rules that forbid tech giants from illegally capturing and using customer data or using technology to bar access to competitors’ products. The slew of fines and heightened regulations led to the stock’s underperformance. Additionally, Vipshop Holdings, Limited, a Chinese online retail company, detracted from relative performance. Shares fell over the period as the company underperformed due to growth slowdown concerns and a general negative view on Chinese ecommerce stocks.
Within the health care sector, holdings of Vertex Pharmaceutical, Inc. detracted from relative performance. The global biotechnology company’s stock fell as it discontinued clinical trials over the past 12 months for two of its experimental treatments for the rare genetic disorder alpha-1 antitrypsin.
Lord Abbett Growth Leaders Fund
For the fiscal year ended October 31, 2021, the Fund returned 37.77%, reflecting performance at the net asset value (NAV) of Class A shares with all distributions reinvested, compared to its benchmark, the Russell 1000® Growth Index,8 which returned 43.21% over the same period.
The trailing twelve-month period was primarily a story of the dramatic economic and market recovery that occurred within the U.S., despite the persistent presence of COVID-19. The S&P 500® Index2 and the
20
tech-heavy Nasdaq Composite3 returned 42.91% and 42.99%, respectively. Small cap stocks4 outperformed large cap stocks5 (50.80% vs. 43.51%), while value6 outperformed growth7 (44.97% vs. 42.81%).
Following volatility throughout the fall of 2020, markets rallied in November with the Dow Jones Industrial Average having its best month since 1987. The rally was largely attributed to the conclusion of the U.S. Presidential election and positive vaccine news. Pfizer and BioNTech announced in November that an initial analysis of a late-stage study showed that their vaccine was over 90% effective. Follow-up data concluded that the efficacy rate for the vaccine was 95%. Shortly thereafter, both Moderna and AstraZeneca announced studies indicating their vaccines were over 90% effective. These positive vaccine developments helped bolster optimism about the economy reopening which drove a rotation from growth and momentum stocks to value and cyclical stocks.
To start the new year, various factors impacted markets, although the longstanding bullish narrative surrounding stimulus and vaccine optimism remained largely intact. Momentum continued behind the pro-cyclical and value rotation on the back of the Democrats’ surprise victory in the Georgia U.S. Senate runoff elections. As such, value outperformed growth during the first quarter by the largest margin in two decades. Overall, the S&P 500® Index reported growth in earnings of 52% during the first quarter of 2021.
Inflation fears and renewed concerns over variants of the coronavirus did little to slow the market down during the second quarter of 2021, as the S&P 500® Index and Nasdaq Composite returned 8.55% and 9.68%, respectively, with both indexes breaching all-time highs. After lagging meaningfully since the announcement of the vaccine news, growth outperformed value during the quarter. Second quarter reported earnings were even stronger than the first quarter, with the blended growth rate for the S&P 500® Index at 88%, which was the highest year-over-year growth since fourth quarter of 2009. In aggregate, companies were reporting earnings 17.1% ahead of consensus in the second quarter, the fourth highest on record, and revenues 4.9% ahead of consensus, the highest on record.
The bullish narrative continued into the start of the third quarter. For most of July and August, investor focus was largely centered around themes such as a central bank liquidity tailwind, continued vaccine progress, upside in corporate earnings surprises, and reopening momentum. However, U.S. markets were met with increasing headwinds towards the latter half of the quarter, which included the increased spread of the Delta variant, rising concerns over supply chain and input price pressures on corporate earnings. This was reflected by consumer prices rising 5.4% year-over-year, in both June and July (the fastest pace since August 2008). Inflation maintained its record pace in August as consumer prices rose 5.3% year-over-year, albeit below economist expectations for
21
the month. Uncertainty around the U.S. Federal Reserve (the “Fed”) tapering presented additional headwinds to the market. Toward the end of the third quarter, the Fed indicated that a reduction in its $120B per month asset-purchase plan might soon be warranted. U.S. markets were also affected by negative headlines overseas, most notably China’s regulatory crackdown of the private education and technology sectors and broad worries about a default by Chinese real estate developer Evergrande. These headwinds culminated in a volatile September, with all major U.S. indices finishing in negative territory. Specifically, the S&P 500® Index snapped a streak of seven consecutive months of positive returns and had its worst performing month since March 2020.
The U.S. equity market started the fourth quarter strong as all major indices exhibited positive performance and reached record highs. Both the S&P 500® Index and the Nasdaq Composite returned over 7% in October, with the Dow Jones Industrial Average posting a return of 5.93%. This followed four straight weeks of gains for each index, as there were more tailwinds than headwinds – which pushed stocks generally higher throughout October. Strong consumer demand, underpinned by robust corporate and consumer balance sheets, has helped keep operating leverage and margins elevated for corporations, despite increased supply chain and input price pressures. The bullish narrative in U.S. markets has also been driven by the continued trend of outsized
inflows, a decline in Delta variant cases and a pickup in expectations for additional fiscal stimulus. However, areas of concern continued to revolve around the shift in the transient versus persistent inflation debate and dampened earnings revision momentum.
The portfolio’s position in Tesla, Inc., a designer and manufacturer of electric vehicles and energy storage systems, was the largest individual contributor to relative performance. Tesla’s strong run has been well documented, as the company attained a $1 trillion market cap in late October. Shares of the company have rapidly climbed as the company’s execution, capital expenditure discipline, and strong orders drove the advance in the stock price. We maintain our high conviction in the stock and it remains one of the portfolio’s largest active overweights.
The portfolio’s position in NVIDIA Corporation, a designer and manufacturer of computer graphics processors, chipsets, and related multimedia software, was also a notable contributor to relative performance over the period. Similar to Tesla, NVIDIA is among the largest active overweights in the portfolio. While shares of the company were relatively flat during the market rotation from growth to value throughout the first half of the fiscal year, shares soared throughout the summer after the company reported 30% year-over-year growth for the second quarter of 2021 in their all-important datacenter segment and raised its full year guidance.
Conversely, stock selection within the biotechnology sector was a primary
22
detractor from relative performance during the period. Due to increased uncertainty from global supply chain issues, inflationary concerns, and the Delta variant headwind, among other factors, investors overwhelmingly favored larger cash-rich companies generating high levels of current profits. As a result, smaller biotechnology companies mostly struggled, as they generally lack strong earnings and revenue growth while their drugs and therapies are still in the developmental stage. Specifically, the portfolio’s positions in Arena Pharmaceuticals, Mirati Therapeutics, Inc., and Turning Point Therapeutics were among the largest detractors from performance.
The portfolio’s position in Amazon.com, Inc., the world’s leading online retail shopping platform, also detracted from relative performance as the stock meaningfully lagged the rest of consumer discretionary sector. While we believe the company has continued to execute well throughout the recovery it remains one of the portfolio’s largest active underweights.
Lord Abbett Health Care Fund
For the fiscal year ended October 31, 2021, the Fund returned 28.56%, reflecting performance at the net asset value (NAV) of Class A Shares with all distributions reinvested, compared to its benchmark, the MSCI ACWI Health Care Index with Net Dividends,12 which returned 28.57% over the same period.
The trailing twelve-month period was primarily a story of the dramatic economic
and market recovery that occurred within the U.S., despite the persistent presence of COVID-19. The S&P 500® Index2 and the tech-heavy Nasdaq Composite3 returned 42.91% and 42.99%, respectively. Small cap stocks4 outperformed large cap stocks5 (50.80% vs. 43.51%), while value6 outperformed growth7 (44.97% vs. 42.81%).
Following volatility throughout the fall of 2020, markets rallied in November with the Dow Jones Industrial Average having its best month since 1987. The rally was largely attributed to the conclusion of the U.S. Presidential election and positive vaccine news. Pfizer and BioNTech announced in November that an initial analysis of a late-stage study showed that their vaccine was over 90% effective. Follow-up data concluded that the efficacy rate for the vaccine was 95%. Shortly thereafter, both Moderna and AstraZeneca announced studies indicating their vaccines were over 90% effective. These positive vaccine developments helped bolster optimism about the economy reopening which drove a rotation from growth and momentum stocks to value and cyclical stocks.
To start the new year, various factors impacted markets, although the longstanding bullish narrative surrounding stimulus and vaccine optimism remained largely intact. Momentum continued behind the pro-cyclical and value rotation on the back of the Democrats’ surprise victory in the Georgia U.S. Senate runoff elections. As such, value outperformed growth during the first quarter by the largest margin in two decades. Overall, the S&P 500® Index
23
reported growth in earnings of 52% during the first quarter of 2021.
Inflation fears and renewed concerns over variants of the coronavirus did little to slow the market down during the second quarter of 2021, as the S&P 500® Index and Nasdaq Composite returned 8.55% and 9.68%, respectively, with both indexes breaching all-time highs. After lagging meaningfully since the announcement of the vaccine news, growth outperformed value during the quarter. Second quarter reported earnings were even stronger than the first quarter, with the blended growth rate for the S&P 500® Index at 88%, which was the highest year-over-year growth since fourth quarter of 2009. In aggregate, companies were reporting earnings 17.1% ahead of consensus in the second quarter, the fourth highest on record, and revenues 4.9% ahead of consensus, the highest on record.
The bullish narrative continued into the start of the third quarter. For most of July and August, investor focus was largely centered around themes such as a central bank liquidity tailwind, continued vaccine progress, upside in corporate earnings surprises, and reopening momentum. However, U.S. markets were met with increasing headwinds towards the latter half of the quarter, which included the increased spread of the Delta variant, rising concerns over supply chain and input price pressures on corporate earnings. This was reflected by consumer prices rising 5.4% year-over-year, in both June and July (the fastest pace since August 2008). Inflation maintained its record pace in August as
consumer prices rose 5.3% year-over-year, albeit below economist expectations for the month. Uncertainty around the U.S. Federal Reserve (the “Fed”) tapering presented additional headwinds to the market. Toward the end of the third quarter, the Fed indicated that a reduction in its $120B per month asset-purchase plan might soon be warranted. U.S. markets were also affected by negative headlines overseas, most notably China’s regulatory crackdown of the private education and technology sectors and broad worries about a default by Chinese real estate developer Evergrande. These headwinds culminated in a volatile September, with all major U.S. indices finishing in negative territory. Specifically, the S&P 500® Index snapped a streak of seven consecutive months of positive returns and had its worst performing month since March 2020.
The U.S. equity market started the fourth quarter strong as all major indices exhibited positive performance and reached record highs. Both the S&P 500® Index and the Nasdaq Composite returned over 7% in October, with the Dow Jones Industrial Average posting a return of 5.93%. This followed four straight weeks of gains for each index, as there were more tailwinds than headwinds – which pushed stocks generally higher throughout October. Strong consumer demand, underpinned by robust corporate and consumer balance sheets, has helped keep operating leverage and margins elevated for corporations, despite increased supply chain and input price pressures. The bullish
24
narrative in U.S. markets has also been driven by the continued trend of outsized inflows, a decline in Delta variant cases and a pickup in expectations for additional fiscal stimulus. However, areas of concern continued to revolve around the shift in the transient versus persistent inflation debate and dampened earnings revision momentum.
Our investment philosophy is focused on identifying disruptive healthcare innovators and is rooted in the belief that the market persistently underestimates the return potential of these companies. We believe we can deliver consistently strong returns through specialized sector expertise and an active approach to identify promising companies and trends early in their life cycles. In addition, we seek to invest in areas that possess large patient populations and where there are unmet needs, such as diabetes, Alzheimer’s, cardiology, and oncology.
Security selection within medical devices was a primary contributor to relative performance during the period, as more people have been able to get elective procedures compared to during the pandemic-induced lockdowns throughout 2020. Within the subsector, the portfolio’s position in Dexcom, Inc., a developer and manufacturer of continuous glucose monitoring systems for diabetes management, was among the largest individual contributors and is currently one of the portfolio’s largest overweights. The portfolio’s positions in Inspire Medical Systems, Inc. and Danaher Corporation
were also notable contributors within the subsector.
In addition, the portfolio’s positions in Eli Lilly & Co. and UnitedHealth Group were also among the largest contributors to performance. We believe that COVID-19 helped highlight the companies that thought differently about patient access and care. In the case of UnitedHealth, they provided over $1.5 billion in immediate assistance and premium support to customers, as many people had been unable to access routine or planned care due to the pandemic. Eli Lilly also took several measures to assist its customers throughout the pandemic, including offering anyone who has commercial insurance, or no insurance, their monthly prescription of insulin for $35 through the Lilly Insulin Value Program. Eli Lily remains one of the portfolio’s largest overweights.
Conversely, stock selection within the biotechnology sector was a primary detractor from relative performance during the period. Due to increased uncertainty from global supply chain issues, inflationary concerns, and the Delta variant headwind, among other factors, investors overwhelmingly favored larger cash-rich companies generating high levels of current profits. As a result, smaller biotechnology companies mostly struggled, because we believe they generally lack strong earnings and revenue growth while their drugs and therapies are still in the developmental stage. Specifically, the portfolio’s positions in Arena Pharmaceuticals, Mirati Therapeutics, Inc., and Turning Point
25
Therapeutics were among the largest detractors from performance.
Lord Abbett International Equity Fund
For the fiscal year ended October 31, 2021, the Fund returned 33.15%, reflecting performance at the net asset value (“NAV”) of Class A Shares with all distributions reinvested, compared to its benchmark, the MSCI ACWI ex-U.S. Index with Net Dividends13, which returned 29.66% over the same period.
The trailing twelve-month period was characterized by several market-moving events. A bullish narrative dominated for the better part of the period. Investor focus remained on the U.S. central bank liquidity tailwind, fiscal stimulus, vaccine progress, reopening momentum, a strong corporate profit backdrop and robust equity inflows. However, inflation was the bigger story from a risk sentiment perspective. There was an unrelenting flurry of headlines and corporate commentary about upward pressure on prices from supply chain disruptions, higher raw-materials costs, shipping constraints and a tightening labor market. Headline U.S. consumer prices rose 0.4% in September, following gains of 0.3% month-on-month in August. In September, core consumer prices increased 0.2% month-on-month, following a 0.1% gain in August. Headline prices were up 5.4% year-on-year in September, while core prices were up 4.0% year-on-year.
While concerns about an inflation overshoot were pervasive, the U.S. Federal Reserve (the “Fed”) remained consistent in
its messaging earlier in 2021 around expectations that price pressures would be transitory, and the peak inflation theme gained traction through the second quarter, even as economists suggested that ‘transitory’ may be longer than expected. In the Fed’s latest meeting, in October 2021, Fed Chairman Jerome Powell reiterated the most recent rhetorical shift among policymakers toward a recognition that inflationary pressures may remain for longer than first thought. While the base case is that supply difficulties will be resolved, Powell noted that policymakers must be patient and watch the economy carefully. In addition, the Chairman noted that despite the likely need to begin tapering asset purchases, it is not time for the Fed to raise rates, as the U.S. labor market only holds approximately five million jobs below the 2020 high and still has room to recover further. Also of note, U.S. Treasury yields rose meaningfully throughout the period. The 10-year U.S. Treasury yield rose from 0.88% as of October 31, 2020 to 1.56% as of one year later, while reaching a high of 1.75% in March 2021. The quick rise in rates, followed by a period of rate moderation, and finally a late 3rd quarter escalation in rate volatility, led to similarly variable equity market movement, as the growth versus value equity dynamic shifted several times throughout the year.
Meanwhile, the European Central Bank (the “ECB”) also maintained interest rates at 0% during this twelve-month period. At its most recent meeting, in October 2021, the ECB reiterated that it expected the
26
current rise in inflation to be transitory. A decision on how to conduct asset purchases following the end of the Pandemic Emergency Purchase Programme (PEPP) was postponed until December. The central bank currently purchases assets at €20 billion per month. Similar to other global central banks, the Bank of Japan (the “BoJ”) introduced several measures to combat the pressures from COVID-19, including aggressive purchases of corporate debt and a new lending facility to funnel money to smaller firms via financial institutions. However, Japan was hit by 5 waves of the virus, and lockdowns and closures had a particularly dampening effect on economic activity. While other major central banks have begun to unwind their easing policies - or have indicated that they are ready to do so - the BoJ did not look set to pursue a path toward the normalization of policy anytime soon, given price momentum in Japan was much weaker than in other countries. In its latest meeting, the BoJ kept interest rates and its asset purchase program unchanged.
Risk assets continued to recover through the spring of 2021 on the back of progress with respect to COVID-19 treatments and vaccines, commentary from several corporations that indicated stabilization, a continuation of massive monetary and fiscal policy globally, and the Democrats’ surprise victory in the Georgia U.S. Senate runoff elections. Markets became more cautious towards the summer, as the spread of the Delta variant of COVID-19 dominated the headlines and the U.S. case count reached over 100k a
day by the end of July. However, economists and strategists were fairly sanguine about the global recovery and market risks, given vaccine efficacy, high vaccination rates in the most vulnerable populations, higher natural immunity, reluctance to impose new restrictions, and broader fatigue surrounding social distancing and other behavioral changes.
Sentiment overseas moved largely in line with that of the U.S., and non-U.S. equity markets continued their ascent. Two of the major outliers were Japan and China. Japanese equities closed out the 12-month period underperforming broader global developed markets by 1700 basis points, as flare-ups of COVID-19 cases in the country continued to occur and the government extended a state of emergency to combat the spread of the virus all the way through November 2021. As such, Japan was one of the few major developed economies that continued to show year-over-year gross domestic product declines through 1Q21, before finally experiencing growth in Q2. Chinese equities were choppy throughout the period before closing out at a modest gain. In late February and early March, China’s stock market fell sharply on the heels of rising U.S. yields and inflation expectations, sending high-flying technology shares plummeting. Most recently, in June and July, reforms to the private tutoring sector triggered volatility, with the changes coming hot on the heels of increased scrutiny being applied to the technology sector, as well as actions taken to stabilize the housing market. Finally, in September, worsening debt problems at
27
Evergrande, China’s third-largest real estate developer, dominated headlines as concerns grew about a potential debt restructuring of the company, whose debt load exceeded USD 300 billion. China’s Ministry of Housing and Urban Rural Development told banks that Evergrande would not be able to make its interest payments due on September 20. This sparked fear of contagion and a global fallout akin to the Lehman downfall in 2008. Meanwhile, Eurozone equity markets rose steadily during the period with the tailwind of strong macroeconomic data and as vaccine distribution continued to head in the right direction.
During the period, the Fund’s outperformance relative to the benchmark was driven by stock selection within the consumer discretionary and health care sectors. Within the consumer discretionary sector, holdings in Volkswagen AG, a German multinational automotive manufacturing company, contributed to relative performance as shares rose on the back of a strong recovery in the auto market. In addition, as one of the world’s leading volume producers, Volkswagen benefitted from economies of scale from common platforms across a number of models that enabled cost savings unattainable by smaller competitors. An overweight position in LVMH Moet Hennessy Louis Vuitton SE also contributed to relative performance. The luxury-goods sector was one of the first to be hit by the COVID-19 crisis, partly due to its exposure to Asia, where the virus originated, and the suspension of international tourism. That
reliance on Asia, and China in particular, also helped the industry begin to recover earlier than others as Asian economies bounced back last year.
Security selection in the health care sector also contributed to relative performance. Specifically, an overweight position in Novo Nordisk AS contributed to relative performance. Shares of the Danish pharmaceutical company rose after the company reported stellar second quarter results, highlighting the success of both of its key drugs, new obesity treatment Wegovy and the older and more established Saxenda.
Conversely, stock selection within the financials and materials sectors detracted from relative performance over the period. Within the financials sector, shares of AIA Group, Ltd., a Hong Kong-based life insurance company, and LSE Group PLC, a U.K.-based international markets infrastructure business, detracted from relative performance. Broadly speaking, we believe both stocks underperformed meaningfully because they are growth stocks in a predominantly value sector. More specifically, AIA Group struggled because of the pandemic-induced lockdowns in Hong Kong and China and the inability to sell insurance face-to-face. LSE lowered guidance on higher costs and the stock suffered as it was already trading at relatively high multiples.
Within the materials sector, shares of China Resources Cement detracted from relative performance, as the Chinese cement and concrete manufacturing company’s stock fell due to weakening
28
sales volumes, rising SG&A expenses, and rising cost inflation.
Lord Abbett International Opportunities Fund
For the fiscal year ended October 31, 2021, the Fund returned 36.14%, reflecting performance at the net asset value (“NAV”) of Class A Shares with all distributions reinvested, compared to its benchmark, the S&P Developed Ex-U.S. SmallCap® Index14, which returned 36.89% over the same period.
The trailing twelve-month period was characterized by several market-moving events. A bullish narrative dominated for the better part of the period. Investor focus remained on the U.S. central bank liquidity tailwind, fiscal stimulus, vaccine progress, reopening momentum, a strong corporate profit backdrop and robust equity inflows. However, inflation was the bigger story from a risk sentiment perspective. There was an unrelenting flurry of headlines and corporate commentary about upward pressure on prices from supply chain disruptions, higher raw-materials costs, shipping constraints and a tightening labor market. Headline U.S. consumer prices rose 0.4% in September, following gains of 0.3% month-on-month in August. In September, core consumer prices increased 0.2% month-on-month, following a 0.1% gain in August. Headline prices were up 5.4% year-on-year in September, while core prices were up 4.0% year-on-year.
While concerns about an inflation overshoot were pervasive, the U.S. Federal Reserve (the “Fed”) remained consistent in
its messaging earlier in 2021 around expectations that price pressures would be transitory, and the peak inflation theme gained traction through the second quarter, even as economists suggested that ‘transitory’ may be longer than expected. In the Fed’s latest meeting, in October 2021, Fed Chairman Jerome Powell reiterated the most recent rhetorical shift among policymakers toward a recognition that inflationary pressures may remain for longer than first thought. While the base case is that supply difficulties will be resolved, Powell noted that policymakers must be patient and watch the economy carefully. In addition, the Chairman noted that despite the likely need to begin tapering asset purchases, it is not time for the Fed to raise rates, as the U.S. labor market only holds approximately five million jobs below the 2020 high and still has room to recover further. Also of note, U.S. Treasury yields rose meaningfully throughout the period. The 10-year U.S. Treasury yield rose from 0.88% as of October 31, 2020 to 1.56% as of one year later, while reaching a high of 1.75% in March 2021. The quick rise in rates, followed by a period of rate moderation, and finally a late 3rd quarter escalation in rate volatility, led to similarly variable equity market movement, as the growth versus value equity dynamic shifted several times throughout the year.
Meanwhile, the European Central Bank (the “ECB’) also maintained interest rates at 0% during this twelve-month period. At its most recent meeting, in October 2021, the ECB reiterated that it expected the current
29
rise in inflation to be transitory. A decision on how to conduct asset purchases following the end of the Pandemic Emergency Purchase Programme (PEPP) was postponed until December. The central bank currently purchases assets at €20 billion per month. Similar to other global central banks, the Bank of Japan (the “BoJ”) introduced several measures to combat the pressures from COVID-19, including aggressive purchases of corporate debt and a new lending facility to funnel money to smaller firms via financial institutions. However, Japan was hit by 5 waves of the virus, and lockdowns and closures had a particularly dampening effect on economic activity. While other major central banks have begun to unwind their easing policies – or have indicated that they are ready to do so – the BoJ did not look set to pursue a path toward the normalization of policy anytime soon, given price momentum in Japan was much weaker than in other countries. In its latest meeting, the BoJ kept interest rates and its asset purchase program unchanged.
Risk assets continued to recover through the spring of 2021 on the back of progress with respect to COVID-19 treatments and vaccines, commentary from several corporations that indicated stabilization, a continuation of massive monetary and fiscal policy globally, and the Democrats’ surprise victory in the Georgia U.S. Senate runoff elections. Markets became more cautious towards the summer, as the spread of the Delta variant of COVID-19 dominated the headlines and the U.S. case count reached over 100k a
day by the end of July. However, economists and strategists were fairly sanguine about the global recovery and market risks, given vaccine efficacy, high vaccination rates in the most vulnerable populations, higher natural immunity, reluctance to impose new restrictions, and broader fatigue surrounding social distancing and other behavioral changes.
Sentiment overseas moved largely in line with that of the U.S. and non-U.S. equity markets continued their ascent. Two of the major outliers were Japan and China. Japanese equities closed out the 12-month period underperforming broader global developed markets by 1700 basis points, as flare-ups of COVID-19 cases in the country continued to occur and the government extended a state of emergency to combat the spread of the virus all the way through November 2021. As such, Japan was one of the few major developed economies that continued to show year-over-year gross domestic product declines through 1Q21, before finally experiencing growth in Q2. Chinese equities were choppy throughout the period before closing out at a modest gain. In late February and early March, China’s stock market fell sharply on the heels of rising U.S. yields and inflation expectations, sending high-flying technology shares plummeting. Most recently, in June and July, reforms to the private tutoring sector triggered volatility, with the changes coming hot on the heels of increased scrutiny being applied to the technology sector, as well as actions taken to stabilize the housing market. Finally, in September, worsening debt problems at
30
Evergrande, China’s third-largest real estate developer, dominated headlines as concerns grew about a potential debt restructuring of the company, whose debt load exceeded USD 300 billion. China’s Ministry of Housing and Urban Rural Development told banks that Evergrande would not be able to make its interest payments due on September 20. This sparked fear of contagion and a global fallout akin to the Lehman downfall in 2008. Meanwhile, Eurozone equity markets rose steadily during the period with the tailwind of strong macroeconomic data and as vaccine distribution continued to head in the right direction.
Stock selection, most notably in the consumer and consumer staples sectors, was the primary driver of relative underperformance during the period. Within the consumer discretionary sector, shares of Melco International Development, Ltd. detracted from relative performance. Shares of the Hong Kong-based entertainment and development company, which predominantly operates casinos, underperformed because the reopening of Macau continued to get pushed back, which sheds light on the complicated nature and timing of economic reopening globally. In addition, the Fund’s exposure to ASOS PLC, a U.K.-based online fashion retail company, detracted. Most of the company’s exposure is in the U.K., U.S., and the rest of Europe. The U.K. and the U.S. have had some of the best vaccine rates and Europe is catching up quickly, which weighed on the stock as people are expected to ease back into
brick-and-mortar retail in lieu of online shopping.
Within the consumer staples sector, shares of Coco-Cola Bottlers Japan Holdings, Inc., a Japanese beverage company, also detracted from relative performance. The company has a wide distribution of beverages through vending machines that can be found in train stations and buildings. As this is a reopening play, the stock underperformed with Japan’s COVID-related shutdowns persisting for longer than expected.
Conversely, stock selection in the information technology and industrials sectors contributed to relative performance. Within the information technology sector, shares of AT & S Austria Technologie & Systemtechnik AG, contributed to relative performance. Shares of the Austrian manufacturer of high-end printed circuit boards and substrates for semiconductors rose sharply on the back of continued strong momentum of the IC substrate market as well as positive developments in company financials. In addition, holdings of Aixtron SE contributed to relative performance during the period. Shares of the German company, which designs, produces and sells equipment required for making compound semiconductors, rose after management raised the company’s revenue, earnings and order guidance twice this year, citing broad-based strength in customer demand and order guidance.
Within the industrials sector, an overweight position in Sulzer AG contributed to relative performance, as
31
shares of the company rose throughout the period. The Swiss industrial machinery and equipment manufacturing company benefited from economic reopening and expectations for global growth, as the stock price tends to be very highly correlated to oil prices. Sulzer is a global leader in fluid engineering, specializing in pumping, agitation, mixing, separation and application technologies for fluids of all types.
Lord Abbett International Value Fund
For the fiscal year ended October 31, 2021, the Fund returned 36.44%, reflecting performance at the net asset value (“NAV”) of Class A Shares with all distributions reinvested, compared to its benchmark, the MSCI EAFE Value Index with Net Dividends,15 which returned 38.31% over the same period.
The trailing twelve-month period was characterized by several market-moving events. A bullish narrative dominated for the better part of the period. Investor focus remained on the U.S. central bank liquidity tailwind, fiscal stimulus, vaccine progress, reopening momentum, a strong corporate profit backdrop and robust equity inflows. However, inflation was the bigger story from a risk sentiment perspective. There was an unrelenting flurry of headlines and corporate commentary about upward pressure on prices from supply chain disruptions, higher raw-materials costs, shipping constraints and a tightening labor market. Headline U.S. consumer prices rose 0.4% in September, following gains of
0.3% month-on-month in August. In September, core consumer prices increased 0.2% month-on-month, following a 0.1% gain in August. Headline prices were up 5.4% year-on-year in September, while core prices were up 4.0% year-on-year.
While concerns about an inflation overshoot were pervasive, the U.S. Federal Reserve (the “Fed”) remained consistent in its messaging earlier in 2021 around expectations that price pressures would be transitory, and the peak inflation theme gained traction through the second quarter, even as economists suggested that ‘transitory’ may be longer than expected. In the Fed’s latest meeting, in October 2021, Fed Chairman Jerome Powell reiterated the most recent rhetorical shift among policymakers toward a recognition that inflationary pressures may remain for longer than first thought. While the base case is that supply difficulties will be resolved, Powell noted that policymakers must be patient and watch the economy carefully. In addition, the Chairman noted that despite the likely need to begin tapering asset purchases, it is not time for the Fed to raise rates, as the U.S. labor market only holds approximately five million jobs below the 2020 high and still has room to recover further. Also of note, U.S. Treasury yields rose meaningfully throughout the period. The 10-year U.S. Treasury yield rose from 0.88% as of October 31, 2020 to 1.56% as of one year later, while reaching a high of 1.75% in March 2021. The quick rise in rates, followed by a period of rate moderation, and finally a late 3rd quarter escalation in
32
rate volatility, led to similarly variable equity market movement, as the growth versus value equity dynamic shifted several times throughout the year.
Meanwhile, the European Central Bank (ECB) also maintained interest rates at 0% during this twelve-month period. At its most recent meeting, in October 2021, the European Central Bank (ECB) reiterated that it expected the current rise in inflation to be transitory. A decision on how to conduct asset purchases following the end of the Pandemic Emergency Purchase Programme (PEPP) was postponed until December. The central bank currently purchases assets at € 20 billion per month. Similar to other global central banks, the Bank of Japan (the “BoJ”) introduced several measures to combat the pressures from COVID-19, including aggressive purchases of corporate debt and a new lending facility to funnel money to smaller firms via financial institutions. However, Japan was hit by 5 waves of the virus, and lockdowns and closures had a particularly dampening effect on economic activity. While other major central banks have begun to unwind their easing policies - or have indicated that they are ready to do so - the BoJ did not look set to pursue a path toward the normalization of policy anytime soon, given price momentum in Japan was much weaker than in other countries. In its latest meeting, the BoJ kept interest rates and its asset purchase program unchanged.
Risk assets continued to recover through the spring of 2021 on the back of progress with respect to COVID-19
treatments and vaccines, commentary from several corporations that indicated stabilization, a continuation of massive monetary and fiscal policy globally, and the Democrats’ surprise victory in the Georgia U.S. Senate runoff elections. Markets became more cautious towards the summer, as the spread of the Delta variant of COVID-19 dominated the headlines and the U.S. case count reached over 100k a day by the end of July. However, economists and strategists were fairly sanguine about the global recovery and market risks, given vaccine efficacy, high vaccination rates in the most vulnerable populations, higher natural immunity, reluctance to impose new restrictions, and broader fatigue surrounding social distancing and other behavioral changes.
Sentiment overseas moved largely in line with that of the U.S., and non-U.S. equity markets continued their ascent. Two of the major outliers were Japan and China. Japanese equities closed out the 12-month period underperforming broader global developed markets by 1700 basis points, as flare-ups of COVID-19 cases in the country continued to occur and the government extended a state of emergency to combat the spread of the virus all the way through November 2021. As such, Japan was one of the few major developed economies that continued to show year-over-year gross domestic product declines through 1Q21, before finally experiencing growth in Q2. Chinese equities were choppy throughout the period before closing out at a modest gain. In late February and early March, China’s stock market fell sharply on the
33
heels of rising U.S. yields and inflation expectations, sending high-flying technology shares plummeting. Most recently, in June and July, reforms to the private tutoring sector triggered volatility, with the changes coming hot on the heels of increased scrutiny being applied to the technology sector, as well as actions taken to stabilize the housing market. Finally, in September, worsening debt problems at Evergrande, China’s third-largest real estate developer, dominated headlines as concerns grew about a potential debt restructuring of the company, whose debt load exceeded USD 300 billion. China’s Ministry of Housing and Urban Rural Development told banks that Evergrande would not be able to make its interest payments due on September 20. This sparked fear of contagion and a global fallout akin to the Lehman downfall in 2008. Meanwhile, Eurozone equity markets rose steadily during the period with the tailwind of strong macroeconomic data and as vaccine distribution continued to head in the right direction.
During the period, the Fund’s underperformance relative to the benchmark was driven by stock selection within the consumer discretionary and materials sectors. Within the consumer discretionary sector, shares of Alibaba Group Holdings, Ltd., a Chinese online and mobile marketplace in retail and wholesale trade, fell meaningfully throughout the year. In April 2021, the company was fined $2.8 billion for violating anti-monopoly rules. In mid-August, the State Administration for Market Regulation issued
a comprehensive list of rules that forbid tech giants from illegally capturing and using customer data or using technology to bar access to competitors’ products. The slew of fines and heightened regulations led to the stock’s underperformance. Additionally, an overweight position in NagaCorp, Ltd. detracted from relative performance throughout the year. The Cambodia-based hotel and casino operating company’s stock fell as uncertainty related to COVID-19 vaccination effectiveness in Cambodia and the country’s overall handling of the pandemic weighed on shares. These were critical factors for the future success of a company that depends on the stable influx of tourists.
Within the materials sector, shares of China Resources Cement detracted from relative performance, as the Chinese cement and concrete manufacturing company’s stock fell due to weakening sales volumes, rising SG&A expenses, and rising cost inflation.
Conversely, stock selection within the industrials and consumer staples sectors contributed to relative performance. Within the industrials sector, shares of Ashtead Group PLC, a British industrial equipment rental company, rose as the company had a strong increase in revenues and market share, in an industry that has a bright outlook due to recovering demand, constrained supply of new machinery, and some potential surges in utilization from weather and overall recovery. Additionally, Compagnie de Saint-Gobain SA., a France-based manufacturer of materials for the construction, mobility, and health care
34
markets, contributed to relative performance. The company’s stock outperformed as the company was a beneficiary of economic stimulus and a reallocation of consumer savings towards renovation spending.
Within the consumer staples sector, shares of Asahi Group Holdings, Ltd., a Japanese food and beverages company, also contributed to relative performance. The company’s stock rose meaningfully throughout the year as global economic reopening and a faster-than-expected recovery in beverage sales in Australia and Europe were tailwinds to topline growth.
Lord Abbett Micro Cap Growth Fund
For the fiscal year ended October 31, 2021, the Fund returned 47.12%, reflecting performance at the net asset value (NAV) of Class A shares with all distributions reinvested, compared to its benchmark, the Russell Microcap® Growth Index,16 which returned 45.71% over the same period.
The trailing twelve-month period was primarily a story of the dramatic economic and market recovery that occurred within the U.S., despite the persistent presence of COVID-19. The S&P 500®) Index2 and the tech-heavy Nasdaq Composite3 returned 42.91% and 42.99%, respectively. Small cap stocks4 outperformed large cap stocks5 (50.80% vs. 43.51%), while value6 outperformed growth7 (44.97% vs. 42.81%).
Following volatility throughout the fall of 2020, markets rallied in November with the Dow Jones Industrial Average having its best month since 1987. The rally was
largely attributed to the conclusion of the U.S. Presidential election and positive vaccine news. Pfizer and BioNTech announced in November that an initial analysis of a late-stage study showed that their vaccine was over 90% effective. Follow-up data concluded that the efficacy rate for the vaccine was 95%. Shortly thereafter, both Moderna and AstraZeneca announced studies indicating their vaccines were over 90% effective. These positive vaccine developments helped bolster optimism about the economy reopening which drove a rotation from growth and momentum stocks to value and cyclical stocks.
To start the new year, various factors impacted markets, although the longstanding bullish narrative surrounding stimulus and vaccine optimism remained largely intact. Momentum continued behind the pro-cyclical and value rotation on the back of the Democrats’ surprise victory in the Georgia U.S. Senate runoff elections. As such, value outperformed growth during the first quarter by the largest margin in two decades. Overall, the S&P 500® Index reported growth in earnings of 52% during the first quarter of 2021.
Inflation fears and renewed concerns over variants of the coronavirus did little to slow the market down during the second quarter of 2021, as the S&P 500® Index and Nasdaq Composite returned 8.55% and 9.68%, respectively, with both indexes breaching all-time highs. After lagging meaningfully since the announcement of the vaccine news, growth outperformed value during the quarter. Second quarter
35
reported earnings were even stronger than the first quarter, with the blended growth rate for the S&P 500® Index at 88%, which was the highest year-over-year growth since fourth quarter of 2009. In aggregate, companies were reporting earnings 17.1% ahead of consensus in the second quarter, the fourth highest on record, and revenues 4.9% ahead of consensus, the highest on record.
The bullish narrative continued into the start of the third quarter. For most of July and August, investor focus was largely centered around themes such as a central bank liquidity tailwind, continued vaccine progress, upside in corporate earnings surprises, and reopening momentum. However, U.S. markets were met with increasing headwinds towards the latter half of the quarter, which included the increased spread of the Delta variant, rising concerns over supply chain and input price pressures on corporate earnings. This was reflected by consumer prices rising 5.4% year-over-year, in both June and July (the fastest pace since August 2008). Inflation maintained its record pace in August as consumer prices rose 5.3% year-over-year, albeit below economist expectations for the month. Uncertainty around the U.S. Federal Reserve (the “Fed”) tapering presented additional headwinds to the market. Toward the end of the third quarter, the Fed indicated that a reduction in its $120B per month asset-purchase plan might soon be warranted. U.S. markets were also affected by negative headlines overseas, most notably China’s regulatory crackdown of the private
education and technology sectors and broad worries about a default by Chinese real estate developer Evergrande. These headwinds culminated in a volatile September, with all major U.S. indices finishing in negative territory. Specifically, the S&P 500® Index snapped a streak of seven consecutive months of positive returns and had its worst performing month since March 2020.
The U.S. equity market started the fourth quarter strong as all major indices exhibited positive performance and reached record highs. Both the S&P 500® Index and the Nasdaq Composite returned over 7% in October, with the Dow Jones Industrial Average posting a return of 5.93%. This followed four straight weeks of gains for each index, as there were more tailwinds than headwinds – which pushed stocks generally higher throughout October. Strong consumer demand, underpinned by robust corporate and consumer balance sheets, has helped keep operating leverage and margins elevated for corporations, despite increased supply chain and input price pressures. The bullish narrative in U.S. markets has also been driven by the continued trend of outsized inflows, a decline in Delta variant cases and a pickup in expectations for additional fiscal stimulus. However, areas of concern continued to revolve around the shift in the transient versus persistent inflation debate and dampened earnings revision momentum.
Security selection within medical devices was a primary contributor to relative performance during the period, as
36
more people have been able to get elective procedures compared to during the pandemic-induced lockdowns throughout 2020. The portfolio’s position in Shockwave Medical, Inc., a medical device company focused on cardiovascular disease treatments, was a primary contributor to relative performance. Shockwave has reported a string of strong earnings reports over the period, with revenue growth and forward estimates consistently above market consensus estimates. Looking ahead, we believe elective procedures are expected to continue to recover and the company’s new product in the U.S. (the C2 Coronary Catheter) could provide a boost to guidance in fourth quarter. We first initiated the Fund’s position in Shockwave in March 2019 and still maintain conviction in the stock today.
The portfolio’s position in Calix, Inc., a provider of cloud and software platforms, was also a notable contributor to relative performance over the period and as of the date of this report is currently the portfolio’s largest active overweight. We believe that Calix is enjoying strong demand trends, as service providers continue to compete with each other on the quality of their internet speeds and bandwidth size and grow their offerings to new areas, such as streaming services, remote work, and remote learning.
Conversely, stock selection within the biotechnology sector was a primary detractor from relative performance during the period. Due to increased uncertainty from global supply chain issues, inflationary concerns, and the Delta
variant headwind, among other factors, investors overwhelmingly favored larger cash-rich companies generating high levels of current profits. As a result, smaller biotechnology companies mostly struggled, because we believe they generally lack strong earnings and revenue growth while their drugs and therapies are still in the developmental stage. Specifically, the portfolio’s positions in Seres Therapeutics, Inc., Protagonist Therapeutics, Inc., and Orchard Therapeutics, PLC, were among the largest detractors from performance.
While the Fund has since exited its positions in Seres Therapeutics and Orchard Therapeutics, it still maintains a modest position in Protagonist Therapeutics. Shares of Protagonist fell dramatically in September after the U.S. Food and Drug Administration (the “FDA”) placed a clinical hold on Rusfertide, which halted the treatments of patients in the middle of three different Phase 2 trials. The FDA applied the hold after the company notified the agency about the development of skin cancer among mice that had been exposed to the drug. However, the stock rallied throughout October after the FDA removed the hold, clearing the way for trials to resume.
Lord Abbett Value Opportunities Fund
For the fiscal year ended October 31, 2021, the Fund returned 47.52%, reflecting performance at the net asset value (“NAV”) of Class A shares, with all distributions reinvested, compared to its benchmark, the
37
Russell 2500TM Index,17 which returned 49.43% over the same period.
The trailing twelve-month period was primarily a story of the dramatic economic and market recovery that occurred within the U.S., despite the persistent presence of COVID-19. The S&P 500® Index2 and the tech-heavy Nasdaq Composite3 returned 42.91% and 42.99%, respectively. Small cap stocks4 outperformed large cap stocks5 (50.80% vs. 43.51%), while value6 outperformed growth7 (44.97% vs. 42.81%).
Following volatility throughout the fall of 2020, markets rallied in November with the Dow Jones Industrial Average having its best month since 1987. The rally was largely attributed to the conclusion of the U.S. Presidential election and positive vaccine news. Pfizer and BioNTech announced in November that an initial analysis of a late-stage study showed that their vaccine was over 90% effective. Follow-up data concluded that the efficacy rate for the vaccine was 95%. Following the Pfizer/BioNTech announcement, Moderna announced that its COVID-19 vaccine was 94.5% effective, and AstraZeneca said the vaccine the company developed with the University of Oxford was 90% effective. These positive vaccine developments helped bolster optimism about the economy reopening which drove a rotation from growth and momentum stocks to value and cyclical stocks.
To start the new year, various factors impacted markets, although the longstanding bullish narrative surrounding stimulus and vaccine optimism remained largely intact. Momentum continued behind
the pro-cyclical and value rotation on the back of the Democrats’ surprise victory in the Georgia U.S. Senate runoff elections. As such, value outperformed growth during the first quarter by the largest margin in two decades. Overall, the S&P 500® Index reported growth in earnings of 52% during the first quarter of 2021.
Inflation fears and renewed concerns over variants of the coronavirus did little to slow the market during the second quarter of 2021, as the S&P 500® Index and Nasdaq Composite returned 8.55% and 9.68%, respectively, with both indexes breaching all-time highs. After lagging meaningfully since the announcement of the vaccine news, growth outperformed value during the quarter. Second quarter earnings were even stronger than the first quarter, with the blended growth rate for the S&P 500® Index at 88%, which was the highest year-over-year growth since fourth quarter of 2009. In aggregate, companies were reporting earnings 17.1% ahead of consensus in the second quarter, the fourth highest on record, and revenues 4.9% ahead of consensus, the highest on record.
The bullish narrative continued into the start of the third quarter. For most of July and August, investor focus was largely centered around themes such as a central bank liquidity tailwind, continued vaccine progress, upside in corporate earnings surprises, and reopening momentum. However, U.S. markets were met with increasing headwinds towards the latter half of the quarter, which included the increased spread of the Delta variant, rising concerns over supply chain and input price
38
pressures on corporate earnings. This was reflected by consumer prices rising 5.4% year-over-year, in both June and July (the fastest pace since August 2008). Inflation maintained its record pace in August as consumer prices rose 5.3% year-over-year, albeit below economist expectations for the month. Uncertainty around the U.S. Federal Reserve (the “Fed”) tapering presented additional headwinds to the market. Toward the end of the third quarter, the Fed indicated that a reduction in its $120B per month asset-purchase plan might soon be warranted. U.S. markets were also affected by negative headlines overseas, most notably China’s regulatory crackdown of the private education and technology sectors and broad worries about a default by Chinese real estate developer Evergrande. These headwinds culminated in a volatile September, with all major U.S. indices finishing in negative territory. Specifically, the S&P 500® Index snapped a streak of seven consecutive months of positive returns and had its worst performing month since March 2020.
The U.S. equity market started the fourth quarter strong as all major indices exhibited positive performance and reached record highs. Both the S&P 500® Index and the Nasdaq Composite returned over 7% in October, with the Dow Jones Industrial Average posting a return of 5.93%. This followed four straight weeks of gains for each index, as there were more tailwinds than headwinds, which pushed stocks generally higher throughout October. Strong consumer demand,
underpinned by robust corporate and consumer balance sheets, has helped keep operating leverage and margins elevated for corporations, despite increased supply chain and input price pressures. The bullish narrative in U.S. markets has also been driven by the continued trend of outsized inflows, a decline in Delta variant cases and a pickup in expectations for additional fiscal stimulus. However, areas of concern continued to revolve around the shift in the transient versus persistent inflation debate and dampened earnings revision momentum.
The largest detractor from relative performance during the 12-month period ending October 31, 2021, was the Fund’s position in Purple Innovation Inc. (“Purple”), a mattress company. Shares of Purple fell significantly in March after the company missed earnings estimates due to a deceleration of demand in December for both the direct-to consumer and wholesale businesses. The company faced further headwinds when there was a production accident in May which caused production to be shut down and sales expectations to be lowered. Another detractor from relative performance was the Fund’s position in Allison Transmission Holdings Inc., an American manufacturer and distributor of vehicle propulsion solutions. Shares came under pressure at the start of the summer as industry supply chain constraints and higher cost spending created headwinds for the company. The Fund’s holding in Sabre Corporation, a global travel and tourism company, also detracted from relative performance. Shares of the
39
company fell sharply after first quarter earnings fell short of expectations due to international government restrictions and lower fees due to a higher mix of domestic leisure in North America. The stock continued to lag as the spread of the delta variant impeded global travel.
Conversely, the Fund’s holding of Bio-Techne Corp., a company that develops and manufactures life science instruments, was the largest contributor to relative performance over the period. The firm’s stock rose significantly in February after the company reported a 19% organic growth rate over the quarter, driven by growth in their biopharma, academia and government segments. Generac Holdings Inc., a manufacturer of backup power generation products, also contributed to relative performance. The stock rallied at the start of the summer as investors became increasingly confident that Generac’s core home standby segment will
surprise to the upside in 2021 and 2022 on capacity additions and robust demand. Western Alliance Bancorp, a bank holding company, also contributed to relative performance. The firm exceeded earnings expectations throughout the year but largely in the second quarter due to strong loan and deposit growth. Additionally, shares rose significantly in February after the company announced that it had signed a definitive agreement to acquire AmeriHome, a national multi-channel mortgage purchaser and servicer. The acquisition is expected to add 30% to consensus 2022 EPS (earnings per share) estimates.
The Funds’ portfolios are actively managed and, therefore, holdings and the weightings of a particular issuer or particular sector as a percentage of portfolio assets are subject to change. Sectors may include many industries.
1 The Russell 2000® Index measures the performance of the 2,000 smallest companies in the Russell 3000® Index, which represents approximately 10% of the total market capitalization of the Russell 3000® Index.
2 The S&P 500® Index is widely regarded as the standard for measuring large cap U.S. stock market performance and includes a representative sample of leading companies in leading industries.
3 The Nasdaq Composite Index is the market capitalization-weighted index of over 2,500 common equities listed on the Nasdaq stock exchange.
4 As represented by the Russell 2000® Index as of 10/31/2021.
5 As represented by the Russell 1000® Index as of 10/31/2021.
6 As represented by the Russell 3000® Value Index as of 10/31/2021.
7 As represented by the Russell 3000® Growth Index as of 10/31/2021.
8 The Russell 1000® Growth Index measures the performance of those Russell 1000® Index companies with higher price-to-book ratios and higher forecasted growth values.
9 The Russell 1000® Value Index measures the performance of those Russell 1000 companies with lower price-to-book ratios and lower forecasted growth values.
10 The Russell 2000 Value® Index measures the performance of those stocks of the Russell 2000 Index with lower price-to-book ratios and lower relative forecasted growth rates.
11 The MSCI ACWI (All Country World Index) with Net Dividends is a free float-adjusted market capitalization weighted index that is designed to measure the equity market performance of developed and emerging markets. The MSCI ACWI Index with Net
40
Dividends approximates the minimum possible dividend reinvestment. The dividend is reinvested after deduction of withholding tax, applying the rate to non-resident individuals who do not benefit from double taxation treaties. MSCI uses withholding tax rates applicable to Luxembourg holding companies, as Luxembourg applies the highest rates.
12 The MSCI ACWI Health Care Index includes large and mid cap securities across 23 Developed Markets (DM) and 26 Emerging Markets (EM) countries. All securities in the index are classified in the Health Care Industry as per the Global Industry Classification Standard.
13 The MSCI ACWI (All Country World Index) ex-U.S. Index is a subset of the MSCI ACWI Index. The MSCI ACWI (All Country World Index) Index is a free float-adjusted market capitalization weighted index that is designed to measure the equity market performance of developed and emerging markets. The MSCI ACWI ex-U.S. Index with Gross Dividends approximates the maximum possible dividend reinvestment. The amount reinvested is the entire dividend distributed to individuals domiciled in the country of the company but does not include tax credits. The MSCI ACWI ex-U.S. Index with Net Dividends approximates the minimum possible dividend reinvestment. The dividend is reinvested after deduction of withholding tax, applying the rate to non-resident individuals who do not benefit from double taxation treaties. MSCI uses withholding tax rates applicable to Luxembourg holding companies, as Luxembourg applies the highest rates.
14 The S&P Developed Ex-U.S. SmallCap® Index captures the bottom 15% of companies domiciled in the developed markets (excluding the United States) within the S&P Global BMI with a float-adjusted market capitalization of at least US$100 million and a value traded of at least US$50 million for the past 12 months at the time of the annual reconstitution. Stocks are excluded if their market capitalization falls below US$75 million, or if the value traded is less than US$35 million at the time of reconstitution.
15 The MSCI EAFE Value Index captures large and mid-cap securities exhibiting overall value style characteristics across Developed Markets countries around the world, excluding the U.S. and Canada. Gross Dividends approximates the maximum possible dividend reinvestment. The amount reinvested is the entire dividend distributed to individuals resident in the country of the company, but does not include tax credits. Net Dividends approximates the minimum possible dividend reinvestment. The dividend is
reinvested after deduction of withholding tax, applying the rate to non-resident individuals who do not benefit from double taxation treaties. MSCI uses withholding tax rates applicable to Luxembourg holding companies, as Luxembourg applies the highest rates.
16 The Russell Microcap® Growth Index measures the performance of those Russell Microcap companies with higher price-to-book ratios and higher forecasted growth values.
17 The Russell 2500TM Index is a market cap weighted index that includes the smallest 2,500 companies covered in the Russell 3000® Index universe of United States-based listed equities.
Unless otherwise specified, indexes reflect total return, with all dividends reinvested. Indexes are unmanaged, do not reflect the deduction of fees or expenses, and are not available for direct investment.
Important Performance and Other Information
Performance data quoted in the following pages reflect past performance and are no guarantee of future results. Current performance may be higher or lower than the performance quoted. The investment return and principal value of an investment in the Funds will fluctuate so that shares, on any given day or when redeemed, may be worth more or less than their original cost. You can obtain performance data current to the most recent month end by calling Lord Abbett at 888-522-2388 or referring to www.lordabbett.com.
Except where noted, comparative Fund performance does not account for the deduction of sales charges and would be different if sales charges were included. Each Fund offers classes of shares with distinct pricing options. For a full description of the differences in pricing alternatives, please see each Fund’s prospectus.
During certain periods shown, expense waivers and reimbursements were in place. Without such waivers and expense reimbursements, the Funds’ returns would have been lower.
The annual commentary above discusses the views of the Funds’ management and various portfolio holdings of the Funds as of October 31, 2021. These views and portfolio holdings may have changed after this date. Information provided in the commentary is not a recommendation to buy or sell securities. Because the Funds’ portfolio is actively managed and may change significantly, the Funds may no longer own the securities described above or may have otherwise changed their positions in the securities.
41
For more recent information about the Funds’ portfolio holdings, please visit www.lordabbett.com.
A Note about Risk: See Notes to Financial Statements for a discussion of investment risks. For a more detailed discussion of the risks associated with each Fund, please see each Fund’s prospectus.
Mutual funds are not insured by the FDIC, are not deposits or other obligations of, or guaranteed by, banks, and are subject to investment risks including possible loss of principal amount invested.
42
Alpha Strategy Fund
Below is a comparison of a $10,000 investment in Class A shares with the same investment in the Russell 2000® Index, the 85% Russell 2000® Index/15% S&P Developed Ex-U.S. SmallCap Index and the Lipper Small-Cap Core Category Funds Average, assuming reinvestment of all dividends and distributions. The performance of other classes will be greater than or less than the performance shown in the graph below due to different sales loads and expenses applicable to such classes. The graph and performance table below do not reflect the deduction of taxes that a shareholder would pay on Fund distributions or the redemption of Fund shares. During certain periods, expenses of the Fund have been waived or reimbursed by Lord Abbett; without such waiver or reimbursement of expenses, the Fund’s returns would have been lower. Past performance is no guarantee of future results.
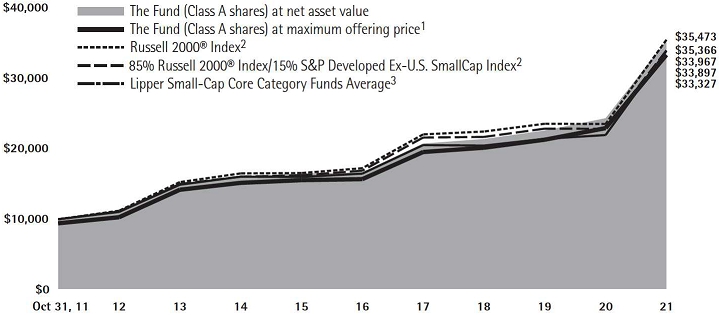
Average Annual Total Returns at Maximum Applicable
Sales Charge for the Periods Ended October 31, 2021
| 1 Year | 5 Years | 10 Years | Life of Class | ||||||
| Class A4 | 36.94% | 14.89% | 12.79% | – | |||||
| Class C5 | 43.16% | 15.40% | 12.62% | – | |||||
| Class F6 | 45.53% | 16.44% | 13.63% | – | |||||
| Class F37 | 45.81% | – | – | 15.73% | |||||
| Class I6 | 45.64% | 16.55% | 13.74% | – | |||||
| Class R26 | 44.78% | 15.85% | 13.07% | – | |||||
| Class R36 | 44.95% | 15.97% | 13.18% | – | |||||
| Class R48 | 45.25% | 16.26% | – | 11.59% | |||||
| Class R58 | 45.65% | 16.56% | – | 11.88% | |||||
| Class R68 | 45.79% | 16.65% | – | 11.95% |
43
1 Reflects the deduction of the maximum initial sales charge of 5.75%.
2 Performance for each unmanaged index does not reflect any fees or expenses. The performance of each index is not necessarily representative of the Fund’s performance.
3 Source: Lipper Inc. The performance of the average is not necessarily representative of the Fund’s performance.
4 Total return, which is the percentage change in net asset value, after deduction of the maximum initial sales charge of 5.75% applicable to Class A shares, with all dividends and distributions reinvested for the periods shown ended October 31,
2021, is calculated using the SEC-required uniform method to compute such return.
5 The 1% CDSC for Class C shares normally applies before the first anniversary of the purchase date. Performance for other periods is at net asset value.
6 Performance is at net asset value.
7 Commenced operations and performance for the Class began on April 4, 2017. Performance is at its net asset value.
8 Commenced operations and performance for the classes began on June 30, 2015. Performance is at net asset value.
44
Durable Growth Fund
Investment Comparison
Below is a comparison of a $10,000 investment in Class A shares with the same investment in the Russell 1000® Growth Index, assuming reinvestment of all dividends and distributions. The performance of other classes will be greater than or less than the performance shown in the graph below due to different sales loads and expenses applicable to such classes. The graph and performance table below do not reflect the deduction of taxes that a shareholder would pay on Fund distributions or the redemption of Fund shares. During certain periods, expenses of the Fund have been waived or reimbursed by Lord Abbett; without such waiver or reimbursements of expense, the Fund’s returns would have been lower. Past performance is no guarantee of future results.
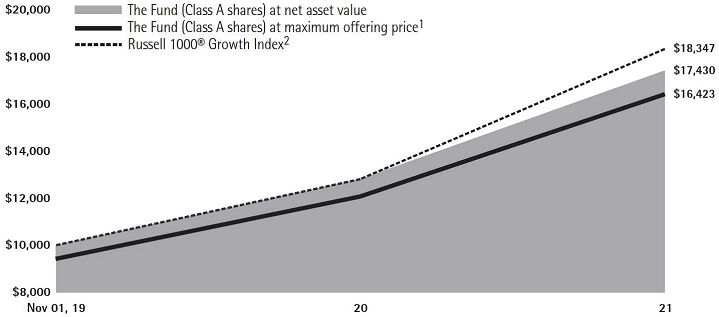
Average Annual Total Returns at Maximum Applicable
Sales Charge for the Period Ended October 31, 2021
| 1 Year | Life of Class | ||||
| Class A3 | 28.19% | 28.15% | |||
| Class C4 | 33.97% | 31.03% | |||
| Class F5 | 36.30% | 32.32% | |||
| Class F35 | 36.31% | 32.37% | |||
| Class I5 | 36.32% | 32.34% | |||
| Class R35 | 35.60% | 31.66% | |||
| Class R45 | 35.95% | 32.00% | |||
| Class R55 | 36.27% | 32.32% | |||
| Class R65 | 36.31% | 32.37% |
1 Reflects the deduction of the maximum initial sales charge of 5.75%.
2 Performance for the unmanaged index does not reflect any fees or expenses. The performance of the index is not necessarily representative of the Fund’s performance.
3 Class A shares commenced operations on November 1, 2020 and performance for the Class began on November 4, 2020. Total return, which is the percentage change in net asset value, after deduction of the maximum initial sales charge of 5.75% applicable to Class A shares, with all dividends and distributions reinvested for the periods shown ended
October 31, 2021, is calculated using the SEC required uniform method to compute such return.
4 Class C shares commenced operations on November 1, 2020 and performance for the Class began on November 4, 2020. The 1% CDSC for Class C shares normally applies before the first anniversary of the purchase date. Performance for other periods is at net asset value.
5 Commenced operations on November 1, 2020 and performance for the Classes began on November 4, 2020. Performance is at net asset value.
45
Focused Growth Fund
Investment Comparison
Below is a comparison of a $10,000 investment in Class A shares with the same investment in the Russell 1000® Growth Index, assuming reinvestment of all dividends and distributions. The performance of other classes will be greater than or less than the performance shown in the graph below due to different sales loads and expenses applicable to such classes. The graph and performance table below do not reflect the deduction of taxes that a shareholder would pay on Fund distributions or the redemption of Fund shares. During certain periods, expenses of the Fund have been waived or reimbursed by Lord Abbett; without such waiver or reimbursements of expense, the Fund’s returns would have been lower. Past performance is no guarantee of future results.
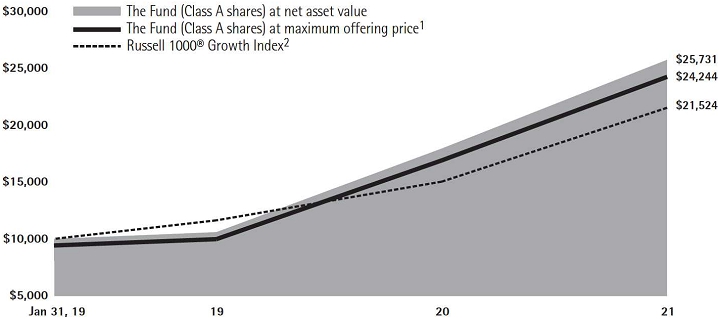
Average Annual Total Returns at Maximum Applicable
Sales Charge for the Period Ended October 31, 2021
| 1 Year | Life of Class | ||||
| Class A3 | 35.24% | 38.03% | |||
| Class C4 | 41.43% | 40.02% | |||
| Class F5 | 43.85% | 41.43% | |||
| Class F35 | 43.95% | 41.52% | |||
| Class I5 | 43.90% | 41.43% | |||
| Class R35 | 43.15% | 40.72% | |||
| Class R45 | 43.50% | 41.08% | |||
| Class R55 | 43.90% | 41.43% | |||
| Class R65 | 43.95% | 41.52% |
1 Reflects the deduction of the maximum initial sales charge of 5.75%.
2 Performance for the unmanaged index does not reflect any fees or expenses. The performance of the index is not necessarily representative of the Fund’s performance. Performance of the index begins on January 31, 2019.
3 Class A shares commenced operations on January 30, 2019 and performance for the Class began on January 31, 2019. Total return, which is the percentage change in net asset value, after deduction of the maximum initial sales charge of 5.75% applicable to Class A shares, with all dividends and distributions reinvested for the periods shown ended October 31, 2021, is calculated using the SEC-required uniform method to compute such return.
4 Class C shares commenced operations on January 30, 2019 and performance for the Class began on January 31, 2019. The 1% CDSC for Class C shares normally applies before the first anniversary of the purchase date.
5 Commenced operations on January 30, 2019 and performance for the Classes began on January 31, 2019. Performance is at net asset value.
46
Focused Large Cap Value Fund
Investment Comparison
Below is a comparison of a $10,000 investment in Class A shares with the same investment in the Russell 1000® Value Index, assuming reinvestment of all dividends and distributions. The performance of other classes will be greater than or less than the performance shown in the graph below due to different sales loads and expenses applicable to such classes. The graph and performance table below do not reflect the deduction of taxes that a shareholder would pay on Fund distributions or the redemption of Fund shares. During certain periods, expenses of the Fund have been waived or reimbursed by Lord Abbett; without such waiver or reimbursements of expense, the Fund’s returns would have been lower. Past performance is no guarantee of future results.
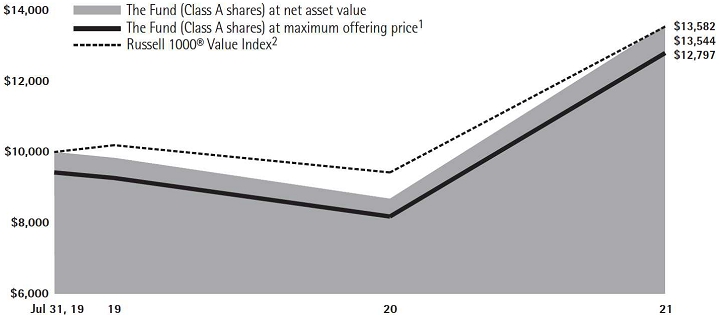
Average Annual Total Returns at Maximum Applicable
Sales Charge for the Period Ended October 31, 2021
| 1 Year | Life of Class | ||||
| Class A3 | 47.50% | 11.57% | |||
| Class C4 | 54.29% | 13.72% | |||
| Class F5 | 56.78% | 14.80% | |||
| Class F35 | 56.91% | 14.87% | |||
| Class I5 | 56.79% | 14.87% | |||
| Class R35 | 56.09% | 14.26% | |||
| Class R45 | 56.46% | 14.55% | |||
| Class R55 | 56.83% | 14.84% | |||
| Class R65 | 56.86% | 14.89% |
1 Reflects the deduction of the maximum initial sales charge of 5.75%.
2 Performance for the unmanaged index does not reflect any fees or expenses. The performance of the index is not necessarily representative of the Fund’s performance. Performance of the index begins on July 31, 2019.
3 Class A shares commenced operations on July 26, 2019 and performance for the Class began on July 31, 2019. Total return, which is the percentage change in net asset value, after deduction of the maximum initial sales charge of 5.75% applicable to Class A shares, with all dividends and distributions reinvested for the periods shown ended October 31, 2021, is calculated using the SEC required uniform method to compute such return.
4 Class C shares commenced operations on July 26, 2019 and performance for the Class began on July 31, 2019. The 1% CDSC for Class C shares normally applies before the first anniversary of the purchase date. Performance for other periods is at net asset value.
5 Commenced operations on July 26, 2019 and performance for the Classes began on July 31, 2019. Performance is at net asset value.
47
Focused Small Cap Value Fund
Investment Comparison
Below is a comparison of a $10,000 investment in Class A shares with the same investment in the Russell 2000® Value Index and the Russell 2000® Index, assuming reinvestment of all dividends and distributions. The performance of the other class will be greater than or less than the performance shown in the graph below due to different sales loads and expenses applicable to such class. The graph and performance table below do not reflect the deduction of taxes that a shareholder would pay on Fund distributions or the redemption of Fund shares. During certain periods, expenses of the Fund have been waived or reimbursed by Lord Abbett; without such waiver or reimbursement of expenses, the Fund’s returns would have been lower. Past performance is no guarantee of future results.
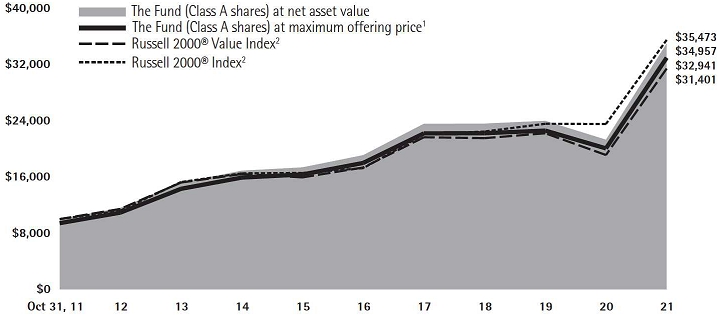
Average Annual Total Returns at Maximum Applicable
Sales Charge for the Periods Ended October 31, 2021
| 1 Year | 5 Years | 10 Years | Life of Class | ||||||
| Class A3 | 54.78% | 11.54% | 12.66% | – | |||||
| Class C4 | 62.10% | – | – | 15.43% | |||||
| Class F5 | 64.73% | – | – | 16.65% | |||||
| Class F35 | 64.72% | – | – | 16.72% | |||||
| Class I6 | 64.71% | 13.00% | 13.43% | – | |||||
| Class R55 | 64.71% | – | – | 16.65% | |||||
| Class R65 | 64.69% | – | – | 16.73% |
1 Reflects the deduction of the maximum initial sales charge of 5.75%.
2 Performance for each unmanaged index does not reflect any fees or expenses. The performance of each index is not necessarily representative of the Fund’s performance.
3 Total return, which is the percentage change in net asset value, after deduction of the maximum initial sales charge of 5.75% applicable to Class A shares, with all dividends and distributions reinvested for the periods shown ended October 31, 2021, is calculated using the SEC required uniform method to compute such return.
4 Class C shares commenced operations on June 28, 2019 and performance for the Class began on July 1, 2019. The 1% CDSC for Class C shares normally applies before the first anniversary of the purchase date. Performance for other periods is at net asset value.
5 Commenced operations on June 28, 2019 and performance for the Class began on July 1, 2019. Performance is at net asset value.
6 Performance is at net asset value.
48
Fundamental Equity Fund
Investment Comparison
Below is a comparison of a $10,000 investment in Class A shares with the same investment in the Russell 1000® Value Index, Russell 3000® Value Index, Russell 3000® Index, and S&P 500® Index, assuming reinvestment of all dividends and distributions. The performance of other classes will be greater than or less than the performance shown in the graph below due to different sales loads and expenses applicable to such classes. The graph and performance table below do not reflect the deduction of taxes that a shareholder would pay on Fund distributions or the redemption of Fund shares. During certain periods, expenses of the Fund have been waived or reimbursed by Lord Abbett; without such waiver or reimbursement of expenses, the Fund’s returns would have been lower. Past performance is no guarantee of future results.
![]()
Average Annual Total Returns at Maximum Applicable
Sales Charge for the Periods Ended October 31, 2021
| 1 Year | 5 Years | 10 Years | Life of Class | ||||||
| Class A3 | 36.60% | 10.68% | 10.66% | – | |||||
| Class C4 | 42.75% | 11.18% | 10.51% | – | |||||
| Class F5 | 45.02% | 12.18% | 11.51% | – | |||||
| Class F36 | 45.36% | – | – | 11.16% | |||||
| Class I5 | 45.21% | 12.29% | 11.62% | – | |||||
| Class P5 | 44.55% | 11.79% | 11.13% | – | |||||
| Class R25 | 44.28% | 11.62% | 10.96% | – | |||||
| Class R35 | 44.54% | 11.73% | 11.07% | – | |||||
| Class R47 | 44.80% | 12.01% | – | 9.84% | |||||
| Class R57 | 45.17% | 12.30% | – | 10.12% | |||||
| Class R67 | 45.31% | 12.41% | – | 10.22% |
1 Reflects the deduction of the maximum initial sales charge of 5.75%.
2 Performance for each unmanaged index does not reflect any fees or expenses. The performance of each index is not necessarily representative of the Fund’s performance.
3 Total return, which is the percentage change in net asset value, after deduction of the maximum initial sales charge of 5.75% applicable to Class A shares, with all dividends and distributions reinvested for the periods shown ended October 31, 2021, is calculated using the SEC-required uniform method to compute such return.
4 The 1% CDSC for Class C shares normally applies before the first anniversary of the purchase date. Performance for other periods is at net asset value.
5 Performance is at net asset value.
6 Commenced operations and performance for the Class began on April 4, 2017. Performance is at net asset value.
7 Commenced operations and performance for the classes began on June 30, 2015. Performance is at net asset value.
49
Global Equity Fund
Investment Comparison
Below is a comparison of a $10,000 investment in Class A shares with the same investment in the Morgan Stanley Capital International (MSCI) All Country World Index with Net Dividends and the MSCI All Country World Index with Gross Dividends, assuming reinvestment of all dividends and distributions. The MSCI All Country World Index with Net Dividends reflects a reduction in dividends after taking into account withholding of taxes by certain foreign countries represented in the MSCI All Country World Index. The performance of other classes will be greater than or less than the performance shown in the graph below due to different sales loads and expenses applicable to such classes. The graph and performance table below do not reflect the deduction of taxes that a shareholder would pay on Fund distributions or the redemption of Fund shares. During certain periods, expenses of the Fund have been waived or reimbursed by Lord Abbett; without such waiver or reimbursements of expense, the Fund’s returns would have been lower. Past performance is no guarantee of future results.
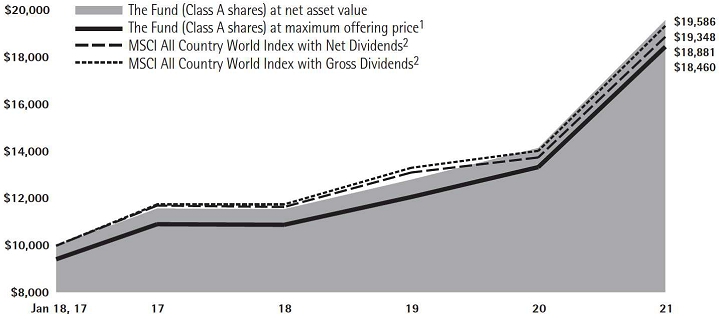
Average Annual Total Returns at Maximum Applicable
Sales Charge for the Periods Ended October 31, 2021
| 1 Year | Life of Class | ||||
| Class A3 | 30.40% | 13.67% | |||
| Class C4 | 36.27% | 14.23% | |||
| Class F5 | 38.59% | 15.27% | |||
| Class F36 | 38.90% | 15.38% | |||
| Class I5 | 38.78% | 14.77% | |||
| Class R35 | 37.85% | 15.10% | |||
| Class R45 | 38.39% | 15.38% | |||
| Class R55 | 38.78% | 15.42% | |||
| Class R65 | 38.82% | 15.49% |
1 Reflects the deduction of the maximum initial sales charge of 5.75%.
2 Performance for each unmanaged index does not reflect any fees or expenses. The performance of each index is not necessarily representative of the Fund’s performance. Performance of each index begins on January 18, 2017.
3 Class A shares commenced operations on January 17, 2017 and performance for the Class began on January 18, 2017. Total return, which is the percentage change in net asset value, after deduction of the maximum initial sales charge of 5.75% applicable to Class A shares, with all dividends and distributions reinvested for the periods shown ended October 31, 2021, is calculated using the SEC-required uniform method to compute such return.
4 Class C shares commenced operations on January 17, 2017 and performance for the Class began on January 18, 2017. The 1% CDSC for Class C shares normally applies before the first anniversary of the purchase date. Performance for other periods is at net asset value.
5 Commenced operations on January 17, 2017 and performance for the Class began on January 18, 2017. Performance is at net asset value.
6 Commenced operations and performance for the class began on April 4, 2017. Performance is at net asset value.
50
Growth Leaders Fund
Investment Comparison
Below is a comparison of a $10,000 investment in Class A shares with the same investment in the Russell 1000® Growth Index, Russell 3000® Growth Index, and S&P 500® Index, assuming reinvestment of all dividends and distributions. The performance of other classes will be greater than or less than the performance shown in the graph below due to different sales loads and expenses applicable to such classes. The graph and performance table below do not reflect the deduction of taxes that a shareholder would pay on Fund distributions or the redemption of Fund shares. During certain periods, expenses of the Fund have been waived or reimbursed by Lord Abbett; without such waiver or reimbursement of expenses, the Fund’s returns would have been lower. Past performance is no guarantee of future results.
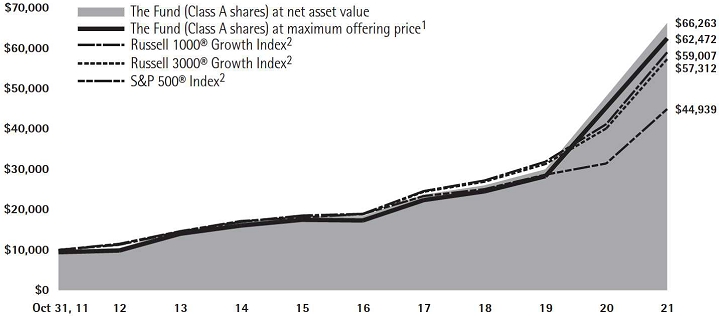
Average Annual Total Returns at Maximum Applicable
Sales Charge for the Periods Ended October 31, 2021
| 1 Year | 5 Years | 10 Years | Life of Class | ||||||
| Class A3 | 29.84% | 27.75% | 20.11% | – | |||||
| Class C4 | 35.75% | 28.32% | 19.95% | – | |||||
| Class F5 | 38.13% | 29.60% | 21.08% | – | |||||
| Class F36 | 38.23% | – | – | 30.33% | |||||
| Class I5 | 38.13% | 29.61% | 21.15% | – | |||||
| Class R25 | 37.32% | 28.83% | 20.56% | – | |||||
| Class R35 | 37.44% | 28.96% | 20.58% | – | |||||
| Class R47 | 37.79% | 29.28% | – | 22.53% | |||||
| Class R57 | 38.13% | 29.61% | – | 22.85% | |||||
| Class R67 | 38.23% | 29.69% | – | 22.93% |
51
1 Reflects the deduction of the maximum initial sales charge of 5.75%.
2 Performance for each unmanaged index does not reflect any fees or expenses. The performance of each index is not necessarily representative of the Fund’s performance. Performance for each index begins on June 30, 2011.
3 Class A shares commenced operations on June 24, 2011 and performance for the Class began on June 30, 2011. Total return, which is the percentage change in net asset value, after deduction of the maximum initial sales charge of 5.75% applicable to Class A shares, with all dividends and distributions reinvested for the periods shown ended October 31, 2021, is calculated using the SEC-required uniform method to compute such return.
4 Class C shares commenced operations on June 24, 2011 and performance for the Class began on June 30, 2011. The 1% CDSC for Class C shares normally applies before the first anniversary of the purchase date. Performance for other periods is at net asset value.
5 Commenced operations on June 24, 2011 and performance for the Class began on June 30, 2011. Performance is at net asset value.
6 Commenced operations and performance for the Class began on April 4, 2017. Performance is at net asset value.
7 Commenced operations and performance for the classes began on June 30, 2015. Performance is at net asset value.
52
Health Care Fund
Investment Comparison
Below is a comparison of a $10,000 investment in Class A shares with the same investment in the Morgan Stanley Capital International (MSCI) All Country World Index ACWI Health Care Net Index and MSCI ACWI Health Care Gross Index, assuming reinvestment of all dividends and distributions. The performance of other classes will be greater than or less than the performance shown in the graph below due to different sales loads and expenses applicable to such classes. The graph and performance table below do not reflect the deduction of taxes that a shareholder would pay on Fund distributions or the redemption of Fund shares. During certain periods, expenses of the Fund have been waived or reimbursed by Lord Abbett; without such waiver or reimbursements of expense, the Fund’s returns would have been lower. Past performance is no guarantee of future results.
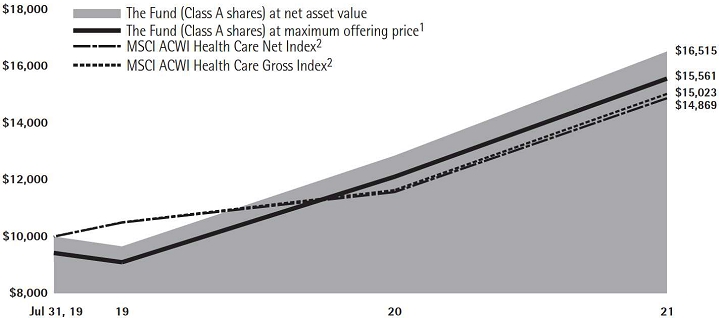
Average Annual Total Returns at Maximum Applicable
Sales Charge for the Period Ended October 31, 2021
| 1 Year | Life of Class | ||||
| Class A3 | 21.14% | 21.69% | |||
| Class C4 | 26.57% | 24.01% | |||
| Class F5 | 28.88% | 25.24% | |||
| Class F35 | 28.91% | 25.32% | |||
| Class I5 | 28.82% | 25.24% | |||
| Class R35 | 28.19% | 24.62% | |||
| Class R45 | 28.50% | 24.93% | |||
| Class R55 | 28.86% | 25.26% | |||
| Class R65 | 28.89% | 25.34% |
1 Reflects the deduction of the maximum initial sales charge of 5.75%.
2 Performance for the unmanaged index does not reflect any fees or expenses. The performance of the index is not necessarily representative of the Fund’s performance. Performance of the index begins on July 31, 2019.
3 Total return, which is the percentage change in net asset value, after deduction of the maximum initial sales charge of 5.75% applicable to Class A shares, with all dividends and distributions reinvested for the periods shown ended October 31, 2021, is calculated using the SEC required uniform method to compute such return.
4 The 1% CDSC for Class C shares normally applies before the first anniversary of the purchase date. Performance for other periods is at net asset value.
5 Performance is at net asset value.
53
International Equity Fund
Investment Comparison
Below is a comparison of a $10,000 investment in Class A shares with the same investment in the Morgan Stanley Capital International (MSCI) All Country World Index (ACWI) ex-USA® Index with Net Dividends and the MSCI ACWI ex-USA® Index with Gross Dividends, assuming reinvestment of all dividends and distributions. The MSCI ACWI ex-USA Index with Net Dividends reflects a reduction in dividends after taking into account withholding of taxes by certain foreign countries represented in the MSCI ACWI ex-USA Index. The performance of other classes will be greater than or less than the performance shown in the graph below due to different sales loads and expenses applicable to such classes. The graph and performance table below do not reflect the deduction of taxes that a shareholder would pay on Fund distributions or the redemption of Fund shares. During certain periods, expenses of the Fund have been waived or reimbursed by Lord Abbett; without such waiver or reimbursement of expenses, the Fund’s returns would have been lower. Past performance is no guarantee of future results.
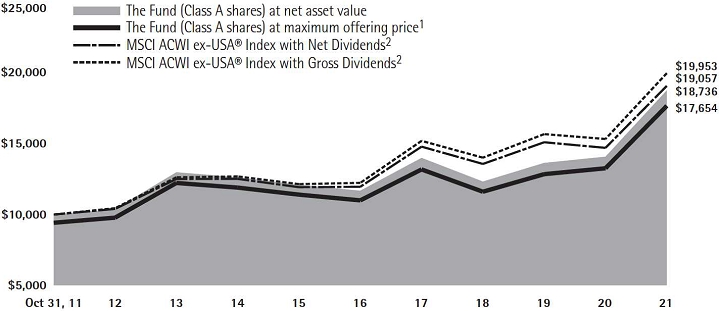
Average Annual Total Returns at Maximum Applicable
Sales Charge for the Periods Ended October 31, 2021
| 1 Year | 5 Years | 10 Years | Life of Class | ||||||
| Class A3 | 25.49% | 8.64% | 5.85% | – | |||||
| Class C4 | 31.20% | 9.10% | 5.73% | – | |||||
| Class F5 | 33.43% | 10.16% | 6.72% | – | |||||
| Class F36 | 33.57% | – | – | 10.34% | |||||
| Class I5 | 33.55% | 10.28% | 6.84% | – | |||||
| Class P5 | 32.90% | 9.70% | 6.30% | – | |||||
| Class R25 | 32.70% | 9.54% | 6.14% | – | |||||
| Class R35 | 32.81% | 9.65% | 6.25% | – | |||||
| Class R47 | 33.11% | 9.94% | – | 6.58% | |||||
| Class R57 | 33.50% | 10.20% | – | 6.84% | |||||
| Class R67 | 33.60% | 10.31% | – | 6.97% |
54
1 Reflects the deduction of the maximum initial sales charge of 5.75%.
2 Performance for each unmanaged index does not reflect any fees or expenses. The performance of each index is not necessarily representative of the Fund’s performance.
3 Total return, which is the percentage change in net asset value, after deduction of the maximum initial sales charge of 5.75% applicable to Class A shares, with all dividends and distributions reinvested for the periods shown ended October 31, 2021, is calculated using the SEC-required uniform method to compute such return.
4 The 1% CDSC for Class C shares normally applies before the first anniversary of the purchase date. Performance for other periods is at net asset value.
5 Performance is at net asset value.
6 Commenced operations and performance for the Class began on April 4, 2017. Performance is at net asset value.
7 Commenced operations and performance for the classes began on June 30, 2015. Performance is at net asset value.
55
International Opportunities Fund
Investment Comparison
Below is a comparison of a $10,000 investment in Class A shares with the same investment in the S&P Developed Ex-U.S. SmallCap® Index, assuming reinvestment of all dividends and distributions. The performance of other classes will be greater than or less than the performance shown in the graph below due to different sales loads and expenses applicable to such classes. The graph and performance table below do not reflect the deduction of taxes that a shareholder would pay on Fund distributions or the redemption of Fund shares. During certain periods, expenses of the Fund have been waived or reimbursed by Lord Abbett; without such waiver or reimbursement of expenses, the Fund’s returns would have been lower. Past performance is no guarantee of future results.
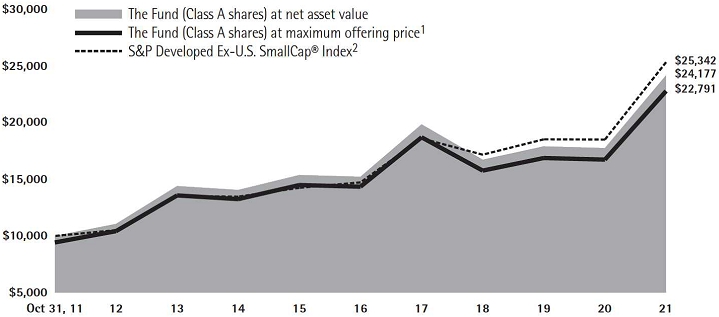
Average Annual Total Returns at Maximum Applicable
Sales Charge for the Periods Ended October 31, 2021
| 1 Year | 5 Years | 10 Years | Life of Class | ||||||
| Class A3 | 28.29% | 8.40% | 8.59% | – | |||||
| Class C4 | 34.25% | 8.89% | 8.46% | – | |||||
| Class F5 | 36.38% | 9.85% | 9.42% | – | |||||
| Class F36 | 36.65% | – | – | 9.19% | |||||
| Class I5 | 36.55% | 9.97% | 9.53% | – | |||||
| Class P5 | 35.96% | 9.48% | 9.04% | – | |||||
| Class R25 | 35.74% | 9.32% | 8.88% | – | |||||
| Class R35 | 35.90% | 9.43% | 9.00% | – | |||||
| Class R47 | 36.19% | 9.70% | – | 6.93% | |||||
| Class R57 | 36.49% | 9.97% | – | 7.20% | |||||
| Class R67 | 36.65% | 10.06% | – | 7.31% |
1 Reflects the deduction of the maximum initial sales charge of 5.75%.
2 Performance for the unmanaged index does not reflect any fees or expenses. The performance of the index is not necessarily representative of the Fund’s performance.
3 Total return, which is the percentage change in net asset value, after deduction of the maximum initial sales charge of 5.75% applicable to Class A shares, with all dividends and distributions reinvested for the periods shown ended October 31, 2021, is calculated using the SEC-required uniform method to compute such return.
4 The 1% CDSC for Class C shares normally applies before the first anniversary of the purchase date. Performance is at net asset value.
5 Performance is at net asset value.
6 Commenced operations and performance for the Class began on April 4, 2017. Performance is at net asset value.
7 Commenced operations and performance for the classes began on June 30, 2015. Performance is at net asset value.
56
International Value Fund
Investment Comparison
Below is a comparison of a $10,000 investment in Class A shares with the same investment in the Morgan Stanley Capital International (MSCI) EAFE Value Index with Net Dividends and the MSCI EAFE Value Index with Gross Dividends, assuming reinvestment of all dividends and distributions. The MSCI EAFE Value Index with Net Dividends reflects a reduction in dividends after taking into account withholding of taxes by certain foreign countries represented in the MSCI EAFE Value Index. The performance of other classes will be greater than or less than the performance shown in the graph due to different sales loads and expenses applicable to such classes. The graph and performance table below do not reflect the deduction of taxes that a shareholder would pay on Fund distributions or the redemption of Fund shares. During certain periods, expenses of the Fund have been waived or reimbursed by Lord Abbett; without such waiver or reimbursements of expense, the Fund’s returns would have been lower. Past performance is no guarantee of future results.
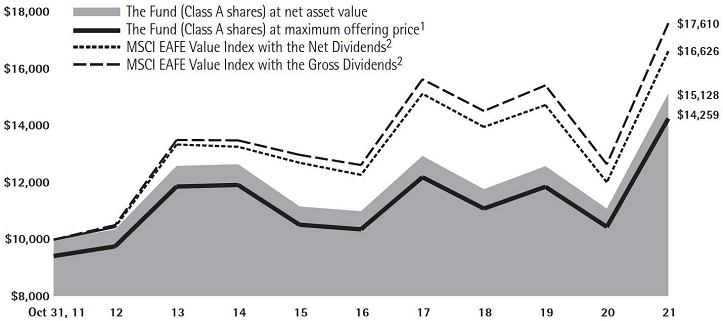
Average Annual Total Returns at Maximum Applicable
Sales Charge for the Periods Ended October 31, 2021
| 1 Year | 5 Years | 10 Years | Life of Class | ||||||
| Class A3 | 28.55% | 5.33% | 3.61% | – | |||||
| Class C4 | 34.37% | 5.74% | 3.47% | – | |||||
| Class F5 | 36.78% | 6.81% | 4.46% | – | |||||
| Class F36 | 36.87% | – | – | 6.17% | |||||
| Class I5 | 36.86% | 6.87% | 4.54% | – | |||||
| Class R25 | 36.04% | 6.12% | 3.86% | – | |||||
| Class R35 | 36.00% | 6.29% | 3.99% | – | |||||
| Class R47 | 36.35% | 6.56% | – | 3.42% | |||||
| Class R57 | 36.82% | 6.83% | – | 3.69% | |||||
| Class R67 | 36.87% | 6.88% | – | 3.75% |
1 Reflects the deduction of the maximum initial sales charge of 5.75%.
2 Performance for each unmanaged index does not reflect any fees or expenses. The performance of each index is not necessarily representative of the Fund’s performance.
3 Total return, which is the percentage change in net asset value, after deduction of the maximum initial sales charge of 5.75% applicable to Class A shares, with all dividends and distributions reinvested for the periods shown ended October 31, 2021, is calculated using the SEC-required uniform method to compute such return.
4 The 1% CDSC for Class C shares normally applies before the first anniversary of the purchase date. Performance for other periods is at net asset value.
5 Performance is at net asset value.
6 Commenced operations and performance for the Class began on April 4, 2017. Performance is at net asset value.
7 Commenced operations and performance for the classes began on June 30, 2015. Performance is at net asset value.
57
Micro Cap Growth Fund
Investment Comparison
Below is a comparison of a $10,000 investment in Class A shares with the same investment in the Russell Microcap® Growth Index and the Russell Microcap® Index, assuming reinvestment of all dividends and distributions. The performance of the other classes will be greater than or less than the performance shown in the graph below due to different sales loads and expenses applicable to such classes. The graph and performance table below do not reflect the deduction of taxes that a shareholder would pay on Fund distributions or the redemption of Fund shares. During certain periods, expenses of the Fund have been waived or reimbursed by Lord Abbett; without such waiver or reimbursement of expenses, the Fund’s returns would have been lower. Past performance is no guarantee of future results.
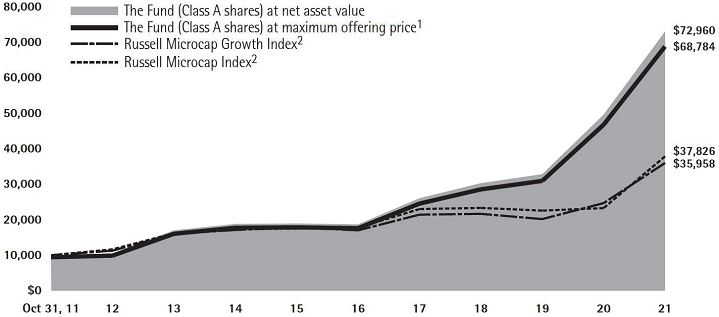
Average Annual Total Returns at Maximum Applicable
Sales Charge for the Periods Ended October 31, 2021
| 1 Year | 5 Years | 10 Years | Life of Class | ||||||
| Class A3 | 38.64% | 29.78% | 21.27% | – | |||||
| Class C4 | 45.03% | – | – | 39.52% | |||||
| Class F5 | 47.39% | – | – | 40.87% | |||||
| Class I6 | 47.39% | 31.44% | 22.07% | – |
1 Reflects the deduction of the maximum initial sales charge of 5.75%.
2 Performance for each unmanaged index does not reflect any fees or expenses. The performance of each index is not necessarily representative of the Fund’s performance.
3 Total return, which is the percentage change in net asset value, after deduction of the maximum initial sales charge of 5.75% applicable to Class A shares, with all dividends and distributions reinvested for the periods shown ended October
31, 2021, is calculated using the SEC required uniform method to compute such return.
4 Class C shares commenced operations and performance for the Class began on August 28, 2020. The 1% CDSC for Class C shares normally applies before the first anniversary of the purchase date. Performance is at net asset value.
5 Commenced operations and performance for the Class began on August 28, 2020. Performance is at net asset value.
6 Performance is at net asset value.
58
Value Opportunities Fund
Investment Comparison
Below is a comparison of a $10,000 investment in Class A shares with the same investment in the Russell 2500TM Index and the Russell 2500TM Value Index, assuming reinvestment of all dividends and distributions. The performance of other classes will be greater than or less than the performance shown in the graph below due to different sales loads and expenses applicable to such classes. The graph and performance table below do not reflect the deduction of taxes that a shareholder would pay on Fund distributions or the redemption of Fund shares. During certain periods, expenses of the Fund have been waived or reimbursed by Lord Abbett; without such waiver or reimbursement of expenses, the Fund’s returns would have been lower. Past performance is no guarantee of future results.
![]()
Average Annual Total Returns at Maximum Applicable
Sales Charge for the Periods Ended October 31, 2021
| 1 Year | 5 Years | 10 Years | Life of Class | ||||||
| Class A3 | 39.00% | 11.65% | 11.43% | – | |||||
| Class C4 | 45.42% | 12.14% | 11.29% | – | |||||
| Class F5 | 47.76% | 13.17% | 12.30% | – | |||||
| Class F36 | 48.05% | – | – | 12.57% | |||||
| Class I5 | 47.93% | 13.27% | 12.40% | – | |||||
| Class P5 | 47.19% | 12.76% | 11.91% | – | |||||
| Class R25 | 47.03% | 12.62% | 11.75% | – | |||||
| Class R35 | 47.20% | 12.73% | 11.85% | – | |||||
| Class R47 | 47.50% | 13.00% | – | 10.19% | |||||
| Class R57 | 47.87% | 13.27% | – | 10.46% | |||||
| Class R67 | 48.02% | 13.38% | – | 10.57% |
1 Reflects the deduction of the maximum initial sales charge of 5.75%.
2 Performance for each unmanaged index does not reflect any fees or expenses. The performance of each index is not necessarily representative of the Fund’s performance.
3 Total return, which is the percentage change in net asset value, after deduction of the maximum initial sales charge of 5.75% applicable to Class A shares, with all dividends and distributions reinvested for the periods shown ended October 31, 2021, is calculated using the SEC-required uniform method to compute such return.
4 The 1% CDSC for Class C shares normally applies before the first anniversary of the purchase date. Performance for other periods is at net asset value.
5 Performance is at net asset value.
6 Commenced operations and performance for the Class began on April 4, 2017. Performance is at net asset value.
7 Commenced operations and performance for the classes began on June 30, 2015. Performance is at net asset value.
59
Expense Example
As a shareholder of a Fund, you incur two types of costs: (1) transaction costs, including sales charges (loads) on purchase payments (these charges vary among the share classes); and (2) ongoing costs, including management fees; distribution and service (12b-1) fees (these charges vary among the share classes); and other Fund expenses. This Example is intended to help you understand your ongoing costs (in dollars) of investing in each Fund and to compare these costs with the ongoing costs of investing in other mutual funds.
The Example is based on an investment of $1,000 invested at the beginning of the period and held for the entire period (May 1, 2021 through October 31, 2021).
Actual Expenses
For each class of each Fund, the first line of the table on the following pages provides information about actual account values and actual expenses. You may use the information in this line, together with the amount you invested, to estimate the expenses that you paid over the period. Simply divide your account value by $1,000 (for example, an $8,600 account value divided by $1,000 = 8.6), then multiply the result by the number in the first line under the heading titled “Expenses Paid During Period 5/1/21 – 10/31/21” to estimate the expenses you paid on your account during this period.
Hypothetical Example for Comparison Purposes
For each class of each Fund, the second line of the table on the following pages provides information about hypothetical account values and hypothetical expenses based on the Fund’s actual expense ratio and an assumed rate of return of 5% per year before expenses, which is not the Fund’s actual return. The hypothetical account values and expenses may not be used to estimate the actual ending account balance or expenses you paid for the period. You may use this information to compare the ongoing costs of investing in each Fund and other funds. To do so, compare this 5% hypothetical example with the 5% hypothetical examples that appear in the shareholder reports of the other funds.
60
Alpha Strategy Fund
Please note that the expenses shown in the table are meant to highlight your ongoing costs only and do not reflect any transactional costs, such as sales charges (loads). Therefore, the second line of the table is useful in comparing ongoing costs only, and will not help you determine the relative total costs of owning different funds. In addition, if these transactional costs were included, your costs would have been higher.
| Beginning Account Value | Ending Account Value | Expenses Paid During Period†# | |||||||||||
| 5/1/21 | 10/31/21 | 5/1/21 – 10/31/21 | |||||||||||
| Class A | |||||||||||||
| Actual | $ | 1,000.00 | $ | 1,011.00 | $ | 2.13 | |||||||
| Hypothetical (5% Return Before Expenses) | $ | 1,000.00 | $ | 1,023.09 | $ | 2.14 | |||||||
| Class C | |||||||||||||
| Actual | $ | 1,000.00 | $ | 1,006.90 | $ | 5.92 | |||||||
| Hypothetical (5% Return Before Expenses) | $ | 1,000.00 | $ | 1,019.31 | $ | 5.96 | |||||||
| Class F | |||||||||||||
| Actual | $ | 1,000.00 | $ | 1,011.90 | $ | 1.37 | |||||||
| Hypothetical (5% Return Before Expenses) | $ | 1,000.00 | $ | 1,023.84 | $ | 1.38 | |||||||
| Class F3 | |||||||||||||
| Actual | $ | 1,000.00 | $ | 1,012.80 | $ | 0.36 | |||||||
| Hypothetical (5% Return Before Expenses) | $ | 1,000.00 | $ | 1,024.85 | $ | 0.36 | |||||||
| Class I | |||||||||||||
| Actual | $ | 1,000.00 | $ | 1,012.20 | $ | 0.86 | |||||||
| Hypothetical (5% Return Before Expenses) | $ | 1,000.00 | $ | 1,024.35 | $ | 0.87 | |||||||
| Class R2 | |||||||||||||
| Actual | $ | 1,000.00 | $ | 1,009.10 | $ | 3.90 | |||||||
| Hypothetical (5% Return Before Expenses) | $ | 1,000.00 | $ | 1,021.32 | $ | 3.92 | |||||||
| Class R3 | |||||||||||||
| Actual | $ | 1,000.00 | $ | 1,009.70 | $ | 3.39 | |||||||
| Hypothetical (5% Return Before Expenses) | $ | 1,000.00 | $ | 1,021.83 | $ | 3.41 | |||||||
| Class R4 | |||||||||||||
| Actual | $ | 1,000.00 | $ | 1,011.00 | $ | 2.13 | |||||||
| Hypothetical (5% Return Before Expenses) | $ | 1,000.00 | $ | 1,023.09 | $ | 2.14 | |||||||
| Class R5 | |||||||||||||
| Actual | $ | 1,000.00 | $ | 1,012.20 | $ | 0.86 | |||||||
| Hypothetical (5% Return Before Expenses) | $ | 1,000.00 | $ | 1,024.35 | $ | 0.87 | |||||||
| Class R6 | |||||||||||||
| Actual | $ | 1,000.00 | $ | 1,012.80 | $ | 0.36 | |||||||
| Hypothetical (5% Return Before Expenses) | $ | 1,000.00 | $ | 1,024.85 | $ | 0.36 | |||||||
| † | For each class of the Fund, net expenses are equal to the annualized expense ratio for such class (0.42% for Class A, 1.17% for Class C, 0.27% for Class F, 0.07% for Class F3, 0.17% for Class I, 0.77% for Class R2, 0.67% for Class R3, 0.42% for Class R4, 0.17% for Class R5 and 0.07% for Class R6) multiplied by the average account value over the period, multiplied by 184/365 (to reflect one-half year period). |
| # | Does not include expenses of Underlying Funds in which Alpha Strategy Fund invests. |
61
Portfolio Holdings Presented by Portfolio Allocation
October 31, 2021
| Underlying Fund Name | %* | |||
| Lord Abbett Developing Growth Fund, Inc. - Class I | 19.92 | % | ||
| Lord Abbett Securities Trust-Focused Small Cap Value Fund - Class I | 10.23 | % | ||
| Lord Abbett Securities Trust-International Opportunities Fund - Class I | 19.36 | % | ||
| Lord Abbett Securities Trust-Micro-Cap Growth Fund - Class I | 9.69 | % | ||
| Lord Abbett Research Fund, Inc.-Small Cap Value Fund - Class I | 20.28 | % | ||
| Lord Abbett Securities Trust-Value Opportunities Fund - Class I | 20.42 | % | ||
| Repurchase Agreement | 0.10 | % | ||
| Total | 100.00 | % | ||
| * | Represents percent of total investments. |
62
Durable Growth Fund
Please note that the expenses shown in the table are meant to highlight your ongoing costs only and do not reflect any transactional costs, such as sales charges (loads). Therefore, the second line of the table is useful in comparing ongoing costs only, and will not help you determine the relative total costs of owning different funds. In addition, if these transactional costs were included, your costs would have been higher.
| Beginning Account Value | Ending Account Value | Expenses Paid During Period† | |||||||||||
| 5/1/21 | 10/31/21 | 5/1/21 – 10/31/21 | |||||||||||
| Class A | |||||||||||||
| Actual | $ | 1,000.00 | $ | 1,112.10 | $ | 5.06 | |||||||
| Hypothetical (5% Return Before Expenses) | $ | 1,000.00 | $ | 1,020.42 | $ | 4.84 | |||||||
| Class C | |||||||||||||
| Actual | $ | 1,000.00 | $ | 1,108.10 | $ | 9.03 | |||||||
| Hypothetical (5% Return Before Expenses) | $ | 1,000.00 | $ | 1,016.64 | $ | 8.64 | |||||||
| Class F | |||||||||||||
| Actual | $ | 1,000.00 | $ | 1,113.50 | $ | 3.73 | |||||||
| Hypothetical (5% Return Before Expenses) | $ | 1,000.00 | $ | 1,021.68 | $ | 3.57 | |||||||
| Class F3 | |||||||||||||
| Actual | $ | 1,000.00 | $ | 1,113.60 | $ | 3.68 | |||||||
| Hypothetical (5% Return Before Expenses) | $ | 1,000.00 | $ | 1,021.73 | $ | 3.52 | |||||||
| Class I | |||||||||||||
| Actual | $ | 1,000.00 | $ | 1,113.60 | $ | 3.73 | |||||||
| Hypothetical (5% Return Before Expenses) | $ | 1,000.00 | $ | 1,021.68 | $ | 3.57 | |||||||
| Class R3 | |||||||||||||
| Actual | $ | 1,000.00 | $ | 1,110.80 | $ | 6.38 | |||||||
| Hypothetical (5% Return Before Expenses) | $ | 1,000.00 | $ | 1,019.16 | $ | 6.11 | |||||||
| Class R4 | |||||||||||||
| Actual | $ | 1,000.00 | $ | 1,112.20 | $ | 5.06 | |||||||
| Hypothetical (5% Return Before Expenses) | $ | 1,000.00 | $ | 1,020.42 | $ | 4.84 | |||||||
| Class R5 | |||||||||||||
| Actual | $ | 1,000.00 | $ | 1,113.20 | $ | 3.73 | |||||||
| Hypothetical (5% Return Before Expenses) | $ | 1,000.00 | $ | 1,021.68 | $ | 3.57 | |||||||
| Class R6 | |||||||||||||
| Actual | $ | 1,000.00 | $ | 1,113.60 | $ | 3.68 | |||||||
| Hypothetical (5% Return Before Expenses) | $ | 1,000.00 | $ | 1,021.73 | $ | 3.52 | |||||||
| † | For each class of the Fund, net expenses are equal to the annualized expense ratio for such class (0.95% for Class A, 1.70% for Class C, 0.70% for Class F, 0.69% for Class F3, 0.70% for Class I, 1.20% for Class R3, 0.95% for Class R4, 0.70% for Class R5 and 0.69% for Class R6) multiplied by the average account value over the period, multiplied by 184/365 (to reflect one-half year period). |
63
Portfolio Holdings Presented by Sector
October 31, 2021
| Sector* | %** | |||
| Communication Services | 15.89 | % | ||
| Consumer Discretionary | 16.33 | % | ||
| Consumer Staples | 4.26 | % | ||
| Financials | 1.88 | % | ||
| Health Care | 12.89 | % | ||
| Industrials | 6.31 | % | ||
| Information Technology | 36.23 | % | ||
| Materials | 3.12 | % | ||
| Real Estate | 1.56 | % | ||
| Repurchase Agreements | 1.53 | % | ||
| Total | 100.00 | % | ||
| * | A sector may comprise several industries. | |
| ** | Represents percent of total investments. |
64
Focused Growth Fund
Please note that the expenses shown in the table are meant to highlight your ongoing costs only and do not reflect any transactional costs, such as sales charges (loads). Therefore, the second line of the table is useful in comparing ongoing costs only, and will not help you determine the relative total costs of owning different funds. In addition, if these transactional costs were included, your costs would have been higher.
| Beginning Account Value | Ending Account Value | Expenses Paid During Period† | |||||||||||
| 5/1/21 | 10/31/21 | 5/1/21 – 10/31/21 | |||||||||||
| Class A | |||||||||||||
| Actual | $ | 1,000.00 | $ | 1,148.30 | $ | 5.69 | |||||||
| Hypothetical (5% Return Before Expenses) | $ | 1,000.00 | $ | 1,019.91 | $ | 5.35 | |||||||
| Class C | |||||||||||||
| Actual | $ | 1,000.00 | $ | 1,144.10 | $ | 9.73 | |||||||
| Hypothetical (5% Return Before Expenses) | $ | 1,000.00 | $ | 1,016.13 | $ | 9.15 | |||||||
| Class F | |||||||||||||
| Actual | $ | 1,000.00 | $ | 1,149.90 | $ | 4.34 | |||||||
| Hypothetical (5% Return Before Expenses) | $ | 1,000.00 | $ | 1,021.17 | $ | 4.08 | |||||||
| Class F3 | |||||||||||||
| Actual | $ | 1,000.00 | $ | 1,150.30 | $ | 4.12 | |||||||
| Hypothetical (5% Return Before Expenses) | $ | 1,000.00 | $ | 1,021.37 | $ | 3.87 | |||||||
| Class I | |||||||||||||
| Actual | $ | 1,000.00 | $ | 1,149.90 | $ | 4.34 | |||||||
| Hypothetical (5% Return Before Expenses) | $ | 1,000.00 | $ | 1,021.17 | $ | 4.08 | |||||||
| Class R3 | |||||||||||||
| Actual | $ | 1,000.00 | $ | 1,147.20 | $ | 7.04 | |||||||
| Hypothetical (5% Return Before Expenses) | $ | 1,000.00 | $ | 1,018.65 | $ | 6.61 | |||||||
| Class R4 | |||||||||||||
| Actual | $ | 1,000.00 | $ | 1,148.60 | $ | 5.69 | |||||||
| Hypothetical (5% Return Before Expenses) | $ | 1,000.00 | $ | 1,019.91 | $ | 5.35 | |||||||
| Class R5 | |||||||||||||
| Actual | $ | 1,000.00 | $ | 1,149.90 | $ | 4.34 | |||||||
| Hypothetical (5% Return Before Expenses) | $ | 1,000.00 | $ | 1,021.17 | $ | 4.08 | |||||||
| Class R6 | |||||||||||||
| Actual | $ | 1,000.00 | $ | 1,150.30 | $ | 4.12 | |||||||
| Hypothetical (5% Return Before Expenses) | $ | 1,000.00 | $ | 1,021.37 | $ | 3.87 | |||||||
| † | For each class of the Fund, net expenses are equal to the annualized expense ratio for such class (1.05% for Class A, 1.80% for Class C, 0.80% for Class F, 0.76% for Class F3, 0.80% for Class I, 1.30% for Class R3, 1.05% for Class R4, 0.80% for Class R5 and 0.76% for Class R6) multiplied by the average account value over the period, multiplied by 184/365 (to reflect one-half year period). |
65
Portfolio Holdings Presented by Sector
October 31, 2021
| Sector* | %** | |||
| Communication Services | 16.98 | % | ||
| Consumer Discretionary | 15.92 | % | ||
| Financials | 5.14 | % | ||
| Health Care | 5.83 | % | ||
| Industrials | 7.69 | % | ||
| Information Technology | 45.68 | % | ||
| Repurchase Agreements | 2.76 | % | ||
| Total | 100.00 | % | ||
| * | A sector may comprise several industries. | |
| ** | Represents percent of total investments. |
66
Focused Large Cap Value Fund
Please note that the expenses shown in the table are meant to highlight your ongoing costs only and do not reflect any transactional costs, such as sales charges (loads). Therefore, the second line of the table is useful in comparing ongoing costs only, and will not help you determine the relative total costs of owning different funds. In addition, if these transactional costs were included, your costs would have been higher.
| Beginning Account Value | Ending Account Value | Expenses Paid During Period† | |||||||||||
| 5/1/21 | 10/31/21 | 5/1/21 – 10/31/21 | |||||||||||
| Class A | |||||||||||||
| Actual | $ | 1,000.00 | $ | 1,039.30 | $ | 4.73 | |||||||
| Hypothetical (5% Return Before Expenses) | $ | 1,000.00 | $ | 1,020.57 | $ | 4.69 | |||||||
| Class C | |||||||||||||
| Actual | $ | 1,000.00 | $ | 1,035.50 | $ | 8.57 | |||||||
| Hypothetical (5% Return Before Expenses) | $ | 1,000.00 | $ | 1,016.79 | $ | 8.49 | |||||||
| Class F | |||||||||||||
| Actual | $ | 1,000.00 | $ | 1,040.60 | $ | 3.50 | |||||||
| Hypothetical (5% Return Before Expenses) | $ | 1,000.00 | $ | 1,021.78 | $ | 3.47 | |||||||
| Class F3 | |||||||||||||
| Actual | $ | 1,000.00 | $ | 1,040.90 | $ | 3.45 | |||||||
| Hypothetical (5% Return Before Expenses) | $ | 1,000.00 | $ | 1,021.83 | $ | 3.41 | |||||||
| Class I | |||||||||||||
| Actual | $ | 1,000.00 | $ | 1,040.90 | $ | 3.45 | |||||||
| Hypothetical (5% Return Before Expenses) | $ | 1,000.00 | $ | 1,021.83 | $ | 3.41 | |||||||
| Class R3 | |||||||||||||
| Actual | $ | 1,000.00 | $ | 1,038.30 | $ | 5.86 | |||||||
| Hypothetical (5% Return Before Expenses) | $ | 1,000.00 | $ | 1,019.46 | $ | 5.80 | |||||||
| Class R4 | |||||||||||||
| Actual | $ | 1,000.00 | $ | 1,039.30 | $ | 4.57 | |||||||
| Hypothetical (5% Return Before Expenses) | $ | 1,000.00 | $ | 1,020.72 | $ | 4.53 | |||||||
| Class R5 | |||||||||||||
| Actual | $ | 1,000.00 | $ | 1,040.90 | $ | 3.24 | |||||||
| Hypothetical (5% Return Before Expenses) | $ | 1,000.00 | $ | 1,022.03 | $ | 3.21 | |||||||
| Class R6 | |||||||||||||
| Actual | $ | 1,000.00 | $ | 1,040.30 | $ | 3.50 | |||||||
| Hypothetical (5% Return Before Expenses) | $ | 1,000.00 | $ | 1,021.78 | $ | 3.47 | |||||||
| † | For each class of the Fund, net expenses are equal to the annualized expense ratio for such class (0.92% for Class A, 1.67% for Class C, 0.68% for Class F, 0.67% for Class F3, 0.67% for Class I, 1.14% for Class R3, 0.89% for Class R4, 0.63% for Class R5 and 0.68% for Class R6) multiplied by the average account value over the period, multiplied by 184/365 (to reflect one-half year period). |
67
Portfolio Holdings Presented by Sector
October 31, 2021
| Sector* | %** | |||
| Communication Services | 9.32 | % | ||
| Consumer Discretionary | 12.79 | % | ||
| Consumer Staples | 5.05 | % | ||
| Energy | 7.43 | % | ||
| Financials | 24.68 | % | ||
| Health Care | 12.90 | % | ||
| Industrials | 13.13 | % | ||
| Information Technology | 7.33 | % | ||
| Materials | 2.44 | % | ||
| Utilities | 3.24 | % | ||
| Repurchase Agreements | 1.69 | % | ||
| Total | 100.00 | % | ||
| * | A sector may comprise several industries. | |
| ** | Represents percent of total investments. |
68
Focused Small Cap Value Fund
Please note that the expenses shown in the table are meant to highlight your ongoing costs only and do not reflect any transactional costs, such as sales charges (loads). Therefore, the second line of the table is useful in comparing ongoing costs only, and will not help you determine the relative total costs of owning different funds. In addition, if these transactional costs were included, your costs would have been higher.
| Beginning Account Value | Ending Account Value | Expenses Paid During Period† | |||||||||||
| 5/1/21 | 10/31/21 | 5/1/21 – 10/31/21 | |||||||||||
| Class A | |||||||||||||
| Actual | $ | 1,000.00 | $ | 998.70 | $ | 6.20 | |||||||
| Hypothetical (5% Return Before Expenses) | $ | 1,000.00 | $ | 1,019.00 | $ | 6.26 | |||||||
| Class C | |||||||||||||
| Actual | $ | 1,000.00 | $ | 994.80 | $ | 9.91 | |||||||
| Hypothetical (5% Return Before Expenses) | $ | 1,000.00 | $ | 1,015.27 | $ | 10.01 | |||||||
| Class F | |||||||||||||
| Actual | $ | 1,000.00 | $ | 999.70 | $ | 4.89 | |||||||
| Hypothetical (5% Return Before Expenses) | $ | 1,000.00 | $ | 1,020.32 | $ | 4.94 | |||||||
| Class F3 | |||||||||||||
| Actual | $ | 1,000.00 | $ | 1,000.00 | $ | 4.59 | |||||||
| Hypothetical (5% Return Before Expenses) | $ | 1,000.00 | $ | 1,020.62 | $ | 4.63 | |||||||
| Class I | |||||||||||||
| Actual | $ | 1,000.00 | $ | 999.70 | $ | 4.84 | |||||||
| Hypothetical (5% Return Before Expenses) | $ | 1,000.00 | $ | 1,020.37 | $ | 4.89 | |||||||
| Class R5 | |||||||||||||
| Actual | $ | 1,000.00 | $ | 999.70 | $ | 4.79 | |||||||
| Hypothetical (5% Return Before Expenses) | $ | 1,000.00 | $ | 1,020.42 | $ | 4.84 | |||||||
| Class R6 | |||||||||||||
| Actual | $ | 1,000.00 | $ | 1,000.00 | $ | 4.79 | |||||||
| Hypothetical (5% Return Before Expenses) | $ | 1,000.00 | $ | 1,020.42 | $ | 4.84 | |||||||
| † | For each class of the Fund, net expenses are equal to the annualized expense ratio for such class (1.23% for Class A, 1.97% for Class C, 0.97% for Class F, 0.91% for Class F3, 0.96% for Class I, 0.95% for Class R5 and 0.95% for Class R6) multiplied by the average account value over the period, multiplied by 184/365 (to reflect one-half year period). |
69
Portfolio Holdings Presented by Sector
October 31, 2021
| Sector* | %** | |||
| Communication Services | 4.24 | % | ||
| Consumer Discretionary | 7.32 | % | ||
| Consumer Staples | 3.87 | % | ||
| Energy | 10.69 | % | ||
| Financials | 30.91 | % | ||
| Health Care | 4.95 | % | ||
| Industrials | 14.73 | % | ||
| Information Technology | 8.38 | % | ||
| Materials | 6.60 | % | ||
| Real Estate | 5.78 | % | ||
| Repurchase Agreements | 1.51 | % | ||
| Money Market Funds(a) | 0.92 | % | ||
| Time Deposits(a) | 0.10 | % | ||
| Total | 100.00 | % | ||
| * | A sector may comprise several industries. | |
| ** | Represents percent of total investments. | |
| (a) | Securities were purchased with the cash collateral from loaned securities. |
70
Fundamental Equity Fund
Please note that the expenses shown in the table are meant to highlight your ongoing costs only and do not reflect any transactional costs, such as sales charges (loads). Therefore, the second line of the table is useful in comparing ongoing costs only, and will not help you determine the relative total costs of owning different funds. In addition, if these transactional costs were included, your costs would have been higher.
| Beginning Account Value | Ending Account Value | Expenses Paid During Period† | |||||||||||
| 5/1/21 | 10/31/21 | 5/1/21 – 10/31/21 | |||||||||||
| Class A | |||||||||||||
| Actual | $ | 1,000.00 | $ | 1,083.60 | $ | 4.94 | |||||||
| Hypothetical (5% Return Before Expenses) | $ | 1,000.00 | $ | 1,020.47 | $ | 4.79 | |||||||
| Class C | |||||||||||||
| Actual | $ | 1,000.00 | $ | 1,080.00 | $ | 8.86 | |||||||
| Hypothetical (5% Return Before Expenses) | $ | 1,000.00 | $ | 1,016.69 | $ | 8.59 | |||||||
| Class F | |||||||||||||
| Actual | $ | 1,000.00 | $ | 1,084.70 | $ | 4.15 | |||||||
| Hypothetical (5% Return Before Expenses) | $ | 1,000.00 | $ | 1,021.22 | $ | 4.02 | |||||||
| Class F3 | |||||||||||||
| Actual | $ | 1,000.00 | $ | 1,085.30 | $ | 3.31 | |||||||
| Hypothetical (5% Return Before Expenses) | $ | 1,000.00 | $ | 1,022.03 | $ | 3.21 | |||||||
| Class I | |||||||||||||
| Actual | $ | 1,000.00 | $ | 1,085.20 | $ | 3.63 | |||||||
| Hypothetical (5% Return Before Expenses) | $ | 1,000.00 | $ | 1,021.73 | $ | 3.52 | |||||||
| Class P | |||||||||||||
| Actual | $ | 1,000.00 | $ | 1,082.50 | $ | 5.98 | |||||||
| Hypothetical (5% Return Before Expenses) | $ | 1,000.00 | $ | 1,019.46 | $ | 5.80 | |||||||
| Class R2 | |||||||||||||
| Actual | $ | 1,000.00 | $ | 1,082.00 | $ | 6.77 | |||||||
| Hypothetical (5% Return Before Expenses) | $ | 1,000.00 | $ | 1,018.70 | $ | 6.56 | |||||||
| Class R3 | |||||||||||||
| Actual | $ | 1,000.00 | $ | 1,082.50 | $ | 6.25 | |||||||
| Hypothetical (5% Return Before Expenses) | $ | 1,000.00 | $ | 1,019.21 | $ | 6.06 | |||||||
| Class R4 | |||||||||||||
| Actual | $ | 1,000.00 | $ | 1,083.30 | $ | 4.94 | |||||||
| Hypothetical (5% Return Before Expenses) | $ | 1,000.00 | $ | 1,020.47 | $ | 4.79 | |||||||
| Class R5 | |||||||||||||
| Actual | $ | 1,000.00 | $ | 1,085.10 | $ | 3.63 | |||||||
| Hypothetical (5% Return Before Expenses) | $ | 1,000.00 | $ | 1,021.73 | $ | 3.52 | |||||||
| Class R6 | |||||||||||||
| Actual | $ | 1,000.00 | $ | 1,086.10 | $ | 3.31 | |||||||
| Hypothetical (5% Return Before Expenses) | $ | 1,000.00 | $ | 1,022.03 | $ | 3.21 | |||||||
| † | For each class of the Fund, net expenses are equal to the annualized expense ratio for such class (0.94% for Class A, 1.69% for Class C, 0.79% for Class F, 0.63% for Class F3, 0.69% for Class I, 1.14% for Class P, 1.29% for Class R2, 1.19% for Class R3, 0.94% for Class R4, 0.69% for Class R5 and 0.63% for Class R6) multiplied by the average account value over the period, multiplied by 184/365 (to reflect one-half year period). |
71
Portfolio Holdings Presented by Sector
October 31, 2021
| Sector* | %** | |||
| Communication Services | 6.17 | % | ||
| Consumer Discretionary | 6.93 | % | ||
| Consumer Staples | 6.66 | % | ||
| Energy | 6.52 | % | ||
| Financials | 23.35 | % | ||
| Health Care | 16.05 | % | ||
| Industrials | 11.36 | % | ||
| Information Technology | 11.75 | % | ||
| Materials | 4.45 | % | ||
| Real Estate | 3.19 | % | ||
| Utilities | 3.10 | % | ||
| Repurchase Agreements | 0.47 | % | ||
| Total | 100.00 | % | ||
| * | A sector may comprise several industries. | |
| ** | Represents percent of total investments. |
72
Global Equity Fund
Please note that the expenses shown in the table are meant to highlight your ongoing costs only and do not reflect any transactional costs, such as sales charges (loads). Therefore, the second line of the table is useful in comparing ongoing costs only, and will not help you determine the relative total costs of owning different funds. In addition, if these transactional costs were included, your costs would have been higher.
| Beginning Account Value | Ending Account Value | Expenses Paid During Period† | |||||||||||
| 5/1/21 | 10/31/21 | 5/1/21 – 10/31/21 | |||||||||||
| Class A | |||||||||||||
| Actual | $ | 1,000.00 | $ | 1,055.30 | $ | 4.66 | |||||||
| Hypothetical (5% Return Before Expenses) | $ | 1,000.00 | $ | 1,020.67 | $ | 4.58 | |||||||
| Class C | |||||||||||||
| Actual | $ | 1,000.00 | $ | 1,050.60 | $ | 8.53 | |||||||
| Hypothetical (5% Return Before Expenses) | $ | 1,000.00 | $ | 1,016.89 | $ | 8.39 | |||||||
| Class F | |||||||||||||
| Actual | $ | 1,000.00 | $ | 1,055.80 | $ | 3.89 | |||||||
| Hypothetical (5% Return Before Expenses) | $ | 1,000.00 | $ | 1,021.42 | $ | 3.82 | |||||||
| Class F3 | |||||||||||||
| Actual | $ | 1,000.00 | $ | 1,057.00 | $ | 3.16 | |||||||
| Hypothetical (5% Return Before Expenses) | $ | 1,000.00 | $ | 1,022.13 | $ | 3.11 | |||||||
| Class I | |||||||||||||
| Actual | $ | 1,000.00 | $ | 1,055.80 | $ | 3.37 | |||||||
| Hypothetical (5% Return Before Expenses) | $ | 1,000.00 | $ | 1,021.93 | $ | 3.31 | |||||||
| Class R3 | |||||||||||||
| Actual | $ | 1,000.00 | $ | 1,053.70 | $ | 5.95 | |||||||
| Hypothetical (5% Return Before Expenses) | $ | 1,000.00 | $ | 1,019.41 | $ | 5.85 | |||||||
| Class R4 | |||||||||||||
| Actual | $ | 1,000.00 | $ | 1,055.20 | $ | 4.66 | |||||||
| Hypothetical (5% Return Before Expenses) | $ | 1,000.00 | $ | 1,020.67 | $ | 4.58 | |||||||
| Class R5 | |||||||||||||
| Actual | $ | 1,000.00 | $ | 1,055.80 | $ | 3.37 | |||||||
| Hypothetical (5% Return Before Expenses) | $ | 1,000.00 | $ | 1,021.93 | $ | 3.31 | |||||||
| Class R6 | |||||||||||||
| Actual | $ | 1,000.00 | $ | 1,056.40 | $ | 3.16 | |||||||
| Hypothetical (5% Return Before Expenses) | $ | 1,000.00 | $ | 1,022.13 | $ | 3.11 | |||||||
| † | For each class of the Fund, net expenses are equal to the annualized expense ratio for such class (0.90% for Class A, 1.65% for Class C, 0.75% for Class F, 0.61% for Class F3, 0.65% for Class I, 1.15% for Class R3, 0.90% for Class R4, 0.65% for Class R5 and 0.61% for Class R6) multiplied by the average account value over the period, multiplied by 184/365 (to reflect one-half year period). |
73
Portfolio Holdings Presented by Sector
October 31, 2021
| Sector* | %** | |||
| Communication Services | 8.61 | % | ||
| Consumer Discretionary | 10.96 | % | ||
| Consumer Staples | 6.40 | % | ||
| Energy | 3.65 | % | ||
| Financials | 16.63 | % | ||
| Health Care | 10.82 | % | ||
| Industrials | 8.80 | % | ||
| Information Technology | 23.83 | % | ||
| Materials | 3.37 | % | ||
| Real Estate | 2.93 | % | ||
| Utilities | 1.23 | % | ||
| Repurchase Agreements | 2.77 | % | ||
| Total | 100.00 | % | ||
| * | A sector may comprise several industries. | |
| ** | Represents percent of total investments. |
74
Growth Leaders Fund
Please note that the expenses shown in the table are meant to highlight your ongoing costs only and do not reflect any transactional costs, such as sales charges (loads). Therefore, the second line of the table is useful in comparing ongoing costs only, and will not help you determine the relative total costs of owning different funds. In addition, if these transactional costs were included, your costs would have been higher.
| Beginning Account Value | Ending Account Value | Expenses Paid During Period† | |||||||||||
| 5/1/21 | 10/31/21 | 5/1/21 – 10/31/21 | |||||||||||
| Class A | |||||||||||||
| Actual | $ | 1,000.00 | $ | 1,138.70 | $ | 4.85 | |||||||
| Hypothetical (5% Return Before Expenses) | $ | 1,000.00 | $ | 1,020.67 | $ | 4.58 | |||||||
| Class C | |||||||||||||
| Actual | $ | 1,000.00 | $ | 1,134.60 | $ | 8.88 | |||||||
| Hypothetical (5% Return Before Expenses) | $ | 1,000.00 | $ | 1,016.89 | $ | 8.39 | |||||||
| Class F | |||||||||||||
| Actual | $ | 1,000.00 | $ | 1,140.00 | $ | 3.51 | |||||||
| Hypothetical (5% Return Before Expenses) | $ | 1,000.00 | $ | 1,021.93 | $ | 3.31 | |||||||
| Class F3 | |||||||||||||
| Actual | $ | 1,000.00 | $ | 1,140.70 | $ | 3.13 | |||||||
| Hypothetical (5% Return Before Expenses) | $ | 1,000.00 | $ | 1,022.28 | $ | 2.96 | |||||||
| Class I | |||||||||||||
| Actual | $ | 1,000.00 | $ | 1,140.00 | $ | 3.51 | |||||||
| Hypothetical (5% Return Before Expenses) | $ | 1,000.00 | $ | 1,021.93 | $ | 3.31 | |||||||
| Class R2 | |||||||||||||
| Actual | $ | 1,000.00 | $ | 1,136.90 | $ | 6.73 | |||||||
| Hypothetical (5% Return Before Expenses) | $ | 1,000.00 | $ | 1,018.90 | $ | 6.36 | |||||||
| Class R3 | |||||||||||||
| Actual | $ | 1,000.00 | $ | 1,137.30 | $ | 6.20 | |||||||
| Hypothetical (5% Return Before Expenses) | $ | 1,000.00 | $ | 1,019.41 | $ | 5.85 | |||||||
| Class R4 | |||||||||||||
| Actual | $ | 1,000.00 | $ | 1,138.70 | $ | 4.85 | |||||||
| Hypothetical (5% Return Before Expenses) | $ | 1,000.00 | $ | 1,020.67 | $ | 4.58 | |||||||
| Class R5 | |||||||||||||
| Actual | $ | 1,000.00 | $ | 1,140.20 | $ | 3.51 | |||||||
| Hypothetical (5% Return Before Expenses) | $ | 1,000.00 | $ | 1,021.93 | $ | 3.31 | |||||||
| Class R6 | |||||||||||||
| Actual | $ | 1,000.00 | $ | 1,140.70 | $ | 3.13 | |||||||
| Hypothetical (5% Return Before Expenses) | $ | 1,000.00 | $ | 1,022.28 | $ | 2.96 | |||||||
| † | For each class of the Fund, net expenses are equal to the annualized expense ratio for such class (0.90% for Class A, 1.65% for Class C, 0.65% for Class F, 0.58% for Class F3, 0.65% for Class I, 1.25% for Class R2, 1.15% for Class R3, 0.90% for Class R4, 0.65% for Class R5 and 0.58% for Class R6) multiplied by the average account value over the period, multiplied by 184/365 (to reflect one-half year period). |
75
Portfolio Holdings Presented by Sector
October 31, 2021
| Sector* | %** | |||
| Communication Services | 14.42 | % | ||
| Consumer Discretionary | 14.62 | % | ||
| Consumer Staples | 0.52 | % | ||
| Financials | 7.01 | % | ||
| Health Care | 8.95 | % | ||
| Industrials | 3.86 | % | ||
| Information Technology | 48.07 | % | ||
| Materials | 0.77 | % | ||
| Repurchase Agreements | 1.76 | % | ||
| Money Market Funds(a) | 0.02 | % | ||
| Time Deposits(a) | 0.00 | %(b) | ||
| Total | 100.00 | % | ||
| * | A sector may comprise several industries. | |
| ** | Represents percent of total investments. | |
| (a) | Securities were purchased with the cash collateral from loaned securities. | |
| (b) | Represents amount less than 0.01%. |
76
Health Care Fund
Please note that the expenses shown in the table are meant to highlight your ongoing costs only and do not reflect any transactional costs, such as sales charges (loads). Therefore, the second line of the table is useful in comparing ongoing costs only, and will not help you determine the relative total costs of owning different funds. In addition, if these transactional costs were included, your costs would have been higher.
| Beginning Account Value | Ending Account Value | Expenses Paid During Period† | |||||||||||
| 5/1/21 | 10/31/21 | 5/1/21 – 10/31/21 | |||||||||||
| Class A | |||||||||||||
| Actual | $ | 1,000.00 | $ | 1,082.30 | $ | 5.41 | |||||||
| Hypothetical (5% Return Before Expenses) | $ | 1,000.00 | $ | 1,020.01 | $ | 5.24 | |||||||
| Class C | |||||||||||||
| Actual | $ | 1,000.00 | $ | 1,078.00 | $ | 9.32 | |||||||
| Hypothetical (5% Return Before Expenses) | $ | 1,000.00 | $ | 1,016.23 | $ | 9.05 | |||||||
| Class F | |||||||||||||
| Actual | $ | 1,000.00 | $ | 1,083.40 | $ | 4.10 | |||||||
| Hypothetical (5% Return Before Expenses) | $ | 1,000.00 | $ | 1,021.27 | $ | 3.97 | |||||||
| Class F3 | |||||||||||||
| Actual | $ | 1,000.00 | $ | 1,084.00 | $ | 3.73 | |||||||
| Hypothetical (5% Return Before Expenses) | $ | 1,000.00 | $ | 1,021.63 | $ | 3.62 | |||||||
| Class I | |||||||||||||
| Actual | $ | 1,000.00 | $ | 1,083.50 | $ | 4.10 | |||||||
| Hypothetical (5% Return Before Expenses) | $ | 1,000.00 | $ | 1,021.27 | $ | 3.97 | |||||||
| Class R3 | |||||||||||||
| Actual | $ | 1,000.00 | $ | 1,080.70 | $ | 6.71 | |||||||
| Hypothetical (5% Return Before Expenses) | $ | 1,000.00 | $ | 1,018.75 | $ | 6.51 | |||||||
| Class R4 | |||||||||||||
| Actual | $ | 1,000.00 | $ | 1,082.30 | $ | 5.41 | |||||||
| Hypothetical (5% Return Before Expenses) | $ | 1,000.00 | $ | 1,020.01 | $ | 5.24 | |||||||
| Class R5 | |||||||||||||
| Actual | $ | 1,000.00 | $ | 1,084.00 | $ | 4.10 | |||||||
| Hypothetical (5% Return Before Expenses) | $ | 1,000.00 | $ | 1,021.27 | $ | 3.97 | |||||||
| Class R6 | |||||||||||||
| Actual | $ | 1,000.00 | $ | 1,083.90 | $ | 3.73 | |||||||
| Hypothetical (5% Return Before Expenses) | $ | 1,000.00 | $ | 1,021.63 | $ | 3.62 | |||||||
| † | For each class of the Fund, net expenses are equal to the annualized expense ratio for such class (1.03% for Class A, 1.78% for Class C, 0.78% for Class F, 0.71% for Class F3, 0.78% for Class I, 1.28% for Class R3, 1.03% for Class R4, 0.78% for Class R5 and 0.71% for Class R6) multiplied by the average account value over the period, multiplied by 184/365 (to reflect one-half year period). |
77
Portfolio Holdings Presented by Sector
October 31, 2021
| Sector* | %** | |||
| Consumer Discretionary | 0.66 | % | ||
| Health Care | 94.69 | % | ||
| Information Technology | 0.82 | % | ||
| Repurchase Agreements | 3.66 | % | ||
| Money Market Funds(a) | 0.15 | % | ||
| Time Deposits(a) | 0.02 | % | ||
| Total | 100.00 | % | ||
| * | A sector may comprise several industries. | |
| ** | Represents percent of total investments. | |
| (a) | Securities were purchased with the cash collateral from loaned securities. |
78
International Equity Fund
Please note that the expenses shown in the table are meant to highlight your ongoing costs only and do not reflect any transactional costs, such as sales charges (loads). Therefore, the second line of the table is useful in comparing ongoing costs only, and will not help you determine the relative total costs of owning different funds. In addition, if these transactional costs were included, your costs would have been higher.
| Beginning Account Value | Ending Account Value | Expenses Paid During Period† | |||||||||||
| 5/1/21 | 10/31/21 | 5/1/21 – 10/31/21 | |||||||||||
| Class A | |||||||||||||
| Actual | $ | 1,000.00 | $ | 1,050.50 | $ | 6.05 | |||||||
| Hypothetical (5% Return Before Expenses) | $ | 1,000.00 | $ | 1,019.31 | $ | 5.96 | |||||||
| Class C | |||||||||||||
| Actual | $ | 1,000.00 | $ | 1,046.50 | $ | 9.90 | |||||||
| Hypothetical (5% Return Before Expenses) | $ | 1,000.00 | $ | 1,015.53 | $ | 9.75 | |||||||
| Class F | |||||||||||||
| Actual | $ | 1,000.00 | $ | 1,051.30 | $ | 4.96 | |||||||
| Hypothetical (5% Return Before Expenses) | $ | 1,000.00 | $ | 1,020.37 | $ | 4.89 | |||||||
| Class F3 | |||||||||||||
| Actual | $ | 1,000.00 | $ | 1,052.30 | $ | 4.35 | |||||||
| Hypothetical (5% Return Before Expenses) | $ | 1,000.00 | $ | 1,020.97 | $ | 4.28 | |||||||
| Class I | |||||||||||||
| Actual | $ | 1,000.00 | $ | 1,052.40 | $ | 4.45 | |||||||
| Hypothetical (5% Return Before Expenses) | $ | 1,000.00 | $ | 1,020.87 | $ | 4.38 | |||||||
| Class P | |||||||||||||
| Actual | $ | 1,000.00 | $ | 1,049.20 | $ | 7.08 | |||||||
| Hypothetical (5% Return Before Expenses) | $ | 1,000.00 | $ | 1,018.30 | $ | 6.97 | |||||||
| Class R2 | |||||||||||||
| Actual | $ | 1,000.00 | $ | 1,048.70 | $ | 7.85 | |||||||
| Hypothetical (5% Return Before Expenses) | $ | 1,000.00 | $ | 1,017.54 | $ | 7.73 | |||||||
| Class R3 | |||||||||||||
| Actual | $ | 1,000.00 | $ | 1,048.90 | $ | 7.33 | |||||||
| Hypothetical (5% Return Before Expenses) | $ | 1,000.00 | $ | 1,018.05 | $ | 7.22 | |||||||
| Class R4 | |||||||||||||
| Actual | $ | 1,000.00 | $ | 1,050.20 | $ | 6.05 | |||||||
| Hypothetical (5% Return Before Expenses) | $ | 1,000.00 | $ | 1,019.31 | $ | 5.96 | |||||||
| Class R5 | |||||||||||||
| Actual | $ | 1,000.00 | $ | 1,052.10 | $ | 4.76 | |||||||
| Hypothetical (5% Return Before Expenses) | $ | 1,000.00 | $ | 1,020.57 | $ | 4.69 | |||||||
| Class R6 | |||||||||||||
| Actual | $ | 1,000.00 | $ | 1,052.30 | $ | 4.35 | |||||||
| Hypothetical (5% Return Before Expenses) | $ | 1,000.00 | $ | 1,020.97 | $ | 4.28 | |||||||
| † | For each class of the Fund, net expenses are equal to the annualized expense ratio for such class (1.17% for Class A, 1.92% for Class C, 0.96% for Class F, 0.84% for Class F3, 0.86% for Class I, 1.37% for Class P, 1.52% for Class R2, 1.42% for Class R3, 1.17% for Class R4, 0.92% for Class R5 and 0.84% for Class R6) multiplied by the average account value over the period, multiplied by 184/365 (to reflect one-half year period). |
79
Portfolio Holdings Presented by Sector
October 31, 2021
| Sector* | %** | |||
| Communication Services | 3.12 | % | ||
| Consumer Discretionary | 14.38 | % | ||
| Consumer Staples | 7.87 | % | ||
| Energy | 4.59 | % | ||
| Financials | 19.18 | % | ||
| Health Care | 10.53 | % | ||
| Industrials | 17.14 | % | ||
| Information Technology | 11.34 | % | ||
| Materials | 5.56 | % | ||
| Real Estate | 1.23 | % | ||
| Utilities | 2.70 | % | ||
| Repurchase Agreements | 2.16 | % | ||
| Money Market Funds(a) | 0.18 | % | ||
| Time Deposits(a) | 0.02 | % | ||
| Total | 100.00 | % | ||
| * | A sector may comprise several industries. | |
| ** | Represents percent of total investments. | |
| (a) | Securities were purchased with the cash collateral from loaned securities. |
80
International Opportunities Fund
Please note that the expenses shown in the table are meant to highlight your ongoing costs only and do not reflect any transactional costs, such as sales charges (loads). Therefore, the second line of the table is useful in comparing ongoing costs only, and will not help you determine the relative total costs of owning different funds. In addition, if these transactional costs were included, your costs would have been higher.
| Beginning Account Value | Ending Account Value | Expenses Paid During Period† | |||||||||||
| 5/1/21 | 10/31/21 | 5/1/21 – 10/31/21 | |||||||||||
| Class A | |||||||||||||
| Actual | $ | 1,000.00 | $ | 1,027.40 | $ | 6.08 | |||||||
| Hypothetical (5% Return Before Expenses) | $ | 1,000.00 | $ | 1,019.21 | $ | 6.06 | |||||||
| Class C | |||||||||||||
| Actual | $ | 1,000.00 | $ | 1,024.10 | $ | 9.90 | |||||||
| Hypothetical (5% Return Before Expenses) | $ | 1,000.00 | $ | 1,015.43 | $ | 9.86 | |||||||
| Class F | |||||||||||||
| Actual | $ | 1,000.00 | $ | 1,028.20 | $ | 5.32 | |||||||
| Hypothetical (5% Return Before Expenses) | $ | 1,000.00 | $ | 1,019.96 | $ | 5.30 | |||||||
| Class F3 | |||||||||||||
| Actual | $ | 1,000.00 | $ | 1,029.70 | $ | 4.40 | |||||||
| Hypothetical (5% Return Before Expenses) | $ | 1,000.00 | $ | 1,020.87 | $ | 4.38 | |||||||
| Class I | |||||||||||||
| Actual | $ | 1,000.00 | $ | 1,028.90 | $ | 4.81 | |||||||
| Hypothetical (5% Return Before Expenses) | $ | 1,000.00 | $ | 1,020.47 | $ | 4.79 | |||||||
| Class P | |||||||||||||
| Actual | $ | 1,000.00 | $ | 1,026.70 | $ | 7.10 | |||||||
| Hypothetical (5% Return Before Expenses) | $ | 1,000.00 | $ | 1,018.20 | $ | 7.07 | |||||||
| Class R2 | |||||||||||||
| Actual | $ | 1,000.00 | $ | 1,025.50 | $ | 7.86 | |||||||
| Hypothetical (5% Return Before Expenses) | $ | 1,000.00 | $ | 1,017.44 | $ | 7.83 | |||||||
| Class R3 | |||||||||||||
| Actual | $ | 1,000.00 | $ | 1,026.10 | $ | 7.40 | |||||||
| Hypothetical (5% Return Before Expenses) | $ | 1,000.00 | $ | 1,017.90 | $ | 7.38 | |||||||
| Class R4 | |||||||||||||
| Actual | $ | 1,000.00 | $ | 1,027.50 | $ | 6.08 | |||||||
| Hypothetical (5% Return Before Expenses) | $ | 1,000.00 | $ | 1,019.21 | $ | 6.06 | |||||||
| Class R5 | |||||||||||||
| Actual | $ | 1,000.00 | $ | 1,028.90 | $ | 4.81 | |||||||
| Hypothetical (5% Return Before Expenses) | $ | 1,000.00 | $ | 1,020.47 | $ | 4.79 | |||||||
| Class R6 | |||||||||||||
| Actual | $ | 1,000.00 | $ | 1,029.20 | $ | 4.40 | |||||||
| Hypothetical (5% Return Before Expenses) | $ | 1,000.00 | $ | 1,020.87 | $ | 4.38 | |||||||
| † | For each class of the Fund, net expenses are equal to the annualized expense ratio for such class (1.19% for Class A, 1.94% for Class C, 1.04% for Class F, 0.86% for Class F3, 0.94% for Class I, 1.39% for Class P, 1.54% for Class R2, 1.45% for Class R3, 1.19% for Class R4, 0.94% for Class R5 and 0.86% for Class R6) multiplied by the average account value over the period, multiplied by 184/365 (to reflect one-half year period). |
81
Portfolio Holdings Presented by Sector
October 31, 2021
| Sector* | %** | |||
| Communication Services | 3.17 | % | ||
| Consumer Discretionary | 12.29 | % | ||
| Consumer Staples | 4.49 | % | ||
| Financials | 13.07 | % | ||
| Health Care | 6.75 | % | ||
| Industrials | 24.55 | % | ||
| Information Technology | 11.22 | % | ||
| Materials | 10.63 | % | ||
| Real Estate | 9.46 | % | ||
| Utilities | 2.73 | % | ||
| Repurchase Agreements | 1.64 | % | ||
| Total | 100.00 | % | ||
| * | A sector may comprise several industries. | |
| ** | Represents percent of total investments. |
82
International Value Fund
Please note that the expenses shown in the table are meant to highlight your ongoing costs only and do not reflect any transactional costs, such as sales charges (loads). Therefore, the second line of the table is useful in comparing ongoing costs only, and will not help you determine the relative total costs of owning different funds. In addition, if these transactional costs were included, your costs would have been higher.
| Beginning Account Value | Ending Account Value | Expenses Paid During Period† | |||||||||||
| 5/1/21 | 10/31/21 | 5/1/21 – 10/31/21 | |||||||||||
| Class A | |||||||||||||
| Actual | $ | 1,000.00 | $ | 1,003.60 | $ | 5.66 | |||||||
| Hypothetical (5% Return Before Expenses) | $ | 1,000.00 | $ | 1,019.56 | $ | 5.70 | |||||||
| Class C | |||||||||||||
| Actual | $ | 1,000.00 | $ | 999.40 | $ | 9.42 | |||||||
| Hypothetical (5% Return Before Expenses) | $ | 1,000.00 | $ | 1,015.78 | $ | 9.50 | |||||||
| Class F | |||||||||||||
| Actual | $ | 1,000.00 | $ | 1,005.50 | $ | 4.65 | |||||||
| Hypothetical (5% Return Before Expenses) | $ | 1,000.00 | $ | 1,020.57 | $ | 4.69 | |||||||
| Class F3 | |||||||||||||
| Actual | $ | 1,000.00 | $ | 1,004.90 | $ | 3.99 | |||||||
| Hypothetical (5% Return Before Expenses) | $ | 1,000.00 | $ | 1,021.22 | $ | 4.02 | |||||||
| Class I | |||||||||||||
| Actual | $ | 1,000.00 | $ | 1,004.80 | $ | 4.14 | |||||||
| Hypothetical (5% Return Before Expenses) | $ | 1,000.00 | $ | 1,021.07 | $ | 4.18 | |||||||
| Class R2 | |||||||||||||
| Actual | $ | 1,000.00 | $ | 1,001.70 | $ | 7.42 | |||||||
| Hypothetical (5% Return Before Expenses) | $ | 1,000.00 | $ | 1,017.80 | $ | 7.48 | |||||||
| Class R3 | |||||||||||||
| Actual | $ | 1,000.00 | $ | 1,002.20 | $ | 6.91 | |||||||
| Hypothetical (5% Return Before Expenses) | $ | 1,000.00 | $ | 1,018.30 | $ | 6.97 | |||||||
| Class R4 | |||||||||||||
| Actual | $ | 1,000.00 | $ | 1,003.60 | $ | 5.66 | |||||||
| Hypothetical (5% Return Before Expenses) | $ | 1,000.00 | $ | 1,019.56 | $ | 5.70 | |||||||
| Class R5 | |||||||||||||
| Actual | $ | 1,000.00 | $ | 1,003.60 | $ | 4.39 | |||||||
| Hypothetical (5% Return Before Expenses) | $ | 1,000.00 | $ | 1,020.82 | $ | 4.43 | |||||||
| Class R6 | |||||||||||||
| Actual | $ | 1,000.00 | $ | 1,004.90 | $ | 3.99 | |||||||
| Hypothetical (5% Return Before Expenses) | $ | 1,000.00 | $ | 1,021.22 | $ | 4.02 | |||||||
| † | For each class of the Fund, net expenses are equal to the annualized expense ratio for such class (1.12% for Class A, 1.87% for Class C, 0.92% for Class F, 0.79% for Class F3, 0.82% for Class I, 1.47% for Class R2, 1.37% for Class R3, 1.12% for Class R4, 0.87% for Class R5 and 0.79% for Class R6) multiplied by the average account value over the period, multiplied by 184/365 (to reflect one-half year period). |
83
Portfolio Holdings Presented by Sector
October 31, 2021
| Sector* | %** | |||
| Communication Services | 1.40 | % | ||
| Consumer Discretionary | 10.52 | % | ||
| Consumer Staples | 6.52 | % | ||
| Energy | 7.09 | % | ||
| Financials | 26.43 | % | ||
| Health Care | 7.88 | % | ||
| Industrials | 16.20 | % | ||
| Information Technology | 4.80 | % | ||
| Materials | 4.98 | % | ||
| Real Estate | 4.94 | % | ||
| Utilities | 5.78 | % | ||
| Repurchase Agreements | 3.21 | % | ||
| Money Market Funds(a) | 0.22 | % | ||
| Time Deposits(a) | 0.03 | % | ||
| Total | 100.00 | % | ||
| * | A sector may comprise several industries. | |
| ** | Represents percent of total investments. | |
| (a) | Securities were purchased with the cash collateral from loaned securities. |
84
Micro Cap Growth Fund
Please note that the expenses shown in the table are meant to highlight your ongoing costs only and do not reflect any transactional costs, such as sales charges (loads). Therefore, the second line of the table is useful in comparing ongoing costs only, and will not help you determine the relative total costs of owning different funds. In addition, if these transactional costs were included, your costs would have been higher.
| Beginning Account Value | Ending Account Value | Expenses Paid During Period† | |||||||||||
| 5/1/21 | 10/31/21 | 5/1/21 – 10/31/21 | |||||||||||
| Class A | |||||||||||||
| Actual | $ | 1,000.00 | $ | 951.40 | $ | 7.08 | |||||||
| Hypothetical (5% Return Before Expenses) | $ | 1,000.00 | $ | 1,017.95 | $ | 7.32 | |||||||
| Class C | |||||||||||||
| Actual | $ | 1,000.00 | $ | 947.60 | $ | 10.75 | |||||||
| Hypothetical (5% Return Before Expenses) | $ | 1,000.00 | $ | 1,014.17 | $ | 11.12 | |||||||
| Class F | |||||||||||||
| Actual | $ | 1,000.00 | $ | 952.30 | $ | 5.86 | |||||||
| Hypothetical (5% Return Before Expenses) | $ | 1,000.00 | $ | 1,019.21 | $ | 6.06 | |||||||
| Class I | |||||||||||||
| Actual | $ | 1,000.00 | $ | 952.30 | $ | 5.86 | |||||||
| Hypothetical (5% Return Before Expenses) | $ | 1,000.00 | $ | 1,019.21 | $ | 6.06 | |||||||
| † | For each class of the Fund, net expenses are equal to the annualized expense ratio for such class (1.44% for Class A, 2.19% for Class C, 1.19% for Class F and 1.19% for Class I multiplied by the average account value over the period, multiplied by 184/365 (to reflect one-half year period). |
85
Portfolio Holdings Presented by Sector
October 31, 2021
| Sector* | %** | |||
| Communication Services | 5.66 | % | ||
| Consumer Discretionary | 14.90 | % | ||
| Consumer Staples | 4.06 | % | ||
| Financials | 5.96 | % | ||
| Health Care | 30.09 | % | ||
| Industrials | 14.60 | % | ||
| Information Technology | 21.70 | % | ||
| Repurchase Agreements | 0.99 | % | ||
| Money Market Funds(a) | 1.84 | % | ||
| Time Deposits(a) | 0.20 | % | ||
| Total | 100.00 | % | ||
| * | A sector may comprise several industries. | |
| ** | Represents percent of total investments. | |
| (a) | Securities were purchased with the cash collateral from loaned securities. |
86
Value Opportunities Fund
Please note that the expenses shown in the table are meant to highlight your ongoing costs only and do not reflect any transactional costs, such as sales charges (loads). Therefore, the second line of the table is useful in comparing ongoing costs only, and will not help you determine the relative total costs of owning different funds. In addition, if these transactional costs were included, your costs would have been higher.
| Beginning Account Value | Ending Account Value | Expenses Paid During Period† | |||||||||||
| 5/1/21 | 10/31/21 | 5/1/21 – 10/31/21 | |||||||||||
| Class A | |||||||||||||
| Actual | $ | 1,000.00 | $ | 1,051.00 | $ | 5.84 | |||||||
| Hypothetical (5% Return Before Expenses) | $ | 1,000.00 | $ | 1,019.51 | $ | 5.75 | |||||||
| Class C | |||||||||||||
| Actual | $ | 1,000.00 | $ | 1,047.30 | $ | 9.75 | |||||||
| Hypothetical (5% Return Before Expenses) | $ | 1,000.00 | $ | 1,015.68 | $ | 9.60 | |||||||
| Class F | |||||||||||||
| Actual | $ | 1,000.00 | $ | 1,051.80 | $ | 5.07 | |||||||
| Hypothetical (5% Return Before Expenses) | $ | 1,000.00 | $ | 1,020.27 | $ | 4.99 | |||||||
| Class F3 | |||||||||||||
| Actual | $ | 1,000.00 | $ | 1,052.70 | $ | 4.14 | |||||||
| Hypothetical (5% Return Before Expenses) | $ | 1,000.00 | $ | 1,021.17 | $ | 4.08 | |||||||
| Class I | |||||||||||||
| Actual | $ | 1,000.00 | $ | 1,052.30 | $ | 4.55 | |||||||
| Hypothetical (5% Return Before Expenses) | $ | 1,000.00 | $ | 1,020.77 | $ | 4.48 | |||||||
| Class P | |||||||||||||
| Actual | $ | 1,000.00 | $ | 1,050.00 | $ | 6.92 | |||||||
| Hypothetical (5% Return Before Expenses) | $ | 1,000.00 | $ | 1,018.45 | $ | 6.82 | |||||||
| Class R2 | |||||||||||||
| Actual | $ | 1,000.00 | $ | 1,049.20 | $ | 7.70 | |||||||
| Hypothetical (5% Return Before Expenses) | $ | 1,000.00 | $ | 1,017.69 | $ | 7.58 | |||||||
| Class R3 | |||||||||||||
| Actual | $ | 1,000.00 | $ | 1,049.80 | $ | 7.13 | |||||||
| Hypothetical (5% Return Before Expenses) | $ | 1,000.00 | $ | 1,018.25 | $ | 7.02 | |||||||
| Class R4 | |||||||||||||
| Actual | $ | 1,000.00 | $ | 1,051.10 | $ | 5.84 | |||||||
| Hypothetical (5% Return Before Expenses) | $ | 1,000.00 | $ | 1,019.51 | $ | 5.75 | |||||||
| Class R5 | |||||||||||||
| Actual | $ | 1,000.00 | $ | 1,052.30 | $ | 4.60 | |||||||
| Hypothetical (5% Return Before Expenses) | $ | 1,000.00 | $ | 1,020.72 | $ | 4.53 | |||||||
| Class R6 | |||||||||||||
| Actual | $ | 1,000.00 | $ | 1,052.80 | $ | 4.14 | |||||||
| Hypothetical (5% Return Before Expenses) | $ | 1,000.00 | $ | 1,021.17 | $ | 4.08 | |||||||
| † | For each class of the Fund, net expenses are equal to the annualized expense ratio for such class (1.13% for Class A, 1.89% for Class C, 0.98% for Class F, 0.80% for Class F3, 0.88% for Class I, 1.34% for Class P, 1.49% for Class R2, 1.38% for Class R3, 1.13% for Class R4, 0.89% for Class R5 and 0.80% for Class R6) multiplied by the average account value over the period, multiplied by 184/365 (to reflect one-half year period). |
87
Portfolio Holdings Presented by Sector
October 31, 2021
| Sector* | %** | |||
| Communication Services | 2.93 | % | ||
| Consumer Discretionary | 10.06 | % | ||
| Consumer Staples | 2.83 | % | ||
| Energy | 3.71 | % | ||
| Financials | 14.97 | % | ||
| Health Care | 13.70 | % | ||
| Industrials | 18.22 | % | ||
| Information Technology | 13.48 | % | ||
| Materials | 9.50 | % | ||
| Real Estate | 7.66 | % | ||
| Utilities | 2.35 | % | ||
| Repurchase Agreements | 0.59 | % | ||
| Total | 100.00 | % | ||
| * | A sector may comprise several industries. | |
| ** | Represents percent of total investments. |
88
Schedule of Investments
ALPHA STRATEGY FUND October 31, 2021
| Investments | Shares | Fair Value (000) | ||||||
| LONG-TERM INVESTMENTS 100.04% | ||||||||
| INVESTMENTS IN UNDERLYING FUNDS(a)(b) 100.04% | ||||||||
| Lord Abbett Developing Growth Fund, Inc. – Class I*(c) | 4,229 | $ | 175,650 | |||||
| Lord Abbett Securities Trust-Focused Small Cap Value Fund – Class I(d) | 2,726 | 90,235 | ||||||
| Lord Abbett Securities Trust – International Opportunities Fund – Class I*(d) | 7,733 | 170,754 | ||||||
| Lord Abbett Securities Trust – Micro-Cap Growth Fund – Class I*(d) | 3,595 | 85,448 | ||||||
| Lord Abbett Research Fund, Inc. – Small Cap Value Fund – Class I(d) | 7,767 | 178,800 | ||||||
| Lord Abbett Securities Trust-Value Opportunities Fund - Class I(d) | 7,218 | 180,099 | ||||||
| Total Investments in Underlying Funds (cost 674,095,004) | 880,986 | |||||||
| Investments | Principal Amount (000) | Fair Value (000) | ||||||
| SHORT-TERM INVESTMENTS 0.10% | ||||||||
| Repurchase Agreements 0.10% | ||||||||
| Repurchase Agreement dated 10/29/2021, 0.00% due 11/1/2021 with Fixed Income Clearing Corp. collateralized by $955,700 of U.S. Treasury Note at .500% due 10/31/2027; value: $911,958; proceeds: $894,051 (cost $894,051) | $894 | $ | 894 | |||||
| Total Investments in Securities 100.14% (cost $674,989,055) | 881,880 | |||||||
| Other Assets and Liabilities – Net (0.14)% | (1,254 | ) | ||||||
| Net Assets 100.00% | $ | 880,626 | ||||||
| * | Non-income producing security. | |
| (a) | Affiliated issuer (see Note 13). | |
| (b) | These investments offer daily redemptions. | |
| (c) | Fund investment objective is long-term growth of capital through a diversified and actively managed portfolio consisting of developing growth companies, many of which are traded over the counter. | |
| (d) | Fund investment objective is long-term capital appreciation. |
The following is a summary of the inputs used as of October 31, 2021 in valuing the Fund’s investments carried at fair value(1):
| Investment Type(2) | Level 1 (000) | Level 2 (000) | Level 3 (000) | Total (000) | ||||||||||||||
| Long-Term Investments | ||||||||||||||||||
| Investments in Underlying Funds | $ | – | $ | 880,986 | $ | – | $ | 880,986 | ||||||||||
| Short-Term Investments | ||||||||||||||||||
| Repurchase Agreements | – | 894 | – | 894 | ||||||||||||||
| Total | $ | – | $ | 881,880 | $ | – | $ | 881,880 | ||||||||||
| (1) | Refer to Note 2(l) for a description of fair value measurements and the three-tier hierarchy of inputs. | |
| (2) | See Schedule of Investments for fair values in each industry and identification of foreign issuers and/or geography. When applicable each Level 3 security is identified on the Schedule of Investments along with the valuation technique utilized. |
A reconciliation of Level 3 investments is presented when the Fund has a material amount of Level 3 investments at the beginning or end of the year in relation to the Fund’s net assets.
| See Notes to Financial Statements. | 89 |
Schedule of Investments
DURABLE GROWTH FUND October 31, 2021
| Investments | Shares | Fair Value (000) | ||||||
| LONG-TERM INVESTMENTS 98.48% | ||||||||
| COMMON STOCKS 98.48% | ||||||||
| Aerospace & Defense 2.05% | ||||||||
| Airbus SE*(a) | EUR | 9,600 | $ | 1,231 | ||||
| CAE, Inc. (Canada)*(b) | 55,445 | 1,684 | ||||||
| TransDigm Group, Inc.* | 3,607 | 2,250 | ||||||
| Total | 5,165 | |||||||
| Automobiles 1.40% | ||||||||
| Tesla, Inc.* | 3,165 | 3,526 | ||||||
| Banks 1.04% | ||||||||
| First Republic Bank | 12,040 | 2,605 | ||||||
| Beverages 1.73% | ||||||||
| Brown-Forman Corp. Class B | 14,416 | 979 | ||||||
| Coca-Cola Co. (The) | 59,787 | 3,370 | ||||||
| Total | 4,349 | |||||||
| Biotechnology 1.99% | ||||||||
| Genmab A/S ADR* | 36,349 | 1,623 | ||||||
| Natera, Inc.* | 15,913 | 1,823 | ||||||
| Seagen, Inc.* | 8,910 | 1,571 | ||||||
| Total | 5,017 | |||||||
| Capital Markets 0.84% | ||||||||
| Moody’s Corp. | 5,245 | 2,120 | ||||||
| Chemicals 0.93% | ||||||||
| Air Products & Chemicals, Inc. | 7,840 | 2,350 | ||||||
| Construction Materials 0.99% | ||||||||
| Vulcan Materials Co. | 13,080 | 2,487 | ||||||
| Containers & Packaging 1.20% | ||||||||
| Avery Dennison Corp. | 7,096 | 1,545 | ||||||
| Ball Corp. | 16,032 | 1,467 | ||||||
| Total | 3,012 | |||||||
| Entertainment 3.05% | ||||||||
| Activision Blizzard, Inc. | 16,993 | 1,329 | ||||||
| Netflix, Inc.* | 7,084 | 4,890 | ||||||
| Walt Disney Co. (The)* | 8,657 | 1,463 | ||||||
| Total | 7,682 | |||||||
| Investments | Shares | Fair Value (000) | ||||||
| Equity Real Estate Investment Trusts 1.56% | ||||||||
| SBA Communications Corp. | 11,405 | $ | 3,938 | |||||
| Food & Staples Retailing 1.46% | ||||||||
| Sysco Corp. | 24,406 | 1,877 | ||||||
| Walmart, Inc. | 11,959 | 1,787 | ||||||
| Total | 3,664 | |||||||
| Health Care Equipment & Supplies 5.43% | ||||||||
| Align Technology, Inc.* | 5,158 | 3,220 | ||||||
| Danaher Corp. | 7,115 | 2,218 | ||||||
| DexCom, Inc.* | 5,338 | 3,327 | ||||||
| Intuitive Surgical, Inc.* | 6,485 | 2,342 | ||||||
| West Pharmaceutical Services, Inc. | 4,312 | 1,854 | ||||||
| Zimmer Biomet Holdings, Inc. | 4,959 | 710 | ||||||
| Total | 13,671 | |||||||
| Health Care Technology 0.47% | ||||||||
| Veeva Systems, Inc. Class A* | 3,716 | 1,178 | ||||||
| Hotels, Restaurants & Leisure 2.10% | ||||||||
| Airbnb, Inc. Class A* | 6,509 | 1,111 | ||||||
| Chipotle Mexican Grill, Inc.* | 1,451 | 2,581 | ||||||
| Hilton Worldwide Holdings, Inc.* | 11,002 | 1,584 | ||||||
| Total | 5,276 | |||||||
| Industrial Conglomerates 1.38% | ||||||||
| Honeywell International, Inc. | 8,131 | 1,778 | ||||||
| Roper Technologies, Inc. | 3,460 | 1,688 | ||||||
| Total | 3,466 | |||||||
| Information Technology Services 6.61% | ||||||||
| Fidelity National Information Services, Inc. | 18,010 | 1,995 | ||||||
| Genpact Ltd. | 38,341 | 1,892 | ||||||
| Mastercard, Inc. Class A | 12,796 | 4,293 | ||||||
| PayPal Holdings, Inc.* | 17,549 | 4,082 | ||||||
| Twilio, Inc. Class A* | 5,438 | 1,584 | ||||||
| Visa, Inc. Class A | 13,242 | 2,804 | ||||||
| Total | 16,650 | |||||||
| 90 | See Notes to Financial Statements. |
Schedule of Investments (continued)
DURABLE GROWTH FUND October 31, 2021
| Investments | Shares | Fair Value (000) | ||||||
| Interactive Media & Services 12.84% | ||||||||
| Alphabet, Inc. Class A* | 6,496 | $ | 19,234 | |||||
| Match Group, Inc.* | 15,589 | 2,350 | ||||||
| Meta Platforms, Inc. Class A* | 28,300 | 9,157 | ||||||
| Snap, Inc. Class A* | 30,459 | 1,602 | ||||||
| Total | 32,343 | |||||||
| Internet & Direct Marketing Retail 7.31% | ||||||||
| Amazon.com, Inc.* | 5,460 | 18,413 | ||||||
| Life Sciences Tools & Services 1.14% | ||||||||
| 10X Genomics, Inc. Class A* | 7,552 | 1,218 | ||||||
| Repligen Corp.* | 5,700 | 1,656 | ||||||
| Total | 2,874 | |||||||
| Machinery 0.68% | ||||||||
| Stanley Black & Decker, Inc. | 9,483 | 1,704 | ||||||
| Personal Products 1.08% | ||||||||
| Estee Lauder Cos., Inc. (The) Class A | 8,369 | 2,714 | ||||||
| Pharmaceuticals 3.86% | ||||||||
| AstraZeneca plc ADR | 28,392 | 1,771 | ||||||
| Eli Lilly & Co. | 16,363 | 4,169 | ||||||
| Zoetis, Inc. | 17,506 | 3,785 | ||||||
| Total | 9,725 | |||||||
| Road & Rail 2.20% | ||||||||
| Norfolk Southern Corp. | 6,791 | 1,990 | ||||||
| Old Dominion Freight Line, Inc. | 8,628 | 2,945 | ||||||
| Uber Technologies, Inc.* | 13,934 | 611 | ||||||
| Total | 5,546 | |||||||
| Semiconductors & Semiconductor Equipment 7.03% | ||||||||
| Analog Devices, Inc. | 15,431 | 2,677 | ||||||
| Lam Research Corp. | 3,932 | 2,216 | ||||||
| NVIDIA Corp. | 36,310 | 9,283 | ||||||
| NXP Semiconductors NV (Netherlands)(b) | 8,851 | 1,778 | ||||||
| QUALCOMM, Inc. | 13,223 | 1,759 | ||||||
| Total | 17,713 | |||||||
| Investments | Shares | Fair Value (000) | ||||||
| Software 17.78% | ||||||||
| Cadence Design Systems, Inc.* | 14,380 | $ | 2,489 | |||||
| DocuSign, Inc.* | 4,072 | 1,133 | ||||||
| Microsoft Corp. | 82,533 | 27,370 | ||||||
| RingCentral, Inc. Class A* | 10,244 | 2,497 | ||||||
| salesforce.com, Inc.* | 19,977 | 5,987 | ||||||
| ServiceNow, Inc.* | 6,427 | 4,485 | ||||||
| Splunk, Inc.* | 4,915 | 810 | ||||||
| Total | 44,771 | |||||||
| Specialty Retail 3.58% | ||||||||
| Burlington Stores, Inc.* | 9,928 | 2,743 | ||||||
| Five Below, Inc.* | 3,975 | 784 | ||||||
| Home Depot, Inc. (The) | 14,790 | 5,498 | ||||||
| Total | 9,025 | |||||||
| Technology Hardware, Storage & Peripherals 4.81% | ||||||||
| Apple, Inc. | 80,906 | 12,120 | ||||||
| Textiles, Apparel & Luxury Goods 1.94% | ||||||||
| NIKE, Inc. Class B | 29,152 | 4,877 | ||||||
| Total Common Stocks (cost $213,876,403) | 247,981 | |||||||
| See Notes to Financial Statements. | 91 |
Schedule of Investments (concluded)
DURABLE GROWTH FUND October 31, 2021
| Investments | Principal Amount (000) | Fair Value (000) | ||||||
| SHORT-TERM INVESTMENTS 1.53% | ||||||||
| Repurchase Agreements 1.53% | ||||||||
| Repurchase Agreement dated 10/29/2021, 0.00% due 11/1/2021 with Fixed Income Clearing Corp. collateralized by $4,133,600 of U.S. Treasury Note at 0.50% due 10/31/2027; value: $3,944,409; proceeds: $3,866,976 (cost $3,866,976) | $3,867 | $ | 3,867 | |||||
| Total Investments in Securities 100.01% (cost $217,743,379) | 251,848 | |||||||
| Other Assets and Liabilities – Net (0.01)% | (29 | ) | ||||||
| Net Assets 100.00% | $ | 251,819 | ||||||
| ADR | American Depositary Receipt. | |
| EUR | Euro. | |
| * | Non-income producing security. | |
| (a) | Investment in non-U.S. dollar denominated securities. | |
| (b) | Foreign security traded in U.S. dollars. |
The following is a summary of the inputs used as of October 31, 2021 in valuing the Fund’s investments carried at fair value(1):
| Investment Type(2) | Level 1 (000) | Level 2 (000) | Level 3 (000) | Total (000) | ||||||||||||||
| Long-Term Investments | ||||||||||||||||||
| Common Stocks | ||||||||||||||||||
| Aerospace & Defense | $ | 3,934 | $ | 1,231 | $ | – | $ | 5,165 | ||||||||||
| Remaining Industries | 242,816 | – | – | 242,816 | ||||||||||||||
| Short-Term Investments | ||||||||||||||||||
| Repurchase Agreements | – | 3,867 | – | 3,867 | ||||||||||||||
| Total | $ | 246,750 | $ | 5,098 | $ | – | $ | 251,848 | ||||||||||
| (1) | Refer to Note 2(l) for a description of fair value measurements and the three-tier hierarchy of inputs. | |
| (2) | See Schedule of Investments for fair values in each industry and identification of foreign issuers and/or geography. The table above is presented by Investment Type. Industries are presented within an Investment Type should such Investment Type include securities classified as two or more levels within the three-tier fair value hierarchy. When applicable each Level 3 security is identified on the Schedule of Investments along with the valuation technique utilized. |
A reconciliation of Level 3 investments is presented when the Fund has a material amount of Level 3 investments at the beginning or end of the year in relation to the Fund’s net assets.
| 92 | See Notes to Financial Statements. |
Schedule of Investments
FOCUSED GROWTH FUND October 31, 2021
| Investments | Shares | Fair Value (000) | ||||||
| LONG-TERM INVESTMENTS 97.29% | ||||||||
| COMMON STOCKS 97.29% | ||||||||
| �� | ||||||||
| Aerospace & Defense 2.66% | ||||||||
| Axon Enterprise, Inc.* | 7,722 | $ | 1,390 | |||||
| Automobiles 9.80% | ||||||||
| Tesla, Inc.* | 4,603 | 5,128 | ||||||
| Banks 2.67% | ||||||||
| SVB Financial Group* | 1,945 | 1,395 | ||||||
| Biotechnology 0.90% | ||||||||
| Intellia Therapeutics, Inc.* | 3,534 | 470 | ||||||
| Capital Markets 2.47% | ||||||||
| Coinbase Global, Inc. Class A* | 4,055 | 1,295 | ||||||
| Commercial Services & Supplies 1.92% | ||||||||
| Copart, Inc.* | 6,460 | 1,003 | ||||||
| Electrical Equipment 3.12% | ||||||||
| Generac Holdings, Inc.* | 3,276 | 1,633 | ||||||
| Electronic Equipment, Instruments & Components 2.75% | ||||||||
| Trimble, Inc.* | 16,495 | 1,441 | ||||||
| Entertainment 6.66% | ||||||||
| Live Nation Entertainment, Inc.* | 9,955 | 1,007 | ||||||
| Netflix, Inc.* | 1,978 | 1,365 | ||||||
| Sea Ltd. ADR* | 3,235 | 1,112 | ||||||
| Total | 3,484 | |||||||
| Health Care Equipment & Supplies 4.93% | ||||||||
| Align Technology, Inc.* | 1,196 | 747 | ||||||
| DexCom, Inc.* | 1,704 | 1,062 | ||||||
| IDEXX Laboratories, Inc.* | 1,160 | 772 | ||||||
| Total | 2,581 | |||||||
| Hotels, Restaurants & Leisure 2.01% | ||||||||
| Airbnb, Inc. Class A* | 6,163 | 1,052 | ||||||
| Investments | Shares | Fair Value (000) | ||||||
| Information Technology Services 8.28% | ||||||||
| Affirm Holdings, Inc.* | 10,318 | $ | 1,677 | |||||
| EPAM Systems, Inc.* | 1,714 | 1,154 | ||||||
| Shopify, Inc. Class A (Canada)*(a) | 438 | 642 | ||||||
| Square, Inc. Class A* | 3,366 | 857 | ||||||
| Total | 4,330 | |||||||
| Interactive Media & Services 10.33% | ||||||||
| Alphabet, Inc. Class A* | 1,466 | 4,341 | ||||||
| Meta Platforms, Inc. Class A* | 3,282 | 1,062 | ||||||
| Total | 5,403 | |||||||
| Internet & Direct Marketing Retail 2.08% | ||||||||
| Amazon.com, Inc.* | 323 | 1,089 | ||||||
| Semiconductors & Semiconductor Equipment 11.46% | ||||||||
| Advanced Micro Devices, Inc.* 13,545 | 1,628 | |||||||
| Applied Materials, Inc. | 10,172 | 1,390 | ||||||
| NVIDIA Corp. | 11,646 | 2,978 | ||||||
| Total | 5,996 | |||||||
| Software 18.48% | ||||||||
| Crowdstrike Holdings, Inc. Class A* | 5,273 | 1,486 | ||||||
| Datadog, Inc. Class A* | 8,549 | 1,428 | ||||||
| DocuSign, Inc.* | 3,395 | 945 | ||||||
| HubSpot, Inc.* | 1,790 | 1,450 | ||||||
| Microsoft Corp. | 13,142 | 4,358 | ||||||
| Total | 9,667 | |||||||
| Technology Hardware, Storage & Peripherals 4.74% | ||||||||
| Apple, Inc. | 16,539 | 2,478 | ||||||
| Textiles, Apparel & Luxury Goods 2.03% | ||||||||
| Crocs, Inc.* | 6,588 | 1,064 | ||||||
| Total Common Stocks (cost $39,461,327) | 50,899 | |||||||
| See Notes to Financial Statements. | 93 |
Schedule of Investments (concluded)
FOCUSED GROWTH FUND October 31, 2021
| Investments | Principal Amount (000) | Fair Value (000) | ||||||
| SHORT-TERM INVESTMENTS 2.76% | ||||||||
| Repurchase Agreements 2.76% | ||||||||
| Repurchase Agreement dated 10/29/2021, 0.00% due 11/1/2021 with Fixed Income Clearing Corp. collateralized by $1,343,400 of U.S. Treasury Inflation Indexed Note at 0.125% due 10/15/2026; value: $1,473,103; proceeds: $1,444,140 (cost $1,444,140) | $1,444 | $ | 1,444 | |||||
| Total Investments in Securities 100.05% (cost $40,905,467) | 52,343 | |||||||
| Other Assets and Liabilities – Net (0.05)% | (24 | ) | ||||||
| Net Assets 100.00% | $ | 52,319 | ||||||
| ADR | American Depositary Receipt. | |
| * | Non-income producing security. | |
| (a) | Foreign security traded in U.S. dollars. |
The following is a summary of the inputs used as of October 31, 2021 in valuing the Fund’s investments carried at fair value(1):
| Investment Type(2) | Level 1 (000) | Level 2 (000) | Level 3 (000) | Total (000) | ||||||||||||||
| Long-Term Investments | ||||||||||||||||||
| Common Stocks | $ | 50,899 | $ | – | $ | – | $ | 50,899 | ||||||||||
| Short-Term Investments | ||||||||||||||||||
| Repurchase Agreements | – | 1,444 | – | 1,444 | ||||||||||||||
| Total | $ | 50,899 | $ | 1,444 | $ | – | $ | 52,343 | ||||||||||
| (1) | Refer to Note 2(l) for a description of fair value measurements and the three-tier hierarchy of inputs. | |
| (2) | See Schedule of Investments for fair values in each industry and identification of foreign issuers and/or geography. When applicable each Level 3 security is identified on the Schedule of Investments along with the valuation technique utilized. |
A reconciliation of Level 3 investments is presented when the Fund has a material amount of Level 3 investments at the beginning or end of the year in relation to the Fund’s net assets.
| 94 | See Notes to Financial Statements. |
Schedule of Investments
FOCUSED LARGE CAP VALUE FUND October 31, 2021
| Investments | Shares | Fair Value (000) | ||||||
| LONG-TERM INVESTMENTS 98.40% | ||||||||
| COMMON STOCKS 98.40% | ||||||||
| Aerospace & Defense 6.25% | ||||||||
| Lockheed Martin Corp. | 50,610 | $ | 16,819 | |||||
| Raytheon Technologies Corp. | 283,340 | 25,177 | ||||||
| Total | 41,996 | |||||||
| Automobiles 2.91% | ||||||||
| General Motors Co.* | 359,290 | 19,556 | ||||||
| Banks 9.77% | ||||||||
| CIT Group, Inc. | 462,994 | 22,932 | ||||||
| Citigroup, Inc. | 257,800 | 17,829 | ||||||
| Wells Fargo & Co. | 486,600 | 24,895 | ||||||
| Total | 65,656 | |||||||
| Biotechnology 3.12% | ||||||||
| AbbVie, Inc. | 183,120 | 20,998 | ||||||
| Building Products 2.86% | ||||||||
| Masco Corp. | 293,260 | 19,223 | ||||||
| Capital Markets 8.41% | ||||||||
| Ameriprise Financial, Inc. | 94,190 | 28,458 | ||||||
| KKR & Co., Inc. | 352,370 | 28,073 | ||||||
| Total | 56,531 | |||||||
| Chemicals 2.45% | ||||||||
| Dow, Inc. | 293,570 | 16,431 | ||||||
| Electric: Utilities 3.24% | ||||||||
| NRG Energy, Inc. | 546,400 | 21,796 | ||||||
| Energy Equipment & Services 1.60% | ||||||||
| Schlumberger NV | 333,790 | 10,768 | ||||||
| Food & Staples Retailing 2.64% | ||||||||
| BJ’s Wholesale Club Holdings, Inc.* | 304,000 | 17,766 | ||||||
| Investments | Shares | Fair Value (000) | ||||||
| Health Care Providers & Services 7.29% | ||||||||
| CVS Health Corp. | 232,790 | $ | 20,783 | |||||
| McKesson Corp. | 85,500 | 17,774 | ||||||
| Universal Health Services, Inc. Class B | 84,280 | 10,459 | ||||||
| Total | 49,016 | |||||||
| Hotels, Restaurants & Leisure 4.03% | ||||||||
| Caesars Entertainment, Inc.* | 247,430 | 27,084 | ||||||
| Household Products 2.41% | ||||||||
| Spectrum Brands Holdings, Inc. | 173,000 | 16,219 | ||||||
| Information Technology Services 4.80% | ||||||||
| Euronet Worldwide, Inc.* | 175,500 | 19,690 | ||||||
| Sabre Corp.* | 1,211,093 | 12,571 | ||||||
| Total | 32,261 | |||||||
| Insurance 6.52% | ||||||||
| Fidelity National Financial, Inc. | 472,650 | 22,645 | ||||||
| Hartford Financial Services Group, Inc. (The) | 290,810 | 21,209 | ||||||
| Total | 43,854 | |||||||
| Interactive Media & Services 3.86% | ||||||||
| Alphabet, Inc. Class A* | 8,760 | 25,938 | ||||||
| Machinery 4.03% | ||||||||
| Allison Transmission Holdings, Inc. | 307,310 | 10,252 | ||||||
| Parker-Hannifin Corp. | 56,760 | 16,834 | ||||||
| Total | 27,086 | |||||||
| Media 5.47% | ||||||||
| Comcast Corp. Class A | 314,990 | 16,200 | ||||||
| Nexstar Media Group, Inc. Class A | 137,270 | 20,581 | ||||||
| Total | 36,781 | |||||||
| See Notes to Financial Statements. | 95 |
Schedule of Investments (concluded)
FOCUSED LARGE CAP VALUE FUND October 31, 2021
| Investments | Shares | Fair Value (000) | ||||||
| Oil, Gas & Consumable Fuels 5.83% | ||||||||
| Marathon Petroleum Corp. | 173,520 | $ | 11,440 | |||||
| Pioneer Natural Resources Co. | 89,130 | 16,666 | ||||||
| Royal Dutch Shell plc Class A ADR | 241,300 | 11,080 | ||||||
| Total | 39,186 | |||||||
| Pharmaceuticals 2.50% | ||||||||
| Organon & Co. | 457,340 | 16,807 | ||||||
| Software 2.54% | ||||||||
| McAfee Corp. Class A | 799,210 | 17,079 | ||||||
| Specialty Retail 5.87% | ||||||||
| Lowe’s Cos., Inc. | 99,830 | 23,342 | ||||||
| TJX Cos., Inc. (The) | 245,850 | 16,101 | ||||||
| Total | 39,443 | |||||||
| Total Common Stocks (cost $548,187,241) | 661,475 | |||||||
| Investments | Principal Amount (000) | Fair Value (000) | ||||||
| SHORT-TERM INVESTMENTS 1.69% | ||||||||
| Repurchase Agreements 1.69% | ||||||||
| Repurchase Agreement dated 10/29/2021, 0.00% due 11/1/2021 with Fixed Income Clearing Corp. collateralized by $10,559,700 of U.S. Treasury Inflation Indexed Note at 0.125% due 10/15/2026; value: $11,579,220; proceeds: $11,352,114 (cost $11,352,114) | $11,352 | $ | 11,352 | |||||
| Total Investments in Securities 100.09% (cost $559,539,355) | 672,827 | |||||||
| Other Assets and Liabilities – Net (0.09)% | (623 | ) | ||||||
| Net Assets 100.00% | $ | 672,204 | ||||||
| ADR | American Depositary Receipt. | |
| * | Non-income producing security. |
The following is a summary of the inputs used as of October 31, 2021 in valuing the Fund’s investments carried at fair value(1):
| Investment Type(2) | Level 1 (000) | Level 2 (000) | Level 3 (000) | Total (000) | ||||||||||||||
| Long-Term Investments | ||||||||||||||||||
| Common Stocks | $ | 661,475 | $ | – | $ | – | $ | 661,475 | ||||||||||
| Short-Term Investments | ||||||||||||||||||
| Repurchase Agreements | – | 11,352 | – | 11,352 | ||||||||||||||
| Total | $ | 661,475 | $ | 11,352 | $ | – | $ | 672,827 | ||||||||||
| (1) | Refer to Note 2(l) for a description of fair value measurements and the three-tier hierarchy of inputs. | |
| (2) | See Schedule of Investments for fair values in each industry and identification of foreign issuers and/or geography. When applicable each Level 3 security is identified on the Schedule of Investments along with the valuation technique utilized. |
A reconciliation of Level 3 investments is presented when the Fund has a material amount of Level 3 investments at the beginning or end of the year in relation to the Fund’s net assets.
| 96 | See Notes to Financial Statements. |
Schedule of Investments
FOCUSED SMALL CAP VALUE FUND October 31, 2021
| Investments | Shares | Fair Value (000) | ||||||
| LONG-TERM INVESTMENTS 97.76% | ||||||||
| COMMON STOCKS 97.76% | ||||||||
| Airlines 1.65% | ||||||||
| Hawaiian Holdings, Inc.* | 188,459 | $ | 3,647 | |||||
| Auto Components 1.97% | ||||||||
| American Axle & Manufacturing Holdings, Inc.* | 480,759 | 4,365 | ||||||
| Banks 13.79% | ||||||||
| Bancorp, Inc. (The)* | 272,987 | 8,340 | ||||||
| Customers Bancorp, Inc.* | 119,892 | 6,389 | ||||||
| First BanCorp | 363,755 | 4,965 | ||||||
| Pacific Premier Bancorp, Inc. | 117,300 | 4,926 | ||||||
| Western Alliance Bancorp | 50,773 | 5,894 | ||||||
| Total | 30,514 | |||||||
| Building Products 2.56% | ||||||||
| Masonite International Corp.* | 47,144 | 5,658 | ||||||
| Capital Markets 7.47% | ||||||||
| CI Financial Corp.(a) CAD | 214,500 | 4,891 | ||||||
| Evercore, Inc. Class A | 32,520 | 4,938 | ||||||
| Victory Capital Holdings, Inc. Class A | 176,569 | 6,692 | ||||||
| Total | 16,521 | |||||||
| Commercial Services & Supplies 3.87% | ||||||||
| RR Donnelley & Sons Co.* | 657,803 | 4,210 | ||||||
| SP Plus Corp.* | 134,918 | 4,351 | ||||||
| Total | 8,561 | |||||||
| Construction Materials 2.43% | ||||||||
| Eagle Materials, Inc. | 36,241 | 5,377 | ||||||
| Consumer Finance 1.27% | ||||||||
| Atlanticus Holdings Corp.* | 36,320 | 2,814 | ||||||
| Containers & Packaging 2.29% | ||||||||
| Pactiv Evergreen, Inc. | 364,900 | 5,076 | ||||||
| Investments | Shares | Fair Value (000) | ||||||
| Electrical Equipment 2.18% | ||||||||
| GrafTech International Ltd. | 451,317 | $ | 4,829 | |||||
| Energy Equipment & Services 2.47% | ||||||||
| Valaris Ltd.* | 155,051 | 5,461 | ||||||
| Entertainment 2.25% | ||||||||
| Marcus Corp. (The)*(b) | 267,869 | 4,974 | ||||||
| Equity Real Estate Investment Trusts 4.32% | ||||||||
| Outfront Media, Inc. | 147,667 | 3,675 | ||||||
| Sunstone Hotel Investors, Inc.* | 476,072 | 5,875 | ||||||
| Total | 9,550 | |||||||
| Health Care Equipment & Supplies 1.24% | ||||||||
| NuVasive, Inc.* | 51,500 | 2,748 | ||||||
| Health Care Providers & Services 1.67% | ||||||||
| Tenet Healthcare Corp.* | 51,582 | 3,696 | ||||||
| Hotels, Restaurants & Leisure 1.97% | ||||||||
| Bally’s Corp.* | 95,102 | 4,357 | ||||||
| Household Products 1.91% | ||||||||
| Spectrum Brands Holdings, Inc. | 45,062 | 4,225 | ||||||
| Information Technology Services 4.55% | ||||||||
| Alliance Data Systems Corp. | 44,857 | 3,824 | ||||||
| International Money Express, Inc.* | 372,377 | 6,234 | ||||||
| Total | 10,058 | |||||||
| Insurance 4.64% | ||||||||
| American Equity Investment Life Holding Co. | 148,173 | 4,722 | ||||||
| Stewart Information Services Corp. | 77,925 | 5,546 | ||||||
| Total | 10,268 | |||||||
| Interactive Media & Services 2.01% | ||||||||
| Cars.com, Inc.* | 341,557 | 4,447 | ||||||
| Machinery 2.38% | ||||||||
| Columbus McKinnon Corp. | 111,466 | 5,269 | ||||||
| See Notes to Financial Statements. | 97 |
Schedule of Investments (continued)
FOCUSED SMALL CAP VALUE FUND October 31, 2021
| Investments | Shares | Fair Value (000) | ||||||
| Metals & Mining 1.89% | ||||||||
| Lundin Mining Corp.(a) CAD | 481,300 | $ | 4,188 | |||||
| Oil, Gas & Consumable Fuels 8.26% | ||||||||
| Chesapeake Energy Corp. | 82,579 | 5,264 | ||||||
| International Seaways, Inc. | 189,201 | 3,320 | ||||||
| MEG Energy Corp.*(a) CAD | 628,100 | 5,628 | ||||||
| Par Pacific Holdings, Inc.* | 261,908 | 4,049 | ||||||
| Total | 18,261 | |||||||
| Pharmaceuticals 2.05% | ||||||||
| Organon & Co. | 123,417 | 4,536 | ||||||
| Professional Services 2.13% | ||||||||
| TrueBlue, Inc.* | 169,100 | 4,709 | ||||||
| Real Estate Management & Development 1.48% | ||||||||
| Realogy Holdings Corp.* | 188,575 | 3,266 | ||||||
| Semiconductors & Semiconductor Equipment 2.40% | ||||||||
| Silicon Motion Technology Corp. ADR | 74,302 | 5,306 | ||||||
| Specialty Retail 3.40% | ||||||||
| JOANN, Inc.(b) | 320,930 | 3,280 | ||||||
| Sally Beauty Holdings, Inc.* | 277,869 | 4,240 | ||||||
| Total | 7,520 | |||||||
| Technology Hardware, Storage & Peripherals 1.46% | ||||||||
| Diebold Nixdorf, Inc.* | 357,984 | 3,222 | ||||||
| Thrifts & Mortgage Finance 3.83% | ||||||||
| Axos Financial, Inc.* | 99,416 | 5,269 | ||||||
| Flagstar Bancorp, Inc. | 67,800 | 3,199 | ||||||
| Total | 8,468 | |||||||
| Tobacco 1.97% | ||||||||
| Turning Point Brands, Inc. | 114,171 | 4,358 | ||||||
| Total Common Stocks (cost $183,502,305) | 216,249 | |||||||
| Investments | Principal Amount (000) | Fair Value (000) | ||||||
| SHORT-TERM INVESTMENTS 2.54% | ||||||||
| Repurchase Agreements 1.52% | ||||||||
| Repurchase Agreement dated 10/29/2021, 0.00% due 11/1/2021 with Fixed Income Clearing Corp. collateralized by $3,613,800 of U.S. Treasury Note at 0.375% due 09/30/2027; value: $3,420,920; proceeds: $3,353,776 (cost $3,353,776) | $3,354 | $ | 3,354 | |||||
| Shares | ||||||||
| Money Market Funds 0.92% | ||||||||
| Fidelity Government Portfolio(c) (cost $2,030,769) | 2,030,769 | 2,031 | ||||||
| Time Deposits 0.10% | ||||||||
| CitiBank N.A.(c) (cost $225,641) | 225,641 | 226 | ||||||
| Total Short-Term Investments (cost $5,610,186) | 5,611 | |||||||
| Total Investments in Securities 100.30% (cost $189,112,491) | 221,860 | |||||||
| Other Assets and Liabilities – Net (0.30)% | (657 | ) | ||||||
| Net Assets 100.00% | $ | 221,203 | ||||||
| ADR | American Depositary Receipt. | |
| CAD | Canadian Dollar. | |
| * | Non-income producing security. | |
| (a) | Investment in non-U.S. dollar denominated securities. | |
| (b) | All or a portion of this security is temporarily on loan to unaffiliated broker/dealers. | |
| (c) | Security was purchased with the cash collateral from loaned securities. |
| 98 | See Notes to Financial Statements. |
Schedule of Investments (concluded)
FOCUSED SMALL CAP VALUE FUND October 31, 2021
The following is a summary of the inputs used as of October 31, 2021 in valuing the Fund’s investments carried at fair value(1):
| Investment Type(2) | Level 1 (000) | Level 2 (000) | Level 3 (000) | Total (000) | ||||||||||||
| Long-Term Investments | ||||||||||||||||
| Common Stocks | $ | 216,249 | $ | – | $ | – | $ | 216,249 | ||||||||
| Short-Term Investments | ||||||||||||||||
| Repurchase Agreements | – | 3,354 | – | 3,354 | ||||||||||||
| Money Market Funds | 2,031 | – | – | 2,031 | ||||||||||||
| Time Deposits | – | 226 | – | 226 | ||||||||||||
| Total | $ | 218,280 | $ | 3,580 | $ | – | $ | 221,860 | ||||||||
| (1) | Refer to Note 2(l) for a description of fair value measurements and the three-tier hierarchy of inputs. | |
| (2) | See Schedule of Investments for fair values in each industry and identification of foreign issuers and/or geography. When applicable each Level 3 security is identified on the Schedule of Investments along with the valuation technique utilized. |
A reconciliation of Level 3 investments is presented when the Fund has a material amount of Level 3 investments at the beginning or end of the year in relation to the Fund’s net assets.
| See Notes to Financial Statements. | 99 |
Schedule of Investments
FUNDAMENTAL EQUITY FUND October 31, 2021
| Investments | Shares | Fair Value (000) | ||||||
| LONG-TERM INVESTMENTS 99.56% | ||||||||
| COMMON STOCKS 99.56% | ||||||||
| Aerospace & Defense 4.33% | ||||||||
| Lockheed Martin Corp. | 86,380 | $ | 28,706 | |||||
| Raytheon Technologies Corp. | 478,410 | 42,512 | ||||||
| Teledyne Technologies, Inc.* | 34,300 | 15,408 | ||||||
| Total | 86,626 | |||||||
| Automobiles 2.00% | ||||||||
| General Motors Co.* | 736,340 | 40,079 | ||||||
| Banks 9.38% | ||||||||
| CIT Group, Inc. | 672,960 | 33,332 | ||||||
| Citigroup, Inc. | 525,190 | 36,322 | ||||||
| East West Bancorp, Inc. | 436,970 | 34,730 | ||||||
| Wells Fargo & Co. | 825,270 | 42,221 | ||||||
| Western Alliance Bancorp | 352,980 | 40,977 | ||||||
| Total | 187,582 | |||||||
| Beverages 1.26% | ||||||||
| PepsiCo, Inc. | 156,350 | 25,266 | ||||||
| Biotechnology 1.42% | ||||||||
| AbbVie, Inc. | 247,700 | 28,404 | ||||||
| Building Products 3.08% | ||||||||
| Carlisle Cos., Inc. | 138,550 | 30,885 | ||||||
| Masco Corp. | 467,960 | 30,675 | ||||||
| Total | 61,560 | |||||||
| Capital Markets 5.89% | ||||||||
| Ameriprise Financial, Inc. | 130,320 | 39,374 | ||||||
| Blackstone Group, Inc. (The) | 286,350 | 39,636 | ||||||
| Morgan Stanley | 377,210 | 38,770 | ||||||
| Total | 117,780 | |||||||
| Chemicals 3.05% | ||||||||
| PPG Industries, Inc. | 181,210 | 29,097 | ||||||
| Valvoline, Inc. | 938,590 | 31,874 | ||||||
| Total | 60,971 | |||||||
| Investments | Shares | Fair Value (000) | ||||||
| Communications Equipment 1.19% | ||||||||
| Cisco Systems, Inc. | 423,930 | $ | 23,727 | |||||
| Construction & Engineering 1.22% | ||||||||
| EMCOR Group, Inc. | 201,460 | 24,475 | ||||||
| Consumer Finance 1.69% | ||||||||
| American Express Co. | 194,310 | 33,767 | ||||||
| Containers & Packaging 0.56% | ||||||||
| Avery Dennison Corp. | 51,823 | 11,283 | ||||||
| Diversified Financial Services 1.60% | ||||||||
| Equitable Holdings, Inc. | 955,240 | 32,000 | ||||||
| Electric: Utilities 2.48% | ||||||||
| NextEra Energy, Inc. | 290,120 | 24,756 | ||||||
| NRG Energy, Inc. | 624,490 | 24,911 | ||||||
| Total | 49,667 | |||||||
| Equity Real Estate Investment Trusts 3.20% | ||||||||
| Alexandria Real Estate Equities, Inc. | 98,020 | 20,010 | ||||||
| Host Hotels & Resorts, Inc.* | 1,212,270 | 20,403 | ||||||
| Prologis, Inc. | 162,420 | 23,544 | ||||||
| Total | 63,957 | |||||||
| Food & Staples Retailing 1.74% | ||||||||
| BJ’s Wholesale Club Holdings, Inc.* | 594,565 | 34,746 | ||||||
| Health Care Equipment & Supplies 2.89% | ||||||||
| Medtronic plc (Ireland)(a) | 301,850 | 36,180 | ||||||
| Zimmer Biomet Holdings, Inc. | 150,720 | 21,571 | ||||||
| Total | 57,751 | |||||||
| Health Care Providers & Services 4.76% | ||||||||
| McKesson Corp. | 94,450 | 19,634 | ||||||
| UnitedHealth Group, Inc. | 164,100 | 75,563 | ||||||
| Total | 95,197 | |||||||
| Hotels, Restaurants & Leisure 1.88% | ||||||||
| Caesars Entertainment, Inc.* | 343,670 | 37,618 | ||||||
| 100 | See Notes to Financial Statements. |
Schedule of Investments (continued)
FUNDAMENTAL EQUITY FUND October 31, 2021
| Investments | Shares | Fair Value (000) | ||||||
| Household Products 2.94% | ||||||||
| Procter & Gamble Co. (The) | 411,950 | $ | 58,905 | |||||
| Insurance 4.80% | ||||||||
| American International Group, Inc. | 684,080 | 40,422 | ||||||
| Arch Capital Group Ltd.* | 624,040 | 26,098 | ||||||
| Fidelity National Financial, Inc. | 616,720 | 29,547 | ||||||
| Total | 96,067 | |||||||
| Interactive Media & Services 3.28% | ||||||||
| Alphabet, Inc. Class A* | 22,180 | 65,673 | ||||||
| Life Sciences Tools & Services 1.57% | ||||||||
| Thermo Fisher Scientific, Inc. | 49,492 | 31,332 | ||||||
| Machinery 0.36% | ||||||||
| Allison Transmission Holdings, Inc. | 214,039 | 7,140 | ||||||
| Media 2.06% | ||||||||
| Comcast Corp. Class A | 800,600 | 41,175 | ||||||
| Metals & Mining 0.84% | ||||||||
| Reliance Steel & Aluminum Co. | 114,810 | 16,781 | ||||||
| Multi-Line Retail 1.28% | ||||||||
| Target Corp. | 98,700 | 25,624 | ||||||
| Multi-Utilities 0.61% | ||||||||
| CMS Energy Corp. | 203,937 | 12,308 | ||||||
| Oil, Gas & Consumable Fuels 6.52% | ||||||||
| Chesapeake Energy Corp. | 466,650 | 29,744 | ||||||
| Marathon Petroleum Corp. | 379,820 | 25,042 | ||||||
| Pioneer Natural Resources Co. | 196,400 | 36,723 | ||||||
| Royal Dutch Shell plc Class A ADR | 847,810 | 38,931 | ||||||
| Total | 130,440 | |||||||
| Personal Products 0.72% | ||||||||
| Unilever plc(b) GBP | 268,250 | 14,363 | ||||||
| Investments | Shares | Fair Value (000) | ||||||
| Pharmaceuticals 5.42% | ||||||||
| Eli Lilly & Co. | 125,272 | $ | 31,915 | |||||
| Organon & Co. | 949,500 | 34,894 | ||||||
| Pfizer, Inc. | 952,750 | 41,673 | ||||||
| Total | 108,482 | |||||||
| Road & Rail 1.50% | ||||||||
| Norfolk Southern Corp. | 102,630 | 30,076 | ||||||
| Semiconductors & Semiconductor Equipment 4.61% | ||||||||
| KLA Corp. | 56,450 | 21,042 | ||||||
| Micron Technology, Inc. | 207,580 | 14,344 | ||||||
| Taiwan Semiconductor Manufacturing Co. Ltd. ADR | 186,710 | 21,229 | ||||||
| Texas Instruments, Inc. | 189,630 | 35,552 | ||||||
| Total | 92,167 | |||||||
| Software 2.05% | ||||||||
| Microsoft Corp. | 123,680 | 41,015 | ||||||
| Specialty Retail 1.77% | ||||||||
| Lowe’s Cos., Inc. | 151,450 | 35,412 | ||||||
| Technology Hardware, Storage & Peripherals 3.14% | ||||||||
| Apple, Inc. | 201,740 | 30,221 | ||||||
| NetApp, Inc. | 364,190 | 32,522 | ||||||
| Total | 62,743 | |||||||
| Trading Companies & Distributors 1.64% | ||||||||
| AerCap Holdings NV (Ireland)*(a) | 556,420 | 32,851 | ||||||
| Wireless Telecommunication Services 0.83% | ||||||||
| T-Mobile US, Inc.* | 144,390 | 16,609 | ||||||
| Total Common Stocks (cost $1,505,744,109) | 1,991,619 | |||||||
| See Notes to Financial Statements. | 101 |
Schedule of Investments (concluded)
FUNDAMENTAL EQUITY FUND October 31, 2021
| Investments | Principal Amount (000) | Fair Value (000) | ||||||
| SHORT-TERM INVESTMENTS 0.47% | ||||||||
| Repurchase Agreements 0.47% | ||||||||
| Repurchase Agreement dated 10/29/2021, 0.00% due 11/1/2021 with Fixed Income Clearing Corp. collateralized by $10,093,000 of U.S. Treasury Note at 0.375% due 09/30/2027; value: $9,554,304; proceeds: $9,366,953 (cost $9,366,953) | $9,367 | $ | 9,367 | |||||
| Total Investments in Securities 100.03% (cost $1,515,111,062) | 2,000,986 | |||||||
| Other Assets and Liabilities – Net (0.03)% | (619 | ) | ||||||
| Net Assets 100.00% | $ | 2,000,367 | ||||||
| ADR | American Depositary Receipt. | |
| GBP | British pound. | |
| * | Non-income producing security. | |
| (a) | Foreign security traded in U.S. dollars. | |
| (b) | Investment in non-U.S. dollar denominated securities. |
The following is a summary of the inputs used as of October 31, 2021 in valuing the Fund’s investments carried at fair value(1):
| Investment Type(2) | Level 1 (000) | Level 2 (000) | Level 3 (000) | Total (000) | ||||||||||||
| Long-Term Investments | ||||||||||||||||
| Common Stocks | ||||||||||||||||
| Personal Products | $ | – | $ | 14,363 | $ | – | $ | 14,363 | ||||||||
| Remaining Industries | 1,977,256 | – | – | 1,977,256 | ||||||||||||
| Short-Term Investments | ||||||||||||||||
| Repurchase Agreements | – | 9,367 | – | 9,367 | ||||||||||||
| Total | $ | 1,977,256 | $ | 23,730 | $ | – | $ | 2,000,986 | ||||||||
| (1) | Refer to Note 2(l) for a description of fair value measurements and the three-tier hierarchy of inputs. | |
| (2) | See Schedule of Investments for fair values in each industry and identification of foreign issuers and/or geography. When applicable each Level 3 security is identified on the Schedule of Investments along with the valuation technique utilized. |
A reconciliation of Level 3 investments is presented when the Fund has a material amount of Level 3 investments at the beginning or end of the year in relation to the Fund’s net assets.
| 102 | See Notes to Financial Statements. |
Schedule of Investments
GLOBAL EQUITY FUND October 31, 2021
| Investments | Shares | U.S. $ Fair Value (000) | ||||||
| LONG-TERM INVESTMENTS 97.43% | ||||||||
| COMMON STOCKS 97.43% | ||||||||
| Argentina 0.22% | ||||||||
| Internet & Direct Marketing Retail | ||||||||
| MercadoLibre, Inc.* | 17 | $ | 25 | |||||
| Austria 0.86% | ||||||||
| Banks | ||||||||
| BAWAG Group AG†* | 1,596 | 100 | ||||||
| Canada 2.46% | ||||||||
| Aerospace & Defense 0.72% | ||||||||
| CAE, Inc.* | 2,749 | 83 | ||||||
| Banks 1.74% | ||||||||
| Royal Bank of Canada | 1,940 | 202 | ||||||
| Total Canada | 285 | |||||||
| China 1.74% | ||||||||
| Construction Materials 0.62% | ||||||||
| China Resources Cement Holdings Ltd. | 85,051 | 72 | ||||||
| Interactive Media & Services 0.50% | ||||||||
| Tencent Holdings Ltd. | 950 | 58 | ||||||
| Internet & Direct Marketing Retail 0.62% | ||||||||
| Alibaba Group Holding Ltd.* | 3,477 | 71 | ||||||
| Total China | 201 | |||||||
| Denmark 1.27% | ||||||||
| Biotechnology | ||||||||
| Genmab A/S* | 328 | 147 | ||||||
| France 6.30% | ||||||||
| Beverages 0.92% | ||||||||
| Pernod Ricard SA | 466 | 107 | ||||||
| Construction & Engineering 0.31% | ||||||||
| Vinci SA | 339 | 36 | ||||||
| Investments | Shares | U.S. $ Fair Value (000) | ||||||
| France (continued) | ||||||||
| Insurance 1.40% | ||||||||
| AXA SA | 5,569 | $ | 162 | |||||
| Life Sciences Tools & Services 1.05% | ||||||||
| Sartorius Stedim Biotech | 219 | 121 | ||||||
| Media 0.38% | ||||||||
| Criteo SA ADR* | 1,319 | 44 | ||||||
| Software 0.48% | ||||||||
| Esker SA | 165 | 56 | ||||||
| Textiles, Apparel & Luxury Goods 1.76% | ||||||||
| LVMH Moet Hennessy Louis Vuitton SE | 259 | 203 | ||||||
| Total France | 729 | |||||||
| Germany 0.80% | ||||||||
| Semiconductors & Semiconductor Equipment | ||||||||
| Infineon Technologies AG | 1,984 | 93 | ||||||
| Hong Kong 0.68% | ||||||||
| Real Estate Management & Development | ||||||||
| Kerry Properties Ltd. | 27,773 | 79 | ||||||
| India 2.08% | ||||||||
| Banks 0.85% | ||||||||
| ICICI Bank Ltd. ADR | 4,638 | 98 | ||||||
| Information Technology Services 1.23% | ||||||||
| Infosys Ltd. ADR | 6,354 | 142 | ||||||
| Total India | 240 | |||||||
| Japan 5.85% | ||||||||
| Auto Components 0.60% | ||||||||
| Denso Corp. | 960 | 70 | ||||||
| Electrical Equipment 0.73% | ||||||||
| Fuji Electric Co. Ltd. | 1,728 | 84 | ||||||
| See Notes to Financial Statements. | 103 |
Schedule of Investments (continued)
GLOBAL EQUITY FUND October 31, 2021
| Investments | Shares | U.S. $ Fair Value (000) | ||||||
| Japan (continued) | ||||||||
| Electronic Equipment, Instruments & Components 1.41% | ||||||||
| Keyence Corp. | 270 | $ | 163 | |||||
| Household Durables 1.22% | ||||||||
| Sony Group Corp. | 1,218 | 141 | ||||||
| Machinery 1.42% | ||||||||
| Ebara Corp. | 1,326 | 72 | ||||||
| Fujitec Co. Ltd. | 4,022 | 92 | ||||||
| 164 | ||||||||
| Personal Products 0.47% | ||||||||
| Shiseido Co. Ltd. | 804 | 54 | ||||||
| Total Japan | 676 | |||||||
| Mexico 0.90% | ||||||||
| Banks | ||||||||
| Grupo Financiero Banorte SAB de CV | 16,451 | 104 | ||||||
| Netherlands 5.88% | ||||||||
| Information Technology Services 1.51% | ||||||||
| Adyen NV†* | 58 | 175 | ||||||
| Insurance 1.37% | ||||||||
| NN Group NV | 2,985 | 159 | ||||||
| Oil, Gas & Consumable Fuels 1.56% | ||||||||
| Royal Dutch Shell plc A Shares | 7,856 | 180 | ||||||
| Semiconductors & Semiconductor Equipment 1.44% | ||||||||
| ASML Holding NV | 204 | 166 | ||||||
| Total Netherlands | �� | 680 | ||||||
| South Africa 0.87% | ||||||||
| Metals & Mining | ||||||||
| Anglo American plc | 2,652 | 101 | ||||||
| Investments | Shares | U.S. $ Fair Value (000) | ||||||
| South Korea 2.25% | ||||||||
| Interactive Media & Services 0.86% | ||||||||
| NAVER Corp. | 286 | $ | 99 | |||||
| Technology Hardware, Storage & Peripherals 1.39% | ||||||||
| Samsung Electronics Co. Ltd. | 2,689 | 161 | ||||||
| Total South Korea | 260 | |||||||
| Spain 1.24% | ||||||||
| Electric: Utilities | ||||||||
| Iberdrola SA | 12,077 | 143 | ||||||
| Sweden 0.69% | ||||||||
| Electronic Equipment, Instruments & Components | ||||||||
| Hexagon AB B Shares | 4,984 | 80 | ||||||
| Switzerland 2.96% | ||||||||
| Capital Markets 1.90% | ||||||||
| UBS Group AG | 12,037 | 219 | ||||||
| Life Sciences Tools & Services 1.06% | ||||||||
| Lonza Group AG | 150 | 123 | ||||||
| Total Switzerland | 342 | |||||||
| Taiwan 1.24% | ||||||||
| Semiconductors & Semiconductor Equipment | ||||||||
| Taiwan Semiconductor Manufacturing Co. Ltd. | 6,742 | 143 | ||||||
| United Kingdom 2.65% | ||||||||
| Equity Real Estate Investment Trusts 0.80% | ||||||||
| UNITE Group plc (The) | 6,229 | 93 | ||||||
| Insurance 0.42% | ||||||||
| Prudential plc | 2,390 | 48 | ||||||
| Multi-Line Retail 0.87% | ||||||||
| Next plc | 925 | 101 | ||||||
| Pharmaceuticals 0.56% | ||||||||
| AstraZeneca plc | 518 | 65 | ||||||
| Total United Kingdom | 307 | |||||||
| 104 | See Notes to Financial Statements. |
Schedule of Investments (continued)
GLOBAL EQUITY FUND October 31, 2021
| Investments | Shares | U.S. $ Fair Value (000) | ||||||
| United States 56.49% | ||||||||
| Aerospace & Defense 0.73% | ||||||||
| TransDigm Group, Inc.* | 135 | $ | 84 | |||||
| Automobiles 0.43% | ||||||||
| General Motors Co.* | 924 | 50 | ||||||
| Banks 1.35% | ||||||||
| Western Alliance Bancorp | 1,343 | 156 | ||||||
| Beverages 1.07% | ||||||||
| Coca-Cola Co. (The) | 2,196 | 124 | ||||||
| Biotechnology 1.23% | ||||||||
| Natera, Inc.* | 653 | 75 | ||||||
| Vertex Pharmaceuticals, Inc.* | 363 | 67 | ||||||
| 142 | ||||||||
| Building Products 0.90% | ||||||||
| Carlisle Cos., Inc. | 466 | 104 | ||||||
| Capital Markets 4.22% | ||||||||
| Ameriprise Financial, Inc. | 454 | 137 | ||||||
| Cboe Global Markets, Inc. | 843 | 112 | ||||||
| KKR & Co., Inc. | 1,283 | 102 | ||||||
| Morgan Stanley | 1,333 | 137 | ||||||
| 488 | ||||||||
| Chemicals 1.89% | ||||||||
| Axalta Coating Systems Ltd.* | 910 | 28 | ||||||
| Valvoline, Inc. | 5,608 | 191 | ||||||
| 219 | ||||||||
| Consumer Finance 1.18% | ||||||||
| Ally Financial, Inc. | 1,007 | 48 | ||||||
| American Express Co. | 509 | 89 | ||||||
| 137 | ||||||||
| Diversified Financial Services 0.46% | ||||||||
| Equitable Holdings, Inc. | 1,594 | 53 | ||||||
| Electrical Equipment 0.94% | ||||||||
| AMETEK, Inc. | 824 | 109 | ||||||
| Investments | Shares | U.S. $ Fair Value (000) | ||||||
| United States (continued) | ||||||||
| Entertainment 0.49% | ||||||||
| Live Nation Entertainment, Inc.* | 444 | $ | 45 | |||||
| Roku, Inc.* | 41 | 12 | ||||||
| 57 | ||||||||
| Equity Real Estate Investment Trusts 1.45% | ||||||||
| Alexandria Real Estate Equities, Inc. | 488 | 99 | ||||||
| Prologis, Inc. | 475 | 69 | ||||||
| 168 | ||||||||
| Food & Staples Retailing 2.49% | ||||||||
| Sysco Corp. | 688 | 53 | ||||||
| Walmart, Inc. | 1,573 | 235 | ||||||
| 288 | ||||||||
| Health Care Equipment & Supplies 2.07% | ||||||||
| Align Technology, Inc.* | 177 | 111 | ||||||
| DexCom, Inc.* | 137 | 85 | ||||||
| Zimmer Biomet Holdings, Inc. | 302 | 43 | ||||||
| 239 | ||||||||
| Health Care Providers & Services 2.37% | ||||||||
| UnitedHealth Group, Inc. | 594 | 274 | ||||||
| Hotels, Restaurants & Leisure 0.83% | ||||||||
| Caesars Entertainment, Inc.* | 521 | 57 | ||||||
| Starbucks Corp. | 372 | 39 | ||||||
| 96 | ||||||||
| Information Technology Services 1.02% | ||||||||
| Mastercard, Inc. Class A | 351 | �� | 118 | |||||
| Interactive Media & Services 6.40% | ||||||||
| Alphabet, Inc. Class A* | 184 | 545 | ||||||
| Meta Platforms, Inc. Class A* | 602 | 195 | ||||||
| 740 | ||||||||
| Internet & Direct Marketing Retail 2.95% | ||||||||
| Amazon.com, Inc.* | 101 | 341 | ||||||
| See Notes to Financial Statements. | 105 |
Schedule of Investments (continued)
GLOBAL EQUITY FUND October 31, 2021
| Investments | Shares | U.S. $ Fair Value (000) | ||||||
| United States (continued) | ||||||||
| Machinery 1.74% | ||||||||
| Crane Co. | 1,244 | $ | 129 | |||||
| Fortive Corp. | 952 | 72 | ||||||
| 201 | ||||||||
| Oil, Gas & Consumable Fuels 2.10% | ||||||||
| Marathon Petroleum Corp. | 1,723 | 114 | ||||||
| Pioneer Natural Resources Co. | 691 | 129 | ||||||
| 243 | ||||||||
| Personal Products 1.46% | ||||||||
| Estee Lauder Cos., Inc. (The) Class A | 522 | 169 | ||||||
| Pharmaceuticals 1.24% | ||||||||
| Eli Lilly & Co. | 562 | 143 | ||||||
| Road & Rail 1.33% | ||||||||
| Norfolk Southern Corp. | 527 | 154 | ||||||
| Semiconductors & Semiconductor Equipment 3.50% | ||||||||
| Applied Materials, Inc. | 812 | 111 | ||||||
| NVIDIA Corp. | 1,151 | 294 | ||||||
| 405 | ||||||||
| Software 7.43% | ||||||||
| Cadence Design Systems, Inc.* | 200 | 35 | ||||||
| Microsoft Corp. | 1,982 | 657 | ||||||
| salesforce.com, Inc.* | 557 | 167 | ||||||
| 859 | ||||||||
| Specialty Retail 0.34% | ||||||||
| Burlington Stores, Inc.* | 146 | 40 | ||||||
| Technology Hardware, Storage & Peripherals 1.74% | ||||||||
| Apple, Inc. | 1,341 | 201 | ||||||
| Textiles, Apparel & Luxury Goods 1.14% | ||||||||
| NIKE, Inc. Class B | 787 | 132 | ||||||
| Total United States | 6,534 | |||||||
| Total Common Stocks (cost $9,380,057) | 11,269 | |||||||
| Investments | Principal Amount (000) | U.S. $ Fair Value (000) | ||||||
| SHORT-TERM INVESTMENTS 2.78% | ||||||||
| Repurchase Agreements 2.78% | ||||||||
| Repurchase Agreement dated 10/29/2021, 0.00% due 11/1/2021 with Fixed Income Clearing Corp. collateralized by $298,200 of U.S. Treasury Inflation Index Note at 0.125% due 10/15/2026; value: $326,991; proceeds: $320,545 (cost $320,545) | $321 | $ | 321 | |||||
| Total Investments in Securities100.21% (cost $9,700,602) | 11,590 | |||||||
| Other Assets and Liabilities – Net (0.21)% | (24 | ) | ||||||
| Net Assets 100.00% | $ | 11,566 | ||||||
| ADR | American Depositary Receipt. | |
| * | Non-income producing security. | |
| † | Security was purchased pursuant to Rule 144A under the Securities Act of 1933 and, unless registered under such Act or exempted from registration, may only be resold to qualified institutional buyers. At October 31, 2021, the total value of Rule 144A securities was $275, which represents 2.38% of net assets. |
| 106 | See Notes to Financial Statements. |
Schedule of Investments (concluded)
GLOBAL EQUITY FUND October 31, 2021
The following is a summary of the inputs used as of October 31, 2021 in valuing the Fund’s investments carried at fair value(1):
| Investment Type(2) | Level 1 (000) | Level 2 (000) | Level 3 (000) | Total (000) | ||||||||||||
| Long-Term Investments | ||||||||||||||||
| Common Stocks | ||||||||||||||||
| Austria | $ | – | $ | 100 | $ | – | $ | 100 | ||||||||
| China | – | 201 | – | 201 | ||||||||||||
| Denmark | – | 147 | – | 147 | ||||||||||||
| France | 100 | 629 | – | 729 | ||||||||||||
| Germany | – | 93 | – | 93 | ||||||||||||
| Hong Kong | – | 79 | – | 79 | ||||||||||||
| Japan | – | 676 | – | 676 | ||||||||||||
| Netherlands | – | 680 | – | 680 | ||||||||||||
| South Africa | – | 101 | – | 101 | ||||||||||||
| South Korea | – | 260 | – | 260 | ||||||||||||
| Sweden | – | 80 | – | 80 | ||||||||||||
| Switzerland | – | 342 | – | 342 | ||||||||||||
| Taiwan | – | 143 | – | 143 | ||||||||||||
| United Kingdom | – | 307 | – | 307 | ||||||||||||
| Remaining Countries | 7,331 | – | – | 7,331 | ||||||||||||
| Short-Term Investments | ||||||||||||||||
| Repurchase Agreements | – | 321 | – | 321 | ||||||||||||
| Total | $ | 7,431 | $ | 4,159 | $ | – | $ | 11,590 | ||||||||
| (1) | Refer to Note 2(l) for a description of fair value measurements and the three-tier hierarchy of inputs. | |
| (2) | See Schedule of Investments for fair values in each industry and identification of foreign issuers and/or geography. The table above is presented by Investment Type. Industries are presented within an Investment Type should such Investment Type include securities classified as two or more levels within the three-tier fair value hierarchy. When applicable each Level 3 security is identified on the Schedule of Investments along with the valuation technique utilized. |
A reconciliation of Level 3 investments is presented when the Fund has a material amount of Level 3 investments at the beginning or end of the year in relation to the Fund’s net assets.
| See Notes to Financial Statements. | 107 |
Schedule of Investments
GROWTH LEADERS FUND October 31, 2021
| Investments | Shares | Fair Value (000) | ||||||
| LONG-TERM INVESTMENTS 98.87% | ||||||||
| COMMON STOCKS 98.87% | ||||||||
| Aerospace & Defense 1.25% | ||||||||
| Axon Enterprise, Inc.* | 722,784 | $ | 130,072 | |||||
| Automobiles 7.27% | ||||||||
| Tesla, Inc.* | 679,390 | 756,840 | ||||||
| Banks 2.89% | ||||||||
| First Republic Bank | 466,904 | 101,005 | ||||||
| SVB Financial Group* | 278,972 | 200,135 | ||||||
| Total | 301,140 | |||||||
| Biotechnology 0.84% | ||||||||
| Intellia Therapeutics, Inc.* | 365,103 | 48,551 | ||||||
| Sarepta Therapeutics, Inc.* | 496,293 | 39,272 | ||||||
| Total | 87,823 | |||||||
| Capital Markets 4.17% | ||||||||
| Blackstone Group, Inc. (The) | 662,563 | 91,712 | ||||||
| Coinbase Global, Inc. Class A* | 664,485 | 212,250 | ||||||
| MSCI, Inc. | 195,745 | 130,147 | ||||||
| Total | 434,109 | |||||||
| Chemicals 0.77% | ||||||||
| Albemarle Corp. | 321,476 | 80,520 | ||||||
| Commercial Services & Supplies 1.03% | ||||||||
| Copart, Inc.* | 692,356 | 107,516 | ||||||
| Communications Equipment 0.86% | ||||||||
| Arista Networks, Inc.* | 217,867 | 89,258 | ||||||
| Electrical Equipment 1.61% | ||||||||
| Generac Holdings, Inc.* | 335,919 | 167,476 | ||||||
| Electronic Equipment, Instruments & Components 3.09% | ||||||||
| Amphenol Corp. Class A | 1,455,168 | 111,713 | ||||||
| Cognex Corp. | 834,139 | 73,062 | ||||||
| Trimble, Inc.* | 1,565,328 | 136,763 | ||||||
| Total | 321,538 | |||||||
| Investments | Shares | Fair Value (000) | ||||||
| Entertainment 5.39% | ||||||||
| Live Nation Entertainment, Inc.* | 1,493,537 | $ | 151,071 | |||||
| Netflix, Inc.* | 413,471 | 285,423 | ||||||
| Sea Ltd. ADR* | 362,332 | 124,487 | ||||||
| Total | 560,981 | |||||||
| Health Care Equipment & Supplies 5.71% | ||||||||
| Align Technology, Inc.* | 160,419 | 100,161 | ||||||
| DexCom, Inc.* | 308,312 | 192,143 | ||||||
| Edwards Lifesciences Corp.* | 864,606 | 103,597 | ||||||
| IDEXX Laboratories, Inc.* | 140,226 | 93,410 | ||||||
| Intuitive Surgical, Inc.* | 290,297 | 104,835 | ||||||
| Total | 594,146 | |||||||
| Hotels, Restaurants & Leisure 1.00% | ||||||||
| Airbnb, Inc. Class A* | 611,256 | 104,317 | ||||||
| Information Technology Services 6.47% | ||||||||
| Affirm Holdings, Inc.* | 1,306,865 | 212,365 | ||||||
| EPAM Systems, Inc.* | 292,956 | 197,230 | ||||||
| Shopify, Inc. Class A (Canada)*(a) | 53,244 | 78,095 | ||||||
| Square, Inc. Class A* | 522,477 | 132,970 | ||||||
| Toast, Inc. Class A*(b) | 97,114 | 5,168 | ||||||
| Visa, Inc. Class A | 223,704 | 47,374 | ||||||
| Total | 673,202 | |||||||
| Interactive Media & Services 9.13% | ||||||||
| Alphabet, Inc. Class A* | 208,889 | 618,504 | ||||||
| Match Group, Inc.* | 473,525 | 71,398 | ||||||
| Meta Platforms, Inc. Class A* | 587,489 | 190,094 | ||||||
| Snap, Inc. Class A* | 1,343,084 | 70,619 | ||||||
| Total | 950,615 | |||||||
| Internet & Direct Marketing Retail 1.97% | ||||||||
| Amazon.com, Inc.* | 43,683 | 147,318 | ||||||
| MercadoLibre, Inc. (Argentina)*(a) | 39,211 | 58,072 | ||||||
| Total | 205,390 | |||||||
| 108 | See Notes to Financial Statements. |
Schedule of Investments (continued)
GROWTH LEADERS FUND October 31, 2021
| Investments | Shares | Fair Value (000) | ||||||
| Life Sciences Tools & Services 0.97% | ||||||||
| Agilent Technologies, Inc. | 642,427 | $ | 101,176 | |||||
| Personal Products 0.52% | ||||||||
| Estee Lauder Cos., Inc. (The) Class A | 159,828 | 51,837 | ||||||
| Olaplex Holdings, Inc.* | 97,111 | 2,710 | ||||||
| Total | 54,547 | |||||||
| Pharmaceuticals 1.49% | ||||||||
| Zoetis, Inc. | 716,325 | 154,870 | ||||||
| Semiconductors & Semiconductor Equipment 10.28% | ||||||||
| Advanced Micro Devices, Inc.* | 1,687,355 | 202,871 | ||||||
| Applied Materials, Inc. | 1,233,357 | 168,538 | ||||||
| Enphase Energy, Inc.* | 349,860 | 81,038 | ||||||
| Monolithic Power Systems, Inc. | 324,044 | 170,272 | ||||||
| NVIDIA Corp. | 1,751,244 | 447,741 | ||||||
| Total | 1,070,460 | |||||||
| Software 23.06% | ||||||||
| Asana, Inc. Class A* | 977,969 | 132,808 | ||||||
| Atlassian Corp. plc Class A (Australia)*(a) | 391,574 | 179,392 | ||||||
| Crowdstrike Holdings, Inc. Class A* | 657,533 | 185,293 | ||||||
| Datadog, Inc. Class A* | 728,292 | 121,661 | ||||||
| DocuSign, Inc.* | 347,421 | 96,684 | ||||||
| Five9, Inc.* | 314,055 | 49,624 | ||||||
| Freshworks, Inc. Class A* | 534,124 | 26,840 | ||||||
| Gitlab, Inc. Class A* | 49,027 | 5,501 | ||||||
| HubSpot, Inc.* | 222,278 | 180,096 | ||||||
| Intuit, Inc. | 200,974 | 125,808 | ||||||
| Microsoft Corp. | 2,424,760 | 804,099 | ||||||
| Palantir Technologies, Inc. Class A* | 3,864,793 | 100,021 | ||||||
| Paycom Software, Inc.* | 268,223 | 146,946 | ||||||
| SentinelOne, Inc. Class A*(b) | 310,580 | 20,622 | ||||||
| Investments | Shares | Fair Value (000) | ||||||
| Software (continued) | ||||||||
| ServiceNow, Inc.* | 194,801 | $ | 135,924 | |||||
| Unity Software, Inc.* | 592,732 | 89,686 | ||||||
| Total | 2,401,005 | |||||||
| Specialty Retail 0.91% | ||||||||
| Carvana Co.* | 148,532 | 45,032 | ||||||
| RH* | 75,502 | 49,803 | ||||||
| Total | 94,835 | |||||||
| Technology Hardware, Storage & Peripherals 4.63% | ||||||||
| Apple, Inc. | 3,220,100 | 482,371 | ||||||
| Textiles, Apparel & Luxury Goods 3.56% | ||||||||
| Crocs, Inc.* | 767,209 | 123,866 | ||||||
| Lululemon Athletica, Inc. (Canada)*(a) | 366,333 | 170,715 | ||||||
| NIKE, Inc. Class B | 454,289 | 75,998 | ||||||
| Total | 370,579 | |||||||
| Total Common Stocks (cost $7,739,470,428) | $ | 10,294,786 | ||||||
| See Notes to Financial Statements. | 109 |
Schedule of Investments (concluded)
GROWTH LEADERS FUND October 31, 2021
| Investments | Principal Amount (000) | Fair Value (000) | ||||||
| SHORT-TERM INVESTMENTS 1.79% | ||||||||
| Repurchase Agreements 1.77% | ||||||||
| Repurchase Agreement dated 10/29/2021, 0.00% due 11/1/2021 with Fixed Income Clearing Corp. collateralized by $191,020,900 of U.S. Treasury Note at .50% due 06/30/2027; , $4,500,500 of U.S. Treasury Note at 2.25% due 08/15/2027; value: $187,929,795; proceeds: $184,244,835 (cost $184,244,835) | $184,245 | $ | 184,245 | |||||
| Investments | Shares | Fair Value (000) | ||||||
| Money Market Funds 0.02% | ||||||||
| Fidelity Government Portfolio(c) (cost $1,749,804) | 1,749,804 | $ | 1,750 | |||||
| Time Deposits 0.00% | ||||||||
| CitiBank N.A.(c) (cost $194,423) | 194,423 | 194 | ||||||
| Total Short-Term Investments (cost $186,189,062) | 186,189 | |||||||
| Total Investments in Securities 100.66% (cost $7,925,659,490) | 10,480,975 | |||||||
| Other Assets and Liabilities – Net (0.66)% | (68,843 | ) | ||||||
| Net Assets 100.00% | $ | 10,412,132 | ||||||
| ADR | American Depositary Receipt. | |
| * | Non-income producing security. | |
| (a) | Foreign security traded in U.S. dollars. | |
| (b) | All or a portion of this security is temporarily on loan to unaffiliated broker/dealers. | |
| (c) | Security was purchased with the cash collateral from loaned securities. |
The following is a summary of the inputs used as of October 31, 2021 in valuing the Fund’s investments carried at fair value(1):
| Investment Type(2) | Level 1 (000) | Level 2 (000) | Level 3 (000) | Total (000) | ||||||||||||
| Long-Term Investments | ||||||||||||||||
| Common Stocks | $ | 10,294,786 | $ | – | $ | – | $ | 10,294,786 | ||||||||
| Short-Term Investments | ||||||||||||||||
| Repurchase Agreements | – | 184,245 | – | 184,245 | ||||||||||||
| Money Market Funds | 1,750 | – | – | 1,750 | ||||||||||||
| Time Deposits | – | 194 | – | 194 | ||||||||||||
| Total | $ | 10,296,536 | $ | 184,439 | $ | – | $ | 10,480,975 | ||||||||
| (1) | Refer to Note 2(l) for a description of fair value measurements and the three-tier hierarchy of inputs. | |
| (2) | See Schedule of Investments for fair values in each industry and identification of foreign issuers and/or geography When applicable each Level 3 security is identified on the Schedule of Investments along with the valuation technique utilized. |
A reconciliation of Level 3 investments is presented when the Fund has a material amount of Level 3 investments at the beginning or end of the year in relation to the Fund’s net assets.
| 110 | See Notes to Financial Statements. |
Schedule of Investments
HEALTH CARE FUND October 31, 2021
| Investments | Shares | U.S. $ Fair Value (000) | ||||||
| LONG-TERM INVESTMENTS 96.08% | ||||||||
| COMMON STOCKS 96.08% | ||||||||
| Belgium 0.77% | ||||||||
| Pharmaceuticals | ||||||||
| UCB SA | 501 | $ | 60 | |||||
| Canada 1.22% | ||||||||
| Biotechnology | ||||||||
| BELLUS Health, Inc.* | 5,900 | 44 | ||||||
| Xenon Pharmaceuticals, Inc.* | 1,688 | 52 | ||||||
| 96 | ||||||||
| Denmark 4.28% | ||||||||
| Biotechnology 1.51% | ||||||||
| Genmab A/S* | 261 | 118 | ||||||
| Pharmaceuticals 2.77% | ||||||||
| Novo Nordisk A/S Class B | 1,981 | 217 | ||||||
| Total Denmark | 335 | |||||||
| France 1.67% | ||||||||
| Life Sciences Tools & Services 0.79% | ||||||||
| Sartorius Stedim Biotech | 113 | 62 | ||||||
| Pharmaceuticals 0.88% | ||||||||
| Sanofi | 681 | 69 | ||||||
| Total France | 131 | |||||||
| Germany 1.61% | ||||||||
| Biotechnology 0.73% | ||||||||
| BioNTech SE ADR* | 205 | 57 | ||||||
| Pharmaceuticals 0.88% | ||||||||
| Merck KGaA | 290 | 69 | ||||||
| Total Germany | 126 | |||||||
| Investments | Shares | U.S. $ Fair Value (000) | ||||||
| Netherlands 1.40% | ||||||||
| Biotechnology | ||||||||
| Argenx SE* | 254 | $ | 76 | |||||
| Merus NV* | 1,200 | 34 | ||||||
| 110 | ||||||||
| Sweden 0.64% | ||||||||
| Life Sciences Tools & Services | ||||||||
| Olink Holding AB ADR* | 1,568 | 50 | ||||||
| Switzerland 7.17% | ||||||||
| Biotechnology 0.37% | ||||||||
| CRISPR Therapeutics AG* | 320 | 29 | ||||||
| Health Care Equipment & Supplies 1.11% | ||||||||
| Alcon, Inc. | 1,041 | 87 | ||||||
| Life Sciences Tools & Services 1.58% | ||||||||
| Lonza Group AG | 151 | 124 | ||||||
| Pharmaceuticals 4.11% | ||||||||
| Roche Holding AG | 832 | 322 | ||||||
| Total Switzerland | 562 | |||||||
| United Kingdom 3.78% | ||||||||
| Pharmaceuticals | ||||||||
| AstraZeneca plc | 2,363 | 296 | ||||||
| United States 73.54% | ||||||||
| Biotechnology 16.28% | ||||||||
| Arena Pharmaceuticals, Inc.* | 907 | 52 | ||||||
| Biohaven Pharmaceutical Holding Co. Ltd.* | 385 | 55 | ||||||
| Blueprint Medicines Corp.* | 393 | 44 | ||||||
| Bridgebio Pharma, Inc.* | 794 | 39 | ||||||
| Curis, Inc.* | 2,671 | 17 | ||||||
| Horizon Therapeutics plc* | 936 | 112 | ||||||
| Insmed, Inc.* | 2,540 | 77 | ||||||
| Intellia Therapeutics, Inc.* | 496 | 66 | ||||||
| See Notes to Financial Statements. | 111 |
Schedule of Investments (continued)
HEALTH CARE FUND October 31, 2021
| Investments | Shares | U.S. $ Fair Value (000) | ||||||
| United States (continued) | ||||||||
| Biotechnology (continued) | ||||||||
| Karuna Therapeutics, Inc.* | 347 | $ | 49 | |||||
| Krystal Biotech, Inc.* | 948 | 48 | ||||||
| Mirati Therapeutics, Inc.* | 418 | 79 | ||||||
| Natera, Inc.* | 999 | 115 | ||||||
| Neurocrine Biosciences, Inc.* | 598 | 63 | ||||||
| Rigel Pharmaceuticals, Inc.* | 15,178 | 51 | ||||||
| Rocket Pharmaceuticals, Inc.* | 1,075 | 32 | ||||||
| Sarepta Therapeutics, Inc.* | 380 | 30 | ||||||
| Seagen, Inc.* | 506 | 89 | ||||||
| SpringWorks Therapeutics, Inc.* | 687 | 46 | ||||||
| TG Therapeutics, Inc.* | 1,997 | 62 | ||||||
| Turning Point Therapeutics, Inc.* | 556 | 23 | ||||||
| Ultragenyx Pharmaceutical, Inc.* | 468 | 39 | ||||||
| Vertex Pharmaceuticals, Inc.* | 477 | 88 | ||||||
| 1,276 | ||||||||
| Health Care Equipment & Supplies 24.38% | ||||||||
| Abbott Laboratories | 545 | 70 | ||||||
| Align Technology, Inc.* | 231 | 144 | ||||||
| Axonics, Inc.* | 581 | 43 | ||||||
| Cooper Cos., Inc. (The) | 219 | 91 | ||||||
| CryoPort, Inc.* | 588 | 48 | ||||||
| Danaher Corp. | 747 | 233 | ||||||
| DexCom, Inc.* | 259 | 162 | ||||||
| Edwards Lifesciences Corp.* | 1,277 | 153 | ||||||
| IDEXX Laboratories, Inc.* | 171 | 114 | ||||||
| Inari Medical, Inc.* | 364 | 33 | ||||||
| Insulet Corp.* | 372 | 115 | ||||||
| Intuitive Surgical, Inc.* | 543 | 196 | ||||||
| Medtronic plc | 1,596 | 191 | ||||||
| Outset Medical, Inc.* | 1,018 | 54 | ||||||
| Penumbra, Inc.* | 145 | 40 | ||||||
| Pulmonx Corp.* | 788 | 31 | ||||||
| Shockwave Medical, Inc.* | 243 | 52 | ||||||
| Silk Road Medical, Inc.* | 712 | 42 | ||||||
| Zimmer Biomet Holdings, Inc. | 683 | 98 | ||||||
| 1,910 | ||||||||
| Investments | Shares | U.S. $ Fair Value (000) | ||||||
| United States (continued) | ||||||||
| Health Care Providers & Services 8.79% | ||||||||
| AmerisourceBergen Corp. | 645 | $ | 79 | |||||
| HCA Healthcare, Inc. | 558 | 140 | ||||||
| Humana, Inc. | 85 | 39 | ||||||
| Oak Street Health, Inc.* | 653 | 31 | ||||||
| Tenet Healthcare Corp.* | 821 | 59 | ||||||
| UnitedHealth Group, Inc. | 742 | 341 | ||||||
| 689 | ||||||||
| Health Care Technology 1.84% | ||||||||
| Cerner Corp. | 668 | 50 | ||||||
| Doximity, Inc. Class A*(a) | 189 | 13 | ||||||
| Inspire Medical Systems, Inc.* | 302 | 81 | ||||||
| 144 | ||||||||
| Life Sciences Tools & Services 10.34% | ||||||||
| 10X Genomics, Inc. Class A* | 349 | 56 | ||||||
| Agilent Technologies, Inc. | 453 | 71 | ||||||
| Akoya Biosciences, Inc.* | 3,667 | 49 | ||||||
| Bio-Rad Laboratories, Inc. Class A* | 107 | 85 | ||||||
| Charles River Laboratories International, Inc.* | 90 | 40 | ||||||
| Maravai LifeSciences Holdings, Inc. Class A* | 1,110 | 47 | ||||||
| Quanterix Corp.* | 741 | 38 | ||||||
| Rapid Micro Biosystems, Inc. Class A* | 1,850 | 38 | ||||||
| Repligen Corp.* | 335 | 97 | ||||||
| Thermo Fisher Scientific, Inc. | 456 | 289 | ||||||
| 810 | ||||||||
| Pharmaceuticals 10.43% | ||||||||
| Catalent, Inc.* | 604 | 83 | ||||||
| Eli Lilly & Co. | 1,161 | 296 | ||||||
| Intra-Cellular Therapies, Inc.* | 1,504 | 65 | ||||||
| Merck & Co., Inc. | 1,474 | 130 | ||||||
| NGM Biopharmaceuticals, Inc.* | 1,600 | 29 | ||||||
| Organon & Co. | 1,061 | 39 | ||||||
| Zoetis, Inc. | 809 | 175 | ||||||
| 817 | ||||||||
| 112 | See Notes to Financial Statements. |
Schedule of Investments (continued)
HEALTH CARE FUND October 31, 2021
| Investments | Shares | U.S. $ Fair Value (000) | ||||||
| United States (continued) | ||||||||
| Semiconductors & Semiconductor Equipment 0.82% | ||||||||
| Brooks Automation, Inc. | 550 | $ | 64 | |||||
| Specialty Retail 0.66% | ||||||||
| Petco Health & Wellness Co., Inc.* | 2,105 | 52 | ||||||
| Total United States | 5,762 | |||||||
| Total Common Stocks (cost $6,303,684) | 7,528 | |||||||
| Principal Amount (000) | ||||||||
| SHORT-TERM INVESTMENTS 3.82% | ||||||||
| Repurchase Agreements 3.65% | ||||||||
| Repurchase Agreement dated 10/29/2021, 0.00% due 11/1/2021 with Fixed Income Clearing Corp. collateralized by $266,400 of U.S. Treasury Inflation Indexed Note at 0.125% due 10/15/2026; value: $292,120; proceeds: $286,372 (cost $286,372) | $286 | 286 | ||||||
| Investments | Shares | U.S. $ Fair Value (000) | ||||||
| Money Market Funds 0.16% | ||||||||
| Fidelity Government Portfolio(b) (cost $11,907) | 11,907 | $ | 12 | |||||
| Time Deposits 0.01% | ||||||||
| CitiBank N.A.(b) (cost $1,323) | 1,323 | 1 | ||||||
| Total Short-Term Investments (cost $299,602) | 299 | |||||||
| Total Investments in Securities 99.90% (cost $6,603,286) | 7,827 | |||||||
| Other Assets and Liabilities – Net 0.10% | 8 | |||||||
| Net Assets 100.00% | $ | 7,835 | ||||||
| ADR | American Depositary Receipt. | |
| * | Non-income producing security. | |
| (a) | All or a portion of this security is temporarily on loan to unaffiliated broker/dealers. | |
| (b) | Security was purchased with the cash collateral from loaned securities. |
| See Notes to Financial Statements. | 113 |
Schedule of Investments (concluded)
HEALTH CARE FUND October 31, 2021
The following is a summary of the inputs used as of October 31, 2021 in valuing the Fund’s investments carried at fair value(1):
| Investment Type(2) | Level 1 (000) | Level 2 (000) | Level 3 (000) | Total (000) | ||||||||||||
| Long-Term Investments | ||||||||||||||||
| Common Stocks | ||||||||||||||||
| Belgium | $ | – | $ | 60 | $ | – | $ | 60 | ||||||||
| Denmark | – | 335 | – | 335 | ||||||||||||
| France | – | 131 | – | 131 | ||||||||||||
| Germany | 57 | 69 | – | 126 | ||||||||||||
| Netherlands | 34 | 76 | – | 110 | ||||||||||||
| Switzerland | 116 | 446 | – | 562 | ||||||||||||
| United Kingdom | – | 296 | – | 296 | ||||||||||||
| Remaining Countries | 5,908 | – | – | 5,908 | ||||||||||||
| Short-Term Investments | ||||||||||||||||
| Repurchase Agreements | – | 286 | – | 286 | ||||||||||||
| Money Market Funds | 12 | – | – | 12 | ||||||||||||
| Time Deposits | – | 1 | – | 1 | ||||||||||||
| Total | $ | 6,127 | $ | 1,700 | $ | – | $ | 7,827 | ||||||||
| (1) | Refer to Note 2(l) for a description of fair value measurements and the three-tier hierarchy of inputs. | |
| (2) | See Schedule of Investments for fair values in each industry and identification of foreign issuers and/or geography. The table above is presented by Investment Type. Industries are presented within an Investment Type should such Investment Type include securities classified as two or more levels within the three- tier fair value hierarchy. When applicable each Level 3 security is identified on the Schedule of Investments along with the valuation technique utilized. |
A reconciliation of Level 3 investments is presented when the Fund has a material amount of Level 3 investments at the beginning or end of the year in relation to the Fund’s net assets.
| 114 | See Notes to Financial Statements. |
Schedule of Investments
INTERNATIONAL EQUITY FUND October 31, 2021
| Investments | Shares | U.S. $ Fair Value (000) | ||||||
| LONG-TERM INVESTMENTS 97.42% | ||||||||
| COMMON STOCKS 97.42% | ||||||||
| Argentina 0.65% | ||||||||
| Internet & Direct Marketing Retail | ||||||||
| MercadoLibre, Inc.* | 1,826 | $ | 2,704 | |||||
| Australia 2.95% | ||||||||
| Capital Markets 1.14% | ||||||||
| Macquarie Group Ltd. | 31,871 | 4,705(a) | ||||||
| Equity Real Estate Investment Trusts 0.66% | ||||||||
| Goodman Group | 165,808 | 2,745 | ||||||
| Metals & Mining 1.15% | ||||||||
| BHP Group Ltd. | 173,442 | 4,764 | ||||||
| Total Australia | 12,214 | |||||||
| Austria 1.67% | ||||||||
| Banks 0.80% | ||||||||
| BAWAG Group AG†* | 52,456 | 3,299 | ||||||
| Oil, Gas & Consumable Fuels 0.87% | ||||||||
| OMV AG | 59,884 | 3,626 | ||||||
| Total Austria | 6,925 | |||||||
| Belgium 0.83% | ||||||||
| Banks | ||||||||
| KBC Group NV | 36,705 | 3,418 | ||||||
| Canada 2.75% | ||||||||
| Aerospace & Defense 0.90% | ||||||||
| CAE, Inc.* | 122,517 | 3,715 | ||||||
| Banks 1.06% | ||||||||
| Royal Bank of Canada | 42,300 | 4,403 | ||||||
| Oil, Gas & Consumable Fuels 0.79% | ||||||||
| Pembina Pipeline Corp.(b) | 98,619 | 3,265 | ||||||
| Total Canada | 11,383 | |||||||
| Investments | Shares | U.S. $ Fair Value (000) | ||||||
| China 3.03% | ||||||||
| Interactive Media & Services 0.83% | ||||||||
| Tencent Holdings Ltd. | 56,700 | $ | 3,449 | |||||
| Internet & Direct Marketing Retail 1.71% | ||||||||
| Alibaba Group Holding Ltd.* | 199,400 | 4,100 | ||||||
| JD.com, Inc. Class A* | 75,950 | 2,974 | ||||||
| 7,074 | ||||||||
| Textiles, Apparel & Luxury Goods 0.49% | ||||||||
| ANTA Sports Products Ltd. | 130,720 | 2,025 | ||||||
| Total China | 12,548 | |||||||
| Denmark 4.87% | ||||||||
| Air Freight & Logistics 1.04% | ||||||||
| DSV PANALPINA A/S | 18,574 | 4,317 | ||||||
| Beverages 0.77% | ||||||||
| Carlsberg A/S Class B | 19,367 | 3,198 | ||||||
| Biotechnology 1.14% | ||||||||
| Genmab A/S* | 10,548 | 4,739 | ||||||
| Pharmaceuticals 1.92% | ||||||||
| Novo Nordisk A/S Class B | 72,401 | 7,939 | ||||||
| Total Denmark | 20,193 | |||||||
| Finland 1.32% | ||||||||
| Banks | ||||||||
| Nordea Bank Abp | 446,411 | 5,467 | ||||||
| France 15.15% | ||||||||
| Aerospace & Defense 1.78% | ||||||||
| Airbus SE* | 32,254 | 4,138 | ||||||
| Safran SA | 23,926 | 3,220 | ||||||
| 7,358 | ||||||||
| Auto Components 0.95% | ||||||||
| Cie Generale des Etablissements | ||||||||
| Michelin SCA | 25,144 | 3,953 | ||||||
| See Notes to Financial Statements. | 115 |
Schedule of Investments (continued)
INTERNATIONAL EQUITY FUND October 31, 2021
| Investments | Shares | U.S. $ Fair Value (000) | ||||||
| France (continued) | ||||||||
| Beverages 1.14% | ||||||||
| Pernod Ricard SA | 20,612 | $ | 4,742 | |||||
| Building Products 1.04% | ||||||||
| Cie de Saint-Gobain | 62,419 | 4,308 | ||||||
| Chemicals 1.02% | ||||||||
| Air Liquide SA | 25,249 | 4,215 | ||||||
| Construction & Engineering 0.59% | ||||||||
| Vinci SA | 23,077 | 2,467 | ||||||
| Information Technology Services 1.01% | ||||||||
| Capgemini SE | 17,991 | 4,195 | ||||||
| Insurance 0.78% | ||||||||
| AXA SA | 110,702 | 3,221 | ||||||
| Life Sciences Tools & Services 0.79% | ||||||||
| Sartorius Stedim Biotech | 5,933 | 3,270 | ||||||
| Multi-Utilities 0.85% | ||||||||
| Veolia Environnement SA(b) | 108,478 | 3,543 | ||||||
| Oil, Gas & Consumable Fuels 0.85% | ||||||||
| TOTAL SE | 70,124 | 3,511 | ||||||
| Personal Products 1.65% | ||||||||
| L’Oreal SA | 14,930 | 6,830 | ||||||
| Textiles, Apparel & Luxury Goods 2.70% | ||||||||
| Kering SA | 5,365 | 4,027 | ||||||
| LVMH Moet Hennessy Louis Vuitton SE | 9,137 | 7,164 | ||||||
| 11,191 | ||||||||
| Total France | 62,804 | |||||||
| Germany 5.49% | ||||||||
| Air Freight & Logistics 1.30% | ||||||||
| Deutsche Post AG Registered Shares | 87,003 | 5,386 | ||||||
| Auto Components 0.59% | ||||||||
| Continental AG* | 20,778 | 2,443 | ||||||
| Investments | Shares | U.S. $ Fair Value (000) | ||||||
| Germany (continued) | ||||||||
| Automobiles 0.92% | ||||||||
| Volkswagen AG | 11,694 | $ | 3,802 | |||||
| Chemicals 0.73% | ||||||||
| Symrise AG | 21,849 | 3,022 | ||||||
| Semiconductors & Semiconductor Equipment 1.11% | ||||||||
| Infineon Technologies AG | 98,106 | 4,594 | ||||||
| Textiles, Apparel & Luxury Goods 0.84% | ||||||||
| adidas AG | 10,712 | 3,506 | ||||||
| Total Germany | 22,753 | |||||||
| Hong Kong 2.30% | ||||||||
| Insurance 1.32% | ||||||||
| AIA Group Ltd. | 485,882 | 5,445 | ||||||
| Machinery 0.98% | ||||||||
| Techtronic Industries Co. Ltd. | 198,315 | 4,075 | ||||||
| Total Hong Kong | 9,520 | |||||||
| Hungary 0.81% | ||||||||
| Banks | ||||||||
| OTP Bank Nyrt* | 56,008 | 3,365 | ||||||
| India 2.47% | ||||||||
| Banks 1.75% | ||||||||
| ICICI Bank Ltd. ADR | 216,236 | 4,573 | ||||||
| State Bank of India | 400,848 | 2,697 | ||||||
| 7,270 | ||||||||
| Information Technology Services 0.72% | ||||||||
| Infosys Ltd. ADR | 133,147 | 2,967 | ||||||
| Total India | 10,237 | |||||||
| Indonesia 0.97% | ||||||||
| Banks | ||||||||
| Bank Rakyat Indonesia Persero Tbk PT | 13,449,066 | 4,037 | ||||||
| 116 | See Notes to Financial Statements. |
Schedule of Investments (continued)
INTERNATIONAL EQUITY FUND October 31, 2021
| Investments | Shares | U.S. $ Fair Value (000) | ||||||
| Ireland 1.03% | ||||||||
| Construction Materials | ||||||||
| CRH plc | 88,995 | $ | 4,257 | |||||
| Japan 14.78% | ||||||||
| Auto Components 1.22% | ||||||||
| Denso Corp. | 69,785 | 5,059 | ||||||
| Automobiles 1.54% | ||||||||
| Toyota Motor Corp. | 362,000 | 6,387 | ||||||
| Banks 0.70% | ||||||||
| Sumitomo Mitsui Financial Group, Inc. | 89,500 | 2,904 | ||||||
| Beverages 0.58% | ||||||||
| Asahi Group Holdings Ltd. | 52,825 | 2,397 | ||||||
| Building Products 0.93% | ||||||||
| Daikin Industries Ltd. | 17,575 | 3,849 | ||||||
| Diversified Financial Services 0.76% | ||||||||
| ORIX Corp. | 158,800 | 3,157 | ||||||
| Electrical Equipment 0.74% | ||||||||
| Fuji Electric Co. Ltd. | 63,100 | 3,086 | ||||||
| Electronic Equipment, Instruments & Components 2.26% | ||||||||
| Keyence Corp. | 9,040 | 5,457 | ||||||
| Omron Corp. | 40,700 | 3,892 | ||||||
| 9,349 | ||||||||
| Health Care Equipment & Supplies 0.97% | ||||||||
| Hoya Corp. | 27,200 | 4,004 | ||||||
| Household Durables 1.56% | ||||||||
| Sony Group Corp. | 55,900 | 6,473 | ||||||
| Machinery 2.08% | ||||||||
| Ebara Corp. | 69,800 | 3,809 | ||||||
| FANUC Corp. | 14,200 | 2,806 | ||||||
| Fujitec Co. Ltd. | 88,000 | 1,999 | ||||||
| 8,614 | ||||||||
| Investments | Shares | U.S. $ Fair Value (000) | ||||||
| Japan (continued) | ||||||||
| Specialty Retail 0.47% | ||||||||
| Fast Retailing Co. Ltd. | 2,950 | $ | 1,958 | |||||
| Trading Companies & Distributors 0.97% | ||||||||
| ITOCHU Corp. | 140,900 | 4,019 | ||||||
| Total Japan | 61,256 | |||||||
| Mexico 1.18% | ||||||||
| Banks 0.69% | ||||||||
| Grupo Financiero Banorte | ||||||||
| SAB de CV | 452,617 | 2,866 | ||||||
| Transportation Infrastructure 0.49% | ||||||||
| Grupo Aeroportuario del Pacifico SAB de CV ADR | 16,133 | 2,037 | ||||||
| Total Mexico | 4,903 | |||||||
| Netherlands 5.66% | ||||||||
| Chemicals 0.65% | ||||||||
| Akzo Nobel NV | 23,368 | 2,685 | ||||||
| Information Technology Services 1.03% | ||||||||
| Adyen NV†* | 1,417 | 4,276 | ||||||
| Insurance 1.05% | ||||||||
| NN Group NV | 81,205 | 4,341 | ||||||
| Oil, Gas & Consumable Fuels 1.05% | ||||||||
| Royal Dutch Shell plc A Shares | 189,590 | 4,343 | ||||||
| Semiconductors & Semiconductor Equipment 1.88% | ||||||||
| ASML Holding NV | 9,593 | 7,798 | ||||||
| Total Netherlands | 23,443 | |||||||
| Norway 1.92% | ||||||||
| Machinery 0.90% | ||||||||
| AutoStore Holdings Ltd.* | 943,588 | 3,719 | ||||||
| See Notes to Financial Statements. | 117 |
Schedule of Investments (continued)
INTERNATIONAL EQUITY FUND October 31, 2021
| Investments | Shares | U.S. $ Fair Value (000) | ||||||
| Norway (continued) | ||||||||
| Oil, Gas & Consumable Fuels 1.02% | ||||||||
| Equinor ASA | 167,222 | $ | 4,237 | |||||
| Total Norway | 7,956 | |||||||
| Singapore 0.69% | ||||||||
| Banks | ||||||||
| United Overseas Bank Ltd. | 143,300 | 2,849 | ||||||
| South Africa 0.98% | ||||||||
| Metals & Mining | ||||||||
| Anglo American plc | 106,190 | 4,040 | ||||||
| South Korea 1.34% | ||||||||
| Interactive Media & Services 0.51% | ||||||||
| NAVER Corp. | 6,016 | 2,092 | ||||||
| Technology Hardware, Storage & Peripherals 0.83% | ||||||||
| Samsung Electronics Co. Ltd. | 57,548 | 3,445 | ||||||
| Total South Korea | 5,537 | |||||||
| Spain 3.36% | ||||||||
| Banks 0.86% | ||||||||
| Banco Bilbao Vizcaya Argentaria SA | 513,336 | 3,592 | ||||||
| Diversified Telecommunication Services 0.91% | ||||||||
| Cellnex Telecom SA† | 61,186 | 3,763 | ||||||
| Electric: Utilities 1.04% | ||||||||
| Iberdrola SA | 363,953 | 4,298 | ||||||
| Information Technology Services 0.55% | ||||||||
| Amadeus IT Group SA* | 34,122 | 2,283 | ||||||
| Total Spain | 13,936 | |||||||
| Sweden 1.00% | ||||||||
| Machinery | ||||||||
| Atlas Copco AB A Shares | 64,499 | 4,154 | ||||||
| Investments | Shares | U.S. $ Fair Value (000) | ||||||
| Switzerland 6.95% | ||||||||
| Capital Markets 1.40% | ||||||||
| UBS Group AG | 318,696 | $ | 5,801 | |||||
| Food Products 2.33% | ||||||||
| Nestle SA Registered Shares | 73,192 | 9,655 | ||||||
| Life Sciences Tools & Services 1.51% | ||||||||
| Lonza Group AG | 7,627 | 6,268 | ||||||
| Pharmaceuticals 1.70% | ||||||||
| Roche Holding AG | 18,156 | 7,033 | ||||||
| Textiles, Apparel & Luxury Goods 0.01% | ||||||||
| On Holding AG Class A* | 1,814 | 62 | ||||||
| Total Switzerland | 28,819 | |||||||
| Taiwan 2.79% | ||||||||
| Entertainment 0.87% | ||||||||
| Sea Ltd. ADR* | 10,486 | 3,602 | ||||||
| Semiconductors & Semiconductor Equipment 1.92% | ||||||||
| Taiwan Semiconductor Manufacturing Co. Ltd. ADR | 17,946 | 2,041 | ||||||
| Taiwan Semiconductor Manufacturing Co. Ltd. | 279,230 | 5,925 | ||||||
| 7,966 | ||||||||
| Total Taiwan | 11,568 | |||||||
| United Kingdom 7.39% | ||||||||
| Banks 0.64% | ||||||||
| Barclays plc | 961,632 | 2,654 | ||||||
| Beverages 1.38% | ||||||||
| Diageo plc | 114,955 | 5,719 | ||||||
| Capital Markets 0.70% | ||||||||
| Petershill Partners plc†* | 708,281 | 2,909 | ||||||
| Electric: Utilities 0.81% | ||||||||
| SSE plc | 148,287 | 3,340 | ||||||
| 118 | See Notes to Financial Statements. |
Schedule of Investments (continued)
INTERNATIONAL EQUITY FUND October 31, 2021
| Investments | Shares | U.S. $ Fair Value (000) | ||||||
| United Kingdom (continued) | ||||||||
| Equity Real Estate Investment Trusts 0.56% | ||||||||
| UNITE Group plc (The) | 156,747 | $ | 2,340 | |||||
| Insurance 0.87% | ||||||||
| Prudential plc | 176,263 | 3,597 | ||||||
| Multi-Line Retail 0.68% | ||||||||
| Next plc | 25,965 | 2,830 | ||||||
| Pharmaceuticals 1.75% | ||||||||
| AstraZeneca plc | 57,923 | 7,246 | ||||||
| Total United Kingdom | 30,635 | |||||||
| United States 3.09% | ||||||||
| Biotechnology 0.74% | ||||||||
| Horizon Therapeutics plc* | 25,532 | 3,062 | ||||||
| Electrical Equipment 1.32% | ||||||||
| Schneider Electric SE | 31,814 | 5,485 | ||||||
| Trading Companies & Distributors 1.03% | ||||||||
| Ferguson plc | 28,404 | 4,274 | ||||||
| Total United States | 12,821 | |||||||
| Total Common Stocks (cost $313,843,982) | 403,742 | |||||||
| Principal Amount (000) | ||||||||
| SHORT-TERM INVESTMENTS 2.35% | ||||||||
| Repurchase Agreements 2.15% | ||||||||
| Repurchase Agreement dated 10/29/2021, 0.00% due 11/1/2021 with Fixed Income Clearing Corp. collateralized by $8,288,200 of U.S. Treasury Inflation Indexed Note at 0.125% due 10/15/2026; value: $9,088,411; proceeds: $8,910,118 (cost $8,910,118) | $8,910 | 8,910 | ||||||
| Investments | Shares | U.S. $ Fair Value (000) | ||||||
| Money Market Funds 0.18% | ||||||||
| Fidelity Government Portfolio(c) (cost $755,274) | 755,274 | $ | 755 | |||||
| Time Deposits 0.02% | ||||||||
| CitiBank N.A.(c) (cost $83,920) | 83,920 | 84 | ||||||
| Total Short-Term Investments (cost $9,749,312) | 9,749 | |||||||
| Total Investments in Securities 99.77% (cost $323,593,294) | 413,491 | |||||||
| Other Assets and Liabilities – Net 0.23% | 942 | |||||||
| Net Assets 100.00% | $ | 414,433 | ||||||
| ADR | American Depositary Receipt. | |
| * | Non-income producing security. | |
| † | Security was purchased pursuant to Rule 144A under the Securities Act of 1933 and, unless registered under such Act or exempted from registration, may only be resold to qualified institutional buyers. At October 31, 2021, the total value of Rule 144A securities was $14,247, which represents 3.44% of net assets. | |
| (a) | Level 3 Investment as described in Note 2(l) in the Notes to Financials. Security fair valued by the Pricing Committee. | |
| (b) | All or a portion of this security is temporarily on loan to unaffiliated broker/dealers. | |
| (c) | Security was purchased with the cash collateral from loaned securities. |
| See Notes to Financial Statements. | 119 |
Schedule of Investments (concluded)
INTERNATIONAL EQUITY FUND October 31, 2021
The following is a summary of the inputs used as of October 31, 2021 in valuing the Fund’s investments carried at fair value(1):
| Investment Type(2) | Level 1 (000) | Level 2 (000) | Level 3 (000) | Total (000) | ||||||||||||
| Long-Term Investments | ||||||||||||||||
| Common Stocks | ||||||||||||||||
| Argentina | $ | 2,704 | $ | – | $ | – | $ | 2,704 | ||||||||
| Australia | – | 7,509 | 4,705 | 12,214 | ||||||||||||
| Canada | 11,383 | – | – | 11,383 | ||||||||||||
| India | 7,540 | 2,697 | – | 10,237 | ||||||||||||
| Mexico | 4,903 | – | – | 4,903 | ||||||||||||
| Norway | 3,719 | 4,237 | – | 7,956 | ||||||||||||
| Spain | 4,298 | 9,638 | – | 13,936 | ||||||||||||
| Switzerland | 62 | 28,757 | – | 28,819 | ||||||||||||
| Taiwan | 5,643 | 5,925 | – | 11,568 | ||||||||||||
| United Kingdom | 2,909 | 27,726 | – | 30,635 | ||||||||||||
| United States | 3,062 | 9,759 | – | 12,821 | ||||||||||||
| Remaining Countries | – | 256,566 | – | 256,566 | ||||||||||||
| Short-Term Investments | ||||||||||||||||
| Repurchase Agreements | – | 8,910 | – | 8,910 | ||||||||||||
| Money Market Funds | 755 | – | – | 755 | ||||||||||||
| Time Deposits | – | 84 | – | 84 | ||||||||||||
| Total | $ | 46,978 | $ | 361,808 | $ | 4,705 | $ | 413,491 | ||||||||
| (1) | Refer to Note 2(l) for a description of fair value measurements and the three-tier hierarchy of inputs. | |
| (2) | See Schedule of Investments for fair values in each industry and identification of foreign issuers and/or geography. The table above is presented by Investment Type. Industries are presented within an Investment Type should such Investment Type include securities classified as two or more levels within the three- tier fair value hierarchy .When applicable, each Level 3 security is identified on the Schedule of Investments along with the valuation technique utilized. |
A reconciliation of Level 3 investments is presented when the Fund has a material amount of Level 3 investments at the beginning or end of the year in relation to the Fund’s net assets.
The following is a reconciliation of investments with unobservable inputs (Level 3) that were used in determining fair value:
| Investment Type | Common Stocks | |||
| Balance as of November 1, 2020 | $ | – | ||
| Accrued Discounts (Premiums) | – | |||
| Realized Gain (Loss) | 279,367 | |||
| Change in Unrealized Appreciation (Depreciation) | 1,848,490 | |||
| Purchases | – | |||
| Sales | (1,126,120 | ) | ||
| Transfers into Level 3 | 3,703,348 | |||
| Transfers out of Level 3 | – | |||
| Balance as of October 31, 2021 | $ | 4,705,085 | ||
| Change in unrealized appreciation/depreciation for the year ended October 31, 2021, related to Level 3 investments held at October 31, 2021 | $ | 1,848,490 | ||
| 120 | See Notes to Financial Statements. |
Schedule of Investments
INTERNATIONAL OPPORTUNITIES FUND October 31, 2021
| Investments | Shares | U.S. $ Fair Value (000) | ||||||
| LONG-TERM INVESTMENTS 97.38% | ||||||||
| COMMON STOCKS 97.38% | ||||||||
| Australia 4.01% | ||||||||
| Auto Components 1.53% | ||||||||
| GUD Holdings Ltd. | 769,251 | $ | 7,120 | |||||
| Electric: Utilities 0.99% | ||||||||
| AusNet Services | 2,468,497 | 4,591 | ||||||
| Food Products 0.50% | ||||||||
| Costa Group Holdings Ltd. | 1,040,843 | 2,301 | ||||||
| Professional Services 0.99% | ||||||||
| IPH Ltd. | 707,285 | 4,594 | ||||||
| Total Australia | 18,606 | |||||||
| Austria 4.58% | ||||||||
| Banks 1.48% | ||||||||
| BAWAG Group AG†* | 109,048 | 6,858 | ||||||
| Electronic Equipment, Instruments & Components 1.25% | ||||||||
| AT&S Austria Technologie & Systemtechnik AG | 150,991 | 5,794 | ||||||
| Machinery 1.85% | ||||||||
| ANDRITZ AG | 151,425 | 8,601 | ||||||
| Total Austria | 21,253 | |||||||
| Belgium 2.29% | ||||||||
| Equity Real Estate Investment Trusts 1.15% | ||||||||
| Cofinimmo SA | 32,987 | 5,322 | ||||||
| Real Estate Management & Development 1.14% | ||||||||
| Shurgard Self Storage SA | 86,400 | 5,293 | ||||||
| Total Belgium | 10,615 | |||||||
| Canada 3.04% | ||||||||
| Aerospace & Defense 0.54% | ||||||||
| CAE, Inc.* | 83,000 | 2,517 | ||||||
| Metals & Mining 1.12% | ||||||||
| Capstone Mining Corp.* | 1,231,800 | 5,165 | ||||||
| Investments | Shares | U.S. $ Fair Value (000) | ||||||
| Canada (continued) | ||||||||
| Paper & Forest Products 1.38% | ||||||||
| Interfor Corp. | 279,700 | $ | 6,405 | |||||
| Total Canada | 14,087 | |||||||
| China 0.85% | ||||||||
| Food & Staples Retailing 0.36% | ||||||||
| Yixintang Pharmaceutical Group Co. Ltd. Class A | 332,911 | 1,652 | ||||||
| Textiles, Apparel & Luxury Goods 0.49% | ||||||||
| Xtep International Holdings Ltd. | 1,751,500 | 2,291 | ||||||
| Total China | 3,943 | |||||||
| Finland 1.19% | ||||||||
| Machinery | ||||||||
| Konecranes OYJ | 133,218 | 5,541 | ||||||
| France 2.69% | ||||||||
| Construction Materials 0.96% | ||||||||
| Vicat SA | 104,455 | 4,458 | ||||||
| Health Care Providers & Services 1.08% | ||||||||
| Korian SA | 149,496 | 4,980 | ||||||
| Software 0.65% | ||||||||
| Esker SA | 8,835 | 3,018 | ||||||
| Total France | 12,456 | |||||||
| Germany 8.58% | ||||||||
| Aerospace & Defense 0.93% | ||||||||
| Montana Aerospace AG†* | 120,462 | 4,305 | ||||||
| Industrial Conglomerates 1.69% | ||||||||
| Rheinmetall AG | 80,639 | 7,824 | ||||||
| Life Sciences Tools & Services 1.17% | ||||||||
| Gerresheimer AG | 59,340 | 5,445 | ||||||
| Media 0.90% | ||||||||
| Stroeer SE & Co. KGaA | 49,355 | 4,186 | ||||||
| See Notes to Financial Statements. | 121 |
Schedule of Investments (continued)
INTERNATIONAL OPPORTUNITIES FUND October 31, 2021
| Investments | Shares | U.S. $ Fair Value (000) | ||||||
| Germany (continued) | ||||||||
| Real Estate Management & Development 2.59% | ||||||||
| PATRIZIA AG | 264,783 | $ | 7,315 | |||||
| TAG Immobilien AG | 155,058 | 4,711 | ||||||
| 12,026 | ||||||||
| Semiconductors & Semiconductor Equipment 0.54% | ||||||||
| Aixtron SE | 106,461 | 2,528 | ||||||
| Specialty Retail 0.76% | ||||||||
| MYT Netherlands Parent BV ADR* | 132,783 | 3,506 | ||||||
| Total Germany | 39,820 | |||||||
| Hong Kong 1.74% | ||||||||
| Hotels, Restaurants & Leisure 0.32% | ||||||||
| Melco International Development Ltd.* | 1,144,000 | 1,486 | ||||||
| Real Estate Management & Development 0.73% | ||||||||
| Kerry Properties Ltd. | 1,197,500 | 3,385 | ||||||
| Textiles, Apparel & Luxury Goods 0.69% | ||||||||
| Stella International Holdings Ltd. | 2,701,432 | 3,218 | ||||||
| Total Hong Kong | 8,089 | |||||||
| Iceland 1.23% | ||||||||
| Machinery | ||||||||
| Marel HF | 852,233 | 5,714 | ||||||
| India 2.83% | ||||||||
| Banks 1.34% | ||||||||
| Federal Bank Ltd. | 4,770,629 | 6,230 | ||||||
| Capital Markets 1.49% | ||||||||
| UTI Asset Management Co. Ltd. | 496,931 | 6,882 | ||||||
| Total India | 13,112 | |||||||
| Israel 0.68% | ||||||||
| Capital Markets | ||||||||
| Tel Aviv Stock Exchange Ltd. | 574,737 | 3,150 | ||||||
| Investments | Shares | U.S. $ Fair Value (000) | ||||||
| Italy 3.97% | ||||||||
| Auto Components 1.04% | ||||||||
| Brembo SpA | 365,129 | $ | 4,796 | |||||
| Construction Materials 0.61% | ||||||||
| Buzzi Unicem SpA | 121,880 | 2,843 | ||||||
| Diversified Financial Services 1.61% | ||||||||
| Banca Mediolanum SpA | 521,395 | 5,254 | ||||||
| doValue SpA† | 232,683 | 2,231 | ||||||
| 7,485 | ||||||||
| Textiles, Apparel & Luxury Goods 0.71% | ||||||||
| Salvatore Ferragamo SpA* | 153,889 | 3,274 | ||||||
| Total Italy | 18,398 | |||||||
| Japan 18.91% | ||||||||
| Auto Components 0.36% | ||||||||
| FCC Co. Ltd. | 120,700 | 1,671 | ||||||
| Banks 1.17% | ||||||||
| Aozora Bank Ltd. | 236,100 | 5,401 | ||||||
| Beverages 1.04% | ||||||||
| Coca-Cola Bottlers Japan Holdings, Inc. | 349,600 | 4,811 | ||||||
| Building Products 1.27% | ||||||||
| Sanwa Holdings Corp. | 505,900 | 5,901 | ||||||
| Chemicals 0.95% | ||||||||
| Kansai Paint Co. Ltd. | 190,100 | 4,402 | ||||||
| Construction & Engineering 1.22% | ||||||||
| SHO-BOND Holdings Co. Ltd. | 135,200 | 5,663 | ||||||
| Distributors 1.04% | ||||||||
| PALTAC Corp. | 109,200 | 4,835 | ||||||
| Information Technology Services 3.59% | ||||||||
| NS Solutions Corp. | 226,000 | 7,596 | ||||||
| Simplex Holdings, Inc.* | 212,500 | 4,577 | ||||||
| TIS, Inc. | 164,800 | 4,490 | ||||||
| 16,663 | ||||||||
| 122 | See Notes to Financial Statements. |
Schedule of Investments (continued)
INTERNATIONAL OPPORTUNITIES FUND October 31, 2021
| Investments | Shares | U.S. $ Fair Value (000) | ||||||
| Japan (continued) | ||||||||
| Machinery 4.26% | ||||||||
| CKD Corp. | 180,600 | $ | 3,581 | |||||
| DMG Mori Co. Ltd. | 371,600 | 6,399 | ||||||
| Fujitec Co. Ltd. | 202,200 | 4,593 | ||||||
| OSG Corp. | 313,100 | 5,209 | ||||||
| 19,782 | ||||||||
| Professional Services 1.00% | ||||||||
| TechnoPro Holdings, Inc. | 145,300 | 4,644 | ||||||
| Real Estate Management & Development 0.48% | ||||||||
| CRE Inc/Japan | 142,800 | 2,240 | ||||||
| Software 0.84% | ||||||||
| Money Forward, Inc.* | 57,500 | 3,907 | ||||||
| Thrifts & Mortgage Finance 0.77% | ||||||||
| Aruhi Corp. | 307,300 | 3,563 | ||||||
| Wireless Telecommunication Services 0.92% | ||||||||
| Okinawa Cellular Telephone Co. | 94,500 | 4,258 | ||||||
| Total Japan | 87,741 | |||||||
| Mexico 2.43% | ||||||||
| Banks 1.71% | ||||||||
| Banco Santander Mexico SA Institucion de Banca Multiple Grupo Financiero Santand ADR | 1,226,949 | 7,914 | ||||||
| Consumer Finance 0.72% | ||||||||
| Gentera SAB de CV* | 5,583,000 | 3,341 | ||||||
| Total Mexico | 11,255 | |||||||
| Norway 2.11% | ||||||||
| Semiconductors & Semiconductor Equipment 0.76% | ||||||||
| Nordic Semiconductor ASA* | 119,670 | 3,556 | ||||||
| Software 1.35% | ||||||||
| Crayon Group Holding ASA†* | 194,836 | 4,550 | ||||||
| Investments | Shares | U.S. $ Fair Value (000) | ||||||
| Norway (continued) | ||||||||
| Software (continued) | ||||||||
| LINK Mobility Group Holding ASA* | 528,122 | $ | 1,703 | |||||
| 6,253 | ||||||||
| Total Norway | 9,809 | |||||||
| Portugal 1.71% | ||||||||
| Multi-Utilities | ||||||||
| REN - Redes Energeticas Nacionais SGPS SA | 2,601,582 | 7,925 | ||||||
| South Korea 2.17% | ||||||||
| Chemicals 1.05% | ||||||||
| Soulbrain Co. Ltd./New | 21,727 | 4,877 | ||||||
| Semiconductors & Semiconductor Equipment 0.79% | ||||||||
| WONIK IPS Co. Ltd. | 105,163 | 3,650 | ||||||
| Software 0.33% | ||||||||
| Douzone Bizon Co. Ltd. | 22,179 | 1,548 | ||||||
| Total South Korea | 10,075 | |||||||
| Spain 2.47% | ||||||||
| Containers & Packaging 1.41% | ||||||||
| Vidrala SA | 61,722 | 6,543 | ||||||
| Professional Services 1.06% | ||||||||
| Applus Services SA | 545,507 | 4,937 | ||||||
| Total Spain | 11,480 | |||||||
| Sweden 6.74% | ||||||||
| Auto Components 1.26% | ||||||||
| Dometic Group AB† | 401,340 | 5,854 | ||||||
| Biotechnology 0.85% | ||||||||
| Vitrolife AB | 60,637 | 3,947 | ||||||
| Commercial Services & Supplies 1.47% | ||||||||
| Loomis AB | 252,739 | 6,825 | ||||||
| See Notes to Financial Statements. | 123 |
Schedule of Investments (continued)
INTERNATIONAL OPPORTUNITIES FUND October 31, 2021
| Investments | Shares | U.S. $ Fair Value (000) | ||||||
| Sweden (continued) | ||||||||
| Diversified Consumer Services 0.62% | ||||||||
| Cary Group AB* | 212,933 | $ | 2,851 | |||||
| Food & Staples Retailing 0.76% | ||||||||
| Axfood AB | 144,643 | 3,546 | ||||||
| Internet & Direct Marketing Retail 0.78% | ||||||||
| Boozt AB†* | 215,076 | 3,623 | ||||||
| Software 1.00% | ||||||||
| Cint Group AB* | 306,950 | 4,632 | ||||||
| Total Sweden | 31,278 | |||||||
| Switzerland 3.37% | ||||||||
| Containers & Packaging 0.46% | ||||||||
| SIG Combibloc Group AG* | 82,193 | 2,150 | ||||||
| Health Care Equipment & Supplies 1.01% | ||||||||
| Medmix AG†* | 98,144 | 4,692 | ||||||
| Life Sciences Tools & Services 1.00% | ||||||||
| Tecan Group AG | 7,576 | 4,642 | ||||||
| Machinery 0.90% | ||||||||
| Sulzer AG | 42,165 | 4,145 | ||||||
| Total Switzerland | 15,629 | |||||||
| United Kingdom 18.46% | ||||||||
| Aerospace & Defense 1.09% | ||||||||
| Senior plc* | 2,298,460 | 5,039 | ||||||
| Beverages 1.79% | ||||||||
| Britvic plc | 684,438 | 8,318 | ||||||
| Biotechnology 0.77% | ||||||||
| Genus plc | 47,031 | 3,567 | ||||||
| Capital Markets 1.56% | ||||||||
| Man Group plc | 2,269,110 | 7,226 | ||||||
| Investments | Shares | U.S. $ Fair Value (000) | ||||||
| United Kingdom (continued) | ||||||||
| Construction Materials 1.25% | ||||||||
| Breedon Group plc | 4,320,949 | $ | 5,795 | |||||
| Entertainment 0.63% | ||||||||
| Frontier Developments plc* | 87,093 | 2,938 | ||||||
| Equity Real Estate Investment Trusts 2.22% | ||||||||
| Big Yellow Group plc | 232,182 | 4,700 | ||||||
| UNITE Group plc (The) | 376,604 | 5,623 | ||||||
| 10,323 | ||||||||
| Household Durables 0.80% | ||||||||
| Focusrite plc | 201,229 | 3,732 | ||||||
| Insurance 0.43% | ||||||||
| Lancashire Holdings Ltd. | 285,233 | 1,975 | ||||||
| Machinery 1.17% | ||||||||
| Concentric AB | 184,164 | 5,420 | ||||||
| Media 0.69% | ||||||||
| S4 Capital plc* | 321,687 | 3,195 | ||||||
| Multi-Line Retail 1.14% | ||||||||
| B&M European Value Retail SA | 610,115 | 5,286 | ||||||
| Pharmaceuticals 0.80% | ||||||||
| Dechra Pharmaceuticals plc | 53,209 | 3,728 | ||||||
| Professional Services 1.01% | ||||||||
| SThree plc | 582,992 | 4,699 | ||||||
| Real Estate Management & Development 1.05% | ||||||||
| Savills plc | 250,405 | 4,859 | ||||||
| Specialty Retail 0.63% | ||||||||
| WH Smith plc* | 136,541 | 2,923 | ||||||
| Trading Companies & Distributors 1.43% | ||||||||
| Grafton Group plc | 360,624 | 6,624 | ||||||
| Total United Kingdom | 85,647 | |||||||
| 124 | See Notes to Financial Statements. |
Schedule of Investments (continued)
INTERNATIONAL OPPORTUNITIES FUND October 31, 2021
| Investments | Shares | U.S. $ Fair Value (000) | ||||||
| United States 1.33% | ||||||||
| Exchange- Traded Funds | ||||||||
| VanEck Vectors Junior Gold Miners | 142,655 | $ | 6,173 | |||||
| Total Common Stocks (cost $399,157,340) | 451,796 | |||||||
| Investments | Principal Amount (000) | U.S. $ Fair Value (000) | ||||||
| SHORT-TERM INVESTMENTS 1.62% | ||||||||
| Repurchase Agreements 1.62% | ||||||||
| Repurchase Agreement dated 10/29/2021, 0.00% due 11/1/2021 with Fixed Income Clearing Corp. collateralized by $8,099,600 of U.S. Treasury Note at 0.375% due 9/30/2027; value: $7,667,298; proceeds: $7,516,954 (cost $7,516,954) | $7,517 | $ | 7,517 | |||||
| Total Investments in Securities 99.00% (cost $406,674,294) | 459,313 | |||||||
| Other Assets and Liabilities – Net(a) 1.00% | 4,635 | |||||||
| Net Assets 100.00% | $ | 463,948 | ||||||
| ADR | American Depositary Receipt. | |
| † | Security was purchased pursuant to Rule 144A under the Securities Act of 1933 and, unless registered under such Act or exempted from registration, may only be resold to qualified institutional buyers. At October 31, 2021, the total value of Rule 144A securities was $32,113, which represents 6.92% of net assets. | |
| * | Non-income producing security. | |
| (a) | Other Assets and Liabilities - Net include net unrealized appreciation on total return swaps as follows: |
Open Total Return Swap Contracts at October 31, 2021:
| Swap Counterparty | Referenced Index* | Referenced Spread | Units | Position | Termination Date | Notional Amount | Notional Value | Unrealized Appreciation | ||||||||||||||
| Bank of America | MLLACEB | 1 Mo. LIBOR + 0.49% | 94,010 | Long | 6/15/2022 | $9,413,221 | $9,413,221 | $0 | ||||||||||||||
| * | Merrill Lynch Custom Basket Index. |
LIBOR London Interbank Offered Rate.
| See Notes to Financial Statements. | 125 |
Schedule of Investments (concluded)
INTERNATIONAL OPPORTUNITIES FUND October 31, 2021
The following is a summary of the inputs used as of October 31, 2021 in valuing the Fund’s investments carried at fair value(1):
| Investment Type(2) | Level 1 (000) | Level 2 (000) | Level 3 (000) | Total (000) | ||||||||||||
| Long-Term Investments | ||||||||||||||||
| Common Stocks | ||||||||||||||||
| Belgium | $ | 5,293 | $ | 5,322 | $ | – | $ | 10,615 | ||||||||
| Canada | 14,087 | – | – | 14,087 | ||||||||||||
| France | 3,018 | 9,438 | – | 12,456 | ||||||||||||
| Germany | 10,821 | 28,999 | – | 39,820 | ||||||||||||
| Hong Kong | 3,218 | 4,871 | – | 8,089 | ||||||||||||
| Iceland | 5,714 | – | – | 5,714 | ||||||||||||
| Japan | 4,577 | 83,164 | – | 87,741 | ||||||||||||
| Mexico | 11,255 | – | – | 11,255 | ||||||||||||
| Portugal | 7,925 | – | – | 7,925 | ||||||||||||
| Spain | 11,480 | – | – | 11,480 | ||||||||||||
| Sweden | 14,308 | 16,970 | – | 31,278 | ||||||||||||
| Switzerland | 4,692 | 10,937 | – | 15,629 | ||||||||||||
| United Kingdom | 53,009 | 32,638 | – | 85,647 | ||||||||||||
| United States | 6,173 | – | – | 6,173 | ||||||||||||
| Remaining Countries | – | 103,887 | – | 103,887 | ||||||||||||
| Short-Term Investments | ||||||||||||||||
| Repurchase Agreements | – | 7,517 | – | 7,517 | ||||||||||||
| Total | $ | 155,570 | $ | 303,743 | $ | – | $ | 459,313 | ||||||||
| Other Financial Instruments | ||||||||||||||||
| Total Return Swap Contracts | ||||||||||||||||
| Assets | $ | – | $ | – | $ | – | $ | – | ||||||||
| Liabilities | – | – | – | – | ||||||||||||
| Total | $ | – | $ | – | $ | – | $ | – | ||||||||
| (1) | Refer to Note 2(l) for a description of fair value measurements and the three-tier hierarchy of inputs. | |
| (2) | See Schedule of Investments for fair values in each industry and identification of foreign issuers and/or geography. The table above is presented by Investment Type. Industries are presented within an Investment Type should such Investment Type include securities classified as two or more levels within the three-tier fair value hierarchy. When applicable each Level 3 security is identified on the Schedule of Investments along with the valuation technique utilized. |
A reconciliation of Level 3 investments is presented when the Fund has a material amount of Level 3 investments at the beginning or end of the year in relation to the Fund’s net assets.
| 126 | See Notes to Financial Statements. |
Schedule of Investments
INTERNATIONAL VALUE FUND October 31, 2021
| Investments | Shares | U.S. $ Fair Value (000) | ||||||
| LONG-TERM INVESTMENTS 96.93% | ||||||||
| COMMON STOCKS 96.93% | ||||||||
| Australia 4.01% | ||||||||
| Banks 0.96% | ||||||||
| National Australia Bank Ltd. | 287,366 | $ | 6,248 | |||||
| Equity Real Estate Investment Trusts 1.35% | ||||||||
| Goodman Group | 531,550 | 8,801 | ||||||
| Metals & Mining 1.70% | ||||||||
| BHP Group Ltd. | 403,407 | 11,080 | ||||||
| Total Australia | 26,129 | |||||||
| Austria 3.18% | ||||||||
| Banks 1.70% | ||||||||
| BAWAG Group AG†* | 175,525 | 11,040 | ||||||
| Oil, Gas & Consumable Fuels 1.48% | ||||||||
| OMV AG | 159,765 | 9,673 | ||||||
| Total Austria | 20,713 | |||||||
| Belgium 0.98% | ||||||||
| Beverages 0.28% | ||||||||
| Anheuser-Busch InBev SA | 29,218 | 1,787 | ||||||
| Equity Real Estate Investment Trusts 0.70% | ||||||||
| Cofinimmo SA | 28,270 | 4,561 | ||||||
| Total Belgium | 6,348 | |||||||
| Canada 2.43% | ||||||||
| Banks 1.35% | ||||||||
| Royal Bank of Canada | 84,400 | 8,785 | ||||||
| Oil, Gas & Consumable Fuels 1.08% | ||||||||
| Pembina Pipeline Corp.(a) | 211,933 | 7,016 | ||||||
| Total Canada | 15,801 | |||||||
| Investments | Shares | U.S. $ Fair Value (000) | ||||||
| China 1.66% | ||||||||
| Construction Materials 0.52% | ||||||||
| China Resources Cement Holdings Ltd. | 4,040,000 | $ | 3,397 | |||||
| Real Estate Management & Development 0.46% | ||||||||
| Logan Group Co., Ltd. | 2,972,000 | 2,977 | ||||||
| Specialty Retail 0.68% | ||||||||
| Topsports International Holdings Ltd.† | 3,652,000 | 4,437 | ||||||
| Total China | 10,811 | |||||||
| Finland 1.58% | ||||||||
| Banks | ||||||||
| Nordea Bank Abp | 837,391 | 10,255 | ||||||
| France 18.19% | ||||||||
| Aerospace & Defense 3.08% | ||||||||
| Airbus SE* | 63,867 | 8,193 | ||||||
| Safran SA | 30,872 | 4,155 | ||||||
| Thales SA | 83,298 | 7,686 | ||||||
| 20,034 | ||||||||
| Banks 1.75% | ||||||||
| Credit Agricole SA | 753,544 | 11,369 | ||||||
| Building Products 1.69% | ||||||||
| Cie de Saint-Gobain | 159,693 | 11,021 | ||||||
| Construction & Engineering 0.76% | ||||||||
| Vinci SA | 46,223 | 4,942 | ||||||
| Diversified Telecommunication Services 1.40% | ||||||||
| Orange SA | 837,504 | 9,133 | ||||||
| Gas Utilities 0.61% | ||||||||
| Rubis SCA | 124,364 | 3,986 | ||||||
| Information Technology Services 1.41% | ||||||||
| Capgemini SE | 39,396 | 9,186 | ||||||
| See Notes to Financial Statements. | 127 |
Schedule of Investments (continued)
INTERNATIONAL VALUE FUND October 31, 2021
| Investments | Shares | U.S. $ Fair Value (000) | ||||||
| France (continued) | ||||||||
| Insurance 1.91% | ||||||||
| AXA SA | 426,671 | $ | 12,413 | |||||
| Multi-Utilities 2.21% | ||||||||
| Engie SA | 342,664 | 4,874 | ||||||
| Veolia Environnement SA(a) | 290,540 | 9,489 | ||||||
| 14,363 | ||||||||
| Pharmaceuticals 2.38% | ||||||||
| Sanofi | 154,004 | 15,469 | ||||||
| Textiles, Apparel & Luxury Goods 0.99% | ||||||||
| Kering SA | 8,624 | 6,472 | ||||||
| Total France | 118,388 | |||||||
| Germany 7.12% | ||||||||
| Air Freight & Logistics 1.45% | ||||||||
| Deutsche Post AG Registered Shares | 152,309 | 9,429 | ||||||
| Auto Components 0.66% | ||||||||
| Continental AG* | 36,398 | 4,279 | ||||||
| Automobiles 1.30% | ||||||||
| Volkswagen AG | 26,051 | 8,469 | ||||||
| Chemicals 1.22% | ||||||||
| BASF SE | 110,498 | 7,953 | ||||||
| Insurance 1.73% | ||||||||
| Allianz SE Registered Shares | 48,506 | 11,264 | ||||||
| Semiconductors & Semiconductor Equipment 0.76% | ||||||||
| Infineon Technologies AG | 105,501 | 4,941 | ||||||
| Total Germany | 46,335 | |||||||
| Hong Kong 1.18% | ||||||||
| Real Estate Management & Development | ||||||||
| Kerry Properties Ltd. | 2,720,500 | 7,690 | ||||||
| Investments | Shares | U.S. $ Fair Value (000) | ||||||
| India 1.61% | ||||||||
| Banks 0.90% | ||||||||
| Federal Bank Ltd. | 4,475,072 | $ | 5,844 | |||||
| Oil, Gas & Consumable Fuels 0.71% | ||||||||
| Petronet LNG Ltd. | 1,509,864 | 4,635 | ||||||
| Total India | 10,479 | |||||||
| Ireland 0.97% | ||||||||
| Beverages | ||||||||
| C&C Group plc* | 1,775,503 | 6,298 | ||||||
| Italy 1.44% | ||||||||
| Electric: Utilities | ||||||||
| Enel SpA | 1,118,952 | 9,368 | ||||||
| Japan 16.87% | ||||||||
| Auto Components 1.54% | ||||||||
| Denso Corp. | 138,700 | 10,055 | ||||||
| Banks 1.79% | ||||||||
| Sumitomo Mitsui Financial Group, Inc. | 359,600 | 11,669 | ||||||
| Beverages 1.50% | ||||||||
| Asahi Group Holdings Ltd. | 214,500 | 9,734 | ||||||
| Building Products 1.34% | ||||||||
| Sanwa Holdings Corp. | 750,000 | 8,748 | ||||||
| Diversified Financial Services 1.68% | ||||||||
| ORIX Corp. | 549,100 | 10,914 | ||||||
| Electrical Equipment 1.37% | ||||||||
| Fuji Electric Co. Ltd. | 182,900 | 8,943 | ||||||
| Electronic Equipment, Instruments & Components 0.88% | ||||||||
| Murata Manufacturing Co. Ltd. | 77,400 | 5,742 | ||||||
| Household Durables 1.64% | ||||||||
| Sony Group Corp. | 92,000 | 10,653 | ||||||
| 128 | See Notes to Financial Statements. |
Schedule of Investments (continued)
INTERNATIONAL VALUE FUND October 31, 2021
| Investments | Shares | U.S. $ Fair Value (000) | ||||||
| Japan (continued) | ||||||||
| Industrial Conglomerates 1.44% | ||||||||
| Hitachi Ltd. | 162,200 | $ | 9,347 | |||||
| Information Technology Services 0.74% | ||||||||
| SCSK Corp. | 237,600 | 4,808 | ||||||
| Insurance 0.83% | ||||||||
| Tokio Marine Holdings, Inc. | 102,700 | 5,409 | ||||||
| Machinery 0.64% | ||||||||
| Fujitec Co. Ltd. | 182,000 | 4,134 | ||||||
| Trading Companies & Distributors 1.48% | ||||||||
| ITOCHU Corp. | 336,700 | 9,603 | ||||||
| Total Japan | 109,759 | |||||||
| Mexico 1.46% | ||||||||
| Banks 0.69% | ||||||||
| Grupo Financiero Banorte SAB de CV | 704,866 | 4,463 | ||||||
| Transportation Infrastructure 0.77% | ||||||||
| Grupo Aeroportuario del Pacifico SAB de CV Class B* | 398,700 | 5,026 | ||||||
| Total Mexico | 9,489 | |||||||
| Netherlands 4.74% | ||||||||
| Food & Staples Retailing 1.92% | ||||||||
| Koninklijke Ahold Delhaize NV | 383,638 | 12,481 | ||||||
| Oil, Gas & Consumable Fuels 2.82% | ||||||||
| Royal Dutch Shell plc Class A ADR | 400,636 | 18,397 | ||||||
| Total Netherlands | 30,878 | |||||||
| Singapore 1.05% | ||||||||
| Banks | ||||||||
| United Overseas Bank Ltd. | 343,400 | 6,826 | ||||||
| Investments | Shares | U.S. $ Fair Value (000) | ||||||
| South Africa 1.56% | ||||||||
| Metals & Mining | ||||||||
| Anglo American plc | 266,233 | $ | 10,128 | |||||
| South Korea 1.03% | ||||||||
| Technology Hardware, Storage & Peripherals | ||||||||
| Samsung Electronics Co. Ltd. | 112,198 | 6,718 | ||||||
| Spain 1.34% | ||||||||
| Banks | ||||||||
| Banco Bilbao Vizcaya Argentaria SA | 1,250,805 | 8,753 | ||||||
| Sweden 2.00% | ||||||||
| Commercial Services & Supplies 0.99% | ||||||||
| Loomis AB | 237,180 | 6,404 | ||||||
| Oil, Gas & Consumable Fuels 1.01% | ||||||||
| Lundin Energy AB | 166,631 | 6,581 | ||||||
| Total Sweden | 12,985 | |||||||
| Switzerland 5.35% | ||||||||
| Capital Markets 2.35% | ||||||||
| UBS Group AG | 840,109 | 15,292 | ||||||
| Pharmaceuticals 3.00% | ||||||||
| Novartis AG Registered Shares | 109,054 | 9,020 | ||||||
| Roche Holding AG | 27,188 | 10,533 | ||||||
| 19,553 | ||||||||
| Total Switzerland | 34,845 | |||||||
| United Kingdom 15.95% | ||||||||
| Banks 2.74% | ||||||||
| Barclays plc | 3,023,070 | 8,342 | ||||||
| Standard Chartered plc | 1,405,032 | 9,502 | ||||||
| 17,844 | ||||||||
| Electric: Utilities 1.54% | ||||||||
| SSE plc | 446,061 | 10,045 | ||||||
| See Notes to Financial Statements. | 129 |
Schedule of Investments (continued)
INTERNATIONAL VALUE FUND October 31, 2021
| Investments | Shares | U.S. $ Fair Value (000) | ||||||
| United Kingdom (continued) | ||||||||
| Equity Real Estate Investment Trusts 1.26% | ||||||||
| UNITE Group plc (The) | 550,669 | $ | 8,222 | |||||
| Household Durables 1.15% | ||||||||
| Persimmon plc | 201,042 | 7,491 | ||||||
| Insurance 2.20% | ||||||||
| Beazley plc* | 793,817 | 4,237 | ||||||
| Prudential plc | 492,390 | 10,049 | ||||||
| 14,286 | ||||||||
| Multi-Line Retail 1.37% | ||||||||
| Next plc | 81,700 | 8,904 | ||||||
| Pharmaceuticals 2.53% | ||||||||
| AstraZeneca plc | 85,385 | 10,682 | ||||||
| GlaxoSmithKline plc | 278,914 | 5,790 | ||||||
| 16,472 | ||||||||
| Tobacco 1.89% | ||||||||
| British American Tobacco plc | 164,493 | 5,722 | ||||||
| Imperial Brands plc | 310,601 | 6,554 | ||||||
| 12,276 | ||||||||
| Trading Companies & Distributors 1.27% | ||||||||
| Ashtead Group plc | 98,498 | 8,255 | ||||||
| Total United Kingdom | 103,795 | |||||||
| United States 1.23% | ||||||||
| Auto Components | ||||||||
| Lear Corp. | 46,450 | 7,983 | ||||||
| Total Common Stocks (cost $560,849,776) | 630,774 | |||||||
| Investments | Principal Amount (000) | U.S. $ Fair Value (000) | ||||||
| SHORT-TERM INVESTMENTS 3.48% | ||||||||
| Repurchase Agreements 3.23% | ||||||||
| Repurchase Agreement dated 10/29/2021, 0.00% due 11/1/2021 with Fixed Income Clearing Corp. collateralized by $20,247,300 of U.S. Treasury Note at 2.25% due 08/15/2027; value: $21,405,498; proceeds: $20,985,776 (cost $20,985,776) | $20,986 | $ | 20,986 | |||||
| Shares | ||||||||
| Money Market Funds 0.22% | ||||||||
| Fidelity Government Portfolio(b) (cost $1,462,426) | 1,462,426 | 1,462 | ||||||
| Time Deposits 0.03% | ||||||||
| CitiBank N.A.(b) (cost $162,492) | 162,492 | 162 | ||||||
| Total Short-Term Investments (cost $22,610,694) | 22,610 | |||||||
| Total Investments in Securities 100.41% (cost $583,460,470) | 653,384 | |||||||
| Other Assets and Liabilities – Net (0.41)% | (2,661 | ) | ||||||
| Net Assets 100.00% | $ | 650,723 | ||||||
| ADR | American Depositary Receipt. | |
| † | Security was purchased pursuant to Rule 144A under the Securities Act of 1933 and, unless registered under such Act or exempted from registration, may only be resold to qualified institutional buyers. At October 31, 2021, the total value of Rule 144A securities was $15,477, which represents 2.38% of net assets. | |
| * | Non-income producing security. | |
| (a) | All or a portion of this security is temporarily on loan to unaffiliated broker/dealers. | |
| (b) | Security was purchased with the cash collateral from loaned securities. |
| 130 | See Notes to Financial Statements. |
Schedule of Investments (concluded)
INTERNATIONAL VALUE FUND October 31, 2021
The following is a summary of the inputs used as of October 31, 2021 in valuing the Fund’s investments carried at fair value(1):
| Investment Type(2) | Level 1 (000) | Level 2 (000) | Level 3 (000) | Total (000) | ||||||||||||
| Long-Term Investments | ||||||||||||||||
| Common Stocks | ||||||||||||||||
| Canada | $ | 15,801 | $ | – | $ | – | $ | 15,801 | ||||||||
| Ireland | 6,298 | – | – | 6,298 | ||||||||||||
| Mexico | 9,489 | – | – | 9,489 | ||||||||||||
| Netherlands | 18,397 | 12,481 | – | 30,878 | ||||||||||||
| Sweden | 6,404 | 6,581 | – | 12,985 | ||||||||||||
| United Kingdom | 4,237 | 99,558 | – | 103,795 | ||||||||||||
| United States | 7,983 | – | – | 7,983 | ||||||||||||
| Remaining Countries | – | 443,545 | – | 443,545 | ||||||||||||
| Short-Term Investments | ||||||||||||||||
| Repurchase Agreements | – | 20,986 | – | 20,986 | ||||||||||||
| Money Market Funds | 1,462 | – | – | 1,462 | ||||||||||||
| Time Deposits | – | 162 | – | 162 | ||||||||||||
| Total | $ | 70,071 | $ | 583,313 | $ | – | $ | 653,384 | ||||||||
| (1) | Refer to Note 2(l) for a description of fair value measurements and the three-tier hierarchy of inputs. | |
| (2) | See Schedule of Investments for fair values in each industry and identification of foreign issuers and/or geography. The table above is presented by Investment Type. Industries are presented within an Investment Type should such Investment Type include securities classified as two or more levels within the three-tier fair value hierarchy. When applicable each Level 3 security is identified on the Schedule of Investments along with the valuation technique utilized. |
A reconciliation of Level 3 investments is presented when the Fund has a material amount of Level 3 investments at the beginning or end of the year in relation to the Fund’s net assets.
| See Notes to Financial Statements. | 131 |
Schedule of Investments
MICRO CAP GROWTH FUND October 31, 2021
| Investments | Shares | Fair Value (000) | ||||||
| LONG-TERM INVESTMENTS 98.55% | ||||||||
| COMMON STOCKS 98.55% | ||||||||
| Air Freight & Logistics 1.50% | ||||||||
| Atlas Air Worldwide Holdings, Inc.* | 73,462 | $ | 5,959 | |||||
| Auto Components 1.51% | ||||||||
| Gentherm, Inc.* | 81,386 | 5,992 | ||||||
| Banks 2.94% | ||||||||
| Bancorp, Inc. (The)* | 201,621 | 6,160 | ||||||
| Silvergate Capital Corp. Class A* | 35,233 | 5,518 | ||||||
| Total | 11,678 | |||||||
| Beverages 1.98% | ||||||||
| Celsius Holdings, Inc.* | 81,460 | 7,863 | ||||||
| Biotechnology 12.77% | ||||||||
| Beam Therapeutics, Inc.* | 23,642 | 2,099 | ||||||
| BELLUS Health, Inc. (Canada)*(a)(b) | 301,481 | 2,234 | ||||||
| CareDx, Inc.* | 49,714 | 2,536 | ||||||
| Curis, Inc.* | 396,013 | 2,574 | ||||||
| Gossamer Bio, Inc.* | 143,664 | 1,784 | ||||||
| Insmed, Inc.* | 69,001 | 2,080 | ||||||
| Karuna Therapeutics, Inc.* | 41,453 | 5,819 | ||||||
| Krystal Biotech, Inc.* | 105,117 | 5,265 | ||||||
| Merus NV (Netherlands)*(a) | 70,305 | 1,972 | ||||||
| Myovant Sciences Ltd. (United Kingdom)*(a) | 177,883 | 3,892 | ||||||
| Protagonist Therapeutics, Inc.* | 60,266 | 1,878 | ||||||
| Rigel Pharmaceuticals, Inc.* | 1,604,032 | 5,390 | ||||||
| Rocket Pharmaceuticals, Inc.* | 85,759 | 2,548 | ||||||
| Syndax Pharmaceuticals, Inc.* | 105,561 | 2,053 | ||||||
| TG Therapeutics, Inc.* | 71,332 | 2,227 | ||||||
| Turning Point Therapeutics, Inc.* | 27,933 | 1,162 | ||||||
| Xenon Pharmaceuticals, Inc. (Canada)*(a) | 167,780 | 5,226 | ||||||
| Total | 50,739 | |||||||
| Investments | Shares | Fair Value (000) | ||||||
| Capital Markets 3.12% | ||||||||
| AssetMark Financial Holdings, Inc.* | 203,093 | $ | 5,207 | |||||
| Piper Sandler Cos. | 43,560 | 7,174 | ||||||
| Total | 12,381 | |||||||
| Commercial Services & Supplies 2.40% | ||||||||
| Montrose Environmental Group, Inc.* | 139,267 | 9,547 | ||||||
| Communications Equipment 3.25% | ||||||||
| Calix, Inc.* | 206,028 | 12,895 | ||||||
| Construction & Engineering 2.04% | ||||||||
| Ameresco, Inc. Class A* | 98,796 | 8,114 | ||||||
| Diversified Telecommunication Services 1.99% | ||||||||
| Ooma, Inc.* | 342,126 | 7,903 | ||||||
| Electronic Equipment, Instruments & Components 1.27% | ||||||||
| OSI Systems, Inc.* | 54,035 | 5,031 | ||||||
| Health Care Equipment & Supplies 10.80% | ||||||||
| Axonics, Inc.* | 134,719 | 9,882 | ||||||
| CryoPort, Inc.* | 78,784 | 6,424 | ||||||
| NeuroPace, Inc.*(b) | 130,269 | 1,975 | ||||||
| OrthoPediatrics Corp.* | 108,226 | 7,703 | ||||||
| Outset Medical, Inc.* | 79,804 | 4,251 | ||||||
| Pulmonx Corp.* | 117,605 | 4,578 | ||||||
| Shockwave Medical, Inc.* | 18,512 | 3,956 | ||||||
| SI-BONE, Inc.* | 82,566 | 1,862 | ||||||
| Treace Medical Concepts, Inc.* | 99,139 | 2,286 | ||||||
| Total | 42,917 | |||||||
| Health Care Providers & Services 0.92% | ||||||||
| Castle Biosciences, Inc.* | 58,457 | 3,645 | ||||||
| Health Care Technology 1.20% | ||||||||
| Health Catalyst, Inc.* | 90,719 | 4,775 | ||||||
| Hotels, Restaurants & Leisure 2.61% | ||||||||
| Kura Sushi USA, Inc. Class A* | 42,932 | 1,828 | ||||||
| Lindblad Expeditions Holdings, Inc.* | 154,215 | 2,306 | ||||||
| Monarch Casino & Resort, Inc.* | 86,625 | 6,256 | ||||||
| Total | 10,390 | |||||||
| 132 | See Notes to Financial Statements. |
Schedule of Investments (continued)
MICRO CAP GROWTH FUND October 31, 2021
| Investments | Shares | Fair Value (000) | ||||||
| Household Durables 5.41% | ||||||||
| Green Brick Partners, Inc.* | 178,623 | $ | 4,653 | |||||
| LGI Homes, Inc.* | 26,299 | 3,927 | ||||||
| Lovesac Co. (The)* | 102,620 | 8,005 | ||||||
| Sonos, Inc.* | 150,801 | 4,919 | ||||||
| Total | 21,504 | |||||||
| Household Products 0.87% | ||||||||
| Central Garden & Pet Co.* | 66,831 | 3,447 | ||||||
| Interactive Media & Services 0.93% | ||||||||
| Eventbrite, Inc. Class A* | 182,971 | 3,703 | ||||||
| Leisure Products 0.89% | ||||||||
| Johnson Outdoors, Inc. Class A | 14,341 | 1,523 | ||||||
| Malibu Boats, Inc. Class A* | 28,537 | 2,015 | ||||||
| Total | 3,538 | |||||||
| Life Sciences Tools & Services 2.19% | ||||||||
| Codexis, Inc.* | 58,907 | 2,048 | ||||||
| NanoString Technologies, Inc.* | 50,309 | 2,430 | ||||||
| Quanterix Corp.* | 83,852 | 4,244 | ||||||
| Total | 8,722 | |||||||
| Machinery 5.63% | ||||||||
| Chart Industries, Inc.* | 28,753 | 5,104 | ||||||
| Evoqua Water Technologies Corp.* | 115,403 | 4,828 | ||||||
| Shyft Group, Inc. (The) | 237,832 | 9,801 | ||||||
| Westport Fuel System, Inc. (Canada)*(a)(b) | 801,783 | 2,638 | ||||||
| Total | 22,371 | |||||||
| Media 1.25% | ||||||||
| Criteo SA ADR* | 150,741 | 4,981 | ||||||
| Personal Products 1.28% | ||||||||
| elf Beauty, Inc.* | 157,854 | 5,100 | ||||||
| Pharmaceuticals 2.69% | ||||||||
| Fulcrum Therapeutics, Inc.* | 68,185 | 1,510 | ||||||
| Intra-Cellular Therapies, Inc.* | 173,170 | 7,458 | ||||||
| Pliant Therapeutics, Inc.*(b) | 108,361 | 1,726 | ||||||
| Total | 10,694 | |||||||
| Investments | Shares | Fair Value (000) | ||||||
| Professional Services 2.14% | ||||||||
| Kforce, Inc. | 78,591 | $ | 5,090 | |||||
| Willdan Group, Inc.* | 101,901 | 3,406 | ||||||
| Total | 8,496 | |||||||
| Semiconductors & Semiconductor Equipment 5.97% | ||||||||
| CEVA, Inc.* | 100,464 | 4,582 | ||||||
| Ichor Holdings Ltd.* | 141,561 | 6,189 | ||||||
| Impinj, Inc.* | 92,966 | 6,482 | ||||||
| Rambus, Inc.* | 277,241 | 6,451 | ||||||
| Total | 23,704 | |||||||
| Software 10.73% | ||||||||
| Agilysys, Inc.* | 87,986 | 4,199 | ||||||
| Arteris, Inc.* | 191,460 | 4,279 | ||||||
| Cerence, Inc.* | 55,775 | 5,864 | ||||||
| Domo, Inc. Class B* | 59,993 | 5,300 | ||||||
| Sprout Social, Inc. Class A* | 86,855 | 11,090 | ||||||
| Telos Corp.* | 193,728 | 5,019 | ||||||
| Zuora, Inc. Class A* | 314,178 | 6,868 | ||||||
| Total | 42,619 | |||||||
| Specialty Retail 4.72% | ||||||||
| Children’s Place, Inc. (The)* | 30,908 | 2,562 | ||||||
| Citi Trends, Inc.* | 77,620 | 6,005 | ||||||
| Container Store Group, Inc. (The)* | 486,912 | 5,385 | ||||||
| Sleep Number Corp.* | 54,144 | 4,783 | ||||||
| Total | 18,735 | |||||||
| Technology Hardware, Storage & Peripherals 0.85% | ||||||||
| Avid Technology, Inc.* | 117,749 | 3,372 | ||||||
| Trading Companies & Distributors 1.12% | ||||||||
| Rush Enterprises, Inc. Class A | 85,618 | 4,459 | ||||||
| Wireless Telecommunication Services 1.58% | ||||||||
| Gogo, Inc.*(b) | 386,472 | 6,284 | ||||||
| Total Common Stocks (cost $312,444,470) | 391,558 | |||||||
| See Notes to Financial Statements. | 133 |
Schedule of Investments (concluded)
MICRO CAP GROWTH FUND October 31, 2021
| Investments | Principal Amount (000) | Fair Value (000) | ||||||
| SHORT-TERM INVESTMENTS 3.08% | ||||||||
| Repurchase Agreements 1.00% | ||||||||
| Repurchase Agreement dated 10/29/2021, 0.00% due 11/1/2021 with Fixed Income Clearing Corp. collateralized by $4,283,800 of U.S. Treasury Note at 0.375% due 09/30/2027; value: $4,055,160; proceeds: $3,975,645 (cost $3,975,645) | $3,976 | $ | 3,976 | |||||
| Investments | Shares | Fair Value (000) | ||||||
| Money Market Funds 1.87% | ||||||||
| Fidelity Government Portfolio(c) (cost $7,428,695) | 7,428,695 | $ | 7,429 | |||||
| Time Deposits 0.21% | ||||||||
| CitiBank N.A.(c) (cost $825,411) | 825,411 | 825 | ||||||
| Total Short-Term Investments (cost $12,229,751) | 12,230 | |||||||
| Total Investments in Securities 101.63% (cost $324,674,221) | 403,788 | |||||||
| Other Assets and Liabilities – Net (1.63)% | (6,473 | ) | ||||||
| Net Assets 100.00% | $ | 397,315 | ||||||
| ADR | American Depositary Receipt. | |
| * | Non-income producing security. | |
| (a) | Foreign security traded in U.S. dollars. | |
| (b) | All or a portion of this security is temporarily on loan to unaffiliated broker/dealers. | |
| (c) | Security was purchased with the cash collateral from loaned securities. |
The following is a summary of the inputs used as of October 31, 2021 in valuing the Fund’s investments carried at fair value(1):
| Investment Type(2) | Level 1 (000) | Level 2 (000) | Level 3 (000) | Total (000) | ||||||||||||
| Long-Term Investments | ||||||||||||||||
| Common Stocks | $ | 391,558 | $ | – | $ | – | $ | 391,558 | ||||||||
| Short-Term Investments | ||||||||||||||||
| Repurchase Agreements | – | 3,976 | – | 3,976 | ||||||||||||
| Money Market Funds | 7,429 | – | – | 7,429 | ||||||||||||
| Time Deposits | – | 825 | – | 825 | ||||||||||||
| Total | $ | 398,987 | $ | 4,801 | $ | – | $ | 403,788 | ||||||||
| (1) | Refer to Note 2(l) for a description of fair value measurements and the three-tier hierarchy of inputs. | |
| (2) | See Schedule of Investments for fair values in each industry and identification of foreign issuers and/or geography. When applicable each Level 3 security is identified on the Schedule of Investments along with the valuation technique utilized. |
A reconciliation of Level 3 investments is presented when the Fund has a material amount of Level 3 investments at the beginning or end of the year in relation to the Fund’s net assets.
| 134 | See Notes to Financial Statements. |
Schedule of Investments
VALUE OPPORTUNITIES FUND October 31, 2021
| Investments | Shares | Fair Value (000) | ||||||
| LONG-TERM INVESTMENTS 99.31% | ||||||||
| COMMON STOCKS 99.31% | ||||||||
| Auto Components 2.31% | ||||||||
| LCI Industries | 126,745 | $ | 17,699 | |||||
| Lear Corp. | 157,941 | 27,142 | ||||||
| Total | 44,841 | |||||||
| Banks 7.74% | ||||||||
| East West Bancorp, Inc. | 438,235 | 34,831 | ||||||
| Pacific Premier Bancorp, Inc. | 488,957 | 20,531 | ||||||
| Signature Bank | 116,973 | 34,837 | ||||||
| SVB Financial Group* | 32,584 | 23,376 | ||||||
| Western Alliance Bancorp | 314,155 | 36,470 | ||||||
| Total | 150,045 | |||||||
| Biotechnology 1.20% | ||||||||
| Horizon Therapeutics plc* | 193,291 | 23,178 | ||||||
| Building Products 6.01% | ||||||||
| Allegion plc (Ireland)(a) | 139,987 | 17,960 | ||||||
| Carlisle Cos., Inc. | 173,588 | 38,696 | ||||||
| Masonite International Corp.* | 269,224 | 32,310 | ||||||
| Simpson Manufacturing Co., Inc. | 259,996 | 27,583 | ||||||
| Total | 116,549 | |||||||
| Capital Markets 3.69% | ||||||||
| Cboe Global Markets, Inc. | 189,435 | 24,994 | ||||||
| Evercore, Inc. Class A | 124,756 | 18,943 | ||||||
| Moelis & Co. Class A | 380,556 | 27,682 | ||||||
| Total | 71,619 | |||||||
| Chemicals 5.09% | ||||||||
| Avient Corp. | 563,522 | 30,363 | ||||||
| Axalta Coating Systems Ltd.* | 919,158 | 28,668 | ||||||
| Valvoline, Inc. | 1,167,612 | 39,652 | ||||||
| Total | 98,683 | |||||||
| Construction & Engineering 1.39% | ||||||||
| EMCOR Group, Inc. | 221,402 | 26,898 | ||||||
| Investments | Shares | Fair Value (000) | ||||||
| Construction Materials 1.34% | ||||||||
| Eagle Materials, Inc. | 175,739 | $ | 26,073 | |||||
| Containers & Packaging 1.72% | ||||||||
| Avery Dennison Corp. | 153,103 | 33,334 | ||||||
| Electric: Utilities 2.35% | ||||||||
| IDACORP, Inc. | 217,982 | 22,740 | ||||||
| Portland General Electric Co. | 461,967 | 22,779 | ||||||
| Total | 45,519 | |||||||
| Electrical Equipment 2.12% | ||||||||
| Generac Holdings, Inc.* | 82,598 | 41,180 | ||||||
| Electronic Equipment, Instruments & Components 1.75% | ||||||||
| Littelfuse, Inc. | 115,340 | 33,973 | ||||||
| Equity Real Estate Investment Trusts 6.56% | ||||||||
| CoreSite Realty Corp. | 207,521 | 29,563 | ||||||
| First Industrial Realty Trust, Inc. | 577,436 | 33,624 | ||||||
| Innovative Industrial Properties, Inc. | 38,100 | 10,024 | ||||||
| National Storage Affiliates Trust | 436,694 | 27,276 | ||||||
| Sunstone Hotel Investors, Inc.* | 2,172,500 | 26,809 | ||||||
| Total | 127,296 | |||||||
| Food & Staples Retailing 1.84% | ||||||||
| BJ’s Wholesale Club Holdings, Inc.* | 609,983 | 35,647 | ||||||
| Health Care Equipment & Supplies 3.80% | ||||||||
| Cooper Cos., Inc. (The) | 45,912 | 19,142 | ||||||
| NuVasive, Inc.* | 349,685 | 18,659 | ||||||
| STERIS plc | 153,584 | 35,899 | ||||||
| Total | 73,700 | |||||||
| Health Care Providers & Services 1.71% | ||||||||
| Molina Healthcare, Inc.* | 111,951 | 33,106 | ||||||
| Hotels, Restaurants & Leisure 1.84% | ||||||||
| Caesars Entertainment, Inc.* 326,400 | 35,728 | |||||||
| See Notes to Financial Statements. | 135 |
Schedule of Investments (continued)
VALUE OPPORTUNITIES FUND October 31, 2021
| Investments | Shares | Fair Value (000) | ||||||
| Household Durables 3.20% | ||||||||
| Helen of Troy Ltd.* | 100,135 | $ | 22,525 | |||||
| Leggett & Platt, Inc. | 396,900 | 18,595 | ||||||
| Sonos, Inc.* | 639,010 | 20,845 | ||||||
| Total | 61,965 | |||||||
| Information Technology Services 3.96% | ||||||||
| Alliance Data Systems Corp. | 280,248 | 23,891 | ||||||
| Euronet Worldwide, Inc.* | 250,804 | 28,138 | ||||||
| Jack Henry & Associates, Inc. | 148,628 | 24,743 | ||||||
| Total | 76,772 | |||||||
| Insurance 3.52% | ||||||||
| American Financial Corp, Inc./OH | 224,579 | 30,552 | ||||||
| Stewart Information Services Corp. | 530,960 | 37,788 | ||||||
| Total | 68,340 | |||||||
| Life Sciences Tools & Services 6.99% | ||||||||
| Bio-Techne Corp. | 67,737 | 35,471 | ||||||
| Charles River Laboratories International, Inc.* | 86,694 | 38,898 | ||||||
| PerkinElmer, Inc. | 192,629 | 34,074 | ||||||
| Repligen Corp.* | 93,226 | 27,082 | ||||||
| Total | 135,525 | |||||||
| Machinery 4.10% | ||||||||
| Allison Transmission Holdings, Inc. | 438,526 | 14,629 | ||||||
| Columbus McKinnon Corp. | 560,667 | 26,503 | ||||||
| Crane Co. | 371,295 | 38,347 | ||||||
| Total | 79,479 | |||||||
| Media 2.92% | ||||||||
| Criteo SA ADR* | 766,452 | 25,323 | ||||||
| TechTarget, Inc.* | 332,771 | 31,384 | ||||||
| Total | 56,707 | |||||||
| Metals & Mining 1.33% | ||||||||
| Reliance Steel & Aluminum Co. | 176,929 | 25,860 | ||||||
| Investments | Shares | Fair Value (000) | ||||||
| Oil, Gas & Consumable Fuels 3.71% | ||||||||
| Chesapeake Energy Corp. | 392,266 | $ | 25,003 | |||||
| Devon Energy Corp. | 809,334 | 32,438 | ||||||
| Par Pacific Holdings, Inc.* | 936,569 | 14,479 | ||||||
| Total | 71,920 | |||||||
| Professional Services 1.07% | ||||||||
| Booz Allen Hamilton Holding Corp. | 237,961 | 20,669 | ||||||
| Real Estate Management & Development 1.09% | ||||||||
| Marcus & Millichap, Inc.* | 449,600 | 21,176 | ||||||
| Road & Rail 1.91% | ||||||||
| Saia, Inc.* | 118,251 | 36,970 | ||||||
| Semiconductors & Semiconductor Equipment 5.05% | ||||||||
| Brooks Automation, Inc. | 253,250 | 29,491 | ||||||
| Entegris, Inc. | 300,359 | 42,285 | ||||||
| Silicon Motion Technology Corp. ADR | 366,590 | 26,178 | ||||||
| Total | 97,954 | |||||||
| Software 2.70% | ||||||||
| Aspen Technology, Inc.* | 189,239 | 29,652 | ||||||
| CommVault Systems, Inc.* | 369,580 | 22,729 | ||||||
| Total | 52,381 | |||||||
| Specialty Retail 2.70% | ||||||||
| Burlington Stores, Inc.* | 67,743 | 18,717 | ||||||
| Williams-Sonoma, Inc. | 181,166 | 33,648 | ||||||
| Total | 52,365 | |||||||
| Tobacco 0.99% | ||||||||
| Turning Point Brands, Inc. | 501,936 | 19,159 | ||||||
| Trading Companies & Distributors 1.61% | ||||||||
| AerCap Holdings NV (Ireland)*(a) | 529,597 | 31,267 | ||||||
| Total Common Stocks (cost $1,338,168,200) | 1,925,878 | |||||||
| 136 | See Notes to Financial Statements. |
Schedule of Investments (concluded)
VALUE OPPORTUNITIES FUND October 31, 2021
| Investments | Principal Amount (000) | Fair Value (000) | ||||||
| SHORT-TERM INVESTMENTS 0.59% | ||||||||
| Repurchase Agreements 0.59% | ||||||||
| Repurchase Agreement dated 10/29/2021, 0.00% due 11/1/2021 with Fixed Income Clearing Corp. collateralized by $11,105,000 of U.S. Treasury Note at 2.25% due 08/15/2027; value: $11,740,235; proceeds: $11,509,952 (cost $11,509,952) | $11,510 | $ | 11,510 | |||||
| Total Investments in Securities 99.90% (cost $1,349,678,152) | 1,937,388 | |||||||
| Other Assets and Liabilities – Net 0.10% | 1,861 | |||||||
| Net Assets 100.00% | $ | 1,939,249 | ||||||
| ADR | American Depositary Receipt. | |
| * | Non-income producing security. | |
| (a) | Foreign security traded in U.S. dollars. |
The following is a summary of the inputs used as of October 31, 2021 in valuing the Fund’s investments carried at fair value(1):
| Investment Type(2) | Level 1 (000) | Level 2 (000) | Level 3 (000) | Total (000) | ||||||||||||
| Long-Term Investments | ||||||||||||||||
| Common Stocks | $ | 1,925,878 | $ | – | $ | – | $ | 1,925,878 | ||||||||
| Short-Term Investments | ||||||||||||||||
| Repurchase Agreements | – | 11,510 | – | 11,510 | ||||||||||||
| Total | $ | 1,925,878 | $ | 11,510 | $ | – | $ | 1,937,388 | ||||||||
| (1) | Refer to Note 2(l) for a description of fair value measurements and the three-tier hierarchy of inputs. | |
| (2) | See Schedule of Investments for fair values in each industry and identification of foreign issuers and/or geography. When applicable each Level 3 security is identified on the Schedule of Investments along with the valuation technique utilized. |
A reconciliation of Level 3 investments is presented when the Fund has a material amount of Level 3 investments at the beginning or end of the year in relation to the Fund’s net assets.
| See Notes to Financial Statements. | 137 |
Statements of Assets and Liabilities
October 31, 2021
| Alpha Strategy Fund | Durable Growth Fund | Focused Growth Fund | |||||||||||||
| ASSETS: | |||||||||||||||
| Investments in securities, at cost | $ | 894,051 | $ | 217,743,379 | $ | 40,905,467 | |||||||||
| Investments in Underlying Funds, at cost | 674,095,004 | – | – | ||||||||||||
| Investments in securities, at fair value including $0, $0, $0, $0, $2,166,411, $0 and $0, respectively, of securities loaned | $ | 894,051 | $ | 251,848,281 | $ | 52,342,895 | |||||||||
| Investments in Underlying Funds, at value | 880,986,259 | – | – | ||||||||||||
| Cash | – | – | – | ||||||||||||
| Foreign cash, at value (cost $0, $0, $0, $0, $0, $0 and $1,020, respectively) | – | – | – | ||||||||||||
| Receivables: | |||||||||||||||
| Capital shares sold | 559,734 | 476 | 37,407 | ||||||||||||
| From advisor (See Note 3) | 19 | – | 21,239 | ||||||||||||
| Investment securities sold | – | 1,066,507 | – | ||||||||||||
| Dividends | – | 26,616 | – | ||||||||||||
| Securities lending income receivable | – | – | – | ||||||||||||
| Prepaid expenses and other assets | 48,354 | 77,708 | 19,033 | ||||||||||||
| Total assets | 882,488,417 | 253,019,588 | 52,420,574 | ||||||||||||
| LIABILITIES: | |||||||||||||||
| Payables: | |||||||||||||||
| Investments in Underlying Funds purchased | 106,099 | – | – | ||||||||||||
| Capital shares reacquired | 1,205,136 | – | 2,830 | ||||||||||||
| 12b–1 distribution plan | 165,527 | 1,089 | 7,352 | ||||||||||||
| Trustees’ fees | 147,459 | 9,273 | 1,566 | ||||||||||||
| Fund administration | 29,525 | 8,390 | 1,685 | ||||||||||||
| Investment securities purchased | – | 884,460 | – | ||||||||||||
| Management fee | – | 115,366 | 27,376 | ||||||||||||
| Offering costs | – | 1,905 | 25,298 | ||||||||||||
| To bank | – | 90,405 | – | ||||||||||||
| Payable for collateral due to broker for securities lending | – | – | – | ||||||||||||
| Foreign currency overdraft | – | 28 | – | ||||||||||||
| Accrued expenses | 208,936 | 90,171 | 35,952 | ||||||||||||
| Total liabilities | 1,862,682 | 1,201,087 | 102,059 | ||||||||||||
| Commitments and contingent liabilities | |||||||||||||||
| NET ASSETS | $ | 880,625,735 | $ | 251,818,501 | $ | 52,318,515 | |||||||||
| COMPOSITION OF NET ASSETS: | |||||||||||||||
| Paid-in capital | $ | 675,493,954 | $ | 175,830,382 | $ | 33,736,970 | |||||||||
| Total distributable earnings (loss) | 205,131,781 | 75,988,119 | 18,581,545 | ||||||||||||
| Net Assets | $ | 880,625,735 | $ | 251,818,501 | $ | 52,318,515 | |||||||||
| 138 | See Notes to Financial Statements. |
| Focused Large Cap Value Fund | Focused Small Cap Value Fund | Fundamental Equity Fund | Global Equity Fund | |||||||||||||||
| $ | 559,539,355 | $ | 189,112,491 | $ | 1,515,111,062 | $ | 9,700,602 | |||||||||||
| – | – | – | – | |||||||||||||||
| $ | 672,826,979 | $ | 221,859,880 | $ | 2,000,986,329 | $ | 11,590,477 | |||||||||||
| – | – | – | – | |||||||||||||||
| – | 422,888 | – | 6,692 | |||||||||||||||
| – | – | – | 1,023 | |||||||||||||||
| 101,925 | 489,549 | 258,490 | 1,084 | |||||||||||||||
| 250 | 5,815 | – | 24,397 | |||||||||||||||
| 3,865,144 | 1,486,254 | 42,305,151 | 16,670 | |||||||||||||||
| 1,009,764 | 38,709 | 3,745,050 | 10,621 | |||||||||||||||
| – | 689 | – | – | |||||||||||||||
| 84,642 | 46,008 | 77,134 | 12,566 | |||||||||||||||
| 677,888,704 | 224,349,792 | 2,047,372,154 | 11,663,530 | |||||||||||||||
| – | – | – | – | |||||||||||||||
| – | 210,652 | 1,313,110 | 9 | |||||||||||||||
| 4,746 | 14,186 | 326,436 | 2,027 | |||||||||||||||
| 25,289 | 21,175 | 574,082 | 657 | |||||||||||||||
| 22,226 | 7,499 | 66,967 | 375 | |||||||||||||||
| 3,210,659 | 422,888 | 43,373,965 | 6,692 | |||||||||||||||
| 327,839 | 149,979 | 917,769 | 4,219 | |||||||||||||||
| – | – | – | – | |||||||||||||||
| 1,993,249 | – | – | – | |||||||||||||||
| – | 2,256,410 | – | – | |||||||||||||||
| – | – | 38 | – | |||||||||||||||
| 100,632 | 64,337 | 433,031 | 83,639 | |||||||||||||||
| 5,684,640 | 3,147,126 | 47,005,398 | 97,618 | |||||||||||||||
| $ | 672,204,064 | $ | 221,202,666 | $ | 2,000,366,756 | $ | 11,565,912 | |||||||||||
| $ | 410,814,055 | $ | 168,745,312 | $ | 1,301,347,868 | $ | 8,082,356 | |||||||||||
| 261,390,009 | 52,457,354 | 699,018,888 | 3,483,556 | |||||||||||||||
| $ | 672,204,064 | $ | 221,202,666 | $ | 2,000,366,756 | $ | 11,565,912 | |||||||||||
| See Notes to Financial Statements. | 139 |
Statements of Assets and Liabilities (continued)
October 31, 2021
| Alpha Strategy Fund | Durable Growth Fund | Focused Growth Fund | |||||||||||||
| Net assets by class: | |||||||||||||||
| Class A Shares | $ | 542,197,278 | $ | 3,710,536 | $ | 18,332,174 | |||||||||
| Class C Shares | $ | 56,364,799 | $ | 368,358 | $ | 2,700,720 | |||||||||
| Class F Shares | $ | 144,741,779 | $ | 479,186 | $ | 18,620,773 | |||||||||
| Class F3 Shares | $ | 56,368,795 | $ | 187,910 | $ | 1,216,888 | |||||||||
| Class I Shares | $ | 43,112,062 | $ | 246,153,199 | $ | 4,587,390 | |||||||||
| Class P Shares | – | – | – | ||||||||||||
| Class R2 Shares | $ | 1,433,347 | – | – | |||||||||||
| Class R3 Shares | $ | 25,883,019 | $ | 16,913 | $ | 23,965 | |||||||||
| Class R4 Shares | $ | 4,620,629 | $ | 16,998 | $ | 24,118 | |||||||||
| Class R5 Shares | $ | 518,295 | $ | 17,068 | $ | 24,291 | |||||||||
| Class R6 Shares | $ | 5,385,732 | $ | 868,333 | $ | 6,788,196 | |||||||||
| Outstanding shares by class (unlimited number of authorized shares of beneficial interest): | |||||||||||||||
| Class A Shares | 17,840,997 | 145,575 | 506,919 | ||||||||||||
| Class C Shares | 2,401,236 | 14,666 | 76,270 | ||||||||||||
| Class F Shares | 4,710,481 | 18,718 | 510,946 | ||||||||||||
| Class F3 Shares | 1,778,419 | 7,342 | 33,333 | ||||||||||||
| Class I Shares | 1,365,928 | 9,622,475 | 125,888 | ||||||||||||
| Class P Shares | – | – | – | ||||||||||||
| Class R2 Shares | 49,773 | – | – | ||||||||||||
| Class R3 Shares | 889,786 | 667 | 667 | ||||||||||||
| Class R4 Shares | 152,490 | 667 | 667 | ||||||||||||
| Class R5 Shares | 16,417 | 667 | 667 | ||||||||||||
| Class R6 Shares | 169,862 | �� | 33,930 | 185,937 | |||||||||||
| Net asset value, offering and redemption price per share (Net assets divided by outstanding shares): | |||||||||||||||
| Class A Shares-Net asset value | $30.39 | $25.49 | $36.16 | ||||||||||||
| Class A Shares-Maximum offering price (Net asset value plus sales charge of 5.75%) | $32.24 | $27.05 | $38.37 | ||||||||||||
| Class C Shares-Net asset value | $23.47 | $25.12 | $35.41 | ||||||||||||
| Class F Shares-Net asset value | $30.73 | $25.60 | $36.44 | ||||||||||||
| Class F3 Shares-Net asset value* | $31.70 | $25.59 | $36.51 | ||||||||||||
| Class I Shares-Net asset value | $31.56 | $25.58 | $36.44 | ||||||||||||
| Class P Shares-Net asset value | – | – | – | ||||||||||||
| Class R2 Shares-Net asset value | $28.80 | – | – | ||||||||||||
| Class R3 Shares-Net asset value | $29.09 | $25.36 | $35.92 | ||||||||||||
| Class R4 Shares-Net asset value* | $30.30 | $25.48 | $36.18 | ||||||||||||
| Class R5 Shares-Net asset value* | $31.57 | $25.57 | $36.44 | ||||||||||||
| Class R6 Shares-Net asset value* | $31.71 | $25.59 | $36.51 | ||||||||||||
| * | Net asset value may not recalculate due to rounding of fractional shares. |
| 140 | See Notes to Financial Statements. |
| Focused Large Cap Value Fund | Focused Small Cap Value Fund | Fundamental Equity Fund | Global Equity Fund | |||||||||||||||
| $ | 7,713,989 | $ | 19,525,148 | $ | 1,382,625,166 | $ | 5,016,114 | |||||||||||
| $ | 3,600,955 | $ | 5,028,103 | $ | 55,600,315 | $ | 825,864 | |||||||||||
| $ | 2,394,271 | $ | 66,993,383 | $ | 146,249,261 | $ | 2,145,971 | |||||||||||
| $ | 17,775 | $ | 14,226 | $ | 19,916,126 | $ | 18,375 | |||||||||||
| $ | 656,898,895 | $ | 118,350,686 | $ | 281,392,025 | $ | 1,837,099 | |||||||||||
| – | – | $ | 4,880,915 | – | ||||||||||||||
| – | – | $ | 3,270,651 | – | ||||||||||||||
| $ | 13,408 | – | $ | 86,248,965 | $ | 470,227 | ||||||||||||
| $ | 12,759 | – | $ | 2,988,326 | $ | 18,672 | ||||||||||||
| $ | 12,805 | $ | 16,657 | $ | 985,834 | $ | 18,860 | |||||||||||
| $ | 1,539,207 | $ | 11,274,463 | $ | 16,209,172 | $ | 1,214,730 | |||||||||||
| 405,181 | 637,722 | 91,956,707 | 302,079 | |||||||||||||||
| 189,867 | 154,976 | 4,243,195 | 50,313 | |||||||||||||||
| 124,564 | 2,023,233 | 9,846,899 | 128,881 | |||||||||||||||
| 931 | 429 | 1,305,005 | 1,102 | |||||||||||||||
| 34,398,405 | 3,575,017 | 18,557,668 | 110,239 | |||||||||||||||
| – | – | 332,276 | – | |||||||||||||||
| – | – | 223,360 | – | |||||||||||||||
| 706 | – | 5,866,502 | 28,548 | |||||||||||||||
| 670 | – | 199,821 | 1,123 | |||||||||||||||
| 671 | 503 | 64,984 | 1,132 | |||||||||||||||
| 80,551 | 340,001 | 1,061,566 | 72,863 | |||||||||||||||
| $19.04 | $30.62 | $15.04 | $16.61 | |||||||||||||||
| $20.20 | $32.49 | $15.96 | $17.62 | |||||||||||||||
| $18.97 | $32.44 | $13.10 | $16.41 | |||||||||||||||
| $19.22 | $33.11 | $14.85 | $16.65 | |||||||||||||||
| $19.10 | $33.15 | $15.26 | $16.68 | |||||||||||||||
| $19.10 | $33.10 | $15.16 | $16.66 | |||||||||||||||
| – | – | $14.69 | – | |||||||||||||||
| – | – | $14.64 | – | |||||||||||||||
| $18.99 | – | $14.70 | $16.47 | |||||||||||||||
| $19.04 | – | $14.96 | $16.62 | |||||||||||||||
| $19.09 | $33.10 | $15.17 | $16.66 | |||||||||||||||
| $19.11 | $33.16 | $15.27 | $16.67 | |||||||||||||||
| See Notes to Financial Statements. | 141 |
Statements of Assets and Liabilities (continued)
October 31, 2021
| Growth Leaders Fund | Health Care Fund | International Equity Fund | |||||||||||||
| ASSETS: | |||||||||||||||
| Investments in securities, at cost | $ | 7,925,659,490 | $ | 6,603,286 | $ | 323,593,294 | |||||||||
| Investments in securities, at fair value including $1,911,005, $12,993, $780,760, $0, $1,504,654 and $7,868,929, respectively, of securities loaned | $ | 10,480,975,128 | $ | 7,827,558 | $ | 413,490,799 | |||||||||
| Cash | 88,880,232 | – | – | ||||||||||||
| Cash at broker | – | – | – | ||||||||||||
| Foreign cash, at value (cost $0, $0, $0, $4,202,167, $290,489 and $0, respectively) | – | – | – | ||||||||||||
| Receivables: | |||||||||||||||
| Capital shares sold | 14,059,636 | 1,094 | 1,596,970 | ||||||||||||
| Interest and dividends | 1,067,621 | 2,402 | 1,339,633 | ||||||||||||
| From advisor (See Note 3) | 344,602 | 16,722 | 6,185 | ||||||||||||
| Securities lending income receivable | 3,586 | 27 | 165 | ||||||||||||
| Investment securities sold | – | 93,709 | 243,726 | ||||||||||||
| From broker | – | – | – | ||||||||||||
| Prepaid expenses and other assets | 189,308 | 62,732 | – | ||||||||||||
| Total assets | 10,585,520,113 | 8,004,244 | 416,677,478 | ||||||||||||
| LIABILITIES: | |||||||||||||||
| Payables: | |||||||||||||||
| Investment securities purchased | 155,348,021 | 77,459 | 426,095 | ||||||||||||
| Capital shares reacquired | 8,331,801 | 455 | 106,675 | ||||||||||||
| Management fee | 4,232,124 | 3,953 | 241,615 | ||||||||||||
| Payable for collateral due to broker for securities lending | 1,944,227 | 13,230 | 839,194 | ||||||||||||
| Payable due to broker for swap collateral | – | – | – | ||||||||||||
| 12b-1 distribution plan | 1,812,545 | 1,403 | 52,084 | ||||||||||||
| Trustees’ fees | 523,105 | 254 | 104,921 | ||||||||||||
| Fund administration | 331,775 | 255 | 13,807 | ||||||||||||
| Offering costs | – | 23,615 | – | ||||||||||||
| To bank | – | 16,250 | – | ||||||||||||
| Foreign capital gains taxes deferred | – | – | – | ||||||||||||
| Foreign currency overdraft | – | – | 187,248 | ||||||||||||
| Accrued expenses and other liabilities | 864,642 | 32,230 | 272,701 | ||||||||||||
| Total liabilities | 173,388,240 | 169,104 | 2,244,340 | ||||||||||||
| Commitments and contingent liabilities | |||||||||||||||
| NET ASSETS | $ | 10,412,131,873 | $ | 7,835,140 | $ | 414,433,138 | |||||||||
| COMPOSITION OF NET ASSETS: | |||||||||||||||
| Paid-in capital | $ | 5,908,170,907 | $ | 6,095,497 | $ | 282,046,904 | |||||||||
| Total distributable earnings (loss) | 4,503,960,966 | 1,739,643 | 132,386,234 | ||||||||||||
| Net Assets | $ | 10,412,131,873 | $ | 7,835,140 | $ | 414,433,138 | |||||||||
| 142 | See Notes to Financial Statements. |
| International Opportunities Fund | International Value Fund | Micro Cap Growth Fund | |||||||||||
| $ | 406,674,294 | $ | 583,460,470 | $ | 324,674,221 | ||||||||
| $ | 459,313,138 | $ | 653,384,398 | $ | 403,787,648 | ||||||||
| – | – | 396,601 | |||||||||||
| 470,000 | – | – | |||||||||||
| 3,906,927 | 290,921 | – | |||||||||||
| 567,474 | 218,239 | 699,851 | |||||||||||
| 1,095,271 | 2,939,011 | – | |||||||||||
| – | 14,284 | 13,872 | |||||||||||
| 7,388 | 2,135 | 2,331 | |||||||||||
| 3,651,759 | 2,776,850 | 4,793,918 | |||||||||||
| 287,671 | – | – | |||||||||||
| 34,038 | 23,793 | 62,800 | |||||||||||
| 469,333,666 | 659,649,631 | 409,757,021 | |||||||||||
| 3,584,753 | 6,042,569 | 3,387,089 | |||||||||||
| 184,944 | 333,522 | 325,096 | |||||||||||
| 293,252 | 383,589 | 295,085 | |||||||||||
| – | 1,624,918 | 8,254,106 | |||||||||||
| 470,000 | – | – | |||||||||||
| 40,846 | 62,720 | 37,677 | |||||||||||
| 83,136 | 155,169 | 25,458 | |||||||||||
| 15,640 | 21,919 | 13,115 | |||||||||||
| – | – | – | |||||||||||
| – | – | – | |||||||||||
| 473,866 | – | – | |||||||||||
| – | – | – | |||||||||||
| 238,856 | 302,005 | 104,279 | |||||||||||
| 5,385,293 | 8,926,411 | 12,441,905 | |||||||||||
| $ | 463,948,373 | $ | 650,723,220 | $ | 397,315,116 | ||||||||
| $ | 418,687,010 | $ | 980,996,147 | $ | 332,935,150 | ||||||||
| 45,261,363 | (330,272,927 | ) | 64,379,966 | ||||||||||
| $ | 463,948,373 | $ | 650,723,220 | $ | 397,315,116 | ||||||||
| See Notes to Financial Statements. | 143 |
Statements of Assets and Liabilities (continued)
October 31, 2021
| Value Opportunities Fund | |||||
| ASSETS: | |||||
| Investments in securities, at cost | $ | 1,349,678,152 | |||
| Investments in securities, at fair value | $ | 1,937,388,335 | |||
| Receivables: | |||||
| Capital shares sold | 1,182,231 | ||||
| Investment securities sold | 5,473,023 | ||||
| Dividends | 537,619 | ||||
| Prepaid expenses and other assets | 71,661 | ||||
| Total assets | 1,944,652,869 | ||||
| LIABILITIES: | |||||
| Payables: | |||||
| Capital shares reacquired | 1,299,685 | ||||
| Management fee | 1,178,101 | ||||
| 12b-1 distribution plan | 229,591 | ||||
| Trustees’ fees | 361,000 | ||||
| Fund administration | 64,893 | ||||
| To bank | 1,814,910 | ||||
| Accrued expenses and other liabilities | 455,223 | ||||
| Total liabilities | 5,403,403 | ||||
| Commitments and contingent liabilities | |||||
| NET ASSETS | $ | 1,939,249,466 | |||
| COMPOSITION OF NET ASSETS: | |||||
| Paid-in capital | $ | 1,125,105,774 | |||
| Total distributable earnings (loss) | 814,143,692 | ||||
| Net Assets | $ | 1,939,249,466 | |||
| 144 | See Notes to Financial Statements. |
This page is intentionally left blank.
145
Statements of Assets and Liabilities (concluded)
October 31, 2021
| Growth Leaders Fund | Health Care Fund | International Equity Fund | |||||||||||||
| Net assets by class: | |||||||||||||||
| Class A Shares | $ | 2,713,886,641 | $ | 3,506,867 | $ | 193,679,827 | |||||||||
| Class C Shares | $ | 1,142,001,578 | $ | 785,946 | $ | 7,621,838 | |||||||||
| Class F Shares | $ | 4,331,228,082 | $ | 587,413 | $ | 24,909,472 | |||||||||
| Class F3 Shares | $ | 697,857,788 | $ | 40,303 | $ | 5,928,258 | |||||||||
| Class I Shares | $ | 1,282,160,621 | $ | 19,536 | $ | 170,043,958 | |||||||||
| Class P Shares | – | – | $ | 12,607 | |||||||||||
| Class R2 Shares | $ | 3,275,043 | – | $ | 177,762 | ||||||||||
| Class R3 Shares | $ | 21,927,890 | $ | 14,545 | $ | 6,114,102 | |||||||||
| Class R4 Shares | $ | 18,548,504 | $ | 14,634 | $ | 1,684,704 | |||||||||
| Class R5 Shares | $ | 19,721,694 | $ | 14,717 | $ | 80,683 | |||||||||
| Class R6 Shares | $ | 181,524,032 | $ | 2,851,179 | $ | 4,179,927 | |||||||||
| Outstanding shares by class (unlimited number of authorized shares of beneficial interest): | |||||||||||||||
| Class A Shares | 51,493,977 | 159,716 | 10,963,464 | ||||||||||||
| Class C Shares | 24,183,587 | 36,459 | 434,563 | ||||||||||||
| Class F Shares | 79,980,575 | 26,602 | 1,414,165 | ||||||||||||
| Class F3 Shares | 12,716,373 | 1,826 | 330,869 | ||||||||||||
| Class I Shares | 23,501,676 | 885 | 9,510,808 | ||||||||||||
| Class P Shares | – | – | 713 | ||||||||||||
| Class R2 Shares | 63,818 | – | 10,061 | ||||||||||||
| Class R3 Shares | 427,575 | 667 | 351,728 | ||||||||||||
| Class R4 Shares | 351,816 | 667 | 95,823 | ||||||||||||
| Class R5 Shares | 361,336 | 667 | 4,538 | ||||||||||||
| Class R6 Shares | 3,307,774 | 129,104 | 233,399 | ||||||||||||
| Net asset value, offering and redemption price per share (Net assets divided by outstanding shares): | |||||||||||||||
| Class A Shares-Net asset value | $52.70 | $21.96 | $17.67 | ||||||||||||
| Class A Shares-Maximum offering price (Net asset value plus sales charge of 5.75%) | $55.92 | $23.30 | $18.75 | ||||||||||||
| Class C Shares-Net asset value | $47.22 | $21.56 | $17.54 | ||||||||||||
| Class F Shares-Net asset value | $54.15 | $22.08 | $17.61 | ||||||||||||
| Class F3 Shares-Net asset value | $54.88 | $22.07 | $17.92 | ||||||||||||
| Class I Shares-Net asset value | $54.56 | $22.07 | $17.88 | ||||||||||||
| Class P Shares-Net asset value | – | – | $17.69 | ||||||||||||
| Class R2 Shares-Net asset value* | $51.32 | – | $17.67 | ||||||||||||
| Class R3 Shares-Net asset value | $51.28 | $21.82 | $17.38 | ||||||||||||
| Class R4 Shares-Net asset value* | $52.72 | $21.95 | $17.58 | ||||||||||||
| Class R5 Shares-Net asset value* | $54.58 | $22.07 | $17.78 | ||||||||||||
| Class R6 Shares-Net asset value* | $54.88 | $22.08 | $17.91 | ||||||||||||
| * | Net asset value may not recalculate due to rounding of fractional shares. |
| 146 | See Notes to Financial Statements. |
| International Opportunities Fund | International Value Fund | Micro Cap Growth Fund | Value Opportunities Fund | |||||||||||||||
| $ | 130,087,996 | $ | 242,421,823 | $ | 61,063,467 | $ | 851,297,716 | |||||||||||
| $ | 14,487,782 | $ | 10,707,360 | $ | 13,531,725 | $ | 76,310,082 | |||||||||||
| $ | 54,601,283 | $ | 29,093,613 | $ | 167,300,409 | $ | 189,251,214 | |||||||||||
| $ | 30,503,712 | $ | 25,102,878 | – | $ | 255,539,077 | ||||||||||||
| $ | 193,183,088 | $ | 334,987,653 | $ | 155,419,515 | $ | 412,963,646 | |||||||||||
| $ | 140,138 | – | – | $ | 17,140,966 | |||||||||||||
| $ | 2,770,679 | $ | 27,445 | – | $ | 5,845,205 | ||||||||||||
| $ | 6,837,571 | $ | 6,839,871 | – | $ | 42,046,750 | ||||||||||||
| $ | 2,868,991 | $ | 152,508 | – | $ | 42,666,176 | ||||||||||||
| $ | 3,282,681 | $ | 15,430 | – | $ | 2,066,072 | ||||||||||||
| $ | 25,184,452 | $ | 1,374,639 | – | $ | 44,122,562 | ||||||||||||
| 6,088,863 | 30,307,825 | 3,154,515 | 35,912,351 | |||||||||||||||
| 740,399 | 1,349,577 | 576,132 | 3,830,335 | |||||||||||||||
| 2,577,331 | 3,616,416 | 7,038,523 | 7,766,641 | |||||||||||||||
| 1,373,033 | 3,114,444 | – | 10,155,717 | |||||||||||||||
| 8,747,634 | 41,539,675 | 6,538,606 | 16,550,536 | |||||||||||||||
| 6,402 | – | – | 742,612 | |||||||||||||||
| 132,615 | 3,342 | – | 261,249 | |||||||||||||||
| 328,417 | 845,186 | – | 1,848,190 | |||||||||||||||
| 134,935 | 19,109 | – | 1,802,308 | |||||||||||||||
| 148,743 | 1,921 | – | 82,736 | |||||||||||||||
| 1,133,532 | 170,505 | – | 1,754,966 | |||||||||||||||
| $21.36 | $8.00 | $19.36 | $23.70 | |||||||||||||||
| $22.66 | $8.49 | $20.54 | $25.15 | |||||||||||||||
| $19.57 | $7.93 | $23.49 | $19.92 | |||||||||||||||
| $21.19 | $8.04 | $23.77 | $24.37 | |||||||||||||||
| $22.22 | $8.06 | – | $25.16 | |||||||||||||||
| $22.08 | $8.06 | $23.77 | $24.95 | |||||||||||||||
| $21.89 | – | – | $23.08 | |||||||||||||||
| $20.89 | $8.21 | – | $22.37 | |||||||||||||||
| $20.82 | $8.09 | – | $22.75 | |||||||||||||||
| $21.26 | $7.98 | – | $23.67 | |||||||||||||||
| $22.07 | $8.03 | – | $24.97 | |||||||||||||||
| $22.22 | $8.06 | – | $25.14 | |||||||||||||||
| See Notes to Financial Statements. | 147 |
For the Year Ended October 31, 2021
| Alpha Strategy Fund | Durable Growth Fund | Focused Growth Fund | |||||||||||||
| Investment income: | |||||||||||||||
| Dividends (net of foreign withholding taxes of $0, $2,160, $0, $123,606, $17,574, $340,063 and $11,159, respectively) | $ | 3,086,158 | $ | 1,061,844 | $ | 75,225 | |||||||||
| Securities lending net income | – | 3,639 | 105 | ||||||||||||
| Interest and other | – | – | 1,969 | ||||||||||||
| Total investment income | 3,086,158 | 1,065,483 | 77,299 | ||||||||||||
| Expenses: | |||||||||||||||
| Management fee | 861,739 | 1,101,464 | 289,857 | ||||||||||||
| 12b-1 distribution plan–Class A | 1,300,742 | 6,616 | 40,629 | ||||||||||||
| 12b-1 distribution plan–Class C | 620,672 | 3,044 | 23,776 | ||||||||||||
| 12b-1 distribution plan–Class F | 155,085 | 420 | 15,576 | ||||||||||||
| 12b-1 distribution plan–Class P | – | – | – | ||||||||||||
| 12b-1 distribution plan–Class R2 | 9,416 | – | – | ||||||||||||
| 12b-1 distribution plan–Class R3 | 130,392 | 75 | 104 | ||||||||||||
| 12b-1 distribution plan–Class R4 | 11,306 | 38 | 52 | ||||||||||||
| Shareholder servicing | 804,032 | 31,680 | 39,160 | ||||||||||||
| Fund administration | 344,696 | 80,107 | 17,837 | ||||||||||||
| Registration | 129,346 | 115,891 | 129,098 | ||||||||||||
| Professional | 36,210 | 39,879 | 50,372 | ||||||||||||
| Trustees’ fees | 31,447 | 7,847 | 1,558 | ||||||||||||
| Custody | 11,229 | 6,529 | 2,515 | ||||||||||||
| Reports to shareholders | 7,595 | 4,258 | 6,131 | ||||||||||||
| Other | 17,810 | 41,377 | 13,216 | ||||||||||||
| Gross expenses | 4,471,717 | 1,439,225 | 629,881 | ||||||||||||
| Expense reductions (See Note 9) | (746 | ) | (3 | ) | (35 | ) | |||||||||
| Fees waived and expenses reimbursed (See Note 3) | (872,968 | ) | (27,749 | ) | (211,905 | ) | |||||||||
| Net expenses | 3,598,003 | 1,411,473 | 417,941 | ||||||||||||
| Net investment income (loss) | (511,845 | ) | (345,990 | ) | (340,642 | ) | |||||||||
| Net realized and unrealized gain (loss): | |||||||||||||||
| Capital gain distributions received from Underlying Funds | 35,492,244 | – | – | ||||||||||||
| Net realized gain (loss) on investment in underlying funds | 6,759,279 | – | – | ||||||||||||
| Net realized gain (loss) on investments | – | 57,880,736 | 9,218,038 | ||||||||||||
| Net realized gain (loss) on futures contracts | – | – | – | ||||||||||||
| Net realized gain (loss) on foreign currency related transactions | – | 611 | – | ||||||||||||
| Net change in unrealized appreciation/depreciation on underlying funds | 252,436,410 | – | – | ||||||||||||
| Net change in unrealized appreciation/depreciation on investments | – | 4,004,199 | 5,660,302 | ||||||||||||
| 148 | See Notes to Financial Statements. |
| Focused Large Cap Value Fund | Focused Small Cap Value Fund | Fundamental Equity Fund | Global Equity Fund | |||||||||||||||
| $ | 18,574,325 | $ | 2,574,633 | $ | 38,027,978 | $ | 161,366 | |||||||||||
| 429 | 19,241 | 101 | 679 | |||||||||||||||
| 867 | 3,056 | 120 | 12,450 | |||||||||||||||
| 18,575,621 | 2,596,930 | 38,028,199 | 174,495 | |||||||||||||||
| 4,106,467 | 1,677,148 | 10,354,373 | 43,575 | |||||||||||||||
| 9,178 | 39,278 | 3,212,579 | 10,313 | |||||||||||||||
| 16,900 | 30,096 | 627,616 | 7,226 | |||||||||||||||
| 2,115 | 41,722 | 138,775 | 1,826 | |||||||||||||||
| – | – | 20,299 | – | |||||||||||||||
| – | – | 20,431 | – | |||||||||||||||
| 60 | – | 432,995 | 1,825 | |||||||||||||||
| 29 | – | 7,630 | 43 | |||||||||||||||
| 15,693 | 49,553 | 1,744,024 | 7,371 | |||||||||||||||
| 278,405 | 83,857 | 752,350 | 3,873 | |||||||||||||||
| 119,757 | 110,939 | 134,004 | 131,457 | |||||||||||||||
| 46,603 | 47,404 | 75,422 | 87,472 | |||||||||||||||
| 24,973 | 7,129 | 69,687 | 347 | |||||||||||||||
| 19,156 | 9,693 | 46,860 | 26,449 | |||||||||||||||
| 15,919 | 11,774 | 63,505 | 7,750 | |||||||||||||||
| 80,228 | 28,795 | 135,376 | 9,746 | |||||||||||||||
| 4,735,483 | 2,137,388 | 17,835,926 | 339,273 | |||||||||||||||
| (6 | ) | (58 | ) | (1,495 | ) | (8 | ) | |||||||||||
| (21,466 | ) | (51,804 | ) | (46,860 | ) | (255,453 | ) | |||||||||||
| 4,714,011 | 2,085,526 | 17,787,571 | 83,812 | |||||||||||||||
| 13,861,610 | 511,404 | 20,240,628 | 90,683 | |||||||||||||||
| – | – | – | – | |||||||||||||||
| �� | ||||||||||||||||||
| – | – | – | – | |||||||||||||||
| 183,466,341 | 31,178,159 | 336,291,492 | 1,626,745 | |||||||||||||||
| – | – | – | 2,683 | |||||||||||||||
| – | 309 | 20,115 | (575 | ) | ||||||||||||||
| – | – | – | – | |||||||||||||||
| 87,931,950 | 34,938,865 | 319,338,804 | 1,066,609 | |||||||||||||||
| See Notes to Financial Statements. | 149 |
Statements of Operations (continued)
For the Year Ended October 31, 2021
| Alpha Strategy Fund | Durable Growth Fund | Focused Growth Fund | |||||||||||||
| Net realized and unrealized gain (loss): | |||||||||||||||
| Net change in unrealized appreciation/depreciation on translation of assets and liabilities denominated in foreign currencies | – | 1 | – | ||||||||||||
| Net realized and unrealized gain (loss) | 294,687,933 | 61,885,547 | 14,878,340 | ||||||||||||
| Net Increase in Net Assets Resulting From Operations | $ | 294,176,088 | $ | 61,539,557 | $ | 14,537,698 | |||||||||
| 150 | See Notes to Financial Statements. |
| Focused Large Cap Value Fund | Focused Small Cap Value Fund | Fundamental Equity Fund | Global Equity Fund | |||||||||||||||
| – | – | (4,491 | ) | (1,590 | ) | |||||||||||||
| 271,398,291 | 66,117,333 | 655,645,920 | 2,693,872 | |||||||||||||||
| $ | 285,259,901 | $ | 66,628,737 | $ | 675,886,548 | $ | 2,784,555 | |||||||||||
| See Notes to Financial Statements. | 151 |
Statements of Operations (continued)
For the Year Ended October 31, 2021
| Growth Leaders Fund | Health Care Fund | International Equity Fund | |||||||||||||
| Investment income: | |||||||||||||||
| Dividends (net of foreign withholding taxes of $0, $1,802, $1,032,874, $985,508, $2,361,958, and $0, respectively) | $ | 24,796,911 | $ | 34,880 | $ | 8,752,760 | |||||||||
| Securities lending net income | 352,275 | 324 | 50,577 | ||||||||||||
| Interest and other | – | 214 | – | ||||||||||||
| Interest earned from Interfund Lending (See Note 11) | 328 | – | – | ||||||||||||
| Total investment income | 25,149,514 | 35,418 | 8,803,337 | ||||||||||||
| Expenses: | |||||||||||||||
| Management fee | 45,810,108 | 41,271 | 2,854,506 | ||||||||||||
| 12b-1 distribution plan–Class A | 5,794,900 | 7,578 | 470,055 | ||||||||||||
| 12b-1 distribution plan–Class C | 10,570,400 | 7,799 | 78,994 | ||||||||||||
| 12b-1 distribution plan–Class F | 3,693,532 | 450 | 16,066 | ||||||||||||
| 12b-1 distribution plan–Class P | – | – | 76 | ||||||||||||
| 12b-1 distribution plan–Class R2 | 11,729 | – | 1,051 | ||||||||||||
| 12b-1 distribution plan–Class R3 | 107,580 | 68 | 31,192 | ||||||||||||
| 12b-1 distribution plan–Class R4 | 40,092 | 34 | 3,908 | ||||||||||||
| Shareholder servicing | 6,246,796 | 6,248 | 361,263 | ||||||||||||
| Fund administration | 3,584,809 | 2,663 | 163,115 | ||||||||||||
| Registration | 489,073 | 116,567 | 125,296 | ||||||||||||
| Reports to shareholders | 385,931 | 3,929 | 15,921 | ||||||||||||
| Trustees’ fees | 321,112 | 227 | 15,110 | ||||||||||||
| Professional | 117,328 | 46,778 | 107,704 | ||||||||||||
| Custody | 99,941 | 11,633 | 112,893 | ||||||||||||
| Other | 171,634 | 9,894 | 68,581 | ||||||||||||
| Gross expenses | 77,444,965 | 255,139 | 4,425,731 | ||||||||||||
| Expense reductions (See Note 9) | (7,215 | ) | (4 | ) | (203 | ) | |||||||||
| Fees waived and expenses reimbursed (See Note 3) | (3,793,473 | ) | (189,436 | ) | (212,846 | ) | |||||||||
| Net expenses | 73,644,277 | 65,699 | 4,212,682 | ||||||||||||
| Net investment income (loss) | (48,494,763 | ) | (30,281 | ) | 4,590,655 | ||||||||||
| Net realized and unrealized gain (loss): | |||||||||||||||
| Net realized gain (loss) on investments | 2,288,838,895 | 616,675 | 75,347,621 | ||||||||||||
| Net realized gain (loss) on forward foreign currency exchange contracts | – | – | 4,979 | ||||||||||||
| Net realized gain (loss) on swap contracts | – | – | – | ||||||||||||
| Net realized gain (loss) on foreign currency related transactions | – | (357 | ) | (62,961 | ) | ||||||||||
| Net change in unrealized appreciation/depreciation on investments | 474,533,430 | 796,292 | 35,393,351 | ||||||||||||
| Net change in unrealized appreciation/depreciation on swap contracts | – | – | – | ||||||||||||
| Net change in unrealized appreciation/depreciation on deferred foreign capital gains taxes | – | – | – | ||||||||||||
| Net change in unrealized appreciation/depreciation on translation of assets and liabilities denominated in foreign currencies | – | (9 | ) | (30,673 | ) | ||||||||||
| Net realized and unrealized gain (loss) | 2,763,372,325 | 1,412,601 | 110,652,317 | ||||||||||||
| Net Increase in Net Assets Resulting From Operations | $ | 2,714,877,562 | $ | 1,382,320 | $ | 115,242,972 | |||||||||
| 152 | See Notes to Financial Statements. |
| International Opportunities Fund | International Value Fund | Micro Cap Growth Fund | |||||||||||
| $ | 9,989,421 | $ | 23,384,422 | $ | 166,161 | ||||||||
| 40,553 | 238,805 | 91,384 | |||||||||||
| – | 21,490 | – | |||||||||||
| – | – | – | |||||||||||
| 10,029,974 | 23,644,717 | 257,545 | |||||||||||
| 3,480,549 | 4,237,369 | 3,196,352 | |||||||||||
| 305,571 | 595,944 | 140,806 | |||||||||||
| 150,727 | 132,703 | 104,652 | |||||||||||
| 53,622 | 29,525 | 144,421 | |||||||||||
| 662 | – | – | |||||||||||
| 17,704 | 151 | – | |||||||||||
| 64,451 | 33,155 | – | |||||||||||
| 7,513 | 313 | – | |||||||||||
| 377,386 | 401,541 | 371,032 | |||||||||||
| 185,629 | 242,135 | 142,060 | |||||||||||
| 124,086 | 114,642 | 113,208 | |||||||||||
| 18,779 | 27,451 | 25,952 | |||||||||||
| 17,099 | 22,221 | 12,357 | |||||||||||
| 73,466 | 86,377 | 72,016 | |||||||||||
| 85,961 | 166,324 | 26,256 | |||||||||||
| 68,181 | 90,331 | 43,269 | |||||||||||
| 5,031,386 | 6,180,182 | 4,392,381 | |||||||||||
| (220 | ) | (278 | ) | (255 | ) | ||||||||
| (85,961 | ) | (312,414 | ) | (170,677 | ) | ||||||||
| 4,945,205 | 5,867,490 | 4,221,449 | |||||||||||
| 5,084,769 | 17,777,227 | (3,963,904 | ) | ||||||||||
| 88,371,318 | 63,055,150 | (8,607,312 | ) | ||||||||||
| 1,320 | (3,678 | ) | – | ||||||||||
| 3,982,574 | – | – | |||||||||||
| (92,586 | ) | (43,784 | ) | – | |||||||||
| 39,561,598 | 78,177,632 | 45,629,143 | |||||||||||
| 39,110 | – | – | |||||||||||
| (473,866 | ) | – | – | ||||||||||
| (64,512 | ) | (77,578 | ) | – | |||||||||
| 131,324,956 | 141,107,742 | 37,021,831 | |||||||||||
| $ | 136,409,725 | $ | 158,884,969 | $ | 33,057,927 | ||||||||
| See Notes to Financial Statements. | 153 |
Statements of Operations (concluded)
For the Year Ended October 31, 2021
| Value Opportunities Fund | |||||
| Investment income: | |||||
| Dividends (net of foreign withholding taxes of $15,769) | $ | 20,522,629 | |||
| Securities lending net income | 280 | ||||
| Interest and other | 1,124 | ||||
| Interest earned from Interfund Lending (See Note 11) | 262 | ||||
| Total investment income | 20,524,295 | ||||
| Expenses: | |||||
| Management fee | 12,604,448 | ||||
| 12b-1 distribution plan–Class A | 1,965,948 | ||||
| 12b-1 distribution plan–Class C | 776,241 | ||||
| 12b-1 distribution plan–Class F | 173,906 | ||||
| 12b-1 distribution plan–Class P | 78,257 | ||||
| 12b-1 distribution plan–Class R2 | 34,576 | ||||
| 12b-1 distribution plan–Class R3 | 215,967 | ||||
| 12b-1 distribution plan–Class R4 | 102,140 | ||||
| Shareholder servicing | 1,459,186 | ||||
| Fund administration | 691,683 | ||||
| Registration | 139,173 | ||||
| Reports to shareholders | 90,627 | ||||
| Trustees’ fees | 63,016 | ||||
| Professional | 68,983 | ||||
| Custody | 36,967 | ||||
| Other | 128,125 | ||||
| Gross expenses | 18,629,243 | ||||
| Expense reductions (See Note 9) | (1,130 | ) | |||
| Fees waived and expenses reimbursed (See Note 3) | (36,967 | ) | |||
| Net expenses | 18,591,146 | ||||
| Net investment income | 1,933,149 | ||||
| Net realized and unrealized gain (loss): | |||||
| Net realized gain (loss) on investments | 257,838,408 | ||||
| Net change in unrealized appreciation/depreciation on investments | 371,649,199 | ||||
| Net realized and unrealized gain (loss) | 629,487,607 | ||||
| Net Increase in Net Assets Resulting From Operations | $ | 631,420,756 | |||
| 154 | See Notes to Financial Statements. |
This page is intentionally left blank.
155
Statements of Changes in Net Assets
| Alpha Strategy Fund | ||||||||
| INCREASE (DECREASE) IN NET ASSETS | For the Year Ended October 31, 2021 | For the Year Ended October 31, 2020 | ||||||
| Operations: | ||||||||
| Net investment income (loss) | $ | (511,845 | ) | $ | 1,304,289 | |||
| Capital gain distributions received from Underlying Funds | 35,492,244 | 99,573,231 | ||||||
| Net realized gain (loss) on investments in Underlying Funds | 6,759,279 | – | ||||||
| Net realized gain (loss) on investments and foreign currency related transactions | – | (30,709,183 | ) | |||||
| Net change in unrealized appreciation/depreciation on investments in Underlying Funds | 252,436,410 | (29,903,227 | ) | |||||
| Net change in unrealized appreciation/depreciation on investments and translation of assets and liabilities denominated in foreign currencies | – | – | ||||||
| Net increase in net assets resulting from operations | 294,176,088 | 40,265,110 | ||||||
| Distributions to shareholders: | ||||||||
| Class A | (36,326,702 | ) | (64,393,529 | ) | ||||
| Class C | (5,578,728 | ) | (15,294,929 | ) | ||||
| Class F | (10,913,306 | ) | (23,235,257 | ) | ||||
| Class F3 | (3,009,774 | ) | (4,127,641 | ) | ||||
| Class I | (2,587,002 | ) | (11,845,960 | ) | ||||
| Class R2 | (133,961 | ) | (211,258 | ) | ||||
| Class R3 | (1,901,142 | ) | (3,583,900 | ) | ||||
| Class R4 | (331,944 | ) | (473,062 | ) | ||||
| Class R5 | (58,163 | ) | (39,612 | ) | ||||
| Class R6 | (349,071 | ) | (566,017 | ) | ||||
| Total distributions to shareholders | (61,189,793 | ) | (123,771,165 | ) | ||||
| Capital share transactions (Net of share conversions) (See Note 16): | ||||||||
| Net proceeds from sales of shares | 114,712,744 | 105,654,769 | ||||||
| Reinvestment of distributions | 51,990,922 | 107,813,540 | ||||||
| Cost of shares reacquired | (186,625,910 | ) | (379,849,409 | ) | ||||
| Net increase (decrease) in net assets resulting from capital share transactions | (19,922,244 | ) | (166,381,100 | ) | ||||
| Net increase (decrease) in net assets | 213,064,051 | (249,887,155 | ) | |||||
| NET ASSETS: | ||||||||
| Beginning of year | $ | 667,561,684 | $ | 917,448,839 | ||||
| End of year | $ | 880,625,735 | $ | 667,561,684 | ||||
| 156 | See Notes to Financial Statements. |
| Durable Growth Fund | |||||||
| For the Year Ended October 31, 2021 | For the Year Ended October 31, 2020 | ||||||
| $ | (345,990 | ) | $ | 111,994 | |||
| – | – | ||||||
| – | – | ||||||
| 57,881,347 | 3,657,615 | ||||||
| – | – | ||||||
| 4,004,200 | 30,100,703 | ||||||
| 61,539,557 | 33,870,312 | ||||||
| (41,259 | ) | (185 | ) | ||||
| (6,867 | ) | – | |||||
| (9,112 | ) | (493 | ) | ||||
| (3,874 | ) | (128 | ) | ||||
| (4,522,876 | ) | (573 | ) | ||||
| – | – | ||||||
| (338 | ) | (4 | ) | ||||
| (338 | ) | (8 | ) | ||||
| (351 | ) | (12 | ) | ||||
| (6,629 | ) | (583 | ) | ||||
| (4,591,644 | ) | (1,986 | ) | ||||
| 161,700,411 | 209,915,954 | ||||||
| 4,567,842 | 1,986 | ||||||
| (173,164,902 | ) | (42,019,029 | ) | ||||
| (6,896,649 | ) | 167,898,911 | |||||
| 50,051,264 | 201,767,237 | ||||||
| $ | 201,767,237 | $ | – | ||||
| $ | 251,818,501 | $ | 201,767,237 | ||||
| See Notes to Financial Statements. | 157 |
Statements of Changes in Net Assets (continued)
| Focused Growth Fund | ||||||||
| INCREASE (DECREASE) IN NET ASSETS | For the Year Ended October 31, 2021 | For the Year Ended October 31, 2020 | ||||||
| Operations: | ||||||||
| Net investment income (loss) | $ | (340,642 | ) | $ | (111,490 | ) | ||
| Net realized gain on investments | 9,218,038 | 2,455,601 | ||||||
| Net change in unrealized appreciation/depreciation on investments | 5,660,302 | 5,252,603 | ||||||
| Net increase in net assets resulting from operations | 14,537,698 | 7,596,714 | ||||||
| Distributions to shareholders: | ||||||||
| Class A | (886,905 | ) | – | |||||
| Class C | (133,700 | ) | – | |||||
| Class F | (439,125 | ) | – | |||||
| Class F3 | (62,060 | ) | – | |||||
| Class I | (191,131 | ) | – | |||||
| Class R3 | (1,241 | ) | – | |||||
| Class R4 | (1,241 | ) | – | |||||
| Class R5 | (1,241 | ) | – | |||||
| Class R6 | (288,328 | ) | – | |||||
| Total distributions to shareholders | (2,004,972 | ) | – | |||||
| Capital share transactions (Net of share conversions) (See Note 16): | ||||||||
| Net proceeds from sales of shares | 28,587,805 | 19,017,459 | ||||||
| Reinvestment of distributions | 1,631,744 | – | ||||||
| Cost of shares reacquired | (18,655,061 | ) | (8,318,577 | ) | ||||
| Net increase (decrease) in net assets resulting from capital share transactions | 11,564,488 | 10,698,882 | ||||||
| Net increase in net assets | 24,097,214 | 18,295,596 | ||||||
| NET ASSETS: | ||||||||
| Beginning of year | $ | 28,221,301 | $ | 9,925,705 | ||||
| End of year | $ | 52,318,515 | $ | 28,221,301 | ||||
| 158 | See Notes to Financial Statements. |
| Focused Large Cap Value Fund | |||||||
| For the Year Ended October 31, 2021 | For the Year Ended October 31, 2020 | ||||||
| $ | 13,861,610 | $ | 5,470,643 | ||||
| 183,466,341 | 30,885,296 | ||||||
| 87,931,950 | 25,234,361 | ||||||
| 285,259,901 | 61,590,300 | ||||||
| (60,321 | ) | (2,766 | ) | ||||
| (5,688 | ) | (326 | ) | ||||
| (2,739 | ) | (2,983 | ) | ||||
| (930 | ) | (3,213 | ) | ||||
| (38,796,164 | ) | (249,650 | ) | ||||
| (631 | ) | (43 | ) | ||||
| (647 | ) | (53 | ) | ||||
| (670 | ) | (64 | ) | ||||
| (43,348 | ) | (3,681 | ) | ||||
| (38,911,138 | ) | (262,779 | ) | ||||
| 265,974,611 | 443,320,189 | ||||||
| 38,863,410 | 262,311 | ||||||
| (308,115,579 | ) | (116,144,085 | ) | ||||
| (3,277,558 | ) | 327,438,415 | |||||
| 243,071,205 | 388,765,936 | ||||||
| $ | 429,132,859 | $ | 40,366,923 | ||||
| $ | 672,204,064 | $ | 429,132,859 | ||||
| See Notes to Financial Statements. | 159 |
Statements of Changes in Net Assets (continued)
| Focused Small Cap Value Fund | ||||||||
| INCREASE (DECREASE) IN NET ASSETS | For the Year Ended October 31, 2021 | For the Year Ended October 31, 2020 | ||||||
| Operations: | ||||||||
| Net investment income | $ | 511,404 | $ | 858,932 | ||||
| Net realized gain (loss) on investments and foreign currency related transactions | 31,178,468 | (9,462,735 | ) | |||||
| Net change in unrealized appreciation/depreciation on investments and translation of assets and liabilities denominated in foreign currencies | 34,938,865 | (5,688,781 | ) | |||||
| Net increase (decrease) in net assets resulting from operations | 66,628,737 | (14,292,584 | ) | |||||
| Distributions to shareholders: | ||||||||
| Class A | (28,973 | ) | (930,691 | ) | ||||
| Class C | (754 | ) | (1,499 | ) | ||||
| Class F | (30,291 | ) | (1,499 | ) | ||||
| Class F3 | (106 | ) | (1,500 | ) | ||||
| Class I | (812,033 | ) | (16,913,603 | ) | ||||
| Class P | – | – | ||||||
| Class R2 | – | – | ||||||
| Class R3 | – | (1,500 | ) | |||||
| Class R4 | – | (1,500 | ) | |||||
| Class R5 | (106 | ) | (1,500 | ) | ||||
| Class R6 | (22,082 | ) | (224,135 | ) | ||||
| Total distributions to shareholders | (894,345 | ) | (18,077,427 | ) | ||||
| Capital share transactions (Net of share conversions) (See Note 16): | ||||||||
| Net proceeds from sales of shares | 212,502,734 | 15,626,914 | ||||||
| Reinvestment of distributions | 837,976 | 17,320,956 | ||||||
| Cost of shares reacquired | (133,436,361 | ) | (46,226,137 | ) | ||||
| Net increase (decrease) in net assets resulting from capital share transactions | 79,904,349 | (13,278,267 | ) | |||||
| Net increase (decrease) in net assets | 145,638,741 | (45,648,278 | ) | |||||
| NET ASSETS: | ||||||||
| Beginning of year | $ | 75,563,925 | $ | 121,212,203 | ||||
| End of year | $ | 221,202,666 | $ | 75,563,925 | ||||
| 160 | See Notes to Financial Statements. |
| Fundamental Equity Fund | |||||||
| For the Year Ended October 31, 2021 | For the Year Ended October 31, 2020 | ||||||
| $ | 20,240,628 | $ | 36,289,803 | ||||
| 336,311,607 | (113,951,656 | ) | |||||
| 319,334,313 | (121,243,336 | ) | |||||
| 675,886,548 | (198,905,189 | ) | |||||
| (21,213,472 | ) | (139,407,947 | ) | ||||
| (572,357 | ) | (16,649,980 | ) | ||||
| (2,559,816 | ) | (18,953,313 | ) | ||||
| (344,061 | ) | (2,109,059 | ) | ||||
| (5,925,825 | ) | (62,285,911 | ) | ||||
| (66,114 | ) | (512,324 | ) | ||||
| (52,157 | ) | (400,670 | ) | ||||
| (1,331,556 | ) | (9,958,420 | ) | ||||
| (42,824 | ) | (503,129 | ) | ||||
| (20,468 | ) | (150,353 | ) | ||||
| (254,289 | ) | (2,273,124 | ) | ||||
| (32,382,939 | ) | (253,204,230 | ) | ||||
| 115,386,860 | 229,532,972 | ||||||
| 31,120,384 | 243,117,741 | ||||||
| (409,122,438 | ) | (889,621,209 | ) | ||||
| (262,615,194 | ) | (416,970,496 | ) | ||||
| 380,888,415 | (869,079,915 | ) | |||||
| $ | 1,619,478,341 | $ | 2,488,558,256 | ||||
| $ | 2,000,366,756 | $ | 1,619,478,341 | ||||
| See Notes to Financial Statements. | 161 |
Statements of Changes in Net Assets (continued)
| Global Equity Fund | ||||||||
| INCREASE (DECREASE) IN NET ASSETS | For the Year Ended October 31, 2021 | For the Year Ended October 31, 2020 | ||||||
| Operations: | ||||||||
| Net investment income (loss) | $ | 90,683 | $ | 67,902 | ||||
| Net realized gain on investments, futures contracts and foreign currency related transactions | 1,628,853 | 332,104 | ||||||
| Net change in unrealized appreciation/depreciation on investments and translation of assets and liabilities denominated in foreign currencies | 1,065,019 | 186,386 | ||||||
| Net increase in net assets resulting from operations | 2,784,555 | 586,392 | ||||||
| Distributions to shareholders: | ||||||||
| Class A | (145,688 | ) | (41,267 | ) | ||||
| Class C | (25,807 | ) | (1,897 | ) | ||||
| Class F | (81,627 | ) | (17,441 | ) | ||||
| Class F3 | (806 | ) | (181 | ) | ||||
| Class I | (80,420 | ) | (17,804 | ) | ||||
| Class R2 | – | (107 | ) | |||||
| Class R3 | (11,511 | ) | (1,908 | ) | ||||
| Class R4 | (781 | ) | (150 | ) | ||||
| Class R5 | (820 | ) | (182 | ) | ||||
| Class R6 | (36,540 | ) | (8,710 | ) | ||||
| Total distributions to shareholders | (384,000 | ) | (89,647 | ) | ||||
| Capital share transactions (Net of share conversions) (See Note 16): | ||||||||
| Net proceeds from sales of shares | 2,858,607 | 1,069,800 | ||||||
| Reinvestment of distributions | 198,859 | 80,997 | ||||||
| Cost of shares reacquired | (813,973 | ) | (3,270,513 | ) | ||||
| Net increase (decrease) in net assets resulting from capital share transactions | 2,243,493 | (2,119,716 | ) | |||||
| Net increase (decrease) in net assets | 4,644,048 | (1,622,971 | ) | |||||
| NET ASSETS: | ||||||||
| Beginning of year | $ | 6,921,864 | $ | 8,544,835 | ||||
| End of year | $ | 11,565,912 | $ | 6,921,864 | ||||
| 162 | See Notes to Financial Statements. |
| Growth Leaders Fund | |||||||
| For the Year Ended October 31, 2021 | For the Year Ended October 31, 2020 | ||||||
| $ | (48,494,763 | ) | $ | (26,344,558 | ) | ||
| 2,288,838,895 | 757,776,433 | ||||||
| 474,533,430 | 1,676,037,268 | ||||||
| 2,714,877,562 | 2,407,469,143 | ||||||
| (188,612,920 | ) | (81,848,840 | ) | ||||
| (102,803,513 | ) | (55,520,466 | ) | ||||
| (291,014,340 | ) | (115,075,437 | ) | ||||
| (28,723,116 | ) | (5,998,021 | ) | ||||
| (97,566,085 | ) | (41,625,583 | ) | ||||
| (159,823 | ) | (94,793 | ) | ||||
| (2,024,661 | ) | (1,134,003 | ) | ||||
| (1,271,829 | ) | (604,646 | ) | ||||
| (1,359,076 | ) | (741,362 | ) | ||||
| (6,678,295 | ) | (2,986,993 | ) | ||||
| (720,213,658 | ) | (305,630,144 | ) | ||||
| 3,457,707,398 | 2,471,905,296 | ||||||
| 665,061,830 | 278,119,573 | ||||||
| (2,657,088,235 | ) | (1,640,138,043 | ) | ||||
| 1,465,680,993 | 1,109,886,826 | ||||||
| 3,460,344,897 | 3,211,725,825 | ||||||
| $ | 6,951,786,976 | $ | 3,740,061,151 | ||||
| $ | 10,412,131,873 | $ | 6,951,786,976 | ||||
| See Notes to Financial Statements. | 163 |
Statements of Changes in Net Assets (continued)
| Health Care Fund | ||||||||
| INCREASE (DECREASE) IN NET ASSETS | For the Year Ended October 31, 2021 | For the Year Ended October 31, 2020 | ||||||
| Operations: | ||||||||
| Net investment income (loss) | $ | (30,281 | ) | $ | (4,997 | ) | ||
| Net realized gain (loss) on investments, forward foreign currency exchange contracts and foreign currency related transactions | 616,318 | 528,143 | ||||||
| Net change in unrealized appreciation/depreciation on investments and translation of assets and liabilities denominated in foreign currencies | 796,283 | 454,407 | ||||||
| Net increase in net assets resulting from operations | 1,382,320 | 977,553 | ||||||
| Distributions to shareholders: | ||||||||
| Class A | (273,120 | ) | – | |||||
| Class C | (58,883 | ) | – | |||||
| Class F | (13,072 | ) | (37 | ) | ||||
| Class F3 | (4,262 | ) | (346 | ) | ||||
| Class I | (2,047 | ) | (54 | ) | ||||
| Class P | – | – | ||||||
| Class R2 | – | – | ||||||
| Class R3 | (1,541 | ) | – | |||||
| Class R4 | (1,541 | ) | – | |||||
| Class R5 | (1,546 | ) | (5 | ) | ||||
| Class R6 | (145,457 | ) | (563 | ) | ||||
| Total distributions to shareholders | (501,469 | ) | (1,005 | ) | ||||
| Capital share transactions (Net of share conversions) (See Note 16): | ||||||||
| Net proceeds from sales of shares | 4,699,933 | 3,071,760 | ||||||
| Reinvestment of distributions | 299,070 | 788 | ||||||
| Cost of shares reacquired | (1,782,577 | ) | (2,931,160 | ) | ||||
| Net increase (decrease) in net assets resulting from capital share transactions | 3,216,426 | 141,388 | ||||||
| Net increase (decrease) in net assets | 4,097,277 | 1,117,936 | ||||||
| NET ASSETS: | ||||||||
| Beginning of year | $ | 3,737,863 | $ | 2,619,927 | ||||
| End of year | $ | 7,835,140 | $ | 3,737,863 | ||||
| 164 | See Notes to Financial Statements. |
| International Equity Fund | |||||||
| For the Year Ended October 31, 2021 | For the Year Ended October 31, 2020 | ||||||
| $ | 4,590,655 | $ | 4,016,518 | ||||
| 75,289,639 | (12,093,836 | ) | |||||
| 35,362,678 | 17,428,458 | ||||||
| 115,242,972 | 9,351,140 | ||||||
| (1,991,486 | ) | (2,639,912 | ) | ||||
| (19,196 | ) | (71,571 | ) | ||||
| (147,298 | ) | (800,991 | ) | ||||
| (69,008 | ) | (76,992 | ) | ||||
| (2,805,314 | ) | (3,329,607 | ) | ||||
| (278 | ) | (544 | ) | ||||
| (914 | ) | (5,530 | ) | ||||
| (51,482 | ) | (89,018 | ) | ||||
| (15,302 | ) | (16,392 | ) | ||||
| (1,028 | ) | (1,430 | ) | ||||
| (34,250 | ) | (43,726 | ) | ||||
| (5,135,556 | ) | (7,075,713 | ) | ||||
| 33,002,179 | 30,457,636 | ||||||
| 5,052,206 | 6,953,332 | ||||||
| (98,186,274 | ) | (127,708,023 | ) | ||||
| (60,131,889 | ) | (90,297,055 | ) | ||||
| 49,975,527 | (88,021,628 | ) | |||||
| $ | 364,457,611 | $ | 452,479,239 | ||||
| $ | 414,433,138 | $ | 364,457,611 | ||||
| See Notes to Financial Statements. | 165 |
Statements of Changes in Net Assets (continued)
| International Opportunities Fund | ||||||||
| INCREASE (DECREASE) IN NET ASSETS | For the Year Ended October 31, 2021 | For the Year Ended October 31, 2020 | ||||||
| Operations: | ||||||||
| Net investment income | $ | 5,084,769 | $ | 2,261,426 | ||||
| Net realized gain (loss) on investments, forward foreign currency exchange contracts, swaps and foreign currency related transactions | 92,262,626 | (25,026,389 | ) | |||||
| Net change in unrealized appreciation/depreciation on investments, swaps and translation of assets and liabilities denominated in foreign currencies | 39,062,330 | 9,294,435 | ||||||
| Net increase (decrease) in net assets resulting from operations | 136,409,725 | (13,470,528 | ) | |||||
| Distributions to shareholders: | ||||||||
| Class A | – | (1,578,626 | ) | |||||
| Class C | – | (105,055 | ) | |||||
| Class F | – | (1,183,908 | ) | |||||
| Class F3 | – | (280,820 | ) | |||||
| Class I | – | (3,153,719 | ) | |||||
| Class P | – | (891 | ) | |||||
| Class R2 | – | (28,321 | ) | |||||
| Class R3 | – | (187,243 | ) | |||||
| Class R4 | – | (84,735 | ) | |||||
| Class R5 | – | (266,449 | ) | |||||
| Class R6 | – | (509,434 | ) | |||||
| Total distributions to shareholders | – | (7,379,201 | ) | |||||
| Capital share transactions (Net of share conversions) (See Note 16): | ||||||||
| Net proceeds from sales of shares | 71,129,338 | 66,574,037 | ||||||
| Reinvestment of distributions | – | 6,975,121 | ||||||
| Cost of shares reacquired | (130,656,497 | ) | (226,633,725 | ) | ||||
| Net increase (decrease) in net assets resulting from capital share transactions | (59,527,159 | ) | (153,084,567 | ) | ||||
| Net increase (decrease) in net assets | 76,882,566 | (173,934,296 | ) | |||||
| NET ASSETS: | ||||||||
| Beginning of year | $ | 387,065,807 | $ | 561,000,103 | ||||
| End of year | $ | 463,948,373 | $ | 387,065,807 | ||||
| 166 | See Notes to Financial Statements. |
| International Value Fund | |||||||
| For the Year Ended October 31, 2021 | For the Year Ended October 31, 2020 | ||||||
| $ | 17,777,227 | $ | 10,083,610 | ||||
| 63,007,688 | (48,705,025 | ) | |||||
| 78,100,054 | (25,856,479 | ) | |||||
| 158,884,969 | (64,477,894 | ) | |||||
| (6,652,226 | ) | (4,117,368 | ) | ||||
| (267,647 | ) | (254,834 | ) | ||||
| (863,813 | ) | (602,335 | ) | ||||
| (718,721 | ) | (464,168 | ) | ||||
| (9,028,337 | ) | (4,323,381 | ) | ||||
| – | – | ||||||
| (591 | ) | (218 | ) | ||||
| (165,652 | ) | (103,892 | ) | ||||
| (3,223 | ) | (701 | ) | ||||
| (411 | ) | (215 | ) | ||||
| (40,348 | ) | (25,750 | ) | ||||
| (17,740,969 | ) | (9,892,862 | ) | ||||
| 145,056,895 | 70,419,560 | ||||||
| 17,417,073 | 9,692,061 | ||||||
| (98,246,005 | ) | (140,459,945 | ) | ||||
| 64,227,963 | (60,348,324 | ) | |||||
| 205,371,963 | (134,719,080 | ) | |||||
| $ | 445,351,257 | $ | 580,070,337 | ||||
| $ | 650,723,220 | $ | 445,351,257 | ||||
| See Notes to Financial Statements. | 167 |
Statements of Changes in Net Assets (concluded)
| Micro Cap Growth Fund | ||||||||
| INCREASE (DECREASE) IN NET ASSETS | For the Year Ended October 31, 2021 | For the Year Ended October 31, 2020 | ||||||
| Operations: | ||||||||
| Net investment income (loss) | $ | (3,963,904 | ) | $ | (1,500,087 | ) | ||
| Net realized gain (loss) on investments | (8,607,312 | ) | 36,500,948 | |||||
| Net change in unrealized appreciation/depreciation on investments | 45,629,143 | 16,451,637 | ||||||
| Net increase in net assets resulting from operations | 33,057,927 | 51,452,498 | ||||||
| Distributions to shareholders: | ||||||||
| Class A | (3,732,335 | ) | (2,158,436 | ) | ||||
| Class C | (305,530 | ) | – | |||||
| Class F | (3,797,520 | ) | – | |||||
| Class F3 | – | – | ||||||
| Class I | (22,252,242 | ) | (18,035,766 | ) | ||||
| Class P | – | – | ||||||
| Class R2 | – | – | ||||||
| Class R3 | – | – | ||||||
| Class R4 | – | – | ||||||
| Class R5 | – | – | ||||||
| Class R6 | – | – | ||||||
| Total distributions to shareholders | (30,087,627 | ) | (20,194,202 | ) | ||||
| Capital share transactions (Net of share conversions) (See Note 16): | ||||||||
| Net proceeds from sales of shares | 422,163,379 | 36,535,765 | ||||||
| Reinvestment of distributions | 24,252,834 | 18,151,507 | ||||||
| Cost of shares reacquired | (167,481,227 | ) | (102,948,159 | ) | ||||
| Net increase (decrease) in net assets resulting from capital share transactions | 278,934,986 | (48,260,887 | ) | |||||
| Net increase (decrease) in net assets | 281,905,286 | (17,002,591 | ) | |||||
| NET ASSETS: | ||||||||
| Beginning of year | $ | 115,409,830 | $ | 132,412,421 | ||||
| End of year | $ | 397,315,116 | $ | 115,409,830 | ||||
| 168 | See Notes to Financial Statements. |
| Value Opportunities Fund | |||||||
| For the Year Ended October 31, 2021 | For the Year Ended October 31, 2020 | ||||||
| $ | 1,933,149 | $ | 5,295,341 | ||||
| 257,838,408 | 91,012,863 | ||||||
| 371,649,199 | (76,099,606 | ) | |||||
| 631,420,756 | 20,208,598 | ||||||
| (38,007,203 | ) | (85,094,354 | ) | ||||
| (4,497,264 | ) | (17,196,886 | ) | ||||
| (8,497,131 | ) | (22,240,666 | ) | ||||
| (11,931,245 | ) | (27,977,023 | ) | ||||
| (13,160,064 | ) | (31,069,513 | ) | ||||
| (906,655 | ) | (2,448,798 | ) | ||||
| (302,914 | ) | (736,437 | ) | ||||
| (2,492,301 | ) | (6,339,609 | ) | ||||
| (1,994,555 | ) | (4,776,365 | ) | ||||
| (120,442 | ) | (306,961 | ) | ||||
| (1,814,164 | ) | (4,315,563 | ) | ||||
| (83,723,938 | ) | (202,502,175 | ) | ||||
| 329,686,948 | 156,871,893 | ||||||
| 81,622,220 | 196,957,357 | ||||||
| (395,166,158 | ) | (649,877,862 | ) | ||||
| 16,143,010 | (296,048,612 | ) | |||||
| 563,839,828 | (478,342,189 | ) | |||||
| $ | 1,375,409,638 | $ | 1,853,751,827 | ||||
| $ | 1,939,249,466 | $ | 1,375,409,638 | ||||
| See Notes to Financial Statements. | 169 |
ALPHA STRATEGY FUND
| Per Share Operating Performance: | ||||||||||||||||||||||||||||
| Investment Operations: | Distributions to shareholders from: | |||||||||||||||||||||||||||
| Net asset value, beginning of period | Net invest- ment income (loss)(b) | Net realized and unrealized gain | Total from invest- ment opera- tions | Net investment income | Net realized gain | Total distri- butions | ||||||||||||||||||||||
| Class A | ||||||||||||||||||||||||||||
| 10/31/2021 | $22.60 | $(0.02 | ) | $ 9.90 | $ 9.88 | $(0.36 | ) | $(1.73 | ) | $(2.09 | ) | |||||||||||||||||
| 10/31/2020 | 24.04 | 0.03 | 1.82 | 1.85 | – | (3.29 | ) | (3.29 | ) | |||||||||||||||||||
| 10/31/2019 | 26.62 | (0.03 | ) | 0.87 | 0.84 | (0.26 | ) | (3.16 | ) | (3.42 | ) | |||||||||||||||||
| 10/31/2018 | 28.92 | (0.05 | ) | 0.93 | 0.88 | – | (3.18 | ) | (3.18 | ) | ||||||||||||||||||
| 10/31/2017 | 25.94 | (0.05 | ) | 5.96 | 5.91 | – | (2.93 | ) | (2.93 | ) | ||||||||||||||||||
| Class C | ||||||||||||||||||||||||||||
| 10/31/2021 | 17.82 | (0.17 | ) | 7.74 | 7.57 | (0.19 | ) | (1.73 | ) | (1.92 | ) | |||||||||||||||||
| 10/31/2020 | 19.73 | (0.09 | ) | 1.47 | 1.38 | – | (3.29 | ) | (3.29 | ) | ||||||||||||||||||
| 10/31/2019 | 22.43 | (0.17 | ) | 0.66 | 0.49 | (0.03 | ) | (3.16 | ) | (3.19 | ) | |||||||||||||||||
| 10/31/2018 | 25.03 | (0.21 | ) | 0.79 | 0.58 | – | (3.18 | ) | (3.18 | ) | ||||||||||||||||||
| 10/31/2017 | 22.96 | (0.21 | ) | 5.21 | 5.00 | – | (2.93 | ) | (2.93 | ) | ||||||||||||||||||
| Class F | ||||||||||||||||||||||||||||
| 10/31/2021 | 22.82 | 0.03 | 10.01 | 10.04 | (0.40 | ) | (1.73 | ) | (2.13 | ) | ||||||||||||||||||
| 10/31/2020 | 24.22 | 0.08 | 1.81 | 1.89 | – | (3.29 | ) | (3.29 | ) | |||||||||||||||||||
| 10/31/2019 | 26.80 | 0.01 | 0.87 | 0.88 | (0.30 | ) | (3.16 | ) | (3.46 | ) | ||||||||||||||||||
| 10/31/2018 | 29.06 | – | (d) | 0.92 | 0.92 | – | (3.18 | ) | (3.18 | ) | ||||||||||||||||||
| 10/31/2017 | 26.01 | (0.02 | ) | 6.00 | 5.98 | – | (2.93 | ) | (2.93 | ) | ||||||||||||||||||
| Class F3 | ||||||||||||||||||||||||||||
| 10/31/2021 | 23.47 | 0.07 | 10.32 | 10.39 | (0.43 | ) | (1.73 | ) | (2.16 | ) | ||||||||||||||||||
| 10/31/2020 | 24.78 | 0.10 | 1.88 | 1.98 | – | (3.29 | ) | (3.29 | ) | |||||||||||||||||||
| 10/31/2019 | 27.32 | 0.05 | 0.91 | 0.96 | (0.34 | ) | (3.16 | ) | (3.50 | ) | ||||||||||||||||||
| 10/31/2018 | 29.52 | 0.05 | 0.93 | 0.98 | – | (3.18 | ) | (3.18 | ) | |||||||||||||||||||
| 4/4/2017 to 10/31/2017(e) | 26.15 | (0.01 | ) | 3.38 | 3.37 | – | – | – | ||||||||||||||||||||
| Class I | ||||||||||||||||||||||||||||
| 10/31/2021 | 23.39 | 0.05 | 10.27 | 10.32 | (0.42 | ) | (1.73 | ) | (2.15 | ) | ||||||||||||||||||
| 10/31/2020 | 24.72 | 0.11 | 1.85 | 1.96 | – | (3.29 | ) | (3.29 | ) | |||||||||||||||||||
| 10/31/2019 | 27.29 | 0.03 | 0.89 | 0.92 | (0.33 | ) | (3.16 | ) | (3.49 | ) | ||||||||||||||||||
| 10/31/2018 | 29.50 | 0.02 | 0.95 | 0.97 | – | (3.18 | ) | (3.18 | ) | |||||||||||||||||||
| 10/31/2017 | 26.34 | 0.02 | 6.07 | 6.09 | – | (2.93 | ) | (2.93 | ) | |||||||||||||||||||
| Class R2 | ||||||||||||||||||||||||||||
| 10/31/2021 | 21.52 | (0.09 | ) | 9.40 | 9.31 | (0.30 | ) | (1.73 | ) | (2.03 | ) | |||||||||||||||||
| 10/31/2020 | 23.11 | (0.04 | ) | 1.74 | 1.70 | – | (3.29 | ) | (3.29 | ) | ||||||||||||||||||
| 10/31/2019 | 25.65 | (0.10 | ) | 0.83 | 0.73 | (0.11 | ) | (3.16 | ) | (3.27 | ) | |||||||||||||||||
| 10/31/2018 | 28.07 | (0.13 | ) | 0.89 | 0.76 | – | (3.18 | ) | (3.18 | ) | ||||||||||||||||||
| 10/31/2017 | 25.34 | (0.14 | ) | 5.80 | 5.66 | – | (2.93 | ) | (2.93 | ) | ||||||||||||||||||
| 170 | See Notes to Financial Statements. |
| Ratios to Average Net Assets:(a) | Supplemental Data: | |||||||||||||||||||||||||
| Net asset value, end of period | Total return(c) (%) | Total expenses after waivers and/or reim- bursements (%) | Total expenses (%) | Net invest- ment income (loss) (%) | Net assets, end of period (000) | Portfolio turnover rate (%) | ||||||||||||||||||||
| $30.39 | 45.31 | 0.41 | 0.52 | (0.06 | ) | $542,197 | 7 | |||||||||||||||||||
| 22.60 | 7.72 | 0.43 | 0.53 | 0.16 | 400,088 | 16 | ||||||||||||||||||||
| 24.04 | 5.65 | 0.44 | 0.54 | (0.13 | ) | 482,675 | 17 | |||||||||||||||||||
| 26.62 | 3.11 | 0.42 | 0.52 | (0.17 | ) | 508,472 | 8 | |||||||||||||||||||
| 28.92 | 24.55 | 0.41 | 0.54 | (0.19 | ) | 510,601 | 6 | |||||||||||||||||||
| 23.47 | 44.16 | 1.16 | 1.26 | (0.77 | ) | 56,365 | 7 | |||||||||||||||||||
| 17.82 | 6.98 | 1.18 | 1.28 | (0.52 | ) | 54,247 | 16 | |||||||||||||||||||
| 19.73 | 4.86 | 1.19 | 1.29 | (0.85 | ) | 97,096 | 17 | |||||||||||||||||||
| 22.43 | 2.31 | 1.17 | 1.27 | (0.87 | ) | 140,681 | 8 | |||||||||||||||||||
| 25.03 | 23.69 | 1.16 | 1.29 | (0.92 | ) | 224,568 | 6 | |||||||||||||||||||
| 30.73 | 45.53 | 0.26 | 0.37 | 0.09 | 144,742 | 7 | ||||||||||||||||||||
| 22.82 | 7.89 | 0.28 | 0.38 | 0.37 | 120,797 | 16 | ||||||||||||||||||||
| 24.22 | 5.81 | 0.29 | 0.39 | 0.04 | 176,784 | 17 | ||||||||||||||||||||
| 26.80 | 3.25 | 0.27 | 0.37 | (0.01 | ) | 204,245 | 8 | |||||||||||||||||||
| 29.06 | 24.78 | 0.27 | 0.39 | (0.06 | ) | 247,908 | 6 | |||||||||||||||||||
| 31.70 | 45.81 | 0.08 | 0.18 | 0.25 | 56,369 | 7 | ||||||||||||||||||||
| 23.47 | 8.10 | 0.09 | 0.19 | 0.44 | 33,179 | 16 | ||||||||||||||||||||
| 24.78 | 6.03 | 0.10 | 0.20 | 0.20 | 32,219 | 17 | ||||||||||||||||||||
| 27.32 | 3.42 | 0.08 | 0.19 | 0.17 | 33,677 | 8 | ||||||||||||||||||||
| 29.52 | 12.89 | (f) | 0.09 | (g) | 0.19 | (g) | (0.08 | )(g) | 34,672 | 6 | ||||||||||||||||
| 31.56 | 45.64 | 0.16 | 0.27 | 0.18 | 43,112 | 7 | ||||||||||||||||||||
| 23.39 | 8.02 | 0.18 | 0.28 | 0.51 | 28,481 | 16 | ||||||||||||||||||||
| 24.72 | 5.88 | 0.19 | 0.29 | 0.11 | 92,448 | 17 | ||||||||||||||||||||
| 27.29 | 3.38 | 0.17 | 0.27 | 0.08 | 87,441 | 8 | ||||||||||||||||||||
| 29.50 | 24.90 | 0.16 | 0.30 | 0.06 | 69,232 | 6 | ||||||||||||||||||||
| 28.80 | 44.78 | 0.76 | 0.86 | (0.34 | ) | 1,433 | 7 | |||||||||||||||||||
| 21.52 | 7.39 | 0.78 | 0.88 | (0.19 | ) | 1,430 | 16 | |||||||||||||||||||
| 23.11 | 5.26 | 0.79 | 0.89 | (0.45 | ) | 1,476 | 17 | |||||||||||||||||||
| 25.65 | 2.75 | 0.77 | 0.87 | (0.49 | ) | 2,531 | 8 | |||||||||||||||||||
| 28.07 | 24.11 | 0.76 | 0.89 | (0.55 | ) | 3,064 | 6 | |||||||||||||||||||
| See Notes to Financial Statements. | 171 |
Financial Highlights (continued)
ALPHA STRATEGY FUND
| Per Share Operating Performance: | ||||||||||||||||||||||||||||
| Investment Operations: | Distributions to shareholders from: | |||||||||||||||||||||||||||
| Net asset value, beginning of period | Net invest- ment income (loss)(b) | Net realized and unrealized gain | Total from invest- ment opera- tions | Net investment income | Net realized gain | Total distri- butions | ||||||||||||||||||||||
| Class R3 | ||||||||||||||||||||||||||||
| 10/31/2021 | $21.70 | $(0.08 | ) | $ 9.50 | $ 9.42 | $(0.30 | ) | $(1.73 | ) | $(2.03 | ) | |||||||||||||||||
| 10/31/2020 | 23.26 | (0.01 | ) | 1.74 | 1.73 | – | (3.29 | ) | (3.29 | ) | ||||||||||||||||||
| 10/31/2019 | 25.86 | (0.09 | ) | 0.84 | 0.75 | (0.19 | ) | (3.16 | ) | (3.35 | ) | |||||||||||||||||
| 10/31/2018 | 28.25 | (0.11 | ) | 0.90 | 0.79 | – | (3.18 | ) | (3.18 | ) | ||||||||||||||||||
| 10/31/2017 | 25.46 | (0.11 | ) | 5.83 | 5.72 | – | (2.93 | ) | (2.93 | ) | ||||||||||||||||||
| Class R4 | ||||||||||||||||||||||||||||
| 10/31/2021 | 22.54 | (0.01 | ) | 9.86 | 9.85 | (0.36 | ) | (1.73 | ) | (2.09 | ) | |||||||||||||||||
| 10/31/2020 | 23.98 | 0.02 | 1.83 | 1.85 | – | (3.29 | ) | (3.29 | ) | |||||||||||||||||||
| 10/31/2019 | 26.58 | (0.04 | ) | 0.87 | 0.83 | (0.27 | ) | (3.16 | ) | (3.43 | ) | |||||||||||||||||
| 10/31/2018 | 28.88 | (0.06 | ) | 0.94 | 0.88 | – | (3.18 | ) | (3.18 | ) | ||||||||||||||||||
| 10/31/2017 | 25.90 | (0.09 | ) | 6.00 | 5.91 | – | (2.93 | ) | (2.93 | ) | ||||||||||||||||||
| Class R5 | ||||||||||||||||||||||||||||
| 10/31/2021 | 23.40 | 0.10 | 10.22 | 10.32 | (0.42 | ) | (1.73 | ) | (2.15 | ) | ||||||||||||||||||
| 10/31/2020 | 24.73 | 0.03 | 1.93 | 1.96 | – | (3.29 | ) | (3.29 | ) | |||||||||||||||||||
| 10/31/2019 | 27.30 | 0.03 | 0.89 | 0.92 | (0.33 | ) | (3.16 | ) | (3.49 | ) | ||||||||||||||||||
| 10/31/2018 | 29.52 | 0.02 | 0.94 | 0.96 | – | (3.18 | ) | (3.18 | ) | |||||||||||||||||||
| 10/31/2017 | 26.35 | (0.04 | ) | 6.14 | 6.10 | – | (2.93 | ) | (2.93 | ) | ||||||||||||||||||
| Class R6 | ||||||||||||||||||||||||||||
| 10/31/2021 | 23.48 | 0.08 | 10.31 | 10.39 | (0.43 | ) | (1.73 | ) | (2.16 | ) | ||||||||||||||||||
| 10/31/2020 | 24.78 | 0.10 | 1.89 | 1.99 | – | (3.29 | ) | (3.29 | ) | |||||||||||||||||||
| 10/31/2019 | 27.33 | 0.05 | 0.90 | 0.95 | (0.34 | ) | (3.16 | ) | (3.50 | ) | ||||||||||||||||||
| 10/31/2018 | 29.52 | 0.05 | 0.94 | 0.99 | – | (3.18 | ) | (3.18 | ) | |||||||||||||||||||
| 10/31/2017 | 26.34 | (0.01 | ) | 6.12 | 6.11 | – | (2.93 | ) | (2.93 | ) | ||||||||||||||||||
| (a) | Does not include expenses of the Underlying Funds in which the Fund invests. |
| (b) | Calculated using average shares outstanding during the period. |
| (c) | Total return for Classes A and C does not consider the effects of sales loads and assumes the reinvestment of all distributions. Total return for all other classes assumes the reinvestment of all distributions. |
| (d) | Amount less than $0.01. |
| (e) | Commenced on April 4, 2017. |
| (f) | Not annualized. |
| (g) | Annualized. |
| 172 | See Notes to Financial Statements. |
| Ratios to Average Net Assets:(a) | Supplemental Data: | |||||||||||||||||||||||||
| Net asset value, end of period | Total return(c) (%) | Total expenses after waivers and/or reim- bursements (%) | Total expenses (%) | Net invest- ment income (loss) (%) | Net assets, end of period (000) | Portfolio turnover rate (%) | ||||||||||||||||||||
| $29.09 | 44.95 | 0.66 | 0.76 | (0.30 | ) | $25,883 | 7 | |||||||||||||||||||
| 21.70 | 7.47 | 0.68 | 0.78 | (0.07 | ) | 20,860 | 16 | |||||||||||||||||||
| 23.26 | 5.38 | 0.69 | 0.79 | (0.38 | ) | 26,729 | 17 | |||||||||||||||||||
| 25.86 | 2.84 | 0.67 | 0.77 | (0.40 | ) | 28,601 | 8 | |||||||||||||||||||
| 28.25 | 24.24 | 0.65 | 0.79 | (0.43 | ) | 33,190 | 6 | |||||||||||||||||||
| 30.30 | 45.25 | 0.41 | 0.52 | (0.04 | ) | 4,621 | 7 | |||||||||||||||||||
| 22.54 | 7.79 | 0.43 | 0.53 | 0.09 | 3,715 | 16 | ||||||||||||||||||||
| 23.98 | 5.61 | 0.44 | 0.54 | (0.16 | ) | 3,461 | 17 | |||||||||||||||||||
| 26.58 | 3.12 | 0.42 | 0.52 | (0.22 | ) | 3,236 | 8 | |||||||||||||||||||
| 28.88 | 24.60 | 0.42 | 0.53 | (0.34 | ) | 1,998 | 6 | |||||||||||||||||||
| 31.57 | 45.65 | 0.16 | 0.27 | 0.33 | 518 | 7 | ||||||||||||||||||||
| 23.40 | 8.02 | 0.18 | 0.28 | 0.14 | 623 | 16 | ||||||||||||||||||||
| 24.73 | 5.90 | 0.19 | 0.29 | 0.13 | 296 | 17 | ||||||||||||||||||||
| 27.30 | 3.34 | 0.17 | 0.27 | 0.06 | 106 | 8 | ||||||||||||||||||||
| 29.52 | 24.93 | 0.18 | 0.28 | (0.13 | ) | 84 | 6 | |||||||||||||||||||
| 31.71 | 45.79 | 0.08 | 0.18 | 0.28 | 5,386 | 7 | ||||||||||||||||||||
| 23.48 | 8.14 | 0.09 | 0.19 | 0.46 | 4,143 | 16 | ||||||||||||||||||||
| 24.78 | 5.98 | 0.10 | 0.20 | 0.19 | 4,266 | 17 | ||||||||||||||||||||
| 27.33 | 3.45 | 0.08 | 0.19 | 0.17 | 3,619 | 8 | ||||||||||||||||||||
| 29.52 | 24.98 | 0.09 | 0.19 | 1.34 | 3,855 | 6 | ||||||||||||||||||||
| See Notes to Financial Statements. | 173 |
Financial Highlights (continued)
DURABLE GROWTH FUND
| Per Share Operating Performance: | ||||||||||||||||||||||||||||
| Investment Operations: | Distributions to shareholders from: | |||||||||||||||||||||||||||
| Net asset value, beginning of period | Net invest- ment income (loss)(a) | Net realized and unrealized gain | Total from invest- ment opera- tions | Net investment income | Net realized gain | Total distri- butions | ||||||||||||||||||||||
| Class A | ||||||||||||||||||||||||||||
| 10/31/2021 | $19.21 | $(0.10 | ) | $6.89 | $6.79 | $ – | $(0.51 | ) | $(0.51 | ) | ||||||||||||||||||
| 10/31/2020 | 15.00 | (0.03 | ) | 4.25 | 4.22 | (0.01 | ) | – | (0.01 | ) | ||||||||||||||||||
| Class C | ||||||||||||||||||||||||||||
| 10/31/2021 | 19.08 | (0.26 | ) | 6.81 | 6.55 | – | (0.51 | ) | (0.51 | ) | ||||||||||||||||||
| 10/31/2020 | 15.00 | (0.14 | ) | 4.22 | 4.08 | – | – | – | ||||||||||||||||||||
| Class F | ||||||||||||||||||||||||||||
| 10/31/2021 | 19.25 | (0.04 | ) | 6.90 | 6.86 | – | (0.51 | ) | (0.51 | ) | ||||||||||||||||||
| 10/31/2020 | 15.00 | 0.04 | 4.22 | 4.26 | (0.01 | ) | – | (0.01 | ) | |||||||||||||||||||
| Class F3 | ||||||||||||||||||||||||||||
| 10/31/2021 | 19.26 | (0.03 | ) | 6.89 | 6.86 | (0.02 | ) | (0.51 | ) | (0.53 | ) | |||||||||||||||||
| 10/31/2020 | 15.00 | 0.04 | 4.24 | 4.28 | (0.02 | ) | – | (0.02 | ) | |||||||||||||||||||
| Class I | ||||||||||||||||||||||||||||
| 10/31/2021 | 19.25 | (0.04 | ) | 6.90 | 6.86 | (0.02 | ) | (0.51 | ) | (0.53 | ) | |||||||||||||||||
| 10/31/2020 | 15.00 | 0.01 | 4.26 | 4.27 | (0.02 | ) | – | (0.02 | ) | |||||||||||||||||||
| Class R3 | ||||||||||||||||||||||||||||
| 10/31/2021 | 19.17 | (0.15 | ) | 6.85 | 6.70 | – | (0.51 | ) | (0.51 | ) | ||||||||||||||||||
| 10/31/2020 | 15.00 | (0.05 | ) | 4.23 | 4.18 | (0.01 | ) | – | (0.01 | ) | ||||||||||||||||||
| Class R4 | ||||||||||||||||||||||||||||
| 10/31/2021 | 19.21 | (0.09 | ) | 6.87 | 6.78 | – | (0.51 | ) | (0.51 | ) | ||||||||||||||||||
| 10/31/2020 | 15.00 | (0.01 | ) | 4.23 | 4.22 | (0.01 | ) | – | (0.01 | ) | ||||||||||||||||||
| Class R5 | ||||||||||||||||||||||||||||
| 10/31/2021 | 19.25 | (0.04 | ) | 6.89 | 6.85 | (0.02 | ) | (0.51 | ) | (0.53 | ) | |||||||||||||||||
| 10/31/2020 | 15.00 | 0.03 | 4.24 | 4.27 | (0.02 | ) | – | (0.02 | ) | |||||||||||||||||||
| Class R6 | ||||||||||||||||||||||||||||
| 10/31/2021 | 19.26 | (0.04 | ) | 6.90 | 6.86 | (0.02 | ) | (0.51 | ) | (0.53 | ) | |||||||||||||||||
| 10/31/2020 | 15.00 | 0.06 | 4.22 | 4.28 | (0.02 | ) | – | (0.02 | ) | |||||||||||||||||||
| (a) | Calculated using average shares outstanding during the period. |
| (b) | Total return for Classes A and C does not consider the effects of sales loads and assumes the reinvestment of all distributions. Total return for all other classes assumes the reinvestment of all distributions. |
| 174 | See Notes to Financial Statements. |
| Ratios to Average Net Assets: | Supplemental Data: | |||||||||||||||||||||||||
| Net asset value, end of period | Total return(b) (%) | Total expenses after waivers and/or reim- bursements (%) | Total expenses (%) | Net invest- ment income (loss) (%) | Net assets, end of period (000) | Portfolio turnover rate (%) | ||||||||||||||||||||
| $25.49 | 36.00 | 0.95 | 0.97 | (0.42 | ) | $ | 3,711 | 96 | ||||||||||||||||||
| 19.21 | 28.16 | 0.95 | 1.29 | (0.18 | ) | 1,538 | 52 | |||||||||||||||||||
| 25.12 | 34.97 | 1.70 | 1.72 | (1.16 | ) | 368 | 96 | |||||||||||||||||||
| 19.08 | 27.20 | 1.70 | 2.61 | (0.84 | ) | 228 | 52 | |||||||||||||||||||
| 25.60 | 36.30 | 0.70 | 0.82 | (0.16 | ) | 479 | 96 | |||||||||||||||||||
| 19.25 | 28.46 | 0.70 | 2.24 | 0.25 | 346 | 52 | ||||||||||||||||||||
| 25.59 | 36.31 | 0.67 | 0.71 | (0.13 | ) | 188 | 96 | |||||||||||||||||||
| 19.26 | 28.55 | 0.64 | 1.73 | 0.24 | 141 | 52 | ||||||||||||||||||||
| 25.58 | 36.32 | 0.70 | 0.71 | (0.17 | ) | 246,153 | 96 | |||||||||||||||||||
| 19.25 | 28.48 | 0.70 | 0.69 | 0.07 | 199,234 | 52 | ||||||||||||||||||||
| 25.36 | 35.60 | 1.20 | 1.21 | (0.64 | ) | 17 | 96 | |||||||||||||||||||
| 19.17 | 27.84 | 1.20 | 2.25 | (0.32 | ) | 13 | 52 | |||||||||||||||||||
| 25.48 | 35.95 | 0.95 | 0.96 | (0.40 | ) | 17 | 96 | |||||||||||||||||||
| 19.21 | 28.16 | 0.95 | 2.00 | (0.07 | ) | 13 | 52 | |||||||||||||||||||
| 25.57 | 36.27 | 0.70 | 0.72 | (0.17 | ) | 17 | 96 | |||||||||||||||||||
| 19.25 | 28.48 | 0.70 | 1.75 | 0.18 | 13 | 52 | ||||||||||||||||||||
| 25.59 | 36.31 | 0.67 | 0.71 | (0.17 | ) | 868 | 96 | |||||||||||||||||||
| 19.26 | 28.55 | 0.64 | 2.37 | 0.37 | 241 | 52 | ||||||||||||||||||||
| See Notes to Financial Statements. | 175 |
Financial Highlights (continued)
FOCUSED GROWTH FUND
| Per Share Operating Performance: | ||||||||||||||||||||||||
| Investment Operations: | Distributions to shareholders from: | |||||||||||||||||||||||
| Net asset value, beginning of period | Net investment (loss)(a) | Net realized and unrealized gain | Total from investment operations | Net realized gain | Net asset value, end of period | |||||||||||||||||||
| Class A | ||||||||||||||||||||||||
| 10/31/2021 | $26.90 | $(0.27 | ) | $11.39 | $11.12 | $(1.86 | ) | $36.16 | ||||||||||||||||
| 10/31/2020 | 15.88 | (0.17 | ) | 11.19 | 11.02 | – | 26.90 | |||||||||||||||||
| 1/30/2019 to 10/31/2019(c)(d) | 15.00 | (0.10 | ) | 0.98 | 0.88 | – | 15.88 | |||||||||||||||||
| Class C | ||||||||||||||||||||||||
| 10/31/2021 | 26.56 | (0.50 | ) | 11.21 | 10.71 | (1.86 | ) | 35.41 | ||||||||||||||||
| 10/31/2020 | 15.80 | (0.37 | ) | 11.13 | 10.76 | – | 26.56 | |||||||||||||||||
| 1/30/2019 to 10/31/2019(c)(d) | 15.00 | (0.19 | ) | 0.99 | 0.80 | – | 15.80 | |||||||||||||||||
| Class F | ||||||||||||||||||||||||
| 10/31/2021 | 27.03 | (0.20 | ) | 11.47 | 11.27 | (1.86 | ) | 36.44 | ||||||||||||||||
| 10/31/2020 | 15.91 | (0.13 | ) | 11.25 | 11.12 | – | 27.03 | |||||||||||||||||
| 1/30/2019 to 10/31/2019(c)(d) | 15.00 | (0.07 | ) | 0.98 | 0.91 | – | 15.91 | |||||||||||||||||
| Class F3 | ||||||||||||||||||||||||
| 10/31/2021 | 27.06 | (0.18 | ) | 11.49 | 11.31 | (1.86 | ) | 36.51 | ||||||||||||||||
| 10/31/2020 | 15.92 | (0.09 | ) | 11.23 | 11.14 | – | 27.06 | |||||||||||||||||
| 1/30/2019 to 10/31/2019(c)(d) | 15.00 | (0.06 | ) | 0.98 | 0.92 | – | 15.92 | |||||||||||||||||
| Class I | ||||||||||||||||||||||||
| 10/31/2021 | 27.03 | (0.20 | ) | 11.47 | 11.27 | (1.86 | ) | 36.44 | ||||||||||||||||
| 10/31/2020 | 15.92 | (0.11 | ) | 11.22 | 11.11 | – | 27.03 | |||||||||||||||||
| 1/30/2019 to 10/31/2019(c)(d) | 15.00 | (0.07 | ) | 0.99 | 0.92 | – | 15.92 | |||||||||||||||||
| Class R3 | ||||||||||||||||||||||||
| 10/31/2021 | 26.79 | (0.35 | ) | 11.34 | 10.99 | (1.86 | ) | 35.92 | ||||||||||||||||
| 10/31/2020 | 15.86 | (0.21 | ) | 11.14 | 10.93 | – | 26.79 | |||||||||||||||||
| 1/30/2019 to 10/31/2019(c)(d) | 15.00 | (0.13 | ) | 0.99 | 0.86 | – | 15.86 | |||||||||||||||||
| 176 | See Notes to Financial Statements. |
| Ratios to Average Net Assets: | Supplemental Data: | |||||||||||||||||||||
| Total return(b) (%) | Total expenses after waivers and/or reim- bursements (%) | Total expenses (%) | Net investment (loss) (%) | Net assets, end of period (000) | Portfolio turnover rate (%) | |||||||||||||||||
| 43.48 | 1.05 | 1.49 | (0.87 | ) | $ | 18,332 | 166 | |||||||||||||||
| 69.40 | 1.05 | 2.25 | (0.79 | ) | 12,485 | 126 | ||||||||||||||||
| 5.87 | (e) | 1.05 | (f) | 3.09 | (f) | (0.83 | )(f) | 4,889 | 130 | (e) | ||||||||||||
| 42.43 | 1.80 | 2.24 | (1.62 | ) | 2,701 | 166 | ||||||||||||||||
| 68.10 | 1.78 | 2.87 | (1.61 | ) | 1,849 | 126 | ||||||||||||||||
| 5.33 | (e) | 1.80 | (f) | 4.10 | (f) | (1.55 | )(f) | 156 | 130 | (e) | ||||||||||||
| 43.85 | 0.80 | 1.34 | (0.63 | ) | 18,621 | 166 | ||||||||||||||||
| 69.89 | 0.80 | 2.03 | (0.58 | ) | 5,821 | 126 | ||||||||||||||||
| 6.07 | (e) | 0.80 | (f) | 3.14 | (f) | (0.56 | )(f) | 1,005 | 130 | (e) | ||||||||||||
| 43.95 | 0.75 | 1.16 | (0.57 | ) | 1,217 | 166 | ||||||||||||||||
| 69.97 | 0.72 | 2.01 | (0.44 | ) | 902 | 126 | ||||||||||||||||
| 6.13 | (e) | 0.73 | (f) | 3.07 | (f) | (0.48 | )(f) | 531 | 130 | (e) | ||||||||||||
| 43.90 | 0.80 | 1.24 | (0.62 | ) | 4,587 | 166 | ||||||||||||||||
| 69.72 | 0.80 | 2.04 | (0.52 | ) | 2,712 | 126 | ||||||||||||||||
| 6.13 | (e) | 0.80 | (f) | 2.91 | (f) | (0.60 | )(f) | 1,492 | 130 | (e) | ||||||||||||
| 43.15 | 1.30 | 1.73 | (1.11 | ) | 24 | 166 | ||||||||||||||||
| 68.92 | 1.30 | 2.52 | (1.01 | ) | 18 | 126 | ||||||||||||||||
| 5.73 | (e) | 1.30 | (f) | 3.64 | (f) | (1.06 | )(f) | 11 | 130 | (e) | ||||||||||||
| See Notes to Financial Statements. | 177 |
Financial Highlights (continued)
FOCUSED GROWTH FUND
| Per Share Operating Performance: | ||||||||||||||||||||||||
| Investment Operations: | Distributions to shareholders from: | |||||||||||||||||||||||
| Net asset value, beginning of period | Net investment (loss)(a) | Net realized and unrealized gain | Total from investment operations | Net realized gain | Net asset value, end of period | |||||||||||||||||||
| Class R4 | ||||||||||||||||||||||||
| 10/31/2021 | $26.91 | $(0.27 | ) | $11.40 | $11.13 | $(1.86 | ) | $36.18 | ||||||||||||||||
| 10/31/2020 | 15.89 | (0.16 | ) | 11.18 | 11.02 | – | 26.91 | |||||||||||||||||
| 1/30/2019 to 10/31/2019(c)(d) | 15.00 | (0.10 | ) | 0.99 | 0.89 | – | 15.89 | |||||||||||||||||
| Class R5 | ||||||||||||||||||||||||
| 10/31/2021 | 27.02 | (0.20 | ) | 11.48 | 11.28 | (1.86 | ) | 36.44 | ||||||||||||||||
| 10/31/2020 | 15.91 | (0.10 | ) | 11.21 | 11.11 | – | 27.02 | |||||||||||||||||
| 1/30/2019 to 10/31/2019(c)(d) | 15.00 | (0.07 | ) | 0.98 | 0.91 | – | 15.91 | |||||||||||||||||
| Class R6 | ||||||||||||||||||||||||
| 10/31/2021 | 27.06 | (0.18 | ) | 11.49 | 11.31 | (1.86 | ) | 36.51 | ||||||||||||||||
| 10/31/2020 | 15.92 | (0.10 | ) | 11.24 | 11.14 | – | 27.06 | |||||||||||||||||
| 1/30/2019 to 10/31/2019(c)(d) | 15.00 | (0.06 | ) | 0.98 | 0.92 | – | 15.92 | |||||||||||||||||
| (a) | Calculated using average shares outstanding during the period. |
| (b) | Total return for Classes A and C does not consider the effects of sales loads and assumes the reinvestment of all distributions. Total return for all other classes assumes the reinvestment of all distributions. |
| (c) | Net investment income, net realized and unrealized gain amounted to less than $.01 for the period 1/30/2019 through 1/31/2019. |
| (d) | Commencement of operations was 1/30/2019, SEC effective date was 1/31/2019 and date shares first became available to the public was 2/1/2019. |
| (e) | Not annualized. |
| (f) | Annualized. |
| 178 | See Notes to Financial Statements. |
| Ratios to Average Net Assets: | Supplemental Data: | |||||||||||||||||||||
| Total return(b) (%) | Total expenses after waivers and/or reim- bursements (%) | Total expenses (%) | Net investment (loss) (%) | Net assets, end of period (000) | Portfolio turnover rate (%) | |||||||||||||||||
| 43.50 | 1.05 | 1.48 | (0.86 | ) | $ | 24 | 166 | |||||||||||||||
| 69.35 | 1.05 | 2.27 | (0.75 | ) | 18 | 126 | ||||||||||||||||
| 5.93 | (e) | 1.05 | (f) | 3.37 | (f) | (0.80 | )(f) | 11 | 130 | (e) | ||||||||||||
| 43.90 | 0.80 | 1.25 | (0.63 | ) | 24 | 166 | ||||||||||||||||
| 69.83 | 0.80 | 2.02 | (0.49 | ) | 18 | 126 | ||||||||||||||||
| 6.07 | (e) | 0.80 | (f) | 3.12 | (f) | (0.55 | )(f) | 11 | 130 | (e) | ||||||||||||
| 43.95 | 0.75 | 1.16 | (0.57 | ) | 6,788 | 166 | ||||||||||||||||
| 69.97 | 0.72 | 1.99 | (0.45 | ) | 4,400 | 126 | ||||||||||||||||
| 6.13 | (e) | 0.73 | (f) | 2.83 | (f) | (0.50 | )(f) | 1,821 | 130 | (e) | ||||||||||||
| See Notes to Financial Statements. | 179 |
Financial Highlights (continued)
FOCUSED LARGE CAP VALUE FUND
| Per Share Operating Performance: | ||||||||||||||||||||||||||||
| Investment Operations: | Distributions to shareholders from: | |||||||||||||||||||||||||||
| Net asset value, beginning of period | Net invest- ment income(a) | Net realized and unrealized gain (loss) | Total from invest- ment opera- tions | Net investment income | Net realized gain | Total distri- butions | ||||||||||||||||||||||
| Class A | ||||||||||||||||||||||||||||
| 10/31/2021 | $12.95 | $0.38 | $ 6.68 | $ 7.06 | $(0.16 | ) | $(0.81 | ) | $(0.97 | ) | ||||||||||||||||||
| 10/31/2020 | 14.75 | 0.27 | (1.99 | ) | (1.72 | ) | (0.08 | ) | – | (0.08 | ) | |||||||||||||||||
| 7/26/2019 to 10/31/2019(c)(d) | 15.00 | 0.06 | (0.31 | )(e) | (0.25 | ) | – | – | – | |||||||||||||||||||
| Class C | ||||||||||||||||||||||||||||
| 10/31/2021 | 12.87 | 0.25 | 6.66 | 6.91 | – | (0.81 | ) | (0.81 | ) | |||||||||||||||||||
| 10/31/2020 | 14.72 | 0.17 | (1.98 | ) | (1.81 | ) | (0.04 | ) | – | (0.04 | ) | |||||||||||||||||
| 7/26/2019 to 10/31/2019(c)(d) | 15.00 | 0.03 | (0.31 | )(e) | (0.28 | ) | – | – | – | |||||||||||||||||||
| Class F | ||||||||||||||||||||||||||||
| 10/31/2021 | 12.98 | 0.49 | 6.64 | 7.13 | (0.08 | ) | (0.81 | ) | (0.89 | ) | ||||||||||||||||||
| 10/31/2020 | 14.76 | 0.31 | (2.00 | ) | (1.69 | ) | (0.09 | ) | – | (0.09 | ) | |||||||||||||||||
| 7/26/2019 to 10/31/2019(c)(d) | 15.00 | 0.07 | (0.31 | )(e) | (0.24 | ) | – | – | – | |||||||||||||||||||
| Class F3 | ||||||||||||||||||||||||||||
| 10/31/2021 | 12.98 | 0.37 | 6.75 | 7.12 | (0.19 | ) | (0.81 | ) | (1.00 | ) | ||||||||||||||||||
| 10/31/2020 | 14.76 | 0.32 | (2.00 | ) | (1.68 | ) | (0.10 | ) | – | (0.10 | ) | |||||||||||||||||
| 7/26/2019 to 10/31/2019(c)(d) | 15.00 | 0.07 | (0.31 | )(e) | (0.24 | ) | – | – | – | |||||||||||||||||||
| Class I | ||||||||||||||||||||||||||||
| 10/31/2021 | 12.99 | 0.35 | 6.76 | 7.11 | (0.19 | ) | (0.81 | ) | (1.00 | ) | ||||||||||||||||||
| 10/31/2020 | 14.76 | 0.30 | (1.97 | ) | (1.67 | ) | (0.10 | ) | – | (0.10 | ) | |||||||||||||||||
| 7/26/2019 to 10/31/2019(c)(d) | 15.00 | 0.04 | (0.28 | )(e) | (0.24 | ) | – | – | – | |||||||||||||||||||
| Class R3 | ||||||||||||||||||||||||||||
| 10/31/2021 | 12.92 | 0.29 | 6.71 | 7.00 | (0.12 | ) | (0.81 | ) | (0.93 | ) | ||||||||||||||||||
| 10/31/2020 | 14.74 | 0.23 | (1.99 | ) | (1.76 | ) | (0.06 | ) | – | (0.06 | ) | |||||||||||||||||
| 7/26/2019 to 10/31/2019(c)(d) | 15.00 | 0.05 | (0.31 | )(e) | (0.26 | ) | – | – | – | |||||||||||||||||||
| 180 | See Notes to Financial Statements. |
| Ratios to Average Net Assets: | Supplemental Data: | |||||||||||||||||||||||||
| Net asset value, end of period | Total return(b) (%) | Total expenses after waivers and/or reim- bursements (%) | Total expenses (%) | Net invest- ment income (%) | Net assets, end of period (000) | Portfolio turnover rate (%) | ||||||||||||||||||||
| $19.04 | 56.50 | 0.93 | 0.93 | 2.08 | $ 7,714 | 99 | ||||||||||||||||||||
| 12.95 | (11.74 | ) | 0.96 | 1.09 | 2.08 | 541 | 128 | |||||||||||||||||||
| 14.75 | (1.67 | )(f) | 0.96 | (g) | 4.40 | (g) | 1.57 | (g) | 508 | 16 | (f) | |||||||||||||||
| 18.97 | 55.29 | 1.67 | 1.67 | 1.36 | 3,601 | 99 | ||||||||||||||||||||
| 12.87 | (12.35 | ) | 1.71 | 1.83 | 1.32 | 77 | 128 | |||||||||||||||||||
| 14.72 | (1.87 | )(f) | 1.71 | (g) | 5.27 | (g) | 0.75 | (g) | 108 | 16 | (f) | |||||||||||||||
| 19.22 | 56.78 | 0.68 | 0.78 | 2.60 | 2,394 | 99 | ||||||||||||||||||||
| 12.98 | (11.54 | ) | 0.71 | 0.98 | 2.33 | 40 | 128 | |||||||||||||||||||
| 14.76 | (1.60 | )(f) | 0.71 | (g) | 4.37 | (g) | 1.75 | (g) | 492 | 16 | (f) | |||||||||||||||
| 19.10 | 56.91 | 0.67 | 0.67 | 2.13 | 18 | 99 | ||||||||||||||||||||
| 12.98 | (11.50 | ) | 0.63 | 0.84 | 2.40 | 12 | 128 | |||||||||||||||||||
| 14.76 | (1.60 | )(f) | 0.63 | (g) | 4.21 | (g) | 1.83 | (g) | 492 | 16 | (f) | |||||||||||||||
| 19.10 | 56.79 | 0.68 | 0.68 | 1.99 | 656,899 | 99 | ||||||||||||||||||||
| 12.99 | (11.43 | ) | 0.71 | 0.75 | 2.34 | 428,070 | 128 | |||||||||||||||||||
| 14.76 | (1.60 | )(f) | 0.71 | (g) | 1.07 | (g) | 1.10 | (g) | 38,221 | 16 | (f) | |||||||||||||||
| 18.99 | 56.09 | 1.15 | 1.15 | 1.65 | 13 | 99 | ||||||||||||||||||||
| 12.92 | (11.98 | ) | 1.21 | 1.34 | 1.75 | 9 | 128 | |||||||||||||||||||
| 14.74 | (1.73 | )(f) | 1.21 | (g) | 4.78 | (g) | 1.24 | (g) | 10 | 16 | (f) | |||||||||||||||
| See Notes to Financial Statements. | 181 |
Financial Highlights (continued)
FOCUSED LARGE CAP VALUE FUND
| Per Share Operating Performance: | ||||||||||||||||||||||||||||
| Investment Operations: | Distributions to shareholders from: | |||||||||||||||||||||||||||
| Net asset value, beginning of period | Net invest- ment income(a) | Net realized and unrealized gain (loss) | Total from invest- ment opera- tions | Net investment income | Net realized gain | Total distri- butions | ||||||||||||||||||||||
| Class R4 | ||||||||||||||||||||||||||||
| 10/31/2021 | $12.95 | $0.33 | $ 6.73 | $ 7.06 | $(0.16 | ) | $(0.81 | ) | $(0.97 | ) | ||||||||||||||||||
| 10/31/2020 | 14.75 | 0.27 | (1.99 | ) | (1.72 | ) | (0.08 | ) | – | (0.08 | ) | |||||||||||||||||
| 7/26/2019 to 10/31/2019(c)(d) | 15.00 | 0.06 | (0.31 | )(e) | (0.25 | ) | – | – | – | |||||||||||||||||||
| Class R5 | ||||||||||||||||||||||||||||
| 10/31/2021 | 12.98 | 0.38 | 6.73 | 7.11 | (0.19 | ) | (0.81 | ) | (1.00 | ) | ||||||||||||||||||
| 10/31/2020 | 14.76 | 0.30 | (1.98 | ) | (1.68 | ) | (0.10 | ) | – | (0.10 | ) | |||||||||||||||||
| 7/26/2019 to 10/31/2019(c)(d) | 15.00 | 0.07 | (0.31 | )(e) | (0.24 | ) | – | – | – | |||||||||||||||||||
| Class R6 | ||||||||||||||||||||||||||||
| 10/31/2021 | 12.99 | 0.39 | 6.73 | 7.12 | (0.19 | ) | (0.81 | ) | (1.00 | ) | ||||||||||||||||||
| 10/31/2020 | 14.76 | 0.32 | (1.99 | ) | (1.67 | ) | (0.10 | ) | – | (0.10 | ) | |||||||||||||||||
| 7/26/2019 to 10/31/2019(c)(d) | 15.00 | 0.07 | (0.31 | )(e) | (0.24 | ) | – | – | – | |||||||||||||||||||
| (a) | Calculated using average shares outstanding during the period. |
| (b) | Total return for Classes A and C does not consider the effects of sales loads and assumes the reinvestment of all distributions. Total return for all other classes assumes the reinvestment of all distributions. |
| (c) | Net investment income, net realized and unrealized gain amounted to less than $.01 for the period 7/26/2019 through 7/31/2019. |
| (d) | Commencement of operations was 7/26/2019, SEC effective date was 7/31/2019 and date shares first became available to the public was 8/1/2019. |
| (e) | Realized and unrealized gain (loss) per share does not correlate to the aggregate of the net realized and unrealized gain(loss) in the Statement of Operations for the period ended October 31, 2019, primarily due to the timing of the sales and repurchases of the Fund’s shares in relation to fluctuating market values of the Fund’s portfolio. |
| (f) | Not annualized. |
| (g) | Annualized. |
| 182 | See Notes to Financial Statements. |
| Ratios to Average Net Assets: | Supplemental Data: | |||||||||||||||||||||||||
| Net asset value, end of period | Total return(b) (%) | Total expenses after waivers and/or reim- bursements (%) | Total expenses (%) | Net invest- ment income (%) | Net assets, end of period (000) | Portfolio turnover rate (%) | ||||||||||||||||||||
| $19.04 | 56.46 | 0.90 | 0.90 | 1.89 | $ 13 | 99 | ||||||||||||||||||||
| 12.95 | (11.74 | ) | 0.96 | 1.08 | 2.00 | 9 | 128 | |||||||||||||||||||
| 14.75 | (1.67 | )(f) | 0.96 | (g) | 4.51 | (g) | 1.47 | (g) | 10 | 16 | (f) | |||||||||||||||
| 19.09 | 56.83 | 0.65 | 0.65 | 2.14 | 13 | 99 | ||||||||||||||||||||
| 12.98 | (11.51 | ) | 0.71 | 0.84 | 2.24 | 9 | 128 | |||||||||||||||||||
| 14.76 | (1.60 | )(f) | 0.71 | (g) | 4.27 | (g) | 1.75 | (g) | 10 | 16 | (f) | |||||||||||||||
| 19.11 | 56.86 | 0.68 | 0.68 | 2.17 | 1,539 | 99 | ||||||||||||||||||||
| 12.99 | (11.43 | ) | 0.63 | 0.81 | 2.38 | 366 | 128 | |||||||||||||||||||
| 14.76 | (1.60 | )(f) | 0.63 | (g) | 4.21 | (g) | 1.83 | (g) | 517 | 16 | (f) | |||||||||||||||
| See Notes to Financial Statements. | 183 |
Financial Highlights (continued)
FOCUSED SMALL CAP VALUE FUND
| Per Share Operating Performance: | ||||||||||||||||||||||||||||
| Investment Operations: | Distributions to shareholders from: | |||||||||||||||||||||||||||
| Net asset value, beginning of period | Net invest- ment income (loss)(a) | Net realized and unrealized gain (loss) | Total from invest- ment opera- tions | Net investment income | Net realized gain | Total distri- butions | ||||||||||||||||||||||
| Class A | ||||||||||||||||||||||||||||
| 10/31/2021 | $18.77 | $ 0.01 | $12.00 | $12.01 | $(0.16 | ) | $ – | $(0.16 | ) | |||||||||||||||||||
| 10/31/2020 | 25.14 | 0.14 | (2.40 | ) | (2.26 | ) | – | (4.11 | ) | (4.11 | ) | |||||||||||||||||
| 10/31/2019 | 29.02 | (0.04 | ) | 0.39 | 0.35 | – | (4.23 | ) | (4.23 | ) | ||||||||||||||||||
| 10/31/2018 | 34.92 | (0.32 | ) | 0.47 | 0.15 | – | (6.05 | ) | (6.05 | ) | ||||||||||||||||||
| 10/31/2017 | 33.65 | (0.27 | ) | 7.56 | 7.29 | – | (6.02 | ) | (6.02 | ) | ||||||||||||||||||
| Class C | ||||||||||||||||||||||||||||
| 10/31/2021 | 19.99 | (0.30 | ) | 12.87 | 12.57 | (0.12 | ) | – | (0.12 | ) | ||||||||||||||||||
| 10/31/2020 | 26.71 | (0.08 | ) | (2.53 | ) | (2.61 | ) | – | (4.11 | ) | (4.11 | ) | ||||||||||||||||
| 6/28/2019 to 10/31/2019(c) | 27.39 | (0.03 | ) | (0.65 | ) | (0.68 | ) | – | – | – | ||||||||||||||||||
| Class F | ||||||||||||||||||||||||||||
| 10/31/2021 | 20.30 | 0.01 | 13.04 | 13.05 | (0.24 | ) | – | (0.24 | ) | |||||||||||||||||||
| 10/31/2020 | 26.80 | 0.09 | (2.48 | ) | (2.39 | ) | – | (4.11 | ) | (4.11 | ) | |||||||||||||||||
| 6/28/2019 to 10/31/2019(c) | 27.39 | 0.06 | (0.65 | ) | (0.59 | ) | – | – | – | |||||||||||||||||||
| Class F3 | ||||||||||||||||||||||||||||
| 10/31/2021 | 20.32 | 0.11 | 12.97 | 13.08 | (0.25 | ) | – | (0.25 | ) | |||||||||||||||||||
| 10/31/2020 | 26.80 | 0.19 | (2.56 | ) | (2.37 | ) | – | (4.11 | ) | (4.11 | ) | |||||||||||||||||
| 6/28/2019 to 10/31/2019(c) | 27.39 | 0.06 | (0.65 | ) | (0.59 | ) | – | – | – | |||||||||||||||||||
| Class I | ||||||||||||||||||||||||||||
| 10/31/2021 | 20.30 | 0.11 | 12.94 | 13.05 | (0.25 | ) | – | (0.25 | ) | |||||||||||||||||||
| 10/31/2020 | 26.80 | 0.19 | (2.58 | ) | (2.39 | ) | – | (4.11 | ) | (4.11 | ) | |||||||||||||||||
| 10/31/2019 | 30.64 | (0.02 | ) | 0.41 | 0.39 | – | (4.23 | ) | (4.23 | ) | ||||||||||||||||||
| 10/31/2018 | 36.53 | (0.33 | ) | 0.49 | 0.16 | – | (6.05 | ) | (6.05 | ) | ||||||||||||||||||
| 10/31/2017 | 34.95 | (0.28 | ) | 7.88 | 7.60 | – | (6.02 | ) | (6.02 | ) | ||||||||||||||||||
| Class R5 | ||||||||||||||||||||||||||||
| 10/31/2021 | 20.29 | 0.10 | 12.96 | 13.06 | (0.25 | ) | – | (0.25 | ) | |||||||||||||||||||
| 10/31/2020 | 26.80 | 0.17 | (2.57 | ) | (2.40 | ) | – | (4.11 | ) | (4.11 | ) | |||||||||||||||||
| 6/28/2019 to 10/31/2019(c) | 27.39 | 0.05 | (0.64 | ) | (0.59 | ) | – | – | – | |||||||||||||||||||
| Class R6 | ||||||||||||||||||||||||||||
| 10/31/2021 | 20.33 | 0.07 | 13.01 | 13.08 | (0.25 | ) | – | (0.25 | ) | |||||||||||||||||||
| 10/31/2020 | 26.81 | 0.18 | (2.55 | ) | (2.37 | ) | – | (4.11 | ) | (4.11 | ) | |||||||||||||||||
| 6/28/2019 to 10/31/2019(c) | 27.39 | 0.09 | (0.67 | ) | (0.58 | ) | – | – | – | |||||||||||||||||||
| (a) | Calculated using average shares outstanding during the period. |
| (b) | Total return for Classes A and C does not consider the effects of sales loads and assumes the reinvestment of all distributions. Total return for all other classes assumes the reinvestment of all distributions. |
| (c) | Commencement of operation was 6/28/2019 and date shares first became available to the public was 7/1/2019. |
| (d) | Not annualized. |
| (e) | Annualized. |
| 184 | See Notes to Financial Statements. |
| Ratios to Average Net Assets: | Supplemental Data: | |||||||||||||||||||||||||
| Net asset value, end of period | Total return(b) (%) | Total expenses after waivers and/or reim- bursements (%) | Total expenses (%) | Net investment income (loss) (%) | Net assets, end of period (000) | Portfolio turnover rate (%) | ||||||||||||||||||||
| $30.62 | 64.27 | 1.22 | 1.22 | 0.03 | $ 19,525 | 116 | ||||||||||||||||||||
| 18.77 | (11.21 | ) | 1.28 | 1.40 | 0.72 | 3,253 | 77 | |||||||||||||||||||
| 25.14 | 1.68 | 1.53 | 1.58 | (0.16 | ) | 5,729 | 135 | |||||||||||||||||||
| 29.02 | 0.11 | 1.63 | 1.63 | (1.02 | ) | 6,382 | 57 | |||||||||||||||||||
| 34.92 | 23.38 | 1.66 | 1.66 | (0.81 | ) | 6,698 | 48 | |||||||||||||||||||
| 32.44 | 63.10 | 1.96 | 1.96 | (0.95 | ) | 5,028 | 116 | |||||||||||||||||||
| 19.99 | (12.01 | ) | 2.03 | 2.20 | (0.42 | ) | 102 | 77 | ||||||||||||||||||
| 26.71 | (2.48 | )(d) | 2.03 | (e) | 2.14 | (e) | (0.37 | )(e) | 10 | 135 | ||||||||||||||||
| 33.11 | 64.73 | 0.97 | 1.07 | 0.04 | 66,993 | 116 | ||||||||||||||||||||
| 20.30 | (11.00 | ) | 1.03 | 1.30 | 0.43 | 784 | 77 | |||||||||||||||||||
| 26.80 | (2.15 | )(d) | 1.03 | (e) | 1.30 | (e) | 0.65 | (e) | 10 | 135 | ||||||||||||||||
| 33.15 | 64.72 | 0.92 | 0.92 | 0.35 | 14 | 116 | ||||||||||||||||||||
| 20.32 | (10.88 | ) | 0.95 | 1.14 | 0.92 | 9 | 77 | |||||||||||||||||||
| 26.80 | (2.15 | )(d) | 0.95 | (e) | 1.15 | (e) | 0.71 | (e) | 10 | 135 | ||||||||||||||||
| 33.10 | 64.71 | 0.95 | 0.96 | 0.35 | 118,351 | 116 | ||||||||||||||||||||
| 20.30 | (11.00 | ) | 1.03 | 1.18 | 0.92 | 69,689 | 77 | |||||||||||||||||||
| 26.80 | 1.77 | 1.45 | 1.50 | (0.07 | ) | 114,088 | 135 | |||||||||||||||||||
| 30.64 | 0.10 | 1.63 | 1.63 | (1.02 | ) | 127,236 | 57 | |||||||||||||||||||
| 36.53 | 23.40 | 1.66 | 1.66 | (0.80 | ) | 135,852 | 48 | |||||||||||||||||||
| 33.10 | 64.71 | 0.94 | 0.94 | 0.31 | 17 | 116 | ||||||||||||||||||||
| 20.29 | (11.00 | ) | 1.03 | 1.16 | 0.83 | 9 | 77 | |||||||||||||||||||
| 26.80 | (2.15 | )(d) | 1.03 | (e) | 1.15 | (e) | 0.62 | (e) | 10 | 135 | ||||||||||||||||
| 33.16 | 64.69 | 0.94 | 0.95 | 0.22 | 11,274 | 116 | ||||||||||||||||||||
| 20.33 | (10.87 | ) | 0.95 | 1.16 | 0.90 | 1,717 | 77 | |||||||||||||||||||
| 26.81 | (2.12 | )(d) | 0.95 | (e) | 1.24 | (e) | 1.01 | (e) | 1,336 | 135 | ||||||||||||||||
| See Notes to Financial Statements. | 185 |
Financial Highlights (continued)
FUNDAMENTAL EQUITY FUND
| Per Share Operating Performance: | ||||||||||||||||||||||||||||
| Investment Operations: | Distributions to shareholders from: | |||||||||||||||||||||||||||
| Net asset value, beginning of period | Net invest- ment income(a) | Net realized and unrealized gain (loss) | Total from invest- ment opera- tions | Net investment income | Net realized gain | Total distri- butions | ||||||||||||||||||||||
| Class A | ||||||||||||||||||||||||||||
| 10/31/2021 | $10.56 | $0.14 | $ 4.55 | $ 4.69 | $(0.21 | ) | $ – | $(0.21 | ) | |||||||||||||||||||
| 10/31/2020 | 12.53 | 0.19 | (0.88 | ) | (0.69 | ) | (0.19 | ) | (1.09 | ) | (1.28 | ) | ||||||||||||||||
| 10/31/2019 | 12.64 | 0.19 | 0.79 | 0.98 | (0.18 | ) | (0.91 | ) | (1.09 | ) | ||||||||||||||||||
| 10/31/2018 | 13.99 | 0.16 | 0.10 | 0.26 | (0.18 | ) | (1.43 | ) | (1.61 | ) | ||||||||||||||||||
| 10/31/2017 | 12.54 | 0.17 | 1.94 | 2.11 | (0.19 | ) | (0.47 | ) | (0.66 | ) | ||||||||||||||||||
| Class C | ||||||||||||||||||||||||||||
| 10/31/2021 | 9.19 | 0.04 | 3.96 | 4.00 | (0.09 | ) | – | (0.09 | ) | |||||||||||||||||||
| 10/31/2020 | 11.04 | 0.10 | (0.77 | ) | (0.67 | ) | (0.09 | ) | (1.09 | ) | (1.18 | ) | ||||||||||||||||
| 10/31/2019 | 11.22 | 0.09 | 0.69 | 0.78 | (0.05 | ) | (0.91 | ) | (0.96 | ) | ||||||||||||||||||
| 10/31/2018 | 12.58 | 0.06 | 0.08 | 0.14 | (0.07 | ) | (1.43 | ) | (1.50 | ) | ||||||||||||||||||
| 10/31/2017 | 11.33 | 0.07 | 1.76 | 1.83 | (0.11 | ) | (0.47 | ) | (0.58 | ) | ||||||||||||||||||
| Class F | ||||||||||||||||||||||||||||
| 10/31/2021 | 10.44 | 0.16 | 4.48 | 4.64 | (0.23 | ) | – | (0.23 | ) | |||||||||||||||||||
| 10/31/2020 | 12.40 | 0.21 | (0.87 | ) | (0.66 | ) | (0.21 | ) | (1.09 | ) | (1.30 | ) | ||||||||||||||||
| 10/31/2019 | 12.52 | 0.21 | 0.78 | 0.99 | (0.20 | ) | (0.91 | ) | (1.11 | ) | ||||||||||||||||||
| 10/31/2018 | 13.87 | 0.18 | 0.10 | 0.28 | (0.20 | ) | (1.43 | ) | (1.63 | ) | ||||||||||||||||||
| 10/31/2017 | 12.44 | 0.19 | 1.93 | 2.12 | (0.22 | ) | (0.47 | ) | (0.69 | ) | ||||||||||||||||||
| Class F3 | ||||||||||||||||||||||||||||
| 10/31/2021 | 10.71 | 0.19 | 4.60 | 4.79 | (0.24 | ) | – | (0.24 | ) | |||||||||||||||||||
| 10/31/2020 | 12.69 | 0.23 | (0.90 | ) | (0.67 | ) | (0.22 | ) | (1.09 | ) | (1.31 | ) | ||||||||||||||||
| 10/31/2019 | 12.78 | 0.23 | 0.80 | 1.03 | (0.21 | ) | (0.91 | ) | (1.12 | ) | ||||||||||||||||||
| 10/31/2018 | 14.12 | 0.21 | 0.09 | 0.30 | (0.21 | ) | (1.43 | ) | (1.64 | ) | ||||||||||||||||||
| 4/4/2017 to 10/31/2017(c) | 13.24 | 0.11 | 0.77 | 0.88 | – | – | – | |||||||||||||||||||||
| Class I | ||||||||||||||||||||||||||||
| 10/31/2021 | 10.65 | 0.18 | 4.57 | 4.75 | (0.24 | ) | – | (0.24 | ) | |||||||||||||||||||
| 10/31/2020 | 12.63 | 0.22 | (0.89 | ) | (0.67 | ) | (0.22 | ) | (1.09 | ) | (1.31 | ) | ||||||||||||||||
| 10/31/2019 | 12.73 | 0.22 | 0.80 | 1.02 | (0.21 | ) | (0.91 | ) | (1.12 | ) | ||||||||||||||||||
| 10/31/2018 | 14.09 | 0.19 | 0.09 | 0.28 | (0.21 | ) | (1.43 | ) | (1.64 | ) | ||||||||||||||||||
| 10/31/2017 | 12.62 | 0.21 | 1.96 | 2.17 | (0.23 | ) | (0.47 | ) | (0.70 | ) | ||||||||||||||||||
| Class P | ||||||||||||||||||||||||||||
| 10/31/2021 | 10.33 | 0.11 | 4.44 | 4.55 | (0.19 | ) | – | (0.19 | ) | |||||||||||||||||||
| 10/31/2020 | 12.28 | 0.17 | (0.86 | ) | (0.69 | ) | (0.17 | ) | (1.09 | ) | (1.26 | ) | ||||||||||||||||
| 10/31/2019 | 12.40 | 0.16 | 0.77 | 0.93 | (0.14 | ) | (0.91 | ) | (1.05 | ) | ||||||||||||||||||
| 10/31/2018 | 13.74 | 0.13 | 0.09 | 0.22 | (0.13 | ) | (1.43 | ) | (1.56 | ) | ||||||||||||||||||
| 10/31/2017 | 12.32 | 0.14 | 1.92 | 2.06 | (0.17 | ) | (0.47 | ) | (0.64 | ) | ||||||||||||||||||
| Class R2 | ||||||||||||||||||||||||||||
| 10/31/2021 | 10.30 | 0.09 | 4.43 | 4.52 | (0.18 | ) | – | (0.18 | ) | |||||||||||||||||||
| 10/31/2020 | 12.24 | 0.15 | (0.86 | ) | (0.71 | ) | (0.14 | ) | (1.09 | ) | (1.23 | ) | ||||||||||||||||
| 10/31/2019 | 12.33 | 0.14 | 0.78 | 0.92 | (0.10 | ) | (0.91 | ) | (1.01 | ) | ||||||||||||||||||
| 10/31/2018 | 13.68 | 0.11 | 0.10 | 0.21 | (0.13 | ) | (1.43 | ) | (1.56 | ) | ||||||||||||||||||
| 10/31/2017 | 12.27 | 0.12 | 1.91 | 2.03 | (0.15 | ) | (0.47 | ) | (0.62 | ) | ||||||||||||||||||
| 186 | See Notes to Financial Statements. |
| Ratios to Average Net Assets: | Supplemental Data: | |||||||||||||||||||||||||
| Net asset value, end of period | Total return(b) (%) | Total expenses after waivers and/or reim- bursements (%) | Total expenses (%) | Net invest- ment income (%) | Net assets, end of period (000) | Portfolio turnover rate (%) | ||||||||||||||||||||
| $15.04 | 44.87 | 0.96 | 0.96 | 1.06 | $1,382,625 | 73 | ||||||||||||||||||||
| 10.56 | (6.39 | ) | 0.94 | 0.94 | 1.79 | 1,067,309 | 59 | |||||||||||||||||||
| 12.53 | 8.52 | 0.99 | 0.99 | 1.57 | 1,378,201 | 88 | ||||||||||||||||||||
| 12.64 | 1.99 | 0.96 | 0.96 | 1.22 | 1,446,816 | 92 | ||||||||||||||||||||
| 13.99 | 17.45 | 0.96 | 0.96 | 1.29 | 1,571,170 | 96 | ||||||||||||||||||||
| 13.10 | 43.75 | 1.71 | 1.71 | 0.32 | 55,600 | 73 | ||||||||||||||||||||
| 9.19 | (7.07 | ) | 1.69 | 1.69 | 1.05 | 60,191 | 59 | |||||||||||||||||||
| 11.04 | 7.71 | 1.74 | 1.74 | 0.83 | 157,803 | 88 | ||||||||||||||||||||
| 11.22 | 1.21 | 1.71 | 1.71 | 0.48 | 232,937 | 92 | ||||||||||||||||||||
| 12.58 | 16.63 | 1.71 | 1.71 | 0.55 | 445,017 | 96 | ||||||||||||||||||||
| 14.85 | 45.02 | 0.81 | 0.81 | 1.21 | 146,249 | 73 | ||||||||||||||||||||
| 10.44 | (6.22 | ) | 0.79 | 0.79 | 1.93 | 116,340 | 59 | |||||||||||||||||||
| 12.40 | 8.71 | 0.84 | 0.84 | 1.73 | 183,310 | 88 | ||||||||||||||||||||
| 12.52 | 2.17 | 0.81 | 0.81 | 1.38 | 247,704 | 92 | ||||||||||||||||||||
| 13.87 | 17.62 | 0.81 | 0.81 | 1.43 | 323,584 | 96 | ||||||||||||||||||||
| 15.26 | 45.36 | 0.63 | 0.63 | 1.39 | 19,916 | 73 | ||||||||||||||||||||
| 10.71 | (6.11 | ) | 0.63 | 0.63 | 2.10 | 15,378 | 59 | |||||||||||||||||||
| 12.69 | 8.92 | 0.64 | 0.64 | 1.92 | 20,698 | 88 | ||||||||||||||||||||
| 12.78 | 2.36 | 0.62 | 0.62 | 1.57 | 20,270 | 92 | ||||||||||||||||||||
| 14.12 | 6.65 | (d) | 0.62 | (e) | 0.62 | (e) | 1.42 | (e) | 20,497 | 96 | ||||||||||||||||
| 15.16 | 45.21 | 0.71 | 0.71 | 1.32 | 281,392 | 73 | ||||||||||||||||||||
| 10.65 | (6.16 | ) | 0.69 | 0.69 | 2.06 | 262,216 | 59 | |||||||||||||||||||
| 12.63 | 8.84 | 0.74 | 0.74 | 1.79 | 613,182 | 88 | ||||||||||||||||||||
| 12.73 | 2.19 | 0.71 | 0.71 | 1.48 | 92,508 | 92 | ||||||||||||||||||||
| 14.09 | 17.81 | 0.72 | 0.72 | 1.54 | 120,146 | 96 | ||||||||||||||||||||
| 14.69 | 44.55 | 1.16 | 1.16 | 0.84 | 4,881 | 73 | ||||||||||||||||||||
| 10.33 | (6.54 | ) | 1.14 | 1.14 | 1.58 | 3,614 | 59 | |||||||||||||||||||
| 12.28 | 8.30 | 1.19 | 1.19 | 1.36 | 5,117 | 88 | ||||||||||||||||||||
| 12.40 | 1.77 | 1.16 | 1.16 | 1.02 | 5,648 | 92 | ||||||||||||||||||||
| 13.74 | 17.28 | 1.17 | 1.17 | 1.11 | 7,096 | 96 | ||||||||||||||||||||
| 14.64 | 44.28 | 1.31 | 1.31 | 0.72 | 3,271 | 73 | ||||||||||||||||||||
| 10.30 | (6.68 | ) | 1.29 | 1.29 | 1.44 | 3,082 | 59 | |||||||||||||||||||
| 12.24 | 8.17 | 1.34 | 1.34 | 1.20 | 4,009 | 88 | ||||||||||||||||||||
| 12.33 | 1.64 | 1.31 | 1.31 | 0.88 | 3,587 | 92 | ||||||||||||||||||||
| 13.68 | 17.07 | 1.31 | 1.31 | 0.93 | 8,062 | 96 | ||||||||||||||||||||
| See Notes to Financial Statements. | 187 |
Financial Highlights (continued)
FUNDAMENTAL EQUITY FUND
| Per Share Operating Performance: | ||||||||||||||||||||||||||||
| Investment Operations: | Distributions to shareholders from: | |||||||||||||||||||||||||||
| Net asset value, beginning of period | Net invest- ment income(a) | Net realized and unrealized gain (loss) | Total from invest- ment opera- tions | Net investment income | Net realized gain | Total distri- butions | ||||||||||||||||||||||
| Class R3 | ||||||||||||||||||||||||||||
| 10/31/2021 | $10.33 | $0.11 | $ 4.44 | $ 4.55 | $(0.18 | ) | $ – | $(0.18 | ) | |||||||||||||||||||
| 10/31/2020 | 12.28 | 0.16 | (0.86 | ) | (0.70 | ) | (0.16 | ) | (1.09 | ) | (1.25 | ) | ||||||||||||||||
| 10/31/2019 | 12.40 | 0.16 | 0.77 | 0.93 | (0.14 | ) | (0.91 | ) | (1.05 | ) | ||||||||||||||||||
| 10/31/2018 | 13.75 | 0.12 | 0.10 | 0.22 | (0.14 | ) | (1.43 | ) | (1.57 | ) | ||||||||||||||||||
| 10/31/2017 | 12.34 | 0.14 | 1.90 | 2.04 | (0.16 | ) | (0.47 | ) | (0.63 | ) | ||||||||||||||||||
| Class R4 | ||||||||||||||||||||||||||||
| 10/31/2021 | 10.50 | 0.14 | 4.52 | 4.66 | (0.20 | ) | – | (0.20 | ) | |||||||||||||||||||
| 10/31/2020 | 12.46 | 0.19 | (0.87 | ) | (0.68 | ) | (0.19 | ) | (1.09 | ) | (1.28 | ) | ||||||||||||||||
| 10/31/2019 | 12.58 | 0.19 | 0.78 | 0.97 | (0.18 | ) | (0.91 | ) | (1.09 | ) | ||||||||||||||||||
| 10/31/2018 | 13.94 | 0.16 | 0.10 | 0.26 | (0.19 | ) | (1.43 | ) | (1.62 | ) | ||||||||||||||||||
| 10/31/2017 | 12.52 | 0.16 | 1.95 | 2.11 | (0.22 | ) | (0.47 | ) | (0.69 | ) | ||||||||||||||||||
| Class R5 | ||||||||||||||||||||||||||||
| 10/31/2021 | 10.66 | 0.18 | 4.57 | 4.75 | (0.24 | ) | – | (0.24 | ) | |||||||||||||||||||
| 10/31/2020 | 12.63 | 0.22 | (0.88 | ) | (0.66 | ) | (0.22 | ) | (1.09 | ) | (1.31 | ) | ||||||||||||||||
| 10/31/2019 | 12.74 | 0.22 | 0.79 | 1.01 | (0.21 | ) | (0.91 | ) | (1.12 | ) | ||||||||||||||||||
| 10/31/2018 | 14.09 | 0.19 | 0.10 | 0.29 | (0.21 | ) | (1.43 | ) | (1.64 | ) | ||||||||||||||||||
| 10/31/2017 | 12.63 | 0.19 | 1.97 | 2.16 | (0.23 | ) | (0.47 | ) | (0.70 | ) | ||||||||||||||||||
| Class R6 | ||||||||||||||||||||||||||||
| 10/31/2021 | 10.72 | 0.19 | 4.60 | 4.79 | (0.24 | ) | – | (0.24 | ) | |||||||||||||||||||
| 10/31/2020 | 12.69 | 0.23 | (0.89 | ) | (0.66 | ) | (0.22 | ) | (1.09 | ) | (1.31 | ) | ||||||||||||||||
| 10/31/2019 | 12.79 | 0.23 | 0.79 | 1.02 | (0.21 | ) | (0.91 | ) | (1.12 | ) | ||||||||||||||||||
| 10/31/2018 | 14.12 | 0.21 | 0.10 | 0.31 | (0.21 | ) | (1.43 | ) | (1.64 | ) | ||||||||||||||||||
| 10/31/2017 | 12.64 | 0.21 | 1.97 | 2.18 | (0.23 | ) | (0.47 | ) | (0.70 | ) | ||||||||||||||||||
| (a) | Calculated using average shares outstanding during the period. |
| (b) | Total return for Classes A and C does not consider the effects of sales loads and assumes the reinvestment of all distributions. Total return for all other classes assumes the reinvestment of all distributions. |
| (c) | Commenced on April 4, 2017. |
| (d) | Not annualized. |
| (e) | Annualized. |
| 188 | See Notes to Financial Statements. |
| Ratios to Average Net Assets: | Supplemental Data: | |||||||||||||||||||||||||
| Net asset value, end of period | Total return(b) (%) | Total expenses after waivers and/or reim- bursements (%) | Total expenses (%) | Net invest- ment income (%) | Net assets, end of period (000) | Portfolio turnover rate (%) | ||||||||||||||||||||
| $14.70 | 44.54 | 1.21 | 1.21 | 0.81 | $ 86,249 | 73 | ||||||||||||||||||||
| 10.33 | (6.62 | ) | 1.19 | 1.19 | 1.54 | 76,817 | 59 | |||||||||||||||||||
| 12.28 | 8.27 | 1.24 | 1.24 | 1.32 | 98,059 | 88 | ||||||||||||||||||||
| 12.40 | 1.66 | 1.21 | 1.21 | 0.97 | 116,719 | 92 | ||||||||||||||||||||
| 13.75 | 17.19 | 1.21 | 1.21 | 1.04 | 147,010 | 96 | ||||||||||||||||||||
| 14.96 | 44.80 | 0.96 | 0.96 | 1.04 | 2,988 | 73 | ||||||||||||||||||||
| 10.50 | (6.35 | ) | 0.94 | 0.94 | 1.79 | 2,228 | 59 | |||||||||||||||||||
| 12.46 | 8.51 | 0.99 | 0.99 | 1.56 | 4,880 | 88 | ||||||||||||||||||||
| 12.58 | 2.00 | 0.96 | 0.96 | 1.22 | 5,164 | 92 | ||||||||||||||||||||
| 13.94 | 17.45 | 0.95 | 0.95 | 1.19 | 4,355 | 96 | ||||||||||||||||||||
| 15.17 | 45.17 | 0.71 | 0.71 | 1.31 | 986 | 73 | ||||||||||||||||||||
| 10.66 | (6.08 | ) | 0.69 | 0.69 | 2.07 | 901 | 59 | |||||||||||||||||||
| 12.63 | 8.76 | 0.74 | 0.74 | 1.80 | 1,482 | 88 | ||||||||||||||||||||
| 12.74 | 2.28 | 0.71 | 0.71 | 1.45 | 810 | 92 | ||||||||||||||||||||
| 14.09 | 17.73 | 0.70 | 0.70 | 1.40 | 1,049 | 96 | ||||||||||||||||||||
| 15.27 | 45.31 | 0.63 | 0.63 | 1.39 | 16,209 | 73 | ||||||||||||||||||||
| 10.72 | (6.03 | ) | 0.63 | 0.63 | 2.10 | 11,403 | 59 | |||||||||||||||||||
| 12.69 | 8.83 | 0.64 | 0.64 | 1.89 | 21,815 | 88 | ||||||||||||||||||||
| 12.79 | 2.36 | 0.62 | 0.62 | 1.57 | 16,864 | 92 | ||||||||||||||||||||
| 14.12 | 17.97 | 0.62 | 0.62 | 1.51 | 6,440 | 96 | ||||||||||||||||||||
| See Notes to Financial Statements. | 189 |
Financial Highlights (continued)
GLOBAL EQUITY FUND
| Per Share Operating Performance: | ||||||||||||||||||||||||||||
| Investment Operations: | Distributions to shareholders from: | |||||||||||||||||||||||||||
| Net asset value, beginning of period | Net invest- ment income (loss)(a) | Net realized and unrealized gain (loss) | Total from invest- ment opera- tions | Net investment income | Net realized gain | Total distri- butions | ||||||||||||||||||||||
| Class A | ||||||||||||||||||||||||||||
| 10/31/2021 | $12.59 | $0.14 | $ 4.57 | $ 4.71 | $(0.18 | ) | $(0.51 | ) | $(0.69 | ) | ||||||||||||||||||
| 10/31/2020 | 11.52 | 0.11 | 1.09 | 1.20 | (0.13 | ) | – | (0.13 | ) | |||||||||||||||||||
| 10/31/2019 | 10.93 | 0.13 | 0.97 | 1.10 | (0.09 | ) | (0.42 | ) | (0.51 | ) | ||||||||||||||||||
| 10/31/2018 | 11.58 | 0.09 | (0.11 | ) | (0.02 | ) | (0.11 | ) | (0.52 | ) | (0.63 | ) | ||||||||||||||||
| 1/17/2017 to 10/31/2017(c) | 10.00 | 0.08 | 1.50 | 1.58 | – | – | – | |||||||||||||||||||||
| Class C | ||||||||||||||||||||||||||||
| 10/31/2021 | 12.46 | 0.02 | 4.53 | 4.55 | (0.09 | ) | (0.51 | ) | (0.60 | ) | ||||||||||||||||||
| 10/31/2020 | 11.40 | 0.02 | 1.08 | 1.10 | (0.04 | ) | – | (0.04 | ) | |||||||||||||||||||
| 10/31/2019 | 10.81 | 0.05 | 0.97 | 1.02 | (0.01 | ) | (0.42 | ) | (0.43 | ) | ||||||||||||||||||
| 10/31/2018 | 11.52 | 0.01 | (0.12 | ) | (0.11 | ) | (0.08 | ) | (0.52 | ) | (0.60 | ) | ||||||||||||||||
| 1/17/2017 to 10/31/2017(c) | 10.00 | (0.02 | ) | 1.54 | 1.52 | – | – | – | ||||||||||||||||||||
| Class F | ||||||||||||||||||||||||||||
| 10/31/2021 | 12.62 | 0.16 | 4.59 | 4.75 | (0.21 | ) | (0.51 | ) | (0.72 | ) | ||||||||||||||||||
| 10/31/2020 | 11.54 | 0.12 | 1.11 | 1.23 | (0.15 | ) | – | (0.15 | ) | |||||||||||||||||||
| 10/31/2019 | 10.94 | 0.15 | 0.97 | 1.12 | (0.10 | ) | (0.42 | ) | (0.52 | ) | ||||||||||||||||||
| 10/31/2018 | 11.60 | 0.11 | (0.12 | ) | (0.01 | ) | (0.13 | ) | (0.52 | ) | (0.65 | ) | ||||||||||||||||
| 1/17/2017 to 10/31/2017(c) | 10.00 | 0.10 | 1.50 | 1.60 | – | – | – | |||||||||||||||||||||
| Class F3 | ||||||||||||||||||||||||||||
| 10/31/2021 | 12.63 | 0.19 | 4.60 | 4.79 | (0.23 | ) | (0.51 | ) | (0.74 | ) | ||||||||||||||||||
| 10/31/2020 | 11.56 | 0.14 | 1.10 | 1.24 | (0.17 | ) | – | (0.17 | ) | |||||||||||||||||||
| 10/31/2019 | 10.96 | 0.16 | 0.97 | 1.13 | (0.11 | ) | (0.42 | ) | (0.53 | ) | ||||||||||||||||||
| 10/31/2018 | 11.61 | 0.12 | (0.11 | ) | 0.01 | (0.14 | ) | (0.52 | ) | (0.66 | ) | |||||||||||||||||
| 4/4/2017 to 10/31/2017(f) | 10.28 | 0.07 | 1.26 | 1.33 | – | – | – | |||||||||||||||||||||
| Class I | ||||||||||||||||||||||||||||
| 10/31/2021 | 12.62 | 0.18 | 4.59 | 4.77 | (0.22 | ) | (0.51 | ) | (0.73 | ) | ||||||||||||||||||
| 10/31/2020 | 11.55 | 0.14 | 1.09 | 1.23 | (0.16 | ) | – | (0.16 | ) | |||||||||||||||||||
| 10/31/2019 | 10.95 | 0.16 | 0.97 | 1.13 | (0.11 | ) | (0.42 | ) | (0.53 | ) | ||||||||||||||||||
| 10/31/2018 | 11.61 | 0.12 | (0.12 | ) | – | (0.14 | ) | (0.52 | ) | (0.66 | ) | |||||||||||||||||
| 1/17/2017 to 10/31/2017(c) | 10.00 | 0.10 | 1.51 | 1.61 | – | – | – | |||||||||||||||||||||
| Class R3 | ||||||||||||||||||||||||||||
| 10/31/2021 | 12.51 | 0.11 | 4.52 | 4.63 | (0.16 | ) | (0.51 | ) | (0.67 | ) | ||||||||||||||||||
| 10/31/2020 | 11.45 | 0.08 | 1.09 | 1.17 | (0.11 | ) | – | (0.11 | ) | |||||||||||||||||||
| 10/31/2019 | 10.90 | 0.11 | 0.96 | 1.07 | (0.10 | ) | (0.42 | ) | (0.52 | ) | ||||||||||||||||||
| 10/31/2018 | 11.56 | 0.03 | (0.09 | ) | (0.06 | ) | (0.08 | ) | (0.52 | ) | (0.60 | ) | ||||||||||||||||
| 1/17/2017 to 10/31/2017(c) | 10.00 | 0.06 | 1.50 | 1.56 | – | – | – | |||||||||||||||||||||
| 190 | See Notes to Financial Statements. |
| Ratios to Average Net Assets: | Supplemental Data: | |||||||||||||||||||||||||
| Net asset value, end of period | Total return(b) (%) | Total expenses after waivers and/or reim- bursements (%) | Total expenses (%) | Net invest- ment income (loss) (%) | Net assets, end of period (000) | Portfolio turnover rate (%) | ||||||||||||||||||||
| $16.61 | 38.37 | 0.90 | 3.53 | 0.88 | $5,016 | 87 | ||||||||||||||||||||
| 12.59 | 10.52 | 0.90 | 4.32 | 0.92 | 2,622 | 141 | ||||||||||||||||||||
| 11.52 | 10.85 | 0.90 | 4.20 | 1.24 | 3,551 | 65 | ||||||||||||||||||||
| 10.93 | (0.22 | ) | 0.95 | 5.07 | 0.79 | 3,124 | 108 | |||||||||||||||||||
| 11.58 | 15.80 | (d) | 1.05 | (e) | 5.00 | (e) | 0.96 | (e) | 1,667 | 140 | ||||||||||||||||
| 16.41 | 37.27 | 1.65 | 4.29 | 0.14 | 826 | 87 | ||||||||||||||||||||
| 12.46 | 9.75 | 1.65 | 5.12 | 0.17 | 537 | 141 | ||||||||||||||||||||
| 11.40 | 10.05 | 1.65 | 4.96 | 0.46 | 581 | 65 | ||||||||||||||||||||
| 10.81 | (1.07 | ) | 1.70 | 5.76 | 0.07 | 699 | 108 | |||||||||||||||||||
| 11.52 | 15.20 | (d) | 1.80 | (e) | 5.61 | (e) | (0.24 | )(e) | 336 | 140 | ||||||||||||||||
| 16.65 | 38.59 | 0.75 | 3.40 | 1.07 | 2,146 | 87 | ||||||||||||||||||||
| 12.62 | 10.73 | 0.75 | 4.23 | 1.06 | 1,445 | 141 | ||||||||||||||||||||
| 11.54 | 11.07 | 0.75 | 4.09 | 1.37 | 2,207 | 65 | ||||||||||||||||||||
| 10.94 | (0.19 | ) | 0.82 | 4.90 | 0.94 | 1,203 | 108 | |||||||||||||||||||
| 11.60 | 16.00 | (d) | 0.90 | (e) | 4.86 | (e) | 1.12 | (e) | 1,178 | 140 | ||||||||||||||||
| 16.68 | 38.90 | 0.61 | 3.20 | 1.20 | 18 | 87 | ||||||||||||||||||||
| 12.63 | 10.78 | 0.62 | 4.09 | 1.19 | 14 | 141 | ||||||||||||||||||||
| 11.56 | 11.22 | 0.63 | 3.88 | 1.50 | 13 | 65 | ||||||||||||||||||||
| 10.96 | 0.01 | 0.69 | 4.80 | 1.08 | 11 | 108 | ||||||||||||||||||||
| 11.61 | 12.94 | (d) | 0.75 | (e) | 4.78 | (e) | 1.04 | (e) | 11 | 140 | ||||||||||||||||
| 16.66 | 38.78 | 0.65 | 3.30 | 1.16 | 1,837 | 87 | ||||||||||||||||||||
| 12.62 | 10.75 | 0.65 | 4.16 | 1.18 | 1,400 | 141 | ||||||||||||||||||||
| 11.55 | 11.19 | 0.65 | 3.95 | 1.49 | 1,264 | 65 | ||||||||||||||||||||
| 10.95 | (0.10 | ) | 0.72 | 4.81 | 1.03 | 1,137 | 108 | |||||||||||||||||||
| 11.61 | 16.10 | (d) | 0.80 | (e) | 4.76 | (e) | 1.23 | (e) | 1,137 | 140 | ||||||||||||||||
| 16.47 | 37.85 | 1.15 | 3.78 | 0.70 | 470 | 87 | ||||||||||||||||||||
| 12.51 | 10.25 | 1.15 | 4.67 | 0.68 | 241 | 141 | ||||||||||||||||||||
| 11.45 | 10.63 | 1.15 | 4.46 | 0.98 | 200 | 65 | ||||||||||||||||||||
| 10.90 | (0.56 | ) | 1.18 | 5.98 | 0.27 | 165 | 108 | |||||||||||||||||||
| 11.56 | 15.60 | (d) | 1.30 | (e) | 5.25 | (e) | 0.74 | (e) | 12 | 140 | ||||||||||||||||
| See Notes to Financial Statements. | 191 |
Financial Highlights (continued)
GLOBAL EQUITY FUND
| Per Share Operating Performance: | ||||||||||||||||||||||||||||
| Investment Operations: | Distributions to shareholders from: | |||||||||||||||||||||||||||
| Net asset value, beginning of period | Net invest- ment income (loss)(a) | Net realized and unrealized gain (loss) | Total from invest- ment opera- tions | Net investment income | Net realized gain | Total distri- butions | ||||||||||||||||||||||
| Class R4 | ||||||||||||||||||||||||||||
| 10/31/2021 | $12.60 | $0.14 | $ 4.58 | $ 4.72 | $(0.19 | ) | $(0.51 | ) | $(0.70 | ) | ||||||||||||||||||
| 10/31/2020 | 11.53 | 0.11 | 1.10 | 1.21 | (0.14 | ) | – | (0.14 | ) | |||||||||||||||||||
| 10/31/2019 | 10.93 | 0.13 | 0.97 | 1.10 | (0.08 | ) | (0.42 | ) | (0.50 | ) | ||||||||||||||||||
| 10/31/2018 | 11.58 | 0.10 | (0.12 | ) | (0.02 | ) | (0.11 | ) | (0.52 | ) | (0.63 | ) | ||||||||||||||||
| 1/17/2017 to 10/31/2017(c) | 10.00 | 0.08 | 1.50 | 1.58 | – | – | – | |||||||||||||||||||||
| Class R5 | ||||||||||||||||||||||||||||
| 10/31/2021 | 12.62 | 0.18 | 4.59 | 4.77 | (0.22 | ) | (0.51 | ) | (0.73 | ) | ||||||||||||||||||
| 10/31/2020 | 11.55 | 0.14 | 1.09 | 1.23 | (0.16 | ) | – | (0.16 | ) | |||||||||||||||||||
| 10/31/2019 | 10.95 | 0.16 | 0.97 | 1.13 | (0.11 | ) | (0.42 | ) | (0.53 | ) | ||||||||||||||||||
| 10/31/2018 | 11.61 | 0.12 | (0.12 | ) | – | (0.14 | ) | (0.52 | ) | (0.66 | ) | |||||||||||||||||
| 1/17/2017 to 10/31/2017(c) | 10.00 | 0.10 | 1.51 | 1.61 | – | – | – | |||||||||||||||||||||
| Class R6 | ||||||||||||||||||||||||||||
| 10/31/2021 | 12.63 | 0.19 | 4.59 | 4.78 | (0.23 | ) | (0.51 | ) | (0.74 | ) | ||||||||||||||||||
| 10/31/2020 | 11.56 | 0.14 | 1.10 | 1.24 | (0.17 | ) | – | (0.17 | ) | |||||||||||||||||||
| 10/31/2019 | 10.96 | 0.17 | 0.96 | 1.13 | (0.11 | ) | (0.42 | ) | (0.53 | ) | ||||||||||||||||||
| 10/31/2018 | 11.61 | 0.13 | (0.12 | ) | 0.01 | (0.14 | ) | (0.52 | ) | (0.66 | ) | |||||||||||||||||
| 1/17/2017 to 10/31/2017(c) | 10.00 | 0.11 | 1.50 | 1.61 | – | – | – | |||||||||||||||||||||
| (a) | Calculated using average shares outstanding during the period. |
| (b) | Total return for Classes A and C does not consider the effects of sales loads and assumes the reinvestment of all distributions. Total return for all other classes assumes the reinvestment of all distributions. |
| (c) | Commenced on January 17, 2017. |
| (d) | Not annualized. |
| (e) | Annualized. |
| (f) | Commenced on April 4, 2017. |
| 192 | See Notes to Financial Statements. |
| Ratios to Average Net Assets: | Supplemental Data: | |||||||||||||||||||||||||
| Net asset value, end of period | Total return(b) (%) | Total expenses after waivers and/or reim- bursements (%) | Total expenses (%) | Net invest- ment income (loss) (%) | Net assets, end of period (000) | Portfolio turnover rate (%) | ||||||||||||||||||||
| $16.62 | 38.39 | 0.90 | 3.54 | 0.92 | $ 19 | 87 | ||||||||||||||||||||
| 12.60 | 10.51 | 0.90 | 4.41 | 0.92 | 14 | 141 | ||||||||||||||||||||
| 11.53 | 10.89 | 0.90 | 4.18 | 1.24 | 13 | 65 | ||||||||||||||||||||
| 10.93 | (0.24 | ) | 0.97 | 5.05 | 0.83 | 12 | 108 | |||||||||||||||||||
| 11.58 | 15.80 | (d) | 1.05 | (e) | 5.00 | (e) | 0.93 | (e) | 12 | 140 | ||||||||||||||||
| 16.66 | 38.78 | 0.65 | 3.29 | 1.16 | 19 | 87 | ||||||||||||||||||||
| 12.62 | 10.75 | 0.65 | 4.15 | 1.17 | 14 | 141 | ||||||||||||||||||||
| 11.55 | 11.19 | 0.65 | 3.93 | 1.49 | 13 | 65 | ||||||||||||||||||||
| 10.95 | (0.10 | ) | 0.72 | 4.80 | 1.03 | 12 | 108 | |||||||||||||||||||
| 11.61 | 16.10 | (d) | 0.80 | (e) | 4.74 | (e) | 1.25 | (e) | 12 | 140 | ||||||||||||||||
| 16.67 | 38.82 | 0.61 | 3.21 | 1.21 | 1,215 | 87 | ||||||||||||||||||||
| 12.63 | 10.87 | 0.62 | 4.09 | 1.21 | 635 | 141 | ||||||||||||||||||||
| 11.56 | 11.13 | 0.63 | 3.88 | 1.56 | 690 | 65 | ||||||||||||||||||||
| 10.96 | 0.01 | 0.63 | 4.62 | 1.12 | 236 | 108 | ||||||||||||||||||||
| 11.61 | 16.10 | (d) | 0.75 | (e) | 4.72 | (e) | 1.30 | (e) | 12 | 140 | ||||||||||||||||
| See Notes to Financial Statements. | 193 |
Financial Highlights (continued)
GROWTH LEADERS FUND
| Per Share Operating Performance: | ||||||||||||||||||||||||
| Investment Operations: | Distributions to shareholders from: | |||||||||||||||||||||||
| Net asset value, beginning of period | Net investment income (loss)(a) | Net realized and unrealized gain | Total from investment operations | Net realized gain | Net asset value, end of period | |||||||||||||||||||
| Class A | ||||||||||||||||||||||||
| 10/31/2021 | $42.25 | $(0.28 | ) | $15.10 | $14.82 | $(4.37 | ) | $52.70 | ||||||||||||||||
| 10/31/2020 | 28.61 | (0.19 | ) | 16.17 | 15.98 | (2.34 | ) | 42.25 | ||||||||||||||||
| 10/31/2019 | 29.82 | (0.13 | ) | 3.57 | 3.44 | (4.65 | ) | 28.61 | ||||||||||||||||
| 10/31/2018 | 28.97 | (0.14 | ) | 2.82 | 2.68 | (1.83 | ) | 29.82 | ||||||||||||||||
| 10/31/2017 | 22.42 | (0.06 | ) | 6.61 | 6.55 | – | 28.97 | |||||||||||||||||
| Class C | ||||||||||||||||||||||||
| 10/31/2021 | 38.53 | (0.57 | ) | 13.63 | 13.06 | (4.37 | ) | 47.22 | ||||||||||||||||
| 10/31/2020 | 26.47 | (0.39 | ) | 14.79 | 14.40 | (2.34 | ) | 38.53 | ||||||||||||||||
| 10/31/2019 | 28.14 | (0.31 | ) | 3.29 | 2.98 | (4.65 | ) | 26.47 | ||||||||||||||||
| 10/31/2018 | 27.63 | (0.35 | ) | 2.69 | 2.34 | (1.83 | ) | 28.14 | ||||||||||||||||
| 10/31/2017 | 21.54 | (0.24 | ) | 6.33 | 6.09 | – | 27.63 | |||||||||||||||||
| Class F | ||||||||||||||||||||||||
| 10/31/2021 | 43.20 | (0.17 | ) | 15.49 | 15.32 | (4.37 | ) | 54.15 | ||||||||||||||||
| 10/31/2020 | 29.14 | (0.11 | ) | 16.51 | 16.40 | (2.34 | ) | 43.20 | ||||||||||||||||
| 10/31/2019 | 30.21 | (0.06 | ) | 3.64 | 3.58 | (4.65 | ) | 29.14 | ||||||||||||||||
| 10/31/2018 | 29.26 | (0.07 | ) | 2.85 | 2.78 | (1.83 | ) | 30.21 | ||||||||||||||||
| 10/31/2017 | 22.59 | (0.01 | ) | 6.68 | 6.67 | – | 29.26 | |||||||||||||||||
| Class F3 | ||||||||||||||||||||||||
| 10/31/2021 | 43.70 | (0.15 | ) | 15.70 | 15.55 | (4.37 | ) | 54.88 | ||||||||||||||||
| 10/31/2020 | 29.43 | (0.10 | ) | 16.71 | 16.61 | (2.34 | ) | 43.70 | ||||||||||||||||
| 10/31/2019 | 30.45 | (0.05 | ) | 3.68 | 3.63 | (4.65 | ) | 29.43 | ||||||||||||||||
| 10/31/2018 | 29.46 | (0.06 | ) | 2.88 | 2.82 | (1.83 | ) | 30.45 | ||||||||||||||||
| 4/4/2017 to 10/31/2017(c) | 24.81 | (0.03 | ) | 4.68 | 4.65 | – | 29.46 | |||||||||||||||||
| Class I | ||||||||||||||||||||||||
| 10/31/2021 | 43.49 | (0.17 | ) | 15.61 | 15.44 | (4.37 | ) | 54.56 | ||||||||||||||||
| 10/31/2020 | 29.32 | (0.11 | ) | 16.62 | 16.51 | (2.34 | ) | 43.49 | ||||||||||||||||
| 10/31/2019 | 30.37 | (0.06 | ) | 3.66 | 3.60 | (4.65 | ) | 29.32 | ||||||||||||||||
| 10/31/2018 | 29.40 | (0.07 | ) | 2.87 | 2.80 | (1.83 | ) | 30.37 | ||||||||||||||||
| 10/31/2017 | 22.69 | (0.01 | ) | 6.72 | 6.71 | – | 29.40 | |||||||||||||||||
| Class R2 | ||||||||||||||||||||||||
| 10/31/2021 | 41.38 | (0.44 | ) | 14.75 | 14.31 | (4.37 | ) | 51.32 | ||||||||||||||||
| 10/31/2020 | 28.15 | (0.27 | ) | 15.84 | 15.57 | (2.34 | ) | 41.38 | ||||||||||||||||
| 10/31/2019 | 29.51 | (0.22 | ) | 3.51 | 3.29 | (4.65 | ) | 28.15 | ||||||||||||||||
| 10/31/2018 | 28.78 | (0.24 | ) | 2.80 | 2.56 | (1.83 | ) | 29.51 | ||||||||||||||||
| 10/31/2017 | 22.35 | (0.15 | ) | 6.58 | 6.43 | – | 28.78 | |||||||||||||||||
| Class R3 | ||||||||||||||||||||||||
| 10/31/2021 | 41.31 | (0.39 | ) | 14.73 | 14.34 | (4.37 | ) | 51.28 | ||||||||||||||||
| 10/31/2020 | 28.09 | (0.26 | ) | 15.82 | 15.56 | (2.34 | ) | 41.31 | ||||||||||||||||
| 10/31/2019 | 29.43 | (0.19 | ) | 3.50 | 3.31 | (4.65 | ) | 28.09 | ||||||||||||||||
| 10/31/2018 | 28.68 | (0.21 | ) | 2.79 | 2.58 | (1.83 | ) | 29.43 | ||||||||||||||||
| 10/31/2017 | 22.25 | (0.12 | ) | 6.55 | 6.43 | – | 28.68 | |||||||||||||||||
| 194 | See Notes to Financial Statements. |
| Ratios to Average Net Assets: | Supplemental Data: | |||||||||||||||||||||
| Total return(b) (%) | Total expenses after waivers and/or reimburse- ments (%) | Total expenses (%) | Net investment (loss) (%) | Net assets, end of period (000) | Portfolio turnover rate (%) | |||||||||||||||||
| 37.77 | 0.89 | 0.89 | (0.61 | ) | $2,713,887 | 140 | ||||||||||||||||
| 60.35 | 0.90 | 0.90 | (0.56 | ) | 1,920,930 | 93 | ||||||||||||||||
| 15.32 | 0.93 | 0.93 | (0.48 | ) | 1,001,973 | 143 | ||||||||||||||||
| 9.68 | 0.91 | 0.91 | (0.47 | ) | 900,405 | 161 | ||||||||||||||||
| 29.21 | 0.91 | 0.96 | (0.23 | ) | 754,101 | 192 | ||||||||||||||||
| 36.75 | 1.64 | 1.64 | (1.36 | ) | 1,142,002 | 140 | ||||||||||||||||
| 59.17 | 1.65 | 1.65 | (1.29 | ) | 906,259 | 93 | ||||||||||||||||
| 14.45 | 1.68 | 1.68 | (1.23 | ) | 631,400 | 143 | ||||||||||||||||
| 8.87 | 1.65 | 1.66 | (1.21 | ) | 595,344 | 161 | ||||||||||||||||
| 28.27 | 1.66 | 1.71 | (0.99 | ) | 523,008 | 192 | ||||||||||||||||
| 38.13 | 0.64 | 0.74 | (0.36 | ) | 4,331,228 | 140 | ||||||||||||||||
| 60.72 | 0.65 | 0.75 | (0.31 | ) | 2,708,762 | 93 | ||||||||||||||||
| 15.63 | 0.68 | 0.78 | (0.23 | ) | 1,444,533 | 143 | ||||||||||||||||
| 9.94 | 0.66 | 0.76 | (0.22 | ) | 1,315,881 | 161 | ||||||||||||||||
| 29.53 | 0.70 | 0.81 | (0.04 | ) | 1,103,103 | 192 | ||||||||||||||||
| 38.23 | 0.58 | 0.58 | (0.30 | ) | 697,858 | 140 | ||||||||||||||||
| 60.84 | 0.59 | 0.59 | (0.29 | ) | 265,851 | 93 | ||||||||||||||||
| 15.68 | 0.62 | 0.62 | (0.19 | ) | 74,378 | 143 | ||||||||||||||||
| 10.01 | 0.60 | 0.60 | (0.18 | ) | 44,379 | 161 | ||||||||||||||||
| 18.74 | (d) | 0.59 | (e) | 0.62 | (e) | (0.19 | )(e) | 18,841 | 192 | |||||||||||||
| 38.13 | 0.64 | 0.64 | (0.36 | ) | 1,282,161 | 140 | ||||||||||||||||
| 60.72 | 0.65 | 0.65 | (0.31 | ) | 1,037,283 | 93 | ||||||||||||||||
| 15.62 | 0.68 | 0.68 | (0.20 | ) | 520,195 | 143 | ||||||||||||||||
| 9.96 | 0.66 | 0.66 | (0.21 | ) | 702,389 | 161 | ||||||||||||||||
| 29.57 | 0.67 | 0.70 | (0.06 | ) | 303,795 | 192 | ||||||||||||||||
| 37.32 | 1.24 | 1.24 | (0.96 | ) | 3,275 | 140 | ||||||||||||||||
| 59.75 | 1.25 | 1.25 | (0.84 | ) | 1,551 | 93 | ||||||||||||||||
| 14.94 | 1.28 | 1.28 | (0.82 | ) | 1,153 | 143 | ||||||||||||||||
| 9.31 | 1.26 | 1.26 | (0.79 | ) | 1,332 | 161 | ||||||||||||||||
| 28.77 | 1.26 | 1.30 | (0.60 | ) | 1,784 | 192 | ||||||||||||||||
| 37.44 | 1.14 | 1.14 | (0.86 | ) | 21,928 | 140 | ||||||||||||||||
| 59.94 | 1.15 | 1.15 | (0.79 | ) | 18,790 | 93 | ||||||||||||||||
| 15.03 | 1.18 | 1.18 | (0.71 | ) | 13,610 | 143 | ||||||||||||||||
| 9.41 | 1.16 | 1.16 | (0.71 | ) | 15,206 | 161 | ||||||||||||||||
| 28.90 | 1.16 | 1.21 | (0.48 | ) | 13,261 | 192 | ||||||||||||||||
| See Notes to Financial Statements. | 195 |
Financial Highlights (continued)
GROWTH LEADERS FUND
| Per Share Operating Performance: | ||||||||||||||||||||||||
| Investment Operations: | Distributions to shareholders from: | Net | ||||||||||||||||||||||
| Net asset value, beginning of period | Net investment income (loss)(a) | Net realized and unrealized gain | Total from investment operations | Net realized gain | asset value, end of period | |||||||||||||||||||
| Class R4 | ||||||||||||||||||||||||
| 10/31/2021 | $42.26 | $(0.28 | ) | $15.11 | $14.83 | $(4.37 | ) | $52.72 | ||||||||||||||||
| 10/31/2020 | 28.62 | (0.18 | ) | 16.16 | 15.98 | (2.34 | ) | 42.26 | ||||||||||||||||
| 10/31/2019 | 29.82 | (0.13 | ) | 3.58 | 3.45 | (4.65 | ) | 28.62 | ||||||||||||||||
| 10/31/2018 | 28.97 | (0.15 | ) | 2.83 | 2.68 | (1.83 | ) | 29.82 | ||||||||||||||||
| 10/31/2017 | 22.42 | (0.08 | ) | 6.63 | 6.55 | – | 28.97 | |||||||||||||||||
| Class R5 | ||||||||||||||||||||||||
| 10/31/2021 | 43.51 | (0.17 | ) | 15.61 | 15.44 | (4.37 | ) | 54.58 | ||||||||||||||||
| 10/31/2020 | 29.33 | (0.10 | ) | 16.62 | 16.52 | (2.34 | ) | 43.51 | ||||||||||||||||
| 10/31/2019 | 30.38 | (0.06 | ) | 3.66 | 3.60 | (4.65 | ) | 29.33 | ||||||||||||||||
| 10/31/2018 | 29.41 | (0.07 | ) | 2.87 | 2.80 | (1.83 | ) | 30.38 | ||||||||||||||||
| 10/31/2017 | 22.70 | – | (f) | 6.71 | 6.71 | – | 29.41 | |||||||||||||||||
| Class R6 | ||||||||||||||||||||||||
| 10/31/2021 | 43.70 | (0.15 | ) | 15.70 | 15.55 | (4.37 | ) | 54.88 | ||||||||||||||||
| 10/31/2020 | 29.43 | (0.08 | ) | 16.69 | 16.61 | (2.34 | ) | 43.70 | ||||||||||||||||
| 10/31/2019 | 30.45 | (0.05 | ) | 3.68 | 3.63 | (4.65 | ) | 29.43 | ||||||||||||||||
| 10/31/2018 | 29.46 | (0.05 | ) | 2.87 | 2.82 | (1.83 | ) | 30.45 | ||||||||||||||||
| 10/31/2017 | 22.72 | (0.02 | ) | 6.76 | 6.74 | – | 29.46 | |||||||||||||||||
| (a) | Calculated using average shares outstanding during the period. |
| (b) | Total return for Classes A and C does not consider the effects of sales loads and assumes the reinvestment of all distributions. Total return for all other classes assumes the reinvestment of all distributions. |
| (c) | Commenced on April 4, 2017. |
| (d) | Not annualized. |
| (e) | Annualized. |
| (f) | Amount less than $0.01. |
| 196 | See Notes to Financial Statements. |
| Ratios to Average Net Assets: | Supplemental Data: | |||||||||||||||||||
| Total return(b) (%) | Total expenses after waivers and/or reimburse- ments (%) | Total expenses (%) | Net investment (loss) (%) | Net assets, end of period (000) | Portfolio turnover rate (%) | |||||||||||||||
| 37.79 | 0.89 | 0.89 | (0.61 | ) | $18,549 | 140 | ||||||||||||||
| 60.33 | 0.90 | 0.90 | (0.55 | ) | 12,667 | 93 | ||||||||||||||
| 15.35 | 0.93 | 0.93 | (0.47 | ) | 6,543 | 143 | ||||||||||||||
| 9.68 | 0.91 | 0.91 | (0.47 | ) | 6,345 | 161 | ||||||||||||||
| 29.21 | 0.92 | 0.95 | (0.31 | ) | 4,698 | 192 | ||||||||||||||
| 38.13 | 0.64 | 0.64 | (0.36 | ) | 19,722 | 140 | ||||||||||||||
| 60.74 | 0.65 | 0.65 | (0.29 | ) | 14,216 | 93 | ||||||||||||||
| 15.61 | 0.68 | 0.68 | (0.22 | ) | 9,344 | 143 | ||||||||||||||
| 9.96 | 0.66 | 0.66 | (0.22 | ) | 8,598 | 161 | ||||||||||||||
| 29.56 | 0.67 | 0.71 | (0.01 | ) | 5,810 | 192 | ||||||||||||||
| 38.23 | 0.58 | 0.58 | (0.30 | ) | 181,524 | 140 | ||||||||||||||
| 60.84 | 0.60 | 0.60 | (0.24 | ) | 65,478 | 93 | ||||||||||||||
| 15.68 | 0.62 | 0.62 | (0.18 | ) | 36,932 | 143 | ||||||||||||||
| 10.01 | 0.60 | 0.60 | (0.16 | ) | 25,657 | 161 | ||||||||||||||
| 29.67 | 0.59 | 0.62 | (0.06 | ) | 20,884 | 192 | ||||||||||||||
| See Notes to Financial Statements. | 197 |
Financial Highlights (continued)
HEALTH CARE FUND
| Per Share Operating Performance: | ||||||||||||||||||||||||||||
| Investment Operations: | Distributions to shareholders from: | |||||||||||||||||||||||||||
| Net asset value, beginning of period | Net invest- ment income (loss)(a) | Net realized and unrealized gain (loss) | Total from invest- ment opera- tions | Net investment income | Net realized gain | Total distri- butions | ||||||||||||||||||||||
| Class A | ||||||||||||||||||||||||||||
| 10/31/2021 | $ 19.27 | $ (0.10 | ) | $ 5.10 | $ 5.00 | $ – | $ (2.31 | ) | $(2.31 | ) | ||||||||||||||||||
| 10/31/2020 | 14.48 | (0.06 | ) | 4.85 | 4.79 | – | – | – | ||||||||||||||||||||
| 7/26/2019 to 10/31/2019(c)(d) | 15.00 | (0.01 | ) | (0.51 | ) | (0.52 | ) | – | – | – | ||||||||||||||||||
| Class C | ||||||||||||||||||||||||||||
| 10/31/2021 | 19.09 | (0.25 | ) | 5.03 | 4.78 | – | (2.31 | ) | (2.31 | ) | ||||||||||||||||||
| 10/31/2020 | 14.45 | (0.19 | ) | 4.83 | 4.64 | – | – | – | ||||||||||||||||||||
| 7/26/2019 to 10/31/2019(c)(d) | 15.00 | (0.04 | ) | (0.51 | ) | (0.55 | ) | – | – | – | ||||||||||||||||||
| Class F | ||||||||||||||||||||||||||||
| 10/31/2021 | 19.32 | (0.05 | ) | 5.12 | 5.07 | – | (2.31 | ) | (2.31 | ) | ||||||||||||||||||
| 10/31/2020 | 14.49 | – | (g) | 4.83 | 4.83 | – | (g) | – | – | |||||||||||||||||||
| 7/26/2019 to 10/31/2019(c)(d) | 15.00 | (0.01 | ) | (0.50 | ) | (0.51 | ) | – | – | – | ||||||||||||||||||
| Class F3 | ||||||||||||||||||||||||||||
| 10/31/2021 | 19.33 | (0.04 | ) | 5.11 | 5.07 | (0.02 | ) | (2.31 | ) | (2.33 | ) | |||||||||||||||||
| 10/31/2020 | 14.49 | 0.02 | 4.83 | 4.85 | (0.01 | ) | – | (0.01 | ) | |||||||||||||||||||
| 7/26/2019 to 10/31/2019(c)(d) | 15.00 | – | (g) | (0.51 | ) | (0.51 | ) | – | – | – | ||||||||||||||||||
| Class I | ||||||||||||||||||||||||||||
| 10/31/2021 | 19.32 | (0.05 | ) | 5.11 | 5.06 | – | (2.31 | ) | (2.31 | ) | ||||||||||||||||||
| 10/31/2020 | 14.49 | – | (g) | 4.84 | 4.84 | (0.01 | ) | – | (0.01 | ) | ||||||||||||||||||
| 7/26/2019 to 10/31/2019(c)(d) | 15.00 | (0.01 | ) | (0.50 | ) | (0.51 | ) | – | – | – | ||||||||||||||||||
| Class R3 | ||||||||||||||||||||||||||||
| 10/31/2021 | 19.21 | (0.15 | ) | 5.07 | 4.92 | – | (2.31 | ) | (2.31 | ) | ||||||||||||||||||
| 10/31/2020 | 14.47 | (0.10 | ) | 4.84 | 4.74 | – | – | – | ||||||||||||||||||||
| 7/26/2019 to 10/31/2019(c)(d) | 15.00 | (0.02 | ) | (0.51 | ) | (0.53 | ) | – | – | – | ||||||||||||||||||
| Class R4 | ||||||||||||||||||||||||||||
| 10/31/2021 | 19.27 | (0.10 | ) | 5.09 | 4.99 | – | (2.31 | ) | (2.31 | ) | ||||||||||||||||||
| 10/31/2020 | 14.48 | (0.05 | ) | 4.84 | 4.79 | – | – | – | ||||||||||||||||||||
| 7/26/2019 to 10/31/2019(c)(d) | 15.00 | (0.01 | ) | (0.51 | ) | (0.52 | ) | – | – | – | ||||||||||||||||||
| 198 | See Notes to Financial Statements. |
| Ratios to Average Net Assets: | Supplemental Data: | |||||||||||||||||||||||||
| Net asset value, end of period | Total return(b) (%) | Total expenses after waivers and/or reim- bursements (%) | Total expenses (%) | Net invest- ment income (loss) (%) | Net assets, end of period (000) | Portfolio turnover rate (%) | ||||||||||||||||||||
| $ 21.96 | 28.56 | 1.03 | 3.90 | (0.50 | ) | $3,507 | 59 | |||||||||||||||||||
| 19.27 | 33.08 | 1.03 | 6.30 | (0.34 | ) | 2,022 | 114 | |||||||||||||||||||
| 14.48 | (3.47 | )(e) | 1.03 | (f) | 9.00 | (f) | (0.36 | )(f) | 906 | 16 | (e) | |||||||||||||||
| 21.56 | 27.57 | 1.78 | 4.62 | (1.25 | ) | 786 | 59 | |||||||||||||||||||
| 19.09 | 32.11 | 1.78 | 7.05 | (1.11 | ) | 328 | 114 | |||||||||||||||||||
| 14.45 | (3.67 | )(e) | 1.78 | (f) | 9.84 | (f) | (1.17 | )(f) | 129 | 16 | (e) | |||||||||||||||
| 22.08 | 28.88 | 0.78 | 3.63 | (0.23 | ) | 587 | 59 | |||||||||||||||||||
| 19.32 | 33.34 | 0.78 | 5.73 | – | (h) | 109 | 114 | |||||||||||||||||||
| 14.49 | (3.40 | )(e) | 0.78 | (f) | 8.95 | (f) | (0.16 | )(f) | 483 | 16 | (e) | |||||||||||||||
| 22.07 | 28.91 | 0.71 | 3.55 | (0.18 | ) | 40 | 59 | |||||||||||||||||||
| 19.33 | 33.49 | 0.70 | 5.37 | 0.11 | 35 | 114 | ||||||||||||||||||||
| 14.49 | (3.40 | )(e) | 0.70 | (f) | 8.72 | (f) | (0.08 | )(f) | 483 | 16 | (e) | |||||||||||||||
| 22.07 | 28.82 | 0.78 | 3.66 | (0.25 | ) | 20 | 59 | |||||||||||||||||||
| 19.32 | 33.40 | 0.78 | 5.53 | 0.02 | 17 | 114 | ||||||||||||||||||||
| 14.49 | (3.40 | )(e) | 0.78 | (f) | 8.85 | (f) | (0.16 | )(f) | 106 | 16 | (e) | |||||||||||||||
| 21.82 | 28.19 | 1.28 | 4.17 | (0.75 | ) | 15 | 59 | |||||||||||||||||||
| 19.21 | 32.76 | 1.28 | 6.53 | (0.57 | ) | 13 | 114 | |||||||||||||||||||
| 14.47 | (3.53 | )(e) | 1.28 | (f) | 9.36 | (f) | (0.64 | )(f) | 10 | 16 | (e) | |||||||||||||||
| 21.95 | 28.50 | 1.03 | 3.92 | (0.50 | ) | 15 | 59 | |||||||||||||||||||
| 19.27 | 33.08 | 1.03 | 6.27 | (0.31 | ) | 13 | 114 | |||||||||||||||||||
| 14.48 | (3.47 | )(e) | 1.03 | (f) | 9.12 | (f) | (0.40 | )(f) | 10 | 16 | (e) | |||||||||||||||
| See Notes to Financial Statements. | 199 |
Financial Highlights (continued)
HEALTH CARE FUND
| Per Share Operating Performance: | ||||||||||||||||||||||||||||
| Investment Operations: | Distributions to shareholders from: | |||||||||||||||||||||||||||
| Net asset value, beginning of period | Net invest- ment income (loss)(a) | Net realized and unrealized gain (loss) | Total from invest- ment opera- tions | Net investment income | Net realized gain | Total distri- butions | ||||||||||||||||||||||
| Class R5 | ||||||||||||||||||||||||||||
| 10/31/2021 | $ 19.32 | $ (0.05 | ) | $ 5.12 | $ 5.07 | $ (0.01 | ) | $ (2.31 | ) | $ (2.32 | ) | |||||||||||||||||
| 10/31/2020 | 14.49 | (0.01 | ) | 4.85 | 4.84 | (0.01 | ) | – | (0.01 | ) | ||||||||||||||||||
| 7/26/2019 to 10/31/2019(c)(d) | 15.00 | (0.01 | ) | (0.50 | ) | (0.51 | ) | – | – | – | ||||||||||||||||||
| Class R6 | ||||||||||||||||||||||||||||
| 10/31/2021 | 19.34 | (0.04 | ) | 5.11 | 5.07 | (0.02 | ) | (2.31 | ) | (2.33 | ) | |||||||||||||||||
| 10/31/2020 | 14.49 | 0.01 | 4.85 | 4.86 | (0.01 | ) | – | (0.01 | ) | |||||||||||||||||||
| 7/26/2019 to 10/31/2019(c)(d) | 15.00 | – | (g) | (0.51 | ) | (0.51 | ) | – | – | – | ||||||||||||||||||
| (a) | Calculated using average shares outstanding during the period. |
| (b) | Total return for Classes A and C does not consider the effects of sales loads and assumes the reinvestment of all distributions. Total return for all other classes assumes the reinvestment of all distributions. |
| (c) | Net investment income, net realized and unrealized gain amounted to less than $.01 for the period 7/26/2019 through 7/31/2019. |
| (d) | Commencement of operations was 7/26/2019, SEC effective date was 7/31/2019 and date shares first became available to the public was 8/1/2019. |
| (e) | Not annualized. |
| (f) | Annualized. |
| (g) | Amount less than $0.01. |
| (h) | Amount is less than 0.01%. |
| 200 | See Notes to Financial Statements. |
| Ratios to Average Net Assets: | Supplemental Data: | |||||||||||||||||||||||||
| Net asset value, end of period | Total return(b) (%) | Total expenses after waivers and/or reim- bursements (%) | Total expenses (%) | Net invest- ment income (loss) (%) | Net assets, end of period (000) | Portfolio turnover rate (%) | ||||||||||||||||||||
| $ 22.07 | 28.86 | 0.78 | 3.67 | (0.24 | ) | $ 15 | 59 | |||||||||||||||||||
| 19.32 | 33.39 | 0.78 | 6.02 | (0.06 | ) | 13 | 114 | |||||||||||||||||||
| 14.49 | (3.40 | )(e) | 0.78 | (f) | 8.83 | (f) | (0.16 | )(f) | 10 | 16 | (e) | |||||||||||||||
| 22.08 | 28.89 | 0.70 | 3.48 | (0.17 | ) | 2,851 | 59 | |||||||||||||||||||
| 19.34 | 33.56 | 0.70 | 5.83 | 0.07 | 1,188 | 114 | ||||||||||||||||||||
| 14.49 | (3.40 | )(e) | 0.70 | (f) | 8.72 | (f) | (0.08 | )(f) | 484 | 16 | (e) | |||||||||||||||
| See Notes to Financial Statements. | 201 |
Financial Highlights (continued)
INTERNATIONAL EQUITY FUND
| Per Share Operating Performance: | ||||||||||||||||||||||||
| Investment Operations: | Distributions to shareholders from: | |||||||||||||||||||||||
| Net asset value, beginning of period | Net investment income(a) | Net realized and unrealized gain (loss) | Total from investment operations | Net investment income | Net asset value, end of period | |||||||||||||||||||
| Class A | ||||||||||||||||||||||||
| 10/31/2021 | $13.41 | $0.17 | $ 4.27 | $ 4.44 | $(0.18 | ) | $17.67 | |||||||||||||||||
| 10/31/2020 | 13.19 | 0.12 | 0.30 | 0.42 | (0.20 | ) | 13.41 | |||||||||||||||||
| 10/31/2019 | 12.18 | 0.18 | 1.08 | 1.26 | (0.25 | ) | 13.19 | |||||||||||||||||
| 10/31/2018 | 14.10 | 0.19 | (1.83 | ) | (1.64 | ) | (0.28 | ) | 12.18 | |||||||||||||||
| 10/31/2017 | 12.03 | 0.18 | 2.15 | 2.33 | (0.26 | ) | 14.10 | |||||||||||||||||
| Class C | ||||||||||||||||||||||||
| 10/31/2021 | 13.31 | 0.05 | 4.22 | 4.27 | (0.04 | ) | 17.54 | |||||||||||||||||
| 10/31/2020 | 13.08 | 0.02 | 0.30 | 0.32 | (0.09 | ) | 13.31 | |||||||||||||||||
| 10/31/2019 | 12.02 | 0.08 | 1.08 | 1.16 | (0.10 | ) | 13.08 | |||||||||||||||||
| 10/31/2018 | 13.92 | 0.09 | (1.82 | ) | (1.73 | ) | (0.17 | ) | 12.02 | |||||||||||||||
| 10/31/2017 | 11.86 | 0.09 | 2.13 | 2.22 | (0.16 | ) | 13.92 | |||||||||||||||||
| Class F | ||||||||||||||||||||||||
| 10/31/2021 | 13.36 | 0.22 | 4.22 | 4.44 | (0.19 | ) | 17.61 | |||||||||||||||||
| 10/31/2020 | 13.13 | 0.10 | 0.35 | 0.45 | (0.22 | ) | 13.36 | |||||||||||||||||
| 10/31/2019 | 12.12 | 0.20 | 1.08 | 1.28 | (0.27 | ) | 13.13 | |||||||||||||||||
| 10/31/2018 | 14.02 | 0.22 | (1.82 | ) | (1.60 | ) | (0.30 | ) | 12.12 | |||||||||||||||
| 10/31/2017 | 11.96 | 0.22 | 2.12 | 2.34 | (0.28 | ) | 14.02 | |||||||||||||||||
| Class F3 | ||||||||||||||||||||||||
| 10/31/2021 | 13.59 | 0.23 | 4.32 | 4.55 | (0.22 | ) | 17.92 | |||||||||||||||||
| 10/31/2020 | 13.36 | 0.16 | 0.30 | 0.46 | (0.23 | ) | 13.59 | |||||||||||||||||
| 10/31/2019 | 12.32 | 0.22 | 1.11 | 1.33 | (0.29 | ) | 13.36 | |||||||||||||||||
| 10/31/2018 | 14.25 | 0.24 | (1.86 | ) | (1.62 | ) | (0.31 | ) | 12.32 | |||||||||||||||
| 4/4/2017 to 10/31/2017(c) | 12.34 | 0.05 | 1.86 | 1.91 | – | 14.25 | ||||||||||||||||||
| Class I | ||||||||||||||||||||||||
| 10/31/2021 | 13.56 | 0.21 | 4.32 | 4.53 | (0.21 | ) | 17.88 | |||||||||||||||||
| 10/31/2020 | 13.33 | 0.16 | 0.30 | 0.46 | (0.23 | ) | 13.56 | |||||||||||||||||
| 10/31/2019 | 12.30 | 0.23 | 1.08 | 1.31 | (0.28 | ) | 13.33 | |||||||||||||||||
| 10/31/2018 | 14.23 | 0.25 | (1.87 | ) | (1.62 | ) | (0.31 | ) | 12.30 | |||||||||||||||
| 10/31/2017 | 12.13 | 0.24 | 2.16 | 2.40 | (0.30 | ) | 14.23 | |||||||||||||||||
| Class P | ||||||||||||||||||||||||
| 10/31/2021 | 13.42 | 0.09 | 4.31 | 4.40 | (0.13 | ) | 17.69 | |||||||||||||||||
| 10/31/2020 | 13.20 | 0.09 | 0.30 | 0.39 | (0.17 | ) | 13.42 | |||||||||||||||||
| 10/31/2019 | 12.17 | 0.16 | 1.09 | 1.25 | (0.22 | ) | 13.20 | |||||||||||||||||
| 10/31/2018 | 14.10 | 0.14 | (1.82 | ) | (1.68 | ) | (0.25 | ) | 12.17 | |||||||||||||||
| 10/31/2017 | 12.03 | 0.15 | 2.16 | 2.31 | (0.24 | ) | 14.10 | |||||||||||||||||
| Class R2 | ||||||||||||||||||||||||
| 10/31/2021 | 13.39 | 0.12 | 4.25 | 4.37 | (0.09 | ) | 17.67 | |||||||||||||||||
| 10/31/2020 | 13.17 | 0.06 | 0.32 | 0.38 | (0.16 | ) | 13.39 | |||||||||||||||||
| 10/31/2019 | 12.13 | 0.14 | 1.08 | 1.22 | (0.18 | ) | 13.17 | |||||||||||||||||
| 10/31/2018 | 14.05 | 0.13 | (1.83 | ) | (1.70 | ) | (0.22 | ) | 12.13 | |||||||||||||||
| 10/31/2017 | 11.99 | 0.16 | 2.12 | 2.28 | (0.22 | ) | 14.05 | |||||||||||||||||
| 202 | See Notes to Financial Statements. |
| Ratios to Average Net Assets: | Supplemental Data: | |||||||||||||||||||||
| Total return(b) (%) | Total expenses after waivers and/or reim- bursements (%) | Total expenses (%) | Net investment income (%) | Net assets, end of period (000) | Portfolio turnover rate (%) | |||||||||||||||||
| 33.15 | 1.17 | 1.19 | 1.04 | $ 193,680 | 58 | |||||||||||||||||
| 3.23 | 1.17 | 1.21 | 0.90 | 154,161 | 77 | |||||||||||||||||
| 10.64 | 1.17 | 1.17 | 1.43 | 178,701 | 88 | |||||||||||||||||
| (11.91 | ) | 1.15 | 1.16 | 1.34 | 194,360 | 124 | ||||||||||||||||
| 19.80 | 1.12 | 1.22 | 1.43 | 241,626 | 163 | |||||||||||||||||
| 32.20 | 1.92 | 1.94 | 0.28 | 7,622 | 58 | |||||||||||||||||
| 2.27 | 1.92 | 2.00 | 0.17 | 6,676 | 77 | |||||||||||||||||
| 9.88 | 1.92 | 1.92 | 0.68 | 10,652 | 88 | |||||||||||||||||
| (12.59 | ) | 1.90 | 1.92 | 0.65 | 12,821 | 124 | ||||||||||||||||
| 19.02 | 1.85 | 1.95 | 0.71 | 25,687 | 163 | |||||||||||||||||
| 33.43 | 0.96 | 1.04 | 1.30 | 24,909 | 58 | |||||||||||||||||
| 3.39 | 0.96 | 1.03 | 0.77 | 10,435 | 77 | |||||||||||||||||
| 10.90 | 0.96 | 1.02 | 1.64 | 48,782 | 88 | |||||||||||||||||
| (11.77 | ) | 0.92 | 1.01 | 1.63 | 58,347 | 124 | ||||||||||||||||
| 20.17 | 0.87 | 1.06 | 1.71 | 63,479 | 163 | |||||||||||||||||
| 33.57 | 0.84 | 0.86 | 1.38 | 5,928 | 58 | |||||||||||||||||
| 3.53 | 0.84 | 0.86 | 1.23 | 4,489 | 77 | |||||||||||||||||
| 11.13 | 0.84 | 0.85 | 1.76 | 4,527 | 88 | |||||||||||||||||
| (11.62 | ) | 0.78 | 0.85 | 1.73 | 5,083 | 124 | ||||||||||||||||
| 15.48 | (d) | 0.68 | (e) | 0.91 | (e) | 0.65 | (e) | 5,847 | 163 | |||||||||||||
| 33.55 | 0.86 | 0.94 | 1.24 | 170,044 | 58 | |||||||||||||||||
| 3.52 | 0.86 | 0.94 | 1.20 | 179,796 | 77 | |||||||||||||||||
| 11.04 | 0.86 | 0.92 | 1.82 | 198,368 | 88 | |||||||||||||||||
| (11.65 | ) | 0.82 | 0.91 | 1.78 | 277,141 | 124 | ||||||||||||||||
| 20.26 | 0.77 | 0.96 | 1.87 | 292,598 | 163 | |||||||||||||||||
| 32.90 | 1.37 | 1.39 | 0.53 | 13 | 58 | |||||||||||||||||
| 2.96 | 1.37 | 1.40 | 0.72 | 38 | 77 | |||||||||||||||||
| 10.50 | 1.37 | 1.37 | 1.25 | 42 | 88 | |||||||||||||||||
| (12.14 | ) | 1.35 | 1.36 | 1.02 | 40 | 124 | ||||||||||||||||
| 19.59 | 1.32 | 1.42 | 1.19 | 89 | 163 | |||||||||||||||||
| 32.70 | 1.52 | 1.54 | 0.70 | 178 | 58 | |||||||||||||||||
| 2.86 | 1.52 | 1.54 | 0.46 | 137 | 77 | |||||||||||||||||
| 10.32 | 1.52 | 1.52 | 1.09 | 451 | 88 | |||||||||||||||||
| (12.28 | ) | 1.50 | 1.52 | 0.93 | 375 | 124 | ||||||||||||||||
| 19.40 | 1.47 | 1.56 | 1.22 | 679 | 163 | |||||||||||||||||
| See Notes to Financial Statements. | 203 |
Financial Highlights (continued)
INTERNATIONAL EQUITY FUND
| Per Share Operating Performance: | ||||||||||||||||||||||||
| Investment Operations: | Distributions to shareholders from: | |||||||||||||||||||||||
| Net asset value, beginning of period | Net investment income(a) | Net realized and unrealized gain (loss) | Total from investment operations | Net investment income | Net asset value, end of period | |||||||||||||||||||
| Class R3 | ||||||||||||||||||||||||
| 10/31/2021 | $13.20 | $0.13 | $ 4.18 | $4.31 | $ (0.13 | ) | $17.38 | |||||||||||||||||
| 10/31/2020 | 12.98 | 0.08 | 0.30 | 0.38 | (0.16 | ) | 13.20 | |||||||||||||||||
| 10/31/2019 | 11.98 | 0.15 | 1.06 | 1.21 | (0.21 | ) | 12.98 | |||||||||||||||||
| 10/31/2018 | 13.87 | 0.14 | (1.79 | ) | (1.65 | ) | (0.24 | ) | 11.98 | |||||||||||||||
| 10/31/2017 | 11.84 | 0.15 | 2.12 | 2.27 | (0.24 | ) | 13.87 | |||||||||||||||||
| Class R4 | ||||||||||||||||||||||||
| 10/31/2021 | 13.35 | 0.18 | 4.23 | 4.41 | (0.18 | ) | 17.58 | |||||||||||||||||
| 10/31/2020 | 13.14 | 0.11 | 0.30 | 0.41 | (0.20 | ) | 13.35 | |||||||||||||||||
| 10/31/2019 | 12.13 | 0.18 | 1.09 | 1.27 | (0.26 | ) | 13.14 | |||||||||||||||||
| 10/31/2018 | 14.07 | 0.19 | (1.83 | ) | (1.64 | ) | (0.30 | ) | 12.13 | |||||||||||||||
| 10/31/2017 | 12.00 | 0.17 | 2.16 | 2.33 | (0.26 | ) | 14.07 | |||||||||||||||||
| Class R5 | ||||||||||||||||||||||||
| 10/31/2021 | 13.50 | 0.22 | 4.27 | 4.49 | (0.21 | ) | 17.78 | |||||||||||||||||
| 10/31/2020 | 13.27 | 0.15 | 0.31 | 0.46 | (0.23 | ) | 13.50 | |||||||||||||||||
| 10/31/2019 | 12.26 | 0.21 | 1.08 | 1.29 | (0.28 | ) | 13.27 | |||||||||||||||||
| 10/31/2018 | 14.19 | 0.22 | (1.84 | ) | (1.62 | ) | (0.31 | ) | 12.26 | |||||||||||||||
| 10/31/2017 | 12.11 | 0.16 | 2.21 | 2.37 | (0.29 | ) | 14.19 | |||||||||||||||||
| Class R6 | ||||||||||||||||||||||||
| 10/31/2021 | 13.58 | 0.23 | 4.32 | 4.55 | (0.22 | ) | 17.91 | |||||||||||||||||
| 10/31/2020 | 13.35 | 0.16 | 0.30 | 0.46 | (0.23 | ) | 13.58 | |||||||||||||||||
| 10/31/2019 | 12.32 | 0.22 | 1.10 | 1.32 | (0.29 | ) | 13.35 | |||||||||||||||||
| 10/31/2018 | 14.24 | 0.24 | (1.85 | ) | (1.61 | ) | (0.31 | ) | 12.32 | |||||||||||||||
| 10/31/2017 | 12.14 | 0.26 | 2.14 | 2.40 | (0.30 | ) | 14.24 | |||||||||||||||||
| (a) | Calculated using average shares outstanding during the period. |
| (b) | Total return for Classes A and C does not consider the effects of sales loads and assumes the reinvestment of all distributions. Total return for all other classes assumes the reinvestment of all distributions. |
| (c) | Commenced on April 4, 2017. |
| (d) | Not annualized. |
| (e) | Annualized. |
| 204 | See Notes to Financial Statements. |
| Ratios to Average Net Assets: | Supplemental Data: | |||||||||||||||||||||
| Total return(b) (%) | Total expenses after waivers and/or reim- bursements (%) | Total expenses (%) | Net investment income (%) | Net assets, end of period (000) | Portfolio turnover rate (%) | |||||||||||||||||
| 32.81 | 1.42 | 1.44 | 0.80 | $ 6,114 | 58 | |||||||||||||||||
| 2.92 | 1.42 | 1.46 | 0.67 | 5,354 | 77 | |||||||||||||||||
| 10.39 | 1.42 | 1.42 | 1.21 | 7,208 | 88 | |||||||||||||||||
| (12.18 | ) | 1.40 | 1.41 | 1.05 | 8,954 | 124 | ||||||||||||||||
| 19.63 | 1.34 | 1.44 | 1.23 | 12,674 | 163 | |||||||||||||||||
| 33.11 | 1.17 | 1.19 | 1.06 | 1,685 | 58 | |||||||||||||||||
| 3.17 | 1.17 | 1.20 | 0.90 | 1,165 | 77 | |||||||||||||||||
| 10.77 | 1.17 | 1.17 | 1.46 | 1,180 | 88 | |||||||||||||||||
| (11.96 | ) | 1.15 | 1.16 | 1.36 | 948 | 124 | ||||||||||||||||
| 19.92 | 1.10 | 1.18 | 1.25 | 582 | 163 | |||||||||||||||||
| 33.50 | 0.92 | 0.94 | 1.30 | 81 | 58 | |||||||||||||||||
| 3.39 | 0.92 | 0.94 | 1.18 | 64 | 77 | |||||||||||||||||
| 11.00 | 0.92 | 0.92 | 1.68 | 81 | 88 | |||||||||||||||||
| (11.68 | ) | 0.90 | 0.91 | 1.61 | 69 | 124 | ||||||||||||||||
| 20.10 | 0.87 | 0.94 | 1.21 | 71 | 163 | |||||||||||||||||
| 33.60 | 0.84 | 0.86 | 1.36 | 4,180 | 58 | |||||||||||||||||
| 3.53 | 0.84 | 0.86 | 1.23 | 2,143 | 77 | |||||||||||||||||
| 11.04 | 0.84 | 0.85 | 1.78 | 2,489 | 88 | |||||||||||||||||
| (11.62 | ) | 0.78 | 0.85 | 1.73 | 2,667 | 124 | ||||||||||||||||
| 20.35 | 0.70 | 0.86 | 2.04 | 3,074 | 163 | |||||||||||||||||
| See Notes to Financial Statements. | 205 |
Financial Highlights (continued)
INTERNATIONAL OPPORTUNITIES FUND
| Per Share Operating Performance: | ||||||||||||||||||||||||||||
| Investment Operations: | Distributions to shareholders from: | |||||||||||||||||||||||||||
| Net asset value, beginning of period | Net invest- ment income (loss)(a) | Net realized and unrealized gain (loss) | Total from invest- ment opera- tions | Net investment income | Net realized gain | Total distri- butions | ||||||||||||||||||||||
| Class A | ||||||||||||||||||||||||||||
| 10/31/2021 | $15.69 | $ 0.20 | $ 5.47 | $5.67 | $ – | $ – | $ – | |||||||||||||||||||||
| 10/31/2020 | 16.02 | 0.06 | (0.18 | ) | (0.12 | ) | (0.21 | ) | – | (0.21 | ) | |||||||||||||||||
| 10/31/2019 | 16.84 | 0.16 | 0.77 | 0.93 | (0.17 | ) | (1.58 | ) | (1.75 | ) | ||||||||||||||||||
| 10/31/2018 | 20.88 | 0.14 | (3.28 | ) | (3.14 | ) | (0.17 | ) | (0.73 | ) | (0.90 | ) | ||||||||||||||||
| 10/31/2017 | 16.13 | 0.09 | 4.77 | 4.86 | (0.11 | ) | – | (0.11 | ) | |||||||||||||||||||
| Class C | ||||||||||||||||||||||||||||
| 10/31/2021 | 14.47 | 0.04 | 5.06 | 5.10 | – | – | – | |||||||||||||||||||||
| 10/31/2020 | 14.78 | (0.05 | ) | (0.19 | ) | (0.24 | ) | (0.07 | ) | – | (0.07 | ) | ||||||||||||||||
| 10/31/2019 | 15.61 | 0.04 | 0.71 | 0.75 | – | (c) | (1.58 | ) | (1.58 | ) | ||||||||||||||||||
| 10/31/2018 | 19.46 | – | (c) | (3.05 | ) | (3.05 | ) | (0.07 | ) | (0.73 | ) | (0.80 | ) | |||||||||||||||
| 10/31/2017 | 15.03 | (0.04 | ) | 4.47 | 4.43 | – | – | – | ||||||||||||||||||||
| Class F | ||||||||||||||||||||||||||||
| 10/31/2021 | 15.53 | 0.23 | 5.43 | 5.66 | – | – | – | |||||||||||||||||||||
| 10/31/2020 | 15.86 | 0.07 | (0.17 | ) | (0.10 | ) | (0.23 | ) | – | (0.23 | ) | |||||||||||||||||
| 10/31/2019 | 16.70 | 0.18 | 0.76 | 0.94 | (0.20 | ) | (1.58 | ) | (1.78 | ) | ||||||||||||||||||
| 10/31/2018 | 20.70 | 0.18 | (3.25 | ) | (3.07 | ) | (0.20 | ) | (0.73 | ) | (0.93 | ) | ||||||||||||||||
| 10/31/2017 | 16.00 | 0.11 | 4.73 | 4.84 | (0.14 | ) | – | (0.14 | ) | |||||||||||||||||||
| Class F3 | ||||||||||||||||||||||||||||
| 10/31/2021 | 16.26 | 0.29 | 5.67 | 5.96 | – | – | – | |||||||||||||||||||||
| 10/31/2020 | 16.59 | 0.12 | (0.20 | ) | (0.08 | ) | (0.25 | ) | – | (0.25 | ) | |||||||||||||||||
| 10/31/2019 | 17.38 | 0.22 | 0.80 | 1.02 | (0.23 | ) | (1.58 | ) | (1.81 | ) | ||||||||||||||||||
| 10/31/2018 | 21.49 | 0.23 | (3.39 | ) | (3.16 | ) | (0.22 | ) | (0.73 | ) | (0.95 | ) | ||||||||||||||||
| 4/4/2017 to 10/31/2017(e) | 17.75 | (0.02 | ) | 3.76 | 3.74 | – | – | – | ||||||||||||||||||||
| Class I | ||||||||||||||||||||||||||||
| 10/31/2021 | 16.17 | 0.26 | 5.65 | 5.91 | – | – | – | |||||||||||||||||||||
| 10/31/2020 | 16.51 | 0.10 | (0.19 | ) | (0.09 | ) | (0.25 | ) | – | (0.25 | ) | |||||||||||||||||
| 10/31/2019 | 17.32 | 0.21 | 0.79 | 1.00 | (0.23 | ) | (1.58 | ) | (1.81 | ) | ||||||||||||||||||
| 10/31/2018 | 21.44 | 0.19 | (3.37 | ) | (3.18 | ) | (0.21 | ) | (0.73 | ) | (0.94 | ) | ||||||||||||||||
| 10/31/2017 | 16.56 | 0.14 | 4.90 | 5.04 | (0.16 | ) | – | (0.16 | ) | |||||||||||||||||||
| Class P | ||||||||||||||||||||||||||||
| 10/31/2021 | 16.10 | 0.17 | 5.62 | 5.79 | – | – | – | |||||||||||||||||||||
| 10/31/2020 | 16.43 | 0.05 | (0.22 | ) | (0.17 | ) | (0.16 | ) | – | (0.16 | ) | |||||||||||||||||
| 10/31/2019 | 17.18 | 0.14 | 0.79 | 0.93 | (0.10 | ) | (1.58 | ) | (1.68 | ) | ||||||||||||||||||
| 10/31/2018 | 21.26 | 0.10 | (3.33 | ) | (3.23 | ) | (0.12 | ) | (0.73 | ) | (0.85 | ) | ||||||||||||||||
| 10/31/2017 | 16.40 | 0.04 | 4.88 | 4.92 | (0.06 | ) | – | (0.06 | ) | |||||||||||||||||||
| Class R2 | ||||||||||||||||||||||||||||
| 10/31/2021 | 15.39 | 0.12 | 5.38 | 5.50 | – | – | – | |||||||||||||||||||||
| 10/31/2020 | 15.72 | 0.01 | (0.20 | ) | (0.19 | ) | (0.14 | ) | – | (0.14 | ) | |||||||||||||||||
| 10/31/2019 | 16.54 | 0.11 | 0.75 | 0.86 | (0.10 | ) | (1.58 | ) | (1.68 | ) | ||||||||||||||||||
| 10/31/2018 | 20.53 | 0.06 | (3.21 | ) | (3.15 | ) | (0.11 | ) | (0.73 | ) | (0.84 | ) | ||||||||||||||||
| 10/31/2017 | 15.89 | 0.04 | 4.69 | 4.73 | (0.09 | ) | – | (0.09 | ) | |||||||||||||||||||
| 206 | See Notes to Financial Statements. |
| Ratios to Average Net Assets: | Supplemental Data: | |||||||||||||||||||||||||
| Net asset value, end of period | Total return(b) (%) | Total expenses after waivers and/or reim- bursements (%) | Total expenses (%) | Net invest- ment income (loss) (%) | Net assets, end of period (000) | Portfolio turnover rate (%) | ||||||||||||||||||||
| $21.36 | 36.14 | 1.19 | 1.21 | 1.00 | $ 130,088 | 74 | ||||||||||||||||||||
| 15.69 | (0.84 | ) | 1.21 | 1.24 | 0.41 | 96,338 | 55 | |||||||||||||||||||
| 16.02 | 7.05 | 1.25 | 1.25 | 1.04 | 126,700 | 58 | ||||||||||||||||||||
| 16.84 | (15.72 | ) | 1.20 | 1.20 | 0.73 | 172,940 | 81 | |||||||||||||||||||
| 20.88 | 30.38 | 1.23 | 1.23 | 0.50 | 190,861 | 76 | ||||||||||||||||||||
| 19.57 | 35.25 | 1.95 | 1.96 | 0.22 | 14,488 | 74 | ||||||||||||||||||||
| 14.47 | (1.63 | ) | 1.97 | 1.99 | (0.38 | ) | 12,840 | 55 | ||||||||||||||||||
| 14.78 | 6.23 | 2.00 | 2.00 | 0.29 | 22,450 | 58 | ||||||||||||||||||||
| 15.61 | (16.34 | ) | 1.95 | 1.95 | – | (d) | 33,874 | 81 | ||||||||||||||||||
| 19.46 | 29.47 | 1.97 | 1.97 | (0.26 | ) | 39,434 | 76 | |||||||||||||||||||
| 21.19 | 36.38 | 1.05 | 1.06 | 1.13 | 54,601 | 74 | ||||||||||||||||||||
| 15.53 | (0.72 | ) | 1.07 | 1.09 | 0.44 | 43,222 | 55 | |||||||||||||||||||
| 15.86 | 7.19 | 1.09 | 1.09 | 1.20 | 91,019 | 58 | ||||||||||||||||||||
| 16.70 | (15.58 | ) | 1.05 | 1.05 | 0.91 | 206,400 | 81 | |||||||||||||||||||
| 20.70 | 30.59 | 1.07 | 1.07 | 0.58 | 264,221 | 76 | ||||||||||||||||||||
| 22.22 | 36.65 | 0.86 | 0.88 | 1.36 | 30,504 | 74 | ||||||||||||||||||||
| 16.26 | (0.54 | ) | 0.89 | 0.91 | 0.75 | 17,579 | 55 | |||||||||||||||||||
| 16.59 | 7.43 | 0.91 | 0.91 | 1.40 | 19,153 | 58 | ||||||||||||||||||||
| 17.38 | (15.46 | ) | 0.87 | 0.87 | 1.11 | 22,158 | 81 | |||||||||||||||||||
| 21.49 | 21.13 | (f) | 0.89 | (g) | 0.89 | (g) | (0.15 | )(g) | 18,095 | 76 | ||||||||||||||||
| 22.08 | 36.55 | 0.95 | 0.96 | 1.24 | 193,183 | 74 | ||||||||||||||||||||
| 16.17 | (0.62 | ) | 0.97 | 0.99 | 0.66 | 146,416 | 55 | |||||||||||||||||||
| 16.51 | 7.24 | 1.00 | 1.00 | 1.32 | 221,455 | 58 | ||||||||||||||||||||
| 17.32 | (15.46 | ) | 0.95 | 0.95 | 0.94 | 235,952 | 81 | |||||||||||||||||||
| 21.44 | 30.74 | 0.99 | 0.99 | 0.76 | 249,331 | 76 | ||||||||||||||||||||
| 21.89 | 35.96 | 1.39 | 1.41 | 0.80 | 140 | 74 | ||||||||||||||||||||
| 16.10 | (1.08 | ) | 1.41 | 1.43 | 0.30 | 119 | 55 | |||||||||||||||||||
| 16.43 | 6.80 | 1.45 | 1.45 | 0.91 | 96 | 58 | ||||||||||||||||||||
| 17.18 | (15.87 | ) | 1.40 | 1.40 | 0.50 | 132 | 81 | |||||||||||||||||||
| 21.26 | 30.12 | 1.45 | 1.45 | 0.23 | 229 | 76 | ||||||||||||||||||||
| 20.89 | 35.74 | 1.55 | 1.56 | 0.63 | 2,771 | 74 | ||||||||||||||||||||
| 15.39 | (1.24 | ) | 1.57 | 1.59 | 0.06 | 2,522 | 55 | |||||||||||||||||||
| 15.72 | 6.67 | 1.60 | 1.60 | 0.72 | 3,318 | 58 | ||||||||||||||||||||
| 16.54 | (16.00 | ) | 1.55 | 1.55 | 0.32 | 3,476 | 81 | |||||||||||||||||||
| 20.53 | 29.96 | 1.57 | 1.57 | 0.21 | 5,228 | 76 | ||||||||||||||||||||
| See Notes to Financial Statements. | 207 |
Financial Highlights (continued)
INTERNATIONAL OPPORTUNITIES FUND
| Per Share Operating Performance: | ||||||||||||||||||||||||||||
| Investment Operations: | Distributions to shareholders from: | |||||||||||||||||||||||||||
| Net asset value, beginning of period | Net invest- ment income (loss)(a) | Net realized and unrealized gain (loss) | Total from invest- ment opera- tions | Net investment income | Net realized gain | Total distri- butions | ||||||||||||||||||||||
| Class R3 | ||||||||||||||||||||||||||||
| 10/31/2021 | $15.32 | $0.10 | $ 5.40 | $ 5.50 | $ – | $ – | $ – | |||||||||||||||||||||
| 10/31/2020 | 15.64 | 0.02 | (0.19 | ) | (0.17 | ) | (0.15 | ) | – | (0.15 | ) | |||||||||||||||||
| 10/31/2019 | 16.53 | 0.09 | 0.77 | 0.86 | (0.17 | ) | (1.58 | ) | (1.75 | ) | ||||||||||||||||||
| 10/31/2018 | 20.49 | 0.10 | (3.21 | ) | (3.11 | ) | (0.12 | ) | (0.73 | ) | (0.85 | ) | ||||||||||||||||
| 10/31/2017 | 15.85 | 0.02 | 4.71 | 4.73 | (0.09 | ) | – | (0.09 | ) | |||||||||||||||||||
| Class R4 | ||||||||||||||||||||||||||||
| 10/31/2021 | 15.61 | 0.18 | 5.47 | 5.65 | – | – | – | |||||||||||||||||||||
| 10/31/2020 | 15.95 | 0.07 | (0.19 | ) | (0.12 | ) | (0.22 | ) | – | (0.22 | ) | |||||||||||||||||
| 10/31/2019 | 16.79 | 0.14 | 0.78 | 0.92 | (0.18 | ) | (1.58 | ) | (1.76 | ) | ||||||||||||||||||
| 10/31/2018 | 20.82 | 0.16 | (3.28 | ) | (3.12 | ) | (0.18 | ) | (0.73 | ) | (0.91 | ) | ||||||||||||||||
| 10/31/2017 | 16.11 | 0.10 | 4.75 | 4.85 | (0.14 | ) | – | (0.14 | ) | |||||||||||||||||||
| Class R5 | ||||||||||||||||||||||||||||
| 10/31/2021 | 16.17 | 0.14 | 5.76 | 5.90 | – | – | – | |||||||||||||||||||||
| 10/31/2020 | 16.50 | 0.08 | (0.16 | ) | (0.08 | ) | (0.25 | ) | – | (0.25 | ) | |||||||||||||||||
| 10/31/2019 | 17.32 | 0.16 | 0.83 | 0.99 | (0.23 | ) | (1.58 | ) | (1.81 | ) | ||||||||||||||||||
| 10/31/2018 | 21.43 | 0.21 | (3.38 | ) | (3.17 | ) | (0.21 | ) | (0.73 | ) | (0.94 | ) | ||||||||||||||||
| 10/31/2017 | 16.56 | 0.15 | 4.88 | 5.03 | (0.16 | ) | – | (0.16 | ) | |||||||||||||||||||
| Class R6 | ||||||||||||||||||||||||||||
| 10/31/2021 | 16.26 | 0.24 | 5.72 | 5.96 | – | – | – | |||||||||||||||||||||
| 10/31/2020 | 16.59 | 0.11 | (0.19 | ) | (0.08 | ) | (0.25 | ) | – | (0.25 | ) | |||||||||||||||||
| 10/31/2019 | 17.39 | 0.21 | 0.80 | 1.01 | (0.23 | ) | (1.58 | ) | (1.81 | ) | ||||||||||||||||||
| 10/31/2018 | 21.49 | 0.21 | (3.36 | ) | (3.15 | ) | (0.22 | ) | (0.73 | ) | (0.95 | ) | ||||||||||||||||
| 10/31/2017 | 16.60 | 0.20 | 4.85 | 5.05 | (0.16 | ) | – | (0.16 | ) | |||||||||||||||||||
| (a) | Calculated using average shares outstanding during the period. |
| (b) | Total return for Classes A and C does not consider the effects of sales loads and assumes the reinvestment of all distributions. Total return for all other classes assumes the reinvestment of all distributions. |
| (c) | Amount less than $0.01. |
| (d) | Amount is less than 0.01%. |
| (e) | Commenced on April 4, 2017. |
| (f) | Not annualized. |
| (g) | Annualized. |
| 208 | See Notes to Financial Statements. |
| Ratios to Average Net Assets: | Supplemental Data: | |||||||||||||||||||||||||
| Net asset value, end of period | Total return(b) (%) | Total expenses after waivers and/or reim- bursements (%) | Total expenses (%) | Net invest- ment income (loss) (%) | Net assets, end of period (000) | Portfolio turnover rate (%) | ||||||||||||||||||||
| $20.82 | 35.90 | 1.45 | 1.47 | 0.51 | $ 6,838 | 74 | ||||||||||||||||||||
| 15.32 | (1.17 | ) | 1.46 | 1.49 | 0.10 | 15,313 | 55 | |||||||||||||||||||
| 15.64 | 6.77 | 1.50 | 1.50 | 0.58 | 19,568 | 58 | ||||||||||||||||||||
| 16.53 | (15.87 | ) | 1.46 | 1.46 | 0.54 | 35,677 | 81 | |||||||||||||||||||
| 20.49 | 30.07 | 1.47 | 1.47 | 0.14 | 9,828 | 76 | ||||||||||||||||||||
| 21.26 | 36.19 | 1.20 | 1.22 | 0.91 | 2,869 | 74 | ||||||||||||||||||||
| 15.61 | (0.90 | ) | 1.21 | 1.24 | 0.44 | 4,889 | 55 | |||||||||||||||||||
| 15.95 | 7.06 | 1.25 | 1.25 | 0.93 | 6,293 | 58 | ||||||||||||||||||||
| 16.79 | (15.70 | ) | 1.20 | 1.20 | 0.80 | 5,606 | 81 | |||||||||||||||||||
| 20.82 | 30.43 | 1.23 | 1.23 | 0.55 | 3,334 | 76 | ||||||||||||||||||||
| 22.07 | 36.49 | 0.95 | 0.97 | 0.70 | 3,283 | 74 | ||||||||||||||||||||
| 16.17 | (0.56 | ) | 0.96 | 0.99 | 0.47 | 15,842 | 55 | |||||||||||||||||||
| 16.50 | 7.25 | 1.00 | 1.00 | 1.00 | 17,765 | 58 | ||||||||||||||||||||
| 17.32 | (15.47 | ) | 0.97 | 0.97 | 1.06 | 39,621 | 81 | |||||||||||||||||||
| 21.43 | 30.69 | 0.98 | 0.98 | 0.79 | 4,121 | 76 | ||||||||||||||||||||
| 22.22 | 36.65 | 0.87 | 0.89 | 1.14 | 25,184 | 74 | ||||||||||||||||||||
| 16.26 | (0.54 | ) | 0.89 | 0.91 | 0.72 | 31,986 | 55 | |||||||||||||||||||
| 16.59 | 7.37 | 0.91 | 0.91 | 1.30 | 33,183 | 58 | ||||||||||||||||||||
| 17.39 | (15.41 | ) | 0.87 | 0.87 | 1.04 | 34,281 | 81 | |||||||||||||||||||
| 21.49 | 30.85 | 0.90 | 0.90 | 1.03 | 17,212 | 76 | ||||||||||||||||||||
| See Notes to Financial Statements. | 209 |
Financial Highlights (continued)
INTERNATIONAL VALUE FUND
| Per Share Operating Performance: | ||||||||||||||||||||||||
| Investment Operations: | Distributions to shareholders from: | |||||||||||||||||||||||
| Net asset value, beginning of period | Net investment income (loss)(a) | Net realized and unrealized gain (loss) | Total from investment operations | Net investment income | Net asset value, end of period | |||||||||||||||||||
| Class A | ||||||||||||||||||||||||
| 10/31/2021 | $ | 6.03 | $ | 0.21 | $ | 1.98 | $ | 2.19 | $ | (0.22 | ) | $ | 8.00 | |||||||||||
| 10/31/2020 | 6.98 | 0.12 | (0.94 | ) | (0.82 | ) | (0.13 | ) | 6.03 | |||||||||||||||
| 10/31/2019 | 6.73 | 0.20 | 0.26 | 0.46 | (0.21 | ) | 6.98 | |||||||||||||||||
| 10/31/2018 | 7.63 | 0.22 | (0.89 | ) | (0.67 | ) | (0.23 | ) | 6.73 | |||||||||||||||
| 10/31/2017 | 6.71 | 0.22 | 0.95 | 1.17 | (0.25 | ) | 7.63 | |||||||||||||||||
| Class C | ||||||||||||||||||||||||
| 10/31/2021 | 5.98 | 0.15 | 1.96 | 2.11 | (0.16 | ) | 7.93 | |||||||||||||||||
| 10/31/2020 | 6.92 | 0.07 | (0.94 | ) | (0.87 | ) | (0.07 | ) | 5.98 | |||||||||||||||
| 10/31/2019 | 6.67 | 0.15 | 0.25 | 0.40 | (0.15 | ) | 6.92 | |||||||||||||||||
| 10/31/2018 | 7.56 | 0.16 | (0.88 | ) | (0.72 | ) | (0.17 | ) | 6.67 | |||||||||||||||
| 10/31/2017 | 6.66 | 0.17 | 0.92 | 1.09 | (0.19 | ) | 7.56 | |||||||||||||||||
| Class F | ||||||||||||||||||||||||
| 10/31/2021 | 6.06 | 0.23 | 1.98 | 2.21 | (0.23 | ) | 8.04 | |||||||||||||||||
| 10/31/2020 | 7.01 | 0.13 | (0.94 | ) | (0.81 | ) | (0.14 | ) | 6.06 | |||||||||||||||
| 10/31/2019 | 6.76 | 0.21 | 0.26 | 0.47 | (0.22 | ) | 7.01 | |||||||||||||||||
| 10/31/2018 | 7.66 | 0.23 | (0.89 | ) | (0.66 | ) | (0.24 | ) | 6.76 | |||||||||||||||
| 10/31/2017 | 6.73 | 0.24 | 0.95 | 1.19 | (0.26 | ) | 7.66 | |||||||||||||||||
| Class F3 | ||||||||||||||||||||||||
| 10/31/2021 | 6.07 | 0.24 | 1.99 | 2.23 | (0.24 | ) | 8.06 | |||||||||||||||||
| 10/31/2020 | 7.02 | 0.14 | (0.95 | ) | (0.81 | ) | (0.14 | ) | 6.07 | |||||||||||||||
| 10/31/2019 | 6.77 | 0.22 | 0.26 | 0.48 | (0.23 | ) | 7.02 | |||||||||||||||||
| 10/31/2018 | 7.67 | 0.24 | (0.89 | ) | (0.65 | ) | (0.25 | ) | 6.77 | |||||||||||||||
| 4/4/2017 to 10/31/2017(c) | 7.03 | (0.01 | ) | 0.79 | 0.78 | (0.14 | ) | 7.67 | ||||||||||||||||
| Class I | ||||||||||||||||||||||||
| 10/31/2021 | 6.07 | 0.25 | 1.98 | 2.23 | (0.24 | ) | 8.06 | |||||||||||||||||
| 10/31/2020 | 7.03 | 0.15 | (0.97 | ) | (0.82 | ) | (0.14 | ) | 6.07 | |||||||||||||||
| 10/31/2019 | 6.77 | 0.23 | 0.25 | 0.48 | (0.22 | ) | 7.03 | |||||||||||||||||
| 10/31/2018 | 7.68 | 0.23 | (0.89 | ) | (0.66 | ) | (0.25 | ) | 6.77 | |||||||||||||||
| 10/31/2017 | 6.75 | 0.25 | 0.94 | 1.19 | (0.26 | ) | 7.68 | |||||||||||||||||
| Class R2 | ||||||||||||||||||||||||
| 10/31/2021 | 6.18 | 0.19 | 2.03 | 2.22 | (0.19 | ) | 8.21 | |||||||||||||||||
| 10/31/2020 | 7.14 | 0.07 | (0.96 | ) | (0.89 | ) | (0.07 | ) | 6.18 | |||||||||||||||
| 10/31/2019 | 6.88 | 0.18 | 0.26 | 0.44 | (0.18 | ) | 7.14 | |||||||||||||||||
| 10/31/2018 | 7.80 | 0.18 | (0.90 | ) | (0.72 | ) | (0.20 | ) | 6.88 | |||||||||||||||
| 10/31/2017 | 6.86 | 0.21 | 0.95 | 1.16 | (0.22 | ) | 7.80 | |||||||||||||||||
| Class R3 | ||||||||||||||||||||||||
| 10/31/2021 | 6.10 | 0.20 | 1.99 | 2.19 | (0.20 | ) | 8.09 | |||||||||||||||||
| 10/31/2020 | 7.05 | 0.11 | (0.95 | ) | (0.84 | ) | (0.11 | ) | 6.10 | |||||||||||||||
| 10/31/2019 | 6.80 | 0.18 | 0.26 | 0.44 | (0.19 | ) | 7.05 | |||||||||||||||||
| 10/31/2018 | 7.71 | 0.19 | (0.89 | ) | (0.70 | ) | (0.21 | ) | 6.80 | |||||||||||||||
| 10/31/2017 | 6.78 | 0.21 | 0.95 | 1.16 | (0.23 | ) | 7.71 | |||||||||||||||||
| 210 | See Notes to Financial Statements. |
| Ratios to Average Net Assets: | Supplemental Data: | |||||||||||||||||||||
| Total return(b) (%) | Total expenses after waivers and/or reim- bursements (%) | Total expenses (%) | Net investment income (loss) (%) | Net assets, end of period (000) | Portfolio turnover rate (%) | |||||||||||||||||
| 36.44 | 1.12 | 1.14 | 2.73 | $ | 242,422 | 61 | ||||||||||||||||
| (11.89 | ) | 1.12 | 1.18 | 1.91 | 186,426 | 71 | ||||||||||||||||
| 6.91 | 1.12 | 1.16 | 2.97 | 256,381 | 62 | |||||||||||||||||
| (9.05 | ) | 1.12 | 1.14 | 2.85 | 290,289 | 74 | ||||||||||||||||
| 17.68 | 1.12 | 1.14 | 3.15 | 367,465 | 61 | |||||||||||||||||
| 35.37 | 1.87 | 1.89 | 1.88 | 10,707 | 61 | |||||||||||||||||
| (12.58 | ) | 1.87 | 1.93 | 1.09 | 13,027 | 71 | ||||||||||||||||
| 6.12 | 1.87 | 1.91 | 2.17 | 32,274 | 62 | |||||||||||||||||
| (9.71 | ) | 1.87 | 1.89 | 2.07 | 45,888 | 74 | ||||||||||||||||
| 16.60 | 1.87 | 1.89 | 2.41 | 68,558 | 61 | |||||||||||||||||
| 36.78 | 0.92 | 0.99 | 2.93 | 29,094 | 61 | |||||||||||||||||
| (11.69 | ) | 0.92 | 1.03 | 2.06 | 23,560 | 71 | ||||||||||||||||
| 7.04 | 0.92 | 1.01 | 3.10 | 37,857 | 62 | |||||||||||||||||
| (8.87 | ) | 0.91 | 0.99 | 3.06 | 54,167 | 74 | ||||||||||||||||
| 17.96 | 0.91 | 0.99 | 3.37 | 95,299 | 61 | |||||||||||||||||
| 36.87 | 0.79 | 0.83 | 3.06 | 25,103 | 61 | |||||||||||||||||
| (11.57 | ) | 0.80 | 0.85 | 2.24 | 18,311 | 71 | ||||||||||||||||
| 7.15 | 0.81 | 0.84 | 3.28 | 24,764 | 62 | |||||||||||||||||
| (8.76 | ) | 0.82 | 0.83 | 3.21 | 26,911 | 74 | ||||||||||||||||
| 11.16 | (d) | 0.77 | (e) | 0.83 | (e) | (0.19 | )(e) | 27,215 | 61 | |||||||||||||
| 36.86 | 0.82 | 0.89 | 3.14 | 334,988 | 61 | |||||||||||||||||
| (11.71 | ) | 0.82 | 0.93 | 2.26 | 197,616 | 71 | ||||||||||||||||
| 7.29 | 0.82 | 0.91 | 3.35 | 219,764 | 62 | |||||||||||||||||
| (8.89 | ) | 0.81 | 0.89 | 3.05 | 310,984 | 74 | ||||||||||||||||
| 18.02 | 0.81 | 0.89 | 3.48 | 471,341 | 61 | |||||||||||||||||
| 36.04 | 1.47 | 1.49 | 2.37 | 27 | 61 | |||||||||||||||||
| (12.47 | ) | 1.47 | 1.55 | 0.99 | 20 | 71 | ||||||||||||||||
| 6.54 | 1.47 | 1.51 | 2.64 | 449 | 62 | |||||||||||||||||
| (9.44 | ) | 1.47 | 1.49 | 2.35 | 369 | 74 | ||||||||||||||||
| 17.17 | 1.47 | 1.49 | 2.93 | 592 | 61 | |||||||||||||||||
| 36.00 | 1.37 | 1.39 | 2.50 | 6,840 | 61 | |||||||||||||||||
| (12.00 | ) | 1.37 | 1.43 | 1.69 | 5,394 | 71 | ||||||||||||||||
| 6.56 | 1.37 | 1.41 | 2.70 | 7,029 | 62 | |||||||||||||||||
| (9.35 | ) | 1.37 | 1.39 | 2.41 | 7,801 | 74 | ||||||||||||||||
| 17.35 | 1.37 | 1.39 | 2.90 | 12,888 | 61 | |||||||||||||||||
| See Notes to Financial Statements. | 211 |
Financial Highlights (continued)
INTERNATIONAL VALUE FUND
| Per Share Operating Performance: | ||||||||||||||||||||||||
| Investment Operations: | Distributions to shareholders from: | |||||||||||||||||||||||
| Net asset value, beginning of period | Net investment income (loss)(a) | Net realized and unrealized gain (loss) | Total from investment operations | Net investment income | Net asset value, end of period | |||||||||||||||||||
| Class R4 | ||||||||||||||||||||||||
| 10/31/2021 | $ | 6.01 | $ | 0.24 | $ | 1.95 | $ | 2.19 | $ | (0.22 | ) | $ | 7.98 | |||||||||||
| 10/31/2020 | 6.97 | 0.13 | (0.96 | ) | (0.83 | ) | (0.13 | ) | 6.01 | |||||||||||||||
| 10/31/2019 | 6.72 | 0.20 | 0.26 | 0.46 | (0.21 | ) | 6.97 | |||||||||||||||||
| 10/31/2018 | 7.62 | 0.20 | (0.87 | ) | (0.67 | ) | (0.23 | ) | 6.72 | |||||||||||||||
| 10/31/2017 | 6.71 | 0.21 | 0.95 | 1.16 | (0.25 | ) | 7.62 | |||||||||||||||||
| Class R5 | ||||||||||||||||||||||||
| 10/31/2021 | 6.05 | 0.24 | 1.98 | 2.22 | (0.24 | ) | 8.03 | |||||||||||||||||
| 10/31/2020 | 7.01 | 0.14 | (0.96 | ) | (0.82 | ) | (0.14 | ) | 6.05 | |||||||||||||||
| 10/31/2019 | 6.76 | 0.23 | 0.25 | 0.48 | (0.23 | ) | 7.01 | |||||||||||||||||
| 10/31/2018 | 7.66 | 0.24 | (0.89 | ) | (0.65 | ) | (0.25 | ) | 6.76 | |||||||||||||||
| 10/31/2017 | 6.74 | 0.24 | 0.94 | 1.18 | (0.26 | ) | 7.66 | |||||||||||||||||
| Class R6 | ||||||||||||||||||||||||
| 10/31/2021 | 6.07 | 0.24 | 1.99 | 2.23 | (0.24 | ) | 8.06 | |||||||||||||||||
| 10/31/2020 | 7.02 | 0.14 | (0.95 | ) | (0.81 | ) | (0.14 | ) | 6.07 | |||||||||||||||
| 10/31/2019 | 6.77 | 0.22 | 0.26 | 0.48 | (0.23 | ) | 7.02 | |||||||||||||||||
| 10/31/2018 | 7.67 | 0.24 | (0.89 | ) | (0.65 | ) | (0.25 | ) | 6.77 | |||||||||||||||
| 10/31/2017 | 6.75 | 0.26 | 0.92 | 1.18 | (0.26 | ) | 7.67 | |||||||||||||||||
| (a) | Calculated using average shares outstanding during the period. |
| (b) | Total return for Classes A and C does not consider the effects of sales loads and assumes the reinvestment of all distributions. Total return for all other classes assumes the reinvestment of all distributions. |
| (c) | Commenced on April 4, 2017. |
| (d) | Not annualized. |
| (e) | Annualized. |
| 212 | See Notes to Financial Statements. |
| Ratios to Average Net Assets: | Supplemental Data: | |||||||||||||||||||||
| Total return(b) (%) | Total expenses after waivers and/or reim- bursements (%) | Total expenses (%) | Net investment income (loss) (%) | Net assets, end of period (000) | Portfolio turnover rate (%) | |||||||||||||||||
| 36.35 | 1.12 | 1.14 | 2.98 | $ | 153 | 61 | ||||||||||||||||
| (11.90 | ) | 1.12 | 1.17 | 2.05 | 36 | 71 | ||||||||||||||||
| 6.92 | 1.12 | 1.17 | 2.99 | 36 | 62 | |||||||||||||||||
| (9.06 | ) | 1.12 | 1.13 | 2.67 | 40 | 74 | ||||||||||||||||
| 17.60 | 1.11 | 1.11 | 2.85 | 38 | 61 | |||||||||||||||||
| 36.82 | 0.87 | 0.88 | 3.09 | 15 | 61 | |||||||||||||||||
| (11.74 | ) | 0.87 | 0.91 | 2.20 | 9 | 71 | ||||||||||||||||
| 7.16 | 0.87 | 0.89 | 3.36 | 10 | 62 | |||||||||||||||||
| (8.78 | ) | 0.86 | 0.86 | 3.12 | 10 | 74 | ||||||||||||||||
| 17.90 | 0.87 | 0.86 | 3.39 | 11 | 61 | |||||||||||||||||
| 36.87 | 0.79 | 0.83 | 3.06 | 1,375 | 61 | |||||||||||||||||
| (11.57 | ) | 0.80 | 0.85 | 2.17 | 952 | 71 | ||||||||||||||||
| 7.15 | 0.81 | 0.84 | 3.22 | 1,507 | 62 | |||||||||||||||||
| (8.76 | ) | 0.82 | 0.83 | 3.17 | 1,758 | 74 | ||||||||||||||||
| 17.88 | 0.81 | 0.83 | 3.45 | 2,229 | 61 | |||||||||||||||||
| See Notes to Financial Statements. | 213 |
Financial Highlights (continued)
MICRO CAP GROWTH FUND
| Per Share Operating Performance: | ||||||||||||||||||||||||
| Investment Operations: | Distributions to shareholders from: | |||||||||||||||||||||||
| Net asset value, beginning of period | Net investment (loss)(a) | Net realized and unrealized gain | Total from investment operations | Net realized gain | Net asset value, end of period | |||||||||||||||||||
| Class A | ||||||||||||||||||||||||
| 10/31/2021 | $ | 17.51 | $ | (0.25 | ) | $ | 7.18 | $ | 6.93 | $ | (5.08 | ) | $ | 19.36 | ||||||||||
| 10/31/2020 | 13.83 | (0.18 | ) | 6.23 | 6.05 | (2.37 | ) | 17.51 | ||||||||||||||||
| 10/31/2019 | 18.05 | (0.21 | ) | 0.98 | 0.77 | (4.99 | ) | 13.83 | ||||||||||||||||
| 10/31/2018 | 18.26 | (0.26 | ) | 2.75 | 2.49 | (2.70 | ) | 18.05 | ||||||||||||||||
| 10/31/2017 | 13.09 | (0.21 | ) | 5.38 | 5.17 | – | 18.26 | |||||||||||||||||
| Class C | ||||||||||||||||||||||||
| 10/31/2021 | 20.44 | (0.49 | ) | 8.62 | 8.13 | (5.08 | ) | 23.49 | ||||||||||||||||
| 8/28/2020 to 10/31/2020(c) | 20.16 | (0.07 | ) | 0.35 | 0.28 | – | 20.44 | |||||||||||||||||
| Class F | ||||||||||||||||||||||||
| 10/31/2021 | 20.47 | (0.25 | ) | 8.63 | 8.38 | (5.08 | ) | 23.77 | ||||||||||||||||
| 8/28/2020 to 10/31/2020(c) | 20.16 | (0.04 | ) | 0.35 | 0.31 | – | 20.47 | |||||||||||||||||
| Class I | ||||||||||||||||||||||||
| 10/31/2021 | 20.47 | (0.24 | ) | 8.62 | 8.38 | (5.08 | ) | 23.77 | ||||||||||||||||
| 10/31/2020 | 15.77 | (0.19 | ) | 7.26 | 7.07 | (2.37 | ) | 20.47 | ||||||||||||||||
| 10/31/2019 | 19.84 | (0.24 | ) | 1.16 | 0.92 | (4.99 | ) | 15.77 | ||||||||||||||||
| 10/31/2018 | 19.80 | (0.29 | ) | 3.03 | 2.74 | (2.70 | ) | 19.84 | ||||||||||||||||
| 10/31/2017 | 14.20 | (0.23 | ) | 5.83 | 5.60 | – | 19.80 | |||||||||||||||||
| (a) | Calculated using average shares outstanding during the period. |
| (b) | Total return for Classes A and C does not consider the effects of sales loads and assumes the reinvestment of all distributions. Total return for all other classes assumes the reinvestment of all distributions. |
| (c) | Commenced on August 28, 2020. |
| (d) | Not annualized. |
| (e) | Annualized. |
| 214 | See Notes to Financial Statements. |
| Ratios to Average Net Assets: | Supplemental Data: | |||||||||||||||||||||
| Total return(b) (%) | Total expenses after waivers and/or reim- bursements (%) | Total expenses (%) | Net investment (loss) (%) | Net assets, end of period (000) | Portfolio turnover rate (%) | |||||||||||||||||
| 47.12 | 1.36 | 1.37 | (1.29 | ) | $ | 61,063 | 102 | |||||||||||||||
| 51.19 | 1.56 | 1.56 | (1.32 | ) | 11,747 | 115 | ||||||||||||||||
| 8.33 | 1.66 | 1.66 | (1.48 | ) | 12,590 | 94 | ||||||||||||||||
| 16.32 | 1.63 | 1.63 | (1.43 | ) | 11,616 | 73 | ||||||||||||||||
| 39.39 | 1.67 | 1.67 | (1.36 | ) | 9,893 | 105 | ||||||||||||||||
| 46.03 | 2.12 | 2.13 | (2.05 | ) | 13,532 | 102 | ||||||||||||||||
| 1.29 | (d) | 2.03 | (e) | 2.05 | (e) | (1.91 | )(e) | 849 | 115 | (d) | ||||||||||||
| 47.39 | 1.12 | 1.22 | (1.05 | ) | 167,300 | 102 | ||||||||||||||||
| 1.49 | (d) | 1.10 | (e) | 1.20 | (e) | (0.97 | )(e) | 12,089 | 115 | (d) | ||||||||||||
| 47.39 | 1.11 | 1.12 | (1.03 | ) | 155,420 | 102 | ||||||||||||||||
| 51.47 | 1.44 | 1.45 | (1.19 | ) | 90,725 | 115 | ||||||||||||||||
| 8.34 | 1.66 | 1.66 | (1.48 | ) | 119,822 | 94 | ||||||||||||||||
| 16.31 | 1.63 | 1.63 | (1.43 | ) | 133,719 | 73 | ||||||||||||||||
| 39.44 | 1.67 | 1.67 | (1.36 | ) | 139,068 | 105 | ||||||||||||||||
| See Notes to Financial Statements. | 215 |
Financial Highlights (continued)
VALUE OPPORTUNITIES FUND
| Per Share Operating Performance: | ||||||||||||||||||||||||||||
| Investment Operations: | Distributions to shareholders from: | |||||||||||||||||||||||||||
| Net asset value, beginning of period | Net invest- ment income (loss)(a) | Net realized and unrealized gain (loss) | Total from invest- ment opera- tions | Net investment income | Net realized gain | Total distri- butions | ||||||||||||||||||||||
| Class A | ||||||||||||||||||||||||||||
| 10/31/2021 | $ | 16.98 | $ | 0.01 | $ | 7.76 | $ | 7.77 | $ | (0.05 | ) | $ | (1.00 | ) | $ | (1.05 | ) | |||||||||||
| 10/31/2020 | 18.62 | 0.05 | 0.39 | 0.44 | (0.07 | ) | (2.01 | ) | (2.08 | ) | ||||||||||||||||||
| 10/31/2019 | 19.50 | 0.05 | 0.84 | 0.89 | (0.01 | ) | (1.76 | ) | (1.77 | ) | ||||||||||||||||||
| 10/31/2018 | 20.80 | 0.01 | (0.06 | ) | (0.05 | ) | – | (1.25 | ) | (1.25 | ) | |||||||||||||||||
| 10/31/2017 | 18.95 | 0.03 | 2.95 | 2.98 | – | (1.13 | ) | (1.13 | ) | |||||||||||||||||||
| Class C | ||||||||||||||||||||||||||||
| 10/31/2021 | 14.47 | (0.13 | ) | 6.58 | 6.45 | – | (1.00 | ) | (1.00 | ) | ||||||||||||||||||
| 10/31/2020 | 16.22 | (0.06 | ) | 0.32 | 0.26 | – | (2.01 | ) | (2.01 | ) | ||||||||||||||||||
| 10/31/2019 | 17.32 | (0.07 | ) | 0.73 | 0.66 | – | (1.76 | ) | (1.76 | ) | ||||||||||||||||||
| 10/31/2018 | 18.75 | (0.12 | ) | (0.06 | ) | (0.18 | ) | – | (1.25 | ) | (1.25 | ) | ||||||||||||||||
| 10/31/2017 | 17.31 | (0.11 | ) | 2.68 | 2.57 | – | (1.13 | ) | (1.13 | ) | ||||||||||||||||||
| Class F | ||||||||||||||||||||||||||||
| 10/31/2021 | 17.42 | 0.04 | 7.98 | 8.02 | (0.07 | ) | (1.00 | ) | (1.07 | ) | ||||||||||||||||||
| 10/31/2020 | 19.06 | 0.07 | 0.39 | 0.46 | (0.09 | ) | (2.01 | ) | (2.10 | ) | ||||||||||||||||||
| 10/31/2019 | 19.92 | 0.08 | 0.86 | 0.94 | (0.04 | ) | (1.76 | ) | (1.80 | ) | ||||||||||||||||||
| 10/31/2018 | 21.18 | 0.04 | (0.04 | ) | – | (0.01 | ) | (1.25 | ) | (1.26 | ) | |||||||||||||||||
| 10/31/2017 | 19.28 | 0.05 | 3.00 | 3.05 | (0.02 | ) | (1.13 | ) | (1.15 | ) | ||||||||||||||||||
| Class F3 | ||||||||||||||||||||||||||||
| 10/31/2021 | 17.95 | 0.09 | 8.21 | 8.30 | (0.09 | ) | (1.00 | ) | (1.09 | ) | ||||||||||||||||||
| 10/31/2020 | 19.56 | 0.11 | 0.41 | 0.52 | (0.12 | ) | (2.01 | ) | (2.13 | ) | ||||||||||||||||||
| 10/31/2019 | 20.38 | 0.12 | 0.88 | 1.00 | (0.06 | ) | (1.76 | ) | (1.82 | ) | ||||||||||||||||||
| 10/31/2018 | 21.65 | 0.08 | (0.05 | ) | 0.03 | (0.05 | ) | (1.25 | ) | (1.30 | ) | |||||||||||||||||
| 4/4/2017 to 10/31/2017(c) | 20.25 | (0.03 | ) | 1.43 | 1.40 | – | – | – | ||||||||||||||||||||
| Class I | ||||||||||||||||||||||||||||
| 10/31/2021 | 17.82 | 0.06 | 8.16 | 8.22 | (0.09 | ) | (1.00 | ) | (1.09 | ) | ||||||||||||||||||
| 10/31/2020 | 19.45 | 0.09 | 0.41 | 0.50 | (0.12 | ) | (2.01 | ) | (2.13 | ) | ||||||||||||||||||
| 10/31/2019 | 20.29 | 0.10 | 0.88 | 0.98 | (0.06 | ) | (1.76 | ) | (1.82 | ) | ||||||||||||||||||
| 10/31/2018 | 21.59 | 0.06 | (0.06 | ) | – | (0.05 | ) | (1.25 | ) | (1.30 | ) | |||||||||||||||||
| 10/31/2017 | 19.62 | 0.08 | 3.06 | 3.14 | (0.04 | ) | (1.13 | ) | (1.17 | ) | ||||||||||||||||||
| Class P | ||||||||||||||||||||||||||||
| 10/31/2021 | 16.55 | (0.03 | ) | 7.56 | 7.53 | (0.00 | )(f) | (1.00 | ) | (1.00 | ) | |||||||||||||||||
| 10/31/2020 | 18.20 | 0.02 | 0.37 | 0.39 | (0.03 | ) | (2.01 | ) | (2.04 | ) | ||||||||||||||||||
| 10/31/2019 | 19.13 | 0.01 | 0.82 | 0.83 | – | (1.76 | ) | (1.76 | ) | |||||||||||||||||||
| 10/31/2018 | 20.46 | (0.03 | ) | (0.05 | ) | (0.08 | ) | – | (1.25 | ) | (1.25 | ) | ||||||||||||||||
| 10/31/2017 | 18.70 | (0.01 | ) | 2.90 | 2.89 | – | (1.13 | ) | (1.13 | ) | ||||||||||||||||||
| Class R2 | ||||||||||||||||||||||||||||
| 10/31/2021 | 16.09 | (0.06 | ) | 7.34 | 7.28 | – | (1.00 | ) | (1.00 | ) | ||||||||||||||||||
| 10/31/2020 | 17.75 | (0.01 | ) | 0.37 | 0.36 | (0.01 | ) | (2.01 | ) | (2.02 | ) | |||||||||||||||||
| 10/31/2019 | 18.72 | (0.01 | ) | 0.80 | 0.79 | – | (1.76 | ) | (1.76 | ) | ||||||||||||||||||
| 10/31/2018 | 20.06 | (0.06 | ) | (0.03 | ) | (0.09 | ) | – | (1.25 | ) | (1.25 | ) | ||||||||||||||||
| 10/31/2017 | 18.38 | (0.05 | ) | 2.86 | 2.81 | – | (1.13 | ) | (1.13 | ) | ||||||||||||||||||
| 216 | See Notes to Financial Statements. |
| Ratios to Average Net Assets: | Supplemental Data: | |||||||||||||||||||||||||
| Net asset value, end of period | Total return(b) (%) | Total expenses after waivers and/or reim- bursements (%) | Total expenses (%) | Net invest- ment income (loss) (%) | Net assets, end of period (000) | Portfolio turnover rate (%) | ||||||||||||||||||||
| $ | 23.70 | 47.52 | 1.15 | 1.15 | 0.04 | $ | 851,298 | 56 | ||||||||||||||||||
| 16.98 | 2.35 | 1.18 | 1.18 | 0.29 | 625,448 | 36 | ||||||||||||||||||||
| 18.62 | 5.22 | 1.18 | 1.18 | 0.29 | 775,746 | 51 | ||||||||||||||||||||
| 19.50 | (0.28 | ) | 1.11 | 1.11 | 0.06 | 922,813 | 54 | |||||||||||||||||||
| 20.80 | 16.23 | 1.15 | 1.15 | 0.14 | 1,028,166 | 57 | ||||||||||||||||||||
| 19.92 | 46.42 | 1.90 | 1.90 | (0.70 | ) | 76,310 | 56 | |||||||||||||||||||
| 14.47 | 1.57 | 1.93 | 1.93 | (0.45 | ) | 63,709 | 36 | |||||||||||||||||||
| 16.22 | 4.48 | 1.93 | 1.93 | (0.46 | ) | 142,020 | 51 | |||||||||||||||||||
| 17.32 | (1.05 | ) | 1.87 | 1.87 | (0.69 | ) | 225,551 | 54 | ||||||||||||||||||
| 18.75 | 15.35 | 1.89 | 1.89 | (0.61 | ) | 335,148 | 57 | |||||||||||||||||||
| 24.37 | 47.76 | 1.00 | 1.00 | 0.19 | 189,251 | 56 | ||||||||||||||||||||
| 17.42 | 2.50 | 1.03 | 1.03 | 0.44 | 138,870 | 36 | ||||||||||||||||||||
| 19.06 | 5.38 | 1.03 | 1.03 | 0.45 | 210,350 | 51 | ||||||||||||||||||||
| 19.92 | (0.03 | ) | 0.97 | 0.97 | 0.22 | 390,627 | 54 | |||||||||||||||||||
| 21.18 | 16.34 | 1.00 | 1.00 | 0.27 | 807,684 | 57 | ||||||||||||||||||||
| 25.16 | 48.05 | 0.81 | 0.81 | 0.38 | 255,539 | 56 | ||||||||||||||||||||
| 17.95 | 2.69 | 0.83 | 0.83 | 0.64 | 200,055 | 36 | ||||||||||||||||||||
| 19.56 | 5.61 | 0.83 | 0.83 | 0.64 | 260,948 | 51 | ||||||||||||||||||||
| 20.38 | 0.13 | 0.78 | 0.78 | 0.39 | 331,176 | 54 | ||||||||||||||||||||
| 21.65 | 6.91 | (d) | 0.79 | (e) | 0.79 | (e) | (0.25 | )(e) | 315,394 | 57 | ||||||||||||||||
| 24.95 | 47.93 | 0.89 | 0.89 | 0.28 | 412,964 | 56 | ||||||||||||||||||||
| 17.82 | 2.58 | 0.93 | 0.93 | 0.54 | 218,137 | 36 | ||||||||||||||||||||
| 19.45 | 5.51 | 0.93 | 0.93 | 0.54 | 292,610 | 51 | ||||||||||||||||||||
| 20.29 | (0.02 | ) | 0.86 | 0.86 | 0.30 | 450,720 | 54 | |||||||||||||||||||
| 21.59 | 16.51 | 0.90 | 0.90 | 0.41 | 397,265 | 57 | ||||||||||||||||||||
| 23.08 | 47.19 | 1.35 | 1.35 | (0.16 | ) | 17,141 | 56 | |||||||||||||||||||
| 16.55 | 2.18 | 1.38 | 1.38 | 0.10 | 16,560 | 36 | ||||||||||||||||||||
| 18.20 | 5.05 | 1.38 | 1.38 | 0.08 | 22,113 | 51 | ||||||||||||||||||||
| 19.13 | (0.49 | ) | 1.31 | 1.31 | (0.14 | ) | 25,501 | 54 | ||||||||||||||||||
| 20.46 | 15.96 | 1.35 | 1.35 | (0.05 | ) | 33,644 | 57 | |||||||||||||||||||
| 22.37 | 47.03 | 1.50 | 1.50 | (0.30 | ) | 5,845 | 56 | |||||||||||||||||||
| 16.09 | 1.96 | 1.53 | 1.53 | (0.06 | ) | 4,879 | 36 | |||||||||||||||||||
| 17.75 | 4.88 | 1.53 | 1.53 | (0.07 | ) | 6,483 | 51 | |||||||||||||||||||
| 18.72 | (0.50 | ) | 1.46 | 1.46 | (0.29 | ) | 7,339 | 54 | ||||||||||||||||||
| 20.06 | 15.79 | 1.50 | 1.50 | (0.25 | ) | 9,047 | 57 | |||||||||||||||||||
| See Notes to Financial Statements. | 217 |
Financial Highlights (concluded)
VALUE OPPORTUNITIES FUND
| Per Share Operating Performance: | ||||||||||||||||||||||||||||
| Investment Operations: | Distributions to shareholders from: | |||||||||||||||||||||||||||
| Net asset value, beginning of period | Net invest- ment income (loss)(a) | Net realized and unrealized gain (loss) | Total from invest- ment opera- tions | Net investment income | Net realized gain | Total distri- butions | ||||||||||||||||||||||
| Class R3 | ||||||||||||||||||||||||||||
| 10/31/2021 | $ | 16.33 | $ | (0.04 | ) | $ | 7.46 | $ | 7.42 | $ | – | $ | (1.00 | ) | $ | (1.00 | ) | |||||||||||
| 10/31/2020 | 17.97 | 0.01 | 0.37 | 0.38 | (0.01 | ) | (2.01 | ) | (2.02 | ) | ||||||||||||||||||
| 10/31/2019 | 18.92 | 0.01 | 0.80 | 0.81 | – | (1.76 | ) | (1.76 | ) | |||||||||||||||||||
| 10/31/2018 | 20.25 | (0.04 | ) | (0.04 | ) | (0.08 | ) | – | (1.25 | ) | (1.25 | ) | ||||||||||||||||
| 10/31/2017 | 18.52 | (0.02 | ) | 2.88 | 2.86 | – | (1.13 | ) | (1.13 | ) | ||||||||||||||||||
| Class R4 | ||||||||||||||||||||||||||||
| 10/31/2021 | 16.95 | 0.01 | 7.75 | 7.76 | (0.04 | ) | (1.00 | ) | (1.04 | ) | ||||||||||||||||||
| 10/31/2020 | 18.60 | 0.05 | 0.37 | 0.42 | (0.06 | ) | (2.01 | ) | (2.07 | ) | ||||||||||||||||||
| 10/31/2019 | 19.47 | 0.05 | 0.85 | 0.90 | (0.01 | ) | (1.76 | ) | (1.77 | ) | ||||||||||||||||||
| 10/31/2018 | 20.79 | 0.01 | (0.06 | ) | (0.05 | ) | (0.02 | ) | (1.25 | ) | (1.27 | ) | ||||||||||||||||
| 10/31/2017 | 18.95 | – | 2.99 | 2.99 | (0.02 | ) | (1.13 | ) | (1.15 | ) | ||||||||||||||||||
| Class R5 | ||||||||||||||||||||||||||||
| 10/31/2021 | 17.83 | 0.06 | 8.17 | 8.23 | (0.09 | ) | (1.00 | ) | (1.09 | ) | ||||||||||||||||||
| 10/31/2020 | 19.46 | 0.09 | 0.41 | 0.50 | (0.12 | ) | (2.01 | ) | (2.13 | ) | ||||||||||||||||||
| 10/31/2019 | 20.30 | 0.10 | 0.88 | 0.98 | (0.06 | ) | (1.76 | ) | (1.82 | ) | ||||||||||||||||||
| 10/31/2018 | 21.59 | 0.07 | (0.07 | ) | – | (0.04 | ) | (1.25 | ) | (1.29 | ) | |||||||||||||||||
| 10/31/2017 | 19.63 | 0.10 | 3.03 | 3.13 | (0.04 | ) | (1.13 | ) | (1.17 | ) | ||||||||||||||||||
| Class R6 | ||||||||||||||||||||||||||||
| 10/31/2021 | 17.93 | 0.09 | 8.21 | 8.30 | (0.09 | ) | (1.00 | ) | (1.09 | ) | ||||||||||||||||||
| 10/31/2020 | 19.55 | 0.11 | 0.40 | 0.51 | (0.12 | ) | (2.01 | ) | (2.13 | ) | ||||||||||||||||||
| 10/31/2019 | 20.37 | 0.12 | 0.88 | 1.00 | (0.06 | ) | (1.76 | ) | (1.82 | ) | ||||||||||||||||||
| 10/31/2018 | 21.65 | 0.08 | (0.06 | ) | 0.02 | (0.05 | ) | (1.25 | ) | (1.30 | ) | |||||||||||||||||
| 10/31/2017 | 19.66 | 0.09 | 3.07 | 3.16 | (0.04 | ) | (1.13 | ) | (1.17 | ) | ||||||||||||||||||
| (a) | Calculated using average shares outstanding during the period. |
| (b) | Total return for Classes A and C does not consider the effects of sales loads and assumes the reinvestment of all distributions. Total return for all other classes assumes the reinvestment of all distributions. |
| (c) | Commenced on April 4, 2017. |
| (d) | Not annualized. |
| (e) | Annualized. |
| (f) | Amount less than $0.01. |
| 218 | See Notes to Financial Statements. |
| Ratios to Average Net Assets: | Supplemental Data: | |||||||||||||||||||||||||
| Net asset value, end of period | Total return(b) (%) | Total expenses after waivers and/or reim- bursements (%) | Total expenses (%) | Net invest- ment income (loss) (%) | Net assets, end of period (000) | Portfolio turnover rate (%) | ||||||||||||||||||||
| $ | 22.75 | 47.20 | 1.40 | 1.40 | (0.20 | ) | $ | 42,047 | 56 | |||||||||||||||||
| 16.33 | 2.09 | 1.43 | 1.43 | 0.05 | 41,390 | 36 | ||||||||||||||||||||
| 17.97 | 4.94 | 1.43 | 1.43 | 0.04 | 56,855 | 51 | ||||||||||||||||||||
| 18.92 | (0.45 | ) | 1.36 | 1.36 | (0.19 | ) | 77,440 | 54 | ||||||||||||||||||
| 20.25 | 15.94 | 1.39 | 1.39 | (0.10 | ) | 88,592 | 57 | |||||||||||||||||||
| 23.67 | 47.50 | 1.15 | 1.15 | 0.04 | 42,666 | 56 | ||||||||||||||||||||
| 16.95 | 2.34 | 1.18 | 1.18 | 0.29 | 34,990 | 36 | ||||||||||||||||||||
| 18.60 | 5.27 | 1.18 | 1.18 | 0.29 | 43,879 | 51 | ||||||||||||||||||||
| 19.47 | (0.30 | ) | 1.11 | 1.11 | 0.06 | 54,408 | 54 | |||||||||||||||||||
| 20.79 | 16.27 | 1.15 | 1.15 | (0.01 | ) | 63,867 | 57 | |||||||||||||||||||
| 24.97 | 47.87 | 0.90 | 0.90 | 0.28 | 2,066 | 56 | ||||||||||||||||||||
| 17.83 | 2.58 | 0.93 | 0.93 | 0.55 | 1,971 | 36 | ||||||||||||||||||||
| 19.46 | 5.55 | 0.93 | 0.93 | 0.52 | 2,599 | 51 | ||||||||||||||||||||
| 20.30 | (0.01 | ) | 0.87 | 0.87 | 0.31 | 1,927 | 54 | |||||||||||||||||||
| 21.59 | 16.46 | 0.89 | 0.89 | 0.51 | 5,111 | 57 | ||||||||||||||||||||
| 25.14 | 48.02 | 0.81 | 0.81 | 0.39 | 44,123 | 56 | ||||||||||||||||||||
| 17.93 | 2.69 | 0.83 | 0.83 | 0.64 | 29,402 | 36 | ||||||||||||||||||||
| 19.55 | 5.62 | 0.83 | 0.83 | 0.66 | 40,149 | 51 | ||||||||||||||||||||
| 20.37 | 0.08 | 0.78 | 0.78 | 0.39 | 93,784 | 54 | ||||||||||||||||||||
| 21.65 | 16.60 | 0.78 | 0.78 | 0.45 | 104,218 | 57 | ||||||||||||||||||||
| See Notes to Financial Statements. | 219 |
| 1. | ORGANIZATION |
Lord Abbett Securities Trust (the “Trust”) is registered under the Investment Company Act of 1940, as amended (the “Act”), as an open-end management investment company and was organized as a Delaware statutory trust on February 26, 1993.
As of October 31, 2021, the Trust currently consists of fourteen funds. All funds are diversified except Lord Abbett Focused Growth Fund and Lord Abbett Focused Large Cap Value Fund. This report covers the following fourteen funds (separately, a “Fund” and collectively, the “Funds”) and their respective active share classes:
| Funds | Classes | |
| Lord Abbett Alpha Strategy Fund (“Alpha Strategy Fund”) | A, C, F, F3, I, R2, R3, R4, R5 and R6 | |
| Lord Abbett Durable Growth Fund (“Durable Growth Fund”) | A, C, F, F3, I, R3, R4, R5 and R6 | |
| Lord Abbett Focused Growth Fund (“Focused Growth Fund”) | A, C, F, F3, I, R3, R4, R5 and R6 | |
| Lord Abbett Focused Large Cap Value Fund (“Focused Large Cap Value Fund”) | A, C, F, F3, I, R3, R4, R5 and R6 | |
| Lord Abbett Focused Small Cap Value Fund (“Focused Small Cap Value Fund”) | A, C, F, F3, I, R5 and R6 | |
| Lord Abbett Fundamental Equity Fund (“Fundamental Equity Fund”) | A, C, F, F3 I, P, R2, R3, R4, R5 and R6 | |
| Lord Abbett Global Equity Fund (“Global Equity Fund”, formerly “Global Equity Research Fund”) | A, C, F, F3, I, R3, R4, R5 and R6 | |
| Lord Abbett Growth Leaders Fund (“Growth Leaders Fund”) | A, C, F, F3, I, R2, R3, R4, R5 and R6 | |
| Lord Abbett Health Care Fund (“Health Care Fund”) | A, C, F, F3, I, R3, R4, R5 and R6 | |
| Lord Abbett International Equity Fund (“International Equity Fund”) | A, C, F, F3, I, P, R2, R3, R4, R5 and R6 | |
| Lord Abbett International Opportunities Fund (“International Opportunities Fund”) | A, C, F, F3, I, P, R2, R3, R4, R5 and R6 | |
| Lord Abbett International Value Fund (“International Value Fund”) | A, C, F, F3, I, R2, R3, R4, R5 and R6 | |
| Lord Abbett Micro-Cap Growth Fund (“Micro Cap Growth Fund”) | A,C,F and I | |
| Lord Abbett Value Opportunities Fund (“Value Opportunities Fund”) | A, C, F, F3, I, P, R2, R3, R4, R5 and R6 |
The Funds’ Class P shares are closed to substantially all investors, with certain exceptions as set forth in the Funds’ prospectus.
Each of Alpha Strategy Fund’s, Focused Large Cap Value Fund’s, Focused Small Cap Value Fund’s, Global Equity Fund’s, Health Care Fund’s, International Equity Fund’s, International Opportunities Fund’s, and Value Opportunities Fund’s investment objective is to seek long-term capital appreciation. Micro Cap Growth Fund’s investment objective is long-term capital appreciation. Alpha Strategy Fund invests principally in other funds (“Underlying Funds”) managed by Lord, Abbett & Co. LLC (“Lord Abbett”). Fundamental Equity Fund’s investment objective is long-term growth of capital and income without excessive fluctuations in market value. Durable Growth Fund’s, Growth Leaders Fund’s and Focused Growth Fund’s investment objective is to seek capital appreciation. International Value Fund’s investment objective is to seek a high level of total return.
Each class of shares has different expenses and dividends. A front-end sales charge is normally added to the net asset value (“NAV”) for Class A shares. There is no front-end sales charge in the case of Class C, F, F3, I, P, R2, R3, R4, R5 and R6 shares, although there may be a contingent deferred sales charge (“CDSC”) in certain cases as follows: Class A shares purchased without a sales charge and redeemed before the first day of the month in which the one-year anniversary of the purchase falls (subject to certain exceptions as set forth in each Fund’s prospectus); and Class C shares redeemed before the first anniversary of purchase. Class C shares automatically convert to Class A
220
Notes to Financial Statements (continued)
shares on the 25th day of the month (or, if the 25th day is not a business day, the next business day thereafter) following the eighth anniversary of the month on which the purchase order was accepted, provided that the Fund or financial intermediary through which a shareholder purchased Class C shares has records verifying that the C shares have been held at least eight years.
On September 28, 2021, the Board of Trustees (the “Board”) approved a change in the name of Lord Abbett Global Equity Research Fund to Lord Abbett Global Equity Fund effective November 1, 2021.
The preparation of the financial statements in conformity with accounting principles generally accepted in the United States of America (“U.S. GAAP”) requires management to make certain estimates and assumptions that affect the reported amounts of assets and liabilities and disclosure of contingent assets and liabilities at the date of the financial statements and the reported amounts of increases and decreases in net assets from operations during the reporting period. Actual results could differ from those estimates. These Funds are considered investment companies under U.S. GAAP and follow the accounting and reporting guidance applicable to investment companies.
| 2. | SIGNIFICANT ACCOUNTING POLICIES |
| (a) | Investment Valuation–Under procedures approved by the Funds’ Board, Lord, Abbett & Co. LLC (“Lord Abbett”), each Fund’s investment manager, has formed a Pricing Committee to administer the pricing and valuation of portfolio investments and to ensure that prices utilized reasonably reflect fair value. Among other things, these procedures allow the Funds to utilize independent pricing services, quotations from securities and financial instrument dealers and other market sources to determine fair value. |
| Securities actively traded on any recognized U.S. or non-U.S. exchange or on The NASDAQ Stock Market LLC are valued at the last sale price or official closing price on the exchange or system on which they are principally traded. Events occurring after the close of trading on non-U.S. exchanges may result in adjustments to the valuation of foreign securities to reflect their fair value as of the close of regular trading on the New York Stock Exchange (“NYSE”). When valuing foreign equity securities that meet certain criteria, the Board has approved the use of an independent fair valuation service that values such securities to reflect market trading that occurs after the close of the applicable foreign markets of comparable securities or other instruments that correlate to the fair-valued securities. Unlisted equity securities are valued at the last quoted sale price or, if no sale price is available, at the mean between the most recently quoted bid and asked prices. Exchange traded options and futures contracts are valued at the last quoted sale price in the market where they are principally traded. If no sale has occurred, the mean between the most recently quoted bid and asked prices is used. Forward foreign currency exchange contracts are valued using daily forward exchange rates. Swaps are valued daily using independent pricing services or quotations from broker/dealers to the extent available. Investments in the Underlying Funds are valued at their NAV each business day at the close of regular trading on the NYSE, normally 4:00 p.m. Eastern time. | |
| Securities for which prices are not readily available are valued at fair value as determined by the Pricing Committee. The Pricing Committee considers a number of factors, including observable and unobservable inputs, when arriving at fair value. The Pricing Committee may use related or comparable assets or liabilities, recent transactions, market multiples, book values and other relevant information to determine the fair value of portfolio investments. The Board or a designated committee thereof regularly reviews fair value determinations made by |
221
Notes to Financial Statements (continued)
| the Pricing Committee and may employ techniques such as reviewing related market activity, reviewing inputs and assumptions, and retrospectively comparing prices of subsequent purchases and sales transactions to fair value determinations made by the Pricing Committee. | |
| Investments in open-end money market mutual funds are valued at their NAV as of the close of each business day. Short-term securities with 60 days or less remaining to maturity are valued using the amortized cost method, which approximates fair value. | |
| (b) | Security Transactions–Security transactions are recorded as of the date that the securities are purchased or sold (trade date). Realized gains and losses on sales of portfolio securities are calculated using the identified-cost method. Realized and unrealized gains (losses) are allocated to each class of shares based upon the relative proportion of net assets at the beginning of the day. |
| (c) | Investment Income–Dividend income is recorded on the ex-dividend date. Interest income is recorded on the accrual basis as earned. Discounts are accreted and premiums are amortized using the effective interest method and are included in Interest and other on the Statements of Operations. Withholding taxes on foreign dividends have been provided for in accordance with the applicable country’s tax rules and rates. Investment income is allocated to each class of shares based upon the relative proportion of net assets at the beginning of the day. |
| (d) | Income Taxes–It is the policy of each Fund to meet the requirements of Subchapter M of the Internal Revenue Code applicable to regulated investment companies and to distribute substantially all taxable income and capital gains to its shareholders. Therefore, no income tax provision is required. |
| Each Fund files U.S. federal and various state and local tax returns. No income tax returns are currently under examination. The statute of limitations on each Fund’s filed U.S. federal tax returns remains open for the fiscal years ended October 31, 2018 through October 31, 2021. The statutes of limitations on the Trust’s state and local tax returns may remain open for an additional year depending upon the jurisdiction. | |
| (e) | Expenses–Expenses incurred by the Trust that do not specifically relate to an individual fund are generally allocated to the Funds within the Trust on a pro rata basis by relative net assets. Expenses, excluding class- specific expenses, are allocated to each class of shares based upon the relative proportion of net assets at the beginning of the day. In addition, Class F3 and R6 bear only their class-specific shareholder servicing expenses. Class A, C, F, P, R2, R3 and R4 shares bear their class- specific share of all expenses and fees relating to the Funds’ 12b-1 Distribution Plan. |
| (f) | Foreign Transactions–The books and records of each Fund are maintained in U.S. dollars and transactions denominated in foreign currencies are recorded in each Fund’s records at the rate prevailing when earned or recorded. Asset and liability accounts that are denominated in foreign currencies are adjusted daily to reflect current exchange rates and any unrealized gain (loss) is included in Net change in unrealized appreciation/depreciation on translation of assets and liabilities denominated in foreign currencies in each Fund’s Statement of Operations. The resultant exchange gains and losses upon settlement of such transactions are included in Net realized gain (loss) on foreign currency related transactions in each Fund’s Statement of Operations. The Funds do not isolate that portion of the results of operations arising as a result of changes in the foreign exchange rates from the changes in market prices of the securities. |
| Each Fund uses foreign currency exchange contracts to facilitate transactions in foreign denominated securities. Losses from these transactions may arise from changes in the value of |
222
Notes to Financial Statements (continued)
| the foreign currency or if the counterparties do not perform under the contracts’ terms. | |
| (g) | Forward Foreign Currency Exchange Contracts–Each Fund may enter into forward foreign currency exchange contracts in order to reduce their exposure to changes in foreign currency exchange rates on foreign portfolio holdings, or gain or reduce exposure to foreign currency solely for investment purposes. A forward foreign currency exchange contract is a commitment to purchase or sell a foreign currency at a future date at a negotiated rate. The contracts are valued daily at forward exchange rates and any unrealized gain (loss) is included in Net change in unrealized appreciation/depreciation on foreign currency exchange contracts in each Fund’s Statement of Operations. The gain (loss) arising from the difference between the U.S. dollar cost of the original contract and the value of the foreign currency in U.S. dollars upon closing of such contracts is included in Net realized gain (loss) on forward foreign currency exchange contracts in each Fund’s Statement of Operations. |
| (h) | Futures Contracts–Each Fund may purchase and sell futures contracts to enhance returns, to attempt to economically hedge some of its investment risk, or as a substitute position in lieu of holding the underlying asset on which the instrument is based. At the time of entering into a futures transaction, an investor is required to deposit and maintain a specified amount of cash or eligible securities called “initial margin.” Subsequent payments made or received by a Fund called “variation margin” are made on a daily basis as the market price of the futures contract fluctuates. Each Fund will record an unrealized gain (loss) based on the amount of variation margin. When a contract is closed, a realized gain (loss) is recorded equal to the difference between the opening and closing value of the contract. |
| (i) | Repurchase Agreements–Each Fund may enter into repurchase agreements with respect to securities. A repurchase agreement is a transaction in which a fund acquires a security and simultaneously commits to resell that security to the seller (a bank or securities dealer) at an agreed-upon price on an agreed-upon date. Each Fund requires at all times that the repurchase agreement be collateralized by cash, or by securities of the U.S. Government, its agencies, its instrumentalities, or U.S. Government sponsored enterprises having a value equal to, or in excess of, the value of the repurchase agreement (including accrued interest). If the seller of the agreement defaults on its obligation to repurchase the underlying securities at a time when the fair value of these securities has declined, a Fund may incur a loss upon disposition of the securities. |
| (j) | When-Issued or Forward Transactions–Each Fund may purchase portfolio securities on a when-issued or forward basis. When-issued or forward transactions involve a commitment by a Fund to purchase securities, with payment and delivery (“settlement”) to take place in the future, in order to secure what is considered to be an advantageous price or yield at the time of entering into the transaction. During the period between purchase and settlement, the fair value of the securities will fluctuate and assets consisting of cash and/or marketable securities (normally short-term U.S. Government or U.S. Government sponsored enterprise securities) marked to market daily in an amount sufficient to make payment at settlement will be segregated at each Fund’s custodian in order to pay for the commitment. At the time each Fund makes the commitment to purchase a security on a when-issued basis, it will record the transaction and reflect the liability for the purchase and fair value of the security in determining its NAV. Each Fund, generally, has the ability to close out a purchase obligation on |
223
Notes to Financial Statements (continued)
| or before the settlement date rather than take delivery of the security. Under no circumstances will settlement for such securities take place more than 120 days after the purchase date. | |
| (k) | Total Return Swaps–Each Fund may enter into total return swap agreements to obtain exposure to a security or market without owning such security or investing directly in that market. Each Fund may agree to make payments that are the equivalent of interest in exchange for the right to receive payments equivalent to any appreciation in the value of an underlying security, index or other asset, as well as receive payments equivalent to any distributions made on that asset, over the term of the swap. If the value of the asset underlying a total return swap declines over the term of the swap, each Fund also may be required to pay an amount equal to that decline in value to their counterparty. |
| (l) | Fair Value Measurements–Fair value is defined as the price that each Fund would receive upon selling an investment or transferring a liability in an orderly transaction to an independent buyer in the principal or most advantageous market of the investment. A three-tier hierarchy is used to maximize the use of observable market data and minimize the use of unobservable inputs and to establish classification of fair value measurements for disclosure purposes. Inputs refer broadly to the assumptions that market participants would use in pricing the asset or liability, including assumptions about risk - for example, the risk inherent in a particular valuation technique used to measure fair value (such as a pricing model) and/or the risk inherent in the inputs to the valuation technique. Inputs may be observable or unobservable. Observable inputs reflect the assumptions market participants would use in pricing the asset or liability. Observable inputs are based on market data obtained from sources independent of the reporting entity. Unobservable inputs reflect the reporting entity’s own assumptions about the assumptions market participants would use in pricing the asset or liability. Unobservable inputs are based on the best information available in the circumstances. The three-tier hierarchy classification is determined based on the lowest level of inputs that is significant to the fair value measurement, and is summarized in the three broad Levels listed below: |
| • | Level 1 – | unadjusted quoted prices in active markets for identical investments; | |
| • | Level 2 – | other significant observable inputs (including quoted prices for similar investments, interest rates, prepayment speeds, credit risk, etc.); and | |
| • | Level 3 – | significant unobservable inputs (including each Fund’s own assumptions in determining the fair value of investments). |
A summary of inputs used in valuing each Fund’s investments and other financial instruments as of October 31, 2021 and, if applicable, Level 3 rollforwards for the fiscal year then ended is included in each Fund’s Schedule of Investments.
Changes in valuation techniques may result in transfers into or out of an assigned level within the three-tier hierarchy. The inputs or methodology used for valuing securities are not necessarily an indication of the risk associated with investing in those securities.
224
Notes to Financial Statements (continued)
| 3. | MANAGEMENT FEE AND OTHER TRANSACTIONS WITH AFFILIATES |
Management Fee
The Trust has a management agreement with Lord Abbett, pursuant to which Lord Abbett provides the Funds with investment management services and executive and other personnel, provides office space and pays for ordinary and necessary office and clerical expenses relating to research and statistical work and supervision of each Fund’s investment portfolio.
The management fee is based on each Fund’s average daily net assets at the following annual rates:
| Alpha Strategy Fund | .10%* |
| * | Lord Abbett is voluntarily waiving the entire management fee of .10%. Lord Abbett may discontinue the voluntary waiver at any time without notice. |
| Durable Growth Fund | |
| First $2 billion | .55% |
| Over $2 billion | .50% |
| Focused Growth Fund | |
| First $1 billion | .65% |
| Next $1 billion | .63% |
| Next $5 billion | .60% |
| Over $7 billion | .59% |
| Focused Large Cap Value Fund | |
| First $1 billion | .59% |
| Over $1 billion | .53% |
| Focused Small Cap Value Fund | .80% |
| Fundamental Equity Fund | |
| First $200 million | .75% |
| Next $300 million | .65% |
| Over $500 million | .50% |
| Global Equity Fund | |
| First $1 billion | .45% |
| First $2 billion | .43% |
| Over $3 billion | .41% |
| Growth Leaders Fund | |
| First $2 billion | .55% |
| Over $2 billion | .50% |
| Health Care Fund | |
| First $1 billion | .62% |
| Over $1 billion | .51% |
225
Notes to Financial Statements (continued)
| International Equity Fund | |
| First $1 billion | .70% |
| Next $1 billion | .65% |
| Over $2 billion | .60% |
| International Opportunities Fund | |
| First $1 billion | .75% |
| Next $1 billion | .70% |
| Over $2 billion | .65% |
| International Value Fund | |
| First $1 billion | .70% |
| Next $1 billion | .65% |
| Over $2 billion | .60% |
| Micro Cap Growth Fund | .90% |
| Value Opportunities Fund | |
| First $1 billion | .75% |
| Next $1 billion | .70% |
| Next $3 billion | .65% |
| Over $5 billion | .58% |
For the fiscal year ended October 31, 2021, the effective management fee, net of any applicable waivers, was based on each Fund’s average daily net assets at the following annualized rates:
| Net Effective Management Fee | ||
| Alpha Strategy Fund | .00% | |
| Durable Growth Fund | .54% | |
| Focused Growth Fund | .21% | |
| Focused Large Cap Value Fund | .59% | |
| Focused Small Cap Value Fund | .80% | |
| Fundamental Equity Fund | .55% | |
| Global Equity Fund | .00% | |
| Growth Leaders Fund | .51% | |
| Health Care Fund | .00% | |
| International Equity Fund | .68% | |
| International Opportunities Fund | .75% | |
| International Value Fund | .68% | |
| Micro Cap Growth Fund | .90% | |
| Value Opportunities Fund | .73% |
In addition, Lord Abbett provides certain administrative services to each Fund pursuant to an Administrative Services Agreement in return for a fee at an annual rate of ..04% of each Fund’s average daily net assets. Lord Abbett voluntarily waived the following fund administration fees during the fiscal year ended October 31, 2021:
| Fund | Fund Administration Fee | ||
| Alpha Strategy Fund | $ | 11,229 | |
| Durable Growth Fund | 6,529 | ||
| Focused Growth Fund | 2,515 | ||
| Focused Large Cap Value Fund | 19,156 | ||
| Focused Small Cap Value Fund | 9,693 | ||
| Fundamental Equity Fund | 46,860 | ||
226
Notes to Financial Statements (continued)
| Fund | Fund Administration Fee | |
| Global Equity Fund | 26,449 | |
| Growth Leaders Fund | 99,941 | |
| Health Care Fund | 11,633 | |
| International Equity Fund | 112,893 | |
| International Opportunities Fund | 85,961 | |
| International Value Fund | 166,324 | |
| Micro Cap Growth Fund | 26,256 | |
| Value Opportunities Fund | 36,967 |
For the fiscal year ended October 31, 2021 and continuing through February 28, 2022, Lord Abbett has contractually agreed to waive its fees and reimburse expenses to the extent necessary to limit total net annual operating expenses, excluding 12b-1 fees, to the following annual rates:
| Effective March 1, 2021 | Prior to March 1, 2021 | |||||||||||||||||||||||
| Classes* | Classes* | |||||||||||||||||||||||
| Fund | A, C, P, R2, R3, R4 and R5 | F and I | F3 and R6 | A, C, P, R2, R3, R4 and R5 | F and I | F3 and R6 | ||||||||||||||||||
| Durable Growth Fund | .70 | % | .70 | % | .69 | % | .70 | % | .70 | % | .64 | % | ||||||||||||
| Focused Growth Fund | .80 | % | .80 | % | .76 | % | .80 | % | .80 | % | .72 | % | ||||||||||||
| Focused Large Cap Value Fund | .71 | % | .71 | % | .70 | % | .71 | % | .71 | % | .63 | % | ||||||||||||
| Focused Small Cap Value Fund | 1.03 | % | 1.03 | % | 1.00 | % | 1.03 | % | 1.03 | % | .95 | % | ||||||||||||
| Global Equity Fund | .65 | % | .65 | % | .61 | % | .65 | % | .65 | % | .61 | % | ||||||||||||
| Health Care Fund | .78 | % | .78 | % | .71 | % | .78 | % | .78 | % | .70 | % | ||||||||||||
| International Equity Fund | .92 | % | .86 | % | .84 | % | .92 | % | .86 | % | .84 | % | ||||||||||||
| International Value Fund | .87 | % | .82 | % | .79 | % | .87 | % | .82 | % | .80 | % | ||||||||||||
| * | If applicable. |
All contractual fee waivers and expense reimbursement agreements between the Funds and Lord Abbett may be terminated only upon the approval of the Funds’ Board.
12b–1 Distribution Plan
Each Fund has adopted a distribution plan with respect to Class A, C, F, P, R2, R3 and R4 shares pursuant to Rule 12b–1 under the Act, which provides for the payment of ongoing distribution and service fees to Lord Abbett Distributor LLC (the “Distributor”), an affiliate of Lord Abbett. The following annual rates have been authorized by the Board pursuant to the plan:
| Fees* | Class A | Class C | Class F(1)(2) | Class P(3) | Class R2 | Class R3 | Class R4 | |||||||
| Service | .25% | .25% | – | .25% | .25% | .25% | .25% | |||||||
| Distribution | – | .75% | .10% | .20% | .35% | .25% | – |
| * | The Funds may designate a portion of the aggregate fee as attributable to service activities for purposes of calculating Financial Industry Regulatory Authority, Inc. (“FINRA”) sales charge limitations. | |
| (1) | The Class F Share Rule 12b-1 fee may be designated as a service fee in limited circumstances as described in the Funds’ prospectus. | |
| (2) | For the period ended October 31, 2021 and continuing through February 28, 2022, the Distributor has contractually agreed to waive Durable Growth Fund’s, Focused Growth Fund’s, Focused Large Cap Value Fund’s, Focused Small Cap Value Fund’s, Growth Leaders Fund’s, Health Care Fund’s and Micro Cap Growth Fund’s 0.10% Rule 12b-1 fee for Class F shares. These agreements may be terminated only by the Fund’s Board. | |
| (3) | Fundamental Equity Fund, International Equity Fund, International Opportunities Fund and Value Opportunities Fund only. |
Class F3, I, R5 and R6 shares do not have a distribution plan.
227
Notes to Financial Statements (continued)
Commissions
Distributor received the following commissions on sales of shares of the Funds, after concessions were paid to authorized dealers, for the fiscal year ended October 31, 2021:
| Distributor Commissions | Dealers’ Concessions | |||||||
| Alpha Strategy Fund | $ | 61,914 | $ | 338,557 | ||||
| Durable Growth Fund | – | – | ||||||
| Focused Growth Fund | 16,542 | 92,984 | ||||||
| Focused Large Cap Value Fund | – | – | ||||||
| Focused Small Cap Value Fund | 28,873 | 160,042 | ||||||
| Fundamental Equity Fund | 78,395 | 414,008 | ||||||
| Global Equity Fund | 2,775 | 14,307 | ||||||
| Growth Leaders Fund | 1,098,608 | 6,135,254 | ||||||
| Health Care Fund | – | – | ||||||
| International Equity Fund | 20,114 | 106,220 | ||||||
| International Opportunities Fund | 34,742 | 189,256 | ||||||
| International Value Fund | 48,765 | 254,412 | ||||||
| Micro Cap Growth Fund | 71,565 | 406,643 | ||||||
| Value Opportunities Fund | 85,988 | 456,946 | ||||||
Distributor received the following amount of CDSCs for the fiscal year October 31, 2021:
| Class A | Class C | |||||||
| Alpha Strategy Fund | $ | 1,406 | $ | 2,928 | ||||
| Durable Growth Fund | – | – | ||||||
| Focused Growth Fund | 11 | – | ||||||
| Focused Large Cap Value Fund | – | – | ||||||
| Focused Small Cap Value Fund | 657 | 1,976 | ||||||
| Fundamental Equity Fund | 320 | 2,225 | ||||||
| Global Equity Fund | – | – | ||||||
| Growth Leaders Fund | 40,770 | 94,774 | ||||||
| Health Care Fund | – | 2,442 | ||||||
| International Equity Fund | 73 | 267 | ||||||
| International Opportunities Fund | 214 | 325 | ||||||
| International Value Fund | 1,055 | 321 | ||||||
| Micro Cap Growth Fund | 816 | 7,548 | ||||||
| Value Opportunities Fund | 1,206 | 1,483 | ||||||
One Trustee and certain of the Trust’s officers have an interest in Lord Abbett.
Other Related Parties
As of October 31, 2021, the percentages of Durable Growth Fund’s, Focused Large Cap Value Fund’s, Focused Small Cap Value Fund’s, Fundamental Equity Fund’s, Growth Leaders Fund’s, International Equity Fund’s, International Opportunities Fund’s, International Value Fund’s, Micro Cap Growth Fund’s and Value Opportunities Fund’s outstanding shares owned by each Fund of Funds were as follows:
228
Notes to Financial Statements (continued)
| Fund of Funds | Durable Growth Fund | Focused Large Cap Value Fund | Focused Small Cap Value Fund | Funda- mental Equity Fund | Growth Leaders Fund | Inter- national Equity Fund | Inter- national Oppor- tunities Fund | Inter- national Value Fund | Micro Cap Growth Fund | Value Oppor- tunities Fund | ||||||||||
| Alpha Strategy Fund | – | – | 40.50% | – | – | – | 36.12% | – | 20.77% | 8.94% | ||||||||||
| Multi-Asset Balanced Opportunity Fund | 70.88% | 75.22% | 6.47% | 8.43% | 2.82% | 26.57% | – | 34.16% | – | 5.51% | ||||||||||
| Multi-Asset Income Fund | 26.87% | 22.49% | 2.48% | 2.90% | 0.84% | 13.51% | – | 14.65% | – | 1.71% |
| 4. | DISTRIBUTIONS AND CAPITAL LOSS CARRYFORWARDS |
Dividends from net investment income, if any, are declared and paid quarterly for International Value Fund and annually for Alpha Strategy Fund, Durable Growth Fund, Focused Growth Fund, Focused Large Cap Value Fund, Focused Small Cap Value Fund, Fundamental Equity Fund, Global Equity Fund, Growth Leaders Fund, International Equity Fund, Healthcare Fund, International Opportunities Fund, Micro Cap Growth Fund and Value Opportunities Fund. Taxable net realized gains from investment transactions, reduced by allowable capital loss carryforwards, if any, are declared and distributed to shareholders at least annually. The capital loss carryforward amount, if any, is available to offset future net capital gains. Dividends and distributions to shareholders are recorded on the ex-dividend date. The amounts of dividends and distributions from net investment income and net realized capital gains are determined in accordance with federal income tax regulations, which may differ from U.S. GAAP. These book/tax differences are either considered temporary or permanent in nature. To the extent these differences are permanent in nature, such amounts are reclassified within the components of net assets based on their federal tax basis treatment; temporary differences do not require reclassification. Dividends and distributions, which exceed earnings and profits for tax purposes, are reported as a tax return of capital.
The tax character of distributions paid during the fiscal year ended October 31, 2021 and fiscal year ended October 31, 2020 were as follows:
| Alpha Strategy Fund | Durable Growth Fund | |||||||||||||||
| Year Ended 10/31/2021 | Year Ended 10/31/2020 | Year Ended 10/31/2021 | Year Ended 10/31/2020 | |||||||||||||
| Distributions paid from: | ||||||||||||||||
| Ordinary income | $ | 10,405,649 | $ | – | $ | 4,591,644 | $ | 1,986 | ||||||||
| Net long-term capital gains | 50,784,144 | 123,771,165 | – | – | ||||||||||||
| Total distributions paid | $ | 61,189,793 | $ | 123,771,165 | $ | 4,591,644 | $ | 1,986 | ||||||||
| Focused Growth Fund | Focused Large Cap Value Fund | |||||||||||||||
| Year Ended 10/31/2021 | Year Ended 10/31/2020 | Year Ended 10/31/2021 | Year Ended 10/31/2020 | |||||||||||||
| Distributions paid from: | ||||||||||||||||
| Ordinary income | $ | 1,864,114 | $ | – | $ | 38,911,138 | $ | 262,779 | ||||||||
| Net long-term capital gains | 140,858 | – | – | – | ||||||||||||
| Total distributions paid | $ | 2,004,972 | $ | – | $ | 38,911,138 | $ | 262,779 | ||||||||
229
Notes to Financial Statements (continued)
| Focused Small Cap Value Fund | Fundamental Equity Fund | |||||||||||||||
| Year Ended 10/31/2021 | Year Ended 10/31/2020 | Year Ended 10/31/2021 | Year Ended 10/31/2020 | |||||||||||||
| Distributions paid from: | ||||||||||||||||
| Ordinary income | $ | 894,345 | $ | 314 | $ | 32,382,939 | $ | 37,662,246 | ||||||||
| Net long-term capital gains | – | 18,077,113 | – | 215,541,984 | ||||||||||||
| Total distributions paid | $ | 894,345 | $ | 18,077,427 | $ | 32,382,939 | $ | 253,204,230 | ||||||||
| Global Equity Fund | Growth Leaders Fund | |||||||||||||||
| Year Ended 10/31/2021 | Year Ended 10/31/2020 | Year Ended 10/31/2021 | Year Ended 10/31/2020 | |||||||||||||
| Distributions paid from: | ||||||||||||||||
| Ordinary income | $ | 105,849 | $ | 89,647 | $ | 392,566,629 | $ | 50,781,905 | ||||||||
| Net long-term capital gains | 278,151 | – | 327,647,029 | 254,848,239 | ||||||||||||
| Total distributions paid | $ | 384,000 | $ | 89,647 | $ | 720,213,658 | $ | 305,630,144 | ||||||||
| Health Care Fund | International Equity Fund | |||||||||||||||
| Year Ended 10/31/2021 | Year Ended 10/31/2020 | Year Ended 10/31/2021 | Year Ended 10/31/2020 | |||||||||||||
| Distributions paid from: | ||||||||||||||||
| Ordinary income | $ | 493,359 | $ | 1,005 | $ | 5,135,556 | $ | 7,075,713 | ||||||||
| Net long-term capital gains | 8,110 | – | – | – | ||||||||||||
| Total distributions paid | $ | 501,469 | $ | 1,005 | $ | 5,135,556 | $ | 7,075,713 | ||||||||
| International Opportunities Fund | International Value Fund | |||||||||||||||
| Year Ended 10/31/2021 | Year Ended 10/31/2020 | Year Ended 10/31/2021 | Year Ended 10/31/2020 | |||||||||||||
| Distributions paid from: | ||||||||||||||||
| Ordinary income | $ | – | $ | 7,379,201 | $ | 17,740,969 | $ | 9,892,862 | ||||||||
| Net long-term capital gains | – | – | – | – | ||||||||||||
| Total distributions paid | $ | – | $ | 7,379,201 | $ | 17,740,969 | $ | 9,892,862 | ||||||||
| Micro Cap Growth | Value Opportunities Fund | |||||||||||||||
| Year Ended 10/31/2021 | Year Ended 10/31/2020 | Year Ended 10/31/2021 | Year Ended 10/31/2020 | |||||||||||||
| Distributions paid from: | ||||||||||||||||
| Ordinary income | $ | 13,473,195 | $ | – | $ | 4,614,398 | $ | 7,526,613 | ||||||||
| Net long-term capital gains | 16,614,432 | 20,194,202 | 79,109,540 | 194,975,562 | ||||||||||||
| Total distributions paid | $ | 30,087,627 | $ | 20,194,202 | $ | 83,723,938 | $ | 202,502,175 | ||||||||
As of October 31, 2021, the components of accumulated gains (losses) on a tax-basis were as follows:
| Alpha Strategy Fund | Durable Growth Fund | Focused Growth Fund | Focused Large Cap Value Fund | |||||||||||||
| Undistributed ordinary income – net | $ | – | $ | 19,865,224 | $ | 5,657,923 | $ | 124,883,713 | ||||||||
| Undistributed long-term capital gains | 32,797,730 | 22,446,569 | 1,575,562 | 25,263,053 | ||||||||||||
| Total undistributed earnings | 32,797,730 | 42,311,793 | 7,233,485 | 150,146,766 | ||||||||||||
| Temporary differences | (2,313,170 | ) | (9,273 | ) | (1,566 | ) | (25,289 | ) | ||||||||
| Unrealized gains (losses) – net | 174,647,221 | 33,685,599 | 11,349,626 | 111,268,532 | ||||||||||||
| Total accumulated gains – net | $ | 205,131,781 | $ | 75,988,119 | $ | 18,581,545 | $ | 261,390,009 | ||||||||
230
Notes to Financial Statements (continued)
| Focused Small Cap Value Fund | Fundamental Equity Fund | Global Equity Fund | Growth Leaders Fund | |||||||||||||
| Undistributed ordinary income – net | $ | 13,227,300 | $ | 16,444,311 | $ | 946,711 | $ | 684,501,607 | ||||||||
| Undistributed long-term capital gains | 8,108,074 | 209,607,377 | 660,919 | 1,278,882,716 | ||||||||||||
| Total undistributed earnings | 21,335,374 | 226,051,688 | 1,607,630 | 1,963,384,323 | ||||||||||||
| Capital loss carryforwards* | – | – | – | – | ||||||||||||
| Temporary differences | (21,175 | ) | (574,082 | ) | (657 | ) | (523,105 | ) | ||||||||
| Unrealized gains (losses) – net | 31,143,155 | 473,541,282 | 1,876,583 | 2,541,099,748 | ||||||||||||
| Total accumulated gains – net | $ | 52,457,354 | $ | 699,018,888 | $ | 3,483,556 | $ | 4,503,960,966 | ||||||||
| Health Care Fund | International Equity Fund | International Opportunities Fund | International Value Fund | |||||||||||||
| Undistributed ordinary income – net | $ | 142,937 | $ | 5,415,999 | $ | 10,755,402 | $ | 7,962,681 | ||||||||
| Undistributed long-term capital gains | 385,484 | 40,771,804 | – | – | ||||||||||||
| Total undistributed earnings | 528,421 | 46,187,803 | 10,755,402 | 7,962,681 | ||||||||||||
| Capital loss carryforwards* | – | – | (12,794,006 | ) | (387,093,125 | ) | ||||||||||
| Temporary differences | (254 | ) | (104,923 | ) | (83,134 | ) | (155,168 | ) | ||||||||
| Unrealized gains (losses) – net | 1,211,476 | 86,303,354 | 47,383,101 | 49,012,685 | ||||||||||||
| Total accumulated gains (losses) – net | $ | 1,739,643 | $ | 132,386,234 | $ | 45,261,363 | $ | (330,272,927 | ) | |||||||
| Micro Cap Growth Fund | Value Opportunities Fund | |||||||||||||||
| Undistributed ordinary income – net | $ | – | $ | 25,755,286 | ||||||||||||
| Undistributed long-term capital gains | – | 205,396,950 | ||||||||||||||
| Total undistributed earnings | – | 231,152,236 | ||||||||||||||
| Capital loss carryforwards* | (5,780,315 | ) | – | |||||||||||||
| Temporary differences | (2,179,676 | ) | (361,000 | ) | ||||||||||||
| Unrealized gains (losses) – net | 72,339,957 | 583,352,456 | ||||||||||||||
| Total accumulated gains – net | $ | 64,379,966 | $ | 814,143,692 | ||||||||||||
| * | The capital losses will carry forward indefinitely. |
At the Fund’s election, certain losses incurred within the taxable year (“Qualified Late-Year Losses”) are deemed to arise on the first business day of the Fund’s next taxable year. Alpha Strategy Fund and Micro Cap Growth Fund incurred and will elect to defer $2,165,711 and $2,154,518, respectively, of late-year ordinary losses during the fiscal year ended October 31, 2021.
As of October 31, 2021, the aggregate unrealized security gains and losses on investments and other financial instruments based on cost for U.S. federal income tax purposes were as follows:
| Alpha Strategy Fund | Durable Growth Fund | Focused Growth Fund | Focused Large Cap Value Fund | |||||||||||||
| Tax cost | $ | 707,233,089 | $ | 218,162,683 | $ | 40,993,269 | $ | 561,558,447 | ||||||||
| Gross unrealized gain | 174,647,221 | 37,476,353 | 11,529,456 | 125,846,435 | ||||||||||||
| Gross unrealized loss | – | (3,790,755 | ) | (179,830 | ) | (14,577,903 | ) | |||||||||
| Net unrealized security gain (loss) | $ | 174,647,221 | $ | 33,685,598 | $ | 11,349,626 | $ | 111,268,532 | ||||||||
231
Notes to Financial Statements (continued)
| Focused Small Cap Value Fund | Fundamental Equity Fund | Global Equity Fund | Growth Leaders Fund | |||||||||||||
| Tax cost | $ | 190,716,725 | $ | 1,527,441,489 | $ | 9,713,941 | $ | 7,939,875,380 | ||||||||
| Gross unrealized gain | 39,628,374 | 489,504,697 | 2,021,502 | 2,593,037,352 | ||||||||||||
| Gross unrealized loss | (8,485,219 | ) | (15,959,857 | ) | (144,966 | ) | (51,937,604 | ) | ||||||||
| Net unrealized security gain (loss) | $ | 31,143,155 | $ | 473,544,840 | $ | 1,876,536 | $ | 2,541,099,748 | ||||||||
| Health Care Fund | International Equity Fund | International Opportunities Fund | International Value Fund | |||||||||||||
| Tax cost | $ | 6,616,129 | $ | 327,200,675 | $ | 411,442,145 | $ | 604,386,582 | ||||||||
| Gross unrealized gain | 1,423,697 | 89,142,293 | 64,655,710 | 67,821,414 | ||||||||||||
| Gross unrealized loss | (212,268 | ) | (2,852,617 | ) | (16,784,717 | ) | (18,823,598 | ) | ||||||||
| Net unrealized security gain (loss) | $ | 1,211,429 | $ | 86,289,676 | $ | 47,870,993 | $ | 48,997,816 | ||||||||
| Micro Cap Growth Fund | Value Opportunities Fund | |||||||||||||||
| Tax cost | $ | 331,447,691 | $ | 1,354,035,879 | ||||||||||||
| Gross unrealized gain | 94,122,978 | 612,529,453 | ||||||||||||||
| Gross unrealized loss | (21,783,021 | ) | (29,176,997 | ) | ||||||||||||
| Net unrealized security gain (loss) | $ | 72,339,957 | $ | 583,352,456 | ||||||||||||
The difference between book-basis and tax-basis unrealized gains (losses) is attributable to the tax treatment of certain securities, certain distributions, other financial instruments and wash sales.
Permanent items identified during the fiscal year ended October 31, 2021 have been reclassified among the components of net assets based on their tax basis treatment as follows:
| Total Distributable Earnings (Loss | ) | Paid-in Capital | ||||||
| Durable Growth Fund | $ | (14,884,452 | ) | $ | 14,884,452 | |||
| Focused Growth Fund | (1,692,123 | ) | 1,692,123 | |||||
| Focused Large Cap Value Fund | (46,472,004 | ) | 46,472,004 | |||||
| Focused Small Cap Value Fund | (2,372,461 | ) | 2,372,461 | |||||
| Fundamental Equity | (9,248,676 | ) | 9,248,676 | |||||
| Global Equity | (62,047 | ) | 62,047 | |||||
| Growth Leaders | (289,639,628 | ) | 289,639,628 | |||||
| Health Care Fund | (46,892 | ) | 46,892 | |||||
| Micro Cap Growth | 405 | (405 | ) | |||||
| Value Opportunities Fund | (25,825,701 | ) | 25,825,701 | |||||
The permanent differences are attributable to the tax treatment of certain expenses and certain distributions.
| 5. | PORTFOLIO SECURITIES TRANSACTIONS |
Purchases and sales of investment securities (excluding short-term investments) for the fiscal year ended October 31, 2021 were as follows:
| Purchases | Sales | |||||||
| Alpha Strategy Fund | $ | 60,072,911 | $ | 107,183,939 | ||||
| Durable Growth Fund | 195,746,309 | 210,732,893 | ||||||
| Focused Growth Fund | 80,874,671 | 71,847,697 | ||||||
| Focused Large Cap Value Fund | 652,884,137 | 687,294,821 | ||||||
| Focused Small Cap Value Fund | 302,483,262 | 227,655,974 | ||||||
232
Notes to Financial Statements (continued)
| Purchases | Sales | |||||||
| Fundamental Equity Fund | $ | 1,358,155,113 | $ | 1,630,933,272 | ||||
| Global Equity Fund | 9,936,781 | 8,138,866 | ||||||
| Growth Leaders Fund | 13,052,622,557 | 12,305,137,051 | ||||||
| Health Care Fund | 6,346,495 | 3,735,762 | ||||||
| International Equity Fund | 230,884,530 | 301,917,339 | ||||||
| International Opportunities Fund | 329,120,716 | 382,437,660 | ||||||
| International Value Fund | 422,372,979 | 363,095,384 | ||||||
| Micro Cap Growth Fund | 587,993,801 | 345,362,450 | ||||||
| Value Opportunities Fund | 957,225,535 | 1,031,001,717 | ||||||
There were no purchases or sales of U.S. Government securities for the fiscal year ended October 31, 2021.
Each Fund is permitted to purchase and sell securities (“cross-trade”) from and to other Lord Abbett funds or client accounts pursuant to procedures approved by the Board in compliance with Rule 17a-7 under the Act (the “Rule”). Each cross-trade is executed at a fair market price in compliance with provisions of the Rule. For the fiscal year ended October 31, 2021, the following Funds engaged in cross-trades:
| Fund | Purchases | Sales | Gain/(Loss | ) | ||||||||
| Durable Growth Fund | $ | 5,491,583 | $ | 24,106,827 | $ | 6,828,639 | ||||||
| Focused Growth Fund | 133,906 | – | – | |||||||||
| Focused Large Cap Value Fund | 21,006,042 | 18,051,841 | 3,026,345 | |||||||||
| Focused Small Cap Value Fund | 420,509 | 10,103,252 | (128,005 | ) | ||||||||
| Fundamental Equity Fund | 4,807,554 | 26,314,932 | 5,893,072 | |||||||||
| Growth Leaders Fund | 35,337,244 | 4,360,046 | 1,775,182 | |||||||||
| International Equity Fund | – | 1,709,249 | 445,424 | |||||||||
| International Opportunities Fund | 325,624 | 137,034 | 47,519 | |||||||||
| International Value Fund | 1,709,249 | 456,718 | 198,659 | |||||||||
| Micro Cap Growth Fund | 239,824 | 11,592,486 | 2,214,187 | |||||||||
| Value Opportunities Fund | 22,326,852 | 1,035,430 | 648,514 | |||||||||
| 6. | DISCLOSURES ABOUT DERIVATIVE INSTRUMENTS AND HEDGING ACTIVITIES |
International Equity Fund, International Opportunities Fund and International Value Fund entered into forward foreign currency exchange contracts for the fiscal year ended October 31, 2021 (as described in Note 2(g)). A forward foreign currency exchange contract reduces each Fund’s exposure to changes in the value of the currency it will deliver (or settle in cash) and increases its exposure to changes in the value of the currency it will receive (or settle in cash) for the duration of the contract. Each Fund’s use of forward foreign currency exchange contracts involves the risk that Lord Abbett will not accurately predict currency movements, and each Fund’s returns could be reduced as a result. Forward foreign currency exchange contracts are subject to the risk that those currencies will decline in value relative to the U.S. dollar, or, in the case of hedged positions, that the U.S. dollar will decline relative to the currency being hedged. Currency rates in foreign countries may fluctuate significantly over short periods of time. Each Fund’s risk of loss from counterparty credit risk is the unrealized appreciation on forward foreign currency exchange contracts.
Global Equity Fund entered into E-Mini S&P Index futures contracts for the fiscal year ended October 31, 2021 (as described in Note 2(h)) to manage cash. The Fund bears the risk that the underlying index will move unexpectedly, in which case the Fund may realize a loss. There is minimal counterparty credit risk to the Fund since futures are exchange traded and the exchange’s clearinghouse, as counterparty to all exchange traded futures, guarantees futures against default.
233
Notes to Financial Statements (continued)
International Opportunities Fund entered into total return swaps on indexes for the fiscal year ended October 31, 2021 (as described in Note 2(k) to hedge credit risk. The Fund may enter into total return swap agreements to obtain exposure to a security or market without owning such security or investing directly in that market. The Fund may agree to make payments that are the equivalent of interest in exchange for the right to receive payments equivalent to any appreciation in the value of an underlying security, index or other asset, as well as receive payments equivalent to any distributions made on that asset, over the term of the swap. If the value of the asset underlying a total return swap declines over the term of the swap, the Fund also may be required to pay an amount equal to that decline in value to their counterparty.
Transactions in derivative instruments for the fiscal year ended October 31, 2021, were as follows:
| Global Equity Fund | ||||||||
| Equity Contracts | ||||||||
| Net Realized Gain (Loss) | ||||||||
| Futures Contracts(1) | $ | 2,683 | ||||||
| Average Number of Contracts/Notional Amounts* | ||||||||
| Futures Contracts | – | (2) | ||||||
| International Equity Fund | ||||||||
| Foreign Currency Contracts | ||||||||
| Net Realized Gain (Loss) | ||||||||
| Forward Foreign Currency Exchange Contracts(3) | $ | 4,979 | ||||||
| Average Number of Contracts/Notional Amounts* | ||||||||
| Forward Foreign Currency Exchange Contracts(4) | $ | 90,853 | ||||||
| International Opportunities Fund | ||||||||
| Equity Contracts | Foreign Currency Contracts | |||||||
| Net Realized Gain (Loss) | ||||||||
| Forward Foreign Currency Exchange Contracts(3) | $ | – | $ | 1,320 | ||||
| Total Return Swap Contracts(5) | 3,982,574 | – | ||||||
| Net Change in Unrealized Appreciation/Depreciation | ||||||||
| Total Return Swap Contracts(6) | 39,110 | – | ||||||
| Average Number of Contracts/Notional Amounts* | ||||||||
| Total Return Swap Contracts(4) | 94,076 | – | ||||||
| Forward Foreign Currency Exchange Contracts(4) | – | 37,695 | ||||||
| International Value Fund | ||||||||
| Foreign Currency Contracts | ||||||||
| Net Realized Gain (Loss) | ||||||||
| Forward Foreign Currency Exchange Contracts(3) | $ | (3,678 | ) | |||||
| Average Number of Contracts/Notional Amounts* | ||||||||
| Forward Foreign Currency Exchange Contracts(4) | $ | 94,146 | ||||||
| * | Calculated based on the number of contracts or notional amounts for the fiscal year ended October 31, 2021. |
| (1) | Statements of Operations location: Net realized gain (loss) on futures contracts. |
| (2) | Contract less than 1. |
234
Notes to Financial Statements (continued)
| (3) | Statements of Operations location: Net realized gain (loss) on forward foreign currency exchange contracts. |
| (4) | Amount represents notional amounts in U.S. dollars. |
| (5) | Statements of Operations location: Net realized gain (loss) on swap contracts. |
| (6) | Statements of Operations location: Net change in unrealized appreciation/depreciation on swap contracts. |
| 7. | DISCLOSURES ABOUT OFFSETTING ASSETS AND LIABILITIES |
The Financial Accounting Standards Board (“FASB”) requires disclosures intended to help better assess the effect or potential effect of offsetting arrangements on a fund’s financial position. The following tables illustrate gross and net information about recognized assets and liabilities eligible for offset in the Statements of Assets and Liabilities; and disclose such amounts subject to an enforceable master netting agreement or similar agreement, by a counterparty. A master netting agreement is an agreement between a fund and a counterparty which provides for the net settlement of amounts owed under all contracts traded under that agreement, as well as cash collateral, through a single payment by one party to the other in the event of default on or termination of any one contract. The Funds’ accounting policy with respect to balance sheet offsetting is that, absent an event of default by the counterparty or a termination of the agreement, the master netting agreement does not result in an offset of reported amounts of financial assets and liabilities in the Statements of Assets and Liabilities across transactions between the Funds and the applicable counterparty:
| Alpha Strategy Fund | ||||||||||||
| Description | Gross Amounts of Recognized Assets | Gross Amounts Offset in the Statement of Assets and Liabilities | Net Amounts of Assets Presented in the Statement of Assets and Liabilities | |||||||||
| Repurchase Agreements | $ | 894,051 | $ | – | $ | 894,051 | ||||||
| Total | $ | 894,051 | $ | – | $ | 894,051 | ||||||
| Net Amount of Assets Presented in | Amounts Not Offset in the Statement of Assets and Liabilities | |||||||||||||||||||
| Counterparty | the Statement of Assets and Liabilities | Financial Instruments | Cash Collateral Received(a | ) | Securities Collateral Received(a | ) | Net Amount(b | ) | ||||||||||||
| Fixed Income Clearing Corp. | $ | 894,051 | $ | – | $ | – | $ | (894,051 | ) | $ | – | |||||||||
| Total | $ | 894,051 | $ | – | $ | – | $ | (894,051 | ) | $ | – | |||||||||
| Durable Growth Fund | ||||||||||||
| Description | Gross Amounts of Recognized Assets | Gross Amounts Offset in the Statement of Assets and Liabilities | Net Amounts of Assets Presented in the Statement of Assets and Liabilities | |||||||||
| Repurchase Agreements | $ | 3,866,976 | $ | – | $ | 3,866,976 | ||||||
| Total | $ | 3,866,976 | $ | – | $ | 3,866,976 | ||||||
| Net Amount of Assets Presented in | Amounts Not Offset in the Statement of Assets and Liabilities | |||||||||||||||||||
| Counterparty | the Statement of Assets and Liabilities | Financial Instruments | Cash Collateral Received(a | ) | Securities Collateral Received(a | ) | Net Amount(b | ) | ||||||||||||
| Fixed Income Clearing Corp. | $ | 3,866,976 | $ | – | $ | – | $ | (3,866,976 | ) | $ | – | |||||||||
| Total | $ | 3,866,976 | $ | – | $ | – | $ | (3,866,976 | ) | $ | – | |||||||||
235
Notes to Financial Statements (continued)
| Focused Growth Fund | ||||||||||||
| Description | Gross Amounts of Recognized Assets | Gross Amounts Offset in the Statement of Assets and Liabilities | Net Amounts of Assets Presented in the Statement of Assets and Liabilities | |||||||||
| Repurchase Agreements | $ | 1,444,140 | $ | – | $ | 1,444,140 | ||||||
| Total | $ | 1,444,140 | $ | – | $ | 1,444,140 | ||||||
| Net Amount of Assets Presented in | Amounts Not Offset in the Statement of Assets and Liabilities | |||||||||||||||||||
| Counterparty | the Statement of Assets and Liabilities | Financial Instruments | Cash Collateral Received(a | ) | Securities Collateral Received(a | ) | Net Amount(b | ) | ||||||||||||
| Fixed Income Clearing Corp. | $ | 1,444,140 | $ | – | $ | – | $ | (1,444,140 | ) | $ | – | |||||||||
| Total | $ | 1,444,140 | $ | – | $ | – | $ | (1,444,140 | ) | $ | – | |||||||||
| Focused Large Cap Value Fund | ||||||||||||
| Description | Gross Amounts of Recognized Assets | Gross Amounts Offset in the Statement of Assets and Liabilities | Net Amounts of Assets Presented in the Statement of Assets and Liabilities | |||||||||
| Repurchase Agreements | $ | 11,352,114 | $ | – | $ | 11,352,114 | ||||||
| Total | $ | 11,352,114 | $ | – | $ | 11,352,114 | ||||||
| Net Amount of Assets Presented in | Amounts Not Offset in the Statement of Assets and Liabilities | |||||||||||||||||||
| Counterparty | the Statement of Assets and Liabilities | Financial Instruments | Cash Collateral Received(a | ) | Securities Collateral Received(a | ) | Net Amount(b | ) | ||||||||||||
| Fixed Income Clearing Corp. | $ | 11,352,114 | $ | – | $ | – | $ | (11,352,114 | ) | $ | – | |||||||||
| Total | $ | 11,352,114 | $ | – | $ | – | $ | (11,352,114 | ) | $ | – | |||||||||
| Focused Small Cap Value Fund | ||||||||||||
| Description | Gross Amounts of Recognized Assets | Gross Amounts Offset in the Statement of Assets and Liabilities | Net Amounts of Assets Presented in the Statement of Assets and Liabilities | |||||||||
| Repurchase Agreements | $ | 3,353,776 | $ | – | $ | 3,353,776 | ||||||
| Total | $ | 3,353,776 | $ | – | $ | 3,353,776 | ||||||
| Net Amount of Assets Presented in | Amounts Not Offset in the Statement of Assets and Liabilities | |||||||||||||||||||
| Counterparty | the Statement of Assets and Liabilities | Financial Instruments | Cash Collateral Received(a | ) | Securities Collateral Received(a | ) | Net Amount(b | ) | ||||||||||||
| Fixed Income Clearing Corp. | $ | 3,353,776 | $ | – | $ | – | $ | (3,353,776 | ) | $ | – | |||||||||
| Total | $ | 3,353,776 | $ | – | $ | – | $ | (3,353,776 | ) | $ | – | |||||||||
236
Notes to Financial Statements (continued)
| Fundamental Equity Fund | ||||||||||||
| Gross Amounts | Net Amounts of | |||||||||||
| Offset in the | Assets Presented | |||||||||||
| Gross Amounts of | Statement of Assets | in the Statement of | ||||||||||
| Description | Recognized Assets | and Liabilities | Assets and Liabilities | |||||||||
| Repurchase Agreements | $ | 9,366,953 | $ | – | $ | 9,366,953 | ||||||
| Total | $ | 9,366,953 | $ | – | $ | 9,366,953 | ||||||
| Net Amount | ||||||||||||||||||||
| of Assets | Amounts Not Offset in the | |||||||||||||||||||
| Presented in | Statement of Assets and Liabilities | |||||||||||||||||||
| the Statement | Cash | Securities | ||||||||||||||||||
| of Assets and | Financial | Collateral | Collateral | Net | ||||||||||||||||
| Counterparty | Liabilities | Instruments | Received(a | ) | Received(a | ) | Amount(b | ) | ||||||||||||
| Fixed Income Clearing Corp. | $ | 9,366,953 | $ | – | $ | – | $(9,366,953) | $ | – | |||||||||||
| Total | $ | 9,366,953 | $ | – | $ | – | $ | (9,366,953 | ) | $ | – | |||||||||
| Global Equity Fund | ||||||||||||
| Gross Amounts | Net Amounts of | |||||||||||
| Offset in the | Assets Presented | |||||||||||
| Gross Amounts of | Statement of Assets | in the Statement of | ||||||||||
| Description | Recognized Assets | and Liabilities | Assets and Liabilities | |||||||||
| Repurchase Agreements | $ | 320,545 | $ | – | $ | 320,545 | ||||||
| Total | $ | 320,545 | $ | – | $ | 320,545 | ||||||
| Net Amount | ||||||||||||||||||||
| of Assets | Amounts Not Offset in the | |||||||||||||||||||
| Presented in | Statement of Assets and Liabilities | |||||||||||||||||||
| the Statement | Cash | Securities | ||||||||||||||||||
| of Assets and | Financial | Collateral | Collateral | Net | ||||||||||||||||
| Counterparty | Liabilities | Instruments | Received(a | ) | Received(a | ) | Amount(b | ) | ||||||||||||
| Fixed Income Clearing Corp. | $ | 320,545 | $ | – | $ | – | $ | (320,545 | ) | $ | – | |||||||||
| Total | $ | 320,545 | $ | – | $ | – | $ | (320,545 | ) | $ | – | |||||||||
| Growth Leaders Fund | ||||||||||||
| Gross Amounts | Net Amounts of | |||||||||||
| Offset in the | Assets Presented | |||||||||||
| Gross Amounts of | Statement of Assets | in the Statement of | ||||||||||
| Description | Recognized Assets | and Liabilities | Assets and Liabilities | |||||||||
| Repurchase Agreements | $ | 184,244,835 | $ | – | $ | 184,244,835 | ||||||
| Total | $ | 184,244,835 | $ | – | $ | 184,244,835 | ||||||
| Net Amount | ||||||||||||||||||||
| of Assets | Amounts Not Offset in the | |||||||||||||||||||
| Presented in | Statement of Assets and Liabilities | |||||||||||||||||||
| the Statement | Cash | Securities | ||||||||||||||||||
| of Assets and | Financial | Collateral | Collateral | Net | ||||||||||||||||
| Counterparty | Liabilities | Instruments | Received(a | ) | Received(a | ) | Amount(b | ) | ||||||||||||
| Fixed Income Clearing Corp. | $ | 184,244,835 | $ | – | $ | – | $ | (184,244,835 | ) | $ | – | |||||||||
| Total | $ | 184,244,835 | $ | – | $ | – | $ | (184,244,835 | ) | $ | – | |||||||||
237
Notes to Financial Statements (continued)
| Health Care Fund | ||||||||||||
| Gross Amounts | Net Amounts of | |||||||||||
| Offset in the | Assets Presented | |||||||||||
| Gross Amounts of | Statement of Assets | in the Statement of | ||||||||||
| Description | Recognized Assets | and Liabilities | Assets and Liabilities | |||||||||
| Repurchase Agreements | $ | 286,372 | $ | – | $ | 286,372 | ||||||
| Total | $ | 286,372 | $ | – | $ | 286,372 | ||||||
| Net Amount | ||||||||||||||||||||
| of Assets | Amounts Not Offset in the | |||||||||||||||||||
| Presented in | Statement of Assets and Liabilities | |||||||||||||||||||
| the Statement | Cash | Securities | ||||||||||||||||||
| of Assets and | Financial | Collateral | Collateral | Net | ||||||||||||||||
| Counterparty | Liabilities | Instruments | Received(a | ) | Received(a | ) | Amount(b | ) | ||||||||||||
| Fixed Income Clearing Corp. | $ | 286,372 | $ | – | $ | – | $ | (286,372 | ) | $ | – | |||||||||
| Total | $ | 286,372 | $ | – | $ | – | $ | (286,372 | ) | $ | – | |||||||||
| International Equity Fund | ||||||||||||
| Gross Amounts | Net Amounts of | |||||||||||
| Offset in the | Assets Presented | |||||||||||
| Gross Amounts of | Statement of Assets | in the Statement of | ||||||||||
| Description | Recognized Assets | and Liabilities | Assets and Liabilities | |||||||||
| Repurchase Agreements | $ | 8,910,118 | $ | – | $ | 8,910,118 | ||||||
| Total | $ | 8,910,118 | $ | – | $ | 8,910,118 | ||||||
| Net Amount | ||||||||||||||||||||
| of Assets | Amounts Not Offset in the | |||||||||||||||||||
| Presented in | Statement of Assets and Liabilities | |||||||||||||||||||
| the Statement | Cash | Securities | ||||||||||||||||||
| of Assets and | Financial | Collateral | Collateral | Net | ||||||||||||||||
| Counterparty | Liabilities | Instruments | Received(a | ) | Received(a | ) | Amount(b | ) | ||||||||||||
| Fixed Income Clearing Corp. | $ | 8,910,118 | $ | – | $ | – | $ | (8,910,118 | ) | $ | – | |||||||||
| Total | $ | 8,910,118 | $ | – | $ | – | $ | (8,910,118 | ) | $ | – | |||||||||
| International Opportunities Fund | ||||||||||||
| Gross Amounts | Net Amounts of | |||||||||||
| Offset in the | Assets Presented | |||||||||||
| Gross Amounts of | Statement of Assets | in the Statement of | ||||||||||
| Description | Recognized Assets | and Liabilities | Assets and Liabilities | |||||||||
| Repurchase Agreements | $ | 7,516,954 | $ | – | $ | 7,516,954 | ||||||
| Total | $ | 7,516,954 | $ | – | $ | 7,516,954 | ||||||
| Net Amount | ||||||||||||||||||||
| of Assets | Amounts Not Offset in the | |||||||||||||||||||
| Presented in | Statement of Assets and Liabilities | |||||||||||||||||||
| the Statement | Cash | Securities | ||||||||||||||||||
| of Assets and | Financial | Collateral | Collateral | Net | ||||||||||||||||
| Counterparty | Liabilities | Instruments | Received(a | ) | Received(a) | Amount(b | ) | |||||||||||||
| Fixed Income Clearing Corp. | $ | 7,516,954 | $ | – | $ | – | $ | (7,516,954 | ) | $ | – | |||||||||
| Total | $ | 7,516,954 | $ | – | $ | – | $ | (7,516,954 | ) | $ | – | |||||||||
238
Notes to Financial Statements (continued)
| International Value Fund | ||||||||||||
| Gross Amounts | Net Amounts of | |||||||||||
| Offset in the | Assets Presented | |||||||||||
| Gross Amounts of | Statement of Assets | in the Statement of | ||||||||||
| Description | Recognized Assets | and Liabilities | Assets and Liabilities | |||||||||
| Repurchase Agreements | $ | 20,985,776 | $ | – | $ | 20,985,776 | ||||||
| Total | $ | 20,985,776 | $ | – | $ | 20,985,776 | ||||||
| Net Amount | ||||||||||||||||||||
| of Assets | Amounts Not Offset in the | |||||||||||||||||||
| Presented in | Statement of Assets and Liabilities | |||||||||||||||||||
| the Statement | Cash | Securities | ||||||||||||||||||
| of Assets and | Financial | Collateral | Collateral | Net | ||||||||||||||||
| Counterparty | Liabilities | Instruments | Received(a | ) | Received(a | ) | Amount(b | ) | ||||||||||||
| Fixed Income Clearing Corp. | $ | 20,985,776 | $ | – | $ | – | $ | (20,985,776 | ) | $ | – | |||||||||
| Total | $ | 20,985,776 | $ | – | $ | – | $ | (20,985,776 | ) | $ | – | |||||||||
| Micro Cap Growth Fund | ||||||||||||
| Gross Amounts | Net Amounts of | |||||||||||
| Offset in the | Assets Presented | |||||||||||
| Gross Amounts of | Statement of Assets | in the Statement of | ||||||||||
| Description | Recognized Assets | and Liabilities | Assets and Liabilities | |||||||||
| Repurchase Agreements | $ | 3,975,645 | $ | – | $ | 3,975,645 | ||||||
| Total | $ | 3,975,645 | $ | – | $ | 3,975,645 | ||||||
| Net Amount | ||||||||||||||||||||
| of Assets | Amounts Not Offset in the | |||||||||||||||||||
| Presented in | Statement of Assets and Liabilities | |||||||||||||||||||
| the Statement | Cash | Securities | ||||||||||||||||||
| of Assets and | Financial | Collateral | Collateral | Net | ||||||||||||||||
| Counterparty | Liabilities | Instruments | Received(a | ) | Received(a | ) | Amount(b | ) | ||||||||||||
| Fixed Income Clearing Corp. | $ | 3,975,645 | $ | – | $ | – | $ | (3,975,645 | ) | $ | – | |||||||||
| Total | $ | 3,975,645 | $ | – | $ | – | $ | (3,975,645 | ) | $ | – | |||||||||
| Value Opportunities Fund | ||||||||||||
| Gross Amounts | Net Amounts of | |||||||||||
| Offset in the | Assets Presented | |||||||||||
| Gross Amounts of | Statement of Assets | in the Statement of | ||||||||||
| Description | Recognized Assets | and Liabilities | Assets and Liabilities | |||||||||
| Repurchase Agreements | $ | 11,509,952 | $ | – | $ | 11,509,952 | ||||||
| Total | $ | 11,509,952 | $ | – | $ | 11,509,952 | ||||||
| Net Amount | ||||||||||||||||||||
| of Assets | Amounts Not Offset in the | |||||||||||||||||||
| Presented in | Statement of Assets and Liabilities | |||||||||||||||||||
| the Statement | Cash | Securities | ||||||||||||||||||
| of Assets and | Financial | Collateral | Collateral | Net | ||||||||||||||||
| Counterparty | Liabilities | Instruments | Received(a | ) | Received(a | ) | Amount(b | ) | ||||||||||||
| Fixed Income Clearing Corp. | $ | 11,509,952 | $ | – | $ | – | $ | (11,509,952 | ) | $ | – | |||||||||
| Total | $ | 11,509,952 | $ | – | $ | – | $ | (11,509,952 | ) | $ | – | |||||||||
| (a) | Collateral disclosed is limited to an amount not to exceed 100% of the net amount of assets (liabilities) presented in the Statements of Assets and Liabilities, for each respective counterparty. |
| (b) | Net amount represents the amount owed to the Fund by the counterparty as of October 31, 2021. |
239
Notes to Financial Statements (continued)
| 8. | TRUSTEES’ REMUNERATION |
The Trust’s officers and one Trustee, who are associated with Lord Abbett, do not receive any compensation from the Trust for serving in such capacities. Independent Trustees’ fees are allocated among all Lord Abbett-sponsored funds based on the net assets of each fund. There is an equity-based plan available to all Independent Trustees under which Independent Trustees must defer receipt of a portion of, and may elect to defer receipt of an additional portion of Trustees’ fees. The deferred amounts are treated as though equivalent dollar amounts had been invested in the funds. Such amounts and earnings accrued thereon are included in Trustees’ fees on the Statements of Operations and in Trustees’ fees payable on the Statements of Assets and Liabilities and are not deductible for U.S. federal income tax purposes until such amounts are paid.
| 9. | EXPENSE REDUCTIONS |
The Trust has entered into an arrangement with its transfer agent and custodian, whereby credits realized as a result of uninvested cash balances are used to reduce a portion of each Fund’s expenses.
| 10. | LINE OF CREDIT |
For the period ended August 4, 2021, the Funds (except Alpha Strategy Fund), and certain other funds managed by Lord Abbett (collectively, the “Participating Funds”) entered into a syndicated line of credit facility with various lenders for $1.17 billion (the “Syndicated Facility”) whereas State Street Bank and Trust Company (“SSB”) participated as a lender and as agent for the lenders. The Participating Funds were subject to graduated borrowing limits of one-third of Funds net assets (if Fund net assets are less than $750 million), $250 million, $300 million, $600 million, or $900 million, based on past borrowings and likelihood of future borrowings, among other factors.
Effective August 5, 2021, the Participating Funds entered into a Syndicated Facility with various lenders for $1.275 billion whereas SSB participates as a lender and as agent for the lenders. The Participating Funds are subject to graduated borrowing limits of one-third of Funds net assets (if Fund net assets are less than $750 million), $250 million, $300 million, $700 million, or $1 billion, based on past borrowings and likelihood of future borrowings, among other factors.
For the fiscal year ended October 31, 2021, the Participating Funds were party to an additional line of credit facility with SSB for $330 million (the “Bilateral Facility”), $250 million committed and $80 million uncommitted. Under the Bilateral Facility, the Participating Funds are subject to graduated borrowing limits of one-third of Funds net assets (if net assets are less than $750 million), $250 million, $300 million, or $330 million, based on past borrowings and likelihood of future borrowings, among other factors.
The Syndicated Facility and the Bilateral Facility are to be used for temporary or emergency purposes as additional sources of liquidity to satisfy redemptions.
For the fiscal year ended October 31, 2021, the Funds did not utilize the Syndicated Facility or Bilateral Facility.
| 11. | INTERFUND LENDING PROGRAM |
Pursuant to an exemptive order issued by the U.S. Securities and Exchange Commission (“SEC exemptive order”) certain registered open-end management investment companies managed by Lord Abbett, including each Fund, participate in a joint lending and borrowing program (the “Interfund Lending Program”). The SEC exemptive order allows the Funds to borrow money from and lend money to each other for temporary or emergency purposes subject to the limitations and conditions.
240
Notes to Financial Statements (continued)
For the fiscal year ended October 31, 2021, the following Funds participated as a lenders:
| Fund | Average Amount Loaned | Average Interest Rate | Interest Income | ||||
| Growth Leaders Fund | $21,840,007 | 0.55% | $328 | ||||
| Value Opportunities Fund | 17,514,869 | 0.55% | 262 |
| 12. | CUSTODIAN AND ACCOUNTING AGENT |
SSB is the Trust’s custodian and accounting agent. SSB performs custodial, accounting and recordkeeping functions relating to portfolio transactions and calculating each Fund’s NAV.
| 13. | TRANSACTIONS WITH AFFILIATED ISSUERS |
An affiliated issuer is one in which a Fund has ownership of at least 5% of the outstanding voting securities of the underlying issuer at any point during the fiscal year or any company which is under common ownership or control. Alpha Strategy Fund had the following transactions with affiliated issuers (i.e. the Underlying Funds) during the year ended October 31, 2021:
| Alpha Strategy Fund | ||||||||||||||||||||||||||||||||
| Affiliated Issuer | Value at 10/31/2020 | Purchases at Cost | Proceeds From Sales | Net Realized Gain (Loss) | Change in Appreciation (Depreciation) | Value at 10/31/2021 | Shares as of 10/31/2021 | Dividend Income | ||||||||||||||||||||||||
| Lord Abbett Developing Growth Fund, Inc. – Class I | $ | 135,399,903 | 20,184,316 | (12,582,347 | ) | $ | 18,688,319 | (a) | $ | 25,567,101 | $ | 175,650,188 | 4,228,459 | $ | – | |||||||||||||||||
| Lord Abbett Securities Trust – Focused Small Cap Value Fund – Class I | 67,384,060 | 1,459,571 | (18,574,676 | ) | (1,517,469 | ) | 41,483,684 | 90,235,170 | 2,726,138 | 785,231 | ||||||||||||||||||||||
| Lord Abbett Securities Trust – International Opportunities Fund – Class I | 129,478,917 | 5,679,780 | (12,405,432 | ) | 2,906,793 | 45,093,522 | 170,753,580 | 7,733,405 | – | |||||||||||||||||||||||
| Lord Abbett Securities Trust - Micro-Cap Growth Fund – Class I | 67,247,368 | 21,356,528 | (18,241,819 | ) | 22,484,855 | (b) | 8,986,096 | 85,447,699 | 3,594,771 | – | ||||||||||||||||||||||
| Lord Abbett Research Fund, Inc. – Small-Cap Value Fund – Class I | 133,392,192 | 2,293,936 | (25,317,982 | ) | (9,545,904 | ) | 77,978,079 | 178,800,321 | 7,767,173 | 1,619,126 | ||||||||||||||||||||||
| Lord Abbett Securities Trust – Value Opportunities Fund – Class I | 135,999,158 | 9,098,778 | (20,061,682 | ) | 9,234,929 | (c) | 53,327,928 | 180,099,301 | 7,218,409 | 681,801 | ||||||||||||||||||||||
| Total | $ | 42,251,523 | $ | 252,436,410 | $ | 880,986,259 | $ | 3,086,158 | ||||||||||||||||||||||||
| (a) | Includes $11,607,104 of distributed capital gains. |
| (b) | Includes $16,385,329 of distributed capital gains. |
| (c) | Includes $7,499,811 of distributed capital gains. |
| 14. | SECURITIES LENDING AGREEMENT |
The Funds have established a securities lending agreement with Citibank, N.A. for the lending of securities to qualified brokers in exchange for securities or cash collateral equal to at least the market value of securities loaned, plus interest, if applicable. Cash collateral is invested in an approved money market fund. In accordance with the Funds’ securities lending agreement, the market value of securities on loan is determined each day at the close of business and any
241
Notes to Financial Statements (continued)
additional collateral required to cover the value of securities on loan is delivered to the Funds on the next business day. As with other extensions of credit, the Funds may experience a delay in the recovery of their securities or incur a loss should the borrower of the securities breach its agreement with the Funds or the borrower becomes insolvent at a time when the collateral is insufficient to cover the cost of repurchasing securities on loan. Any income earned from securities lending is included in Securities lending net income on the Statements of Operations.
The initial collateral received by the Funds are required to have a value equal to at least 100% of the market value of the securities loaned. The collateral must be marked-to-market daily to cover increases in the market value of the securities loaned (or potentially a decline in the value of the collateral). In general, the risk of borrower default will be borne by Citibank, N.A.; the Funds will bear the risk of loss with respect to the investment of the cash collateral. The advantage of such loans is that the Funds continue to receive income on loaned securities while receiving a portion of any securities lending fees and earning returns on the cash amounts which may be reinvested for the purchase of investments in securities.
As of October 31, 2021, the market value of securities loaned and collateral received for the Funds were as follows:
| Funds | Market Value of Securities Loaned | Collateral Received(1) | |||
| Focused Small Cap Value Fund | 2,166,411 | 2,256,410 | |||
| Growth Leaders Fund | 1,911,005 | 1,944,227 | |||
| Health Care Fund | 12,993 | 13,230 | |||
| International Equity Fund | 780,760 | 839,194 | |||
| International Value Fund | 1,504,654 | 1,624,918 | |||
| Micro Cap Growth Fund | 7,868,929 | 8,254,106 |
| (1) | Statements of Assets and Liabilities location: Payable for collateral due to broker for securities lending. |
| 15. | INVESTMENT RISKS |
Each Fund is subject to the general risks and considerations associated with equity investing. The value of the Funds’ investments will fluctuate in response to movements in the equity securities markets in general and to the changing prospects of individual companies in which the Funds invest. If a Fund’s assessment of a company’s value or prospects for exceeding earnings expectations or market conditions is wrong, the Fund could suffer losses or produce poor performance relative to other funds, even in a favorable market.
Large company stocks, in which Durable Growth Fund, Focused Growth Fund, Focused Large Cap Value Fund, Fundamental Equity Fund, Global Equity Fund, Growth Leaders Fund, International Equity Fund and International Value Fund invest, may perform differently than the market as a whole and other types of stocks, such as small company stocks. Small and mid-sized company stocks, in which Alpha Strategy Fund, Focused Small Cap Value Fund, Focused Growth Fund, Fundamental Equity Fund, Growth Leaders Fund, International Equity Fund, International Opportunities Fund and Value Opportunities Fund invest, may be less able to weather economic shifts or other adverse developments than those of larger, more established companies.
In general, Durable Growth Fund, Focused Growth Fund and Growth Leaders Fund employ a growth investing style, Global Equity Fund employs a blended growth investing and value investing style, and Focused Large Cap Value Fund, Focused Small Cap Value Fund, Fundamental Equity Fund, International Value Fund and Value Opportunities Fund employ a value investing style. Growth stocks generally are
242
Notes to Financial Statements (continued)
more volatile than value stocks. The price of value stocks may lag the market for long periods of time.
Global Equity Fund, International Equity Fund, International Opportunities Fund and International Value Fund are subject to the risks of investing in foreign securities. Foreign securities may pose greater risks than domestic securities, including greater price fluctuations, economic, political, and social instability and subject to less government supervision, lack of transparency, inadequate regulatory and accounting standards, foreign taxes, and higher transaction costs. Foreign investments also may be affected by changes in currency rates or currency controls. These risks are generally greater for securities issued by companies in emerging market companies. Similarly, due to their investments in multinational and foreign companies, Alpha Strategy Fund, Durable Growth Fund, Focused Growth Fund, Focused Large Cap Value Fund, Focused Small Cap Value Fund, Fundamental Equity Fund, Growth Leaders Fund, Health Care Fund, and Value Opportunities Fund are subject to the risks of investing in foreign securities and similarly may experience increased market, liquidity, currency, political, informational, and other risks.
Health Care Fund is subject to the risks of investing in the health care sector, including changes in government regulations, dependence on patents and intellectual property rights, expenses and losses from litigation based on product liability and similar claims, industry competition, extensive research and development, marketing, and sales costs, and rapid technological change and potential for product obsolescence. Health Care Fund is also subject to the risks of investing in structured securities. As a result, Health Care Fund is subject to the same risks associated with direct investments in the underlying securities or other instruments they seek to replicate, as well as liquidity risk and the risk that the issuer and/or the counterparty of the structured security may be unable to perform under the terms of the instrument, or may disagree as to the meaning or application of such terms.
International Value Fund is subject to the risks of investing in dividend paying stocks. Dividend paying stocks may be sensitive to changes in market interest rates, and the prices of such stocks may decline as rates rise. There is no guarantee that companies that currently pay dividends will continue to do so. International Value Fund may be subject to the volatility of stocks that have high dividends per share due to recent decreases in their share prices.
Alpha Strategy Fund’s investments are concentrated in the Underlying Funds and, as a result, the Fund’s performance is directly related to their performance and subject to their risks. In addition, the Fund is exposed to the same risks as the Underlying Funds in direct proportion to the allocation of its assets among the Underlying Funds.
Alpha Strategy Fund, Global Equity Fund, Health Care Fund, International Equity Fund, International Opportunities Fund and International Value Fund are subject to the risks associated with derivatives, which may be different from and greater than the risks associated with investing directly in securities and other investments. Derivatives may be subject to risks such as liquidity risk, leveraging risk, interest rate risk, market risk, and credit risk. Illiquid securities may lower the Funds’ returns since the Funds may be unable to sell these securities at their desired time or price. Derivatives also may involve the risk of mispricing or improper valuation and the risk that changes in the value of the derivative may not correlate perfectly with the value of the underlying asset, rate or index. Whether a Fund’s use of derivatives is successful will depend on, among other things, the Fund’s ability to correctly forecast market movements, changes in foreign exchange and interest rates, and other factors. If a Fund incorrectly forecasts these and other factors, its performance could suffer. A Fund’s use of derivatives could result in a loss exceeding the amount of the Fund’s investment in these instruments.
243
Notes to Financial Statements (continued)
Health Care Fund, Focused Large Cap Value Fund and Focused Small Cap Value Fund are subject to the general risks and considerations associated with investing in fixed income securities. The value of an investment will change as interest rates fluctuate and in response to market movements. When interest rates rise, the prices of fixed income securities are likely to decline; when interest rates fall, such prices tend to rise. Longer-term securities are usually more sensitive to interest rate changes. There is also the risk that an issuer of a fixed income security will fail to make timely payments of principal and/or interest to a Fund, a risk that is greater with high-yield bonds (sometimes called “junk bonds”) in which one or more of the Funds may invest. Some issuers, particularly of high-yield bonds, may default as to principal and/or interest payments after a Fund purchases their securities. A default, or concerns in the market about an increase in risk of default, may result in losses to each Fund. High-yield bonds are subject to greater price fluctuations and increased liquidity risk, as well as additional risks.
Focused Growth Fund and Focused Large Cap Value Fund are non-diversified mutual funds under the Act. The value of each Fund’s investments may be more adversely affected by a single economic, political or regulatory event than the value of the investments of a diversified mutual fund.
Durable Growth Fund, Focused Growth Fund, Focused Large Cap Value Fund, Global Equity Fund and Health Care Fund are newly organized and there can be no assurance that a Fund will reach or maintain a sufficient asset size to effectively implement its investment strategy. A Fund’s gross expense ratio may fluctuate during its initial operating period because of the Fund’s relatively smaller asset size and, until the Fund achieves sufficient scale, a Fund shareholder may experience proportionally higher Fund expenses than would be experienced by shareholders of a fund with a larger asset base.
Geopolitical and other events (e.g., wars, terrorism, natural disasters, epidemics or pandemics such as the COVID-19 outbreak which began in late 2019) may disrupt securities markets and adversely affect global economies and markets, thereby decreasing the value of each Fund’s investments. Market disruptions can also prevent the Funds from implementing its investment strategies and achieving its investment objective.
The transmission of COVID-19 and efforts to contain its spread have resulted in, among other things, border closings and other significant travel restrictions and disruptions, significant disruptions to business operations, supply chains and customer activity, lower consumer demand for goods and services, event cancellations and restrictions, service cancellations, reductions and other changes, significant challenges in healthcare service preparation and delivery, and prolonged quarantines, as well as general concern and uncertainty. The impact of the COVID-19 outbreak could negatively affect the global economy, the economies of individual countries, and the financial performance of individual issuers, sectors, industries, asset classes, and markets in significant and unforeseen ways.
The COVID-19 pandemic and its effects may last for an extended period of time, and in either case could result in significant market volatility, exchange trading suspensions and closures, declines in global financial markets, higher default rates, and a substantial economic downturn or recession. The foregoing could disrupt the operations of each Fund and its service providers, adversely affect the value and liquidity of each Fund’s investments, and negatively impact each Fund’s performance and your investment in each Fund.
These factors, and others, can affect each Fund’s performance.
244
Notes to Financial Statements (continued)
| 16. | SUMMARY OF CAPITAL TRANSACTIONS |
Transactions in shares of beneficial interest were as follows:
| Alpha Strategy Fund | Year Ended October 31, 2021 | Year Ended October 31, 2020 | ||||||||||||||
| Class A Shares | Shares | Amount | Shares | Amount | ||||||||||||
| Shares sold | 1,577,648 | $ | 45,220,318 | 2,089,872 | $ | 43,355,666 | ||||||||||
| Converted from Class C* | 373,268 | 10,849,172 | 1,101,831 | 23,484,272 | ||||||||||||
| Reinvestment of distributions | 1,198,333 | 31,252,535 | 2,522,201 | 56,648,626 | ||||||||||||
| Shares reacquired | (3,015,003 | ) | (86,005,823 | ) | (8,088,314 | ) | (168,814,292 | ) | ||||||||
| Increase (decrease) | 134,246 | $ | 1,316,202 | (2,374,410 | ) | $ | (45,325,728 | ) | ||||||||
| Class C Shares | ||||||||||||||||
| Shares sold | 258,243 | $ | 5,763,669 | 448,811 | $ | 7,536,122 | ||||||||||
| Reinvestment of distributions | 260,342 | 5,277,141 | 745,028 | 13,276,398 | ||||||||||||
| Shares reacquired | (680,695 | ) | (15,066,444 | ) | (1,677,782 | ) | (28,359,437 | ) | ||||||||
| Converted to Class A* | (481,239 | ) | (10,849,172 | ) | (1,392,677 | ) | (23,484,272 | ) | ||||||||
| Decrease | (643,349 | ) | $ | (14,874,806 | ) | (1,876,620 | ) | $ | (31,031,189 | ) | ||||||
| Class F Shares | ||||||||||||||||
| Shares sold | 1,160,187 | $ | 33,279,687 | 1,045,928 | $ | 22,416,684 | ||||||||||
| Reinvestment of distributions | 290,792 | 7,656,554 | 772,654 | 17,500,621 | ||||||||||||
| Shares reacquired | (2,033,224 | ) | (59,074,811 | ) | (3,825,862 | ) | (76,385,706 | ) | ||||||||
| Decrease | (582,245 | ) | $ | (18,138,570 | ) | (2,007,280 | ) | $ | (36,468,401 | ) | ||||||
| Class F3 Shares | ||||||||||||||||
| Shares sold | 660,493 | $ | 19,999,580 | 488,060 | $ | 10,125,114 | ||||||||||
| Reinvestment of distributions | 110,980 | 3,009,774 | 177,457 | 4,127,641 | ||||||||||||
| Shares reacquired | (406,560 | ) | (12,126,926 | ) | (552,465 | ) | (12,025,640 | ) | ||||||||
| Increase | 364,913 | $ | 10,882,428 | 113,052 | $ | 2,227,115 | ||||||||||
| Class I Shares | ||||||||||||||||
| Shares sold | 180,777 | $ | 5,505,880 | 790,561 | $ | 16,748,038 | ||||||||||
| Reinvestment of distributions | 82,792 | 2,237,040 | 508,610 | 11,799,741 | ||||||||||||
| Shares reacquired | (115,206 | ) | (3,409,355 | ) | (3,821,379 | ) | (81,468,364 | ) | ||||||||
| Increase (decrease) | 148,363 | $ | 4,333,565 | (2,522,208 | ) | $ | (52,920,585 | ) | ||||||||
| Class R2 Shares | ||||||||||||||||
| Shares sold | 4,782 | $ | 128,775 | 15,003 | $ | 312,973 | ||||||||||
| Reinvestment of distributions | 4,691 | 116,299 | 7,418 | 159,120 | ||||||||||||
| Shares reacquired | (26,161 | ) | (698,573 | ) | (19,809 | ) | (363,370 | ) | ||||||||
| Increase (decrease) | (16,688 | ) | $ | (453,499 | ) | 2,612 | $ | 108,723 | ||||||||
| Class R3 Shares | ||||||||||||||||
| Shares sold | 93,216 | $ | 2,573,701 | 136,052 | $ | 2,723,948 | ||||||||||
| Reinvestment of distributions | 76,015 | 1,901,142 | 165,768 | 3,583,900 | ||||||||||||
| Shares reacquired | (240,531 | ) | (6,568,862 | ) | (489,838 | ) | (10,160,044 | ) | ||||||||
| Decrease | (71,300 | ) | $ | (2,094,019 | ) | (188,018 | ) | $ | (3,852,196 | ) | ||||||
245
Notes to Financial Statements (continued)
| Alpha Strategy Fund | Year Ended October 31, 2021 | Year Ended October 31, 2020 | ||||||||||||||
| Class R4 Shares | Shares | Amount | Shares | Amount | ||||||||||||
| Shares sold | 34,574 | $ | 971,847 | 43,297 | $ | 922,234 | ||||||||||
| Reinvestment of distributions | 12,105 | 314,743 | 20,202 | 452,531 | ||||||||||||
| Shares reacquired | (59,024 | ) | (1,668,467 | ) | (42,994 | ) | (897,945 | ) | ||||||||
| Increase (decrease) | (12,345 | ) | $ | (381,877 | ) | 20,505 | $ | 476,820 | ||||||||
| Class R5 Shares | ||||||||||||||||
| Shares sold | 2,244 | $ | 62,291 | 27,836 | $ | 610,946 | ||||||||||
| Reinvestment of distributions | 2,152 | 58,163 | 1,707 | 39,612 | ||||||||||||
| Shares reacquired | (14,588 | ) | (427,373 | ) | (14,890 | ) | (337,903 | ) | ||||||||
| Increase (decrease) | (10,192 | ) | $ | (306,919 | ) | 14,653 | $ | 312,655 | ||||||||
| Class R6 Shares | ||||||||||||||||
| Shares sold | 41,717 | $ | 1,206,996 | 41,185 | $ | 903,044 | ||||||||||
| Reinvestment of distributions | 6,175 | 167,531 | 9,684 | 225,350 | ||||||||||||
| Shares reacquired | (54,466 | ) | (1,579,276 | ) | (46,584 | ) | (1,036,708 | ) | ||||||||
| Increase (decrease) | (6,574 | ) | $ | (204,749 | ) | 4,285 | $ | 91,686 | ||||||||
| Durable Growth Fund | Year Ended October 31, 2021 | For the period ended October 31, 2020 | ||||||||||||||
| Class A Shares | Shares | Amount | Shares | Amount | ||||||||||||
| Shares sold | 65,836 | $ | 1,484,482 | 105,323 | $ | 1,704,548 | ||||||||||
| Converted from Class C* | 81 | 1,969 | – | – | ||||||||||||
| Reinvestment of distributions | 2,031 | 41,259 | 12 | 185 | ||||||||||||
| Shares reacquired | (2,443 | ) | (58,468 | ) | (25,265 | ) | (414,525 | ) | ||||||||
| Increase | 65,505 | $ | 1,469,242 | 80,070 | $ | 1,290,208 | ||||||||||
| Class C Shares | ||||||||||||||||
| Shares sold | 4,745 | $ | 102,886 | 12,788 | $ | 210,965 | ||||||||||
| Reinvestment of distributions | 156 | 3,151 | – | – | ||||||||||||
| Shares reacquired | (2,083 | ) | (44,817 | ) | (858 | ) | (12,757 | ) | ||||||||
| Converted to Class A* | (82 | ) | (1,969 | ) | – | – | ||||||||||
| Increase | 2,736 | $ | 59,251 | 11,930 | $ | 198,208 | ||||||||||
| Class F Shares | ||||||||||||||||
| Shares sold | 1,135 | $ | 26,655 | 34,968 | $ | 530,262 | ||||||||||
| Reinvestment of distributions | 27 | 556 | 32 | 493 | ||||||||||||
| Shares reacquired | (427 | ) | (10,762 | ) | (17,017 | ) | (261,750 | ) | ||||||||
| Increase | 735 | $ | 16,449 | 17,983 | $ | 269,005 | ||||||||||
| Class F3 Shares | ||||||||||||||||
| Shares sold | – | $ | 15 | 7,334 | $ | 110,000 | ||||||||||
| Reinvestment of distributions | – | – | 8 | 128 | ||||||||||||
| Increase | – | $ | 15 | 7,342 | $ | 110,128 | ||||||||||
| Class I Shares | ||||||||||||||||
| Shares sold | 6,682,720 | $ | 159,569,733 | 12,457,602 | $ | 206,631,112 | ||||||||||
| Reinvestment of distributions | 222,364 | 4,522,876 | 38 | 573 | ||||||||||||
| Shares reacquired | (7,630,362 | ) | (173,026,092 | ) | (2,109,887 | ) | (40,830,092 | ) | ||||||||
| Increase (decrease) | (725,278 | ) | $ | (8,933,483 | ) | 10,347,753 | $ | 165,801,593 | ||||||||
246
Notes to Financial Statements (continued)
| Durable Growth Fund | Year Ended October 31, 2021 | For the period ended October 31, 2020 | ||||||||||||||
| Class R3 Shares | Shares | Amount | Shares | Amount | ||||||||||||
| Shares sold | – | $ | – | 667 | $ | 10,000 | ||||||||||
| Reinvestment of distributions | – | – | – | 4 | ||||||||||||
| Shares reacquired | – | – | – | 59 | ||||||||||||
| Increase | – | $ | – | 667 | $ | 10,063 | ||||||||||
| Class R4 Shares | ||||||||||||||||
| Shares sold | – | $ | – | 667 | $ | 10,000 | ||||||||||
| Reinvestment of distributions | – | – | – | 8 | ||||||||||||
| Shares reacquired | – | – | – | 36 | ||||||||||||
| Increase | – | $ | – | 667 | $ | 10,044 | ||||||||||
| Class R5 Shares | ||||||||||||||||
| Shares sold | – | $ | – | 668 | $ | 10,000 | ||||||||||
| Reinvestment of distributions | – | – | 1 | 12 | ||||||||||||
| Increase | – | $ | – | 669 | $ | 10,012 | ||||||||||
| Class R6 Shares | ||||||||||||||||
| Shares sold | 22,449 | $ | 516,640 | 45,312 | $ | 699,067 | ||||||||||
| Reinvestment of distributions | – | – | 38 | 583 | ||||||||||||
| Shares reacquired | (1,039 | ) | (24,763 | ) | (32,830 | ) | (500,000 | ) | ||||||||
| Increase | 21,410 | $ | 491,877 | 12,520 | $ | 199,650 | ||||||||||
| Focused Growth Fund | Year Ended October 31, 2021 | Year Ended October 31, 2020 | ||||||||||||||
| Class A Shares | Shares | Amount | Shares | Amount | ||||||||||||
| Shares sold | 227,205 | $ | 6,974,750 | 434,819 | $ | 9,703,851 | ||||||||||
| Converted from Class C* | 2,801 | 82,690 | 2,497 | 60,294 | ||||||||||||
| Reinvestment of distributions | 31,858 | 880,243 | – | – | ||||||||||||
| Shares reacquired | (219,094 | ) | (6,735,424 | ) | (281,008 | ) | (5,735,273 | ) | ||||||||
| Increase | 42,770 | $ | 1,202,259 | 156,308 | $ | 4,028,872 | ||||||||||
| Class C Shares | ||||||||||||||||
| Shares sold | 25,353 | $ | 772,258 | 71,782 | $ | 1,605,692 | ||||||||||
| Reinvestment of distributions | 4,406 | 120,046 | – | – | ||||||||||||
| Shares reacquired | (25,955 | ) | (612,243 | ) | (9,531 | ) | (205,158 | ) | ||||||||
| Converted to Class A* | 2,845 | (82,690 | ) | (2,523 | ) | (60,294 | ) | |||||||||
| Increase | 6,649 | $ | 197,371 | 59,728 | $ | 1,340,240 | ||||||||||
| Class F Shares | ||||||||||||||||
| Shares sold | 566,618 | $ | 17,517,555 | 190,397 | $ | 4,699,476 | ||||||||||
| Reinvestment of distributions | 15,807 | 439,126 | – | – | ||||||||||||
| Shares reacquired | (286,846 | ) | (9,271,791 | ) | (38,191 | ) | (777,214 | ) | ||||||||
| Increase | 295,579 | $ | 8,684,890 | 152,206 | $ | 3,922,262 | ||||||||||
| Class I Shares | ||||||||||||||||
| Shares sold | 32,702 | $ | 1,016,191 | 38,511 | $ | 965,055 | ||||||||||
| Reinvestment of distributions | 6,880 | 191,131 | – | – | ||||||||||||
| Shares reacquired | (14,031 | ) | (432,144 | ) | (31,893 | ) | (712,410 | ) | ||||||||
| Increase | 25,551 | $ | 775,178 | 6,618 | $ | 252,645 | ||||||||||
247
Notes to Financial Statements (continued)
| Focused Growth Fund | Year Ended October 31, 2021 | Year Ended October 31, 2020 | ||||||||||||||
| Class R3 Shares | Shares | Amount | Shares | Amount | ||||||||||||
| Shares sold | – | $ | 18 | – | $ | – | ||||||||||
| Increase | – | $ | 18 | – | $ | – | ||||||||||
| Class R6 Shares | ||||||||||||||||
| Shares sold | 74,408 | $ | 2,307,033 | 91,308 | $ | 2,043,385 | ||||||||||
| Reinvestment of distributions | 43 | 1,198 | – | – | ||||||||||||
| Shares reacquired | (51,112 | ) | (1,603,459 | ) | (43,053 | ) | (888,522 | ) | ||||||||
| Increase | 23,339 | $ | 704,772 | 48,255 | $ | 1,154,863 | ||||||||||
| Focused Large Cap Value Fund | Year Ended October 31, 2021 | Year Ended October 31, 2020 | ||||||||||||||
| Class A Shares | Shares | Amount | Shares | Amount | ||||||||||||
| Shares sold | 468,989 | $ | 8,408,017 | 58,910 | $ | 782,489 | ||||||||||
| Reinvestment of distributions | 4,008 | 60,322 | 182 | 2,767 | ||||||||||||
| Shares reacquired | (109,618 | ) | (1,958,950 | ) | (51,695 | ) | (735,734 | ) | ||||||||
| Increase | 363,379 | $ | 6,509,389 | 7,397 | $ | 49,522 | ||||||||||
| Class C Shares | ||||||||||||||||
| Shares sold | 230,080 | $ | 4,169,543 | 11,228 | $ | 132,753 | ||||||||||
| Reinvestment of distributions | 332 | 5,009 | 21 | 326 | ||||||||||||
| Shares reacquired | (46,492 | ) | (847,693 | ) | (12,635 | ) | (172,705 | ) | ||||||||
| Increase (decrease) | 183,920 | $ | 3,326,859 | (1,386 | ) | $ | (39,626 | ) | ||||||||
| Class F Shares | ||||||||||||||||
| Shares sold | 372,465 | $ | 6,925,879 | 4,808 | $ | 62,373 | ||||||||||
| Reinvestment of distributions | 126 | 1,909 | 196 | 2,983 | ||||||||||||
| Shares reacquired | (251,099 | ) | (4,759,311 | ) | (35,265 | ) | (481,111 | ) | ||||||||
| Increase (decrease) | 121,492 | $ | 2,168,477 | (30,261 | ) | $ | (415,755 | ) | ||||||||
| Class F3 Shares | ||||||||||||||||
| Reinvestment of distributions | – | $ | – | 211 | $ | 3,213 | ||||||||||
| Shares reacquired | – | – | (32,613 | ) | (445,593 | ) | ||||||||||
| Decrease | – | $ | – | (32,402 | ) | $ | (442,380 | ) | ||||||||
| Class I Shares | ||||||||||||||||
| Shares sold | 14,993,191 | $ | 245,204,603 | 39,120,270 | $ | 441,893,283 | ||||||||||
| Reinvestment of distributions | 2,576,106 | 38,796,164 | 16,392 | 249,649 | ||||||||||||
| Shares reacquired | (16,135,630 | ) | (300,086,544 | ) | (8,761,641 | ) | (113,729,358 | ) | ||||||||
| Increase (decrease) | 1,433,667 | $ | (16,085,777 | ) | 30,375,021 | $ | 328,413,574 | |||||||||
| Class R3 Shares | ||||||||||||||||
| Shares sold | 31 | $ | 533 | 5 | $ | 73 | ||||||||||
| Reinvestment of distributions | – | 6 | 3 | 43 | ||||||||||||
| Increase | 31 | $ | 539 | 8 | $ | 116 | ||||||||||
248
Notes to Financial Statements (continued)
| Focused Large Cap Value Fund | Year Ended October 31, 2021 | Year Ended October 31, 2020 | ||||||||||||||
| Class R4 Shares | Shares | Amount | Shares | Amount | ||||||||||||
| Reinvestment of distributions | – | $ | – | 3 | $ | 53 | ||||||||||
| Increase | – | $ | – | 3 | $ | 53 | ||||||||||
| Class R5 Shares | ||||||||||||||||
| Reinvestment of distributions | – | $ | – | 4 | $ | 64 | ||||||||||
| Increase | – | $ | – | 4 | $ | 64 | ||||||||||
| Class R6 Shares | ||||||||||||||||
| Shares sold | 77,715 | $ | 1,266,036 | 36,297 | $ | 449,218 | ||||||||||
| Reinvestment of distributions | – | – | 211 | 3,213 | ||||||||||||
| Shares reacquired | (25,361 | ) | (463,081 | ) | (43,319 | ) | (579,584 | ) | ||||||||
| Increase (decrease) | 52,354 | $ | 802,955 | (6,811 | ) | $ | (127,153 | ) | ||||||||
| Year Ended | Year Ended | |||||||||||||||
| Focused Small Cap Value Fund | October 31, 2021 | October 31, 2020 | ||||||||||||||
| Class A Shares | Shares | Amount | Shares | Amount | ||||||||||||
| Shares sold | 845,956 | $ | 23,174,025 | 438,085 | $ | 9,162,393 | ||||||||||
| Reinvestment of distributions | 1,225 | 28,969 | 42,884 | 930,586 | ||||||||||||
| Shares reacquired | (382,795 | ) | (11,610,984 | ) | (535,543 | ) | (8,651,100 | ) | ||||||||
| Increase (decrease) | 464,386 | $ | 11,592,010 | (54,574 | ) | $ | 1,441,879 | |||||||||
| Class C Shares | ||||||||||||||||
| Shares sold | 175,936 | $ | 5,508,892 | 5,401 | $ | 107,961 | ||||||||||
| Reinvestment of distributions | 27 | 673 | 69 | 1,597 | ||||||||||||
| Shares reacquired | (26,111 | ) | (813,509 | ) | (711 | ) | (11,019 | ) | ||||||||
| Increase | 149,852 | $ | 4,696,056 | 4,759 | $ | 98,539 | ||||||||||
| Class F Shares | ||||||||||||||||
| Shares sold | 3,317,447 | $ | 106,261,107 | 41,829 | $ | 800,286 | ||||||||||
| Reinvestment of distributions | 904 | 23,071 | 64 | 1,500 | ||||||||||||
| Shares reacquired | (1,333,770 | ) | (42,228,342 | ) | (3,606 | ) | (71,014 | ) | ||||||||
| Increase | 1,984,581 | $ | 64,055,836 | 38,287 | $ | 730,772 | ||||||||||
| Class F3 Shares | ||||||||||||||||
| Reinvestment of distributions | – | $ | – | 64 | $ | 1,500 | ||||||||||
| Increase | – | $ | – | 64 | $ | 1,500 | ||||||||||
| Class I Shares | ||||||||||||||||
| Shares sold | 2,471,662 | $ | 64,816,148 | 198,740 | $ | 4,446,865 | ||||||||||
| Reinvestment of distributions | 30,795 | 785,263 | 699,990 | 16,379,773 | ||||||||||||
| Shares reacquired | (2,361,182 | ) | (74,138,893 | ) | (1,722,466 | ) | (37,155,659 | ) | ||||||||
| Increase (decrease) | 141,275 | $ | (8,537,482 | ) | (823,736 | ) | $ | (16,329,021 | ) | |||||||
| Class R3 Shares | ||||||||||||||||
| Reinvestment of distributions | – | $ | – | 64 | $ | 1,500 | ||||||||||
| Shares reacquired | – | – | (429 | ) | (6,320 | ) | ||||||||||
| Decrease | – | $ | – | (365 | ) | $ | (4,820 | ) | ||||||||
249
Notes to Financial Statements (continued)
| Focused Small Cap Value Fund | Year Ended October 31, 2021 | Year Ended October 31, 2020 | ||||||||||||||
| Class R4 Shares | Shares | Amount | Shares | Amount | ||||||||||||
| Reinvestment of distributions | – | $ | – | 64 | $ | 1,500 | ||||||||||
| Shares reacquired | – | – | (429 | ) | (6,336 | ) | ||||||||||
| Decrease | – | $ | – | (365 | ) | $ | (4,836 | ) | ||||||||
| Class R5 Shares | ||||||||||||||||
| Shares sold | 74 | $ | 2,415 | – | $ | – | ||||||||||
| Reinvestment of distributions | – | – | 64 | 1,500 | ||||||||||||
| Increase | 74 | $ | 2,415 | 64 | $ | 1,500 | ||||||||||
| Class R6 Shares | ||||||||||||||||
| Shares sold | 397,673 | $ | 12,740,147 | 52,623 | $ | 1,109,409 | ||||||||||
| Reinvestment of distributions | – | – | 64 | 1,500 | ||||||||||||
| Shares reacquired | (142,154 | ) | (4,644,633 | ) | (18,034 | ) | (324,689 | ) | ||||||||
| Increase | 255,519 | $ | 8,095,514 | 34,653 | $ | 786,220 | ||||||||||
| Fundamental Equity Fund | Year Ended October 31, 2021 | Year Ended October 31, 2020 | ||||||||||||||
| Class A Shares | Shares | Amount | Shares | Amount | ||||||||||||
| Shares sold | 2,676,009 | $ | 35,640,102 | 4,188,498 | $ | 43,418,303 | ||||||||||
| Converted from Class C* | 1,390,056 | 18,865,411 | 5,226,450 | 55,203,791 | ||||||||||||
| Reinvestment of distributions | 1,687,369 | 20,096,561 | 11,401,124 | 132,025,015 | ||||||||||||
| Shares reacquired | (14,828,200 | ) | (193,764,334 | ) | (29,769,304 | ) | (317,448,216 | ) | ||||||||
| Decrease | (9,074,766 | ) | $ | (119,162,260 | ) | (8,953,232 | ) | $ | (86,801,107 | ) | ||||||
| Class C Shares | ||||||||||||||||
| Shares sold | 445,808 | $ | 5,156,014 | 691,274 | $ | 6,387,499 | ||||||||||
| Reinvestment of distributions | 54,080 | 565,135 | 1,522,175 | 15,434,858 | ||||||||||||
| Shares reacquired | (1,216,486 | ) | (13,961,855 | ) | (3,965,989 | ) | (37,181,352 | ) | ||||||||
| Converted to Class A* | (1,589,677 | ) | (18,865,411 | ) | (5,993,619 | ) | (55,203,791 | ) | ||||||||
| Decrease | (2,306,275 | ) | $ | (27,106,117 | ) | (7,746,159 | ) | $ | (70,562,786 | ) | ||||||
| Class F Shares | ||||||||||||||||
| Shares sold | 1,246,981 | $ | 16,078,637 | 1,433,812 | $ | 15,575,714 | ||||||||||
| Reinvestment of distributions | 213,893 | 2,513,246 | 1,631,329 | 18,629,776 | ||||||||||||
| Shares reacquired | (2,761,188 | ) | (35,756,240 | ) | (6,705,371 | ) | (70,451,225 | ) | ||||||||
| Decrease | (1,300,314 | ) | $ | (17,164,357 | ) | (3,640,230 | ) | $ | (36,245,735 | ) | ||||||
| Class F3 Shares | ||||||||||||||||
| Shares sold | 208,976 | $ | 2,855,973 | 288,689 | $ | 3,142,272 | ||||||||||
| Reinvestment of distributions | 28,553 | 344,061 | 180,261 | 2,109,059 | ||||||||||||
| Shares reacquired | (368,288 | ) | (4,913,026 | ) | (664,831 | ) | (7,264,981 | ) | ||||||||
| Decrease | (130,759 | ) | $ | (1,712,992 | ) | (195,881 | ) | $ | (2,013,650 | ) | ||||||
| Class I Shares | ||||||||||||||||
| Shares sold | 2,920,077 | $ | 40,739,479 | 12,582,859 | $ | 140,110,329 | ||||||||||
| Reinvestment of distributions | 493,649 | 5,913,918 | 5,308,220 | 61,787,685 | ||||||||||||
| Shares reacquired | (9,477,972 | ) | (122,050,051 | ) | (41,834,305 | ) | (408,261,259 | ) | ||||||||
| Decrease | (6,064,246 | ) | $ | (75,396,654 | ) | (23,943,226 | ) | $ | (206,363,245 | ) | ||||||
250
Notes to Financial Statements (continued)
| Fundamental Equity Fund | Year Ended October 31, 2021 | Year Ended October 31, 2020 | ||||||||||||||
| Class P Shares | Shares | Amount | Shares | Amount | ||||||||||||
| Shares sold | 124,281 | $ | 1,712,500 | 38,910 | $ | 395,112 | ||||||||||
| Reinvestment of distributions | 5,670 | 66,114 | 45,179 | 512,324 | ||||||||||||
| Shares reacquired | (147,627 | ) | (1,945,316 | ) | (150,905 | ) | (1,618,060 | ) | ||||||||
| Decrease | (17,676 | ) | $ | (166,702 | ) | (66,816 | ) | $ | (710,624 | ) | ||||||
| Class R2 Shares | ||||||||||||||||
| Shares sold | 32,455 | $ | 430,641 | 48,263 | $ | 494,664 | ||||||||||
| Reinvestment of distributions | 3,723 | 43,336 | 25,619 | 290,000 | ||||||||||||
| Shares reacquired | (112,128 | ) | (1,489,358 | ) | (102,194 | ) | (1,093,622 | ) | ||||||||
| Decrease | (75,950 | ) | $ | (1,015,381 | ) | (28,312 | ) | $ | (308,958 | ) | ||||||
| Class R3 Shares | ||||||||||||||||
| Shares sold | 669,634 | $ | 8,680,825 | 1,538,350 | $ | 15,852,051 | ||||||||||
| Reinvestment of distributions | 114,003 | 1,331,556 | 877,394 | 9,958,420 | ||||||||||||
| Shares reacquired | (2,350,779 | ) | (30,566,662 | ) | (2,966,968 | ) | (30,852,539 | ) | ||||||||
| Decrease | (1,567,142 | ) | $ | (20,554,281 | ) | (551,224 | ) | $ | (5,042,068 | ) | ||||||
| Class R4 Shares | ||||||||||||||||
| Shares sold | 81,998 | $ | 1,132,180 | 76,886 | $ | 831,775 | ||||||||||
| Reinvestment of distributions | 2,821 | 33,433 | 36,123 | 415,774 | ||||||||||||
| Shares reacquired | (97,206 | ) | (1,336,153 | ) | (292,446 | ) | (3,170,812 | ) | ||||||||
| Decrease | (12,387 | ) | $ | (170,540 | ) | (179,437 | ) | $ | (1,923,263 | ) | ||||||
| Class R5 Shares | ||||||||||||||||
| Shares sold | 28,735 | $ | 393,931 | 81,760 | $ | 955,940 | ||||||||||
| Reinvestment of distributions | 1,707 | 20,468 | 10,804 | 125,869 | ||||||||||||
| Shares reacquired | (49,981 | ) | (674,551 | ) | (125,349 | ) | (1,307,288 | ) | ||||||||
| Decrease | (19,539 | ) | $ | (260,152 | ) | (32,785 | ) | $ | (225,479 | ) | ||||||
| Class R6 Shares | ||||||||||||||||
| Shares sold | 187,199 | $ | 2,566,578 | 219,870 | $ | 2,369,313 | ||||||||||
| Reinvestment of distributions | 15,967 | 192,556 | 156,188 | 1,828,961 | ||||||||||||
| Shares reacquired | (205,674 | ) | (2,664,892 | ) | (1,030,695 | ) | (10,971,855 | ) | ||||||||
| Increase (decrease) | (2,508 | ) | $ | 94,242 | (654,637 | ) | $ | (6,773,581 | ) | |||||||
| Global Equity Fund | Year Ended October 31, 2021 | Year Ended October 31, 2020 | ||||||||||||||
| Class A Shares | Shares | Amount | Shares | Amount | ||||||||||||
| Shares sold | 103,176 | $ | 1,557,336 | 67,708 | $ | 783,138 | ||||||||||
| Converted from Class C* | 1,862 | 27,152 | 2,969 | 35,757 | ||||||||||||
| Reinvestment of distributions | 11,222 | 158,567 | 3,449 | 41,353 | ||||||||||||
| Shares reacquired | (22,473 | ) | (336,424 | ) | (174,136 | ) | (1,903,357 | ) | ||||||||
| Increase (decrease) | 93,787 | $ | 1,406,631 | (100,010 | ) | $ | (1,043,109 | ) | ||||||||
| Class C Shares | ||||||||||||||||
| Shares sold | 9,030 | $ | 136,360 | 11,199 | $ | 132,299 | ||||||||||
| Reinvestment of distributions | 1,848 | 25,985 | 157 | 1,871 | ||||||||||||
| Shares reacquired | (1,802 | ) | (27,094 | ) | (16,261 | ) | (187,627 | ) | ||||||||
| Converted to Class A* | (1,873 | ) | (27,152 | ) | (2,995 | ) | (35,757 | ) | ||||||||
| Increase (decrease) | 7,203 | $ | 108,099 | (7,900 | ) | $ | (89,214 | ) | ||||||||
251
Notes to Financial Statements (continued)
| Global Equity Fund | Year Ended October 31, 2021 | Year Ended October 31, 2020 | ||||||||||||||
| Class F Shares | Shares | Amount | Shares | Amount | ||||||||||||
| Shares sold | 23,396 | $ | 366,257 | 878 | $ | 11,000 | ||||||||||
| Reinvestment of distributions | 198 | 2,796 | 1,452 | 17,441 | ||||||||||||
| Shares reacquired | (9,212 | ) | (136,295 | ) | (79,072 | ) | (932,988 | ) | ||||||||
| Increase (decrease) | 14,382 | $ | 232,758 | (76,742 | ) | $ | (904,547 | ) | ||||||||
| Class F3 Shares | ||||||||||||||||
| Reinvestment of distributions | – | $ | – | 15 | $ | 181 | ||||||||||
| Increase | – | $ | – | 15 | $ | 181 | ||||||||||
| Class I Shares | ||||||||||||||||
| Reinvestment of distributions | – | $ | – | 1,484 | $ | 17,804 | ||||||||||
| Shares reacquired | (670 | ) | (10,000 | ) | – | – | ||||||||||
| Increase (decrease) | (670 | ) | $ | (10,000 | ) | 1,484 | $ | 17,804 | ||||||||
| Class R3 Shares | ||||||||||||||||
| Shares sold | 28,939 | $ | 437,198 | 1,641 | $ | 19,964 | ||||||||||
| Reinvestment of distributions | 818 | 11,511 | 160 | 1,908 | ||||||||||||
| Shares reacquired | (20,440 | ) | (299,203 | ) | (55 | ) | (667 | ) | ||||||||
| Increase | 9,317 | $ | 149,506 | 1,746 | $ | 21,205 | ||||||||||
| Class R4 Shares | ||||||||||||||||
| Reinvestment of distributions | – | $ | – | 12 | $ | 150 | ||||||||||
| Increase | – | $ | – | 12 | $ | 150 | ||||||||||
| Class R5 Shares | ||||||||||||||||
| Reinvestment of distributions | – | $ | – | 15 | $ | 182 | ||||||||||
| Increase | – | $ | – | 15 | $ | 182 | ||||||||||
| Class R6 Shares | ||||||||||||||||
| Shares sold | 22,941 | $ | 361,456 | 9,840 | $ | 123,399 | ||||||||||
| Shares reacquired | (358 | ) | (4,957 | ) | (19,272 | ) | (234,374 | ) | ||||||||
| Increase (decrease) | 22,583 | $ | 356,499 | (9,432 | ) | $ | (110,975 | ) | ||||||||
| Growth Leaders Fund | Year Ended October 31, 2021 | Year Ended October 31, 2020 | ||||||||||||||
| Class A Shares | Shares | Amount | Shares | Amount | ||||||||||||
| Shares sold | 12,618,737 | $ | 583,012,996 | 18,281,151 | $ | 613,241,998 | ||||||||||
| Converted from Class C* | 1,575,362 | 74,374,788 | 1,928,904 | 72,420,199 | ||||||||||||
| Reinvestment of distributions | 4,198,551 | 175,541,399 | 2,858,584 | 78,067,940 | ||||||||||||
| Shares reacquired | (12,365,757 | ) | (566,553,743 | ) | (12,621,781 | ) | (409,386,625 | ) | ||||||||
| Increase | 6,026,893 | $ | 266,375,440 | 10,446,858 | $ | 354,343,512 | ||||||||||
| Class C Shares | ||||||||||||||||
| Shares sold | 4,528,845 | $ | 188,073,952 | 5,995,648 | $ | 178,733,815 | ||||||||||
| Reinvestment of distributions | 2,592,659 | 97,795,114 | 2,026,352 | 50,820,908 | ||||||||||||
| Shares reacquired | (4,706,111 | ) | (194,784,763 | ) | (6,241,038 | ) | (184,768,951 | ) | ||||||||
| Converted to Class A* | (1,751,967 | ) | (74,374,788 | ) | (2,110,329 | ) | (72,420,199 | ) | ||||||||
| Increase (decrease) | 663,426 | $ | 16,709,515 | (329,367 | ) | $ | (27,634,427 | ) | ||||||||
252
Notes to Financial Statements (continued)
| Growth Leaders Fund | Year Ended October 31, 2021 | Year Ended October 31, 2020 | ||||||||||||||
| Class F Shares | Shares | Amount | Shares | Amount | ||||||||||||
| Shares sold | 37,605,038 | $ | 1,779,963,107 | 30,664,509 | $ | 1,054,984,638 | ||||||||||
| Reinvestment of distributions | 6,025,591 | 258,256,825 | 3,547,411 | 98,830,859 | ||||||||||||
| Shares reacquired | (26,348,047 | ) | (1,246,249,512 | ) | (21,088,458 | ) | (700,112,273 | ) | ||||||||
| Increase | 17,282,582 | $ | 791,970,420 | 13,123,462 | $ | 453,703,224 | ||||||||||
| Class F3 Shares | ||||||||||||||||
| Shares sold | 8,538,984 | $ | 411,256,288 | 4,295,402 | $ | 162,030,303 | ||||||||||
| Reinvestment of distributions | 661,604 | 28,720,216 | 212,922 | 5,998,021 | ||||||||||||
| Shares reacquired | (2,567,381 | ) | (123,713,803 | ) | (952,101 | ) | (33,483,279 | ) | ||||||||
| Increase | 6,633,207 | $ | 316,262,701 | 3,556,223 | $ | 134,545,045 | ||||||||||
| Class I Shares | ||||||||||||||||
| Shares sold | 7,523,038 | $ | 361,849,545 | 12,502,496 | $ | 421,762,720 | ||||||||||
| Reinvestment of distributions | 2,243,922 | 96,892,532 | 1,446,088 | 40,562,759 | ||||||||||||
| Shares reacquired | (10,114,172 | ) | (474,476,907 | ) | (7,842,296 | ) | (277,609,307 | ) | ||||||||
| Increase (decrease) | (347,212 | ) | $ | (15,734,830 | ) | 6,106,288 | $ | 184,716,172 | ||||||||
| Class R2 Shares | ||||||||||||||||
| Shares sold | 57,980 | $ | 2,630,122 | 56,383 | $ | 1,897,951 | ||||||||||
| Reinvestment of distributions | 3,327 | 135,853 | 1,660 | 44,544 | ||||||||||||
| Shares reacquired | (34,978 | ) | (1,607,330 | ) | (61,514 | ) | (1,810,369 | ) | ||||||||
| Increase (decrease) | 26,329 | $ | 1,158,645 | (3,471 | ) | $ | 132,126 | |||||||||
| Class R3 Shares | ||||||||||||||||
| Shares sold | 127,159 | $ | 5,737,355 | 104,458 | $ | 3,386,244 | ||||||||||
| Reinvestment of distributions | 49,580 | 2,021,888 | 42,361 | 1,134,001 | ||||||||||||
| Shares reacquired | (203,986 | ) | (9,264,032 | ) | (176,443 | ) | (6,023,366 | ) | ||||||||
| Decrease | (27,247 | ) | $ | (1,504,789 | ) | (29,624 | ) | $ | (1,503,121 | ) | ||||||
| Class R4 Shares | ||||||||||||||||
| Shares sold | 131,947 | $ | 6,088,231 | 189,027 | $ | 5,694,409 | ||||||||||
| Reinvestment of distributions | 18,437 | 771,054 | 10,913 | 298,136 | ||||||||||||
| Shares reacquired | (98,280 | ) | (4,540,228 | ) | (128,858 | ) | (4,353,339 | ) | ||||||||
| Increase | 52,104 | $ | 2,319,057 | 71,082 | $ | 1,639,206 | ||||||||||
| Class R5 Shares | ||||||||||||||||
| Shares sold | 202,881 | $ | 9,556,872 | 119,938 | $ | 4,183,168 | ||||||||||
| Reinvestment of distributions | 31,460 | 1,359,076 | 26,421 | 741,362 | ||||||||||||
| Shares reacquired | (199,722 | ) | (9,546,091 | ) | (138,213 | ) | (4,812,019 | ) | ||||||||
| Increase | 34,619 | $ | 1,369,857 | 8,146 | $ | 112,511 | ||||||||||
| Class R6 Shares | ||||||||||||||||
| Shares sold | 2,274,302 | $ | 109,538,930 | 738,445 | $ | 25,990,050 | ||||||||||
| Reinvestment of distributions | 82,190 | 3,567,873 | 57,545 | 1,621,043 | ||||||||||||
| Shares reacquired | (547,006 | ) | (26,351,826 | ) | (552,495 | ) | (17,778,515 | ) | ||||||||
| Increase | 1,809,486 | $ | 86,754,977 | 243,495 | $ | 9,832,578 | ||||||||||
253
Notes to Financial Statements (continued)
| Health Care Fund | Year Ended October 31, 2021 | Year Ended October 31, 2020 | ||||||||||||||
| Class A Shares | Shares | Amount | Shares | Amount | ||||||||||||
| Shares sold | 93,469 | $ | 1,888,394 | 91,012 | $ | 1,606,250 | ||||||||||
| Converted from Class C* | 1,078 | 20,376 | – | – | ||||||||||||
| Reinvestment of distributions | 13,407 | 242,002 | – | – | ||||||||||||
| Shares reacquired | (53,158 | ) | (1,062,543 | ) | (48,656 | ) | (799,696 | ) | ||||||||
| Increase | 54,796 | $ | 1,088,229 | 42,356 | $ | 806,554 | ||||||||||
| Class C Shares | ||||||||||||||||
| Shares sold | 42,736 | $ | 851,529 | 18,378 | $ | 325,976 | ||||||||||
| Reinvestment of distributions | 2,699 | 48,170 | – | – | ||||||||||||
| Shares reacquired | (25,051 | ) | (504,667 | ) | (10,151 | ) | (175,759 | ) | ||||||||
| Converted to Class A* | (1,093 | ) | (20,376 | ) | – | – | ||||||||||
| Increase | 19,291 | $ | 374,656 | 8,227 | $ | 150,217 | ||||||||||
| Class F Shares | ||||||||||||||||
| Shares sold | 23,496 | $ | 473,930 | 6,790 | $ | 120,001 | ||||||||||
| Reinvestment of distributions | 491 | 8,898 | 2 | 37 | ||||||||||||
| Shares reacquired | (3,040 | ) | (61,905 | ) | (34,470 | ) | (633,133 | ) | ||||||||
| Increase (decrease) | 20,947 | $ | 420,923 | (27,678 | ) | $ | (513,095 | ) | ||||||||
| Class F3 Shares | ||||||||||||||||
| Reinvestment of distributions | – | $ | – | 23 | $ | 346 | ||||||||||
| Shares reacquired | – | – | (31,530 | ) | (577,083 | ) | ||||||||||
| Decrease | – | $ | – | (31,507 | ) | $ | (576,737 | ) | ||||||||
| Class I Shares | ||||||||||||||||
| Reinvestment of distributions | (1 | ) | $ | – | 4 | $ | 54 | |||||||||
| Shares reacquired | 1 | – | (6,452 | ) | (118,013 | ) | ||||||||||
| Decrease | – | $ | – | (6,448 | ) | $ | (117,959 | ) | ||||||||
| Class R5 Shares | ||||||||||||||||
| Reinvestment of distributions | – | $ | – | – | $ | 5 | ||||||||||
| Increase | – | $ | – | – | $ | 5 | ||||||||||
| Class R6 Shares | ||||||||||||||||
| Shares sold | 75,313 | $ | 1,486,080 | 62,558 | $ | 1,019,533 | ||||||||||
| Reinvestment of distributions | – | – | 23 | 346 | ||||||||||||
| Shares reacquired | (7,643 | ) | (153,462 | ) | (34,524 | ) | (627,476 | ) | ||||||||
| Increase | 67,670 | $ | 1,332,618 | 28,057 | $ | 392,403 | ||||||||||
| International Equity Fund | Year Ended October 31, 2021 | Year Ended October 31, 2020 | ||||||||||||||
| Class A Shares | Shares | Amount | Shares | Amount | ||||||||||||
| Shares sold | 866,494 | $ | 14,280,450 | 642,645 | $ | 8,200,504 | ||||||||||
| Converted from Class C* | 33,029 | 558,425 | 149,893 | 1,969,103 | ||||||||||||
| Reinvestment of distributions | 125,034 | 1,944,287 | 189,205 | 2,569,398 | ||||||||||||
| Shares reacquired | (1,553,164 | ) | (25,640,612 | ) | (3,033,576 | ) | (37,897,966 | ) | ||||||||
| Decrease | (528,607 | ) | $ | (8,857,450 | ) | (2,051,833 | ) | $ | (25,158,961 | ) | ||||||
254
Notes to Financial Statements (continued)
| International Equity Fund | Year Ended October 31, 2021 | Year Ended October 31, 2020 | ||||||||||||||
| Class C Shares | Shares | Amount | Shares | Amount | ||||||||||||
| Shares sold | 52,720 | $ | 859,771 | 41,975 | $ | 518,824 | ||||||||||
| Reinvestment of distributions | 1,234 | 19,178 | 5,240 | 71,063 | ||||||||||||
| Shares reacquired | (87,845 | ) | (1,453,229 | ) | (208,954 | ) | (2,595,055 | ) | ||||||||
| Converted to Class A* | (33,171 | ) | (558,425 | ) | (150,680 | ) | (1,969,103 | ) | ||||||||
| Decrease | (67,062 | ) | $ | (1,132,705 | ) | (312,419 | ) | $ | (3,974,271 | ) | ||||||
| Class F Shares | ||||||||||||||||
| Shares sold | 757,577 | $ | 12,936,223 | 134,470 | $ | 1,779,804 | ||||||||||
| Reinvestment of distributions | 9,333 | 144,479 | 58,859 | 794,605 | ||||||||||||
| Shares reacquired | (133,899 | ) | (2,239,606 | ) | (3,126,496 | ) | (38,695,120 | ) | ||||||||
| Increase (decrease) | 633,011 | $ | 10,841,096 | (2,933,167 | ) | $ | (36,120,711 | ) | ||||||||
| Class F3 Shares | ||||||||||||||||
| Shares sold | 80,444 | $ | 1,368,799 | 79,051 | $ | 1,057,492 | ||||||||||
| Reinvestment of distributions | 4,387 | 69,008 | 5,613 | 76,992 | ||||||||||||
| Shares reacquired | (84,279 | ) | (1,411,344 | ) | (93,281 | ) | (1,222,927 | ) | ||||||||
| Increase (decrease) | 552 | $ | 26,463 | (8,617 | ) | $ | (88,443 | ) | ||||||||
| Class I Shares | ||||||||||||||||
| Shares sold | 30,175 | $ | 521,302 | 1,321,968 | $ | 17,511,567 | ||||||||||
| Reinvestment of distributions | 178,682 | 2,805,307 | 243,036 | 3,329,599 | ||||||||||||
| Shares reacquired | (3,953,549 | ) | (64,868,896 | ) | (3,189,966 | ) | (43,162,311 | ) | ||||||||
| Decrease | (3,744,692 | ) | $ | (61,542,287 | ) | (1,624,962 | ) | $ | (22,321,145 | ) | ||||||
| Class P Shares | ||||||||||||||||
| Shares sold | 7 | $ | 103 | 48 | $ | 610 | ||||||||||
| Reinvestment of distributions | 18 | 278 | 39 | 544 | ||||||||||||
| Shares reacquired | (2,120 | ) | (33,178 | ) | (486 | ) | (6,471 | ) | ||||||||
| Decrease | (2,095 | ) | $ | (32,797 | ) | (399 | ) | $ | (5,317 | ) | ||||||
| Class R2 Shares | ||||||||||||||||
| Shares sold | 1,510 | $ | 25,044 | 3,283 | $ | 41,953 | ||||||||||
| Reinvestment of distributions | 59 | 914 | 162 | 2,195 | ||||||||||||
| Shares reacquired | (1,723 | ) | (29,536 | ) | (27,471 | ) | (299,532 | ) | ||||||||
| Decrease | (154 | ) | $ | (3,578 | ) | (24,026 | ) | $ | (255,384 | ) | ||||||
| Class R3 Shares | ||||||||||||||||
| Shares sold | 60,283 | $ | 986,472 | 72,743 | $ | 893,248 | ||||||||||
| Reinvestment of distributions | 3,356 | 51,482 | 6,649 | 89,018 | ||||||||||||
| Shares reacquired | (117,485 | ) | (1,908,756 | ) | (229,010 | ) | (2,953,782 | ) | ||||||||
| Decrease | (53,846 | ) | $ | (870,802 | ) | (149,618 | ) | $ | (1,971,516 | ) | ||||||
| Class R4 Shares | ||||||||||||||||
| Shares sold | 22,758 | $ | 374,708 | 26,181 | $ | 334,025 | ||||||||||
| Reinvestment of distributions | 988 | 15,301 | 1,213 | 16,392 | ||||||||||||
| Shares reacquired | (15,169 | ) | (250,732 | ) | (29,947 | ) | (383,267 | ) | ||||||||
| Increase (decrease) | 8,577 | $ | 139,277 | (2,553 | ) | $ | (32,850 | ) | ||||||||
255
Notes to Financial Statements (continued)
| International Equity Fund | Year Ended October 31, 2021 | Year Ended October 31, 2020 | ||||||||||||||
| Class R5 Shares | Shares | Amount | Shares | Amount | ||||||||||||
| Shares sold | 528 | $ | 8,854 | 1,555 | $ | 20,106 | ||||||||||
| Reinvestment of distributions | 54 | 848 | 104 | 1,430 | ||||||||||||
| Shares reacquired | (800 | ) | (13,844 | ) | (3,025 | ) | (40,745 | ) | ||||||||
| Decrease | (218 | ) | $ | (4,142 | ) | (1,366 | ) | $ | (19,209 | ) | ||||||
| Class R6 Shares | ||||||||||||||||
| Shares sold | 95,921 | $ | 1,640,453 | 7,203 | $ | 99,503 | ||||||||||
| Reinvestment of distributions | 71 | 1,124 | 152 | 2,096 | ||||||||||||
| Shares reacquired | (20,345 | ) | (336,541 | ) | (36,013 | ) | (450,847 | ) | ||||||||
| Increase (decrease) | 75,647 | $ | 1,305,036 | (28,658 | ) | $ | (349,248 | ) | ||||||||
| International Opportunities Fund | Year Ended October 31, 2021 | Year Ended October 31, 2020 | ||||||||||||||
| Class A Shares | Shares | Amount | Shares | Amount | ||||||||||||
| Shares sold | 1,020,365 | $ | 20,734,426 | 760,276 | $ | 11,555,309 | ||||||||||
| Converted from Class C* | 56,486 | 1,157,283 | 105,250 | 1,636,396 | ||||||||||||
| Reinvestment of distributions | – | – | 87,790 | 1,454,675 | ||||||||||||
| Shares reacquired | (1,129,310 | ) | (22,544,684 | ) | (2,721,200 | ) | (40,979,780 | ) | ||||||||
| Decrease | (52,459 | ) | $ | (652,975 | ) | (1,767,884 | ) | $ | (26,333,400 | ) | ||||||
| Class C Shares | ||||||||||||||||
| Shares sold | 98,943 | $ | 1,805,973 | 123,408 | $ | 1,808,409 | ||||||||||
| Reinvestment of distributions | – | – | 6,381 | 98,204 | ||||||||||||
| Shares reacquired | (184,163 | ) | (3,387,765 | ) | (647,947 | ) | (8,895,347 | ) | ||||||||
| Converted to Class A* | (61,458 | ) | (1,157,283 | ) | (113,756 | ) | (1,636,396 | ) | ||||||||
| Decrease | (146,678 | ) | $ | (2,739,075 | ) | (631,914 | ) | $ | (8,625,130 | ) | ||||||
| Class F Shares | ||||||||||||||||
| Shares sold | 603,623 | $ | 11,596,436 | 781,507 | $ | 11,657,260 | ||||||||||
| Reinvestment of distributions | – | – | 62,372 | 1,022,286 | ||||||||||||
| Shares reacquired | (809,112 | ) | (15,871,515 | ) | (3,799,996 | ) | (55,967,692 | ) | ||||||||
| Decrease | (205,489 | ) | $ | (4,275,079 | ) | (2,956,117 | ) | $ | (43,288,146 | ) | ||||||
| Class F3 Shares | ||||||||||||||||
| Shares sold | 568,476 | $ | 12,066,160 | 339,811 | $ | 5,211,076 | ||||||||||
| Reinvestment of distributions | – | – | 16,394 | 280,820 | ||||||||||||
| Shares reacquired | (276,690 | ) | (5,795,476 | ) | (429,731 | ) | (6,706,269 | ) | ||||||||
| Increase (decrease) | 291,786 | $ | 6,270,684 | (73,526 | ) | $ | (1,214,373 | ) | ||||||||
| Class I Shares | ||||||||||||||||
| Shares sold | 509,328 | $ | 10,221,845 | 383,771 | $ | 5,985,361 | ||||||||||
| Reinvestment of distributions | – | – | 184,630 | 3,147,949 | ||||||||||||
| Shares reacquired | (814,010 | ) | (17,506,626 | ) | (4,927,626 | ) | (76,300,116 | ) | ||||||||
| Decrease | (304,682 | ) | $ | (7,284,781 | ) | (4,359,225 | ) | $ | (67,166,806 | ) | ||||||
| Class P Shares | ||||||||||||||||
| Shares sold | 310 | $ | 6,474 | 2,368 | $ | 38,976 | ||||||||||
| Reinvestment of distributions | – | – | 52 | 891 | ||||||||||||
| Shares reacquired | (1,318 | ) | (28,552 | ) | (871 | ) | (13,302 | ) | ||||||||
| Increase (decrease) | (1,008 | ) | $ | (22,078 | ) | 1,549 | $ | 26,565 | ||||||||
256
Notes to Financial Statements (continued)
| International Opportunities Fund | Year Ended October 31, 2021 | Year Ended October 31, 2020 | ||||||||||||||
| Class R2 Shares | Shares | Amount | Shares | Amount | ||||||||||||
| Shares sold | 19,444 | $ | 387,386 | 46,675 | $ | 655,760 | ||||||||||
| Reinvestment of distributions | – | – | 1,631 | 26,601 | ||||||||||||
| Shares reacquired | (50,635 | ) | (1,000,966 | ) | (95,590 | ) | (1,378,536 | ) | ||||||||
| Decrease | (31,191 | ) | $ | (613,580 | ) | (47,284 | ) | $ | (696,175 | ) | ||||||
| Class R3 Shares | ||||||||||||||||
| Shares sold | 98,606 | $ | 1,906,895 | 316,332 | $ | 4,596,548 | ||||||||||
| Reinvestment of distributions | – | – | 11,544 | 187,243 | ||||||||||||
| Shares reacquired | (769,436 | ) | (15,146,837 | ) | (579,477 | ) | (8,227,429 | ) | ||||||||
| Decrease | (670,830 | ) | $ | (13,239,942 | ) | (251,601 | ) | $ | (3,443,638 | ) | ||||||
| Class R4 Shares | ||||||||||||||||
| Shares sold | 38,326 | $ | 767,766 | 90,472 | $ | 1,337,820 | ||||||||||
| Reinvestment of distributions | – | – | 4,037 | 66,568 | ||||||||||||
| Shares reacquired | (216,539 | ) | (3,983,010 | ) | (175,841 | ) | (2,801,502 | ) | ||||||||
| Decrease | (178,213 | ) | $ | (3,215,244 | ) | (81,332 | ) | $ | (1,397,114 | ) | ||||||
| Class R5 Shares | ||||||||||||||||
| Shares sold | 40,176 | $ | 803,376 | 527,631 | $ | 8,196,957 | ||||||||||
| Reinvestment of distributions | – | – | 15,637 | 266,448 | ||||||||||||
| Shares reacquired | (871,351 | ) | (17,560,650 | ) | (639,879 | ) | (8,882,336 | ) | ||||||||
| Decrease | (831,175 | ) | $ | (16,757,274 | ) | (96,611 | ) | $ | (418,931 | ) | ||||||
| Class R6 Shares | ||||||||||||||||
| Shares sold | 540,028 | $ | 10,832,601 | 1,005,911 | $ | 15,530,561 | ||||||||||
| Reinvestment of distributions | – | – | 24,719 | 423,436 | ||||||||||||
| Shares reacquired | (1,373,932 | ) | (27,830,416 | ) | (1,063,705 | ) | (16,481,416 | ) | ||||||||
| Decrease | (833,904 | ) | $ | (16,997,815 | ) | (33,075 | ) | $ | (527,419 | ) | ||||||
| International Value Fund | Year Ended October 31, 2021 | Year Ended October 31, 2020 | ||||||||||||||
| Class A Shares | Shares | Amount | Shares | Amount | ||||||||||||
| Shares sold | 3,061,134 | $ | 23,907,213 | 3,362,540 | $ | 20,988,271 | ||||||||||
| Converted from Class C* | 606,743 | 4,752,785 | 1,257,977 | 7,942,129 | ||||||||||||
| Reinvestment of distributions | 831,708 | 6,490,509 | 642,320 | 4,069,241 | ||||||||||||
| Shares reacquired | (5,124,680 | ) | (39,688,743 | ) | (11,073,443 | ) | (69,291,701 | ) | ||||||||
| Decrease | (625,095 | ) | $ | (4,538,236 | ) | (5,810,606 | ) | $ | (36,292,060 | ) | ||||||
| Class C Shares | ||||||||||||||||
| Shares sold | 69,931 | $ | 547,796 | 116,560 | $ | 736,623 | ||||||||||
| Reinvestment of distributions | 33,787 | 260,067 | 36,121 | 231,625 | ||||||||||||
| Shares reacquired | (321,117 | ) | (2,473,707 | ) | (1,370,675 | ) | (8,502,971 | ) | ||||||||
| Converted to Class A* | (611,906 | ) | (4,752,785 | ) | (1,268,228 | ) | (7,942,129 | ) | ||||||||
| Decrease | (829,305 | ) | $ | (6,418,629 | ) | (2,486,222 | ) | $ | (15,476,852 | ) | ||||||
| Class F Shares | ||||||||||||||||
| Shares sold | 447,227 | $ | 3,520,651 | 1,276,200 | $ | 8,124,091 | ||||||||||
| Reinvestment of distributions | 95,359 | 748,699 | 81,787 | 520,986 | ||||||||||||
| Shares reacquired | (815,451 | ) | (6,336,462 | ) | (2,869,473 | ) | (17,538,005 | ) | ||||||||
| Decrease | (272,865 | ) | $ | (2,067,112 | ) | (1,511,486 | ) | $ | (8,892,928 | ) | ||||||
257
Notes to Financial Statements (continued)
| International Value Fund | Year Ended October 31, 2021 | Year Ended October 31, 2020 | ||||||||||||||
| Class F3 Shares | Shares | Amount | Shares | Amount | ||||||||||||
| Shares sold | 739,152 | $ | 5,894,112 | 682,416 | $ | 4,290,243 | ||||||||||
| Reinvestment of distributions | 91,373 | 718,721 | 73,214 | 464,168 | ||||||||||||
| Shares reacquired | (733,863 | ) | (5,776,493 | ) | (1,264,958 | ) | (8,054,376 | ) | ||||||||
| Increase (decrease) | 96,662 | $ | 836,340 | (509,328 | ) | $ | (3,299,965 | ) | ||||||||
| Class I Shares | ||||||||||||||||
| Shares sold | 13,551,374 | $ | 109,805,842 | 5,843,812 | $ | 35,479,009 | ||||||||||
| Reinvestment of distributions | 1,142,639 | 9,028,328 | 678,632 | 4,300,880 | ||||||||||||
| Shares reacquired | (5,696,989 | ) | (42,372,150 | ) | (5,256,212 | ) | (34,690,399 | ) | ||||||||
| Increase | 8,997,024 | $ | 76,462,020 | 1,266,232 | $ | 5,089,490 | ||||||||||
| Class R2 Shares | ||||||||||||||||
| Shares sold | 1,002 | $ | 8,031 | 881 | $ | 5,868 | ||||||||||
| Reinvestment of distributions | 74 | 591 | 35 | 218 | ||||||||||||
| Shares reacquired | (988 | ) | (7,800 | ) | (60,515 | ) | (433,765 | ) | ||||||||
| Increase (decrease) | 88 | $ | 822 | (59,599 | ) | $ | (427,679 | ) | ||||||||
| Class R3 Shares | ||||||||||||||||
| Shares sold | 131,877 | $ | 1,063,380 | 114,119 | $ | 720,791 | ||||||||||
| Reinvestment of distributions | 20,973 | 165,652 | 16,184 | 103,892 | ||||||||||||
| Shares reacquired | (192,616 | ) | (1,485,389 | ) | (241,677 | ) | (1,541,470 | ) | ||||||||
| Decrease | (39,766 | ) | $ | (256,357 | ) | (111,374 | ) | $ | (716,787 | ) | ||||||
| Class R4 Shares | ||||||||||||||||
| Shares sold | 15,394 | $ | 117,905 | 2,990 | $ | 20,347 | ||||||||||
| Reinvestment of distributions | 408 | 3,223 | 112 | 701 | ||||||||||||
| Shares reacquired | (2,743 | ) | (20,780 | ) | (2,223 | ) | (13,255 | ) | ||||||||
| Increase | 13,059 | $ | 100,348 | 879 | $ | 7,793 | ||||||||||
| Class R5 Shares | ||||||||||||||||
| Shares sold | 515 | $ | 4,185 | 39 | $ | 212 | ||||||||||
| Reinvestment of distributions | 7 | 53 | 12 | 80 | ||||||||||||
| Shares reacquired | (102 | ) | (849 | ) | (36 | ) | (228 | ) | ||||||||
| Increase | 420 | $ | 3,389 | 15 | $ | 64 | ||||||||||
| Class R6 Shares | ||||||||||||||||
| Shares sold | 24,459 | $ | 187,780 | 8,479 | $ | 54,105 | ||||||||||
| Reinvestment of distributions | 154 | 1,230 | 42 | 270 | ||||||||||||
| Shares reacquired | (10,950 | ) | (83,632 | ) | (66,232 | ) | (393,775 | ) | ||||||||
| Increase (decrease) | 13,663 | $ | 105,378 | (57,711 | ) | $ | (339,400 | ) | ||||||||
| Micro Cap Growth Fund | Year Ended October 31, 2021 | Year Ended October 31, 2020 | ||||||||||||||
| Class A Shares | Shares | Amount | Shares | Amount | ||||||||||||
| Shares sold | 3,899,533 | $ | 79,008,714 | 315,734 | $ | 5,250,326 | ||||||||||
| Converted from Class C* | 2,848 | 55,236 | – | – | ||||||||||||
| Reinvestment of distributions | 216,420 | 3,339,369 | 178,087 | 2,158,413 | ||||||||||||
| Shares reacquired | (1,635,265 | ) | (31,860,611 | ) | (733,350 | ) | (10,796,624 | ) | ||||||||
| Increase (decrease) | 2,483,536 | $ | 50,542,708 | (239,529 | ) | $ | (3,387,885 | ) | ||||||||
258
Notes to Financial Statements (continued)
| Micro Cap Growth Fund | Year Ended October 31, 2021 | Year Ended October 31, 2020 | ||||||||||||||
| Class C Shares(a) | Shares | Amount | Shares | Amount | ||||||||||||
| Shares sold | 610,825 | $ | 15,046,196 | 43,721 | $ | 922,143 | ||||||||||
| Reinvestment of distributions | 16,075 | 303,011 | – | – | ||||||||||||
| Shares reacquired | (89,983 | ) | (2,091,787 | ) | (2,165 | ) | (44,235 | ) | ||||||||
| Converted to Class A* | (2,341 | ) | (55,236 | ) | – | – | ||||||||||
| Increase | 534,576 | $ | 13,202,184 | 41,556 | $ | 877,908 | ||||||||||
| Class F Shares(a) | ||||||||||||||||
| Shares sold | 10,540,463 | $ | 266,716,166 | 602,649 | $ | 12,452,364 | ||||||||||
| Reinvestment of distributions | 199,630 | 3,773,009 | – | – | ||||||||||||
| Shares reacquired | (4,292,107 | ) | (101,849,880 | ) | (12,112 | ) | (240,374 | ) | ||||||||
| Increase | 6,447,986 | $ | 168,639,295 | 590,537 | $ | 12,211,990 | ||||||||||
| Class I Shares | ||||||||||||||||
| Shares sold | 2,545,959 | $ | 61,392,303 | 973,448 | $ | 17,910,932 | ||||||||||
| Reinvestment of distributions | 890,870 | 16,837,445 | 1,130,254 | 15,993,094 | ||||||||||||
| Shares reacquired | (1,330,048 | ) | (31,678,949 | ) | (5,269,377 | ) | (91,866,926 | ) | ||||||||
| Increase (decrease) | 2,106,781 | $ | 46,550,799 | (3,165,675 | ) | $ | (57,962,900 | ) | ||||||||
| Value Opportunities Fund | Year Ended October 31, 2021 | Year Ended October 31, 2020 | ||||||||||||||
| Class A Shares | Shares | Amount | Shares | Amount | ||||||||||||
| Shares sold | 3,005,986 | $ | 64,495,583 | 2,910,034 | $ | 46,055,482 | ||||||||||
| Converted from Class C* | 505,585 | 11,030,413 | 2,248,670 | 37,248,763 | ||||||||||||
| Reinvestment of distributions | 1,967,336 | 36,454,708 | 4,842,769 | 81,745,942 | ||||||||||||
| Shares reacquired | (6,408,852 | ) | (134,991,512 | ) | (14,813,832 | ) | (239,951,578 | ) | ||||||||
| Decrease | (929,945 | ) | $ | (23,010,808 | ) | (4,812,359 | ) | $ | (74,901,391 | ) | ||||||
| Class C Shares | ||||||||||||||||
| Shares sold | 644,345 | $ | 11,394,166 | 318,879 | $ | 4,435,295 | ||||||||||
| Reinvestment of distributions | 284,339 | 4,458,433 | 1,138,754 | 16,511,937 | ||||||||||||
| Shares reacquired | (900,371 | ) | (16,016,634 | ) | (3,181,663 | ) | (44,706,161 | ) | ||||||||
| Converted to Class A* | (599,570 | ) | (11,030,413 | ) | (2,631,705 | ) | (37,248,763 | ) | ||||||||
| Decrease | (571,257 | ) | $ | (11,194,448 | ) | (4,355,735 | ) | $ | (61,007,692 | ) | ||||||
| Class F Shares | ||||||||||||||||
| Shares sold | 1,797,604 | $ | 37,847,528 | 1,381,384 | $ | 23,429,724 | ||||||||||
| Reinvestment of distributions | 439,721 | 8,363,493 | 1,260,844 | 21,812,599 | ||||||||||||
| Shares reacquired | (2,441,356 | ) | (51,421,396 | ) | (5,708,517 | ) | (94,731,088 | ) | ||||||||
| Decrease | (204,031 | ) | $ | (5,210,375 | ) | (3,066,289 | ) | $ | (49,488,765 | ) | ||||||
| Class F3 Shares | ||||||||||||||||
| Shares sold | 1,596,849 | $ | 36,558,401 | 1,695,794 | $ | 28,270,170 | ||||||||||
| Reinvestment of distributions | 608,403 | 11,930,790 | 1,568,561 | 27,904,698 | ||||||||||||
| Shares reacquired | (3,195,857 | ) | (71,397,694 | ) | (5,458,935 | ) | (94,169,448 | ) | ||||||||
| Decrease | (990,605 | ) | $ | (22,908,503 | ) | (2,194,580 | ) | $ | (37,994,580 | ) | ||||||
259
Notes to Financial Statements (concluded)
| Value Opportunities Fund | Year Ended October 31, 2021 | Year Ended October 31, 2020 | ||||||||||||||
| Class I Shares | Shares | Amount | Shares | Amount | ||||||||||||
| Shares sold | 6,520,855 | $ | 152,442,751 | 2,064,402 | $ | 34,869,803 | ||||||||||
| Reinvestment of distributions | 675,691 | 13,148,938 | 1,753,254 | 30,997,529 | ||||||||||||
| Shares reacquired | (2,888,534 | ) | (63,604,654 | ) | (6,620,246 | ) | (111,712,805 | ) | ||||||||
| Increase (decrease) | 4,308,012 | $ | 101,987,035 | (2,802,590 | ) | $ | (45,845,473 | ) | ||||||||
| Class P Shares | ||||||||||||||||
| Shares sold | 79,069 | $ | 1,623,649 | 96,551 | $ | 1,526,223 | ||||||||||
| Reinvestment of distributions | 50,134 | 906,422 | 148,473 | 2,448,323 | ||||||||||||
| Shares reacquired | (387,193 | ) | (7,742,666 | ) | (459,366 | ) | (7,377,885 | ) | ||||||||
| Decrease | (257,990 | ) | $ | (5,212,595 | ) | (214,342 | ) | $ | (3,403,339 | ) | ||||||
| Class R2 Shares | ||||||||||||||||
| Shares sold | 31,406 | $ | 644,725 | 48,385 | $ | 720,604 | ||||||||||
| Reinvestment of distributions | 16,949 | 297,456 | 40,808 | 654,971 | ||||||||||||
| Shares reacquired | (90,409 | ) | (1,814,660 | ) | (151,121 | ) | (2,282,070 | ) | ||||||||
| Decrease | (42,054 | ) | $ | (872,479 | ) | (61,928 | ) | $ | (906,495 | ) | ||||||
| Class R3 Shares | ||||||||||||||||
| Shares sold | 392,875 | $ | 8,002,976 | 462,949 | $ | 7,040,130 | ||||||||||
| Reinvestment of distributions | 139,781 | 2,492,301 | 389,411 | 6,339,608 | ||||||||||||
| Shares reacquired | (1,219,492 | ) | (24,413,278 | ) | (1,480,687 | ) | (23,164,281 | ) | ||||||||
| Decrease | (686,836 | ) | $ | (13,918,001 | ) | (628,327 | ) | $ | (9,784,543 | ) | ||||||
| Class R4 Shares | ||||||||||||||||
| Shares sold | 289,822 | $ | 6,215,019 | 248,272 | $ | 3,995,003 | ||||||||||
| Reinvestment of distributions | 106,339 | 1,968,337 | 272,329 | 4,591,465 | ||||||||||||
| Shares reacquired | (657,886 | ) | (13,558,997 | ) | (816,106 | ) | (13,379,541 | ) | ||||||||
| Decrease | (261,725 | ) | $ | (5,375,641 | ) | (295,505 | ) | $ | (4,793,073 | ) | ||||||
| Class R5 Shares | ||||||||||||||||
| Shares sold | 20,489 | $ | 459,253 | 32,461 | $ | 592,474 | ||||||||||
| Reinvestment of distributions | 5,925 | 115,427 | 16,871 | 298,450 | ||||||||||||
| Shares reacquired | (54,178 | ) | (1,187,542 | ) | (72,377 | ) | (1,293,024 | ) | ||||||||
| Decrease | (27,764 | ) | $ | (612,862 | ) | (23,045 | ) | $ | (402,100 | ) | ||||||
| Class R6 Shares | ||||||||||||||||
| Shares sold | 438,800 | $ | 10,002,897 | 343,530 | $ | 5,936,985 | ||||||||||
| Reinvestment of distributions | 75,851 | 1,485,915 | 205,390 | 3,651,835 | ||||||||||||
| Shares reacquired | (399,116 | ) | (9,017,125 | ) | (963,533 | ) | (17,109,981 | ) | ||||||||
| Increase (decrease) | 115,535 | $ | 2,471,687 | (414,613 | ) | $ | (7,521,161 | ) | ||||||||
| * | Automatic conversion of Class C shares occurs on the 25th day of the month (or, if the 25th day was not a business day, the next business day thereafter) following the eighth anniversary of the day on which the purchase order was accepted. Prior to June 30, 2020, conversion occurred following the tenth anniversary of the day on which the purchase was accepted. |
| (a) | Commenced on August 28, 2020. |
260
Report of Independent Registered Public Accounting Firm
To the shareholders and the Board of Trustees of Lord Abbett Securities Trust
Opinion on the Financial Statements and Financial Highlights
We have audited the accompanying statements of assets and liabilities, including the schedules of investments, of Lord Abbett Alpha Strategy Fund, Lord Abbett Durable Growth Fund, Lord Abbett Focused Growth Fund, Lord Abbett Focused Large Cap Value Fund, Lord Abbett Focused Small Cap Value Fund, Lord Abbett Fundamental Equity Fund, Lord Abbett Global Equity Fund (formerly Lord Abbett Global Equity Research Fund), Lord Abbett Growth Leaders Fund, Lord Abbett Health Care Fund, Lord Abbett International Equity Fund, Lord Abbett International Opportunities Fund, Lord Abbett International Value Fund, Lord Abbett Micro Cap Growth Fund and Lord Abbett Value Opportunities Fund, the funds constituting the Lord Abbett Securities Trust (the “Trust”), as of October 31, 2021, the related statements of operations for the year then ended, the statements of changes in net assets for each of the two years in the period then ended, the financial highlights for each of the five years in the period then ended for the Trust, except for the Funds listed in the table below; the related statements of operations, changes in net assets, and the financial highlights for the periods indicated in the table below; and the related notes. In our opinion, the financial statements and financial highlights present fairly, in all material respects, the financial position of each of the funds listed above constituting the Trust as of October 31, 2021, and the results of their operations for the year then ended, the changes in their net assets for each of the two years in the period then ended and the financial highlights for each of the five years in the period then ended (or for the period listed in the table below), in conformity with accounting principles generally accepted in the United States of America.
| Individual Funds constituting Lord Abbett Securities Trust | Financial Highlights |
| Lord Abbett Global Equity Fund (formerly Lord Abbett Global Equity Research Fund) | For the years ended October 31, 2021, 2020, 2019, 2018, and the period from January 17, 2017 (commencement of operations) through October 31, 2017 |
| Lord Abbett Durable Growth Fund | For the years ended October 31, 2021 and October 31, 2020 |
| Lord Abbett Focused Growth Fund | For the years ended October 31, 2021 and 2020, and the period from January 30, 2019 (commencement of operations) through October 31, 2019 |
| Lord Abbett Focused Large Cap Value Fund | For the years ended October 31, 2021 and 2020, and the period from July 26, 2019 (commencement of operations) through October 31, 2019 |
| Lord Abbett Health Care Fund | For the years ended October 31, 2021 and 2020, and the period from July 26, 2019 (commencement of operations) through October 31, 2019 |
Basis for Opinion
These financial statements and financial highlights are the responsibility of the Trust’s management. Our responsibility is to express an opinion on the Trust’s financial statements and financial highlights based on our audits. We are a public accounting firm registered with the Public Company Accounting Oversight Board (United States) (PCAOB) and are required to be independent with respect to the Trust in accordance with the U.S. federal securities laws and the applicable rules and regulations of the Securities and Exchange Commission and the PCAOB.
We conducted our audits in accordance with the standards of the PCAOB. Those standards require that we plan and perform the audit to obtain reasonable assurance about whether the financial statements and financial highlights are free of material misstatement, whether due to error or fraud. The Trust is not required to have, nor were we engaged to perform, an audit of its internal
261
control over financial reporting. As part of our audits we are required to obtain an understanding of internal control over financial reporting but not for the purpose of expressing an opinion on the effectiveness of the Trust’s internal control over financial reporting. Accordingly, we express no such opinion.
Our audits included performing procedures to assess the risks of material misstatement of the financial statements and financial highlights, whether due to error or fraud, and performing procedures that respond to those risks. Such procedures included examining, on a test basis, evidence regarding the amounts and disclosures in the financial statements and financial highlights. Our audits also included evaluating the accounting principles used and significant estimates made by management, as well as evaluating the overall presentation of the financial statements and financial highlights. Our procedures included confirmation of securities owned as of October 31, 2021, by correspondence with the custodian and brokers; when replies were not received from brokers, we performed other auditing procedures. We believe that our audits provide a reasonable basis for our opinion.
DELOITTE & TOUCHE LLP
New York, New York
December 23, 2021
We have served as the auditor of one or more Lord Abbett Family of Funds’ investment companies since 1932.
262
Investments in Underlying Funds (unaudited)
Alpha Strategy Fund invests in Underlying Funds managed by Lord Abbett. As of October 31, 2021, Alpha Strategy Fund’s long-term investments were allocated among the Underlying Funds as follows:
Alpha Strategy Fund’s Investments:
| Underlying Fund Name | % of Investments |
| Lord Abbett Developing Growth Fund, Inc. | 19.94% |
| Lord Abbett Focused Small Cap Value Fund | 10.24% |
| Lord Abbett International Opportunities Fund | 19.38% |
| Lord Abbett Micro Cap Growth Fund | 9.70% |
| Lord Abbett Small Cap Value Fund | 20.30% |
| Lord Abbett Value Opportunities Fund | 20.44% |
| Total | 100.00% |
| Developing Growth Fund | |
| Ten Largest Holdings | % of Investments |
| Crocs, Inc. | 2.68% |
| Inmode Ltd. | 2. 23% |
| Calix, Inc. | 2.18% |
| Endava plc | 2.02% |
| Axon Enterprise, Inc. | 2.00% |
| Semtech Corp. | 1.90% |
| Shockwave Medical, Inc. | 1.88% |
| Diodes, Inc. | 1.79% |
| Rapid7, Inc. | 1.76% |
| Sprout Social, Inc. Class A | 1.76% |
| Holdings by Sector | % of Investments |
| Communication Services | 3.55% |
| Consumer Discretionary | 16.60% |
| Consumer Staples | 2.78% |
| Financials | 5.49% |
| Health Care | 25.80% |
| Industrials | 12.91% |
| Information Technology | 29.39% |
| Materials | 3.10% |
| Repurchase Agreements | 0.38% |
| Total | 100.00% |
| Focused Small Cap Value Fund | |
| Ten Largest Holdings | % of Investments |
| Bancorp, Inc. (The) | 3.76% |
| Victory Capital Holdings, Inc. | 3.02% |
| Customers Bancorp, Inc. | 2.88% |
| International Money Express, Inc. | 2.81% |
| Western Alliance Bancorp | 2.65% |
| Sunstone Hotel Investors, Inc. | 2.65% |
| Masonite International Corp. | 2.55% |
| MEG Energy Corp. | 2.54% |
| Stewart Information Services Corp. | 2.50% |
| Valaris Ltd. | 2.46% |
263
| Investments in Underlying Funds (unaudited)(continued) | |
| Holdings by Sector | % of Investments |
| Communication Services | 4.25% |
| Consumer Discretionary | 7.32% |
| Consumer Staples | 3.87% |
| Energy | 10.69% |
| Financials | 30.91% |
| Health Care | 4.95% |
| Industrials | 14.73% |
| Information Technology | 8.38% |
| Materials | 6.60% |
| Real Estate Investment Trusts | 5.78% |
| Repurchase Agreements | 1.51% |
| Time Deposits | 0.10% |
| Money Market Funds | 0.91% |
| Total | 100.00% |
| International Opportunities Fund | |
| Ten Largest Holdings | % of Investments |
| ANDRITZ AG | 1.87% |
| Britvic plc | 1.81% |
| REN - Redes Energeticas Nacionais SGPS SA | 1.73% |
| Banco Santander Mexico SA Institucion de Banca Multiple Grupo Financiero Santand | 1.72% |
| Rheinmetall AG | 1.70% |
| NS Solutions Corp. | 1.65% |
| PATRIZIA AG | 1.59% |
| Man Group plc | 1.57% |
| GUD Holdings Ltd. | 1.55% |
| UTI Asset Management Co. Ltd. | 1.50% |
| Holdings by Sector | % of Investments |
| Communication Services | 3.17% |
| Consumer Discretionary | 12.29% |
| Consumer Staples | 4.49% |
| Financials | 13.07% |
| Health Care | 6.75% |
| Industrials | 24.55% |
| Information Technology | 11.22% |
| Materials | 10.63% |
| Real Estate Investment Trusts | 9.46% |
| Utilities | 2.73% |
| Repurchase Agreements | 1.64% |
| Total | 100.00% |
264
| Investments in Underlying Funds (unaudited)(continued) | |
| Micro Cap Growth Fund | |
| Ten Largest Holdings | % of Investments |
| Calix, Inc. | 3.19% |
| Sprout Social, Inc. | 2.75% |
| Axonics, Inc. | 2.45% |
| Shyft Group, Inc. (The) | 2.43% |
| Montrose Environmental Group, Inc. | 2.36% |
| Ameresco, Inc. | 2.01% |
| Lovesac Co. (The) | 1.98% |
| Ooma, Inc. | 1.96% |
| Celsius Holdings, Inc. | 1.95% |
| OrthoPediatrics Corp. | 1.91% |
| Holdings by Sector | % of Investments |
| Communication Services | 5.66% |
| Consumer Discretionary | 14.90% |
| Consumer Staples | 4.06% |
| Financials | 5.96% |
| Health Care | 30.09% |
| Industrials | 14.60% |
| Information Technology | 21.70% |
| Repurchase Agreements | 0.99% |
| Time Deposits | 0.20% |
| Money Market Funds | 1.84% |
| Total | 100.00% |
| Small Cap Value Fund | |
| Ten Largest Holdings | % of Investments |
| Bancorp, Inc. (The) | 3.03% |
| Triumph Bancorp, Inc. | 2.86% |
| Customers Bancorp, Inc. | 2.67% |
| MEG Energy Corp. | 2.20% |
| PacWest Bancorp | 2.19% |
| Valvoline, Inc. | 2.07% |
| Avient Corp. | 2.06% |
| Victory Capital Holdings, Inc. | 2.02% |
| International Money Express, Inc. | 2.02% |
| Crane Co. | 1.96% |
265
| Investments in Underlying Funds (unaudited)(concluded) | |
| Holdings by Sector | % of Investments |
| Communication Services | 4.31% |
| Consumer Discretionary | 7.52% |
| Consumer Staples | 2.82% |
| Energy | 7.28% |
| Financials | 26.24% |
| Health Care | 7.06% |
| Industrials | 16.00% |
| Information Technology | 11.30% |
| Materials | 6.41% |
| Real Estate Investment Trusts | 9.13% |
| Utilities | 1.58% |
| Repurchase Agreements | 0.35% |
| Total | 100.00% |
| Value Opportunities Fund | |
| Ten Largest Holdings | % of Investments |
| Entegris, Inc. | 2.18% |
| Generac Holdings, Inc. | 2.13% |
| Valvoline, Inc. | 2.05% |
| Charles River Laboratories International, Inc. | 2.01% |
| Carlisle Cos., Inc. | 2.00% |
| Crane Co. | 1.98% |
| Stewart Information Services Corp. | 1.95% |
| Saia, Inc. | 1.91% |
| Western Alliance Bancorp | 1.88% |
| STERIS plc | 1.85% |
| Holdings by Sector | % of Investments |
| Communication Services | 2.93% |
| Consumer Discretionary | 10.06% |
| Consumer Staples | 2.83% |
| Energy | 3.71% |
| Financials | 14.97% |
| Health Care | 13.70% |
| Industrials | 18.22% |
| Information Technology | 13.48% |
| Materials | 9.50% |
| Real Estate Investment Trusts | 7.66% |
| Utilities | 2.35% |
| Repurchase Agreements | 0.59% |
| Total | 100.00% |
266
Basic Information About Management
The Board is responsible for the management of the business and affairs of the Fund in accordance with the laws of the state of organization. The Board elects officers who are responsible for the day-to-day operations of the Fund and who execute policies authorized by the Board. The Board also approves an investment adviser to the Fund and continues to monitor the cost and quality of the services the investment adviser provides, and annually considers whether to renew the contract with the investment adviser. Generally, each Board member holds office until his/her successor is elected and qualified or until his/her earlier resignation or removal, as provided in the Fund’s organizational documents.
Lord, Abbett & Co. LLC (“Lord Abbett”), a Delaware limited liability company, is the Fund’s investment adviser. Designated Lord Abbett personnel are responsible for the day-to-day management of the Fund.
Independent Board Members
The following Independent Board Members also are board members of each of the 14 investment companies in the Lord Abbett Family of Funds, which consist of 62 investment portfolios.
| Name, Address and Year of Birth | Current Position and Length of Service with the Fund | Principal Occupation and Other Directorships During the Past Five Years | ||
| Evelyn E. Guernsey Lord, Abbett & Co. LLC c/o Legal Dept. 90 Hudson Street Jersey City, NJ 07302 (1955) | Board member since 2011 | Principal Occupation: None.
Other Directorships: None. | ||
| Julie A. Hill Lord, Abbett & Co. LLC c/o Legal Dept. 90 Hudson Street Jersey City, NJ 07302 (1946) | Board member since 2004 | Principal Occupation: Owner and CEO of The Hill Company, a business consulting firm (since 1998).
Other Directorships: Currently serves as director of Anthem, Inc., a health benefits company (since 1994). | ||
| Kathleen M. Lutito Lord, Abbett & Co. LLC c/o Legal Dept. 90 Hudson Street Jersey City, NJ 07302 (1963) | Board member since 2017 | Principal Occupation: President and Chief Investment Officer of CenturyLink Investment Management Company (since 2006).
Other Directorships: None. | ||
| James M. McTaggart Lord, Abbett & Co. LLC c/o Legal Dept. 90 Hudson Street Jersey City, NJ 07302 (1947) | Board member since 2012 | Principal Occupation: Independent management advisor and consultant (since 2012).
Other Directorships: Blyth, Inc., a home products company (2004-2015). | ||
| Charles O. Prince Lord, Abbett & Co. LLC c/o Legal Dept. 90 Hudson Street Jersey City, NJ 07302 (1950) | Board member since 2019 | Principal Occupation: None. Formerly Chairman and Chief Executive Officer, Citigroup, Inc. (Retired 2007).
Other Directorships: Currently serves as director of Johnson & Johnson (2006-Present). Previously served as director of Xerox Corporation (2008-2018). |
267
Basic Information About Management (continued)
| Name, Address and Year of Birth | Current Position and Length of Service with the Fund | Principal Occupation and Other Directorships During the Past Five Years | ||
Karla M. Rabusch (1959) | Board member since 2017 | Principal Occupation: President and Director of Wells Fargo Funds Management, LLC (2003-2017); President of Wells Fargo Funds (2003-2016).
Other Directorships: None. | ||
| Lorin Patrick | ||||
| Taylor Radtke Lord, Abbett & Co. LLC c/o Legal Dept. 90 Hudson Street Jersey City, NJ 07302 (1968) | Board member since 2021 | Principal Occupation: Partner and Co-Founder of M Seven 8 Partners LLC, a venture capital firm (since 2016). Formerly partner, Goldman Sachs.
Other Directorships: Currently serves as director of Assured Guaranty (2021–Present). | ||
| Leah Song Richardson Lord, Abbett & Co. LLC c/o Legal Dept. 90 Hudson Street Jersey City, NJ 07302 (1966) | Board member since 2021 | Principal Occupation: President of Colorado College (since 2021) and was formerly Dean at University of California, Irvine–School of Law (2017–2021) and formerly Professor of Law at University of California, Irvine (2014–2017).
Other Directorships: None. | ||
| Mark A. Schmid Lord, Abbett & Co. LLC c/o Legal Dept. 90 Hudson Street Jersey City, NJ 07302 (1959) | Board member since 2016 | Principal Occupation: None.
Other Directorships: None. | ||
| James L.L. Tullis Lord, Abbett & Co. LLC c/o Legal Dept. 90 Hudson Street Jersey City, NJ 07302 (1947) | Board member since 2006; Chairman since 2017 | Principal Occupation: Chairman of Tullis Health Investors-FL LLC (since 2018); CEO of Tullis-Dickerson and Co. Inc., a venture capital management firm (1990–2016).
Other Directorships: Currently serves as director of Crane Co. (since 1998), Alphatec Spine (since 2018), electroCore, Inc. (since 2018), and Exagen Inc. (since 2019). |
Interested Board Members
Mr. Sieg is affiliated with Lord Abbett and is an “interested person” of the Fund as defined in the Act. Mr. Sieg is a board member of each of the 14 investment companies in the Lord Abbett Family of Funds, which consist of 62 investment portfolios. Mr. Sieg is an officer of the Lord Abbett Family of Funds.
| Name, Address and Year of Birth | Current Position and Length of Service with the Fund | Principal Occupation and Other Directorships During the Past Five Years | ||
| Douglas B. Sieg Lord, Abbett & Co. LLC 90 Hudson Street Jersey City, NJ 07302 (1969) | Board member since 2016; President and Chief Executive Officer since 2018 | Principal Occupation: Managing Partner (since 2018) and was formerly Head of Client Services, joined Lord Abbett in 1994.
Other Directorships: None. |
268
Basic Information About Management (continued)
Officers
None of the officers listed below have received compensation from the Fund. All of the officers of the Fund also may be officers of the other Lord Abbett Funds and maintain offices at 90 Hudson Street, Jersey City, NJ 07302. Unless otherwise indicated, the position(s) and title(s) listed under the “Principal Occupation During the Past Five Years” column indicate each officer’s position(s) and title(s) with Lord Abbett. Each officer serves for an indefinite term (i.e., until his or her death, resignation, retirement, or removal).
| Name and Year of Birth | Current Position with the Fund | Length of Service of Current Position | Principal Occupation During the Past Five Years | |||
| Douglas B. Sieg (1969) | President and Chief Executive Officer | Elected as President and Chief Executive Officer in 2018 | Managing Partner of Lord Abbett (since 2018) and was formerly Head of Client Services, joined Lord Abbett in 1994. | |||
| Jackson C. Chan (1964) | AML Compliance Officer | Elected in 2018 | Deputy Chief Compliance Officer and Director of Regulatory Affairs, joined Lord Abbett in 2014. | |||
| Pamela P. Chen (1978) | Vice President, Assistant Secretary and Privacy Officer | Elected as Vice President and Assistant Secretary in 2018 and Privacy Officer in 2019 | Associate General Counsel, joined Lord Abbett in 2017 and was formerly Special Counsel at Schulte, Roth & Zabel LLP (2005–2017). | |||
| John T. Fitzgerald (1975) | Vice President and Assistant Secretary | Elected in 2018 | Deputy General Counsel, joined Lord Abbett in 2018 and was formerly Deputy Head of U.S. Funds Legal, Executive Director and Assistant General Counsel at JPMorgan Chase (2005–2018). | |||
| Vito A. Fronda (1969) | Vice President and Assistant Treasurer | Elected as Vice President and Assistant Treasurer in 2021 | Partner and Director of U.S. Fund Treasury & Global Taxation, joined Lord Abbett in 2003. | |||
| Michael J. Hebert (1976) | Chief Financial Officer and Treasurer | Elected as Chief Financial Officer and Treasurer in 2021 | Head of Global Fund Finance, joined Lord Abbett in 2021 and was formerly Vice President at Eaton Vance Management (EVM) (2014-2021) and Calvert Research & Management (CRM) (2016-2021), and Assistant Treasurer of registered investment companies managed, advised or administered by EVM and CRM during such years. |
269
Basic Information About Management (concluded)
| Name and Year of Birth | Current Position with the Fund | Length of Service of Current Position | Principal Occupation During the Past Five Years | |||
| Linda Y. Kim (1980) | Vice President and Assistant Secretary | Elected in 2016 | Counsel, joined Lord Abbett in 2015. | |||
| Joseph M. McGill (1962) | Chief Compliance Officer | Elected in 2014 | Partner and Chief Compliance Officer, joined Lord Abbett in 2014. | |||
| Amanda S. Ryan (1978) | Vice President and Assistant Secretary | Elected in 2018 | Counsel, joined Lord Abbett in 2016. | |||
| Lawrence B. Stoller (1963) | Vice President, Secretary and Chief Legal Officer | Elected as Vice President and Secretary in 2007 and Chief Legal Officer in 2019 | Partner and General Counsel, joined Lord Abbett in 2007. |
Please call 888-522-2388 for a copy of the statement of additional information, which contains further information about the Fund’s Board members. It is available free upon request.
270
Liquidity Risk Management Program
Pursuant to Rule 22e-4 under the 1940 Act, each Fund has adopted a Liquidity Risk Management Program and Policy (“Program”). The Program is designed to assess, manage and periodically review each Fund’s liquidity risk. Liquidity risk is defined under Rule 22e-4 as the risk that each Fund could not meet redemption requests without significant dilution of remaining investors’ interests in the Fund. The Board has appointed Lord Abbett as the administrator for each Fund’s Program. At the June 2-3, 2021 meeting, Lord Abbett provided the Board with a report addressing the operation of the Program and assessing its adequacy and effectiveness of implementation for the period March 1, 2020 through March 1, 2021. Lord Abbett reported that the Program operated effectively during the period. In particular, Lord Abbett reported that: each Fund did not breach its 15% limit on illiquid investments at any point during the period and all regulatory reporting related to Rule 22e-4 was completed on time and without issue during the period. There can be no assurance that the Program will achieve its objectives in the future. Please refer to the Funds’ prospectus for more information regarding each Fund’s exposure to liquidity risk and other principal risks to which an investment in each Fund may be subject.
Householding
The Trust has adopted a policy that allows it to send only one copy of each Fund’s prospectus, proxy material, annual report and semiannual report (or related notice of internet availability of annual report and semiannual report) to certain shareholders residing at the same “household.” This reduces Fund expenses, which benefits you and other shareholders. If you need additional copies or do not want your mailings to be “householded,” please call Lord Abbett at 888-522-2388 or send a written request with your name, the name of your fund or funds and your account number or numbers to Lord Abbett Family of Funds, P.O. Box 219336, Kansas City, MO 64121.
Proxy Voting Policies, Procedures and Records
A description of the policies and procedures that Lord Abbett uses to vote proxies related to each Fund’s portfolio securities, and information on how Lord Abbett voted each Fund’s proxies during the 12-month period ended June 30 are available without charge, upon request, (i) by calling 888-522-2388; (ii) on Lord Abbett’s Website at www.lordabbett.com; and (iii) on the Securities and Exchange Commission’s (“SEC”) Website at www.sec.gov.
Shareholder Reports and Quarterly Portfolio Disclosure
The Funds are required to file their complete schedule of portfolio holdings with the SEC for their first and third fiscal quarters as an attachment to Form N-PORT. Copies of the filings are available without charge, upon request on the SEC’s Website at www.sec.gov and may be available by calling Lord Abbett at 888-522-2388.
271
Tax Information
The percentages below reflect the portion of ordinary income distributions that are eligible for the corporate dividend received deduction (DRD) and qualified dividend income (QDI) for individual shareholders:
| Fund Name | DRD | QDI | |||
| Alpha Strategy Fund | 32% | 32% | |||
| Durable Growth Fund | 100% | 100% | |||
| Focused Growth Fund | 3% | 3% | |||
| Focused Large Cap Value Fund | 21% | 22% | |||
| Focused Small Cap Value Fund | 100% | 100% | |||
| Fundamental Equity Fund | 100% | 100% | |||
| Global Equity Fund | 39% | 100% | |||
| Growth Leaders Fund | 5% | 5% | |||
| Health Care Fund | 100% | 100% | |||
| International Equity Fund | 0% | 100% | |||
| International Opportunities Fund | 0% | 0% | |||
| International Value Fund | 1% | 96% | |||
| Micro Cap Growth | 1% | 1% | |||
| Value Opportunities Fund | 100% | 100% |
Additionally, of the distributions paid to the shareholders during the fiscal year ended October 31, 2021, the following amounts represent short-term and long-term capital gains:
| Fund Name | Short-Term Capital Gains | Long-Term Capital Gains | |||
| Alpha Strategy Fund | $ – | $ 50,784,144 | |||
| Durable Growth Fund | 4,421,949 | – | |||
| Focused Growth Fund | 1,864,114 | 140,858 | |||
| Focused Large Cap Value Fund | 31,512,021 | – | |||
| Global Equity Fund | – | 278,151 | |||
| Growth Leaders Fund | 392,566,629 | 327,647,029 | |||
| Health Care Fund | 491,910 | 8,110 | |||
| Micro Cap Growth | 13,473,195 | 16,614,432 | |||
| Value Opportunities Fund | 276,299 | 79,109,540 | |||
| The Funds listed below intend to pass through foreign source income and foreign taxes as follows: | |||||
| Fund Name | Foreign Source Income | Foreign Taxes | |||
| International Equity Fund | $ 9,212,173 | $433,261 | |||
| International Opportunities Fund | 10,789,927 | 249,517 | |||
| International Value Fund | 24,815,286 | 362,413 | |||
272
 | ||||
This report, when not used for the general information of shareholders of the Fund, is to be distributed only if preceded or accompanied by a current fund prospectus.
Lord Abbett mutual fund shares are distributed by LORD ABBETT DISTRIBUTOR LLC. | Lord Abbett Securities Trust
Lord Abbett Alpha Strategy Fund Lord Abbett Durable Growth Fund Lord Abbett Focused Growth Fund Lord Abbett Focused Large Cap Value Fund Lord Abbett Focused Small Cap Value Fund Lord Abbett Fundamental Equity Fund Lord Abbett Global Equity Fund Lord Abbett Growth Leaders Fund Lord Abbett Health Care Fund Lord Abbett International Equity Fund Lord Abbett International Opportunities Fund Lord Abbett International Value Fund Lord Abbett Micro-Cap Growth Fund Lord Abbett Value Opportunities Fund | LST-2 (12/21) |

| Item 2: | Code of Ethics. |
| (a) | In accordance with applicable requirements, the Registrant adopted a Sarbanes-Oxley Code of Ethics on June 19, 2003 that applies to the principal executive officer and senior financial officers of the Registrant (“Code of Ethics”). The Code of Ethics was in effect during the fiscal year ended October 31, 2021 (the “Period”). |
| (b) | Not applicable. |
| (c) | The Registrant has not amended the Code of Ethics as described in Form N-CSR during the Period. |
| (d) | The Registrant has not granted any waiver, including an implicit waiver, from a provision of the Code of Ethics as described in Form N-CSR during the Period. |
| (e) | Not applicable. |
| (f) | See Item 12(a)(1) concerning the filing of the Code of Ethics. |
| Item 3: | Audit Committee Financial Expert. |
The Registrant’s board of trustees has determined that each of the following independent trustees who are members of the audit committee is an audit committee financial expert: Evelyn E. Guernsey, Karla M. Rabusch and Mark A. Schmid. Each of these persons is independent within the meaning of the Form N-CSR.
| Item 4: | Principal Accountant Fees and Services. |
In response to sections (a), (b), (c) and (d) of Item 4, the aggregate fees billed to the Registrant for the fiscal years ended October 31, 2021 and 2020 by the Registrant’s principal accounting firm, Deloitte & Touche LLP, the member firms of Deloitte Touche Tohmatsu and their respective affiliates (collectively, “Deloitte”) were as follows:
| Fiscal year ended: | ||||||
| 2021 | 2020 | |||||
| Audit Fees {a} | $560,000 | $566,500 | ||||
| Audit-Related Fees | - 0 - | - 0 - | ||||
| Total audit and audit-related fees | 560,000 | 566,500 | ||||
| Tax Fees {b} | 82,337 | 88,193 | ||||
| All Other Fees | - 0 - | - 0 - | ||||
| Total Fees | $642,337 | $654,693 | ||||
{a} Consists of fees for audits of the Registrant’s annual financial statements.
{b} Fees for the fiscal year ended October 31, 2021 and 2020 consist of fees for preparing the U.S. Income Tax Return for Regulated Investment Companies, New Jersey Corporation Business Tax Return, New Jersey Annual Report Form, U.S. Return of Excise Tax on Undistributed Income of Investment Companies, IRS Forms 1099-MISC and 1096 Annual Summary and Transmittal of U.S. Information Returns.
(e) (1) Pursuant to Rule 2-01(c) (7) of Regulation S-X, the Registrant’s Audit Committee has adopted pre-approval policies and procedures. Such policies and procedures generally provide that the Audit Committee must pre-approve:
| · | any audit, audit-related, tax, and other services to be provided to the Lord Abbett Funds, including the Registrant, and | |
| · | any audit-related, tax, and other services to be provided to the Registrant’s investment adviser and any entity controlling, controlled by or under common control with the investment adviser that provides ongoing services to one or more Funds comprising the Registrant if the engagement relates directly to operations and financial reporting of a Fund, by the independent auditor to assure that the provision of such services does not impair the auditor’s independence. |
The Audit Committee has delegated pre-approval authority to its Chairman, subject to a fee limit of $10,000 per event, and not to exceed $25,000 annually. The Chairman will report any pre-approval decisions to the Audit Committee at its next scheduled meeting. Unless a type of service to be provided by the independent auditor has received general pre-approval, it must be pre-approved by the Audit Committee. Any proposed services exceeding pre-approved cost levels will require specific pre-approval by the Audit Committee.
(e) (2) The Registrant’s Audit Committee has approved 100% of the services described in this Item 4 (b) through (d).
(f) Not applicable.
(g) The aggregate non-audit fees billed by Deloitte for services rendered to the Registrant are shown above in the response to Item 4 (a), (b), (c) and (d) as “All Other Fees”.
The aggregate non-audit fees billed by Deloitte for services rendered to the Registrant’s investment adviser, Lord, Abbett & Co. LLC (“Lord Abbett”), for the fiscal years ended October 31, 2021 and 2020 were:
| Fiscal year ended: | ||
| 2021 | 2020 | |
| All Other Fees {a} | $220,000 | $214,142 |
{a} Consist of fees for Independent Services Auditors’ Report on Controls Placed in Operation and Tests of Operating Effectiveness related to Lord Abbett’s Asset Management Services (“SOC-1 Report”).
The aggregate non-audit fees billed by Deloitte for services rendered to entities under the common control of Lord Abbett for the fiscal years ended October 31, 2021 and 2020 were:
| Fiscal year ended: | ||
| 2021 | 2020 | |
| All Other Fees | $ - 0 - | $ - 0- |
(h) The Registrant’s Audit Committee has considered the provision of non-audit services that were rendered to the Registrant’s investment adviser, and any entity controlling, controlled by or under common control with the investment adviser that provides ongoing services to the Registrant, that were not pre-approved pursuant to Rule 2-01 (c)(7)(ii) of Regulation S-X and has determined that the provision of such services is compatible with maintaining Deloitte’s independence.
| Item 5: | Audit Committee of Listed Registrants. |
Not applicable.
| Item 6: | Investments. |
Not applicable.
| Item 7: | Disclosure of Proxy Voting Policies and Procedures for Closed-End Management Investment Companies. |
Not applicable.
| Item 8: | Portfolio Managers of Closed-End Management Investment Companies. |
Not applicable.
| Item 9: | Purchases of Equity Securities by Closed-End Management Investment Company and Affiliated Purchasers. |
Not applicable.
| Item 10: | Submission of Matters to a Vote of Security Holders. |
Not applicable.
| Item 11: | Controls and Procedures. |
| (a) | The principal executive officer and principal financial & accounting officer have concluded as of a date within 90 days of the filing date of this report, based on their evaluation of the Registrant’s disclosure controls and procedures (as defined in Rule 30a-3(c) under the Investment Company Act of 1940), that the design of such procedures is effective to provide reasonable assurance that material information required to be disclosed by the Registrant on Form N-CSR is recorded, processed, summarized and reported within the time periods specified in the Commission’s rules and forms. |
| (b) | There were no changes in the Registrant’s internal control over financial reporting (as defined in Rule 30a-3(d) under the Investment Company Act of 1940) that occurred during the period covered by this report that have materially affected, or are reasonably likely to materially affect, the Registrant’s internal control over financial reporting. |
| Item 12: | Disclosure of Securities Lending Activities for Closed-End Management Investment Companies. |
Not applicable.
| Item 13: | Exhibits. |
| (a)(1) | The Lord Abbett Family of Funds Sarbanes-Oxley Code of Ethics for the Principal Executive Officer and Senior Financial Officers is attached hereto as part of EX-99.CODEETH. |
SIGNATURES
Pursuant to the requirements of the Securities Exchange Act of 1934 and the Investment Company Act of 1940, the Registrant has duly caused this report to be signed on its behalf by the undersigned, thereunto duly authorized.
| LORD ABBETT SECURITIES TRUST | ||
| By: | /s/ Douglas B. Sieg | |
| Douglas B. Sieg | ||
| President and Chief Executive Officer |
December 23, 2021
Pursuant to the requirements of the Securities Exchange Act of 1934 and the Investment Company Act of 1940, this report has been signed below by the following persons on behalf of the Registrant and in the capacities and on the dates indicated.
| By: | /s/ Douglas B. Sieg | |
| Douglas B. Sieg | ||
| President and Chief Executive Officer |
December 23, 2021
| By: | /s/ Michael J. Hebert | |
| Michael J. Hebert | ||
| Chief Financial Officer and Treasurer |
December 23, 2021