SEPTEMBER 30, 2008
RYDEX SERIES FUNDS SEMI-ANNUAL REPORT
DOMESTIC EQUITY FUNDS
MULTI-CAP CORE EQUITY FUND
SECTOR ROTATION FUND
ALTERNATIVE INVESTMENT FUNDS
ABSOLUTE RETURN STRATEGIES FUND
ALTERNATIVE STRATEGIES ALLOCATION FUND
COMMODITIES STRATEGY FUND
HEDGED EQUITY FUND
INTERNATIONAL ROTATION FUND
MANAGED FUTURES STRATEGY FUND
REAL ESTATE FUND
STRENGTHENING DOLLAR 2x STRATEGY FUND
WEAKENING DOLLAR 2x STRATEGY FUND
GO GREEN!
ELIMINATE MAILBOX CLUTTER
Go paperless with Rydex eDelivery—a service giving you full
online access to account information and documents. Save time,
cut down on mailbox clutter and be a friend to the environment
with eDelivery.
With Rydex eDelivery you can:
•
View online confirmations and statements at your
convenience.
•
Receive email notifications when your most recent
confirmations, statements and other account documents
are available for review.
•
Access prospectuses, annual reports and semiannual
reports online.
It’s easy to enroll:
1/ Visit www.rydexinvestments.com
e
RYDEX
DELIVERY
2/ Click on the Rydex eDelivery logo
3/ Follow the simple enrollment instructions
If you have questions about Rydex eDelivery services,
contact one of our Shareholder Service Representatives
at 800.820.0888.
This report and the financial statements contained herein are submitted for the general information of our shareholders. The
report is not authorized for distribution to prospective investors unless preceded or accompanied by an effective prospectus.
Distributed by Rydex Distributors, Inc.
TABLE OF CONTENTS
LETTER TO OUR SHAREHOLDERS
. . . . . . . . . . . . . . . . . . . . . . . . . . . . . . . . . . . . . . . . . . . . . . . . . . . . . . . . . .
2
A BRIEF NOTE ON THE COMPOUNDING OF RETURNS
. . . . . . . . . . . . . . . . . . . . . . . . . . . . . . . . . . . . . . . . .
3
ABOUT SHAREHOLDERS’ FUND EXPENSES
. . . . . . . . . . . . . . . . . . . . . . . . . . . . . . . . . . . . . . . . . . . . . . . . . .
4
FUND PROFILES
. . . . . . . . . . . . . . . . . . . . . . . . . . . . . . . . . . . . . . . . . . . . . . . . . . . . . . . . . . . . . . . . . . . . . . . .
7
SCHEDULES OF INVESTMENTS
. . . . . . . . . . . . . . . . . . . . . . . . . . . . . . . . . . . . . . . . . . . . . . . . . . . . . . . . . . . .
13
STATEMENTS OF ASSETS AND LIABILITIES
. . . . . . . . . . . . . . . . . . . . . . . . . . . . . . . . . . . . . . . . . . . . . . . . . . .
48
STATEMENTS OF OPERATIONS
. . . . . . . . . . . . . . . . . . . . . . . . . . . . . . . . . . . . . . . . . . . . . . . . . . . . . . . . . . . .
50
STATEMENTS OF CHANGES IN NET ASSETS
. . . . . . . . . . . . . . . . . . . . . . . . . . . . . . . . . . . . . . . . . . . . . . . . .
52
FINANCIAL HIGHLIGHTS
. . . . . . . . . . . . . . . . . . . . . . . . . . . . . . . . . . . . . . . . . . . . . . . . . . . . . . . . . . . . . . . . .
56
NOTES TO FINANCIAL STATEMENTS
. . . . . . . . . . . . . . . . . . . . . . . . . . . . . . . . . . . . . . . . . . . . . . . . . . . . . . .
61
OTHER INFORMATION
. . . . . . . . . . . . . . . . . . . . . . . . . . . . . . . . . . . . . . . . . . . . . . . . . . . . . . . . . . . . . . . . . . .
74
INFORMATION ON BOARD OF TRUSTEES AND OFFICERS
. . . . . . . . . . . . . . . . . . . . . . . . . . . . . . . . . . . . . .
75
THE RYDEX SERIES FUNDS SEMI-ANNUAL REPORT
|
1
LETTER TO OUR SHAREHOLDERS
DEAR SHAREHOLDER:
Most economic and market surveys tend to focus on more recent events because those that occurred
earlier seem distant and less important. That dynamic was never so evident as in the April-to-September
period, when events of just the previous three weeks completely overwhelmed everything that came
before. In an incredibly short period of time, the entire global financial system seized up as the lubricant of
any economy—bank lending—came to a complete halt. The resulting crash in global stock markets that
began in September continued well into October.
In less than a month, the shape of the entire financial system was changed forever. The Wall Street model of
large, aggressive, risk-taking investment banks was completely swept aside, as financial titans such as Merrill
Lynch, Morgan Stanley, Goldman Sachs and Lehman Brothers collapsed, merged with, or were reborn as
commercial banks. It’s clear now that the decision by the U.S. Government to let Lehman Brothers fail was
the catalytic event, as the dramatic failure of an institution that weathered the Great Depression and two
world wars, laid bare the failings of the traditional investment banking model. Financial dominos tumbled as
a wave of commercial bank failures—the most since the savings and loan crisis of the 1990s—unfolded in the
third quarter, culminating with the collapse of Washington Mutual, the largest bank failure in U.S. history.
The other huge and profound shift was the nationalization of the global financial system. Several events point
to a nearly total takeover of the global financial system: the takeover of Fannie Mae and Freddie Mac, AIG
and Washington Mutual; the seizure of IndyMac; the forced merger of Wachovia; and the massive capital
infusion and government guarantee of nearly every financial instrument available (both here and in Europe).
In this history-making period, government at all levels moved with unprecedented speed, scope and
coordination to save the financial system, and with it, the global economy. In the United States, this
culminated with the U.S. Treasury’s $700 billion bail-out plan that will essentially buy up all the bad
mortgage assets clogging the financial system.
Rejection of that plan by the House of Representatives in late September sent the markets into a tailspin,
with the Dow suffering its largest point drop in history, while sending the index to three-year lows. Over
the past six months, the Dow Jones IndustrialSM Average and the S&P 500® Index each lost more than 10%
of their value, with virtually all of those declines coming in the last two weeks of September. T-Bill yields
fell to near zero and interest rates on longer-dated Treasuries fell to decade lows in the market’s massive
flight to safety.
It’s not all doom and gloom, however. This volatile market environment has burst the commodity bubble
and has resulted in a huge slowdown in global inflation. This helps the emerging markets whose
economies have been pummeled by the rise in food and energy costs. Slowing inflation has also ushered
in a period of unprecedented dollar strength, which gives the Federal Reserve additional room to ease.
Interest rates could hardly be lower and stocks are cheaper than they have been in some time. With the
massive amounts of liquidity pumped into the system, stocks could rally sharply in the months ahead.
Having gone through multiple false bottoms so far this year, the question that still remains is: Can any rally
be sustained? The answer to that question is fairly straightforward. First, the allocation of credit in bond
and money markets needs to resume. Simply put: A stock market recovery is not possible without it. As I
write this, there is definite improvement on that front, but it remains slow and sporadic. Also, the process
of de-leveraging (that is, selling assets accumulated during boom times) will be with us for a while. All of
this is occurring during a period where global economic growth is downshifting rapidly. While this does
not preclude any stock market rallies, it may make them temporary. Astute stock selection, the use of
rotational strategies, exposure to currency movements, the implementation of long/short strategies and a
focus on quality—above all else—are the keys to investment success in difficult and uncharted terrain.
We appreciate the trust you have placed in our firm’s quality and integrity by investing with Rydex
Investments.
Sincerely,
David C. Reilly, CFA
Director of Portfolio Strategy
2
|
THE RYDEX SERIES FUNDS SEMI-ANNUAL REPORT
A BRIEF NOTE ON THE COMPOUNDING OF RETURNS (Unaudited)
Many of the Rydex Funds described in this report are benchmarked daily to leveraged or inverse
leveraged versions of published indices. To properly evaluate the performance of these funds, it is
essential to understand the effect of mathematical compounding on their respective returns.
Because of the nonlinear effects of leverage applied over time, it is possible for a fund to perform in line
with its benchmark for several individual periods in a row, yet seem to trail the benchmark over the entire
period. It is also possible that a fund that performs in-line with its benchmark on a daily basis may seem to
outperform its benchmark over longer periods.
An Example of Compounding
For example, consider a hypothetical fund that is designed to produce returns that correspond to 150%
of an index. On the first day of a period, the index rises from a level of 100 to a level of 106, producing a
6.0% gain and an expectation that the fund will rise by 9.0%. On the same day, the fund’s net asset value
(“NAV”) increases from $10.00 to $10.90 for a gain of 9.0%—in line with its benchmark.
On day two, assume the index falls from 106 to 99 for a loss of about 6.6%. The fund, as expected, falls
9.9% to a price of $9.82. On each day, the fund performed exactly in line with its benchmark, but for the
two-day period, the fund was down 1.8%, while the index was down only 1.0%. Without taking into account
the daily compounding of returns, one would expect the fund to lose 1.5% and would see the fund as
trailing by 0.3% when in fact it had performed perfectly. This example is summarized in the table below.
Index
Index
Fund
Fund
Level
Performance
Expectation
Fund NAV
Performance
Assessment
Start
100
$10.00
Day 1
106
6.0%
9.0%
$10.90
9.0%
In line
Day 2
99
-6.6%
-9.9%
$
9.82
-9.9%
In line
Cumulative
-1.0%
-1.5%
-1.8%
-0.3%
As illustrated by this simple example, the effect of leverage can make it difficult to form expectations or
judgments about fund performance given only the returns of the unleveraged index.
In general, any change in direction in an index will produce compounding that seems to work against an
investor. Were the index to move in the same direction (either up or down) for two or more periods in a
row, the compounding of those returns would work in an investor’s favor, causing the fund to seemingly
beat its benchmark.
As a general rule of thumb, more leverage in a fund will magnify the compounding effect, while less
leverage will generally produce results that are more in line with expectations. In addition, periods of high
volatility in an underlying index will also cause the effects of compounding to be more pronounced, while
lower volatility will produce a more muted effect.
THE RYDEX SERIES FUNDS SEMI-ANNUAL REPORT
|
3
ABOUT SHAREHOLDERS’ FUND EXPENSES (Unaudited)
All mutual funds have operating expenses and it is important for our shareholders to understand the
impact of costs on their investments. Shareholders of a Fund incur two types of costs: (i) transaction
costs, including sales charges (loads) on purchase payments, reinvested dividends, or other distributions;
redemption fees; and exchange fees; and (ii) ongoing costs, including management fees, administrative
services, and shareholder reports, among others. These ongoing costs, or operating expenses, are
deducted from a fund’s gross income and reduce the investment return of the fund.
A fund’s expenses are expressed as a percentage of its average net assets, which is known as the expense
ratio. The following examples are intended to help investors understand the ongoing costs (in dollars) of
investing in a Fund and to compare these costs with the ongoing costs of investing in other mutual funds.
The examples are based on an investment of $1,000 made at the beginning of the period and held for the
entire six-month period beginning March 31, 2008 and ending September 30, 2008.
The following tables illustrate a Fund’s costs in two ways:
Table 1. Based on actual Fund return. This section helps investors estimate the actual expenses paid
over the period. The “Ending Account Value” shown is derived from the Fund’s actual return, and the
fourth column shows the dollar amount that would have been paid by an investor who started with
$1,000 in the Fund. Investors may use the information here, together with the amount invested, to
estimate the expenses paid over the period. Simply divide the Fund’s account value by $1,000 (for
example, an $8,600 account value divided by $1,000 = 8.6), then multiply the result by the number
provided under the heading “Expenses Paid During Period.”
Table 2. Based on hypothetical 5% return. This section is intended to help investors compare a Fund’s
cost with those of other mutual funds. The table provides information about hypothetical account values
and hypothetical expenses based on the Fund’s actual expense ratio and an assumed rate of return of
5% per year before expenses, which is not the Fund’s actual return. The hypothetical account values and
expenses may not be used to estimate the actual ending account balance or expenses paid during the
period. The example is useful in making comparisons because the U.S. Securities and Exchange
Commission (the “SEC”) requires all mutual funds to calculate expenses based on the 5% return.
Investors can assess a Fund’s costs by comparing this hypothetical example with the hypothetical
examples that appear in shareholder reports of other funds.
Certain retirement plans such as IRA, SEP, Roth IRA and 403(b) accounts are charged an annual $15
maintenance fee. Upon liquidating a retirement account, a $15 account-closing fee will be taken from
the proceeds of the redemption.
The calculations illustrated above assume no shares were bought or sold during the period. Actual costs
may have been higher or lower, depending on the amount of investment and the timing of any purchases
or redemptions.
Note that the expenses shown in the table are meant to highlight and help compare ongoing costs only
and do not reflect any transactional costs which may be incurred by a Fund.
More information about a Fund’s expenses, including annual expense ratios for the past five years, can be
found in the Financial Highlights section of this report. For additional information on operating expenses
and other shareholder costs, please refer to the appropriate Fund prospectus.
4
|
THE RYDEX SERIES FUNDS SEMI-ANNUAL REPORT
ABOUT SHAREHOLDERS’ FUND EXPENSES (Unaudited) (continued)
Beginning
Ending
Expenses
Expense
Account Value
Account Value
Paid During
Ratio†
March 31, 2008
September 30, 2008
Period*
Table 1. Based on actual Fund return
Multi-Cap Core Equity Fund
A-Class
1.14%
$1,000.00
$
893.10
$
5.41
C-Class
1.88%
1,000.00
889.60
8.91
H-Class
1.13%
1,000.00
893.10
5.36
Sector Rotation Fund
A-Class
1.68%
1,000.00
898.90
8.00
C-Class
2.43%
1,000.00
894.90
11.54
H-Class
1.67%
1,000.00
898.40
7.95
Absolute Return Strategies Fund
A-Class
1.98%
1,000.00
966.70
9.76
C-Class
2.72%
1,000.00
963.10
13.39
H-Class
1.97%
1,000.00
966.70
9.71
Alternative Strategies Allocation Fund
A-Class
0.00%
1,000.00
955.70
—
C-Class
0.75%
1,000.00
952.10
3.67
H-Class
0.00%
1,000.00
955.30
—
Commodities Strategy Fund
A-Class
1.20%
1,000.00
942.20
5.84
C-Class
1.95%
1,000.00
938.70
9.48
H-Class
1.20%
1,000.00
942.40
5.84
Hedged Equity Fund
A-Class
2.18%
1,000.00
952.00
10.67
C-Class
2.94%
1,000.00
948.40
14.36
H-Class
2.19%
1,000.00
952.00
10.72
International Rotation Fund
A-Class
1.67%
1,000.00
818.60
7.61
C-Class
2.42%
1,000.00
815.70
11.02
H-Class
1.67%
1,000.00
818.70
7.61
Managed Futures Strategy Fund
A-Class
1.68%
1,000.00
950.10
8.21
C-Class
2.42%
1,000.00
946.50
11.81
H-Class
1.67%
1,000.00
950.10
8.16
Real Estate Fund
A-Class
1.64%
1,000.00
969.20
8.10
C-Class
2.39%
1,000.00
965.60
11.78
H-Class
1.63%
1,000.00
969.80
8.05
Strengthening Dollar 2x Strategy Fund
A-Class
1.67%
1,000.00
1,179.80
9.13
C-Class
2.42%
1,000.00
1,175.60
13.20
H-Class
1.67%
1,000.00
1,179.50
9.12
Weakening Dollar 2x Strategy Fund
A-Class
1.67%
1,000.00
829.50
7.66
C-Class
2.42%
1,000.00
826.50
11.08
H-Class
1.67%
1,000.00
829.70
7.66
THE RYDEX SERIES FUNDS SEMI-ANNUAL REPORT
|
5
ABOUT SHAREHOLDERS’ FUND EXPENSES (Unaudited) (concluded)
Beginning
Ending
Expenses
Expense
Account Value
Account Value
Paid During
Ratio†
March 31, 2008
September 30, 2008
Period*
Table 2. Based on hypothetical 5% return (before expenses)
Multi-Cap Core Equity Fund
A-Class
1.14%
$1,000.00
$1,019.35
$
5.77
C-Class
1.88%
1,000.00
1,015.64
9.50
H-Class
1.13%
1,000.00
1,019.40
5.72
Sector Rotation Fund
A-Class
1.68%
1,000.00
1,016.65
8.49
C-Class
2.43%
1,000.00
1,012.89
12.26
H-Class
1.67%
1,000.00
1,016.70
8.44
Absolute Return Strategies Fund
A-Class
1.98%
1,000.00
1,015.14
10.00
C-Class
2.72%
1,000.00
1,011.43
13.72
H-Class
1.97%
1,000.00
1,015.19
9.95
Alternative Strategies Allocation Fund
A-Class
0.00%
1,000.00
1,025.07
—
C-Class
0.75%
1,000.00
1,021.31
3.80
H-Class
0.00%
1,000.00
1,025.07
—
Commodities Strategy Fund
A-Class
1.20%
1,000.00
1,019.05
6.07
C-Class
1.95%
1,000.00
1,015.29
9.85
H-Class
1.20%
1,000.00
1,019.05
6.07
Hedged Equity Fund
A-Class
2.18%
1,000.00
1,014.14
11.01
C-Class
2.94%
1,000.00
1,010.33
14.82
H-Class
2.19%
1,000.00
1,014.09
11.06
International Rotation Fund
A-Class
1.67%
1,000.00
1,016.70
8.44
C-Class
2.42%
1,000.00
1,012.94
12.21
H-Class
1.67%
1,000.00
1,016.70
8.44
Managed Futures Strategy Fund
A-Class
1.68%
1,000.00
1,016.65
8.49
C-Class
2.42%
1,000.00
1,012.94
12.21
H-Class
1.67%
1,000.00
1,016.70
8.44
Real Estate Fund
A-Class
1.64%
1,000.00
1,016.85
8.29
C-Class
2.39%
1,000.00
1,013.09
12.06
H-Class
1.63%
1,000.00
1,016.90
8.24
Strengthening Dollar 2x Strategy Fund
A-Class
1.67%
1,000.00
1,016.70
8.44
C-Class
2.42%
1,000.00
1,012.94
12.21
H-Class
1.67%
1,000.00
1,016.70
8.44
Weakening Dollar 2x Strategy Fund
A-Class
1.67%
1,000.00
1,016.70
8.44
C-Class
2.42%
1,000.00
1,012.94
12.21
H-Class
1.67%
1,000.00
1,016.70
8.44
* Expenses are equal to the Fund’s annualized expense ratio, multiplied by the average account value over the period, multiplied by
the number of days in the most recent fiscal half-year, then divided by 365.
† This ratio represents annualized Total Expenses, which include dividend expense from securities sold short. Excluding short dividend
expense, the operating expense ratio would be 0.58%, 0.57%, and 0.57% lower in the A-Class, C-Class, and H-Class, respectively, of
the Absolute Return Strategies Fund. Excluding short dividend expense, the operating expense ratio would be 0.78%, 0.79%, and
0.79% lower in the A-Class, C-Class, and H-Class, respectively, of the Hedged Equity Fund. Excluding short dividend expense, the
operating expense ratio would be 0.03% lower in each class of the Managed Futures Fund.
6
|
THE RYDEX SERIES FUNDS SEMI-ANNUAL REPORT
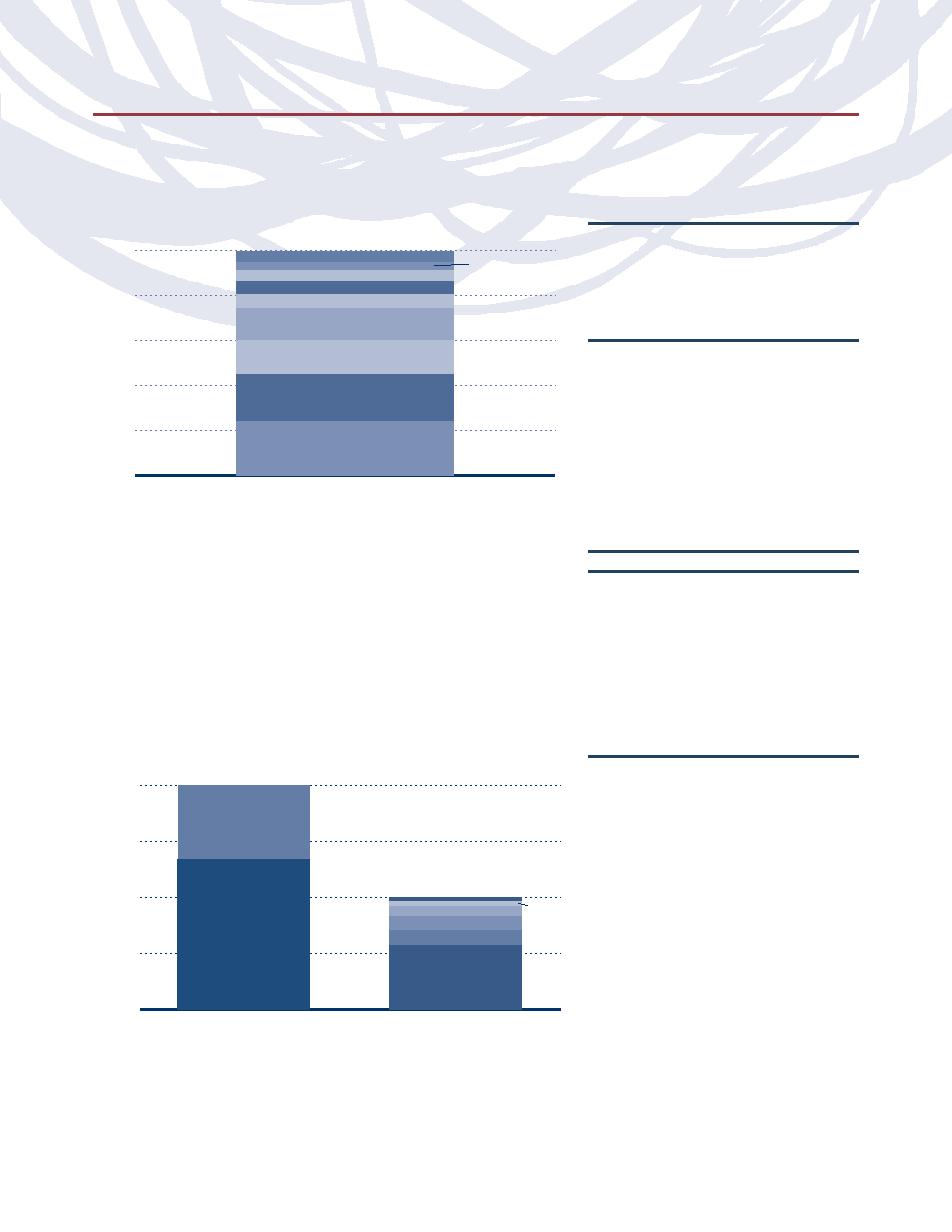
FUND PROFILES (Unaudited)
MULTI-CAP CORE EQUITY FUND
OBJECTIVE: Seeks long-term capital appreciation.
Holdings Diversification (Market Exposure as % of Net Assets)
Inception Dates:
A-Class
March 31, 2004
100%
Telecommunication Services
Materials
C-Class
September 23, 2002
Utilities
H-Class
September 23, 2002
Consumer Staples
80%
Energy
Ten Largest Holdings (% of Total Net Assets)
Consumer Discretionary
60%
Exxon Mobil Corp.
1.5%
Industrials
Chevron Corp.
1.0%
Health Care
Bank of America Corp.
1.0%
40%
International Business Machines Corp.
1.0%
Information
Wal-Mart Stores, Inc.
0.8%
Technology
20%
General Electric Co.
0.8%
Financials
Citigroup, Inc.
0.8%
Hewlett-Packard Co.
0.8%
0%
Multi-Cap Core Equity Fund
Procter & Gamble Co.
0.7%
Intel Corp.
0.7%
“Holdings Diversification (Market Exposure as % of Net Assets)” excludes any
Top Ten Total
9.1%
temporary cash investments.
“Ten Largest Holdings” exclude any temporary cash
or derivative investments.
SECTOR ROTATION FUND
OBJECTIVE: Seeks long-term capital appreciation.
Holdings Diversification (Market Exposure as % of Net Assets)
Inception Dates:
A-Class
March 31, 2004
100%
Financials
C-Class
March 22, 2002
H-Class
March 22, 2002
Industrials
80%
Ten Largest Holdings (% of Total Net Assets)
60%
Consumer Staples
Procter & Gamble Co.
3.8%
Philip Morris International, Inc.
3.1%
Thermo Fisher Scientific, Inc.
2.8%
40%
Wal-Mart Stores, Inc.
2.1%
Altria Group, Inc.
2.0%
Health Care
20%
Medtronic, Inc.
1.9%
Alcon, Inc. — SP ADR
1.9%
Baxter International, Inc.
1.7%
0%
Sector Rotation Fund
Coca-Cola Co.
1.7%
PepsiCo, Inc.
1.6%
“Holdings Diversification (Market Exposure as % of Net Assets)” excludes any
Top Ten Total
22.6%
temporary cash investments.
“Ten Largest Holdings” exclude any temporary cash
or derivative investments.
THE RYDEX SERIES FUNDS SEMI-ANNUAL REPORT
|
7
FUND PROFILES (Unaudited) (continued)
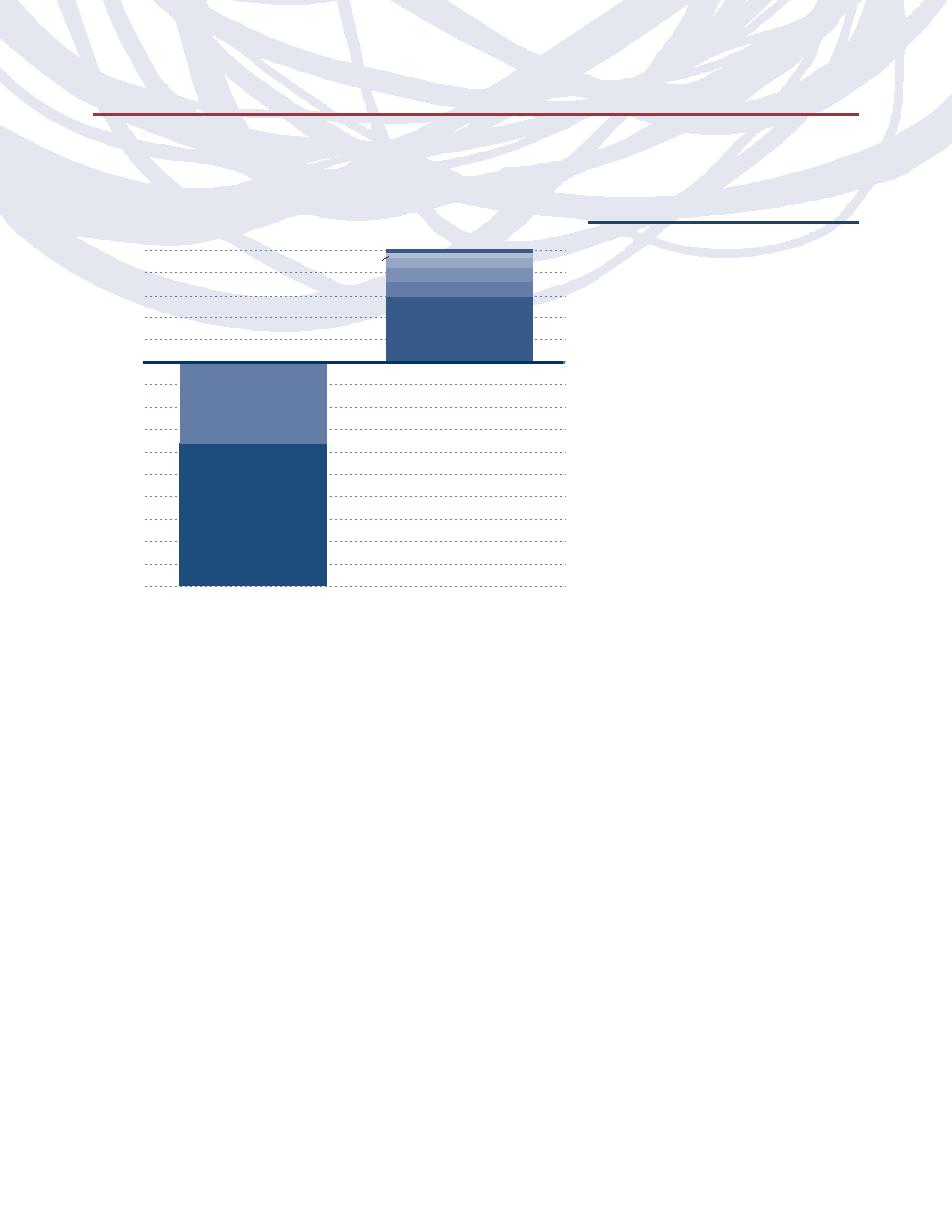
ABSOLUTE RETURN STRATEGIES FUND
OBJECTIVE: To provide capital appreciation consistent with the return and risk characteristics of the hedge fund universe. The
secondary objective is to achieve these returns with low correlation to and less volatility than equity indices.
Holdings Diversification (Market Exposure as % of Net Assets)
Inception Dates:
50%
A-Class
September 19, 2005
40%
C-Class
September 19, 2005
H-Class
September 19, 2005
30%
20%
Ten Largest Long Holdings
10%
(% of Total Net Assets)
0%
iShares MSCI Emerging Markets
-10%
Index Fund
1.8%
-20%
Northwest Airlines Corp.
0.8%
Greenfield Online, Inc.
0.7%
Wm. Wrigley Jr. Co.
0.6%
Thermo Fisher Scientific, Inc.
0.6%
Hercules, Inc.
0.6%
Puget Energy, Inc.
0.6%
Vanguard Emerging Markets ETF
0.6%
Absolute Return Strategies Fund
Absolute Return Strategies Fund
Long Holdings
Short Holdings
Photon Dynamics, Inc.
0.6%
Darwin Professional Underwriters, Inc.
0.6%
“Holdings Diversification (Market Exposure as % of Net Assets)” excludes any
Top Ten Total
7.5%
temporary cash investments.
“Ten Largest Long Holdings” exclude any
temporary cash or derivative investments.
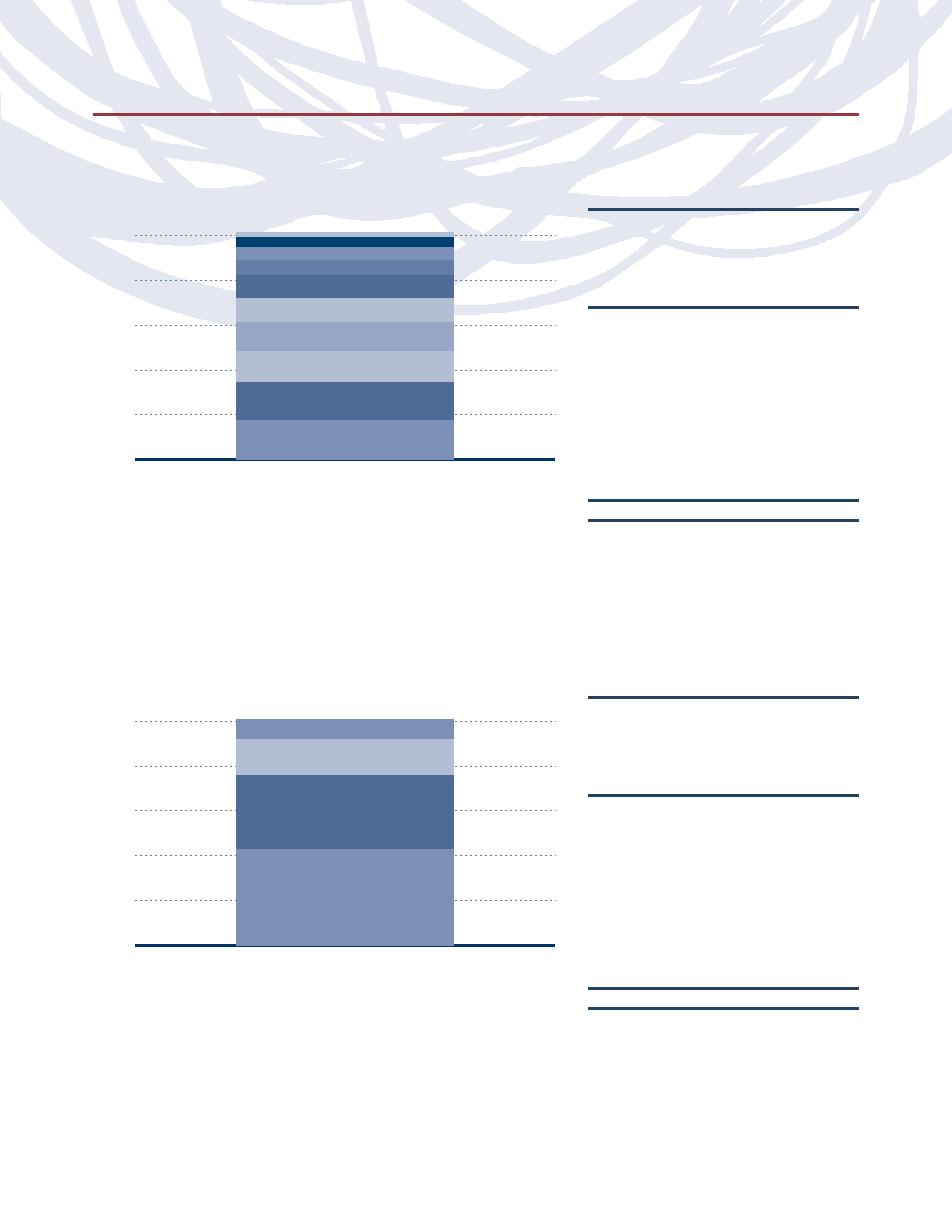
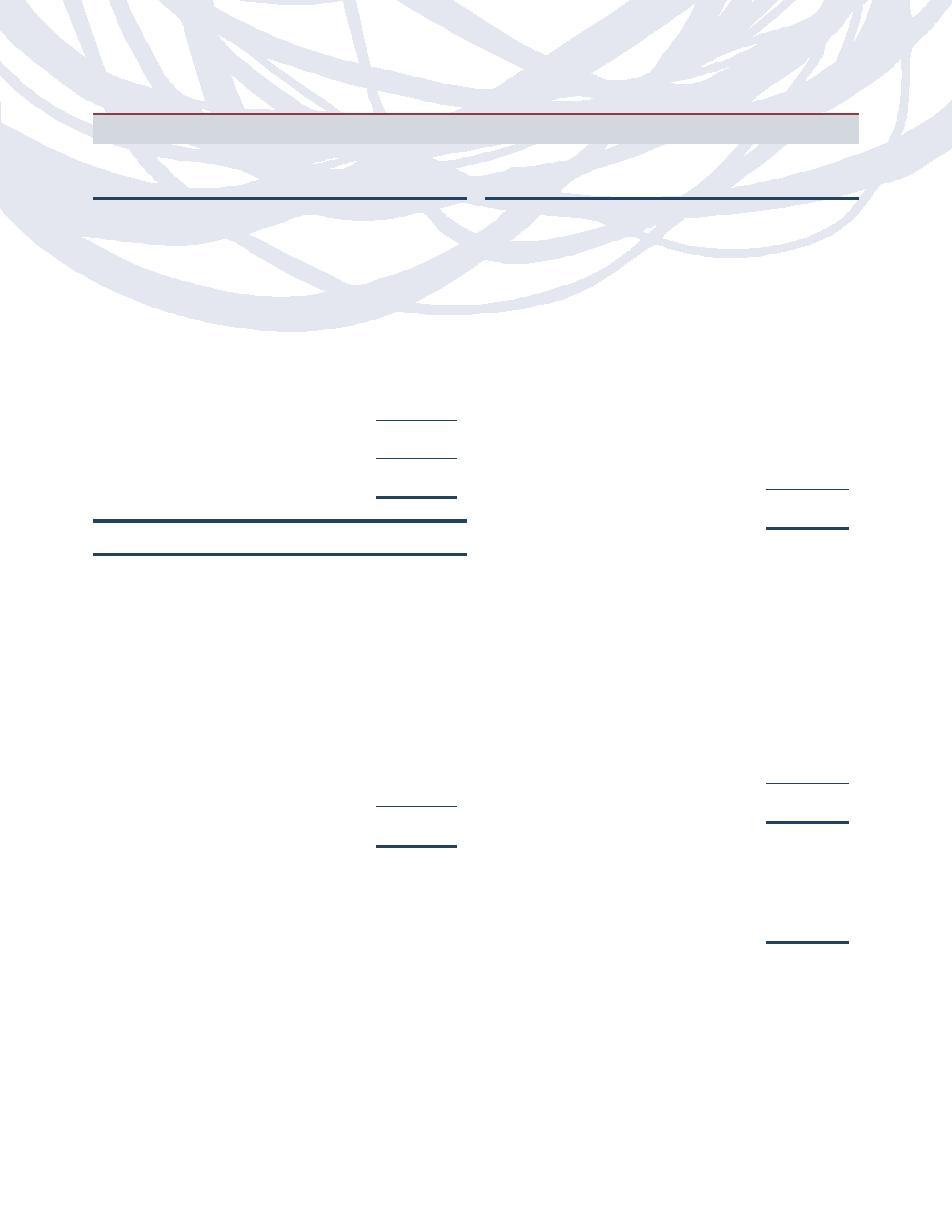
ALTERNATIVE STRATEGIES ALLOCATION FUND
OBJECTIVE: To deliver a return that has a low correlation to the returns of traditional stock and bond asset classes as well as
provide capital appreciation.
Industry Diversification (Market Exposure as % of Net Assets)
Inception Dates:
A-Class
March 7, 2008
100%
C-Class
March 7, 2008
H-Class
March 7, 2008
80%
Domestic Equity Funds
Holdings (% of Total Net Assets)
Currency Exchange Traded Funds
Rydex Series Funds — Managed
60%
Futures Strategy Fund
37.3%
PowerShares DB G10 Currency
40%
Harvest Fund
12.8%
Alternative Investment Funds
Rydex Series Funds —
20%
Commodities Strategy Fund
12.3%
Rydex Series Funds —
Absolute Return Strategies Fund
10.8%
0%
Alternative Strategies Allocation Fund
Rydex Series Funds — Real
Estate Fund
10.2%
“Industry Diversification (Market Exposure as % of Net Assets)” excludes any
Grand Total
83.4%
temporary cash investments.
“Holdings” exclude any temporary cash or
derivative investments.
0.00
8
8
|
|
THE RYDEX SERIES FUNDS SEMI-ANNUAL REPORT
THE RYDEX SERIES FUNDS SEMI-ANNUAL REPORT
FUND PROFILES (Unaudited) (continued)
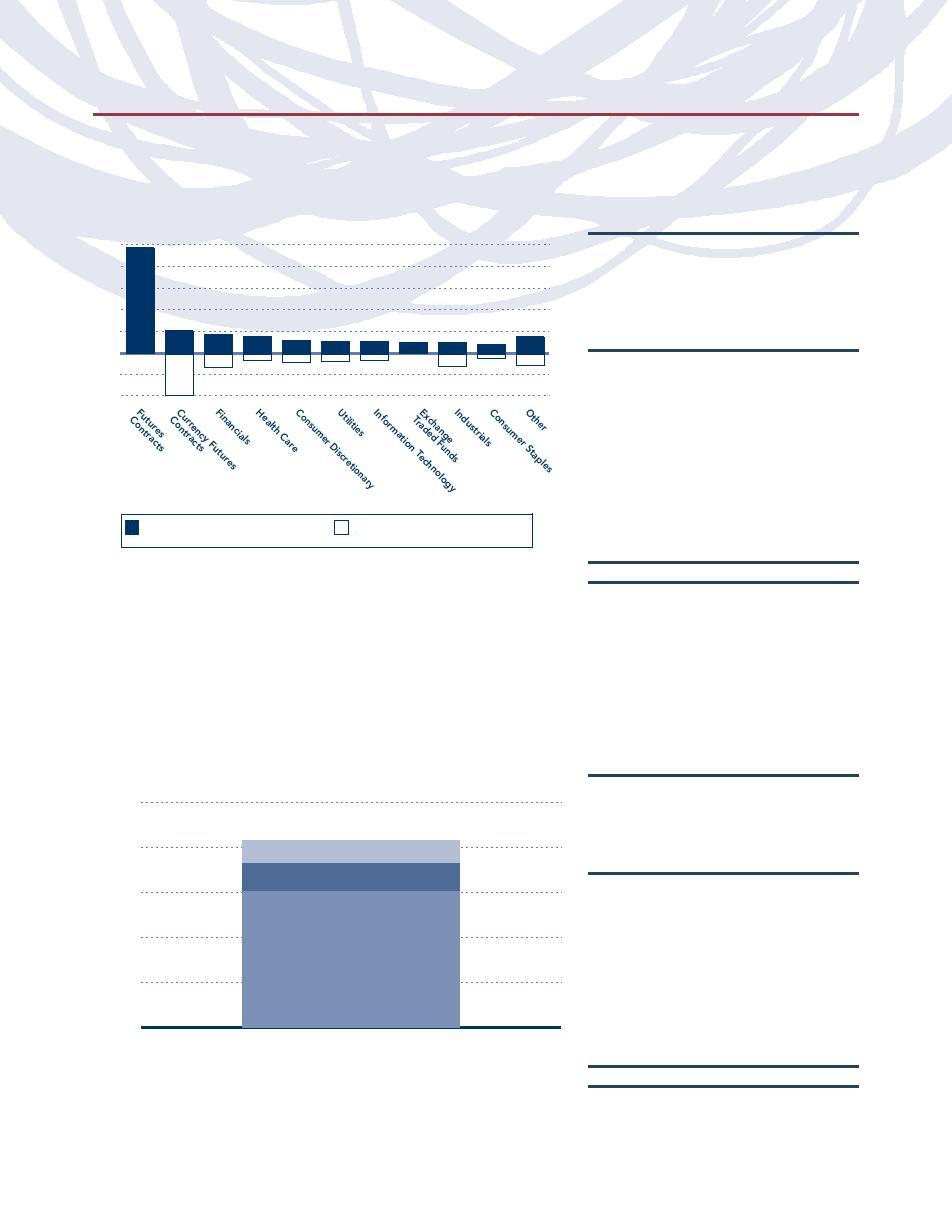
COMMODITIES STRATEGY FUND
OBJECTIVE:
Seeks to provide investment results that correlate to the performance of a benchmark for commodities. The
Fund’s current benchmark is the S&P Goldman Sachs Commodity Index (“GSCI™”).
Holdings Diversification (Market Exposure as % of Net Assets)
Inception Dates:
A-Class
May 25, 2005
120%
C-Class
May 25, 2005
H-Class
May 25, 2005
Precious Metals
100%
Livestock
Industrial Metals
The Fund invests principally in exchange traded
funds and in derivative instruments such as
80%
Agriculture
structured notes, futures contracts, and options on
S&P GSCI
index futures.
60%
Total Return
Structured Notes
Energy
40%
20%
Exchange
Traded
Funds
0%
Commodities
S&P GSCI
Strategy Fund
Total Return Index
“Holdings Diversification (Market Exposure as % of Net Assets)” excludes any
temporary cash investments.
HEDGED EQUITY FUND
OBJECTIVE: To provide capital appreciation consistent with the return and risk characteristics of the long/short hedge fund
universe. The secondary objective is to achieve these returns with low correlation to and less volatility than equity indices.
Holdings Diversification (Market Exposure as % of Net Assets)
Inception Dates:
70%
A-Class
September 19, 2005
60%
C-Class
September 19, 2005
50%
H-Class
September 19, 2005
40%
30%
Ten Largest Long Holdings
20%
(% of Total Net Assets)
10%
iShares MSCI Emerging Markets
0%
Index Fund
3.7%
-10%
Thermo Fisher Scientific, Inc.
0.9%
Baxter International, Inc.
0.7%
UGI Corp.
0.6%
Nike, Inc. — Class B
0.6%
Vanguard Emerging Markets ETF
0.6%
Allied World Assurance Company
Holdings Ltd.
0.6%
Hedged Equity Fund Long Holdings
Hedged Equity Fund Short Holdings
Charles Schwab Corp.
0.6%
Verizon Communications, Inc.
0.6%
“Holdings Diversification (Market Exposure as % of Net Assets)” excludes any
McDonald’s Corp.
0.5%
temporary cash investments.
Top Ten Total
9.4%
“Ten Largest Long Holdings” exclude any
temporary cash or derivative investments.
THE RYDEX SERIES FUNDS SEMI-ANNUAL REPORT
THE RYDEX SERIES FUNDS SEMI-ANNUAL REPORT
|
|
9
9
FUND PROFILES (Unaudited) (continued)
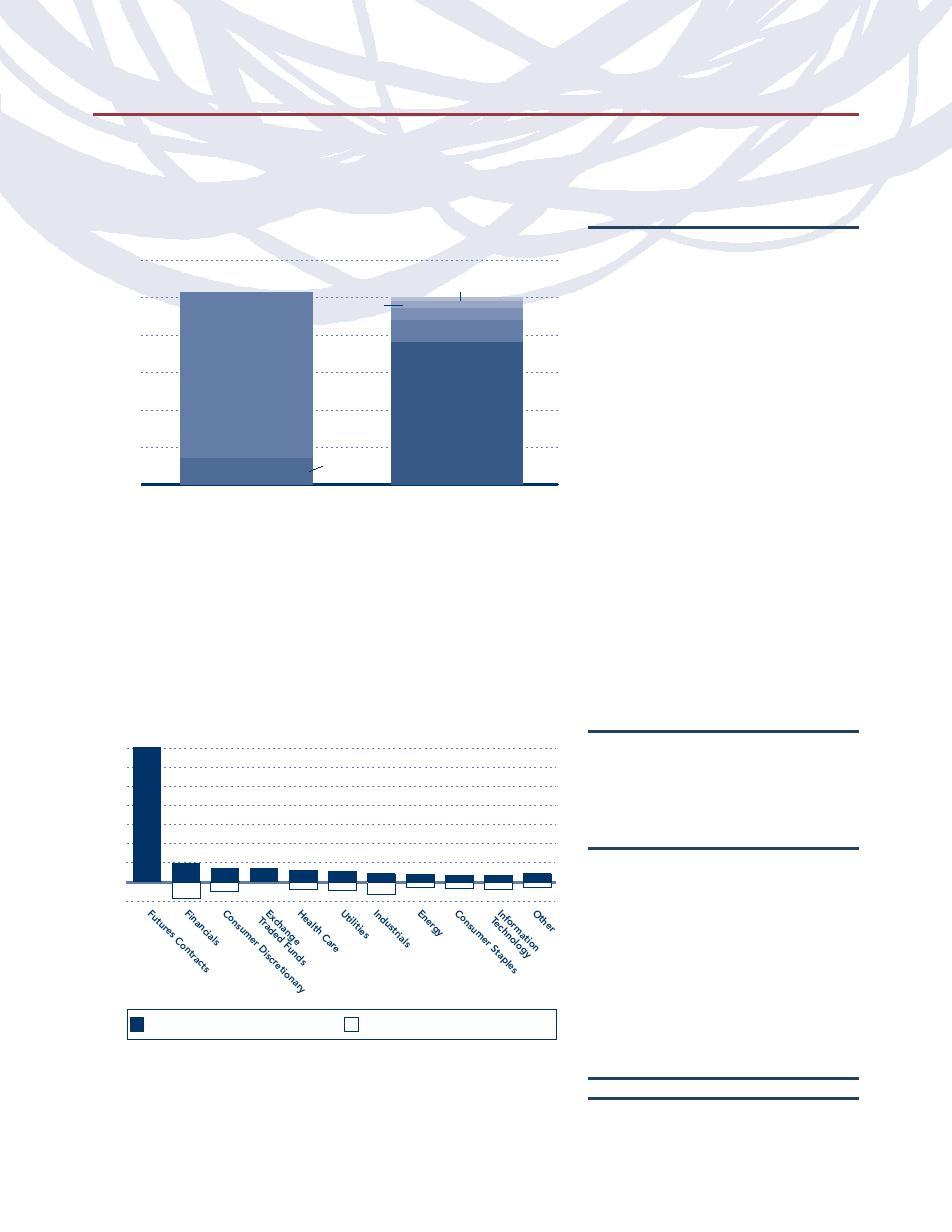
INTERNATIONAL ROTATION FUND
OBJECTIVE: Seeks long-term capital appreciation.
Holdings Diversification (Market Exposure as % of Net Assets)
Inception Dates:
100%
A-Class
Exchange
Australia
August 31, 2007
Traded Funds
North America
C-Class
August 31, 2007
80%
H-Class
August 31, 2007
North America
Asia
The Fund invests principally in exchange traded
60%
funds and derivative investments such as swap
agreements, futures contracts and options on
Asia
currencies.
40%
Europe
20%
Europe
Other
0%
International
MSCI World
Rotation Fund
Ex USA Index
“Holdings Diversification (Market Exposure as % of Net Assets)” excludes any
temporary cash investments.
MANAGED FUTURES STRATEGY FUND
OBJECTIVE: To provide investment results that match the performance of a benchmark for measuring trends in the commodity
and financial futures markets. The Fund’s current benchmark is the Standard & Poor’s Diversified Trends Indicator® .
Holdings Diversification (Market Exposure as % of Net Assets)
Inception Dates:
Commodity Futures
A-Class
March 2, 2007
Contracts
100%
C-Class
March 2, 2007
Futures Contracts
Commodity
Commodity
H-Class
March 2, 2007
Futures
Contracts
Futures
80%
Short Sales
Contracts
The Fund invests principally in exchange traded
Short Sales
S&P
funds and derivative investments such as structured
Diversified
notes, futures contracts, and options on index
60%
Currency Futures
Trends Indicator
futures.
Contracts
Price Return
Short Sales
Linked Notes
40%
Futures
Contracts
S&P Diversified
Short Sales
Trends Indicator
20%
Total Return
Linked Notes
0%
Managed Futures
S&P Diversified
Strategy Fund
Trends Indicator
“Holdings Diversification (Market Exposure as % of Net Assets)” excludes any
temporary cash investments.
10
|
THE RYDEX SERIES FUNDS SEMI-ANNUAL REPORT
FUND PROFILES (Unaudited) (continued)
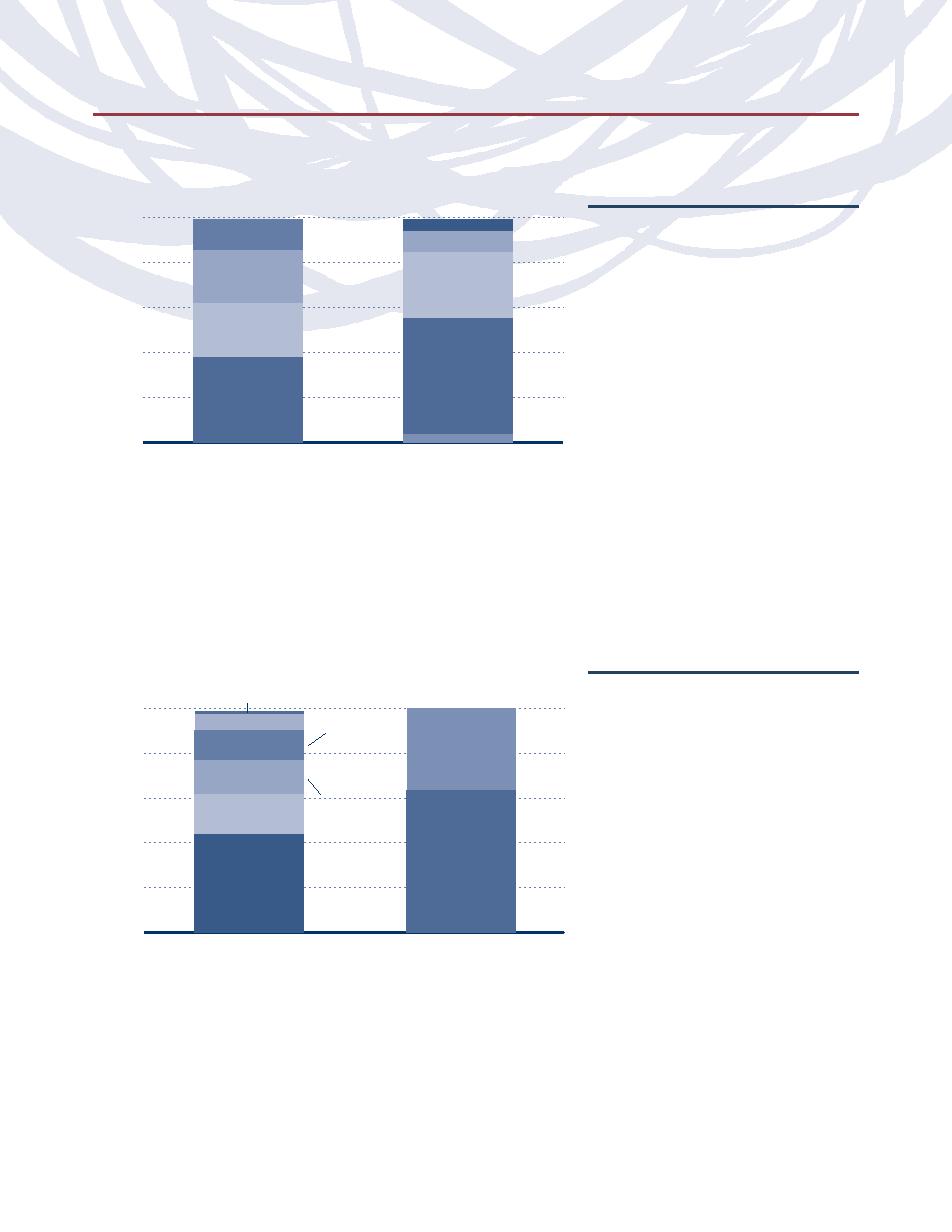
REAL ESTATE FUND
OBJECTIVE:
Seeks to provide capital appreciation by investing in companies that are involved in the real estate industry
including real estate investment trusts (“REITs”).
Holdings Diversification (Market Exposure as % of Net Assets)
Inception Dates:
A-Class
September 1, 2004
100%
Other
Diversified
C-Class
February 20, 2004
Mortgage REITs
Real Estate
H-Class
February 20, 2004
Industrial REITs
Activities
80%
Diversified REITs
Ten Largest Holdings
Residential REITs
(% of Total Net Assets)
60%
Office REITs
Simon Property Group, Inc.
3.2%
Public Storage
2.9%
40%
Retail REITs
Vornado Realty Trust
2.5%
Brookfield Asset Management, Inc. —
20%
Class A
2.4%
Specialized REITs
Equity Residential
2.4%
Boston Properties, Inc.
2.2%
0%
Real Estate Fund
HCP, Inc.
2.2%
KIMCO Realty Corp.
2.1%
“Holdings Diversification (Market Exposure as % of Net Assets)” excludes any
Plum Creek Timber Co., Inc. (REIT)
2.0%
temporary cash investments.
ProLogis
1.9%
Top Ten Total
23.8%
“Ten Largest Holdings” exclude any temporary cash
or derivative investments.
STRENGTHENING DOLLAR 2x STRATEGY FUND
OBJECTIVE:
To provide investment results that will match the performance of a specific benchmark on a daily basis. The
Fund’s current benchmark is 200% of the performance of the U.S. Dollar Index® .
Holdings Diversification (Market Exposure as % of Net Assets)
Inception Dates:
A-Class
May 25, 2005
200%
C-Class
May 25, 2005
H-Class
May 25, 2005
Currency Index
150%
Swap Agreements
The Fund invests principally in derivative
investments such as currency index swap
agreements, futures contracts, and options on index
100%
Swedish Krona
futures.
British Pound
Swiss
U.S. Dollar Index
Japanese Yen
Franc
Futures Contracts
Canadian Dollar
50%
Euro
0%
Strengthening Dollar
U.S. Dollar Index
2x Strategy Fund
“Holdings Diversification (Market Exposure as % of Net Assets)” excludes any
temporary cash investments.
THE RYDEX SERIES FUNDS SEMI-ANNUAL REPORT
|
11
FUND PROFILES (Unaudited) (concluded)
WEAKENING DOLLAR 2x STRATEGY FUND
OBJECTIVE:
To provide investment results that will match the performance of a specific benchmark on a daily basis. The
Fund’s current benchmark is 200% of the inverse performance of the U.S Dollar Index.
Holdings Diversification (Market Exposure as % of Net Assets)
Inception Dates:
Swedish Krona
A-Class
May 25, 2005
100%
Swiss
C-Class
May 25, 2005
80%
Franc
British Pound
Japanese Yen
H-Class
May 25, 2005
60%
Canadian Dollar
The Fund invests principally in derivative
40%
Euro
investments such as currency index swap
20%
agreements, futures contracts, and options on index
futures.
0%
-20%
Currency Index
-40%
Swap Agreements
Short Sales
-60%
-80%
-100%
-120%
U.S. Dollar Index
-140%
Futures Contracts
Short Sales
-160%
-180%
-200%
Weakening Dollar
U.S. Dollar Index
2x Strategy Fund
“Holdings Diversification (Market Exposure as % of Net Assets)” excludes any
temporary cash investments.
12
12
|
|
THE RYDEX SERIES FUNDS SEMI-ANNUAL REPORT
THE RYDEX SERIES FUNDS SEMI-ANNUAL REPORT
SCHEDULE OF INVESTMENTS (Unaudited)
September 30, 2008
MULTI-CAP CORE EQUITY FUND
MARKET
MARKET
SHARES
VALUE
SHARES
VALUE
COMMON STOCKS 101.0%
Mack-Cali Realty Corp.
1,220
$
41,321
Columbia Banking Systems, Inc.
2,230
39,538
FINANCIALS 17.5%
First Horizon National Corp.
4,091
38,290
Bank of America Corp.
5,280
$
184,800
MGIC Investment Corp.
5,390
37,892
Citigroup, Inc.
7,330
150,338
Max Capital Group Ltd.
1,510
35,077
Wells Fargo & Co.
2,340
87,820
Associated Estates Realty Corp.
2,340
30,490
JPMorgan Chase & Co.
1,570
73,319
MetLife, Inc.
450
25,200
PNC Financial Services
Reinsurance Group of America,
Group, Inc.
900
67,230
Inc. — Class A
450
24,300
Unum Group
2,620
65,762
National Financial Partners Corp.
1,440
21,600
AFLAC, Inc.
1,090
64,037
Charles Schwab Corp.
830
21,580
BB&T Corp.
1,680
63,504
Annaly Capital
Ameriprise Financial, Inc.
1,660
63,412
Management, Inc.
1,400
18,830
Hudson City Bancorp, Inc.
3,380
62,361
PennantPark Investment Corp.
2,380
17,636
Health Care REIT, Inc.
1,140
60,682
Post Properties, Inc.
630
17,621
American Financial Group, Inc.
2,030
59,885
Waddell & Reed Financial,
Platinum Underwriters
Inc. — Class A
680
16,830
Holdings Ltd.
1,680
59,606
Patriot Capital Funding, Inc.
2,620
16,689
Loews Corp.
1,480
58,445
East-West Bancorp, Inc.
1,150
15,755
IPC Holdings Ltd.
1,920
58,003
Sterling Savings Bank
1,060
15,370
Validus Holdings Ltd.
2,490
57,893
Wachovia Corp.
4,310
15,085
Capital One Financial Corp.
1,120
57,120
Hersha Hospitality Trust
1,620
12,053
Nationwide Health
Public Storage
90
8,911
Properties, Inc.
1,580
56,848
Park National Corp.
50
3,900
Axis Capital Holdings Ltd.
1,780
56,444
Bank of New York Mellon Corp.
100
3,258
Entertainment Properties Trust
1,020
55,814
U.S. Bancorp
80
2,882
Digital Realty Trust, Inc.
1,150
54,338
E*Trade Financial Corp.*
870
2,436
Marshall & Ilsley Corp.
2,620
52,793
CIT Group, Inc.
300
2,088
Getty Realty Corp.
2,380
52,765
American International
Education Realty Trust, Inc.
4,700
52,076
Group, Inc.
540
1,798
NYSE Euronext
1,320
51,718
Liberty Property Trust
40
1,506
Hospitality Properties Trust
2,520
51,710
Total Financials
3,230,248
Fidelity National Financial,
INFORMATION TECHNOLOGY 16.7%
Inc. — Class A
3,500
51,450
International Business
Hercules Technology Growth
Machines Corp.
1,530
178,949
Capital, Inc.
5,280
51,216
Hewlett-Packard Co.
3,030
140,107
Agree Realty Corp.
1,790
51,194
Intel Corp.
7,160
134,107
Urstadt Biddle Properties, Inc.
2,730
51,188
Microsoft Corp.
4,540
121,173
Medallion Financial Corp.
4,860
50,884
Apple, Inc.*
930
105,704
Prospect Capital Corp.
3,950
50,600
Accenture Ltd. — Class A
1,840
69,920
Renasant Corp.
2,310
50,150
Corning, Inc.
4,340
67,878
International Assets
Oracle Corp.*
3,240
65,804
Holding Corp.*
2,060
49,667
Adobe Systems, Inc.*
1,660
65,520
Hanover Insurance Group, Inc.
1,090
49,617
Symantec Corp.*
3,200
62,656
Transatlantic Holdings, Inc.
900
48,915
Motorola, Inc.
8,710
62,189
Sanders Morris Harris Group Inc.
5,620
48,613
Mantech International
Weingarten Realty Investors
1,360
48,511
Corp. — Class A*
1,040
61,662
Fifth Third Bancorp
4,020
47,838
Texas Instruments, Inc.
2,850
61,275
MBIA, Inc.
3,900
46,410
CACI International,
FelCor Lodging Trust, Inc.
6,450
46,182
Inc. — Class A*
1,210
60,621
Cardinal Financial Corp.
5,590
45,167
Cisco Systems, Inc.*
2,620
59,107
Harleysville National Corp.†
2,640
44,827
Take-Two Interactive
State Auto Financial Corp.
1,530
44,477
Software, Inc.
3,580
58,712
Oriental Financial Group
2,460
43,936
CA, Inc.
2,910
58,084
Huntington Bancshares, Inc.
5,350
42,747
See Notes to Financial Statements.
THE RYDEX SERIES FUNDS SEMI-ANNUAL REPORT
|
13
SCHEDULE OF INVESTMENTS (Unaudited) (continued)
September 30, 2008
MULTI-CAP CORE EQUITY FUND
MARKET
MARKET
SHARES
VALUE
SHARES
VALUE
Computer Sciences Corp.*
1,430
$
57,472
Thermo Fisher Scientific, Inc.*
1,210
$
66,550
Skyworks Solutions, Inc.*
6,690
55,928
Genzyme Corp.*
820
66,330
Western Digital Corp.*
2,570
54,792
Myriad Genetics, Inc.*
1,020
66,178
Automatic Data Processing, Inc.
1,280
54,720
Becton, Dickinson & Co.
800
64,208
JDS Uniphase Corp.*
6,160
52,114
Medco Health Solutions, Inc.*
1,420
63,900
Heartland Payment Systems, Inc.
2,020
51,631
Biogen Idec, Inc.*
1,270
63,868
Quality Systems, Inc.
1,220
51,557
OSI Pharmaceuticals, Inc.*
1,270
62,598
Marvell Technology Group Ltd.*
5,540
51,522
Varian Medical Systems, Inc.*
1,050
59,986
Ingram Micro, Inc. — Class A*
3,200
51,424
Computer Programs &
Website Pros, Inc.*
9,370
50,598
Systems, Inc.
2,050
59,348
Broadcom Corp. — Class A*
2,710
50,487
Bio-Rad Laboratories,
InfoSpace, Inc.
4,600
49,910
Inc. — Class A*
590
58,481
Plexus Corp.*
2,390
49,473
Genentech, Inc.*
650
57,642
Intersil Corp. — Class A
2,970
49,243
Hologic, Inc.*
2,910
56,250
Applied Micro Circuits Corp.*
8,210
49,096
Amedisys, Inc.*
1,140
55,484
SAIC, Inc.*
2,410
48,754
Intuitive Surgical, Inc.*
230
55,425
Fairchild Semiconductor
Perrigo Co.
1,420
54,613
International, Inc.*
5,360
47,650
Mylan Laboratories, Inc.*
4,740
54,131
FactSet Research Systems Inc.
910
47,548
Cardiac Science Corp.*
5,200
53,872
CommScope, Inc.*
1,340
46,418
Invitrogen Corp.*
1,420
53,676
Avnet, Inc.*
1,880
46,304
Hill-Rom Holdings, Inc.
1,760
53,346
Amkor Technology, Inc.*
7,230
46,055
Edwards Lifesciences Corp.*
920
53,139
Akamai Technologies, Inc.*
2,630
45,867
Pfizer, Inc.
2,830
52,185
Super Micro Computer, Inc.*
5,080
45,771
Martek Biosciences Corp.
1,660
52,157
Jabil Circuit, Inc.
4,730
45,124
Inverness Medical
Multi-Fineline Electronix, Inc.*
2,800
41,412
Innovations, Inc.*
1,710
51,300
PC Mall, Inc.*
5,670
38,726
Greatbatch, Inc.*
2,090
51,289
Seagate Technology
3,120
37,814
Express Scripts, Inc.*
690
50,936
TeleCommunication Systems,
Community Health
Inc. — Class A*
5,460
37,729
Systems, Inc.*
1,720
50,413
Radisys Corp.*
4,067
34,976
Tenet Healthcare Corp.*
8,870
49,229
Google, Inc. — Class A*
80
32,042
Zoll Medical Corp.*
1,480
48,426
Hackett Group, Inc.*
5,706
31,041
Emergency Medical Services
Arris Group, Inc.*
3,780
29,219
Corp. — Class A*
1,620
48,406
Interwoven, Inc.*
1,820
25,698
Sun Healthcare Group, Inc.*
3,210
47,059
Integrated Device
Molina Healthcare, Inc.*
1,510
46,810
Technology, Inc.*
2,950
22,951
Sirona Dental Systems, Inc.*
1,940
45,163
Sohu.com, Inc.*
410
22,858
Cardinal Health, Inc.
840
41,395
Cogo Group, Inc.*
3,970
20,922
Universal Health Services,
VMware, Inc.*
730
19,447
Inc. — Class B
730
40,902
Silicon Image, Inc.*
3,480
18,583
Charles River Laboratories
Imation Corp.
660
14,909
International, Inc.*
710
39,426
Brightpoint, Inc.*
1,980
14,256
Applied Biosystems Inc.
1,140
39,045
Qualcomm, Inc.
260
11,172
Invacare Corp.
1,380
33,313
Linear Technology Corp.
200
6,132
National Healthcare Corp.
610
28,743
MEMC Electronic Materials, Inc.*
10
283
Henry Schein, Inc.*
490
26,382
Total Information Technology
3,093,096
HLTH Corp.*
2,140
24,460
HEALTH CARE 13.9%
Cerner Corp.*
450
20,088
Abbott Laboratories
2,090
120,342
eResearch Technology, Inc.*
1,430
17,031
Johnson & Johnson, Inc.
1,580
109,462
Merck & Co., Inc.
260
8,206
Eli Lilly & Co.
1,880
82,776
Providence Service Corp.*
804
7,879
Bristol-Myers Squibb Co.
3,940
82,149
Amgen, Inc.*
60
3,556
Schering-Plough Corp.
3,970
73,326
Total Health Care
2,570,879
14
|
THE RYDEX SERIES FUNDS SEMI-ANNUAL REPORT
See Notes to Financial Statements.
SCHEDULE OF INVESTMENTS (Unaudited) (continued)
September 30, 2008
MULTI-CAP CORE EQUITY FUND
MARKET
MARKET
SHARES
VALUE
SHARES
VALUE
INDUSTRIALS 12.6%
SkyWest, Inc.
510
$
8,150
General Electric Co.
6,070
$
154,785
Fushi Copperweld, Inc.*
460
4,457
Union Pacific Corp.
1,080
76,853
AAR Corp.*
10
166
Lockheed Martin Corp.
690
75,672
Total Industrials
2,318,250
Emerson Electric Co.
1,760
71,790
CONSUMER DISCRETIONARY 11.1%
Burlington Northern
Walt Disney Co.
2,810
86,239
Santa Fe Corp.
720
66,550
Nike, Inc. — Class B
1,040
69,576
Honeywell International, Inc.
1,600
66,480
Liberty Global, Inc. — Class A*
2,240
67,872
Southwest Airlines Co.
4,520
65,585
Amazon.com, Inc.*
890
64,756
Fluor Corp.
1,170
65,169
Comcast Corp. — Class A
3,000
58,890
ITT Corporation
1,170
65,064
Johnson Controls, Inc.
1,910
57,930
CSX Corp.
1,190
64,938
Ross Stores, Inc.
1,560
57,423
Parker Hannifin Corp.
1,185
62,805
Carnival Corp.
1,600
56,560
Raytheon Co.
1,170
62,607
Omnicom Group, Inc.
1,460
56,298
Northrop Grumman Corp.
970
58,724
Whirlpool Corp.
710
56,296
Textron, Inc.
2,003
58,648
Darden Restaurants, Inc.
1,930
55,256
Eaton Corp.
1,030
57,865
DIRECTV Group, Inc.*
2,080
54,434
EMCOR Group, Inc.*
2,130
56,062
Best Buy Company, Inc.
1,450
54,375
Cummins, Inc.
1,280
55,962
Polo Ralph Lauren Corp.
800
53,312
ABM Industries, Inc.
2,470
53,945
Brookfield Homes Corp.
3,610
51,840
Regal-Beloit Corp.
1,240
52,725
Foot Locker, Inc.
3,180
51,389
Griffon Corp.*
5,780
52,136
Bob Evans Farms, Inc.
1,880
51,305
EnerSys*
2,590
51,049
1-800-FLOWERS.com, Inc.*
8,200
49,364
Norfolk Southern Corp.
770
50,982
Unifirst Corp.
1,120
48,261
URS Corp.*
1,390
50,971
Polaris Industries, Inc.
1,033
46,991
Terex Corp.*
1,640
50,053
Core-Mark Holding Co., Inc.*
1,880
46,981
Comfort Systems USA, Inc.
3,710
49,566
Stage Stores, Inc.
3,410
46,581
AGCO Corp.*
1,150
49,001
TJX Companies, Inc.
1,520
46,390
Hawaiian Holdings, Inc.*
5,220
48,442
P.F. Chang’s China Bistro, Inc.*
1,950
45,903
Tecumseh Products Co. —
McDonald’s Corp.
740
45,658
Class A*
1,920
48,077
Royal Caribbean Cruises Ltd.
2,190
45,442
Metalico, Inc.*
8,040
47,436
Sauer, Inc.
1,840
45,430
Manitowoc Co., Inc.
2,938
45,686
Fuqi International, Inc.*
5,540
45,151
NN, Inc.
3,530
45,360
Panera Bread Co. — Class A*
880
44,792
Pacer International, Inc.
2,550
41,998
La-Z-Boy, Inc.
4,730
44,084
Genco Shipping & Trading Ltd.
1,200
39,888
Jo-Ann Stores, Inc.*
2,070
43,429
VSE Corp.
1,120
37,778
DineEquity, Inc.†
2,540
42,824
CAI International, Inc.*
3,220
35,613
ArvinMeritor, Inc.
3,280
42,771
Volt Information Sciences, Inc.*
3,890
34,932
Kenneth Cole Productions,
NACCO Industries, Inc. —
Inc. — Class A
2,580
37,926
Class A
290
27,411
Fred’s, Inc.
2,580
36,688
SPX Corp.
330
25,410
Christopher & Banks Corp.
4,740
36,356
Insteel Industries, Inc.
1,850
25,141
Goodyear Tire & Rubber Co.*
2,260
34,601
TBS International Ltd. —
Live Nation, Inc.*
2,000
32,540
Class A*
1,750
23,555
Meritage Homes Corp.*
1,240
30,628
Eagle Bulk Shipping Inc.
1,600
22,304
Modine Manufacturing Co.
1,380
19,982
Cenveo, Inc.*
2,544
19,563
Exide Technologies*
2,380
17,564
NCI Building Systems, Inc.*
540
17,145
DeVry, Inc.
280
13,871
Tyco International Ltd.
480
16,810
Sonic Automotive, Inc.
1,600
13,536
Goodrich Corp.
390
16,224
Big Lots, Inc.*
470
13,080
Delta Air Lines, Inc.*
2,100
15,645
ITT Educational Services, Inc.*
120
9,709
Boeing Co.
250
14,337
Systemax, Inc.
630
8,858
Knoll, Inc.
710
10,735
See Notes to Financial Statements.
THE RYDEX SERIES FUNDS SEMI-ANNUAL REPORT
|
15
SCHEDULE OF INVESTMENTS (Unaudited) (continued)
September 30, 2008
MULTI-CAP CORE EQUITY FUND
MARKET
MARKET
SHARES
VALUE
SHARES
VALUE
Harman International
Pantry, Inc.*
2,600
$
55,094
Industries, Inc.
170
$
5,792
Corn Products International, Inc.
1,610
51,971
EW Scripps Co. — Class A
450
3,181
Tyson Foods, Inc. — Class A
4,300
51,342
Macy’s, Inc.
110
1,978
Coca-Cola Co.
960
50,765
Petsmart, Inc.
30
741
Sanderson Farms, Inc.
1,370
50,334
Total Consumer Discretionary
2,050,834
PepsiAmericas, Inc.
2,330
48,277
ENERGY 10.1%
Farmer Brothers Co.
1,920
47,750
Exxon Mobil Corp.
3,630
281,906
Susser Holdings Corp.*
3,150
47,439
Chevron Corp.
2,260
186,405
Zhongpin, Inc.*
4,450
47,303
Occidental Petroleum Corp.
1,350
95,107
PepsiCo, Inc.
610
43,475
Apache Corp.
700
72,996
Costco Wholesale Corp.
590
38,309
Murphy Oil Corp.
1,110
71,195
Philip Morris International, Inc.
770
37,037
Transocean, Inc.*
640
70,298
Cal-Maine Foods, Inc.†
1,320
36,221
Noble Corp.
1,500
65,850
Anheuser-Busch Companies, Inc.
470
30,494
Hess Corp.
800
65,664
Central European
ENSCO International, Inc.
1,110
63,969
Distribution Corp.*
660
29,971
ConocoPhillips
870
63,727
Colgate-Palmolive Co.
360
27,126
Williams Companies, Inc.
2,440
57,706
Archer-Daniels-Midland Co.
470
10,298
Cimarex Energy Co.
1,150
56,247
Spartan Stores, Inc.
210
5,225
Plains Exploration &
AgFeed Industries, Inc.*
360
2,844
Production Co.*
1,590
55,904
Spectrum Brands, Inc.*
1,360
1,890
Swift Energy Co.*
1,380
53,392
Total Consumer Staples
1,271,400
Arch Coal, Inc.
1,560
51,308
UTILITIES 5.7%
Crosstex Energy, Inc.
2,050
51,189
MDU Resources Group, Inc.
2,130
61,780
Oil States International, Inc.*
1,430
50,551
CenterPoint Energy, Inc.
4,120
60,029
Schlumberger Ltd.
640
49,978
DTE Energy Co.
1,470
58,977
Mariner Energy, Inc.*
2,370
48,585
Pepco Holdings, Inc.
2,550
58,421
Unit Corp.*
850
42,347
Laclede Group, Inc.
1,180
57,218
W&T Offshore, Inc.
1,410
38,479
Southern Co.
1,470
55,404
Halliburton Co.
1,110
35,953
Mge Energy, Inc.
1,550
55,103
Massey Energy Co.
980
34,957
Integrys Energy Group, Inc.
1,090
54,435
Alpha Natural Resources, Inc.*
580
29,829
Pinnacle West Capital Corp.
1,570
54,024
Frontline Ltd.
530
25,477
UGI Corp.
2,090
53,880
Exterran Holdings, Inc.*
700
22,372
NorthWestern Corp.
2,140
53,778
Clayton Williams Energy, Inc.*
290
20,454
Oneok, Inc.
1,540
52,976
Western Refining, Inc.
1,870
18,906
Great Plains Energy, Inc.
2,350
52,217
Gulfport Energy Corp.*
1,810
18,191
Unisource Energy Corp.
1,760
51,374
Sunoco, Inc.
450
16,011
Central Vermont Public
Whiting Petroleum Corp.*
200
14,252
Service Corp.
2,180
51,099
Tesoro Corp.
680
11,213
Sierra Pacific Resources
5,330
51,061
Hornbeck Offshore
Atmos Energy Corp.
1,900
50,578
Services, Inc.*
270
10,427
CH Energy Group, Inc.
1,130
49,234
Encore Acquisition Co.*
90
3,760
Alliant Energy Corp.
1,330
42,839
World Fuel Services Corp.
160
3,685
Empire District Electric Co.
1,280
27,328
PHI, Inc.*
10
369
Dynegy Inc.*
460
1,647
Total Energy
1,858,659
Total Utilities
1,053,402
CONSUMER STAPLES 6.9%
MATERIALS 4.4%
Wal-Mart Stores, Inc.
2,600
155,714
International Paper Co.
2,600
68,068
Procter & Gamble Co.
1,980
137,986
Cabot Corp.
1,690
53,708
Altria Group, Inc.
4,110
81,542
Greif, Inc. — Class A
800
52,496
Kroger Co.
2,360
64,853
Ashland, Inc.
1,789
52,310
Sysco Corp.
1,920
59,193
Wausau Paper Corp.
5,160
52,271
Bunge Ltd.
933
58,947
CF Industries Holdings, Inc.
550
50,303
16
|
THE RYDEX SERIES FUNDS SEMI-ANNUAL REPORT
See Notes to Financial Statements.
SCHEDULE OF INVESTMENTS (Unaudited) (concluded)
September 30, 2008
MULTI-CAP CORE EQUITY FUND
MARKET
SHARES
VALUE
The Mosaic Co.
703
$
47,818
Schweitzer-Mauduit
International, Inc.
2,500
47,475
United States Steel Corp.
610
47,342
Innophos Holdings, Inc.
1,940
47,297
PolyOne Corp.*
6,970
44,956
Steel Dynamics, Inc.
2,630
44,947
AK Steel Holding Corp.
1,290
33,437
Terra Industries, Inc.
1,110
32,634
Schnitzer Steel Industries,
Inc. — Class A
810
31,784
Reliance Steel & Aluminum Co.
680
25,820
Cleveland-Cliffs, Inc.
440
23,294
General Steel Holdings, Inc.*
3,180
22,705
Quaker Chemical Corp.
780
22,199
MeadWestvaco Corp.
450
10,490
A.M. Castle & Co.
430
7,430
Monsanto Co.
10
990
Total Materials
819,774
TELECOMMUNICATION SERVICES 2.1%
AT&T, Inc.
3,180
88,785
Verizon Communications, Inc.
2,000
64,180
NII Holdings, Inc. — Class B*
1,530
58,018
Embarq Corp.
1,400
56,770
NTELOS Holdings Corp.
1,880
50,553
Syniverse Holdings, Inc.*
2,910
48,335
Fairpoint Communications, Inc.
1,580
13,699
Total Telecommunication Services
380,340
Total Common Stocks
(Cost $19,839,241)
18,646,882
SECURITIES LENDING COLLATERAL 0.5%
Mount Vernon Securities
Lending Trust Prime
Portfolio (Note 11)
87,820
87,820
Total Securities Lending Collateral
(Cost $87,820)
87,820
Total Investments 101.5%
(Cost $19,927,061)
$18,734,702
Liabilities in Excess of
Other Assets – (1.5)%
$
(277,172)
Net Assets – 100.0%
$18,457,530
*
Non-Income Producing Security.
†
All or a portion of this security is on loan at September 30, 2008 — See Note 11.
REIT — Real Estate Investment Trust.
See Notes to Financial Statements.
THE RYDEX SERIES FUNDS SEMI-ANNUAL REPORT
|
17
SCHEDULE OF INVESTMENTS (Unaudited)
September 30, 2008
SECTOR ROTATION FUND
MARKET
MARKET
SHARES
VALUE
SHARES
VALUE
COMMON STOCKS 100.2%
CONSUMER STAPLES 33.0%
Procter & Gamble Co.
159,100
$
11,087,679
HEALTH CARE 42.7%
Philip Morris International, Inc.
186,600
8,975,460
Thermo Fisher Scientific, Inc.*
147,700
$
8,123,500
Wal-Mart Stores, Inc.
102,200
6,120,758
Medtronic, Inc.
113,400
5,681,340
Altria Group, Inc.
296,100
5,874,624
Alcon, Inc. — SP ADR
33,681
5,439,818
Coca-Cola Co.
91,900
4,859,672
Baxter International, Inc.
75,500
4,955,065
PepsiCo, Inc.
66,800
4,760,836
Covidien Ltd.
80,000
4,300,800
Colgate-Palmolive Co.
61,100
4,603,885
Genentech, Inc.*
48,200
4,274,376
Kimberly-Clark Corp.
63,100
4,091,404
Applied Biosystems Inc.
122,500
4,195,625
Lorillard, Inc.
45,900
3,265,785
Covance, Inc.*
46,500
4,111,065
Anheuser-Busch Companies, Inc.
45,800
2,971,504
Waters Corp.*
66,900
3,892,242
UST, Inc.
43,800
2,914,452
Amgen, Inc.*
64,200
3,805,134
Diageo PLC — SP ADR
41,100
2,830,146
Stryker Corp.
61,000
3,800,300
CVS Caremark Corp.
81,400
2,739,924
Pharmaceutical Product
Clorox Co.
37,100
2,325,799
Development, Inc.
90,700
3,750,445
Walgreen Co.
69,800
2,161,008
Illumina, Inc.*
87,000
3,526,110
Reynolds American, Inc.
43,425
2,111,323
Becton, Dickinson & Co.
42,500
3,411,050
Costco Wholesale Corp.
32,500
2,110,225
Millipore Corp.*
48,700
3,350,560
Energizer Holdings, Inc.*
21,100
1,699,605
Boston Scientific Corp.*
260,200
3,192,654
Kroger Co.
61,500
1,690,020
Invitrogen Corp.*
83,500
3,156,300
Sysco Corp.
54,000
1,664,820
Charles River Laboratories
Church & Dwight Co., Inc.
24,800
1,539,832
International, Inc.*
56,100
3,115,233
Safeway, Inc.
53,300
1,264,276
Zimmer Holdings, Inc.*
44,600
2,879,376
Coca-Cola Enterprises, Inc.
74,100
1,242,657
St. Jude Medical, Inc.*
66,000
2,870,340
Dr Pepper Snapple Group, Inc.*
45,900
1,215,432
PerkinElmer, Inc.
112,300
2,804,131
Molson Coors Brewing Co. —
Gilead Sciences, Inc.*
61,100
2,784,938
Class B
25,000
1,168,750
Bio-Rad Laboratories,
Pepsi Bottling Group, Inc.
37,400
1,090,958
Inc. — Class A*
28,001
2,775,459
Brown-Forman Corp. — Class B
12,900
926,349
Techne Corp.*
37,800
2,726,136
Constellation Brands, Inc. —
Bruker BioSciences Corp.*
193,950
2,585,353
Class A*†
42,300
907,758
C.R. Bard, Inc.
26,100
2,476,107
Universal Corp.
16,954
832,272
Intuitive Surgical, Inc.*
9,600
2,313,408
SUPERVALU, INC.
37,800
820,260
Parexel International Corp.*
80,200
2,298,532
Hansen Natural Corp.*
25,300
765,325
Celgene Corp.*
35,200
2,227,456
Vector Group Ltd.
40,019
706,736
Varian Medical Systems, Inc.*†
38,800
2,216,644
PepsiAmericas, Inc.
32,449
672,343
Genzyme Corp.*
26,400
2,135,496
Whole Foods Market, Inc.
33,100
662,993
Hospira, Inc.*
50,400
1,925,280
Longs Drug Stores Corp.
8,700
658,068
DENTSPLY International, Inc.
48,300
1,813,182
BJ’s Wholesale Club, Inc.*
15,500
602,330
Varian, Inc.*
40,991
1,758,514
Central European
Hologic, Inc.*
81,300
1,571,529
Distribution Corp.*
12,000
544,920
Biogen Idec, Inc.*
29,000
1,458,410
WD-40 Co.
15,132
543,693
ImClone Systems, Inc.*
19,500
1,217,580
Casey’s General Stores, Inc.
16,500
497,805
Cephalon, Inc.*†
13,900
1,077,111
Ruddick Corp.
15,200
493,240
Vertex Pharmaceuticals, Inc.*†
30,400
1,010,496
United Natural Foods, Inc.*
17,000
424,830
Myriad Genetics, Inc.*†
12,200
791,536
Winn-Dixie Stores, Inc.*
24,300
337,770
Alexion Pharmaceuticals, Inc.*
20,100
789,930
Total Consumer Staples
96,777,526
OSI Pharmaceuticals, Inc.*
15,500
763,995
INDUSTRIALS 15.8%
United Therapeutics Corp.*
7,075
744,078
Union Pacific Corp.
53,500
3,807,060
BioMarin Pharmaceuticals, Inc.*†
25,500
675,495
Burlington Northern
Amylin Pharmaceuticals, Inc.*
31,500
636,930
Santa Fe Corp.
38,100
3,521,583
Total Health Care
125,409,059
Southwest Airlines Co.†
229,600
3,331,496
18
|
THE RYDEX SERIES FUNDS SEMI-ANNUAL REPORT
See Notes to Financial Statements.
SCHEDULE OF INVESTMENTS (Unaudited) (concluded)
September 30, 2008
SECTOR ROTATION FUND
MARKET
MARKET
SHARES
VALUE
SHARES
VALUE
Norfolk Southern Corp.
50,200
$
3,323,742
SECURITIES LENDING COLLATERAL 3.1%
Canadian National Railway Co.
63,800
3,051,554
Mount Vernon Securities
CSX Corp.
51,600
2,815,812
Lending Trust Prime
AMR Corp.*
215,100
2,112,282
Portfolio (Note 11)
9,166,804
$
9,166,804
Northwest Airlines Corp.*†
215,400
1,945,062
Total Securities Lending Collateral
Delta Air Lines, Inc.*†
260,900
1,943,705
(Cost $9,166,804)
9,166,804
Continental Airlines, Inc. —
Class B*
111,100
1,853,148
FACE
JetBlue Airways Corp.*
291,200
1,441,440
AMOUNT
J.B. Hunt Transport Services, Inc.
39,400
1,314,778
UAL Corp.†
149,300
1,312,347
REPURCHASE AGREEMENTS 0.1%
Copa Holdings SA
39,000
1,267,500
Repurchase Agreements (Note 7)
SkyWest, Inc.
77,500
1,238,450
Morgan Stanley
Allegiant Travel Co.*
34,800
1,229,136
issued 09/30/08 at 0.05%
Kansas City Southern*
27,000
1,197,720
due 10/01/08
$65,154
65,154
Ryder System, Inc.
18,500
1,147,000
Mizuho Financial Group, Inc.
Alaska Air Group, Inc.*
54,200
1,105,138
issued 09/30/08 at 0.26%
US Airways Group, Inc.*†
166,900
1,006,407
due 10/01/08
53,968
53,968
Con-way, Inc.
20,200
891,022
Morgan Stanley
Landstar System, Inc.†
20,200
890,012
issued 09/30/08 at 0.10%
Hertz Global Holdings, Inc.*†
116,300
880,391
due 10/01/08
38,208
38,208
Werner Enterprises, Inc.
39,600
859,716
Total Repurchase Agreements
Heartland Express, Inc.†
51,700
802,384
(Cost $157,330)
157,330
Knight Transportation, Inc.
44,100
748,377
Total Investments 103.4%
AirTran Holdings, Inc.*
284,700
691,821
(Cost $313,452,797)
$ 303,363,042
Old Dominion Freight Line, Inc.*
22,700
643,318
Liabilities in Excess of
Total Industrials
46,372,401
Other Assets – (3.4)%
$
(9,867,329)
FINANCIALS 8.7%
Net Assets – 100.0%
$ 293,495,713
HSBC Holdings PLC — SP ADR
58,700
4,744,721
Wells Fargo & Co.
108,500
4,072,005
U.S. Bancorp
76,300
2,748,326
Barclays PLC — SP ADR
102,300
2,526,810
PNC Financial Services
Group, Inc.
23,300
1,740,510
BB&T Corp.
43,300
1,636,740
SunTrust Banks, Inc.
29,200
1,313,708
M&T Bank Corp.
12,700
1,133,475
UnionBanCal Corp.
14,600
1,070,034
Marshall & Ilsley Corp.
40,600
818,090
Fifth Third Bancorp
67,200
799,680
Regions Financial Corp.†
83,000
796,800
KeyCorp
66,400
792,816
Comerica, Inc.
23,300
764,007
Wachovia Corp.
149,200
522,200
Total Financials
25,479,922
Total Common Stocks
(Cost $304,128,663)
294,038,908
*
Non-Income Producing Security.
†
All or a portion of this security is on loan at September 30, 2008 — See Note 11.
ADR — American Depository Receipt.
See Notes to Financial Statements.
THE RYDEX SERIES FUNDS SEMI-ANNUAL REPORT
|
19
SCHEDULE OF INVESTMENTS (Unaudited)
September 30, 2008
ABSOLUTE RETURN STRATEGIES FUND
MARKET
MARKET
SHARES
VALUE
SHARES
VALUE
COMMON STOCKS 52.7%
Cincinnati Financial Corp.§
4,290
$
122,008
State Street Corp.§
2,110
120,017
FINANCIALS 9.3%
Macerich Co.§
1,800
114,570
Darwin Professional
Waddell & Reed Financial,
Underwriters, Inc.*
39,830
$
1,239,112
Inc. — Class A§
3,650
90,337
Charles Schwab Corp.§
40,319
1,048,294
Protective Life Corp.§
2,870
81,824
Nationwide Financial
Genworth Financial,
Services, Inc.
21,010
1,036,423
Inc. — Class A§
8,320
71,635
Allied World Assurance
NYSE Euronext§
1,270
49,759
Company Holdings Ltd
27,699
983,868
Endurance Specialty
Aon Corp.§
20,549
923,883
Holdings Ltd.
1,240
38,341
Hilb Rogal & Hobbs Co.
17,249
806,218
Jones Lang LaSalle, Inc.§
690
30,001
Travelers Companies, Inc.§
14,800
668,960
IntercontinentalExchange, Inc.*§
220
17,750
Loews Corp.§
16,929
668,526
Leucadia National Corp.§
290
13,178
Plum Creek Timber Co.,
Total Financials
19,965,299
Inc. (REIT)§
11,990
597,821
HEALTH CARE 8.2%
Annaly Capital
Thermo Fisher Scientific, Inc.*§
24,399
1,341,945
Management, Inc.
41,069
552,378
Applied Biosystems Inc.
35,979
1,232,281
Castlepoint Holdings Ltd.
49,490
550,824
Apria Healthcare Group, Inc.*
65,309
1,191,236
MetLife, Inc.§
9,330
522,480
Baxter International, Inc.§
17,749
1,164,867
Blackrock, Inc.
2,580
501,810
Alpharma, Inc. — Class A*
30,224
1,114,963
Axis Capital Holdings Ltd.
15,690
497,530
Genentech, Inc.*
12,520
1,110,274
JPMorgan Chase & Co.§
10,310
481,477
Vital Signs, Inc.
14,610
1,079,679
PartnerRe Ltd.
7,020
477,992
Datascope Corp.
17,978
928,204
Hanover Insurance Group, Inc.§
10,300
468,856
HLTH Corp.*
64,540
737,692
Unum Group§
18,239
457,799
Barr Pharmaceuticals, Inc.*
9,680
632,104
AFLAC, Inc.§
7,200
423,000
LifePoint Hospitals, Inc.*§
15,359
493,638
Philadelphia Consolidated
Hill-Rom Holdings, Inc.§
15,290
463,440
Holding Corp.*
6,930
405,890
C.R. Bard, Inc.§
4,880
462,966
Invesco Ltd.§
19,179
402,375
ImClone Systems, Inc.*
7,280
454,563
Transatlantic Holdings, Inc.
7,220
392,407
WellPoint, Inc.*§
9,030
422,333
Liberty Media Corp - Capital*
28,740
384,541
Express Scripts, Inc.*§
5,360
395,675
Federated Investors,
Covance, Inc.*§
3,870
342,147
Inc. — Class B§
13,070
377,069
Pfizer, Inc.§
18,350
338,374
Arthur J. Gallagher & Co.§
14,660
376,175
Millipore Corp.*§
4,710
324,048
Chubb Corp.§
6,000
329,400
Techne Corp.*§
4,350
313,722
Hudson City Bancorp, Inc.§
17,769
327,838
Charles River Laboratories
Allstate Corp.§
6,970
321,456
International, Inc.*§
4,600
255,438
T. Rowe Price Group, Inc.§
5,900
316,889
DENTSPLY International, Inc.§
6,550
245,887
ProLogis§
7,640
315,303
Medco Health Solutions, Inc.*§
5,060
227,700
Janus Capital Group, Inc.§
12,210
296,459
Pharmaceutical Product
Goldman Sachs Group, Inc.§
2,000
256,000
Development, Inc.§
5,320
219,982
Ameriprise Financial, Inc.§
6,130
234,166
Hologic, Inc.*§
10,870
210,117
Health Care REIT, Inc.§
3,820
203,339
McKesson Corp.§
3,680
198,021
Northern Trust Corp.§
2,800
202,160
Aetna, Inc.§
5,290
191,022
Hartford Financial Services
Biogen Idec, Inc.*§
3,640
183,056
Group, Inc.§
4,140
169,699
Quest Diagnostics, Inc.§
3,060
158,110
Nationwide Health
Perrigo Co.§
3,520
135,379
Properties, Inc.§
4,370
157,233
Coventry Health Care, Inc.*§
2,770
90,164
Everest Re Group Ltd.§
1,740
150,562
Community Health
HCP, Inc.§
3,620
145,271
Systems, Inc.*§
2,860
83,827
People’s United Financial, Inc.
7,320
140,910
Illumina, Inc.*
2,020
81,871
Host Hotels & Resorts, Inc.§
10,240
136,090
Waters Corp.*§
1,290
75,052
W.R. Berkley Corp.§
5,730
134,941
Inverness Medical Innovations*
388
73,720
American Financial Group, Inc.§
4,490
132,455
20
|
THE RYDEX SERIES FUNDS SEMI-ANNUAL REPORT
See Notes to Financial Statements.
SCHEDULE OF INVESTMENTS (Unaudited) (continued)
September 30, 2008
ABSOLUTE RETURN STRATEGIES FUND
MARKET
MARKET
SHARES
VALUE
SHARES
VALUE
Amgen, Inc.*§
1,230
$
72,902
DreamWorks Animation
BioMarin Pharmaceuticals, Inc.*
2,550
67,550
SKG, Inc. — Class A*§
5,260
$
165,427
PerkinElmer, Inc.§
2,160
53,935
BorgWarner, Inc.§
5,010
164,178
Bio-Rad Laboratories,
DeVry, Inc.§
3,130
155,060
Inc. — Class A*
540
53,525
Bluegreen Corp.*
22,340
154,369
Medtronic, Inc.§
1,060
53,106
Ross Stores, Inc.§
4,170
153,498
Alcon, Inc. — SP ADR
320
51,683
CTC Media, Inc.*
9,180
137,700
Humana, Inc.*§
1,220
50,264
LKQ Corp.*
7,990
135,590
Bruker BioSciences Corp.*
3,730
49,721
Yum! Brands, Inc.§
3,770
122,940
Parexel International Corp.*
1,540
44,136
Hanesbrands, Inc.*§
4,860
105,705
Covidien Ltd.§
750
40,320
Snap-On, Inc.§
1,940
102,160
Varian, Inc.*§
790
33,891
Whirlpool Corp.§
1,260
99,905
Intuitive Surgical, Inc.*§
140
33,737
Central European Media
Becton, Dickinson & Co.§
400
32,104
Enterprises Ltd. — Class A*†
1,460
95,484
Zimmer Holdings, Inc.*§
420
27,115
Strayer Education, Inc.§
370
74,096
St. Jude Medical, Inc.*§
620
26,964
Discovery Communications,
Cephalon, Inc.*§
270
20,922
Inc. — Class A*
4,765
67,901
Varian Medical Systems, Inc.*§
360
20,567
Discovery Communications, Inc.*
4,765
67,472
Alexion Pharmaceuticals, Inc.*
380
14,934
Penske Auto Group, Inc.†
5,730
65,723
Myriad Genetics, Inc.*
230
14,922
Barnes & Noble, Inc.§
2,430
63,374
OSI Pharmaceuticals, Inc.*
300
14,787
priceline.com, Inc.*§
920
62,956
United Therapeutics Corp.*
120
12,620
Johnson Controls, Inc.§
1,690
51,258
Vertex Pharmaceuticals, Inc.*§
290
9,640
Apollo Group, Inc. — Class A*§
790
46,847
Inverness Medical
Big Lots, Inc.*§
1,620
45,085
Innovations, Inc.*
250
7,500
Tiffany & Co.§
1,220
43,334
Total Health Care
17,780,342
Autoliv, Inc.
1,220
41,175
CONSUMER DISCRETIONARY 6.0%
Dick’s Sporting Goods, Inc.*§
1,990
38,964
Nike, Inc. — Class B§
16,179
1,082,375
CBS Corp.§
2,610
38,054
McDonald’s Corp.§
15,359
947,650
Weight Watchers
Landry’s Restaurants, Inc.†
60,518
941,055
International, Inc.
1,010
36,966
Wendy’s/Arby’s Group,
Urban Outfitters, Inc.*§
910
29,002
Inc. — Class A
143,858
756,695
Matthews International
Hasbro, Inc.§
18,730
650,306
Corp. — Class A§
530
26,892
Service Corporation
Corinthian Colleges, Inc.*§
1,730
25,950
International§
76,267
637,592
TRW Automotive
Amazon.com, Inc.*§
8,620
627,191
Holdings Corp.*
1,610
25,615
Burger King Holdings, Inc.
20,299
498,544
AutoZone, Inc.*§
200
24,668
Regal Entertainment
Regis Corp.§
850
23,375
Group — Class A†
30,080
474,662
Sotheby’s§
1,080
21,665
Stewart Enterprises,
Coinstar, Inc.*
620
19,840
Inc. — Class A†
59,878
470,641
ITT Educational Services, Inc.*§
230
18,609
TJX Companies, Inc.§
15,239
465,094
Capella Education Co.*
360
15,430
Walt Disney Co.§
9,970
305,979
Advance Auto Parts, Inc.§
350
13,881
Comcast Corp. — Class A§
13,930
273,446
Ascent Media Corp. - Class A*
476
11,619
Mohawk Industries, Inc.*§
4,020
270,908
M.D.C. Holdings, Inc.§
170
6,220
Home Depot, Inc.§
10,190
263,819
Total Consumer Discretionary
12,901,432
Time Warner, Inc.§
18,540
243,059
UTILITIES 5.8%
Liberty Global, Inc. — Class A*
7,370
223,311
Puget Energy, Inc.
49,219
1,314,147
DIRECTV Group, Inc.*§
7,800
204,126
Constellation Energy Group, Inc.
44,460
1,080,378
Lowe’s Companies, Inc.§
8,540
202,313
UGI Corp.
41,218
1,062,600
Royal Caribbean Cruises Ltd.†
9,530
197,748
TECO Energy, Inc.§
57,488
904,286
GameStop Corp. — Class A*§
5,660
193,629
TransAlta Corp.†
32,190
884,581
Carnival Corp.§
5,460
193,011
Calpine Corp.*
63,869
830,297
CKX, Inc.*
29,268
180,291
FirstEnergy Corp.§
11,419
764,959
See Notes to Financial Statements.
THE RYDEX SERIES FUNDS SEMI-ANNUAL REPORT
|
21
SCHEDULE OF INVESTMENTS (Unaudited) (continued)
September 30, 2008
ABSOLUTE RETURN STRATEGIES FUND
MARKET
MARKET
SHARES
VALUE
SHARES
VALUE
Public Service Enterprise
Fidelity National Information
Group, Inc.§
19,409
$
636,421
Services, Inc.§
5,560
$
102,638
Questar Corp.§
14,050
574,926
ANSYS, Inc.*§
2,510
95,054
Energen Corp.§
12,409
561,880
Novellus Systems, Inc.*§
4,420
86,809
Atmos Energy Corp.
18,859
502,027
Compuware Corp.*§
8,439
81,774
American Water Works
EchoStar Corp. — Class A*
3,180
76,638
Company, Inc.
22,660
487,190
Itron, Inc.*
840
74,365
MDU Resources Group, Inc.§
15,739
456,431
Sohu.com, Inc.*
1,120
62,440
National Fuel Gas Co.§
10,820
456,388
Flir Systems, Inc.*§
1,560
59,935
Pepco Holdings, Inc.§
19,300
442,163
Cypress Semiconductor Corp.*§
10,720
55,958
DTE Energy Co.§
10,420
418,050
CommScope, Inc.*§
1,560
54,038
DPL, Inc.§
15,680
388,864
ADC Telecommunications, Inc.*§
6,350
53,658
Oneok, Inc.§
5,490
188,856
Ingram Micro, Inc. — Class A*§
3,330
53,513
AES Corp.*§
13,720
160,387
KLA-Tencor Corp.§
1,240
39,246
Xcel Energy, Inc.§
7,950
158,920
Nvidia Corp.*§
2,760
29,560
Equitable Resources, Inc.§
3,570
130,948
BMC Software, Inc.*§
740
21,186
Exelon Corp.§
1,520
95,182
Western Union Co.§
500
12,335
SCANA Corp.§
2,330
90,707
Total Information Technology
12,421,623
Total Utilities
12,590,588
INDUSTRIALS 5.4%
INFORMATION TECHNOLOGY 5.8%
Northwest Airlines Corp.*
180,626
1,631,053
Greenfield Online, Inc.*
82,447
1,434,578
DRS Technologies, Inc.§
15,789
1,211,806
Photon Dynamics, Inc.*
83,167
1,276,613
Allied Waste Industries, Inc.*
100,158
1,112,755
NDS Group PLC - SP ADR*
21,070
1,177,602
IKON Office Solutions, Inc.
64,146
1,091,123
International Rectifier Corp.*
51,696
983,258
Deere & Co.§
11,230
555,885
SI International, Inc.*
22,890
687,845
Copart, Inc.*§
12,960
492,480
Secure Computing Corp.*
123,710
677,931
Brink’s Co.§
6,830
416,767
Foundry Networks, Inc.*
33,799
615,480
SPX Corp.§
5,130
395,010
Synopsys, Inc.*§
22,830
455,459
Flowserve Corp.§
4,320
383,486
Hewlett-Packard Co.§
8,680
401,363
AGCO Corp.*§
7,310
311,479
Applied Materials, Inc.§
21,100
319,243
Ryder System, Inc.§
4,550
282,100
QLogic Corp.*§
20,499
314,865
McDermott International, Inc.*
10,770
275,173
VeriSign, Inc.*§
11,520
300,442
Waste Management, Inc.§
8,130
256,014
Qualcomm, Inc.§
5,810
249,656
Norfolk Southern Corp.§
3,750
248,287
MasterCard, Inc.§
1,270
225,209
Jacobs Engineering
United Online, Inc.
23,859
224,513
Group, Inc.*§
4,120
223,757
Hewitt Associates,
Joy Global, Inc.§
4,540
204,936
Inc. — Class A*
6,160
224,470
SunPower Corp.*
2,939
202,967
Amphenol Corp. —
Valmont Industries, Inc.
2,330
192,668
Class A§
5,140
206,320
Cummins, Inc.§
4,180
182,750
Arrow Electronics, Inc.*§
7,470
195,863
Eaton Corp.§
2,780
156,180
Dolby Laboratories, Inc. —
CSX Corp.§
2,180
118,963
Class A*
5,390
189,674
Precision Castparts Corp.§
1,510
118,958
Western Digital Corp.*§
8,190
174,611
Bucyrus International, Inc. —
MEMC Electronic Materials, Inc.*§
5,990
169,277
Class A
2,480
110,806
Avnet, Inc.*§
6,080
149,750
Timken Co.§
3,590
101,776
Affiliated Computer Services,
GATX Corp.§
2,410
95,364
Inc. — Class A*§
2,780
140,751
Kansas City Southern*§
1,960
86,946
Computer Sciences Corp.*§
3,490
140,263
First Solar, Inc.*
460
86,899
Lam Research Corp.*§
4,390
138,241
Fluor Corp.§
1,530
85,221
Zebra Technologies Corp. —
ABB Ltd. — SP ADR
4,140
80,316
Class A*§
4,910
136,744
Union Pacific Corp.§
1,030
73,295
Apple Computer, Inc.*§
1,170
132,982
Quanta Services, Inc.*§
2,660
71,847
Trimble Navigation Ltd.*§
4,620
119,473
Emerson Electric Co.§
1,750
71,382
22
|
THE RYDEX SERIES FUNDS SEMI-ANNUAL REPORT
See Notes to Financial Statements.
SCHEDULE OF INVESTMENTS (Unaudited) (continued)
September 30, 2008
ABSOLUTE RETURN STRATEGIES FUND
MARKET
MARKET
SHARES
VALUE
SHARES
VALUE
Burlington Northern
Pepsi Bottling Group, Inc.§
4,980
$
145,267
Santa Fe Corp.§
730
$
67,474
Safeway, Inc.§
6,110
144,929
Manitowoc Co., Inc.§
3,920
60,956
Wal-Mart Stores, Inc.§
1,890
113,192
Foster Wheeler Ltd.*
1,660
59,943
PepsiCo, Inc.§
1,280
91,226
Canadian National Railway Co.
1,230
58,831
SUPERVALU, INC.§
3,660
79,422
Woodward Governor Co.
1,540
54,316
Kimberly-Clark Corp.§
1,210
78,456
FTI Consulting, Inc.*
690
49,846
Diageo PLC — SP ADR
790
54,399
Granite Construction, Inc.§
1,060
37,969
Coca-Cola Co.§
1,000
52,880
Energy Conversion Devices, Inc.*
560
32,620
Clorox Co.§
710
44,510
Suntech Power Holdings
Energizer Holdings, Inc.*§
400
32,220
Co. Ltd. — SP ADR*
850
30,489
Church & Dwight Co., Inc.§
480
29,803
Roper Industries, Inc.§
520
29,619
NBTY, Inc.*§
680
20,074
United Rentals, Inc.*§
1,940
29,566
Brown-Forman Corp. —
Sunpower Corp.*
400
28,372
Class B§
250
17,953
AMETEK, Inc.§
690
28,131
Hansen Natural Corp.*
490
14,823
J.B. Hunt Transport
WD-40 Co.
310
11,138
Services, Inc.§
760
25,361
Total Consumer Staples
9,316,212
Brady Corp. — Class A
660
23,285
ENERGY 3.2%
GrafTech International Ltd.*
1,240
18,736
National-Oilwell Varco, Inc.*§
13,580
682,123
Con-way, Inc.§
390
17,203
Alpha Natural Resources, Inc.*
12,740
655,218
Werner Enterprises, Inc.§
760
16,500
SEACOR Holdings, Inc.*†
5,860
462,647
Heartland Express, Inc.
1,000
15,520
ConocoPhillips§
5,670
415,327
Regal-Beloit Corp.
350
14,882
ENSCO International, Inc.§
7,190
414,360
Knight Transportation, Inc.
850
14,424
Cimarex Energy Co.§
6,710
328,186
Hubbell, Inc. — Class B§
410
14,370
Anadarko Petroleum Corp.§
6,370
309,009
Walter Industries, Inc.
300
14,235
Frontline Ltd.†
6,200
298,034
American Superconductor
FMC Technologies, Inc.*§
6,290
292,799
Corp.*
550
12,963
Patterson-UTI Energy, Inc.§
14,119
282,662
Old Dominion Freight Line, Inc.*
440
12,470
Noble Corp.§
5,600
245,840
Belden, Inc.
380
12,080
Unit Corp.*
4,890
243,620
Donaldson Co., Inc.§
200
8,382
Stone Energy Corp.*
5,120
216,730
General Cable Corp.*
200
7,126
Transocean, Inc.*§
1,970
216,385
Steelcase, Inc. — Class A
570
6,128
Superior Energy Services*§
6,230
194,002
Boeing Co.§
50
2,868
Chesapeake Energy Corp.§
4,670
167,466
Total Industrials
11,733,114
Denbury Resources, Inc.*§
8,190
155,938
CONSUMER STAPLES 4.3%
Apache Corp.§
1,070
111,580
Wm. Wrigley Jr. Co.
17,340
1,376,796
Whiting Petroleum Corp.*
1,440
102,614
UST, Inc.
15,847
1,054,459
Massey Energy Co.§
2,850
101,659
Corn Products International, Inc.
26,088
842,121
Hess Corp.§
1,130
92,750
Herbalife Ltd.
20,400
806,208
Encore Acquisition Co.*§
2,180
91,080
Molson Coors Brewing
Diamond Offshore Drilling, Inc.
800
82,448
Co. — Class B§
15,109
706,346
Exxon Mobil Corp.§
980
76,107
Anheuser-Busch Companies, Inc.
10,700
694,216
PetroHawk Energy Corp.*
3,420
73,975
Costco Wholesale Corp.§
9,780
635,016
Chevron Corp.§
610
50,313
Dr Pepper Snapple Group, Inc.*
17,019
450,663
Range Resources Corp.§
1,140
48,872
PepsiAmericas, Inc.§
16,950
351,204
Arch Coal, Inc.§
1,440
47,362
Bunge Ltd.
4,860
307,055
Consol Energy, Inc.§
1,020
46,808
Coca-Cola Enterprises, Inc.§
14,130
236,960
BP PLC — SP ADR
870
43,648
Procter & Gamble Co.§
3,060
213,251
Halliburton Co.§
1,310
42,431
BJ’s Wholesale Club, Inc.*§
5,040
195,854
Helmerich & Payne, Inc.§
870
37,575
Central European Distribution
Royal Dutch Shell PLC —
Corp.*
4,000
181,640
SP ADR
590
34,816
Reynolds American, Inc.§
3,570
173,573
EOG Resources, Inc.§
360
32,206
CVS Caremark Corp.§
4,770
160,558
Weatherford International Ltd.*§
1,230
30,922
See Notes to Financial Statements.
THE RYDEX SERIES FUNDS SEMI-ANNUAL REPORT
|
23
SCHEDULE OF INVESTMENTS (Unaudited) (continued)
September 30, 2008
ABSOLUTE RETURN STRATEGIES FUND
MARKET
MARKET
SHARES
VALUE
SHARES
VALUE
Occidental Petroleum Corp.§
420
$
29,589
American Tower Corp. —
Tenaris SA — SP ADR
780
29,086
Class A*§
11,419
$
410,742
Smith International, Inc.§
450
26,388
SBA Communications Corp.*
15,239
394,233
Devon Energy Corp.§
280
25,536
AT&T, Inc.§
10,820
302,094
Canadian Natural Resources Ltd.
340
23,276
Telephone & Data Systems, Inc.§
1,660
59,345
Cameron International Corp.*§
590
22,739
U.S. Cellular Corp.*
690
32,375
XTO Energy, Inc.§
380
17,678
NII Holdings, Inc. — Class B*
470
17,822
W&T Offshore, Inc.
250
6,822
MetroPCS Communications,
Atwood Oceanics, Inc.*
150
5,460
Inc.*
370
5,176
Total Energy
6,914,086
Total Telecommunication Services
4,028,420
MATERIALS 2.8%
Total Common Stocks
Hercules, Inc.
66,449
1,315,026
(Cost $124,786,624)
113,791,441
Fording Canadian Coal Trust†
12,430
1,031,690
Rohm & Haas Co.
9,610
672,700
EXCHANGE TRADED FUNDS 5.4%
Crown Holdings, Inc.*
17,270
383,567
iShares MSCI Emerging Markets
Lubrizol Corp.§
8,070
348,140
Index Fund
111,934
3,865,081
Dow Chemical Co.§
9,550
303,499
Vanguard Emerging
United States Steel Corp.§
3,730
289,485
Markets ETF
37,340
1,294,204
International Paper Co.§
10,230
267,821
iShares S&P GSCI Commodity
Steel Dynamics, Inc.§
9,640
164,748
Indexed Trust*
19,420
1,044,796
The Mosaic Co.
2,370
161,207
Nuveen Equity Premium
Huntsman Corp.
12,170
153,342
Opportunity Fund
64,740
842,267
Reliance Steel & Aluminum Co.§
3,800
144,286
Nuveen Equity Premium and
Alcoa, Inc.§
6,250
141,125
Growth Fund†
62,020
810,601
Nalco Holding Co.
6,060
112,352
Eaton Vance Tax-Managed
AK Steel Holding Corp.§
4,100
106,272
Buy-Write Income Fund
60,310
787,046
Commercial Metals Co.§
3,850
65,027
Nuveen Core Equity Alpha Fund
63,660
773,469
Monsanto Co.§
630
62,357
First Trust Enhanced Equity
Albemarle Corp.§
1,980
61,063
Income Fund, Inc.
66,770
741,147
CF Industries Holdings, Inc.§
620
56,705
Eaton Vance Tax-Managed
Potash Corporation
Buy-Write Opportunities Fund
61,870
740,584
of Saskatchewan
400
52,804
Liberty All Star Equity Fund
155,728
702,333
Terra Industries, Inc.§
1,540
45,276
Total Exchange Traded Funds
E.I. du Pont de Nemours
(Cost $14,239,065)
11,601,528
and Co.§
920
37,076
SECURITIES LENDING COLLATERAL 0.8%
Praxair, Inc.§
420
30,131
Mount Vernon Securities
Air Products & Chemicals, Inc.§
330
22,602
Lending Trust Prime
Agrium, Inc.
380
21,310
Portfolio (Note 11)
1,786,618
1,786,618
Sigma-Aldrich Corp.§
340
17,823
PPG Industries, Inc.§
300
17,496
Total Securities Lending Collateral
Owens-Illinois, Inc.*
550
16,170
(Cost $1,786,618)
1,786,618
Carpenter Technology Corp.§
620
15,903
CONTRACTS
Intrepid Potash, Inc.*
470
14,166
Temple-Inland, Inc.§
600
9,156
OPTIONS PURCHASED 0.0%
Put Options On:
Total Materials
6,140,325
iShares S&P GSCI Commodity
TELECOMMUNICATION SERVICES 1.9%
Index Expiring October 2008
Verizon Communications, Inc.§
29,989
962,347
with strike price of 53
171
25,650
Crown Castle
Total Options Purchased
International Corp.*
26,609
770,863
(Cost $18,054)
25,650
Gilat Satellite Networks Ltd.*
113,536
659,644
CenturyTel, Inc.§
11,290
413,779
24
|
THE RYDEX SERIES FUNDS SEMI-ANNUAL REPORT
See Notes to Financial Statements.
SCHEDULE OF INVESTMENTS (Unaudited) (continued)
September 30, 2008
ABSOLUTE RETURN STRATEGIES FUND
FACE
MARKET
MARKET
AMOUNT
VALUE
SHARES
VALUE
REPURCHASE AGREEMENTS 13.1%
Nabors Industries Ltd.*
10,390
$
(258,919)
Repurchase Agreements (Note 7)
Exterran Holdings, Inc.*
9,250
(295,630)
Credit Suisse Group
Teekay Corp.
13,180
(347,688)
issued 09/30/08 at 0.25%
Tetra Technologies, Inc.*
28,300
(391,955)
due 10/01/08§
$21,498,405
$21,498,405
Baker Hughes, Inc.
8,050
(487,347)
Morgan Stanley
BJ Services Co.
31,300
(598,769)
issued 09/30/08 at 0.05%
Total Energy
(4,717,535)
due 10/01/08
2,795,823
2,795,823
MATERIALS (2.5)%
Mizuho Financial Group, Inc.
Westlake Chemical Corp.
240
(5,047)
issued 09/30/08 at 0.26%
RPM International, Inc.
440
(8,510)
due 10/01/08
2,315,849
2,315,849
Century Aluminum Co.*
370
(10,245)
Morgan Stanley
Cabot Corp.
1,510
(47,988)
issued 09/30/08 at 0.10%
Allegheny Technologies, Inc.
1,630
(48,167)
due 10/01/08
1,639,539
1,639,539
Chemtura Corp.
11,110
(50,662)
Total Repurchase Agreements
Celanese Corp.
2,160
(60,286)
(Cost $28,249,616)
28,249,616
International Flavors &
Total Long Securities 72.0%
Fragrances, Inc.
1,700
(67,082)
(Cost $169,079,977)
$ 155,454,853
Teck Cominco Ltd. — Class B
2,990
(87,069)
Ecolab, Inc.
2,640
(128,093)
SHARES
Eastman Chemical Co.
2,350
(129,391)
COMMON STOCKS SOLD SHORT (35.0)%
Valhi, Inc.
7,500
(135,000)
Smurfit-Stone Container Corp.*
29,370
(138,039)
TELECOMMUNICATION SERVICES (0.2)%
Titanium Metals Corp.
14,170
(160,688)
Clearwire Corp.*
2,950
(35,046)
Eagle Materials, Inc.
9,060
(202,672)
Qwest Communications
Domtar Corp.*
47,779
(219,783)
International, Inc
35,340
(114,148)
Scotts Miracle-Gro Co. —
Sprint Nextel Corp.
34,430
(210,023)
Class A
14,160
(334,742)
Ashland, Inc.
11,970
(350,003)
Total Telecommunication Services
(359,217)
Newmont Mining Corp.
9,570
(370,933)
ENERGY (2.2)%
Weyerhaeuser Co.
7,250
(439,205)
SandRidge Energy, Inc.*
120
(2,352)
Sealed Air Corp.
23,870
(524,901)
Patriot Coal Corp.*
100
(2,905)
Cliffs Natural Resources, Inc.
10,560
(559,046)
Key Energy Services, Inc.*
680
(7,888)
Pactiv Corp.*
22,840
(567,117)
Southwestern Energy Co.*
680
(20,767)
Bemis Co., Inc.
25,279
(662,563)
Continental Resources, Inc.*
880
(34,522)
Total Materials
(5,307,232)
El Paso Corp.
3,970
(50,657)
Global Industries Ltd.*
7,990
(55,451)
CONSUMER STAPLES (2.5)%
Valero Energy Corp.
2,000
(60,600)
Altria Group, Inc.
2,780
(55,155)
Helix Energy Solutions
Rite Aid Corp.*
104,969
(85,025)
Group, Inc.*
2,970
(72,112)
Constellation Brands,
Hercules Offshore, Inc.*
7,330
(111,123)
Inc. — Class A*
9,060
(194,428)
Tesoro Corp.
6,920
(114,111)
Tyson Foods, Inc. — Class A
17,150
(204,771)
Frontier Oil Corp.
8,060
(148,465)
Smithfield Foods, Inc.*
16,170
(256,780)
Peabody Energy Corp.
3,820
(171,900)
Del Monte Foods Co.
33,170
(258,726)
Overseas Shipholding Group
3,070
(179,012)
Colgate-Palmolive Co.
4,500
(339,075)
Plains Exploration &
Sara Lee Corp.
28,850
(364,376)
Production Co.*
5,580
(196,193)
Alberto-Culver Co.
18,360
(500,126)
Sunoco, Inc.
5,650
(201,027)
Avon Products, Inc.
13,140
(546,230)
Stone Energy Corp.
5,120
(216,730)
Walgreen Co.
20,950
(648,612)
Holly Corp.
7,550
(218,346)
Dean Foods Co.*
38,310
(894,922)
Newfield Exploration Co.*
7,310
(233,847)
Hershey Co.
24,329
(961,969)
Marathon Oil Corp.
6,000
(239,220)
Total Consumer Staples
(5,310,193)
See Notes to Financial Statements.
THE RYDEX SERIES FUNDS SEMI-ANNUAL REPORT
|
25
SCHEDULE OF INVESTMENTS (Unaudited) (continued)
September 30, 2008
ABSOLUTE RETURN STRATEGIES FUND
MARKET
MARKET
SHARES
VALUE
SHARES
VALUE
INFORMATION TECHNOLOGY (3.3)%
Celgene Corp.*
830
$
(52,522)
MoneyGram International, Inc.
2,530
$
(3,593)
WellCare Health Plans, Inc.*
2,090
(75,240)
Acxiom Corp.
290
(3,637)
Lincare Holdings Inc.
2,690
(80,942)
Broadcom Corp. — Class A*
290
(5,403)
King Pharmaceuticals, Inc.*
8,500
(81,430)
Vishay Intertechnology, Inc.*
990
(6,554)
Health Management
Ciena Corp.*
830
(8,366)
Associates, Inc. — Class A*
22,450
(93,392)
Fairchild Semiconductor
Brookdale Senior Living Inc.
5,720
(125,783)
International, Inc.*
2,920
(25,959)
Schering-Plough Corp.
7,650
(141,296)
F5 Networks, Inc.*
1,120
(26,186)
Gilead Sciences, Inc.*
3,230
(147,223)
Brocade Communications
Mylan, Inc.*
15,840
(180,893)
Systems, Inc.*
4,830
(28,111)
Hospira, Inc.*
5,060
(193,292)
Varian Semiconductor
UnitedHealth Group, Inc.
8,360
(212,260)
Equipment Associates, Inc.*
1,660
(41,699)
Health Net, Inc.*
9,970
(235,292)
Akamai Technologies, Inc.*
3,450
(60,168)
Teva Pharmaceutical
Google, Inc. — Class A*
170
(68,088)
Industries Ltd. — SP ADR
5,960
(272,908)
Cognizant Technology Solutions
Tenet Healthcare Corp.*
52,250
(289,988)
Corp. — Class A*
3,230
(73,741)
Stryker Corp.
4,760
(296,548)
Novell, Inc.*
16,750
(86,095)
Genzyme Corp.*
3,690
(298,484)
Xerox Corp.
8,440
(97,313)
CooperCompanies, Inc.
9,430
(327,787)
LSI Logic Corp.*
20,560
(110,202)
Sepracor, Inc.*
19,409
(355,379)
Rambus, Inc.*
10,500
(134,925)
Advanced Medical Optics, Inc.*
20,100
(357,378)
Cadence Design Systems, Inc.*
20,360
(137,634)
Merck & Co., Inc.
11,610
(366,412)
Salesforce.com, Inc.*
2,988
(144,619)
Amylin Pharmaceuticals, Inc.*
18,180
(367,600)
SanDisk Corp.*
7,430
(145,257)
Omnicare, Inc.
15,050
(432,989)
Integrated Device
Invitrogen Corp.*
12,220
(461,916)
Technology, Inc.*
18,900
(147,042)
Watson Pharmaceuticals, Inc.*
16,270
(463,695)
Unisys Corp.*
58,360
(160,490)
Allergan, Inc.
10,760
(554,140)
Altera Corp.
7,770
(160,684)
Boston Scientific Corp.*
62,980
(772,765)
Convergys Corp.
11,890
(175,734)
Total Health Care
(7,304,326)
Sun Microsystems, Inc.*
26,060
(198,056)
UTILITIES (4.0)%
NCR Corp.*
9,670
(213,224)
Northeast Utilities System
1,220
(31,293)
Atmel Corp.*
63,640
(215,740)
Centerpoint Energy, Inc.
2,850
(41,525)
Paychex, Inc.
6,690
(220,971)
Duke Energy Corp.
2,690
(46,887)
United Online, Inc.
23,859
(224,513)
Great Plains Energy, Inc.
8,180
(181,760)
Teradyne, Inc.*
28,910
(225,787)
Allegheny Energy, Inc.
5,850
(215,105)
Tech Data Corp.*
7,690
(229,547)
Alliant Energy Corp.
7,770
(250,272)
Micron Technology, Inc.*
61,160
(247,698)
Mirant Corp.*
13,980
(255,694)
Advanced Micro Devices, Inc.*
47,330
(248,483)
Reliant Energy, Inc.*
45,809
(336,696)
Tyco Electronics Ltd.
9,600
(265,536)
Consolidated Edison, Inc.
8,040
(345,398)
Tellabs, Inc.*
69,070
(280,424)
Ameren Corp.
10,290
(401,619)
Jabil Circuit, Inc.
30,420
(290,207)
PPL Corp.
11,250
(416,475)
Adobe Systems, Inc.*
9,030
(356,414)
Pinnacle West Capital Corp.
12,700
(437,007)
WebMD Health Corp.*
13,620
(405,059)
Southern Union Co.
23,280
(480,732)
Motorola, Inc.
72,180
(515,365)
PG&E Corp.
12,910
(483,480)
Electronic Arts, Inc.*
15,790
(584,072)
NRG Energy, Inc.*
21,050
(520,988)
JDS Uniphase Corp.*
76,590
(647,951)
Hawaiian Electric Industries, Inc.
18,240
(530,966)
Total Information Technology
(7,220,543)
Sierra Pacific Resources
57,170
(547,689)
HEALTH CARE (3.4)%
Dynegy, Inc. - Class A*
178,610
(639,424)
Bristol-Myers Squibb Co.
440
(9,174)
CMS Energy Corp.
53,970
(673,006)
PDL BioPharma, Inc.
1,170
(10,893)
NiSource, Inc.
57,230
(844,715)
Cardinal Health, Inc.
240
(11,827)
Aqua America, Inc.
54,180
(963,320)
Kinetic Concepts, Inc.*
1,220
(34,880)
Total Utilities
(8,644,048)
26
|
THE RYDEX SERIES FUNDS SEMI-ANNUAL REPORT
See Notes to Financial Statements.
SCHEDULE OF INVESTMENTS (Unaudited) (continued)
September 30, 2008
ABSOLUTE RETURN STRATEGIES FUND
MARKET
MARKET
SHARES
VALUE
SHARES
VALUE
CONSUMER DISCRETIONARY (4.2)%
Goodyear Tire & Rubber Co.*
23,430
$
(358,713)
RH Donnelley Corp.*
1,560
$
(3,104)
Saks, Inc.*
40,860
(377,955)
Idearc, Inc.
7,210
(9,013)
Scripps Networks Interactive,
Harte-Hanks, Inc.
1,850
(19,185)
Inc. — Class A
12,460
(452,423)
Coldwater Creek, Inc.*
6,580
(38,098)
Eastman Kodak Co.
37,260
(573,059)
Morningstar, Inc.*
760
(42,157)
Wendy’s/Arby’s Group, Inc. —
Chico’s FAS, Inc.*
8,720
(47,698)
Class A
143,580
(755,231)
Brunswick Corp.
4,140
(52,951)
Total Consumer Discretionary
(9,036,492)
AnnTaylor Stores Corp.*
2,710
(55,934)
INDUSTRIALS (6.1)%
Ryland Group, Inc.
2,140
(56,753)
HNI Corp.
120
(3,041)
Scientific Games Corp. —
BE Aerospace, Inc.*
440
(6,965)
Class A*
2,530
(58,241)
Thomas & Betts Corp.*
630
(24,614)
Tim Hortons, Inc.
2,090
(61,927)
Avery Dennison Corp.
1,020
(45,370)
Gannett Co., Inc.
3,790
(64,089)
Shaw Group Inc.*
1,900
(58,387)
Macy’s, Inc.
3,760
(67,605)
Avis Budget Group, Inc.*
11,500
(66,010)
Interpublic Group of
Manpower Inc.
1,950
(84,162)
Companies, Inc.*
9,900
(76,725)
Hertz Global Holdings, Inc.*
16,140
(122,180)
Career Education Corp.*
4,800
(78,480)
Carlisle Companies, Inc.
4,309
(129,141)
International Game Technology
4,890
(84,010)
Oshkosh Corp.
10,470
(137,785)
Cablevision Systems Corp. —
Armstrong World Industries, Inc
5,330
(154,037)
Class A
3,390
(85,292)
Dun & Bradstreet Corp.
1,770
(167,017)
Penn National Gaming Inc.*
3,360
(89,275)
Rockwell Collins, Inc.
3,540
(170,239)
Jones Apparel Group, Inc.
5,020
(92,920)
Fastenal Co.
3,710
(183,237)
Williams-Sonoma, Inc.
6,430
(104,037)
UTi Worldwide, Inc.
11,110
(189,092)
JC Penney Co., Inc.
3,210
(107,021)
Graco, Inc.
5,470
(194,787)
Virgin Media, Inc.
15,290
(120,791)
Monster Worldwide, Inc.*
13,100
(195,321)
Coach, Inc.*
4,830
(120,943)
Copa Holdings SA
6,140
(199,550)
Marriott International, Inc. —
Corporate Executive Board Co.
6,620
(206,875)
Class A
4,690
(122,362)
WESCO International, Inc.*
6,670
(214,641)
Boyd Gaming Corp.
13,220
(123,739)
Cintas Corp.
8,960
(257,242)
OfficeMax, Inc.
14,390
(127,927)
Expeditors International
Warner Music Group Corp.
17,290
(131,404)
Washington, Inc.
7,400
(257,816)
Office Depot, Inc.*
22,850
(132,987)
Continental Airlines, Inc.*
16,290
(271,717)
KB Home
6,770
(133,234)
Landstar System, Inc.
6,560
(289,034)
New York Times Co. — Class A
9,690
(138,470)
AMR Corp.*
30,780
(302,260)
Hearst-Argyle Television, Inc.
6,890
(153,854)
FedEx Corp.
3,880
(306,675)
Thor Industries, Inc.
6,669
(165,525)
CH Robinson Worldwide, Inc.
7,220
(367,931)
Harman International
Owens Corning, Inc.*
15,900
(380,169)
Industries, Inc.
5,260
(179,208)
Stericycle, Inc.*
6,700
(394,697)
Lennar Corp. — Class A
11,970
(181,824)
Robert Half International, Inc.
18,460
(456,885)
Wyndham Worldwide Corp.
11,760
(184,750)
Toro Co.
11,450
(472,885)
Centex Corp.
12,790
(207,198)
USG Corp.*
18,800
(481,280)
WABCO Holdings, Inc.
6,870
(244,160)
Tyco International Ltd.
13,980
(489,580)
Meredith Corp.
8,910
(249,836)
Masco Corp.
27,980
(501,961)
DR Horton, Inc.
20,710
(269,644)
Pitney Bowes, Inc.
17,280
(574,733)
H&R Block, Inc.
12,290
(279,598)
Southwest Airlines Co.
47,550
(689,951)
Toll Brothers, Inc.*
11,700
(295,191)
United Parcel Service, Inc. —
RadioShack Corp.
17,780
(307,238)
Class B
15,540
(977,311)
Pulte Homes, Inc.
22,410
(313,068)
Republic Services, Inc.
44,230
(1,326,015)
Liz Claiborne, Inc.
20,410
(335,336)
Delta Air Lines, Inc.*
237,059
(1,766,090)
Federal-Mogul Corp.*
27,760
(348,388)
Starbucks Corp.*
24,070
(357,921)
Total Industrials
(13,116,680)
See Notes to Financial Statements.
THE RYDEX SERIES FUNDS SEMI-ANNUAL REPORT
|
27
SCHEDULE OF INVESTMENTS (Unaudited) (continued)
September 30, 2008
ABSOLUTE RETURN STRATEGIES FUND
MARKET
MARKET
SHARES
VALUE
SHARES
VALUE
FINANCIALS (6.7)%
Duke Realty Corp.
7,450
$
(183,121)
TCF Financial Corp.
340
$
(6,120)
Keycorp
15,780
(188,413)
PMI Group, Inc.
2,630
(7,759)
Student Loan Corp.
2,069
(192,417)
Taubman Centers, Inc.
220
(11,000)
AvalonBay Communities, Inc.
2,000
(196,840)
Comerica, Inc.
340
(11,149)
First American Corp.
6,800
(200,600)
CNA Financial Corp.
540
(14,170)
Eaton Vance Corp.
5,840
(205,743)
Camden Property Trust
370
(16,968)
Kimco Realty Corp.
5,860
(216,468)
American International
Webster Financial Corp.
8,630
(217,908)
Group, Inc.
5,890
(19,614)
Brandywine Realty Trust
14,560
(233,397)
National City Corp.
11,540
(20,195)
Franklin Resources, Inc.
2,730
(240,595)
SEI Investments Co.
1,030
(22,866)
New York Community
iStar Financial, Inc.
10,450
(27,170)
Bancorp, Inc.
14,660
(246,141)
Marshall & Ilsley Corp.
1,390
(28,009)
MSCI, Inc. — Class A*
10,500
(252,000)
CapitalSource, Inc.
2,390
(29,397)
SLM Corp.*
21,210
(261,731)
CIT Group, Inc.
5,260
(36,610)
Brown & Brown, Inc.
12,270
(265,277)
BRE Properties, Inc.
900
(44,100)
Essex Property Trust, Inc.
2,290
(270,976)
MGIC Investment Corp.
7,790
(54,764)
Citigroup, Inc.
13,420
(275,244)
Morgan Stanley
2,390
(54,970)
Popular, Inc.
37,770
(313,113)
E*Trade Financial Corp.*
19,750
(55,300)
Fifth Third Bancorp
26,580
(316,302)
AmeriCredit Corp.*
5,560
(56,323)
Lazard Ltd. — Class A
7,480
(319,845)
Equity Residential
1,290
(57,289)
St Joe Co.*
8,380
(327,574)
General Growth Properties, Inc.
4,090
(61,759)
Huntington Bancshares, Inc.
42,600
(340,374)
MF Global Ltd.*
14,320
(62,149)
Willis Group Holdings Ltd.
11,850
(382,281)
Kilroy Realty Corp.
1,320
(63,083)
Marsh & McLennan
Wachovia Corp.
19,020
(66,570)
Companies, Inc.
12,860
(408,434)
Legg Mason, Inc.
1,850
(70,411)
Federal Realty Investment Trust
4,850
(415,160)
HRPT Properties Trust
10,760
(74,136)
Capital One Financial Corp.
8,620
(439,620)
Discover Financial Services
6,140
(84,855)
Simon Property Group, Inc.
4,600
(446,200)
CME Group, Inc.
260
(96,593)
Moody’s Corp.
14,450
(491,300)
Fidelity National Financial, Inc —
M&T Bank Corp.
5,630
(502,478)
Class A
6,580
(96,726)
PNC Financial Services
CB Richard Ellis Group, Inc. —
Group, Inc.
6,840
(510,948)
Class A*
7,570
(101,211)
Tower Group, Inc.
23,039
(542,799)
Ventas, Inc.
2,070
(102,299)
UDR, Inc.
20,780
(543,397)
Old Republic International Corp.
8,980
(114,495)
Digital Realty Trust, Inc.
17,660
(834,434)
Conseco, Inc.*
34,170
(120,278)
Total Financials
(14,510,286)
Developers Diversified
Total Common Stocks Sold Short
Realty Corp.
3,880
(122,957)
(Proceeds $87,373,094)
(75,526,553)
Public Storage
1,390
(137,624)
CBL & Associates
CONTRACTS
Properties, Inc.
6,970
(139,958)
Vornado Realty Trust
1,560
(141,882)
OPTIONS WRITTEN (0.6)%
Whitney Holding Corp.
5,890
(142,833)
Call Options On:
Capitol Federal Financial
3,480
(154,268)
NDS Group PLC-SP ADR
SunTrust Banks, Inc.
3,460
(155,665)
Expiring October 2008 with
Regency Centers Corp.
2,460
(164,057)
strike price of 60
17
(765)
Sovereign Bancorp, Inc.
44,050
(173,998)
Alpha Natural Resources Inc.
First Horizon National Corp.
18,695
(174,989)
Expiring October 2008 with
Merrill Lynch & Co., Inc.
6,920
(175,076)
strike price of 85
17
(850)
Regions Financial Corp.
18,460
(177,216)
iShares MSCI Emerging Market
XL Capital
10,050
(180,297)
Index Expiring October 2008
with strike price of 39
706
(44,478)
28
|
THE RYDEX SERIES FUNDS SEMI-ANNUAL REPORT
See Notes to Financial Statements.
SCHEDULE OF INVESTMENTS (Unaudited) (concluded)
September 30, 2008
ABSOLUTE RETURN STRATEGIES FUND
MARKET
UNREALIZED
CONTRACTS
VALUE
CONTRACTS
GAIN (LOSS)
Constellation Energy Group
December 2008 Nikkei-225 Stock
Expiring October 2008 with
Average Index Futures Contracts
strike price of 25
420
$
(56,700)
(Aggregate Market Value
Alpharma Inc. — Class A Expiring
of Contracts $8,275,050)
142
$
(383,897)
October 2008 with
December 2008 Russell 2000
strike price of 35
300
(84,000)
Index Mini Futures Contracts
Genentech Inc. Expiring
(Aggregate Market Value
October 2008 with
of Contracts $12,817,840)
188
(479,986)
strike price of 80
110
(111,100)
December 2008 S&P MidCap 400
S&P Index Futures Contracts
Index Mini Futures Contracts
Expiring October 2008 with
(Aggregate Market Value
strike price of 1190
119
(1,038,275)
of Contracts $8,855,980)
122
(583,230)
Total Options Written
December 2008 S&P 500 Index
(Premiums Received $2,678,700)
(1,336,168)
Mini Futures Contracts
Other Assets in Excess
(Aggregate Market Value
of Liabilities – 28.0%
$
60,543,494
of Contracts $39,614,063)
675
(1,784,545)
Net Assets – 100.0%
$ 215,998,347
(Total Aggregate Market Value
of Contracts $106,338,526)
$
(3,592,812)
UNREALIZED
GAIN (LOSS)
CURRENCY FUTURES
CURRENCY FUTURES
CONTRACTS SOLD SHORT
CONTRACTS PURCHASED
December 2008 Canadian Dollar
December 2008 British
Currency Futures Contracts
Pound Futures Contracts
(Aggregate Market Value
(Aggregate Market Value
of Contracts $659,680)
7
$
(4,918)
of Contracts $7,909,844)
71
$
177,764
December 2008 Swiss Franc
December 2008 New Zealand
Futures Contracts
Dollar Futures Contracts
(Aggregate Market Value
(Aggregate Market Value
of Contracts $7,171,200)
64
(96,160)
of Contracts $7,561,620)
114
48,587
December 2008 Japanese Yen
December 2008 Australian
Futures Contracts
Dollar Futures Contracts
(Aggregate Market Value
(Aggregate Market Value
of Contracts $8,430,363)
71
(168,359)
of Contracts $7,407,200)
94
(140,502)
(Total Aggregate Market Value
(Total Aggregate Market Value
of Contracts $16,261,243)
$
(269,437)
of Contracts $22,878,664)
$
85,849
FUTURES CONTRACTS
FUTURES CONTRACTS PURCHASED
SOLD SHORT
December 2008 U.S. 10-Year Treasury
December 2008 U.S. Dollar Index
Note Index Future Contracts
Futures Contracts
(Aggregate Market Value
(Aggregate Market Value
of Contracts $24,755,625)
216
$
(174,679)
of Contracts $25,808,250)
325
$
212,826
December 2008 Dow Jones EURO STOXX
50 Index Futures Contracts
(Aggregate Market Value
of Contracts $12,019,998)
275
(186,475)
*
Non-Income Producing Security.
†
All or a portion of this security is on loan at September 30, 2008 — See Note 11.
§
All or a portion of this security is pledged as short security collateral at September 30, 2008.
ADR — American Depository Receipt.
REIT — Real Estate Investment Trust.
See Notes to Financial Statements.
THE RYDEX SERIES FUNDS SEMI-ANNUAL REPORT
|
29
SCHEDULE OF INVESTMENTS (Unaudited)
September 30, 2008
ALTERNATIVE STRATEGIES ALLOCATION FUND
MARKET
SHARES
VALUE
CURRENCY EXCHANGE TRADED
FUNDS 12.8%
PowerShares DB G10
Currency Harvest Fund*
178,508
$
4,330,604
Total Currency Exchange
Traded Funds
(Cost $4,773,989)
4,330,604
MUTUAL FUNDS† 70.6%
Rydex Series Funds - Managed
Futures Strategy Fund
469,348
12,601,998
Rydex Series Funds -
Commodities Strategy Fund*
135,606
4,173,952
Rydex Series Funds - Absolute
Return Strategies Fund
153,802
3,658,939
Rydex Series Funds - Real
Estate Fund
109,632
3,444,637
Total Mutual Funds
(Cost $25,045,068)
23,879,526
FACE
AMOUNT
REPURCHASE AGREEMENT 5.4%
Repurchase Agreement (Note 7)
Credit Suisse Group
issued 09/30/08 at 0.25%
due 10/01/08
$1,842,648
$
1,842,648
Total Repurchase Agreement
(Cost $1,842,648)
1,842,648
Total Investments 88.8%
(Cost $31,661,705)
$30,052,778
Other Assets in Excess
of Liabilities – 11.2%
$
3,771,569
Net Assets – 100.0%
$33,824,347
*
Non-Income Producing Security.
†
A-Class shares of Affiliated Funds
30
|
THE RYDEX SERIES FUNDS SEMI-ANNUAL REPORT
See Notes to Financial Statements.
SCHEDULE OF INVESTMENTS (Unaudited)
September 30, 2008
COMMODITIES STRATEGY FUND
MARKET
SHARES
VALUE
EXCHANGE TRADED FUNDS 9.9%
iShares S&P GSCI Commodity
Indexed Trust*
139,014
$
7,478,954
Total Exchange Traded Funds
(Cost $7,393,069)
7,478,954
FACE
AMOUNT
STRUCTURED NOTES † 30.0%
Credit Suisse Securities (USA) LLC,
S&P GSCI Total Return
Linked Notes at 2.57%
due 09/24/09
$15,223,200
15,104,002
Swedish Export Credit Corp.,
S&P GSCI Total Return
Linked Notes at 2.53%
due 11/17/08
7,000,000
7,477,400
Total Structured Notes
(Cost $19,471,720)
22,581,402
REPURCHASE AGREEMENT 60.0%
Repurchase Agreement (Note 7)
Credit Suisse Group
issued 09/30/08 at 0.25%
due 10/01/08
45,336,316
45,336,316
Total Repurchase Agreement
(Cost $45,336,316)
45,336,316
Total Investments 99.9%
(Cost $72,201,105)
$75,396,672
Other Assets in Excess
of Liabilities – 0.1%
$
108,427
Net Assets – 100.0%
$75,505,099
*
Non-Income Producing Security.
†
Structured Notes are leveraged, providing a market exposure to the underlying benchmark greater than the face amount. The total
market exposure to the Benchmark is $67,027,802 as of September 30, 2008 — See Note 2.
See Notes to Financial Statements.
THE RYDEX SERIES FUNDS SEMI-ANNUAL REPORT
|
31
SCHEDULE OF INVESTMENTS (Unaudited)
September 30, 2008
HEDGED EQUITY FUND
MARKET
MARKET
SHARES
VALUE
SHARES
VALUE
COMMON STOCKS 47.6%
Waddell & Reed Financial,
Inc. — Class A§
360
$
8,910
FINANCIALS 10.0%
NYSE Euronext§
180
7,052
Allied World Assurance
Endurance Specialty
Company Holdings Ltd.
3,450
$
122,545
Holdings Ltd.
170
5,256
Charles Schwab Corp.§
4,710
122,460
Jones Lang LaSalle, Inc.§
120
5,218
Aon Corp.§
2,410
108,354
IntercontinentalExchange, Inc.*§
30
2,420
Travelers Companies, Inc.§
2,080
94,016
Total Financials
2,029,868
Loews Corp.§
1,990
78,585
CONSUMER DISCRETIONARY 6.5%
MetLife, Inc.§
1,310
73,360
Nike, Inc. — Class B§
1,900
127,110
Axis Capital Holdings Ltd.
2,210
70,079
McDonald’s Corp.§
1,800
111,060
JPMorgan Chase & Co.§
1,450
67,715
Hasbro, Inc.§
2,440
84,717
PartnerRe Ltd.
990
67,409
Service Corporation
Annaly Capital
International§
9,110
76,160
Management, Inc.
5,010
67,384
Amazon.com, Inc.*§
1,030
74,943
Hanover Insurance Group, Inc.§
1,450
66,004
Regal Entertainment Group —
Plum Creek Timber Co.,
Class A
4,230
66,749
Inc. (REIT)§
1,190
59,333
Burger King Holdings, Inc.
2,480
60,909
Blackrock, Inc.
300
58,350
TJX Companies, Inc.§
1,790
54,631
Invesco Ltd.§
2,700
56,646
Walt Disney Co.§
1,400
42,966
Transatlantic Holdings, Inc.
1,020
55,437
Comcast Corp. — Class A§
1,960
38,475
Liberty Media Corp - Capital*
4,050
54,189
Mohawk Industries, Inc.*§
570
38,412
Unum Group§
2,140
53,714
Home Depot, Inc.§
1,430
37,023
Arthur J. Gallagher & Co.§
2,060
52,860
Time Warner, Inc.§
2,610
34,217
AFLAC, Inc.§
840
49,350
Liberty Global, Inc. — Class A*
1,040
31,512
Federated Investors, Inc. —
Lowe’s Companies, Inc.§
1,230
29,139
Class B§
1,620
46,737
DIRECTV Group, Inc.*§
1,100
28,787
Chubb Corp.§
840
46,116
Royal Caribbean Cruises Ltd.
1,340
27,805
Allstate Corp.§
980
45,198
Carnival Corp.§
770
27,219
ProLogis§
1,070
44,159
DreamWorks Animation SKG,
Hudson City Bancorp, Inc.§
2,080
38,376
Inc. — Class A*§
740
23,273
Goldman Sachs Group, Inc.§
280
35,840
GameStop Corp. — Class A*§
650
22,236
Janus Capital Group, Inc.§
1,410
34,235
BorgWarner, Inc.§
590
19,334
Ameriprise Financial, Inc.§
860
32,852
Ross Stores, Inc.§
490
18,037
T. Rowe Price Group, Inc.§
560
30,078
DeVry, Inc.§
350
17,339
Health Care REIT, Inc.§
450
23,953
CTC Media, Inc.*
1,130
16,950
Hartford Financial Services
LKQ Corp.*
940
15,952
Group, Inc.§
580
23,774
Yum! Brands, Inc.§
440
14,348
Everest Re Group Ltd.§
250
21,632
Whirlpool Corp.§
180
14,272
People’s United Financial, Inc.
1,030
19,827
Central European Media
Host Hotels & Resorts, Inc.§
1,440
19,138
Enterprises Ltd. — Class A*†
190
12,426
W.R. Berkley Corp.§
810
19,075
Hanesbrands, Inc.*§
570
12,397
Northern Trust Corp.§
260
18,772
Snap-On, Inc.§
230
12,112
Nationwide Health
Penske Auto Group, Inc.†
810
9,291
Properties, Inc.§
520
18,710
Barnes & Noble, Inc.§
340
8,867
American Financial Group, Inc.§
630
18,585
Discovery Communications,
HCP, Inc.§
450
18,059
Inc. — Class A*
560
7,980
Cincinnati Financial Corp.§
600
17,064
Discovery Communications, Inc.*
560
7,930
Macerich Co.§
250
15,913
Johnson Controls, Inc.§
240
7,279
State Street Corp.§
240
13,651
priceline.com, Inc.*§
100
6,843
Protective Life Corp.§
400
11,404
Big Lots, Inc.*§
230
6,401
Genworth Financial, Inc. —
Weight Watchers
Class A§
1,170
10,074
International, Inc.
170
6,222
Tiffany & Co.§
170
6,038
32
|
THE RYDEX SERIES FUNDS SEMI-ANNUAL REPORT
See Notes to Financial Statements.
SCHEDULE OF INVESTMENTS (Unaudited) (continued)
September 30, 2008
HEDGED EQUITY FUND
MARKET
MARKET
SHARES
VALUE
SHARES
VALUE
Autoliv, Inc.
170
$
5,738
Bio-Rad Laboratories, Inc. —
Dick’s Sporting Goods, Inc.*§
280
5,482
Class A*
90
$
8,921
CBS Corp.§
370
5,395
Bruker BioSciences Corp.*
620
8,265
Apollo Group, Inc. — Class A*§
80
4,744
Alcon, Inc. — SP ADR
50
8,076
Matthews International
Parexel International Corp.*
250
7,165
Corp. — Class A§
90
4,567
Humana, Inc.*§
170
7,004
Corinthian Colleges, Inc.*§
290
4,350
Covidien Ltd.§
120
6,451
Strayer Education, Inc.§
20
4,005
BioMarin Pharmaceuticals, Inc.*
240
6,358
Regis Corp.§
140
3,850
Becton, Dickinson & Co.§
70
5,618
TRW Automotive
Varian, Inc.*§
130
5,577
Holdings Corp.*
230
3,659
Zimmer Holdings, Inc.*§
70
4,519
Sotheby’s§
180
3,611
St. Jude Medical, Inc.*§
100
4,349
ITT Educational Services, Inc.*§
40
3,236
Varian Medical Systems, Inc.*§
60
3,428
Coinstar, Inc.*
100
3,200
Cephalon, Inc.*§
40
3,100
Capella Education Co.*
60
2,572
Myriad Genetics, Inc.*
40
2,595
AutoZone, Inc.*§
20
2,467
OSI Pharmaceuticals, Inc.*
50
2,465
Advance Auto Parts, Inc.§
40
1,586
Intuitive Surgical, Inc.*§
10
2,410
Ascent Media Corp. — Class A*
56
1,367
Alexion Pharmaceuticals, Inc.*
60
2,358
M.D.C. Holdings, Inc.§
20
732
United Therapeutics Corp.*
20
2,103
Brunswick Corp.
16
205
Vertex Pharmaceuticals, Inc.*§
60
1,994
Total Consumer Discretionary
1,318,127
Inverness Medical
HEALTH CARE 6.2%
Innovations, Inc.*
60
1,800
Thermo Fisher Scientific, Inc.*§
3,190
175,450
UnitedHealth Group, Inc.§
1
25
Baxter International, Inc.§
2,180
143,073
Total Health Care
1,260,849
LifePoint Hospitals, Inc.*§
2,160
69,422
UTILITIES 5.4%
C.R. Bard, Inc.§
690
65,460
UGI Corp.
5,090
131,220
Hill-Rom Holdings, Inc.§
2,150
65,166
TECO Energy, Inc.§
6,850
107,750
WellPoint, Inc.*§
1,270
59,398
FirstEnergy Corp.§
1,340
89,767
Pfizer, Inc.§
2,580
47,575
Public Service Enterprise
Millipore Corp.*§
690
47,472
Group, Inc.§
2,240
73,450
Express Scripts, Inc.*§
630
46,507
Atmos Energy Corp.
2,660
70,809
Covance, Inc.*§
500
44,205
American Water Works
Techne Corp.*§
550
39,666
Company, Inc.
3,190
68,585
Charles River Laboratories
Questar Corp.§
1,650
67,518
International, Inc.*§
630
34,984
Energen Corp.§
1,460
66,109
DENTSPLY International, Inc.§
890
33,411
Pepco Holdings, Inc.§
2,720
62,315
Hologic, Inc.*§
1,550
29,961
DTE Energy Co.§
1,470
58,976
Pharmaceutical Product
DPL, Inc.§
2,210
54,808
Development, Inc.§
710
29,358
MDU Resources Group, Inc.§
1,850
53,650
McKesson Corp.§
520
27,981
National Fuel Gas Co.§
1,210
51,038
Aetna, Inc.§
740
26,721
NRG Energy, Inc.*
1,780
44,055
Medco Health Solutions, Inc.*§
590
26,550
AES Corp.*§
2,200
25,718
Biogen Idec, Inc.*§
450
22,631
Xcel Energy, Inc.§
1,120
22,389
Quest Diagnostics, Inc.§
430
22,218
Oneok, Inc.§
640
22,016
Invitrogen Corp.*
430
16,254
SCANA Corp.§
330
12,847
Perrigo Co.§
410
15,769
Equitable Resources, Inc.§
210
7,703
Coventry Health Care, Inc.*§
390
12,695
Exelon Corp.§
110
6,888
Waters Corp.*§
210
12,218
PG&E Corp.§
1
37
Amgen, Inc.*§
200
11,854
Total Utilities
1,097,648
Community Health
INDUSTRIALS 4.3%
Systems, Inc.*§
400
11,724
Deere & Co.§
1,320
65,340
Illumina, Inc.*
260
10,538
Brink’s Co.§
960
58,579
Medtronic, Inc.§
180
9,018
Copart, Inc.*§
1,520
57,760
PerkinElmer, Inc.§
360
8,989
See Notes to Financial Statements.
THE RYDEX SERIES FUNDS SEMI-ANNUAL REPORT
|
33
SCHEDULE OF INVESTMENTS (Unaudited) (continued)
September 30, 2008
HEDGED EQUITY FUND
MARKET
MARKET
SHARES
VALUE
SHARES
VALUE
Flowserve Corp.§
560
$
49,711
Old Dominion Freight Line, Inc.*
70
$
1,984
SPX Corp.§
620
47,740
Belden, Inc.
60
1,907
Ryder System, Inc.§
650
40,300
General Cable Corp.*
30
1,069
AGCO Corp.*§
850
36,218
Walter Industries, Inc.
20
949
Waste Management, Inc.§
1,140
35,899
Steelcase, Inc. — Class A
80
860
McDermott International, Inc.*
1,350
34,492
Donaldson Co., Inc.§
20
838
Norfolk Southern Corp.§
490
32,443
Boeing Co.
10
574
SunPower Corp.*
345
23,856
Total Industrials
866,622
Joy Global, Inc.§
520
23,473
ENERGY 4.1%
Valmont Industries, Inc.
270
22,326
National-Oilwell Varco, Inc.*§
1,670
83,884
Jacobs Engineering
SEACOR Holdings, Inc.*†
820
64,739
Group, Inc.*§
410
22,267
ConocoPhillips§
810
59,332
Eaton Corp.§
390
21,910
ENSCO International, Inc.§
1,020
58,783
Cummins, Inc.§
470
20,548
Cimarex Energy Co.§
940
45,975
Precision Castparts Corp.§
210
16,544
Anadarko Petroleum Corp.§
910
44,144
CSX Corp.§
300
16,371
Patterson-UTI Energy, Inc.§
1,990
39,840
Timken Co.§
510
14,459
Noble Corp.§
800
35,120
GATX Corp.§
340
13,454
Frontline Ltd.
730
35,091
First Solar, Inc.*
70
13,224
Unit Corp.*
690
34,376
ABB Ltd. — SP ADR
680
13,192
FMC Technologies, Inc.*§
690
32,119
Bucyrus International, Inc. —
Transocean, Inc.*§
290
31,854
Class A
280
12,510
Superior Energy Services*§
880
27,403
Union Pacific Corp.§
170
12,097
Chesapeake Energy Corp.§
660
23,668
Emerson Electric Co.§
290
11,829
Denbury Resources, Inc.*§
960
18,278
Burlington Northern
Apache Corp.§
140
14,599
Santa Fe Corp.§
120
11,092
Massey Energy Co.§
363
12,948
Kansas City Southern*§
250
11,090
Exxon Mobil Corp.§
160
12,426
Quanta Services, Inc.*§
370
9,994
Whiting Petroleum Corp.*
170
12,114
Canadian National Railway Co.
200
9,566
Hess Corp.§
140
11,491
Woodward Governor Co.
250
8,818
Diamond Offshore Drilling, Inc.
110
11,337
Manitowoc Co., Inc.§
550
8,553
Encore Acquisition Co.*§
250
10,445
Fluor Corp.§
140
7,798
PetroHawk Energy Corp.*
400
8,652
Foster Wheeler Ltd.*
180
6,500
Chevron Corp.§
100
8,248
FTI Consulting, Inc.*
80
5,779
Halliburton Co.§
220
7,126
Energy Conversion Devices, Inc.*
90
5,243
BP PLC — SP ADR
140
7,024
Roper Industries, Inc.§
90
5,126
Royal Dutch Shell PLC —
Suntech Power Holdings Co.
SP ADR
100
5,901
Ltd. — SP ADR*
140
5,022
Arch Coal, Inc.§
170
5,591
Sunpower Corp.*
70
4,965
Range Resources Corp.§
130
5,573
United Rentals, Inc.*§
310
4,724
Helmerich & Payne, Inc.§
120
5,183
AMETEK, Inc.§
110
4,485
Consol Energy, Inc.§
110
5,048
J.B. Hunt Transport
Weatherford International Ltd.*§
200
5,028
Services, Inc.§
130
4,338
Occidental Petroleum Corp.§
70
4,931
Granite Construction, Inc.§
120
4,298
Tenaris SA — SP ADR
130
4,848
Brady Corp. — Class A
110
3,881
Devon Energy Corp.§
50
4,560
GrafTech International Ltd.*
210
3,173
EOG Resources, Inc.§
50
4,473
Werner Enterprises, Inc.§
130
2,822
Canadian Natural Resources Ltd.
60
4,108
Con-way, Inc.§
60
2,647
Smith International, Inc.§
70
4,105
Regal-Beloit Corp.
60
2,551
Cameron International Corp.*§
100
3,854
Heartland Express, Inc.
160
2,483
XTO Energy, Inc.§
60
2,791
Hubbell, Inc. — Class B§
70
2,454
W&T Offshore, Inc.
30
819
Knight Transportation, Inc.
140
2,376
Atwood Oceanics, Inc.*
20
728
American Superconductor
Corp.*
90
2,121
Total Energy
818,557
34
|
THE RYDEX SERIES FUNDS SEMI-ANNUAL REPORT
See Notes to Financial Statements.
SCHEDULE OF INVESTMENTS (Unaudited) (continued)
September 30, 2008
HEDGED EQUITY FUND
MARKET
MARKET
SHARES
VALUE
SHARES
VALUE
CONSUMER STAPLES 3.5%
Lam Research Corp.*§
620
$
19,524
Herbalife Ltd.
2,630
$
103,938
Zebra Technologies Corp. —
Molson Coors Brewing Co. —
Class A*§
690
19,216
Class B§
1,820
85,085
Fidelity National Information
Costco Wholesale Corp.§
1,150
74,669
Services, Inc.§
970
17,906
Dr Pepper Snapple Group, Inc.*
2,420
64,082
Apple Computer, Inc.*§
130
14,776
PepsiAmericas, Inc.§
2,120
43,926
Trimble Navigation Ltd.*§
540
13,964
Bunge Ltd.
580
36,644
Novellus Systems, Inc.*§
620
12,177
Procter & Gamble Co.§
510
35,542
EchoStar Corp. — Class A*
450
10,845
Coca-Cola Enterprises, Inc.§
2,060
34,546
Compuware Corp.*§
990
9,593
BJ’s Wholesale Club, Inc.*§
710
27,591
ANSYS, Inc.*§
240
9,089
Reynolds American, Inc.§
500
24,310
Itron, Inc.*
100
8,853
Central European
Ingram Micro, Inc. — Class A*§
470
7,553
Distribution Corp.*
470
21,343
ADC Telecommunications, Inc.*§
890
7,520
Pepsi Bottling Group, Inc.§
720
21,002
CommScope, Inc.*§
210
7,274
Safeway, Inc.§
860
20,399
Sohu.com, Inc.*
120
6,690
CVS Corp.§
560
18,850
Cypress Semiconductor Corp.*§
1,260
6,577
PepsiCo, Inc.§
210
14,967
Nvidia Corp.*§
520
5,569
SUPERVALU, INC.§
620
13,454
KLA-Tencor Corp.§
170
5,381
Wal-Mart Stores, Inc.§
220
13,176
Flir Systems, Inc.*§
110
4,226
Kimberly-Clark Corp.§
200
12,968
Vishay Intertechnology, Inc.*§
480
3,178
Coca-Cola Co.§
180
9,518
BMC Software, Inc.*§
90
2,577
Diageo PLC — SP ADR
130
8,952
Western Union Co.§
60
1,480
Clorox Co.§
120
7,523
Convergys Corp.*§
1
15
NBTY, Inc.*§
230
6,790
Total Information Technology
690,477
Energizer Holdings, Inc.*§
70
5,638
TELECOMMUNICATION SERVICES 2.1%
Church & Dwight Co., Inc.§
80
4,967
Verizon Communications, Inc.§
3,750
120,337
Brown-Forman Corp. —
Crown Castle International
Class B§
40
2,872
Corp.*
3,120
90,386
Hansen Natural Corp.*
80
2,420
CenturyTel, Inc.§
1,590
58,274
WD-40 Co.
50
1,797
American Tower Corp. —
Total Consumer Staples
716,969
Class A*§
1,420
51,077
INFORMATION TECHNOLOGY 3.4%
AT&T, Inc.§
1,520
42,438
Synopsys, Inc.*§
3,210
64,039
SBA Communications Corp.*
1,470
38,029
Hewlett-Packard Co.§
1,220
56,413
Telephone & Data Systems, Inc.§
230
8,223
Applied Materials, Inc.§
2,970
44,936
U.S. Cellular Corp.*
100
4,692
QLogic Corp.*§
2,400
36,864
NII Holdings, Inc. — Class B*
110
4,171
VeriSign, Inc.*§
1,320
34,426
MetroPCS Communications,
Qualcomm, Inc.§
680
29,220
Inc.*
50
700
Arrow Electronics, Inc.*§
1,050
27,531
Total Telecommunication Services
418,327
Hewitt Associates, Inc. —
MATERIALS 2.1%
Class A*
720
26,237
Crown Holdings, Inc.*
2,430
53,970
Amphenol Corp. — Class A§
630
25,288
Lubrizol Corp.§
1,140
49,180
MasterCard, Inc.§
140
24,826
Dow Chemical Co.§
1,370
43,539
MEMC Electronic
International Paper Co.§
1,440
37,699
Materials, Inc.*§
830
23,456
United States Steel Corp.§
440
34,148
Dolby Laboratories, Inc. —
The Mosaic Co.
310
21,086
Class A*
630
22,170
Alcoa, Inc.§
880
19,870
Avnet, Inc.*§
860
21,182
Steel Dynamics, Inc.§
1,130
19,312
Western Digital Corp.*§
960
20,467
Reliance Steel & Aluminum Co.§
450
17,086
Affiliated Computer Services,
Nalco Holding Co.
850
15,759
Inc. — Class A*§
390
19,746
AK Steel Holding Corp.§
500
12,960
Computer Sciences Corp.*§
490
19,693
Monsanto Co.§
100
9,898
See Notes to Financial Statements.
THE RYDEX SERIES FUNDS SEMI-ANNUAL REPORT
|
35
SCHEDULE OF INVESTMENTS (Unaudited) (continued)
September 30, 2008
HEDGED EQUITY FUND
MARKET
FACE
MARKET
SHARES
VALUE
AMOUNT
VALUE
Potash Corporation of
REPURCHASE AGREEMENTS 32.4%
Saskatchewan
70
$
9,241
Repurchase Agreements (Note 7)
Commercial Metals Co.§
540
9,121
Credit Suisse Group
Albemarle Corp.§
280
8,635
issued 09/30/08 at 0.25%
Cleveland-Cliffs, Inc.
160
8,470
due 10/01/08
$6,096,541
$
6,096,541
CF Industries Holdings, Inc.§
80
7,317
Morgan Stanley
E.I. du Pont de Nemours
issued 09/30/08 at 0.05%
and Co.§
150
6,045
due 10/01/08
189,897
189,897
Terra Industries, Inc.§
180
5,292
Mizuho Financial Group, Inc.
Temple-Inland, Inc.§
340
5,188
issued 09/30/08 at 0.26%
Praxair, Inc.§
70
5,022
due 10/01/08
157,297
157,297
Air Products & Chemicals, Inc.§
50
3,425
Morgan Stanley
Agrium, Inc.
60
3,365
issued 09/30/08 at 0.10%
Sigma-Aldrich Corp.§
60
3,145
due 10/01/08
111,360
111,360
PPG Industries, Inc.§
50
2,916
Total Repurchase Agreements
Carpenter Technology Corp.§
90
2,309
(Cost $6,555,095)
6,555,095
Intrepid Potash, Inc.*
70
2,110
Total Long Securities 87.0%
Total Materials
416,108
(Cost $18,938,389)
$17,614,505
Total Common Stocks
(Cost $10,604,078)
9,633,552
SHARES
EXCHANGE TRADED FUNDS 6.8%
COMMON STOCKS SOLD SHORT (42.8)%
iShares MSCI Emerging Markets
TELECOMMUNICATION SERVICES (0.2)%
Index Fund
21,531
743,465
Clearwire Corp.*
210
(2,495)
Vanguard Emerging Markets ETF
3,563
123,494
Qwest Communications
Nuveen Equity Premium
International, Inc
4,180
(13,501)
Opportunity Fund
6,080
79,101
Sprint Nextel Corp.
4,330
(26,413)
Nuveen Equity Premium and
Growth Fund
5,870
76,721
Total Telecommunication Services
(42,409)
Eaton Vance Tax-Managed
ENERGY (2.7)%
Buy-Write Income Fund
5,710
74,515
Massey Energy Co.
3
(107)
Nuveen Core Equity Alpha Fund
6,020
73,143
Patriot Coal Corp.*
10
(291)
First Trust Enhanced Equity
SandRidge Energy, Inc.*
20
(392)
Income Fund, Inc.
6,320
70,152
Key Energy Services, Inc.*
80
(928)
Eaton Vance Tax-Managed
Valero Energy Corp.
70
(2,121)
Buy-Write Opportunities Fund
5,850
70,025
Southwestern Energy Co.*
100
(3,054)
Liberty All Star Equity Fund
14,620
65,936
Global Industries Ltd.*
890
(6,177)
Total Exchange Traded Funds
Continental Resources, Inc.*
160
(6,277)
(Cost $1,729,910)
1,376,552
El Paso Corp.
560
(7,146)
SECURITIES LENDING COLLATERAL 0.2%
Helix Energy Solutions
Mount Vernon Securities
Group, Inc.*
350
(8,498)
Lending Trust Prime
Tesoro Corp.
760
(12,532)
Portfolio (Note 11)
49,306
49,306
Hercules Offshore, Inc.*
1,040
(15,766)
Total Securities Lending Collateral
Frontier Oil Corp.
920
(16,946)
(Cost $49,306)
49,306
Sunoco, Inc.
640
(22,771)
Peabody Energy Corp.
540
(24,300)
Marathon Oil Corp.
640
(25,517)
Overseas Shipholding Group
440
(25,656)
Holly Corp.
890
(25,739)
Plains Exploration &
Production Co.*
790
(27,776)
Nabors Industries Ltd.*
1,230
(30,652)
Newfield Exploration Co.*
1,040
(33,270)
36
|
THE RYDEX SERIES FUNDS SEMI-ANNUAL REPORT
See Notes to Financial Statements.
SCHEDULE OF INVESTMENTS (Unaudited) (continued)
September 30, 2008
HEDGED EQUITY FUND
MARKET
MARKET
SHARES
VALUE
SHARES
VALUE
Exterran Holdings, Inc.*
1,260
$
(40,270)
Kinetic Concepts, Inc.*
140
$
(4,003)
Teekay Corp.
1,640
(43,263)
Celgene Corp.*
100
(6,328)
Tetra Technologies, Inc.*
3,350
(46,398)
King Pharmaceuticals, Inc.*
670
(6,419)
Baker Hughes, Inc.
930
(56,302)
Lincare Holdings Inc.
250
(7,523)
BJ Services Co.
3,660
(70,016)
WellCare Health Plans, Inc.*
250
(9,000)
Total Energy
(552,164)
Health Management Associates,
MATERIALS (2.8)%
Inc. — Class A*
2,560
(10,650)
Westlake Chemical Corp.
31
(634)
Brookdale Senior Living Inc.
520
(11,435)
RPM International, Inc.
60
(1,160)
Schering-Plough Corp.
900
(16,623)
Century Aluminum Co.*
50
(1,385)
UnitedHealth Group, Inc.
801
(20,337)
Cabot Corp.
110
(3,496)
Mylan, Inc.*
1,870
(21,355)
Allegheny Technologies, Inc.
130
(3,842)
Gilead Sciences, Inc.*
530
(24,157)
Chemtura Corp.
1,580
(7,205)
Health Net, Inc.*
1,080
(25,488)
International Flavors &
Hospira, Inc.*
710
(27,122)
Fragrances, Inc.
240
(9,470)
Tenet Healthcare Corp.*
7,410
(41,126)
Celanese Corp.
340
(9,489)
Genzyme Corp.*
510
(41,254)
Smurfit-Stone Container Corp.*
3,470
(16,309)
Stryker Corp.
670
(41,741)
Ecolab, Inc.
360
(17,467)
Sepracor, Inc.*
2,289
(41,912)
Eastman Chemical Co.
330
(18,170)
CooperCompanies, Inc.
1,229
(42,720)
Titanium Metals Corp.
1,680
(19,051)
Amylin Pharmaceuticals, Inc.*
2,260
(45,697)
Valhi, Inc.
1,070
(19,260)
Advanced Medical Optics, Inc.*
2,580
(45,872)
Ashland, Inc.
700
(20,468)
Merck & Co., Inc.
1,560
(49,234)
Eagle Materials, Inc.
1,160
(25,949)
Omnicare, Inc.
1,780
(51,211)
Domtar Corp.*
5,650
(25,990)
Watson Pharmaceuticals, Inc.*
2,310
(65,835)
Scotts Miracle-Gro Co. —
Allergan, Inc.
1,530
(78,795)
Class A
1,670
(39,479)
Boston Scientific Corp.*
7,980
(97,915)
Newmont Mining Corp.
1,360
(52,714)
Total Health Care
(837,574)
Sealed Air Corp.
2,800
(61,572)
INFORMATION TECHNOLOGY (4.2)%
Weyerhaeuser Co.
1,030
(62,397)
Acxiom Corp.
31
(390)
Pactiv Corp.*
2,700
(67,041)
MoneyGram International, Inc.
360
(511)
Bemis Co., Inc.
2,989
(78,342)
Broadcom Corp. — Class A*
30
(559)
Total Materials
(560,890)
Ciena Corp.*
100
(1,008)
CONSUMER STAPLES (3.4)%
Brocade Communications
Altria Group, Inc.
390
(7,738)
Systems, Inc.*
260
(1,513)
Rite Aid Corp.*
12,410
(10,052)
F5 Networks, Inc.*
130
(3,039)
Del Monte Foods Co.
2,829
(22,066)
Fairchild Semiconductor
Tyson Foods, Inc. - Class A
2,030
(24,238)
International, Inc.*
350
(3,112)
Constellation Brands, Inc. —
Varian Semiconductor Equipment
Class A*
1,190
(25,537)
Associates, Inc.*
200
(5,024)
Smithfield Foods, Inc.*
2,170
(34,460)
Xerox Corp.
640
(7,379)
Colgate-Palmolive Co.
610
(45,964)
Google, Inc. — Class A*
20
(8,010)
Sara Lee Corp.
4,090
(51,657)
Akamai Technologies, Inc.*
490
(8,546)
Alberto-Culver Co.
2,610
(71,096)
Cognizant Technology Solutions
Walgreen Co.
2,480
(76,781)
Corp. — Class A*
460
(10,502)
Avon Products, Inc.
2,100
(87,297)
Novell, Inc.*
2,380
(12,233)
Dean Foods Co.*
4,810
(112,362)
Cadence Design Systems, Inc.*
2,220
(15,007)
Hershey Co.
2,879
(113,836)
LSI Logic Corp.*
2,920
(15,651)
SanDisk Corp.*
850
(16,618)
Total Consumer Staples
(683,083)
Convergys Corp.
1,191
(17,603)
HEALTH CARE (4.1)%
Integrated Device
Bristol-Myers Squibb Co.
50
(1,043)
Technology, Inc.*
2,360
(18,361)
PDL BioPharma, Inc.
140
(1,303)
Rambus, Inc.*
1,490
(19,147)
Cardinal Health, Inc.
30
(1,478)
Unisys Corp.*
7,389
(20,320)
See Notes to Financial Statements.
THE RYDEX SERIES FUNDS SEMI-ANNUAL REPORT
|
37
SCHEDULE OF INVESTMENTS (Unaudited) (continued)
September 30, 2008
HEDGED EQUITY FUND
MARKET
MARKET
SHARES
VALUE
SHARES
VALUE
Altera Corp.
1,100
$
(22,748)
Career Education Corp.*
540
$
(8,829)
Sun Microsystems, Inc.*
3,080
(23,408)
Tim Hortons, Inc.
300
(8,889)
Salesforce.com, Inc.*
500
(24,200)
Macy’s, Inc.
520
(9,350)
Teradyne, Inc.*
3,710
(28,975)
Morningstar, Inc.*
180
(9,985)
Advanced Micro Devices, Inc.*
5,600
(29,400)
Penn National Gaming Inc.*
400
(10,628)
Micron Technology, Inc.*
7,350
(29,768)
Interpublic Group of
NCR Corp.*
1,370
(30,209)
Companies, Inc.*
1,400
(10,850)
Atmel Corp.*
9,030
(30,612)
International Game Technology
690
(11,854)
Paychex, Inc.
950
(31,379)
JC Penney Co., Inc.
360
(12,002)
Tech Data Corp.*
1,090
(32,537)
Cablevision Systems Corp. —
Tellabs, Inc.*
8,470
(34,388)
Class A
480
(12,077)
Jabil Circuit, Inc.
3,740
(35,680)
Williams-Sonoma, Inc.
760
(12,297)
Tyco Electronics Ltd.
1,360
(37,618)
Jones Apparel Group, Inc.
710
(13,142)
Adobe Systems, Inc.*
1,280
(50,522)
Boyd Gaming Corp.
1,490
(13,946)
Motorola, Inc.
8,970
(64,046)
Virgin Media, Inc.
1,810
(14,299)
Electronic Arts, Inc.*
2,240
(82,858)
Office Depot, Inc.*
2,600
(15,132)
JDS Uniphase Corp.*
10,230
(86,546)
KB Home
770
(15,154)
Total Information Technology
(859,422)
OfficeMax, Inc.
1,720
(15,291)
UTILITIES (4.8)%
Warner Music Group Corp.
2,040
(15,504)
Northeast Utilities System
140
(3,591)
Coach, Inc.*
680
(17,027)
Centerpoint Energy, Inc.
400
(5,828)
Marriott International, Inc. —
Duke Energy Corp.
380
(6,623)
Class A
670
(17,480)
Alliant Energy Corp.
569
(18,327)
Thor Industries, Inc.
780
(19,360)
Great Plains Energy, Inc.
970
(21,553)
New York Times Co. — Class A
1,380
(19,720)
Mirant Corp.*
1,650
(30,179)
Harman International
Allegheny Energy, Inc.
830
(30,519)
Industries, Inc.
620
(21,123)
Pinnacle West Capital Corp.
1,170
(40,260)
Lennar Corp. — Class A
1,420
(21,570)
Consolidated Edison, Inc.
940
(40,382)
Hearst-Argyle Television, Inc.
980
(21,883)
Reliant Energy, Inc.*
5,840
(42,924)
Centex Corp.
1,370
(22,194)
Ameren Corp.
1,290
(50,349)
Wyndham Worldwide Corp.
1,520
(23,879)
PG&E Corp.
1,441
(53,965)
Meredith Corp.
1,050
(29,442)
Southern Union Co.
2,749
(56,767)
WABCO Holdings, Inc.
970
(34,474)
Sierra Pacific Resources
6,110
(58,534)
DR Horton, Inc.
2,720
(35,414)
PPL Corp.
1,600
(59,232)
RadioShack Corp.
2,080
(35,942)
Hawaiian Electric Industries, Inc.
2,590
(75,395)
H&R Block, Inc.
1,680
(38,220)
CMS Energy Corp.
6,380
(79,559)
Pulte Homes, Inc.
2,840
(39,675)
Dynegy, Inc. - Class A*
22,860
(81,839)
Liz Claiborne, Inc.
2,510
(41,239)
NiSource, Inc.
6,750
(99,630)
Toll Brothers, Inc.*
1,660
(41,882)
Aqua America, Inc.
6,740
(119,837)
Starbucks Corp.*
3,040
(45,205)
Federal-Mogul Corp.*
3,940
(49,447)
Total Utilities
(975,293)
Saks, Inc.*
5,500
(50,875)
CONSUMER DISCRETIONARY (5.3)%
Goodyear Tire & Rubber Co.*
3,330
(50,982)
Urban Outfitters, Inc.*
10
(319)
Scripps Networks Interactive,
RH Donnelley Corp.*
180
(358)
Inc. — Class A
1,770
(64,269)
Idearc, Inc.
850
(1,063)
Eastman Kodak Co.
4,620
(71,056)
Harte-Hanks, Inc.
220
(2,281)
Total Consumer Discretionary
(1,070,009)
Coldwater Creek, Inc.*
780
(4,516)
Chico’s FAS, Inc.*
1,030
(5,634)
INDUSTRIALS (6.4)%
Gannett Co., Inc.
370
(6,257)
HNI Corp.
10
(253)
Brunswick Corp.
506
(6,472)
BE Aerospace, Inc.*
50
(792)
AnnTaylor Stores Corp.*
320
(6,605)
Thomas & Betts Corp.*
70
(2,735)
Ryland Group, Inc.
250
(6,630)
Avery Dennison Corp.
150
(6,672)
Scientific Games Corp. —
Avis Budget Group, Inc.*
1,220
(7,003)
Class A*
360
(8,287)
Manpower Inc.
230
(9,927)
38
|
THE RYDEX SERIES FUNDS SEMI-ANNUAL REPORT
See Notes to Financial Statements.
SCHEDULE OF INVESTMENTS (Unaudited) (continued)
September 30, 2008
HEDGED EQUITY FUND
MARKET
MARKET
SHARES
VALUE
SHARES
VALUE
Shaw Group Inc.*
340
$
(10,448)
E*Trade Financial Corp.*
2,350
$
(6,580)
Hertz Global Holdings, Inc.*
1,740
(13,172)
General Growth Properties, Inc.
480
(7,248)
Delta Air Lines, Inc.*
1,899
(14,148)
Morgan Stanley
340
(7,820)
Carlisle Companies, Inc.
480
(14,386)
Equity Residential
180
(7,994)
Oshkosh Corp.
1,130
(14,871)
MF Global Ltd.*
1,850
(8,029)
Armstrong World Industries, Inc
760
(21,964)
Wachovia Corp.
2,320
(8,120)
Monster Worldwide, Inc.*
1,550
(23,111)
Legg Mason, Inc.
220
(8,373)
Graco, Inc.
650
(23,147)
HRPT Properties Trust
1,270
(8,750)
Dun & Bradstreet Corp.
250
(23,590)
Kilroy Realty Corp.
190
(9,080)
Copa Holdings SA
730
(23,725)
Discover Financial Services
690
(9,536)
UTi Worldwide, Inc.
1,400
(23,828)
Old Republic International Corp.
890
(11,348)
Rockwell Collins, Inc.
500
(24,045)
CB Richard Ellis Group, Inc. —
WESCO International, Inc.*
790
(25,422)
Class A*
850
(11,365)
Corporate Executive Board Co.
820
(25,625)
Fidelity National Financial, Inc —
Fastenal Co.
530
(26,177)
Class A
930
(13,671)
FedEx Corp.
380
(30,035)
Conseco, Inc.*
4,210
(14,819)
Cintas Corp.
1,060
(30,433)
CME Group, Inc.
40
(14,860)
Continental Airlines, Inc.*
1,860
(31,025)
CBL & Associates
AMR Corp.*
3,530
(34,665)
Properties, Inc.
820
(16,466)
Expeditors International
Whitney Holding Corp.
700
(16,975)
Washington, Inc.
1,050
(36,582)
Developers Diversified
Landstar System, Inc.
920
(40,535)
Realty Corp.
550
(17,430)
Owens Corning, Inc.*
2,140
(51,167)
SunTrust Banks, Inc.
400
(17,996)
CH Robinson Worldwide, Inc.
1,020
(51,979)
Regions Financial Corp.
1,990
(19,104)
Robert Half International, Inc.
2,180
(53,955)
Ventas, Inc.
400
(19,768)
Toro Co.
1,350
(55,755)
Public Storage
200
(19,802)
Stericycle, Inc.*
990
(58,321)
Vornado Realty Trust
220
(20,009)
Tyco International Ltd.
1,760
(61,635)
Merrill Lynch & Co., Inc.
850
(21,505)
Masco Corp.
3,490
(62,611)
Duke Realty Corp.
880
(21,630)
USG Corp.*
2,540
(65,024)
Capitol Federal Financial
490
(21,722)
Pitney Bowes, Inc.
2,450
(81,487)
First Horizon National Corp.
2,340
(21,898)
Southwest Airlines Co.
5,620
(81,546)
Keycorp
1,870
(22,328)
United Parcel Service, Inc. —
Sovereign Bancorp, Inc.
5,680
(22,436)
Class B
2,200
(138,358)
XL Capital
1,290
(23,143)
Total Industrials
(1,300,151)
Regency Centers Corp.
350
(23,342)
FINANCIALS (8.8)%
Student Loan Corp.
260
(24,180)
Comerica, Inc.
20
(656)
Webster Financial Corp.
1,000
(25,250)
TCF Financial Corp.
40
(720)
First American Corp.
930
(27,435)
PMI Group, Inc.
310
(915)
AvalonBay Communities, Inc.
280
(27,558)
CNA Financial Corp.
60
(1,574)
Brandywine Realty Trust
1,720
(27,572)
Camden Property Trust
50
(2,293)
Eaton Vance Corp.
830
(29,241)
American International
Kimco Realty Corp.
830
(30,660)
Group, Inc.
690
(2,298)
Brown & Brown, Inc.
1,450
(31,349)
National City Corp.
1,410
(2,468)
Franklin Resources, Inc.
390
(34,371)
iStar Financial, Inc.
1,170
(3,042)
SLM Corp.*
2,830
(34,922)
Marshall & Ilsley Corp.
160
(3,224)
New York Community
SEI Investments Co.
150
(3,330)
Bancorp, Inc.
2,080
(34,923)
CapitalSource, Inc.
280
(3,444)
Citigroup, Inc.
1,710
(35,072)
CIT Group, Inc.
500
(3,480)
MSCI, Inc. — Class A*
1,490
(35,760)
Leucadia National Corp.
80
(3,635)
Essex Property Trust, Inc.
320
(37,866)
AmeriCredit Corp.*
510
(5,166)
Popular, Inc.
4,630
(38,383)
BRE Properties, Inc.
110
(5,390)
Fifth Third Bancorp
3,380
(40,222)
Taubman Centers, Inc.
110
(5,500)
Huntington Bancshares, Inc.
5,320
(42,507)
MGIC Investment Corp.
920
(6,468)
Lazard Ltd. — Class A
1,060
(45,326)
See Notes to Financial Statements.
THE RYDEX SERIES FUNDS SEMI-ANNUAL REPORT
|
39
SCHEDULE OF INVESTMENTS (Unaudited) (concluded)
September 30, 2008
HEDGED EQUITY FUND
MARKET
UNREALIZED
SHARES
VALUE
CONTRACTS
LOSS
Capital One Financial Corp.
890
$
(45,390)
FUTURES CONTRACTS PURCHASED
St Joe Co.*
1,190
(46,517)
December 2008 Dow Jones EURO
Marsh & McLennan
STOXX 50 Index Futures Contracts
Companies, Inc.
1,820
(57,803)
(Aggregate Market Value
Federal Realty Investment Trust
690
(59,064)
of Contracts $1,966,909)
45
$
(11,966)
M&T Bank Corp.
670
(59,798)
December 2008 Nikkei-225 Stock
Moody’s Corp.
1,830
(62,220)
Average Index Futures Contracts
Simon Property Group, Inc.
650
(63,050)
(Aggregate Market Value
PNC Financial Services
of Contracts $1,340,325)
23
(62,180)
Group, Inc.
970
(72,459)
December 2008 S&P MidCap 400
UDR, Inc.
2,950
(77,143)
Index Mini Futures Contracts
Digital Realty Trust, Inc.
2,510
(118,598)
(Aggregate Market Value
Total Financials
(1,791,383)
of Contracts $1,306,620)
18
(89,814)
Total Common Stocks Sold Short
December 2008 Russell 2000
(Proceeds $10,051,582)
(8,672,377)
Index Mini Futures Contracts
(Aggregate Market Value
of Contracts $68,180)
31
(97,071)
CONTRACTS
December 2008 S&P 500 Index
Mini Futures Contracts
OPTIONS WRITTEN (1.1)%
(Aggregate Market Value
Call Options On:
of Contracts $7,629,375)
130
(371,976)
iShares MSCI Emerging Market
Index Futures Contracts
(Total Aggregate Market Value
Expiring October 2008 with
of Contracts $14,356,809)
$
(633,007)
strike price of 39
136
(8,568)
October 2008 S&P 500 Index
Futures Contracts
Expiring October 2008 with
strike price of 1190
24
(209,400)
Total Options Written
(Premiums Received $496,137)
(217,968)
Other Assets in Excess
of Liabilities – 13.0%
$
2,631,823
Net Assets – 100.0%
$20,246,328
*
Non-Income Producing Security.
†
All or a portion of this security is on loan at September 30, 2008 — See Note 11.
§
All or a portion of this security is pledged as short security collateral at September 30, 2008.
ADR — American Depository Receipt.
REIT — Real Estate Investment Trust.
40
|
THE RYDEX SERIES FUNDS SEMI-ANNUAL REPORT
See Notes to Financial Statements.
SCHEDULE OF INVESTMENTS (Unaudited)
September 30, 2008
INTERNATIONAL ROTATION FUND
MARKET
UNREALIZED
SHARES
VALUE
CONTRACTS
LOSS
EXCHANGE TRADED FUNDS 13.7%
FUTURES CONTRACTS PURCHASED
Vanguard European ETF
27,100
$
1,446,327
October 2008 CAC 40 Index
iShares MSCI Australia
Futures Contracts
Index Fund
26,600
546,364
(Aggregate Market Value
iShares MSCI Pacific ex-Japan
of Contracts $925,253)
16
$
(14,896)
Index Fund
11,600
416,440
October 2008 SGX MSCI Singapore
iShares MSCI Sweden
Index Futures Contracts
Index Fund
3,850
78,656
(Aggregate Market Value
Total Exchange Traded Funds
of Contracts $937,416)
23
(27,389)
(Cost $2,966,175)
2,487,787
December 2008 Nikkei-225 Stock
Average Index Futures Contracts
FACE
AMOUNT
(Aggregate Market Value
of Contracts $3,438,225)
59
(158,407)
REPURCHASE AGREEMENTS 77.8%
December 2008 FTSE 100 Index
Repurchase Agreements (Note 7)
Futures Contracts
Morgan Stanley
(Aggregate Market Value
issued 09/30/08 at 0.05%
of Contracts $5,928,927)
66
(225,833)
due 10/01/08
$5,865,688
5,865,688
December 2008 Toronto Stock Exchange
Mizuho Financial Group, Inc.
60 Index Futures Contracts
issued 09/30/08 at 0.26%
(Aggregate Market Value
due 10/01/08
4,858,693
4,858,693
of Contracts $4,327,608)
32
(267,754)
Morgan Stanley
(Total Aggregate Market Value
issued 09/30/08 at 0.10%
of Contracts $15,557,430)
$
(694,279)
due 10/01/08
3,439,783
3,439,783
Total Repurchase Agreements
(Cost $14,164,164)
14,164,164
Total Investments 91.5%
(Cost $17,130,339)
$16,651,951
Other Assets in Excess
of Liabilities – 8.5%
$
1,545,496
Net Assets – 100.0%
$18,197,447
See Notes to Financial Statements.
THE RYDEX SERIES FUNDS SEMI-ANNUAL REPORT
|
41
CONSOLIDATED SCHEDULE OF INVESTMENTS (Unaudited)
September 30, 2008
MANAGED FUTURES STRATEGY FUND
FACE
MARKET
FACE
MARKET
AMOUNT
VALUE
AMOUNT
VALUE
STRUCTURED NOTES† 17.6%
Swedish Export Credit Corp.,
Eksportfinans, S&P Diversified
S&P Diversified Trends
Trends Indicator Total Return
Indicator Total Return
Linked Notes 2.49%
Linked Notes 2.53%
due 01/26/09
$
22,000,000
$
21,198,602
due 09/25/09
$
8,000,000
$
7,400,169
Goldman Sachs Group, Inc.,
Total Structured Notes
S&P Diversified Trends
(Cost $187,000,000)
160,063,691
Indicator Total Return
Linked Notes 2.70%
REPURCHASE AGREEMENTS 80.4%
due 02/17/09
20,000,000
18,943,386
Repurchase Agreements (Note 7)
Swedish Export Credit Corp.,
Morgan Stanley
S&P Diversified Trends
issued 09/30/08 at 0.05%
Indicator Total Return
due 10/01/08
294,372,637
294,372,637
Linked Notes 2.55%
Mizuho Financial Group, Inc.
due 03/16/09
20,000,000
16,435,481
issued 09/30/08 at 0.26%
Swedish Export Credit Corp.,
due 10/01/08
243,836,058
243,836,058
S&P Diversified Trends
Morgan Stanley
Indicator Total Return
issued 09/30/08 at 0.10%
Linked Notes 2.54%
due 10/01/08
172,627,298
172,627,298
due 04/24/09*
20,000,000
16,055,204
Credit Suisse Group
Merrill Lynch & Co., S&P
issued 09/30/08 at 0.25%
Diversified Trends
due 10/01/08
16,892,978
16,892,978
Indicator Price Return
Total Repurchase Agreements
Linked Notes 2.68%
(Cost $727,728,971)
727,728,971
due 05/13/09
20,000,000
15,615,389
Swedish Export Credit Corp.,
Total Investments 98.0%
S&P Diversified Trends
(Cost $914,728,971)
$887,792,662
Indicator Total Return
Other Assets in Excess
Linked Notes 2.54%
of Liabilities – 2.0%
$
17,673,922
due 06/02/09*
15,000,000
11,919,891
Net Assets – 100.0%
$905,466,584
Merrill Lynch & Co., S&P
UNREALIZED
Diversified Trends
CONTRACTS
GAIN (LOSS)
Indicator Price Return
Linked Notes 2.70%
FUTURES CONTRACTS PURCHASED
due 03/16/09
15,000,000
10,963,607
December 2008 U.S. 10-Year Treasury
Swedish Export Credit Corp.,
Note Index Future Contracts
S&P Diversified Trends
(Aggregate Market Value
Indicator Total Return
of Contracts $33,465,938)
292
$
234,921
Linked Notes 2.53%
December 2008 U.S. Treasury Bond
due 11/17/08*
10,000,000
10,859,318
Futures Contracts
Merrill Lynch & Co., S&P
(Aggregate Market Value
Diversified Trends
of Contracts $33,349,453)
285
(603,432)
Indicator Price Return
(Total Aggregate Market Value
Linked Notes 3.65%
of Contracts $66,815,391)
$
(368,511)
due 06/29/09
15,000,000
10,800,286
Swedish Export Credit Corp.,
COMMODITY FUTURES CONTRACTS
S&P Diversified Trends
PURCHASED
Indicator Total Return
March 2009 Sugar Futures Contracts
Linked Notes 2.55%
(Aggregate Market Value
due 12/22/08*
10,000,000
10,539,808
of Contracts $4,329,674)
283
(229,507)
Goldman Sachs Group, Inc.,
December 2008 Coffee
S&P Diversified Trends
Futures Contracts
Indicator Total Return
(Aggregate Market Value
Linked Notes 2.96%
of Contracts $6,212,681)
127
(711,318)
due 03/26/09
12,000,000
9,332,550
42
42
|
|
THE RYDEX SERIES FUNDS SEMI-ANNUAL REPORT
THE RYDEX SERIES FUNDS SEMI-ANNUAL REPORT
See Notes to Financial Statements.
See Notes to Financial Statements.
CONSOLIDATED SCHEDULE OF INVESTMENTS (Unaudited) (concluded)
September 30, 2008
MANAGED FUTURES STRATEGY FUND
UNREALIZED
UNREALIZED
CONTRACTS
GAIN (LOSS)
CONTRACTS
GAIN (LOSS)
(Total Aggregate Market Value
December 2008 Silver
of Contracts $10,542,355)
$
(940,825)
Futures Contracts
(Aggregate Market Value
CURRENCY FUTURES
of Contracts $7,025,850)
117
$
2,059,154
CONTRACTS SOLD SHORT
December 2008 Wheat
December 2008 Euro Currency
Futures Contracts
Futures Contracts
(Aggregate Market Value
(Aggregate Market Value
of Contracts $8,602,000)
253
1,642,663
of Contracts $58,471,150)
331
436,065
December 2008 Lean Hogs
December 2008 Australian
Futures Contracts
Dollar Futures Contracts
(Aggregate Market Value
(Aggregate Market Value
of Contracts $8,230,400)
320
1,300,982
of Contracts $8,825,600)
112
293,229
December 2008 Live Cattle
December 2008 Swiss Franc
Futures Contracts
Futures Contracts
(Aggregate Market Value
(Aggregate Market Value
of Contracts $13,487,100)
335
937,921
of Contracts $8,964,000)
80
34,337
December 2008 Cotton
December 2008 Canadian
Futures Contracts
Dollar Currency Futures Contracts
(Aggregate Market Value
(Aggregate Market Value
of Contracts $3,807,125)
133
781,016
of Contracts $4,617,760)
49
(38,678)
December 2008 Cocoa
December 2008 British Pound
Futures Contracts
Futures Contracts
(Aggregate Market Value
(Aggregate Market Value
of Contracts $4,399,760)
172
282,336
of Contracts $23,061,094)
207
(340,251)
December 2008 Gold
December 2008 Japanese Yen
Futures Contracts
Futures Contracts
(Aggregate Market Value
(Aggregate Market Value
of Contracts $17,998,650)
207
(1,336,906)
of Contracts $55,094,200)
464
(579,925)
(Total Aggregate Market Value
(Total Aggregate Market Value
of Contracts $120,141,260)
$
15,460,654
of Contracts $159,033,804)
$
(195,223)
COMMODITY FUTURES CONTRACTS
SOLD SHORT
November 2008 Soybean
Futures Contracts
(Aggregate Market Value
of Contracts $18,966,750)
363
$
4,158,190
December 2008 Copper
Futures Contracts
(Aggregate Market Value
of Contracts $20,293,000)
280
3,272,479
December 2008 Corn
Futures Contracts
(Aggregate Market Value
of Contracts $17,330,625)
711
2,362,819
†
Structured Notes are leveraged, providing a market exposure to the underlying benchmark greater than the face amount. The total
market exposure is $396,684,409 and $137,379,281, for the S&P Diversified Trends Indicator Total Return and the S&P Diversified
Trends Indicator Price Return, respectively, as of September 30, 2008 — See Note 2.
See Notes to Financial Statements.
THE RYDEX SERIES FUNDS SEMI-ANNUAL REPORT
|
43
SCHEDULE OF INVESTMENTS (Unaudited)
September 30, 2008
REAL ESTATE FUND
MARKET
MARKET
SHARES
VALUE
SHARES
VALUE
COMMON STOCKS 99.5%
OFFICE REIT 15.4%
Boston Properties, Inc.
8,044
$
753,401
REAL ESTATE INVESTMENT TRUST (REIT) 91.1%
Alexandria Real Estate Equities,
SPECIALIZED REIT 24.0%
Inc.
4,039
454,387
Public Storage
10,054
$
995,446
Duke Realty Corp.
17,708
435,263
HCP, Inc.
18,369
737,148
Digital Realty Trust, Inc.
9,206
434,983
Plum Creek Timber Co., Inc.
SL Green Realty Corp.
6,060
392,688
(REIT)
13,746
685,376
Douglas Emmett, Inc.
16,719
385,707
Ventas, Inc.
12,910
638,012
Highwoods Properties, Inc.
9,602
341,447
Host Hotels & Resorts, Inc.
45,153
600,083
Corporate Office Properties Trust
Health Care REIT, Inc.
9,952
529,745
SBI
8,189
330,426
Rayonier, Inc.
9,413
445,706
Mack-Cali Realty Corp.
9,542
323,188
Nationwide Health Properties, Inc.
11,666
419,743
BioMed Realty Trust, Inc.
11,930
315,549
Senior Housing Properties Trust
16,535
394,029
Kilroy Realty Corp.
6,058
289,512
Potlatch Corp.
6,590
305,710
Brandywine Realty Trust
17,426
279,339
Entertainment Properties Trust
5,510
301,507
HRPT Properties Trust
40,192
276,923
Hospitality Properties Trust
14,524
298,032
Lexington Realty Trust
15,131
260,556
Healthcare Realty Trust, Inc.
9,667
281,793
Total Office REIT
5,273,369
Omega Healthcare Investors, Inc.
14,025
275,732
RESIDENTIAL REIT 14.0%
Extra Space Storage, Inc.
16,402
251,935
Equity Residential
18,119
804,665
Sovran Self Storage, Inc.
5,257
234,935
AvalonBay Communities, Inc.
6,540
643,667
LaSalle Hotel Properties
9,467
220,770
UDR, Inc.
16,379
428,311
DiamondRock Hospitality Co.
22,464
204,422
Essex Property Trust, Inc.
3,380
399,955
Medical Properties Trust Inc.†
17,710
201,009
Apartment Investment &
U-Store-It Trust†
15,680
192,394
Management Co. — Class A
11,200
392,224
Total Specialized REIT
8,213,527
BRE Properties, Inc. — Class A
7,596
372,204
RETAIL REIT 20.8%
Camden Property Trust
7,816
358,442
Simon Property Group, Inc.
11,181
1,084,557
Home Properties, Inc.
5,585
323,651
KIMCO Realty Corp.
19,302
713,016
Equity Lifestyle Properties, Inc.
5,327
282,491
Federal Realty Investment Trust
6,584
563,590
American Campus Communities,
Regency Centers Corp.
7,884
525,784
Inc.
7,970
270,023
Macerich Co.
8,205
522,248
Post Properties, Inc.
8,987
251,366
Developers Diversified Realty
Mid-America Apartment
Corp.
13,559
429,685
Communities, Inc.
4,941
242,801
Weingarten Realty Investors
11,895
424,295
Total Residential REIT
4,769,800
Taubman Centers, Inc.
7,569
378,450
DIVERSIFIED REIT 6.2%
Realty Income Corp.
14,292
365,875
Vornado Realty Trust
9,392
854,202
General Growth Properties, Inc.
21,187
319,924
Liberty Property Trust
11,635
438,058
National Retail Properties, Inc.
13,284
318,152
Washington Real Estate
Tanger Factory Outlet Centers,
Investment Trust†
8,897
325,897
Inc.
6,696
293,218
Cousins Properties, Inc.
11,159
281,541
Equity One, Inc.
13,438
275,344
Colonial Properties Trust
11,017
205,908
CBL & Associates Properties, Inc.
12,690
254,815
Inland Real Estate Corp.†
15,307
240,167
Total Diversified REIT
2,105,606
Acadia Realty Trust
8,550
216,144
INDUSTRIAL REIT 5.9%
Pennsylvania Real Estate
ProLogis
16,025
661,352
Investment Trust
10,175
191,799
AMB Property Corp.
9,855
446,431
Total Retail REIT
7,117,063
First Industrial Realty Trust, Inc.†
9,282
266,208
Eastgroup Properties, Inc.
5,330
258,718
DCT Industrial Trust, Inc.
32,250
241,553
DuPont Fabros Technology, Inc.
10,009
152,637
Total Industrial REIT
2,026,899
44
|
THE RYDEX SERIES FUNDS SEMI-ANNUAL REPORT
See Notes to Financial Statements.
SCHEDULE OF INVESTMENTS (Unaudited) (concluded)
September 30, 2008
REAL ESTATE FUND
MARKET
SHARES
VALUE
MORTGAGE REIT 4.8%
Annaly Capital Management, Inc.
42,360
$
569,742
CapitalSource, Inc.
34,020
418,446
MFA Mortgage Investments, Inc.
38,912
252,928
Redwood Trust, Inc.
8,190
177,969
Capstead Mortgage Corp.
15,860
173,667
iStar Financial, Inc.†
23,886
62,103
Total Mortgage REIT
1,654,855
Total Real Estate Investment Trust (REIT)
31,161,119
REAL ESTATE MANAGEMENT & DEVELOPEMENT 8.4%
Brookfield Asset Management,
Inc. — Class A
30,528
837,689
Brookfield Properties Corp.
32,785
519,314
The St. Joe Co.*
11,650
455,398
Forest City Enterprises, Inc. —
Class A
11,939
366,169
CB Richard Ellis Group, Inc. —
Class A*
22,800
304,836
Jones Lang LaSalle, Inc.
5,314
231,053
Forestar Real Estate Group, Inc.*
9,870
145,583
Total Real Estate Management &
Developement
2,860,042
Total Common Stocks
(Cost $30,605,093)
34,021,161
SECURITIES LENDING COLLATERAL 1.3%
Mount Vernon Securities
Lending Trust Prime
Portfolio (Note 11)
442,391
442,391
Total Securities Lending Collateral
(Cost $442,391)
442,391
Total Investments 100.8%
(Cost $31,047,484)
$34,463,552
Liabilities in Excess
of Other Assets – (0.8)%
$
(272,094)
Net Assets – 100.0%
$34,191,458
*
Non-Income Producing Security.
†
All or a portion of this security is on loan at September 30, 2008 — See Note 11.
REIT — Real Estate Investment Trust.
See Notes to Financial Statements.
THE RYDEX SERIES FUNDS SEMI-ANNUAL REPORT
|
45
SCHEDULE OF INVESTMENTS (Unaudited)
September 30, 2008
STRENGTHENING DOLLAR 2x STRATEGY FUND
FACE
MARKET
AMOUNT
VALUE
FEDERAL AGENCY DISCOUNT NOTES 26.0%
Federal Home Loan Bank*
3.00% due 12/15/08
$25,000,000
$
24,843,750
3.10% due 01/12/09
25,000,000
24,778,264
Total Federal Agency Discount Notes
(Cost $49,622,014)
49,622,014
REPURCHASE AGREEMENTS 67.6%
Repurchase Agreements (Note 7)
Morgan Stanley
issued 09/30/08 at 0.05%
due 10/01/08
45,941,042
45,941,042
Mizuho Financial Group, Inc.
issued 09/30/08 at 0.26%
due 10/01/08
38,054,089
38,054,089
Morgan Stanley
issued 09/30/08 at 0.10%
due 10/01/08
26,940,948
26,940,948
Credit Suisse Group
issued 09/30/08 at 0.25%
due 10/01/08†
18,551,543
18,551,543
Total Repurchase Agreements
(Cost $129,487,622)
129,487,622
Total Investments 93.6%
(Cost $179,109,636)
$179,109,636
Other Assets in Excess
of Liabilities – 6.4%
$
12,306,361
Net Assets – 100.0%
$191,415,997
UNREALIZED
CONTRACTS
GAIN
FUTURES CONTRACTS PURCHASED
December 2008 U.S. Dollar
Index Futures Contracts
(Aggregate Market Value of
Contracts $255,620,790)
3,219
$
2,480,242
UNITS
CURRENCY INDEX SWAP AGREEMENT
Goldman Sachs International
November 2008 U.S. Dollar Index
Swap, Terminating 11/25/08**
(Notional Market Value
$126,861,360)
1,594,589
$
3,278,499
*
The issuer is a publicly traded company that operates under a Congressional charter; its securities are neither issued nor guaranteed
by the U.S. Government.
**
Total Return based on U.S. Dollar Index +/- financing at a variable rate.
†
All or a portion of this security is pledged as currency index swap collateral at September 30, 2008.
46
|
THE RYDEX SERIES FUNDS SEMI-ANNUAL REPORT
See Notes to Financial Statements.
SCHEDULE OF INVESTMENTS (Unaudited)
September 30, 2008
WEAKENING DOLLAR 2x STRATEGY FUND
FACE
MARKET
AMOUNT
VALUE
FEDERAL AGENCY DISCOUNT NOTES 32.7%
Federal Home Loan Bank*
3.00% due 12/15/08
$25,000,000
$24,843,750
Total Federal Agency Discount Notes
(Cost $24,843,750)
24,843,750
REPURCHASE AGREEMENTS 72.7%
Repurchase Agreements (Note 7)
Morgan Stanley
issued 09/30/08 at 0.05%
due 10/01/08
18,535,587
18,535,587
Mizuho Financial Group, Inc.
issued 09/30/08 at 0.26%
due 10/01/08
15,353,480
15,353,480
Morgan Stanley
issued 09/30/08 at 0.10%
due 10/01/08
10,869,721
10,869,721
Credit Suisse Group
issued 09/30/08 at 0.25%
due 10/01/08†
10,466,507
10,466,507
Total Repurchase Agreements
(Cost $55,225,295)
55,225,295
Total Investments 105.4%
(Cost $80,069,045)
$80,069,045
Liabilities in Excess
of Other Assets – (5.4)%
$ (4,114,181)
Net Assets – 100.0%
$75,954,864
UNREALIZED
CONTRACTS
LOSS
FUTURES CONTRACTS SOLD SHORT
December 2008 U.S. Dollar
Index Futures Contracts
(Aggregate Market Value of
Contracts $95,927,280)
1,208
$ (2,345,135)
UNITS
CURRENCY INDEX SWAP AGREEMENT
SOLD SHORT
Goldman Sachs International
November 2008 U.S. Dollar Index
Swap, Terminating 11/25/08**
(Notional Market Value
$55,342,261)
695,627
$ (1,561,014)
*
The issuer is a publicly traded company that operates under a Congressional charter; its securities are neither issued nor guaranteed
by the U.S. Government.
**
Total Return based on U.S. Dollar Index +/- financing at a variable rate.
†
All or a portion of this security is pledged as currency index swap collateral at September 30, 2008.
See Notes to Financial Statements.
THE RYDEX SERIES FUNDS SEMI-ANNUAL REPORT
|
47
STATEMENTS OF ASSETS AND LIABILITIES (Unaudited)
Absolute
Alternative
Multi-Cap
Sector
Return
Strategies
Core Equity
Rotation
Strategies
Allocation
Fund
Fund
Fund
Fund
ASSETS
Investment Securities
$18,734,702
$303,205,712
$127,205,237
$28,210,130
Repurchase Agreements
—
157,330
28,249,616
1,842,648
Total Investments
18,734,702
303,363,042
155,454,853
30,052,778
Segregated Cash with Broker
—
—
46,748,809
—
Cash
—
—
1,674
—
Deposits with Brokers for Securities Sold Short
—
—
87,614,998
—
Receivable for Swap Units Sold
—
—
—
—
Variation Margin on Futures Contracts
—
—
2,130,861
—
Receivable for Securities Sold
—
48,024,700
40,097,901
—
Receivable for Fund Shares Sold
1,351
202,267
390,606
4,635,985
Investment Income Receivable
27,473
393,381
273,134
13
Receivable for Options Written Premium
—
—
203,434
—
Total Assets
18,763,526
351,983,390
332,916,270
34,688,776
LIABILITIES
Short Sales at Market Value
—
—
75,526,553
—
Written Options at Market Value
—
—
1,336,168
—
Payable for Swap Units Sold
—
—
—
—
Variation Margin on Futures Contracts
—
—
—
—
Payable upon Return of Securities Loaned
87,820
9,166,804
1,786,618
—
Payable for Securities Purchased
—
47,196,125
37,131,615
859,999
Payable for Fund Shares Redeemed
76,212
1,432,400
725,477
—
Investment Advisory Fees Payable
5,668
246,813
207,961
—
Transfer Agent and Administrative Fees Payable
4,443
68,559
—
—
Distribution and Service Fees Payable
11,504
131,061
73,068
4,430
Portfolio Accounting Fees Payable
1,777
25,533
—
—
Custody Fees Payable
689
28,147
—
—
Overdraft Due to Custodian Bank
104,069
—
—
—
Short Sales Dividends Payable
—
—
102,141
—
Other Liabilities
13,814
192,235
28,322
—
Total Liabilities
305,996
58,487,677
116,917,923
864,429
NET ASSETS
$18,457,530
$293,495,713
$215,998,347
$33,824,347
NET ASSETS CONSIST OF
Paid-In Capital
$23,696,345
$366,259,318
$243,007,682
$35,750,345
Undistributed Net Investment Income (Loss)
128,867
(1,031,711)
1,245,084
(9,763)
Accumulated Net Realized Gain (Loss) on Investments
(4,175,323)
(61,642,139)
(24,254,794)
(307,308)
Net Unrealized Appreciation (Depreciation)
on Investments
(1,192,359)
(10,089,755)
(3,999,625)
(1,608,927)
NET ASSETS
$18,457,530
$293,495,713
$215,998,347
$33,824,347
A-Class
$
1,047,229
$
47,508,331
$
65,136,060
$
7,484,407
C-Class
10,062,286
96,575,057
45,081,792
7,778,216
H-Class
7,348,015
149,412,325
105,780,495
18,561,724
SHARES OUTSTANDING
A-Class
99,453
3,931,174
2,737,924
315,304
C-Class
1,014,856
8,399,066
1,939,613
329,002
H-Class
697,561
12,323,867
4,443,476
782,102
NET ASSET VALUES
A-Class
$10.53
$12.09
$23.79
$23.74
A-Class Maximum Offering Price*
11.06
12.69
24.98
24.92
C-Class
9.91
11.50
23.24
23.64
H-Class
10.53
12.12
23.81
23.73
Cost of Investments
$19,927,061
$313,452,797
$169,079,977
$31,661,705
Proceeds from Short Sales
—
—
87,373,094
—
Premiums Received for Written Options
—
—
2,678,700
—
* Net asset value adjusted for the maximum sales charge of 4.75% of offering price, calculated NAV/(1-4.75%).
48
|
THE RYDEX SERIES FUNDS SEMI-ANNUAL REPORT
See Notes to Financial Statements.
September 30, 2008
Managed
Futures
Strengthening
Weakening
Commodities
Hedged
International
Strategy
Dollar 2x
Dollar 2x
Strategy
Equity
Rotation
Fund
Real Estate
Strategy
Strategy
Fund
Fund
Fund
(Consolidated)
Fund
Fund
Fund
$
30,060,356
$11,059,410
$
2,487,787
$160,063,691
$34,463,552
$ 49,622,014
$24,843,750
45,336,316
6,555,095
14,164,164
727,728,971
—
129,487,622
55,225,295
75,396,672
17,614,505
16,651,951
887,792,662
34,463,552
179,109,636
80,069,045
—
660,562
1,071,446
12,891,290
—
4,828,500
1,812,000
785,948
—
171
—
—
—
—
—
10,086,015
—
—
—
—
—
—
—
—
—
—
3,164,945
—
—
757,364
691,955
4,387,660
—
5,713,410
—
15,093
3,467,096
76,719
—
350,746
—
—
335,142
1,700
5,625
3,829,985
329,037
869,598
351,812
33,951
31,085
53
561,844
162,969
542
240
—
—
—
—
—
—
—
76,566,806
32,618,327
18,497,920
909,463,441
35,306,304
193,686,631
82,233,097
—
8,672,377
—
—
—
—
—
—
217,968
—
—
—
—
—
—
—
—
—
—
—
2,106,715
—
—
—
—
—
—
2,271,040
—
49,306
—
—
442,391
—
—
—
3,201,880
—
—
—
—
—
918,952
175,931
261,364
2,559,880
79,964
1,986,284
1,748,841
27,106
19,763
14,591
626,070
18,543
127,495
53,949
15,378
—
4,053
173,908
5,454
35,415
14,986
20,952
6,347
5,504
226,269
6,266
48,110
20,755
6,151
—
1,621
47,684
2,182
14,166
5,994
1,845
3
486
21,428
675
4,273
1,798
—
13,596
—
—
547,561
—
—
—
10,174
—
—
—
—
—
71,323
4,654
12,854
341,618
11,810
54,891
54,155
1,061,707
12,371,999
300,473
3,996,857
1,114,846
2,270,634
6,278,233
$
75,505,099
$20,246,328
$18,197,447
$905,466,584
$34,191,458
$191,415,997
$75,954,864
$
61,815,937
$25,702,450
$29,024,967
$924,245,737
$38,562,195
$176,215,260
$86,043,564
910,561
78,030
(2,442,888)
4,947,782
316,728
(1,750,768)
3,663,253
9,583,034
(5,234,635)
(7,211,965)
(10,746,721)
(8,103,533)
11,192,764
(9,845,804)
3,195,567
(299,517)
(1,172,667)
(12,980,214)
3,416,068
5,758,741
(3,906,149)
$
75,505,099
$20,246,328
$18,197,447
$905,466,584
$34,191,458
$191,415,997
$75,954,864
$
14,945,024
$
5,542,531
$10,716,280
$204,524,752
$
6,092,413
$ 21,678,646
$11,645,780
9,234,151
3,102,845
2,135,401
90,899,177
2,005,145
15,062,765
8,679,706
51,325,924
11,600,952
5,345,766
610,042,655
26,093,900
154,674,586
55,629,378
485,364
254,209
570,874
7,617,778
193,879
925,545
479,591
307,801
145,671
114,639
3,425,003
66,042
659,874
368,066
1,667,448
531,878
284,661
22,721,686
830,602
6,612,187
2,292,005
$30.79
$21.80
$18.77
$26.85
$31.42
$23.42
$24.28
32.33
22.89
19.71
28.19
32.99
24.59
25.49
30.00
21.30
18.63
26.54
30.36
22.83
23.58
30.78
21.81
18.78
26.85
31.42
23.39
24.27
$
72,201,105
$18,938,389
$17,130,339
$914,728,971
$31,047,484
$179,109,636
$80,069,045
—
10,051,582
—
—
—
—
—
—
496,137
—
—
—
—
—
THE RYDEX SERIES FUNDS SEMI-ANNUAL REPORT
|
49
STATEMENTS OF OPERATIONS (Unaudited)
Absolute
Alternative
Multi-Cap
Sector
Return
Strategies
Core Equity
Rotation
Strategies
Allocation
Fund
Fund
Fund
Fund
INVESTMENT INCOME
Interest
$
3,831
$
47,066
$
1,474,999
$
5,136
Income from Securities Lending, net
23,969
212,443
51,150
—
Dividends, Net of Foreign Tax Withheld
314,906
2,646,000
1,508,490
—
Other Income
—
—
—
—
Total Income
342,706
2,905,509
3,034,639
5,136
EXPENSES
Investment Advisory Fees
50,146
1,878,809
1,345,880
—
Transfer Agent and Administrative Fees
34,972
521,891
—
—
Distribution & Service Fees:
A-Class
2,460
66,751
69,750
—
C-Class
73,909
592,091
256,768
15,010
H-Class
14,034
307,117
158,641
—
Portfolio Accounting Fees
13,989
187,862
—
—
Short Sales Dividend Expense
—
—
669,026
—
Trustees’ Fees*
1,695
19,708
—
—
Custody Fees
4,513
80,490
—
136
Miscellaneous
18,121
282,501
—
—
Total Expenses
213,839
3,937,220
2,500,065
15,146
Less Expenses Waived by Advisor
—
—
—
—
Net Expenses
213,839
3,937,220
2,500,065
15,146
Net Investment Income (Loss)
128,867
(1,031,711)
534,574
(10,010)
REALIZED AND UNREALIZED GAIN (LOSS) ON INVESTMENTS
Net Realized Gain (Loss) on:
Investment Securities
(1,701,112)
(19,578,935)
2,611,169
(307,308)
Currency Index Swaps
—
—
—
—
Futures Contracts
39,085
—
(8,344,898)
—
Securities Sold Short
—
—
4,011,339
—
Total Net Realized Gain (Loss)
(1,662,027)
(19,578,935)
(1,722,390)
(307,308)
Net Change in Unrealized Appreciation (Depreciation) on:
Investment Securities
(908,488)
(33,526,036)
(8,833,361)
(1,578,286)
Currency Index Swaps
—
—
—
—
Futures Contracts
14,380
—
(4,946,710)
—
Securities Sold Short
—
—
6,680,299
—
Net Change in Unrealized Appreciation (Depreciation)
(894,108)
(33,526,036)
(7,099,772)
(1,578,286)
Net Gain (Loss) on Investments
(2,556,135)
(53,104,971)
(8,822,162)
(1,885,594)
Net Increase (Decrease) in Net Assets
from Operations
$(2,427,268)
$(54,136,682)
$
(8,287,588)
$(1,895,604)
Rebate Income on Proceeds for Securities Sold Short,
included in Interest
$
—
$
—
$
429,287
$
—
Foreign Tax Withheld
90
53,720
2,807
—
* Relates to Trustees not deemed "interested persons" within the meaning of Section 2(a)(19) of the 1940 Act.
50
|
THE RYDEX SERIES FUNDS SEMI-ANNUAL REPORT
See Notes to Financial Statements.
Period Ended September 30, 2008
Managed
Futures
Strengthening
Weakening
Commodities
Hedged
International
Strategy
Dollar 2x
Dollar 2x
Strategy
Equity
Rotation
Fund
Real Estate
Strategy
Strategy
Fund
Fund
Fund
(Consolidated)
Fund
Fund
Fund
$
592,484
$
180,142
$
208,746
$
7,503,271
$
1,268
$ 1,126,306
$
1,170,362
48,801
4,239
—
63,126
37,148
—
—
—
152,530
119,868
271,954
557,256
—
—
5,416
—
—
—
—
—
—
646,701
336,911
328,614
7,838,351
595,672
1,126,306
1,170,362
685,358
144,215
137,985
3,571,460
141,156
522,322
524,989
228,453
—
38,329
936,528
41,516
145,090
145,830
27,894
7,491
20,407
219,649
10,023
15,575
21,255
62,660
23,063
17,193
374,001
11,135
70,812
73,082
184,893
18,094
13,624
623,375
28,709
111,812
106,305
90,555
—
15,332
276,432
16,606
58,036
58,332
—
98,500
—
111,259
—
—
—
8,999
—
1,451
26,039
1,335
3,440
7,009
23,541
—
3,975
100,200
6,121
15,551
15,075
121,638
—
20,638
515,017
22,343
77,699
75,871
1,433,991
291,363
268,934
6,753,960
278,944
1,020,337
1,027,748
(290,422)
—
—
(199,961)
—
—
—
1,143,569
291,363
268,934
6,553,999
278,944
1,020,337
1,027,748
(496,868)
45,548
59,680
1,284,352
316,728
105,969
142,614
10,681,096
475,517
(2,163,625)
8,333,370
(3,733,508)
—
—
794,463
—
—
—
—
4,132,190
549,837
—
(1,368,135)
(3,673,791)
(26,649,686)
—
9,402,495
(4,929,643)
790,129
463,563
—
(1,137,695)
—
—
—
12,265,688
(429,055)
(5,837,416)
(19,454,011)
(3,733,508)
13,534,685
(4,379,806)
(10,187,002)
(574,051)
466,603
(43,053,154)
1,602,312
—
—
—
—
—
—
—
5,126,691
(13,630,658)
—
(834,879)
(533,834)
13,956,096
—
2,628,745
(3,345,832)
—
857,325
—
(14,681)
—
—
—
(10,187,002)
(551,605)
(67,231)
(29,111,739)
1,602,312
7,755,436
(16,976,490)
2,078,686
(980,660)
(5,904,647)
(48,565,750)
(2,131,196)
21,290,121
(21,356,296)
$
1,581,818
$
(935,112)
$(5,844,967)
$(47,281,398)
$(1,814,468)
$21,396,090
$(21,213,682)
$
—
$
76,678
$
—
$
—
$
—
$
—
$
—
—
195
—
—
2,566
—
—
THE RYDEX SERIES FUNDS SEMI-ANNUAL REPORT
|
51
STATEMENTS OF CHANGES IN NET ASSETS
Multi-Cap
Sector Rotation
Core Equity Fund
Fund
Period
Year
Period
Year
Ended
Ended
Ended
Ended
September 30,
March 31,
September 30,
March 31,
2008†
2008
2008†
2008
FROM OPERATIONS
Net Investment Income (Loss)
$
128,867
$
154,839
$
(1,031,711)
$
(1,283,152)
Net Realized Gain (Loss) on Investments
(1,662,027)
1,727,148
(19,578,935)
(23,253,004)
Net Change in Unrealized Appreciation (Depreciation)
on Investments
(894,108)
(9,486,742)
(33,526,036)
1,680,010
Net Increase (Decrease) in Net Assets from Operations
(2,427,268)
(7,604,755)
(54,136,682)
(22,856,146)
Distributions to Shareholders from:
Net Investment Income
A-Class
—
(3,504)
—
—
C-Class
—
(24,471)
—
—
H-Class
—
(22,326)
—
—
Realized Gain on Investments
A-Class
—
(582,465)
—
(2,965,934)
C-Class
—
(4,017,324)
—
(7,784,003)
H-Class
—
(3,710,898)
—
(15,425,954)
Total Distributions to Shareholders
—
(8,360,988)
—
(26,175,891)
SHARE TRANSACTIONS
Proceeds from Shares Purchased
A-Class
347,896
2,764,650
23,577,728
38,627,448
C-Class
883,264
8,439,215
12,164,730
44,066,197
H-Class
2,638,087
6,611,755
183,163,113
278,158,887
Redemption Fees Collected
A-Class
835
1,097
7,787
26,493
C-Class
6,181
6,533
17,867
66,027
H-Class
4,661
7,492
33,935
114,836
Value of Shares Purchased through Dividend Reinvestment
A-Class
—
581,390
—
2,702,394
C-Class
—
3,744,401
—
7,259,013
H-Class
—
3,211,062
—
14,155,545
Cost of Shares Redeemed
A-Class
(2,675,186)
(4,536,301)
(19,100,389)
(27,230,934)
C-Class
(5,315,737)
(18,623,553)
(19,394,746)
(46,959,917)
H-Class
(7,464,047)
(31,206,054)
(176,069,908)
(217,722,031)
Net Increase (Decrease) in Net Assets From
Share Transactions
(11,574,046)
(28,998,313)
4,400,117
93,263,958
Net Increase (Decrease) in Net Assets
(14,001,314)
(44,964,056)
(49,736,565)
44,231,921
NET ASSETS—BEGINNING OF PERIOD
32,458,844
77,422,900
343,232,278
299,000,357
NET ASSETS—END OF PERIOD
$ 18,457,530
$ 32,458,844
$293,495,713
$ 343,232,278
Undistributed Net Investment Income (Loss)—
End of Period
$
128,867
$
—
$
(1,031,711)
$
—
* Since the commencement of operations: March 7, 2008.
† Unaudited
52
|
THE RYDEX SERIES FUNDS SEMI-ANNUAL REPORT
See Notes to Financial Statements.
Absolute Return
Alternative Strategies
Commodities
Strategies Fund
Allocation Fund
Strategy Fund
Hedged Equity Fund
Period
Year
Period
Year
Period
Year
Period
Year
Ended
Ended
Ended
Ended
Ended
Ended
Ended
Ended
September 30,
March 31,
September 30,
March 31,
September 30,
March 31,
September 30,
March 31,
2008†
2008
2008†
2008*
2008†
2008
2008†
2008
$
534,574
$
6,183,924
$
(10,010)
$
247
$
(496,868)
$
1,820,924
$
45,548
$
1,113,346
(1,722,390)
(14,682,495)
(307,308)
—
12,265,688
10,534,067
(429,055)
(3,544,178)
(7,099,772)
(4,060,931)
(1,578,286)
(30,641)
(10,187,002)
9,210,448
(551,605)
(1,020,817)
(8,287,588)
(12,559,502)
(1,895,604)
(30,394)
1,581,818
21,565,439
(935,112)
(3,451,649)
—
(1,619,281)
—
—
—
(109,198)
—
(256,063)
—
(1,944,242)
—
—
—
(74,170)
—
(264,730)
—
(5,952,339)
—
—
—
(267,525)
—
(1,297,480)
—
(175,613)
—
—
—
—
—
(7,986)
—
(210,855)
—
—
—
—
—
(8,257)
—
(645,538)
—
—
—
—
—
(40,467)
—
(10,547,868)
—
—
—
(450,893)
—
(1,874,983)
46,240,834
40,780,536
7,939,142
1,128,617
22,762,907
20,571,490
2,712,984
2,946,000
4,475,215
34,354,420
8,370,334
154,649
9,635,692
12,460,496
361,760
3,437,524
22,275,634
100,077,742
25,241,589
3,917,739
158,232,931
272,980,653
2,184,995
16,601,499
4,354
3,288
5,596
3
39,446
65,524
803
981
3,413
4,167
5,242
—
22,381
40,266
616
1,052
8,420
13,008
13,014
20
254,119
392,598
1,941
4,573
—
1,575,032
—
—
—
104,193
—
204,865
—
2,046,966
—
—
—
68,104
—
254,071
—
5,954,321
—
—
—
239,163
—
1,306,654
(19,856,420)
(38,116,726)
(1,169,584)
(898)
(25,451,214)
(16,044,064)
(2,392,613)
(3,858,525)
(12,701,008)
(24,156,055)
(226,788)
(1,900)
(10,027,216)
(8,184,148)
(2,346,119)
(5,887,950)
(54,697,975)
(126,906,668)
(9,624,954)
(1,476)
(235,804,538)
(198,501,063)
(6,784,705)
(26,587,232)
(14,247,533)
(4,369,969)
30,553,591
5,196,754
(80,335,492)
84,193,212
(6,260,338)
(11,576,488)
(22,535,121)
(27,477,339)
28,657,987
5,166,360
(78,753,674)
105,307,758
(7,195,450)
(16,903,120)
238,533,468
266,010,807
5,166,360
—
154,258,773
48,951,015
27,441,778
44,344,898
$215,998,347
$238,533,468
$33,824,347
$
5,166,360
$ 75,505,099
$154,258,773
$20,246,328
$ 27,441,778
$
1,245,084
$
710,510
$
(9,763)
$
247
$
910,561
$
1,407,429
$
78,030
$
32,482
THE RYDEX SERIES FUNDS SEMI-ANNUAL REPORT
|
53
STATEMENTS OF CHANGES IN NET ASSETS (concluded)
International Rotation
Managed Futures
Fund
Strategy Fund
Period
Period
Year
Ended
Year
Ended
Ended
September 30,
Ended
September 30,
March 31,
2008†
March 31,
2008†
2008*
(Consolidated)
2008
FROM OPERATIONS
Net Investment Income
$
59,680
$
529,027
$
1,284,352
$
4,299,654
Net Realized Gain (Loss) on Investments
(5,837,416)
(3,599,755)
(19,454,011)
9,166,125
Net Change in Unrealized Appreciation (Depreciation)
on Investments
(67,231)
(1,105,436)
(29,111,739)
15,936,657
Net Increase (Decrease) in Net Assets from Operations
(5,844,967)
(4,176,164)
(47,281,398)
29,402,436
Distributions to Shareholders from:
Net Investment Income
A-Class
—
(270,789)
—
—
C-Class
—
(81,207)
—
—
H-Class
—
(153,426)
—
—
Realized Gain on Investments
A-Class
—
(159,929)
—
(7,011)
C-Class
—
(47,961)
—
(2,198)
H-Class
—
(90,614)
—
(17,515)
Total Distributions to Shareholders
—
(803,926)
—
(26,724)
SHARE TRANSACTIONS
Proceeds from Shares Purchased
A-Class
9,956,954
23,067,035
134,151,906
117,885,098
C-Class
1,030,421
9,620,731
59,308,763
44,369,104
H-Class
12,568,315
34,841,686
443,620,761
307,063,434
Redemption Fees Collected
A-Class
17,626
14,179
79,511
30,370
C-Class
3,777
9,795
34,508
9,542
H-Class
11,395
43,318
228,105
79,960
Value of Shares Purchased through Dividend Reinvestment
A-Class
—
426,494
—
6,244
C-Class
—
127,790
—
2,079
H-Class
—
242,525
—
16,284
Cost of Shares Redeemed
A-Class
(9,270,588)
(7,500,179)
(47,656,006)
(20,213,507)
C-Class
(1,879,917)
(5,443,101)
(9,234,969)
(3,549,917)
H-Class
(19,257,261)
(19,608,491)
(125,206,233)
(49,792,127)
Net Increase (Decrease) in Net Assets From
Share Transactions
(6,819,278)
35,841,782
455,326,346
395,906,564
Net Increase (Decrease) in Net Assets
(12,664,245)
30,861,692
408,044,948
425,282,276
NET ASSETS—BEGINNING OF PERIOD
30,861,692
—
497,421,636
72,139,360
NET ASSETS—END OF PERIOD
$ 18,197,447
$ 30,861,692
$905,466,584
$497,421,636
Undistributed Net Investment Income (Loss)—
End of Period
$
(2,442,888)
$
(2,502,568)
$
4,947,782
$
3,663,430
* Since commencement of operations: August 31, 2007.
† Unaudited
54
|
THE RYDEX SERIES FUNDS SEMI-ANNUAL REPORT
See Notes to Financial Statements.
Real Estate
Strengthening Dollar 2x
Weakening Dollar 2x
Fund
Strategy Fund
Strategy Fund
Period
Year
Period
Year
Period
Year
Ended
Ended
Ended
Ended
Ended
Ended
September 30,
March 31,
September 30,
March 31,
September 30,
March 31,
2008†
2008
2008†
2008
2008†
2008
$
316,728
$
245,081
$
105,969
$
711,796
$
142,614
$
3,571,191
(3,733,508)
688,587
13,534,685
(7,852,075)
(4,379,806)
27,087,048
1,602,312
(6,818,462)
7,755,436
(1,750,940)
(16,976,490)
8,815,090
(1,814,468)
(5,884,794)
21,396,090
(8,891,219)
(21,213,682)
39,473,329
—
(19,151)
—
—
—
(4,162,016)
—
(19,174)
—
—
—
(3,293,861)
—
(29,207)
—
—
—
(19,472,969)
—
—
—
—
—
(2,766)
—
—
—
—
—
(2,190)
—
—
—
—
—
(12,945)
—
(67,532)
—
—
—
(26,946,747)
20,593,174
4,261,397
29,822,694
17,956,828
10,773,512
43,416,675
19,845,865
24,881,486
62,545,400
32,866,033
26,749,747
35,113,807
136,890,971
225,566,473
336,408,850
273,514,131
156,981,481
255,507,428
—
—
—
—
—
—
—
—
—
—
—
—
—
—
—
—
—
—
—
18,938
—
—
—
3,290,478
—
18,663
—
—
—
2,829,351
—
28,965
—
—
—
16,757,981
(16,854,251)
(9,310,916)
(12,598,214)
(13,972,483)
(18,284,976)
(48,841,856)
(20,035,554)
(27,239,102)
(56,126,456)
(28,379,029)
(37,126,196)
(31,865,100)
(123,730,454)
(233,291,275)
(227,969,415)
(249,841,075)
(189,544,972)
(287,257,877)
16,709,751
(15,065,371)
132,082,859
32,144,405
(50,451,404)
(11,049,113)
14,895,283
(21,017,697)
153,478,949
23,253,186
(71,665,086)
1,477,469
19,296,175
40,313,872
37,937,048
14,683,862
147,619,950
146,142,481
$
34,191,458
$
19,296,175
$191,415,997
$
37,937,048
$
75,954,864
$ 147,619,950
$
316,728
$
—
$
(1,750,768)
$
(1,856,737)
$
3,663,253
$
3,520,639
THE RYDEX SERIES FUNDS SEMI-ANNUAL REPORT
|
55
FINANCIAL HIGHLIGHTS
This table is presented to show selected data for a share outstanding throughout each period, and to assist shareholders in evaluating a Fund’s performance for the periods presented.
Net
Net Increase
Realized
(Decrease)
RATIOS TO
and
in Net
Net Increase
NET
AVERAGE NET ASSETS:
NET ASSET
Net
Unrealized
Asset Value
Distributions
Distributions
(Decrease)
ASSET
Net
Net Assets,
VALUE,
Investment
Gains
Resulting
from Net
from Net
Redemption
in Net
VALUE,
Total
Investment
Portfolio
End of
BEGINNING
Income
(Losses) on
from
Investment
Realized
Total
Fees
Asset
END OF
Investment
Total
Income
Turnover
Period (000’s
Period Ended
OF PERIOD
(Loss)†
Investments
Operations
Income
Gains
Distributions
Collected
Value
PERIOD
Return†††
Expenses
(Loss)
Rate
omitted)
Multi-Cap Core Equity Fund A-Class
September 30, 2008D
$11.79
$ .07
$ (1.34)
$ (1.27)
$
—
$
—
$
—
$
.01
$
(1.26)
$10.53
(10.69)%
1.14%**
1.21%**
136%
$
1,047
March 31, 2008
17.05
.10
(2.58)
(2.48)
(.02)
(2.76)
(2.78)
—§
(5.26)
11.79
(15.78)%
1.21%
0.64%
149%
3,361
March 31, 2007
16.72
.05
1.38
1.43
—
(1.10)
(1.10)
—§
.33
17.05
8.89%
1.32%
0.32%
138%
5,680
March 31, 2006
15.01
(.01)
2.59
2.58
—
(.87)
(.87)
—
1.71
16.72
17.55%
1.66%
(0.08)%
168%
3,079
March 31, 2005
14.44
.02
1.16
1.18
—
(.61)
(.61)
—
.57
15.01
8.16%
1.57%
0.16%
159%
906
March 31, 2004*
14.44
—
—
—
—
—
—
—
—
14.44
0.00%
0.00%**à
0.00%**
226%
1
Multi-Cap Core Equity Fund C-Class
September 30, 2008D
11.14
.03
(1.26)
(1.23)
—
—
—
—§
(1.23)
9.91
(11.04)%
1.88%**
0.58%**
136%
10,062
March 31, 2008
16.39
(.02)
(2.45)
(2.47)
(.02)
(2.76)
(2.78)
—§
(5.25)
11.14
(16.39)%
1.97%
(0.13)%
149%
15,906
March 31, 2007
16.24
(.09)
1.34
1.25
—
(1.10)
(1.10)
—§
.15
16.39
8.03%
2.12%
(0.54)%
138%
30,181
March 31, 2006
14.71
(.13)
2.53
2.40
—
(.87)
(.87)
—
1.53
16.24
16.68%
2.40%
(0.87)%
168%
30,981
March 31, 2005
14.27
(.10)
1.15
1.05
—
(.61)
(.61)
—
.44
14.71
7.34%
2.31%
(0.71)%
159%
34,793
March 31, 2004
10.11
(.11)
4.38
4.27
—
(.11)
(.11)
—
4.16
14.27
42.29%
2.24%
(0.87)%
226%
23,811
Multi-Cap Core Equity Fund H-Class
September 30, 2008D
11.79
.08
(1.34)
(1.26)
—
—
—
—§
(1.26)
10.53
(10.69)%
1.13%**
1.31%**
136%
7,348
March 31, 2008
17.04
.09
(2.56)
(2.47)
(.02)
(2.76)
(2.78)
—§
(5.25)
11.79
(15.73)%
1.23%
0.57%
149%
13,192
March 31, 2007
16.72
.03
1.39
1.42
—
(1.10)
(1.10)
—§
.32
17.04
8.83%
1.38%
0.18%
138%
41,562
March 31, 2006
15.01
(.02)
2.60
2.58
—
(.87)
(.87)
—
1.71
16.72
17.55%
1.64%
(0.11)%
168%
53,323
March 31, 2005
14.44
—§
1.18
1.18
—
(.61)
(.61)
—
.57
15.01
8.16%
1.56%
0.03%
159%
51,139
March 31, 2004
10.15
(.01)
4.41
4.40
—
(.11)
(.11)
—
4.29
14.44
43.41%
1.49%
(0.11)%
226%
42,568
Sector Rotation Fund A-Class
September 30, 2008D
13.45
(.02)
(1.34)
(1.36)
—
—
—
—§
(1.36)
12.09
(10.11)%
1.68%**
(0.28)%**
259%
47,508
March 31, 2008
14.08
(.01)
.30
.29
—
(.93)
(.93)
.01
(.63)
13.45
1.50%
1.65%
(0.08)%
278%
49,148
March 31, 2007
14.15
(.01)
.38
.37
—
(.44)
(.44)
—§
(.07)
14.08
2.75%
1.64%
(0.09)%
373%
39,804
March 31, 2006
11.10
(.04)
3.09
3.05
—
—
—
—
3.05
14.15
27.48%
1.67%
(0.33)%
263%
30,593
March 31, 2005
10.45
(.02)
.67
.65
—
—
—
—
.65
11.10
6.22%
1.63%
(0.19)%
262%
2,989
March 31, 2004*
10.45
—
—
—
—
—
—
—
—
10.45
0.00%
0.00%**à
0.00%**
253%
5
Sector Rotation Fund C-Class
September 30, 2008D
12.85
(.07)
(1.28)
(1.35)
—
—
—
—§
(1.35)
11.50
(10.51)%
2.43%**
(1.00)%**
259%
96,575
March 31, 2008
13.58
(.12)
.31
.19
—
(.93)
(.93)
.01
(.73)
12.85
0.81%
2.41%
(0.80)%
278%
115,136
March 31, 2007
13.76
(.11)
.37
.26
—
(.44)
(.44)
—§
(.18)
13.58
2.02%
2.39%
(0.86)%
373%
118,422
March 31, 2006
10.87
(.12)
3.01
2.89
—
—
—
—
2.89
13.76
26.59%
2.41%
(0.95)%
263%
118,083
March 31, 2005
10.30
(.10)
.67
.57
—
—
—
—
.57
10.87
5.53%
2.38%
(1.03)%
262%
54,604
March 31, 2004
7.53
(.16)
2.93
2.77
—
—
—
—
2.77
10.30
36.79%
2.41%
(1.66)%
253%
59,192
Sector Rotation Fund H-Class
September 30, 2008D
13.49
(.02)
(1.35)
(1.37)
—
—
—
—§
(1.37)
12.12
(10.16)%
1.67%**
(0.30)%**
259%
149,412
March 31, 2008
14.12
(.02)
.31
.29
—
(.93)
(.93)
.01
(.63)
13.49
1.50%
1.65%
(0.13)%
278%
178,949
March 31, 2007
14.18
(.02)
.40
.38
—
(.44)
(.44)
—§
(.06)
14.12
2.81%
1.65%
(0.16)%
373%
140,774
March 31, 2006
11.12
(.03)
3.09
3.06
—
—
—
—
3.06
14.18
27.52%
1.66%
(0.25)%
263%
246,029
March 31, 2005
10.45
(.03)
.70
.67
—
—
—
—
.67
11.12
6.41%
1.64%
(0.31)%
262%
56,725
March 31, 2004
7.58
(.09)
2.96
2.87
—
—
—
—
2.87
10.45
37.86%
1.66%
(0.88)%
253%
86,677
FINANCIAL HIGHLIGHTS (continued)
This table is presented to show selected data for a share outstanding throughout each period, and to assist shareholders in evaluating a Fund’s performance for the periods presented.
Net
Net Increase
Realized
(Decrease)
RATIOS TO
and
in Net
Net Increase
NET
AVERAGE NET ASSETS:
NET ASSET
Net
Unrealized
Asset Value
Distributions
Distributions
(Decrease)
ASSET
Net
Net Assets,
VALUE,
Investment
Gains
Resulting
from Net
from Net
Redemption
in Net
VALUE,
Total
Investment
Portfolio
End of
BEGINNING
Income
(Losses) on
from
Investment
Realized
Total
Fees
Asset
END OF
Investment
Total
Net
Operating
Income
Turnover
Period (000’s
Period Ended
OF PERIOD
(Loss)†
Investments
Operations
Income
Gains
Distributions
Collected
Value
PERIOD
Return†††
Expenses
Expenses
Expenses††
(Loss)
Rate
omitted)
Absolute Return Strategies Fund A-Class
September 30, 2008D
$24.61
$ .07
$
(.89)
$
(.82)
$
—
$
—
$
—
$
—§
$
(.82)
$23.79
(3.33)%
1.98%**
1.98%**
1.40%**
0.58%**
716%
$
65,136
March 31, 2008
26.44
.58
(1.53)
(.95)
(.79)
(.09)
(.88)
—§
(1.83)
24.61
(3.72)%
1.96%
1.96%
1.40%
2.18%
509%
42,193
March 31, 2007
25.52
.71
.80
1.51
(.38)
(.22)
(.60)
.01
.92
26.44
6.05%
1.93%
1.93%
1.43%
2.74%
298%
41,771
March 31, 2006*
25.00
.29
.24
.53
(.07)
—
(.07)
.06
.52
25.52
2.36%
1.87%**
1.87%**
1.45%**
2.20%**
127%
5,791
Absolute Return Strategies Fund C-Class
September 30, 2008D
24.13
(.01)
(.88)
(.89)
—
—
—
—§
(.89)
23.24
(3.69)%
2.72%**
2.72%**
2.15%**
(0.11)%**
716%
45,082
March 31, 2008
26.14
.37
(1.50)
(1.13)
(.79)
(.09)
(.88)
—§
(2.01)
24.13
(4.46)%
2.71%
2.71%
2.15%
1.41%
509%
54,857
March 31, 2007
25.42
.51
.80
1.31
(.38)
(.22)
(.60)
.01
.72
26.14
5.28%
2.66%
2.66%
2.16%
1.99%
298%
48,052
March 31, 2006*
25.00
.19
.24
.43
(.07)
—
(.07)
.06
.42
25.42
1.96%
2.65%**
2.65%**
2.23%**
1.42%**
127%
7,352
Absolute Return Strategies Fund H-Class
September 30, 2008D
24.63
.08
(.90)
(.82)
—
—
—
—§
(.82)
23.81
(3.33)%
1.97%**
1.97%**
1.40%**
0.63%**
716%
105,780
March 31, 2008
26.46
.58
(1.53)
(.95)
(.79)
(.09)
(.88)
—§
(1.83)
24.63
(3.71)%
1.95%
1.95%
1.39%
2.21%
509%
141,483
March 31, 2007
25.53
.72
.80
1.52
(.38)
(.22)
(.60)
.01
.93
26.46
6.09%
1.90%
1.90%
1.40%
2.78%
298%
176,187
March 31, 2006*
25.00
.29
.25
.54
(.07)
—
(.07)
.06
.53
25.53
2.40%
1.83%**
1.83%**
1.41%**
2.18%**
127%
30,796
Alternative Strategies Allocation Fund A-Class
September 30, 2008D
24.84
.01
(1.14)
(1.13)
—
—
—
.03
(1.10)
23.74
(4.43)%
0.00%**
0.00%**
0.00%**
0.06%**
21%
7,484
March 31, 2008*
25.00
—§
(.16)
(.16)
—
—
—
—
(.16)
24.84
(0.64)%
0.00%**à
0.00%** à
0.00%** à
0.16%**
—
1,121
Alternative Strategies Allocation Fund C-Class
September 30, 2008D
24.83
(.08)
(1.14)
(1.22)
—
—
—
.03
(1.19)
23.64
(4.79)%
0.75%**
0.75%**
0.75%**
(0.69)%**
21%
7,778
March 31, 2008*
25.00
(.01)
(.16)
(.17)
—
—
—
—
(.17)
24.83
(0.68)%
0.68%**à
0.68%** à
0.68%** à
(0.56)%**
—
152
Alternative Strategies Allocation Fund H-Class
September 30, 2008D
24.84
.01
(1.16)
(1.15)
—
—
—
.04
(1.11)
23.73
(4.47)%
0.00%**
0.00%**
0.00%**
0.06%**
21%
18,562
March 31, 2008*
25.00
—§
(.16)
(.16)
—
—
—
—
(.16)
24.84
(0.64)%
0.00%**à
0.00%**
à
0.00%** à
0.12%**
—
3,893
Commodities Strategy Fund A-Class
September 30, 2008D
32.68
(.07)
(1.89)
(1.96)
—
—
—
.07
(1.89)
30.79
(5.78)%
1.52%**
1.20%**
1.20%**
(0.39)%**
135%
14,945
March 31, 2008
23.81
.68
8.27
8.95
(.22)
—
(.22)
.14
8.87
32.68
38.48%
1.51%
1.19%
1.19%
2.49%
405%
18,579
March 31, 2007
27.29
.63
(4.15)
(3.52)
—
—
—
.04
(3.48)
23.81
(12.75)%
1.46%
1.17%
1.17%
2.57%
672%
9,720
March 31, 2006*
25.00
.61
1.68
2.29
—
—
—
—
2.29
27.29
9.16%
1.71%**
1.71%**
1.71%**
2.76%**
—
8,751
Commodities Strategy Fund C-Class
September 30, 2008D
31.96
(.19)
(1.83)
(2.02)
—
—
—
.06
(1.96)
30.00
(6.13)%
2.27%**
1.95%**
1.95%**
(1.07)%**
135%
9,234
March 31, 2008
23.47
.48
8.09
8.57
(.22)
—
(.22)
.14
8.49
31.96
37.41%
2.26%
1.94%
1.94%
1.79%
405%
10,793
March 31, 2007
27.10
.56
(4.23)
(3.67)
—
—
—
.04
(3.63)
23.47
(13.39)%
2.23%
1.94%
1.94%
2.23%
672%
4,169
March 31, 2006*
25.00
.42
1.68
2.10
—
—
—
—
2.10
27.10
8.40%
2.34%**
2.34%**
2.34%**
1.79%**
—
4,128
Commodities Strategy Fund H-Class
September 30, 2008D
32.66
(.10)
(1.85)
(1.95)
—
—
—
.07
(1.88)
30.78
(5.76)%
1.52%**
1.20%**
1.20%**
(0.52)%**
135%
51,326
March 31, 2008
23.81
.60
8.30
8.90
(.22)
—
(.22)
.17
8.85
32.66
38.39%
1.51%
1.19%
1.19%
2.10%
405%
124,886
March 31, 2007
27.29
.77
(4.28)
(3.51)
—
—
—
.03
(3.48)
23.81
(12.75)%
1.49%
1.20%
1.20%
2.99%
672%
35,062
March 31, 2006*
25.00
.61
1.68
2.29
—
—
—
—
2.29
27.29
9.16%
1.57%**
1.57%**
1.57%**
2.56%**
—
29,028
FINANCIAL HIGHLIGHTS (continued)
This table is presented to show selected data for a share outstanding throughout each period, and to assist shareholders in evaluating a Fund’s performance for the periods presented.
Net
Net Increase
Realized
(Decrease)
RATIOS TO
and
in Net
Net Increase
NET
AVERAGE NET ASSETS:
NET ASSET
Net
Unrealized
Asset Value
Distributions
Distributions
(Decrease)
ASSET
Net
Net Assets,
VALUE,
Investment
Gains
Resulting
from Net
from Net
Redemption
in Net
VALUE,
Total
Investment
Portfolio
End of
BEGINNING
Income
(Losses) on
from
Investment
Realized
Total
Fees
Asset
END OF
Investment
Total
Net
Operating
Income
Turnover
Period (000’s
Period Ended
OF PERIOD
(Loss)†
Investments
Operations
Income
Gains
Distributions
Collected
Value
PERIOD
Return†††
Expenses
Expenses
Expenses††
(Loss)
Rate
omitted)
Hedged Equity Fund A-Class
September 30, 2008D
$22.90
$ .06
$ (1.16)
$ (1.10)
$
—
$
—
$
—
$
—§
$ (1.10)
$21.80
(4.80)%
2.18%**
2.18%**
1.40%**
0.53%**
597%
$
5,543
March 31, 2008
26.29
.67
(2.94)
(2.27)
(1.09)
(.03)
(1.12)
—§
(3.39)
22.90
(8.98)%
2.04%
2.04%
1.41%
2.59%
433%
5,553
March 31, 2007
25.86
.82
.63
1.45
(.52)
(.51)
(1.03)
.01
.43
26.29
5.82%
2.13%
2.13%
1.41%
3.15%
282%
7,086
March 31, 2006*
25.00
.26
.65
.91
(.09)
—
(.09)
.04
.86
25.86
3.81%
2.10%**
2.10%**
1.44%**
1.91%**
159%
1,672
Hedged Equity Fund C-Class
September 30, 2008D
22.46
(.03)
(1.13)
(1.16)
—
—
—
—§
(1.16)
21.30
(5.16)%
2.94%**
2.94%**
2.15%**
(0.26)%**
597%
3,103
March 31, 2008
25.99
.48
(2.89)
(2.41)
(1.09)
(.03)
(1.12)
—§
(3.53)
22.46
(9.63)%
2.78%
2.78%
2.15%
1.89%
433%
5,226
March 31, 2007
25.76
.62
.63
1.25
(.52)
(.51)
(1.03)
.01
.23
25.99
5.05%
2.89%
2.89%
2.17%
2.40%
282%
8,312
March 31, 2006*
25.00
.16
.65
.81
(.09)
—
(.09)
.04
.76
25.76
3.41%
2.86%**
2.86%**
2.20%**
1.16%**
159%
2,957
Hedged Equity Fund H-Class
September 30, 2008D
22.91
.06
(1.16)
(1.10)
—
—
—
—§
(1.10)
21.81
(4.80)%
2.19%**
2.19%**
1.40%**
0.49%**
597%
11,601
March 31, 2008
26.30
.68
(2.95)
(2.27)
(1.09)
(.03)
(1.12)
—§
(3.39)
22.91
(8.97)%
2.03%
2.03%
1.40%
2.63%
433%
16,663
March 31, 2007
25.86
.81
.65
1.46
(.52)
(.51)
(1.03)
.01
.44
26.30
5.86%
2.13%
2.13%
1.41%
3.14%
282%
28,947
March 31, 2006*
25.00
.26
.65
.91
(.09)
—
(.09)
.04
.86
25.86
3.81%
2.07%**
2.07%**
1.41%**
1.96%**
159%
17,321
International Rotation Fund A-Class
September 30, 2008D
22.93
.07
(4.25)
(4.18)
—
—
—
.02
(4.16)
18.77
(18.14)%
1.67%**
1.67%**
1.67%**
0.58%**
93%
10,716
March 31, 2008*
25.00
.53
(1.98)
(1.45)
(.41)
(.24)
(.65)
.03
(2.07)
22.93
(5.93)%
1.74%**
1.74%**
1.74%**
3.68%**
160%
13,483
International Rotation Fund C-Class
September 30, 2008D
22.84
(.04)
(4.20)
(4.24)
—
—
—
.03
(4.21)
18.63
(18.43)%
2.42%**
2.42%**
2.42%**
(0.33)%**
93%
2,135
March 31, 2008*
25.00
.39
(1.96)
(1.57)
(.41)
(.24)
(.65)
.06
(2.16)
22.84
(6.29)%
2.49%**
2.49%**
2.49%**
2.70%**
160%
3,603
International Rotation Fund H-Class
September 30, 2008D
22.94
.04
(4.22)
(4.18)
—
—
—
.02
(4.16)
18.78
(18.13)%
1.67%**
1.67%**
1.67%**
0.33%**
93%
5,346
March 31, 2008*
25.00
.45
(1.95)
(1.50)
(.41)
(.24)
(.65)
.09
(2.06)
22.94
(5.89)%
1.75%**
1.75%**
1.75%**
3.19%**
160%
13,775
Managed Futures Strategy Fund A-Class
September 30, 2008D
28.26
.06
(1.48)
(1.42)
—
—
—
.01
(1.41)
26.85
(4.99)%
1.73%**
1.68%**
1.65%**
0.42%**
68%
204,525
March 31, 2008
25.03
.57
2.64
3.21
—
(—)§
(—)§
.02
3.23
28.26
12.92%
1.72%
1.72%
1.69%
2.15%
154%
128,744
March 31, 2007*
25.00
.09
(.06)
.03
—
—
—
—§
.03
25.03
0.12%
1.81%**
1.81%**
1.81%**
2.06%**
20%
23,655
Managed Futures Strategy Fund C-Class
September 30, 2008D
28.04
(.05)
(1.46)
(1.51)
—
—
—
.01
(1.50)
26.54
(5.35)%
2.48%**
2.42%**
2.39%**
(0.34)%**
68%
90,899
March 31, 2008
25.02
.35
2.65
3.00
—
(—)§
(—)§
.02
3.02
28.04
12.08%
2.48%
2.48%
2.45%
1.30%
154%
46,005
March 31, 2007*
25.00
.05
(.03)
.02
—
—
—
—§
.02
25.02
0.08%
2.60%**
2.60%**
2.60%**
1.15%**
20%
2,703
Managed Futures Strategy Fund H-Class
September 30, 2008D
28.26
.06
(1.48)
(1.42)
—
—
—
.01
(1.41)
26.85
(4.99)%
1.73%**
1.67%**
1.64%**
0.42%**
68%
610,043
March 31, 2008
25.03
.58
2.63
3.21
—
(—)§
(—)§
.02
3.23
28.26
12.92%
1.73%
1.73%
1.70%
2.17%
154%
322,673
March 31, 2007*
25.00
.09
(.06)
.03
—
—
—
—§
.03
25.03
0.12%
1.77%**
1.77%**
1.77%**
2.19%**
20%
45,781
FINANCIAL HIGHLIGHTS (continued)
This table is presented to show selected data for a share outstanding throughout each period, and to assist shareholders in evaluating a Fund’s performance for the periods presented.
Net
Net Increase
Realized
(Decrease)
RATIOS TO
and
in Net
Net Increase
NET
AVERAGE NET ASSETS:
NET ASSET
Net
Unrealized
Asset Value
Distributions
Distributions
(Decrease)
ASSET
Net
Net Assets,
VALUE,
Investment
Gains
Resulting
from Net
from Net
in Net
VALUE,
Total
Investment
Portfolio
End of
BEGINNING
Income
(Losses) on
from
Investment
Realized
Total
Asset
END OF
Investment
Total
Income
Turnover
Period (000’s
Period Ended
OF PERIOD
(Loss)†
Investments
Operations
Income
Gains
Distributions
Value
PERIOD
Return†††
Expenses
(Loss)
Rate
omitted)
Real Estate Fund A-Class
September 30, 2008D
$32.42
$ .35
$
(1.35)
$ (1.00)
$
—
$
—
$
—
$ (1.00)
$ 31.42
(3.08)%
1.64%**
2.12%**
366%
$
6,092
March 31, 2008
42.16
.54
(10.05)
(9.51)
(.23)
—
(.23)
(9.74)
32.42
(22.59)%
1.64%
1.45%
832%
2,866
March 31, 2007
36.46
.46
5.53
5.99
(.17)
(.12)
(.29)
5.70
42.16
16.43%
1.61%
1.10%
762%
9,061
March 31, 2006
27.84
.64
8.18
8.82
—
(.20)
(.20)
8.62
36.46
31.75%
1.57%
2.02%
1,304%
375
March 31, 2005*
26.66
.09
1.24
1.33
(.03)
(.12)
(.15)
1.18
27.84
4.98%
1.54%**
0.52%**
1,773%
71
Real Estate Fund C-Class
September 30, 2008D
31.44
.35
(1.43)
(1.08)
—
—
—
(1.08)
30.36
(3.44)%
2.39%**
2.17%**
366%
2,005
March 31, 2008
41.22
.29
(9.84)
(9.55)
(.23)
—
(.23)
(9.78)
31.44
(23.21)%
2.39%
0.78%
832%
2,290
March 31, 2007
35.93
.19
5.39
5.58
(.17)
(.12)
(.29)
5.29
41.22
15.53%
2.36%
0.48%
762%
5,469
March 31, 2006
27.64
.43
8.06
8.49
—
(.20)
(.20)
8.29
35.93
30.79%
2.36%
1.35%
1,304%
3,548
March 31, 2005
26.63
.41
.75
1.16
(.03)
(.12)
(.15)
1.01
27.64
4.35%
2.32%
1.52%
1,773%
1,293
March 31, 2004*
25.00
.02
1.61
1.63
—
—
—
1.63
26.63
6.52%
2.36%**
0.72%**
102%
7,562
Real Estate Fund H-Class
September 30, 2008D
32.40
.30
(1.28)
(.98)
—
—
—
(.98)
31.42
(3.02)%
1.63%**
1.81%**
366%
26,094
March 31, 2008
42.14
.53
(10.04)
(9.51)
(.23)
—
(.23)
(9.74)
32.40
(22.60)%
1.64%
1.43%
832%
14,140
March 31, 2007
36.47
.54
5.42
5.96
(.17)
(.12)
(.29)
5.67
42.14
16.34%
1.62%
1.35%
762%
25,784
March 31, 2006
27.85
.57
8.25
8.82
—
(.20)
(.20)
8.62
36.47
31.74%
1.59%
1.78%
1,304%
49,591
March 31, 2005
26.65
.58
.77
1.35
(.03)
(.12)
(.15)
1.20
27.85
5.06%
1.58%
2.08%
1,773%
8,186
March 31, 2004*
25.00
.10
1.55
1.65
—
—
—
1.65
26.65
6.60%
1.61%**
3.83%**
102%
75,916
Strengthening Dollar 2x Strategy Fund A-Class
September 30, 2008D
19.85
.03
3.54
3.57
—
—
—
3.57
23.42
17.98%
1.67%**
0.25%**
—
21,679
March 31, 2008
25.35
.39
(5.89)
(5.50)
—
—
—
(5.50)
19.85
(21.70)%
1.66%
1.73%
—
2,795
March 31, 2007
27.74
.91
(3.30)
(2.39)
—
—
—
(2.39)
25.35
(8.62)%
1.66%
3.53%
—
108
March 31, 2006*
25.00
.50
2.37
2.87
(.13)
—
(.13)
2.74
27.74
11.47%
1.68%**
2.17%**
—
91
Strengthening Dollar 2x Strategy Fund C-Class
September 30, 2008D
19.42
(.05)
3.46
3.41
—
—
—
3.41
22.83
17.56%
2.42%**
(0.46)%**
—
15,063
March 31, 2008
24.99
.42
(5.99)
(5.57)
—
—
—
(5.57)
19.42
(22.29)%
2.40%
1.84%
—
6,131
March 31, 2007
27.56
.70
(3.27)
(2.57)
—
—
—
(2.57)
24.99
(9.33)%
2.40%
2.75%
—
2,630
March 31, 2006*
25.00
.36
2.33
2.69
(.13)
—
(.13)
2.56
27.56
10.75%
2.41%**
1.51%**
—
769
Strengthening Dollar 2x Strategy Fund H-Class
September 30, 2008D
19.83
.03
3.53
3.56
—
—
—
3.56
23.39
17.95%
1.67%**
0.27%**
—
154,675
March 31, 2008
25.33
.57
(6.07)
(5.50)
—
—
—
(5.50)
19.83
(21.71)%
1.66%
2.44%
—
29,011
March 31, 2007
27.71
.90
(3.28)
(2.38)
—
—
—
(2.38)
25.33
(8.59)%
1.66%
3.47%
—
11,946
March 31, 2006*
25.00
.51
2.33
2.84
(.13)
—
(.13)
2.71
27.71
11.35%
1.66%**
2.19%**
—
7,270
FINANCIAL HIGHLIGHTS (concluded)
This table is presented to show selected data for a share outstanding throughout each period, and to assist shareholders in evaluating a Fund’s performance for the periods presented.
Net
Net Increase
Realized
(Decrease)
RATIOS TO
and
in Net
Net Increase
NET
AVERAGE NET ASSETS:
NET ASSET
Net
Unrealized
Asset Value
Distributions
Distributions
(Decrease)
ASSET
Net
Net Assets,
VALUE,
Investment
Gains
Resulting
from Net
from Net
in Net
VALUE,
Total
Investment
Portfolio
End of
BEGINNING
Income
(Losses) on
from
Investment
Realized
Total
Asset
END OF
Investment
Total
Income
Turnover
Period (000’s
Period Ended
OF PERIOD
(Loss)†
Investments
Operations
Income
Gains
Distributions
Value
PERIOD
Return†††
Expenses
(Loss)
Rate
omitted)
Weakening Dollar 2x Strategy Fund A-Class
September 30, 2008D
$29.27
$ .05
$ (5.04)
$ (4.99)
$
—
$ —
$
—
$ (4.99)
$24.28
(17.05)%
1.67%**
0.34%**
—
$ 11,646
March 31, 2008
26.18
.70
7.17
7.87
(4.78)
(—)§
(4.78)
3.09
29.27
32.49%
1.67%
2.51%
—
22,148
March 31, 2007
22.70
.91
2.57
3.48
—
—
—
3.48
26.18
15.33%
1.65%
3.63%
—
21,502
March 31, 2006*
25.00
.51
(2.67)
(2.16)
(.14)
—
(.14)
(2.30)
22.70
(8.65)%
1.70%**
2.66%**
—
2,989
Weakening Dollar 2x Strategy Fund C-Class
September 30, 2008D
28.53
(.06)
(4.89)
(4.95)
—
—
—
(4.95)
23.58
(17.35)%
2.42%**
(0.41)%**
—
8,680
March 31, 2008
25.81
.43
7.07
7.50
(4.78)
(—)§
(4.78)
2.72
28.53
31.47%
2.41%
1.57%
—
21,604
March 31, 2007
22.55
.71
2.55
3.26
—
—
—
3.26
25.81
14.46%
2.40%
2.87%
—
14,160
March 31, 2006*
25.00
.34
(2.65)
(2.31)
(.14)
—
(.14)
(2.45)
22.55
(9.25)%
2.46%**
1.79%**
—
3,916
Weakening Dollar 2x Strategy Fund H-Class
September 30, 2008D
29.25
.05
(5.03)
(4.98)
—
—
—
(4.98)
24.27
(17.03)%
1.67%**
0.34%**
—
55,629
March 31, 2008
26.18
.68
7.17
7.85
(4.78)
(—)§
(4.78)
3.07
29.25
32.41%
1.67%
2.45%
—
103,867
March 31, 2007
22.69
.90
2.59
3.49
—
—
—
3.49
26.18
15.38%
1.65%
3.60%
—
110,480
March 31, 2006*
25.00
.49
(2.66)
(2.17)
(.14)
—
(.14)
(2.31)
22.69
(8.69)%
1.68%**
2.53%**
—
51,710
*
Since the commencement of operations:
February 20, 2004 — Real Estate Fund C-Class and H-Class;
March 31, 2004 — Multi-Cap Core Equity Fund A-Class and Sector Rotation Fund A-Class;
September 1, 2004 — Real Estate Fund A-Class;
May 25, 2005 — Commodities Strategy Fund A-Class, C-Class and H-Class, Strengthening Dollar 2x Strategy Fund A-Class, C-Class and H-Class,
Weakening Dollar 2x Strategy Fund A-Class, C-Class and H-Class;
September 19, 2005 — Absolute Return Strategies Fund A-Class, C-Class and H Class and Hedged Equity Fund A-Class, C-Class and H-Class;
March 2, 2007 — Managed Futures Strategy Fund A-Class, C-Class and H-Class;
August 31, 2007 — International Rotation Fund A-Class, C-Class and H Class;
March 7, 2008— Alternative Strategies Allocation Fund A-Class, C-Class and H-Class.
**
Annualized
† Calculated using the average daily shares outstanding for the period.
†† Operating expenses exclude short dividends expense.
††† Total investment return does not reflect the impact of any applicable sales charges and has not been annualized.
à Expense ratios are calculated for one day only and are not indicative of future class performance.
§ Less than $.01 per share.
D Unaudited
NOTES TO FINANCIAL STATEMENTS (Unaudited)
1.
Organization and Significant Accounting Policies
Trust. Rydex Distributors, Inc. (the “Distributor”) acts
Organization
as principal underwriter for the Trust. Both Rydex
The Rydex Series Funds (the “Trust”) is registered with
Investments and the Distributor are affiliated entities.
the SEC under the Investment Company Act of 1940 (the
Significant Accounting Policies
“1940 Act”) as a non-diversified, open-ended investment
The following significant accounting policies are in
company. The Trust offers five separate classes of shares,
conformity with U.S. generally accepted accounting
Investor Class Shares, Advisor Class Shares, A-Class
principles and are consistently followed by the Trust. All
Shares, C-Class Shares, and H-Class Shares. C-Class
time references are based on Eastern Time. The informa-
Shares have a 1% contingent deferred sales charge
tion contained in these notes may not apply to every
(“CDSC”) if shares are redeemed within 12 months of
Fund in the Trust.
purchase. Sales of shares of each Class are made without
a sales charge at the NAV, with the exception of A-Class
A. Equity securities listed on an exchange (New York
Shares. A-Class Shares are sold at the NAV, plus the
Stock Exchange (“NYSE”) or American Stock Exchange)
applicable front-end sales charge, except for the U.S.
are valued at the last quoted sales price as of the close
Government Money Market Fund. The sales charge
of business on the NYSE, usually 4:00 p.m. on the valua-
varies depending on the amount purchased, but will not
tion date. Equity securities listed on the NASDAQ market
exceed 4.75%. A-Class Share purchases of $1 million or
system are valued at the NASDAQ Official Closing Price,
more are exempt from the front-end sales charge but
usually as of 4:00 p.m. on the valuation date. Short-term
have a 1% CDSC if shares are redeemed within 18
securities, if any, are valued at amortized cost, which
months of purchase.
approximates market value.
At September 30, 2008, the Trust consisted of fifty-four
Listed options held by the Trust are valued at the Official
separate Funds: twenty-two Benchmark Funds, one
Settlement Price listed by the exchange, usually as of
Money Market Fund, eleven Alternative Strategy Funds,
4:00 p.m. In the event that a settlement price is not
seventeen Sector Funds, and three Essential Portfolio
available, fair valuation is enacted. Over-the-counter
Funds. This report covers the Alternative Strategy Funds
options held by the Trust are valued using the average
(the “Funds”), while the Money Market Fund, the
bid price obtained from one or more security dealers.
Benchmark Funds, the Sector Funds and the Essential
The value of futures contracts purchased and sold by the
Portfolio Funds are contained in separate reports.
Trust is accounted for using the unrealized gain or loss
The Alternative Strategies Allocation Fund is a “fund of
on the contracts that is determined by marking the
funds,” which means that the Fund seeks to achieve its
contracts to their current realized settlement prices.
investment objective by investing primarily in other
Financial futures contracts are valued at the last quoted
Rydex mutual funds (the “underlying funds”) instead of
sales price, usually as of 4:00 p.m. on the valuation date.
individual securities.
In the event that the exchange for a specific futures
contract closes earlier than 4:00 p.m., the futures con-
As of September 30, 2008, only A-Class, C-Class and
tract is valued at the Official Settlement Price of the
H-Class Shares had been issued in the Alternative
exchange. However, the underlying securities from which
Strategy Funds. All share classes of the Multi-Cap Core
the futures contract value is derived are monitored until
Equity Fund, Sector Rotation Fund, Absolute Return
4:00 p.m. to determine if fair valuation would provide a
Strategies Fund, Alternative Strategies Allocation Fund,
more accurate valuation.
Commodities Strategy Fund, Hedged Equity Fund, and
International Rotation Fund are subject to a 1% redemp-
Structured notes are valued in accordance with the terms
tion fee when shares are redeemed within 30 days of
of their agreement at the value of the underlying index
purchase. All share classes of the Managed Futures
close, usually 4:00 p.m., adjusted for any interest accruals
Strategy Fund are subject to a 1% redemption fee when
and financing charges. If the securities comprising the
shares are redeemed within 90 days of purchase.
underlying index cease trading before a Fund’s close of
business, the index will be fair valued with the use of an
Valu-Trac Investment Management Limited serves as the
appropriate market indicator.
investment sub-advisor to the International Rotation Fund
and is responsible for the development and on-going
Traditional open-end investment companies (“Mutual
maintenance of the investment management strategy
Funds”) are valued at their NAV as of the close of busi-
utilized by that Fund.
ness, usually 4:00 p.m. on the valuation date. Exchange
Traded Funds (“ETFs”) and closed-end investment
Rydex Investments provides advisory, transfer agent and
companies are valued at the last quoted sales price.
administrative services, and accounting services to the
THE RYDEX SERIES FUNDS SEMI-ANNUAL REPORT
|
61
NOTES TO FINANCIAL STATEMENTS (Unaudited) (continued)
The value of domestic equity index and credit default
regulations which may differ from U.S. generally
swap agreements entered into by a Fund is accounted
accepted accounting principles.
for using the unrealized gain or loss on the agreements
D. When a Fund engages in a short sale of an equity or
that is determined by marking the agreements to the
fixed income security, an amount equal to the proceeds
last quoted value of the index that the swap pertains to
is reflected as an asset and an equivalent liability. The
at the close of the NYSE, usually 4:00 p.m. The swap’s
amount of the liability is subsequently marked-to-market
market value is then adjusted to include dividends
to reflect the market value of the short sale. The Fund
accrued, financing charges and/or interest associated
maintains a segregated account of cash and/or securities
with the swap agreements.
as collateral for short sales. The Fund is exposed to
The value of foreign equity index and currency index
market risk based on the amount, if any, that the market
swap agreements entered into by a Fund is accounted
value of the security exceeds the market value of the
for using the unrealized gain or loss on the agreements
securities in the segregated account. Fees, if any, paid
that is determined by marking the agreements to the
to brokers to borrow securities in connection with short
price at which orders are being filled at the close of the
sales are considered part of the cost of short sale trans-
NYSE, usually 4:00 p.m. In the event that no order is
actions. In addition, the Fund must pay out the dividend
filled at 4:00 p.m., the security dealer provides a fair
rate of the equity or coupon rate of the treasury obliga-
value quote at which the swap agreement is valued. The
tion to the lender and records this as an expense. Short
swap’s market value is then adjusted to include dividends
dividends or interest expense is a cost associated with
accrued, financing charges and/or interest associated
the investment objective of short sales transactions,
with the swap agreements.
rather than an operational cost associated with the day-
Investments, for which market quotations are not readily
to-day management of any mutual fund. The Funds may
available, are fair valued as determined in good faith by
also receive rebate income from the broker resulting
Rydex Investments under the direction of the Board of
from the investment of the proceeds from securities
Trustees using methods established or ratified by the
sold short.
Board of Trustees. These methods include, but are not
E. Upon the purchase of an option by a Fund, the pre-
limited to: (i) general information as to how these securi-
mium paid is recorded as an investment, the value of
ties and assets trade; (ii) in connection with futures con-
which is marked-to-market daily. When a purchased
tracts and options thereupon, and other derivative
option expires, that Fund will realize a loss in the amount
investments, information as to how (a) these contracts
of the cost of the option. When a Fund enters into a
and other derivative investments trade in the futures or
closing sale transaction, that Fund will realize a gain or
other derivative markets, respectively, and (b) the securi-
loss depending on whether the proceeds from the clos-
ties underlying these contracts and other derivative
ing sale transaction are greater or less than the cost of
investments trade in the cash market; and (iii) other infor-
the option. When a Fund exercises a put option, that
mation and considerations, including current values in
Fund will realize a gain or loss from the sale of the
related-markets.
underlying security and the proceeds from such sale will
B. Securities transactions are recorded on the trade date
be decreased by the premium originally paid. When a
for financial reporting purposes. Realized gains and
Fund exercises a call option, the cost of the security pur-
losses from securities transactions are recorded using the
chased by that Fund upon exercise will be increased by
identified cost basis. Proceeds from lawsuits related to
the premium originally paid. When a Fund writes (sells)
investment holdings are recorded as realized gains in the
an option, an amount equal to the premium received is
respective Fund. Dividend income is recorded on the
entered in that Fund’s accounting records as an asset
ex-dividend date, net of applicable taxes withheld by
and equivalent liability. The amount of the liability is
foreign countries. Interest income, including amortization
subsequently marked to-market to reflect the current
of premiums and accretion of discount, is accrued on a
value of the option written. When a written option
daily basis. Distributions received from investments in
expires, or if a Fund enters into a closing purchase trans-
REITs are recorded as dividend income on the ex-divi-
action, that Fund realizes a gain (or loss if the cost of a
dend date, subject to reclassification upon notice of the
closing purchase transaction exceeds the premium
character of such distribution by the issuer.
received when the option was sold).
C. Distributions of net investment income and net real-
F. The Trust may enter into stock and bond index futures
ized capital gains, if any, are declared and paid at least
contracts and options on such futures contracts. Futures
annually. Distributions are recorded on the ex-dividend
contracts are contracts for delayed delivery of securities
date and are determined in accordance with income tax
at specified future delivery date and at a specific price.
62
|
THE RYDEX SERIES FUNDS SEMI-ANNUAL REPORT
NOTES TO FINANCIAL STATEMENTS (Unaudited) (continued)
Upon entering into a contract, a Fund deposits and
investors and pays back the principal, adjusted for per-
maintains as collateral such initial margin as required by
formance of the underlying benchmark, at a specified
the exchange on which the transaction is effected.
maturity date. In addition, the contract may require
Pursuant to the contract, the Fund agrees to receive
periodic interest payments. Structured notes are used
from or pay to the broker an amount of cash equal to
to obtain exposure to a market without owning or
the daily fluctuation in value of the contract. Such
taking physical custody of securities or commodities.
receipts or payments are known as variation margin and
Fluctuations in value of the structured notes are recorded
are recorded by the Fund as unrealized gains or losses.
as unrealized gains and losses in the accompanying
When the contract is closed, the Fund records a realized
financial statements. Coupon payments are recorded as
gain or loss equal to the difference between the value of
income while net payments are recorded as net realized
the contract at the time it was opened and the value at
gains or losses.
the time it was closed.
I. Investment securities and other assets and liabilities
G. The Trust may enter into domestic equity index and
denominated in foreign currencies are translated into
domestic currency index swap agreements, which are
U.S. dollar amounts at the date of valuation. Purchases
over-the-counter contracts in which one party agrees to
and sales of investment securities and income and
make periodic payments based on the change in market
expense items denominated in foreign currencies are
value of a specified equity security, basket of equity
translated into U.S. dollar amounts on the respective
securities, equity index or domestic currency index, in
dates of such transactions. The Trust does not isolate
return for periodic payments based on a fixed or variable
that portion of the results of operations resulting from
interest rate or the change in market value of a different
changes in foreign exchange rates on investments from
equity security, basket of equity securities, equity index
the fluctuations arising from changes in market prices
or domestic currency index. Swap agreements are used
of securities held. Such fluctuations are included with
to obtain exposure to an equity or market without own-
the net realized and unrealized gain and loss from
ing or taking physical custody of securities. The swap
investments.
agreements are marked-to-market daily based upon
Reported net realized foreign exchange gains or losses
quotations from market makers and the change, if any, is
arise from sales of foreign currencies and currency gains
recorded as unrealized gain or loss. Payments received
or losses realized between the trade and settlement
or made as a result of an agreement or termination of
dates on investment transactions. Net unrealized
the agreement are recognized as realized gains or losses.
exchange gains and losses arise from changes in the fair
The Trust may enter into credit default swap agreements
values of assets and liabilities other than investments in
where one party, the protection buyer, makes an upfront
securities at the fiscal period end, resulting from changes
or periodic payment to a counterparty, the protection
in exchange rates.
seller, in exchange for the right to receive a contingent
J. The Trust may enter into forward currency contracts
payment. The maximum amount of the payment may
primarily to hedge against foreign currency exchange
equal the notional amount, at par, of the underlying index
rate risks on its non-U.S. dollar denominated investment
or security as a result of a related credit event. Upfront
securities. When entering into a forward currency con-
payments received or made by a Fund, are amortized
tract, a Fund agrees to receive or deliver a fixed quantity
over the expected life of the agreement. Periodic pay-
of foreign currency for an agreed-upon price on an
ments received or paid by a Fund are recorded as realized
agreed future date. These contracts are valued daily
gains or losses. The credit default contracts are marked-
and the corresponding unrealized gain or loss on the
to-market daily based upon quotations from market
contracts, as measured by the difference between the
makers and the change, if any, is recorded as unrealized
forward foreign exchange rates at the dates of entry
gain or loss. Payments received or made as a result of a
into the contracts and the forward rates at the reporting
credit event or termination of the contract are recog-
date, is included in the Statement of Assets and
nized, net of a proportional amount of the upfront
Liabilities. Realized and unrealized gains and losses are
payment, as realized gains or losses.
included in the Statement of Operations.
H. The Trust may invest in structured notes, which are
K. The Funds may leave cash overnight in their cash
over-the-counter contracts linked to the performance of
account with the custodian, U.S. Bank. Periodically, a Fund
an underlying benchmark such as interest rates, equity
may have cash due to the custodian bank as an overdraft
markets, equity indices, commodities indices, corporate
balance. A fee is incurred on this overdraft, calculated by
credits or foreign exchange markets. A structured note is
multiplying the overdraft by a rate based on the federal
a type of bond in which an issuer borrows money from
funds rate. Segregated cash with the broker is held as
THE RYDEX SERIES FUNDS SEMI-ANNUAL REPORT
|
63
NOTES TO FINANCIAL STATEMENTS (Unaudited) (continued)
collateral for investments in derivative instruments such
Conversely, if the security increases in price during the
as futures contracts and equity index swap agreements.
period, that Fund will realize a loss on the transaction.
L. Certain U.S. Government and Agency Obligations are
The risk of such price increases is the principal risk of
traded on a discount basis; the interest rates shown on
engaging in short sales.
the Schedules of Investments reflect the discount rates
The risk associated with purchasing options is limited to
paid at the time of purchase by the Funds. Other securi-
the premium originally paid. The risk in writing a covered
ties bear interest at the rates shown, payable at fixed
call option is that a Fund may forego the opportunity for
dates through maturity. The Funds may also purchase
profit if the market price of the underlying security
American Depository Receipts, U.S. Government securi-
increases and the option is exercised. The risk in writing
ties, and enter into repurchase agreements.
a covered put option is that a Fund may incur a loss if
M. Interest and dividend income, most expenses, all
the market price of the underlying security decreases
realized gains and losses, and all unrealized gains and
and the option is exercised. In addition, there is the risk
losses are allocated to the Classes based upon the value
that a Fund may not be able to enter into a closing
of the outstanding shares in each Class. Certain costs,
transaction because of an illiquid secondary market or,
such as distribution fees related to A-Class Shares and
for over-the-counter options, because of the counter-
H-Class Shares and service and distribution fees related
party’s inability to perform.
to C-Class Shares, are charged directly to such Classes.
There are several risks in connection with the use of
In addition, certain expenses have been allocated to the
futures contracts. Risks may be caused by an imperfect
individual Funds in the Trust on a pro rata basis upon
correlation between movements in the price of the
the respective aggregate net asset value of each Fund
instruments and the price of the underlying securities. In
included in the Trust.
addition, there is the risk that a Fund may not be able to
N. The preparation of financial statements in conformity
enter into a closing transaction because of an illiquid
with U.S. generally accepted accounting principles
secondary market.
requires management to make estimates and assump-
There are several risks associated with the use of struc-
tions that affect the reported amount of assets and liabil-
tured notes. Structured notes are leveraged, thereby
ities and disclosure of contingent assets and liabilities at
providing an exposure to the underlying benchmark
the date of the financial statements and the reported
greater than the face amount and increasing the volatility
amounts of revenues and expenses during the reporting
of each note relative to the change in the underlying
period. Actual results could differ from these estimates.
linked financial instrument. A highly liquid secondary
O. Throughout the normal course of business, the
market may not exist for the structured notes a Fund
Funds enter into contracts that contain a variety of
invests in, which may make it difficult for that Fund to
representations and warranties which provide general
sell the structured notes it holds at an acceptable price
indemnifications. The Funds’ maximum exposure under
or to accurately value them. In addition, structured notes
these arrangements is unknown, as this would involve
are subject to the risk that the counterparty to the instru-
future claims that may be made against the Funds and/or
ment, or issuer, might not pay interest when due or repay
their affiliates that have not yet occurred. However,
principal at maturity of the obligation. Although the
based on experience, the Funds expect the risk of loss
Trust will not invest in any structured notes unless Rydex
to be remote.
Investments believes that the issuer is creditworthy, a
Fund does bear the risk of loss of the amount expected
2.
Financial Instruments
to be received in the event of the default or bankruptcy
As part of its investment strategy, the Trust may utilize
of the issuer.
short sales and a variety of derivative instruments includ-
There are several risks associated with the use of swap
ing, options, futures, options on futures, structured
agreements that are different from those associated
notes, and swap agreements. These investments involve,
with ordinary portfolio securities transactions, due to the
to varying degrees, elements of market risk and risks in
fact they could be considered illiquid. Although the Trust
excess of the amounts recognized in the Statements of
will not enter into any swap agreement unless Rydex
Assets and Liabilities.
Investments believes that the other party to the transac-
Short sales are transactions in which a Fund sells an
tion is creditworthy, the Funds bear the risk of loss of the
equity or fixed income security it does not own. If the
amount expected to be received under a swap agree-
security sold short decreases in price between the time
ment in the event of the default or bankruptcy of the
the Fund sells the security and closes its short position,
agreement counterparty.
that Fund will realize a gain on the transaction.
64
|
THE RYDEX SERIES FUNDS SEMI-ANNUAL REPORT
NOTES TO FINANCIAL STATEMENTS (Unaudited) (continued)
There are several risks associated with credit default swaps. Credit default swaps involve the exchange of a fixed-rate pre-
mium for protection against the loss in value of an underlying debt instrument in the event of a defined credit event (such
as payment default or bankruptcy). Under the terms of the swap, one party acts as a “guarantor,” receiving a periodic pay-
ment that is a fixed percentage applied to a notional principal amount. In return, the party agrees to purchase the notional
amount of the underlying instrument, at par, if a credit event occurs during the term of the swap. A Fund may enter into
credit default swaps in which that Fund or its counterparty acts as guarantor. By acting as the guarantor of a swap, that
Fund assumes the market and credit risk of the underlying instrument, including liquidity and loss of value.
In conjunction with the use of short sales, options, futures, options on futures, structured notes and swap agreements, the
Funds are required to maintain collateral in various forms. The Funds use, where appropriate, depending on the financial
instrument utilized and the broker involved, margin deposits at the broker, cash and/or securities segregated at the custo-
dian bank, discount notes, or the repurchase agreements allocated to each Fund.
The risks inherent in the use of short sales, options, futures contracts, options on futures contracts, structured notes, and
swap agreements, include i) adverse changes in the value of such instruments; ii) imperfect correlation between the price
of the instruments and movements in the price of the underlying securities, indices, or futures contracts; iii) the possible
absence of a liquid secondary market for any particular instrument at any time; and iv) the potential of counterparty default.
The Trust has established strict counterparty credit guidelines and enters into transactions only with financial institutions of
investment grade or better.
3.
Call Options Written
Transactions in options written during the period ended September 30, 2008, were as follows:
Absolute Return Strategies Fund
Hedged Equity Fund
Number of
Premiums
Number of
Premiums
Contracts
Received
Contracts
Received
Options outstanding at March 31, 2008
119
$ 2,468,798
19
$
394,178
Options written
5,550
14,322,996
466
2,695,110
Options terminated in closing purchase transactions
(2,578)
(9,625,790)
(247)
(1,802,257)
Options expired
(1,307)
(4,476,949)
(78)
(790,894)
Options exercised
(95)
(10,355)
—
—
Options outstanding at September 30, 2008
1,689
$ 2,678,700
160
$
496,137
4.
Basis For Consolidation For the Managed Futures Strategy Fund
The Managed Futures Strategy Fund (the “MFS Fund”) may invest up to 25% of its total assets in a wholly-owned and con-
trolled Cayman Islands subsidiary (the “Subsidiary”) acting as an investment vehicle in order to effect certain investments
for the MFS Fund consistent with the MFS Fund’s investment objectives and policies specified in its prospectus and state-
ment of additional information. A subscription agreement was entered into between the MFS Fund and the Subsidiary on
May 1, 2008, comprising the entire issued share capital of the Subsidiary with the intent that the MFS Fund will remain
the sole shareholder and retain all rights. As of September 30, 2008, net assets of the MFS Fund were approximately
$905 million, of which approximately $155 million, or approximately 17%, represented the MFS Fund’s ownership of all
issued shares and voting rights of the Subsidiary.
5.
Fees And Other Transactions With Affiliates
Under the terms of an investment advisory contract, the Trust pays Rydex Investments investment advisory fees calculated
at an annualized rate of 0.85% of the average daily net assets of the Real Estate Fund; 0.90% of the average daily net
assets of the Sector Rotation Fund, International Rotation Fund, Managed Futures Strategy Fund, the Strengthening Dollar
2x Strategy Fund, and the Weakening Dollar 2x Strategy Fund; and 1.15% of the average daily net assets of the Absolute
Return Strategies Fund and the Hedged Equity Fund. The Alternative Strategies Allocation Fund does not pay Rydex
Investments a management fee.
Additional terms under the investment advisory contract, include a Trustee vote to implement a performance adjustment for
the Multi-Cap Core Equity Fund. This Fund pays Rydex Investments investment advisory fees calculated at a basic annual
fee rate of 0.70% of its average daily net assets, adding or subtracting a performance rate up to 0.20%. The basic annual
fee rate, along with the performance adjustment allows the total fee to increase to a maximum of 0.90% or decrease to a
THE RYDEX SERIES FUNDS SEMI-ANNUAL REPORT
|
65
NOTES TO FINANCIAL STATEMENTS (Unaudited) (continued)
minimum of 0.50%, depending on the investment per-
shares of an underlying fund that is subject to a redemp-
formance of the Fund relative to the Russell 3000 Index
tion fee, that Fund will be responsible for paying the
(the “Index”). The performance comparison will be made
redemption fee to the underlying funds.
for a rolling 12-month period, with performance adjust-
Rydex Investments provides transfer agent and adminis-
ments made at the end of each month. Because the
trative services to the Funds for fees calculated at an
performance adjustment is applied relative to the per-
annualized rate of 0.25% of the average daily net assets
formance of the Index, Rydex Investments could receive
of each Fund. Fees related to the Absolute Return
a positive performance adjustment even during periods
Strategies Fund, Alternative Strategies Allocation Fund,
where the Fund’s performance is negative. At
and Hedged Equity Fund are paid by Rydex Investments,
September 30, 2008, the effective management fee was
as noted previously.
0.50% of the Fund’s average daily net assets.
Rydex Investments provides accounting services to the
The investment advisory fee for the Commodities
Trust calculated at an annualized rate of 0.10% on the
Strategy Fund is calculated at an annualized rate of
first $250 million of the average daily net assets, 0.075%
0.75% of the average daily net assets of the Fund.
on the next $250 million of the average daily net assets,
Effective May 1, 2006, Rydex Investments has contractu-
0.05% on the next $250 million of the average daily net
ally agreed to waive its 0.75% investment advisory fee
assets, and 0.03% on the average daily net assets over
to the extent necessary to limit the ordinary operating
$750 million of each Fund. Fees related to the Absolute
expenses of the Commodities Strategy Fund (but exclud-
Return Strategies Fund, Alternative Strategies Allocation
ing interest expenses, brokerage commissions and
Fund, and Hedged Equity Fund are paid by Rydex
extraordinary expenses) to not more than 1.20%, 1.95%,
Investments, as noted previously.
and 1.20% per annum of the average monthly net assets
of the A-Class, C-Class, and H-Class of the Fund (the
Rydex Investments engages external service providers to
“Contractual Fee Waiver”). The Contractual Fee Waiver
perform other necessary services for the Trust, such as
may not be modified or eliminated prior to August 1,
audit and accounting related services, legal services, cus-
2009, except with the approval of the Board of Trustees.
tody, printing and mailing, etc., on a pass-through basis.
There is no guarantee that the contractual fee waiver will
Such expenses vary from Fund to Fund and are allocated
continue beyond August 1, 2009.
to the Funds based on relative net assets. Any of these
expenses allocated to the Absolute Return Strategies
As part of its agreement with the Trust, Rydex
Fund, Alternative Strategies Allocation Fund, and
Investments will pay all expenses of the Absolute Return
Hedged Equity Fund are paid by Rydex Investments,
Strategies Fund, Alternative Strategies Allocation Fund,
as noted previously. Organizational and setup costs for
and Hedged Equity Fund, including the cost of transfer
new funds are paid by the Trust.
agency, custody, fund administration, legal, audit and
other services, except interest expense, taxes (expected
The Funds, with the exception of the Alternative
to be de minimis), brokerage commissions and other
Strategies Allocation Fund, have adopted a Distribution
expenses connected with execution of portfolio transac-
Plan applicable to its A-Class Shares and H-Class Shares
tions, short dividend expenses, and extraordinary
for which the Distributor and other firms that provide
expenses. For the year ended September 30, 2008,
distribution and/or shareholder services (“Service
Rydex Investments paid expenses in the amount of
Providers”) may receive compensation. If a Service
$208,365 and $25,935, for the Absolute Return
Provider provides distribution services, the Trust will pay
Strategies Fund and Hedged Equity Fund, respectively.
distribution fees to the Distributor at an annual rate not
to exceed 0.25% of average daily net assets, pursuant to
The Alternative Strategies Allocation Fund indirectly
Rule 12b-1 of the 1940 Act. The Distributor, in turn, will
bears a proportionate share of the total operating
pay the Service Provider out of its fees.
expenses (including investment management, share-
holder servicing, custody, transfer agency, audit and
The Funds have adopted a separate Distribution and
other underlying fund expenses) of the underlying funds
Shareholder Services Plan applicable to its C-Class
in which the Fund invests. In addition, some underlying
Shares. Under this plan, 0.75% of the Alternative
funds charge redemption fees if a shareholder, including
Strategies Allocation Fund’s average daily net assets and
a Fund, redeems shares before the end of the funds’
1.00% of the remaining Funds’ average daily net assets
requisite holding period. Therefore, if the Fund sells
are accrued to pay annual distribution and service fees.
66
|
THE RYDEX SERIES FUNDS SEMI-ANNUAL REPORT
NOTES TO FINANCIAL STATEMENTS (Unaudited) (continued)
The annual 0.25% service fee compensates the share-
threshold would be recorded as a tax benefit or expense
holder’s financial advisor for providing on-going services
in the current year. Management has analyzed the Funds’
to the shareholder. The annual distribution fee of 0.50%
tax positions taken on federal income tax returns for all
for Alternative Strategies Allocation Fund and 0.75% for
open tax years for purposes of complying with FIN 48,
the remaining Funds reimburses the Distributor for pay-
and has concluded that no provision for income tax was
ing the shareholder’s financial advisor an on-going sales
required in the Funds’ financial statements.
commission. The Distributor advances the first year’s
The MFS Fund intends to invest up to 25% of its assets in
service and distribution fees to the Financial Advisor. The
the Subsidiary which is expected to provide the Fund
Distributor retains the service and distribution fees on
with exposure to the commodities markets within the lim-
accounts with no authorized dealer of record.
itations of the federal tax requirement under Subchapter M
The Alternative Strategies Allocation Fund has not
of the Code. The MFS Fund has received a private letter
adopted a Distribution Plan and a Shareholder Services
ruling from the IRS that concludes that the income the
Plan with respect to A-Class Shares and H-Class Shares.
MFS Fund receives from the Subsidiary will constitute
Instead, the Fund invests in underlying funds that have
qualifying income for purposes of Subchapter M of the
a distribution plan that allows the underlying funds to
Code. The Subsidiary will be classified as a corporation
pay distribution fees to the Distributor and other firms
for U.S. federal income tax purposes. A foreign corpora-
that provide distribution services (“Service Providers”).
tion, such as the Subsidiary, will generally not be subject
The underlying funds will pay distribution fees to the
to U.S. federal income taxation unless it is deemed to be
Distributor at an annual rate not to exceed 0.25% of
engaged in a U.S. trade or business.
average daily net assets, pursuant to Rule 12b-1 under
The Funds file U.S. federal income tax returns and returns
the 1940 Act, as amended. If a Service Provider provides
in various foreign jurisdictions in which they invest. While
distribution or shareholder services, the Distributor will,
the statute of limitations remains open to examine the
in turn, pay the Service Provider for the services it pro-
Funds’ U.S. federal income tax returns filed for the fiscal
vides at an annual rate not to exceed 0.25% of the
years 2004 to 2007, no examinations are in progress or
average daily net assets of a Fund.
anticipated at this time.
During the period ended September 30, 2008, the
Income and capital gain distributions are determined in
Distributor retained sales charges of $557,030, relating
accordance with Federal income tax regulations, which
to sales of A-Class Shares of the Trust.
may differ from U.S. generally accepted accounting prin-
Certain officers and trustees of the Trust are also officers
ciples. These differences are primarily due to differing
of Rydex Investments and the Distributor.
treatments for derivatives, foreign currency transactions,
6.
Federal Income Tax Information
losses deferred due to wash sales, losses deferred due
to post-October losses, and excise tax regulations.
The Funds intend to comply with the provisions of
Subchapter M of the Internal Revenue Code applicable
Permanent book and tax basis differences, if any, will
to regulated investment companies and will distribute
result in reclassifications. This includes net operating
substantially all net investment income and capital gains
losses not utilized during the current period, capital loss
to shareholders. Therefore, no Federal income tax provi-
carry forward expired, and the utilization of earnings
sion has been recorded.
and profits distributed to the shareholders on redemption
of shares as part of the dividends paid deduction for
The Funds adopted Financial Accounting Standards
income tax purposes. These reclassifications have no
Board (FASB) Interpretation No. 48 “Accounting for
effect on net assets or net asset values per share. Any
Uncertainty in Income Taxes” (“FIN 48”). FIN 48 provides
undistributed ordinary income or long-term capital
guidance for how uncertain tax positions should be rec-
gain remaining at fiscal year end is distributed in the
ognized, measured, presented and disclosed in the
following year.
financial statements. FIN 48 requires the evaluation of
tax positions taken or expected to be taken in the
The Funds recognize interest and penalties, if any,
course of preparing the Fund’s tax returns to determine
related to unrecognized tax benefits as income tax
whether the tax positions are “more-likely-than-not” of
expense in the statement of operations. During the
being sustained by the applicable tax authority. Tax posi-
period, the Funds did not incur any interest or penalties.
tions not deemed to meet the more-likely-than-not
THE RYDEX SERIES FUNDS SEMI-ANNUAL REPORT
|
67
NOTES TO FINANCIAL STATEMENTS (Unaudited) (continued)
At September 30, 2008, the cost of securities for Federal income tax purposes, the aggregate gross unrealized gain for all
securities for which there was an excess of value over tax cost and the aggregate gross unrealized loss for all securities for
which there was an excess of tax cost over value, were as follows:
Tax
Tax
Net
Tax
Unrealized
Unrealized
Unrealized
Fund
Cost
Gain
Loss
Gain (Loss)
Multi-Cap Core Equity Fund
$
20,115,435
$
1,168,485
$
(2,549,218)
$
(1,380,733)
Sector Rotation Fund
313,452,797
5,605,003
(15,694,758)
(10,089,755)
Absolute Return Strategies Fund
170,786,235
17,208,134
(19,350,443)
(2,142,309)
Alternative Strategies Allocation Fund
31,975,771
8,762
(1,931,755)
(1,922,993)
Commodities Strategy Fund
72,201,105
3,229,203
(33,636)
3,195,567
Hedged Equity Fund
19,051,587
2,227,762
(2,007,470)
220,292
International Rotation Fund
17,130,339
—
(478,388)
(478,388)
Managed Futures Strategy Fund
914,728,972
1,449,000
(28,385,310)
(26,936,310)
Real Estate Fund
31,807,057
3,212,581
(556,086)
2,656,495
Strengthening Dollar 2x Strategy Fund
179,109,636
—
—
—
Weakening Dollar 2x Strategy Fund
80,069,045
—
—
—
7.
Repurchase Agreements
The Funds transfer uninvested cash balances into a single joint account, the daily aggregate balance of which is invested in
one or more repurchase agreements collateralized by obligations of the U.S. Treasury and/or U.S. Government Agencies.
The collateral is in the possession of the Fund’s custodian and is evaluated to ensure that its market value exceeds by, at a
minimum, 102% of the original face amount of the repurchase agreements. Each Fund holds a pro rata share of the collat-
eral based on the dollar amount of the repurchase agreement entered into by each Fund.
The repurchase agreements executed by the joint account and outstanding as of September 30, 2008, were as follows:
Counterparty
Terms of Agreement
Face Value
Market Value
Repurchase Price
Morgan Stanley
0.15% due 10/01/08
$682,099,856
$
682,099,856
$
682,102,698
Mizuho Financial Group, Inc.
0.26% due 10/01/08
565,000,000
565,000,000
565,004,081
Morgan Stanley
0.10% due 10/01/08
400,000,000
400,000,000
400,001,111
Credit Suisse Group
0.25% due 10/01/08
139,360,464
139,360,464
139,361,432
$1,786,460,320
$1,786,469,322
As of September 30, 2008, the collateral for the repurchase agreements in the joint account was as follows:
Security Type
Maturity Dates
Range of Rates
Par Value
Market Value
U.S. Treasury Notes
12/31/08 – 08/15/17
3.375% – 4.750%
-->
3.375% – 4.750%
$793,096,500
$
816,275,910
U.S. TIP Bond
04/15/28
3.625%
289,705,400
474,835,309
U.S. Treasury Bonds
05/15/16 – 04/15/28
3.625% – 7.250%
-->
3.625% – 7.250%
216,596,900
279,371,569
U.S. Treasury Bills
10/02/08 – 09/24/09
—
252,540,300
251,799,789
$1,822,282,577
In the event of counterparty default, the Funds have the right to collect the collateral to offset losses incurred. There is
potential loss to the Funds in the event the Funds are delayed or prevented from exercising their rights to dispose of the
collateral securities, including the risk of a possible decline in the value of the underlying securities during the period while
the Funds seek to assert their rights. The Funds’ investment advisor, acting under the supervision of the Board of Trustees,
reviews the value of the collateral and the creditworthiness of those banks and dealers with which the Funds enter into
repurchase agreements to evaluate potential risks.
68
|
THE RYDEX SERIES FUNDS SEMI-ANNUAL REPORT
NOTES TO FINANCIAL STATEMENTS (Unaudited) (continued)
8.
Fair Value Measurement
The Funds adopted Statement of Financial Accounting Standard No. 157 (“FAS 157”) Fair Value Measurement which pro-
vided enhanced guidance for using fair value to measure assets and liabilities. The standard requires companies to provide
expanded information about the assets and liabilities measured at fair value and the potential effect of these fair valuations
on an entity’s financial performance. The standard does not expand the use of fair value in any new circumstances, but pro-
vides clarification on acceptable fair valuation methods and applications.
Various inputs may be used to determine the value of the fund’s investments. These inputs are summarized in three broad
levels:
Level 1 — quoted prices in active markets for identical securities.
Level 2 — other significant observable inputs (including quoted prices for similar securities, interest rates, prepayment
speeds, credit risk, etc.).
Level 3 — significant unobservable inputs (including the fund’s own assumptions used to determine the fair value
of investments).
The inputs or methodologies used for valuing securities are not necessarily an indication of the risk associated with
investing in those securities.
The following table summarizes the inputs used to value the Funds’ net assets as of September 30, 2008:
Level 1
Level 1
Level 2
Level 2
Level 3
Level 3
Investments
Other Financial
Investments
Other Financial
Investments
Other Financial
Fund
In Securities
Instruments
In Securities
Instruments
In Securities
Instruments
Total
Assets
Multi-Cap Core Equity Fund
$
18,734,702
$
—
$
—
$
—
$
—
$
—
$
18,734,702
Sector Rotation Fund
303,363,042
—
—
—
—
—
303,363,042
Absolute Return Strategies
Fund
155,454,853
—
—
—
—
—
155,454,853
Alternative Strategies
Allocation Fund
30,052,778
—
—
—
—
—
30,052,778
Commodities Strategy Fund
52,815,270
—
—
22,581,402
—
—
75,396,672
Hedged Equity Fund
17,614,505
—
—
—
—
—
17,614,505
International Rotation Fund
16,651,951
—
—
—
—
—
16,651,951
Managed Futures Strategy
Fund
727,728,971
—
—
174,388,297
—
—
902,117,268
Real Estate Fund
34,463,552
—
—
—
—
—
34,463,552
Strengthening Dollar 2x
Strategy Fund
129,487,622
—
49,622,014
5,758,741
—
—
184,868,377
Weakening Dollar 2x
Strategy Fund
55,225,295
—
24,843,750
—
—
—
80,069,045
Liabilities
Multi-Cap Core Equity Fund
—
—
—
—
—
—
—
Sector Rotation Fund
—
—
—
—
—
—
—
Absolute Return Strategies
Fund
76,862,721
2,809,614
—
753,960
—
—
80,426,295
Alternative Strategies
Allocation Fund
—
—
—
—
—
—
—
Commodities Strategy Fund
—
—
—
—
—
—
—
Hedged Equity Fund
8,890,345
558,861
—
74,146
—
—
9,523,352
International Rotation Fund
—
—
—
694,279
—
—
694,279
Managed Futures Strategy
Fund
—
368,511
—
—
—
—
368,511
Real Estate Fund
—
—
—
—
—
—
—
Strengthening Dollar 2x
Strategy Fund
—
—
—
—
—
—
—
Weakening Dollar 2x
Strategy Fund
—
—
—
3,906,149
—
—
3,906,149
THE RYDEX SERIES FUNDS SEMI-ANNUAL REPORT
|
69
NOTES TO FINANCIAL STATEMENTS (Unaudited) (continued)
9.
Securities Transactions
During the period ended September 30, 2008, the cost of purchases and proceeds from sales of investment securities,
excluding short-term and temporary cash investments, were:
Alternative
Multi-Cap
Absolute Return
Strategies
Commodities
Core Equity
Sector Rotation
Strategies
Allocation
Strategy
Hedged Equity
Fund
Fund
Fund
Fund
Fund
Fund
Purchases
$36,724,626
$1,059,079,600
$881,252,880
$27,786,611
$118,075,538
$85,441,961
Sales
$45,643,680
$1,026,817,195
$905,454,535
$
3,457,084
$154,237,112
$94,824,458
Strengthening
Weakening
International
Managed
Dollar
Dollar
Rotation
Futures Strategy
Real Estate
2x Strategy
2x Strategy
Fund
Fund
Fund
Fund
Fund
Purchases
$
7,951,568
$
305,210,701
$130,470,637
$
—
$
—
Sales
$16,316,215
$
136,391,673
$113,182,748
$
—
$
—
70
|
THE RYDEX SERIES FUNDS SEMI-ANNUAL REPORT
NOTES TO FINANCIAL STATEMENTS (Unaudited) (continued)
10.
Share Transactions
The Trust is authorized to issue an unlimited number of shares (no par value). Transactions in shares for the periods presented were:
Shares Purchased
Purchased through Dividend Reinvestment
Shares Redeemed
Net Shares Purchased (Redeemed)
Period Ended
Year Ended
Period Ended
Year Ended
Period Ended
Year Ended
Period Ended
Year Ended
September 30,
March 31,
September 30,
March 31,
September 30,
March 31,
September 30,
March 31,
2008†
2008
2008†
2008
2008†
2008
2008†
2008
Multi-Cap Core Equity Fund
A-Class
28,563
183,758
—
45,561
(214,110)
(277,562)
(185,547)
(48,243)
C-Class
76,459
578,996
—
309,961
(489,280)
(1,303,090)
(412,821)
(414,133)
H-Class
221,096
450,833
—
251,651
(642,181)
(2,022,499)
(421,085)
(1,320,015)
Sector Rotation Fund
A-Class
1,646,606
2,515,971
—
180,762
(1,369,418)
(1,870,200)
277,188
826,533
C-Class
896,643
2,985,049
—
507,269
(1,461,025)
(3,247,704)
(564,382)
244,614
H-Class
12,274,901
17,462,062
—
944,333
(13,216,127)
(15,112,460)
(941,226)
3,293,935
Absolute Return Strategies Fund
A-Class
1,823,546
1,539,342
—
61,772
(800,196)
(1,466,196)
1,023,350
134,918
C-Class
181,530
1,299,950
—
81,715
(514,995)
(946,572)
(333,465)
435,093
H-Class
879,990
3,737,413
—
233,503
(2,181,803)
(4,883,815)
(1,301,813)
(912,899)
Alternative Strategies Allocation Fund
A-Class
317,571
45,145*
—
—*
(47,376)
(36)*
270,195
45,109*
C-Class
332,267
6,211*
—
—*
(9,400)
(76)*
322,867
6,135*
H-Class
1,011,844
156,802*
—
—*
(386,484)
(60)*
625,360
156,742*
Commodities Strategy Fund
A-Class
611,539
735,802
—
4,195
(694,681)
(579,667)
(83,142)
160,330
C-Class
254,979
468,782
—
2,792
(284,869)
(311,479)
(29,890)
160,095
H-Class
4,278,928
9,361,274
—
9,632
(6,434,890)
(7,020,121)
(2,155,962)
2,350,785
Hedged Equity Fund
A-Class
113,747
111,860
—
8,201
(102,024)
(147,120)
11,723
(27,059)
C-Class
15,633
134,682
—
10,345
(102,700)
(232,135)
(87,067)
(87,108)
H-Class
92,493
629,575
—
52,308
(288,003)
(1,055,321)
(195,510)
(373,438)
International Rotation Fund
A-Class
409,802
873,569*
—
16,911*
(427,045)
(302,363)*
(17,243)
588,117*
C-Class
44,124
371,274*
—
5,073*
(87,277)
(218,555)*
(43,153)
157,792*
H-Class
521,541
1,363,614*
—
9,613*
(837,465)
(772,642)*
(315,924)
600,585*
Managed Futures Strategy Fund
A-Class
4,817,221
4,382,451
—
235
(1,755,227)
(771,855)
3,061,994
3,610,831
C-Class
2,128,703
1,663,914
—
79
(344,384)
(131,337)
1,784,319
1,532,656
H-Class
15,879,665
11,517,109
—
614
(4,576,100)
(1,928,419)
11,303,565
9,589,304
* Since the commencement of operations: March 7, 2008 — Alternative Strategies Allocation Fund; August 31, 2007 — International Rotation Fund.
† Unaudited.
NOTES TO FINANCIAL STATEMENTS ((Unaudited) (continued)
Shares Purchased
Purchased through Dividend Reinvestment
Shares Redeemed
Net Shares Purchased (Redeemed)
Period Ended
Year Ended
Period Ended
Year Ended
Period Ended
Year Ended
Period Ended
Year Ended
September 30,
March 31,
September 30,
March 31,
September 30,
March 31,
September 30,
March 31,
2008†
2008
2008†
2008
2008†
2008
2008†
2008
Real Estate Fund
A-Class
619,493
112,803
—
557
(514,000)
(239,901)
105,493
(126,541)
C-Class
638,827
700,464
—
564
(645,633)
(760,867)
(6,806)
(59,839)
H-Class
4,166,428
6,023,194
—
852
(3,772,300)
(6,199,457)
394,128
(175,411)
Strengthening Dollar 2x Strategy Fund
A-Class
1,377,536
787,126
—
—
(592,849)
(650,512)
784,687
136,614
C-Class
2,985,821
1,457,961
—
—
(2,641,642)
(1,247,514)
344,179
210,447
H-Class
15,811,562
12,026,223
—
—
(10,662,491)
(11,034,788)
5,149,071
991,435
Weakening Dollar 2x Strategy Fund
A-Class
381,170
1,514,334
—
127,340
(658,368)
(1,706,145)
(277,198)
(64,471)
C-Class
1,049,349
1,265,049
—
112,053
(1,438,619)
(1,168,330)
(389,270)
208,772
H-Class
5,748,352
9,101,734
—
648,780
(7,007,073)
(10,420,234)
(1,258,721)
(669,720)
NOTES TO FINANCIAL STATEMENTS (Unaudited) (concluded)
11.
Portfolio Securities Loaned
The Funds may lend their securities to approved brokers to earn additional income. Security lending income shown on
the statement of operations is shown net of rebates paid to borrowers and earnings on cash collateral investments shared
with the lending agent. Within this arrangement, the Fund acts as the lender, U.S. Bank acts as the agent, and other
approved registered broker dealers act as the borrowers. The Funds receive cash collateral, valued at a minimum of 100%
of the value of the securities on loan, which is initially held in a segregated account at U.S. Bank. Under the terms of the
Funds’ securities lending agreement with U.S Bank, cash collateral may be invested by U.S. Bank in certain high quality, liq-
uid investments. At September 30, 2008, the cash collateral investments consisted of a money market mutual fund. The
Funds bear the risk of loss on cash collateral investments. Collateral is maintained over the life of the loan in an amount not
less than the value of loaned securities, as determined at the close of fund business each day; any additional collateral
required due to changes in security values is delivered to the Fund the next business day. Although the collateral mitigates
risk, the Funds could experience a delay in recovering its securities and a possible loss of income or value if the borrower
fails to return the securities. The Funds have the right under the securities lending agreement to recover the securities from
the borrower on demand.
The following represents a breakdown of the collateral:
MUTUAL FUND
Issuer
Shares
Market Value
Mount Vernon Securities Lending Trust
11,532,939
$ 11,532,939
Total Mutual Fund
$11,532,939
At September 30, 2008 the following Funds participated in securities lending and received cash collateral:
Fund
Cash Collateral
Value of Securities Loaned
Multi-Cap Core Equity Fund
$
87,820
$
85,786
Sector Rotation Fund
9,166,804
8,845,545
Absolute Return Strategies Fund
1,786,618
1,792,921
Hedged Equity Fund
49,306
49,024
Real Estate Fund
442,391
444,735
12. New Accounting Pronouncements
In March 2008, the FASB issued FAS 161, “Disclosures about Derivative Instruments and Hedging Activities.” The new
requirement is intended to improve disclosures around an entity’s derivatives activity and help investors understand how
entities use derivatives, how they are accounted for and how they affect the financial position and operations of that entity.
FAS 161 is effective for fiscal years and interim periods beginning after November 15, 2008.
THE RYDEX SERIES FUNDS SEMI-ANNUAL REPORT
|
73
OTHER INFORMATION (Unaudited)
Proxy Voting Information
A description of the policies and procedures that the Trust uses to determine how to vote proxies relating to securities held
in the Funds’ portfolios is available, without charge and upon request, by calling 1-800-820-0888. This information is also
available from the EDGAR database on the SEC’s website at http://www.sec.gov.
Information regarding how the Funds voted proxies relating to portfolio securities during the most recent 12-month period
ended June 30 is available without charge, upon request, by calling 1-800-820-0888. This information is also available from
the EDGAR database on the SEC’s website at http://www.sec.gov.
Quarterly Portfolio Schedules Information
The Trust files its complete schedule of portfolio holdings with the SEC for the first and third quarters of each fiscal year on
Form N-Q; which are available on the SEC’s website at http://www.sec.gov. The Funds’ Forms N-Q may be reviewed and
copied at the SEC’s Public Reference Room in Washington, DC, and that information on the operation of the Public
Reference Room may be obtained by calling 1-800-SEC-0330. Copies of the portfolio holdings are also available to share-
holders, without charge and upon request, by calling 1-800-820-0888.
Rydex Investments Board Review and Approval of the Investment Advisory Agreement
The Advisory Agreements dated January 18, 2008 between Rydex Series Funds, on behalf of the Funds, and PADCO
Advisors, Inc. were last approved by shareholders at Special Meetings held on October 4, 2007, November 1, 2007,
January 31, 2008 and February 12, 2008. Subject to the terms and conditions provided for in the Advisory Agreements,
each Advisory Agreement remains in effect for an initial two year term from the date of the Agreement and remains in
effect for periods of one year thereafter subject to Board approval. Therefore, the Advisory Agreements are next sched-
uled to be approved by the Board of Trustees at the Trust’s August 2009 Meeting.
The Sub-Advisory Agreement dated August 27, 2007 between PADCO Advisors, Inc. and Valu-Trac Investment
Management Limited, with respect to the International Rotation Fund, was approved by the Board of Trustees on August
27, 2007. Subject to the terms and conditions provided for in the Sub-Advisory Agreement, the Sub-Advisory Agreement
remains in effect for an initial two year term from the date of the Sub-Advisory Agreement and remains in effect for periods
of one year thereafter subject to Board approval. Therefore, the Sub-Advisory Agreement is next scheduled to be
approved by the Board of Trustees at the Trust’s August 2009 Meeting.
74
|
THE RYDEX SERIES FUNDS SEMI-ANNUAL REPORT
INFORMATION ON BOARD OF TRUSTEES AND OFFICERS (Unaudited)
A Board of Trustees oversees all Rydex Investments, in which its members have no stated term of service, and continue to serve
after election until resignation. The Statement of Additional Information includes further information about Fund Trustees and
Officers, and can be obtained without charge by calling 1-800-820-0888.
All Trustees and Officers may be reached c/o Rydex Investments, 9601 Blackwell Rd., Suite 500, Rockville, MD 20850.
TRUSTEES AND OFFICERS
Length of Service
Name, Position and
As Trustee
Number of
––––––––––––––––––––––––––
Year of Birth
––––––––––––––––––––––––––
(Year Began)
–––––––––––––––––––
Funds Overseen
Carl G. Verboncoeur*
Rydex Series Funds – 2004
158
Trustee, President (1952)
Rydex Variable Trust – 2004
Rydex Dynamic Funds – 2004
Rydex ETF Trust – 2004
Principal Occupations During Past Five Years: Treasurer of Rydex Specialized Products, LLC (2005 to present) Chief Executive
Officer of Rydex Specialized Products, LLC (2005 to 2008); Chief Executive Officer of Rydex Investments and Rydex Distributors,
Inc. (2003 to present); Executive Vice President of Rydex Investments (2000 to 2003)
Michael P. Byrum*
Rydex Series Funds – 2005
150
Trustee, Vice President
Rydex Variable Trust – 2005
(1970)
Rydex Dynamic Funds – 2005
Rydex ETF Trust – 2005
Principal Occupations During Past Five Years: Chief Investment Officer of Rydex Investments (2003 to present); Secretary of
Rydex Specialized Products, LLC (2005 to 2008); Vice President of Rydex Series Funds (1997 to present); Vice President of Rydex
Variable Trust (1998 to present); Vice President of Rydex Dynamic Funds (1999 to present); Vice President of Rydex ETF Trust
(2002 to present); President and Trustee of Rydex Capital Partners SPhinX Fund (2003 to 2006); President of Rydex Investments
(2004 to present); Chief Operating Officer of Rydex Investments and Rydex Distributors, Inc. (2003 to 2004)
INDEPENDENT TRUSTEES
Length of Service
Name, Position and
As Trustee
Number of
––––––––––––––––––––––––––
Year of Birth
––––––––––––––––––––––––––
(Year Began)
–––––––––––––––––––
Funds Overseen
John O. Demaret
Rydex Series Funds – 1997
150
Trustee, Chairman of the
Rydex Variable Trust – 1998
Board (1940)
Rydex Dynamic Funds – 1999
Rydex ETF Trust – 2003
Principal Occupations During Past Five Years: Retired
Corey A. Colehour
Rydex Series Funds – 1993
150
Trustee (1945)
Rydex Variable Trust – 1998
Rydex Dynamic Funds – 1999
Rydex ETF Trust – 2003
Principal Occupations During Past Five Years: Retired (2006 to present); Owner and President of Schield Management
Company, registered investment adviser (2005 to 2006); Senior Vice President of Marketing and Co-Owner of Schield
Management Company, registered investment adviser (1985 to 2005)
J. Kenneth Dalton
Rydex Series Funds – 1995
150
Trustee (1941)
Rydex Variable Trust – 1998
Rydex Dynamic Funds – 1999
Rydex ETF Trust – 2003
Principal Occupations During Past Five Years: Mortgage Banking Consultant and Investor, The Dalton Group
THE RYDEX SERIES FUNDS SEMI-ANNUAL REPORT
|
75
INFORMATION ON BOARD OF TRUSTEES AND OFFICERS (Unaudited) (concluded)
Length of Service
Name, Position and
As Trustee
Number of
––––––––––––––––––––––––––
Year of Birth
––––––––––––––––––––––––––
(Year Began)
–––––––––––––––––––
Funds Overseen
Werner E. Keller
Rydex Series Funds – 2005
150
Trustee (1940)
Rydex Variable Trust – 2005
Rydex Dynamic Funds – 2005
Rydex ETF Trust – 2005
Principal Occupations During Past Five Years: Retired (2001 to present); Chairman, Centurion Capital Management (1991 to 2001)
Thomas F. Lydon, Jr.
Rydex Series Funds – 2005
150
Trustee (1960)
Rydex Variable Trust – 2005
Rydex Dynamic Funds – 2005
Rydex ETF Trust – 2005
Principal Occupations During Past Five Years: President, Global Trends Investments
Patrick T. McCarville
Rydex Series Funds – 1997
150
Trustee (1942)
Rydex Variable Trust – 1998
Rydex Dynamic Funds – 1999
Rydex ETF Trust – 2003
Principal Occupations During Past Five Years: Founder and Chief Executive Officer, Par Industries, Inc.
Roger Somers
Rydex Series Funds – 1993
150
Trustee (1944)
Rydex Variable Trust – 1998
Rydex Dynamic Funds – 1999
Rydex ETF Trust – 2003
Principal Occupations During Past Five Years: Owner, Arrow Limousine
EXECUTIVE OFFICERS
Name, Position and
Principal Occupations
––––––––––––––
Year of Birth
During Past Five Years
–––––––––––––
Nick Bonos*
Chief Financial Officer of Rydex Specialized Products, LLC (2005 to present);
Vice President and Treasurer (1963)
Vice President and Treasurer of Rydex Series Funds, Rydex Variable Trust,
Rydex Dynamic Funds, and Rydex ETF Trust (2003 to present); Senior Vice
President of Rydex Investments (2003 to present); Vice President and
Treasurer of Rydex Capital Partners SPhinX Fund (2003 to 2006)
Joanna M. Haigney*
Chief Compliance Officer of Rydex Series Funds, Rydex Variable Trust, and
Chief Compliance Officer and
Rydex Dynamic Funds (2004 to present); Secretary of Rydex Series Funds,
Secretary (1966)
Rydex Variable Trust, and Rydex Dynamic Funds (2000 to present); Secretary
of Rydex ETF Trust (2002 to present); Vice President of Compliance of Rydex
Investments (2000 to present); Secretary of Rydex Capital Partners SPhinX
Fund (2003 to 2006)
Joseph Arruda*
Assistant Treasurer of Rydex Series Funds, Rydex Variable Trust, Rydex
Assistant Treasurer (1966)
Dynamic Funds, Rydex ETF Trust (2006 to present); Senior Vice President of
Rydex Investments (2008 to present); Vice President of Rydex Investments
(2004 to 2008); Director of Accounting of Rydex Investments (2003 to 2004)
Paula Billos*
Controller of Rydex Series Funds, Rydex Variable Trust, Rydex Dynamic
Controller (1974)
Funds, Rydex ETF Trust (2006 to present); Director of Fund Administration of
Rydex Investments (2001 to present)
* Officers of the Funds are deemed to be “interested persons” of the Trust, within the meaning of Section 2(a)(19) of the 1940 Act, inasmuch as
this person is affiliated with Rydex Investments.
76
|
THE RYDEX SERIES FUNDS SEMI-ANNUAL REPORT
This page intentionally left blank.
9601 Blackwell Road, Suite 500
Rockville, MD 20850
www.rydexinvestments.com
800-820-0888
RSTF–SEMI–0908x0309