BANKING FUND
BASIC MATERIALS FUND
BIOTECHNOLOGY FUND
CONSUMER PRODUCTS FUND
ELECTRONICS FUND
ENERGY FUND
SEPTEMBER 30, 2008
RYDEX SERIES FUNDS SECTOR FUNDS SEMI-ANNUAL REPORT
ENERGY SERVICES FUND
FINANCIAL SERVICES FUND
HEALTH CARE FUND
INTERNET FUND
LEISURE FUND
PRECIOUS METALS FUND
RETAILING FUND
TECHNOLOGY FUND
TELECOMMUNICATIONS FUND
TRANSPORTATION FUND
UTILITIES FUND
GO GREEN!
ELIMINATE MAILBOX CLUTTER
Go paperless with Rydex eDelivery—a service giving you full
online access to account information and documents. Save time,
cut down on mailbox clutter and be a friend to the environment
with eDelivery.
With Rydex eDelivery you can:
•
View online confirmations and statements at your
convenience.
•
Receive email notifications when your most recent
confirmations, statements and other account documents
are available for review.
•
Access prospectuses, annual reports and semiannual
reports online.
It’s easy to enroll:
1/ Visit www.rydexinvestments.com
e
RYDEX
DELIVERY
2/ Click on the Rydex eDelivery logo
3/ Follow the simple enrollment instructions
If you have questions about Rydex eDelivery services,
contact one of our Shareholder Service Representatives
at 800.820.0888.
This report and the financial statements contained herein are submitted for the general information of our shareholders. The
report is not authorized for distribution to prospective investors unless preceded or accompanied by an effective prospectus.
Distributed by Rydex Distributors, Inc.
TABLE OF CONTENTS
LETTER TO OUR SHAREHOLDERS
. . . . . . . . . . . . . . . . . . . . . . . . . . . . . . . . . . . . . . . . . . . . . . . . . . . . . . . . .
2
ABOUT SHAREHOLDERS’ FUND EXPENSES
. . . . . . . . . . . . . . . . . . . . . . . . . . . . . . . . . . . . . . . . . . . . . . . . . .
3
FUND PROFILES
. . . . . . . . . . . . . . . . . . . . . . . . . . . . . . . . . . . . . . . . . . . . . . . . . . . . . . . . . . . . . . . . . . . . . . .
8
SCHEDULES OF INVESTMENTS
. . . . . . . . . . . . . . . . . . . . . . . . . . . . . . . . . . . . . . . . . . . . . . . . . . . . . . . . . . .
17
STATEMENTS OF ASSETS AND LIABILITIES
. . . . . . . . . . . . . . . . . . . . . . . . . . . . . . . . . . . . . . . . . . . . . . . . . . .
38
STATEMENTS OF OPERATIONS
. . . . . . . . . . . . . . . . . . . . . . . . . . . . . . . . . . . . . . . . . . . . . . . . . . . . . . . . . . .
42
STATEMENTS OF CHANGES IN NET ASSETS
. . . . . . . . . . . . . . . . . . . . . . . . . . . . . . . . . . . . . . . . . . . . . . . . .
46
FINANCIAL HIGHLIGHTS
. . . . . . . . . . . . . . . . . . . . . . . . . . . . . . . . . . . . . . . . . . . . . . . . . . . . . . . . . . . . . . . .
52
NOTES TO FINANCIAL STATEMENTS
. . . . . . . . . . . . . . . . . . . . . . . . . . . . . . . . . . . . . . . . . . . . . . . . . . . . . .
63
OTHER INFORMATION
. . . . . . . . . . . . . . . . . . . . . . . . . . . . . . . . . . . . . . . . . . . . . . . . . . . . . . . . . . . . . . . . . .
72
INFORMATION ON BOARD OF TRUSTEES AND OFFICERS
. . . . . . . . . . . . . . . . . . . . . . . . . . . . . . . . . . . . . .
73
THE RYDEX SERIES FUNDS SEMI-ANNUAL REPORT
|
1
LETTER TO OUR SHAREHOLDERS
DEAR SHAREHOLDER:
Most economic and market surveys tend to focus on more recent events because those that occurred earlier
seem distant and less important. That dynamic was never so evident as in the April-to-September period, when
events of just the previous three weeks completely overwhelmed everything that came before. In an incredibly
short period of time, the entire global financial system seized up as the lubricant of any economy—bank
lending—came to a complete halt. The resulting crash in global stock markets that began in September
continued well into October.
In less than a month, the shape of the entire financial system was changed forever. The Wall Street model of large,
aggressive, risk-taking investment banks was completely swept aside, as financial titans such as Merrill Lynch,
Morgan Stanley, Goldman Sachs and Lehman Brothers collapsed, merged with, or were reborn as commercial
banks. It’s clear now that the decision by the U.S. Government to let Lehman Brothers fail was the catalytic event,
as the dramatic failure of an institution that weathered the Great Depression and two world wars, laid bare the
failings of the traditional investment banking model. Financial dominos tumbled as a wave of commercial bank
failures—the most since the savings and loan crisis of the 1990s—unfolded in the third quarter, culminating with
the collapse of Washington Mutual, the largest bank failure in U.S. history.
The other huge and profound shift was the nationalization of the global financial system. Several events point
to a nearly total takeover of the global financial system: the takeover of Fannie Mae and Freddie Mac, AIG and
Washington Mutual; the seizure of IndyMac; the forced merger of Wachovia; and the massive capital infusion
and government guarantee of nearly every financial instrument available (both here and in Europe).
In this history-making period, government at all levels moved with unprecedented speed, scope and coordination
to save the financial system, and with it, the global economy. In the United States, this culminated with the
U.S. Treasury’s $700 billion bail-out plan that will essentially buy up all the bad mortgage assets clogging the
financial system.
Rejection of that plan by the House of Representatives in late September sent the markets into a tailspin, with
the Dow suffering its largest point drop in history, while sending the index to three-year lows. Over the past six
months, the Dow Jones IndustrialSM Average and the S&P 500® Index each lost more than 10% of their value,
with virtually all of those declines coming in the last two weeks of September. T-Bill yields fell to near zero and
interest rates on longer-dated Treasuries fell to decade lows in the market’s massive flight to safety.
It’s not all doom and gloom, however. This volatile market environment has burst the commodity bubble and has
resulted in a huge slowdown in global inflation. This helps the emerging markets whose economies have been
pummeled by the rise in food and energy costs. Slowing inflation has also ushered in a period of unprecedented
dollar strength, which gives the Federal Reserve additional room to ease. Interest rates could hardly be lower and
stocks are cheaper than they have been in some time. With the massive amounts of liquidity pumped into the
system, stocks could rally sharply in the months ahead.
Having gone through multiple false bottoms so far this year, the question that still remains is: Can any rally be
sustained? The answer to that question is fairly straightforward. First, the allocation of credit in bond and money
markets needs to resume. Simply put: A stock market recovery is not possible without it. As I write this, there is
definite improvement on that front, but it remains slow and sporadic. Also, the process of de-leveraging (that is,
selling assets accumulated during boom times) will be with us for a while. All of this is occurring during a period
where global economic growth is downshifting rapidly. While this does not preclude any stock market rallies, it may
make them temporary. Astute stock selection, the use of rotational strategies, exposure to currency movements,
the implementation of long/short strategies and a focus on quality—above all else—are the keys to investment
success in difficult and uncharted terrain.
We appreciate the trust you have placed in our firm’s quality and integrity by investing with Rydex Investments.
Sincerely,
David C. Reilly, CFA
Director of Portfolio Strategy
2
|
THE RYDEX SERIES FUNDS SEMI-ANNUAL REPORT
ABOUT SHAREHOLDERS’ FUND EXPENSES (Unaudited)
All mutual funds have operating expenses and it is important for our shareholders to understand the
impact of costs on their investments. Shareholders of a Fund incur two types of costs: (i) transaction
costs, including sales charges (loads) on purchase payments, reinvested dividends, or other distributions;
redemption fees; and exchange fees; and (ii) ongoing costs, including management fees, administrative
services, and shareholder reports, among others. These ongoing costs, or operating expenses, are
deducted from a fund’s gross income and reduce the investment return of the fund.
A fund’s expenses are expressed as a percentage of its average net assets, which is known as the expense
ratio. The following examples are intended to help investors understand the ongoing costs (in dollars) of
investing in a Fund and to compare these costs with the ongoing costs of investing in other mutual funds.
The examples are based on an investment of $1,000 made at the beginning of the period and held for
the entire six-month period beginning March 31, 2008 and ending September 30, 2008.
The following tables illustrate a Fund’s costs in two ways:
Table 1. Based on actual Fund return. This section helps investors estimate the actual expenses paid over
the period. The “Ending Account Value” shown is derived from the Fund’s actual return, and the fourth
column shows the dollar amount that would have been paid by an investor who started with $1,000 in
the Fund. Investors may use the information here, together with the amount invested, to estimate the
expenses paid over the period. Simply divide the Fund’s account value by $1,000 (for example, an
$8,600 account value divided by $1,000 = 8.6), then multiply the result by the number provided under
the heading “Expenses Paid During Period.”
Table 2. Based on hypothetical 5% return. This section is intended to help investors compare a Fund’s
cost with those of other mutual funds. The table provides information about hypothetical account
values and hypothetical expenses based on the Fund’s actual expense ratio and an assumed rate of
return of 5% per year before expenses, which is not the Fund’s actual return. The hypothetical account
values and expenses may not be used to estimate the actual ending account balance or expenses
paid during the period. The example is useful in making comparisons because the U.S. Securities and
Exchange Commission (the “SEC”) requires all mutual funds to calculate expenses based on the 5%
return. Investors can assess a Fund’s costs by comparing this hypothetical example with the hypotheti-
cal examples that appear in shareholder reports of other funds.
Certain retirement plans such as IRA, SEP, Roth IRA and 403(b) accounts are charged an annual $15
maintenance fee. Upon liquidating a retirement account, a $15 account-closing fee will be taken from
the proceeds of the redemption.
The calculations illustrated above assume no shares were bought or sold during the period. Actual
costs may have been higher or lower, depending on the amount of investment and the timing of any
purchases or redemptions.
Note that the expenses shown in the table are meant to highlight and help compare ongoing costs only
and do not reflect any transactional costs which may be incurred by a Fund.
More information about a Fund’s expenses, including annual expense ratios for the past five years, can be
found in the Financial Highlights section of this report. For additional information on operating expenses
and other shareholder costs, please refer to the appropriate Fund prospectus.
THE RYDEX SERIES FUNDS SEMI-ANNUAL REPORT
|
3
ABOUT SHAREHOLDERS’ FUND EXPENSES (Unaudited) (continued)
Beginning
Ending
Expenses
Expense
Account Value
Account Value
Paid During
Ratio†
March 31, 2008
September 30, 2008
Period*
Table 1. Based on actual fund return
Banking Fund
Investor Class
1.38%
$1,000.00
$
863.80
$
6.45
Advisor Class
1.87%
1,000.00
862.80
8.73
A-Class
1.60%
1,000.00
862.90
7.47
C-Class
2.39%
1,000.00
859.00
11.14
Basic Materials Fund
Investor Class
1.37%
1,000.00
754.60
6.03
Advisor Class
1.87%
1,000.00
752.60
8.22
A-Class
1.62%
1,000.00
753.50
7.14
C-Class
2.37%
1,000.00
750.10
10.40
Biotechnology Fund
Investor Class
1.38%
1,000.00
1,086.00
7.22
Advisor Class
1.88%
1,000.00
1,082.40
9.81
A-Class
1.63%
1,000.00
1,084.20
8.52
C-Class
2.38%
1,000.00
1,080.90
12.42
Consumer Products Fund
Investor Class
1.37%
1,000.00
953.00
6.71
Advisor Class
1.88%
1,000.00
950.50
9.19
A-Class
1.63%
1,000.00
951.80
7.98
C-Class
2.37%
1,000.00
948.50
11.58
Electronics Fund
Investor Class
1.35%
1,000.00
850.90
6.26
Advisor Class
1.90%
1,000.00
848.30
8.80
A-Class
1.61%
1,000.00
848.70
7.46
C-Class
2.46%
1,000.00
847.50
11.39
Energy Fund
Investor Class
1.37%
1,000.00
843.20
6.31
Advisor Class
1.87%
1,000.00
840.80
8.62
A-Class
1.62%
1,000.00
842.20
7.48
C-Class
2.37%
1,000.00
838.80
10.92
Energy Services Fund
Investor Class
1.37%
1,000.00
834.40
6.30
Advisor Class
1.87%
1,000.00
832.30
8.59
A-Class
1.62%
1,000.00
833.50
7.45
C-Class
2.37%
1,000.00
830.10
10.86
Financial Services Fund
Investor Class
1.37%
1,000.00
865.40
6.41
Advisor Class
1.88%
1,000.00
863.00
8.78
A-Class
1.62%
1,000.00
864.10
7.57
C-Class
2.37%
1,000.00
861.20
11.06
Health Care Fund
Investor Class
1.34%
1,000.00
991.60
6.69
Advisor Class
1.96%
1,000.00
988.90
9.77
A-Class
1.64%
1,000.00
989.80
8.18
C-Class
2.40%
1,000.00
986.40
11.95
4
|
THE RYDEX SERIES FUNDS SEMI-ANNUAL REPORT
ABOUT SHAREHOLDERS’ FUND EXPENSES (Unaudited) (continued)
Beginning
Ending
Expenses
Expense
Account Value
Account Value
Paid During
Ratio†
March 31, 2008
September 30, 2008
Period*
Internet Fund
Investor Class
1.37%
$1,000.00
$
845.40
$
6.34
Advisor Class
1.87%
1,000.00
843.30
8.64
A-Class
1.62%
1,000.00
844.20
7.49
C-Class
2.37%
1,000.00
841.20
10.94
Leisure Fund
Investor Class
1.37%
1,000.00
805.20
6.20
Advisor Class
1.87%
1,000.00
803.40
8.45
A-Class
1.62%
1,000.00
804.30
7.33
C-Class
2.37%
1,000.00
801.10
10.70
Precious Metals Fund
Investor Class
1.27%
1,000.00
670.90
5.32
Advisor Class
1.77%
1,000.00
669.20
7.41
A-Class
1.52%
1,000.00
670.10
6.36
C-Class
2.27%
1,000.00
667.30
9.49
Retailing Fund
Investor Class
1.37%
1,000.00
923.70
6.61
Advisor Class
1.88%
1,000.00
919.80
9.05
A-Class
1.63%
1,000.00
923.10
7.86
C-Class
2.38%
1,000.00
919.10
11.45
Technology Fund
Investor Class
1.37%
1,000.00
876.00
6.44
Advisor Class
1.88%
1,000.00
874.00
8.83
A-Class
1.63%
1,000.00
875.40
7.66
C-Class
2.36%
1,000.00
871.40
11.07
Telecommunications Fund
Investor Class
1.34%
1,000.00
821.00
6.12
Advisor Class
1.96%
1,000.00
819.20
8.94
A-Class
1.64%
1,000.00
820.00
7.48
C-Class
2.38%
1,000.00
816.50
10.84
Transportation Fund
Investor Class
1.37%
1,000.00
929.40
6.63
Advisor Class
1.87%
1,000.00
927.10
9.03
A-Class
1.62%
1,000.00
927.80
7.83
C-Class
2.37%
1,000.00
924.90
11.44
Utilities Fund
Investor Class
1.37%
1,000.00
884.90
6.47
Advisor Class
1.87%
1,000.00
882.50
8.82
A-Class
1.62%
1,000.00
883.60
7.65
C-Class
2.37%
1,000.00
880.40
11.17
THE RYDEX SERIES FUNDS SEMI-ANNUAL REPORT
|
5
ABOUT SHAREHOLDERS’ FUND EXPENSES (Unaudited) (continued)
Beginning
Ending
Expenses
Expense
Account Value
Account Value
Paid During
Ratio†
March 31, 2008
September 30, 2008
Period*
Table 2. Based on hypothetical 5% return (before expenses)
Banking Fund
Investor Class
1.38%
$1,000.00
$1,018.15
$
6.98
Advisor Class
1.87%
1,000.00
1,015.69
9.45
A-Class
1.60%
1,000.00
1,017.05
8.09
C-Class
2.39%
1,000.00
1,013.09
12.06
Basic Materials Fund
Investor Class
1.37%
1,000.00
1,018.20
6.93
Advisor Class
1.87%
1,000.00
1,015.69
9.45
A-Class
1.62%
1,000.00
1,016.95
8.19
C-Class
2.37%
1,000.00
1,013.19
11.96
Biotechnology Fund
Investor Class
1.38%
1,000.00
1,018.15
6.98
Advisor Class
1.88%
1,000.00
1,015.64
9.50
A-Class
1.63%
1,000.00
1,016.90
8.24
C-Class
2.38%
1,000.00
1,013.14
12.01
Consumer Products Fund
Investor Class
1.37%
1,000.00
1,018.20
6.93
Advisor Class
1.88%
1,000.00
1,015.64
9.50
A-Class
1.63%
1,000.00
1,016.90
8.24
C-Class
2.37%
1,000.00
1,013.19
11.96
Electronics Fund
Investor Class
1.35%
1,000.00
1,018.30
6.83
Advisor Class
1.90%
1,000.00
1,015.54
9.60
A-Class
1.61%
1,000.00
1,017.00
8.14
C-Class
2.46%
1,000.00
1,012.73
12.41
Energy Fund
Investor Class
1.37%
1,000.00
1,018.20
6.93
Advisor Class
1.87%
1,000.00
1,015.69
9.45
A-Class
1.62%
1,000.00
1,016.95
8.19
C-Class
2.37%
1,000.00
1,013.19
11.96
Energy Services Fund
Investor Class
1.37%
1,000.00
1,018.20
6.93
Advisor Class
1.87%
1,000.00
1,015.69
9.45
A-Class
1.62%
1,000.00
1,016.95
8.19
C-Class
2.37%
1,000.00
1,013.19
11.96
Financial Services Fund
Investor Class
1.37%
1,000.00
1,018.20
6.93
Advisor Class
1.88%
1,000.00
1,015.64
9.50
A-Class
1.62%
1,000.00
1,016.95
8.19
C-Class
2.37%
1,000.00
1,013.19
11.96
Health Care Fund
Investor Class
1.34%
1,000.00
1,018.35
6.78
Advisor Class
1.96%
1,000.00
1,015.24
9.90
A-Class
1.64%
1,000.00
1,016.85
8.29
C-Class
2.40%
1,000.00
1,013.04
12.11
6
|
THE RYDEX SERIES FUNDS SEMI-ANNUAL REPORT
ABOUT SHAREHOLDERS’ FUND EXPENSES (Unaudited) (concluded)
Beginning
Ending
Expenses
Expense
Account Value
Account Value
Paid During
Ratio†
March 31, 2008
September 30, 2008
Period*
Internet Fund
Investor Class
1.37%
$1,000.00
$1,018.20
$
6.93
Advisor Class
1.87%
1,000.00
1,015.69
9.45
A-Class
1.62%
1,000.00
1,016.95
8.19
C-Class
2.37%
1,000.00
1,013.19
11.96
Leisure Fund
Investor Class
1.37%
1,000.00
1,018.20
6.93
Advisor Class
1.87%
1,000.00
1,015.69
9.45
A-Class
1.62%
1,000.00
1,016.95
8.19
C-Class
2.37%
1,000.00
1,013.19
11.96
Precious Metals Fund
Investor Class
1.27%
1,000.00
1,018.70
6.43
Advisor Class
1.77%
1,000.00
1,016.19
8.95
A-Class
1.52%
1,000.00
1,017.45
7.69
C-Class
2.27%
1,000.00
1,013.69
11.46
Retailing Fund
Investor Class
1.37%
1,000.00
1,018.20
6.93
Advisor Class
1.88%
1,000.00
1,015.64
9.50
A-Class
1.63%
1,000.00
1,016.90
8.24
C-Class
2.38%
1,000.00
1,013.14
12.01
Technology Fund
Investor Class
1.37%
1,000.00
1,018.20
6.93
Advisor Class
1.88%
1,000.00
1,015.64
9.50
A-Class
1.63%
1,000.00
1,016.90
8.24
C-Class
2.36%
1,000.00
1,013.24
11.91
Telecommunications Fund
Investor Class
1.34%
1,000.00
1,018.35
6.78
Advisor Class
1.96%
1,000.00
1,015.24
9.90
A-Class
1.64%
1,000.00
1,016.85
8.29
C-Class
2.38%
1,000.00
1,013.14
12.01
Transportation Fund
Investor Class
1.37%
1,000.00
1,018.20
6.93
Advisor Class
1.87%
1,000.00
1,015.69
9.45
A-Class
1.62%
1,000.00
1,016.95
8.19
C-Class
2.37%
1,000.00
1,013.19
11.96
Utilities Fund
Investor Class
1.37%
1,000.00
1,018.20
6.93
Advisor Class
1.87%
1,000.00
1,015.69
9.45
A-Class
1.62%
1,000.00
1,016.95
8.19
C-Class
2.37%
1,000.00
1,013.19
11.96
*
Expenses are equal to the Fund’s annualized expense ratio, multiplied by the average account value over the period, multiplied by
the number of days in the most recent fiscal half-year, then divided by 365.
†
Annualized
THE RYDEX SERIES FUNDS SEMI-ANNUAL REPORT
|
7
FUND PROFILES (Unaudited)
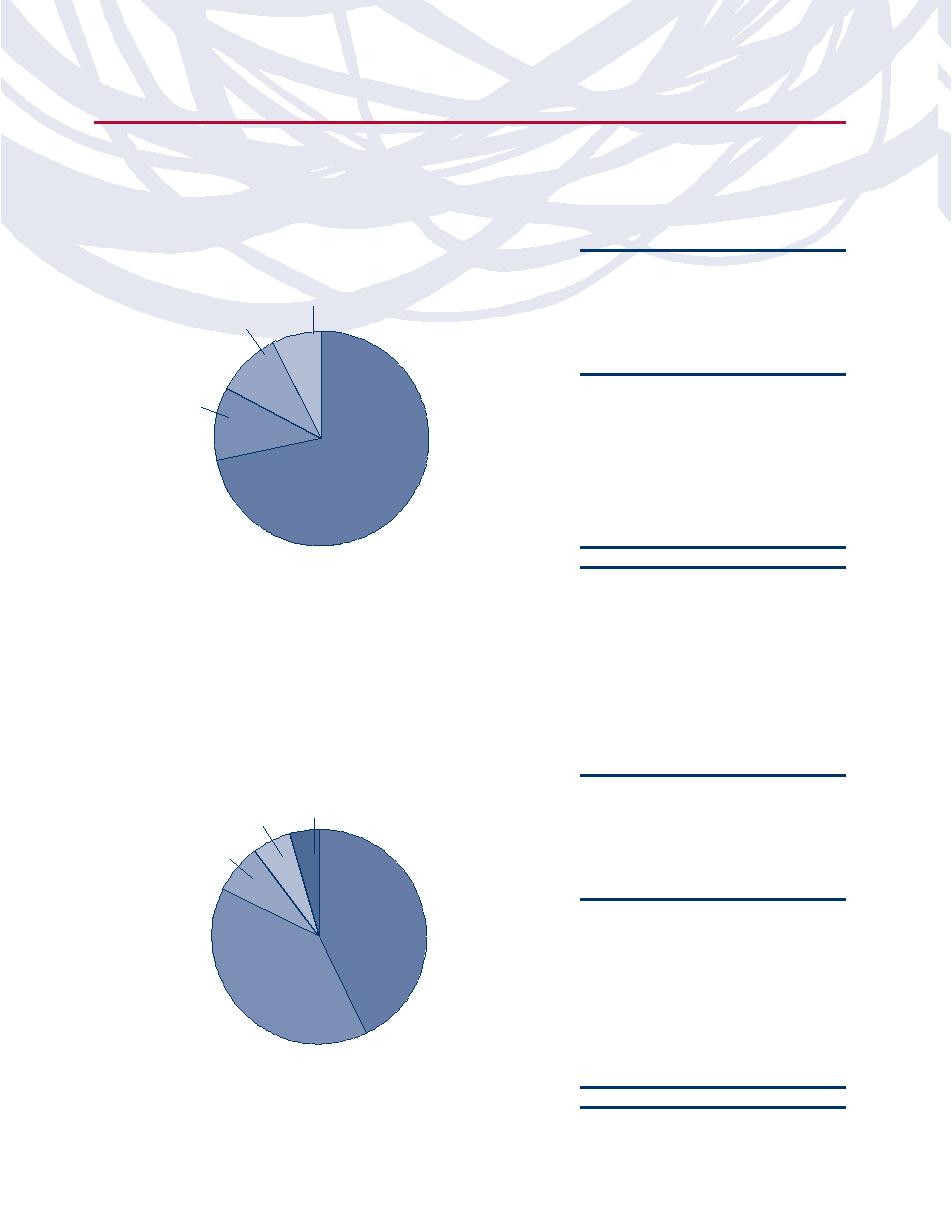
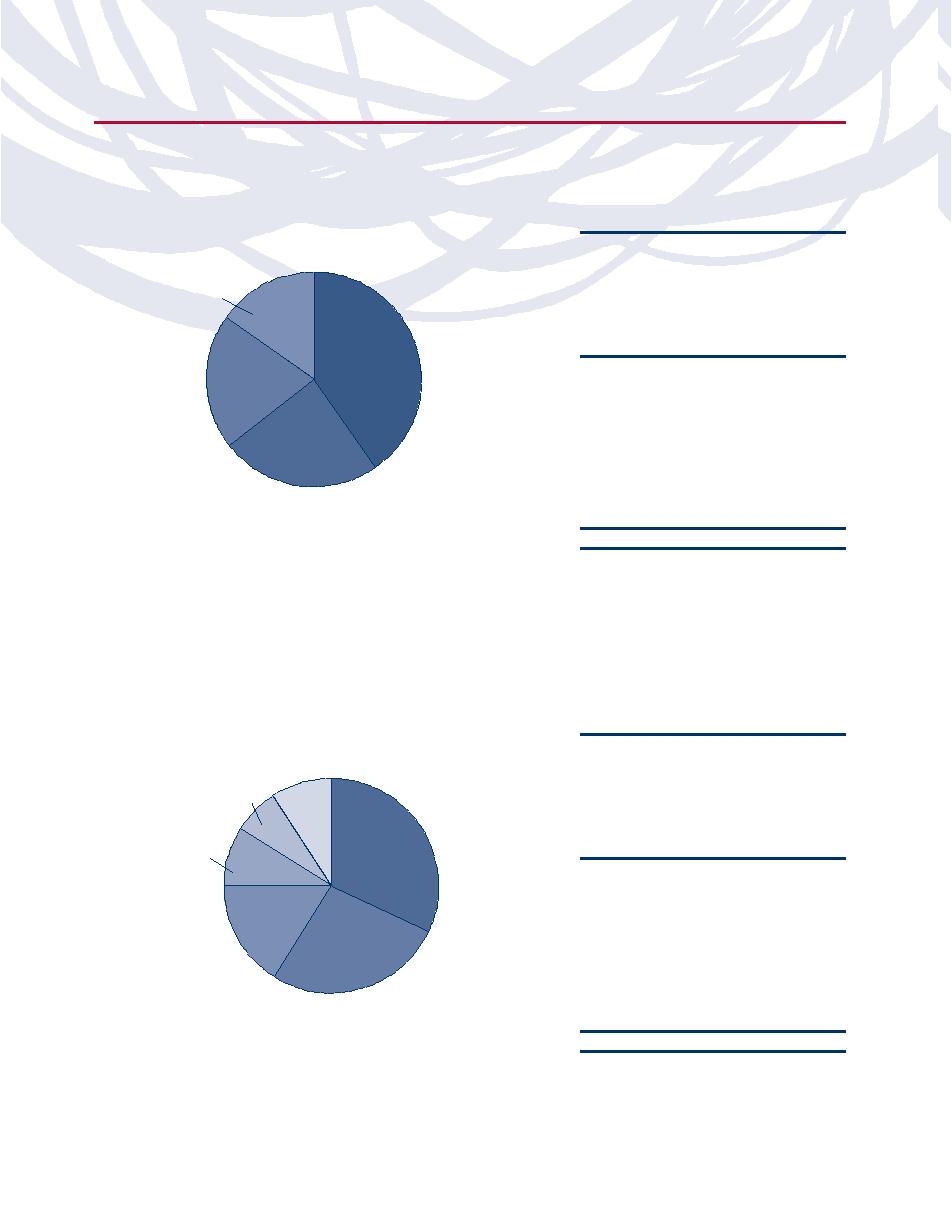
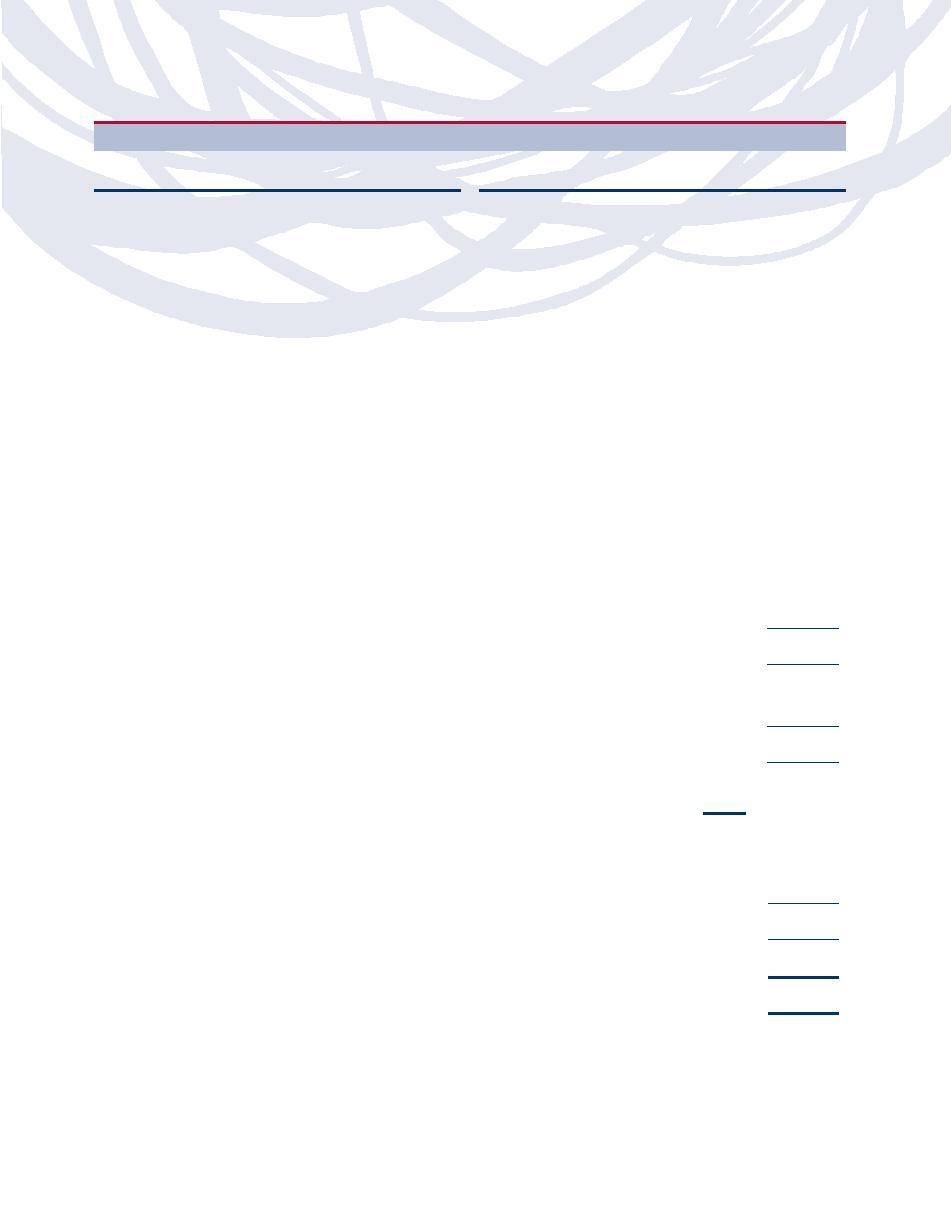
BANKING FUND
OBJECTIVE:
Seeks capital appreciation by investing in companies that are involved in the banking sector, including
commercial banks (and their holding companies) and savings and loan institutions.
Industry Diversification (Market Exposure as % of Net Assets)
Inception Dates:
Capital
Investor Class
April 1, 1998
Diversified
Markets
Advisor Class
April 1, 1998
Financial
7%
A-Class
September 1, 2004
Services
C-Class
March 30, 2001
10%
Ten Largest Holdings
(% of Total Net Assets)
Wells Fargo & Co.
5.7%
Thrifts &
Bank of America Corp.
4.9%
Mortgage
Commercial
U.S. Bancorp
4.8%
Finance
Banks
JPMorgan Chase & Co.
4.8%
11%
72%
HSBC Holdings PLC — SP ADR
4.4%
Credit Suisse Group AG — SP ADR
4.2%
Barclays PLC — SP ADR
3.5%
UBS AG — SP ADR
3.1%
PNC Financial Services Group, Inc.
2.9%
BB&T Corp.
2.8%
Top Ten Total
41.1%
Banking Fund
“Ten Largest Holdings” exclude any
“Industry Diversification (Market Exposure as % of Net Assets)” excludes any
temporary cash or derivative investments.
temporary cash investments.
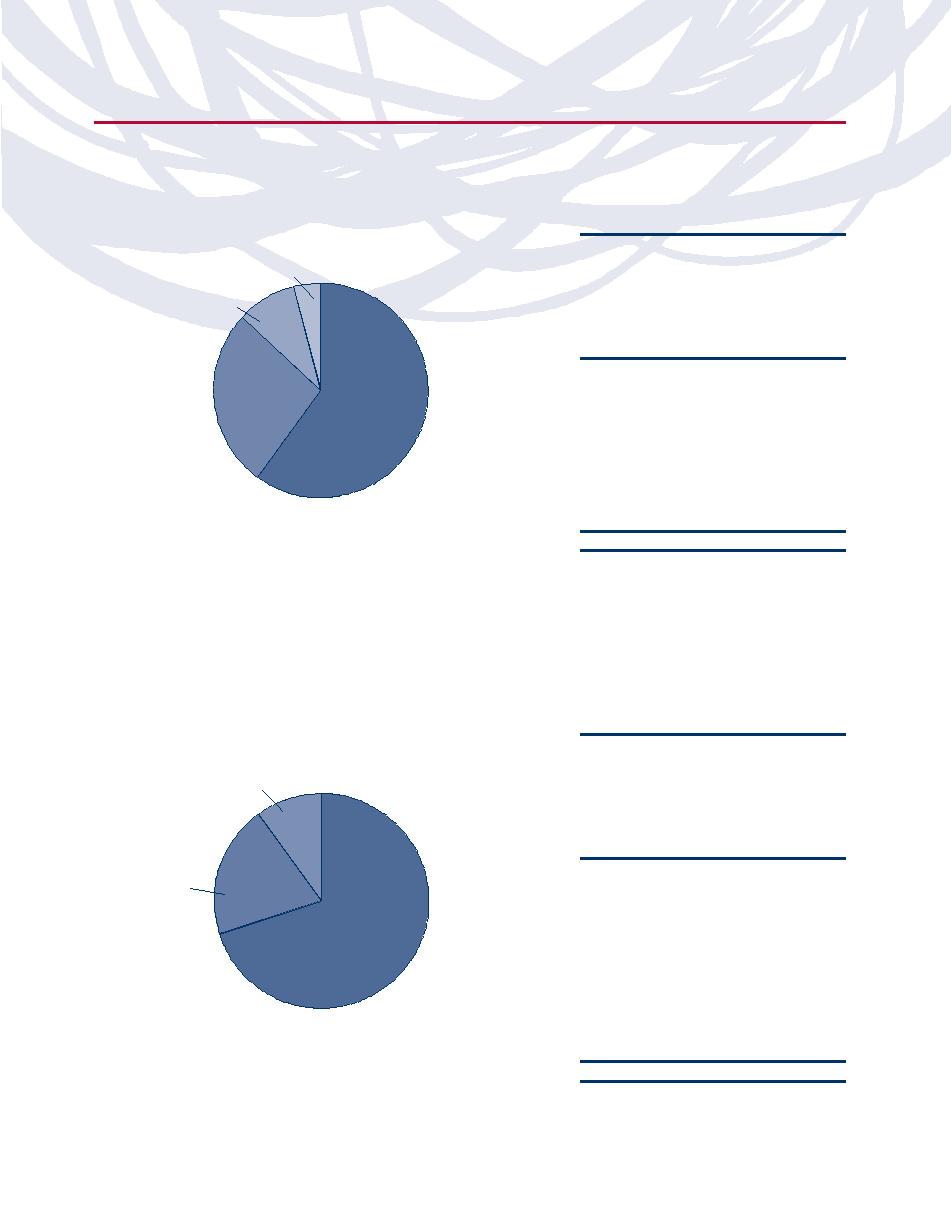
BASIC MATERIALS FUND
OBJECTIVE:
Seeks capital appreciation by investing in companies engaged in the mining, manufacture or sale of basic
materials, such as lumber, steel, iron, aluminum, concrete, chemicals and other basic building and manufacturing materials.
Industry Diversification (Market Exposure as % of Net Assets)
Inception Dates:
Construction
Investor Class
April 1, 1998
Paper & Forest
Products
Materials 4%
Advisor Class
April 14, 1998
A-Class
September 1, 2004
6%
C-Class
May 3, 2001
Containers
& Packaging
Ten Largest Holdings
8%
(% of Total Net Assets)
Metals
BHP Billiton Ltd. — SP ADR
3.9%
& Mining
Monsanto Co.
3.4%
43%
ArcelorMittal
3.2%
Chemicals
Rio Tinto PLC — SP ADR
3.1%
39%
Companhia Vale do Rio Doce —
SP ADR
3.0%
E.I. du Pont de Nemours and Co.
2.8%
Dow Chemical Co.
2.6%
Potash Corporation of Saskatchewan
2.5%
Basic Materials Fund
Barrick Gold Corp.
2.4%
Praxair, Inc.
2.0%
“Industry Diversification (Market Exposure as % of Net Assets)” excludes any
Top Ten Total
28.9%
temporary cash investments.
“Ten Largest Holdings” exclude any
temporary cash or derivative investments.
8
|
THE RYDEX SERIES FUNDS SEMI-ANNUAL REPORT
FUND PROFILES (Unaudited) (continued)
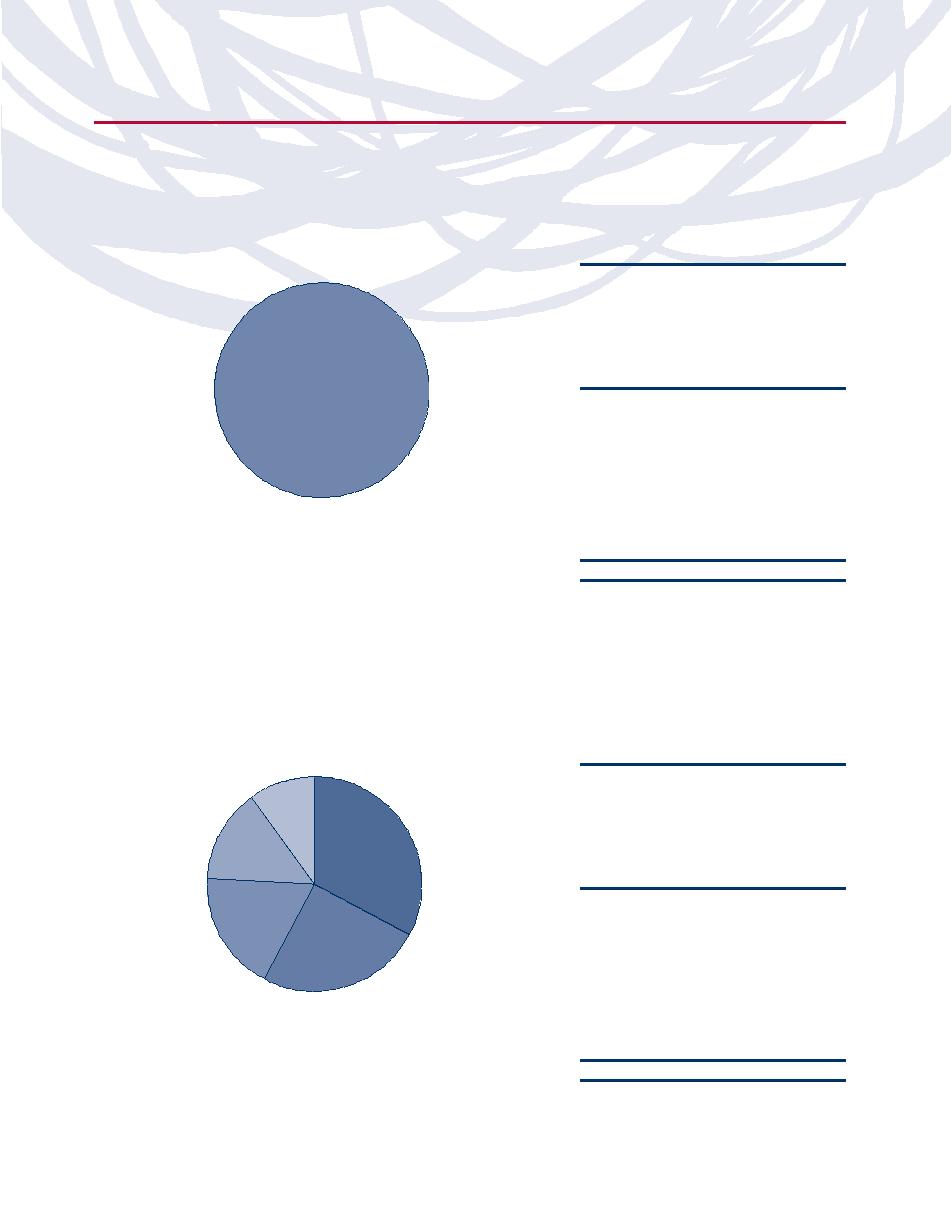
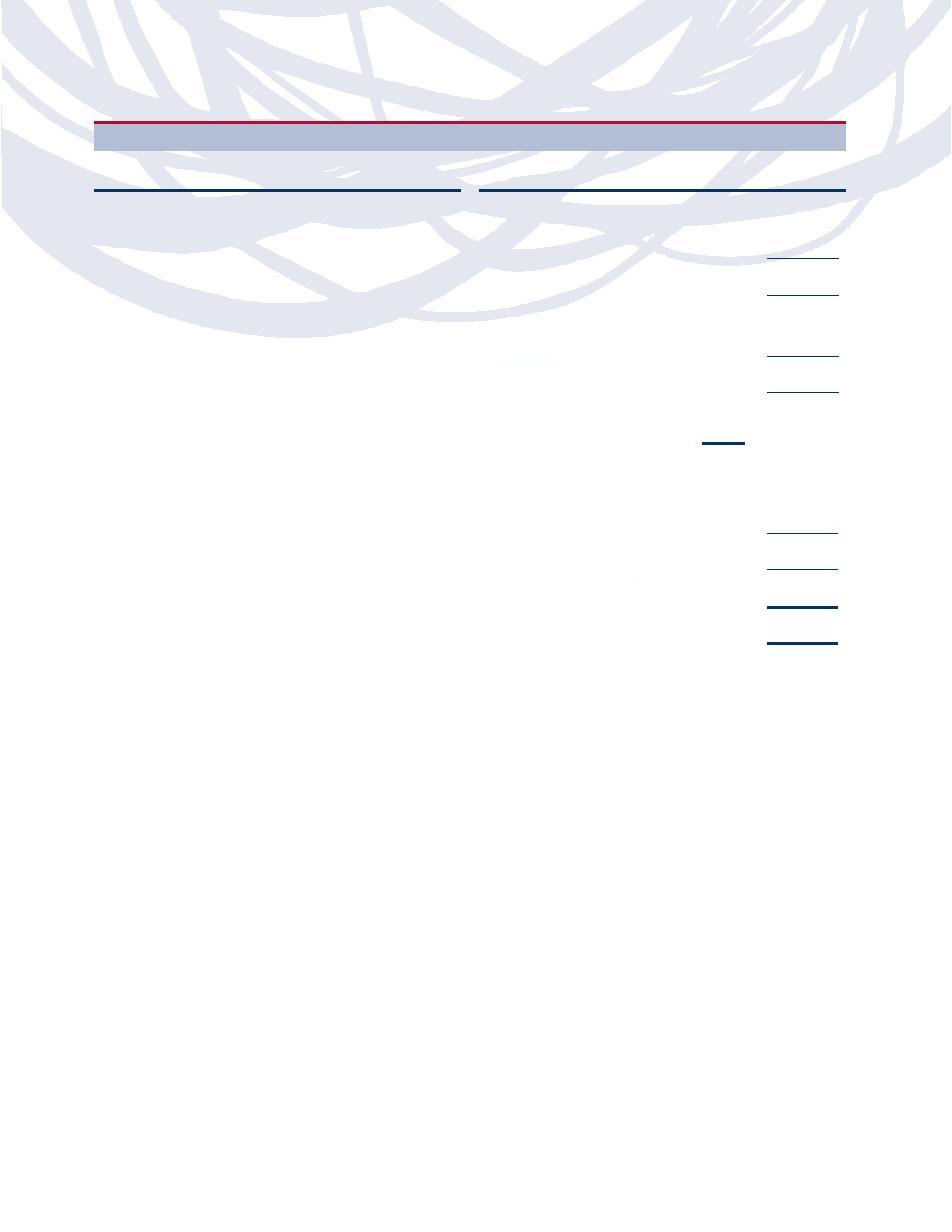
BIOTECHNOLOGY FUND
OBJECTIVE:
Seeks capital appreciation by investing in companies that are involved in the biotechnology industry, including
companies involved in research and development, genetic or biological engineering and in the design, manufacture or sale of
related biotechnology products or services.
Industry Diversification (Market Exposure as % of Net Assets)
Inception Dates:
Investor Class
April 1, 1998
Advisor Class
April 1, 1998
A-Class
September 1, 2004
C-Class
March 30, 2001
Ten Largest Holdings
Biotechnology
(% of Total Net Assets)
100%
Genentech, Inc.
12.4%
Amgen, Inc.
10.4%
Gilead Sciences, Inc.
7.2%
Celgene Corp.
6.1%
Genzyme Corp.
5.8%
Biogen Idec, Inc.
4.2%
ImClone Systems, Inc.
3.4%
Biotechnology Fund
Cephalon, Inc.
2.9%
Vertex Pharmaceuticals, Inc.
2.7%
“Industry Diversification (Market Exposure as % of Net Assets)” excludes any
Myriad Genetics, Inc.
2.2%
temporary cash investments.
Top Ten Total
57.3%
“Ten Largest Holdings” exclude any
temporary cash or derivative investments.
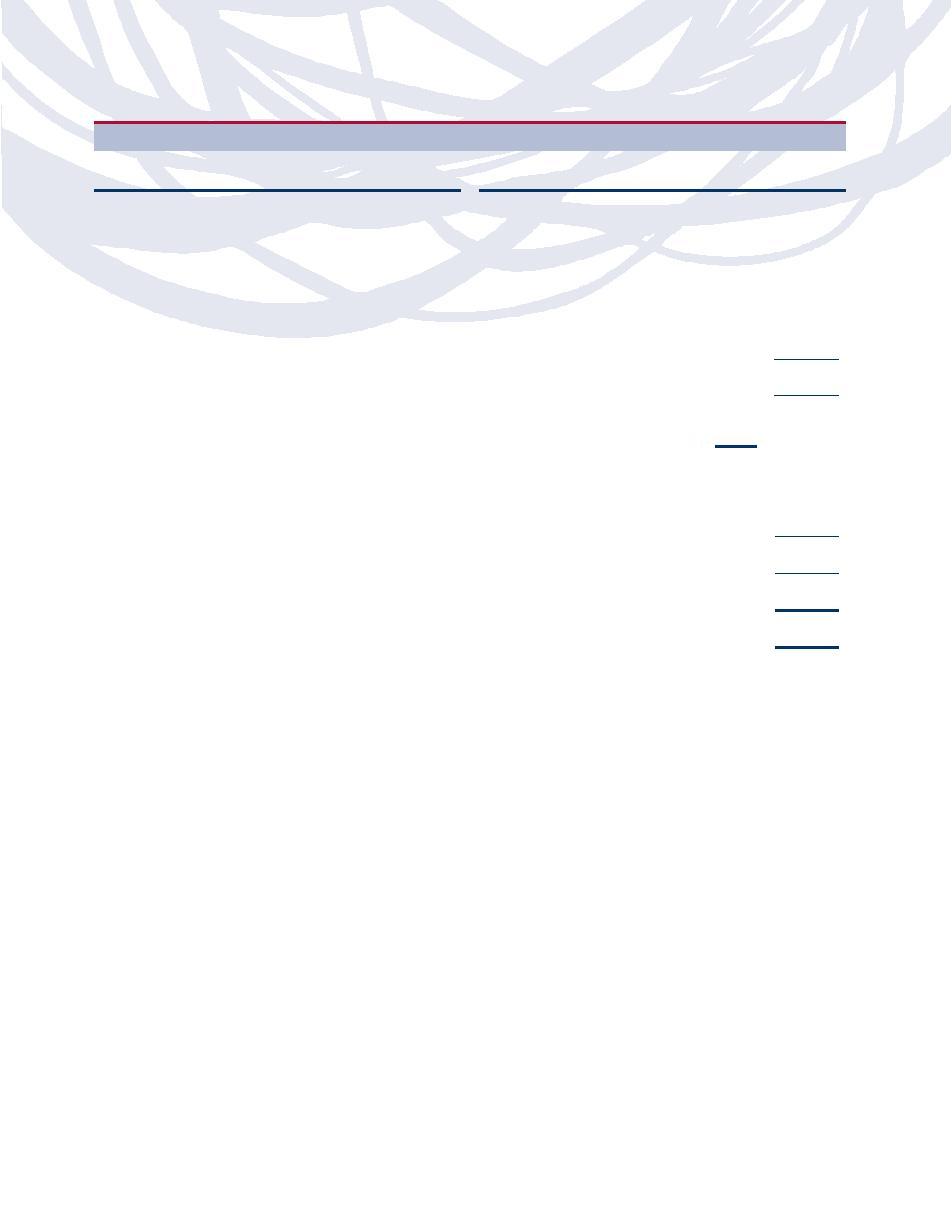
CONSUMER PRODUCTS FUND
OBJECTIVE:
Seeks capital appreciation by investing in companies engaged in manufacturing finished goods and services both
domestically and internationally.
Industry Diversification (Market Exposure as % of Net Assets)
Inception Dates:
Investor Class
July 6, 1998
Other
Advisor Class
August 17, 1998
10%
A-Class
September 1, 2004
C-Class
July 24, 2001
Tobacco
14%
Food Products
Ten Largest Holdings
33%
(% of Total Net Assets)
Household
Procter & Gamble Co.
7.7%
Products
Coca-Cola Co.
5.8%
18%
PepsiCo, Inc.
5.6%
Beverages
Philip Morris International, Inc.
5.0%
25%
Kraft Foods, Inc. — Class A
3.7%
Unilever NV
3.5%
Anheuser-Busch Companies, Inc.
3.4%
Consumer Products Fund
Colgate-Palmolive Co.
3.3%
Diageo PLC — SP ADR
3.2%
“Industry Diversification (Market Exposure as % of Net Assets)” excludes any
Altria Group, Inc.
3.2%
temporary cash investments.
Top Ten Total
44.4%
“Ten Largest Holdings” exclude any
temporary cash or derivative investments.
THE RYDEX SERIES FUNDS SEMI-ANNUAL REPORT
|
9
FUND PROFILES (Unaudited) (continued)
ELECTRONICS FUND
OBJECTIVE:
Seeks capital appreciation by investing in companies that are involved in the electronics sector, including
semiconductor manufacturers and distributors, and makers and vendors of other electronic components and devices.
Industry Diversification (Market Exposure as % of Net Assets)
Inception Dates:
Investor Class
April 1, 1998
Other 1%
Advisor Class
April 2, 1998
A-Class
September 1, 2004
C-Class
March 26, 2001
Ten Largest Holdings
Semiconductor
(% of Total Net Assets)
Equipment
22%
Intel Corp.
10.1%
Taiwan Semiconductor Manufacturing
Company Ltd. — SP ADR
7.0%
Semiconductors
Texas Instruments, Inc.
4.9%
77%
Applied Materials, Inc.
4.3%
STMicroelectronics NV — SP ADR
3.1%
Xilinx, Inc.
2.7%
Analog Devices, Inc.
2.7%
Linear Technology Corp.
2.7%
Electronics Fund
Altera Corp.
2.6%
ASML Holding NV
2.5%
“Industry Diversification (Market Exposure as % of Net Assets)” excludes any
Top Ten Total
42.6%
temporary cash investments.
“Ten Largest Holdings” exclude any
temporary cash or derivative investments.
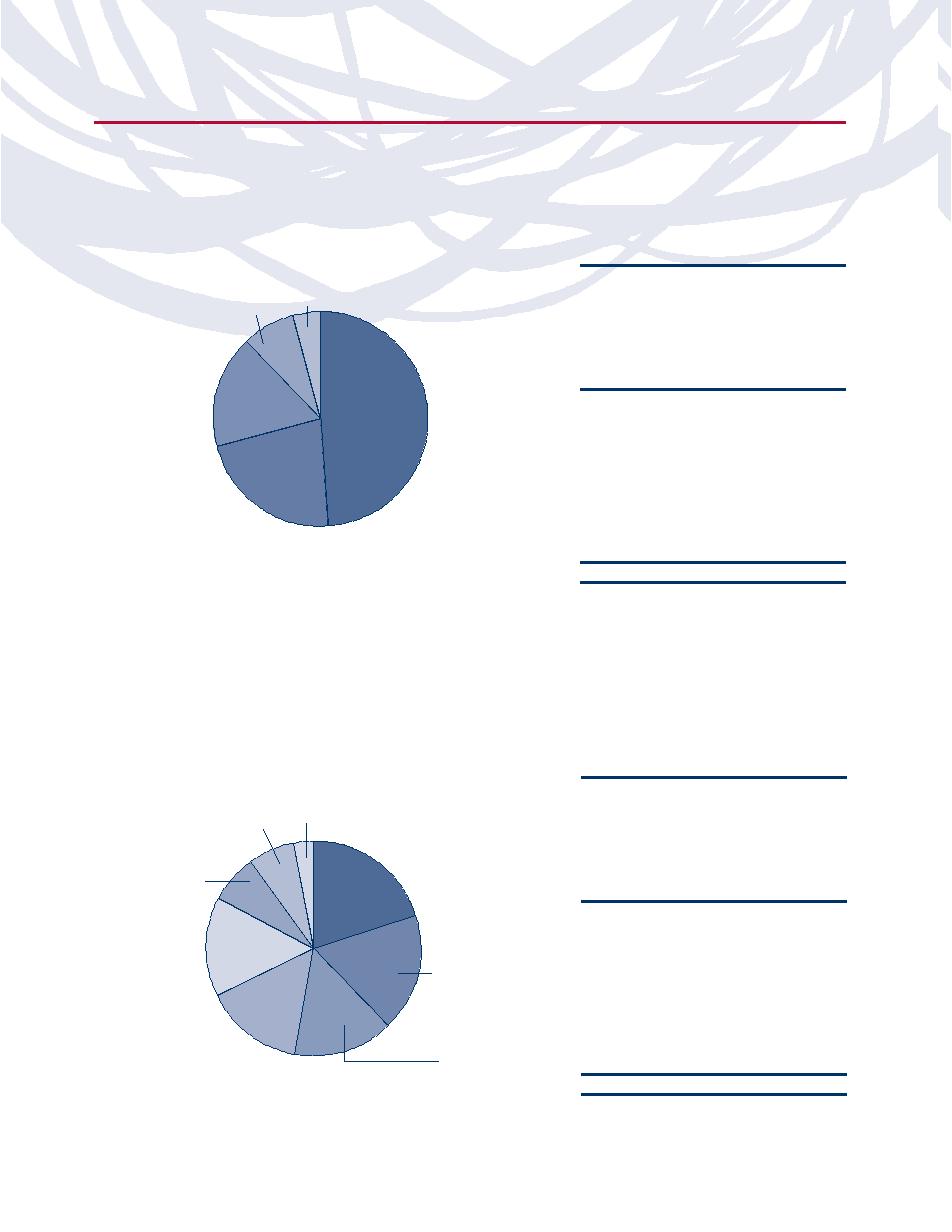
ENERGY FUND
OBJECTIVE:
Seeks capital appreciation by investing in companies involved in the energy field, including the exploration,
production and development of oil, gas, coal and alternative sources of energy.
Industry Diversification (Market Exposure as % of Net Assets)
Inception Dates:
Investor Class
April 21, 1998
Advisor Class
May 5, 1998
Oil & Gas
Other
A-Class
September 1, 2004
Drilling
12%
C-Class
April 19, 2001
9%
Integrated
Oil & Gas
Ten Largest Holdings
34%
(% of Total Net Assets)
Oil & Gas
Equipment &
Exxon Mobil Corp.
7.2%
Services
Chevron Corp.
4.6%
17%
Oil & Gas
BP PLC — SP ADR
4.1%
Exploration &
ConocoPhillips
3.6%
Production
28%
Royal Dutch Shell PLC — SP ADR
3.3%
Petroleo Brasiliero SA
3.3%
Schlumberger Ltd.
3.1%
Energy Fund
Occidental Petroleum Corp.
2.7%
Devon Energy Corp.
2.2%
“Industry Diversification (Market Exposure as % of Net Assets)” excludes any
Apache Corp.
2.1%
temporary cash investments.
Top Ten Total
36.2%
“Ten Largest Holdings” exclude any
temporary cash or derivative investments.
10
|
THE RYDEX SERIES FUNDS SEMI-ANNUAL REPORT
FUND PROFILES (Unaudited) (continued)
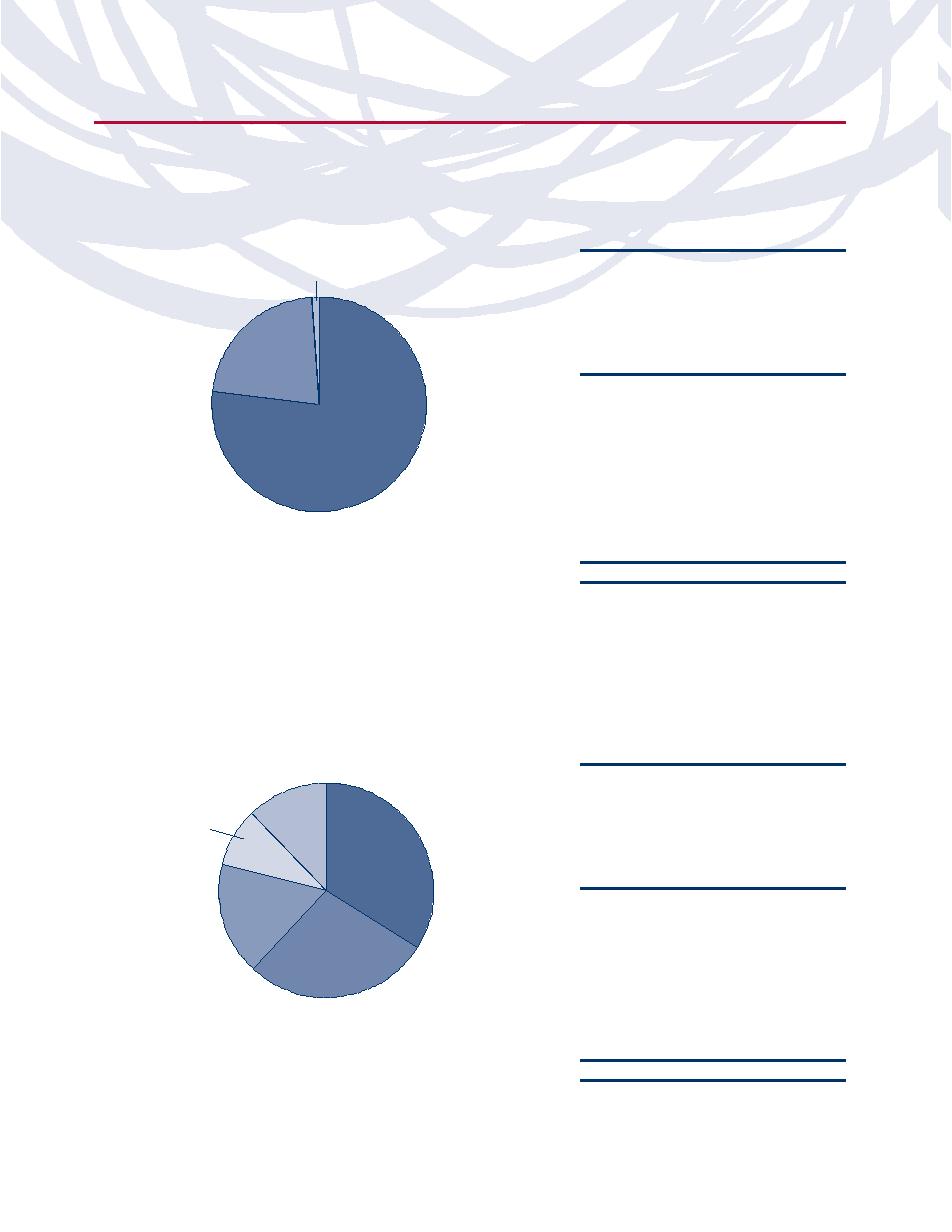
ENERGY SERVICES FUND
OBJECTIVE:
Seeks capital appreciation by investing in companies that are involved in the energy services field, including those
that provide services and equipment in the areas of oil, coal and gas exploration and production.
Industry Diversification (Market Exposure as % of Net Assets)
Inception Dates:
Investor Class
April 1, 1998
Advisor Class
April 2, 1998
A-Class
September 1, 2004
C-Class
March 30, 2001
Ten Largest Holdings
Energy Equipment
(% of Total Net Assets)
& Services
Schlumberger Ltd.
10.7%
100%
Transocean, Inc.
6.4%
Halliburton Co.
5.5%
Baker Hughes, Inc.
4.7%
National-Oilwell Varco, Inc.
4.6%
Tenaris SA — SP ADR
4.5%
Diamond Offshore Drilling, Inc.
4.3%
Energy Services Fund
Smith International, Inc.
4.3%
Weatherford International Ltd.
4.1%
“Industry Diversification (Market Exposure as % of Net Assets)” excludes any
Noble Corp.
3.8%
temporary cash investments.
Top Ten Total
52.9%
“Ten Largest Holdings” exclude any
temporary cash or derivative investments.
FINANCIAL SERVICES FUND
OBJECTIVE:
Seeks capital appreciation by investing in companies that are involved in the financial services sector.
Industry Diversification (Market Exposure as % of Net Assets)
Inception Dates:
Investor Class
April 2, 1998
Advisor Class
April 6, 1998
Other
A-Class
September 1, 2004
Diversified
7%
C-Class
April 19, 2001
Financial
Services
12%
Insurance
Ten Largest Holdings
27%
(% of Total Net Assets)
Capital
Bank of America Corp.
2.7%
Markets
HSBC Holdings PLC — SP ADR
2.6%
17%
Commercial
JPMorgan Chase & Co.
2.5%
Real Estate
Banks
Wells Fargo & Co.
2.4%
Investment
19%
Citigroup, Inc.
2.0%
Trusts
U.S. Bancorp
1.7%
18%
AXA — SP ADR
1.6%
Credit Suisse Group AG — SP ADR
1.5%
Financial Services Fund
Allianz SE — SP ADR
1.3%
Barclays PLC — SP ADR
1.2%
“Industry Diversification (Market Exposure as % of Net Assets)” excludes any
temporary cash investments.
Top Ten Total
19.5%
“Ten Largest Holdings” exclude any
temporary cash or derivative investments.
THE RYDEX SERIES FUNDS SEMI-ANNUAL REPORT
|
11
FUND PROFILES (Unaudited) (continued)
HEALTH CARE FUND
OBJECTIVE:
Seeks capital appreciation by investing in companies that are involved in the health care industry.
Industry Diversification (Market Exposure as % of Net Assets)
Inception Dates:
Investor Class
April 17, 1998
Advisor Class
May 11, 1998
Biotechnology
A-Class
September 1, 2004
16%
C-Class
March 30, 2001
Ten Largest Holdings
(% of Total Net Assets)
Health Care
Pharmaceuticals
Johnson & Johnson, Inc.
4.3%
Providers
40%
Novartis AG — SP ADR
3.4%
& Services
Pfizer, Inc.
3.4%
20%
GlaxoSmithKline PLC — SP ADR
3.1%
Health Care
Equipment
Genentech, Inc.
3.1%
& Supplies
Abbott Laboratories
2.9%
24%
Sanofi-Aventis — SP ADR
2.7%
Amgen, Inc.
2.6%
Health Care Fund
AstraZeneca PLC — SP ADR
2.4%
Merck & Company, Inc.
2.3%
“Industry Diversification (Market Exposure as % of Net Assets)” excludes any
Top Ten Total
30.2%
temporary cash investments.
“Ten Largest Holdings” exclude any
temporary cash or derivative investments.
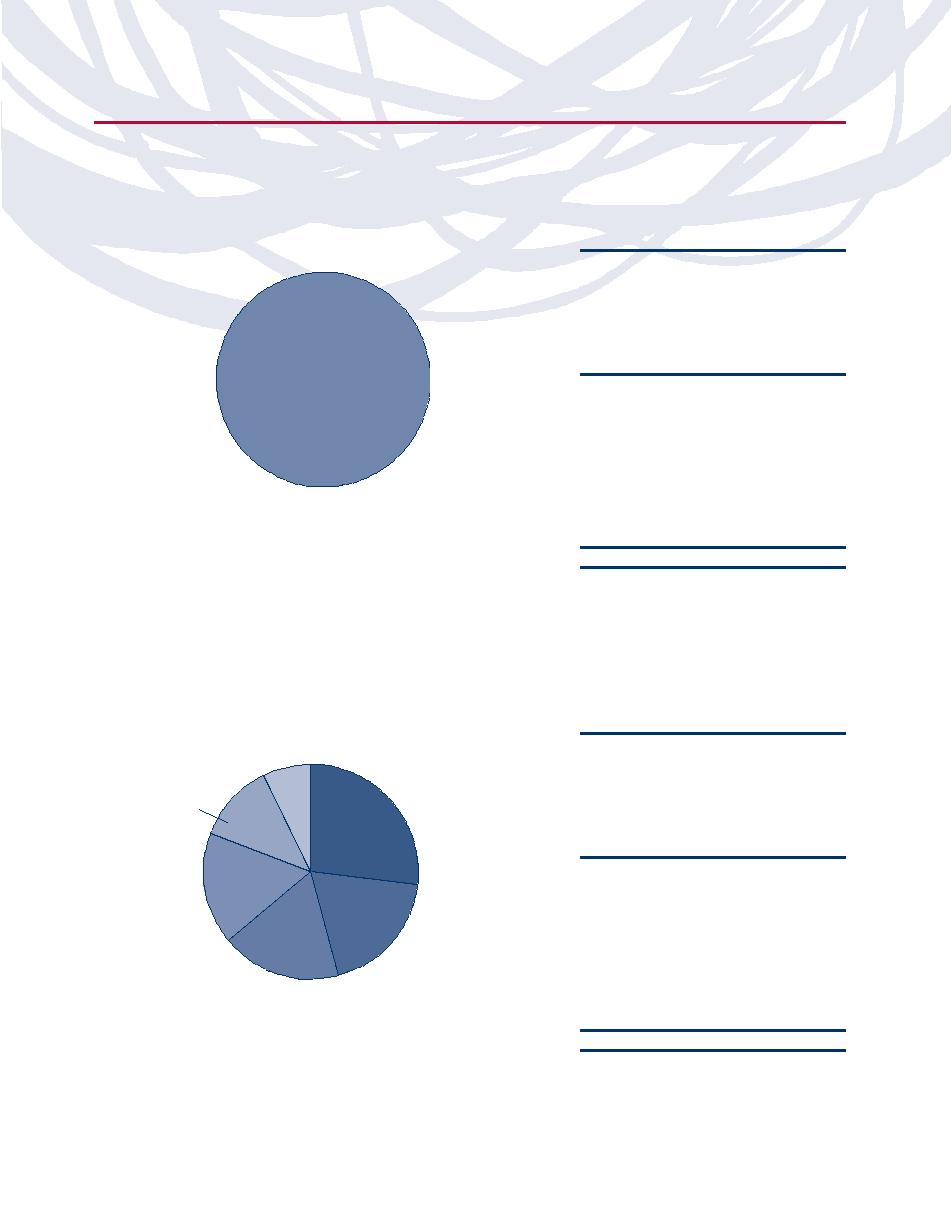
INTERNET FUND
OBJECTIVE:
Seeks capital appreciation by investing in companies that provide products or services designed for or related to
the Internet.
Industry Diversification (Market Exposure as % of Net Assets)
Inception Dates:
Investor Class
April 6, 2000
Advisor Class
April 6, 2000
Media
A-Class
September 1, 2004
7%
Other
C-Class
April 19, 2001
9%
Internet &
Catalog Retail
Ten Largest Holdings
9%
Communications
(% of Total Net Assets)
Equipment
Cisco Systems, Inc.
11.9%
32%
Google, Inc. — Class A
8.5%
Software
Qualcomm, Inc.
8.2%
16%
Internet
Time Warner, Inc.
6.5%
Software
Amazon.com, Inc.
5.6%
& Services
eBay, Inc.
5.3%
27%
Research In Motion Ltd.
4.9%
Yahoo!, Inc.
4.3%
Internet Fund
Symantec Corp.
4.1%
Intuit, Inc.
3.4%
“Industry Diversification (Market Exposure as % of Net Assets)” excludes any
Top Ten Total
62.7%
temporary cash investments.
“Ten Largest Holdings” exclude any
temporary cash or derivative investments.
12
|
THE RYDEX SERIES FUNDS SEMI-ANNUAL REPORT
FUND PROFILES (Unaudited) (continued)
LEISURE FUND
OBJECTIVE:
Seeks capital appreciation by investing in companies in the leisure and entertainment businesses.
Industry Diversification (Market Exposure as % of Net Assets)
Inception Dates:
Software
Investor Class
April 1, 1998
4%
Advisor Class
June 3, 1998
Leisure Equipment
A-Class
September 1, 2004
& Products
C-Class
May 3, 2001
9%
Ten Largest Holdings
(% of Total Net Assets)
McDonald’s Corp.
7.6%
Walt Disney Co.
6.8%
Media
27%
Time Warner, Inc.
5.8%
Hotels, Restaurants
Carnival Corp.
4.1%
& Leisure
News Corp. — Class A
3.8%
60%
Yum! Brands, Inc.
3.4%
Las Vegas Sands Corp.
3.1%
Viacom, Inc. — Class B
3.1%
Starbucks Corp.
3.0%
Leisure Fund
Electronic Arts, Inc.
2.7%
“Industry Diversification (Market Exposure as % of Net Assets)” excludes any
Top Ten Total
43.4%
temporary cash investments.
“Ten Largest Holdings” exclude any
temporary cash or derivative investments.
PRECIOUS METALS FUND
OBJECTIVE:
To provide capital appreciation by investing in U.S. and foreign companies that are involved in the precious
metals sector, including exploration, mining, production and development, and other precious metals-related services.
Industry Diversification (Market Exposure as % of Net Assets)
Inception Dates:
Diversified Metals
Investor Class
December 1, 1993
& Mining
Advisor Class
August 1, 2003
10%
A-Class
September 1, 2004
C-Class
April 27, 2001
Ten Largest Holdings
Precious Metals
(% of Total Net Assets)
& Minerals
Freeport-McMoRan Copper
20%
& Gold, Inc.
9.1%
Barrick Gold Corp.
8.4%
Newmont Mining Corp.
8.2%
Goldcorp, Inc.
7.0%
Gold
70%
Agnico-Eagle Mines Ltd.
6.5%
Kinross Gold Corp.
5.0%
Yamana Gold, Inc.
4.6%
Gold Fields Ltd. — SP ADR
4.5%
AngloGold Ashanti Ltd. — SP ADR
3.9%
Precious Metals Fund
Cia de Minas Buenaventura SA —
SP ADR
3.7%
“Industry Diversification (Market Exposure as % of Net Assets)” excludes any
Top Ten Total
60.9%
temporary cash investments.
“Ten Largest Holdings” exclude any
temporary cash or derivative investments.
THE RYDEX SERIES FUNDS SEMI-ANNUAL REPORT
|
13
FUND PROFILES (Unaudited) (continued)
RETAILING FUND
OBJECTIVE:
Seeks capital appreciation by investing in companies engaged in merchandising finished goods and services,
including department stores, restaurant franchises, mail-order operations and other companies involved in selling products to
consumers.
Industry Diversification (Market Exposure as % of Net Assets)
Inception Dates:
Other
Investor Class
April 1, 1998
Internet &
4%
Advisor Class
April 21, 1998
Catalog Retail
A-Class
September 1, 2004
8%
C-Class
May 9, 2001
Ten Largest Holdings
Multiline
(% of Total Net Assets)
Retail
Wal-Mart Stores, Inc.
9.7%
17%
Specialty Retail
Home Depot, Inc.
4.3%
49%
CVS Caremark Corp.
4.0%
Food & Drug
Lowe’s Companies, Inc.
4.0%
Retailing
Target Corp.
3.9%
22%
Amazon.com, Inc.
3.4%
Walgreen Co.
3.3%
Costco Wholesale Corp.
3.1%
Staples, Inc.
2.5%
Retailing Fund
Kohl’s Corp.
2.4%
Top Ten Total
40.6%
“Industry Diversification (Market Exposure as % of Net Assets)” excludes any
temporary cash investments.
“Ten Largest Holdings” exclude any
temporary cash or derivative investments.
TECHNOLOGY FUND
OBJECTIVE:
Seeks capital appreciation by investing in companies that are involved in the technology sector, including
computer software and service companies, semiconductor manufacturers, networking and telecommunications equipment
manufacturers, PC hardware and peripherals companies.
Industry Diversification (Market Exposure as % of Net Assets)
Inception Dates:
Investor Class
April 14, 1998
Internet Software
Other
& Services
3%
Advisor Class
April 29, 1998
A-Class
September 1, 2004
7%
C-Class
April 18, 2001
Electronic Equipment
& Instruments
7%
Ten Largest Holdings
Software
(% of Total Net Assets)
20%
Microsoft Corp.
4.2%
International Business Machines Corp.
3.3%
IT Consulting
Semiconductor
& Services
Cisco Systems, Inc.
3.2%
& Semiconductor
15%
Equipment
Hewlett-Packard Co.
3.0%
18%
Oracle Corp.
2.7%
Computers &
Intel Corp.
2.6%
Peripherals
Google, Inc. — Class A
2.3%
15%
Communications
Apple, Inc.
2.2%
Equipment
Qualcomm, Inc.
2.2%
15%
SAP AG — SP ADR
2.1%
Technology Fund
Top Ten Total
27.8%
“Industry Diversification (Market Exposure as % of Net Assets)” excludes any
“Ten Largest Holdings” exclude any
temporary cash investments.
temporary cash or derivative investments.
14
|
THE RYDEX SERIES FUNDS SEMI-ANNUAL REPORT
FUND PROFILES (Unaudited) (continued)
TELECOMMUNICATIONS FUND
OBJECTIVE: Seeks capital appreciation by investing in companies engaged in the development, manufacture or sale of
communications services or communications equipment.
Industry Diversification (Market Exposure as % of Net Assets)
Inception Dates:
Wireless
Investor Class
April 1, 1998
Telecommunication
Advisor Class
April 1, 1998
Services
A-Class
September 1, 2004
25%
C-Class
April 18, 2001
Ten Largest Holdings
Communications
(% of Total Net Assets)
Equipment
40%
AT&T, Inc.
8.5%
Cisco Systems, Inc.
8.3%
Vodafone Group PLC — SP ADR
6.6%
Diversified
Telecommunication
Verizon Communications, Inc.
6.4%
Services
Qualcomm, Inc.
5.7%
35%
Deutsche Telekom AG — SP ADR
5.4%
Nokia Oyj — SP ADR
4.9%
Telecommunications Fund
America Movil SAB de CV — SP ADR
4.9%
BCE, Inc.
3.5%
“Industry Diversification (Market Exposure as % of Net Assets)” excludes any
Research In Motion Ltd.
3.4%
temporary cash investments.
Top Ten Total
57.6%
“Ten Largest Holdings” exclude any
temporary cash or derivative investments.
TRANSPORTATION FUND
OBJECTIVE: Seeks capital appreciation by investing in companies engaged in providing transportation services or companies
engaged in the design, manufacture, distribution or sale of transportation equipment.
Industry Diversification (Market Exposure as % of Net Assets)
Inception Dates:
Marine
Investor Class
April 2, 1998
6%
Advisor Class
June 9, 1998
A-Class
September 1, 2004
C-Class
May 14, 2001
Ten Largest Holdings
Airlines
(% of Total Net Assets)
15%
United Parcel Service, Inc. — Class B
8.8%
Road & Rail
Union Pacific Corp.
7.8%
53%
Burlington Northern Santa Fe Corp.
7.3%
Air Freight
Norfolk Southern Corp.
6.7%
& Couriers
26%
FedEx Corp.
6.5%
Canadian National Railway Co.
6.1%
CSX Corp.
4.8%
Southwest Airlines Co.
4.2%
CH Robinson Worldwide, Inc.
3.7%
Transportation Fund
Expeditors International of
Washington, Inc.
3.2%
“Industry Diversification (Market Exposure as % of Net Assets)” excludes any
Top Ten Total
59.1%
temporary cash investments.
“Ten Largest Holdings” exclude any
temporary cash or derivative investments.
THE RYDEX SERIES FUNDS SEMI-ANNUAL REPORT
|
15
FUND PROFILES (Unaudited) (concluded)
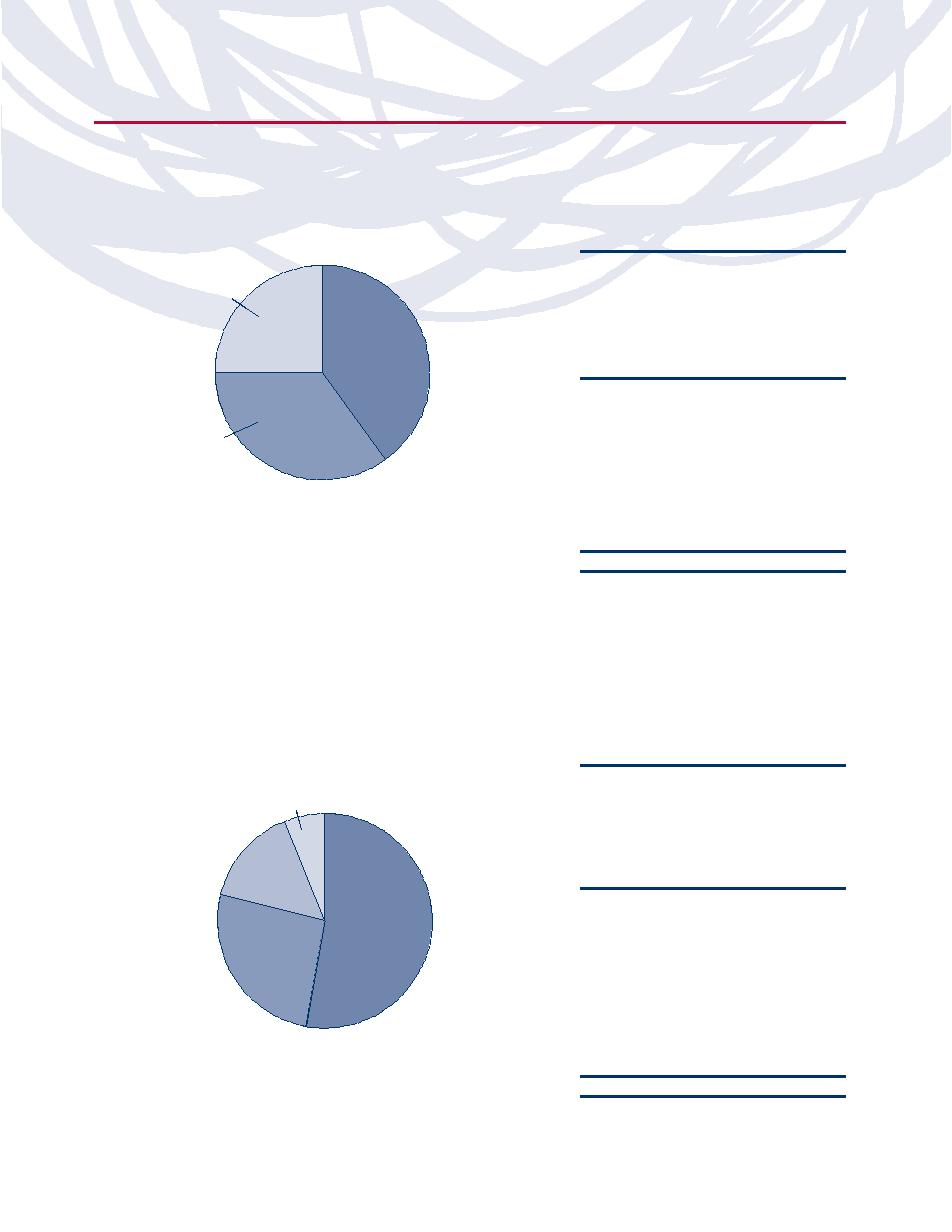
UTILITIES FUND
OBJECTIVE:
Seeks capital appreciation by investing in companies that operate public utilities.
Industry Diversification (Market Exposure as % of Net Assets)
Inception Dates:
Investor Class
April 3, 2000
Other
5%
Advisor Class
April 3, 2000
A-Class
September 1, 2004
C-Class
April 27, 2001
Gas
Utilities
Ten Largest Holdings
11%
(% of Total Net Assets)
Multi-Utilities
Exelon Corp.
3.9%
42%
Southern Co.
3.9%
Dominion Resources, Inc.
3.4%
Duke Energy Corp.
3.3%
Electric Utilities
FirstEnergy Corp.
3.0%
42%
FPL Group, Inc.
2.8%
American Electric Power Company, Inc.
2.6%
Entergy Corp.
2.6%
Consolidated Edison, Inc.
2.6%
Utilities Fund
PG&E Corp.
2.6%
Top Ten Total
30.7%
“Industry Diversification (Market Exposure as % of Net Assets)” excludes any
temporary cash investments.
“Ten Largest Holdings” exclude any
temporary cash or derivative investments.
16
|
THE RYDEX SERIES FUNDS SEMI-ANNUAL REPORT
SCHEDULE OF INVESTMENTS (Unaudited)
September 30, 2008
BANKING FUND
MARKET
MARKET
SHARES
VALUE
SHARES
VALUE
COMMON STOCKS 99.2%
Hancock Holding Co.
3,500
$
178,500
Webster Financial Corp.
7,038
177,710
Wells Fargo & Co.
36,716
$
1,377,951
PrivateBancorp, Inc.
4,260
177,472
Bank of America Corp.
33,651
1,177,785
First Niagara Financial Group, Inc.
11,240
177,030
U.S. Bancorp
32,498
1,170,578
Astoria Financial Corp.
8,514
176,495
JPMorgan Chase & Co.
25,046
1,169,648
FNB Corp.
10,870
173,703
HSBC Holdings PLC — SP ADR
13,055
1,055,236
NewAlliance Bancshares, Inc.
11,548
173,566
Credit Suisse Group AG — SP ADR
21,079
1,017,694
Washington Federal, Inc.
9,284
171,290
Barclays PLC — SP ADR
34,407
849,853
Glacier Bancorp, Inc.
6,800
168,436
UBS AG — SP ADR*
42,414
743,942
Prosperity Bancshares, Inc.
4,950
168,251
PNC Financial Services Group, Inc.
9,258
691,573
Old National Bancorp
8,400
168,168
BB&T Corp.
18,175
687,015
Investors Bancorp, Inc.*
11,075
166,679
SunTrust Banks, Inc.
12,860
578,571
MB Financial Corp.
4,990
165,019
UnionBanCal Corp.
7,052
516,841
Northwest Bancorp, Inc.
5,884
162,045
M&T Bank Corp.
5,180
462,315
CVB Financial Corp.
11,360
157,904
Hudson City Bancorp, Inc.
21,825
402,671
First Midwest Bancorp, Inc.
6,419
155,597
People’s United Financial, Inc.
19,007
365,885
Park National Corp.†
1,946
151,788
Marshall & Ilsley Corp.
17,273
348,051
Trustmark Corp.
7,220
149,743
Regions Financial Corp.†
34,440
330,624
Sovereign Bancorp, Inc.
37,678
148,828
KeyCorp
27,440
327,634
Signature Bank*
4,100
143,008
Zions Bancorporation†
7,981
308,865
First Financial Bankshares, Inc.
2,680
139,038
Comerica, Inc.
9,322
305,668
National Penn Bancshares, Inc.
9,490
138,554
Fifth Third Bancorp
25,420
302,498
Provident Financial Services, Inc.
7,930
130,924
New York Community Bancorp, Inc.
17,781
298,543
National City Corp.
54,874
96,030
TFS Financial Corp
22,493
281,612
Washington Mutual, Inc.
58,616
4,777
Cullen/Frost Bankers, Inc.
4,263
255,780
Total Common Stocks
Capitol Federal Financial
5,589
247,760
(Cost $22,191,195)
24,024,030
Synovus Financial Corp.
23,725
245,554
Commerce Bancshares, Inc.
5,144
238,682
SECURITIES LENDING COLLATERAL 2.7%
Valley National Bancorp†
11,243
235,653
Mount Vernon Securities Lending
BOK Financial Corp.
4,866
235,563
Trust Prime Portfolio (Note 8)
638,933
638,933
TCF Financial Corp.
12,397
223,146
Total Securities Lending Collateral
Huntington Bancshares, Inc.
27,691
221,251
(Cost $638,933)
638,933
BancorpSouth, Inc.
7,845
220,680
City National Corp.
4,057
220,295
FACE
Popular, Inc.†
26,549
220,091
AMOUNT
Bank of Hawaii Corp.
4,112
219,786
REPURCHASE AGREEMENT 1.2%
Associated Banc-Corp.
10,910
217,654
Repurchase Agreement (Note 4)
Susquehanna Bancshares, Inc.†
10,150
198,128
Credit Suisse Group
International Bancshares Corp.
7,186
194,022
issued 09/30/08 at 0.25%
First Horizon National Corp.
20,560
192,446
due 10/01/08
$299,237
299,237
Fulton Financial Corp.†
17,481
190,718
Colonial BancGroup, Inc.
23,935
188,129
Total Repurchase Agreement
United Bankshares, Inc.
5,340
186,900
(Cost $299,237)
299,237
SVB Financial Group*
3,182
184,301
Total Investments 103.1%
UMB Financial Corp.
3,505
184,083
(Cost $23,129,365)
$24,962,200
Wilmington Trust Corp.
6,361
183,388
Liabilities in Excess of
Whitney Holding Corp.†
7,558
183,281
Other Assets – (3.1)%
$
(750,239)
FirstMerit Corp.
8,708
182,868
Net Assets – 100.0%
$24,211,961
Wachovia Corp.
51,809
181,331
Westamerica Bancorporation
3,145
180,932
* Non-Income Producing Security.
† All or a portion of this security is on loan at September 30, 2008 — See Note 8.
ADR—American Depository Receipt.
See Notes to Financial Statements.
THE RYDEX SERIES FUNDS SEMI-ANNUAL REPORT
|
17
SCHEDULE OF INVESTMENTS (Unaudited)
September 30, 2008
BASIC MATERIALS FUND
MARKET
MARKET
SHARES
VALUE
SHARES
VALUE
COMMON STOCKS 99.8%
International Flavors & Fragrances,
Inc.
10,825
$
427,155
BHP Billiton Ltd. — SP ADR
37,496
$
1,949,417
Ball Corp.
10,780
425,702
Monsanto Co.
16,903
1,673,059
Yamana Gold, Inc.
51,039
425,155
ArcelorMittal
32,628
1,611,171
Huntsman Corp.
32,927
414,880
Rio Tinto PLC — SP ADR
6,133
1,530,184
Sonoco Products Co.
13,859
411,335
Companhia Vale do Rio Doce —
Bemis Co.
15,601
408,902
SP ADR
78,800
1,509,020
Lubrizol Corp.
9,466
408,363
E.I. du Pont de Nemours and Co.
35,041
1,412,152
FMC Corp.
7,932
407,625
Dow Chemical Co.
40,579
1,289,601
Crown Holdings, Inc.*
18,166
403,467
Potash Corporation of Saskatchewan
9,400
1,240,894
Celanese Corp.
14,324
399,783
Barrick Gold Corp.
33,131
1,217,233
Cleveland-Cliffs, Inc.
7,442
393,979
Praxair, Inc.
14,264
1,023,299
Randgold Resources Ltd. —
Syngenta AG — SP ADR
23,100
977,592
SP ADR
9,400
385,682
The Mosaic Co.
14,355
976,427
AptarGroup, Inc.
9,690
378,976
Goldcorp, Inc.
30,571
966,961
Hercules, Inc.
18,507
366,254
Weyerhaeuser Co.
15,720
952,318
Packaging Corporation of America
15,791
366,035
Newmont Mining Corp.
23,433
908,263
Nalco Holding Co.
19,715
365,516
Ecolab, Inc.
18,270
886,460
Albemarle Corp.
11,838
365,084
Rohm & Haas Co.†
12,519
876,330
Domtar Corp.*
79,000
363,400
International Paper Co.
33,180
868,652
RPM International, Inc.†
18,635
360,401
Freeport-McMoRan Copper &
Sociedad Quimica y Minera de
Gold, Inc.
15,164
862,073
Chile SA — SP ADR
13,000
327,730
Alcoa, Inc.
38,051
859,192
Steel Dynamics, Inc.
19,130
326,932
Cemex SA de CV — SP ADR*
46,429
799,507
Terra Industries, Inc.†
10,990
323,106
Southern Copper Corp.
41,375
789,435
Eldorado Gold Corp.*
51,038
319,498
Air Products & Chemicals, Inc.
11,296
773,663
Allegheny Technologies, Inc.
10,597
313,141
Vulcan Materials Co.
10,063
749,694
Reliance Steel & Aluminum Co.†
8,110
307,937
PPG Industries, Inc.
12,698
740,547
AK Steel Holding Corp.
11,800
305,856
Nucor Corp.
17,693
698,874
Ashland, Inc.
9,691
283,365
Kinross Gold Corp.
40,424
651,635
Rockwood Holdings, Inc.*
10,896
279,591
Agnico-Eagle Mines Ltd.
11,146
613,810
Cytec Industries, Inc.
7,113
276,767
Sigma-Aldrich Corp.
11,537
604,770
Compass Minerals International,
Gerdau SA — SP ADR
51,600
572,760
Inc.
5,141
269,337
Agrium, Inc.
9,993
560,407
Pan American Silver Corp.*
12,000
266,760
AngloGold Ashanti Ltd. — SP ADR
24,200
559,020
Commercial Metals Co.
15,282
258,113
United States Steel Corp.
6,951
539,467
Aracruz Celulose SA — SP ADR
6,800
249,628
Martin Marietta Materials, Inc.
4,792
536,608
Silver Wheaton Corp.*†
30,372
247,532
Cia de Minas Buenaventura SA —
Olin Corp.
12,700
246,380
SP ADR
22,600
530,648
Century Aluminum Co.*
7,100
196,599
Gold Fields Ltd. — SP ADR
54,871
526,213
Total Common Stocks
MeadWestvaco Corp.
20,883
486,783
(Cost $44,689,503)
49,750,482
Sealed Air Corp.
21,877
481,075
Pactiv Corp.*
18,926
469,933
SECURITIES LENDING COLLATERAL 2.2%
Airgas, Inc.
9,199
456,730
Mount Vernon Securities Lending
Eastman Chemical Co.
8,182
450,501
Trust Prime Portfolio (Note 8)
1,069,448
1,069,448
Owens-Illinois, Inc.*
14,725
432,915
Total Securities Lending Collateral
Harmony Gold Mining Co. Ltd. —
(Cost $1,069,448)
1,069,448
SP ADR*†
44,450
430,276
CF Industries Holdings, Inc.
4,690
428,947
18
|
THE RYDEX SERIES FUNDS SEMI-ANNUAL REPORT
See Notes to Financial Statements.
SCHEDULE OF INVESTMENTS (Unaudited) (concluded)
September 30, 2008
BASIC MATERIALS FUND
FACE
MARKET
AMOUNT
VALUE
REPURCHASE AGREEMENT 1.0%
Repurchase Agreement (Note 4)
Credit Suisse Group
issued 09/30/08 at 0.25%
due 10/01/08
$521,524
$
521,524
Total Repurchase Agreement
(Cost $521,524)
521,524
Total Investments 103.0%
(Cost $46,280,475)
$51,341,454
Liabilities in Excess of
Other Assets – (3.0)%
$ (1,480,724)
Net Assets – 100.0%
$49,860,730
* Non-Income Producing Security.
† All or a portion of this security is on loan at September 30, 2008 — See Note 8.
ADR—American Depository Receipt.
See Notes to Financial Statements.
THE RYDEX SERIES FUNDS SEMI-ANNUAL REPORT
|
19
SCHEDULE OF INVESTMENTS (Unaudited)
September 30, 2008
BIOTECHNOLOGY FUND
MARKET
MARKET
SHARES
VALUE
SHARES
VALUE
COMMON STOCKS 99.9%
SECURITIES LENDING COLLATERAL 8.0%
Mount Vernon Securities Lending
Genentech, Inc.*
125,920
$11,166,586
Trust Prime Portfolio (Note 8)
7,182,660
$
7,182,660
Amgen, Inc.*
158,307
9,382,856
Total Securities Lending Collateral
Gilead Sciences, Inc.*
142,782
6,508,003
(Cost $7,182,660)
7,182,660
Celgene Corp.*
86,378
5,466,000
Genzyme Corp.*
64,480
5,215,787
FACE
Biogen Idec, Inc.*
75,141
3,778,841
AMOUNT
ImClone Systems, Inc.*
48,933
3,055,376
Cephalon, Inc.*†
33,679
2,609,786
REPURCHASE AGREEMENT 0.2%
Vertex Pharmaceuticals, Inc.*†
72,683
2,415,983
Repurchase Agreement (Note 4)
Myriad Genetics, Inc.*†
30,130
1,954,834
Credit Suisse Group
Alexion Pharmaceuticals, Inc.*
49,482
1,944,643
issued 09/30/08 at 0.25%
OSI Pharmaceuticals, Inc.*
37,854
1,865,824
due 10/01/08
$202,446
202,446
United Therapeutics Corp.*
16,035
1,686,401
Total Repurchase Agreement
BioMarin Pharmaceuticals, Inc.*†
62,550
1,656,949
(Cost $202,446)
202,446
Amylin Pharmaceuticals, Inc.*
79,864
1,614,850
Total Investments 108.1%
Regeneron Pharmaceuticals, Inc.*
73,710
1,609,089
(Cost $61,704,464)
$97,130,594
Isis Pharmaceuticals, Inc.*
87,557
1,478,838
Liabilities in Excess of
Onyx Pharmaceuticals, Inc.*
40,000
1,447,200
Other Assets – (8.1)%
$ (7,299,156)
Celera Corp.*
87,425
1,350,716
Net Assets – 100.0%
$89,831,438
Cubist Pharmaceuticals, Inc.*†
59,020
1,312,015
Alkermes, Inc.*
89,372
1,188,648
Alnylam Pharmaceuticals, Inc.*
39,608
1,146,652
Seattle Genetics, Inc.*
102,420
1,095,894
Martek Biosciences Corp.
33,900
1,065,138
PDL BioPharma, Inc.
114,303
1,064,161
Human Genome Sciences, Inc.*
160,135
1,016,857
CV Therapeutics, Inc.*
93,226
1,006,841
Rigel Pharmaceuticals, Inc.*
42,300
987,705
GTx, Inc.*†
51,312
975,954
InterMune, Inc.*†
54,654
935,130
Genomic Health, Inc.*†
40,119
908,695
Medarex, Inc.*
134,865
872,576
Dendreon Corp.*†
149,270
852,332
Theravance, Inc.*†
68,200
849,772
Acorda Therapeutics, Inc.*
35,248
840,665
Incyte Corp.*
107,357
821,281
Indevus Pharmaceuticals, Inc.*†
231,500
775,525
Savient Pharmaceuticals, Inc.*
50,123
747,334
Momenta Pharmaceuticals, Inc.*
55,700
730,227
Cepheid, Inc.*
49,100
679,053
Zymogenetics, Inc.*†
97,226
647,525
Enzon Pharmaceuticals, Inc.*
85,878
633,780
Progenics Pharmaceuticals, Inc.*†
47,176
627,912
Arena Pharmaceuticals, Inc.*
120,151
600,755
Sangamo Biosciences, Inc.*†
68,000
523,600
Metabolix, Inc.*†
47,700
518,976
Cell Genesys, Inc.*†
189,700
111,923
Total Common Stocks
(Cost $54,319,358)
89,745,488
* Non-Income Producing Security.
† All or a portion of this security is on loan at September 30, 2008 — See Note 8.
20
|
THE RYDEX SERIES FUNDS SEMI-ANNUAL REPORT
See Notes to Financial Statements.
SCHEDULE OF INVESTMENTS (Unaudited)
September 30, 2008
CONSUMER PRODUCTS FUND
MARKET
MARKET
SHARES
VALUE
SHARES
VALUE
COMMON STOCKS 99.7%
Smithfield Foods, Inc.*
9,273
$
147,255
Central European Distribution
Procter & Gamble Co.
25,112
$
1,750,055
Corp.*
2,899
131,644
Coca-Cola Co.
24,679
1,305,026
Total Common Stocks
PepsiCo, Inc.
17,876
1,274,023
(Cost $19,342,389)
22,593,243
Philip Morris International, Inc.
23,377
1,124,434
Kraft Foods, Inc. — Class A
25,860
846,915
SECURITIES LENDING COLLATERAL 1.2%
Unilever NV
27,903
785,748
Mount Vernon Securities Lending
Anheuser-Busch Companies, Inc.
11,901
772,137
Trust Prime Portfolio (Note 8)
268,570
268,570
Colgate-Palmolive Co.
9,808
739,033
Total Securities Lending Collateral
Diageo PLC — SP ADR
10,612
730,742
(Cost $268,570)
268,570
Altria Group, Inc.
36,583
725,807
Kimberly-Clark Corp.
9,986
647,492
FACE
General Mills, Inc.
8,316
571,476
AMOUNT
Kellogg Co.
9,799
549,724
REPURCHASE AGREEMENT 0.2%
Avon Products, Inc.
12,439
517,089
Repurchase Agreement (Note 4)
Sysco Corp.
16,379
504,965
Credit Suisse Group
Wm. Wrigley Jr. Co.
6,034
479,100
issued 09/30/08 at 0.25%
Kroger Co.
17,215
473,068
due 10/01/08
$41,585
41,585
H.J. Heinz Co.
9,175
458,475
Campbell Soup Co.
11,732
452,855
Total Repurchase Agreement
Reynolds American, Inc.
8,739
424,890
(Cost $41,585)
41,585
Lorillard, Inc.
5,767
410,322
Total Investments 101.1%
UST, Inc.
6,023
400,770
(Cost $19,652,544)
$22,903,398
Cadbury PLC — SP ADR
9,576
392,041
Liabilities in Excess of
Archer-Daniels-Midland Co.
17,225
377,400
Other Assets – (1.1)%
$
(250,658)
Clorox Co.
5,811
364,292
Net Assets – 100.0%
$22,652,740
Safeway, Inc.
14,695
348,565
ConAgra Foods, Inc.
17,580
342,107
Sara Lee Corp.
26,607
336,046
Coca-Cola Enterprises, Inc.
19,557
327,971
Hershey Co.
7,936
313,789
Pepsi Bottling Group, Inc.
10,223
298,205
Estee Lauder Companies, Inc. —
Class A†
5,879
293,421
Molson Coors Brewing Co. —
Class B
5,866
274,235
Energizer Holdings, Inc.*
3,295
265,412
Hormel Foods Corp.
7,075
256,681
Bunge Ltd.
4,009
253,289
Church & Dwight Co., Inc.
4,033
250,409
Brown-Forman Corp. — Class B
3,466
248,893
McCormick & Co., Inc.
6,262
240,774
Dean Foods Co.*
10,128
236,590
Constellation Brands, Inc. —
Class A*
10,817
232,133
SUPERVALU, INC.
9,505
206,258
Tyson Foods, Inc. — Class A
15,273
182,360
Whole Foods Market, Inc.†
9,059
181,452
Corn Products International, Inc.
4,581
147,875
* Non-Income Producing Security.
† All or a portion of this security is on loan at September 30, 2008 — See Note 8.
ADR—American Depository Receipt.
See Notes to Financial Statements.
THE RYDEX SERIES FUNDS SEMI-ANNUAL REPORT
|
21
SCHEDULE OF INVESTMENTS (Unaudited)
September 30, 2008
ELECTRONICS FUND
MARKET
MARKET
SHARES
VALUE
SHARES
VALUE
COMMON STOCKS 99.6%
Formfactor, Inc.*
3,829
$
66,701
RF Micro Devices, Inc.*
22,390
65,379
Intel Corp.
39,594
$
741,596
Cymer, Inc.*
2,489
63,046
Taiwan Semiconductor Manufacturing
Triquint Semiconductor, Inc.*
12,220
58,534
Company Ltd. — SP ADR†
54,704
512,576
Power Integrations, Inc.*
2,370
57,117
Texas Instruments, Inc.
16,537
355,545
Diodes, Inc.*
3,068
56,605
Applied Materials, Inc.
20,901
316,232
Cypress Semiconductor Corp.*
5,926
30,934
STMicroelectronics NV — SP ADR
21,971
223,665
Total Common Stocks
Xilinx, Inc.
8,382
196,558
(Cost $5,249,093)
7,284,117
Analog Devices, Inc.
7,410
195,253
Linear Technology Corp.†
6,324
193,894
SECURITIES LENDING COLLATERAL 4.6%
Altera Corp.
9,163
189,491
Mount Vernon Securities Lending
ASML Holding NV
10,555
185,874
Trust Prime Portfolio (Note 8)
338,218
338,218
Nvidia Corp.*
17,145
183,623
Total Securities Lending Collateral
Broadcom Corp. — Class A*
9,611
179,053
(Cost $338,218)
338,218
Microchip Technology, Inc.
5,885
173,196
KLA-Tencor Corp.
5,044
159,643
FACE
Lam Research Corp.*
4,725
148,790
AMOUNT
MEMC Electronic Materials, Inc.*
5,055
142,854
REPURCHASE AGREEMENT 0.4%
National Semiconductor Corp.
8,157
140,382
Repurchase Agreement (Note 4)
Marvell Technology Group Ltd.*
15,075
140,197
Credit Suisse Group
Advanced Micro Devices, Inc.*
26,257
137,849
issued 09/30/08 at 0.25%
Infineon Technologies AG —
due 10/01/08
$32,884
32,884
SP ADR*
23,680
132,371
LSI Logic Corp.*†
24,280
130,141
Total Repurchase Agreement
Micron Technology, Inc.*
28,993
117,422
(Cost $32,884)
32,884
Cree, Inc.*
5,097
116,110
Total Investments 104.6%
Microsemi Corp.*
4,330
110,328
(Cost $5,620,195)
$7,655,219
Sunpower Corp.*
1,581
109,171
Liabilities in Excess of
ON Semiconductor Corp.*
16,055
108,532
Other Assets – (4.6)%
$
(338,599)
Novellus Systems, Inc.*
5,324
104,563
Net Assets – 100.0%
$7,316,620
Atmel Corp.*
28,635
97,073
PMC - Sierra, Inc.*
12,883
95,592
Varian Semiconductor Equipment
Associates, Inc.*
3,703
93,019
Silicon Laboratories, Inc.*
2,968
91,118
International Rectifier Corp.*
4,774
90,801
Intersil Corp. — Class A
5,418
89,830
Skyworks Solutions, Inc.*
9,512
79,520
Rambus, Inc.*
6,078
78,102
Hittite Microwave Corp.*
2,322
78,019
Integrated Device Technology, Inc.*
10,000
77,800
Teradyne, Inc.*
9,955
77,749
Atheros Communications, Inc.*
3,283
77,413
Semtech Corp.*
5,050
70,498
FEI Co.*
2,934
69,859
Amkor Technology, Inc.*
10,877
69,286
MKS Instruments, Inc.*
3,476
69,207
Fairchild Semiconductor International,
Inc.*
7,750
68,898
Tessera Technologies, Inc.*
4,107
67,108
* Non-Income Producing Security.
† All or a portion of this security is on loan at September 30, 2008 — See Note 8.
ADR—American Depository Receipt.
22
|
THE RYDEX SERIES FUNDS SEMI-ANNUAL REPORT
See Notes to Financial Statements.
SCHEDULE OF INVESTMENTS (Unaudited)
September 30, 2008
ENERGY FUND
MARKET
MARKET
SHARES
VALUE
SHARES
VALUE
COMMON STOCKS 99.4%
Cimarex Energy Co.
11,075
$
541,678
Helmerich & Payne, Inc.
12,324
532,274
Exxon Mobil Corp.
75,301
$
5,847,876
Denbury Resources, Inc.*
26,499
504,541
Chevron Corp.
45,567
3,758,366
Arch Coal, Inc.
15,000
493,350
BP PLC — SP ADR
66,318
3,327,174
Tidewater, Inc.
8,776
485,839
ConocoPhillips
40,029
2,932,124
Frontline Ltd.†
10,085
484,786
Royal Dutch Shell PLC — SP ADR
45,939
2,710,860
PetroHawk Energy Corp.*
22,225
480,727
Petroleo Brasileiro SA†
61,400
2,698,530
Cabot Oil & Gas Corp.
13,117
474,048
Schlumberger Ltd.
32,575
2,543,782
Rowan Companies, Inc.
15,444
471,814
Occidental Petroleum Corp.
30,665
2,160,349
Whiting Petroleum Corp.*
6,545
466,397
Devon Energy Corp.
19,854
1,810,685
Newfield Exploration Co.*
14,475
463,055
Apache Corp.
16,080
1,676,822
Dresser-Rand Group, Inc.*
14,622
460,154
Canadian Natural Resources Ltd.
23,320
1,596,487
Oceaneering International, Inc.*
8,305
442,823
Transocean, Inc.*
13,912
1,528,094
CNX Gas Corp.*
19,458
435,665
Marathon Oil Corp.
37,470
1,493,929
Plains Exploration & Production Co.*
12,024
422,764
Hess Corp.
17,022
1,397,166
Quicksilver Resources, Inc.*
21,515
422,339
XTO Energy, Inc.
28,884
1,343,684
Patterson-UTI Energy, Inc.
20,910
418,618
Halliburton Co.
40,271
1,304,378
Alpha Natural Resources, Inc.*
7,985
410,668
EOG Resources, Inc.
14,260
1,275,700
IHS Inc.*
8,270
393,983
Anadarko Petroleum Corp.
25,506
1,237,296
Atwood Oceanics, Inc.*
10,750
391,300
Valero Energy Corp.
36,842
1,116,313
Comstock Resources, Inc.*
7,600
380,380
Baker Hughes, Inc.
18,337
1,110,122
St. Mary Land & Exploration Co.
10,600
377,890
Spectra Energy Corp.
45,703
1,087,731
Unit Corp.*
7,480
372,654
National-Oilwell Varco, Inc.*
21,625
1,086,224
Superior Energy Services*
11,938
371,749
Chesapeake Energy Corp.
30,043
1,077,342
Encore Acquisition Co.*
8,737
365,032
Tenaris SA — SP ADR
28,530
1,063,884
Helix Energy Solutions Group, Inc.*
14,982
363,763
Diamond Offshore Drilling, Inc.†
9,897
1,019,985
Massey Energy Co.
9,985
356,165
Talisman Energy, Inc.
68,980
980,896
SandRidge Energy, Inc.*
16,725
327,810
Weatherford International Ltd.*
38,635
971,284
Teekay Shipping Corp.
12,235
322,759
Murphy Oil Corp.
14,368
921,563
W&T Offshore, Inc.
11,620
317,110
Williams Companies, Inc.
38,849
918,779
Exterran Holdings, Inc.*
9,485
303,141
Noble Corp.
20,474
898,809
EXCO Resources, Inc.*
17,600
287,232
Nexen, Inc.
37,350
867,640
Foundation Coal Holdings, Inc.
7,600
270,408
Smith International, Inc.
14,770
866,113
Patriot Coal Corp.*†
9,000
261,450
Southwestern Energy Co.*
27,855
850,692
Total Common Stocks
Peabody Energy Corp.†
18,850
848,250
(Cost $51,990,010)
80,530,350
Noble Energy, Inc.
13,586
755,246
ENSCO International, Inc.†
13,033
751,092
SECURITIES LENDING COLLATERAL 5.0%
Ultra Petroleum Corp.*
13,345
738,512
Mount Vernon Securities Lending
Cameron International Corp.*
19,106
736,345
Trust Prime Portfolio (Note 8)
4,061,970
4,061,970
El Paso Corp.
57,516
733,904
Total Securities Lending Collateral
Pioneer Natural Resources Co.
12,675
662,649
(Cost $4,061,970)
4,061,970
Range Resources Corp.
15,239
653,296
Total Investments 104.4%
Consol Energy, Inc.
13,792
632,915
(Cost $56,051,980)
$84,592,320
Cameco Corp.
27,439
612,164
Liabilities in Excess of
Nabors Industries Ltd.*
24,084
600,173
Other Assets – (4.4)%
$ (3,584,360)
FMC Technologies, Inc.*
12,759
593,931
Sunoco, Inc.†
16,536
588,351
Net Assets – 100.0%
$81,007,960
BJ Services Co.
30,381
581,188
Continental Resources, Inc.*
14,530
570,012
Pride International, Inc.*
18,997
562,501
Forest Oil Corp.*
11,185
554,776
* Non-Income Producing Security.
† All or a portion of this security is on loan at September 30, 2008 — See Note 8.
ADR—American Depository Receipt.
See Notes to Financial Statements.
THE RYDEX SERIES FUNDS SEMI-ANNUAL REPORT
|
23
SCHEDULE OF INVESTMENTS (Unaudited)
September 30, 2008
ENERGY SERVICES FUND
MARKET
FACE
MARKET
SHARES
VALUE
AMOUNT
VALUE
COMMON STOCKS 100.2%
REPURCHASE AGREEMENT 0.0%
Repurchase Agreement (Note 4)
Schlumberger Ltd.
189,604
$
14,806,177
Credit Suisse Group
Transocean, Inc.*
80,850
8,880,564
issued 09/30/08 at 0.25%
Halliburton Co.
234,453
7,593,933
due 10/01/08
$15,721
$
15,721
Baker Hughes, Inc.
106,813
6,466,459
Total Repurchase Agreement
National-Oilwell Varco, Inc.*
125,828
6,320,340
(Cost $15,721)
15,721
Tenaris SA — SP ADR
165,870
6,185,292
Total Investments 114.8%
Diamond Offshore Drilling, Inc.†
57,570
5,933,164
(Cost $120,502,722)
$159,107,665
Smith International, Inc.†
100,641
5,901,588
Weatherford International Ltd.*
224,629
5,647,173
Liabilities in Excess of
Noble Corp.†
118,890
5,219,271
Other Assets – (14.8)%
$ (20,504,497)
ENSCO International, Inc.†
75,884
4,373,195
Net Assets – 100.0%
$138,603,168
Cameron International Corp.*
111,119
4,282,526
Nabors Industries Ltd.*
140,269
3,495,504
FMC Technologies, Inc.*
74,332
3,460,155
BJ Services Co.
176,711
3,380,481
Pride International, Inc.*
110,318
3,266,516
Helmerich & Payne, Inc.
71,670
3,095,427
Tidewater, Inc.†
50,623
2,802,489
Rowan Companies, Inc.†
89,782
2,742,840
Dresser-Rand Group, Inc.*
85,081
2,677,499
Oceaneering International, Inc.*
48,303
2,575,516
Patterson-UTI Energy, Inc.†
121,751
2,437,455
Atwood Oceanics, Inc.*
62,794
2,285,702
IHS Inc.*
47,917
2,282,766
SEACOR Holdings, Inc.*†
27,617
2,180,362
Superior Energy Services*
69,594
2,167,157
Unit Corp.*
43,096
2,147,043
Helix Energy Solutions Group, Inc.*
87,362
2,121,149
Dril-Quip, Inc.*
46,703
2,026,443
RPC, Inc.†
132,913
1,868,757
Grey Wolf, Inc.*
240,100
1,867,978
Oil States International, Inc.*
52,665
1,861,708
Exterran Holdings, Inc.*
55,031
1,758,791
Key Energy Services, Inc.*
148,307
1,720,361
Complete Production Services,
Inc.*†
82,767
1,666,100
Hercules Offshore*
92,180
1,397,449
Total Common Stocks
(Cost $100,290,387)
138,895,330
SECURITIES LENDING COLLATERAL 14.6%
Mount Vernon Securities Lending
Trust Prime Portfolio (Note 8)
20,196,614
20,196,614
Total Securities Lending Collateral
(Cost $20,196,614)
20,196,614
* Non-Income Producing Security.
† All or a portion of this security is on loan at September 30, 2008 — See Note 8.
ADR—American Depository Receipt.
24
|
THE RYDEX SERIES FUNDS SEMI-ANNUAL REPORT
See Notes to Financial Statements.
SCHEDULE OF INVESTMENTS (Unaudited)
September 30, 2008
FINANCIAL SERVICES FUND
MARKET
MARKET
SHARES
VALUE
SHARES
VALUE
COMMON STOCKS 99.8%
Hudson City Bancorp, Inc.
4,899
$
90,387
Plum Creek Timber Co., Inc. (REIT)
1,777
88,601
Bank of America Corp.
11,892
$
416,220
NYSE Euronext
2,217
86,862
HSBC Holdings PLC — SP ADR
5,076
410,293
Hartford Financial Services Group,
JPMorgan Chase & Co.
8,404
392,467
Inc.
2,119
86,858
Wells Fargo & Co.
9,992
375,000
ProLogis
2,079
85,800
Citigroup, Inc.
15,429
316,449
AvalonBay Communities, Inc.
842
82,870
U.S. Bancorp
7,287
262,478
Moody’s Corp.
2,428
82,552
AXA — SP ADR
7,684
250,959
Ventas, Inc.
1,670
82,531
Credit Suisse Group AG — SP ADR
4,730
228,364
People’s United Financial, Inc.†
4,265
82,101
Allianz SE — SP ADR
14,910
204,416
TD Ameritrade Holding Corp.*
5,067
82,085
Barclays PLC — SP ADR
7,722
190,733
Ameriprise Financial, Inc.
2,131
81,404
MetLife, Inc.
3,394
190,064
CNA Financial Corp.
3,044
79,875
Prudential Financial, Inc.
2,428
174,816
Invesco Ltd.
3,756
78,801
Goldman Sachs Group, Inc.
1,365
174,720
Philadelphia Consolidated Holding
American Express Co.
4,831
171,162
Corp.*
1,341
78,542
Bank of New York Mellon Corp.
5,214
169,872
Marshall & Ilsley Corp.
3,874
78,061
Charles Schwab Corp.
6,511
169,286
Host Hotels & Resorts, Inc.
5,843
77,653
UBS AG — SP ADR*
9,516
166,911
Nasdaq Stock Market, Inc.*
2,468
75,447
PNC Financial Services Group, Inc.
2,104
157,169
Regions Financial Corp.
7,725
74,160
Travelers Companies, Inc.
3,430
155,036
Annaly Capital Management, Inc.
5,490
73,840
BB&T Corp.
4,078
154,148
KeyCorp
6,153
73,467
AFLAC, Inc.
2,586
151,927
Federal Realty Investment Trust
849
72,674
Allstate Corp.
3,206
147,861
American Capital Ltd.
2,816
71,836
Simon Property Group, Inc.
1,450
140,650
Everest Re Group Ltd.
825
71,387
Chubb Corp.
2,539
139,391
White Mountains Insurance Group
Capital One Financial Corp.
2,712
138,312
Ltd.
150
70,462
CME Group, Inc.
369
137,087
Zions Bancorporation
1,811
70,086
Blackrock, Inc.
697
135,566
Comerica, Inc.
2,115
69,351
SunTrust Banks, Inc.
2,922
131,461
Discover Financial Services
4,996
69,045
Merrill Lynch & Co., Inc.
5,184
131,155
Health Care REIT, Inc.
1,293
68,826
State Street Corp.
2,287
130,085
Legg Mason, Inc.
1,801
68,546
ACE Ltd.
2,403
130,074
Assurant, Inc.
1,240
68,200
Public Storage, Inc.
1,307
129,406
Fifth Third Bancorp
5,698
67,806
Franklin Resources, Inc.
1,461
128,758
Regency Centers Corp.
1,016
67,757
Loews Corp.
3,217
127,039
Torchmark Corp.
1,128
67,454
Marsh & McLennan Companies, Inc.
3,857
122,498
Cincinnati Financial Corp.
2,367
67,317
UnionBanCal Corp.
1,600
117,264
Brookfield Properties Corp.
4,246
67,257
Morgan Stanley
4,937
113,551
New York Community Bancorp, Inc.
3,993
67,042
Northern Trust Corp.
1,538
111,044
Macerich Co.
1,051
66,896
Vornado Realty Trust
1,200
109,140
Arch Capital Group Ltd.*
915
66,822
Brookfield Asset Management, Inc. —
IntercontinentalExchange, Inc.*
819
66,077
Class A
3,950
108,388
Axis Capital Holdings Ltd.
2,042
64,752
T. Rowe Price Group, Inc.
1,998
107,313
TFS Financial Corp
5,057
63,314
M&T Bank Corp.
1,179
105,226
Jefferies Group, Inc.
2,775
62,160
Equity Residential
2,347
104,230
Raymond James Financial, Inc.†
1,884
62,134
Aon Corp.
2,300
103,408
Willis Group Holdings Ltd.
1,925
62,101
Principal Financial Group, Inc.
2,352
102,288
SEI Investments Co.
2,674
59,363
Boston Properties, Inc.
1,032
96,657
Reinsurance Group of America,
HCP, Inc.
2,379
95,469
Inc. — Class A
1,095
59,130
Lincoln National Corp.
2,213
94,739
Alexandria Real Estate Equities, Inc.
525
59,063
Progressive Corp.
5,442
94,691
The St. Joe Co.*
1,505
58,830
Leucadia National Corp.
2,078
94,424
HCC Insurance Holdings, Inc.
2,166
58,482
KIMCO Realty Corp.
2,502
92,424
Eaton Vance Corp.
1,657
58,376
Unum Group
3,649
91,590
Alleghany Corp.*
159
58,035
See Notes to Financial Statements.
THE RYDEX SERIES FUNDS SEMI-ANNUAL REPORT
|
25
SCHEDULE OF INVESTMENTS (Unaudited) (concluded)
September 30, 2008
FINANCIAL SERVICES FUND
MARKET
MARKET
SHARES
VALUE
SHARES
VALUE
AMB Property Corp.
1,280
$
57,984
Camden Property Trust
1,005
$
46,089
Cullen/Frost Bankers, Inc.
964
57,840
Nationwide Financial Services, Inc.
920
45,384
W.R. Berkley Corp.
2,454
57,792
Federated Investors, Inc. — Class B
1,567
45,208
PartnerRe Ltd.
840
57,196
Arthur J. Gallagher & Co.
1,753
44,982
SLM Corp.*
4,628
57,110
UMB Financial Corp.
805
42,279
Rayonier, Inc.
1,203
56,962
Erie Indemnity Co. — Class A
1,000
42,270
Capitol Federal Financial
1,280
56,742
Mack-Cali Realty Corp.
1,247
42,236
RenaissanceRe Holdings Ltd.
1,090
56,680
General Growth Properties, Inc.
2,747
41,480
Liberty Property Trust
1,504
56,626
Genworth Financial, Inc. — Class A
4,767
41,044
Duke Realty Corp.
2,289
56,264
Wachovia Corp.
11,620
40,670
Markel Corp.*
160
56,240
CB Richard Ellis Group, Inc. —
Developers Diversified Realty Corp.
1,758
55,711
Class A*
2,948
39,415
Digital Realty Trust, Inc.
1,175
55,519
Waddell & Reed Financial, Inc. —
UDR, Inc.
2,117
55,360
Class A
1,500
37,125
Janus Capital Group, Inc.
2,270
55,116
Protective Life Corp.
1,298
37,006
American Financial Group, Inc.
1,868
55,106
CIT Group, Inc.
5,295
36,853
Synovus Financial Corp.
5,321
55,072
Student Loan Corp.
390
36,270
Weingarten Realty Investors
1,540
54,932
Allied Capital Corp.
3,214
34,711
Transatlantic Holdings, Inc.
1,010
54,894
Sovereign Bancorp, Inc.
8,459
33,413
Mercury General Corp.
1,001
54,805
MSCI, Inc. — Class A*
1,374
32,976
Brown & Brown, Inc.
2,516
54,396
American International Group, Inc.
9,484
31,582
Old Republic International Corp.
4,265
54,379
GLG Partners, Inc.†
4,755
25,772
Commerce Bancshares, Inc.
1,171
54,334
National City Corp.
12,310
21,543
Nationwide Health Properties, Inc.
1,509
54,294
Washington Mutual, Inc.
13,258
1,081
CapitalSource, Inc.
4,403
54,157
Total Common Stocks
BOK Financial Corp.
1,108
53,638
(Cost $13,932,047)
15,452,475
Valley National Bancorp†
2,555
53,553
Fidelity National Financial, Inc. —
SECURITIES LENDING COLLATERAL 1.0%
Class A
3,640
53,508
Mount Vernon Securities Lending
Affiliated Managers Group, Inc.*
645
53,438
Trust Prime Portfolio (Note 8)
151,435
151,435
Odyssey Re Holdings Corp.
1,220
53,436
Total Securities Lending Collateral
First American Corp.
1,800
53,100
(Cost $151,435)
151,435
Essex Property Trust, Inc.
440
52,065
Senior Housing Properties Trust
2,145
51,115
FACE
Apartment Investment & Management
AMOUNT
Co. — Class A
1,448
50,709
REPURCHASE AGREEMENT 0.5%
Bank of Hawaii Corp.
945
50,510
Repurchase Agreement (Note 4)
City National Corp.
925
50,228
Credit Suisse Group
SL Green Realty Corp.
773
50,090
issued 09/30/08 at 0.25%
XL Capital Ltd.
2,791
50,071
due 10/01/08
$79,397
79,397
Douglas Emmett, Inc.
2,162
49,877
Huntington Bancshares, Inc.
6,217
49,674
Total Repurchase Agreement
Associated Banc-Corp.
2,483
49,536
(Cost $79,397)
79,397
Taubman Centers, Inc.
969
48,450
Total Investments 101.3%
Stancorp Financial Group, Inc.
925
48,100
(Cost $14,162,879)
$15,683,307
BRE Properties, Inc. — Class A
975
47,775
Liabilities in Excess of
Forest City Enterprises, Inc. —
Other Assets – (1.3)%
$
(195,464)
Class A
1,550
47,539
Net Assets – 100.0%
$15,487,843
Apollo Investment Corp.
2,787
47,518
Realty Income Corp.
1,855
47,488
* Non-Income Producing Security.
† All or a portion of this security is on loan at September 30, 2008 — See Note 8.
ADR—American Depository Receipt.
REIT—Real Estate Investment Trust.
26
|
THE RYDEX SERIES FUNDS SEMI-ANNUAL REPORT
See Notes to Financial Statements.
SCHEDULE OF INVESTMENTS (Unaudited)
September 30, 2008
HEALTH CARE FUND
MARKET
MARKET
SHARES
VALUE
SHARES
VALUE
COMMON STOCKS 99.7%
Forest Laboratories, Inc.*
12,479
$
352,906
DaVita, Inc.*
6,042
344,454
Johnson & Johnson, Inc.
27,711
$
1,919,818
Hospira, Inc.*
8,714
332,875
Novartis AG — SP ADR
29,210
1,543,456
AmerisourceBergen Corp.
8,834
332,600
Pfizer, Inc.
82,458
1,520,526
Covance, Inc.*
3,730
329,769
GlaxoSmithKline PLC — SP ADR
32,157
1,397,543
Applied Biosystems Inc.
9,602
328,869
Genentech, Inc.*
15,466
1,371,525
Cephalon, Inc.*
4,223
327,240
Abbott Laboratories
22,274
1,282,537
Coventry Health Care, Inc.*
9,760
317,688
Sanofi-Aventis — SP ADR
37,087
1,219,050
Waters Corp.*
5,431
315,976
Amgen, Inc.*
19,445
1,152,505
DENTSPLY International, Inc.
8,352
313,534
AstraZeneca PLC — SP ADR†
24,438
1,072,339
Pharmaceutical Product Development,
Merck & Company, Inc.
32,757
1,033,811
Inc.
7,348
303,840
Medtronic, Inc.
19,608
982,361
Henry Schein, Inc.*
5,560
299,350
Alcon, Inc. — SP ADR
5,820
939,988
Vertex Pharmaceuticals, Inc.*†
8,936
297,033
Eli Lilly & Co.
20,839
917,541
Beckman Coulter, Inc.
4,144
294,183
Teva Pharmaceutical Industries
Illumina, Inc.*
7,060
286,142
Ltd. — SP ADR
19,120
875,505
Hologic, Inc.*
14,048
271,548
Baxter International, Inc.
13,058
856,997
Perrigo Co.†
6,920
266,143
Wyeth
22,766
840,976
Millipore Corp.*
3,855
265,224
Bristol-Myers Squibb Co.
40,286
839,963
IDEXX Laboratories, Inc.*
4,670
255,916
Gilead Sciences, Inc.*
17,538
799,382
Cerner Corp.*
5,730
255,787
UnitedHealth Group, Inc.
31,034
787,953
Patterson Companies, Inc.*
8,391
255,170
Covidien Ltd.
13,830
743,501
Charles River Laboratories
Schering-Plough Corp.
36,800
679,696
International, Inc.*
4,552
252,773
WellPoint, Inc.*
14,528
679,475
Warner Chilcott Ltd.*
16,384
247,726
Celgene Corp.*
10,622
672,160
Invitrogen Corp.*
6,520
246,456
Stryker Corp.
10,551
657,327
Mylan Laboratories, Inc.*
21,025
240,106
Medco Health Solutions, Inc.*
14,298
643,410
IMS Health, Inc.
12,413
234,730
Genzyme Corp.*
7,916
640,325
Edwards Lifesciences Corp.*
4,000
231,040
Thermo Fisher Scientific, Inc.*
11,635
639,925
PerkinElmer, Inc.
8,890
221,983
Express Scripts, Inc.*
8,515
628,577
Community Health Systems, Inc.*
6,980
204,584
Becton, Dickinson & Co.
7,349
589,831
Amylin Pharmaceuticals, Inc.*
9,814
198,439
Aetna, Inc.
15,843
572,091
Elan Corp. PLC — SP ADR*†
16,360
174,561
Boston Scientific Corp.*
44,991
552,040
Total Common Stocks
Cardinal Health, Inc.
11,191
551,492
(Cost $39,187,241)
44,722,865
Allergan, Inc.
10,340
532,510
McKesson Corp.
9,737
523,948
SECURITIES LENDING COLLATERAL 0.6%
Zimmer Holdings, Inc.*
7,708
497,628
Mount Vernon Securities Lending
St. Jude Medical, Inc.*
11,410
496,221
Trust Prime Portfolio (Note 8)
288,825
288,825
Biogen Idec, Inc.*
9,226
463,976
Total Securities Lending Collateral
C.R. Bard, Inc.
4,604
436,781
(Cost $288,825)
288,825
Quest Diagnostics, Inc.
8,429
435,526
Total Investments 100.3%
CIGNA Corp.
12,335
419,143
(Cost $39,476,066)
$45,011,690
Shire PLC — SP ADR
8,680
414,470
Liabilities in Excess of
Intuitive Surgical, Inc.*
1,686
406,292
Other Assets – (0.3)%
$
(129,944)
Barr Pharmaceuticals, Inc.*
5,912
386,054
Varian Medical Systems, Inc.*†
6,706
383,114
Net Assets – 100.0%
$44,881,746
Laboratory Corporation of America
Holdings*
5,461
379,540
ImClone Systems, Inc.*†
6,021
375,951
Humana, Inc.*
8,967
369,440
* Non-Income Producing Security.
† All or a portion of this security is on loan at September 30, 2008 — See Note 8.
ADR—American Depository Receipt.
See Notes to Financial Statements.
THE RYDEX SERIES FUNDS SEMI-ANNUAL REPORT
|
27
SCHEDULE OF INVESTMENTS (Unaudited)
September 30, 2008
INTERNET FUND
MARKET
FACE
MARKET
SHARES
VALUE
AMOUNT
VALUE
COMMON STOCKS 99.7%
REPURCHASE AGREEMENT 0.8%
Repurchase Agreement (Note 4)
Cisco Systems, Inc.*
15,167
$
342,168
Credit Suisse Group
Google, Inc. — Class A*
612
245,118
issued 09/30/08 at 0.25%
Qualcomm, Inc.
5,457
234,487
due 10/01/08
$21,670
$
21,670
Time Warner, Inc.
14,308
187,578
Total Repurchase Agreement
Amazon.com, Inc.*
2,203
160,290
(Cost $21,670)
21,670
eBay, Inc.*
6,752
151,110
Total Investments 103.8%
Research In Motion Ltd.*
2,067
141,176
(Cost $1,707,444)
$2,980,555
Yahoo!, Inc.*
7,182
124,249
Symantec Corp.*
6,072
118,890
Liabilities in Excess of
Intuit, Inc.*
3,113
98,402
Other Assets – (3.8)%
$
(110,157)
Juniper Networks, Inc.*
4,359
91,844
Net Assets – 100.0%
$2,870,398
McAfee, Inc.*
1,993
67,682
Broadcom Corp. — Class A*
3,587
66,826
Baidu.com — SP ADR*
265
65,781
Qwest Communications International,
Inc.
19,640
63,437
Sun Microsystems, Inc.*
8,336
63,354
Check Point Software Technologies
Ltd.*†
2,751
62,558
BMC Software, Inc.*
2,083
59,636
VeriSign, Inc.*
2,142
55,863
Foundry Networks, Inc.*
3,027
55,122
Expedia, Inc.*
3,296
49,803
HLTH Corp.*
3,689
42,165
Red Hat, Inc.*†
2,773
41,789
Equinix, Inc.*†
575
39,939
priceline.com, Inc.*
539
36,884
Sohu.com, Inc.*
654
36,460
Akamai Technologies, Inc.*
2,056
35,857
Monster Worldwide, Inc.*
2,308
34,412
F5 Networks, Inc.*
1,443
33,737
IAC/InterActiveCorp*
1,723
29,808
Ciena Corp.*
1,872
18,870
Ticketmaster*
689
7,393
Total Common Stocks
(Cost $1,589,577)
2,862,688
SECURITIES LENDING COLLATERAL 3.3%
Mount Vernon Securities Lending
Trust Prime Portfolio (Note 8)
96,197
96,197
Total Securities Lending Collateral
(Cost $96,197)
96,197
* Non-Income Producing Security.
† All or a portion of this security is on loan at September 30, 2008 — See Note 8.
ADR—American Depository Receipt.
28
|
THE RYDEX SERIES FUNDS SEMI-ANNUAL REPORT
See Notes to Financial Statements.
SCHEDULE OF INVESTMENTS (Unaudited)
September 30, 2008
LEISURE FUND
MARKET
MARKET
SHARES
VALUE
SHARES
VALUE
COMMON STOCKS 99.8%
Sonic Corp.*
1,629
$
23,735
Cheesecake Factory, Inc.*
1,617
23,641
McDonald’s Corp.
3,451
$
212,927
Take-Two Interactive Software, Inc.
1,401
22,976
Walt Disney Co.
6,223
190,984
Bob Evans Farms, Inc.
824
22,487
Time Warner, Inc.
12,446
163,167
Orient-Express Hotels Ltd. —
Carnival Corp.
3,297
116,549
Class A
910
21,958
News Corp. — Class A
8,940
107,191
Chipotle Mexican Grill, Inc. —
Yum! Brands, Inc.
2,970
96,852
Class A*
338
18,756
Las Vegas Sands Corp.*
2,444
88,253
THQ, Inc.*
1,523
18,337
Viacom, Inc. — Class B*
3,504
87,039
Total Common Stocks
Starbucks Corp.*
5,664
84,224
(Cost $2,197,587)
2,814,251
Electronic Arts, Inc.*
2,055
76,014
Marriott International, Inc. — Class A
2,911
75,948
FACE
Wynn Resorts Ltd.
918
74,945
AMOUNT
MGM MIRAGE*
2,591
73,843
Mattel, Inc.
3,543
63,916
REPURCHASE AGREEMENT 0.5%
Tim Hortons, Inc.
2,030
60,149
Repurchase Agreement (Note 4)
Eastman Kodak Co.
3,570
54,907
Credit Suisse Group
Hasbro, Inc.
1,521
52,809
issued 09/30/08 at 0.25%
International Game Technology, Inc.
2,937
50,458
due 10/01/08
$13,015
13,015
Starwood Hotels & Resorts
Total Repurchase Agreement
Worldwide, Inc.
1,777
50,005
(Cost $13,015)
13,015
Royal Caribbean Cruises Ltd.
2,347
48,700
Total Investments 100.3%
Darden Restaurants, Inc.
1,670
47,812
(Cost $2,210,602)
$2,827,266
Burger King Holdings, Inc.
1,739
42,710
Liabilities in Excess of
Marvel Entertainment, Inc.*
1,242
42,402
Other Assets – (0.3)%
$
(8,410)
DreamWorks Animation SKG, Inc. —
Net Assets – 100.0%
$2,818,856
Class A*
1,285
40,413
Wyndham Worldwide Corp.
2,541
39,919
Penn National Gaming, Inc.*
1,405
37,331
Regal Entertainment Group —
Class A
2,256
35,600
Wendy’s/Arby’s Group, Inc. —
Class A
6,428
33,811
Choice Hotels International, Inc.
1,243
33,685
Bally Technologies, Inc.*
1,112
33,671
Brinker International, Inc.
1,853
33,150
WMS Industries, Inc.*
1,075
32,863
Scientific Games Corp. — Class A*
1,402
32,274
CTC Media, Inc.*
2,087
31,305
Panera Bread Co. — Class A*
614
31,253
Polaris Industries, Inc.
684
31,115
Liberty Media Corp - Capital*
2,259
30,225
Gaylord Entertainment Co.*
997
29,282
Pool Corp.
1,233
28,766
Vail Resorts, Inc.*
810
28,309
Jack in the Box, Inc.*
1,333
28,126
Brunswick Corp.
2,175
27,818
Life Time Fitness, Inc.*
874
27,330
Warner Music Group Corp.
3,588
27,269
International Speedway Corp. —
Class A
695
27,042
* Non-Income Producing Security.
See Notes to Financial Statements.
THE RYDEX SERIES FUNDS SEMI-ANNUAL REPORT
|
29
SCHEDULE OF INVESTMENTS (Unaudited)
September 30, 2008
PRECIOUS METALS FUND
MARKET
FACE
MARKET
SHARES
VALUE
AMOUNT
VALUE
COMMON STOCKS 99.6%
REPURCHASE AGREEMENT 0.6%
Repurchase Agreement (Note 4)
Freeport-McMoRan Copper &
Credit Suisse Group
Gold, Inc.
295,688
$
16,809,863
issued 09/30/08 at 0.25%
Barrick Gold Corp.
422,554
15,524,634
due 10/01/08
$1,165,038
$
1,165,038
Newmont Mining Corp.
393,472
15,250,975
Total Repurchase Agreement
Goldcorp, Inc.
409,939
12,966,371
(Cost $1,165,038)
1,165,038
Agnico-Eagle Mines Ltd.
219,843
12,106,754
Total Investments 114.5%
Kinross Gold Corp.†
577,908
9,315,877
(Cost $165,780,708)
$212,432,893
Yamana Gold, Inc.
1,030,677
8,585,539
Gold Fields Ltd. — SP ADR
875,132
8,392,516
Liabilities in Excess of
AngloGold Ashanti Ltd. —
Other Assets – (14.5)%
$ (26,956,564)
SP ADR
314,461
7,264,049
Net Assets – 100.0%
$185,476,329
Cia de Minas Buenaventura
SA — SP ADR
293,276
6,886,121
Randgold Resources Ltd. —
SP ADR†
163,013
6,688,423
Royal Gold, Inc.†
164,616
5,919,591
Harmony Gold Mining Co.
Ltd. — SP ADR*
594,615
5,755,873
Pan American Silver Corp.*†
250,177
5,561,435
Coeur d’Alene Mines Corp.*†
3,604,232
5,514,475
Iamgold Corp.
959,734
5,393,705
Silver Wheaton Corp.*†
644,727
5,254,525
Eldorado Gold Corp.*
771,217
4,827,818
Hecla Mining Co.*†
973,663
4,556,743
Stillwater Mining Co.*†
758,624
4,407,606
Silver Standard Resources, Inc.*†
237,472
3,925,412
Golden Star Resources Ltd.*†
2,135,245
3,245,572
Novagold Resources, Inc.*†
461,843
3,006,598
Northgate Minerals Corp.*
2,024,544
2,672,398
Allied Nevada Gold Corp.*
325,428
1,861,448
US Gold Corp.*†
1,188,777
1,569,186
Apex Silver Mines Ltd.*†
834,392
1,435,154
Total Common Stocks
(Cost $138,046,476)
184,698,661
SECURITIES LENDING COLLATERAL 14.3%
Mount Vernon Securities Lending
Trust Prime Portfolio (Note 8)
26,569,194
26,569,194
Total Securities Lending Collateral
(Cost $26,569,194)
26,569,194
* Non-Income Producing Security.
† All or a portion of this security is on loan at September 30, 2008 — See Note 8.
ADR—American Depository Receipt.
30
|
THE RYDEX SERIES FUNDS SEMI-ANNUAL REPORT
See Notes to Financial Statements.
SCHEDULE OF INVESTMENTS (Unaudited)
September 30, 2008
RETAILING FUND
MARKET
MARKET
SHARES
VALUE
SHARES
VALUE
COMMON STOCKS 99.7%
Dick’s Sporting Goods, Inc.*
5,324
$
104,244
J. Crew Group, Inc.*
3,465
98,995
Wal-Mart Stores, Inc.†
20,262
$
1,213,491
priceline.com, Inc.*
1,440
98,539
Home Depot, Inc.
20,880
540,583
Barnes & Noble, Inc.†
3,713
96,835
CVS Caremark Corp.
14,911
501,904
Office Depot, Inc.*
15,729
91,543
Lowe’s Companies, Inc.
20,912
495,405
Williams-Sonoma, Inc.
5,633
91,142
Target Corp.
9,914
486,282
Rent-A-Center, Inc.*
4,083
90,969
Amazon.com, Inc.*
5,895
428,920
Saks, Inc.*†
9,066
83,861
Walgreen Co.
13,163
407,527
IAC/InterActiveCorp*
4,610
79,753
Costco Wholesale Corp.
5,938
385,554
AnnTaylor Stores Corp.*
3,806
78,556
Staples, Inc.
13,690
308,025
Penske Auto Group, Inc.†
6,591
75,599
Kohl’s Corp.*
6,572
302,838
Ticketmaster*
1,848
19,829
Sears Holdings Corp.*
3,220
301,070
Total Common Stocks
Best Buy Company, Inc.
7,922
297,075
(Cost $11,783,516)
12,479,356
The Gap, Inc.
16,212
288,249
TJX Companies, Inc.
8,506
259,603
SECURITIES LENDING COLLATERAL 10.1%
Bed Bath & Beyond, Inc.*
7,223
226,874
Mount Vernon Securities Lending
AutoZone, Inc.*
1,747
215,475
Trust Prime Portfolio (Note 8)
1,271,617
1,271,617
J.C. Penney Company, Inc.
6,450
215,043
Total Securities Lending Collateral
Macy’s, Inc.
11,708
210,510
(Cost $1,271,617)
1,271,617
Sherwin-Williams Co.
3,648
208,520
Liberty Media Corp - Interactive*
15,717
202,906
FACE
Genuine Parts Co.
4,936
198,477
AMOUNT
Limited Brands, Inc.
11,167
193,412
REPURCHASE AGREEMENT 0.5%
Nordstrom, Inc.
6,603
190,298
Repurchase Agreement (Note 4)
Urban Outfitters, Inc.*
5,584
177,962
Credit Suisse Group
Longs Drug Stores Corp.
2,213
167,391
issued 09/30/08 at 0.25%
Ross Stores, Inc.
4,487
165,166
due 10/01/08
$62,202
62,202
GameStop Corp. — Class A*
4,762
162,908
O’Reilly Automotive, Inc.*
5,754
154,035
Total Repurchase Agreement
Tiffany & Co.
4,302
152,807
(Cost $62,202)
62,202
Advance Auto Parts, Inc.
3,744
148,487
Total Investments 110.3%
Petsmart, Inc.
5,954
147,123
(Cost $13,117,335)
$13,813,175
Guess?, Inc.
4,099
142,604
Liabilities in Excess of
American Eagle Outfitters, Inc.
9,235
140,834
Other Assets – (10.3)%
$ (1,293,001)
Family Dollar Stores, Inc.
5,879
139,332
Net Assets – 100.0%
$12,520,174
Dollar Tree, Inc.*
3,776
137,295
CarMax, Inc.*
9,759
136,626
Foot Locker, Inc.
8,370
135,259
Expedia, Inc.*
8,818
133,240
RadioShack Corp.
7,642
132,054
AutoNation, Inc.*
11,137
125,180
LKQ Corp.*
6,850
116,245
Abercrombie & Fitch Co. —
Class A
2,939
115,944
Aeropostale, Inc.*
3,529
113,316
Netflix, Inc.*
3,651
112,743
BJ’s Wholesale Club, Inc.*
2,894
112,461
Big Lots, Inc.*
4,037
112,350
Buckle, Inc.
1,905
105,804
Sally Beauty Holdings, Inc.*†
12,126
104,284
* Non-Income Producing Security.
† All or a portion of this security is on loan at September 30, 2008 — See Note 8.
See Notes to Financial Statements.
THE RYDEX SERIES FUNDS SEMI-ANNUAL REPORT
|
31
SCHEDULE OF INVESTMENTS (Unaudited)
September 30, 2008
TECHNOLOGY FUND
MARKET
MARKET
SHARES
VALUE
SHARES
VALUE
COMMON STOCKS 99.6%
ASML Holding NV
4,124
$
72,624
Nvidia Corp.*
6,691
71,661
Microsoft Corp.
17,625
$
470,412
Baidu.com — SP ADR*
286
70,994
International Business Machines
Amphenol Corp. — Class A
1,765
70,847
Corp.
3,156
369,126
McAfee, Inc.*
2,083
70,739
Cisco Systems, Inc.*
15,870
358,027
Alliance Data Systems Corp.*
1,116
70,732
Hewlett-Packard Co.
7,233
334,454
Broadcom Corp. — Class A*
3,759
70,030
Oracle Corp.*
15,065
305,970
Computer Sciences Corp.*
1,739
69,890
Intel Corp.
15,462
289,603
Amdocs, Ltd.*
2,539
69,518
Google, Inc. — Class A*
642
257,134
Cognizant Technology Solutions
Apple, Inc.*
2,181
247,892
Corp. — Class A*
3,038
69,358
Qualcomm, Inc.
5,711
245,402
Microchip Technology, Inc.
2,293
67,483
SAP AG — SP ADR†
4,550
243,106
Sun Microsystems, Inc.*
8,721
66,280
Nokia Oyj — SP ADR
11,304
210,820
SanDisk Corp.*
3,372
65,923
Taiwan Semiconductor Manufacturing
Affiliated Computer Services, Inc. —
Company Ltd. — SP ADR†
21,369
200,228
Class A*
1,295
65,566
Canon, Inc. — SP ADR
5,050
190,637
NetApp, Inc.*
3,591
65,464
eBay, Inc.*
7,067
158,159
Check Point Software Technologies
Research In Motion Ltd.*
2,159
147,460
Ltd.*†
2,875
65,377
EMC Corp*
12,194
145,840
Seagate Technology
5,390
65,327
Dell, Inc.*
8,729
143,854
Flir Systems, Inc.*
1,690
64,930
Telefonaktiebolaget LM Ericsson —
Iron Mountain, Inc.*
2,643
64,516
SP ADR
15,170
143,053
Flextronics International Ltd.*
8,947
63,345
Automatic Data Processing, Inc.
3,346
143,041
BMC Software, Inc.*
2,181
62,442
Visa, Inc.
2,330
143,039
KLA-Tencor Corp.
1,972
62,414
Accenture Ltd. — Class A
3,732
141,816
Citrix Systems, Inc.*
2,445
61,761
Texas Instruments, Inc.
6,457
138,825
Salesforce.com, Inc.*
1,263
61,129
Adobe Systems, Inc.*
3,426
135,224
SAIC, Inc.*
2,980
60,285
Corning, Inc.
8,359
130,735
Satyam Computer Services Ltd. —
Yahoo!, Inc.*
7,510
129,923
SP ADR†
3,630
58,624
Western Union Co.
5,180
127,791
VeriSign, Inc.*
2,244
58,524
Symantec Corp.*
6,355
124,431
Lam Research Corp.*
1,849
58,225
Applied Materials, Inc.
8,163
123,506
Hewitt Associates, Inc. — Class A*
1,560
56,846
Infosys Technologies Ltd. —
Mettler Toledo International, Inc.*
580
56,840
SP ADR
3,640
121,248
Global Payments, Inc.
1,259
56,479
Motorola, Inc.
16,752
119,609
MEMC Electronic Materials, Inc.*
1,974
55,785
Paychex, Inc.
3,178
104,969
Avnet, Inc.*
2,250
55,417
Intuit, Inc.*
3,253
102,827
National Semiconductor Corp.
3,188
54,865
Juniper Networks, Inc.*
4,565
96,185
Marvell Technology Group Ltd.*
5,886
54,740
Tyco Electronics Ltd.
3,450
95,427
Fidelity National Information
MasterCard, Inc.
534
94,694
Services, Inc.
2,954
54,531
Electronic Arts, Inc.*
2,477
91,624
Advanced Micro Devices, Inc.*
10,253
53,828
Agilent Technologies, Inc.*
3,064
90,878
Western Digital Corp.*
2,503
53,364
CA, Inc.
4,487
89,561
NCR Corp.*
2,409
53,118
Xerox Corp.
7,731
89,138
Teradata Corp.*
2,720
53,040
STMicroelectronics NV — SP ADR
8,583
87,375
DST Systems, Inc.*
946
52,967
AU Optronics Corp. — SP ADR
7,579
86,097
Lexmark International, Inc.*
1,626
52,959
Fiserv, Inc.*
1,758
83,189
Itron, Inc.*
590
52,233
Autodesk, Inc.*
2,387
80,084
Infineon Technologies AG —
Xilinx, Inc.
3,271
76,705
SP ADR*
9,248
51,696
Analog Devices, Inc.
2,893
76,231
LSI Logic Corp.*†
9,482
50,824
Linear Technology Corp.
2,472
75,792
Arrow Electronics, Inc.*
1,936
50,762
Alcatel-Lucent*
19,301
74,116
ANSYS, Inc.*
1,270
48,095
Altera Corp.
3,579
74,014
Trimble Navigation Ltd.*
1,858
48,048
Harris Corp.
1,575
72,765
Ingram Micro, Inc. — Class A*
2,984
47,953
32
|
THE RYDEX SERIES FUNDS SEMI-ANNUAL REPORT
See Notes to Financial Statements.
SCHEDULE OF INVESTMENTS (Unaudited) (concluded)
September 30, 2008
TECHNOLOGY FUND
MARKET
SHARES
VALUE
Synopsys, Inc.*
2,321
$
46,304
Total System Services, Inc.
2,820
46,248
Micron Technology, Inc.*
11,326
45,870
Sunpower Corp.*
636
43,907
Red Hat, Inc.*†
2,905
43,778
Nuance Communications, Inc.*
3,480
42,421
ON Semiconductor Corp.*
6,270
42,385
Equinix, Inc.*†
610
42,371
CommScope, Inc.*
1,110
38,450
Broadridge Financial Solutions, Inc.
2,480
38,167
Akamai Technologies, Inc.*
2,161
37,688
VMware, Inc.*†
1,410
37,562
Brocade Communications Systems,
Inc.*
6,400
37,248
Intersil Corp. — Class A
2,114
35,050
Jabil Circuit, Inc.
3,470
33,104
Nortel Networks Corp.*
7,843
17,568
Cypress Semiconductor Corp.*
2,319
12,105
Total Common Stocks
(Cost $9,241,687)
11,280,660
SECURITIES LENDING COLLATERAL 2.4%
Mount Vernon Securities Lending
Trust Prime Portfolio (Note 8)
276,698
276,698
Total Securities Lending Collateral
(Cost $276,698)
276,698
FACE
AMOUNT
REPURCHASE AGREEMENT 0.5%
Repurchase Agreement (Note 4)
Credit Suisse Group
issued 09/30/08 at 0.25%
due 10/01/08
$57,993
57,993
Total Repurchase Agreement
(Cost $57,993)
57,993
Total Investments 102.5%
(Cost $9,576,378)
$11,615,351
Liabilities in Excess of
Other Assets – (2.5)%
$
(285,778)
Net Assets – 100.0%
$11,329,573
* Non-Income Producing Security.
† All or a portion of this security is on loan at September 30, 2008 — See Note 8.
ADR—American Depository Receipt.
See Notes to Financial Statements.
THE RYDEX SERIES FUNDS SEMI-ANNUAL REPORT
|
33
SCHEDULE OF INVESTMENTS (Unaudited)
September 30, 2008
TELECOMMUNICATIONS FUND
MARKET
MARKET
SHARES
VALUE
SHARES
VALUE
COMMON STOCKS 99.5%
SECURITIES LENDING COLLATERAL 1.6%
Mount Vernon Securities Lending
AT&T, Inc.
19,250
$
537,460
Trust Prime Portfolio (Note 8)
98,892
$
98,892
Cisco Systems, Inc.*
23,308
525,828
Total Securities Lending Collateral
Vodafone Group PLC — SP ADR
18,722
413,756
(Cost $98,892)
98,892
Verizon Communications, Inc.
12,623
405,072
Qualcomm, Inc.
8,385
360,303
FACE
Deutsche Telekom AG — SP ADR
22,530
343,132
AMOUNT
Nokia Oyj — SP ADR
16,598
309,553
America Movil SAB de CV —
REPURCHASE AGREEMENT 0.7%
SP ADR
6,663
308,897
Repurchase Agreement (Note 4)
BCE, Inc.
6,411
222,526
Credit Suisse Group
Research In Motion Ltd.*
3,180
217,194
issued 09/30/08 at 0.25%
Telefonaktiebolaget LM Ericsson —
due 10/01/08
$42,265
42,265
SP ADR
22,270
210,006
Total Repurchase Agreement
Corning, Inc.
12,277
192,012
(Cost $42,265)
42,265
Motorola, Inc.
24,594
175,601
Total Investments 101.8%
American Tower Corp. — Class A*
4,446
159,923
(Cost $4,995,840)
$6,428,339
Sprint Nextel Corp.
25,719
156,886
Liabilities in Excess of
Juniper Networks, Inc.*
6,694
141,043
Other Assets – (1.8)%
$
(112,354)
Crown Castle International Corp.*
3,949
114,403
Net Assets – 100.0%
$6,315,985
Alcatel-Lucent*
28,344
108,841
Harris Corp.
2,301
106,306
Embarq Corp.
2,595
105,227
NII Holdings, Inc. — Class B*
2,711
102,801
Qwest Communications International,
Inc.†
30,181
97,485
Windstream Corp.
8,614
94,237
MetroPCS Communications, Inc.*
6,590
92,194
CenturyTel, Inc.
2,409
88,290
Level 3 Communications, Inc.*
32,269
87,126
Frontier Communications Corp.
7,552
86,848
Tele Norte Leste Participacoes SA —
ADR
4,700
82,062
Leap Wireless International, Inc. —
Class B*
1,845
70,294
U.S. Cellular Corp.*
1,390
65,219
SBA Communications Corp.*
2,505
64,804
CommScope, Inc.*
1,630
56,463
Brocade Communications Systems,
Inc.*
9,400
54,708
Brasil Telecom Participacoes SA —
SP ADR
1,084
52,964
F5 Networks, Inc.*
2,220
51,904
Nortel Networks Corp.*
11,524
25,814
Total Common Stocks
(Cost $4,854,683)
6,287,182
* Non-Income Producing Security.
† All or a portion of this security is on loan at September 30, 2008 — See Note 8.
ADR—American Depository Receipt.
34
|
THE RYDEX SERIES FUNDS SEMI-ANNUAL REPORT
See Notes to Financial Statements.
SCHEDULE OF INVESTMENTS (Unaudited)
September 30, 2008
TRANSPORTATION FUND
MARKET
MARKET
SHARES
VALUE
SHARES
VALUE
COMMON STOCKS 99.8%
SECURITIES LENDING COLLATERAL 7.1%
Mount Vernon Securities Lending
United Parcel Service, Inc. —
Trust Prime Portfolio (Note 8)
1,665,634
$
1,665,634
Class B
32,701
$
2,056,566
Total Securities Lending Collateral
Union Pacific Corp.
25,650
1,825,254
(Cost $1,665,634)
1,665,634
Burlington Northern Santa Fe Corp.
18,340
1,695,166
Norfolk Southern Corp.
23,489
1,555,207
FACE
FedEx Corp.
19,150
1,513,616
AMOUNT
Canadian National Railway Co.†
29,612
1,416,342
CSX Corp.
20,471
1,117,102
REPURCHASE AGREEMENT 1.6%
Southwest Airlines Co.
67,442
978,583
Repurchase Agreement (Note 4)
CH Robinson Worldwide, Inc.†
16,865
859,440
Credit Suisse Group
Expeditors International of
issued 09/30/08 at 0.25%
Washington, Inc.
21,364
744,322
due 10/01/08
$375,488
375,488
J.B. Hunt Transport Services, Inc.
17,852
595,721
Total Repurchase Agreement
AMR Corp.*
58,002
569,580
(Cost $375,488)
375,488
Kansas City Southern*
12,425
551,173
Total Investments 108.5%
Ryder System, Inc.
8,686
538,532
(Cost $23,582,474)
$25,345,933
Continental Airlines, Inc. —
Liabilities in Excess of
Class B*
32,050
534,594
Other Assets – (8.5)%
$ (1,977,712)
Hertz Global Holdings, Inc.*†
62,566
473,625
Net Assets – 100.0%
$23,368,221
Northwest Airlines Corp.*
52,325
472,495
Delta Air Lines, Inc.*
63,336
471,853
Landstar System, Inc.†
9,794
431,524
Alexander & Baldwin, Inc.
9,211
405,560
Con-way, Inc.
9,135
402,945
Kirby Corp.*
10,582
401,481
JetBlue Airways Corp.*
78,504
388,595
Werner Enterprises, Inc.
17,286
375,279
HUB Group, Inc. — Class A*
9,764
367,615
UTI Worldwide, Inc.
21,399
364,211
Heartland Express, Inc.
23,153
359,334
Knight Transportation, Inc.
20,065
340,503
Genesee & Wyoming, Inc. —
Class A*
8,663
325,036
Old Dominion Freight Line, Inc.*
9,785
277,307
Atlas Air Worldwide Holdings Co.,
Inc.*
6,420
258,790
DryShips Inc.†
7,128
252,973
Genco Shipping & Trading Ltd.†
6,454
214,531
Eagle Bulk Shipping Inc.†
12,192
169,956
Total Common Stocks
(Cost $21,541,352)
23,304,811
* Non-Income Producing Security.
† All or a portion of this security is on loan at September 30, 2008 — See Note 8.
See Notes to Financial Statements.
THE RYDEX SERIES FUNDS SEMI-ANNUAL REPORT
|
35
SCHEDULE OF INVESTMENTS (Unaudited)
September 30, 2008
UTILITIES FUND
MARKET
MARKET
SHARES
VALUE
SHARES
VALUE
COMMON STOCKS 99.6%
AGL Resources, Inc.
6,174
$
193,740
Energen Corp.
4,176
189,089
Exelon Corp.
11,523
$
721,570
Vectren Corp.
6,784
188,934
Southern Co.
19,132
721,085
Mirant Corp.*†
10,125
185,186
Dominion Resources, Inc.
14,758
631,347
Southern Union Co.
8,950
184,818
Duke Energy Corp.
35,006
610,155
Sierra Pacific Resources
17,937
171,836
FirstEnergy Corp.
8,115
543,624
Great Plains Energy, Inc.
7,570
168,205
FPL Group, Inc.
10,274
516,782
Constellation Energy Group, Inc.
6,178
150,125
American Electric Power
Ormat Technologies, Inc.
4,013
145,792
Company, Inc.
13,107
485,352
Reliant Energy, Inc.*
17,833
131,073
Entergy Corp.
5,366
477,628
Dynegy Inc.*
33,795
120,986
Consolidated Edison, Inc.
10,934
469,725
Total Common Stocks
PG&E Corp.
12,539
469,586
(Cost $15,235,496)
18,274,939
Public Service Enterprise Group, Inc.
14,125
463,159
Progress Energy, Inc.†
10,325
445,317
SECURITIES LENDING COLLATERAL 10.2%
Sempra Energy
8,804
444,338
Mount Vernon Securities Lending
Edison International
10,489
418,511
Trust Prime Portfolio (Note 8)
1,866,524
1,866,524
PPL Corp.
11,298
418,252
Total Securities Lending Collateral
Xcel Energy, Inc.†
19,048
380,770
(Cost $1,866,524)
1,866,524
Ameren Corp.†
9,303
363,096
DTE Energy Co.†
8,063
323,488
FACE
AES Corp.*†
26,245
306,804
AMOUNT
Wisconsin Energy Corp.
6,680
299,932
REPURCHASE AGREEMENT 0.7%
SCANA Corp.
7,388
287,615
Repurchase Agreement (Note 4)
Allegheny Energy, Inc.
7,797
286,696
Credit Suisse Group
MDU Resources Group, Inc.†
9,830
285,070
issued 09/30/08 at 0.25%
Questar Corp.
6,925
283,371
due 10/01/08
$120,848
120,848
CenterPoint Energy, Inc.
18,859
274,776
Pepco Holdings, Inc.†
11,663
267,199
Total Repurchase Agreement
Northeast Utilities†
10,276
263,579
(Cost $120,848)
120,848
Calpine Corp.*
19,969
259,597
Total Investments 110.5%
NRG Energy, Inc.*†
10,416
257,796
(Cost $17,222,868)
$20,262,311
Pinnacle West Capital Corp.†
7,329
252,191
Liabilities in Excess of
Integrys Energy Group, Inc.
5,045
251,947
Other Assets – (10.5)%
$ (1,922,249)
NSTAR
7,471
250,278
Net Assets – 100.0%
$18,340,062
Puget Energy, Inc.
9,245
246,841
Alliant Energy Corp.
7,505
241,736
NiSource, Inc.
16,330
241,031
Equitable Resources, Inc.
6,154
225,729
Hawaiian Electric Industries, Inc.†
7,675
223,419
Piedmont Natural Gas Co.†
6,929
221,451
OGE Energy Corp.
7,030
217,086
Aqua America, Inc.
12,090
214,960
National Fuel Gas Co.†
5,075
214,064
Oneok, Inc.
6,189
212,902
UGI Corp.
8,220
211,912
TECO Energy, Inc.
13,393
210,672
DPL, Inc.†
8,439
209,287
Westar Energy, Inc.
9,051
208,535
CMS Energy Corp.†
16,606
207,077
Atmos Energy Corp.
7,675
204,309
ITC Holdings Corp.†
3,931
203,508
* Non-Income Producing Security.
† All or a portion of this security is on loan at September 30, 2008 — See Note 8.
36
|
THE RYDEX SERIES FUNDS SEMI-ANNUAL REPORT
See Notes to Financial Statements.
This page intentionally left blank.
THE RYDEX SERIES FUNDS SEMI-ANNUAL REPORT
|
37
STATEMENTS OF ASSETS AND LIABILITIES (Unaudited)
Basic
Bio-
Consumer
Banking
Materials
technology
Products
Fund
Fund
Fund
Fund
ASSETS
Investment Securities
$ 24,662,963
$
50,819,930
$
96,928,148
$ 22,861,813
Repurchase Agreements
299,237
521,524
202,446
41,585
Total Investments
24,962,200
51,341,454
97,130,594
22,903,398
Cash
—
1,405
—
—
Receivable for Securities Sold
—
—
851,320
—
Receivable for Fund Shares Sold
249,659
418,616
91,403
46,115
Investment Income Receivable
78,126
82,709
35
81,109
Total Assets
25,289,985
51,844,184
98,073,352
23,030,622
LIABILITIES
Payable upon Return of Securities Loaned
638,933
1,069,448
7,182,660
268,570
Payable for Securities Purchased
148,448
—
—
—
Payable for Fund Shares Redeemed
259,331
773,162
895,491
68,041
Investment Advisory Fees Payable
13,316
44,423
73,535
16,722
Transfer Agent and Administrative Fees Payable
3,917
13,066
21,628
4,918
Distribution and Service Fees Payable
5,462
8,996
9,700
4,881
Portfolio Accounting Fees Payable
1,567
5,226
8,651
1,967
Custody Fees Payable
550
1,855
2,623
711
Overdraft Due to Custodian Bank
—
—
—
—
Other Liabilities
6,500
67,278
47,626
12,072
Total Liabilities
1,078,024
1,983,454
8,241,914
377,882
NET ASSETS
$ 24,211,961
$
49,860,730
$
89,831,438
$ 22,652,740
NET ASSETS CONSIST OF
Paid-In Capital
$ 77,068,012
$
71,525,747
$ 233,361,160
$ 35,782,847
Undistributed Net Investment Income (Loss)
517,205
405,229
(295,454)
522,230
Accumulated Net Realized Loss on Investments
(55,206,091)
(27,131,225)
(178,660,398)
(16,903,191)
Net Unrealized Appreciation on Investments
1,832,835
5,060,979
35,426,130
3,250,854
NET ASSETS
$ 24,211,961
$
49,860,730
$
89,831,438
$ 22,652,740
Investor Class
$ 12,829,101
$
34,519,163
$
73,068,251
$ 11,227,242
Advisor Class
6,775,956
4,650,007
7,672,176
5,070,079
A-Class
1,302,038
4,595,397
4,395,518
3,758,841
C-Class
3,304,866
6,096,163
4,695,493
2,596,578
SHARES OUTSTANDING
Investor Class
1,964,273
906,027
3,128,318
323,626
Advisor Class
1,109,933
127,980
347,553
153,359
A-Class
210,886
124,968
197,330
112,540
C-Class
553,599
172,836
216,882
80,643
NET ASSET VALUES
Investor Class
$6.53
$38.10
$23.36
$34.69
Advisor Class
6.10
36.33
22.07
33.06
A-Class
6.17
36.77
22.27
33.40
A-Class Maximum Offering Price*
6.48
38.60
23.38
35.07
C-Class
5.97
35.27
21.65
32.20
Cost of Investments
$ 23,129,365
$
46,280,475
$
61,704,464
$ 19,652,544
*
Net asset value adjusted for the maximum sales charge of 4.75% of offering price, calculated NAV/(1-4.75%).
38
|
THE RYDEX SERIES FUNDS SEMI-ANNUAL REPORT
See Notes to Financial Statements.
September 30, 2008
Energy
Financial
Health
Precious
Electronics
Energy
Services
Services
Care
Internet
Leisure
Metals
Fund
Fund
Fund
Fund
Fund
Fund
Fund
Fund
$
7,622,335
$
84,592,320
$159,091,944
$ 15,603,910
$ 45,011,690
$
2,958,885
$
2,814,251
$211,267,855
32,884
—
15,721
79,397
—
21,670
13,015
1,165,038
7,655,219
84,592,320
159,107,665
15,683,307
45,011,690
2,980,555
2,827,266
212,432,893
—
—
—
1,269
—
—
—
19,057
—
5,500,096
1,698,390
—
852,194
—
—
—
226,374
80,878
69,355
142,216
35,667
2,800
503,270
1,342,269
470
43,963
68,991
42,554
69,532
—
1,916
9,090
7,882,063
90,217,257
160,944,401
15,869,346
45,969,083
2,983,355
3,332,452
213,803,309
338,218
4,061,970
20,196,614
151,435
288,825
96,197
—
26,569,194
201,295
—
—
—
—
—
492,078
—
9,945
1,305,271
1,857,789
203,226
369,960
7,705
13,335
1,490,252
5,721
68,462
112,690
10,872
60,551
2,689
2,911
109,118
1,683
20,136
33,144
3,198
17,809
791
856
36,373
1,392
17,302
26,365
3,771
9,955
1,120
1,157
15,766
673
8,054
13,258
1,279
7,124
316
342
14,549
202
2,416
6,770
801
2,385
111
103
4,365
—
3,664,954
—
—
299,684
—
—
—
6,314
60,732
94,603
6,921
31,044
4,028
2,814
87,363
565,443
9,209,297
22,341,233
381,503
1,087,337
112,957
513,596
28,326,980
$
7,316,620
$
81,007,960
$138,603,168
$ 15,487,843
$ 44,881,746
$
2,870,398
$
2,818,856
$185,476,329
$ 170,202,667
$
66,830,929
$164,962,132
$ 60,321,603
$ 71,095,918
$ 39,895,639
$ 17,952,916
$183,556,008
(6,128)
(139,073)
(811,580)
379,395
(17,593)
14,365
(4,587)
(537,623)
(164,914,943)
(14,224,236)
(64,152,327)
(46,733,583)
(31,732,203)
(38,312,717)
(15,746,137)
(44,194,241)
2,035,024
28,540,340
38,604,943
1,520,428
5,535,624
1,273,111
616,664
46,652,185
$
7,316,620
$
81,007,960
$138,603,168
$ 15,487,843
$ 44,881,746
$
2,870,398
$
2,818,856
$185,476,329
$
5,008,147
$
52,269,188
$
93,127,418
$
7,167,106
$ 29,672,931
$
1,204,142
$
1,447,796
$160,175,768
1,079,993
8,056,513
13,319,863
1,723,362
5,757,633
954,883
1,052,367
3,879,988
309,868
7,242,380
13,526,598
1,838,934
1,945,698
80,312
80,431
6,066,438
918,612
13,439,879
18,629,289
4,758,441
7,505,484
631,061
238,262
15,354,135
584,914
2,272,015
1,923,081
813,783
2,095,466
36,951
56,685
3,415,752
133,184
367,563
288,611
204,296
429,088
30,647
43,584
84,802
37,822
327,000
289,823
215,788
143,690
2,551
3,301
131,274
115,582
631,480
413,874
581,060
572,821
20,833
10,027
351,883
$8.56
$23.01
$48.43
$8.81
$14.16
$32.59
$25.54
$46.89
8.11
21.92
46.15
8.44
13.42
31.16
24.15
45.75
8.19
22.15
46.67
8.52
13.54
31.48
24.37
46.21
8.60
23.25
49.00
8.94
14.22
33.05
25.59
48.51
7.95
21.28
45.01
8.19
13.10
30.29
23.76
43.63
$
5,620,195
$
56,051,980
$120,502,722
$ 14,162,879
$ 39,476,066
$
1,707,444
$
2,210,602
$165,780,708
THE RYDEX SERIES FUNDS SEMI-ANNUAL REPORT
|
39
STATEMENTS OF ASSETS AND LIABILITIES (Unaudited) (concluded)
Telecom-
Retailing
Technology
munications
Transportation
Fund
Fund
Fund
Fund
ASSETS
Investment Securities
$ 13,750,973
$
11,557,358
$
6,386,074
$ 24,970,445
Repurchase Agreements
62,202
57,993
42,265
375,488
Total Investments
13,813,175
11,615,351
6,428,339
25,345,933
Cash
—
—
—
6,993
Receivable for Securities Sold
—
—
—
962,535
Receivable for Fund Shares Sold
516,649
32,823
249,691
782,670
Investment Income Receivable
7,397
4,252
7,309
23,271
Total Assets
14,337,221
11,652,426
6,685,339
27,121,402
LIABILITIES
Payable upon Return of Securities Loaned
1,271,617
276,698
98,892
1,665,634
Payable for Securities Purchased
488,023
—
252,349
—
Payable for Fund Shares Redeemed
37,559
18,391
1,575
2,046,343
Investment Advisory Fees Payable
9,860
9,873
5,430
18,358
Transfer Agent and Administrative Fees Payable
2,900
2,904
1,597
5,400
Distribution and Service Fees Payable
2,016
3,215
2,255
2,706
Portfolio Accounting Fees Payable
1,160
1,162
639
2,160
Custody Fees Payable
352
348
203
785
Other Liabilities
3,560
10,262
6,414
11,795
Total Liabilities
1,817,047
322,853
369,354
3,753,181
NET ASSETS
$ 12,520,174
$
11,329,573
$
6,315,985
$ 23,368,221
NET ASSETS CONSIST OF
Paid-In Capital
$ 47,261,850
$
87,735,309
$
45,530,734
$ 43,472,962
Undistributed Net Investment Income (Loss)
(14,043)
(50,072)
202,344
(7,508)
Accumulated Net Realized Loss on Investments
(35,423,473)
(78,394,637)
(40,849,592)
(21,860,692)
Net Unrealized Appreciation on Investments
695,840
2,038,973
1,432,499
1,763,459
NET ASSETS
$ 12,520,174
$
11,329,573
$
6,315,985
$ 23,368,221
Investor Class
$ 10,228,395
$
6,766,597
$
3,765,415
$ 18,959,354
Advisor Class
972,574
1,684,267
751,087
2,032,212
A-Class
53,096
558,813
141,219
431,362
C-Class
1,266,109
2,319,896
1,658,264
1,945,293
SHARES OUTSTANDING
Investor Class
959,293
656,236
269,202
809,221
Advisor Class
95,234
170,935
56,394
92,919
A-Class
5,147
56,405
10,544
19,523
C-Class
128,017
241,147
127,655
88,726
NET ASSET VALUES
Investor Class
$10.66
$10.31
$13.99
$23.43
Advisor Class
10.21
9.85
13.32
21.87
A-Class
10.32
9.91
13.39
22.09
A-Class Maximum Offering Price*
10.83
10.40
14.06
23.19
C-Class
9.89
9.62
12.99
21.92
Cost of Investments
$ 13,117,335
$
9,576,378
$
4,995,840
$ 23,582,474
*
Net asset value adjusted for the maximum sales charge of 4.75% of offering price, calculated NAV/(1-4.75%).
40
|
THE RYDEX SERIES FUNDS SEMI-ANNUAL REPORT
See Notes to Financial Statements.
September 30, 2008
Utilities
Fund
$20,141,463
120,848
20,262,311
—
113,509
230,034
39,649
20,645,503
1,866,524
—
399,992
13,229
3,891
6,240
1,556
541
13,468
2,305,441
$18,340,062
$20,273,121
210,675
(5,183,177)
3,039,443
$18,340,062
$
5,383,962
4,044,476
3,128,253
5,783,371
207,700
163,657
125,219
243,971
$25.92
24.71
24.98
26.23
23.71
$17,222,868
THE RYDEX SERIES FUNDS SEMI-ANNUAL REPORT
|
41
STATEMENTS OF OPERATIONS (Unaudited)
Basic
Bio-
Consumer
Banking
Materials
technology
Products
Fund
Fund
Fund
Fund
INVESTMENT INCOME
Interest
$
668
$
7,888
$
4,103
$
1,503
Income from Securities Lending, net
14,811
91,063
83,176
5,551
Dividends, Net of Foreign Tax Withheld
330,710
1,238,111
316,808
308,133
Total Income
346,189
1,337,062
404,087
315,187
EXPENSES
Investment Advisory Fees
62,168
681,692
402,522
92,886
Transfer Agent and Administrative Fees
18,285
200,498
118,389
27,320
Distribution & Service Fees:
Advisor Class
5,821
29,416
18,595
12,941
A-Class
1,240
9,391
4,158
2,958
C-Class
16,079
61,854
23,475
18,921
Portfolio Accounting Fees
7,314
80,199
47,355
10,928
Registration Fees
2,089
37,045
16,613
7,936
Trustees’ Fees*
543
8,873
3,787
1,415
Custody Fees
2,750
21,664
18,922
3,392
Miscellaneous
7,662
68,466
45,725
6,071
Total Expenses
123,951
1,199,098
699,541
184,768
Net Investment Income (Loss)
222,238
137,964
(295,454)
130,419
REALIZED AND UNREALIZED GAIN (LOSS) ON INVESTMENTS
Net Realized Gain (Loss) on:
Investment Securities
(5,117,952)
709,862
(4,659,638)
(521,256)
Total Net Realized Gain (Loss)
(5,117,952)
709,862
(4,659,638)
(521,256)
Net Change in Unrealized Appreciation (Depreciation) on:
Investment Securities
1,004,166
(28,474,219)
8,113,809
(1,635,388)
Net Change in Unrealized Appreciation (Depreciation)
1,004,166
(28,474,219)
8,113,809
(1,635,388)
Net Gain (Loss) on Investments
(4,113,786)
(27,764,357)
3,454,171
(2,156,644)
Net Increase (Decrease) in Net Assets from Operations
$(3,891,548)
$(27,626,393)
$ 3,158,717
$(2,026,225)
Foreign Tax Withheld
$
3,962
$
25,739
$
—
$
2,944
*
Relates to Trustees not deemed “interested persons” within the meaning of Section 2(a)(19) of the 1940 Act.
42
|
THE RYDEX SERIES FUNDS SEMI-ANNUAL REPORT
See Notes to Financial Statements.
Period Ended September 30, 2008
Energy
Financial
Health
Precious
Electronics
Energy
Services
Services
Care
Internet
Leisure
Metals
Fund
Fund
Fund
Fund
Fund
Fund
Fund
Fund
$
881
$
6,675
$
11,462
$
703
$
2,739
$
415
$
322
$
11,831
10,883
55,337
97,071
9,238
16,742
4,522
4,310
119,613
79,495
900,360
674,753
228,631
414,475
14,906
31,813
653,399
91,259
962,372
783,286
238,572
433,956
19,843
36,445
784,843
54,618
587,106
855,512
58,986
245,423
29,712
22,153
687,290
16,064
172,678
251,621
17,349
72,183
8,739
6,516
229,097
2,672
37,342
48,975
5,196
22,334
3,499
3,402
25,081
145
9,368
19,113
1,880
1,085
215
189
11,431
6,647
108,698
145,548
14,457
32,866
5,592
1,757
124,202
6,426
69,071
100,573
6,939
28,873
3,495
2,606
91,639
3,875
28,102
41,192
3,234
9,974
3,365
1,788
44,898
762
6,852
9,767
653
2,004
569
339
9,860
1,702
19,137
31,385
2,365
8,852
1,010
726
24,109
4,476
63,091
91,180
5,861
27,955
1,031
1,556
74,859
97,387
1,101,445
1,594,866
116,920
451,549
57,227
41,032
1,322,466
(6,128)
(139,073)
(811,580)
121,652
(17,593)
(37,384)
(4,587)
(537,623)
(962,344)
(2,791,479)
(11,987,884)
(1,914,957)
(2,651,358)
311,834
(191,482)
(4,599,895)
(962,344)
(2,791,479)
(11,987,884)
(1,914,957)
(2,651,358)
311,834
(191,482)
(4,599,895)
(1,247,762)
(19,766,964)
(33,213,095)
347,136
(1,908,299)
(819,198)
(989,021)
(61,749,966)
(1,247,762)
(19,766,964)
(33,213,095)
347,136
(1,908,299)
(819,198)
(989,021)
(61,749,966)
(2,210,106)
(22,558,443)
(45,200,979)
(1,567,821)
(4,559,657)
(507,364)
(1,180,503)
(66,349,861)
$(2,216,234)
$(22,697,516)
$(46,012,559)
$(1,446,169)
$(4,577,250)
$(544,748)
$(1,185,090)
$(66,887,484)
$
7,636
$
18,247
$
—
$
5,745
$
14,857
$
—
$
—
$
28,316
THE RYDEX SERIES FUNDS SEMI-ANNUAL REPORT
|
43
STATEMENTS OF OPERATIONS (Unaudited) (concluded)
Telecom-
Retailing
Technology
munications
Transportation
Fund
Fund
Fund
Fund
INVESTMENT INCOME
Interest
$
561
$
1,416
$
427
$
1,879
Income from Securities Lending, net
6,112
12,451
5,201
15,629
Dividends, Net of Foreign Tax Withheld
36,493
111,036
191,618
178,750
Total Income
43,166
124,903
197,246
196,258
EXPENSES
Investment Advisory Fees
29,525
91,460
45,838
114,462
Transfer Agent and Administrative Fees
8,684
26,900
13,482
33,665
Distribution & Service Fees:
Advisor Class
2,504
9,128
4,178
8,679
A-Class
111
864
394
487
C-Class
6,836
17,360
14,436
10,689
Portfolio Accounting Fees
3,473
10,760
5,393
13,466
Registration Fees
1,381
5,890
5,325
3,800
Trustees’ Fees*
287
1,225
924
962
Custody Fees
1,206
3,230
1,578
3,767
Miscellaneous
3,202
8,158
1,409
14,139
Total Expenses
57,209
174,975
92,957
204,116
Net Investment Income (Loss)
(14,043)
(50,072)
104,289
(7,858)
REALIZED AND UNREALIZED GAIN (LOSS) ON INVESTMENTS
Net Realized Gain (Loss) on:
Investment Securities
(989,706)
(1,418,122)
557,961
(3,139,200)
Total Net Realized Gain (Loss)
(989,706)
(1,418,122)
557,961
(3,139,200)
Net Change in Unrealized Appreciation (Depreciation) on:
Investment Securities
(887,988)
(1,484,904)
(2,667,451)
(204,450)
Net Change in Unrealized Appreciation (Depreciation)
(887,988)
(1,484,904)
(2,667,451)
(204,450)
Net Loss on Investments
(1,877,694)
(2,903,026)
(2,109,490)
(3,343,650)
Net Decrease in Net Assets from Operations
$(1,891,737)
$ (2,953,098)
$(2,005,201)
$(3,351,508)
Foreign Tax Withheld
$
—
$
10,392
$
13,504
$
1,954
*
Relates to Trustees not deemed “interested persons” within the meaning of Section 2(a)(19) of the 1940 Act.
44
|
THE RYDEX SERIES FUNDS SEMI-ANNUAL REPORT
See Notes to Financial Statements.
Period Ended September 30, 2008
Utilities
Fund
$
1,201
8,419
438,889
448,509
117,479
34,553
9,307
3,787
35,370
13,821
7,861
1,630
3,917
10,109
237,834
210,675
(883,596)
(883,596)
(2,278,958)
(2,278,958)
(3,162,554)
$(2,951,879)
$
—
THE RYDEX SERIES FUNDS SEMI-ANNUAL REPORT
|
45
STATEMENTS OF CHANGES IN NET ASSETS
Basic
Banking Fund
Materials Fund
Period
Year
Period
Year
Ended
Ended
Ended
Ended
September 30,
March 31,
September 30,
March 31,
2008†
2008
2008†
2008
FROM OPERATIONS
Net Investment Income (Loss)
$
222,238
$
294,966
$
137,964
$
261,175
Net Realized Gain (Loss) on Investments
(5,117,952)
(4,869,053)
709,862
(4,600,233)
Net Change in Unrealized Appreciation (Depreciation) on Investments
1,004,166
(842,133)
(28,474,219)
18,153,290
Net Increase (Decrease) in Net Assets from Operations
(3,891,548)
(5,416,220)
(27,626,393)
13,814,232
Distributions to Shareholders from:
Net Investment Income
Investor Class
—
(98,571)
—
(165,464)
Advisor Class
—
(6,043)
—
(21,758)
A-Class
—
(9,992)
—
(12,589)
C-Class
—
(19,529)
—
(21,169)
Realized Gain on Investments
Investor Class
—
—
—
—
Advisor Class
—
—
—
—
A-Class
—
—
—
—
C-Class
—
—
—
—
Total Distributions to Shareholders
—
(134,135)
—
(220,980)
SHARE TRANSACTIONS
Proceeds from Shares Purchased
Investor Class
103,189,103
203,166,852
197,704,111
439,272,110
Advisor Class
18,450,995
21,640,798
18,105,181
54,726,975
A-Class
4,546,477
1,436,715
2,472,547
13,027,976
C-Class
16,024,042
18,442,782
15,526,938
49,665,852
Value of Shares Purchased through Dividend Reinvestment
Investor Class
—
93,964
—
152,731
Advisor Class
—
5,828
—
20,952
A-Class
—
9,633
—
10,167
C-Class
—
19,077
—
19,950
Cost of Shares Redeemed
Investor Class
(95,234,901)
(201,370,951)
(262,607,434)
(396,951,253)
Advisor Class
(12,122,088)
(21,521,627)
(23,273,560)
(60,576,786)
A-Class
(3,436,122)
(837,855)
(3,106,884)
(9,173,446)
C-Class
(15,751,919)
(17,529,872)
(19,811,946)
(45,239,675)
Net Increase (Decrease) in Net Assets From Share Transactions
15,665,587
3,555,344
(74,991,047)
44,955,553
Net Increase (Decrease) in Net Assets
11,774,039
(1,995,011)
(102,617,440)
58,548,805
NET ASSETS—BEGINNING OF PERIOD
12,437,922
14,432,933
152,478,170
93,929,365
NET ASSETS—END OF PERIOD
$ 24,211,961
$
12,437,922
$
49,860,730
$ 152,478,170
Undistributed Net Investment Income (Loss)—End of Period
$
517,205
$
294,967
$
405,229
$
267,265
†
Unaudited
46
|
THE RYDEX SERIES FUNDS SEMI-ANNUAL REPORT
See Notes to Financial Statements.
Biotechnology
Consumer
Electronics
Energy
Fund
Products Fund
Fund
Fund
Period
Year
Period
Year
Period
Year
Period
Year
Ended
Ended
Ended
Ended
Ended
Ended
Ended
Ended
September 30,
March 31,
September 30,
March 31,
September 30,
March 31,
September 30,
March 31,
2008†
2008
2008†
2008
2008†
2008
2008†
2008
$
(295,454)
$
(803,226)
$
130,419
$
391,809
$
(6,128)
$
(117,811)
$
(139,073)
$
(455,175)
(4,659,638)
8,483,131
(521,256)
(400,491)
(962,344)
(38,543)
(2,791,479)
12,292,100
8,113,809
(5,396,782)
(1,635,388)
(2,401,918)
(1,247,762)
(5,411,072)
(19,766,964)
5,885,819
3,158,717
2,283,123
(2,026,225)
(2,410,600)
(2,216,234)
(5,567,426)
(22,697,516)
17,722,744
—
—
—
(321,818)
—
—
—
—
—
—
—
(111,506)
—
—
—
—
—
—
—
(20,984)
—
—
—
—
—
—
—
(30,543)
—
—
—
—
—
—
—
—
—
—
—
(1,578,479)
—
—
—
—
—
—
—
(519,390)
—
—
—
—
—
—
—
(168,071)
—
—
—
—
—
—
—
(666,174)
—
—
—
(484,851)
—
—
—
(2,932,114)
232,695,256
183,304,085
67,513,563
151,791,697
54,290,962
215,488,751
240,111,299
287,360,532
23,762,782
32,423,444
10,864,275
56,728,350
5,858,836
26,169,260
25,445,789
44,333,359
3,489,476
2,961,797
4,232,999
1,616,504
384,134
111,227
5,775,061
6,365,023
20,182,052
25,354,829
7,689,515
11,122,974
13,580,745
34,632,029
27,912,505
66,709,476
—
—
—
316,700
—
—
—
1,496,122
—
—
—
104,700
—
—
—
499,301
—
—
—
19,917
—
—
—
158,240
—
—
—
29,764
—
—
—
624,378
(210,308,839)
(199,452,087)
(63,981,755)
(163,567,156)
(57,414,059)
(216,091,092)
(233,455,086)
(308,834,979)
(20,474,603)
(33,603,351)
(10,704,221)
(55,915,348)
(5,035,267)
(26,889,511)
(33,995,700)
(44,143,704)
(1,461,546)
(1,367,300)
(1,873,620)
(3,923,949)
(118,524)
(130,645)
(3,677,572)
(4,229,618)
(19,119,571)
(24,185,847)
(8,753,757)
(12,711,020)
(13,462,216)
(36,168,055)
(32,815,143)
(68,472,728)
28,765,007
(14,564,430)
4,986,999
(14,386,867)
(1,915,389)
(2,878,036)
(4,698,847)
(18,134,598)
31,923,724
(12,281,307)
2,960,774
(17,282,318)
(4,131,623)
(8,445,462)
(27,396,363)
(3,343,968)
57,907,714
70,189,021
19,691,966
36,974,284
11,448,243
19,893,705
108,404,323
111,748,291
$
89,831,438
$
57,907,714
$ 22,652,740
$
19,691,966
$
7,316,620
$
11,448,243
$
81,007,960
$ 108,404,323
$
(295,454)
$
—
$
522,230
$
391,811
$
(6,128)
$
—
$
(139,073)
$
—
THE RYDEX SERIES FUNDS SEMI-ANNUAL REPORT
|
47
STATEMENTS OF CHANGES IN NET ASSETS (continued)
Energy Services
Financial Services
Fund
Fund
Period
Year
Period
Year
Ended
Ended
Ended
Ended
September 30,
March 31,
September 30,
March 31,
2008†
2008
2008†
2008
FROM OPERATIONS
Net Investment Income (Loss)
$
(811,580)
$
(1,889,075)
$
121,652
$
257,743
Net Realized Gain (Loss) on Investments
(11,987,884)
20,207,317
(1,914,957)
(4,179,459)
Net Change in Unrealized Appreciation (Depreciation) on Investments
(33,213,095)
12,541,125
347,136
(2,588,828)
Net Increase (Decrease) in Net Assets from Operations
(46,012,559)
30,859,367
(1,446,169)
(6,510,544)
Distributions to Shareholders from:
Net Investment Income
Investor Class
—
—
—
(139,823)
Advisor Class
—
—
—
(32,761)
A-Class
—
—
—
(10,414)
C-Class
—
—
—
(47,595)
Total Distributions to Shareholders
—
—
—
(230,593)
SHARE TRANSACTIONS
Proceeds from Shares Purchased
Investor Class
306,849,086
516,306,399
71,514,741
178,520,044
Advisor Class
27,887,783
62,191,229
7,314,902
16,984,925
A-Class
14,967,963
21,824,266
1,338,727
5,818,516
C-Class
24,286,060
58,602,325
14,575,052
19,379,048
Value of Shares Purchased through Dividend Reinvestment
Investor Class
—
—
—
99,191
Advisor Class
—
—
—
20,165
A-Class
—
—
—
10,414
C-Class
—
—
—
46,687
Cost of Shares Redeemed
Investor Class
(262,496,841)
(543,513,435)
(68,727,340)
(192,752,012)
Advisor Class
(26,632,722)
(68,802,543)
(7,218,426)
(30,824,724)
A-Class
(8,229,818)
(18,489,295)
(603,515)
(5,001,171)
C-Class
(31,401,019)
(59,576,438)
(12,070,725)
(20,681,664)
Net Increase (Decrease) in Net Assets From Share Transactions
45,230,492
(31,457,492)
6,123,416
(28,380,581)
Net Increase (Decrease) in Net Assets
(782,067)
(598,125)
4,677,247
(35,121,718)
NET ASSETS—BEGINNING OF PERIOD
139,385,235
139,983,360
10,810,596
45,932,314
NET ASSETS—END OF PERIOD
$ 138,603,168
$ 139,385,235
$ 15,487,843
$
10,810,596
Undistributed Net Investment Income (Loss)—End of Period
$
(811,580)
$
—
$
379,395
$
257,743
†
Unaudited
48
|
THE RYDEX SERIES FUNDS SEMI-ANNUAL REPORT
See Notes to Financial Statements.
Health Care
Internet
Leisure
Precious
Fund
Fund
Fund
Metals Fund
Period
Year
Period
Year
Period
Year
Period
Year
Ended
Ended
Ended
Ended
Ended
Ended
Ended
Ended
September 30,
March 31,
September 30,
March 31,
September 30,
March 31,
September 30,
March 31,
2008†
2008
2008†
2008
2008†
2008
2008†
2008
$
(17,593)
$
(215,989)
$
(37,384)
$
101,522
$
(4,587)
$
(8,462)
$
(537,623)
$
(1,400,490)
(2,651,358)
509,538
311,834
(2,901,982)
(191,482)
2,014,268
(4,599,895)
28,380,022
(1,908,299)
(3,879,926)
(819,198)
(1,008,378)
(989,021)
(3,003,499)
(61,749,966)
10,721,531
(4,577,250)
(3,586,377)
(544,748)
(3,808,838)
(1,185,090)
(997,693)
(66,887,484)
37,701,063
—
—
—
(24,448)
—
—
—
—
—
—
—
(12,991)
—
—
—
—
—
—
—
(942)
—
—
—
—
—
—
—
(11,619)
—
—
—
—
—
—
—
(50,000)
—
—
—
—
241,583,572
170,424,221
17,466,629
144,300,520
39,365,199
62,178,348
462,859,634
856,256,103
19,996,371
42,157,203
4,242,940
32,142,870
6,490,223
18,862,916
23,331,781
50,461,624
1,589,110
849,342
172,706
548,167
13,601
190,020
6,612,574
15,380,251
17,342,831
30,999,619
15,261,101
17,504,124
111,622
3,634,670
72,233,754
107,551,122
—
—
—
24,215
—
—
—
—
—
—
—
11,073
—
—
—
—
—
—
—
834
—
—
—
—
—
—
—
11,489
—
—
—
—
(229,737,426)
(180,573,385)
(20,159,100)
(142,710,703)
(40,431,207)
(67,256,920)
(400,371,463)
(886,454,565)
(27,278,139)
(45,283,724)
(4,436,709)
(30,916,073)
(6,732,494)
(21,995,823)
(27,761,568)
(48,200,441)
(305,369)
(854,546)
(175,903)
(542,355)
(112,445)
(2,184,788)
(8,610,962)
(10,353,561)
(15,299,514)
(33,307,674)
(16,408,598)
(16,578,965)
(231,185)
(6,222,325)
(74,782,041)
(110,015,752)
7,891,436
(15,588,944)
(4,036,934)
3,795,196
(1,526,686)
(12,793,902)
53,511,709
(25,375,219)
3,314,186
(19,175,321)
(4,581,682)
(63,642)
(2,711,776)
(13,791,595)
(13,375,775)
12,325,844
41,567,560
60,742,881
7,452,080
7,515,722
5,530,632
19,322,227
198,852,104
186,526,260
$
44,881,746
$
41,567,560
$
2,870,398
$
7,452,080
$
2,818,856
$
5,530,632
$ 185,476,329
$ 198,852,104
$
(17,593)
$
—
$
14,365
$
51,749
$
(4,587)
$
—
$
(537,623)
$
—
THE RYDEX SERIES FUNDS SEMI-ANNUAL REPORT
|
49
STATEMENTS OF CHANGES IN NET ASSETS (concluded)
Retailing
Technology
Fund
Fund
Period
Year
Period
Year
Ended
Ended
Ended
Ended
September 30,
March 31,
September 30,
March 31,
2008†
2008
2008†
2008
FROM OPERATIONS
Net Investment Income (Loss)
$
(14,043)
$
(51,033)
$
(50,072)
$
(277,462)
Net Realized Gain (Loss) on Investments
(989,706)
566,519
(1,418,122)
(1,443,937)
Net Change in Unrealized Appreciation (Depreciation) on Investments
(887,988)
(2,210,637)
(1,484,904)
(674,525)
Net Decrease in Net Assets from Operations
(1,891,737)
(1,695,151)
(2,953,098)
(2,395,924)
Distributions to Shareholders from:
Net Investment Income
Investor Class
—
—
—
—
Advisor Class
—
—
—
—
A-Class
—
—
—
—
C-Class
—
—
—
—
Total Distributions to Shareholders
—
—
—
—
SHARE TRANSACTIONS
Proceeds from Shares Purchased
Investor Class
42,665,156
95,906,677
56,292,831
146,891,214
Advisor Class
7,353,915
15,058,156
7,835,690
18,854,281
A-Class
42,395
58,665
500,302
5,217,961
C-Class
896,984
4,756,786
12,781,671
19,349,832
Value of Shares Purchased through Dividend Reinvestment
Investor Class
—
—
—
—
Advisor Class
—
—
—
—
A-Class
—
—
—
—
C-Class
—
—
—
—
Cost of Shares Redeemed
Investor Class
(33,970,474)
(95,675,235)
(57,499,947)
(149,463,648)
Advisor Class
(7,038,555)
(16,896,896)
(7,831,904)
(21,492,964)
A-Class
(83,484)
(307,600)
(384,782)
(4,861,496)
C-Class
(797,895)
(5,720,387)
(12,398,494)
(18,008,540)
Net Increase (Decrease) in Net Assets From Share Transactions
9,068,042
(2,819,834)
(704,633)
(3,513,360)
Net Increase (Decrease) in Net Assets
7,176,305
(4,514,985)
(3,657,731)
(5,909,284)
NET ASSETS—BEGINNING OF PERIOD
5,343,869
9,858,854
14,987,304
20,896,588
NET ASSETS—END OF PERIOD
$ 12,520,174
$
5,343,869
$ 11,329,573
$
14,987,304
Undistributed Net Investment Income (Loss)—End of Period
$
(14,043)
$
—
$
(50,072)
$
—
†
Unaudited
50
|
THE RYDEX SERIES FUNDS SEMI-ANNUAL REPORT
See Notes to Financial Statements.
Telecommunications
Transportation
Utilities
Fund
Fund
Fund
Period
Year
Period
Year
Period
Year
Ended
Ended
Ended
Ended
Ended
Ended
September 30,
March 31,
September 30,
March 31,
September 30,
March 31,
2008†
2008
2008†
2008
2008†
2008
$
104,289
$
97,854
$
(7,858)
$
350
$
210,675
$
654,782
557,961
201,874
(3,139,200)
295,047
(883,596)
6,356,354
(2,667,451)
(3,038,765)
(204,450)
(2,961,457)
(2,278,958)
(9,572,561)
(2,005,201)
(2,739,037)
(3,351,508)
(2,666,060)
(2,951,879)
(2,561,425)
—
(18,694)
—
—
—
(430,333)
—
(2,783)
—
—
—
(157,597)
—
(1,872)
—
—
—
(75,704)
—
(7,181)
—
—
—
(136,366)
—
(30,530)
—
—
—
(800,000)
22,068,894
180,185,204
124,655,089
174,508,871
86,685,829
241,295,818
6,291,867
30,857,598
8,427,872
20,140,716
13,681,551
38,052,494
81,573
2,611,638
590,932
220,459
1,577,326
3,401,360
12,652,091
33,656,940
24,099,260
24,674,026
29,265,364
45,508,020
—
17,996
—
—
—
414,442
—
2,585
—
—
—
138,212
—
1,794
—
—
—
66,425
—
7,112
—
—
—
113,760
(28,289,178)
(184,156,771)
(119,824,470)
(162,218,237)
(91,095,992)
(312,890,132)
(6,035,991)
(36,543,698)
(11,379,435)
(17,650,375)
(12,050,961)
(46,606,744)
(355,110)
(4,094,776)
(342,323)
(449,412)
(1,097,739)
(4,889,499)
(13,359,076)
(34,681,335)
(23,152,258)
(28,483,367)
(31,842,011)
(46,922,835)
(6,944,930)
(12,135,713)
3,074,667
10,742,681
(4,876,633)
(82,318,679)
(8,950,131)
(14,905,280)
(276,841)
8,076,621
(7,828,512)
(85,680,104)
15,266,116
30,171,396
23,645,062
15,568,441
26,168,574
111,848,678
$
6,315,985
$
15,266,116
$
23,368,221
$
23,645,062
$ 18,340,062
$
26,168,574
$
202,344
$
98,055
$
(7,508)
$
350
$
210,675
$
—
THE RYDEX SERIES FUNDS SEMI-ANNUAL REPORT
|
51
FINANCIAL HIGHLIGHTS
This table is presented to show selected data for a share outstanding throughout each period, and to assist shareholders in evaluating a Fund’s performance for the periods presented.
RATIOS TO
AVERAGE NET ASSETS:
Net Realized
Net Increase
NET ASSET
Net
and
(Decrease)
Distributions
Distributions
Net Increase
NET ASSET
Net
Net Assets,
VALUE,
Investment
Unrealized
in Net Assets
from Net
from Net
(Decrease) in
VALUE,
Total
Investment
Portfolio
End of
BEGINNING
Income
Gains (Losses)
Value Resulting
Investment
Realized
Total
Net Asset
END OF
Investment
Total
Income
Turnover
Period (000’s
Period Ended
OF PERIOD
(Loss)†
on Investments
from Operations
Income
Gains
Distributions
Value
PERIOD
Return††
Expenses
(Loss)
Rate
omitted)
Banking Fund Investor Class
September 30, 2008D
$
7.56
$
.11
$
(1.14)
$
(1.03)
$
—
$
—
$
—
$
(1.03)
$
6.53
(13.62)%
1.38%**
3.32%**
582%
$ 12,829
March 31, 2008
11.03
.25
(3.62)
(3.37)
(.10)
—
(.10)
(3.47)
7.56
(30.69)%
1.37%
2.59%
1,417%
7,035
March 31, 2007
10.86
.20
.05
.25
(.08)
—
(.08)
.17
11.03
2.24%
1.32%
1.79%
954%
9,229
March 31, 2006
10.17
.16
.69
.85
(.16)
—
(.16)
.69
10.86
8.41%
1.34%
1.48%
1,834%
8,713
March 31, 2005
10.25
.13
.05
.18
(.26)
—
(.26)
(.08)
10.17
1.61%
1.34%
1.26%
1,692%
4,899
March 31, 2004
7.30
.14
2.89
3.03
(.08)
—
(.08)
2.95
10.25
41.53%
1.36%
1.51%
1,435%
12,504
Banking Fund Advisor Class
September 30, 2008D
7.07
.09
(1.06)
(.97)
—
—
—
(.97)
6.10
(13.72)%
1.87%**
3.02%**
582%
6,776
March 31, 2008
10.39
.20
(3.42)
(3.22)
(.10)
—
(.10)
(3.32)
7.07
(31.14)%
1.85%
2.32%
1,417%
1,449
March 31, 2007
10.30
.11
.06
.17
(.08)
—
(.08)
.09
10.39
1.58%
1.88%
1.08%
954%
1,836
March 31, 2006
9.72
.12
.62
.74
(.16)
—
(.16)
.58
10.30
7.66%
1.84%
1.20%
1,834%
1,537
March 31, 2005
9.85
.06
.07
.13
(.26)
—
(.26)
(.13)
9.72
1.17%
1.86%
0.60%
1,692%
2,955
March 31, 2004
7.06
.09
2.78
2.87
(.08)
—
(.08)
2.79
9.85
40.67%
1.86%
1.04%
1,435%
3,712
Banking Fund A-Class
September 30, 2008D
7.15
.10
(1.08)
(.98)
—
—
—
(.98)
6.17
(13.71)%
1.60%**
3.19%**
582%
1,302
March 31, 2008
10.47
.20
(3.42)
(3.22)
(.10)
—
(.10)
(3.32)
7.15
(30.90)%
1.55%
2.33%
1,417%
547
March 31, 2007
10.34
.17
.04
.21
(.08)
—
(.08)
.13
10.47
1.96%
1.62%
1.54%
954%
187
March 31, 2006
9.72
.14
.64
.78
(.16)
—
(.16)
.62
10.34
8.07%
1.62%
1.40%
1,834%
97
March 31, 2005*
10.06
.06
(.14)
(.08)
(.26)
—
(.26)
(.34)
9.72
0.95%
1.57%**
1.03%**
1,692%
15
Banking Fund C-Class
September 30, 2008D
6.95
.07
(1.05)
(.98)
—
—
—
(.98)
5.97
(14.10)%
2.39%**
2.29%**
582%
3,305
March 31, 2008
10.27
.16
(3.38)
(3.22)
(.10)
—
(.10)
(3.32)
6.95
(31.51)%
2.35%
1.89%
1,417%
3,408
March 31, 2007
10.20
.07
.08
.15
(.08)
—
(.08)
.07
10.27
1.40%
2.37%
0.63%
954%
3,180
March 31, 2006
9.66
.06
.64
.70
(.16)
—
(.16)
.54
10.20
7.29%
2.35%
0.59%
1,834%
673
March 31, 2005
9.87
.04
.01
.05
(.26)
—
(.26)
(.21)
9.66
0.35%
2.34%
0.43%
1,692%
867
March 31, 2004
7.12
.04
2.79
2.83
(.08)
—
(.08)
2.75
9.87
39.76%
2.37%
0.41%
1,435%
1,829
Basic Materials Fund Investor Class
September 30, 2008D
50.49
.08
(12.47)
(12.39)
—
—
—
(12.39)
38.10
(24.54)%
1.37%**
0.29%**
98%
34,519
March 31, 2008
42.25
.15
8.18
8.33
(.09)
—
(.09)
8.24
50.49
19.71%
1.37%
0.31%
225%
120,870
March 31, 2007
35.23
.41
6.91
7.32
(.30)
—
(.30)
7.02
42.25
20.86%
1.36%
1.09%
442%
68,862
March 31, 2006
30.66
.32
4.44
4.76
(.19)
—
(.19)
4.57
35.23
15.60%
1.35%
1.04%
826%
23,630
March 31, 2005
25.46
.14
5.06
5.20
—
—
—
5.20
30.66
20.42%
1.33%
0.51%
891%
34,039
March 31, 2004
17.22
.05
8.32
8.37
(.13)
—
(.13)
8.24
25.46
48.70%
1.38%
0.20%
1,669%
29,749
Basic Materials Fund Advisor Class
September 30, 2008D
48.27
(.05)
(11.89)
(11.94)
—
—
—
(11.94)
36.33
(24.74)%
1.87%**
(0.19)%**
98%
4,650
March 31, 2008
40.61
(.11)
7.86
7.75
(.09)
—
(.09)
7.66
48.27
19.08%
1.87%
(0.25)%
225%
11,899
March 31, 2007
34.03
.26
6.62
6.88
(.30)
—
(.30)
6.58
40.61
20.30%
1.87%
0.72%
442%
15,974
March 31, 2006
29.78
.16
4.28
4.44
(.19)
—
(.19)
4.25
34.03
14.98%
1.85%
0.55%
826%
7,619
March 31, 2005
24.85
.01
4.92
4.93
—
—
—
4.93
29.78
19.84%
1.82%
0.03%
891%
12,987
March 31, 2004
16.89
.02
8.07
8.09
(.13)
—
(.13)
7.96
24.85
47.99%
1.87%
0.09%
1,669%
13,483
Basic Materials Fund A-Class
September 30, 2008D
48.80
.03
(12.06)
(12.03)
—
—
—
(12.03)
36.77
(24.65)%
1.62%**
0.11%**
98%
4,595
March 31, 2008
40.92
.03
7.94
7.97
(.09)
—
(.09)
7.88
48.80
19.47%
1.62%
0.07%
225%
6,985
March 31, 2007
34.19
.33
6.70
7.03
(.30)
—
(.30)
6.73
40.92
20.65%
1.62%
0.92%
442%
2,076
March 31, 2006
29.84
.29
4.25
4.54
(.19)
—
(.19)
4.35
34.19
15.29%
1.63%
0.97%
826%
659
March 31, 2005*
25.80
.07
3.97
4.04
—
—
—
4.04
29.84
15.66%
1.55%**
0.44%**
891%
210
FINANCIAL HIGHLIGHTS (continued)
This table is presented to show selected data for a share outstanding throughout each period, and to assist shareholders in evaluating a Fund’s performance for the periods presented.
RATIOS TO
AVERAGE NET ASSETS:
Net Realized
Net Increase
NET ASSET
Net
and
(Decrease)
Distributions
Distributions
Net Increase
NET ASSET
Net
Net Assets,
VALUE,
Investment
Unrealized
in Net Assets
from Net
from Net
(Decrease) in
VALUE,
Total
Investment
Portfolio
End of
BEGINNING
Income
Gains (Losses)
Value Resulting
Investment
Realized
Total
Net Asset
END OF
Investment
Total
Income
Turnover
Period (000’s
Period Ended
OF PERIOD
(Loss)†
on Investments
from Operations
Income
Gains
Distributions
Value
PERIOD
Return††
Expenses
(Loss)
Rate
omitted)
Basic Materials Fund C-Class
September 30, 2008D
$47.02
$ (.16)
$ (11.59)
$ (11.75)
$
—
$
—
$
—
$ (11.75)
$35.27
(24.99)%
2.37%**
(0.65)%**
98%
$
6,096
March 31, 2008
39.76
(.28)
7.63
7.35
(.09)
—
(.09)
7.26
47.02
18.48%
2.37%
(0.63)%
225%
12,725
March 31, 2007
33.48
.04
6.54
6.58
(.30)
—
(.30)
6.28
39.76
19.74%
2.37%
0.11%
442%
7,017
March 31, 2006
29.44
.03
4.20
4.23
(.19)
—
(.19)
4.04
33.48
14.44%
2.36%
0.11%
826%
6,041
March 31, 2005
24.68
(.12)
4.88
4.76
—
—
—
4.76
29.44
19.29%
2.32%
(0.43)%
891%
7,421
March 31, 2004
16.86
(.14)
8.09
7.95
(.13)
—
(.13)
7.82
24.68
47.25%
2.38%
(0.62)%
1,669%
5,311
Biotechnology Fund Investor Class
September 30, 2008D
21.51
(.06)
1.91
1.85
—
—
—
1.85
23.36
8.60%
1.38%**
(0.51)%**
189%
73,068
March 31, 2008
21.21
(.22)
.52
.30
—
—
—
.30
21.51
1.41%
1.39%
(0.94)%
193%
47,696
March 31, 2007
23.45
(.27)
(1.97)
(2.24)
—
—
—
(2.24)
21.21
(9.55)%
1.37%
(1.23)%
269%
61,366
March 31, 2006
17.59
(.26)
6.12
5.86
—
—
—
5.86
23.45
33.31%
1.34%
(1.25)%
338%
104,126
March 31, 2005
20.56
(.24)
(2.73)
(2.97)
—
—
—
(2.97)
17.59
(14.45)%
1.33%
(1.25)%
585%
74,890
March 31, 2004
13.75
(.24)
7.05
6.81
—
—
—
6.81
20.56
49.53%
1.35%
(1.31)%
548%
135,619
Biotechnology Fund Advisor Class
September 30, 2008D
20.39
(.13)
1.81
1.68
—
—
—
1.68
22.07
8.24%
1.88%**
(1.13)%**
189%
7,672
March 31, 2008
20.20
(.31)
.50
.19
—
—
—
.19
20.39
0.94%
1.89%
(1.42)%
193%
4,220
March 31, 2007
22.44
(.37)
(1.87)
(2.24)
—
—
—
(2.24)
20.20
(9.98)%
1.87%
(1.75)%
269%
5,295
March 31, 2006
16.91
(.36)
5.89
5.53
—
—
—
5.53
22.44
32.70%
1.86%
(1.76)%
338%
26,240
March 31, 2005
19.86
(.32)
(2.63)
(2.95)
—
—
—
(2.95)
16.91
(14.85)%
1.83%
(1.75)%
585%
10,231
March 31, 2004
13.35
(.32)
6.83
6.51
—
—
—
6.51
19.86
48.76%
1.84%
(1.79)%
548%
12,708
Biotechnology Fund A-Class
September 30, 2008D
20.54
(.09)
1.82
1.73
—
—
—
1.73
22.27
8.42%
1.63%**
(0.79)%**
189%
4,396
March 31, 2008
20.30
(.27)
.51
.24
—
—
—
.24
20.54
1.18%
1.62%
(1.26)%
193%
2,321
March 31, 2007
22.50
(.31)
(1.89)
(2.20)
—
—
—
(2.20)
20.30
(9.78)%
1.62%
(1.50)%
269%
849
March 31, 2006
16.93
(.33)
5.90
5.57
—
—
—
5.57
22.50
32.90%
1.63%
(1.52)%
338%
5,087
March 31, 2005*
17.89
(.16)
(.80)
(.96)
—
—
—
(.96)
16.93
(5.37)%
1.53%**
(1.47)%**
585%
74
Biotechnology Fund C-Class
September 30, 2008D
20.03
(.18)
1.80
1.62
—
—
—
1.62
21.65
8.09%
2.38%**
(1.61)%**
189%
4,695
March 31, 2008
19.95
(.42)
.50
.08
—
—
—
.08
20.03
0.40%
2.38%
(1.99)%
193%
3,671
March 31, 2007
22.27
(.46)
(1.86)
(2.32)
—
—
—
(2.32)
19.95
(10.42)%
2.36%
(2.23)%
269%
2,678
March 31, 2006
16.87
(.47)
5.87
5.40
—
—
—
5.40
22.27
32.01%
2.36%
(2.27)%
338%
7,786
March 31, 2005
19.92
(.42)
(2.63)
(3.05)
—
—
—
(3.05)
16.87
(15.31)%
2.33%
(2.23)%
585%
2,625
March 31, 2004
13.47
(.43)
6.88
6.45
—
—
—
6.45
19.92
47.88%
2.36%
(2.32)%
548%
3,567
Consumer Products Fund Investor Class
September 30, 2008D
36.40
.27
(1.98)
(1.71)
—
—
—
(1.71)
34.69
(4.70)%
1.37%**
1.53%**
300%
11,227
March 31, 2008
36.11
.52
.13
.65
(.36)
—
(.36)
.29
36.40
1.72%
1.37%
1.37%
449%
8,722
March 31, 2007
31.03
.43
4.71
5.14
(.06)
—
(.06)
5.08
36.11
16.58%
1.37%
1.29%
455%
21,814
March 31, 2006
30.50
.30
.65
.95
(.42)
—
(.42)
.53
31.03
3.13%
1.32%
0.98%
813%
11,815
March 31, 2005
28.68
.18
1.65
1.83
(.01)
—
(.01)
1.82
30.50
6.40%
1.33%
0.60%
907%
15,470
March 31, 2004
20.85
.14
7.74
7.88
(.05)
—
(.05)
7.83
28.68
37.84%
1.36%
0.56%
914%
23,560
Consumer Products Fund Advisor Class
September 30, 2008D
34.78
.19
(1.91)
(1.72)
—
—
—
(1.72)
33.06
(4.95)%
1.88%**
1.12%**
300%
5,070
March 31, 2008
34.68
.15
.31
.46
(.36)
—
(.36)
.10
34.78
1.25%
1.87%
0.42%
449%
5,384
March 31, 2007
29.96
.20
4.58
4.78
(.06)
—
(.06)
4.72
34.68
15.97%
1.86%
0.64%
455%
5,754
March 31, 2006
29.66
.03
.69
.72
(.42)
—
(.42)
.30
29.96
2.44%
1.82%
0.08%
813%
6,487
March 31, 2005
27.99
.05
1.63
1.68
(.01)
—
(.01)
1.67
29.66
6.02%
1.82%
0.19%
907%
26,851
March 31, 2004
20.46
(.04)
7.62
7.58
(.05)
—
(.05)
7.53
27.99
37.10%
1.86%
(0.18)%
914%
13,357
FINANCIAL HIGHLIGHTS (continued)
This table is presented to show selected data for a share outstanding throughout each period, and to assist shareholders in evaluating a Fund’s performance for the periods presented.
RATIOS TO
AVERAGE NET ASSETS:
Net Realized
Net Increase
NET ASSET
Net
and
(Decrease)
Distributions
Distributions
Net Increase
NET ASSET
Net
Net Assets,
VALUE,
Investment
Unrealized
in Net Assets
from Net
from Net
(Decrease) in
VALUE,
Total
Investment
Portfolio
End of
BEGINNING
Income
Gains (Losses)
Value Resulting
Investment
Realized
Total
Net Asset
END OF
Investment
Total
Income
Turnover
Period (000’s
Period Ended
OF PERIOD
(Loss)†
on Investments
from Operations
Income
Gains
Distributions
Value
PERIOD
Return††
Expenses
(Loss)
Rate
omitted)
Consumer Products Fund A-Class
September 30, 2008D
$35.09
$
.20
$
(1.89)
$
(1.69)
$
—
$
—
$
—
$
(1.69)
$33.40
(4.82)%
1.63%**
1.15%**
300%
$
3,759
March 31, 2008
34.90
.50
.05
.55
(.36)
—
(.36)
.19
35.09
1.50%
1.63%
1.38%
449%
1,682
March 31, 2007
30.07
.42
4.47
4.89
(.06)
—
(.06)
4.83
34.90
16.27%
1.61%
1.30%
455%
3,935
March 31, 2006
29.69
.18
.62
.80
(.42)
—
(.42)
.38
30.07
2.71%
1.60%
0.62%
813%
1,475
March 31, 2005*
27.42
.06
2.22
2.28
(.01)
—
(.01)
2.27
29.69
8.33%
1.56%**
0.42%**
907%
463
Consumer Products Fund C-Class
September 30, 2008D
33.95
.07
(1.82)
(1.75)
—
—
—
(1.75)
32.20
(5.15)%
2.37%**
0.39%**
300%
2,597
March 31, 2008
34.04
.17
.10
.27
(.36)
—
(.36)
(.09)
33.95
0.71%
2.37%
0.49%
449%
3,903
March 31, 2007
29.55
.20
4.35
4.55
(.06)
—
(.06)
4.49
34.04
15.41%
2.36%
0.62%
455%
5,472
March 31, 2006
29.53
(.03)
.47
.44
(.42)
—
(.42)
.02
29.55
1.50%
2.33%
(0.11)%
813%
1,340
March 31, 2005
27.92
(.13)
1.75
1.62
(.01)
—
(.01)
1.61
29.53
5.82%
2.31%
(0.44)%
907%
8,048
March 31, 2004
20.52
(.20)
7.65
7.45
(.05)
—
(.05)
7.40
27.92
36.36%
2.37%
(0.79)%
914%
4,259
Electronics Fund Investor Class
September 30, 2008D
10.06
(—)§
(1.50)
(1.50)
—
—
—
(1.50)
8.56
(14.91)%
1.35%**
(0.00)%**
404%
5,008
March 31, 2008
12.46
(.05)
(2.35)
(2.40)
—
—
—
(2.40)
10.06
(19.26)%
1.36%
(0.37)%
784%
9,835
March 31, 2007
13.52
(.10)
(.96)
(1.06)
—
—
—
(1.06)
12.46
(7.84)%
1.37%
(0.76)%
759%
15,376
March 31, 2006
10.31
(.11)
3.32
3.21
—
—
—
3.21
13.52
31.13%
1.34%
(0.91)%
911%
34,194
March 31, 2005
13.43
(.08)
(3.04)
(3.12)
—
—
—
(3.12)
10.31
(23.23)%
1.33%
(0.76)%
1,106%
27,150
March 31, 2004
8.08
(.15)
5.50
5.35
—
—
—
5.35
13.43
66.21%
1.36%
(1.20)%
1,359%
46,200
Electronics Fund Advisor Class
September 30, 2008D
9.56
(.02)
(1.43)
(1.45)
—
—
—
(1.45)
8.11
(15.17)%
1.90%**
(0.34)%**
404%
1,080
March 31, 2008
11.88
(.12)
(2.20)
(2.32)
—
—
—
(2.32)
9.56
(19.53)%
1.88%
(0.98)%
784%
566
March 31, 2007
12.98
(.15)
(.95)
(1.10)
—
—
—
(1.10)
11.88
(8.47)%
1.87%
(1.20)%
759%
1,511
March 31, 2006
9.95
(.16)
3.19
3.03
—
—
—
3.03
12.98
30.45%
1.84%
(1.39)%
911%
14,089
March 31, 2005
13.02
(.14)
(2.93)
(3.07)
—
—
—
(3.07)
9.95
(23.58)%
1.83%
(1.32)%
1,106%
12,613
March 31, 2004
7.87
(.21)
5.36
5.15
—
—
—
5.15
13.02
65.44%
1.85%
(1.70)%
1,359%
3,341
Electronics Fund A-Class
September 30, 2008D
9.65
(.02)
(1.44)
(1.46)
—
—
—
(1.46)
8.19
(15.13)%
1.61%**
(0.33)%**
404%
310
March 31, 2008
11.99
(.11)
(2.23)
(2.34)
—
—
—
(2.34)
9.65
(19.52)%
1.62%
(0.90)%
784%
85
March 31, 2007
13.03
(.11)
(.93)
(1.04)
—
—
—
(1.04)
11.99
(7.98)%
1.63%
(0.94)%
759%
130
March 31, 2006
9.96
(.14)
3.21
3.07
—
—
—
3.07
13.03
30.82%
1.64%
(1.18)%
911%
1,253
March 31, 2005*
9.22
(.07)
.81
.74
—
—
—
.74
9.96
8.03%
1.59%**
(1.21)%**
1,106%
1
Electronics Fund C-Class
September 30, 2008D
9.38
(.03)
(1.40)
(1.43)
—
—
—
(1.43)
7.95
(15.25)%
2.46%**
(0.59)%**
404%
919
March 31, 2008
11.73
(.15)
(2.20)
(2.35)
—
—
—
(2.35)
9.38
(20.03)%
2.38%
(1.26)%
784%
962
March 31, 2007
12.86
(.20)
(.93)
(1.13)
—
—
—
(1.13)
11.73
(8.79)%
2.36%
(1.72)%
759%
2,876
March 31, 2006
9.90
(.21)
3.17
2.96
—
—
—
2.96
12.86
29.90%
2.36%
(1.91)%
911%
5,015
March 31, 2005
13.00
(.20)
(2.90)
(3.10)
—
—
—
(3.10)
9.90
(23.85)%
2.33%
(1.86)%
1,106%
2,119
March 31, 2004
7.91
(.27)
5.36
5.09
—
—
—
5.09
13.00
64.35%
2.36%
(2.20)%
1,359%
1,111
Energy Fund Investor Class
September 30, 2008D
27.29
.01
(4.29)
(4.28)
—
—
—
(4.28)
23.01
(15.68)%
1.37%**
0.04%**
142%
52,269
March 31, 2008
23.19
(.03)
4.86
4.83
—
(.73)
(.73)
4.10
27.29
20.91%
1.37%
(0.10)%
188%
63,325
March 31, 2007
21.68
(—)§
1.92
1.92
—
(.41)
(.41)
1.51
23.19
8.87%
1.36%
(0.01)%
283%
75,204
March 31, 2006
17.12
.02
5.02
5.04
(.03)
(.45)
(.48)
4.56
21.68
29.60%
1.34%
0.08%
415%
90,331
March 31, 2005
11.94
.05
5.14
5.19
(.01)
—
(.01)
5.18
17.12
43.43%
1.33%
0.40%
546%
111,762
March 31, 2004
8.80
—§
3.17
3.17
(.03)
—
(.03)
3.14
11.94
36.12%
1.36%
0.04%
913%
61,800
FINANCIAL HIGHLIGHTS (continued)
This table is presented to show selected data for a share outstanding throughout each period, and to assist shareholders in evaluating a Fund’s performance for the periods presented.
RATIOS TO
AVERAGE NET ASSETS:
Net Realized
Net Increase
NET ASSET
Net
and
(Decrease)
Distributions
Distributions
Net Increase
NET ASSET
Net
Net Assets,
VALUE,
Investment
Unrealized
in Net Assets
from Net
from Net
(Decrease) in
VALUE,
Total
Investment
Portfolio
End of
BEGINNING
Income
Gains (Losses)
Value Resulting
Investment
Realized
Total
Net Asset
END OF
Investment
Total
Net
Income
Turnover
Period (000’s
Period Ended
OF PERIOD
(Loss)†
on Investments
from Operations
Income
Gains
Distributions
Value
PERIOD
Return††
Expenses
Expenses
(Loss)
Rate
omitted)
Energy Fund Advisor Class
September 30, 2008D
$26.07
$ (.09)
$
(4.06)
$
(4.15)
$
—
$
—
$
—
$
(4.15)
$21.92
(15.92)%
1.87%**
1.87%**
(0.58)%**
142%
$
8,057
March 31, 2008
22.29
(.15)
4.66
4.51
—
(.73)
(.73)
3.78
26.07
20.31%
1.86%
1.86%
(0.58)%
188%
17,713
March 31, 2007
20.96
(.12)
1.86
1.74
—
(.41)
(.41)
1.33
22.29
8.31%
1.86%
1.86%
(0.54)%
283%
14,613
March 31, 2006
16.65
(.07)
4.86
4.79
(.03)
(.45)
(.48)
4.31
20.96
28.93%
1.85%
1.84%
(0.38)%
415%
18,162
March 31, 2005
11.68
(.02)
5.00
4.98
(.01)
—
(.01)
4.97
16.65
42.60%
1.82%
1.82%
(0.11)%
546%
25,000
March 31, 2004
8.63
(.03)
3.11
3.08
(.03)
—
(.03)
3.05
11.68
35.79%
1.92%
1.92%
(0.25)%
913%
4,895
Energy Fund A-Class
September 30, 2008D
26.30
(.04)
(4.11)
(4.15)
—
—
—
(4.15)
22.15
(15.78)%
1.62%**
1.62%**
(0.26)%**
142%
7,242
March 31, 2008
22.44
(.08)
4.67
4.59
—
(.73)
(.73)
3.86
26.30
20.54%
1.61%
1.61%
(0.31)%
188%
6,378
March 31, 2007
21.04
(.06)
1.87
1.81
—
(.41)
(.41)
1.40
22.44
8.62%
1.61%
1.61%
(0.29)%
283%
3,307
March 31, 2006
16.68
(.05)
4.89
4.84
(.03)
(.45)
(.48)
4.36
21.04
29.18%
1.61%
1.60%
(0.25)%
415%
3,210
March 31, 2005*
12.79
.02
3.88
3.90
(.01)
—
(.01)
3.89
16.68
30.46%
1.45%**
1.45%**
0.19%**
546%
744
Energy Fund C-Class
September 30, 2008D
25.37
(.13)
(3.96)
(4.09)
—
—
—
(4.09)
21.28
(16.12)%
2.37%**
2.37%**
(0.96)%**
142%
13,440
March 31, 2008
21.81
(.27)
4.56
4.29
—
(.73)
(.73)
3.56
25.37
19.74%
2.36%
2.36%
(1.07)%
188%
20,989
March 31, 2007
20.62
(.21)
1.81
1.60
—
(.41)
(.41)
1.19
21.81
7.77%
2.36%
2.36%
(1.00)%
283%
18,624
March 31, 2006
16.47
(.16)
4.79
4.63
(.03)
(.45)
(.48)
4.15
20.62
28.27%
2.35%
2.35%
(0.88)%
415%
23,734
March 31, 2005
11.60
(.08)
4.96
4.88
(.01)
—
(.01)
4.87
16.47
42.03%
2.33%
2.33%
(0.61)%
546%
17,993
March 31, 2004
8.63
(.12)
3.12
3.00
(.03)
—
(.03)
2.97
11.60
34.86%
2.36%
2.36%
(1.08)%
913%
6,571
Energy Services Fund Investor Class
September 30, 2008D
58.04
(.20)
(9.41)
(9.61)
—
—
—
(9.61)
48.43
(16.56)%
1.37%**
1.37%**
(0.60)%**
90%
93,127
March 31, 2008
47.47
(.43)
11.00
10.57
—
—
—
10.57
58.04
22.27%
1.37%
1.37%
(0.77)%
193%
82,691
March 31, 2007
45.05
(.36)
2.78
2.42
—
—
—
2.42
47.47
5.37%
1.36%
1.36%
(0.80)%
196%
91,095
March 31, 2006
30.12
(.30)
15.23
14.93
—
—
—
14.93
45.05
49.57%
1.35%
1.35%
(0.81)%
324%
147,439
March 31, 2005
21.74
(.22)
8.60
8.38
—
—
—
8.38
30.12
38.55%
1.31%
1.31%
(0.85)%
501%
99,603
March 31, 2004
17.37
(.18)
4.55
4.37
—
—
—
4.37
21.74
25.16%
1.37%
1.37%
(0.96)%
1,009%
47,344
Energy Services Fund Advisor Class
September 30, 2008D
55.45
(.34)
(8.96)
(9.30)
—
—
—
(9.30)
46.15
(16.77)%
1.87%**
1.87%**
(1.08)%**
90%
13,320
March 31, 2008
45.58
(.69)
10.56
9.87
—
—
—
9.87
55.45
21.65%
1.87%
1.87%
(1.28)%
193%
15,929
March 31, 2007
43.46
(.58)
2.70
2.12
—
—
—
2.12
45.58
4.88%
1.86%
1.86%
(1.35)%
196%
18,237
March 31, 2006
29.21
(.47)
14.72
14.25
—
—
—
14.25
43.46
48.78%
1.85%
1.85%
(1.33)%
324%
44,033
March 31, 2005
21.18
(.33)
8.36
8.03
—
—
—
8.03
29.21
37.91%
1.82%
1.82%
(1.37)%
501%
24,647
March 31, 2004
17.01
(.27)
4.44
4.17
—
—
—
4.17
21.18
24.51%
1.87%
1.87%
(1.39)%
1,009%
25,302
Energy Services Fund A-Class
September 30, 2008D
55.99
(.27)
(9.05)
(9.32)
—
—
—
(9.32)
46.67
(16.65)%
1.62%**
1.62%**
(0.86)%**
90%
13,527
March 31, 2008
45.90
(.55)
10.64
10.09
—
—
—
10.09
55.99
21.98%
1.62%
1.62%
(1.01)%
193%
11,450
March 31, 2007
43.67
(.41)
2.64
2.23
—
—
—
2.23
45.90
5.11%
1.61%
1.61%
(0.97)%
196%
6,151
March 31, 2006
29.25
(.39)
14.81
14.42
—
—
—
14.42
43.67
49.30%
1.63%
1.63%
(1.00)%
324%
6,569
March 31, 2005*
23.18
(.18)
6.25
6.07
—
—
—
6.07
29.25
26.19%
1.53%**
1.53%**
(1.13)%**
501%
313
Energy Services Fund C-Class
September 30, 2008D
54.22
(.48)
(8.73)
(9.21)
—
—
—
(9.21)
45.01
(16.99)%
2.37%**
2.37%**
(1.57)%**
90%
18,629
March 31, 2008
44.79
(.93)
10.36
9.43
—
—
—
9.43
54.22
21.05%
2.37%
2.37%
(1.76)%
193%
29,316
March 31, 2007
42.92
(.74)
2.61
1.87
—
—
—
1.87
44.79
4.36%
2.36%
2.36%
(1.77)%
196%
24,500
March 31, 2006
28.98
(.65)
14.59
13.94
—
—
—
13.94
42.92
48.10%
2.36%
2.36%
(1.82)%
324%
27,542
March 31, 2005
21.12
(.45)
8.31
7.86
—
—
—
7.86
28.98
37.22%
2.31%
2.31%
(1.84)%
501%
11,529
March 31, 2004
17.04
(.35)
4.43
4.08
—
—
—
4.08
21.12
23.94%
2.37%
2.37%
(1.86)%
1,009%
2,833
FINANCIAL HIGHLIGHTS (continued)
This table is presented to show selected data for a share outstanding throughout each period, and to assist shareholders in evaluating a Fund’s performance for the periods presented.
RATIOS TO
AVERAGE NET ASSETS:
Net Realized
Net Increase
NET ASSET
Net
and
(Decrease)
Distributions
Distributions
Net Increase
NET ASSET
Net
Net Assets,
VALUE,
Investment
Unrealized
in Net Assets
from Net
from Net
(Decrease) in
VALUE,
Total
Investment
Portfolio
End of
BEGINNING
Income
Gains (Losses)
Value Resulting
Investment
Realized
Total
Net Asset
END OF
Investment
Total
Net
Income
Turnover
Period (000’s
Period Ended
OF PERIOD
(Loss)†
on Investments
from Operations
Income
Gains
Distributions
Value
PERIOD
Return††
Expenses
Expenses
(Loss)
Rate
omitted)
Financial Services Fund Investor Class
September 30, 2008D
$10.18
$
.10
$
(1.47)
$
(1.37)
$
—
$
—
$
—
$
(1.37)
$
8.81
(13.46)%
1.37%**
1.37%**
2.12%**
410%
$
7,167
March 31, 2008
14.25
.17
(4.02)
(3.85)
(.22)
—
(.22)
(4.07)
10.18
(27.26)%
1.38%
1.38%
1.25%
913%
4,640
March 31, 2007
13.26
.14
.91
1.05
(.06)
—
(.06)
.99
14.25
7.94%
1.34%
1.34%
1.03%
534%
22,658
March 31, 2006
11.40
.17
1.81
1.98
(.12)
—
(.12)
1.86
13.26
17.42%
1.36%
1.34%
1.32%
821%
12,226
March 31, 2005
11.09
.10
.29
.39
(.08)
—
(.08)
.31
11.40
3.46%
1.33%
1.33%
0.91%
1,005%
7,741
March 31, 2004
7.66
.09
3.38
3.47
(.04)
—
(.04)
3.43
11.09
45.36%
1.36%
1.36%
0.94%
1,200%
34,423
Financial Services Fund Advisor Class
September 30, 2008D
9.78
.07
(1.41)
(1.34)
—
—
—
(1.34)
8.44
(13.70)%
1.88%**
1.88%**
1.55%**
410%
1,723
March 31, 2008
13.76
.09
(3.85)
(3.76)
(.22)
—
(.22)
(3.98)
9.78
(27.58)%
1.89%
1.89%
0.70%
913%
1,957
March 31, 2007
12.88
.07
.87
.94
(.06)
—
(.06)
.88
13.76
7.32%
1.84%
1.84%
0.54%
534%
16,786
March 31, 2006
11.13
.10
1.77
1.87
(.12)
—
(.12)
1.75
12.88
16.85%
1.85%
1.83%
0.82%
821%
6,801
March 31, 2005
10.89
.05
.27
.32
(.08)
—
(.08)
.24
11.13
2.88%
1.83%
1.83%
0.43%
1,005%
27,181
March 31, 2004
7.57
.04
3.32
3.36
(.04)
—
(.04)
3.32
10.89
44.45%
1.86%
1.86%
0.39%
1,200%
40,885
Financial Services Fund A-Class
September 30, 2008D
9.86
.08
(1.42)
(1.34)
—
—
—
(1.34)
8.52
(13.59)%
1.62%**
1.62%**
1.75%**
410%
1,839
March 31, 2008
13.82
.16
(3.90)
(3.74)
(.22)
—
(.22)
(3.96)
9.86
(27.32)%
1.59%
1.59%
1.42%
913%
1,367
March 31, 2007
12.91
.10
.87
.97
(.06)
—
(.06)
.91
13.82
7.54%
1.61%
1.61%
0.74%
534%
1,107
March 31, 2006
11.13
.14
1.76
1.90
(.12)
—
(.12)
1.78
12.91
17.12%
1.65%
1.64%
1.18%
821%
4,295
March 31, 2005*
10.75
.05
.41
.46
(.08)
—
(.08)
.38
11.13
4.22%
1.55%**
1.55%**
0.70%**
1,005%
5
Financial Services Fund C-Class
September 30, 2008D
9.51
.04
(1.36)
(1.32)
—
—
—
(1.32)
8.19
(13.88)%
2.37%**
2.37%**
0.97%**
410%
4,758
March 31, 2008
13.46
.05
(3.78)
(3.73)
(.22)
—
(.22)
(3.95)
9.51
(27.98)%
2.37%
2.37%
0.45%
913%
2,847
March 31, 2007
12.67
.01
.84
.85
(.06)
—
(.06)
.79
13.46
6.73%
2.34%
2.34%
0.06%
534%
5,382
March 31, 2006
11.01
.01
1.77
1.78
(.12)
—
(.12)
1.66
12.67
16.21%
2.36%
2.34%
0.11%
821%
2,081
March 31, 2005
10.84
(.01)
.26
.25
(.08)
—
(.08)
.17
11.01
2.24%
2.33%
2.33%
(0.10)%
1,005%
1,689
March 31, 2004
7.57
(.02)
3.33
3.31
(.04)
—
(.04)
3.27
10.84
43.78%
2.37%
2.37%
(0.23)%
1,200%
2,242
Health Care Fund Investor Class
September 30, 2008D
14.28
.01
(.13)
(.12)
—
—
—
(.12)
14.16
(0.84)%
1.34%**
1.34%**
0.08%**
411%
29,673
March 31, 2008
15.28
(.02)
(.98)
(1.00)
—
—
—
(1.00)
14.28
(6.54)%
1.37%
1.37%
(0.13)%
444%
22,062
March 31, 2007
14.54
.03
.71
.74
—
—
—
.74
15.28
5.09%
1.35%
1.35%
0.23%
545%
33,878
March 31, 2006
12.71
(.05)
1.88
1.83
—
—
—
1.83
14.54
14.40%
1.33%
1.33%
(0.35)%
568%
46,432
March 31, 2005
12.50
(.05)
.26
.21
—
—
—
.21
12.71
1.68%
1.34%
1.34%
(0.42)%
610%
35,500
March 31, 2004
9.21
(.07)
3.36
3.29
—
—
—
3.29
12.50
35.72%
1.36%
1.36%
(0.56)%
1,204%
19,801
Health Care Fund Advisor Class
September 30, 2008D
13.57
(.01)
(.14)
(.15)
—
—
—
(.15)
13.42
(1.11)%
1.96%**
1.96%**
(0.08)%**
411%
5,758
March 31, 2008
14.59
(.09)
(.93)
(1.02)
—
—
—
(1.02)
13.57
(6.99)%
1.86%
1.86%
(0.60)%
444%
13,099
March 31, 2007
13.94
(.05)
.70
.65
—
—
—
.65
14.59
4.66%
1.85%
1.85%
(0.37)%
545%
17,327
March 31, 2006
12.25
(.12)
1.81
1.69
—
—
—
1.69
13.94
13.80%
1.84%
1.84%
(0.89)%
568%
14,577
March 31, 2005
12.11
(.10)
.24
.14
—
—
—
.14
12.25
1.16%
1.84%
1.84%
(0.83)%
610%
16,511
March 31, 2004
8.97
(.12)
3.26
3.14
—
—
—
3.14
12.11
35.01%
1.85%
1.85%
(1.05)%
1,204%
27,102
Health Care Fund A-Class
September 30, 2008D
13.68
(.02)
(.12)
(.14)
—
—
—
(.14)
13.54
(1.02)%
1.64%**
1.64%**
(0.29)%**
411%
1,946
March 31, 2008
14.67
(.06)
(.93)
(.99)
—
—
—
(.99)
13.68
(6.75)%
1.61%
1.61%
(0.36)%
444%
730
March 31, 2007
13.98
(.02)
.71
.69
—
—
—
.69
14.67
4.94%
1.60%
1.60%
(0.13)%
545%
818
March 31, 2006
12.25
(.08)
1.81
1.73
—
—
—
1.73
13.98
14.12%
1.62%
1.62%
(0.60)%
568%
2,239
March 31, 2005*
11.65
(.05)
.65
.60
—
—
—
.60
12.25
5.15%
1.56%**
1.56%**
(0.65)%**
610%
1
FINANCIAL HIGHLIGHTS (continued)
This table is presented to show selected data for a share outstanding throughout each period, and to assist shareholders in evaluating a Fund’s performance for the periods presented.
RATIOS TO
AVERAGE NET ASSETS:
Net Realized
Net Increase
NET ASSET
Net
and
(Decrease)
Distributions
Distributions
Net Increase
NET ASSET
Net
Net Assets,
VALUE,
Investment
Unrealized
in Net Assets
from Net
from Net
(Decrease) in
VALUE,
Total
Investment
Portfolio
End of
BEGINNING
Income
Gains (Losses)
Value Resulting
Investment
Realized
Total
Net Asset
END OF
Investment
Total
Income
Turnover
Period (000’s
Period Ended
OF PERIOD
(Loss)†
on Investments
from Operations
Income
Gains
Distributions
Value
PERIOD
Return††
Expenses
(Loss)
Rate
omitted)
Health Care Fund C-Class
September 30, 2008D
$13.28
$ (.06)
$
(.12)
$
(.18)
$
—
$
—
$
—
$
(.18)
$13.10
(1.36)%
2.40%**
(0.89)%**
411%
$
7,505
March 31, 2008
14.35
(.16)
(.91)
(1.07)
—
—
—
(1.07)
13.28
(7.46)%
2.37%
(1.12)%
444%
5,677
March 31, 2007
13.79
(.10)
.66
.56
—
—
—
.56
14.35
4.06%
2.34%
(0.73)%
545%
8,720
March 31, 2006
12.19
(.18)
1.78
1.60
—
—
—
1.60
13.79
13.13%
2.34%
(1.39)%
568%
7,114
March 31, 2005
12.11
(.16)
.24
.08
—
—
—
.08
12.19
0.66%
2.33%
(1.36)%
610%
4,017
March 31, 2004
9.03
(.18)
3.26
3.08
—
—
—
3.08
12.11
34.11%
2.37%
(1.60)%
1,204%
2,865
Internet Fund Investor Class
September 30, 2008D
38.55
(.16)
(5.80)
(5.96)
—
—
—
(5.96)
32.59
(15.46)%
1.37%**
(0.76)%**
484%
1,204
March 31, 2008
41.11
.46à
(2.87)
(2.41)
(.15)
—
(.15)
(2.56)
38.55
(5.92)%
1.38%
1.00%àà
870%
4,365
March 31, 2007
40.22
(.44)
1.33
.89
—
—
—
.89
41.11
2.21%
1.37%
(1.09)%
864%
5,496
March 31, 2006
32.29
(.40)
8.33
7.93
—
—
—
7.93
40.22
24.56%
1.34%
(1.10)%
1,371%
16,288
March 31, 2005
35.66
(.43)
(2.94)
(3.37)
—
—
—
(3.37)
32.29
(9.45)%
1.34%
(1.23)%
1,947%
5,210
March 31, 2004
20.43
(.41)
15.64
15.23
—
—
—
15.23
35.66
74.55%
1.36%
(1.31)%
1,340%
15,292
Internet Fund Advisor Class
September 30, 2008D
36.95
(.25)
(5.54)
(5.79)
—
—
—
(5.79)
31.16
(15.67)%
1.87%**
(1.33)%**
484%
955
March 31, 2008
39.61
(.09)à
(2.42)
(2.51)
(.15)
—
(.15)
(2.66)
36.95
(6.40)%
1.88%
(0.21)%àà
870%
1,364
March 31, 2007
38.94
(.63)
1.30
.67
—
—
—
.67
39.61
1.72%
1.87%
(1.60)%
864%
863
March 31, 2006
31.41
(.55)
8.08
7.53
—
—
—
7.53
38.94
23.97%
1.85%
(1.58)%
1,371%
3,696
March 31, 2005
34.85
(.60)
(2.84)
(3.44)
—
—
—
(3.44)
31.41
(9.87)%
1.83%
(1.72)%
1,947%
829
March 31, 2004
20.05
(.54)
15.34
14.80
—
—
—
14.80
34.85
73.82%
1.86%
(1.81)%
1,340%
12,090
Internet Fund A-Class
September 30, 2008D
37.29
(.21)
(5.60)
(5.81)
—
—
—
(5.81)
31.48
(15.58)%
1.62%**
(1.04)%**
484%
80
March 31, 2008
39.87
(.19)à
(2.24)
(2.43)
(.15)
—
(.15)
(2.58)
37.29
(6.16)%
1.63%
(0.44)%àà
870%
116
March 31, 2007
39.07
(.52)
1.32
.80
—
—
—
.80
39.87
2.05%
1.61%
(1.37)%
864%
139
March 31, 2006
31.45
(.50)
8.12
7.62
—
—
—
7.62
39.07
24.23%
1.63%
(1.36)%
1,371%
470
March 31, 2005*
30.65
(.31)
1.11
.80
—
—
—
.80
31.45
2.61%
1.55%**
(1.46)%**
1,947%
4
Internet Fund C-Class
September 30, 2008D
36.01
(.37)
(5.35)
(5.72)
—
—
—
(5.72)
30.29
(15.88)%
2.37%**
(1.94)%**
484%
631
March 31, 2008
38.79
(.38)à
(2.25)
(2.63)
(.15)
—
(.15)
(2.78)
36.01
(6.84)%
2.37%
(0.89)%àà
870%
1,608
March 31, 2007
38.30
(.78)
1.27
.49
—
—
—
.49
38.79
1.28%
2.36%
(2.10)%
864%
1,017
March 31, 2006
31.06
(.73)
7.97
7.24
—
—
—
7.24
38.30
23.31%
2.35%
(2.09)%
1,371%
2,273
March 31, 2005
34.64
(.73)
(2.85)
(3.58)
—
—
—
(3.58)
31.06
(10.33)%
2.33%
(2.19)%
1,947%
1,596
March 31, 2004
20.04
(.72)
15.32
14.60
—
—
—
14.60
34.64
72.85%
2.36%
(2.31)%
1,340%
1,556
Leisure Fund Investor Class
September 30, 2008D
31.72
(.01)
(6.17)
(6.18)
—
—
—
(6.18)
25.54
(19.48)%
1.37%**
(0.07)%**
813%
1,448
March 31, 2008
35.87
.09
(4.24)
(4.15)
—
—
—
(4.15)
31.72
(11.57)%
1.39%
0.24%
646%
3,283
March 31, 2007
32.56
(—)§
3.31
3.31
—
—
—
3.31
35.87
10.17%
1.37%
(0.01)%
675%
9,130
March 31, 2006
30.50
(.07)
2.13
2.06
—
—
—
2.06
32.56
6.75%
1.34%
(0.25)%
734%
16,418
March 31, 2005
27.66
(.17)
3.01
2.84
—
—
—
2.84
30.50
10.27%
1.31%
(0.57)%
1,046%
15,080
March 31, 2004
17.88
(.06)
9.84
9.78
—
—
—
9.78
27.66
54.70%
1.36%
(0.31)%
1,870%
25,030
Leisure Fund Advisor Class
September 30, 2008D
30.06
(.02)
(5.89)
(5.91)
—
—
—
(5.91)
24.15
(19.66)%
1.87%**
(0.15)%**
813%
1,052
March 31, 2008
34.14
(.07)
(4.01)
(4.08)
—
—
—
(4.08)
30.06
(11.95)%
1.89%
(0.22)%
646%
1,611
March 31, 2007
31.15
(.10)
3.09
2.99
—
—
—
2.99
34.14
9.60%
1.87%
(0.32)%
675%
4,903
March 31, 2006
29.34
(.32)
2.13
1.81
—
—
—
1.81
31.15
6.17%
1.80%
(1.10)%
734%
5,372
March 31, 2005
26.74
(.30)
2.90
2.60
—
—
—
2.60
29.34
9.72%
1.82%
(1.10)%
1,046%
27,750
March 31, 2004
17.37
(.23)
9.60
9.37
—
—
—
9.37
26.74
53.94%
1.86%
(1.06)%
1,870%
39,789
FINANCIAL HIGHLIGHTS (continued)
This table is presented to show selected data for a share outstanding throughout each period, and to assist shareholders in evaluating a Fund’s performance for the periods presented.
RATIOS TO
AVERAGE NET ASSETS:
Net Realized
Net Increase
NET ASSET
and
(Decrease)
Distributions
Distributions
Net Increase
NET ASSET
Net Assets,
VALUE,
Net
Unrealized
in Net Assets
from Net
from Net
(Decrease) in
VALUE,
Total
Net
Portfolio
End of
BEGINNING
Investment
Gains (Losses)
Value Resulting
Investment
Realized
Total
Net Asset
END OF
Investment
Total
Investment
Turnover
Period (000’s
Period Ended
OF PERIOD
Loss†
on Investments
from Operations
Income
Gains
Distributions
Value
PERIOD
Return††
Expenses
Loss
Rate
omitted)
Leisure Fund A-Class
September 30, 2008D
$30.30
$ (.06)
$
(5.87)
$
(5.93)
$
—
$
—
$
—
$
(5.93)
$24.37
(19.57)%
1.62%**
(0.43)%**
813%
$
80
March 31, 2008
34.32
(.07)
(3.95)
(4.02)
—
—
—
(4.02)
30.30
(11.71)%
1.67%
(0.20)%
646%
206
March 31, 2007
31.24
(.14)
3.22
3.08
—
—
—
3.08
34.32
9.86%
1.60%
(0.41)%
675%
2,198
March 31, 2006
29.34
(.14)
2.04
1.90
—
—
—
1.90
31.24
6.48%
1.60%
(0.49)%
734%
68
March 31, 2005*
24.59
(.08)
4.83
4.75
—
—
—
4.75
29.34
19.32%
1.55%**
(1.02)%**
1,046%
12
Leisure Fund C-Class
September 30, 2008D
29.66
(.16)
(5.74)
(5.90)
—
—
—
(5.90)
23.76
(19.89)%
2.37%**
(1.13)%**
813%
238
March 31, 2008
33.86
(.28)
(3.92)
(4.20)
—
—
—
(4.20)
29.66
(12.40)%
2.40%
(0.81)%
646%
430
March 31, 2007
31.05
(.31)
3.12
2.81
—
—
—
2.81
33.86
9.05%
2.36%
(0.96)%
675%
3,091
March 31, 2006
29.39
(.40)
2.06
1.66
—
—
—
1.66
31.05
5.65%
2.32%
(1.40)%
734%
997
March 31, 2005
26.93
(.40)
2.86
2.46
—
—
—
2.46
29.39
9.13%
2.31%
(1.44)%
1,046%
2,502
March 31, 2004
17.61
(.38)
9.70
9.32
—
—
—
9.32
26.93
52.92%
2.37%
(1.59)%
1,870%
2,165
Precious Metals Fund Investor Class
September 30, 2008D
69.89
(.13)
(22.87)
(23.00)
—
—
—
(23.00)
46.89
(32.91)%
1.27%**
(0.42)%**
116%
160,176
March 31, 2008
56.21
(.37)
14.05
13.68
—
—
—
13.68
69.89
24.34%
1.27%
(0.58)%
203%
149,805
March 31, 2007
54.50
(.03)
1.74
1.71
—
—
—
1.71
56.21
3.14%
1.26%
(0.05)%
259%
149,876
March 31, 2006
35.64
(.07)
18.93
18.86
—
—
—
18.86
54.50
52.92%
1.24%
(0.16)%
277%
213,017
March 31, 2005
44.32
(.05)
(8.63)
(8.68)
—
—
—
(8.68)
35.64
(19.58)%
1.23%
(0.12)%
358%
130,718
March 31, 2004
26.78
(.12)
17.67
17.55
(.01)
—
(.01)
17.54
44.32
65.53%
1.26%
(0.32)%
550%
236,961
Precious Metals Fund Advisor Class
September 30, 2008D
68.36
(.28)
(22.33)
(22.61)
—
—
—
(22.61)
45.75
(33.08)%
1.77%**
(0.89)%**
116%
3,880
March 31, 2008
55.24
(.69)
13.81
13.12
—
—
—
13.12
68.36
23.75%
1.77%
(1.09)%
203%
11,817
March 31, 2007
53.83
(.27)
1.68
1.41
—
—
—
1.41
55.24
2.62%
1.76%
(0.51)%
259%
8,387
March 31, 2006
35.37
(.28)
18.74
18.46
—
—
—
18.46
53.83
52.19%
1.75%
(0.70)%
277%
14,087
March 31, 2005
44.17
(.03)
(8.77)
(8.80)
—
—
—
(8.80)
35.37
(19.92)%
1.72%
(0.09)%
358%
8,596
March 31, 2004*
31.68
(.18)
12.68
12.50
(.01)
—
(.01)
12.49
44.17
39.46%
1.72%**
(0.68)%**
550%
2,112
Precious Metals Fund A-Class
September 30, 2008D
68.96
(.20)
(22.55)
(22.75)
—
—
—
(22.75)
46.21
(32.99)%
1.52%**
(0.65)%**
116%
6,066
March 31, 2008
55.59
(.55)
13.92
13.37
—
—
—
13.37
68.96
24.05%
1.52%
(0.84)%
203%
10,911
March 31, 2007
54.03
(.15)
1.71
1.56
—
—
—
1.56
55.59
2.89%
1.51%
(0.28)%
259%
4,778
March 31, 2006
35.41
(.19)
18.81
18.62
—
—
—
18.62
54.03
52.58%
1.52%
(0.43)%
277%
5,701
March 31, 2005*
37.26
(.01)
(1.84)
(1.85)
—
—
—
(1.85)
35.41
(4.97)%
1.45%**
(0.02)%**
358%
217
Precious Metals Fund C-Class
September 30, 2008D
65.38
(.41)
(21.34)
(21.75)
—
—
—
(21.75)
43.63
(33.27)%
2.27%**
(1.38)%**
116%
15,354
March 31, 2008
53.12
(.97)
13.23
12.26
—
—
—
12.26
65.38
23.08%
2.27%
(1.60)%
203%
26,319
March 31, 2007
52.02
(.51)
1.61
1.10
—
—
—
1.10
53.12
2.11%
2.26%
(1.00)%
259%
23,486
March 31, 2006
34.37
(.46)
18.11
17.65
—
—
—
17.65
52.02
51.35%
2.25%
(1.20)%
277%
24,266
March 31, 2005
43.16
(.39)
(8.40)
(8.79)
—
—
—
(8.79)
34.37
(20.37)%
2.23%
(1.08)%
358%
20,426
March 31, 2004
26.35
(.51)
17.33
16.82
(.01)
—
(.01)
16.81
43.16
63.83%
2.27%
(1.38)%
550%
17,998
Retailing Fund Investor Class
September 30, 2008D
11.54
(.01)
(.87)
(.88)
—
—
—
(.88)
10.66
(7.63)%
1.37%**
(0.16)%**
490%
10,228
March 31, 2008
14.47
(.04)
(2.89)
(2.93)
—
—
—
(2.93)
11.54
(20.25)%
1.37%
(0.27)%
1,205%
3,152
March 31, 2007
13.48
(.06)
1.05
.99
—
—
—
.99
14.47
7.34%
1.36%
(0.45)%
952%
4,033
March 31, 2006
12.30
(.08)
1.26
1.18
—
—
—
1.18
13.48
9.59%
1.33%
(0.60)%
1,163%
7,608
March 31, 2005
11.74
(.06)
.62
.56
—
—
—
.56
12.30
4.77%
1.33%
(0.54)%
1,505%
7,529
March 31, 2004
8.00
(.08)
3.82
3.74
—
—
—
3.74
11.74
46.75%
1.35%
(0.78)%
1,825%
11,738
FINANCIAL HIGHLIGHTS (continued)
This table is presented to show selected data for a share outstanding throughout each period, and to assist shareholders in evaluating a Fund’s performance for the periods presented.
RATIOS TO
AVERAGE NET ASSETS:
Net Realized
Net Increase
NET ASSET
Net
and
(Decrease)
Distributions
Distributions
Net Increase
NET ASSET
Net
Net Assets,
VALUE,
Investment
Unrealized
in Net Assets
from Net
from Net
(Decrease) in
VALUE,
Total
Investment
Portfolio
End of
BEGINNING
Income
Gains (Losses)
Value Resulting
Investment
Realized
Total
Net Asset
END OF
Investment
Total
Income
Turnover
Period (000’s
Period Ended
OF PERIOD
(Loss)†
on Investments
from Operations
Income
Gains
Distributions
Value
PERIOD
Return††
Expenses
(Loss)
Rate
omitted)
Retailing Fund Advisor Class
September 30, 2008D
$11.10
$ (.03)
$
(.86)
$
(.89)
$
—
$
—
$
—
$
(.89)
$10.21
(8.02)%
1.88%**
(0.61)%**
490%
$
973
March 31, 2008
13.97
(.12)
(2.75)
(2.87)
—
—
—
(2.87)
11.10
(20.54)%
1.87%
(0.89)%
1,205%
800
March 31, 2007
13.07
(.10)
1.00
.90
—
—
—
.90
13.97
6.89%
1.86%
(0.73)%
952%
2,791
March 31, 2006
11.99
(.15)
1.23
1.08
—
—
—
1.08
13.07
9.01%
1.82%
(1.18)%
1,163%
3,385
March 31, 2005
11.49
(.12)
.62
.50
—
—
—
.50
11.99
4.35%
1.83%
(1.09)%
1,505%
6,445
March 31, 2004
7.85
(.13)
3.77
3.64
—
—
—
3.64
11.49
46.37%
1.85%
(1.25)%
1,825%
15,863
Retailing Fund A-Class
September 30, 2008D
11.18
(.02)
(.84)
(.86)
—
—
—
(.86)
10.32
(7.69)%
1.63%**
(0.30)%**
490%
53
March 31, 2008
14.04
(.10)
(2.76)
(2.86)
—
—
—
(2.86)
11.18
(20.37)%
1.63%
(0.73)%
1,205%
101
March 31, 2007
13.10
(.07)
1.01
.94
—
—
—
.94
14.04
7.18%
1.57%
(0.54)%
952%
385
March 31, 2006
12.01
(.11)
1.20
1.09
—
—
—
1.09
13.10
9.08%
1.59%
(0.87)%
1,163%
46
March 31, 2005*
10.45
(.07)
1.63
1.56
—
—
—
1.56
12.01
14.93%
1.68%**
(1.03)%**
1,505%
1
Retailing Fund C-Class
September 30, 2008D
10.76
(.06)
(.81)
(.87)
—
—
—
(.87)
9.89
(8.09)%
2.38%**
(1.08)%**
490%
1,266
March 31, 2008
13.62
(.17)
(2.69)
(2.86)
—
—
—
(2.86)
10.76
(21.00)%
2.37%
(1.36)%
1,205%
1,291
March 31, 2007
12.80
(.15)
.97
.82
—
—
—
.82
13.62
6.41%
2.34%
(1.17)%
952%
2,650
March 31, 2006
11.80
(.20)
1.20
1.00
—
—
—
1.00
12.80
8.47%
2.34%
(1.65)%
1,163%
1,586
March 31, 2005
11.37
(.17)
.60
.43
—
—
—
.43
11.80
3.78%
2.33%
(1.52)%
1,505%
1,774
March 31, 2004
7.81
(.18)
3.74
3.56
—
—
—
3.56
11.37
45.58%
2.36%
(1.72)%
1,825%
2,362
Technology Fund Investor Class
September 30, 2008D
11.77
(.02)
(1.44)
(1.46)
—
—
—
(1.46)
10.31
(12.40)%
1.37%**
(0.26)%**
265%
6,767
March 31, 2008
12.53
(.10)
(.66)
(.76)
—
—
—
(.76)
11.77
(6.07)%
1.37%
(0.72)%
694%
9,916
March 31, 2007
12.35
(.11)
.29
.18
—
—
—
.18
12.53
1.46%
1.36%
(0.91)%
684%
14,274
March 31, 2006
10.35
(.09)
2.12
2.03
(.03)
—
(.03)
2.00
12.35
19.65%
1.33%
(0.79)%
666%
21,182
March 31, 2005
11.40
.03
(1.08)
(1.05)
—
—
—
(1.05)
10.35
(9.21)%
1.31%
0.33%
1,304%
13,346
March 31, 2004
7.11
(.11)
4.40
4.29
—
—
—
4.29
11.40
60.34%
1.36%
(1.07)%
1,853%
17,114
Technology Fund Advisor Class
September 30, 2008D
11.27
(.04)
(1.38)
(1.42)
—
—
—
(1.42)
9.85
(12.60)%
1.88%**
(0.58)%**
265%
1,684
March 31, 2008
12.05
(.15)
(.63)
(.78)
—
—
—
(.78)
11.27
(6.47)%
1.88%
(1.16)%
694%
2,077
March 31, 2007
11.94
(.16)
.27
.11
—
—
—
.11
12.05
0.92%
1.86%
(1.41)%
684%
4,807
March 31, 2006
10.06
(.14)
2.05
1.91
(.03)
—
(.03)
1.88
11.94
19.02%
1.84%
(1.32)%
666%
12,737
March 31, 2005
11.13
.02
(1.09)
(1.07)
—
—
—
(1.07)
10.06
(9.61)%
1.83%
0.21%
1,304%
10,693
March 31, 2004
6.97
(.16)
4.32
4.16
—
—
—
4.16
11.13
59.68%
1.86%
(1.58)%
1,853%
17,972
Technology Fund A-Class
September 30, 2008D
11.32
(.02)
(1.39)
(1.41)
—
—
—
(1.41)
9.91
(12.46)%
1.63%**
(0.40)%**
265%
559
March 31, 2008
12.09
(.11)
(.66)
(.77)
—
—
—
(.77)
11.32
(6.37)%
1.60%
(0.86)%
694%
546
March 31, 2007
11.95
(.14)
.28
.14
—
—
—
.14
12.09
1.17%
1.61%
(1.18)%
684%
278
March 31, 2006
10.07
(.13)
2.04
1.91
(.03)
—
(.03)
1.88
11.95
19.00%
1.63%
(1.15)%
666%
633
March 31, 2005*
9.32
—
.75
.75
—
—
—
.75
10.07
8.05%
1.54%**
0.00%**
1,304%
6
Technology Fund C-Class
September 30, 2008D
11.04
(.07)
(1.35)
(1.42)
—
—
—
(1.42)
9.62
(12.86)%
2.36%**
(1.18)%**
265%
2,320
March 31, 2008
11.87
(.21)
(.62)
(.83)
—
—
—
(.83)
11.04
(6.99)%
2.35%
(1.67)%
694%
2,448
March 31, 2007
11.81
(.22)
.28
.06
—
—
—
.06
11.87
0.51%
2.35%
(1.91)%
684%
1,538
March 31, 2006
10.01
(.21)
2.04
1.83
(.03)
—
(.03)
1.80
11.81
18.31%
2.35%
(1.88)%
666%
2,800
March 31, 2005
11.10
—
(1.09)
(1.09)
—
—
—
(1.09)
10.01
(9.82)%
2.32%
0.00%
1,304%
1,284
March 31, 2004
7.00
(.21)
4.31
4.10
—
—
—
4.10
11.10
58.57%
2.36%
(2.13)%
1,853%
1,101
FINANCIAL HIGHLIGHTS (continued)
This table is presented to show selected data for a share outstanding throughout each period, and to assist shareholders in evaluating a Fund’s performance for the periods presented.
RATIOS TO
AVERAGE NET ASSETS:
Net Realized
Net Increase
NET ASSET
Net
and
(Decrease)
Distributions
Distributions
Net Increase
NET ASSET
Net
Net Assets,
VALUE,
Investment
Unrealized
in Net Assets
from Net
from Net
(Decrease) in
VALUE,
Total
Investment
Portfolio
End of
BEGINNING
Income
Gains (Losses)
Value Resulting
Investment
Realized
Total
Net Asset
END OF
Investment
Total
Income
Turnover
Period (000’s
Period Ended
OF PERIOD
(Loss)†
on Investments
from Operations
Income
Gains
Distributions
Value
PERIOD
Return††
Expenses
(Loss)
Rate
omitted)
Telecommunications Fund Investor Class
September 30, 2008D
$17.04
$
.19
$
(3.24)
$
(3.05)
$
—
$
—
$
—
$
(3.05)
$13.99
(17.90)%
1.34%**
2.17%**
291%
$
3,765
March 31, 2008
19.02
.12
(2.08)
(1.96)
(.02)
—
(.02)
(1.98)
17.04
(10.32)%
1.37%
0.58%
528%
11,134
March 31, 2007
17.74
.16
1.23
1.39
(.11)
—
(.11)
1.28
19.02
7.87%
1.37%
0.89%
430%
16,699
March 31, 2006
14.33
.21
3.60
3.81
(.40)
—
(.40)
3.41
17.74
26.96%
1.38%
1.30%
820%
56,695
March 31, 2005
15.48
.09
(1.24)
(1.15)
—
—
—
(1.15)
14.33
(7.43)%
1.35%
0.60%
1,142%
6,003
March 31, 2004
10.05
—§
5.48
5.48
(.05)
—
(.05)
5.43
15.48
54.59%
1.37%
0.01%
1,506%
14,406
Telecommunications Fund Advisor Class
September 30, 2008D
16.26
.20
(3.14)
(2.94)
—
—
—
(2.94)
13.32
(18.08)%
1.96%**
2.32%**
291%
751
March 31, 2008
18.24
(.02)
(1.94)
(1.96)
(.02)
—
(.02)
(1.98)
16.26
(10.76)%
1.88%
(0.09)%
528%
835
March 31, 2007
17.10
.04
1.21
1.25
(.11)
—
(.11)
1.14
18.24
7.35%
1.83%
0.22%
430%
6,584
March 31, 2006
13.88
.12
3.50
3.62
(.40)
—
(.40)
3.22
17.10
26.46%
1.82%
0.81%
820%
8,487
March 31, 2005
15.07
.03
(1.22)
(1.19)
—
—
—
(1.19)
13.88
(7.90)%
1.86%
0.19%
1,142%
1,922
March 31, 2004
9.81
(.08)
5.39
5.31
(.05)
—
(.05)
5.26
15.07
54.20%
1.87%
(0.58)%
1,506%
7,376
Telecommunications Fund A-Class
September 30, 2008D
16.33
.18
(3.12)
(2.94)
—
—
—
(2.94)
13.39
(18.00)%
1.64%**
2.17%**
291%
141
March 31, 2008
18.28
.03
(1.96)
(1.93)
(.02)
—
(.02)
(1.95)
16.33
(10.57)%
1.61%
0.13%
528%
451
March 31, 2007
17.15
.05
1.19
1.24
(.11)
—
(.11)
1.13
18.28
7.27%
1.49%
0.28%
430%
2,126
March 31, 2006
13.90
(.03)
3.68
3.65
(.40)
—
(.40)
3.25
17.15
26.64%
1.88%
(0.18)%
820%
4,193
March 31, 2005*
13.55
.11
.24
.35
—
—
—
.35
13.90
2.58%
1.54%**
1.25%**
1,142%
3
Telecommunications Fund C-Class
September 30, 2008D
15.91
.10
(3.02)
(2.92)
—
—
—
(2.92)
12.99
(18.35)%
2.38%**
1.21%**
291%
1,658
March 31, 2008
17.93
(.10)
(1.90)
(2.00)
(.02)
—
(.02)
(2.02)
15.91
(11.17)%
2.37%
(0.50)%
528%
2,846
March 31, 2007
16.90
(.06)
1.20
1.14
(.11)
—
(.11)
1.03
17.93
6.78%
2.33%
(0.35)%
430%
4,763
March 31, 2006
13.81
.01
3.48
3.49
(.40)
—
(.40)
3.09
16.90
25.65%
2.31%
0.09%
820%
2,827
March 31, 2005
15.06
(.07)
(1.18)
(1.25)
—
—
—
(1.25)
13.81
(8.30)%
2.38%
(0.51)%
1,142%
1,784
March 31, 2004
9.84
(.15)
5.42
5.27
(.05)
—
(.05)
5.22
15.06
53.62%
2.37%
(1.09)%
1,506%
3,635
Transportation Fund Investor Class
September 30, 2008D
25.21
.01
(1.79)
(1.78)
—
—
—
(1.78)
23.43
(7.06)%
1.37%**
0.08%**
445%
18,959
March 31, 2008
29.16
.06
(4.01)
(3.95)
—
—
—
(3.95)
25.21
(13.55)%
1.36%
0.22%
952%
17,420
March 31, 2007
28.30
(.14)
1.00
.86
—
—
—
.86
29.16
3.04%
1.36%
(0.48)%
686%
6,635
March 31, 2006
22.42
(.09)
5.97
5.88
—
—
—
5.88
28.30
26.23%
1.37%
(0.36)%
669%
45,580
March 31, 2005
18.84
(.11)
3.69
3.58
—
—
—
3.58
22.42
19.00%
1.32%
(0.51)%
929%
7,890
March 31, 2004
15.03
(.06)
3.87
3.81
—
—
—
3.81
18.84
25.35%
1.36%
(0.34)%
1,624%
3,792
Transportation Fund Advisor Class
September 30, 2008D
23.59
(.05)
(1.67)
(1.72)
—
—
—
(1.72)
21.87
(7.29)%
1.87%**
(0.38)%**
445%
2,032
March 31, 2008
27.42
(.01)
(3.82)
(3.83)
—
—
—
(3.83)
23.59
(13.97)%
1.87%
(0.05)%
952%
5,152
March 31, 2007
26.75
(.26)
.93
.67
—
—
—
.67
27.42
2.50%
1.86%
(0.97)%
686%
3,556
March 31, 2006
21.31
(.19)
5.63
5.44
—
—
—
5.44
26.75
25.53%
1.86%
(0.81)%
669%
8,478
March 31, 2005
18.02
(.21)
3.50
3.29
—
—
—
3.29
21.31
18.26%
1.82%
(1.05)%
929%
5,748
March 31, 2004
14.40
(.12)
3.74
3.62
—
—
—
3.62
18.02
25.14%
1.83%
(0.73)%
1,624%
4,284
Transportation Fund A-Class
September 30, 2008D
23.81
(.02)
(1.70)
(1.72)
—
—
—
(1.72)
22.09
(7.22)%
1.62%**
(0.15)%**
445%
431
March 31, 2008
27.60
—§
(3.79)
(3.79)
—
—
—
(3.79)
23.81
(13.73)%
1.62%
0.00%
952%
228
March 31, 2007
26.87
(.19)
.92
.73
—
—
—
.73
27.60
2.72%
1.61%
(0.70)%
686%
483
March 31, 2006
21.34
(.17)
5.70
5.53
—
—
—
5.53
26.87
25.91%
1.66%
(0.71)%
669%
3,044
March 31, 2005*
18.73
(.09)
2.70
2.61
—
—
—
2.61
21.34
13.93%
1.54%**
(0.71)%**
929%
22
FINANCIAL HIGHLIGHTS (continued)
This table is presented to show selected data for a share outstanding throughout each period, and to assist shareholders in evaluating a Fund’s performance for the periods presented.
RATIOS TO
AVERAGE NET ASSETS:
Net Realized
Net Increase
NET ASSET
Net
and
(Decrease)
Distributions
Distributions
Net Increase
NET ASSET
Net
Net Assets,
VALUE,
Investment
Unrealized
in Net Assets
from Net
from Net
(Decrease) in
VALUE,
Total
Investment
Portfolio
End of
BEGINNING
Income
Gains (Losses)
Value Resulting
Investment
Realized
Total
Net Asset
END OF
Investment
Total
Income
Turnover
Period (000’s
Period Ended
OF PERIOD
(Loss)†
on Investments
from Operations
Income
Gains
Distributions
Value
PERIOD
Return††
Expenses
(Loss)
Rate
omitted)
Transportation Fund C-Class
September 30, 2008D
$23.70
$ (.10)
$
(1.68)
$
(1.78)
$
—
$
—
$
—
$
(1.78)
$21.92
(7.51)%
2.37%**
(0.82)%**
445%
$
1,945
March 31, 2008
27.68
(.20)
(3.78)
(3.98)
—
—
—
(3.98)
23.70
(14.38)%
2.38%
(0.73)%
952%
845
March 31, 2007
27.14
(.40)
.94
.54
—
—
—
.54
27.68
1.99%
2.37%
(1.47)%
686%
4,894
March 31, 2006
21.71
(.35)
5.78
5.43
—
—
—
5.43
27.14
25.01%
2.38%
(1.43)%
669%
5,385
March 31, 2005
18.43
(.32)
3.60
3.28
—
—
—
3.28
21.71
17.80%
2.32%
(1.51)%
929%
1,807
March 31, 2004
14.85
(.25)
3.83
3.58
—
—
—
3.58
18.43
24.11%
2.36%
(1.53)%
1,624%
656
Utilities Fund Investor Class
September 30, 2008D
29.29
.28
(3.65)
(3.37)
—
—
—
(3.37)
25.92
(11.51)%
1.37%**
1.80%**
302%
5,384
March 31, 2008
31.89
.51
(2.31)
(1.80)
(.80)
—
(.80)
(2.60)
29.29
(5.88)%
1.39%
1.57%
375%
11,242
March 31, 2007
24.90
.52
6.83
7.35
(.36)
—
(.36)
6.99
31.89
29.64%
1.37%
1.86%
557%
84,150
March 31, 2006
23.62
.51
1.21
1.72
(.44)
—
(.44)
1.28
24.90
7.25%
1.33%
1.99%
728%
11,717
March 31, 2005
20.57
.53
2.82
3.35
(.30)
—
(.30)
3.05
23.62
16.35%
1.33%
2.46%
1,124%
17,861
March 31, 2004
16.38
.45
4.71
5.16
(.97)
—
(.97)
4.19
20.57
32.11%
1.35%
2.50%
1,609%
19,170
Utilities Fund Advisor Class
September 30, 2008D
28.00
.20
(3.49)
(3.29)
—
—
—
(3.29)
24.71
(11.75)%
1.87%**
1.40%**
302%
4,044
March 31, 2008
30.65
.32
(2.17)
(1.85)
(.80)
—
(.80)
(2.65)
28.00
(6.28)%
1.88%
1.02%
375%
2,960
March 31, 2007
24.08
.37
6.56
6.93
(.36)
—
(.36)
6.57
30.65
28.90%
1.86%
1.38%
557%
11,929
March 31, 2006
22.96
.36
1.20
1.56
(.44)
—
(.44)
1.12
24.08
6.76%
1.83%
1.46%
728%
1,427
March 31, 2005
20.10
.42
2.74
3.16
(.30)
—
(.30)
2.86
22.96
15.78%
1.83%
1.95%
1,124%
8,045
March 31, 2004
16.11
.30
4.66
4.96
(.97)
—
(.97)
3.99
20.10
31.39%
1.84%
1.91%
1,609%
1,072
Utilities Fund A-Class
September 30, 2008D
28.27
.26
(3.55)
(3.29)
—
—
—
(3.29)
24.98
(11.64)%
1.62%**
1.78%**
302%
3,128
March 31, 2008
30.87
.42
(2.22)
(1.80)
(.80)
—
(.80)
(2.60)
28.27
(6.07)%
1.63%
1.38%
375%
3,032
March 31, 2007
24.18
.43
6.62
7.05
(.36)
—
(.36)
6.69
30.87
29.28%
1.61%
1.52%
557%
4,756
March 31, 2006
23.00
.44
1.18
1.62
(.44)
—
(.44)
1.18
24.18
7.01%
1.60%
1.75%
728%
626
March 31, 2005*
20.66
.40
2.24
2.64
(.30)
—
(.30)
2.34
23.00
12.84%
1.54%**
2.98%**
1,124%
128
Utilities Fund C-Class
September 30, 2008D
26.93
.13
(3.35)
(3.22)
—
—
—
(3.22)
23.71
(11.96)%
2.37%**
0.94%**
302%
5,783
March 31, 2008
29.66
.18
(2.11)
(1.93)
(.80)
—
(.80)
(2.73)
26.93
(6.77)%
2.38%
0.60%
375%
8,934
March 31, 2007
23.42
.22
6.38
6.60
(.36)
—
(.36)
6.24
29.66
28.30%
2.36%
0.82%
557%
11,013
March 31, 2006
22.47
.24
1.15
1.39
(.44)
—
(.44)
.95
23.42
6.15%
2.34%
1.00%
728%
5,346
March 31, 2005
19.77
.29
2.71
3.00
(.30)
—
(.30)
2.70
22.47
15.23%
2.32%
1.39%
1,124%
4,807
March 31, 2004
15.93
.22
4.59
4.81
(.97)
—
(.97)
3.84
19.77
30.80%
2.36%
1.19%
1,609%
3,948
FINANCIAL HIGHLIGHTS (concluded)
* Since the commencement of operations:
August 1, 2003—Precious Metals Advisor Class;
September 1, 2004—Banking Fund A-Class, Basic Materials A-Class, Biotechnology Fund A-Class, Consumer Products Fund A-Class, Electronics Fund A-Class, Energy Fund A-Class,
Energy Services Fund A-Class, Financial Services Fund A-Class, Health Care Fund A-Class, Internet Fund A-Class, Leisure Fund A-Class, Precious Metals Fund A-Class, Retailing Fund
A-Class, Technology Fund A-Class, Telecommunications Fund A-Class, Transportation Fund A-Class and Utilities Fund A-Class.
** Annualized
† Calculated using the average daily shares outstanding for the period.
†† Total investment return does not reflect the impact of any applicable sales charges and has not been annualized.
à Net investment income per share includes $0.88, $0.84, $0.83, and $0.81 for Investor Class, Advisor Class, A-Class, and C-Class, respectively, resulting from a special dividend from Palm,
Inc. on October 25, 2007.
àà Net investment income to average assets includes 1.91% for Investor Class, Advisor Class, A-Class, and C-Class, resulting from a special dividend from Palm, Inc. on October 25, 2007.
§ Less than $.01 per share.
D Unaudited
NOTES TO FINANCIAL STATEMENTS (Unaudited)
1.
Organization and Significant Accounting
A. Equity securities listed on an exchange (New York
Policies
Stock Exchange (“NYSE”) or American Stock Exchange)
Organization
are valued at the last quoted sales price as of the close
The Rydex Series Funds (the “Trust”) is registered with
of business on the NYSE, usually 4:00 p.m. on the
the SEC under the Investment Company Act of 1940
valuation date. Equity securities listed on the NASDAQ
(the “1940 Act”) as a non-diversified, open-ended
market system are valued at the NASDAQ Official
investment company. The Trust offers five separate
Closing Price, usually as of 4:00 p.m. on the valuation
classes of shares, Investor Class Shares, Advisor Class
date. Investments in open end mutual funds are valued
Shares, A-Class Shares, C-Class Shares, and H-Class
at their net asset value on the valuation date. Short-term
Shares. C-Class Shares have a 1% CDSC if shares are
securities, if any, are valued at amortized cost, which
redeemed within 12 months of purchase. Sales of shares
approximates market value.
of each Class are made without a sales charge at the net
Investments, for which market quotations are not
asset value per share, with the exception of A-Class
readily available, are fair valued as determined in good
Shares. A-Class Shares are sold at net asset value, plus
faith by Rydex Investments under direction of the
the applicable front-end sales charge, except for the
Board of Trustees using methods established or ratified
U.S. Government Money Market Fund. The sales charge
by the Board of Trustees. These methods include, but
varies depending on the amount purchased, but will not
are not limited to: (i) general information as to how
exceed 4.75%. A-Class Share purchases of $1 million or
these securities and assets trade; (ii) in connection with
more are exempt from the front-end sales charge but
futures contracts and options thereupon, and other
have a 1% CDSC if shares are redeemed within 18
derivative investments, information as to how (a) these
months of purchase.
contracts and other derivative investments trade in the
At September 30, 2008, the Trust consisted of fifty-four
futures or other derivative markets, respectively, and
separate Funds: twenty-two Benchmark Funds, one
(b) the securities underlying these contracts and other
Money Market Fund, eleven Alternative Strategies Funds,
derivative investments trade in the cash market; and
seventeen Sector Funds, and three Essential Portfolio
(iii) other information and considerations, including
Funds. This report covers the seventeen Sector Funds (the
current values in related markets.
“Funds”), while the Money Market Fund, the Benchmark
B. Securities transactions are recorded on the trade
Funds, the Alternative Strategies Funds and the Essential
date for financial reporting purposes. Realized gains
Portfolio Funds are contained in separate reports.
and losses from securities transactions are recorded
Rydex Investments provides advisory, transfer agent
using the identified cost basis. Proceeds from lawsuits
and administrative services, and accounting services to
related to investment holdings are recorded as realized
the Trust. Rydex Distributors, Inc. (the “Distributor”)
gains in the respective Fund. Dividend income is
acts as principal underwriter for the Trust. Both Rydex
recorded on the ex-dividend date, net of applicable
Investments and the Distributor are affiliated entities.
taxes withheld by foreign countries. Interest income,
including amortization of premiums and accretion of
The Sector Funds invest in a specific industry sector. To
discount, is accrued on a daily basis. Distributions
the extent that investments are concentrated in a single
received from investments in REITs are recorded as
sector, the Funds are subject to legislative or regulatory
dividend income on the ex-dividend date, subject to
changes, adverse market conditions and/or increased
reclassification upon notice of the character of such
competition affecting such sector.
distribution by the issuer.
The Funds seek capital appreciation and invest
C. Distributions of net investment income and net
substantially all of their assets in equity securities of
realized capital gains, if any, are declared and paid at
companies involved in their sector. The Funds may also
least annually. Distributions are recorded on the ex-
purchase American Depository Receipts, U.S. Government
dividend date and are determined in accordance with
securities, and enter into repurchase agreements.
income tax regulations which may differ from U.S.
Significant Accounting Policies
generally accepted accounting principles.
The following significant accounting policies are in
D. The Funds may leave cash overnight in their cash
conformity with U.S. generally accepted accounting
account with the custodian, U.S. Bank. Periodically, a
principles and are consistently followed by the Trust. All
Fund may have cash due to the custodian bank as an
time references are based on Eastern Time.
overdraft balance. A fee is incurred on this overdraft,
calculated by multiplying the overdraft by a rate based
on the federal funds rate.
THE RYDEX SERIES FUNDS SEMI-ANNUAL REPORT
|
63
NOTES TO FINANCIAL STATEMENTS (Unaudited) (continued)
E. Interest and dividend income, most expenses, all
printing and mailing, etc. on a pass-through basis. Such
realized gains and losses, and all unrealized gains and
expenses vary from Fund to Fund and are allocated to
losses are allocated to the Classes based upon the value
the Funds based on relative net assets. Organizational
of the outstanding shares in each Class. Certain costs,
and setup costs for new Funds are paid by the Trust.
such as distribution fees relating to A-Class Shares and
The Trust has adopted a Distribution Plan and
service and distribution fees related to Advisor Class
Shareholder Services Plan applicable to its Advisor
Shares and C-Class Shares, are charged directly to
Class Shares and a Distribution Plan applicable to
specific Classes. In addition, certain expenses have been
A-Class Shares for which Rydex Distributors, Inc.
allocated to the individual Funds in the Trust on a pro
(the “Distributor”), an affiliated entity, and other firms
rata basis upon the respective aggregate net assets of
that provide distribution and/or shareholder services
each Fund included in the Trust.
(“Service Providers”) may receive compensation. If a
F. The preparation of financial statements in conformity
Service Provider provides distribution services, the Trust
with U.S. generally accepted accounting principles
will pay distribution fees to the Distributor at an annual
requires management to make estimates and assumptions
rate not to exceed 0.25% of average daily net assets,
that affect the reported amount of assets and liabilities
pursuant to Rule 12b-1 of the 1940 Act. The Distributor,
and disclosure of contingent assets and liabilities at the
in turn, will pay the Service Provider out of its fees. The
date of the financial statements and the reported
Distributor may, at its discretion, retain a portion of such
amounts of revenues and expenses during the reporting
payments to compensate itself for distribution services.
period. Actual results could differ from these estimates.
With regard to Advisor Class Shares only, if a Service
G. Throughout the normal course of business, the
Provider provides shareholder services, the Distributor
Funds enter into contracts that contain a variety of
will receive shareholder servicing fees from the Trust at
representations and warranties which provide general
an annual rate not to exceed 0.25% of average daily net
indemnifications. The Funds’ maximum exposure under
assets. The Distributor, in turn, will pay the Service
these arrangements is unknown, as this would involve
Provider out of its fees.
future claims that may be made against the Funds
The Trust has adopted a separate Distribution and
and/or their affiliates that have not yet occurred.
Shareholder Services Plan applicable to its C-Class
However, based on experience, the Funds expect the
Shares that allows the Funds to pay annual distribution
risk of loss to be remote.
and service fees of 1.00% of the Funds’ C-Class Shares
2.
Fees And Other Transactions With Affiliates
average daily net assets. The annual 0.25% service fee
compensates the shareholder’s financial advisor for
Under the terms of an investment advisory contract,
providing on-going services to the shareholder. The
the Trust pays Rydex Investments investment advisory
annual 0.75% distribution fee reimburses the Distributor
fees calculated at an annualized rate of 0.85% of the
for paying the shareholder’s financial advisor an ongoing
average daily net assets of each of the Funds, except
sales commission. The Distributor advances the first
the Precious Metals Fund, which is 0.75% of the average
year’s service and distribution fees to the Financial
daily net assets.
Advisor. The Distributor retains the service and
Rydex Investments provides transfer agent and
distribution fees on accounts with no authorized dealer
administrative services to the Funds for fees calculated
of record.
at an annualized rate of 0.25% of the average daily net
During the period ended September 30, 2008, the
assets of each Fund.
Distributor retained sales charges of $557,030 relating
Rydex Investments also provides accounting services to
to sales of A-Class Shares of the Trust.
the Trust for fees calculated at an annualized rate of
Certain officers and trustees of the Trust are also officers
0.10% on the first $250 million of the average daily net
of Rydex Investments and the Distributor.
assets, 0.075% on the next $250 million of the average
daily net assets, 0.05% on the next $250 million of the
average daily net assets, and 0.03% on the average daily
net assets over $750 million of each Fund.
Rydex Investments engages external service providers to
perform other necessary services to the Trust, such as
accounting and auditing related services, legal services,
64
|
THE RYDEX SERIES FUNDS SEMI-ANNUAL REPORT
NOTES TO FINANCIAL STATEMENTS (Unaudited) (continued)
3.
Federal Income Tax Information
The Funds intend to comply with the provisions of Subchapter M of the Internal Revenue Code applicable to regulated
investment companies and will distribute substantially all net investment income and capital gains to shareholders.
Therefore, no Federal income tax provision has been recorded.
The Funds adopted Financial Accounting Standards Board (FASB) Interpretation No. 48 “Accounting for Uncertainty in
Income Taxes” (“FIN 48”). FIN 48 provides guidance for how uncertain tax positions should be recognized, measured,
presented and disclosed in the financial statements. FIN 48 requires the evaluation of tax positions taken or expected to be
taken in the course of preparing the Fund’s tax returns to determine whether the tax positions are “more-likely-than-not”
of being sustained by the applicable tax authority. Tax positions not deemed to meet the more-likely-than-not threshold
would be recorded as a tax benefit or expense in the current year. Management has analyzed the Funds’ tax positions
taken on federal income tax returns for all open tax years for purposes of complying with FIN 48, and has concluded that
no provision for income tax was required in the Funds’ financial statements.
The Funds file U.S. federal income tax returns and returns in various foreign jurisdictions in which they invest. While the
statute of limitations remains open to examine the Funds’ U.S. federal income tax returns filed for the fiscal years 2004 to
2007, no examinations are in progress or anticipated at this time.
Income and capital gain distributions are determined in accordance with Federal income tax regulations, which may differ
from U.S. generally accepted accounting principles. These differences are primarily due to differing treatments for losses
deferred due to wash sales, losses deferred due to post-October losses, and excise tax regulations.
Permanent book and tax basis differences, if any, will result in reclassifications. This includes net operating losses not
utilized during the current period, capital loss carry forward expired, and the utilization of earnings and profits distributed
to the shareholders on redemption of shares as part of the dividends paid deduction for income tax purposes. These
reclassifications have no effect on net assets or net asset values per share. Any undistributed ordinary income or long-term
capital gain remaining at fiscal year end is distributed in the following year.
The Funds recognize interest and penalties, if any, related to unrecognized tax benefits as income tax expense in the
statement of operations. During the period, the Funds did not incur any interest or penalties.
At September 30, 2008, the cost of securities for Federal income tax purposes, the aggregate gross unrealized gain for all
securities for which there was an excess of value over tax cost and the aggregate gross unrealized loss for all securities for
which there was an excess of tax cost over value, were as follows:
Tax
Tax
Net
Tax
Unrealized
Unrealized
Unrealized
Fund
Cost
Gain
Loss
Gain (Loss)
Banking Fund
$
27,599,263
$
—
$
(2,637,063)
$
(2,637,063)
Basic Materials Fund
46,280,475
9,545,541
(4,484,562)
5,060,979
Biotechnology Fund
65,610,683
32,963,822
(1,443,911)
31,519,911
Consumer Products Fund
20,363,107
2,949,240
(408,949)
2,540,291
Electronics Fund
5,620,195
2,197,257
(162,233)
2,035,024
Energy Fund
60,529,713
27,057,328
(2,994,721)
24,062,607
Energy Services Fund
127,364,920
39,273,869
(7,531,124)
31,742,745
Financial Services Fund
14,583,558
1,742,814
(643,065)
1,099,749
Health Care Fund
39,617,808
5,782,263
(388,381)
5,393,882
Internet Fund
1,707,444
1,357,044
(83,933)
1,273,111
Leisure Fund
2,210,602
662,805
(46,141)
616,664
Precious Metals Fund
183,697,228
39,593,629
(10,857,964)
28,735,665
Retailing Fund
13,672,982
366,414
(226,221)
140,193
Technology Fund
9,576,378
2,686,233
(647,260)
2,038,973
Telecommunications Fund
4,995,840
1,570,618
(138,119)
1,432,499
Transportation Fund
26,708,591
—
(1,362,658)
(1,362,658)
Utilities Fund
17,948,873
2,661,959
(348,521)
2,313,438
THE RYDEX SERIES FUNDS SEMI-ANNUAL REPORT
|
65
NOTES TO FINANCIAL STATEMENTS (Unaudited) (continued)
4.
Repurchase Agreements
The Funds transfer uninvested cash balances into a single joint account, the daily aggregate balance of which is invested
in one or more repurchase agreements collateralized by obligations of the U.S. Treasury and/or U.S. Government
Agencies. The collateral is in the possession of the Funds’ custodian and is evaluated to ensure that its market value
exceeds by, at a minimum, 102% of the original face amount of the repurchase agreements. Each Fund holds a pro rata
share of the collateral based on the dollar amount of the repurchase agreement entered into by each Fund.
The repurchase agreements executed by the joint account and outstanding as of September 30, 2008, were as follows:
Counterparty
Terms of Agreement
Face Value
Market Value
Repurchase Price
Credit Suisse Group
0.25% due 10/01/08
$50,881,212
$50,881,212
$50,881,565
$50,881,212
$50,881,565
As of September 30, 2008, the collateral for the repurchase agreements in the joint account was as follows:
Security Type
Maturity Date
Rate
Par Value
Market Value
U.S. Treasury Bond
08/15/27
6.375%
$40,425,000
$51,905,245
$51,905,245
In the event of counterparty default, the Funds have the right to collect the collateral to offset losses incurred. There is
potential loss to the Funds in the event the Funds are delayed or prevented from exercising their rights to dispose of the
collateral securities, including the risk of a possible decline in the value of the underlying securities during the period while
the Funds seek to assert their rights. The Funds’ investment advisor, acting under the supervision of the Board of Trustees,
reviews the value of the collateral and the credit worthiness of those banks and dealers with which the Funds enter into
repurchase agreements to evaluate potential risks.
5.
Fair Value Measurement
The Funds adopted Statement of Financial Accounting Standard No. 157 (“FAS 157”) Fair Value Measurement which
provided enhanced guidance for using fair value to measure assets and liabilities. The standard requires companies to
provide expanded information about the assets and liabilities measured at fair value and the potential effect of these fair
valuations on an entity’s financial performance. The standard does not expand the use of fair value in any new
circumstances, but provides clarification on acceptable fair valuation methods and applications.
Various inputs may be used to determine the value of the fund’s investments. These inputs are summarized in three
broad levels:
Level 1—quoted prices in active markets for identical securities.
Level 2—other significant observable inputs (including quoted prices for similar securities, interest rates, prepayment
speeds, credit risk, etc.).
Level 3—significant unobservable inputs (including the fund’s own assumptions used to determine the fair value of
investments).
The inputs or methodologies used for valuing securities are not necessarily an indication of the risk associated with
investing in those securities.
The following table summarizes the inputs used to value the Funds’ net assets as of September 30, 2008:
Level 1
Level 1
Level 2
Level 2
Level 3
Level 3
Investments
Other Financial
Investments
Other Financial
Investments
Other Financial
Fund
In Securities
Instruments
In Securities
Instruments
In Securities
Instruments
Total
Assets
Banking Fund
$
24,962,200
$
—
$
—
$
—
$
—
$
—
$
24,962,200
Basic Materials Fund
51,341,454
—
—
—
—
—
51,341,454
Biotechnology Fund
97,130,594
—
—
—
—
—
97,130,594
Consumer Products Fund
22,903,398
—
—
—
—
—
22,903,398
Electronics Fund
7,655,219
—
—
—
—
—
7,655,219
Energy Fund
84,592,320
—
—
—
—
—
84,592,320
Energy Services Fund
159,107,665
—
—
—
—
—
159,107,665
Financial Services Fund
15,683,307
—
—
—
—
—
15,683,307
Health Care Fund
45,011,690
—
—
—
—
—
45,011,690
66
|
THE RYDEX SERIES FUNDS SEMI-ANNUAL REPORT
NOTES TO FINANCIAL STATEMENTS (Unaudited) (continued)
Level 1
Level 1
Level 2
Level 2
Level 3
Level 3
Investments
Other Financial
Investments
Other Financial
Investments
Other Financial
Fund
In Securities
Instruments
In Securities
Instruments
In Securities
Instruments
Total
Assets
Internet Fund
$
2,980,555
$
—
$
—
$
—
$
—
$
—
$
2,980,555
Leisure Fund
2,827,266
—
—
—
—
—
2,827,266
Precious Metals Fund
212,432,893
—
—
—
—
—
212,432,893
Retailing Fund
13,813,175
—
—
—
—
—
13,813,175
Technology Fund
11,615,351
—
—
—
—
—
11,615,351
Telecommunications Fund
6,428,339
—
—
—
—
—
6,428,339
Transportation Fund
25,345,933
—
—
—
—
—
25,345,933
Utilities Fund
20,262,311
—
—
—
—
—
20,262,311
6.
Securities Transactions
During the period ended September 30, 2008, the cost of purchases and proceeds from sales of investment securities,
excluding short-term and temporary cash investments, were:
Basic
Biotech-
Consumer
Energy
Financial
Banking
Materials
nology
Products
Electronics
Energy
Services
Services
Fund
Fund
Fund
Fund
Fund
Fund
Fund
Fund
Purchases
$
99,173,144
$148,703,038
$194,785,599
$
68,685,119
$48,870,181
$191,486,785
$219,106,065
$ 61,854,910
Sales
$
83,379,852
$222,784,332 $166,000,823
-->
$222,784,332
$166,000,823
$
63,517,776
$50,765,906
$196,612,969 $173,712,725
-->
$196,612,969
$173,712,725
$ 55,599,376
Health
Precious
Telecommu-
Transpor-
Care
Internet
Leisure
Metals
Retailing
Technology
nications
tation
Fund
Fund
Fund
Fund
Fund
Fund
Fund
Fund
Purchases
$215,972,977
$
29,734,662
$
38,486,306
$265,652,068
$40,910,637
$
54,993,619
$
31,296,221
$114,964,930
Sales
$207,977,025
$
33,772,221
$
39,998,888
$213,542,476
$31,856,140
$
55,718,326
$
38,141,947
$111,827,310
Utilities
Fund
Purchases
$82,553,445
Sales
$87,162,094
THE RYDEX SERIES FUNDS SEMI-ANNUAL REPORT
|
67
NOTES TO FINANCIAL STATEMENTS (continued)
7.
Share Transactions
The Trust is authorized to issue an unlimited number of shares (no par value). Transactions in shares for the periods presented were:
Purchased through Dividend
Shares Purchased
Reinvestment
Shares Redeemed
Net Shares Purchased (Redeemed)
Period Ended
Year Ended
Period Ended
Year Ended
Period Ended
Year Ended
Period Ended
Year Ended
September 30,
March 31,
September 30,
March 31,
September 30,
March 31,
September 30,
March 31,
2008†
2008
2008†
2008
2008†
2008
2008†
2008
Banking Fund
Investor Class
15,296,151
21,846,292
—
10,788
(14,262,374)
(21,763,236)
1,033,777
93,844
Advisor Class
2,817,134
2,392,085
—
713
(1,911,982)
(2,364,733)
905,152
28,065
A-Class
667,779
157,111
—
1,168
(533,388)
(99,684)
134,391
58,595
C-Class
2,844,226
2,137,813
—
2,373
(2,781,006)
(1,959,403)
63,220
180,783
Basic Materials Fund
Investor Class
3,782,174
9,085,830
—
3,061
(5,269,978)
(8,324,844)
(1,487,804)
764,047
Advisor Class
363,361
1,199,375
—
438
(481,870)
(1,346,702)
(118,509)
(146,889)
A-Class
47,613
291,891
—
211
(65,784)
(199,691)
(18,171)
92,411
C-Class
322,758
1,091,168
—
428
(420,519)
(997,507)
(97,761)
94,089
Biotechnology Fund
Investor Class
9,602,168
8,046,628
—
—
(8,691,229)
(8,721,870)
910,939
(675,242)
Advisor Class
1,037,013
1,497,669
—
—
(896,427)
(1,552,796)
140,586
(55,127)
A-Class
149,884
135,897
—
—
(65,582)
(64,710)
84,302
71,187
C-Class
919,322
1,177,345
—
—
(885,717)
(1,128,343)
33,605
49,002
Consumer Products Fund
Investor Class
1,871,214
4,016,214
—
8,104
(1,787,200)
(4,388,872)
84,014
(364,554)
Advisor Class
316,225
1,582,674
—
2,801
(317,690)
(1,596,552)
(1,465)
(11,077)
A-Class
121,228
44,328
—
528
(56,639)
(109,674)
64,589
(64,818)
C-Class
226,446
318,383
—
814
(260,744)
(365,011)
(34,298)
(45,814)
Electronics Fund
Investor Class
5,103,027
17,002,054
—
—
(5,495,569)
(17,258,806)
(392,542)
(256,752)
Advisor Class
578,513
2,105,493
—
—
(504,547)
(2,173,508)
73,966
(68,015)
A-Class
40,417
8,618
—
—
(11,416)
(10,673)
29,001
(2,055)
C-Class
1,415,132
2,830,491
—
—
(1,402,124)
(2,973,066)
13,008
(142,575)
Energy Fund
Investor Class
8,244,730
10,638,142
—
56,372
(8,293,356)
(11,616,824)
(48,626)
(922,310)
Advisor Class
861,752
1,762,826
—
19,658
(1,173,747)
(1,758,559)
(311,995)
23,925
A-Class
217,492
253,497
—
6,179
(132,994)
(164,562)
84,498
95,114
C-Class
1,021,676
2,665,760
—
25,217
(1,217,592)
(2,717,401)
(195,916)
(26,424)
†
Unaudited
NOTES TO FINANCIAL STATEMENTS (continued)
Purchased through Dividend
Shares Purchased
Reinvestment
Shares Redeemed
Net Shares Purchased (Redeemed)
Period Ended
Year Ended
Period Ended
Year Ended
Period Ended
Year Ended
Period Ended
Year Ended
September 30,
March 31,
September 30,
March 31,
September 30,
March 31,
September 30,
March 31,
2008†
2008
2008†
2008
2008†
2008
2008†
2008
Energy Services Fund
Investor Class
4,590,494
9,256,758
—
—
(4,092,196)
(9,751,153)
498,298
(494,395)
Advisor Class
452,139
1,168,172
—
—
(450,770)
(1,281,003)
1,369
(112,831)
A-Class
222,671
411,495
—
—
(137,360)
(340,981)
85,311
70,514
C-Class
397,958
1,121,336
—
—
(524,763)
(1,127,685)
(126,805)
(6,349)
Financial Services Fund
Investor Class
7,430,828
13,776,325
—
8,349
(7,072,843)
(14,918,648)
357,985
(1,133,974)
Advisor Class
801,418
1,398,907
—
1,766
(797,270)
(2,420,423)
4,148
(1,019,750)
A-Class
142,622
513,531
—
905
(65,452)
(455,908)
77,170
58,528
C-Class
1,608,607
1,645,721
—
4,191
(1,326,793)
(1,750,355)
281,814
(100,443)
Health Care Fund
Investor Class
16,063,601
10,762,494
—
—
(15,512,723)
(11,434,633)
550,878
(672,139)
Advisor Class
1,422,290
2,801,976
—
—
(1,958,735)
(3,024,301)
(536,445)
(222,325)
A-Class
112,239
54,923
—
—
(21,914)
(57,339)
90,325
(2,416)
C-Class
1,260,385
2,103,521
—
—
(1,115,109)
(2,283,572)
145,276
(180,051)
Internet Fund
Investor Class
418,737
3,124,058
—
516
(495,012)
(3,145,031)
(76,275)
(20,457)
Advisor Class
109,946
734,811
—
246
(116,201)
(719,945)
(6,255)
15,112
A-Class
4,191
11,469
—
18
(4,742)
(11,875)
(551)
(388)
C-Class
393,444
405,600
—
261
(417,276)
(387,417)
(23,832)
18,444
Leisure Fund
Investor Class
1,332,777
1,738,265
—
—
(1,379,574)
(1,889,317)
(46,797)
(151,052)
Advisor Class
232,480
545,887
—
—
(242,501)
(635,902)
(10,021)
(90,015)
A-Class
472
5,561
—
—
(3,982)
(62,795)
(3,510)
(57,234)
C-Class
3,863
105,164
—
—
(8,345)
(181,941)
(4,482)
(76,777)
Precious Metals Fund
Investor Class
7,839,301
13,597,521
—
—
(6,566,975)
(14,120,431)
1,272,326
(522,910)
Advisor Class
378,303
798,827
—
—
(466,355)
(777,799)
(88,052)
21,028
A-Class
102,662
229,689
—
—
(129,612)
(157,400)
(26,950)
72,289
C-Class
1,212,061
1,793,782
—
—
(1,262,723)
(1,833,355)
(50,662)
(39,573)
Retailing Fund
Investor Class
3,661,718
7,136,814
—
—
(2,975,615)
(7,142,396)
686,103
(5,582)
Advisor Class
666,565
1,192,997
—
—
(643,395)
(1,320,740)
23,170
(127,743)
A-Class
3,816
4,451
—
—
(7,722)
(22,806)
(3,906)
(18,355)
C-Class
81,970
400,140
—
—
(73,940)
(474,793)
8,030
(74,653)
†
Unaudited
NOTES TO FINANCIAL STATEMENTS (continued)
Purchased through Dividend
Shares Purchased
Reinvestment
Shares Redeemed
Net Shares Purchased (Redeemed)
Period Ended
Year Ended
Period Ended
Year Ended
Period Ended
Year Ended
Period Ended
Year Ended
September 30,
March 31,
September 30,
March 31,
September 30,
March 31,
September 30,
March 31,
2008†
2008
2008†
2008
2008†
2008
2008†
2008
Technology Fund
Investor Class
4,385,410
10,696,083
—
—
(4,571,533)
(10,992,938)
(186,123)
(296,855)
Advisor Class
642,739
1,437,570
—
—
(656,031)
(1,652,207)
(13,292)
(214,637)
A-Class
40,287
430,423
—
—
(32,073)
(405,192)
8,214
25,231
C-Class
1,074,004
1,515,054
—
—
(1,054,682)
(1,422,849)
19,322
92,205
Telecommunications Fund
Investor Class
1,262,830
8,701,195
—
884
(1,647,180)
(8,926,630)
(384,350)
(224,551)
Advisor Class
373,950
1,541,682
—
133
(368,900)
(1,851,468)
5,050
(309,653)
A-Class
4,451
125,840
—
92
(21,542)
(214,571)
(17,091)
(88,639)
C-Class
775,535
1,699,854
—
373
(826,765)
(1,786,944)
(51,230)
(86,717)
Transportation Fund
Investor Class
4,810,026
6,123,111
—
—
(4,691,729)
(5,659,770)
118,297
463,341
Advisor Class
348,698
756,857
—
—
(474,127)
(668,223)
(125,429)
88,634
A-Class
24,158
8,262
—
—
(14,216)
(16,170)
9,942
(7,908)
C-Class
999,347
952,957
—
—
(946,260)
(1,094,116)
53,087
(141,159)
Utilities Fund
Investor Class
2,825,982
7,500,882
—
12,752
(3,002,132)
(9,768,940)
(176,150)
(2,255,306)
Advisor Class
479,245
1,229,917
—
4,441
(421,335)
(1,517,764)
57,910
(283,406)
A-Class
55,579
110,391
—
2,116
(37,629)
(159,322)
17,950
(46,815)
C-Class
1,085,175
1,555,870
—
3,795
(1,173,005)
(1,599,189)
(87,830)
(39,524)
†
Unaudited
NOTES TO FINANCIAL STATEMENTS (Unaudited) (concluded)
8.
Portfolio Securities Loaned
The Funds may lend their securities to approved brokers to earn additional income. Security lending income shown on the
statement of operations is shown net of rebates paid to borrowers and earnings on cash collateral investments shared with
the lending agent. Within this arrangement, the Funds act as the lender, U.S. Bank acts as the agent, and other approved
registered broker dealers act as the borrowers. The Funds receive cash collateral, valued at 100% of the value of the
securities on loan, which is initially held in a segregated account at U.S. Bank. Under the terms of the Funds’ securities
lending agreement with U.S. Bank, cash collateral may be invested by U.S. Bank in certain high quality, liquid investments.
At September 30, 2008, the cash collateral investments consisted of a money market mutual fund. The Funds bear the risk
of loss on cash collateral investments. Collateral is maintained over the life of the loan in an amount not less than the value
of loaned securities, as determined at the close of fund business each day; any additional collateral required due to
changes in security values is delivered to the Fund the next business day. Although the collateral mitigates risk, the Funds
could experience a delay in recovering its securities and a possible loss of income or value if the borrower fails to return
the securities. The Funds have the right under the securities lending agreement to recover the securities from the borrower
on demand.
The following represents a breakdown of the collateral:
MUTUAL FUND
Issuer
Shares
Market Value
Mount Vernon Securities Lending Trust
66,041,429
$66,041,429
Total Mutual Fund
$66,041,429
At September 30, 2008, the following Funds participated in securities lending and received cash collateral:
Value of
Cash
Securities
Fund
Collateral
Loaned
Banking Fund
$
638,933
$
663,962
Basic Materials Fund
1,069,448
1,043,449
Biotechnology Fund
7,182,660
6,885,579
Consumer Products Fund
268,570
268,342
Electronics Fund
338,218
335,258
Energy Fund
4,061,970
4,303,654
Energy Services Fund
20,196,614
20,363,161
Financial Services Fund
151,435
163,281
Healthcare Fund
288,825
275,617
Internet Fund
96,197
94,490
Precious Metals Fund
26,569,194
23,271,585
Retailing Fund
1,271,617
1,230,612
Technology Fund
276,698
277,429
Telecommunications Fund
98,892
79,855
Transportation Fund
1,665,634
1,654,891
Utilities Fund
1,866,524
1,827,612
9.
New Accounting Pronouncements
In March 2008, the FASB issued FAS 161, “Disclosures about Derivative Instruments and Hedging Activities.” The new
requirement is intended to improve disclosures around an entity’s derivatives activity and help investors understand how
entities use derivatives, how they are accounted for and how they affect the financial position and operations of that entity.
FAS 161 is effective for fiscal years and interim periods beginning after November 15, 2008.
THE RYDEX SERIES FUNDS SEMI-ANNUAL REPORT
|
71
OTHER INFORMATION (Unaudited)
Proxy Voting Information
A description of the policies and procedures that the Trust uses to determine how to vote proxies relating to securities held
in the Funds’ portfolios is available, without charge and upon request, by calling 1-800-820-0888. This information is also
available from the EDGAR database on the SEC’s website at http://www.sec.gov.
Information regarding how the Funds voted proxies relating to portfolio securities during the most recent 12-month period
ended June 30 is available without charge, upon request, by calling 1-800-820-0888. This information is also available from
the EDGAR database on the SEC’s website at http://www.sec.gov.
Quarterly Portfolio Schedules Information
The Trust files its complete schedule of portfolio holdings with the SEC for the first and third quarters of each fiscal year on
Form N-Q; which are available on the SEC’s website at http://www.sec.gov. The Funds’ Forms N-Q may be reviewed and
copied at the SEC’s Public Reference Room in Washington, DC, and that information on the operation of the Public
Reference Room may be obtained by calling 1-800-SEC-0330. Copies of the portfolio holdings are also available to
shareholders, without charge and upon request, by calling 1-800-820-0888.
Rydex Investments Board Review and Approval of the Investment Advisory Agreement
The Advisory Agreements dated January 18, 2008 between Rydex Series Funds, on behalf of the Funds, and PADCO
Advisors, Inc. were last approved by shareholders at Special Meetings held on October 4, 2007, November 1, 2007,
January 31, 2008 and February 12, 2008. Subject to the terms and conditions provided for in the Advisory Agreements,
each Advisory Agreement remains in effect for an initial two year term from the date of the Agreement and remains in
effect for periods of one year thereafter subject to Board approval. Therefore, the Advisory Agreements are next
scheduled to be approved by the Board of Trustees at the Trust’s August 2009 Meeting.
72
|
THE RYDEX SERIES FUNDS SEMI-ANNUAL REPORT
INFORMATION ON BOARD OF TRUSTEES AND OFFICERS (Unaudited)
A Board of Trustees oversees all Rydex Investments, in which its members have no stated term of service, and continue to
serve after election until resignation. The Statement of Additional Information includes further information about Fund
Trustees and Officers, and can be obtained without charge by calling 1-800-820-0888.
All Trustees and Officers may be reached c/o Rydex Investments, 9601 Blackwell Rd., Suite 500, Rockville, MD 20850.
TRUSTEES AND OFFICERS
Length of Service
Name, Position and
As Trustee
Number of
Year of Birth
(Year Began)
Funds Overseen
––––––––––––––––––––––––
–––––––––––––––––––––––––––––
––––––––––——––––––––––––
Carl G. Verboncoeur*
Rydex Series Funds – 2004
158
Trustee, President (1952)
Rydex Variable Trust – 2004
Rydex Dynamic Funds – 2004
Rydex ETF Trust – 2004
Principal Occupations During Past Five Years: Treasurer of Rydex Specialized Products, LLC (2005 to present) Chief Executive
Officer of Rydex Specialized Products, LLC (2005 to 2008); Chief Executive Officer of Rydex Investments and Rydex Distributors,
Inc. (2003 to present); Executive Vice President of Rydex Investments (2000 to 2003)
Michael P. Byrum*
Rydex Series Funds – 2005
150
Trustee, Vice President
Rydex Variable Trust – 200
(1970)
Rydex Dynamic Funds – 2005
Rydex ETF Trust – 2005
Principal Occupations During Past Five Years: Chief Investment Officer of Rydex Investments (2003 to present); Secretary of
Rydex Specialized Products, LLC (2005 to 2008); Vice President of Rydex Series Funds (1997 to present); Vice President of Rydex
Variable Trust (1998 to present); Vice President of Rydex Dynamic Funds (1999 to present); Vice President of Rydex ETF Trust
(2002 to present); President and Trustee of Rydex Capital Partners SPhinX Fund (2003 to 2006); President of Rydex Investments
(2004 to present); Chief Operating Officer of Rydex Investments and Rydex Distributors, Inc. (2003 to 2004)
INDEPENDENT TRUSTEES
Length of Service
Name, Position and
As Trustee
Number of
Year of Birth
(Year Began)
Funds Overseen
–––––––––––––––––––––––––
–––––––––––––––––––––––––––––
––––––––––——––––––––––––
John O. Demaret
Rydex Series Funds – 1997
150
Trustee, Chairman of the
Rydex Variable Trust – 1998
Board (1940)
Rydex Dynamic Funds – 1999
Rydex ETF Trust – 2003
Principal Occupations During Past Five Years: Retired
Corey A. Colehour
Rydex Series Funds – 1993
150
Trustee (1945)
Rydex Variable Trust – 1998
Rydex Dynamic Funds – 1999
Rydex ETF Trust – 2003
Principal Occupations During Past Five Years: Retired (2006 to present); Owner and President of Schield Management
Company, registered investment adviser (2005 to 2006); Senior Vice President of Marketing and Co-Owner of Schield
Management Company, registered investment adviser (1985 to 2005)
J. Kenneth Dalton
Rydex Series Funds – 1995
150
Trustee (1941)
Rydex Variable Trust – 1998
Rydex Dynamic Funds – 1999
Rydex ETF Trust – 2003
Principal Occupations During Past Five Years: Mortgage Banking Consultant and Investor, The Dalton Group
THE RYDEX SERIES FUNDS SEMI-ANNUAL REPORT
|
73
INFORMATION ON BOARD OF TRUSTEES AND OFFICERS (Unaudited) (concluded)
Length of Service
Name, Position and
As Trustee
Number of
Year of Birth
(Year Began)
Funds Overseen
––––––––––––––––––––––––
–––––––––––––––––––––––––––––
––––––––––——––––––––––––
Werner E. Keller
Rydex Series Fun – – 2005
150
Trustee (1940)
Rydex Variable Trust – 2005
Rydex Dynamic Funds – 2005
Rydex ETF Trust – 2005
Principal Occupations During Past Five Years: Retired (2001 to present); Chairman, Centurion Capital Management (1991 to 2001)
Thomas F. Lydon, Jr.
Rydex Series Funds – 2005
150
Trustee (1960)
Rydex Variable Trust – 2005
Rydex Dynamic Funds – 2005
Rydex ETF Trust – 2005
Principal Occupations During Past Five Years: President, Global Trends Investments
Patrick T. McCarville
Rydex Series Funds – 1997
150
Trustee (1942)
Rydex Variable Trust – 1998
Rydex Dynamic Funds – 1999
Rydex ETF Trust – 2003
Principal Occupations During Past Five Years: Founder and Chief Executive Officer, Par Industries, Inc.
Roger Somers
Rydex Series Funds – 1993
150
Trustee (1944)
Rydex Variable Trust – 1998
Rydex Dynamic Funds – 1999
Rydex ETF Trust – 2003
Principal Occupations During Past Five Years: Owner, Arrow Limousine
EXECUTIVE OFFICERS
Name, Position and
Principal Occupations
––––––––––––––––––––––––––
Year of Birth
–––––––––––––––––––––
During Past Five Years
Nick Bonos*
Chief Financial Officer of Rydex Specialized Products, LLC (2005 to present);
Vice President and Treasurer (1963)
Vice President and Treasurer of Rydex Series Funds, Rydex Variable Trust, Rydex
Dynamic Funds, and Rydex ETF Trust (2003 to present); Senior Vice President of
Rydex Investments (2003 to present); Vice President and Treasurer of Rydex
Capital Partners SPhinX Fund (2003 to 2006)
Joanna M. Haigney*
Chief Compliance Officer of Rydex Series Funds, Rydex Variable Trust, and
Chief Compliance Officer and
Rydex Dynamic Funds (2004 to present); Secretary of Rydex Series Funds, Rydex
Secretary (1966)
Variable Trust, and Rydex Dynamic Funds (2000 to present); Secretary of Rydex
ETF Trust (2002 to present); Vice President of Compliance of Rydex Investments
(2000 to present); Secretary of Rydex Capital Partners SPhinX Fund (2003 to 2006)
Joseph Arruda*
Assistant Treasurer of Rydex Series Funds, Rydex Variable Trust, Rydex Dynamic
Assistant Treasurer (1966)
Funds, Rydex ETF Trust (2006 to present); Senior Vice President of Rydex
Investments (2008 to present); Vice President of Rydex Investments (2004 to
2008); Director of Accounting of Rydex Investments (2003 to 2004)
Paula Billos*
Controller of Rydex Series Funds, Rydex Variable Trust, Rydex Dynamic Funds,
Controller (1974)
Rydex ETF Trust (2006 to present); Director of Fund Administration of Rydex
Investments (2001 to present)
* Officers of the Funds are deemed to be “interested persons” of the Trust, within the meaning of Section 2(a)(19) of the 1940 Act, inasmuch as
this person is affiliated with Rydex Investments.
74
|
THE RYDEX SERIES FUNDS SEMI-ANNUAL REPORT
This page intentionally left blank.
This page intentionally left blank.
This page intentionally left blank.
9601 Blackwell Road, Suite 500
Rockville, MD 20850
www.rydexinvestments.com
800-820-0888
RSECF-SEMI-0908x0309