SEPTEMBER 30, 2008
RYDEX SERIES FUNDS SEMI-ANNUAL REPORT
BENCHMARK FUNDS
NOVA FUND
INVERSE GOVERNMENT LONG BOND STRATEGY FUND
S&P 500 FUND
HIGH YIELD STRATEGY FUND
INVERSE S&P 500 STRATEGY FUND
INVERSE HIGH YIELD STRATEGY FUND
NASDAQ-100® FUND
EUROPE 1.25x STRATEGY FUND
(Formerly, OTC Fund)
JAPAN 2x STRATEGY FUND
INVERSE NASDAQ-100® STRATEGY FUND
(Formerly, Inverse OTC Strategy Fund)
SMALL-CAP VALUE FUND
MID-CAP 1.5x STRATEGY FUND
MID-CAP VALUE FUND
INVERSE MID-CAP STRATEGY FUND
LARGE-CAP VALUE FUND
RUSSELL 2000® 1.5x STRATEGY FUND
SMALL-CAP GROWTH FUND
RUSSELL 2000® FUND
MID-CAP GROWTH FUND
INVERSE RUSSELL 2000® STRATEGY FUND
LARGE-CAP GROWTH FUND
GOVERNMENT LONG BOND 1.2x STRATEGY FUND
U.S. GOVERNMENT MONEY MARKET FUND
GO GREEN!
ELIMINATE MAILBOX CLUTTER
Go paperless with Rydex eDelivery—a service giving you full
online access to account information and documents. Save time,
cut down on mailbox clutter and be a friend to the environment
with eDelivery.
With Rydex eDelivery you can:
•
View online confirmations and statements at your
convenience.
•
Receive email notifications when your most recent
confirmations, statements and other account documents
are available for review.
•
Access prospectuses, annual reports and semiannual
reports online.
It’s easy to enroll:
1/ Visit www.rydexinvestments.com
e
RYDEX
DELIVERY
2/ Click on the Rydex eDelivery logo
3/ Follow the simple enrollment instructions
If you have questions about Rydex eDelivery services,
contact one of our Shareholder Service Representatives
at 800.820.0888.
This report and the financial statements contained herein are submitted for the general information of our shareholders. The
report is not authorized for distribution to prospective investors unless preceded or accompanied by an effective prospectus.
Distributed by Rydex Distributors, Inc.
TABLE OF CONTENTS
LETTER TO OUR SHAREHOLDERS
. . . . . . . . . . . . . . . . . . . . . . . . . . . . . . . . . . . . . . . . . . . . . . . . . . . . . . . . . .
2
A BRIEF NOTE ON THE COMPOUNDING OF RETURNS
. . . . . . . . . . . . . . . . . . . . . . . . . . . . . . . . . . . . . . . .
3
ABOUT SHAREHOLDERS’ FUND EXPENSES
. . . . . . . . . . . . . . . . . . . . . . . . . . . . . . . . . . . . . . . . . . . . . . . . . .
4
FUND PROFILES
. . . . . . . . . . . . . . . . . . . . . . . . . . . . . . . . . . . . . . . . . . . . . . . . . . . . . . . . . . . . . . . . . . . . . . . .
9
SCHEDULES OF INVESTMENTS
. . . . . . . . . . . . . . . . . . . . . . . . . . . . . . . . . . . . . . . . . . . . . . . . . . . . . . . . . . . .
21
STATEMENTS OF ASSETS AND LIABILITIES
. . . . . . . . . . . . . . . . . . . . . . . . . . . . . . . . . . . . . . . . . . . . . . . . . .
108
STATEMENTS OF OPERATIONS
. . . . . . . . . . . . . . . . . . . . . . . . . . . . . . . . . . . . . . . . . . . . . . . . . . . . . . . . . . . .
112
STATEMENTS OF CHANGES IN NET ASSETS
. . . . . . . . . . . . . . . . . . . . . . . . . . . . . . . . . . . . . . . . . . . . . . . . .
116
FINANCIAL HIGHLIGHTS
. . . . . . . . . . . . . . . . . . . . . . . . . . . . . . . . . . . . . . . . . . . . . . . . . . . . . . . . . . . . . . . . .
124
NOTES TO FINANCIAL STATEMENTS
. . . . . . . . . . . . . . . . . . . . . . . . . . . . . . . . . . . . . . . . . . . . . . . . . . . . . . .
135
OTHER INFORMATION
. . . . . . . . . . . . . . . . . . . . . . . . . . . . . . . . . . . . . . . . . . . . . . . . . . . . . . . . . . . . . . . . . .
149
INFORMATION ON BOARD OF TRUSTEES AND OFFICERS
. . . . . . . . . . . . . . . . . . . . . . . . . . . . . . . . . . . . . .
150
THE RYDEX SERIES FUNDS SEMI-ANNUAL REPORT
|
1
LETTER TO OUR SHAREHOLDERS
DEAR SHAREHOLDER:
Most economic and market surveys tend to focus on more recent events because those that occurred
earlier seem distant and less important. That dynamic was never so evident as in the April-to-September
period, when events of just the previous three weeks completely overwhelmed everything that came
before. In an incredibly short period of time, the entire global financial system seized up as the lubricant
of any economy—bank lending—came to a complete halt. The resulting crash in global stock markets that
began in September continued well into October.
In less than a month, the shape of the entire financial system was changed forever. The Wall Street model
of large, aggressive, risk-taking investment banks was completely swept aside, as financial titans such as
Merrill Lynch, Morgan Stanley, Goldman Sachs and Lehman Brothers collapsed, merged with, or were
reborn as commercial banks. It’s clear now that the decision by the U.S. Government to let Lehman
Brothers fail was the catalytic event, as the dramatic failure of an institution that weathered the Great
Depression and two world wars, laid bare the failings of the traditional investment banking model.
Financial dominos tumbled as a wave of commercial bank failures—the most since the savings and loan
crisis of the 1990s—unfolded in the third quarter, culminating with the collapse of Washington Mutual, the
largest bank failure in U.S. history.
The other huge and profound shift was the nationalization of the global financial system. Several events
point to a nearly total takeover of the global financial system: the takeover of Fannie Mae and Freddie
Mac, AIG and Washington Mutual; the seizure of IndyMac; the forced merger of Wachovia; and the
massive capital infusion and government guarantee of nearly every financial instrument available (both
here and in Europe).
In this history-making period, government at all levels moved with unprecedented speed, scope and
coordination to save the financial system, and with it, the global economy. In the United States, this
culminated with the U.S. Treasury’s $700 billion bail-out plan that will essentially buy up all the bad
mortgage assets clogging the financial system.
Rejection of that plan by the House of Representatives in late September sent the markets into a tailspin,
with the Dow suffering its largest point drop in history, while sending the index to three-year lows. Over the
past six months, the Dow Jones IndustrialSM Average and the S&P 500® Index each lost more than 10% of
their value, with virtually all of those declines coming in the last two weeks of September. T-Bill yields fell to
near zero and interest rates on longer-dated Treasuries fell to decade lows in the market’s massive flight to
safety.
It’s not all doom and gloom, however. This volatile market environment has burst the commodity bubble
and has resulted in a huge slowdown in global inflation. This helps the emerging markets whose
economies have been pummeled by the rise in food and energy costs. Slowing inflation has also ushered
in a period of unprecedented dollar strength, which gives the Federal Reserve additional room to ease.
Interest rates could hardly be lower and stocks are cheaper than they have been in some time. With the
massive amounts of liquidity pumped into the system, stocks could rally sharply in the months ahead.
Having gone through multiple false bottoms so far this year, the question that still remains is: Can any rally
be sustained? The answer to that question is fairly straightforward. First, the allocation of credit in bond
and money markets needs to resume. Simply put: A stock market recovery is not possible without it. As I
write this, there is definite improvement on that front, but it remains slow and sporadic. Also, the process
of de-leveraging (that is, selling assets accumulated during boom times) will be with us for a while. All of
this is occurring during a period where global economic growth is downshifting rapidly. While this does
not preclude any stock market rallies, it may make them temporary. Astute stock selection, the use of
rotational strategies, exposure to currency movements, the implementation of long/short strategies and a
focus on quality—above all else—are the keys to investment success in difficult and uncharted terrain.
We appreciate the trust you have placed in our firm’s quality and integrity by investing with
Rydex Investments.
Sincerely,
David C. Reilly, CFA
Director of Portfolio Strategy
2
|
THE RYDEX SERIES FUNDS SEMI-ANNUAL REPORT
A BRIEF NOTE ON THE COMPOUNDING OF RETURNS (Unaudited)
Many of the Rydex Funds described in this report are benchmarked daily to leveraged or inverse
leveraged versions of published indices. To properly evaluate the performance of these funds, it is
essential to understand the effect of mathematical compounding on their respective returns.
Because of the nonlinear effects of leverage applied over time, it is possible for a fund to perform in line
with its benchmark for several individual periods in a row, yet seem to trail the benchmark over the entire
period. It is also possible that a fund that performs in-line with its benchmark on a daily basis may seem to
outperform its benchmark over longer periods.
An Example of Compounding
For example, consider a hypothetical fund that is designed to produce returns that correspond to 150% of
an index. On the first day of a period, the index rises from a level of 100 to a level of 106, producing a
6.0% gain and an expectation that the fund will rise by 9.0%. On the same day, the fund’s net asset value
(“NAV”) increases from $10.00 to $10.90 for a gain of 9.0%–in line with its benchmark.
On day two, assume the index falls from 106 to 99 for a loss of about 6.6%. The fund, as expected, falls
9.9% to a price of $9.82. On each day, the fund performed exactly in line with its benchmark, but for
the two-day period, the fund was down 1.8%, while the index was down only 1.0%. Without taking into
account the daily compounding of returns, one would expect the fund to lose 1.5% and would see the
fund as trailing by 0.3% when in fact it had performed perfectly. This example is summarized in the
table below.
Index
Index
Fund
Fund
Level
Performance
Expectation
Fund NAV
Performance
Assessment
Start
100
$10.00
Day 1
106
6.0%
9.0%
$10.90
9.0%
In line
Day 2
99
-6.6%
-9.9%
$
9.82
-9.9%
In line
Cumulative
-1.0%
-1.5%
-1.8%
-0.3%
As illustrated by this simple example, the effect of leverage can make it difficult to form expectations or
judgments about fund performance given only the returns of the unleveraged index.
In general, any change in direction in an index will produce compounding that seems to work against an
investor. Were the index to move in the same direction (either up or down) for two or more periods in a
row, the compounding of those returns would work in an investor’s favor, causing the fund to seemingly
beat its benchmark.
As a general rule of thumb, more leverage in a fund will magnify the compounding effect, while less
leverage will generally produce results that are more in line with expectations. In addition, periods of high
volatility in an underlying index will also cause the effects of compounding to be more pronounced, while
lower volatility will produce a more muted effect.
THE RYDEX SERIES FUNDS SEMI-ANNUAL REPORT
|
3
ABOUT SHAREHOLDERS’ FUND EXPENSES (Unaudited)
All mutual funds have operating expenses and it is important for our shareholders to understand the
impact of costs on their investments. Shareholders of a Fund incur two types of costs: (i) transaction costs,
including sales charges (loads) on purchase payments, reinvested dividends, or other distributions;
redemption fees; and exchange fees; and (ii) ongoing costs, including management fees, administrative
services, and shareholder reports, among others. These ongoing costs, or operating expenses, are
deducted from a fund’s gross income and reduce the investment return of the fund.
A fund’s expenses are expressed as a percentage of its average net assets, which is known as the
expense ratio. The following examples are intended to help investors understand the ongoing costs (in
dollars) of investing in a Fund and to compare these costs with the ongoing costs of investing in other
mutual funds. The examples are based on an investment of $1,000 made at the beginning of the period
and held for the entire six-month period beginning March 31, 2008 and ending September 30, 2008.
The following tables illustrate a Fund’s costs in two ways:
Table 1. Based on actual Fund return. This section helps investors estimate the actual expenses paid
over the period. The “Ending Account Value” shown is derived from the Fund’s actual return, and the
fourth column shows the dollar amount that would have been paid by an investor who started with
$1,000 in the Fund. Investors may use the information here, together with the amount invested, to
estimate the expenses paid over the period. Simply divide the Fund’s account value by $1,000 (for
example, an $8,600 account value divided by $1,000 = 8.6), then multiply the result by the number
provided under the heading “Expenses Paid During Period.”
Table 2. Based on hypothetical 5% return. This section is intended to help investors compare a Fund’s
cost with those of other mutual funds. The table provides information about hypothetical account
values and hypothetical expenses based on the Fund’s actual expense ratio and an assumed rate of
return of 5% per year before expenses, which is not the Fund’s actual return. The hypothetical account
values and expenses may not be used to estimate the actual ending account balance or expenses paid
during the period. The example is useful in making comparisons because the U.S. Securities and
Exchange Commission (the “SEC”) requires all mutual funds to calculate expenses based on the 5%
return. Investors can assess a Fund’s costs by comparing this hypothetical example with the
hypothetical examples that appear in shareholder reports of other funds.
Certain retirement plans such as IRA, SEP, Roth IRA and 403(b) accounts are charged an annual $15
maintenance fee. Upon liquidating a retirement account, a $15 account-closing fee will be taken from the
proceeds of the redemption.
The calculations illustrated above assume no shares were bought or sold during the period. Actual
costs may have been higher or lower, depending on the amount of investment and the timing of any
purchases or redemptions.
Note that the expenses shown in the table are meant to highlight and help compare ongoing costs only
and do not reflect any transactional costs which may be incurred by a Fund.
More information about a Fund’s expenses, including annual expense ratios for the past five years, can be
found in the Financial Highlights section of this report. For additional information on operating expenses
and other shareholder costs, please refer to the appropriate Fund prospectus.
4
|
THE RYDEX SERIES FUNDS SEMI-ANNUAL REPORT
ABOUT SHAREHOLDERS’ FUND EXPENSES (Unaudited) (continued)
Beginning
Ending
Expenses
Expense
Account Value
Account Value
Paid During
Ratio†
March 31, 2008
September 30, 2008
Period*
Table 1. Based on actual Fund return
Nova Fund
Investor Class
1.28%
$1,000.00
$
823.20
$
5.86
Advisor Class
1.78%
1,000.00
821.20
8.13
A-Class
1.54%
1,000.00
821.90
7.02
C-Class
2.28%
1,000.00
819.00
10.41
S&P 500 Fund
A-Class
1.52%
1,000.00
889.70
7.19
C-Class
2.27%
1,000.00
886.10
10.75
H-Class
1.53%
1,000.00
889.60
7.23
Inverse S&P 500 Strategy Fund
Investor Class
1.42%
1,000.00
1,097.80
7.49
Advisor Class
1.93%
1,000.00
1,094.60
10.12
A-Class
1.67%
1,000.00
1,096.40
8.79
C-Class
2.43%
1,000.00
1,092.40
12.73
NASDAQ-100® Fund
Investor Class
1.28%
1,000.00
895.90
6.10
Advisor Class
1.78%
1,000.00
894.00
8.47
A-Class
1.54%
1,000.00
894.30
7.29
C-Class
2.28%
1,000.00
891.30
10.83
Inverse NASDAQ-100® Strategy Fund
Investor Class
1.46%
1,000.00
1,077.10
7.58
Advisor Class
1.96%
1,000.00
1,074.10
10.18
A-Class
1.71%
1,000.00
1,075.80
8.88
C-Class
2.46%
1,000.00
1,071.80
12.76
Mid-Cap 1.5x Strategy Fund
A-Class
1.67%
1,000.00
872.80
7.83
C-Class
2.42%
1,000.00
869.50
11.33
H-Class
1.67%
1,000.00
873.10
7.83
Inverse Mid-Cap Strategy Fund
A-Class
1.67%
1,000.00
1,065.00
8.64
C-Class
2.42%
1,000.00
1,060.60
12.49
H-Class
1.67%
1,000.00
1,064.50
8.63
Russell 2000® 1.5x Strategy Fund
A-Class
1.69%
1,000.00
952.80
8.29
C-Class
2.44%
1,000.00
949.10
11.94
H-Class
1.69%
1,000.00
952.50
8.29
Russell 2000® Fund
A-Class
1.54%
1,000.00
983.00
7.67
C-Class
2.29%
1,000.00
979.00
11.38
H-Class
1.54%
1,000.00
983.00
7.67
Inverse Russell 2000® Strategy Fund
A-Class
2.23%
1,000.00
962.10
10.95
C-Class
2.97%
1,000.00
959.00
14.59
H-Class
2.22%
1,000.00
962.40
10.92
Government Long Bond 1.2x Strategy Fund
Investor Class
0.97%
1,000.00
1,012.00
4.88
Advisor Class
1.47%
1,000.00
1,010.30
7.40
A-Class
1.22%
1,000.00
1,011.60
6.15
C-Class
1.97%
1,000.00
1,007.00
9.91
Inverse Government Long Bond Strategy Fund
Investor Class
4.00%
1,000.00
1,000.00
20.07
Advisor Class
4.51%
1,000.00
998.80
22.58
A-Class
4.16%
1,000.00
998.80
20.83
C-Class
4.97%
1,000.00
995.50
24.88
THE RYDEX SERIES FUNDS SEMI-ANNUAL REPORT
|
5
ABOUT SHAREHOLDERS’ FUND EXPENSES (Unaudited) (continued)
Beginning
Ending
Expenses
Expense
Account Value
Account Value
Paid During
Ratio†
March 31, 2008
September 30, 2008
Period*
High Yield Strategy Fund
A-Class
1.55%
$1,000.00
$
993.80
$
7.77
C-Class
2.31%
1,000.00
990.00
11.54
H-Class
1.58%
1,000.00
993.40
7.91
Inverse High Yield Strategy Fund
A-Class
1.52%
1,000.00
1,009.60
7.64
C-Class
2.27%
1,000.00
1,006.10
11.40
H-Class
1.52%
1,000.00
1,009.90
7.65
Europe 1.25x Strategy Fund
A-Class
1.67%
1,000.00
759.10
7.35
C-Class
2.42%
1,000.00
756.20
10.65
H-Class
1.71%
1,000.00
759.20
7.53
Japan 2x Strategy Fund
A-Class
1.52%
1,000.00
724.10
6.56
C-Class
2.27%
1,000.00
722.30
9.78
H-Class
1.52%
1,000.00
724.10
6.56
Small-Cap Value Fund
A-Class
1.52%
1,000.00
930.70
7.37
C-Class
2.27%
1,000.00
927.30
10.98
H-Class
1.52%
1,000.00
930.60
7.36
Mid-Cap Value Fund
A-Class
1.52%
1,000.00
926.00
7.34
C-Class
2.27%
1,000.00
922.50
10.95
H-Class
1.52%
1,000.00
926.30
7.33
Large-Cap Value Fund
A-Class
1.52%
1,000.00
842.50
7.02
C-Class
2.27%
1,000.00
839.60
10.46
H-Class
1.52%
1,000.00
843.00
7.01
Small-Cap Growth Fund
A-Class
1.52%
1,000.00
990.90
7.60
C-Class
2.28%
1,000.00
986.90
11.35
H-Class
1.56%
1,000.00
991.30
7.80
Mid-Cap Growth Fund
A-Class
1.57%
1,000.00
948.60
7.66
C-Class
2.31%
1,000.00
945.70
11.29
H-Class
1.54%
1,000.00
948.70
7.55
Large-Cap Growth Fund
A-Class
1.52%
1,000.00
882.90
7.18
C-Class
2.27%
1,000.00
879.70
10.70
H-Class
1.52%
1,000.00
882.90
7.18
U.S. Government Money Market Fund
Investor Class
0.92%
1,000.00
1,007.10
4.65
Advisor Class
1.42%
1,000.00
1,004.60
7.15
A-Class
1.17%
1,000.00
1,005.90
5.90
C-Class
1.92%
1,000.00
1,002.10
9.66
6
|
THE RYDEX SERIES FUNDS SEMI-ANNUAL REPORT
ABOUT SHAREHOLDERS’ FUND EXPENSES (Unaudited) (continued)
Beginning
Ending
Expenses
Expense
Account Value
Account Value
Paid During
Ratio†
March 31, 2008
September 30, 2008
Period*
Table 2. Based on hypothetical 5% return (before expenses)
Nova Fund
Investor Class
1.28%
$1,000.00
$1,018.65
$
6.48
Advisor Class
1.78%
1,000.00
1,016.14
9.00
A-Class
1.54%
1,000.00
1,017.35
7.79
C-Class
2.28%
1,000.00
1,013.64
11.51
S&P 500 Fund
A-Class
1.52%
1,000.00
1,017.45
7.69
C-Class
2.27%
1,000.00
1,013.69
11.46
H-Class
1.53%
1,000.00
1,017.40
7.74
Inverse S&P 500 Strategy Fund
Investor Class
1.42%
1,000.00
1,017.95
7.18
Advisor Class
1.93%
1,000.00
1,015.39
9.75
A-Class
1.67%
1,000.00
1,016.70
8.44
C-Class
2.43%
1,000.00
1,012.89
12.26
NASDAQ-100® Fund
Investor Class
1.28%
1,000.00
1,018.65
6.48
Advisor Class
1.78%
1,000.00
1,016.14
9.00
A-Class
1.54%
1,000.00
1,017.35
7.79
C-Class
2.28%
1,000.00
1,013.64
11.51
Inverse NASDAQ-100® Strategy Fund
Investor Class
1.46%
1,000.00
1,017.75
7.38
Advisor Class
1.96%
1,000.00
1,015.24
9.90
A-Class
1.71%
1,000.00
1,016.50
8.64
C-Class
2.46%
1,000.00
1,012.73
12.41
Mid-Cap 1.5x Strategy Fund
A-Class
1.67%
1,000.00
1,016.70
8.44
C-Class
2.42%
1,000.00
1,012.94
12.21
H-Class
1.67%
1,000.00
1,016.70
8.44
Inverse Mid-Cap Strategy Fund
A-Class
1.67%
1,000.00
1,016.70
8.44
C-Class
2.42%
1,000.00
1,012.94
12.21
H-Class
1.67%
1,000.00
1,016.70
8.44
Russell 2000® 1.5x Strategy Fund
A-Class
1.69%
1,000.00
1,016.60
8.54
C-Class
2.44%
1,000.00
1,012.84
12.31
H-Class
1.69%
1,000.00
1,016.60
8.54
Russell 2000® Fund
A-Class
1.54%
1,000.00
1,017.35
7.79
C-Class
2.29%
1,000.00
1,013.59
11.56
H-Class
1.54%
1,000.00
1,017.35
7.79
Inverse Russell 2000® Strategy Fund
A-Class
2.23%
1,000.00
1,013.89
11.26
C-Class
2.97%
1,000.00
1,010.18
14.97
H-Class
2.22%
1,000.00
1,013.94
11.21
Government Long Bond 1.2x Strategy Fund
Investor Class
0.97%
1,000.00
1,020.21
4.91
Advisor Class
1.47%
1,000.00
1,017.70
7.44
A-Class
1.22%
1,000.00
1,018.95
6.17
C-Class
1.97%
1,000.00
1,015.19
9.95
Inverse Government Long Bond Strategy Fund
Investor Class
4.00%
1,000.00
1,005.01
20.11
Advisor Class
4.51%
1,000.00
1,002.46
22.64
A-Class
4.16%
1,000.00
1,004.21
20.90
C-Class
4.97%
1,000.00
1,000.15
24.92
THE RYDEX SERIES FUNDS SEMI-ANNUAL REPORT
|
7
ABOUT SHAREHOLDERS’ FUND EXPENSES (Unaudited) (concluded)
Beginning
Ending
Expenses
Expense
Account Value
Account Value
Paid During
Ratio†
March 31, 2008
September 30, 2008
Period*
High Yield Strategy Fund
A-Class
1.55%
$1,000.00
$1,017.30
$
7.84
C-Class
2.31%
1,000.00
1,013.49
11.66
H-Class
1.58%
1,000.00
1,017.15
7.99
Inverse High Yield Strategy Fund
A-Class
1.52%
1,000.00
1,017.45
7.69
C-Class
2.27%
1,000.00
1,013.69
11.46
H-Class
1.52%
1,000.00
1,017.45
7.69
Europe 1.25x Strategy Fund
A-Class
1.67%
1,000.00
1,016.70
8.44
C-Class
2.42%
1,000.00
1,012.94
12.21
H-Class
1.71%
1,000.00
1,016.50
8.64
Japan 2x Strategy Fund
A-Class
1.52%
1,000.00
1,017.45
7.69
C-Class
2.27%
1,000.00
1,013.69
11.46
H-Class
1.52%
1,000.00
1,017.45
7.69
Small-Cap Value Fund
A-Class
1.52%
1,000.00
1,017.45
7.69
C-Class
2.27%
1,000.00
1,013.69
11.46
H-Class
1.52%
1,000.00
1,017.45
7.69
Mid-Cap Value Fund
A-Class
1.52%
1,000.00
1,017.45
7.69
C-Class
2.27%
1,000.00
1,013.69
11.46
H-Class
1.52%
1,000.00
1,017.45
7.69
Large-Cap Value Fund
A-Class
1.52%
1,000.00
1,017.45
7.69
C-Class
2.27%
1,000.00
1,013.69
11.46
H-Class
1.52%
1,000.00
1,017.45
7.69
Small-Cap Growth Fund
A-Class
1.52%
1,000.00
1,017.45
7.69
C-Class
2.28%
1,000.00
1,013.64
11.51
H-Class
1.56%
1,000.00
1,017.25
7.89
Mid-Cap Growth Fund
A-Class
1.57%
1,000.00
1,017.20
7.94
C-Class
2.31%
1,000.00
1,013.49
11.66
H-Class
1.54%
1,000.00
1,017.35
7.79
Large-Cap Growth Fund
A-Class
1.52%
1,000.00
1,017.45
7.69
C-Class
2.27%
1,000.00
1,013.69
11.46
H-Class
1.52%
1,000.00
1,017.45
7.69
U.S. Government Money Market Fund
Investor Class
0.92%
1,000.00
1,020.46
4.66
Advisor Class
1.42%
1,000.00
1,017.95
7.18
A-Class
1.17%
1,000.00
1,019.20
5.92
C-Class
1.92%
1,000.00
1,015.44
9.70
* Expenses are equal to the Fund's annualized expense ratio, multiplied by the average account value over the period, multiplied by the
number of days in the most recent fiscal half-year, then divided by 365.
† This ratio represents annualized Total Expenses, which include interest and dividend expense from securities sold short. Excluding short
interest expense, the operating expense ratio of the Inverse Government Long Bond Strategy Fund would be 2.60%, 2.60%, 2.50%, and
2.57% lower for the Investor Class, Advisor Class, A-Class and C-Class, respectively. Excluding short dividend expense, the operating expense
ratio of the Inverse Russell 2000® Fund would be 0.53% lower for each class of the Fund.
8
|
THE RYDEX SERIES FUNDS SEMI-ANNUAL REPORT
FUND PROFILES (Unaudited)
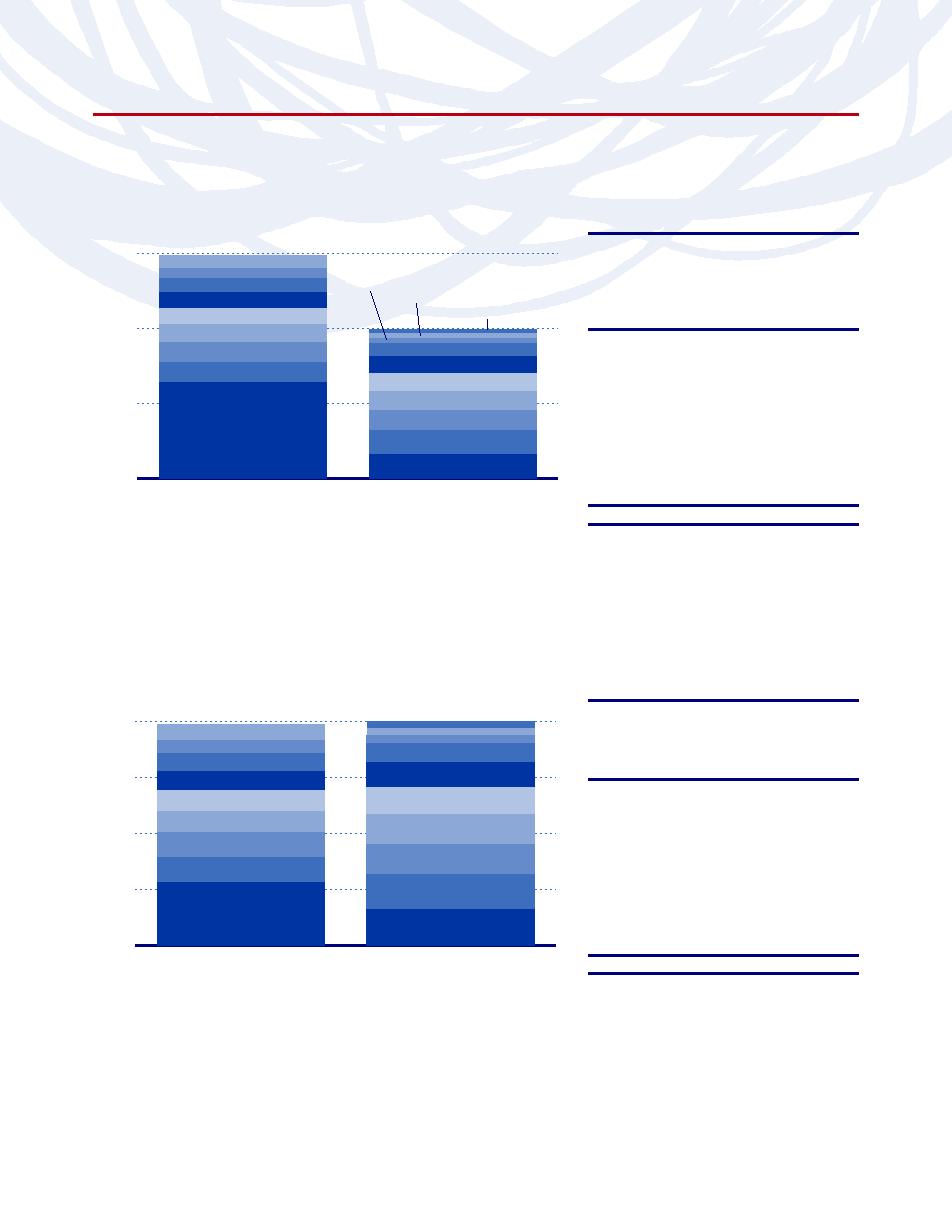
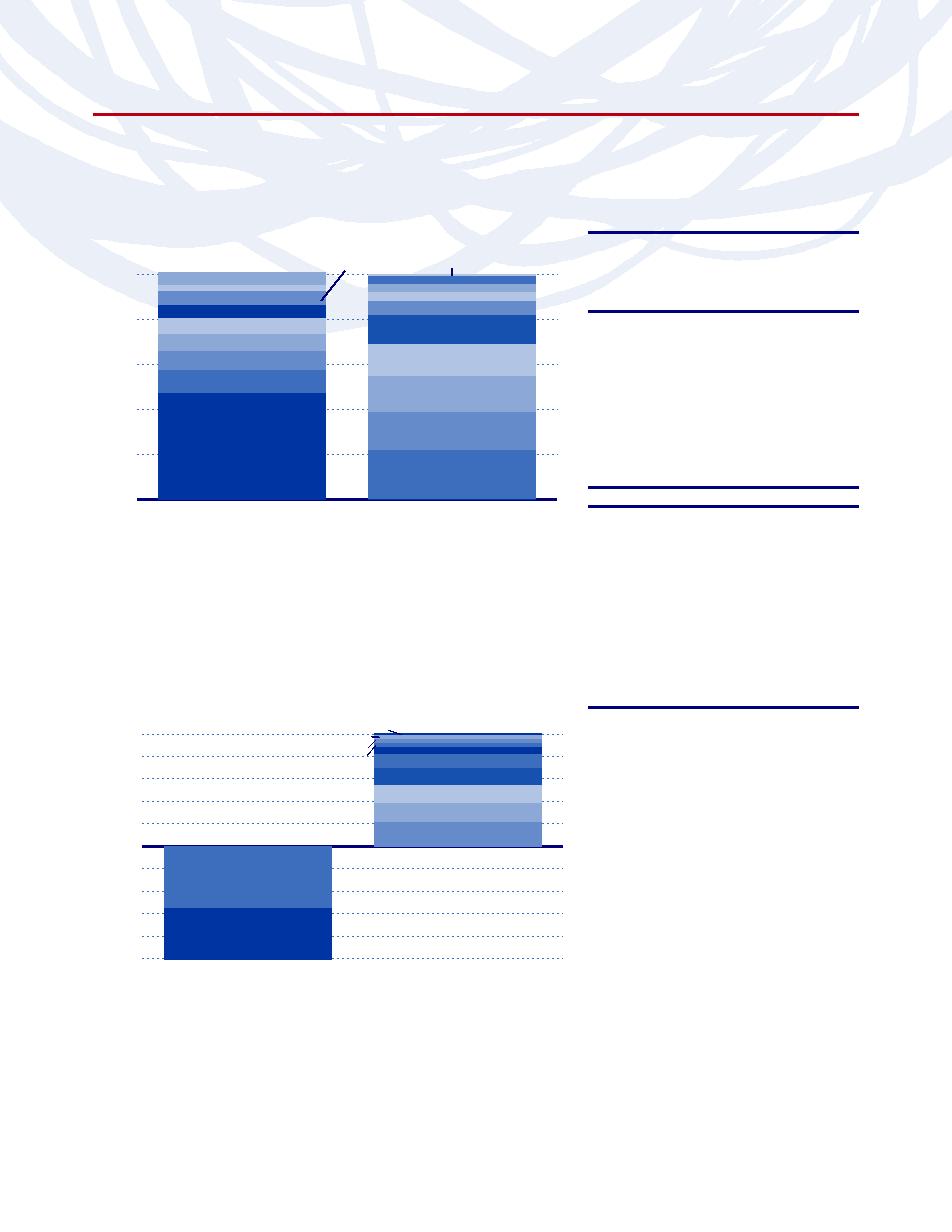
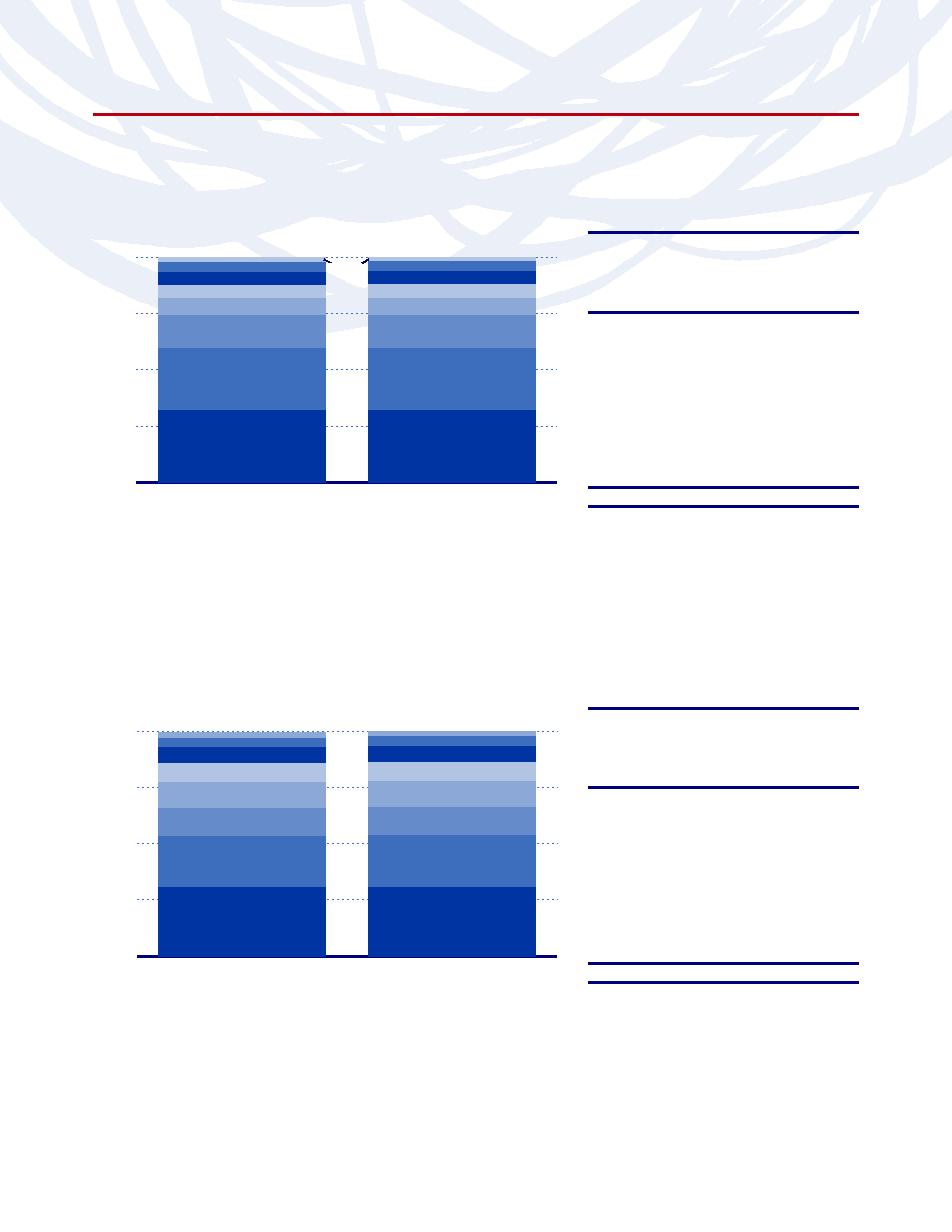
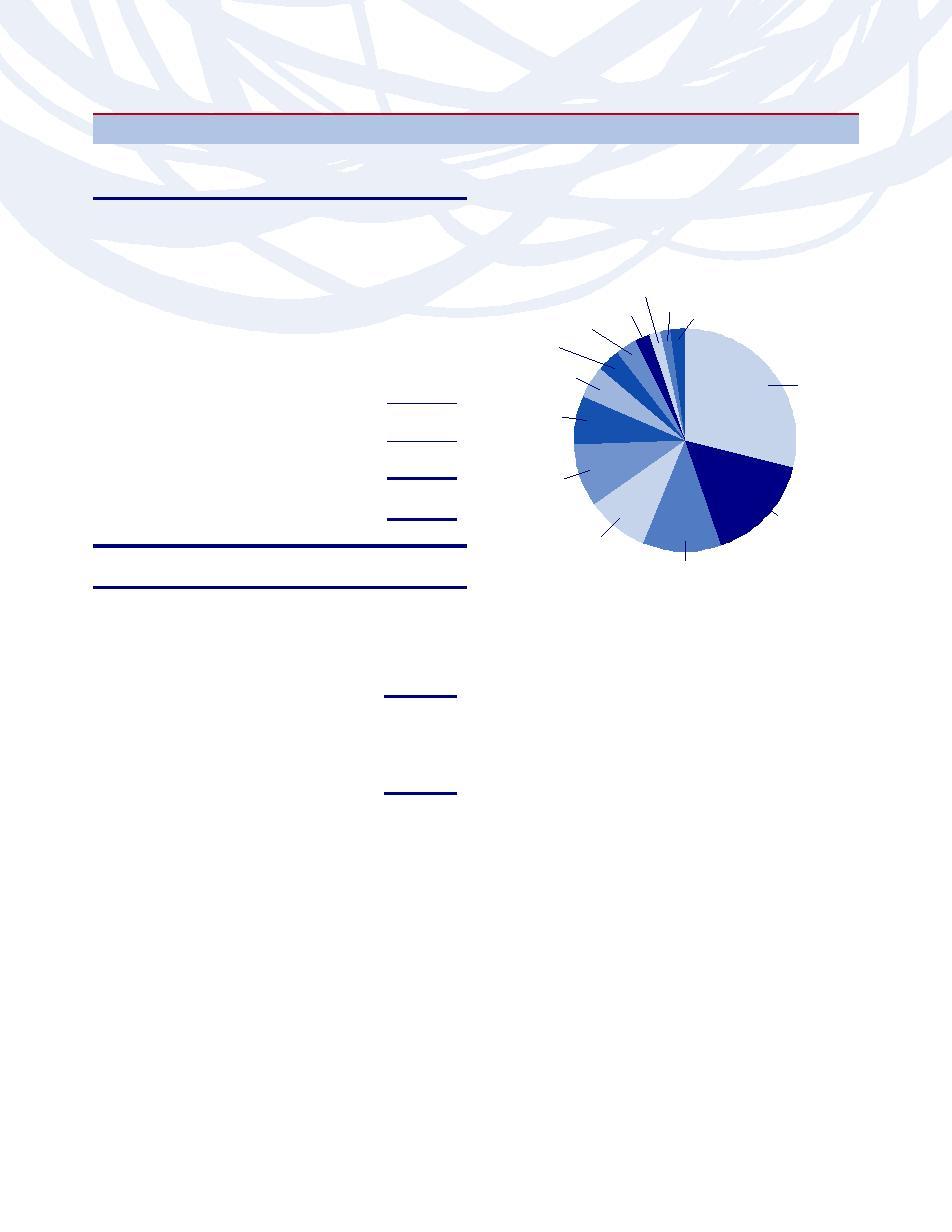
NOVA FUND
OBJECTIVE: To provide investment results that match the performance of a specific benchmark on a daily basis. The Fund’s
current benchmark is 150% of the performance of the S&P 500 Index.
Holdings Diversification (Market Exposure as % of Net Assets)
Inception Dates:
Investor Class
July 12, 1993
150%
Other
Advisor Class
October 15, 1998
Consumer Discretionary
A-Class
Industrials
Utilities
March 31, 2004
Consumer Staples
Materials
C-Class
March 14, 2001
Health Care
Telecommunication Services
Ten Largest Holdings (% of Total Net Assets)
100%
Energy
Exxon Mobil Corp.
3.4%
Financials
Consumer Discretionary
General Electric Co.
2.1%
Information Technology
Industrials
Microsoft Corp.
1.8%
Consumer Staples
Procter & Gamble Co.
1.8%
50%
Health Care
Johnson & Johnson, Inc.
1.6%
S&P 500 Index
Energy
JPMorgan Chase & Co.
1.4%
Mini Futures Contracts
Financials
Chevron Corp.
1.4%
Information Technology
AT&T, Inc.
1.4%
0%
International Business Machines Corp.
1.3%
Nova Fund
S&P 500 Index
Bank of America Corp.
1.3%
Top Ten Total
17.5%
“Holdings Diversification (Market Exposure as % of Net Assets)” excludes
any temporary cash investments.
“Ten Largest Holdings” exclude any temporary
cash or derivative investments.
S&P 500 FUND
OBJECTIVE: To provide investment results that match the performance of a specific benchmark on a daily basis. The Fund’s
current benchmark is the S&P 500 Index.
Holdings Diversification (Market Exposure as % of Net Assets)
Inception Dates:
A-Class
May 31, 2006
100%
Telecommunication Services
Other
Materials
C-Class
May 31, 2006
Utilities
Consumer Discretionary
H-Class
May 31, 2006
Consumer Discretionary
Industrials
Industrials
Ten Largest Holdings (% of Total Net Assets)
75%
Consumer Staples
Exxon Mobil Corp.
2.8%
Health Care
Consumer Staples
General Electric Co.
1.7%
Energy
Health Care
Procter & Gamble Co.
1.5%
50%
Financials
Microsoft Corp.
1.4%
Energy
Johnson & Johnson, Inc.
1.3%
Information Technology
JPMorgan Chase & Co.
1.2%
25%
Financials
Chevron Corp.
1.2%
S&P 500 Index
AT&T, Inc.
1.1%
Mini Futures Contracts
Information Technology
Bank of America Corp.
1.1%
0%
International Business Machines Corp.
1.1%
S&P 500 Fund
S&P 500 Index
Top Ten Total
14.4%
“Holdings Diversification (Market Exposure as % of Net Assets)” excludes
“Ten Largest Holdings” exclude any temporary
any temporary cash investments.
cash or derivative investments.
THE RYDEX SERIES FUNDS SEMI-ANNUAL REPORT
|
9
FUND PROFILES (Unaudited) (continued)
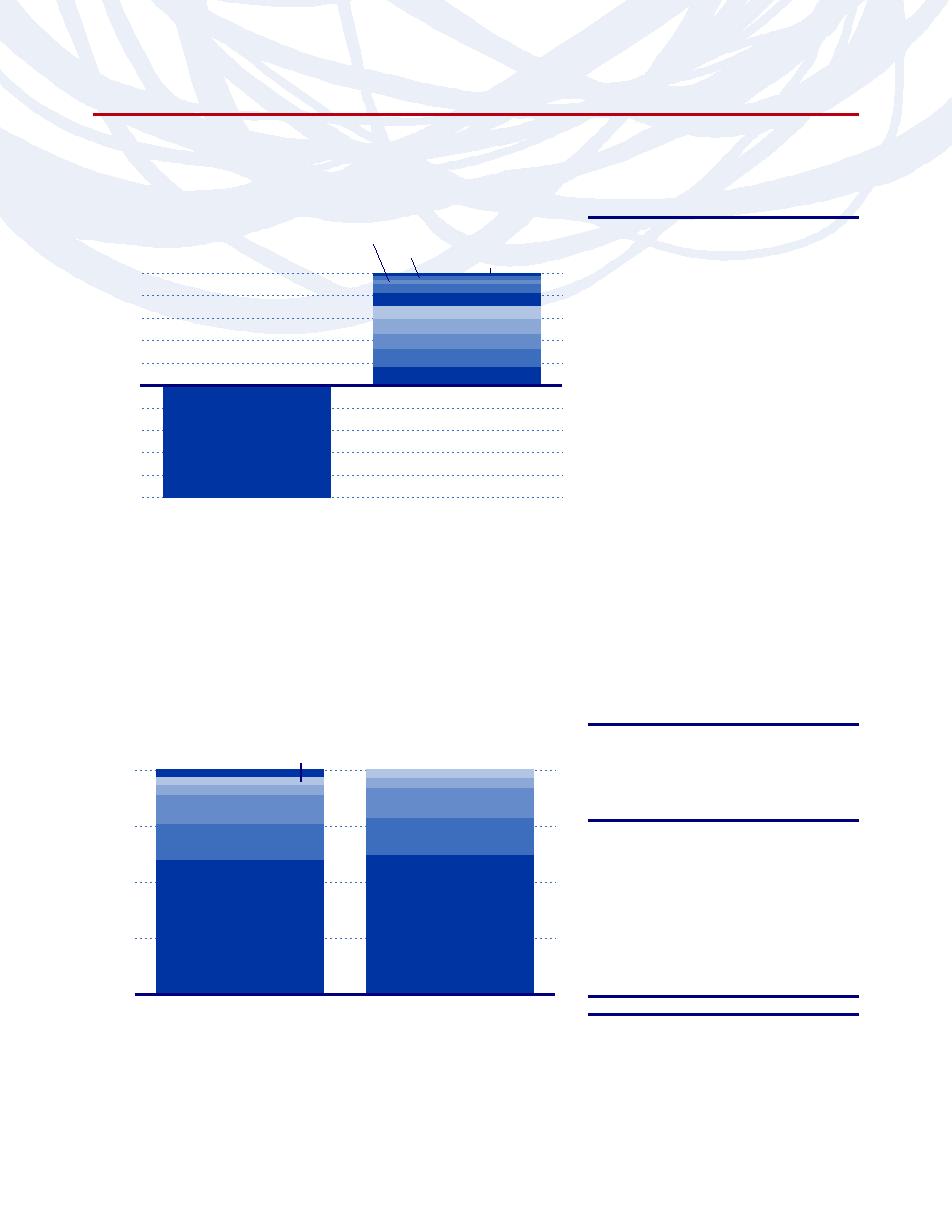
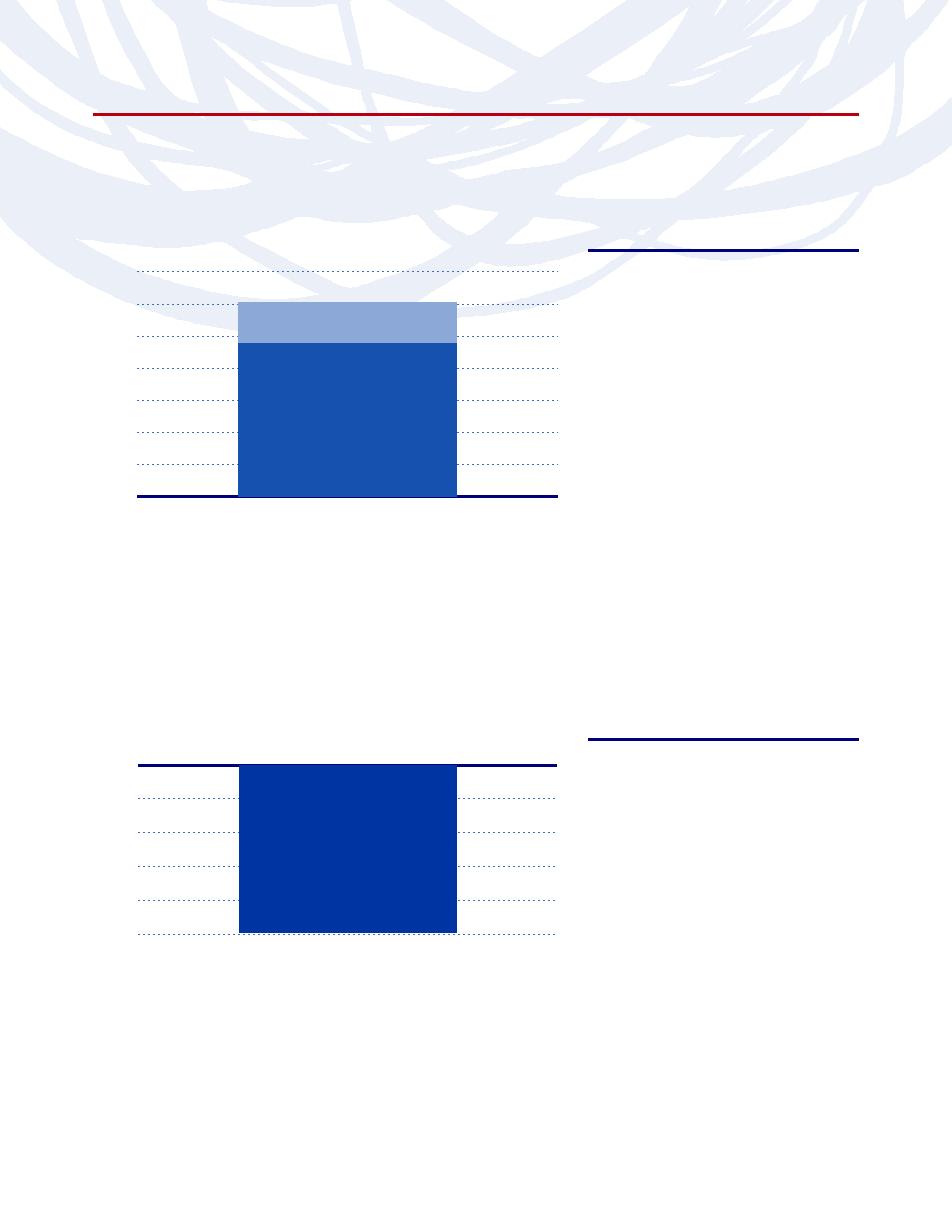
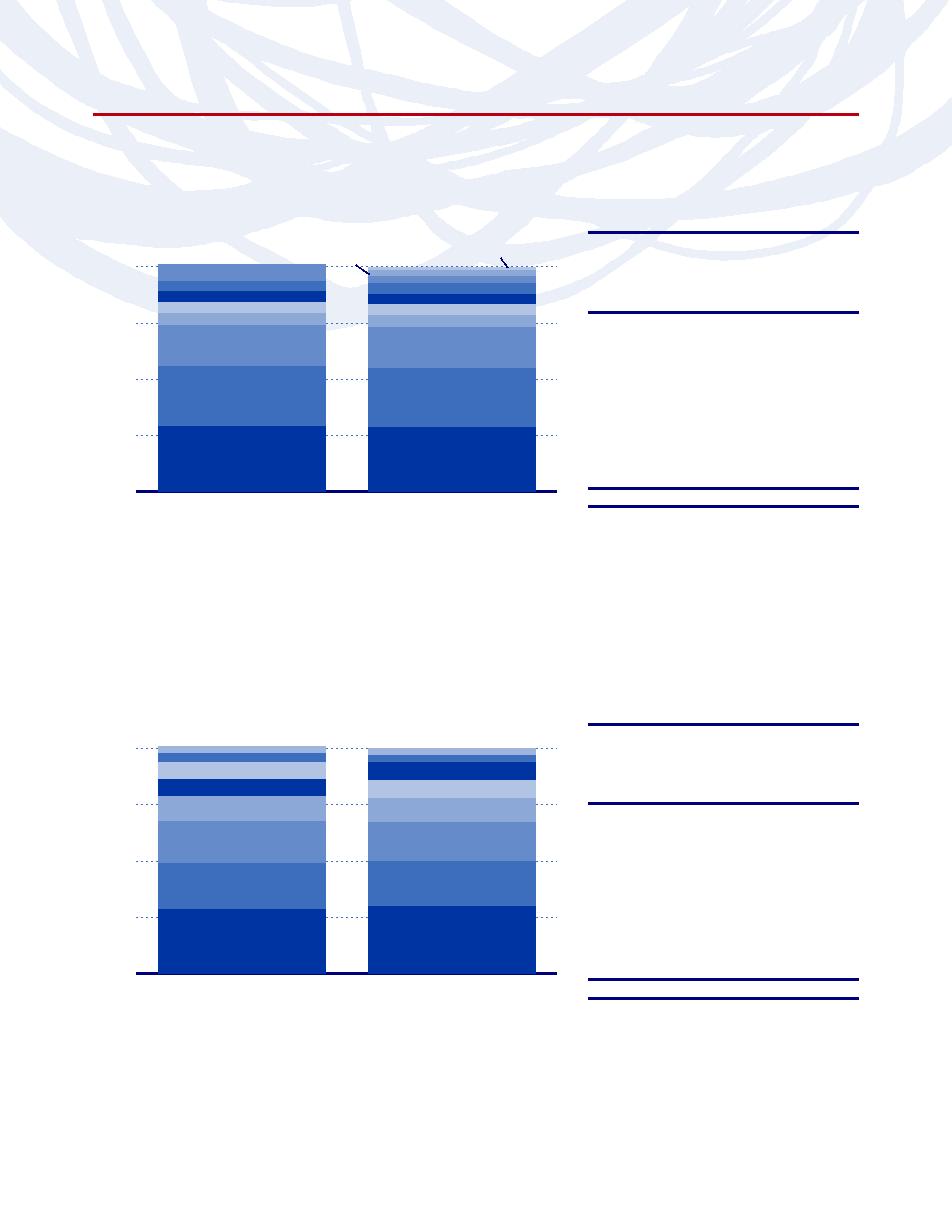
INVERSE S&P 500 STRATEGY FUND
OBJECTIVE: To provide investment results that will inversely correlate to the performance of the S&P 500 Index.
Holdings Diversification (Market Exposure as % of Net Assets)
Inception Dates:
Investor Class
January 7, 1994
Utilities
Advisor Class
August 5, 1998
Materials
Telecommunications Services
A-Class
March 31, 2004
100%
C-Class
March 15, 2001
Consumer Discretionary
80%
Industrials
60%
Consumer Staples
The Fund invests principally in derivative investments
Health Care
such as equity index swap agreements, futures
40%
Energy
contracts, and options on index futures.
Financials
20%
Information Technology
0%
-20%
-40%
S&P 500 Index
Mini Futures Contracts
-60%
Short Sales
-80%
-100%
Inverse S&P 500
S&P 500 Index
Strategy Fund
“Holdings Diversification (Market Exposure as % of Net Assets)” excludes
any temporary cash investments.
NASDAQ-100® FUND
OBJECTIVE: To provide investment results that correspond to a benchmark for over-the-counter securities. The Fund’s current
benchmark is the NASDAQ-100 Index® .
Holdings Diversification (Market Exposure as % of Net Assets)
Inception Dates:
Investor Class
February 14, 1994
NASDAQ-100 Index
Mini Futures Contracts
Advisor Class
September 22, 1998
100%
Other
Other
A-Class
March 31, 2004
Industrials
Industrials
C-Class
March 26, 2001
Consumer Discretionary
Consumer Discretionary
Ten Largest Holdings (% of Total Net Assets)
75%
9.9%
Health Care
Health Care
Apple, Inc.
Qualcomm, Inc.
6.0%
Microsoft Corp.
5.9%
50%
Google, Inc. — Class A
4.1%
Cisco Systems, Inc.
3.4%
Information Technology
Information Technology
Oracle Corp.
3.1%
25%
Gilead Sciences, Inc.
2.9%
Research In Motion Ltd.
2.7%
Intel Corp.
2.6%
Amgen, Inc.
2.1%
0%
NASDAQ-100® Fund
NASDAQ-100 Index
Top Ten Total
42.7%
“Holdings Diversification (Market Exposure as % of Net Assets)” excludes
“Ten Largest Holdings” exclude any temporary
cash or derivative investments.
any temporary cash investments.
10
|
THE RYDEX SERIES FUNDS SEMI-ANNUAL REPORT
FUND PROFILES (Unaudited) (continued)
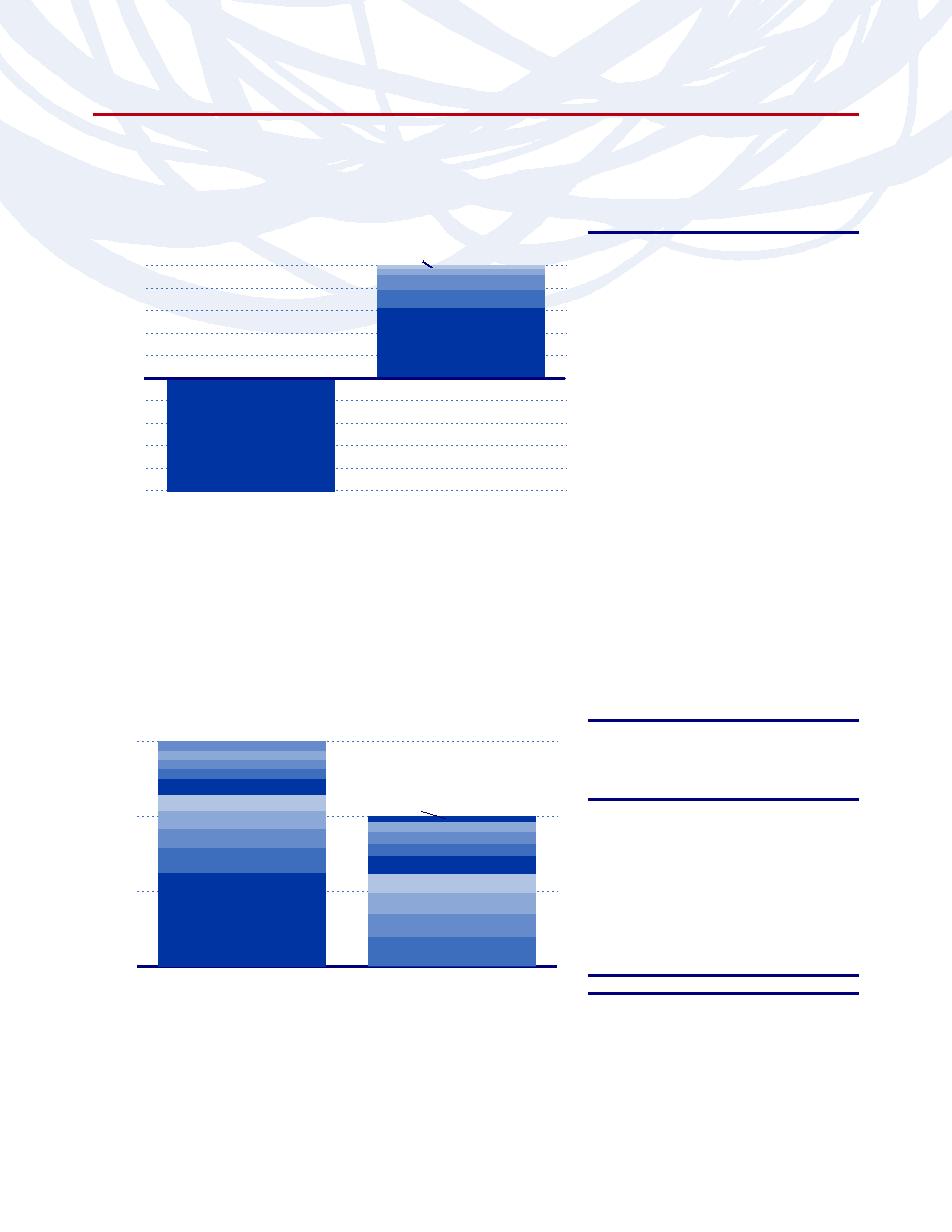
INVERSE NASDAQ-100® STRATEGY FUND
OBJECTIVE: To provide investment results that will match the performance of a specific benchmark. The Fund’s current
benchmark is the inverse of the performance of the NASDAQ-100 Index.
Holdings Diversification (Market Exposure as % of Net Assets)
Inception Dates:
Investor Class
September 3, 1998
Other
100%
Advisor Class
August 1, 2003
Industrials
Consumer Discretionary
A-Class
March 31, 2004
80%
Health Care
C-Class
March 7, 2001
60%
40%
The Fund invests principally in derivative investments
Information Technology
such as equity index swap agreements, futures
20%
contracts, and options on index futures.
0%
-20%
-40%
NASDAQ-100 Index
Mini Futures Contracts
-60%
Short Sales
-80%
-100%
Inverse NASDAQ-100®
NASDAQ-100 Index
Strategy Fund
“Holdings Diversification (Market Exposure as % of Net Assets)” excludes
any temporary cash investments.
MID-CAP 1.5x STRATEGY FUND
OBJECTIVE: To provide investment results that correlate to the performance of a specific benchmark for mid-cap securities.
The Fund’s current benchmark is the S&P MidCap 400® Index.
Holdings Diversification (Market Exposure as % of Net Assets)
Inception Dates:
A-Class
March 31, 2004
150%
Other
C-Class
August 20, 2001
Materials
Energy
H-Class
August 16, 2001
Utilities
Health Care
Ten Largest Holdings (% of Total Net Assets)
Information Technology
Other
100%
FMC Technologies, Inc.
0.5%
Consumer Discretionary
Materials
New York Community Bancorp, Inc.
0.5%
Industrials
Energy
Utilities
Cleveland-Cliffs, Inc.
0.5%
Financials
Health Care
DENTSPLY International, Inc.
0.5%
Information Technology
Covance, Inc.
0.5%
50%
Health Care REIT, Inc.
0.5%
Consumer Discretionary
Flir Systems, Inc.
0.5%
S&P MidCap 400 Index
Mini Futures Contracts
Industrials
Everest Re Group Ltd.
0.5%
Financials
MDU Resources Group, Inc.
0.5%
0%
Cephalon, Inc.
0.5%
Mid-Cap 1.5x Strategy Fund
S&P MidCap 400 Index
Top Ten Total
5.0%
“Holdings Diversification (Market Exposure as % of Net Assets)” excludes
“Ten Largest Holdings” exclude any temporary
any temporary cash investments.
cash or derivative investments.
THE RYDEX SERIES FUNDS SEMI-ANNUAL REPORT
|
11
FUND PROFILES (Unaudited) (continued)
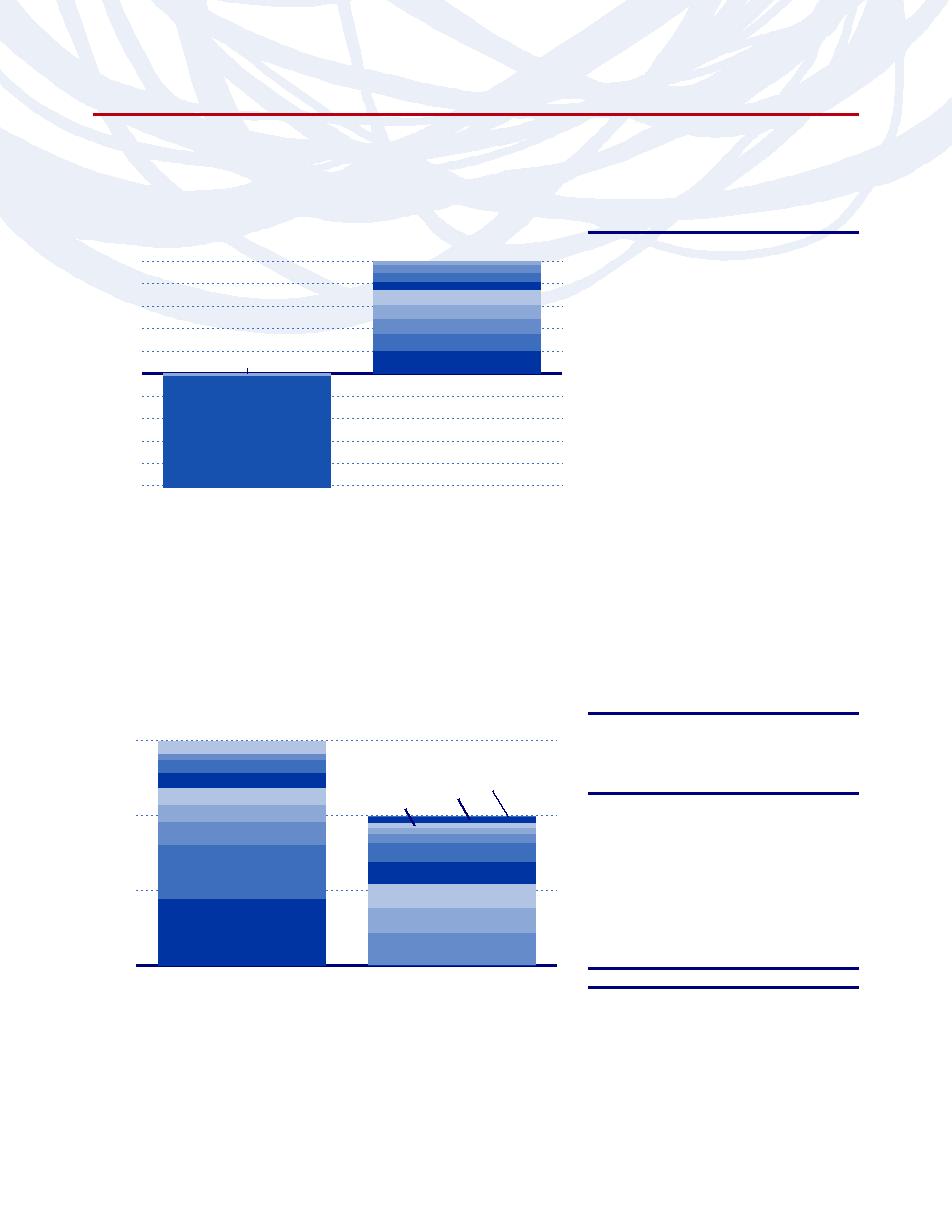
INVERSE MID-CAP STRATEGY FUND
OBJECTIVE: To provide investment results that will match the performance of a specific benchmark. The Fund’s current
benchmark is the inverse of the performance of the S&P MidCap 400 Index.
Holdings Diversification (Market Exposure as % of Net Assets)
Inception Dates:
A-Class
March 31, 2004
100%
Other
C-Class
February 20, 2004
Materials
Energy
80%
H-Class
February 20, 2004
Utilities
Health Care
60%
Information Technology
The Fund invests principally in derivative investments
40%
Consumer Discretionary
such as equity index swap agreements, futures
S&P MidCap 400 Index
Industrials
20%
contracts, and options on index futures.
Mini Futures Contracts
Short Sales
Financials
0%
-20%
-40%
S&P MidCap 400 Index
Swap Agreement
-60%
Short Sales
-80%
-100%
Inverse Mid-Cap
S&P MidCap 400 Index
Strategy Fund
“Holdings Diversification (Market Exposure as % of Net Assets)” excludes
any temporary cash investments.
RUSSELL 2000® 1.5x STRATEGY FUND
OBJECTIVE: To provide investment results that correlate to the performance of a specific benchmark for small-cap securities.
The Fund’s current benchmark is the Russell 2000® Index.
Holdings Diversification (Market Exposure as % of Net Assets)
Inception Dates:
A-Class
March 31, 2004
150%
Other
C-Class
January 23, 2001
Energy
H-Class
November 1, 2000
Consumer Discretionary
Health Care
Telecommunication Services
Ten Largest Holdings (% of Total Net Assets)
Industrials
Consumer Staples
Utilities
Ralcorp Holdings, Inc.
0.3%
100%
Information Technology
Alexion Pharmaceuticals, Inc.
0.2%
Financials
Materials
Energy
Myriad Genetics, Inc.
0.2%
Consumer Discretionary
OSI Pharmaceuticals, Inc.
0.2%
Russell 2000 Index
Swap Agreement
Health Care
Senior Housing Properties Trust
0.2%
50%
Industrials
Foundry Networks, Inc.
0.2%
Energy Conversion Devices, Inc.
0.2%
Information Technology
Russell 2000 Index
Realty Income Corp.
0.2%
Mini Futures Contracts
ITC Holdings Corp.
0.2%
Financials
0%
Wabtec Corp.
0.2%
Russell 2000® 1.5x
Russell 2000 Index
Top Ten Total
2.1%
Strategy Fund
“Ten Largest Holdings” exclude any temporary
cash or derivative investments.
“Holdings Diversification (Market Exposure as % of Net Assets)” excludes
any temporary cash investments.
12
|
THE RYDEX SERIES FUNDS SEMI-ANNUAL REPORT
FUND PROFILES (Unaudited) (continued)
RUSSELL 2000® FUND
OBJECTIVE: To provide investment results that match the performance of a specific benchmark on a daily basis. The Fund’s
current benchmark is the Russell 2000 Index.
Holdings Diversification (Market Exposure as % of Net Assets)
Inception Dates:
A-Class
May 31, 2006
Russell 2000 Index
Swap Agreement
Telecommunication Services
C-Class
May 31, 2006
100%
Other
Consumer Staples
H-Class
May 31, 2006
Energy
Utilities
Materials
Ten Largest Holdings (% of Total Net Assets)
Consumer Discretionary
Energy
80%
Health Care
Ralcorp Holdings, Inc.
0.2%
Consumer Discretionary
Industrials
Alexion Pharmaceuticals, Inc.
0.1%
Information Technology
Health Care
Myriad Genetics, Inc.
0.1%
60%
OSI Pharmaceuticals, Inc.
0.1%
Financials
Industrials
Senior Housing Properties Trust
0.1%
40%
Longs Drug Stores Corp.
0.1%
Foundry Networks, Inc.
0.1%
Information Technology
Russell 2000 Index
Waste Connections, Inc.
0.1%
20%
Mini Futures Contracts
Energy Conversion Devices, Inc.
0.1%
Financials
Realty Income Corp.
0.1%
0%
Top Ten Total
1.1%
Russell 2000® Fund
Russell 2000 Index
“Ten Largest Holdings” exclude any temporary
“Holdings Diversification (Market Exposure as % of Net Assets)” excludes
cash or derivative investments.
any temporary cash investments.
INVERSE RUSSELL 2000® STRATEGY FUND
OBJECTIVE: To provide investment results that will match the performance of a specific benchmark. The Fund’s current
benchmark is the inverse of the performance of the Russell 2000 Index.
Holdings Diversification (Market Exposure as % of Net Assets)
Inception Dates:
A-Class
March 31, 2004
Telecommunication Services
100%
Consumer Staples
C-Class
February 20, 2004
Utilities
Energy
80%
Materials
H-Class
February 20, 2004
Consumer Discretionary
60%
Health Care
The Fund invests principally in short sales of
Industrials
40%
securities and derivative investments such as equity
Information Technology
20%
index swap agreements, futures contracts, and
Financials
options on index futures.
0%
-20%
Russell 2000 Index
Mini Futures Contracts
Short Sales
-40%
-60%
Russell 2000 Index Swap
-80%
Agreement Short Sales
-100%
Inverse Russell 2000®
Russell 2000 Index
Strategy Fund
“Holdings Diversification (Market Exposure as % of Net Assets)” excludes
any temporary cash investments.
THE RYDEX SERIES FUNDS SEMI-ANNUAL REPORT
|
13
FUND PROFILES (Unaudited) (continued)
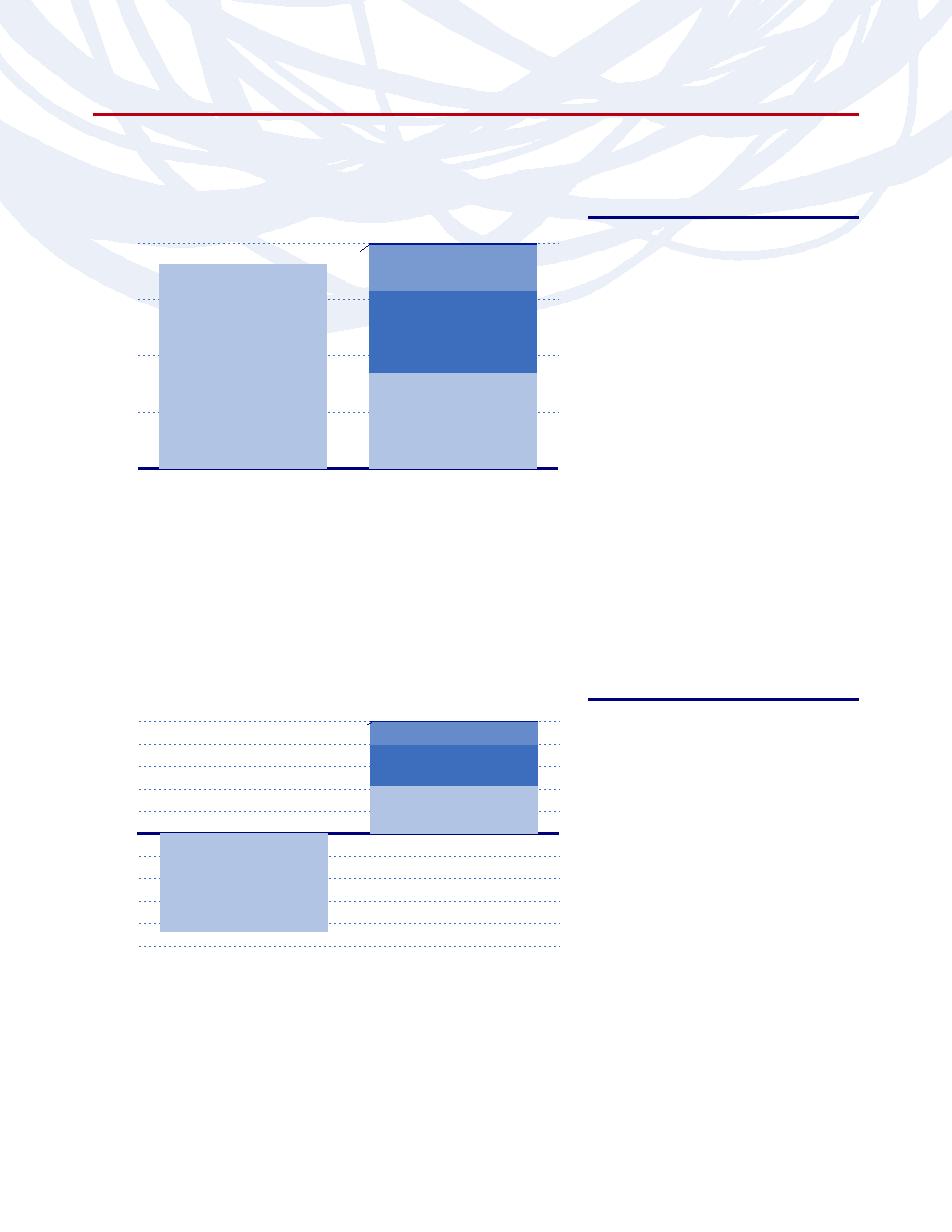
GOVERNMENT LONG BOND 1.2x STRATEGY FUND
OBJECTIVE: To provide investment results that correspond to a benchmark for U.S. Government securities. The Fund’s current
benchmark is 120% of the price movement of the Long Treasury Bond. The Long Treasury Bond is the U.S. Treasury bond with the
longest maturity, which is currently 30 years.
Holdings Diversification (Market Exposure as % of Net Assets)
Inception Dates:
Investor Class
January 3, 1994
140%
Advisor Class
August 1, 2003
A-Class
March 31, 2004
120%
U.S. Treasury Bond
C-Class
May 2, 2001
100%
Futures Contracts
The Fund invests principally in U.S. Government
80%
securities and in derivative investments such as
futures and options contracts.
60%
U.S. Treasury Obligations
40%
20%
0%
Government Long Bond 1.2x Strategy Fund
“Holdings Diversification (Market Exposure as % of Net Assets)” excludes
any temporary cash investments.
INVERSE GOVERNMENT LONG BOND STRATEGY FUND
OBJECTIVE: To provide total returns that will inversely correlate to the price movements of a benchmark for U.S. Treasury debt
instruments or futures contracts on a specified debt instrument. The Fund’s current benchmark is the inverse of the daily price
movement of the Long Treasury Bond. The Long Treasury Bond is the U.S. Treasury bond with the longest maturity, which is
currently 30 years.
Holdings Diversification (Market Exposure as % of Net Assets)
Inception Dates:
Investor Class
March 3, 1995
0%
Advisor Class
August 1, 2003
A-Class
March 31, 2004
-20%
C-Class
March 28, 2001
-40%
U.S. Treasury Bond
The Fund invests principally in short sales and
Futures Contracts
derivative investments such as futures contracts,
-60%
Short Sales
and options on index futures.
-80%
-100%
Inverse Government Long Bond Strategy Fund
“Holdings Diversification (Market Exposure as % of Net Assets)” excludes
any temporary cash investments.
14
|
THE RYDEX SERIES FUNDS SEMI-ANNUAL REPORT
FUND PROFILES (Unaudited) (continued)
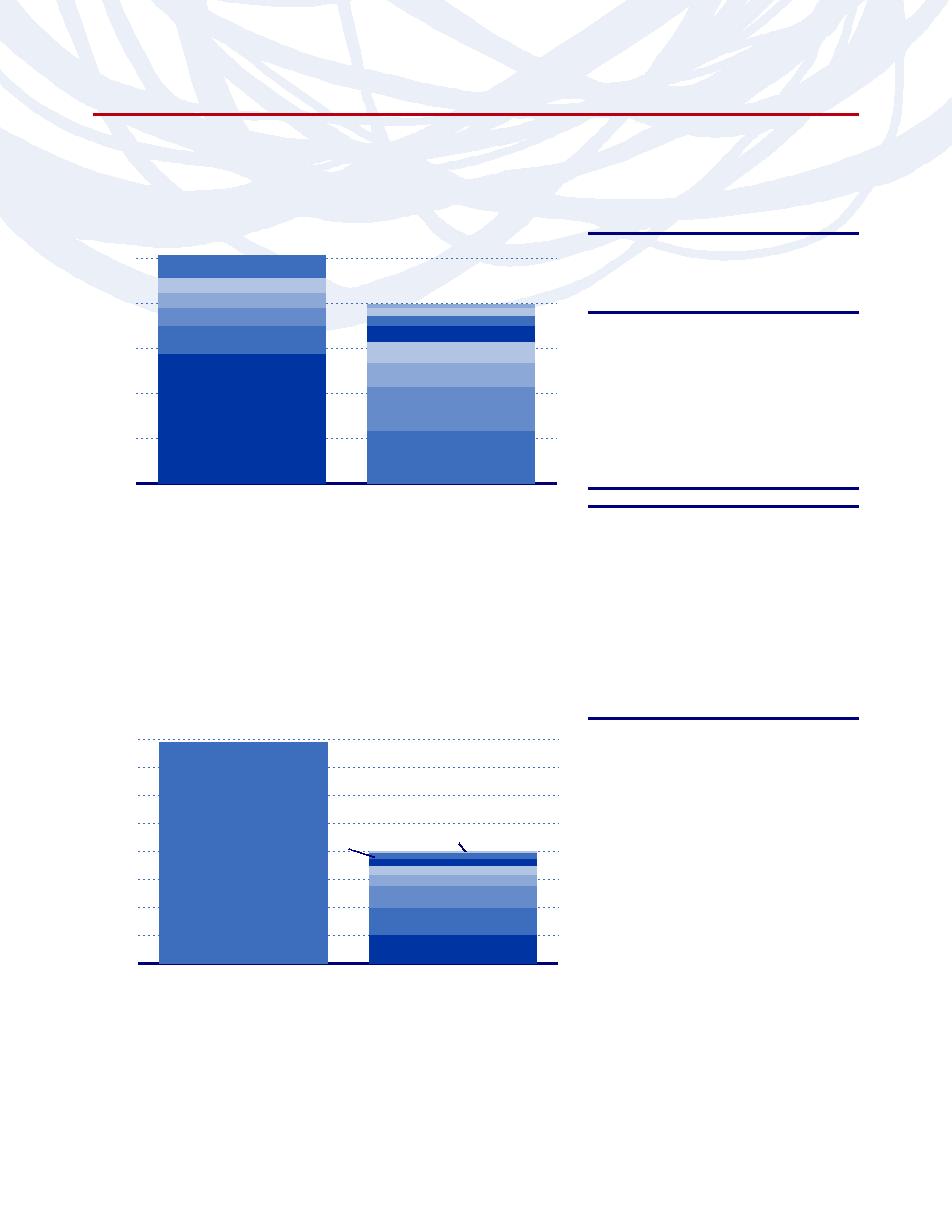
HIGH YIELD STRATEGY FUND
OBJECTIVE: Seeks to provide investment results that correlate to the performance of the high yield bond market.
Holdings Diversification (Market Exposure as % of Net Assets)
Inception Dates:
A-Class
April 16, 2007
100%
Other
C-Class
April 16, 2007
CAA Rated Bonds
H-Class
April 16, 2007
75%
The Fund invests principally in derivative investments
such as high yield credit default swap agreements
BA Rated Bonds
and futures contracts.
50%
High Yield Index Credit Default
Swap Agreement Protection Sold
25%
B Rated Bonds
0%
High Yield Strategy Fund
Barclays Capital U.S.
Corporate High Yield Index
“Holdings Diversification (Market Exposure as % of Net Assets)” excludes
any temporary cash investments.
INVERSE HIGH YIELD STRATEGY FUND
OBJECTIVE: Seeks to provide investment results that inversely correlate to the performance of the high yield
bond market.
Holdings Diversification (Market Exposure as % of Net Assets)
Inception Dates:
H-Class
April 16, 2007
100%
Other
CAA Rated Bonds
A-Class
April 16, 2007
80%
C-Class
April 16, 2007
60%
BA Rated Bonds
The Fund invests principally in derivative investments
40%
such as high yield credit default swap agreements
20%
B Rated Bonds
and futures contracts.
0%
-20%
-40%
High Yield Index Credit Default
Swap Agreement
-60%
Protection Purchased
-80%
-100%
Inverse High Yield
Barclays Capital U.S.
Strategy Fund
Corporate High Yield Index
“Holdings Diversification (Market Exposure as % of Net Assets)” excludes
any temporary cash investments.
THE RYDEX SERIES FUNDS SEMI-ANNUAL REPORT
|
15
FUND PROFILES (Unaudited) (continued)
EUROPE 1.25x STRATEGY FUND
OBJECTIVE: To provide investment results that correlate to the performance of a specific benchmark. The Fund’s current
benchmark is the Dow Jones STOXX® 50 Index.
Holdings Diversification (Market Exposure as % of Net Assets)
Inception Dates:
A-Class
March 31, 2004
125%
Other
C-Class
May 10, 2001
H-Class
May 8, 2000
Energy
100%
Telecommunication Services
Other
Ten Largest Holdings (% of Total Net Assets)
Health Care
Industrial
Utilities
HSBC Holdings PLC — SP ADR
3.0%
Financials
Novartis AG — SP ADR
Basic Materials
3.0%
75%
Communications
GlaxoSmithKline PLC — SP ADR
2.7%
Energy
BP PLC — SP ADR
2.5%
50%
Total SA — SP ADR
2.3%
Dow Jones STOXX 50 Index
Futures Contracts
Consumer, Non-cyclical
Telefonica SA — SP ADR
2.3%
Vodafone Group PLC — SP ADR
2.1%
25%
Sanofi-Aventis — SP ADR
1.8%
Financial
France Telecom SA — SP ADR
1.8%
Royal Dutch Shell PLC — SP ADR
1.8%
0%
Europe 1.25x
Dow Jones STOXX 50 Index
Top Ten Total
23.3%
Strategy Fund
“Ten Largest Holdings” excludes any temporary
cash or derivative investments.
“Holdings Diversification (Market Exposure as % of Net Assets)” excludes
any temporary cash investments.
JAPAN 2x STRATEGY FUND
OBJECTIVE:
To provide investment results that correlate to the performance of a specific benchmark. The Fund’s current
benchmark is the 200% of the fair value of the Nikkei-225 Stock Average Index.
Holdings Diversification (Market Exposure as % of Net Assets)
Inception Dates:
A-Class
February 22, 2008
200%
C-Class
February 22, 2008
175%
H-Class
February 22, 2008
150%
The Fund invests principally in derivative investments
such as equity index swap agreements, futures
125%
contracts, and options on index futures.
Nikkei-225
Basic Materials
Other
100%
Stock Average Index
Communications
Futures Contracts
Financial
75%
Technology
Consumer, Non-cyclical
50%
Consumer, Cyclical
25%
Industrial
0%
Japan 2x Strategy
Nikkei-225
Fund
Stock Average Index
“Holdings Diversification (Market Exposure as % of Net Assets)” excludes
any temporary cash investments.
16
|
THE RYDEX SERIES FUNDS SEMI-ANNUAL REPORT
FUND PROFILES (Unaudited) (continued)
SMALL-CAP VALUE FUND
OBJECTIVE:
To provide investment results that match the performance of a benchmark for small-cap value securities. The
Fund’s current benchmark is the S&P SmallCap 600/Citigroup Pure Value Index.
Holdings Diversification (Market Exposure as % of Net Assets)
Inception Dates:
A-Class
September 1, 2004
100%
Consumer Staples
Other
Consumer Staples
C-Class
February 20, 2004
Information Technology
Information Technology
H-Class
February 20, 2004
Materials
Materials
Utilities
Utilities
Ten Largest Holdings (% of Total Net Assets)
75%
Finish Line, Inc. — Class A
4.7%
Industrials
Industrials
M/I Homes, Inc.
2.0%
Wabash National Corp.
1.8%
50%
La-Z-Boy, Inc.
1.8%
Financials
Financials
Stewart Information Services Corp.
1.7%
First Bancorp Puerto Rico
1.6%
25%
Haverty Furniture Companies, Inc.
1.5%
Consumer Discretionary
Consumer Discretionary
Arkansas Best Corp.
1.5%
Gevity HR, Inc.
1.5%
0%
Jo-Ann Stores, Inc.
1.5%
Small-Cap Value Fund
S&P SmallCap 600/Citigroup
Top Ten Total
19.6%
Pure Value Index
“Ten Largest Holdings” exclude any temporary
“Holdings Diversification (Market Exposure as % of Net Assets)” excludes
cash or derivative investments.
any temporary cash investments.
MID-CAP VALUE FUND
OBJECTIVE:
To provide investment results that match the performance of the benchmark for mid-cap value securities. The
Fund’s current benchmark is the S&P MidCap 400/Citigroup Pure Value Index.
Holdings Diversification (Market Exposure as % of Net Assets)
Inception Dates:
A-Class
September 1, 2004
100%
Consumer Staples
Consumer Staples
Health Care
Health Care
C-Class
February 20, 2004
Materials
Materials
H-Class
February 20, 2004
Information Technology
Information Technology
Ten Largest Holdings (% of Total Net Assets)
75%
Industrials
Industrials
ArvinMeritor, Inc.
3.3%
Furniture Brands International, Inc.
2.8%
Utilities
Utilities
Foot Locker, Inc.
2.4%
50%
Fidelity National Financial, Inc. — Class A
2.3%
Kelly Services, Inc. — Class A
2.3%
Consumer Discretionary
Consumer Discretionary
Ryland Group, Inc.
2.0%
25%
Imation Corp.
1.9%
Financials
Financials
Charming Shoppes, Inc.
1.9%
YRC Worldwide, Inc.
1.7%
0%
Rent-A-Center, Inc.
1.7%
Mid-Cap Value Fund
S&P MidCap 400/Citigroup
Top Ten Total
22.3%
Pure Value Index
“Ten Largest Holdings” exclude any temporary
“Holdings Diversification (Market Exposure as % of Net Assets)” excludes
cash or derivative investments.
any temporary cash investments.
THE RYDEX SERIES FUNDS SEMI-ANNUAL REPORT
|
17
FUND PROFILES (Unaudited) (continued)
LARGE-CAP VALUE FUND
OBJECTIVE:
To provide investment results that match the performance of a benchmark for large-cap value securities. The
Fund’s current benchmark is the S&P 500/Citigroup Pure Value Index.
Holdings Diversification (Market Exposure as % of Net Assets)
Inception Dates:
A-Class
September 1, 2004
Information Technology
Telecommunication Services
100%
C-Class
February 20, 2004
Other
Energy
H-Class
February 20, 2004
Consumer Staples
Consumer Staples
Health Care
Health Care
Materials
Ten Largest Holdings (% of Total Net Assets)
Materials
Industrials
75%
Industrials
D.R. Horton, Inc.
3.0%
Utilities
Utilities
KB HOME
2.9%
Lennar Corp. — Class A
2.6%
50%
Jones Apparel Group, Inc.
2.5%
Consumer Discretionary
Consumer Discretionary
Spectra Energy Corp.
2.5%
Integrys Energy Group, Inc.
2.0%
Ryder System, Inc.
1.9%
25%
Dillard's, Inc. — Class A
1.7%
Financials
Financials
NiSource, Inc.
1.6%
Tyson Foods, Inc. — Class A
1.5%
0%
Top Ten Total
22.2%
Large-Cap Value Fund
S&P 500/Citigroup
Pure Value Index
“Ten Largest Holdings” exclude any temporary
cash or derivative investments.
“Holdings Diversification (Market Exposure as % of Net Assets)” excludes
any temporary cash investments.
SMALL-CAP GROWTH FUND
OBJECTIVE:
To provide investment results that match the performance of a benchmark for small-cap growth securities. The
Fund’s current benchmark is the S&P SmallCap 600/Citigroup Pure Growth Index.
Holdings Diversification (Market Exposure as % of Net Assets)
Inception Dates:
A-Class
September 1, 2004
100%
Consumer Staples
Consumer Staples
Materials
C-Class
February 20, 2004
Materials
Industrials
Energy
H-Class
February 20, 2004
Energy
Industrials
Ten Largest Holdings (% of Total Net Assets)
75%
Financials
Financials
Greenhill & Company, Inc.
1.9%
Meritage Homes Corp.
1.8%
Health Care
Health Care
LHC Group, Inc.
1.7%
50%
PetMed Express, Inc.
1.6%
Information Technology
Information Technology
j2 Global Communications, Inc.
1.6%
HealthExtras, Inc.
1.5%
25%
Quality Systems, Inc.
1.5%
Wilshire Bancorp, Inc.
1.4%
Consumer Discretionary
Consumer Discretionary
Websense, Inc.
1.4%
0%
Basic Energy Services, Inc.
1.4%
Small-Cap Growth Fund
S&P SmallCap 600/Citigroup
Top Ten Total
15.8%
Pure Growth Index
“Ten Largest Holdings” exclude any temporary
cash or derivative investments.
“Holdings Diversification (Market Exposure as % of Net Assets)” excludes
any temporary cash investments.
18
|
THE RYDEX SERIES FUNDS SEMI-ANNUAL REPORT
FUND PROFILES (Unaudited) (continued)
MID-CAP GROWTH FUND
OBJECTIVE:
To provide investment results that match the performance of a benchmark for mid-cap growth securities. The
Fund’s current benchmark is the S&P MidCap 400/Citigroup Pure Growth Index.
Holdings Diversification (Market Exposure as % of Net Assets)
Inception Dates:
A-Class
September 1, 2004
100%
Consumer Staples
Consumer Staples
C-Class
February 20, 2004
Materials
Materials
Financials
Financials
H-Class
February 20, 2004
Energy
Energy
Ten Largest Holdings (% of Total Net Assets)
75%
Industrials
Industrials
Encore Acquisition Co.
2.5%
Psychiatric Solutions, Inc.
2.2%
Information Technology
Information Technology
Aeropostale, Inc.
2.1%
50%
DreamWorks Animation SKG, Inc. — Class A
2.0%
Health Care
Health Care
Digital River, Inc.
1.9%
NVR, Inc.
1.8%
25%
Cleveland-Cliffs, Inc.
1.7%
Consumer Discretionary
Consumer Discretionary
Philadelphia Consolidated Holding Corp.
1.7%
United Therapeutics Corp.
1.7%
0%
Urban Outfitters, Inc.
1.7%
Mid-Cap Growth Fund
S&P MidCap 400/Citigroup
Top Ten Total
19.3%
Pure Growth Index
“Ten Largest Holdings” exclude any temporary
“Holdings Diversification (Market Exposure as % of Net Assets)” excludes
cash or derivative investments.
any temporary cash investments.
LARGE-CAP GROWTH FUND
OBJECTIVE:
To provide investment results that match the performance of a benchmark for large-cap growth securities.
The Fund’s current benchmark is the S&P 500/Citigroup Pure Growth Index.
Holdings Diversification (Market Exposure as % of Net Assets)
Inception Dates:
A-Class
September 1, 2004
100%
Other
Utilities
Materials
C-Class
February 20, 2004
Financials
Financials
H-Class
February 20, 2004
Industrials
Industrials
Ten Largest Holdings (% of Total Net Assets)
75%
Consumer Staples
Consumer Staples
Sears Holdings Corp.
1.4%
Energy
Energy
Express Scripts, Inc.
1.2%
Varian Medical Systems, Inc.
1.2%
50%
Information Technology
Information Technology
Zimmer Holdings, Inc.
1.2%
Moody’s Corp.
1.2%
XTO Energy, Inc.
1.1%
Consumer Discretionary
Consumer Discretionary
25%
Coach, Inc.
1.1%
Intuitive Surgical, Inc.
1.1%
Health Care
Health Care
Amazon.com, Inc.
1.1%
0%
Bed Bath & Beyond, Inc.
1.1%
Large-Cap Growth Fund
S&P 500/Citigroup
Top Ten Total
11.7%
Pure Growth Index
“Ten Largest Holdings” exclude any temporary
cash or derivative investments.
“Holdings Diversification (Market Exposure as % of Net Assets)” excludes
any temporary cash investments.
THE RYDEX SERIES FUNDS SEMI-ANNUAL REPORT
|
19
FUND PROFILES (Unaudited) (concluded)
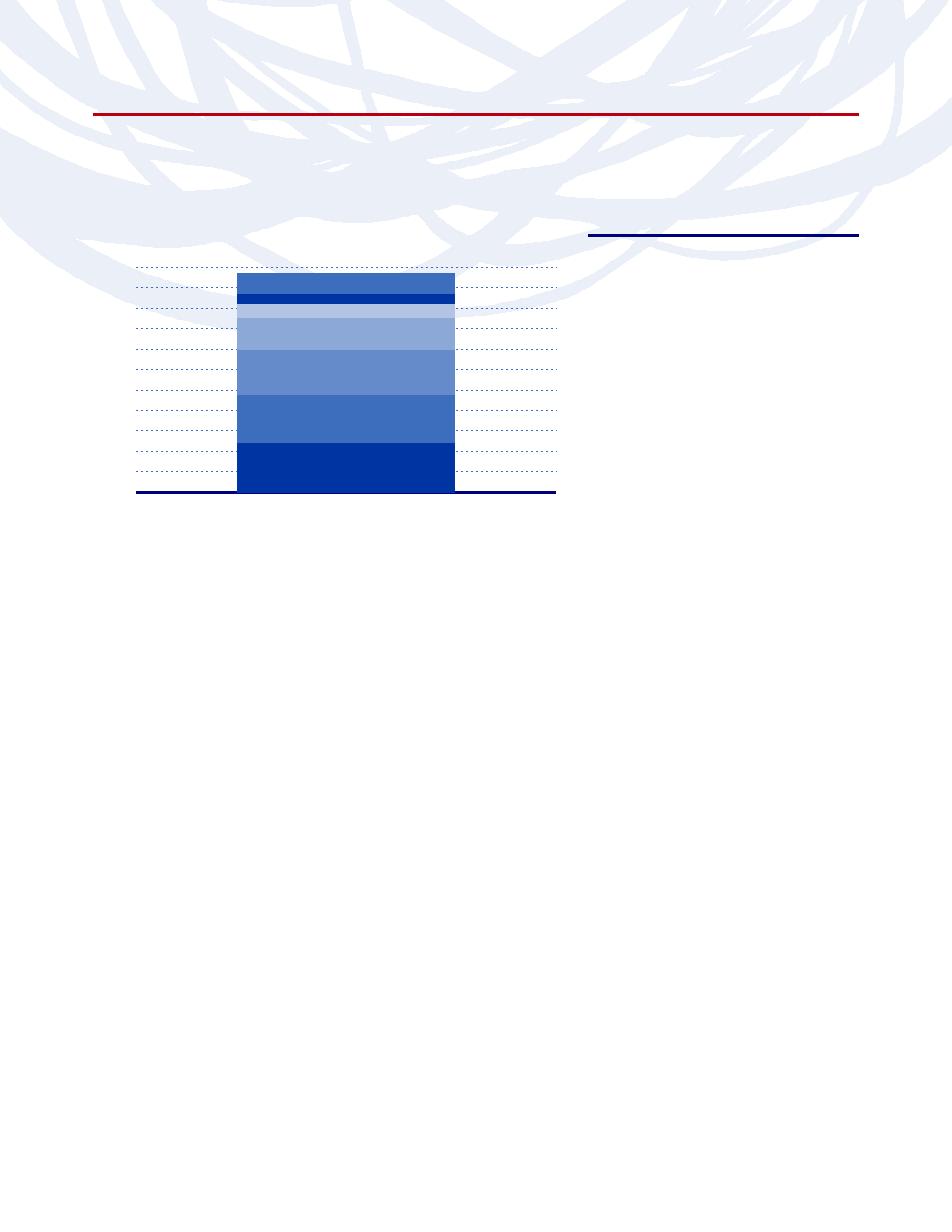
U.S. GOVERNMENT MONEY MARKET FUND
OBJECTIVE:
To provide security of principal, high current income and liquidity by investing in securities issued by the U.S.
Government, its agencies or instrumentalities.
Holdings Diversification (Market Exposure as % of Net Assets)
Inception Dates:
Investor Class
December 1, 1993
110%
Advisor Class
April 1, 1998
100%
Other
A-Class
March 31, 2004
Freddie Mac—FADN
C-Class
October 19, 2000
90%
Farmer Mac—FADN
80%
Fannie Mae—FADN
The Fund invests principally in money market
70%
instruments issued or guaranteed as to principal
60%
Repurchase Agreements
and interest by the U.S. Government, its agencies
50%
or instrumentalities.
40%
Federal Home Loan Bank—FAB
30%
20%
10%
Federal Home Loan Bank—FADN
0%
U.S. Government Money Market Fund
FAB — Federal Agency Bonds
FADN — Federal Agency Discount Notes.
20
|
THE RYDEX SERIES FUNDS SEMI-ANNUAL REPORT
SCHEDULE OF INVESTMENTS (Unaudited)
September 30, 2008
NOVA FUND
MARKET
MARKET
SHARES
VALUE
SHARES
VALUE
COMMON STOCKS 84.9%
Affiliated Computer Services,
Inc. — Class A*
780
$
39,491
INFORMATION TECHNOLOGY 13.6%
Citrix Systems, Inc.*
1,460
36,880
Microsoft Corp.
63,040
$
1,682,538
SanDisk Corp.*
1,810
35,385
International Business Machines
Fidelity National Information
Corp.
10,880
1,272,525
Services, Inc.
1,520
28,059
Cisco Systems, Inc.*
46,891
1,057,861
Teradata Corp.*
1,430
27,885
Hewlett-Packard Co.
19,665
909,310
LSI Logic Corp.*†
5,060
27,122
Intel Corp.
44,658
836,444
National Semiconductor Corp.
1,565
26,934
Apple, Inc.*
7,110
808,123
Total System Services, Inc.
1,590
26,076
Google, Inc. — Class A*
1,920
768,998
Molex, Inc.
1,144
25,683
Oracle Corp.*
31,462
638,993
Advanced Micro Devices, Inc.*
4,776
25,074
Qualcomm, Inc.
13,079
562,005
Micron Technology, Inc.*
6,036
24,446
Dell, Inc.*
14,000
230,720
Akamai Technologies, Inc.*
1,360
23,718
Texas Instruments, Inc.
10,362
222,783
Lexmark International, Inc.*
710
23,125
EMC Corp*
16,630
198,895
Compuware Corp.*
2,050
19,865
eBay, Inc.*
8,770
196,273
QLogic Corp.*
1,050
16,128
Corning, Inc.
12,464
194,937
Jabil Circuit, Inc.
1,690
16,123
Yahoo!, Inc.*
11,130
192,549
Novellus Systems, Inc.*
782
15,358
Automatic Data Processing, Inc.
4,085
174,634
JDS Uniphase Corp.*
1,720
14,551
Adobe Systems, Inc.*
4,260
168,142
Convergys Corp.*
980
14,484
Applied Materials, Inc.
10,608
160,499
Novell, Inc.*
2,765
14,212
Western Union Co.
5,850
144,319
Tellabs, Inc.*
3,185
12,931
Symantec Corp.*
6,740
131,969
Teradyne, Inc.*
1,324
10,340
Motorola, Inc.
18,006
128,563
Unisys Corp.*
2,890
7,948
Tyco Electronics Ltd.
3,790
104,831
Ciena Corp.*
715
7,207
MasterCard, Inc.
580
102,851
Total Information Technology
13,000,426
Electronic Arts, Inc.*
2,551
94,361
FINANCIALS 13.4%
Juniper Networks, Inc.*
4,282
90,222
JPMorgan Chase & Co.
29,258
1,366,349
Paychex, Inc.
2,580
85,217
Bank of America Corp.
36,069
1,262,415
Agilent Technologies, Inc.*
2,865
84,976
Wells Fargo & Co.
26,249
985,125
Intuit, Inc.*
2,580
81,554
Citigroup, Inc.
43,537
892,944
Xerox Corp.
7,000
80,710
U.S. Bancorp
13,785
496,536
Broadcom Corp. — Class A*
3,479
64,814
Goldman Sachs Group, Inc.
3,490
446,720
CA, Inc.
3,160
63,074
American Express Co.
9,292
329,216
Fiserv, Inc.*
1,320
62,462
Merrill Lynch & Co., Inc.
12,228
309,368
Autodesk, Inc.*
1,810
60,725
MetLife, Inc.
5,462
305,872
Analog Devices, Inc.
2,284
60,183
Bank of New York Mellon Corp.
9,119
297,097
Amphenol Corp. — Class A
1,420
56,999
Prudential Financial, Inc.
3,392
244,224
Linear Technology Corp.
1,744
53,471
AFLAC, Inc.
3,786
222,427
Cognizant Technology Solutions
Travelers Companies, Inc.
4,721
213,389
Corp. — Class A*
2,340
53,422
PNC Financial Services Group, Inc.
2,756
205,873
Xilinx, Inc.
2,184
51,215
Morgan Stanley
8,863
203,849
MEMC Electronic Materials, Inc.*
1,791
50,614
CME Group, Inc.
540
200,615
Harris Corp.
1,076
49,711
Allstate Corp.
4,336
199,976
Altera Corp.
2,377
49,156
State Street Corp.
3,435
195,383
Computer Sciences Corp.*
1,220
49,032
Charles Schwab Corp.
7,404
192,504
NetApp, Inc.*
2,630
47,945
Simon Property Group, Inc.
1,810
175,570
Nvidia Corp.*
4,418
47,317
BB&T Corp.
4,348
164,354
Sun Microsystems, Inc.*
5,951
45,228
Chubb Corp.
2,875
157,837
BMC Software, Inc.*
1,530
43,804
Capital One Financial Corp.
2,999
152,949
KLA-Tencor Corp.
1,369
43,329
Marsh & McLennan Companies,
Microchip Technology, Inc.
1,449
42,644
Inc.
4,114
130,661
Salesforce.com, Inc.*
840
40,656
SunTrust Banks, Inc.
2,820
126,872
VeriSign, Inc.*
1,526
39,798
See Notes to Financial Statements.
THE RYDEX SERIES FUNDS SEMI-ANNUAL REPORT
|
21
| SCHEDULE OF INVESTMENTS (Unaudited) (continued) |
| THE RYDEX SERIES FUNDS SEMI-ANNUAL REPORT |
| 22 | | | | | See Notes to Financial Statements. |
| Northern Trust Corp. | | 1,751 | | $ | | 126,422 | | Federated Investors, Inc. — |
| Loews Corp. | | 2,873 | | 113,455 | | Class B | | 710 | | $ | | 20,483 |
| T. Rowe Price Group, Inc. | | 110,374 | | MBIA, Inc. | | 1,570 | | 18,683 |
| Franklin Resources, Inc. | | 1,220 | | 107,519 | | CB Richard Ellis Group, Inc. — |
| Public Storage | | 1,010 | | 100,000 | | Class A* | | 1,380 | | 18,451 |
| Aon Corp. | | 2,200 | | 98,912 | | Sovereign Bancorp, Inc. | | 4,310 | | 17,024 |
| Vornado Realty Trust | | 1,082 | | 98,408 | | CIT Group, Inc. | | 2,290 | | 15,938 |
| Hartford Financial Services Group, | | First Horizon National Corp. | | 15,140 |
| | Inc. | | 2,398 | | 98,294 | | E*Trade Financial Corp.* | | 4,310 | | 12,068 |
| Equity Residential | | 2,180 | | 96,814 | | National City Corp. | | 6,018 | | 10,532 |
| Progressive Corp. | | 5,420 | | 94,308 | | MGIC Investment Corp. | | 1,000 | | 7,030 |
| Principal Financial Group, Inc. | | 89,328 |
| Boston Properties, Inc. | | 949 | | 88,883 |
| Lincoln National Corp. | | 2,050 | | 87,760 |
| Hudson City Bancorp, Inc. | | 75,479 |
| American International Group, Inc. | | 71,362 |
| Plum Creek Timber Co., Inc. |
| KIMCO Realty Corp. | | 1,820 | | 67,231 |
| Ameriprise Financial, Inc. | | 65,628 |
| Leucadia National Corp. | | 1,420 | | 64,525 |
| Wachovia Corp. | | 17,073 | | 59,755 |
| AvalonBay Communities, Inc. | | 59,643 |
| Host Hotels & Resorts, Inc. | | 55,419 |
| Fifth Third Bancorp | | 4,563 | | 54,300 |
| Regions Financial Corp. | | 5,492 | | 52,723 |
| Discover Financial Services | | 52,392 |
| IntercontinentalExchange, Inc.* | | 49,215 |
| XL Capital Ltd. | | 2,504 | | 44,922 |
| Legg Mason, Inc. | | 1,119 | | 42,589 |
| American Capital Ltd. | | 1,660 | | 42,347 |
| Marshall & Ilsley Corp. | | 2,050 | | 41,307 |
| Comerica, Inc. | | 1,210 | | 39,676 |
| Cincinnati Financial Corp. | | 36,972 |
| Zions Bancorporation | | 920 | | 35,604 |
| Developers Diversified Realty |
| Janus Capital Group, Inc. | | 30,569 |
| Genworth Financial, Inc. — |
| General Growth Properties, Inc. | | 27,633 |
| | Management Co. — Class A | | 24,164 |
| Huntington Bancshares, Inc. | | 23,235 |
| Exxon Mobil Corp. | | 41,710 | | 3,239,199 |
| Chevron Corp. | | 16,500 | | 1,360,920 |
| ConocoPhillips | | 12,200 | | 893,650 |
| Schlumberger Ltd. | | 9,633 | | 752,241 |
| Occidental Petroleum Corp. | | 462,152 |
| Devon Energy Corp. | | 3,550 | | 323,760 |
| Transocean, Inc.* | | 2,560 | | 281,190 |
| Halliburton Co. | | 7,040 | | 228,026 |
| Marathon Oil Corp. | | 5,670 | | 226,063 |
| XTO Energy, Inc. | | 4,410 | | 205,153 |
| Anadarko Petroleum Corp. | | 182,398 |
| EOG Resources, Inc. | | 2,000 | | 178,920 |
| National-Oilwell Varco, Inc.* | | 168,270 |
| Chesapeake Energy Corp. | | 150,253 |
| Baker Hughes, Inc. | | 2,480 | | 150,139 |
| Weatherford International Ltd.* | | 137,516 |
| Valero Energy Corp. | | 4,200 | | 127,260 |
| Spectra Energy Corp. | | 4,940 | | 117,572 |
| Williams Companies, Inc. | | 109,499 |
| Smith International, Inc. | | 1,729 | | 101,389 |
| Murphy Oil Corp. | | 1,530 | | 98,134 |
| Peabody Energy Corp. | | 2,180 | | 98,100 |
| Southwestern Energy Co.* | | 84,290 |
| Noble Energy, Inc. | | 1,390 | | 77,270 |
| Consol Energy, Inc. | | 1,470 | | 67,458 |
| Cameron International Corp.* | | 67,445 |
| ENSCO International, Inc. | | 66,274 |
| Nabors Industries Ltd.* | | 2,250 | | 56,070 |
| Range Resources Corp. | | 1,250 | | 53,588 |
| Pioneer Natural Resources Co. | | 50,189 |
| BJ Services Co. | | 2,360 | | 45,147 |
| Cabot Oil & Gas Corp. | | 830 | | 29,996 |
| Rowan Companies, Inc. | | 910 | | 27,801 |
| Massey Energy Co. | | 680 | | 24,256 |
2,055
1,618
2,054
4,091
21,430
1,718
606
4,170
3,791
610
1,300
1,259
1,830
690
2,908
6,560
3,760
3,350
4,190
5,470
4,630
2,760
1,750
1,150
960
| HEALTH CARE 11.1% | | CONSUMER STAPLES 10.3% |
| SCHEDULE OF INVESTMENTS (Unaudited) (continued) |
| THE RYDEX SERIES FUNDS SEMI-ANNUAL REPORT |
| See Notes to Financial Statements. | | | | | 23 |
| Johnson & Johnson, Inc. | | $ | | Procter & Gamble Co. | | 24,127 | | $ |
| Pfizer, Inc. | | 54,127 | | 998,102 | | Wal-Mart Stores, Inc. | | 17,783 | | 1,065,024 |
| Abbott Laboratories | | 12,368 | | 712,149 | | PepsiCo, Inc. | | 12,463 | | 888,238 |
| Merck & Co., Inc. | | 17,185 | | 542,359 | | Coca-Cola Co. | | 15,761 | | 833,442 |
| Amgen, Inc.* | | 8,500 | | 503,795 | | Philip Morris International, Inc. | | 786,627 |
| Medtronic, Inc. | | 9,060 | | 453,906 | | Kraft Foods, Inc. — Class A | | 393,459 |
| Wyeth | | 10,702 | | 395,332 | | CVS Caremark Corp. | | 11,373 | | 382,815 |
| Eli Lilly & Co. | | 8,023 | | 353,253 | | Anheuser-Busch Companies, Inc. | | 373,449 |
| Gilead Sciences, Inc.* | | 7,390 | | 336,836 | | Altria Group, Inc. | | 16,299 | | 323,372 |
| Bristol-Myers Squibb Co. | | 331,202 | | Colgate-Palmolive Co. | | 4,034 | | 303,962 |
| Baxter International, Inc. | | 5,040 | | 330,775 | | Walgreen Co. | | 7,828 | | 242,355 |
| UnitedHealth Group, Inc. | | 248,314 | | Costco Wholesale Corp. | | 3,438 | | 223,229 |
| Schering-Plough Corp. | | 13,031 | | 240,683 | | Kimberly-Clark Corp. | | 3,281 | | 212,740 |
| Celgene Corp.* | | 3,650 | | 230,972 | | General Mills, Inc. | | 2,652 | | 182,246 |
| Covidien Ltd. | | 4,030 | | 216,653 | | Sysco Corp. | | 4,747 | | 146,350 |
| WellPoint, Inc.* | | 4,108 | | 192,131 | | Kroger Co. | | 5,194 | | 142,731 |
| Thermo Fisher Scientific, Inc.* | | 184,800 | | Avon Products, Inc. | | 3,420 | | 142,169 |
| Medco Health Solutions, Inc.* | | 182,385 | | Wm. Wrigley Jr. Co. | | 1,727 | | 137,124 |
| Genzyme Corp.* | | 2,160 | | 174,722 | | H.J. Heinz Co. | | 2,468 | | 123,326 |
| Becton, Dickinson & Co. | | 1,960 | | 157,310 | | Kellogg Co. | | 2,009 | | 112,705 |
| Boston Scientific Corp.* | | 147,706 | | Archer-Daniels-Midland Co. | | 111,522 |
| Express Scripts, Inc.* | | 1,980 | | 146,164 | | Lorillard, Inc. | | 1,370 | | 97,476 |
| Cardinal Health, Inc. | | 2,880 | | 141,926 | | Safeway, Inc. | | 3,446 | | 81,739 |
| Aetna, Inc. | | 3,781 | | 136,532 | | UST, Inc. | | 1,180 | | 78,517 |
| Allergan, Inc. | | 2,468 | | 127,102 | | Sara Lee Corp. | | 5,567 | | 70,311 |
| Stryker Corp. | | 1,990 | | 123,977 | | Clorox Co. | | 1,110 | | 69,586 |
| McKesson Corp. | | 2,220 | | 119,458 | | ConAgra Foods, Inc. | | 3,572 | | 69,511 |
| St. Jude Medical, Inc.* | | 2,740 | | 119,163 | | Campbell Soup Co. | | 1,700 | | 65,620 |
| Biogen Idec, Inc.* | | 2,330 | | 117,176 | | Reynolds American, Inc. | | 1,341 | | 65,200 |
| Zimmer Holdings, Inc.* | | 1,810 | | 116,854 | | Molson Coors Brewing Co. — |
| C.R. Bard, Inc. | | 800 | | 75,896 | | Class B | | 1,187 | | 55,492 |
| CIGNA Corp. | | 2,209 | | 75,062 | | Hershey Co. | | 1,330 | | 52,588 |
| Intuitive Surgical, Inc.* | | 310 | | 74,704 | | Estee Lauder Companies, Inc. — |
| Forest Laboratories, Inc.* | | 69,286 | | Class A† | | 920 | | 45,917 |
| Quest Diagnostics, Inc. | | 1,270 | | 65,621 | | Brown-Forman Corp. — Class B | | 45,240 |
| Laboratory Corporation of | | Coca-Cola Enterprises, Inc. | | 41,774 |
| | America Holdings* | | 890 | | 61,855 | | McCormick & Co., Inc. | | 1,016 | | 39,065 |
| Varian Medical Systems, Inc.* | | 57,130 | | SUPERVALU, INC. | | 1,700 | | 36,890 |
| Barr Pharmaceuticals, Inc.* | | 56,811 | | Constellation Brands, Inc. — |
| Humana, Inc.* | | 1,356 | | 55,867 | | Class A* | | 1,528 | | 32,791 |
| Hospira, Inc.* | | 1,280 | | 48,896 | | Pepsi Bottling Group, Inc. | | 32,087 |
| DaVita, Inc.* | | 840 | | 47,888 | | Tyson Foods, Inc. — Class A | | 28,775 |
| AmerisourceBergen Corp. | | 47,815 | | Dean Foods Co.* | | 1,207 | | 28,196 |
| Applied Biosystems Inc. | | 1,360 | | 46,580 | | Whole Foods Market, Inc. | | 22,173 |
| Coventry Health Care, Inc.* | | 38,734 |
| Millipore Corp.* | | 440 | | 30,272 |
| Mylan Laboratories, Inc.* | | 27,922 |
| IMS Health, Inc. | | 1,460 | | 27,609 |
| PerkinElmer, Inc. | | 958 | | 23,921 |
| Watson Pharmaceuticals, Inc.* | | 23,797 |
| Patterson Companies, Inc.* | | 22,199 |
| King Pharmaceuticals, Inc.* | | 18,921 |
| Tenet Healthcare Corp.* | | 3,330 | | 18,482 |
| General Electric Co. | | 79,870 | | 2,036,685 |
| United Parcel Service, Inc. — |
| United Technologies Corp. | | 464,864 |
| Lockheed Martin Corp. | | 2,670 | | 292,819 |
| Caterpillar, Inc. | | 4,890 | | 291,444 |
22,440
1,554,643
1,681,411
16,354
12,014
5,756
15,885
9,780
3,360
4,053
12,038
5,090
2,450
630
2,491
1,000
870
1,100
2,410
1,270
1,107
1,190
2,445
835
730
1,975
7,740
| | CONSUMER DISCRETIONARY 7.2% |
| SCHEDULE OF INVESTMENTS (Unaudited) (continued) |
| THE RYDEX SERIES FUNDS SEMI-ANNUAL REPORT |
| 24 | | | | | See Notes to Financial Statements. |
| Union Pacific Corp. | | 4,090 | | $ | | 291,044 |
| Emerson Electric Co. | | 6,230 | | 254,122 | | McDonald’s Corp. | | 8,924 | | $ | | 550,611 |
| Honeywell International, Inc. | | 248,469 | | Comcast Corp. — Class A | | 459,931 |
| General Dynamics Corp. | | 3,190 | | 234,848 | | Walt Disney Co. | | 14,889 | | 456,943 |
| Burlington Northern Santa Fe | | Time Warner, Inc. | | 28,352 | | 371,695 |
| | Corp. | | 2,270 | | 209,816 | | Home Depot, Inc. | | 13,445 | | 348,091 |
| Norfolk Southern Corp. | | 3,010 | | 199,292 | | Target Corp. | | 5,970 | | 292,828 |
| FedEx Corp. | | 2,500 | | 197,600 | | Lowe’s Companies, Inc. | | 11,730 | | 277,884 |
| Raytheon Co. | | 3,350 | | 179,258 | | News Corp. — Class A | | 18,199 | | 218,206 |
| CSX Corp. | | 3,270 | | 178,444 | | Nike, Inc. — Class B | | 3,150 | | 210,735 |
| Deere & Co. | | 3,430 | | 169,785 | | Amazon.com, Inc.* | | 2,561 | | 186,338 |
| Northrop Grumman Corp. | | 164,063 | | Johnson Controls, Inc. | | 4,770 | | 144,674 |
| Illinois Tool Works, Inc. | | 3,210 | | 142,684 | | Staples, Inc. | | 5,629 | | 126,652 |
| Danaher Corp. | | 2,050 | | 142,270 | | Yum! Brands, Inc. | | 3,759 | | 122,581 |
| Tyco International Ltd. | | 3,810 | | 133,426 | | Carnival Corp. | | 3,461 | | 122,346 |
| Waste Management, Inc. | | 124,071 | | Viacom, Inc. — Class B* | | 4,913 | | 122,039 |
| Paccar, Inc. | | 2,920 | | 111,515 | | DIRECTV Group, Inc.* | | 4,640 | | 121,429 |
| L-3 Communications Holdings, Inc. | 96,354 | | Kohl’s Corp.* | | 2,450 | | 112,896 |
| Precision Castparts Corp. | | 87,761 | | TJX Companies, Inc. | | 3,370 | | 102,852 |
| Southwest Airlines Co. | | 5,890 | | 85,464 | | Best Buy Company, Inc. | | 2,704 | | 101,400 |
| ITT Corporation | | 1,460 | | 81,191 | | Omnicom Group, Inc. | | 2,560 | | 98,714 |
| Fluor Corp. | | 1,440 | | 80,208 | | Ford Motor Co.* | | 18,160 | | 94,432 |
| Ingersoll-Rand Co. — Class A | | 79,639 | | Starbucks Corp.* | | 5,870 | | 87,287 |
| Eaton Corp. | | 1,330 | | 74,719 | | McGraw-Hill Companies, Inc. | | 80,605 |
| Parker Hannifin Corp. | | 1,350 | | 71,550 | | CBS Corp. | | 5,460 | | 79,607 |
| Cummins, Inc. | | 1,630 | | 71,264 | | Harley-Davidson, Inc. | | 1,890 | | 70,497 |
| CH Robinson Worldwide, Inc. | | 69,815 | | Fortune Brands, Inc. | | 1,200 | | 68,832 |
| Rockwell Collins, Inc. | | 1,280 | | 61,555 | | Coach, Inc.* | | 2,710 | | 67,858 |
| Dover Corp. | | 1,510 | | 61,230 | | The Gap, Inc. | | 3,698 | | 65,750 |
| Expeditors International of | | Bed Bath & Beyond, Inc.* | | 65,647 |
| | Washington, Inc. | | 1,710 | | 59,576 | | Marriott International, Inc. — |
| Textron, Inc. | | 2,000 | | 58,560 | | Class A | | 2,330 | | 60,790 |
| Cooper Industries Ltd. — Class A | | 55,930 | | Macy’s, Inc. | | 3,339 | | 60,035 |
| Pitney Bowes, Inc. | | 1,670 | | 55,544 | | H&R Block, Inc. | | 2,630 | | 59,832 |
| Jacobs Engineering Group, Inc.* | | 53,224 | | J.C. Penney Company, Inc. | | 58,545 |
| Masco Corp. | | 2,890 | | 51,847 | | VF Corp. | | 700 | | 54,117 |
| Fastenal Co. | | 1,040 | | 51,366 | | Mattel, Inc. | | 2,855 | | 51,504 |
| W.W. Grainger, Inc. | | 520 | | 45,224 | | Genuine Parts Co. | | 1,279 | | 51,429 |
| Rockwell Automation, Inc. | | 43,688 | | Apollo Group, Inc. — Class A* | | 50,405 |
| Goodrich Corp. | | 1,000 | | 41,600 | | Whirlpool Corp. | | 600 | | 47,574 |
| RR Donnelley & Sons Co. | | 41,456 | | GameStop Corp. — Class A* | | 44,747 |
| Avery Dennison Corp. | | 860 | | 38,253 | | Sherwin-Williams Co. | | 774 | | 44,242 |
| Equifax, Inc. | | 1,030 | | 35,484 | | Sears Holdings Corp.* | | 460 | | 43,010 |
| Pall Corp. | | 960 | | 33,014 | | General Motors Corp. | | 4,550 | | 42,998 |
| Robert Half International, Inc. | | 30,938 | | International Game Technology, |
| Cintas Corp. | | 1,060 | | 30,433 | | Inc. | | 2,475 | | 42,521 |
| Allied Waste Industries, Inc.* | | 30,219 | | AutoZone, Inc.* | | 340 | | 41,936 |
| Ryder System, Inc. | | 450 | | 27,900 | | Starwood Hotels & Resorts |
| Terex Corp.* | | 780 | | 23,806 | | Worldwide, Inc. | | 1,474 | | 41,478 |
| Manitowoc Co., Inc. | | 1,044 | | 16,234 | | Limited Brands, Inc. | | 2,266 | | 39,247 |
| Monster Worldwide, Inc.* | | 979 | | 14,597 | | Newell Rubbermaid, Inc. | 2,225 | | 38,404 |
| | Nordstrom, Inc. | | 1,255 | | 36,169 |
| | Eastman Kodak Co. | | 2,288 | | 35,189 |
5,980
23,430
2,710
3,940
980
1,114
2,555
2,550
1,370
2,090
1,400
980
1,756
1,170
850
1,690
1,308
1,250
2,720
| Total Consumer Discretionary |
| | TELECOMMUNICATION SERVICES 2.6% |
| SCHEDULE OF INVESTMENTS (Unaudited) (continued) |
| THE RYDEX SERIES FUNDS SEMI-ANNUAL REPORT |
| See Notes to Financial Statements. | | | | | 25 |
| Darden Restaurants, Inc. | | 1,130 | | $ | | 32,352 | | AES Corp.* | | 5,400 | | $ | | 63,126 |
| Gannett Co., Inc. | | 1,830 | | 30,945 | | Questar Corp. | | 1,390 | | 56,879 |
| Polo Ralph Lauren Corp. | | 460 | | 30,654 | | DTE Energy Co. | | 1,310 | | 52,557 |
| Goodyear Tire & Rubber Co.* | | 29,701 | | Allegheny Energy, Inc. | | 1,360 | | 50,007 |
| Interpublic Group of Companies, | | CenterPoint Energy, Inc. | | 2,740 | | 39,922 |
| | Inc.* | | 3,825 | | 29,644 | | Pepco Holdings, Inc. | | 1,620 | | 37,114 |
| Black & Decker Corp. | | 480 | | 29,160 | | Constellation Energy Group, Inc. | | 34,749 |
| D.R. Horton, Inc. | | 2,210 | | 28,774 | | NiSource, Inc. | | 2,200 | | 32,472 |
| Leggett & Platt, Inc. | | 1,290 | | 28,109 | | Integrys Energy Group, Inc. | | 30,463 |
| Washington Post Co. — Class B | | 27,838 | | Pinnacle West Capital Corp. | | 27,872 |
| Abercrombie & Fitch Co. — | | TECO Energy, Inc. | | 1,710 | | 26,898 |
| | Class A | | 700 | | 27,615 | | CMS Energy Corp. | | 1,810 | | 22,571 |
| Stanley Works | | 630 | | 26,296 | | Nicor, Inc. | | 360 | | 15,966 |
| Scripps Networks Interactive, | | Dynegy Inc.* | | 4,060 | | 14,535 |
| Family Dollar Stores, Inc. | 1,096 | | 25,975 |
| Expedia, Inc.* | | 1,680 | | 25,385 |
| Pulte Homes, Inc. | | 1,714 | | 23,945 |
| Wyndham Worldwide Corp. | | 22,025 |
| RadioShack Corp. | | 1,032 | | 17,833 |
| Lennar Corp. — Class A | | 1,140 | | 17,317 |
| Harman International Industries, |
| New York Times Co. — Class A | | 13,433 |
| Office Depot, Inc.* | | 2,183 | | 12,705 |
| Liz Claiborne, Inc. | | 760 | | 12,487 |
| Jones Apparel Group, Inc. | | 12,402 |
| AutoNation, Inc.* | | 870 | | 9,779 |
| Dillard’s, Inc. — Class A | | 460 | | 5,428 |
| | Eastman Chemical Co. | | 610 | | 33,587 |
| Exelon Corp. | | 5,280 | | 330,634 | | MeadWestvaco Corp. | | 1,370 | | 31,935 |
| Southern Co. | | 6,180 | | 232,924 | | Ball Corp. | | 780 | | 30,802 |
| Dominion Resources, Inc. | | 199,355 | | Sealed Air Corp. | | 1,270 | | 27,927 |
| Duke Energy Corp. | | 10,160 | | 177,089 | | Pactiv Corp.* | | 1,050 | | 26,072 |
| FPL Group, Inc. | | 3,280 | | 164,984 | | International Flavors & Fragrances, |
| FirstEnergy Corp. | | 2,450 | | 164,126 | | Inc. | | 630 | | 24,860 |
| Entergy Corp. | | 1,540 | | 137,075 | | Allegheny Technologies, Inc. | | 23,936 |
| Public Service Enterprise Group, | | AK Steel Holding Corp. | | 900 | | 23,328 |
| | Inc. | | 4,080 | | 133,783 | | Bemis Co. | | 800 | | 20,968 |
| American Electric Power Co., Inc. | | 119,607 | | Hercules, Inc. | | 910 | | 18,009 |
| PPL Corp. | | 3,010 | | 111,430 | | Ashland, Inc. | | 460 | | 13,450 |
| PG&E Corp. | | 2,880 | | 107,856 | | Titanium Metals Corp. | | 680 | | 7,711 |
| Edison International | | 2,620 | | 104,538 |
| Consolidated Edison, Inc. | | 94,082 |
| Progress Energy, Inc. | | 2,100 | | 90,573 |
| Xcel Energy, Inc. | | 3,580 | | 71,564 |
| E.I. du Pont de Nemours and Co. | | 291,772 |
| Dow Chemical Co. | | 7,430 | | 236,126 |
| Praxair, Inc. | | 2,530 | | 181,502 |
| Freeport-McMoRan Copper & |
| Newmont Mining Corp. | | 3,670 | | 142,249 |
| Air Products & Chemicals, Inc. | | 116,433 |
| Weyerhaeuser Co. | | 1,700 | | 102,986 |
| International Paper Co. | | 3,430 | | 89,797 |
| PPG Industries, Inc. | | 1,320 | | 76,982 |
| United States Steel Corp. | | 940 | | 72,953 |
| Rohm & Haas Co.† | | 990 | | 69,300 |
| Vulcan Materials Co. | | 880 | | 65,560 |
| Sigma-Aldrich Corp. | | 1,010 | | 52,944 |
| CF Industries Holdings, Inc. | | 41,157 |
| AT&T, Inc. | | 46,808 | | 1,306,879 |
| Verizon Communications, Inc. | | 725,009 |
| Sprint Nextel Corp. | | 22,586 | | 137,775 |
| American Tower Corp. — Class A* | 111,831 |
1,940
1,430
610
50
810
1,402
940
670
4,660
810
3,230
2,190
7,240
1,700
450
22,593
3,109
SCHEDULE OF INVESTMENTS (Unaudited) (concluded)
September 30, 2008
NOVA FUND
MARKET
SHARES
VALUE
Embarq Corp.
1,131
$
45,862
Windstream Corp.
3,477
38,039
Qwest Communications
International, Inc.
11,653
37,639
CenturyTel, Inc.
803
29,430
Frontier Communications Corp.
2,508
28,842
Total Telecommunication Services
2,461,306
Total Common Stocks
(Cost $72,601,816)
81,406,381
SECURITIES LENDING COLLATERAL 0.1%
Mount Vernon Securities
Lending Trust Prime
Portfolio (Note 9)
85,572
85,572
Total Securities Lending Collateral
(Cost $85,572)
85,572
FACE
AMOUNT
REPURCHASE AGREEMENTS 11.0%
Repurchase Agreements (Note 5)
Morgan Stanley
issued 09/30/08 at 0.05%
due 10/01/08
$4,362,028
4,362,028
Mizuho Financial Group, Inc.
issued 09/30/08 at 0.26%
due 10/01/08
3,613,174
3,613,174
Morgan Stanley
issued 09/30/08 at 0.10%
due 10/01/08
2,558,000
2,558,000
Total Repurchase Agreements
(Cost $10,533,202)
10,533,202
Total Investments 96.0%
(Cost $83,220,590)
$92,025,155
Other Assets in Excess
of Liabilities – 4.0%
$
3,871,473
Net Assets – 100.0%
$95,896,628
UNREALIZED
CONTRACTS
LOSS
FUTURES CONTRACTS PURCHASED
December 2008 S&P 500 Index
Mini Futures Contracts
(Aggregate Market Value
of Contracts $61,680,563)
1,051
$ (1,535,967)
* Non-Income Producing Security.
† All or a portion of this security is on loan at September 30, 2008 — See Note 9.
REIT — Real Estate Investment Trust
26
|
THE RYDEX SERIES FUNDS SEMI-ANNUAL REPORT
See Notes to Financial Statements.
| INFORMATION TECHNOLOGY 11.2% |
| | Total Information Technology |
| SCHEDULE OF INVESTMENTS (Unaudited) |
| THE RYDEX SERIES FUNDS SEMI-ANNUAL REPORT |
| See Notes to Financial Statements. | | | | | 27 |
| | Affiliated Computer Services, |
| | Inc. — Class A* | | 1,010 | | $ | | 51,136 |
| | Citrix Systems, Inc.* | | 1,915 | | 48,373 |
| Microsoft Corp. | | 81,540 | | $ | 2,176,303 | | SanDisk Corp.* | | 2,363 | | 46,197 |
| International Business Machines | | Fidelity National Information |
| | Corp. | | 14,010 | | 1,638,610 | | Services, Inc. | | 1,971 | | 36,385 |
| Cisco Systems, Inc.* | | 61,090 | | 1,378,190 | | Teradata Corp.* | | 1,850 | | 36,075 |
| Hewlett-Packard Co. | | 25,330 | | 1,171,259 | | LSI Logic Corp.* | | 6,661 | | 35,703 |
| Intel Corp. | | 58,140 | | 1,088,962 | | National Semiconductor Corp. | | 34,764 |
| Apple, Inc.* | | 9,246 | | 1,050,900 | | Total System Services, Inc. | | 34,046 |
| Google, Inc. — Class A* | | 2,472 | | 990,085 | | Molex, Inc. | | 1,480 | | 33,226 |
| Oracle Corp.* | | 40,846 | | 829,582 | | Advanced Micro Devices, Inc.* | | 32,970 |
| Qualcomm, Inc. | | 16,970 | | 729,201 | | Micron Technology, Inc.* | 7,870 | | 31,874 |
| Dell, Inc.* | | 18,226 | | 300,365 | | Akamai Technologies, Inc.* | | 30,782 |
| Texas Instruments, Inc. | | 13,560 | | 291,540 | | Lexmark International, Inc.* | | 30,258 |
| EMC Corp* | | 21,410 | | 256,064 | | Compuware Corp.* | | 2,645 | | 25,630 |
| Corning, Inc. | | 16,320 | | 255,245 | | QLogic Corp.* | | 1,379 | | 21,181 |
| eBay, Inc.* | | 11,328 | | 253,521 | | Jabil Circuit, Inc. | | 2,204 | | 21,026 |
| Yahoo!, Inc.* | | 14,416 | | 249,397 | | Novellus Systems, Inc.* | | 1,030 | | 20,229 |
| Automatic Data Processing, Inc. | | 224,865 | | JDS Uniphase Corp.* | | 2,220 | | 18,781 |
| Adobe Systems, Inc.* | | 5,558 | | 219,374 | | Convergys Corp.* | | 1,260 | | 18,623 |
| Applied Materials, Inc. | | 13,870 | | 209,853 | | Novell, Inc.* | | 3,570 | | 18,350 |
| Western Union Co. | | 7,630 | | 188,232 | | Tellabs, Inc.* | | 4,110 | | 16,687 |
| Symantec Corp.* | | 8,728 | | 170,894 | | Teradyne, Inc.* | | 1,750 | | 13,668 |
| Motorola, Inc. | | 23,430 | | 167,290 | | Unisys Corp.* | | 3,720 | | 10,230 |
| Tyco Electronics Ltd. | | 4,885 | | 135,119 | | Ciena Corp.* | | 930 | | 9,374 |
| MasterCard, Inc. | | 758 | | 134,416 |
| Electronic Arts, Inc.* | | 3,300 | | 122,067 |
| Juniper Networks, Inc.* | | 5,620 | | 118,413 |
| Paychex, Inc. | | 3,334 | | 110,122 |
| Agilent Technologies, Inc.* | | 109,742 |
| Intuit, Inc.* | | 3,354 | | 106,020 |
| Broadcom Corp. — Class A* | | 84,953 |
| Autodesk, Inc.* | | 2,360 | | 79,178 |
| Analog Devices, Inc. | | 3,000 | | 79,050 |
| Amphenol Corp. — Class A | | 74,941 |
| Linear Technology Corp. | | 2,290 | | 70,211 |
| Cognizant Technology Solutions |
| | Corp. — Class A* | | 3,063 | | 69,928 |
| MEMC Electronic Materials, Inc.* | | 66,128 |
| Computer Sciences Corp.* | | 63,098 |
| Sun Microsystems, Inc.* | | 7,790 | | 59,204 |
| KLA-Tencor Corp. | | 1,790 | | 56,654 |
| BMC Software, Inc.* | | 1,972 | | 56,458 |
| Microchip Technology, Inc. | | 55,917 |
| Salesforce.com, Inc.* | | 1,096 | | 53,046 |
| VeriSign, Inc.* | | 2,000 | | 52,160 |
| JPMorgan Chase & Co. | | 38,100 | | 1,779,270 |
| Bank of America Corp. | | 47,159 | | 1,650,565 |
| Wells Fargo & Co. | | 34,215 | | 1,284,089 |
| Citigroup, Inc. | | 56,305 | | 1,154,816 |
| U.S. Bancorp | | 18,012 | | 648,792 |
| Goldman Sachs Group, Inc. | | 574,720 |
| American Express Co. | | 11,992 | | 424,877 |
| Merrill Lynch & Co., Inc. | | 400,752 |
| MetLife, Inc. | | 7,100 | | 397,600 |
| Bank of New York Mellon Corp. | | 386,073 |
| Prudential Financial, Inc. | | 4,420 | | 318,240 |
| Travelers Companies, Inc. | | 276,172 |
| PNC Financial Services Group, |
| Morgan Stanley | | 11,465 | | 263,695 |
| Allstate Corp. | | 5,600 | | 258,272 |
| CME Group, Inc. | | 694 | | 257,828 |
| State Street Corp. | | 4,458 | | 253,571 |
| Charles Schwab Corp. | | 9,652 | | 250,952 |
| Simon Property Group, Inc. | | 227,465 |
| Capital One Financial Corp. | | 198,390 |
| Marsh & McLennan Companies, |
2,020
2,076
6,280
1,765
929
5,260
3,700
4,560
1,867
2,340
1,570
1,900
4,490
15,840
11,850
6,110
2,345
3,890
| SCHEDULE OF INVESTMENTS (Unaudited) (continued) |
| THE RYDEX SERIES FUNDS SEMI-ANNUAL REPORT |
| 28 | | | | | See Notes to Financial Statements. |
| Northern Trust Corp. | | 2,290 | | $ | | 165,338 | | Apartment Investment & |
| SunTrust Banks, Inc. | | 3,658 | | 164,573 | | Management Co. — Class A | | $ | | 31,448 |
| Loews Corp. | | 3,740 | | 147,693 | | Huntington Bancshares, Inc. | | 30,282 |
| T. Rowe Price Group, Inc. | | 143,943 | | Federated Investors, Inc. — |
| Franklin Resources, Inc. | | 1,582 | | 139,422 | | Class B | | 918 | | 26,484 |
| Public Storage | | 1,311 | | 129,802 | | MBIA, Inc. | | 2,054 | | 24,443 |
| Vornado Realty Trust | | 1,423 | | 129,422 | | CB Richard Ellis Group, Inc. — |
| Aon Corp. | | 2,870 | | 129,035 | | Class A* | | 1,807 | | 24,160 |
| Hartford Financial Services Group, | | Sovereign Bancorp, Inc. | | 5,620 | | 22,199 |
| | Inc. | | 3,120 | | 127,889 | | CIT Group, Inc. | | 2,973 | | 20,692 |
| Equity Residential | | 2,836 | | 125,947 | | First Horizon National Corp. | | 19,603 |
| Progressive Corp. | | 7,075 | | 123,105 | | E*Trade Financial Corp.* | | 5,653 | | 15,828 |
| Principal Financial Group, Inc. | | 116,379 | | National City Corp. | | 7,870 | | 13,772 |
| Boston Properties, Inc. | | 1,240 | | 116,138 | | MGIC Investment Corp. | | 1,302 | | 9,153 |
| Lincoln National Corp. | | 2,660 | | 113,875 |
| NYSE Euronext | | 2,750 | | 107,745 |
| Hudson City Bancorp, Inc. | | 99,076 |
| American International Group, |
| Plum Creek Timber Co., Inc. |
| KIMCO Realty Corp. | | 2,371 | | 87,585 |
| Ameriprise Financial, Inc. | | 85,568 |
| Leucadia National Corp. | | 1,850 | | 84,064 |
| AvalonBay Communities, Inc. | | 78,736 |
| Wachovia Corp. | | 22,324 | | 78,134 |
| Host Hotels & Resorts, Inc. | | 72,218 |
| Fifth Third Bancorp | | 5,970 | | 71,043 |
| Regions Financial Corp. | | 7,191 | | 69,034 |
| Discover Financial Services | | 68,547 |
| Assurant, Inc. | | 1,230 | | 67,650 |
| IntercontinentalExchange, Inc.* | | 63,414 |
| XL Capital Ltd. | | 3,230 | | 57,946 |
| Legg Mason, Inc. | | 1,468 | | 55,872 |
| American Capital Ltd. | | 2,146 | | 54,744 |
| Marshall & Ilsley Corp. | | 2,678 | | 53,962 |
| Comerica, Inc. | | 1,566 | | 51,349 |
| Cincinnati Financial Corp. | | 47,779 |
| Zions Bancorporation | | 1,190 | | 46,053 |
| Janus Capital Group, Inc. | | 39,941 |
| Developers Diversified Realty |
| Genworth Financial, Inc. — |
| General Growth Properties, Inc. | | 35,908 |
| Exxon Mobil Corp. | | 54,116 | | 4,202,649 |
| Chevron Corp. | | 21,438 | | 1,768,206 |
| ConocoPhillips | | 15,894 | | 1,164,235 |
| Schlumberger Ltd. | | 12,613 | | 984,949 |
| Occidental Petroleum Corp. | | 601,925 |
| Devon Energy Corp. | | 4,636 | | 422,803 |
| Transocean, Inc.* | | 3,357 | | 368,733 |
| Halliburton Co. | | 9,227 | | 298,862 |
| Marathon Oil Corp. | | 7,395 | | 294,839 |
| XTO Energy, Inc. | | 5,770 | | 268,420 |
| Anadarko Petroleum Corp. | | 237,990 |
| EOG Resources, Inc. | | 2,612 | | 233,669 |
| National-Oilwell Varco, Inc.* | | 220,560 |
| Baker Hughes, Inc. | | 3,250 | | 196,755 |
| Chesapeake Energy Corp. | | 196,190 |
| Weatherford International Ltd.* | | 180,028 |
| Valero Energy Corp. | | 5,491 | | 166,377 |
| Spectra Energy Corp. | | 6,461 | | 153,772 |
| Williams Companies, Inc. | | 142,799 |
| Smith International, Inc. | | 2,269 | | 133,054 |
| Peabody Energy Corp. | | 2,857 | | 128,565 |
| Murphy Oil Corp. | | 2,004 | | 128,537 |
| Southwestern Energy Co.* | | 110,219 |
| Noble Energy, Inc. | | 1,806 | | 100,396 |
| Cameron International Corp.* | | 88,372 |
| Consol Energy, Inc. | | 1,924 | | 88,292 |
| ENSCO International, Inc. | | 86,964 |
| Nabors Industries Ltd.* | | 2,948 | | 73,464 |
| Range Resources Corp. | | 1,623 | | 69,578 |
| Pioneer Natural Resources Co. | | 62,736 |
| BJ Services Co. | | 3,100 | | 59,303 |
| Cabot Oil & Gas Corp. | | 1,086 | | 39,248 |
| Rowan Companies, Inc. | | 1,191 | | 36,385 |
898
3,790
2,680
2,094
2,676
5,370
2,240
800
5,434
4,960
786
1,680
1,645
2,378
8,544
4,906
4,391
5,471
7,161
6,038
3,609
2,293
1,509
1,200
| SCHEDULE OF INVESTMENTS (Unaudited) (continued) |
| THE RYDEX SERIES FUNDS SEMI-ANNUAL REPORT |
| See Notes to Financial Statements. | | | | | 29 |
| Massey Energy Co. | | 886 | | $ | | 31,604 | | Watson Pharmaceuticals, Inc.* | | $ | | 30,780 |
| Tesoro Corp. | | 1,430 | | 23,581 | | Patterson Companies, Inc.* | | 28,981 |
| | King Pharmaceuticals, Inc.* | | 24,429 |
| | Tenet Healthcare Corp.* | | 4,356 | | 24,176 |
| Pfizer, Inc. | | 69,709 | | 1,285,434 |
| Abbott Laboratories | | 15,940 | | 917,825 | | Procter & Gamble Co. | | 31,380 | | 2,186,872 |
| Merck & Co., Inc. | | 22,160 | | 699,370 | | Wal-Mart Stores, Inc.† | | 23,190 | | 1,388,849 |
| Amgen, Inc.* | | 11,028 | | 653,630 | | PepsiCo, Inc. | | 16,190 | | 1,153,861 |
| Medtronic, Inc. | | 11,722 | | 587,272 | | Coca-Cola Co. | | 20,560 | | 1,087,213 |
| Wyeth | | 13,790 | | 509,403 | | Philip Morris International, Inc. | | 1,025,492 |
| Eli Lilly & Co. | | 10,350 | | 455,710 | | Kraft Foods, Inc. — Class A | | 514,175 |
| Gilead Sciences, Inc.* | | 9,593 | | 437,249 | | CVS Caremark Corp. | | 14,840 | | 499,514 |
| Bristol-Myers Squibb Co. | | 426,799 | | Anheuser-Busch Companies, Inc. | | 482,707 |
| Baxter International, Inc. | | 6,490 | | 425,939 | | Altria Group, Inc. | | 21,300 | | 422,592 |
| UnitedHealth Group, Inc. | | 320,955 | | Colgate-Palmolive Co. | | 5,230 | | 394,080 |
| Schering-Plough Corp. | | 16,810 | | 310,481 | | Walgreen Co. | | 10,244 | | 317,154 |
| Celgene Corp.* | | 4,739 | | 299,884 | | Costco Wholesale Corp. | | 4,500 | | 292,185 |
| Covidien Ltd. | | 5,198 | | 279,444 | | Kimberly-Clark Corp. | | 4,290 | | 278,164 |
| WellPoint, Inc.* | | 5,290 | | 247,413 | | General Mills, Inc. | | 3,480 | | 239,146 |
| Thermo Fisher Scientific, Inc.* | | 238,150 | | Sysco Corp. | | 6,230 | | 192,071 |
| Medco Health Solutions, Inc.* | | 235,350 | | Kroger Co. | | 6,770 | | 186,040 |
| Genzyme Corp.* | | 2,802 | | 226,654 | | Avon Products, Inc. | | 4,405 | | 183,116 |
| Becton, Dickinson & Co. | | 2,532 | | 203,218 | | Wm. Wrigley Jr. Co. | | 2,230 | | 177,062 |
| Boston Scientific Corp.* | | 190,430 | | H.J. Heinz Co. | | 3,230 | | 161,403 |
| Express Scripts, Inc.* | | 2,576 | | 190,160 | | Archer-Daniels-Midland Co. | | 145,921 |
| Cardinal Health, Inc. | | 3,719 | | 183,272 | | Kellogg Co. | | 2,590 | | 145,299 |
| Aetna, Inc. | | 4,880 | | 176,217 | | Lorillard, Inc. | | 1,800 | | 128,070 |
| Allergan, Inc. | | 3,180 | | 163,770 | | Safeway, Inc. | | 4,500 | | 106,740 |
| Stryker Corp. | | 2,578 | | 160,609 | | UST, Inc. | | 1,538 | | 102,339 |
| St. Jude Medical, Inc.* | | 3,564 | | 154,998 | | Sara Lee Corp. | | 7,300 | | 92,199 |
| McKesson Corp. | | 2,854 | | 153,574 | | ConAgra Foods, Inc. | | 4,680 | | 91,073 |
| Biogen Idec, Inc.* | | 3,028 | | 152,278 | | Clorox Co. | | 1,441 | | 90,336 |
| Zimmer Holdings, Inc.* | | 2,352 | | 151,845 | | Reynolds American, Inc. | | 1,760 | | 85,571 |
| C.R. Bard, Inc. | | 1,046 | | 99,234 | | Campbell Soup Co. | | 2,192 | | 84,611 |
| Intuitive Surgical, Inc.* | | 409 | | 98,561 | | Molson Coors Brewing Co. — |
| CIGNA Corp. | | 2,840 | | 96,503 | | Class B | | 1,560 | | 72,930 |
| Forest Laboratories, Inc.* | | 90,072 | | Hershey Co. | | 1,724 | | 68,167 |
| Quest Diagnostics, Inc. | | 1,649 | | 85,204 | | Estee Lauder Companies, Inc. — |
| Laboratory Corporation of | | Class A | | 1,196 | | 59,692 |
| | America Holdings* | | 1,161 | | 80,690 | | Brown-Forman Corp. — Class B | | 58,166 |
| Varian Medical Systems, Inc.* | | 74,955 | | Coca-Cola Enterprises, Inc. | | 55,006 |
| Barr Pharmaceuticals, Inc.* | | 74,573 | | McCormick & Co., Inc. | | 1,330 | | 51,138 |
| Humana, Inc.* | | 1,750 | | 72,100 | | SUPERVALU, INC. | | 2,200 | | 47,740 |
| Hospira, Inc.* | | 1,666 | | 63,641 | | Constellation Brands, Inc. — |
| DaVita, Inc.* | | 1,094 | | 62,369 | | Class A* | | 2,000 | | 42,920 |
| AmerisourceBergen Corp. | | 62,235 | | Pepsi Bottling Group, Inc. | | 41,305 |
| Waters Corp.* | | 1,033 | | 60,100 | | Tyson Foods, Inc. — Class A | | 37,181 |
| Applied Biosystems Inc. | | 1,750 | | 59,938 | | Dean Foods Co.* | | 1,580 | | 36,909 |
| Coventry Health Care, Inc.* | | 50,355 | | Whole Foods Market, Inc. | | 29,044 |
| Millipore Corp.* | | 570 | | 39,216 |
| IMS Health, Inc. | | 1,908 | | 36,080 |
| Mylan Laboratories, Inc.* | | 35,973 |
| PerkinElmer, Inc. | | 1,240 | | 30,963 |
| Johnson & Johnson, Inc. | | 2,004,686 |
1,080
953
2,550
21,320
15,700
20,470
7,440
12,641
4,330
5,230
15,520
6,660
3,185
810
1,312
3,280
1,142
1,653
1,416
3,114
1,547
1,450
3,150
28,936
| | CONSUMER DISCRETIONARY 5.9% |
| SCHEDULE OF INVESTMENTS (Unaudited) (continued) |
| THE RYDEX SERIES FUNDS SEMI-ANNUAL REPORT |
| 30 | | | | | See Notes to Financial Statements. |
| | Allied Waste Industries, Inc.* | | $ | | 39,485 |
| General Electric Co. | | 102,881 | | $ | 2,623,465 | | Cintas Corp. | | 1,374 | | 39,448 |
| United Parcel Service, Inc. — | | Ryder System, Inc. | | 600 | | 37,200 |
| | Class B | | 10,578 | | 665,250 | | Terex Corp.* | | 1,019 | | 31,100 |
| United Technologies Corp. | | 598,798 | | Manitowoc Co., Inc. | | 1,350 | | 20,992 |
| 3M Co. | | 7,235 | | 494,223 | | Monster Worldwide, Inc.* | | 19,085 |
| Lockheed Martin Corp. | | 3,480 | | 381,652 |
| Union Pacific Corp. | | 5,351 | | 380,777 |
| Caterpillar, Inc. | | 6,356 | | 378,818 |
| Emerson Electric Co. | | 8,020 | | 327,136 |
| Honeywell International, Inc. | | 319,935 |
| General Dynamics Corp. | | 4,151 | | 305,597 |
| Burlington Northern Santa Fe |
| Norfolk Southern Corp. | | 3,940 | | 260,867 |
| Northrop Grumman Corp. | | 211,829 |
| Danaher Corp. | | 2,672 | | 185,437 |
| Illinois Tool Works, Inc. | | 4,140 | | 184,023 |
| Tyco International Ltd. | | 4,941 | | 173,034 |
| Waste Management, Inc. | | 159,654 |
| L-3 Communications Holdings, |
| Precision Castparts Corp. | | 113,443 |
| Southwest Airlines Co. | | 7,723 | | 112,061 |
| ITT Corporation | | 1,908 | | 106,104 |
| Ingersoll-Rand Co. — Class A | | 102,549 |
| Parker Hannifin Corp. | | 1,730 | | 91,690 |
| CH Robinson Worldwide, Inc. | | 91,116 |
| Rockwell Collins, Inc. | | 1,673 | | 80,455 |
| Expeditors International of |
| | Washington, Inc. | | 2,246 | | 78,251 |
| Pitney Bowes, Inc. | | 2,183 | | 72,607 |
| Cooper Industries Ltd. — Class A | | 71,910 |
| Jacobs Engineering Group, Inc.* | | 69,625 |
| W.W. Grainger, Inc. | | 670 | | 58,270 |
| Rockwell Automation, Inc. | | 56,943 |
| Goodrich Corp. | | 1,302 | | 54,163 |
| RR Donnelley & Sons Co. | | 53,696 |
| Avery Dennison Corp. | | 1,110 | | 49,373 |
| Robert Half International, Inc. | | 39,847 |
| McDonald’s Corp. | | 11,630 | | 717,571 |
| Walt Disney Co. | | 19,400 | | 595,386 |
| Comcast Corp. — Class A | | 594,122 |
| Time Warner, Inc. | | 37,050 | | 485,725 |
| Home Depot, Inc. | | 17,562 | | 454,680 |
| Lowe’s Companies, Inc. | | 15,160 | | 359,140 |
| News Corp. — Class A | | 23,740 | | 284,643 |
| Nike, Inc. — Class B | | 4,104 | | 274,558 |
| Amazon.com, Inc.* | | 3,300 | | 240,108 |
| Johnson Controls, Inc. | | 6,140 | | 186,226 |
| Staples, Inc. | | 7,350 | | 165,375 |
| Carnival Corp. | | 4,520 | | 159,782 |
| Viacom, Inc. — Class B* | | 6,420 | | 159,473 |
| Yum! Brands, Inc. | | 4,850 | | 158,159 |
| DIRECTV Group, Inc.* | | 5,997 | | 156,941 |
| Kohl’s Corp.* | | 3,152 | | 145,244 |
| TJX Companies, Inc. | | 4,370 | | 133,372 |
| Best Buy Company, Inc. | | 3,490 | | 130,875 |
| Omnicom Group, Inc. | | 3,339 | | 128,752 |
| Ford Motor Co.* | | 23,610 | | 122,772 |
| Starbucks Corp.* | | 7,581 | | 112,729 |
| McGraw-Hill Companies, Inc. | | 105,166 |
| Harley-Davidson, Inc. | | 2,472 | | 92,206 |
| Fortune Brands, Inc. | | 1,550 | | 88,908 |
| Bed Bath & Beyond, Inc.* | | 85,310 |
| Marriott International, Inc. — |
| H&R Block, Inc. | | 3,452 | | 78,533 |
| J.C. Penney Company, Inc. | | 76,615 |
| Genuine Parts Co. | | 1,670 | | 67,151 |
| Apollo Group, Inc. — Class A* | | 66,297 |
| Sherwin-Williams Co. | | 1,020 | | 58,303 |
| GameStop Corp. — Class A* | | 57,815 |
| General Motors Corp. | | 5,855 | | 55,330 |
| Sears Holdings Corp.* | | 590 | | 55,165 |
| International Game Technology, |
3,554
9,970
1,280
7,700
3,499
5,070
1,440
3,290
1,788
1,800
1,282
1,525
2,189
1,610
30,266
3,327
2,716
2,298
1,118
1,690
| Total Consumer Discretionary |
| SCHEDULE OF INVESTMENTS (Unaudited) (continued) |
| THE RYDEX SERIES FUNDS SEMI-ANNUAL REPORT |
| See Notes to Financial Statements. | | | | | 31 |
| Starwood Hotels & Resorts | | American Electric Power Co., |
| | Worldwide, Inc. | | 1,930 | | $ | | 54,310 | | Inc. | | 4,200 | | $ | | 155,526 |
| AutoZone, Inc.* | | 435 | | 53,653 | | PPL Corp. | | 3,900 | | 144,378 |
| Limited Brands, Inc. | | 2,950 | | 51,094 | | PG&E Corp. | | 3,748 | | 140,363 |
| Newell Rubbermaid, Inc. | | 2,870 | | 49,536 | | Edison International | | 3,390 | | 135,261 |
| Nordstrom, Inc. | | 1,650 | | 47,553 | | Sempra Energy | | 2,567 | | 129,557 |
| Eastman Kodak Co. | | 2,980 | | 45,832 | | Consolidated Edison, Inc. | | 123,037 |
| Tiffany & Co. | | 1,280 | | 45,466 | | Progress Energy, Inc. | | 2,744 | | 118,349 |
| Hasbro, Inc. | | 1,300 | | 45,136 | | Xcel Energy, Inc. | | 4,672 | | 93,393 |
| Darden Restaurants, Inc. | | 1,464 | | 41,914 | | Ameren Corp. | | 2,205 | | 86,061 |
| Gannett Co., Inc. | | 2,389 | | 40,398 | | AES Corp.* | | 7,058 | | 82,508 |
| Polo Ralph Lauren Corp. | | 600 | | 39,984 | | Questar Corp. | | 1,819 | | 74,434 |
| Goodyear Tire & Rubber Co.* | | 38,811 | | DTE Energy Co. | | 1,714 | | 68,766 |
| Interpublic Group of Companies, | | Allegheny Energy, Inc. | | 1,759 | | 64,678 |
| | Inc.* | | 4,930 | | 38,208 | | CenterPoint Energy, Inc. | | 3,582 | | 52,190 |
| D.R. Horton, Inc. | | 2,897 | | 37,719 | | Pepco Holdings, Inc. | | 2,122 | | 48,615 |
| Black & Decker Corp. | | 620 | | 37,665 | | Constellation Energy Group, Inc. | | 45,392 |
| Leggett & Platt, Inc. | | 1,686 | | 36,738 | | NiSource, Inc. | | 2,884 | | 42,568 |
| Abercrombie & Fitch Co. — | | Integrys Energy Group, Inc. | | 40,401 |
| | Class A | | 910 | | 35,900 | | Pinnacle West Capital Corp. | | 36,371 |
| Family Dollar Stores, Inc. | 1,440 | | 34,128 | | TECO Energy, Inc. | | 2,235 | | 35,157 |
| Stanley Works | | 816 | | 34,060 | | CMS Energy Corp. | | 2,360 | | 29,429 |
| Scripps Networks Interactive, | | Nicor, Inc. | | 470 | | 20,845 |
| | Inc. — Class A | | 930 | | 33,768 | | Dynegy Inc.* | | 5,285 | | 18,920 |
| Washington Post Co. — Class B | | 33,406 |
| Expedia, Inc.* | | 2,171 | | 32,804 |
| Pulte Homes, Inc. | | 2,210 | | 30,874 |
| Wyndham Worldwide Corp. | | 28,906 |
| RadioShack Corp. | | 1,360 | | 23,501 |
| Lennar Corp. — Class A | | 1,489 | | 22,618 |
| Harman International Industries, |
| New York Times Co. — Class A | | 17,405 |
| Office Depot, Inc.* | | 2,838 | | 16,517 |
| Liz Claiborne, Inc. | | 996 | | 16,364 |
| Jones Apparel Group, Inc. | | 16,289 |
| AutoNation, Inc.* | | 1,115 | | 12,533 |
| Dillard’s, Inc. — Class A | | 600 | | 7,080 |
| | Sigma-Aldrich Corp. | | 1,328 | | 69,614 |
| Exelon Corp. | | 6,833 | | 427,883 | | CF Industries Holdings, Inc. | | 54,602 |
| Southern Co. | | 8,035 | | 302,839 | | Eastman Chemical Co. | | 808 | | 44,489 |
| Dominion Resources, Inc. | | 258,348 | | MeadWestvaco Corp. | | 1,798 | | 41,911 |
| Duke Energy Corp. | | 13,216 | | 230,355 | | Ball Corp. | | 1,010 | | 39,885 |
| FPL Group, Inc. | | 4,250 | | 213,775 | | Sealed Air Corp. | | 1,666 | | 36,635 |
| FirstEnergy Corp. | | 3,165 | | 212,023 | | Pactiv Corp.* | | 1,379 | | 34,241 |
| Entergy Corp. | | 1,994 | | 177,486 | | International Flavors & Fragrances, |
| Public Service Enterprise Group, | | Inc. | | 828 | | 32,673 |
| | Inc. | | 5,291 | | 173,492 | | Allegheny Technologies, Inc. | | 31,234 |
| E.I. du Pont de Nemours and |
| Dow Chemical Co. | | 9,698 | | 308,202 |
| Praxair, Inc. | | 3,302 | | 236,886 |
| Freeport-McMoRan Copper & |
| Newmont Mining Corp. | | 4,802 | | 186,126 |
| Air Products & Chemicals, Inc. | | 151,911 |
| Weyerhaeuser Co. | | 2,220 | | 134,488 |
| International Paper Co. | | 4,497 | | 117,731 |
| PPG Industries, Inc. | | 1,724 | | 100,544 |
| United States Steel Corp. | | 95,926 |
| Rohm & Haas Co. | | 1,305 | | 91,350 |
| Vulcan Materials Co. | | 1,156 | | 86,122 |
2,864
2,535
1,868
809
1,057
60
1,840
1,218
880
597
6,039
1,057
2,218
1,236
SCHEDULE OF INVESTMENTS (Unaudited) (concluded)
September 30, 2008
S&P 500 FUND
MARKET
UNREALIZED
SHARES
VALUE
CONTRACTS
LOSS
AK Steel Holding Corp.
1,178
$
30,534
FUTURES CONTRACTS PURCHASED
Bemis Co.
1,040
27,258
December 2008 S&P 500 Index
Hercules, Inc.
1,179
23,332
Mini Futures Contracts
Ashland, Inc.
600
17,544
(Aggregate Market Value
Titanium Metals Corp.
900
10,206
of Contracts $42,431,063)
723
$
(1,220,494)
Total Materials
3,597,849
TELECOMMUNICATION SERVICES 2.1%
AT&T, Inc.
60,940
1,701,445
Verizon Communications, Inc.
29,450
945,050
Sprint Nextel Corp.
29,522
180,084
American Tower Corp. —
Class A*
4,070
146,398
Embarq Corp.
1,470
59,608
Windstream Corp.
4,550
49,777
Qwest Communications
International, Inc.
15,350
49,581
CenturyTel, Inc.
1,060
38,849
Frontier Communications Corp.
3,270
37,605
Total Telecommunication Services
3,208,397
Total Common Stocks
(Cost $110,499,279)
105,751,162
SECURITIES LENDING COLLATERAL 0.0%
Mount Vernon Securities
Lending Trust Prime
Portfolio (Note 9)
41,536
41,536
Total Securities Lending Collateral
(Cost $41,536)
41,536
FACE
AMOUNT
REPURCHASE AGREEMENTS 25.8%
Repurchase Agreements (Note 5)
Morgan Stanley
issued 09/30/08 at 0.05%
due 10/01/08
$16,081,914
16,081,914
Mizuho Financial Group, Inc.
issued 09/30/08 at 0.26%
due 10/01/08
13,321,043
13,321,043
Morgan Stanley
issued 09/30/08 at 0.10%
due 10/01/08
9,430,827
9,430,827
Total Repurchase Agreements
(Cost $38,833,784)
38,833,784
Total Investments 96.0%
(Cost $149,374,599)
$144,626,482
Other Assets in Excess
of Liabilities – 4.0%
$
6,037,923
Net Assets – 100.0%
$150,664,405
* Non-Income Producing Security.
† All or a portion of this security is on loan at September 30, 2008 — See Note 9.
REIT — Real Estate Investment Trust.
32
|
THE RYDEX SERIES FUNDS SEMI-ANNUAL REPORT
See Notes to Financial Statements.
SCHEDULE OF INVESTMENTS (Unaudited)
September 30, 2008
INVERSE S&P 500 STRATEGY FUND
FACE
MARKET
AMOUNT
VALUE
FEDERAL AGENCY DISCOUNT NOTES 61.5%
Federal Home Loan Bank*
2.50% due 10/10/08
$25,000,000
$
24,984,375
2.37% due 10/27/08
25,000,000
24,957,208
2.55% due 12/19/08
25,000,000
24,860,104
3.00% due 12/15/08
25,000,000
24,845,526
2.32% due 01/08/09
25,000,000
24,840,500
3.10% due 01/12/09
25,000,000
24,776,211
Freddie Mac*
2.85% due 01/26/09
50,000,000
49,536,875
Total Federal Agency Discount Notes
(Cost $198,800,799)
198,800,799
REPURCHASE AGREEMENTS 34.8%
Repurchase Agreements (Note 5)
Morgan Stanley
issued 09/30/08 at 0.05%
due 10/01/08
46,545,220
46,545,220
Mizuho Financial Group, Inc.
issued 09/30/08 at 0.26%
due 10/01/08
38,554,545
38,554,545
Morgan Stanley
issued 09/30/08 at 0.10%
due 10/01/08
27,295,253
27,295,253
Total Repurchase Agreements
(Cost $112,395,018)
112,395,018
Total Investments 96.3%
(Cost $311,195,817)
$311,195,817
Other Assets in Excess
of Liabilities – 3.7%
$
12,021,489
Net Assets – 100.0%
$323,217,306
UNREALIZED
CONTRACTS
GAIN
FUTURES CONTRACTS SOLD SHORT
December 2008 S&P 500 Index
Mini Futures Contracts
(Aggregate Market Value
of Contracts $319,377,375)
5,442
$
8,530,334
* The issuer is a publicly traded company that operates under a Congressional charter; its securities are neither issued nor guaranteed by the
U.S. Government.
See Notes to Financial Statements.
THE RYDEX SERIES FUNDS SEMI-ANNUAL REPORT
|
33
| COMMON STOCKS 96.6% | | HEALTH CARE 16.2% |
| INFORMATION TECHNOLOGY 59.7% |
| | CONSUMER DISCRETIONARY 12.7% |
| | Total Consumer Discretionary |
| Total Information Technology |
| SCHEDULE OF INVESTMENTS (Unaudited) |
| THE RYDEX SERIES FUNDS SEMI-ANNUAL REPORT |
| 34 | | | | | See Notes to Financial Statements. |
| | Gilead Sciences, Inc.* | | 351,850 | | $ |
| | Amgen, Inc.* | | 191,530 | | 11,351,983 |
| Apple, Inc.* | | 479,890 | | $ | | Teva Pharmaceutical Industries |
| Qualcomm, Inc. | | 768,656 | | 33,029,148 | | Ltd. — SP ADR† | | 244,490 | | 11,195,197 |
| Microsoft Corp. | | 1,220,430 | | 32,573,277 | | Celgene Corp.* | | 175,167 | | 11,084,568 |
| Google, Inc. — Class A* | | 22,630,581 | | Genzyme Corp.* | | 130,810 | | 10,581,221 |
| Cisco Systems, Inc.* | | 819,660 | | 18,491,530 | | Express Scripts, Inc.* | | 85,470 | | 6,309,395 |
| Oracle Corp.* | | 835,950 | | 16,978,144 | | Biogen Idec, Inc.* | | 122,540 | | 6,162,537 |
| Research In Motion Ltd.* | | 14,981,537 | | Intuitive Surgical, Inc.* | | 15,070 | | 3,631,569 |
| Intel Corp. | | 764,600 | | 14,320,958 | | DENTSPLY International, Inc. | | 2,080,842 |
| eBay, Inc.* | | 376,721 | | 8,431,016 | | Vertex Pharmaceuticals, Inc.* | | 2,029,634 |
| Adobe Systems, Inc.* | | 201,910 | | 7,969,388 | | Hologic, Inc.* | | 104,650 | | 2,022,885 |
| Activision Blizzard, Inc.* | | 7,055,213 | | Cephalon, Inc.*† | | 25,720 | | 1,993,043 |
| Symantec Corp.* | | 340,770 | | 6,672,277 | | Henry Schein, Inc.* | | 34,610 | | 1,863,402 |
| Intuit, Inc.*† | | 157,050 | | 4,964,350 | | Patterson Companies, Inc.* | | 1,375,444 |
| Electronic Arts, Inc.*† | | 124,830 | | 4,617,462 | | Amylin Pharmaceuticals, Inc.* | | 1,038,701 |
| Dell, Inc.* | | 279,810 | | 4,611,269 |
| Yahoo!, Inc.* | | 258,732 | | 4,476,064 |
| Paychex, Inc. | | 133,010 | | 4,393,320 |
| Applied Materials, Inc. | | 269,480 | | 4,077,232 |
| Fiserv, Inc.* | | 79,690 | | 3,770,931 |
| Linear Technology Corp.† | | 3,525,471 |
| Altera Corp. | | 164,320 | | 3,398,138 |
| Xilinx, Inc.† | | 142,440 | | 3,340,218 |
| Autodesk, Inc.*† | | 91,030 | | 3,054,056 |
| Juniper Networks, Inc.* | | 2,923,231 |
| Broadcom Corp. — Class A* | | 2,907,211 |
| KLA-Tencor Corp.† | | 81,530 | | 2,580,424 |
| Baidu.com - SP ADR* | | 10,250 | | 2,544,357 |
| Cognizant Technology Solutions |
| | Corp. — Class A* | | 110,380 | | 2,519,975 |
| Flextronics International Ltd.* | | 2,500,019 |
| NetApp, Inc.* | | 132,960 | | 2,423,861 |
| Nvidia Corp.* | | 212,270 | | 2,273,412 |
| Flir Systems, Inc.* | | 56,580 | | 2,173,804 |
| Citrix Systems, Inc.* | | 84,162 | | 2,125,932 |
| Marvell Technology Group Ltd.* | | 2,082,270 |
| | Technologies Ltd.*† | | 82,210 | | 1,869,455 |
| VeriSign, Inc.* | | 70,750 | | 1,845,160 |
| Microchip Technology, Inc. | | 1,749,702 |
| Lam Research Corp.* | | 50,310 | | 1,584,262 |
| Logitech International SA*† | | 1,580,396 |
| SanDisk Corp.* | | 80,178 | | 1,567,480 |
| Infosys Technologies Ltd. — |
| Akamai Technologies, Inc.* | | 1,097,674 |
| IAC/InterActiveCorp* | | 56,360 | | 975,028 |
| Sun Microsystems, Inc.* | | 966,788 |
| Cadence Design Systems, Inc.* | | 715,952 |
| Comcast Corp. — Class A | | 10,991,819 |
| DIRECTV Group, Inc.* | | 313,940 | | 8,215,810 |
| Amazon.com, Inc.* | | 109,830 | | 7,991,231 |
| Starbucks Corp.* | | 394,530 | | 5,866,661 |
| Sears Holdings Corp.*† | | 51,350 | | 4,801,225 |
| Bed Bath & Beyond, Inc.* | | 4,272,074 |
| Staples, Inc. | | 185,500 | | 4,173,750 |
| Apollo Group, Inc. — Class A*† | | 3,690,832 |
| Wynn Resorts Ltd.† | | 43,930 | | 3,586,445 |
| Liberty Media Corp - Interactive* | 2,728,270 |
| Garmin Ltd.*† | | 74,670 | | 2,534,300 |
| Liberty Global, Inc. — Class A*† | 1,847,694 |
| DISH Network Corp. — Class A* | 1,781,220 |
| Expedia, Inc.* | | 109,471 | | 1,654,107 |
| Petsmart, Inc. | | 48,720 | | 1,203,871 |
| Virgin Media, Inc.† | | 138,990 | | 1,098,021 |
| Sirius XM Radio, Inc.* | | 761,503 |
| Discovery Communications, |
| | Inc. — Class A* | | 46,220 | | 658,635 |
| Paccar, Inc. | | 158,180 | | 6,040,894 |
| CH Robinson Worldwide, Inc.† | | 3,323,509 |
| Expeditors International of |
| | Washington, Inc. | | 81,240 | | 2,830,402 |
| Fastenal Co. | | 55,150 | | 2,723,859 |
| Foster Wheeler Ltd.* | | 58,520 | | 2,113,157 |
| Cintas Corp. | | 71,680 | | 2,057,933 |
| Stericycle, Inc.*† | | 34,850 | | 2,053,014 |
| Joy Global, Inc. | | 41,110 | | 1,855,705 |
16,037,323
54,544,297
56,503
219,349
55,430
61,060
457,240
45,230
51,370
114,986
138,739
156,050
353,110
223,900
59,453
67,770
62,940
127,209
105,910
559,950
136,010
62,240
211,330
60,980
84,820
1,335,970
65,218
SCHEDULE OF INVESTMENTS (Unaudited) (concluded)
September 30, 2008
NASDAQ-100® FUND
MARKET
MARKET
SHARES
VALUE
VALUE
Ryanair Holdings PLC —
Total Investments 105.4%
SP ADR*†
45,160
$
1,012,939
(Cost $390,261,545)
$579,326,074
Monster Worldwide, Inc.*
49,140
732,677
Liabilities in Excess of
Total Industrials
24,744,089
Other Assets – (5.4)%
$ (29,483,978)
CONSUMER STAPLES 1.4%
Net Assets – 100.0%
$549,842,096
Costco Wholesale Corp.
88,940
5,774,874
Hansen Natural Corp.*
35,480
1,073,270
UNREALIZED
CONTRACTS
LOSS
Whole Foods Market, Inc.†
53,430
1,070,203
Total Consumer Staples
7,918,347
FUTURES CONTRACTS PURCHASED
December 2008 NASDAQ-100 Index
TELECOMMUNICATION SERVICES 1.4%
Mini Futures Contracts
Millicom International Cellular
(Aggregate Market Value
SA†
40,660
2,792,122
of Contracts $19,605,420)
612
$
(733,121)
NII Holdings, Inc. — Class B*
62,540
2,371,517
Level 3 Communications, Inc.*
590,110
1,593,297
Leap Wireless International,
Inc. — Class B*
26,700
1,017,270
Total Telecommunication Services
7,774,206
MATERIALS 0.7%
Sigma-Aldrich Corp.
46,990
2,463,216
Steel Dynamics, Inc.
80,300
1,372,327
Total Materials
3,835,543
Total Common Stocks
(Cost $342,157,794)
531,222,323
SECURITIES LENDING COLLATERAL 5.4%
Mount Vernon Securities
Lending Trust Prime
Portfolio (Note 9)
29,320,434
29,320,434
Total Securities Lending Collateral
(Cost $29,320,434)
29,320,434
FACE
AMOUNT
REPURCHASE AGREEMENTS 3.4%
Repurchase Agreements (Note 5)
Morgan Stanley
issued 09/30/08 at 0.05%
due 10/01/08
$7,778,580
7,778,580
Mizuho Financial Group, Inc.
issued 09/30/08 at 0.26%
due 10/01/08
6,443,188
6,443,188
Morgan Stanley
issued 09/30/08 at 0.10%
due 10/01/08
4,561,549
4,561,549
Total Repurchase Agreements
(Cost $18,783,317)
18,783,317
* Non-Income Producing Security.
† All or a portion of this security is on loan at September 30, 2008 — See Note 9.
ADR — American Depository Receipt.
See Notes to Financial Statements.
THE RYDEX SERIES FUNDS SEMI-ANNUAL REPORT
|
35
SCHEDULE OF INVESTMENTS (Unaudited)
September 30, 2008
INVERSE NASDAQ-100® STRATEGY FUND
FACE
MARKET
AMOUNT
VALUE
REPURCHASE AGREEMENTS 97.0%
Repurchase Agreements (Note 5)
Morgan Stanley
issued 09/30/08 at 0.05%
due 10/01/08
$27,818,821
$27,818,821
Mizuho Financial Group, Inc.
issued 09/30/08 at 0.26%
due 10/01/08
23,043,011
23,043,011
Morgan Stanley
issued 09/30/08 at 0.10%
due 10/01/08
16,313,636
16,313,636
Total Repurchase Agreements
(Cost $67,175,468)
67,175,468
Total Investments 97.0%
(Cost $67,175,468)
$67,175,468
Other Assets in Excess
of Liabilities – 3.0%
$
2,046,115
Net Assets – 100.0%
$69,221,583
UNREALIZED
CONTRACTS
GAIN
FUTURES CONTRACTS SOLD SHORT
December 2008 NASDAQ-100 Index
Mini Futures Contracts
(Aggregate Market Value of
Contracts $69,131,530)
2,158
$
3,716,816
36
|
THE RYDEX SERIES FUNDS SEMI-ANNUAL REPORT
See Notes to Financial Statements.
| MID-CAP 1.5x STRATEGY FUND |
| SCHEDULE OF INVESTMENTS (Unaudited) |
| THE RYDEX SERIES FUNDS SEMI-ANNUAL REPORT |
| See Notes to Financial Statements. | | | | | 37 |
| | Hospitality Properties Trust | | $ | | 30,780 |
| | BancorpSouth, Inc. | | 1,090 | | 30,662 |
| | SVB Financial Group* | | 520 | | 30,118 |
| New York Community Bancorp, Inc. | $ | | 92,512 | | First Niagara Financial Group, Inc. | | 29,453 |
| Health Care REIT, Inc. | | 1,630 | | 86,765 | | Potlatch Corp. | | 630 | | 29,226 |
| Everest Re Group Ltd. | | 990 | | 85,665 | | Jones Lang LaSalle, Inc. | | 650 | | 28,262 |
| Federal Realty Investment Trust | | 80,464 | | FirstMerit Corp. | | 1,290 | | 27,090 |
| Macerich Co. | | 1,190 | | 75,743 | | Astoria Financial Corp. | | 1,290 | | 26,742 |
| Regency Centers Corp. | | 1,120 | | 74,693 | | Westamerica Bancorporation | | 26,464 |
| AMB Property Corp. | | 1,570 | | 71,121 | | Washington Federal, Inc. | | 26,015 |
| Eaton Vance Corp. | | 1,860 | | 65,528 | | Colonial BancGroup, Inc. | | 25,466 |
| Rayonier, Inc. | | 1,264 | | 59,850 | | Webster Financial Corp. | | 840 | | 21,210 |
| Duke Realty Corp. | | 2,350 | | 57,763 | | Unitrin, Inc. | | 790 | | 19,703 |
| Alexandria Real Estate Equities, Inc. | 57,375 | | AmeriCredit Corp.* | | 1,860 | | 18,842 |
| Cullen/Frost Bankers, Inc. | | 950 | | 57,000 | | Cathay General Bancorp | | 790 | | 18,802 |
| Liberty Property Trust | | 1,490 | | 56,098 | | Cousins Properties, Inc. | | 690 | | 17,409 |
| Nationwide Health Properties, | | PacWest Bancorp | | 390 | | 11,150 |
| | Inc. | | 1,550 | | 55,769 | | Equity One, Inc. | | 510 | | 10,450 |
| Philadelphia Consolidated Holding | | Horace Mann Educators Corp. | | 8,108 |
| | Corp.* | | 930 | | 54,470 | | The PMI Group, Inc. | | 1,110 | | 3,275 |
| Affiliated Managers Group, Inc.* | | 53,852 |
| W.R. Berkley Corp. | | 2,240 | | 52,752 |
| Raymond James Financial, Inc. | | 50,789 |
| Fidelity National Financial, Inc. — |
| HCC Insurance Holdings, Inc. | | 49,680 |
| Essex Property Trust, Inc. | | 410 | | 48,515 |
| SEI Investments Co. | | 2,150 | | 47,730 |
| Old Republic International Corp. | | 47,175 |
| Synovus Financial Corp. | | 4,500 | | 46,575 |
| Commerce Bancshares, Inc. | | 46,400 |
| First American Corp. | | 1,480 | | 43,660 |
| Jefferies Group, Inc. | | 1,920 | | 43,008 |
| Weingarten Realty Investors | | 42,447 |
| Realty Income Corp. | | 1,620 | | 41,472 |
| Bank of Hawaii Corp. | | 770 | | 41,156 |
| Associated Banc-Corp. | | 2,040 | | 40,698 |
| Stancorp Financial Group, Inc. | | 40,560 |
| BRE Properties, Inc. — Class A | | 40,180 |
| Brown & Brown, Inc. | | 1,850 | | 39,997 |
| Camden Property Trust | | 850 | | 38,981 |
| Apollo Investment Corp. | | 2,280 | | 38,874 |
| Arthur J. Gallagher & Co. | | 38,233 |
| Hanover Insurance Group, Inc. | | 36,871 |
| Highwoods Properties, Inc. | | 35,916 |
| Mack-Cali Realty Corp. | | 1,050 | | 35,564 |
| American Financial Group, Inc. | | 35,400 |
| City National Corp. | | 640 | | 34,752 |
| Waddell & Reed Financial, Inc. — |
| TCF Financial Corp. | | 1,850 | | 33,300 |
| Protective Life Corp. | | 1,120 | | 31,931 |
| Mercury General Corp. | | 570 | | 31,208 |
| Wilmington Trust Corp. | | 1,080 | | 31,136 |
| Dun & Bradstreet Corp. | | 870 | | 82,093 |
| Roper Industries, Inc. | | 1,440 | | 82,022 |
| Stericycle, Inc.* | | 1,370 | | 80,707 |
| Joy Global, Inc. | | 1,730 | | 78,092 |
| Quanta Services, Inc.* | | 2,810 | | 75,898 |
| Republic Services, Inc. | | 2,480 | | 74,350 |
| Kansas City Southern* | | 1,450 | | 64,322 |
| Manpower, Inc. | | 1,270 | | 54,813 |
| Donaldson Co., Inc. | | 1,260 | | 52,807 |
| DRS Technologies, Inc. | | 660 | | 50,655 |
| Corrections Corporation of |
| Alliant Techsystems, Inc.* | | 530 | | 49,788 |
| Lincoln Electric Holdings, Inc. | | 43,731 |
| J.B. Hunt Transport Services, Inc. | | 43,715 |
| Shaw Group, Inc.* | | 1,340 | | 41,178 |
| Thomas & Betts Corp.* | | 920 | | 35,944 |
1,500
5,510
1,870
940
460
1,410
3,240
510
630
650
1,540
1,840
3,700
1,000
1,190
780
820
1,490
810
1,010
1,200
680
1,310
| CONSUMER DISCRETIONARY 11.6% |
| MID-CAP 1.5x STRATEGY FUND |
| SCHEDULE OF INVESTMENTS (Unaudited) (continued) |
| THE RYDEX SERIES FUNDS SEMI-ANNUAL REPORT |
| 38 | | | | | See Notes to Financial Statements. |
| Trinity Industries, Inc. | | 1,310 | | $ | | 33,706 | | Lamar Advertising Co. — Class A* | $ | | 37,686 |
| Kennametal, Inc. | | 1,230 | | 33,358 | | Service Corporation International | | 34,443 |
| MSC Industrial Direct Co. — | | Aeropostale, Inc.* | | 1,070 | | 34,358 |
| | Class A | | 720 | | 33,170 | | Guess?, Inc. | | 960 | | 33,398 |
| Con-way, Inc. | | 730 | | 32,200 | | The Warnaco Group, Inc.* | 730 | | 33,062 |
| Hubbell, Inc. — Class B | | 900 | | 31,545 | | Hanesbrands, Inc.* | | 1,500 | | 32,625 |
| GATX Corp. | | 780 | | 30,865 | | Gentex Corp. | | 2,270 | | 32,461 |
| Carlisle Companies, Inc. | | 980 | | 29,371 | | Phillips-Van Heusen Corp. | | 820 | | 31,086 |
| Alexander & Baldwin, Inc. | | 660 | | 29,060 | | Chipotle Mexican Grill, Inc. — |
| Nordson Corp. | | 550 | | 27,011 | | Class A* | | 530 | | 29,410 |
| BE Aerospace, Inc.* | | 1,590 | | 25,170 | | Brinker International, Inc. | | 28,982 |
| Crane Co. | | 780 | | 23,174 | | John Wiley & Sons, Inc. — Class A | 27,910 |
| Herman Miller, Inc. | | 890 | | 21,778 | | Tupperware Brands Corp. | | 990 | | 27,354 |
| Granite Construction, Inc. | | 520 | | 18,626 | | Marvel Entertainment, Inc.* | | 26,971 |
| Mine Safety Appliances Co. | | 18,298 | | Dick’s Sporting Goods, Inc.* | | 26,629 |
| HNI Corp.† | | 710 | | 17,991 | | Matthews International Corp. — |
| Corporate Executive Board Co. | | 17,188 | | Class A | | 490 | | 24,863 |
| Oshkosh Corp. | | 1,190 | | 15,660 | | Scientific Games Corp. — Class A* | 23,941 |
| Werner Enterprises, Inc. | | 680 | | 14,763 | | Rent-A-Center, Inc.* | | 1,070 | | 23,840 |
| Navigant Consulting, Inc.* | 740 | | 14,719 | | J. Crew Group, Inc.* | | 830 | | 23,713 |
| JetBlue Airways Corp.* | | 2,930 | | 14,504 | | Williams-Sonoma, Inc. | | 1,390 | | 22,490 |
| United Rentals, Inc.* | | 950 | | 14,478 | | Sotheby’s | | 1,080 | | 21,665 |
| Korn/Ferry International, Inc.* | | 13,365 | | M.D.C. Holdings, Inc. | | 590 | | 21,588 |
| Rollins, Inc. | | 660 | | 12,527 | | Netflix, Inc.* | | 690 | | 21,307 |
| Deluxe Corp. | | 820 | | 11,800 | | Saks, Inc.* | | 2,270 | | 20,997 |
| Alaska Air Group, Inc.* | | 570 | | 11,622 | | Corinthian Colleges, Inc.* | | 20,550 |
| YRC Worldwide, Inc.*† | | 920 | | 11,003 | | Career Education Corp.* | | 19,293 |
| Federal Signal Corp. | | 760 | | 10,412 | | Regis Corp. | | 690 | | 18,975 |
| Avis Budget Group, Inc.* | | 9,299 | | AnnTaylor Stores Corp.* | | 910 | | 18,782 |
| Kelly Services, Inc. — Class A | | 8,192 | | Collective Brands, Inc.* | | 1,020 | | 18,676 |
| AirTran Holdings, Inc.* | | 1,880 | | 4,568 | | Under Armour, Inc.* | | 580 | | 18,421 |
| | Ryland Group, Inc. | | 680 | | 18,034 |
| | Life Time Fitness, Inc.*† | | 560 | | 17,511 |
| | International Speedway Corp. — |
| | Chico’s FAS, Inc.* | | 2,830 | | 15,480 |
| | ArvinMeritor, Inc. | | 1,180 | | 15,387 |
| | Cheesecake Factory, Inc.* | | 15,205 |
| | Barnes & Noble, Inc.† | | 580 | | 15,126 |
| | Callaway Golf Co. | | 1,040 | | 14,633 |
| | Thor Industries, Inc. | | 570 | | 14,147 |
| | Bob Evans Farms, Inc. | | 490 | | 13,372 |
| | Timberland Co. — Class A* | | 13,201 |
| | American Greetings Corp. — |
| | Scholastic Corp. | | 420 | | 10,786 |
| | Charming Shoppes, Inc.* | | 8,900 |
| | Boyd Gaming Corp. | | 910 | | 8,518 |
| | Belo Corp. — Class A | | 1,410 | | 8,404 |
| | 99 Cents Only Stores* | | 750 | | 8,228 |
| | Modine Manufacturing Co. | | 7,530 |
| | Pacific Sunwear of California, Inc.* | | 7,067 |
| | Furniture Brands International, Inc. | | 6,943 |
| | Valassis Communications, Inc.* | | 6,668 |
| Ross Stores, Inc. | | 2,110 | | 77,669 |
| BorgWarner, Inc. | | 1,860 | | 60,952 |
| Advance Auto Parts, Inc. | 1,530 | | 60,680 |
| Mohawk Industries, Inc.* | | 890 | | 59,977 |
| Urban Outfitters, Inc.* | | 1,820 | | 58,003 |
| O’Reilly Automotive, Inc.* | | 57,555 |
| Dollar Tree, Inc.* | | 1,450 | | 52,722 |
| Toll Brothers, Inc.* | | 2,080 | | 52,478 |
| American Eagle Outfitters, Inc. | | 50,325 |
| Petsmart, Inc. | | 2,030 | | 50,161 |
| Strayer Education, Inc. | | 220 | | 44,057 |
| priceline.com, Inc.* | | 620 | | 42,427 |
| DreamWorks Animation SKG, |
| | Inc. — Class A* | | 1,290 | | 40,570 |
| ITT Educational Services, Inc.* | | 40,455 |
| Foot Locker, Inc. | | 2,480 | | 40,077 |
| Wendy’s/Arby’s Group, Inc. — |
1,220
4,120
1,620
690
790
480
1,360
550
1,040
750
1,370
1,180
1,620
430
1,040
760
1,820
520
1,050
660
770
2,150
3,300
500
| Total Consumer Discretionary |
| INFORMATION TECHNOLOGY 11.2% |
| | Total Information Technology |
| MID-CAP 1.5x STRATEGY FUND |
| SCHEDULE OF INVESTMENTS (Unaudited) (continued) |
| THE RYDEX SERIES FUNDS SEMI-ANNUAL REPORT |
| See Notes to Financial Statements. | | | | | 39 |
| Hovnanian Enterprises, Inc. — | | Fairchild Semiconductor |
| | Class A* | | 810 | | $ | | 6,472 | | International, Inc.* | | 2,000 | | $ | | 17,780 |
| Borders Group, Inc. | | 970 | | 6,363 | | Plantronics, Inc. | | 780 | | 17,566 |
| Harte-Hanks, Inc. | | 610 | | 6,326 | | ADTRAN, Inc. | | 890 | | 17,346 |
| Media General, Inc. | | 370 | | 4,599 | | Mentor Graphics Corp.* | | 1,480 | | 16,798 |
| Coldwater Creek, Inc.* | | 760 | | 4,400 | | ADC Telecommunications, Inc.* | | 15,971 |
| Blyth, Inc. | | 380 | | 4,309 | | SRA International, Inc. — Class A* | | 15,388 |
| Entercom Communications Corp. | | 2,209 | | 3Com Corp.* | | 6,500 | | 15,145 |
| | MPS Group, Inc.* | | 1,490 | | 15,019 |
| | ValueClick, Inc.* | | 1,390 | | 14,220 |
| | RF Micro Devices, Inc.* | | 4,190 | | 12,235 |
| | Wind River Systems, Inc.* | | 11,100 |
| | ACI Worldwide, Inc.* | | 550 | | 9,636 |
| | Advent Software, Inc.* | | 260 | | 9,160 |
| | Dycom Industries, Inc.* | | 630 | | 8,203 |
| Trimble Navigation Ltd.* | | 1,930 | | 49,910 |
| Synopsys, Inc.* | | 2,310 | | 46,084 | | DENTSPLY International, Inc. | | 89,345 |
| Foundry Networks, Inc.* | | 2,360 | | 42,976 | | Covance, Inc.* | | 1,010 | | 89,294 |
| Ingram Micro, Inc. — Class A* | | 42,746 | | Cephalon, Inc.* | | 1,090 | | 84,464 |
| Lender Processing Services, Inc. | | 40,897 | | Hologic, Inc.* | | 4,110 | | 79,446 |
| Sybase, Inc.* | | 1,290 | | 39,500 | | Pharmaceutical Product |
| CommScope, Inc.* | | 1,130 | | 39,143 | | Development, Inc. | | 1,910 | | 78,979 |
| DST Systems, Inc.* | | 680 | | 38,073 | | Vertex Pharmaceuticals, Inc.* | | 78,446 |
| FactSet Research Systems Inc. | | 35,530 | | Henry Schein, Inc.* | | 1,430 | | 76,991 |
| Diebold, Inc. | | 1,050 | | 34,765 | | Beckman Coulter, Inc. | | 990 | | 70,280 |
| Broadridge Financial Solutions, Inc. | 34,628 | | Charles River Laboratories |
| Parametric Technology Corp.* | | 34,040 | | International, Inc.* | | 1,090 | | 60,528 |
| Intersil Corp. — Class A | | 1,980 | | 32,828 | | Invitrogen Corp.* | | 1,470 | | 55,566 |
| Cree, Inc.* | | 1,410 | | 32,120 | | IDEXX Laboratories, Inc.* | | 950 | | 52,060 |
| Polycom, Inc.* | | 1,360 | | 31,457 | | ResMed, Inc.* | | 1,210 | | 52,030 |
| F5 Networks, Inc.* | | 1,290 | | 30,160 | | Edwards Lifesciences Corp.* | | 51,984 |
| Zebra Technologies Corp. — | | Cerner Corp.* | | 1,090 | | 48,658 |
| | Class A* | | 1,050 | | 29,243 | | Omnicare, Inc. | | 1,670 | | 48,046 |
| Cadence Design Systems, Inc.* | | 28,189 | | Perrigo Co. | | 1,240 | | 47,690 |
| Jack Henry & Associates, Inc. | | 28,055 | | Gen-Probe, Inc.* | | 870 | | 46,154 |
| Metavante Technologies, Inc.* | | 27,734 | | Universal Health Services, Inc. — |
| National Instruments Corp. | | 27,346 | | Class B | | 820 | | 45,945 |
| NeuStar, Inc.* | | 1,260 | | 25,061 | | Community Health Systems, Inc.* | | 45,137 |
| Atmel Corp.* | | 7,150 | | 24,239 | | Techne Corp.* | | 620 | | 44,714 |
| Tech Data Corp.* | | 810 | | 24,179 | | Health Net, Inc.* | | 1,720 | | 40,592 |
| Silicon Laboratories, Inc.* | | 770 | | 23,639 | | VCA Antech, Inc.* | | 1,350 | | 39,785 |
| International Rectifier Corp.* | | 22,253 | | Endo Pharmaceuticals Holdings, |
| Gartner, Inc. — Class A* | | 950 | | 21,546 | | Inc.* | | 1,920 | | 38,400 |
| Integrated Device Technology, Inc.* | 21,162 | | United Therapeutics Corp.* | | 37,861 |
| Macrovision Solutions Corp.* | | 20,609 | | Steris Corp. | | 950 | | 35,701 |
| Vishay Intertechnology, Inc.* | | 19,794 | | Lincare Holdings, Inc.* | | 1,180 | | 35,506 |
| Digital River, Inc.* | | 590 | | 19,116 | | Psychiatric Solutions, Inc.* | | 890 | | 33,776 |
| Fair Isaac Corp. | | 780 | | 17,979 | | Sepracor, Inc.* | | 1,740 | | 31,859 |
| Flir Systems, Inc.* | | 2,230 | | 85,677 |
| Western Digital Corp.* | | 3,550 | | 75,686 |
| Alliance Data Systems Corp.* | | 68,450 |
| Lam Research Corp.* | | 2,010 | | 63,295 |
| Global Payments, Inc. | | 1,280 | | 57,421 |
| Arrow Electronics, Inc.* | | 1,920 | | 50,342 |
1,890
680
440
1,110
2,380
2,660
1,340
2,360
680
2,250
1,850
900
4,170
1,380
1,440
910
1,540
1,170
2,720
360
1,340
2,990
1,080
| MID-CAP 1.5x STRATEGY FUND |
| SCHEDULE OF INVESTMENTS (Unaudited) (continued) |
| THE RYDEX SERIES FUNDS SEMI-ANNUAL REPORT |
| 40 | | | | | See Notes to Financial Statements. |
| Hill-Rom Holdings, Inc. | | 1,000 | | $ | | 30,310 | | Patterson-UTI Energy, Inc. | | $ | | 50,250 |
| Valeant Pharmaceuticals | | Oceaneering International, Inc.* | | 47,455 |
| | International* | | 1,410 | | 28,863 | | Tidewater, Inc. | | 820 | | 45,395 |
| LifePoint Hospitals, Inc.* | | 850 | | 27,319 | | Superior Energy Services* | | 40,171 |
| Kinetic Concepts, Inc.* | | 910 | | 26,017 | | Helix Energy Solutions Group, Inc.* | 35,692 |
| WellCare Health Plans, Inc.* | | 24,120 | | Quicksilver Resources, Inc.* | | 35,530 |
| Varian, Inc.* | | 470 | | 20,163 | | Encore Acquisition Co.* | | 850 | | 35,513 |
| PDL BioPharma, Inc. | | 1,910 | | 17,782 | | Exterran Holdings, Inc.* | | 1,050 | | 33,558 |
| Health Management Associates, | | Frontier Oil Corp. | | 1,660 | | 30,577 |
| | Inc. — Class A* | | 3,920 | | 16,307 | | Patriot Coal Corp.* | | 1,020 | | 29,631 |
| Advanced Medical Optics, Inc.* | | 14,757 | | Overseas Shipholding Group, Inc. | | 25,073 |
| Medicis Pharmaceutical Corp. — | | Bill Barrett Corp.* | | 590 | | 18,945 |
| Kindred Healthcare, Inc.* | | 480 | | 13,234 |
| Apria Healthcare Group, Inc.* | | 12,768 |
| Affymetrix, Inc.* | | 1,130 | | 8,746 |
| MDU Resources Group, Inc. | | 84,970 | | Steel Dynamics, Inc. | | 2,860 | | 48,877 |
| Wisconsin Energy Corp. | | 1,870 | | 83,963 | | Sonoco Products Co. | | 1,590 | | 47,191 |
| Equitable Resources, Inc. | | 77,028 | | Lubrizol Corp. | | 1,090 | | 47,023 |
| SCANA Corp. | | 1,870 | | 72,799 | | Albemarle Corp. | | 1,460 | | 45,026 |
| Northeast Utilities | | 2,490 | | 63,868 | | Terra Industries, Inc. | | 1,470 | | 43,218 |
| Oneok, Inc. | | 1,670 | | 57,448 | | AptarGroup, Inc. | | 1,090 | | 42,630 |
| NSTAR | | 1,710 | | 57,285 | | RPM International, Inc. | | 2,080 | | 40,227 |
| Alliant Energy Corp. | | 1,770 | | 57,012 | | Reliance Steel & Aluminum Co. | | 38,729 |
| Puget Energy, Inc. | | 2,080 | | 55,536 | | Packaging Corporation of |
| National Fuel Gas Co. | | 1,300 | | 54,834 | | America | | 1,660 | | 38,479 |
| Energen Corp. | | 1,150 | | 52,072 | | Greif, Inc. — Class A | | 550 | | 36,091 |
| OGE Energy Corp. | | 1,470 | | 45,394 | | Valspar Corp. | | 1,600 | | 35,664 |
| DPL, Inc. | | 1,820 | | 45,136 | | Cabot Corp. | | 1,030 | | 32,733 |
| Great Plains Energy, Inc. | | 1,900 | | 42,218 | | Commercial Metals Co. | | 1,840 | | 31,078 |
| Westar Energy, Inc. | | 1,730 | | 39,859 | | Cytec Industries, Inc. | | 760 | | 29,572 |
| Hawaiian Electric Industries, Inc. | | 39,299 | | Temple-Inland, Inc. | | 1,700 | | 25,942 |
| AGL Resources, Inc. | | 1,230 | | 38,597 | | Olin Corp. | | 1,200 | | 23,280 |
| Aqua America, Inc. | | 2,160 | | 38,405 | | Sensient Technologies Corp. | | 21,660 |
| Vectren Corp. | | 1,290 | | 35,927 | | Carpenter Technology Corp. | | 18,212 |
| Sierra Pacific Resources | | 3,750 | | 35,925 | | Minerals Technologies, Inc. | | 17,808 |
| WGL Holdings, Inc. | | 800 | | 25,960 | | Chemtura Corp. | | 3,880 | | 17,693 |
| IDACORP, Inc. | | 720 | | 20,945 | | Scotts Miracle-Gro Co. — |
| Black Hills Corp. | | 620 | | 19,263 | | Class A | | 690 | | 16,312 |
| PNM Resources, Inc. | | 1,380 | | 14,131 | | Worthington Industries, Inc. | | 14,342 |
| | Louisiana-Pacific Corp. | | 1,450 | | 13,485 |
| Pride International, Inc.* | | 2,770 | | 82,020 |
| Arch Coal, Inc. | | 2,310 | | 75,976 | | Energizer Holdings, Inc.* | | 930 | | 74,912 |
| Denbury Resources, Inc.* | | 75,399 | | Church & Dwight Co., Inc. | | 66,436 |
| Helmerich & Payne, Inc. | | 1,690 | | 72,991 | | Ralcorp Holdings, Inc.* | | 900 | | 60,669 |
| Forest Oil Corp.* | | 1,440 | | 71,424 | | J.M. Smucker Co. | | 880 | | 44,607 |
| Newfield Exploration Co.* | | 67,819 | | Hormel Foods Corp. | | 1,120 | | 40,634 |
| Cimarex Energy Co. | | 1,330 | | 65,050 | | Corn Products International, Inc. | | 38,413 |
| Plains Exploration & Production | | BJ’s Wholesale Club, Inc.* | | 950 | | 36,917 |
| | Co.* | | 1,720 | | 60,475 | | Alberto-Culver Co. | | 1,350 | | 36,774 |
| | Cleveland-Cliffs, Inc. | | 1,710 | | 90,527 |
| | Martin Marietta Materials, Inc. | | 73,907 |
| FMC Technologies, Inc.* | | 2,040 | | 94,962 |
2,510
890
1,290
1,470
670
1,810
830
430
700
2,930
2,100
1,020
1,350
770
710
300
960
3,960
1,070
2,120
1,190
660
SCHEDULE OF INVESTMENTS (Unaudited) (concluded)
September 30, 2008
MID-CAP 1.5x STRATEGY FUND
MARKET
UNREALIZED
SHARES
VALUE
CONTRACTS
GAIN (LOSS)
Hansen Natural Corp.*
1,180
$
35,695
FUTURES CONTRACTS PURCHASED
Smithfield Foods, Inc.*
1,870
29,696
December 2008 S&P MidCap 400 Index
NBTY, Inc.*
870
25,682
Mini Futures Contracts
Ruddick Corp.
630
20,444
(Aggregate Market Value
Universal Corp.
410
20,127
of Contracts $10,888,500)
150
$
(767,535)
PepsiAmericas, Inc.
920
19,062
Lancaster Colony Corp.
320
12,051
UNITS
Tootsie Roll Industries, Inc.
410
11,853
Total Consumer Staples
573,972
EQUITY INDEX SWAP AGREEMENT
Credit Suisse Capital, LLC
TELECOMMUNICATION SERVICES 0.4%
December 2008 S&P MidCap 400 Index
Telephone & Data Systems, Inc.
1,710
61,133
Swap, Terminating 12/29/08**
Cincinnati Bell, Inc.*
3,770
11,649
(Notional Market Value
Total Telecommunication Services
72,782
$581,791)
800
$
—
Total Common Stocks
(Cost $15,567,212)
14,864,772
SECURITIES LENDING COLLATERAL 0.2%
Mount Vernon Securities
Lending Trust Prime
Portfolio (Note 9)
20,776
20,776
Total Securities Lending Collateral
(Cost $20,776)
20,776
FACE
AMOUNT
REPURCHASE AGREEMENTS 10.0%
Repurchase Agreements (Note 5)
Morgan Stanley
issued 09/30/08 at 0.05%
due 10/01/08
$693,917
693,917
Mizuho Financial Group, Inc.
issued 09/30/08 at 0.26%
due 10/01/08
574,788
574,788
Morgan Stanley
issued 09/30/08 at 0.10%
due 10/01/08
406,930
406,930
Credit Suisse Group
issued 09/30/08 at 0.25%
due 10/01/08††
83,233
83,233
Total Repurchase Agreements
(Cost $1,758,868)
1,758,868
Total Investments 95.0%
(Cost $17,346,856)
$16,644,416
Other Assets in Excess
of Liabilities – 5.0%
$
884,258
Net Assets – 100.0%
$17,528,674
* Non-Income Producing Security.
** Total Return based on S&P MidCap 400 Index +/- financing at a variable rate.
† All or a portion of this security is on loan at September 30, 2008 — See Note 9.
†† All or a portion of this security is pledged as equity index swap collateral at September 30, 2008.
REIT — Real Estate Investment Trust.
See Notes to Financial Statements.
THE RYDEX SERIES FUNDS SEMI-ANNUAL REPORT
|
41
SCHEDULE OF INVESTMENTS (Unaudited)
September 30, 2008
INVERSE MID-CAP STRATEGY FUND
FACE
MARKET
AMOUNT
VALUE
REPURCHASE AGREEMENTS 74.0%
Repurchase Agreements (Note 5)
Morgan Stanley
issued 09/30/08 at 0.05%
due 10/01/08
$ 1,417,025
$1,417,025
Mizuho Financial Group, Inc.
issued 09/30/08 at 0.26%
due 10/01/08
1,173,757
1,173,757
Morgan Stanley
issued 09/30/08 at 0.10%
due 10/01/08
830,978
830,978
Credit Suisse Group
issued 09/30/08 at 0.25%
due 10/01/08†
310,453
310,453
Total Repurchase Agreements
(Cost $3,732,213)
3,732,213
Total Investments 74.0%
(Cost $3,732,213)
$3,732,213
Other Assets in Excess
of Liabilities – 26.0%
$1,312,448
Net Assets – 100.0%
$5,044,661
UNREALIZED
CONTRACTS
GAIN (LOSS)
FUTURES CONTRACTS SOLD SHORT
December 2008 S&P MidCap 400 Index
Mini Futures Contracts
(Aggregate Market Value
of Contracts $72,590)
1
$
(2,962)
UNITS
EQUITY INDEX SWAP AGREEMENT
SOLD SHORT
Credit Suisse Capital, LLC
December 2008 S&P MidCap 400 Index
Swap, Terminating 12/29/08*
(Notional Market Value
$5,028,356)
6,914
$
—
* Total Return based on S&P MidCap 400 Index +/- financing at a variable rate.
† All or a portion of this security is pledged as equity index swap collateral at September 30, 2008.
42
|
THE RYDEX SERIES FUNDS SEMI-ANNUAL REPORT
See Notes to Financial Statements.
| RUSSELL 2000® 1.5x STRATEGY FUND |
| SCHEDULE OF INVESTMENTS (Unaudited) |
| THE RYDEX SERIES FUNDS SEMI-ANNUAL REPORT |
| See Notes to Financial Statements. | | | | | 43 |
| | Post Properties, Inc. | | 770 | | $ | | 21,537 |
| | Selective Insurance Group, Inc. | | 21,316 |
| | Extra Space Storage, Inc. | | 21,197 |
| Senior Housing Properties Trust | $ | | 47,422 | | Eastgroup Properties, Inc. | | 430 | | 20,872 |
| Realty Income Corp. | | 1,760 | | 45,056 | | Cathay General Bancorp | | 860 | | 20,468 |
| Apollo Investment Corp. | | 2,470 | | 42,113 | | Stifel Financial Corp.* | | 410 | | 20,459 |
| Aspen Insurance Holdings Ltd. | | 40,700 | | First Midwest Bancorp, Inc. | | 20,362 |
| Highwoods Properties, Inc. | | 35,204 | | Delphi Financial Group, Inc. — |
| BioMed Realty Trust, Inc. | | 32,798 | | Class A | | 720 | | 20,189 |
| Home Properties, Inc. | | 550 | | 31,872 | | National Penn Bancshares, Inc. | | 20,148 |
| Potlatch Corp. | | 680 | | 31,545 | | RLI Corp. | | 320 | | 19,869 |
| Washington Real Estate Investment | | MB Financial Corp. | | 600 | | 19,842 |
| | Trust | | 860 | | 31,502 | | Argo Group International Holdings |
| ProAssurance Corp.* | | 560 | | 31,360 | | Ltd.* | | 530 | | 19,530 |
| National Retail Properties, Inc. | | 30,416 | | Cousins Properties, Inc. | | 760 | | 19,175 |
| Platinum Underwriters Holdings | | First Financial Bankshares, Inc. | | 18,677 |
| | Ltd. | | 850 | | 30,158 | | Equity Lifestyle Properties, Inc. | | 18,560 |
| SVB Financial Group* | | 520 | | 30,118 | | Odyssey Re Holdings Corp. | | 18,396 |
| First Niagara Financial Group, Inc. | | 29,925 | | Phoenix Companies, Inc. | | 18,388 |
| Hilb Rogal & Hobbs Co. | | 630 | | 29,446 | | Cash America International, Inc. | | 18,380 |
| FirstMerit Corp. | | 1,400 | | 29,400 | | Signature Bank* | | 520 | | 18,138 |
| Susquehanna Bancshares, Inc.† | | 29,085 | | Trustmark Corp. | | 860 | | 17,836 |
| Entertainment Properties Trust | | 29,002 | | Ares Capital Corp. | | 1,690 | | 17,627 |
| Westamerica Bancorporation | | 28,765 | | Provident Financial Services, Inc. | | 17,170 |
| UMB Financial Corp. | | 540 | | 28,361 | | First Commonwealth Financial |
| NewAlliance Bancshares, Inc. | | 28,256 | | Corp. | | 1,270 | | 17,107 |
| Colonial BancGroup, Inc. | | 27,510 | | Sovran Self Storage, Inc. | | 380 | | 16,982 |
| Corporate Office Properties Trust | | NBT Bancorp, Inc. | | 560 | | 16,755 |
| | SBI | | 670 | | 27,034 | | LaSalle Hotel Properties | | 700 | | 16,324 |
| Montpelier Re Holdings Ltd. | | 26,746 | | Pacific Capital Bancorp† | | 800 | | 16,280 |
| IPC Holdings Ltd. | | 870 | | 26,283 | | CVB Financial Corp. | | 1,150 | | 15,985 |
| Validus Holdings Ltd. | | 1,120 | | 26,040 | | Assured Guaranty Ltd. | | 970 | | 15,772 |
| Omega Healthcare Investors, Inc. | | 25,755 | | Inland Real Estate Corp. | | 990 | | 15,533 |
| Healthcare Realty Trust, Inc. | | 25,652 | | Interactive Brokers Group, Inc. — |
| American Campus Communities, | | Class A* | | 700 | | 15,519 |
| | Inc. | | 730 | | 24,732 | | Lexington Realty Trust | | 900 | | 15,498 |
| Knight Capital Group, Inc. — | | PrivateBancorp, Inc. | | 370 | | 15,414 |
| | Class A* | | 1,630 | | 24,222 | | TrustCo Bank Corp. | | 1,310 | | 15,340 |
| Tanger Factory Outlet Centers, Inc. | 24,084 | | Colonial Properties Trust | | 820 | | 15,326 |
| International Bancshares Corp. | | 24,030 | | Umpqua Holding Corp. | | 1,040 | | 15,298 |
| Zenith National Insurance Corp. | | 23,816 | | S&T Bancorp, Inc.† | | 410 | | 15,100 |
| FNB Corp. | | 1,490 | | 23,810 | | East-West Bancorp, Inc. | | 1,100 | | 15,070 |
| Glacier Bancorp, Inc. | | 940 | | 23,284 | | PS Business Parks, Inc. | | 260 | | 14,976 |
| Prosperity Bancshares, Inc. | | 23,113 | | Employers Holdings, Inc. | | 860 | | 14,947 |
| United Bankshares, Inc. | | 660 | | 23,100 | | DiamondRock Hospitality Co. | | 14,924 |
| Old National Bancorp | | 1,150 | | 23,023 | | KBW, Inc.* | | 450 | | 14,823 |
| Hancock Holding Co. | | 450 | | 22,950 | | Park National Corp. | | 190 | | 14,820 |
| Max Capital Group Ltd. | | 980 | | 22,765 | | Piper Jaffray Companies, Inc.* | | 14,272 |
| Mid-America Apartment | | optionsXpress Holdings, Inc. | | 14,177 |
| | Communities, Inc. | | 460 | | 22,604 | | Acadia Realty Trust | | 560 | | 14,157 |
| DCT Industrial Trust, Inc. | | 2,980 | | 22,320 | | First Bancorp Puerto Rico | | 13,604 |
| MFA Mortgage Investments, Inc. | | 22,295 | | Navigators Group, Inc.* | | 230 | | 13,340 |
| Greenhill & Co., Inc. | | 300 | | 22,125 | | National Health Investors, Inc. | | 13,330 |
| First Industrial Realty Trust, Inc.† | | 22,084 | | Sterling Bancshares, Inc. | | 1,270 | | 13,271 |
930
1,380
1,990
1,480
840
990
1,240
1,380
1,270
360
350
420
1,900
1,990
510
1,490
530
500
1,040
1,880
3,500
1,620
1,310
880
550
890
650
680
1,640
330
730
1,230
3,430
390
770
| RUSSELL 2000® 1.5x STRATEGY FUND |
| SCHEDULE OF INVESTMENTS (Unaudited) (continued) |
| THE RYDEX SERIES FUNDS SEMI-ANNUAL REPORT |
| 44 | | | | | See Notes to Financial Statements. |
| Franklin Street Properties Corp., | | Cedar Shopping Centers, Inc. | | $ | | 8,725 |
| | Inc. | | 1,020 | | $ | | 13,260 | | Harleysville Group, Inc. | | 230 | | 8,694 |
| Community Bank System, Inc. | | 13,078 | | Simmons First National Corp. | | 8,544 |
| Medical Properties Trust Inc. | | 13,052 | | Texas Capital Bancshares, Inc.* | | 8,512 |
| Sterling Savings Bank | | 900 | | 13,050 | | SWS Group, Inc. | | 420 | | 8,467 |
| Brookline Bancorp, Inc. | | 1,010 | | 12,918 | | Anworth Mortgage Asset Corp. | | 8,466 |
| Chemical Financial Corp. | | 410 | | 12,767 | | Ashford Hospitality Trust, Inc. | | 8,424 |
| Portfolio Recovery Associates, Inc.* | 12,644 | | Central Pacific Financial Corp.† | | 8,405 |
| Ezcorp, Inc. — Class A* | | 670 | | 12,596 | | Boston Private Financial Holdings, |
| Redwood Trust, Inc. | | 570 | | 12,386 | | Inc. | | 950 | | 8,303 |
| UCBH Holdings, Inc. | | 1,920 | | 12,307 | | Northwest Bancorp, Inc. | | 300 | | 8,262 |
| WesBanco, Inc. | | 460 | | 12,245 | | Tower Group, Inc. | | 350 | | 8,246 |
| Wintrust Financial Corp. | | 410 | | 12,033 | | Cohen & Steers, Inc. | | 290 | | 8,216 |
| Sunstone Hotel Investors, Inc. | | 12,015 | | Universal Health Realty Income |
| Pinnacle Financial Partners, Inc.* | | 12,012 | | Trust | | 210 | | 8,169 |
| PacWest Bancorp | | 420 | | 12,008 | | Univest Corp. of Pennsylvania | | 8,140 |
| Alexander’s, Inc.* | | 30 | | 12,000 | | Saul Centers, Inc. | | 160 | | 8,086 |
| City Holding Co. | | 280 | | 11,830 | | First Busey Corp. | | 440 | | 8,065 |
| LTC Properties, Inc. | | 400 | | 11,728 | | StellarOne Corp. | | 390 | | 8,061 |
| IBERIABANK Corp. | | 220 | | 11,627 | | Hilltop Holdings, Inc.* | | 780 | | 8,050 |
| Ambac Financial Group, Inc. | | 11,603 | | Aircastle Ltd. | | 810 | | 8,027 |
| Pennsylvania Real Estate | | TowneBank | | 360 | | 7,920 |
| | Investment Trust | | 610 | | 11,498 | | Renasant Corp. | | 360 | | 7,816 |
| Greenlight Capital Re Ltd. — | | FelCor Lodging Trust, Inc. | | 7,804 |
| | Class A* | | 500 | | 11,495 | | GAMCO Investors, Inc. — Class A | | 7,709 |
| Equity One, Inc. | | 560 | | 11,474 | | Oriental Financial Group | | 420 | | 7,501 |
| Investors Bancorp, Inc.* | | 760 | | 11,438 | | NorthStar Realty Finance Corp. | | 7,440 |
| Investors Real Estate Trust | | 11,190 | | First Merchants Corp. | | 320 | | 7,296 |
| United Fire & Casualty Co. | | 11,150 | | State Auto Financial Corp. | | 7,267 |
| Infinity Property & Casualty Corp. | | 11,124 | | Riskmetrics Group, Inc.* | | 370 | | 7,241 |
| Frontier Financial Corp.† | | 820 | | 11,013 | | First Potomac Realty Trust | 420 | | 7,220 |
| Capstead Mortgage Corp. | | 10,731 | | Beneficial Mutual Bancorp, Inc.* | | 7,210 |
| Safety Insurance Group, Inc. | | 10,620 | | FPIC Insurance Group, Inc.* | | 7,195 |
| U-Store-It Trust | | 860 | | 10,552 | | American Equity Investment Life |
| National Financial Partners Corp. | | 10,350 | | Holding Co. | | 950 | | 7,125 |
| Parkway Properties, Inc. | | 270 | | 10,222 | | Capital Southwest Corp. | | 50 | | 7,102 |
| Financial Federal Corp. | | 440 | | 10,085 | | Tejon Ranch Co. De* | | 190 | | 7,058 |
| World Acceptance Corp.* | | 280 | | 10,080 | | Radian Group, Inc. | | 1,400 | | 7,056 |
| Pico Holdings, Inc.* | | 280 | | 10,055 | | SY Bancorp, Inc. | | 230 | | 7,043 |
| Strategic Hotels & Resorts, Inc. | | 9,739 | | FCStone Group, Inc.* | | 390 | | 7,016 |
| Enstar Group* | | 100 | | 9,736 | | Glimcher Realty Trust | | 660 | | 6,890 |
| National Western Life Insurance | | eHealth, Inc.* | | 430 | | 6,880 |
| | Co. — Class A | | 40 | | 9,683 | | Meadowbrook Insurance Group, |
| Bank Mutual Corp. | | 840 | | 9,534 | | Inc. | | 960 | | 6,778 |
| First Financial Bancorp | | 650 | | 9,490 | | Banco Latinoamericano de |
| First Financial Corp. | | 200 | | 9,396 | | Exportaciones SA | | 470 | | 6,777 |
| United Community Banks, Inc. | | 9,293 | | SCBT Financial Corp. | | 180 | | 6,768 |
| Provident New York Bancorp | | 9,254 | | Urstadt Biddle Properties, Inc. | | 6,750 |
| South Financial Group, Inc. | | 9,236 | | Suffolk Bancorp | | 170 | | 6,700 |
| Harleysville National Corp. | | 9,169 | | Getty Realty Corp. | | 300 | | 6,651 |
| Forestar Real Estate Group, Inc.* | | 9,145 | | WSFS Financial Corp. | | 110 | | 6,600 |
| Horace Mann Educators Corp. | | 9,009 | | LandAmerica Financial Group, Inc. | | 6,547 |
| Community Trust Bancorp, Inc. | | 8,944 | | Flushing Financial Corp. | | 370 | | 6,475 |
| Stewart Information Services Corp. | | 8,925 | | Dollar Financial Corp.* | | 420 | | 6,464 |
| Independent Bank Corp. | | 280 | | 8,728 | | Castlepoint Holdings Ltd. | | 580 | | 6,455 |
660
520
240
1,150
410
1,430
2,080
260
500
890
390
220
4,980
1,090
130
960
1,000
390
250
270
980
570
280
140
690
1,290
701
700
360
1,260
540
620
700
270
260
300
| RUSSELL 2000® 1.5x STRATEGY FUND |
| SCHEDULE OF INVESTMENTS (Unaudited) (continued) |
| THE RYDEX SERIES FUNDS SEMI-ANNUAL REPORT |
| See Notes to Financial Statements. | | | | | 45 |
| MVC Capital, Inc. | | 420 | | $ | | 6,405 | | Ocwen Financial Corp.* | | 620 | | $ | | 4,991 |
| Crawford & Co. — Class B* | | 6,384 | | Capitol Bancorp, Ltd. | | 250 | | 4,872 |
| American Physicians Capital, Inc. | | 6,349 | | Republic Bancorp, Inc. | | 160 | | 4,851 |
| Bancfirst Corp. | | 130 | | 6,283 | | PMA Capital Corp.* | | 550 | | 4,851 |
| Calamos Asset Management, | | CNA Surety Corp.* | | 290 | | 4,843 |
| | Inc. — Class A | | 350 | | 6,272 | | SeaBright Insurance Holdings, Inc.* | | 4,810 |
| MainSource Financial Group, Inc. | | 6,272 | | Arrow Financial Corp. | | 160 | | 4,706 |
| Capital City Bank Group, Inc. | | 6,270 | | Peapack Gladstone Financial Corp. | | 4,690 |
| Hersha Hospitality Trust | | 840 | | 6,250 | | Hatteras Financial Corp. | | 200 | | 4,640 |
| Dime Community Bancshares | | 6,240 | | Lakeland Financial Corp. | | 210 | | 4,612 |
| Sandy Spring Bancorp, Inc. | | 6,188 | | United Financial Bancorp, Inc. | | 4,603 |
| CapLease, Inc. | | 780 | | 6,185 | | United America Indemnity Ltd. — |
| FBL Financial Group, Inc. — Class A | 6,136 | | Class A* | | 320 | | 4,554 |
| 1st Source Corp. | | 260 | | 6,110 | | Camden National Corp. | | 130 | | 4,544 |
| Ramco-Gershenson Properties Trust | 6,053 | | Capital Trust, Inc. — Class A | | 4,495 |
| Amerisafe, Inc.* | | 330 | | 6,006 | | Sterling Bancorp† | | 310 | | 4,483 |
| First Community Bancshares, Inc. | | 6,003 | | Nara Bancorp, Inc. | | 400 | | 4,480 |
| Presidential Life Corp. | | 380 | | 6,000 | | Old Second Bancorp, Inc.† | | 4,445 |
| Home Bancshares, Inc. | | 230 | | 5,950 | | Southwest Bancorp, Inc. | | 250 | | 4,418 |
| RAIT Financial Trust | | 1,080 | | 5,929 | | MarketAxess Holdings, Inc.* | | 4,358 |
| Prospect Capital Corp. | | 460 | | 5,893 | | Enterprise Financial Services Corp. | | 4,286 |
| Newcastle Investment Corp. | | 5,842 | | First Bancorp | | 250 | | 4,275 |
| Heartland Financial USA, Inc. | | 5,764 | | Westwood Holdings Group, Inc. | | 4,266 |
| Berkshire Hills Bancorp, Inc. | | 5,760 | | Nelnet, Inc. — Class A | | 300 | | 4,260 |
| Sun Communities, Inc. | | 290 | | 5,745 | | Abington Bancorp, Inc. | | 420 | | 4,250 |
| Compass Diversified Trust | | 410 | | 5,715 | | The PMI Group, Inc.† | | 1,410 | | 4,160 |
| Bank of the Ozarks, Inc. | | 210 | | 5,670 | | Thomas Properties Group, Inc. | | 4,141 |
| Westfield Financial, Inc. | | 550 | | 5,665 | | First Financial Northwest, Inc. | | 4,128 |
| Gladstone Capital Corp. | | 370 | | 5,639 | | Northfield Bancorp, Inc.* | | 340 | | 4,117 |
| Provident Bankshares Corp. | | 5,632 | | Lakeland Bancorp, Inc. | | 350 | | 4,092 |
| Guaranty Bancorp* | | 910 | | 5,551 | | Darwin Professional Underwriters, |
| NGP Capital Resources Co. | | 5,537 | | Inc.* | | 130 | | 4,044 |
| Hercules Technology Growth Capital, | | ESSA Bancorp, Inc. | | 290 | | 4,031 |
| | Inc. | | 570 | | 5,529 | | Penson Worldwide Co., Inc.* | | 4,022 |
| Union Bankshares Corp. | | 230 | | 5,520 | | Wilshire Bancorp, Inc. | | 330 | | 4,016 |
| Columbia Banking Systems, Inc.† | | 5,496 | | LaBranche & Co., Inc.* | | 890 | | 4,005 |
| Anthracite Capital, Inc. | | 1,020 | | 5,467 | | Agree Realty Corp. | | 140 | | 4,004 |
| Advanta Corp. | | 660 | | 5,432 | | CoBiz Financial, Inc. | | 330 | | 3,963 |
| Education Realty Trust, Inc. | | 5,429 | | West Coast Bancorp | | 270 | | 3,958 |
| GFI Group, Inc. | | 1,150 | | 5,416 | | Danvers Bancorp, Inc. | | 310 | | 3,953 |
| Green Bankshares, Inc. | | 230 | | 5,407 | | BancTrust Financial Group, Inc. | | 3,936 |
| Citizens, Inc.* | | 650 | | 5,343 | | Maguire Properties, Inc. | | 660 | | 3,934 |
| Flagstone Reinsurance Holdings | | 5,340 | | Peoples Bancorp, Inc. | | 180 | | 3,919 |
| Washington Trust Bancorp, Inc. | | 5,320 | | West Bancorporation, Inc. | | 300 | | 3,909 |
| Southside Bancshares, Inc. | | 5,292 | | Consolidated-Tomoka Land Co. | | 3,887 |
| First Financial Holdings, Inc. | | 5,236 | | Oritani Financial Corp.* | | 230 | | 3,876 |
| TradeStation Group, Inc.* | | 560 | | 5,236 | | Shore Bancshares, Inc. | | 150 | | 3,855 |
| Triko Bancshares | | 240 | | 5,167 | | Kite Realty Group Trust | | 350 | | 3,850 |
| Friedman Billings Ramsey Group, | | Smithtown Bancorp, Inc. | | 170 | | 3,825 |
| | Inc. — Class A* | | 2,570 | | 5,140 | | Financial Institutions, Inc. | | 190 | | 3,802 |
| Citizens Banking Corp. | | 1,660 | | 5,113 | | Kearny Financial Corp. | | 310 | | 3,794 |
| Western Alliance Bancorp, Inc.* | | 5,102 | | Winthrop Realty Trust | | 970 | | 3,783 |
| First Cash Financial Services, Inc.* | | 5,100 | | City Bank | | 240 | | 3,744 |
| Tompkins Financial Corp. | | 100 | | 5,050 | | First Place Financial Corp. | | 290 | | 3,727 |
| BankFinancial Corp. | | 340 | | 4,991 | | State Bancorp, Inc. | | 250 | | 3,725 |
420
150
370
320
200
140
410
280
310
220
270
290
160
240
540
190
920
230
90
180
410
400
580
380
290
310
490
300
520
200
210
90
200
330
340
| RUSSELL 2000® 1.5x STRATEGY FUND |
| SCHEDULE OF INVESTMENTS (Unaudited) (continued) |
| THE RYDEX SERIES FUNDS SEMI-ANNUAL REPORT |
| 46 | | | | | See Notes to Financial Statements. |
| Maiden Holdings Ltd. | | 850 | | $ | | 3,698 | | American Safety Insurance |
| Kansas City Life Insurance Co. | | 3,680 | | Holdings Ltd.* | | 180 | | $ | | 2,720 |
| Amtrust Financial Services, Inc. | | 3,669 | | Oceanfirst Financial Corp. | | 150 | | 2,718 |
| Chimera Investment Corp. | | 3,664 | | Sierra Bancorp | | 130 | | 2,712 |
| Donegal Group, Inc. — Class A | | 3,626 | | Pennsylvania Commerce Bancorp, |
| Life Partners Holdings, Inc. | | 3,597 | | Inc.* | | 90 | | 2,683 |
| Diamond Hill Investment Group, | | Flagstar Bancorp, Inc. | | 900 | | 2,682 |
| | Inc.* | | 40 | | 3,597 | | BlackRock Kelso Capital Corp. | | 2,652 |
| Baldwind & Lyons, Inc. — Class B | | 3,596 | | Monmouth Real Estate Investment |
| Ameris Bancorp | | 240 | | 3,564 | | Corp. — Class A | | 340 | | 2,649 |
| First Mercury Financial Corp.* | | 3,563 | | National Interstate Corp. | | 110 | | 2,643 |
| Cascade Bancorp. | | 390 | | 3,467 | | Care Investment Trust, Inc. | | 2,640 |
| Citizens & Northern Corp. | 160 | | 3,448 | | Bryn Mawr Bank Corp. | | 120 | | 2,638 |
| MCG Capital Corp. | | 1,310 | | 3,432 | | Corus Bankshares, Inc. | | 650 | | 2,633 |
| NewStar Financial, Inc.* | | 420 | | 3,398 | | Gladstone Investment Corp. | | 2,614 |
| Cardinal Financial Corp. | | 420 | | 3,394 | | Kohlberg Capital Corp. | | 300 | | 2,577 |
| Yadkin Valley Financial Corp. | | 3,392 | | Guaranty Financial Group, Inc.* | | 2,568 |
| Sun Bancorp, Inc.* | | 250 | | 3,388 | | AmCOMP, Inc.* | | 220 | | 2,552 |
| Quanta Capital Holdings Ltd. | | 3,367 | | Arbor Realty Trust, Inc. | | 250 | | 2,500 |
| ViewPoint Financial Group | | 3,325 | | BGC Partners, Inc. - Class A | | 2,488 |
| Mission West Properties | | 340 | | 3,312 | | One Liberty Properties, Inc. | | 2,474 |
| Encore Capital Group, Inc.* | | 3,288 | | United Security Bancshares | | 2,454 |
| Hanmi Financial Corp. | | 650 | | 3,283 | | Anchor BanCorp Wisconsin, Inc. | | 2,426 |
| Associated Estates Realty Corp. | | 3,258 | | First South Bancorp, Inc.† | | 140 | | 2,418 |
| Amcore Financial, Inc. | | 350 | | 3,238 | | Rockville Financial, Inc. | | 150 | | 2,363 |
| DuPont Fabros Technology, Inc. | | 3,203 | | United Community Financial Corp. | | 2,300 |
| Ladenburg Thalmann Financial | | Patriot Capital Funding, Inc. | | 2,293 |
| | Services, Inc.* | | 1,770 | | 3,186 | | Resource Capital Corp. | | 370 | | 2,242 |
| FBR Capital Markets Corp.* | | 3,110 | | Roma Financial Corp. | | 150 | | 2,213 |
| Evercore Partners, Inc. — Class A | | 3,057 | | US Global Investors, Inc. — Class A | 2,211 |
| Stratus Properties, Inc.* | | 110 | | 3,027 | | Advance America Cash Advance |
| First Marblehead Corp. | | 1,200 | | 2,988 | | Centers, Inc. | | 730 | | 2,183 |
| Farmers Capital Bank Corp. | | 2,972 | | Clifton Savings Bancorp, Inc. | | 2,158 |
| EMC Insurance Group, Inc. | | 2,948 | | NYMAGIC, Inc. | | 80 | | 2,020 |
| American Capital Agency Corp. | | 2,944 | | Encore Bancshares, Inc.* | | 110 | | 1,980 |
| Sanders Morris Harris Group Inc. | | 2,941 | | NASB Financial, Inc. | | 60 | | 1,949 |
| First Bancorp, Inc. | | 150 | | 2,940 | | Epoch Holding Corp. | | 180 | | 1,899 |
| Cogdell Spencer, Inc. | | 180 | | 2,887 | | FirstFed Financial Corp.*† | | 240 | | 1,882 |
| Banner Corp. | | 240 | | 2,882 | | JER Investors Trust, Inc. | | 390 | | 1,880 |
| Kayne Anderson Energy | | Gramercy Capital Corp. | | 720 | | 1,865 |
| | Development Co. | | 170 | | 2,878 | | Meridian Interstate Bancorp, Inc.* | | 1,838 |
| Integra Bank Corp. | | 360 | | 2,873 | | Credit Acceptance Corp.* | | 100 | | 1,700 |
| Harris & Harris Group, Inc.* | | 2,871 | | International Assets Holding Corp.* | 1,688 |
| Thomas Weisel Partners Group, | | Cardtronics, Inc.* | | 210 | | 1,651 |
| | Inc.* | | 340 | | 2,866 | | Grubb & Ellis Co. | | 600 | | 1,620 |
| Centerstate Banks of Florida, Inc. | | 2,859 | | Resource America, Inc. — Class A | | 1,615 |
| Ames National Corp. | | 110 | | 2,855 | | Midwest Banc Holdings, Inc. | | 1,560 |
| Seacoast Banking Corporation of | | Home Federal Bancorp, Inc. | | 1,403 |
| | Florida | | 260 | | 2,790 | | Fox Chase Bancorp, Inc.* | | 110 | | 1,287 |
| Pacific Continental Corp. | | 190 | | 2,782 | | Independence Holding Co. | | 1,271 |
| Premierwest Bancorp | | 340 | | 2,744 | | Broadpoint Securities Group, Inc.* | | 1,218 |
| PennantPark Investment Corp. | | 2,742 | | Waterstone Financial, Inc.* | | 1,172 |
| Asset Acceptance Capital Corp.* | | 2,740 | | CompuCredit Corp.*† | | 280 | | 1,098 |
| Heritage Commerce Corp. | | 2,740 | | W Holding Co., Inc. | | 1,980 | | 1,069 |
| Medallion Financial Corp. | | 260 | | 2,722 | | Ampal American Israel — Class A* | | 1,051 |
80
270
590
200
100
230
150
250
230
380
200
650
1,220
190
580
140
240
150
330
250
210
460
360
480
170
220
110
180
100
170
340
180
450
70
160
170
390
110
110
420
370
120
260
180
340
| INFORMATION TECHNOLOGY 11.7% |
| RUSSELL 2000® 1.5x STRATEGY FUND |
| SCHEDULE OF INVESTMENTS (Unaudited) (continued) |
| THE RYDEX SERIES FUNDS SEMI-ANNUAL REPORT |
| See Notes to Financial Statements. | | | | | 47 |
| Primus Guaranty Ltd.* | | 400 | | $ | | 1,048 | | Progress Software Corp.* | | 720 | | $ | | 18,713 |
| Pzena Investment Management, | | j2 Global Communications, Inc.* | | 17,979 |
| | Inc. — Class A | | 110 | | 1,043 | | Mentor Graphics Corp.* | | 1,580 | | 17,933 |
| First Acceptance Corp.* | | 300 | | 1,020 | | Synaptics, Inc.* | | 585 | | 17,679 |
| Doral Financial Corp.* | | 90 | | 983 | | Websense, Inc.* | | 780 | | 17,433 |
| Downey Financial Corp. | | 350 | | 980 | | Net 1 UEPS Technologies, Inc.* | | 17,417 |
| Hallmark Financial Services, Inc.* | | 909 | | L-1 Identity Solutions, Inc.* | | 17,266 |
| Meruelo Maddux Properties, Inc.* | | 903 | | MKS Instruments, Inc.* | | 860 | | 17,123 |
| Brooklyn Federal Bancorp, Inc. | | 887 | | SRA International, Inc. — Class A* | | 16,746 |
| Santander BanCorp | | 80 | | 864 | | MPS Group, Inc.* | | 1,640 | | 16,531 |
| Federal Agricultural Mortgage | | Benchmark Electronics, Inc.* | | 16,474 |
| | Corp. | | 160 | | 656 | | Arris Group, Inc.* | | 2,130 | | 16,465 |
| FX Real Estate and Entertainment, | | 3Com Corp.* | | 7,000 | | 16,310 |
| | Inc.* | | 180 | | 187 | | EarthLink, Inc.* | | 1,900 | | 16,150 |
| | Quest Software, Inc.* | | 1,260 | | 15,989 |
| | Rofin-Sinar Technologies, Inc.* | | 15,917 |
| | Infinera Corp.* | | 1,610 | | 15,392 |
| | ValueClick, Inc.* | | 1,500 | | 15,345 |
| | Lawson Software, Inc.* | | 2,190 | | 15,330 |
| | Semtech Corp.* | | 1,070 | | 14,937 |
| | Formfactor, Inc.* | | 850 | | 14,807 |
| | Harmonic, Inc.* | | 1,630 | | 13,773 |
| | Tessera Technologies, Inc.* | | 13,726 |
| | Euronet Worldwide, Inc.* | | 820 | | 13,719 |
| | RF Micro Devices, Inc.* | | 4,560 | | 13,315 |
| | Scansource, Inc.* | | 460 | | 13,243 |
| | Cabot Microelectronics Corp.* | | 13,153 |
| | Checkpoint Systems, Inc.* | | 690 | | 12,986 |
| | Sanmina-SCI Corp.* | | 9,200 | | 12,880 |
| | Electronics for Imaging, Inc.* | | 12,816 |
| | Power Integrations, Inc.* | | 530 | | 12,773 |
| | Data Domain, Inc.* | | 570 | | 12,694 |
| | Quality Systems, Inc. | | 300 | | 12,678 |
| | MTS Systems Corp. | | 300 | | 12,630 |
| | United Online, Inc. | | 1,340 | | 12,609 |
| | SYKES Enterprises, Inc.* | | 570 | | 12,517 |
| | Avid Technology, Inc.* | | 520 | | 12,511 |
| | Wind River Systems, Inc.* | | 12,500 |
| | DealerTrack Holdings, Inc.* | | 12,462 |
| | Riverbed Technology, Inc.* | | 12,144 |
| | Amkor Technology, Inc.* | | 1,890 | | 12,039 |
| | Triquint Semiconductor, Inc.* | | 11,927 |
| Foundry Networks, Inc.* | | 2,530 | | 46,071 |
| Micros Systems, Inc.* | | 1,410 | | 37,591 |
| Parametric Technology Corp.* | | 36,800 |
| Polycom, Inc.* | | 1,520 | | 35,158 |
| Microsemi Corp.* | | 1,360 | | 34,653 |
| Anixter International, Inc.* | 520 | | 30,945 |
| Concur Technologies, Inc.* | | 28,695 |
| PMC - Sierra, Inc.* | | 3,800 | | 28,196 |
| Jack Henry & Associates, Inc. | | 26,429 |
| CACI International, Inc. — Class A* | 26,052 |
| Perot Systems Corp. — Class A* | | 26,025 |
| Solera Holdings, Inc.* | | 900 | | 25,848 |
| VistaPrint Ltd.* | | 770 | | 25,287 |
| Atheros Communications, Inc.* | | 24,287 |
| TIBCO Software, Inc.* | | 3,240 | | 23,717 |
| Skyworks Solutions, Inc.* | | 23,659 |
| Gartner, Inc. — Class A* | | 1,030 | | 23,360 |
| Macrovision Solutions Corp.* | | 21,993 |
| Take-Two Interactive Software, |
| Blackboard, Inc.* | | 540 | | 21,757 |
| Mantech International Corp. — |
| Intermec, Inc.* | | 1,070 | | 21,015 |
| Digital River, Inc.* | | 640 | | 20,736 |
| Comtech Telecommunications |
| Informatica Corp.* | | 1,540 | | 20,005 |
| Wright Express Corp.* | | 670 | | 19,999 |
| Omniture, Inc.* | | 1,080 | | 19,829 |
| VeriFone Holdings, Inc.* | | 1,190 | | 19,683 |
| Fair Isaac Corp. | | 840 | | 19,362 |
| Cybersource Corp.* | | 1,200 | | 19,332 |
| Plantronics, Inc. | | 850 | | 19,142 |
| InterDigital, Inc.* | | 790 | | 18,999 |
770
780
100
1,130
740
60
740
1,170
520
840
410
920
1,250
740
970
2,490
2,000
750
1,300
520
1,500
1,030
2,830
1,430
| RUSSELL 2000® 1.5x STRATEGY FUND |
| SCHEDULE OF INVESTMENTS (Unaudited) (continued) |
| THE RYDEX SERIES FUNDS SEMI-ANNUAL REPORT |
| 48 | | | | | See Notes to Financial Statements. |
| Imation Corp. | | 520 | | $ | | 11,747 | | Micrel, Inc. | | 860 | | $ | | 7,800 |
| Ultimate Software Group, Inc.* | | 11,610 | | Ness Technologies, Inc.* | | 680 | | 7,800 |
| Rogers Corp.* | | 310 | | 11,464 | | Advanced Energy Industries, Inc.* | | 7,798 |
| Hittite Microwave Corp.* | | 340 | | 11,424 | | Cavium Networks, Inc.* | | 530 | | 7,462 |
| Littelfuse, Inc.* | | 380 | | 11,297 | | CTS Corp. | | 580 | | 7,412 |
| Sapient Corp.* | | 1,520 | | 11,294 | | Zoran Corp.* | | 900 | | 7,344 |
| Interwoven, Inc.* | | 790 | | 11,155 | | TTM Technologies, Inc.* | | 740 | | 7,341 |
| Palm, Inc. | | 1,860 | | 11,104 | | Cogent, Inc.* | | 710 | | 7,256 |
| Insight Enterprises, Inc.* | | 810 | | 10,862 | | Netezza Corp.* | | 680 | | 7,215 |
| Heartland Payment Systems, Inc. | | 10,735 | | Finisar Corp.* | | 6,850 | | 6,918 |
| Sycamore Networks, Inc.* | | 10,724 | | SI International, Inc.* | | 230 | | 6,911 |
| CSG Systems International, Inc.* | | 10,693 | | Adaptec, Inc.* | | 2,100 | | 6,888 |
| ACI Worldwide, Inc.* | | 600 | | 10,512 | | JDA Software Group, Inc.* | | 6,844 |
| Technitrol, Inc. | | 710 | | 10,501 | | Extreme Networks, Inc.* | | 2,020 | | 6,807 |
| ViaSat, Inc.* | | 440 | | 10,375 | | China Security & Surveillance |
| Black Box Corp. | | 300 | | 10,359 | | Technology, Inc.* | | 490 | | 6,801 |
| Advent Software, Inc.* | | 290 | | 10,217 | | Silicon Image, Inc.* | | 1,270 | | 6,782 |
| Sonus Networks, Inc.* | | 3,540 | | 10,195 | | Starent Networks Corp.* | | 520 | | 6,729 |
| OmniVision Technologies, Inc.* | | 10,155 | | SYNNEX Corp.* | | 300 | | 6,702 |
| ATMI, Inc.* | | 560 | | 10,069 | | Applied Micro Circuits Corp.* | | 6,698 |
| Tyler Technologies, Inc.* | | 660 | | 10,012 | | Newport Corp.* | | 620 | | 6,684 |
| Mastec, Inc.* | | 750 | | 9,967 | | Electro Scientific Industries, Inc.* | | 6,683 |
| Standard Microsystems Corp.* | | 9,742 | | Sigma Designs, Inc.* | | 460 | | 6,541 |
| Manhattan Associates, Inc.* | | 9,606 | | InfoSpace, Inc. | | 600 | | 6,510 |
| Entegris, Inc.* | | 1,980 | | 9,583 | | Ciber, Inc.* | | 930 | | 6,501 |
| MicroStrategy, Inc. — Class A* | | 9,525 | | Utstarcom, Inc.* | | 1,920 | | 6,470 |
| Vocus, Inc.* | | 280 | | 9,509 | | IPG Photonics Corp.* | | 330 | | 6,438 |
| Daktronics, Inc. | | 570 | | 9,496 | | OSI SYSTEMS INC* | | 270 | | 6,348 |
| Diodes, Inc.* | | 500 | | 9,225 | | Cohu, Inc. | | 400 | | 6,328 |
| Brooks Automation, Inc.* | | 9,196 | | Terremark Worldwide, Inc.* | | 6,320 |
| Netgear, Inc.* | | 610 | | 9,150 | | Stratasys, Inc.*† | | 360 | | 6,289 |
| Dycom Industries, Inc.* | | 700 | | 9,114 | | Emcore Corp.*† | | 1,270 | | 6,274 |
| SPSS, Inc.* | | 310 | | 9,102 | | Brightpoint, Inc.* | | 870 | | 6,264 |
| Netlogic Microsystems, Inc.* | | 9,072 | | Cirrus Logic, Inc.* | | 1,130 | | 6,158 |
| Powerwave Technologies, Inc.* | | 9,029 | | RightNow Technologies, Inc.* | | 6,034 |
| MercadoLibre, Inc.* | | 440 | | 8,954 | | EMS Technologies, Inc.* | | 270 | | 6,024 |
| Taleo Corp.* | | 450 | | 8,950 | | Integral Systems, Inc.* | | 290 | | 6,023 |
| Commvault Systems, Inc.* | | 740 | | 8,917 | | Bel Fuse, Inc. — Class B | | 210 | | 5,979 |
| SAVVIS, Inc.* | | 650 | | 8,736 | | Constant Contact, Inc.* | | 350 | | 5,974 |
| DTS, Inc. — Class A* | | 310 | | 8,627 | | Faro Technologies, Inc.* | | 290 | | 5,907 |
| Bankrate, Inc.* | | 220 | | 8,560 | | Methode Electronics, Inc. — |
| Park Electrochemical Corp. | | 8,484 | | Class A | | 660 | | 5,900 |
| MSC.Software Corp.* | | 780 | | 8,346 | | Symyx Technologies, Inc.* | | 580 | | 5,748 |
| EPIQ Systems, Inc.* | | 610 | | 8,296 | | Volterra Semiconductor Corp.* | | 5,601 |
| ModusLink Global Solutions, Inc.* | | 8,168 | | AsiaInfo Holdings, Inc.* | | 600 | | 5,508 |
| Veeco Instruments, Inc.* | | 550 | | 8,145 | | Actel Corp.* | | 440 | | 5,491 |
| TNS, Inc.* | | 420 | | 8,135 | | Universal Display Corp.* | | 500 | | 5,480 |
| Epicor Software Corp.* | | 1,030 | | 8,127 | | comScore, Inc.* | | 310 | | 5,465 |
| Blue Coat Systems, Inc.* | | 570 | | 8,088 | | Ixia* | | 740 | | 5,454 |
| Greenfield Online, Inc.* | | 460 | | 8,004 | | Internet Capital Group, Inc.* | | 5,434 |
| RealNetworks, Inc.* | | 1,570 | | 7,976 | | Netscout Systems, Inc.* | | 510 | | 5,426 |
| Forrester Research, Inc.* | | 270 | | 7,916 | | Syntel, Inc. | | 220 | | 5,390 |
| Art Technology Group, Inc.* | | 7,850 | | Neutral Tandem, Inc.* | | 290 | | 5,377 |
| Monolithic Power Systems, Inc.* | | 7,816 | | Supertex, Inc.* | | 190 | | 5,350 |
430
570
420
3,320
610
450
890
1,120
470
390
430
160
1,100
920
300
2,280
480
350
440
850
670
2,230
450
| RUSSELL 2000® 1.5x STRATEGY FUND |
| SCHEDULE OF INVESTMENTS (Unaudited) (continued) |
| THE RYDEX SERIES FUNDS SEMI-ANNUAL REPORT |
| See Notes to Financial Statements. | | | | | 49 |
| S1 Corp.* | | 860 | | $ | | 5,263 | | Actuate Corp.* | | 1,050 | | $ | | 3,675 |
| Seachange International, Inc.* | | 5,216 | | Eagle Test Systems, Inc.* | | 240 | | 3,674 |
| Secure Computing Corp.* | | 920 | | 5,042 | | Advanced Analogic Technologies, |
| Echelon Corp.* | | 510 | | 5,039 | | Inc.* | | 790 | | 3,674 |
| LoopNet, Inc.* | | 510 | | 5,013 | | Perficient, Inc.* | | 550 | | 3,652 |
| Rackable Systems, Inc.* | | 510 | | 5,003 | | i2 Technologies, Inc.* | | 270 | | 3,642 |
| Exar Corp.* | | 650 | | 4,979 | | Synchronoss Technologies, Inc.* | | 3,576 |
| Ultratech, Inc.* | | 410 | | 4,961 | | Global Cash Access Holdings, Inc.* | | 3,542 |
| SonicWALL, Inc.* | | 930 | | 4,873 | | FalconStor Software, Inc.* | | 660 | | 3,538 |
| Vasco Data Security International* | | 4,869 | | Mercury Computer Systems, Inc.* | | 3,471 |
| NIC, Inc. | | 690 | | 4,761 | | Harris Stratex Networks, Inc. — |
| Photon Dynamics, Inc.* | | 310 | | 4,758 | | Class A* | | 440 | | 3,436 |
| Hutchinson Technology, Inc.* | | 4,748 | | Spansion, Inc.* | | 2,210 | | 3,426 |
| Move, Inc.* | | 2,230 | | 4,728 | | Super Micro Computer, Inc.* | | 3,424 |
| Silicon Storage Technology, Inc.* | | 4,727 | | Transmeta Corp.* | | 210 | | 3,404 |
| Aruba Networks, Inc.* | | 910 | | 4,668 | | Zygo Corp., Inc.* | | 270 | | 3,397 |
| Vignette Corp.* | | 430 | | 4,618 | | Radisys Corp.* | | 390 | | 3,354 |
| Digi International, Inc.* | | 450 | | 4,590 | | Novatel Wireless, Inc.* | | 550 | | 3,333 |
| SuccessFactors, Inc.* | | 420 | | 4,578 | | iGate Corp.* | | 380 | | 3,295 |
| Switch & Data Facilities Co., Inc.* | | 4,482 | | Pegasystems, Inc. | | 250 | | 3,228 |
| Rudolph Technologies, Inc.* | | 4,441 | | DSP Group, Inc.* | | 420 | | 3,213 |
| Hughes Communications, Inc.* | | 4,404 | | MRV Communications, Inc.* | | 3,194 |
| Measurement Specialties, Inc.* | | 4,360 | | Semitool, Inc.* | | 390 | | 3,190 |
| Oplink Communications, Inc.* | | 4,345 | | Keynote Systems, Inc.* | | 240 | | 3,180 |
| ShoreTel, Inc.* | | 750 | | 4,305 | | NCI, Inc.* | | 110 | | 3,133 |
| Cass Information Systems, Inc. | | 4,302 | | Immersion Corp.* | | 530 | | 3,085 |
| Maxwell Technologies, Inc.* | | 4,269 | | PC-Tel, Inc. | | 330 | | 3,076 |
| Marchex, Inc. | | 410 | | 4,219 | | DemandTec, Inc.* | | 340 | | 3,063 |
| Kulicke & Soffa Industries, Inc.* | | 4,194 | | Anadigics, Inc.* | | 1,090 | | 3,063 |
| Radiant Systems, Inc.* | | 480 | | 4,171 | | Globecomm Systems, Inc.* | | 3,059 |
| Lattice Semiconductor Corp.* | | 4,120 | | Magma Design Automation, Inc.* | | 3,055 |
| The Knot, Inc.* | | 490 | | 4,092 | | DivX, Inc.* | | 470 | | 3,041 |
| STEC, Inc.*† | | 530 | | 4,081 | | 3PAR, Inc.* | | 470 | | 3,032 |
| Mattson Technology, Inc.* | | 860 | | 4,068 | | Internap Network Services Corp.* | | 3,028 |
| Intevac, Inc.* | | 380 | | 4,043 | | Axcelis Technologies, Inc.* | | 3,026 |
| TeleCommunication Systems, | | Double-Take Software, Inc.* | | 2,985 |
| | Inc. — Class A* | | 580 | | 4,008 | | Compellent Technologies, Inc.* | | 2,976 |
| Parkervision, Inc.* | | 400 | | 4,000 | | Loral Space & Communications, |
| Pericom Semiconductor Corp.* | | 3,990 | | Inc.* | | 200 | | 2,954 |
| Symmetricom, Inc.* | | 800 | | 3,976 | | Cray, Inc.* | | 570 | | 2,953 |
| Bottomline Technologies, Inc.* | | 3,952 | | Gevity HR, Inc. | | 400 | | 2,912 |
| Agilysys, Inc. | | 390 | | 3,935 | | Ceva, Inc.* | | 350 | | 2,905 |
| Online Resources Corp.* | | 500 | | 3,885 | | Monotype Imaging Holdings, Inc.* | | 2,894 |
| Hackett Group, Inc.* | | 710 | | 3,862 | | Opnet Technologies, Inc.* | | 230 | | 2,801 |
| Phoenix Technologies, Ltd.* | | 3,835 | | Liquidity Services Inc.* | | 250 | | 2,713 |
| IXYS Corp. | | 420 | | 3,818 | | Orbcomm, Inc.* | | 550 | | 2,712 |
| LTX-Credence Corp.* | | 2,170 | | 3,776 | | Presstek, Inc.* | | 480 | | 2,707 |
| infoGROUP, Inc. | | 570 | | 3,768 | | MIPS Technology, Inc.* | | 770 | | 2,703 |
| Smith Micro Software, Inc.* | | 3,763 | | Acme Packet, Inc.* | | 470 | | 2,693 |
| Ebix, Inc.* | | 40 | | 3,758 | | Chordiant Software, Inc.* | | 520 | | 2,668 |
| Quantum Corp.* | | 3,570 | | 3,749 | | Internet Brands, Inc. — Class A* | | 2,649 |
| Gerber Scientific, Inc.* | | 410 | | 3,747 | | Safeguard Scientifics, Inc.* | | 2,638 |
| Kopin Corp.* | | 1,200 | | 3,744 | | Website Pros, Inc.* | | 480 | | 2,592 |
| Hypercom Corp.* | | 930 | | 3,701 | | Sourcefire, Inc.* | | 350 | | 2,552 |
540
380
700
470
390
410
380
1,450
360
530
120
2,730
250
360
120
320
930
350
2,000
760
870
1,780
300
240
380
380
260
480
530
380
2,110
| | Total Information Technology |
| RUSSELL 2000® 1.5x STRATEGY FUND |
| SCHEDULE OF INVESTMENTS (Unaudited) (continued) |
| THE RYDEX SERIES FUNDS SEMI-ANNUAL REPORT |
| 50 | | | | | See Notes to Financial Statements. |
| Techwell, Inc.* | | 270 | | $ | | 2,546 | | Midway Games, Inc.* | | 200 | | $ | | 474 |
| Trident Microsystems, Inc.* | | 2,544 | | Elixir Gaming Technologies, Inc.* | | 386 |
| Anaren, Inc.* | | 250 | | 2,538 | | Entropic Communications, Inc.* | | 226 |
| PLX Technology, Inc.* | | 490 | | 2,509 |
| CPI International, Inc.* | | 170 | | 2,462 |
| SupportSoft, Inc.* | | 800 | | 2,400 |
| Cogo Group, Inc.* | | 450 | | 2,372 |
| Smart Modular Technologies WWH, |
| Multi-Fineline Electronix, Inc.* | | 2,219 |
| Renaissance Learning, Inc. | 170 | | 2,208 |
| ExlService Holdings, Inc.* | | 250 | | 2,195 |
| Interactive Intelligence, Inc.* | | 2,165 |
| American Software, Inc. — Class A | | 2,126 |
| BigBand Networks, Inc.* | | 570 | | 2,103 |
| PROS Holdings, Inc.* | | 220 | | 2,066 |
| Asyst Technologies, Inc.* | | 860 | | 2,064 |
| Callidus Software, Inc.* | | 520 | | 2,059 |
| Dice Holdings, Inc.* | | 270 | | 1,917 |
| TheStreet.com, Inc. | | 320 | | 1,917 |
| Isilon Systems, Inc.* | | 430 | | 1,896 |
| China Information Security |
| | Technology, Inc.* | | 400 | | 1,880 |
| ICx Technologies, Inc.* | | 240 | | 1,850 |
| Ultra Clean Holdings* | | 340 | | 1,714 |
| TechTarget, Inc.* | | 240 | | 1,680 |
| Sonic Solutions, Inc.* | | 380 | | 1,672 |
| Rubicon Technology, Inc.* | | 230 | | 1,661 |
| SiRF Technology Holdings, Inc.* | | 1,565 |
| Photronics, Inc.* | | 730 | | 1,372 |
| Limelight Networks Inc.* | | 500 | | 1,250 |
| HSW International, Inc.* | | 480 | | 1,248 |
| PC Connection, Inc.* | | 160 | | 1,070 |
| Guidance Software, Inc.* | | 160 | | 750 |
| Nextwave Wireless, Inc.* | | 840 | | 504 |
| Energy Conversion Devices, Inc.* | | 45,435 |
| Waste Connections, Inc.* | | 39,445 |
| Watson Wyatt & Co. Holdings | | 36,800 |
| Woodward Governor Co. | | 35,975 |
| Curtiss-Wright Corp. | | 780 | | 35,451 |
| Teledyne Technologies, Inc.* | | 34,868 |
| Moog, Inc. — Class A* | | 740 | | 31,731 |
| GrafTech International Ltd.* | | 31,278 |
| EMCOR Group, Inc.* | | 1,180 | | 31,058 |
| Brady Corp. — Class A | | 870 | | 30,694 |
| Acuity Brands, Inc. | | 700 | | 29,232 |
| Tetra Tech, Inc.* | | 1,020 | | 24,541 |
| Actuant Corp. — Class A | | 970 | | 24,483 |
| Orbital Sciences Corp.* | | 1,020 | | 24,449 |
| HUB Group, Inc. — Class A* | | 24,096 |
| IKON Office Solutions, Inc.† | | 23,984 |
| Regal-Beloit Corp. | | 560 | | 23,811 |
| Herman Miller, Inc. | | 970 | | 23,736 |
| Baldor Electric Co. | | 800 | | 23,048 |
| Clean Harbors, Inc.* | | 340 | | 22,967 |
| ESCO Technologies, Inc.* | | 450 | | 21,676 |
| Mine Safety Appliances Co. | | 20,585 |
| Huron Consulting Group, Inc.* | | 20,513 |
| Granite Construction, Inc. | | 570 | | 20,417 |
| Esterline Technologies Corp.* | | 20,191 |
| Genesee & Wyoming, Inc. — |
| TransDigm Group, Inc.* | | 580 | | 19,853 |
| Applied Industrial Technologies, |
| United Stationers, Inc.* | | 410 | | 19,610 |
| Mueller Water Products, Inc. — |
| Franklin Electric Co., Inc. | | 400 | | 17,820 |
| Resources Connection, Inc.* | | 17,799 |
| Geo Group, Inc.* | | 880 | | 17,785 |
| Simpson Manufacturing Co., Inc.† | | 17,608 |
| American Superconductor Corp.* | | 17,206 |
| Knight Transportation, Inc. | | 16,800 |
1,060
1,170
160
150
240
390
1,050
780
1,150
740
1,020
610
2,070
640
1,410
540
360
510
790
650
730
990
| RUSSELL 2000® 1.5x STRATEGY FUND |
| SCHEDULE OF INVESTMENTS (Unaudited) (continued) |
| THE RYDEX SERIES FUNDS SEMI-ANNUAL REPORT |
| See Notes to Financial Statements. | | | | | 51 |
| Barnes Group, Inc. | | 830 | | $ | | 16,783 | | American Reprographics Co.* | | $ | | 10,867 |
| Navigant Consulting, Inc.* | 840 | | 16,708 | | NCI Building Systems, Inc.* | | 10,795 |
| ABM Industries, Inc. | | 760 | | 16,598 | | Interface, Inc. — Class A | | 920 | | 10,460 |
| II-VI, Inc.* | | 420 | | 16,237 | | Viad Corp. | | 360 | | 10,364 |
| SkyWest, Inc. | | 1,010 | | 16,140 | | School Specialty, Inc.* | | 330 | | 10,293 |
| Werner Enterprises, Inc. | | 740 | | 16,065 | | Universal Forest Products, Inc. | | 10,124 |
| Middleby Corp.* | | 290 | | 15,750 | | Administaff, Inc. | | 370 | | 10,071 |
| CoStar Group, Inc.* | | 340 | | 15,433 | | Tennant Co. | | 290 | | 9,935 |
| Lindsay Manufacturing Co. | | 15,277 | | Pacer International, Inc. | | 600 | | 9,882 |
| Robbins & Myers, Inc. | | 490 | | 15,156 | | Quanex Building Products Corp. | | 9,754 |
| Heartland Express, Inc. | | 970 | | 15,054 | | Astec Industries, Inc.* | | 310 | | 9,557 |
| JetBlue Airways Corp.* | | 2,996 | | 14,830 | | American Science & Engineering, |
| Mueller Industries, Inc. | | 640 | | 14,726 | | Inc. | | 160 | | 9,557 |
| Korn/Ferry International, Inc.* | | 14,256 | | EnerSys* | | 480 | | 9,461 |
| Albany International Corp. — | | NACCO Industries, Inc. — Class A | | 9,452 |
| | Class A | | 520 | | 14,212 | | Gorman-Rupp Co. | | 250 | | 9,430 |
| Chart Industries, Inc.* | | 490 | | 13,994 | | RSC Holdings, Inc.* | | 830 | | 9,429 |
| Genco Shipping & Trading Ltd. | | 13,961 | | Comfort Systems USA, Inc. | | 9,352 |
| Watts Industries, Inc. — Class A | | 13,948 | | Atlas Air Worldwide Holdings Co., |
| Briggs & Stratton Corp. | | 860 | | 13,915 | | Inc.* | | 230 | | 9,271 |
| Evergreen Solar, Inc.* | | 2,490 | | 13,745 | | Interline Brands, Inc.* | | 560 | | 9,078 |
| Healthcare Services Group | | 13,717 | | Advisory Board Co.* | | 300 | | 9,048 |
| A.O. Smith Corp. | | 350 | | 13,716 | | Heidrick & Struggles International, |
| Rollins, Inc. | | 720 | | 13,666 | | Inc. | | 300 | | 9,045 |
| Forward Air Corp. | | 500 | | 13,615 | | Axsys Technologies, Inc.* | | 150 | | 8,841 |
| Old Dominion Freight Line, Inc.* | | 13,603 | | Gibraltar Industries, Inc. | | 470 | | 8,794 |
| Triumph Group, Inc. | | 290 | | 13,256 | | Kelly Services, Inc. — Class A | | 8,763 |
| Arkansas Best Corp. | | 390 | | 13,139 | | AZZ, Inc.* | | 210 | | 8,688 |
| EnPro Industries, Inc.* | | 350 | | 13,006 | | Exponent, Inc.* | | 260 | | 8,603 |
| Deluxe Corp. | | 890 | | 12,807 | | Allegiant Travel Co.* | | 240 | | 8,477 |
| RBC Bearings, Inc.* | | 380 | | 12,802 | | Teletech Holdings, Inc.* | | 680 | | 8,459 |
| Titan International, Inc. | | 600 | | 12,792 | | M&F Worldwide Corp.* | | 200 | | 8,000 |
| Knoll, Inc. | | 840 | | 12,701 | | Taser International, Inc.* | | 1,090 | | 7,793 |
| Alaska Air Group, Inc.* | | 620 | | 12,642 | | Columbus McKinnon Corp. — |
| Circor International, Inc. | | 290 | | 12,595 | | Class A* | | 330 | | 7,778 |
| Seaboard Corp. | | 10 | | 12,570 | | American Ecology Corp. | | 280 | | 7,748 |
| Kaman Corp. — Class A | | 440 | | 12,531 | | Apogee Enterprises, Inc. | | 500 | | 7,515 |
| PHH Corp.* | | 940 | | 12,493 | | Tredegar Corp. | | 420 | | 7,472 |
| Heico Corp. | | 380 | | 12,472 | | Rush Enterprises, Inc. — Class A* | | 7,424 |
| TrueBlue, Inc.* | | 770 | | 12,443 | | Blount International, Inc.* | | 660 | | 7,346 |
| Perini Corp.* | | 470 | | 12,121 | | DynCorp International, Inc. — |
| Beacon Roofing Supply, Inc.* | | 12,027 | | Class A* | | 430 | | 7,207 |
| US Airways Group, Inc.* | | 1,980 | | 11,939 | | Insituform Technologies, Inc. — |
| YRC Worldwide, Inc.* | | 990 | | 11,840 | | Class A* | | 480 | | 7,181 |
| Mcgrath Rentcorp | | 410 | | 11,816 | | FuelCell Energy, Inc.* | | 1,190 | | 7,176 |
| Badger Meter, Inc. | | 250 | | 11,737 | | ACCO Brands Corp.* | | 940 | | 7,088 |
| Layne Christensen Co.* | | 330 | | 11,692 | | Tecumseh Products Co. — Class A* | 7,011 |
| Mobile Mini, Inc.* | | 600 | | 11,598 | | Cascade Corp. | | 160 | | 7,010 |
| Team, Inc.* | | 320 | | 11,558 | | Northwest Pipe Co.* | | 160 | | 6,979 |
| Ameron International Corp. | | 11,464 | | Ennis Inc. | | 450 | | 6,957 |
| Federal Signal Corp. | | 830 | | 11,371 | | GeoEye, Inc.* | | 310 | | 6,860 |
| Eagle Bulk Shipping Inc. | | 810 | | 11,291 | | Griffon Corp.*† | | 760 | | 6,855 |
| G & K Services, Inc. — Class A | | 11,237 | | Altra Holdings, Inc.* | | 460 | | 6,790 |
| AAR Corp.* | | 670 | | 11,115 | | Amerco, Inc.* | | 160 | | 6,709 |
| Raven Industries, Inc.† | | 280 | | 11,018 | | Gencorp, Inc.* | | 990 | | 6,673 |
630
340
290
210
640
800
100
420
700
510
750
480
460
580
770
280
160
340
| RUSSELL 2000® 1.5x STRATEGY FUND |
| SCHEDULE OF INVESTMENTS (Unaudited) (continued) |
| THE RYDEX SERIES FUNDS SEMI-ANNUAL REPORT |
| 52 | | | | | See Notes to Financial Statements. |
| Cubic Corp. | | 270 | | $ | | 6,639 | | 3D Systems Corp.* | | 310 | | $ | | 4,417 |
| American Commercial Lines, Inc.* | | 6,597 | | Celadon Group, Inc.* | | 380 | | 4,359 |
| CBIZ, Inc.* | | 780 | | 6,591 | | Great Lakes Dredge & Dock Corp. |
| Furmanite Corp.* | | 630 | | 6,514 | | Co. | | 690 | | 4,354 |
| Hawaiian Holdings, Inc.* | | 690 | | 6,403 | | Ducommun, Inc. | | 180 | | 4,298 |
| Cenveo, Inc.* | | 830 | | 6,383 | | Pike Electric Corp.* | | 290 | | 4,272 |
| Republic Airways Holdings, Inc.* | | 6,216 | | AAON, Inc. | | 230 | | 4,184 |
| Colfax Corp.* | | 370 | | 6,183 | | Insteel Industries, Inc. | | 300 | | 4,077 |
| Kenexa Corp. — Class A* | | 390 | | 6,158 | | American Woodmark Corp. | | 4,041 |
| Freightcar America, Inc. | | 210 | | 6,147 | | Aceto Corp. | | 420 | | 4,028 |
| Standex International Corp. | | 6,105 | | Herley Industries, Inc.* | | 230 | | 3,933 |
| Innerworkings, Inc.* | | 550 | | 6,099 | | Schawk, Inc. | | 260 | | 3,931 |
| Polypore International, Inc.* | | 6,023 | | Teekay Tankers Ltd. | | 230 | | 3,894 |
| Fuel Tech, Inc.* | | 330 | | 5,970 | | Orion Marine Group, Inc.* | | 3,881 |
| Kimball International, Inc. — | | PeopleSupport, Inc.* | | 330 | | 3,858 |
| | Class B | | 550 | | 5,940 | | Thermadyne Holdings Corp.* | | 3,834 |
| EnergySolutions, Inc. | | 580 | | 5,800 | | Applied Signal Technology, Inc. | | 3,824 |
| Encore Wire Corp. | | 320 | | 5,795 | | Met-Pro Corp. | | 260 | | 3,793 |
| LB Foster Co. — Class A* | | 190 | | 5,780 | | Duff & Phelps Corp. — Class A* | | 3,785 |
| Aerovironment, Inc.* | | 180 | | 5,751 | | Odyssey Marine Exploration, Inc.* | | 3,768 |
| Hill International, Inc.* | | 410 | | 5,678 | | Courier Corp. | | 180 | | 3,665 |
| Stanley, Inc.* | | 150 | | 5,536 | | Ampco-Pittsburgh Corp. | | 140 | | 3,626 |
| Kadant, Inc.* | | 240 | | 5,465 | | NN, Inc. | | 280 | | 3,598 |
| Greenbrier Companies, Inc. | | 5,463 | | LECG Corp.* | | 440 | | 3,551 |
| Bowne & Co., Inc. | | 470 | | 5,428 | | Arlington Tankers Ltd. | | 220 | | 3,384 |
| Kforce, Inc.* | | 530 | | 5,411 | | Ultrapetrol Bahamas Ltd.* | | 430 | | 3,375 |
| Argon ST, Inc.* | | 230 | | 5,403 | | Standard Parking Corp.* | | 150 | | 3,333 |
| Houston Wire & Cable Co. | | 5,323 | | PMFG, Inc.* | | 230 | | 3,333 |
| Powell Industries, Inc.* | | 130 | | 5,305 | | Flow International Corp.* | | 650 | | 3,302 |
| Gehl Co.* | | 180 | | 5,297 | | Capstone Turbine Corp.* | | 3,264 |
| Marten Transport Ltd.* | | 270 | | 5,268 | | Hurco Companies, Inc.* | | 110 | | 3,253 |
| CRA International, Inc.* | | 190 | | 5,221 | | Sterling Construction Co., Inc.* | | 3,240 |
| Sun Hydraulics Corp. | | 200 | | 5,208 | | DXP Enterprises, Inc.* | | 60 | | 3,199 |
| TAL International Group, Inc. | | 5,205 | | LaBarge, Inc.* | | 210 | | 3,163 |
| Cornell Companies, Inc.* | | 190 | | 5,164 | | Force Protection, Inc.* | | 1,176 | | 3,152 |
| Consolidated Graphics, Inc.* | | 5,156 | | Saia, Inc.* | | 230 | | 3,054 |
| K-Tron International, Inc.* | | 40 | | 5,153 | | Waste Services Inc.* | | 410 | | 3,038 |
| CDI Corp. | | 230 | | 5,136 | | Valence Technology, Inc.*† | | 3,036 |
| Horizon Lines, Inc. — Class A† | | 5,132 | | Vicor Corp. | | 340 | | 3,019 |
| Dynamic Materials Corp. | | 220 | | 5,106 | | LMI Aerospace, Inc.* | | 150 | | 3,017 |
| Ladish Co., Inc.* | | 250 | | 5,062 | | Hudson Highland Group, Inc.* | | 2,989 |
| Wabash National Corp. | | 530 | | 5,008 | | Preformed Line Products Co. | | 2,917 |
| Electro Rent Corp. | | 370 | | 4,969 | | Lydall, Inc.* | | 290 | | 2,793 |
| AirTran Holdings, Inc.* | | 2,030 | | 4,933 | | LSI Industries, Inc. | | 330 | | 2,729 |
| Graham Corp. | | 90 | | 4,869 | | Titan Machinery, Inc.* | | 130 | | 2,705 |
| Ener1, Inc.* | | 620 | | 4,842 | | H&E Equipment Services, Inc.* | | 2,705 |
| On Assignment, Inc.* | | 610 | | 4,807 | | Commercial Vehicle Group, Inc.* | | 2,631 |
| Trex Co., Inc.* | | 260 | | 4,709 | | Textainer Group Holdings Ltd. | | 2,582 |
| Spherion Corp.* | | 950 | | 4,626 | | American Railcar Industries, Inc. | | 2,566 |
| Casella Waste Systems, Inc. — | | Standard Register Co. | | 260 | | 2,561 |
| | Class A* | | 390 | | 4,579 | | First Advantage Corp. — Class A* | | 2,529 |
| DHT Maritime, Inc. | | 680 | | 4,570 | | China Fire & Security Group, Inc.* | | 2,522 |
| Dynamex, Inc.* | | 160 | | 4,554 | | TurboChef Technologies, Inc.* | | 2,522 |
| Multi-Color Corp. | | 190 | | 4,539 | | Park-Ohio Holdings Corp.* | | 2,505 |
| Michael Baker Corp.* | | 130 | | 4,524 | | Metalico, Inc.* | | 420 | | 2,478 |
620
610
180
220
280
370
230
220
180
830
280
310
2,530
200
250
170
880
520
430
50
280
370
170
160
180
240
410
140
| RUSSELL 2000® 1.5x STRATEGY FUND |
| SCHEDULE OF INVESTMENTS (Unaudited) (continued) |
| THE RYDEX SERIES FUNDS SEMI-ANNUAL REPORT |
| See Notes to Financial Statements. | | | | | 53 |
| Advanced Battery Technologies, | | Psychiatric Solutions, Inc.* | | 960 | | $ | | 36,432 |
| | Inc.* | | 760 | | $ | | 2,455 | | Onyx Pharmaceuticals, Inc.* | | 34,733 |
| Universal Truckload Services, Inc.* | | 2,436 | | Owens & Minor, Inc. | | 710 | | 34,435 |
| COMSYS IT Partners, Inc.* | | 2,430 | | Bio-Rad Laboratories, Inc. — |
| TBS International Ltd. — Class A* | | 2,423 | | Class A* | | 330 | | 32,710 |
| Fushi Copperweld, Inc.* | | 250 | | 2,423 | | NuVasive, Inc.* | | 620 | | 30,585 |
| International Shipholding Corp.* | | 2,409 | | Masimo Corp.* | | 800 | | 29,760 |
| Patriot Transportation Holding, Inc.* | 2,370 | | Magellan Health Services, Inc.* | | 28,742 |
| Key Technology, Inc.* | | 100 | | 2,370 | | Healthsouth Corp.* | | 1,530 | | 28,198 |
| ICF International, Inc.* | | 120 | | 2,370 | | Parexel International Corp.* | | 28,087 |
| VSE Corp. | | 70 | | 2,361 | | Haemonetics Corp.* | | 450 | | 27,774 |
| PRG-Schultz International, Inc.* | | 2,330 | | West Pharmaceutical Services, Inc. | | 27,339 |
| Xerium Technologies, Inc. | | 360 | | 2,318 | | Alpharma, Inc. — Class A* | | 26,561 |
| Microvision, Inc.* | | 1,180 | | 2,289 | | Isis Pharmaceuticals, Inc.* | | 26,517 |
| Integrated Electrical Services, Inc.* | | 2,283 | | Sequenom, Inc.* | | 980 | | 26,088 |
| China Architectural Engineering, | | Thoratec Corp.* | | 950 | | 24,937 |
| | Inc.* | | 320 | | 2,269 | | Valeant Pharmaceuticals |
| Beacon Power Corp.* | | 1,540 | | 2,233 | | International* | | 1,210 | | 24,769 |
| Twin Disc, Inc. | | 150 | | 2,064 | | Regeneron Pharmaceuticals, Inc.* | | 23,576 |
| Volt Information Sciences, Inc.* | | 1,976 | | AMERIGROUP Corp.* | | 930 | | 23,473 |
| Lawson Products, Inc. | | 70 | | 1,936 | | Auxilium Pharmaceuticals, Inc.* | | 23,004 |
| Alamo Group, Inc. | | 110 | | 1,876 | | Amedisys, Inc.* | | 460 | | 22,388 |
| China BAK Battery, Inc.* | | 520 | | 1,872 | | American Medical Systems |
| Power-One, Inc.* | | 1,290 | | 1,871 | | Holdings, Inc.* | | 1,260 | | 22,378 |
| Flanders Corp.* | | 280 | | 1,764 | | Alkermes, Inc.* | | 1,660 | | 22,078 |
| EnerNOC, Inc.* | | 170 | | 1,758 | | Varian, Inc.* | | 510 | | 21,879 |
| PowerSecure International, Inc.* | | 1,757 | | Cubist Pharmaceuticals, Inc.* | | 21,785 |
| Ultralife Batteries, Inc.* | | 220 | | 1,705 | | Celera Corp.* | | 1,390 | | 21,475 |
| Builders FirstSource, Inc.* | | 280 | | 1,677 | | XenoPort, Inc.* | | 440 | | 21,336 |
| Trimas Corp.* | | 250 | | 1,640 | | Medicines Co.* | | 900 | | 20,898 |
| Harbin Electric, Inc.* | | 130 | | 1,541 | | PSS World Medical, Inc.* | | 20,865 |
| CAI International, Inc.* | | 130 | | 1,438 | | Dionex Corp.* | | 320 | | 20,336 |
| Coleman Cable Inc.* | | 140 | | 1,404 | | Meridian Bioscience, Inc. | | 700 | | 20,328 |
| Plug Power, Inc.* | | 1,390 | | 1,376 | | Eclipsys Corp.* | | 940 | | 19,693 |
| Akeena Solar, Inc.* | | 360 | | 1,364 | | Wright Medical Group, Inc.* | | 19,482 |
| Amrep Corp. PLC* | | 30 | | 1,272 | | PDL BioPharma, Inc. | | 2,070 | | 19,272 |
| ICT Group, Inc.* | | 150 | | 1,208 | | Healthspring, Inc.* | | 860 | | 18,198 |
| Omega Flex, Inc. | | 50 | | 1,128 | | Luminex Corp.* | | 720 | | 18,007 |
| Medis Technologies Ltd.* | | 540 | | 972 | | Alnylam Pharmaceuticals, Inc.* | | 17,949 |
| Protection One, Inc.* | | 110 | | 969 | | Martek Biosciences Corp. | | 570 | | 17,909 |
| Orion Energy Systems Inc.* | | 898 | | Sciele Pharma, Inc. | | 550 | | 16,934 |
| United Capital Corp.* | | 30 | | 795 | | Chemed Corp. | | 410 | | 16,835 |
| Ascent Solar Technologies, Inc.* | | 790 | | Conmed Corp.* | | 500 | | 16,000 |
| Dollar Thrifty Automotive Group, | | Viropharma, Inc.* | | 1,210 | | 15,875 |
| | Inc.* | | 370 | | 714 | | Phase Forward, Inc.* | | 740 | | 15,473 |
| China Direct, Inc.* | | 100 | | 422 | | Centene Corp.* | | 750 | | 15,382 |
| | Acorda Therapeutics, Inc.* | | 15,264 |
| | Human Genome Sciences, Inc.* | | 14,922 |
| | HealthExtras, Inc.* | | 570 | | 14,888 |
| | Rigel Pharmaceuticals, Inc.* | | 14,710 |
| | Medicis Pharmaceutical Corp. — |
| | Medarex, Inc.* | | 2,210 | | 14,299 |
| Alexion Pharmaceuticals, Inc.* | | 52,269 |
| Myriad Genetics, Inc.* | | 770 | | 49,958 |
| OSI Pharmaceuticals, Inc.* | 990 | | 48,797 |
| United Therapeutics Corp.* | | 41,016 |
| Immucor, Inc.* | | 1,220 | | 38,991 |
960
100
250
180
110
30
700
980
260
560
720
1,570
130
1,080
220
710
290
980
1,070
640
620
160
130
640
2,350
630
1,330
390
| RUSSELL 2000® 1.5x STRATEGY FUND |
| SCHEDULE OF INVESTMENTS (Unaudited) (continued) |
| THE RYDEX SERIES FUNDS SEMI-ANNUAL REPORT |
| 54 | | | | | See Notes to Financial Statements. |
| Savient Pharmaceuticals, Inc.* | | $ | | 14,015 | | Durect Corp.* | | 1,420 | | $ | | 7,952 |
| AmSurg Corp.* | | 550 | | 14,008 | | Res-Care, Inc.* | | 430 | | 7,800 |
| Apria Healthcare Group, Inc.* | | 13,862 | | Halozyme Therapeutics, Inc.* | | 7,780 |
| Cepheid, Inc.* | | 990 | | 13,692 | | Molina Healthcare, Inc.* | | 250 | | 7,750 |
| Integra LifeSciences Holdings | | Abaxis, Inc.* | | 380 | | 7,486 |
| | Corp.* | | 310 | | 13,649 | | Albany Molecular Research, Inc.* | | 7,417 |
| Invacare Corp. | | 560 | | 13,518 | | Par Pharmaceutical Companies, |
| Kindred Healthcare, Inc.* | | 490 | | 13,509 | | Inc.* | | 600 | | 7,374 |
| KV Pharmaceutical Co.* | | 570 | | 12,945 | | LHC Group, Inc.* | | 250 | | 7,120 |
| ArthroCare Corp.* | | 460 | | 12,751 | | Omnicell, Inc.* | | 540 | | 7,101 |
| Allscripts Healthcare Solutions, Inc.* | 12,316 | | MWI Veterinary Supply, Inc.* | | 7,072 |
| ev3, Inc.* | | 1,220 | | 12,249 | | National Healthcare Corp. | | 7,068 |
| athenahealth, Inc.* | | 360 | | 11,977 | | Neogen Corp.* | | 250 | | 7,045 |
| PharMerica Corp.* | | 530 | | 11,920 | | Hanger Orthopedic Group, Inc.* | | 6,980 |
| Datascope Corp.† | | 230 | | 11,875 | | Cyberonics, Inc.* | | 410 | | 6,970 |
| Gentiva Health Services, Inc.* | | 11,854 | | Questcor Pharmaceuticals, Inc.* | | 6,909 |
| Zoll Medical Corp.* | | 360 | | 11,779 | | Allos Therapeutics, Inc.* | | 920 | | 6,817 |
| Bruker BioSciences Corp.* | | 11,730 | | Sirona Dental Systems, Inc.* | | 6,751 |
| Align Technology, Inc.* | | 1,080 | | 11,696 | | Angiodynamics, Inc.* | | 420 | | 6,636 |
| Medivation, Inc.* | | 440 | | 11,642 | | Arena Pharmaceuticals, Inc.* | | 6,400 |
| Landauer, Inc. | | 160 | | 11,640 | | CryoLife, Inc.* | | 480 | | 6,298 |
| Symmetry Medical, Inc.* | | 620 | | 11,507 | | Array Biopharma, Inc.* | | 820 | | 6,298 |
| Analogic Corp. | | 230 | | 11,445 | | Enzo Biochem, Inc.* | | 560 | | 6,149 |
| CV Therapeutics, Inc.* | | 1,050 | | 11,340 | | Progenics Pharmaceuticals, Inc.* | | 6,123 |
| Seattle Genetics, Inc.* | | 1,050 | | 11,235 | | GTx, Inc.* | | 320 | | 6,086 |
| AMAG Pharmaceuticals, Inc.* | | 11,232 | | Assisted Living Concepts, Inc. — |
| Theravance, Inc.* | | 900 | | 11,214 | | Class A* | | 950 | | 6,051 |
| Exelixis, Inc.* | | 1,820 | | 11,066 | | Pain Therapeutics, Inc.* | | 600 | | 5,862 |
| Sun Healthcare Group, Inc.* | | 10,995 | | NPS Pharmaceuticals, Inc.* | | 5,855 |
| Natus Medical, Inc.* | | 480 | | 10,877 | | Odyssey HealthCare, Inc.* | | 5,785 |
| Sunrise Senior Living, Inc.* | | 10,756 | | Pharmasset, Inc.* | | 290 | | 5,786 |
| Abiomed, Inc.* | | 590 | | 10,472 | | Bio-Reference Labs, Inc.* | | 200 | | 5,780 |
| AMN Healthcare Services, Inc.* | | 10,366 | | ICU Medical, Inc.* | | 190 | | 5,778 |
| Vital Signs, Inc. | | 140 | | 10,346 | | Enzon Pharmaceuticals, Inc.* | | 5,756 |
| HMS Holdings Corp.* | | 430 | | 10,303 | | Nektar Therapeutics* | | 1,600 | | 5,744 |
| Kendle International, Inc.* | | 230 | | 10,283 | | IRIS International, Inc.* | | 320 | | 5,728 |
| Incyte Corp.* | | 1,320 | | 10,098 | | Momenta Pharmaceuticals, Inc.* | | 5,637 |
| inVentiv Health, Inc.* | | 570 | | 10,066 | | RehabCare Group, Inc.* | | 310 | | 5,611 |
| Healthways, Inc.* | | 610 | | 9,839 | | Orthofix International NV* | | 5,589 |
| Greatbatch, Inc.* | | 400 | | 9,816 | | MedAssets, Inc.* | | 320 | | 5,504 |
| Vivus, Inc.* | | 1,200 | | 9,528 | | Genomic Health, Inc.* | | 240 | | 5,436 |
| InterMune, Inc.* | | 550 | | 9,410 | | Air Methods Corp.* | | 190 | | 5,379 |
| Affymetrix, Inc.* | | 1,200 | | 9,288 | | Geron Corp.* | | 1,350 | | 5,333 |
| Dendreon Corp.*† | | 1,620 | | 9,250 | | Salix Pharmaceuticals Ltd.* | | 5,320 |
| SonoSite, Inc.* | | 290 | | 9,106 | | Life Sciences Research, Inc.* | | 5,250 |
| Merit Medical Systems, Inc.* | | 9,010 | | Accuray, Inc.* | | 630 | | 5,084 |
| eResearch Technology, Inc.* | | 8,932 | | Akorn, Inc.* | | 990 | | 5,079 |
| RTI Biologics, Inc.* | | 930 | | 8,695 | | Idera Pharmaceuticals, Inc.* | | 5,065 |
| Cougar Biotechnology, Inc.* | | 8,681 | | Noven Pharmaceuticals, Inc.* | | 5,022 |
| Cross Country Healthcare, Inc.* | | 8,634 | | Medcath Corp.* | | 280 | | 5,018 |
| Conceptus, Inc.* | | 520 | | 8,622 | | Osiris Therapeutics, Inc.* | | 260 | | 5,015 |
| SurModics, Inc.* | | 270 | | 8,502 | | Sangamo Biosciences, Inc.*† | | 4,928 |
| Emeritus Corp.* | | 340 | | 8,466 | | XOMA Ltd.* | | 2,300 | | 4,830 |
| Universal American Financial Corp.* | 8,289 | | Vnus Medical Technologies, Inc.* | | 4,814 |
940
760
1,060
410
990
180
150
400
440
940
880
290
1,280
460
290
750
820
570
780
590
780
430
300
830
150
480
750
360
260
430
530
640
680
230
| RUSSELL 2000® 1.5x STRATEGY FUND |
| SCHEDULE OF INVESTMENTS (Unaudited) (continued) |
| THE RYDEX SERIES FUNDS SEMI-ANNUAL REPORT |
| See Notes to Financial Statements. | | | | | 55 |
| Emergency Medical Services | | Capital Senior Living Corp.* | | $ | | 2,964 |
| | Corp. — Class A* | | 160 | | $ | | 4,781 | | Novavax, Inc.* | | 1,010 | | 2,929 |
| Cypress Bioscience, Inc.* | | 650 | | 4,778 | | Ardea Biosciences, Inc.* | | 210 | | 2,904 |
| Skilled Healthcare Group, Inc. — | | Clinical Data, Inc.* | | 180 | | 2,894 |
| | Class A* | | 300 | | 4,767 | | Cytokinetics, Inc.* | | 610 | | 2,891 |
| Pozen, Inc.*† | | 450 | | 4,730 | | Exactech, Inc.* | | 130 | | 2,891 |
| Computer Programs & Systems, | | Nighthawk Radiology Holdings, |
| | Inc. | | 160 | | 4,632 | | Inc.* | | 400 | | 2,888 |
| Somanetics Corp.* | | 210 | | 4,593 | | DexCom, Inc.* | | 460 | | 2,847 |
| Genoptix Inc.* | | 140 | | 4,574 | | Stereotaxis, Inc.* | | 470 | | 2,844 |
| Indevus Pharmaceuticals, Inc.* | | 4,523 | | IPC The Hospitalist Co., Inc.* | | 2,827 |
| Alliance Imaging, Inc.* | | 440 | | 4,519 | | BMP Sunstone Corp.* | | 400 | | 2,776 |
| Omrix Biopharmaceuticals, Inc.* | | 4,485 | | Adolor Corp.* | | 800 | | 2,760 |
| Insulet Corp.* | | 320 | | 4,454 | | Tercica, Inc.* | | 300 | | 2,682 |
| Almost Family, Inc.* | | 110 | | 4,351 | | FGX International Holdings Ltd.* | | 2,657 |
| Zymogenetics, Inc.* | | 650 | | 4,329 | | Inspire Pharmaceuticals, Inc.* | | 2,606 |
| ImmunoGen, Inc.* | | 880 | | 4,321 | | Spectranetics Corp.* | | 550 | | 2,547 |
| Palomar Medical Technologies, | | BioMimetic Therapeutics, Inc.* | | 2,544 |
| | Inc.* | | 320 | | 4,307 | | Repligen Corp.* | | 540 | | 2,543 |
| Ligand Pharmaceuticals, Inc. — | | Accelrys, Inc.* | | 460 | | 2,525 |
| | Class B* | | 1,460 | | 4,307 | | Lexicon Genetics, Inc.* | | 1,390 | | 2,474 |
| Dyax Corp.* | | 960 | | 4,224 | | PharmaNet Development Group, |
| Nabi Biopharmaceuticals* | | 900 | | 4,194 | | Inc.* | | 340 | | 2,455 |
| Synovis Life Technologies, Inc.* | | 4,140 | | Ensign Group, Inc. | | 140 | | 2,393 |
| Kensey Nash Corp.* | | 130 | | 4,090 | | Molecular Insight Pharmaceuticals, |
| Triple-S Management Corp. — | | Inc.* | | 310 | | 2,381 |
| | Class B* | | 250 | | 4,073 | | Caraco Pharm Labs, Inc.* | | 190 | | 2,377 |
| Vital Images, Inc.* | | 270 | | 4,050 | | Caliper Life Sciences, Inc.* | | 2,324 |
| Hansen Medical, Inc.* | | 300 | | 4,032 | | Arqule, Inc.* | | 700 | | 2,254 |
| Corvel Corp.* | | 140 | | 4,005 | | Javelin Pharmaceuticals, Inc.* | | 2,210 |
| OraSure Technologies, Inc.* | | 3,985 | | Synta Pharmaceuticals Corp.* | | 2,210 |
| Orexigen Therapeutics, Inc.* | | 3,777 | | Columbia Labs, Inc. Com* | 810 | | 2,122 |
| Micrus Endovascular Corp.* | | 3,767 | | Cantel Medical Corp.* | | 220 | | 2,116 |
| US Physical Therapy, Inc.* | | 210 | | 3,646 | | TranS1, Inc.* | | 210 | | 2,077 |
| Metabolix, Inc.* | | 330 | | 3,590 | | Chindex International, Inc.* | | 2,063 |
| Optimer Pharmaceuticals, Inc.* | | 3,578 | | Five Star Quality Care, Inc.* | | 2,063 |
| Affymax, Inc.* | | 180 | | 3,573 | | Providence Service Corp.* | | 2,058 |
| Cardiac Science Corp.* | | 340 | | 3,522 | | Alexza Pharmaceuticals, Inc.* | | 2,025 |
| I-Flow Corp.* | | 370 | | 3,445 | | Immunomedics, Inc.* | | 1,130 | | 2,011 |
| MannKind Corp.*† | | 890 | | 3,435 | | CardioNet, Inc.* | | 80 | | 1,997 |
| TomoTherapy, Inc.* | | 710 | | 3,252 | | Alphatec Holdings, Inc.* | | 430 | | 1,978 |
| Medical Action Industries, Inc.* | | 3,151 | | NxStage Medical, Inc.* | | 450 | | 1,899 |
| Neurocrine Biosciences, Inc.* | | 3,142 | | Nanosphere, Inc.* | | 220 | | 1,877 |
| Discovery Laboratories, Inc.* | | 3,142 | | Maxygen Inc.* | | 440 | | 1,861 |
| Idenix Pharmaceuticals, Inc.* | | 3,109 | | Cytori Therapeutics, Inc.* | | 350 | | 1,848 |
| Cadence Pharmaceuticals, Inc.* | | 3,108 | | Targacept, Inc.* | | 310 | | 1,801 |
| Obagi Medical Products, Inc.* | | 3,094 | | Acadia Pharmaceuticals, Inc.* | | 1,528 |
| Atrion Corp. | | 30 | | 3,091 | | BioForm Medical, Inc.* | | 380 | | 1,490 |
| Cambrex Corp.* | | 500 | | 3,075 | | RadNet, Inc.* | | 370 | | 1,484 |
| Cynosure, Inc.* | | 170 | | 3,050 | | Opko Health, Inc.* | | 830 | | 1,453 |
| Depomed, Inc.* | | 830 | | 3,030 | | MAP Pharmaceuticals, Inc.* | | 1,417 |
| Celldex Therapeutics, Inc.* | | 3,024 | | Sucampo Pharmaceuticals, Inc. — |
| Emergent Biosolutions, Inc.* | | 3,011 | | Class A* | | 160 | | 1,365 |
| Orthovita, Inc.* | | 1,150 | | 2,990 | | Amicus Therapeutics, Inc.* | | 80 | | 1,210 |
| Ariad Pharmaceuticals, Inc.* | | 2,989 | | Vision-Sciences, Inc.* | | 290 | | 1,157 |
390
1,350
110
250
240
730
230
220
830
850
810
290
350
270
190
450
550
210
410
240
670
1,680
430
350
310
570
140
260
230
1,210
| CONSUMER DISCRETIONARY 8.7% |
| RUSSELL 2000® 1.5x STRATEGY FUND |
| SCHEDULE OF INVESTMENTS (Unaudited) (continued) |
| THE RYDEX SERIES FUNDS SEMI-ANNUAL REPORT |
| 56 | | | | | See Notes to Financial Statements. |
| Acura Pharmaceuticals, Inc.* | | $ | | 984 | | Sonic Corp.* | | 1,040 | | $ | | 15,153 |
| Virtual Radiologic Corp.* | | 120 | | 979 | | Buckle, Inc. | | 270 | | 14,996 |
| MiddleBrook Pharmaceuticals, Inc.* | | 930 | | Bob Evans Farms, Inc. | | 540 | | 14,737 |
| National Research Corp. | | 30 | | 920 | | Timberland Co. — Class A* | | 14,417 |
| Cell Genesys, Inc.* | | 1,490 | | 879 | | Sally Beauty Holdings, Inc.*† | | 14,104 |
| Marshall Edwards, Inc.* | | 360 | | 774 | | Children’s Place Retail Stores, Inc.* | 13,673 |
| Rexahn Pharmaceuticals, Inc.* | | 658 | | Meritage Homes Corp.*† | | 530 | | 13,091 |
| Jazz Pharmaceuticals, Inc.* | | 642 | | Iconix Brand Group, Inc.* | | 13,080 |
| Biodel, Inc.* | | 190 | | 637 | | American Greetings Corp. — |
| Protalix BioTherapeutics, Inc.* | | 424 | | Class A | | 850 | | 12,996 |
| | Quiksilver, Inc.* | | 2,190 | | 12,571 |
| | Buffalo Wild Wings, Inc.* | | 310 | | 12,474 |
| | Ethan Allen Interiors, Inc. | | 430 | | 12,049 |
| | Brown Shoe Co., Inc. | | 730 | | 11,957 |
| | Jakks Pacific, Inc.* | | 480 | | 11,957 |
| | Dress Barn, Inc.* | | 780 | | 11,926 |
| | Helen of Troy Ltd.* | | 520 | | 11,840 |
| | Dillard’s, Inc. — Class A | | 990 | | 11,682 |
| | CEC Entertainment, Inc.* | | 350 | | 11,620 |
| | Stewart Enterprises, Inc. — |
| | Scholastic Corp. | | 420 | | 10,786 |
| | Jos. A. Bank Clothiers, Inc.* | | 10,752 |
| | Capella Education Co.* | | 250 | | 10,715 |
| | Standard-Pacific Corp.* | | 2,150 | | 10,556 |
| | Papa John’s International, Inc.* | | 10,321 |
| | P.F. Chang’s China Bistro, Inc.* | | 9,887 |
| | Hibbett Sports Inc.* | | 490 | | 9,810 |
| | Exide Technologies* | | 1,310 | | 9,668 |
| | CKE Restaurants, Inc. | | 910 | | 9,646 |
| | Charming Shoppes, Inc.* | | 9,633 |
| | Steiner Leisure Ltd.* | | 280 | | 9,626 |
| | Skechers U.S.A., Inc. — Class A* | | 9,593 |
| | NutriSystem, Inc.† | | 530 | | 9,392 |
| | Belo Corp. — Class A | | 1,550 | | 9,238 |
| | Jo-Ann Stores, Inc.* | | 440 | | 9,231 |
| | American Public Education, Inc.* | | 9,173 |
| | Stage Stores, Inc. | | 660 | | 9,016 |
| | 99 Cents Only Stores* | | 810 | | 8,886 |
| | Columbia Sportswear Co. | | 210 | | 8,812 |
| | ATC Technology Corp.* | | 370 | | 8,784 |
| | Cooper Tire & Rubber Co. | | 8,772 |
| | Group 1 Automotive, Inc. | | 400 | | 8,692 |
| | Cato Corp. — Class A | | 480 | | 8,424 |
| | Churchill Downs, Inc. | | 170 | | 8,327 |
| | Dana Holding Corp.* | | 1,720 | | 8,325 |
| | Pacific Sunwear of California, Inc.* | | 8,278 |
| Aeropostale, Inc.* | | 1,160 | | 37,248 |
| The Warnaco Group, Inc.* | | 790 | | 35,779 |
| Tupperware Brands Corp. | | 29,840 |
| Marvel Entertainment, Inc.* | | 29,019 |
| Bally Technologies, Inc.* | | 950 | | 28,766 |
| Matthews International Corp. — |
| Polaris Industries, Inc. | | 570 | | 25,929 |
| Rent-A-Center, Inc.* | | 1,160 | | 25,845 |
| Tractor Supply Co.* | | 580 | | 24,389 |
| Deckers Outdoor Corp.* | | 230 | | 23,938 |
| WMS Industries, Inc.* | | 760 | | 23,233 |
| Wolverine World Wide, Inc. | | 22,756 |
| Corinthian Colleges, Inc.* | | 22,200 |
| Jack in the Box, Inc.* | | 1,020 | | 21,522 |
| Aaron Rents, Inc. | | 790 | | 21,385 |
| Live Nation, Inc.* | | 1,310 | | 21,314 |
| J. Crew Group, Inc.* | | 740 | | 21,142 |
| Gaylord Entertainment Co.* | | 20,853 |
| Collective Brands, Inc.* | | 1,110 | | 20,324 |
| Ryland Group, Inc. | | 740 | | 19,625 |
| Brunswick Corp. | | 1,520 | | 19,441 |
| Men’s Wearhouse, Inc. | | 900 | | 19,116 |
| Vail Resorts, Inc.* | | 540 | | 18,873 |
| Life Time Fitness, Inc.*† | | 600 | | 18,762 |
| Under Armour, Inc.* | | 570 | | 18,103 |
| Cheesecake Factory, Inc.* | | 16,959 |
| Chico’s FAS, Inc.* | | 3,060 | | 16,738 |
| ArvinMeritor, Inc. | | 1,280 | | 16,691 |
| Callaway Golf Co. | | 1,150 | | 16,180 |
| Interactive Data Corp. | | 630 | | 15,889 |
| Tempur-Pedic International, Inc. | | 15,288 |
140
620
830
1,640
410
510
130
1,000
190
320
380
420
1,970
570
190
1,020
1,230
1,080
850
860
1,480
710
1,160
1,300
| RUSSELL 2000® 1.5x STRATEGY FUND |
| SCHEDULE OF INVESTMENTS (Unaudited) (continued) |
| THE RYDEX SERIES FUNDS SEMI-ANNUAL REPORT |
| See Notes to Financial Statements. | | | | | 57 |
| Domino’s Pizza, Inc.* | | 680 | | $ | | 8,255 | | CKX, Inc.* | | 910 | | $ | | 5,606 |
| Cabela’s, Inc. — Class A* | | 680 | | 8,214 | | Zumiez, Inc.* | | 340 | | 5,603 |
| Texas Roadhouse, Inc.* | | 910 | | 8,181 | | Volcom, Inc.* | | 320 | | 5,530 |
| Modine Manufacturing Co. | | 8,109 | | Talbots, Inc. | | 420 | | 5,502 |
| National CineMedia, Inc. | | 730 | | 8,066 | | M/I Homes, Inc.† | | 240 | | 5,467 |
| RCN Corp.* | | 650 | | 7,969 | | Overstock.com, Inc.*† | | 270 | | 5,349 |
| Pinnacle Entertainment, Inc.* | | 7,862 | | Visteon Corp.* | | 2,270 | | 5,266 |
| K-Swiss, Inc. — Class A | | 450 | | 7,830 | | Ambassadors Group, Inc. | | 330 | | 5,250 |
| Red Robin Gourmet Burgers, Inc.* | | 7,772 | | Ruby Tuesday, Inc.* | | 900 | | 5,211 |
| True Religion Apparel, Inc.* | | 7,755 | | Charter Communications, Inc. — |
| Steven Madden, Ltd.* | | 310 | | 7,682 | | Class A* | | 7,080 | | 5,168 |
| Superior Industries International, | | CROCS, Inc.* | | 1,440 | | 5,155 |
| | Inc. | | 400 | | 7,664 | | Morgans Hotel Group Co.* | | 5,128 |
| Furniture Brands International, Inc. | | 7,574 | | DineEquity, Inc. | | 300 | | 5,058 |
| Jackson Hewitt Tax Service, Inc. | | 7,517 | | HOT Topic, Inc.* | | 760 | | 5,024 |
| thinkorswim Group, Inc.* | | 900 | | 7,497 | | Sealy Corp. | | 770 | | 4,974 |
| Champion Enterprises, Inc.* | | 7,492 | | Media General, Inc. | | 400 | | 4,972 |
| Finish Line, Inc. — Class A | 740 | | 7,393 | | American Apparel, Inc.* | | 590 | | 4,838 |
| Fuel Systems Solutions, Inc.* | | 7,234 | | Hayes Lemmerz International, Inc.* | | 4,778 |
| Valassis Communications, Inc.* | | 7,188 | | Blyth, Inc. | | 420 | | 4,763 |
| Lululemon Athletica, Inc.* | | 310 | | 7,139 | | California Pizza Kitchen, Inc.* | | 4,762 |
| Cinemark Holdings, Inc. | | 520 | | 7,072 | | Fisher Communications, Inc. | | 4,728 |
| Borders Group, Inc. | | 1,050 | | 6,888 | | Sauer, Inc. | | 190 | | 4,691 |
| Peet’s Coffee & Tea, Inc.* | | 240 | | 6,701 | | Shuffle Master, Inc.* | | 920 | | 4,683 |
| Harte-Hanks, Inc. | | 640 | | 6,637 | | Christopher & Banks Corp. | | 4,679 |
| Raser Technologies, Inc.* | | 780 | | 6,630 | | Speedway Motorsports, Inc. | | 4,675 |
| Bebe Stores, Inc. | | 670 | | 6,546 | | Ulta Salon Cosmetics & Fragrance, |
| Winnebago Industries, Inc. | | 6,460 | | Inc.* | | 350 | | 4,648 |
| Oxford Industries, Inc. | | 250 | | 6,457 | | Cox Radio Inc. — Class A* | | 4,646 |
| Monro Muffler Brake, Inc. | | 280 | | 6,457 | | iRobot Corp.* | | 310 | | 4,594 |
| PetMed Express, Inc.* | | 410 | | 6,437 | | Sinclair Broadcast Group, Inc. — |
| Pier 1 Imports, Inc.* | | 1,550 | | 6,401 | | Class A | | 910 | | 4,586 |
| Hovnanian Enterprises, Inc. — | | PEP Boys-Manny Moe & Jack | | 4,511 |
| | Class A* | | 800 | | 6,392 | | Dolan Media Co.* | | 440 | | 4,440 |
| GSI Commerce, Inc.*† | | 410 | | 6,347 | | McClatchy Co. — Class A | | 990 | | 4,356 |
| Asbury Automotive Group, Inc. | | 6,336 | | Weyco Group, Inc. | | 130 | | 4,351 |
| Universal Technical Institute, Inc.* | | 6,312 | | Steak n Shake Co.*† | | 500 | | 4,340 |
| Blockbuster, Inc. — Class A* | | 6,293 | | G-III Apparel Group Ltd.* | | 230 | | 4,303 |
| Movado Group, Inc. | | 280 | | 6,258 | | American Axle & Manufacturing |
| Universal Electronics, Inc.* | 250 | | 6,245 | | Holdings, Inc. | | 800 | | 4,288 |
| Ameristar Casinos, Inc. | | 440 | | 6,244 | | Denny’s Corp.* | | 1,650 | | 4,257 |
| Leapfrog Enterprises, Inc.* | | 6,019 | | Tween Brands, Inc.* | | 430 | | 4,210 |
| RC2 Corp.* | | 300 | | 6,000 | | Citi Trends, Inc.* | | 250 | | 4,073 |
| National Presto Industries, Inc. | | 5,960 | | Beazer Homes USA, Inc.* | | 680 | | 4,066 |
| DG FastChannel, Inc.* | | 270 | | 5,918 | | Mediacom Communications |
| Drew Industries, Inc.* | | 340 | | 5,817 | | Corp.* | | 680 | | 4,026 |
| The Wet Seal, Inc. — Class A* | | 5,808 | | Core-Mark Holding Co., Inc.* | | 3,998 |
| Pre-Paid Legal Services, Inc.* | | 5,776 | | Cavco Industries, Inc.* | | 110 | | 3,977 |
| Coldwater Creek, Inc.* | | 990 | | 5,732 | | Knology, Inc.* | | 490 | | 3,954 |
| World Wrestling Entertainment, | | Big 5 Sporting Goods Corp. | | 3,922 |
| | Inc. | | 370 | | 5,720 | | New York & Co., Inc.* | | 400 | | 3,816 |
| Wendy’s/Arby’s Group, Inc. — | | Sonic Automotive, Inc. | | 450 | | 3,807 |
| | Class A | | 1,080 | | 5,681 | | Unifi, Inc.* | | 780 | | 3,775 |
| Maidenform Brands, Inc.* | | 390 | | 5,659 | | Orbitz Worldwide, Inc.* | | 640 | | 3,757 |
| Marcus Corp. | | 350 | | 5,628 | | Martha Stewart Omnimedia, Inc.* | | 3,744 |
560
1,040
290
300
470
720
490
1,350
210
1,750
830
370
120
610
240
500
440
730
550
370
3,070
570
80
1,600
160
140
380
440
| | Total Consumer Discretionary |
| RUSSELL 2000® 1.5x STRATEGY FUND |
| SCHEDULE OF INVESTMENTS (Unaudited) (continued) |
| THE RYDEX SERIES FUNDS SEMI-ANNUAL REPORT |
| 58 | | | | | See Notes to Financial Statements. |
| Charlotte Russe Holding, Inc.* | | $ | | 3,690 | | Libbey, Inc. | | 250 | | $ | | 2,128 |
| Avatar Holdings Inc.* | | 110 | | 3,630 | | Build-A-Bear Workshop, Inc.* | | 2,111 |
| CSS Industries, Inc. | | 140 | | 3,604 | | MarineMax, Inc.*† | | 280 | | 2,024 |
| BJ’s Restaurants, Inc.* | | 300 | | 3,582 | | Lumber Liquidators, Inc.* | | 160 | | 2,010 |
| Journal Communications, Inc. — | | Learning Tree International, Inc.* | | 1,992 |
| | Class A | | 730 | | 3,562 | | Cumulus Media, Inc. — Class A* | | 1,960 |
| Haverty Furniture Companies, Inc. | | 3,546 | | Retail Ventures, Inc.* | | 500 | | 1,950 |
| drugstore.com, Inc.* | | 1,450 | | 3,408 | | Global Traffic Network, Inc.* | | 1,947 |
| Steinway Musical Instruments, Inc.* | | 3,398 | | Dover Downs Gaming & |
| Midas, Inc.* | | 240 | | 3,302 | | Entertainment, Inc. | | 240 | | 1,867 |
| Gaiam, Inc.* | | 310 | | 3,286 | | AH Belo Corp. - Class A | | 360 | | 1,858 |
| Shutterfly, Inc.* | | 340 | | 3,267 | | Quantum Fuel Systems |
| Krispy Kreme Doughnuts, Inc.* | | 3,234 | | Technologies Worldwide, Inc.*† | | 1,845 |
| Idearc, Inc. | | 2,560 | | 3,200 | | Princeton Review, Inc.* | | 230 | | 1,840 |
| AFC Enterprises, Inc.* | | 440 | | 3,194 | | Town Sports International Holdings, |
| Conn’s, Inc.* | | 170 | | 3,181 | | Inc.* | | 300 | | 1,830 |
| Skyline Corp. | | 120 | | 3,172 | | Nautilus, Inc.*† | | 400 | | 1,828 |
| America’s Car Mart, Inc.* | | 170 | | 3,160 | | Spartan Motors, Inc. | | 560 | | 1,781 |
| DSW, Inc.* | | 230 | | 3,151 | | Stein Mart, Inc. | | 440 | | 1,720 |
| Perry Ellis International, Inc.* | | 3,131 | | Great Wolf Resorts, Inc.* | | 470 | | 1,720 |
| Landry’s Restaurants, Inc. | | 200 | | 3,110 | | Palm Harbor Homes, Inc.* | 170 | | 1,685 |
| Hooker Furniture Corp. | | 170 | | 3,018 | | Syms Corp.* | | 120 | | 1,621 |
| Luby’s, Inc.* | | 370 | | 2,975 | | Rex Stores Corp.* | | 140 | | 1,617 |
| Global Sources Ltd.* | | 290 | | 2,920 | | Wonder Auto Technology, Inc.* | | 1,603 |
| Stamps.com, Inc.* | | 250 | | 2,918 | | Bluegreen Corp.* | | 220 | | 1,520 |
| K12 Inc.* | | 110 | | 2,915 | | Playboy Enterprises, Inc. — |
| Cherokee, Inc. | | 130 | | 2,857 | | Class B* | | 370 | | 1,458 |
| Stoneridge, Inc.* | | 250 | | 2,813 | | Dover Motorsports, Inc. | | 260 | | 1,417 |
| Audiovox Corp. — Class A* | | 2,811 | | Marine Products Corp. | | 170 | | 1,411 |
| Entravision Communications | | Fuqi International, Inc.* | | 170 | | 1,386 |
| | Corp. — Class A* | | 1,030 | | 2,771 | | Ruth’s Chris Steak House* | | 350 | | 1,376 |
| Lee Enterprises, Inc. | | 780 | | 2,730 | | Cache, Inc.* | | 200 | | 1,374 |
| O’Charleys, Inc. | | 310 | | 2,713 | | Fleetwood Enterprises, Inc.* | | 1,346 |
| 1-800-FLOWERS.com, Inc.* | | 2,709 | | Gray Television, Inc. | | 740 | | 1,273 |
| Systemax, Inc. | | 190 | | 2,671 | | Riviera Holdings Corp.* | | 170 | | 1,250 |
| Casual Male Retail Group, Inc.* | | 2,555 | | Rick’s Cabaret International, Inc.* | | 1,080 |
| Amerigon, Inc.* | | 380 | | 2,500 | | Primedia, Inc.† | | 440 | | 1,069 |
| Outdoor Channel Holdings, Inc.* | | 2,464 | | Crown Media Holdings, Inc. — |
| Shoe Carnival, Inc.* | | 150 | | 2,457 | | Class A* | | 190 | | 956 |
| Citadel Broadcasting Corp.* | | 2,449 | | Lincoln Educational Services Corp.* | | 926 |
| Isle of Capri Casinos, Inc.* | | 270 | | 2,435 | | Six Flags, Inc.* | | 1,260 | | 869 |
| Smith & Wesson Holding Corp.* | | 2,431 | | Einstein Noah Restaurant Group, |
| Dorman Products, Inc.* | | 190 | | 2,381 | | Inc.* | | 80 | | 806 |
| Lin TV Corp. — Class A* | | 460 | | 2,374 | | Westwood One, Inc.* | | 1,230 | | 677 |
| RH Donnelley Corp.* | | 1,190 | | 2,368 | | Value Line, Inc. | | 20 | | 670 |
| Kenneth Cole Productions, Inc. — | | Aristotle Corp.* | | 20 | | 159 |
| Brookfield Homes Corp. | | 160 | | 2,298 |
| Monarch Casino & Resort, Inc.* | | 2,278 |
| Entercom Communications Corp. | | 2,259 |
| Circuit City Stores, Inc. | | 2,930 | | 2,227 |
| Russ Berrie & Co., Inc.* | | 290 | | 2,224 |
| Tuesday Morning Corp.* | | 530 | | 2,189 |
| EXCO Resources, Inc.* | | 2,590 | | 42,269 |
| Comstock Resources, Inc.* | | 39,539 |
| Penn Virginia Corp. | | 720 | | 38,477 |
| Berry Petroleum Co. — Class A | | 28,660 |
| Concho Resources, Inc.* | | 960 | | 26,506 |
| Arena Resources, Inc.* | | 660 | | 25,641 |
360
290
160
460
310
210
120
980
1,430
210
250
300
1,320
450
650
110
280
3,140
70
650
200
450
790
740
| RUSSELL 2000® 1.5x STRATEGY FUND |
| SCHEDULE OF INVESTMENTS (Unaudited) (continued) |
| THE RYDEX SERIES FUNDS SEMI-ANNUAL REPORT |
| See Notes to Financial Statements. | | | | | 59 |
| Grey Wolf, Inc.* | | 3,100 | | $ | | 24,118 | | Callon Petroleum Co.* | | 360 | | $ | | 6,491 |
| Dril-Quip, Inc.* | | 540 | | 23,431 | | Clayton Williams Energy, Inc.* | | 6,348 |
| Stone Energy Corp.* | | 550 | | 23,281 | | Energy XXI Bermuda Ltd. | | 6,323 |
| McMoRan Exploration Co.* | | 22,222 | | ENGlobal Corp.* | | 470 | | 6,237 |
| ION Geophysical Corp.* | | 1,470 | | 20,859 | | Allis-Chalmers Energy, Inc.* | | 6,199 |
| Lufkin Industries, Inc. | | 260 | | 20,631 | | Harvest Natural Resources, Inc.* | | 6,173 |
| Bill Barrett Corp.* | | 640 | | 20,550 | | TXCO Resources, Inc.* | | 610 | | 6,124 |
| Swift Energy Co.* | | 530 | | 20,506 | | Dawson Geophysical Co.* | | 130 | | 6,070 |
| Atlas America, Inc. | | 600 | | 20,466 | | VeraSun Energy Corp.* | | 1,780 | | 5,571 |
| Nordic American Tanker Shipping | | 19,236 | | Clean Energy Fuels Corp.* | | 5,377 |
| CARBO Ceramics, Inc. | | 360 | | 18,580 | | Western Refining, Inc. | | 520 | | 5,257 |
| BPZ Resources, Inc.*† | | 1,040 | | 17,888 | | FX Energy, Inc.* | | 700 | | 5,208 |
| Willbros Group, Inc.* | | 670 | | 17,755 | | Energy Partners Ltd.* | | 550 | | 4,769 |
| GulfMark Offshore, Inc.* | | 390 | | 17,503 | | Bronco Drilling Co., Inc.* | | 460 | | 4,701 |
| Crosstex Energy, Inc. | | 700 | | 17,479 | | Gulfport Energy Corp.* | | 460 | | 4,623 |
| Carrizo Oil & Gas, Inc.* | | 470 | | 17,047 | | Rex Energy Corp.* | | 290 | | 4,570 |
| Goodrich Petroleum Corp.* | | 17,000 | | Venoco, Inc.* | | 350 | | 4,550 |
| Complete Production Services, | | Rentech, Inc.* | | 2,880 | | 3,830 |
| | Inc.* | | 830 | | 16,708 | | Trico Marine Services, Inc.* | | 3,758 |
| Rosetta Resources, Inc.* | | 890 | | 16,340 | | Panhandle Oil and Gas, Inc. — |
| Ship Finance International Ltd. | | 15,739 | | Class A | | 130 | | 3,722 |
| Parker Drilling Co.* | | 1,960 | | 15,719 | | Natural Gas Services Group, Inc.* | | 3,669 |
| Hornbeck Offshore Services, Inc.* | | 15,448 | | CVR Energy, Inc.* | | 400 | | 3,408 |
| Basic Energy Services, Inc.* | | 15,336 | | Northern Oil And Gas, Inc.* | | 3,008 |
| Delta Petroleum Corp.* | | 1,080 | | 14,666 | | Gasco Energy, Inc.* | | 1,630 | | 2,967 |
| Bristow Group, Inc.* | | 420 | | 14,213 | | BMB Munai, Inc.* | | 690 | | 2,864 |
| NATCO Group, Inc.* | | 350 | | 14,063 | | OYO Geospace Corp.* | | 70 | | 2,750 |
| GMX Resources, Inc.* | | 290 | | 13,862 | | Toreador Resources Corp.* | | 2,607 |
| International Coal Group, Inc.* | | 13,790 | | Endeavour International Corp.* | | 2,600 |
| Contango Oil & Gas Co.* | | 230 | | 12,415 | | Alon USA Energy, Inc. | | 190 | | 2,561 |
| Petroleum Development Corp.* | | 11,536 | | Union Drilling, Inc.* | | 240 | | 2,542 |
| World Fuel Services Corp. | | 500 | | 11,515 | | Westmoreland Coal Co.* | | 160 | | 2,528 |
| Petroquest Energy, Inc.* | | 750 | | 11,512 | | National Coal Corp.* | | 480 | | 2,510 |
| Pioneer Drilling Co.* | | 860 | | 11,438 | | Meridian Resource Corp.* | | 2,484 |
| Newpark Resources, Inc.* | | 11,388 | | Tri-Valley Corp.* | | 390 | | 2,473 |
| USEC, Inc.* | | 1,930 | | 10,441 | | RAM Energy Resources, Inc.* | | 2,341 |
| Warren Resources, Inc.* | | 1,010 | | 10,080 | | Approach Resources, Inc.* | | 2,314 |
| James River Coal Co.* | | 440 | | 9,676 | | Bolt Technology Corp.* | | 150 | | 2,171 |
| Oilsands Quest, Inc.* | | 3,050 | | 9,119 | | Delek US Holdings, Inc. | | 230 | | 2,132 |
| General Maritime Corp. | | 460 | | 8,961 | | Double Eagle Petroleum Co.* | | 1,999 |
| PHI, Inc.* | | 240 | | 8,863 | | APCO Argentina, Inc. | | 70 | | 1,982 |
| Brigham Exploration Co.* | | 800 | | 8,792 | | Abraxas Petroleum Corp.* | | 1,905 |
| Matrix Service Co.* | | 450 | | 8,595 | | Cano Petroleum, Inc.* | | 820 | | 1,894 |
| ATP Oil & Gas Corp.* | | 480 | | 8,549 | | Cheniere Energy, Inc.* | | 840 | | 1,890 |
| T-3 Energy Services, Inc. — | | Sulphco, Inc.* | | 920 | | 1,849 |
| | Class A* | | 220 | | 8,166 | | GeoMet, Inc.* | | 320 | | 1,741 |
| Cal Dive International, Inc.* | | 8,162 | | Mitcham Industries, Inc.* | | 170 | | 1,715 |
| Golar LNG Ltd. | | 610 | | 8,101 | | American Oil & Gas, Inc.* | | 640 | | 1,670 |
| Knightsbridge Tankers Ltd. | | 7,941 | | GeoGlobal Resources, Inc.* | | 1,663 |
| Superior Well Services, Inc.* | | 7,340 | | Houston American Energy Corp. | | 1,643 |
| Gulf Island Fabrication, Inc. | | 7,239 | | Aventine Renewable Energy |
| Vaalco Energy, Inc.* | | 1,030 | | 7,045 | | Holdings, Inc.* | | 510 | | 1,612 |
| RPC, Inc.† | | 500 | | 7,030 | | Geokinetics, Inc.* | | 80 | | 1,520 |
| Parallel Petroleum Corp.* | | 720 | | 6,782 | | PrimeEnergy Corp.* | | 20 | | 1,480 |
| Gran Tierra Energy, Inc.* | | 1,800 | | 6,678 | | Uranium Resources, Inc.* | | 850 | | 1,437 |
90
2,080
940
490
610
600
380
390
220
730
210
400
720
370
290
2,210
1,970
260
1,350
1,560
810
160
140
730
770
300
660
290
260
210
| RUSSELL 2000® 1.5x STRATEGY FUND |
| SCHEDULE OF INVESTMENTS (Unaudited) (continued) |
| THE RYDEX SERIES FUNDS SEMI-ANNUAL REPORT |
| 60 | | | | | See Notes to Financial Statements. |
| Evergreen Energy Inc.* | | 1,470 | | $ | | 1,382 | | A.M. Castle & Co. | | 290 | | $ | | 5,011 |
| Quest Resource Corp.* | | 480 | | 1,277 | | American Vanguard Corp. | | 330 | | 4,976 |
| Georesources, Inc.* | | 110 | | 1,261 | | Neenah Paper, Inc. | | 250 | | 4,950 |
| Pacific Ethanol, Inc.* | | 770 | | 1,070 | | Innospec, Inc. | | 410 | | 4,945 |
| GreenHunter Energy, Inc.* | | 70 | | 998 | | General Moly, Inc.* | | 1,090 | | 4,742 |
| | Olympic Steel, Inc. | | 160 | | 4,718 |
| | Allied Nevada Gold Corp.* | | 4,462 |
| | Innophos Holdings, Inc. | | 180 | | 4,388 |
| | Flotek Industries, Inc.* | | 390 | | 4,290 |
| | LSB Industries, Inc.* | | 300 | | 4,155 |
| | Stillwater Mining Co.* | | 690 | | 4,009 |
| | ShengdaTech, Inc.* | | 520 | | 3,640 |
| | Horsehead Holding Corp.* | | 3,599 |
| | AbitibiBowater, Inc.* | | 920 | | 3,560 |
| | U S Concrete, Inc.* | | 690 | | 3,084 |
| | Universal Stainless & Alloy* | | 3,066 |
| | KapStone Paper and Packaging |
| | Mercer International, Inc.* | 520 | | 1,903 |
| | AEP Industries, Inc.* | | 90 | | 1,800 |
| | Apex Silver Mines Ltd.* | | 1,020 | | 1,754 |
| | Bway Holding Co.* | | 130 | | 1,525 |
| | General Steel Holdings, Inc.*† | | 1,357 |
| | NL Industries, Inc. | | 120 | | 1,232 |
| | United States Lime & Minerals, |
| | China Precision Steel, Inc.* | | 999 |
| | Sutor Technology Group Ltd.* | | 428 |
| Hecla Mining Co.*† | | 2,210 | | 10,343 |
| Haynes International, Inc.* | 210 | | 9,834 | | ITC Holdings Corp. | | 860 | | 44,522 |
| Headwaters, Inc.* | | 730 | | 9,745 | | Westar Energy, Inc. | | 1,820 | | 41,933 |
| A. Schulman, Inc. | | 470 | | 9,297 | | Piedmont Natural Gas Co. | | 40,589 |
| Balchem Corp. | | 310 | | 8,268 | | Nicor, Inc. | | 780 | | 34,593 |
| Zoltek Companies, Inc.* | | 480 | | 8,213 | | WGL Holdings, Inc. | | 860 | | 27,907 |
| RTI International Metals, Inc.* | | 7,824 | | Cleco Corp. | | 1,040 | | 26,260 |
| Wausau Paper Corp. | | 770 | | 7,800 | | New Jersey Resources Corp. | | 26,200 |
| Westlake Chemical Corp. | | 330 | | 6,940 | | Portland General Electric Co. | | 25,789 |
| Brush Engineered Materials, Inc.* | | 6,499 | | Northwest Natural Gas Co. | | 23,920 |
| Zep, Inc. | | 360 | | 6,350 | | IDACORP, Inc. | | 790 | | 22,981 |
| Graphic Packaging Holding Co.* | | 6,275 | | Southwest Gas Corp. | | 750 | | 22,695 |
| Myers Industries, Inc. | | 490 | | 6,179 | | Black Hills Corp. | | 670 | | 20,817 |
| Stepan Co. | | 110 | | 6,003 | | Allete, Inc. | | 450 | | 20,025 |
| Buckeye Technologies, Inc.* | | 5,569 | | Avista Corp. | | 920 | | 19,973 |
| Spartech Corp. | | 530 | | 5,247 | | South Jersey Industries, Inc. | | 18,564 |
| Schweitzer-Mauduit International, | | Laclede Group, Inc. | | 380 | | 18,426 |
| | Inc. | | 270 | | 5,127 | | Unisource Energy Corp. | | 600 | | 17,514 |
| Quaker Chemical Corp. | | 180 | | 5,123 | | NorthWestern Corp. | | 680 | | 17,088 |
| Hercules, Inc. | | 1,960 | | 38,788 |
| Compass Minerals International, |
| Rock-Tenn Co. — Class A | | 660 | | 26,387 |
| Sensient Technologies Corp. | | 23,348 |
| Solutia, Inc.* | | 1,640 | | 22,960 |
| Silgan Holdings, Inc. | | 440 | | 22,480 |
| Minerals Technologies, Inc. | | 19,589 |
| W.R. Grace & Co.* | | 1,250 | | 18,900 |
| Rockwood Holdings, Inc.* | | 720 | | 18,475 |
| Royal Gold, Inc. | | 510 | | 18,340 |
| Texas Industries, Inc. | | 410 | | 16,753 |
| Worthington Industries, Inc. | | 16,733 |
| Louisiana-Pacific Corp. | | 1,790 | | 16,647 |
| Arch Chemicals, Inc. | | 430 | | 15,179 |
| Coeur d’Alene Mines Corp.* | | 14,611 |
| Calgon Carbon Corp.* | | 710 | | 14,456 |
| Amcol International Corp. | | 450 | | 14,067 |
| Koppers Holdings, Inc. | | 360 | | 13,468 |
| Kaiser Aluminum Corp. | | 270 | | 11,596 |
| Deltic Timber Corp. | | 180 | | 11,455 |
| PolyOne Corp.* | | 1,620 | | 10,449 |
780
610
120
190
300
130
1,270
400
730
1,090
350
460
2,510
680
520
830
330
1,120
9,550
| | TELECOMMUNICATION SERVICES 0.8% |
| RUSSELL 2000® 1.5x STRATEGY FUND |
| SCHEDULE OF INVESTMENTS (Unaudited) (continued) |
| THE RYDEX SERIES FUNDS SEMI-ANNUAL REPORT |
| See Notes to Financial Statements. | | | | | 61 |
| El Paso Electric Co.* | | 780 | | $ | | 16,380 | | Smart Balance, Inc.* | | 1,090 | | $ | | 7,150 |
| Otter Tail Power Co. | | 520 | | 15,980 | | Boston Beer Co., Inc. — Class A* | | 7,124 |
| UIL Holding Corp. | | 440 | | 15,105 | | American Oriental Bioengineering, |
| PNM Resources, Inc. | | 1,330 | | 13,619 | | Inc.* | | 1,070 | | 6,944 |
| Mge Energy, Inc. | | 380 | | 13,509 | | Weis Markets, Inc. | | 190 | | 6,842 |
| California Water Service Group | | 13,090 | | Central Garden and Pet Co. — |
| Empire District Electric Co. | | 12,597 | | Class A* | | 1,120 | | 6,664 |
| CH Energy Group, Inc. | | 270 | | 11,764 | | Great Atlantic & Pacific Tea |
| American States Water Co. | | 11,550 | | Company, Inc* | | 610 | | 6,600 |
| Ormat Technologies, Inc. | | 310 | | 11,262 | | Cal-Maine Foods, Inc. | | 230 | | 6,311 |
| EnergySouth, Inc. | | 130 | | 7,986 | | Alliance One International, Inc.* | | 5,852 |
| SJW Corp. | | 230 | | 6,893 | | Prestige Brands Holdings, Inc. — |
| Southwest Water Co.† | | 420 | | 5,355 | | Class A* | | 590 | | 5,239 |
| Connecticut Water Service, Inc. | | 4,343 | | Ingles Markets, Inc. — Class A | | 5,023 |
| Consolidated Water Co., Inc. | | 4,255 | | USANA Health Sciences, Inc.* | | 4,919 |
| Central Vermont Public Service | | Pricesmart, Inc. | | 250 | | 4,185 |
| | Corp. | | 180 | | 4,219 | | Star Scientific, Inc.* | | 1,140 | | 4,058 |
| Middlesex Water Co. | | 230 | | 4,018 | | Omega Protein Corp.* | | 320 | | 3,763 |
| Cadiz, Inc.* | | 210 | | 4,005 | | Synutra International, Inc.* | | 3,623 |
| Chesapeake Utilities Corp. | | 3,985 | | Zhongpin, Inc.* | | 320 | | 3,402 |
| Synthesis Energy Systems, Inc.* | | 2,134 | | Inter Parfums, Inc. | | 240 | | 3,254 |
| US Geothermal, Inc.* | | 1,080 | | 1,937 | | Coca-Cola Bottling Co. |
| | Farmer Brothers Co. | | 120 | | 2,984 |
| | Village Super Market | | 60 | | 2,860 |
| | Imperial Sugar Co., Inc. | | 210 | | 2,843 |
| | AgFeed Industries, Inc.* | | 340 | | 2,686 |
| | Calavo Growers, Inc. | | 180 | | 2,243 |
| | Griffin Land & Nurseries, Inc. | | 2,225 |
| | Maui Land & Pineapple Co., Inc.* | | 2,199 |
| | Susser Holdings Corp.* | | 140 | | 2,108 |
| | Pilgrim’s Pride Corp.† | | 780 | | 1,942 |
| | National Beverage Corp.* | | 190 | | 1,685 |
| | China Sky One Medical, Inc.* | | 1,580 |
| | American Dairy, Inc.* | | 120 | | 1,216 |
| | Reddy Ice Holdings, Inc. | | 310 | | 1,132 |
| | Schiff Nutrition International, Inc.* | | 1,093 |
| | Spectrum Brands, Inc.* | | 700 | | 973 |
| | Lifeway Foods, Inc.* | | 80 | | 936 |
| | HQ Sustainable Maritime Industries, |
| Vector Group Ltd. | | 570 | | 10,066 | | tw telecom Inc.* | | 2,550 | | 26,494 |
| Nash Finch Co. | | 220 | | 9,486 | | Premiere Global Services, Inc.* | | 15,044 |
| Spartan Stores, Inc. | | 380 | | 9,454 | | Syniverse Holdings, Inc.* | | 890 | | 14,783 |
| J&J Snack Foods Corp. | | 250 | | 8,478 | | NTELOS Holdings Corp. | | 520 | | 13,983 |
| Pantry, Inc.* | | 390 | | 8,264 | | Fairpoint Communications, Inc. | | 13,352 |
| Elizabeth Arden, Inc.* | | 420 | | 8,245 | | Cincinnati Bell, Inc.* | | 4,220 | | 13,040 |
| Diamond Foods, Inc. | | 280 | | 7,848 |
| Ralcorp Holdings, Inc.* | | 980 | | 66,062 |
| Longs Drug Stores Corp. | | 540 | | 40,846 |
| Flowers Foods, Inc. | | 1,340 | | 39,342 |
| Casey’s General Stores, Inc. | | 26,550 |
| Hain Celestial Group, Inc.* | | 19,271 |
| United Natural Foods, Inc.* | | 18,493 |
| Fresh Del Monte Produce, Inc.* | | 16,206 |
| TreeHouse Foods, Inc.* | | 540 | | 16,038 |
| Darling International, Inc.* | | 15,665 |
| Nu Skin Enterprises, Inc. | | 860 | | 13,949 |
| Lancaster Colony Corp. | | 350 | | 13,181 |
| Winn-Dixie Stores, Inc.* | | 940 | | 13,066 |
| Sanderson Farms, Inc. | | 350 | | 12,859 |
| Chiquita Brands International, Inc.* | 11,858 |
| Tootsie Roll Industries, Inc. | | 11,853 |
| Green Mountain Coffee Roasters, |
150
340
590
300
1,540
150
220
250
120
180
120
440
60
80
130
160
1,070
1,540
880
700
740
730
1,410
750
410
SCHEDULE OF INVESTMENTS (Unaudited) (concluded)
September 30, 2008
RUSSELL 2000® 1.5x STRATEGY FUND
MARKET
FACE
MARKET
SHARES
VALUE
AMOUNT
VALUE
Iowa Telecommunications Services,
REPURCHASE AGREEMENTS 29.3%
Inc.
560
$
10,461
Repurchase Agreements (Note 5)
Alaska Communications Systems
Morgan Stanley
Group, Inc.
750
9,172
issued 09/30/08 at 0.05%
Shenandoah Telecommunications
due 10/01/08
$2,386,600
$
2,386,600
Co.
410
9,049
Mizuho Financial Group, Inc.
Centennial Communications Corp.*
1,170
7,301
issued 09/30/08 at 0.26%
General Communication, Inc. —
due 10/01/08
1,976,879
1,976,879
Class A*
780
7,223
Credit Suisse Group
Global Crossing*
450
6,822
issued 09/30/08 at 0.25%
iPCS, Inc. — Class A*
300
6,681
due 10/01/08††
1,807,529
1,807,529
Cogent Communications Group,
Morgan Stanley
Inc.*
830
6,407
issued 09/30/08 at 0.10%
Cbeyond, Inc.*
420
6,044
due 10/01/08
1,399,560
1,399,560
Consolidated Communications
Total Repurchase Agreements
Holdings, Inc.
400
6,032
(Cost $7,570,568)
7,570,568
PAETEC Holding Corp.*
2,140
4,601
Total Investments 99.4%
Atlantic Tele-Network, Inc.
160
4,480
(Cost $25,629,896)
$25,698,032
USA Mobility, Inc.*
400
4,400
FiberTower Corp.*
2,090
2,884
Other Assets in Excess
ICO Global Communications
of Liabilities – 0.6%
$
160,410
Holdings Ltd.*
1,800
1,962
Net Assets – 100.0%
$25,858,442
Ibasis, Inc.
550
1,919
Hungarian Telephone & Cable
UNREALIZED
Corp.*
80
1,592
CONTRACTS
GAIN (LOSS)
Virgin Mobile USA, Inc. — Class A*
530
1,558
FUTURES CONTRACTS PURCHASED
Globalstar, Inc.*
730
1,241
December 2008 Russell 2000 Index
TerreStar Corp.*
1,010
1,010
Mini Futures Contracts
IDT Corp. — Class B*
940
696
(Aggregate Market Value
Total Telecommunication Services
198,231
of Contracts $11,522,420)
169
$
(552,446)
Total Common Stocks
(Cost $17,838,234)
17,906,370
UNITS
SECURITIES LENDING COLLATERAL 0.9%
EQUITY INDEX SWAP AGREEMENT
Mount Vernon Securities
Credit Suisse Capital, LLC
Lending Trust Prime
December 2008 Russell 2000 Index
Portfolio (Note 9)
221,094
221,094
Swap, Terminating 12/29/08**
Total Securities Lending Collateral
(Notional Market Value
(Cost $221,094)
221,094
$9,310,647)
13,701
$
—
* Non-Income Producing Security.
** Total Return based on Russell 2000 Index +/- financing at a variable rate.
† All or a portion of this security is on loan at September 30, 2008 — See Note 9.
†† All or a portion of this security is pledged as equity index swap collateral at September 30, 2008.
62
|
THE RYDEX SERIES FUNDS SEMI-ANNUAL REPORT
See Notes to Financial Statements.
| SCHEDULE OF INVESTMENTS (Unaudited) |
| THE RYDEX SERIES FUNDS SEMI-ANNUAL REPORT |
| See Notes to Financial Statements. | | | | | 63 |
| | Cousins Properties, Inc. | | 795 | | $ | | 20,058 |
| | Greenhill & Co., Inc. | | 270 | | 19,912 |
| | Post Properties, Inc. | | 700 | | 19,579 |
| Senior Housing Properties Trust | $ | | 43,132 | | Extra Space Storage, Inc. | | 19,354 |
| Realty Income Corp. | | 1,600 | | 40,960 | | Selective Insurance Group, Inc. | | 19,253 |
| Apollo Investment Corp. | | 2,250 | | 38,362 | | Eastgroup Properties, Inc. | | 390 | | 18,931 |
| Aspen Insurance Holdings Ltd. | | 37,125 | | First Midwest Bancorp, Inc. | | 18,665 |
| Highwoods Properties, Inc. | | 35,560 | | Cathay General Bancorp | | 780 | | 18,564 |
| BioMed Realty Trust, Inc. | | 29,888 | | Stifel Financial Corp.* | | 370 | | 18,463 |
| Home Properties, Inc. | | 500 | | 28,975 | | National Penn Bancshares, Inc. | | 18,396 |
| Potlatch Corp. | | 620 | | 28,762 | | Delphi Financial Group, Inc. — |
| Washington Real Estate Investment | | Class A | | 650 | | 18,226 |
| | Trust | | 780 | | 28,571 | | MB Financial Corp. | | 550 | | 18,188 |
| ProAssurance Corp.* | | 510 | | 28,560 | | Sovran Self Storage, Inc. | | 405 | | 18,099 |
| National Retail Properties, Inc. | | 27,782 | | Argo Group International Holdings |
| Platinum Underwriters Holdings | | Ltd.* | | 490 | | 18,056 |
| | Ltd. | | 770 | | 27,320 | | RLI Corp. | | 290 | | 18,006 |
| First Niagara Financial Group, Inc. | | 27,247 | | First Financial Bankshares, Inc. | | 17,120 |
| SVB Financial Group* | | 470 | | 27,222 | | Equity Lifestyle Properties, Inc. | | 16,970 |
| Healthcare Realty Trust, Inc. | | 27,109 | | Phoenix Companies, Inc. | | 16,724 |
| Hilb Rogal & Hobbs Co. | | 580 | | 27,109 | | Odyssey Re Holdings Corp. | | 16,644 |
| FirstMerit Corp. | | 1,280 | | 26,880 | | Cash America International, Inc. | | 16,578 |
| Susquehanna Bancshares, Inc. | | 26,547 | | Signature Bank* | | 470 | | 16,394 |
| Westamerica Bancorporation | | 26,464 | | Lexington Realty Trust | | 945 | | 16,273 |
| Entertainment Properties Trust | | 26,266 | | Trustmark Corp. | | 780 | | 16,177 |
| NewAlliance Bancshares, Inc. | | 25,852 | | Ares Capital Corp. | | 1,540 | | 16,062 |
| UMB Financial Corp. | | 490 | | 25,735 | | First Commonwealth Financial |
| Omega Healthcare Investors, Inc. | | 25,361 | | Corp. | | 1,160 | | 15,625 |
| Colonial BancGroup, Inc. | | 25,066 | | Provident Financial Services, Inc. | | 15,519 |
| Corporate Office Properties Trust | | NBT Bancorp, Inc. | | 510 | | 15,259 |
| | SBI | | 610 | | 24,613 | | Pacific Capital Bancorp | | 730 | | 14,855 |
| Montpelier Re Holdings Ltd. | | 24,435 | | LaSalle Hotel Properties | | 630 | | 14,692 |
| IPC Holdings Ltd. | | 790 | | 23,866 | | CVB Financial Corp. | | 1,050 | | 14,595 |
| Validus Holdings Ltd. | | 1,020 | | 23,715 | | Assured Guaranty Ltd. | | 880 | | 14,309 |
| Mid-America Apartment | | Inland Real Estate Corp. | | 910 | | 14,278 |
| | Communities, Inc. | | 472 | | 23,194 | | Interactive Brokers Group, Inc. — |
| American Campus Communities, | | Class A* | | 640 | | 14,189 |
| | Inc. | | 670 | | 22,700 | | PrivateBancorp, Inc. | | 340 | | 14,164 |
| Knight Capital Group, Inc. — | | TrustCo Bank Corp. | | 1,200 | | 14,052 |
| | Class A* | | 1,480 | | 21,993 | | Colonial Properties Trust | | 750 | | 14,017 |
| Tanger Factory Outlet Centers, | | S&T Bancorp, Inc. | | 380 | | 13,995 |
| | Inc. | | 500 | | 21,895 | | Umpqua Holding Corp. | | 950 | | 13,974 |
| International Bancshares Corp. | | 21,870 | | PS Business Parks, Inc. | | 240 | | 13,824 |
| FNB Corp. | | 1,360 | | 21,733 | | East-West Bancorp, Inc. | | 999 | | 13,686 |
| Zenith National Insurance Corp. | | 21,618 | | DiamondRock Hospitality Co. | | 13,650 |
| Prosperity Bancshares, Inc. | | 21,074 | | Employers Holdings, Inc. | | 780 | | 13,556 |
| Glacier Bancorp, Inc. | | 850 | | 21,054 | | KBW, Inc.* | | 410 | | 13,505 |
| Old National Bancorp | | 1,050 | | 21,021 | | Park National Corp. | | 170 | | 13,260 |
| United Bankshares, Inc. | | 600 | | 21,000 | | optionsXpress Holdings, Inc. | | 13,011 |
| Hancock Holding Co. | | 410 | | 20,910 | | Piper Jaffray Companies, Inc.* | | 12,975 |
| Max Capital Group Ltd. | | 890 | | 20,675 | | Acadia Realty Trust | | 510 | | 12,893 |
| MFA Mortgage Investments, Inc. | | 20,345 | | First Bancorp Puerto Rico | | 12,387 |
| DCT Industrial Trust, Inc. | | 2,710 | | 20,298 | | Navigators Group, Inc.* | | 209 | | 12,122 |
| First Industrial Realty Trust, Inc.† | | 20,076 | | Sterling Bancshares, Inc. | | 1,160 | | 12,122 |
1,810
1,260
840
1,350
770
1,000
1,130
1,260
1,160
1,730
330
320
930
1,810
380
460
1,360
460
480
1,720
1,290
3,189
940
1,480
810
590
1,500
620
670
300
3,130
1,120
700
| SCHEDULE OF INVESTMENTS (Unaudited) (continued) |
| THE RYDEX SERIES FUNDS SEMI-ANNUAL REPORT |
| 64 | | | | | See Notes to Financial Statements. |
| Franklin Street Properties Corp., | | Horace Mann Educators Corp. | | $ | | 8,237 |
| | Inc. | | 930 | | $ | | 12,090 | | Independent Bank Corp. | | 260 | | 8,104 |
| Alexander’s, Inc.* | | 30 | | 12,000 | | Stewart Information Services Corp. | | 8,032 |
| National Health Investors, Inc. | | 11,963 | | Harleysville Group, Inc. | | 210 | | 7,938 |
| Medical Properties Trust Inc. | | 11,917 | | Cedar Shopping Centers, Inc. | | 7,932 |
| Sterling Savings Bank | | 820 | | 11,890 | | Simmons First National Corp. | | 7,832 |
| Community Bank System, Inc. | | 11,820 | | Anworth Mortgage Asset Corp. | | 7,696 |
| Chemical Financial Corp. | | 379 | | 11,802 | | SWS Group, Inc. | | 380 | | 7,661 |
| Brookline Bancorp, Inc. | | 920 | | 11,767 | | Ashford Hospitality Trust, Inc. | | 7,654 |
| Portfolio Recovery Associates, Inc.* | 11,671 | | Saul Centers, Inc. | | 150 | | 7,581 |
| Ezcorp, Inc. — Class A* | | 610 | | 11,468 | | Central Pacific Financial Corp. | | 7,564 |
| Redwood Trust, Inc. | | 520 | | 11,300 | | Tower Group, Inc. | | 320 | | 7,539 |
| UCBH Holdings, Inc. | | 1,750 | | 11,217 | | Boston Private Financial Holdings, |
| WesBanco, Inc. | | 420 | | 11,180 | | Inc. | | 859 | | 7,508 |
| PacWest Bancorp | | 390 | | 11,150 | | American Equity Investment Life |
| Pinnacle Financial Partners, Inc.* | | 11,088 | | Holding Co. | | 993 | | 7,447 |
| Sunstone Hotel Investors, Inc. | | 10,935 | | StellarOne Corp. | | 360 | | 7,441 |
| Wintrust Financial Corp. | | 370 | | 10,859 | | Northwest Bancorp, Inc. | | 270 | | 7,436 |
| Greenlight Capital Re Ltd. — | | Univest Corp. of Pennsylvania | | 7,400 |
| | Class A* | | 460 | | 10,575 | | Universal Health Realty Income |
| IBERIABANK Corp. | | 200 | | 10,570 | | Trust | | 190 | | 7,391 |
| City Holding Co. | | 250 | | 10,562 | | Cohen & Steers, Inc. | | 260 | | 7,366 |
| Pennsylvania Real Estate | | Aircastle Ltd. | | 740 | | 7,333 |
| | Investment Trust | | 560 | | 10,556 | | First Busey Corp. | | 400 | | 7,332 |
| LTC Properties, Inc. | | 360 | | 10,555 | | Hilltop Holdings, Inc.* | | 710 | | 7,327 |
| Ambac Financial Group, Inc. | | 10,555 | | TowneBank | | 330 | | 7,260 |
| Investors Bancorp, Inc.* | | 700 | | 10,535 | | Renasant Corp. | | 330 | | 7,164 |
| Equity One, Inc. | | 510 | | 10,450 | | GAMCO Investors, Inc. — Class A | | 7,116 |
| United Fire & Casualty Co. | | 10,292 | | Capital Southwest Corp. | | 50 | | 7,103 |
| Investors Real Estate Trust | 910 | | 10,183 | | FelCor Lodging Trust, Inc. | | 990 | | 7,088 |
| Frontier Financial Corp. | | 739 | | 9,925 | | NorthStar Realty Finance Corp. | | 6,820 |
| Infinity Property & Casualty Corp. | | 9,888 | | Oriental Financial Group | | 380 | | 6,787 |
| Safety Insurance Group, Inc. | | 9,862 | | First Potomac Realty Trust | 390 | | 6,704 |
| Capstead Mortgage Corp. | | 9,745 | | Tejon Ranch Co. De* | | 180 | | 6,687 |
| National Western Life Insurance | | FPIC Insurance Group, Inc.* | | 6,681 |
| | Co. — Class A | | 40 | | 9,683 | | Crawford & Co. — Class B* | | 6,658 |
| U-Store-It Trust | | 780 | | 9,571 | | Riskmetrics Group, Inc.* | | 340 | | 6,654 |
| Getty Realty Corp. | | 430 | | 9,533 | | First Merchants Corp. | | 290 | | 6,612 |
| World Acceptance Corp.* | | 260 | | 9,360 | | Beneficial Mutual Bancorp, Inc.* | | 6,578 |
| Pico Holdings, Inc.* | | 260 | | 9,337 | | FCStone Group, Inc.* | | 360 | | 6,476 |
| National Financial Partners Corp. | | 9,300 | | SY Bancorp, Inc. | | 210 | | 6,430 |
| Financial Federal Corp. | | 400 | | 9,168 | | Radian Group, Inc. | | 1,270 | | 6,401 |
| Texas Capital Bancshares, Inc.* | | 9,134 | | State Auto Financial Corp. | | 6,395 |
| Parkway Properties, Inc. | | 240 | | 9,086 | | Glimcher Realty Trust | | 600 | | 6,264 |
| Strategic Hotels & Resorts, Inc. | | 8,909 | | eHealth, Inc.* | | 390 | | 6,240 |
| Enstar Group* | | 89 | | 8,665 | | Meadowbrook Insurance Group, |
| Bank Mutual Corp. | | 759 | | 8,615 | | Inc. | | 880 | | 6,213 |
| First Financial Bancorp | | 590 | | 8,614 | | Banco Latinoamericano de |
| United Community Banks, Inc. | | 8,493 | | Exportaciones SA | | 430 | | 6,201 |
| Harleysville National Corp. | | 8,490 | | Urstadt Biddle Properties, Inc. | | 6,188 |
| First Financial Corp. | | 180 | | 8,456 | | SCBT Financial Corp. | | 160 | | 6,016 |
| South Financial Group, Inc. | | 8,429 | | WSFS Financial Corp. | | 100 | | 6,000 |
| Provident New York Bancorp | | 8,329 | | Capital City Bank Group, Inc. | | 5,957 |
| Forestar Real Estate Group, Inc.* | | 8,260 | | Flushing Financial Corp. | | 340 | | 5,950 |
| Community Trust Bancorp, Inc. | | 8,256 | | Suffolk Bancorp | | 150 | | 5,912 |
640
270
350
1,050
600
220
470
1,300
1,890
240
450
360
810
200
4,530
120
360
880
240
260
890
130
438
520
620
440
220
1,180
640
500
330
1,150
630
190
560
240
| SCHEDULE OF INVESTMENTS (Unaudited) (continued) |
| THE RYDEX SERIES FUNDS SEMI-ANNUAL REPORT |
| See Notes to Financial Statements. | | | | | 65 |
| Castlepoint Holdings Ltd. | | 530 | | $ | | 5,899 | | BankFinancial Corp. | | 310 | | $ | | 4,551 |
| Dollar Financial Corp.* | | 380 | | 5,848 | | Republic Bancorp, Inc. | | 150 | | 4,548 |
| LandAmerica Financial Group, Inc. | | 5,820 | | Tompkins Financial Corp. | | 90 | | 4,545 |
| Bancfirst Corp. | | 120 | | 5,800 | | Ocwen Financial Corp.* | | 560 | | 4,508 |
| MVC Capital, Inc. | | 380 | | 5,795 | | Capitol Bancorp, Ltd. | | 230 | | 4,483 |
| Sandy Spring Bancorp, Inc. | | 5,746 | | PMA Capital Corp.* | | 500 | | 4,410 |
| Calamos Asset Management, | | Peapack Gladstone Financial Corp. | | 4,355 |
| | Inc. — Class A | | 320 | | 5,734 | | CNA Surety Corp.* | | 260 | | 4,342 |
| MainSource Financial Group, Inc. | | 5,684 | | SeaBright Insurance Holdings, Inc.* | | 4,290 |
| Hersha Hospitality Trust | | 760 | | 5,654 | | Camden National Corp. | | 120 | | 4,194 |
| 1st Source Corp. | | 240 | | 5,640 | | Hatteras Financial Corp. | | 180 | | 4,176 |
| Dime Community Bancshares | | 5,631 | | Lakeland Financial Corp. | | 190 | | 4,172 |
| CapLease, Inc. | | 710 | | 5,630 | | United Financial Bancorp, Inc. | | 4,158 |
| Ramco-Gershenson Properties | | United America Indemnity Ltd. — |
| | Trust | | 250 | | 5,605 | | Class A* | | 290 | | 4,127 |
| FBL Financial Group, Inc. — | | Arrow Financial Corp. | | 140 | | 4,117 |
| | Class A | | 200 | | 5,578 | | Old Second Bancorp, Inc. | | 220 | | 4,074 |
| American Physicians Capital, Inc. | | 5,503 | | Southwest Bancorp, Inc. | | 230 | | 4,064 |
| Amerisafe, Inc.* | | 300 | | 5,460 | | Sterling Bancorp | | 280 | | 4,049 |
| Berkshire Hills Bancorp, Inc. | | 5,440 | | Nara Bancorp, Inc. | | 360 | | 4,032 |
| Home Bancshares, Inc. | | 210 | | 5,433 | | Capital Trust, Inc. — Class A | | 4,030 |
| Bank of the Ozarks, Inc. | | 200 | | 5,400 | | Nelnet, Inc. — Class A | | 280 | | 3,976 |
| Friedman Billings Ramsey Group, | | MarketAxess Holdings, Inc.* | | 3,954 |
| | Inc. — Class A* | | 2,697 | | 5,394 | | Abington Bancorp, Inc. | | 390 | | 3,947 |
| RAIT Financial Trust | | 980 | | 5,380 | | First Bancorp | | 230 | | 3,933 |
| Prospect Capital Corp. | | 420 | | 5,380 | | Consolidated-Tomoka Land Co. | | 3,887 |
| Presidential Life Corp. | | 340 | | 5,369 | | Thomas Properties Group, Inc. | | 3,838 |
| Compass Diversified Trust | | 379 | | 5,283 | | Enterprise Financial Services Corp. | | 3,835 |
| Newcastle Investment Corp. | | 5,271 | | Westwood Holdings Group, Inc. | | 3,792 |
| Heartland Financial USA, Inc. | | 5,263 | | The PMI Group, Inc. | | 1,280 | | 3,776 |
| First Community Bancshares, Inc. | | 5,253 | | Northfield Bancorp, Inc.* | | 310 | | 3,754 |
| Sun Communities, Inc. | | 260 | | 5,151 | | Penson Worldwide Co., Inc.* | | 3,745 |
| Westfield Financial, Inc. | | 500 | | 5,150 | | Lakeland Bancorp, Inc. | | 320 | | 3,741 |
| Columbia Banking Systems, Inc. | | 5,142 | | ESSA Bancorp, Inc. | | 269 | | 3,739 |
| Guaranty Bancorp* | | 830 | | 5,063 | | Darwin Professional Underwriters, |
| Provident Bankshares Corp. | | 5,049 | | Inc.* | | 120 | | 3,733 |
| Hercules Technology Growth Capital, | | First Financial Northwest, Inc. | | 3,715 |
| | Inc. | | 520 | | 5,044 | | West Coast Bancorp | | 250 | | 3,665 |
| Union Bankshares Corp. | | 210 | | 5,040 | | BancTrust Financial Group, Inc. | | 3,660 |
| Gladstone Capital Corp. | | 330 | | 5,029 | | Wilshire Bancorp, Inc. | | 300 | | 3,651 |
| Advanta Corp. | | 610 | | 5,020 | | LaBranche & Co., Inc.* | | 810 | | 3,645 |
| Education Realty Trust, Inc. | | 4,986 | | West Bancorporation, Inc. | | 279 | | 3,635 |
| NGP Capital Resources Co. | | 4,954 | | Smithtown Bancorp, Inc. | | 160 | | 3,600 |
| Green Bankshares, Inc. | | 210 | | 4,937 | | CoBiz Financial, Inc. | | 299 | | 3,591 |
| Flagstone Reinsurance Holdings | | 4,930 | | Maguire Properties, Inc. | | 600 | | 3,576 |
| GFI Group, Inc. | | 1,040 | | 4,898 | | Danvers Bancorp, Inc. | | 279 | | 3,557 |
| Citizens, Inc.* | | 590 | | 4,850 | | Oritani Financial Corp.* | | 210 | | 3,539 |
| Southside Bancshares, Inc. | | 4,788 | | Kite Realty Group Trust | | 320 | | 3,520 |
| Washington Trust Bancorp, Inc. | | 4,788 | | Peoples Bancorp, Inc. | | 160 | | 3,483 |
| TradeStation Group, Inc.* | | 510 | | 4,769 | | First Place Financial Corp. | | 269 | | 3,457 |
| Triko Bancshares | | 220 | | 4,737 | | Donegal Group, Inc. — Class A | | 3,445 |
| First Financial Holdings, Inc. | | 4,712 | | City Bank | | 220 | | 3,432 |
| Citizens Banking Corp. | | 1,520 | | 4,682 | | Agree Realty Corp. | | 120 | | 3,432 |
| Western Alliance Bancorp, Inc.* | | 4,638 | | Winthrop Realty Trust | | 880 | | 3,432 |
| First Cash Financial Services, Inc.* | | 4,635 | | Kearny Financial Corp. | | 280 | | 3,427 |
240
260
130
290
330
370
280
130
170
260
490
90
380
170
830
80
210
140
270
290
520
360
279
450
340
480
190
180
190
180
300
309
| SCHEDULE OF INVESTMENTS (Unaudited) (continued) |
| THE RYDEX SERIES FUNDS SEMI-ANNUAL REPORT |
| 66 | | | | | See Notes to Financial Statements. |
| State Bancorp, Inc. | | 230 | | $ | | 3,427 | | Premierwest Bancorp | | 310 | | $ | | 2,502 |
| Financial Institutions, Inc. | | 170 | | 3,402 | | Pacific Continental Corp. | | 170 | | 2,489 |
| Amtrust Financial Services, Inc. | | 3,398 | | Seacoast Banking Corporation of |
| Maiden Holdings Ltd. | | 780 | | 3,393 | | Florida | | 230 | | 2,468 |
| Shore Bancshares, Inc. | | 130 | | 3,341 | | PennantPark Investment Corp. | | 2,445 |
| Baldwind & Lyons, Inc. — Class B | | 3,332 | | Flagstar Bancorp, Inc. | | 820 | | 2,444 |
| Chimera Investment Corp. | | 3,291 | | Heritage Commerce Corp. | | 2,435 |
| First Mercury Financial Corp.* | | 3,278 | | Corus Bankshares, Inc. | | 599 | | 2,426 |
| Life Partners Holdings, Inc. | | 90 | | 3,237 | | Monmouth Real Estate Investment |
| Kansas City Life Insurance Co. | | 3,220 | | Corp. — Class A | | 310 | | 2,415 |
| Ameris Bancorp | | 210 | | 3,119 | | Care Investment Trust, Inc. | | 2,411 |
| MCG Capital Corp. | | 1,190 | | 3,118 | | BlackRock Kelso Capital Corp. | | 2,410 |
| Sun Bancorp, Inc.* | | 230 | | 3,117 | | Medallion Financial Corp. | | 230 | | 2,408 |
| Cascade Bancorp. | | 349 | | 3,103 | | Gladstone Investment Corp. | | 2,408 |
| NewStar Financial, Inc.* | | 380 | | 3,074 | | National Interstate Corp. | | 100 | | 2,403 |
| Quanta Capital Holdings Ltd. | | 3,064 | | Bryn Mawr Bank Corp. | | 109 | | 2,396 |
| Cardinal Financial Corp. | | 379 | | 3,062 | | Pennsylvania Commerce Bancorp, |
| Yadkin Valley Financial Corp. | | 3,053 | | Inc.* | | 80 | | 2,385 |
| Cogdell Spencer, Inc. | | 190 | | 3,048 | | Guaranty Financial Group, Inc.* | | 2,331 |
| Ladenburg Thalmann Financial | | Kohlberg Capital Corp. | | 270 | | 2,319 |
| | Services, Inc.* | | 1,690 | | 3,042 | | One Liberty Properties, Inc. | | 2,297 |
| Mission West Properties | | 310 | | 3,019 | | BGC Partners, Inc. - Class A | | 2,274 |
| Citizens & Northern Corp. | 140 | | 3,017 | | First South Bancorp, Inc. | | 130 | | 2,245 |
| Encore Capital Group, Inc.* | | 3,014 | | Rockville Financial, Inc. | | 140 | | 2,205 |
| Associated Estates Realty Corp. | | 2,997 | | Arbor Realty Trust, Inc. | | 220 | | 2,200 |
| Hanmi Financial Corp. | | 590 | | 2,980 | | Anchor BanCorp Wisconsin, Inc. | | 2,198 |
| ViewPoint Financial Group | | 2,975 | | United Security Bancshares | | 2,127 |
| Amcore Financial, Inc. | | 320 | | 2,960 | | Patriot Capital Funding, Inc. | | 2,102 |
| DuPont Fabros Technology, Inc. | | 2,898 | | United Community Financial Corp. | | 2,100 |
| Evercore Partners, Inc. — Class A | | 2,859 | | Roma Financial Corp. | | 140 | | 2,065 |
| FBR Capital Markets Corp.* | | 2,845 | | Resource Capital Corp. | | 340 | | 2,060 |
| American Capital Agency Corp. | | 2,771 | | Clifton Savings Bancorp, Inc. | | 2,038 |
| Stratus Properties, Inc.* | | 100 | | 2,752 | | US Global Investors, Inc. — |
| First Bancorp, Inc. | | 139 | | 2,724 | | Class A | | 200 | | 2,010 |
| First Marblehead Corp. | | 1,090 | | 2,714 | | JER Investors Trust, Inc. | | 415 | | 2,000 |
| Kayne Anderson Energy | | Advance America Cash Advance |
| | Development Co. | | 160 | | 2,709 | | Centers, Inc. | | 660 | | 1,973 |
| Farmers Capital Bank Corp. | | 2,702 | | Encore Bancshares, Inc.* | | 100 | | 1,800 |
| Diamond Hill Investment Group, | | Epoch Holding Corp. | | 170 | | 1,794 |
| | Inc.* | | 30 | | 2,698 | | NYMAGIC, Inc. | | 70 | | 1,768 |
| Anthracite Capital, Inc. | | 502 | | 2,691 | | Meridian Interstate Bancorp, Inc.* | | 1,736 |
| Sanders Morris Harris Group Inc. | | 2,682 | | FirstFed Financial Corp.*† | | 220 | | 1,725 |
| Centerstate Banks of Florida, Inc. | | 2,681 | | Gramercy Capital Corp. | | 660 | | 1,709 |
| Banner Corp. | | 220 | | 2,642 | | International Assets Holding Corp.* | 1,688 |
| Integra Bank Corp. | | 330 | | 2,633 | | NASB Financial, Inc. | | 50 | | 1,625 |
| EMC Insurance Group, Inc. | | 89 | | 2,624 | | Fifth Street Finance Corp. | | 160 | | 1,608 |
| Harris & Harris Group, Inc.* | | 2,616 | | Credit Acceptance Corp.* | | 90 | | 1,530 |
| Thomas Weisel Partners Group, | | Resource America, Inc. — Class A | | 1,520 |
| | Inc.* | | 310 | | 2,613 | | Cardtronics, Inc.* | | 190 | | 1,493 |
| Ames National Corp. | | 100 | | 2,595 | | Grubb & Ellis Co. | | 550 | | 1,485 |
| American Safety Insurance | | Midwest Banc Holdings, Inc. | | 1,400 |
| | Holdings Ltd.* | | 170 | | 2,569 | | AmCOMP, Inc.* | | 110 | | 1,276 |
| Oceanfirst Financial Corp. | | 140 | | 2,537 | | Home Federal Bancorp, Inc. | | 1,275 |
| Asset Acceptance Capital Corp.* | | 2,530 | | Fox Chase Bancorp, Inc.* | | 100 | | 1,170 |
| Sierra Bancorp | | 120 | | 2,503 | | Independence Holding Co. | | 1,155 |
250
330
139
530
160
230
70
210
209
350
1,110
180
590
130
530
220
230
299
170
130
330
190
420
159
439
160
170
100
170
310
150
70
410
160
350
100
240
100
| INFORMATION TECHNOLOGY 8.2% |
| SCHEDULE OF INVESTMENTS (Unaudited) (continued) |
| THE RYDEX SERIES FUNDS SEMI-ANNUAL REPORT |
| See Notes to Financial Statements. | | | | | 67 |
| Broadpoint Securities Group, Inc.* | $ | | 1,099 | | Cybersource Corp.* | | 1,089 | | $ | | 17,544 |
| Waterstone Financial, Inc.* | | 1,075 | | ADTRAN, Inc. | | 890 | | 17,346 |
| Downey Financial Corp. | | 370 | | 1,036 | | Plantronics, Inc. | | 770 | | 17,340 |
| Doral Financial Corp.* | | 90 | | 983 | | InterDigital, Inc.* | | 720 | | 17,316 |
| CompuCredit Corp.* | | 250 | | 980 | | Progress Software Corp.* | | 660 | | 17,153 |
| W Holding Co., Inc. | | 1,800 | | 972 | | j2 Global Communications, Inc.* | | 16,345 |
| Primus Guaranty Ltd.* | | 370 | | 969 | | Mentor Graphics Corp.* | | 1,429 | | 16,219 |
| Ampal American Israel — Class A* | | 958 | | Synaptics, Inc.* | | 535 | | 16,168 |
| Pzena Investment Management, | | Websense, Inc.* | | 710 | | 15,868 |
| | Inc. — Class A | | 100 | | 948 | | Net 1 UEPS Technologies, Inc.* | | 15,854 |
| First Acceptance Corp.* | | 270 | | 918 | | L-1 Identity Solutions, Inc.* | | 15,738 |
| Santander BanCorp | | 80 | | 864 | | MKS Instruments, Inc.* | | 790 | | 15,729 |
| Meruelo Maddux Properties, Inc.* | | 830 | | SRA International, Inc. — Class A* | | 15,162 |
| Hallmark Financial Services, Inc.* | | 818 | | Benchmark Electronics, Inc.* | | 15,066 |
| Brooklyn Federal Bancorp, Inc. | | 740 | | MPS Group, Inc.* | | 1,490 | | 15,019 |
| Federal Agricultural Mortgage | | Arris Group, Inc.* | | 1,940 | | 14,996 |
| | Corp. | | 149 | | 611 | | 3Com Corp.* | | 6,370 | | 14,842 |
| FX Real Estate and Entertainment, | | EarthLink, Inc.* | | 1,730 | | 14,705 |
| | Inc.* | | 160 | | 166 | | Avocent Corp.* | | 710 | | 14,527 |
| | Quest Software, Inc.* | | 1,140 | | 14,467 |
| | Rofin-Sinar Technologies, Inc.* | | 14,387 |
| | Infinera Corp.* | | 1,470 | | 14,053 |
| | ValueClick, Inc.* | | 1,370 | | 14,015 |
| | Formfactor, Inc.* | | 769 | | 13,396 |
| | Lawson Software, Inc.* | | 1,870 | | 13,090 |
| | Harmonic, Inc.* | | 1,490 | | 12,590 |
| | Tessera Technologies, Inc.* | | 12,418 |
| | Euronet Worldwide, Inc.* | | 740 | | 12,380 |
| | RF Micro Devices, Inc.* | | 4,160 | | 12,147 |
| | Scansource, Inc.* | | 420 | | 12,092 |
| | Cabot Microelectronics Corp.* | | 11,870 |
| | Checkpoint Systems, Inc.* | | 630 | | 11,857 |
| | Quality Systems, Inc. | | 280 | | 11,833 |
| | MTS Systems Corp. | | 280 | | 11,788 |
| | Sanmina-SCI Corp.* | | 8,390 | | 11,746 |
| | Electronics for Imaging, Inc.* | | 11,687 |
| | Data Domain, Inc.* | | 520 | | 11,580 |
| | Power Integrations, Inc.* | | 480 | | 11,568 |
| | Avid Technology, Inc.* | | 480 | | 11,549 |
| | United Online, Inc. | | 1,220 | | 11,480 |
| | SYKES Enterprises, Inc.* | | 520 | | 11,419 |
| | Wind River Systems, Inc.* | | 11,400 |
| Foundry Networks, Inc.* | | 2,300 | | 41,883 |
| Micros Systems, Inc.* | | 1,290 | | 34,391 |
| Parametric Technology Corp.* | | 33,488 |
| Polycom, Inc.* | | 1,380 | | 31,919 |
| Microsemi Corp.* | | 1,240 | | 31,595 |
| Anixter International, Inc.* | 470 | | 27,970 |
| CACI International, Inc. — Class A* | 27,805 |
| Concur Technologies, Inc.* | | 26,017 |
| PMC - Sierra, Inc.* | | 3,460 | | 25,673 |
| Jack Henry & Associates, Inc. | | 23,989 |
| Perot Systems Corp. — Class A* | | 23,769 |
| Solera Holdings, Inc.* | | 820 | | 23,550 |
| VistaPrint Ltd.* | | 700 | | 22,988 |
| Atheros Communications, Inc.* | | 22,165 |
| TIBCO Software, Inc.* | | 2,950 | | 21,594 |
| Skyworks Solutions, Inc.* | | 21,569 |
| Gartner, Inc. — Class A* | | 940 | | 21,319 |
| Wright Express Corp.* | | 703 | | 20,985 |
| Fair Isaac Corp. | | 887 | | 20,445 |
| Macrovision Solutions Corp.* | | 19,994 |
| Take-Two Interactive Software, Inc. | 19,844 |
| Blackboard, Inc.* | | 490 | | 19,742 |
| Digital River, Inc.* | | 590 | | 19,116 |
| Mantech International Corp. — |
| Comtech Telecommunications |
| Informatica Corp.* | | 1,400 | | 18,186 |
| VeriFone Holdings, Inc.* | | 1,080 | | 17,863 |
379
110
700
310
710
1,030
680
670
90
1,070
50
470
760
370
839
1,140
1,820
555
680
1,180
1,370
940
2,580
1,300
1,210
| SCHEDULE OF INVESTMENTS (Unaudited) (continued) |
| THE RYDEX SERIES FUNDS SEMI-ANNUAL REPORT |
| 68 | | | | | See Notes to Financial Statements. |
| DealerTrack Holdings, Inc.* | | $ | | 11,283 | | RealNetworks, Inc.* | | 1,430 | | $ | | 7,264 |
| Riverbed Technology, Inc.* | | 11,143 | | Art Technology Group, Inc.* | | 7,146 |
| Amkor Technology, Inc.* | | 1,720 | | 10,956 | | Monolithic Power Systems, Inc.* | | 7,122 |
| Triquint Semiconductor, Inc.* | | 10,878 | | Advanced Energy Industries, Inc.* | | 7,114 |
| MAXIMUS, Inc. | | 290 | | 10,684 | | Ness Technologies, Inc.* | | 620 | | 7,111 |
| Ultimate Software Group, Inc.* | | 10,530 | | Micrel, Inc. | | 780 | | 7,075 |
| Hittite Microwave Corp.* | | 310 | | 10,416 | | CTS Corp. | | 530 | | 6,773 |
| Rogers Corp.* | | 280 | | 10,354 | | Cavium Networks, Inc.* | | 480 | | 6,758 |
| Sapient Corp.* | | 1,390 | | 10,328 | | Zoran Corp.* | | 820 | | 6,691 |
| Interwoven, Inc.* | | 720 | | 10,166 | | TTM Technologies, Inc.* | | 670 | | 6,646 |
| Littelfuse, Inc.* | | 340 | | 10,108 | | Cogent, Inc.* | | 650 | | 6,643 |
| Palm, Inc. | | 1,690 | | 10,089 | | Netezza Corp.* | | 620 | | 6,578 |
| Heartland Payment Systems, Inc. | | 9,968 | | SI International, Inc.* | | 210 | | 6,310 |
| Insight Enterprises, Inc.* | | 740 | | 9,923 | | Finisar Corp.* | | 6,240 | | 6,302 |
| Sycamore Networks, Inc.* | | 9,755 | | Adaptec, Inc.* | | 1,910 | | 6,265 |
| CSG Systems International, Inc.* | | 9,641 | | China Security & Surveillance |
| Black Box Corp. | | 279 | | 9,634 | | Technology, Inc.* | | 450 | | 6,246 |
| Technitrol, Inc. | | 650 | | 9,613 | | JDA Software Group, Inc.* | | 6,236 |
| ACI Worldwide, Inc.* | | 540 | | 9,461 | | Silicon Image, Inc.* | | 1,160 | | 6,194 |
| ViaSat, Inc.* | | 400 | | 9,432 | | Newport Corp.* | | 570 | | 6,145 |
| Sonus Networks, Inc.* | | 3,220 | | 9,274 | | Electro Scientific Industries, Inc.* | | 6,115 |
| OmniVision Technologies, Inc.* | | 9,242 | | Applied Micro Circuits Corp.* | | 6,100 |
| ATMI, Inc.* | | 510 | | 9,170 | | Starent Networks Corp.* | | 470 | | 6,082 |
| Advent Software, Inc.* | | 260 | | 9,160 | | SYNNEX Corp.* | | 270 | | 6,032 |
| Tyler Technologies, Inc.* | | 600 | | 9,102 | | Sigma Designs, Inc.* | | 420 | | 5,972 |
| Mastec, Inc.* | | 680 | | 9,037 | | Ciber, Inc.* | | 850 | | 5,941 |
| Standard Microsystems Corp.* | | 8,993 | | Utstarcom, Inc.* | | 1,750 | | 5,897 |
| Manhattan Associates, Inc.* | | 8,713 | | OSI SYSTEMS INC* | | 250 | | 5,877 |
| Entegris, Inc.* | | 1,800 | | 8,712 | | InfoSpace, Inc. | | 540 | | 5,859 |
| Daktronics, Inc. | | 520 | | 8,663 | | IPG Photonics Corp.* | | 300 | | 5,853 |
| Vocus, Inc.* | | 250 | | 8,490 | | Terremark Worldwide, Inc.* | | 5,771 |
| Diodes, Inc.* | | 460 | | 8,487 | | Stratasys, Inc.* | | 330 | | 5,765 |
| Netgear, Inc.* | | 560 | | 8,400 | | Emcore Corp.* | | 1,160 | | 5,730 |
| Brooks Automation, Inc.* | | 999 | | 8,352 | | Cohu, Inc. | | 360 | | 5,695 |
| MicroStrategy, Inc. — Class A* | | 8,334 | | Brightpoint, Inc.* | | 790 | | 5,688 |
| Powerwave Technologies, Inc.* | | 8,237 | | Cirrus Logic, Inc.* | | 1,030 | | 5,613 |
| SPSS, Inc.* | | 280 | | 8,221 | | Integral Systems, Inc.* | | 270 | | 5,608 |
| Dycom Industries, Inc.* | | 630 | | 8,203 | | EMS Technologies, Inc.* | | 250 | | 5,577 |
| Commvault Systems, Inc.* | | 680 | | 8,194 | | RightNow Technologies, Inc.* | | 5,531 |
| Netlogic Microsystems, Inc.* | | 8,165 | | Constant Contact, Inc.* | | 320 | | 5,462 |
| Taleo Corp.* | | 410 | | 8,155 | | Bel Fuse, Inc. — Class B | | 190 | | 5,409 |
| MercadoLibre, Inc.* | | 400 | | 8,140 | | Methode Electronics, Inc. — |
| SAVVIS, Inc.* | | 590 | | 7,930 | | Class A | | 600 | | 5,364 |
| Bankrate, Inc.* | | 200 | | 7,782 | | Faro Technologies, Inc.* | | 260 | | 5,296 |
| DTS, Inc. — Class A* | | 279 | | 7,765 | | Symyx Technologies, Inc.* | | 530 | | 5,252 |
| Park Electrochemical Corp. | | 7,757 | | Volterra Semiconductor Corp.* | | 5,092 |
| EPIQ Systems, Inc.* | | 560 | | 7,616 | | Supertex, Inc.* | | 180 | | 5,069 |
| MSC.Software Corp.* | | 710 | | 7,597 | | AsiaInfo Holdings, Inc.* | | 550 | | 5,049 |
| TNS, Inc.* | | 390 | | 7,554 | | Universal Display Corp.* | | 460 | | 5,042 |
| Epicor Software Corp.* | | 940 | | 7,417 | | Netscout Systems, Inc.* | | 470 | | 5,001 |
| Veeco Instruments, Inc.* | | 500 | | 7,405 | | Actel Corp.* | | 399 | | 4,980 |
| ModusLink Global Solutions, Inc.* | | 7,400 | | Internet Capital Group, Inc.* | | 4,947 |
| Blue Coat Systems, Inc.* | | 520 | | 7,379 | | Ixia* | | 670 | | 4,938 |
| Greenfield Online, Inc.* | | 420 | | 7,308 | | comScore, Inc.* | | 280 | | 4,936 |
| Forrester Research, Inc.* | | 249 | | 7,301 | | Syntel, Inc. | | 200 | | 4,900 |
670
890
2,030
410
2,271
520
390
390
3,020
550
410
430
810
1,020
360
390
840
140
2,080
440
270
320
400
770
610
| SCHEDULE OF INVESTMENTS (Unaudited) (continued) |
| THE RYDEX SERIES FUNDS SEMI-ANNUAL REPORT |
| See Notes to Financial Statements. | | | | | 69 |
| Neutral Tandem, Inc.* | | 260 | | $ | | 4,820 | | Perficient, Inc.* | | 510 | | $ | | 3,386 |
| S1 Corp.* | | 780 | | 4,774 | | Gerber Scientific, Inc.* | | 370 | | 3,382 |
| Seachange International, Inc.* | | 4,733 | | i2 Technologies, Inc.* | | 250 | | 3,372 |
| Extreme Networks, Inc.* | | 1,400 | | 4,718 | | Eagle Test Systems, Inc.* | | 220 | | 3,368 |
| Echelon Corp.* | | 469 | | 4,634 | | Actuate Corp.* | | 960 | | 3,360 |
| Rackable Systems, Inc.* | | 470 | | 4,611 | | Advanced Analogic Technologies, |
| Secure Computing Corp.* | | 840 | | 4,603 | | Inc.* | | 720 | | 3,348 |
| LoopNet, Inc.* | | 460 | | 4,522 | | Synchronoss Technologies, Inc.* | | 3,293 |
| Exar Corp.* | | 590 | | 4,519 | | FalconStor Software, Inc.* | | 600 | | 3,216 |
| Ultratech, Inc.* | | 370 | | 4,477 | | Mercury Computer Systems, Inc.* | | 3,204 |
| SonicWALL, Inc.* | | 840 | | 4,402 | | Global Cash Access Holdings, Inc.* | | 3,188 |
| Vasco Data Security International* | | 4,351 | | Super Micro Computer, Inc.* | | 3,154 |
| NIC, Inc. | | 630 | | 4,347 | | Spansion, Inc.* | | 2,020 | | 3,131 |
| Move, Inc.* | | 2,030 | | 4,304 | | Harris Stratex Networks, Inc. — |
| Silicon Storage Technology, Inc.* | | 4,303 | | Class A* | | 400 | | 3,124 |
| Photon Dynamics, Inc.* | | 280 | | 4,298 | | Transmeta Corp.* | | 190 | | 3,080 |
| Hutchinson Technology, Inc.* | | 4,285 | | iGate Corp.* | | 350 | | 3,035 |
| Aruba Networks, Inc.* | | 830 | | 4,258 | | Novatel Wireless, Inc.* | | 500 | | 3,030 |
| Vignette Corp.* | | 390 | | 4,189 | | Zygo Corp., Inc.* | | 240 | | 3,019 |
| Digi International, Inc.* | | 410 | | 4,182 | | Radisys Corp.* | | 350 | | 3,010 |
| SuccessFactors, Inc.* | | 380 | | 4,142 | | Pegasystems, Inc. | | 230 | | 2,969 |
| Hughes Communications, Inc.* | | 4,037 | | Semitool, Inc.* | | 360 | | 2,945 |
| Rudolph Technologies, Inc.* | | 4,022 | | Keynote Systems, Inc.* | | 220 | | 2,915 |
| Measurement Specialties, Inc.* | | 4,011 | | DSP Group, Inc.* | | 380 | | 2,907 |
| Switch & Data Facilities Co., Inc.* | | 3,984 | | MRV Communications, Inc.* | | 2,902 |
| Oplink Communications, Inc.* | | 3,983 | | NCI, Inc.* | | 100 | | 2,848 |
| Cass Information Systems, Inc. | | 3,943 | | Ebix, Inc.* | | 30 | | 2,819 |
| Marchex, Inc. | | 380 | | 3,910 | | Magma Design Automation, Inc.* | | 2,814 |
| ShoreTel, Inc.* | | 680 | | 3,903 | | Globecomm Systems, Inc.* | | 2,797 |
| Maxwell Technologies, Inc.* | | 3,869 | | PC-Tel, Inc. | | 300 | | 2,796 |
| Hypercom Corp.* | | 970 | | 3,861 | | Immersion Corp.* | | 480 | | 2,794 |
| Kulicke & Soffa Industries, Inc.* | | 3,833 | | DemandTec, Inc.* | | 309 | | 2,784 |
| Radiant Systems, Inc.* | | 440 | | 3,824 | | Internap Network Services Corp.* | | 2,784 |
| STEC, Inc.* | | 490 | | 3,773 | | Anadigics, Inc.* | | 990 | | 2,782 |
| The Knot, Inc.* | | 450 | | 3,757 | | DivX, Inc.* | | 429 | | 2,776 |
| Lattice Semiconductor Corp.* | | 3,749 | | 3PAR, Inc.* | | 430 | | 2,774 |
| Mattson Technology, Inc.* | | 780 | | 3,689 | | Axcelis Technologies, Inc.* | | 2,754 |
| BearingPoint, Inc.* | | 3,440 | | 3,681 | | Compellent Technologies, Inc.* | | 2,728 |
| Pericom Semiconductor Corp.* | | 3,675 | | Gevity HR, Inc. | | 370 | | 2,694 |
| TeleCommunication Systems, | | Cray, Inc.* | | 520 | | 2,694 |
| | Inc. — Class A* | | 530 | | 3,662 | | Double-Take Software, Inc.* | | 2,687 |
| Bottomline Technologies, Inc.* | | 3,640 | | Monotype Imaging Holdings, Inc.* | | 2,671 |
| Agilysys, Inc. | | 360 | | 3,632 | | Loral Space & Communications, |
| Symmetricom, Inc.* | | 730 | | 3,628 | | Inc.* | | 180 | | 2,659 |
| Intevac, Inc.* | | 340 | | 3,618 | | Ceva, Inc.* | | 320 | | 2,656 |
| Parkervision, Inc.* | | 360 | | 3,600 | | Rackspace Hosting* | | 270 | | 2,638 |
| Online Resources Corp.* | | 460 | | 3,574 | | Opnet Technologies, Inc.* | | 210 | | 2,558 |
| Hackett Group, Inc.* | | 650 | | 3,536 | | Liquidity Services Inc.* | | 230 | | 2,496 |
| IXYS Corp. | | 380 | | 3,454 | | Presstek, Inc.* | | 440 | | 2,482 |
| LTX-Credence Corp.* | | 1,980 | | 3,445 | | Orbcomm, Inc.* | | 500 | | 2,465 |
| infoGROUP, Inc. | | 520 | | 3,437 | | Acme Packet, Inc.* | | 430 | | 2,464 |
| Phoenix Technologies, Ltd.* | | 3,436 | | MIPS Technology, Inc.* | | 700 | | 2,457 |
| Quantum Corp.* | | 3,250 | | 3,412 | | Internet Brands, Inc. — Class A* | | 2,440 |
| Smith Micro Software, Inc.* | | 3,408 | | Chordiant Software, Inc.* | | 470 | | 2,411 |
| Kopin Corp.* | | 1,090 | | 3,401 | | Safeguard Scientifics, Inc.* | | 2,400 |
490
350
360
630
420
350
1,320
370
110
480
230
320
2,480
330
110
700
320
290
850
800
1,820
1,620
220
350
270
350
240
430
350
480
1,920
| | Total Information Technology |
| SCHEDULE OF INVESTMENTS (Unaudited) (continued) |
| THE RYDEX SERIES FUNDS SEMI-ANNUAL REPORT |
| 70 | | | | | See Notes to Financial Statements. |
| Website Pros, Inc.* | | 440 | | $ | | 2,376 | | Guidance Software, Inc.* | | 150 | | $ | | 704 |
| Anaren, Inc.* | | 230 | | 2,335 | | Nextwave Wireless, Inc.* | | 770 | | 462 |
| Sourcefire, Inc.* | | 320 | | 2,333 | | Midway Games, Inc.* | | 180 | | 427 |
| Microtune, Inc.* | | 860 | | 2,305 | | Elixir Gaming Technologies, Inc.* | | 353 |
| Trident Microsystems, Inc.* | | 2,304 | | Entropic Communications, Inc.* | | 212 |
| PLX Technology, Inc.* | | 440 | | 2,253 |
| SupportSoft, Inc.* | | 730 | | 2,190 |
| Cogo Group, Inc.* | | 410 | | 2,161 |
| CPI International, Inc.* | | 149 | | 2,158 |
| Smart Modular Technologies |
| Multi-Fineline Electronix, Inc.* | | 2,071 |
| Interactive Intelligence, Inc.* | | 1,984 |
| American Software, Inc. — Class A | | 1,962 |
| Renaissance Learning, Inc. | 150 | | 1,949 |
| ExlService Holdings, Inc.* | | 220 | | 1,932 |
| BigBand Networks, Inc.* | | 520 | | 1,919 |
| Callidus Software, Inc.* | | 480 | | 1,901 |
| Asyst Technologies, Inc.* | | 789 | | 1,894 |
| PROS Holdings, Inc.* | | 200 | | 1,878 |
| Dice Holdings, Inc.* | | 250 | | 1,775 |
| TheStreet.com, Inc. | | 290 | | 1,737 |
| Isilon Systems, Inc.* | | 390 | | 1,720 |
| ICx Technologies, Inc.* | | 220 | | 1,696 |
| China Information Security |
| | Technology, Inc.* | | 360 | | 1,692 |
| Ultra Clean Holdings* | | 310 | | 1,562 |
| Sonic Solutions, Inc.* | | 350 | | 1,540 |
| TechTarget, Inc.* | | 220 | | 1,540 |
| Rubicon Technology, Inc.* | | 210 | | 1,516 |
| SiRF Technology Holdings, Inc.* | | 1,430 |
| Photronics, Inc.* | | 660 | | 1,241 |
| Limelight Networks Inc.* | | 460 | | 1,150 |
| HSW International, Inc.* | | 440 | | 1,144 |
| PC Connection, Inc.* | | 150 | | 1,004 |
| Waste Connections, Inc.* | | 41,469 |
| Energy Conversion Devices, Inc.* | | 41,357 |
| Watson Wyatt & Co. Holdings | | 33,319 |
| Woodward Governor Co. | | 930 | | 32,801 |
| Curtiss-Wright Corp. | | 710 | | 32,269 |
| Teledyne Technologies, Inc.* | | 32,010 |
| Moog, Inc. — Class A* | | 670 | | 28,730 |
| GrafTech International Ltd.* | | 28,558 |
| EMCOR Group, Inc.* | | 1,070 | | 28,162 |
| Brady Corp. — Class A | | 789 | | 27,836 |
| Acuity Brands, Inc. | | 640 | | 26,726 |
| Tetra Tech, Inc.* | | 930 | | 22,376 |
| Actuant Corp. — Class A | | 880 | | 22,211 |
| Orbital Sciences Corp.* | | 920 | | 22,052 |
| HUB Group, Inc. — Class A* | | 21,837 |
| Herman Miller, Inc. | | 890 | | 21,778 |
| IKON Office Solutions, Inc. | | 21,773 |
| Regal-Beloit Corp. | | 510 | | 21,685 |
| Baldor Electric Co. | | 730 | | 21,031 |
| Clean Harbors, Inc.* | | 309 | | 20,873 |
| ESCO Technologies, Inc.* | | 410 | | 19,750 |
| Huron Consulting Group, Inc.* | | 18,803 |
| Mine Safety Appliances Co. | | 18,679 |
| Granite Construction, Inc. | | 520 | | 18,626 |
| Esterline Technologies Corp.* | | 18,211 |
| TransDigm Group, Inc.* | | 530 | | 18,142 |
| Applied Industrial Technologies, Inc. | 18,043 |
| Genesee & Wyoming, Inc. — |
| United Stationers, Inc.* | | 370 | | 17,697 |
| Knight Transportation, Inc. | | 17,598 |
| Geo Group, Inc.* | | 810 | | 16,370 |
| Mueller Water Products, Inc. — |
| Resources Connection, Inc.* | | 16,222 |
| Franklin Electric Co., Inc. | | 360 | | 16,038 |
| Simpson Manufacturing Co., Inc. | | 15,983 |
1,070
960
150
140
220
360
960
1,209
710
670
560
1,890
580
1,280
330
490
460
670
1,037
720
590
| SCHEDULE OF INVESTMENTS (Unaudited) (continued) |
| THE RYDEX SERIES FUNDS SEMI-ANNUAL REPORT |
| See Notes to Financial Statements. | | | | | 71 |
| American Superconductor Corp.* | $ | | 15,556 | | Ameron International Corp. | | $ | | 10,031 |
| Ceradyne, Inc.* | | 420 | | 15,397 | | American Reprographics Co.* | | 10,005 |
| Barnes Group, Inc. | | 760 | | 15,367 | | NCI Building Systems, Inc.* | | 9,842 |
| Navigant Consulting, Inc.* | 760 | | 15,116 | | Raven Industries, Inc. | | 250 | | 9,837 |
| II-VI, Inc.* | | 390 | | 15,077 | | Comfort Systems USA, Inc. | | 9,686 |
| ABM Industries, Inc. | | 690 | | 15,070 | | Interface, Inc. — Class A | | 840 | | 9,551 |
| SkyWest, Inc. | | 920 | | 14,702 | | Viad Corp. | | 330 | | 9,501 |
| Middleby Corp.* | | 269 | | 14,609 | | School Specialty, Inc.* | | 299 | | 9,326 |
| Werner Enterprises, Inc. | | 670 | | 14,546 | | Universal Forest Products, Inc. | | 9,077 |
| CoStar Group, Inc.* | | 310 | | 14,071 | | Pacer International, Inc. | | 550 | | 9,058 |
| Lindsay Manufacturing Co. | | 13,822 | | Quanex Building Products Corp. | | 8,992 |
| Heartland Express, Inc. | | 880 | | 13,658 | | Astec Industries, Inc.* | | 290 | | 8,941 |
| Robbins & Myers, Inc. | | 440 | | 13,609 | | Tennant Co. | | 260 | | 8,908 |
| Mueller Industries, Inc. | | 590 | | 13,576 | | Gorman-Rupp Co. | | 230 | | 8,676 |
| JetBlue Airways Corp.* | | 2,740 | | 13,563 | | RSC Holdings, Inc.* | | 750 | | 8,520 |
| Alaska Air Group, Inc.* | | 658 | | 13,417 | | NACCO Industries, Inc. — Class A | | 8,507 |
| Korn/Ferry International, Inc.* | | 13,009 | | EnerSys* | | 430 | | 8,475 |
| Chart Industries, Inc.* | | 450 | | 12,852 | | Atlas Air Worldwide Holdings Co., |
| Albany International Corp. — | | Inc.* | | 210 | | 8,465 |
| | Class A | | 470 | | 12,845 | | American Science & Engineering, |
| Genco Shipping & Trading Ltd. | | 12,631 | | Inc. | | 140 | | 8,362 |
| Briggs & Stratton Corp. | | 780 | | 12,620 | | Interline Brands, Inc.* | | 510 | | 8,267 |
| Watts Industries, Inc. — Class A | | 12,581 | | Axsys Technologies, Inc.* | | 139 | | 8,193 |
| Seaboard Corp. | | 10 | | 12,570 | | Advisory Board Co.* | | 270 | | 8,143 |
| A.O. Smith Corp. | | 320 | | 12,541 | | Heidrick & Struggles International, |
| Evergreen Solar, Inc.* | | 2,270 | | 12,530 | | Inc. | | 270 | | 8,140 |
| Rollins, Inc. | | 660 | | 12,527 | | AZZ, Inc.* | | 190 | | 7,860 |
| Forward Air Corp. | | 460 | | 12,526 | | Gibraltar Industries, Inc. | | 420 | | 7,858 |
| Old Dominion Freight Line, Inc.* | | 12,470 | | Kelly Services, Inc. — Class A | | 7,811 |
| Healthcare Services Group | | 12,437 | | Allegiant Travel Co.* | | 220 | | 7,770 |
| Arkansas Best Corp. | | 360 | | 12,128 | | Teletech Holdings, Inc.* | | 620 | | 7,713 |
| EnPro Industries, Inc.* | | 320 | | 11,891 | | Exponent, Inc.* | | 230 | | 7,611 |
| Triumph Group, Inc. | | 260 | | 11,885 | | M&F Worldwide Corp.* | | 180 | | 7,200 |
| Circor International, Inc. | | 270 | | 11,726 | | American Ecology Corp. | | 260 | | 7,194 |
| Deluxe Corp. | | 810 | | 11,656 | | Taser International, Inc.* | | 990 | | 7,079 |
| Knoll, Inc. | | 770 | | 11,642 | | Columbus McKinnon Corp. — |
| Titan International, Inc. | | 540 | | 11,513 | | Class A* | | 300 | | 7,071 |
| Heico Corp. | | 350 | | 11,487 | | CBIZ, Inc.* | | 820 | | 6,929 |
| RBC Bearings, Inc.* | | 340 | | 11,455 | | Furmanite Corp.* | | 670 | | 6,928 |
| PHH Corp.* | | 860 | | 11,429 | | Apogee Enterprises, Inc. | | 460 | | 6,914 |
| Kaman Corp. — Class A | | 400 | | 11,392 | | Rush Enterprises, Inc. — Class A* | | 6,784 |
| TrueBlue, Inc.* | | 700 | | 11,312 | | Tredegar Corp. | | 380 | | 6,760 |
| Beacon Roofing Supply, Inc.* | | 10,934 | | Blount International, Inc.* | | 600 | | 6,678 |
| US Airways Group, Inc.* | | 1,800 | | 10,854 | | Insituform Technologies, Inc. — |
| Badger Meter, Inc. | | 230 | | 10,798 | | Class A* | | 440 | | 6,582 |
| YRC Worldwide, Inc.* | | 900 | | 10,764 | | DynCorp International, Inc. — |
| Administaff, Inc. | | 393 | | 10,697 | | Class A* | | 390 | | 6,536 |
| Mcgrath Rentcorp | | 370 | | 10,663 | | FuelCell Energy, Inc.* | | 1,080 | | 6,512 |
| Mobile Mini, Inc.* | | 550 | | 10,631 | | Tecumseh Products Co. — Class A* | 6,510 |
| Layne Christensen Co.* | | 300 | | 10,629 | | ACCO Brands Corp.* | | 860 | | 6,484 |
| Team, Inc.* | | 290 | | 10,475 | | Ennis Inc. | | 410 | | 6,339 |
| Federal Signal Corp. | | 760 | | 10,412 | | Amerco, Inc.* | | 150 | | 6,290 |
| Eagle Bulk Shipping Inc. | | 740 | | 10,316 | | Griffon Corp.* | | 690 | | 6,224 |
| G & K Services, Inc. — Class A | | 10,245 | | Altra Holdings, Inc.* | | 420 | | 6,199 |
| AAR Corp.* | | 610 | | 10,120 | | GeoEye, Inc.* | | 279 | | 6,174 |
660
140
580
310
725
260
190
590
90
730
380
460
440
410
680
530
700
260
310
| SCHEDULE OF INVESTMENTS (Unaudited) (continued) |
| THE RYDEX SERIES FUNDS SEMI-ANNUAL REPORT |
| 72 | | | | | See Notes to Financial Statements. |
| Cubic Corp. | | 250 | | $ | | 6,148 | | Multi-Color Corp. | | 170 | | $ | | 4,061 |
| Cascade Corp. | | 140 | | 6,133 | | Ducommun, Inc. | | 170 | | 4,060 |
| Northwest Pipe Co.* | | 140 | | 6,107 | | Celadon Group, Inc.* | | 350 | | 4,015 |
| Gencorp, Inc.* | | 900 | | 6,066 | | 3D Systems Corp.* | | 280 | | 3,990 |
| American Commercial Lines, Inc.* | | 5,958 | | Pike Electric Corp.* | | 270 | | 3,977 |
| Hawaiian Holdings, Inc.* | | 630 | | 5,846 | | Great Lakes Dredge & Dock Corp. |
| Cenveo, Inc.* | | 760 | | 5,844 | | Co. | | 630 | | 3,975 |
| Kenexa Corp. — Class A* | | 360 | | 5,684 | | AAON, Inc. | | 210 | | 3,820 |
| Colfax Corp.* | | 340 | | 5,681 | | American Woodmark Corp. | | 3,817 |
| Cornell Companies, Inc.* | | 207 | | 5,626 | | Insteel Industries, Inc. | | 280 | | 3,805 |
| Republic Airways Holdings, Inc.* | | 5,605 | | Aceto Corp. | | 390 | | 3,740 |
| Freightcar America, Inc. | | 190 | | 5,561 | | Schawk, Inc. | | 240 | | 3,629 |
| Standex International Corp. | | 5,550 | | Herley Industries, Inc.* | | 210 | | 3,591 |
| Innerworkings, Inc.* | | 500 | | 5,545 | | Duff & Phelps Corp. — Class A* | | 3,575 |
| Fuel Tech, Inc.* | | 299 | | 5,409 | | Orion Marine Group, Inc.* | | 3,567 |
| Kimball International, Inc. — Class B | 5,400 | | Teekay Tankers Ltd. | | 210 | | 3,555 |
| Polypore International, Inc.* | | 5,378 | | PeopleSupport, Inc.* | | 300 | | 3,507 |
| Wabash National Corp. | | 565 | | 5,339 | | Met-Pro Corp. | | 240 | | 3,502 |
| Encore Wire Corp. | | 290 | | 5,252 | | Thermadyne Holdings Corp.* | | 3,501 |
| GT Solar International, Inc.* | | 5,208 | | Applied Signal Technology, Inc. | | 3,476 |
| EnergySolutions, Inc. | | 520 | | 5,200 | | Odyssey Marine Exploration, Inc.* | | 3,450 |
| LB Foster Co. — Class A* | | 170 | | 5,171 | | Ampco-Pittsburgh Corp. | | 130 | | 3,367 |
| Stanley, Inc.* | | 140 | | 5,167 | | Courier Corp. | | 160 | | 3,258 |
| K-Tron International, Inc.* | | 40 | | 5,153 | | LECG Corp.* | | 400 | | 3,228 |
| Hill International, Inc.* | | 370 | | 5,125 | | NN, Inc. | | 250 | | 3,213 |
| Aerovironment, Inc.* | | 160 | | 5,112 | | DXP Enterprises, Inc.* | | 60 | | 3,199 |
| Greenbrier Companies, Inc. | | 5,073 | | Standard Parking Corp.* | | 140 | | 3,111 |
| Kadant, Inc.* | | 220 | | 5,009 | | Arlington Tankers Ltd. | | 200 | | 3,076 |
| Argon ST, Inc.* | | 210 | | 4,933 | | Ultrapetrol Bahamas Ltd.* | | 390 | | 3,062 |
| Kforce, Inc.* | | 480 | | 4,901 | | Flow International Corp.* | | 590 | | 2,997 |
| Powell Industries, Inc.* | | 120 | | 4,897 | | Capstone Turbine Corp.* | | 2,967 |
| Consolidated Graphics, Inc.* | | 4,853 | | Hurco Companies, Inc.* | | 100 | | 2,957 |
| Bowne & Co., Inc. | | 420 | | 4,851 | | Sterling Construction Co., Inc.* | | 2,916 |
| Houston Wire & Cable Co. | | 4,808 | | PMFG, Inc.* | | 200 | | 2,898 |
| TAL International Group, Inc. | | 4,789 | | Force Protection, Inc.* | | 1,080 | | 2,894 |
| Gehl Co.* | | 160 | | 4,709 | | LaBarge, Inc.* | | 190 | | 2,861 |
| Sun Hydraulics Corp. | | 180 | | 4,687 | | Waste Services Inc.* | | 380 | | 2,816 |
| Marten Transport Ltd.* | | 240 | | 4,682 | | LMI Aerospace, Inc.* | | 140 | | 2,815 |
| CRA International, Inc.* | | 170 | | 4,672 | | Saia, Inc.* | | 210 | | 2,789 |
| CDI Corp. | | 209 | | 4,667 | | Hudson Highland Group, Inc.* | | 2,780 |
| Ladish Co., Inc.* | | 230 | | 4,658 | | Valence Technology, Inc.* | | 800 | | 2,760 |
| Dynamic Materials Corp. | | 200 | | 4,642 | | Vicor Corp. | | 310 | | 2,753 |
| Horizon Lines, Inc. — Class A | | 4,639 | | H&E Equipment Services, Inc.* | | 2,512 |
| Electro Rent Corp. | | 340 | | 4,566 | | Lydall, Inc.* | | 260 | | 2,504 |
| AirTran Holdings, Inc.* | | 1,850 | | 4,496 | | Titan Machinery, Inc.* | | 120 | | 2,497 |
| Ener1, Inc.* | | 570 | | 4,452 | | LSI Industries, Inc. | | 300 | | 2,481 |
| On Assignment, Inc.* | | 560 | | 4,413 | | Commercial Vehicle Group, Inc.* | | 2,410 |
| Trex Co., Inc.* | | 240 | | 4,346 | | American Railcar Industries, Inc. | | 2,406 |
| Graham Corp. | | 80 | | 4,328 | | Patriot Transportation Holding, Inc.* | 2,370 |
| Dynamex, Inc.* | | 150 | | 4,269 | | Preformed Line Products Co. | | 2,334 |
| Spherion Corp.* | | 870 | | 4,237 | | Park-Ohio Holdings Corp.* | | 2,326 |
| Casella Waste Systems, Inc. — | | China Fire & Security Group, Inc.* | | 2,312 |
| | Class A* | | 360 | | 4,226 | | TBS International Ltd. — Class A* | | 2,288 |
| Michael Baker Corp.* | | 120 | | 4,176 | | Textainer Group Holdings Ltd. | | 2,279 |
| DHT Maritime, Inc. | | 620 | | 4,166 | | TurboChef Technologies, Inc.* | | 2,276 |
560
170
550
200
170
340
500
250
210
480
200
760
260
2,300
160
180
280
230
400
470
260
339
150
30
40
130
220
170
150
370
| SCHEDULE OF INVESTMENTS (Unaudited) (continued) |
| THE RYDEX SERIES FUNDS SEMI-ANNUAL REPORT |
| See Notes to Financial Statements. | | | | | 73 |
| Standard Register Co. | | 230 | | $ | | 2,266 | | United Therapeutics Corp.* | | $ | | 37,861 |
| First Advantage Corp. — Class A* | | 2,248 | | Immucor, Inc.* | | 1,110 | | 35,476 |
| Metalico, Inc.* | | 380 | | 2,242 | | Steris Corp. | | 930 | | 34,949 |
| COMSYS IT Partners, Inc.* | | 2,236 | | Psychiatric Solutions, Inc.* | | 880 | | 33,396 |
| Advanced Battery Technologies, | | Onyx Pharmaceuticals, Inc.* | | 31,838 |
| | Inc.* | | 690 | | 2,229 | | Owens & Minor, Inc. | | 650 | | 31,525 |
| Fushi Copperweld, Inc.* | | 230 | | 2,229 | | Bio-Rad Laboratories, Inc. — |
| Energy Recovery, Inc.* | | 230 | | 2,206 | | Class A* | | 300 | | 29,736 |
| Universal Truckload Services, Inc.* | | 2,192 | | NuVasive, Inc.* | | 560 | | 27,625 |
| International Shipholding Corp.* | | 2,190 | | Masimo Corp.* | | 730 | | 27,156 |
| PRG-Schultz International, Inc.* | | 2,150 | | Magellan Health Services, Inc.* | | 26,278 |
| Key Technology, Inc.* | | 90 | | 2,133 | | Healthsouth Corp.* | | 1,390 | | 25,618 |
| Xerium Technologies, Inc. | | 330 | | 2,125 | | Parexel International Corp.* | | 25,507 |
| Integrated Electrical Services, Inc.* | | 2,107 | | Haemonetics Corp.* | | 410 | | 25,305 |
| Microvision, Inc.* | | 1,070 | | 2,076 | | West Pharmaceutical Services, |
| China Architectural Engineering, | | Inc. | | 510 | | 24,898 |
| | Inc.* | | 290 | | 2,056 | | AMERIGROUP Corp.* | | 982 | | 24,786 |
| Beacon Power Corp.* | | 1,400 | | 2,030 | | Isis Pharmaceuticals, Inc.* | | 24,153 |
| VSE Corp. | | 60 | | 2,024 | | Sequenom, Inc.* | | 890 | | 23,692 |
| ICF International, Inc.* | | 100 | | 1,975 | | Thoratec Corp.* | | 860 | | 22,575 |
| Lawson Products, Inc. | | 70 | | 1,936 | | Valeant Pharmaceuticals |
| Twin Disc, Inc. | | 140 | | 1,926 | | International* | | 1,100 | | 22,517 |
| China BAK Battery, Inc.* | | 520 | | 1,872 | | Regeneron Pharmaceuticals, Inc.* | | 21,372 |
| Volt Information Sciences, Inc.* | | 1,796 | | Amedisys, Inc.* | | 420 | | 20,441 |
| Power-One, Inc.* | | 1,180 | | 1,711 | | American Medical Systems |
| Alamo Group, Inc. | | 100 | | 1,705 | | Holdings, Inc.* | | 1,150 | | 20,424 |
| PowerSecure International, Inc.* | | 1,636 | | Varian, Inc.* | | 470 | | 20,163 |
| Flanders Corp.* | | 250 | | 1,575 | | Alkermes, Inc.* | | 1,510 | | 20,083 |
| EnerNOC, Inc.* | | 150 | | 1,551 | | Cubist Pharmaceuticals, Inc.* | | 19,785 |
| Ultralife Batteries, Inc.* | | 200 | | 1,550 | | Celera Corp.* | | 1,260 | | 19,467 |
| Trimas Corp.* | | 230 | | 1,509 | | XenoPort, Inc.* | | 400 | | 19,396 |
| Builders FirstSource, Inc.* | | 250 | | 1,498 | | PSS World Medical, Inc.* | | 980 | | 19,110 |
| Harbin Electric, Inc.* | | 120 | | 1,422 | | Medicines Co.* | | 820 | | 19,040 |
| CAI International, Inc.* | | 120 | | 1,327 | | Dionex Corp.* | | 290 | | 18,429 |
| Coleman Cable Inc.* | | 130 | | 1,304 | | Meridian Bioscience, Inc. | | 630 | | 18,295 |
| Amrep Corp. PLC* | | 30 | | 1,272 | | Eclipsys Corp.* | | 859 | | 17,996 |
| Plug Power, Inc.* | | 1,270 | | 1,257 | | Wright Medical Group, Inc.* | | 17,960 |
| Akeena Solar, Inc.* | | 330 | | 1,251 | | PDL BioPharma, Inc. | | 1,890 | | 17,596 |
| Omega Flex, Inc. | | 50 | | 1,128 | | Healthspring, Inc.* | | 780 | | 16,505 |
| ICT Group, Inc.* | | 140 | | 1,127 | | Martek Biosciences Corp. | | 520 | | 16,338 |
| Accuride Corp.* | | 560 | | 896 | | Luminex Corp.* | | 650 | | 16,256 |
| Medis Technologies Ltd.* | | 490 | | 882 | | Alnylam Pharmaceuticals, Inc.* | | 16,212 |
| Protection One, Inc.* | | 100 | | 881 | | Sciele Pharma, Inc. | | 500 | | 15,395 |
| United Capital Corp.* | | 30 | | 795 | | Chemed Corp. | | 370 | | 15,192 |
| Orion Energy Systems Inc.* | | 785 | | Viropharma, Inc.* | | 1,110 | | 14,563 |
| Ascent Solar Technologies, Inc.* | | 724 | | Conmed Corp.* | | 449 | | 14,368 |
| Dollar Thrifty Automotive Group, | | Phase Forward, Inc.* | | 680 | | 14,219 |
| | Inc.* | | 340 | | 656 | | Centene Corp.* | | 690 | | 14,152 |
| China Direct, Inc.* | | 110 | | 464 | | Acorda Therapeutics, Inc.* | | 14,071 |
| | Human Genome Sciences, Inc.* | | 13,589 |
| | HealthExtras, Inc.* | | 520 | | 13,582 |
| | Rigel Pharmaceuticals, Inc.* | | 13,543 |
| | Alpharma, Inc. — Class A* | | 13,280 |
| | Medicis Pharmaceutical Corp. — |
| Alexion Pharmaceuticals, Inc.* | | 47,553 |
| Myriad Genetics, Inc.* | | 710 | | 46,065 |
| OSI Pharmaceuticals, Inc.* | 900 | | 44,361 |
360
160
230
880
90
100
240
640
890
120
1,430
979
200
270
890
590
560
140
119
590
2,140
580
360
1,210
| SCHEDULE OF INVESTMENTS (Unaudited) (continued) |
| THE RYDEX SERIES FUNDS SEMI-ANNUAL REPORT |
| 74 | | | | | See Notes to Financial Statements. |
| Medarex, Inc.* | | 2,020 | | $ | | 13,069 | | Emeritus Corp.* | | 309 | | $ | | 7,694 |
| Volcano Corp.* | | 750 | | 12,967 | | Universal American Financial Corp.* | 7,558 |
| Savient Pharmaceuticals, Inc.* | | 12,823 | | SurModics, Inc.* | | 240 | | 7,558 |
| AmSurg Corp.* | | 500 | | 12,735 | | Quidel Corp.* | | 450 | | 7,384 |
| Mentor Corp. | | 530 | | 12,646 | | Durect Corp.* | | 1,289 | | 7,218 |
| Apria Healthcare Group, Inc.* | | 12,586 | | Molina Healthcare, Inc.* | | 230 | | 7,130 |
| Cepheid, Inc.* | | 900 | | 12,447 | | Res-Care, Inc.* | | 390 | | 7,075 |
| Integra LifeSciences Holdings | | Halozyme Therapeutics, Inc.* | | 7,046 |
| | Corp.* | | 280 | | 12,328 | | Par Pharmaceutical Companies, |
| Invacare Corp. | | 510 | | 12,311 | | Inc.* | | 550 | | 6,759 |
| Kindred Healthcare, Inc.* | | 440 | | 12,131 | | Albany Molecular Research, Inc.* | | 6,693 |
| KV Pharmaceutical Co.* | | 520 | | 11,809 | | Abaxis, Inc.* | | 339 | | 6,678 |
| ArthroCare Corp.* | | 420 | | 11,642 | | LHC Group, Inc.* | | 230 | | 6,550 |
| Auxilium Pharmaceuticals, Inc.* | | 11,340 | | Neogen Corp.* | | 230 | | 6,481 |
| Allscripts Healthcare Solutions, | | Enzo Biochem, Inc.* | | 590 | | 6,478 |
| | Inc.* | | 900 | | 11,196 | | Omnicell, Inc.* | | 490 | | 6,443 |
| ev3, Inc.* | | 1,110 | | 11,144 | | Cyberonics, Inc.* | | 379 | | 6,443 |
| athenahealth, Inc.* | | 330 | | 10,979 | | MWI Veterinary Supply, Inc.* | | 6,286 |
| Landauer, Inc. | | 150 | | 10,912 | | Sirona Dental Systems, Inc.* | | 6,286 |
| Zoll Medical Corp.* | | 330 | | 10,798 | | Hanger Orthopedic Group, Inc.* | | 6,282 |
| PharMerica Corp.* | | 480 | | 10,795 | | Questcor Pharmaceuticals, Inc.* | | 6,248 |
| Datascope Corp. | | 209 | | 10,791 | | Allos Therapeutics, Inc.* | | 840 | | 6,224 |
| Gentiva Health Services, Inc.* | | 10,776 | | National Healthcare Corp. | | 6,126 |
| Bruker BioSciences Corp.* | | 10,664 | | Angiodynamics, Inc.* | | 379 | | 5,988 |
| Align Technology, Inc.* | | 980 | | 10,613 | | Arena Pharmaceuticals, Inc.* | | 5,850 |
| Medivation, Inc.* | | 400 | | 10,584 | | CryoLife, Inc.* | | 440 | | 5,773 |
| Analogic Corp. | | 210 | | 10,450 | | Array Biopharma, Inc.* | | 750 | | 5,760 |
| AMAG Pharmaceuticals, Inc.* | | 10,418 | | Progenics Pharmaceuticals, Inc.* | | 5,590 |
| Symmetry Medical, Inc.* | | 560 | | 10,394 | | Assisted Living Concepts, Inc. — |
| CV Therapeutics, Inc.* | | 960 | | 10,368 | | Class A* | | 870 | | 5,542 |
| Seattle Genetics, Inc.* | | 960 | | 10,272 | | GTx, Inc.* | | 290 | | 5,516 |
| Theravance, Inc.* | | 820 | | 10,217 | | Pharmasset, Inc.* | | 270 | | 5,387 |
| Exelixis, Inc.* | | 1,660 | | 10,093 | | NPS Pharmaceuticals, Inc.* | | 5,355 |
| Natus Medical, Inc.* | | 440 | | 9,970 | | Odyssey HealthCare, Inc.* | | 5,278 |
| Sun Healthcare Group, Inc.* | | 9,969 | | Pain Therapeutics, Inc.* | | 540 | | 5,276 |
| Sunrise Senior Living, Inc.* | | 9,791 | | RehabCare Group, Inc.* | | 290 | | 5,249 |
| Vital Signs, Inc. | | 130 | | 9,607 | | Nektar Therapeutics* | | 1,460 | | 5,241 |
| Abiomed, Inc.* | | 539 | | 9,567 | | Enzon Pharmaceuticals, Inc.* | | 5,240 |
| Kendle International, Inc.* | | 210 | | 9,389 | | Bio-Reference Labs, Inc.* | | 180 | | 5,202 |
| HMS Holdings Corp.* | | 390 | | 9,344 | | IRIS International, Inc.* | | 290 | | 5,191 |
| AMN Healthcare Services, Inc.* | | 9,312 | | ICU Medical, Inc.* | | 170 | | 5,170 |
| inVentiv Health, Inc.* | | 520 | | 9,183 | | Momenta Pharmaceuticals, Inc.* | | 5,113 |
| Incyte Corp.* | | 1,200 | | 9,180 | | Orthofix International NV* | | 5,030 |
| Healthways, Inc.* | | 560 | | 9,033 | | MedAssets, Inc.* | | 290 | | 4,988 |
| Greatbatch, Inc.* | | 360 | | 8,834 | | Genomic Health, Inc.* | | 220 | | 4,983 |
| Vivus, Inc.* | | 1,090 | | 8,655 | | Life Sciences Research, Inc.* | | 4,900 |
| InterMune, Inc.* | | 500 | | 8,555 | | Geron Corp.* | | 1,230 | | 4,859 |
| SonoSite, Inc.* | | 270 | | 8,478 | | Air Methods Corp.* | | 170 | | 4,813 |
| Dendreon Corp.* | | 1,470 | | 8,394 | | Salix Pharmaceuticals Ltd.* | | 4,808 |
| Merit Medical Systems, Inc.* | | 8,259 | | Osiris Therapeutics, Inc.* | | 240 | | 4,630 |
| eResearch Technology, Inc.* | | 8,099 | | Affymetrix, Inc.* | | 597 | | 4,621 |
| Cougar Biotechnology, Inc.* | | 8,014 | | Akorn, Inc.* | | 900 | | 4,617 |
| Conceptus, Inc.* | | 480 | | 7,958 | | Accuray, Inc.* | | 569 | | 4,592 |
| RTI Biologics, Inc.* | | 850 | | 7,947 | | Noven Pharmaceuticals, Inc.* | | 4,555 |
| Cross Country Healthcare, Inc.* | | 7,819 | | Idera Pharmaceuticals, Inc.* | | 4,502 |
620
860
690
960
370
350
160
270
360
850
400
130
800
1,170
269
420
750
520
680
710
710
530
390
270
140
750
440
680
240
390
480
320
| SCHEDULE OF INVESTMENTS (Unaudited) (continued) |
| THE RYDEX SERIES FUNDS SEMI-ANNUAL REPORT |
| See Notes to Financial Statements. | | | | | 75 |
| Emergency Medical Services | | Orthovita, Inc.* | | 1,050 | | $ | | 2,730 |
| | Corp. — Class A* | | 150 | | $ | | 4,482 | | Ariad Pharmaceuticals, Inc.* | | 2,715 |
| Medcath Corp.* | | 250 | | 4,480 | | Cynosure, Inc.* | | 149 | | 2,673 |
| Sangamo Biosciences, Inc.* | | 4,466 | | Nighthawk Radiology Holdings, |
| Skilled Healthcare Group, Inc. — | | Inc.* | | 370 | | 2,671 |
| | Class A* | | 280 | | 4,449 | | Exactech, Inc.* | | 120 | | 2,669 |
| Vnus Medical Technologies, Inc.* | | 4,395 | | Novavax, Inc.* | | 920 | | 2,668 |
| XOMA Ltd.* | | 2,090 | | 4,389 | | Ardea Biosciences, Inc.* | | 190 | | 2,628 |
| Computer Programs & Systems, | | Stereotaxis, Inc.* | | 430 | | 2,602 |
| | Inc. | | 150 | | 4,343 | | Clinical Data, Inc.* | | 160 | | 2,573 |
| Cypress Bioscience, Inc.* | | 590 | | 4,337 | | IPC The Hospitalist Co., Inc.* | | 2,570 |
| Pozen, Inc.* | | 410 | | 4,309 | | BMP Sunstone Corp.* | | 370 | | 2,568 |
| Genoptix Inc.* | | 130 | | 4,247 | | DexCom, Inc.* | | 410 | | 2,538 |
| Somanetics Corp.* | | 190 | | 4,155 | | Adolor Corp.* | | 730 | | 2,519 |
| Omrix Biopharmaceuticals, Inc.* | | 4,126 | | FGX International Holdings Ltd.* | | 2,435 |
| Alliance Imaging, Inc.* | | 400 | | 4,108 | | Tercica, Inc.* | | 270 | | 2,414 |
| Indevus Pharmaceuticals, Inc.* | | 4,087 | | Inspire Pharmaceuticals, Inc.* | | 2,392 |
| Insulet Corp.* | | 290 | | 4,037 | | BioMimetic Therapeutics, Inc.* | | 2,323 |
| Almost Family, Inc.* | | 100 | | 3,955 | | Spectranetics Corp.* | | 500 | | 2,315 |
| Zymogenetics, Inc.* | | 590 | | 3,929 | | Repligen Corp.* | | 490 | | 2,308 |
| ImmunoGen, Inc.* | | 800 | | 3,928 | | Accelrys, Inc.* | | 420 | | 2,306 |
| Ligand Pharmaceuticals, Inc. — | | Lexicon Genetics, Inc.* | | 1,270 | | 2,261 |
| | Class B* | | 1,330 | | 3,924 | | PharmaNet Development Group, |
| Palomar Medical Technologies, | | Inc.* | | 310 | | 2,238 |
| | Inc.* | | 290 | | 3,903 | | Ensign Group, Inc. | | 130 | | 2,222 |
| Dyax Corp.* | | 880 | | 3,872 | | Molecular Insight Pharmaceuticals, |
| Nabi Biopharmaceuticals* | | 820 | | 3,821 | | Inc.* | | 280 | | 2,150 |
| Synovis Life Technologies, Inc.* | | 3,764 | | Caliper Life Sciences, Inc.* | | 2,128 |
| Vital Images, Inc.* | | 250 | | 3,750 | | Caraco Pharm Labs, Inc.* | | 170 | | 2,127 |
| Corvel Corp.* | | 130 | | 3,719 | | Arqule, Inc.* | | 640 | | 2,061 |
| OraSure Technologies, Inc.* | | 3,641 | | Javelin Pharmaceuticals, Inc.* | | 2,028 |
| Hansen Medical, Inc.* | | 270 | | 3,629 | | Synta Pharmaceuticals Corp.* | | 1,981 |
| Triple-S Management Corp. — | | Atrion Corp. | | 19 | | 1,958 |
| | Class B* | | 220 | | 3,584 | | Columbia Labs, Inc. Com* | 740 | | 1,939 |
| Micrus Endovascular Corp.* | | 3,488 | | Cantel Medical Corp.* | | 200 | | 1,924 |
| Kensey Nash Corp.* | | 110 | | 3,461 | | TranS1, Inc.* | | 190 | | 1,879 |
| Orexigen Therapeutics, Inc.* | | 3,453 | | Alexza Pharmaceuticals, Inc.* | | 1,877 |
| US Physical Therapy, Inc.* | | 190 | | 3,298 | | Five Star Quality Care, Inc.* | | 1,875 |
| Metabolix, Inc.* | | 300 | | 3,264 | | Providence Service Corp.* | | 1,862 |
| Optimer Pharmaceuticals, Inc.* | | 3,260 | | Chindex International, Inc.* | | 1,846 |
| Cardiac Science Corp.* | | 310 | | 3,212 | | Immunomedics, Inc.* | | 1,030 | | 1,833 |
| I-Flow Corp.* | | 340 | | 3,165 | | Alphatec Holdings, Inc.* | | 390 | | 1,794 |
| MannKind Corp.* | | 810 | | 3,127 | | CardioNet, Inc.* | | 70 | | 1,747 |
| Capital Senior Living Corp.* | | 3,063 | | NxStage Medical, Inc.* | | 410 | | 1,730 |
| TomoTherapy, Inc.* | | 650 | | 2,977 | | Affymax, Inc.* | | 87 | | 1,727 |
| Idenix Pharmaceuticals, Inc.* | | 2,892 | | Nanosphere, Inc.* | | 200 | | 1,706 |
| Medical Action Industries, Inc.* | | 2,889 | | Maxygen Inc.* | | 400 | | 1,692 |
| Discovery Laboratories, Inc.* | | 2,861 | | Targacept, Inc.* | | 290 | | 1,685 |
| Neurocrine Biosciences, Inc.* | | 2,861 | | Cytori Therapeutics, Inc.* | | 310 | | 1,637 |
| Cadence Pharmaceuticals, Inc.* | | 2,842 | | Cytokinetics, Inc.* | | 295 | | 1,398 |
| Cambrex Corp.* | | 460 | | 2,829 | | Acadia Pharmaceuticals, Inc.* | | 1,394 |
| Obagi Medical Products, Inc.* | | 2,794 | | BioForm Medical, Inc.* | | 350 | | 1,372 |
| Celldex Therapeutics, Inc.* | | 2,791 | | RadNet, Inc.* | | 340 | | 1,363 |
| Depomed, Inc.* | | 760 | | 2,774 | | Opko Health, Inc.* | | 760 | | 1,330 |
| Emergent Biosolutions, Inc.* | | 2,749 | | MAP Pharmaceuticals, Inc.* | | 1,214 |
1,099
580
210
100
230
220
1,220
670
210
200
760
740
780
260
250
320
380
500
190
410
170
403
400
220
1,530
610
320
520
280
240
210
120
| CONSUMER DISCRETIONARY 6.1% |
| SCHEDULE OF INVESTMENTS (Unaudited) (continued) |
| THE RYDEX SERIES FUNDS SEMI-ANNUAL REPORT |
| 76 | | | | | See Notes to Financial Statements. |
| Amicus Therapeutics, Inc.* | | 80 | | $ | | 1,210 | | Interactive Data Corp. | | 580 | | $ | | 14,628 |
| Sucampo Pharmaceuticals, Inc. — | | Coinstar, Inc.* | | 440 | | 14,080 |
| | Class A* | | 140 | | 1,194 | | Tempur-Pedic International, Inc. | | 13,877 |
| Vision-Sciences, Inc.* | | 270 | | 1,077 | | Sonic Corp.* | | 950 | | 13,841 |
| National Research Corp. | | 30 | | 920 | | Bob Evans Farms, Inc. | | 490 | | 13,372 |
| Acura Pharmaceuticals, Inc.* | | 914 | | Buckle, Inc. | | 240 | | 13,330 |
| Virtual Radiologic Corp.* | | 110 | | 898 | | Timberland Co. — Class A* | | 13,201 |
| MiddleBrook Pharmaceuticals, Inc.* | | 855 | | Sally Beauty Holdings, Inc.* | | 12,814 |
| Cell Genesys, Inc.* | | 1,359 | | 802 | | Zale Corp.* | | 510 | | 12,750 |
| Marshall Edwards, Inc.* | | 330 | | 710 | | Brown Shoe Co., Inc. | | 775 | | 12,694 |
| Rexahn Pharmaceuticals, Inc.* | | 593 | | Children’s Place Retail Stores, Inc.* | 12,339 |
| Jazz Pharmaceuticals, Inc.* | | 593 | | Iconix Brand Group, Inc.* | | 910 | | 11,903 |
| Biodel, Inc.* | | 170 | | 570 | | Meritage Homes Corp.* | | 480 | | 11,856 |
| Protalix BioTherapeutics, Inc.* | | 379 | | American Greetings Corp. — |
| | Quiksilver, Inc.* | | 1,990 | | 11,423 |
| | Buffalo Wild Wings, Inc.* | | 279 | | 11,227 |
| | Helen of Troy Ltd.* | | 480 | | 10,930 |
| | Ethan Allen Interiors, Inc. | | 390 | | 10,928 |
| | Dress Barn, Inc.* | | 710 | | 10,856 |
| | Jakks Pacific, Inc.* | | 430 | | 10,711 |
| | CEC Entertainment, Inc.* | | 320 | | 10,624 |
| | Dillard’s, Inc. — Class A | | 900 | | 10,620 |
| | Stewart Enterprises, Inc. — |
| | Jos. A. Bank Clothiers, Inc.* | | 9,744 |
| | Standard-Pacific Corp.* | | 1,960 | | 9,624 |
| | Papa John’s International, Inc.* | | 9,506 |
| | Capella Education Co.* | | 220 | | 9,429 |
| | Hibbett Sports Inc.* | | 450 | | 9,009 |
| | P.F. Chang’s China Bistro, Inc.* | | 8,945 |
| | Steiner Leisure Ltd.* | | 260 | | 8,939 |
| | CKE Restaurants, Inc. | | 830 | | 8,798 |
| | Exide Technologies* | | 1,190 | | 8,782 |
| | Charming Shoppes, Inc.* | | 8,753 |
| | Skechers U.S.A., Inc. — Class A* | | 8,752 |
| | NutriSystem, Inc. | | 480 | | 8,506 |
| | Belo Corp. — Class A | | 1,410 | | 8,404 |
| | Jo-Ann Stores, Inc.* | | 400 | | 8,392 |
| | Columbia Sportswear Co. | | 199 | | 8,350 |
| | Stage Stores, Inc. | | 610 | | 8,333 |
| | American Public Education, Inc.* | | 8,208 |
| | 99 Cents Only Stores* | | 740 | | 8,118 |
| | ATC Technology Corp.* | | 340 | | 8,072 |
| | Group 1 Automotive, Inc. | | 370 | | 8,040 |
| | Cooper Tire & Rubber Co. | | 7,998 |
| | Cato Corp. — Class A | | 440 | | 7,722 |
| Aeropostale, Inc.* | | 1,060 | | 34,037 |
| The Warnaco Group, Inc.* | | 720 | | 32,609 |
| Tupperware Brands Corp. | | 980 | | 27,077 |
| Marvel Entertainment, Inc.* | | 26,288 |
| Bally Technologies, Inc.* | | 860 | | 26,041 |
| Matthews International Corp. — |
| Wolverine World Wide, Inc. | | 24,079 |
| Polaris Industries, Inc. | | 520 | | 23,655 |
| Rent-A-Center, Inc.* | | 1,050 | | 23,394 |
| Tractor Supply Co.* | | 530 | | 22,286 |
| Deckers Outdoor Corp.* | | 210 | | 21,857 |
| WMS Industries, Inc.* | | 690 | | 21,093 |
| Corinthian Colleges, Inc.* | | 20,235 |
| Jack in the Box, Inc.* | | 930 | | 19,623 |
| Live Nation, Inc.* | | 1,200 | | 19,524 |
| Aaron Rents, Inc. | | 720 | | 19,490 |
| J. Crew Group, Inc.* | | 670 | | 19,142 |
| Gaylord Entertainment Co.* | | 19,090 |
| Collective Brands, Inc.* | | 1,010 | | 18,493 |
| Ryland Group, Inc. | | 670 | | 17,768 |
| Brunswick Corp. | | 1,380 | | 17,650 |
| Men’s Wearhouse, Inc. | | 820 | | 17,417 |
| Life Time Fitness, Inc.* | | 550 | | 17,198 |
| Vail Resorts, Inc.* | | 490 | | 17,125 |
| Under Armour, Inc.* | | 520 | | 16,515 |
| Cheesecake Factory, Inc.* | | 15,483 |
| Chico’s FAS, Inc.* | | 2,790 | | 15,261 |
| ArvinMeritor, Inc. | | 1,160 | | 15,126 |
| Callaway Golf Co. | | 1,050 | | 14,773 |
1,180
130
760
570
1,490
460
370
120
170
290
350
380
1,790
520
170
930
770
910
1,349
650
1,059
SCHEDULE OF INVESTMENTS (Unaudited) (continued)
September 30, 2008
RUSSELL 2000® FUND
MARKET
MARKET
SHARES
VALUE
SHARES
VALUE
Dana Holding Corp.*
1,560
$
7,550
Wendy’s/Arby’s Group, Inc. —
La-Z-Boy, Inc.
810
7,549
Class A
990
$
5,184
Domino’s Pizza, Inc.*
620
7,527
Marcus Corp.
320
5,146
Cabela’s, Inc. — Class A*
620
7,490
CKX, Inc.*
830
5,113
Texas Roadhouse, Inc.*
830
7,462
Talbots, Inc.
390
5,109
Modine Manufacturing Co.
510
7,385
Zumiez, Inc.*
310
5,109
Churchill Downs, Inc.
149
7,298
Maidenform Brands, Inc.*
350
5,078
National CineMedia, Inc.
660
7,293
M/I Homes, Inc.
220
5,012
Red Robin Gourmet Burgers, Inc.*
270
7,236
Volcom, Inc.*
290
5,011
RCN Corp.*
590
7,233
Visteon Corp.*
2,070
4,802
Pinnacle Entertainment, Inc.*
950
7,182
Ambassadors Group, Inc.
299
4,757
K-Swiss, Inc. — Class A
410
7,134
Overstock.com, Inc.*
240
4,754
Pacific Sunwear of California, Inc.*
1,040
6,999
Ruby Tuesday, Inc.*
820
4,748
True Religion Apparel, Inc.*
270
6,979
CROCS, Inc.*
1,320
4,726
Furniture Brands International, Inc.
660
6,943
Charter Communications, Inc. —
Steven Madden, Ltd.*
280
6,938
Class A*
6,450
4,708
Jackson Hewitt Tax Service, Inc.
450
6,903
Morgans Hotel Group Co.*
430
4,691
Superior Industries International,
HOT Topic, Inc.*
690
4,561
Inc.
360
6,898
DineEquity, Inc.
270
4,552
thinkorswim Group, Inc.*
820
6,831
Sealy Corp.
700
4,522
Champion Enterprises, Inc.*
1,230
6,826
Media General, Inc.
360
4,475
Finish Line, Inc. — Class A
669
6,683
Sauer, Inc.
180
4,444
Blockbuster, Inc. — Class A*
3,227
6,615
American Apparel, Inc.*
540
4,428
Valassis Communications, Inc.*
760
6,582
Blyth, Inc.
390
4,423
Fuel Systems Solutions, Inc.*
190
6,545
Hayes Lemmerz International, Inc.*
1,600
4,368
Lululemon Athletica, Inc.*
280
6,448
Fisher Communications, Inc.
110
4,334
Cinemark Holdings, Inc.
470
6,392
Cox Radio Inc. — Class A*
410
4,330
Borders Group, Inc.
960
6,298
Christopher & Banks Corp.
560
4,295
Peet’s Coffee & Tea, Inc.*
220
6,142
Speedway Motorsports, Inc.
220
4,286
Raser Technologies, Inc.*
710
6,035
Shuffle Master, Inc.*
840
4,276
Harte-Hanks, Inc.
580
6,015
Ulta Salon Cosmetics & Fragrance,
Monro Muffler Brake, Inc.
260
5,996
Inc.*
320
4,250
PetMed Express, Inc.*
380
5,966
California Pizza Kitchen, Inc.*
330
4,247
Bebe Stores, Inc.
610
5,960
Sinclair Broadcast Group, Inc. —
Winnebago Industries, Inc.
460
5,943
Class A
830
4,183
Hovnanian Enterprises, Inc. —
iRobot Corp.*
280
4,150
Class A*
730
5,833
PEP Boys-Manny Moe & Jack
670
4,141
Pier 1 Imports, Inc.*
1,410
5,823
Dolan Media Co.*
400
4,036
Universal Technical Institute, Inc.*
340
5,800
McClatchy Co. — Class A
900
3,960
Asbury Automotive Group, Inc.
500
5,760
G-III Apparel Group Ltd.*
210
3,929
GSI Commerce, Inc.*
370
5,728
American Axle & Manufacturing
Oxford Industries, Inc.
220
5,683
Holdings, Inc.
730
3,913
Ameristar Casinos, Inc.
400
5,676
Steak n Shake Co.*
450
3,906
RC2 Corp.*
280
5,600
Denny’s Corp.*
1,499
3,867
Movado Group, Inc.
250
5,587
Tween Brands, Inc.*
390
3,818
Universal Electronics, Inc.*
220
5,496
Core-Mark Holding Co., Inc.*
150
3,748
Leapfrog Enterprises, Inc.*
520
5,491
Citi Trends, Inc.*
230
3,747
Pre-Paid Legal Services, Inc.*
130
5,364
Beazer Homes USA, Inc.*
620
3,708
Drew Industries, Inc.*
310
5,304
Haverty Furniture Companies, Inc.
322
3,684
The Wet Seal, Inc. — Class A*
1,450
5,263
Weyco Group, Inc.
110
3,682
DG FastChannel, Inc.*
240
5,261
Mediacom Communications Corp.*
620
3,670
World Wrestling Entertainment,
Knology, Inc.*
450
3,631
Inc.
340
5,256
Cavco Industries, Inc.*
100
3,615
National Presto Industries, Inc.
70
5,215
Steinway Musical Instruments, Inc.*
127
3,597
Coldwater Creek, Inc.*
900
5,211
New York & Co., Inc.*
370
3,530
See Notes to Financial Statements.
THE RYDEX SERIES FUNDS SEMI-ANNUAL REPORT
|
77
SCHEDULE OF INVESTMENTS (Unaudited) (continued)
September 30, 2008
RUSSELL 2000® FUND
MARKET
MARKET
SHARES
VALUE
SHARES
VALUE
Big 5 Sporting Goods Corp.
340
$
3,509
Lodgian, Inc.*
260
$
2,028
Sonic Automotive, Inc.
410
3,469
Russ Berrie & Co., Inc.*
260
1,994
Unifi, Inc.*
710
3,436
Dover Downs Gaming &
Orbitz Worldwide, Inc.*
580
3,405
Entertainment, Inc.
255
1,984
Martha Stewart Omnimedia, Inc.*
400
3,404
Tuesday Morning Corp.*
480
1,982
Charlotte Russe Holding, Inc.*
330
3,382
Libbey, Inc.
230
1,957
Avatar Holdings Inc.*
100
3,300
hhgregg, Inc.*
200
1,950
Journal Communications, Inc. —
Build-A-Bear Workshop, Inc.*
260
1,893
Class A
670
3,270
Lumber Liquidators, Inc.*
150
1,884
BJ’s Restaurants, Inc.*
270
3,224
MarineMax, Inc.*
260
1,880
RHI Entertainment*
210
3,129
Retail Ventures, Inc.*
460
1,794
drugstore.com, Inc.*
1,320
3,102
Cumulus Media, Inc. — Class A*
420
1,789
CSS Industries, Inc.
120
3,089
Global Traffic Network, Inc.*
190
1,761
Midas, Inc.*
220
3,027
Learning Tree International, Inc.*
140
1,743
Shutterfly, Inc.*
310
2,979
Town Sports International Holdings,
America’s Car Mart, Inc.*
160
2,974
Inc.*
279
1,702
Gaiam, Inc.*
279
2,957
Princeton Review, Inc.*
210
1,680
Krispy Kreme Doughnuts, Inc.*
890
2,937
Quantum Fuel Systems
Idearc, Inc.
2,330
2,912
Technologies Worldwide, Inc.*
1,300
1,677
Skyline Corp.
110
2,907
AH Belo Corp. — Class A
320
1,651
AFC Enterprises, Inc.*
399
2,897
Nautilus, Inc.*
360
1,645
DSW, Inc.*
210
2,877
Spartan Motors, Inc.
510
1,622
Perry Ellis International, Inc.*
190
2,833
Palm Harbor Homes, Inc.*
160
1,586
Conn’s, Inc.*
150
2,806
Great Wolf Resorts, Inc.*
430
1,574
Landry’s Restaurants, Inc.
180
2,799
Stein Mart, Inc.
400
1,564
Luby’s, Inc.*
340
2,734
Dover Motorsports, Inc.
277
1,510
Global Sources Ltd.*
270
2,719
Rex Stores Corp.*
130
1,501
Stamps.com, Inc.*
230
2,684
Wonder Auto Technology, Inc.*
230
1,474
K12 Inc.*
100
2,650
Bluegreen Corp.*
200
1,382
Audiovox Corp. — Class A*
280
2,624
Syms Corp.*
100
1,351
Cherokee, Inc.
119
2,616
Playboy Enterprises, Inc. — Class B*
340
1,340
Stoneridge, Inc.*
230
2,587
Marine Products Corp.
160
1,328
O’Charleys, Inc.
290
2,537
Ruth’s Chris Steak House*
320
1,258
Entravision Communications
Cache, Inc.*
180
1,237
Corp. — Class A*
940
2,529
Fleetwood Enterprises, Inc.*
1,210
1,234
Hooker Furniture Corp.
140
2,485
Fuqi International, Inc.*
150
1,223
Lee Enterprises, Inc.
709
2,481
Riviera Holdings Corp.*
160
1,176
1-800-FLOWERS.com, Inc.*
410
2,468
Gray Television, Inc.
670
1,152
Systemax, Inc.
170
2,390
Rick’s Cabaret International, Inc.*
100
982
Entercom Communications Corp.
473
2,374
Primedia, Inc.
400
972
Casual Male Retail Group, Inc.*
590
2,319
Lincoln Educational Services Corp.*
70
926
Amerigon, Inc.*
350
2,303
Crown Media Holdings, Inc. —
Shoe Carnival, Inc.*
140
2,293
Class A*
170
855
Isle of Capri Casinos, Inc.*
250
2,255
Six Flags, Inc.*
1,150
794
Citadel Broadcasting Corp.*
2,860
2,231
Einstein Noah Restaurant Group,
Smith & Wesson Holding Corp.*
590
2,207
Inc.*
70
706
Outdoor Channel Holdings, Inc.*
250
2,200
Value Line, Inc.
20
670
RH Donnelley Corp.*
1,090
2,169
Westwood One, Inc.*
1,120
616
Lin TV Corp. — Class A*
420
2,167
GateHouse Media, Inc.
500
510
Brookfield Homes Corp.
150
2,154
Aristotle Corp.*
19
151
Dorman Products, Inc.*
170
2,130
Total Consumer Discretionary
2,058,540
Kenneth Cole Productions, Inc. —
ENERGY 3.0%
Class A
140
2,058
EXCO Resources, Inc.*
2,360
38,515
Monarch Casino & Resort, Inc.*
180
2,050
Comstock Resources, Inc.*
720
36,036
Circuit City Stores, Inc.
2,670
2,029
78
|
THE RYDEX SERIES FUNDS SEMI-ANNUAL REPORT
See Notes to Financial Statements.
SCHEDULE OF INVESTMENTS (Unaudited) (continued)
September 30, 2008
RUSSELL 2000® FUND
MARKET
MARKET
SHARES
VALUE
SHARES
VALUE
Penn Virginia Corp.
660
$
35,270
Clayton Williams Energy, Inc.*
90
$
6,348
Berry Petroleum Co. — Class A
773
29,938
Parallel Petroleum Corp.*
650
6,123
Concho Resources, Inc.*
870
24,021
Gran Tierra Energy, Inc.*
1,640
6,084
Arena Resources, Inc.*
600
23,310
Callon Petroleum Co.*
330
5,950
McMoRan Exploration Co.*
950
22,458
Energy XXI Bermuda Ltd.
1,890
5,746
Grey Wolf, Inc.*
2,830
22,017
ENGlobal Corp.*
430
5,706
Dril-Quip, Inc.*
490
21,261
Harvest Natural Resources, Inc.*
560
5,667
Stone Energy Corp.*
500
21,165
Dawson Geophysical Co.*
120
5,603
ION Geophysical Corp.*
1,340
19,015
Allis-Chalmers Energy, Inc.*
440
5,566
Atlas America, Inc.
550
18,760
TXCO Resources, Inc.*
550
5,522
Bill Barrett Corp.*
580
18,624
VeraSun Energy Corp.*
1,620
5,071
Swift Energy Co.*
480
18,571
Clean Energy Fuels Corp.*
340
4,811
Lufkin Industries, Inc.
230
18,250
FX Energy, Inc.*
639
4,754
Nordic American Tanker Shipping
540
17,312
Western Refining, Inc.
470
4,752
CARBO Ceramics, Inc.
320
16,515
Energy Partners Ltd.*
500
4,335
BPZ Resources, Inc.*
950
16,340
Brigham Exploration Co.*
392
4,308
Willbros Group, Inc.*
610
16,165
Bronco Drilling Co., Inc.*
420
4,292
GulfMark Offshore, Inc.*
360
16,157
Venoco, Inc.*
320
4,160
Crosstex Energy, Inc.
640
15,981
Gulfport Energy Corp.*
410
4,120
Goodrich Petroleum Corp.*
361
15,736
Rex Energy Corp.*
260
4,098
Carrizo Oil & Gas, Inc.*
430
15,596
Rentech, Inc.*
2,620
3,485
Complete Production Services, Inc.*
760
15,299
Panhandle Oil and Gas, Inc. —
Rosetta Resources, Inc.*
810
14,872
Class A
120
3,436
Ship Finance International Ltd.
670
14,445
Trico Marine Services, Inc.*
200
3,416
Hornbeck Offshore Services, Inc.*
370
14,289
Natural Gas Services Group, Inc.*
190
3,319
Parker Drilling Co.*
1,780
14,276
CVR Energy, Inc.*
360
3,067
Delta Petroleum Corp.*
980
13,308
Northern Oil And Gas, Inc.*
340
2,764
Bristow Group, Inc.*
380
12,859
Gasco Energy, Inc.*
1,480
2,694
NATCO Group, Inc.*
320
12,858
BMB Munai, Inc.*
630
2,614
International Coal Group, Inc.*
2,010
12,542
Toreador Resources Corp.*
270
2,427
GMX Resources, Inc.*
260
12,428
Endeavour International Corp.*
1,800
2,376
Contango Oil & Gas Co.*
210
11,336
Westmoreland Coal Co.*
150
2,370
Petroquest Energy, Inc.*
690
10,591
OYO Geospace Corp.*
60
2,357
Pioneer Drilling Co.*
790
10,507
Union Drilling, Inc.*
220
2,330
Newpark Resources, Inc.*
1,420
10,366
National Coal Corp.*
440
2,301
World Fuel Services Corp.
450
10,363
Alon USA Energy, Inc.
170
2,292
Petroleum Development Corp.*
230
10,205
Meridian Resource Corp.*
1,230
2,263
USEC, Inc.*
1,760
9,522
Tri-Valley Corp.*
350
2,219
Warren Resources, Inc.*
920
9,182
RAM Energy Resources, Inc.*
740
2,139
James River Coal Co.*
400
8,796
Approach Resources, Inc.*
140
2,024
Oilsands Quest, Inc.*
2,770
8,282
Bolt Technology Corp.*
139
2,011
General Maritime Corp.
420
8,182
Delek US Holdings, Inc.
210
1,947
PHI, Inc.*
220
8,125
Double Eagle Petroleum Co.*
130
1,856
Matrix Service Co.*
410
7,831
Cheniere Energy, Inc.*
770
1,732
ATP Oil & Gas Corp.*
439
7,819
Cano Petroleum, Inc.*
750
1,732
Basic Energy Services, Inc.*
350
7,455
Abraxas Petroleum Corp.*
660
1,723
Golar LNG Ltd.
560
7,437
APCO Argentina, Inc.
60
1,699
T-3 Energy Services, Inc. —
Sulphco, Inc.*
840
1,688
Class A*
200
7,424
GeoMet, Inc.*
290
1,578
Cal Dive International, Inc.*
700
7,420
Geokinetics, Inc.*
80
1,520
Knightsbridge Tankers Ltd.
270
7,147
Houston American Energy Corp.
240
1,517
Superior Well Services, Inc.*
260
6,581
American Oil & Gas, Inc.*
580
1,514
Gulf Island Fabrication, Inc.
190
6,549
Mitcham Industries, Inc.*
150
1,513
RPC, Inc.
460
6,468
GeoGlobal Resources, Inc.*
600
1,512
Vaalco Energy, Inc.*
930
6,361
See Notes to Financial Statements.
THE RYDEX SERIES FUNDS SEMI-ANNUAL REPORT
|
79
SCHEDULE OF INVESTMENTS (Unaudited) (continued)
September 30, 2008
RUSSELL 2000® FUND
MARKET
MARKET
SHARES
VALUE
SHARES
VALUE
Aventine Renewable Energy
Spartech Corp.
480
$
4,752
Holdings, Inc.*
460
$
1,454
Schweitzer-Mauduit International,
Uranium Resources, Inc.*
780
1,318
Inc.
250
4,747
Evergreen Energy Inc.*
1,340
1,260
Neenah Paper, Inc.
230
4,554
Quest Resource Corp.*
440
1,170
Quaker Chemical Corp.
160
4,554
Georesources, Inc.*
100
1,146
American Vanguard Corp.
300
4,524
GreenHunter Energy, Inc.*
70
998
A.M. Castle & Co.
260
4,493
Pacific Ethanol, Inc.*
700
973
Innospec, Inc.
370
4,462
PrimeEnergy Corp.*
10
740
General Moly, Inc.*
990
4,306
Total Energy
1,013,648
Innophos Holdings, Inc.
170
4,145
MATERIALS 1.9%
Olympic Steel, Inc.
140
4,129
Hercules, Inc.
1,790
35,424
Allied Nevada Gold Corp.*
710
4,061
Compass Minerals International,
Flotek Industries, Inc.*
360
3,960
Inc.
510
26,719
LSB Industries, Inc.*
270
3,740
Rock-Tenn Co. — Class A
600
23,988
Stillwater Mining Co.*
620
3,602
Olin Corp.
1,180
22,892
GenTek, Inc.*
140
3,599
Sensient Technologies Corp.
760
21,379
ShengdaTech, Inc.*
480
3,360
Solutia, Inc.*
1,490
20,860
AbitibiBowater, Inc.*
840
3,251
Silgan Holdings, Inc.
400
20,436
Horsehead Holding Corp.*
550
3,245
Minerals Technologies, Inc.
300
17,808
Penford Corp.
180
3,184
Texas Industries, Inc.
427
17,447
Landec Corp.*
370
3,030
W.R. Grace & Co.*
1,140
17,237
U S Concrete, Inc.*
630
2,816
Rockwood Holdings, Inc.*
660
16,936
Universal Stainless & Alloy*
110
2,811
Royal Gold, Inc.
460
16,542
ICO, Inc.*
440
2,468
H.B. Fuller Co.
770
16,070
AEP Industries, Inc.*
90
1,800
Worthington Industries, Inc.
1,020
15,239
KapStone Paper and Packaging
Louisiana-Pacific Corp.
1,630
15,159
Corp.*
280
1,778
Ferro Corp.
690
13,869
Mercer International, Inc.*
480
1,757
Arch Chemicals, Inc.
390
13,767
Apex Silver Mines Ltd.*
931
1,601
Coeur d’Alene Mines Corp.*
8,700
13,311
Bway Holding Co.*
120
1,408
Calgon Carbon Corp.*
650
13,234
General Steel Holdings, Inc.*
170
1,214
Amcol International Corp.
410
12,817
United States Lime & Minerals, Inc.*
30
1,155
Deltic Timber Corp.
197
12,537
NL Industries, Inc.
110
1,130
Koppers Holdings, Inc.
330
12,345
China Precision Steel, Inc.*
270
899
NewMarket Corp.
210
11,038
Boise, Inc.*
560
874
OM Group, Inc.*
480
10,800
Verso Paper Corp.
220
581
Kaiser Aluminum Corp.
250
10,737
Sutor Technology Group Ltd.*
120
395
Glatfelter
710
9,613
Total Materials
654,896
PolyOne Corp.*
1,470
9,481
UTILITIES 1.8%
Hecla Mining Co.*
2,010
9,407
ITC Holdings Corp.
780
40,381
Haynes International, Inc.*
190
8,898
Westar Energy, Inc.
1,660
38,246
Headwaters, Inc.*
660
8,811
Piedmont Natural Gas Co.
1,160
37,074
A. Schulman, Inc.
430
8,505
Nicor, Inc.
710
31,488
Balchem Corp.
290
7,734
WGL Holdings, Inc.
780
25,311
Zoltek Companies, Inc.*
430
7,357
Cleco Corp.
950
23,987
Wausau Paper Corp.
700
7,091
New Jersey Resources Corp.
660
23,687
RTI International Metals, Inc.*
360
7,042
Portland General Electric Co.
990
23,423
Westlake Chemical Corp.
300
6,309
Northwest Natural Gas Co.
420
21,840
Brush Engineered Materials, Inc.*
320
5,942
IDACORP, Inc.
710
20,654
Zep, Inc.
330
5,821
Southwest Gas Corp.
680
20,577
Graphic Packaging Holding Co.*
2,280
5,700
Black Hills Corp.
610
18,953
Myers Industries, Inc.
450
5,674
Allete, Inc.
410
18,245
Stepan Co.
100
5,457
Avista Corp.
840
18,236
Buckeye Technologies, Inc.*
620
5,078
Otter Tail Power Co.
560
17,209
80
|
THE RYDEX SERIES FUNDS SEMI-ANNUAL REPORT
See Notes to Financial Statements.
SCHEDULE OF INVESTMENTS (Unaudited) (continued)
September 30, 2008
RUSSELL 2000® FUND
MARKET
MARKET
SHARES
VALUE
SHARES
VALUE
South Jersey Industries, Inc.
470
$
16,779
J&J Snack Foods Corp.
220
$
7,460
Laclede Group, Inc.
340
16,487
Pantry, Inc.*
350
7,416
Unisource Energy Corp.
540
15,763
Diamond Foods, Inc.
250
7,007
NorthWestern Corp.
620
15,581
Smart Balance, Inc.*
990
6,494
El Paso Electric Co.*
710
14,910
American Oriental Bioengineering,
PNM Resources, Inc.
1,370
14,029
Inc.*
980
6,360
UIL Holding Corp.
400
13,732
Boston Beer Co., Inc. — Class A*
130
6,174
Mge Energy, Inc.
350
12,442
Weis Markets, Inc.
170
6,122
California Water Service Group
310
11,935
Central Garden and Pet Co. —
Empire District Electric Co.
530
11,315
Class A*
1,020
6,069
CH Energy Group, Inc.
250
10,892
Great Atlantic & Pacific Tea
American States Water Co.
270
10,395
Company, Inc*
560
6,059
Ormat Technologies, Inc.
280
10,172
Cal-Maine Foods, Inc.
200
5,488
EnergySouth, Inc.
120
7,372
Alliance One International, Inc.*
1,400
5,320
SJW Corp.
210
6,294
Prestige Brands Holdings, Inc. —
Southwest Water Co.
390
4,973
Class A*
530
4,706
Consolidated Water Co., Inc.
230
3,915
Ingles Markets, Inc. — Class A
200
4,566
Connecticut Water Service, Inc.
130
3,764
USANA Health Sciences, Inc.*
110
4,509
Central Vermont Public Service
Pricesmart, Inc.
230
3,850
Corp.
160
3,750
Star Scientific, Inc.*
1,040
3,702
Middlesex Water Co.
210
3,669
Omega Protein Corp.*
290
3,410
Chesapeake Utilities Corp.
110
3,653
Synutra International, Inc.*
160
3,221
Cadiz, Inc.*
190
3,623
Zhongpin, Inc.*
290
3,083
Synthesis Energy Systems, Inc.*
400
1,940
Inter Parfums, Inc.
220
2,983
US Geothermal, Inc.*
980
1,744
Arden Group, Inc.
20
2,912
Total Utilities
598,440
Alico, Inc.
60
2,846
CONSUMER STAPLES 1.8%
Farmer Brothers Co.
110
2,736
Ralcorp Holdings, Inc.*
890
59,995
Coca-Cola Bottling Co.
Longs Drug Stores Corp.
565
42,737
Consolidated
59
2,576
Flowers Foods, Inc.
1,220
35,819
Imperial Sugar Co., Inc.
190
2,573
Casey’s General Stores, Inc.
799
24,106
AgFeed Industries, Inc.*
310
2,449
Ruddick Corp.
670
21,741
Village Super Market
50
2,383
Chattem, Inc.*
270
21,109
B&G Foods, Inc.
320
2,288
Universal Corp.
400
19,636
Calavo Growers, Inc.
160
1,994
Hain Celestial Group, Inc.*
640
17,619
Maui Land & Pineapple Co., Inc.*
70
1,924
United Natural Foods, Inc.*
680
16,993
Griffin Land & Nurseries, Inc.
50
1,854
Fresh Del Monte Produce, Inc.*
660
14,652
Susser Holdings Corp.*
120
1,807
Nu Skin Enterprises, Inc.
900
14,598
Pilgrim’s Pride Corp.
710
1,768
TreeHouse Foods, Inc.*
490
14,553
National Beverage Corp.*
170
1,508
Darling International, Inc.*
1,290
14,332
China Sky One Medical, Inc.*
120
1,458
Lancaster Colony Corp.
320
12,051
American Dairy, Inc.*
110
1,114
Winn-Dixie Stores, Inc.*
850
11,815
Schiff Nutrition International, Inc.*
150
1,025
Sanderson Farms, Inc.
320
11,757
Reddy Ice Holdings, Inc.
279
1,018
Tootsie Roll Industries, Inc.
380
10,986
Mannatech, Inc.
250
1,000
Chiquita Brands International, Inc.*
680
10,751
Lifeway Foods, Inc.*
80
936
Green Mountain Coffee Roasters,
Spectrum Brands, Inc.*
630
876
Inc.*
270
10,622
HQ Sustainable Maritime Industries,
Andersons, Inc.
290
10,214
Inc.*
110
557
Lance, Inc.
430
9,757
Total Consumer Staples
592,957
WD-40 Co.
260
9,342
TELECOMMUNICATION SERVICES 0.5%
Vector Group Ltd.
520
9,183
tw telecom Inc.*
2,320
24,105
Spartan Stores, Inc.
350
8,708
Fairpoint Communications, Inc.
1,628
14,115
Nash Finch Co.
200
8,624
Premiere Global Services, Inc.*
980
13,779
Elizabeth Arden, Inc.*
390
7,656
Syniverse Holdings, Inc.*
810
13,454
See Notes to Financial Statements.
THE RYDEX SERIES FUNDS SEMI-ANNUAL REPORT
|
81
SCHEDULE OF INVESTMENTS (Unaudited) (concluded)
September 30, 2008
RUSSELL 2000® FUND
MARKET
FACE
MARKET
SHARES
VALUE
AMOUNT
VALUE
NTELOS Holdings Corp.
470
$
12,638
REPURCHASE AGREEMENTS 73.5%
Cincinnati Bell, Inc.*
3,840
11,865
Repurchase Agreements (Note 5)
Iowa Telecommunications
Morgan Stanley
Services, Inc.
510
9,527
issued 09/30/08 at 0.05%
Alaska Communications Systems
due 10/01/08
$10,129,048
$10,129,048
Group, Inc.
680
8,316
Mizuho Financial Group, Inc.
Shenandoah Telecommunications
issued 09/30/08 at 0.26%
Co.
370
8,166
due 10/01/08
8,390,137
8,390,137
Centennial Communications
Morgan Stanley
Corp.*
1,060
6,614
issued 09/30/08 at 0.10%
General Communication, Inc. —
due 10/01/08
5,939,920
5,939,920
Class A*
710
6,575
Credit Suisse Group
Global Crossing*
410
6,216
issued 09/30/08 at 0.25%
iPCS, Inc. — Class A*
270
6,013
due 10/01/08††
409,028
409,028
Cogent Communications Group,
Total Repurchase Agreements
Inc.*
750
5,790
(Cost $24,868,133)
24,868,133
Consolidated Communications
Total Investments 122.0%
Holdings, Inc.
370
5,580
(Cost $41,707,109)
$41,264,778
Cbeyond, Inc.*
380
5,468
PAETEC Holding Corp.*
1,950
4,192
Liabilities in Excess of
Atlantic Tele-Network, Inc.
149
4,172
Other Assets – (22.0)%
$ (7,431,267)
USA Mobility, Inc.*
370
4,070
Net Assets – 100.0%
$33,833,511
FiberTower Corp.*
1,900
2,622
ICO Global Communications
UNREALIZED
Holdings Ltd.*
1,640
1,788
CONTRACTS
G
AIN
(L
OSS
)
Ibasis, Inc.
500
1,745
FUTURES CONTRACTS PURCHASED
Hungarian Telephone & Cable
December 2008 Russell 2000 Index
Corp.*
80
1,592
Mini Futures Contracts
Virgin Mobile USA, Inc. — Class A*
480
1,411
(Aggregate Market Value
Globalstar, Inc.*
660
1,122
of Contracts $11,522,420)
232
$
(417,909)
TerreStar Corp.*
920
920
Vonage Holdings Corp.*
810
818
UNITS
IDT Corp. — Class B*
850
629
EQUITY INDEX SWAP AGREEMENT
Total Telecommunication Services
183,302
Credit Suisse Capital, LLC
Total Common Stocks
December 2008 Russell 2000 Index
(Cost $16,835,097)
16,392,766
Swap, Terminating 12/29/08**
SECURITIES LENDING COLLATERAL 0.0%
(Notional Market Value
Mount Vernon Securities
$9,310,647)
2,957
$
—
Lending Trust Prime
Portfolio (Note 9)
3,879
3,879
Total Securities Lending Collateral
(Cost $3,879)
3,879
* Non-Income Producing Security.
** Total Return based on Russell 2000 Index +/- financing at a variable rate.
† All or a portion of this security is on loan at September 30, 2008 — See Note 9.
†† All or a portion of this security is pledged as equity index swap collateral at September 30, 2008.
82
|
THE RYDEX SERIES FUNDS SEMI-ANNUAL REPORT
See Notes to Financial Statements.
SCHEDULE OF INVESTMENTS (Unaudited)
September 30, 2008
INVERSE RUSSELL 2000® STRATEGY FUND
FACE
MARKET
AMOUNT
VALUE
REPURCHASE AGREEMENTS 96.5%
Repurchase Agreements (Note 5)
Morgan Stanley
issued 09/30/08 at 0.05%
due 10/01/08
$15,898,884
$15,898,884
Mizuho Financial Group, Inc.
issued 09/30/08 at 0.26%
due 10/01/08
13,169,435
13,169,435
Morgan Stanley
issued 09/30/08 at 0.10%
due 10/01/08
9,323,494
9,323,494
Credit Suisse Group
issued 09/30/08 at 0.25%
due 10/01/08†
1,552,988
1,552,988
Total Repurchase Agreements
(Cost $39,944,801)
39,944,801
Total Long Securities 96.5%
(Cost $39,944,801)
$39,944,801
SHARES
COMMON STOCKS SOLD SHORT 0.0%
INFORMATION TECHNOLOGY 0.0%
DMRC Corp.*
126
(1,584)
Total Information Technology
(1,584)
Total Common Stocks Sold Short
(Proceeds $1,412)
(1,584)
Other Assets in Excess
of Liabilities – 3.5%
$
1,443,518
Net Assets – 100.0%
$41,386,735
UNREALIZED
CONTRACTS
GAIN
FUTURES CONTRACTS SOLD SHORT
December 2008 Russell 2000 Index
Mini Futures Contracts
(Aggregate Market Value
of Contracts $22,976,660)
337
$
583,219
UNITS
EQUITY INDEX SWAP AGREEMENT
SOLD SHORT
Credit Suisse Capital, LLC
December 2008 Russell 2000 Index
Swap, Terminating 12/29/08**
(Notional Market Value
$18,596,800)
27,365
$
—
* Non-Income Producing Security.
** Total Return based on Russell 2000 Index +/- financing at a variable rate.
† All or a portion of this security is pledged as equity index swap collateral at September 30, 2008.
See Notes to Financial Statements.
THE RYDEX SERIES FUNDS SEMI-ANNUAL REPORT
|
83
SCHEDULE OF INVESTMENTS (Unaudited)
September 30, 2008
GOVERNMENT LONG BOND 1.2x STRATEGY FUND
FACE
MARKET
AMOUNT
VALUE
U.S. TREASURY OBLIGATIONS 95.6%
U.S. Treasury Bond
4.50% due 05/15/38
$47,000,000
$48,432,031
Total U.S. Treasury Obligations
(Cost $46,999,667)
48,432,031
REPURCHASE AGREEMENTS 4.0%
Repurchase Agreements (Note 5)
Morgan Stanley
issued 09/30/08 at 0.05%
due 10/01/08
844,841
844,841
Mizuho Financial Group, Inc.
issued 09/30/08 at 0.26%
due 10/01/08
699,802
699,802
Morgan Stanley
issued 09/30/08 at 0.10%
due 10/01/08
495,435
495,435
Total Repurchase Agreements
(Cost $2,040,078)
2,040,078
Total Investments 99.6%
(Cost $49,039,745)
$50,472,109
Other Assets in Excess
of Liabilities – 0.4%
$
184,122
Net Assets – 100.0%
$50,656,231
UNREALIZED
CONTRACTS
LOSS
FUTURES CONTRACTS PURCHASED
December 2008 U.S. Treasury Bond
Futures Contracts
(Aggregate Market Value
of Contracts $19,541,609)
167
$
(14,318)
84
|
THE RYDEX SERIES FUNDS SEMI-ANNUAL REPORT
See Notes to Financial Statements.
SCHEDULE OF INVESTMENTS (Unaudited)
September 30, 2008
INVERSE GOVERNMENT LONG BOND STRATEGY FUND
FACE
MARKET
UNREALIZED
AMOUNT
VALUE
CONTRACTS
GAIN
FEDERAL AGENCY DISCOUNT NOTES 77.4%
FUTURES CONTRACTS SOLD SHORT
Fannie Mae*
December 2008 U.S. Treasury Bond
1.98% due 12/04/08
$100,000,000
$
99,648,000
Futures Contracts
2.70% due 12/01/08
50,000,000
49,771,250
(Aggregate Market Value of
Federal Home Loan Bank*
Contracts $719,880,125)
6,152
$
10,541,695
3.00% due 01/05/09
100,000,000
99,200,000
2.32% due 10/01/08
25,000,000
25,000,000
Freddie Mac*
2.45% due 12/16/08
100,000,000
99,482,777
Total Federal Agency Discount Notes
(Cost $373,102,027)
373,102,027
CONTRACTS
OPTIONS PURCHASED 0.0%
Call Options on:
December 2008 U.S. Treasury
Bond Index Futures Contracts
Expiring November 2008
with strike price of 159†
3,168
—
Total Options Purchased
(Cost $55,852)
—
FACE
AMOUNT
REPURCHASE AGREEMENTS 16.8%
Repurchase Agreements (Note 5)
Morgan Stanley
issued 09/30/08 at 0.05%
due 10/01/08
$33,632,884
33,632,884
Mizuho Financial Group, Inc.
issued 09/30/08 at 0.26%
due 10/01/08
27,858,941
27,858,941
Morgan Stanley
issued 09/30/08 at 0.10%
due 10/01/08
19,723,144
19,723,144
Total Repurchase Agreements
(Cost $81,214,969)
81,214,969
Total Investments 94.2%
(Cost $454,372,848)
$454,316,996
Other Assets in Excess
of Liabilities – 5.8%
$
27,931,392
Net Assets – 100.0%
$482,248,388
* The issuer is a publicly traded company that operates under a Congressional charter; its securities are neither issued nor guaranteed by the
U.S. Government.
† Security is fair valued.
See Notes to Financial Statements.
THE RYDEX SERIES FUNDS SEMI-ANNUAL REPORT
|
85
SCHEDULE OF INVESTMENTS (Unaudited)
September 30, 2008
HIGH YIELD STRATEGY FUND
FACE
MARKET
AMOUNT
VALUE
REPURCHASE AGREEMENTS 110.5%
Repurchase Agreements (Note 5)
Credit Suisse Group
issued 09/30/08 at 0.25%
due 10/01/08†
$10,810,046
$10,810,046
Morgan Stanley
issued 09/30/08 at 0.05%
due 10/01/08
4,622,618
4,622,618
Mizuho Financial Group, Inc.
issued 09/30/08 at 0.26%
due 10/01/08
3,829,027
3,829,027
Morgan Stanley
issued 09/30/08 at 0.10%
due 10/01/08
2,710,816
2,710,816
Total Repurchase Agreements
(Cost $21,972,507)
21,972,507
Total Investments 110.5%
(Cost $21,972,507)
$21,972,507
Liabilities in Excess of
Other Assets – (10.5)%
$
(2,087,240)
Net Assets – 100.0%
$19,885,267
UNREALIZED
CONTRACTS
GAIN (LOSS)
FUTURES CONTRACTS PURCHASED
December 2008 U.S. 5 Year
Treasury Note Futures Contracts
(Aggregate Market Value
of Contracts $13,586,977)
121
$
34,084
NOTIONAL
PRINCIPAL
CREDIT DEFAULT SWAP AGREEMENT
PROTECTION SOLD
Goldman Sachs International
CDX North American
High Yield Index Swap
Agreement, Series 10
Protection Premium Rate
5.00% Terminating 06/20/13
$20,000,000
$
(464,871)
† All or a portion of this security is pledged as credit default swap collateral at September 30, 2008.
86
|
THE RYDEX SERIES FUNDS SEMI-ANNUAL REPORT
See Notes to Financial Statements.
SCHEDULE OF INVESTMENTS (Unaudited)
September 30, 2008
INVERSE HIGH YIELD STRATEGY FUND
FACE
MARKET
AMOUNT
VALUE
REPURCHASE AGREEMENTS 87.2%
Repurchase Agreements (Note 5)
Morgan Stanley
issued 09/30/08 at 0.05%
due 10/01/08
$6,560,117
$
6,560,117
Mizuho Financial Group, Inc.
issued 09/30/08 at 0.26%
due 10/01/08
5,433,906
5,433,906
Morgan Stanley
issued 09/30/08 at 0.10%
due 10/01/08
3,847,013
3,847,013
Total Repurchase Agreements
(Cost $15,841,036)
15,841,036
Total Investments 87.2%
(Cost $15,841,036)
$15,841,036
Other Assets in Excess
of Liabilities – 12.8%
$
2,318,232
Net Assets – 100.0%
$18,159,268
UNREALIZED
CONTRACTS
GAIN
FUTURES CONTRACTS SOLD SHORT
December 2008 U.S. 5 Year
Treasury Note Futures Contracts
(Aggregate Market Value
of Contracts $11,902,641)
106
$
47,181
NOTIONAL
PRINCIPAL
CREDIT DEFAULT SWAP AGREEMENT
PROTECTION PURCHASED
Goldman Sachs International
CDX North American
High Yield Index Swap
Agreement, Series 10
Protection Premium Rate
5.00% Terminating 06/20/13
$17,500,000
$
599,354
See Notes to Financial Statements.
THE RYDEX SERIES FUNDS SEMI-ANNUAL REPORT
|
87
SCHEDULE OF INVESTMENTS (Unaudited)
September 30, 2008
EUROPE 1.25x STRATEGY FUND
MARKET
MARKET
SHARES
VALUE
SHARES
VALUE
COMMON STOCKS 54.9%
MATERIALS 3.3%
Rio Tinto PLC — SP ADR
590
$
147,205
FINANCIALS 15.6%
BHP Billiton Ltd. — SP ADR
2,320
120,616
HSBC Holdings PLC —
Anglo American PLC —
SP ADR
5,650
$
456,690
SP ADR
6,160
103,057
Banco Santander Central
ArcelorMittal
1,810
89,378
Hispano SA — SP ADR
17,671
265,419
Syngenta AG — SP ADR
840
35,549
Banco Bilbao Vizcaya
Total Materials
495,805
Argentaria SA — SP ADR†
12,931
209,094
CONSUMER STAPLES 3.2%
AXA — SP ADR
6,240
203,798
Unilever NV
7,360
207,257
Credit Suisse Group AG —
Diageo PLC — SP ADR
2,880
198,317
SP ADR
3,990
192,637
British American Tobacco
Allianz SE — SP ADR
13,161
180,437
PLC — SP ADR
1,320
81,840
Barclays PLC — SP ADR
6,830
168,701
Deutsche Bank AG — SP ADR
2,310
168,145
Total Consumer Staples
487,414
UBS AG — SP ADR*
9,401
164,894
INFORMATION TECHNOLOGY 2.6%
ING Groep NV — SP ADR
6,010
128,614
Nokia Oyj — SP ADR
9,471
176,634
Lloyds TSB Group PLC —
SAP AG — SP ADR
2,880
153,878
SP ADR
7,010
117,277
Telefonaktiebolaget LM
Allied Irish Banks PLC —
Ericsson — SP ADR
7,050
66,482
SP ADR
3,230
53,101
Total Information Technology
396,994
Willis Group Holdings Ltd.
1,510
48,713
INDUSTRIALS 2.1%
Total Financials
2,357,520
Siemens AG — SP ADR
2,100
197,169
HEALTH CARE 10.1%
Koninklijke Philips
Novartis AG — SP ADR
8,451
446,551
Electronics NV — SP ADR
2,730
74,393
GlaxoSmithKline PLC —
Ryanair Holdings PLC —
SP ADR
9,481
412,044
SP ADR*
1,680
37,682
Sanofi-Aventis — SP ADR
8,481
278,771
Total Industrials
309,244
AstraZeneca PLC — SP ADR
4,600
201,848
CONSUMER DISCRETIONARY 1.2%
Novo Nordisk A/S — SP ADR
1,520
77,824
Daimler AG — SP ADR†
2,730
137,865
Teva Pharmaceutical
Carnival PLC — SP ADR
1,470
45,570
Industries Ltd. — SP ADR
1,120
51,285
Alcon, Inc. — SP ADR
310
50,068
Total Consumer Discretionary
183,435
Total Health Care
1,518,391
UTILITIES 0.3%
Veolia Environnement —
TELECOMMUNICATION SERVICES 8.4%
SP ADR
990
40,867
Telefonica SA — SP ADR
4,810
343,867
Vodafone Group PLC —
Total Utilities
40,867
SP ADR
14,301
316,052
Total Common Stocks
France Telecom SA — SP ADR
9,781
273,966
(Cost $7,844,335)
8,271,253
Deutsche Telekom AG —
SECURITIES LENDING COLLATERAL 2.0%
SP ADR
11,241
171,200
Mount Vernon Securities Lending
BT Group PLC — SP ADR†
5,650
163,907
Trust Prime Portfolio (Note 9)
305,120
305,120
Total Telecommunication Services
1,268,992
Total Securities Lending Collateral
ENERGY 8.1%
(Cost $305,120)
305,120
BP PLC — SP ADR
7,560
379,285
Total SA — SP ADR
5,710
346,483
Royal Dutch Shell PLC —
SP ADR
4,610
272,036
Eni SpA — SP ADR
3,420
181,089
Compagnie Generale de
Geophysique SA, Inc. —
SP ADR*
1,060
33,698
Total Energy
1,212,591
88
|
THE RYDEX SERIES FUNDS SEMI-ANNUAL REPORT
See Notes to Financial Statements.
SCHEDULE OF INVESTMENTS (Unaudited) (concluded)
September 30, 2008
EUROPE 1.25x STRATEGY FUND
FACE
MARKET
AMOUNT
VALUE
REPURCHASE AGREEMENTS 39.3%
Country Diversification
Repurchase Agreements (Note 5)
Morgan Stanley
issued 09/30/08 at 0.05%
Sweden
due 10/01/08
$2,455,649
$
2,455,649
2%
Greece
Mizuho Financial Group, Inc.
Finland
1%
Other
Ireland
2%
issued 09/30/08 at 0.26%
2%
3%
due 10/01/08
2,034,074
2,034,074
Italy
3%
Morgan Stanley
Luxembourg
Great
issued 09/30/08 at 0.10%
5%
Britain
due 10/01/08
1,440,053
1,440,053
29%
Total Repurchase Agreements
Spain
7%
(Cost $5,929,776)
5,929,776
Total Investments 96.2%
(Cost $14,079,231)
$14,506,149
Germany
Other Assets in Excess
9%
of Liabilities – 3.8%
$
577,499
Net Assets – 100.0%
$15,083,648
France
Netherlands
16%
UNREALIZED
9%
Switzerland
CONTRACTS
LOSS
12%
The pie chart above reflects percentages of
CURRENCY FUTURES
the market value of Common Stocks.
CONTRACTS PURCHASED
December 2008 EURO Currency
Futures Contracts
(Aggregate Market Value
of Contracts $10,952,300)
62
$
(103,823)
FUTURES CONTRACTS PURCHASED
December 2008 Dow Jones EURO
STOXX 50 Index Futures Contracts
(Aggregate Market Value
of Contracts $10,839,853)
248
$
(4,764)
* Non-Income Producing Security.
† All or a portion of this security is on loan at September 30, 2008 — See Note 9.
ADR — American Depository Receipt.
See Notes to Financial Statements.
THE RYDEX SERIES FUNDS SEMI-ANNUAL REPORT
|
89
SCHEDULE OF INVESTMENTS (Unaudited)
September 30, 2008
JAPAN 2x STRATEGY FUND
FACE
MARKET
AMOUNT
VALUE
REPURCHASE AGREEMENTS 15.2%
Repurchase Agreements (Note 5)
Morgan Stanley
issued 09/30/08 at 0.05%
due 10/01/08
$177,445
$
177,445
Mizuho Financial Group, Inc.
issued 09/30/08 at 0.26%
due 10/01/08
146,982
146,982
Morgan Stanley
issued 09/30/08 at 0.10%
due 10/01/08
104,058
104,058
Total Repurchase Agreements
(Cost $428,485)
428,485
Total Investments 15.2%
(Cost $428,485)
$
428,485
Other Assets in Excess
of Liabilities – 84.8%
$
2,381,678
Net Assets – 100.0%
$
2,810,163
UNREALIZED
CONTRACTS
GAIN (LOSS)
CURRENCY FUTURES
CONTRACTS PURCHASED
December 2008 Japanese Yen
Currency Futures Contracts
(Aggregate Market Value
of Contracts $5,461,625)
46
$
88,695
FUTURES CONTRACTS PURCHASED
December 2008 Nikkei-225 Stock
Average Index Futures Contracts
(Aggregate Market Value
of Contracts $5,536,125)
95
$
(210,618)
90
|
THE RYDEX SERIES FUNDS SEMI-ANNUAL REPORT
See Notes to Financial Statements.
SCHEDULE OF INVESTMENTS (Unaudited)
September 30, 2008
SMALL-CAP VALUE FUND
MARKET
MARKET
SHARES
VALUE
SHARES
VALUE
COMMON STOCKS 100.0%
Umpqua Holding Corp.
15,694
$
230,859
Lexington Realty Trust
12,680
218,350
CONSUMER DISCRETIONARY 31.8%
Susquehanna Bancshares, Inc.
11,078
216,243
Finish Line, Inc. — Class A
155,436
$
1,552,807
BioMed Realty Trust, Inc.
8,107
214,430
M/I Homes, Inc.†
29,105
663,012
Parkway Properties, Inc.
5,581
211,297
La-Z-Boy, Inc.
64,071
597,142
Flagstar Bancorp, Inc.
69,267
206,416
Haverty Furniture
Medical Properties Trust Inc.†
18,015
204,470
Companies, Inc.
44,509
509,183
First Financial Bancorp
13,786
201,276
Jo-Ann Stores, Inc.*
23,080
484,218
Mid-America Apartment
Stein Mart, Inc.†
112,671
440,544
Communities, Inc.
3,966
194,889
Bassett Furniture Industries, Inc.
49,968
427,226
First Commonwealth
Standard Motor Products, Inc.
60,388
375,613
Financial Corp.
14,264
192,136
Fred’s, Inc.
25,502
362,638
Old National Bancorp
9,544
191,071
Group 1 Automotive, Inc.
15,335
333,230
Home Properties, Inc.
3,291
190,713
National Presto Industries, Inc.
4,223
314,613
Pennsylvania Real Estate
Oxford Industries, Inc.
11,616
300,041
Investment Trust
9,634
181,601
Tuesday Morning Corp.*
72,007
297,389
Independent Bank Corp.†
28,573
176,867
Zale Corp.*
11,358
283,950
Community Bank System, Inc.
6,925
174,164
Brunswick Corp.
21,027
268,935
Corus Bankshares, Inc.†
42,577
172,437
Cato Corp. — Class A
14,810
259,915
Presidential Life Corp.†
10,464
165,227
Superior Industries
Sterling Bancorp†
10,668
154,259
International, Inc.†
13,523
259,101
Urstadt Biddle Properties, Inc.
8,160
153,000
Arctic Cat, Inc.
27,594
252,485
National Retail Properties, Inc.
6,328
151,556
Nautilus, Inc.*
49,922
228,144
Senior Housing Properties Trust
6,223
148,294
OfficeMax Inc.
23,886
212,347
Sovran Self Storage, Inc.
3,282
146,673
Brown Shoe Co., Inc.
12,482
204,455
Entertainment Properties Trust
2,491
136,307
Ruby Tuesday, Inc.*
34,100
197,439
LTC Properties, Inc.
4,619
135,429
PEP Boys-Manny Moe & Jack
31,631
195,480
Selective Insurance Group, Inc.
5,778
132,432
Live Nation, Inc.*
11,918
193,906
Brookline Bancorp, Inc.
9,651
123,436
Lithia Motors, Inc. — Class A
36,486
157,255
Sterling Savings Bank
8,385
121,582
Sonic Automotive, Inc.†
18,129
153,371
Irwin Financial Corp.
30,482
120,404
O’Charleys, Inc.
16,751
146,571
National Penn Bancshares, Inc.
8,226
120,100
Landry’s Restaurants, Inc.
8,744
135,969
Inland Real Estate Corp.†
7,639
119,856
MarineMax, Inc.*†
16,727
120,936
Whitney Holding Corp.
4,924
119,407
Ethan Allen Interiors, Inc.
3,906
109,446
BankAtlantic Bancorp, Inc. —
Audiovox Corp. — Class A*
9,269
86,851
Class A
14,202
116,456
Libbey, Inc.
9,970
84,845
Kite Realty Group Trust
10,298
113,278
Steak n Shake Co.*
9,198
79,839
Dime Community Bancshares
7,199
109,569
Big 5 Sporting Goods Corp.
7,322
75,563
Bank Mutual Corp.
9,115
103,455
Monaco Coach Corp.
38,113
74,320
TrustCo Bank Corp.
8,294
97,123
Cabela’s, Inc. — Class A*
5,030
60,762
Financial Federal Corp.
4,200
96,264
CKE Restaurants, Inc.
5,053
53,562
Provident Bankshares Corp.†
9,723
94,410
CPI Corp.
4,153
44,645
DiamondRock Hospitality Co.
10,025
91,227
Total Consumer Discretionary
10,597,748
United Fire & Casualty Co.
3,118
89,144
FINANCIALS 27.9%
South Financial Group, Inc.
12,142
89,001
Stewart Information
Hanmi Financial Corp.
17,489
88,319
Services Corp.
19,195
571,051
United Bankshares, Inc.
2,322
81,270
First Bancorp Puerto Rico†
48,218
533,291
PS Business Parks, Inc.
1,299
74,822
LandAmerica Financial
First Midwest Bancorp, Inc.
2,128
51,583
Group, Inc.
16,635
403,399
FirstFed Financial Corp.*†
4,570
35,829
SWS Group, Inc.
18,729
377,577
Guaranty Financial Group, Inc.*
7,972
31,489
Colonial Properties Trust
15,873
296,666
Anchor BanCorp Wisconsin, Inc.
2,866
21,065
Safety Insurance Group, Inc.†
6,737
255,534
Total Financials
9,286,327
Central Pacific Financial Corp.†
14,237
239,324
See Notes to Financial Statements.
THE RYDEX SERIES FUNDS SEMI-ANNUAL REPORT
|
91
SCHEDULE OF INVESTMENTS (Unaudited) (continued)
September 30, 2008
SMALL-CAP VALUE FUND
MARKET
MARKET
SHARES
VALUE
SHARES
VALUE
INDUSTRIALS 14.4%
Material Sciences Corp.*
13,416
$
77,142
Wabash National Corp.†
63,587
$
600,897
A.M. Castle & Co.
4,327
74,770
Arkansas Best Corp.
14,771
497,635
Omnova Solutions, Inc.*
19,196
38,200
Standex International Corp.
15,898
441,170
Total Materials
2,046,148
Gibraltar Industries, Inc.
17,516
327,724
INFORMATION TECHNOLOGY 5.8%
Universal Forest Products, Inc.
8,769
306,126
Gevity HR, Inc.
66,761
486,020
Standard Register Co.
24,417
240,507
SYNNEX Corp.*
18,705
417,870
Watsco, Inc.
4,604
231,489
Ciber, Inc.*
22,393
156,527
Applied Signal Technology, Inc.
11,955
207,778
CTS Corp.
12,072
154,280
Spherion Corp.*
41,961
204,350
Insight Enterprises, Inc.*
8,622
115,621
ABM Industries, Inc.
8,867
193,655
Park Electrochemical Corp.
4,142
100,402
Griffon Corp.*†
21,273
191,883
Black Box Corp.
2,585
89,260
Volt Information Sciences, Inc.*†
19,501
175,119
Symmetricom, Inc.*
16,968
84,331
A.O. Smith Corp.
4,176
163,657
Benchmark Electronics, Inc.*
5,872
82,678
Tredegar Corp.
9,123
162,298
Gerber Scientific, Inc.*
8,867
81,044
Briggs & Stratton Corp.
8,668
140,248
Rudolph Technologies, Inc.*
8,598
72,051
Lydall, Inc.*
13,008
125,267
Methode Electronics, Inc. —
CDI Corp.
5,193
115,960
Class A
5,623
50,270
NCI Building Systems, Inc.*
3,275
103,981
Photronics, Inc.*
16,420
30,870
C&D Technologies, Inc.*†
14,557
82,684
Lawson Products, Inc.
2,901
80,213
Total Information Technology
1,921,224
United Stationers, Inc.*
1,555
74,376
CONSUMER STAPLES 4.4%
Mueller Industries, Inc.
3,111
71,584
Nash Finch Co.
9,285
400,369
Insituform Technologies, Inc. —
Central Garden and Pet Co. —
Class A*
4,539
67,903
Class A*
62,923
374,392
Total Industrials
4,806,504
Spartan Stores, Inc.
9,839
244,794
Alliance One International, Inc.*
48,288
183,494
UTILITIES 7.8%
Longs Drug Stores Corp.
1,555
117,620
Laclede Group, Inc.
7,791
377,786
Lance, Inc.
3,836
87,039
Atmos Energy Corp.
13,397
356,628
Spectrum Brands, Inc.*†
23,702
32,946
CH Energy Group, Inc.
5,766
251,225
Great Atlantic & Pacific
Southwest Gas Corp.
7,417
224,438
Tea Company, Inc*
2,463
26,650
Avista Corp.
8,072
175,243
Allete, Inc.
3,579
159,265
Total Consumer Staples
1,467,304
Piedmont Natural Gas Co.
4,512
144,204
HEALTH CARE 1.8%
UIL Holding Corp.
4,118
141,371
Owens & Minor, Inc.
3,205
155,443
Unisource Energy Corp.
4,732
138,127
Cambrex Corp.*
24,320
149,568
New Jersey Resources Corp.
3,838
137,746
Datascope Corp.†
2,662
137,439
UGI Corp.
5,129
132,226
Gentiva Health Services, Inc.*
3,462
93,266
Central Vermont Public
Medcath Corp.*
4,247
76,106
Service Corp.†
4,855
113,801
Total Health Care
611,822
Cleco Corp.
4,222
106,605
Total Common Stocks
Northwest Natural Gas Co.
1,603
83,356
(Cost $33,044,459)
33,342,617
Southern Union Co.
3,076
63,519
Total Utilities
2,605,540
SECURITIES LENDING COLLATERAL 4.5%
MATERIALS 6.1%
Mount Vernon Securities
Rock-Tenn Co. — Class A
8,095
323,638
Lending Trust Prime
PolyOne Corp.*
45,142
291,166
Portfolio (Note 9)
1,516,971
1,516,971
Wausau Paper Corp.
28,601
289,728
Total Securities Lending Collateral
Quaker Chemical Corp.
9,171
261,007
(Cost $1,516,971)
1,516,971
Stepan Co.
4,350
237,379
A. Schulman, Inc.
9,911
196,040
Georgia Gulf Corp.
71,376
178,440
Schweitzer-Mauduit
International, Inc.
4,141
78,638
92
|
THE RYDEX SERIES FUNDS SEMI-ANNUAL REPORT
See Notes to Financial Statements.
SCHEDULE OF INVESTMENTS (Unaudited) (concluded)
September 30, 2008
SMALL-CAP VALUE FUND
FACE
MARKET
AMOUNT
VALUE
REPURCHASE AGREEMENTS 1.0%
Repurchase Agreements (Note 5)
Morgan Stanley
issued 09/30/08 at 0.05%
due 10/01/08
$
137,419
$
137,419
Mizuho Financial Group, Inc.
issued 09/30/08 at 0.26%
due 10/01/08
113,827
113,827
Morgan Stanley
issued 09/30/08 at 0.10%
due 10/01/08
80,586
80,586
Total Repurchase Agreements
(Cost $331,832)
331,832
Total Investments 105.5%
(Cost $34,893,262)
$35,191,420
Liabilities in Excess of
Other Assets – (5.5)%
$ (1,848,092)
Net Assets – 100.0%
$33,343,328
* Non-Income Producing Security.
† All or a portion of this security is on loan at September 30, 2008 — See Note 9.
See Notes to Financial Statements.
THE RYDEX SERIES FUNDS SEMI-ANNUAL REPORT
|
93
SCHEDULE OF INVESTMENTS (Unaudited)
September 30, 2008
MID-CAP VALUE FUND
MARKET
MARKET
SHARES
VALUE
SHARES
VALUE
COMMON STOCKS 98.9%
Charming Shoppes, Inc.*
28,971
$
141,668
Rent-A-Center, Inc.*
5,593
124,612
FINANCIALS 30.3%
Modine Manufacturing Co.
6,618
95,829
Fidelity National Financial, Inc. —
Media General, Inc.†
7,139
88,738
Class A
11,657
$
171,358
Borders Group, Inc.
11,526
75,611
First American Corp.
3,760
110,920
Collective Brands, Inc.*
3,777
69,157
First Niagara Financial Group, Inc.
6,526
102,784
Bob Evans Farms, Inc.
1,731
47,239
Highwoods Properties, Inc.
2,623
93,274
Regis Corp.
1,597
43,917
Old Republic International Corp.
7,298
93,049
99 Cents Only Stores*
3,757
41,214
Liberty Property Trust
2,292
86,294
Entercom Communications Corp.
7,764
38,975
AmeriCredit Corp.*
8,142
82,478
Lear Corp.*
3,139
32,960
Mack-Cali Realty Corp.
2,250
76,207
Scholastic Corp.
1,255
32,228
Mercury General Corp.
1,288
70,518
Belo Corp. — Class A
5,389
32,118
American Financial Group, Inc.
2,138
63,071
Barnes & Noble, Inc.
1,161
30,279
TCF Financial Corp.
3,485
62,730
Boyd Gaming Corp.
823
7,703
Health Care REIT, Inc.
1,130
60,150
Total Consumer Discretionary
1,672,015
FirstMerit Corp.
2,739
57,519
UTILITIES 12.3%
New York Community Bancorp, Inc.
3,417
57,371
Hawaiian Electric Industries, Inc.
3,564
103,748
Nationwide Health Properties, Inc.
1,540
55,409
WGL Holdings, Inc.
2,447
79,405
Webster Financial Corp.
2,194
55,398
Vectren Corp.
2,795
77,841
Duke Realty Corp.
2,213
54,396
Great Plains Energy, Inc.
3,113
69,171
UDR, Inc.
2,030
53,085
Westar Energy, Inc.
2,661
61,309
Protective Life Corp.
1,849
52,715
AGL Resources, Inc.
1,948
61,128
Hospitality Properties Trust
2,557
52,470
SCANA Corp.
1,543
60,069
Camden Property Trust
1,088
49,896
Oneok, Inc.
1,671
57,482
Colonial BancGroup, Inc.
6,059
47,624
PNM Resources, Inc.
4,980
50,995
Cousins Properties, Inc.
1,868
47,130
Puget Energy, Inc.
1,875
50,062
Weingarten Realty Investors
1,298
46,300
OGE Energy Corp.
1,536
47,432
Associated Banc-Corp.
2,182
43,531
NSTAR
1,381
46,264
Hanover Insurance Group, Inc.
952
43,335
IDACORP, Inc.
1,476
42,937
Arthur J. Gallagher & Co.
1,625
41,698
Alliant Energy Corp.
1,297
41,776
Unitrin, Inc.
1,491
37,186
Black Hills Corp.
1,181
36,694
Equity One, Inc.
1,760
36,062
Sierra Pacific Resources
1,813
17,369
Astoria Financial Corp.
1,736
35,987
BRE Properties, Inc. — Class A
715
35,035
Total Utilities
903,682
Realty Income Corp.
1,339
34,278
INDUSTRIALS 12.2%
Everest Re Group Ltd.
386
33,401
Kelly Services, Inc. — Class A
8,667
165,106
Washington Federal, Inc.
1,600
29,520
YRC Worldwide, Inc.*†
10,551
126,190
PacWest Bancorp
978
27,961
Federal Signal Corp.
8,403
115,121
Horace Mann Educators Corp.
2,147
27,632
Alaska Air Group, Inc.*
3,601
73,425
BancorpSouth, Inc.
980
27,567
GATX Corp.
1,627
64,381
Apollo Investment Corp.
1,600
27,280
Avis Budget Group, Inc.*
11,113
63,789
Wilmington Trust Corp.
883
25,457
Werner Enterprises, Inc.
2,480
53,841
The PMI Group, Inc.
6,613
19,508
Trinity Industries, Inc.
1,977
50,868
Total Financials
2,227,584
Manpower, Inc.
958
41,347
Timken Co.
1,441
40,852
CONSUMER DISCRETIONARY 22.8%
United Rentals, Inc.*
2,618
39,898
ArvinMeritor, Inc.†
18,767
244,722
JetBlue Airways Corp.*
6,536
32,353
Furniture Brands International, Inc.
19,241
202,415
Teleflex, Inc.
490
31,110
Foot Locker, Inc.
10,686
172,686
Ryland Group, Inc.
5,654
149,944
Total Industrials
898,281
94
|
THE RYDEX SERIES FUNDS SEMI-ANNUAL REPORT
See Notes to Financial Statements.
SCHEDULE OF INVESTMENTS (Unaudited) (concluded)
September 30, 2008
MID-CAP VALUE FUND
MARKET
FACE
MARKET
SHARES
VALUE
AMOUNT
VALUE
INFORMATION TECHNOLOGY 8.1%
REPURCHASE AGREEMENTS 0.5%
Imation Corp.
6,273
$
141,707
Repurchase Agreements (Note 5)
Ingram Micro, Inc. — Class A*
5,106
82,053
Morgan Stanley
Palm, Inc.
13,246
79,079
issued 09/30/08 at 0.05%
Acxiom Corp.
5,767
72,318
due 10/01/08
$14,872
$
14,872
SAIC, Inc.*
3,470
70,198
Mizuho Financial Group, Inc.
Tech Data Corp.*
1,859
55,491
issued 09/30/08 at 0.26%
Diebold, Inc.
1,093
36,189
due 10/01/08
12,318
12,318
Vishay Intertechnology, Inc.*
5,009
33,160
Morgan Stanley
Arrow Electronics, Inc.*
1,049
27,505
issued 09/30/08 at 0.10%
Total Information Technology
597,700
due 10/01/08
8,721
8,721
MATERIALS 7.1%
Total Repurchase Agreements
Olin Corp.
3,679
71,373
(Cost $35,911)
35,911
RPM International, Inc.
3,416
66,065
Total Investments 101.9%
Ferro Corp.
3,088
62,069
(Cost $6,778,883)
$7,485,044
Chemtura Corp.
12,402
56,553
Liabilities in Excess of
Louisiana-Pacific Corp.
5,829
54,210
Other Assets – (1.9)%
$
(143,005)
Valspar Corp.
2,117
47,188
Net Assets – 100.0%
$7,342,039
Worthington Industries, Inc.
3,143
46,956
Sonoco Products Co.
1,341
39,801
Sensient Technologies Corp.
1,030
28,974
Cabot Corp.
906
28,793
Lubrizol Corp.
494
21,311
Total Materials
523,293
HEALTH CARE 3.7%
Kindred Healthcare, Inc.*
3,920
108,074
Omnicare, Inc.
2,835
81,563
Health Management
Associates, Inc. — Class A*
19,519
81,199
Total Health Care
270,836
CONSUMER STAPLES 2.4%
Universal Corp.
1,734
85,122
J.M. Smucker Co.
646
32,746
Smithfield Foods, Inc.*
1,862
29,569
Ruddick Corp.
787
25,538
Total Consumer Staples
172,975
Total Common Stocks
(Cost $6,560,205)
7,266,366
SECURITIES LENDING COLLATERAL 2.5%
Mount Vernon Securities Lending
Trust Prime Portfolio (Note 9)
182,767
182,767
Total Securities Lending Collateral
(Cost $182,767)
182,767
* Non-Income Producing Security.
† All or a portion of this security is on loan at September 30, 2008 — See Note 9.
REIT — Real Estate Investment Trust.
See Notes to Financial Statements.
THE RYDEX SERIES FUNDS SEMI-ANNUAL REPORT
|
95
SCHEDULE OF INVESTMENTS (Unaudited)
September 30, 2008
LARGE-CAP VALUE FUND
MARKET
MARKET
SHARES
VALUE
SHARES
VALUE
COMMON STOCKS 101.0%
KB HOME
21,080
$
414,854
Lennar Corp. — Class A†
24,490
372,003
FINANCIALS 29.0%
Jones Apparel Group, Inc.
19,152
354,503
E*Trade Financial Corp.*
69,883
$
195,672
Dillard’s, Inc. — Class A
21,240
250,632
BB&T Corp.
4,674
176,677
AutoNation, Inc.*
18,190
204,456
Allstate Corp.
3,424
157,915
Leggett & Platt, Inc.†
9,093
198,136
Equity Residential
3,368
149,573
Whirlpool Corp.
2,175
172,456
Apartment Investment &
Centex Corp.
10,290
166,698
Management Co. — Class A
4,227
148,030
New York Times Co. — Class A
11,426
163,278
Marsh & McLennan
Ford Motor Co.*
24,623
128,040
Companies, Inc.
4,540
144,190
Big Lots, Inc.*
4,000
111,320
Bank of America Corp.
4,082
142,870
Macy’s, Inc.
6,039
108,581
MBIA, Inc.
11,714
139,397
Gannett Co., Inc.
6,060
102,475
Comerica, Inc.
4,250
139,357
CBS Corp.
6,498
94,741
JPMorgan Chase & Co.
2,878
134,403
Limited Brands, Inc.
5,320
92,142
Citigroup, Inc.
6,535
134,033
Eastman Kodak Co.
5,118
78,715
First Horizon National Corp.
13,651
127,769
Liz Claiborne, Inc.
4,360
71,635
HCP, Inc.
3,178
127,533
Time Warner, Inc.
5,310
69,614
American Capital Ltd.†
4,728
120,611
J.C. Penney Company, Inc.
2,060
68,680
Travelers Companies, Inc.
2,664
120,413
Mattel, Inc.
3,345
60,344
Marshall & Ilsley Corp.
5,645
113,747
Office Depot, Inc.*
9,090
52,904
Huntington Bancshares, Inc.
13,883
110,925
Carnival Corp.
1,468
51,894
KeyCorp
8,734
104,284
Total Consumer Discretionary
3,813,464
U.S. Bancorp
2,849
102,621
UTILITIES 18.2%
Zions Bancorporation
2,600
100,620
Integrys Energy Group, Inc.
5,855
292,399
Wells Fargo & Co.
2,675
100,393
NiSource, Inc.
15,378
226,979
Capital One Financial Corp.
1,910
97,410
DTE Energy Co.
5,240
210,229
CIT Group, Inc.
13,960
97,162
Nicor, Inc.
4,061
180,105
Cincinnati Financial Corp.
3,372
95,900
Duke Energy Corp.
10,108
176,182
SunTrust Banks, Inc.
2,036
91,600
Progress Energy, Inc.†
4,041
174,288
Regions Financial Corp.
8,954
85,958
Pinnacle West Capital Corp.
4,957
170,570
M&T Bank Corp.
926
82,645
Consolidated Edison, Inc.
3,860
165,826
Developers Diversified
TECO Energy, Inc.
10,126
159,282
Realty Corp.
2,561
81,158
Pepco Holdings, Inc.
6,140
140,667
Host Hotels & Resorts, Inc.
5,450
72,430
Xcel Energy, Inc.
6,555
131,035
Lincoln National Corp.
1,690
72,349
Ameren Corp.
2,707
105,654
PNC Financial Services
CenterPoint Energy, Inc.
6,832
99,542
Group, Inc.
962
71,861
Southern Co.
2,533
95,469
Chubb Corp.
1,200
65,880
PG&E Corp.
2,109
78,982
XL Capital Ltd.
3,630
65,122
American Electric
Sovereign Bancorp, Inc.
16,190
63,951
Power Co., Inc.
2,061
76,319
Fifth Third Bancorp
5,250
62,475
CMS Energy Corp.
5,610
69,957
Morgan Stanley
2,700
62,100
Dominion Resources, Inc.
1,584
67,764
Merrill Lynch & Co., Inc.
1,860
47,058
Hartford Financial Services
Total Utilities
2,621,249
Group, Inc.
1,078
44,187
INDUSTRIALS 5.5%
Genworth Financial, Inc. —
Ryder System, Inc.
4,474
277,388
Class A
4,923
42,387
Masco Corp.
7,588
136,129
National City Corp.
16,832
29,456
Tyco International Ltd.
3,110
108,912
General Growth Properties, Inc.
1,790
27,029
Allied Waste Industries, Inc.*
8,975
99,712
Wachovia Corp.
5,336
18,676
RR Donnelley & Sons Co.
2,511
61,595
Total Financials
4,167,827
Avery Dennison Corp.
1,230
54,711
Northrop Grumman Corp.
778
47,100
CONSUMER DISCRETIONARY 26.5%
D.R. Horton, Inc.
32,670
425,363
Total Industrials
785,547
96
|
THE RYDEX SERIES FUNDS SEMI-ANNUAL REPORT
See Notes to Financial Statements.
SCHEDULE OF INVESTMENTS (Unaudited) (concluded)
September 30, 2008
LARGE-CAP VALUE FUND
MARKET
FACE
MARKET
SHARES
VALUE
AMOUNT
VALUE
MATERIALS 4.9%
REPURCHASE AGREEMENTS 1.8%
Weyerhaeuser Co.
2,505
$
151,753
Repurchase Agreements (Note 5)
International Paper Co.
5,510
144,252
Morgan Stanley
Ashland, Inc.
4,423
129,328
issued 09/30/08 at 0.05%
Bemis Co.
4,304
112,808
due 10/01/08
$109,225
$
109,225
Dow Chemical Co.
3,243
103,063
Mizuho Financial Group, Inc.
MeadWestvaco Corp.
2,666
62,144
issued 09/30/08 at 0.26%
Total Materials
703,348
due 10/01/08
90,473
90,473
HEALTH CARE 4.8%
Morgan Stanley
AmerisourceBergen Corp.
5,656
212,948
issued 09/30/08 at 0.10%
Tenet Healthcare Corp.*
18,961
105,234
due 10/01/08
64,052
64,052
Covidien Ltd.
1,900
102,144
Total Repurchase Agreements
McKesson Corp.
1,892
101,808
(Cost $263,750)
263,750
Cardinal Health, Inc.
1,753
86,388
Total Investments 103.4%
Pfizer, Inc.
4,088
75,383
(Cost $13,883,538)
$14,871,246
Total Health Care
683,905
Liabilities in Excess of
CONSUMER STAPLES 4.6%
Other Assets – (3.4)%
$
(489,372)
Tyson Foods, Inc. — Class A
18,293
218,418
Net Assets – 100.0%
$14,381,874
SUPERVALU, INC.
6,375
138,337
Kroger Co.
3,620
99,478
Dean Foods Co.*
4,230
98,813
Reynolds American, Inc.
1,275
61,991
Safeway, Inc.
2,107
49,978
Total Consumer Staples
667,015
TELECOMMUNICATION SERVICES 3.6%
Frontier Communications Corp.
9,958
114,517
Embarq Corp.
2,672
108,349
Verizon Communications, Inc.
2,841
91,168
Windstream Corp.
7,366
80,584
Sprint Nextel Corp.
12,159
74,170
AT&T, Inc.
1,948
54,388
Total Telecommunication Services
523,176
ENERGY 2.4%
Spectra Energy Corp.
14,810
352,478
Total Energy
352,478
INFORMATION TECHNOLOGY 1.5%
Jabil Circuit, Inc.
14,050
134,037
Micron Technology, Inc.*
18,615
75,391
Total Information Technology
209,428
Total Common Stocks
(Cost $13,539,729)
14,527,437
SECURITIES LENDING COLLATERAL 0.6%
Mount Vernon Securities Lending
Trust Prime Portfolio (Note 9)
80,059
80,059
Total Securities Lending Collateral
(Cost $80,059)
80,059
* Non-Income Producing Security.
† All or a portion of this security is on loan at September 30, 2008 — See Note 9.
See Notes to Financial Statements.
THE RYDEX SERIES FUNDS SEMI-ANNUAL REPORT
|
97
SCHEDULE OF INVESTMENTS (Unaudited)
September 30, 2008
SMALL-CAP GROWTH FUND
MARKET
MARKET
SHARES
VALUE
SHARES
VALUE
COMMON STOCKS 101.0%
Bankrate, Inc.*
6,148
$
239,219
Concur Technologies, Inc.*
4,275
163,562
CONSUMER DISCRETIONARY 28.5%
Epicor Software Corp.*
20,452
161,366
Meritage Homes Corp.*†
14,187
$
350,419
United Online, Inc.
15,245
143,456
PetMed Express, Inc.*†
20,527
322,274
Comtech
Panera Bread Co. — Class A*
5,421
275,929
Telecommunications Corp.*
2,912
143,387
True Religion Apparel, Inc.*
9,836
254,260
CACI International, Inc. —
Standard-Pacific Corp.*
50,445
247,685
Class A*
2,798
140,180
Stage Stores, Inc.
17,251
235,649
Smith Micro Software, Inc.*
19,457
138,145
NutriSystem, Inc.†
13,266
235,073
Tyler Technologies, Inc.*
8,473
128,535
Coinstar, Inc.*
7,301
233,632
DealerTrack Holdings, Inc.*
7,526
126,738
Pool Corp.†
9,635
224,784
Netgear, Inc.*
8,385
125,775
K-Swiss, Inc. — Class A
11,614
202,084
Intevac, Inc.*
11,186
119,019
Gymboree Corp.*
5,404
191,842
SPSS, Inc.*
3,820
112,155
Jos. A. Bank Clothiers, Inc.*
5,372
180,499
Faro Technologies, Inc.*
5,441
110,833
Tractor Supply Co.*
4,135
173,877
Secure Computing Corp.*
20,138
110,356
Volcom, Inc.*
10,027
173,266
InfoSpace, Inc.
9,848
106,851
Papa John’s International, Inc.*
6,142
166,817
Scansource, Inc.*
3,593
103,443
Hibbett Sports Inc.*
7,932
158,799
EPIQ Systems, Inc.*
7,377
100,327
CEC Entertainment, Inc.*
4,754
157,833
Blackbaud, Inc.
5,220
96,309
Pre-Paid Legal Services, Inc.*
3,631
149,815
Daktronics, Inc.
5,081
84,650
Dress Barn, Inc.*
9,513
145,454
Micros Systems, Inc.*
3,140
83,712
Arbitron, Inc.
3,235
144,572
Sonic Solutions, Inc.*†
15,491
68,160
Polaris Industries, Inc.
2,957
134,514
Brightpoint, Inc.*
8,726
62,827
Zumiez, Inc.*
8,008
131,972
Stratasys, Inc.*
3,456
60,376
P.F. Chang’s China Bistro, Inc.*
5,605
131,942
Diodes, Inc.*
3,178
58,634
Stamps.com, Inc.*
10,833
126,421
ViaSat, Inc.*
2,484
58,573
Universal Technical
LoJack Corp.*
6,376
42,655
Institute, Inc.*
6,084
103,793
Total Information Technology
4,032,202
Drew Industries, Inc.*
6,052
103,550
HEALTH CARE 18.7%
Shuffle Master, Inc.*
20,224
102,940
LHC Group, Inc.*
11,841
337,232
Sonic Corp.*
6,469
94,253
HealthExtras, Inc.*
11,185
292,152
Deckers Outdoor Corp.*
769
80,037
Martek Biosciences Corp.
8,819
277,093
Fossil, Inc.*
2,673
75,459
Palomar Medical
Christopher & Banks Corp.
9,128
70,012
Technologies, Inc.*
15,870
213,610
Monarch Casino &
Immucor, Inc.*
5,763
184,185
Resort, Inc.*
5,572
63,465
Sciele Pharma, Inc.
5,888
181,292
LKQ Corp.*
3,228
54,779
AMN Healthcare
WMS Industries, Inc.*
1,752
53,559
Services, Inc.*
9,117
160,186
Select Comfort Corp.*
22,735
37,513
Integra LifeSciences
CROCS, Inc.*
7,276
26,048
Holdings Corp.*
3,468
152,696
Total Consumer Discretionary
5,614,820
PharMerica Corp.*
6,362
143,081
INFORMATION TECHNOLOGY 20.5%
Molina Healthcare, Inc.*
4,148
128,588
j2 Global Communications, Inc.*
13,543
316,229
inVentiv Health, Inc.*
6,581
116,220
Quality Systems, Inc.
6,875
290,538
Cooper Companies, Inc.
3,316
115,264
Websense, Inc.*
12,621
282,079
Kendle International, Inc.*
2,502
111,864
Wright Express Corp.*
8,513
254,113
Dionex Corp.*
1,689
107,336
98
|
THE RYDEX SERIES FUNDS SEMI-ANNUAL REPORT
See Notes to Financial Statements.
SCHEDULE OF INVESTMENTS (Unaudited) (continued)
September 30, 2008
SMALL-CAP GROWTH FUND
MARKET
MARKET
SHARES
VALUE
SHARES
VALUE
Merit Medical Systems, Inc.*
5,675
$
106,520
Petroleum
AmSurg Corp.*
3,757
95,691
Development Corp.*
3,679
$
163,237
Pediatrix Medical Group, Inc.*
1,765
95,169
CARBO Ceramics, Inc.
3,013
155,501
Kensey Nash Corp.*
2,780
87,459
Superior Well Services, Inc.*
4,766
120,628
Par Pharmaceutical
Dril-Quip, Inc.*
995
43,173
Companies, Inc.*
6,880
84,555
Total Energy
1,536,260
American Medical Systems
INDUSTRIALS 7.6%
Holdings, Inc.*
4,728
83,969
Landstar System, Inc.
4,745
209,065
Amedisys, Inc.*
1,703
82,885
Ceradyne, Inc.*
4,733
173,512
Abaxis, Inc.*
3,644
71,787
Orbital Sciences Corp.*
6,719
161,055
Air Methods Corp.*
2,496
70,662
Knight Transportation, Inc.
9,052
153,613
ICU Medical, Inc.*
2,296
69,821
Simpson
LCA-Vision, Inc.
14,945
69,345
Manufacturing Co., Inc.†
4,835
130,980
Sunrise Senior Living, Inc.*
4,805
66,261
Heartland Express, Inc.
7,629
118,402
Haemonetics Corp.*
971
59,930
Curtiss-Wright Corp.
2,547
115,761
SurModics, Inc.*
1,767
55,643
Toro Co.
2,453
101,309
Healthways, Inc.*
3,152
50,842
Teledyne Technologies, Inc.*
1,677
95,857
PharmaNet Development
Forward Air Corp.
3,441
93,698
Group, Inc.*
2,862
20,664
Waste Connections, Inc.*
2,724
93,433
Total Health Care
3,692,002
AAR Corp.*
3,592
59,591
FINANCIALS 11.1%
Total Industrials
1,506,276
Greenhill & Co., Inc.
5,075
374,281
MATERIALS 3.8%
Wilshire Bancorp, Inc.
23,335
283,987
Headwaters, Inc.*
17,098
228,258
Portfolio Recovery
Deltic Timber Corp.
3,418
217,522
Associates, Inc.*
5,459
265,471
NewMarket Corp.
2,874
151,057
TradeStation Group, Inc.*
20,572
192,348
Balchem Corp.
3,808
101,559
Zenith National
Brush Engineered
Insurance Corp.
4,906
179,756
Materials, Inc.*
2,775
51,532
Infinity Property &
Casualty Corp.
4,255
175,306
Total Materials
749,928
World Acceptance Corp.*
4,659
167,724
CONSUMER STAPLES 3.0%
optionsXpress Holdings, Inc.
8,613
167,265
Mannatech, Inc.†
45,006
180,024
PrivateBancorp, Inc.
3,152
131,312
Green Mountain Coffee
Nara Bancorp, Inc.
10,175
113,960
Roasters, Inc.*
2,889
113,653
First Cash Financial
Chattem, Inc.*
1,412
110,390
Services, Inc.*
6,254
93,810
Boston Beer Co., Inc. —
UCBH Holdings, Inc.
6,727
43,120
Class A*
2,219
105,380
Total Financials
2,188,340
United Natural Foods, Inc.*
3,562
89,015
ENERGY 7.8%
Total Consumer Staples
598,462
Basic Energy Services, Inc.*
13,012
277,156
Total Common Stocks
Unit Corp.*
4,438
221,101
(Cost $19,317,336)
19,918,290
St. Mary Land &
Exploration Co.
5,545
197,679
SECURITIES LENDING COLLATERAL 2.4%
Hornbeck Offshore
Mount Vernon Securities Lending
Services, Inc.*
4,691
181,166
Trust Prime Portfolio (Note 9)
480,527
480,527
Penn Virginia Corp.
3,305
176,619
Total Securities Lending Collateral
(Cost $480,527)
480,527
See Notes to Financial Statements.
THE RYDEX SERIES FUNDS SEMI-ANNUAL REPORT
|
99
SCHEDULE OF INVESTMENTS (Unaudited) (concluded)
September 30, 2008
SMALL-CAP GROWTH FUND
FACE
MARKET
AMOUNT
VALUE
REPURCHASE AGREEMENTS 1.1%
Repurchase Agreements (Note 5)
Morgan Stanley
issued 09/30/08 at 0.05%
due 10/01/08
$
91,680
$
91,680
Mizuho Financial Group, Inc.
issued 09/30/08 at 0.26%
due 10/01/08
75,941
75,941
Morgan Stanley
issued 09/30/08 at 0.10%
due 10/01/08
53,763
53,763
Total Repurchase Agreements
(Cost $221,384)
221,384
Total Investments 104.5%
(Cost $20,019,247)
$20,620,201
Liabilities in Excess of
Other Assets – (4.5)%
$
(893,620)
Net Assets – 100.0%
$19,726,581
* Non-Income Producing Security.
† All or a portion of this security is on loan at September 30, 2008 — See Note 9.
100
|
THE RYDEX SERIES FUNDS SEMI-ANNUAL REPORT
See Notes to Financial Statements.
SCHEDULE OF INVESTMENTS (Unaudited)
September 30, 2008
MID-CAP GROWTH FUND
MARKET
MARKET
SHARES
VALUE
SHARES
VALUE
COMMON STOCKS 100.7%
Kinetic Concepts, Inc.*
4,326
$
123,680
ResMed, Inc.*
2,871
123,453
CONSUMER DISCRETIONARY 30.2%
Gen-Probe, Inc.*
2,166
114,906
Aeropostale, Inc.*
9,439
$
303,086
Hologic, Inc.*
5,815
112,404
DreamWorks Animation
Community Health
SKG, Inc. — Class A*
9,463
297,611
Systems, Inc.*
3,549
104,021
NVR, Inc.*
470
268,840
Henry Schein, Inc.*
1,542
83,021
Urban Outfitters, Inc.*
7,775
247,789
Covance, Inc.*
869
76,828
Toll Brothers, Inc.*
9,798
247,204
Cerner Corp.*
1,704
76,067
Ross Stores, Inc.
6,011
221,265
Affymetrix, Inc.*
8,628
66,781
Strayer Education, Inc.
1,017
203,664
Charles River Laboratories
Marvel Entertainment, Inc.*
5,580
190,501
International, Inc.*
1,015
56,363
ITT Educational Services, Inc.*
2,068
167,322
Medicis Pharmaceutical
Dollar Tree, Inc.*
4,441
161,475
Corp. — Class A
2,969
44,268
Corinthian Colleges, Inc.*
10,658
159,870
Total Health Care
2,903,307
The Warnaco Group, Inc.*
3,341
151,314
INFORMATION TECHNOLOGY 17.8%
Under Armour, Inc.*
4,750
150,860
Digital River, Inc.*
8,545
276,858
Timberland Co. — Class A*
8,395
145,821
Flir Systems, Inc.*
5,670
217,841
Advance Auto Parts, Inc.
3,599
142,736
F5 Networks, Inc.*
8,515
199,081
Chico’s FAS, Inc.*
25,559
139,808
Silicon Laboratories, Inc.*
5,189
159,302
Matthews International
DST Systems, Inc.*
2,758
154,420
Corp. — Class A
2,693
136,643
Cree, Inc.*
6,745
153,651
Career Education Corp.*
7,805
127,612
Western Digital Corp.*
7,095
151,265
John Wiley & Sons, Inc. —
ACI Worldwide, Inc.*
8,522
149,305
Class A
2,620
105,979
FactSet Research Systems Inc.
2,825
147,606
Valassis Communications, Inc.*
11,193
96,931
McAfee, Inc.*
3,780
128,369
American Eagle Outfitters, Inc.
5,972
91,073
Global Payments, Inc.
2,755
123,589
priceline.com, Inc.*
1,285
87,933
Plantronics, Inc.
5,434
122,374
O’Reilly Automotive, Inc.*
3,174
84,968
Alliance Data Systems Corp.*
1,754
111,169
Scientific Games Corp. —
ANSYS, Inc.*
2,380
90,131
Class A*
3,468
79,833
SRA International, Inc. —
Williams-Sonoma, Inc.
4,824
78,052
Class A*
3,625
82,034
Chipotle Mexican Grill, Inc. —
Gartner, Inc. — Class A*
3,281
74,413
Class A*
1,286
71,360
Fair Isaac Corp.
3,148
72,561
Cheesecake Factory, Inc.*
4,846
70,849
Macrovision Solutions Corp.*
4,425
68,057
Sotheby’s
3,397
68,144
ValueClick, Inc.*
6,385
65,319
Pacific Sunwear of
Trimble Navigation Ltd.*
2,360
61,030
California, Inc.*
10,030
67,502
Guess?, Inc.
1,795
62,448
Total Information Technology
2,608,375
Total Consumer Discretionary
4,428,493
INDUSTRIALS 10.0%
Navigant Consulting, Inc.*
11,397
226,686
HEALTH CARE 19.8%
Joy Global, Inc.
3,540
159,796
Psychiatric Solutions, Inc.*
8,593
326,104
Alliant Techsystems, Inc.*
1,660
155,940
United Therapeutics Corp.*
2,360
248,201
Dun & Bradstreet Corp.
1,505
142,012
Sepracor, Inc.*
10,796
197,675
Graco, Inc.
3,964
141,158
Invitrogen Corp.*
5,200
196,560
Korn/Ferry International, Inc.*
7,417
132,171
Endo Pharmaceuticals
Rollins, Inc.
5,519
104,751
Holdings, Inc.*
7,551
151,020
Donaldson Co., Inc.
2,353
98,614
VCA Antech, Inc.*
4,920
144,992
Copart, Inc.*
2,293
87,134
Techne Corp.*
1,987
143,303
Corporate Executive Board Co.
2,498
78,062
Pharmaceutical Product
Stericycle, Inc.*
1,204
70,928
Development, Inc.
3,213
132,858
Mine Safety Appliances Co.
1,831
69,798
Apria Healthcare Group, Inc.*
7,028
128,191
IDEXX Laboratories, Inc.*
2,320
127,136
Total Industrials
1,467,050
Lincare Holdings, Inc.*
4,170
125,475
See Notes to Financial Statements.
THE RYDEX SERIES FUNDS SEMI-ANNUAL REPORT
|
101
SCHEDULE OF INVESTMENTS (Unaudited) (concluded)
September 30, 2008
MID-CAP GROWTH FUND
MARKET
FACE
MARKET
SHARES
VALUE
AMOUNT
VALUE
ENERGY 8.2%
REPURCHASE AGREEMENTS 0.8%
Encore Acquisition Co.*
8,761
$
366,035
Repurchase Agreements (Note 5)
Cimarex Energy Co.
4,163
203,612
Morgan Stanley
Helix Energy Solutions
issued 09/30/08 at 0.05%
Group, Inc.*
4,910
119,215
due 10/01/08
$50,774
$
50,774
FMC Technologies, Inc.*
2,288
106,506
Mizuho Financial Group, Inc.
Frontier Oil Corp.
4,959
91,345
issued 09/30/08 at 0.26%
Denbury Resources, Inc.*
4,405
83,871
due 10/01/08
42,058
42,058
Oceaneering International, Inc.*
1,560
83,179
Morgan Stanley
Newfield Exploration Co.*
2,207
70,602
issued 09/30/08 at 0.10%
Quicksilver Resources, Inc.*
3,548
69,647
due 10/01/08
29,775
29,775
Total Energy
1,194,012
Total Repurchase Agreements
FINANCIALS 6.5%
(Cost $122,607)
122,607
Philadelphia Consolidated
Total Investments 101.5%
Holding Corp.*
4,291
251,324
(Cost $13,202,359)
$14,882,858
Brown & Brown, Inc.
6,390
138,152
Liabilities in Excess of
W.R. Berkley Corp.
5,706
134,376
Other Assets – (1.5)%
$
(217,520)
Jones Lang LaSalle, Inc.
3,006
130,701
Net Assets – 100.0%
$14,665,338
Eaton Vance Corp.
3,156
111,186
SEI Investments Co.
4,257
94,505
Affiliated Managers Group, Inc.*
1,110
91,964
Total Financials
952,208
MATERIALS 4.2%
Cleveland-Cliffs, Inc.
4,792
253,688
Steel Dynamics, Inc.
8,028
137,199
Commercial Metals Co.
7,421
125,341
Terra Industries, Inc.
3,527
103,694
Total Materials
619,922
CONSUMER STAPLES 4.0%
Hansen Natural Corp.*
6,137
185,644
Energizer Holdings, Inc.*
1,943
156,509
NBTY, Inc.*
4,517
133,342
Church & Dwight Co., Inc.
1,794
111,389
Total Consumer Staples
586,884
Total Common Stocks
(Cost $13,079,752)
14,760,251
* Non-Income Producing Security.
102
|
THE RYDEX SERIES FUNDS SEMI-ANNUAL REPORT
See Notes to Financial Statements.
SCHEDULE OF INVESTMENTS (Unaudited)
September 30, 2008
LARGE-CAP GROWTH FUND
MARKET
MARKET
SHARES
VALUE
SHARES
VALUE
COMMON STOCKS 101.0%
Polo Ralph Lauren Corp.
820
$
54,645
Omnicom Group, Inc.
1,403
54,100
HEALTH CARE 19.9%
McGraw-Hill Companies, Inc.
1,460
46,151
Express Scripts, Inc.*
1,993
$
147,123
Harman International
Varian Medical Systems, Inc.*
2,457
140,368
Industries, Inc.
1,308
44,563
Zimmer Holdings, Inc.*
2,174
140,353
GameStop Corp. — Class A*
1,080
36,947
Intuitive Surgical, Inc.*
550
132,539
International Game
DaVita, Inc.*
2,190
124,852
Technology, Inc.
1,737
29,842
Amgen, Inc.*
2,094
124,111
Total Consumer Discretionary
2,271,773
Gilead Sciences, Inc.*
2,282
104,014
INFORMATION TECHNOLOGY 18.8%
St. Jude Medical, Inc.*
2,365
102,854
Google, Inc. — Class A*
292
116,952
Forest Laboratories, Inc.*
3,499
98,952
Intuit, Inc.*
3,692
116,704
Barr Pharmaceuticals, Inc.*
1,464
95,599
Yahoo!, Inc.*
6,087
105,305
Celgene Corp.*
1,494
94,540
Qualcomm, Inc.
2,378
102,183
IMS Health, Inc.
4,863
91,959
Cognizant Technology
Medtronic, Inc.
1,804
90,380
Solutions Corp. — Class A*
4,444
101,456
Waters Corp.*
1,460
84,943
Lexmark International, Inc.*
2,886
93,997
Patterson Companies, Inc.*
2,696
81,985
Adobe Systems, Inc.*
2,348
92,675
Laboratory Corporation of
Fiserv, Inc.*
1,840
87,069
America Holdings*
1,119
77,771
Oracle Corp.*
4,281
86,947
Biogen Idec, Inc.*
1,540
77,447
Symantec Corp.*
4,386
85,878
Stryker Corp.
1,220
76,006
Dell, Inc.*
5,059
83,372
Quest Diagnostics, Inc.
1,390
71,821
Cisco Systems, Inc.*
3,435
77,494
Hospira, Inc.*
1,873
71,549
Apple, Inc.*
670
76,152
Johnson & Johnson, Inc.
1,008
69,834
eBay, Inc.*
3,282
73,451
Coventry Health Care, Inc.*
2,114
68,811
Amphenol Corp. — Class A
1,790
71,851
C.R. Bard, Inc.
656
62,235
Autodesk, Inc.*
2,038
68,375
Genzyme Corp.*
740
59,859
Salesforce.com, Inc.*
1,310
63,404
Becton, Dickinson & Co.
680
54,577
QLogic Corp.*†
4,118
63,252
UnitedHealth Group, Inc.
2,105
53,446
SanDisk Corp.*
3,218
62,912
Total Health Care
2,397,928
MasterCard, Inc.
350
62,065
CONSUMER DISCRETIONARY 18.9%
Microsoft Corp.
2,310
61,654
Sears Holdings Corp.*
1,845
172,507
Western Union Co.
2,340
57,728
Coach, Inc.*
5,481
137,244
NetApp, Inc.*
3,068
55,930
Amazon.com, Inc.*
1,809
131,623
Harris Corp.
1,176
54,331
Bed Bath & Beyond, Inc.*
4,149
130,320
Total System Services, Inc.
3,259
53,448
Apollo Group, Inc. — Class A*
2,160
128,088
Citrix Systems, Inc.*
1,841
46,504
TJX Companies, Inc.
4,053
123,697
Motorola, Inc.
6,250
44,625
AutoZone, Inc.*
950
117,173
Akamai Technologies, Inc.*
2,440
42,554
H&R Block, Inc.
4,965
112,954
Electronic Arts, Inc.*
1,083
40,060
Lowe’s Companies, Inc.
4,091
96,916
National Semiconductor Corp.
2,250
38,722
Harley-Davidson, Inc.
2,449
91,348
BMC Software, Inc.*
1,070
30,634
Darden Restaurants, Inc.
3,190
91,330
Nvidia Corp.*
1,873
20,060
Black & Decker Corp.
1,478
89,788
MEMC Electronic
Starbucks Corp.*
5,700
84,759
Materials, Inc.*
680
19,217
Yum! Brands, Inc.
2,502
81,590
Total Information Technology
2,256,961
Kohl’s Corp.*
1,688
77,783
ENERGY 12.8%
Expedia, Inc.*
4,810
72,679
XTO Energy, Inc.
2,955
137,467
Goodyear Tire & Rubber Co.*
4,580
70,120
Apache Corp.
1,120
116,794
Nike, Inc. — Class B
1,010
67,569
EOG Resources, Inc.
1,300
116,298
Abercrombie & Fitch Co. —
ConocoPhillips
1,330
97,423
Class A
1,660
65,487
Chesapeake Energy Corp.
2,570
92,160
Best Buy Company, Inc.
1,668
62,550
Schlumberger Ltd.
1,130
88,242
See Notes to Financial Statements.
THE RYDEX SERIES FUNDS SEMI-ANNUAL REPORT
|
103
SCHEDULE OF INVESTMENTS (Unaudited) (continued)
September 30, 2008
LARGE-CAP GROWTH FUND
MARKET
MARKET
SHARES
VALUE
SHARES
VALUE
Sunoco, Inc.
2,350
$
83,613
FINANCIALS 7.2%
Devon Energy Corp.
915
83,448
Moody’s Corp.†
4,100
$
139,400
Murphy Oil Corp.
1,230
78,892
Progressive Corp.
7,221
125,645
Exxon Mobil Corp.
990
76,884
CB Richard Ellis Group, Inc. —
Halliburton Co.
2,270
73,525
Class A*
7,890
105,489
Transocean, Inc.*
660
72,494
Leucadia National Corp.
2,166
98,423
BJ Services Co.
3,369
64,449
SLM Corp.*
6,068
74,879
Pioneer Natural Resources Co.
1,080
56,462
IntercontinentalExchange, Inc.*
910
73,419
Smith International, Inc.
935
54,828
CME Group, Inc.
188
69,844
Valero Energy Corp.
1,730
52,419
Federated Investors, Inc. —
Southwestern Energy Co.*
1,360
41,534
Class B
2,296
66,239
Cabot Oil & Gas Corp.
1,140
41,200
Franklin Resources, Inc.
530
46,709
Consol Energy, Inc.
816
37,446
American Express Co.
1,134
40,178
Baker Hughes, Inc.
610
36,929
NYSE Euronext
566
22,176
Cameron International Corp.*
912
35,149
Total Financials
862,401
Total Energy
1,537,656
MATERIALS 5.5%
CONSUMER STAPLES 9.0%
United States Steel Corp.
1,400
108,654
Anheuser-Busch
Ball Corp.
2,643
104,372
Companies, Inc.
1,770
114,838
Nucor Corp.
2,378
93,931
Clorox Co.
1,810
113,469
Freeport-McMoRan
Avon Products, Inc.
2,494
103,675
Copper & Gold, Inc.
1,320
75,042
UST, Inc.
1,529
101,740
Ecolab, Inc.
1,324
64,240
Kellogg Co.
1,655
92,845
Sigma-Aldrich Corp.
1,190
62,380
Hershey Co.
2,254
89,123
Titanium Metals Corp.
5,049
57,256
Campbell Soup Co.
2,230
86,078
CF Industries Holdings, Inc.
580
53,047
Colgate-Palmolive Co.
1,134
85,447
Pactiv Corp.*
2,000
49,660
Estee Lauder
Total Materials
668,582
Companies, Inc. — Class A
1,676
83,649
UTILITIES 1.0%
Wm. Wrigley Jr. Co.
1,007
79,956
Questar Corp.
1,188
48,613
Pepsi Bottling Group, Inc.
2,265
66,070
AES Corp.*
3,907
45,673
PepsiCo, Inc.
878
62,575
Constellation Energy Group, Inc.
890
21,627
Total Consumer Staples
1,079,465
Total Utilities
115,913
INDUSTRIALS 7.9%
Total Common Stocks
Lockheed Martin Corp.
760
83,349
(Cost $11,180,457)
12,145,392
Caterpillar, Inc.
1,350
80,460
Expeditors International of
SECURITIES LENDING COLLATERAL 0.1%
Washington, Inc.
2,160
75,254
Mount Vernon Securities Lending
L-3 Communications
Trust Prime Portfolio (Note 9)
8,704
8,704
Holdings, Inc.
764
75,117
Total Securities Lending Collateral
CH Robinson Worldwide, Inc.
1,350
68,796
(Cost $8,704)
8,704
Cummins, Inc.
1,560
68,203
Pitney Bowes, Inc.
2,000
66,520
Danaher Corp.
945
65,583
Rockwell Collins, Inc.
1,250
60,113
Fastenal Co.
1,180
58,280
Equifax, Inc.
1,640
56,498
General Dynamics Corp.
754
55,509
ITT Corporation
938
52,162
Terex Corp.*
1,090
33,267
Rockwell Automation, Inc.
820
30,619
Jacobs Engineering Group, Inc.*
460
24,983
Total Industrials
954,713
104
|
THE RYDEX SERIES FUNDS SEMI-ANNUAL REPORT
See Notes to Financial Statements.
SCHEDULE OF INVESTMENTS (Unaudited) (concluded)
September 30, 2008
LARGE-CAP GROWTH FUND
FACE
MARKET
AMOUNT
VALUE
REPURCHASE AGREEMENTS 0.7%
Repurchase Agreements (Note 5)
Morgan Stanley
issued 09/30/08 at 0.05%
due 10/01/08
$34,755
$
34,755
Mizuho Financial Group, Inc.
issued 09/30/08 at 0.26%
due 10/01/08
28,788
28,788
Morgan Stanley
issued 09/30/08 at 0.10%
due 10/01/08
20,381
20,381
Total Repurchase Agreements
(Cost $83,924)
83,924
Total Investments 101.8%
(Cost $11,273,085)
$12,238,020
Liabilities in Excess of
Other Assets – (1.8)%
$
(213,465)
Net Assets – 100.0%
$12,024,555
* Non-Income Producing Security.
† All or a portion of this security is on loan at September 30, 2008 — See Note 9.
See Notes to Financial Statements.
THE RYDEX SERIES FUNDS SEMI-ANNUAL REPORT
|
105
SCHEDULE OF INVESTMENTS (Unaudited)
September 30, 2008
U.S. GOVERNMENT MONEY MARKET FUND
FACE
MARKET
FACE
MARKET
AMOUNT
VALUE
AMOUNT
VALUE
FEDERAL AGENCY DISCOUNT NOTES 73.3%
REPURCHASE AGREEMENTS 21.7%
Fannie Mae*
Repurchase Agreements (Note 5)
2.50% due 01/12/09
$100,000,000
$
99,284,722
Morgan Stanley
2.48% due 10/27/08
50,000,000
49,910,444
issued 09/30/08 at 0.05%
2.28% due 01/28/09
50,000,000
49,623,167
due 10/01/08
$132,489,714
$
132,489,714
2.76% due 01/26/09
25,000,000
24,775,750
Mizuho Financial Group, Inc.
2.77% due 02/02/09
25,000,000
24,761,472
issued 09/30/08 at 0.26%
2.79% due 02/25/09
25,000,000
24,715,187
due 10/01/08
109,744,472
109,744,472
2.66% due 01/05/09
10,000,000
9,929,067
Morgan Stanley
Farmer Mac*
issued 09/30/08 at 0.10%
2.20% due 10/01/08
25,000,000
25,000,000
due 10/01/08
77,695,201
77,695,201
2.34% due 10/14/08
25,000,000
24,978,875
Total Repurchase Agreements
2.35% due 10/16/08
25,000,000
24,975,521
(Cost $319,929,387)
319,929,387
2.50% due 12/12/08
25,000,000
24,875,000
Total Investments 106.6%
Federal Farm Credit*
(Cost $1,569,900,143)
$1,569,900,143
2.15% due 10/23/08
25,000,000
24,967,153
2.18% due 10/29/08
25,000,000
24,957,611
Liabilities in Excess of
Federal Home Loan Bank*
Other Assets – (6.6)%
$
(97,344,938)
2.56% due 10/02/08
50,000,000
49,996,444
Net Assets – 100.0%
$1,472,555,205
2.62% due 10/07/08
50,000,000
49,978,167
2.47% due 10/10/08
50,000,000
49,969,125
2.50% due 10/27/08
50,000,000
49,909,722
2.80% due 12/17/08
50,000,000
49,696,904
2.31% due 01/12/09
50,000,000
49,669,542
2.61% due 01/15/09
50,000,000
49,615,750
3.30% due 01/02/09
50,000,000
49,573,750
3.10% due 01/12/09
50,000,000
49,556,528
2.46% due 11/14/08
25,000,000
24,924,833
3.29% due 01/02/09
25,000,000
24,787,521
2.80% due 02/17/09
25,000,000
24,729,722
Freddie Mac*
2.32% due 10/06/08
25,000,000
24,991,944
2.02% due 10/14/08
25,000,000
24,981,764
2.09% due 10/20/08
25,000,000
24,972,424
2.33% due 10/31/08
25,000,000
24,951,458
2.41% due 11/19/08
25,000,000
24,917,993
Total Federal Agency Discount Notes
(Cost $1,079,977,560)
1,079,977,560
FEDERAL AGENCY BONDS 11.6%
Federal Home Loan Bank*
3.25% due 01/14/09
50,000,000
50,000,000
2.88% due 01/30/09
50,000,000
49,996,639
2.26% due 10/10/08
25,000,000
24,998,754
2.80% due 03/17/09
15,000,000
15,000,000
2.85% due 03/04/09
15,000,000
15,000,000
2.23% due 03/12/09
15,000,000
14,997,803
Total Federal Agency Bonds
(Cost $169,993,196)
169,993,196
* The issuer is a publicly traded company that operates under a Congressional charter; its securities are neither issued nor guaranteed by the
U.S. Government.
106
|
THE RYDEX SERIES FUNDS SEMI-ANNUAL REPORT
See Notes to Financial Statements.
This page intentionally left blank.
THE RYDEX SERIES FUNDS SEMI-ANNUAL REPORT
|
107
STATEMENTS OF ASSETS AND LIABILITIES (Unaudited)
Inverse
S&P 500
Nova
S&P 500
Strategy
NASDAQ-100®
Fund
Fund
Fund
Fund
ASSETS
Investment Securities
$
81,491,953
$105,792,698
$198,800,799
$
560,542,757
Repurchase Agreements
10,533,202
38,833,784
112,395,018
18,783,317
Total Investments
92,025,155
144,626,482
311,195,817
579,326,074
Segregated Cash with Broker
4,807,681
3,758,421
24,967,152
1,413,677
Cash
—
2,991
—
—
Deposits with Brokers for Securities Sold Short
—
—
—
—
Receivable for Swap Units Sold
3,314
3,480
—
—
Variation Margin on Futures Contracts
3,037,696
2,413,287
1,440,000
1,194,908
Receivable for Securities Sold
—
1,556,135
—
115,309
Receivable for Fund Shares Sold
316,233
517,140
5,039,210
2,180,223
Investment Income Receivable
127,420
107,913
419
33,332
Total Assets
100,317,499
152,985,849
342,642,598
584,263,523
LIABILITIES
Short Sales at Market Value
—
—
—
—
Payable for Swap Units Sold
—
—
98,118
2,541
Variation Margin on Futures Contracts
—
—
16,518,323
—
Payable upon Return of Securities Loaned
85,572
41,536
—
29,320,434
Payable for Securities Purchased
1,670,436
—
—
117,728
Payable for Fund Shares Redeemed
2,483,186
2,108,259
2,315,006
4,040,487
Investment Advisory Fees Payable
61,312
70,384
228,612
364,792
Transfer Agent and Administrative Fees Payable
20,437
23,461
63,503
121,597
Distribution and Service Fees Payable
26,045
28,894
31,555
17,856
Portfolio Accounting Fees Payable
8,175
9,385
24,017
39,217
Custody Fees Payable
2,458
3,187
7,620
14,592
Short Sales Dividends Payable
—
—
—
—
Dividends Payable
—
—
—
—
Other Liabilities
63,250
36,338
138,538
382,183
Total Liabilities
4,420,871
2,321,444
19,425,292
34,421,427
NET ASSETS
$
95,896,628
$150,664,405
$323,217,306
$
549,842,096
NET ASSETS CONSIST OF
Paid-In Capital
$272,353,003
$166,300,700
$580,857,049
$1,107,598,949
Undistributed Net Investment Income (Loss)
798,828
197,157
4,917,755
(2,367,907)
Accumulated Net Realized Loss on Investments
(184,523,801)
(9,864,841)
(271,087,832)
(743,720,354)
Net Unrealized Appreciation (Depreciation) on Investments
7,268,598
(5,968,611)
8,530,334
188,331,408
NET ASSETS
$
95,896,628
$150,664,405
$323,217,306
$
549,842,096
Investor Class
$
55,021,460
N/A
$256,726,785
$
519,826,973
Advisor Class
16,773,465
N/A
14,450,569
15,144,488
A-Class
4,173,656
$
8,154,604
27,207,740
4,383,408
C-Class
19,928,047
6,553,267
24,832,212
10,487,227
H-Class
N/A
135,956,534
N/A
N/A
SHARES OUTSTANDING
Investor Class
2,558,044
N/A
5,846,938
49,138,044
Advisor Class
826,098
N/A
349,992
1,508,551
A-Class
203,173
353,613
653,617
431,706
C-Class
1,007,828
289,479
614,360
1,074,213
H-Class
N/A
5,901,234
N/A
N/A
NET ASSET VALUES
Investor Class
$21.51
N/A
$43.91
$10.58
Advisor Class
20.30
N/A
41.29
10.04
A-Class
20.54
$23.06
41.63
10.15
A-Class Maximum Offering Price*
21.56
24.21
43.71
10.66
C-Class
19.77
22.64
40.42
9.76
H-Class
N/A
23.04
N/A
N/A
Cost of Investments
$
83,220,590
$149,374,599
$311,195,817
$
390,261,545
Proceeds from Short Sales
—
—
—
—
* Net asset value adjusted for the maximum sales charge of 4.75% of offering price, calculated NAV/(1-4.75%).
108
|
THE RYDEX SERIES FUNDS SEMI-ANNUAL REPORT
See Notes to Financial Statements.
September 30, 2008
Inverse
Inverse
Inverse
Government
Inverse
NASDAQ-100®
Mid-Cap
Mid-Cap
Russell 2000®
Russell 2000®
Long Bond
Government
Strategy
1.5x Strategy
Strategy
1.5x Strategy
Russell 2000®
Strategy
1.2x Strategy
Long Bond
Fund
Fund
Fund
Fund
Fund
Fund
Fund
Strategy Fund
$
—
$14,885,548
$
—
$ 18,127,464
$16,396,645
$
—
$ 48,432,031
$373,102,027
67,175,468
1,758,868
3,732,213
7,570,568
24,868,133
39,944,801
2,040,078
81,214,969
67,175,468
16,644,416
3,732,213
25,698,032
41,264,778
39,944,801
50,472,109
454,316,996
6,090,091
480,001
3,200
709,800
974,400
1,488,804
417,500
15,324,148
—
—
—
—
101,100
—
—
—
—
—
—
—
—
1,412
—
—
24,101
—
559,674
—
—
1,246,002
—
—
—
408,014
—
575,411
1,967,127
—
—
14,030,001
—
—
—
63,911
20,834
—
—
—
1,109,765
261,445
802,964
39,327
121,505
75,435
1,717,861
2,938,178
250
16,478
—
20,964
6,555
154
798,880
303
74,399,675
17,810,354
5,098,051
27,107,445
44,456,299
42,756,608
53,406,350
486,609,626
—
—
—
—
—
1,584
—
—
—
83,514
—
816,044
408,984
—
—
—
4,036,527
—
2,346
—
—
1,087,348
553,188
—
—
20,776
—
221,094
3,879
—
—
—
—
—
—
—
10,154,964
—
1,534,538
—
1,030,369
135,016
38,101
149,496
1,131
195,831
565,682
3,530,865
47,395
13,983
4,225
22,294
23,383
30,646
28,453
333,794
13,165
3,884
1,174
6,193
7,794
8,513
11,381
92,721
5,934
8,915
1,813
13,697
8,382
12,646
17,647
125,886
5,266
1,554
469
2,477
3,118
3,405
5,691
32,776
1,580
466
141
743
935
1,022
1,876
11,127
—
—
—
—
—
5,790
—
—
—
—
—
—
—
—
223
—
37,856
13,572
5,121
16,965
10,218
23,088
31,440
234,069
5,178,092
281,680
53,390
1,249,003
10,622,788
1,369,873
2,750,119
4,361,238
$
69,221,583
$17,528,674
$
5,044,661
$ 25,858,442
$33,833,511
$41,386,735
$ 50,656,231
$482,248,388
$190,624,450
$27,676,214
$11,241,939
$ 37,198,474
$36,099,831
$74,457,177
$ 55,896,078
$764,837,429
833,423
(16,350)
43,243
(21,616)
8,431
225,254
183,622
(3,080,086)
(125,953,106)
(8,661,215)
(6,237,559)
(10,834,106)
(1,414,511)
(33,878,743)
(6,841,515)
(289,994,798)
3,716,816
(1,469,975)
(2,962)
(484,310)
(860,240)
583,047
1,418,046
10,485,843
$
69,221,583
$17,528,674
$
5,044,661
$ 25,858,442
$33,833,511
$41,386,735
$ 50,656,231
$482,248,388
$
59,521,099
N/A
N/A
N/A
N/A
N/A
$ 19,590,579
$253,040,072
932,494
N/A
N/A
N/A
N/A
N/A
11,267,005
36,120,548
3,352,822
$
1,082,478
$
732,942
$
1,588,018
$
3,895,304
$
2,885,824
13,613,573
60,453,105
5,415,168
7,213,767
771,759
11,269,958
908,271
7,278,670
6,185,074
132,634,663
N/A
9,232,429
3,539,960
13,000,466
29,029,936
31,222,241
N/A
N/A
2,598,336
N/A
N/A
N/A
N/A
N/A
1,670,994
15,048,488
41,800
N/A
N/A
N/A
N/A
N/A
965,323
2,204,017
148,638
38,289
18,566
58,234
168,143
76,803
1,159,915
3,652,028
257,352
269,966
20,312
438,169
39,847
200,812
528,204
8,515,852
N/A
326,406
89,707
476,855
1,252,833
830,416
N/A
N/A
$22.91
N/A
N/A
N/A
N/A
N/A
$11.72
$16.81
22.31
N/A
N/A
N/A
N/A
N/A
11.67
16.39
22.56
$28.27
$39.48
$27.27
$23.17
$37.57
11.74
16.55
23.69
29.68
41.45
28.63
24.33
39.44
12.33
17.38
21.04
26.72
37.99
25.72
22.79
36.25
11.71
15.58
N/A
28.29
39.46
27.26
23.17
37.60
N/A
N/A
$
67,175,468
$17,346,856
$
3,732,213
$ 25,629,896
$41,707,109
$39,944,801
$ 49,039,745
$454,372,848
—
—
—
—
—
1,412
—
—
THE RYDEX SERIES FUNDS SEMI-ANNUAL REPORT
|
109
STATEMENTS OF ASSETS AND LIABILITIES (Unaudited) (concluded)
Inverse
High Yield
High Yield
Europe
Japan
Strategy
Strategy
1.25x Strategy
2x Strategy
Fund
Fund
Fund
Fund
ASSETS
Investment Securities
$
—
$
—
$
8,576,373
$
—
Repurchase Agreements
21,972,507
15,841,036
5,929,776
428,485
Total Investments
21,972,507
15,841,036
14,506,149
428,485
Unrealized Appreciation on Swap
—
599,354
—
—
Unamortized Upfront Premiums Received
—
1,139,708
—
—
Segregated Cash with Broker
193,600
169,600
1,806,421
1,844,559
Cash
—
—
1,531
—
Receivable for Credit Default Swap Settlement
25,000
—
—
—
Receivable for Swap Units Sold
—
—
24,288
29,483
Variation Margin on Futures Contracts
—
92,087
125,273
174,141
Receivable for Securities Sold
—
—
301,658
—
Receivable for Fund Shares Sold
25,495
607,683
593,046
614,176
Investment Income Receivable
117
—
50,236
—
Receivable from Advisor
—
—
—
17,395
Other Assets
—
—
—
—
Total Assets
22,216,719
18,449,468
17,408,602
3,108,239
LIABILITIES
Payable for Credit Default Swap Settlement
—
21,875
—
—
Unamortized Upfront Premiums Paid
1,522,629
—
—
—
Unrealized Depreciation on Swap
464,871
—
—
—
Variation Margin on Futures Contracts
189,819
—
—
—
Payable upon Return of Securities Loaned
—
—
305,120
—
Payable for Fund Shares Redeemed
76,410
242,571
1,980,525
292,884
Investment Advisory Fees Payable
29,134
8,561
12,210
1,753
Transfer Agent and Administrative Fees Payable
9,711
2,854
3,392
584
Distribution and Service Fees Payable
10,084
4,520
5,408
768
Portfolio Accounting Fees Payable
3,884
1,142
1,357
234
Custody Fees Payable
1,165
342
407
70
Dividends Payable
—
—
—
—
Other Liabilities
23,745
8,335
16,535
1,783
Total Liabilities
2,331,452
290,200
2,324,954
298,076
NET ASSETS
$19,885,267
$18,159,268
$15,083,648
$ 2,810,163
NET ASSETS CONSIST OF
Paid-In Capital
$24,765,962
$17,268,079
$25,350,016
$ 4,239,136
Undistributed Net Investment Income (Loss)
584,003
18,428
(2,401,758)
10,764
Accumulated Net Realized Gain (Loss) on Investments
(5,033,911)
226,226
(8,182,941)
(1,317,814)
Net Unrealized Appreciation (Depreciation) on Investments
(430,787)
646,535
318,331
(121,923)
NET ASSETS
$19,885,267
$18,159,268
$15,083,648
$ 2,810,163
Investor Class
N/A
N/A
N/A
N/A
Advisor Class
N/A
N/A
N/A
N/A
A-Class
$
8,432,860
$
1,685,235
$
889,402
$
127,164
C-Class
666,781
2,973,973
3,097,553
255,697
H-Class
10,785,626
13,500,060
11,096,693
2,427,302
SHARES OUTSTANDING
Investor Class
N/A
N/A
N/A
N/A
Advisor Class
N/A
N/A
N/A
N/A
A-Class
348,971
32,562
52,656
6,990
C-Class
27,918
57,894
195,082
14,106
H-Class
447,234
260,175
656,720
133,432
NET ASSET VALUES
Investor Class
N/A
N/A
N/A
N/A
Advisor Class
N/A
N/A
N/A
N/A
A-Class
$24.16
$51.75
$16.89
$18.19
A-Class Maximum Offering Price*
25.36
54.33
17.73
19.10
C-Class
23.88
51.37
15.88
18.13
H-Class
24.12
51.89
16.90
18.19
Cost of Investments
$21,972,507
$15,841,036
$14,079,231
$
428,485
* Net asset value adjusted for the maximum sales charge of 4.75% of offering price, calculated NAV/(1-4.75%).
110
|
THE RYDEX SERIES FUNDS SEMI-ANNUAL REPORT
See Notes to Financial Statements.
September 30, 2008
U.S.
Small-Cap
Mid-Cap
Large-Cap
Small-Cap
Mid-Cap
Large-Cap
Government
Value
Value
Value
Growth
Growth
Growth
Money Market
Fund
Fund
Fund
Fund
Fund
Fund
Fund
$ 34,859,588
$
7,449,133
$14,607,496
$ 20,398,817
$ 14,760,251
$ 12,154,096
$1,249,970,756
331,832
35,911
263,750
221,384
122,607
83,924
319,929,387
35,191,420
7,485,044
14,871,246
20,620,201
14,882,858
12,238,020
1,569,900,143
—
—
—
—
—
—
—
—
—
—
—
—
—
—
—
—
—
—
—
—
—
2,113
—
—
—
—
—
9,008,975
—
—
—
—
—
—
—
—
—
—
—
—
—
—
—
—
—
—
—
—
—
527,023
52,443
296,832
387,524
—
372,290
—
4,400
15,430
23,442
521,832
19,223
5,290
62,819,485
48,535
11,158
64,313
5,463
4,769
7,791
603,718
—
—
—
—
—
—
—
—
—
—
—
—
—
1,572
35,773,491
7,564,075
15,255,833
21,535,020
14,906,850
12,623,391
1,642,333,893
—
—
—
—
—
—
—
—
—
—
—
—
—
—
—
—
—
—
—
—
—
—
—
—
—
—
—
—
1,516,971
182,767
80,059
480,527
—
8,704
—
867,060
24,067
755,754
1,300,712
197,958
558,197
168,103,108
17,237
5,013
13,848
10,639
12,710
8,234
536,384
5,746
1,671
4,616
3,546
4,237
2,745
214,554
12,949
2,330
5,890
4,284
6,114
5,048
177,564
2,298
668
1,846
1,419
1,695
1,098
58,998
704
201
573
476
776
514
34,176
—
—
—
—
—
—
30,041
7,198
5,319
11,373
6,836
18,022
14,296
623,863
2,430,163
222,036
873,959
1,808,439
241,512
598,836
169,778,688
$ 33,343,328
$
7,342,039
$14,381,874
$ 19,726,581
$ 14,665,338
$ 12,024,555
$1,472,555,205
$ 46,217,206
$10,296,476
$19,922,938
$ 24,615,751
$ 23,204,294
$ 21,524,791
$1,472,746,515
169,247
81,018
489,454
(49,935)
(203,457)
(85,619)
(20,987)
(13,341,283)
(3,741,616)
(7,018,226)
(5,440,189)
(10,015,998)
(10,379,552)
(170,323)
298,158
706,161
987,708
600,954
1,680,499
964,935
—
$ 33,343,328
$
7,342,039
$14,381,874
$ 19,726,581
$ 14,665,338
$ 12,024,555
$1,472,555,205
N/A
N/A
N/A
N/A
N/A
N/A
$1,118,020,463
N/A
N/A
N/A
N/A
N/A
N/A
178,219,792
$
232,107
$
594,771
$
245,640
$
225,675
$
4,841,745
$
1,685,968
34,253,308
11,748,234
1,066,662
1,644,791
1,759,366
2,195,859
2,759,114
142,061,642
21,362,987
5,680,606
12,491,443
17,741,540
7,627,734
7,579,473
N/A
N/A
N/A
N/A
N/A
N/A
N/A
1,118,481,227
N/A
N/A
N/A
N/A
N/A
N/A
178,481,262
9,389
21,609
14,574
8,300
191,512
76,064
34,239,728
492,895
40,178
102,050
66,897
90,038
128,833
142,079,421
865,341
206,390
740,691
652,110
301,404
342,002
N/A
N/A
N/A
N/A
N/A
N/A
N/A
$1.00
N/A
N/A
N/A
N/A
N/A
N/A
1.00
$24.72
$27.52
$16.85
$27.19
$25.28
$22.17
1.00
25.95
28.89
17.69
28.55
26.54
23.28
1.00
23.84
26.55
16.12
26.30
24.39
21.42
1.00
24.69
27.52
16.86
27.21
25.31
22.16
N/A
$ 34,893,262
$
6,778,883
$13,883,538
$ 20,019,247
$ 13,202,359
$ 11,273,085
$1,569,900,143
THE RYDEX SERIES FUNDS SEMI-ANNUAL REPORT
|
111
STATEMENTS OF OPERATIONS (Unaudited)
Inverse
S&P 500
Nova
S&P 500
Strategy
NASDAQ-100®
Fund
Fund
Fund
Fund
INVESTMENT INCOME
Interest
$
224,341
$
293,869
$
3,074,059
$
213,500
Income from Securities Lending, net
43,252
17,411
—
415,932
Dividends, Net of Foreign Tax Withheld
1,142,564
579,083
—
1,557,593
Total Income
1,410,157
890,363
3,074,059
2,187,025
EXPENSES
Investment Advisory Fees
492,743
322,497
1,244,615
2,587,809
Transfer Agent and Administrative Fees
164,248
107,499
345,726
862,603
Distribution & Service Fees:
Advisor Class
53,509
—
34,177
48,655
A-Class
10,850
5,175
20,689
5,888
C-Class
136,368
53,434
120,247
69,179
H-Class
—
88,965
—
—
Audit and Outside Service Fees
23,368
7,512
40,858
90,271
Portfolio Accounting Fees
65,699
43,000
134,558
266,427
Registration Fees
45,111
12,687
79,076
276,526
Short Sales Interest Expense
—
—
—
—
Short Sales Dividend Expense
—
—
—
—
Trustees’ Fees*
7,523
2,903
14,095
32,979
Custody Fees
18,416
11,812
36,310
90,604
Miscellaneous
25,496
40,281
75,032
223,991
Total Expenses
1,043,331
695,765
2,145,383
4,554,932
Net Investment Income (Loss)
366,826
194,598
928,676
(2,367,907)
REALIZED AND UNREALIZED GAIN (LOSS) ON INVESTMENTS
Net Realized Gain (Loss) on:
Investment Securities
(2,107,136)
(3,530,572)
—
(2,800,992)
Equity Index Swaps
(2,226,983)
(2,885,001)
15,574,458
(454,560)
Futures Contracts
(3,828,124)
1,366,378
(1,994,171)
(2,598,383)
Securities Sold Short
—
—
—
—
Total Net Realized Gain (Loss)
(8,162,243)
(5,049,195)
13,580,287
(5,853,935)
Net Change in Unrealized Appreciation (Depreciation) on:
Investment Securities
(9,513,383)
(5,715,867)
—
(56,704,116)
Equity Index Swaps
(156,965)
(2,172)
901,991
(126,350)
Futures Contracts
(1,655,123)
(1,759,801)
9,417,337
(695,332)
Securities Sold Short
—
—
—
—
Net Change in Unrealized Appreciation (Depreciation)
(11,325,471)
(7,477,840)
10,319,328
(57,525,798)
Net Gain (Loss) on Investments
(19,487,714)
(12,527,035)
23,899,615
(63,379,733)
Net Increase (Decrease) in Net Assets from Operations
$(19,120,888) $(12,332,437)
-->
$(19,120,888)
$(12,332,437)
$24,828,291
$(65,747,640)
Foreign Tax Withheld
$
—
$
—
$
—
$
28,322
* Relates to Trustees not deemed “interested persons” within the meaning of Section 2(a)(19) of the 1940 Act.
112
|
THE RYDEX SERIES FUNDS SEMI-ANNUAL REPORT
See Notes to Financial Statements.
Period Ended September 30, 2008
Inverse
Inverse
Inverse
Government
Inverse
NASDAQ-100®
Mid-Cap
Mid-Cap
Russell 2000®
Russell 2000®
Long Bond
Government
Strategy
1.5x Strategy
Strategy
1.5x Strategy
Russell 2000®
Strategy
1.2x Strategy
Long Bond
Fund
Fund
Fund
Fund
Fund
Fund
Fund
Strategy Fund
$
629,344
$
111,808
$
116,033
$
113,490
$
100,063
$
621,861
$ 1,357,980
$
7,892,117
—
11,322
—
27,342
3,866
—
—
—
—
127,758
—
178,503
27,338
—
—
—
629,344
250,888
116,033
319,335
131,267
621,861
1,357,980
7,892,117
277,199
125,501
50,564
157,062
58,261
209,299
155,981
2,288,201
77,000
34,861
14,046
43,628
19,420
58,139
62,392
635,612
6,366
—
—
—
—
—
43,750
82,673
2,638
1,902
837
5,022
2,114
6,140
18,717
74,920
33,957
46,202
6,247
60,505
3,934
31,389
33,810
685,026
—
21,408
11,646
23,480
16,323
44,151
—
—
11,285
5,406
2,848
5,524
665
7,917
11,709
63,384
30,800
13,945
5,618
17,451
7,768
23,255
31,196
219,537
29,688
8,665
3,699
13,362
3,317
18,292
18,156
100,582
—
—
—
—
—
—
—
6,560,648
—
—
—
—
—
122,588
—
—
3,595
1,684
850
1,814
288
2,640
3,541
24,061
8,046
3,626
1,454
4,562
2,135
6,049
8,534
66,522
10,954
4,038
610
8,541
8,611
10,027
10,690
171,037
491,528
267,238
98,419
340,951
122,836
539,886
398,476
10,972,203
137,816
(16,350)
17,614
(21,616)
8,431
81,975
959,504
(3,080,086)
—
(372,170)
—
(743,300)
(194,259)
—
(23,537)
(41,459)
250
(493,084)
(876,938)
(930,471)
616,588
(1,625,506)
—
—
(1,061,589)
101,554
564,537
468,974
(1,163,999)
(1,053,343)
369,561
(19,622,245)
—
—
—
—
—
394,609
—
(11,633,154)
(1,061,339)
(763,700)
(312,401)
(1,204,797)
(741,670)
(2,284,240)
346,024
(31,296,858)
—
(1,015,365)
—
59,798
(460,219)
—
(2,306,535)
(44,995)
1,098,348
19,836
(1,158,618)
91,106
(12,486)
151,107
—
—
3,748,233
(962,719)
4,303
(797,460)
(434,624)
620,664
(845,208)
15,527,378
—
—
—
—
—
(1,780,527)
—
13,734,403
4,846,581
(1,958,248)
(1,154,315)
(646,556)
(907,329)
(1,008,756)
(3,151,743)
29,216,786
3,785,242
(2,721,948)
(1,466,716)
(1,851,353)
(1,648,999)
(3,292,996)
(2,805,719)
(2,080,072)
$ 3,923,058
$(2,738,298)
$(1,449,102)
$(1,872,969)
$(1,640,568)
$(3,211,021)
$(1,846,215)
$
(5,160,158)
$
—
$
—
$
—
$
75
$
11
$
—
$
—
$
—
THE RYDEX SERIES FUNDS SEMI-ANNUAL REPORT
|
113
STATEMENTS OF OPERATIONS (Unaudited) (concluded)
Inverse
High Yield
High Yield
Europe
Japan
Strategy
Strategy
1.25x Strategy
2x Strategy
Fund
Fund
Fund
Fund
INVESTMENT INCOME
Interest
$
808,662
$160,275
$
138,441
$
48,724
Income from Securities Lending, net
—
—
8,423
—
Dividends, Net of Foreign Tax Withheld
—
—
299,288
—
Total Income
808,662
160,275
446,152
48,724
EXPENSES
Investment Advisory Fees
288,428
64,598
118,895
18,547
Transfer Agent and Administrative Fees
96,143
21,533
33,026
6,182
Distribution & Service Fees:
Advisor Class
—
—
—
—
A-Class
31,018
2,180
1,799
824
C-Class
4,671
14,778
26,776
2,903
H-Class
63,957
15,658
24,533
4,633
Audit and Outside Service Fees
8,390
2,107
7,337
346
Portfolio Accounting Fees
38,457
8,613
13,211
2,473
Registration Fees
9,704
3,935
14,700
430
Trustees’ Fees*
2,800
988
2,070
186
Custody Fees
10,127
2,233
3,416
640
Miscellaneous
55,004
5,224
(1,478)
2,548
Total Expenses
608,699
141,847
244,285
39,712
Net Investment Income (Loss)
199,963
18,428
201,867
9,012
REALIZED AND UNREALIZED GAIN (LOSS) ON INVESTMENTS
Net Realized Gain (Loss) on:
Investment Securities
—
—
81,629
—
Credit Default/Equity Index Swaps
(1,508,824)
279,991
(2,480,648)
(437,992)
Futures Contracts
(535,025)
478,810
(549,022)
(611,489)
Net Increase from Payments by Affiliates
—
—
—
17,395
Total Net Realized Gain (Loss)
(2,043,849)
758,801
(2,948,041)
(1,032,086)
Net Change in Unrealized Appreciation (Depreciation) on:
Investment Securities
—
—
(2,142,805)
—
Credit Default/Equity Index Swaps
147,302
(60,143)
(48,170)
(54,558)
Futures Contracts
(283,679)
121,300
(243,075)
(299,522)
Net Change in Unrealized Appreciation (Depreciation)
(136,377)
61,157
(2,434,050)
(354,080)
Net Gain (Loss) on Investments
(2,180,226)
819,958
(5,382,091)
(1,386,166)
Net Increase (Decrease) in Net Assets from Operations
$(1,980,263)
$838,386
$(5,180,224)
$(1,377,154)
Foreign Tax Withheld
$
—
$
—
$
44,895
$
—
*Relates to Trustees not deemed “interested persons” within the meaning of Section 2(a)(19) of the 1940 Act.
114
|
THE RYDEX SERIES FUNDS SEMI-ANNUAL REPORT
See Notes to Financial Statements.
Period Ended September 30, 2008
U.S.
Small-Cap
Mid-Cap
Large-Cap
Small-Cap
Mid-Cap
Large-Cap
Government
Value
Value
Value
Growth
Growth
Growth
Money Market
Fund
Fund
Fund
Fund
Fund
Fund
Fund
$
1,299
$
471
$
982
$
957
$
3,455
$
1,704
$14,974,461
30,683
13,882
20,621
24,463
39,260
19,960
11,336
189,217
157,574
298,755
33,412
64,765
130,318
—
221,199
171,927
320,358
58,832
107,480
151,982
14,985,797
63,204
39,545
62,433
46,681
139,560
108,956
3,198,814
21,068
13,182
20,811
15,560
46,520
36,319
1,279,525
—
—
—
—
—
—
405,600
2,013
1,816
3,647
1,337
4,182
8,135
33,052
21,282
14,425
10,490
16,368
30,012
22,251
607,001
13,734
7,759
14,541
10,131
34,835
22,620
—
2,424
2,619
6,721
1,805
4,339
6,549
187,637
8,427
5,273
8,325
6,224
18,608
14,527
361,142
2,827
4,137
9,782
2,972
7,252
10,563
295,645
688
702
1,731
575
1,749
2,038
65,062
2,546
1,415
2,263
1,722
5,157
4,071
172,626
5,929
36
(6,518)
5,392
18,723
1,572
353,664
144,142
90,909
134,226
108,767
310,937
237,601
6,959,768
77,057
81,018
186,132
(49,935)
(203,457)
(85,619)
8,026,029
(4,964,950)
(704,269)
(3,089,600)
(713,660)
(2,352,566)
(1,279,771)
(39,306)
—
—
—
—
—
—
—
—
—
—
—
—
—
—
—
—
—
—
—
—
—
(4,964,950)
(704,269)
(3,089,600)
(713,660)
(2,352,566)
(1,279,771)
(39,306)
1,330,705
219,706
(1,161,016)
(123,994)
(535,272)
(1,499,090)
—
—
—
—
—
—
—
—
—
—
—
—
—
—
—
1,330,705
219,706
(1,161,016)
(123,994)
(535,272)
(1,499,090)
—
(3,634,245)
(484,563)
(4,250,616)
(837,654)
(2,887,838)
(2,778,861)
(39,306)
$(3,557,188)
$(403,545)
$(4,064,484)
$(887,589)
$(3,091,295)
$(2,864,480)
$
7,986,723
$
295
$
—
$
—
$
—
$
—
$
—
$
—
THE RYDEX SERIES FUNDS SEMI-ANNUAL REPORT
|
115
STATEMENTS OF CHANGES IN NET ASSETS
Nova Fund
S&P 500 Fund
Period
Year
Period
Year
Ended
Ended
Ended
Ended
September 30,
March 31,
September 30,
March 31,
2008†
2008
2008†
2008
FROM OPERATIONS
Net Investment Income (Loss)
$
366,826
$
1,814,491
$
194,598
$
390,281
Net Realized Gain (Loss) on Investments
(8,162,243)
(9,551,255)
(5,049,195)
(4,633,846)
Net Change in Unrealized Appreciation (Depreciation) on Investments
(11,325,471)
(18,422,080)
(7,477,840)
949,099
Net Increase (Decrease) in Net Assets from Operations
(19,120,888)
(26,158,844)
(12,332,437)
(3,294,466)
Distributions to Shareholders from:
Net Investment Income
Investor Class
—
(2,576,835)
—
—
Advisor Class
—
(587,393)
—
—
A-Class
—
(263,460)
—
(5,509)
C-Class
—
(872,315)
—
(22,779)
H-Class
—
—
—
(121,712)
Realized Gain on Investments
A-Class
—
—
—
—
C-Class
—
—
—
—
H-Class
—
—
—
—
Total Distributions to Shareholders
—
(4,300,003)
—
(150,000)
SHARE TRANSACTIONS
Proceeds from Shares Purchased
Investor Class
138,413,663
341,259,500
—
—
Advisor Class
25,220,935
68,277,906
—
—
A-Class
6,401,650
14,230,806
12,924,482
19,984,413
C-Class
8,609,410
35,778,708
72,127,194
100,930,691
H-Class
—
—
343,301,874
243,409,668
Value of Shares Purchased through Dividend Reinvestment
Investor Class
—
2,412,637
—
—
Advisor Class
—
502,879
—
—
A-Class
—
215,508
—
3,583
C-Class
—
815,962
—
22,414
H-Class
—
—
—
121,524
Cost of Shares Redeemed
Investor Class
(147,499,788)
(362,877,907)
—
—
Advisor Class
(24,564,017)
(83,015,389)
—
—
A-Class
(13,126,820)
(16,109,773)
(6,484,678)
(19,732,723)
C-Class
(13,835,974)
(43,779,722)
(72,253,568)
(94,416,991)
H-Class
—
—
(275,775,418)
(168,129,248)
Net Increase (Decrease) in Net Assets From Share Transactions
(20,380,941)
(42,288,885)
73,839,886
82,193,331
Net Increase (Decrease) in Net Assets
(39,501,829)
(72,747,732)
61,507,449
78,748,865
NET ASSETS—BEGINNING OF PERIOD
135,398,457
208,146,189
89,156,956
10,408,091
NET ASSETS—END OF PERIOD
$
95,896,628
$ 135,398,457
$ 150,664,405
$
89,156,956
Undistributed Net Investment Income (Loss)—End of Period
$
798,828
$
432,002
$
197,157
$
2,559
† Unaudited
116
|
THE RYDEX SERIES FUNDS SEMI-ANNUAL REPORT
See Notes to Financial Statements.
Inverse
Inverse
Mid-Cap
S&P 500 Strategy Fund
NASDAQ-100® Fund
NASDAQ-100® Strategy Fund
1.5x Strategy Fund
Period
Year
Period
Year
Period
Year
Period
Year
Ended
Ended
Ended
Ended
Ended
Ended
Ended
Ended
September 30,
March 31,
September 30,
March 31,
September 30,
March 31,
September 30,
March 31,
2008†
2008
2008†
2008
2008†
2008
2008†
2008
$
928,676
$
9,239,729
$
(2,367,907)
$
(3,871,579)
$
137,816
$
2,739,850
$
(16,350)
$
184,928
13,580,287
8,497,642
(5,853,935)
37,550,926
(1,061,339)
(8,791,690)
(763,700)
(4,634,390)
10,319,328
5,979,963
(57,525,798)
(35,808,024)
4,846,581
1,330,389
(1,958,248)
(4,432,221)
24,828,291
23,717,334
(65,747,640)
(2,128,677)
3,923,058
(4,721,451)
(2,738,298)
(8,881,683)
—
(10,150,499)
—
—
—
(2,469,997)
—
—
—
(544,365)
—
—
—
(93,712)
—
—
—
(417,734)
—
—
—
(220,499)
—
(13,285)
—
(1,287,404)
—
—
—
(365,790)
—
(81,268)
—
—
—
—
—
—
—
(155,448)
—
—
—
—
—
—
—
(86,908)
—
—
—
—
—
—
—
(531,658)
—
—
—
—
—
—
—
(1,016,946)
—
(12,400,002)
—
—
—
(3,149,998)
—
(1,885,513)
299,537,350
415,012,456
302,843,741
555,891,864
91,020,735
266,757,622
—
—
37,024,669
48,201,826
67,257,199
139,974,270
1,287,422
11,607,871
—
—
27,996,150
23,979,245
6,420,741
15,782,415
3,428,373
9,715,769
587,962
4,937,608
31,067,365
107,600,065
66,826,892
93,532,178
23,496,615
37,796,095
13,047,178
19,972,516
—
—
—
—
—
—
98,068,145
338,407,973
—
9,133,319
—
—
—
2,169,008
—
—
—
457,021
—
—
—
78,193
—
—
—
354,871
—
—
—
145,081
—
89,731
—
1,125,213
—
—
—
345,264
—
579,143
—
—
—
—
—
—
—
1,101,301
(285,031,784)
(504,104,091)
(338,516,143)
(573,819,417)
(94,776,531)
(308,127,363)
—
—
(35,444,193)
(60,172,882)
(65,727,187)
(132,669,492)
(4,027,789)
(18,768,096)
—
—
(11,972,027)
(26,601,648)
(7,789,458)
(13,135,349)
(2,130,391)
(11,615,256)
(955,875)
(5,770,358)
(40,607,344)
(120,326,325)
(65,220,370)
(92,744,657)
(25,979,353)
(47,225,030)
(12,997,913)
(26,383,646)
—
—
—
—
—
—
(99,204,441)
(345,280,940)
22,570,186
(105,340,930)
(33,904,585)
(7,188,188)
(7,680,919)
(57,120,842)
(1,454,944)
(12,346,672)
47,398,477
(94,023,598)
(99,652,225)
(9,316,865)
(3,757,861)
(64,992,291)
(4,193,242)
(23,113,868)
275,818,829
369,842,427
649,494,321
658,811,186
72,979,444
137,971,735
21,721,916
44,835,784
$ 323,217,306
$ 275,818,829
$ 549,842,096
$ 649,494,321
$ 69,221,583
$
72,979,444
$ 17,528,674
$
21,721,916
$
4,917,755
$
3,989,079
$
(2,367,907)
$
—
$
833,423
$
695,607
$
(16,350)
$
—
THE RYDEX SERIES FUNDS SEMI-ANNUAL REPORT
|
117
STATEMENTS OF CHANGES IN NET ASSETS (continued)
Inverse
Russell 2000®
Mid-Cap Strategy Fund
1.5x Strategy Fund
Period
Year
Period
Year
Ended
Ended
Ended
Ended
September 30,
March 31,
September 30,
March 31,
2008†
2008
2008†
2008
FROM OPERATIONS
Net Investment Income (Loss)
$
17,614
$
379,675
$
(21,616)
$
328,224
Net Realized Gain (Loss) on Investments
(312,401)
264,155
(1,204,797)
(6,256,309)
Net Change in Unrealized Appreciation (Depreciation) on Investments
(1,154,315)
1,132,496
(646,556)
(7,678,425)
Net Increase (Decrease) in Net Assets from Operations
(1,449,102)
1,776,326
(1,872,969)
(13,606,510)
Distributions to Shareholders from:
Net Investment Income
Investor Class
—
—
—
—
Advisor Class
—
—
—
—
A-Class
—
(14,414)
—
(11,847)
C-Class
—
(12,714)
—
(39,861)
H-Class
—
(392,699)
—
(53,601)
Total Distributions to Shareholders
—
(419,827)
—
(105,309)
SHARE TRANSACTIONS
Proceeds from Shares Purchased
Investor Class
—
—
—
—
Advisor Class
—
—
—
—
A-Class
656,297
1,473,841
3,281,717
5,608,927
C-Class
3,839,155
19,784,055
9,487,297
27,002,919
H-Class
32,071,528
100,782,437
88,823,268
243,835,904
Value of Shares Purchased through Dividend Reinvestment
Investor Class
—
—
—
—
Advisor Class
—
—
—
—
A-Class
—
10,623
—
11,014
C-Class
—
11,651
—
35,684
H-Class
—
377,291
—
50,275
Cost of Shares Redeemed
Investor Class
—
—
—
—
Advisor Class
—
—
—
—
A-Class
(856,875)
(1,125,508)
(6,130,340)
(5,958,829)
C-Class
(4,590,317)
(19,223,442)
(8,378,166)
(31,943,301)
H-Class
(73,639,472)
(71,243,410)
(88,435,878)
(264,626,266)
Net Increase (Decrease) in Net Assets From Share Transactions
(42,519,684)
30,847,538
(1,352,102)
(25,983,673)
Net Increase (Decrease) in Net Assets
(43,968,786)
32,204,037
(3,225,071)
(39,695,492)
NET ASSETS—BEGINNING OF PERIOD
49,013,447
16,809,410
29,083,513
68,779,005
NET ASSETS—END OF PERIOD
$
5,044,661
$
49,013,447
$ 25,858,442
$
29,083,513
Undistributed Net Investment Income (Loss)—End of Period
$
43,243
$
25,629
$
(21,616)
$
—
† Unaudited
118
|
THE RYDEX SERIES FUNDS SEMI-ANNUAL REPORT
See Notes to Financial Statements.
Russell 2000®
Inverse
Government Long Bond
Inverse Government
Fund
Russell 2000® Strategy Fund
1.2x Strategy Fund
Long Bond Strategy Fund
Period
Year
Period
Year
Period
Year
Period
Year
Ended
Ended
Ended
Ended
Ended
Ended
Ended
Ended
September 30,
March 31,
September 30,
March 31,
September 30,
March 31,
September 30,
March 31,
2008†
2008
2008†
2008
2008†
2008
2008†
2008
$
8,431
$
130,395
$
81,975
$
1,842,934
$
959,504
$
2,568,216
$
(3,080,086)
$
10,945,020
(741,670)
(214,609)
(2,284,240)
4,123,664
346,024
(1,773,685)
(31,296,858)
(28,527,890)
(907,329)
(361,722)
(1,008,756)
1,287,153
(3,151,743)
5,317,858
29,216,786
(24,199,216)
(1,640,568)
(445,936)
(3,211,021)
7,253,751
(1,846,215)
6,112,389
(5,160,158)
(41,782,086)
—
—
—
—
(390,897)
(1,420,257)
—
(8,268,999)
—
—
—
—
(251,631)
(415,210)
—
(1,048,257)
—
(3,218)
—
(262,498)
(236,215)
(478,407)
—
(1,181,600)
—
(6,072)
—
(314,182)
(80,761)
(254,342)
—
(5,301,155)
—
(24,871)
—
(1,673,321)
—
—
—
—
—
(34,161)
—
(2,250,001)
(959,504)
(2,568,216)
—
(15,800,011)
—
—
—
—
418,807,503
824,506,330
613,529,985
1,047,079,062
—
—
—
—
358,611,783
180,695,157
374,222,991
151,234,508
5,044,208
6,689,164
1,341,361
15,262,274
10,176,669
27,478,043
49,383,998
27,820,957
5,367,525
11,788,819
16,963,008
29,493,508
79,110,951
79,769,479
50,828,713
57,936,431
193,754,218
112,455,644
77,366,306
226,253,216
—
—
—
—
—
—
—
—
371,617
1,291,988
—
5,921,254
—
—
—
—
249,547
411,265
—
873,772
—
3,055
—
245,925
213,057
372,582
—
1,052,303
—
4,822
—
264,680
77,803
221,778
—
4,607,055
—
24,724
—
1,475,890
—
—
—
—
—
—
—
—
(429,210,810)
(837,686,520)
(596,271,937)
(1,097,133,564)
—
—
—
—
(371,398,155)
(166,581,027)
(362,661,749)
(167,400,041)
(1,814,522)
(6,005,450)
(4,896,261)
(19,266,022)
(16,469,588)
(20,498,724)
(24,923,722)
(58,850,467)
(5,150,878)
(11,713,559)
(15,454,939)
(32,705,884)
(79,567,570)
(89,766,321)
(41,319,899)
(130,620,082)
(167,639,814)
(121,115,706)
(86,227,267)
(237,600,325)
—
—
—
—
29,560,737
(7,868,487)
(10,907,792)
(16,576,738)
(29,027,193)
214,030
62,788,380
(157,478,812)
27,920,169
(8,348,584)
(14,118,813)
(11,572,988)
(31,832,912)
3,758,203
57,628,222
(215,060,909)
5,913,342
14,261,926
55,505,548
67,078,536
82,489,143
78,730,940
424,620,166
639,681,075
$
33,833,511
$
5,913,342
$ 41,386,735
$
55,505,548
$
50,656,231
$
82,489,143
$ 482,248,388
$
424,620,166
$
8,431
$
—
$
225,254
$
143,279
$
183,622
$
183,622
$
(3,080,086)
$
—
THE RYDEX SERIES FUNDS SEMI-ANNUAL REPORT
|
119
STATEMENTS OF CHANGES IN NET ASSETS (continued)
High Yield
Inverse High Yield
Strategy Fund
Strategy Fund
Period
Year
Period
Year
Ended
Ended
Ended
Ended
September 30,
March 31,
September 30,
March 31,
2008†
2008*
2008†
2008*
FROM OPERATIONS
Net Investment Income
$
199,963
$
597,094
$
18,428
$
327,727
Net Realized Gain (Loss) on Investments
(2,043,849)
(2,022,664)
758,801
(1,151,097)
Net Change in Unrealized Appreciation (Depreciation) on Investments
(136,377)
(294,410)
61,157
585,378
Net Increase (Decrease) in Net Assets from Operations
(1,980,263)
(1,719,980)
838,386
(237,992)
Distributions to Shareholders from:
Net Investment Income
A-Class
—
(94,059)
—
—
C-Class
—
(3,119)
—
—
H-Class
—
(252,822)
—
—
Realized Gain on Investments
A-Class
—
—
—
—
C-Class
—
—
—
—
H-Class
—
—
—
—
Total Distributions to Shareholders
—
(350,000)
—
—
SHARE TRANSACTIONS
Proceeds from Shares Purchased
A-Class
159,284,004
49,111,859
4,034,411
18,335,302
C-Class
2,167,740
4,241,692
1,470,752
6,037,467
H-Class
291,932,025
298,135,020
135,440,159
159,139,664
Value of Shares Purchased through Dividend Reinvestment
A-Class
—
93,585
—
—
C-Class
—
3,048
—
—
H-Class
—
252,521
—
—
Cost of Shares Redeemed
A-Class
(159,985,023)
(37,905,292)
(4,046,659)
(16,310,916)
C-Class
(2,490,329)
(3,224,690)
(1,467,831)
(3,060,250)
H-Class
(344,864,090)
(232,816,560)
(129,276,267)
(152,736,958)
Net Increase (Decrease) in Net Assets From Share Transactions
(53,955,673)
77,891,183
6,154,565
11,404,309
Net Increase (Decrease) in Net Assets
(55,935,936)
75,821,203
6,992,951
11,166,317
NET ASSETS—BEGINNING OF PERIOD
75,821,203
—
11,166,317
—
NET ASSETS—END OF PERIOD
$
19,885,267
$
75,821,203
$
18,159,268
$
11,166,317
Undistributed Net Investment Income (Loss)—End of Period
$
584,003
$
384,040
$
18,428
$
—
* Since commencement of operations: April 16, 2007 — High Yield Strategy Fund and Inverse High Yield Strategy Fund; February 22, 2008 —
Japan 2x Strategy Fund.
† Unaudited
120
|
THE RYDEX SERIES FUNDS SEMI-ANNUAL REPORT
See Notes to Financial Statements.
Europe
Japan
Small-Cap
Mid-Cap
1.25x Strategy Fund
2x Strategy Fund
Value Fund
Value Fund
Period
Year
Period
Year
Period
Year
Period
Year
Ended
Ended
Ended
Ended
Ended
Ended
Ended
Ended
September 30,
March 31,
September 30,
March 31,
September 30,
March 31,
September 30,
March 31,
2008†
2008
2008†
2008*
2008†
2008
2008†
2008
$
201,867
$
1,874,122
$
9,012
$
607
$
77,057
$
145,848
$
81,018
$
300,251
(2,948,041)
(583,438)
(1,032,086)
(285,728)
(4,964,950)
(3,529,923)
(704,269)
2,556,717
(2,434,050)
(4,787,080)
(354,080)
232,157
1,330,705
(4,152,139)
219,706
(4,572,641)
(5,180,224)
(3,496,396)
(1,377,154)
(52,964)
(3,557,188)
(7,536,214)
(403,545)
(1,715,673)
—
(27,890)
—
—
—
(18,247)
—
(78,237)
—
(143,919)
—
—
—
(7,413)
—
(41,598)
—
(573,127)
—
—
—
(28,903)
—
(157,115)
—
(84,392)
—
—
—
—
—
—
—
(435,477)
—
—
—
—
—
—
—
(1,734,199)
—
—
—
—
—
—
—
(2,999,004)
—
—
—
(54,563)
—
(276,950)
141,985
12,571,808
272,427
655,392
2,088,309
5,591,744
1,166,390
6,102,704
56,046,222
164,682,136
15,317,417
1,074,730
13,803,783
33,963,980
15,147,594
27,510,830
79,090,094
425,839,427
33,028,957
13,009,228
65,368,129
139,955,762
27,181,359
93,270,475
—
102,592
—
—
—
18,143
—
72,305
—
555,797
—
—
—
7,069
—
39,879
—
2,247,120
—
—
—
28,137
—
152,723
(688,172)
(22,788,995)
(618,042)
(56,585)
(4,500,468)
(5,725,821)
(3,427,380)
(7,404,551)
(58,161,762)
(167,193,672)
(15,153,076)
(829,607)
(15,276,777)
(20,857,249)
(14,630,880)
(34,318,144)
(85,733,554)
(458,269,642)
(34,778,807)
(7,681,753)
(93,130,862)
(93,517,092)
(28,082,491)
(162,625,394)
(9,305,187)
(42,253,429)
(1,931,124)
6,171,405
(31,647,886)
59,464,673
(2,645,408)
(77,199,173)
(14,485,411)
(48,748,829)
(3,308,278)
6,118,441
(35,205,074)
51,873,896
(3,048,953)
(79,191,796)
29,569,059
78,317,888
6,118,441
—
68,548,402
16,674,506
10,390,992
89,582,788
$ 15,083,648
$
29,569,059
$
2,810,163
$
6,118,441
$
33,343,328
$
68,548,402
$
7,342,039
$
10,390,992
$
(2,401,758)
$
(2,603,625)
$
10,764
$
1,752
$
169,247
$
92,190
$
81,018
$
—
THE RYDEX SERIES FUNDS SEMI-ANNUAL REPORT
|
121
STATEMENTS OF CHANGES IN NET ASSETS (concluded)
Large-Cap
Small-Cap
Value Fund
Growth Fund
Period
Year
Period
Year
Ended
Ended
Ended
Ended
September 30,
March 31,
September 30,
March 31,
2008†
2008
2008†
2008
FROM OPERATIONS
Net Investment Income (Loss)
$
186,132
$
875,220
$
(49,935)
$
(181,870)
Net Realized Gain (Loss) on Investments
(3,089,600)
26,243,034
(713,660)
730,805
Net Change in Unrealized Appreciation (Depreciation) on Investments
(1,161,016)
(23,545,348)
(123,994)
(1,728,062)
Net Increase (Decrease) in Net Assets from Operations
(4,064,484)
3,572,906
(887,589)
(1,179,127)
Distributions to Shareholders from:
Net Investment Income
Investor Class
—
—
—
—
Advisor Class
—
—
—
—
A-Class
—
(259,465)
—
—
C-Class
—
(384,645)
—
—
H-Class
—
(580,308)
—
—
Realized Gain on Investments
A-Class
—
(765,247)
—
(101,616)
C-Class
—
(1,134,442)
—
(327,448)
H-Class
—
(1,711,515)
—
(222,904)
Total Distributions to Shareholders
—
(4,835,622)
—
(651,968)
SHARE TRANSACTIONS
Proceeds from Shares Purchased
Investor Class
—
—
—
—
Advisor Class
—
—
—
—
A-Class
2,249,004
8,142,461
886,307
8,648,656
C-Class
10,734,135
56,251,502
33,431,344
71,659,894
H-Class
112,559,295
236,489,451
61,634,135
116,986,235
Value of Shares Purchased through Dividend Reinvestment
Investor Class
—
—
—
—
Advisor Class
—
—
—
—
A-Class
—
993,745
—
101,611
C-Class
—
1,442,982
—
327,318
H-Class
—
2,241,255
—
222,054
Cost of Shares Redeemed
Investor Class
—
—
—
—
Advisor Class
—
—
—
—
A-Class
(5,624,672)
(8,107,705)
(2,605,569)
(7,810,332)
C-Class
(10,650,074)
(76,358,825)
(33,901,491)
(76,836,624)
H-Class
(115,386,852)
(405,771,580)
(49,007,677)
(128,439,749)
Net Increase (Decrease) in Net Assets From Share Transactions
(6,119,164)
(184,676,714)
10,437,049
(15,140,937)
Net Increase (Decrease) in Net Assets
(10,183,648)
(185,939,430)
9,549,460
(16,972,032)
NET ASSETS—BEGINNING OF PERIOD
24,565,522
210,504,952
10,177,121
27,149,153
NET ASSETS—END OF PERIOD
$
14,381,874
$
24,565,522
$
19,726,581
$
10,177,121
Undistributed Net Investment Income (Loss)—End of Period
$
489,454
$
303,322
$
(49,935)
$
—
† Unaudited
122
|
THE RYDEX SERIES FUNDS SEMI-ANNUAL REPORT
See Notes to Financial Statements.
Mid-Cap
Large-Cap
U.S. Government
Growth Fund
Growth Fund
Money Market Fund
Period
Year
Period
Year
Period
Year
Ended
Ended
Ended
Ended
Ended
Ended
September 30,
March 31,
September 30,
March 31,
September 30,
March 31,
2008†
2008
2008†
2008
2008†
2008
$
(203,457)
$
(300,551)
$
(85,619)
$
(424,286)
$
8,026,029
$
43,732,402
(2,352,566)
(4,673,720)
(1,279,771)
(4,624,388)
(39,306)
1,840
(535,272)
(149,780)
(1,499,090)
(1,638,431)
—
—
(3,091,295)
(5,124,051)
(2,864,480)
(6,687,105)
7,986,723
43,734,242
—
—
—
—
(6,877,137)
(34,843,919)
—
—
—
—
(741,652)
(5,056,359)
—
—
—
—
(154,236)
(686,982)
—
—
—
—
(253,002)
(3,145,141)
—
—
—
—
—
—
—
(215,956)
—
(61,132)
—
—
—
(147,969)
—
(210,937)
—
—
—
(703,587)
—
(560,509)
—
—
—
(1,067,512)
—
(832,578)
(8,026,027)
(43,732,401)
—
—
—
—
7,501,817,303
16,744,764,573
—
—
—
—
2,381,240,453
3,541,832,288
6,095,176
7,741,318
7,516,057
7,583,898
51,476,753
86,075,767
61,822,064
46,185,102
6,468,171
121,153,557
694,433,277
1,349,987,737
181,478,368
230,118,496
58,250,273
199,536,612
—
—
—
—
—
—
6,816,269
34,409,275
—
—
—
—
740,009
5,026,273
—
214,830
—
60,489
141,762
611,010
—
146,362
—
207,581
247,038
3,040,004
—
698,887
—
545,152
—
—
—
—
—
—
(7,369,166,884)
(16,782,939,167)
—
—
—
—
(2,362,867,612)
(3,591,814,816)
(5,124,801)
(6,349,744)
(10,424,848)
(4,409,453)
(38,553,186)
(84,291,559)
(61,374,336)
(48,784,216)
(7,565,945)
(118,548,255)
(674,037,092)
(1,352,007,025)
(184,586,625)
(220,140,598)
(61,188,879)
(232,280,349)
—
—
(1,690,154)
9,830,437
(6,945,171)
(26,150,768)
192,288,090
(45,305,640)
(4,781,449)
3,638,874
(9,809,651)
(33,670,451)
192,248,786
(45,303,799)
19,446,787
15,807,913
21,834,206
55,504,657
1,280,306,419
1,325,610,218
$
14,665,338
$
19,446,787
$ 12,024,555
$
21,834,206
$ 1,472,555,205
$
1,280,306,419
$
(203,457)
$
—
$
(85,619)
$
—
$
(20,987)
$
(20,989)
THE RYDEX SERIES FUNDS SEMI-ANNUAL REPORT
|
123
FINANCIAL HIGHLIGHTS
This table is presented to show selected data for a share outstanding throughout each period, and to assist shareholders in evaluating a Fund’s performance for the periods presented.
RATIOS TO
AVERAGE NET ASSETS:
Net Realized
Net Increase
NET ASSET
Net
and
(Decrease)
Distributions
Distributions
Net Increase
NET ASSET
Net
Combined
Net Assets,
VALUE,
Investment
Unrealized
in Net Asset
from Net
from Net
(Decrease) in
VALUE,
Total
Investment
Net
Portfolio
End of
BEGINNING
Income
Gains (Losses)
Value Resulting
Investment
Realized
Total
Net Asset
END OF
Investment
Total
Net
Income
Investment
Turnover
Period (000’s
Period Ended
OF PERIOD
(Loss)†
on Investments
from Operations
Income
Gains
Distributions
Value
PERIOD
Return††
Expenses■
Expenses■
(Loss)
Income (Loss)▲
Rate
omitted)
Nova Fund Investor Class
September 30, 2008D
$26.13
$
.11
$
(4.73)
$ (4.62)
$
—
$
—
$
—
$
(4.62)
$21.51
(17.68)%
1.28%**
1.28%**
0.86%**
—
83%
$
55,021
March 31, 2008
30.92
.40
(4.51)
(4.11)
(.68)
—
(.68)
(4.79)
26.13
(13.71)%
1.27%
1.27%
1.26%
—
115%
74,674
March 31, 2007
28.89
(.15)
4.19
4.04
(2.01)
—
(2.01)
2.03
30.92
13.99%
1.25%
1.25%
1.23%
—
144%
113,195
March 31, 2006
25.96
(.12)
3.90
3.78
(.85)
—
(.85)
2.93
28.89
14.68%
1.35%
1.23%
(0.45)%
0.95%
192%
139,786
March 31, 2005
24.12
(.11)
1.95
1.84
—
—
—
1.84
25.96
7.63%
1.21%
1.21%
(0.44)%
0.82%
388%
175,042
March 31, 2004
15.54
.07
8.51
8.58
—
—
—
8.58
24.12
55.25%
1.25%
1.25%
0.35%
1.16%
540%
187,051
Nova Fund Advisor Class
September 30, 2008D
24.72
.05
(4.47)
(4.42)
—
—
—
(4.42)
20.30
(17.88)%
1.78%**
1.78%**
0.38%**
—
83%
16,773
March 31, 2008
29.44
.23
(4.27)
(4.04)
(.68)
—
(.68)
(4.72)
24.72
(14.16)%
1.77%
1.77%
0.78%
—
115%
19,218
March 31, 2007
27.73
(.28)
4.00
3.72
(2.01)
—
(2.01)
1.71
29.44
13.41%
1.75%
1.75%
0.73%
—
144%
36,441
March 31, 2006
25.08
(.25)
3.75
3.50
(.85)
—
(.85)
2.65
27.73
14.07%
1.85%
1.74%
(0.96)%
0.44%
192%
41,002
March 31, 2005
23.42
(.23)
1.89
1.66
—
—
—
1.66
25.08
7.09%
1.71%
1.71%
(0.94)%
0.32%
388%
52,642
March 31, 2004
15.17
(.05)
8.30
8.25
—
—
—
8.25
23.42
54.42%
1.74%
1.74%
(0.24)%
0.57%
540%
46,405
Nova Fund A-Class
September 30, 2008D
24.99
.08
(4.53)
(4.45)
—
—
—
(4.45)
20.54
(17.81)%
1.54%**
1.54%**
0.59%**
—
83%
4,174
March 31, 2008
29.67
.29
(4.29)
(4.00)
(.68)
—
(.68)
(4.68)
24.99
(13.92)%
1.52%
1.52%
0.97%
—
115%
11,791
March 31, 2007
27.87
(.21)
4.02
3.81
(2.01)
—
(2.01)
1.80
29.67
13.67%
1.50%
1.50%
0.98%
—
144%
15,586
March 31, 2006
25.15
(.19)
3.76
3.57
(.85)
—
(.85)
2.72
27.87
14.32%
1.60%
1.49%
(0.71)%
0.69%
192%
29,315
March 31, 2005
23.42
(.17)
1.90
1.73
—
—
—
1.73
25.15
7.39%
1.45%
1.45%
(0.68)%
0.58%
388%
18,463
March 31, 2004*
23.42
—
—
—
—
—
—
—
23.42
0.00%
0.00%**à
0.00%**à
0.00%**
0.81%**
540%
1
Nova Fund C-Class
September 30, 2008D
24.14
(.02)
(4.35)
(4.37)
—
—
—
(4.37)
19.77
(18.10)%
2.28%**
2.28%**
(0.13)%**
—
83%
19,928
March 31, 2008
28.91
.07
(4.16)
(4.09)
(.68)
—
(.68)
(4.77)
24.14
(14.60)%
2.27%
2.27%
0.24%
—
115%
29,715
March 31, 2007
27.39
(.42)
3.95
3.53
(2.01)
—
(2.01)
1.52
28.91
12.88%
2.25%
2.25%
0.23%
—
144%
42,925
March 31, 2006
24.89
(.38)
3.73
3.35
(.85)
—
(.85)
2.50
27.39
13.58%
2.35%
2.24%
(1.46)%
(0.06)%
192%
50,131
March 31, 2005
23.36
(.35)
1.88
1.53
—
—
—
1.53
24.89
6.55%
2.21%
2.21%
(1.44)%
(0.18)%
388%
49,464
March 31, 2004
15.20
(.12)
8.28
8.16
—
—
—
8.16
23.36
53.72%
2.26%
2.26%
(0.56)%
0.25%
540%
32,710
S&P 500 Fund A-Class
September 30, 2008D
25.92
.08
(2.94)
(2.86)
—
—
—
(2.86)
23.06
(11.03)%
1.52%**
1.52%**
0.64%**
—
100%
8,155
March 31, 2008
27.32
.52
(1.78)
(1.26)
(.14)
—
(.14)
(1.40)
25.92
(4.68)%
1.51%
1.51%
1.86%
—
396%
2,358
March 31, 2007*
25.00
.30
2.53
2.83
(.11)
(.40)
(.51)
2.32
27.32
11.34%
1.55%**
1.55%**
1.35%**
—
119%
2,063
S&P 500 Fund C-Class
September 30, 2008D
25.55
(.03)
(2.88)
(2.91)
—
—
—
(2.91)
22.64
(11.39)%
2.27%**
2.27%**
(0.22)%**
—
100%
6,553
March 31, 2008
27.15
.18
(1.64)
(1.46)
(.14)
—
(.14)
(1.60)
25.55
(5.45)%
2.25%
2.25%
0.67%
—
396%
7,836
March 31, 2007*
25.00
.19
2.47
2.66
(.11)
(.40)
(.51)
2.15
27.15
10.65%
2.25%**
2.25%**
0.84%**
—
119%
1,971
S&P 500 Fund H-Class
September 30, 2008D
25.90
.07
(2.93)
(2.86)
—
—
—
(2.86)
23.04
(11.04)%
1.53%**
1.53%**
0.54%**
—
100%
135,957
March 31, 2008
27.31
.39
(1.66)
(1.27)
(.14)
—
(.14)
(1.41)
25.90
(4.72)%
1.48%
1.48%
1.40%
—
396%
78,963
March 31, 2007*
25.00
.30
2.52
2.82
(.11)
(.40)
(.51)
2.31
27.31
11.29%
1.54%**
1.54%**
1.33%**
—
119%
6,374
Inverse S&P 500 Strategy Fund Investor Class
September 30, 2008D
40.00
.16
3.75
3.91
—
—
—
3.91
43.91
9.78%
1.42%**
1.42%**
0.80%**
—
—
256,727
March 31, 2008
37.85
.93
2.74
3.67
(1.52)
—
(1.52)
2.15
40.00
10.24%
1.41%
1.41%
3.08%
—
—
223,044
March 31, 2007†††
40.30
(.20)
(1.15)
(1.35)
(1.10)
—
(1.10)
(2.45)
37.85
(3.26)%
1.36%
1.36%
3.85%
—
—
293,092
March 31, 2006†††
43.45
(.20)
(2.35)
(2.55)
(.60)
—
(.60)
(3.15)
40.30
(5.84)%
1.41%
1.38%
(0.45)%
2.29%
—
329,785
March 31, 2005†††
45.85
(.20)
(2.20)
(2.40)
—
—
—
(2.40)
43.45
(5.23)%
1.38%
1.38%
(0.46)%
0.25%
—
326,085
March 31, 2004†††
65.30
(.20)
(17.25)
(17.45)
—
(2.00)
(2.00)
(19.45)
45.85
(26.90)%
1.38%
1.38%
(0.37)%
(0.28)%
—
353,496
FINANCIAL HIGHLIGHTS (continued)
This table is presented to show selected data for a share outstanding throughout each period, and to assist shareholders in evaluating a Fund's performance for the periods presented.
RATIOS TO
AVERAGE NET ASSETS:
Net Realized
Net Increase
NET ASSET
Net
and
(Decrease)
Distributions
Distributions
Net Increase
NET ASSET
Net
Combined
Net Assets,
VALUE,
Investment
Unrealized
in Net Asset
from Net
from Net
(Decrease) in
VALUE,
Total
Investment
Net
Portfolio
End of
BEGINNING
Income
Gains (Losses)
Value Resulting
Investment
Realized
Total
Net Asset
END OF
Investment
Total
Net
Income
Investment
Turnover
Period (000’s
Period Ended
OF PERIOD
(Loss)†
on Investments
from Operations
Income
Gains
Distributions
Value
PERIOD
Return††
Expenses■
Expenses■
(Loss)
Income (Loss)▲
Rate
omitted)
Inverse S&P 500 Strategy Fund Advisor Class
September 30, 2008D
$37.72
$
.05
$
3.52
$
3.57
$
—
$
—
$
—
$
3.57
$41.29
9.46%
1.93%**
1.93%**
0.28%**
—
—
$
14,451
March 31, 2008
36.00
.73
2.51
3.24
(1.52)
—
(1.52)
1.72
37.72
9.56%
1.92%
1.92%
2.64%
—
—
11,131
March 31, 2007†††
38.55
(.35)
(1.10)
(1.45)
(1.10)
—
(1.10)
(2.55)
36.00
(3.67)%
1.87%
1.87%
3.34%
—
—
22,712
March 31, 2006†††
41.80
(.40)
(2.25)
(2.65)
(.60)
—
(.60)
(3.25)
38.55
(6.32)%
1.91%
1.88%
(0.95)%
1.79%
—
45,332
March 31, 2005†††
44.35
(.40)
(2.15)
(2.55)
—
—
—
(2.55)
41.80
(5.75)%
1.88%
1.88%
(0.96)%
(0.25)%
—
40,964
March 31, 2004†††
63.50
(.45)
(16.70)
(17.15)
—
(2.00)
(2.00)
(19.15)
44.35
(27.19)%
1.87%
1.87%
(0.86)%
(0.77)%
—
45,073
Inverse S&P 500 Strategy Fund A-Class
September 30, 2008D
37.97
.10
3.56
3.66
—
—
—
3.66
41.63
9.64%
1.67%**
1.67%**
0.53%**
—
—
27,208
March 31, 2008
36.10
.81
2.58
3.39
(1.52)
—
(1.52)
1.87
37.97
9.95%
1.66%
1.66%
2.83%
—
—
9,344
March 31, 2007†††
38.60
(.25)
(1.15)
(1.40)
(1.10)
—
(1.10)
(2.50)
36.10
(3.53)%
1.61%
1.61%
3.60%
—
—
11,388
March 31, 2006†††
41.85
(.30)
(2.35)
(2.65)
(.60)
—
(.60)
(3.25)
38.60
(6.31)%
1.66%
1.63%
(0.70)%
2.04%
—
8,932
March 31, 2005†††
44.35
(.30)
(2.20)
(2.50)
—
—
—
(2.50)
41.85
(5.64)%
1.63%
1.63%
(0.71)%
0.00%
—
7,318
March 31, 2004*†††
44.35
—
—
—
—
—
—
—
44.35
0.00%
0.00%**à
0.00%**à
0.00%**
0.09%**
—
1
Inverse S&P 500 Strategy Fund C-Class
September 30, 2008D
37.00
(.04)
3.46
3.42
—
—
—
3.42
40.42
9.24%
2.43%**
2.43%**
(0.19)%**
—
—
24,832
March 31, 2008
35.50
.58
2.44
3.02
(1.52)
—
(1.52)
1.50
37.00
9.07%
2.41%
2.41%
2.14%
—
—
32,299
March 31, 2007†††
38.25
(.55)
(1.10)
(1.65)
(1.10)
—
(1.10)
(2.75)
35.50
(4.22)%
2.36%
2.36%
2.85%
—
—
42,651
March 31, 2006†††
41.65
(.60)
(2.20)
(2.80)
(.60)
—
(.60)
(3.40)
38.25
(6.70)%
2.41%
2.38%
(1.45)%
1.29%
—
39,146
March 31, 2005†††
44.45
(.65)
(2.15)
(2.80)
—
—
—
(2.80)
41.65
(6.30)%
2.38%
2.38%
(1.46)%
(0.75)%
—
43,763
March 31, 2004†††
64.00
(.70)
(16.85)
(17.55)
—
(2.00)
(2.00)
(19.55)
44.45
(27.62)%
2.39%
2.39%
(1.42)%
(1.33)%
—
45,604
NASDAQ-100® Fund Investor Class
September 30, 2008D
11.81
(.04)
(1.19)
(1.23)
—
—
—
(1.23)
10.58
(10.41)%
1.28%**
1.28%**
(0.65)%**
—
38%
519,827
March 31, 2008
11.78
(.06)
.09
.03
—
—
—
.03
11.81
0.25%
1.28%
1.28%
(0.50)%
—
57%
617,923
March 31, 2007
11.34
(.06)
.50
.44
—
—
—
.44
11.78
3.88%
1.22%
1.22%
(0.52)%
—
71%
635,744
March 31, 2006
9.94
(.05)
1.49
1.44
(.04)
—
(.04)
1.40
11.34
14.45%
1.20%
1.20%
(0.49)%
—
122%
893,295
March 31, 2005
9.73
.04
.17
.21
—
—
—
.21
9.94
2.16%
1.20%
1.20%
0.40%
—
132%
801,185
March 31, 2004
7.02
(.09)
2.80
2.71
—
—
—
2.71
9.73
38.60%
1.22%
1.22%
(0.98)%
—
139%
858,816
NASDAQ-100® Fund Advisor Class
September 30, 2008D
11.23
(.07)
(1.12)
(1.19)
—
—
—
(1.19)
10.04
(10.60)%
1.78%**
1.78%**
(1.14)%**
—
38%
15,144
March 31, 2008
11.26
(.12)
.09
(.03)
—
—
—
(.03)
11.23
(0.27)%
1.78%
1.78%
(0.99)%
—
57%
15,184
March 31, 2007
10.90
(.11)
.47
.36
—
—
—
.36
11.26
3.30%
1.73%
1.73%
(1.07)%
—
71%
9,349
March 31, 2006
9.60
(.10)
1.44
1.34
(.04)
—
(.04)
1.30
10.90
13.92%
1.70%
1.70%
(1.00)%
—
122%
27,832
March 31, 2005
9.46
(.02)
.16
.14
—
—
—
.14
9.60
1.48%
1.69%
1.69%
(0.25)%
—
132%
19,887
March 31, 2004
6.85
(.13)
2.74
2.61
—
—
—
2.61
9.46
38.10%
1.71%
1.71%
(1.47)%
—
139%
57,535
NASDAQ-100® Fund A-Class
September 30, 2008D
11.35
(.05)
(1.15)
(1.20)
—
—
—
(1.20)
10.15
(10.57)%
1.54%**
1.54%**
(0.87)%**
—
38%
4,383
March 31, 2008
11.36
(.09)
.08
(.01)
—
—
—
(.01)
11.35
(0.09)%
1.54%
1.54%
(0.76)%
—
57%
6,044
March 31, 2007
10.96
(.08)
.48
.40
—
—
—
.40
11.36
3.65%
1.46%
1.46%
(0.73)%
—
71%
3,686
March 31, 2006
9.63
(.08)
1.45
1.37
(.04)
—
(.04)
1.33
10.96
14.18%
1.46%
1.46%
(0.78)%
—
122%
2,491
March 31, 2005
9.46
.06
.11
.17
—
—
—
.17
9.63
1.80%
1.45%
1.45%
0.59%
—
132%
1,818
March 31, 2004*
9.46
—
—
—
—
—
—
—
9.46
0.00%
0.00%**à
0.00%**à
0.00%**
—
139%
1
NASDAQ-100® Fund C-Class
September 30, 2008D
10.95
(.09)
(1.10)
(1.19)
—
—
—
(1.19)
9.76
(10.87)%
2.28%**
2.28%**
(1.63)%**
—
38%
10,487
March 31, 2008
11.02
(.18)
.11
(.07)
—
—
—
(.07)
10.95
(0.64)%
2.28%
2.28%
(1.50)%
—
57%
10,343
March 31, 2007
10.73
(.16)
.45
.29
—
—
—
.29
11.02
2.70%
2.22%
2.22%
(1.55)%
—
71%
10,032
March 31, 2006
9.50
(.16)
1.43
1.27
(.04)
—
(.04)
1.23
10.73
13.33%
2.21%
2.21%
(1.52)%
—
122%
18,707
March 31, 2005
9.41
(.03)
.12
.09
—
—
—
.09
9.50
0.96%
2.19%
2.19%
(0.33)%
—
132%
14,422
March 31, 2004
6.86
(.18)
2.73
2.55
—
—
—
2.55
9.41
37.17%
2.23%
2.23%
(1.97)%
—
139%
13,653
FINANCIAL HIGHLIGHTS (continued)
This table is presented to show selected data for a share outstanding throughout each period, and to assist shareholders in evaluating a Fund's performance for the periods presented.
RATIOS TO
AVERAGE NET ASSETS:
Net Realized
Net Increase
NET ASSET
Net
and
(Decrease)
Distributions
Distributions
Net Increase
NET ASSET
Net
Combined
Net Assets,
VALUE,
Investment
Unrealized
in Net Asset
from Net
from Net
(Decrease) in
VALUE,
Total
Investment
Net
Portfolio
End of
BEGINNING
Income
Gains (Losses)
Value Resulting
Investment
Realized
Total
Net Asset
END OF
Investment
Total
Net
Income
Investment
Turnover
Period (000’s
Period Ended
OF PERIOD
(Loss)†
on Investments
from Operations
Income
Gains
Distributions
Value
PERIOD
Return††
Expenses■
Expenses■
(Loss)
Income (Loss)▲
Rate
omitted)
Inverse NASDAQ-100® Strategy Fund Investor Class
September 30, 2008D
$21.27
$
.06
$
1.58
$
1.64
$
—
$
—
$
—
$
1.64
$22.91
7.71%
1.46%**
1.46%**
0.58%**
—
—
$
59,521
March 31, 2008
21.67
.59
(.30)
.29
(.69)
—
(.69)
(.40)
21.27
1.92%
1.47%
1.47%
2.98%
—
—
59,819
March 31, 2007
21.80
(.11)
.54
.43
(.56)
—
(.56)
(.13)
21.67
2.01%
1.40%
1.40%
3.79%
—
—
104,617
March 31, 2006
24.55
(.11)
(2.31)
(2.42)
(.33)
—
(.33)
(2.75)
21.80
(9.85)%
1.39%
1.38%
(0.45)%
2.22%
—
143,742
March 31, 2005
25.69
(.11)
(1.03)
(1.14)
—
—
—
(1.14)
24.55
(4.44)%
1.38%
1.38%
(0.46)%
0.20%
—
198,288
March 31, 2004
37.79
(.13)
(11.97)
(12.10)
—
—
—
(12.10)
25.69
(32.02)%
1.40%
1.40%
(0.47)%
(0.37)%
—
209,994
Inverse NASDAQ-100® Strategy Fund Advisor Class
September 30, 2008D
20.77
.02
1.52
1.54
—
—
—
1.54
22.31
7.41%
1.96%**
1.96%**
0.23%**
—
—
932
March 31, 2008
21.28
.51
(.33)
.18
(.69)
—
(.69)
(.51)
20.77
1.43%
1.98%
1.98%
2.56%
—
—
3,744
March 31, 2007
21.51
(.22)
.55
.33
(.56)
—
(.56)
(.23)
21.28
1.56%
1.90%
1.90%
3.29%
—
—
11,436
March 31, 2006
24.34
(.22)
(2.28)
(2.50)
(.33)
—
(.33)
(2.83)
21.51
(10.27)%
1.89%
1.89%
(0.96)%
1.71%
—
10,390
March 31, 2005
25.60
(.24)
(1.02)
(1.26)
—
—
—
(1.26)
24.34
(4.92)%
1.88%
1.88%
(0.96)%
(0.30)%
—
17,059
March 31, 2004*
29.97
(.16)
(4.21)
(4.37)
—
—
—
(4.37)
25.60
(14.58)%
1.90%**
1.90%**
(0.97)%**
(0.87)%**
—
17,975
Inverse NASDAQ-100® Strategy Fund A-Class
September 30, 2008D
20.97
.02
1.57
1.59
—
—
—
1.59
22.56
7.58%
1.71%**
1.71%**
0.25%**
—
—
3,353
March 31, 2008
21.43
.52
(.29)
.23
(.69)
—
(.69)
(.46)
20.97
1.65%
1.72%
1.72%
2.61%
—
—
1,784
March 31, 2007
21.61
(.16)
.54
.38
(.56)
—
(.56)
(.18)
21.43
1.79%
1.64%
1.64%
3.55%
—
—
4,086
March 31, 2006
24.39
(.16)
(2.29)
(2.45)
(.33)
—
(.33)
(2.78)
21.61
(10.04)%
1.63%
1.63%
(0.70)%
1.97%
—
2,108
March 31, 2005
25.60
(.17)
(1.04)
(1.21)
—
—
—
(1.21)
24.39
(4.73)%
1.62%
1.62%
(0.70)%
(0.04)%
—
5,697
March 31, 2004*
25.60
—
—
—
—
—
—
—
25.60
0.00%
0.00%**à
0.00%**à
0.00%**
0.10%**
—
1
Inverse NASDAQ-100® Strategy Fund C-Class
September 30, 2008D
19.63
(.04)
1.45
1.41
—
—
—
1.41
21.04
7.18%
2.46%**
2.46%**
(0.38)%**
—
—
5,415
March 31, 2008
20.27
.38
(.33)
.05
(.69)
—
(.69)
(.64)
19.63
0.85%
2.48%
2.48%
2.05%
—
—
7,633
March 31, 2007
20.63
(.32)
.52
.20
(.56)
—
(.56)
(.36)
20.27
1.00%
2.40%
2.40%
2.79%
—
—
17,834
March 31, 2006
23.48
(.32)
(2.20)
(2.52)
(.33)
—
(.33)
(2.85)
20.63
(10.73)%
2.40%
2.39%
(1.46)%
1.21%
—
13,527
March 31, 2005
24.83
(.35)
(1.00)
(1.35)
—
—
—
(1.35)
23.48
(5.44)%
2.38%
2.38%
(1.46)%
(0.80)%
—
15,693
March 31, 2004
36.92
(.38)
(11.71)
(12.09)
—
—
—
(12.09)
24.83
(32.75)%
2.41%
2.41%
(1.48)%
(1.38)%
—
34,375
Mid-Cap 1.5x Strategy Fund A-Class
September 30, 2008D
32.39
.02
(4.14)
(4.12)
—
—
—
(4.12)
28.27
(12.72)%
1.67%**
1.67%**
0.09%**
—
97%
1,082
March 31, 2008
41.56
.23
(7.46)
(7.23)
(.26)
(1.68)
(1.94)
(9.17)
32.39
(18.29)%
1.67%
1.67%
0.57%
—
226%
1,571
March 31, 2007
40.14
.05
2.74
2.79
—
(1.37)
(1.37)
1.42
41.56
7.11%
1.67%
1.67%
0.13%
—
296%
2,806
March 31, 2006
31.86
.01
8.65
8.66
—
(.38)
(.38)
8.28
40.14
27.27%
1.92%
1.66%
0.03%
—
528%
4,948
March 31, 2005
28.30
(.03)
3.59
3.56
—
—
—
3.56
31.86
12.58%
1.63%
1.63%
(0.10)%
—
669%
1,050
March 31, 2004*
28.30
—
—
—
—
—
—
—
28.30
0.00%
0.00%**à
0.00%**à
0.00%**
—
1,239%
4
Mid-Cap 1.5x Strategy Fund C-Class
September 30, 2008D
30.73
(.11)
(3.90)
(4.01)
—
—
—
(4.01)
26.72
(13.05)%
2.42%**
2.42%**
(0.65)%**
—
97%
7,214
March 31, 2008
39.82
(.08)
(7.07)
(7.15)
(.26)
(1.68)
(1.94)
(9.09)
30.73
(18.90)%
2.42%
2.42%
(0.20)%
—
226%
8,388
March 31, 2007
38.81
(.23)
2.61
2.38
—
(1.37)
(1.37)
1.01
39.82
6.29%
2.41%
2.41%
(0.62)%
—
296%
17,112
March 31, 2006
31.03
(.25)
8.41
8.16
—
(.38)
(.38)
7.78
38.81
26.38%
2.66%
2.40%
(0.72)%
—
528%
28,836
March 31, 2005
27.76
(.26)
3.53
3.27
—
—
—
3.27
31.03
11.78%
2.37%
2.37%
(0.91)%
—
669%
17,912
March 31, 2004
15.85
(.31)
12.22
11.91
—
—
—
11.91
27.76
75.14%
2.41%
2.41%
(1.31)%
—
1,239%
14,444
Mid-Cap 1.5x Strategy Fund H-Class
September 30, 2008D
32.40
.03
(4.14)
(4.11)
—
—
—
(4.11)
28.29
(12.69)%
1.67%**
1.67%**
0.15%**
—
97%
9,232
March 31, 2008
41.58
.25
(7.49)
(7.24)
(.26)
(1.68)
(1.94)
(9.18)
32.40
(18.31)%
1.67%
1.67%
0.61%
—
226%
11,763
March 31, 2007
40.17
.06
2.72
2.78
—
(1.37)
(1.37)
1.41
41.58
7.08%
1.67%
1.67%
0.16%
—
296%
24,918
March 31, 2006
31.86
—§§
8.69
8.69
—
(.38)
(.38)
8.31
40.17
27.36%
1.90%
1.64%
0.01%
—
528%
50,883
March 31, 2005
28.30
(.06)
3.62
3.56
—
—
—
3.56
31.86
12.58%
1.62%
1.62%
(0.21)%
—
669%
59,274
March 31, 2004
16.04
(.14)
12.40
12.26
—
—
—
12.26
28.30
76.43%
1.66%
1.66%
(0.56)%
—
1,239%
68,193
FINANCIAL HIGHLIGHTS (continued)
This table is presented to show selected data for a share outstanding throughout each period, and to assist shareholders in evaluating a Fund's performance for the periods presented.
RATIOS TO
AVERAGE NET ASSETS:
Net Realized
Net Increase
NET ASSET
Net
and
(Decrease)
Distributions
Distributions
Net Increase
NET ASSET
Net
Net Assets,
VALUE,
Investment
Unrealized
in Net Asset
from Net
from Net
(Decrease) in
VALUE,
Total
Investment
Portfolio
End of
BEGINNING
Income
Gains (Losses)
Value Resulting
Investment
Realized
Total
Net Asset
END OF
Investment
Total
Net
Income
Turnover
Period (000’s
Period Ended
OF PERIOD
(Loss)†
on Investments
from Operations
Income
Gains
Distributions
Value
PERIOD
Return††
Expenses
Expenses
(Loss)
Rate
omitted)
Inverse Mid-Cap Strategy Fund A-Class
September 30, 2008D
$37.07
$
.05
$
2.36
$
2.41
$
—
$
—
$
—
$
2.41
$39.48
6.50%
1.67%**
1.67%**
0.29%**
—
$
733
March 31, 2008
33.78
.81
3.11
3.92
(.63)
—
(.63)
3.29
37.07
11.83%
1.66%
1.66%
2.35%
—
906
March 31, 2007
37.03
1.35
(1.81)
(.46)
(2.79)
—
(2.79)
(3.25)
33.78
(1.35)%
1.65%
1.65%
3.52%
—
477
March 31, 2006
44.01
.87
(7.20)
(6.33)
(.65)
—
(.65)
(6.98)
37.03
(14.44)%
1.66%
1.66%
2.12%
—
161
March 31, 2005
49.01
(.06)
(4.94)
(5.00)
—
—
—
(5.00)
44.01
(10.20)%
1.63%
1.63%
(0.13)%
—
61
March 31, 2004*
49.01
—
—
—
—
—
—
—
49.01
0.00%
0.00%**à
0.00%**à
0.00%**
—
1
Inverse Mid-Cap Strategy Fund C-Class
September 30, 2008D
35.82
(.07)
2.24
2.17
—
—
—
2.17
37.99
6.06%
2.42%**
2.42%**
(0.41)%**
—
772
March 31, 2008
32.89
.60
2.96
3.56
(.63)
—
(.63)
2.93
35.82
11.05%
2.41%
2.41%
1.83%
—
1,478
March 31, 2007
36.43
1.05
(1.80)
(.75)
(2.79)
—
(2.79)
(3.54)
32.89
(2.19)%
2.40%
2.40%
2.81%
—
801
March 31, 2006
43.62
.15
(6.69)
(6.54)
(.65)
—
(.65)
(7.19)
36.43
(15.05)%
2.41%
2.41%
1.54%
—
1,147
March 31, 2005
48.98
(.27)
(5.09)
(5.36)
—
—
—
(5.36)
43.62
(10.94)%
2.36%
2.36%
(0.58)%
—
1,011
March 31, 2004*
50.00
(.08)
(.94)
(1.02)
—
—
—
(1.02)
48.98
(2.04)%
2.23%**
2.23%**
(1.45)%**
—
137
Inverse Mid-Cap Strategy Fund H-Class
September 30, 2008D
37.07
.07
2.32
2.39
—
—
—
2.39
39.46
6.45%
1.67%**
1.67%**
0.41%**
—
3,540
March 31, 2008
33.78
.78
3.14
3.92
(.63)
—
(.63)
3.29
37.07
11.83%
1.65%
1.65%
2.26%
—
46,630
March 31, 2007
37.04
1.35
(1.82)
(.47)
(2.79)
—
(2.79)
(3.26)
33.78
(1.38)%
1.66%
1.66%
3.51%
—
15,531
March 31, 2006
44.01
.83
(7.15)
(6.32)
(.65)
—
(.65)
(6.97)
37.04
(14.42)%
1.64%
1.64%
2.01%
—
18,475
March 31, 2005
49.01
.18
(5.18)
(5.00)
—
—
—
(5.00)
44.01
(10.20)%
1.60%
1.60%
0.39%
—
30,073
March 31, 2004*
50.00
(.05)
(.94)
(.99)
—
—
—
(.99)
49.01
(1.98)%
1.54%**
1.54%**
(0.74)%**
—
2,678
Russell 2000® 1.5x Strategy Fund A-Class
September 30, 2008D
28.62
.02
(1.37)
(1.35)
—
—
—
(1.35)
27.27
(4.72)%
1.69%**
1.69%**
0.11%**
192%
1,588
March 31, 2008
37.24
.29
(8.83)
(8.54)
(.08)
—
(.08)
(8.62)
28.62
(22.98)%
1.67%
1.67%
0.81%
227%
4,372
March 31, 2007
37.33
.10
1.24
1.34
—
(1.43)
(1.43)
(.09)
37.24
3.60%
1.66%
1.66%
0.28%
179%
5,976
March 31, 2006
27.54
.04
9.75
9.79
—
—
—
9.79
37.33
35.55%
2.06%
1.65%
0.13%
441%
6,789
March 31, 2005
26.22
(.03)
1.51
1.48
—
(.16)
(.16)
1.32
27.54
5.63%
1.61%
1.61%
(0.10)%
501%
3,340
March 31, 2004*
26.22
—
—
—
—
—
—
—
26.22
0.00%
0.00%**à
0.00%**à
0.00%**
965%
4
Russell 2000® 1.5x Strategy Fund C-Class
September 30, 2008D
27.10
(.09)
(1.29)
(1.38)
—
—
—
(1.38)
25.72
(5.09)%
2.44%**
2.44%**
(0.63)%**
192%
11,270
March 31, 2008
35.51
.03
(8.36)
(8.33)
(.08)
—
(.08)
(8.41)
27.10
(23.50)%
2.42%
2.42%
0.09%
227%
10,873
March 31, 2007
35.93
(.16)
1.17
1.01
—
(1.43)
(1.43)
(.42)
35.51
2.81%
2.41%
2.41%
(0.47)%
179%
19,942
March 31, 2006
26.69
(.21)
9.45
9.24
—
—
—
9.24
35.93
34.62%
2.81%
2.40%
(0.70)%
441%
31,956
March 31, 2005
25.63
(.26)
1.48
1.22
—
(.16)
(.16)
1.06
26.69
4.75%
2.37%
2.37%
(1.00)%
501%
18,915
March 31, 2004
12.75
(.28)
13.16
12.88
—
—
—
12.88
25.63
101.02%
2.41%
2.41%
(1.34)%
965%
48,851
Russell 2000® 1.5x Strategy Fund H-Class
September 30, 2008D
28.62
.02
(1.38)
(1.36)
—
—
—
(1.36)
27.26
(4.75)%
1.69%**
1.69%**
0.15%**
192%
13,000
March 31, 2008
37.22
.30
(8.82)
(8.52)
(.08)
—
(.08)
(8.60)
28.62
(22.93)%
1.67%
1.67%
0.83%
227%
13,839
March 31, 2007
37.32
.10
1.23
1.33
—
(1.43)
(1.43)
(.10)
37.22
3.57%
1.66%
1.66%
0.27%
179%
42,861
March 31, 2006
27.51
.03
9.78
9.81
—
—
—
9.81
37.32
35.66%
2.05%
1.64%
0.10%
441%
170,698
March 31, 2005
26.22
(.07)
1.52
1.45
—
(.16)
(.16)
1.29
27.51
5.52%
1.62%
1.62%
(0.26)%
501%
68,084
March 31, 2004
12.94
(.14)
13.42
13.28
—
—
—
13.28
26.22
102.63%
1.66%
1.66%
(0.62)%
965%
174,320
Russell 2000® Fund A-Class
September 30, 2008D
23.57
.02
(.42)
(.40)
—
—
—
(.40)
23.17
(1.70)%
1.54%**
1.54%**
0.14%**
316%
3,895
March 31, 2008
27.64
.34
(4.21)
(3.87)
(.20)
—
(.20)
(4.07)
23.57
(14.08)%
1.51%
1.51%
1.26%
535%
909
March 31, 2007*
25.00
.35
2.43
2.78
(.14)
—
(.14)
2.64
27.64
11.13%
1.51%**
1.51%**
1.54%**
335%
275
Russell 2000® Fund C-Class
September 30, 2008D
23.28
(.06)
(.43)
(.49)
—
—
—
(.49)
22.79
(2.10)%
2.29%**
2.29%**
(0.52)%**
316%
908
March 31, 2008
27.48
.23
(4.23)
(4.00)
(.20)
—
(.20)
(4.20)
23.28
(14.63)%
2.27%
2.27%
0.85%
535%
678
March 31, 2007*
25.00
.17
2.45
2.62
(.14)
—
(.14)
2.48
27.48
10.49%
2.28%**
2.28%**
0.76%**
335%
739
FINANCIAL HIGHLIGHTS (continued)
This table is presented to show selected data for a share outstanding throughout each period, and to assist shareholders in evaluating a Fund's performance for the periods presented.
RATIOS TO
AVERAGE NET ASSETS:
Net Realized
Net Increase
NET ASSET
Net
and
(Decrease)
Distributions
Distributions
Net Increase
NET ASSET
Net
Net Assets,
VALUE,
Investment
Unrealized
in Net Asset
from Net
from Net
(Decrease) in
VALUE,
Total
Investment
Portfolio
End of
BEGINNING
Income
Gains (Losses)
Value Resulting
Investment
Realized
Total
Net Asset
END OF
Investment
Total
Operating
Income
Turnover
Period (000’s
Period Ended
OF PERIOD
(Loss)†
on Investments
from Operations
Income
Gains
Distributions
Value
PERIOD
Return††
Expenses
Expenses§
(Loss)
Rate
omitted)
Russell 2000® Fund H-Class
September 30, 2008D
$23.57
$
.02
$
(.42)
$
(.40)
$
—
$
—
$
—
$
(.40)
$23.17
(1.70)%
1.54%**
1.54%**
0.14%**
316%
$
29,030
March 31, 2008
27.64
.51
(4.38)
(3.87)
(.20)
—
(.20)
(4.07)
23.57
(14.08)%
1.52%
1.52%
1.86%
535%
4,327
March 31, 2007*
25.00
.34
2.44
2.78
(.14)
—
(.14)
2.64
27.64
11.13%
1.52%**
1.52%**
1.55%**
335%
13,248
Inverse Russell 2000® Strategy Fund A-Class
September 30, 2008D
39.05
.10
(1.58)
(1.48)
—
—
—
(1.48)
37.57
(3.79)%
2.23%**
1.70%**
0.52%**
—
2,886
March 31, 2008
35.00
1.06
4.40
5.46
(1.41)
—
(1.41)
4.05
39.05
16.11%
1.89%
1.67%
2.96%
—
6,816
March 31, 2007
36.96
1.38
(1.65)
(.27)
(1.69)
—
(1.69)
(1.96)
35.00
(0.67)%
1.65%
1.65%
3.64%
—
9,905
March 31, 2006
46.09
.85
(9.26)
(8.41)
(.72)
—
(.72)
(9.13)
36.96
(18.40)%
1.63%
1.63%
1.97%
—
1,067
March 31, 2005
48.80
(.02)
(2.69)
(2.71)
—
—
—
(2.71)
46.09
(5.55)%
1.63%
1.63%
(0.03)%
—
404
March 31, 2004*
48.80
—
—
—
—
—
—
—
48.80
0.00%
0.00%**à
0.00%**à
0.00%**
—
1
Inverse Russell 2000® Strategy Fund C-Class
September 30, 2008D
37.80
(.06)
(1.49)
(1.55)
—
—
—
(1.55)
36.25
(4.10)%
2.97%**
2.44%**
(0.33)%**
—
7,279
March 31, 2008
34.18
.76
4.27
5.03
(1.41)
—
(1.41)
3.62
37.80
15.22%
2.67%
2.42%
2.17%
—
6,136
March 31, 2007
36.40
1.07
(1.60)
(.53)
(1.69)
—
(1.69)
(2.22)
34.18
(1.40)%
2.40%
2.40%
2.87%
—
8,455
March 31, 2006
45.71
.56
(9.15)
(8.59)
(.72)
—
(.72)
(9.31)
36.40
(18.95)%
2.40%
2.40%
1.33%
—
3,164
March 31, 2005
48.77
(.49)
(2.57)
(3.06)
—
—
—
(3.06)
45.71
(6.27)%
2.39%
2.39%
(0.97)%
—
3,951
March 31, 2004*
50.00
(.08)
(1.15)
(1.23)
—
—
—
(1.23)
48.77
(2.46)%
2.24%**
2.24%**
(1.42)%**
—
492
Inverse Russell 2000® Strategy Fund H-Class
September 30, 2008D
39.07
.08
(1.55)
(1.47)
—
—
—
(1.47)
37.60
(3.76)%
2.22%**
1.69%**
0.45%**
—
31,222
March 31, 2008
35.02
1.05
4.41
5.46
(1.41)
—
(1.41)
4.05
39.07
16.10%
1.89%
1.67%
2.93%
—
42,554
March 31, 2007
36.98
1.36
(1.63)
(.27)
(1.69)
—
(1.69)
(1.96)
35.02
(0.67)%
1.65%
1.65%
3.56%
—
48,718
March 31, 2006
46.09
.91
(9.30)
(8.39)
(.72)
—
(.72)
(9.11)
36.98
(18.36)%
1.65%
1.65%
2.14%
—
52,201
March 31, 2005
48.80
.04
(2.75)
(2.71)
—
—
—
(2.71)
46.09
(5.55)%
1.63%
1.63%
0.09%
—
46,832
March 31, 2004*
50.00
(.04)
(1.16)
(1.20)
—
—
—
(1.20)
48.80
1.54%**
1.54%**
(0.72)%**
—
5,054
Government Long Bond 1.2x Strategy Fund Investor Class
September 30, 2008D
11.78
.20
(.07)
.13
(.19)
—
(.19)
(.06)
11.72
1.20%
0.97%**
0.97%**
3.38%**
1,080%
19,591
March 31, 2008
10.59
.40
1.19
1.59
(.40)
—
(.40)
1.19
11.78
15.43%
0.97%
0.97%
3.75%
1,142%
30,695
March 31, 2007
10.50
.41
.09
.50
(.41)
—
(.41)
.09
10.59
4.87%
0.96%
0.96%
3.92%
1,357%
40,816
March 31, 2006
11.04
.42
(.54)
(.12)
(.42)
—
(.42)
(.54)
10.50
(1.37)%
0.94%
0.94%
3.69%
1,451%
33,223
March 31, 2005
11.03
.42
—
.42
(.41)
—
(.41)
.01
11.04
4.04%
0.93%
0.93%
3.95%
737%
25,992
March 31, 2004
10.95
.41
.08
.49
(.41)
—
(.41)
.08
11.03
4.65%
0.95%
0.95%
3.84%
1,143%
25,188
Government Long Bond 1.2x Strategy Fund Advisor Class
September 30, 2008D
11.72
.16
(.05)
.11
(.16)
—
(.16)
(.05)
11.67
1.03%
1.47%**
1.47%**
2.88%**
1,080%
11,267
March 31, 2008
10.54
.34
1.19
1.53
(.35)
—
(.35)
1.18
11.72
14.82%
1.47%
1.47%
3.13%
1,142%
25,181
March 31, 2007
10.50
.37
.03
.40
(.36)
—
(.36)
.04
10.54
3.86%
1.46%
1.46%
3.44%
1,357%
10,815
March 31, 2006
11.07
.37
(.57)
(.20)
(.37)
—
(.37)
(.57)
10.50
(2.10)%
1.42%
1.42%
3.16%
1,451%
21,200
March 31, 2005
11.04
.36
.04
.40
(.37)
—
(.37)
.03
11.07
3.75%
1.41%
1.41%
3.32%
737%
53,283
March 31, 2004*
10.00
.23
1.04
1.27
(.23)
—
(.23)
1.04
11.04
12.84%
1.45%**
1.45%**
3.21%**
1,143%
46,690
Government Long Bond 1.2x Strategy Fund A-Class
September 30, 2008D
11.79
.18
(.05)
.13
(.18)
—
(.18)
(.05)
11.74
1.16%
1.22%**
1.22%**
3.15%**
1,080%
13,614
March 31, 2008
10.60
.38
1.19
1.57
(.38)
—
(.38)
1.19
11.79
15.13%
1.22%
1.22%
3.44%
1,142%
20,374
March 31, 2007
10.50
.38
.10
.48
(.38)
—
(.38)
.10
10.60
4.71%
1.22%
1.22%
3.64%
1,357%
11,460
March 31, 2006
11.07
.40
(.58)
(.18)
(.39)
—
(.39)
(.57)
10.50
(1.88)%
1.17%
1.17%
3.45%
1,451%
1,503
March 31, 2005
11.05
.39
.02
.41
(.39)
—
(.39)
.02
11.07
3.86%
1.15%
1.15%
3.63%
737%
1,703
March 31, 2004*
11.05
—
—
—
—
—
—
—
11.05
0.00%
0.00%**à
0.00%**à
0.00%**
1,143%
1
FINANCIAL HIGHLIGHTS (continued)
This table is presented to show selected data for a share outstanding throughout each period, and to assist shareholders in evaluating a Fund’s performance for the periods presented.
RATIOS TO
AVERAGE NET ASSETS:
Net Realized
Net Increase
Combined
NET ASSET
Net
and
(Decrease)
Distributions
Distributions
Net Increase
NET ASSET
Net
Net
Net Assets,
VALUE,
Investment
Unrealized
in Net Asset
from Net
from Net
(Decrease) in
VALUE,
Total
Investment
Investment
Portfolio
End of
BEGINNING
Income
Gains (Losses)
Value Resulting
Investment
Realized
Total
Net Asset
END OF
Investment
Total
Operating
Income
Income
Turnover
Period (000’s
Period Ended
OF PERIOD
(Loss)†
on Investments
from Operations
Income
Gains
Distributions
Value
PERIOD
Return††
Expenses■
Expenses§
(Loss)
(Loss)▲
Rate
omitted)
Government Long Bond 1.2x Strategy Fund C-Class
September 30, 2008D
$11.77
$
.14
$
(.06)
$
.08
$
(.14)
$
—
$
(.14)
$
(.06)
$11.71
0.70%
1.97%**
1.97%**
2.39%**
—
1,080%
$
6,185
March 31, 2008
10.59
.30
1.18
1.48
(.30)
—
(.30)
1.18
11.77
14.20%
1.98%
1.98%
2.80%
—
1,142%
6,239
March 31, 2007
10.50
.31
.08
.39
(.30)
—
(.30)
.09
10.59
3.84%
1.96%
1.96%
2.93%
—
1,357%
15,640
March 31, 2006
11.07
.31
(.57)
(.26)
(.31)
—
(.31)
(.57)
10.50
(2.61)%
1.93%
1.93%
2.69%
—
1,451%
7,293
March 31, 2005
11.05
.31
.02
.33
(.31)
—
(.31)
.02
11.07
3.10%
1.92%
1.92%
2.86%
—
737%
11,005
March 31, 2004
10.97
.30
.08
.38
(.30)
—
(.30)
.08
11.05
3.59%
1.96%
1.96%
2.85%
—
1,143%
3,828
Inverse Government Long Bond Strategy Fund Investor Class
September 30, 2008D
16.81
(.08)
.08
—
—
—
—
—
16.81
0.00%
4.00%**
1.40%**
(0.89)%**
—
314%
253,040
March 31, 2008
19.37
.49
(2.39)
(1.90)
(.66)
—
(.66)
(2.56)
16.81
(9.98)%
3.45%
1.40%
2.56%
—
550%
237,900
March 31, 2007
19.69
(.09)
.40
.31
(.63)
—
(.63)
(.32)
19.37
1.66%
4.97%
1.36%
3.68%
—
192%
313,117
March 31, 2006
18.94
(.07)
.82
.75
—
—
—
.75
19.69
3.96%
4.66%
1.33%
(0.40)%
0.78%
179%
768,588
March 31, 2005
19.77
(.08)
(.75)
(.83)
—
—
—
(.83)
18.94
(4.20)%
5.11%
1.32%
(0.40)%
1.53%
101%
1,472,040
March 31, 2004
21.23
(.09)
(1.37)
(1.46)
—
—
—
(1.46)
19.77
(6.88)%
5.57%
1.38%
(0.45)%
(3.84)%
187%
898,294
Inverse Government Long Bond Strategy Fund Advisor Class
September 30, 2008D
16.41
(.12)
.10
(.02)
—
—
—
(.02)
16.39
(0.12)%
4.51%**
1.91%**
(1.38)%**
—
314%
36,121
March 31, 2008
19.01
.34
(2.28)
(1.94)
(.66)
—
(.66)
(2.60)
16.41
(10.39)%
4.10%
1.90%
1.84%
—
550%
24,891
March 31, 2007
19.43
(.18)
.39
.21
(.63)
—
(.63)
(.42)
19.01
1.17%
5.47%
1.86%
3.18%
—
192%
43,782
March 31, 2006
18.79
(.16)
.80
.64
—
—
—
.64
19.43
3.41%
5.16%
1.83%
(0.90)%
0.28%
179%
99,546
March 31, 2005
19.71
(.17)
(.75)
(.92)
—
—
—
(.92)
18.79
(4.67)%
5.61%
1.82%
(0.90)%
1.03%
101%
232,541
March 31, 2004*
22.41
(.13)
(2.57)
(2.70)
—
—
—
(2.70)
19.71
(12.05)%
6.05%**
1.86%**
(0.93)%**
(4.32)%**
187%
52,298
Inverse Government Long Bond Strategy Fund A-Class
September 30, 2008D
16.57
(.09)
.07
(.02)
—
—
—
(.02)
16.55
(0.12)%
4.16%**
1.66%**
(1.09)%**
—
314%
60,453
March 31, 2008
19.16
.44
(2.37)
(1.93)
(.66)
—
(.66)
(2.59)
16.57
(10.25)%
3.86%
1.65%
2.37%
—
550%
37,256
March 31, 2007
19.52
(.14)
.41
.27
(.63)
—
(.63)
(.36)
19.16
1.47%
5.22%
1.61%
3.43%
—
192%
69,606
March 31, 2006
18.84
(.12)
.80
.68
—
—
—
.68
19.52
3.61%
4.91%
1.58%
(0.65)%
0.53%
179%
124,679
March 31, 2005
19.71
(.13)
(.74)
(.87)
—
—
—
(.87)
18.84
(4.41)%
5.35%
1.56%
(0.64)%
1.29%
101%
177,178
March 31, 2004*
19.71
—
—
—
—
—
—
—
19.71
0.00%
0.00%**à
0.00%**à
0.00%**
(3.39)%**
187%
5,057
Inverse Government Long Bond Strategy Fund C-Class
September 30, 2008D
15.65
(.15)
.08
(.07)
—
—
—
(.07)
15.58
(0.45)%
4.97%**
2.40%**
(1.87)%**
—
314%
132,635
March 31, 2008
18.26
.29
(2.24)
(1.95)
(.66)
—
(.66)
(2.61)
15.65
(10.87)%
4.44%
2.40%
1.62%
—
550%
124,572
March 31, 2007
18.78
(.27)
.38
.11
(.63)
—
(.63)
(.52)
18.26
0.67%
5.97%
2.36%
2.68%
—
192%
213,175
March 31, 2006
18.25
(.25)
.78
.53
—
—
—
.53
18.78
2.90%
5.66%
2.33%
(1.40)%
(0.22)%
179%
533,862
March 31, 2005
19.24
(.27)
(.72)
(.99)
—
—
—
(.99)
18.25
(5.15)%
6.11%
2.32%
(1.40)%
0.53%
101%
893,249
March 31, 2004
20.88
(.29)
(1.35)
(1.64)
—
—
—
(1.64)
19.24
(7.85)%
6.57%
2.38%
(1.45)%
(4.84)%
187%
489,918
High Yield Strategy Fund A-Class
September 30, 2008D
24.31
.06
(.21)
(.15)
—
—
—
(.15)
24.16
(0.62)%
1.55%**
1.55%**
0.47%**
—
—
8,433
March 31, 2008*
25.00
.69
(1.31)
(.62)
(.07)
—
(.07)
(.69)
24.31
(2.49)%
1.50%**
1.50%**
2.79%**
—
—
10,530
High Yield Strategy Fund C-Class
September 30, 2008D
24.12
(—)§§
(.24)
(.24)
—
—
—
(.24)
23.88
(1.00)%
2.31%**
2.31%**
(0.03)%**
—
—
667
March 31, 2008*
25.00
.46
(1.27)
(.81)
(.07)
—
(.07)
(.88)
24.12
(3.25)%
2.22%**
2.22%**
1.90%**
—
—
1,001
High Yield Strategy Fund H-Class
September 30, 2008D
24.28
.07
(.23)
(.16)
—
—
—
(.16)
24.12
(0.66)%
1.58%**
1.58%**
0.55%**
—
—
10,786
March 31, 2008*
25.00
.62
(1.27)
(.65)
(.07)
—
(.07)
(.72)
24.28
(2.61)%
1.49%**
1.49%**
2.55%**
—
—
64,290
Inverse High Yield Strategy Fund A-Class
September 30, 2008D
51.26
.12
.37
.49
—
—
—
.49
51.75
0.96%
1.52%**
1.52%**
0.47%**
—
—
1,685
March 31, 2008*
50.00
.54
.72
1.26
—
—
—
1.26
51.26
2.52%
1.52%**
1.52%**
1.09%**
—
—
1,673
FINANCIAL HIGHLIGHTS (continued)
This table is presented to show selected data for a share outstanding throughout each period, and to assist shareholders in evaluating a Fund’s performance for the periods presented.
RATIOS TO
AVERAGE NET ASSETS:
Net Realized
Net Increase
NET ASSET
Net
and
(Decrease)
Distributions
Distributions
Net Increase
NET ASSET
Net
Net Assets,
VALUE,
Investment
Unrealized
in Net Asset
from Net
from Net
(Decrease) in
VALUE,
Total
Investment
Portfolio
End of
BEGINNING
Income
Gains (Losses)
Value Resulting
Investment
Realized
Total
Net Asset
END OF
Investment
Total
Net
Income
Turnover
Period (000’s
Period Ended
OF PERIOD
(Loss)†
on Investments
from Operations
Income
Gains
Distributions
Value
PERIOD
Return††
Expenses
Expenses
(Loss)
Rate
omitted)
Inverse High Yield Strategy Fund C-Class
September 30, 2008D
$51.06
$
(.06)
$
.37
$
.31
$
—
$
—
$
—
$
.31
$51.37
0.61%
2.27%**
2.27%**
(0.24)%**
—
$
2,974
March 31, 2008*
50.00
(.62)
1.68
1.06
—
—
—
1.06
51.06
2.12%
2.26%**
2.26%**
(1.25)%**
—
2,958
Inverse High Yield Strategy Fund H-Class
September 30, 2008D
51.38
.07
.44
.51
—
—
—
.51
51.89
0.99%
1.52%**
1.52%**
0.28%**
—
13,500
March 31, 2008*
50.00
1.44
(.06)
1.38
—
—
—
1.38
51.38
2.76%
1.52%**
1.52%**
2.84%**
—
6,536
Europe 1.25x Strategy Fund A-Class
September 30, 2008D
22.25
.17
(5.53)
(5.36)
—
—
—
(5.36)
16.89
(24.09)%
1.67%**
1.67%**
1.53%**
115%
889
March 31, 2008
24.13
.62
(1.57)
(.95)
(.23)
(.70)
(.93)
(1.88)
22.25
(4.60)%
1.69%
1.69%
2.42%
320%
1,750
March 31, 2007
20.06
.54
3.65
4.19
(.12)
—
(.12)
4.07
24.13
20.90%
1.54%
1.54%
2.33%
373%
10,892
March 31, 2006
17.14
.18
3.06
3.24
—
(.32)
(.32)
2.92
20.06
19.10%
1.67%
1.66%
1.02%
454%
1,378
March 31, 2005
14.98
.05
2.59
2.64
(.47)
(.01)
(.48)
2.16
17.14
17.56%
1.62%
1.62%
0.29%
—
180
March 31, 2004*
14.98
—
—
—
—
—
—
—
14.98
0.00%
0.00%**à
0.00%**à
0.00%**
—
1
Europe 1.25x Strategy Fund C-Class
September 30, 2008D
21.00
.08
(5.20)
(5.12)
—
—
—
(5.12)
15.88
(24.38)%
2.42%**
2.42%**
0.80%**
115%
3,098
March 31, 2008
22.98
.31
(1.36)
(1.05)
(.23)
(.70)
(.93)
(1.98)
21.00
(5.28)%
2.40%
2.40%
1.27%
320%
6,149
March 31, 2007
19.25
.39
3.46
3.85
(.12)
—
(.12)
3.73
22.98
20.01%
2.40%
2.40%
1.85%
373%
9,539
March 31, 2006
16.57
.10
2.90
3.00
—
(.32)
(.32)
2.68
19.25
18.30%
2.42%
2.41%
0.59%
454%
8,703
March 31, 2005
14.62
(.09)
2.52
2.43
(.47)
(.01)
(.48)
1.95
16.57
16.55%
2.37%
2.37%
(0.57)%
—
5,717
March 31, 2004
9.74
(1.18)
6.77
5.59
—
(.71)
(.71)
4.88
14.62
57.29%
2.47%
2.47%
(8.31)%
—
1,999
Europe 1.25x Strategy Fund H-Class
September 30, 2008D
22.26
.19
(5.55)
(5.36)
—
—
—
(5.36)
16.90
(24.08)%
1.71%**
1.71%**
1.73%**
115%
11,097
March 31, 2008
24.14
.57
(1.52)
(.95)
(.23)
(.70)
(.93)
(1.88)
22.26
(4.60)%
1.67%
1.67%
2.20%
320%
21,670
March 31, 2007
20.06
.59
3.61
4.20
(.12)
—
(.12)
4.08
24.14
20.95%
1.66%
1.66%
2.63%
373%
57,887
March 31, 2006
17.13
.22
3.03
3.25
—
(.32)
(.32)
2.93
20.06
19.17%
1.64%
1.63%
1.21%
454%
46,066
March 31, 2005
14.98
.05
2.58
2.63
(.47)
(.01)
(.48)
2.15
17.13
17.49%
1.61%
1.61%
0.28%
—
62,957
March 31, 2004
9.88
(1.65)
7.46
5.81
—
(.71)
(.71)
5.10
14.98
58.72%
1.73%
1.73%
(11.25)%
—
35,914
Japan 2x Strategy Fund A-Class
September 30, 2008D
25.12
.09
(7.02)
(6.93)
—
—
—
(6.93)
18.19
(27.59)%
1.52%**
1.52%**
0.75%**
—
127
March 31, 2008*
25.00
—§§
.12
.12
—
—
—
.12
25.12
0.48%
1.25%**
1.25%**
(0.12)%**
—
636
Japan 2x Strategy Fund C-Class
September 30, 2008D
25.10
(.02)
(6.95)
(6.97)
—
—
—
(6.97)
18.13
(27.77)%
2.27%**
2.27%**
(0.15)%**
—
256
March 31, 2008*
25.00
(.02)
.12
.10
—
—
—
.10
25.10
0.40%
2.21%**
2.21%**
(0.74)%**
—
240
Japan 2x Strategy Fund H-Class
September 30, 2008D
25.12
.05
(6.98)
(6.93)
—
—
—
(6.93)
18.19
(27.59)%
1.52%**
1.52%**
0.38%**
—
2,427
March 31, 2008*
25.00
—§§
.12
.12
—
—
—
.12
25.12
0.48%
1.44%**
1.44%**
0.17%**
—
5,243
Small-Cap Value Fund A-Class
September 30, 2008D
26.56
.28
(2.12)
(1.84)
—
—
—
(1.84)
24.72
(6.93)%
1.52%**
1.52%**
2.10%**
367%
232
March 31, 2008
35.54
.26
(8.97)
(8.71)
(.27)
—
(.27)
(8.98)
26.56
(24.54)%
1.53%
1.53%
0.82%
566%
2,945
March 31, 2007
33.40
.23
1.94
2.17
—
(.03)
(.03)
2.14
35.54
6.49%
1.51%
1.51%
0.66%
728%
3,929
March 31, 2006
28.22
(.03)
5.71
5.68
—
(.50)
(.50)
5.18
33.40
20.35%
1.46%
1.46%
(0.11)%
806%
335
March 31, 2005*
25.28
(.06)
3.13
3.07
—
(.13)
(.13)
2.94
28.22
12.14%
1.43%**
1.43%**
(0.37)%**
744%
714
FINANCIAL HIGHLIGHTS (continued)
This table is presented to show selected data for a share outstanding throughout each period, and to assist shareholders in evaluating a Fund’s performance for the periods presented.
RATIOS TO
AVERAGE NET ASSETS:
Net Realized
Net Increase
NET ASSET
Net
and
(Decrease)
Distributions
Distributions
Net Increase
NET ASSET
Net
Net Assets,
VALUE,
Investment
Unrealized
in Net Asset
from Net
from Net
(Decrease) in
VALUE,
Total
Investment
Portfolio
End of
BEGINNING
Income
Gains (Losses)
Value Resulting
Investment
Realized
Total
Net Asset
END OF
Investment
Total
Income
Turnover
Period (000’s
Period Ended
OF PERIOD
(Loss)†
on Investments
from Operations
Income
Gains
Distributions
Value
PERIOD
Return††
Expenses
(Loss)
Rate
omitted)
Small-Cap Value Fund C-Class
September 30, 2008D
$25.71
$
.01
$
(1.88)
$
(1.87)
$
—
$
—
$
—
$
(1.87)
$23.84
(7.27)%
2.27%**
0.04%**
367%
$ 11,748
March 31, 2008
34.68
.28
(8.98)
(8.70)
(.27)
—
(.27)
(8.97)
25.71
(25.12)%
2.26%
0.99%
566%
14,040
March 31, 2007
32.85
(.05)
1.91
1.86
—
(.03)
(.03)
1.83
34.68
5.65%
2.26%
(0.16)%
728%
2,268
March 31, 2006
28.01
(.18)
5.52
5.34
—
(.50)
(.50)
4.84
32.85
19.29%
2.27%
(0.60)%
806%
18,779
March 31, 2005
25.59
(.24)
2.79
2.55
—
(.13)
(.13)
2.42
28.01
9.96%
2.21%
(0.89)%
744%
12,119
March 31, 2004*
25.00
(.05)
.64
.59
—
—
—
.59
25.59
2.36%
2.11%**
(1.68)%**
177%
2,207
Small-Cap Value Fund H-Class
September 30, 2008D
26.53
.14
(1.98)
(1.84)
—
—
—
(1.84)
24.69
(6.94)%
1.52%**
1.08%**
367%
21,363
March 31, 2008
35.51
.33
(9.04)
(8.71)
(.27)
—
(.27)
(8.98)
26.53
(24.56)%
1.48%
1.04%
566%
51,563
March 31, 2007
33.38
.15
2.01
2.16
—
(.03)
(.03)
2.13
35.51
6.46%
1.52%
0.46%
728%
10,478
March 31, 2006
28.24
.06
5.58
5.64
—
(.50)
(.50)
5.14
33.38
20.20%
1.50%
0.19%
806%
102,448
March 31, 2005
25.62
(.01)
2.76
2.75
—
(.13)
(.13)
2.62
28.24
10.73%
1.47%
(0.04)%
744%
75,748
March 31, 2004*
25.00
(.01)
.63
.62
—
—
—
.62
25.62
2.48%
1.41%**
(0.21)%**
177%
19,900
Mid-Cap Value Fund A-Class
September 30, 2008D
29.72
.24
(2.44)
(2.20)
—
—
—
(2.20)
27.52
(7.40)%
1.52%**
1.52%**
455%
595
March 31, 2008
36.58
.44
(6.37)
(5.93)
(.93)
—
(.93)
(6.86)
29.72
(16.45)%
1.53%
1.25%
297%
2,797
March 31, 2007
31.83
.34
4.57
4.91
—
(.16)
(.16)
4.75
36.58
15.45%
1.53%
1.00%
625%
4,744
March 31, 2006
27.49
.06
4.47
4.53
(—)§§
(.19)
(.19)
4.34
31.83
16.51%
1.48%
0.21%
558%
1,480
March 31, 2005*
24.58
.11
2.91
3.02
(—)§§
(.11)
(.11)
2.91
27.49
12.29%
1.42%**
0.69%**
731%
312
Mid-Cap Value Fund C-Class
September 30, 2008D
28.78
.20
(2.43)
(2.23)
—
—
—
(2.23)
26.55
(7.75)%
2.27%**
1.33%**
455%
1,067
March 31, 2008
35.75
.30
(6.34)
(6.04)
(.93)
—
(.93)
(6.97)
28.78
(17.15)%
2.28%
0.88%
297%
1,082
March 31, 2007
31.34
.11
4.46
4.57
—
(.16)
(.16)
4.41
35.75
14.61%
2.28%
0.33%
625%
8,326
March 31, 2006
27.29
(.10)
4.34
4.24
(—)§§
(.19)
(.19)
4.05
31.34
15.57%
2.25%
(0.35)%
558%
7,270
March 31, 2005
25.11
(.07)
2.36
2.29
(—)§§
(.11)
(.11)
2.18
27.29
9.12%
2.21%
(0.28)%
731%
8,831
March 31, 2004*
25.00
(.02)
.13
.11
—
—
—
.11
25.11
0.44%
2.11%**
(0.50)%**
172%
710
Mid-Cap Value Fund H-Class
September 30, 2008D
29.71
.25
(2.44)
(2.19)
—
—
—
(2.19)
27.52
(7.37)%
1.52%**
1.64%**
455%
5,681
March 31, 2008
36.58
.35
(6.29)
(5.94)
(.93)
—
(.93)
(6.87)
29.71
(16.48)%
1.54%
0.96%
297%
6,512
March 31, 2007
31.82
.46
4.46
4.92
—
(.16)
(.16)
4.76
36.58
15.49%
1.52%
1.39%
625%
76,513
March 31, 2006
27.49
.07
4.45
4.52
(—)§§
(.19)
(.19)
4.33
31.82
16.47%
1.48%
0.25%
558%
31,340
March 31, 2005
25.13
.21
2.26
2.47
(—)§§
(.11)
(.11)
2.36
27.49
9.83%
1.46%
0.77%
731%
115,660
March 31, 2004*
25.00
.01
.12
.13
—
—
—
.13
25.13
0.52%
1.41%**
0.19%**
172%
18,064
Large-Cap Value Fund A-Class
September 30, 2008D
20.00
.21
(3.36)
(3.15)
—
—
—
(3.15)
16.85
(15.75)%
1.52%**
2.14%**
778%
246
March 31, 2008
33.46
.49
(6.10)
(5.61)
(1.99)
(5.86)
(7.85)
(13.46)
20.00
(19.98)%
1.52%
1.67%
289%
4,269
March 31, 2007
29.12
.37
4.33
4.70
(.21)
(.15)
(.36)
4.34
33.46
16.21%
1.50%
1.17%
389%
5,348
March 31, 2006
26.56
.19
2.77
2.96
—
(.40)
(.40)
2.56
29.12
11.20%
1.47%
0.70%
1,054%
713
March 31, 2005*
24.68
.12
1.81
1.93
(—)§§
(.05)
(.05)
1.88
26.56
7.82%
1.43%**
0.77%**
747%
211
Large-Cap Value Fund C-Class
September 30, 2008D
19.20
.14
(3.22)
(3.08)
—
—
—
(3.08)
16.12
(16.04)%
2.27%**
1.46%**
778%
1,645
March 31, 2008
32.68
.14
(5.77)
(5.63)
(1.99)
(5.86)
(7.85)
(13.48)
19.20
(20.57)%
2.29%
0.48%
289%
1,838
March 31, 2007
28.67
.09
4.28
4.37
(.21)
(.15)
(.36)
4.01
32.68
15.31%
2.27%
0.29%
389%
21,075
March 31, 2006
26.38
.04
2.65
2.69
—
(.40)
(.40)
2.29
28.67
10.25%
2.26%
0.14%
1,054%
4,344
March 31, 2005
24.85
.01
1.57
1.58
(—)§§
(.05)
(.05)
1.53
26.38
6.35%
2.20%
0.03%
747%
4,636
March 31, 2004*
25.00
(.02)
(.13)
(.15)
—
—
—
(.15)
24.85
(0.60)%
2.10%**
(0.53)%**
202%
2,612
FINANCIAL HIGHLIGHTS (continued)
This table is presented to show selected data for a share outstanding throughout each period, and to assist shareholders in evaluating a Fund’s performance for the periods presented.
RATIOS TO
AVERAGE NET ASSETS:
Net Realized
Net Increase
NET ASSET
Net
and
(Decrease)
Distributions
Distributions
Net Increase
NET ASSET
Net
Net Assets,
VALUE,
Investment
Unrealized
in Net Asset
from Net
from Net
(Decrease) in
VALUE,
Total
Investment
Portfolio
End of
BEGINNING
Income
Gains (Losses)
Value Resulting
Investment
Realized
Total
Net Asset
END OF
Investment
Total
Income
Turnover
Period (000’s
Period Ended
OF PERIOD
(Loss)†
on Investments
from Operations
Income
Gains
Distributions
Value
PERIOD
Return††
Expenses
(Loss)
Rate
omitted)
Large-Cap Value Fund H-Class
September 30, 2008D
$20.00
$
.22
$
(3.36)
$
(3.14)
$
—
$
—
$
—
$
(3.14)
$16.86
(15.70)%
1.52%**
2.40%**
778%
$ 12,491
March 31, 2008
33.46
.36
(5.97)
(5.61)
(1.99)
(5.86)
(7.85)
(13.46)
20.00
(19.98)%
1.53%
1.11%
289%
18,459
March 31, 2007
29.12
.35
4.35
4.70
(.21)
(.15)
(.36)
4.34
33.46
16.21%
1.51%
1.12%
389%
184,082
March 31, 2006
26.56
.23
2.73
2.96
—
(.40)
(.40)
2.56
29.12
11.20%
1.49%
0.82%
1,054%
56,005
March 31, 2005
24.87
.16
1.58
1.74
(—)§§
(.05)
(.05)
1.69
26.56
6.99%
1.47%
0.63%
747%
24,974
March 31, 2004*
25.00
.01
(.14)
(.13)
—
—
—
(.13)
24.87
(0.52)%
1.41%**
0.34%**
202%
8,094
Small-Cap Growth Fund A-Class
September 30, 2008D
27.43
(.11)
(.13)
(.24)
—
—
—
(.24)
27.19
(0.91)%
1.52%**
(0.78)%**
547%
226
March 31, 2008
32.61
(.13)
(3.72)
(3.85)
—
(1.33)
(1.33)
(5.18)
27.43
(12.27)%
1.52%
(0.40)%
834%
1,938
March 31, 2007
32.25
(.29)
.65
.36
—
—
—
.36
32.61
1.12%
1.56%
(0.93)%
623%
1,408
March 31, 2006
27.96
(.18)
5.27
5.09
—
(.80)
(.80)
4.29
32.25
18.41%
1.47%
(0.61)%
1,003%
943
March 31, 2005*
24.43
(.12)
3.90
3.78
—
(.25)
(.25)
3.53
27.96
15.49%
1.43%**
(0.74)%**
983%
76
Small-Cap Growth Fund C-Class
September 30, 2008D
26.65
(.20)
(.15)
(.35)
—
—
—
(.35)
26.30
(1.31)%
2.28%**
(1.40)%**
547%
1,759
March 31, 2008
31.94
(.51)
(3.45)
(3.96)
—
(1.33)
(1.33)
(5.29)
26.65
(12.88)%
2.29%
(1.57)%
834%
1,980
March 31, 2007
31.82
(.58)
.70
.12
—
—
—
.12
31.94
0.38%
2.32%
(1.83)%
623%
7,570
March 31, 2006
27.78
(.47)
5.31
4.84
—
(.80)
(.80)
4.04
31.82
17.63%
2.27%
(1.57)%
1,003%
5,972
March 31, 2005
25.33
(.44)
3.14
2.70
—
(.25)
(.25)
2.45
27.78
10.68%
2.21%
(1.58)%
983%
2,710
March 31, 2004*
25.00
(.04)
.37
.33
—
—
—
.33
25.33
1.32%
2.08%**
(1.31)%**
117%
2,505
Small-Cap Growth Fund H-Class
September 30, 2008D
27.45
(.08)
(.16)
(.24)
—
—
—
(.24)
27.21
(0.87)%
1.56%**
(0.57)%**
547%
17,742
March 31, 2008
32.62
(.26)
(3.58)
(3.84)
—
(1.33)
(1.33)
(5.17)
27.45
(12.23)%
1.53%
(0.79)%
834%
6,259
March 31, 2007
32.27
(.33)
.68
.35
—
—
—
.35
32.62
1.08%
1.53%
(1.05)%
623%
18,171
March 31, 2006
27.97
(.22)
5.32
5.10
—
(.80)
(.80)
4.30
32.27
18.44%
1.50%
(0.73)%
1,003%
73,489
March 31, 2005
25.34
(.23)
3.11
2.88
—
(.25)
(.25)
2.63
27.97
11.38%
1.46%
(0.84)%
983%
26,145
March 31, 2004*
25.00
(.02)
.36
.34
—
—
—
.34
25.34
1.36%
1.41%**
(0.85)%**
117%
2,544
Mid-Cap Growth Fund A-Class
September 30, 2008D
26.65
(.14)
(1.23)
(1.37)
—
—
—
(1.37)
25.28
(5.14)%
1.57%**
(0.98)%**
524%
4,842
March 31, 2008
30.72
(.27)
(1.42)
(1.69)
—
(2.38)
(2.38)
(4.07)
26.65
(6.26)%
1.52%
(0.88)%
736%
3,863
March 31, 2007
31.94
(.08)
.48
.40
—
(1.62)
(1.62)
(1.22)
30.72
1.36%
1.51%
(0.25)%
537%
2,777
March 31, 2006
26.85
(.17)
5.39
5.22
—
(.13)
(.13)
5.09
31.94
19.47%
1.48%
(0.60)%
681%
1,530
March 31, 2005*
23.91
(.09)
3.04
2.95
—
(.01)
(.01)
2.94
26.85
12.33%
1.46%**
(0.58)%**
1,211%
553
Mid-Cap Growth Fund C-Class
September 30, 2008D
25.79
(.25)
(1.15)
(1.40)
—
—
—
(1.40)
24.39
(5.43)%
2.31%**
(1.80)%**
524%
2,196
March 31, 2008
30.01
(.50)
(1.34)
(1.84)
—
(2.38)
(2.38)
(4.22)
25.79
(6.92)%
2.28%
(1.69)%
736%
1,426
March 31, 2007
31.47
(.42)
.58
.16
—
(1.62)
(1.62)
(1.46)
30.01
0.60%
2.27%
(1.40)%
537%
5,316
March 31, 2006
26.66
(.42)
5.36
4.94
—
(.13)
(.13)
4.81
31.47
18.55%
2.26%
(1.43)%
681%
3,305
March 31, 2005
25.15
(.37)
1.89
1.52
—
(.01)
(.01)
1.51
26.66
6.04%
2.21%
(1.43)%
1,211%
2,313
March 31, 2004*
25.00
(.05)
.20
.15
—
—
—
.15
25.15
0.60%
2.10%**
(1.50)%**
356%
1,172
Mid-Cap Growth Fund H-Class
September 30, 2008D
26.68
(.14)
(1.23)
(1.37)
—
—
—
(1.37)
25.31
(5.13)%
1.54%**
(0.96)%**
524%
7,628
March 31, 2008
30.75
(.28)
(1.41)
(1.69)
—
(2.38)
(2.38)
(4.07)
26.68
(6.25)%
1.51%
(0.92)%
736%
14,158
March 31, 2007
31.95
(.24)
.66
.42
—
(1.62)
(1.62)
(1.20)
30.75
1.42%
1.52%
(0.80)%
537%
7,715
March 31, 2006
26.86
(.19)
5.41
5.22
—
(.13)
(.13)
5.09
31.95
19.46%
1.50%
(0.63)%
681%
48,888
March 31, 2005
25.17
(.17)
1.87
1.70
—
(.01)
(.01)
1.69
26.86
6.75%
1.46%
(0.66)%
1,211%
23,733
March 31, 2004*
25.00
(.02)
.19
.17
—
—
—
.17
25.17
0.68%
1.41%**
(0.75)%**
356%
625
FINANCIAL HIGHLIGHTS (continued)
This table is presented to show selected data for a share outstanding throughout each period, and to assist shareholders in evaluating a Fund’s performance for the periods presented.
RATIOS TO
AVERAGE NET ASSETS:
Net Realized
Net Increase
NET ASSET
Net
and
(Decrease)
Distributions
Distributions
Net Increase
NET ASSET
Net
Net Assets,
VALUE,
Investment
Unrealized
in Net Asset
from Net
from Net
(Decrease) in
VALUE,
Total
Investment
Portfolio
End of
BEGINNING
Income
Gains (Losses)
Value Resulting
Investment
Realized
Total
Net Asset
END OF
Investment
Total
Net
Income
Turnover
Period (000’s
Period Ended
OF PERIOD
(Loss)†
on Investments
from Operations
Income
Gains
Distributions
Value
PERIOD
Return††
Expenses
Expenses
(Loss)
Rate
omitted)
Large-Cap Growth Fund A-Class
September 30, 2008D
$25.11
$
(.07)
$
(2.87)
$ (2.94)
$
—
$
—
$
—
$ (2.94)
$22.17
(11.71)%
1.52%**
1.52%**
(0.52)%**
220%
$
1,686
March 31, 2008
27.17
(.15)
(1.52)
(1.67)
—
(.39)
(.39)
(2.06)
25.11
(6.28)%
1.51%
1.51%
(0.53)%
450%
5,443
March 31, 2007
26.11
(.13)
1.19
1.06
—
—
—
1.06
27.17
4.06%
1.52%
1.52%
(0.51)%
1,029%
2,675
March 31, 2006
24.48
(.07)
1.72
1.65
—
(.02)
(.02)
1.63
26.11
6.76%
1.48%
1.48%
(0.29)%
1,276%
914
March 31, 2005*
23.44
.09
.95
1.04
—
(—)§§
(—)§§
1.04
24.48
4.45%
1.45%**
1.45%**
0.62%**
2,018%
74
Large-Cap Growth Fund C-Class
September 30, 2008D
24.35
(.15)
(2.78)
(2.93)
—
—
—
(2.93)
21.42
(12.03)%
2.27%**
2.27%**
(1.17)%**
220%
2,759
March 31, 2008
26.57
(.32)
(1.51)
(1.83)
—
(.39)
(.39)
(2.22)
24.35
(7.02)%
2.27%
2.27%
(1.21)%
450%
4,453
March 31, 2007
25.74
(.37)
1.20
.83
—
—
—
.83
26.57
3.22%
2.28%
2.28%
(1.44)%
1,029%
3,743
March 31, 2006
24.30
(.26)
1.72
1.46
—
(.02)
(.02)
1.44
25.74
6.03%
2.23%
2.23%
(1.04)%
1,276%
5,249
March 31, 2005
24.18
(.01)
.13
.12
—
(—)§§
(—)§§
.12
24.30
0.51%
2.20%
2.20%
(0.06)%
2,018%
19,703
March 31, 2004*
25.00
(.05)
(.77)
(.82)
—
—
—
(.82)
24.18
(3.28)%
2.08%**
2.08%**
(1.25)%**
296%
—
Large-Cap Growth Fund H-Class
September 30, 2008D
25.10
(.06)
(2.88)
(2.94)
—
—
—
(2.94)
22.16
(11.71)%
1.52%**
1.52%**
(0.47)%**
220%
7,579
March 31, 2008
27.16
(.17)
(1.50)
(1.67)
—
(.39)
(.39)
(2.06)
25.10
(6.28)%
1.53%
1.53%
(0.62)%
450%
11,937
March 31, 2007
26.11
(.14)
1.19
1.05
—
—
—
1.05
27.16
4.02%
1.52%
1.52%
(0.53)%
1,029%
49,087
March 31, 2006
24.49
(.05)
1.69
1.64
—
(.02)
(.02)
1.62
26.11
6.71%
1.49%
1.49%
(0.19)%
1,276%
32,258
March 31, 2005
24.18
.37
(.06)
.31
—
(—)§§
(—)§§
.31
24.49
1.30%
1.47%
1.47%
1.52%
2,018%
11,762
March 31, 2004*
25.00
(—)§§
(.82)
(.82)
—
—
—
(.82)
24.18
(3.28)%
1.41%**
1.41%**
(0.16)%**
296%
793
U.S. Government Money Market Fund Investor Class
September 30, 2008D
1.00
.01
—
.01
(.01)
—
(.01)
—
1.00
0.71%
0.92%**
0.92%**
1.42%**
—
1,118,020
March 31, 2008
1.00
.04
—
.04
(.04)
—
(.04)
—
1.00
3.76%
0.93%
0.93%
3.71%
—
978,584
March 31, 2007
1.00
.04
—
.04
(.04)
—
(.04)
—
1.00
4.26%
0.92%
0.92%
4.20%
—
982,347
March 31, 2006
1.00
.03
—
.03
(.03)
—
(.03)
—
1.00
2.79%
0.88%
0.88%
2.74%
—
975,088
March 31, 2005
1.00
.01
—
.01
(.01)
—
(.01)
—
1.00
0.82%
0.87%
0.87%
0.81%
—
1,196,009
March 31, 2004
1.00
—§§
—
—§§
(—)§§
—
(—)§§
—
1.00
0.18%
0.90%
0.90%
0.18%
—
1,057,062
U.S. Government Money Market Fund Advisor Class
September 30, 2008D
1.00
—§§
—
—§§
(—)§§
—
(—)§§
—
1.00
0.46%
1.42%**
1.42%**
0.91%**
—
178,220
March 31, 2008
1.00
.03
—
.03
(.03)
—
(.03)
—
1.00
3.24%
1.43%
1.43%
3.25%
—
159,111
March 31, 2007
1.00
.04
—
.04
(.04)
—
(.04)
—
1.00
3.75%
1.42%
1.42%
3.70%
—
204,068
March 31, 2006
1.00
.02
—
.02
(.02)
—
(.02)
—
1.00
2.28%
1.39%
1.39%
2.21%
—
151,828
March 31, 2005
1.00
—§§
—
—§§
(—)§§
—
(—)§§
—
1.00
0.43%
1.38%
1.25%
0.39%
—
245,890
March 31, 2004
1.00
—§§
—
—§§
(—)§§
—
(—)§§
—
1.00
0.01%
1.38%
1.08%
0.01%
—
249,599
U.S. Government Money Market Fund A-Class
September 30, 2008D
1.00
.01
—
.01
(.01)
—
(.01)
—
1.00
0.59%
1.17%**
1.17%**
1.17%**
—
34,253
March 31, 2008
1.00
.03
—
.03
(.03)
—
(.03)
—
1.00
3.51%
1.18%
1.18%
3.45%
—
21,174
March 31, 2007
1.00
.04
—
.04
(.04)
—
(.04)
—
1.00
4.01%
1.17%
1.17%
3.97%
—
18,779
March 31, 2006
1.00
.03
—
.03
(.03)
—
(.03)
—
1.00
2.51%
1.15%
1.15%
2.66%
—
14,324
March 31, 2005
1.00
.01
—
.01
(.01)
—
(.01)
—
1.00
0.59%
1.10%
1.10%
0.93%
—
7,335
March 31, 2004*
1.00
—
—
—
—
—
—
—
1.00
0.00%
0.00%**à
0.00%**à
0.00%**
—
1
U.S. Government Money Market Fund C-Class
September 30, 2008D
1.00
—§§
—
—§§
(—)§§
—
(—)§§
—
1.00
0.21%
1.92%**
1.92%**
0.42%**
—
142,062
March 31, 2008
1.00
.03
—
.03
(.03)
—
(.03)
—
1.00
2.74%
1.93%
1.93%
2.69%
—
121,436
March 31, 2007
1.00
.03
—
.03
(.03)
—
(.03)
—
1.00
3.24%
1.92%
1.92%
3.20%
—
120,415
March 31, 2006
1.00
.02
—
.02
(.02)
—
(.02)
—
1.00
1.76%
1.89%
1.89%
1.72%
—
131,045
March 31, 2005
1.00
—§§
—
—§§
(—)§§
—
(—)§§
—
1.00
0.19%
1.87%
1.51%
0.19%
—
155,668
March 31, 2004
1.00
—§§
—
—§§
(—)§§
—
(—)§§
—
1.00
0.01%
1.90%
1.08%
0.01%
—
131,704
FINANCIAL HIGHLIGHTS (concluded)
* Since the commencement of operations:
August 1, 2003 — Inverse NASDAQ-100® Strategy Fund Advisor Class, Government Long Bond 1.2x Strategy Fund Advisor Class, and Inverse Government Long Bond Strategy Fund Advisor Class;
February 20, 2004 — Inverse Mid-Cap Strategy Fund C-Class and H-Class, Inverse Russell 2000® Strategy Fund C-Class and H-Class, Small-Cap Value Fund C-Class and H-Class, Mid-Cap Value C-Class and H-Class, Large-Cap
Value Fund C-Class and H-Class, Small-Cap Growth Fund C-Class and H-Class, Mid-Cap Growth Fund C-Class and H-Class, and Large-Cap Growth Fund C-Class and H-Class;
March 31, 2004 — Nova Fund A-Class, Inverse S&P 500 Strategy Fund A-Class, NASDAQ-100® Fund A-Class, Inverse NASDAQ-100® Strategy Fund A-Class, Mid-Cap 1.5x Strategy Fund A-Class, Inverse Mid-Cap Strategy Fund
A-Class, Russell 2000® 1.5x Strategy Fund A-Class, Inverse Russell 2000® Strategy Fund A-Class, Government Long Bond 1.2x Strategy Fund A-Class, Inverse Government Long Bond Strategy Fund A-Class, Europe 1.25x
Strategy Fund A-Class, and U.S. Government Money Market Fund A-Class;
September 1, 2004 — Small-Cap Value Fund A-Class, Mid-Cap Value Fund A-Class, Large-Cap Value Fund A-Class, Small-Cap Growth Fund A-Class, Mid-Cap Growth Fund A-Class, and Large-Cap Growth Fund A-Class;
May 31, 2006 — S&P 500 Fund A-Class, C-Class and H-Class and Russell 2000® Fund A-Class, C-Class and H-Class;
April 16, 2007 — High Yield Strategy Fund A-Class, C-Class and H-Class and Inverse High Yield Strategy Fund A-Class, C-Class and H-Class;
February 22, 2008 —Japan 2x Strategy Fund A-Class, C-Class and H-Class.
** Annualized
† Calculated using the average daily shares outstanding for the period.
†† Total investment return does not reflect the impact of any applicable sales charges and has not been annualized.
††† Inverse S&P 500 Strategy Fund — Per share amounts for the periods ended March 31, 2004 through March 31, 2007 have been restated to reflect a 1:5 reverse stock split effective April 23, 2007.
à Expense ratios for the period ended March 31, 2004 are calculated for one day only and are not indicative of future class performance.
§ Operating Expenses exclude interest and dividend expense from securities sold short.
§§ Less than $.01 per share.
D Unaudited
Prior to April 1, 2007, the Nova Fund, Inverse S&P 500 Strategy Fund, Inverse NASDAQ-100® Strategy Fund, and Inverse Government Long Bond Strategy Fund operated under a Master-Feeder Structure.
▲ Ratios represent combined net investment income of the former Master Portfolio and the Fund. Ratios shown under the caption “Net Investment Income (Loss)” for the year ended March 31, 2006 and preceding periods did
not reflect the net investment income of the former Master Portfolio. This has no effect on the Fund's net asset value, per share value or total increase (decrease) in net assets from operations during any period.
■ Expense ratios to average net assets include expenses of the corresponding former Master Portfolio for the year ended March 31, 2007 and preceding periods.
NOTES TO FINANCIAL STATEMENTS (Unaudited)
1.
Organization and Significant Accounting Policies
All equity securities for the morning NAV are valued at
Organization
the current sales price as of 10:45 a.m. on the valuation
The Rydex Series Funds (the “Trust”) is registered with
date. Equity securities listed on an exchange (NYSE or
the SEC under the Investment Company Act of 1940
American Stock Exchange) are valued at the last quoted
(the “1940 Act”) as a non-diversified, open-ended
sales price as of the close of business on the NYSE,
investment company. The Trust offers five separate
usually 4:00 p.m. on the valuation date for the afternoon
classes of shares, Investor Class Shares, Advisor Class
NAV. Equity securities listed on the NASDAQ market
Shares, A-Class Shares, C-Class Shares, and H-Class
system are valued at the NASDAQ Official Closing Price,
Shares. C-Class Shares have a 1% contingent deferred
usually as of 4:00 p.m. on the valuation date. Short-term
sales charge (“CDSC”) if shares are redeemed within 12
securities, if any, are valued at amortized cost, which
months of purchase. Sales of shares of each Class are
approximates market value.
made without a sales charge at the net asset value per
Listed options held by the Trust are valued at the their
share, with the exception of A-Class Shares. A-Class
last bid price for twice a day pricing or the Official
Shares are sold at net asset value, plus the applicable
Settlement Price listed by the exchange, usually as of 4:00
front-end sales charge, except for the U.S. Government
p.m. Over-the-Counter options held by the Trust are
Money Market Fund. The sales charge varies depending
valued using the average bid price obtained from one or
on the amount purchased, but will not exceed 4.75%.
more security dealers.
A-Class Share purchases of $1 million or more are
The value of futures contracts purchased and sold by the
exempt from the front-end sales charge but have a 1%
Trust is accounted for using the unrealized gain or loss
CDSC if shares are redeemed within 18 months of
on the contracts that is determined by marking the
purchase.
contracts to their current realized settlement prices.
At September 30, 2008, the Trust consisted of fifty-four
Financial futures contracts are valued as of the spot price
separate Funds: twenty-two Benchmark Funds, one
at 10:45 a.m. on the valuation date for the morning
Money Market Fund, eleven Alternative Strategy Funds,
pricing cycle. Financial futures contracts are valued at the
seventeen Sector Funds, and three Essential Portfolio
last quoted sales price, usually as of 4:00 p.m. on the
Funds. This report covers the twenty-two Benchmark
valuation date for the afternoon NAV cycle. In the event
Funds and the Money Market Fund (the “Funds”), while
that the exchange for a specific futures contract closes
the Sector Funds, the Alternative Strategy Funds, and
earlier than 4:00 p.m., the futures contract is valued at
the Essential Portfolio Funds are contained in separate
the Official Settlement Price of the exchange. However,
reports.
the underlying securities from which the futures contract
Rydex Investments provides advisory, transfer agent and
value is derived are monitored until 4:00 p.m. to
administrative services, and accounting services to the
determine if fair valuation would provide a more
Trust. Rydex Distributors, Inc. (the “Distributor”) acts as
accurate valuation.
principal underwriter for the Trust. Both Rydex
Debt securities with a maturity greater than 60 days are
Investments and the Distributor are affiliated entities.
valued at the last traded fill price at the close of the
Significant Accounting Policies
Funds’ pricing cycle, unless no trades were executed. If
there are no trades, a security is valued at the reported
The following significant accounting policies are in
bid price, at the close of the Funds’ pricing cycle, usually
conformity with U.S. generally accepted accounting
4:00 p.m.
principles and are consistently followed by the Trust. All
time references are based on Eastern Time. The
Structured notes are valued in accordance with the terms
information contained in these notes may not apply to
of their agreement at the value of the underlying index
every Fund in the Trust.
close, usually 4:00 p.m., adjusted for any interest accruals
and financing charges. If the securities comprising the
A. The Trust calculates a NAV twice each business day,
underlying index cease trading before a Fund’s close of
first in the morning and again in the afternoon for the
business, the index will be fair valued with the use of an
Russell 2000® Fund and the S&P 500 Fund. All other
appropriate market indicator.
Funds in the Trust will price at the afternoon NAV.
The morning NAV is calculated at 10:45 a.m., and the
Traditional open-end investment companies (“Mutual
afternoon NAV is calculated at the close of the New
Funds”) are valued at their NAV as of the close of
York Stock Exchange (“NYSE”), usually 4:00 p.m. The
business, usually 4:00 p.m. on the valuation date.
NAV is calculated using the current market value of
Exchange Traded Funds (“ETFs”) and closed-end
each Fund’s total assets as of the respective time of
investment companies are valued at the last quoted
calculation. These financial statements are based on the
sales price.
September 30, 2008 afternoon NAV.
THE RYDEX SERIES FUNDS SEMI-ANNUAL REPORT
|
135
NOTES TO FINANCIAL STATEMENTS (Unaudited) (continued)
The value of domestic equity index and credit default
realized capital gains in all Funds, if any, are declared
swap agreements entered into by a Fund is accounted
and paid at least annually. Distributions are recorded on
for using the unrealized gain or loss on the agreements
the ex-dividend date and are determined in accordance
that is determined by marking the agreements to the
with income tax regulations which may differ from U.S.
last quoted value of the index that the swap pertains to
generally accepted accounting principles.
at the close of the NYSE, usually 4:00 p.m. The swap’s
D. When a Fund engages in a short sale of an equity or
market value is then adjusted to include dividends
fixed income security, an amount equal to the proceeds
accrued, financing charges and/or interest associated
is reflected as an asset and an equivalent liability. The
with the swap agreements.
amount of the liability is subsequently marked-to-market
The value of foreign equity and currency index swap
to reflect the market value of the short sale. The Fund
agreements entered into by a Fund is accounted for
maintains a segregated account of cash and/or securities
using the unrealized gain or loss on the agreements that
as collateral for short sales. The Fund is exposed to
is determined by marking the agreements to the price at
market risk based on the amount, if any, that the market
which orders are being filled at the close of the NYSE,
value of the security exceeds the market value of the
usually 4:00 p.m. In the event that no order is filled at
securities in the segregated account. Fees, if any, paid to
4:00p.m., the security dealer provides a fair value quote
brokers to borrow securities in connection with short
at which the swap agreement is valued. The swap’s
sales are considered part of the cost of short sale
market value is then adjusted to include dividends
transactions. In addition, the Fund must pay out the
accrued, financing charges and/or interest associated
dividend rate of the equity or coupon rate of the
with the swap agreements.
treasury obligation to the lender and records this as an
Investments for which market quotations are not readily
expense. Short dividends or interest expense is a cost
available are fair valued as determined in good faith by
associated with the investment objective of short sales
Rydex Investments under the direction of the Board of
transactions, rather than an operational cost associated
Trustees using methods established or ratified by the
with the day-to-day management of any mutual fund.
Board of Trustees. These methods include, but are not
E. Upon the purchase of an option by a Fund, the
limited to:(i) general information as to how these
premium paid is recorded as an investment, the value of
securities and assets trade; (ii) in connection with futures
which is marked-to-market daily. When a purchased
contracts and options thereupon, and other derivative
option expires, that Fund will realize a loss in the
investments, information as to how (a) these contracts
amount of the cost of the option. When a Fund enters
and other derivative investments trade in the futures or
into a closing sale transaction, that Fund will realize a
other derivative markets, respectively, and (b) the
gain or loss depending on whether the proceeds from
securities underlying these contracts and other
the closing sale transaction are greater or less than the
derivative investments trade in the cash market; and
cost of the option. When a Fund exercises a put option,
(iii)other information and considerations, including
that Fund will realize a gain or loss from the sale of the
current values in related-markets.
underlying security and the proceeds from such sale will
B. Securities transactions are recorded on the trade date
be decreased by the premium originally paid. When a
for financial reporting purposes. Realized gains and
Fund exercises a call option, the cost of the security
losses from securities transactions are recorded using
purchased by that Fund upon exercise will be increased
the identified cost basis. Proceeds from lawsuits related
by the premium originally paid. When a Fund writes
to investment holdings are recorded as realized gains in
(sells) an option, an amount equal to the premium
the respective Fund. Dividend income is recorded on the
received is entered in that Fund’s accounting records as
ex-dividend date, net of applicable taxes withheld by
an asset and equivalent liability. The amount of the
foreign countries. Interest income, including amortization
liability is subsequently marked-to-market to reflect the
of premiums and accretion of discount, is accrued on a
current value of the option written. When a written
daily basis. Distributions received from investments in
option expires, or if a Fund enters into a closing
REITs are recorded as dividend income on the ex-
purchase transaction, that Fund realizes a gain (or loss if
dividend date, subject to reclassification upon notice of
the cost of a closing purchase transaction exceeds the
the character of such distribution by the issuer.
premium received when the option was sold).
C. Distributions from net investment income are
F. The Trust may enter into stock and bond index futures
declared daily and paid monthly in the Government
contracts and options on such futures contracts. Futures
Long Bond 1.2x Strategy Fund and the U.S. Government
contracts are contracts for delayed delivery of securities
Money Market Fund. Distributions of net investment
at a specified future delivery date and at a specific price.
income in the remaining Funds and distributions of net
Upon entering into a contract, a Fund deposits and
136
|
THE RYDEX SERIES FUNDS SEMI-ANNUAL REPORT
NOTES TO FINANCIAL STATEMENTS (Unaudited) (continued)
maintains as collateral such initial margin as required by
maturity date. In addition, the contract may require
the exchange on which the transaction is effected.
periodic interest payments. Structured notes are used to
Pursuant to the contract, the Fund agrees to receive
obtain exposure to a market without owning or taking
from or pay to the broker an amount of cash equal to
physical custody of securities or commodities.
the daily fluctuation in value of the contract. Such
Fluctuations in value of the structured notes are
receipts or payments are known as variation margin and
recorded as unrealized gains and losses in the
are recorded by the Fund as unrealized gains or losses.
accompanying financial statements. Coupon payments
When the contract is closed, the Fund records a realized
are recorded as income while net payments are recorded
gain or loss equal to the difference between the value of
as net realized gains or losses.
the contract at the time it was opened and the value at
I. Investment securities and other assets and liabilities
the time it was closed.
denominated in foreign currencies are translated into
G. The Trust may enter into domestic equity index and
U.S. dollar amounts at the date of valuation. Purchases
domestic currency index swap agreements, which are
and sales of investment securities and income and
over the-counter contracts in which one party agrees to
expense items denominated in foreign currencies are
make periodic payments based on the change in market
translated into U.S. dollar amounts on the respective
value of a specified equity security, basket of equity
dates of such transactions. The Trust does not isolate
securities, equity index or domestic currency index, in
that portion of the results of operations resulting from
return for periodic payments based on a fixed or variable
changes in foreign exchange rates on investments from
interest rate or the change in market value of a different
the fluctuations arising from changes in market prices of
equity security, basket of equity securities, equity index
securities held. Such fluctuations are included with the
or domestic currency index. Swap agreements are used
net realized and unrealized gain and loss from
to obtain exposure to an equity or market without
investments.
owning or taking physical custody of securities. The swap
Reported net realized foreign exchange gains or losses
agreements are marked-to-market daily based upon
arise from sales of foreign currencies and currency gains
quotations from market makers and the change, if any, is
or losses realized between the trade and settlement
recorded as unrealized gain or loss. Payments received
dates on investment transactions. Net unrealized
or made as a result of an agreement or termination of
exchange gains and losses arise from changes in the fair
the agreement are recognized as realized gains or losses.
values of assets and liabilities other than investments in
The Trust may enter into credit default swap agreements
securities at the fiscal period end, resulting from changes
where one party, the protection buyer, makes an upfront
in exchange rates.
or periodic payment to a counterparty, the protection
J. The Trust may enter into forward currency contracts
seller, in exchange for the right to receive a contingent
primarily to hedge against foreign currency exchange
payment. The maximum amount of the payment may
rate risks on its non-U.S. dollar denominated investment
equal the notional amount, at par, of the underlying
securities. When entering into a forward currency
index or security as a result of a related credit event.
contract, a Fund agrees to receive or deliver a fixed
Upfront payments received or made by a Fund, are
quantity of foreign currency for an agreed-upon price on
amortized over the expected life of the agreement.
an agreed future date. These contracts are valued daily
Periodic payments received or paid by a Fund are
and the corresponding unrealized gain or loss on the
recorded as realized gains or losses. The credit default
contracts, as measured by the difference between the
contracts are marked-to-market daily based upon
forward foreign exchange rates at the dates of entry into
quotations from market makers and the change, if any,
the contracts and the forward rates at the reporting
is recorded as unrealized gain or loss. Payments
date, is included in the Statement of Assets and
received or made as a result of a credit event or
Liabilities. Realized and unrealized gains and losses are
termination of the contract are recognized, net of a
included in the Statement of Operations.
proportional amount of the upfront payment, as
realized gains or losses.
K. Certain U.S. Government and Agency Obligations are
traded on a discount basis; the interest rates shown on
H. The Trust may invest in structured notes, which are
the Schedules of Investments reflect the effective rates
over the-counter contracts linked to the performance of
at the time of purchase by the Funds. Other securities
an underlying benchmark such as interest rates, equity
bear interest at the rates shown, payable at fixed dates
markets, equity indices, commodities indices, corporate
through maturity. The Funds may also purchase
credits or foreign exchange markets. A structured note is
American Depository Receipts, U.S. Government
a type of bond in which an issuer borrows money from
securities, and enter into repurchase agreements.
investors and pays back the principal, adjusted for
performance of the underlying benchmark, at a specified
THE RYDEX SERIES FUNDS SEMI-ANNUAL REPORT
|
137
NOTES TO FINANCIAL STATEMENTS (Unaudited) (continued)
L. The Funds may leave cash overnight in their cash
such price increases is the principal risk of engaging in
account with the custodian, U.S. Bank. Periodically, a
short sales.
Fund may have cash due to the custodian bank as an
The risk associated with purchasing options is limited to
overdraft balance. A fee is incurred on this overdraft,
the premium originally paid. The risk in writing a covered
calculated by multiplying the overdraft by a rate
call option is that a Fund may forego the opportunity for
based on the federal funds rate. Segregated cash with
profit if the market price of the underlying security
the broker is held as collateral for investments in
increases and the option is exercised. The risk in writing
derivative instruments such as futures contracts and
a covered put option is that a Fund may incur a loss if
index swap agreements.
the market price of the underlying security decreases
M. Interest and dividend income, most expenses, all
and he option is exercised. In addition, there is the risk
realized gains and losses, and all unrealized gains and
that a Fund may not be able to enter into a closing
losses are allocated to the Classes based upon the value
transaction because of an illiquid secondary market or,
of the outstanding shares in each Class. Certain costs,
for over-the-counter options, because of the
such as distribution fees relating to A-Class Shares and
counterparty’s inability to perform.
H-Class Shares and service and distribution fees related
There are several risks in connection with the use of
to Advisor Class Shares and C-Class Shares, are charged
futures contracts. Risks may be caused by an imperfect
directly to specific Classes. In addition, certain expenses
correlation between movements in the price of the
have been allocated to the individual Funds in the Trust
instruments and the price of the underlying securities. In
on a pro rata basis upon the respective aggregate net
addition, there is the risk that a Fund may not be able to
assets of each Fund included in the Trust.
enter into a closing transaction because of an illiquid
N. The preparation of financial statements in conformity
secondary market.
with U.S. generally accepted accounting principles
There are several risks associated with the use of
requires management to make estimates and
structured notes. Structured notes are leveraged,
assumptions that affect the reported amount of assets
thereby providing an exposure to the underlying
and liabilities and disclosure of contingent assets and
benchmark greater than the face amount and increasing
liabilities at the date of the financial statements and the
the volatility of each note relative to the change in the
reported amounts of revenues and expenses during the
underlying linked financial instrument. A highly liquid
reporting period. Actual results could differ from these
secondary market may not exist for the structured notes
estimates.
a Fund invests in, which may make it difficult for that
O. Throughout the normal course of business, the Funds
Fund to sell the structured notes it holds at an
enter into contracts that contain a variety of
acceptable price or to accurately value them. In addition,
representations and warranties which provide general
structured notes are subject to the risk that the
indemnifications. The Funds’ maximum exposure under
counterparty to the instrument, or issuer, might not pay
these arrangements is unknown, as this would involve
interest when due or repay principal at maturity of the
future claims that may be made against the Funds
obligation. Although the Trust will not invest in any
and/or their affiliates that have not yet occurred.
structured notes unless Rydex Investments believes that
However, based on experience, the Funds expect the
the issuer is creditworthy, a Fund does bear the risk of
risk of loss to be remote.
loss of the amount expected to be received in the event
2.
Financial Instruments
of the default or bankruptcy of the issuer.
As part of its investment strategy, the Trust may utilize
There are several risks associated with the use of swap
short sales and a variety of derivative instruments
agreements that are different from those associated with
including, options, futures, options on futures, structured
ordinary portfolio securities transactions, due to the fact
notes and swap agreements. These investments involve,
they could be considered illiquid. Although the Trust will
to varying degrees, elements of market risk and risks in
not enter into any swap agreement unless Rydex
excess of the amounts recognized in the Statements of
Investments believes that the other party to the
Assets and Liabilities.
transaction is creditworthy, the Funds bear the risk of
loss of the amount expected to be received under a
Short sales are transactions in which a Fund sells an
swap agreement in the event of the default or
equity or fixed income security it does not own. If the
bankruptcy of the agreement counterparty.
security sold short decreases in price between the time
the Fund sells the security and closes its short position,
There are several risks associated with credit default
that Fund will realize gain on the transaction. Conversely,
swaps. Credit default swaps involve the exchange of a
if the security increases in price during the period, that
fixed-rate premium for protection against the loss in
Fund will realize a loss on the transaction. The risk of
value of an underlying debt instrument in the event of a
138
|
THE RYDEX SERIES FUNDS SEMI-ANNUAL REPORT
NOTES TO FINANCIAL STATEMENTS (Unaudited) (continued)
defined credit event (such as payment default or
Rydex Investments also provides accounting services to
bankruptcy). Under the terms of the swap, one party acts
the Trust for fees calculated at an annualized rate of
as a “guarantor,” receiving a periodic payment that is a
0.10% on the first $250 million of the average daily net
fixed percentage applied to a notional principal amount.
assets, 0.075% on the next $250 million of the average
In return, the party agrees to purchase the notional
daily net assets, 0.05% on the next $250 million of the
amount of the underlying instrument, at par, if a credit
average daily net assets, and 0.03% on the average daily
event occurs during the term of the swap. A Fund may
net assets over $750 million of each Fund.
enter into credit default swaps in which that Fund or its
Rydex Investments engages external service providers to
counterparty acts as guarantor. By acting as the
perform other necessary services to the Trust, such as
guarantor of a swap, that Fund assumes the market and
accounting and auditing services, legal services, printing
credit risk of the underlying instrument, including
and mailing, etc., on a pass-through basis. Such
liquidity and loss of value.
expenses vary from Fund to Fund and are allocated to
In conjunction with the use of short sales, options,
the Funds based on relative net assets. Organizational
futures, options on futures, structured notes and swap
and setup costs for new Funds are paid by the Trust.
agreements, the Funds are required to maintain collateral
The Trust has adopted a Distribution and Shareholder
in various forms. The Funds use, where appropriate,
Services Plan applicable to Advisor Class Shares and
depending on the financial instrument utilized and the
a Distribution Plan applicable to A-Class Shares and
broker involved, margin deposits at the broker, cash
H-Class Shares for which the Distributor and other firms
and/or securities segregated at the custodian bank,
that provide distribution and/or shareholder services
discount notes, or the repurchase agreements allocated
(“Service Providers”) may receive compensation. If a
to each Fund.
Service Provider provides distribution services, the Trust
The risks inherent in the use of short sales, options,
will pay distribution fees to the Distributor at an annual
futures contracts, options on futures contracts, structured
rate not to exceed 0.25% of average daily net assets,
notes, and swap agreements, include i) adverse changes
pursuant to Rule 12b-1 of the 1940 Act. The Distributor,
in the value of such instruments; ii) imperfect correlation
in turn, will pay the Service Provider out of its fees. The
between the price of the instruments and movements in
Distributor may, at its discretion, retain a portion of such
the price of the underlying securities, indices, or futures
payments to compensate itself for distribution services.
contracts; iii) the possible absence of a liquid secondary
With regard to Advisor Class Shares only, if a Service
market for any particular instrument at any time; and iv)
Provider provides shareholders services, the Distributor
the potential of counterparty default. The Trust has
will receive shareholder servicing fees from the Trust at
established strict counterparty credit guidelines and
an annual rate not to exceed 0.25% of average daily net
enters into transactions only with financial institutions of
assets. The Distributor, in turn, will pay the Service
investment grade or better.
Provider out of its fees.
3.
Fees And Other Transactions With Affiliates
The Trust has adopted a separate Distribution and
Under the terms of an investment advisory contract, the
Shareholder Services Plan applicable to its C-Class
Trust pays Rydex Investments investment advisory fees
Shares that allows the Funds to pay annual distribution
calculated at an annualized rate of 0.50% of the average
and service fees of 1.00% of the Funds’ C-Class Shares
daily net assets of the Government Long Bond 1.2x
average daily net assets. The annual 0.25% service fee
Strategy Fund and the U.S. Government Money Market
compensates the shareholder’s financial advisor for
Fund; 0.75% of the average daily net assets of the Nova
providing on-going services to the shareholder. The
Fund, S&P 500 Fund, High Yield Fund, Inverse High Yield
annual 0.75% distribution fee reimburses the Distributor
Fund, NASDAQ-100® Fund, Russell 2000® Fund, Japan
for paying the shareholder’s financial advisor an ongoing
2x Strategy Fund, Small-Cap Value Fund, Mid-Cap Value
sales commission. The Distributor advances the first
Fund, Large-Cap Value Fund, Small-Cap Growth Fund,
year’s service and distribution fees to the Financial Advisor.
Mid-Cap Growth Fund, and the Large-Cap Growth Fund;
The Distributor retains the service and distribution fees
and 0.90% of the average daily net assets of the
on accounts with no authorized dealer of record.
remaining Funds covered in this report.
During the period ended September 30, 2008, the
Rydex Investments provides transfer agent and
Distributor retained sales charges of $557,030 relating to
administrative services to the Trust for fees calculated at
sales of A-Class Shares of the Trust.
an annualized rate of 0.20% of the average daily net
During the period ended September 30, 2008, Rydex
assets of the Government Long Bond 1.2x Strategy Fund
Investments reimbursed the Japan 2x Strategy Fund in
and the U.S. Government Money Market Fund; and
the amount of $17,395 ($0.127 per share) related to
0.25% of the average daily net assets for the remaining
estimated losses on amounts receivable from Lehman
Funds covered in this report.
Brothers Finance S.A. and certain of its affiliates.
THE RYDEX SERIES FUNDS SEMI-ANNUAL REPORT
|
139
NOTES TO FINANCIAL STATEMENTS (Unaudited) (continued)
Certain officers and trustees of the Trust are also officers of Rydex Investments and the Distributor.
4.
Federal Income Tax Information
The Funds intend to comply with the provisions of Subchapter M of the Internal Revenue Code applicable to regulated
investment companies and will distribute substantially all net investment income and capital gains to shareholders.
Therefore, no Federal income tax provision has been recorded.
The Funds adopted Financial Accounting Standards Board (FASB) Interpretation No. 48 Accounting for Uncertainty in
Income Taxes” (“FIN 48”). FIN 48 provides guidance for how uncertain tax positions should be recognized, measured,
presented and disclosed in the financial statements. FIN 48 requires the evaluation of tax positions taken or expected to be
taken in the course of preparing the Fund’s tax returns to determine whether the tax positions are “more-likelythan-not” of
being sustained by the applicable tax authority. Tax positions not deemed to meet the more-likely-than-not threshold
would be recorded as a tax benefit or expense in the current year. Management has analyzed the Funds’ tax positions
taken on federal income tax returns for all open tax years for purposes of complying with FIN 48, and has concluded that
no provision for income tax was required in the Funds’ financial statements.
The Funds file U.S. federal income tax returns and returns in various foreign jurisdictions in which they invest. While the
statute of limitations remains open to examine the Funds’ U.S. federal income tax returns filed for the fiscal years 2004 to
2007, no examinations are in progress or anticipated at this time.
Income and capital gain distributions are determined in accordance with Federal income tax regulations, which may differ
from U.S. generally accepted accounting principles. These differences are primarily due to differing treatments for
derivatives, foreign currency transactions, losses deferred due to wash sales, losses deferred due to post-October losses,
and excise tax regulations.
Permanent book and tax basis differences, if any, will result in reclassifications. This includes net operating losses not
utilized during the current period, capital loss carry forward expired, and the utilization of earnings and profits distributed
to the shareholders on redemption of shares as part of the dividends paid deduction for income tax purposes. These
reclassifications have no effect on net assets or net asset values per share. Any undistributed ordinary income or long-term
capital gain remaining at fiscal year end is distributed in the following year.
The Funds recognize interest and penalties, if any, related to unrecognized tax benefits as income tax expense in the
statement of operations. During the period, the Funds did not incur any interest or penalties.
At September 30, 2008, the cost of securities for Federal income tax purposes, the aggregate gross unrealized gain for all
securities for which there was an excess of value over tax cost and the aggregate gross unrealized loss for all securities for
which there was an excess of tax cost over value were as follows:
Tax
Tax
Net
Tax
Unrealized
Unrealized
Unrealized
Fund
Cost
Gain
Loss
Gain (Loss)
Nova Fund
$
84,355,740
$
13,955,878
$
(6,286,463)
$
7,669,415
S&P 500 Fund
152,171,099
1,124,169
(8,668,786)
(7,544,617)
Inverse S&P 500 Strategy Fund
311,195,817
—
—
—
NASDAQ-100® Fund
392,525,006
212,173,553
(25,372,485)
186,801,068
Inverse NASDAQ-100® Strategy Fund
67,175,468
—
—
—
Mid-Cap 1.5x Strategy Fund
17,467,160
640,204
(1,462,948)
(822,744)
Inverse Mid-Cap Strategy Fund
3,732,213
—
—
—
Russell 2000® 1.5x Strategy Fund
25,826,644
1,406,469
(1,535,081)
(128,612)
Russell 2000® Fund
41,942,786
108,295
(786,303)
(678,008)
Inverse Russell 2000® Strategy Fund
39,944,801
—
—
—
Government Long Bond 1.2x Strategy Fund
49,410,919
1,061,190
—
1,061,190
Inverse Government Long Bond Strategy Fund
454,372,848
—
(55,852)
(55,852)
High Yield Strategy Fund
21,972,507
—
—
—
Inverse High Yield Strategy Fund
15,841,036
—
—
—
Europe 1.25x Strategy Fund
14,668,266
340,819
(502,936)
(162,117)
Japan 2x Strategy Fund
428,485
—
—
—
Small-Cap Value Fund
34,893,262
1,780,280
(1,482,122)
298,158
Mid-Cap Value Fund
6,778,883
802,390
(96,229)
706,161
140
|
THE RYDEX SERIES FUNDS SEMI-ANNUAL REPORT
NOTES TO FINANCIAL STATEMENTS (Unaudited) (continued)
Tax
Tax
Net
Tax
Unrealized
Unrealized
Unrealized
Fund
Cost
Gain
Loss
Gain (Loss)
Large-Cap Value Fund
$
14,620,079
$
1,003,212
$
(752,045)
$
251,167
Small-Cap Growth Fund
21,985,037
—
(1,364,836)
(1,364,836)
Mid-Cap Growth Fund
13,202,359
2,016,488
(335,989)
1,680,499
Large-Cap Growth Fund
11,273,085
1,537,043
(572,108)
964,935
U.S.Government Money Market Fund
1,569,900,143
—
—
—
5.
Repurchase Agreements
The Funds transfer uninvested cash balances into a single joint account, the daily aggregate balance of which is invested
in one or more repurchase agreements collateralized by obligations of the U.S. Treasury and/or U.S. Government
Agencies. The collateral is in the possession of the Funds’ custodian and is evaluated to ensure that its market value
exceeds by, at a minimum, 102% of the original face amount of the repurchase agreements. Each Fund holds a pro rata
share of the collateral based on the dollar amount of the repurchase agreement entered into by each Fund.
The repurchase agreements executed by the joint account and outstanding as of September 30, 2008, were as follows:
Counterparty
Terms of Agreement
Face Value
Market Value
Repurchase Price
Morgan Stanley
0.15% due 10/01/08
$682,099,856
$
682,099,856
$
682,102,698
Mizuho Financial Group, Inc.
0.26% due 10/01/08
565,000,000
565,000,000
565,004,081
Morgan Stanley
0.10% due 10/01/08
400,000,000
400,000,000
400,001,111
Credit Suisse Group
0.25% due 10/01/08
88,479,252
88,479,252
88,479,866
$1,735,579,108
$1,735,587,756
As of September 30, 2008, the collateral for the repurchase agreements in the joint account was as follows:
Security Type
Maturity Dates
Range of Rates
Par Value
Market Value
U.S. Treasury Notes
12/31/08 - 08/15/17
3.375% - 4.750%
-->
3.375% - 4.750%
$793,096,500
$
816,275,910
U.S. TIP Bond
04/15/28
3.625%
289,705,400
474,835,309
U.S. Treasury Bills
10/02/08 - 09/24/09
—
252,540,300
251,799,789
U.S. Treasury Bonds
05/15/16 - 04/15/28
3.625% - 7.250%
176,171,900
227,466,324
$1,770,377,332
In the event of counterparty default, the Funds have the right to collect the collateral to offset losses incurred. There is
potential loss to the Funds in the event the Funds are delayed or prevented from exercising their rights to dispose of the
collateral securities, including the risk of a possible decline in the value of the underlying securities during the period while
the Funds seek to assert their rights. The Funds’ investment advisor, acting under the supervision of the Board of Trustees,
reviews the value of the collateral and the creditworthiness of those banks and dealers with which the Funds enter into
repurchase agreements to evaluate potential risks.
6.
Fair Value Measurement
The Funds adopted Statement of Financial Accounting Standard No. 157 (“FAS 157”) Fair Value Measurement which
provided enhanced guidance for using fair value to measure assets and liabilities. The standard requires companies to
provide expanded information about the assets and liabilities measured at fair value and the potential effect of these fair
valuations on an entity’s financial performance. The standard does not expand the use of fair value in any new
circumstances, but provides clarification on acceptable fair valuation methods and applications.
Various inputs may be used to determine the value of the fund’s investments. These inputs are summarized in three
broad levels:
Level 1 — quoted prices in active markets for identical securities.
Level 2 — other significant observable inputs (including quoted prices for similar securities, interest rates, prepayment
speeds, credit risk, etc.).
Level 3 — significant unobservable inputs (including the fund’s own assumptions used to determine the fair value of
investments)
The inputs or methodologies used for valuing securities are not necessarily an indication of the risk associated with
investing in those securities.
THE RYDEX SERIES FUNDS SEMI-ANNUAL REPORT
|
141
NOTES TO FINANCIAL STATEMENTS (Unaudited) (continued)
The following table summarizes the inputs used to value the Funds’ net assets as of September 30, 2008:
Level 1
Level 2
Level 3
Level 1
Other
Level 2
Other
Level 3
Other
Investments
Financial
Investments
Financial
Investments
Financial
Fund
In Securities
Instruments
In Securities
Instruments
In Securities
Instruments
Total
Assets
Nova Fund
$
92,025,155
$
—
$
—
$
—
$
—
$
—
$
92,025,155
S&P 500 Fund
144,626,482
—
—
—
—
—
144,626,482
Inverse S&P 500
Strategy Fund
112,395,018
8,530,334
198,800,799
—
—
—
319,726,151
NASDAQ-100® Fund
579,326,074
—
—
—
—
—
579,326,074
Inverse NASDAQ-100®
Strategy Fund
67,175,468
3,716,816
—
—
—
—
70,892,284
Mid-Cap 1.5x
Strategy Fund
16,644,416
—
—
—
—
—
16,644,416
Inverse Mid-Cap
Strategy Fund
3,732,213
—
—
—
—
—
3,732,213
Russell 2000® 1.5x
Strategy Fund
25,698,032
—
—
—
—
—
25,698,032
Russell 2000® Fund
41,264,778
—
—
—
—
—
41,264,778
Inverse Russell 2000®
Strategy Fund
39,944,801
583,219
—
—
—
—
40,528,020
Government Long Bond
1.2x Strategy Fund
50,472,109
—
—
—
—
—
50,472,109
Inverse Government
Long Bond
Strategy Fund
81,214,969
10,541,695
373,102,027
—
—
—
464,858,691
High Yield
Strategy Fund
21,972,507
34,084
—
—
—
—
22,006,591
Inverse High Yield
Strategy Fund
15,841,036
646,535
—
—
—
—
16,487,571
Europe 1.25x
Strategy Fund
14,506,149
—
—
—
—
—
14,506,149
Japan 2x Strategy Fund
428,485
—
—
—
—
—
428,485
Small-Cap Value Fund
35,191,420
—
—
—
—
—
35,191,420
Mid-Cap Value Fund
7,485,044
—
—
—
—
—
7,485,044
Large-Cap Value Fund
14,871,246
—
—
—
—
—
14,871,246
Small-Cap Growth Fund
20,620,201
—
—
—
—
—
20,620,201
Mid-Cap Growth Fund
14,882,858
—
—
—
—
—
14,882,858
Large-Cap Growth Fund
12,238,020
—
—
—
—
—
12,238,020
U.S. Government Money
Market Fund
1,569,900,143
—
—
—
—
—
1,569,900,143
Liabilities
Nova Fund
—
1,535,967
—
—
—
—
1,535,967
S&P 500 Fund
—
1,220,494
—
—
—
—
1,220,494
Inverse S&P 500
Strategy Fund
—
—
—
—
—
—
—
NASDAQ-100® Fund
—
733,121
—
—
—
—
733,121
Inverse NASDAQ-100®
Strategy Fund
—
—
—
—
—
—
—
Mid-Cap 1.5x
Strategy Fund
—
767,535
—
—
—
—
767,535
Inverse Mid-Cap
Strategy Fund
—
2,962
—
—
—
—
2,962
Russell 2000® 1.5x
Strategy Fund
—
552,446
—
—
—
—
552,446
Russell 2000® Fund
—
417,909
—
—
—
—
417,909
Inverse Russell 2000®
Strategy Fund
—
—
1,584
—
—
—
1,584
Government Long Bond
1.2x Strategy Fund
—
14,318
—
—
—
—
14,318
Inverse Government
Long Bond
Strategy Fund
—
—
—
—
—
—
—
High Yield
Strategy Fund
—
464,871
—
—
—
—
464,871
Inverse High Yield
Strategy Fund
—
—
—
—
—
—
—
Europe 1.25x
Strategy Fund
—
—
—
108,587
—
—
108,587
Japan 2x Strategy Fund
—
—
—
121,923
—
—
121,923
Small-Cap Value Fund
—
—
—
—
—
—
—
Mid-Cap Value Fund
—
—
—
—
—
—
—
Large-Cap Value Fund
—
—
—
—
—
—
—
Small-Cap Growth Fund
—
—
—
—
—
—
—
Mid-Cap Growth Fund
—
—
—
—
—
—
—
Large-Cap Growth Fund
—
—
—
—
—
—
—
U.S. Government
Money Market Fund
—
—
—
—
—
—
—
142
|
THE RYDEX SERIES FUNDS SEMI-ANNUAL REPORT
NOTES TO FINANCIAL STATEMENTS (Unaudited) (continued)
7.
Securities Transactions
During the period ended September 30, 2008, the cost of purchases and proceeds from sales of investment securities,
excluding short term and temporary cash investments, were:
Inverse
Inverse
Inverse
Nova
S&P 500
S&P 500
NASDAQ-100®
NASDAQ-100®
Mid-Cap 1.5x
Mid-Cap
Fund
Fund
Strategy Fund
Fund
Strategy Fund
Strategy Fund
Strategy Fund
Purchases
$
87,301,924
$124,809,383
$
—
$246,557,058
$
—
$
17,075,170
$
—
Sales
$110,012,341
$
60,192,186
$
—
$288,297,593
$
—
$
16,681,001
$
—
Inverse
Government
Inverse
Russell
Russell 2000®
Long Bond
Government
Inverse
2000® 1.5x
Russell 2000®
Strategy
1.2x Strategy
Long Bond
High Yield
High Yield
Strategy Fund
Fund
Fund
Fund
Strategy Fund
Strategy Fund
Strategy Fund
Purchases
$
44,548,068
$
29,438,883
$
—
$630,061,491
$
866,834,024
$
—
$
—
Sales
$
48,014,236
$
16,697,951
$
—
$666,048,698
$1,175,501,526
$
—
$
—
Small-Cap
Mid-Cap
Large-Cap
Small-Cap
Mid-Cap
Europe 1.25x
Japan 2x
Value
Value
Value
Growth
Growth
Strategy Fund
Strategy Fund
Fund
Fund
Fund
Fund
Fund
Purchases
$
14,457,541
$
—
$ 75,152,190
$
39,574,866
$
120,506,628
$
79,484,656
$ 212,456,440
Sales
$
17,537,753
$
—
$106,193,408
$
42,156,997
$
126,206,203
$
68,829,205
$ 214,242,658
Large-Cap U.S. Government
Growth
Money Market
Fund
Fund
Purchases
$
59,870,373
$
—
Sales
$
66,771,641
$
—
THE RYDEX SERIES FUNDS SEMI-ANNUAL REPORT
|
143
NOTES TO FINANCIAL STATEMENTS (continued)
8.
Share Transactions
The Trust is authorized to issue an unlimited number of shares (no par value). Transactions in shares for the periods presented were:
Shares Purchased
Purchased through Dividend Reinvestment
Shares Redeemed
Net Shares Purchased (Redeemed)
Period Ended
Year Ended
Period Ended
Year Ended
Period Ended
Year Ended
Period Ended
Year Ended
September 30,
March 31,
September 30,
March 31,
September 30,
March 31,
September 30,
March 31,
2008†
2008
2008†
2008
2008†
2008
2008†
2008
Nova Fund
Investor Class
5,446,050
10,763,436
—
75,348
(5,746,223)
(11,641,404)
(300,173)
(802,620)
Advisor Class
1,072,165
2,287,134
—
16,569
(1,023,354)
(2,764,194)
48,811
(460,491)
A-Class
250,113
486,941
—
7,031
(518,862)
(547,325)
(268,749)
(53,353)
C-Class
366,930
1,227,847
—
27,492
(590,077)
(1,509,363)
(223,147)
(254,024)
S&P 500 Fund
A-Class
516,965
717,124
—
124
(254,325)
(701,805)
262,640
15,443
C-Class
2,827,914
3,802,327
—
787
(2,845,143)
(3,568,990)
(17,229)
234,124
H-Class
13,719,661
8,954,070
—
4,221
(10,866,729)
(6,143,418)
2,852,932
2,814,873
Inverse S&P 500 Strategy Fund
Investor Class
7,344,820
11,985,693
—
259,306
(7,074,146)
(45,382,295)
270,674
(33,137,296)
Advisor Class
959,934
1,435,780
—
13,737
(905,031)
(4,310,762)
54,903
(2,861,245)
A-Class
716,557
724,012
—
10,606
(309,036)
(2,065,981)
407,521
(1,331,363)
C-Class
829,659
3,180,263
—
34,413
(1,088,147)
(8,351,679)
(258,488)
(5,137,003)
NASDAQ-100® Fund
Investor Class
24,289,419
42,755,463
—
—
(27,489,202)
(44,366,095)
(3,199,783)
(1,610,632)
Advisor Class
5,710,521
11,133,034
—
—
(5,554,240)
(10,611,159)
156,281
521,875
A-Class
529,751
1,224,853
—
—
(630,762)
(1,016,650)
(101,011)
208,203
C-Class
5,813,869
7,582,203
—
—
(5,684,251)
(7,547,831)
129,618
34,372
Inverse NASDAQ-100® Strategy Fund
Investor Class
4,528,245
13,266,797
—
121,160
(4,742,168)
(15,402,931)
(213,923)
(2,014,974)
Advisor Class
66,260
584,179
—
4,466
(204,722)
(945,671)
(138,462)
(357,026)
A-Class
168,029
486,070
—
8,211
(104,451)
(599,900)
63,578
(105,619)
C-Class
1,268,613
2,065,870
—
20,816
(1,400,026)
(2,577,766)
(131,413)
(491,080)
Mid-Cap 1.5x Strategy Fund
A-Class
16,786
114,194
—
2,239
(26,996)
(135,455)
(10,210)
(19,022)
C-Class
386,992
499,616
—
15,201
(389,981)
(671,558)
(2,989)
(156,741)
H-Class
2,771,822
8,197,410
—
27,478
(2,808,473)
(8,461,182)
(36,651)
(236,294)
Inverse Mid-Cap Strategy Fund
A-Class
18,678
42,249
—
323
(24,551)
(32,269)
(5,873)
10,303
C-Class
113,850
603,381
—
366
(134,789)
(586,835)
(20,939)
16,912
H-Class
894,311
2,884,473
—
11,489
(2,062,644)
(2,097,722)
(1,168,333)
798,240
Russell 2000® 1.5x Strategy Fund
A-Class
111,398
155,573
—
312
(205,906)
(163,625)
(94,508)
(7,740)
C-Class
331,064
794,721
—
1,065
(294,107)
(956,120)
36,957
(160,334)
H-Class
2,908,552
6,640,565
—
1,424
(2,915,254)
(7,309,867)
(6,702)
(667,878)
Russell 2000® Fund
A-Class
204,631
253,665
—
114
(75,047)
(225,169)
129,584
28,610
C-Class
221,936
441,630
—
182
(211,205)
(439,576)
10,731
2,236
H-Class
7,953,518
4,122,727
—
924
(6,884,226)
(4,419,348)
1,069,292
(295,697)
† Unaudited
NOTES TO FINANCIAL STATEMENTS (continued)
Shares Purchased
Purchased through Dividend Reinvestment
Shares Redeemed
Net Shares Purchased (Redeemed)
Period Ended
Year Ended
Period Ended
Year Ended
Period Ended
Year Ended
Period Ended
Year Ended
September 30,
March 31,
September 30,
March 31,
September 30,
March 31,
September 30,
March 31,
2008†
2008
2008†
2008
2008†
2008
2008†
2008
Inverse Russell 2000® Strategy Fund
A-Class
36,261
430,239
—
7,114
(134,007)
(545,832)
(97,746)
(108,479)
C-Class
474,776
847,999
—
7,889
(436,275)
(940,973)
38,501
(85,085)
H-Class
2,037,456
6,274,357
—
42,668
(2,296,272)
(6,618,998)
(258,816)
(301,973)
Government Long Bond 1.2x Strategy Fund
Investor Class
37,220,034
76,783,346
32,871
119,095
(38,187,579)
(78,150,310)
(934,674)
(1,247,869)
Advisor Class
31,907,429
16,143,329
22,140
37,347
(33,112,262)
(15,059,265)
(1,182,693)
1,121,411
A-Class
883,125
2,480,041
18,890
33,796
(1,470,057)
(1,867,065)
(568,042)
646,772
C-Class
6,991,191
7,398,417
6,875
20,651
(7,000,136)
(8,365,974)
(2,070)
(946,906)
Inverse Government Long Bond Strategy Fund
Investor Class
35,525,345
55,942,835
—
335,286
(34,625,269)
(58,292,241)
900,076
(2,014,120)
Advisor Class
22,220,366
8,604,796
—
50,624
(21,532,946)
(9,441,570)
687,420
(786,150)
A-Class
2,904,138
1,523,588
—
60,408
(1,499,922)
(2,969,787)
1,404,216
(1,385,791)
C-Class
3,170,416
3,335,250
—
279,343
(2,613,139)
(7,328,114)
557,277
(3,713,521)
High Yield Strategy Fund
A-Class
6,339,178
1,930,328*
—
3,634*
(6,423,328)
(1,500,841)*
(84,150)
433,121*
C-Class
88,267
170,873*
—
119*
(101,862)
(129,479)*
(13,595)
41,513*
H-Class
11,714,384
11,912,677*
—
9,814*
(13,914,972)
(9,274,669)*
(2,200,588)
2,647,822*
Inverse High Yield Strategy Fund
A-Class
79,922
350,188*
—
—*
(79,996)
(317,552)*
(74)
32,636*
C-Class
29,228
117,922*
—
—*
(29,256)
(60,000)*
(28)
57,922*
H-Class
2,679,202
3,107,955*
—
—*
(2,546,224)
(2,980,758)*
132,978
127,197*
Europe 1.25x Strategy Fund
A-Class
6,584
481,557
—
3,796
(32,574)
(858,069)
(25,990)
(372,716)
C-Class
2,736,573
6,793,370
—
21,736
(2,834,308)
(6,937,333)
(97,735)
(122,227)
H-Class
3,661,818
16,294,141
—
83,104
(3,978,652)
(17,801,896)
(316,834)
(1,424,651)
Japan 2x Strategy Fund
A-Class
11,710
27,605**
—
—**
(30,027)
(2,298)**
(18,317)
25,307**
C-Class
645,529
44,347**
—
—**
(640,968)
(34,802)**
4,561
9,545**
H-Class
1,353,100
528,213**
—
—**
(1,428,358)
(319,523)**
(75,258)
208,690**
Small-Cap Value Fund
A-Class
78,443
177,319
—
644
(179,941)
(177,608)
(101,498)
355
C-Class
568,172
1,259,064
—
258
(621,429)
(778,563)
(53,257)
480,759
H-Class
2,632,385
4,777,161
—
999
(3,710,554)
(3,129,747)
(1,078,169)
1,648,413
* Since the commencement of operations: April 16, 2007.
** Since the commencement of operations: February 22, 2008.
† Unaudited
NOTES TO FINANCIAL STATEMENTS (continued)
Shares Purchased
Purchased through Dividend Reinvestment
Shares Redeemed
Net Shares Purchased (Redeemed)
Period Ended
Year Ended
Period Ended
Year Ended
Period Ended
Year Ended
Period Ended
Year Ended
September 30,
March 31,
September 30,
March 31,
September 30,
March 31,
September 30,
March 31,
2008†
2008
2008†
2008
2008†
2008
2008†
2008
Mid-Cap Value Fund
A-Class
37,420
174,959
—
2,215
(109,932)
(212,737)
(72,512)
(35,563)
C-Class
494,128
845,951
—
1,257
(491,559)
(1,042,478)
2,569
(195,270)
H-Class
914,577
2,664,509
—
4,679
(927,332)
(4,541,599)
(12,755)
(1,872,411)
Large-Cap Value Fund
A-Class
112,978
279,929
—
42,908
(311,803)
(269,266)
(198,825)
53,571
C-Class
566,918
2,025,443
—
64,737
(560,586)
(2,639,246)
6,332
(549,066)
H-Class
6,127,921
9,372,167
—
96,773
(6,310,007)
(14,047,706)
(182,086)
(4,578,766)
Small-Cap Growth Fund
A-Class
30,823
262,368
—
3,278
(93,170)
(238,178)
(62,347)
27,468
C-Class
1,215,240
2,189,483
—
10,842
(1,222,653)
(2,363,032)
(7,413)
(162,707)
H-Class
2,152,573
3,527,056
—
7,158
(1,728,443)
(3,863,333)
424,130
(329,119)
Mid-Cap Growth Fund
A-Class
220,290
250,895
—
7,273
(173,716)
(203,641)
46,574
54,527
C-Class
2,267,597
1,561,001
—
5,107
(2,232,845)
(1,687,976)
34,752
(121,868)
H-Class
6,319,241
7,525,765
—
23,635
(6,548,545)
(7,269,598)
(229,304)
279,802
Large-Cap Growth Fund
A-Class
281,775
277,830
—
2,193
(422,478)
(161,710)
(140,703)
118,313
C-Class
267,242
4,408,801
—
7,740
(321,288)
(4,374,533)
(54,046)
42,008
H-Class
2,268,325
7,048,426
—
19,766
(2,401,829)
(8,400,012)
(133,504)
(1,331,820)
U.S. Government Money Market Fund
Investor Class
7,501,815,928
16,744,764,573
6,817,645
34,409,275
(7,369,166,884)
(16,782,939,166)
139,466,689
(3,765,318)
Advisor Class
2,381,240,439
3,541,832,288
740,023
5,026,273
(2,362,867,612)
(3,591,814,815)
19,112,850
(44,956,254)
A-Class
51,476,754
86,075,767
141,762
611,010
(38,553,187)
(84,291,559)
13,065,329
2,395,218
C-Class
694,433,242
1,349,987,737
247,073
3,040,004
(674,037,092)
(1,352,007,026)
20,643,223
1,020,715
† Unaudited
NOTES TO FINANCIAL STATEMENTS (Unaudited) (continued)
9.
Portfolio Securities Loaned
The Funds may lend their securities to approved brokers to earn additional income. Security lending income shown on the
statement of operations is shown net of rebates paid to borrowers and earnings on cash collateral investments shared with
the lending agent. Within this arrangement, the Funds act as the lender, U.S. Bank acts as the agent, and other approved
registered broker dealers act as the borrowers. The Funds receive cash collateral, valued at a minimum of 100% of the
value of the securities on loan, which is initially held in a segregated account at U.S. Bank. Under the terms of the Funds’
securities lending agreement with U.S.Bank, cash collateral may be invested by U.S. Bank in certain high quality, liquid
investments. At September 30, 2008, the cash collateral investments consisted of a money market mutual fund and
repurchase agreement. The Funds bear the risk of loss on cash collateral investments. Collateral is maintained over the life
of the loan in an amount not less than the value of loaned securities, as determined at the close of fund business each day;
any additional collateral required due to changes in security values is delivered to the Fund the next business day. Although
the collateral mitigates risk, the Funds could experience a delay in recovering its securities and a possible loss of income or
value if the borrower fails to return the securities. The Funds have the right under the securities lending agreement to
recover the securities from the borrower on demand.
The following represents a breakdown of the collateral:
MUTUAL FUND
Issuer
Shares
Market Value
Mount Vernon Securities Lending Trust
32,267,439
$32,267,439
Total Mutual Fund
$32,267,439
At September 30, 2008, the following Funds participated in securities lending and received cash collateral:
Fund
Cash Collateral
Value of Securities Loaned
Nova Fund
$
85,572
$
82,956
S&P 500 Fund
41,536
38,869
NASDAQ-100® Fund
29,320,434
29,201,950
Mid-Cap 1.5x Strategy Fund
20,776
20,106
Russell 2000® 1.5x Strategy Fund
221,094
215,417
Russell 2000® Fund
3,879
3,833
Europe 1.25x Strategy Fund
305,120
280,907
Small-Cap Value Fund
1,516,971
1,525,145
Mid-Cap Value Fund
182,767
181,108
Large-Cap Value Fund
80,059
85,496
Small-Cap Growth Fund
480,527
450,023
Large-Cap Growth Fund
8,704
9,199
10. New Accounting Pronouncements
In March 2008, the FASB issued FAS 161, “Disclosures about Derivative Instruments and Hedging Activities.” The new
requirement is intended to improve disclosures around an entity’s derivatives activity and help investors understand how
entities use derivatives, how they are accounted for and how they affect the financial position and operations of that entity.
FAS 161 is effective for fiscal years and interim periods beginning after November 15, 2008.
11. NASDAQ Name Change
Effective April 1, 2008, the OTC Fund and the Inverse OTC Strategy Fund changed their Fund names to the
NASDAQ-100® Fund and the Inverse NASDAQ-100® Strategy Fund, respectively. The name change will have no impact
on the Funds’ investment objectives, tickers and CUSIPS.
12. Subsequent Event
U.S. Government Money Market Fund (the “Fund”) has filed a Guarantee Agreement with the United States Department
of the Treasury (the “Treasury”) to participate in the Treasury’s Temporary Guarantee Program for Money Market Funds (the
“Program”).
THE RYDEX SERIES FUNDS SEMI-ANNUAL REPORT
|
147
NOTES TO FINANCIAL STATEMENTS (Unaudited) (concluded)
Under the Program, the Treasury will guarantee the share price of shares of the Fund held by shareholders as of
September 19, 2008 at $1.00 per share if the Fund’s net asset value per share falls below $0.995 (a “Guarantee Event”)
and the Fund liquidates. Recovery under the Program is subject to certain conditions and limitations, including the following:
•
For shareholders of a Fund, the Program provides a guarantee for the lesser of (a) the number of Fund shares owned
by the shareholder as of the close of business on September 19, 2008, or (b) the number of Fund shares owned by the
shareholder on the date of a Guarantee Event.
•
The total amount of coverage available for all participants in the Program is limited to the amount of funds available
under the Federal Exchange Stabilization Fund at the time of a Guarantee Event (currently approximately $50 billion).
•
In order to recover, a Guarantee Event must occur during the term of the Program.
Fund shares acquired by investors after September 19, 2008 that increase the number of Fund shares the investor held as
of the close of business on September 19, 2008 are not eligible for protection under the Program. In addition, Fund shares
acquired by investors who did not hold Fund shares as of the close of business on September 19, 2008 are not eligible for
protection under the Program.
The Program will be in effect for a three month term expiring on December 18, 2008, after which the Secretary of the
Treasury will review the need for, and terms of, the Program. Participation in the initial three months of the Program
requires a payment to the Treasury in the amount of .01% of the value of all shares outstanding as of September 19, 2008,
which has been paid by the Fund. The Secretary may extend the Program through the close of business on September 18,
2009. If the Program is extended, the Fund will consider whether to continue to participate and pay any additional fees.
148
|
THE RYDEX SERIES FUNDS SEMI-ANNUAL REPORT
OTHER INFORMATION (Unaudited)
Proxy Voting Information
A description of the policies and procedures that the Trust uses to determine how to vote proxies relating to securities held
in the Funds' portfolios is available, without charge and upon request, by calling 1-800-820-0888. This information is also
available from the EDGAR database on the SEC's website at http://www.sec.gov.
Information regarding how the Funds voted proxies relating to portfolio securities during the most recent 12-month period
ended June 30 is available without charge, upon request, by calling 1-800-820-0888. This information is also available from
the EDGAR database on the SEC’s website at http://www.sec.gov.
Quarterly Portfolio Schedules Information
The Trust files its complete schedule of portfolio holdings with the SEC for the first and third quarters of each fiscal year on
Form N-Q; which are available on the SEC’s website at http://www.sec.gov. The Funds' Forms N-Q may be reviewed and
copied at the SEC’s Public Reference Room in Washington, DC, and that information on the operation of the Public
Reference Room may be obtained by calling 1-800-SEC-0330. Copies of the portfolio holdings are also available to
shareholders, without charge and upon request, by calling 1-800-820-0888.
Rydex Investments Board Review and Approval of the Investment Advisory Agreement
The Advisory Agreements dated January 18, 2008 between Rydex Series Funds, on behalf of the Funds, and PADCO
Advisors, Inc. were last approved by shareholders at Special Meetings held on October 4, 2007, November 1, 2007,
January 31, 2008 and February 12, 2008. Subject to the terms and conditions provided for in the Advisory Agreements,
each Advisory Agreement remains in effect for an initial two year term from the date of the Agreement and remains in
effect for periods of one year thereafter subject to Board approval. Therefore, the Advisory Agreements are next
scheduled to be approved by the Board of Trustees at the Trust’s August 2009 Meeting.
THE RYDEX SERIES FUNDS SEMI-ANNUAL REPORT
|
149
INFORMATION ON BOARD OF TRUSTEES AND OFFICERS (Unaudited)
A Board of Trustees oversees all Rydex Investments, in which its members have no stated term of service, and continue to
serve after election until resignation. The Statement of Additional Information includes further information about Fund
Trustees and Officers, and can be obtained without charge by calling 1-800-820-0888.
All Trustees and Officers may be reached c/o Rydex Investments, 9601 Blackwell Rd., Suite 500, Rockville, MD 20850.
TRUSTEES AND OFFICERS
Length of Service
Name, Position and
As Trustee
Number of
––––––––––––––––––––––––––––––
Year of Birth
–––––––––––––––––––––––––––
(Year Began)
––––––––––––––––––––––––
Funds Overseen
Carl G. Verboncoeur*
Rydex Series Funds – 2004
158
Trustee, President (1952)
Rydex Variable Trust – 2004
Rydex Dynamic Funds – 2004
Rydex ETF Trust – 2004
Principal Occupations During Past Five Years: Treasurer of Rydex Specialized Products, LLC (2005 to present) Chief Executive
Officer of Rydex Specialized Products, LLC (2005 to 2008); Chief Executive Officer of Rydex Investments and Rydex Distributors,
Inc. (2003 to present); Executive Vice President of Rydex Investments (2000 to 2003)
Michael P. Byrum*
Rydex Series Funds – 2005
150
Trustee, Vice President
Rydex Variable Trust – 2005
(1970)
Rydex Dynamic Funds – 2005
Rydex ETF Trust – 2005
Principal Occupations During Past Five Years: Chief Investment Officer of Rydex Investments (2003 to present); Secretary of
Rydex Specialized Products, LLC (2005 to 2008); Vice President of Rydex Series Funds (1997 to present); Vice President of Rydex
Variable Trust (1998 to present); Vice President of Rydex Dynamic Funds (1999 to present); Vice President of Rydex ETF Trust
(2002 to present); President and Trustee of Rydex Capital Partners SPhinX Fund (2003 to 2006); President of Rydex Investments
(2004 to present); Chief Operating Officer of Rydex Investments and Rydex Distributors, Inc. (2003 to 2004)
INDEPENDENT TRUSTEES
Length of Service
Name, Position and
As Trustee
Number of
––––––––––––––––––––––––––––––
Year of Birth
–––––––––––––––––––––––––––
(Year Began)
––––––––––––––––––––––––
Funds Overseen
John O. Demaret
Rydex Series Funds – 1997
150
Trustee, Chairman of the
Rydex Variable Trust – 1998
Board (1940)
Rydex Dynamic Funds – 1999
Rydex ETF Trust – 2003
Principal Occupations During Past Five Years: Retired
Corey A. Colehour
Rydex Series Funds – 1993
150
Trustee (1945)
Rydex Variable Trust – 1998
Rydex Dynamic Funds – 1999
Rydex ETF Trust – 2003
Principal Occupations During Past Five Years: Retired (2006 to present); Owner and President of Schield Management
Company, registered investment adviser (2005 to 2006); Senior Vice President of Marketing and Co-Owner of Schield
Management Company, registered investment adviser (1985 to 2005)
J. Kenneth Dalton
Rydex Series Funds – 1995
150
Trustee (1941)
Rydex Variable Trust – 1998
Rydex Dynamic Funds – 1999
Rydex ETF Trust – 2003
Principal Occupations During Past Five Years: Mortgage Banking Consultant and Investor, The Dalton Group
150
|
THE RYDEX SERIES FUNDS SEMI-ANNUAL REPORT
INFORMATION ON BOARD OF TRUSTEES AND OFFICERS (Unaudited) (concluded)
Length of Service
Name, Position and
As Trustee
Number of
––––––––––––––––––––––––
Year of Birth
–––––––––––––––––––––––––––
(Year Began)
––––––––––––––––––––––––
Funds Overseen
Werner E. Keller
Rydex Series Funds – 2005
150
Trustee (1940)
Rydex Variable Trust – 2005
Rydex Dynamic Funds – 2005
Rydex ETF Trust – 2005
Principal Occupations During Past Five Years: Retired (2001 to present); Chairman, Centurion Capital Management (1991 to 2001)
Thomas F. Lydon, Jr.
Rydex Series Funds – 2005
150
Trustee (1960)
Rydex Variable Trust – 2005
Rydex Dynamic Funds – 2005
Rydex ETF Trust – 2005
Principal Occupations During Past Five Years: President, Global Trends Investments
Patrick T. McCarville
Rydex Series Funds – 1997
150
Trustee (1942)
Rydex Variable Trust – 1998
Rydex Dynamic Funds – 1999
Rydex ETF Trust – 2003
Principal Occupations During Past Five Years: Founder and Chief Executive Officer, Par Industries, Inc.
Roger Somers
Rydex Series Funds – 1993
150
Trustee (1944)
Rydex Variable Trust – 1998
Rydex Dynamic Funds – 1999
Rydex ETF Trust – 2003
Principal Occupations During Past Five Years: Owner, Arrow Limousine
EXECUTIVE OFFICERS
Name, Position and
Principal Occupations
–––––––––––––––––––––––
Year of Birth
–––––––––––––––––––––––––––––––––––
During Past Five Years
Nick Bonos*
Chief Financial Officer of Rydex Specialized Products, LLC (2005 to present);
Vice President and Treasurer (1963)
Vice President and Treasurer of Rydex Series Funds, Rydex Variable Trust,
Rydex Dynamic Funds, and Rydex ETF Trust (2003 to present); Senior Vice
President of Rydex Investments (2003 to present); Vice President and
Treasurer of Rydex Capital Partners SPhinX Fund (2003 to 2006)
Joanna M. Haigney*
Chief Compliance Officer of Rydex Series Funds, Rydex Variable Trust, and
Chief Compliance Officer and
Rydex Dynamic Funds (2004 to present); Secretary of Rydex Series Funds,
Secretary (1966)
Rydex Variable Trust, and Rydex Dynamic Funds (2000 to present); Secretary
of Rydex ETF Trust (2002 to present); Vice President of Compliance of Rydex
Investments (2000 to present); Secretary of Rydex Capital Partners SPhinX
Fund (2003 to 2006)
Joseph Arruda*
Assistant Treasurer of Rydex Series Funds, Rydex Variable Trust, Rydex
Assistant Treasurer (1966)
Dynamic Funds, Rydex ETF Trust (2006 to present); Senior Vice President of
Rydex Investments (2008 to present); Vice President of Rydex Investments
(2004 to 2008); Director of Accounting of Rydex Investments (2003 to 2004)
Paula Billos*
Controller of Rydex Series Funds, Rydex Variable Trust, Rydex Dynamic
Controller (1974)
Funds, Rydex ETF Trust (2006 to present); Director of Fund Administration of
Rydex Investments (2001 to present)
* Officers of the Funds are deemed to be “interested persons” of the Trust, within the meaning of Section 2(a)(19) of the 1940 Act, inasmuch as
this person is affiliated with Rydex Investments.
THE RYDEX SERIES FUNDS SEMI-ANNUAL REPORT
|
151
This page intentionally left blank.
This page intentionally left blank.
9601 Blackwell Road, Suite 500
Rockville, MD 20850
www.rydexinvestments.com
800-820-0888
RBENF-SEMI-0908x0309