UNITED STATES
SECURITIES AND EXCHANGE COMMISSION
Washington, D.C. 20549
FORM N-CSR
CERTIFIED SHAREHOLDER REPORT OF
REGISTERED MANAGEMENT INVESTMENT COMPANIES
| | |
Investment Company Act file number: | | 811-07692 |
Legg Mason Investors Trust, Inc.
|
| 100 Light Street, Baltimore, MD 21202 |
| Address of Principal Executive Offices: |
Richard M. Wachterman, Esq.
Legg Mason & Co., LLC
100 Light Street
Baltimore, MD 21202
|
| Name and address of agent for service: |
Registrant’s telephone number, including area code: (410) 539-0000
Date of fiscal year end: March 31, 2008
Date of reporting period: March 31, 2008
| Item 1. | Report to Shareholders |
| | |
| Annual Report to Shareholders | | 1 |
To Our Shareholders
We are pleased to provide you with Legg Mason Investors Trust’s annual report for American Leading Companies Trust and U.S. Small-Capitalization Value Trust, for the year ended March 31, 2008.
| | | | | | |
| | | Total Returns | |
| | | 3 Months | | | 1 Year | |
American Leading Companies Trust: | | | | | | |
Primary Class | | –14.39 | % | | –16.24 | % |
Institutional Class | | –14.18 | % | | –15.37 | % |
S&P 500 Stock Composite IndexA | | –9.44 | % | | –5.08 | % |
| | |
U.S. Small-Capitalization Value Trust: | | | | | | |
Primary Class | | –4.23 | % | | –17.94 | % |
Institutional Class | | –4.00 | % | | –17.17 | % |
Russell 2000 IndexB | | –9.90 | % | | –13.00 | % |
The performance data quoted represent past performance and do not guarantee future results. The performance stated may have been due to extraordinary market conditions, which may not be duplicated in the future. Current performance may be lower or higher than the performance data quoted. To obtain the most recent month-end performance information for the Primary Class please visit www.leggmason.com/individualinvestors. For the Institutional Class please visit www.lminstitutionalfunds.com. The investment return and principal value of the Funds will fluctuate so that an investor’s shares, when redeemed, may be worth more or less than the original cost. Calculations assume reinvestment of dividends and capital gain distributions. Performance would have been lower if fees had not been waived in various periods. Performance figures for periods shorter than one year represent cumulative figures and are not annualized.
PricewaterhouseCoopers LLP, the Funds’ independent registered public accounting firm, has completed its annual audit, and audited financial statements for the fiscal year ended March 31, 2008, are included in this report.
Information about each Fund’s performance over longer periods of time is shown in the respective Performance Information sections within this report. For more information about each Fund’s share classes included in this report, please contact your financial advisor.
Many Primary Class shareholders invest regularly in Fund shares on a dollar cost averaging basis. Most do so by authorizing automatic, monthly transfers of $50 or more
A | S&P 500 Stock Composite Index — A market capitalization-weighted index, composed of 500 widely held common stocks, that is generally considered representative of the U.S. stock market. |
B | Russell 2000® Index — An unmanaged index comprised of the 2,000 smallest companies of the 3,000 largest U.S. companies based on market capitalization. |
| | |
| 2 | | Annual Report to Shareholders |
from their bank checking or brokerage accounts. Dollar cost averaging is a convenient and sensible way to invest, as it encourages continued purchases over time regardless of fluctuating price levels. Of course, it does not ensure a profit nor protect against declines in the value of your investment. Your financial advisor will be happy to help you establish a dollar cost averaging account should you wish to do so.
|
| Sincerely, |
|

|
| Mark R. Fetting |
| President |
|
| April 21, 2008 |
| | |
| Annual Report to Shareholders | | 3 |
Management’s Discussion of Fund Performance
American Leading Companies
Total returns for the American Leading Companies Trust for various periods ended March 31, 2008, are presented below along with those of some comparative indicesA:
| | | | | | | | | | | | | | | | | | |
| | | | | | | | | Average Annual Total Returns
Through March 31, 2008 | |
| | | First Quarter
2008 | | | One
Year | | | Three
Years | | | Five
Years | | | Ten
Years | | | Since
InceptionB | |
American Leading | | | | | | | | | | | | | | | | | | |
Companies | | | | | | | | | | | | | | | | | | |
Primary Class | | –14.39 | % | | –16.24 | % | | +0.19 | % | | +8.62 | % | | +2.81 | % | | +7.28 | % |
Institutional Class | | –14.18 | % | | –15.37 | % | | +1.20 | % | | +9.72 | % | | N/A | | | +3.16 | % |
S&P 500 Stock Composite | | | | | | | | | | | | | | | | | | |
Index | | –9.44 | % | | –5.08 | % | | +5.85 | % | | +11.32 | % | | +3.50 | % | | +9.45 | % |
Dow Jones Industrial | | | | | | | | | | | | | | | | | | |
Average | | –6.92 | % | | +1.57 | % | | +7.75 | % | | +11.46 | % | | +5.51 | % | | +11.02 | % |
NASDAQ Composite | | | | | | | | | | | | | | | | | | |
Index | | –13.88 | % | | –5.12 | % | | +5.27 | % | | +11.92 | % | | +2.70 | % | | 7.99 | %C |
S&P Mid-Cap 400 index | | –8.85 | % | | –6.97 | % | | +7.06 | % | | +15.10 | % | | +9.02 | % | | +12.31 | % |
Russell 2000 Index | | –9.90 | % | | –13.00 | % | | +5.06 | % | | +14.90 | % | | +4.96 | % | | +8.73 | % |
Dow Jones Wilshire 5000 | | | | | | | | | | | | | | | | | | |
Index | | –9.52 | % | | –5.75 | % | | +6.37 | % | | +12.45 | % | | +3.95 | % | | +9.37 | % |
Russell 1000 Growth Index | | –10.18 | % | | –0.75 | % | | +6.33 | % | | +9.96 | % | | +1.28 | % | | +7.94 | % |
Russell 1000 Value Index | | –8.72 | % | | –9.99 | % | | +6.01 | % | | +13.68 | % | | +5.54 | % | | +10.45 | % |
The performance data quoted represent past performance and do not guarantee future results. The performance stated may have been due to extraordinary market conditions, which may not be duplicated in the future. Current performance may be lower or higher than the performance data quoted. To obtain the most recent month-end performance information for the Primary Class please visit www.leggmason.com/individualinvestors. For the Institutional Class please visit www.lminstitutionalfunds.com. The investment return and principal value of the Fund will fluctuate so that an investor’s shares, when redeemed, may be worth more or less than the original cost. Calculations assume reinvestment of dividends and capital gain distributions. Performance would have been lower if fees had not been waived in various periods.
The fiscal year ended March 31, 2008, was a difficult one for the stock market as the Dow Jones Industrial Average was the only major market index to post a positive return.
A | See Glossary of Index Definitions on page 76. Although it is not possible to invest directly in an index, it is possible to purchase investment vehicles designed to track the performance of certain indices. Past performance does not guarantee future results. |
B | The inception date of the Primary Class is September 1, 1993. The inception date of the Institutional Class is June 14, 2001. Index returns are for the periods beginning August 31, 1993. |
C | This return does not include reinvestment of dividends or capital distributions. |
| | |
| 4 | | Annual Report to Shareholders |
Management’s Discussion of Fund Performance — Continued
Value-based investment styles were especially hard hit during the year, as the Russell 1000 Value Index underperformed the S&P 500 Stock Composite Index (S&P 500) by nearly five percentage points and also underperformed the Russell 1000 Growth Index by over nine percentage points.
The fiscal year began positively with the S&P 500 posting mid-single-digit returns through June 2007. During the summer, and especially in August, deterioration in the subprime mortgage market, which had begun to surface in the spring morphed into a full-blown financial crisis as credit concerns expanded to include more highly rated mortgages and an alphabet soup of structured investment products including collateralized debt obligations (CDO), asset-backed commercial paper (ABCP), mortgage-backed securities (MBS) and the like. Following the Federal Reserve Board’sD (Fed) initial efforts in August to restore liquidity and confidence to the credit markets, the S&P 500 rallied to an all-time high of 1,565.15 on October 9, 2007, five years to the day from its bear market low of 776.76 on October 9, 2002. The financial crisis took a renewed turn for the worse in the December 2007 and March 2008 quarters, as credit spreads on a broad range of fixed-income instruments widened substantially, subprime mortgage delinquency and default rates spiked up, and massive asset write-downs were recorded by a wide range of financial institutions. As the housing market continued to deteriorate and losses on Wall Street mounted, the financial crisis moved from Wall Street to Main Street. Declining stock prices and weakening home prices, coupled with soaring oil and commodity prices, knocked consumer confidence for a loop, causing a slowdown in consumer spending, which has pushed the economy to the brink of recession. From its closing high in October 2007, the S&P 500 dropped 18.4% to a closing low of 1276.60 on March 17, 2008. Since then, the market has rallied somewhat as the Fed-brokered acquisition of Bear Stearns by JPMorgan Chase and its aggressive measures to restore liquidity to the credit markets appears to have steadied the equity market, at least for the time being.
American Leading Companies Trust (ALC) substantially underperformed its primary benchmark, the S&P 500, during the year ended March 31, 2008, declining 16.24% versus a 5.08% decline in the index. ALC also significantly trailed other major market indices and peer fund averages. Roughly half of ALC’s underperformance relative to the S&P 500 was attributable to its financial holdings, where the Fund entered the year with an overweighted position in what proved to be the worst-performing sector of the market in fiscal 2008. ALC’s financial stocks also performed worse than the sector, on average, with Countrywide Financial Corporation, Citigroup Inc., Ambac Financial Group Inc. (sold during the year), American International Group,
D | Federal Reserve Board (Fed) — is charged with, among other things, managing the nation’s monetary policy by influencing the monetary and credit conditions in the economy in pursuit of maximum employment, stable prices, and moderate long-term interest rates. |
| | |
| Annual Report to Shareholders | | 5 |
Inc., Washington Mutual Inc. and XL Capital Ltd. being the most significant negative contributors. Next on the list of detractors from performance were the managed care stocks – UnitedHealth Group Inc., WellPoint Inc. and Health Net Inc. – whose poor showing accounted for about 20% of the shortfall in Fund results versus the S&P 500. Other significant detractors from performance included: Jabil Circuit, Inc., Sprint Nextel Corp., and UAL Corp., which collectively reduced results by about five and one-half percentage points. There were a few bright spots in the portfolio in an otherwise disappointing year. Nokia Oyj – Sponsored ADR was up 42.0% for the fiscal year and contributed about 125 basis pointsE (bps) to performance. In addition, ALC’s energy stocks were up an average of 38.9% versus a 22.1% return for the energy stocks in the S&P 500. This superior stock selection in the energy group helped offset the portfolio’s underweighting in energy versus the benchmark, enabling the portfolio’s energy stocks to match the market’s energy sector in terms of total contribution to return. Finally, despite the fact that consumer discretionary stocks were the second worst-performing sector in the market last year, ALC’s holdings in this group were stronger, on average, and thus contributed positively to relative returns. Amazon.com, Inc. (sold during the year), Apollo Group Inc. (also sold before year end) and The TJX Cos., Inc. were notable positive contributors in this group.
|
| David E. Nelson, CFA |
|
| April 21, 2008 |
| DJIA: 12,825.02 |
E | 100 basis points (bps) = 1% |
| | |
| 6 | | Annual Report to Shareholders |
Expense Example
American Leading Companies Trust
As a shareholder of the Fund, you incur ongoing costs, including management fees, distribution and service (12b-1) fees on Primary Class shares, and other Fund expenses. This example is intended to help you understand your ongoing costs (in dollars) of investing in the Fund and to compare these costs with the ongoing costs of investing in other mutual funds. The example is based on an investment of $1,000 invested on October 1, 2007, and held through March 31, 2008. The ending value assumes dividends were reinvested at the time they were paid.
Actual Expenses
The first line for each class in the table below provides information about actual account values and actual expenses for each class. You may use the information in this line, together with the amount you invested, to estimate the expenses that you paid over the period. Simply divide your account value by $1,000 (for example, an $8,600 account value divided by $1,000 = 8.6), then multiply the result by the number in the first line under the heading entitled “Expenses Paid During the Period” to estimate the expenses you paid on your account if your shares were held through the entire period.
Hypothetical Example for Comparison Purposes
The second line for each class in the table below provides information about hypothetical account values and hypothetical expenses based on the relevant class’s actual expense ratio and an assumed rate of return of 5% per year before expenses, which is not the class’s actual return. The hypothetical account values and expenses may not be used to estimate the actual ending account balance or expenses you paid for the period. You may use this information to compare the ongoing costs of investing in the Fund and other funds. To do so, compare these 5% hypothetical examples with the 5% hypothetical examples for the relevant class that appear in the shareholder reports of other funds.
| | | | | | | | | |
| | | Beginning
Account
Value
10/1/07 | | Ending
Account
Value
3/31/08 | | Expenses PaidA
During the Period
10/1/07 to 03/31/08 |
Primary Class | | | | | | | | | |
Actual | | $ | 1,000.00 | | $ | 785.40 | | $ | 8.17 |
Hypothetical (5% return before expenses) | | | 1,000.00 | | | 1,015.92 | | | 9.22 |
Institutional Class | | | | | | | | | |
Actual | | $ | 1,000.00 | | $ | 789.40 | | $ | 3.53 |
Hypothetical (5% return before expenses) | | | 1,000.00 | | | 1,021.12 | | | 3.99 |
A | These calculations are based on expenses incurred in the most recent fiscal half-year. The dollar amounts shown as “Expenses Paid” are equal to the annualized expense ratios of 1.83% and 0.79% for the Primary Class and Institutional Class respectively, multiplied by the average values over the period, multiplied by the number of days in the most recent fiscal half-year (183) and divided by 366. |
| | |
| Annual Report to Shareholders | | 7 |
Performance Information
American Leading Companies Trust
The graphs on the following pages compare the Fund’s total returns to that of the S&P 500 Stock Composite Index. The graphs illustrate the cumulative total return of an initial $10,000 investment in the Primary Class and an initial $1,000,000 investment in the Institutional Class, for the periods indicated. The lines for the Fund represent the total return after deducting all Fund investment management and other administrative expenses and the transaction costs of buying and selling securities. The lines representing the securities market index do not take into account any transaction costs associated with buying and selling securities in the index or other administrative expenses. Both the Fund’s results and the index’s results assume reinvestment of all dividends and distributions.
Total return measures investment performance in terms of appreciation or depreciation in a fund’s net asset value per share, plus dividends and any capital gain distributions. Average annual returns tend to smooth out variations in a fund’s return, so that they differ from actual year-to-year results.
| | |
| 8 | | Annual Report to Shareholders |
Performance Information — Continued
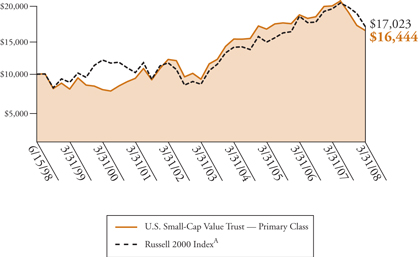
Growth of a $10,000 Investment — Primary Class
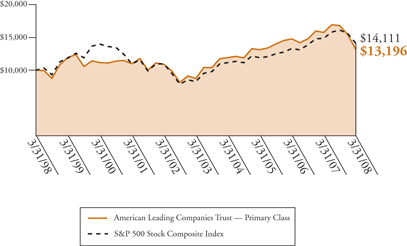
Periods Ended March 31, 2008
| | | | | | |
| | | Cumulative
Total Return | | | Average Annual
Total Return | |
One Year | | –16.24 | % | | –16.24 | % |
Five Years | | +51.19 | % | | +8.62 | % |
Ten Years | | +31.96 | % | | +2.81 | % |
The performance data quoted represent past performance and do not guarantee future results. The performance stated may have been due to extraordinary market conditions, which may not be duplicated in the future. Current performance may be lower or higher than the performance data quoted. To obtain the most recent month-end performance information please visit www.leggmason.com/individual investors. The investment return and principal value of the Fund will fluctuate so that an investor’s shares, when redeemed, may be worth more or less than the original cost. Calculations assume reinvestment of dividends and capital gain distributions. Performance would have been lower if fees had not been waived in various periods.
The graph and table do not reflect the deduction of taxes that a shareholder would pay on Fund distributions or the redemption of Fund shares.
| | |
| Annual Report to Shareholders | | 9 |
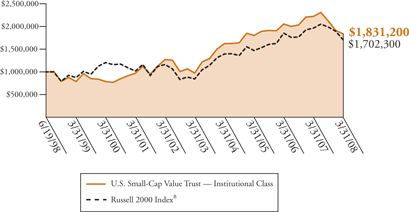
Growth of a $1,000,000 Investment — Institutional Class
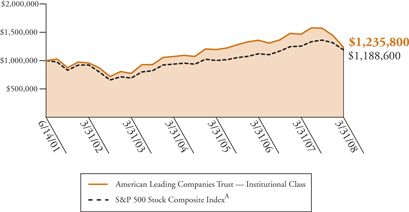
Periods Ended March 31, 2008
| | | | | | |
| | | Cumulative
Total Return | | | Average Annual
Total Return | |
One Year | | –15.37 | % | | –15.37 | % |
Five Years | | +58.99 | % | | +9.72 | % |
Life of Class* | | +23.58 | % | | +3.16 | % |
| * | Inception date: June 14, 2001 |
The performance data quoted represent past performance and do not guarantee future results. The performance stated may have been due to extraordinary market conditions, which may not be duplicated in the future. Current performance may be lower or higher than the performance data quoted. To obtain the most recent month-end performance information please visit www.lminstitutionalfunds.com. The investment return and principal value of the Fund will fluctuate so that an investor’s shares, when redeemed, may be worth more or less than the original cost. Calculations assume reinvestment of dividends and capital gain distributions. Performance would have been lower if fees had not been waived in various periods.
The graph and table do not reflect the deduction of taxes that a shareholder would pay on Fund distributions or the redemption of Fund shares.
A | Index returns are for periods beginning May 31, 2001. |
| | |
| 10 | | Annual Report to Shareholders |
Performance Information — Continued
Portfolio Composition (as of March 31, 2008)B
(As a percentage of the portfolio)
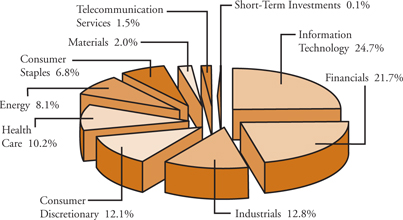
Top Ten Holdings (as of March 31, 2008)
| | | |
Security | | % of
Net Assets | |
J.P. Morgan Chase and Co. | | 5.0 | % |
General Electric Co. | | 3.6 | % |
Yahoo! Inc. | | 3.4 | % |
American International Group Inc. | | 3.3 | % |
Nokia Oyj – ADR | | 3.2 | % |
Philip Morris International Inc. | | 3.0 | % |
International Business Machines Corp. | | 2.9 | % |
Lloyds TSB Group PLC | | 2.9 | % |
Texas Instruments Inc. | | 2.8 | % |
UAL Corp. | | 2.8 | % |
B | The Fund is actively managed. As a result, the composition of its portfolio holdings and sectors is subject to change at any time. |
| | |
| Annual Report to Shareholders | | 11 |
Selected Portfolio Performance C
| | | | | |
Strongest performers for the year ended March 31, 2008D | |
1. | | Apache Corp. | | +72.2 | % |
2. | | Transocean Inc. | | +56.0 | % |
3. | | Devon Energy Corp. | | +51.7 | % |
4. | | Anadarko Petroleum Corp. | | +47.6 | % |
5. | | Nokia Oyj – ADR | | +42.0 | % |
6. | | United States Steel Corp. | | +29.1 | % |
7. | | Noble Corp. | | +26.6 | % |
8. | | The TJX Cos. Inc. | | +24.2 | % |
9. | | International Business Machines Corp. | | +24.0 | % |
10. | | Caterpillar Inc. | | +19.0 | % |
| | | | | |
Weakest performers for the year ended March 31, 2008D | |
1. | | Countrywide Financial Corp. | | –82.9 | % |
2. | | Washington Mutual Inc. | | –73.0 | % |
3. | | Sprint Nextel Corp. | | –64.6 | % |
4. | | XL Capital Ltd. | | –56.6 | % |
5. | | Citigroup Inc. | | –56.3 | % |
6. | | Merrill Lynch and Co. Inc. | | –49.1 | % |
7. | | WellPoint Inc. | | –45.6 | % |
8. | | Pulte Homes Inc. | | –44.4 | % |
9. | | Health Net Inc. | | –42.8 | % |
10. | | Centex Corp. | | –41.8 | % |
Portfolio Changes
| | |
Securities added during the quarter | | Securities sold during the quarter |
Capital One Financial Corp. | | Ambac Financial Group |
Philip Morris International Inc. | | Intel Corp. |
| | XM Satellite Radio Holdings Inc. |
C | Individual security performance is measured by the change in the security’s price; for stocks, dividends are assumed to be reinvested at the time they were paid. |
D | Securities held for the entire year. |
| | |
| 12 | | Annual Report to Shareholders |
Portfolio of Investments
American Leading Companies Trust
March 31, 2008
| | | | | | |
| | | Shares/Par | | Value | |
Common Stocks and Equity Interests — 100.1% | | | | | | |
Consumer Discretionary — 12.1% | | | | | | |
Automobiles — 0.7% | | | | | | |
General Motors Corp. | | 235,000 | | $ | 4,476,750 | |
| | | | | | |
Household Durables — 3.4% | | | | | | |
Centex Corp. | | 180,000 | | | 4,357,800 | |
Lennar Corp. | | 415,000 | | | 7,806,150 | |
Pulte Homes Inc. | | 570,000 | | | 8,293,500 | |
| | | | | | |
| | | | | 20,457,450 | |
| | | | | | |
Internet and Catalog Retail — 1.1% | | | | | | |
Expedia Inc. | | 300,000 | | | 6,567,000 | A |
| | | | | | |
Media — 3.6% | | | | | | |
The DIRECTV Group Inc. | | 600,000 | | | 14,874,000 | A |
Time Warner Inc. | | 480,000 | | | 6,729,600 | |
| | | | | | |
| | | | | 21,603,600 | |
| | | | | | |
Multiline Retail — 1.4% | | | | | | |
Sears Holdings Corp. | | 80,000 | | | 8,167,200 | A |
| | | | | | |
Specialty Retail — 1.9% | | | | | | |
The TJX Cos. Inc. | | 340,000 | | | 11,243,800 | |
| | | | | | |
Consumer Staples — 6.8% | | | | | | |
Beverages — 1.1% | | | | | | |
The Pepsi Bottling Group Inc. | | 200,000 | | | 6,782,000 | |
| | | | | | |
Food Products — 1.4% | | | | | | |
Kraft Foods Inc. | | 276,809 | | | 8,583,847 | |
| | | | | | |
| | |
| Annual Report to Shareholders | | 13 |
| | | | | | |
| | | Shares/Par | | Value | |
Consumer Staples — Continued | | | | | | |
Tobacco — 4.3% | | | | | | |
Altria Group Inc. | | 350,000 | | $ | 7,770,000 | |
Philip Morris International Inc. | | 350,000 | | | 17,703,000 | A |
| | | | | | |
| | | | | 25,473,000 | |
| | | | | | |
Energy — 8.1% | | | | | | |
Energy Equipment and Services — 3.6% | | | | | | |
Baker Hughes Inc. | | 71,000 | | | 4,863,500 | |
Noble Corp. | | 175,000 | | | 8,692,250 | |
Transocean Inc. | | 58,000 | | | 7,841,600 | A |
| | | | | | |
| | | | | 21,397,350 | |
| | | | | | |
Oil, Gas and Consumable Fuels — 4.5% | | | | | | |
Anadarko Petroleum Corp. | | 94,000 | | | 5,924,820 | |
Apache Corp. | | 70,000 | | | 8,457,400 | |
Devon Energy Corp. | | 100,000 | | | 10,433,000 | |
Exxon Mobil Corp. | | 30,000 | | | 2,537,400 | |
| | | | | | |
| | | | | 27,352,620 | |
| | | | | | |
Financials — 21.7% | | | | | | |
Capital Markets — 1.4% | | | | | | |
Merrill Lynch and Co. Inc. | | 100,000 | | | 4,074,000 | |
Morgan Stanley | | 90,000 | | | 4,113,000 | |
| | | | | | |
| | | | | 8,187,000 | |
| | | | | | |
Commercial Banks — 2.9% | | | | | | |
Lloyds TSB Group PLC | | 1,950,000 | | | 17,454,011 | |
| | | | | | |
Consumer Finance — 0.5% | | | | | | |
Capital One Financial Corp. | | 60,000 | | | 2,953,200 | |
| | | | | | |
| | |
| 14 | | Annual Report to Shareholders |
Portfolio of Investments — Continued
American Leading Companies Trust — Continued
| | | | | | |
| | | Shares/Par | | Value | |
Financials — Continued | | | | | | |
Diversified Financial Services — 9.6% | | | | | | |
Bank of America Corp. | | 395,000 | | $ | 14,974,450 | |
Citigroup Inc. | | 597,500 | | | 12,798,450 | |
J.P. Morgan Chase and Co. | | 700,000 | | | 30,065,000 | |
| | | | | | |
| | | | | 57,837,900 | |
| | | | | | |
Insurance — 5.4% | | | | | | |
American International Group Inc. | | 450,000 | | | 19,462,500 | |
The Travelers Cos. Inc. | | 190,000 | | | 9,091,500 | |
XL Capital Ltd. | | 140,000 | | | 4,137,000 | |
| | | | | | |
| | | | | 32,691,000 | |
| | | | | | |
Thrifts and Mortgage Finance — 1.9% | | | | | | |
Countrywide Financial Corp. | | 1,330,000 | | | 7,315,000 | |
Washington Mutual Inc. | | 373,000 | | | 3,841,900 | |
| | | | | | |
| | | | | 11,156,900 | |
| | | | | | |
Health Care — 10.3% | | | | | | |
Biotechnology — 1.1% | | | | | | |
Amgen Inc. | | 160,000 | | | 6,684,800 | A |
Health Care Providers and Services — 6.0% | | | | | | |
Health Net Inc. | | 268,000 | | | 8,254,400 | A |
UnitedHealth Group Inc. | | 480,000 | | | 16,492,800 | |
WellPoint Inc. | | 250,000 | | | 11,032,500 | A |
| | | | | | |
| | | | | 35,779,700 | |
| | | | | | |
Pharmaceuticals — 3.2% | | | | | | |
Johnson and Johnson | | 180,000 | | | 11,676,600 | |
Pfizer Inc. | | 350,000 | | | 7,325,500 | |
| | | | | | |
| | | | | 19,002,100 | |
| | | | | | |
| | |
| Annual Report to Shareholders | | 15 |
| | | | | | |
| | | Shares/Par | | Value | |
Industrials — 12.8% | | | | | | |
Aerospace and Defense — 4.9% | | | | | | |
General Dynamics Corp. | | 180,000 | | $ | 15,006,600 | |
Lockheed Martin Corp. | | 145,000 | | | 14,398,500 | |
| | | | | | |
| | | | | 29,405,100 | |
| | | | | | |
Airlines — 2.8% | | | | | | |
UAL Corp. | | 770,000 | | | 16,578,100 | |
| | | | | | |
Industrial Conglomerates — 3.6% | | | | | | |
General Electric Co. | | 585,000 | | | 21,650,850 | |
| | | | | | |
Machinery — 1.5% | | | | | | |
Caterpillar Inc. | | 119,000 | | | 9,316,510 | |
| | | | | | |
Information Technology — 24.8% | | | | | | |
Communications Equipment — 3.2% | | | | | | |
Nokia Oyj — ADR | | 599,703 | | | 19,088,546 | |
| | | | | | |
Computers and Peripherals — 5.6% | | | | | | |
Hewlett-Packard Co. | | 350,000 | | | 15,981,000 | |
International Business Machines Corp. | | 152,000 | | | 17,501,280 | |
| | | | | | |
| | | | | 33,482,280 | |
| | | | | | |
Electronic Equipment and Instruments — 2.6% | | | | | | |
Flextronics International Ltd. | | 575,000 | | | 5,399,250 | A |
Jabil Circuit Inc. | | 1,100,000 | | | 10,406,000 | |
| | | | | | |
| | | | | 15,805,250 | |
| | | | | | |
Internet Software and Services — 5.4% | | | | | | |
eBay Inc. | | 400,000 | | | 11,936,000 | A |
Yahoo! Inc. | | 700,000 | | | 20,251,000 | A |
| | | | | | |
| | | | | 32,187,000 | |
| | | | | | |
| | |
| 16 | | Annual Report to Shareholders |
Portfolio of Investments — Continued
American Leading Companies Trust — Continued
| | | | | | |
| | | Shares/Par | | Value |
Information Technology — Continued | | | | | | |
IT Services — 1.5% | | | | | | |
Accenture Ltd. | | | 250,000 | | $ | 8,792,500 |
| | | | | | |
Semiconductors and Semiconductor Equipment — 4.6% | | | | | | |
Applied Materials Inc. | | | 550,000 | | | 10,730,500 |
Texas Instruments Inc. | | | 600,000 | | | 16,962,000 |
| | | | | | |
| | | | | | 27,692,500 |
| | | | | | |
Software — 1.9% | | | | | | |
Microsoft Corp. | | | 405,000 | | | 11,493,900 |
| | | | | | |
Materials — 2.0% | | | | | | |
Metals and Mining — 2.0% | | | | | | |
Alcoa Inc. | | | 50,000 | | | 1,803,000 |
United States Steel Corp. | | | 80,000 | | | 10,149,600 |
| | | | | | |
| | | | | | 11,952,600 |
| | | | | | |
Telecommunication Services — 1.5% | | | | | | |
Wireless Telecommunication Services — 1.5% | | | | | | |
Sprint Nextel Corp. | | | 1,300,000 | | | 8,697,000 |
| | | | | | |
Total Common Stocks and Equity Interests
(Cost — $451,492,547) | | | | | | 599,993,364 |
| | | | | | |
Repurchase Agreements — 0.1% | | | | | | |
| | |
Goldman Sachs & Co. | | | | | | |
2.60%, dated 3/31/08, to be repurchased at $338,466 on 4/1/08 (Collateral: $348,158 Fannie Mae mortgage-backed securities, 5.00% due 10/1/35, value $346,998) | | $ | 338,442 | | | 338,442 |
| | |
| Annual Report to Shareholders | | 17 |
| | | | | | | |
| | | Shares/Par | | Value | |
| | | | | | | |
JPMorgan Chase and Co.
2.30%, dated 3/31/08, to be repurchased at $338,464 on 4/1/08 (Collateral: $334,000 Fannie Mae note, 5.25%, due 1/15/09, value $345,634) | | $ | 338,442 | | $ | 338,442 | |
| | | | | | | |
Total Repurchase Agreements (Cost — $676,884) | | | | | | 676,884 | |
| | | | | | | |
Total Investments — 100.2% (Cost — $452,169,431)B | | | | | | 600,670,248 | |
Other Assets Less Liabilities — (0.2)% | | | | | | (925,299 | ) |
| | | | | | | |
Net Assets — 100.0% | | | | | $ | 599,744,949 | |
| | | | | | | |
B | At March 31, 2008, the aggregate gross unrealized appreciation and depreciation of investments for federal income tax purposes were substantially as follows: |
| | | | |
Gross unrealized appreciation | | $ | 202,481,431 | |
| |
Gross unrealized depreciation | | | (56,662,698 | ) |
| | | | |
| |
Net unrealized appreciation | | $ | 145,818,733 | |
| | | | |
| ADR | — American Depository Receipt |
See notes to financial statements.
| | |
| 18 | | Annual Report to Shareholders |
Statement of Assets and Liabilities
American Leading Companies Trust
March 31, 2008
| | | | | | | |
Assets: | | | | | | | |
Investment securities at market value
(Cost – $451,492,547) | | | | | $ | 599,993,364 | |
Short-term securities at value (Cost – $676,884) | | | | | | 676,884 | |
Receivable for securities sold | | | | | | 1,976,676 | |
Dividends and interest receivable | | | | | | 1,542,971 | |
Receivable for fund shares sold | | | | | | 264,265 | |
Other assets | | | | | | 6,976 | |
| | | | | | | |
Total assets | | | | | | 604,461,136 | |
| | |
Liabilities: | | | | | | | |
Payable for fund shares repurchased | | $ | 3,587,021 | | | | |
Accrued distribution and service fees | | | 462,844 | | | | |
Accrued management fee | | | 365,256 | | | | |
Accrued expenses | | | 301,066 | | | | |
| | | | | | | |
Total liabilities | | | | | | 4,716,187 | |
| | | | | | | |
Net Assets | | | | | $ | 599,744,949 | |
| | | | | | | |
Net assets consist of: | | | | | | | |
Accumulated paid-in-capital | | | | | $ | 456,037,128 | |
Undistributed net investment income | | | | | | 1,667,958 | |
Accumulated net realized loss on investments and foreign currency transactions | | | | | | (6,456,548 | ) |
Unrealized appreciation of investments | | | | | | 148,496,411 | |
| | | | | | | |
Net Assets | | | | | $ | 599,744,949 | |
| | | | | | | |
Net Asset Value Per Share: | | | | | | | |
Primary Class (27,216,359 shares outstanding) | | | | | $ | 19.52 | |
| | | | | | | |
Institutional Class (3,332,677 shares outstanding) | | | | | $ | 20.57 | |
| | | | | | | |
See notes to financial statements.
| | |
| Annual Report to Shareholders | | 19 |
Statement of Operations
American Leading Companies Trust
For the Year Ended March 31, 2008
| | | | | | | | |
Investment Income: | | | | | | | | |
Dividends | | $ | 15,360,674 | | | | | |
Interest | | | 328,048 | | | | | |
Less: Foreign taxes withheld | | | (81,087 | ) | | | | |
| | | | | | | | |
Total income | | | | | | $ | 15,607,635 | |
| | |
Expenses: | | | | | | | | |
Management fees | | | 5,590,730 | | | | | |
Distribution and service fees: | | | | | | | | |
Primary Class | | | 7,223,571 | | | | | |
Audit and legal fees | | | 40,292 | | | | | |
Custodian fees | | | 94,214 | | | | | |
Directors’ fees and expenses | | | 67,300 | | | | | |
Registration fees | | | 43,904 | | | | | |
Reports to shareholders | | | 195,027 | | | | | |
Transfer agent and shareholder servicing expense: | | | | | | | | |
Primary Class | | | 469,530 | | | | | |
Institutional Class | | | 15,264 | | | | | |
Other expenses | | | 78,985 | | | | | |
| | | | | | | | |
| | | 13,818,817 | | | | | |
Less: Compensating balance credits | | | (5,076 | ) | | | | |
| | | | | | | | |
Net expenses | | | | | | | 13,813,741 | |
| | | | | | | | |
Net Investment Income | | | | | | | 1,793,894 | |
| | |
Net Realized and Unrealized Gain/(Loss) on Investments: | | | | | | | | |
| | |
Net realized gain on: | | | | | | | | |
Investments | | | 38,762,908 | | | | | |
Foreign currency transactions | | | 20,912 | | | | | |
| | | | | | | | |
| | | | | | | 38,783,820 | |
| | | | | | | | |
Change in unrealized appreciation/(depreciation) of: | | | | | | | | |
Investments | | | (160,516,555 | ) | | | | |
Assets and liabilities denominated in foreign currency | | | (21,681 | ) | | | | |
| | | | | | | | |
| | | | | | | (160,538,236 | ) |
| | | | | | | | |
Net Realized and Unrealized Loss on Investments | | | | | | | (121,754,416 | ) |
| | | | | | | | |
Change in Net Assets Resulting From Operations | | | | | | $ | (119,960,522 | ) |
| | | | | | | | |
See notes to financial statements.
| | |
| 20 | | Annual Report to Shareholders |
Statement of Changes in Net Assets
American Leading Companies Trust
| | | | | | | | |
| | | For the Year Ended
March 31, 2008 | | | For the Year Ended
March 31, 2007 | |
Change in Net Assets: | | | | | | | | |
| | |
Net investment income (loss) | | $ | 1,793,894 | | | $ | (1,390,777 | ) |
| | |
Net realized gain | | | 38,783,820 | | | | 32,569,446 | |
| | |
Change in unrealized appreciation/ (depreciation) | | | (160,538,236 | ) | | | 20,679,721 | |
| | | | | | | | |
Change in net assets resulting from operations | | | (119,960,522 | ) | | | 51,858,390 | |
| | |
Distributions to shareholders from: | | | | | | | | |
Net investment income: | | | | | | | | |
Primary Class | | | — | | | | (442,116 | ) |
Institutional Class | | | — | | | | (122,938 | ) |
Net realized gain on investments: | | | | | | | | |
Primary Class | | | (44,369,956 | ) | | | (39,878,038 | ) |
Institutional Class | | | (4,690,375 | ) | | | (1,711,197 | ) |
| | |
Change in net assets from fund share transactions: | | | | | | | | |
Primary Class | | | (82,074,308 | ) | | | (2,542,988 | ) |
Institutional Class | | | 13,294,031 | | | | 31,278,504 | |
| | | | | | | | |
Change in net assets | | | (237,801,130 | ) | | | 38,439,617 | |
| | |
Net Assets: | | | | | | | | |
| | |
Beginning of year | | | 837,546,079 | | | | 799,106,462 | |
| | | | | | | | |
End of year | | $ | 599,744,949 | | | $ | 837,546,079 | |
| | | | | | | | |
Undistributed net investment income and overdistributed net investment income, respectively | | $ | 1,667,958 | | | $ | (47,362 | ) |
| | | | | | | | |
See notes to financial statements.
| | |
| Annual Report to Shareholders | | 21 |
Financial Highlights
American Leading Companies Trust
For a share of each class of capital stock outstanding:
Primary Class:
| | | | | | | | | | | | | | | | | | | | |
| | | Years Ended March 31, | |
| | | 2008 | | | 2007 | | | 2006 | | | 2005 | | | 2004 | |
Net asset value, beginning of year | | $ | 24.87 | | | $ | 24.59 | | | $ | 21.85 | | | $ | 19.85 | | | $ | 14.54 | |
| | | | | | | | | | | | | | | | | | | | |
Investment operations: | | | | | | | | | | | | | | | | | | | | |
Net investment income/(loss) | | | .03 | A | | | (.06 | )A | | | .01 | | | | — | B | | | .01 | |
Net realized and unrealized gain/(loss) | | | (3.81 | ) | | | 1.64 | | | | 2.73 | | | | 2.01 | | | | 5.30 | |
| | | | | | | | | | | | | | | | | | | | |
Total from investment operations | | | (3.78 | ) | | | 1.58 | | | | 2.74 | | | | 2.01 | | | | 5.31 | |
| | | | | | | | | | | | | | | | | | | | |
Distributions from: | | | | | | | | | | | | | | | | | | | | |
Net investment income | | | — | | | | (.01 | ) | | | — | | | | (.01 | ) | | | — | B |
Net realized gain on investments | | | (1.57 | ) | | | (1.29 | ) | | | — | | | | — | | | | — | |
| | | | | | | | | | | | | | | | | | | | |
Total distributions | | | (1.57 | ) | | | (1.30 | ) | | | — | | | | (.01 | ) | | | — | |
| | | | | | | | | | | | | | | | | | | | |
Net asset value, end of year | | $ | 19.52 | | | $ | 24.87 | | | $ | 24.59 | | | $ | 21.85 | | | $ | 19.85 | |
| | | | | | | | | | | | | | | | | | | | |
Total return | | | (16.24 | )% | | | 6.68 | % | | | 12.54 | % | | | 10.12 | % | | | 36.54 | % |
| | | | | |
Ratios to Average Net Assets:C | | | | | | | | | | | | | | | | | | | | |
Total expenses | | | 1.83 | % | | | 1.85 | % | | | 1.86 | % | | | 1.88 | % | | | 1.90 | % |
Expenses net of waivers, if any | | | 1.83 | % | | | 1.85 | % | | | 1.86 | % | | | 1.88 | % | | | 1.90 | % |
Expenses net of all reductions | | | 1.83 | % | | | 1.85 | % | | | 1.86 | % | | | 1.88 | % | | | 1.90 | % |
Net investment income (loss) | | | .12 | % | | | (.23 | )% | | | .04 | % | | | (.01 | )% | | | .05 | % |
Supplemental Data: | | | | | | | | | | | | | | | | | | | | |
Portfolio turnover rate | | | 28.4 | % | | | 19.0 | % | | | 14.3 | % | | | 19.4 | % | | | 19.6 | % |
Net assets, end of year (in thousands) | | $ | 531,186 | | | $ | 765,000 | | | $ | 757,630 | | | $ | 654,019 | | | $ | 585,295 | |
| | | | | | | | | | | | | | | | | | | | |
A | Computed using average daily shares outstanding. |
B | Amount less than $.01 per share. |
C | Total expenses reflects operating expenses prior to any voluntary expense waivers and/or compensating balance credits. Expenses net of waivers reflects total expenses before compensating balance credits but net of any voluntary expense waivers. Expenses net of all reductions reflects expenses less any compensating balance credits and/or voluntary expense waivers. |
See notes to financial statements.
| | |
| 22 | | Annual Report to Shareholders |
Financial Highlights — Continued
American Leading Companies Trust
Institutional Class:
| | | | | | | | | | | | | | | | | | | | |
| | | Years Ended March 31, | |
| | | 2008 | | | 2007 | | | 2006 | | | 2005 | | | 2004 | |
Net asset value, beginning of year | | $ | 25.86 | | | $ | 25.33 | | | $ | 22.34 | | | $ | 20.28 | | | $ | 14.83 | |
| | | | | | | | | | | | | | | | | | | | |
Investment operations: | | | | | | | | | | | | | | | | | | | | |
Net investment income | | | .31 | A | | | .23 | A | | | .22 | | | | .21 | | | | .20 | |
Net realized and unrealized gain/(loss) | | | (4.03 | ) | | | 1.67 | | | | 2.82 | | | | 2.06 | | | | 5.42 | |
| | | | | | | | | | | | | | | | | | | | |
Total from investment operations | | | (3.72 | ) | | | 1.90 | | | | 3.04 | | | | 2.27 | | | | 5.62 | |
| | | | | | | | | | | | | | | | | | | | |
Distributions from: | | | | | | | | | | | | | | | | | | | | |
Net investment income | | | — | | | | (.08 | ) | | | (.05 | ) | | | (.21 | ) | | | (.17 | ) |
Net realized gain on investments | | | (1.57 | ) | | | (1.29 | ) | | | — | | | | — | | | | — | |
| | | | | | | | | | | | | | | | | | | | |
Total distributions | | | (1.57 | ) | | | (1.37 | ) | | | (.05 | ) | | | (.21 | ) | | | (.17 | ) |
| | | | | | | | | | | | | | | | | | | | |
Net asset value, end of year | | $ | 20.57 | | | $ | 25.86 | | | $ | 25.33 | | | $ | 22.34 | | | $ | 20.28 | |
| | | | | | | | | | | | | | | | | | | | |
Total return | | | (15.37 | )% | | | 7.77 | % | | | 13.63 | % | | | 11.21 | % | | | 37.96 | % |
| | | | | |
Ratios to Average Net Assets:C | | | | | | | | | | | | | | | | | | | | |
Total expenses | | | .79 | % | | | .82 | % | | | .84 | % | | | .90 | % | | | .85 | % |
Expenses net of waivers, if any | | | .79 | % | | | .82 | % | | | .84 | % | | | .90 | % | | | .85 | % |
Expenses net of all reductions | | | .79 | % | | | .82 | % | | | .84 | % | | | .90 | % | | | .85 | % |
Net investment income | | | 1.22 | % | | | .90 | % | | | 1.09 | % | | | .99 | % | | | 1.14 | % |
Supplemental Data: | | | | | | | | | | | | | | | | | | | | |
Portfolio turnover rate | | | 28.4 | % | | | 19.0 | % | | | 14.3 | % | | | 19.4 | % | | | 19.6 | % |
Net assets, end of year (in thousands) | | $ | 68,559 | | | $ | 72,546 | | | $ | 41,476 | | | $ | 21,386 | | | $ | 16,996 | |
| | | | | | | | | | | | | | | | | | | | |
See notes to financial statements.
| | |
| Annual Report to Shareholders | | 23 |
Management’s Discussion of Fund Performance
U.S. Small-Capitalization Value Trust
Total returns for the U.S. Small-Capitalization Value Trust (“Fund”) for various periods ended March 31, 2008, are presented below, along with those of some comparative indicesA:
| | | | | | | | | | | | | | | |
| | | | | | | | | Average Annual Total Returns
Through March 31, 2008 | |
| | | First Quarter
2008 | | | One
Year | | | Three
Years | | | Five
Years | | | Since
InceptionB | |
U.S. Small-Cap Value Trust | | | | | | | | | | | | | | | |
Primary Class | | –4.23 | % | | –17.94 | % | | –0.37 | % | | +12.17 | % | | +5.21 | % |
Institutional Class | | –4.00 | % | | –17.17 | % | | +0.63 | % | | +13.37 | % | | +6.39 | % |
Russell 1000 Index | | –9.48 | % | | –5.40 | % | | +6.19 | % | | +11.86 | % | | +4.02 | % |
Russell 1000 Growth Index | | –10.18 | % | | –0.75 | % | | +6.33 | % | | +9.96 | % | | +1.46 | % |
Russell 1000 Value Index | | –8.72 | % | | –9.99 | % | | +6.01 | % | | +13.68 | % | | +5.72 | % |
Russell 2000 Index | | –9.90 | % | | –13.00 | % | | +5.06 | % | | +14.90 | % | | +5.58 | % |
Russell 2000 Value Index | | –6.53 | % | | –16.88 | % | | +4.33 | % | | +15.45 | % | | +7.93 | % |
Russell 2500 Index | | –9.37 | % | | –11.27 | % | | +6.01 | % | | +15.67 | % | | +7.49 | % |
Russell 2500 Value Index | | –7.22 | % | | –16.54 | % | | +4.41 | % | | +15.56 | % | | +8.36 | % |
Russell Midcap Index | | –9.98 | % | | –8.92 | % | | +7.36 | % | | +16.31 | % | | +8.11 | % |
Russell Midcap Value Index | | –8.64 | % | | –14.12 | % | | +6.57 | % | | +16.77 | % | | +8.62 | % |
S&P 500 Stock Composite Index | | –9.44 | % | | –5.08 | % | | +5.85 | % | | +11.32 | % | | +3.64 | % |
The performance data quoted represent past performance and do not guarantee future results. The performance stated may have been due to extraordinary market conditions, which may not be duplicated in the future. Current performance may be lower or higher than the performance data quoted. To obtain the most recent month-end performance information for the Primary Class please visit www.leggmason.com/individual investors. For the Institutional Class please visit www.lminstitutionalfunds.com. The investment return and principal value of the Fund will fluctuate so that an investor’s shares, when redeemed, may be worth more or less than the original cost. Calculations assume reinvestment of dividends and capital gain distributions. Performance would have been lower if fees had not been waived in various periods.
The last 12 months have been an extraordinary period for the U.S. economy and for global financial markets. The relative calm of a year ago was disrupted by a series of unanticipated crises, originating primarily from the collapsing U.S. housing market.
A | See Glossary of Index Definitions on page 76. Although it is not possible to invest directly in an index, it is possible to purchase investment vehicles designed to track the performance of certain indices. Past performance does not guarantee future results. |
B | The inception date of the Primary Class is June 15, 1998. The inception date of the Institutional Class is June 19, 1998. Index returns are for the periods beginning May 31, 1998. |
| | |
| 24 | | Annual Report to Shareholders |
Management’s Discussion of Fund Performance — Continued
Declining U.S. home prices severely impaired the mortgage market and its problem then spread throughout the financial world to infect various banks (domestically and globally), hedge funds, the municipal bond market, investment banks, and money market funds. Investors, financial institutions, and regulators seemed constantly caught off guard by the pervasive impact that the declining value of mortgages had on global financial markets.
U.S. equity returns reflected the troubled times, as stock prices fell through much of the period, including the latest quarter. For the 12 months, larger stocks declined the least, with the S&P 500 Index off –5.1% and the Russell 1000 Index down –5.4%, while the Russell 2000 Index dropped –13.0% and the Russell 2000 Value Index retreated –16.9%. Value stocks also trailed growth over the year, although smaller cap stocks and value stocks performed better relatively in the most recent quarter. The financial stocks were some of the worst performers this last year, reflecting the turmoil among these companies while consumer durable and retailer stock suffered as consumer spending slowed. Materials, commodity, and energy stocks performed quite well as continued global growth pushed demand and prices for their products.
Monetary authorities, particularly the U.S. Federal Reserve Board (Fed)C, moved aggressively to maintain financial stability. In addition to supporting the Bear Stearns rescue by JPMorgan, the Fed took the historic action of broadening its practices to allow for direct lending to investment banks. The Fed also cut short rates on March 18, 2008 to 2.25%, a full 3.0% reduction from a year ago. As the first quarter of 2008 closed, these measures seemed to succeed, at least for the short-run, in restoring liquidity and relieving stress in the financial markets. News on the economic front also deteriorated over the last year as mortgage delinquencies and foreclosures continued to rise and housing prices continued to fall. Additional reports confirmed that the slowdown was moving from Wall Street to the broader economy as consumer confidence fell, retail sales were weak, and employment softened. The Fed also had to contend with inflation as energy, grains, and other commodities traded near record levels, compounded by a weaker dollar. Globally, economic news was mixed, but growth seemed more resilient outside the U.S.
Over the last year, the Fund’s return trailed the returns for the Russell 2000 Index and Russell 2000 Value Index. The Fund has generally been underweight in the materials stocks, including steel and fertilizer producers, which hurt performance, but overweight in energy services firms, which helped to offset those losses. One negative for the Fund was that its industrial holdings have not benefited as much from the resilient global
C | Federal Reserve Board (Fed) – is charged with, among other things, managing the nation’s monetary policy by influencing the monetary and credit conditions in the economy in pursuit of maximum employment, stable prices, and moderate long-term interest rates. |
| | |
| Annual Report to Shareholders | | 25 |
economy as the typical small cap industrial and its holdings’ returns lagged. In the financial sector, the Fund’s significant position in the mortgage lenders was a negative for it as this group was one of the worst performers for the year. On the other hand, the Fund’s small-cap banks and insurance companies held up relatively well and benefited the Fund’s performance. Finally, utility stocks have been defensive in this difficult year, and the Fund both had an overweight position in these stocks and our holdings performed better than the typical small-cap utility.
During the last year, we reduced the Fund’s holdings in consumer discretionary stocks, while increasing our weighting in energy and information technology stocks. These changes have been the result of both the relative performance of each group and the changes to their valuation within our quantitative models. Our weight in the financial sector is relatively unchanged and this remains the largest sector in about a third of the portfolio.
|
Henry Otto |
Steve Tonkovich |
|
April 24, 2008 |
DJIA: 12,848.95 |
| | |
| 26 | | Annual Report to Shareholders |
Expense Example
U.S. Small-Capitalization Value Trust
As a shareholder of the Fund, you incur ongoing costs, including management fees, distribution and service (12b-1) fees on Primary Class shares, and other Fund expenses. This example is intended to help you understand your ongoing costs (in dollars) of investing in the Fund and to compare these costs with the ongoing costs of investing in other mutual funds. The example is based on an investment of $1,000 invested on October 1, 2007, and held through March 31, 2008. The ending value assumes dividends were reinvested at the time they were paid.
Actual Expenses
The first line for each class in the table below provides information about actual account values and actual expenses for each class. You may use the information in this line, together with the amount you invested, to estimate the expenses that you paid over the period. Simply divide your account value by $1,000 (for example, an $8,600 account value divided by $1,000 = 8.6), then multiply the result by the number in the first line under the heading entitled “Expenses Paid During the Period” to estimate the expenses you paid on your account if your shares were held through the entire period.
Hypothetical Example for Comparison Purposes
The second line for each class in the table below provides information about hypothetical account values and hypothetical expenses based on the relevant class’s actual expense ratio and an assumed rate of return of 5% per year before expenses, which is not the class’s actual return. The hypothetical account values and expenses may not be used to estimate the actual ending account balance or expenses you paid for the period. You may use this information to compare the ongoing costs of investing in the Fund and other funds. To do so, compare these 5% hypothetical examples with the 5% hypothetical examples for the relevant class that appear in the shareholder reports of other funds.
| | | | | | | | | |
| | | Beginning
Account
Value
10/1/07 | | Ending
Account
Value
3/31/08 | | Expenses PaidA
During the
Period
10/1/07 to 3/31/08 |
Primary Class: | | | | | | | | | |
Actual | | $ | 1,000.00 | | $ | 862.30 | | $ | 9.31 |
Hypothetical (5% return before expenses) | | | 1,000.00 | | | 1,015.07 | | | 10.08 |
| | | |
Institutional Class: | | | | | | | | | |
Actual | | $ | 1,000.00 | | $ | 866.60 | | $ | 4.67 |
Hypothetical (5% return before expenses) | | | 1,000.00 | | | 1,020.07 | | | 5.05 |
| A | These calculations are based on expenses incurred in the most recent fiscal half-year. The dollar amounts shown as “Expenses Paid” are equal to the annualized expense ratios of 2.00% and 1.00% for the Primary Class and Institutional Class respectively, multiplied by the average values over the period, multiplied by the number of days in the most recent fiscal half-year (183) and divided by 366. |
| | |
| Annual Report to Shareholders | | 27 |
Performance Information
U.S. Small-Capitalization Value Trust
The graphs on the following pages compare the Fund’s total returns to that of the Russell 2000 Index. The graphs illustrate the cumulative total return of an initial $10,000 investment in the Primary Class and an initial $1,000,000 investment in the Institutional Class, for the periods indicated. The lines for the Fund represent the total return after deducting all Fund investment management and other administrative expenses and the transaction costs of buying and selling securities. The lines representing the securities market index do not take into account any transaction costs associated with buying and selling securities in the index or other administrative expenses. Both the Fund’s results and the index’s results assume reinvestment of all dividends and distributions.
Total return measures investment performance in terms of appreciation or depreciation in a fund’s net asset value per share, plus dividends and any capital gain distributions. Average annual returns tend to smooth out variations in a fund’s return, so that they differ from actual year-to-year results.
| | |
| 28 | | Annual Report to Shareholders |
Performance Information — Continued
Growth of a $10,000 Investment — Primary Class
Periods Ended March 31, 2008
| | | | | | |
| | | Cumulative
Total Return | | | Average Annual
Total Return | |
One Year | | -17.94 | % | | -17.94 | % |
Five Years | | +77.54 | % | | +12.17 | % |
Life of Class* | | +64.44 | % | | +5.21 | % |
| | | | | | |
| * | Inception date: June 15, 1998 |
The performance data quoted represent past performance and do not guarantee future results. The performance stated may have been due to extraordinary market conditions, which may not be duplicated in the future. Current performance may be lower or higher than the performance data quoted. To obtain the most recent month-end performance information please visit www.leggmason.com/individual investors. The investment return and principal value of the Fund will fluctuate so that an investor’s shares, when redeemed, may be worth more or less than the original cost. Calculations assume reinvestment of dividends and capital gain distributions. Performance would have been lower if fees had not been waived in various periods.
The graph and table do not reflect the deduction of taxes that a shareholder would pay on Fund distributions or the redemption of Fund shares.
A | Index returns are for periods beginning May 31, 1998. |
| | |
| Annual Report to Shareholders | | 29 |
Growth of a $1,000,000 Investment — Institutional Class
Periods Ended March 31, 2008
| | | | | | |
| | | Cumulative
Total Return | | | Average Annual
Total Return | |
One Year | | -17.17 | % | | -17.17 | % |
Five Years | | +87.29 | % | | +13.37 | % |
Life of Class* | | +83.20 | % | | +6.39 | % |
| | | | | | |
| * | Inception date: June 19, 1998 |
The performance data quoted represent past performance and do not guarantee future results. The performance stated may have been due to extraordinary market conditions, which may not be duplicated in the future. Current performance may be lower or higher than the performance data quoted. To obtain the most recent month-end performance information please visit www.lminstitutionalfunds.com. The investment return and principal value of the Fund will fluctuate so that an investor’s shares, when redeemed, may be worth more or less than the original cost. Calculations assume reinvestment of dividends and capital gain distributions. Performance would have been lower if fees had not been waived in various periods.
The graph and table do not reflect the deduction of taxes that a shareholder would pay on Fund distributions or the redemption of Fund shares.
B | Index returns are for periods beginning June 30, 1998. |
| | |
| 30 | | Annual Report to Shareholders |
Performance Information — Continued
Portfolio Composition (as of March 31, 2008)C
(As a percentage of the portfolio)
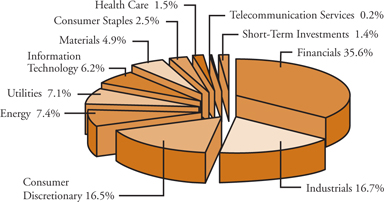
Top Ten Holdings (as of March 31, 2008)
| | | |
Security | | % of
Net Assets | |
Odyssey Re Holdings Corp. | | 1.4 | % |
Westar Energy Inc. | | 1.3 | % |
Con-way Inc. | | 1.3 | % |
SkyWest Inc. | | 1.2 | % |
Del Monte Foods Co. | | 1.1 | % |
Rent-A-Center Inc. | | 1.1 | % |
Stone Energy Corp. | | 1.1 | % |
StanCorp Financial Group Inc. | | 1.1 | % |
Atmos Energy Corp. | | 1.1 | % |
Hanover Insurance Group Inc. | | 1.1 | % |
C | The Fund is actively managed. As a result, the composition of its portfolio holdings and sectors is subject to change at any time. |
| | |
| Annual Report to Shareholders | | 31 |
Selected Portfolio Performance D
| | | | | |
Strongest performers for the year ended March 31, 2008E | |
1. | | GrafTech International Ltd. | | +78.5 | % |
2. | | Stone Energy Corp. | | +76.2 | % |
3. | | Hornbeck Offshore Services Inc. | | +59.4 | % |
4. | | Ampco-Pittsburgh Corp. | | +51.2 | % |
5. | | Industrial Services of America Inc. | | +51.0 | % |
6. | | Bristow Group Inc. | | +47.2 | % |
7. | | Ameron International Corp. | | +43.6 | % |
8. | | Callon Petroleum Co. | | +33.3 | % |
9. | | Hastings Entertainment Inc. | | +28.9 | % |
10. | | Gulfmark Offshore Inc. | | +25.4 | % |
| | | | | |
Weakest performers for the year ended March 31, 2008E | |
1. | | USEC Inc. | | –77.2 | % |
2. | | PFF Bancorp Inc. | | –71.6 | % |
3. | | Mesa Air Group Inc. | | –68.8 | % |
4. | | YRC Worldwide Inc. | | –67.4 | % |
5. | | Provident Bankshares Corp. | | –65.6 | % |
6. | | Mercantile Bank Corp. | | –65.6 | % |
7. | | Marlin Business Services Corp. | | –65.5 | % |
8. | | Big 5 Sporting Goods Corp. | | –65.5 | % |
9. | | Tuesday Morning Corp. | | –65.1 | % |
10. | | McClatchy Co. | | –64.5 | % |
D | Individual security performance is measured by the change in the security’s price; for stocks, dividends are assumed to be reinvested at the time they were paid. Portfolio changes are not reported for U.S. Small-Cap due to the Fund’s high volume of trading. |
E | Securities held for the entire year. |
| | |
| 32 | | Annual Report to Shareholders |
Portfolio of Investments
U.S. Small-Capitalization Value Trust
March 31, 2008
| | | | | | |
| | | Shares/Par | | Value | |
Common Stocks and Equity Interests — 99.3% | | | | | | |
Consumer Discretionary — 16.6% | | | | | | |
Auto Components — 1.1% | | | | | | |
Aftermarket Technology Corp. | | 3,815 | | $ | 74,164 | A |
ArvinMeritor Inc. | | 33,110 | | | 414,206 | |
Dorman Products Inc. | | 11,250 | | | 120,937 | A |
Modine Manufacturing Co. | | 14,610 | | | 211,699 | |
Superior Industries International Inc. | | 6,500 | | | 134,875 | |
TRW Automotive Holdings Corp. | | 18,760 | | | 438,421 | A |
| | | | | | |
| | | | | 1,394,302 | |
| | | | | | |
Distributors — 0.1% | | | | | | |
Audiovox Corp. | | 5,000 | | | 53,400 | A |
Core-Mark Holding Co. Inc. | | 900 | | | 25,866 | A |
| | | | | | |
| | | | | 79,266 | |
| | | | | | |
Diversified Consumer Services — 0.4% | | | | | | |
Pre-Paid Legal Services Inc. | | 12,140 | | | 514,857 | A |
| | | | | | |
Hotels, Restaurants and Leisure — 1.9% | | | | | | |
Bluegreen Corp. | | 35,830 | | | 240,061 | A |
CBRL Group Inc. | | 27,250 | | | 974,733 | |
CEC Entertainment Inc. | | 12,340 | | | 356,379 | A |
Domino’s Pizza Inc. | | 7,100 | | | 95,779 | |
Dover Downs Gaming and Entertainment Inc. | | 5,900 | | | 50,209 | |
Frisch’s Restaurants Inc. | | 5,800 | | | 133,400 | |
Interstate Hotels and Resorts Inc. | | 3,000 | | | 14,340 | A |
Landry’s Restaurants Inc. | | 3,100 | | | 50,468 | |
Ruth’s Chris Steak House Inc. | | 1,900 | | | 13,129 | A |
Speedway Motorsports Inc. | | 19,740 | | | 494,882 | |
| | | | | | |
| | | | | 2,423,380 | |
| | | | | | |
Household Durables — 1.9% | | | | | | |
Bassett Furniture Industries Inc. | | 2,800 | | | 34,552 | |
Blyth Inc. | | 4,700 | | | 92,684 | |
Craftmade International Inc. | | 8,581 | | | 69,077 | |
CSS Industries Inc. | | 17,370 | | | 607,255 | |
| | |
| Annual Report to Shareholders | | 33 |
| | | | | | |
| | | Shares/Par | | Value | |
Consumer Discretionary — Continued | | | | | | |
Household Durables — Continued | | | | | | |
Ethan Allen Interiors Inc. | | 41,530 | | $ | 1,180,698 | |
Furniture Brands International Inc. | | 11,800 | | | 138,060 | |
Hooker Furniture Corp. | | 13,430 | | | 300,026 | |
La-Z-Boy Inc. | | 8,400 | | | 70,056 | |
| | | | | | |
| | | | | 2,492,408 | |
| | | | | | |
Internet and Catalog Retail — N.M. | | | | | | |
FTD Group Inc. | | 3,400 | | | 45,628 | |
Systemax Inc. | | 300 | | | 3,618 | |
| | | | | | |
| | | | | 49,246 | |
| | | | | | |
Leisure Equipment and Products — 1.2% | | | | | | |
Aldila Inc. | | 5,200 | | | 59,280 | |
Escalade Inc. | | 8,065 | | | 71,537 | |
JAKKS Pacific Inc. | | 34,060 | | | 939,034 | A |
MarineMax Inc. | | 15,200 | | | 189,392 | A |
Polaris Industries Inc. | | 8,490 | | | 348,175 | |
| | | | | | |
| | | | | 1,607,418 | |
| | | | | | |
Media — 1.2% | | | | | | |
AH Belo Corp. | | 7,148 | | | 81,702 | A |
Alloy Inc. | | 3,300 | | | 24,458 | A |
Belo Corp. | | 35,740 | | | 377,772 | |
Cox Radio Inc. | | 3,500 | | | 41,580 | A |
Getty Images Inc. | | 4,670 | | | 149,440 | A |
Journal Communications Inc. | | 40,380 | | | 298,004 | |
McClatchy Co. | | 5,720 | | | 61,204 | |
Saga Communications Inc. | | 15,100 | | | 84,560 | A |
Scholastic Corp. | | 300 | | | 9,081 | A |
Valassis Communications Inc. | | 35,040 | | | 380,184 | A |
| | | | | | |
| | | | | 1,507,985 | |
| | | | | | |
Multiline Retail — 0.1% | | | | | | |
Tuesday Morning Corp. | | 38,110 | | | 197,410 | A |
| | | | | | |
| | |
| 34 | | Annual Report to Shareholders |
Portfolio of Investments — Continued
U.S. Small-Capitalization Value Trust — Continued
| | | | | | |
| | | Shares/Par | | Value | |
Consumer Discretionary — Continued | | | | | | |
Specialty Retail — 6.9% | | | | | | |
Aaron Rents Inc. | | 5,500 | | $ | 118,470 | |
America’s Car-Mart Inc. | | 1,200 | | | 15,108 | A |
Asbury Automotive Group Inc. | | 47,380 | | | 651,949 | |
Big 5 Sporting Goods Corp. | | 20,790 | | | 182,328 | |
Build-A-Bear Workshop Inc. | | 11,510 | | | 104,626 | A |
Charlotte Russe Holding Inc. | | 9,280 | | | 160,915 | A |
Charming Shoppes Inc. | | 79,696 | | | 384,932 | A |
Collective Brands Inc. | | 10,190 | | | 123,503 | A |
Conn’s Inc. | | 26,900 | | | 438,739 | A |
Foot Locker Inc. | | 6,000 | | | 70,620 | |
Genesco Inc. | | 9,240 | | | 213,536 | A |
Group 1 Automotive Inc. | | 30,800 | | | 723,184 | |
Hastings Entertainment Inc. | | 18,850 | | | 148,161 | A |
Haverty Furniture Cos. Inc. | | 4,100 | | | 43,624 | |
Jos. A Bank Clothiers Inc. | | 3,998 | | | 81,959 | A |
Lithia Motors Inc. | | 18,520 | | | 188,163 | |
Penske Automotive Group Inc. | | 62,150 | | | 1,209,439 | |
Rent-A-Center Inc. | | 78,320 | | | 1,437,172 | A |
REX Stores Corp. | | 17,055 | | | 335,472 | A |
Shoe Carnival Inc. | | 3,300 | | | 44,649 | A |
Sonic Automotive Inc. | | 43,240 | | | 888,582 | |
Stage Stores Inc. | | 20,115 | | | 325,863 | |
The Cato Corp. | | 22,210 | | | 331,818 | |
The Dress Barn Inc. | | 18,260 | | | 236,284 | A |
Zale Corp. | | 21,270 | | | 420,295 | A |
| | | | | | |
| | | | | 8,879,391 | |
| | | | | | |
Textiles, Apparel and Luxury Goods — 1.8% | | | | | | |
Brown Shoe Co. Inc. | | 16,880 | | | 254,382 | |
Columbia Sportswear Co. | | 3,000 | | | 132,090 | |
Culp Inc. | | 3,000 | | | 22,560 | A |
Jones Apparel Group Inc. | | 27,260 | | | 365,829 | |
K-Swiss Inc. | | 18,410 | | | 291,246 | |
Lakeland Industries Inc. | | 500 | | | 5,845 | A |
Maidenform Brands Inc. | | 8,390 | | | 136,505 | A |
| | |
| Annual Report to Shareholders | | 35 |
| | | | | | |
| | | Shares/Par | | Value | |
Consumer Discretionary — Continued | | | | | | |
Textiles, Apparel and Luxury Goods — Continued | | | | | | |
Perry Ellis International Inc. | | 1,700 | | $ | 37,111 | A |
Skechers U.S.A. Inc. | | 12,540 | | | 253,433 | A |
Steven Madden Ltd. | | 5,423 | | | 92,896 | A |
The Timberland Co. | | 35,850 | | | 492,221 | A |
Unifi Inc. | | 9,300 | | | 26,877 | A |
UniFirst Corp. | | 6,500 | | | 241,085 | |
| | | | | | |
| | | | | 2,352,080 | |
| | | | | | |
Consumer Staples — 2.5% | | | | | | |
Food Products — 1.5% | | | | | | |
Chiquita Brands International Inc. | | 6,100 | | | 140,971 | A |
Del Monte Foods Co. | | 154,390 | | | 1,471,337 | |
Monterey Gourmet Foods Inc. | | 4,100 | | | 12,546 | A |
Sanderson Farms Inc. | | 7,700 | | | 292,677 | |
| | | | | | |
| | | | | 1,917,531 | |
| | | | | | |
Personal Products — 0.5% | | | | | | |
CCA Industries Inc. | | 2,700 | | | 24,516 | |
Elizabeth Arden Inc. | | 3,000 | | | 59,850 | A |
Mannatech Inc. | | 19,500 | | | 139,035 | |
NBTY Inc. | | 7,900 | | | 236,605 | A |
Nutraceutical International Corp. | | 10,270 | | | 133,510 | A |
Parlux Fragrances Inc. | | 2,100 | | | 6,174 | A |
Schiff Nutrition International Inc. | | 10,660 | | | 63,853 | |
| | | | | | |
| | | | | 663,543 | |
| | | | | | |
Tobacco — 0.5% | | | | | | |
Universal Corp. | | 10,460 | | | 685,444 | |
| | | | | | |
Energy — 7.5% | | | | | | |
Energy Equipment and Services — 4.5% | | | | | | |
Allis-Chalmers Energy Inc. | | 1,300 | | | 17,927 | A |
Basic Energy Services Inc. | | 4,800 | | | 105,984 | A |
Bristow Group Inc. | | 10,110 | | | 542,604 | A |
Bronco Drilling Co. Inc. | | 9,480 | | | 152,723 | A |
Cal Dive International Inc. | | 14,435 | | | 149,835 | A |
| | |
| 36 | | Annual Report to Shareholders |
Portfolio of Investments — Continued
U.S. Small-Capitalization Value Trust — Continued
| | | | | | |
| | | Shares/Par | | Value | |
Energy — Continued | | | | | | |
Energy Equipment and Services — Continued | | | | | | |
Complete Production Services Inc. | | 6,900 | | $ | 158,286 | A |
Grey Wolf Inc. | | 81,960 | | | 555,689 | A |
Gulfmark Offshore Inc. | | 13,230 | | | 723,945 | A |
Hercules Offshore Inc. | | 900 | | | 22,608 | A |
Hornbeck Offshore Services Inc. | | 9,080 | | | 414,684 | A |
Key Energy Services Inc. | | 1,300 | | | 17,446 | A |
Lufkin Industries Inc. | | 6,500 | | | 414,830 | |
Oil States International Inc. | | 14,800 | | | 663,188 | A |
Parker Drilling Co. | | 7,300 | | | 47,158 | A |
PHI Inc. | | 1,100 | | | 34,694 | A |
Pioneer Drilling Co. | | 22,200 | | | 353,646 | A |
SEACOR Holdings Inc. | | 1,500 | | | 128,040 | A |
Superior Well Services Inc. | | 17,180 | | | 375,727 | A |
Trico Marine Services Inc. | | 6,700 | | | 261,099 | A |
Union Drilling Inc. | | 15,400 | | | 269,346 | A |
Unit Corp. | | 900 | | | 50,985 | A |
W-H Energy Services Inc. | | 5,800 | | | 399,330 | A |
| | | | | | |
| | | | | 5,859,774 | |
| | | | | | |
Oil, Gas and Consumable Fuels — 3.0% | | | | | | |
Alon USA Energy Inc. | | 9,030 | | | 137,346 | |
Brigham Exploration Co. | | 47,680 | | | 289,418 | A |
Callon Petroleum Co. | | 19,250 | | | 348,232 | A |
Delek US Holdings Inc. | | 23,400 | | | 296,478 | |
Overseas Shipholding Group Inc. | | 2,000 | | | 140,080 | |
Rosetta Resources Inc. | | 2,000 | | | 39,475 | A |
St Mary Land and Exploration Co. | | 600 | | | 23,100 | |
Stone Energy Corp. | | 27,070 | | | 1,416,032 | A |
Swift Energy Co. | | 7,300 | | | 328,427 | A |
USEC Inc. | | 28,820 | | | 106,634 | A |
VAALCO Energy Inc. | | 600 | | | 2,982 | A |
W&T Offshore Inc. | | 20,400 | | | 695,844 | |
| | | | | | |
| | | | | 3,824,048 | |
| | | | | | |
| | |
| Annual Report to Shareholders | | 37 |
| | | | | | |
| | | Shares/Par | | Value | |
Financials — 35.8% | | | | | | |
Capital Markets — N.M. | | | | | | |
FirstCity Financial Corp. | | 1,100 | | $ | 6,930 | A |
SWS Group Inc. | | 4,200 | | | 51,366 | |
| | | | | | |
| | | | | 58,296 | |
| | | | | | |
Commercial Banks — 15.4% | | | | | | |
1st Source Corp. | | 7,500 | | | 157,875 | |
American National Bankshares Inc. | | 9,480 | | | 199,080 | |
Ameris Bancorp | | 4,200 | | | 67,452 | |
Arrow Financial Corp. | | 11,087 | | | 249,347 | |
BancFirst Corp. | | 11,008 | | | 503,946 | |
BancorpSouth Inc. | | 18,160 | | | 420,586 | |
Cadence Financial Corp. | | 5,300 | | | 84,641 | |
Camden National Corp. | | 11,750 | | | 397,620 | |
Cathay General Bancorp | | 17,670 | | | 366,299 | |
Chemical Financial Corp. | | 19,211 | | | 457,990 | |
Citizens Banking Corp. | | 60,334 | | | 749,951 | |
City Bank | | 6,000 | | | 133,620 | |
Columbia Banking System Inc. | | 18,943 | | | 423,944 | |
Community Bank System Inc. | | 21,210 | | | 520,918 | |
Community Trust Bancorp Inc. | | 20,876 | | | 611,667 | |
F.N.B. Corp. | | 50,840 | | | 793,612 | |
First Bancorp | | 7,078 | | | 141,065 | |
First Community Bancshares Inc. | | 11,450 | | | 417,009 | |
First M&F Corp. | | 10,686 | | | 154,947 | |
First Merchants Corp. | | 7,500 | | | 214,050 | |
First Midwest Bancorp Inc. | | 16,290 | | | 452,373 | |
First United Corp. | | 8,086 | | | 160,265 | |
Firstbank Corp. | | 1,201 | | | 16,096 | |
FNB Corp. | | 6,737 | | | 70,738 | |
Fulton Financial Corp. | | 76,210 | | | 936,621 | |
German American Bancorp Inc. | | 9,870 | | | 125,546 | |
Great Southern Bancorp Inc. | | 5,600 | | | 87,416 | |
Greene Bancshares Inc. | | 2,900 | | | 51,301 | |
Harleysville National Corp. | | 2,270 | | | 32,733 | |
IBERIABANK Corp. | | 5,775 | | | 255,544 | |
| | |
| 38 | | Annual Report to Shareholders |
Portfolio of Investments — Continued
U.S. Small-Capitalization Value Trust — Continued
| | | | | | |
| | | Shares/Par | | Value | |
Financials — Continued | | | | | | |
Commercial Banks — Continued | | | | | | |
Independent Bank Corp. | | 10,370 | | $ | 107,641 | |
International Bancshares Corp. | | 41,106 | | | 928,173 | |
Lakeland Financial Corp. | | 11,060 | | | 250,509 | |
Macatawa Bank Corp. | | 6,725 | | | 70,007 | |
MainSource Financial Group Inc. | | 16,214 | | | 251,319 | |
Mercantile Bank Corp. | | 2,455 | | | 25,336 | |
Merchants Bancshares Inc. | | 4,200 | | | 96,096 | |
National Penn Bancshares Inc. | | 22,683 | | | 412,604 | |
NBT Bancorp Inc. | | 35,190 | | | 781,218 | |
Northrim BanCorp Inc. | | 8,820 | | | 160,348 | |
Old Point Financial Corp. | | 1,971 | | | 37,710 | |
PAB Bankshares Inc. | | 13,520 | | | 185,900 | |
Pacific Capital Bancorp | | 19,150 | | | 411,725 | |
Park National Corp. | | 6,600 | | | 467,610 | |
Penns Woods Bancorp Inc. | | 4,680 | | | 155,142 | |
Peoples Bancorp Inc. | | 11,558 | | | 278,663 | |
Prosperity Bancshares Inc. | | 4,100 | | | 117,506 | |
Provident Bankshares Corp. | | 16,505 | | | 177,264 | |
Renasant Corp. | | 9,102 | | | 204,795 | |
Republic First Bancorp Inc. | | 14,418 | | | 71,081 | A |
Royal Bancshares of Pennsylvania Inc. | | 1,450 | | | 20,981 | |
S&T Bancorp Inc. | | 7,900 | | | 254,143 | |
Sierra Bancorp | | 5,840 | | | 126,202 | |
Simmons First National Corp. | | 8,290 | | | 246,462 | |
Southwest Bancorp Inc. | | 10,460 | | | 183,155 | |
Susquehanna Bancshares Inc. | | 23,890 | | | 486,639 | |
Taylor Capital Group Inc. | | 5,564 | | | 91,361 | |
TriCo Bancshares | | 13,377 | | | 231,556 | |
Trustmark Corp. | | 52,630 | | | 1,172,596 | |
Union Bankshares Corp. | | 5,800 | | | 112,346 | |
United Bankshares Inc. | | 17,670 | | | 470,905 | |
Univest Corp. of Pennsylvania | | 9,970 | | | 261,114 | |
Washington Trust Bancorp Inc. | | 6,100 | | | 151,402 | |
WesBanco Inc. | | 14,410 | | | 356,071 | |
West Bancorporation | | 7,700 | | | 101,332 | |
| | |
| Annual Report to Shareholders | | 39 |
| | | | | | |
| | | Shares/Par | | Value | |
Financials — Continued | | | | | | |
Commercial Banks — Continued | | | | | | |
West Coast Bancorp | | 9,230 | | $ | 134,666 | |
Whitney Holding Corp. | | 36,820 | | | 912,768 | |
Wintrust Financial Corp. | | 2,400 | | | 83,880 | |
Yadkin Valley Financial Corp. | | 6,100 | | | 77,165 | |
| | | | | | |
| | | | | 19,919,643 | |
| | | | | | |
Consumer Finance — 0.6% | | | | | | |
AmeriCredit Corp. | | 43,930 | | | 442,375 | A |
Credit Acceptance Corp. | | 11,550 | | | 179,371 | A |
Nelnet Inc. | | 12,880 | | | 151,340 | |
World Acceptance Corp. | | 1,700 | | | 54,145 | A |
| | | | | | |
| | | | | 827,231 | |
| | | | | | |
Diversified Financial Services — 0.6% | | | | | | |
Asset Acceptance Capital Corp. | | 32,820 | | | 316,057 | |
California First National Bancorp | | 6,600 | | | 63,756 | |
Financial Federal Corp. | | 12,340 | | | 269,135 | |
Marlin Business Services Corp. | | 8,180 | | | 61,677 | A |
Medallion Financial Corp. | | 1,800 | | | 16,272 | |
| | | | | | |
| | | | | 726,897 | |
| | | | | | |
Insurance — 14.6% | | | | | | |
21st Century Holding Co. | | 800 | | | 10,248 | |
American Equity Investment Life Holding Co. | | 54,000 | | | 501,120 | |
American Physicians Capital Inc. | | 900 | | | 41,724 | |
Amtrust Financial Services Inc. | | 5,600 | | | 90,776 | |
Baldwin and Lyons Inc. | | 1,300 | | | 33,384 | |
CNA Surety Corp. | | 43,930 | | | 675,643 | A |
Conseco Inc. | | 46,960 | | | 478,992 | A |
Delphi Financial Group Inc. | | 42,825 | | | 1,251,775 | |
Donegal Group Inc. — Class A | | 7,245 | | | 126,063 | |
Donegal Group Inc. — Class B | | 3,672 | | | 65,912 | |
Eastern Insurance Holdings Inc. | | 1,000 | | | 14,480 | |
EMC Insurance Group Inc. | | 5,962 | | | 160,318 | |
FBL Financial Group Inc. | | 35,900 | | | 1,022,791 | |
First Mercury Financial Corp. | | 1,700 | | | 29,597 | A |
| | |
| 40 | | Annual Report to Shareholders |
Portfolio of Investments — Continued
U.S. Small-Capitalization Value Trust — Continued
| | | | | | |
| | | Shares/Par | | Value | |
Financials — Continued | | | | | | |
Insurance — Continued | | | | | | |
FPIC Insurance Group Inc. | | 900 | | $ | 42,426 | A |
Hallmark Financial Services Inc. | | 1,900 | | | 21,204 | A |
Hanover Insurance Group Inc. | | 33,270 | | | 1,368,728 | |
Harleysville Group Inc. | | 18,260 | | | 659,003 | |
Horace Mann Educators Corp. | | 43,930 | | | 767,897 | |
Infinity Property and Casualty Corp. | | 24,980 | | | 1,039,168 | |
IPC Holdings Ltd. | | 5,900 | | | 165,200 | |
Max Capital Group Ltd. | | 5,300 | | | 138,807 | |
Meadowbrook Insurance Group Inc. | | 47,090 | | | 367,773 | |
Mercer Insurance Group Inc. | | 1,900 | | | 33,041 | |
Mercury General Corp. | | 440 | | | 19,496 | |
Montpelier Re Holdings Ltd. | | 9,100 | | | 146,055 | |
National Interstate Corp. | | 8,090 | | | 188,902 | |
National Western Life Insurance Co. | | 3,200 | | | 693,728 | |
Navigators Group Inc. | | 7,300 | | | 397,120 | A |
Nymagic Inc. | | 8,190 | | | 185,995 | |
Odyssey Re Holdings Corp. | | 48,290 | | | 1,774,658 | |
Platinum Underwriters Holdings Ltd. | | 4,900 | | | 159,054 | |
PMA Capital Corp. | | 3,300 | | | 28,182 | A |
Presidential Life Corp. | | 32,770 | | | 571,509 | |
ProAssurance Corp. | | 3,300 | | | 177,639 | A |
ProCentury Corp. | | 12,240 | | | 220,320 | |
RLI Corp. | | 8,590 | | | 425,806 | |
Safety Insurance Group Inc. | | 22,205 | | | 757,857 | |
SeaBright Insurance Holdings | | 9,280 | | | 136,694 | A |
Selective Insurance Group Inc. | | 25,170 | | | 601,060 | |
Specialty Underwriters’ Alliance Inc. | | 6,400 | | | 27,264 | A |
StanCorp Financial Group Inc. | | 29,610 | | | 1,412,693 | |
State Auto Financial Corp. | | 15,790 | | | 459,963 | |
Stewart Information Services Corp. | | 1,700 | | | 47,583 | |
The Phoenix Cos. Inc. | | 50,540 | | | 617,093 | |
Unico American Corp. | | 5,200 | | | 48,880 | A |
United America Indemnity Ltd. | | 2,100 | | | 40,446 | A |
United Fire and Casualty Co. | | 14,416 | | | 539,158 | |
| | |
| Annual Report to Shareholders | | 41 |
| | | | | | |
| | | Shares/Par | | Value | |
Financials — Continued | | | | | | |
Insurance — Continued | | | | | | |
Unitrin Inc. | | 1,500 | | $ | 53,010 | |
Universal Insurance Holdings Inc. | | 3,600 | | | 13,608 | |
| | | | | | |
| | | | | 18,849,843 | |
| | | | | | |
Thrifts and Mortgage Finance — 4.6% | | | | | | |
Anchor Bancorp Wisconsin Inc. | | 30,680 | | | 582,000 | |
Corus Bankshares Inc. | | 71,470 | | | 695,403 | |
First Defiance Financial Corp. | | 2,902 | | | 53,252 | |
First Financial Holdings Inc. | | 13,720 | | | 321,871 | |
First Financial Service Corp. | | 6,382 | | | 152,211 | |
First Place Financial Corp. | | 15,382 | | | 199,966 | |
FirstFed Financial Corp. | | 14,780 | | | 401,277 | A |
Flushing Financial Corp. | | 16,930 | | | 297,629 | |
Harrington West Financial Group Inc. | | 7,555 | | | 61,724 | |
HMN Financial Inc. | | 5,900 | | | 136,172 | |
Legacy Bancorp Inc. | | 800 | | | 11,176 | |
NewAlliance Bancshares Inc. | | 10,200 | | | 125,052 | |
North Central Bancshares Inc. | | 2,300 | | | 66,953 | |
Parkvale Financial Corp. | | 8,590 | | | 230,556 | |
PFF Bancorp Inc. | | 19,080 | | | 158,746 | |
Timberland Bancorp Inc. | | 12,640 | | | 147,256 | |
United Financial Bancorp Inc. | | 1,600 | | | 17,728 | |
Washington Federal Inc. | | 56,447 | | | 1,289,249 | |
Webster Financial Corp. | | 28,530 | | | 795,131 | |
WSFS Financial Corp. | | 4,000 | | | 197,120 | |
| | | | | | |
| | | | | 5,940,472 | |
| | | | | | |
Health Care — 1.5% | | | | | | |
Biotechnology — 0.1% | | | | | | |
Trimeris Inc. | | 10,290 | | | 67,091 | A |
| | | | | | |
Health Care Equipment and Supplies — 0.1% | | | | | | |
Cardiac Science Corp. | | 5,100 | | | 42,585 | A |
HealthTronics Inc. | | 3,300 | | | 10,692 | A |
National Dentex Corp. | | 2,022 | | | 26,064 | A |
| | |
| 42 | | Annual Report to Shareholders |
Portfolio of Investments — Continued
U.S. Small-Capitalization Value Trust — Continued
| | | | | | |
| | | Shares/Par | | Value | |
Health Care — Continued | | | | | | |
Health Care Equipment and Supplies — Continued | | | | | | |
Span-America Medical Systems Inc. | | 300 | | $ | 3,540 | |
Theragenics Corp. | | 3,400 | | | 13,396 | A |
| | | | | | |
| | | | | 96,277 | |
| | | | | | |
Health Care Providers and Services — 1.2% | | | | | | |
Advocat Inc. | | 2,700 | | | 29,376 | A |
Apria Healthcare Group Inc. | | 33,460 | | | 660,835 | A |
Healthspring Inc. | | 5,600 | | | 78,848 | A |
LifePoint Hospitals Inc. | | 27,160 | | | 746,085 | A |
Lincare Holdings Inc. | | 1,000 | | | 28,110 | A |
Universal American Financial Corp. | | 7,600 | | | 80,560 | A |
| | | | | | |
| | | | | 1,623,814 | |
| | | | | | |
Life Sciences Tools and Services — 0.1% | | | | | | |
Albany Molecular Research Inc. | | 7,900 | | | 95,906 | A |
| | | | | | |
Pharmaceuticals — N.M. | | | | | | |
Caraco Pharmaceutical Laboratories Ltd. | | 1,100 | | | 19,745 | A |
King Pharmaceuticals Inc. | | 4,060 | | | 35,322 | A |
| | | | | | |
| | | | | 55,067 | |
| | | | | | |
Industrials — 16.8% | | | | | | |
Aerospace and Defense — 0.1% | | | | | | |
Astronics Corp. | | 600 | | | 11,592 | A |
Herley Industries Inc. | | 1,400 | | | 14,476 | A |
SIFCO Industries Inc. | | 4,700 | | | 48,410 | A |
| | | | | | |
| | | | | 74,478 | |
| | | | | | |
Air Freight and Logistics — 0.7% | | | | | | |
ABX Air Inc. | | 48,080 | | | 141,355 | A |
Air T Inc. | | 1,100 | | | 10,582 | |
Atlas Air Worldwide Holdings Inc. | | 2,200 | | | 121,000 | A |
Pacer International Inc. | | 26,950 | | | 442,789 | |
Park-Ohio Holdings Corp. | | 9,700 | | | 152,387 | A |
| | | | | | |
| | | | | 868,113 | |
| | | | | | |
| | |
| Annual Report to Shareholders | | 43 |
| | | | | | |
| | | Shares/Par | | Value | |
Industrials — Continued | | | | | | |
Airlines — 2.2% | | | | | | |
Alaska Air Group Inc. | | 4,500 | | $ | 88,290 | A |
Mesa Air Group Inc. | | 54,620 | | | 128,357 | A |
Pinnacle Airlines Corp. | | 17,000 | | | 148,410 | A |
Republic Airways Holdings Inc. | | 43,930 | | | 951,524 | A |
SkyWest Inc. | | 71,360 | | | 1,507,123 | |
| | | | | | |
| | | | | 2,823,704 | |
| | | | | | |
Building Products — 2.2% | | | | | | |
Ameron International Corp. | | 5,580 | | | 521,897 | |
Lennox International Inc. | | 34,620 | | | 1,245,282 | |
NCI Building Systems Inc. | | 9,050 | | | 219,010 | A |
Simpson Manufacturing Co. Inc. | | 11,960 | | | 325,073 | |
U.S. Home Systems Inc. | | 2,600 | | | 9,438 | A |
Universal Forest Products Inc. | | 17,180 | | | 553,196 | |
| | | | | | |
| | | | | 2,873,896 | |
| | | | | | |
Commercial Services and Supplies — 2.1% | | | | | | |
Comforce Corp. | | 12,730 | | | 26,606 | A |
COMSYS IT Partners Inc. | | 1,700 | | | 14,382 | A |
Deluxe Corp. | | 30,840 | | | 592,436 | |
Ennis Inc. | | 18,060 | | | 303,047 | |
Heidrick and Struggles International Inc. | | 2,100 | | | 68,313 | |
Herman Miller Inc. | | 4,500 | | | 110,565 | |
Industrial Services of America Inc. | | 3,400 | | | 33,932 | |
Kelly Services Inc. | | 12,730 | | | 261,729 | |
Kforce Inc. | | 1,500 | | | 13,260 | A |
Kimball International Inc. | | 6,100 | | | 65,392 | |
Knoll Inc. | | 17,280 | | | 199,411 | |
Korn/Ferry International | | 5,800 | | | 98,020 | A |
Mobile Mini Inc. | | 4,300 | | | 81,700 | A |
PeopleSupport Inc. | | 4,900 | | | 44,688 | A |
RCM Technologies Inc. | | 1,200 | | | 4,632 | A |
TrueBlue Inc. | | 29,910 | | | 401,990 | A |
United Stationers Inc. | | 3,800 | | | 181,260 | A |
Virco Manufacturing | | 9,300 | | | 48,639 | |
| | |
| 44 | | Annual Report to Shareholders |
Portfolio of Investments — Continued
U.S. Small-Capitalization Value Trust — Continued
| | | | | | |
| | | Shares/Par | | Value | |
Industrials — Continued | | | | | | |
Commercial Services and Supplies — Continued | | | | | | |
Volt Information Sciences Inc. | | 8,980 | | $ | 152,301 | A |
VSE Corp. | | 1,200 | | | 33,876 | |
WCA Waste Corp. | | 4,200 | | | 25,536 | A |
| | | | | | |
| | | | | 2,761,715 | |
| | | | | | |
Construction and Engineering — 0.4% | | | | | | |
Michael Baker Corp. | | 900 | | | 20,214 | A |
Northwest Pipe Co. | | 2,900 | | | 123,221 | A |
Perini Corp. | | 10,700 | | | 387,661 | A |
| | | | | | |
| | | | | 531,096 | |
| | | | | | |
Electrical Equipment — 1.9% | | | | | | |
A.O. Smith Corp. | | 16,190 | | | 532,165 | |
Acuity Brands Inc. | | 9,260 | | | 397,717 | |
GrafTech International Ltd. | | 45,800 | | | 742,418 | A |
Plug Power Inc. | | 19,600 | | | 60,956 | A |
Regal-Beloit Corp. | | 18,460 | | | 676,190 | |
SL Industries Inc. | | 100 | | | 1,990 | A |
Superior Essex Inc. | | 2,300 | | | 64,676 | A |
Technology Research Corp. | | 300 | | | 855 | |
| | | | | | |
| | | | | 2,476,967 | |
| | | | | | |
Industrial Conglomerates — N.M. | | | | | | |
Standex International Corp. | | 42 | | | 938 | |
| | | | | | |
Machinery — 3.2% | | | | | | |
Accuride Corp. | | 26,210 | | | 214,398 | A |
Actuant Corp. | | 11,360 | | | 343,185 | |
American Railcar Industries Inc. | | 2,500 | | | 50,825 | |
Ampco-Pittsburgh Corp. | | 4,700 | | | 202,053 | |
Baldwin Technology Co. | | 600 | | | 1,542 | A |
Columbus McKinnon Corp. | | 20 | | | 620 | A |
Crane Co. | | 10,490 | | | 423,271 | |
Gardner Denver Inc. | | 12,998 | | | 482,226 | A |
Gehl Co. | | 8,590 | | | 145,515 | A |
Hurco Cos. Inc. | | 2,800 | | | 130,984 | A |
| | |
| Annual Report to Shareholders | | 45 |
| | | | | | |
| | | Shares/Par | | Value | |
Industrials — Continued | | | | | | |
Machinery — Continued | | | | | | |
Kennametal Inc. | | 7,900 | | $ | 232,497 | |
Mueller Industries Inc. | | 26,160 | | | 754,716 | |
NACCO Industries Inc. | | 200 | | | 16,188 | |
NN Inc. | | 17,515 | | | 170,421 | |
The Timken Co. | | 29,685 | | | 882,238 | |
Wabash National Corp. | | 4,400 | | | 39,556 | |
| | | | | | |
| | | | | 4,090,235 | |
| | | | | | |
Marine — 0.1% | | | | | | |
International Shipholding Corp. | | 5,500 | | | 105,490 | A |
TBS International Ltd. | | 3,200 | | | 96,640 | A |
| | | | | | |
| | | | | 202,130 | |
| | | | | | |
Road and Rail — 2.7% | | | | | | |
Arkansas Best Corp. | | 18,060 | | | 575,391 | |
Con-way Inc. | | 32,870 | | | 1,626,407 | |
P.A.M. Transportation Services Inc. | | 7,200 | | | 112,032 | A |
Ryder System Inc. | | 700 | | | 42,637 | |
Saia Inc. | | 11,300 | | | 179,218 | A |
USA Truck Inc. | | 1,000 | | | 12,910 | A |
Werner Enterprises Inc. | | 25,380 | | | 471,053 | |
YRC Worldwide Inc. | | 36,430 | | | 477,962 | A |
| | | | | | |
| | | | | 3,497,610 | |
| | | | | | |
Trading Companies and Distributors — 1.2% | | | | | | |
Applied Industrial Technologies Inc. | | 7,900 | | | 236,131 | |
GATX Corp. | | 5,700 | | | 222,699 | |
H&E Equipment Services Inc. | | 300 | | | 3,771 | A |
Rush Enterprises Inc. | | 2,400 | | | 38,016 | A |
TAL International Group Inc. | | 5,500 | | | 129,635 | |
United Rentals Inc. | | 47,190 | | | 889,060 | A |
Willis Lease Finance Corp. | | 800 | | | 10,056 | A |
| | | | | | |
| | | | | 1,529,368 | |
| | | | | | |
| | |
| 46 | | Annual Report to Shareholders |
Portfolio of Investments — Continued
U.S. Small-Capitalization Value Trust — Continued
| | | | | | |
| | | Shares/Par | | Value | |
Information Technology — 6.3% | | | | | | |
Communications Equipment — 0.2% | | | | | | |
ADC Telecommunications Inc. | | 10,070 | | $ | 121,646 | A |
Communications Systems Inc. | | 800 | | | 8,616 | |
Performance Technologies Inc. | | 1,480 | | | 6,778 | A |
Sycamore Networks Inc. | | 44,800 | | | 163,968 | A |
| | | | | | |
| | | | | 301,008 | |
| | | | | | |
Computers and Peripherals — 0.2% | | | | | | |
Adaptec Inc. | | 6,400 | | | 18,816 | A |
Hauppauge Digital Inc. | | 3,100 | | | 10,416 | A |
Hutchinson Technology Inc. | | 11,600 | | | 184,556 | A |
Key Tronic Corp. | | 10,370 | | | 26,858 | A |
Rackable Systems Inc. | | 6,600 | | | 60,192 | A |
| | | | | | |
| | | | | 300,838 | |
| | | | | | |
Electronic Equipment and Instruments — 3.3% | | | | | | |
ADDvantage Technologies Group Inc. | | 4,700 | | | 16,262 | A |
Anixter International Inc. | | 7,100 | | | 454,684 | A |
Benchmark Electronics Inc. | | 53,900 | | | 967,505 | A |
CPI International Inc. | | 1,400 | | | 13,888 | A |
CTS Corp. | | 3,500 | | | 37,450 | |
DDi Corp. | | 2,100 | | | 9,744 | A |
Frequency Electronics Inc. | | 1,800 | | | 14,004 | |
Insight Enterprises Inc. | | 18,230 | | | 319,025 | A |
PC Connection Inc. | | 2,800 | | | 22,176 | A |
RadiSys Corp. | | 3,500 | | | 35,315 | A |
SYNNEX Corp. | | 37,710 | | | 800,206 | A |
Tech Data Corp. | | 11,400 | | | 373,920 | A |
TTM Technologies Inc. | | 27,400 | | | 310,168 | A |
Vishay Intertechnology Inc. | | 74,705 | | | 676,827 | A |
Wireless Telecom Group Inc. | | 39,190 | | | 60,745 | A |
Wireless Xcessories Group Inc. | | 3,200 | | | 4,160 | A |
Zones Inc. | | 11,900 | | | 97,699 | A |
| | | | | | |
| | | | | 4,213,778 | |
| | | | | | |
| | |
| Annual Report to Shareholders | | 47 |
| | | | | | |
| | | Shares/Par | | Value | |
Information Technology — Continued | | | | | | |
Internet Software and Services — 0.7% | | | | | | |
RealNetworks Inc. | | 20,100 | | $ | 115,173 | A |
United Online Inc. | | 67,350 | | | 711,216 | |
| | | | | | |
| | | | | 826,389 | |
| | | | | | |
IT Services — 0.1% | | | | | | |
Computer Task Group Inc. | | 2,000 | | | 8,240 | A |
Edgewater Technology Inc. | | 1,300 | | | 6,851 | A |
Ness Technologies Inc. | | 4,600 | | | 43,654 | A |
StarTek Inc. | | 2,860 | | | 26,341 | A |
TSR Inc. | | 7,100 | | | 29,820 | |
| | | | | | |
| | | | | 114,906 | |
| | | | | | |
Semiconductors and Semiconductor Equipment — 1.8% | | | | | | |
Advanced Energy Industries Inc. | | 17,280 | | | 229,133 | A |
Axcelis Technologies Inc. | | 9,600 | | | 53,760 | A |
Integrated Silicon Solution Inc. | | 6,500 | | | 39,325 | A |
Kulicke and Soffa Industries Inc. | | 18,550 | | | 88,669 | A |
MKS Instruments Inc. | | 41,950 | | | 897,730 | A |
Nanometrics Inc. | | 1,900 | | | 13,585 | A |
ON Semiconductor Corp. | | 16,800 | | | 95,424 | A |
Photronics Inc. | | 26,550 | | | 253,552 | A |
RF Micro Devices Inc. | | 47,360 | | | 125,978 | A |
Rudolph Technologies Inc. | | 7,700 | | | 75,229 | A |
Sigma Designs Inc. | | 7,100 | | | 160,957 | A |
Ultra Clean Holdings Inc. | | 15,500 | | | 151,900 | A |
White Electronic Designs Corp. | | 1,900 | | | 8,580 | A |
Zoran Corp. | | 11,900 | | | 162,554 | A |
| | | | | | |
| | | | | 2,356,376 | |
| | | | | | |
Software — N.M. | | | | | | |
Dynamics Research Corp. | | 900 | | | 9,099 | A |
Pervasive Software Inc. | | 2,000 | | | 7,800 | A |
Versant Corp. | | 789 | | | 19,804 | A |
| | | | | | |
| | | | | 36,703 | |
| | | | | | |
| | |
| 48 | | Annual Report to Shareholders |
Portfolio of Investments — Continued
U.S. Small-Capitalization Value Trust — Continued
| | | | | | |
| | | Shares/Par | | Value | |
Materials — 5.0% | | | | | | |
Chemicals — 2.4% | | | | | | |
Hercules Inc. | | 25,860 | | $ | 472,979 | |
ICO Inc. | | 6,600 | | | 45,804 | A |
Material Sciences Corp. | | 1,400 | | | 10,864 | A |
Olin Corp. | | 66,850 | | | 1,320,956 | |
PolyOne Corp. | | 52,810 | | | 336,400 | A |
RPM International Inc. | | 19,570 | | | 409,796 | |
Spartech Corp. | | 1,600 | | | 13,520 | |
Westlake Chemical Corp. | | 33,180 | | | 432,999 | |
| | | | | | |
| | | | | 3,043,318 | |
| | | | | | |
Construction Materials — 0.5% | | | | | | |
Eagle Materials Inc. | | 1,700 | | | 60,435 | |
Headwaters Inc. | | 39,390 | | | 519,554 | A |
U.S. Concrete Inc. | | 31,130 | | | 118,294 | A |
| | | | | | |
| | | | | 698,283 | |
| | | | | | |
Containers and Packaging — 1.1% | | | | | | |
Rock-Tenn Co. | | 1,500 | | | 44,955 | |
Silgan Holdings Inc. | | 26,620 | | | 1,321,150 | |
| | | | | | |
| | | | | 1,366,105 | |
| | | | | | |
Metals and Mining — 0.7% | | | | | | |
A.M. Castle and Co. | | 800 | | | 21,600 | |
Gibraltar Industries Inc. | | 24,882 | | | 291,866 | |
Worthington Industries Inc. | | 39,100 | | | 659,617 | |
| | | | | | |
| | | | | 973,083 | |
| | | | | | |
Paper and Forest Products — 0.3% | | | | | | |
Buckeye Technologies Inc. | | 22,400 | | | 249,984 | A |
Schweitzer-Mauduit International Inc. | | 3,700 | | | 85,618 | |
| | | | | | |
| | | | | 335,602 | |
| | | | | | |
Telecommunication Services — 0.2% | | | | | | |
Diversified Telecommunication Services — 0.2% | | | | | | |
Cincinnati Bell Inc. | | 48,070 | | | 204,778 | A |
| | | | | | |
| | |
| Annual Report to Shareholders | | 49 |
| | | | | | |
| | | Shares/Par | | Value | |
Telecommunication Services — Continued | | | | | | |
Wireless Telecommunication Services — N.M. | | | | | | |
USA Mobility Inc. | | 2,300 | | $ | 16,422 | A |
| | | | | | |
Utilities — 7.1% | | | | | | |
Electric Utilities — 3.3% | | | | | | |
Allete Inc. | | 6,200 | | | 239,444 | |
Great Plains Energy Inc. | | 27,050 | | | 666,782 | |
IDACORP Inc. | | 32,670 | | | 1,049,034 | |
Portland General Electric Co. | | 27,900 | | | 629,145 | |
Westar Energy Inc. | | 72,560 | | | 1,652,191 | |
| | | | | | |
| | | | | 4,236,596 | |
| | | | | | |
Gas Utilities — 3.1% | | | | | | |
AGL Resources Inc. | | 10,270 | | | 352,466 | |
Atmos Energy Corp. | | 55,080 | | | 1,404,540 | |
Nicor Inc. | | 17,280 | | | 579,053 | |
Southwest Gas Corp. | | 7,300 | | | 204,108 | |
The Laclede Group Inc. | | 10,300 | | | 366,989 | |
WGL Holdings Inc. | | 35,080 | | | 1,124,665 | |
| | | | | | |
| | | | | 4,031,821 | |
| | | | | | |
Multi-Utilities — 0.7% | | | | | | |
Avista Corp. | | 12,900 | | | 252,324 | |
Black Hills Corp. | | 10,960 | | | 392,149 | |
PNM Resources Inc. | | 2,940 | | | 36,662 | |
Puget Energy Inc. | | 9,160 | | | 236,969 | |
| | | | | | |
| | | | | 918,104 | |
| | | | | | |
Total Common Stocks and Equity Interests
(Cost — $136,152,772) | | | | | 128,412,980 | |
| | | | | | |
| | |
| 50 | | Annual Report to Shareholders |
Portfolio of Investments — Continued
U.S. Small-Capitalization Value Trust — Continued
| | | | | | | |
| | | Shares/Par | | Value | |
Repurchase Agreements — 1.5% | | | | | | | |
Goldman Sachs & Co.
2.60%, dated 3/31/08, to be repurchased at $931,536 on 4/1/08 (Collateral: $956,416 Fannie Mae mortgage-backed securities, 5.00%, due 10/1/35, value $953,228) | | $ | 931,469 | | $ | 931,469 | |
JPMorgan Chase and Co.
2.30%, dated 3/31/08, to be repurchased at $931,528 on 4/1/08 (Collateral: $936,000 Freddie Mac bond, 5.45% due 9/2/11, value $952,100) | | | 931,468 | | | 931,468 | |
| | | | | | | |
Total Repurchase Agreements (Cost — $1,862,937) | | | | | | 1,862,937 | |
| | | | | | | |
Total Investments — 100.8% (Cost — $138,015,709)B | | | | | | 130,275,917 | |
Other Assets Less Liabilities — (0.8)% | | | | | | (984,905 | ) |
| | | | | | | |
Net Assets — 100.0% | | | | | $ | 129,291,012 | |
| | | | | | | |
N.M. Not Meaningful.
B | At March 31, 2008, the aggregate gross unrealized appreciation and depreciation of investments for federal income tax purposes were substantially as follows: |
| | | | |
Gross unrealized appreciation | | $ | 14,591,458 | |
Gross unrealized depreciation | | | (22,333,888 | ) |
| | | | |
Net unrealized depreciation | | $ | (7,742,430 | ) |
| | | | |
See notes to financial statements.
| | |
| Annual Report to Shareholders | | 51 |
Statement of Assets and Liabilities
U.S. Small-Capitalization Value Trust
March 31, 2008
| | | | | | | |
Assets: | | | | | | | |
Investment securities at market value
(Cost – $136,152,772) | | | | | $ | 128,412,980 | |
Short-term securities at value (Cost – $1,862,937) | | | | | | 1,862,937 | |
Receivable for securities sold | | | | | | 2,289,105 | |
Dividends and interest receivable | | | | | | 191,822 | |
Receivable for fund shares sold | | | | | | 144,534 | |
| | | | | | | |
Total assets | | | | | | 132,901,378 | |
Liabilities: | | | | | | | |
Payable for securities purchased | | $ | 2,452,067 | | | | |
Payable for fund shares repurchased | | | 858,976 | | | | |
Accrued distribution and service fees | | | 167,789 | | | | |
Accrued management fee | | | 4,705 | | | | |
Accrued expenses | | | 126,829 | | | | |
| | | | | | | |
Total liabilities | | | | | | 3,610,366 | |
| | | | | | | |
Net Assets | | | | | $ | 129,291,012 | |
| | | | | | | |
Net assets consist of: | | | | | | | |
Accumulated paid-in-capital | | | | | $ | 136,477,688 | |
Undistributed net investment income | | | | | | 318,019 | |
Accumulated net realized gain on investments | | | | | | 235,097 | |
Net unrealized depreciation on investments | | | | | | (7,739,792 | ) |
| | | | | | | |
Net Assets | | | | | $ | 129,291,012 | |
| | | | | | | |
Net Asset Value Per Share: | | | | | | | |
Primary Class (10,952,917 shares outstanding) | | | | | $ | 9.50 | |
| | | | | | | |
Institutional Class (2,287,795 shares outstanding) | | | | | $ | 11.05 | |
| | | | | | | |
See notes to financial statements.
| | |
| 52 | | Annual Report to Shareholders |
Statement of Operations
U.S. Small-Capitalization Value Trust
For the Year Ended March 31, 2008
| | | | | | | | |
Investment Income: | | | | | | | | |
Dividends | | $ | 3,936,382 | | | | | |
Interest | | | 161,985 | | | | | |
Other income | | | 625 | | | | | |
| | | | | | | | |
Total income | | | | | | $ | 4,098,992 | |
| | |
Expenses: | | | | | | | | |
Management fees | | | 1,558,494 | | | | | |
Distribution and service fees: | | | | | | | | |
Primary Class | | | 1,640,158 | | | | | |
Audit and legal fees | | | 37,388 | | | | | |
Custodian fees | | | 46,970 | | | | | |
Directors’ fees and expenses | | | 67,348 | | | | | |
Registration fees | | | 39,463 | | | | | |
Reports to shareholders | | | 103,996 | | | | | |
Transfer agent and shareholder servicing expense: | | | | | | | | |
Primary Class | | | 147,614 | | | | | |
Institutional Class | | | 13,702 | | | | | |
Other expenses | | | 18,338 | | | | | |
| | | | | | | | |
| | | 3,673,471 | | | | | |
Less: Fees Waived | | | (86,298 | ) | | | | |
Compensating balance credits | | | (2,357 | ) | | | | |
| | | | | | | | |
Net expenses | | | | | | | 3,584,816 | |
| | | | | | | | |
Net Investment Income | | | | | | | 514,176 | |
Net Realized and Unrealized Gain/(Loss) on Investments: | | | | | | | | |
Net realized gain on investments | | | 20,425,094 | | | | | |
Change in unrealized appreciation/(depreciation) of investments | | | (56,545,169 | ) | | | | |
| | | | | | | | |
Net Realized and Unrealized Loss on Investments | | | | | | | (36,120,075 | ) |
| | | | | | | | |
Change in Net Assets Resulting From Operations | | | | | | $ | (35,605,899 | ) |
| | | | | | | | |
See notes to financial statements.
| | |
| Annual Report to Shareholders | | 53 |
Statement of Changes in Net Assets
U.S. Small-Capitalization Value Trust
| | | | | | | | |
| | | For the Year Ended
March 31, 2008 | | | For the Year Ended
March 31, 2007 | |
Change in Net Assets: | | | | | | | | |
| | |
Net investment income (loss) | | $ | 514,176 | | | $ | (55,095 | ) |
| | |
Net realized gain | | | 20,425,094 | | | | 30,763,772 | |
| | |
Change in unrealized appreciation/ (depreciation) | | | (56,545,169 | ) | | | (14,450,301 | ) |
| | | | | | | | |
Change in net assets resulting from operations | | | (35,605,899 | ) | | | 16,258,376 | |
Distributions to shareholders from: | | | | | | | | |
Net realized gain on investments: | | | | | | | | |
Primary Class | | | (23,950,967 | ) | | | (26,097,530 | ) |
Institutional Class | | | (3,985,324 | ) | | | (3,413,743 | ) |
Change in net assets from fund share transactions: | | | | | | | | |
Primary Class | | | (49,660,316 | ) | | | (12,106,583 | ) |
Institutional Class | | | 673,996 | | | | (878,578 | ) |
| | | | | | | | |
Change in net assets | | | (112,528,510 | ) | | | (26,238,058 | ) |
| | |
Net Assets: | | | | | | | | |
| | |
Beginning of year | | | 241,819,522 | | | | 268,057,580 | |
| | | | | | | | |
End of year | | $ | 129,291,012 | | | $ | 241,819,522 | |
| | | | | | | | |
Undistributed net investment income and accumulated net investment loss, respectively | | $ | 318,019 | | | $ | (39,434 | ) |
| | | | | | | | |
See notes to financial statements.
| | |
| 54 | | Annual Report to Shareholders |
Financial Highlights
U.S. Small-Capitalization Value Trust
For a share of each class of capital stock outstanding:
Primary Class:
| | | | | | | | | | | | | | | | | | | | |
| | | Years Ended March 31, | |
| | | 2008 | | | 2007 | | | 2006 | | | 2005 | | | 2004 | |
Net asset value, beginning of year | | $ | 13.73 | | | $ | 14.51 | | | $ | 14.43 | | | $ | 14.52 | | | $ | 8.93 | |
| | | | | | | | | | | | | | | | | | | | |
Investment operations: | | | | | | | | | | | | | | | | | | | | |
Net investment income/(loss) | | | .01 | A | | | (.02 | )A | | | (.06 | ) | | | (.05 | ) | | | (.07 | ) |
Net realized and unrealized gain/(loss) | | | (2.30 | ) | | | .98 | | | | 1.77 | | | | 1.38 | | | | 5.75 | |
| | | | | | | | | | | | | | | | | | | | |
Total from investment operations | | | (2.29 | ) | | | .96 | | | | 1.71 | | | | 1.33 | | | | 5.68 | |
| | | | | | | | | | | | | | | | | | | | |
Distributions from: | | | | | | | | | | | | | | | | | | | | |
Net realized gain on investments | | | (1.94 | ) | | | (1.74 | ) | | | (1.63 | ) | | | (1.42 | ) | | | (.09 | ) |
| | | | | | | | | | | | | | | | | | | | |
Total distributions | | | (1.94 | ) | | | (1.74 | ) | | | (1.63 | ) | | | (1.42 | ) | | | (.09 | ) |
| | | | | | | | | | | | | | | | | | | | |
Net asset value, end of year | | $ | 9.50 | | | $ | 13.73 | | | $ | 14.51 | | | $ | 14.43 | | | $ | 14.52 | |
| | | | | | | | | | | | | | | | | | | | |
Total return | | | (17.94 | )% | | | 7.00 | % | | | 12.63 | % | | | 9.67 | % | | | 63.71 | % |
| | | | | |
Ratios to Average Net Assets:B | | | | | | | | | | | | | | | | | | | | |
Total expenses | | | 2.05 | % | | | 2.04 | % | | | 2.01 | % | | | 2.00 | % | | | 2.05 | % |
Expenses net of waivers, if any | | | 2.00 | % | | | 2.00 | % | | | 2.00 | % | | | 2.00 | % | | | 2.00 | % |
Expenses net of all reductions | | | 2.00 | % | | | 2.00 | % | | | 2.00 | % | | | 2.00 | % | | | 2.00 | % |
Net investment income (loss) | | | .10 | % | | | (.15 | )% | | | (.40 | )% | | | (.39 | )% | | | (.61 | )% |
Supplemental Data: | | | | | | | | | | | | | | | | | | | | |
Portfolio turnover rate | | | 31.7 | % | | | 28.9 | % | | | 30.9 | % | | | 46.7 | % | | | 44.3 | % |
Net assets, end of year (in thousands) | | $ | 104,013 | | | $ | 207,926 | | | $ | 232,061 | | | $ | 242,719 | | | $ | 226,351 | |
| | | | | | | | | | | | | | | | | | | | |
A | Computed using average daily shares outstanding. |
B | Total expenses reflects operating expenses prior to any voluntary expense waivers and/or compensating balance credits. Expenses net of waivers reflects total expenses before compensating balance credits but net of any voluntary expense waivers. Expenses net of all reductions reflects expenses less any compensating balance credits and/or voluntary expense waivers. |
See notes to financial statements.
| | |
| Annual Report to Shareholders | | 55 |
Institutional Class:
| | | | | | | | | | | | | | | | | | | | |
| | | Years Ended March 31, | |
| | | 2008 | | | 2007 | | | 2006 | | | 2005 | | | 2004 | |
Net asset value, beginning of year | | $ | 15.48 | | | $ | 15.99 | | | $ | 15.59 | | | $ | 15.39 | | | $ | 9.36 | |
| | | | | | | | | | | | | | | | | | | | |
Investment operations: | | | | | | | | | | | | | | | | | | | | |
Net investment income | | | .16 | A | | | .13 | A | | | — | C | | | .09 | | | | .05 | |
Net realized and unrealized gain/(loss) | | | (2.65 | ) | | | 1.10 | | | | 2.03 | | | | 1.53 | | | | 6.07 | |
| | | | | | | | | | | | | | | | | | | | |
Total from investment operations | | | (2.49 | ) | | | 1.23 | | | | 2.03 | | | | 1.62 | | | | 6.12 | |
| | | | | | | | | | | | | | | | | | | | |
Distributions from: | | | | | | | | | | | | | | | | | | | | |
Net realized gain on investments | | | (1.94 | ) | | | (1.74 | ) | | | (1.63 | ) | | | (1.42 | ) | | | (.09 | ) |
| | | | | | | | | | | | | | | | | | | | |
Total distributions | | | (1.94 | ) | | | (1.74 | ) | | | (1.63 | ) | | | (1.42 | ) | | | (.09 | ) |
| | | | | | | | | | | | | | | | | | | | |
Net asset value, end of year | | $ | 11.05 | | | $ | 15.48 | | | $ | 15.99 | | | $ | 15.59 | | | $ | 15.39 | |
| | | | | | | | | | | | | | | | | | | | |
Total return | | | (17.17 | )% | | | 8.09 | % | | | 13.81 | % | | | 11.06 | % | | | 65.49 | % |
| | | | | |
Ratios to Average Net Assets:B | | | | | | | | | | | | | | | | | | | | |
Total expenses | | | 1.01 | % | | | 1.00 | % | | | .98 | % | | | .93 | % | | | .98 | % |
Expenses net of waivers, if any | | | 1.00 | % | | | 1.00 | % | | | .98 | % | | | .93 | % | | | .98 | % |
Expenses net of all reductions | | | 1.00 | % | | | 1.00 | % | | | .98 | % | | | .93 | % | | | .98 | % |
Net investment income | | | 1.13 | % | | | .85 | % | | | .66 | % | | | .69 | % | | | .41 | % |
Supplemental Data: | | | | | | | | | | | | | | | | | | | | |
Portfolio turnover rate | | | 31.7 | % | | | 28.9 | % | | | 30.9 | % | | | 46.7 | % | | | 44.3 | % |
Net assets, end of year (in thousands) | | $ | 25,278 | | | $ | 33,894 | | | $ | 35,997 | | | $ | 14,349 | | | $ | 10,351 | |
| | | | | | | | | | | | | | | | | | | | |
C | Amount less than $.01 per share. |
See notes to financial statements.
| | |
| 56 | | Annual Report to Shareholders |
Notes to Financial Statements
Legg Mason Investors Trust, Inc.
1. Organization and Significant Accounting Policies:
The Legg Mason Investors Trust, Inc. (“Corporation”), consisting of American Leading Companies Trust (“American Leading Companies”) and U.S. Small-Capitalization Value Trust (“U.S. Small-Cap”) (each a “Fund”), is registered under the Investment Company Act of 1940, as amended (“1940 Act”), as an open-end, diversified investment company.
Each Fund consists of three classes of shares: Primary Class, Institutional Class and Financial Intermediary Class. The Financial Intermediary Class is not currently active in either Fund. The income and expenses of the Funds are allocated proportionately to each class of shares based on daily net assets, except for Rule 12b-1 distribution and service fees, which are charged only on Primary Class shares, and transfer agent and shareholder servicing expenses, which are determined separately for each class.
Preparation of the financial statements in accordance with accounting principles generally accepted in the United States of America requires management to make estimates and assumptions that affect the reported amounts and disclosures in the financial statements. Actual results could differ from those estimates. The following is a summary of significant accounting policies followed by the Funds in the preparation of their financial statements:
Security Valuation
Equity securities traded on national securities exchanges are valued at the last quoted sales price, except securities traded on the Nasdaq Stock Market, Inc. (“NASDAQ”) which are valued in accordance with the NASDAQ Official Closing Price. Over the counter securities are valued at the mean between the latest bid and asked prices as furnished by dealers who make markets in such securities or by an independent pricing service. Fixed income securities, for which market quotations are readily available, are valued at current market value.
Each Fund’s securities are valued on the basis of readily available market quotations or, lacking such quotations, at fair value as determined under policies approved by and under the general oversight of the Board of Directors. In determining fair value, all relevant qualitative and quantitative factors known to a Fund are considered. These factors are subject to change over time and are reviewed periodically. Each Fund may use fair value pricing instead of market quotations to value one or more securities if the Fund believes that, because of special circumstances, doing so would more accurately reflect the prices the Fund would expect to realize on the current sale of those securities. Further, because of the inherent uncertainty of fair valuation, those estimated values may differ significantly from quoted or published values or from the values that would have been used had a ready market for the investments existed, and the differences could be material. At March 31, 2008, there were no fair valued securities in either of the Funds.
| | |
| Annual Report to Shareholders | | 57 |
Security Transactions
Security transactions are accounted for as of the trade date. Realized gains and losses from security transactions are reported on an identified cost basis for both financial reporting and federal income tax purposes.
For the year ended March 31, 2008, security transactions (excluding short-term investments were:)
| | | | | | |
| | | Purchases | | Proceeds From Sales |
American Leading Companies | | $ | 223,764,712 | | $ | 317,349,236 |
U.S. Small-Cap | | | 60,322,150 | | | 125,674,158 |
Foreign Currency Translation
Assets and liabilities initially expressed in non-U.S. currencies are translated into U.S. dollars using currency exchange rates determined prior to the close of trading on the New York Stock Exchange, usually at 2:00 p.m. Eastern time. Purchases and sales of securities and income and expenses are translated into U.S. dollars at the prevailing market rates on the dates of such transactions. The effects of changes in non-U.S. currency exchange rates on investment securities and other assets and liabilities are included with the net realized and unrealized gain or loss on investment securities for each fund.
Repurchase Agreements
The Funds may engage in repurchase agreement transactions. Under the terms of a typical repurchase agreement, a fund takes possession of an underlying debt obligation subject to an obligation of the seller to repurchase, and of the fund to resell, the debt obligation at an agreed-upon price and time, thereby determining the yield during a fund’s holding period. This arrangement results in a fixed rate of return that is not subject to market fluctuations during the fund’s holding period. The value of the collateral is at all times at least equal to the total amount of the repurchase obligation, including interest. In the event of counterparty default, a fund has the right to use the collateral to satisfy the terms of the repurchase agreement. However, there could be potential loss to the fund in the event the fund is delayed or prevented from exercising its right to dispose of the collateral securities, including the risk of a possible decline in the value of the collateral securities during the period in which the fund seeks to assert its rights. The Funds’ investment advisers review the value of the collateral and the creditworthiness of those banks and dealers with which the Fund’s enter into repurchase agreements to evaluate potential risks.
| | |
| 58 | | Annual Report to Shareholders |
Notes to Financial Statements — Continued
Legg Mason Investors Trust, Inc. — Continued
Compensating Balance Credits
Each fund has an arrangement with their custodian bank whereby a portion of the custodian’s fee is paid indirectly by credits earned on the Funds’ cash on deposit with the bank. This deposit arrangement is an alternative to purchasing overnight investments.
Commission Recapture
American Leading Companies has entered into a directed brokerage agreement with State Street Bank & Trust Company (“State Street”). Under the agreement, State Street Bank will rebate to the Fund a percentage of commissions generated by the Fund. Such payments are included with realized gain/(loss) on investment transactions. During the fiscal year ended March 31, 2008, the Fund did not receive any commission rebates.
Investment Income and Distributions to Shareholders
Interest income and expenses are recorded on the accrual basis. Bond premiums and discounts are amortized for financial reporting and federal income tax purposes. Dividend income is recorded on the ex-dividend date. Dividends from net investment income, if available, are determined at the class level and paid annually for each Fund. Distributions from net realized capital gains, which are calculated at the Fund level, are declared and paid annually in June, if available. An additional distribution may be made in December, to the extent necessary, in order to comply with federal excise tax requirements. Distributions are determined in accordance with federal income tax regulations, which may differ from those determined in accordance with accounting principles generally accepted in the United States of America. Accordingly, periodic reclassifications are made within each Fund’s capital accounts to reflect income and gains available for distribution under federal income tax regulations.
Foreign Taxes
The Funds are subject to foreign income taxes imposed by certain countries in which each invests. Foreign income taxes are accrued by the Funds and withheld from dividend and interest income.
Other
In the normal course of business, each Fund enters into contracts that provide general indemnifications. Each Fund’s maximum exposure under these arrangements is dependent on claims that may be made against that Fund in the future and, therefore, cannot be estimated. However, based on experience, the risk of material loss from such claims is considered remote.
2. Federal Income Taxes:
It is each Fund’s policy to comply with the federal income and excise tax requirements of the Internal Revenue Code of 1986, as amended, applicable to regulated
| | |
| Annual Report to Shareholders | | 59 |
investment companies. Accordingly, each Fund intends to distribute substantially all of its taxable income and net realized gains, if any, to shareholders each year. Therefore, no federal income tax provision is required in either Fund’s financial statements.
Management has analyzed each Fund’s tax positions taken on federal income tax returns for all open tax years and has concluded that as of March 31, 2008, no provision for income tax would be required in either Fund’s financial statements. Each Fund’s federal and state income and federal excise tax returns for tax years for which the applicable statutes of limitations have not expired are subject to examination by the Internal Revenue Service and state departments of revenue.
Under the applicable foreign tax laws, a withholding tax may be imposed on interest, dividends and capital gains at various rates.
Reclassifications:
Accounting principles generally accepted in the United States of America require that certain components of net assets be adjusted to reflect permanent differences between financial and tax reporting. These reclassifications have no effect on net assets or net asset values per share. During the current year, the following reclassifications have been made:
| | | | | | | | | | | | | | |
Fund | | Undistributed Net
Investment Income | | | Accumulated Net
Realized Gain/(Loss) | | | Paid-in
Capital | |
American Leading Companies | | (A) | | $ | 1,253,574 | | | $ | (484,494 | ) | | $ | (769,080 | ) |
| | (B) | | | (1,332,146 | ) | | | 1,332,146 | | | | — | |
U.S. Small-Cap | | (C) | | $ | (115,504 | ) | | $ | (461,329 | ) | | $ | 576,833 | |
| | (D) | | | (41,329 | ) | | | 41,329 | | | | — | |
A | Other book/tax temporary differences are attributable primarily to the deferral of post-October capital losses for tax purposes and the book/tax differences in the timing of the deductibility of various expenses. |
B | Reclassifications are primarily due to foreign currency transactions treated as ordinary income for tax purposes and a prior year tax net operating loss which offsets short-term capital gains. |
C | Reclassifications are primarily due to distributions related to the redemption of Fund shares. |
D | Reclassifications are primarily due to a prior year tax net operating loss which offsets short-term capital gains for tax purposes. |
| | |
| 60 | | Annual Report to Shareholders |
Notes to Financial Statements — Continued
Legg Mason Investors Trust, Inc. — Continued
Distributions to Shareholders:
The tax character of distributions paid during the fiscal year ended March 31, 2008 was as follows:
| | | | | | |
| | | American Leading
Companies | | U.S. Small-Cap |
Distributions paid from: | | | | | | |
Ordinary Income | | $ | 1,708,893 | | $ | 4,083,013 |
Net Long-term Capital Gains | | | 47,351,438 | | | 23,853,278 |
| | | | | | |
Total Distributions Paid | | $ | 49,060,331 | | $ | 27,936,291 |
| | | | | | |
The tax character of distributions paid during the fiscal years ended March 31, 2007 was as follows:
| | | | | | |
| | | American Leading
Companies | | U.S. Small-Cap |
Distributions paid from: | | | | | | |
Ordinary Income | | $ | 561,353 | | $ | 3,029,792 |
Net Long-term Capital Gains | | | 41,592,935 | | | 26,481,481 |
| | | | | | |
Total Distributions Paid | | $ | 42,154,288 | | $ | 29,511,273 |
| | �� | | | | |
Accumulated Earnings on a Tax Basis:
As of March 31, 2008, the components of accumulated earnings on a tax basis were as follows:
| | | | | | | | |
| | | American Leading
Companies | | | U.S. Small-Cap | |
Undistributed ordinary income — net | | $ | 1,759,209 | | | $ | 453,975 | |
Undistributed long-term capital gains — net | | | — | | | | 237,735 | |
| | | | | | | | |
Total undistributed earnings | | $ | 1,759,209 | | | $ | 691,710 | |
Other book/tax temporary differences | | | (3,865,715 | )A | | | (135,956 | )C |
| | |
Unrealized appreciation/(depreciation) | | | 145,814,327 | B | | | (7,742,430 | )D |
| | | | | | | | |
Total accumulated earnings/(losses) — net | | $ | 143,707,821 | | | $ | (7,186,676 | ) |
| | | | | | | | |
A | Other book/tax temporary differences are attributable primarily to the deferral of post-October capital losses for tax purposes and the book/tax differences in the timing of the deductibility of various expenses. |
B | The difference between book-basis and tax-basis unrealized appreciation/(depreciation) is attributable primarily to the tax deferral of losses on wash sales and the book/tax difference in the treatment of distributions from certain securities. |
C | Other book/tax temporary differences are attributable primarily to the book/tax differences in the timing of the deductibility of various expenses. |
D | The difference between book-basis and tax-basis unrealized appreciation/(depreciation) is attributable primarily to the tax deferral of losses on wash sales. |
| | |
| Annual Report to Shareholders | | 61 |
Tax Cost of Investments:
As of March 31, 2008, the aggregate cost of investments for federal income tax purposes were as follows:
| | | |
American Leading Companies | | $ | 454,851,515 |
U.S. Small-Cap | | $ | 138,018,347 |
3. Transactions With Affiliates:
American Leading Companies has an investment advisory and management agreement with Legg Mason Capital Management, Inc. (“LMCM”). Pursuant to the agreement, LMCM provides American Leading Companies with investment advisory, management and administrative services for which the Fund pays a fee, computed daily and payable monthly, at an annual rate of the Fund’s average daily net assets.
U.S. Small-Cap has a management agreement with Legg Mason Fund Adviser, Inc. (“LMFA”). Pursuant to the agreement, LMFA provides U.S. Small-Cap with management and administrative services for which the Fund pays a fee, computed daily and payable monthly, at an annual rate of the Fund’s average daily net assets.
The following chart summarizes the management fees for each of the Funds:
| | | | |
Fund | | Management
Fee | | Asset Breakpoint |
American Leading Companies | | 0.70% | | on assets up to $2 billion |
| | 0.65% | | on assets in excess of $2 billion |
| | |
U.S. Small-Cap | | 0.85% | | on assets up to $100 million |
| | 0.75% | | on assets $100 million – $1 billion |
| | 0.65% | | on assets in excess of $1 billion |
LMCM and LMFA have voluntarily agreed to waive their fees in any month to the extent a Fund’s expenses (exclusive of taxes, interest, brokerage and extraordinary expenses) exceed during that month certain annual rates of that Fund’s average daily net assets until August 1, 2008. For the year ended March 31, 2008, LMFA waived distribution fees in the amount of $86,298 for U.S. Small-Cap.
The following chart summarizes the expense limitations for each of the Funds:
| | | | | | |
Fund | | Primary Class
Expense Limitation | | | Institutional Class
Expense Limitation | |
American Leading Companies | | 1.95 | % | | 0.95 | % |
U.S. Small-Cap | | 2.00 | % | | 1.00 | % |
| | |
| 62 | | Annual Report to Shareholders |
Notes to Financial Statements — Continued
Legg Mason Investors Trust, Inc. — Continued
Brandywine Global Investment Management, LLC (“Brandywine Global”) serves as investment adviser to U.S. Small-Cap. Brandywine Global is responsible, subject to the general supervision of LMFA, for the actual investment activity of the Fund. LMFA pays Brandywine Global a fee for its services, computed daily and payable monthly, at an annual rate equal to 58.8% of the fee received by LMFA.
Legg Mason Investor Services, LLC (“LMIS”), serves as the Funds’ distributor. LMIS receives an annual distribution fee and an annual service fee based on each Fund’s Primary Class’s average daily net assets, computed daily and payable monthly as follows:
| | | | | | |
Fund | | Distribution
Fee | | | Service
Fee | |
American Leading Companies | | | | | | |
Primary Class | | 0.75 | % | | 0.25 | % |
U.S. Small-Cap | | | | | | |
Primary Class | | 0.75 | % | | 0.25 | % |
LMFA serves as administrator to American Leading Companies under an administrative services agreement with LMCM. For LMFA’s services to American Leading Companies, LMCM (not the Fund) pays LMFA a fee, calculated daily and payable monthly, of 0.05% of the average daily net assets of the Fund.
LM Fund Services, Inc. (“LMFS”) a registered transfer agent, had an agreement with the Funds’ transfer agent pursuant to which LMFS received payments from the Funds’ transfer agent with respect to accounts where third parties provided certain services to the Funds. These payments were used to offset the Funds’ expenses for such services. These payments totaled $39,125 for American Leading Companies; and $11,531 for U.S. Small-Cap for the year ended March 31, 2008. The agreement was terminated effective August 1, 2007 and LMFS no longer receives payments from the Funds’ transfer agent.
LMCM, LMFA, Brandywine Global, LMIS, and LMFS are wholly owned subsidiaries and corporate affiliates of Legg Mason, Inc.
Under a Deferred Compensation Plan (the “Plan”), directors may elect to defer receipt of all or a specified portion of their compensation. A participating director may select one or more funds in which his or her deferred director’s fees will be deemed to be invested. Deferred amounts remain in the fund until distributed in accordance with the Plan.
4. Line of Credit:
The Funds, along with certain other Legg Mason Funds, participate in a $400 million line of credit (“Credit Agreement”) to be used for temporary or emergency purposes. Pursuant to the Credit Agreement, each participating fund is liable only for principal
| | |
| Annual Report to Shareholders | | 63 |
and interest payments related to borrowings made by that fund. Borrowings under the Credit Agreement bear interest at a rate equal to the prevailing federal funds rate plus the federal funds rate margin. The Funds made no borrowings under the Credit Agreement during the fiscal year ended March 31, 2008.
5. Fund Share Transactions:
At March 31, 2008, there were 250,000,000, and 50,000,000 shares authorized at $.001 par value for the Primary Classes of American Leading Companies, and U.S. Small-Cap, respectively. At March 31, 2008, there were 100,000,000, and 50,000,000 shares authorized at $.001 par value for the Financial Intermediary Classes of American Leading Companies, and U.S. Small-Cap, respectively (the Financial Intermediary Class of each Fund is not currently operational). At March 31, 2008, there were 250,000,000, and 50,000,000 shares authorized at $.001 par value for the Institutional Classes of American Leading Companies, and U.S. Small-Cap, respectively.
Share transactions are detailed below:
American Leading Companies Trust
| | | | | | | | | | | | | | |
| | | Year Ended
March 31, 2008 | | | Year Ended
March 31, 2007 | |
| | | Shares | | | Amount | | | Shares | | | Amount | |
Primary Class | | | | | | | | | | | | | | |
Shares sold | | 2,357,186 | | | $ | 56,648,242 | | | 3,500,222 | | | $ | 84,946,094 | |
Shares issued on reinvestment | | 1,793,915 | | | | 42,205,622 | | | 1,614,446 | | | | 38,909,898 | |
Shares repurchased | | (7,694,594 | ) | | | (180,928,172 | ) | | (5,165,072 | ) | | | (126,398,980 | ) |
| | | | | | | | | | | | | | |
Net Decrease | | (3,543,493 | ) | | $ | (82,074,308 | ) | | (50,404 | ) | | $ | (2,542,988 | ) |
| | | | | | | | | | | | | | |
Institutional Class | | | | | | | | | | | | | | |
Shares sold | | 978,756 | | | $ | 24,402,089 | | | 1,926,906 | | | $ | 50,116,952 | |
Shares issued on reinvestment | | 188,146 | | | | 4,645,699 | | | 72,560 | | | | 1,795,611 | |
Shares repurchased | | (639,339 | ) | | | (15,753,757 | ) | | (831,821 | ) | | | (20,634,059 | ) |
| | | | | | | | | | | | | | |
Net Increase | | 527,563 | | | $ | 13,294,031 | | | 1,167,645 | | | $ | 31,278,504 | |
| | | | | | | | | | | | | | |
| | |
| 64 | | Annual Report to Shareholders |
Notes to Financial Statements — Continued
Legg Mason Investors Trust, Inc. — Continued
U.S. Small-Capitalization Value Trust
| | | | | | | | | | | | | | |
| | | Year Ended
March 31, 2008 | | | Year Ended
March 31, 2007 | |
| | | Shares | | | Amount | | | Shares | | | Amount | |
Primary Class | | | | | | | | | | | | | | |
Shares sold | | 546,261 | | | $ | 6,603,007 | | | 1,158,306 | | | $ | 16,222,500 | |
Shares issued on reinvestment | | 2,093,967 | | | | 22,785,853 | | | 1,848,900 | | | | 25,280,312 | |
Shares repurchased | | (6,828,085 | ) | | | (79,049,176 | ) | | (3,859,371 | ) | | | (53,609,395 | ) |
| | | | | | | | | | | | | | |
Net Decrease | | (4,187,857 | ) | | $ | (49,660,316 | ) | | (852,165 | ) | | $ | (12,106,583 | ) |
| | | | | | | | | | | | | | |
Institutional Class | | | | | | | | | | | | | | |
Shares sold | | 822,469 | | | $ | 11,074,327 | | | 633,277 | | | $ | 9,832,820 | |
Shares issued on reinvestment | | 319,399 | | | | 3,985,324 | | | 223,291 | | | | 3,413,743 | |
Shares repurchased | | (1,043,915 | ) | | | (14,385,655 | ) | | (918,276 | ) | | | (14,125,141 | ) |
| | | | | | | | | | | | | | |
Net Increase (Decrease) | | 97,953 | | | $ | 673,996 | | | (61,708 | ) | | $ | (878,578 | ) |
| | | | | | | | | | | | | | |
6. Recent Accounting Pronouncements
In June 2006, the Financial Accounting Standards Board (“FASB”) issued FASB Interpretation 48 (“FIN 48” or the “Interpretation”), Accounting for Uncertainty in Income Taxes — an interpretation of FASB Statement 109. FIN 48 supplements FASB Statement 109, Accounting for Income Taxes and establishes financial reporting rules regarding recognition, measurement, presentation, and disclosure in its financial statements of tax positions that a fund has taken or expects to take on a tax return. FIN 48 became effective for fiscal periods beginning after December 15, 2006. Effective April 1, 2007, the Fund adopted FIN 48. There was no material impact to the financial statements or disclosure thereto as a result of this adoption.
In September 2006, the FASB released Statement of Financial Accounting Standards No. 157 “Fair Value Measurements” (“FAS 157”). FAS 157 establishes an authoritative definition of fair value, sets out a framework for measuring fair value, and requires additional disclosures about fair-value measurements. For registered investment companies, the application of FAS 157 is required for fiscal years, beginning after November 15, 2007 and interim periods within those fiscal years. Management has evaluated the implication of FAS 157 and does not believe the adoption of FAS 157 will materially impact the amount recorded in the financial statements, however, additional disclosure will be required in subsequent reports.
| | |
| Annual Report to Shareholders | | 65 |
In March 2008, the Financial Accounting Standards Board issued Statement of Financial Accounting Standards No. 161, “Disclosures about Derivative Instruments and Hedging Activities” (“FAS 161”). FAS 161 is effective for fiscal years and interim periods beginning after November 15, 2008. FAS 161 requires enhanced disclosures about a fund’s derivative and hedging activities, including how such activities are accounted for and their effect on a fund’s financial position, performance and cash flows. Management is currently evaluating the impact the adoption of FAS 161 will have on the Funds’ financial statements and related disclosures.
The Funds’ investment policies do not permit the Funds to engage in derivative transactions. Unless the Funds’ policies change to permit engaging in derivative transactions, FAS 161 will have no impact on the Funds’ disclosures.
| | |
| 66 | | Annual Report to Shareholders |
Report of Independent Registered Public Accounting Firm
To the Board of Directors of Legg Mason Investors Trust, Inc. and Shareholders of American Leading Companies Trust and U.S. Small-Capitalization Value Trust:
In our opinion, the accompanying statements of assets and liabilities, including the schedules of investments, and the related statements of operations and of changes in net assets and the financial highlights present fairly, in all material respects, the financial position of American Leading Companies Trust and U.S. Small-Capitalization Value Trust (comprising Legg Mason Investors Trust, Inc., the “Funds”) at March 31, 2008, the results of each of their operations for the year then ended, the changes in their net assets for each of the two years in the period then ended and the financial highlights for each of the five years in the period then ended, in conformity with accounting principles generally accepted in the United States of America. These financial statements and financial highlights (hereafter referred to as “financial statements”) are the responsibility of the Funds’ management; our responsibility is to express an opinion on these financial statements based on our audits. We conducted our audits of these financial statements in accordance with the standards of the Public Company Accounting Oversight Board (United States). Those standards require that we plan and perform the audit to obtain reasonable assurance about whether the financial statements are free of material misstatement. An audit includes examining, on a test basis, evidence supporting the amounts and disclosures in the financial statements, assessing the accounting principles used and significant estimates made by management, and evaluating the overall financial statement presentation. We believe that our audits, which included confirmation of securities at March 31, 2008 by correspondence with the custodian and brokers, provide a reasonable basis for our opinion.
PricewaterhouseCoopers LLP
Baltimore, Maryland
May 27, 2008
| | |
| Annual Report to Shareholders | | 67 |
Important Tax Information (Unaudited):
The following information is provided with respect to the distributions paid during the taxable year ended March 31, 2008:
| | | | | | | | | | | | | | | |
| | | American Leading
Companies | | | U.S. Small-Cap | |
Record Date: | | | 6/20/2007 | | | 12/12/2007 | | | | 6/20/2007 | | | | 12/12/2007 | |
Payable Date: | | | 6/22/2007 | | | 12/14/2007 | | | | 6/22/2007 | | | | 12/14/2007 | |
| | | | | | | | | | | | | | | |
Ordinary Income: | | | | | | | | | | | | | | | |
Qualified Dividend Income For Individuals | | | — | | | 100.00 | % | | | 61.24 | % | | | 100.00 | % |
Dividends Qualifying for the Dividends Received Deduction for Corporations | | | — | | | 100.00 | % | | | 74.78 | % | | | 74.78 | % |
| | | | | | | | | | | | | | | |
Long-Term Capital Gain | | $ | 0.094770 | | $ | 1.424000 | | | $ | 0.329860 | | | $ | 1.346600 | |
| | | | | | | | | | | | | | | |
Additionally, American Leading Companies and U.S. Small-Cap designate $99,149 and $410,534, respectively, paid in connection with the redemption of Fund shares as long-term capital gain dividends for the taxable year ended March 31, 2008.
Please retain this information for your records.
| | |
| 68 | | Annual Report to Shareholders |
Directors and Officers
The table below provides information about each of the Corporation’s directors and officers, including biographical information about their business experience and information about their relationships with Legg Mason, Inc. and its affiliates. The mailing address of each director and officer is 100 Light Street, Attn: Fund Secretary, 32nd Floor, Baltimore, Maryland 21202.
| | | | | | | | |
Name,
(Year of Birth)
and Position with
Corporation | | Term of
Office and
Length of
Time
ServedA | | Number of Funds
in Fund Complex
Overseen | | Other Directorships Held | | Principal Occupation(s) During the Past Five Years |
| INDEPENDENT DIRECTORSB : |
| | | | |
Hearn, Ruby P. (1940) Director | | Since 2004 | | 14 | | None | | Senior Vice President Emerita of The Robert Wood Johnson Foundation (non-profit) since 2001. Formerly: Senior Vice President of The Robert Wood Johnson Foundation (1996- 2001). |
| | | | |
Lehman, Arnold L. (1944) Lead Independent Director | | Since 1993 | | 14 | | None | | Director of the Brooklyn Museum since 1997; Trustee of American Federation of Arts since 1998. Formerly: Director of The Baltimore Museum of Art (1979-1997). |
| | | | |
Masters, Robin J.W. (1955) Director | | Since 2002 | | 14 | | Director of Cheyne Capital International Limited (investment advisory firm). Director/Trustee of Legg Mason Asian Funds plc, Legg Mason Institutional Funds plc, Western Asset Fixed Income Funds plc., and Western Asset Debt Securities Fund plc. | | Retired. Formerly: Chief Investment Officer of ACE Limited (insurance) (1986-2000). |
| | | | |
McGovern, Jill E. (1944) Director | | Since 1993 | | 14 | | None | | Senior Consultant, American Institute for Contemporary German Studies (AICGS) since 2007. Formerly: Chief Executive Officer of The Marrow Foundation (non-profit) (1993- 2007); Executive Director of the Baltimore International Festival (1991-1993); Senior Assistant to the President of The Johns Hopkins University (1986-1990). |
| | |
| Annual Report to Shareholders | | 69 |
| | | | | | | | |
Name,
(Year of Birth)
and Position with
Corporation | | Term of
Office and
Length of
Time
ServedA | | Number of Funds
in Fund Complex
Overseen | | Other Directorships Held | | Principal Occupation(s) During the Past Five Years |
Mehlman, Arthur S. (1942) Director | | Since 2002 | | Director/Trustee of all Legg Mason funds consisting of 14 portfolios; Director/Trustee of the Royce Family of Funds consisting of 27 portfolios. | | Director of Municipal Mortgage & Equity, LLC. | | Retired. Formerly: Partner, KPMG LLP (international accounting firm) (1972-2002). |
| | | | |
O’Brien, G. Peter (1945) Director | | Since 1999 | | Director/Trustee of all Legg Mason funds consisting of 14 portfolios; Director/Trustee of the Royce Family of Funds consisting of 27 portfolios. | | Director of Technology Investment Capital Corp. | | Retired. Trustee Emeritus of Colgate University; Board Member, Hill House, Inc. (residential home care); Board Member, Bridges School (pre- school). Formerly: Managing Director, Equity Capital Markets Group of Merrill Lynch & Co. (1971-1999). |
| | | | |
Rowan, S. Ford (1943) Director | | Since 2002 | | 14 | | None | | Chairman, National Center for Critical Incident Analysis, National Defense University, since 2004; Director of Santa Fe Institute (scientific research institute) since 1999. Formerly: Consultant, Rowan & Blewitt Inc. (management consulting) (1984-2007). |
| | | | |
Tarola, Robert M. (1950) Director | | Since 2004 | | 14 | | None | | Senior Vice President of W. R. Grace & Co. (specialty chemicals) since 1999. Member, Standing Advisory Group of the Public Company Accounting Oversight Board since 2007. Formerly: Chief Financial Officer of W. R. Grace & Co. (specialty chemicals) (1999-2008) and of MedStar Health, Inc. (healthcare) (1996-1999); Partner, Price Waterhouse, LLP (accounting and auditing) (1984-1996). |
|
| INTERESTED DIRECTORSC : |
| | | | |
Curley Jr., John F. (1939) Chairman and Director | | Since 1993 | | 14 | | None | | Chairman of the Board of all Legg Mason Funds. Formerly: Vice Chairman and Director of Legg Mason, Inc. and Legg Mason Wood Walker, Incorporated (1982-1998); Director of Legg Mason Fund Adviser, Inc. (1982-1998) and Western Asset Management Company (1986-1998) (each a registered investment adviser). |
| | |
| 70 | | Annual Report to Shareholders |
Directors and Officers — Continued
| | | | | | | | |
Name,
(Year of Birth)
and Position with
Corporation | | Term of
Office and
Length of
Time
ServedA | | Number of Funds
in Fund Complex
Overseen | | Other Directorships Held | | Principal Occupation(s) During the Past Five Years |
Fetting, Mark R. (1954) President and Director | | Since 2002 | | President and Director/Trustee of all Legg Mason funds consisting of 14 portfolios; Director/Trustee of the Royce Family of Funds consisting of 27 portfolios. | | None | | President, CEO and Director Legg Mason, Inc. since 2008. Formerly: Senior Executive Vice President of Legg Mason, Inc., Director and/or officer of various Legg Mason, Inc. affiliates (2000-2008). Division President and Senior Officer of Prudential Financial Group, Inc. and related companies, including fund boards and consulting services to subsidiary companies (1991-2000); Partner, Greenwich Associates (financial consulting); Vice President, T. Rowe Price Group, Inc. |
|
| EXECUTIVE OFFICERSD : |
| | | | |
Karpinski, Marie K. (1949) Vice President and Chief Financial Officer | | Since 1993 | | 14 | | None | | Vice President and Chief Financial Officer of all Legg Mason Funds. Vice President and Treasurer of Legg Mason Fund Adviser, Inc. Vice President and Principal Financial and Accounting Officer of Western Asset Funds, Inc., Western Asset Income Fund and Western Asset Premier Bond Fund; Treasurer and Principal Financial and Accounting Officer of Western Asset/Claymore Inflation- Linked Securities & Income Fund (2003-present), and Western Asset/Claymore Inflation-Linked Opportunities & Income Fund (2004-present). |
| | | | |
Merz, Gregory T. (1958) Vice President and Chief Legal Officer | | Since 2003 | | 14 | | None | | Vice President and Deputy General Counsel of Legg Mason, Inc. since 2003. Formerly: Associate General Counsel, Fidelity Investments (1993- 2002). |
| | | | |
Wachterman, Richard M. (1947) Secretary | | Since 2004 | | 14 | | None | | Associate General Counsel of Legg Mason, Inc. since 2004. Formerly: Managing Director, Victory Capital Management, Inc. (investment management) (1993-2003). |
| | |
| Annual Report to Shareholders | | 71 |
| | | | | | | | |
Name,
(Year of Birth)
and Position with
Corporation | | Term of
Office and
Length of
Time
ServedA | | Number of Funds
in Fund Complex
Overseen | | Other Directorships Held | | Principal Occupation(s) During the Past Five Years |
Becker, Ted P. (1951) Vice President and Chief Compliance Officer | | Since 2007 | | 14 | | None | | Director of Global Compliance at Legg Mason (2006 to present); Managing Director of Compliance at Legg Mason & Co. (2005 to present); Chief Compliance Officer with certain mutual funds associated with Legg Mason & Co. (since 2006); Chief Compliance Officer of Legg Mason Partners Funds and certain affiliates; Managing Director of Compliance at Citigroup Asset Management (2002 to 2005). Prior to 2002, Managing Director-Internal Audit & Risk Review at Citigroup Inc. |
| | | | |
Hughes, Wm. Shane (1968) Treasurer | | Since 2006 | | 11 | | None | | Assistant Vice President and Manager, Funds Accounting of Legg Mason & Co., LLC since 2005. Formerly: Assistant Vice President of Legg Mason Wood Walker, Incorporated (2002-2005) and Manager, Funds Accounting, Legg Mason Wood Walker, Incorporated (1997-2005). |
ADDITIONAL INFORMATION ABOUT THE CORPORATION’S DIRECTORS AND OFFICERS IS CONTAINED IN THE STATEMENT OF ADDITIONAL INFORMATION, AVAILABLE WITHOUT CHARGE UPON REQUEST BY CALLING 1-800-822-5544 OR ON THE SECURITIES AND EXCHANGE COMMISSION WEBSITE
(http://www.sec.gov).
A | Officers of the Corporation are elected annually to serve until their successors are elected and qualified. Directors of the Corporation serve a term of indefinite length until their retirement, in accordance with the Board’s retirement policy, resignation or removal, and stand for re-election by shareholders only as and when required by the 1940 Act. |
B | Each of the Independent Directors serves on the standing committees of the Board of Directors, which include the Audit Committee (chair: Arthur Mehlman), the Nominating Committee (co-chairs: Peter O’Brien and Jill McGovern), and the Independent Directors Committee (chair: Arnold Lehman). |
C | Mr. Curley and Mr. Fetting are considered to be interested persons, as defined in the 1940 Act, of the Corporation on the basis of their current or former employment with the Funds’ investment advisers or its affiliated entities (including the Funds’ principal underwriter) and Legg Mason, Inc., the parent holding company of these entities as well as their ownership of Legg Mason, Inc. stock. |
D | Officers of the Corporation are interested persons (as defined in the 1940 Act). |
| | |
| 72 | | Annual Report to Shareholders |
Board Consideration of Legg Mason American Leading Companies Trust’s Investment Advisory and Management Agreement
At its November 2007 meeting, the Board of Directors (the “Board”), including all of the Independent Directors, approved the continuation of the Investment Advisory and Management Agreement (the “Agreement”) between Legg Mason Capital Management, Inc. (the “Adviser”) and Legg Mason Investors Trust, Inc., on behalf of Legg Mason American Leading Companies Trust (“American Leading Companies”). In voting to approve the continuation of the Agreement, the Board considered whether continuance would be in the best interest of American Leading Companies and its shareholders, an evaluation largely based on the nature and quality of the services provided under the Agreement and the overall fairness of the Agreement to American Leading Companies. In considering the Agreement, the Board did not identify any single factor or item of information as all-important or controlling. Based on its evaluation of all material factors, including those described below, the Board concluded that the terms of the Agreement are reasonable and fair and that the continuation of the Agreement is in the best interest of American Leading Companies and its shareholders.
Prior to the Board action, the Independent Directors met as a committee to consider their recommendation as to continuance of the Agreement. As part of the process to consider the Agreement, legal counsel to American Leading Companies requested certain information from the Adviser on behalf of the Independent Directors, and in response, the Adviser provided an extensive report that addressed specific factors designed to inform the Board’s consideration of the Agreement. Counsel also provided the Independent Directors and the Board with a memorandum detailing their responsibilities pertaining to the continuance of the Agreement.
In addition to the November meeting, the Independent Directors meeting as a committee held an additional meeting in October 2007 at which they reviewed and analyzed materials relating to the Agreement. The Independent Directors also retained independent consultants to assist them in their review and analysis of the Agreement. The Board meets at least another three times per year in order to oversee the Legg Mason Funds, including meetings at which the portfolio manager of American Leading Companies or others submit or make presentations and discuss performance, compliance and other applicable issues. The Board also drew upon its long association with the Adviser and its personnel and the Board members’ familiarity with the Adviser’s culture and the manner in which it has sought to strengthen and enhance itself.
With respect to the nature, scope and quality of the services provided, the Board considered the experience and commitment of the Adviser’s personnel and its efforts to build and support a strong service team. The Board also considered the nature and quality of the Adviser’s investment process. In assessing performance, the Board compared American Leading Companies’ returns to the average of an appropriate Lipper category, a specified benchmark index and a peer group of investment
| | |
| Annual Report to Shareholders | | 73 |
companies pursuing similar strategies, all over multiple time periods. The Board noted American Leading Companies’ performance record and the measures that the Adviser was taking in an effort to achieve attractive long-term performance. The Board also considered the level of service provided by the Adviser and its affiliates to American Leading Companies, including oversight of the transfer agent and the custodian and preparation of regulatory filings. The Board considered the Adviser’s procedures for executing portfolio transactions for American Leading Companies. The Board also reviewed the Adviser’s report on its policies and procedures for the selection of brokers and dealers and on obtaining research from brokers.
In determining whether the terms of the Agreement are reasonable and fair, the Board considered the terms and fee structure of the Agreement. In that connection, the Board considered the costs to the Adviser in providing services to American Leading Companies and profitability for the Adviser and its affiliates from their overall association with American Leading Companies. The Board reviewed information about the advisory fee schedule and overall expense ratio of American Leading Companies and comparable fee schedules and expense ratios of a peer group of funds. In considering whether any economies of scale experienced by the Adviser in providing services to American Leading Companies were shared with American Leading Companies, the Board noted that American Leading Companies’ advisory fee structure provides for a reduction of the effective fee rate as asset levels increase and that the Adviser has voluntarily waived fees for American Leading Companies. Finally, the Board considered other benefits accruing to the Adviser and its affiliates by virtue of their relationship to American Leading Companies.
After an evaluation of all material factors, including those in the foregoing discussion, the Board concluded that the continuation of the Agreement is in the best interest of American Leading Companies.
| | |
| 74 | | Annual Report to Shareholders |
Board Consideration of Legg Mason U.S. Small-Capitalization Value Trust’s Investment Advisory Agreement and Management Agreement
At its November 2007 meeting, the Board of Directors (the “Board”), including all of the Independent Directors, approved the continuation of the Management Agreement between Legg Mason Fund Adviser, Inc. (the “Manager”) and Legg Mason Investors Trust, Inc., on behalf of Legg Mason U.S. Small-Capitalization Value Trust (“U.S. Small-Cap”), and the Investment Advisory Agreement between the Manager and Brandywine Global Investment Management, LLC (the “Adviser”) (each an “Agreement”). In voting to approve the continuation of each Agreement, the Board considered whether continuance would be in the best interest of U.S. Small-Cap and its shareholders, an evaluation largely based on the nature and quality of the services provided under each Agreement and the overall fairness of each Agreement to U.S. Small-Cap. In considering each Agreement, the Board did not identify any single factor or item of information as all-important or controlling. Based on its evaluation of all material factors, including those described below, the Board concluded that the terms of each Agreement are reasonable and fair and that the continuation of each Agreement is in the best interest of U.S. Small-Cap and its shareholders.
Prior to the Board action, the Independent Directors met as a committee to consider their recommendation as to continuance of each Agreement. As part of the process to consider each Agreement, legal counsel to U.S. Small-Cap requested certain information from the Manager and the Adviser on behalf of the Independent Directors, and in response, the Manager and the Adviser provided extensive reports that addressed specific factors designed to inform the Board’s consideration of each Agreement. Counsel also provided the Independent Directors and the Board with a memorandum detailing their responsibilities pertaining to the continuance of each Agreement.
In addition to the November meeting, the Independent Directors meeting as a committee held an additional meeting in October 2007 at which they reviewed and analyzed materials relating to each Agreement. The Independent Directors also retained independent consultants to assist them in their review and analysis of each Agreement. The Board meets at least another three times per year in order to oversee the Legg Mason Funds, including meetings at which the portfolio managers of U.S. Small-Cap or others submit or make presentations and discuss performance, compliance and other applicable issues. The Board also drew upon its long association with the Manager, the Adviser and their personnel and the Board members’ familiarity with their culture and the manner in which the management entities have sought to strengthen and enhance themselves.
With respect to the nature, scope and quality of the services provided, the Board considered the experience and commitment of the Manager’s and the Adviser’s personnel and their efforts to build and support a strong service team. The Board also considered the nature and quality of the Adviser’s investment process. In assessing
| | |
| Annual Report to Shareholders | | 75 |
performance, the Board compared U.S. Small-Cap’s returns to the average of an appropriate Lipper category, a specified benchmark index and a peer group of investment companies pursuing similar strategies, all over multiple time periods. The Board noted U.S. Small-Cap’s performance record and the measures that the Manager and the Adviser were taking in an effort to achieve attractive long-term performance. The Board also considered the level of service provided by the Manager to U.S. Small-Cap, including oversight of the transfer agent and the custodian and preparation of regulatory filings. The Board considered the Adviser’s procedures for executing portfolio transactions for U.S. Small-Cap. The Board also reviewed the Adviser’s report on its policies and procedures for the selection of brokers and dealers and on obtaining research from brokers.
In determining whether the terms of each Agreement are reasonable and fair, the Board considered the terms and fee structure of each Agreement. In that connection, the Board considered the costs to the Manager and the Adviser in providing services to U.S. Small-Cap and profitability for the Manager and its affiliates from their overall association with U.S. Small-Cap. The Board reviewed information about the advisory fee schedule and overall expense ratio of U.S. Small-Cap and comparable fee schedules and expense ratios of a peer group of funds. In considering whether any economies of scale experienced by the Manager and the Adviser in providing services to U.S. Small-Cap were shared with U.S. Small-Cap, the Board noted that U.S. Small-Cap’s advisory fee structure provides for a reduction of the effective fee rate as asset levels increase and that the Manager has voluntarily waived fees for U.S. Small Cap. The Board also compared U.S. Small-Cap’s advisory fee schedule to the advisory fees charged by the Manager and the Adviser to their other accounts managed in a similar style. In that connection, the Board considered the differences in the level of services provided and the differences in responsibility of the Manager and the Adviser to U.S. Small-Cap and to the other accounts. Finally, the Board considered other benefits accruing to the Manager, the Adviser and their affiliates by virtue of their relationship to U.S. Small-Cap.
After an evaluation of all material factors, including those in the foregoing discussion, the Board concluded that the continuation of each Agreement is in the best interest of U.S. Small-Cap.
| | |
| 76 | | Annual Report to Shareholders |
Glossary of Index Definitions
Dow Jones Industrial Average — A total return price-weighted average based on the price movements of 30 blue chip stocks, computed by reinvesting quarterly dividends on a monthly basis.
Dow Jones Wilshire 5000 Index — A market capitalization-weighted index composed of over 5,000 equity securities for companies considered by the investment community to be U.S. companies, and is generally considered representative of the U.S. equity market.
NASDAQ Composite Index — A market capitalization price-only index that tracks the performance of domestic common stocks traded on the regular NASDAQ market, as well as National Market System traded foreign common stocks and ADRs.
Russell 1000 Index — Measures the performance of the 1,000 largest companies in the Russell 3000 Index, which represents approximately 92% of the total market capitalization of the Russell 3000 Index.
Russell 1000 Growth Index — Measures the performance of those Russell 1000 companies with higher price-to-book ratios and higher forecasted growth values.
Russell 1000 Value Index — Measures the performance of those Russell 1000 companies with lower price-to-book ratios and lower forecasted growth values.
Russell 2000 Index — An unmanaged index comprised of the 2,000 smallest companies of the 3,000 largest U.S. companies based on market capitalization.
Russell 2000 Value Index — Measures the performance of those Russell 2000 companies with lower price-to-book ratios and lower forecasted growth values.
Russell 2500 Index — The Russell 2500 Index offers investors access to the small to mid-cap segment of the U.S. equity universe, commonly referred to as “smid” cap. The Russell 2500 is constructed to provide a comprehensive and unbiased barometer for the small to mid-cap segment and is completely reconstituted annually to ensure larger stocks do not distort the performance and characteristics of the true small to mid-cap opportunity set. The Russell 2500 includes the smallest 2500 securities in the Russell 3000.
Russell 2500 Value Index — The Russell 2500 Value Index offers investors access to the small to mid-cap value segment of the U.S. equity universe. The Russell 2500 Value is constructed to provide a comprehensive and unbiased barometer of the small to mid-cap value market. Based on ongoing empirical research of investment manager behavior, the methodology used to determine value probability approximates the aggregate small to mid-cap value manager’s opportunity set.
Russell Midcap Index — The Russell Midcap Index measures the performance of the 800 smallest companies in the Russell 1000 Index, as ranked by total market capitalization, which represents approximately 35% of the total market capitalization of the Russell 1000 Index.
Russell Midcap Value Index — The Russell Midcap Value Index offers investors access to the mid-cap value segment of the U.S. equity universe. The Russell Midcap Value Index is constructed to provide a comprehensive and unbiased barometer of the mid-cap value market. Based on ongoing empirical research of investment manager behavior, the methodology used to determine value probability approximates the aggregate mid-cap value manager’s opportunity set.
| | |
| Annual Report to Shareholders | | 77 |
S&P 500 Stock Composite Index — A market capitalization-weighted index, composed of 500 widely held common stocks, that is generally considered representative of the U.S. stock market.
S&P Mid-Cap 400 Index — A market capitalization-weighted index, composed of 400 stocks, that is generally considered representative of mid-sized U.S. companies.
Notes
Fund Information
Investment Managers
For American Leading Companies Trust:
Legg Mason Capital Management, Inc.
Baltimore, MD
For U.S. Small-Cap Value Trust:
Legg Mason Fund Adviser, Inc.
Baltimore, MD
Investment Advisers
For American Leading Companies Trust:
Legg Mason Capital Management, Inc.
Baltimore, MD
For U.S. Small-Cap Value Trust:
Brandywine Global Investment Management, LLC
Philadelphia, PA
Board of Directors
John F. Curley, Jr., Chairman
Mark R. Fetting, President
Dr. Ruby P. Hearn
Arnold L. Lehman
Robin J.W. Masters
Dr. Jill E. McGovern
Arthur S. Mehlman
G. Peter O’Brien
S. Ford Rowan
Robert M. Tarola
Officers
Marie K. Karpinski, Vice President and Chief Financial Officer
Gregory T. Merz, Vice President and Chief Legal Officer
Ted P. Becker, Vice President and Chief Compliance Officer
Wm. Shane Hughes, Treasurer
Susan C. Curry, Assistant Treasurer
William S. Kirby, Assistant Treasurer
Richard M. Wachterman, Secretary
Peter J. Ciliberti, Assistant Secretary
Transfer and Shareholder Servicing Agent
Boston Financial Data Services
Braintree, MA
Custodian
State Street Bank & Trust Company
Boston, MA
Counsel
Kirkpatrick & Lockhart Preston Gates Ellis LLP
Washington, DC
Independent Registered Public Accounting Firm
PricewaterhouseCoopers LLP
Baltimore, MD
About the Legg Mason Funds
| | |
Equity Funds American Leading Companies Trust Classic Valuation Fund Growth Trust Special Investment Trust U.S. Small-Capitalization Value Trust Value Trust Specialty Fund Opportunity Trust Global Funds Emerging Markets Trust International Equity Trust Taxable Bond Funds Investment Grade Income Portfolio Limited Duration Bond Portfolio Tax-Free Bond Fund Maryland Tax-Free Income Trust | | Legg Mason, Inc., based in Baltimore, Maryland, has built its reputation, at least in part, on the success of the Legg Mason Funds, introduced in 1979. The primary purpose of our funds is to enable investors to diversify their portfolios across various asset classes and, consequently, enjoy the stability and growth prospects generally associated with diversification. |
| | The success of our funds is contingent on the experience, discipline, and acumen of our fund managers. We believe the quality of our managers is crucial to investment success. Unlike many firms, which focus on a particular asset class or the fluctuations of the market, at Legg Mason we focus on providing a collection of top-notch managers in all the major asset classes. |
| | Information about the policies and procedures that each Fund uses to determine how to vote proxies relating to its portfolio securities is contained in the Statement of Additional Information, available without charge upon request by calling 1-800-822-5544 or on the Securities and Exchange Commission’s (“SEC”) website (http://www.sec.gov). Information regarding how each Fund voted proxies relating to portfolio securities during the most recent twelve-month period ended June 30 is also available on the SEC’s website or through the Legg Mason Funds’ website at www.leggmason.com/individualinvestors. |
| | Each Fund files a complete schedule of portfolio holdings with the SEC for the first and third quarters of each fiscal year on Form N-Q. You may obtain a free copy of each Fund’s portfolio holdings as filed on Form N-Q, by contacting each Fund at the appropriate phone number, address or website listed below. Additionally, each Fund’s Form N-Q is available on the SEC’s website (http://www.sec.gov) or may be reviewed and copied at the SEC’s Public Reference Room in Washington, DC. Information about the operation of the Public Reference Room may be obtained by calling 1-800-SEC-0330. |
This report must be preceded or accompanied by a free prospectus. Investors should consider each Fund’s investment objectives, risks, charges, and expenses carefully before investing. The prospectus contains this and other important information about each Fund. For a free prospectus for this or any other Legg Mason Fund, visit www.leggmason.com/individualinvestors. Please read the prospectus carefully before investing.
| | |
| Legg Mason Funds | | Legg Mason Investor Services-Institutional |
| For Primary Class Shareholders | | For R, FI and I Class Shareholders |
| c/o BFDS | | c/o BFDS, P.O. Box 8037 |
| P.O. Box 55214 | | Boston, MA 02206-8037 |
| Boston, MA 02205-8504 | | 888-425-6432 |
| 800-822-5544 | | www.lminstitutionalfunds.com |
| www.leggmason.com/individualinvestors | | |
| | | | |
| Legg Mason Investor Services, LLC, Distributor | |  |
| A Legg Mason, Inc. Subsidiary | |
| LMF-013/A (05/08) TN08-2138 | |
| Item 2. | Code of Ethics Applicable to Registrant’s Principal Executive Officer and Principal Financial Officer |
| | (a) | Legg Mason Investors Trust, Inc. (“Registrant”) has adopted a Code of Ethics, as defined in the instructions to Form N-CSR that applies to the Registrant’s President and Treasurer, which is designed to deter wrongdoing and to promote: |
| | • | | Honest and ethical conduct, including the ethical handling of actual or apparent conflicts of interest between personal and professional relationships; |
Page 1 of 5
| | • | | Full, fair, accurate, timely and understandable disclosure in reports and documents the Registrant files with, or submits to, the SEC or in other public communications made by the Registrant; |
| | • | | Compliance with applicable governmental laws, rules and regulations; |
| | • | | Prompt internal reporting of violations of the Code of Ethics to an appropriate person or persons identified in the Code of Ethics; and |
| | • | | Accountability for adherence to the Code of Ethics. |
| | (d) | The Registrant has not granted a waiver, including an implicit waiver, from a provision of the Code of Ethics to the Registrant’s principal executive officer, principal financial officer, principal accounting officer or controller, or persons performing similar functions during the period covered by this report. |
| | (f) | A copy of the Code of Ethics is attached as Exhibit 12(a)(1) to this Form N-CSR. |
| Item 3. | Audit Committee Financial Expert |
| | | | |
| (a) | | (1) | | The Registrant’s Board of Directors have determined that the Registrant has at least one Audit Committee financial expert serving on its Audit Committee. |
| (a) | | (2) | | The Audit Committee’s financial experts are Mr. Arthur S. Mehlman and Mr. Robert M. Tarola. They are “independent” as defined in Form N-CSR Item 3(a)(2). |
| Item 4. | Principal Accounting Fees and Services |
| | | | |
| (a) | | Audit Fees |
| |
| | PricewaterhouseCoopers LLP |
| |
| | Fiscal Year Ended March 31, 2007 – $55,200 |
| |
| | Fiscal Year Ended March 31, 2008 – $50,060 |
Page 2 of 5
| | | | |
| (b) | | Audit-Related Fees |
| |
| | There were no additional fees billed to the Registrant during either of the last two fiscal years in addition to those disclosed in Item 4(a). |
| |
| | There were no fees billed to the Registrant for assurance and related services that required preapproval by the Audit Committee pursuant to paragraph (c)(7)(ii) of Rule 2-01 of Regulation S-X during the Registrant’s last two fiscal years. |
| |
| (c) | | Tax Fees |
| |
| | PricewaterhouseCoopers LLP |
| |
| | Fiscal Year Ended March 31, 2007 – $4,400 |
| |
| | Fiscal Year Ended March 31, 2008 – $4,800 |
| |
| | Services include preparation of federal and state income tax returns and preparation of excise tax returns. |
| |
| | There were no fees billed to the Registrant for tax services that required preapproval by the Audit Committee pursuant to paragraph (c)(7)(ii) of Rule 2-01 of Regulation S-X during the Registrant’s last two fiscal years. |
| |
| (d) | | All Other Fees |
| |
| | There were no fees billed to the Registrant during either of the last two fiscal years in addition to those disclosed in Item 4(a) through Item 4(c) above. |
| |
| | There were no fees billed to the Registrant for services not included in Items 4(a) through 4(c) above that required preapproval by the Audit Committee pursuant to paragraph (c)(7)(ii) of Rule 2-01 of Regulation S-X during the Registrant’s last two fiscal years. |
| | |
| (e) | | (1) | | The Audit Committee’s policy is to delegate to its chairperson the authority to preapprove items prior to the next meeting of the Committee. Such preapprovals are reported at the next quarterly meeting of the Audit Committee. |
| | |
| | (2) | | There were no services provided to the Registrant that were approved by the Audit Committee pursuant to paragraph (c)(7)(i)(C) of Rule 2-01 of Regulation S-X. |
Page 3 of 5
| | | | |
| |
| | There were no fees billed to the Registrant for services where pre-approval by the Audit Committee pursuant to paragraph (c)(7)(i)(C) of Rule 2-01 of Regulation S-X during the Registrant’s last two fiscal years. |
| |
| (f) | | The percentage of hours expended by the principal accountant’s engagement to audit the Registrant’s financial statements for the most recent fiscal year that were attributed to work performed by persons other than the principal accountants’ full-time, permanent employees was zero. |
| |
| (g) | | Non-Audit Fees for services rendered to Registrant or Registrant’s investment manager and any entity controlling, controlled by, or under common control with the investment manager. |
| |
| | PricewaterhouseCoopers LLP |
| |
| | Fiscal Year Ended March 31, 2007 – $953,316 |
| |
| | Fiscal Year Ended March 31, 2008 – $1,249,000 |
| |
| (h) | | The members of the Registrant’s Audit Committee have considered whether the non-audit services that were rendered by the Registrant’s principal accountant to the Registrant’s investment adviser and any entity controlling, controlled by, or under common control with the investment adviser that provides ongoing services to the Registrant that were not pre-approved pursuant to paragraph (c)(7)(ii) of Rule 2-01 of Regulation S-X are compatible with maintaining the principal accountant’s independence. |
| Item 5. | Audit Committee of Listed Registrants |
The Registrant is not a listed issuer as defined in Rule 10A-3 under the Securities Exchange Act of 1934.
| Item 6. | Schedule of Investments |
The schedule of investments in securities of unaffiliated issuers is included in the annual report.
| Item 7. | Disclosure of Proxy Voting Policies and Procedures for Closed-End Management Investment Companies |
Not applicable.
| Item 8. | Portfolio Managers of Closed-End Management Investment Companies |
Not applicable.
Page 4 of 5
| Item 9. | Purchases of Equity Securities by Closed-End Management Investment Companies and Affiliated Purchasers |
Not applicable.
| Item 10. | Submission of Matters to a Vote of Security Holders |
The Nominating Committee will accept recommendations for nominations from shareholders. Shareholders may forward recommendations to the Legal Compliance Department at 100 Light Street, 32nd Floor, Baltimore, Maryland 21202, Attn.: Fund Secretary.
| Item 11. | Controls and Procedures |
| | (a) | The Registrant’s principal executive and principal financial officers have concluded, based on their evaluation of the effectiveness of the design and operation of the Registrant’s disclosure controls and procedures (as defined in Rule 30a-3(c) under the Investment Company Act of 1940) as of a date within 90 days of the filing date of this report, that the Registrant’s disclosure controls and procedures are reasonably designed to ensure that information required to be disclosed by the Registrant on Form N-CSR is recorded, processed, summarized and reported within the time periods specified in the SEC’s rule and forms and that information required to be disclosed by the Registrant in the reports that it files or submits on Form N-CSR is accumulated and communicated to the Registrant’s management, including its principal executive and principal financial officers, as appropriate to allow timely decisions regarding required disclosure. |
| | (b) | There were no changes in the Registrant’s internal control over financial reporting (as defined in Rule 30a-3(d) under the Investment Company Act of 1940) during the Registrant’s second fiscal quarter of the period covered by this report that have materially affected, or are reasonably likely to materially affect, the Registrant’s internal control over financial reporting. |
| | (a) | File the exhibits listed below as part of this Form. |
| | (1) | The Registrant’s Code of Ethics applicable to Registrant’s principal executive officer and principal financial officer is attached hereto. |
| | (2) | Separate certifications for the Registrant’s chief executive officer and chief financial officer as required by Rule 30a-2(a) under the Investment Company Act of 1940 are attached hereto. |
| | (b) | Separate certifications for the Registrant’s chief executive officer and chief financial officer pursuant to Section 906 of the Sarbanes-Oxley Act of 2002 are attached hereto. |
Page 5 of 5
SIGNATURES
Pursuant to the requirements of the Securities Exchange Act of 1934 and the Investment Company Act of 1940, the Registrant has duly caused this report to be signed on its behalf by the undersigned, thereunto duly authorized.
| | |
| Legg Mason Investors Trust, Inc. |
| |
| By: | | /s/ Mark R. Fetting |
| Mark R. Fetting |
| President, Legg Mason Investors Trust, Inc. |
| Date: June 5, 2008 |
Pursuant to the requirements of the Securities Exchange Act of 1934 and the Investment Company Act of 1940, this report has been signed below by the following persons on behalf of the Registrant and in the capacities and on the dates indicated.
| | |
| By: | | /s/ Mark R. Fetting |
| Mark R. Fetting |
| President, Legg Mason Investors Trust, Inc. |
| Date: June 5, 2008 |
| | |
| By: | | /s/ Marie K. Karpinski |
| Marie K. Karpinski |
Vice President and Chief Financial Officer, Legg Mason Investors Trust, Inc. |
| Date: June 5, 2008 |